UNITED STATES
SECURITIES AND EXCHANGE COMMISSION
WASHINGTON, D.C. 20549
FORM N-CSR
CERTIFIED SHAREHOLDER REPORT OF REGISTERED
MANAGEMENT INVESTMENT COMPANIES
Investment Company Act file number 811-5724
Oppenheimer Global Strategic Income Fund
(Exact name of registrant as specified in charter)
6803 South Tucson Way, Centennial, Colorado 80112-3924
(Address of principal executive offices) (Zip code)
Arthur S. Gabinet
OppenheimerFunds, Inc.
Two World Financial Center, New York, New York 10281-1008
(Name and address of agent for service)
Registrant’s telephone number, including area code: (303) 768-3200
Date of fiscal year end: September 30
Date of reporting period: 9/28/2012
Item 1. Reports to Stockholders.
ANNUAL REPORT
Oppenheimer Global Strategic Income Fund

Table of Contents
Class A Shares
AVERAGE ANNUAL TOTAL RETURNS AT 9/28/12
| | | | | | | | | | | | | | | | |
| | | Class A Shares of the Fund
| | | Barclays
Capital U.S.
Aggregate
Bond Index | | | Citigroup
World
Government
Bond Index | |
| | | Without Sales Charge | | | With Sales Charge | | | | | | | |
| 1-Year | | | 12.61 | % | | | 7.26 | % | | | 5.16 | % | | | 3.29 | % |
| 5-Year | | | 6.10 | | | | 5.07 | | | | 6.53 | | | | 6.45 | |
| 10-Year | | | 8.27 | | | | 7.74 | | | | 5.32 | | | | 6.71 | |
The performance data quoted represents past performance, which does not guarantee future results. The investment return and principal value of an investment in the Fund will fluctuate so that an investor’s shares, when redeemed, may be worth more or less than their original cost. Fund returns include changes in share price, reinvested distributions, and a 4.75% maximum applicable sales charge except where “without sales charge” is indicated. Returns do not consider capital gains or income taxes on an individual’s investment.
September 28, 2012 was the last business day of the Fund’s fiscal year. See Note 1 of the accompanying Notes to Financial Statements. Index returns are calculated through September 30, 2012.
Fund Performance Discussion
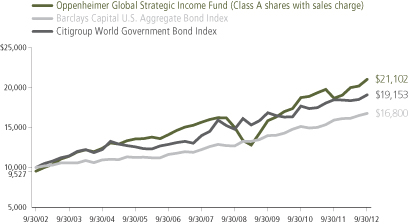
The Fund’s Class A shares (without sales charge) returned 12.61% during the period, outperforming the Barclays Capital U.S. Aggregate Bond Index and the Citigroup World Government Bond Index, which returned 5.16% and 3.29%, respectively. We are particularly pleased that the Fund achieved these results in a volatile market environment, in which investor sentiment shifted along with headlines about an erratic U.S. economic recovery, Europe’s debt crisis and China’s economic slowdown.
MARKET OVERVIEW
The reporting period began in the aftermath of a challenging time in global financial markets. Credit rating agency Standard & Poor’s downgrade of U.S. government debt securities, the intensification of Europe’s difficulties, and the dampening economic effects of inflation-fighting measures in China had triggered steep declines in riskier market segments, including emerging-markets bonds and U.S. high yield securities. In contrast, traditional safe havens, such as
U.S. Treasury securities and German bunds, gained substantial value. Fortunately, better macroeconomic news emerged in October 2011. A declining U.S. unemployment rate, the announcement of credible measures to prevent further deterioration in Europe’s banking system, and a moderation of inflation in China helped assuage investors’ fears, and global financial markets stabilized over the final months of 2011.
COMPARISON OF CHANGE IN VALUE OF $10,000 HYPOTHETICAL INVESTMENTS IN:
| | | | |
| OPPENHEIMER GLOBAL STRATEGIC INCOME FUND | | | 1 | |
Improving macroeconomic conditions gained traction during the first quarter of 2012. The U.S. economy began to produce impressive numbers of new jobs, and the European Central Bank launched dual Long-Term Refinancing Operations to shore up the region’s banking system. Meanwhile, China appeared ready to relax some of its restrictive policies. However, these hopeful developments were dashed in the spring, when U.S. employment gains moderated and some European nations resisted austerity measures. Consequently, riskier parts of the global bond market gave back some of their previous gains.
In an attempt to stimulate growth, central banks in the United States and Europe announced new policy measures over the summer. The Federal Reserve embarked on a third round of quantitative easing (QE3), and the European Central Bank signaled its commitment to purchase massive amounts of debt from troubled members of the European Union. Australia, China and Brazil were also among the major central banks in easing mode during this time.
In this environment, U.S. high yield bonds continued to post attractive results as corporate earnings remained robust and default rates low. To a lesser extent, U.S. government securities also fared well when the Federal Reserve’s aggressively accommodative policies kept interest rates low. Meanwhile, residential mortgage-backed securities (RMBS) benefited from low prepayment rates, and commercial mortgage-backed securities (CMBS) responded well to
robust demand from investors searching for competitively high levels of income.
In international markets, sovereign bonds from the emerging markets rebounded strongly as economic concerns eased in China, Brazil and elsewhere, and an improved economic outlook buoyed corporate bonds in markets such as Russia and China. With a few exceptions, currency investments generally produced flat returns for U.S. residents, masking heightened levels of short-term volatility.
FUND PERFORMANCE
The Fund’s exposure to emerging markets bonds and positive security selection contributed positively to performance this period. High yield bonds in Venezuela and Indonesia fared well, as did high-grade corporate-backed bonds in Russia. In developed markets, the Fund scored successes with sovereign bonds in Italy, the United Kingdom and Australia. Covered bonds in Europe also gained value, prompting us to lock in profits by eliminating the Fund’s position at richer valuations. However, currency investments generally produced mixed results as interest rates fell.
Among the Fund’s U.S. holdings, investments in high yield bonds produced positive returns for the Fund overall. Senior loans also produced positive results for the Fund, although they trailed their high yield counterparts. In high grade, the Fund’s exposure to mortgage backed obligations, including RMBS, CMBS and asset-backed securities (ABS), at the
| | |
| 2 | | OPPENHEIMER GLOBAL STRATEGIC INCOME FUND |
expense of government debt, helped returns during the period. We believed that if there were another round of quantitative easing, the Fed might direct its buying efforts toward the mortgage market. This view proved to be correct. After the Fed announced it would buy $40 billion of mortgage-backed securities monthly until further notice, spreads compressed, valuations climbed and our positioning in mortgages made a strong contribution to performance.
The Fund’s interest-rate strategies detracted mildly from relative performance, as we maintained its average duration in a range we considered shorter than market averages. This position was designed to protect the Fund from the risk that interest rates might climb.
STRATEGY & OUTLOOK
As of the reporting period’s end, we have maintained a generally constructive investment posture. We have maintained the Fund’s emphasis on bonds where, in our judgment, relative values are attractive, including the emerging markets, U.S. government agency securities and senior
bank loans. We remain comfortable with our positioning in senior loans and view the risk/reward tradeoff in the asset class as attractive at period end. We also like credit and maintain a sizeable high yield allocation. We previously hedged some of our high yield positions, and at period end are slowly reducing those hedges. Future macroeconomic conditions will help us determine whether to further reduce these hedges. We have kept the Fund’s average duration in a relatively short position as interest rates appear more likely to rise from current levels than to decline and maintain an underweight exposure to foreign currencies.
We are encouraged by evidence of improving fundamentals in domestic and international economies. In the United States, the unemployment rate has declined and the housing market has shown signs of improvement. Overseas, China appears to have engineered an economic “soft landing,” and Europe seems to have averted a collapse of the euro. While it will take time to resolve Europe’s structural problems, we believe policymakers appear to be on the right track.
| | |
 | |  Arthur P. Steinmetz Portfolio Manager |
| | |
 | |  Krishna Memani Portfolio Manager |
| | |
 | |  Joseph Welsh Portfolio Manager |
| | |
 | |  Sara J. Zervos, Ph.D. Portfolio Manager |
| | | | |
| OPPENHEIMER GLOBAL STRATEGIC INCOME FUND | | | 3 | |
Top Holdings and Allocations*
| | | | |
CORPORATE BONDS & NOTES—TOP
TEN INDUSTRIES | |
| Oil, Gas & Consumable Fuels | | | 5.0 | % |
| Commercial Banks | | | 2.8 | |
| Media | | | 1.9 | |
| Electric Utilities | | | 1.5 | |
| Hotels, Restaurants & Leisure | | | 1.4 | |
| Wireless Telecommunication Services | | | 1.4 | |
| Diversified Telecommunication Services | | | 1.1 | |
| Aerospace & Defense | | | 0.8 | |
| Capital Markets | | | 0.8 | |
| Machinery | | | 0.7 | |
Portfolio holdings and allocations are subject to change. Percentages are as of September 28, 2012, and are based on net assets.
| | | | |
| PORTFOLIO ALLOCATION | |
| Mortgage-Backed Obligations | | | 28.9 | % |
| Corporate Bonds and Notes | | | 25.1 | |
| Foreign Government Obligations | | | 23.6 | |
| Domestic Fixed Income Funds | | | 10.5 | |
| U.S. Government Obligations | | | 3.0 | |
| Asset-Backed Securities | | | 2.3 | |
| Structured Securities | | | 2.3 | |
| Alternative Fund | | | 1.6 | |
| Corporate Loans | | | 1.3 | |
| Money Market Fund | | | 0.7 | |
| Swaptions Purchased | | | 0.3 | |
| Options Purchased | | | 0.2 | |
| Common Stocks | | | 0.1 | |
| Preferred Stocks | | | 0.1 | |
| Wholly-Owned Subsidiary | | | | * |
| Rights, Warrants and Certificates | | | | * |
*Represents a value of less than 0.05%.
Portfolio holdings and allocations are subject to change. Percentages are as of September 28, 2012, and are based on the total market value of investments. The Fund may invest without limit in below investment-grade securities, which carry a greater risk that the issue may default on principal or interest payments, and in foreign securities, which entail higher expenses and risks, such as currency fluctuation.
*September 28, 2012 was the last business day of the Fund’s fiscal year. See Note 1 of the accompanying Notes to Financial Statements.
| | |
| 4 | | OPPENHEIMER GLOBAL STRATEGIC INCOME FUND |
Share Class Performance
AVERAGE ANNUAL RETURNS WITHOUT SALES CHARGE
| | | | | | | | | | | | | | | | |
| | | Inception Date | | | 1-Year | | | 5-Year | | | 10-Year | |
| CLASS A (OPSIX) | | | 10/16/89 | | | | 12.61 | % | | | 6.10 | % | | | 8.27 | % |
| CLASS B (OPSGX) | | | 11/30/92 | | | | 11.84 | % | | | 5.20 | % | | | 7.77 | % |
| CLASS C (OSICX) | | | 5/26/95 | | | | 12.05 | % | | | 5.35 | % | | | 7.46 | % |
| CLASS I (OSIIX) | | | 1/27/12 | | | | N/A | | | | N/A | | | | 7.23 | %* |
| CLASS N (OSINX) | | | 3/1/01 | | | | 12.42 | % | | | 5.70 | % | | | 7.81 | % |
| CLASS Y (OSIYX) | | | 1/26/98 | | | | 12.82 | % | | | 6.39 | % | | | 8.47 | % |
|
AVERAGE ANNUAL RETURNS WITH SALES CHARGE | |
| | | Inception Date | | | 1-Year | | | 5-Year | | | 10-Year | |
| CLASS A (OPSIX) | | | 10/16/89 | | | | 7.26 | % | | | 5.07 | % | | | 7.74 | % |
| CLASS B (OPSGX) | | | 11/30/92 | | | | 6.84 | % | | | 4.88 | % | | | 7.77 | % |
| CLASS C (OSICX) | | | 5/26/95 | | | | 11.05 | % | | | 5.35 | % | | | 7.46 | % |
| CLASS I (OSIIX) | | | 1/27/12 | | | | N/A | | | | N/A | | | | 7.23 | %* |
| CLASS N (OSINX) | | | 3/1/01 | | | | 11.42 | % | | | 5.70 | % | | | 7.81 | % |
| CLASS Y (OSIYX) | | | 1/26/98 | | | | 12.82 | % | | | 6.39 | % | | | 8.47 | % |
| *Shows performance since inception. | | | | | | | | | | | | |
| | | | |
| STANDARDIZED YIELDS | | | | | | | | | | | | |
| For the 30 Days Ended 9/28/12 | | | | | | | | | | | | | | | | |
| CLASS A | | | | | | | 4.22 | % | | | | | | | | |
| CLASS B | | | | | | | 3.51 | % | | | | | | | | |
| CLASS C | | | | | | | 3.67 | % | | | | | | | | |
| CLASS I | | | | | | | 4.80 | % | | | | | | | | |
| CLASS N | | | | | | | 4.04 | % | | | | | | | | |
| CLASS Y | | | | | | | 4.59 | % | | | | | | | | |
The performance data quoted represents past performance, which does not guarantee future results. The investment return and principal value of an investment in the Fund will fluctuate so that an investor’s shares, when redeemed, may be worth more or less than their original cost. Current performance may be lower or higher than the performance quoted. Returns do not consider capital gains or income taxes on an individual’s investment. For performance data current to the most recent month-end, visit oppenheimerfunds.com or call 1.800.CALL OPP (225.5677). Fund returns include changes in share price, reinvested distributions, and the applicable sales charge (unless
| | | | |
| OPPENHEIMER GLOBAL STRATEGIC INCOME FUND | | | 5 | |
otherwise indicated): for Class A shares, the current maximum initial sales charge of
4.75%; for Class B shares, the contingent deferred sales charge of 5% (1-year) and 2% (5-year); and for Class C and N shares, the contingent deferred sales charge of 1% for the 1-year period. There is no sales charge for Class I and Class Y shares. Because Class B shares convert to Class A shares 72 months after purchase, the 10-year return for Class B shares uses Class A performance for the period after conversion.
Standardized yield is based on net investment income for the 30-day period ended 9/28/12 and the maximum offering price at the end of the period for Class A shares and the net asset value for Class B, Class C, Class I, Class N and Class Y shares. Each result is compounded semiannually and then annualized. Falling share prices will tend to artificially raise yields.
The Fund’s performance is compared to the performance of the Barclays Capital U.S. Aggregate Bond Index, an index of U.S. corporate and government bonds, and the Citigroup World Government Bond Index, an index of debt securities of major foreign government bond markets. The indices are unmanaged and cannot be purchased directly by investors. Index performance is shown for illustrative purposes only and does not predict or depict the performance of the Fund. While index comparisons may be useful to provide a benchmark for the Fund’s performance, it must be noted that the Fund’s investments are not limited to the securities comprising the indices.
The Fund’s investment strategy and focus can change over time. The mention of specific fund holdings does not constitute a recommendation by OppenheimerFunds, Inc.
Before investing in any of the Oppenheimer funds, investors should carefully consider a fund’s investment objectives, risks, charges and expenses. Fund prospectuses and summary prospectuses contain this and other information about the funds, and may be obtained by asking your financial advisor, visiting oppenheimerfunds.com, or calling 1.800.CALL OPP (225.5677). Read prospectuses and summary prospectuses carefully before investing.
Shares of Oppenheimer funds are not deposits or obligations of any bank, are not guaranteed by any bank, are not insured by the FDIC or any other agency, and involve investment risks, including the possible loss of the principal amount invested.
| | |
| 6 | | OPPENHEIMER GLOBAL STRATEGIC INCOME FUND |
Fund Expenses
Fund Expenses. As a shareholder of the Fund, you incur two types of costs: (1) transaction costs, which may include sales charges (loads) on purchase payments, contingent deferred sales charges on redemptions and (2) ongoing costs, including management fees; distribution and service fees; and other Fund expenses. These examples are intended to help you understand your ongoing costs (in dollars) of investing in the Fund and to compare these costs with the ongoing costs of investing in other mutual funds.
The examples are based on an investment of $1,000.00 invested at the beginning of the period and held for the entire 6-month period ended September 28, 2012.
Actual Expenses. The first section of the table provides information about actual account values and actual expenses. You may use the information in this section for the class of shares you hold, together with the amount you invested, to estimate the expense that you paid over the period. Simply divide your account value by $1,000.00 (for example, an $8,600.00 account value divided by $1,000.00 = 8.60), then multiply the result by the number in the first section under the heading entitled “Expenses Paid During Period” to estimate the expenses you paid on your account during this period.
Hypothetical Example for Comparison Purposes. The second section of the table provides information about hypothetical account values and hypothetical expenses based on the Fund’s actual expense ratio for each class of shares, and an assumed rate of return of 5% per year for each class before expenses, which is not the actual return. The hypothetical account values and expenses may not be used to estimate the actual ending account balance or expenses you paid for the period. You may use this information to compare the ongoing costs of investing in the Fund and other funds. To do so, compare this 5% hypothetical example for the class of shares you hold with the 5% hypothetical examples that appear in the shareholder reports of the other funds.
Please note that the expenses shown in the table are meant to highlight your ongoing costs only and do not reflect any transactional costs, such as front-end or contingent deferred sales charges (loads), or a $12.00 fee imposed annually on accounts valued at less than $500.00 (subject to exceptions described in the Statement of Additional Information). Therefore, the “hypothetical” section of the table is useful in comparing ongoing costs only, and will not help you determine the relative total costs of owning different funds. In addition, if these transactional costs were included, your costs would have been higher.
| | | | |
| OPPENHEIMER GLOBAL STRATEGIC INCOME FUND | | | 7 | |
Fund Expenses Continued
| | | | | | | | | | | | |
| Actual | | Beginning
Account
Value
April 1, 2012 | | | Ending
Account
Value
September 28, 2012 | | | Expenses
Paid During
6 Months Ended
September 28, 2012 | |
| Class A | | $ | 1,000.00 | | | $ | 1,051.80 | | | $ | 4.78 | |
| Class B | | | 1,000.00 | | | | 1,049.50 | | | | 9.42 | |
| Class C | | | 1,000.00 | | | | 1,050.40 | | | | 8.60 | |
| Class I | | | 1,000.00 | | | | 1,053.80 | | | | 2.95 | |
| Class N | | | 1,000.00 | | | | 1,052.10 | | | | 6.87 | |
| Class Y | | | 1,000.00 | | | | 1,055.30 | | | | 3.87 | |
| | | |
Hypothetical
(5% return before expenses) | | | | | | | | | |
| Class A | | | 1,000.00 | | | | 1,020.08 | | | | 4.72 | |
| Class B | | | 1,000.00 | | | | 1,015.58 | | | | 9.29 | |
| Class C | | | 1,000.00 | | | | 1,016.37 | | | | 8.48 | |
| Class I | | | 1,000.00 | | | | 1,021.86 | | | | 2.91 | |
| Class N | | | 1,000.00 | | | | 1,018.05 | | | | 6.78 | |
| Class Y | | | 1,000.00 | | | | 1,020.97 | | | | 3.82 | |
Expenses are equal to the Fund’s annualized expense ratio for that class, multiplied by the average account value over the period, multiplied by 181/366 (to reflect the one-half year period). Those annualized expense ratios, excluding indirect expenses from affiliated funds, based on the 6-month period ended September 28, 2012 are as follows:
| | | | |
| Class | | Expense Ratios | |
| Class A | | | 0.94 | % |
| Class B | | | 1.85 | |
| Class C | | | 1.69 | |
| Class I | | | 0.58 | |
| Class N | | | 1.35 | |
| Class Y | | | 0.76 | |
The expense ratios reflect voluntary waivers and/or reimbursements of expenses by the Fund’s Manager. Some of these undertakings may be modified or terminated at any time, as indicated in the Fund’s prospectus. The “Financial Highlights” tables in the Fund’s financial statements, included in this report, also show the gross expense ratios, without such waivers or reimbursements and reduction to custodian expenses, if applicable.
| | |
| 8 | | OPPENHEIMER GLOBAL STRATEGIC INCOME FUND |
STATEMENT OF INVESTMENTS September 28, 2012*
| | | | | | | | |
| | | Shares | | | Value | |
| Wholly-Owned Subsidiary—0.0% | | | | | | | | |
Oppenheimer Global Strategic Income Fund (Cayman) Ltd.1,2
(Cost $1,500,000) | | | 15,000 | | | $ | 1,447,210 | |
| | |
| | | Principal
Amount | | | | |
| Asset-Backed Securities—2.7% | | | | | | | | |
| Ally Auto Receivables Trust, Automobile Receivables Nts.: | | | | | | | | |
| Series 2012-2, Cl. C, 2.26%, 7/16/183 | | $ | 3,100,000 | | | | 3,147,969 | |
| Series 2012-A, Cl. D, 3.15%, 10/15/183 | | | 7,604,000 | | | | 7,849,967 | |
Ally Master Owner Trust, Automobile Receivable
Nts., Series 2012-3, Cl. D, 2.571%, 7/15/174 | | | 4,300,000 | | | | 4,303,440 | |
AmeriCredit Automobile Receivables Trust 2012-1, Automobile Receivables- Backed Nts.:
Series 2012-1, Cl. C, 2.67%, 1/8/18 | | | 475,000 | | | | 487,154 | |
| Series 2012-1, Cl. D, 4.72%, 3/8/18 | | | 28,945,000 | | | | 31,068,970 | |
| AmeriCredit Automobile Receivables Trust 2012-3, Automobile Receivables- Backed Nts., Series 2012-3, Cl. D, 3.03%, 7/9/18 | | | 9,375,000 | | | | 9,519,689 | |
| AmeriCredit Automobile Receivables Trust 2012-4, Automobile Receivables-Backed Nts.: | | | | | | | | |
| Series 2012-4, Cl. C, 1.93%, 8/8/18 | | | 6,365,000 | | | | 6,377,253 | |
| Series 2012-4, Cl. D, 2.68%, 10/9/18 | | | 4,260,000 | | | | 4,268,396 | |
Avis Budget Rental Car Funding AESOP LLC, Automobile Receivable
Nts., Series 2010-3A, Cl. A, 4.64%, 5/20/163 | | | 1,750,000 | | | | 1,903,467 | |
Bank of America Auto Trust 2012-1, Automobile Receivable
Nts., Series 2012-1, Cl. D., 2.99%, 3/15/19 | | | 2,220,000 | | | | 2,272,727 | |
CarMax Auto Owner Trust 2012-2, Automobile Receivables
Nts., Series 2012-2, Cl. D, 3.77%, 11/15/18 | | | 4,300,000 | | | | 4,349,454 | |
| CPS Auto Trust, Automobile Receivable Nts., Series 2012-C, Cl. A, 2.26%, 12/16/193 | | | 920,000 | | | | 920,817 | |
| Credit Acceptance Auto Loan Trust, Automobile Receivable Nts.: | | | | | | | | |
| Series 2012-2A, Cl. A, 2.35%, 3/15/203 | | | 710,000 | | | | 710,391 | |
| Series 2012-2A, Cl. B, 5.45%, 9/15/203 | | | 355,000 | | | | 352,948 | |
| DLJ Ltd., Collateralized Bond Obligations, Series 1A, Cl. C2, 11.96%, 4/15/115,6 | | | 15,000,000 | | | | 150 | |
DSC Floorplan Master Owner Trust, Automobile Receivable
Nts., Series 2011-1, Cl. A, 3.91%, 3/15/16 | | | 1,945,000 | | | | 1,993,598 | |
DT Auto Owner Trust 2011-1A, Automobile Receivable
Nts., Series 2011-1A, Cl. C, 3.05%, 8/15/153 | | | 2,710,000 | | | | 2,715,911 | |
| DT Auto Owner Trust 2012-2, Automobile Receivable Nts.: | | | | | | | | |
| Series 2012-2, Cl. C, 2.72%, 4/17/173 | | | 2,475,000 | | | | 2,481,791 | |
| Series 2012-2, Cl. D, 4.35%, 3/15/193 | | | 5,860,000 | | | | 5,883,812 | |
Enterprise Fleet Financing LLC, Automobile Receivable
Nts., Series 2012-2, Cl. A2, 0.72%, 11/20/173,4 | | | 280,000 | | | | 280,205 | |
| Exeter Automobile Receivables Trust, Automobile Receivable Nts.: | | | | | | | | |
| Series 2012-2A, Cl. A, 1.30%, 6/15/173 | | | 1,135,000 | | | | 1,135,231 | |
| Series 2012-2A, Cl. B, 2.22%, 12/15/173 | | | 3,125,000 | | | | 3,136,537 | |
| Series 2012-2A, Cl. C, 3.06%, 7/15/183 | | | 3,715,000 | | | | 3,731,316 | |
| | | | |
| OPPENHEIMER GLOBAL STRATEGIC INCOME FUND | | | 9 | |
STATEMENT OF INVESTMENTS Continued
| | | | | | | | |
| | | Principal
Amount | | | Value | |
| Asset-Backed Securities Continued | | | | | | | | |
Green Tree Financial Corp., Manufactured Housing Contract Sr. Sub.
Pass-Through Certificates, Series 1997-5, Cl. M1, 6.95%, 5/15/29 | | $ | 5,000,000 | | | $ | 4,789,690 | |
| Greenpoint Credit Manufactured Housing Contract Trust, Pass-Through Certificates, Series 2000-3, Cl. IM1, 9.01%, 6/1/317 | | | 989,641 | | | | 126,373 | |
| Ice 1 Em CLO Ltd./Ice 1 Em CLO Corp., Sr. Sec. Sub. Term Nts.: | | | | | | | | |
| Series 2007-1A, Cl. B, 2.419%, 8/15/224,6 | | | 21,000,000 | | | | 14,490,000 | |
| Series 2007-1A, Cl. C, 3.719%, 8/15/224,6 | | | 17,780,000 | | | | 11,734,800 | |
| Series 2007-1A, Cl. D, 5.719%, 8/15/224,6 | | | 17,780,000 | | | | 11,379,200 | |
Madison Avenue CDO Ltd., Collateralized Debt Obligations,
Series 2A, Cl. C1, 2.908%, 3/24/144,6,7 | | | 4,426,820 | | | | 443 | |
Santander Drive Auto Receivables Trust 2011-S1A, Automobile Receivables
Nts., Series 2011-S1A, Cl. D, 3.10%, 5/15/176 | | | 554,597 | | | | 556,788 | |
Santander Drive Auto Receivables Trust 2012-2, Automobile Receivables
Nts., Series 2012-2, Cl. D, 5%, 2/15/18 | | | 1,955,000 | | | | 2,014,075 | |
| Santander Drive Auto Receivables Trust 2012-3, Automobile Receivables Nts.: | | | | | | | | |
| Series 2012-3, Cl. C, 3.01%, 4/16/18 | | | 20,920,000 | | | | 21,229,124 | |
| Series 2012-3, Cl. D, 3.64%, 5/15/18 | | | 24,710,000 | | | | 25,225,302 | |
| Santander Drive Auto Receivables Trust 2012-4, Automobile Receivables Nts., Series 2012-4, Cl. D, 4.18%, 6/15/18 | | | 12,490,000 | | | | 12,714,633 | |
| Santander Drive Auto Receivables Trust 2012-5, Automobile Receivables Nts.: | | | | | | | | |
| Series 2012-5, Cl. C, 3.80%, 8/15/18 | | | 9,775,000 | | | | 9,932,187 | |
| Series 2012-5, Cl. D, 3.63%, 9/17/18 | | | 9,380,000 | | | | 9,650,838 | |
| SLM Student Loan Trust, Student Loan Receivables, Series 2005-B, Cl. B, 0.789%, 6/15/394 | | | 6,586,000 | | | | 4,297,612 | |
| SNAAC Auto Receivables Trust, Automobile Receivable Nts.: | | | | | | | | |
| Series 2012-1A, Cl. B, 3.11%, 6/15/173 | | | 1,875,000 | | | | 1,885,971 | |
| Series 2012-1A, Cl. C, 4.38%, 6/15/173 | | | 1,955,000 | | | | 1,969,463 | |
| United Auto Credit Securitization Trust 2012-1, Automobile Receivables Nts.: | | | | | | | | |
| Series 2012-1, Cl. A2, 1.10%, 3/16/15 | | | 705,000 | | | | 705,000 | |
| Series 2012-1, Cl. B, 1.87%, 9/15/15 | | | 1,195,000 | | | | 1,195,000 | |
| Series 2012-1, Cl. C, 2.52%, 3/15/16 | | | 9,500,000 | | | | 9,500,000 | |
| Series 2012-1, Cl. D, 3.12%, 3/15/18 | | | 6,035,000 | | | | 6,034,578 | |
| Westlake Automobile Receivables Trust 2012-1, Automobile Receivable Nts., Series 2012-1, Cl. D, 1.03%, 6/16/143,4 | | | 705,000 | | | | 705,084 | |
| World Financial Network Credit Card Master Note Trust, Credit Card Receivables, Series 2012-B, Cl. A, 1.76%, 5/17/21 | | | 840,000 | | | | 846,255 | |
| | | | | | |
|
|
|
| Total Asset-Backed Securities (Cost $282,272,821) | | | | | | | 249,873,609 | |
| Corporate Loans—1.5% | | | | | | | | |
| Affinion Group, Inc., Sr. Sec. Credit Facilities 1st Lien Term Loan, Tranche B, 5%, 10/9/164 | | | 4,064,596 | | | | 3,744,509 | |
| Atlantic Broadband Finance LLC, Sr. Sec. Credit Facilities 2nd Lien Term Loan, 9.75%, 10/4/194 | | | 3,225,000 | | | | 3,382,219 | |
| ATP Oil & Gas Corp., Sr. Sec. Credit Facilities 1st Lien Term Loan, Debtor in Possession, Delayed Draw, 8.50%, 2/27/144,8 | | | 1,394,511 | | | | 1,384,052 | |
| | |
| 10 | | OPPENHEIMER GLOBAL STRATEGIC INCOME FUND |
| | | | | | | | |
| | | Principal
Amount | | | Value | |
| Corporate Loans Continued | | | | | | | | |
| ATP Oil & Gas Corp., Sr. Sec. Credit Facilities 1st Lien Term Loan, Debtor in Possession, 8.50%, 2/17/144,8 | | $ | 2,050,489 | | | $ | 2,035,110 | |
| Autoparts Holdings Ltd., Sr. Sec. Credit Facilities 1st Lien Term Loan, 6.50%, 7/29/174 | | | 3,756,556 | | | | 3,756,556 | |
| BJ’S Wholesale Club, Inc., Sr. Sec. Credit Facilities 2nd Lien Term Loan, 9.75%, 3/29/194,8 | | | 1,780,000 | | | | 1,811,150 | |
| Brock Holdings III, Inc., Sr. Sec. Credit Facilities 2nd Lien Term Loan, 10%, 3/16/184 | | | 2,915,000 | | | | 2,922,288 | |
| Chesapeake Energy Corp., Sr. Sec. Credit Facilities Term Loan, 8.50%, 12/2/174 | | | 4,740,000 | | | | 4,761,723 | |
| Clear Channel Communications, Inc., Sr. Sec. Credit Facilities 1st Lien Term Loan, Tranche B, 3.866%, 1/29/164 | | | 15,255,852 | | | | 12,509,799 | |
| Crestwood Holdings LLC, Sr. Sec. Credit Facilities 1st Lien Term Loan, Tranche B, 9.75%, 3/26/184 | | | 4,598,460 | | | | 4,673,185 | |
| Entegra Holdings LLC, Sr. Sec. Credit Facilities 3rd Lien Term Loan, Tranche B, 3.743%, 10/19/154,8,9 | | | 20,738,904 | | | | 12,201,381 | |
| Hallertau SPC, Sr. Sec. Credit Facilities Term Loan, 7.94%, 9/17/135 | | | 32,556,250 | | | | 11,394,688 | |
| iStar Financial, Inc., Sr. Sec. Credit Facilities 1st Lien Term Loan, Tranche A2, 7%, 3/19/174 | | | 9,485,000 | | | | 9,556,138 | |
| Lonestar Intermediate Super Holdings LLC, Sr. Sec. Credit Facilities Term Loan, 11%, 9/2/194 | | | 5,735,000 | | | | 6,129,281 | |
| Navistar, Inc., Sr. Sec. Credit Facilities 1st Lien Term Loan, Tranche B, 7%, 8/17/174 | | | 2,315,000 | | | | 2,352,619 | |
| Nuveen Investments, Inc., Sr. Sec. Credit Facilities 2nd Lien Term Loan, 8.25%, 2/28/194 | | | 10,740,000 | | | | 10,838,454 | |
| OneLink Communications/San Juan Cable LLC, Sr. Sec. Credit Facilities 2nd Lien Term Loan, 10%, 6/9/184 | | | 5,495,000 | | | | 5,577,425 | |
| PQ Corp., Sr. Sec. Credit Facilities 2nd Lien Term Loan, 6.716%, 7/30/154 | | | 2,390,000 | | | | 2,288,425 | |
| Revel Entertainment LLC, Sr. Sec. Credit Facilities 1st Lien Term Loan, 9%, 2/17/174,8 | | | 9,390,000 | | | | 7,460,646 | |
| Springleaf Financial Funding Co., Sr. Sec. Credit Facilities 1st Lien Term Loan, 5.50%, 5/10/174 | | | 5,170,000 | | | | 5,071,770 | |
| SUPERVALU, Inc., Sr. Sec. Credit Facilities 1st Lien Term Loan, Tranche B, 8%, 8/1/184 | | | 9,955,000 | | | | 10,030,439 | |
Texas Competitive Electric Holdings Co. LLC, Non-Extended Sr. Sec. Credit Facilities 1st Lien Term Loan:
3.728%, 10/10/144 | | | 10,778,148 | | | | 8,055,319 | |
| 3.938%, 10/10/144 | | | 1,731,852 | | | | 1,294,343 | |
| Walter Investment Management Corp., Sr. Sec. Credit Facilities 2nd Lien Term Loan, 12.50%, 12/30/164 | | | 2,525,000 | | | | 2,626,000 | |
| | | | | | |
|
|
|
| Total Corporate Loans (Cost $135,807,074) | | | | | | | 135,857,519 | |
| Mortgage-Backed Obligations—34.4% | | | | | | | | |
| Government Agency—22.4% | | | | | | | | |
| FHLMC/FNMA/FHLB/Sponsored—22.0% | | | | | | | | |
| Federal Home Loan Mortgage Corp.: | | | | | | | | |
| 3.50%, 10/1/428 | | | 134,505,000 | | | | 144,256,613 | |
| | | | |
| OPPENHEIMER GLOBAL STRATEGIC INCOME FUND | | | 11 | |
STATEMENT OF INVESTMENTS Continued
| | | | | | | | |
| | | Principal
Amount | | | Value | |
| FHLMC/FNMA/FHLB/Sponsored Continued | | | | | | | | |
| Federal Home Loan Mortgage Corp.: Continued | | | | | | | | |
| 5%, 12/15/34 | | $ | 1,722,203 | | | $ | 1,884,774 | |
| 5.50%, 9/1/39 | | | 4,487,736 | | | | 4,946,306 | |
| 6%, 1/15/19-7/15/24 | | | 3,700,128 | | | | 4,088,754 | |
| 6.50%, 4/15/18-6/15/35 | | | 2,755,117 | | | | 3,100,697 | |
| 7%, 8/15/21-3/1/35 | | | 2,647,032 | | | | 3,144,052 | |
| 7.50%, 1/1/32-2/15/32 | | | 3,376,328 | | | | 4,122,022 | |
| 8.50%, 8/15/31 | | | 189,160 | | | | 238,545 | |
| 10%, 5/15/20 | | | 106,957 | | | | 124,895 | |
| 10.50%, 6/14/20 | | | 62,877 | | | | 76,340 | |
| 11.50%, 11/14/16 | | | 10,285 | | | | 10,520 | |
| 12%, 7/15/15-6/15/17 | | | 38,423 | | | | 41,617 | |
| Federal Home Loan Mortgage Corp., Gtd. Real Estate Mtg. Investment Conduit Multiclass Pass-Through Certificates: | | | | | | | | |
| Series 1360, Cl. PZ, 7.50%, 9/15/22 | | | 3,081,239 | | | | 3,561,728 | |
| Series 151, Cl. F, 9%, 5/15/21 | | | 6,534 | | | | 7,529 | |
| Series 1590, Cl. IA, 1.30%, 10/15/234 | | | 2,555,650 | | | | 2,617,596 | |
| Series 1674, Cl. Z, 6.75%, 2/15/24 | | | 134,031 | | | | 152,861 | |
| Series 2006-11, Cl. PS, 23.773%, 3/25/364 | | | 1,408,955 | | | | 2,128,160 | |
| Series 2034, Cl. Z, 6.50%, 2/15/28 | | | 23,783 | | | | 27,397 | |
| Series 2042, Cl. N, 6.50%, 3/15/28 | | | 30,621 | | | | 35,231 | |
| Series 2043, Cl. ZP, 6.50%, 4/15/28 | | | 2,454,544 | | | | 2,840,397 | |
| Series 2053, Cl. Z, 6.50%, 4/15/28 | | | 24,515 | | | | 28,216 | |
| Series 2116, Cl. ZA, 6%, 1/15/29 | | | 1,493,036 | | | | 1,691,977 | |
| Series 2122, Cl. F, 0.671%, 2/15/294 | | | 65,070 | | | | 65,733 | |
| Series 2279, Cl. PK, 6.50%, 1/15/31 | | | 39,572 | | | | 43,220 | |
| Series 2326, Cl. ZP, 6.50%, 6/15/31 | | | 349,316 | | | | 404,444 | |
| Series 2344, Cl. FP, 1.171%, 8/15/314 | | | 923,301 | | | | 946,222 | |
| Series 2368, Cl. PR, 6.50%, 10/15/31 | | | 53,132 | | | | 61,544 | |
| Series 2368, Cl. TG, 6%, 10/15/16 | | | 259,012 | | | | 274,826 | |
| Series 2401, Cl. FA, 0.871%, 7/15/294 | | | 121,891 | | | | 123,595 | |
| Series 2412, Cl. GF, 1.171%, 2/15/324 | | | 1,620,816 | | | | 1,661,030 | |
| Series 2427, Cl. ZM, 6.50%, 3/15/32 | | | 1,732,146 | | | | 2,007,881 | |
| Series 2451, Cl. FD, 1.221%, 3/15/324 | | | 634,410 | | | | 650,769 | |
| Series 2453, Cl. BD, 6%, 5/15/17 | | | 64,036 | | | | 68,755 | |
| Series 2461, Cl. PZ, 6.50%, 6/15/32 | | | 238,133 | | | | 276,348 | |
| Series 2464, Cl. FI, 1.221%, 2/15/324 | | | 602,976 | | | | 616,032 | |
| Series 2470, Cl. AF, 1.221%, 3/15/324 | | | 1,023,564 | | | | 1,049,958 | |
| Series 2470, Cl. LF, 1.221%, 2/15/324 | | | 616,675 | | | | 630,029 | |
| Series 2471, Cl. FD, 1.221%, 3/15/324 | | | 882,556 | | | | 901,642 | |
| Series 2475, Cl. FB, 1.221%, 2/15/324 | | | 844,575 | | | | 862,864 | |
| Series 2500, Cl. FD, 0.721%, 3/15/324 | | | 276,964 | | | | 280,390 | |
| Series 2517, Cl. GF, 1.221%, 2/15/324 | | | 509,880 | | | | 520,920 | |
| Series 2526, Cl. FE, 0.621%, 6/15/294 | | | 307,377 | | | | 309,893 | |
| Series 2551, Cl. FD, 0.621%, 1/15/334 | | | 204,671 | | | | 206,499 | |
| Series 2551, Cl. LF, 0.721%, 1/15/334 | | | 85,462 | | | | 86,252 | |
| Series 2668, Cl. AZ, 4%, 9/1/18 | | | 467,868 | | | | 493,556 | |
| Series 2676, Cl. KY, 5%, 9/15/23 | | | 1,834,626 | | | | 2,014,970 | |
| Series 2936, Cl. PE, 5%, 2/1/35 | | | 2,807,000 | | | | 3,175,222 | |
| Series 3025, Cl. SJ, 23.941%, 8/15/354 | | | 1,421,307 | | | | 2,166,839 | |
| Series 3465, Cl. HA, 4%, 7/1/17 | | | 269,433 | | | | 277,509 | |
| Series 3617, Cl. DC, 4%, 7/1/27 | | | 1,087,355 | | | | 1,116,450 | |
| Series 3676, Cl. DA, 4%, 4/1/22 | | | 551,806 | | | | 555,698 | |
| Series 3822, Cl. JA, 5%, 6/1/40 | | | 2,953,909 | | | | 3,092,019 | |
| Series 3848, Cl. WL, 4%, 4/1/40 | | | 2,553,513 | | | | 2,727,259 | |
| | |
| 12 | | OPPENHEIMER GLOBAL STRATEGIC INCOME FUND |
| | | | | | | | |
| | | Principal
Amount | | | Value | |
| FHLMC/FNMA/FHLB/Sponsored Continued | | | | | | | | |
| Federal Home Loan Mortgage Corp., Gtd. Real Estate Mtg. Investment Conduit Multiclass Pass-Through Certificates: Continued | | | | | | | | |
| Series 3917, Cl. BA, 4%, 6/1/38 | | $ | 3,029,966 | | | $ | 3,223,505 | |
Federal Home Loan Mortgage Corp., Interest-Only Stripped
Mtg.-Backed Security: | | | | | | | | |
| Series 183, Cl. IO, 12.331%, 4/1/2710 | | | 399,070 | | | | 90,157 | |
| Series 192, Cl. IO, 11.371%, 2/1/2810 | | | 168,751 | | | | 35,248 | |
| Series 2035, Cl. PE, 1.176%, 3/15/2810 | | | 49,188 | | | | 11,655 | |
| Series 2049, Cl. PL, 24.612%, 4/15/2810 | | | 299,146 | | | | 70,306 | |
| Series 205, Cl. IO, 12.912%, 9/1/2910 | | | 1,029,229 | | | | 251,188 | |
| Series 206, Cl. IO, 30.075%, 12/1/2910 | | | 331,385 | | | | 82,658 | |
| Series 207, Cl. IO, 45.107%, 4/1/3010 | | | 357,988 | | | | 94,009 | |
| Series 2074, Cl. S, 55.598%, 7/17/2810 | | | 255,476 | | | | 55,673 | |
| Series 2079, Cl. S, 63.466%, 7/17/2810 | | | 433,771 | | | | 94,001 | |
| Series 214, Cl. IO, 39.308%, 6/1/3110 | | | 305,435 | | | | 65,782 | |
| Series 2177, Cl. SB, 99.999%, 8/15/2910 | | | 271,253 | | | | 67,594 | |
| Series 243, Cl. 6, 0.544%, 12/15/3210 | | | 1,026,031 | | | | 216,519 | |
| Series 2526, Cl. SE, 38.827%, 6/15/2910 | | | 555,430 | | | | 123,112 | |
| Series 2795, Cl. SH, 19.877%, 3/15/2410 | | | 3,892,238 | | | | 697,786 | |
| Series 2802, Cl. AS, 83.429%, 4/15/3310 | | | 632,497 | | | | 33,960 | |
| Series 2819, Cl. S, 53.719%, 6/15/3410 | | | 5,911,849 | | | | 1,290,200 | |
| Series 2920, Cl. S, 66.19%, 1/15/3510 | | | 3,415,908 | | | | 674,680 | |
| Series 2922, Cl. SE, 10.691%, 2/15/3510 | | | 228,785 | | | | 50,450 | |
| Series 3004, Cl. SB, 99.999%, 7/15/3510 | | | 5,946,959 | | | | 1,114,200 | |
| Series 3201, Cl. SG, 5.82%, 8/15/3610 | | | 1,512,046 | | | | 291,330 | |
| Series 3450, Cl. BI, 13.334%, 5/15/3810 | | | 1,728,538 | | | | 308,410 | |
| Series 3606, Cl. SN, 9.161%, 12/15/3910 | | | 898,707 | | | | 147,676 | |
| Series 3659, Cl. IE, 9.229%, 3/1/1910 | | | 3,543,443 | | | | 323,033 | |
| Series 3662, Cl. SM, 26.186%, 10/15/3210 | | | 1,339,990 | | | | 203,992 | |
| Series 3685, Cl. EI, 12.633%, 3/1/1910 | | | 3,100,382 | | | | 239,586 | |
| Series 3736, Cl. SN, 7.59%, 10/15/4010 | | | 2,536,163 | | | | 439,165 | |
| Federal Home Loan Mortgage Corp., Mtg.-Linked Global Debt Securities, 2.06%, 1/15/22 | | | 6,442,208 | | | | 6,583,032 | |
| Federal National Mortgage Assn.: | | | | | | | | |
| 2.50%, 10/1/278 | | | 445,845,000 | | | | 468,694,556 | |
| 2.789%, 10/1/364 | | | 10,033,495 | | | | 10,768,411 | |
| 3.50%, 11/1/428 | | | 469,780,000 | | | | 502,738,003 | |
| 4%, 9/1/18-10/1/18 | | | 5,985,774 | | | | 6,419,208 | |
| 4.50%, 12/1/20 | | | 2,126,115 | | | | 2,301,662 | |
| 4.50%, 10/1/27-10/1/428 | | | 62,707,000 | | | | 67,853,323 | |
| 5%, 2/25/18-12/25/21 | | | 13,721,757 | | | | 14,968,353 | |
| 5%, 10/1/428 | | | 9,343,000 | | | | 10,192,631 | |
| 5.50%, 1/25/22-1/1/36 | | | 2,534,038 | | | | 2,787,487 | |
| 5.50%, 10/1/27-10/1/428 | | | 14,051,000 | | | | 15,385,519 | |
| 6%, 6/25/17-10/1/40 | | | 117,756 | | | | 127,076 | |
| 6%, 10/1/428 | | | 7,090,000 | | | | 7,828,913 | |
| 6.50%, 4/25/18-1/1/34 | | | 9,255,238 | | | | 10,818,543 | |
| 7%, 11/1/17-4/1/34 | | | 14,195,545 | | | | 16,914,683 | |
| 7.50%, 2/25/27-3/25/33 | | | 6,064,234 | | | | 7,405,634 | |
| 8.50%, 7/1/32 | | | 28,352 | | | | 35,344 | |
| 9.50%, 4/25/20-4/8/21 | | | 23,694 | | | | 23,840 | |
| 11%, 7/25/16-2/25/26 | | | 168,457 | | | | 193,190 | |
| 13%, 6/25/15 | | | 22,010 | | | | 23,991 | |
| 15%, 5/9/13 | | | 14 | | | | 14 | |
| | | | |
| OPPENHEIMER GLOBAL STRATEGIC INCOME FUND | | | 13 | |
STATEMENT OF INVESTMENTS Continued
| | | | | | | | |
| | | Principal
Amount | | | Value | |
| FHLMC/FNMA/FHLB/Sponsored Continued | | | | | | | | |
Federal National Mortgage Assn. Grantor Trust, Interest-Only Stripped
Mtg.-Backed Security: | | | | | | | | |
| Trust 2001-T10, Cl. IO, 40.606%, 12/25/4110 | | $ | 76,868,887 | | | $ | 925,478 | |
| Trust 2001-T3, Cl. IO, 37.896%, 11/25/4010 | | | 9,813,775 | | | | 201,425 | |
| Federal National Mortgage Assn., 15 yr.: | | | | | | | | |
| 3%, 10/1/278 | | | 463,835,000 | | | | 491,810,048 | |
| 3.50%, 10/1/278 | | | 5,320,000 | | | | 5,662,475 | |
| Federal National Mortgage Assn., 30 yr., 4%, 10/1/428 | | | 39,765,000 | | | | 42,853,003 | |
| Federal National Mortgage Assn., Gtd. Real Estate Mtg. Investment Conduit Multiclass Pass-Through Certificates: | | | | | | | | |
| Trust 1996-35, Cl. Z, 7%, 7/25/26 | | | 132,189 | | | | 154,247 | |
| Trust 1997-45, Cl. CD, 8%, 7/18/27 | | | 1,015,923 | | | | 1,212,436 | |
| Trust 1998-58, Cl. PC, 6.50%, 10/25/28 | | | 809,951 | | | | 933,173 | |
| Trust 1999-14, Cl. MB, 6.50%, 4/25/29 | | | 39,503 | | | | 45,181 | |
| Trust 1999-54, Cl. LH, 6.50%, 11/25/29 | | | 1,531,198 | | | | 1,761,003 | |
| Trust 2001-19, Cl. Z, 6%, 5/1/31 | | | 790,495 | | | | 897,473 | |
| Trust 2001-44, Cl. QC, 6%, 9/25/16 | | | 137,198 | | | | 146,018 | |
| Trust 2001-51, Cl. OD, 6.50%, 10/25/31 | | | 231,506 | | | | 268,830 | |
| Trust 2001-65, Cl. F, 0.817%, 11/25/314 | | | 1,168,039 | | | | 1,177,083 | |
| Trust 2001-69, Cl. PF, 1.217%, 12/25/314 | | | 1,361,999 | | | | 1,392,176 | |
| Trust 2001-80, Cl. ZB, 6%, 1/25/32 | | | 1,582,198 | | | | 1,794,296 | |
| Trust 2002-12, Cl. PG, 6%, 3/25/17 | | | 797,576 | | | | 860,639 | |
| Trust 2002-19, Cl. PE, 6%, 4/25/17 | | | 411,139 | | | | 437,428 | |
| Trust 2002-21, Cl. PE, 6.50%, 4/25/32 | | | 1,534,643 | | | | 1,715,580 | |
| Trust 2002-29, Cl. F, 1.217%, 4/25/324 | | | 638,482 | | | | 652,441 | |
| Trust 2002-60, Cl. FH, 1.217%, 8/25/324 | | | 1,245,614 | | | | 1,273,191 | |
| Trust 2002-64, Cl. FJ, 1.217%, 4/25/324 | | | 196,242 | | | | 200,533 | |
| Trust 2002-68, Cl. FH, 0.72%, 10/18/324 | | | 411,362 | | | | 416,028 | |
| Trust 2002-81, Cl. FM, 0.717%, 12/25/324 | | | 776,073 | | | | 784,706 | |
| Trust 2002-84, Cl. FB, 1.217%, 12/25/324 | | | 128,906 | | | | 131,726 | |
| Trust 2002-9, Cl. PC, 6%, 3/25/17 | | | 911,406 | | | | 976,835 | |
| Trust 2003-11, Cl. FA, 1.217%, 9/25/324 | | | 175,906 | | | | 179,754 | |
| Trust 2003-112, Cl. AN, 4%, 11/1/18 | | | 886,961 | | | | 936,267 | |
| Trust 2003-116, Cl. FA, 0.617%, 11/25/334 | | | 346,666 | | | | 350,004 | |
| Trust 2003-119, Cl. FK, 0.717%, 5/25/184 | | | 5,190,039 | | | | 5,226,244 | |
| Trust 2003-28, Cl. KG, 5.50%, 4/25/23 | | | 5,556,000 | | | | 6,139,444 | |
| Trust 2004-101, Cl. BG, 5%, 1/25/20 | | | 3,091,042 | | | | 3,300,336 | |
| Trust 2004-W9, Cl. 2A2, 7%, 2/25/44 | | | 1,044,658 | | | | 1,210,300 | |
| Trust 2005-25, Cl. PS, 27.207%, 4/25/354 | | | 613,433 | | | | 1,050,790 | |
| Trust 2005-31, Cl. PB, 5.50%, 4/25/35 | | | 2,865,000 | | | | 3,575,933 | |
| Trust 2005-69, Cl. LE, 5.50%, 11/1/33 | | | 1,585,915 | | | | 1,632,675 | |
| Trust 2005-71, Cl. DB, 4.50%, 8/25/25 | | | 3,407,705 | | | | 3,705,588 | |
| Trust 2006-46, Cl. SW, 23.405%, 6/25/364 | | | 2,025,450 | | | | 3,087,366 | |
| Trust 2007-42, Cl. A, 6%, 2/1/33 | | | 2,117,671 | | | | 2,189,099 | |
| Trust 2008-14, Cl. BA, 4.25%, 3/1/23 | | | 461,900 | | | | 490,585 | |
| Trust 2009-114, Cl. AC, 2.50%, 12/1/23 | | | 882,115 | | | | 909,299 | |
| Trust 2009-36, Cl. FA, 1.157%, 6/25/374 | | | 2,672,970 | | | | 2,717,265 | |
| Trust 2011-122, Cl. EA, 3%, 11/1/29 | | | 2,772,538 | | | | 2,838,149 | |
| Trust 2011-122, Cl. EC, 1.50%, 1/1/20 | | | 2,655,441 | | | | 2,701,378 | |
| Trust 2011-15, Cl. DA, 4%, 3/1/41 | | | 2,379,344 | | | | 2,562,903 | |
| Trust 2011-3, Cl. KA, 5%, 4/1/40 | | | 2,476,567 | | | | 2,704,714 | |
| Trust 2011-6, Cl. BA, 2.75%, 6/1/20 | | | 2,155,224 | | | | 2,236,101 | |
| Trust 2011-88, Cl. AB, 2.50%, 9/1/26 | | | 1,430,236 | | | | 1,479,608 | |
| | |
| 14 | | OPPENHEIMER GLOBAL STRATEGIC INCOME FUND |
| | | | | | | | |
| | | Principal
Amount | | | Value | |
| FHLMC/FNMA/FHLB/Sponsored Continued | | | | | | | | |
Federal National Mortgage Assn., Interest-Only Stripped
Mtg.-Backed Security: | | | | | | | | |
| Trust 2001-61, Cl. SH, 32.109%, 11/18/3110 | | $ | 1,325,807 | | | $ | 267,427 | |
| Trust 2001-63, Cl. SD, 18.884%, 12/18/3110 | | | 38,166 | | | | 7,530 | |
| Trust 2001-68, Cl. SC, 10.992%, 11/25/3110 | | | 24,516 | | | | 4,811 | |
| Trust 2001-78, Cl. JS, 0%, 8/25/4110,11 | | | 2,355,955 | | | | 408,665 | |
| Trust 2001-81, Cl. S, 24.883%, 1/25/3210 | | | 351,083 | | | | 69,175 | |
| Trust 2002-28, Cl. SA, 37.151%, 4/25/3210 | | | 283,154 | | | | 57,918 | |
| Trust 2002-38, Cl. SO, 51.594%, 4/25/3210 | | | 292,341 | | | | 64,203 | |
| Trust 2002-39, Cl. SD, 41.764%, 3/18/3210 | | | 454,838 | | | | 91,006 | |
| Trust 2002-48, Cl. S, 32.509%, 7/25/3210 | | | 437,756 | | | | 82,875 | |
| Trust 2002-52, Cl. SL, 33.781%, 9/25/3210 | | | 269,937 | | | | 51,766 | |
| Trust 2002-53, Cl. SK, 40.361%, 4/25/3210 | | | 283,525 | | | | 67,322 | |
| Trust 2002-56, Cl. SN, 34.435%, 7/25/3210 | | | 600,362 | | | | 113,724 | |
| Trust 2002-65, Cl. SC, 67.764%, 6/25/2610 | | | 920,652 | | | | 206,616 | |
| Trust 2002-77, Cl. IS, 46.489%, 12/18/3210 | | | 498,060 | | | | 118,431 | |
| Trust 2002-77, Cl. SH, 38.392%, 12/18/3210 | | | 483,759 | | | | 106,435 | |
| Trust 2002-89, Cl. S, 54.673%, 1/25/3310 | | | 2,948,459 | | | | 660,682 | |
| Trust 2002-9, Cl. MS, 28.227%, 3/25/3210 | | | 498,866 | | | | 104,739 | |
| Trust 2003-13, Cl. IO, 15.478%, 3/25/3310 | | | 2,223,238 | | | | 496,838 | |
| Trust 2003-23, Cl. ES, 42.084%, 10/25/2210 | | | 3,949,719 | | | | 225,830 | |
| Trust 2003-26, Cl. DI, 8.854%, 4/25/3310 | | | 1,277,527 | | | | 264,899 | |
| Trust 2003-26, Cl. IK, 11.776%, 4/25/3310 | | | 223,883 | | | | 46,423 | |
| Trust 2003-33, Cl. SP, 37.814%, 5/25/3310 | | | 1,608,883 | | | | 263,915 | |
| Trust 2003-4, Cl. S, 31.917%, 2/25/3310 | | | 799,702 | | | | 154,658 | |
| Trust 2003-46, Cl. IH, 0%, 6/1/2310,11 | | | 283,739 | | | | 34,098 | |
| Trust 2004-56, Cl. SE, 16.88%, 10/25/3310 | | | 1,664,396 | | | | 302,862 | |
| Trust 2005-12, Cl. SC, 14.141%, 3/25/3510 | | | 116,773 | | | | 24,842 | |
| Trust 2005-14, Cl. SE, 42.774%, 3/25/3510 | | | 886,331 | | | | 153,478 | |
| Trust 2005-40, Cl. SA, 59.448%, 5/25/3510 | | | 5,015,150 | | | | 993,499 | |
| Trust 2005-40, Cl. SB, 68.758%, 5/25/3510 | | | 2,295,582 | | | | 456,927 | |
| Trust 2005-5, Cl. SD, 12.53%, 1/25/3510 | | | 310,242 | | | | 59,432 | |
| Trust 2005-71, Cl. SA, 63.838%, 8/25/2510 | | | 2,236,307 | | | | 338,171 | |
| Trust 2006-51, Cl. SA, 13.892%, 6/25/3610 | | | 18,210,303 | | | | 2,640,955 | |
| Trust 2006-90, Cl. SX, 99.999%, 9/25/3610 | | | 5,338,119 | | | | 1,517,568 | |
| Trust 2007-75, Cl. BI, 2.546%, 8/25/3710 | | | 4,540,492 | | | | 1,070,270 | |
| Trust 2007-77, Cl. SB, 0%, 12/25/3110,11 | | | 854,418 | | | | 10,001 | |
| Trust 2007-88, Cl. XI, 41.37%, 6/25/3710 | | | 12,577,282 | | | | 2,144,230 | |
| Trust 2008-46, Cl. EI, 14.622%, 6/25/3810 | | | 1,763,407 | | | | 316,898 | |
| Trust 2008-55, Cl. SA, 21.288%, 7/25/3810 | | | 1,948,696 | | | | 289,698 | |
| Trust 2009-8, Cl. BS, 21.865%, 2/25/2410 | | | 1,988,231 | | | | 203,836 | |
| Trust 2010-95, Cl. DI, 10.012%, 11/1/2010 | | | 4,636,705 | | | | 371,576 | |
| Trust 2011-84, Cl. IG, 3.482%, 8/1/1310 | | | 14,914,046 | | | | 221,990 | |
| Trust 221, Cl. 2, 39.565%, 5/1/2310 | | | 437,745 | | | | 94,804 | |
| Trust 247, Cl. 2, 27.371%, 10/1/2310 | | | 186,803 | | | | 42,034 | |
| Trust 252, Cl. 2, 27.925%, 11/1/2310 | | | 51,097 | | | | 11,268 | |
| Trust 254, Cl. 2, 13.857%, 1/1/2410 | | | 148,623 | | | | 31,998 | |
| Trust 2682, Cl. TQ, 99.999%, 10/15/3310 | | | 2,074,883 | | | | 468,319 | |
| Trust 2981, Cl. BS, 99.999%, 5/15/3510 | | | 3,728,262 | | | | 732,616 | |
| Trust 301, Cl. 2, 0.075%, 4/1/2910 | | | 553,319 | | | | 111,963 | |
| Trust 303, Cl. IO, 31.06%, 11/1/2910 | | | 404,179 | | | | 95,688 | |
| Trust 313, Cl. 2, 25.362%, 6/1/3110 | | | 4,592,773 | | | | 837,340 | |
| Trust 319, Cl. 2, 3.908%, 2/1/3210 | | | 1,512,101 | | | | 299,290 | |
| Trust 321, Cl. 2, 4.076%, 4/1/3210 | | | 2,528,216 | | | | 508,715 | |
| Trust 324, Cl. 2, 4.465%, 7/1/3210 | | | 1,093,891 | | | | 220,571 | |
| | | | |
| OPPENHEIMER GLOBAL STRATEGIC INCOME FUND | | | 15 | |
STATEMENT OF INVESTMENTS Continued
| | | | | | | | |
| | | Principal
Amount | | | Value | |
| FHLMC/FNMA/FHLB/Sponsored Continued | | | | | | | | |
Federal National Mortgage Assn., Interest-Only Stripped
Mtg.-Backed Security: Continued | | | | | | | | |
| Trust 328, Cl. 2, 24.805%, 12/1/3210 | | $ | 1,109,322 | | | $ | 205,932 | |
| Trust 331, Cl. 5, 0.663%, 2/1/3310 | | | 2,191,645 | | | | 417,460 | |
| Trust 332, Cl. 2, 16.071%, 3/1/3310 | | | 5,175,578 | | | | 869,798 | |
| Trust 334, Cl. 10, 2.502%, 2/1/3310 | | | 1,891,857 | | | | 376,737 | |
| Trust 334, Cl. 12, 8.507%, 2/1/3310 | | | 2,750,752 | | | | 488,982 | |
| Trust 339, Cl. 7, 42.933%, 7/1/3310 | | | 6,141,760 | | | | 798,548 | |
| Trust 345, Cl. 9, 49.251%, 1/1/3410 | | | 1,843,257 | | | | 219,584 | |
| Trust 351, Cl. 10, 2.435%, 4/1/3410 | | | 770,018 | | | | 102,311 | |
| Trust 351, Cl. 8, 0.494%, 4/1/3410 | | | 1,287,122 | | | | 177,915 | |
| Trust 356, Cl. 10, 18.714%, 6/1/3510 | | | 1,024,298 | | | | 136,137 | |
| Trust 356, Cl. 12, 55.069%, 2/1/3510 | | | 497,580 | | | | 63,344 | |
| Trust 362, Cl. 13, 6.481%, 8/1/3510 | | | 68,124 | | | | 10,127 | |
| Vendee Mortgage Trust, Interest-Only Stripped Mtg.-Backed Security: | | | | | | | | |
| Series 1992-2, Cl. IO, 21.422%, 9/15/2210 | | | 7,547,572 | | | | 124,981 | |
| Series 1995-2B, Cl. 2IO, 25.082%, 6/15/2510 | | | 567,627 | | | | 13,218 | |
| Series 1995-3, Cl. 1IO, 13.531%, 9/15/2510 | | | 18,366,836 | | |
| 99,093
|
|
| | | | | | | | 2,001,706,129 | |
| GNMA/Guaranteed—0.2% | | | | | | | | |
| Government National Mortgage Assn.: | | | | | | | | |
| 1.625%, 7/1/274 | | | 5,120 | | | | 5,302 | |
| 5%, 11/1/34 | | | 503,391 | | | | 528,974 | |
| 7%, 1/29/28-2/8/30 | | | 1,002,304 | | | | 1,205,526 | |
| 8%, 1/29/28-9/29/28 | | | 475,870 | | | | 527,760 | |
| 11%, 11/8/19 | | | 5,338 | | | | 5,793 | |
| 12%, 12/9/13-9/1/15 | | | 9,036 | | | | 10,066 | |
| 12.50%, 12/29/13-11/29/15 | | | 118,189 | | | | 124,220 | |
| 13%, 10/30/15 | | | 251,449 | | | | 269,097 | |
| 13.50%, 6/30/15 | | | 254,102 | | | | 272,768 | |
| Government National Mortgage Assn., Gtd. Real Estate Mtg. Investment Conduit Pass-Through Certificates: | | | | | | | | |
| Series 1999-32, Cl. ZB, 8%, 9/16/29 | | | 4,537,789 | | | | 5,563,129 | |
| Series 2000-12, Cl. ZA, 8%, 2/16/30 | | | 2,299,284 | | | | 2,786,435 | |
| Series 2000-7, Cl. Z, 8%, 1/16/30 | | | 2,000,560 | | | | 2,424,568 | |
Government National Mortgage Assn., Interest-Only Stripped
Mtg.-Backed Security: | | | | | | | | |
| Series 1998-19, Cl. SB, 66.40%, 7/16/2810 | | | 934,212 | | | | 208,182 | |
| Series 1998-6, Cl. SA, 80.548%, 3/16/2810 | | | 566,548 | | | | 126,740 | |
| Series 2007-17, Cl. AI, 22.033%, 4/16/3710 | | | 2,606,250 | | | | 587,719 | |
| Series 2010-111, Cl. GI, 28.396%, 9/1/1310 | | | 35,294,623 | | | | 543,770 | |
| Series 2011-52, Cl. HS, 9.436%, 4/16/4110 | | | 4,563,118 | | |
| 1,318,915
|
|
| | | | | | | | 16,508,964 | |
| Other Agency—0.2% | | | | | | | | |
| NCUA Guaranteed Notes Trust 2010-C1, Gtd. Nts.: | | | | | | | | |
| Series 2010-C1, Cl. A1, 1.60%, 10/29/20 | | | 1,778,980 | | | | 1,810,112 | |
| Series 2010-C1, Cl. A2, 2.90%, 10/29/20 | | | 3,855,000 | | | | 4,144,125 | |
| Series 2010-C1, Cl. APT, 2.65%, 10/29/20 | | | 4,241,891 | | | | 4,487,788 | |
| NCUA Guaranteed Notes Trust 2010-R1, Gtd. Nts., Series 2010-R1, Cl. 1A, 0.678%, 10/7/204 | | | 3,324,225 | | | | 3,339,184 | |
| | |
| 16 | | OPPENHEIMER GLOBAL STRATEGIC INCOME FUND |
| | | | | | | | |
| | | Principal
Amount | | | Value | |
| Other Agency Continued | | | | | | | | |
| NCUA Guaranteed Notes Trust 2010-R3, Gtd. Nts.: | | | | | | | | |
| Series 2010-R3, Cl. 2A, 0.788%, 12/8/204 | | $ | 1,163,252 | | | $ | 1,171,977 | |
| Series 2010-R3, Cl. 3A, 2.40%, 12/8/20 | | | 2,667,909 | | |
| 2,731,939
|
|
| | | | | | | | 17,685,125 | |
| Non-Agency—12.0% | | | | | | | | |
| Commercial—7.2% | | | | | | | | |
| Banc of America Commercial Mortgage Trust 2006-1, Commercial Mtg. Pass-Through Certificates, Series 2006-1, Cl. AJ, 5.46%, 9/1/45 | | | 6,000,000 | | | | 5,651,400 | |
| Banc of America Commercial Mortgage Trust 2006-3, Commercial Mtg. Pass-Through Certificates, Series 2006-3, Cl. AM, 6.053%, 7/10/444 | | | 24,665,000 | | | | 25,127,752 | |
| Banc of America Commercial Mortgage Trust 2006-5, Commercial Mtg. Pass-Through Certificates, Series 2006-5, Cl. AM, 5.448%, 9/1/47 | | | 15,065,000 | | | | 15,376,175 | |
| Banc of America Commercial Mortgage Trust 2007-1, Commercial Mtg. Pass-Through Certificates, Series 2007-1, Cl. AMFX, 5.482%, 1/1/49 | | | 8,000,000 | | | | 8,272,772 | |
| Banc of America Commercial Mortgage Trust 2007-5, Commercial Mtg. Pass-Through Certificates, Series 2007-5, Cl. AM, 5.772%, 2/1/51 | | | 27,490,000 | | | | 30,253,968 | |
Banc of America Commercial Mortgage, Inc., Commercial Mtg.
Pass-Through Certificates: | | | | | | | | |
| Series 2007-3, Cl. AM, 5.893%, 6/1/494 | | | 14,315,000 | | | | 15,223,129 | |
| Series 2008-1, Cl. AM, 6.438%, 2/10/514 | | | 8,165,000 | | | | 9,092,479 | |
| BCAP LLC Trust, Mtg. Pass-Through Certificates: | | | | | | | | |
| Series 2012-RR6, Cl. 1A5, 2.243%, 11/1/366 | | | 869,494 | | | | 863,625 | |
| Series 2012-RR2, Cl. 6A3, 3.117%, 9/1/353,4 | | | 3,266,507 | | | | 3,314,521 | |
| Bear Stearns ARM Trust 2007-4, Mtg. Pass-Through Certificates, Series 2007-4, Cl. 22A1, 5.532%, 6/1/474 | | | 17,359,014 | | | | 14,529,009 | |
| Bear Stearns Commercial Mortgage Securities Trust 2006-PWR13, Commercial Mtg. Pass-Through Certificates, Series 2006-PWR13, Cl. AJ, 5.611%, 9/1/41 | | | 24,370,000 | | | | 22,453,080 | |
| Bear Stearns Commercial Mortgage Securities Trust 2007-PWR17, Commercial Mtg. Pass-Through Certificates: | | | | | | | | |
| Series 2007-PWR17, Cl. AM, 5.915%, 6/1/504 | | | 13,340,000 | | | | 14,700,973 | |
| Series 2007-PWR17, Cl. AJ, 6.089%, 6/1/504 | | | 27,600,000 | | | | 21,911,419 | |
| Bear Stearns Commercial Mortgage Securities Trust 2007-PWR18, Commercial Mtg. Pass-Through Certificates, Series 2007-PWR18, Cl. AM, 6.084%, 6/13/50 | | | 7,657,000 | | | | 8,373,488 | |
| Capital Lease Funding Securitization LP, Interest-Only Corporate-Backed Pass-Through Certificates, Series 1997-CTL1, 80.573%, 6/15/246,10 | | | 844,779 | | | | 41,290 | |
| CD 2007-CD5 Mortgage Trust, Commercial Mtg. Pass-Through Certificates, Series 2007-CD5, Cl. AM, 6.333%, 11/1/444 | | | 9,071,000 | | | | 10,252,974 | |
| CHL Mortgage Pass-Through Trust 2005-17, Mtg. Pass-Through Certificates, Series 2005-17, Cl. 1A8, 5.50%, 9/1/35 | | | 7,126,646 | | | | 7,288,307 | |
| CHL Mortgage Pass-Through Trust 2005-HYB8, Mtg. Pass-Through Certificates, Series 2005-HYB8, Cl. 4A1, 5.806%, 12/20/354 | | | 395,555 | | | | 295,135 | |
| CHL Mortgage Pass-Through Trust 2007-J3, Mtg. Pass-Through Certificates, Series 2007-J3, Cl. A9, 6%, 7/1/37 | | | 27,514,016 | | | | 21,620,417 | |
Citigroup Commercial Mortgage Trust 2008-C7, Commercial Mtg.
Pass-Through Certificates, Series 2008-C7, Cl. AM, 6.263%, 12/1/494 | | | 21,955,000 | | | | 24,116,327 | |
| | | | |
| OPPENHEIMER GLOBAL STRATEGIC INCOME FUND | | | 17 | |
STATEMENT OF INVESTMENTS Continued
| | | | | | | | |
| | | Principal
Amount | | | Value | |
| Commercial Continued | | | | | | | | |
| Citigroup Mortgage Loan Trust, Inc. 2012-8, Mtg. Pass-Through Certificates, Series 2012-8, Cl. 1A1, 2.647%, 10/1/354,6 | | $ | 4,005,000 | | | $ | 3,994,988 | |
| Credit Suisse Commercial Mortgage Trust, Commercial Mtg. Pass-Through Certificates, Series 2007-C3, Cl. A4, 5.866%, 6/1/394 | | | 4,210,000 | | | | 4,775,552 | |
| CSMC Mortgage-Backed Trust 2006-C1, Mtg. Pass-Through Certificates, Series 2006-C1, Cl. AJ, 5.588%, 2/1/394 | | | 9,225,000 | | | | 9,534,485 | |
| DBUBS Mortgage Trust, Commercial Mtg. Pass-Through Certificates, Series 2011-LC1, Cl. E, 5.728%, 11/1/463,4 | | | 9,405,000 | | | | 9,388,283 | |
| Deutsche Alt-B Securities, Inc., Mtg. Pass-Through Certificates, Series 2006-AB4, Cl. A1A, 6.005%, 10/25/36 | | | 1,901,357 | | | | 1,289,537 | |
| Deutsche Mortgage & Asset Receiving, Commercial Mtg. Pass-Through Certificates, Interest-Only Stripped Mtg.-Backed Security, Series 2010-C1, Cl. XPA, 4.90%, 9/1/203,10 | | | 20,309,194 | | | | 1,274,311 | |
| DLJ Mortgage Acceptance Corp., Commercial Mtg. Obligations, Series 1997-CF2, Cl. B30C, 6.99%, 10/15/304,6 | | | 26,541,464 | | | | 5,308,293 | |
FDIC Trust, Commercial Mtg. Pass-Through Certificates, Series 2012-C1,
Cl. A, 0.841%, 5/1/356 | | | 5,069,680 | | | | 5,086,055 | |
| First Horizon Alternative Mortgage Securities Trust 2007-FA2, Mtg. Pass-Through Certificates, Series 2007-FA2, Cl. 1A1, 5.50%, 4/25/37 | | | 3,941,486 | | | | 2,700,296 | |
| GMAC Commercial Mortgage Securities, Inc., Commercial Mtg. Pass-Through Certificates, Series 1998-C1, Cl. F, 7.109%, 5/15/304 | | | 1,845,549 | | | | 1,869,874 | |
Greenwich Capital Commercial Funding Corp./Commercial Mortgage Trust 2006-GG7, Commercial Mtg. Pass-Through Certificates, Series 2006-GG7,
Cl. AJ, 6.065%, 7/10/384 | | | 14,200,000 | | | | 12,657,987 | |
| Greenwich Capital Commercial Funding Corp./Commercial Mortgage Trust 2007-GG11, Commercial Mtg. Pass-Through Certificates: | | | | | | | | |
| Series 2007-GG11, Cl. A4, 5.736%, 12/1/49 | | | 3,720,000 | | | | 4,365,827 | |
| Series 2007-GG11, Cl. AM, 5.867%, 12/1/49 | | | 24,450,000 | | | | 25,804,481 | |
| Greenwich Capital Commercial Funding Corp./Commercial Mortgage Trust 2007-GG9, Commercial Mtg. Pass-Through Certificates, Series 2007-GG9, Cl. AM, 5.475%, 3/1/39 | | | 8,365,000 | | | | 8,686,772 | |
GS Mortgage Securities Corp. II, Commercial Mtg. Obligations,
Series 2011-GC3, Cl. D, 5.728%, 3/1/443,4 | | | 11,396,000 | | | | 10,521,237 | |
| GSR Mortgage Loan Trust 2005-AR4, Mtg. Pass-Through Certificates, Series 2005-AR4, Cl. 6A1, 5.25%, 7/1/35 | | | 1,528,263 | | | | 1,510,115 | |
| IndyMac Index Mortgage Loan Trust 2005-AR23, Mtg. Pass-Through Certificates, Series 2005-AR23, Cl. 6A1, 4.96%, 11/1/354 | | | 5,561,483 | | | | 4,628,922 | |
| JPMorgan Chase Commercial Mortgage Securities Corp., Commercial Mtg. Pass-Through Certificates: | | | | | | | | |
| Series 2007-CB18, Cl. AM, 5.466%, 6/1/47 | | | 20,139,000 | | | | 21,806,721 | |
| Series 2007-CB15, Cl. AJ, 5.502%, 6/1/47 | | | 30,690,000 | | | | 23,687,002 | |
| Series 2006-CIBC15, Cl. AM, 5.855%, 6/1/43 | | | 12,893,000 | | | | 13,179,051 | |
| JPMorgan Chase Commercial Mortgage Securities Trust 2006-CIBC16, Commercial Mtg. Pass-Through Certificates, Series 2006-CIBC16, Cl. AJ, 5.623%, 5/1/45 | | | 8,030,000 | | | | 6,968,823 | |
| JPMorgan Chase Commercial Mortgage Securities Trust 2007-CB19, Commercial Mtg. Pass-Through Certificates, Series 2007-CB19, Cl. AM, 5.918%, 2/1/494 | | | 25,504,000 | | | | 26,597,089 | |
| | |
| 18 | | OPPENHEIMER GLOBAL STRATEGIC INCOME FUND |
| | | | | | | | |
| | | Principal
Amount | | | Value | |
| Commercial Continued | | | | | | | | |
| JPMorgan Chase Commercial Mortgage Securities Trust 2007-LD11, Commercial Mtg. Pass-Through Certificates, Series 2007-LD11, Cl. A4, 6.003%, 6/1/494 | | $ | 3,800,000 | | | $ | 4,422,155 | |
| JPMorgan Chase Commercial Mortgage Securities Trust 2007-LDP11, Commercial Mtg. Pass-Through Certificates, Series 2007-LDP11, Cl. ASB, 6.003%, 6/1/494 | | | 1,922,287 | | | | 2,105,558 | |
| JPMorgan Mortgage Trust 2006-A7, Mtg. Pass-Through Certificates, Series 2006-A7, Cl. 2A2, 2.802%, 1/1/374 | | | 884,740 | | | | 713,148 | |
| JPMorgan, Re-securitized Real Estate Mtg. Investment Conduit Multiclass Pass-Through Certificates, Series 2009-5, Cl. 1A2, 2.614%, 7/1/363,4 | | | 20,165,626 | | | | 13,941,576 | |
| LB-UBS Commercial Mortgage Trust 2006-C3, Commercial Mtg. Pass-Through Certificates, Series 2006-C3, Cl. AJ, 5.72%, 3/11/39 | | | 3,675,000 | | | | 3,427,790 | |
| LB-UBS Commercial Mortgage Trust 2007-C6, Commercial Mtg. Pass-Through Certificates, Series 2007-C6, Cl. AM, 6.114%, 7/11/40 | | | 14,600,000 | | | | 15,511,259 | |
| LB-UBS Commercial Mortgage Trust 2008-C1, Commercial Mtg. Pass-Through Certificates, Series 2008-C1, Cl. AM, 6.325%, 4/11/414 | | | 6,930,000 | | | | 7,829,171 | |
| Lehman Structured Securities Corp., Commercial Mtg. Pass-Through Certificates, Series 2002-GE1, Cl. A, 2.514%, 7/1/243 | | | 187,327 | | | | 168,097 | |
| Lehman Structured Securities Corp., Mtg.-Backed Security, 6%, 5/1/29 | | | 1,183,687 | | | | 227,200 | |
| Merrill Lynch Mortgage Trust 2006-C1, Commercial Mtg. Pass-Through Certificates, Series 2006-C1, Cl. AJ, 5.847%, 5/1/394 | | | 11,155,000 | | | | 10,317,745 | |
| ML-CFC Commercial Mortgage Trust 2006-3, Commercial Mtg. Pass-Through Certificates: | | | | | | | | |
| Series 2006-3, Cl. AM, 5.456%, 7/12/46 | | | 3,602,000 | | | | 3,944,321 | |
| Series 2006-3, Cl. AJ, 5.485%, 7/1/46 | | | 21,180,000 | | | | 18,594,303 | |
| Morgan Stanley Capital I Trust 2007-IQ15, Commercial Mtg. Pass-Through Certificates, Series 2007-IQ15, Cl. AM, 6.076%, 6/1/494 | | | 22,125,000 | | | | 23,393,150 | |
| Morgan Stanley Capital I Trust 2007-IQ16, Commercial Mtg. Pass-Through Certificates, Series 2007-IQ16, Cl. AM, 6.308%, 12/1/494 | | | 7,833,000 | | | | 8,751,227 | |
| RALI Series 2005-QA4 Trust, Mtg. Asset-Backed Pass-Through Certificates, Series 2005-QA4, Cl. A32, 3.479%, 4/25/354 | | | 295,968 | | | | 59,818 | |
| Residential Asset Securitization Trust 2006-A12, Mtg. Pass-Through Certificates, Series 2006-A12, Cl. 1A, 6.25%, 11/1/36 | | | 1,723,205 | | | | 1,253,534 | |
| Sequoia Mortgage Trust, Mtg. Pass-Through Certificates, Series 2012-2, Cl. A2, 3.50%, 3/1/42 | | | 1,816,818 | | | | 1,935,443 | |
| STARM Mortgage Loan Trust 2007-1, Mtg. Pass-Through Certificates, Series 2007-1, Cl. 2A1, 5.809%, 2/1/374 | | | 16,582,066 | | | | 13,608,487 | |
| Structured Adjustable Rate Mortgage Loan Trust 2006-4, Commercial Mtg. Pass-Through Certificates, Series 2006-4, Cl. 6A, 5.402%, 5/1/364 | | | 3,740,656 | | | | 3,049,317 | |
| Wachovia Bank Commercial Mortgage Trust 2006-C23, Commercial Mtg. Pass-Through Certificates, Series 2006-C23, Cl. AJ, 5.515%, 1/1/45 | | | 16,865,000 | | | | 16,251,805 | |
| Wachovia Bank Commercial Mortgage Trust 2006-C25, Commercial Mtg. Pass-Through Certificates, Series 2006-C25, Cl. AJ, 5.923%, 5/1/434 | | | 19,685,000 | | | | 19,826,132 | |
| WaMu Mortgage Pass-Through Certificates 2007-OA3 Trust, Mtg. Pass-Through Certificates, Series 2007-OA3, Cl. 5A, 2.366%, 4/1/474 | | | 1,927,175 | | | | 1,320,387 | |
| | | | |
| OPPENHEIMER GLOBAL STRATEGIC INCOME FUND | | | 19 | |
STATEMENT OF INVESTMENTS Continued
| | | | | | | | |
| | | Principal
Amount | | | Value | |
| Commercial Continued | | | | | | | | |
| Wells Fargo Mortgage-Backed Securities 2004-W Trust, Mtg. Pass-Through Certificates, Series 2004-W, Cl. B2, 2.61%, 11/1/344 | | $ | 1,140,629 | | | $ | 35,196 | |
| Wells Fargo Mortgage-Backed Securities 2005-AR1 Trust, Mtg. Pass-Through Certificates, Series 2005-AR1, Cl. 1A1, 2.61%, 2/1/354 | | | 9,098,842 | | | | 9,067,778 | |
| Wells Fargo Mortgage-Backed Securities 2007-AR3 Trust, Mtg. Pass-Through Certificates, Series 2007-AR3, Cl. A4, 5.733%, 4/1/374 | | | 7,376,844 | | | | 6,620,127 | |
| WFRBS Commercial Mortgage Trust 2011-C3, Interest-Only Commercial Mtg. Pass-Through Certificates, Series 2011-C3, Cl. XA, 9.116%, 3/1/4410 | | | 25,075,021 | | |
| 2,069,253
|
|
| | | | | | | | 652,837,918 | |
| Multifamily—0.8% | | | | | | | | |
| Banc of America Commercial Mortgage, Inc., Commercial Mtg. Pass-Through Certificates, Series 2006-2, Cl. AJ, 5.952%, 5/1/454 | | | 10,705,000 | | | | 10,644,924 | |
| CHL Mortgage Pass-Through Trust 2006-20, Mtg. Pass-Through Certificates, Series 2006-20, Cl. 1A17, 5.75%, 2/1/37 | | | 9,138,223 | | | | 7,786,976 | |
| Citigroup Mortgage Loan Trust, Inc. 2006-AR3, Mtg. Pass-Through Certificates, Series 2006-AR3, Cl. 1A2A, 5.584%, 6/1/364 | | | 19,886,953 | | | | 19,177,535 | |
| Countrywide Alternative Loan Trust 2006-24CB, Mtg. Pass-Through Certificates, Series 2006-424B, Cl. A12, 5.75%, 6/1/36 | | | 5,582,470 | | | | 4,391,685 | |
| JPMorgan Mortgage Trust 2007-A3, Mtg. Pass-Through Certificates, Series 2007-A3, Cl. 3A2M, 5.046%, 5/1/374 | | | 15,417,346 | | | | 14,589,843 | |
| Wells Fargo Mortgage-Backed Securities 2005-AR15 Trust, Mtg. Pass-Through Certificates, Series 2005-AR15, Cl. 1A2, 2.617%, 9/1/354 | | | 1,421,102 | | | | 1,377,906 | |
| Wells Fargo Mortgage-Backed Securities 2006-AR2 Trust, Mtg. Pass-Through Certificates, Series 2006-AR2, Cl. 2A3, 2.617%, 3/1/364 | | | 8,629,301 | | | | 8,199,290 | |
| Wells Fargo Mortgage-Backed Securities 2006-AR6 Trust, Mtg. Pass-Through Certificates, Series 2006-AR6, Cl. 3A1, 2.693%, 3/25/364 | | | 4,372,395 | | |
| 4,117,873
|
|
| | | | | | | | 70,286,032 | |
| Residential—4.0% | | | | | | | | |
| Argent Securities Trust 2004-W8, Asset-Backed Pass-Through Certificates, Series 2004-W8, Cl. A2, 1.177%, 5/25/344 | | | 4,625,802 | | | | 4,178,307 | |
| Banc of America Commercial Mortgage, Inc., Commercial Mtg. Pass-Through Certificates: | | | | | | | | |
| Series 2007-4, Cl. AM, 5.987%, 2/1/514 | | | 23,790,000 | | | | 25,382,181 | |
| Series 2007-1, Cl. 1A3, 6%, 1/1/37 | | | 4,455,552 | | | | 3,851,266 | |
| Banc of America Funding 2007-C Trust, Mtg. Pass-Through Certificates, Series 2007-C, Cl. 1A4, 5.526%, 5/1/364 | | | 7,346,010 | | | | 7,182,065 | |
| Bear Stearns ARM Trust 2004-2, Mtg. Pass-Through Certificates, Series 2004-2, Cl. 12A2, 2.935%, 5/1/344 | | | 6,879,180 | | | | 6,532,321 | |
| Chase Funding Trust 2003-2, Mtg. Loan Asset-Backed Certificates, Series 2003-2, Cl. 2A2, 0.777%, 2/25/334 | | | 22,271 | | | | 20,203 | |
| CHL Mortgage Pass-Through Trust 2005-26, Mtg. Pass-Through Certificates, Series 2005-26, Cl. 1A8, 5.50%, 11/1/35 | | | 5,147,365 | | | | 5,009,035 | |
| CHL Mortgage Pass-Through Trust 2005-29, Mtg. Pass-Through Certificates, Series 2005-29, Cl. A1, 5.75%, 12/1/35 | | | 18,901,519 | | | | 17,549,323 | |
| | |
| 20 | | OPPENHEIMER GLOBAL STRATEGIC INCOME FUND |
| | | | | | | | |
| | | Principal
Amount | | | Value | |
| Residential Continued | | | | | | | | |
| CHL Mortgage Pass-Through Trust 2005-30, Mtg. Pass-Through Certificates, Series 2005-30, Cl. A5, 5.50%, 1/1/36 | | $ | 3,965,253 | | | $ | 4,040,555 | |
| CHL Mortgage Pass-Through Trust 2005-J4, Mtg. Pass-Through Certificates, Series 2005-J4, Cl. A7, 5.50%, 11/1/35 | | | 4,752,357 | | | | 5,006,701 | |
| CHL Mortgage Pass-Through Trust 2006-6, Mtg. Pass-Through Certificates, Series 2006-6, Cl. A3, 6%, 4/1/36 | | | 889,185 | | | | 786,394 | |
| CHL Mortgage Pass-Through Trust 2007-HY3, Mtg. Pass-Through Certificates, Series 2007-HY3, Cl. 1A1, 3.053%, 6/1/474 | | | 5,254,239 | | | | 4,353,684 | |
| Citigroup Mortgage Loan Trust, Inc. 2005-2, Mtg. Pass-Through Certificates, Series 2005-2, Cl. 1A3, 2.662%, 5/1/354 | | | 5,908,017 | | | | 5,753,088 | |
| Citigroup Mortgage Loan Trust, Inc. 2005-3, Mtg. Pass-Through Certificates, Series 2005-3, Cl. 2A4, 2.896%, 8/1/354 | | | 11,574,428 | | | | 9,105,973 | |
| Citigroup Mortgage Loan Trust, Inc. 2006-AR2, Mtg. Pass-Through Certificates, Series 2006-AR2, Cl. 1A2, 2.989%, 3/1/364 | | | 14,543,590 | | | | 12,016,750 | |
| Citigroup, Inc./Deutsche Bank 2007-CD4 Commercial Mortgage Trust, Commercial Mtg. Pass-Through Certificates, Series 2007-CD4, Cl. AMFX, 5.366%, 12/1/49 | | | 23,105,000 | | | | 23,620,542 | |
| Countrywide Alternative Loan Trust 2006-43CB, Mtg. Pass-Through Certificates, Series 2006-43CB, Cl. 1A10, 6%, 2/1/37 | | | 23,677,544 | | | | 18,156,651 | |
| Countrywide Alternative Loan Trust 2007-19, Mtg. Pass-Through Certificates: | | | | | | | | |
| Series 2007-19, Cl. 1A4, 6%, 8/1/37 | | | 8,849,089 | | | | 6,931,018 | |
| Series 2007-19, Cl. 1A34, 6%, 8/1/37 | | | 27,383,419 | | | | 21,447,967 | |
Countrywide Home Loans, Asset-Backed Certificates, Series 2005-16,
Cl. 2AF2, 5.287%, 5/1/364 | | | 1,047,399 | | | | 821,796 | |
| CSMC Mortgage-Backed Trust 2007-3, Mtg. Pass-Through Certificates, Series 2007-3, Cl. 2A10, 6%, 4/1/37 | | | 4,200,432 | | | | 3,634,686 | |
| CWABS Asset-Backed Certificates Trust 2006-25, Asset-Backed Certificates, Series 2006-25, Cl. 2A2, 0.337%, 6/25/474 | | | 4,961,129 | | | | 4,886,709 | |
| CWHEQ Revolving Home Equity Loan Trust, Asset-Backed Certificates: | | | | | | | | |
| Series 2006-H, Cl. 2A1A, 0.371%, 11/15/364 | | | 168,337 | | | | 43,681 | |
| Series 2005-G, Cl. 2A, 0.451%, 12/15/354 | | | 408,708 | | | | 224,789 | |
| GSR Mortgage Loan Trust 2005-AR6, Mtg. Pass-Through Certificates, Series 2005-AR6, Cl. 1A4, 2.646%, 9/1/354 | | | 14,685,090 | | | | 14,856,200 | |
| GSR Mortgage Loan Trust 2006-5F, Mtg. Pass-Through Certificates, Series 2006-5F, Cl. 2A1, 6%, 6/1/36 | | | 1,256,470 | | | | 1,215,917 | |
| Home Equity Mortgage Trust 2005-1, Mtg. Pass-Through Certificates, Series 2005-1, Cl. M6, 5.863%, 6/1/35 | | | 2,774,000 | | | | 1,988,604 | |
| JPMorgan Alternative Loan Trust 2006-S4, Mtg. Pass-Through Certificates, Series 2006-S4, Cl. A6, 5.71%, 12/1/36 | | | 5,304,422 | | | | 4,936,213 | |
| JPMorgan Mortgage Trust 2007-A1, Mtg. Pass-Through Certificates, Series 2007-A1, Cl. 7A1, 3.005%, 7/1/354 | | | 6,667,183 | | | | 6,489,353 | |
| LB-UBS Commercial Mortgage Trust 2007-C7, Commercial Mtg. Pass-Through Certificates, Series 2007-C7, Cl. AM, 6.395%, 9/11/454 | | | 27,890,000 | | | | 29,788,793 | |
Lehman Mortgage Trust, Mtg. Pass-Through Certificates, Series 2006-1,
Cl. 1A3, 5.50%, 2/1/36 | | | 1,254,862 | | | | 997,868 | |
| Mastr Asset-Backed Securities Trust 2006-WMC3, Mtg. Pass-Through Certificates, Series 2006-WMC3, Cl. A3, 0.317%, 8/25/364 | | | 5,037,884 | | | | 1,758,098 | |
| | | | |
| OPPENHEIMER GLOBAL STRATEGIC INCOME FUND | | | 21 | |
STATEMENT OF INVESTMENTS Continued
| | | | | | | | |
| | | Principal
Amount | | | Value | |
| Residential Continued | | | | | | | | |
| Merrill Lynch Mortgage Investors Trust 2006-3, Mtg. Pass-Through Certificates, Series MLCC 2006-3, Cl. 2A1, 2.671%, 10/25/364 | | $ | 6,889,399 | | | $ | 6,933,570 | |
| Merrill Lynch Mortgage Loans, Inc., Mtg. Pass-Through Certificates, Series 2005-A1, Cl. 2A1, 2.632%, 12/25/344 | | | 295,951 | | | | 297,248 | |
| NC Finance Trust, Collateralized Mtg. Obligation Pass-Through Certificates, Series 1999-I, Cl. ECFD, 3.405%, 1/25/295,6 | | | 4,912,783 | | | | 400,392 | |
| Popular ABS Mortgage Pass-Through Trust 2005-6, Mtg. Pass-Through Certificates, Series 2005-6, Cl. A3, 5.175%, 1/1/364 | | | 854,563 | | | | 673,548 | |
| RALI Series 2003-QS1 Trust, Mtg. Asset-Backed Pass-Through Certificates, Series 2003-QS1, Cl. A2, 5.75%, 1/25/33 | | | 17,161 | | | | 17,810 | |
| RALI Series 2006-QS13 Trust, Mtg. Asset-Backed Pass-Through Certificates: | | | | | | | | |
| Series 2006-QS13, Cl. 1A5, 6%, 9/25/36 | | | 5,852,650 | | | | 4,232,692 | |
| Series 2006-QS13, Cl. 1A8, 6%, 9/25/36 | | | 149,758 | | | | 108,306 | |
| RALI Series 2007-QS6 Trust, Mtg. Asset-Backed Pass-Through Certificates, Series 2007-QS6, Cl. A28, 5.75%, 4/25/37 | | | 2,742,242 | | | | 1,949,508 | |
| Residential Asset Securitization Trust 2005-A14, Mtg. Pass-Through Certificates, Series 2005-A14, Cl. A1, 5.50%, 12/1/35 | | | 8,797,610 | | | | 7,809,524 | |
| Residential Asset Securitization Trust 2005-A15, Mtg. Pass-Through Certificates, Series 2005-A15, Cl. 1A4, 5.75%, 2/1/36 | | | 13,092,283 | | | | 11,706,484 | |
| Residential Asset Securitization Trust 2005-A6CB, Mtg. Pass-Through Certificates, Series 2005-A6CB, Cl. A7, 6%, 6/1/35 | | | 11,118,664 | | | | 9,979,757 | |
Terwin Mortgage Trust, Home Equity Asset-Backed Securities,
Series 2006-4SL, Cl. A1, 2.706%, 5/1/373,4,7 | | | 432,407 | | | | 199,424 | |
WaMu Mortgage Pass-Through Certificates 2005-AR12 Trust, Mtg.
Pass-Through Certificates, Series 2007-AR12, Cl. 1A8, 2.488%, 10/1/354 | | | 5,818,751 | | | | 5,321,222 | |
WaMu Mortgage Pass-Through Certificates 2006-AR10 Trust, Mtg.
Pass-Through Certificates, Series 2006-AR10, Cl. 1A2, 2.741%, 9/1/364 | | | 2,261,319 | | | | 1,738,493 | |
WaMu Mortgage Pass-Through Certificates 2007-HY1 Trust, Mtg.
Pass-Through Certificates: | | | | | | | | |
| Series 2007-HY1, Cl. 4A1, 2.704%, 2/1/374 | | | 33,827,254 | | | | 26,466,562 | |
| Series 2007-HY1, Cl. 5A1, 4.866%, 2/1/374 | | | 20,257,182 | | | | 16,204,460 | |
| WaMu Mortgage Pass-Through Certificates 2007-HY5 Trust, Mtg. Pass-Through Certificates, Series 2007-HY5, Cl. 3A1, 5.20%, 5/1/374 | | | 3,497,335 | | | | 3,377,999 | |
| WaMu Mortgage Pass-Through Certificates 2007-HY6 Trust, Mtg. Pass-Through Certificates, Series 2007-HY6, Cl. 2A1, 4.948%, 6/25/374 | | | 8,772,106 | | | | 7,352,147 | |
| WaMu Mortgage Pass-Through Certificates, Mtg. Pass-Through Certificates, Series 2006-AR18, Cl. 3A1, 4.744%, 1/1/374 | | | 2,798,810 | | | | 2,420,751 | |
| Wells Fargo Mortgage-Backed Securities 2005-9 Trust, Mtg. Pass-Through Certificates, Series 2005-9, Cl. 2A6, 5.25%, 10/25/35 | | | 1,997,369 | | | | 2,127,765 | |
Wells Fargo Mortgage-Backed Securities 2006-AR14 Trust, Mtg.
Pass-Through Certificates, Series 2006-AR14, Cl. 1A2, 5.649%, 10/1/364 | | | 8,227,036 | | |
| 8,152,009
|
|
| | | | | | | | 370,036,402 | |
| | | | | | |
|
|
|
| Total Mortgage-Backed Obligations (Cost $3,096,594,256) | | | | | | | 3,129,060,570 | |
| | |
| 22 | | OPPENHEIMER GLOBAL STRATEGIC INCOME FUND |
| | | | | | | | |
| | | Principal
Amount | | | Value | |
| U.S. Government Obligations—3.6% | | | | | | | | |
| Federal Home Loan Mortgage Corp. Nts.: | | | | | | | | |
| 1%, 7/28/17-9/29/17 | | $ | 30,570,000 | | | $ | 30,958,597 | |
| 1.25%, 8/1/19 | | | 3,780,000 | | | | 3,797,316 | |
| 1.25%, 10/2/198 | | | 21,420,000 | | | | 21,355,901 | |
| 2.375%, 1/13/22 | | | 4,097,000 | | | | 4,307,963 | |
| Federal National Mortgage Assn. Nts.: | | | | | | | | |
| 0.875%, 8/28/17-10/26/17 | | | 42,521,000 | | | | 42,787,594 | |
| 4.375%, 10/15/15 | | | 10,660,000 | | | | 11,944,146 | |
| U.S. Treasury Nts.: | | | | | | | | |
| 1.625%, 8/15/2212,13 | | | 136,200,000 | | | | 136,114,875 | |
| 1.75%, 5/15/2213,14 | | | 65,000,000 | | | | 65,949,650 | |
| STRIPS, 0.891%, 8/15/1615 | | | 11,000,000 | | |
| 10,806,642
|
|
| Total U.S. Government Obligations (Cost $327,365,400) | | | | | | | 328,022,684 | |
| Foreign Government Obligations—28.2% | | | | | | | | |
| Angola—0.1% | | | | | | | | |
| Angola (Republic of) Sr. Unsec. Nts., 7%, 8/16/19 | | | 7,260,000 | | | | 8,004,150 | |
| Australia—0.4% | | | | | | | | |
| New South Wales Treasury Corp. Bonds: | | | | | | | | |
| Series 14, 5.50%, 8/1/14 | | | 3,130,000 | AUD | | | 3,402,162 | |
| Series 15, 6%, 4/1/25 | | | 2,290,000 | AUD | | | 2,550,774 | |
| Series 17, 5.50%, 3/1/17 | | | 2,235,000 | AUD | | | 2,551,719 | |
| Queensland Treasury Corp. Nts.: | | | | | | | | |
| Series 15, 6%, 10/14/15 | | | 4,580,000 | AUD | | | 5,167,437 | |
| Series 17, 6%, 9/14/17 | | | 3,660,000 | AUD | | | 4,281,859 | |
| Series 21, 6%, 6/14/21 | | | 4,500,000 | AUD | | | 5,518,890 | |
| Series 24, 5.75%, 7/22/24 | | | 3,820,000 | AUD | | | 4,501,909 | |
| Victoria Treasury Corp. Nts., Series 1116, 5.75%, 11/15/16 | | | 5,575,000 | AUD | | | 6,373,562 | |
| Western Australia Treasury Corp. Nts., Series 15, 7%, 4/15/15 | | | 2,295,000 | AUD | |
| 2,615,268
|
|
| | | | | | | | 36,963,580 | |
| Belgium—0.1% | | | | | | | | |
| Belgium (Kingdom of) Bonds, Series 58, 3.75%, 9/28/20 | | | 9,195,000 | EUR | | | 13,213,278 | |
| Brazil—2.8% | | | | | | | | |
| Brazil (Federative Republic of) Nota Do Tesouro Nacional Nts.: | | | | | | | | |
| 9.762%, 1/1/17 | | | 204,217,000 | BRR | | | 103,991,895 | |
| 9.762%, 1/1/21 | | | 94,893,000 | BRR | | | 47,633,134 | |
| 12.681%, 5/15/4516 | | | 12,885,000 | BRR | | | 17,838,951 | |
| Series NTNB, 12.681%, 5/15/1516 | | | 40,765,000 | BRR | | | 47,970,348 | |
| Series NTNB, 12.998%, 8/15/5016 | | | 11,715,000 | BRR | | | 16,263,615 | |
| Brazil (Federative Republic of) Nota Do Tesouro Nacional Unsec. Bonds, 10%, 1/1/18 | | | 39,555,000 | BRR | |
| 20,117,583
|
|
| | | | | | | | 253,815,526 | |
| Canada—0.2% | | | | | | | | |
| Canada (Government of) Nts., 3.75%, 6/1/19 | | | 6,750,000 | CAD | | | 7,860,856 | |
| Canada (Government of) Treasury Bills, 0.891%, 10/11/1215 | | | 6,725,000 | CAD | |
| 6,838,417
|
|
| | | | | | | | 14,699,273 | |
| | | | |
| OPPENHEIMER GLOBAL STRATEGIC INCOME FUND | | | 23 | |
STATEMENT OF INVESTMENTS Continued
| | | | | | | | |
| | | Principal
Amount | | | Value | |
| Colombia—0.4% | | | | | | | | |
| Bogota Distrio Capital Sr. Bonds, 9.75%, 7/26/283 | | | 4,275,000,000 | COP | | $ | 3,523,515 | |
| Colombia (Republic of) Sr. Unsec. Bonds, 6.125%, 1/18/41 | | | 22,330,000 | | |
| 30,368,800
|
|
| | | | | | | | 33,892,315 | |
| Croatia—0.1% | | | | | | | | |
| Croatia (Republic of) Unsec. Nts., 6.25%, 4/27/173 | | | 7,695,000 | | | | 8,349,075 | |
| Denmark—0.1% | | | | | | | | |
| Denmark (Kingdom of) Bonds, 4%, 11/15/19 | | | 20,305,000 | DKK | | | 4,255,458 | |
| Finland—0.0% | | | | | | | | |
| Finland (Republic of) Sr. Unsec. Bonds, 4.375%, 7/4/19 | | | 1,540,000 | EUR | | | 2,394,609 | |
| France—0.5% | | | | | | | | |
| Caisse D’Amortissement de la Dette Sociale Bonds, 1.625%, 7/6/153 | | | 2,285,000 | | | | 2,326,505 | |
| France (Republic of) Bonds: | | | | | | | | |
| 3.25%, 10/25/21 | | | 3,865,000 | EUR | | | 5,455,164 | |
| 3.75% 10/25/19 | | | 8,370,000 | EUR | | | 12,312,767 | |
| 4%, 4/25/60 | | | 1,890,000 | EUR | | | 2,833,812 | |
| 4.50%, 4/25/41 | | | 3,880,000 | EUR | | | 6,227,555 | |
| France (Republic of) Treasury Nts., 1%, 7/25/17 | | | 13,535,000 | EUR | |
| 17,478,931
|
|
| | | | | | | | 46,634,734 | |
| Germany—0.2% | | | | | | | | |
| Germany (Federal Republic of) Bonds, 2.50%, 7/4/44 | | | 3,885,000 | EUR | | | 5,288,344 | |
| Germany (Federal Republic of) Sec. Bonds, Series 164, 0.50%, 10/13/17 | | | 9,020,000 | EUR | | | 11,584,773 | |
| Germany (Federal Republic of) Unsec. Bonds, 1.50%, 9/4/22 | | | 2,330,000 | EUR | |
| 3,026,736
|
|
| | | | | | | | 19,899,853 | |
| Ghana—0.1% | | | | | | | | |
| Ghana (Republic of) Bonds, 8.50%, 10/4/173 | | | 4,925,000 | | | | 5,811,500 | |
| Hungary—2.3% | | | | | | | | |
| Hungary (Republic of) Bonds: | | | | | | | | |
| 4.75%, 2/3/15 | | | 6,050,000 | | | | 6,086,603 | |
| 6.75%, 11/24/17 | | | 3,337,000,000 | HUF | | | 15,057,185 | |
| Series 13/D, 6.75%, 2/12/13 | | | 11,723,000,000 | HUF | | | 52,794,563 | |
| Series 14/D, 6.75%, 8/22/14 | | | 1,608,000,000 | HUF | | | 7,314,350 | |
| Series 15C, 7.75%, 8/24/15 | | | 4,444,000,000 | HUF | | | 20,579,275 | |
| Series 15/A, 8%, 2/12/15 | | | 850,000,000 | HUF | | | 3,952,871 | |
| Series 16/C, 5.50%, 2/12/16 | | | 1,122,000,000 | HUF | | | 4,905,749 | |
| Series 17/B, 6.75%, 2/24/17 | | | 2,417,000,000 | HUF | | | 10,914,933 | |
| Series 19/A, 6.50%, 6/24/19 | | | 1,773,000,000 | HUF | | | 7,821,060 | |
| Series 20/A, 7.50%, 11/12/20 | | | 1,747,000,000 | HUF | | | 8,021,886 | |
| Series 22A, 7%, 6/24/22 | | | 1,216,000,000 | HUF | | | 5,401,463 | |
| Series 23A, 6%, 11/24/23 | | | 819,000,000 | HUF | | | 3,333,605 | |
| Hungary (Republic of) Sr. Unsec. Bonds, 7.625%, 3/29/41 | | | 3,085,000 | | | | 3,501,475 | |
| Hungary (Republic of) Sr. Unsec. Nts., 5.75%, 6/11/18 | | | 3,155,000 | EUR | | | 4,046,750 | |
| Hungary (Republic of) Sr. Unsec. Unsub. Nts., 6.375%, 3/29/21 | | | 2,050,000 | | | | 2,242,290 | |
| | |
| 24 | | OPPENHEIMER GLOBAL STRATEGIC INCOME FUND |
| | | | | | | | |
| | | Principal
Amount | | | Value | |
| Hungary Continued | | | | | | | | |
| Hungary (Republic of) Treasury Bills: | | | | | | | | |
| 6.655%, 5/29/1315 | | | 394,000,000 | HUF | | $ | 1,702,838 | |
| 6.691%, 4/17/1315 | | | 525,000,000 | HUF | | | 2,290,762 | |
| 6.704%, 12/19/1215 | | | 656,000,000 | HUF | | | 2,915,833 | |
| 6.711%, 12/5/1215 | | | 262,000,000 | HUF | | | 1,167,579 | |
| 6.749%, 12/12/1215 | | | 1,050,000,000 | HUF | | | 4,680,878 | |
| 7.006%, 2/20/1315 | | | 788,000,000 | HUF | | | 3,469,567 | |
| 7.31%, 12/27/1215 | | | 7,687,000,000 | HUF | |
| 34,176,154
|
|
| | | | | | | | 206,377,669 | |
| Indonesia—0.4% | | | | | | | | |
| Indonesia (Republic of) Nts., 5.25%, 1/17/423 | | | 10,235,000 | | | | 11,706,281 | |
| Indonesia (Republic of) Sr. Unsec. Bonds, 4.875%, 5/5/213 | | | 3,640,000 | | | | 4,181,450 | |
| Indonesia (Republic of) Sr. Unsec. Nts., 7.75%, 1/17/383 | | | 4,840,000 | | | | 7,247,900 | |
| Indonesia (Republic of) Unsec. Nts.: | | | | | | | | |
| 3.75%, 4/25/223 | | | 7,980,000 | | | | 8,458,800 | |
| 8.50%, 10/12/353 | | | 3,015,000 | | |
| 4,801,388
|
|
| | | | | | | | 36,395,819 | |
| Ireland—0.0% | | | | | | | | |
| Ireland (Republic of) Treasury Bonds, 4.40%, 6/18/19 | | | 3,360,000 | EUR | | | 4,231,541 | |
| Israel—0.1% | | | | | | | | |
| Israel (State of) Sr. Unsec. Bonds, 4%, 6/30/22 | | | 10,680,000 | | | | 11,367,888 | |
| Italy—0.5% | | | | | | | | |
| Italy (Republic of) Bonds: | | | | | | | | |
| 4%, 9/1/20 | | | 3,370,000 | EUR | | | 4,164,309 | |
| 4.50%, 3/1/19 | | | 9,890,000 | EUR | | | 12,844,113 | |
| 5%, 3/1/22 | | | 1,785,000 | EUR | | | 2,309,320 | |
| 5%, 9/1/40 | | | 3,730,000 | EUR | | | 4,307,201 | |
| Series EU, 1.853%, 10/15/174 | | | 2,295,000 | EUR | | | 2,593,747 | |
| Italy (Republic of) Sr. Unsec. Nts., 4.50%, 6/8/15 | | | 448,000,000 | JPY | | | 6,035,141 | |
| Italy (Republic of) Treasury Bills, 1.548%, 1/31/1315 | | | 7,955,000 | EUR | | | 10,180,065 | |
| Italy (Republic of) Treasury Bonds: | | | | | | | | |
| 4.75%, 9/15/16 | | | 1,830,000 | EUR | | | 2,455,819 | |
| 5.75%, 2/1/33 | | | 1,590,000 | EUR | |
| 2,045,722
|
|
| | | | | | | | 46,935,437 | |
| Ivory Coast—0.0% | | | | | | | | |
| Ivory Coast Bonds, 3.75%, 12/31/32 | | | 4,600,000 | | | | 3,990,500 | |
| Japan—2.0% | | | | | | | | |
| Japan Bonds: | | | | | | | | |
| 2 yr., 0.10%, 5/15/14 | | | 3,589,000,000 | JPY | | | 45,988,960 | |
| 5 yr., 0.30%, 3/20/17 | | | 2,065,000,000 | JPY | | | 26,626,169 | |
| 10 yr., Series 301, 1.50%, 6/20/19 | | | 2,057,000,000 | JPY | | | 28,316,355 | |
| 10 yr., 1.10%, 3/20/21 | | | 840,000,000 | JPY | | | 11,199,878 | |
| 20 yr., Series 112, 2.10%, 6/20/29 | | | 2,550,000,000 | JPY | | | 35,752,444 | |
| 30 yr., 2%, 3/20/42 | | | 1,550,000,000 | JPY | | | 20,401,408 | |
| Japan Sr. Unsec. Bonds, Series 134, 1.80%, 3/20/32 | | | 1,235,000,000 | JPY | | | 16,274,084 | |
| | | | | | |
|
|
|
| | | | | | | | 184,559,298 | |
| | | | |
| OPPENHEIMER GLOBAL STRATEGIC INCOME FUND | | | 25 | |
STATEMENT OF INVESTMENTS Continued
| | | | | | | | |
| | | Principal
Amount | | | Value | |
| Latvia—0.1% | | | | | | | | |
| Latvia (Republic of) Nts., 5.25%, 2/22/173 | | $ | 8,555,000 | | | $ | 9,431,888 | |
| Lithuanua—0.1% | | | | | | | | |
| Lithuania (Republic of) Sr. Unsec. Bonds, 6.625%, 2/1/223 | | | 7,550,000 | | | | 9,390,313 | |
| Malaysia—0.6% | | | | | | | | |
| Central Bank of Malaysia Treasury Bills: | | | | | | | | |
| Series 5312, 2.984%, 1/22/1315 | | | 52,590,000 | MYR | | | 17,050,051 | |
| Series 5612, 3%, 2/7/1315 | | | 52,590,000 | MYR | | | 17,031,847 | |
| Series 6212 2.968%, 2/28/1315 | | | 26,300,000 | MYR | | | 8,501,547 | |
| Malaysia (Government of) Sr. Unsec. Bonds: | | | | | | | | |
| Series 1/06, 4.262%, 9/15/16 | | | 8,050,000 | MYR | | | 2,733,373 | |
| Series 210, 4.012%, 9/15/17 | | | 6,540,000 | MYR | | | 2,207,024 | |
| Wakala Global Sukuk Bhd Bonds, 4.646%, 7/6/213 | | | 8,005,000 | | | | 9,279,180 | |
| | | | | | |
|
|
|
| | | | | | | | 56,803,022 | |
| Mexico—2.9% | | | | | | | | |
| United Mexican States Bonds: | | | | | | | | |
| 4.592%, 11/29/1215 | | | 390,770,000 | MXN | | | 30,134,380 | |
| Series M, 6.50%, 6/10/214 | | | 206,215,000 | MXN | | | 17,528,487 | |
| Series M20, 7.50%, 6/3/274 | | | 391,340,000 | MXN | | | 35,206,143 | |
| Series M10, 7.75%, 12/14/17 | | | 79,435,000 | MXN | | | 6,960,349 | |
| Series M, 8%, 6/11/20 | | | 267,920,000 | MXN | | | 24,614,650 | |
| Series M20, 8.50%, 5/31/294 | | | 195,430,000 | MXN | | | 19,070,631 | |
| Series MI10, 9%, 12/20/124 | | | 207,710,000 | MXN | | | 16,314,669 | |
| United Mexican States Treasury Bills: | | | | | | | | |
| 4.568%, 12/13/1215 | | | 588,270,000 | MXN | | | 45,289,261 | |
| 4.586%, 10/18/1215 | | | 941,900,000 | MXN | |
| 73,003,058
|
|
| | | | | | | | 268,121,628 | |
| Nigeria—0.2% | | | | | | | | |
| Nigeria (Federal Republic of) Treasury Bills: | | | | | | | | |
| 13.662%, 9/5/1315 | | | 1,179,000,000 | NGN | | | 6,626,978 | |
| 14.326%, 6/6/1315 | | | 262,000,000 | NGN | | | 1,528,502 | |
| 15.149%, 3/7/1315 | | | 140,000,000 | NGN | | | 841,420 | |
| 15.205%, 3/28/1315 | | | 520,000,000 | NGN | | | 3,111,720 | |
| Series 364, 15.572%, 4/25/1315 | | | 391,000,000 | NGN | | | 2,316,946 | |
| Series 364, 16.266%, 8/8/1315 | | | 591,000,000 | NGN | | | 3,425,841 | |
| Series 364, 16.895%, 2/7/1315 | | | 526,000,000 | NGN | |
| 3,197,230
|
|
| | | | | | | | 21,048,637 | |
| Panama—0.2% | | | | | | | | |
| Panama (Republic of) Bonds: | | | | | | | | |
| 6.70%, 1/26/36 | | | 4,470,000 | | | | 6,302,700 | |
| 8.875%, 9/30/27 | | | 3,090,000 | | | | 5,028,975 | |
| 9.375%, 4/1/29 | | | 3,945,000 | | |
| 6,736,088
|
|
| | | | | | | | 18,067,763 | |
| Peru—1.0% | | | | | | | | |
| Peru (Republic of) Bonds, 7.35%, 7/21/25 | | | 11,400,000 | | | | 16,758,000 | |
| Peru (Republic of) Sr. Unsec. Bonds: | | | | | | | | |
| 6.95%, 8/12/313 | | | 58,690,000 | PEN | | | 27,061,795 | |
| | |
| 26 | | OPPENHEIMER GLOBAL STRATEGIC INCOME FUND |
| | | | | | | | |
| | | Principal
Amount | | | Value | |
| Peru Continued | | | | | | | | |
| Peru (Republic of) Sr. Unsec. Bonds: Continued | | | | | | | | |
| 8.20%, 8/12/263 | | | 34,160,000 | PEN | | $ | 17,769,118 | |
| Peru (Republic of) Sr. Unsec. Nts., 7.84%, 8/12/203 | | | 49,320,000 | PEN | | | 23,563,473 | |
| Peru (Republic of) Sr. Unsec. Unsub. Bonds, 5.625%, 11/18/50 | | | 7,700,000 | | | | 10,067,750 | |
| | | | | | |
|
|
|
| | | | | | | | 95,220,136 | |
| Philippines—0.1% | | | | | | | | |
| Philippines (Republic of the) Sr. Unsec. Bonds, 5%, 1/13/37 | | | 4,225,000 | | | | 5,027,750 | |
| Philippines (Republic of the) Sr. Unsec. Unsub. Bonds, 6.375%, 10/23/34 | | | 3,285,000 | | | | 4,533,300 | |
| | | | | | |
|
|
|
| | | | | | | | 9,561,050 | |
| Poland—0.5% | | | | | | | | |
| Poland (Republic of) Bonds: | | | | | | | | |
| 5.25%, 10/25/20 | | | 54,860,000 | PLZ | | | 17,915,031 | |
| Series WS0922, 5.75%, 9/23/22 | | | 49,210,000 | PLZ | | | 16,655,872 | |
| Series 0415, 5.50%, 4/25/15 | | | 7,905,000 | PLZ | | | 2,551,067 | |
| Series 1017, 5.25%, 10/25/17 | | | 10,955,000 | PLZ | |
| 3,580,912
|
|
| | | | | | | | 40,702,882 | |
| Portugal—0.0% | | | | | | | | |
| Portuguese (Republic) Sr. Unsec. Bonds: | | | | | | | | |
| 4.10%, 4/15/37 | | | 275,000 | EUR | | | 196,767 | |
| 4.95%, 10/25/23 | | | 455,000 | EUR | | | 425,403 | |
| | | | | | |
|
|
|
| | | | | | | | 622,170 | |
| Qatar—0.2% | | | | | | | | |
| Qatar (State of) Sr. Nts., 5.25%, 1/20/203 | | | 5,945,000 | | | | 7,059,688 | |
| Qatar (State of) Sr. Unsec. Nts.: | | | | | | | | |
| 5.75%, 1/20/423 | | | 4,480,000 | | | | 5,723,200 | |
| 6.40%, 1/20/403 | | | 3,100,000 | | | | 4,247,000 | |
| | | | | | |
|
|
|
| | | | | | | | 17,029,888 | |
| Romania—0.2% | | | | | | | | |
| Romania Sr. Unsec. Bonds, 6.75%, 2/7/223 | | | 15,330,000 | | | | 17,303,738 | |
| Russia—1.7% | | | | | | | | |
| Russian Federation Bonds: | | | | | | | | |
| 7.50%, 3/15/184 | | | 647,400,000 | RUR | | | 20,888,222 | |
| 7.50%, 2/27/194 | | | 612,300,000 | RUR | | | 19,588,909 | |
| 7.60%, 4/14/214 | | | 689,200,000 | RUR | | | 22,104,419 | |
| Series 6206, 7.40%, 6/14/17 | | | 1,687,800,000 | RUR | | | 54,185,982 | |
| Russian Federation Unsec. Bonds: | | | | | | | | |
| 5.625%, 4/4/423 | | | 10,655,000 | | | | 12,813,703 | |
| Series 9, 7.90%, 3/18/214 | | | 157,400,000 | RUR | | | 4,949,812 | |
| Vnesheconombank Via VEB Finance plc Sr. Unsec. Nts., 6.025%, 7/5/223 | | | 6,965,000 | | | | 7,792,442 | |
| Vnesheconombank Via VEB Finance plc Sr. Unsec. Unsub. Nts.: | | | | | | | | |
| 6.80%, 11/22/253 | | | 3,290,000 | | | | 3,882,496 | |
| 6.902%, 7/9/203 | | | 5,185,000 | | | | 6,138,729 | |
| | | | | | |
|
|
|
| | | | | | | | 152,344,714 | |
| | | | |
| OPPENHEIMER GLOBAL STRATEGIC INCOME FUND | | | 27 | |
STATEMENT OF INVESTMENTS Continued
| | | | | | | | |
| | | Principal
Amount | | | Value | |
| Slovakia—0.1% | | | | | | | | |
| Slovakia (Republic of) Bonds, 4.375%, 5/21/223 | | $ | 8,090,000 | | | $ | 8,551,939 | |
| South Africa—2.6% | | | | | | | | |
| South Africa (Republic of) Bonds: | | | | | | | | |
| Series R209, 6.25%, 3/31/36 | | | 233,730,000 | ZAR | | | 22,628,788 | |
| Series R208, 6.75%, 3/31/21 | | | 516,530,000 | ZAR | | | 62,840,780 | |
| Series R213, 7%, 2/28/31 | | | 299,280,000 | ZAR | | | 32,895,090 | |
| Series R207, 7.25%, 1/15/20 | | | 476,840,000 | ZAR | | | 60,006,157 | |
| Series R186, 10.50%, 12/21/26 | | | 359,900,000 | ZAR | | | 54,745,577 | |
| | | | | | |
|
|
|
| | | | | | | | 233,116,392 | |
| Spain—0.2% | | | | | | | | |
| Instituto de Credito Oficial Sr. Unsec. Nts., 5%, 5/15/15 | | | 7,800,000 | NOK | | | 1,276,083 | |
| Spain (Kingdom of) Bonds: | | | | | | | | |
| 5.50%, 7/30/17 | | | 2,720,000 | EUR | | | 3,575,204 | |
| 5.85%, 1/31/22 | | | 4,150,000 | EUR | | | 5,305,812 | |
| Spain (Kingdom of) Sr. Unsec. Bonds, 4.30%, 10/31/19 | | | 2,750,000 | EUR | | | 3,293,936 | |
| Spain (Kingdom of) Sr. Unsub. Bonds, 4.70%, 7/30/41 | | | 1,835,000 | EUR | | | 1,784,443 | |
| Spain (Kingdom of) Unsec. Bonds, 3.30%, 10/31/14 | | | 1,360,000 | EUR | | | 1,742,844 | |
| | | | | | |
|
|
|
| | | | | | | | 16,978,322 | |
| Sri Lanka—0.2% | | | | | | | | |
| Sri Lanka (Democratic Socialist Republic of) Sr. Unsec. Bonds, 5.875%, 7/25/223 | | | 2,460,000 | | | | 2,662,950 | |
| Sri Lanka (Democratic Socialist Republic of) Sr. Unsec. Nts.: | | | | | | | | |
| 6.25%, 10/4/203 | | | 4,750,000 | | | | 5,189,375 | |
| 6.25% 7/27/213 | | | 5,890,000 | | | | 6,433,694 | |
| | | | | | |
|
|
|
| | | | | | | | 14,286,019 | |
| The Netherlands—0.2% | | | | | | | | |
| Netherlands (Kingdom of the) Bonds, 4%, 7/15/19 | | | 9,275,000 | EUR | | | 14,098,589 | |
| Turkey—5.0% | | | | | | | | |
| Turkey (Republic of) Bonds: | | | | | | | | |
| 6.875%, 3/17/36 | | | 9,735,000 | | | | 12,387,788 | |
| 7%, 3/11/19 | | | 4,545,000 | | | | 5,527,856 | |
| 8.984%, 11/7/1215 | | | 353,200,000 | TRY | | | 195,305,991 | |
| 9%, 3/5/14 | | | 55,700,000 | TRY | | | 31,751,092 | |
| 9%, 3/8/17 | | | 131,560,000 | TRY | | | 77,043,761 | |
| 9.50%, 1/12/224 | | | 67,145,000 | TRY | | | 40,703,562 | |
| 9.973%, 7/17/1315 | | | 74,990,000 | TRY | | | 39,526,792 | |
| 10.50%, 1/15/204 | | | 4,165,000 | TRY | | | 2,624,489 | |
| 15.959%, 8/14/1316 | | | 8,410,000 | TRY | | | 6,949,099 | |
| Turkey (Republic of) Nts., 7.50%, 7/14/17 | | | 5,700,000 | | | | 6,854,250 | |
| Turkey (Republic of) Unsec. Bonds: | | | | | | | | |
| 4.50%, 2/11/154,16 | | | 8,255,000 | TRY | | | 4,976,655 | |
| 6.25%, 9/26/22 | | | 15,955,000 | | | | 19,133,236 | |
| Turkey (Republic of) Unsec. Nts.: | | | | | | | | |
| 5.125%, 3/25/22 | | | 4,175,000 | | | | 4,608,156 | |
| 6%, 1/14/41 | | | 8,650,000 | | | | 10,012,375 | |
| | | | | | |
|
|
|
| | | | | | | | 457,405,102 | |
| | |
| 28 | | OPPENHEIMER GLOBAL STRATEGIC INCOME FUND |
| | | | | | | | |
| | | Principal
Amount | | | Value | |
| Ukraine—0.2% | | | | | | | | |
| Ukraine (Republic of) Bonds, 7.75%, 9/23/203 | | $ | 2,980,000 | | | $ | 2,961,256 | |
| Ukraine (Republic of) Sr. Unsec. Nts.: | | | | | | | | |
| 6.75%, 11/14/173 | | | 7,015,000 | | | | 6,734,400 | |
| 7.95%, 2/23/213 | | | 4,535,000 | | | | 4,540,306 | |
| Ukraine (Republic of) Unsec. Bonds, 9.25%, 7/24/173 | | | 4,610,000 | | |
| 4,865,671
|
|
| | | | | | | | 19,101,633 | |
| United Arab Emirates—0.2% | | | | | | | | |
| Emirates of Dubai Sr. Unsec. International Bonds: | | | | | | | | |
| 5.591%, 6/22/21 | | | 3,170,000 | | | | 3,379,220 | |
| 7.75%, 10/5/20 | | | 8,430,000 | | |
| 10,031,700
|
|
| | | | | | | | 13,410,920 | |
| United Kingdom—0.4% | | | | | | | | |
| United Kingdom Treasury Bonds: | | | | | | | | |
| 3.75%, 9/7/21 | | | 3,005,000 | GBP | | | 5,789,658 | |
| 4%, 9/7/16 | | | 5,970,000 | GBP | | | 10,986,566 | |
| 4.75%, 12/7/38 | | | 8,300,000 | GBP | |
| 17,832,783
|
|
| | | | | | | | 34,609,007 | |
| Uruguay—0.2% | | | | | | | | |
| Uruguay (Oriental Republic of) Bonds, 7.625%, 3/21/36 | | | 8,565,000 | | | | 13,425,638 | |
| Uruguay (Oriental Republic of) Unsec. Bonds, 8%, 11/18/22 | | | 5,435,000 | | |
| 7,929,665
|
|
| | | | | | | | 21,355,303 | |
| Venezuela—0.8% | | | | | | | | |
| Venezuela (Republic of) Bonds: | | | | | | | | |
| 9%, 5/7/23 | | | 16,215,000 | | | | 14,350,275 | |
| 11.95%, 8/5/31 | | | 8,190,000 | | | | 8,374,275 | |
| Venezuela (Republic of) Nts., 8.25%, 10/13/24 | | | 7,610,000 | | | | 6,354,350 | |
| Venezuela (Republic of) Sr. Unsec. Unsub. Nts.: | | | | | | | | |
| 7.75%, 10/13/19 | | | 5,575,000 | | | | 4,836,313 | |
| 12.75%, 8/23/22 | | | 3,965,000 | | | | 4,232,638 | |
| Venezuela (Republic of) Unsec. Bonds: | | | | | | | | |
| 7%, 3/31/38 | | | 8,410,000 | | | | 6,202,375 | |
| 7.65%, 4/21/25 | | | 13,840,000 | | | | 10,899,000 | |
| Venezuela (Republic of) Unsec. Nts., 13.625%, 8/15/183 | | | 17,155,000 | | |
| 17,926,975
|
|
| | | | | | |
| 73,176,201
|
|
| Total Foreign Government Obligations (Cost $2,467,442,258) | | | | | | | 2,563,528,759 | |
| Corporate Bonds and Notes—29.9% | | | | | | | | |
| Consumer Discretionary—4.9% | | | | | | | | |
| Auto Components—0.6% | | | | | | | | |
| Continental Rubber of America Corp., 4.50% Sr. Sec. Nts., 9/15/193 | | | 1,445,000 | | | | 1,479,680 | |
| Goodyear Tire & Rubber Co. (The), 8.25% Sr. Unsec. Unsub. Nts., 8/15/20 | | | 10,090,000 | | | | 11,225,125 | |
| | | | |
| OPPENHEIMER GLOBAL STRATEGIC INCOME FUND | | | 29 | |
STATEMENT OF INVESTMENTS Continued
| | | | | | | | |
| | | Principal
Amount | | | Value | |
| Auto Components Continued | | | | | | | | |
| Tower Automotive Holdings USA LLC/TA Holdings Finance, Inc., 10.625% Sr. Sec. Nts., 9/1/173 | | $ | 22,357,000 | | | $ | 24,201,453 | |
| UCI International, Inc., 8.625% Sr. Unsec. Nts., 2/15/19 | | | 2,860,000 | | | | 2,860,000 | |
| Visteon Corp., 6.75% Sr. Unsec. Nts., 4/15/19 | | | 11,465,000 | | | | 12,095,575 | |
| | | | | | |
|
|
|
| | | | | | | | 51,861,833 | |
| Automobiles—0.1% | | | | | | | | |
| Jaguar Land Rover plc: | | | | | | | | |
| 7.75% Sr. Unsec. Bonds, 5/15/183 | | | 1,945,000 | | | | 2,107,894 | |
| 8.25% Sr. Nts., 3/15/203 | | | 900,000 | GBP | |
| 1,573,223
|
|
| | | | | | | | 3,681,117 | |
| Diversified Consumer Services—0.1% | | | | | | | | |
| Monitronics International, Inc., 9.125% Sr. Unsec. Nts., 4/1/20 | | | 4,720,000 | | | | 4,932,400 | |
| ServiceMaster Co.: | | | | | | | | |
| 7% Sr. Nts., 8/15/203 | | | 3,445,000 | | | | 3,548,350 | |
| 8% Sr. Unsec. Unsub. Nts., 2/15/20 | | | 2,990,000 | | |
| 3,184,350
|
|
| | | | | | | | 11,665,100 | |
| Hotels, Restaurants & Leisure—1.4% | | | | | | | | |
| Boyd Gaming Corp., 9.125% Sr. Unsec. Nts., 12/1/18 | | | 8,885,000 | | | | 9,373,675 | |
| Burger King Corp., 9.875% Sr. Unsec. Unsub. Nts., 10/15/18 | | | 4,080,000 | | | | 4,753,200 | |
| Caesars Entertainment Operating Co., Inc., 10% Sr. Sec. Nts., 12/15/18 | | | 45,185,000 | | | | 29,822,100 | |
| Chester Downs & Marina LLC, 9.25% Sr. Sec. Nts., 1/15/203 | | | 3,285,000 | | | | 3,317,850 | |
| CKE Restaurants, Inc., 11.375% Sec. Nts., 7/15/18 | | | 3,625,000 | | | | 4,223,125 | |
| Equinox Holdings, Inc., 9.50% Sr. Sec. Nts., 2/1/166 | | | 8,520,000 | | | | 9,095,100 | |
| HOA Restaurants Group LLC/HOA Finance Corp., 11.25% Sr. Sec. Nts., 4/1/173 | | | 10,730,000 | | | | 9,844,775 | |
| Isle of Capri Casinos, Inc., 7.75% Sr. Unsec. Unsub. Nts., 3/15/19 | | | 9,685,000 | | | | 10,459,800 | |
| Landry’s, Inc., 9.375% Sr. Unsec. Nts., 5/1/203 | | | 9,370,000 | | | | 9,932,200 | |
| MCE Finance Ltd., 10.25% Sr. Sec. Nts., 5/15/18 | | | 4,625,000 | | | | 5,260,938 | |
| MGM Mirage, Inc., 6.625% Sr. Unsec. Nts., 7/15/15 | | | 16,050,000 | | | | 17,253,750 | |
| MGM Resorts International, 6.75% Sr. Unsec. Nts., 10/1/203 | | | 2,055,000 | | | | 2,060,138 | |
| MTR Gaming Group, Inc., 11.50% Sec. Nts., 8/1/19 | | | 4,442,100 | | | | 4,697,521 | |
| Penn National Gaming, Inc., 8.75% Sr. Unsec. Sub. Nts., 8/15/19 | | | 7,515,000 | | | | 8,454,375 | |
| Premier Cruise Ltd., 11% Sr. Nts., 3/15/085,6 | | | 14,750,000 | | | | — | |
| | | | | | |
|
|
|
| | | | | | | | 128,548,547 | |
| Household Durables—0.3% | | | | | | | | |
| Beazer Homes USA, Inc.: | | | | | | | | |
| 6.875% Sr. Unsec. Nts., 7/15/15 | | | 1,125,000 | | | | 1,136,250 | |
| 9.125% Sr. Unsec. Nts., 5/15/19 | | | 13,690,000 | | | | 13,826,900 | |
| Jarden Corp., 6.125% Sr. Unsec. Nts., 11/15/22 | | | 1,075,000 | | | | 1,166,375 | |
| K Hovnanian Enterprises, Inc., 9.125% Sec. Nts., 11/15/203,8 | | | 1,720,000 | | | | 1,735,050 | |
| | |
| 30 | | OPPENHEIMER GLOBAL STRATEGIC INCOME FUND |
| | | | | | | | |
| | | Principal
Amount | | | Value | |
| Household Durables Continued | | | | | | | | |
| Libbey Glass, Inc., 6.875% Sr. Sec. Nts., 5/15/203 | | $ | 3,585,000 | | | $ | 3,871,800 | |
| Reynolds Group Issuer, Inc./Reynolds Group Issuer LLC/Reynolds Group Issuer Luxembourg SA: | | | | | | | | |
| 5.75% Sr. Sec. Nts., 10/15/203 | | | 3,655,000 | | | | 3,659,569 | |
| 9% Sr. Unsec. Unsub. Nts., 4/15/19 | | | 4,740,000 | | |
| 4,858,500
|
|
| | | | | | | | 30,254,444 | |
| Leisure Equipment & Products—0.1% | | | | | | | | |
| FGI Operating Co. LLC/FGI Finance, Inc., 7.875% Sr. Sec. Nts., 5/1/203 | | | 9,370,000 | | | | 10,189,875 | |
| Media—1.9% | | | | | | | | |
| Affinion Group Holdings, Inc., 11.625% Sr. Unsec. Nts., 11/15/15 | | | 5,705,000 | | | | 3,907,925 | |
| Affinion Group, Inc., 7.875% Sr. Unsec. Nts., 12/15/18 | | | 15,120,000 | | | | 12,436,200 | |
| AMC Entertainment, Inc., 8.75% Sr. Unsec. Nts., 6/1/19 | | | 4,440,000 | | | | 4,917,300 | |
| Belo (A.H.) Corp., 7.75% Sr. Unsec. Unsub. Debs., 6/1/27 | | | 13,703,000 | | | | 13,908,545 | |
| Clear Channel Communications, Inc., 5.75% Sr. Unsec. Unsub. Nts., 1/15/13 | | | 14,640,000 | | | | 14,731,500 | |
| CSC Holdings LLC, 6.75% Sr. Unsec. Nts., 11/15/213 | | | 1,995,000 | | | | 2,209,463 | |
| Cumulus Media Holdings, Inc., 7.75% Sr. Unsec. Unsub. Nts., 5/1/19 | | | 5,980,000 | | | | 5,845,450 | |
| DISH DBS Corp.: | | | | | | | | |
| 5.875% Sr. Unsec. Nts., 7/15/223 | | | 6,115,000 | | | | 6,298,450 | |
| 7.875% Sr. Unsec. Nts., 9/1/19 | | | 10,315,000 | | | | 12,042,763 | |
| Entravision Communications Corp., 8.75% Sr. Sec. Nts., 8/1/17 | | | 8,721,000 | | | | 9,462,285 | |
| Gray Television, Inc.: | | | | | | | | |
| 7.50% Sr. Unsec. Nts., 10/1/203,8 | | | 7,825,000 | | | | 7,825,000 | |
| 10.50% Sr. Sec. Nts., 6/29/15 | | | 8,721,000 | | | | 9,494,989 | |
| Newport Television LLC/NTV Finance Corp., 13.75% Sr. Nts., 3/15/173,9 | | | 6,682,145 | | | | 7,233,422 | |
| Nexstar Broadcasting, Inc./Mission Broadcasting, Inc., 8.875% Sec. Nts., 4/15/17 | | | 8,620,000 | | | | 9,417,350 | |
| Sinclair Television Group, Inc.: | | | | | | | | |
| 6.125% Sr. Nts., 10/1/223,8 | | | 7,120,000 | | | | 7,164,500 | |
| 8.375% Sr. Unsec. Nts., 10/15/18 | | | 5,645,000 | | | | 6,251,838 | |
| Unitymedia Hessen GmbH & Co. KG/Unitymedia NRW Gmb H, 7.50% Sr. Sec. Nts., 3/15/19 | | | 7,515,000 | | | | 8,285,288 | |
| Univision Communications, Inc., 7.875% Sr. Sec. Nts., 11/1/203 | | | 7,295,000 | | | | 7,842,125 | |
| UPCB Finance V Ltd., 7.25% Sr. Sec. Nts., 11/15/213 | | | 5,975,000 | | | | 6,527,688 | |
| UPCB Finance VI Ltd., 6.875% Sr. Sec. Nts., 1/15/223 | | | 9,320,000 | | | | 9,925,800 | |
| Virgin Media Finance plc, 5.25% Sr. Unsec. Unsub. Nts., 2/15/22 | | | 3,730,000 | | | | 3,935,150 | |
| | | | | | |
|
|
|
| | | | | | | | 169,663,031 | |
| Specialty Retail—0.3% | | | | | | | | |
| Burlington Coat Factory Warehouse Corp., 10% Sr. Unsec. Nts., 2/15/19 | | | 2,360,000 | | | | 2,622,550 | |
| J. Crew Group, Inc., 8.125% Sr. Unsec. Nts., 3/1/19 | | | 4,660,000 | | | | 4,904,650 | |
| Limited Brands, Inc., 5.625% Sr. Nts., 2/15/22 | | | 9,385,000 | | | | 10,159,263 | |
| Michaels Stores, Inc., 7.75% Sr. Unsec. Nts., 11/1/18 | | | 745,000 | | | | 802,738 | |
| | | | |
| OPPENHEIMER GLOBAL STRATEGIC INCOME FUND | | | 31 | |
STATEMENT OF INVESTMENTS Continued
| | | | | | | | |
| | | Principal
Amount | | | Value | |
| Specialty Retail Continued | | | | | | | | |
| Sally Holdings LLC/Sally Capital, Inc., 6.875% Sr. Unsec. Nts., 11/15/19 | | $ | 8,670,000 | | | $ | 9,688,725 | |
| | | | | | |
|
|
|
| | | | | | | | 28,177,926 | |
| Textiles, Apparel & Luxury Goods—0.1% | | | | | | | | |
| Levi Strauss & Co., 7.625% Sr. Unsec. Unsub. Nts., 5/15/20 | | | 4,440,000 | | | | 4,817,400 | |
| Quiksilver, Inc., 6.875% Sr. Unsec. Nts., 4/15/15 | | | 3,460,000 | | | | 3,460,000 | |
| | | | | | |
|
|
|
| | | | | | | | 8,277,400 | |
| Consumer Staples—1.0% | | | | | | | | |
| Beverages—0.0% | | | | | | | | |
| AmBev International Finance Co. Ltd., 9.50% Sr. Unsec. Unsub. Nts., 7/24/174 | | | 5,535,000 | BRR | | | 3,111,108 | |
| Food & Staples Retailing—0.2% | | | | | | | | |
| Cencosud SA, 5.50% Sr. Unsec. Nts., 1/20/213 | | | 12,405,000 | | | | 13,627,972 | |
| Rite Aid Corp., 7.50% Sr. Sec. Nts., 3/1/17 | | | 3,070,000 | | | | 3,169,775 | |
| | | | | | |
|
|
|
| | | | | | | | 16,797,747 | |
| Food Products—0.6% | | | | | | | | |
| American Seafoods Group LLC, 10.75% Sr. Sub. Nts., 5/15/163 | | | 10,750,000 | | | | 10,938,125 | |
| ASG Consolidated LLC, 12.863% Sr. Nts., 5/15/173,9 | | | 6,897,002 | | | | 6,052,119 | |
| Bumble Bee Acquisition Corp., 9% Sr. Sec. Nts., 12/15/173 | | | 7,873,000 | | | | 8,276,491 | |
| Cosan Overseas Ltd., 8.25% Sr. Unsec. Unsub. Nts., 2/5/49 | | | 6,220,000 | | | | 6,764,250 | |
| MHP SA, 10.25% Sr. Unsec. Nts., 4/29/153 | | | 11,845,000 | | | | 12,081,900 | |
| Southern States Cooperative, Inc., 11.25% Sr. Nts., 5/15/153 | | | 12,045,000 | | |
| 12,617,138
|
|
| | | | | | | | 56,730,023 | |
| Household Products—0.1% | | | | | | | | |
| Spectrum Brands Holdings, Inc., 9.50% Sr. Sec. Nts., 6/15/18 | | | 4,175,000 | | | | 4,728,188 | |
| Personal Products—0.0% | | | | | | | | |
| NBTY, Inc., 9% Sr. Unsec. Nts., 10/1/18 | | | 2,185,000 | | | | 2,441,738 | |
| Tobacco—0.1% | | | | | | | | |
| Alliance One International, Inc., 10% Sr. Unsec. Nts., 7/15/16 | | | 4,525,000 | | | | 4,706,000 | |
| Energy—5.6% | | | | | | | | |
| Energy Equipment & Services—0.6% | | | | | | | | |
| Forbes Energy Services Ltd., 9% Sr. Unsec. Nts., 6/15/19 | | | 3,720,000 | | | | 3,627,000 | |
| Global Geophysical Services, Inc., 10.50% Sr. Unsec. Nts., 5/1/17 | | | 5,080,000 | | | | 4,876,800 | |
| Hercules Offshore, Inc., 7.125% Sr. Sec. Nts., 4/1/173 | | | 4,725,000 | | | | 4,919,906 | |
| Hornbeck Offshore Services, Inc., 5.875% Sr. Unsec. Nts., 4/1/20 | | | 9,530,000 | | | | 9,744,425 | |
| Offshore Group Investments Ltd., 11.50% Sr. Sec. Nts., 8/1/15 | | | 11,910,000 | | | | 13,220,100 | |
| Precision Drilling Corp., 6.625% Sr. Unsec. Nts., 11/15/20 | | | 8,780,000 | | | | 9,394,600 | |
| SESI LLC, 6.375% Sr. Unsec. Nts., 5/1/19 | | | 3,350,000 | | |
| 3,601,250
|
|
| | | | | | | | 49,384,081 | |
| | |
| 32 | | OPPENHEIMER GLOBAL STRATEGIC INCOME FUND |
| | | | | | | | |
| | | Principal
Amount | | | Value | |
| Oil, Gas & Consumable Fuels—5.0% | | | | | | | | |
| Alliance Oil Co. Ltd., 9.875% Sr. Unsec. Nts., 3/11/153 | | $ | 7,030,000 | | | $ | 7,475,351 | |
| Antero Resources Finance Corp., 9.375% Sr. Unsec. Nts., 12/1/17 | | | 7,105,000 | | | | 7,886,550 | |
| Arch Coal, Inc., 7.25% Sr. Unsec. Unsub. Nts., 6/15/21 | | | 2,345,000 | | | | 1,969,800 | |
Atlas Pipeline Partners LP/Atlas Pipeline Finance Corp.:
6.625% Sr. Nts., 10/1/203 | | | 2,845,000 | | | | 2,901,900 | |
| 8.75% Sr. Unsec. Sub. Nts., 6/15/18 | | | 4,725,000 | | | | 5,103,000 | |
| Bill Barrett Corp., 7.625% Sr. Unsec. Unsub. Nts., 10/1/19 | | | 3,720,000 | | | | 3,961,800 | |
BreitBurn Energy Partners LP/BreitBurn Finance Corp., 8.625%
Sr. Unsec. Nts., 10/15/20 | | | 13,225,000 | | | | 14,514,438 | |
| Chaparral Energy, Inc., 9.875% Sr. Unsec. Nts., 10/1/20 | | | 8,605,000 | | | | 9,766,675 | |
Chesapeake Midstream Partners LP/CHKM Finance Corp., 6.125%
Sr. Unsec. Unsub. Nts., 7/15/22 | | | 8,935,000 | | | | 9,493,438 | |
| Cimarex Energy Co., 5.875% Sr. Unsec. Unsub. Nts., 5/1/22 | | | 9,080,000 | | | | 9,624,800 | |
Cloud Peak Energy Resources LLC/Cloud Peak Energy Finance Corp., 8.50%
Sr. Unsec. Unsub. Nts., 12/15/19 | | | 1,790,000 | | | | 1,977,950 | |
| Continental Resources, Inc., 5% Sr. Unsec. Nts., 9/15/22 | | | 5,730,000 | | | | 6,002,175 | |
| EP Energy LLC/Everest Acquisition Finance, Inc., 7.75% Sr. Unsec. Nts., 9/1/223 | | | 3,645,000 | | | | 3,727,013 | |
Gaz Capital SA:
7.288% Sr. Sec. Nts., 8/16/373 | | | 28,770,000 | | | | 36,394,050 | |
| 8.146% Sr. Sec. Nts., 4/11/183 | | | 17,190,000 | | | | 21,027,152 | |
| 8.625% Sr. Sec. Nts., 4/28/343 | | | 10,780,000 | | | | 15,145,900 | |
| 9.25% Sr. Unsec. Unsub. Nts., 4/23/193 | | | 23,270,000 | | | | 30,425,525 | |
| Hiland Partners LP/Hiland Partners Finance Corp., 7.25% Sr. Nts., 10/1/203 | | | 1,035,000 | | | | 1,077,694 | |
| KazMunayGaz National Co., 6.375% Sr. Unsec. Bonds, 4/9/213 | | | 5,690,000 | | | | 6,859,921 | |
| KMG Finance Sub BV, 9.125% Sr. Unsec. Unsub. Nts., 7/2/183 | | | 14,310,000 | | | | 18,574,237 | |
| Linn Energy LLC/Linn Energy Finance Corp., 8.625% Sr. Unsec. Nts., 4/15/20 | | | 16,575,000 | | | | 18,232,500 | |
Lukoil International Finance BV:
6.125% Sr. Unsec. Nts., 11/9/203 | | | 17,010,000 | | | | 19,289,340 | |
| 6.656% Sr. Unsec. Unsub. Bonds, 6/7/223 | | | 4,855,000 | | | | 5,851,392 | |
| 7.25% Sr. Unsec. Unsub. Nts., 11/5/193 | | | 3,700,000 | | | | 4,472,560 | |
| MEG Energy Corp., 6.50% Sr. Unsec. Nts., 3/15/213 | | | 13,740,000 | | | | 14,770,500 | |
| Murray Energy Corp., 10.25% Sr. Sec. Nts., 10/15/153 | | | 7,030,000 | | | | 6,924,550 | |
| Navios Maritime Acquisition Corp., 8.625% Sr. Sec. Nts., 11/1/17 | | | 3,375,000 | | | | 3,231,563 | |
| Odebrecht Drilling Norbe VIII/IX Ltd., 6.35% Sr. Sec. Nts., 6/30/213 | | | 8,031,600 | | | | 9,071,692 | |
| Pemex Project Funding Master Trust, 6.625% Unsec. Unsub. Bonds, 6/15/35 | | | 13,545,000 | | | | 17,066,700 | |
Pertamina Persero PT:
5.25% Nts., 5/23/213 | | | 4,890,000 | | | | 5,446,238 | |
| 6% Sr. Unsec. Nts., 5/3/423 | | | 5,275,000 | | | | 5,736,563 | |
| 6.50% Sr. Unsec. Nts., 5/27/413 | | | 3,520,000 | | | | 4,065,600 | |
Petroleos de Venezuela SA:
4.90% Sr. Unsec. Nts., Series 2014, 10/28/14 | | | 11,540,000 | | | | 10,449,470 | |
| 8.50% Sr. Nts., 11/2/173 | | | 13,140,000 | | | | 11,924,550 | |
| 12.75% Sr. Unsec. Nts., 2/17/223 | | | 6,300,000 | | | | 6,457,500 | |
| | | | |
| OPPENHEIMER GLOBAL STRATEGIC INCOME FUND | | | 33 | |
STATEMENT OF INVESTMENTS Continued
| | | | | | | | |
| | | Principal
Amount | | | Value | |
| Oil, Gas & Consumable Fuels Continued | | | | | | | | |
Petroleos Mexicanos:
1.95% Sr. Unsec. Nts., 12/20/22 | | $ | 655,000 | | | $ | 672,272 | |
| 2% Sr. Unsec. Nts., 12/20/22 | | | 3,255,000 | | | | 3,348,975 | |
| 5.50% Sr. Unsec. Unsub. Nts., 1/21/21 | | | 6,005,000 | | | | 7,070,888 | |
| 5.50% Sr. Unsec. Unsub. Nts., 6/27/44 | | | 11,080,000 | | | | 12,215,700 | |
| 6% Sr. Unsec. Unsub. Nts., 3/5/20 | | | 7,320,000 | | | | 8,784,000 | |
| Petroleum Co. of Trinidad & Tobago Ltd., 9.75% Sr. Unsec. Nts., 8/14/193 | | | 8,960,000 | | | | 11,603,200 | |
Quicksilver Resources, Inc.:
8.25% Sr. Unsec. Nts., 8/1/15 | | | 4,655,000 | | | | 4,457,163 | |
| 11.75% Sr. Nts., 1/1/16 | | | 3,825,000 | | | | 3,882,375 | |
| Range Resources Corp., 8% Sr. Unsec. Sub. Nts., 5/15/19 | | | 4,150,000 | | | | 4,627,250 | |
| Samson Investment Co., 9.75% Sr. Unsec. Nts., 2/15/203 | | | 7,160,000 | | | | 7,383,750 | |
SandRidge Energy, Inc.:
7.50% Sr. Nts., 2/15/233 | | | 5,820,000 | | | | 6,009,150 | |
| 8.75% Sr. Unsec. Nts., 1/15/20 | | | 4,165,000 | | | | 4,529,438 | |
| Schahin II Finance Co. SPV Ltd., 5.875% Sr. Sec. Unsub. Nts., 9/25/223 | | | 10,595,000 | | | | 11,124,750 | |
| SM Energy Co., 6.50% Sr. Nts., 1/1/233 | | | 4,670,000 | | | | 4,909,338 | |
| Tengizchevroil LLP, 6.124% Nts., 11/15/146 | | | 2,461,163 | | | | 2,590,374 | |
Tesoro Logistics LP/Tesoro Logistics Finance Corp., 5.875% Sr.
Nts., 10/1/203 | | | 2,070,000 | | | | 2,126,925 | |
| Venoco, Inc., 8.875% Sr. Unsec. Nts., 2/15/19 | | | 6,700,000 | | |
| 5,862,500
|
|
| | | | | | | | 458,098,135 | |
| Financials—5.2% | | | | | | | | |
| Capital Markets—0.8% | | | | | | | | |
| Banco BTG Pactual SA (Cayman), 5.75% Unsec. Sub. Nts., 9/28/223 | | | 6,145,000 | | | | 6,237,175 | |
| Credit Suisse AG (Guernsey), 1.625% Sec. Bonds, 3/6/153 | | | 1,371,000 | | | | 1,397,197 | |
| Edgen Murray Corp., 12.25% Sr. Sec. Nts., 1/15/15 | | | 6,740,000 | | | | 7,228,650 | |
| Nationstar Mortgage LLC/Nationstar Capital Corp.: | | | | | | | | |
| 7.875% Sr. Unsec. Nts., 10/1/203 | | | 2,065,000 | | | | 2,111,463 | |
| 10.875% Sr. Unsec. Nts., 4/1/15 | | | 17,300,000 | | | | 18,835,375 | |
| Nuveen Investments, Inc., 9.50% Sr. Unsec. Nts., 10/15/203 | | | 3,655,000 | | | | 3,655,000 | |
| Pinafore LLC/Pinafore, Inc., 9% Sec. Nts., 10/1/18 | | | 11,044,000 | | | | 12,369,280 | |
| Springleaf Finance Corp., 6.90% Nts., Series J, 12/15/17 | | | 6,165,000 | | | | 5,271,075 | |
| UBS AG (Jersey Branch): | | | | | | | | |
| 4.28% Unsec. Sub. Nts., 4/29/49 | | | 630,000 | EUR | | | 730,242 | |
| 7.152% Unsec. Sub. Nts., 12/29/49 | | | 455,000 | EUR | | | 592,737 | |
| UBS AG (London), 2.25% Sec. Nts., 3/30/173 | | | 1,800,000 | | | | 1,875,816 | |
| UBS Capital Securities Jersey Ltd., 8.836% Sub. Nts., 4/29/49 | | | 910,000 | EUR | | | 1,186,936 | |
| Verso Paper Holdings LLC/Verso Paper, Inc.: | | | | | | | | |
| 8.75% Sr. Sec. Nts., 2/1/19 | | | 11,805,000 | | | | 5,784,450 | |
| 11.375% Sr. Unsec. Sub. Nts., Series B, 8/1/16 | | | 2,576,000 | | |
| 1,532,720
|
|
| | | | | | | | 68,808,116 | |
| | |
| 34 | | OPPENHEIMER GLOBAL STRATEGIC INCOME FUND |
| | | | | | | | |
| | | Principal
Amount | | | Value | |
| Commercial Banks—2.8% | | | | | | | | |
| Akbank TAS, 5.125% Sr. Unsec. Nts., 7/22/156 | | $ | 5,715,000 | | | $ | 5,936,456 | |
| Alfa Bank/Alfa Bond Issuance plc, 7.875% Nts., 9/25/173 | | | 7,935,000 | | | | 8,591,621 | |
| Banco Bilbao Vizcaya Argentaria SA, 4% Sec. Nts., 2/25/25 | | | 640,000 | EUR | | | 718,482 | |
| Banco BMG SA: | | | | | | | | |
| 8.875% Unsec. Sub. Nts., 8/5/203 | | | 2,115,000 | | | | 1,818,900 | |
| 9.15% Nts., 1/15/166 | | | 4,736,000 | | | | 4,676,800 | |
| 9.95% Unsec. Unsub. Nts., 11/5/193 | | | 4,555,000 | | | | 4,281,700 | |
| Banco do Brasil SA (Cayman), 9.25% Perpetual Jr. Sub. Bonds3,17 | | | 23,560,000 | | | | 28,154,200 | |
| Banco do Estado do Rio Grande do Sul SA, 7.375% Sub Nts., 2/2/223 | | | 8,820,000 | | | | 9,856,350 | |
| Bancolombia SA, 5.125% Unsec. Sub. Nts., 9/11/22 | | | 6,535,000 | | | | 6,633,025 | |
| Bank of Scotland plc: | | | | | | | | |
| 4.875% Sr. Sec. Nts., 12/20/24 | | | 770,000 | GBP | | | 1,495,064 | |
| 4.875% Sr. Sec. Unsub. Nts., 11/8/16 | | | 460,000 | GBP | | | 849,444 | |
| Barclays Bank plc: | | | | | | | | |
| 2.25% Sr. Sec. Bonds, 5/10/173 | | | 3,120,000 | | | | 3,219,584 | |
| 6% Sr. Unsec. Sub. Nts., 1/14/21 | | | 365,000 | EUR | | | 476,151 | |
| BBVA Banco Continental SA, 5% Sr. Unsec. Nts., 8/26/223 | | | 4,890,000 | | | | 5,036,700 | |
| BOM Capital plc, 6.699% Sr. Unsec. Nts., 3/11/153 | | | 17,710,000 | | | | 18,905,425 | |
| CIT Group, Inc.: | | | | | | | | |
| 4.25% Sr. Unsec. Nts., 8/15/17 | | | 1,455,000 | | | | 1,517,577 | |
| 5% Sr. Unsec. Nts., 8/15/22 | | | 5,820,000 | | | | 6,085,741 | |
| Commonwealth Bank of Australia (New York), 0.031% Sr. Unsec. Nts., 12/31/1715 | | | 2,260,000 | | | | 2,268,177 | |
| Corp Andina de Fomento, 4.375% Sr. Unsec. Unsub. Nts., 6/15/22 | | | 5,665,000 | | | | 6,173,524 | |
| Corp Financiera de Desarrollo SA, 4.75% Sr. Unsec. Nts., 2/8/223 | | | 5,265,000 | | | | 5,830,988 | |
| EUROFIMA, 6.25% Bonds, 12/28/18 | | | 3,120,000 | AUD | | | 3,586,476 | |
| Grupo Aval Ltd., 4.75% Sr. Unsec. Nts., 9/26/223 | | | 6,505,000 | | | | 6,423,688 | |
| Halyk Savings Bank of Kazakhstan JSC: | | | | | | | | |
| 7.25% Unsec. Unsub. Nts., 5/3/173 | | | 2,435,000 | | | | 2,541,531 | |
| 9.25% Sr. Nts., 10/16/136 | | | 15,270,000 | | | | 16,190,842 | |
| ICICI Bank Ltd., 6.375% Bonds, 4/30/223,4 | | | 6,340,000 | | | | 6,403,400 | |
| Lloyds TSB Bank plc: | | | | | | | | |
| 6% Sr. Sec. Nts., 2/8/29 | | | 1,365,000 | GBP | | | 2,917,510 | |
| 11.875% Unsec. Sub. Nts., 12/16/21 | | | 2,270,000 | EUR | | | 3,360,608 | |
| Royal Bank of Scotland plc (The): | | | | | | | | |
| 2.375% Sr. Unsec. Sub. Nts., 11/2/15 | | | 275,000 | CHF | | | 276,714 | |
| 13.125% Unsec. Sub. Nts., 3/19/22 | | | 660,000 | AUD | | | 778,231 | |
| Sberbank of Russia Via SB Capital SA: | | | | | | | | |
| 5.40% Sr. Unsec. Nts., 3/24/17 | | | 16,145,000 | | | | 17,369,437 | |
| 6.125% Sr. Nts., 2/7/223 | | | 13,650,000 | | | | 15,117,375 | |
| Societe Generale SCF SA, 1.931% Sec. Unsub. Nts., 6/19/174 | | | 400,000 | | | | 405,073 | |
| Sparebank 1 Boligkreditt AS, 2.30% Sec. Bonds, 6/30/173 | | | 2,250,000 | | | | 2,352,123 | |
| | | | |
| OPPENHEIMER GLOBAL STRATEGIC INCOME FUND | | | 35 | |
STATEMENT OF INVESTMENTS Continued
| | | | | | | | |
| | | Principal
Amount | | | Value | |
| Commercial Banks Continued | | | | | | | | |
| Stadshypotek AB: | | | | | | | | |
| 1.875% Sec. Nts., 10/2/193,8 | | $ | 2,360,000 | | | $ | 2,364,689 | |
| 6% Sec. Unsub. Bonds, 6/21/17 | | | 17,935,000 | SEK | | | 3,198,335 | |
| State Bank of India (London), 4.125% Sr. Unsec. Unsub. Nts., 8/1/173 | | | 11,745,000 | | | | 12,030,204 | |
| Sumitomo Mitsui Banking Corp., 1.80% Sr. Unsec. Nts., 7/18/17 | | | 1,365,000 | | | | 1,388,171 | |
| Swedbank Hypotek AB, 2.375% Sec. Nts., 4/5/173 | | | 1,710,000 | | | | 1,792,841 | |
| Toronto-Dominion Bank (The), 1.50% Sec. Bonds, 3/13/173 | | | 1,830,000 | | | | 1,884,219 | |
| Turkiye Garanti Bankasi AS, 4.175% Sr. Unsec. Nts., 9/13/173 | | | 4,890,000 | | | | 4,905,159 | |
| Turkiye Halk Bankasi AS, 4.875% Sr. Unsec. Nts., 7/19/173 | | | 5,885,000 | | | | 6,039,776 | |
| VTB Capital SA: | | | | | | | | |
| 6.315% Nts., 2/22/183 | | | 13,425,000 | | | | 14,181,633 | |
| 6.465% Sr. Sec. Unsub. Nts., 3/4/153 | | | 3,675,000 | | | | 3,916,705 | |
| Yapi ve Kredi Bankasi AS, 6.75% Sr. Unsec. Nts., 2/8/173 | | | 5,720,000 | | |
| 6,170,450
|
|
| | | | | | | | 258,121,099 | |
| Consumer Finance—0.2% | | | | | | | | |
| Community Choice Financial, Inc., 10.75% Sr. Sec. Nts., 5/1/193 | | | 3,505,000 | | | | 3,434,900 | |
| JSC Astana Finance, 9.16% Nts., 3/14/125 | | | 27,100,000 | | | | 2,032,500 | |
| Speedy Cash, Inc., 10.75% Sr. Sec. Nts., 5/15/183 | | | 5,615,000 | | | | 5,951,900 | |
| TMX Finance LLC/TitleMax Finance Corp., 13.25% Sr. Sec. Nts., 7/15/15 | | | 4,285,000 | | |
| 4,777,775
|
|
| | | | | | | | 16,197,075 | |
| Diversified Financial Services—0.5% | | | | | | | | |
| Autopistas del Nordeste Cayman Ltd., 9.39% Nts., 1/15/263 | | | 9,238,368 | | | | 9,433,297 | |
| Banco Invex SA, 30.969% Mtg.-Backed Certificates, Series 062U, 3/13/344,16 | | | 17,962,375 | MXN | | | 1,612,613 | |
| Caisse Centrale Desjardins du Quebec, 1.60% Sec. Bonds, 3/6/173 | | | 1,830,000 | | | | 1,889,151 | |
| Export Credit Bank of Turkey, 5.875% Sr. Unsec. Nts., 4/24/193 | | | 6,525,000 | | | | 7,197,075 | |
| GMAC LLC, 8% Sr. Unsec. Nts., 11/1/31 | | | 8,835,000 | | | | 10,345,785 | |
| Instituto de Credito Oficial: | | | | | | | | |
| 5% Sr. Unsec. Unsub. Nts., 11/14/16 | | | 2,290,000 | | | | 2,262,790 | |
| 5% Sr. Unsec. Unsub. Nts., 4/10/17 | | | 4,505,000 | | | | 4,416,107 | |
| JPMorgan Hipotecaria su Casita: | | | | | | | | |
| 8.175% Sec. Nts., 8/26/356,16 | | | 20,232,960 | MXN | | | 188,627 | |
| 29.289% Mtg.-Backed Certificates, Series 06U, 9/25/354,16 | | | 7,057,775 | MXN | | | 1,052,683 | |
| PHH Corp., 9.25% Sr. Unsec. Unsub. Nts., 3/1/16 | | | 9,665,000 | | |
| 11,138,913
|
|
| | | | | | | | 49,537,041 | |
| Insurance—0.2% | | | | | | | | |
| International Lease Finance Corp.: | | | | | | | | |
| 8.625% Sr. Unsec. Unsub. Nts., 9/15/15 | | | 7,790,000 | | | | 8,900,075 | |
| 8.75% Sr. Unsec. Unsub. Nts., 3/15/17 | | | 7,988,000 | | | | 9,385,900 | |
| Swiss Reinsurance Co. via ELM BV, 4.568% Sr. Sec. Sub. Nts., 5/25/494 | | | 470,000 | AUD | |
| 384,641
|
|
| | | | | | | | 18,670,616 | |
| | |
| 36 | | OPPENHEIMER GLOBAL STRATEGIC INCOME FUND |
| | | | | | | | |
| | | Principal
Amount | | | Value | |
| Real Estate Investment Trusts (REITs)—0.3% | |
| FelCor Escrow Holdings LLC, 6.75% Sr. Sec. Nts., 6/1/19 | | $ | 9,475,000 | | | $ | 10,209,313 | |
| OMEGA Healthcare Investors, Inc., 6.75% Sr. Unsec. Nts., 10/15/22 | | | 11,990,000 | | | | 13,308,900 | |
| | | | | | |
|
|
|
| | | | | | | | 23,518,213 | |
| Real Estate Management & Development—0.4% | |
| Ainsworth Lumber Co. Ltd., 11% Sr. Unsec. Unsub. Nts., 7/29/153,9 | | | 14,687,685 | | | | 14,026,739 | |
Realogy Corp.:
7.625% Sr. Sec. Nts., 1/15/203 | | | 9,400,000 | | | | 10,410,500 | |
| 9% Sr. Sec. Nts., 1/15/203 | | | 4,810,000 | | | | 5,327,075 | |
| Wallace Theater Holdings, Inc., 12.50% Sr. Sec. Nts., 6/15/133,4 | | | 6,170,000 | | | | 6,139,150 | |
| | | | | | |
|
|
|
| | | | | | | | 35,903,464 | |
| Health Care—1.2% | |
| Biotechnology—0.1% | |
| Grifols SA, 8.25% Sr. Sec. Nts., 2/1/18 | | | 3,760,000 | | | | 4,173,600 | |
| Universal Hospital Services, Inc., 7.625% Sr. Sec. Nts., 8/15/203 | | | 2,165,000 | | | | 2,262,425 | |
| | | | | | |
|
|
|
| | | | | | | | 6,436,025 | |
| Health Care Equipment & Supplies—0.3% | |
| Accellent, Inc., 10% Sr. Unsec. Sub. Nts., 11/1/17 | | | 5,680,000 | | | | 4,828,000 | |
Alere, Inc.:
7.875% Sr. Unsec. Unsub. Nts., 2/1/16 | | | 5,080,000 | | | | 5,334,000 | |
| 8.625% Sr. Unsec. Sub. Nts., 10/1/18 | | | 4,990,000 | | | | 5,264,450 | |
| Biomet, Inc.: | | | | | | | | |
| 6.50% Sr. Unsec. Nts., 8/1/203 | | | 3,805,000 | | | | 3,952,444 | |
| 11.625% Sr. Unsec. Sub. Nts., 10/15/17 | | | 1,992,000 | | | | 2,123,970 | |
| Chiron Merger Sub, Inc., 10.50% Sec. Nts., 11/1/183 | | | 1,135,000 | | | | 1,205,938 | |
| Hologic, Inc., 6.25% Sr. Unsec. Nts., 8/1/203 | | | 665,000 | | | | 708,225 | |
| | | | | | |
|
|
|
| | | | | | | | 23,417,027 | |
| Health Care Providers & Services—0.6% | |
| Catalent Pharma Solutions, Inc., 9.50% Sr. Unsec. Nts., 4/15/15 | | | 1,039 | | | | 1,064 | |
| CHS/Community Health Systems, Inc., 7.125% Sr. Unsec. Unsub. Nts., 7/15/20 | | | 2,880,000 | | | | 3,076,200 | |
| Fresenius Medical Care US Finance II, Inc.: | | | | | | | | |
| 5.625% Sr. Unsec. Nts., 7/31/193 | | | 2,980,000 | | | | 3,181,150 | |
| 5.875% Sr. Unsec. Nts., 1/31/223 | | | 1,490,000 | | | | 1,598,025 | |
| Gentiva Health Services, Inc., 11.50% Sr. Unsec. Unsub. Nts., 9/1/18 | | | 5,730,000 | | | | 5,436,338 | |
| HealthSouth Corp., 8.125% Sr. Unsec. Unsub. Nts., 2/15/20 | | | 1,936,000 | | | | 2,158,640 | |
| Kindred Healthcare, Inc., 8.25% Sr. Unsec. Nts., 6/1/19 | | | 10,540,000 | | | | 10,302,850 | |
| Multiplan, Inc., 9.875% Sr. Nts., 9/1/183 | | | 4,240,000 | | | | 4,706,400 | |
| Oncure Holdings, Inc., 11.75% Sr. Sec. Nts., 5/15/17 | | | 5,760,000 | | | | 3,542,400 | |
| PSS World Medical, Inc., 6.375% Sr. Unsec. Unsub. Nts., 3/1/22 | | | 2,145,000 | | | | 2,292,469 | |
| Radiation Therapy Services, Inc.: | | | | | | | | |
| 8.875% Sr. Sec. Nts., 1/15/17 | | | 5,010,000 | | | | 4,859,700 | |
| 9.875% Sr. Unsec. Sub. Nts., 4/15/17 | | | 4,585,000 | | | | 3,358,513 | |
| | | | |
| OPPENHEIMER GLOBAL STRATEGIC INCOME FUND | | | 37 | |
STATEMENT OF INVESTMENTS Continued
| | | | | | | | |
| | | Principal
Amount | | | Value | |
| Health Care Providers & Services Continued | |
| Select Medical Corp., 7.625% Sr. Unsec. Sub. Nts., 2/1/15 | | $ | 1,096,000 | | | $ | 1,112,440 | |
| US Oncology, Inc., Escrow Shares (related to 9.125% Sr. Sec. Nts., 8/15/17)5 | | | 8,495,000 | | | | 148,663 | |
| Vanguard Health Holding Co. II LLC/Vanguard Holding Co. II, Inc., 8% Sr. Nts., 2/1/18 | | | 7,295,000 | | | | 7,823,888 | |
| | | | | | |
|
|
|
| | | | | | | | 53,598,740 | |
| Health Care Technology—0.0% | |
| MedAssets, Inc., 8% Sr. Unsec. Nts., 11/15/18 | | | 1,175,000 | | | | 1,286,625 | |
| Life Sciences Tools & Services—0.0% | |
| Jaguar Holding Co./Jaguar Merger Sub, Inc., 9.50% Sr. Unsec. Nts., 12/1/193 | | | 3,730,000 | | | | 4,205,575 | |
| Pharmaceuticals—0.2% | |
| DJO Finance LLC/DJO Finance Corp., 10.875% Sr. Unsec. Nts., 11/15/14 | | | 2,615,000 | | | | 2,719,600 | |
| Mylan, Inc., 6% Sr. Nts., 11/15/183 | | | 3,865,000 | | | | 4,116,225 | |
| Valeant Pharmaceuticals International, Inc., 6.875% Sr. Unsec. Nts., 12/1/183 | | | 2,915,000 | | | | 3,082,613 | |
| Warner Chilcott Co. LLC/Warner Chilcott Finance LLC, 7.75% Sr. Unsec. Nts., 9/15/18 | | | 9,185,000 | | | | 9,850,913 | |
| | | | | | |
|
|
|
| | | | | | | | 19,769,351 | |
| Industrials—3.8% | |
| Aerospace & Defense—0.8% | |
| BE Aerospace, Inc., 6.875% Sr. Nts., 10/1/20 | | | 4,026,000 | | | | 4,488,990 | |
| DynCorp International, Inc., 10.375% Sr. Unsec. Nts., 7/1/17 | | | 19,355,000 | | | | 16,790,463 | |
| Embraer SA, 5.15% Sr. Unsec. Unsub. Nts., 6/15/22 | | | 6,140,000 | | | | 6,605,412 | |
| Huntington Ingalls Industries, Inc., 7.125% Sr. Unsec. Unsub. Nts., 3/15/21 | | | 8,420,000 | | | | 9,104,125 | |
| Kratos Defense & Security Solutions, Inc., 10% Sr. Sec. Nts., 6/1/17 | | | 5,208,000 | | | | 5,650,680 | |
| Schaeffler Finance BV, 8.50% Sr. Sec. Nts., 2/15/193 | | | 5,090,000 | | | | 5,726,250 | |
| TransDigm, Inc., 7.75% Sr. Unsec. Sub. Nts., 12/15/18 | | | 12,130,000 | | | | 13,464,300 | |
| Triumph Group, Inc., 8.625% Sr. Unsec. Nts., 7/15/18 | | | 12,170,000 | | | | 13,782,525 | |
| | | | | | |
|
|
|
| | | | | | | | 75,612,745 | |
| Air Freight & Logistics—0.2% | |
| Air Medical Group Holdings, Inc., 9.25% Sr. Sec. Nts., 11/1/18 | | | 4,890,000 | | | | 5,354,550 | |
| SPL Logistics Escrow LLC/SPL Logistics Finance Corp., 8.875% Sr. Sec. Nts., 8/1/203 | | | 9,365,000 | | | | 10,067,375 | |
| | | | | | |
|
|
|
| | | | | | | | 15,421,925 | |
| Airlines—0.2% | |
| American Airlines 2011-2 Class A Pass-Through Trust, 8.625% Sec. Certificates, 4/15/23 | | | 3,610,179 | | | | 3,885,455 | |
| Delta Air Lines, Inc., 12.25% Sr. Sec. Nts., 3/15/153 | | | 13,555,000 | | | | 14,774,950 | |
| | | | | | |
|
|
|
| | | | | | | | 18,660,405 | |
| Building Products—0.2% | |
| Associated Materials LLC, 9.125% Sr. Sec. Nts., 11/1/173 | | | 5,215,000 | | | | 5,136,775 | |
| | |
| 38 | | OPPENHEIMER GLOBAL STRATEGIC INCOME FUND |
| | | | | | | | |
| | | Principal
Amount | | | Value | |
| Building Products Continued | |
| Ply Gem Industries, Inc.: | | | | | | | | |
| 9.375% Sr. Nts., 4/15/173 | | $ | 5,585,000 | | | $ | 5,626,888 | |
| 13.125% Sr. Unsec. Sub. Nts., 7/15/14 | | | 9,460,000 | | | | 10,145,850 | |
| | | | | | |
|
|
|
| | | | | | | | 20,909,513 | |
| Commercial Services & Supplies—0.3% | |
| Cenveo Corp., 8.875% Sec. Nts., 2/1/18 | | | 2,755,000 | | | | 2,624,138 | |
| First Data Corp., 6.75% Sr. Sec. Nts., 11/1/203 | | | 5,820,000 | | | | 5,812,725 | |
| R.R. Donnelley & Sons Co., 7.25% Sr. Nts., 5/15/18 | | | 9,915,000 | | | | 9,890,213 | |
| STHI Holding Corp., 8% Sec. Nts., 3/15/183 | | | 3,755,000 | | | | 4,017,850 | |
| West Corp., 8.625% Sr. Unsec. Nts., 10/1/18 | | | 8,430,000 | | | | 8,893,650 | |
| | | | | | |
|
|
|
| | | | | | | | 31,238,576 | |
| Construction & Engineering—0.4% | |
| IIRSA Norte Finance Ltd., 8.75% Sr. Nts., 5/30/246 | | | 14,199,272 | | | | 17,607,097 | |
| Odebrecht Finance Ltd.: | | | | | | | | |
| 5.125% Sr. Nts., 6/26/223 | | | 8,295,000 | | | | 8,854,913 | |
| 7% Sr. Unsec. Nts., 4/21/203 | | | 4,400,000 | | | | 4,994,000 | |
| 7.125% Sr. Nts., 6/26/423 | | | 6,150,000 | | | | 6,866,475 | |
| | | | | | |
|
|
|
| | | | | | | | 38,322,485 | |
| Electrical Equipment—0.1% | |
| General Cable Corp., 5.75% Sr. Unsec. Unsub. Nts., 10/1/223 | | | 2,760,000 | | | | 2,815,200 | |
| Thermon Industries, Inc., 9.50% Sr. Sec. Nts., 5/1/17 | | | 5,237,000 | | | | 5,858,894 | |
| | | | | | |
|
|
|
| | | | | | | | 8,674,094 | |
| Industrial Conglomerates—0.0% | |
| GE Capital Australia Funding Pty Ltd., 7% Bonds, 10/8/15 | | | 2,105,000 | AUD | | | 2,362,917 | |
| Machinery—0.7% | |
| Actuant Corp., 5.625% Sr. Unsec. Unsub. Nts., 6/15/22 | | | 5,730,000 | | | | 5,973,525 | |
| Cleaver-Brooks, Inc., 12.25% Sr. Sec. Nts., 5/1/166 | | | 8,940,000 | | | | 9,632,850 | |
| CNH Capital LLC, 6.25% Sr. Unsec. Nts., 11/1/163 | | | 2,540,000 | | | | 2,771,775 | |
| Manitowoc Co., Inc. (The), 8.50% Sr. Unsec. Nts., 11/1/20 | | | 12,605,000 | | | | 14,164,869 | |
| Navistar International Corp., 3% Cv. Sr. Sub. Nts., 10/15/14 | | | 3,930,000 | | | | 3,505,069 | |
| Terex Corp., 8% Sr. Unsec. Sub. Nts., 11/15/17 | | | 9,435,000 | | | | 9,812,400 | |
| Thermadyne Holdings Corp., 9% Sr. Sec. Nts., 12/15/17 | | | 9,300,000 | | | | 9,951,000 | |
| Xerium Technologies, Inc., 8.875% Sr. Unsec. Nts., 6/15/18 | | | 5,745,000 | | | | 5,113,050 | |
| | | | | | |
|
|
|
| | | | | | | | 60,924,538 | |
| Marine—0.2% | |
| Drill Rigs Holdings, Inc., 6.50% Sr. Sec. Nts., 10/1/173 | | | 720,000 | | | | 717,300 | |
| Marquette Transportation Co./Marquette Transportation Finance Corp., 10.875% Sec. Nts., 1/15/17 | | | 13,580,000 | | | | 14,360,850 | |
| | | | |
| OPPENHEIMER GLOBAL STRATEGIC INCOME FUND | | | 39 | |
STATEMENT OF INVESTMENTS Continued
| | | | | | | | |
| | | Principal
Amount | | | Value | |
| Marine Continued | |
| Navios Maritime Holdings, Inc./Navios Maritime Finance U.S., Inc., 8.875% Sr. Sec. Nts., 11/1/17 | | $ | 2,750,000 | | | $ | 2,835,938 | |
| | | | | | |
|
|
|
| | | | | | | | 17,914,088 | |
| Professional Services—0.1% | |
| Altegrity, Inc., 10.50% Sr. Unsec. Sub. Nts., 11/1/156 | | | 4,708,000 | | | | 4,143,040 | |
| Road & Rail—0.4% | |
| Avis Budget Car Rental LLC/Avis Budget Finance, Inc., 8.25% Sr. Unsec. Unsub. Nts., 1/15/19 | | | 4,195,000 | | | | 4,588,281 | |
| Hertz Corp. (The), 7.50% Sr. Unsec. Nts., 10/15/18 | | | 11,150,000 | | | | 12,097,750 | |
| Kazakhstan Temir Zholy Finance BV, 6.375% Sr. Unsec. Nts., 10/6/203 | | | 3,215,000 | | | | 3,869,606 | |
| Transnet SOC Ltd., 4% Sr. Unsec. Nts., 7/26/223 | | | 5,965,000 | | | | 6,078,335 | |
| Western Express, Inc., 12.50% Sr. Sec. Nts., 4/15/153 | | | 18,908,000 | | | | 12,762,900 | |
| | | | | | |
|
|
|
| | | | | | | | 39,396,872 | |
| Trading Companies & Distributors—0.2% | |
| UR Financing Escrow Corp.: | |
| 7.375% Sr. Unsec. Nts., 5/15/203 | | | 11,450,000 | | | | 12,337,375 | |
| 7.625% Sr. Unsec. Nts., 4/15/223 | | | 2,865,000 | | | | 3,144,338 | |
| | | | | | |
|
|
|
| | | | | | | | 15,481,713 | |
| Information Technology—1.1% | |
| Communications Equipment—0.2% | |
| Avaya, Inc., 7% Sr. Sec. Nts., 4/1/193 | | | 9,230,000 | | | | 8,630,050 | |
| ViaSat, Inc., 6.875% Sr. Unsec. Unsub. Nts., 6/15/20 | | | 4,298,000 | | | | 4,448,430 | |
| Zayo Group LLC/Zayo Capital, Inc.: | | | | | | | | |
| 8.125% Sr. Sec. Nts., 1/1/20 | | | 2,155,000 | | | | 2,365,113 | |
| 10.125% Sr. Sec. Nts., 7/1/20 | | | 1,440,000 | | | | 1,598,400 | |
| | | | | | |
|
|
|
| | | | | | | | 17,041,993 | |
| Computers & Peripherals—0.1% | |
| Seagate HDD (Cayman), 7% Sr. Unsec. Nts., 11/1/21 | | | 7,885,000 | | | | 8,476,375 | |
| Electronic Equipment, Instruments & Components—0.0% | |
| Anixter, Inc., 5.625% Sr. Unsec. Nts., 5/1/19 | | | 3,575,000 | | | | 3,753,750 | |
| Internet Software & Services—0.2% | |
| ITC DeltaCom, Inc., 10.50% Sr. Sec. Nts., 4/1/16 | | | 17,380,000 | | | | 18,683,500 | |
| IT Services—0.2% | |
| Ceridian Corp., 11.25% Sr. Unsec. Nts., 11/15/15 | | | 5,930,000 | | | | 5,870,700 | |
| First Data Corp.: | | | | | | | | |
| 9.875% Sr. Unsec. Nts., 9/24/15 | | | 4,515,000 | | | | 4,627,875 | |
| 12.625% Sr. Unsec. Nts., 1/15/21 | | | 7,910,000 | | | | 8,236,288 | |
| | | | | | |
|
|
|
| | | | | | | | 18,734,863 | |
| Semiconductors & Semiconductor Equipment—0.3% | |
| Advanced Micro Devices, Inc., 7.75% Sr. Unsec. Nts., 8/1/20 | | | 6,287,000 | | | | 6,412,740 | |
| Amkor Technologies, Inc., 6.625% Sr. Unsec. Nts., 6/1/21 | | | 4,440,000 | | | | 4,528,800 | |
| | |
| 40 | | OPPENHEIMER GLOBAL STRATEGIC INCOME FUND |
| | | | | | | | |
| | | Principal
Amount | | | Value | |
| Semiconductors & Semiconductor Equipment Continued | |
| Freescale Semiconductor, Inc.: | | | | | | | | |
| 9.25% Sr. Sec. Nts., 4/15/183 | | $ | 8,020,000 | | | $ | 8,761,850 | |
| 10.75% Sr. Unsec. Nts., 8/1/20 | | | 8,679,000 | | | | 9,438,413 | |
| | | | | | |
|
|
|
| | | | | | | | 29,141,803 | |
| Software—0.1% | |
| Lawson Software, Inc., 9.375% Sr. Nts., 4/1/193 | | | 1,795,000 | | | | 2,001,425 | |
| SunGard Data Systems, Inc.: | | | | | | | | |
| 7.375% Sr. Unsec. Nts., 11/15/18 | | | 2,685,000 | | | | 2,893,088 | |
| 7.625% Sr. Unsec. Nts., 11/15/20 | | | 2,935,000 | | | | 3,199,150 | |
| | | | | | |
|
|
|
| | | | | | | | 8,093,663 | |
| Materials—2.2% | |
| Chemicals—0.5% | |
| ADS Waste Holdings, Inc., 8.25% Sr. Nts., 10/1/203,8 | | | 1,425,000 | | | | 1,457,063 | |
| Braskem America Finance Co., 7.125% Sr. Unsec. Nts., 7/22/413 | | | 5,745,000 | | | | 6,118,425 | |
| Braskem Finance Ltd.: | | | | | | | | |
| 5.375% Sr. Unsec. Nts., 5/2/223 | | | 8,165,000 | | | | 8,491,600 | |
| 5.75% Sr. Unsec. Nts., 4/15/213 | | | 1,970,000 | | | | 2,098,050 | |
| Ferro Corp., 7.875% Sr. Unsec. Nts., 8/15/18 | | | 4,010,000 | | | | 3,889,700 | |
| Hexion U.S. Finance Corp./Hexion Nova Scotia Finance ULC, 8.875% Sr. Sec. Nts., 2/1/18 | | | 4,775,000 | | | | 4,930,188 | |
| Ineos Finance plc, 8.375% Sr. Sec. Bonds, 2/15/193 | | | 7,170,000 | | | | 7,573,313 | |
| LyondellBasell Industries NV, 6% Sr. Unsec. Nts., 11/15/21 | | | 6,260,000 | | | | 7,167,700 | |
| Mexichem SAB de CV: | | | | | | | | |
| 4.875% Sr. Unsec. Nts., 9/19/223 | | | 3,250,000 | | | | 3,306,875 | |
| 6.75% Sr. Unsec. Nts., 9/19/423 | | | 2,600,000 | | | | 2,704,520 | |
| Scotts Miracle-Gro Co. (The), 6.625% Sr. Unsec. Unsub. Nts., 12/15/20 | | | 1,200,000 | | | | 1,299,000 | |
| | | | | | |
|
|
|
| | | | | | | | 49,036,434 | |
| Construction Materials—0.3% | |
| Building Materials Corp. of America, 6.75% Sr. Nts., 5/1/213 | | | 5,765,000 | | | | 6,327,088 | |
| CEMEX Espana Luxembourg, 9.875% Sr. Sec. Nts., 4/30/193 | | | 7,495,000 | | | | 7,701,113 | |
| CEMEX SAB de CV, 9% Sr. Sec. Nts., 1/11/183 | | | 4,605,000 | | | | 4,628,025 | |
| Ply Gem Industries, Inc., 8.25% Sr. Sec. Nts., 2/15/18 | | | 6,230,000 | | | | 6,533,713 | |
| | | | | | |
|
|
|
| | | | | | | | 25,189,939 | |
| Containers & Packaging—0.4% | |
| Berry Plastics Corp., 9.75% Sec. Nts., 1/15/21 | | | 5,895,000 | | | | 6,749,775 | |
| Consolidated Container Co. LLC/Consolidated Container Capital, Inc., 10.125% Sr. Unsec. Nts., 7/15/203 | | | 2,160,000 | | | | 2,311,200 | |
| Polymer Group, Inc., 7.75% Sr. Sec. Nts., 2/1/19 | | | 10,450,000 | | | | 11,181,500 | |
| Rock-Tenn Co., 4.45% Sr. Unsec. Nts., 3/1/193 | | | 2,150,000 | | | | 2,272,277 | |
| Verso Paper Holdings LLC/Verso Paper, Inc., 11.75% Sr. Sec. Nts., 1/15/193 | | | 15,199,000 | | | | 11,779,225 | |
| | | | | | |
|
|
|
| | | | | | | | 34,293,977 | |
| | | | |
| OPPENHEIMER GLOBAL STRATEGIC INCOME FUND | | | 41 | |
STATEMENT OF INVESTMENTS Continued
| | | | | | | | |
| | | Principal
Amount | | | Value | |
| Metals & Mining—0.6% | | | | | | | | |
| Aleris International, Inc., 7.625% Sr. Unsec. Nts., 2/15/18 | | $ | 8,680,000 | | | $ | 9,265,900 | |
| Alrosa Co. Ltd., 8.25% Sr. Unsec. Nts., 6/23/154 | | | 71,890,000 | RUR | | | 2,319,515 | |
| Alrosa Finance SA, 7.75% Nts., 11/3/203 | | | 11,545,000 | | | | 13,132,438 | |
| Consolidated Minerals Ltd., 8.875% Sr. Sec. Nts., 5/1/163 | | | 4,650,000 | | | | 3,836,250 | |
| CSN Islands XI Corp., 6.875% Sr. Unsec. Nts., 9/21/193 | | | 4,890,000 | | | | 5,476,800 | |
| Ferrexpo Finance plc, 7.875% Sr. Unsec. Bonds, 4/7/163 | | | 5,195,000 | | | | 4,935,250 | |
| JSC Severstal, 6.70% Nts., 10/25/173 | | | 8,775,000 | | | | 9,423,385 | |
| Novelis, Inc., 8.75% Sr. Unsec. Nts., 12/15/20 | | | 2,235,000 | | | | 2,486,438 | |
| Novolipetsk Steel OJSC, 4.95% Nts., 9/26/193 | | | 6,905,000 | | | | 6,855,512 | |
| | | | | | |
|
|
|
| | | | | | | | 57,731,488 | |
| Paper & Forest Products—0.4% | | | | | | | | |
| Appleton Papers, Inc., 10.50% Sr. Sec. Nts., 6/15/153 | | | 4,830,000 | | | | 5,156,025 | |
| Catalyst Paper Corp.: | | | | | | | | |
| 11% Sr. Sec. Nts., 12/15/16 | | | 13,074,634 | | | | 10,328,961 | |
| 13% Sec. Nts., 12/15/164,6 | | | 3,328,703 | | | | 3,228,842 | |
| NewPage Corp., 11.375% Sr. Sec. Nts., 12/31/145 | | | 13,705,000 | | | | 8,702,675 | |
| Norske Skogindustrier ASA, 6.125% Unsec. Bonds, 10/15/153 | | | 7,060,000 | | | | 5,753,900 | |
| | | | | | |
|
|
|
| | | | | | | | 33,170,403 | |
| Telecommunication Services—2.5% | | | | | | | | |
| Diversified Telecommunication Services—1.1% | | | | | | | | |
| Brasil Telecom SA, 9.75% Sr. Unsec. Nts., 9/15/163 | | | 11,210,000 | BRR | | | 5,833,790 | |
| Cincinnati Bell, Inc.: | | | | | | | | |
| 8.25% Sr. Nts., 10/15/17 | | | 6,430,000 | | | | 6,896,175 | |
| 8.75% Sr. Unsec. Sub. Nts., 3/15/18 | | | 4,845,000 | | | | 4,941,900 | |
| Colombia Telecomunicaciones SA ESP, 5.375% Sr. Unsec. Nts., 9/27/223 | | | 4,610,000 | | | | 4,690,675 | |
Frontier Communications Corp.:
8.25% Sr. Unsec. Nts., 4/15/17 | | | 4,515,000 | | | | 5,147,100 | |
| 8.50% Sr. Unsec. Nts., 4/15/20 | | | 3,005,000 | | | | 3,410,675 | |
| Intelsat Bermuda Ltd.: | | | | | | | | |
| 11.25% Sr. Unsec. Nts., 2/4/17 | | | 9,655,000 | | | | 10,246,369 | |
| 11.50% Sr. Unsec. Nts., 2/4/179 | | | 5,259,375 | | | | 5,594,660 | |
| Intelsat Jackson Holdings SA, 7.25% Sr. Unsec. Nts., 10/15/20 | | | 2,810,000 | | | | 3,038,313 | |
| Level 3 Communications, Inc., 8.875% Sr. Unsec. Nts., 6/1/193 | | | 6,595,000 | | | | 6,949,481 | |
| Level 3 Financing, Inc., 9.375% Sr. Unsec. Unsub. Nts., 4/1/19 | | | 4,715,000 | | | | 5,257,225 | |
| Telemar Norte Leste SA, 5.50% Sr. Unsec. Nts., 10/23/203 | | | 27,570,000 | | | | 29,086,350 | |
| Wind Acquisition Finance SA, 7.25% Sr. Sec. Nts., 2/15/183 | | | 9,355,000 | | | | 8,934,025 | |
| Windstream Corp., 7.50% Sr. Unsec. Unsub. Nts., 6/1/223 | | | 4,470,000 | | | | 4,760,550 | |
| | | | | | |
|
|
|
| | | | | | | | 104,787,288 | |
| Wireless Telecommunication Services—1.4% | | | | | | | | |
| America Movil SAB de CV, 8.46% Sr. Unsec. Unsub. Bonds, 12/18/36 | | | 42,300,000 | MXN | | | 3,497,679 | |
| | |
| 42 | | OPPENHEIMER GLOBAL STRATEGIC INCOME FUND |
| | | | | | | | |
| | | Principal
Amount | | | Value | |
| Wireless Telecommunication Services Continued | | | | | | | | |
| Cricket Communications, Inc.: | | | | | | | | |
| 7.75% Sr. Unsec. Nts., 10/15/20 | | $ | 7,695,000 | | | $ | 7,541,100 | |
| 10% Sr. Unsec. Unsub. Nts., 7/15/15 | | | 3,445,000 | | | | 3,634,475 | |
| Digicel Group Ltd., 8.25% Sr. Unsec. Nts., 9/30/203 | | | 4,635,000 | | | | 4,889,925 | |
| Leap Wireless International, Inc., 4.50% Cv. Sr. Unsec. Nts., 7/15/14 | | | 4,980,000 | | | | 4,768,350 | |
| MetroPCS Wireless, Inc., 6.625% Sr. Unsec. Nts., 11/15/20 | | | 9,170,000 | | | | 9,639,963 | |
| MTS International Funding Ltd., 8.625% Sr. Unsec. Nts., 6/22/203 | | | 8,935,000 | | | | 10,911,422 | |
| SBA Telecommunications, Inc., 5.75% Sr. Unsec. Unsub. Nts., 7/15/203 | | | 2,880,000 | | | | 3,034,800 | |
| Sistema International Funding SA, 6.95% Unsec. Nts., 5/17/193 | | | 6,105,000 | | | | 6,456,038 | |
| Sprint Capital Corp.: | | | | | | | | |
| 6.875% Sr. Unsec. Nts., 11/15/28 | | | 5,165,000 | | | | 4,777,625 | |
| 8.75% Nts., 3/15/32 | | | 2,315,000 | | | | 2,407,600 | |
| Sprint Nextel Corp., 9% Sr. Unsec. Nts., 11/15/183 | | | 8,560,000 | | | | 10,293,400 | |
| Vimpel Communications: | | | | | | | | |
| 8.85% Sr. Unsec. Nts., 3/8/224 | | | 78,800,000 | RUR | | | 2,511,521 | |
| 8.85% Sr. Unsec. Nts., 3/8/224 | | | 78,800,000 | RUR | | | 2,511,774 | |
| Vimpel Communications/VIP Finance Ireland Ltd. OJSC: | | | | | | | | |
| 7.748% Sec. Nts., 2/2/213 | | | 5,770,000 | | | | 6,181,113 | |
| 9.125% Sr. Unsec. Nts., 4/30/183 | | | 21,600,000 | | | | 24,833,520 | |
| VimpelCom, 7.504% Sr. Unsec. Unsub. Nts., 3/1/223 | | | 14,110,000 | | | | 14,833,138 | |
| Wind Acquisition Finance SA, 11.75% Sr. Sec. Nts., 7/15/173 | | | 3,080,000 | | | | 2,918,300 | |
| | | | | | |
|
|
|
| | | | | | | | 125,641,743 | |
| Utilities—2.4% | | | | | | | | |
| Electric Utilities—1.5% | | | | | | | | |
| Dubai Electricity & Water Authority, 7.375% Sr. Unsec. Unsub. Nts., 10/21/203 | | | 9,660,000 | | | | 11,340,840 | |
| Empresa Distribuidora y Comercializadora Norte SA, 9.75% Nts., 10/25/223 | | | 3,305,000 | | | | 1,685,550 | |
| Empresas Publicas de Medellin ESP, 7.625% Sr. Unsec. Nts., 7/29/193 | | | 5,160,000 | | | | 6,540,300 | |
| Energy Future Intermediate Holding Co. LLC, 10% Sr. Sec. Nts., 12/1/20 | | | 8,524,000 | | | | 9,632,120 | |
| Eskom Holdings Ltd.: | | | | | | | | |
| 5.75% Sr. Unsec. Bonds, 1/26/213 | | | 5,965,000 | | | | 6,829,925 | |
| 7.85% Sr. Unsec. Unsub. Nts., Series ES26, 4/2/26 | | | 115,000,000 | ZAR | | | 13,717,304 | |
| 10% Nts., Series ES23, 1/25/23 | | | 152,000,000 | ZAR | | | 21,851,639 | |
| Israel Electric Corp. Ltd.: | | | | | | | | |
| 6.70% Sr. Unsec. Nts., 2/10/173 | | | 6,315,000 | | | | 6,827,949 | |
| 7.25% Nts., 1/15/193 | | | 28,895,000 | | | | 31,467,984 | |
| Majapahit Holding BV: | | | | | | | | |
| 7.75% Nts., 10/17/163 | | | 5,530,000 | | | | 6,573,788 | |
| 8% Sr. Unsec. Nts., 8/7/193 | | | 4,620,000 | | | | 5,855,850 | |
| National Power Corp., 5.875% Unsec. Unsub. Bonds, 12/19/16 | | | 421,000,000 | PHP | | | 10,350,131 | |
| Perusahaan Listrik Negara PT, 5.50% Sr. Unsec. Nts., 11/22/213 | | | 7,420,000 | | | | 8,338,225 | |
| | | | | | |
|
|
|
| | | | | | | | 141,011,605 | |
| | | | |
| OPPENHEIMER GLOBAL STRATEGIC INCOME FUND | | | 43 | |
STATEMENT OF INVESTMENTS Continued
| | | | | | | | |
| | | Principal
Amount | | | Value | |
| Energy Traders—0.6% | | | | | | | | |
| AES Corp. (The): | | | | | | | | |
| 7.375% Sr. Unsec. Unsub. Nts., 7/1/21 | | $ | 2,465,000 | | | $ | 2,822,425 | |
| 8% Sr. Unsec. Unsub. Nts., 10/15/17 | | | 4,100,000 | | | | 4,756,000 | |
| Calpine Corp.: | | | | | | | | |
| 7.50% Sr. Sec. Nts., 2/15/213 | | | 4,250,000 | | | | 4,611,250 | |
| 7.875% Sr. Sec. Nts., 1/15/233 | | | 2,620,000 | | | | 2,908,200 | |
| Colbun SA, 6% Sr. Unsec. Nts., 1/21/203 | | | 11,325,000 | | | | 12,776,627 | |
| Comision Federal de Electricidad, 4.875% Sr. Nts., 5/26/213 | | | 6,155,000 | | | | 6,939,763 | |
| Energy Future Holdings Corp., 10% Sr. Sec. Nts., 1/15/20 | | | 8,815,000 | | | | 9,762,613 | |
| First Wind Capital LLC, 10.25% Sr. Sec. Nts., 6/1/186 | | | 1,303,000 | | | | 1,335,575 | |
| Foresight Energy LLC, 9.625% Sr. Unsec. Nts., 8/15/173 | | | 4,490,000 | | | | 4,669,600 | |
| NRG Energy, Inc., 6.625% Sr. Unsec. Nts., 3/15/233 | | | 1,375,000 | | | | 1,407,656 | |
| | | | | | |
|
|
|
| | | | | | | | 51,989,709 | |
| Gas Utilities—0.3% | | | | | | | | |
AmeriGas Finance LLC/AmeriGas Finance Corp., 6.75% Sr. Unsec.
Nts., 5/20/20 | | | 9,085,000 | | | | 9,720,950 | |
Empresa de Energia de Bogota SA ESP, 6.125% Sr. Unsec. Unsub.
Nts., 11/10/213 | | | 4,980,000 | | | | 5,502,900 | |
Transportadora de Gas Internacional SA ESP, 5.70% Sr. Unsec.
Nts., 3/20/223 | | | 7,265,000 | | | | 7,846,200 | |
| | | | | | |
|
|
|
| | | | | | |
| 23,070,050
|
|
| Total Corporate Bonds and Notes (Cost $2,659,286,155) | | | | | | | 2,716,696,754 | |
| | | Shares | | | | |
| Preferred Stocks—0.2% | | | | | | | | |
| Ally Financial, Inc., 7% Cum., Series G, Non-Vtg. | | | 9,759 | | | | 9,129,850 | |
| Greektown Superholdings, Inc., Cv., Series A-11,2 | | | 90,979 | | | | 6,414,020 | |
| | | | | | |
|
|
|
| Total Preferred Stocks (Cost $18,091,008) | | | | | | | 15,543,870 | |
| Common Stocks—0.2% | | | | | | | | |
| American Media Operations, Inc.1,2 | | | 801,816 | | | | 10,423,608 | |
| Arco Capital Corp. Ltd.1,2,6 | | | 2,494,716 | | | | 3,742,074 | |
| Catalyst Paper Corp.2 | | | 754,474 | | | | 844,188 | |
| Global Aviation Holdings, Inc.2 | | | 7,700 | | | | — | |
| Greektown Superholdings, Inc., Series A-11,2 | | | 11,417 | | | | 593,684 | |
| Premier Holdings Ltd.2 | | | 1,088,661 | | |
| —
|
|
| Total Common Stocks (Cost $71,767,210) | | | | | | | 15,603,554 | |
| | | Units | | | | |
| Rights, Warrants and Certificates—0.0% | | | | | | | | |
MediaNews Group, Inc. Wts., Strike Price $0.001, Exp. 3/19/172
(Cost $24,912,707) | | | 88,579 | | | | 3,187 | |
| | |
| 44 | | OPPENHEIMER GLOBAL STRATEGIC INCOME FUND |
| | | | | | | | |
| | | Principal
Amount | | | Value | |
| Structured Securities—2.7% | | | | | | | | |
Barclays Bank plc:
Indonesia (Republic of) Total Return Linked Bonds, 7%, 5/19/27 | | | 30,690,000,000 | IDR | | $ | 3,397,707 | |
| Indonesia (Republic of) Total Return Linked Bonds, 8.25%, 6/17/32 | | | 80,450,000,000 | IDR | | | 9,807,586 | |
| Citigroup Global Markets Holdings, Inc.: | | | | | | | | |
| Colombia (Republic of) Credit Linked Bonds, 11.25%, 10/25/186 | | | 8,155,000,000 | COP | | | 5,785,636 | |
| Colombia (Republic of) Credit Linked Nts., Series 2, 10%, 7/25/24 | | | 41,194,000,000 | COP | | | 29,701,634 | |
| Colombia (Republic of) Credit Linked Nts., Series 2, 10%, 7/25/246 | | | 10,250,000,000 | COP | | | 7,390,439 | |
| Colombia (Republic of) Total Return Linked Bonds, Series 2, 11%, 7/27/20 | | | 10,191,000,000 | COP | | | 7,341,223 | |
Credit Suisse First Boston International, Moitk Total Return Linked
Nts., 21%, 3/30/115 | | | 196,587,000 | RUR | | | — | |
Credit Suisse First Boston, Inc. (Nassau Branch), Russian Specialized Construction & Installation Administration Total Return Linked
Nts., 13%, 5/24/105 | | | 335,100,000 | RUR | | | — | |
Deutsche Bank AG:
Coriolanus Ltd. Sec. Credit Linked Bonds, Series 128, 3.006%, 5/6/256,15 | | | 4,674,011 | | | | 3,438,392 | |
| Coriolanus Ltd. Sec. Credit Linked Bonds, 3.061%, 5/6/256,15 | | | 5,955,409 | | | | 4,381,041 | |
| Coriolanus Ltd. Sec. Credit Linked Bonds, 3.10%, 5/6/256,15 | | | 5,141,542 | | | | 3,782,327 | |
| Coriolanus Ltd. Sec. Credit Linked Bonds, 3.134%, 5/6/256,15 | | | 4,595,890 | | | | 3,380,923 | |
| Coriolanus Ltd. Sec. Credit Linked Bonds, 3.187%, 5/6/256,15 | | | 5,722,256 | | | | 4,209,524 | |
| Coriolanus Ltd. Sec. Credit Linked Bonds, 3.238%, 5/6/256,15 | | | 6,531,087 | | | | 4,804,533 | |
| Coriolanus Ltd. Sec. Credit Linked Bonds, 3.266%, 5/6/256,15 | | | 5,217,574 | | | | 3,838,259 | |
| Coriolanus Ltd. Sec. Credit Linked Bonds, 3.338%, 5/6/256,15 | | | 4,904,297 | | | | 3,607,800 | |
| Coriolanus Ltd. Sec. Credit Linked Nts., 15.755%, 12/31/176,16 | | | 36,050,000 | BRR | | | 21,307,244 | |
| Opic Reforma I Credit Linked Nts., Cl. 2A, 8.308%, 5/22/154,6 | | | 1,803,555 | MXN | | | 133,196 | |
| Opic Reforma I Credit Linked Nts., Cl. 2B, 8.308%, 5/22/154,6 | | | 3,155,364 | MXN | | | 233,029 | |
| Opic Reforma I Credit Linked Nts., Cl. 2C, 8.308%, 5/22/154,6 | | | 47,575,229 | MXN | | | 3,513,509 | |
| Opic Reforma I Credit Linked Nts., Cl. 2D, 8.308%, 5/22/154,6 | | | 3,467,217 | MXN | | | 256,060 | |
| Opic Reforma I Credit Linked Nts., Cl. 2E, 8.308%, 5/22/154,6 | | | 2,518,999 | MXN | | | 186,032 | |
| Opic Reforma I Credit Linked Nts., Cl. 2F, 8.308%, 5/22/154,6 | | | 1,608,758 | MXN | | | 118,809 | |
| Opic Reforma I Credit Linked Nts., Cl. 2G, 8.308%, 5/22/154,6 | | | 296,268 | MXN | | | 21,880 | |
| Goldman Sachs Capital Markets LP, Colombia (Republic of) Credit Linked Nts., Cl. B, 10%, 7/30/243,8 | | | 57,780,000,000 | COP | | | 41,638,905 | |
Goldman Sachs Group, Inc., United Mexican States Credit Linked
Nts., 9.05%, 2/8/373,8,15 | | | 1,131,000,000 | MXN | | | 10,324,354 | |
| Hallertau SPC Credit Linked Nts.: | | | | | | | | |
| Series 2007-01, 2.787%, 12/20/174,6 | | | 24,000,000 | | | | 22,452,000 | |
| Series 2008-01, 9.878%, 8/2/105,6,15 | | | 37,994,727 | BRR | | | — | |
HSBC Bank USA NA, Indonesia (Republic of) Credit Linked
Nts., 8.25%, 6/15/323 | | | 21,300,000,000 | IDR | | | 2,596,664 | |
JPMorgan Chase & Co.:
Colombia (Republic of) Credit Linked Nts., 11%, 7/28/206 | | | 4,890,000,000 | COP | | | 3,523,142 | |
| Indonesia (Republic of) Credit Linked Nts., 7%, 5/19/273 | | | 74,660,000,000 | IDR | | | 8,265,650 | |
| Indonesia (Republic of) Credit Linked Nts., 8.25%, 6/17/323 | | | 4,490,000,000 | IDR | | | 547,372 | |
| LB Peru Trust II Certificates, Series 1998-A, 4.541%, 2/28/165 | | | 14,029,589 | | | | 1,402,959 | |
Merrill Lynch, Colombia (Republic of) Credit Linked
Nts., 10%, 11/17/166 | | | 7,928,000,000 | COP | | | 4,945,047 | |
| | | | |
| OPPENHEIMER GLOBAL STRATEGIC INCOME FUND | | | 45 | |
STATEMENT OF INVESTMENTS Continued
| | | | | | | | |
| | | Principal
Amount | | | Value | |
| Structured Securities Continued | | | | | | | | |
| Morgan Stanley: | | | | | | | | |
| Peru (Republic of) Credit Linked Nts., 6.25%, 3/23/173 | | | 15,932,000 | PEN | | $ | 5,856,352 | |
Russian Federation Total Return Linked Bonds, Series 007,
Cl. VR, 5%, 8/22/34 | | | 186,106,454 | RUR | | | 2,839,413 | |
Morgan Stanley Capital Services, Inc.:
Brazil (Federative Republic of) Credit Linked Nts., 12.561%, 1/5/223,15 | | | 113,353,000 | BRR | | | 12,508,110 | |
| United Mexican States Credit Linked Nts., 5.64%, 11/20/153 | | | 300,000 | | | | 274,080 | |
UBS AG, Indonesia (Republic of) Total Return Linked
Nts., 8.25%, 6/17/32 | | | 72,910,000,000 | IDR | |
| 8,888,345
|
|
| Total Structured Securities (Cost $300,878,585) | | | | | | | 246,699,176 | |
| | | | | | | | | | | | | | | | | |
| | | Expiration
Date | | Strike
Price | | Contracts | | |
| Options Purchased—0.3% | | | | | | | | |
| 3-Month FX Basket Put/USD Call2 | | | | 10/31/12 | | | $ 96.000 | | | | 8,590,000 | | | | | 158 | |
| 90-Day Euro$ Futures, 12/17/12 Put2 | | | | 12/18/12 | | | 99.500 | | | | 1,520 | | | | | 28,500 | |
| Australian Dollar (AUD) Call2 | | | | 10/18/12 | | | 1 AUD per 1.065 USD | | | | 156,275,000 | | | | | 116,222 | |
| Australian Dollar (AUD) Call2 | | | | 10/19/12 | | | 1 AUD per 1.065 USD | | | | 155,000,000 | | | | | 124,724 | |
| Australian Dollar (AUD) Futures, 12/17/12 Call2 | | | | 10/8/12 | | | 104.000 | | | | 143 | | | | | 27,170 | |
| Australian Dollar (AUD) Futures, 12/17/12 Call2 | | | | 10/8/12 | | | 104.500 | | | | 251 | | | | | 25,100 | |
| Australian Dollar (AUD) Futures, 12/17/12 Put2 | | | | 10/8/12 | | | 101.500 | | | | 47 | | | | | 5,170 | |
| Brazilian Real (BRR) Call2 | | | | 10/18/12 | | | 1 USD per 1.820 BBR | | | | 47,310,000 | | | | | — | |
| Brazilian Real (BRR) Call2 | | | | 10/18/12 | | | 1 USD per 1.900 BBR | | | | 49,430,000 | | | | | 659 | |
| British Pound Sterling (GBP) Futures, 12/17/12 Call2 | | | | 10/8/12 | | | 164.000 | | | | 182 | | | | | 4,550 | |
| British Pound Sterling (GBP) Put2 | | | | 9/9/13 | | | 1 GBP per 1.560 USD | | | | 9,113,661 | | | | | 253,424 | |
| British Pound Sterling (GBP) Put2 | | | | 9/11/13 | | | 1 GBP per 1.550 USD | | | | 9,107,724 | | | | | 231,131 | |
| British Pound Sterling (GBP) Put2 | | | | 8/16/13 | | | 1 GBP per 1.550 USD | | | | 12,772,984 | | | | | 303,213 | |
| Canadian Dollar (CAD) Put2 | | | | 10/8/12 | | | 1 AUD per 0.980 CAD | | | | 8,950,000 | | | | | 38 | |
| Candian Dollar (CAD) Futures, 12/18/12 Put2 | | | | 10/8/12 | | | 100.000 | | | | 280 | | | | | 14,000 | |
| Candian Dollar (CAD) Futures, 12/18/12 Put2 | | | | 10/8/12 | | | 100.500 | | | | 401 | | | | | 48,120 | |
| Euro (EUR) Call2 | | | | 12/21/12 | | | 1 GBP per 1.300 USD | | | | 47,410,000 | | | | | 679,600 | |
| Euro (EUR) Call2 | | | | 12/21/12 | | | 1 GBP per 1.300 USD | | | | 53,330,000 | | | | | 764,460 | |
| Euro (EUR) FX Futures, 12/17/12 Call2 | | | | 10/8/12 | | | 1.320 | | | | 59 | | | | | 2,581 | |
| Euro (EUR) FX Futures, 12/17/12 Call2 | | | | 12/10/12 | | | 1.340 | | | | 5 | | | | | 2,313 | |
| Euro (EUR) FX Futures, 12/17/12 Put2 | | | | 10/8/12 | | | 1.290 | | | | 75 | | | | | 60,938 | |
| Euro (EUR) FX Futures, 12/17/12 Put2 | | | | 10/8/12 | | | 1.210 | | | | 729 | | | | | 4,556 | |
| Euro (EUR) FX Futures, 12/17/12 Put2 | | | | 10/8/12 | | | 1.170 | | | | 23 | | | | | 144 | |
| Euro (EUR) FX Futures, 12/17/12 Put2 | | | | 10/8/12 | | | 1.190 | | | | 752 | | | | | 4,700 | |
| | |
| 46 | | OPPENHEIMER GLOBAL STRATEGIC INCOME FUND |
| | | | | | | | | | | | | | | | | |
| | | Expiration
Date | | Strike
Price | | Contracts | | Value |
| Options Purchased Continued | | | | | | | | |
| Euro (EUR) FX Futures, 12/17/12 Put2 | | | | 10/8/12 | | | $ 1.210 | | | | 1,234 | | | | $ | 7,713 | |
| Euro (EUR) FX Futures, 12/17/12 Put2 | | | | 10/8/12 | | | 1.230 | | | | 365 | | | | | 2,281 | |
| Euro (EUR) FX Futures, 12/17/12 Put2 | | | | 10/8/12 | | | 1.240 | | | | 97 | | | | | 606 | |
| Euro (EUR) FX Futures, 12/17/12 Put2 | | | | 10/8/12 | | | 1.260 | | | | 1,062 | | | | | 92,925 | |
| Euro (EUR) FX Futures, 12/17/12 Put2 | | | | 10/8/12 | | | 1.270 | | | | 89 | | | | | 13,350 | |
| Euro (EUR) FX Futures, 12/17/12 Put2 | | | | 10/8/12 | | | 1.280 | | | | 1 | | | | | 563 | |
| Euro (EUR) FX Futures, 12/17/12 Put2 | | | | 11/12/12 | | | 1.230 | | | | 182 | | | | | 45,500 | |
| Euro (EUR) FX Futures, 12/17/12 Put2 | | | | 11/12/12 | | | 1.260 | | | | 128 | | | | | 84,800 | |
| Euro (EUR) FX Futures, 12/17/12 Put2 | | | | 12/10/12 | | | 1.240 | | | | 182 | | | | | 141,050 | |
| Euro (EUR) FX Futures, 12/17/12 Put2 | | | | 12/10/12 | | | 1.270 | | | | 36 | | | | | 61,200 | |
| Euro-Bundesobligation Futures, 12/6/12 Put2 | | | | 10/29/12 | | | 138.500 EUR | | | | 939 | | | | | 205,132 | |
| Euro-Bundesobligation Futures, 12/6/12 Put2 | | | | 10/29/12 | | | 140.000 EUR | | | | 625 | | | | | 337,326 | |
| Indian Rupee (INR) Call2 | | | | 12/21/12 | | | 1 USD per 53.200 INR | | | | 2,307,800,000 | | | | | 671,685 | |
| Japanese Yen (JPY) Call2 | | | | 12/21/12 | | | 1 USD per 77.250 JPY | | | | 735,440,000 | | | | | 87,834 | |
| Japanese Yen (JPY) Call2 | | | | 12/28/12 | | | 1 USD per 77.000 JPY | | | | 1,477,885,000 | | | | | 164,696 | |
Japanese Yen (JPY) Futures,
12/17/12 Put2 | | | | 10/8/12 | | | 126.500 | | | | 13 | | | | | 1,788 | |
Japanese Yen (JPY) Futures,
12/17/12 Put2 | | | | 10/8/12 | | | 127.000 | | | | 50 | | | | | 11,250 | |
Japanese Yen (JPY) Futures,
12/17/12 Put2 | | | | 10/8/12 | | | 127.500 | | | | 271 | | | | | 98,238 | |
Japanese Yen (JPY) Futures,
12/17/12 Put2 | | | | 10/8/12 | | | 122.500 | | | | 18 | | | | | 113 | |
Japanese Yen (JPY) Futures,
12/17/12 Put2 | | | | 10/8/12 | | | 124.500 | | | | 358 | | | | | 6,713 | |
Japanese Yen (JPY) Futures,
12/17/12 Put2 | | | | 10/8/12 | | | 125.000 | | | | 275 | | | | | 8,594 | |
Japanese Yen (JPY) Futures,
12/17/12 Put2 | | | | 10/8/12 | | | 126.000 | | | | 94 | | | | | 8,225 | |
Japanese Yen (JPY) Futures,
12/17/12 Put2 | | | | 11/12/12 | | | 126.000 | | | | 75 | | | | | 45,000 | |
| Japanese Yen (JPY) Put2 | | | | 3/29/13 | | | 1 USD per 85.000 JPY | | | | 740,000,000 | | | | | 24,672 | |
| Japanese Yen (JPY) Put2 | | | | 5/31/13 | | | 1 USD per 82.000 JPY | | | | 1,493,665,337 | | | | | 186,902 | |
| Japanese Yen (JPY) Put2 | | | | 8/22/13 | | | 1 USD per 80.000 JPY | | | | 729,521,058 | | | | | 190,157 | |
| Japanese Yen (JPY) Put2 | | | | 9/11/13 | | | 1 USD per 80.000 JPY | | | | 728,617,882 | | | | | 198,228 | |
| Mexican Nuevo Peso (MXN) Call2 | | | | 11/8/12 | | | 1 USD per 12.740 MXN | | | | 585,700,000 | | | | | 335,981 | |
| Mexican Nuevo Peso (MXN) Call2 | | | | 11/9/12 | | | 1 USD per 12.840 MXN | | | | 668,100,000 | | | | | 556,173 | |
| Mexican Nuevo Peso (MXN) Call2 | | | | 11/13/12 | | | 1 USD per 12.930 MXN | | | | 672,500,000 | | | | | 762,447 | |
| Mexican Nuevo Peso (MXN) Call2 | | | | 11/27/12 | | | 1 USD per 12.780 MXN | | | | 1,998,700,000 | | | | | 1,612,411 | |
| Mexican Nuevo Peso (MXN) Call2 | | | | 12/14/12 | | | 1 USD per 12.440 MXN | | | | 972,165,000 | | | | | 350,018 | |
| Mexican Nuevo Peso (MXN) Call2 | | | | 12/20/12 | | | 1 USD per 12.870 MXN | | | | 365,900,000 | | | | | 440,873 | |
| | | | |
| OPPENHEIMER GLOBAL STRATEGIC INCOME FUND | | | 47 | |
STATEMENT OF INVESTMENTS Continued
| | | | | | | | | | | | | | | | | |
| | | Expiration
Date | | Strike
Price | | Contracts | | Value |
| Options Purchased Continued | | | | | | | | |
| Mexican Nuevo Peso (MXN) Call2 | | | | 12/20/12 | | | 1 USD per 12.870 MXN | | | | 365,900,000 | | | | $ | 440,873 | |
| Mexican Nuevo Peso (MXN) Call2 | | | | 12/20/12 | | | 1 USD per 12.870 MXN | | | | 365,900,000 | | | | | 440,873 | |
| New Taiwain Dollar (TWD) Call2 | | | | 12/14/12 | | | 1 USD per 28.829 TWD | | | | 2,253,700,000 | | | | | 146,378 | |
| New Turkish Lira (TRY) Call2 | | | | 10/19/12 | | | 1 USD per 1.780 TRY | | | | 38,560,000 | | | | | 55,533 | |
| New Turkish Lira (TRY) Call2 | | | | 10/19/12 | | | 1 USD per 1.780 TRY | | | | 30,830,000 | | | | | 45,560 | |
| New Turkish Lira (TRY) Call2 | | | | 10/19/12 | | | 1 USD per 1.780 TRY | | | | 139,050,000 | | | | | 200,254 | |
| New Turkish Lira (TRY) Call2 | | | | 10/19/12 | | | 1 USD per 1.780 TRY | | | | 168,000,000 | | | | | 248,269 | |
| New Turkish Lira (TRY) Call2 | | | | 10/19/12 | | | 1 USD per 1.780 TRY | | | | 34,800,000 | | | | | 51,427 | |
| New Turkish Lira (TRY) Call2 | | | | 11/28/12 | | | 1 USD per 1.830 TRY | | | | 96,500,000 | | | | | 1,134,492 | |
| New Turkish Lira (TRY) Call2 | | | | 12/6/12 | | | 1 USD per 1.840 TRY | | | | 48,270,000 | | | | | 667,054 | |
| New Turkish Lira (TRY) Put2 | | | | 11/28/12 | | | 1 EUR per 2.300 TRY | | | | 26,385,000 | | | | | 235,588 | |
| New Turkish Lira (TRY) Put2 | | | | 12/6/12 | | | 1 EUR per 2.310 TRY | | | | 13,140,000 | | | | | 165,498 | |
| Polish Zloty (PLZ) Call2 | | | | 11/16/12 | | | 1 USD per 3.148 PLZ | | | | 133,530,000 | | | | | 477,063 | |
| Russian Ruble (RUR) Call2 | | | | 11/27/12 | | | 1 USD per 31.150 RUR | | | | 4,873,700,000 | | | | | 2,075,368 | |
| Russian Ruble (RUR) Call2 | | | | 11/29/12 | | | 1 USD per 31.250 RUR | | | | 1,106,600,000 | | | | | 521,762 | |
| Russian Ruble (RUR) Call2 | | | | 12/21/12 | | | 1 USD per 31.000 RUR | | | | 882,000,000 | | | | | 364,566 | |
| Russian Ruble (RUR) Call2 | | | | 12/21/12 | | | 1 USD per 31.000 RUR | | | | 882,000,000 | | | | | 364,566 | |
| Russian Ruble (RUR) Call2 | | | | 12/21/12 | | | 1 USD per 31.000 RUR | | | | 882,000,000 | | | | | 364,566 | |
| South African Rand (ZAR) Call2 | | | | 11/21/12 | | | 1 USD per 8.218 ZAR | | | | 323,950,000 | | | | | 652,490 | |
| South African Rand (ZAR) Call2 | | | | 11/26/12 | | | 1 USD per 8.202 ZAR | | | | 323,025,000 | | | | | 645,992 | |
| South African Rand (ZAR) Call2 | | | | 11/27/12 | | | 1 USD per 8.055 ZAR | | | | 630,135,000 | | | | | 800,221 | |
| South African Rand (ZAR) Call2 | | | | 11/27/12 | | | 1 USD per 8.055 ZAR | | | | 630,135,000 | | | | | 800,221 | |
| South African Rand (ZAR) Call2 | | | | 12/20/12 | | | 1 USD per 8.255 ZAR | | | | 234,800,000 | | | | | 633,051 | |
| South African Rand (ZAR) Call2 | | | | 12/21/12 | | | 1 USD per 8.255 ZAR | | | | 234,800,000 | | | | | 636,130 | |
| South African Rand (ZAR) Call2 | | | | 12/21/12 | | | 1 USD per 8.255 ZAR | | | | 234,800,000 | | | | | 636,130 | |
| South Korean Won (KRW) Call2 | | | | 10/29/12 | | | 1 USD per 1,103.000 KRW | | | | 33,735,000,000 | | | | | 86,024 | |
| South Korean Won (KRW) Call2 | | | | 10/29/12 | | | 1 USD per 1,103.000 KRW | | | | 30,800,000,000 | | | | | 78,540 | |
| South Korean Won (KRW) Call2 | | | | 10/31/12 | | | 1 USD per 1,094.500 KRW | | | | 85,560,000,000 | | | | | 113,795 | |
| South Korean Won (KRW) Call2 | | | | 10/31/12 | | | 1 USD per 1,094.500 KRW | | | | 85,560,000,000 | | | | | 113,795 | |
| South Korean Won (KRW) Call2 | | | | 11/27/12 | | | 1 USD per 1,111.250 KRW | | | | 173,864,000,000 | | | | | 1,297,025 | |
| U.S. Treasury Long Bonds Futures, 12/19/12 Call2 | | | | 10/1/12 | | | 150.000 | | | | 866 | | | | | 13,531 | |
| U.S. Treasury Long Bonds Futures, 12/19/12 Call2 | | | | 10/1/12 | | | 151.000 | | | | 370 | | | | | 5,781 | |
| U.S. Treasury Long Bonds Futures, 12/19/12 Put2 | | | | 10/1/12 | | | 149.000 | | | | 384 | | | | | 6,000 | |
| U.S. Treasury Long Bonds Futures, 12/19/12 Put2 | | | | 10/8/12 | | | 147.000 | | | | 384 | | | | | 78,000 | |
| U.S. Treasury Long Bonds Futures, 12/19/12 Put2 | | | | 10/8/12 | | | 148.000 | | | | 384 | | | | | 156,000 | |
| U.S. Treasury Long Bonds Futures, 12/19/12 Put2 | | | | 10/15/12 | | | 147.000 | | | | 383 | | | | | 137,641 | |
| | |
| 48 | | OPPENHEIMER GLOBAL STRATEGIC INCOME FUND |
| | | | | | | | | | | | | | | | | | | | |
| | | Expiration
Date | | Strike
Price | | Contracts | | Value |
| Options Purchased Continued | | | | | | | | |
| U.S. Treasury Long Bonds, 20 yr. Futures, 12/19/12 Put2 | | | | 10/29/12 | | | | $ | 138.000 | | | | | 698 | | | | $ | 21,813 | |
| U.S. Treasury Long Bonds, 20 yr. Futures, 12/19/12 Put2 | | | | 10/29/12 | | | | | 142.000 | | | | | 698 | | | | | 76,344 | |
| U.S. Treasury Long Bonds, 20 yr. Futures, 12/19/12 Put2 | | | | 10/29/12 | | | | | 144.000 | | | | | 384 | | | | | 96,000 | |
| U.S. Treasury Long Bonds, 20 yr. Futures, 12/19/12 Put2 | | | | 10/29/12 | | | | | 146.000 | | | | | 391 | | | | | 201,609 | |
| U.S. Treasury Long Bonds, 20 yr. Futures, 12/19/12 Put2 | | | | 11/26/12 | | | | | 145.000 | | | | | 384 | | | | | 366,000 | |
| U.S. Treasury Nts., 10 yr. Futures, 12/19/12 Call2 | | | | 10/1/12 | | | | | 134.000 | | | | | 767 | | | | | 11,984 | |
| U.S. Treasury Nts., 10 yr. Futures, 12/19/12 Call2 | | | | 10/29/12 | | | | | 134.000 | | | | | 418 | | | | | 156,750 | |
| U.S. Treasury Nts., 10 yr. Futures, 12/19/12 Call2 | | | | 11/26/12 | | | | | 135.000 | | | | | 688 | | | | | 236,500 | |
| U.S. Treasury Nts., 10 yr. Futures, 12/19/12 Call2 | | | | 11/26/12 | | | | | 136.000 | | | | | 1,076 | | | | | 168,125 | |
| U.S. Treasury Nts., 10 yr. Futures, 12/19/12 Put2 | | | | 10/29/12 | | | | | 128.500 | | | | | 1,324 | | | | | 20,688 | |
| U.S. Treasury Nts., 10 yr. Futures, 12/19/12 Put2 | | | | 10/29/12 | | | | | 129.000 | | | | | 101 | | | | | 1,578 | |
| U.S. Treasury Nts., 10 yr. Futures, 12/19/12 Put2 | | | | 10/29/12 | | | | | 131.000 | | | | | 101 | | | | | 6,313 | |
| U.S. Treasury Nts., 10 yr. Futures, 12/19/12 Put2 | | | | 10/29/12 | | | | | 131.500 | | | | | 1,847 | | | | | 202,016 | |
| U.S. Treasury Nts., 10 yr. Futures, 12/19/12 Put2 | | | | 10/29/12 | | | | | 132.000 | | | | | 698 | | | | | 119,969 | |
| U.S. Treasury Nts., 10 yr. Futures, 12/19/12 Put2 | | | | 10/29/12 | | | | | 132.500 | | | | | 768 | | | | | 204,000 | |
| U.S. Treasury Nts., 10 yr. Futures, 12/19/12 Put2 | | | | 11/26/12 | | | | | 132.000 | | | | | 202 | | | | | 85,219 | |
| | | | | | | | | | | | | | | | | | |
|
|
|
| Total Options Purchased (Cost $36,259,164) | | | | | | | | | | 26,320,880 | |
| | | | | | | | | | | | | | |
| | | | | Swaption
Expiration Date | | | Notional
Amount | | | | |
| Swaptions Purchased—0.3% | | | | | | | | | | | |
| Bank of America NA; Index Credit Default Swaption (European); Swap Terms: Paid: 1%; Received: Protection on CDX.NA.IG.18; Termination Date: 6/20/172 | | | | | 12/20/12 | | | $ | 195,340,000 | | | | 269,271 | |
| Bank of America NA; Index Credit Default Swaption (European); Swap Terms: Paid: 1%; Received: Protection on CDX.NA.IG.18; Termination Date: 6/20/172 | | | | | 12/20/12 | | | | 195,320,000 | | | | 269,244 | |
| Bank of America NA; Interest Rate Swaption (European); Swap Terms: Paid: 1.35%; Received: Three-Month USD BBA LIBOR; Termination Date: 11/5/172 | | | | | 11/2/12 | | | | 4,460,000 | | | | 36 | |
| | | | |
| OPPENHEIMER GLOBAL STRATEGIC INCOME FUND | | | 49 | |
STATEMENT OF INVESTMENTS Continued
| | | | | | | | | | | | | | |
| | | | | Swaption
Expiration Date | | | Notional
Amount | | | Value | |
| Swaptions Purchased Continued | | | | | | | | | | | |
| Bank of America NA; Interest Rate Swaption (European); Swap Terms: Paid: 2%; Received: Three-Month USD BBA LIBOR; Termination Date: 9/3/232 | | | | | 9/3/13 | | | $ | 73,215,000 | | | $ | 1,985,885 | |
| Bank of America NA; Interest Rate Swaption (European); Swap Terms: Paid: 2.90%; Received: Three-Month USD BBA LIBOR; Termination Date: 3/22/432 | | | | | 3/21/13 | | | | 36,390,000 | | | | 1,131,955 | |
| Bank of America NA; Interest Rate Swaption (European); Swap Terms: Paid: 2.95%; Received: Three-Month USD BBA LIBOR; Termination Date: 3/11/432 | | | | | 3/8/13 | | | | 36,365,000 | | | | 929,643 | |
| Bank of America NA; Interest Rate Swaption (European); Swap Terms: Paid: Three-Month CAD BA CDOR; Received: 2.44%; Termination Date: 11/21/222 | | | | | 11/23/12 | | | | 9,070,000 | CAD | | | 242,447 | |
| Bank of America NA; Interest Rate Swaption (European); Swap Terms: Paid: Three-Month USD BBA LIBOR; Received: 1.75%; Termination Date: 1/30/232 | | | | | 1/29/13 | | | | 117,295,000 | | | | 1,618,160 | |
| Bank of America NA; Interest Rate Swaption (European); Swap Terms: Paid: Three-Month USD BBA LIBOR; Received: 2.10%; Termination Date: 7/30/432 | | | | | 7/29/13 | | | | 58,650,000 | | | | 1,149,025 | |
| Bank of America NA; Interest Rate Swaption (European); Swap Terms: Paid: Three-Month USD BBA LIBOR; Received: 2.30%; Termination Date: 12/4/422 | | | | | 12/3/12 | | | | 35,190,000 | | | | 256,394 | |
| Barclays Bank plc; Index Credit Default Swaption (European); Swap Terms: Paid: 1%; Received: Protection on iTraxx Europe Crosover Series 17 Version 1; Termination Date: 6/20/172 | | | | | 12/20/12 | | | | 11,310,000 | EUR | | | 75,656 | |
| Barclays Bank plc; Interest Rate Swaption (European); Swap Terms: Paid: 1.765%; Received: Three-Month USD BBA LIBOR; Termination Date: 7/12/182 | | | | | 7/11/13 | | | | 183,035,000 | | | | 1,179,015 | |
| Barclays Bank plc; Interest Rate Swaption (European); Swap Terms: Paid: 1.85%; Received: Three-Month USD BBA LIBOR; Termination Date: 11/29/222 | | | | | 11/28/12 | | | | 91,205,000 | | | | 649,555 | |
| Barclays Bank plc; Interest Rate Swaption (European); Swap Terms: Paid: 2.695%; Received: Three-Month USD BBA LIBOR; Termination Date: 5/15/232 | | | | | 4/12/13 | | | | 90,380,000 | | | | 325,382 | |
| Barclays Bank plc; Interest Rate Swaption (European); Swap Terms: Paid: 2.905%; Received: Three-Month USD BBA LIBOR; Termination Date: 9/30/452 | | | | | 9/29/15 | | | | 17,454,865 | | | | 2,032,135 | |
| Barclays Bank plc; Interest Rate Swaption (European); Swap Terms: Paid: 3.05%; Received: Three-Month USD BBA LIBOR; Termination Date: 3/18/432 | | | | | 3/15/13 | | | | 54,550,000 | | | | 1,145,803 | |
| Barclays Bank plc; Interest Rate Swaption (European); Swap Terms: Paid: 3.48%; Received: Three-Month USD BBA LIBOR; Termination Date: 4/27/472 | | | | | 4/26/17 | | | | 18,080,000 | | | | 1,819,832 | |
| Barclays Bank plc; Interest Rate Swaption (European); Swap Terms: Paid: Six-Month EUR EURIBOR; Received: 1.75%; Termination Date: 8/28/192 | | | | | 8/27/14 | | | | 18,115,000 | EUR | | | 483,688 | |
| Barclays Bank plc; Interest Rate Swaption (European); Swap Terms: Paid: Three-Month USD BBA LIBOR; Received: 1.53%; Termination Date: 1/30/232 | | | | | 1/29/13 | | | | 234,600,000 | | | | 1,290,024 | |
| | |
| 50 | | OPPENHEIMER GLOBAL STRATEGIC INCOME FUND |
| | | | | | | | | | | | | | |
| | | | | Swaption
Expiration Date | | | Notional
Amount | | | Value | |
| Swaptions Purchased Continued | | | | | | | | �� | | | |
| Goldman Sachs International; Index Credit Default Swaption (European); Swap Terms: Paid: 5%; Received: Protection on CDX.NA.HY.18; Termination Date: 6/20/172 | | | | | 10/18/12 | | | $ | 78,170,000 | | | $ | 31,998 | |
| Goldman Sachs International; Index Credit Default Swaption (European); Swap Terms: Paid: 5%; Received: Protection on CDX.NA.HY.18; Termination Date: 6/20/172 | | | | | 10/18/12 | | | | 78,175,000 | | | | 32,000 | |
| Goldman Sachs International; Index Credit Default Swaption (European); Swap Terms: Paid: 5%; Received: Protection on CDX.NA.HY.18; Termination Date: 6/20/172 | | | | | 12/20/12 | | | | 78,110,000 | | | | 1,170,964 | |
| Goldman Sachs International; Interest Rate Swaption (European); Swap Terms: Paid: 2.495%; Received: Three-Month USD BBA LIBOR; Termination Date: 11/22/222 | | | | | 11/23/12 | | | | 140,900,000 | | | | 22,464 | |
| Goldman Sachs International; Interest Rate Swaption (European); Swap Terms: Paid: 2.95%; Received: Three-Month USD BBA LIBOR; Termination Date: 3/18/432 | | | | | 3/15/13 | | | | 40,000,000 | | | | 1,070,955 | |
| Goldman Sachs International; Interest Rate Swaption (European); Swap Terms: Paid: 3.20%; Received: Three-Month USD BBA LIBOR; Termination Date: 9/24/442 | | | | | 9/23/14 | | | | 36,390,000 | | | | 2,361,811 | |
| Goldman Sachs International; Interest Rate Swaption (European); Swap Terms: Paid: Three-Month USD BBA LIBOR; Received: 2.28%; Termination Date: 10/29/422 | | | | | 10/26/12 | | | | 58,595,000 | | | | 94,459 | |
| Goldman Sachs International; Interest Rate Swaption (European); Swap Terms: Paid: Three-Month USD BBA LIBOR; Received: 2.295%; Termination Date: 10/26/422 | | | | | 10/25/12 | | | | 58,605,000 | | | | 102,735 | |
| Goldman Sachs International; Interest Rate Swaption (European); Swap Terms: Paid: Three-Month USD BBA LIBOR; Received: 2.405%; Termination Date: 11/6/422 | | | | | 11/5/12 | | | | 58,630,000 | | | | 406,235 | |
| JPMorgan Chase Bank NA; Index Credit Default Swaption (European); Swap Terms: Paid: 1%; Received: Protection on CDX.NA.IG.18; Termination Date: 6/20/172 | | | | | 12/20/12 | | | | 195,320,000 | | | | 283,562 | |
| JPMorgan Chase Bank NA; Index Credit Default Swaption (European); Swap Terms: Paid: 5%; Received: Protection on CDX.NA.HY.18; Termination Date: 6/20/172 | | | | | 10/18/12 | | | | 78,195,000 | | | | 21,773 | |
| JPMorgan Chase Bank NA; Index Credit Default Swaption (European); Swap Terms: Paid: 5%; Received: Protection on CDX.NA.HY.18; Termination Date: 6/20/172 | | | | | 12/20/12 | | | | 78,210,000 | | | | 409,770 | |
| JPMorgan Chase Bank NA; Index Credit Default Swaption (European); Swap Terms: Paid: 5%; Received: Protection on CDX.NA.HY.18; Termination Date: 6/20/172 | | | | | 12/20/12 | | | | 78,170,000 | | | | 1,269,949 | |
| JPMorgan Chase Bank NA; Interest Rate Swaption (European); Swap Terms: Paid: 1.65%; Received: Three-Month USD BBA LIBOR; Termination Date: 2/25/182 | | | | | 2/22/13 | | | | 90,585,000 | | | | 60,420 | |
| UBS AG; Index Credit Default Swaption (European); Swap Terms: Paid: 1%; Received: Protection on CDX.NA.IG.18; Termination Date: 6/20/172 | | | | | 12/20/12 | | | | 195,340,000 | | | | 231,877 | |
| | | | |
| OPPENHEIMER GLOBAL STRATEGIC INCOME FUND | | | 51 | |
STATEMENT OF INVESTMENTS Continued
| | | | | | | | | | | | | | |
| | | | | Swaption
Expiration Date | | | Notional
Amount | | | Value | |
| Swaptions Purchased Continued | | | | | | | | | | | |
| UBS AG; Index Credit Default Swaption (European); Swap Terms: Paid: 5%; Received: Protection on CDX.NA.HY.18; Termination Date: 6/20/172 | | | | | 10/18/12 | | | $ | 156,400,000 | | | $ | 12,732 | |
| UBS AG; Interest Rate Swaption (European); Swap Terms: Paid: 2.11%; Received: Six-Month EUR EURIBOR; Termination Date: 1/3/232 | | | | | 1/2/13 | | | | 11,435,000 | EUR | | | 64,237 | |
| UBS AG; Interest Rate Swaption (European); Swap Terms: Paid: 2.215%; Received: Three-Month USD BBA LIBOR; Termination Date: 12/4/222 | | | | | 12/3/12 | | | | 361,350,000 | | | | 486,588 | |
| UBS AG; Interest Rate Swaption (European); Swap Terms: Paid: 2.60%; Received: Three-Month USD BBA LIBOR; Termination Date: 3/28/432 | | | | | 3/27/13 | | | | 37,500,000 | | | | 2,216,428 | |
| UBS AG; Interest Rate Swaption (European); Swap Terms: Paid: 2.98%; Received: Six-Month EUR EURIBOR; Termination Date: 3/4/232 | | | | | 3/1/13 | | | | 90,820,000 | EUR | | | 77,039 | |
| UBS AG; Interest Rate Swaption (European); Swap Terms: Paid: 3%; Received: Three-Month USD BBA LIBOR; Termination Date: 3/4/432 | | | | | 3/1/13 | | | | 54,550,000 | | | | 1,169,144 | |
| UBS AG; Interest Rate Swaption (European); Swap Terms: Paid: 3.025%; Received: Six-Month EUR EURIBOR; Termination Date: 2/27/232 | | | | | 2/26/13 | | | | 90,615,000 | EUR | | | 61,102 | |
| UBS AG; Interest Rate Swaption (European); Swap Terms: Paid: Three-Month AUD BBR BBSW; Received: 3.01%; Termination Date: 4/2/162 | | | | | 3/29/13 | | | | 14,170,000 | AUD | |
| 146,986
|
|
| Total Swaptions Purchased (Cost $89,851,564) | | | | | | | | | | | | | 28,658,378 | |
| | | | | | | | | | | | |
| | | | |
| | | | | | | Shares | | | | |
| Investment Companies—15.2% | | | | | | | | | | |
| Oppenheimer Institutional Money Market Fund, Cl. E, 0.18%1,18 | | | | | | | 76,611,744 | | | | 76,611,744 | |
| Oppenheimer Master Event-Linked Bond Fund, LLC1 | | | | | | | 14,040,336 | | | | 170,695,069 | |
| Oppenheimer Master Loan Fund, LLC1 | | | | | | | 86,834,596 | | | | 1,118,545,356 | |
| Oppenheimer Short Duration Fund, Cl. Y1 | | | | | | | 2,015,944 | | | | 20,199,758 | |
| Total Investment Companies (Cost $1,373,515,733) | | | | | | | 1,386,051,927 | |
| Total Investments, at Value (Cost $10,885,543,935) | | | 119.2 | % | | | 10,843,368,077 | |
| Liabilities in Excess of Other Assets | | | | | | | (19.2 | ) | | | (1,743,745,781 | ) |
| | | | | | |
|
|
|
| Net Assets | | | | | | | 100.0 | % | | | $9,099,622,296 | |
| | | | | | |
|
|
| |
|
|
|
Footnotes to Statement of Investments
*September 28, 2012 represents the last business day of the Fund’s 2012 fiscal year. See Note 1 of the accompanying Notes.
Principal amount, notional amount and strike prize are reported in U.S. Dollars, except for those denoted in the following currencies:
| | |
| AUD | | Australian Dollar |
| BRR | | Brazilian Real |
| CAD | | Canadian Dollar |
| | |
| 52 | | OPPENHEIMER GLOBAL STRATEGIC INCOME FUND |
| | |
| CHF | | Swiss Franc |
| COP | | Colombian Peso |
| DKK | | Danish Krone |
| EUR | | Euro |
| GBP | | British Pound Sterling |
| HUF | | Hungarian Forint |
| IDR | | Indonesia Rupiah |
| JPY | | Japanese Yen |
| MXN | | Mexican Nuevo Peso |
| MYR | | Malaysian Ringgit |
| NGN | | Nigeria Naira |
| NOK | | Norwegian Krone |
| PEN | | Peruvian New Sol |
| PHP | | Philippines Peso |
| PLZ | | Polish Zloty |
| RUR | | Russian Ruble |
| SEK | | Swedish Krona |
| TRY | | New Turkish Lira |
| ZAR | | South African Rand |
1. Is or was an affiliate, as defined in the Investment Company Act of 1940, at or during the period ended September 28, 2012, by virtue of the Fund owning at least 5% of the voting securities of the issuer or as a result of the Fund and the issuer having the same investment adviser. Transactions during the period in which the issuer was an affiliate are as follows:
| | | | | | | | | | | | | | | | | | | | |
| | | Shares
September 30, 2011 | | Gross
Additions | | Gross
Reductions | | Shares
September 28,
2012 |
| American Media Operations, Inc. | | | | 535,548 | | | | | 266,268 | | | | | — | | | | | 801,816 | |
| Arco Capital Corp. Ltd. | | | | 2,494,716 | | | | | — | | | | | — | | | | | 2,494,716 | |
| Greektown Superholdings, Inc., Series A-1 | | | | 8,267 | | | | | 3,150 | | | | | — | | | | | 11,417 | |
| Greektown Superholdings, Inc., Cv., Series A-1 | | | | 109,250 | | | | | 25,888 | | | | | 44,159 | | | | | 90,979 | |
| Oppenheimer Global Strategic Income Fund (Cayman) Ltd.a | | | | — | | | | | 15,000 | | | | | — | | | | | 15,000 | |
| Oppenheimer Institutional Money Market Fund, Cl. E | | | | 757,814,623 | | | | | 2,304,996,915 | | | | | 2,986,199,794 | | | | | 76,611,744 | |
| Oppenheimer Master Event-Linked Bond Fund, LLC | | | | 15,272,235 | | | | | — | | | | | 1,231,899 | | | | | 14,040,336 | |
| Oppenheimer Master Loan Fund, LLC | | | | 98,621,193 | | | | | 752,158 | | | | | 12,538,755 | | | | | 86,834,596 | |
| Oppenheimer Short Duration Fund, Cl. Y | | | | 2,000,139 | | | | | 15,805 | | | | | — | | | | | 2,015,944 | |
| | | | |
| | �� | | | Value | | Income | | Realized
Loss |
| American Media Operations, Inc. | | | | | | | | $ | 10,423,608 | | | | $ | — | | | | $ | — | |
| Arco Capital Corp. Ltd. | | | | | | | | | 3,742,074 | | | | | — | | | | | — | |
| Greektown Superholdings, Inc., Series A-1 | | | | | | | | | 593,684 | | | | | — | | | | | — | |
| Greektown Superholdings, Inc., Cv., Series A-1 | | | | | | | | | 6,414,020 | | | | | — | | | | | 1,280,611 | |
| Oppenheimer Global Strategic Income Fund (Cayman) Ltd.a | | | | | | | | | 1,447,210 | | | | | — | | | | | — | |
| Oppenheimer Institutional Money Market Fund, Cl. E | | | | | | | | | 76,611,744 | | | | | 685,590 | | | | | — | |
| Oppenheimer Master Event-Linked Bond Fund, LLC | | | | | | | | | 170,695,069 | | | | | 14,857,654 | b | | | | 5,684,446 | b |
| Oppenheimer Master Loan Fund, LLC | | | | | | | | | 1,118,545,356 | | | | | 83,003,418 | c | | | | 10,234,623 | c |
| Oppenheimer Short Duration Fund, Cl. Y | | | | | | | | | 20,199,758 | | | | | 130,269 | | | | | — | |
| | | | | | | | |
|
|
|
| | | | | | | | | $ | 1,408,672,523 | | | | $ | 98,676,931 | | | | $ | 17,199,680 | |
| | | | | | | | |
|
|
|
| | | | |
| OPPENHEIMER GLOBAL STRATEGIC INCOME FUND | | | 53 | |
STATEMENT OF INVESTMENTS Continued
Footnotes to Statement of Investments Continued
a. Investment in a wholly-owned subsidiary. See Note 1 of the accompanying Notes and individual financial statements of the entity included herein.
b. Represents the amount allocated to the Fund from Oppenheimer Master Event-Linked Bond Fund, LLC.
c. Represents the amount allocated to the Fund from Oppenheimer Master Loan Fund, LLC.
2. Non-income producing security.
3. Represents securities sold under Rule 144A, which are exempt from registration under the Securities Act of 1933, as amended. These securities have been determined to be liquid under guidelines established by the Board of Trustees. These securities amount to $1,732,958,398 or 19.04% of the Fund’s net assets as of September 28, 2012.
4. Represents the current interest rate for a variable or increasing rate security.
5. This security is not accruing income because the issuer has missed an interest payment on it and/or is not anticipated to make future interest and/or principal payments. The rate shown is the original contractual interest rate. See Note 1 of the accompanying Notes.
6. Restricted security. The aggregate value of restricted securities as of September 28, 2012 was $233,532,523, which represents 2.57% of the Fund’s net assets. See Note 7 of the accompanying Notes. Information concerning restricted securities is as follows:
| | | | | | | | | | | | | | | | | | | | |
| Security | | Acquisition
Dates | | Cost | | Value | | Unrealized
Appreciation
(Depreciation) |
| Akbank TAS, 5.125% Sr. Unsec. Nts., 7/22/15 | | | | 8/7/12 | | | | $ | 5,914,265 | | | | $ | 5,936,456 | | | | $ | 22,191 | |
| Altegrity, Inc., 10.50% Sr. Unsec. Sub. Nts., 11/1/15 | | | | 5/14/09-4/28/10 | | | | | 4,517,630 | | | | | 4,143,040 | | | | | (374,590 | ) |
| Arco Capital Corp. Ltd. | | | | 2/27/07 | | | | | 37,420,740 | | | | | 3,742,074 | | | | | (33,678,666 | ) |
| Banco BMG SA, 9.15% Nts., 1/15/16 | | | | 12/15/05-4/3/12 | | | | | 4,717,583 | | | | | 4,676,800 | | | | | (40,783 | ) |
| BCAP LLC Trust, Mtg. Pass-Through Certificates, Series 2012-RR6, Cl. 1A5, 2.243%, 11/1/36 | | | | 6/14/12 | | | | | 857,538 | | | | | 863,625 | | | | | 6,087 | |
| Capital Lease Funding Securitization LP, Interest-Only Corporate-Backed Pass-Through Certificates, Series 1997-CTL1, 80.573%, 6/15/24 | | | | 4/21/97 | | | | | 133,268 | | | | | 41,290 | | | | | (91,978 | ) |
| Catalyst Paper Corp., 13% Sec. Nts., 12/15/16 | | | | 9/6/12 | | | | | 2,995,099 | | | | | 3,228,842 | | | | | 233,743 | |
| Citigroup Global Markets Holdings, Inc., Colombia (Republic of) Credit Linked Bonds, 11.25%, 10/25/18 | | | | 12/9/08 | | | | | 3,459,837 | | | | | 5,785,636 | | | | | 2,325,799 | |
| Citigroup Global Markets Holdings, Inc., Colombia (Republic of) Credit Linked Nts., Series 2, 10%, 7/25/24 | | | | 3/28/12 | | | | | 7,210,579 | | | | | 7,390,439 | | | | | 179,860 | |
| Citigroup Mortgage Loan Trust, Inc. 2012-8, Mtg. Pass-Through Certificates, Series 2012-8, Cl. 1A1, 2.647%, 10/1/35 | | | | 8/1/12 | | | | | 3,989,981 | | | | | 3,994,988 | | | | | 5,007 | |
| Cleaver-Brooks, Inc., 12.25% Sr. Sec. Nts., 5/1/16 | | | | 4/21/10-5/3/11 | | | | | 9,031,967 | | | | | 9,632,850 | | | | | 600,883 | |
| Deutsche Bank AG, Coriolanus Ltd. Sec. Credit Linked Bonds, Series 128, 3.006%, 5/6/25 | | | | 10/8/10 | | | | | 3,249,037 | | | | | 3,438,392 | | | | | 189,355 | |
| Deutsche Bank AG, Coriolanus Ltd. Sec. Credit Linked Bonds, 3.338%, 5/6/25 | | | | 4/16/09 | | | | | 3,318,075 | | | | | 3,607,800 | | | | | 289,725 | |
| Deutsche Bank AG, Coriolanus Ltd. Sec. Credit Linked Bonds, 3.266%, 5/6/25 | | | | 8/18/09 | | | | | 3,548,892 | | | | | 3,838,259 | | | | | 289,367 | |
| Deutsche Bank AG, Coriolanus Ltd. Sec. Credit Linked Bonds, 3.238%, 5/6/25 | | | | 9/25/09 | | | | | 4,451,684 | | | | | 4,804,533 | | | | | 352,849 | |
| Deutsche Bank AG, Coriolanus Ltd. Sec. Credit Linked Bonds, 3.187%, 5/6/25 | | | | 12/17/09 | | | | | 3,915,926 | | | | | 4,209,524 | | | | | 293,598 | |
| Deutsche Bank AG, Coriolanus Ltd. Sec. Credit Linked Bonds, 3.134%, 5/6/25 | | | | 3/30/10 | | | | | 3,158,715 | | | | | 3,380,923 | | | | | 222,208 | |
| | |
| 54 | | OPPENHEIMER GLOBAL STRATEGIC INCOME FUND |
| | | | | | | | | | | | | | | | | | | | |
| Security | | Acquisition
Dates | | Cost | | Value | | Unrealized
Appreciation
(Depreciation) |
| Deutsche Bank AG, Coriolanus Ltd. Sec. Credit Linked Bonds, 3.10%, 5/6/25 | | | | 5/18/10 | | | | $ | 3,544,822 | | | | $ | 3,782,327 | | | | $ | 237,505 | |
| Deutsche Bank AG, Coriolanus Ltd. Sec. Credit Linked Bonds, 3.061%, 5/6/25 | | | | 7/16/10 | | | | | 4,119,215 | | | | | 4,381,041 | | | | | 261,826 | |
| Deutsche Bank AG, Coriolanus Ltd. Sec. Credit Linked Nts., 15.755%, 12/31/17 | | | | 9/19/07 | | | | | 16,261,423 | | | | | 21,307,244 | | | | | 5,045,821 | |
| Deutsche Bank AG, Opic Reforma I Credit Linked Nts., Cl. 2A, 8.308%, 5/22/15 | | | | 5/21/08 | | | | | 173,895 | | | | | 133,196 | | | | | (40,699 | ) |
| Deutsche Bank AG, Opic Reforma I Credit Linked Nts., Cl. 2B, 8.308%, 5/22/15 | | | | 6/12/08 | | | | | 297,596 | | | | | 233,029 | | | | | (64,567 | ) |
| Deutsche Bank AG, Opic Reforma I Credit Linked Nts., Cl. 2C, 8.308%, 5/22/15 | | | | 6/18/08 | | | | | 4,615,780 | | | | | 3,513,509 | | | | | (1,102,271 | ) |
| Deutsche Bank AG, Opic Reforma I Credit Linked Nts., Cl. 2D, 8.308%, 5/22/15 | | | | 7/8/08 | | | | | 336,091 | | | | | 256,060 | | | | | (80,031 | ) |
| Deutsche Bank AG, Opic Reforma I Credit Linked Nts., Cl. 2E, 8.308%, 5/22/15 | | | | 7/15/08 | | | | | 244,584 | | | | | 186,032 | | | | | (58,552 | ) |
| Deutsche Bank AG, Opic Reforma I Credit Linked Nts., Cl. 2F, 8.308%, 5/22/15 | | | | 8/8/08 | | | | | 158,390 | | | | | 118,809 | | | | | (39,581 | ) |
| Deutsche Bank AG, Opic Reforma I Credit Linked Nts., Cl. 2G, 8.308%, 5/22/15 | | | | 8/22/08 | | | | | 28,080 | | | | | 21,880 | | | | | (6,200 | ) |
| DLJ Ltd., Collateralized Bond Obligations, Series 1A, Cl. C2, 11.96%, 4/15/11 | | | | 4/9/99 | | | | | 15,000,000 | | | | | 150 | | | | | (14,999,850 | ) |
| DLJ Mortgage Acceptance Corp., Commercial Mtg. Obligations, Series 1997-CF2, Cl. B30C, 6.99%, 10/15/30 | | | | 6/27/01 | | | | | 18,779,202 | | | | | 5,308,293 | | | | | (13,470,909 | ) |
| Equinox Holdings, Inc., 9.50% Sr. Sec. Nts., 2/1/16 | | | | 1/22/10-12/20/11 | | | | | 8,533,831 | | | | | 9,095,100 | | | | | 561,269 | |
| FDIC Trust, Commerical Mtg. Pass-Through Certificates, Series 2012-C1, Cl. A, 0.841%, 5/1/35 | | | | 5/10/12 | | | | | 5,069,680 | | | | | 5,086,055 | | | | | 16,375 | |
| First Wind Capital LLC, 10.25% Sr. Sec. Nts., 6/1/18 | | | | 6/7/11 | | | | | 1,340,846 | | | | | 1,335,575 | | | | | (5,271 | ) |
| Hallertau SPC Credit Linked Nts., Series 2007-01, 2.787%, 12/20/17 | | | | 12/13/07-10/23/09 | | | | | 23,071,444 | | | | | 22,452,000 | | | | | (619,444 | ) |
| Hallertau SPC Credit Linked Nts., Series 2008-01, 9.878%, 8/2/10 | | | | 4/18/08-5/6/08 | | | | | 19,017,779 | | | | | — | | | | | (19,017,779 | ) |
| Halyk Savings Bank of Kazakhstan JSC, 9.25% Sr. Nts., 10/16/13 | | | | 1/11/10-4/3/12 | | | | | 15,652,356 | | | | | 16,190,842 | | | | | 538,486 | |
| Ice 1 Em CLO Ltd./Ice 1 Em CLO Corp., Sr. Sec. Sub. Term Nts., Series 2007-1A, Cl. B, 2.419%, 8/15/22 | | | | 11/6/07 | | | | | 18,785,375 | | | | | 14,490,000 | | | | | (4,295,375 | ) |
| Ice 1 Em CLO Ltd./Ice 1 Em CLO Corp., Sr. Sec. Sub. Term Nts., Series 2007-1A, Cl. C, 3.719%, 8/15/22 | | | | 6/8/07 | | | | | 17,780,000 | | | | | 11,734,800 | | | | | (6,045,200 | ) |
| Ice 1 Em CLO Ltd./Ice 1 Em CLO Corp., Sr. Sec. Sub. Term Nts., Series 2007-1A, Cl. D, 5.719%, 8/15/22 | | | | 6/8/07 | | | | | 17,780,000 | | | | | 11,379,200 | | | | | (6,400,800 | ) |
| | | | |
| OPPENHEIMER GLOBAL STRATEGIC INCOME FUND | | | 55 | |
STATEMENT OF INVESTMENTS Continued
Footnotes to Statement of Investments Continued
| | | | | | | | | | | | | | | | | | | | |
| Security | | Acquisition
Dates | | Cost | | Value | | Unrealized
Appreciation
(Depreciation) |
| IIRSA Norte Finance Ltd., 8.75% Sr. Nts., 5/30/24 | | | | 8/3/06-7/30/08 | | | | $ | 14,916,327 | | | | $ | 17,607,097 | | | | $ | 2,690,770 | |
| JPMorgan Chase & Co., Colombia (Republic of) Credit Linked Nts., 11%, 7/28/20 | | | | 8/24/10 | | | | | 3,310,824 | | | | | 3,523,142 | | | | | 212,318 | |
| JPMorgan Hipotecaria su Casita, 8.175% Sec. Nts., 8/26/35 | | | | 3/21/07 | | | | | 1,834,690 | | | | | 188,627 | | | | | (1,646,063 | ) |
Madison Avenue CDO Ltd., Collateralized Debt Obligations,
Series 2A, Cl. C1, 2.908%, 3/24/14 | | | | 2/23/01 | | | | | 3,209,935 | | | | | 443 | | | | | (3,209,492 | ) |
| Merrill Lynch, Colombia (Republic of) Credit Linked Nts., 10%, 11/17/16 | | | | 10/20/06 | | | | | 3,387,746 | | | | | 4,945,047 | | | | | 1,557,301 | |
| NC Finance Trust, Collateralized Mtg. Obligation Pass-Through Certificates, Series 1999-I, Cl. ECFD, 3.405%, 1/25/29 | | | | 8/10/10 | | �� | | | 4,811,624 | | | | | 400,392 | | | | | (4,411,232 | ) |
| Premier Cruise Ltd., 11% Sr. Nts., 3/15/08 | | | | 3/6/98 | | | | | 14,317,825 | | | | | — | | | | | (14,317,825 | ) |
| Santander Drive Auto Receivables Trust 2011-S1A, Automobile Receivables Nts., Series 2011-S1A, Cl. D, 3.10%, 5/15/17 | | | | 2/4/11-4/14/11 | | | | | 555,247 | | | | | 556,788 | | | | | 1,541 | |
| Tengizchevroil LLP, 6.124% Nts., 11/15/14 | | | | 4/29/05-3/16/10 | | | | | 2,478,542 | | | | | 2,590,374 | | | | | 111,832 | |
| | | | | | | | |
|
|
|
| | | | | | | | | $ | 341,303,965 | | | | $ | 233,532,523 | | | | $ | (107,771,442 | ) |
| | | | | | | | |
|
|
|
7. This security is accruing partial income at an anticipated effective rate based on expected interest and/or principal payments. The rate shown is the original contractual interest rate.
8. All or a portion of the security position is when-issued or delayed delivery to be delivered and settled after September 28, 2012. See Note 1 of the accompanying Notes.
9. Interest or dividend is paid-in-kind, when applicable.
10. Interest-Only Strips represent the right to receive the monthly interest payments on an underlying pool of mortgage loans or other receivables. These securities typically decline in price as interest rates decline. Most other fixed income securities increase in price when interest rates decline. The principal amount of the underlying pool represents the notional amount on which current interest is calculated. The price of these securities is typically more sensitive to changes in prepayment rates than traditional mortgage or asset-backed securities (for example, GNMA pass-throughs). Interest rates disclosed represent current yields based upon the current cost basis and estimated timing and amount of future cash flows. These securities amount to $37,014,445 or 0.41% of the Fund’s net assets as of September 28, 2012.
11. The current amortization rate of the security’s cost basis exceeds the future interest payments currently estimated to be received. Both the amortization rate and interest payments are contingent on future mortgage pre-payment speeds and are therefore subject to change.
12. All or a portion of the security position is held in segregated accounts and pledged to cover margin requirements with respect to outstanding written options. The aggregate market value of such securities is $9,147,279. See Note 6 of the accompanying Notes.
13. All or a portion of the security position is held in segregated accounts and pledged to cover margin requirements under certain derivative contracts. The aggregate market value of such securities is $47,760,814. See Note 6 of the accompanying Notes.
14. All or a portion of the security position is held in accounts at a futures clearing merchant and pledged to cover margin requirements on open futures contracts and written options on futures, if applicable. The aggregate market value of such securities is $15,219,150. See Note 6 of the accompanying Notes.
15. Zero coupon bond reflects effective yield on the date of purchase.
16. Denotes an inflation-indexed security: coupon or principal are indexed to a consumer price index.
17. This bond has no contractual maturity date, is not redeemable and contractually pays an indefinite stream of interest. Rate reported represents the current interest rate for this variable rate security.
18. Rate shown is the 7-day yield as of September 28, 2012.
| | |
| 56 | | OPPENHEIMER GLOBAL STRATEGIC INCOME FUND |
Distribution of investments representing geographic holdings, as a percentage of total investments at value, is as follows:
| | | | | | | | | | |
| Geographic Holdings | | Value | | Percent |
| United States | | | $ | 6,764,510,065 | | | | | 62.4 | % |
| Turkey | | | | 490,056,607 | | | | | 4.5 | |
| Russia | | | | 477,007,797 | | | | | 4.4 | |
| Brazil | | | | 468,548,967 | | | | | 4.3 | |
| Mexico | | | | 368,912,659 | | | | | 3.4 | |
| South Africa | | | | 286,397,830 | | | | | 2.6 | |
| Hungary | | | | 206,377,669 | | | | | 1.9 | |
| Japan | | | | 186,979,879 | | | | | 1.7 | |
| Colombia | | | | 171,855,129 | | | | | 1.6 | |
| Peru | | | | 162,397,031 | | | | | 1.5 | |
| Indonesia | | | | 105,915,407 | | | | | 1.0 | |
| Venezuela | | | | 102,007,721 | | | | | 0.9 | |
| Canada | | | | 74,453,653 | | | | | 0.7 | |
| United Kingdom | | | | 60,029,061 | | | | | 0.6 | |
| Italy | | | | 58,787,762 | | | | | 0.5 | |
| Malaysia | | | | 56,803,022 | | | | | 0.5 | |
| Kazakhstan | | | | 52,659,011 | | | | | 0.5 | |
| Israel | | | | 49,663,821 | | | | | 0.5 | |
| Supranational | | | | 47,364,158 | | | | | 0.4 | |
| France | | | | 47,039,807 | | | | | 0.4 | |
| Australia | | | | 43,513,417 | | | | | 0.4 | |
| Philippines | | | | 42,363,181 | | | | | 0.4 | |
| Poland | | | | 41,179,945 | | | | | 0.4 | |
| Germany | | | | 40,712,704 | | | | | 0.4 | |
| The Netherlands | | | | 37,719,777 | | | | | 0.4 | |
| Ukraine | | | | 36,118,783 | | | | | 0.3 | |
| Spain | | | | 28,549,301 | | | | | 0.3 | |
| Chile | | | | 26,404,599 | | | | | 0.2 | |
| United Arab Emirates | | | | 24,751,760 | | | | | 0.2 | |
| India | | | | 21,591,727 | | | | | 0.2 | |
| Uruguay | | | | 21,355,303 | | | | | 0.2 | |
| Nigeria | | | | 21,048,637 | | | | | 0.2 | |
| Panama | | | | 18,067,763 | | | | | 0.2 | |
| Romania | | | | 17,303,738 | | | | | 0.2 | |
| Qatar | | | | 17,029,888 | | | | | 0.2 | |
| Luxembourg | | | | 15,841,029 | | | | | 0.1 | |
| Sri Lanka | | | | 14,286,019 | | | | | 0.1 | |
| Belgium | | | | 13,213,278 | | | | | 0.1 | |
| Trinidad & Tobago | | | | 11,603,200 | | | | | 0.1 | |
| Dominican Republic | | | | 9,433,297 | | | | | 0.1 | |
| Latvia | | | | 9,431,888 | | | | | 0.1 | |
| Lithuanua | | | | 9,390,313 | | | | | 0.1 | |
| Slovakia | | | | 8,551,939 | | | | | 0.1 | |
| Croatia | | | | 8,349,075 | | | | | 0.1 | |
| Norway | | | | 8,106,023 | | | | | 0.1 | |
| Angola | | | | 8,004,150 | | | | | 0.1 | |
| Sweden | | | | 7,355,865 | | | | | 0.1 | |
| Switzerland | | | | 6,167,569 | | | | | 0.1 | |
| Ghana | | | | 5,811,500 | | | | | 0.1 | |
| China | | | | 5,260,938 | | | | | 0.1 | |
| Jamaica | | | | 4,889,925 | | | | | 0.0 | |
| Denmark | | | | 4,255,458 | | | | | 0.0 | |
| Ireland | | | | 4,231,541 | | | | | 0.0 | |
| | | | |
| OPPENHEIMER GLOBAL STRATEGIC INCOME FUND | | | 57 | |
STATEMENT OF INVESTMENTS Continued
Footnotes to Statement of Investments Continued
| | | | | | | | | | |
| Geographic Holdings | | Value | | Percent |
| Ivory Coast | | | $ | 3,990,500 | | | | | 0.0 | % |
| European Union | | | | 3,160,588 | | | | | 0.0 | |
| Finland | | | | 2,394,609 | | | | | 0.0 | |
| Korea, Republic of South | | | | 1,689,179 | | | | | 0.0 | |
| Argentina | | | | 1,685,550 | | | | | 0.0 | |
| Portugal | | | | 622,170 | | | | | 0.0 | |
| Taiwan | | | | 146,378 | | | | | 0.0 | |
| | | |
|
|
|
| Total | | | $ | 10,843,349,560 | | | | | 100.0 | % |
| | | |
|
|
|
| | | | | | | | | | | | | | | | | | | | | | | | | | | | | | | | | | | |
| Foreign Currency Exchange Contracts as of September 28, 2012 are as follows: |
Counterparty/
Contract Description | | Buy/Sell | | Contract
Amount
(000’s) | | | | Expiration
Dates | | Value | | Unrealized
Appreciation | | Unrealized
Depreciation |
| Bank of America: | | | | | | | | | | | | | | | | | | | | | | | | | | | | | | | | |
| Australian Dollar (AUD) | | | | Buy | | | | | 3,560 | | | AUD | | | | 10/24/12 | | | | $ | 3,684,176 | | | | $ | — | | | | $ | 11,816 | |
| Chilean Peso (CLP) | | | | Buy | | | | | 3,848,000 | | | CLP | | | | 10/9/12-12/20/12 | | | | | 8,084,025 | | | | | 358,034 | | | | | 883 | |
| Colombian Peso (COP) | | | | Sell | | | | | 47,223,000 | | | COP | | | | 10/16/12 | | | | | 26,172,498 | | | | | — | | | | | 46,357 | |
| Japanese Yen (JPY) | | | | Sell | | | | | 1,677,000 | | | JPY | | | | 10/24/12-12/20/12 | | | | | 21,495,049 | | | | | 71,171 | | | | | 6,034 | |
| Malaysian Ringgit (MYR) | | | | Buy | | | | | 391,420 | | | MYR | | | | 11/30/12-4/2/13 | | | | | 126,715,286 | | | | | 457,492 | | | | | 95,398 | |
| Malaysian Ringgit (MYR) | | | | Sell | | | | | 203,590 | | | MYR | | | | 10/5/12 | | | | | 66,549,259 | | | | | — | | | | | 168,431 | |
| Peruvian New Sol (PEN) | | | | Sell | | | | | 92,100 | | | PEN | | | | 10/5/12-10/15/12 | | | | | 35,429,634 | | | | | — | | | | | 744,814 | |
| Philippines Peso (PHP) | | | | Sell | | | | | 435,000 | | | PHP | | | | 1/14/13 | | | | | 10,399,955 | | | | | — | | | | | 72,319 | |
| South African Rand (ZAR) | | | | Sell | | | | | 651,910 | | | ZAR | | | | 10/5/12 | | | | | 78,270,803 | | | | | 1,099,681 | | | | | — | |
| | | | | | | | | | | | | | | | | | | | | | | | | | |
|
|
| | |
|
|
|
| | | | | | | | | | | | | | | | | | | | | | | | | | | 1,986,378 | | | | | 1,146,052 | |
| Bank Paribas Asia: | | | | | | | | | | | | | | | | | | | | | | | | | | | | | | | | |
| Australian Dollar (AUD) | | | | Sell | | | | | 4,480 | | | AUD | | | | 12/20/12 | | | | | 4,614,400 | | | | | 33,067 | | | | | 2,204 | |
| Malaysian Ringgit (MYR) | | | | Buy | | | | | 14,905 | | | MYR | | | | 11/30/12 | | | | | 4,842,195 | | | | | 88,567 | | | | | — | |
| Mexican Nuevo Peso (MXN) | | | | Sell | | | | | 12,100 | | | MXN | | | | 12/20/12 | | | | | 932,415 | | | | | — | | | | | 355 | |
| New Zealand Dollar (NZD) | | | | Buy | | | | | 4,165 | | | NZD | | | | 12/20/12 | | | | | 3,433,044 | | | | | — | | | | | 9,185 | |
| Polish Zloty (PLZ) | | | | Buy | | | | | 4,480 | | | PLZ | | | | 12/20/12 | | | | | 1,385,258 | | | | | — | | | | | 49,260 | |
| Polish Zloty (PLZ) | | | | Sell | | | | | 11,680 | | | PLZ | | | | 11/30/12-12/20/12 | | | | | 3,616,492 | | | | | — | | | | | 67,324 | |
| | | | | | | | | | | | | | | | | | | | | | | | | | |
|
|
| | |
|
|
|
| | | | | | | | | | | | | | | | | | | | | | | | | | | 121,634 | | | | | 128,328 | |
| Barclays Capital: | | | | | | | | | | | | | | | | | | | | | | | | | | | | | | | | |
| Chilean Peso (CLP) | | | | Sell | | | | | 1,737,000 | | | CLP | | | | 10/9/12 | | | | | 3,656,093 | | | | | — | | | | | 68,733 | |
| Euro (EUR) | | | | Sell | | | | | 3,045 | | | EUR | | | | 1/23/13 | | | | | 3,918,018 | | | | | — | | | | | 169,592 | |
| Hungarian Forint (HUF) | | | | Buy | | | | | 767,000 | | | HUF | | | | 10/24/12 | | | | | 3,443,946 | | | | | 163,621 | | | | | — | |
| Hungarian Forint (HUF) | | | | Sell | | | | | 1,182,000 | | | HUF | | | | 12/12/12-2/20/13 | | | | | 5,250,121 | | | | | — | | | | | 55,953 | |
| Israeli Shekel (ILS) | | | | Buy | | | | | 7,580 | | | ILS | | | | 4/2/13 | | | | | 1,921,840 | | | | | — | | | | | 55,724 | |
| Israeli Shekel (ILS) | | | | Sell | | | | | 7,580 | | | ILS | | | | 4/2/13 | | | | | 1,921,840 | | | | | 79,269 | | | | | — | |
| Japanese Yen (JPY) | | | | Sell | | | | | 6,854,000 | | | JPY | | | | 10/15/12-12/20/12 | | | | | 87,839,241 | | | | | 123,957 | | | | | — | |
| Mexican Nuevo Peso (MXN) | | | | Buy | | | | | 5,600 | | | MXN | | | | 12/20/12 | | | | | 431,531 | | | | | — | | | | | 563 | |
| Mexican Nuevo Peso (MXN) | | | | Sell | | | | | 136,400 | | | MXN | | | | 10/18/12-12/20/12 | | | | | 10,569,562 | | | | | — | | | | | 389,988 | |
| New Turkish Lira (TRY) | | | | Sell | | | | | 10,680 | | | TRY | | | | 11/7/12 | | | | | 5,910,562 | | | | | — | | | | | 165,822 | |
| Norwegian Krone (NOK) | | | | Buy | | | | | 12,180 | | | NOK | | | | 12/20/12 | | | | | 2,119,557 | | | | | — | | | | | 1,729 | |
| Polish Zloty (PLZ) | | | | Buy | | | | | 950 | | | PLZ | | | | 10/16/12 | | | | | 295,933 | | | | | — | | | | | 7,063 | |
| Russian Ruble (RUR) | | | | Buy | | | | | 220,580 | | | RUR | | | | 11/30/12 | | | | | 6,991,404 | | | | | — | | | | | 125,687 | |
| Russian Ruble (RUR) | | | | Sell | | | | | 423,700 | | | RUR | | | | 10/15/12 | | | | | 13,541,730 | | | | | 7,522 | | | | | — | |
| South African Rand (ZAR) | | | | Buy | | | | | 31,550 | | | ZAR | | | | 12/20/12 | | | | | 3,746,897 | | | | | — | | | | | 45,445 | |
| South African Rand (ZAR) | | | | Sell | | | | | 446,680 | | | ZAR | | | | 10/22/12 | | | | | 53,500,759 | | | | | 509,373 | | | | | — | |
| South Korean Won (KRW) | | | | Buy | | | | | 5,217,000 | | | KRW | | | | 10/15/12 | | | | | 4,684,824 | | | | | 15,114 | | | | | — | |
| | | | | | | | | | | | | | | | | | | | | | | | | | |
|
|
| | |
|
|
|
| | | | | | | | | | | | | | | | | | | | | | | | | | | 898,856 | | | | | 1,086,299 | |
| | |
| 58 | | OPPENHEIMER GLOBAL STRATEGIC INCOME FUND |
| | | | | | | | | | | | | | | | | | | | | | | | | | | | | | | | | | | |
| Foreign Currency Exchange Contracts: Continued |
Counterparty/
Contract Description | | Buy/Sell | | Contract
Amount
(000’s) | | | | Expiration
Dates | | Value | | Unrealized
Appreciation | | Unrealized
Depreciation |
| Citigroup: | | | | | | | | | | | | | | | | | | | | | | | | | | | | | | | | |
| Australian Dollar (AUD) | | | | Sell | | | | | 35,015 | | | AUD | | | | 11/30/12 | | | | $ | 36,126,189 | | | | $ | 366,563 | | | | $ | — | |
| Brazilian Real (BRR) | | | | Buy | | | | | 8,400 | | | BRR | | | | 11/5/12 | | | | | 4,122,847 | | | | | 350 | | | | | — | |
| Chilean Peso (CLP) | | | | Sell | | | | | 1,261,000 | | | CLP | | | | 10/16/12 | | | | | 2,650,942 | | | | | — | | | | | 129,194 | |
| Colombian Peso (COP) | | | | Sell | | | | | 13,044,000 | | | COP | | | | 11/30/12-12/20/12 | | | | | 7,186,835 | | | | | 537 | | | | | 93,042 | |
| Euro (EUR) | | | | Buy | | | | | 72,800 | | | EUR | | | | 10/24/12 | | | | | 93,574,710 | | | | | — | | | | | 728,154 | |
| Euro (EUR) | | | | Sell | | | | | 53,935 | | | EUR | | | | 10/16/12-11/30/12 | | | | | 69,348,451 | | | | | 32,864 | | | | | 749,376 | |
| Hong Kong Dollar (HKD) | | | | Buy | | | | | 10,650 | | | HKD | | | | 10/18/12 | | | | | 1,373,481 | | | | | 255 | | | | | — | |
| Hungarian Forint (HUF) | | | | Buy | | | | | 1,442,000 | | | HUF | | | | 11/6/12 | | | | | 6,463,455 | | | | | 67,784 | | | | | — | |
| Hungarian Forint (HUF) | | | | Sell | | | | | 262,000 | | | HUF | | | | 12/5/12 | | | | | 1,170,484 | | | | | 3,677 | | | | | — | |
| Indonesia Rupiah (IDR) | | | | Buy | | | | | 358,834,000 | | | IDR | | | | 12/20/12-1/16/13 | | | | | 36,954,425 | | | | | 2,625 | | | | | 7,429 | |
| Indonesia Rupiah (IDR) | | | | Sell | | | | | 350,102,000 | | | IDR | | | | 10/5/12 | | | | | 36,551,349 | | | | | — | | | | | 101,375 | |
| Malaysian Ringgit (MYR) | | | | Buy | | | | | 71,440 | | | MYR | | | | 11/30/12-12/20/12 | | | | | 23,193,960 | | | | | 135,310 | | | | | 240 | |
| Malaysian Ringgit (MYR) | | | | Sell | | | | | 46,765 | | | MYR | | | | 10/5/12 | | | | | 15,286,488 | | | | | — | | | | | 53,589 | |
| Mexican Nuevo Peso (MXN) | | | | Buy | | | | | 776,100 | | | MXN | | | | 10/18/12-12/20/12 | | | | | 59,858,543 | | | | | 258,568 | | | | | 30,440 | |
| Mexican Nuevo Peso (MXN) | | | | Sell | | | | | 2,458,552 | | | MXN | | | | 10/2/12-12/13/12 | | | | | 190,370,564 | | | | | 17,614 | | | | | 6,538,434 | |
| New Zealand Dollar (NZD) | | | | Buy | | | | | 195 | | | NZD | | | | 12/20/12 | | | | | 160,731 | | | | | 823 | | | | | — | |
| Norwegian Krone (NOK) | | | | Buy | | | | | 6,290 | | | NOK | | | | 12/20/12 | | | | | 1,094,582 | | | | | — | | | | | 1,809 | |
| Norwegian Krone (NOK) | | | | Sell | | | | | 54,010 | | | NOK | | | | 10/16/12 | | | | | 9,421,932 | | | | | — | | | | | 10,228 | |
| Peruvian New Sol (PEN) | | | | Buy | | | | | 45,040 | | | PEN | | | | 10/5/12 | | | | | 17,333,090 | | | | | 12,439 | | | | | 34,304 | |
| Peruvian New Sol (PEN) | | | | Sell | | | | | 42,040 | | | PEN | | | | 1/16/13 | | | | | 16,088,824 | | | | | 18,455 | | | | | — | |
| Singapore Dollar (SGD) | | | | Sell | | | | | 24,690 | | | SGD | | | | 10/16/12 | | | | | 20,118,533 | | | | | — | | | | | 414,642 | |
| South Korean Won (KRW) | | | | Buy | | | | | 37,901,000 | | | KRW | | | | 11/19/12 | | | | | 33,937,920 | | | | | 524,361 | | | | | — | |
| Swiss Franc (CHF) | | | | Buy | | | | | 1,640 | | | CHF | | | | 11/30/12 | | | | | 1,745,774 | | | | | 38,943 | | | | | — | |
| | | | | | | | | | | | | | | | | | | | | | | | | | |
|
|
| | |
|
|
|
| | | | | | | | | | | | | | | | | | | | | | | | | | | 1,481,168 | | | | | 8,892,256 | |
| Credit Suisse: | | | | | | | | | | | | | | | | | | | | | | | | | | | | | | | | |
| Australian Dollar (AUD) | | | | Sell | | | | | 918 | | | AUD | | | | 10/2/12-12/20/12 | | | | | 945,984 | | | | | 5,719 | | | | | — | |
| British Pound Sterling (GBP) | | | | Buy | | | | | 9,630 | | | GBP | | | | 10/24/12 | | | | | 15,549,362 | | | | | — | | | | | 41,608 | |
| Chilean Peso (CLP) | | | | Sell | | | | | 1,408,000 | | | CLP | | | | 12/20/12 | | | | | 2,932,243 | | | | | 11,932 | | | | | — | |
| Colombian Peso (COP) | | | | Buy | | | | | 390,000 | | | COP | | | | 12/20/12 | | | | | 214,373 | | | | | — | | | | | 1,550 | |
| Euro (EUR) | | | | Buy | | | | | 13,195 | | | EUR | | | | 11/29/12 | | | | | 16,966,915 | | | | | 368,594 | | | | | — | |
| New Turkish Lira (TRY) | | | | Sell | | | | | 45,945 | | | TRY | | | | 11/29/12-7/17/13 | | | | | 25,121,744 | | | | | — | | | | | 775,638 | |
| Polish Zloty (PLZ) | | | | Buy | | | | | 29,690 | | | PLZ | | | | 10/16/12 | | | | | 9,248,696 | | | | | — | | | | | 201,000 | |
| South African Rand (ZAR) | | | | Sell | | | | | 687,865 | | | ZAR | | | | 12/12/12 | | | | | 81,788,592 | | | | | 1,468,892 | | | | | — | |
| Swedish Krona (SEK) | | | | Buy | | | | | 18,750 | | | SEK | | | | 12/20/12 | | | | | 2,847,415 | | | | | — | | | | | 19,710 | |
| Swiss Franc (CHF) | | | | Buy | | | | | 3,645 | | | CHF | | | | 10/24/12 | | | | | 3,877,445 | | | | | — | | | | | 25,124 | |
| | | | | | | | | | | | | | | | | | | | | | | | | | |
|
|
| | |
|
|
|
| | | | | | | | | | | | | | | | | | | | | | | | | | | 1,855,137 | | | | | 1,064,630 | |
| Deutsche Bank Securities, Inc.: | | | | | | | | | | | | | | | | | | | | | | | | | | | | |
| Australian Dollar (AUD) | | | | Buy | | | | | 10,420 | | | AUD | | | | 10/16/12 | | | | | 10,791,867 | | | | | — | | | | | 100,368 | |
| Canadian Dollar (CAD) | | | | Buy | | | | | 15,050 | | | CAD | | | | 10/24/12 | | | | | 15,300,750 | | | | | — | | | | | 81,507 | |
| Czech Koruna (CZK) | | | | Sell | | | | | 40,900 | | | CZK | | | | 12/20/12 | | | | | 2,091,396 | | | | | 31,845 | | | | | — | |
| Hungarian Forint (HUF) | | | | Sell | | | | | 17,265,000 | | | HUF | | | | 10/16/12-5/29/13 | | | | | 77,345,016 | | | | | 34,086 | | | | | 3,072,652 | |
| Indian Rupee (INR) | | | | Buy | | | | | 118,000 | | | INR | | | | 11/19/12 | | | | | 2,216,593 | | | | | 48,226 | | | | | — | |
| Indian Rupee (INR) | | | | Sell | | | | | 49,000 | | | INR | | | | 12/20/12 | | | | | 917,579 | | | | | — | | | | | 12,016 | |
| Japanese Yen (JPY) | | | | Buy | | | | | 1,770,000 | | | JPY | | | | 10/24/12 | | | | | 22,685,294 | | | | | 79,930 | | | | | — | |
| Japanese Yen (JPY) | | | | Sell | | | | | 6,641,000 | | | JPY | | | | 10/15/12 | | | | | 85,108,214 | | | | | — | | | | | 1,202,644 | |
| Malaysian Ringgit (MYR) | | | | Buy | | | | | 259,810 | | | MYR | | | | 10/5/12 | | | | | 84,926,386 | | | | | 2,201,228 | | | | | — | |
| New Turkish Lira (TRY) | | | | Sell | | | | | 64,955 | | | TRY | | | | 10/30/12 | | | | | 35,988,542 | | | | | — | | | | | 981,805 | |
| Polish Zloty (PLZ) | | | | Buy | | | | | 69,090 | | | PLZ | | | | 11/6/12 | | | | | 21,466,005 | | | | | — | | | | | 232,093 | |
| Polish Zloty (PLZ) | | | | Sell | | | | | 72,500 | | | PLZ | | | | 10/16/12-12/20/12 | | | | | 22,536,353 | | | | | 84,116 | | | | | 586,162 | |
| | | | | | | | | | | | | | | | | | | | | | | | | | |
|
|
| | |
|
|
|
| | | | | | | | | | | | | | | | | | | | | | | | | | | 2,479,431 | | | | | 6,269,247 | |
| | | | |
| OPPENHEIMER GLOBAL STRATEGIC INCOME FUND | | | 59 | |
STATEMENT OF INVESTMENTS Continued
Footnotes to Statement of Investments Continued
| | | | | | | | | | | | | | | | | | | | | | | | | | | | | | | | | | | |
| Foreign Currency Exchange Contracts: Continued |
Counterparty/
Contract Description | | Buy/Sell | | Contract
Amount
(000’s) | | | | Expiration
Dates | | Value | | Unrealized
Appreciation | | Unrealized
Depreciation |
| Goldman Sachs & Co.: | | | | | | | | | | | | | | | | | | | | | | | | | | | | | | | | |
| Australian Dollar (AUD) | | | | Sell | | | | | 12,525 | | | AUD | | | | 10/16/12 | | | | $ | 12,971,989 | | | | $ | — | | | | $ | 395,712 | |
| British Pound Sterling (GBP) | | | | Sell | | | | | 8,780 | | | GBP | | | | 10/16/12 | | | | | 14,177,251 | | | | | — | | | | | 621,590 | |
| Colombian Peso (COP) | | | | Buy | | | | | 80,913,023 | | | COP | | | | 10/3/12-10/16/12 | | | | | 44,929,518 | | | | | 31,890 | | | | | 7,789 | |
| Colombian Peso (COP) | | | | Sell | | | | | 51,083,000 | | | COP | | | | 10/16/12 | | | | | 28,311,833 | | | | | — | | | | | 65,773 | |
| Danish Krone (DKK) | | | | Sell | | | | | 1,788 | | | DKK | | | | 10/2/12 | | | | | 308,243 | | | | | 644 | | | | | — | |
| Euro (EUR) | | | | Buy | | | | | 19,765 | | | EUR | | | | 11/29/12-12/7/12 | | | | | 25,415,881 | | | | | 541,768 | | | | | — | |
| Japanese Yen (JPY) | | | | Buy | | | | | 4,421,000 | | | JPY | | | | 11/30/12 | | | | | 56,679,647 | | | | | 742,504 | | | | | 42,367 | |
| Mexican Nuevo Peso (MXN) | | | | Buy | | | | | 338,083 | | | MXN | | | | 10/3/12-12/4/12 | | | | | 26,176,829 | | | | | 407,776 | | | | | — | |
| Mexican Nuevo Peso (MXN) | | | | Sell | | | | | 1,907,315 | | | MXN | | | | 10/1/12-12/20/12 | | | | | 147,440,646 | | | | | 42,550 | | | | | 2,718,222 | |
| New Turkish Lira (TRY) | | | | Sell | | | | | 117,940 | | | TRY | | | | 11/29/12-12/7/12 | | | | | 65,043,593 | | | | | — | | | | | 638,689 | |
| South African Rand (ZAR) | | | | Sell | | | | | 157,130 | | | ZAR | | | | 10/5/12 | | | | | 18,865,628 | | | | | 237,771 | | | | | — | |
| Swedish Krona (SEK) | | | | Buy | | | | | 7,185 | | | SEK | | | | 10/2/12 | | | | | 1,093,858 | | | | | — | | | | | 1,651 | |
| | | | | | | | | | | | | | | | | | | | | | | | | | |
|
|
| | |
|
|
|
| | | | | | | | | | | | | | | | | | | | | | | | | | | 2,004,903 | | | | | 4,491,793 | |
| HSBC: | | | | | | | | | | | | | | | | | | | | | | | | | | | | | | | | |
| Israeli Shekel (ILS) | | | | Sell | | | | | 11,240 | | | ILS | | | | 12/20/12 | | | | | 2,858,942 | | | | | 8,112 | | | | | — | |
| New Turkish Lira (TRY) | | | | Buy | | | | | 12,130 | | | TRY | | | | 7/17/13 | | | | | 6,472,198 | | | | | 243,700 | | | | | — | |
| New Turkish Lira (TRY) | | | | Sell | | | | | 333,540 | | | TRY | | | | 11/7/12 | | | | | 184,588,832 | | | | | — | | | | | 5,651,064 | |
| | | | | | | | | | | | | | | | | | | | | | | | | | |
|
|
| | |
|
|
|
| | | | | | | | | | | | | | | | | | | | | | | | | | | 251,812 | | | | | 5,651,064 | |
| JPMorgan Chase: | | | | | | | | | | | | | | | | | | | | | | | | | | | | | | | | |
| British Pound Sterling (GBP) | | | | Buy | | | | | 2,225 | | | GBP | | | | 12/20/12 | | | | | 3,592,082 | | | | | — | | | | | 15,753 | |
| Euro (EUR) | | | | Sell | | | | | 38,430 | | | EUR | | | | 11/6/12-11/30/12 | | | | | 49,411,966 | | | | | — | | | | | 1,387,678 | |
| Hungarian Forint (HUF) | | | | Buy | | | | | 47,000 | | | HUF | | | | 12/20/12 | | | | | 209,656 | | | | | — | | | | | 3,438 | |
| Hungarian Forint (HUF) | | | | Sell | | | | | 13,537,000 | | | HUF | | | | 10/24/12-2/12/13 | | | | | 60,095,362 | | | | | 26,960 | | | | | 4,354,673 | |
| Indonesia Rupiah (IDR) | | | | Buy | | | | | 382,259,000 | | | IDR | | | | 10/15/12 | | | | | 39,911,537 | | | | | 11,372 | | | | | 462,307 | |
| Japanese Yen (JPY) | | | | Sell | | | | | 759,000 | | | JPY | | | | 10/24/12 | | | | | 9,727,761 | | | | | — | | | | | 32,108 | |
| Malaysian Ringgit (MYR) | | | | Buy | | | | | 3,470 | | | MYR | | | | 12/20/12 | | | | | 1,126,203 | | | | | 2,163 | | | | | 1,926 | |
| Malaysian Ringgit (MYR) | | | | Sell | | | | | 9,455 | | | MYR | | | | 10/5/12 | | | | | 3,090,639 | | | | | — | | | | | 72,765 | |
| Mexican Nuevo Peso (MXN) | | | | Buy | | | | | 294,900 | | | MXN | | | | 10/16/12-12/4/12 | | | | | 22,811,635 | | | | | 611,768 | | | | | 89,034 | |
| New Taiwan Dollar (TWD) | | | | Buy | | | | | 51,000 | | | TWD | | | | 12/20/12 | | | | | 1,740,971 | | | | | — | | | | | 6,801 | |
| New Taiwan Dollar (TWD) | | | | Sell | | | | | 27,000 | | | TWD | | | | 12/20/12 | | | | | 921,691 | | | | | — | | | | | 3,636 | |
| New Turkish Lira (TRY) | | | | Sell | | | | | 24,140 | | | TRY | | | | 11/29/12 | | | | | 13,317,812 | | | | | — | | | | | 122,734 | |
| Norwegian Krone (NOK) | | | | Buy | | | | | 54,010 | | | NOK | | | | 10/16/12 | | | | | 9,421,932 | | | | | — | | | | | 50,100 | |
| Philippines Peso (PHP) | | | | Buy | | | | | 47,000 | | | PHP | | | | 12/20/12 | | | | | 1,123,864 | | | | | 2,600 | | | | | 412 | |
| Polish Zloty (PLZ) | | | | Buy | | | | | 50,210 | | | PLZ | | | | 11/6/12 | | | | | 15,600,060 | | | | | 12,146 | | | | | 11,788 | |
| Polish Zloty (PLZ) | | | | Sell | | | | | 48,170 | | | PLZ | | | | 10/16/12 | | | | | 15,005,378 | | | | | 72,936 | | | | | — | |
| Russian Ruble (RUR) | | | | Buy | | | | | 293,700 | | | RUR | | | | 11/30/12-12/20/12 | | | | | 9,300,003 | | | | | 130,353 | | | | | 19,142 | |
| Russian Ruble (RUR) | | | | Sell | | | | | 1,711,500 | | | RUR | | | | 10/15/12-12/20/12 | | | | | 54,511,239 | | | | | 41,931 | | | | | 1,972,030 | |
| | | | | | | | | | | | | | | | | | | | | | | | | | |
|
|
| | |
|
|
|
| | | | | | | | | | | | | | | | | | | | | | | | | | | 912,229 | | | | | 8,606,325 | |
| Morgan Stanley & Co., Inc.: | | | | | | | | | | | | | | | | | | | | | | | | | | | | |
| Brazilian Real (BRR) | | | | Buy | | | | | 262,425 | | | BRR | | | | 10/2/12-11/5/12 | | | | | 129,444,449 | | | | | 2,427 | | | | | — | |
| Brazilian Real (BRR) | | | | Sell | | | | | 391,125 | | | BRR | | | | 11/5/12 | | | | | 191,970,065 | | | | | — | | | | | 509,606 | |
| Canadian Dollar (CAD) | | | | Buy | | | | | 5,980 | | | CAD | | | | 12/20/12 | | | | | 6,071,350 | | | | | — | | | | | 48,009 | |
| Canadian Dollar (CAD) | | | | Sell | | | | | 4,450 | | | CAD | | | | 10/16/12 | | | | | 4,524,927 | | | | | — | | | | | 5,523 | |
| Euro (EUR) | | | | Sell | | | | | 49,330 | | | EUR | | | | 10/16/12 | | | | | 63,401,933 | | | | | — | | | | | 3,218,248 | |
| Singapore Dollar (SGD) | | | | Sell | | | | | 30,280 | | | SGD | | | | 10/16/12-12/20/12 | | | | | 24,673,501 | | | | | — | | | | | 825,355 | |
| South Korean Won (KRW) | | | | Buy | | | | | 37,902,000 | | | KRW | | | | 10/15/12 | | | | | 34,035,693 | | | | | 972,492 | | | | | — | |
| | | | | | | | | | | | | | | | | | | | | | | | | | |
|
|
| | |
|
|
|
| | | | | | | | | | | | | | | | | | | | | | | | | | | 974,919 | | | | | 4,606,741 | |
| | |
| 60 | | OPPENHEIMER GLOBAL STRATEGIC INCOME FUND |
| | | | | | | | | | | | | | | | | | | | | | | | | | | | | | | | | | | |
| Foreign Currency Exchange Contracts: Continued |
Counterparty/
Contract Description | | Buy/Sell | | Contract
Amount
(000’s) | | | | Expiration
Dates | | Value | | Unrealized
Appreciation | | Unrealized
Depreciation |
| Nomura Securities: | | | | | | | | | | | | | | | | | | | | | | | | | | | | | | | | |
| British Pound Sterling (GBP) | | | | Buy | | | | | 240 | | | GBP | | | | 11/30/12 | | | | $ | 387,477 | | | | $ | 8,757 | | | | $ | — | |
| British Pound Sterling (GBP) | | | | Sell | | | | | 2,880 | | | GBP | | | | 12/20/12 | | | | | 4,649,526 | | | | | 26,154 | | | | | — | |
| Canadian Dollar (CAD) | | | | Sell | | | | | 2,610 | | | CAD | | | | 10/16/12 | | | | | 2,653,946 | | | | | — | | | | | 110,228 | |
| Euro (EUR) | | | | Buy | | | | | 40,909 | | | EUR | | | | 10/3/12-12/20/12 | | | | | 52,604,343 | | | | | 729,236 | | | | | 85,577 | |
| Euro (EUR) | | | | Sell | | | | | 52,749 | | | EUR | | | | 10/3/12-12/20/12 | | | | | 67,803,279 | | | | | 15,326 | | | | | 3,665,858 | |
| Indonesia Rupiah (IDR) | | | | Sell | | | | | 257,114,000 | | | IDR | | | | 10/15/12 | | | | | 26,796,678 | | | | | 182,755 | | | | | — | |
| Japanese Yen (JPY) | | | | Sell | | | | | 5,132,000 | | | JPY | | | | 10/15/12 | | | | | 65,769,516 | | | | | — | | | | | 669,285 | |
| Malaysian Ringgit (MYR) | | | | Sell | | | | | 229,125 | | | MYR | | | | 10/15/12-10/16/12 | | | | | 74,758,981 | | | | | — | | | | | 2,343,144 | |
| Singapore Dollar (SGD) | | | | Buy | | | | | 29,160 | | | SGD | | | | 10/16/12 | | | | | 23,760,892 | | | | | — | | | | | 2,453 | |
| Singapore Dollar (SGD) | | | | Sell | | | | | 14,880 | | | SGD | | | | 10/16/12 | | | | | 12,124,900 | | | | | — | | | | | 255,274 | |
| South Korean Won (KRW) | | | | Sell | | | | | 35,081,000 | | | KRW | | | | 10/15/12-12/20/12 | | | | | 31,498,523 | | | | | — | | | | | 873,571 | |
| | | | | | | | | | | | | | | | | | | | | | | | | | |
|
|
|
| | | | | | | | | | | | | | | | | | | | | | | | | | | 962,228 | | | | | 8,005,390 | |
| RBS Greenwich Capital: | | | | | | | | | | | | | | | | | | | | | | | | | | | | |
| Hungarian Forint (HUF) | | | | Sell | | | | | 6,640,000 | | | HUF | | | | 12/27/12 | | | | | 29,598,623 | | | | | — | | | | | 2,515,132 | |
| New Turkish Lira (TRY) | | | | Buy | | | | | 43,560 | | | TRY | | | | 10/30/12 | | | | | 24,134,569 | | | | | 124,290 | | | | | — | |
| New Turkish Lira (TRY) | | | | Sell | | | | | 101,110 | | | TRY | | | | 10/15/12 | | | | | 56,139,258 | | | | | — | | | | | 1,024,155 | |
| Polish Zloty (PLZ) | | | | Sell | | | | | 40,850 | | | PLZ | | | | 10/16/12-12/20/12 | | | | | 12,704,049 | | | | | — | | | | | 802,458 | |
| Russian Ruble (RUR) | | | | Sell | | | | | 117,900 | | | RUR | | | | 11/30/12 | | | | | 3,736,905 | | | | | 4,269 | | | | | — | |
| Singapore Dollar (SGD) | | | | Buy | | | | | 39,570 | | | SGD | | | | 10/16/12 | | | | | 32,243,432 | | | | | 1,115,634 | | | | | — | |
| | | | | | | | | | | | | | | | | | | | | | | | | | |
|
|
|
| | | | | | | | | | | | | | | | | | | | | | | | | | | 1,244,193 | | | | | 4,341,745 | |
| Standard Chartered Bank | | | | | | | | | | | | | | | | | | | | | | | | | | | | |
| Malaysian Ringgit (MYR) | | | | Buy | | | | | 78,195 | | | MYR | | | | 11/30/12 | | | | | 25,403,247 | | | | | 443,275 | | | | | — | |
| State Street: | | | | | | | | | | | | | | | | | | | | | | | | | | | | |
| Mexican Nuevo Peso (MXN) | | | | Sell | | | | | 840,200 | | | MXN | | | | 10/16/12 | | | | | 65,157,744 | | | | | — | | | | | 3,432,795 | |
| New Turkish Lira (TRY) | | | | Sell | | | | | 23,910 | | | TRY | | | | 11/29/12 | | | | | 13,190,924 | | | | | — | | | | | 176,908 | |
| South African Rand (ZAR) | | | | Sell | | | | | 223,780 | | | ZAR | | | | 10/16/12 | | | | | 26,825,951 | | | | | — | | | | | 422,478 | |
| | | | | | | | | | | | | | | | | | | | | | | | | | |
|
|
|
| | | | | | | | | | | | | | | | | | | | | | | | | | | — | | | | | 4,032,181 | |
| | | | | | | | | | | | | | | | | | | | | | | | | | |
|
|
|
| Total unrealized appreciation and depreciation | | | | | | | | | | | | | | | | $ | 15,616,163 | | | | $ | 58,322,051 | |
| | | | | | | | | | | | | | | | | | | | | | | | | | |
|
|
|
| | | | | | | | | | | | | | | | | | | | | | | | | |
| Futures Contracts as of September 28, 2012 are as follows: |
| Contract Description | | Buy/Sell | | Number of
Contracts | | Expiration
Date | | Value | | Unrealized
Appreciation
(Depreciation) |
| Australian Treasury Bonds, 3 yr. | | | | Sell | | | | | 426 | | | | | 12/17/12 | | | | $ | 48,834,821 | | | | $ | (186,783 | ) |
| Australian Treasury Bonds, 10 yr. | | | | Sell | | | | | 59 | | | | | 12/17/12 | | | | | 7,765,910 | | | | | (15,352 | ) |
| CBOE Volatility Index | | | | Sell | | | | | 228 | | | | | 11/20/12 | | | | | 4,115,400 | | | | | 364,927 | |
| FTSE 100 Index | | | | Sell | | | | | 70 | | | | | 12/21/12 | | | | | 6,457,765 | | | | | 174,803 | |
| Japanese Yen (JPY) | | | | Sell | | | | | 170 | | | | | 12/17/12 | | | | | 27,268,000 | | | | | 85,512 | |
| SPI 200 Index | | | | Sell | | | | | 65 | | | | | 12/20/12 | | | | | 7,389,735 | | | | | 38,295 | |
| Standard & Poor’s 500 E-Mini Index | | | | Buy | | | | | 900 | | | | | 12/21/12 | | | | | 64,539,000 | | | | | (1,120,194 | ) |
| Standard & Poor’s 500 E-Mini Index | | | | Sell | | | | | 1,218 | | | | | 12/21/12 | | | | | 87,342,780 | | | | | 1,510,734 | |
| Standard & Poor’s/Toronto Stock Exchange 60 Index | | | | Sell | | | | | 23 | | | | | 12/20/12 | | | | | 3,278,629 | | | | | 60,752 | |
| U.S. Treasury Long Bonds, 20 yr. | | | | Buy | | | | | 1,061 | | | | | 12/19/12 | | | | | 158,486,875 | | | | | 405,343 | |
| U.S. Treasury Long Bonds, 20 yr. | | | | Sell | | | | | 810 | | | | | 12/19/12 | | | | | 120,993,750 | | | | | (35,855 | ) |
| U.S. Treasury Nts., 2 yr. | | | | Buy | | | | | 620 | | | | | 12/31/12 | | | | | 136,729,375 | | | | | 74,861 | |
| U.S. Treasury Nts., 2 yr. | | | | Sell | | | | | 3,856 | | | | | 12/31/12 | | | | | 850,368,500 | | | | | (367,325 | ) |
| U.S. Treasury Nts., 5 yr. | | | | Buy | | | | | 1,081 | | | | | 12/31/12 | | | | | 134,728,071 | | | | | 348,905 | |
| U.S. Treasury Nts., 5 yr. | | | | Sell | | | | | 757 | | | | | 12/31/12 | | | | | 94,347,039 | | | | | (456,471 | ) |
| U.S. Treasury Nts., 10 yr. | | | | Buy | | | | | 521 | | | | | 12/19/12 | | | | | 69,545,359 | | | | | 268,627 | |
| | | | |
| OPPENHEIMER GLOBAL STRATEGIC INCOME FUND | | | 61 | |
STATEMENT OF INVESTMENTS Continued
Footnotes to Statement of Investments Continued
| | | | | | | | | | | | | | | | | | | | | | | | | |
| Futures Contracts: Continued | | | | | | | | | | |
| Contract Description | | Buy/Sell | | Number of
Contracts | | Expiration
Date | | Value | | Unrealized
Appreciation
(Depreciation) |
| U.S. Treasury Nts., 10 yr. | | | | Sell | | | | | 5,025 | | | | | 12/19/12 | | | | $ | 670,758,984 | | | | | $ (3,912,745 | ) |
| U.S. Treasury Ultra Bonds | | | | Buy | | | | | 806 | | | | | 12/19/12 | | | | | 133,166,313 | | | | | 71,295 | |
| | | | | | | | | | | | | | | | | | | | | | | |
|
|
|
| | | | | | | | | | | | | | | | | | | | | | | | | $(2,690,671 | ) |
| | | | | | | | | | | | | | | | | | | | | | | |
|
|
|
| | | | | | | | | | | | | | | | | | | | | | | | | | | | | | | | | | | | | | | | |
| Written Options as of September 28, 2012 are as follows: |
| Description | | Type | | Number of
Contracts | | Exercise
Price | | | | Expiration
Date | | Premiums
Received | | Value | | Unrealized
Appreciation/
(Depreciation) |
| Australian Dollar (AUD) Futures, 12/17/12 | | | | Put | | | | | 153 | | | | $ | 101.000 | | | | | | | 10/8/12 | | | | $ | 9,073 | | | | $ | (7,650 | ) | | | $ | 1,423 | |
| Australian Dollar (AUD) Futures, 12/17/12 | | | | Put | | | | | 73 | | | | | 100.000 | | | | | | | 10/8/12 | | | | | 3,273 | | | | | (730 | ) | | | | 2,543 | |
| Australian Dollar (AUD) Futures, 12/17/12 | | | | Put | | | | | 17 | | | | | 102.000 | | | | | | | 10/8/12 | | | | | 2,438 | | | | | (3,230 | ) | | | | (792 | ) |
| Australian Dollar (AUD) Futures, 12/17/12 | | | | Put | | | | | 9 | | | | | 99.500 | | | | | | | 10/8/12 | | | | | 166 | | | | | (45 | ) | | | | 121 | |
| Brazilian Real (BRR) | | | | Put | | | | | 60,600,000 | | | |
| 1USD per
2.130BRR |
| | | | | | 12/20/12 | | | | | 228,317 | | | | | (158,796 | ) | | | | 69,521 | |
| Brazilian Real (BRR) | | | | Put | | | | | 60,600,000 | | | |
| 1USD per
2.130BRR |
| | | | | | 12/20/12 | | | | | 219,105 | | | | | (158,796 | ) | | | | 60,309 | |
| Brazilian Real (BRR) | | | | Put | | | | | 60,600,000 | | | |
| 1USD per
2.130BRR |
| | | | | | 12/20/12 | | | | | 211,958 | | | | | (158,796 | ) | | | | 53,162 | |
| British Pound Sterling (GBP) | | | | Put | | | | | 18,215,447 | | | |
| 1GBP per
1.400USD |
| | | | | | 9/11/13 | | | | | 140,004 | | | | | (93,075 | ) | | | | 46,929 | |
| British Pound Sterling (GBP) | | | | Put | | | | | 9,113,661 | | | |
| 1GBP per
1.360USD |
| | | | | | 9/9/13 | | | | | 52,181 | | | | | (22,685 | ) | | | | 29,496 | |
| British Pound Sterling (GBP) | | | | Put | | | | | 12,772,984 | | | |
| 1GBP per
1.350USD |
| | | | | | 8/16/13 | | | | | 115,997 | | | | | (20,653 | ) | | | | 95,344 | |
| Candian Dollar (CAD) Futures, 12/18/12 | | | | Put | | | | | 801 | | | | | 98.500 | | | | | | | 10/8/12 | | | | | 21,906 | | | | | (8,010 | ) | | | | 13,896 | |
| Candian Dollar (CAD) Futures, 12/18/12 | | | | Put | | | | | 800 | | | | | 99.000 | | | | | | | 10/8/12 | | | | | 15,617 | | | | | (8,000 | ) | | | | 7,617 | |
| Euro (EUR) | | | | Call | | | | | 53,330,000 | | | |
| 1EUR per
1.350USD |
| | | | | | 12/21/12 | | | | | 318,940 | | | | | (155,335 | ) | | | | 163,605 | |
| Euro (EUR) | | | | Call | | | | | 47,410,000 | | | |
| 1EUR per
1.350USD |
| | | | | | 12/21/12 | | | | | 297,616 | | | | | (138,092 | ) | | | | 159,524 | |
| Euro (EUR) FX Futures, 12/17/12 | | | | Put | | | | | 2,800 | | | | | 1.200 | | | | | | | 10/8/12 | | | | | 113,309 | | | | | (17,500 | ) | | | | 95,809 | |
| Euro (EUR) FX Futures, 12/17/12 | | | | Put | | | | | 1,458 | | | | | 1.215 | | | | | | | 10/8/12 | | | | | 91,515 | | | | | (9,113 | ) | | | | 82,402 | |
| Euro (EUR) FX Futures, 12/17/12 | | | | Put | | | | | 1,010 | | | | | 1.175 | | | | | | | 10/8/12 | | | | | 138,198 | | | | | (6,313 | ) | | | | 131,885 | |
| Euro (EUR) FX Futures, 12/17/12 | | | | Put | | | | | 802 | | | | | 1.195 | | | | | | | 10/8/12 | | | | | 35,493 | | | | | (5,013 | ) | | | | 30,480 | |
| Euro (EUR) FX Futures, 12/17/12 | | | | Put | | | | | 764 | | | | | 1.245 | | | | | | | 10/8/12 | | | | | 24,824 | | | | | (14,325 | ) | | | | 10,499 | |
| Euro (EUR) FX Futures, 12/17/12 | | | | Put | | | | | 742 | | | | | 1.250 | | | | | | | 10/8/12 | | | | | 26,660 | | | | | (18,550 | ) | | | | 8,110 | |
| Euro (EUR) FX Futures, 12/17/12 | | | | Put | | | | | 671 | | | | | 1.230 | | | | | | | 10/8/12 | | | | | 92,316 | | | | | (4,194 | ) | | | | 88,122 | |
| | |
| 62 | | OPPENHEIMER GLOBAL STRATEGIC INCOME FUND |
| | | | | | | | | | | | | | | | | | | | | | | | | | | | | | | | | | | | | | | | |
| Written Options: Continued |
| Description | | Type | | Number of
Contracts | | Exercise
Price | | | | Expiration
Date | | Premiums
Received | | Value | | Unrealized
Appreciation/
(Depreciation) |
| Euro (EUR) FX Futures, 12/17/12 | | | | Put | | | | | 407 | | | | | $ 1.205 | | | | | | | | | | 11/12/12 | | | | $ | 60,055 | | | | $ | (35,613 | ) | | | $ | 24,442 | |
| Euro (EUR) FX Futures, 12/17/12 | | | | Put | | | | | 365 | | | | | 1.175 | | | | | | | | | | 11/12/12 | | | | | 158,950 | | | | | (9,125 | ) | | | | 149,825 | |
| Euro (EUR) FX Futures, 12/17/12 | | | | Put | | | | | 364 | | | | | 1.175 | | | | | | | | | | 12/10/12 | | | | | 249,351 | | | | | (45,500 | ) | | | | 203,851 | |
| Euro (EUR) FX Futures, 12/17/12 | | | | Put | | | | | 331 | | | | | 1.210 | | | | | | | | | | 12/10/12 | | | | | 125,567 | | | | | (111,713 | ) | | | | 13,854 | |
| Euro (EUR) FX Futures, 12/17/12 | | | | Put | | | | | 120 | | | | | 1.270 | | | | | | | | | | 10/8/12 | | | | | 28,387 | | | | | (28,500 | ) | | | | (113 | ) |
| Euro (EUR) FX Futures, 12/17/12 | | | | Put | | | | | 88 | | | | | 1.240 | | | | | | | | | | 10/8/12 | | | | | 2,474 | | | | | (1,100 | ) | | | | 1,374 | |
| Euro (EUR) FX Futures, 12/17/12 | | | | Put | | | | | 45 | | | | | 1.180 | | | | | | | | | | 10/8/12 | | | | | 2,179 | | | | | (281 | ) | | | | 1,898 | |
| Euro (EUR) FX Futures, 12/17/12 | | | | Put | | | | | 44 | | | | | 1.255 | | | | | | | | | | 10/8/12 | | | | | 3,270 | | | | | (2,200 | ) | | | | 1,070 | |
| Euro-Bundesobligation Futures, 12/6/12 | | | | Put | | | | | 827 | | | | | 137.500 | | | | | EUR | | | | | 10/29/12 | | | | | 116,048 | | | | | (95,646 | ) | | | | 20,402 | |
| Euro-Bundesobligation Futures, 12/6/12 | | | | Put | | | | | 413 | | | | | 136.000 | | | | | EUR | | | | | 10/29/12 | | | | | 15,428 | | | | | (15,922 | ) | | | | (494 | ) |
| Euro-Bundesobligation Futures, 12/6/12 | | | | Put | | | | | 8 | | | | | 137.000 | | | | | EUR | | | | | 10/29/12 | | | | | 917 | | | | | (617 | ) | | | | 300 | |
| France (Republic of) Bonds, 3%, 4/25/22 | | | | Put | | | | | 4,550,000 | | | | | 104.000 | | | | | EUR | | | | | 11/6/12 | | | | | 39,539 | | | | | (22,785 | ) | | | | 16,754 | |
| Hungarian Forint (HUF) | | | | Call | | | | | 33,540,000 | | | |
| 1EUR per
295.000HUF |
| | | | | | | | | 12/20/12 | | | | | 475,820 | | | | | (508,340 | ) | | | | (32,520 | ) |
| Japanese Yen (JPY) | | | | Call | | | | | 1,311,511,028 | | | |
| 1USD per
72.000JPY |
| | | | | | | | | 5/31/13 | | | | | 307,514 | | | | | (104,724 | ) | | | | 202,790 | |
| Japanese Yen (JPY) | | | | Call | | | | | 655,756,094 | | | |
| 1USD per
72.000JPY |
| | | | | | | | | 9/11/13 | | | | | 116,123 | | | | | (95,544 | ) | | | | 20,579 | |
| Japanese Yen (JPY) | | | | Call | | | | | 683,925,992 | | | |
| 1USD per
75.000JPY |
| | | | | | | | | 8/22/13 | | | | | 199,250 | | | | | (169,005 | ) | | | | 30,245 | |
| Japanese Yen (JPY) | | | | Put | | | | | 820,711,190 | | | |
| 1USD per
90.000JPY |
| | | | | | | | | 8/22/13 | | | | | 57,815 | | | | | (28,282 | ) | | | | 29,533 | |
| Japanese Yen (JPY) | | | | Put | | | | | 819,695,118 | | | |
| 1USD per
90.000JPY |
| | | | | | | | | 9/11/13 | | | | | 44,446 | | | | | (32,575 | ) | | | | 11,871 | |
| Japanese Yen (JPY) | | | | Put | | | | | 1,730,465,940 | | | |
| 1USD per
95.000JPY |
| | | | | | | | | 5/31/13 | | | | | 79,610 | | | | | (3,478 | ) | | | | 76,132 | |
| Japanese Yen (JPY) Futures, 12/17/12 | | | | Put | | | | | 992 | | | | | 123.500 | | | | | | | | | | 10/8/12 | | | | | 21,043 | | | | | (6,200 | ) | | | | 14,843 | |
| Japanese Yen (JPY) Futures, 12/17/12 | | | | Put | | | | | 729 | | | | | 121.000 | | | | | | | | | | 10/8/12 | | | | | 88,741 | | | | | (4,556 | ) | | | | 84,185 | |
| Japanese Yen (JPY) Futures, 12/17/12 | | | | Put | | | | | 407 | | | | | 125.500 | | | | | | | | | | 10/8/12 | | | | | 65,908 | | | | | (20,350 | ) | | | | 45,558 | |
| Japanese Yen (JPY) Futures, 12/17/12 | | | | Put | | | | | 357 | | | | | 124.000 | | | | | | | | | | 10/8/12 | | | | | 16,606 | | | | | (4,463 | ) | | | | 12,143 | |
| Japanese Yen (JPY) Futures, 12/17/12 | | | | Put | | | | | 150 | | | | | 123.000 | | | | | | | | | | 11/12/12 | | | | | 18,515 | | | | | (22,500 | ) | | | | (3,985 | ) |
| Mexican Nuevo Peso (MXN) | | | | Call | | | | | 355,600,000 | | | |
| 1USD per
12.500MXN |
| | | | | | | | | 12/20/12 | | | | | 183,490 | | | | | (164,934 | ) | | | | 18,556 | |
| Mexican Nuevo Peso (MXN) | | | | Call | | | | | 355,600,000 | | | |
| 1USD per
12.500MXN |
| | | | | | | | | 12/20/12 | | | | | 188,757 | | | | | (164,934 | ) | | | | 23,823 | |
| Mexican Nuevo Peso (MXN) | | | | Call | | | | | 355,600,000 | | | |
| 1USD per
12.500MXN |
| | | | | | | | | 12/20/12 | | | | | 202,550 | | | | | (164,934 | ) | | | | 37,616 | |
| | | | |
| OPPENHEIMER GLOBAL STRATEGIC INCOME FUND | | | 63 | |
STATEMENT OF INVESTMENTS Continued
Footnotes to Statement of Investments Continued
| | | | | | | | | | | | | | | | | | | | | | | | | | | | | | | | | | | | | | | | |
| Written Options: Continued |
| Description | | Type | | Number of
Contracts | | Exercise
Price | | | | Expiration
Date | | Premiums
Received | | Value | | Unrealized
Appreciation/
(Depreciation) |
| Russian Ruble (RUR) | | | | Put | | | | | 967,000,000 | | | |
| 1USD per
34.000RUR |
| | | | | | | | | 12/21/12 | | | | $ | 184,868 | | | | $ | (93,064 | ) | | | $ | 91,804 | |
| Russian Ruble (RUR) | | | | Put | | | | | 967,000,000 | | | |
| 1USD per
34.000RUR |
| | | | | | | | | 12/21/12 | | | | | 182,024 | | | | | (93,064 | ) | | | | 88,960 | |
| Russian Ruble (RUR) | | | | Put | | | | | 967,000,000 | | | |
| 1USD per
34.000RUR |
| | | | | | | | | 12/21/12 | | | | | 193,400 | | | | | (93,064 | ) | | | | 100,336 | |
| Russian Ruble (RUR) | | | | Put | | | | | 1,345,500,000 | | | |
| 1USD per
38.000RUR |
| | | | | | | | | 11/29/12 | | | | | 594,853 | | | | | (1,130 | ) | | | | 593,723 | |
| South African Rand (ZAR) | | | | Call | | | | | 310,850,000 | | | |
| 1USD per
7.893ZAR |
| | | | | | | | | 11/26/12 | | | | | 351,712 | | | | | (219,106 | ) | | | | 132,606 | |
| South African Rand (ZAR) | | | | Call | | | | | 226,100,000 | | | |
| 1USD per
7.950ZAR |
| | | | | | | | | 12/21/12 | | | | | 319,384 | | | | | (255,154 | ) | | | | 64,230 | |
| South African Rand (ZAR) | | | | Call | | | | | 226,100,000 | | | |
| 1USD per
7.950ZAR |
| | | | | | | | | 12/20/12 | | | | | 318,531 | | | | | (253,298 | ) | | | | 65,233 | |
| South African Rand (ZAR) | | | | Call | | | | | 226,100,000 | | | |
| 1USD per
7.950ZAR |
| | | | | | | | | 12/21/12 | | | | | 317,820 | | | | | (255,154 | ) | | | | 62,666 | |
| South African Rand (ZAR) | | | | Put | | | | | 355,675,000 | | | |
| 1USD per
9.023ZAR |
| | | | | | | | | 11/21/12 | | | | | 482,906 | | | | | (186,349 | ) | | | | 296,557 | |
| South African Rand (ZAR) | | | | Put | | | | | 354,950,000 | | | |
| 1USD per
9.013ZAR |
| | | | | | | | | 11/26/12 | | | | | 521,840 | | | | | (220,126 | ) | | | | 301,714 | |
| South African Rand (ZAR) | | | | Put | | | | | 256,000,000 | | | |
| 1USD per
9.000ZAR |
| | | | | | | | | 12/21/12 | | | | | 320,853 | | | | | (284,114 | ) | | | | 36,739 | |
| South African Rand (ZAR) | | | | Put | | | | | 256,000,000 | | | |
| 1USD per
9.000ZAR |
| | | | | | | | | 12/20/12 | | | | | 319,716 | | | | | (278,961 | ) | | | | 40,755 | |
| South African Rand (ZAR) | | | | Put | | | | | 256,000,000 | | | |
| 1USD per
9.000ZAR |
| | | | | | | | | 12/21/12 | | | | | 336,356 | | | | | (284,114 | ) | | | | 52,242 | |
| South African Rand (ZAR) | | | | Call | | | | | 311,425,000 | | | |
| 1USD per
7.900ZAR |
| | | | | | | | | 11/21/12 | | | | | 284,225 | | | | | (205,460 | ) | | | | 78,765 | |
| Spain (Kingdom of) Bonds, 5.85%, 1/31/22 | | | | Put | | | | | 2,270,000 | | | | | 95.800 | | | | | EUR | | | | | 10/4/12 | | | | | 75,861 | | | | | (76,997 | ) | | | | (1,136 | ) |
| Swedish Krona (SEK) | | | | Put | | | | | 427,000,000 | | | |
| 1USD per
6.800SEK |
| | | | | | | | | 12/20/12 | | | | | 438,931 | | | | | (522,503 | ) | | | | (83,572 | ) |
| Swedish Krona (SEK) | | | | Put | | | | | 427,000,000 | | | |
| 1USD per
6.800SEK |
| | | | | | | | | 12/20/12 | | | | | 482,887 | | | | | (522,503 | ) | | | | (39,616 | ) |
| U.S. Treasury Long Bonds Futures, 12/19/12 | | | | Call | | | | | 17 | | | | | 149.000 | | | | | | | | | | 10/1/12 | | | | | 14,852 | | | | | (6,641 | ) | | | | 8,211 | |
| U.S. Treasury Long Bonds Futures, 12/19/12 | | | | Put | | | | | 768 | | | | | 144.000 | | | | | | | | | | 10/8/12 | | | | | 22,399 | | | | | (24,000 | ) | | | | (1,601 | ) |
| U.S. Treasury Long Bonds Futures, 12/19/12 | | | | Put | | | | | 767 | | | | | 146.000 | | | | | | | | | | 10/8/12 | | | | | 50,892 | | | | | (71,906 | ) | | | | (21,014 | ) |
| U.S. Treasury Long Bonds Futures, 12/19/12 | | | | Put | | | | | 767 | | | | | 144.000 | | | | | | | | | | 10/15/12 | | | | | 44,160 | | | | | (47,938 | ) | | | | (3,778 | ) |
| U.S. Treasury Long Bonds, 20 yr. Futures, 12/19/12 | | | | Put | | | | | 2,160 | | | | | 139.000 | | | | | | | | | | 10/29/12 | | | | | 104,800 | | | | | (101,250 | ) | | | | 3,550 | |
| U.S. Treasury Long Bonds, 20 yr. Futures, 12/19/12 | | | | Put | | | | | 1,396 | | | | | 140.000 | | | | | | | | | | 10/29/12 | | | | | 80,950 | | | | | (87,250 | ) | | | | (6,300 | ) |
| U.S. Treasury Long Bonds, 20 yr. Futures, 12/19/12 | | | | Put | | | | | 767 | | | | | 140.000 | | | | | | | | | | 11/26/12 | | | | | 202,676 | | | | | (227,703 | ) | | | | (25,027 | ) |
| U.S. Treasury Long Bonds, 20 yr. Futures, 12/19/12 | | | | Put | | | | | 84 | | | | | 143.000 | | | | | | | | | | 10/29/12 | | | | | 14,400 | | | | | (14,438 | ) | | | | (38 | ) |
| U.S. Treasury Nts., 10 yr. Futures, 12/19/12 | | | | Put | | | | | 3,390 | | | | | 129.500 | | | | | | | | | | 10/29/12 | | | | | 124,478 | | | | | (52,969 | ) | | | | 71,509 | |
| | |
| 64 | | OPPENHEIMER GLOBAL STRATEGIC INCOME FUND |
| | | | | | | | | | | | | | | | | | | | | | | | | | | | | | | | | | | | | | | | |
| Written Options: Continued |
| Description | | Type | | Number of
Contracts | | Exercise
Price | | | | Expiration
Date | | Premiums
Received | | Value | | Unrealized
Appreciation/
(Depreciation) |
| U.S. Treasury Nts., 10 yr. Futures, 12/19/12 | | | | Put | | | | | 1,608 | | | | | $130.500 | | | | | | | 10/29/12 | | | | $ | 73,156 | | | | $ | (75,375 | ) | | | $ | (2,219 | ) |
| U.S. Treasury Nts., 10 yr. Futures, 12/19/12 | | | | Put | | | | | 404 | | | | | 129.500 | | | | | | | 11/26/12 | | | | | 37,317 | | | | | (44,188 | ) | | | | (6,871 | ) |
| U.S. Treasury Nts., 10 yr. Futures, 12/19/12 | | | | Put | | | | | 202 | | | | | 130.000 | | | | | | | 10/29/12 | | | | | 6,034 | | | | | (6,313 | ) | | | | (279 | ) |
| | | | | | | | | | | | | | | | | | | | | | | | | | |
|
|
| | |
|
|
| | |
|
|
|
| | | | | | | | | | | | | | | | | | | | | | | | | | $ | 11,529,540 | | | | $ | (7,476,854 | ) | | | $ | 4,052,686 | |
| | | | | | | | | | | | | | | | | | | | | | | | | | |
|
|
| | |
|
|
| | |
|
|
|
|
| Exercise price is reported in U.S. Dollars (USD), except for those denoted in the following currency: | |
| EUR | | | | Euro | | | | | | | | | | | | | | | | | | | | | | | | | | | | | | | | | |
| | | | | | | | | | | | | | | | | | | | | | | | | | | | | | | | | | | | | | | | |
| Credit Default Swap Contracts as of September 28, 2012 are as follows: |
Reference Entity/
Swap Counterparty | | Buy/Sell
Credit
Protection | | Notional
Amount
(000’s) | | | | Pay/
Receive
Fixed
Rate | | Termination
Date | | Upfront
Payment
Received/
(Paid) | | Value | | Unrealized
Appreciation
(Depreciation) |
| Banco Bilbao Vizcaya Argentaria Senior Finance SAU: | |
| UBS AG | | | | Sell | | | | | 470 | | | EUR | | | | 3.0 | % | | | | 12/20/17 | | | | $ | 18,326 | | | | $ | 1,335 | | | | $ | 19,661 | |
| UBS AG | | | | Sell | | | | | 470 | | | EUR | | | | 3.0 | | | | | 12/20/17 | | | | | 18,847 | | | | | 814 | | | | | 19,661 | |
| | | | | | | | |
|
|
| | | | | | | | | | | | | | | |
|
|
| | |
|
|
| | |
|
|
|
| | | | | Total | | | | | 940 | | | EUR | | | | | | | | | | | | | | 37,173 | | | | | 2,149 | | | | | 39,322 | |
| Banco Santander SA | |
| UBS AG | | | | Sell | | | | | 900 | | | EUR | | | | 3.0 | | | | | 9/20/17 | | | | | (3,245 | ) | | | | (30,333 | ) | | | | (33,578 | ) |
| | | | | | | | |
|
|
| | | | | | | | | | | | | | | |
|
|
| | |
|
|
| | |
|
|
|
| | | | | Total | | | | | 900 | | | EUR | | | | | | | | | | | | | | (3,245 | ) | | | | (30,333 | ) | | | | (33,578 | ) |
| Barrick Gold Corp. | |
| Goldman Sachs International | | | | Buy | | | | | 16,940 | | | | | | | 1.0 | | | | | 9/20/17 | | | | | (476,996 | ) | | | | 323,627 | | | | | (153,369 | ) |
| | | | | | | | |
|
|
| | | | | | | | | | | | | | | |
|
|
| | |
|
|
| | |
|
|
|
| | | | | Total | | | | | 16,940 | | | | | | | | | | | | | | | | | (476,996 | ) | | | | 323,627 | | | | | (153,369 | ) |
| Caterpillar, Inc. | |
| Citibank NA | | | | Buy | | | | | 17,230 | | | | | | | 1.0 | | | | | 9/20/17 | | | | | 37,811 | | | | | (25,773 | ) | | | | 12,038 | |
| | | | | | | | |
|
|
| | | | | | | | | | | | | | | |
|
|
| | |
|
|
| | |
|
|
|
| | | | | Total | | | | | 17,230 | | | | | | | | | | | | | | | | | 37,811 | | | | | (25,773 | ) | | | | 12,038 | |
| CDX Emerging Market Index, Series 17 | |
| Deutsche Bank AG | | | | Buy | | | | | 19,070 | | | | | | | 5.0 | | | | | 6/20/17 | | | | | 2,484,397 | | | | | (2,436,032 | ) | | | | 48,365 | |
| | | | | | | | |
|
|
| | | | | | | | | | | | | | | |
|
|
| | |
|
|
| | |
|
|
|
| | | | | Total | | | | | 19,070 | | | | | | | | | | | | | | | | | 2,484,397 | | | | | (2,436,032 | ) | | | | 48,365 | |
| Dell, Inc. | |
| Goldman Sachs International | | | | Buy | | | | | 17,230 | | | | | | | 1.0 | | | | | 12/20/17 | | | | | (1,297,849 | ) | | | | 1,251,602 | | | | | (46,247 | ) |
| | | | | | | | |
|
|
| | | | | | | | | | | | | | | |
|
|
| | |
|
|
| | |
|
|
|
| | | | | Total | | | | | 17,230 | | | | | | | | | | | | | | | | | (1,297,849 | ) | | | | 1,251,602 | | | | | (46,247 | ) |
| Devon Energy Corp. | |
| Goldman Sachs International | | | | Buy | | | | | 17,230 | | | | | | | 1.0 | | | | | 12/20/17 | | | | | 195,503 | | | | | (197,481 | ) | | | | (1,978 | ) |
| | | | | | | | |
|
|
| | | | | | | | | | | | | | | |
|
|
| | |
|
|
| | |
|
|
|
| | | | | Total | | | | | 17,230 | | | | | | | | | | | | | | | | | 195,503 | | | | | (197,481 | ) | | | | (1,978 | ) |
| Expedia, Inc. | |
| Credit Suisse International | | | | Sell | | | | | 16,940 | | | | | | | 1.0 | | | | | 9/20/17 | | | | | 547,171 | | | | | (478,150 | ) | | | | 69,021 | |
| | | | | | | | |
|
|
| | | | | | | | | | | | | | | |
|
|
| | |
|
|
| | |
|
|
|
| | | | | Total | | | | | 16,940 | | | | | | | | | | | | | | | | | 547,171 | | | | | (478,150 | ) | | | | 69,021 | |
| Gap, Inc. (The) | |
| Bank of America NA | | | | Sell | | | | | 16,940 | | | | | | | 1.0 | | | | | 9/20/17 | | | | | 866,292 | | | | | (340,150 | ) | | | | 526,142 | |
| | | | | | | | |
|
|
| | | | | | | | | | | | | | | |
|
|
| | |
|
|
| | |
|
|
|
| | | | | Total | | | | | 16,940 | | | | | | | | | | | | | | | | | 866,292 | | | | | (340,150 | ) | | | | 526,142 | |
| | | | |
| OPPENHEIMER GLOBAL STRATEGIC INCOME FUND | | | 65 | |
STATEMENT OF INVESTMENTS Continued
Footnotes to Statement of Investments Continued
| | | | | | | | | | | | | | | | | | | | | | | | | | | | | | | | | | | | | |
| Credit Default Swap Contracts: Continued |
Reference Entity/
Swap Counterparty | | Buy/Sell
Credit
Protection | | Notional
Amount
(000’s) | | | | Pay/
Receive
Fixed
Rate | | Termination
Date | | Upfront
Payment
Received/
(Paid) | | Value | | Unrealized
Appreciation
(Depreciation) |
| Halliburton Co. | |
| Credit Suisse International | | | | Buy | | | | $ | 16,940 | | | | | | | 1.0 | % | | | | 9/20/17 | | | | $ | 91,012 | | | | $ | (299,755 | ) | | | $ | (208,743 | ) |
| | | | | | | | |
|
|
| | | | | | | | | | | | | | |
|
|
| | |
|
|
| | |
|
|
|
| | | | | Total | | | | | 16,940 | | | | | | | | | | | | | | | | | 91,012 | | | | | (299,755 | ) | | | | (208,743 | ) |
| Hungary (Republic of) | |
| Barclays Bank plc | | | | Sell | | | | | 11,630 | | | | | | | 1.0 | | | | | 12/20/17 | | | | | 1,476,747 | | | | | (1,530,515 | ) | | | | (53,768 | ) |
| | | | | | | | |
|
|
| | | | | | | | | | | | | | |
|
|
| | |
|
|
| | |
|
|
|
| | | | | Total | | | | | 11,630 | | | | | | | | | | | | | | | | | 1,476,747 | | | | | (1,530,515 | ) | | | | (53,768 | ) |
| Istanbul Bond Co. SA for Finansbank AS | |
| Morgan Stanley Capital Services, Inc. | | | | Sell | | | | | 15,590 | | | | | | | 1.3 | | | | | 3/24/13 | | | | | — | | | | | (73,179 | ) | | | | (73,179 | ) |
| | | | | | | | |
|
|
| | | | | | | | | | | | | | |
|
|
| | |
|
|
| | |
|
|
|
| | | | | Total | | | | | 15,590 | | | | | | | | | | | | | | | | | — | | | | | (73,179 | ) | | | | (73,179 | ) |
| M.D.C. Holdings, Inc. | |
| Deutsche Bank AG | | | | Sell | | | | | 16,940 | | | | | | | 1.0 | | | | | 9/20/17 | | | | | 499,521 | | | | | (141,060 | ) | | | | 358,461 | |
| | | | | | | | |
|
|
| | | | | | | | | | | | | | |
|
|
| | |
|
|
| | |
|
|
|
| | | | | Total | | | | | 16,940 | | | | | | | | | | | | | | | | | 499,521 | | | | | (141,060 | ) | | | | 358,461 | |
| Peru (Republic of) | |
| Deutsche Bank AG | | | | Buy | | | | | 7,900 | | | | | | | 1.0 | | | | | 12/20/17 | | | | | (18,793 | ) | | | | 38,911 | | | | | 20,118 | |
| | | | | | | | |
|
|
| | | | | | | | | | | | | | |
|
|
| | |
|
|
| | |
|
|
|
| | | | | Total | | | | | 7,900 | | | | | | | | | | | | | | | | | (18,793 | ) | | | | 38,911 | | | | | 20,118 | |
| Sherwin-Williams Co. (The) | |
| Deutsche Bank AG | | | | Sell | | | | | 16,940 | | | | | | | 1.0 | | | | | 9/20/17 | | | | | (305,281 | ) | | | | 376,248 | | | | | 70,967 | |
| | | | | | | | |
|
|
| | | | | | | | | | | | | | |
|
|
| | |
|
|
| | |
|
|
|
| | | | | Total | | | | | 16,940 | | | | | | | | | | | | | | | | | (305,281 | ) | | | | 376,248 | | | | | 70,967 | |
| SLM Corp. | |
| Deutsche Bank AG | | | | Sell | | | | | 16,940 | | | | | | | 5.0 | | | | | 9/20/17 | | | | | (476,913 | ) | | | | 1,160,710 | | | | | 683,797 | |
| | | | | | | | |
|
|
| | | | | | | | | | | | | | |
|
|
| | |
|
|
| | |
|
|
|
| | | | | Total | | | | | 16,940 | | | | | | | | | | | | | | | | | (476,913 | ) | | | | 1,160,710 | | | | | 683,797 | |
| Spain (Kingdom of): | |
| Goldman Sachs International | | | | Buy | | | | | 2,260 | | | EUR | | | | 1.0 | | | | | 9/20/22 | | | | | (362,365 | ) | | | | 399,734 | | | | | 37,369 | |
| Goldman Sachs International | | | | Buy | | | | | 2,360 | | | EUR | | | | 1.0 | | | | | 12/20/22 | | | | | (468,769 | ) | | | | 469,528 | | | | | 759 | |
| UBS AG | | | | Buy | | | | | 900 | | | EUR | | | | 1.0 | | | | | 9/20/17 | | | | | (68,642 | ) | | | | 86,950 | | | | | 18,308 | |
| | | | | | | | |
|
|
| | | | | | | | | | | | | | |
|
|
| | |
|
|
| | |
|
|
|
| | | | | Total | | | | | 5,520 | | | EUR | | | | | | | | | | | | | | (899,776 | ) | | | | 956,212 | | | | | 56,436 | |
| United Mexican States | |
| Barclays Bank plc | | | | Sell | | | | | 4,910 | | | | | | | 1.0 | | | | | 12/20/17 | | | | | (15,574 | ) | | | | (14,320 | ) | | | | (29,894 | ) |
| | | | | | | | |
|
|
| | | | | | | | | | | | | | |
|
|
| | |
|
|
| | |
|
|
|
| | | | | Total | | | | | 4,910 | | | | | | | | | | | | | | | | | (15,574 | ) | | | | (14,320 | ) | | | | (29,894 | ) |
| | | | | | | | | | | | | | | | | | | | | | | | | |
|
|
| | |
|
|
| | |
|
|
|
| | | | | | | | | | | | | | | | | Grand Total Buys | | | | | 115,309 | | | | | (388,689 | ) | | | | (273,380 | ) |
| | | | | | | | | | | | | | | | | Grand Total Sells | | | | | 2,625,891 | | | | | (1,068,600 | ) | | | | 1,557,291 | |
| | | | | | | | | | | | | | | | | | | | | | | | | |
|
|
| | |
|
|
| | |
|
|
|
| | | | | | | | | | | | | Total Credit Default Swaps | | | | $ | 2,741,200 | | | | $ | (1,457,289 | ) | | | $ | 1,283,911 | |
| | | | | | | | | | | | | | | | | | | | | | | | | |
|
|
| | |
|
|
| | |
|
|
|
Notional amount is reported in U.S. Dollars (USD), except for those denoted in the following currency:
| | |
| 66 | | OPPENHEIMER GLOBAL STRATEGIC INCOME FUND |
The table that follows shows the undiscounted maximum potential payment by the Fund related to selling credit protection in credit default swaps:
| | | | | | | | | | | | | | | |
Type of Reference Asset on which the Fund Sold
Protection | | Total Maximum Potential
Payments for Selling
Credit Protection
(Undiscounted) | | Amount
Recoverable* | | Reference
Asset Rating
Range** |
| Investment Grade Single Name Corporate Debt | | | | 1,840,000 | EUR | | | $ | — | | | | | A-to BBB+ | |
| Investment Grade Single Name Corporate Debt | | | | 50,820,000 | USD | | | | — | | | | | A to BBB- | |
| Non-Investment Grade Single Name Corporate Debt | | | | 49,470,000 | USD | | | | — | | | | | BB+ | |
| Investment Grade Sovereign Debt | | | | 4,910,000 | USD | | | | — | | | | | BBB | |
| Non-Investment Grade Sovereign Debt | | | | 11,630,000 | USD | | | | — | | | | | BB+ | |
| | | |
|
|
| | | | | |
| Total EUR | | | | 1,840,000 | EUR | | | $ | — | | | | | | |
| | | |
|
|
| | | | | |
| Total USD | | | $ | 116,830,000 | | | | $ | — | | | | | | |
| | | |
|
|
| | | | | |
* The Fund has no amounts recoverable from related purchased protection. In addition, the Fund has no recourse provisions under the credit derivatives and holds no collateral which can offset or reduce potential payments under a triggering event.
** The period end reference asset security ratings, as rated by any rating organization, are included in the equivalent Standard & Poor’s rating category. The reference asset rating represents the likelihood of a potential credit event on the reference asset which would result in a related payment by the Fund.
| | | | | | | | | | | | | | | | | | | | | | | | | | | | | | |
| Interest Rate Swap Contracts as of September 28, 2012 are as follows: |
Interest Rate/
Swap Counterparty | | Notional
Amount
(000’s) | | | | Paid by the Fund | | Received by
the Fund | | Termination
Date | | Value |
| BZDI: | | | | | | | | | | | | | | | | | | | | | | | | | | | | | | |
| Bank of America NA | | | | 36,410 | | | | | BRR | | | | | BZDI | | | | | 8.090 | % | | | | 1/2/15 | | | | $ | (34,012) | |
| Deutsche Bank AG | | | | 62,360 | | | | | BRR | | | | | BZDI | | | | | 8.080 | | | | | 1/2/15 | | | | | (70,415) | |
| Goldman Sachs International | | | | 105,880 | | | | | BRR | | | | | BZDI | | | | | 7.650 | | | | | 1/2/14 | | | | | (10,334) | |
| Goldman Sachs International | | | | 113,825 | | | | | BRR | | | | | BZDI | | | | | 8.640 | | | | | 1/2/17 | | | | | (314,688) | |
| Goldman Sachs International | | | | 41,530 | | | | | BRR | | | | | BZDI | | | | | 8.080 | | | | | 1/2/15 | | | | | (33,590) | |
| | | |
|
|
| | | | | | | | | | | | | | | | | | | | | | |
|
|
|
| Total | | | | 360,005 | | | | | BRR | | | | | | | | | | | | | | | | | | | | (463,039) | |
| Six-Month AUD BBR BBSW: | | | | | | | | | | | | | | | | | | | | | | | | | | |
| Bank of America NA | | | | 7,095 | | | | | AUD | | | |
| Six-Month AUD
BBR BBSW |
| | | | 3.680 | | | | | 9/28/22 | | | | | 16,592 | |
| Barclays Bank plc | | | | 20,615 | | | | | AUD | | | |
| Six-Month AUD
BBR BBSW |
| | | | 4.029 | | | | | 7/3/22 | | | | | (702,356) | |
| | | |
|
|
| | | | | | | | | | | | | | | | | |
|
|
|
| Total | | | | 27,710 | | | | | AUD | | | | | | | | | | | | | | | | | | | | (685,764) | |
| Six-Month EUR EURIBOR | | | | | | | | | | | | | | | | | | | | | | | | | | | | | | |
| Barclays Bank plc | | | | 17,635 | | | | | EUR | | | |
| Six-Month EUR
EURIBOR |
| | | | 1.734 | | | | | 10/2/22 | | | | | — | |
| Six-Month JPY BBA LIBOR | | | | | | | | | | | | | | | | | | | | | | | | | | | | | | |
| Barclays Bank plc | | | | 1,769,000 | | | | | JPY | | | | | 0.786 | % | | |
| Six-Month
JPY BBA
LIBOR |
| | | | 10/2/22 | | | | | (15,791) | |
| Three-Month CAD BA CDOR: | | | | | | | | | | | | | | | | | | | | | | | | | | |
| Bank of America NA | | | | 22,335 | | | | | CAD | | | | | 1.538 | | | |
| Three-Month
CAD BA
CDOR |
| | | | 8/13/13 | | | | | (70,673) | |
| | | | |
| OPPENHEIMER GLOBAL STRATEGIC INCOME FUND | | | 67 | |
STATEMENT OF INVESTMENTS Continued
Footnotes to Statement of Investments Continued
| | | | | | | | | | | | | | | | | | | | | | | | | | | | | | |
| Interest Rate Swap Contracts: Continued |
| Interest Rate/ Swap Counterparty | | Notional
Amount
(000’s) | | | | Paid by the Fund | | Received by the
Fund | | Termination
Date | | Value |
| Three-Month CAD BA CDOR: Continued | | | | | | | | | | | | | | | | | | | | | |
| Bank of America NA | | | | 8,920 | | | | | CAD | | | | | 1.590 | % | | |
| Three-Month
CAD BA CDOR |
| | | | 8/7/14 | | | | $ | (51,461 | ) |
| Bank of America NA | | | | 18,165 | | | | | CAD | | | | | 2.530 | | | |
| Three-Month
CAD BA CDOR |
| | | | 9/24/22 | | | | | (656,123 | ) |
| Bank of America NA | | | | 36,335 | | | | | CAD | | | | | 2.610 | | | |
| Three-Month
CAD BA CDOR |
| | | | 9/21/22 | | | | | (1,606,360 | ) |
| | | |
|
|
| | | | | | | | | | | | | | | | | |
|
|
|
| Total where Fund pays a fixed rate | | | | 85,755 | | | | | CAD | | | | | | | | | | | | | | | | | | | | (2,384,617 | ) |
| | | |
|
|
| | | | | | | | | | | | | | | | | |
|
|
|
| Bank of America NA | | | | 4,560 | | | | | CAD | | | |
| Three-Month CAD
BA CDOR |
| | | | 2.079 | % | | | | 7/11/22 | | | | | (8,100 | ) |
| Bank of America NA | | | | 4,555 | | | | | CAD | | | |
| Three-Month CAD
BA CDOR |
| | | | 2.010 | | | | | 7/25/22 | | | | | (39,949 | ) |
| | | |
|
|
| | | | | | | | | | | | | | | | | |
|
|
|
| Total where Fund pays a variable rate | | | | 9,115 | | | | | CAD | | | | | | | | | | | | | | | | | | | | (48,049 | ) |
| | | |
|
|
| | | | | | | | | | | | | | | | | |
|
|
|
| Total | | | | 94,870 | | | | | CAD | | | | | | | | | | | | | | | | | | | | (2,432,666 | ) |
| Three-Month USD BBA LIBOR: | | | | | | | | | | | | | | | | | | | | | | | | | | |
| Citibank NA | | | | 18,250 | | | | | | | | | | 0.819 | | | |
| Three-Month USD
BBA LIBOR |
| | | | 9/17/17 | | | | | (59,425 | ) |
| Bank of America NA | | | | 4,280 | | | | | | | | | | 1.550 | | | |
| Three-Month USD
BBA LIBOR |
| | | | 7/27/22 | | | | | 39,597 | |
| Bank of America NA | | | | 4,380 | | | | | | | | | | 1.621 | | | |
| Three-Month USD
BBA LIBOR |
| | | | 7/13/22 | | | | | 6,518 | |
| | | |
|
|
| | | | | | | | | | | | | | | | | |
|
|
|
| Total where Fund pays a fixed rate | | | | 26,910 | | | | | | | | | | | | | | | | | | | | | | | | | (13,310 | ) |
| | | |
|
|
| | | | | | | | | | | | | | | | | |
|
|
|
| Barclays Bank plc | | | | 21,440 | | | | | | | | |
| Three-Month USD
BBA LIBOR |
| | | | 2.358 | | | | | 11/2/21 | | | | | 1,675,002 | |
| | | |
|
|
| | | | | | | | | | | | | | | | | |
|
|
|
| Total where Fund pays a variable rate | | | | 21,440 | | | | | | | | | | | | | | | | | | | | | | | | | 1,675,002 | |
| | | |
|
|
| | | | | | | | | | | | | | | | | |
|
|
|
| Total | | | | 48,350 | | | | | | | | | | | | | | | | | | | | | | | | | 1,661,692 | |
| | | | | | | | | | | | | | | | | | | | | | | |
|
|
|
| | | | | | | | | | | | | | | | | | | | Total Interest Rate Swaps | | | | $ | (1,935,568 | ) |
| | | | | | | | | | | | | | | | | | | | | | | | | | | | |
|
|
|
Notional amount is reported in U.S. Dollars (USD), except for those denoted in the following currencies:
| | |
| AUD | | Australian Dollar |
| BRR | | Brazilian Real |
| CAD | | Canadian Dollar |
| EUR | | Euro |
| JPY | | Japanese Yen |
| | |
| Abbreviations/Definitions are as follows: |
| BA CDOR | | Canada Bankers Acceptances Deposit Offering Rate |
| BBA LIBOR | | British Bankers’ Association London-Interbank Offered Rate |
| BBR BBSW | | Bank Bill Swap Reference Rate (Australian Financial Market) |
| BZDI | | Brazil Interbank Deposit Rate |
| EURIBOR | | Euro Interbank Offered Rate |
| | |
| 68 | | OPPENHEIMER GLOBAL STRATEGIC INCOME FUND |
| | | | | | | | | | | | | | | | | | | | | | | | |
| Total Return Swap Contracts as of September 28, 2012 are as follows: |
Reference Entity/
Swap Counterparty | | Notional
Amount
(000’s) | | | | Paid by
the Fund | | Received by
the Fund | | Termination
Date | | Value |
| Custom Basket of Securities: | | | | | | | | | | | | | | | | | | | | |
| Citibank NA | | | | 15,282 | | | | | AUD | | | One-Month AUD BBA LIBOR plus 50 basis points, and if negative, the absolute value of the Total Return of a Custom Basket of Securities | | If positive, the Total Return of a Custom Basket of Securities | | | | 3/8/13 | | | | $ | 246,057 | |
| Citibank NA | | | | 15,334 | | | | | CAD | | | One-Month CAD BA CDOR plus 30 basis points, and if negative, the absolute value of the Total Return of a Custom Basket of Securities | | If positive, the Total Return of a Custom Basket of Securities | | | | 3/6/13 | | | | | 350,363 | |
| Goldman Sachs International | | | | 85,967 | | | | | | | | One-Month USD BBA LIBOR plus 18 basis points, and if negative, the absolute value of the Total Return of a Custom Basket of Securities | | If positive, the Total Return of a Custom Basket of Securities | | | | 9/9/13 | | | | | 1,658,889 | |
| Goldman Sachs International | | | | 11,665 | | | | | | | | One-Month USD BBA LIBOR plus 25 basis points, and if negative, the absolute value of the Total Return of a Custom Basket of Securities | | If positive, the Total Return of a Custom Basket of Securities | | | | 9/9/13 | | | | | 76,607 | |
| Goldman Sachs International | | | | 119,600 | | | | | HKD | | | One-Month HKD HIBOR HKAB plus 40 basis points, and if negative, the absolute value of the Total Return of a Custom Basket of Securities | | If positive, the Total Return of a Custom Basket of Securities | | | | 9/12/13 | | | | | 1,235,222 | |
| Morgan Stanley & Co. International plc | | | | 4,893 | | | | | GBP | | | One-Month GBP BBA LIBOR plus 50 basis points and if negative, the absolute value of the Total Return of a Custom Basket of Securities | | If positive, the Total Return of a Custom Basket of Securities | | | | 1/10/13 | | | | | 61,257 | |
| | | | | | | | | | | | | | | Reference Entity Total | | | | | 3,628,395 | |
| | | | |
| OPPENHEIMER GLOBAL STRATEGIC INCOME FUND | | | 69 | |
STATEMENT OF INVESTMENTS Continued
Footnotes to Statement of Investments Continued
| | | | | | | | | | | | | | | | | | | | | | | | |
| Total Return Swap Contracts: Continued |
Reference Entity/
Swap Counterparty | | Notional
Amount
(000’s) | | | | Paid by
the Fund | | Received by
the Fund | | Termination
Date | | Value |
| HANG SENG Index Futures Contract expiring 10/30/12 | |
| Goldman Sachs International | | | | 136,803 | | | | | HKD | | | If positive, the Total Return of the HANG SENG Index Futures Contract expiring 10/30/12 | | If negative, the absolute value of the Total Return of the HANG SENG Index Futures Contract expiring 10/30/12 | | | | 11/6/12 | | | | $ | (125,292 | ) |
| IBOVESPA Futures Contract expiring 10/17/12 | |
| Goldman Sachs International | | | | 5,478 | | | | | | | | If positive, the Total Return of the IBOVESPA Futures Contract expiring 10/17/12 | | If negative, the absolute value of the Total Return of the IBOVESPA Futures Contract expiring 10/17/12 | | | | 10/18/12 | | | | | (302,102 | ) |
| | | | | | | | | | | | | | | Total of Total Return Swaps | | | | $ | 3,201,001 | |
| | | | | | | | | | | | | | | | | | | | | | |
|
|
|
Notional amount is reported in U.S. Dollars (USD), except for those denoted in the following currencies:
| | |
| AUD | | Australian Dollar |
| CAD | | Canadian Dollar |
| GBP | | British Pounds Sterling |
| HKD | | Hong Kong Dollar |
Abbreviations are as follows:
| | |
| BA CDOR | | Canada Bankers Acceptances Deposit offering Rate |
| BBA LIBOR | | British Bankers’ Association London-Interbank Offered Rate |
| HANG SENG | | Hang Seng Bank |
| HIBOR | | Hong Kong Interbank Offered Rate |
| HKAB | | Hong Kong Association of Banks |
| IBOVESPA | | Index of stocks that trade on the Sao Paulo, Mercantile & Futures Exchange |
| | | | | | | | | | | | | | | | | | | | | | | | | | | |
| Volatility Swaps as of September 28, 2012 are as follows: |
Reference Entity/
Swap Counterparty | | Notional
Amount
(000’s) | | | | Paid by
the Fund | | Received by
the Fund | | Termination
Date | | Value |
| AUD/CHF Spot Exchange Rate: | | | | | | | | | | | | | | | |
| Bank of America NA | | | | 193 | | | AUD | | The Historic Volatility of the mid AUD/CHF spot exchange rate during the period 9/26/12 to 10/29/12 | | | | 7.450 | % | | | | 10/31/12 | | | | $ | (29,310 | ) |
| Credit Suisse International | | | | 192 | | | AUD | | The Historic Volatility of the mid AUD/CHF spot exchange rate during the period 9/20/12 to 10/22/12 | | | | 7.500 | | | | | 10/24/12 | | | | | 124,774 | |
| JPMorgan Chase Bank NA | | | | 191 | | | AUD | | The Historic Volatility of the mid AUD/CHF spot exchange rate during the period 9/25/12 to 10/25/12 | | | | 7.150 | | | | | 10/29/12 | | | | | (40,286 | ) |
| | | | | | | | | | | | | | | | | | | |
|
|
|
| | | | | | | | | | | | | | Reference Entity Total | | | | | 55,178 | |
| | |
| 70 | | OPPENHEIMER GLOBAL STRATEGIC INCOME FUND |
| | | | | | | | | | | | | | | | | | | | | | | | | | | |
| Volatility Swaps: Continued |
Reference Entity/
Swap Counterparty | | Notional
Amount
(000’s) | | | | Paid by
the Fund | | Received by
the Fund | | Termination
Date | | Value |
| EUR/CHF Spot Exchange Rate: | | | | | | | | | | | | | | | |
| Credit Suisse International | | | | 153 | | | | | EUR | | | The Historic Volatility of the mid EUR/CHF spot exchange rate during the period 9/19/12 to 10/18/12 | | | | 3.500 | % | | | | 10/22/12 | | | | $ | 173,039 | |
| Morgan Stanley Capital Services, Inc. | | | | 153 | | | | | EUR | | | The Historic Volatility of the mid EUR/CHF spot exchange rate during the period 9/18/12 to 10/18/12 | | | | 3.700 | | | | | 10/22/12 | | | | | 216,216 | |
| | | | | | | | | | | | | | | | | | | | | |
|
|
|
| | | | | | | | | | | | | | | | | Reference Entity Total | | | | | 389,255 | |
| EUR/JPY Spot Exchange Rate | |
| Morgan Stanley Capital Services, Inc. | | | | 152 | | | | | EUR | | | 10.250% | | |
| The
Historic
Volatility
of the
mid
EUR/JPY
spot
exchange
rate
during
the
period
9/14/12
to
10/17/12 |
| | | | 10/19/12 | | | | | (39,733 | ) |
| EUR/NZD Spot Exchange Rate | |
| Goldman Sachs Bank USA | | | | 155 | | | | | EUR | | | The Historic Volatility of the mid EUR/NZD spot exchange rate during the period 9/13/12 to 10/15/12 | | | | 6.900 | | | | | 10/17/12 | | | | | (296,925 | ) |
| GBP/CAD Spot Exchange Rate: | |
| Bank of America NA | | | | 124 | | | | | GBP | | | The Historic Volatility of the mid GBP/CAD spot exchange rate during the period 9/28/12 to 10/31/12 | | | | 5.600 | | | | | 11/2/12 | | | | | — | |
| Credit Suisse International | | | | 123 | | | | | GBP | | | The Historic Volatility of the mid GBP/CAD spot exchange rate during the period 9/27/12 to 10/30/12 | | | | 5.700 | | | | | 11/1/12 | | | | | (37,024 | ) |
| | | | | | | | | | | | | | | | | | | | | |
|
|
|
| | | | | | | | | | | | | | | | | Reference Entity Total | | | | | (37,024 | ) |
| | | | |
| OPPENHEIMER GLOBAL STRATEGIC INCOME FUND | | | 71 | |
STATEMENT OF INVESTMENTS Continued
Footnotes to Statement of Investments Continued
| | | | | | | | | | | | | | | | | | | | | | | | |
| Volatility Swaps: Continued |
Reference Entity/
Swap Counterparty | | Notional
Amount
(000’s) | | | | Paid by
the Fund | | Received by
the Fund | | Termination
Date | | Value |
| GBP/CHF Spot Exchange Rate | | | | | | | | | | | | |
| JPMorgan Chase Bank NA | | | | 126 | | | GBP | | The Historic Volatility of the mid GBP/CHF spot exchange rate during the period 9/6/12 to 10/8/12 | | 6.500% | | | | 10/10/12 | | | | $ | 238,622 | |
| GBP/JPY Spot Exchange Rate: | | | | | | | | | | | | | | | | | |
| Deutsche Bank AG | | | | 126 | | | GBP | | 8.550% | | The Historic Volatility of the mid GBP/JPY spot exchange rate during the period 8/31/12 to 10/2/12 | | | | 10/4/12 | | | | | (228,628 | ) |
| Total where Fund pays a fixed rate | | | | 126 | | | GBP | | | | | | | | | | | | | (228,628 | ) |
| Bank of America NA | | | | 126 | | | GBP | | The Historic Volatility of the mid GBP/JPY spot exchange rate during the period 9/5/12 to 10/4/12 | | 8.050 | | | | 10/9/12 | | | | | (431,816 | ) |
| BNP Paribas | | | | 126 | | | GBP | | The Historic Volatility of the mid GBP/JPY spot exchange rate during the period 9/4/12 to 10/4/12 | | 8.300 | | | | 10/9/12 | | | | | (337,835 | ) |
| Goldman Sachs International | | | | 126 | | | GBP | | The Historic Volatility of the mid GBP/JPY spot exchange rate during the period 8/30/12 to 10/2/12 | | 8.650 | | | | 10/4/12 | | | | | (170,159 | ) |
| Total where Fund pays a variable rate | | | | 378 | | | GBP | | | | | | | | | | | | | (939,810 | ) |
| | | | | | | | | | | | Reference Entity Total | | | | | (1,168,438 | ) |
| JPY/EUR Spot Exchange Rate | | | | | | | | | | | | | | | | | |
| JPMorgan Chase Bank NA | | | | 152 | | | EUR | | 10.500 | | The Historic Volatility of the mid JPY/EUR spot exchange rate during the period 9/17/12 to 10/17/12 | | | | 10/19/12 | | | | | (278,929 | ) |
| NZD/CHF Spot Exchange Rate | | | | | | | | | | | | | | |
| Morgan Stanley Capital Services, Inc. | | | | 244 | | | NZD | | The Historic Volatility of the mid NZD/CHF spot exchange rate during the period 9/12/12 to 10/11/12 | | 7.250 | | | | 10/15/12 | | | | | (546,110 | ) |
| | |
| 72 | | OPPENHEIMER GLOBAL STRATEGIC INCOME FUND |
| | | | | | | | | | | | | | | | | | | | | | | | |
| Volatility Swaps: Continued |
Reference Entity/
Swap Counterparty | | Notional
Amount
(000’s) | | | | Paid by
the Fund | | Received by
the Fund | | Termination
Date | | Value |
| USD/SEK Spot Exchange Rate: | | | | | | | | | | | | | | |
| Deutsche Bank AG | | | $ | 200 | | | | | 9.575% | | The Historic Volatility of the mid USD/SEK spot exchange rate during the period 9/10/12 to 10/10/12 | | | | 10/12/12 | | | | $ | 241,445 | |
| JPMorgan Chase Bank NA | | | | 200 | | | | | 9.600 | | The Historic Volatility of the mid USD/SEK spot exchange rate during the period 9/7/12 to 10/9/12 | | | | 10/11/12 | | | | | 207,781 | |
| | | | | | | | | | | | Reference Entity Total | | | | | 449,226 | |
| | | | | | | | | | | | Total Volatility Swaps | | | | $ | (1,234,878) | |
| | | | | | | | | | | | | | | | | | | | |
|
|
|
Notional amount is reported in U.S. Dollars (USD), except for those denoted in the following currencies:
| | |
| AUD | | Australian Dollar |
| EUR | | Euro |
| GBP | | British Pounds Sterling |
| NZD | | New Zealand Dollar |
Abbreviations/Definitions are as follows:
| | |
| CAD | | Canadian Dollar |
| CHF | | Swiss Franc |
| JPY | | Japanese Yen |
| SEK | | Swedish Krona |
The following table aggregates, as of period end, the amount receivable from/(payable to) each counterparty with whom the Fund has entered into a swap agreement. Swaps are individually disclosed in the preceding tables.
| | | | | | | | | | | | | | | | | | | | |
| Swap Summary as of September 28, 2012 is as follows: |
| Swap Counterparty | | Swap Type from
Fund Perspective | | Notional
Amount
(000’s) | | | | Value |
| Bank of America NA: | | | | | | | | | | | | | | | | | |
| | | Credit Default Sell Protection | | | $ | 16,940 | | | | | | | | | $ | (340,150) | |
| | | Interest Rate | | | | 7,095 | | | | | AUD | | | | | 16,592 | |
| | | Interest Rate | | | | 36,410 | | | | | BRR | | | | | (34,012) | |
| | | Interest Rate | | | | 94,870 | | | | | CAD | | | | | (2,432,666) | |
| | | Interest Rate | | | | 8,660 | | | | | | | | | | 46,115 | |
| | | Volatility | | | | 193 | | | | | AUD | | | | | (29,310) | |
| | | Volatility | | | | 250 | | | | | GBP | | | | | (431,816) | |
| | | | | | | | | | | | | | | | |
|
|
|
| | | | | | | | | | | | | | | | | (3,205,247) | |
| | | | |
| OPPENHEIMER GLOBAL STRATEGIC INCOME FUND | | | 73 | |
STATEMENT OF INVESTMENTS Continued
Footnotes to Statement of Investments Continued
| | | | | | | | | | | | | | | | | |
| Swap Summary: Continued |
| Swap Counterparty | | Swap Type from
Fund Perspective | | Notional
Amount
(000’s) | | | | Value |
| Barclays Bank plc: | | | | | | | | | | | | | | | | | |
| | | Credit Default Sell Protection | | | $ | 16,540 | | | | | | | | | $ | (1,544,835 | ) |
| | | Interest Rate | | | | 20,615 | | | | | AUD | | | | | (702,356 | ) |
| | | Interest Rate | | | | 17,635 | | | | | EUR | | | | | — | |
| | | Interest Rate | | | | 1,769,000 | | | | | JPY | | | | | (15,791 | ) |
| | | Interest Rate | | | | 21,440 | | | | | | | | | | 1,675,002 | |
| | | | | | | | | | | | | | | |
|
|
|
| | | | | | | | | | | | | | | | | (587,980 | ) |
| BNP Paribas | | Volatility | | | | 126 | | | | | GBP | | | | | (337,835 | ) |
| Citibank NA: | | | | | | | | | | | | | | | | | |
| | | Credit Default Buy Protection | | | | 17,230 | | | | | | | | | | (25,773 | ) |
| | | Interest Rate | | | | 18,250 | | | | | | | | | | (59,425 | ) |
| | | Total Return | | | | 15,282 | | | | | AUD | | | | | 246,057 | |
| | | Total Return | | | | 15,334 | | | | | CAD | | | | | 350,363 | |
| | | | | | | | | | | | | | | |
|
|
|
| | | | | | | | | | | | | | | | | 511,222 | |
| Credit Suisse International: | | | | | | | | | | | | | | | | | |
| | | Credit Default Buy Protection | | | | 16,940 | | | | | | | | | | (299,755 | ) |
| | | Credit Default Sell Protection | | | | 16,940 | | | | | | | | | | (478,150 | ) |
| | | Volatility | | | | 192 | | | | | AUD | | | | | 124,774 | |
| | | Volatility | | | | 153 | | | | | EUR | | | | | 173,039 | |
| | | Volatility | | | | 123 | | | | | GBP | | | | | (37,024 | ) |
| | | | | | | | | | | | | | | |
|
|
|
| | | | | | | | | | | | | | | | | (517,116 | ) |
| Deutsche Bank AG: | | | | | | | | | | | | | | | | | |
| | | Credit Default Buy Protection | | | | 26,970 | | | | | | | | | | (2,397,121 | ) |
| | | Credit Default Sell Protection | | | | 50,820 | | | | | | | | | | 1,395,898 | |
| | | Interest Rate | | | | 62,360 | | | | | BRR | | | | | (70,415 | ) |
| | | Volatility | | | | 126 | | | | | GBP | | | | | (228,628 | ) |
| | | Volatility | | | | 200 | | | | | | | | | | 241,445 | |
| | | | | | | | | | | | | | | |
|
|
|
| | | | | | | | | | | | | | | | | (1,058,821 | ) |
| Goldman Sachs Bank USA | | Volatility | | | | 155 | | | | | EUR | | | | | (296,925 | ) |
| Goldman Sachs International: | | | | | | | | | | | | | | | | | |
| | | Credit Default Buy Protection | | | | 4,620 | | | | | EUR | | | | | 869,262 | |
| | | Credit Default Buy Protection | | | | 51,400 | | | | | | | | | | 1,377,748 | |
| | | Interest Rate | | | | 261,235 | | | | | BRR | | | | | (358,612 | ) |
| | | Total Return | | | | 256,403 | | | | | HKD | | | | | 1,109,930 | |
| | | Total Return | | | | 103,110 | | | | | | | | | | 1,433,394 | |
| | | Volatility | | | | 127 | | | | | GBP | | | | | (170,159 | ) |
| | | | | | | | | | | | | | | |
|
|
|
| | | | | | | | | | | | | | | | | 4,261,563 | |
| JPMorgan Chase Bank NA: | | | | | | | | | | | | | | | | | |
| | | Volatility | | | | 191 | | | | | AUD | | | | | (40,286 | ) |
| | | Volatility | | | | 152 | | | | | EUR | | | | | (278,929 | ) |
| | | Volatility | | | | 126 | | | | | GBP | | | | | 238,622 | |
| | | Volatility | | | | 200 | | | | | | | | | | 207,781 | |
| | | | | | | | | | | | | | | |
|
|
|
| | | | | | | | | | | | | | | | | 127,188 | |
| Morgan Stanley & Co. International plc | | Total Return | | | | 4,893 | | | | | GBP | | | | | 61,257 | |
| | |
| 74 | | OPPENHEIMER GLOBAL STRATEGIC INCOME FUND |
| | | | | | | | | | | | | | | | | |
| Swap Summary: Continued |
| Swap Counterparty | | Swap Type from
Fund Perspective | | Notional
Amount
(000’s) | | | | Value |
| Morgan Stanley Capital Services, Inc.: | | | | | | | | | | | | | | | | | |
| | | Credit Default Sell Protection | | | $ | 15,590 | | | | | | | | | | $ (73,179 | ) |
| | | Volatility | | | | 305 | | | | | EUR | | | | | 176,483 | |
| | | Volatility | | | | 244 | | | | | NZD | | | | | (546,110 | ) |
| | | | | | | | | | | | | | | |
|
|
|
| | | | | | | | | | | | | | | | | (442,806 | ) |
| UBS AG: | | | | | | | | | | | | | | | | | |
| | | Credit Default Buy Protection | | | | 900 | | | | | EUR | | | | | 86,950 | |
| | | Credit Default Sell Protection | | | | 1,840 | | | | | EUR | | | | | (28,184 | ) |
| | | | | | | | | | | | | | | |
|
|
|
| | | | | | | | | | | | | | | | | 58,766 | |
| | | | | | | | | | | | | | | |
|
|
|
| | | | | | | Total Swaps | | | | | $(1,426,734 | ) |
| | | | | | | | | | | | | | | |
|
|
|
Notional amount is reported in U.S.Dollars (USD), except for those denoted in the following currencies:
| | |
| AUD | | Australian Dollar |
| BRR | | Brazilian Real |
| CAD | | Canadian Dollar |
| EUR | | Euro |
| GBP | | British Pounds Sterling |
| HKD | | Hong Kong Dollar |
| JPY | | Japanese Yen |
| NZD | | New Zealand Dollar |
| | | | | | | | | | | | | | | | | | | | | | | | | | | | | | | | | | |
| As of September 28, 2012, the Fund had entered into the following written swaption contracts: |
Reference Entity/
Swaption
Counterparty | | Swaption
Description | | Underlying Swap
Type from Fund
Perspective | | Notional
Amount
(000’s) | | | | Expiration
Date | | Premium
Received | | Value | | Unrealized
Appreciation
(Depreciation) |
| CDX.NA.HY.18: | | | | | | | | | | | | | | | | | | | | | | | | | | | | | |
| Goldman Sachs International | | Index Credit Default Swaption (European); Swap Terms: Paid: 5%; Received: Protection on CDX.NA.HY.18; Termination Date: 6/20/17 | | Index Credit Default Swap; Pay Fixed | | | $ | 78,175 | | | | | | | 10/18/12 | | | | $ | 425,663 | | | | $ | (1,316,370 | ) | | | $ | (890,707 | ) |
| Goldman Sachs International | | Index Credit Default Swaption (European); Swap Terms: Paid: 5%; Received: Protection on CDX.NA.HY.18; Termination Date: 6/20/17 | | Index Credit Default Swap; Pay Fixed | | | | 156,375 | | | | | | | 12/20/12 | | | | | 975,311 | | | | | (1,393,818 | ) | | | | (418,507 | ) |
| | | | |
| OPPENHEIMER GLOBAL STRATEGIC INCOME FUND | | | 75 | |
STATEMENT OF INVESTMENTS Continued
Footnotes to Statement of Investments Continued
| | | | | | | | | | | | | | | | | | | | | | | | | | | | |
| As of September 28, 2012, the Fund had entered into the following written swaption contracts: Continued |
Reference Entity/
Swaption
Counterparty | | Swaption
Description | | Underlying Swap
Type from Fund
Perspective | | Notional
Amount
(000’s) | | | | Expiration
Date | | Premium
Received | | Value | | Unrealized
Appreciation
(Depreciation) |
| CDX.NA.HY.18: Continued | | | | | | | | | | | | | | | | | | | | | | | | | | |
| Goldman Sachs International | | Index Credit Default Swaption (European); Swap Terms: Paid: 5%; Received: Protection on CDX.NA.HY.18; Termination Date: 6/20/17 | | Index Credit Default Swap; Pay Fixed | | $ 78,170 | | | | | | 10/18/12 | | | | $ | 379,203 | | | | $ | (1,316,286 | ) | | | $ | (937,083 | ) |
| JPMorgan Chase Bank NA | | Index Credit Default Swaption (European); Swap Terms: Paid: 5%; Received: Protection on CDX.NA.HY.18; Termination Date: 6/20/17 | | Index Credit Default Swap; Pay Fixed | | 156,380 | | | | | | 12/20/12 | | | | | 851,489 | | | | | (1,499,974 | ) | | | | (648,485 | ) |
| JPMorgan Chase Bank NA | | Index Credit Default Swaption (European); Swap Terms: Paid: 5%; Received: Protection on CDX.NA.HY.18; Termination Date: 6/20/17 | | Index Credit Default Swap; Pay Fixed | | 78,170 | | | | | | 12/20/12 | | | | | 433,374 | | | | | (1,122,665 | ) | | | | (689,291 | ) |
| JPMorgan Chase Bank NA | | Index Credit Default Swaption (European); Swap Terms: Paid: 5%; Received: Protection on CDX.NA.HY.18; Termination Date: 6/20/17 | | Index Credit Default Swap; Pay Fixed | | 78,195 | | | | | | 10/18/12 | | | | | 356,100 | | | | | (1,288,418 | ) | | | | (932,318 | ) |
| UBS AG | | Index Credit Default Swaption (European);Swap Terms: Paid: 5%; Received: Protection on CDX.NA.HY.18; Termination Date: 6/20/17 | | Index Credit Default Swap; Pay Fixed | | 78,200 | | | | | | 10/18/12 | | | | | 286,447 | | | | | (1,278,666 | ) | | | | (992,219 | ) |
| UBS AG | | Index Credit Default Swaption (European);Swap Terms: Paid: 5%; Received: Protection on CDX.NA.HY.18; Termination Date: 6/20/17 | | Index Credit Default Swap; Pay Fixed | | 78,200 | | | | | | 10/18/12 | | | | | 479,992 | | | | | (1,916,413 | ) | | | | (1,436,421 | ) |
| | | | | | | | | | | | | | | | |
|
|
|
| | | | | Total where Fund pays a fixed rate | | | | | 4,187,579 | | | | | (11,132,610 | ) | | | | (6,945,031 | ) |
| | |
| 76 | | OPPENHEIMER GLOBAL STRATEGIC INCOME FUND |
| | | | | | | | | | | | | | | | | | | | | | | | | | | | |
| As of September 28, 2012, the Fund had entered into the following written swaption contracts: Continued |
Reference Entity/
Swaption
Counterparty | | Swaption
Description | | Underlying Swap
Type from Fund
Perspective | | Notional
Amount
(000’s) | | | | Expiration
Date | | Premium
Received | | Value | | Unrealized
Appreciation
(Depreciation) |
| CDX.NA.HY.18: Continued | | | | | | | | | | | | | | | | | | | | | | | | | | |
| Goldman Sachs International | | Index Credit Default Swaption (European); Swap Terms: Paid: Protection on CDX.NA.HY.18; Received: 5%; Termination Date: 6/20/17 | | Index Credit
Default Swap;
Pay Floating | | $ 78,265 | | | | | | 12/20/12 | | | | $ | 325,426 | | | | $ | (326,887) | | | | $ | (1,461) | |
| JPMorgan Chase Bank NA | | Index Credit Default Swaption (European); Swap Terms: Paid: Protection on CDX.NA.HY.18; Received: 5%; Termination Date: 6/20/17 | | Index Credit
Default Swap;
Pay Floating | | 156,380 | | | | | | 12/20/12 | | | | | 603,783 | | | | | (677,326) | | | | | (73,543) | |
| | | | | | | | | | | | | | | | |
|
|
|
| | | | | Total where Fund pays a floating rate | | | | | 929,209 | | | | | (1,004,213) | | | | | (75,004) | |
| | | | | | | | | | | | | | | | |
|
|
|
| | | | | | | | | | | | | Total | | | | | 5,116,788 | | | | | (12,136,823) | | | | | (7,020,035) | |
| CDX.NA.IG.18 | | | | | | | | | | | | | | | | | | | | | | | | | | |
| Barclays Bank plc | | Index Credit Default Swaption (European); Swap Terms: Paid: 1%; Received: Protection on CDX.NA.IG.18; Termination Date: 6/20/17 | | Index Credit
Default Swap;
Pay Fixed | | 22,620 | | | | | | 12/20/12 | | | | | 58,812 | | | | | (84,185) | | | | | (25,373) | |
| Six-Month EUR EURIBOR: | | | | | | | | | | | | | | | | | | | | | | | | | | |
| Barclays Bank plc | | Interest Rate Swaption (European); Swap Terms: Paid: 2.204%; Received: Six-Month EUR EURIBOR; Termination Date: 8/28/44 | | Interest Rate
Swap;
Pay Fixed | | 4,530 | | EUR | | | | 8/27/14 | | | | | 496,183 | | | | | (365,299) | | | | | 130,884 | |
| Goldman Sachs Bank USA | | Interest Rate Swaption (European); Swap Terms: Paid: 2.71%; Received: Six-Month EUR EURIBOR; Termination Date: 11/17/42 | | Interest Rate
Swap;
Pay Fixed | | 54,325 | | EUR | | | | 11/16/12 | | | | | 2,945,810 | | | | | (1,012,120) | | | | | 1,933,690 | |
| | | | |
| OPPENHEIMER GLOBAL STRATEGIC INCOME FUND | | | 77 | |
STATEMENT OF INVESTMENTS Continued
Footnotes to Statement of Investments Continued
| | | | | | | | | | | | | | | | | | | | | | | | | | | | | | | | | | |
| As of September 28, 2012, the Fund had entered into the following written swaption contracts: Continued |
Reference Entity/
Swaption
Counterparty | | Swaption
Description | | Underlying Swap
Type from Fund
Perspective | | Notional
Amount
(000’s) | | | | Expiration
Date | | Premium
Received | | Value | | Unrealized
Appreciation
(Depreciation) |
| Six-Month EUR EURIBOR: Continued | | | | | | | | | | | | | | | | | | | | |
| Goldman Sachs Bank USA | | Interest Rate Swaption (European); Swap Terms: Paid: 2.65%; Received: Six-Month EUR EURIBOR; Termination Date: 12/1/42 | | Interest Rate
Swap;
Pay Fixed | | | | 54,490 | | | EUR | | | | 11/30/12 | | | | $ | 2,744,174 | | | | $ | (917,174) | | | | $ | 1,827,000 | |
| | | | | | | | | | | | | | | |
|
|
|
| | | | | | | | | | | | | | | | | | | | | 6,186,167 | | | | | (2,294,593) | | | | | 3,891,574 | |
| Six-Month GBP BBA LIBOR | | | | | | | | | | | | | | | | | | | | |
| JPMorgan Chase Bank NA | | Interest Rate Swaption (European); Swap Terms: Paid: 3.231%; Received: Six-Month GBP BBA LIBOR; Termination Date: 2/14/43 | | Interest Rate
Swap;
Pay Fixed | | | | 1,825 | | | GBP | | | | 2/15/13 | | | | | 181,026 | | | | | (210,373) | | | | | (29,347) | |
| Three-Month CAD BA CDOR | | | | | | | | | | | | | | | | | | | | |
| Bank of America NA | | Interest Rate Swaption (European); Swap Terms: Paid: Three-Month CAD BA CDOR; Received: 2.1025%; Termination Date: 1/16/23 | | Interest Rate
Swap;
Pay Floating | | | | 11,375 | | | CAD | | | | 1/17/13 | | | | | 236,547 | | | | | (196,237) | | | | | 40,310 | |
| Three-Month USD BBA LIBOR: | | | | | | | | | | | | | | | | | | | | |
| Bank of America NA | | Interest Rate Swaption (European); Swap Terms: Paid: 2.2825%; Received: Three-Month USD BBA LIBOR; Termination Date: 10/11/22 | | Interest Rate
Swap;
Pay Fixed | | | | 72,450 | | | | | | | 10/9/12 | | | | | 1,717,065 | | | | | (3,936,997) | | | | | (2,219,932) | |
| Goldman Sachs International | | Interest Rate Swaption (European); Swap Terms: Paid: 1.40%; Received: Three-Month USD BBA LIBOR; Termination Date: 1/26/23 | | Interest Rate
Swap;
Pay Fixed | | | | 146,635 | | | | | | | 7/25/13 | | | | | 1,246,398 | | | | | (910,516) | | | | | 335,882 | |
| | |
| 78 | | OPPENHEIMER GLOBAL STRATEGIC INCOME FUND |
| | | | | | | | | | | | | | | | | | | | | | | | | | | | |
| As of September 28, 2012, the Fund had entered into the following written swaption contracts: Continued |
Reference Entity/
Swaption
Counterparty | | Swaption
Description | | Underlying Swap
Type from Fund
Perspective | | Notional
Amount
(000’s) | | | | Expiration
Date | | Premium
Received | | Value | | Unrealized
Appreciation
(Depreciation) |
| Three-Month USD BBA LIBOR: Continued | | | | | | | | | | | | | | | | | | | | | | |
| Goldman Sachs International | | Interest Rate Swaption (European); Swap Terms: Paid 1.405%; Received: Three-Month USD BBA LIBOR; Termination Date: 8/6/23 | | Interest Rate
Swap;
Pay Fixed | | $146,570 | | | | | | 8/5/13 | | | | $ | 1,739,297 | | | | $ | (949,556) | | | | $ | 789,741 | |
| Goldman Sachs International | | Interest Rate Swaption (European); Swap Terms: Paid: 1.30%; Received: Three-Month USD BBA LIBOR; Termination Date: 7/26/23 | | Interest Rate
Swap;
Pay Fixed | | 146,505 | | | | | | 7/25/13 | | | | | 1,465,050 | | | | | (626,920) | | | | | 838,130 | |
| Goldman Sachs International | | Interest Rate Swaption (European); Swap Terms: Paid: 2.90%; Received: Three-Month USD BBA LIBOR; Termination Date: 11/13/22 | | Interest Rate
Swap;
Pay Fixed | | 249,000 | | | | | | 11/9/12 | | | | | 2,247,225 | | | | | (3,220,318) | | | | | (973,093) | |
| | | | | | | | | | | | | | | | |
|
|
|
| | | | | Total where Fund pays a fixed rate | | | | | 8,415,035 | | | | | (9,644,307) | | | | | (1,229,272) | |
| Bank of America NA | | Bank of America NA; Interest Rate Swaption (European); Swap Terms: Paid: Three-Month USD BBA LIBOR; Received: 2.0675%; Termination Date: 1/30/23 | | Interest Rate
Swap;
Pay Floating | | 117,295 | | | | | | 1/29/13 | | | | | 1,442,729 | | | | | (892,898) | | | | | 549,831 | |
| Bank of America NA | | Bank of America NA; Interest Rate Swaption (European); Swap Terms: Paid: Three-Month USD BBA LIBOR; Received: 2.50%; Termination Date: 9/3/23 | | Interest Rate
Swap;
Pay Floating | | 73,215 | | | | | | 9/3/13 | | | | | 1,208,048 | | | | | (923,407) | | | | | 284,641 | |
| Bank of America NA | | Bank of America NA; Interest Rate Swaption (European); Swap Terms: Paid: Three-Month USD BBA LIBOR; Received: 3.45%; Termination Date: 3/11/43 | | Interest Rate
Swap;
Pay Floating | | 36,365 | | | | | | 3/8/13 | | | | | 418,198 | | | | | (234,432) | | | | | 183,766 | |
| | | | |
| OPPENHEIMER GLOBAL STRATEGIC INCOME FUND | | | 79 | |
STATEMENT OF INVESTMENTS Continued
Footnotes to Statement of Investments Continued
| | | | | | | | | | | | | | | | | | | | | | | | | | | | | | | | | | |
| As of September 28, 2012, the Fund had entered into the following written swaption contracts: Continued |
Reference Entity/
Swaption
Counterparty | | Swaption
Description | | Underlying Swap
Type from Fund
Perspective | | Notional
Amount
(000’s) | | | | Expiration
Date | | Premium
Received | | Value | | Unrealized
Appreciation
(Depreciation) |
| Three-Month USD BBA LIBOR: Continued | | | | | | | | | | | | | | | | |
| Barclays Bank plc | | Interest Rate Swaption (European); Swap Terms: Paid: Three-Month USD BBA LIBOR; Received: 2.15%; Termination Date: 11/29/22 | | Interest Rate
Swap;
Pay Floating | | | $ | 91,205 | | | | | | | 11/28/12 | | | | $ | 456,025 | | | | $ | (152,556) | | | | $ | 303,469 | |
| Barclays Bank plc | | Interest Rate Swaption (European); Swap Terms: Paid: Three-Month USD BBA LIBOR; Received: 2.135%; Termination Date: 1/30/23 | | Interest Rate
Swap;
Pay Floating | | | | 234,590 | | | | | | | 1/29/13 | | | | | 2,222,740 | | | | | (1,464,435) | | | | | 758,305 | |
| Barclays Bank plc | | Interest Rate Swaption (European); Swap Terms: Paid: Three-Month USD BBA LIBOR; Received: 1.935%; Termination Date: 9/30/20 | | Interest Rate
Swap;
Pay Floating | | | | 75,056 | | | | | | | 9/29/15 | | | | | 1,921,432 | | | | | (1,992,235) | | | | | (70,803) | |
| Barclays Bank plc | | Interest Rate Swaption (European); Swap Terms: Paid: Three-Month USD BBA LIBOR; Received: 3.50%; Termination Date: 4/27/22 | | Interest Rate
Swap;
Pay Floating | | | | 73,580 | | | | | | | 4/26/17 | | | | | 2,444,230 | | | | | (1,672,297) | | | | | 771,933 | |
| Barclays Bank plc | | Interest Rate Swaption (European); Swap Terms: Paid: Three-Month USD BBA LIBOR; Received: 3.40%; Termination Date: 3/18/43 | | Interest Rate
Swap;
Pay Floating | | | | 54,550 | | | | | | | 3/15/13 | | | | | 984,628 | | | | | (446,386) | | | | | 538,242 | |
| | |
| 80 | | OPPENHEIMER GLOBAL STRATEGIC INCOME FUND |
| | | | | | | | | | | | | | | | | | | | | | | | | | | | |
| As of September 28, 2012, the Fund had entered into the following written swaption contracts: Continued |
Reference Entity/
Swaption
Counterparty | | Swaption
Description | | Underlying Swap
Type from Fund
Perspective | | Notional
Amount
(000’s) | | | | Expiration
Date | | Premium
Received | | Value | | Unrealized
Appreciation
(Depreciation) |
| Three-Month USD BBA LIBOR: Continued | | | | | | | | | | | | | | | | | | | | |
| Goldman Sachs International | | Interest Rate Swaption (European); Swap Terms: Paid: Three-Month USD BBA LIBOR; Received: 1.875%; Termination Date: 9/24/20 | | Interest Rate
Swap;
Pay Floating | | $101,895 | | | | | | 9/23/13 | | | | $ | 1,238,024 | | | | $ | (1,118,784) | | | | $ | 119,240 | |
| Goldman Sachs International | | Interest Rate Swaption (European); Swap Terms: Paid: Three-Month USD BBA LIBOR; Received: 3.45%; Termination Date: 3/18/43 | | Interest Rate
Swap;
Pay Floating | | 40,000 | | | | | | 3/15/13 | | | | | 616,000 | | | | | (282,636) | | | | | 333,364 | |
| UBS AG | | Interest Rate Swaption (European); Swap Terms: Paid: Three-Month USD BBA LIBOR; Received: 3.50%; Termination Date: 3/4/43 | | Interest Rate
Swap;
Pay Floating | | 54,550 | | | | | | 3/1/13 | | | | | 763,700 | | | | | (271,302) | | | | | 492,398 | |
| | | | | | | | | | | | | | | | |
|
|
|
| | | | | Total where Fund pays a floating rate | | | | | 13,715,754 | | | | | (9,451,368) | | | | | 4,264,386 | |
| | | | | | | | | | | | | | | | |
|
|
|
| | | | | | | | | | | | | Total | | | | | 22,130,789 | | | | | (19,095,675) | | | | | 3,035,114 | |
| Three-Month ZAR JIBAR SAFEX: | | | | | | | | | | | | | | | | | | | | | | |
| Barclays Bank plc | | Interest Rate Swaption (European); Swap Terms: Paid: 7%; Received: Three-Month ZAR JIBAR SAFEX; Termination Date: 11/14/22 | | Interest Rate
Swap;
Pay Fixed | | 61,100 | | ZAR | | | | 11/13/12 | | | | | 79,101 | | | | | (201,988) | | | | | (122,887) | |
| JPMorgan Chase Bank NA | | Interest Rate Swaption (European); Swap Terms: Paid: 7%; Received: Three-Month ZAR JIBAR SAFEX; Termination Date: 11/19/22 | | Interest Rate
Swap;
Pay Fixed | | 61,210 | | ZAR | | | | 11/20/12 | | | | | 80,655 | | | | | (207,969) | | | | | (127,314) | |
| | | | |
| OPPENHEIMER GLOBAL STRATEGIC INCOME FUND | | | 81 | |
STATEMENT OF INVESTMENTS Continued
Footnotes to Statement of Investments Continued
| | | | | | | | | | | | | | | | | | | | | | | | | | | | |
| As of September 28, 2012, the Fund had entered into the following written swaption contracts: Continued |
Reference Entity/
Swaption
Counterparty | | Swaption
Description | | Underlying Swap
Type from Fund
Perspective | | Notional
Amount
(000’s) | | | | Expiration
Date | | Premium
Received | | Value | | Unrealized
Appreciation
(Depreciation) |
| Three-Month ZAR JIBAR SAFEX: Continued | | | | | | | | | | | | | | | | | | | | |
| JPMorgan Chase Bank NA | | Interest Rate Swaption (European); Swap Terms: Paid: 7%; Received: Three-Month ZAR JIBAR SAFEX; Termination Date: 12/18/22 | | Interest Rate
Swap;
Pay Fixed | | 61,670 | | ZAR | | | | 12/19/12 | | | | $ | 81,266 | | | | $ | (232,294 | ) | | | $ | (151,028 | ) |
| | | | | | | | | | | | | | | | |
|
|
|
| | | | | | | | | | | | | | | | | | 241,022 | | | | | (642,251 | ) | | | | (401,229 | ) |
| | | | | | | | | | | | | | | | |
|
|
|
| | | | | Total Written Swaptions | | | | $ | 34,151,151 | | | | $ | (34,660,137 | ) | | | $ | (508,986 | ) |
| | | | | | | | | | | | | | | | |
|
|
|
Notional amount is reported in U.S. Dollars (USD), except for those denoted in the following currencies:
| | |
| CAD | | Canadian Dollar |
| EUR | | Euro |
| GBP | | British Pound Sterling |
| ZAR | | South African Rand |
|
| Abbreviations/Definitions are as follows: |
| BA CDOR | | Canada Bankers Acceptances Deposit Offering Rate |
| BBA LIBOR | | British Bankers’ Association London-Interbank Offered Rate |
| CDX.NA.HY.18 | | Markit CDX North American High Yield |
| CDX.NA.IG.18 | | Markit CDX North American Investment Grade High Volatility |
| EURIBOR | | Euro Interbank Offered Rate |
| JIBAR | | South Africa Johannesburg Interbank Agreed Rate |
| SAFEX | | South Africa Futures Exchange |
See accompanying Notes to Financial Statements.
| | |
| 82 | | OPPENHEIMER GLOBAL STRATEGIC INCOME FUND |
STATEMENT OF ASSETS AND LIABILITIES September 28, 20121
| | | | |
| Assets | | | |
| Investments, at value—see accompanying statement of investments: | | | | |
| Unaffiliated companies (cost $9,432,127,711) | | $ | 9,434,695,554 | |
| Affiliated companies (cost $1,451,916,224) | | | 1,407,225,313 | |
| Wholly-owned subsidiary (cost $1,500,000) | |
| 1,447,210
|
|
| | | | 10,843,368,077 | |
| Cash | | | 15,889,801 | |
| Cash—foreign currencies (cost $3,798,520) | | | 3,304,897 | |
| Unrealized appreciation on foreign currency exchange contracts | | | 15,616,163 | |
| Appreciated swaps, at value (net upfront payments paid $1,663,590) | | | 9,102,211 | |
| Depreciated swaps, at value (upfront payments paid $1,774,845) | | | 1,575,229 | |
| Receivables and other assets: | | | | |
| Investments sold (including $469,357,597 sold on a when-issued or delayed delivery basis) | | | 638,635,655 | |
| Interest, dividends and principal paydowns | | | 105,624,800 | |
| Shares of beneficial interest sold | | | 6,540,913 | |
| Closed foreign currency contracts | | | 5,473,338 | |
| Futures margins | | | 1,211,805 | |
| Other | |
| 297,306
|
|
| Total assets | | | 11,646,640,195 | |
| Liabilities | | | |
| Appreciated options written, at value (premiums received $9,459,289) | | | 5,177,248 | |
| Depreciated options written, at value (premiums received $2,070,251) | | | 2,299,606 | |
| Appreciated swaptions written, at value (premiums received $22,667,781) | | | 12,436,955 | |
| Depreciated swaptions written, at value (premiums received $11,483,370) | | | 22,223,182 | |
| Unrealized depreciation on foreign currency exchange contracts | | | 58,322,051 | |
| Appreciated swaps, at value (upfront payments received $4,435,192) | | | 3,421,165 | |
| Depreciated swaps, at value (net upfront payments received $1,744,443) | | | 8,683,009 | |
| Payables and other liabilities: | | | | |
| Investments purchased (including $2,302,491,215 purchased on a when-issued or delayed delivery basis) | | | 2,391,474,333 | |
| Shares of beneficial interest redeemed | | | 16,889,216 | |
| Closed foreign currency contracts | | | 12,109,623 | |
| Dividends | | | 6,779,341 | |
| Foreign capital gains tax | | | 2,363,530 | |
| Distribution and service plan fees | | | 1,641,761 | |
| Transfer and shareholder servicing agent fees | | | 1,000,721 | |
| Futures margins | | | 998,183 | |
| Shareholder communications | | | 407,627 | |
| Trustees’ compensation | | | 236,466 | |
| Other | |
| 553,882
|
|
| Total liabilities | | | 2,547,017,899 | |
| Net Assets | | $
| 9,099,622,296
|
|
1. September 28, 2012 represents the last business day of the Fund’s 2012 fiscal year See Note 1 of the accompanying Notes.
| | | | |
| OPPENHEIMER GLOBAL STRATEGIC INCOME FUND | | | 83 | |
STATEMENT OF ASSETS AND LIABILITIES Continued
| | | | |
| Composition of Net Assets | | | |
| Par value of shares of beneficial interest | | $ | 2,114,922 | |
| Additional paid-in capital | | | 9,702,655,442 | |
| Accumulated net investment income | | | 43,010,460 | |
| Accumulated net realized loss on investments and foreign currency transactions | | | (562,470,412 | ) |
| Net unrealized depreciation on investments and translation of assets and liabilities denominated in foreign currencies | |
| (85,688,116
| )
|
| Net Assets | | $
| 9,099,622,296
|
|
| Net Asset Value Per Share | | | |
| Class A Shares: | | | | |
| Net asset value and redemption price per share (based on net assets of $6,276,192,559 and 1,458,268,784 shares of beneficial interest outstanding) | | | $4.30 | |
| Maximum offering price per share (net asset value plus sales charge of 4.75% of offering price) | | | $4.51 | |
| Class B Shares: | | | | |
| Net asset value, redemption price (excludes applicable contingent deferred sales charge) and offering price per share (based on net assets of $282,503,782 and 65,412,489 shares of beneficial interest outstanding) | | | $4.32 | |
| Class C Shares: | | | | |
| Net asset value, redemption price (excludes applicable contingent deferred sales charge) and offering price per share (based on net assets of $1,522,039,335 and 354,365,489 shares of beneficial interest outstanding) | | | $4.30 | |
| Class I Shares: | | | | |
| Net asset value, redemption price and offering price per share (based on net assets of $51,010,671 and 11,898,656 shares of beneficial interest outstanding) | | | $4.29 | |
| Class N Shares: | | | | |
| Net asset value, redemption price (excludes applicable contingent deferred sales charge) and offering price per share (based on net assets of $238,665,966 and 55,419,888 shares of beneficial interest outstanding) | | | $4.31 | |
| Class Y Shares: | | | | |
| Net asset value, redemption price and offering price per share (based on net assets of $729,209,983 and 169,556,289 shares of beneficial interest outstanding) | | | $4.30 | |
See accompanying Notes to Financial Statements.
| | |
| 84 | | OPPENHEIMER GLOBAL STRATEGIC INCOME FUND |
STATEMENT OF OPERATIONS For the Year Ended September 28, 20121
| | | | |
| Allocation of Income and Expenses from Master Funds2 | | | |
| Net investment income allocated from Oppenheimer Master Event-Linked Bond Fund, LLC: | | | | |
| Interest | | $ | 14,842,829 | |
| Dividends | | | 14,825 | |
| Expenses3 | |
| (709,994
| )
|
| Net investment income allocated from Oppenheimer Master Event-Linked Bond Fund, LLC | | | 14,147,660 | |
| Net investment income allocated from Oppenheimer Master Loan Fund, LLC: | | | | |
| Interest | | | 82,823,113 | |
| Dividends | | | 180,305 | |
| Expenses4 | |
| (3,746,901
| )
|
| Net investment income allocated from Oppenheimer Master Loan Fund, LLC | |
| 79,256,517
|
|
| Total allocation of net investment income from master funds | | | 93,404,177 | |
| Investment Income | | | |
| Interest from unaffiliated companies (net of foreign withholding taxes of $464,042) | | | 478,790,650 | |
| Dividends: | | | | |
| Unaffiliated companies (net of foreign withholding taxes of $209,119) | | | 2,062,059 | |
| Affiliated companies | | | 815,859 | |
| Fee income on when-issued securities | | | 9,690,719 | |
| Other income | |
| 54,415
|
|
| Total investment income | | | 491,413,702 | |
| Expenses | | | |
| Management fees | | | 43,763,844 | |
| Distribution and service plan fees: | | | | |
| Class A | | | 14,330,388 | |
| Class B | | | 2,720,631 | |
| Class C | | | 14,097,046 | |
| Class N | | | 1,140,398 | |
| Transfer and shareholder servicing agent fees: | | | | |
| Class A | | | 7,712,088 | |
| Class B | | | 716,393 | |
| Class C | | | 1,813,441 | |
| Class I | | | 3,591 | |
| Class N | | | 645,668 | |
| Class Y | | | 1,381,753 | |
| Shareholder communications: | | | | |
| Class A | | | 944,945 | |
| Class B | | | 104,732 | |
| Class C | | | 234,030 | |
| Class I | | | 25 | |
| Class N | | | 41,428 | |
| Class Y | | | 104,542 | |
| Custodian fees and expenses | | | 821,796 | |
| Trustees’ compensation | | | 176,861 | |
| Administration service fees | | | 1,500 | |
| Other | |
| 676,786
|
|
| Total expenses | | | 91,431,886 | |
| Less waivers and reimbursements of expenses | |
| (4,525,032
| )
|
| Net expenses | | | 86,906,854 | |
| Net Investment Income | | | 497,911,025 | |
| | | | |
| OPPENHEIMER GLOBAL STRATEGIC INCOME FUND | | | 85 | |
STATEMENT OF OPERATIONS Continued
| | | | |
| Realized and Unrealized Gain (Loss) | | | |
| Net realized gain (loss) on: | | | | |
| Investments from unaffiliated companies (including premiums on options and swaptions exercised) (net of foreign capital gains tax of $1,057,500) | | $ | (59,406,761 | ) |
| Affiliated companies | | | (1,280,611 | ) |
| Closing and expiration of option contracts written | | | 47,973,413 | |
| Closing and expiration of swaption contracts written | | | 23,028,045 | |
| Closing and expiration of futures contracts | | | 11,347,695 | |
| Foreign currency transactions | | | (101,359,743 | ) |
| Swap contracts | | | 13,167,511 | |
| Net realized loss allocated from: | | | | |
| Oppenheimer Master Event-Linked Bond Fund, LLC | | | (5,684,446 | ) |
| Oppenheimer Master Loan Fund, LLC | |
| (10,234,623
| )
|
| Net realized loss | | | (82,449,520 | ) |
| Net change in unrealized appreciation/depreciation on: | | | | |
| Investments (net of foreign capital gains tax of $2,261,050) | | | 524,267,915 | |
| Translation of assets and liabilities denominated in foreign currencies | | | 35,154,478 | |
| Futures contracts | | | (30,177,603 | ) |
| Option contracts written | | | 7,428,749 | |
| Swaption contracts written | | | (237,265 | ) |
| Swap contracts | | | 510,492 | |
| Net change in unrealized appreciation/deprecation allocated from: | | | | |
| Oppenheimer Master Event-Linked Bond Fund, LLC | | | 5,337,471 | |
| Oppenheimer Master Loan Fund, LLC | |
| 54,885,989
|
|
| Net change in unrealized appreciation/depreciation | | | 597,170,226 | |
| Net Increase in Net Assets Resulting from Operations | | $
| 1,012,631,731
|
|
1. September 28, 2012 represents the last business day of the Fund’s 2012 fiscal year. See Note 1 of the accompanying Notes.
2. The Fund invests in certain affiliated mutual funds that expect to be treated as partnerships for tax purposes.
3. Net of expense waivers and/or reimbursements of $7,238
4. Net of expense waivers and/or reimbursements of $41,397
See accompanying Notes to Financial Statements.
| | |
| 86 | | OPPENHEIMER GLOBAL STRATEGIC INCOME FUND |
STATEMENTS OF CHANGES IN NET ASSETS
| | | | | | | | |
| | | Year Ended
September 28,
20121 | | | Year Ended
September 30,
2011 | |
| Operations | | | | | | |
| Net investment income | | $ | 497,911,025 | | | $ | 548,170,137 | |
| Net realized gain (loss) | | | (82,449,520 | ) | | | 223,849,484 | |
| Net change in unrealized appreciation/depreciation | |
| 597,170,226
|
| |
| (793,418,486
| )
|
| Net increase (decrease) in net assets resulting from operations | | | 1,012,631,731 | | | | (21,398,865 | ) |
| Dividends and/or Distributions to Shareholders | | | | | | |
| Dividends from net investment income: | | | | | | | | |
| Class A | | | (330,771,757 | ) | | | (382,490,965 | ) |
| Class B | | | (13,000,514 | ) | | | (16,567,355 | ) |
| Class C | | | (69,498,317 | ) | | | (77,576,438 | ) |
| Class I | | | (723,309 | ) | | | — | |
| Class N | | | (12,083,986 | ) | | | (13,475,211 | ) |
| Class Y | |
| (42,405,408
| )
| |
| (45,233,275
| )
|
| | | | (468,483,291 | ) | | | (535,343,244 | ) |
| Tax return of capital distribution: | | | | | | | | |
| Class A | | | (16,982,855 | ) | | | — | |
| Class B | | | (667,487 | ) | | | — | |
| Class C | | | (3,568,261 | ) | | | — | |
| Class I | | | (37,137 | ) | | | — | |
| Class N | | | (620,430 | ) | | | — | |
| Class Y | |
| (2,177,226
| )
| |
| —
|
|
| | | | (24,053,396 | ) | | | — | |
| Beneficial Interest Transactions | | | | | | |
| Net increase (decrease) in net assets resulting from beneficial interest transactions: | | | | | | | | |
| Class A | | | 60,827,515 | | | | (124,884,015 | ) |
| Class B | | | (18,958,333 | ) | | | (38,939,680 | ) |
| Class C | | | 51,407,175 | | | | 26,600,521 | |
| Class I | | | 49,687,337 | | | | — | |
| Class N | | | (1,212,963 | ) | | | 10,298,920 | |
| Class Y | |
| (21,368,986
| )
| |
| 87,192,160
|
|
| | | | 120,381,745 | | | | (39,732,094 | ) |
| Net Assets | | | | | | |
| Total increase (decrease) | | | 640,476,789 | | | | (596,474,203 | ) |
| Beginning of period | |
| 8,459,145,507
|
| |
| 9,055,619,710
|
|
| End of period (including accumulated net investment income of $43,010,460 and $359,441, respectively) | | $
| 9,099,622,296
|
| | $
| 8,459,145,507
|
|
1. September 28, 2012 represents the last business day of the Fund’s 2012 fiscal year. See Note 1 of the accompanying Notes.
See accompanying Notes to Financial Statements.
| | | | |
| OPPENHEIMER GLOBAL STRATEGIC INCOME FUND | | | 87 | |
FINANCIAL HIGHLIGHTS
| | | | | | | | | | | | | | | | | | | | |
| | | Year Ended
September 28, | | | | | | Year Ended September 30, | |
| Class A | | 20121 | | | 2011 | | | 2010 | | | 2009 | | | 2008 | |
| | | | | | | | | | | | | | | | | | | | | |
| Per Share Operating Data | | | | | | | | | | | | | | | |
| Net asset value, beginning of period | | $ | 4.05 | | | $ | 4.32 | | | $ | 3.91 | | | $ | 3.96 | | | $ | 4.41 | |
| Income (loss) from investment operations: | | | | | | | | | | | | | | | | | |
| Net investment income2 | | | .25 | | | | .27 | | | | .28 | | | | .24 | | | | .24 | |
| Net realized and unrealized gain (loss) | |
| .25
|
| |
| (.28
| )
| |
| .40
|
| |
| (.05
| )
| |
| (.40
| )
|
| Total from investment operations | | | .50 | | | | (.01 | ) | | | .68 | | | | .19 | | | | (.16 | ) |
| Dividends and/or distributions to shareholders: | | | | | | | | | | | | | | | | | |
| Dividends from net investment income | | | (.24 | ) | | | (.26 | ) | | | (.27 | ) | | | (.18 | ) | | | (.29 | ) |
| Tax return of capital distribution | |
| (.01
| )
| |
| —
|
| |
| —
|
| |
| (.06
| )
| |
| —
|
|
| Total dividends and/or distributions to shareholders | | | (.25 | ) | | | (.26 | ) | | | (.27 | ) | | | (.24 | ) | | | (.29 | ) |
| Net asset value, end of period | | $
| 4.30
|
| | $
| 4.05
|
| | $
| 4.32
|
| | $
| 3.91
|
| | $
| 3.96
|
|
| Total Return, at Net Asset Value3 | | | 12.61 | % | | | (0.31 | )% | | | 18.17 | % | | | 5.59 | % | | | (4.01 | )% |
| | | | | | | | | | | | | | | | | | | | | |
| Ratios/Supplemental Data | | | | | | | | | | | | | | | |
| Net assets, end of period (in thousands) | | | $6,276,192 | | | | $5,857,280 | | | | $6,368,118 | | | | $6,019,723 | | | | $7,719,384 | |
| Average net assets (in thousands) | | | $5,865,852 | | | | $6,278,335 | | | | $6,047,257 | | | | $5,942,116 | | | | $7,560,427 | |
| Ratios to average net assets:4,5 | | | | | | | | | | | | | | | | | | | | |
| Net investment income | | | 5.99 | % | | | 6.23 | % | | | 6.91 | % | | | 6.74 | % | | | 5.44 | % |
| Expenses excluding interest and fees from borrowings | | | 0.98 | % | | | 0.97 | % | | | 0.99 | % | | | 0.97 | % | | | 0.91 | % |
| Interest and fees from borrowings | |
| —
|
| |
| —
| 6
| |
| 0.28
| %
| |
| 0.01
| %
| |
| —
|
|
| Total expenses | | | 0.98 | %7 | | | 0.97 | %8 | | | 1.27 | %8 | | | 0.98 | %8 | | | 0.91 | %8 |
| Expenses after payments, waivers and/or reimbursements and reduction to custodian expenses | | | 0.93 | %9 | | | 0.92 | % | | | 1.23 | % | | | 0.96 | % | | | 0.89 | % |
| Portfolio turnover rate10 | | | 74 | % | | | 53 | % | | | 94 | % | | | 96 | % | | | 71 | % |
1. September 28, 2012 represents the last business day of the Fund’s 2012 fiscal year. See Note 1 of the accompanying Notes.
2. Per share amounts calculated based on the average shares outstanding during the period.
3. Assumes an initial investment on the business day before the first day of the fiscal period, with all dividends and distributions reinvested in additional shares on the reinvestment date, and redemption at the net asset value calculated on the last business day of the fiscal period. Sales charges are not reflected in the total returns. Total returns are not annualized for periods less than one full year. Returns do not reflect the deduction of taxes that a shareholder would pay on fund distributions or the redemption of fund shares.
4. Annualized for periods less than one full year.
5. Includes the Fund’s share of the allocated expenses and/or net investment income from the master funds.
6. Less than 0.005%.
7. Ratio including all expenses of the wholly-owned subsidiary and indirect expenses from affiliated funds were as follows:
| | | | |
| Year Ended September 28, 2012 | | | 0.99 | % |
8. Total expenses including all affiliated fund expenses were as follows:
| | | | |
| Year Ended September 30, 2011 | | | 0.97 | % |
| Year Ended September 30, 2010 | | | 1.27 | % |
| Year Ended September 30, 2009 | | | 0.99 | % |
| Year Ended September 30, 2008 | | | 0.92 | % |
9. Ratio including all expenses of the wholly-owned subsidiary and indirect expenses from affiliated funds were as follows:
| | | | |
| Year Ended September 28, 2012 | | | 0.94 | % |
10. The portfolio turnover rate excludes purchase and sale transactions of To Be Announced (TBA) mortgage-related securities as follows:
| | | | | | | | |
| | | Purchase Transactions | | | Sale Transactions | |
| Year Ended September 28, 2012 | | $ | 9,325,024,559 | | | $ | 7,885,278,752 | |
| Year Ended September 30, 2011 | | $ | 3,961,769,663 | | | $ | 3,820,541,826 | |
| Year Ended September 30, 2010 | | $ | 2,754,184,019 | | | $ | 2,975,421,694 | |
| Year Ended September 30, 2009 | | $ | 5,100,694,441 | | | $ | 4,915,091,623 | |
| Year Ended September 30, 2008 | | $ | 1,979,370,856 | | | $ | 1,852,400,340 | |
See accompanying Notes to Financial Statements.
| | |
| 88 | | OPPENHEIMER GLOBAL STRATEGIC INCOME FUND |
| | | | | | | | | | | | | | | | | | | | |
| | | Year Ended
September 28, | | | Year Ended September 30, | |
| Class B | | 20121 | | | 2011 | | | 2010 | | | 2009 | | | 2008 | |
| | | | | | | | | | | | | | | | | | | | | |
| Per Share Operating Data | | | | | | | | | | | | | | | |
| Net asset value, beginning of period | | $ | 4.06 | | | $ | 4.33 | | | $ | 3.93 | | | $ | 3.98 | | | $ | 4.42 | |
| Income (loss) from investment operations: | | | | | | | | | | | | | | | | | | | | |
| Net investment income2 | | | .21 | | | | .23 | | | | .24 | | | | .20 | | | | .20 | |
| Net realized and unrealized gain (loss) | |
| .26
|
| |
| (.28
| )
| |
| .40
|
| |
| (.04
| )
| |
| (.39
| )
|
| Total from investment operations | | | .47 | | | | (.05 | ) | | | .64 | | | | .16 | | | | (.19 | ) |
| Dividends and/or distributions to shareholders: | | | | | | | | | | | | | | | | | |
| Dividends from net investment income | | | (.20 | ) | | | (.22 | ) | | | (.24 | ) | | | (.16 | ) | | | (.25 | ) |
| Tax return of capital distribution | |
| (.01
| )
| |
| —
|
| |
| —
|
| |
| (.05
| )
| |
| —
|
|
| Total dividends and/or distributions to shareholders | | | (.21 | ) | | | (.22 | ) | | | (.24 | ) | | | (.21 | ) | | | (.25 | ) |
| Net asset value, end of period | | $
| 4.32
|
| | $
| 4.06
|
| | $
| 4.33
|
| | $
| 3.93
|
| | $
| 3.98
|
|
| Total Return, at Net Asset Value3 | | | 11.84 | % | | | (1.21 | )% | | | 16.74 | % | | | 4.64 | % | | | (4.54 | )% |
| | | | | | | | | | | | | | | | | | | | | |
| Ratios/Supplemental Data | | | | | | | | | | | | | | | |
| Net assets, end of period (in thousands) | | | $282,504 | | | | $284,757 | | | | $342,069 | | | | $353,248 | | | | $483,485 | |
| Average net assets (in thousands) | | | $272,336 | | | | $320,622 | | | | $331,317 | | | | $355,973 | | | | $540,865 | |
| Ratios to average net assets:4,5 | | | | | | | | | | | | | | | | | | | | |
| Net investment income | | | 5.08 | % | | | 5.31 | % | | | 5.96 | % | | | 5.83 | % | | | 4.61 | % |
| Expenses excluding interest and fees from borrowings | | | 1.89 | % | | | 1.89 | % | | | 1.93 | % | | | 1.89 | % | | | 1.73 | % |
| Interest and fees from borrowings | |
| —
|
| |
| —
| 6
| |
| 0.28
| %
| |
| 0.01
| %
| |
| —
|
|
| Total expenses | | | 1.89 | %7 | | | 1.89 | %8 | | | 2.21 | %8 | | | 1.90 | %8 | | | 1.73 | %8 |
| Expenses after payments, waivers and/or reimbursements and reduction to custodian expenses | | | 1.84 | %9 | | | 1.84 | % | | | 2.17 | % | | | 1.88 | % | | | 1.71 | % |
| Portfolio turnover rate10 | | | 74 | % | | | 53 | % | | | 94 | % | | | 96 | % | | | 71 | % |
1. September 28, 2012 represents the last business day of the Fund’s 2012 fiscal year. See Note 1 of the accompanying Notes.
2. Per share amounts calculated based on the average shares outstanding during the period.
3. Assumes an initial investment on the business day before the first day of the fiscal period, with all dividends and distributions reinvested in additional shares on the reinvestment date, and redemption at the net asset value calculated on the last business day of the fiscal period. Sales charges are not reflected in the total returns. Total returns are not annualized for periods less than one full year. Returns do not reflect the deduction of taxes that a shareholder would pay on fund distributions or the redemption of fund shares.
4. Annualized for periods less than one full year.
5. Includes the Fund’s share of the allocated expenses and/or net investment income from the master funds.
6. Less than 0.005%.
7. Ratio including all expenses of the wholly-owned subsidiary and indirect expenses from affiliated funds were as follows:
| | | | |
| Year Ended September 28, 2012 | | | 1.90 | % |
8. Total expenses including all affiliated fund expenses were as follows:
| | | | |
| Year Ended September 30, 2011 | | | 1.89 | % |
| Year Ended September 30, 2010 | | | 2.21 | % |
| Year Ended September 30, 2009 | | | 1.91 | % |
| Year Ended September 30, 2008 | | | 1.74 | % |
9. Ratio including all expenses of the wholly-owned subsidiary and indirect expenses from affiliated funds were as follows:
| | | | |
| Year Ended September 28, 2012 | | | 1.85 | % |
10. The portfolio turnover rate excludes purchase and sale transactions of To Be Announced (TBA) mortgage-related securities as follows:
| | | | | | | | |
| | | Purchase Transactions | | | Sale Transactions | |
| Year Ended September 28, 2012 | | $ | 9,325,024,559 | | | $ | 7,885,278,752 | |
| Year Ended September 30, 2011 | | $ | 3,961,769,663 | | | $ | 3,820,541,826 | |
| Year Ended September 30, 2010 | | $ | 2,754,184,019 | | | $ | 2,975,421,694 | |
| Year Ended September 30, 2009 | | $ | 5,100,694,441 | | | $ | 4,915,091,623 | |
| Year Ended September 30, 2008 | | $ | 1,979,370,856 | | | $ | 1,852,400,340 | |
See accompanying Notes to Financial Statements.
| | | | |
| OPPENHEIMER GLOBAL STRATEGIC INCOME FUND | | | 89 | |
FINANCIAL HIGHLIGHTS Continued
| | | | | | | | | | | | | | | | | | | | |
| | | Year Ended
September 28, | | | | | | Year Ended September 30, | |
| Class C | | 20121 | | | 2011 | | | 2010 | | | 2009 | | | 2008 | |
| | | | | | | | | | | | | | | | | | | | | |
| Per Share Operating Data | | | | | | | | | | | | | | | |
| Net asset value, beginning of period | | $ | 4.04 | | | $ | 4.31 | | | $ | 3.91 | | | $ | 3.96 | | | $ | 4.40 | |
| Income (loss) from investment operations: | | | | | | | | | | | | | | | | | |
| Net investment income2 | | | .22 | | | | .24 | | | | .25 | | | | .21 | | | | .20 | |
| Net realized and unrealized gain (loss) | |
| .26
|
| |
| (.28
| )
| |
| .39
|
| |
| (.05
| )
| |
| (.38
| )
|
| Total from investment operations | | | .48 | | | | (.04 | ) | | | .64 | | | | .16 | | | | (.18 | ) |
| Dividends and/or distributions to shareholders: | | | | | | | | | | | | | | | | | |
| Dividends from net investment income | | | (.21 | ) | | | (.23 | ) | | | (.24 | ) | | | (.16 | ) | | | (.26 | ) |
| Tax return of capital distribution | |
| (.01
| )
| |
| —
|
| |
| —
|
| |
| (.05
| )
| |
| —
|
|
| Total dividends and/or distributions to shareholders | | | (.22 | ) | | | (.23 | ) | | | (.24 | ) | | | (.21 | ) | | | (.26 | ) |
| Net asset value, end of period | | $
| 4.30
|
| | $
| 4.04
|
| | $
| 4.31
|
| | $
| 3.91
|
| | $
| 3.96
|
|
| Total Return, at Net Asset Value3 | | | 12.05 | % | | | (1.08 | )% | | | 17.01 | % | | | 4.79 | % | | | (4.52 | )% |
| | | | | | | | | | | | | | | | | | | | | |
| Ratios/Supplemental Data | | | | | | | | | | | | | | | |
| Net assets, end of period (in thousands) | | | $1,522,039 | | | | $1,384,378 | | | | $1,448,886 | | | | $1,292,721 | | | | $1,493,804 | |
| Average net assets (in thousands) | | | $1,411,513 | | | | $1,453,972 | | | | $1,330,764 | | | | $1,201,421 | | | | $1,381,340 | |
| Ratios to average net assets:4,5 | | | | | | | | | | | | | | | | | | | | |
| Net investment income | | | 5.24 | % | | | 5.48 | % | | | 6.15 | % | | | 6.00 | % | | | 4.68 | % |
| Expenses excluding interest and fees from borrowings | | | 1.73 | % | | | 1.73 | % | | | 1.75 | % | | | 1.73 | % | | | 1.66 | % |
| Interest and fees from borrowings | |
| —
|
| |
| —
| 6
| |
| 0.28
| %
| |
| 0.01
| %
| |
| —
|
|
| Total expenses | | | 1.73 | %7 | | | 1.73 | %8 | | | 2.03 | %8 | | | 1.74 | %8 | | | 1.66 | %8 |
| Expenses after payments, waivers and/or reimbursements and reduction to custodian expenses | | | 1.68 | %9 | | | 1.68 | % | | | 1.99 | % | | | 1.72 | % | | | 1.64 | % |
| Portfolio turnover rate10 | | | 74 | % | | | 53 | % | | | 94 | % | | | 96 | % | | | 71 | % |
1. September 28, 2012 represents the last business day of the Fund’s 2012 fiscal year. See Note 1 of the accompanying Notes.
2. Per share amounts calculated based on the average shares outstanding during the period.
3. Assumes an initial investment on the business day before the first day of the fiscal period, with all dividends and distributions reinvested in additional shares on the reinvestment date, and redemption at the net asset value calculated on the last business day of the fiscal period. Sales charges are not reflected in the total returns. Total returns are not annualized for periods less than one full year. Returns do not reflect the deduction of taxes that a shareholder would pay on fund distributions or the redemption of fund shares.
4. Annualized for periods less than one full year.
5. Includes the Fund’s share of the allocated expenses and/or net investment income from the master funds.
6. Less than 0.005%.
7. Ratio including all expenses of the wholly-owned subsidiary and indirect expenses from affiliated funds were as follows:
| | | | |
| Year Ended September 28, 2012 | | | 1.74 | % |
8. Total expenses including all affiliated fund expenses were as follows:
| | | | |
| Year Ended September 30, 2011 | | | 1.73 | % |
| Year Ended September 30, 2010 | | | 2.03 | % |
| Year Ended September 30, 2009 | | | 1.75 | % |
| Year Ended September 30, 2008 | | | 1.67 | % |
9. Ratio including all expenses of the wholly-owned subsidiary and indirect expenses from affiliated funds were as follows:
| | | | |
| Year Ended September 28, 2012 | | | 1.69 | % |
10. The portfolio turnover rate excludes purchase and sale transactions of To Be Announced (TBA) mortgage-related securities as follows:
| | | | | | | | |
| | | Purchase Transactions | | | Sale Transactions | |
| Year Ended September 28, 2012 | | $ | 9,325,024,559 | | | $ | 7,885,278,752 | |
| Year Ended September 30, 2011 | | $ | 3,961,769,663 | | | $ | 3,820,541,826 | |
| Year Ended September 30, 2010 | | $ | 2,754,184,019 | | | $ | 2,975,421,694 | |
| Year Ended September 30, 2009 | | $ | 5,100,694,441 | | | $ | 4,915,091,623 | |
| Year Ended September 30, 2008 | | $ | 1,979,370,856 | | | $ | 1,852,400,340 | |
See accompanying Notes to Financial Statements.
| | |
| 90 | | OPPENHEIMER GLOBAL STRATEGIC INCOME FUND |
| | | | |
| | | Period Ended
September 28, | |
| Class I | | 20121,2 | |
| | | | | |
| Per Share Operating Data | | | |
| Net asset value, beginning of period | | | $4.17 | |
| Income (loss) from investment operations: | | | | |
| Net investment income3 | | | .18 | |
| Net realized and unrealized gain | | | .11 | |
| | |
|
|
|
| Total from investment operations | | | .29 | |
| Dividends and/or distributions to shareholders: | | | | |
| Dividends from net investment income | | | (.16 | ) |
| Tax return of capital distribution | | | (.01 | ) |
| | |
|
|
|
| Total dividends and/or distributions to shareholders | | | (.17 | ) |
| Net asset value, end of period | | | $4.29 | |
| | |
|
|
|
| | | | | |
| Total Return, at Net Asset Value4 | | | 7.23 | % |
| | | | | |
| Ratios/Supplemental Data | | | |
| Net assets, end of period (in thousands) | | | $51,011 | |
| Average net assets (in thousands) | | | $17,870 | |
| Ratios to average net assets:5,6 | | | | |
| Net investment income | | | 6.37 | % |
| Expenses excluding interest and fees from borrowings | | | 0.64 | % |
| Interest and fees from borrowings | | | — | |
| | |
|
|
|
| Total expenses7 | | | 0.64 | % |
| Expenses after payments, waivers and/or reimbursements and reduction to custodian expenses8 | | | 0.60 | % |
| Portfolio turnover rate9 | | | 74 | % |
1. September 28, 2012 represents the last business day of the Fund’s 2012 fiscal year. See Note 1 of the accompanying Notes.
2. For the period from January 27, 2012 (inception of offering) to September 28, 2012.
3. Per share amounts calculated based on the average shares outstanding during the period.
4. Assumes an initial investment on the business day before the first day of the fiscal period, with all dividends and distributions reinvested in additional shares on the reinvestment date, and redemption at the net asset value calculated on the last business day of the fiscal period. Sales charges are not reflected in the total returns. Total returns are not annualized for periods less than one full year. Returns do not reflect the deduction of taxes that a shareholder would pay on fund distributions or the redemption of fund shares.
5. Annualized for periods less than one full year.
6. Includes the Fund’s share of the allocated expenses and/or net investment income from the master funds.
7. Ratio including all expenses of the wholly-owned subsidiary and indirect expenses from affiliated funds were as follows:
| | | | |
| Period Ended September 28, 2012 | | | 0.65 | % |
8. Ratio including all expenses of the wholly-owned subsidiary and indirect expenses from affiliated funds were as follows:
| | | | |
| Period Ended September 28, 2012 | | | 0.61 | % |
9. The portfolio turnover rate excludes purchase and sale transactions of To Be Announced (TBA) mortgage-related securities as follows:
| | | | | | | | |
| | | Purchase Transactions | | | Sale Transactions | |
| Period Ended September 28, 2012 | | $ | 9,325,024,559 | | | $ | 7,885,278,752 | |
See accompanying Notes to Financial Statements.
| | | | |
| OPPENHEIMER GLOBAL STRATEGIC INCOME FUND | | | 91 | |
FINANCIAL HIGHLIGHTS Continued
| | | | | | | | | | | | | | | | | | | | |
| | | Year Ended
September 28, | | | | | | Year Ended September 30, | |
| Class N | | 20121 | | | 2011 | | | 2010 | | | 2009 | | | 2008 | |
| | | | | | | | | | | | | | | | | | | | | |
| Per Share Operating Data | | | | | | | | | | | | | | | |
| Net asset value, beginning of period | | $ | 4.05 | | | $ | 4.32 | | | $ | 3.92 | | | $ | 3.97 | | | $ | 4.41 | |
| Income (loss) from investment operations: | | | | | | | | | | | | | | | | | |
| Net investment income2 | | | .23 | | | | .25 | | | | .26 | | | | .22 | | | | .22 | |
| Net realized and unrealized gain (loss) | |
| .26
|
| |
| (.28
| )
| |
| .40
|
| |
| (.05
| )
| |
| (.39
| )
|
| Total from investment operations | | | .49 | | | | (.03 | ) | | | .66 | | | | .17 | | | | (.17 | ) |
| Dividends and/or distributions to shareholders: | | | | | | | | | | | | | | | | | |
| Dividends from net investment income | | | (.22 | ) | | | (.24 | ) | | | (.26 | ) | | | (.16 | ) | | | (.27 | ) |
| Tax return of capital distribution | |
| (.01
| )
| |
| —
|
| |
| —
|
| |
| (.06
| )
| |
| —
|
|
| Total dividends and/or distributions to shareholders | | | (.23 | ) | | | (.24 | ) | | | (.26 | ) | | | (.22 | ) | | | (.27 | ) |
| Net asset value, end of period | | $
| 4.31
|
| | $
| 4.05
|
| | $
| 4.32
|
| | $
| 3.92
|
| | $
| 3.97
|
|
| Total Return, at Net Asset Value3 | | | 12.42 | % | | | (0.73 | )% | | | 17.34 | % | | | 5.14 | % | | | (4.17 | )% |
| | | | | | | | | | | | | | | | | | | | | |
| Ratios/Supplemental Data | | | | | | | | | | | | | | | |
| Net assets, end of period (in thousands) | | | $238,666 | | | | $225,889 | | | | $230,532 | | | | $186,857 | | | | $186,353 | |
| Average net assets (in thousands) | | | $229,983 | | | | $237,655 | | | | $202,619 | | | | $164,067 | | | | $175,884 | |
| Ratios to average net assets:4,5 | | | | | | | | | | | | | | | | | | | | |
| Net investment income | | | 5.59 | % | | | 5.81 | % | | | 6.45 | % | | | 6.34 | % | | | 5.03 | % |
| Expenses excluding interest and fees from borrowings | | | 1.38 | % | | | 1.39 | % | | | 1.44 | % | | | 1.47 | % | | | 1.32 | % |
| Interest and fees from borrowings | |
| —
|
| |
| —
| 6
| |
| 0.28
| %
| |
| 0.01
| %
| |
| —
|
|
| Total expenses | | | 1.38 | %7 | | | 1.39 | %8 | | | 1.72 | %8 | | | 1.48 | %8 | | | 1.32 | %8 |
| Expenses after payments, waivers and/or reimbursements and reduction to custodian expenses | | | 1.33 | %9 | | | 1.34 | % | | | 1.68 | % | | | 1.39 | % | | | 1.30 | % |
| Portfolio turnover rate10 | | | 74 | % | | | 53 | % | | | 94 | % | | | 96 | % | | | 71 | % |
1. September 28, 2012 represents the last business day of the Fund’s 2012 fiscal year. See Note 1 of the accompanying Notes.
2. Per share amounts calculated based on the average shares outstanding during the period.
3. Assumes an initial investment on the business day before the first day of the fiscal period, with all dividends and distributions reinvested in additional shares on the reinvestment date, and redemption at the net asset value calculated on the last business day of the fiscal period. Sales charges are not reflected in the total returns. Total returns are not annualized for periods less than one full year. Returns do not reflect the deduction of taxes that a shareholder would pay on fund distributions or the redemption of fund shares.
4. Annualized for periods less than one full year.
5. Includes the Fund’s share of the allocated expenses and/or net investment income from the master funds.
6. Less than 0.005%.
7. Ratio including all expenses of the wholly-owned subsidiary and indirect expenses from affiliated funds were as follows:
| | | | |
| Year Ended September 28, 2012 | | | 1.39 | % |
8. Total expenses including all affiliated fund expenses were as follows:
| | | | |
| Year Ended September 30, 2011 | | | 1.39 | % |
| Year Ended September 30, 2010 | | | 1.72 | % |
| Year Ended September 30, 2009 | | | 1.49 | % |
| Year Ended September 30, 2008 | | | 1.33 | % |
9. Ratio including all expenses of the wholly-owned subsidiary and indirect expenses from affiliated funds were as follows:
| | | | |
| Year Ended September 28, 2012 | | | 1.34 | % |
10. The portfolio turnover rate excludes purchase and sale transactions of To Be Announced (TBA) mortgage-related securities as follows:
| | | | | | | | |
| | | Purchase Transactions | | | Sale Transactions | |
| Year Ended September 28, 2012 | | $ | 9,325,024,559 | | | $ | 7,885,278,752 | |
| Year Ended September 30, 2011 | | $ | 3,961,769,663 | | | $ | 3,820,541,826 | |
| Year Ended September 30, 2010 | | $ | 2,754,184,019 | | | $ | 2,975,421,694 | |
| Year Ended September 30, 2009 | | $ | 5,100,694,441 | | | $ | 4,915,091,623 | |
| Year Ended September 30, 2008 | | $ | 1,979,370,856 | | | $ | 1,852,400,340 | |
See accompanying Notes to Financial Statements.
| | |
| 92 | | OPPENHEIMER GLOBAL STRATEGIC INCOME FUND |
| | | | | | | | | | | | | | | | | | | | |
| | | Year Ended
September 28, | | | | | | Year Ended September 30, | |
| Class Y | | 20121 | | | 2011 | | | 2010 | | | 2009 | | | 2008 | |
| | | | | | | | | | | | | | | | | | | | | |
| Per Share Operating Data | | | | | | | | | | | | | | | |
| Net asset value, beginning of period | | $ | 4.05 | | | $ | 4.31 | | | $ | 3.91 | | | $ | 3.96 | | | $ | 4.39 | |
| Income (loss) from investment operations: | | | | | | | | | | | | | | | | | |
| Net investment income2 | | | .26 | | | | .28 | | | | .29 | | | | .24 | | | | .25 | |
| Net realized and unrealized gain (loss) | |
| .25
|
| |
| (.27
| )
| |
| .39
|
| |
| (.05
| )
| |
| (.38
| )
|
| Total from investment operations | | | .51 | | | | .01 | | | | .68 | | | | .19 | | | | (.13 | ) |
| Dividends and/or distributions to shareholders: | | | | | | | | | | | | | | | | | |
| Dividends from net investment income | | | (.25 | ) | | | (.27 | ) | | | (.28 | ) | | | (.18 | ) | | | (.30 | ) |
| Tax return of capital distribution | |
| (.01
| )
| |
| —
|
| |
| —
|
| |
| (.06
| )
| |
| —
|
|
| Total dividends and/or distributions to shareholders | | | (.26 | ) | | | (.27 | ) | | | (.28 | ) | | | (.24 | ) | | | (.30 | ) |
| Net asset value, end of period | | $
| 4.30
|
| | $
| 4.05
|
| | $
| 4.31
|
| | $
| 3.91
|
| | $
| 3.96
|
|
| Total Return, at Net Asset Value3 | | | 12.82 | % | | | 0.13 | % | | | 18.10 | % | | | 5.67 | % | | | (3.33 | )% |
| | | | | | | | | | | | | | | | | | | | | |
| Ratios/Supplemental Data | | | | | | | | | | | | | | | |
| Net assets, end of period (in thousands) | | | $729,210 | | | | $706,842 | | | | $666,015 | | | | $290,726 | | | | $313,760 | |
| Average net assets (in thousands) | | | $729,460 | | | | $718,536 | | | | $545,045 | | | | $266,712 | | | | $220,416 | |
| Ratios to average net assets:4,5 | | | | | | | | | | | | | | | | | | | | |
| Net investment income | | | 6.17 | % | | | 6.44 | % | | | 7.08 | % | | | 6.82 | % | | | 5.68 | % |
| Expenses excluding interest and fees from borrowings | | | 0.79 | % | | | 0.77 | % | | | 0.85 | % | | | 0.79 | % | | | 0.66 | % |
| Interest and fees from borrowings | |
| —
|
| |
| —
| 6
| |
| 0.28
| %
| |
| 0.01
| %
| |
| —
|
|
| Total expenses | | | 0.79 | %7 | | | 0.77 | %8 | | | 1.13 | %8 | | | 0.80 | %8 | | | 0.66 | %8 |
| Expenses after payments, waivers and/or reimbursements and reduction to custodian expenses | | | 0.74 | %9 | | | 0.72 | % | | | 1.05 | % | | | 0.78 | % | | | 0.64 | % |
| Portfolio turnover rate10 | | | 74 | % | | | 53 | % | | | 94 | % | | | 96 | % | | | 71 | % |
1. September 28, 2012 represents the last business day of the Fund’s 2012 fiscal year. See Note 1 of the accompanying Notes.
2. Per share amounts calculated based on the average shares outstanding during the period.
3. Assumes an initial investment on the business day before the first day of the fiscal period, with all dividends and distributions reinvested in additional shares on the reinvestment date, and redemption at the net asset value calculated on the last business day of the fiscal period. Sales charges are not reflected in the total returns. Total returns are not annualized for periods less than one full year. Returns do not reflect the deduction of taxes that a shareholder would pay on fund distributions or the redemption of fund shares.
4. Annualized for periods less than one full year.
5. Includes the Fund’s share of the allocated expenses and/or net investment income from the master funds.
6. Less than 0.005%.
7. Ratio including all expenses of the wholly-owned subsidiary and indirect expenses from affiliated funds were as follows:
| | | | |
| Year Ended September 28, 2012 | | | 0.80 | % |
8. Total expenses including all affiliated fund expenses were as follows:
| | | | |
| Year Ended September 30, 2011 | | | 0.77 | % |
| Year Ended September 30, 2010 | | | 1.13 | % |
| Year Ended September 30, 2009 | | | 0.81 | % |
| Year Ended September 30, 2008 | | | 0.67 | % |
9. Ratio including all expenses of the wholly-owned subsidiary and indirect expenses from affiliated funds were as follows:
| | | | |
| Year Ended September 28, 2012 | | | 0.75 | % |
10. The portfolio turnover rate excludes purchase and sale transactions of To Be Announced (TBA) mortgage-related securities as follows:
| | | | | | | | |
| | | Purchase Transactions | | | Sale Transactions | |
| Year Ended September 28, 2012 | | $ | 9,325,024,559 | | | $ | 7,885,278,752 | |
| Year Ended September 30, 2011 | | $ | 3,961,769,663 | | | $ | 3,820,541,826 | |
| Year Ended September 30, 2010 | | $ | 2,754,184,019 | | | $ | 2,975,421,694 | |
| Year Ended September 30, 2009 | | $ | 5,100,694,441 | | | $ | 4,915,091,623 | |
| Year Ended September 30, 2008 | | $ | 1,979,370,856 | | | $ | 1,852,400,340 | |
See accompanying Notes to Financial Statements.
| | | | |
| OPPENHEIMER GLOBAL STRATEGIC INCOME FUND | | | 93 | |
NOTES TO FINANCIAL STATEMENTS
1. Significant Accounting Policies
Oppenheimer Global Strategic Income Fund (the “Fund”) is registered under the Investment Company Act of 1940, as amended, as a diversified open-end management investment company. The Fund’s investment objective is to seek total return. The Fund’s investment adviser is OppenheimerFunds, Inc. (the “Manager”).
The Fund offers Class A, Class C, Class I, Class N and Class Y shares, and previously offered Class B shares for new purchase through June 29, 2012. Subsequent to that date, no new purchases of Class B shares will be permitted, however reinvestment of dividend and/or capital gain distributions and exchanges of Class B shares into and from other Oppenheimer funds will be allowed. Class A shares are sold at their offering price, which is normally net asset value plus a front-end sales charge. Class C and Class N shares are sold, and Class B shares were sold, without a front-end sales charge but may be subject to a contingent deferred sales charge (“CDSC”). Class N shares are sold only through retirement plans. Retirement plans that offer Class N shares may impose charges on those accounts. Class I and Class Y shares are sold to certain institutional investors or intermediaries without either a front-end sales charge or a CDSC, however, the intermediaries may impose charges on their accountholders who beneficially own Class I and Class Y shares. All classes of shares have identical rights and voting privileges with respect to the Fund in general and exclusive voting rights on matters that affect that class alone. Earnings, net assets and net asset value per share may differ due to each class having its own expenses, such as transfer and shareholder servicing agent fees and shareholder communications, directly attributable to that class. Class A, B, C and N shares have separate distribution and/or service plans under which they pay fees. Class I and Class Y shares do not pay such fees. Class B shares will automatically convert to Class A shares 72 months after the date of purchase. Class I shares were first publicly offered on January 27, 2012.
The following is a summary of significant accounting policies consistently followed by the Fund.
Fiscal Year End. The last day of the Fund’s fiscal year was the last day the New York Stock Exchange was open for trading. The Fund’s financial statements have been presented through that date to maintain consistency with the Fund’s net asset value calculations used for shareholder transactions.
Structured Securities. The Fund invests in structured securities whose market values, interest rates and/or redemption prices are linked to the performance of underlying foreign currencies, interest rate spreads, stock market indices, prices of individual securities, commodities or other financial instruments or the occurrence of other specific events. The structured securities are often leveraged, increasing the volatility of each note’s market value relative to the change in the underlying linked financial element or event. Fluctuations in value of these securities are recorded as unrealized gains and losses in the accompanying Statement of Operations. The Fund records a realized gain or loss when a structured security is sold or matures.
| | |
| 94 | | OPPENHEIMER GLOBAL STRATEGIC INCOME FUND |
Securities on a When-Issued or Delayed Delivery Basis. The Fund may purchase securities on a “when-issued” basis, and may purchase or sell securities on a “delayed delivery” basis. “When-issued” or “delayed delivery” refers to securities whose terms and indenture are available and for which a market exists, but which are not available for immediate delivery. Delivery and payment for securities that have been purchased by the Fund on a when-issued basis normally takes place within six months and possibly as long as two years or more after the trade date. During this period, such securities do not earn interest, are subject to market fluctuation and may increase or decrease in value prior to their delivery. The purchase of securities on a when-issued basis may increase the volatility of the Fund’s net asset value to the extent the Fund executes such transactions while remaining substantially fully invested. When the Fund engages in when-issued or delayed delivery transactions, it relies on the buyer or seller, as the case may be, to complete the transaction. Their failure to do so may cause the Fund to lose the opportunity to obtain or dispose of the security at a price and yield it considers advantageous. The Fund may also sell securities that it purchased on a when-issued basis or forward commitment prior to settlement of the original purchase.
As of September 28, 2012, the Fund had purchased securities issued on a when-issued or delayed delivery basis and sold securities issued on a delayed delivery basis as follows:
| | | | |
| | | When-Issued or
Delayed Delivery
Basis Transactions | |
| Purchased securities | | $ | 2,302,491,215 | |
| Sold securities | | | 469,357,597 | |
The Fund may enter into “forward roll” transactions with respect to mortgage-related securities. In this type of transaction, the Fund sells a mortgage-related security to a buyer and simultaneously agrees to repurchase a similar security (same type, coupon and maturity) at a later date at a set price. During the period between the sale and the repurchase, the Fund will not be entitled to receive interest and principal payments on the securities that have been sold. The Fund records the incremental difference between the forward purchase and sale of each forward roll as realized gain (loss) on investments or as fee income in the case of such transactions that have an associated fee in lieu of a difference in the forward purchase and sale price.
Forward roll transactions may be deemed to entail embedded leverage since the Fund purchases mortgage-related securities with extended settlement dates rather than paying for the securities under a normal settlement cycle. This embedded leverage increases the Fund’s market value of investments relative to its net assets which can incrementally increase the volatility of the Fund’s performance. Forward roll transactions can be replicated over multiple settlement periods.
Risks of entering into forward roll transactions include the potential inability of the counterparty to meet the terms of the agreement; the potential of the Fund to receive inferior securities at redelivery as compared to the securities sold to the counterparty; and counterparty credit risk.
| | | | |
| OPPENHEIMER GLOBAL STRATEGIC INCOME FUND | | | 95 | |
NOTES TO FINANCIAL STATEMENTS Continued
1. Significant Accounting Policies Continued
Credit Risk. The Fund invests in high-yield, non-investment-grade bonds, which may be subject to a greater degree of credit risk. Credit risk relates to the ability of the issuer to meet interest or principal payments or both as they become due. The Fund may acquire securities that have missed an interest payment, and is not obligated to dispose of securities whose issuers or underlying obligors subsequently miss an interest payment. Information concerning securities not accruing interest as of September 28, 2012 is as follows:
| | | | |
| Cost | | $ | 134,076,682 | |
| Market Value | | $ | 24,082,027 | |
| Market Value as a % of Net Assets | | | 0.26 | % |
Investment in Oppenheimer Global Strategic Income Fund (Cayman) Ltd. The Fund has established a Cayman Islands company that is wholly-owned and controlled by the Fund (the “Subsidiary”). The Fund may invest up to 25% of its total assets in the Subsidiary. The Subsidiary invests primarily in commodity-linked derivatives (including commodity related futures, options and swap contracts), exchange traded funds and certain fixed-income securities and other investments that may serve as margin or collateral for its derivatives positions. Investments in the Subsidiary are expected to provide the Fund with exposure to commodities markets within the limitations of the federal tax requirements that apply to the Fund. The Subsidiary is subject to the same investment restrictions and guidelines, and follows the same compliance policies and procedures, as the Fund. The Fund wholly owns and controls the Subsidiary, and the Fund and Subsidiary are both managed by the Manager.
The Fund does not consolidate the assets, liabilities, capital or operations of the Subsidiary into its financial statements. Rather, the Subsidiary is separately presented as an investment in the Fund’s Statement of Investments. Shares of the Subsidiary are valued at their net asset value per share. Gains or losses on withdrawals of capital from the Subsidiary by the Fund are recognized on an average cost basis. Unrealized appreciation or depreciation on the Fund’s investment in the Subsidiary is recorded in the Fund’s Statement of Assets and Liabilities and the Fund’s Statement of Operations. Distributions received from the Subsidiary are recorded as income on the ex-dividend date.
For tax purposes, the Subsidiary is an exempted Cayman investment company. The Subsidiary has received an undertaking from the Government of the Cayman Islands exempting it from all local income, profits and capital gains taxes through September of 2030. No such taxes are levied in the Cayman Islands at the present time. For U.S. income tax purposes, the Subsidiary is a Controlled Foreign Corporation and as such is not subject to U.S. income tax. However, as a wholly-owned Controlled Foreign Corporation, the Subsidiary’s net income and capital gain, to the extent of its earnings and profits, will be included each year in the Fund’s investment company taxable income. For the year ended September 28, 2012, the Subsidiary has a deficit of $52,790 in its taxable earnings and profits. In addition, any in-kind capital contributions made by the Fund to the Subsidiary will result in the Fund recognizing taxable gain to the extent of unrealized gain, if any, on
| | |
| 96 | | OPPENHEIMER GLOBAL STRATEGIC INCOME FUND |
securities transferred to the Subsidiary while any unrealized losses on securities so transferred will not be recognized at the time of transfer.
Investment in Oppenheimer Institutional Money Market Fund. The Fund is permitted to invest daily available cash balances in an affiliated money market fund. The Fund may invest the available cash in Class E shares of Oppenheimer Institutional Money Market Fund (“IMMF”) to seek current income while preserving liquidity. IMMF is a registered open-end management investment company, regulated as a money market fund under the Investment Company Act of 1940, as amended. The Manager is also the investment adviser of IMMF. When applicable, the Fund’s investment in IMMF is included in the Statement of Investments. Shares of IMMF are valued at their net asset value per share. As a shareholder, the Fund is subject to its proportional share of IMMF’s Class E expenses, including its management fee. The Manager will waive fees and/or reimburse Fund expenses in an amount equal to the indirect management fees incurred through the Fund’s investment in IMMF.
Investment in Oppenheimer Master Funds. The Fund is permitted to invest in entities sponsored and/or advised by the Manager or an affiliate. Certain of these entities in which the Fund invests are mutual funds registered under the Investment Company Act of 1940 that expect to be treated as partnerships for tax purposes, specifically Oppenheimer Master Loan Fund, LLC and Oppenheimer Master Event-Linked Bond Fund, LLC (the “Master Funds”). Each Master Fund has its own investment risks, and those risks can affect the value of the Fund’s investments and therefore the value of the Fund’s shares. To the extent that the Fund invests more of its assets in one Master Fund than in another, the Fund will have greater exposure to the risks of that Master Fund.
The investment objective of Oppenheimer Master Loan Fund, LLC is to seek as high a level of current income and preservation of capital as is consistent with investing primarily in loans and other debt securities. The investment objective of Oppenheimer Master Event-Linked Bond Fund, LLC is to seek a high level of current income principally derived from interest on debt securities. The Fund’s investments in the Master Funds are included in the Statement of Investments. The Fund recognizes income and gain/(loss) on its investments in each Master Fund according to its allocated pro-rata share, based on its relative proportion of total outstanding Master Fund shares held, of the total net income earned and the net gain/(loss) realized on investments sold by the Master Funds. As a shareholder, the Fund is subject to its proportional share of the Master Funds’ expenses, including their management fee. The Manager will waive fees and/or reimburse Fund expenses in an amount equal to the indirect management fees incurred through the Fund’s investment in the Master Funds.
Foreign Currency Translation. The Fund’s accounting records are maintained in U.S. dollars. The values of securities denominated in foreign currencies and amounts related to the purchase and sale of foreign securities and foreign investment income are translated into U.S. dollars as of the close of the Exchange, normally 4:00 P.M. Eastern time, on each
| | | | |
| OPPENHEIMER GLOBAL STRATEGIC INCOME FUND | | | 97 | |
NOTES TO FINANCIAL STATEMENTS Continued
1. Significant Accounting Policies Continued
day the Exchange is open for trading. Foreign exchange rates may be valued primarily using a reliable bank, dealer or service authorized by the Board of Trustees.
Reported net realized gains and losses from foreign currency transactions arise from sales of portfolio securities, sales and maturities of short-term securities, sales of foreign currencies, exchange rate fluctuations between the trade and settlement dates on securities transactions, and the difference between the amounts of dividends, interest, and foreign withholding taxes recorded on the Fund’s books and the U.S. dollar equivalent of the amounts actually received or paid. Net unrealized appreciation and depreciation on the translation of assets and liabilities denominated in foreign currencies arise from changes in the values of assets and liabilities, including investments in securities at fiscal period end, resulting from changes in exchange rates.
The effect of changes in foreign currency exchange rates on investments is separately identified from the fluctuations arising from changes in market values of securities held and reported with all other foreign currency gains and losses in the Fund’s Statement of Operations.
Allocation of Income, Expenses, Gains and Losses. Income, expenses (other than those attributable to a specific class), gains and losses are allocated on a daily basis to each class of shares based upon the relative proportion of net assets represented by such class. Operating expenses directly attributable to a specific class are charged against the operations of that class.
Federal Taxes. The Fund intends to comply with provisions of the Internal Revenue Code applicable to regulated investment companies and to distribute substantially all of its investment company taxable income, including any net realized gain on investments not offset by capital loss carryforwards, if any, to shareholders. Therefore, no federal income or excise tax provision is required. The Fund files income tax returns in U.S. federal and applicable state jurisdictions. The statute of limitations on the Fund’s tax return filings generally remain open for the three preceding fiscal reporting period ends.
The tax components of capital shown in the following table represent distribution requirements the Fund must satisfy under the income tax regulations, losses the Fund may be able to offset against income and gains realized in future years and unrealized appreciation or depreciation of securities and other investments for federal income tax purposes.
| | | | | | | | | | | | |
Undistributed
Net Investment
Income | | Undistributed
Long-Term
Gain | | | Accumulated
Loss
Carryforward1,2,3,4,5,6 | | | Net Unrealized
Depreciation
Based on Cost of
Securities and Other
Investments for Federal
Income Tax Purposes | |
| $— | | $ | — | | | $ | 532,263,887 | | | $ | (19,661,620 | ) |
| | |
| 98 | | OPPENHEIMER GLOBAL STRATEGIC INCOME FUND |
1. As of September 28, 2012, the Fund had $408,069,017 of net capital loss carryforwards available to offset future realized capital gains, if any, and thereby reduce future taxable gain distributions. Details of the capital loss carryforwards are included in the table below. Capital loss carryovers with no expiration, if any, must be utilized prior to those with expiration dates.
| | | | |
| Expiring | | | |
| 2016 | | $ | 20,567,236 | |
| 2017 | | | 114,107,166 | |
| 2018 | | | 240,345,967 | |
| No expiration | | | 33,048,648 | |
| | |
|
|
|
| Total | | $ | 408,069,017 | |
| | |
|
|
|
Of these losses, $33,835,693 are subject to Sec. 382 loss limitation rules resulting from merger activity. These limitations generally reduce the utilization of these losses to a maximum of $12,593,017 per year and have expiration dates ranging from September 30, 2016 to September 30, 2017.
Of these losses, $33,048,648 are subject to Sec. 382 loss limitation rules resulting from merger activity. These limitations generally reduce the utilization of these losses to a maximum of $12,593,017 per year but do not have expiration dates associated with them.
2. As of September 28, 2012, the Fund had $123,811,998 of post-October losses available to offset future realized capital gains, if any.
3. The Fund had $382,872 of straddle losses which were deferred.
4. During the fiscal year ended September 28, 2012, the Fund utilized $52,006,467 of capital loss carryforward to offset capital gains realized in that fiscal year.
5. During the fiscal year ended September 30, 2011, the Fund utilized $216,108,238 of capital loss carryforward to offset capital gains realized in that fiscal year.
6. During the fiscal year ended September 28, 2012, $70,908,258 of unused capital loss carryforward expired.
Net investment income (loss) and net realized gain (loss) may differ for financial statement and tax purposes. The character of dividends and distributions made during the fiscal year from net investment income or net realized gains may differ from their ultimate characterization for federal income tax purposes. Also, due to timing of dividends and distributions, the fiscal year in which amounts are distributed may differ from the fiscal year in which the income or net realized gain was recorded by the Fund.
Accordingly, the following amounts have been reclassified for September 30, 2012. Net assets of the Fund were unaffected by the reclassifications.
| | | | | | | | |
Reduction to
Paid-in Capital | | Increase
to Accumulated
Net Investment
Income | | | Reduction
to Accumulated Net
Realized Loss
on Investments | |
| $84,730,476 | | $ | 37,276,681 | | | $ | 47,453,795 | |
The tax character of distributions paid during the years ended September 30, 2012 and September 30, 2011 was as follows:
| | | | | | | | |
| | | Year Ended
September 30, 2012 | | | Year Ended
September 30, 2011 | |
| Distributions paid from: | | | | | | | | |
| Ordinary income | | $ | 468,483,291 | | | $ | 535,343,244 | |
| Return of capital | | | 24,053,396 | | | | — | |
| | |
|
|
| |
|
|
|
| Total | | $ | 492,536,687 | | | $ | 535,343,244 | |
| | |
|
|
| |
|
|
|
The aggregate cost of securities and other investments and the composition of unrealized appreciation and depreciation of securities and other investments for federal income tax purposes as of September 28, 2012 are noted in the following table. The primary difference
| | | | |
| OPPENHEIMER GLOBAL STRATEGIC INCOME FUND | | | 99 | |
NOTES TO FINANCIAL STATEMENTS Continued
1. Significant Accounting Policies Continued
between book and tax appreciation or depreciation of securities and other investments, if applicable, is attributable to the tax deferral of losses or tax realization of financial statement unrealized gain or loss.
| | | | |
| Federal tax cost of securities | | $ | 10,861,619,154 | |
| Federal tax cost of other investments | | | (2,785,615,558 | ) |
| | |
|
|
|
| Total federal tax cost | | $ | 8,076,003,596 | |
| | |
|
|
|
| Gross unrealized appreciation | | $ | 736,185,340 | |
| Gross unrealized depreciation | | | (755,846,960 | ) |
| | |
|
|
|
| Net unrealized depreciation | | $ | (19,661,620 | ) |
| | |
|
|
|
Certain foreign countries impose a tax on capital gains which is accrued by the Fund based on unrealized appreciation, if any, on affected securities. The tax is paid when the gain is realized.
Trustees’ Compensation. The Board of Trustees has adopted a compensation deferral plan for independent trustees that enables trustees to elect to defer receipt of all or a portion of the annual compensation they are entitled to receive from the Fund. For purposes of determining the amount owed to the Trustee under the plan, deferred amounts are treated as though equal dollar amounts had been invested in shares of the Fund or in other Oppenheimer funds selected by the Trustee. The Fund purchases shares of the funds selected for deferral by the Trustee in amounts equal to his or her deemed investment, resulting in a Fund asset equal to the deferred compensation liability. Such assets are included as a component of “Other” within the asset section of the Statement of Assets and Liabilities. Deferral of trustees’ fees under the plan will not affect the net assets of the Fund, and will not materially affect the Fund’s assets, liabilities or net investment income per share. Amounts will be deferred until distributed in accordance with the compensation deferral plan.
Dividends and Distributions to Shareholders. Dividends and distributions to shareholders, which are determined in accordance with income tax regulations and may differ from U.S. generally accepted accounting principles, are recorded on the ex-dividend date. Income distributions, if any, are declared daily and paid monthly. Capital gain distributions, if any, are declared and paid annually.
Investment Income. Dividend income is recorded on the ex-dividend date or upon ex-dividend notification in the case of certain foreign dividends where the ex-dividend date may have passed. Non-cash dividends included in dividend income, if any, are recorded at the fair market value of the securities received. Interest income is recognized on an accrual basis. Discount and premium, which are included in interest income on the Statement of Operations, are amortized or accreted daily.
Custodian Fees. “Custodian fees and expenses” in the Statement of Operations may include interest expense incurred by the Fund on any cash overdrafts of its custodian
| | |
| 100 | | OPPENHEIMER GLOBAL STRATEGIC INCOME FUND |
account during the period. Such cash overdrafts may result from the effects of failed trades in portfolio securities and from cash outflows resulting from unanticipated shareholder redemption activity. The Fund pays interest to its custodian on such cash overdrafts, to the extent they are not offset by positive cash balances maintained by the Fund, at a rate equal to the Federal Funds Rate plus 0.50%. The “Reduction to custodian expenses” line item, if applicable, represents earnings on cash balances maintained by the Fund during the period. Such interest expense and other custodian fees may be paid with these earnings.
Security Transactions. Security transactions are recorded on the trade date. Realized gains and losses on securities sold (except for the investments in the Subsidiary) are determined on the basis of identified cost.
Indemnifications. The Fund’s organizational documents provide current and former trustees and officers with a limited indemnification against liabilities arising in connection with the performance of their duties to the Fund. In the normal course of business, the Fund may also enter into contracts that provide general indemnifications. The Fund’s maximum exposure under these arrangements is unknown as this would be dependent on future claims that may be made against the Fund. The risk of material loss from such claims is considered remote.
Other. The preparation of financial statements in conformity with accounting principles generally accepted in the United States of America requires management to make estimates and assumptions that affect the reported amounts of assets and liabilities and disclosure of contingent assets and liabilities at the date of the financial statements and the reported amounts of increases and decreases in net assets from operations during the reporting period. Actual results could differ from those estimates.
2. Securities Valuation
The Fund calculates the net asset value of its shares as of the close of the New York Stock Exchange (the “Exchange”), normally 4:00 P.M. Eastern time, on each day the Exchange is open for trading.
The Fund’s Board has adopted procedures for the valuation of the Fund’s securities and has delegated the day-to-day responsibility for valuation determinations under those procedures to the Manager. The Manager has established a Valuation Committee which is responsible for determining a “fair valuation” for any security for which market quotations are not “readily available.” The Valuation Committee’s fair valuation determinations are subject to review, approval and ratification by the Fund’s Board at its next regularly scheduled meeting covering the calendar quarter in which the fair valuation was determined.
Valuation Methods and Inputs
Securities are valued using unadjusted quoted market prices, when available, as supplied primarily by third party pricing services or dealers.
| | | | |
| OPPENHEIMER GLOBAL STRATEGIC INCOME FUND | | | 101 | |
NOTES TO FINANCIAL STATEMENTS Continued
2. Securities Valuation Continued
The following methodologies are used to determine the market value or the fair value of the types of securities described below:
Securities traded on a registered U.S. securities exchange (including exchange-traded derivatives other than futures and futures options) are valued based on the last sale price of the security reported on the principal exchange on which it is traded, prior to the time when the Fund’s assets are valued. In the absence of a sale, the security is valued at the last sale price on the prior trading day, if it is within the spread of the current day’s closing “bid” and “asked” prices, and if not, at the current day’s closing bid price. A security of a foreign issuer traded on a foreign exchange but not listed on a registered U.S. securities exchange is valued based on the last sale price on the principal exchange on which the security is traded, as identified by the third party pricing service used by the Manager, prior to the time when the Fund’s assets are valued. If the last sale price is unavailable, the security is valued at the most recent official closing price on the principal exchange on which it is traded. If the last sales price or official closing price for a foreign security is not available, the security is valued at the mean between the bid and asked price per the exchange or, if not available from the exchange, obtained from two dealers. If bid and asked prices are not available from either the exchange or two dealers, the security is valued by using one of the following methodologies (listed in order of priority); (1) using a bid from the exchange, (2) the mean between the bid and asked price as provided by a single dealer, or (3) a bid from a single dealer.
Shares of a registered investment company that are not traded on an exchange are valued at that investment company’s net asset value per share.
Corporate and government debt securities (of U.S. or foreign issuers) and municipal debt securities, event-linked bonds, loans, mortgage-backed securities, collateralized mortgage obligations, and asset-backed securities are valued at the mean between the “bid” and “asked” prices utilizing evaluated prices obtained from third party pricing services or broker-dealers who may use matrix pricing methods to determine the evaluated prices.
Short-term money market type debt securities with a remaining maturity of sixty days or less are valued at cost adjusted by the amortization of discount or premium to maturity (amortized cost), which approximates market value. Short-term debt securities with a remaining maturity in excess of sixty days are valued at the mean between the “bid” and “asked” prices utilizing evaluated prices obtained from third party pricing services or broker-dealers.
Structured securities, swaps, swaptions, and other over-the-counter derivatives are valued utilizing evaluated prices obtained from third party pricing services or broker-dealers.
Forward foreign currency exchange contracts are valued utilizing current and forward currency rates obtained from third party pricing services. When the settlement date of a contract is an interim date for which a quotation is not available, interpolated values are derived using the nearest dated forward currency rate.
Futures contracts and futures options traded on a commodities or futures exchange will be valued at the final settlement price or official closing price on the principal exchange as
| | |
| 102 | | OPPENHEIMER GLOBAL STRATEGIC INCOME FUND |
reported by such principal exchange at its trading session ending at, or most recently prior to, the time when the Fund’s assets are valued.
A description of the standard inputs that may generally be considered by the third party pricing vendors in determining their evaluated prices is provided below.
| | |
| Security Type | | Standard inputs generally considered by third-party pricing vendors |
| Corporate debt, government debt, municipal, mortgage-backed and asset-backed securities | | Reported trade data, broker-dealer price quotations, benchmark yields, issuer spreads on comparable securities, the credit quality, yield, maturity, and other appropriate factors. |
| Loans | | Information obtained from market participants regarding reported trade data and broker-dealer price quotations. |
| Event-linked bonds | | Information obtained from market participants regarding reported trade data and broker-dealer price quotations. |
| Structured securities | | Relevant market information such as the price of underlying financial instruments, stock market indices, foreign currencies, interest rate spreads, commodities, or the occurrence of other specific events. |
| Swaps | | Relevant market information, including underlying reference assets such as credit spreads, credit event probabilities, index values, individual security values, forward interest rates, variable interest rates, volatility measures, and forward currency rates. |
If a market value or price cannot be determined for a security using the methodologies described above, or if, in the “good faith” opinion of the Manager, the market value or price obtained does not constitute a “readily available market quotation,” or a significant event has occurred that would materially affect the value of the security the security is fair valued either (i) by a standardized fair valuation methodology applicable to the security type or the significant event as previously approved by the Valuation Committee and the Fund’s Board or (ii) as determined in good faith by the Manager’s Valuation Committee. The Valuation Committee considers all relevant facts that are reasonably available, through either public information or information available to the Manager, when determining the fair value of a security. Fair value determinations by the Manager are subject to review, approval and ratification by the Fund’s Board at its next regularly scheduled meeting covering the calendar quarter in which the fair valuation was determined. Those fair valuation standardized methodologies include, but are not limited to, valuing securities at the last sale price or initially at cost and subsequently adjusting the value based on: changes in company specific fundamentals, changes in an appropriate securities index, or changes in the value of similar securities which may be further adjusted for any discounts related to security-specific resale restrictions. When possible, such methodologies use observable market inputs such as unadjusted quoted prices of similar securities, observable interest rates, currency rates and yield curves. The methodologies used for valuing securities are not necessarily an indication of the risks associated with investing in those securities nor can it be assured that the Fund can obtain the fair value assigned to a security if it were to sell the security.
To assess the continuing appropriateness of security valuations, the Manager, or its third party service provider who is subject to oversight by the Manager, regularly compares prior day prices, prices on comparable securities, and sale prices to the current day prices and
| | | | |
| OPPENHEIMER GLOBAL STRATEGIC INCOME FUND | | | 103 | |
NOTES TO FINANCIAL STATEMENTS Continued
2. Securities Valuation Continued
challenges those prices exceeding certain tolerance levels with the third party pricing service or broker source. For those securities valued by fair valuations, whether through a standardized fair valuation methodology or a fair valuation determination, the Valuation Committee reviews and affirms the reasonableness of the valuations based on such methodologies and fair valuation determinations on a regular basis after considering all relevant information that is reasonably available.
Classifications
Each investment asset or liability of the Fund is assigned a level at measurement date based on the significance and source of the inputs to its valuation. Various data inputs are used in determining the value of each of the Fund’s investments as of the reporting period end. These data inputs are categorized in the following hierarchy under applicable financial accounting standards:
| 1) | | Level 1—unadjusted quoted prices in active markets for identical assets or liabilities (including securities actively traded on a securities exchange) |
| 2) | | Level 2—inputs other than unadjusted quoted prices that are observable for the asset or liability (such as unadjusted quoted prices for similar assets and market corroborated inputs such as interest rates, prepayment speeds, credit risks, etc.) |
| 3) | | Level 3—significant unobservable inputs (including the Manager’s own judgments about assumptions that market participants would use in pricing the asset or liability). |
The inputs used for valuing securities are not necessarily an indication of the risks associated with investing in those securities.
The table below categorizes amounts that are included in the Fund’s Statement of Assets and Liabilities as of September 28, 2012 based on valuation input level:
| | | | | | | | | | | | | | | | | | | | |
| | | Level 1—
Unadjusted
Quoted Prices | | Level 2—
Other Significant
Observable Inputs | | Level 3—
Significant
Unobservable
Inputs | | Value |
| Assets Table | | | | | | | | | | | | | | | | | | | | |
| Investments, at Value: | | | | | | | | | | | | | | | | | | | | |
| Wholly-Owned Subsidiary | | | $ | — | | | | $ | 1,447,210 | | | | $ | — | | | | $ | 1,447,210 | |
| Asset-Backed Securities | | | | — | | | | | 212,269,609 | | | | | 37,604,000 | | | | | 249,873,609 | |
| Corporate Loans | | | | — | | | | | 124,462,831 | | | | | 11,394,688 | | | | | 135,857,519 | |
| Mortgage-Backed Obligations | | | | — | | | | | 3,129,060,570 | | | | | — | | | | | 3,129,060,570 | |
| U.S. Government Obligations | | | | — | | | | | 328,022,684 | | | | | — | | | | | 328,022,684 | |
| Foreign Government Obligations | | | | — | | | | | 2,563,528,759 | | | | | — | | | | | 2,563,528,759 | |
| Corporate Bonds and Notes | | | | — | | | | | 2,711,435,412 | | | | | 5,261,342 | | | | | 2,716,696,754 | |
| Preferred Stocks | | | | — | | | | | 15,543,870 | | | | | — | | | | | 15,543,870 | |
| Common Stocks | | | | — | | | | | 14,759,366 | | | | | 844,188 | | | | | 15,603,554 | |
| Rights, Warrants and Certificates | | | | — | | | | | — | | | | | 3,187 | | | | | 3,187 | |
| Structured Securities | | | | — | | | | | 245,296,217 | | | | | 1,402,959 | | | | | 246,699,176 | |
| Options Purchased | | | | 3,772,070 | | | | | 22,548,810 | | | | | — | | | | | 26,320,880 | |
| Swaptions Purchased | | | | — | | | | | 28,658,378 | | | | | — | | | | | 28,658,378 | |
| Investment Companies | | | | 96,792,985 | | | | | 1,289,240,425 | | | | | — | | | | | 1,386,033,410 | |
| | | |
|
|
|
| Total Investments, at Value | | | | 100,565,055 | | | | | 10,686,274,141 | | | | | 56,510,364 | | | | | 10,843,349,560 | |
| | |
| 104 | | OPPENHEIMER GLOBAL STRATEGIC INCOME FUND |
| | | | | | | | | | | | | | | | | | | | |
| | | Level 1—
Unadjusted
Quoted Prices | | Level 2—
Other Significant
Observable Inputs | | Level 3—
Significant
Unobservable
Inputs | | Value |
| Other Financial Instruments: | | | | | | | | | | | | | | | | | | | | |
| Appreciated swaps, at value | | | $ | — | | | | $ | 9,102,211 | | | | $ | — | | | | $ | 9,102,211 | |
| Depreciated swaps, at value | | | | — | | | | | 1,575,229 | | | | | — | | | | | 1,575,229 | |
| Futures margins | | | | 1,211,805 | | | | | — | | | | | — | | | | | 1,211,805 | |
| Foreign currency exchange contracts | | | | — | | | | | 15,616,163 | | | | | — | | | | | 15,616,163 | |
| | | |
|
|
| | |
|
|
|
| Total Assets | | | $ | 101,776,860 | | | | $ | 10,712,567,744 | | | | $ | 56,510,364 | | | | $ | 10,870,854,968 | |
| | | |
|
|
| | |
|
|
|
| Liabilities Table | | | | | | | | | | | | | | | | | | | | |
| Other Financial Instruments: | | | | | | | | | | | | | | | | | | | | |
| Swaps, at value | | | $ | — | | | | $ | — | | | | $ | — | | | | $ | — | |
| Appreciated swaps, at value | | | | — | | | | | (3,421,165 | ) | | | | — | | | | | (3,421,165 | ) |
| Depreciated swaps, at value | | | | — | | | | | (8,683,009 | ) | | | | — | | | | | (8,683,009 | ) |
| Appreciated swaptions written, at value | | | | — | | | | | (12,436,955 | ) | | | | — | | | | | (12,436,955 | ) |
| Depreciated swaptions written, at value | | | | — | | | | | (22,223,182 | ) | | | | — | | | | | (22,223,182 | ) |
| Appreciated options written, at value | | | | (597,667 | ) | | | | (4,579,581 | ) | | | | — | | | | | (5,177,248 | ) |
| Depreciated options written, at value | | | | (669,263 | ) | | | | (1,630,343 | ) | | | | — | | | | | (2,299,606 | ) |
| Futures margins | | | | (998,183 | ) | | | | — | | | | | — | | | | | (998,183 | ) |
| Foreign currency exchange contracts | | | | — | | | | | (58,322,051 | ) | | | | — | | | | | (58,322,051 | ) |
| | | |
|
|
| | |
|
|
|
| Total Liabilities | | | $ | (2,265,113 | ) | | | $ | (111,296,286 | ) | | | $ | — | | | | $ | (113,561,399 | ) |
| | | |
|
|
| | |
|
|
|
Currency contracts and forwards, if any, are reported at their unrealized appreciation/depreciation at measurement date, which represents the change in the contract’s value from trade date. Futures, if any, are reported at their variation margin at measurement date, which represents the amount due to/from the Fund at that date. All additional assets and liabilities included in the above table are reported at their market value at measurement date.
The table below shows the transfers between Level 2 and Level 3. The Fund’s policy is to recognize transfers in and transfers out as of the beginning of the reporting period.
| | | | | | | | | | | | | | | | | | | | |
| | | Transfers
into Level 2* | | Transfers
out of Level 2** | | Transfers
into Level 3** | | Transfers
out of Level 3* |
| Assets Table | | | | | | | | | | | | | | | | | | | | |
| Investments, at Value: | | | | | | | | | | | | | | | | | | | | |
| Common Stocks | | | $ | 545,539 | | | | $ | — | | | | $ | — | | | | $ | (545,539 | ) |
| Preferred Stocks | | | | 7,750,195 | | | | | — | | | | | — | | | | | (7,750,195 | ) |
| Corporate Bonds and Notes | | | | — | | | | | (3,252,000 | ) | | | | 3,252,000 | | | | | — | |
| | | |
|
|
| | |
|
|
|
| Total Assets | | | $ | 8,295,734 | | | | $ | (3,252,000 | ) | | | $ | 3,252,000 | | | | $ | (8,295,734 | ) |
| | | |
|
|
| | |
|
|
|
*Transferred from Level 3 to Level 2 due to the availability of market data for this security.
**Transferred from Level 2 to Level 3 because of the lack of observable market data.
There have been no significant changes to the fair valuation methodologies of the Fund during the period.
The net asset value per share of the Subsidiary is determined as of the close of the Exchange, on each day the Exchange is open for trading. The net asset value per share is determined by dividing the value of the Subsidiary’s net assets by the number of shares that are outstanding. The Subsidiary values its investments in the same manner as the Fund as described above.
| | | | |
| OPPENHEIMER GLOBAL STRATEGIC INCOME FUND | | | 105 | |
NOTES TO FINANCIAL STATEMENTS Continued
3. Shares of Beneficial Interest
The Fund has authorized an unlimited number of $0.001 par value shares of beneficial interest of each class. Transactions in shares of beneficial interest were as follows:
| | | | | | | | | | | | | | | | |
| | | Year Ended September 28, 20121 | | | Year Ended September 30, 2011 | |
| | | Shares | | | Amount | | | Shares | | | Amount | |
| Class A | | | | | | | | | | | | | | | | |
| Sold | | | 179,677,478 | | | $ | 749,557,749 | | | | 248,013,417 | | | $ | 1,071,416,084 | |
Dividends and/or
distributions reinvested | | | 70,832,429 | | | | 295,211,895 | | | | 70,663,847 | | | | 303,589,497 | |
| Acquisition—Note 8 | | | 73,155,128 | | | | 314,567,048 | | | | — | | | | — | |
| Redeemed | | | (311,973,354 | ) | | | (1,298,509,177 | ) | | | (347,586,613 | ) | | | (1,499,889,596 | ) |
| | |
|
|
| |
|
|
|
| Net increase (decrease) | | | 11,691,681 | | | $ | 60,827,515 | | | | (28,909,349 | ) | | $ | (124,884,015 | ) |
| | |
|
|
| |
|
|
| |
|
|
| |
|
|
|
| | | | | | | | | | | | | | | | | |
| Class B | | | | | | | | | | | | | | | | |
| Sold | | | 10,263,297 | | | $ | 42,836,405 | | | | 15,333,850 | | | $ | 66,448,173 | |
Dividends and/or
distributions reinvested | | | 2,860,313 | | | | 11,961,537 | | | | 3,207,096 | | | | 13,828,747 | |
| Acquisition—Note 8 | | | 4,258,497 | | | | 18,396,708 | | | | — | | | | — | |
| Redeemed | | | (22,059,177 | ) | | | (92,152,983 | ) | | | (27,437,132 | ) | | | (119,216,600 | ) |
| | |
|
|
| |
|
|
|
| Net decrease | | | (4,677,070 | ) | | $ | (18,958,333 | ) | | | (8,896,186 | ) | | $ | (38,939,680 | ) |
| | |
|
|
| |
|
|
| |
|
|
| |
|
|
|
| | | | | | | | | | | | | | | | | |
| Class C | | | | | | | | | | | | | | | | |
| Sold | | | 52,136,654 | | | $ | 216,949,813 | | | | 67,246,894 | | | $ | 289,327,451 | |
Dividends and/or
distributions reinvested | | | 15,102,247 | | | | 62,850,869 | | | | 14,585,663 | | | | 62,522,873 | |
| Acquisition—Note 8 | | | 15,949,561 | | | | 68,423,617 | | | | — | | | | — | |
| Redeemed | | | (71,417,630 | ) | | | (296,817,124 | ) | | | (75,620,751 | ) | | | (325,249,803 | ) |
| | |
|
|
| |
|
|
|
| Net increase | | | 11,770,832 | | | $ | 51,407,175 | | | | 6,211,806 | | | $ | 26,600,521 | |
| | |
|
|
| |
|
|
| |
|
|
| |
|
|
|
| | | | | | | | | | | | | | | | | |
| Class I | | | | | | | | | | | | | | | | |
| Sold | | | 12,098,223 | | | $ | 50,533,216 | | | | — | | | $ | — | |
Dividends and/or
distributions reinvested | | | 168,686 | | | | 718,016 | | | | — | | | | — | |
| Redeemed | | | (368,253 | ) | | | (1,563,895 | ) | | | — | | | | — | |
| | |
|
|
| |
|
|
|
| Net increase | | | 11,898,656 | | | $ | 49,687,337 | | | | — | | | $ | — | |
| | |
|
|
| |
|
|
| |
|
|
| |
|
|
|
| | | | | | | | | | | | | | | | | |
| Class N | | | | | | | | | | | | | | | | |
| Sold | | | 14,121,050 | | | $ | 58,879,745 | | | | 18,963,770 | | | $ | 82,037,573 | |
Dividends and/or
distributions reinvested | | | 2,713,166 | | | | 11,316,412 | | | | 2,700,968 | | | | 11,610,969 | |
| Acquisition—Note 8 | | | 2,539,125 | | | | 10,918,238 | | | | — | | | | — | |
| Redeemed | | | (19,705,631 | ) | | | (82,327,358 | ) | | | (19,292,561 | ) | | | (83,349,622 | ) |
| | |
|
|
| |
|
|
|
| Net increase (decrease) | | | (332,290 | ) | | $ | (1,212,963 | ) | | | 2,372,177 | | | $ | 10,298,920 | |
| | |
|
|
| |
|
|
| |
|
|
| |
|
|
|
| | | | | | | | | | | | | | | | | |
| Class Y | | | | | | | | | | | | | | | | |
| Sold | | | 53,887,592 | | | $ | 224,195,334 | | | | 78,483,612 | | | $ | 338,500,436 | |
Dividends and/or
distributions reinvested | | | 9,517,136 | | | | 39,629,052 | | | | 9,274,828 | | | | 39,812,222 | |
| Acquisition—Note 8 | | | 1,620,678 | | | | 6,968,915 | | | | — | | | | — | |
| Redeemed | | | (70,193,036 | ) | | | (292,162,287 | ) | | | (67,474,536 | ) | | | (291,120,498 | ) |
| | |
|
|
| |
|
|
|
| Net increase (decrease) | | | (5,167,630 | ) | | $ | (21,368,986 | ) | | | 20,283,904 | | | $ | 87,192,160 | |
| | |
|
|
| |
|
|
| |
|
|
| |
|
|
|
1. For the year ended September 28, 2012, for Class A, Class B, Class C, Class N and Class Y shares, and for the period from January 27, 2012 (inception of offering) to September 28, 2012, for Class I shares.
| | |
| 106 | | OPPENHEIMER GLOBAL STRATEGIC INCOME FUND |
4. Purchases and Sales of Securities
The aggregate cost of purchases and proceeds from sales of securities, other than short-term obligations and investments in the Subsidiary and IMMF, for the year ended September 28, 2012, were as follows:
| | | | | | | | |
| | | Purchases | | | Sales | |
| Investment securities | | $ | 4,130,758,332 | | | $ | 4,253,365,246 | |
| U.S. government and government agency obligations | | | 830,844,051 | | | | 756,914,554 | |
| To Be Announced (TBA) mortgage-related securities | | | 9,325,024,559 | | | | 7,885,278,752 | |
5. Fees and Other Transactions with Affiliates
Management Fees. Under the investment advisory agreement, the Fund pays the Manager a management fee based on the daily net assets of the Fund at an annual rate as shown in the following table:
| | | | |
| Fee Schedule | | | |
| Up to $200 million | | | 0.75 | % |
| Next $200 million | | | 0.72 | |
| Next $200 million | | | 0.69 | |
| Next $200 million | | | 0.66 | |
| Next $200 million | | | 0.60 | |
| Next $4 billion | | | 0.50 | |
| Over $5 billion | | | 0.48 | |
Administration Service Fees. The Fund pays the Manager a fee of $1,500 per year for preparing and filing the Fund’s tax returns.
Transfer Agent Fees. OppenheimerFunds Services (“OFS”), a division of the Manager, acts as the transfer and shareholder servicing agent for the Fund. The Fund pays OFS a per account fee. For the year ended September 28, 2012, the Fund paid $12,375,871 to OFS for services to the Fund.
Additionally, Class Y shares are subject to minimum fees of $10,000 annually for assets of $10 million or more. The Class Y shares are subject to the minimum fees in the event that the per account fee does not equal or exceed the applicable minimum fees. OFS may voluntarily waive the minimum fees.
Distribution and Service Plan (12b-1) Fees. Under its General Distributor’s Agreement with the Fund, OppenheimerFunds Distributor, Inc. (the “Distributor”) acts as the Fund’s principal underwriter in the continuous public offering of the Fund’s classes of shares.
Service Plan for Class A Shares. The Fund has adopted a Service Plan (the “Plan”) for Class A shares under Rule 12b-1 of the Investment Company Act of 1940. Under the Plan, the Fund reimburses the Distributor for a portion of its costs incurred for services provided to accounts that hold Class A shares. Reimbursement is made periodically at an annual rate of up to 0.25% of the daily net assets of Class A shares of the Fund. The Distributor currently uses all of those fees to pay dealers, brokers, banks and other financial
| | | | |
| OPPENHEIMER GLOBAL STRATEGIC INCOME FUND | | | 107 | |
NOTES TO FINANCIAL STATEMENTS Continued
5. Fees and Other Transactions with Affiliates Continued
institutions periodically for providing personal service and maintenance of accounts of their customers that hold Class A shares. Any unreimbursed expenses the Distributor incurs with respect to Class A shares in any fiscal year cannot be recovered in subsequent periods. Fees incurred by the Fund under the Plan are detailed in the Statement of Operations.
Distribution and Service Plans for Class B, Class C and Class N Shares. The Fund has adopted Distribution and Service Plans (the “Plans”) for Class B, Class C and Class N shares under Rule 12b-1 of the Investment Company Act of 1940 to compensate the Distributor for its services in connection with the distribution of those shares and servicing accounts. Under the Plans, the Fund pays the Distributor an annual asset-based sales charge of 0.75% on Class B and Class C shares daily net assets and 0.25% on Class N shares daily net assets. The Distributor also receives a service fee of 0.25% per year under each plan. If either the Class B, Class C or Class N plan is terminated by the Fund or by the shareholders of a class, the Board of Trustees and its independent trustees must determine whether the Distributor shall be entitled to payment from the Fund of all or a portion of the service fee and/or asset-based sales charge in respect to shares sold prior to the effective date of such termination. Fees incurred by the Fund under the Plans are detailed in the Statement of Operations. The Distributor determines its uncompensated expenses under the Plans at calendar quarter ends. The Distributor’s aggregate uncompensated expenses under the Plans at September 28, 2012 were as follows:
| | | | |
| Class B | | $ | 165,955,748 | |
| Class C | | | 67,656,248 | |
| Class N | | | 5,811,677 | |
Sales Charges. Front-end sales charges and contingent deferred sales charges (“CDSC”) do not represent expenses of the Fund. They are deducted from the proceeds of sales of Fund shares prior to investment or from redemption proceeds prior to remittance, as applicable. The sales charges retained by the Distributor from the sale of shares and the CDSC retained by the Distributor on the redemption of shares is shown in the following table for the period indicated.
| | | | | | | | | | | | | | | | | | | | |
| Year Ended | | Class A
Front-End
Sales Charges
Retained by
Distributor | | | Class A
Contingent
Deferred
Sales Charges
Retained by
Distributor | | | Class B
Contingent
Deferred
Sales Charges
Retained by
Distributor | | | Class C
Contingent
Deferred
Sales Charges
Retained by
Distributor | | | Class N
Contingent
Deferred
Sales Charges
Retained by
Distributor | |
| September 28, 2012 | | $ | 1,674,315 | | | $ | 15,660 | | | $ | 510,596 | | | $ | 100,801 | | | $ | 7,120 | |
Waivers and Reimbursements of Expenses. The Manager has contractually agreed to waive the management fee it receives from the Fund in an amount equal to the management fee it receives from the Subsidiary. This undertaking will continue in effect for so long as the Fund invests in the Subsidiary and may not be terminated unless approved by the Fund’s Board of Trustees. During the year ended September 28, 2012, the Manager waived $9,413.
| | |
| 108 | | OPPENHEIMER GLOBAL STRATEGIC INCOME FUND |
The Manager will waive fees and/or reimburse Fund expenses in an amount equal to the indirect management fees incurred through the Fund’s investments in underlying funds managed by the Manager or its affiliates. During the year ended September 28, 2012, the Manager waived fees and/or reimbursed the Fund $4,476,919 for management fees.
During the year ended September 28, 2012, the Manager also voluntarily reimbursed $38,700 of additional Fund expenses.
OFS has voluntarily agreed to limit transfer and shareholder servicing agent fees for all classes to 0.35% of average annual net assets per class.
Some of these undertakings may be modified or terminated at any time; some may not be modified or terminated until after one year from the date of the current prospectus, as indicated therein.
6. Risk Exposures and the Use of Derivative Instruments
The Fund’s investment objectives not only permit the Fund to purchase investment securities, they also allow the Fund to enter into various types of derivatives contracts, including, but not limited to, futures contracts, forward foreign currency exchange contracts, credit default swaps, interest rate swaps, total return swaps, and purchased and written options. In doing so, the Fund will employ strategies in differing combinations to permit it to increase, decrease, or change the level or types of exposure to market risk factors. Central to those strategies are features inherent to derivatives that make them more attractive for this purpose than equity and debt securities: they require little or no initial cash investment, they can focus exposure on only certain selected risk factors, and they may not require the ultimate receipt or delivery of the underlying security (or securities) to the contract. This may allow the Fund to pursue its objectives more quickly and efficiently than if it were to make direct purchases or sales of securities capable of effecting a similar response to market factors.
Market Risk Factors. In accordance with its investment objectives, the Fund may use derivatives to increase or decrease its exposure to one or more of the following market risk factors:
Commodity Risk. Commodity risk relates to the change in value of commodities or commodity indexes as they relate to increases or decreases in the commodities market. Commodities are physical assets that have tangible properties. Examples of these types of assets are crude oil, heating oil, metals, livestock, and agricultural products.
Credit Risk. Credit risk relates to the ability of the issuer to meet interest and principal payments, or both, as they come due. In general, lower-grade, higher-yield bonds are subject to credit risk to a greater extent than lower-yield, higher-quality bonds.
Equity Risk. Equity risk relates to the change in value of equity securities as they relate to increases or decreases in the general market.
Foreign Exchange Rate Risk. Foreign exchange rate risk relates to the change in the U.S. dollar value of a security held that is denominated in a foreign currency. The U.S. dollar value of a foreign currency denominated security will decrease as the dollar
| | | | |
| OPPENHEIMER GLOBAL STRATEGIC INCOME FUND | | | 109 | |
NOTES TO FINANCIAL STATEMENTS Continued
6. Risk Exposures and the Use of Derivative Instruments Continued
appreciates against the currency, while the U.S. dollar value will increase as the dollar depreciates against the currency.
Interest Rate Risk. Interest rate risk refers to the fluctuations in value of fixed-income securities resulting from the inverse relationship between price and yield. For example, an increase in general interest rates will tend to reduce the market value of already issued fixed-income investments, and a decline in general interest rates will tend to increase their value. In addition, debt securities with longer maturities, which tend to have higher yields, are subject to potentially greater fluctuations in value from changes in interest rates than obligations with shorter maturities.
Volatility Risk. Volatility risk refers to the magnitude of the movement, but not the direction of the movement, in a financial instrument’s price over a defined time period. Large increases or decreases in a financial instrument’s price over a relative time period typically indicate greater volatility risk, while small increases or decreases in its price typically indicate lower volatility risk.
The Fund’s actual exposures to these market risk factors during the period are discussed in further detail, by derivative type, below.
Risks of Investing in Derivatives. The Fund’s use of derivatives can result in losses due to unanticipated changes in the market risk factors and the overall market. In instances where the Fund is using derivatives to decrease, or hedge, exposures to market risk factors for securities held by the Fund, there are also risks that those derivatives may not perform as expected resulting in losses for the combined or hedged positions.
Derivatives may have little or no initial cash investment relative to their market value exposure and therefore can produce significant gains or losses in excess of their cost. This use of embedded leverage allows the Fund to increase its market value exposure relative to its net assets and can substantially increase the volatility of the Fund’s performance.
Additional associated risks from investing in derivatives also exist and potentially could have significant effects on the valuation of the derivative and the Fund. Typically, the associated risks are not the risks that the Fund is attempting to increase or decrease exposure to, per its investment objectives, but are the additional risks from investing in derivatives. Examples of these associated risks are liquidity risk, which is the risk that the Fund will not be able to sell the derivative in the open market in a timely manner, and counterparty credit risk, which is the risk that the counterparty will not fulfill its obligation to the Fund. Associated risks can be different for each type of derivative and are discussed by each derivative type in the notes that follow.
Counterparty Credit Risk. Certain derivative positions are subject to counterparty credit risk, which is the risk that the counterparty will not fulfill its obligation to the Fund. The Fund’s derivative counterparties are financial institutions who are subject to market conditions that may weaken their financial position. The Fund intends to enter into financial transactions with counterparties that the Manager believes to be creditworthy at the time of the transaction. As of September 28, 2012, the maximum
| | |
| 110 | | OPPENHEIMER GLOBAL STRATEGIC INCOME FUND |
amount of loss that the Fund would incur if the counterparties to its derivative transactions failed to perform would be $82,974,129, which represents gross payments to be received by the Fund on these derivative contracts were they to be unwound as of period end. To reduce this risk the Fund has entered into master netting arrangements, established within the Fund’s International Swap and Derivatives Association, Inc. master agreements, which allow the Fund to net unrealized appreciation and depreciation for certain positions in swaps, over-the-counter options, swaptions, and forward currency exchange contracts for each individual counterparty. The amount of loss that the Fund would incur taking into account these master netting arrangements would be $6,272,708 as of September 28, 2012. In addition, the Fund may require that certain counterparties post cash and/or securities in collateral accounts to cover their net payment obligations for those derivative contracts subject to International Swap and Derivatives Association, Inc. master agreements. If the counterparty fails to perform under these contracts and agreements, the cash and/or securities will be made available to the Fund.
As of September 28, 2012 the Fund has required certain counterparties to post collateral of $1,289,603.
Credit Related Contingent Features. The Fund’s agreements with derivative counterparties have several credit related contingent features that if triggered would allow its derivatives counterparties to close out and demand payment or additional collateral to cover their exposure from the Fund. Credit related contingent features are established between the Fund and its derivatives counterparties to reduce the risk that the Fund will not fulfill its payment obligations to its counterparties. These triggering features include, but are not limited to, a percentage decrease in the Fund’s net assets and or a percentage decrease in the Fund’s Net Asset Value or NAV. The contingent features are established within the Fund’s International Swap and Derivatives Association, Inc. master agreements which govern certain positions in swaps, over-the-counter options and swaptions, and forward currency exchange contracts for each individual counterparty.
As of September 28, 2012, the aggregate fair value of derivative instruments with credit related contingent features in a net liability position was $41,083,269, for which the Fund has posted collateral of $47,760,814. If a contingent feature would have been triggered as of September 28, 2012, the Fund could have been required to pay this amount in cash to its counterparties. If the Fund fails to perform under these contracts and agreements, the cash and/or securities posted as collateral will be made available to the counterparty. Cash posted as collateral for these contracts, if any, is reported on the Statement of Assets and Liabilities; securities posted as collateral, if any, are reported on the Statement of Investments.
| | | | |
| OPPENHEIMER GLOBAL STRATEGIC INCOME FUND | | | 111 | |
NOTES TO FINANCIAL STATEMENTS Continued
6. Risk Exposures and the Use of Derivative Instruments Continued
Valuations of derivative instruments as of September 28, 2012 are as follows:
| | | | | | | | | | | | | | |
| | | Asset Derivatives
| | | | | Liability Derivatives
| |
Derivatives Not
Accounted for as
Hedging Instruments | | Statement of Assets and
Liabilities Location | | Value | | | | | Statement of Assets and
Liabilities Location | | Value | |
| Credit contracts | | Appreciated swaps,
at value | | $ | 2,534,230 | | | | | Appreciated swaps,
at value | | $ | 3,421,165 | |
| Credit contracts | | Depreciated swaps,
at value | | | 1,575,229 | | | | | Depreciated swaps,
at value | | | 2,145,583 | |
| Equity contracts | | Appreciated swaps,
at value | | | 3,628,395 | | | | | Depreciated swaps,
at value | | | 427,394 | |
| Interest rate contracts | | Appreciated swaps,
at value | | | 1,737,709 | | | | | Depreciated swaps,
at value | | | 3,673,277 | |
| Volatility contracts | | Appreciated swaps,
at value | | | 1,201,877 | | | | | Depreciated swaps,
at value | | | 2,436,755 | |
| Foreign exchange contracts | | Futures margins | | | 131,750 | * | | | | | | | | |
| Equity contracts | | Futures margins | | | 479,382 | * | | | | Futures margins | | | 310,500 | * |
| Interest rate contracts | | Futures margins | | | 600,673 | * | | | | Futures margins | | | 619,283 | * |
| Volatility contracts | | | | | | | | | | Futures margins | | | 68,400 | * |
| Foreign exchange contracts | | Closed currency
contracts | | | 5,473,338 | | | | | Closed currency
contracts | | | 12,109,623 | |
| Foreign exchange contracts | | Unrealized
appreciation on
foreign currency
exchange
contracts | | | 15,616,163 | | | | | Unrealized
depreciation on
foreign currency
exchange
contracts | | | 58,322,051 | |
| Foreign exchange contracts | | | | | | | | | | Appreciated
options written,
at value | | | 4,897,340 | |
| Foreign exchange contracts | | | | | | | | | | Depreciated
options written,
at value | | | 1,607,576 | |
| Interest rate contracts | | | | | | | | | | Appreciated
options written,
at value | | | 279,908 | |
| Interest rate contracts | | | | | | | | | | Depreciated
options written,
at value | | | 692,030 | |
| Credit contracts | | | | | | | | | | Depreciated
swaptions written,
at value | | | 12,221,008 | |
| Interest rate contracts | | | | | | | | | | Appreciated
swaptions written,
at value | | | 12,436,955 | |
| Interest rate contracts | | | | | | | | | | Depreciated
swaptions written,
at value | | | 10,002,174 | |
| Credit contracts | | Investments, at
value | | | 4,078,796 | ** | | | | | | | | |
| Foreign exchange contracts | | Investments, at
value | | | 23,378,061 | ** | | | | | | | | |
| Interest rate contracts | | Investments, at
value | | | 27,522,401 | ** | | | | | | | | |
| | | | |
|
| | | |
|
|
|
| Total | | | | $ | 87,958,004 | | | | | | | $ | 125,671,022 | |
| | | | |
|
| | | |
|
|
|
*Includes only the current day’s variation margin. Prior variation margin movements have been reflected in cash on the Statement of Assets and Liabilities upon receipt or payment.
**Amounts relate to purchased option contracts and purchased swaption contracts.
| | |
| 112 | | OPPENHEIMER GLOBAL STRATEGIC INCOME FUND |
The effect of derivative instruments on the Statement of Operations is as follows:
| | | | | | | | | | | | | | | | | | | | | | | | | | | | |
| Amount of Realized Gain or (Loss) Recognized on Derivatives | |
Derivatives
Not
Accounted
for as
Hedging
Instruments | | Investments
from
unaffiliated
companies
(including
premiums
on options
exercised)* | | | Closing and
expiration
of swaption
contracts
written | | | Closing and
expiration
of option
contracts
written | | | Closing and
expiration
of futures
contracts | | | Foreign
currency
transactions | | | Swap
contracts | | | Total | |
| Credit contracts | | $ | — | | | $ | — | | | $ | — | | | $ | — | | | $ | — | | | $ | (5,610,222 | ) | | $ | (5,610,222 | ) |
| Equity contracts | | | — | | | | — | | | | — | | | | (31,962,209 | ) | | | — | | | | 2,206,349 | | | | (29,755,860 | ) |
| Foreign exchange contracts | | | (12,748,989 | ) | | | — | | | | 23,803,786 | | | | 1,605,529 | | | | (16,136,718 | ) | | | 59,835 | | | | (3,416,557 | ) |
| Interest rate contracts | | | (55,176,712 | ) | | | 23,028,045 | | | | 24,169,627 | | | | 40,462,089 | | | | — | | | | 7,604,612 | | | | 40,087,661 | |
| Volatility contracts | | | — | | | | — | | | | — | | | | 1,242,286 | | | | — | | | | 8,906,937 | | | | 10,149,223 | |
| | |
|
|
|
| Total | | $ | (67,925,701 | ) | | $ | 23,028,045 | | | $ | 47,973,413 | | | $ | 11,347,695 | | | $ | (16,136,718 | ) | | $ | 13,167,511 | | | $ | 11,454,245 | |
| | |
|
|
|
*Includes purchased option contracts, purchased swaption contracts and written option contracts exercised, if any.
| | | | | | | | | | | | | | | | | | | | | | | | | | | | |
| Amount of Change in Unrealized Gain or (Loss) Recognized on Derivatives | |
Derivatives
Not
Accounted
for as
Hedging
Instruments | | Investments* | | | Option
contracts
written | | | Swaption
contracts
written | | | Futures
contracts | | | Translation
of assets and
liabilities
denominated
in foreign
currencies | | | Swap
contracts | | | Total | |
| Credit contracts | | $ | (11,717,136 | ) | | $ | — | | | $ | (7,045,408 | ) | | $ | — | | | $ | — | | | $ | (2,395,162 | ) | | $ | (21,157,706 | ) |
| Equity contracts | | | — | | | | — | | | | — | | | | (5,518,491 | ) | | | — | | | | 10,570,834 | | | | 5,052,343 | |
| Foreign exchange contracts | | | (12,004,523 | ) | | | 7,939,909 | | | | — | | | | 85,512 | | | | (34,588,256 | ) | | | — | | | | (38,652,870 | ) |
| Interest rate contracts | | | (69,014,943 | ) | | | (511,160 | ) | | | 6,808,143 | | | | (25,109,551 | ) | | | — | | | | (7,980,698 | ) | | | (95,808,209 | ) |
| Volatility contracts | | | — | | | | — | | | | — | | | | 364,927 | | | | — | | | | 315,518 | | | | 680,445 | |
| | |
|
|
|
| Total | | $ | (92,736,602 | ) | | $ | 7,428,749 | | | $ | (237,265 | ) | | $ | (30,177,603 | ) | | $ | (34,588,256 | ) | | $ | 510,492 | | | $ | (149,800,485 | ) |
| | |
|
|
|
*Includes purchased option contracts and purchased swaption contracts, if any.
Foreign Currency Exchange Contracts
The Fund may enter into foreign currency exchange contracts (“forward contracts”) for the purchase or sale of a foreign currency at a negotiated rate at a future date.
Forward contracts are reported on a schedule following the Statement of Investments. The unrealized appreciation (depreciation) is reported in the Statement of Assets and
| | | | |
| OPPENHEIMER GLOBAL STRATEGIC INCOME FUND | | | 113 | |
NOTES TO FINANCIAL STATEMENTS Continued
6. Risk Exposures and the Use of Derivative Instruments Continued
Liabilities as a receivable or payable and in the Statement of Operations within the change in unrealized appreciation (depreciation). At contract close, the difference between the original cost of the contract and the value at the close date is recorded as a realized gain (loss) in the Statement of Operations.
The Fund has purchased and sold certain forward foreign currency exchange contracts of different currencies in order to acquire currencies to pay for or sell currencies to acquire related foreign securities purchase and sale transactions, respectively, or to convert foreign currencies to U.S. dollars from related foreign securities transactions. These foreign currency exchange contracts are negotiated at the current spot exchange rate with settlement typically within two business days thereafter.
The Fund has entered into forward foreign currency exchange contracts with the obligation to purchase specified foreign currencies in the future at a currently negotiated forward rate in order to take a positive investment perspective on the related currency. These forward foreign currency exchange contracts seek to increase exposure to foreign exchange rate risk.
The Fund has entered into forward foreign currency exchange contracts with the obligation to purchase specified foreign currencies in the future at a currently negotiated forward rate in order to decrease exposure to foreign exchange rate risk associated with foreign currency denominated securities held by the Fund.
The Fund has entered into forward foreign currency exchange contracts with the obligation to sell specified foreign currencies in the future at a currently negotiated forward rate in order to take a negative investment perspective on the related currency. These forward foreign currency exchange contracts seek to increase exposure to foreign exchange rate risk.
The Fund has entered into forward foreign currency exchange contracts with the obligation to sell specified foreign currencies in the future at a currently negotiated forward rate in order to decrease exposure to foreign exchange rate risk associated with foreign currency denominated securities held by the Fund.
During the year ended September 28, 2012, the Fund had daily average contract amounts on forward foreign currency contracts to buy and sell of $1,213,245,704 and $2,001,885,192, respectively.
Additional associated risk to the Fund includes counterparty credit risk. Counterparty credit risk arises from the possibility that the counterparty will default.
Futures Contracts
A futures contract is a commitment to buy or sell a specific amount of a financial instrument, or currency, at a negotiated price on a stipulated future date. The Fund may buy and sell futures contracts and may also buy or write put or call options on these futures contracts.
Futures contracts traded on a commodities or futures exchange will be valued at the final settlement price or official closing price on the principal exchange as reported by such principal exchange at its trading session ending at, or most recently prior to, the time when the Fund’s assets are valued.
| | |
| 114 | | OPPENHEIMER GLOBAL STRATEGIC INCOME FUND |
Upon entering into a futures contract, the Fund is required to deposit either cash or securities (initial margin) in an amount equal to a certain percentage of the contract value. Subsequent payments (variation margin) are made or received by the Fund each day. The variation margin payments are equal to the daily changes in the contract value and are recorded as unrealized gains and losses.
Futures contracts are reported on a schedule following the Statement of Investments. Securities held in collateralized accounts to cover initial margin requirements on open futures contracts are noted in the Statement of Investments. Cash held by the broker to cover initial margin requirements on open futures contracts and the receivable and/or payable for the daily mark to market for the variation margin are noted in the Statement of Assets and Liabilities. The net change in unrealized appreciation and depreciation is reported in the Statement of Operations. Realized gains (losses) are reported in the Statement of Operations at the closing or expiration of futures contracts.
The Fund has purchased futures contracts on various bonds and notes to increase exposure to interest rate risk.
The Fund has sold futures contracts on various bonds and notes to decrease exposure to interest rate risk.
The Fund has purchased futures contracts on various equity indexes to increase exposure to equity risk.
The Fund has sold futures contracts on various equity indexes to decrease exposure to equity risk.
The Fund has purchased futures contracts on various currencies to increase exposure to foreign exchange rate risk.
The Fund has sold futures contracts on various currencies to decrease exposure to foreign exchange rate risk.
The Fund has sold futures contracts, which have values that are linked to the price movement of the related volatility indexes, in order to decrease exposure to volatility risk.
During the year ended September 28, 2012, the Fund had an ending monthly average market value of $1,130,437,723 and $1,151,453,881 on futures contracts purchased and sold, respectively.
Additional associated risks of entering into futures contracts (and related options) include the possibility that there may be an illiquid market where the Fund is unable to liquidate the contract or enter into an offsetting position and, if used for hedging purposes, the risk that the price of the contract will correlate imperfectly with the prices of the Fund’s securities.
Option Activity
The Fund may buy and sell put and call options, or write put and call options. When an option is written, the Fund receives a premium and becomes obligated to sell or purchase the underlying security at a fixed price, upon exercise of the option.
Options are valued daily based upon the last sale price on the principal exchange on which the option is traded. The difference between the premium received or paid, and market value of the option, is recorded as unrealized appreciation or depreciation. The net
| | | | |
| OPPENHEIMER GLOBAL STRATEGIC INCOME FUND | | | 115 | |
NOTES TO FINANCIAL STATEMENTS Continued
6. Risk Exposures and the Use of Derivative Instruments Continued
change in unrealized appreciation or depreciation is reported in the Statement of Operations. When an option is exercised, the cost of the security purchased or the proceeds of the security sale are adjusted by the amount of premium received or paid. Upon the expiration or closing of the option transaction, a gain or loss is reported in the Statement of Operations.
The Fund has purchased call options on currencies to increase exposure to foreign exchange rate risk. A purchased call option becomes more valuable as the price of the underlying financial instrument appreciates relative to the strike price.
The Fund has purchased put options on currencies to decrease exposure to foreign exchange rate risk. A purchased put option becomes more valuable as the price of the underlying financial instrument depreciates relative to the strike price.
The Fund has purchased call options on treasury and/or euro futures to increase exposure to interest rate risk. A purchased call option becomes more valuable as the price of the underlying financial instrument appreciates relative to the strike price.
The Fund has purchased put options on treasury and/or euro futures to decrease exposure to interest rate risk. A purchased put option becomes more valuable as the price of the underlying financial instrument depreciates relative to the strike price.
During the year ended September 28, 2012, the Fund had an ending monthly average market value of $16,530,121 and $4,381,300 on purchased call options and purchased put options, respectively.
Options written, if any, are reported in a schedule following the Statement of Investments and as a liability in the Statement of Assets and Liabilities. Securities held in collateralized accounts to cover potential obligations with respect to outstanding written options are noted in the Statement of Investments.
The risk in writing a call option is that the Fund gives up the opportunity for profit if the market price of the security increases and the option is exercised. The risk in writing a put option is that the Fund may incur a loss if the market price of the security decreases and the option is exercised. The risk in buying an option is that the Fund pays a premium whether or not the option is exercised. The Fund also has the additional risk that there may be an illiquid market where the Fund is unable to close the contract.
The Fund has written put options on currencies to increase exposure to foreign exchange rate risk. A written put option becomes more valuable as the price of the underlying financial instrument appreciates relative to the strike price.
The Fund has written call options on currencies to decrease exposure to foreign exchange rate risk. A written call option becomes more valuable as the price of the underlying financial instrument depreciates relative to the strike price.
The Fund has written call options on treasury and/or euro futures to decrease exposure to interest rate risk. A written call option becomes more valuable as the price of the underlying financial instrument depreciates relative to the strike price.
The Fund has written put options on treasury and/or euro futures to increase exposure to interest rate risk. A written put option becomes more valuable as the price of the underlying financial instrument appreciates relative to the strike price.
| | |
| 116 | | OPPENHEIMER GLOBAL STRATEGIC INCOME FUND |
During the year ended September 28, 2012, the Fund had an ending monthly average market value of $2,073,482 and $3,936,380 on written call options and written put options, respectively.
Additional associated risks to the Fund include counterparty credit risk for over-the-counter options and liquidity risk.
Written option activity for the year ended September 28, 2012 was as follows:
| | | | | | | | | | | | | | | | |
| | | Call Options
| | | Put Options
| |
| | | Number of
Contracts | | | Amount of
Premiums | | | Number of
Contracts | | | Amount of
Premiums | |
| Options outstanding as of | | | | | | | | | | | | | | | | |
| September 30, 2011 | | | 5,987,346,351 | | | $ | 1,744,360 | | | | 11,143,090,933 | | | $ | 4,723,086 | |
| Options written | | | 567,211,921,157 | | | | 31,856,364 | | | | 529,251,210,166 | | | | 61,039,121 | |
| Options closed or expired | | | (537,108,904,377 | ) | | | (26,472,999 | ) | | | (516,103,802,615 | ) | | | (54,602,611 | ) |
| Options exercised | | | (30,937,515,000 | ) | | | (3,231,141 | ) | | | (14,111,751,084 | ) | | | (3,526,640 | ) |
| | |
|
|
| |
|
|
|
| Options outstanding as of September 28, 2012 | | | 5,152,848,131 | | | $ | 3,896,584 | | | | 10,178,747,400 | | | $ | 7,632,956 | |
| | |
|
|
| |
|
|
| |
|
|
| |
|
|
|
Swap Contracts
The Fund may enter into swap contract agreements with a counterparty to exchange a series of cash flows based on either specified reference rates, or the occurrence of a credit event, over a specified period. Such contracts may include interest rate, equity, debt, index, total return, credit and currency swaps.
Swaps are marked to market daily using primarily quotations from pricing services, counterparties and brokers. Swap contracts are reported on a schedule following the Statement of Investments. The values of swap contracts are aggregated by positive and negative values and disclosed separately on the Statement of Assets and Liabilities by contracts in unrealized appreciation and depreciation positions. Upfront payments paid or received, if any, affect the value of the respective swap. Therefore, to determine the unrealized appreciation (depreciation) on swaps, upfront payments paid should be subtracted from, while upfront payments received should be added to, the value of contracts reported as an asset on the Statement of Assets and Liabilities. Conversely, upfront payments paid should be added to, while upfront payments received should be subtracted from the value of contracts reported as a liability. The unrealized appreciation (depreciation) related to the change in the valuation of the notional amount of the swap is combined with the accrued interest due to (owed by) the Fund at termination or settlement. The net change in this amount during the period is included on the Statement of Operations. The Fund also records any periodic payments received from (paid to) the counterparty, including at termination, under such contracts as realized gain (loss) on the Statement of Operations.
Swap contract agreements are exposed to the market risk factor of the specific underlying reference asset. Swap contracts are typically more attractively priced compared to similar investments in related cash securities because they isolate the risk to one market risk factor and eliminate the other market risk factors. Investments in cash securities (for
| | | | |
| OPPENHEIMER GLOBAL STRATEGIC INCOME FUND | | | 117 | |
NOTES TO FINANCIAL STATEMENTS Continued
6. Risk Exposures and the Use of Derivative Instruments Continued
instance bonds) have exposure to multiple risk factors (credit and interest rate risk). Because swaps require little or no initial cash investment, they can expose the Fund to substantial risk in the isolated market risk factor.
Credit Default Swap Contracts. A credit default swap is a bilateral contract that enables an investor to buy or sell protection on a debt security against a defined-issuer credit event, such as the issuer’s failure to make timely payments of interest or principal on the debt security, bankruptcy or restructuring. The Fund may enter into credit default swaps either by buying or selling protection on a single security sovereign debt, or a basket of securities (the “reference asset”).
The buyer of protection pays a periodic fee to the seller of protection based on the notional amount of debt securities underlying the swap contract. The seller of protection agrees to compensate the buyer of protection for future potential losses as a result of a credit event on the reference asset. The contract effectively transfers the credit event risk of the reference asset from the buyer of protection to the seller of protection.
The ongoing value of the contract will fluctuate throughout the term of the contract based primarily on the credit risk of the reference asset. If the credit quality of the reference asset improves relative to the credit quality at contract initiation, the buyer of protection may have an unrealized loss greater than the anticipated periodic fee owed. This unrealized loss would be the result of current credit protection being cheaper than the cost of credit protection at contract initiation. If the buyer elects to terminate the contract prior to its maturity, and there has been no credit event, this unrealized loss will become realized. If the contract is held to maturity, and there has been no credit event, the realized loss will be equal to the periodic fee paid over the life of the contract.
If there is a credit event, the buyer of protection can exercise its rights under the contract and receive a payment from the seller of protection equal to the notional amount of the reference asset less the market value of the reference asset. Upon exercise of the contract the difference between the value of the underlying reference asset and the notional amount is recorded as realized gain (loss) and is included on the Statement of Operations.
The Fund has sold credit protection through credit default swaps to increase exposure to the credit risk of individual securities and/or, indexes that are either unavailable or considered to be less attractive in the bond market.
The Fund has purchased credit protection through credit default swaps to decrease exposure to the credit risk of individual securities and/or, indexes.
For the year ended September 28, 2012, the Fund had ending monthly average notional amounts of $179,396,929 and $151,915,486 on credit default swaps to buy protection and credit default swaps to sell protection, respectively.
Additional associated risks to the Fund include counterparty credit risk and liquidity risk.
| | |
| 118 | | OPPENHEIMER GLOBAL STRATEGIC INCOME FUND |
Interest Rate Swap Contracts. An interest rate swap is an agreement between counterparties to exchange periodic payments based on interest rates. One cash flow stream will typically be a floating rate payment based upon a specified interest rate while the other is typically a fixed interest rate.
The Fund has entered into interest rate swaps in which it pays a floating interest rate and receives a fixed interest rate in order to increase exposure to interest rate risk. Typically, if relative interest rates rise, payments made by the Fund under a swap agreement will be greater than the payments received by the Fund.
The Fund has entered into interest rate swaps in which it pays a fixed interest rate and receives a floating interest rate in order to decrease exposure to interest rate risk. Typically, if relative interest rates rise, payments received by the Fund under the swap agreement will be greater than the payments made by the Fund.
For the year ended September 28, 2012, the Fund had ending monthly average notional amounts of $133,856,848 and $342,819,434 on interest rate swaps which pay a fixed rate and interest rate swaps which receive a fixed rate, respectively.
Additional associated risks to the Fund include counterparty credit risk and liquidity risk.
Total Return Swap Contracts. A total return swap is an agreement between counterparties to exchange periodic payments based on asset or non-asset references. One cash flow is typically based on a non-asset reference (such as an interest rate or index) and the other on the total return of a reference asset (such as a security or a basket of securities). The total return of the reference asset typically includes appreciation or depreciation on the reference asset, plus any interest or dividend payments.
Total return swap contracts are exposed to the market risk factor of the specific underlying financial instrument or index. Total return swaps are less standard in structure than other types of swaps and can isolate and/or, include multiple types of market risk factors including equity risk, credit risk, and interest rate risk.
The Fund has entered into total return swaps on various equity securities or indexes to increase exposure to equity risk. These equity risk related total return swaps require the Fund to pay a floating reference interest rate, or an amount equal to the negative price movement of securities or an index multiplied by the notional amount of the contract. The Fund will receive payments equal to the positive price movement of the same securities or index multiplied by the notional amount of the contract.
The Fund has entered into total return swaps on various equity securities or indexes to decrease exposure to equity risk. These equity risk related total return swaps require the Fund to pay an amount equal to the positive price movement of securities or an index multiplied by the notional amount of the contract. The Fund will receive payments of a floating reference interest rate or an amount equal to the negative price movement of the same securities or index multiplied by the notional amount of the contract.
For the year ended September 28, 2012, the Fund had ending monthly average notional amounts of $200,062,049 and $49,072,039 on total return swaps which are long the reference asset and total return swaps which are short the reference asset, respectively.
| | | | |
| OPPENHEIMER GLOBAL STRATEGIC INCOME FUND | | | 119 | |
NOTES TO FINANCIAL STATEMENTS Continued
6. Risk Exposures and the Use of Derivative Instruments Continued
Additional associated risks to the Fund include counterparty credit risk and liquidity risk.
Currency Swaps. A currency swap is an agreement between counterparties to exchange different currencies equivalent to the notional value at contract inception and reverse the exchange of the same notional values of those currencies at contract termination. The contract may also include periodic exchanges of cash flows based on a specified index or interest rate.
The Fund has entered into currency swap contracts with the obligation to pay an interest rate on various foreign currency notional amounts and receive an interest rate on the dollar notional amount in order to take a negative investment perspective on the related currencies for which the Fund receives a payment. These currency swap contracts seek to decrease exposure to foreign exchange rate risk.
For the year ended September 28, 2012, the Fund had ending monthly average notional amounts of $631,538 on currency swaps.
Additional associated risks to the Fund include counterparty credit risk and liquidity risk.
As of September 28, 2012, the Fund had no such currency swap agreements outstanding.
Volatility Swap Contracts. A volatility swap is an agreement between counterparties to exchange periodic payments based on the measured volatility of a reference security, index, currency or other reference investment over a specified time frame. One cash flow is typically based on the volatility of the reference investment as measured by changes in its price or level while the other cash flow is based on an interest rate or the measured volatility of a different reference investment. The appreciation or depreciation on a volatility swap will typically depend on the magnitude of the reference investment’s volatility, or size of the movement, rather than general directional increases or decreases in its price.
Volatility swaps are less standard in structure than other types of swaps and provide pure, or isolated, exposure to volatility risk of the specific underlying reference investment. Volatility swaps are typically used to speculate on future volatility levels, to trade the spread between realized and expected volatility, or to decrease the volatility exposure of investments held by the Fund.
The Fund has entered into volatility swaps to increase exposure to the volatility risk of various reference investments. These types of volatility swaps require the fund to pay the measured volatility and receive a fixed interest payment over the period of the contract. If the measured volatility of the related reference investment increases over the period, the swaps will depreciate in value. Conversely, if the measured volatility of the related reference investment decreases over the period, the swaps will appreciate in value.
The Fund has entered into volatility swaps to decrease exposure to the volatility risk of various reference investments. These types of volatility swaps require the fund to pay a fixed interest payment and receive the measured volatility over the period of the
| | |
| 120 | | OPPENHEIMER GLOBAL STRATEGIC INCOME FUND |
contract. If the measured volatility of the related reference investment increases over the period, the swaps will appreciate in value. Conversely, if the measured volatility of the related reference investment decreases over the period, the swaps will depreciate in value.
For the year ended September 28, 2012, the Fund had ending monthly average notional amounts of $483,483 and $1,918,271 on volatility swaps which pay volatility and volatility swaps which receive volatility, respectively.
Additional associated risks to the Fund include counterparty credit risk and liquidity risk.
Swaption Transactions
The Fund may enter into a swaption contract which grants the purchaser the right, but not the obligation, to enter into a swap transaction at preset terms detailed in the underlying agreement within a specified period of time. The purchaser pays a premium to the swaption writer who bears the risk of unfavorable changes in the preset terms on the underlying swap.
Swaptions are marked to market daily using primarily portfolio pricing services or quotations from counterparties and brokers. Purchased swaptions are reported as a component of investments in the Statement of Investments, the Statement of Assets and Liabilities and the Statement of Operations. Written swaptions are reported on a schedule following the Statement of Investments and their value is reported as a separate asset or liability line item in the Statement of Assets and Liabilities. The net change in unrealized appreciation or depreciation on written swaptions is separately reported in the Statement of Operations. When a swaption is exercised, the cost of the swap is adjusted by the amount of premium paid or received. Upon the expiration or closing of an unexercised swaption contract, a gain or loss is reported in the Statement of Operations for the amount of the premium paid or received.
The Fund generally will incur a greater risk when it writes a swaption than when it purchases a swaption. When the Fund writes a swaption it will become obligated, upon exercise of the swaption, according to the terms of the underlying agreement. Swaption contracts written by the Fund do not give rise to counterparty credit risk as they obligate the Fund, not its counterparty, to perform. When the Fund purchases a swaption it only risks losing the amount of the premium it paid if the swaption expires unexercised. However, when the Fund exercises a purchased swaption there is a risk that the counterparty will fail to perform or otherwise default on its obligations under the swaption contract.
The Fund purchased swaptions which gives it the option to enter into an interest rate swap in which it pays a floating interest rate and receives a fixed interest rate in order to increase exposure to interest rate risk. A purchased swaption of this type becomes more valuable as the reference interest rate depreciates relative to the preset interest rate.
| | | | |
| OPPENHEIMER GLOBAL STRATEGIC INCOME FUND | | | 121 | |
NOTES TO FINANCIAL STATEMENTS Continued
6. Risk Exposures and the Use of Derivative Instruments Continued
The Fund has purchased swaptions which gives it the option to enter into an interest rate swap in which it pays a fixed interest rate and receives a floating interest rate in order to decrease exposure to interest rate risk. A purchased swaption of this type becomes more valuable as the reference interest rate appreciates relative to the preset interest rate.
The Fund has purchased swaptions which gives it the option to buy credit protection through credit default swaps in order to decrease exposure to the credit risk of individual securities and, or, indexes. A purchased swaption of this type becomes more valuable as the likelihood of a credit event on the reference asset increases.
The Fund has written swaptions which gives it the obligation, if exercised by the purchaser, to enter into an interest rate swap in which it pays a floating interest rate and receives a fixed interest rate in order to increase exposure to interest rate risk. A written swaption of this type becomes more valuable as the reference interest rate depreciates relative to the preset interest rate.
The Fund has written swaptions which gives it the obligation, if exercised by the purchaser, to enter into an interest rate swap in which it pays a fixed interest rate and receives a floating interest rate in order to decrease exposure to interest rate risk. A written swaption of this type becomes more valuable as the reference interest rate appreciates relative to the preset interest rate.
The Fund has written swaptions which give it the obligation, if exercised by the purchaser, to sell credit protection through credit default swaps in order to increase exposure to the credit risk of individual securities and/or, indexes. A written swaption of this type becomes more valuable as the likelihood of a credit event on the reference asset decreases.
The Fund has written swaptions which give it the obligation, if exercised by the purchaser, to buy credit protection through credit default swaps in order to decrease exposure to the credit risk of individual securities and, or, indexes. A written swaption of this type becomes more valuable as the likelihood of a credit event on the reference asset increases.
During the year ended September 28, 2012, the Fund had an ending monthly average market value of $18,005,400 and $24,547,540 on purchased and written swaptions, respectively.
Written swaption activity for the year ended September 28, 2012 was as follows:
| | | | | | | | |
| | | Call Swaptions
| |
| | | Notional
Amount | | | Amount of
Premiums | |
| Swaptions outstanding as of | | | | | | | | |
| September 30, 2011 | | $ | 18,780,000 | | | $ | 231,182 | |
| Swaptions written | | | 14,573,355,922 | | | | 121,186,738 | |
| Swaptions closed or expired | | | (11,384,570,000 | ) | | | (86,007,484 | ) |
| Swaptions exercised | | | (144,450,000 | ) | | | (1,259,285 | ) |
| | |
|
|
|
| Swaptions outstanding as of September 28, 2012 | | $ | 3,063,115,922 | | | $ | 34,151,151 | |
| | |
|
|
|
| | |
| 122 | | OPPENHEIMER GLOBAL STRATEGIC INCOME FUND |
7. Restricted Securities
As of September 28, 2012, investments in securities included issues that are restricted. A restricted security may have a contractual restriction on its resale and is valued under methods approved by the Board of Trustees as reflecting fair value. Securities that are restricted are marked with an applicable footnote on the Statement of Investments. Restricted securities are reported on a schedule following the Statement of Investments.
8. Acquisition of Oppenheimer Champion Income Fund
On September 21, 2012, the Fund acquired all of the net assets of Oppenheimer Champion Income Fund, pursuant to an Agreement and Plan of Reorganization approved by the Oppenheimer Champion Income Fund shareholders on February 14, 2012. The exchange qualified as a tax-free reorganization for federal income tax purposes. The purpose of this acquisition is to combine two funds with similar investment objectives, strategies and risks to allow shareholders to benefit from greater asset growth potential, as well as lowered total expenses.
Details of the merger are shown in the following table:
| | | | | | | | | | | | | | | | |
| | | Exchange Ratio
to One Share of the
Oppenheimer Champion
Income Fund | | | Shares of Beneficial
Interest Issued by
the Fund | | | Value of Issued
Shares of Beneficial
Interest | | | Combined
Net Assets on
September 21, 20121 | |
| Class A | | | 0.4320069767 | | | | 73,155,128 | | | $ | 314,567,048 | | | $ | 6,264,006,608 | |
| Class B | | | 0.4306256944 | | | | 4,258,197 | | | $ | 18,396,708 | | | $ | 281,804,959 | |
| Class C | | | 0.4321876457 | | | | 15,949,561 | | | $ | 68,423,617 | | | $ | 1,517,047,234 | |
| Class N | | | 0.4322581395 | | | | 2,539,125 | | | $ | 10,918238 | | | $ | 240,418,510 | |
| Class Y | | | 0.4242383721 | | | | 1,620,678 | | | $ | 6,968,915 | | | $ | 725,843,933 | |
1. The net assets acquired included net unrealized depreciation of $21,666,477 and an unused capital loss carryforward of $1,090,187,248, potential utilization subject to tax limitations.
Had the merger occurred at the beginning of the reporting period, the Fund’s Statement of Operations would have been adjusted to the following amounts:
|
| Net investment income $536,922,081 |
| Net gain on investments $556,454,238 |
Net increase in net assets resulting from operations $1,093,376,319
9. Pending Litigation |
Since 2009, a number of class action lawsuits have been pending in federal courts against OppenheimerFunds, Inc., the Fund’s investment advisor (the “Manager”), OppenheimerFunds Distributor, Inc., the Fund’s principal underwriter and distributor (the “Distributor”), and certain funds (but not including the Fund) advised by the Manager and distributed by the Distributor (the “Defendant Funds”). Several of these lawsuits also name as defendants certain officers and current and former trustees of the respective Defendant Funds. The lawsuits raise claims under federal securities law and allege, among other things, that the disclosure documents of the respective Defendant Funds contained misrepresentations and omissions and that the respective Defendant Funds’ investment
| | | | |
| OPPENHEIMER GLOBAL STRATEGIC INCOME FUND | | | 123 | |
NOTES TO FINANCIAL STATEMENTS Continued
9. Pending Litigation Continued
policies were not followed. The plaintiffs in these actions seek unspecified damages, equitable relief and awards of attorneys’ fees and litigation expenses. The Defendant Funds’ Boards of Trustees have also engaged counsel to represent the Funds and the present and former Independent Trustees named in those suits.
Other class action and individual lawsuits have been filed since 2008 in various state and federal courts against the Manager and certain of its affiliates by investors seeking to recover investments they allegedly lost as a result of the “Ponzi” scheme run by Bernard L. Madoff and his firm, Bernard L. Madoff Investment Securities, LLC (“BLMIS”). Plaintiffs in these suits allege that they suffered losses as a result of their investments in several funds managed by an affiliate of the Manager and assert a variety of claims, including breach of fiduciary duty, fraud, negligent misrepresentation, unjust enrichment, and violation of federal and state securities laws and regulations, among others. They seek unspecified damages, equitable relief and awards of attorneys’ fees and litigation expenses. Neither the Distributor, nor any of the Oppenheimer mutual funds, their independent trustees or directors are named as defendants in these lawsuits. None of the Oppenheimer mutual funds invested in any funds or accounts managed by Madoff or BLMIS. On February 28, 2011, a stipulation of partial settlement of three groups of consolidated putative class action lawsuits relating to these matters was filed in the U.S. District Court for the Southern District of New York. On August 19, 2011, the court entered an order and final judgment approving the settlement as fair, reasonable and adequate. In September 2011, certain parties filed notices of appeal from the court’s order approving the settlement. The settlement does not resolve other outstanding lawsuits against the Manager and its affiliates relating to BLMIS.
On April 16, 2010, a lawsuit was filed in New York state court against the Manager, an affiliate of the Manager and AAArdvark IV Funding Limited (“AAArdvark IV”), an entity advised by the Manager’s affiliate, in connection with investments made by the plaintiffs in AAArdvark IV. Plaintiffs allege breach of contract against the defendants and seek compensatory damages, costs and disbursements, including attorney fees. On July 15, 2011, a lawsuit was filed in New York state court against the Manager, an affiliate of the Manager and AAArdvark Funding Limited (“AAArdvark I”), an entity advised by the Manager’s affiliate, in connection with investments made by the plaintiffs in AAArdvark I. The complaint alleges breach of contract against the defendants and seeks compensatory damages, costs and disbursements, including attorney fees. On November 9, 2011, a lawsuit was filed in New York state court against the Manager, an affiliate of the Manager and AAArdvark XS Funding Limited (“AAArdvark XS”), an entity advised by the Manager’s affiliate, in connection with investments made by the plaintiffs in AAArdvark XS. The complaint alleges breach of contract against the defendants and seeks compensatory damages, costs and disbursements, including attorney fees.
The Manager believes the lawsuits and appeals described above are without legal merit and, with the exception of actions it has settled, is defending against them vigorously. While it is premature to render any opinion as to the outcome in these lawsuits, or
| | |
| 124 | | OPPENHEIMER GLOBAL STRATEGIC INCOME FUND |
whether any costs that the Defendant Funds may bear in defending the suits might not be reimbursed by insurance, the Manager believes that these suits should not impair the ability of the Manager or the Distributor to perform their respective duties to the Fund, and that the outcome of all of the suits together should not have any material effect on the operations of any of the Oppenheimer mutual funds.
| | | | |
| OPPENHEIMER GLOBAL STRATEGIC INCOME FUND | | | 125 | |
REPORT OF INDEPENDENT REGISTERED PUBLIC ACCOUNTING FIRM
The Board of Trustees and Shareholders of Oppenheimer Global Strategic Income Fund:
We have audited the accompanying statement of assets and liabilities of Oppenheimer Global Strategic Income Fund, including the statement of investments, as of September 28, 2012, and the related statement of operations for the year then ended, the statements of changes in net assets for each of the years in the two-year period then ended and the financial highlights for each of the years or periods in the four-year period then ended. These financial statements and financial highlights are the responsibility of the Fund’s management. Our responsibility is to express an opinion on these financial statements and financial highlights based on our audits. The accompanying financial highlights of Oppenheimer Global Strategic Income Fund for the year ended September 30, 2008 were audited by other auditors whose report dated November 18, 2008 expressed an unqualified opinion on those financial highlights.
We conducted our audits in accordance with the standards of the Public Company Accounting Oversight Board (United States). Those standards require that we plan and perform the audit to obtain reasonable assurance about whether the financial statements and financial highlights are free of material misstatement. An audit includes examining, on a test basis, evidence supporting the amounts and disclosures in the financial statements. Our procedures included confirmation of securities owned as of September 28, 2012, by correspondence with the custodian, transfer agent and brokers, or by other appropriate auditing procedures where replies from brokers were not received. An audit also includes assessing the accounting principles used and significant estimates made by management, as well as evaluating the overall financial statement presentation. We believe that our audits provide a reasonable basis for our opinion.
In our opinion, the financial statements and financial highlights referred to above present fairly, in all material respects, the financial position of Oppenheimer Global Strategic Income Fund as of September 28, 2012, the results of its operations for the year then ended, the changes in its net assets for each of the years in the two-year period then ended and the financial highlights for each of the years or periods in the four-year period then ended, in conformity with U.S. generally accepted accounting principles.
KPMGLLP
Denver, Colorado
November 21, 2012
| | |
| 126 | | OPPENHEIMER GLOBAL STRATEGIC INCOME FUND |
FEDERAL INCOME TAX INFORMATION Unaudited
In early 2012, if applicable, shareholders of record received information regarding all dividends and distributions paid to them by the Fund during calendar year 2011.
Dividends, if any, paid by the Fund during the fiscal year ended September 28, 2012 which are not designated as capital gain distributions should be multiplied by the maximum amount allowable but not less than 0.20% to arrive at the amount eligible for the corporate dividend-received deduction.
A portion, if any, of the dividends paid by the Fund during the fiscal year ended September 28, 2012 which are not designated as capital gain distributions are eligible for lower individual income tax rates to the extent that the Fund has received qualified dividend income as stipulated by recent tax legislation. The maximum amount allowable but not less than $2,218,764 of the Fund’s fiscal year taxable income may be eligible for the lower individual income tax rates. In early 2012, shareholders of record received information regarding the percentage of distributions that are eligible for lower individual income tax rates.
Recent tax legislation allows a regulated investment company to designate distributions not designated as capital gain distributions, as either interest related dividends or short-term capital gain dividends, both of which are exempt from the U.S. withholding tax applicable to non U.S. taxpayers. For the fiscal year ended September 28, 2012, the maximum amount allowable but not less than $202,961,289 of the ordinary distributions to be paid by the Fund qualifies as an interest related dividend.
The foregoing information is presented to assist shareholders in reporting distributions received from the Fund to the Internal Revenue Service. Because of the complexity of the federal regulations which may affect your individual tax return and the many variations in state and local tax regulations, we recommend that you consult your tax advisor for specific guidance.
| | | | |
| OPPENHEIMER GLOBAL STRATEGIC INCOME FUND | | | 127 | |
BOARD APPROVAL OF THE FUND’S INVESTMENT
ADVISORY AGREEMENT Unaudited
Each year, the Board of Trustees (the “Board”), including a majority of the independent Trustees, is required to determine whether to renew the Fund’s investment advisory agreement (the “Agreement”). The Investment Company Act of 1940, as amended, requires that the Board request and evaluate, and that the Manager provide, such information as may be reasonably necessary to evaluate the terms of the Agreement. The Board employs an independent consultant to prepare a report that provides information, including comparative information that the Board requests for that purpose. In addition to in-person meetings focused on this evaluation, the Board receives information throughout the year regarding Fund services, fees, expenses and performance.
The Manager and the independent consultant provided information to the Board on the following factors: (i) the nature, quality and extent of the Manager’s services, (ii) the investment performance of the Fund and the Manager, (iii) the fees and expenses of the Fund, including comparative expense information, (iv) the profitability of the Manager and its affiliates, including an analysis of the cost of providing services, (v) whether economies of scale are realized as the Fund grows and whether fee levels reflect these economies of scale for Fund investors and (vi) other benefits to the Manager from its relationship with the Fund. The Board was aware that there are alternatives to retaining the Manager.
Outlined below is a summary of the principal information considered by the Board as well as the Board’s conclusions.
Nature, Quality and Extent of Services. The Board considered information about the nature, quality and extent of the services provided to the Fund and information regarding the Manager’s key personnel who provide such services. The Manager’s duties include providing the Fund with the services of the portfolio managers and the Manager’s investment team, who provide research, analysis and other advisory services in regard to the Fund’s investments; securities trading services; oversight of third-party service providers; monitoring compliance with applicable Fund policies and procedures and adherence to the Fund’s investment restrictions; and risk management. The Manager is responsible for providing certain administrative services to the Fund as well. Those services include providing and supervising all administrative and clerical personnel who are necessary in order to provide effective corporate administration for the Fund; compiling and maintaining records with respect to the Fund’s operations; preparing and filing reports required by the Securities and Exchange Commission; preparing periodic reports regarding the operations of the Fund for its shareholders; preparing proxy materials for shareholder meetings; and preparing the registration statements required by Federal and state securities laws for the sale of the Fund’s shares. The Manager also provides the Fund with office space, facilities and equipment.
| | |
| 128 | | OPPENHEIMER GLOBAL STRATEGIC INCOME FUND |
The Board also considered the quality of the services provided and the quality of the Manager’s resources that are available to the Fund. The Board took account of the fact that the Manager has had over fifty years of experience as an investment adviser and that its assets under management rank it among the top mutual fund managers in the United States. The Board evaluated the Manager’s advisory, administrative, accounting, legal, compliance services and risk management, and information the Board has received regarding the experience and professional qualifications of the Manager’s key personnel and the size and functions of its staff. In its evaluation of the quality of the portfolio management services provided, the Board considered the experience of Arthur Steinmetz, Krishna Memani, Joseph Welsh and Sara Zervos, the portfolio managers for the Fund, and the Manager’s investment team and analysts. The Board members also considered the totality of their experiences with the Manager as directors or trustees of the Fund and other funds advised by the Manager. The Board considered information regarding the quality of services provided by affiliates of the Manager, which its members have become knowledgeable about in connection with the renewal of the Fund’s service agreements. The Board concluded, in light of the Manager’s experience, reputation, personnel, operations and resources that the Fund benefits from the services provided under the Agreement.
Investment Performance of the Manager and the Fund. Throughout the year, the Manager provided information on the investment performance of the Fund and the Manager, including comparative performance information. The Board also reviewed information, prepared by the Manager and by the independent consultant, comparing the Fund’s historical performance to relevant market indices and to the performance of other retail front-end load and no-load global income funds. The Board noted that the Fund outperformed its performance universe median for the three- and ten-year periods, although it slightly underperformed its performance universe median for the five-year period and underperformed its performance universe median for the one-year period. The Board noted that the Fund’s underperformance for the one-year period was due to the Fund’s overweight to credit risk, with exposure to high yield bonds and senior loans which underperformed in the second half of 2011 in a flight to quality. The Board noted that exposure to commercial mortgages, non-agency mortgages, and emerging market currencies also detracted from relative performance. The Board further noted that in response to heightened volatility in the markets, the Fund adjusted its high yield exposure, reduced overall foreign currency exposure and neutralized its duration posture. The Board considered that for the 2012 year-to-date period ended April 30, 2012, the Fund’s performance was in the first quintile of its performance universe median.
| | | | |
| OPPENHEIMER GLOBAL STRATEGIC INCOME FUND | | | 129 | |
BOARD APPROVAL OF THE FUND’S INVESTMENT
ADVISORY AGREEMENT Unaudited / Continued
Costs of Services by the Manager. The Board reviewed the fees paid to the Manager and the other expenses borne by the Fund. The Board also considered the comparability of the fees charged and the services provided to the Fund to the fees and services for other clients or accounts advised by the Manager. The independent consultant provided comparative data in regard to the fees and expenses of the Fund and other retail front-end load global income funds with comparable asset levels and distribution features. The Board noted that the Fund’s actual management fees and total expenses were lower than its expense group median and average. The Fund’s contractual management fees were equal to that of its expense group median and lower than its expense group average.
Economies of Scale and Profits Realized by the Manager. The Board considered information regarding the Manager’s costs in serving as the Fund’s investment adviser, including the costs associated with the personnel and systems necessary to manage the Fund, and information regarding the Manager’s profitability from its relationship with the Fund. The Board reviewed whether the Manager may realize economies of scale in managing and supporting the Fund. The Board noted that the Fund currently has management fee breakpoints, which are intended to share with Fund shareholders economies of scale that may exist as the Fund’s assets grow.
Other Benefits to the Manager. In addition to considering the profits realized by the Manager, the Board considered information that was provided regarding the direct and indirect benefits the Manager receives as a result of its relationship with the Fund, including compensation paid to the Manager’s affiliates. The Board also considered that the Manager must be able to pay and retain experienced professional personnel at competitive rates to provide quality services to the Fund.
Conclusions. These factors were also considered by the independent Trustees meeting separately from the full Board, assisted by experienced counsel to the Fund and to the independent Trustees. Fund counsel and the independent Trustees’ counsel are independent of the Manager within the meaning and intent of the Securities and Exchange Commission Rules.
Based on its review of the information it received and its evaluations described above, the Board, including a majority of the independent Trustees, decided to continue the Agreement. In addition, the Board, including a majority of the Independent Trustees, approved the restructuring of the Fund’s investment advisory arrangement so that effective January 1, 2013, (i) OFI Global Asset Management, Inc. (“OFI Global”), a wholly owned subsidiary of the Manager, will serve as the investment adviser to the Fund in place of the Manager under a Restated Advisory Agreement (“Restated Advisory Agreement”), and (ii) OFI Global will enter into a Sub-Advisory Agreement (“Sub-Advisory Agreement”)
| | |
| 130 | | OPPENHEIMER GLOBAL STRATEGIC INCOME FUND |
with the Manager to provide investment sub-advisory services to the Fund. OFI Global will pay the Manager a percentage of the net investment advisory fee (after all applicable waivers have been deducted) that it receives from the Fund. The Agreement will continue until earlier of August 31, 2013 or the effective date of the Restated Advisory Agreement between the Fund and OFI Global. The Restated Advisory Agreement and Sub-Advisory Agreement will continue until August 31, 2013.
In arriving at its decisions, the Board did not single out any factor or factors as being more important than others, but considered all of the above information, and considered the terms and conditions of the Agreement, Restated Advisory Agreement and Sub-Advisory Agreement, including the management fees, in light of all the surrounding circumstances.
| | | | |
| OPPENHEIMER GLOBAL STRATEGIC INCOME FUND | | | 131 | |
PORTFOLIO PROXY VOTING POLICIES AND PROCEDURES;
UPDATES TO STATEMENTS OF INVESTMENTS Unaudited
The Fund has adopted Portfolio Proxy Voting Policies and Procedures under which the Fund votes proxies relating to securities (“portfolio proxies”) held by the Fund. A description of the Fund’s Portfolio Proxy Voting Policies and Procedures is available (i) without charge, upon request, by calling the Fund toll-free at 1.800.CALL OPP (225.5677), (ii) on the Fund’s website at oppenheimerfunds.com, and (iii) on the SEC’s website at www.sec.gov. In addition, the Fund is required to file Form N-PX, with its complete proxy voting record for the 12 months ended June 30th, no later than August 31st of each year. The Fund’s voting record is available (i) without charge, upon request, by calling the Fund toll-free at 1.800.CALL OPP (225.5677), and (ii) in the Form N-PX filing on the SEC’s website at www.sec.gov.
The Fund files its complete schedule of portfolio holdings with the SEC for the first quarter and the third quarter of each fiscal year on Form N-Q. The Fund’s Form N-Q filings are available on the SEC’s website at http://www.sec.gov. Those forms may be reviewed and copied at the SEC’s Public Reference Room in Washington, D.C. Information on the operation of the Public Reference Room may be obtained by calling 1-800-SEC-0330.
Householding—Delivery of Shareholder Documents
This is to inform you about OppenheimerFunds’ “householding” policy. If more than one member of your household maintains an account in a particular fund, OppenheimerFunds will mail only one copy of the fund’s prospectus (or, if available, the fund’s summary prospectus), annual and semiannual report and privacy policy. The consolidation of these mailings, called householding, benefits your fund through reduced mailing expense, and benefits you by reducing the volume of mail you receive from OppenheimerFunds. Householding does not affect the delivery of your account statements.
Please note that we will continue to household these mailings for as long as you remain an OppenheimerFunds shareholder, unless you request otherwise. If you prefer to receive multiple copies of these materials, please call us at 1.800.CALL-OPP (225-5677). You may also notify us in writing or via email. We will begin sending you individual copies of the prospectus (or, if available, the summary prospectus), reports and privacy policy within 30 days of receiving your request to stop householding.
| | |
| 132 | | OPPENHEIMER GLOBAL STRATEGIC INCOME FUND |
| | | | |
| OPPENHEIMER GLOBAL STRATEGIC INCOME FUND (CAYMAN) LTD. | | | 133 | |
OPPENHEIMER GLOBAL STRATEGIC INCOME FUND
(CAYMAN) LTD. (the “SUBSIDIARY”)
STATEMENT OF ASSETS AND LIABILITIES September 28, 20121
| | | | |
| Assets | | | |
| Cash | | $ | 1,469,786 | |
| Receivables and other assets: | | | | |
| Other | |
| 3,318
|
|
| Total assets | | | 1,473,104 | |
| Liabilities | | | |
| Payables and other liabilities: | | | | |
| Auditing and other professional fees | | | 24,996 | |
| Other | |
| 898
|
|
| Total liabilities | | | 25,894 | |
| Net Assets | | $
| 1,447,210
|
|
| Composition of Net Assets | | | |
| Par value of shares of beneficial interest | | $ | 150 | |
| Additional paid-in capital | | | 1,499,850 | |
| Accumulated net investment loss | | | (52,790 | ) |
| Net Assets—applicable to 15,000 shares of beneficial interest outstanding | | $
| 1,447,210
|
|
| Net Asset Value, Redemption Price Per Share and Offering Price Per Share | | $ | 96.48 | |
1. September 28, 2012 represents the last business day of the Fund’s 2012 fiscal year. See Note 1 of the accompanying Notes.
See accompanying Notes to Financial Statements.
| | |
| 134 | | OPPENHEIMER GLOBAL STRATEGIC INCOME FUND (CAYMAN) LTD. |
OPPENHEIMER GLOBAL STRATEGIC INCOME FUND
(CAYMAN) LTD. (the “SUBSIDIARY”)
STATEMENT OF OPERATIONS For the Period Ended September 28, 20121,2
| | | | |
| Expenses | | | |
| Management fees | | $ | 9,443 | |
| Auditing and other professional fees | | | 31,238 | |
| Directors’ compensation | | | 9,220 | |
| Custodian fees and expenses | | | 2,599 | |
| Other | |
| 290
|
|
| Total expenses | | | 52,790 | |
| Net Investment Loss | | | (52,790 | ) |
| Net Decrease in Net Assets Resulting from Operations | | $
| (52,790
| )
|
1. September 28, 2012 represents the last business day of the Fund’s 2012 fiscal period. See Note 1 of the accompanying Notes.
2. For the period from November 21, 2011 (commencement of operation) to September 28, 2012.
See accompanying Notes to Financial Statements.
| | | | |
| OPPENHEIMER GLOBAL STRATEGIC INCOME FUND (CAYMAN) LTD. | | | 135 | |
OPPENHEIMER GLOBAL STRATEGIC INCOME FUND
(CAYMAN) LTD. (the “SUBSIDIARY”)
STATEMENT OF CHANGES IN NET ASSETS
| | | | |
| | | Period Ended
September 28,
20121,2 | |
| Operations | | | |
| Net investment loss | | $
| (52,790
| )
|
| Net decrease in net assets resulting from operations | | | (52,790 | ) |
| Capital Transactions | | | |
| Net increase in net assets resulting from capital transactions | | | 1,500,000 | |
| Net Assets | | | |
| Total increase | | | 1,447,210 | |
| Beginning of period | |
| —
|
|
End of period (including accumulated net investment loss
of $52,790 for the period ended September 28, 2012) | |
| $1,447,210
|
|
1. September 28, 2012 represents the last business day of the Fund’s 2012 fiscal period. See Note 1 of the accompanying Notes.
2. For the period from November 21, 2011 (commencement of operations) to September 28, 2012.
See accompanying Notes to Financial Statements.
| | |
| 136 | | OPPENHEIMER GLOBAL STRATEGIC INCOME FUND (CAYMAN) LTD. |
NOTES TO FINANCIAL STATEMENTS
1. Significant Accounting Policies
Oppenheimer Global Strategic Income Fund (Cayman) Ltd. (the “Fund”) is organized as a Cayman Islands Company Limited by Shares. The Fund intends to carry on the business of an investment company and to acquire, invest in and hold by way of investment, sell and deal primarily in commodity-linked derivatives (including commodity futures, financial futures, options and swap contracts) and exchange traded funds (“ETF”). The Fund’s investment adviser is OppenheimerFunds, Inc. (the “Manager”). The Sub-Adviser is Oppenheimer Real Asset Management, Inc. (“ORAMI” or the “Sub-Adviser”), a wholly-owned subsidiary of the Manager. As of September 28, 2012, 100% of the Fund was owned by Oppenheimer Global Strategic Income Fund (“OGSIF”). The Manager is also the investment adviser of OGSIF. The Fund commenced operations on November 21, 2011.
The beneficial interest of each investor in the Fund is represented by units of participating shares. The Fund’s directors may further designate classes of participating shares and series within each class. As of September 28, 2012, the directors have not designated classes or series of outstanding participating shares. During the period ended September 28, 2012, all income, profits, losses and expenses, if any, of the Fund were allocated pro rata to all participating shares of the Fund. Issuance of additional participating shares is at the discretion of the Fund’s directors.
The following is a summary of significant accounting policies consistently followed by the Fund.
Fiscal Year End. The last day of the Fund’s fiscal year was the last day the New York Stock Exchange was open for trading. The Fund’s financial statements have been presented through that date to maintain consistency with the Fund’s net asset value calculations used for shareholder transactions.
Income Taxes. The Fund has received an undertaking from the Government of the Cayman Islands exempting it from all local income, profits and capital gains taxes through September of 2030. No such taxes are levied in the Cayman Islands at the present time. The Fund is a Controlled Foreign Corporation under U.S. tax laws and as such is not subject to U.S. income tax. Therefore, the Fund is not required to record a tax provision.
Dividends and Distributions to Shareholders. Dividends and distributions to shareholders, if any, are declared and paid annually from the Fund’s tax basis earnings and profits. Distributions are recorded on ex-dividend date.
Investment Income. Dividend income is recorded on the ex-dividend date or upon ex-dividend notification in the case of certain foreign dividends where the ex-dividend date may have passed. Non-cash dividends included in dividend income, if any, are recorded at the fair market value of the securities received. Interest income is recognized on an accrual basis. Discount and premium, which are included in interest income on the Statement of Operations, are amortized or accreted daily.
Custodian Fees. “Custodian fees and expenses” in the Statement of Operations may include interest expense incurred by the Fund on any cash overdrafts of its custodian
| | | | |
| OPPENHEIMER GLOBAL STRATEGIC INCOME FUND (CAYMAN) LTD. | | | 137 | |
NOTES TO FINANCIAL STATEMENTS Continued
Custodian Fees Continued
account during the period. Such cash overdrafts may result from the effects of failed trades in portfolio securities and from cash outflows resulting from unanticipated shareholder redemption activity. The Fund pays interest to its custodian on such cash overdrafts, to the extent they are not offset by positive cash balances maintained by the Fund, at a rate equal to the Federal Funds Rate plus 0.50%. The “Reduction to custodian expenses” line item, if applicable, represents earnings on cash balances maintained by the Fund during the period. Such interest expense and other custodian fees may be paid with these earnings.
Security Transactions. Security transactions are recorded on the trade date. Realized gains and losses on securities sold are determined on the basis of identified cost.
Indemnifications. The Fund’s organizational documents provide current and former trustees and officers with a limited indemnification against liabilities arising in connection with the performance of their duties to the Fund. In the normal course of business, the Fund may also enter into contracts that provide general indemnifications. The Fund’s maximum exposure under these arrangements is unknown as this would be dependent on future claims that may be made against the Fund. The risk of material loss from such claims is considered remote.
Other. The preparation of financial statements in conformity with accounting principles generally accepted in the United States of America requires management to make estimates and assumptions that affect the reported amounts of assets and liabilities and disclosure of contingent assets and liabilities at the date of the financial statements and the reported amounts of increases and decreases in net assets from operations during the reporting period. Actual results could differ from those estimates.
2. Capital Transactions
The Fund has authorized 5,000,000 participating shares of $0.01 par value per share. The Fund issued 15,000 participating shares for $1,500,000 on November 21, 2011 in conjunction with OGSIF’s initial capitalization of the Fund. All subsequent capital contributions and withdrawals did not have participating shares associated with the transaction.
Capital transactions were as follows:
| | | | |
| | | Period Ended
September 28,
20121
Amount | |
| Contributions | | $ | 1,500,000 | |
| Withdrawals | | | — | |
| | |
|
|
|
| Net increase | | $ | 1,500,000 | |
| | |
|
|
|
1. For the period from November 21, 2011 (commencement of operations) to September 28, 2012.
| | |
| 138 | | OPPENHEIMER GLOBAL STRATEGIC INCOME FUND (CAYMAN) LTD. |
3. Expenses
Management Fees. Under the investment advisory agreement, the Fund pays the Manager a management fee based on the daily net assets of the Fund at an annual rate as shown in the following table:
| | | | |
| Fee Schedule | | | |
| Up to $200 million | | | 0.75 | % |
| Next $200 million | | | 0.72 | |
| Next $200 million | | | 0.69 | |
| Next $200 million | | | 0.66 | |
| Next $200 million | | | 0.60 | |
| Next $4 billion | | | 0.50 | |
| Over $5 billion | | | 0.48 | |
Sub-Adviser Fees. The Manager retains the Sub-Adviser to provide the day-to-day portfolio management of the Fund. Under the Sub-Advisory Agreement, the Manager pays the Sub-Adviser a fee in monthly installments, based on the daily net assets of the Fund at an annual rate as shown in the following table:
| | | | |
| Fee Schedule | | | |
| Up to $200 million | | | 0.375 | % |
| Next $200 million | | | 0.360 | |
| Next $200 million | | | 0.345 | |
| Next $200 million | | | 0.330 | |
| Next $200 million | | | 0.300 | |
| Next $4 billion | | | 0.250 | |
| Over $5 billion | | | 0.240 | |
The Fund shall bear all fees and expenses related to the business and affairs of the Fund, including among others, directors’ fees, audit fees, custodian fees and expenses in connection with the purchase and sale of securities and other Fund assets.
Some of these undertakings may be modified or terminated at any time; some may not be modified or terminated until after one year from the date of the current prospectus, as indicated therein.
4. Financial Highlights
The following represents the total return of the Fund for the period ended September 28, 2012. Total return was calculated based upon the daily returns of the Fund during this period. The calculation has not been annualized for reporting purposes:
| | | | |
| Period Ended September 28, 20121 | | | (3.52 | )% |
The following represents certain financial ratios of the Fund for the periods noted. The computation of the net investment income and total expense ratios was based upon the daily net assets of the Fund during these periods. The calculations have been annualized for reporting purposes:
| | | | |
| Ratios to average net assets: | | Period Ended
September 28,
20121 | |
| Net investment loss | | | (4.18 | )% |
| Total expenses | | | 4.18 | % |
1. For the period from November 21, 2011 (commencement of operations) through September 28, 2012.
| | | | |
| OPPENHEIMER GLOBAL STRATEGIC INCOME FUND (CAYMAN) LTD. | | | 139 | |
NOTES TO FINANCIAL STATEMENTS Continued
5. Pending Litigation
Since 2009, a number of class action lawsuits have been pending in federal courts against OppenheimerFunds, Inc., the Fund’s investment advisor (the “Manager”), OppenheimerFunds Distributor, Inc., the Fund’s principal underwriter and distributor (the “Distributor”), and certain funds (but not including the Fund) advised by the Manager and distributed by the Distributor (the “Defendant Funds”). Several of these lawsuits also name as defendants certain officers and current and former trustees of the respective Defendant Funds. The lawsuits raise claims under federal securities law and allege, among other things, that the disclosure documents of the respective Defendant Funds contained misrepresentations and omissions and that the respective Defendant Funds’ investment policies were not followed. The plaintiffs in these actions seek unspecified damages, equitable relief and awards of attorneys’ fees and litigation expenses. The Defendant Funds’ Boards of Trustees have also engaged counsel to represent the Funds and the present and former Independent Trustees named in those suits.
Other class action and individual lawsuits have been filed since 2008 in various state and federal courts against the Manager and certain of its affiliates by investors seeking to recover investments they allegedly lost as a result of the “Ponzi” scheme run by Bernard L. Madoff and his firm, Bernard L. Madoff Investment Securities, LLC (“BLMIS”). Plaintiffs in these suits allege that they suffered losses as a result of their investments in several funds managed by an affiliate of the Manager and assert a variety of claims, including breach of fiduciary duty, fraud, negligent misrepresentation, unjust enrichment, and violation of federal and state securities laws and regulations, among others. They seek unspecified damages, equitable relief and awards of attorneys’ fees and litigation expenses. Neither the Distributor, nor any of the Oppenheimer mutual funds, their independent trustees or directors are named as defendants in these lawsuits. None of the Oppenheimer mutual funds invested in any funds or accounts managed by Madoff or BLMIS. On February 28, 2011, a stipulation of partial settlement of three groups of consolidated putative class action lawsuits relating to these matters was filed in the U.S. District Court for the Southern District of New York. On August 19, 2011, the court entered an order and final judgment approving the settlement as fair, reasonable and adequate. In September 2011, certain parties filed notices of appeal from the court’s order approving the settlement. The settlement does not resolve other outstanding lawsuits against the Manager and its affiliates relating to BLMIS.
On April 16, 2010, a lawsuit was filed in New York state court against the Manager, an affiliate of the Manager and AAArdvark IV Funding Limited (“AAArdvark IV”), an entity advised by the Manager’s affiliate, in connection with investments made by the plaintiffs in AAArdvark IV. Plaintiffs allege breach of contract against the defendants and seek compensatory damages, costs and disbursements, including attorney fees. On July 15, 2011, a lawsuit was filed in New York state court against the Manager, an affiliate of the Manager and AAArdvark Funding Limited (“AAArdvark I”), an entity advised by the Manager’s affiliate, in connection with investments made by the plaintiffs in AAArdvark I. The complaint alleges breach of contract against the defendants and seeks compensatory
| | |
| 140 | | OPPENHEIMER GLOBAL STRATEGIC INCOME FUND (CAYMAN) LTD. |
damages, costs and disbursements, including attorney fees. On November 9, 2011, a lawsuit was filed in New York state court against the Manager, an affiliate of the Manager and AAArdvark XS Funding Limited (“AAArdvark XS”), an entity advised by the Manager’s affiliate, in connection with investments made by the plaintiffs in AAArdvark XS. The complaint alleges breach of contract against the defendants and seeks compensatory damages, costs and disbursements, including attorney fees.
The Manager believes the lawsuits and appeals described above are without legal merit and, with the exception of actions it has settled, is defending against them vigorously. While it is premature to render any opinion as to the outcome in these lawsuits, or whether any costs that the Defendant Funds may bear in defending the suits might not be reimbursed by insurance, the Manager believes that these suits should not impair the ability of the Manager or the Distributor to perform their respective duties to the Fund, and that the outcome of all of the suits together should not have any material effect on the operations of any of the Oppenheimer mutual funds.
6. Subsequent Events Evaluation
The Fund has evaluated the need for disclosures and/or adjustments resulting from subsequent events through November 21, 2012, the date the financial statements were available to be issued. This evaluation determined that there are no subsequent events that necessitated disclosures and/or adjustments.
| | | | |
| OPPENHEIMER GLOBAL STRATEGIC INCOME FUND (CAYMAN) LTD. | | | 141 | |
REPORT OF INDEPENDENT REGISTERED PUBLIC ACCOUNTING FIRM
The Board of Directors and Shareholders of Oppenheimer Global Strategic Income Fund (Cayman) Ltd.:
We have audited the accompanying statement of assets and liabilities of Oppenheimer Global Strategic Income Fund (Cayman) Ltd. as of September 28, 2012, and the related statements of operations and changes in net assets for the period from November 21, 2011 (commencement of operations) to September 28, 2012. These financial statements are the responsibility of the Fund’s management. Our responsibility is to express an opinion on these financial statements based on our audit.
We conducted our audit in accordance with the standards of the Public Company Accounting Oversight Board (United States). Those standards require that we plan and perform the audit to obtain reasonable assurance about whether the financial statements are free of material misstatement. An audit includes examining, on a test basis, evidence supporting the amounts and disclosures in the financial statements. An audit also includes assessing the accounting principles used and significant estimates made by management, as well as evaluating the overall financial statement presentation. We believe that our audit provides a reasonable basis for our opinion.
In our opinion, the financial statements referred to above present fairly, in all material respects, the financial position of Oppenheimer Global Strategic Income Fund (Cayman) Ltd. as of September 28, 2012, and the results of its operations and the changes in its net assets for the period from November 21, 2011 to September 28, 2012, in conformity with U.S. generally accepted accounting principles.
KPMGLLP
Denver, Colorado
November 21, 2012
| | |
| 142 | | OPPENHEIMER GLOBAL STRATEGIC INCOME FUND (CAYMAN) LTD. |
TRUSTEES AND OFFICERS BIOS Unaudited
| | |
| Name, Position(s) Held with the Fund, Length of Service, Age | | Principal Occupation(s) During the Past 5 Years; Other Trusteeships/Directorships Held; Number of Portfolios in the Fund Complex Currently Overseen |
| |
| INDEPENDENT TRUSTEES | | The address of each Trustee in the chart below is 6803 S. Tucson Way, Centennial, Colorado 80112-3924. Each Trustee serves for an indefinite term, or until his or her resignation, retirement, death or removal. |
| |
William L. Armstrong, Chairman of the Board of Trustees (since 2003), Trustee (since 1999) Age: 75 | | President, Colorado Christian University (since 2006); Chairman, Cherry Creek Mortgage Company (since 1991), Chairman, Centennial State Mortgage Company (since 1994), Chairman, The El Paso Mortgage Company (since 1993); Chairman, Ambassador Media Corporation (since 1984); Chairman, Broadway Ventures (since 1984); Director of Helmerich & Payne, Inc. (oil and gas drilling/production company) (since 1992), former Director of Campus Crusade for Christ (non-profit) (1991-2008); former Director, The Lynde and Harry Bradley Foundation, Inc. (non-profit organization) (2002-2006); former Chairman of: Transland Financial Services, Inc. (private mortgage banking company) (1997-2003), Great Frontier Insurance (1995-2000), Frontier Real Estate, Inc. (residential real estate brokerage) (1994-2000) and Frontier Title (title insurance agency) (1995-2000); former Director of the following: UNUMProvident (insurance company) (1991-2004), Storage Technology Corporation (computer equipment company) (1991-2003) and International Family Entertainment (television channel) (1992-1997); U.S. Senator (January 1979-January 1991). Oversees 36 portfolios in the OppenheimerFunds complex. Mr. Armstrong has served on the Boards of certain Oppenheimer funds since 1999, during which time he has become familiar with the Fund’s (and other Oppenheimer funds’) financial, accounting, regulatory and investment matters and has contributed to the Boards’ deliberations. |
| |
Edward L. Cameron, Trustee (since 2000) Age: 74 | | Member of The Life Guard of Mount Vernon (George Washington historical site) (June 2000–June 2006); Partner of PricewaterhouseCoopers LLP (accounting firm) (July 1974-June 1999); Chairman of Price Waterhouse LLP Global Investment Management Industry Services Group (accounting firm) (July 1994-June 1998). Oversees 36 portfolios in the OppenheimerFunds complex. Mr. Cameron has served on the Boards of certain Oppenheimer funds since 1999, during which time he has become familiar with the Fund’s (and other Oppenheimer funds’) financial, accounting, regulatory and investment matters and has contributed to the Boards’ deliberations. |
| |
Jon S. Fossel, Trustee (since 1990) Age: 70 | | Chairman of the Board (2006-December 2011) and Director (June 2002-December 2011) of UNUMProvident (insurance company); Director of Northwestern Energy Corp. (public utility corporation) (November 2004-December 2009); Director of P.R. Pharmaceuticals (October 1999-October 2003); Director of Rocky Mountain Elk Foundation (non-profit organization) (February 1998-February 2003 and February 2005-February 2007); Chairman and Director (until October 1996) and President and Chief Executive Officer (until October 1995) of the Manager; President, Chief Executive Officer and Director of the following: Oppenheimer Acquisition Corp. (“OAC”) (parent holding company of the Manager), Shareholders Services, Inc. and Shareholder Financial Services, Inc. (until October 1995). Oversees 36 portfolios in the OppenheimerFunds complex. Mr. Fossel has served on the Boards of certain Oppenheimer funds since 1990, during which time he has become familiar with the Fund’s (and other Oppenheimer funds’) financial, accounting, regulatory and investment matters and has contributed to the Boards’ deliberations. |
| | | | |
| OPPENHEIMER GLOBAL STRATEGIC INCOME FUND | | | 143 | |
TRUSTEES AND OFFICERS BIOS Unaudited / Continued
| | |
Sam Freedman, Trustee (since 1996) Age: 71 | | Director of Colorado UpLIFT (charitable organization) (since September 1984). Mr. Freedman held several positions with the Manager and with subsidiary or affiliated companies of the Manager (until October 1994). Oversees 36 portfolios in the OppenheimerFunds complex. Mr. Freedman has served on the Boards of certain Oppenheimer funds since 1996, during which time he has become familiar with the Fund’s (and other Oppenheimer funds’) financial, accounting, regulatory and investment matters and has contributed to the Boards’ deliberations. |
| |
Richard F. Grabish, Trustee (since 2012) Age: 64 | | Formerly Senior Vice President and Assistant Director of Sales and Marketing (March 1997-December 2007), Director (March 1987-December 2007) and Manager of Private Client Services (June 1985-June 2005) of A.G. Edwards & Sons, Inc. (broker/dealer and investment firm); Chairman and Chief Executive Officer of A.G. Edwards Trust Company, FSB (March 2001-December 2007); President and Vice Chairman of A.G. Edwards Trust Company, FSB (investment adviser) (April 1987-March 2001); President of A.G. Edwards Trust Company, FSB (investment adviser) (June 2005-December 2007). Oversees 36 portfolios in the OppenheimerFunds complex. Mr. Grabish has served on the Boards of certain Oppenheimer funds since 2001, during the course of which he has become familiar with the Fund’s (and other Oppenheimer funds’) financial, accounting, regulatory and investment matters and has contributed to the Boards’ deliberations. |
| |
Beverly L. Hamilton, Trustee (since 2002) Age: 65 | | Trustee of Monterey Institute for International Studies (educational organization) (since February 2000); Board Member of Middlebury College (educational organization) (December 2005-June 2011); Chairman (since 2010) of American Funds’ Emerging Markets Growth Fund, Inc. (mutual fund); Director of The California Endowment (philanthropic organization) (April 2002-April 2008); Director (February 2002-2005) and Chairman of Trustees (2006-2007) of the Community Hospital of Monterey Peninsula; Director (October 1991-2005); Vice Chairman (2006-2009) of American Funds’ Emerging Markets Growth Fund, Inc. (mutual fund); President of ARCO Investment Management Company (February 1991-April 2000); Member of the investment committees of The Rockefeller Foundation (2001-2006) and The University of Michigan (since 2000); Advisor at Credit Suisse First Boston’s Sprout venture capital unit (venture capital fund) (1994-January 2005); Trustee of MassMutual Institutional Funds (investment company) (1996-June 2004); Trustee of MML Series Investment Fund (investment company) (April 1989-June 2004); Member of the investment committee of Hartford Hospital (2000-2003); and Advisor to Unilever (Holland) pension fund (2000-2003). Oversees 36 portfolios in the OppenheimerFunds complex. Ms. Hamilton has served on the Boards of certain Oppenheimer funds since 2002, during which time she has become familiar with the Fund’s (and other Oppenheimer funds’) financial, accounting, regulatory and investment matters and has contributed to the Boards’ deliberations. |
| |
Victoria J. Herget, Trustee (since 2012) Age: 60 | | Independent Director of the First American Funds (mutual fund family) (2003-2011); former Managing Director (1993-2001), Principal (1985-1993), Vice President (1978-1985) and Assistant Vice President (1973-1978) of Zurich Scudder Investments (and its predecessor firms); Board Chair (2008-Present) and Director (2004-Present), United Educators (insurance company); Trustee (1992-2007), Chair of the Board of Trustees (1999-2007), Investment Committee Chair (1994-1999) and Investment Committee member (2007-2010) of Wellesley College; Trustee (since 2000) and Chair (since 2010), Newberry Library; Trustee, Mather LifeWays (since 2001); Trustee, BoardSource (2006-2009) and Chicago City Day School (1994-2005). Oversees 36 portfolios |
| | |
| 144 | | OPPENHEIMER GLOBAL STRATEGIC INCOME FUND |
| | |
Victoria J. Herget, Continued | | in the OppenheimerFunds complex. Ms. Herget has served on the Boards of certain Oppenheimer funds since 2012, during which time she has become familiar with the Fund’s (and other Oppenheimer funds’) financial, accounting, regulatory and investment matters and has contributed to the Boards’ deliberations. |
| |
Robert J. Malone, Trustee (since 2002) Age: 68 | | Board of Directors of Opera Colorado Foundation (non-profit organization) (since March 2008); Director of Jones Knowledge, Inc. (2006-2010); Director of Jones International University (educational organization) (since August 2005); Chairman, Chief Executive Officer and Director of Steele Street Bank & Trust (commercial banking) (since August 2003); Director of Colorado UpLIFT (charitable organization) (1986-2010); Trustee of the Gallagher Family Foundation (non-profit organization) (since 2000); Former Chairman of U.S. Bank-Colorado (subsidiary of U.S. Bancorp and formerly Colorado National Bank) (July 1996-April 1999); Director of Commercial Assets, Inc. (real estate investment trust) (1993-2000); Director of Jones Knowledge, Inc. (2001-July 2004); Director of U.S. Exploration, Inc. (oil and gas exploration) (1997-February 2004); Chairman of the Board (1991-1994) and Trustee (1985-1994) of Regis University; and Chairman of the Board (1990-1991) and Trustee (1984-1999) of Young Presidents Organization. Oversees 36 portfolios in the OppenheimerFunds complex. Mr. Malone has served on the Boards of certain Oppenheimer funds since 2002, during which time he has become familiar with the Fund’s (and other Oppenheimer funds’) financial, accounting, regulatory and investment matters and has contributed to the Boards’ deliberations. |
| |
F. William Marshall, Jr., Trustee (since 2000) Age: 70 | | Trustee Emeritus of Worcester Polytech Institute (WPI) (private university) (since 2009); Trustee of MassMutual Select Funds (formerly MassMutual Institutional Funds) (investment company) (since 1996) and MML Series Investment Fund (investment company) (since 1996) and Mass Mutual Premier Funds (investment company) (since January 2012); President and Treasurer of the SIS Funds (private charitable fund) (January 1999-March 2011); Former Trustee of WPI (1985-2008); Former Chairman of the Board (2004-2006) and Former Chairman of the Investment Committee of WPI (1994-2008); Chairman of SIS & Family Bank, F.S.B. (formerly SIS Bank) (commercial bank) (January 1999-July 1999); Executive Vice President of Peoples Heritage Financial Group, Inc. (commercial bank) (January 1999-July 1999); and Former President and Chief Executive Officer of SIS Bancorp. (1993-1999). Oversees 40 portfolios in the OppenheimerFunds complex. Mr. Marshall has served on the Boards of certain Oppenheimer funds since 2000, during which time he has become familiar with the Fund’s (and other Oppenheimer funds’) financial, accounting, regulatory and investment matters and has contributed to the Boards’ deliberations. |
| |
Karen L. Stuckey, Trustee (since 2012) Age: 59 | | Partner (1990-2012) of PricewaterhouseCoopers LLP (held various positions 1975-1990); Trustee (1992-2006) and member of Executive, Nominating and Audit Committees and Chair of Finance Committee of Lehigh University; and member, Women’s Investment Management Forum since inception. Oversees 36 portfolios in the OppenheimerFunds complex. Ms. Stuckey has served on the Boards of certain Oppenheimer funds since 2012, during which time she has become familiar with the Fund’s (and other Oppenheimer funds’) financial, accounting, regulatory and investment matters and has contributed to the Boards’ deliberations. |
| |
James D. Vaughn, Trustee (since 2012) Age: 67 | | Retired; former managing partner (1994-2001) of Denver office of Deloitte & Touche LLP, (held various positions 1969-1993); Trustee and Chairman of the Audit Committee of Schroder Funds (since 2003); Board member and |
| | | | |
| OPPENHEIMER GLOBAL STRATEGIC INCOME FUND | | | 145 | |
TRUSTEES AND OFFICERS BIOS Unaudited / Continued
| | |
James D. Vaughn, Continued | | Chairman of Audit Committee of AMG National Trust Bank (since 2005); Trustee, Audit Committee member and Investment Committee member, University of South Dakota Foundation (since 1996); Board member, Executive Committee Member, Audit Committee Member and past Board Chair, Junior Achievement (since 1993); former Board member, Mile High United Way, Boys and Girls Clubs, Boy Scouts, Colorado Business Committee for the Arts, Economic Club of Colorado and Metro Denver Network. Oversees 36 portfolios in the OppenheimerFunds complex. Mr. Vaughn has served on the Boards of certain Oppenheimer funds since 2012, during which time he has become familiar with the Fund’s (and other Oppenheimer funds’) financial, accounting, regulatory and investment matters and has contributed to the Boards’ deliberations. |
| INTERESTED TRUSTEE AND OFFICER | | The address of Mr. Glavin is Two World Financial Center, 225 Liberty Street, 11th Floor, New York, New York 10281-1008. Mr. Glavin serves as a Trustee for an indefinite term, or until his resignation, retirement, death or removal and as an Officer for an indefinite term, or until his resignation, retirement, death or removal. Mr. Glavin is an Interested Trustee due to his positions with OppenheimerFunds, Inc. and its affiliates. |
| |
William F. Glavin, Jr., Trustee, President and Principal Executive Officer (since 2009) Age: 54 | | Chairman of the Manager (since December 2009); Chief Executive Officer and Director of the Manager (since January 2009); President of the Manager (since May 2009); Director of Oppenheimer Acquisition Corp. (“OAC”) (the Manager’s parent holding company) (since June 2009); Executive Vice President (March 2006-February 2009) and Chief Operating Officer (July 2007-February 2009) of Massachusetts Mutual Life Insurance Company (OAC’s parent company); Director (May 2004-March 2006) and Chief Operating Officer and Chief Compliance Officer (May 2004-January 2005), President (January 2005-March 2006) and Chief Executive Officer (June 2005-March 2006) of Babson Capital Management LLC; Director (March 2005-March 2006), President (May 2003-March 2006) and Chief Compliance Officer (July 2005-March 2006) of Babson Capital Securities, Inc. (a broker-dealer); President (May 2003-March 2006) of Babson Investment Company, Inc.; Director (May 2004-August 2006) of Babson Capital Europe Limited; Director (May 2004-October 2006) of Babson Capital Guernsey Limited; Director (May 2004-March 2006) of Babson Capital Management LLC; Non-Executive Director (March 2005-March 2007) of Baring Asset Management Limited; Director (February 2005-June 2006) Baring Pension Trustees Limited; Director and Treasurer (December 2003-November 2006) of Charter Oak Capital Management, Inc.; Director (May 2006-September 2006) of C.M. Benefit Insurance Company; Director (May 2008-June 2009) and Executive Vice President (June 2007-July 2009) of C.M. Life Insurance Company; President (March 2006-May 2007) of MassMutual Assignment Company; Director (January 2005-December 2006), Deputy Chairman (March 2005-December 2006) and President (February 2005-March 2005) of MassMutual Holdings (Bermuda) Limited; Director (May 2008-June 2009) and Executive Vice President (June 2007-July 2009) of MML Bay State Life Insurance Company; Chief Executive Officer and President (April 2007-January 2009) of MML Distributors, LLC; and Chairman (March 2006-December 2008) and Chief Executive Officer (May 2007-December 2008) of MML Investors Services, Inc. Oversees 62 portfolios as a Trustee/Director and 94 portfolios as an officer in the OppenheimerFunds complex. |
| | |
| 146 | | OPPENHEIMER GLOBAL STRATEGIC INCOME FUND |
| | |
| OTHER OFFICERS OF THE FUND | | The addresses of the Officers in the chart below are as follows: for Messrs. Steinmetz, Memani, Gabinet and Mss. Zervos and Nasta, Two World Financial Center, 225 Liberty Street, New York, New York 10281-1008, for Messrs. Welsh, Vandehey and Wixted, 6803 S. Tucson Way, Centennial, Colorado 80112-3924. Each Officer serves for an indefinite term or until his or her resignation, retirement, death or removal. |
| |
Arthur P. Steinmetz, Vice President (since 1989) Age: 53 | | Chief Investment Officer of the Manager (since October 2010); Executive Vice President of the Manager (since October 2009). Chief Investment Officer of Fixed-Income Investments of the Manager (April 2009-October 2010); Director of Fixed-Income Investments of the Manager (January 2009-April 2009) and a Senior Vice President of the Manager (March 1993-September 2009). A portfolio manager and an officer of 5 portfolios in the OppenheimerFunds complex. |
| |
Krishna Memani, Vice President (since 2009) Age: 52 | | Director of Fixed Income (since October 2010), Senior Vice President and Head of the Investment Grade Fixed Income Team of the Manager (since March 2009). Prior to joining the Manager, Managing Director and Head of the U.S. and European Credit Analyst Team at Deutsche Bank Securities (June 2006-January 2009); Chief Credit Strategist at Credit Suisse Securities (August 2002-March 2006); a Managing Director and Senior Portfolio Manager at Putnam Investments (September 1998-June 2002). A portfolio manager and an officer of 22 portfolios in the OppenheimerFunds complex. |
| |
Joseph Welsh, Vice President (since 2009) Age: 48 | | Head of the Manager’s High Yield Corporate Debt Team (since April 2009); Senior Vice President of the Manager (since May 2009); Vice President of the Manager (December 2000-April 2009); Assistant Vice President of the Manager (December 1996-November 2000); a high yield bond analyst of the Manager (January 1995-December 1996); a CFA. A portfolio manager and officer of 5 portfolios in the OppenheimerFunds complex. |
| |
Sara J. Zervos, Ph.D. Vice President (since 2010) Age: 43 | | Head of the Global Debt Team (since October 2010); Senior Vice President of the Manager (since January 2011); Vice President of the Manager (April 2008-December 2010). Prior to joining the Manager, a portfolio manager with Sailfish Capital Management (May 2007-February 2008) and a portfolio manager for emerging market debt at Dillon Read Capital Management and OTA Asset Management (June 2004-April 2007). A portfolio manager and officer of 4 portfolios in the OppenheimerFunds complex. |
| |
Arthur S. Gabinet, Secretary and Chief Legal Officer (since 2011) Age: 54 | | Executive Vice President (since May 2010) and General Counsel (since January 2011) of the Manager; General Counsel of the Distributor (since January 2011); General Counsel of Centennial Asset Management Corporation (since January 2011); Executive Vice President and General Counsel of HarbourView Asset Management Corporation (since January 2011); Assistant Secretary (since January 2011) and Director (since January 2011) of OppenheimerFunds International Ltd. and OppenheimerFunds plc; Vice President and Director of Oppenheimer Partnership Holdings, Inc. (since January 2011); Director of Oppenheimer Real Asset Management, Inc. (since January 2011); Executive Vice President and General Counsel of Shareholder Financial Services, Inc. and Shareholder Services, Inc. (since January 2011); Executive Vice President and General Counsel of OFI Private Investments, Inc. (since January 2011); Vice President of OppenheimerFunds Legacy Program (January 2011-January 2012); Executive Vice President and General Counsel of OFI Institutional Asset Management, Inc. (since January 2011); General Counsel, Asset Management of the Manager (May 2010-December 2010); Principal, The Vanguard Group (November 2005-April 2010); District Administrator, U.S. Securities and Exchange Commission (January 2003-October 2005). An officer of 94 portfolios in the OppenheimerFunds complex. |
| | | | |
| OPPENHEIMER GLOBAL STRATEGIC INCOME FUND | | | 147 | |
TRUSTEES AND OFFICERS BIOS Unaudited / Continued
| | |
Christina M. Nasta, Vice President and
Chief Business Officer
(since 2011) Age: 39 | | Senior Vice President of the Manager (since July 2010); Vice President of the Manager (since January 2003); Vice President of OppenheimerFunds Distributor, Inc. (since January 2003). An officer of 94 portfolios in the OppenheimerFunds complex. |
| |
Mark S. Vandehey, Vice President and Chief Compliance Officer (since 2004) Age: 62 | | Senior Vice President and Chief Compliance Officer of the Manager (since March 2004); Chief Compliance Officer of OppenheimerFunds Distributor, Inc., Centennial Asset Management and Shareholder Services, Inc. (since March 2004); Vice President of OppenheimerFunds Distributor, Inc., Centennial Asset Management Corporation and Shareholder Services, Inc. (since June 1983). An officer of 94 portfolios in the OppenheimerFunds complex. |
| |
Brian W. Wixted, Treasurer and Principal Financial & Accounting Officer (since 1999) Age: 52 | | Senior Vice President of the Manager (since March 1999); Treasurer of the Manager and the following: HarbourView Asset Management Corporation, Shareholder Financial Services, Inc., Shareholder Services, Inc., Oppenheimer Real Asset Management, Inc. and Oppenheimer Partnership Holdings, Inc. (March 1999-June 2008), OFI Private Investments, Inc. (March 2000-June 2008), OppenheimerFunds International Ltd. and OppenheimerFunds plc (since May 2000), OFI Institutional Asset Management, Inc. (since November 2000), and OppenheimerFunds Legacy Program (charitable trust program established by the Manager) (June 2003-January 2012); Treasurer and Chief Financial Officer of OFI Trust Company (trust company subsidiary of the Manager) (since May 2000); Assistant Treasurer of OAC (March 1999-June 2008). An officer of 94 portfolios in the OppenheimerFunds complex. |
The Fund’s Statement of Additional Information contains additional information about the Fund’s Trustees and Officers and is available without charge, upon request, by calling 1.800.CALL OPP (225.5677).
| | |
| 148 | | OPPENHEIMER GLOBAL STRATEGIC INCOME FUND |
OPPENHEIMER GLOBAL STRATEGIC INCOME FUND
| | |
| Manager | | OppenheimerFunds, Inc. |
| Distributor | | OppenheimerFunds Distributor, Inc. |
| Transfer and Shareholder Servicing Agent | | OppenheimerFunds Services |
Independent
Registered Public Accounting Firm | | KPMGLLP |
| Counsel | | K&L Gates LLP |
©2012 OppenheimerFunds, Inc. All rights reserved.
| | | | |
| OPPENHEIMER GLOBAL STRATEGIC INCOME FUND | | | 149 | |
PRIVACY POLICY NOTICE
As an Oppenheimer fund shareholder, you are entitled to know how we protect your personal information and how we limit its disclosure.
Information Sources
We obtain nonpublic personal information about our shareholders from the following sources:
| l | | Applications or other forms |
| l | | When you create a user ID and password for online account access |
| l | | When you enroll in eDocs Direct, our electronic document delivery service |
| l | | Your transactions with us, our affiliates or others |
| l | | A software program on our website, often referred to as a “cookie,” which indicates which parts of our site you’ve visited |
| l | | When you set up challenge questions to reset your password online |
If you visit oppenheimerfunds.com and do not log on to the secure account information areas, we do not obtain any personal information about you. When you do log on to a secure area, we do obtain your user ID and password to identify you. We also use this information to provide you with products and services you have requested, to inform you about products and services that you may be interested in and assist you in other ways.
We do not collect personal information through our website unless you willingly provide it to us, either directly by email or in those areas of the website that request information. In order to update your personal information (including your mailing address, email address and phone number) you must first log on and visit your user profile.
If you have set your browser to warn you before accepting cookies, you will receive the warning message with each cookie. You can refuse cookies by turning them off in your browser. However, doing so may limit your access to certain sections of our website.
We use cookies to help us improve and manage our website. For example, cookies help us recognize new versus repeat visitors to the site, track the pages visited, and enable some special features on the website. This data helps us provide a better service for our website visitors.
Protection of Information
We do not disclose any non-public personal information (such as names on a customer list) about current or former customers to anyone, except as permitted by law.
Disclosure of Information
We send your financial advisor (as designated by you) copies of confirmations, account statements and other documents reporting activity in your fund accounts. We may also use details about you and your investments to help us, our financial service affiliates, or firms that jointly market their financial products and services with ours, to better serve your investment needs or suggest financial services or educational material that may be of interest to you. If this requires us to provide you with an opportunity to “opt in” or “opt out” of such information sharing with a firm not affiliated with us, you will receive notification on how to do so, before any such sharing takes place.
Right of Refusal
We will not disclose your personal information to unaffiliated third parties (except as permitted by law), unless we first offer you a reasonable opportunity to refuse or “opt out” of such disclosure.
| | |
| 150 | | OPPENHEIMER GLOBAL STRATEGIC INCOME FUND |
PRIVACY POLICY NOTICE
Internet Security and Encryption
In general, the email services provided by our website are encrypted and provide a secure and private means of communication with us. To protect your own privacy, confidential and/or personal information should only be communicated via email when you are advised that you are using a secure website.
As a security measure, we do not include personal or account information in non-secure emails, and we advise you not to send such information to us in non-secure emails. Instead, you may take advantage of the secure features of our website to encrypt your email correspondence. To do this, you will need to use a browser that supports Secure Sockets Layer (SSL) protocol.
We do not guarantee or warrant that any part of our website, including files available for download, are free of viruses or other harmful code. It is your responsibility to take appropriate precautions, such as use of an anti-virus software package, to protect your computer hardware and software.
| l | | All transactions, including redemptions, exchanges and purchases, are secured by SSL and 128-bit encryption. SSL is used to establish a secure connection between your PC and OppenheimerFunds’ server. It transmits information in an encrypted and scrambled format. |
| l | | Encryption is achieved through an electronic scrambling technology that uses a “key” to code and then decode the data. Encryption acts like the cable converter box you may have on your television set. It scrambles data with a secret code so that no one can make sense of it while it is being transmitted. When the data reaches its destination, the same software unscrambles the data. |
| l | | You can exit the secure area by either closing your browser, or for added security, you can use the Log Out button before you close your browser. |
Other Security Measures
We maintain physical, electronic and procedural safeguards to protect your personal account information. Our employees and agents have access to that information only so that they may offer you products or provide services, for example, when responding to your account questions.
How You Can Help
You can also do your part to keep your account information private and to prevent unauthorized transactions. If you obtain a user ID and password for your account, do not allow it to be used by anyone else. Also, take special precautions when accessing your account on a computer used by others.
Who We Are
This joint notice describes the privacy policies of the Oppenheimer funds, OppenheimerFunds Distributor, Inc., the trustee of OppenheimerFunds Individual Retirement Accounts (IRAs) and the custodian of the OppenheimerFunds 403(b)(7) tax sheltered custodial accounts. It applies to all Oppenheimer fund accounts you presently have, or may open in the future, using your Social Security number—whether or not you remain a shareholder of our funds. This notice was last updated January 16, 2004. In the event it is updated or changed, we will post an updated notice on our website at oppenheimerfunds.com. If you have any questions about these privacy policies, write to us at P.O. Box 5270, Denver, CO 80217-5270, email us by clicking on the Contact Us section of our website at oppenheimerfunds.com or call us at 1.800.CALL OPP (225.5677).
| | | | |
| OPPENHEIMER GLOBAL STRATEGIC INCOME FUND | | | 151 | |
Visit us at oppenheimerfunds.com for 24-hr access to account information and transactions
or call us at 1.800.CALL OPP (1.800.225.5677) for 24-hr automated information and
automated transactions. Representatives also available Mon-Fri 8am-8pm ET.
RA0230.001.0912 November 23, 2012

Item 2. Code of Ethics.
The registrant has adopted a code of ethics that applies to the registrant’s principal executive officer, principal financial officer, principal accounting officer or controller or persons performing similar functions.
Item 3. Audit Committee Financial Expert.
The Board of Trustees of the registrant has determined that F. William Marshall, Jr., the Chairman of the Board’s Audit Committee, is the audit committee financial expert and that Mr. Marshall is “independent” for purposes of this Item 3.
Item 4. Principal Accountant Fees and Services.
The principal accountant for the audit of the registrant’s annual financial statements billed $59,700 in fiscal 2012 and $58,400 in fiscal 2011.
The principal accountant for the audit of the registrant’s annual financial statements billed $7,200 in fiscal 2012 and $1,500 in fiscal 2011.
The principal accountant for the audit of the registrant’s annual financial statements billed $416,206 in fiscal 2012 and $153,900 in fiscal 2011 to the registrant’s investment adviser or any entity controlling, controlled by, or under common control with the adviser that provides ongoing services to the registrant.
Such services include: Internal control reviews, compliance procedures, GIPS attestation procedures, internal audit training, and surprise exams.
The principal accountant for the audit of the registrant’s annual financial statements billed $425 in fiscal 2012 and $6,700 in fiscal 2011.
The principal accountant for the audit of the registrant’s annual financial statements billed $359,124 in fiscal 2012 and no such fees in fiscal 2011 to the registrant’s investment adviser or any entity controlling, controlled by, or under common control with the adviser that provides ongoing services to the registrant.
Such services include: tax compliance, tax planning and tax advice. Tax compliance generally involves preparation of original and amended tax returns, claims for a refund and tax payment-planning services. Tax planning and tax advice includes assistance with tax audits and appeals, tax advice related to mergers and acquisitions and requests for rulings or technical advice from taxing authorities.
The principal accountant for the audit of the registrant’s annual financial statements billed no such fees in fiscal 2012 and no such fees in fiscal 2011.
The principal accountant for the audit of the registrant’s annual financial statements billed no such fees in fiscal 2012 and no such fees in fiscal 2011 to the registrant’s investment adviser or any entity controlling, controlled by, or under common control with the adviser that provides ongoing services to the registrant.
Such fees would include the cost to the principal accountant of attending audit committee meetings and consultations regarding the registrant’s retirement plan with respect to its Trustees.
| (e) | (1) During its regularly scheduled periodic meetings, the registrant’s audit committee will pre-approve all audit, audit-related, tax and other services to be provided by the principal accountants of the registrant. |
The audit committee has delegated pre-approval authority to its Chairman for any subsequent new engagements that arise between regularly scheduled meeting dates provided that any fees such pre-approved are presented to the audit committee at its next regularly scheduled meeting.
Under applicable laws, pre-approval of non-audit services maybe waived provided that: 1) the aggregate amount of all such services provided constitutes no more than five percent of the total amount of fees paid by the registrant to it principal accountant during the fiscal year in which services are provided 2) such services were not recognized by the registrant at the time of engagement as non-audit services and 3) such services are promptly brought to the attention of the audit committee of the registrant and approved prior to the completion of the audit.
(2) 100%
| (f) | Not applicable as less than 50%. |
| (g) | The principal accountant for the audit of the registrant’s annual financial statements billed $782,955 in fiscal 2012 and $162,100 in fiscal 2011 to the registrant and the registrant’s investment adviser or any entity controlling, controlled by, or under common control with the adviser that provides ongoing services to the registrant related to non-audit fees. Those billings did not include any prohibited non-audit services as defined by the Securities Exchange Act of 1934. |
| (h) | The registrant’s audit committee of the board of Trustees has considered whether the provision of non-audit services that were rendered to the registrant’s investment adviser, and any entity controlling, controlled by, or under common control with the investment adviser that provides ongoing services to the registrant that were not pre-approved pursuant to paragraph (c)(7)(ii) of Rule 2-01 of Regulation S-X is compatible with maintaining the principal accountant’s independence. No such services were rendered. |
Item 5. Audit Committee of Listed Registrants
Not applicable.
Item 6. Schedule of Investments.
a) Not applicable. The complete schedule of investments is included in Item 1 of this Form N-CSR.
b) Not applicable.
Item 7. Disclosure of Proxy Voting Policies and Procedures for Closed-End Management Investment Companies.
Not applicable.
Item 8. Portfolio Managers of Closed-End Management Investment Companies.
Not applicable.
Item 9. Purchases of Equity Securities by Closed-End Management Investment Company and Affiliated Purchasers.
Not applicable.
Item 10. Submission of Matters to a Vote of Security Holders.
The Fund’s Governance Committee Provisions with Respect to Nominations of Directors/Trustees to the Respective Boards
| 1. | The Fund’s Governance Committee (the “Committee”) will evaluate potential Board candidates to assess their qualifications. The Committee shall have the authority, upon approval of the Board, to retain an executive search firm to assist in this effort. The Committee may consider recommendations by business and personal contacts of current Board members and by executive search firms which the Committee may engage from time to time and may also consider shareholder recommendations. The Committee may consider the advice and recommendation of the Funds’ investment manager and its affiliates in making the selection. |
| 2. | The Committee shall screen candidates for Board membership. The Committee has not established specific qualifications that it believes must be met by a trustee nominee. In evaluating trustee nominees, the Committee considers, among other things, an individual’s background, skills, and experience; whether the individual is an “interested person” as defined in the Investment Company Act of 1940; and whether the individual would be deemed an “audit committee financial expert” within the meaning of applicable SEC rules. The Committee also considers whether the individual’s background, skills, and experience will complement the background, skills, and experience of other nominees and will contribute to the Board. There are no differences in the manner in which the Committee evaluates nominees for trustees based on whether the nominee is recommended by a shareholder. |
| 3. | The Committee may consider nominations from shareholders for the Board at such times as the Committee meets to consider new nominees for the Board. The Committee shall have the sole discretion to determine the candidates to present to the Board and, in such cases where required, to shareholders. Recommendations for trustee nominees should, at a minimum, be accompanied by the following: |
| | • | | the name, address, and business, educational, and/or other pertinent background of the person being recommended; |
| | • | | a statement concerning whether the person is an “interested person” as defined in the Investment Company Act of 1940; |
| | • | | any other information that the Funds would be required to include in a proxy statement concerning the person if he or she was nominated; and |
| | • | | the name and address of the person submitting the recommendation and, if that person is a shareholder, the period for which that person held Fund shares. |
The recommendation also can include any additional information which the person submitting it believes would assist the Committee in evaluating the recommendation.
| 4. | Shareholders should note that a person who owns securities issued by Massachusetts Mutual Life Insurance Company (the parent company of the Funds’ investment adviser) would be deemed an “interested person” under the Investment Company Act of 1940. In addition, certain other relationships with Massachusetts Mutual Life Insurance Company or its subsidiaries, with registered broker-dealers, or with the Funds’ outside legal counsel may cause a person to be deemed an “interested person.” |
| 5. | Before the Committee decides to nominate an individual as a trustee, Committee members and other directors customarily interview the individual in person. In addition, the individual customarily is asked to complete a detailed questionnaire which is designed to elicit information which must be disclosed under SEC and stock exchange rules and to determine whether the individual is subject to any statutory disqualification from serving as a trustee of a registered investment company. |
Item 11. Controls and Procedures.
Based on their evaluation of the registrant’s disclosure controls and procedures (as defined in rule 30a-3(c) under the Investment Company Act of 1940 (17 CFR 270.30a-3(c)) as of 9/28/2012, the registrant’s principal executive officer and principal financial officer found the registrant’s disclosure controls and procedures to provide reasonable assurances that information required to be disclosed by the registrant in the reports that it files under the Securities Exchange Act of 1934 (a) is accumulated and communicated to registrant’s management, including its principal executive officer and principal financial officer, to allow timely decisions regarding required disclosure, and (b) is recorded, processed, summarized and reported, within the time periods specified in the rules and forms adopted by the U.S. Securities and Exchange Commission.
There have been no changes in the registrant’s internal controls over financial reporting that occurred during the registrant’s second fiscal quarter of the period covered by this report that have materially affected, or are reasonably likely to materially affect, the registrant’s internal control over financial reporting.
Item 12. Exhibits.
| (a) | (1) Exhibit attached hereto. |
(2) Exhibits attached hereto.
(3) Not applicable.
| (b) | Exhibit attached hereto. |
SIGNATURES
Pursuant to the requirements of the Securities Exchange Act of 1934 and the Investment Company Act of 1940, the registrant has duly caused this report to be signed on its behalf by the undersigned, thereunto duly authorized.
Oppenheimer Global Strategic Income Fund
| | |
By: | | /s/ William F. Glavin, Jr. |
| | William F. Glavin, Jr. |
| | Principal Executive Officer |
| |
Date: | | 11/12/2012 |
Pursuant to the requirements of the Securities Exchange Act of 1934 and the Investment Company Act of 1940, this report has been signed below by the following persons on behalf of the registrant and in the capacities and on the dates indicated.
| | |
By: | | /s/ William F. Glavin, Jr. |
| | William F. Glavin, Jr. |
| | Principal Executive Officer |
| |
Date: | | 11/12/2012 |
| | |
By: | | /s/ Brian W. Wixted |
| | Brian W. Wixted |
| | Principal Financial Officer |
| |
Date: | | 11/12/2012 |