Exhibit 99.2
First Quarter 2022 Earnings Results May 20, 2022
2 Disclosure Regarding Forward - Looking Statements This presentation contains “forward - looking” statements within the meaning of Section 27A of the Securities Act of 1933, as amen ded, and Section 21E of the Exchange Act, as amended. The words “believe,” “expect,” “anticipate,” “plan,” "predict," “intend,” "seek," “foresee,” “should,” “would,” “could,” “attempt ,” “appears,” “forecast,” “outlook,” “estimate,” “project,” “potential,” “may,” “will,” “likely,” “guidance,” “goal,” “model,” “target,” “budget” and other similar expressions are intended to identify forw ard - looking statements, which are generally not historical in nature. Statements may be forward looking even in the absence of these particular words. Examples of forward - looking statements include, but are not limited to, statements regarding our financial position, business strategy, and other plans and objectives for our future operations, and generation of free cash flow . These forward - looking statements are based on our current expectations and beliefs concerning future developments and their potential effect on us. The forward - looking statements contained in this pr esentation are largely based on our expectations for the future, which reflect certain estimates and assumptions made by our management. These estimates and assumptions reflect our best judg men t based on currently known market conditions, operating trends, and other factors. Although we believe such estimates and assumptions to be reasonable, they are inherently uncertain an d involve a number of risks and uncertainties that are beyond our control. As such, management’s assumptions about future events may prove to be inaccurate. For a more detailed descriptio n o f the risks and uncertainties involved, see “Risk Factors” in our most recently filed Annual Report on Form 10 - K and subsequent Quarterly Reports on Form 10 - Q. We do not intend to publicly u pdate or revise any forward - looking statements as a result of new information, future events, changes in circumstances, or otherwise. These cautionary statements qualify all forward - looki ng statements attributable to us, or persons acting on our behalf. Management cautions you that the forward - looking statements contained herein are not guarantees of future performance, and we ca nnot assure you that such statements will be realized or that the events and circumstances they describe will occur. Factors that could cause actual results to differ materially from th ose anticipated or implied in the forward - looking statements herein include, but are not limited to a change in the relationship with any of our key suppliers or the unavailability of premium products at competitive prices; a ch ange in negotiated volume discounts, cooperative advertising, and markdown allowances with any of our key suppliers, or the ability to cancel orders an d r eturn excess or unneeded merchandise; our ability to fund our planned capital investments; the impact of volatility in the financial markets or other global economic factors; difficulties in appropriately allocating capital and resources among our strategic opportunities; our ability to realize the expected benefits from recent acquisitions; business opportunities and expansion; i nve stments; expenses; dividends; share repurchases; liquidity; cash flow from operations; use of cash and cash requirements; borrowing capacity and use of proceeds; repatriation of cash to the Unite d S tates; supply chain issues, including delays in merchandise receipts and increasing cost pressure caused by higher oceanic shipping and freight costs; labor shortages; expectations rega rdi ng increased wages; inflation; consumer spending levels; the effect of governmental assistance programs; social unrest; the direct and indirect effects of all variants of the coronavirus pa ndemic (COVID - 19) on our business, including any adverse effects of the U.S. government’s COVID - 19 vaccine mandates; expectations regarding increasing global taxes; the impact of government regula tion, including changes in law; the impact of the adverse outcome of any material litigation against us or judicial decisions that affect us or our industry generally; the effects of wea ther; increased competition; the financial impact of accounting regulations and critical accounting policies; credit risk relating to the risk of loss as a result of non - performance by our cou nterparties ; and any other factors listed in the reports we have filed and may file with the SEC that are incorporated by reference herein. All written and oral forward - looking statements attributabl e to us are expressly qualified in their entirety by this cautionary statement. A forward - looking statement is neither a prediction nor a guarantee of future events or circumstances, and those futu re events or circumstances may not occur. You should not place undue reliance on forward - looking statements, which speak to our views only as of the date of this presentation.
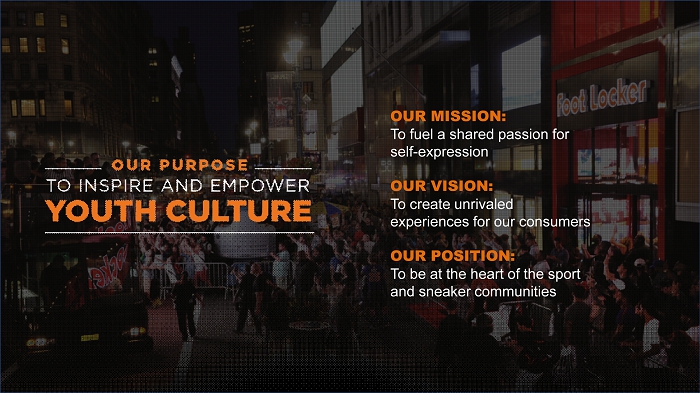
3 OUR MISSION: To fuel a shared passion for self - expression OUR VISION: To create unrivaled experiences for our consumers OUR POSITION: To be at the heart of the sport and sneaker communities
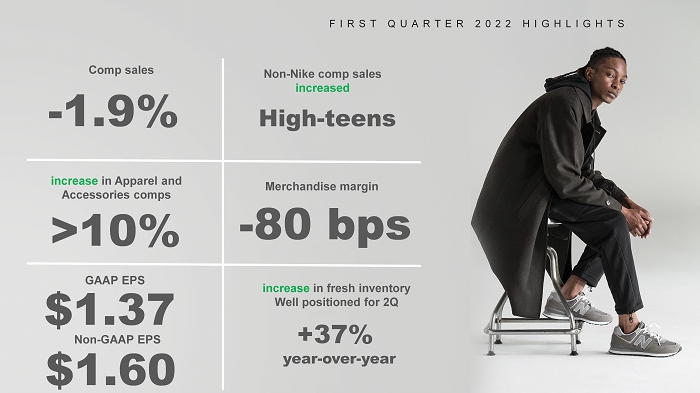
>10% increase in Apparel and Accessories comps $1.37 GAAP EPS +37% year - over - year increase in fresh inventory Well positioned for 2Q FIRST QUARTER 2022 HIGHLIGHTS - 1.9% Comp sales - 80 bps Merchandise margin $1.60 Non - GAAP EPS High - teens Non - Nike comp sales increased
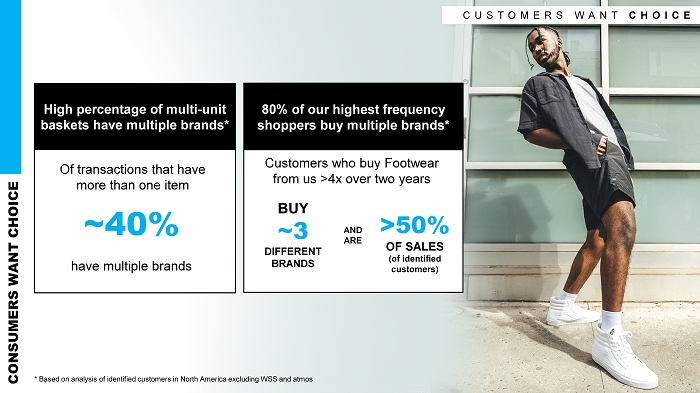
* Based on analysis of identified customers in North America excluding WSS and atmos High percentage of multi - unit baskets have multiple brands* 80% of our highest frequency shoppers buy multiple brands* Customers who buy Footwear from us >4x over two years BUY ~3 DIFFERENT BRANDS AND ARE >50% OF SALES (of identified customers) ~40% have multiple brands Of transactions that have more than one item CONSUMERS WANT CHOICE CUSTOMERS WANT CHOICE
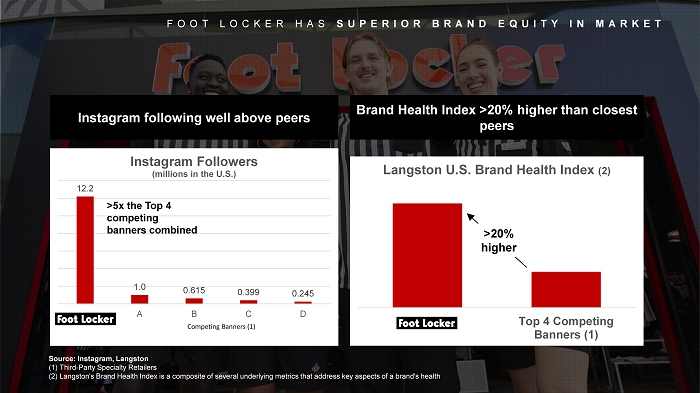
FOOT LOCKER HAS SUPERIOR BRAND EQUITY IN MARKET Source: Instagram, Langston (1) Third - Party Specialty Retailers (2) Langston's Brand Health Index is a composite of several underlying metrics that address key aspects of a brand's health Instagram following well above peers Brand Health Index >20% higher than closest peers Top 4 Competing Banners (1) Langston U.S. Brand Health Index (2) 12.2 1.0 0.615 0.399 0.245 A B C D Instagram Followers (millions in the U.S.) Competing Banners (1) >5x the Top 4 competing banners combined >20% higher
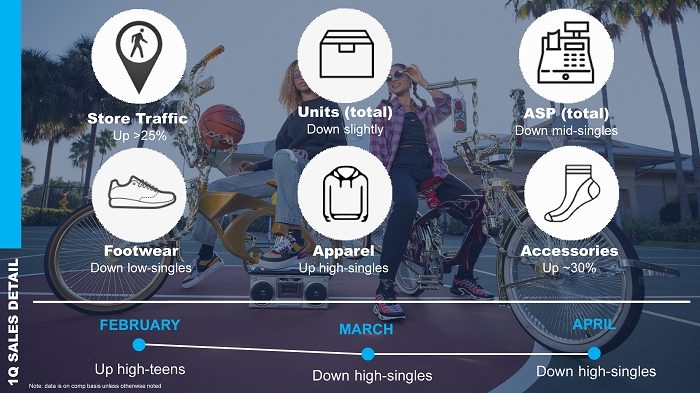
SALES DETAILS Store Traffic Up >25% ASP (total) Down mid - singles Units (total) Down slightly Footwear Down low - singles Apparel Up high - singles Accessories Up ~30% 1Q SALES DETAIL Up high - teens Down high - singles Down high - singles FEBRUARY MARCH APRIL Note: data is on comp basis unless otherwise noted
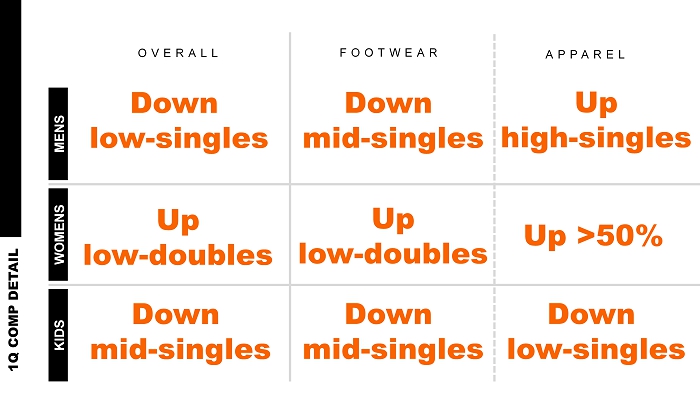
MENS WOMENS KIDS OVERALL Down low - singles Up low - doubles Down mid - singles Up low - doubles Down mid - singles Up high - singles Up >50% Down low - singles 1Q COMP DETAIL APPAREL FOOTWEAR Down mid - singles
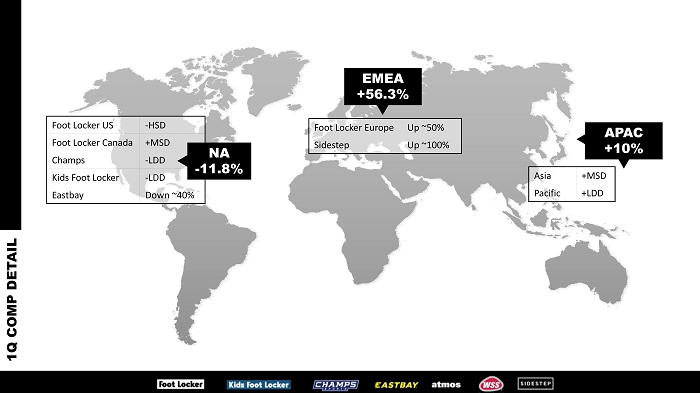
GLOBAL SALES BY REGION APAC +10% 1Q COMP DETAIL EMEA +56.3% Foot Locker US - HSD Foot Locker Canada +MSD Champs - LDD Kids Foot Locker - LDD Eastbay Down ~40% NA - 11.8% Foot Locker Europe Up ~50% Sidestep Up ~100% Asia +MSD Pacific +LDD
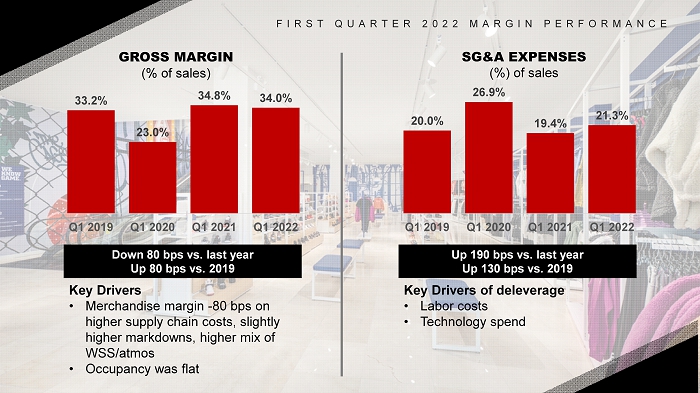
GROSS MARGIN (% of sales) Key Drivers • Merchandise margin - 80 bps on higher supply chain costs, slightly higher markdowns, higher mix of WSS/ atmos • Occupancy was flat SG&A EXPENSES (%) of sales Down 80 bps vs. last year Up 80 bps vs. 2019 20.0% 26.9% 19.4% 21.3% Q1 2019 Q1 2020 Q1 2021 Q1 2022 33.2% 23.0% 34.8% 34.0% Q1 2019 Q1 2020 Q1 2021 Q1 2022 FIRST QUARTER 2022 MARGIN PERFORMANCE Up 190 bps vs. last year Up 130 bps vs. 2019 Key Drivers of deleverage • Labor costs • Technology spend
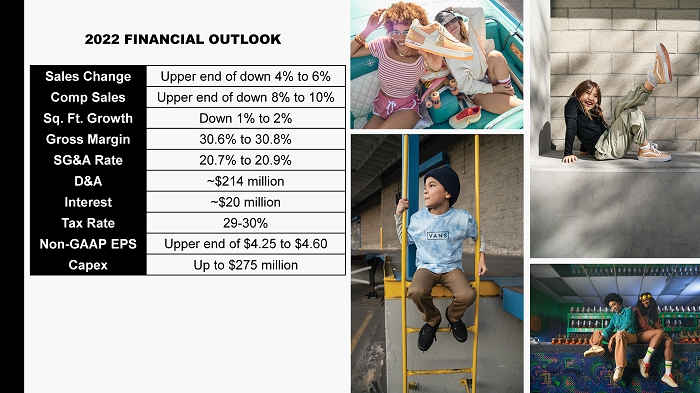
Sales Change Upper end of down 4% to 6% Comp Sales Upper end of down 8% to 10% Sq. Ft. Growth Down 1% to 2% Gross Margin 30.6% to 30.8% SG&A Rate 20.7% to 20.9% D&A ~$214 million Interest ~$20 million Tax Rate 29 - 30% Non - GAAP EPS Upper end of $4.25 to $4.60 Capex Up to $275 million 2022 FINANCIAL OUTLOOK
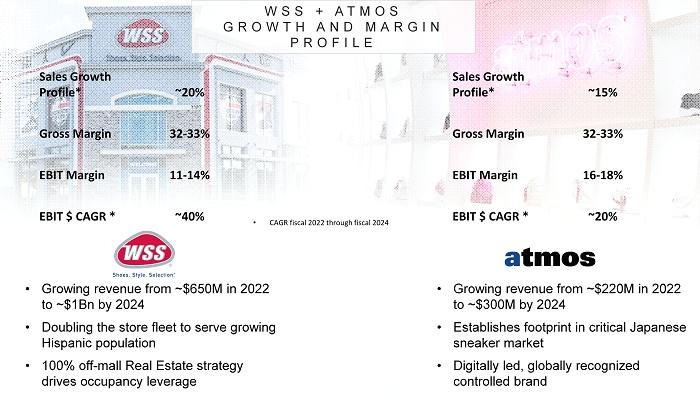
WSS + ATMOS GROWTH AND MARGIN PROFILE • Growing revenue from ~$650M in 2022 to ~$1Bn by 2024 • Doubling the store fleet to serve growing Hispanic population • 100% off - mall Real Estate strategy drives occupancy leverage • Growing revenue from ~$220M in 2022 to ~$300M by 2024 • Establishes footprint in critical Japanese sneaker market • Digitally led, globally recognized controlled brand Sales Growth Profile* ~20% Gross Margin 32 - 33% EBIT Margin 11 - 14% EBIT $ CAGR * ~40% Sales Growth Profile* ~15% Gross Margin 32 - 33% EBIT Margin 16 - 18% EBIT $ CAGR * ~20% • CAGR fiscal 2022 through fiscal 2024
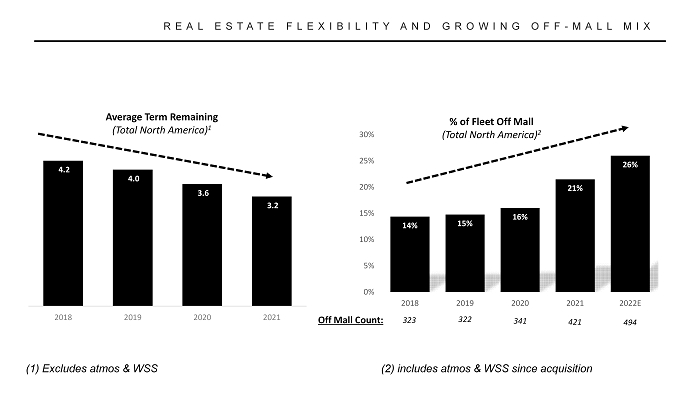
4.2 4.0 3.6 3.2 2018 2019 2020 2021 Average Term Remaining (Total North America) 1 (1) Excludes atmos & WSS REAL ESTATE FLEXIBILITY AND GROWING OFF - MALL MIX 323 322 341 421 494 14% 15% 16% 21% 26% 0% 5% 10% 15% 20% 25% 30% 2018 2019 2020 2021 2022E % of Fleet Off Mall (Total North America) 2 Off Mall Count: (2) includes atmos & WSS since acquisition