Exhibit 99.2
2023 INVESTOR DAY LACING UP FOR THE FUTURE

O F F I C E R F I N A N C I A L I N T E R I M C H I E F A N D F P & A R E L A T I O N S S V P , I N V E S T O R
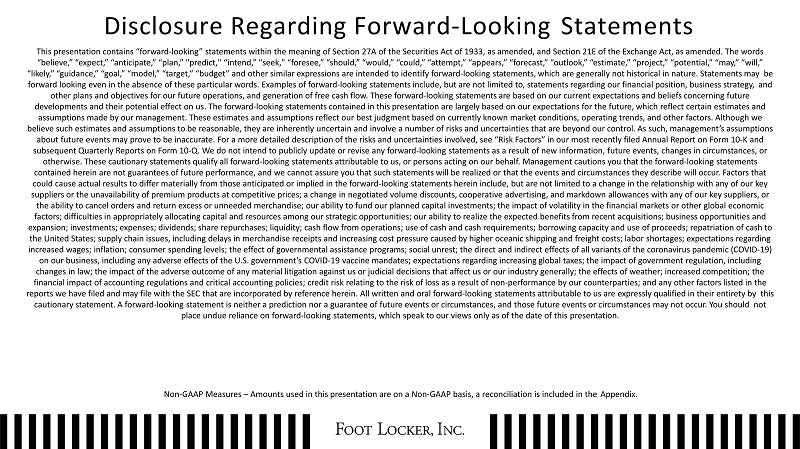
Disclosure Regarding Forward - Looking Statements This presentation contains “forward - looking” statements within the meaning of Section 27A of the Securities Act of 1933, as amended, and Section 21E of the Exchange Act, as amended. The words “believe,” “expect,” “anticipate,” “plan,” "predict," “intend,” "seek," “foresee,” “should,” “would,” “could,” “attempt,” “appears,” “forecast,” “outlook,” “estimate,” “project,” “potential,” “may,” “will,” “likely,” “guidance,” “goal,” “model,” “target,” “budget” and other similar expressions are intended to identify forward - looking statements, which are generally not historical in nature. Statements may be forward looking even in the absence of these particular words. Examples of forward - looking statements include, but are not limited to, statements regarding our financial position, business strategy, and other plans and objectives for our future operations, and generation of free cash flow. These forward - looking statements are based on our current expectations and beliefs concerning future developments and their potential effect on us. The forward - looking statements contained in this presentation are largely based on our expectations for the future, which reflect certain estimates and assumptions made by our management. These estimates and assumptions reflect our best judgment based on currently known market conditions, operating trends, and other factors. Although we believe such estimates and assumptions to be reasonable, they are inherently uncertain and involve a number of risks and uncertainties that are beyond our control. As such, management’s assumptions about future events may prove to be inaccurate. For a more detailed description of the risks and uncertainties involved, see “Risk Factors” in our most recently filed Annual Report on Form 10 - K and subsequent Quarterly Reports on Form 10 - Q. We do not intend to publicly update or revise any forward - looking statements as a result of new information, future events, changes in circumstances, or otherwise. These cautionary statements qualify all forward - looking statements attributable to us, or persons acting on our behalf. Management cautions you that the forward - looking statements contained herein are not guarantees of future performance, and we cannot assure you that such statements will be realized or that the events and circumstances they describe will occur. Factors that could cause actual results to differ materially from those anticipated or implied in the forward - looking statements herein include, but are not limited to a change in the relationship with any of our key suppliers or the unavailability of premium products at competitive prices; a change in negotiated volume discounts, cooperative advertising, and markdown allowances with any of our key suppliers, or the ability to cancel orders and return excess or unneeded merchandise; our ability to fund our planned capital investments; the impact of volatility in the financial markets or other global economic factors; difficulties in appropriately allocating capital and resources among our strategic opportunities; our ability to realize the expected benefits from recent acquisitions; business opportunities and expansion; investments; expenses; dividends; share repurchases; liquidity; cash flow from operations; use of cash and cash requirements; borrowing capacity and use of proceeds; repatriation of cash to the United States; supply chain issues, including delays in merchandise receipts and increasing cost pressure caused by higher oceanic shipping and freight costs; labor shortages; expectations regarding increased wages; inflation; consumer spending levels; the effect of governmental assistance programs; social unrest; the direct and indirect effects of all variants of the coronavirus pandemic (COVID - 19) on our business, including any adverse effects of the U.S. government’s COVID - 19 vaccine mandates; expectations regarding increasing global taxes; the impact of government regulation, including changes in law; the impact of the adverse outcome of any material litigation against us or judicial decisions that affect us or our industry generally; the effects of weather; increa sed competition; the financial impact of accounting regulations and critical accounting policies; credit risk relating to the risk of loss as a result of non - performance by our counterparties; and any other factors listed in the reports we have filed and may file with the SEC that are incorporated by reference herein. All written and oral forward - looking statements attributable to us are expressly qualified in their entirety by this cautionary statement. A forward - looking statement is neither a prediction nor a guarantee of future events or circumstances, and those future events or circumstances may not occur. You should not place undue reliance on forward - looking statements, which speak to our views only as of the date of this presentation. Non - GAAP Measures – Amounts used in this presentation are on a Non - GAAP basis, a reconciliation is included in the Appendix.
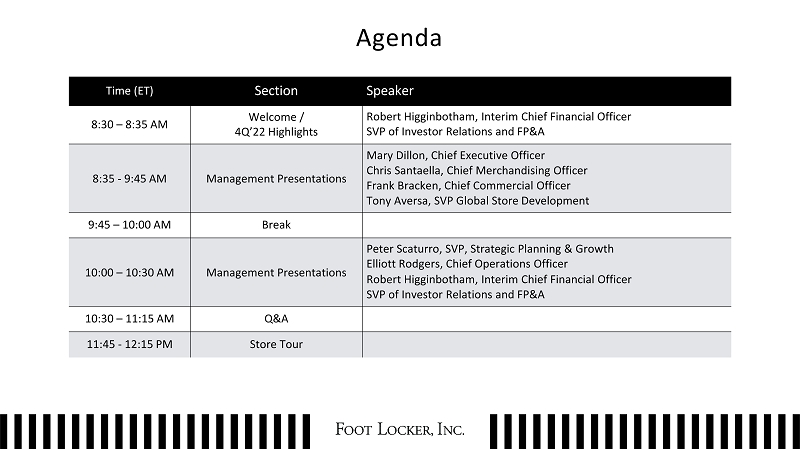
Agenda Speaker Section Time (ET) Robert Higginbotham, Interim Chief Financial Officer SVP of Investor Relations and FP&A Welcome / 4Q’22 Highlights 8:30 – 8:35 AM Mary Dillon, Chief Executive Officer Chris Santaella, Chief Merchandising Officer Frank Bracken, Chief Commercial Officer Tony Aversa, SVP Global Store Development Management Presentations 8:35 - 9:45 AM Break 9:45 – 10:00 AM Peter Scaturro, SVP, Strategic Planning & Growth Elliott Rodgers, Chief Operations Officer Robert Higginbotham, Interim Chief Financial Officer SVP of Investor Relations and FP&A Management Presentations 10:00 – 10:30 AM Q&A 10:30 – 11:15 AM Store Tour 11:45 - 12:15 PM

2 0 2 2 R E S U L T S
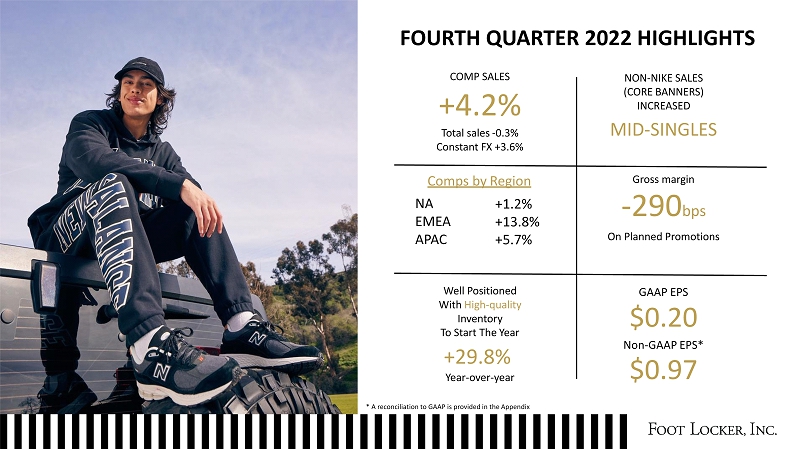
Well Positioned With High - quality Inventory To Start The Year +29.8% Year - over - year COMP SALES +4.2% Total sales - 0.3% Constant FX +3.6% GAAP EPS $0.20 Non - GAAP EPS* $0.97 NON - NIKE SALES (CORE BANNERS) INCREASED MID - SINGLES Gross margin - 290 bps On Planned Promotions Comps by Region NA EMEA APAC +1.2% +13.8% +5.7% * A reconciliation to GAAP is provided in the Appendix FOURTH QUARTER 2022 HIGHLIGHTS
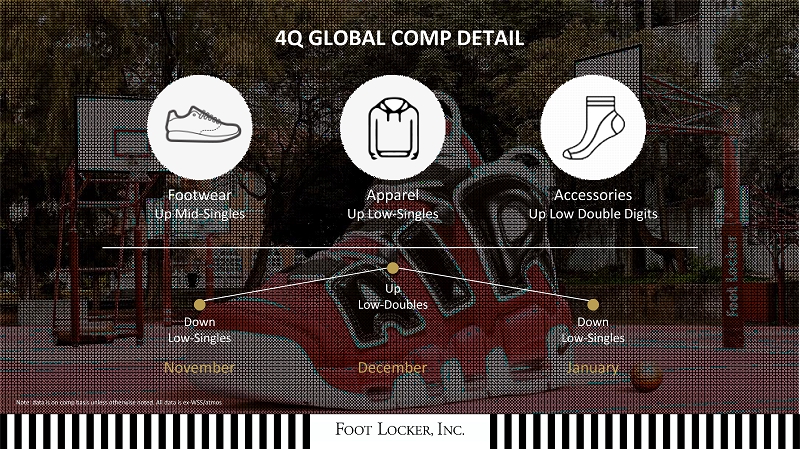
Footwear Up Mid - Singles Down Low - Singles November Apparel Up Low - Singles Up Low - Doubles December Accessories Up Low Double Digits Down Lo w - Singles Janu a ry Note: data is on comp basis unless otherwise noted. All data is ex - WSS/atmos 4Q GLOBAL COMP DETAIL
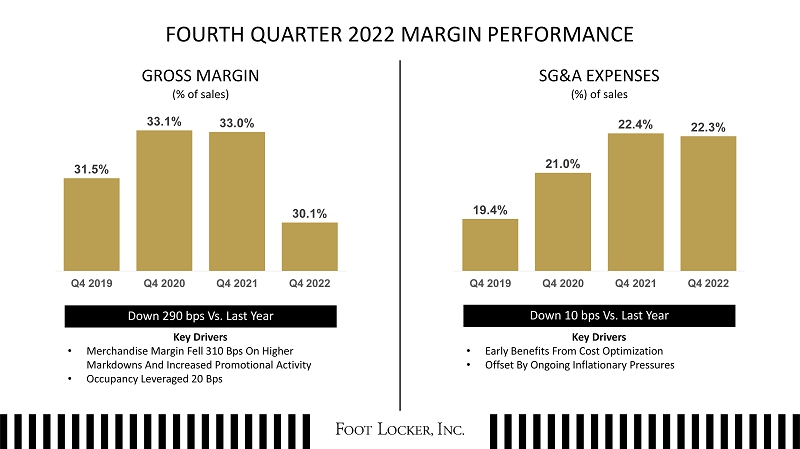
Key Drivers • Merchandise Margin Fell 310 Bps On Higher Markdowns And Increased Promotional Activity • Occupancy Leveraged 20 Bps Down 290 bps Vs. Last Year 31.5% 33.1% 33.0% 30.1% Q4 2019 Q4 2020 Q4 2021 Q4 2022 19.4% 21.0% 22 . 4 % 22.3% Q4 2019 Q4 2020 Q4 2021 Q4 2022 Down 10 bps Vs. Last Year Key Drivers • Early Benefits From Cost Optimization • Offset By Ongoing Inflationary Pressures FOURTH QUARTER 2022 MARGIN PERFORMANCE GROSS MARGIN (% of sales) SG&A EXPENSES (%) of sales
P R E S I D E N T A N D C H I E F E X E C U T I V E O F F I C E R
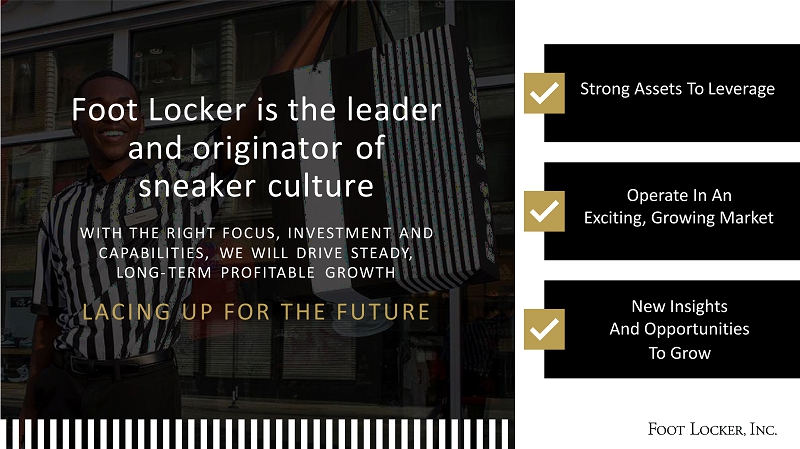
Foot Locker is the leader and originator of sneaker culture WIT H T H E R IG H T F O CU S , INV E ST ME N T A N D CAPABILITIES, WE WILL DRIVE STEADY, LONG - TERM PROFITABLE GROWTH LA CIN G U P F O R TH E FUTU R E Operate In An Exciting, Growing Market New Insights And Opportunities To Grow Strong Assets To Leverage
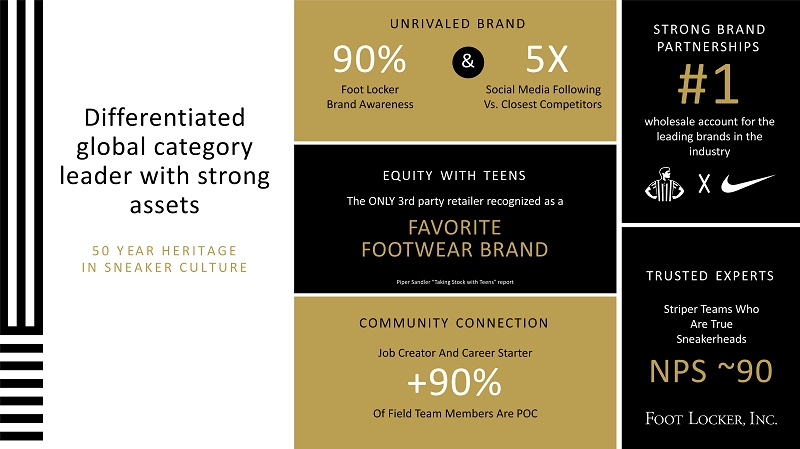
Differentiated global category leader with strong assets 5 0 Y E A R H E R I T A G E I N S N E A K E R C U L T U R E 90% Foot Locker Brand Awareness & 5X Social Media Following Vs. Closest Competitors U NRIVALE D BR AN D COMMUNITY CONNECTION Job Creator And Career Starter +90% Of Field Team Members Are POC NPS ~90 TRUSTED EXPERTS Striper Teams Who Are True Sneakerheads NPS ~90 EQUITY WITH TEENS The ONLY 3rd party retailer recognized as a FAVORITE FOOTWEAR BRAND Piper Sandler “Taking Stock with Teens” report ST R ON G BR AN D PARTNERSHIPS #1 wholesale account for the leading brands in the industry
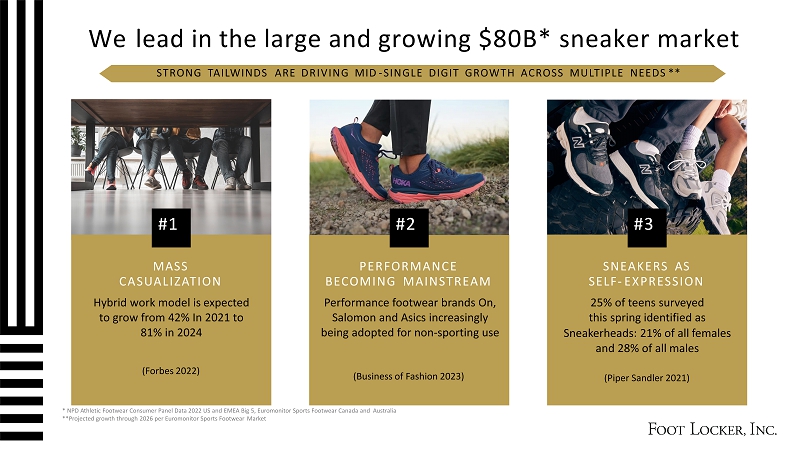
MASS CASUALIZATION Hybrid work model is expected to grow from 42% In 2021 to 81% in 2024 PERFORMANCE BECOMING MAINSTREAM Performance footwear brands On, Salomon and Asics increasingly being adopted for non - sporting use SNEAKERS AS SELF - EXPRESSION 25% of teens surveyed this spring identified as Sneakerheads: 21% of all females and 28% of all males We lead in the large and growing $80B* sneaker market (Forbes 2022) (Business of Fashion 2023) (Piper Sandler 2021) #1 #2 #3 * NPD Athletic Footwear Consumer Panel Data 2022 US and EMEA Big 5, Euromonitor Sports Footwear Canada and Australia **Projected growth through 2026 per Euromonitor Sports Footwear Market STRONG TAILWINDS ARE DRIVING MID - SINGLE DIGIT GROWTH ACROSS MULTIPLE NEEDS **
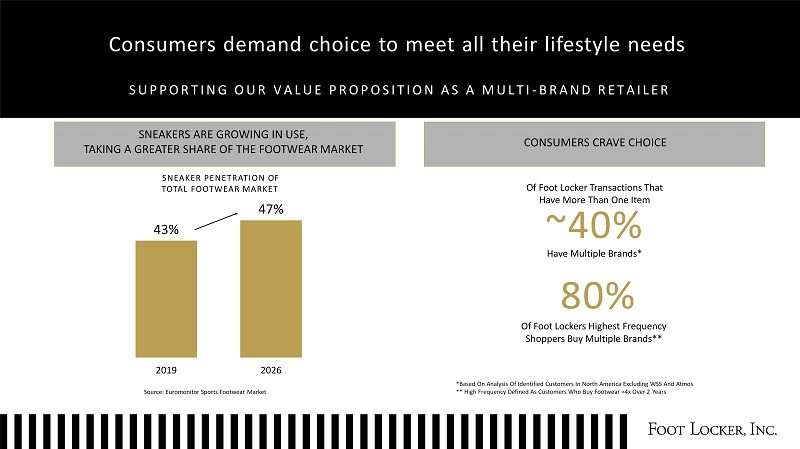
Consumers demand choice to meet all their lifestyle needs S U P P O R T I N G O U R V A L U E P R O P O S I T I O N A S A M U L T I - B R A N D R E T A I L E R 43% 47% 2019 2026 Source: Euromonitor Sports Footwear Market *Based On Analysis Of Identified Customers In North America Excluding WSS And Atmos ** High Frequency Defined As Customers Who Buy Footwear >4x Over 2 Years Of Foot Locker Transactions That Have More Than One Item ~40% Have Multiple Brands* 80% Of Foot Lockers Highest Frequency Shoppers Buy Multiple Brands** SNEAKERS ARE GROWING IN USE, TAKING A GREATER SHARE OF THE FOOTWEAR MARKET SNEAKER PENETRATION OF TOTAL FOOTWEAR MARKET CONSUMERS CRAVE CHOICE
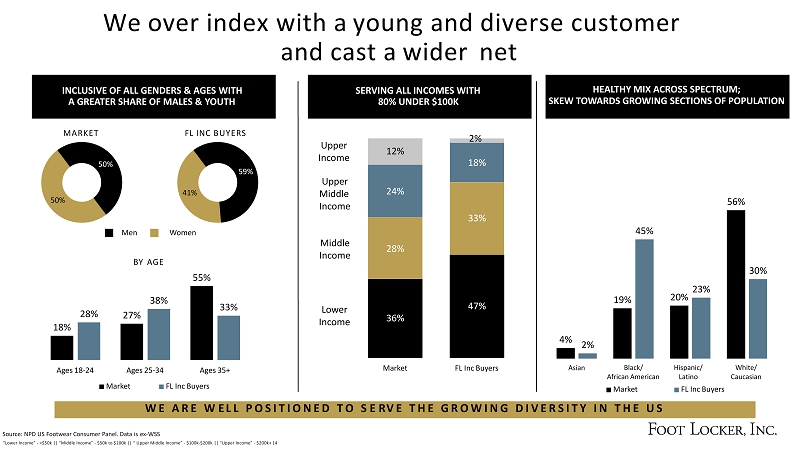
36% 47% 28% 33% 24% 18% 12% 2% M a rket FL Inc Buyers We over index with a young and diverse consumer and cast a wider net W E A R E W E L L P O S I T I O N E D T O S E R V E T H E G R O W I N G D I V E R S I T Y I N T H E U S INCLUSIVE OF ALL GENDERS & AGES WITH A GREATER SHARE OF MALES & YOUTH 50% 50% 59% 41% MARKET FL INC BUYERS 18% 27% 55% 28% 38% 33% Ages 18 - 24 Ages 25 - 34 Ages 35+ Market FL Inc Buyers Men Women BY AGE Source: NPD US Footwear Consumer Panel. Data is ex - WSS “Lower Income” - <$50k || “Middle Income” - $50k to $100k || “ Upper Middle Income” - $100k - $200k || “Upper Income” - $200k+ 14 SERVING ALL INCOMES WITH 80% UNDER $100K Upper Income Middle Income Lower Income Upper Middle I n come HEALTHY MIX ACROSS SPECTRUM; SKEW TOWARDS GROWING SECTIONS OF POPULATION 4% 19% 20% 56% 2% 45% 23% 30% Asian White/ Ca u ca s ian Black/ African American Market H i s p an i c / Latino FL Inc Buyers

Sneaker Consumers have diverse motivations Active At h l e te Quality Seekers 29% 21% 21% 17% 12% Sneaker Sales By Customer Segments Sneak er Maven Active Athl e te Deal F i nd e r Fashio n - Forward Expressionist Qu a lity Seeker Deal Fin ders S neaker Maven Fashio n - Forwa r d Expressionist Source: Foot Locker Teen + Adult Global Footwear Segmentation (Commissioned in Q1 2023). Estimates generated from self - reported retailer purchase behavior, shopper spend, survey incidence rates, and publicly available population statistics. Survey - based market sizing techniques involve respondent biases and researcher assumptions; as a result, data should be interpreted as directional. Markets included: US, CA, UK, FR, IT, ES, IT, and AUS.
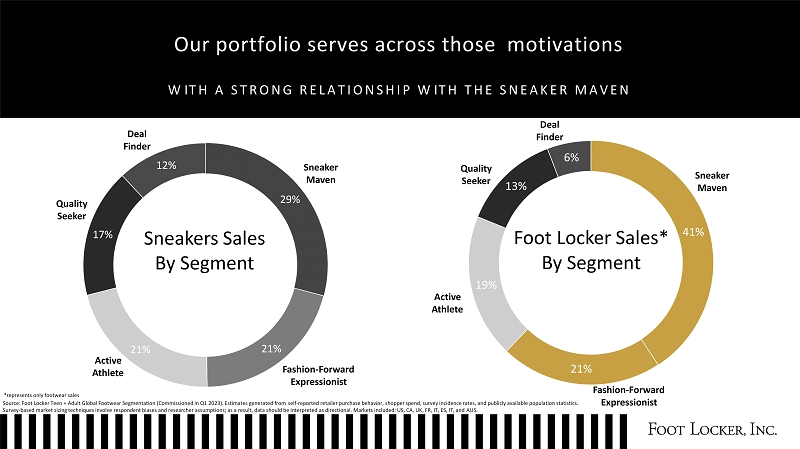
41% 21% 19% 13% 6% Our portfolio serves across those motivations W I T H A S T R O N G R E L A T I O N S H I P W I T H T H E S N E A K E R M A V E N 29% 21% 21% 17% 12% Sneakers Sales By Customer Segment Foot Locker Sales* By Customer Segment Sneak er Maven Active Athlete Fashio n - Forward Expressionist Qu a lity Seeker Deal F i nder Sneak er Maven Active Athlete Fashio n - Forward Expressionist Qu a lity Seeker Deal F i nd e r *represents only footwear sales Source: Foot Locker Teen + Adult Global Footwear Segmentation (Commissioned in Q1 2023). Estimates generated from self - reported retailer purchase behavior, shopper spend, survey incidence rates, and publicly available population statistics. Survey - based market sizing techniques involve respondent biases and researcher assumptions; as a result, data should be interpreted as directional. Markets included: US, CA, UK, FR, IT, ES, IT, and AUS.
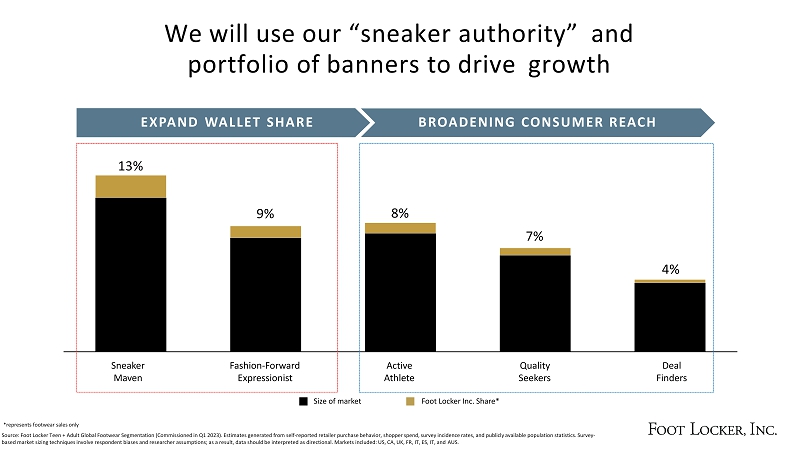
We will use our “sneaker authority” and portfolio of banners to drive growth Sn e aker Maven Active Athlete Deal F i nders Quality S e e k e r s F a shio n - F o rwa r d Expressionist E X PA N D W ALLE T SHAR E B R O AD EN I N G C ON SU ME R REA C H 13% 9% 8% 7% 4% Size of market Foot Locker Inc. Share* *represents footwear sales only Source: Foot Locker Teen + Adult Global Footwear Segmentation (Commissioned in Q1 2023). Estimates generated from self - reported retailer purchase behavior, shopper spend, survey incidence rates, and publicly available population statistics. Survey - based market sizing techniques involve respondent biases and researcher assumptions; as a result, data should be interpreted as directional. Markets included: US, CA, UK, FR, IT, ES, IT, and AUS.
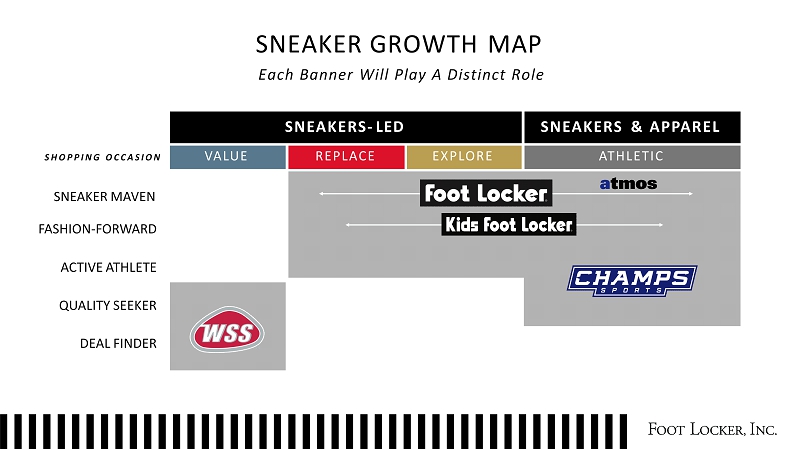
SNEAKER GROWTH MAP E a c h Bann e r W il l P l a y A D i st i n c t Ro l e SNEAKERS - LED SNEAKERS & APPAREL S H O P P I N G O C C A S I O N SNEAKER MAVEN FASHIO N - FORWARD ACTIVE ATHLETE QUALITY SEEKER DEAL FINDER VALUE REPLACE EXPLORE ATHLETIC
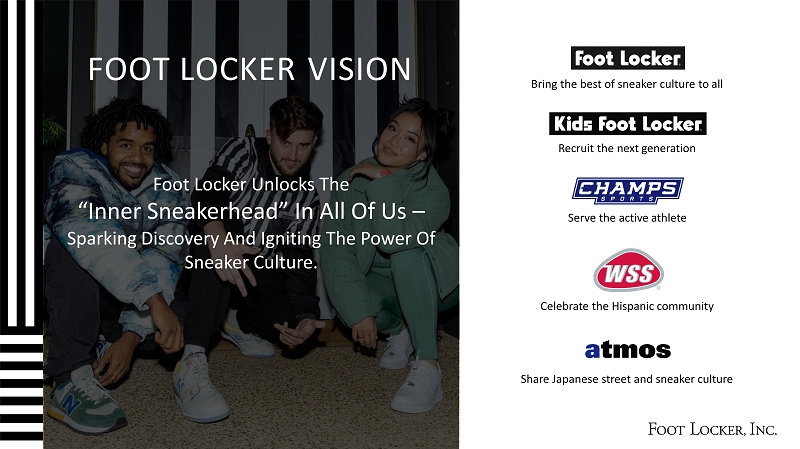
Foot Locker Unlocks The “Inner Sneakerhead” In All Of Us – Sparking Discovery And Igniting The Power Of Sneaker Culture. Serve the active athlete Celebrate the Hispanic community Recruit the next generation Bring the best of sneaker culture to all Share Japanese street and sneaker culture FOOT LOCKER VISION
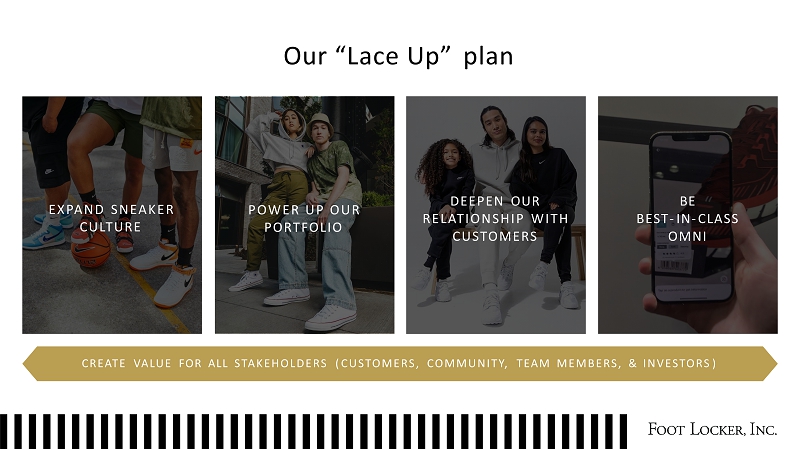
Our “Lace Up” plan EXPAN D S NEAKE R CULTURE PO WE R U P O U R PORTFOLIO DEEPEN OUR RELAT I ON S HI P WI T H CUSTOMERS BE BEST - IN - CLASS OMNI CREATE VALUE FOR ALL STAKEHOLDERS ( CUSTOMERS, COMMUNITY, TEAM MEMBERS, & INVESTORS )
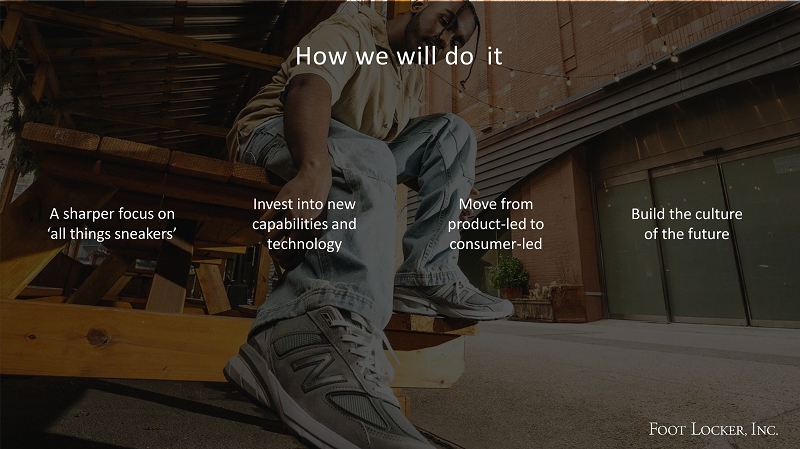
A sharper focus on ‘all things sneakers’ Invest into new capabilities and technology Move from product - led to consumer - led Build the culture of the future How we will do it
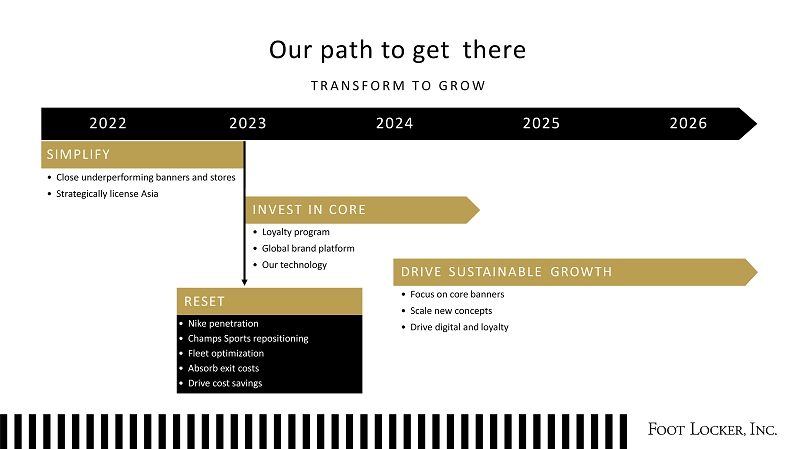
Our path to get there T R A N S F O R M T O G R O W 2022 2023 2024 2025 2026 SIMPLIFY • Close underperforming banners and stores • Strategically license Asia I N VE S T I N C O R E • Loyalty program • Global brand platform • Our technology DRIVE SUSTAINABLE GROWTH • Focus on core banners • Scale new concepts • Drive digital and loyalty • Nike penetration • Champs Sports repositioning • Fleet optimization • Absorb exit costs • Drive cost savings RESET
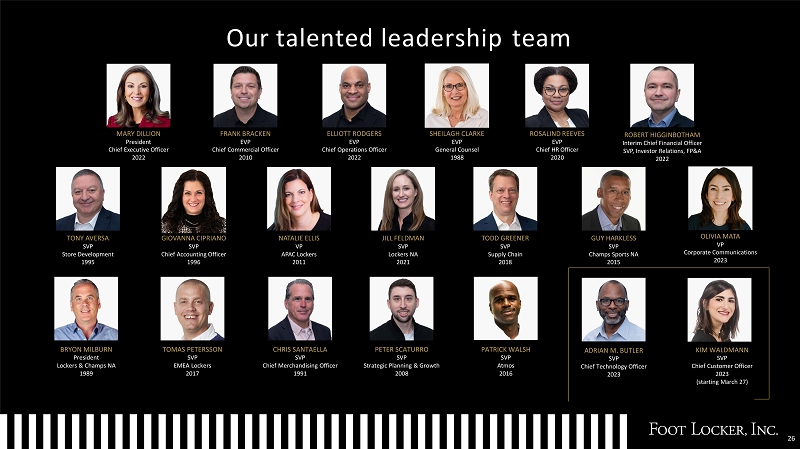
Our talented leadership team 26 FRANK BRACKEN EVP Chief Commercial Officer 2010 ELLIOTT RODGERS EVP Chief Operations Officer 2022 SHEILAGH CLARKE EVP General Counsel 1988 ROSALIND REEVES EVP Chief HR Officer 2020 NATALIE ELLIS VP APAC Lockers 2011 GUY HARKLESS SVP Champs Sports NA 2015 JILL FELDMAN SVP Lockers NA 2021 ROBERT HIGGINBOTHAM Interim Chief Financial Officer SVP, Investor Relations, FP&A 2022 TONY AVERSA SVP Store Development 1995 TODD GREENER SVP Supply Chain 2018 GIOVANNA CIPRIANO SVP Chief Accounting Officer 1996 KIM WALDMANN ADRIAN M. BUTLER PATRICK WALSH PETER SCATURRO CHRIS SANTAELLA TOMAS PETERSSON BRYON MILBURN SVP SVP SVP SVP SVP SVP President Chief Customer Officer Chief Technology Officer Atmos Strategic Planning & Growth Chief Merchandising Officer EMEA Lockers Lockers & Champs NA 2023 (starting March 27) 2023 2016 2008 1991 2017 1989 MARY DILLION President Chief Executive Officer 2022 OLIVIA MATA VP Corporate Communications 2023
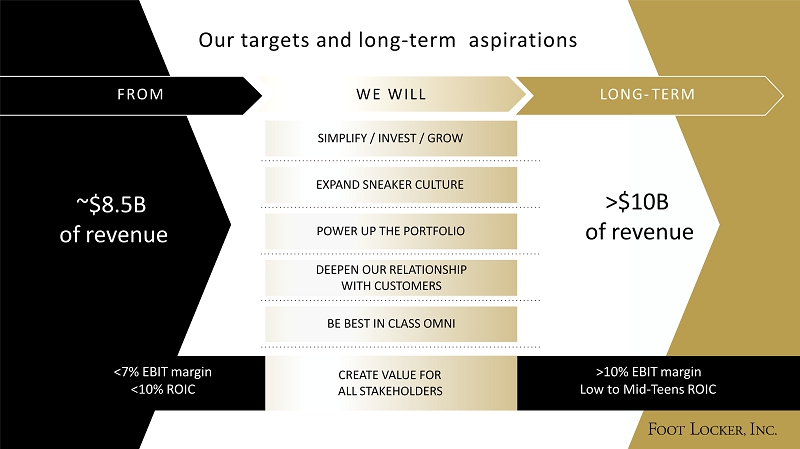
Our targets and long - term aspirations EXPAND SNEAKER CULTURE POWER UP THE PORTFOLIO DEEPEN OUR RELATIONSHIP WITH CUSTOMERS BE BEST IN CLASS OMNI SIMPLIFY / INVEST / GROW W E W IL L LONG - TERM ~$8 . 5 B of revenue >$1 0 B of revenue <7% EBIT margin <10% ROIC >10% EBIT margin Low to Mid - Teens ROIC CREATE VALUE FOR ALL STAKEHOLDERS FR O M
C H I E F M E R C H A N D I S I N G O F F I C E R

S T R A T E G I C I M P E R A T I V E # 1
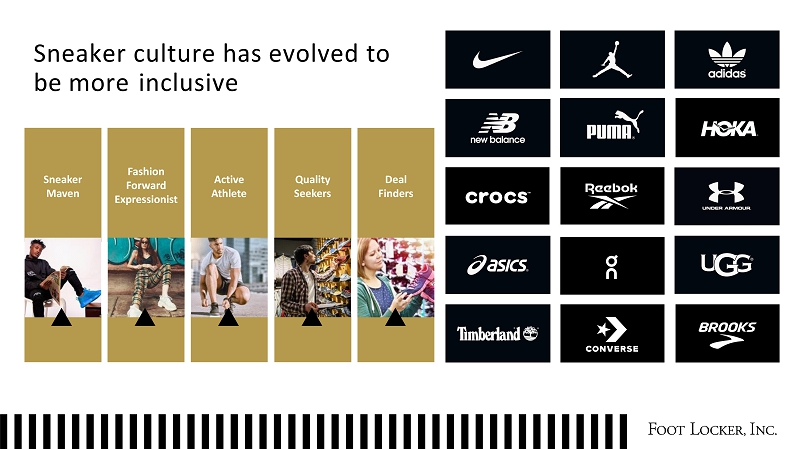
Fashion Forward Expression i st Sneaker Maven Active Athlete Quality Seekers Deal Find e rs Sneaker culture has evolved to be more inclusive
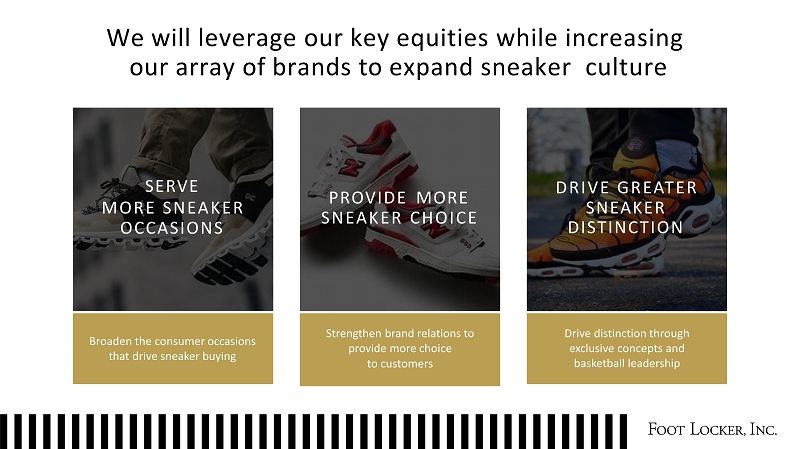
We will leverage our key equities while increasing our array of brands to expand sneaker culture SERVE M O R E S NEA K E R OCCASIONS PROVIDE MORE S NEA K E R C H OI C E DR I V E GR EA T E R SNEAKER DISTINCTION Broaden the consumer occasions that drive sneaker buying Strengthen brand relations to provide more choice to consumers Drive distinction through exclusive concepts and basketball leadership
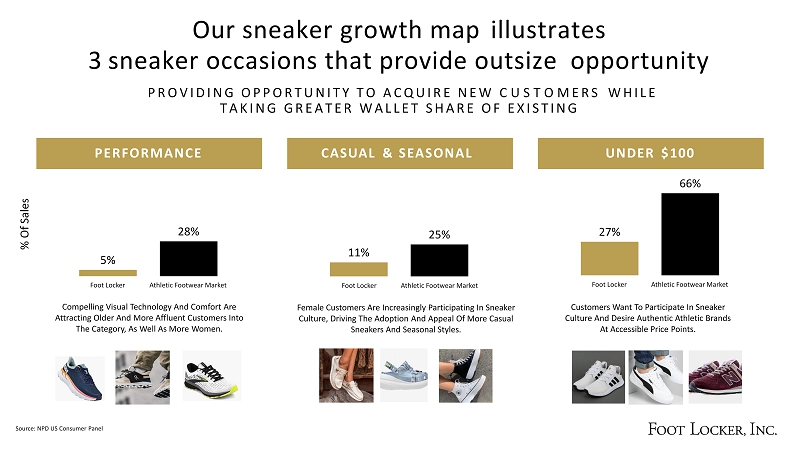
5% Foot Locker Athletic Footwear Market Compelling Visual Technology And Comfort Are Attracting Older And More Affluent Consumers Into The Category, As Well As More Women. 28% 11% 25% Foot Locker Athletic Footwear Market Female Consumers Are Increasingly Participating In Sneaker Culture, Driving The Adoption And Appeal Of More Casual Sneakers And Seasonal Styles. 27% 66% Foot Locker Athletic Footwear Market Consumers Want To Participate In Sneaker Culture And Desire Authentic Athletic Brands At Accessible Price Points. Our sneaker growth map illustrates 3 sneaker occasions that provide outsize opportunity P R O V I D I N G O P P O R T U N I T Y T O A C Q U I R E N E W C O N S U M E R S W H I L E T A K I N G G R E A T E R W A L L E T S H A R E O F E X I S T I N G PERFORMANCE CASUAL & SEASONAL UNDER $ 100 Source: NPD US Consumer Panel % Of Sales
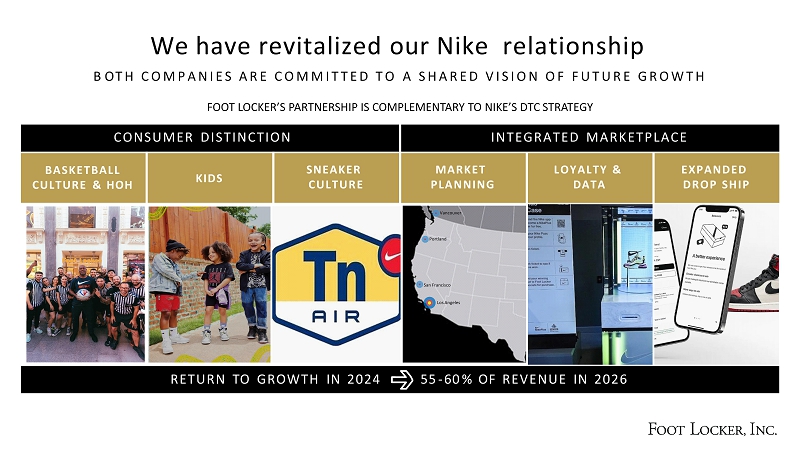
We have revitalized our Nike relationship B O T H C O M P A N I E S A R E C O M M I T T E D T O A S H A R E D V I S I O N O F F U T U R E G R O W T H FOOT LOCKER’S PARTNERSHIP IS COMPLEMENTARY TO NIKE’S DTC STRATEGY INTEGRATED MARKETPLACE CONSUMER DISTINCTION EXPANDED DR O P S HI P L O Y A LT Y & DATA MARKET P L A NNIN G SNEAKER CU LT U R E KIDS BASKETBALL CULTURE & HOH RETURN TO GROWTH IN 2024 55 - 60 % OF REVENUE IN 2026 San Francisco Los Angeles Vancouver Portland Update picture above
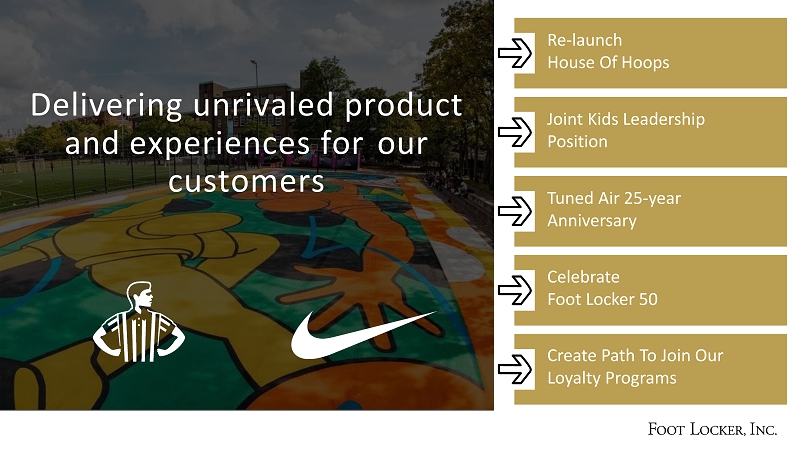
Delivering unrivaled product and experiences for our consumers Re - launch House Of Hoops Joint Kids Leadership Position Tuned Air 25 - year Anniversary Celebrate Foot Locker 50 Create Path To Join Our Loyalty Programs
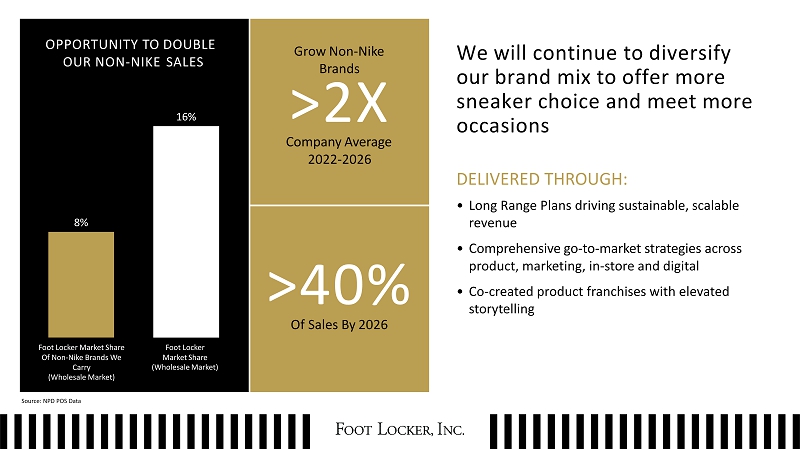
OPPORTUNITY TO DOUBLE OUR NON - NIKE SALES 8% 16% Foot Locker Market Share Of Non - Nike Brands We Carry (Wholesale Market) Foot Locker Market Share (Wholesale Market) We will continue to diversify our brand mix to offer more sneaker choice and meet more occasions DELIVERED THROUGH: • Long Range Plans driving sustainable, scalable revenue • Comprehensive go - to - market strategies across product, marketing, in - store and digital • Co - created product franchises with elevated storytelling >2 X Company Average 2022 - 2026 Grow Non - Nike Brands >40 % Of Sales By 2026 Source: NPD POS Data
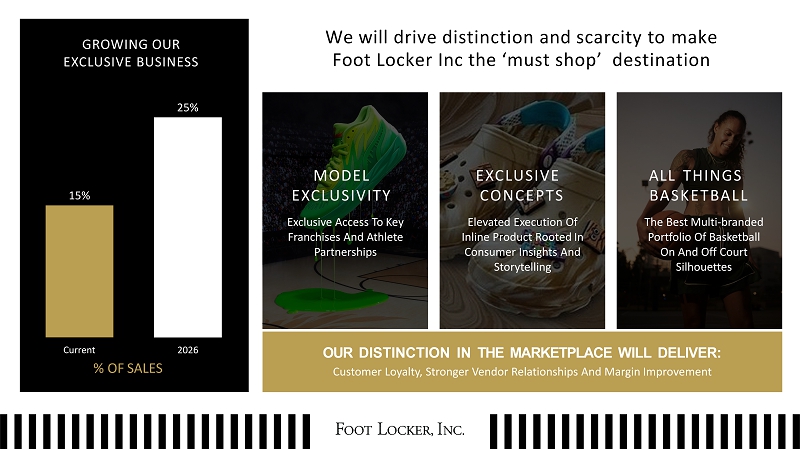
GROWING OUR EXCLUSIVE BUSINESS 15% 25% 2026 Current % OF SALES We will drive distinction and scarcity to make Foot Locker Inc the ‘must shop’ destination MODEL EXCLUSIVITY Exclusive Access To Key Franchises And Athlete Partnerships EXCLUSIVE C O N CE PT S Elevated Execution Of Inline Product Rooted In Consumer Insights And Storytelling ALL THINGS B A SK E TB A L L The Best Multi - branded Portfolio Of Basketball On And Off Court Silhouettes OUR DISTINCTION IN THE MARKETPLACE WILL DELIVER: Customer Loyalty, Stronger Vendor Relationships And Margin Improvement
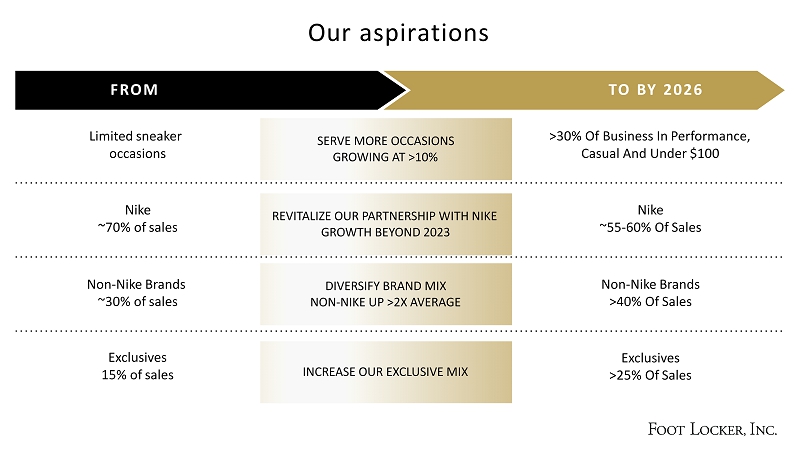
Our aspirations F R O M T O B Y 202 6 Limited sneaker occasions >30% Of Business In Performance, Casual And Under $100 Nike ~70% of sales Nike ~55 - 60% Of Sales Non - Nike Brands ~30% of sales Non - Nike Brands >40% Of Sales Exclusives 15% of sales Exclusives >25% Of Sales INCREASE OUR EXCLUSIVE MIX DIVERSIFY BRAND MIX NON - NIKE UP >2X AVERAGE REVITALIZE OUR PARTNERSHIP WITH NIKE GROWTH BEYOND 2023 SERVE MORE OCCASIONS GROWING AT >10%

C H I E F C O M M E R C I A L O F F I C E R
S T R A T E G I C I M P E R A T I V E # 2 C R E A T I N G D I S T I N C T L A N E S
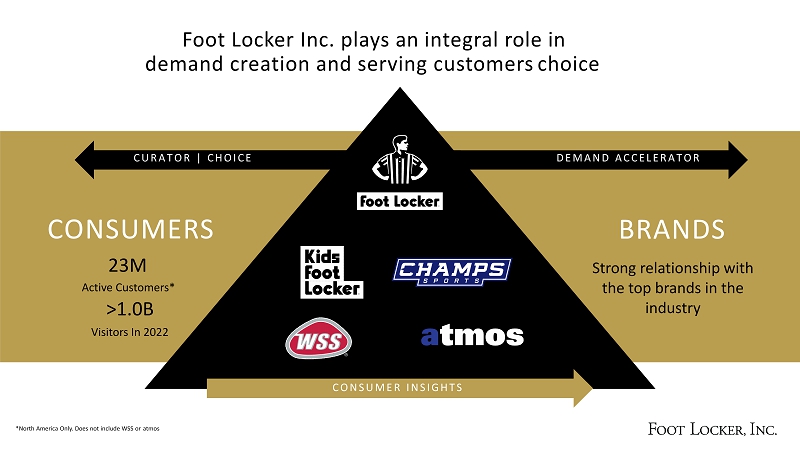
Foot Locker Inc. plays an integral role in demand creation and serving consumers choice D E M A N D A C C E L E R A T O R C U R A T O R | C H O I C E *North America Only. Does not include WSS or atmos CONSUMERS 23M Active Customers* >1.0B Visitors In 2022 BRANDS Strong relationship with the top brands in the industry C O N S U M E R I N S I G H T S
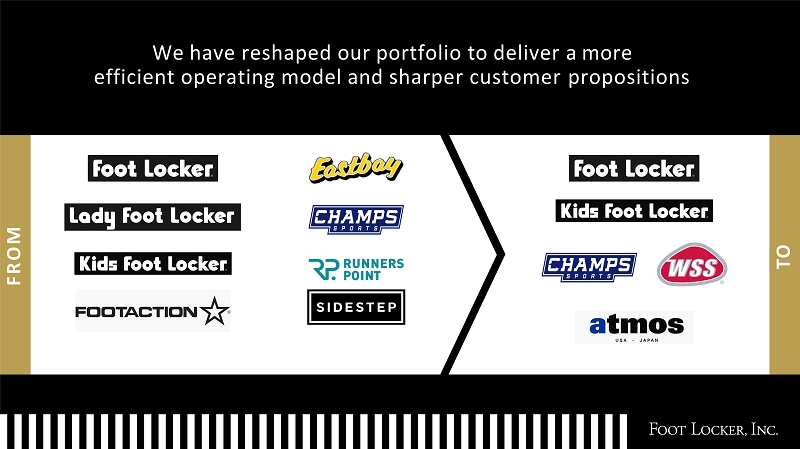
We have reshaped our portfolio to deliver a more efficient operating model and sharper consumer propositions F R O M TO
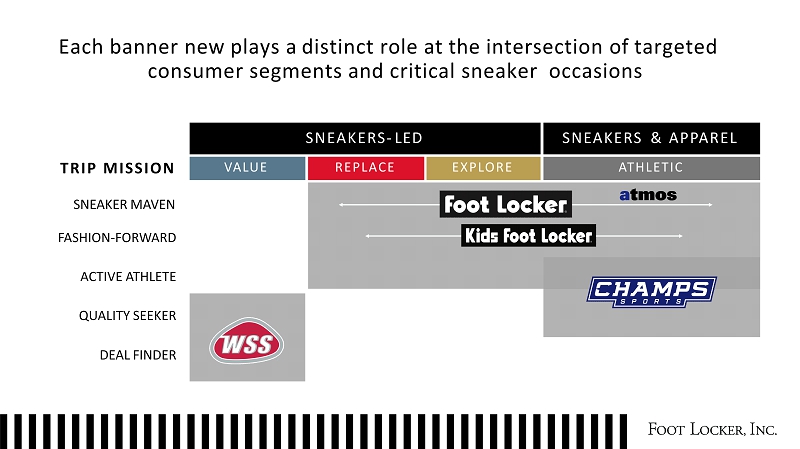
Each banner new plays a distinct role at the intersection of targeted consumer segments and critical sneaker occasions SNEAKERS - LED SNEAKERS & APPAREL T R I P MISSIO N SNEAKER MAVEN FASHIO N - FORWARD ACTIVE ATHLETE QUALITY SEEKER DEAL FINDER VALUE REPLACE EXPLORE ATHLETIC
B R IN G TH E B E S T O F SNEAKER CULTURE T O M O R E C O NSU M E R S
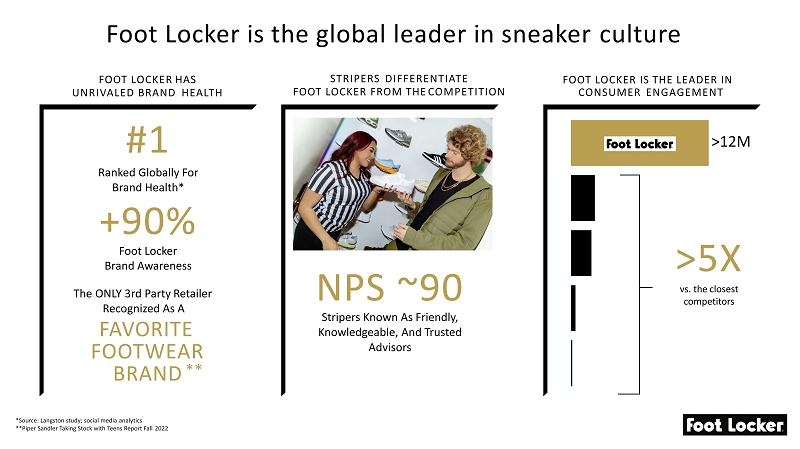
Foot Locker is the global leader in sneaker culture *Source: Langston study; social media analytics **Piper Sandler Taking Stock with Teens Report Fall 2022 FOOT LOCKER HAS UNRIVALED BRAND HEALTH #1 Ranked Globally For Brand Health* + 90 % Foot Locker Brand Awareness The ONLY 3rd Party Retailer Recognized As A FAVORITE F OOTW EA R BRAND ** STRIPERS DIFFERENTIATE FOOT LOCKER FROM THE COMPETITION NPS ~90 Stripers Known As Friendly, Knowledgeable, And Trusted Advisors FOOT LOCKER IS THE LEADER IN CONSUMER ENGAGEMENT >5 X vs. the closest competitors >12M
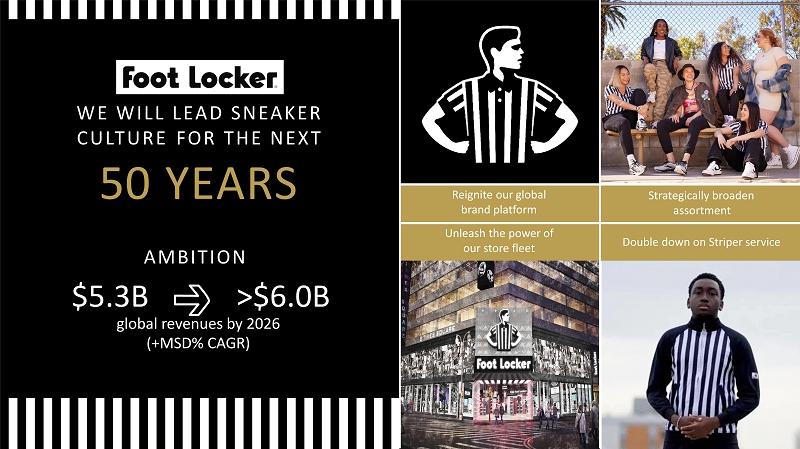
W E W IL L L E A D SN E AKE R C U L TU R E FO R TH E NE X T 50 YEARS AMBITION $5.3 B >$6.0 B global revenues by 2026 (+MSD% CAGR) Reignite our global brand platform Strategically broaden assortment Unleash the power of our store fleet Double down on Striper service

BUILDING COMMUNITIES, NOT JUST STORES MAKING CONNECTIONS, NOT JUST SALES PROUDLY REFLECTING OUR DIVERSITY CELEBRATING ALL KINDS OF SNEAKER LOVE FOOT LOCKER IS THE HEARTBEAT OF SNEAKER CULTURE Welcoming In The World To Experience The Power Of Sneakers
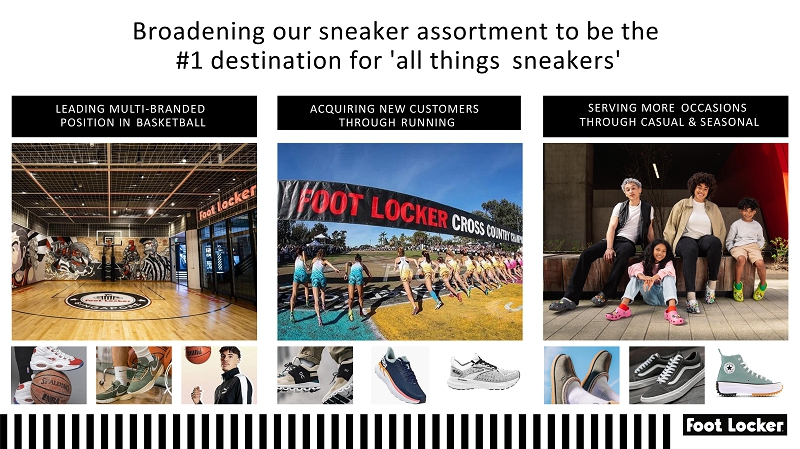
Broadening our sneaker assortment to be the #1 destination for 'all things sneakers' LEADING MULTI - BRANDED POSITION IN BASKETBALL ACQUIRING NEW CONSUMERS THROUGH RUNNING SERVING MORE OCCASIONS THROUGH CASUAL & SEASONAL
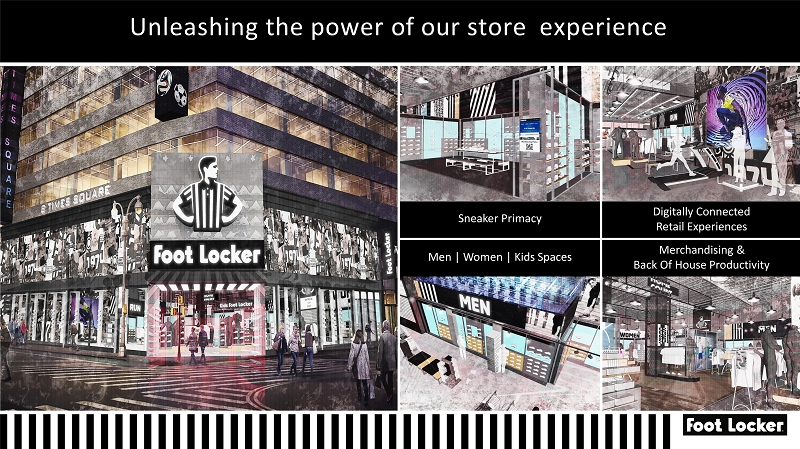
Sneaker Primacy Digitally Connected Retail Experiences Men | Women | Kids Spaces Merchandising & Back Of House Productivity Unleashing the power of our store experience
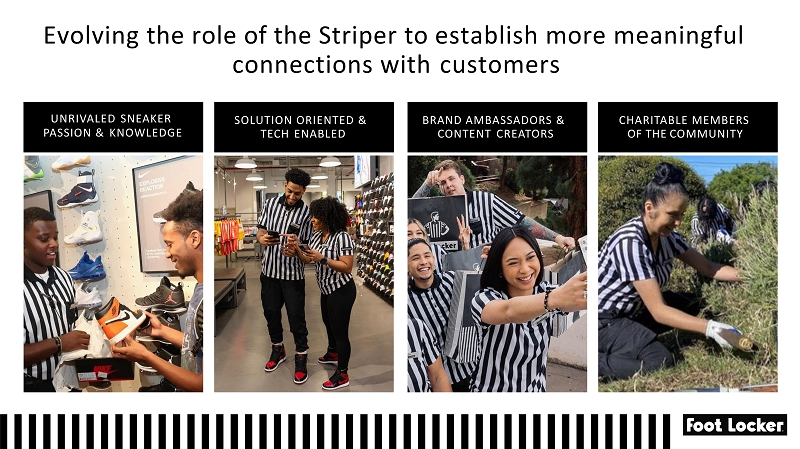
Evolving the role of the Striper to establish more meaningful connections with consumers BRAND AMBASSADORS & CONTENT CREATORS SOLUTION ORIENTED & TECH ENABLED UNRIVALED SNEAKER PASSION & KNOWLEDGE CHARITABLE MEMBERS OF THE COMMUNITY
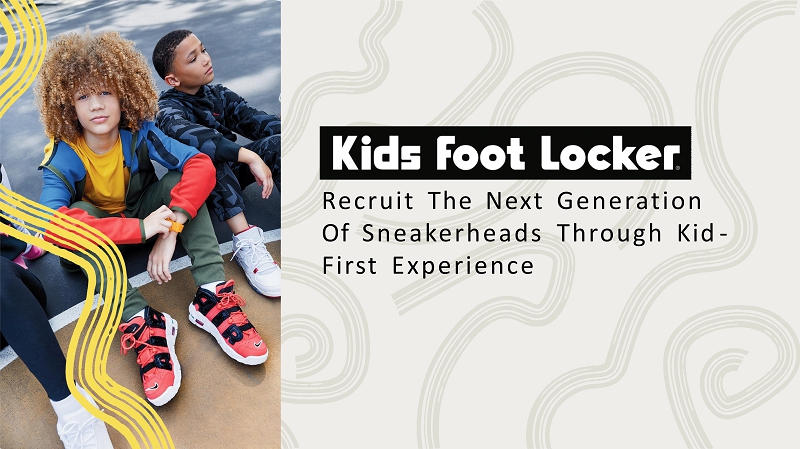
Recruit The Next Generation Of Sneakerheads Through Kid - First Experience
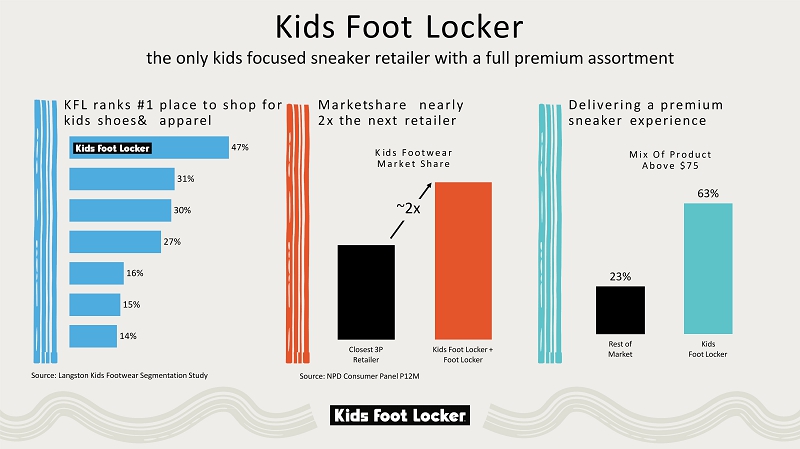
47% 31% 30% 27% 16% 15% 14% Mark e t sh ar e ne ar l y 2 x the next retailer Closest 3P Retailer Kids Foot Locker + Foot Locker D elive r i n g a premiu m sneaker experience 23% 63% Rest of M a rket Kids Foot Locker M i x O f P r o d u c t A b o v e $ 7 5 K F L ra n k s # 1 p l a c e t o sh o p f o r kids shoes & apparel K i d s F o o t w e a r M a r k e t S h a r e Source: NPD Consumer Panel P12M Source: Langston Kids Footwear Segmentation Study ~2x Kids Foot Locker the only kids focused sneaker retailer with a full premium assortment
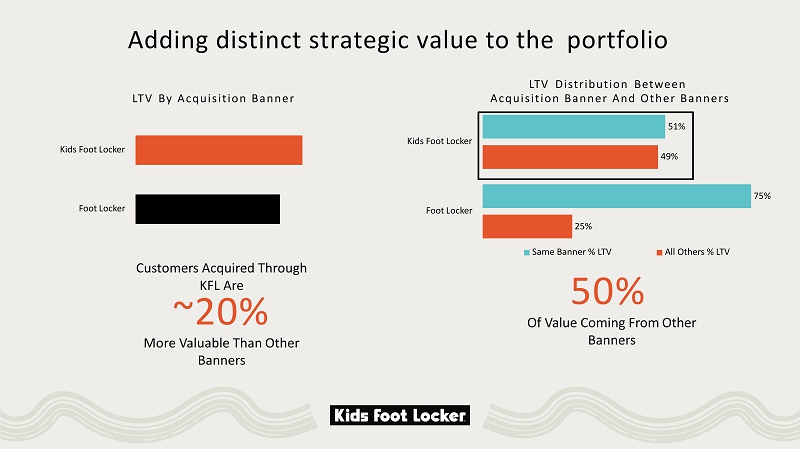
Adding distinct strategic value to the portfolio Kids Foot Locker Foot Locker L T V B y Ac quis i t i o n Ba nne r 75% 51% 49% Kids Foot Locker Foot Locker LTV Distribution Between Ac quis i t i o n Ba nne r A n d Ot he r Ba nner s Customers Acquired Through KFL Are ~20% More Valuable Than Other Banners 25% Same Banner % LTV All Others % LTV 50% Of Value Coming From Other Banners
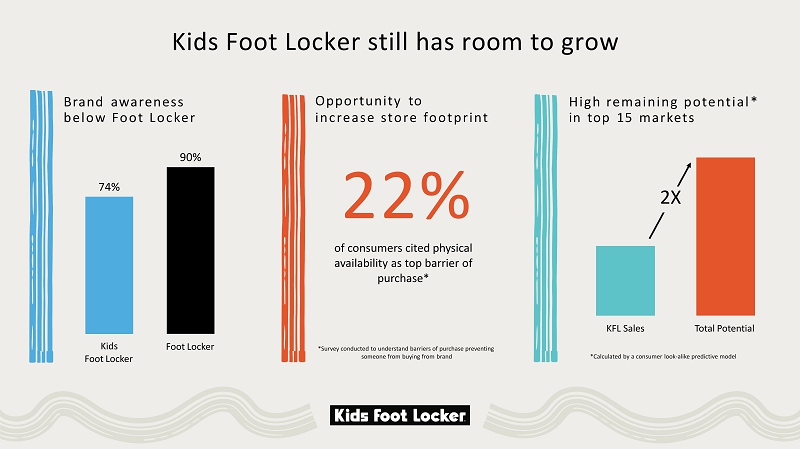
Brand awareness b el o w F oo t Lo c k e r Opportunity to i ncre a s e s tor e f oot pr i n t Kids Foot Locker still has room to grow 74% 90% Kids Foot Locker Foot Locker 22% of consumers cited physical availability as top barrier of purchase* *Survey conducted to understand barriers of purchase preventing someone from buying from brand 2X KFL Sales Total Potential *Calculated by a consumer look - alike predictive model Hi g h r e mai n i n g p o t en t ia l * in top 15 markets
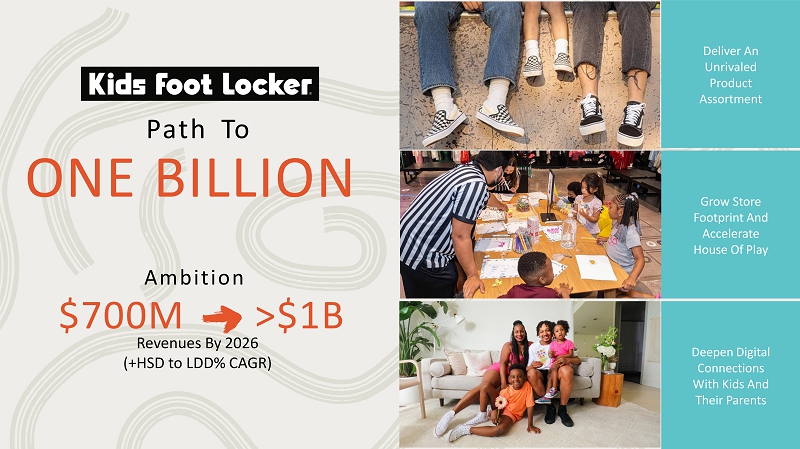
Deliver An Unrivaled Product A s sort m ent Deepen Digital Connections With Kids And Their Parents Grow Store Footprint And Accelerate House Of Play Ambition Revenues By 2026 (+HSD to LDD% CAGR) $700 M > $1 B Path To ONE BILLION ER : Top 2 photos are authentic – bottom photo seems “staged”
Serve the active athlete

Building upon Champs Sports strong reach to serve a broader consumer and further differentiate from Foot Locker Strong Presence In Health & High Brand Awareness Wellness Markets* An Engaged Consumer Base Langston Brand Health Study Jan 2022 90% 66% 45% 25% C h amps Sports *Calculated by per capital population who ‘typically spend &+ exercising per week’ + ‘who control their diet for physical fitness’ 31 26 15 14 New York Los Ange l es Dallas Houston Miami 11 Store Count Market Health Index 1. 2 2. 3 1. 1 1. 2 2. 3 2.3M on Instagram 1.3M on TikTok 570K on Twitter Multi - Branded Sporting Goods Retailers
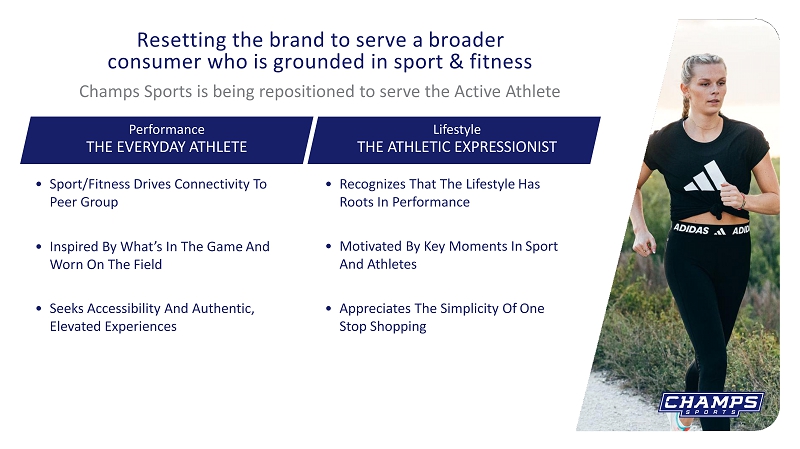
Champs Sports is being repositioned to serve the Active Athlete Resetting the brand to serve a broader consumer who is grounded in sport & fitness • Sport/Fitness Drives Connectivity To Peer Group • Inspired By What’s In The Game And Worn On The Field • Seeks Accessibility And Authentic, Elevated Experiences • Recognizes That The Lifestyle Has Roots In Performance • Motivated By Key Moments In Sport And Athletes • Appreciates The Simplicity Of One Stop Shopping Performance THE EVERYDAY ATHLETE Lifestyle THE ATHLETIC EXPRESSIONIST
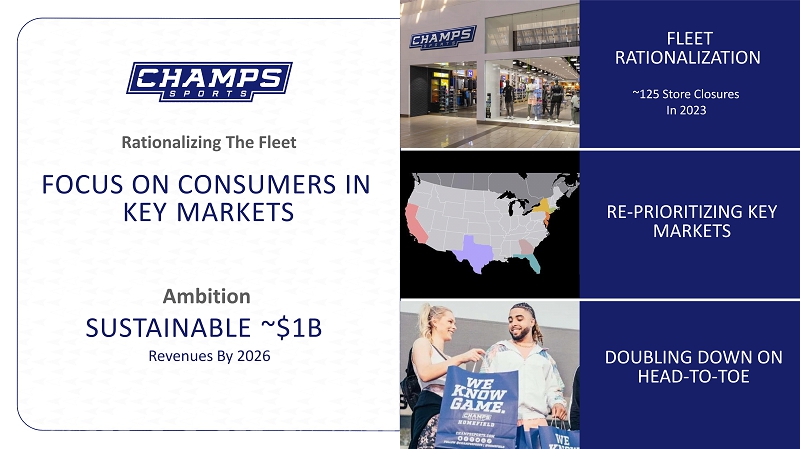
Rationalizing The Fleet Ambition SUSTAINABLE ~$1B Revenues By 2026 ~125 Store Closures In 2023 FOCUS ON CONSUMERS IN KEY MARKETS FLEET RATION A LIZATION RE - PRIORITIZING KEY MARKETS DOUBLING DOWN ON HEAD - TO - TOE
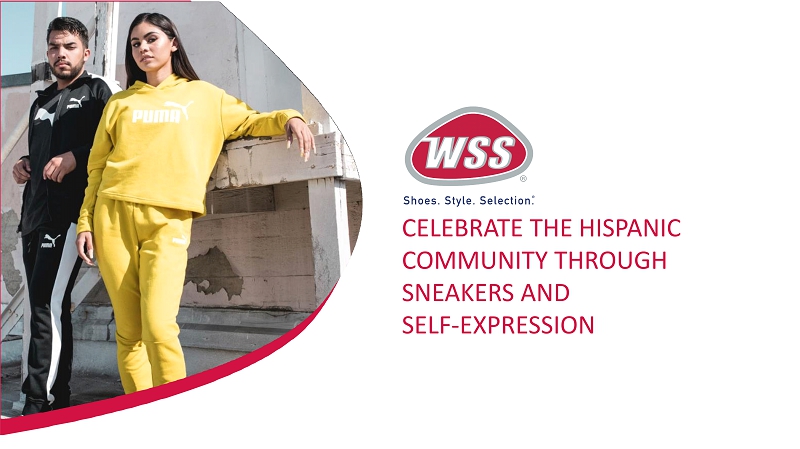
CELEBRATE THE HISPANIC COMMUNITY THROUGH SNEAKERS AND SELF - EXPRESSION
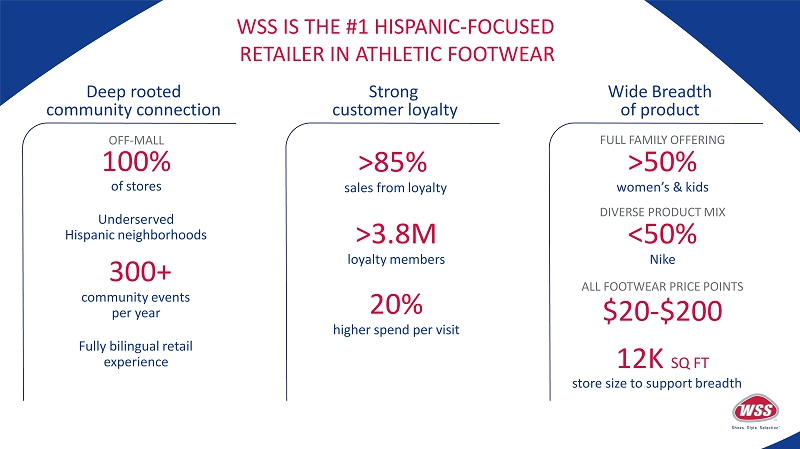
Deep rooted community connection WSS IS THE #1 HISPANIC - FOCUSED RETAILER IN ATHLETIC FOOTWEAR Strong customer loyalty Wide Breadth of product OFF - MALL 100% of stores Underserved Hispanic neighborhoods 300+ community events per year Fully bilingual retail experience >85% sales from loyalty >3.8M loyalty members 20% higher spend per visit FULL FAMILY OFFERING >50% women’s & kids DIVERSE PRODUCT MIX <50% Nike ALL FOOTWEAR PRICE POINTS $20 - $200 12K SQ FT store size to support breadth
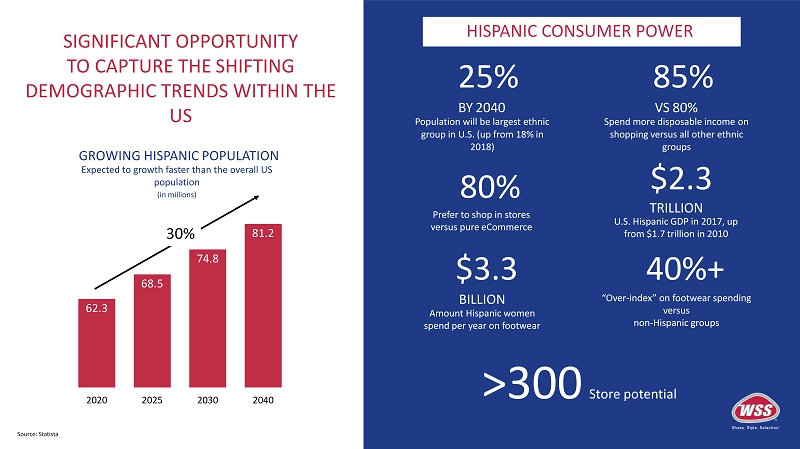
SIGNIFICANT OPPORTUNITY TO CAPTURE THE SHIFTING DEMOGRAPHIC TRENDS WITHIN THE US Source: Statista 62.3 68.5 74.8 81.2 2020 2025 2030 2040 GROWING HISPANIC POPULATION Expected to growth faster than the overall US population (in millions) 30% 25% BY 2040 Population will be largest ethnic group in U.S. (up from 18% in 2018) 85% VS 80% Spend more disposable income on shopping versus all other ethnic groups 80% Prefer to shop in stores versus pure eCommerce $2.3 TRILLION U.S. Hispanic GDP in 2017, up from $1.7 trillion in 2010 $3.3 BILLION Amount Hispanic women spend per year on footwear 40%+ “Over - index” on footwear spending versus non - Hispanic groups >300 Store potential HISPANIC CONSUMER POWER
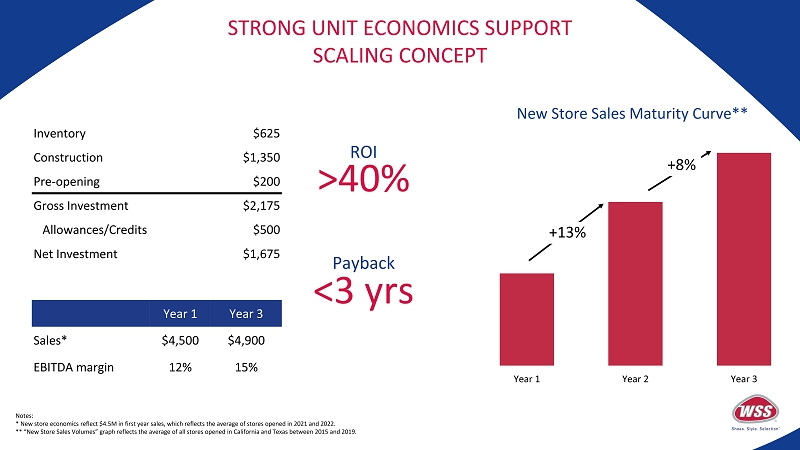
STRONG UNIT ECONOMICS SUPPORT SCALING CONCEPT Year 1 Year 2 Year 3 New Store Sales Maturity Curve** +13% +8% $625 Inventory $1, 3 50 Construction $200 Pre - opening $2, 1 75 Gross Investment $500 Allowances/Credits Net Investment $1,675 Year 1 Year 3 Sales* $4,500 $4,900 EBITDA margin 12% 15% ROI >40% Payback <3 yrs Notes: * New store economics reflect $4.5M in first year sales, which reflects the average of stores opened in 2021 and 2022. ** “New Store Sales Volumes” graph reflects the average of all stores opened in California and Texas between 2015 and 2019.
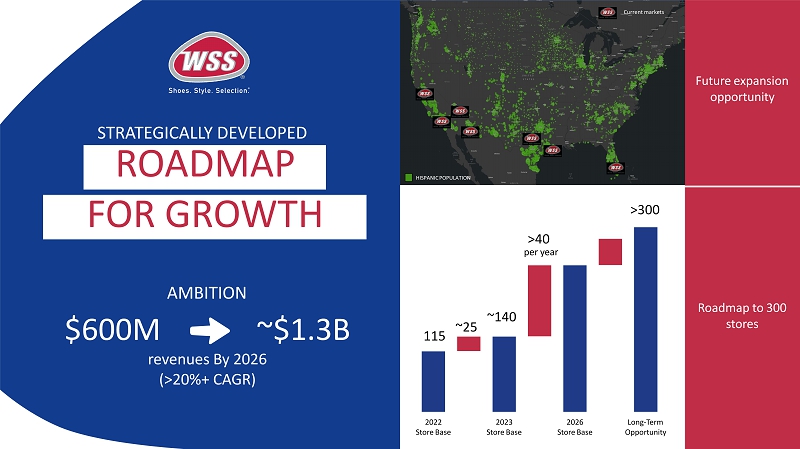
STRATEGICALLY DEVELOPED AMBITION $600M ~ $1.3B revenues By 2026 (>20%+ CAGR) Current markets Roadmap to 300 stores 2022 Store Base 2023 Store Base 2026 Store Base Long - Term Opportunity 11 5 >300 Future expansion opportunity ~ 25 >40 per year ROADMAP FOR GROWTH ~ 140 HISPANIC POPULATION
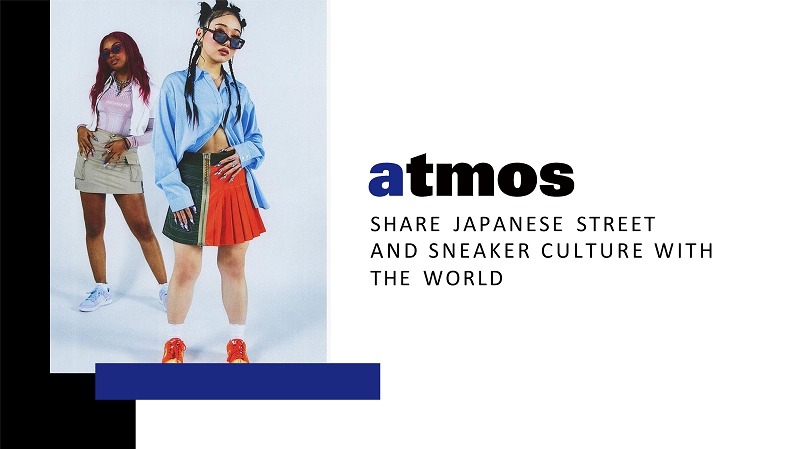
SHARE JAPANESE STREET AN D S NEAKE R C UL T UR E W I T H THE WORLD
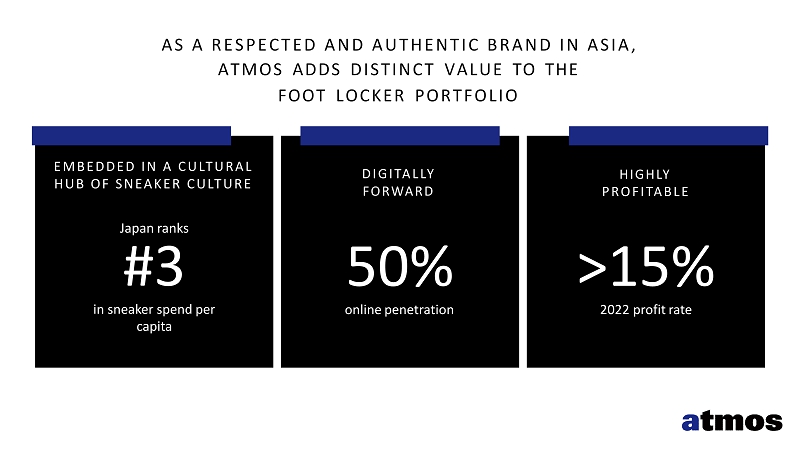
A S A R E S PECTE D A N D A U T H E N T I C B R A N D I N A SI A , ATMOS ADDS DISTINCT VALUE TO THE FOOT LOCKER PORTFOLIO EM BE D D E D I N A C UL T U R A L H U B O F SN E A KE R C U L T U R E Japan ranks #3 in sneaker spend per capita DIG I TALL Y FORWARD HIGHLY P R OF I TABL E 50% online penetration >15% 2022 profit rate
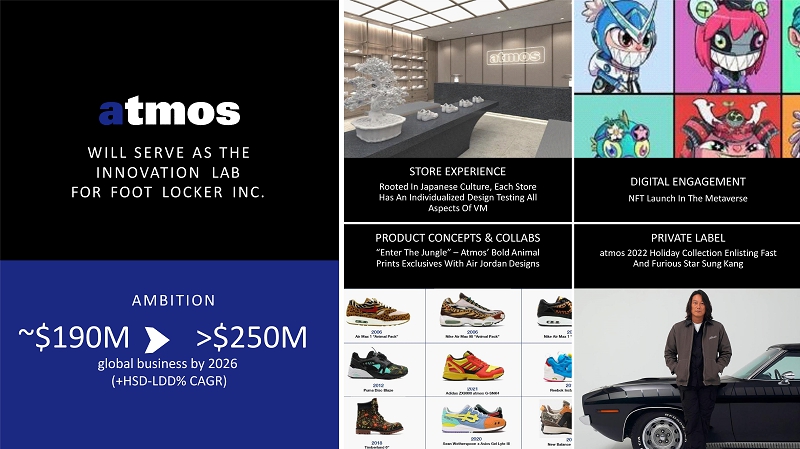
W IL L S ER V E A S T H E INNOVATION LAB FOR FOOT LOCKER INC. AMBITION ~$190 M >$250 M global business by 2026 (+HSD - LDD% CAGR) STORE EXPERIENCE Rooted In Japanese Culture, Each Store Has An Individualized Design Testing All Aspects Of VM DIGITAL ENGAGEMENT NFT Launch In The Metaverse PRODUCT CONCEPTS & COLLABS “Enter The Jungle” – Atmos’ Bold Animal Prints Exclusives With Air Jordan Designs PRIVATE LABEL atmos 2022 Holiday Collection Enlisting Fast And Furious Star Sung Kang
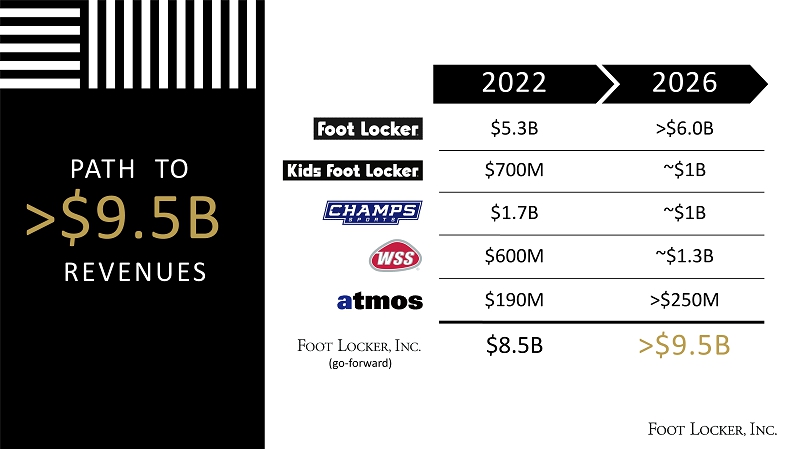
2022 2026 $5.3 B >$6 . 0 B $700M ~ $1B $1. 7 B ~ $1B $600M ~$1.3B $190 M > $25 0 M $8.5 B > $ 9. 5 B PATH TO >$ 9 . 5 B REVENUES (go - forward)
S V P , G L O B A L S T O R E D E V E L O P M E N T
S T R A T E G I C I M P E R A T I V E # 2 T R A N S F O R M I N G T H E R E A L E S T A T E P O R T F O L I O
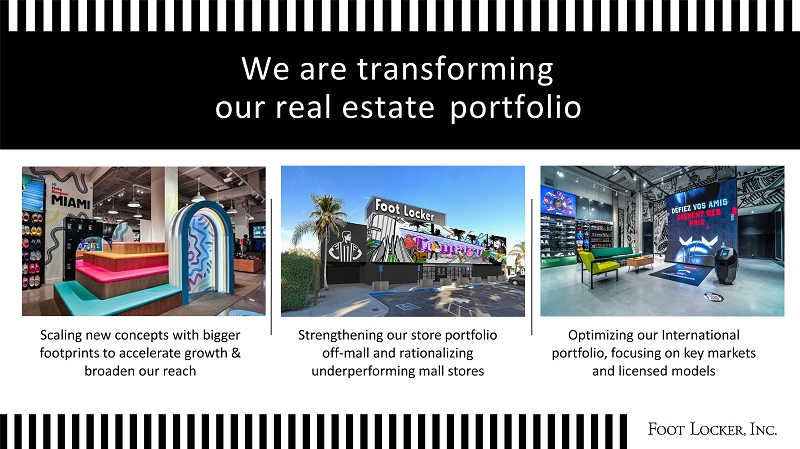
We are transforming our real estate portfolio Scaling new concepts with bigger footprints to accelerate growth & broaden our reach Strengthening our store portfolio off - mall and rationalizing underperforming mall stores Optimizing our International portfolio, focusing on key markets and licensed models
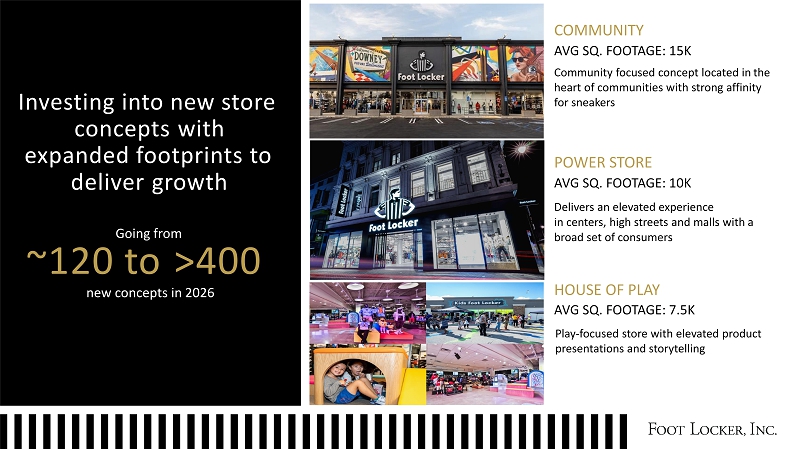
COMMUNITY AVG SQ. FOOTAGE: 15K Community focused concept located in the heart of communities with strong affinity for sneakers POWER STORE AVG SQ. FOOTAGE: 10K Delivers an elevated experience in centers, high streets and malls with a broad set of consumers Investing into new store concepts with expanded footprints to deliver growth Going from ~120 to >400 new concepts in 2026 HOUSE OF PLAY AVG SQ. FOOTAGE: 7.5K Play - focused store with elevated product presentations and storytelling
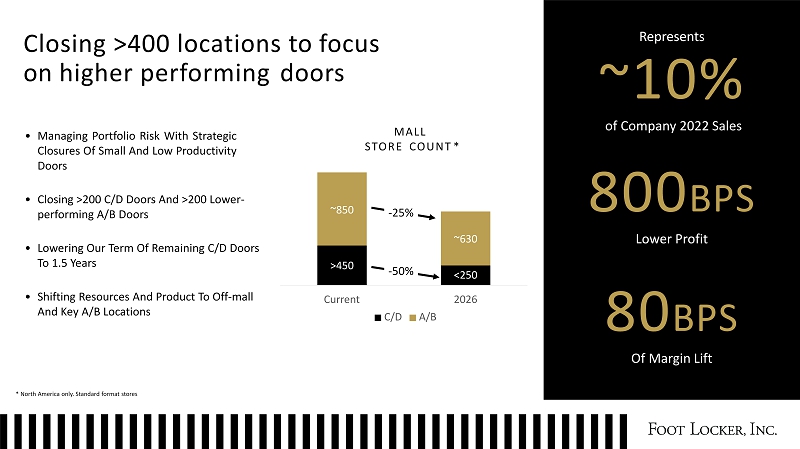
Closing >400 locations to focus on higher performing doors MALL STORE COUNT * • Managing Portfolio Risk With Strategic Closures Of Small And Low Productivity Doors • Closing >200 C/D Doors And >200 Lower - performing A/B Doors • Lowering Our Term Of Remaining C/D Doors To 1.5 Years • Shifting Resources And Product To Off - mall And Key A/B Locations Represents ~10% of Company 2022 Sales 80 0 B P S Lower Profit 80 B P S Of Margin Lift * North America only. Standard format stores >450 <250 ~850 ~630 Cur r ent 2 0 26 C / D A/B - 50% - 25%
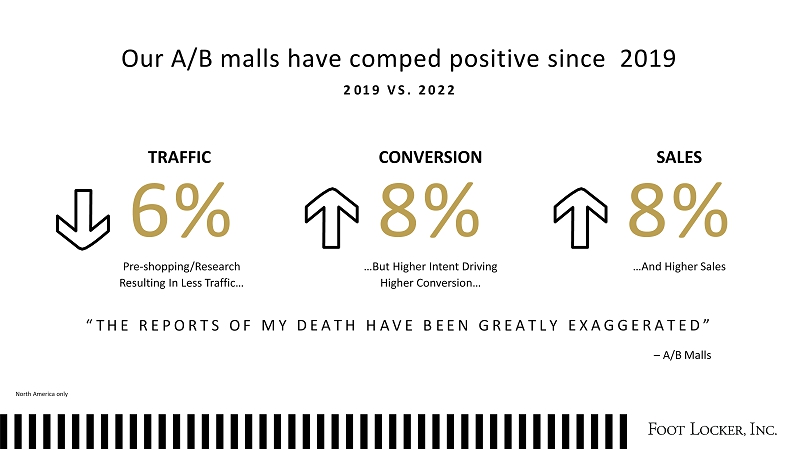
Our A/B malls have comped positive since 2019 2 0 1 9 V S . 2 0 2 2 M Y D E A T H E X A G G E R A T E D ” TRAFFIC 6% Pre - shopping/Research Resulting In Less Traffic… “ T H E R E P O R T S O F SALES 8% …And Higher Sales CONVERSION 8% …But Higher Intent Driving Higher Conversion… H A V E B E E N G R E A T L Y North America only – A/B Malls
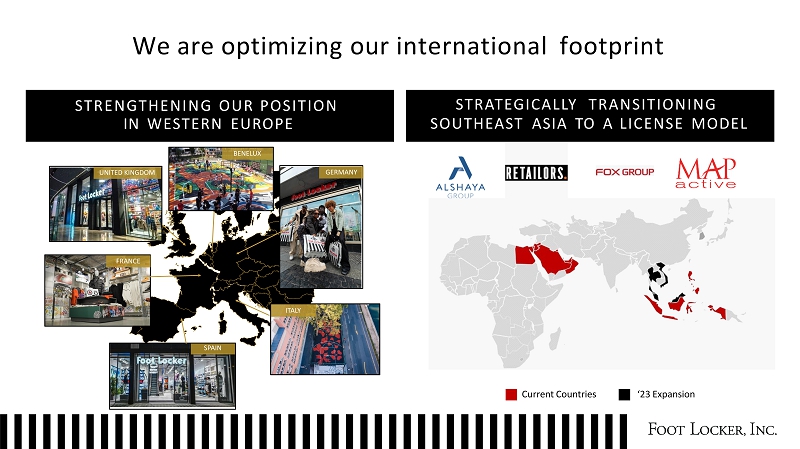
We are optimizing our international footprint S T R E NG TH E N IN G O U R P O SI T I O N IN WESTERN EUROPE STRATEGICALLY TRANSITIONING SOUTHEAST ASIA TO A LICENSE MODEL Current Countries ‘23 Expansion BENELUX FRANCE ITALY SPAIN UNITED KINGDOM GERMANY
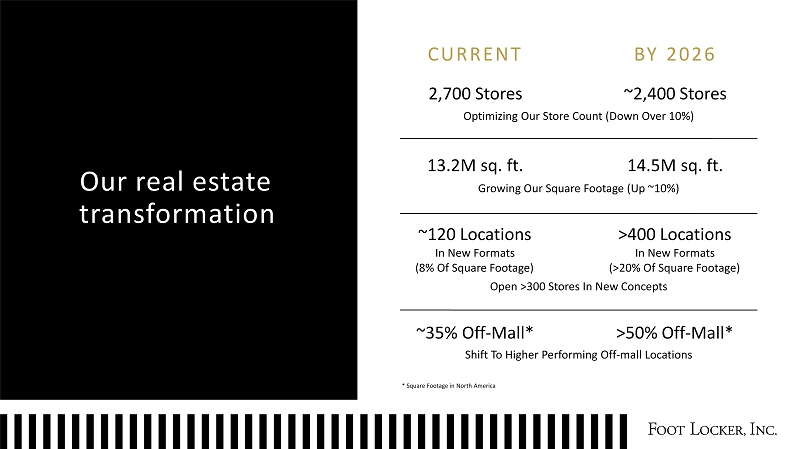
Our real estate t r a n s for m a ti o n C U RR E N T B Y 202 6 2,700 Stores ~2,400 Stores Optimizing Our Store Count (Down Over 10%) 13.2M sq. ft. 14.5M sq. ft. Growing Our Square Footage (Up ~10%) * Square Footage in North America ~120 Locations In New Formats (8% Of Square Footage) >400 Locations In New Formats (>20% Of Square Footage) Open >300 Stores In New Concepts ~35% Off - Mall* >50% Off - Mall* Shift To Higher Performing Off - mall Locations
C H I E F C O M M E R C I A L O F F I C E R
Deepen Our Re l at i on s h i p with Customers S T R A T E G I C I M P E R A T I V E # 3
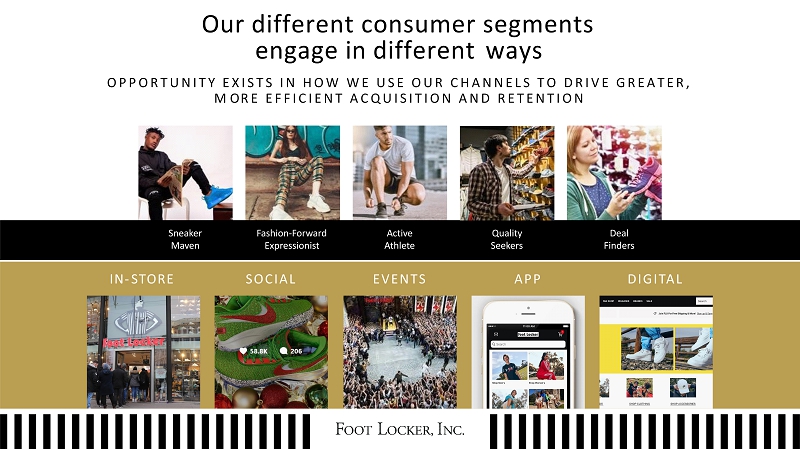
Our different consumer segments engage in different ways O P P O R T U N I T Y E X I S T S I N H O W W E U S E O U R C H A N N E L S T O D R I V E G R E A T E R , M O R E E F F I C I E N T A C Q U I S I T I O N A N D R E T E N T I O N Sn e aker Maven Active Athlete Deal F i nders Quality S e e k e r s F a shio n - F o rwa r d Expressionist IN - STORE EVE N T S DIG I TA L AP P S OCIA L
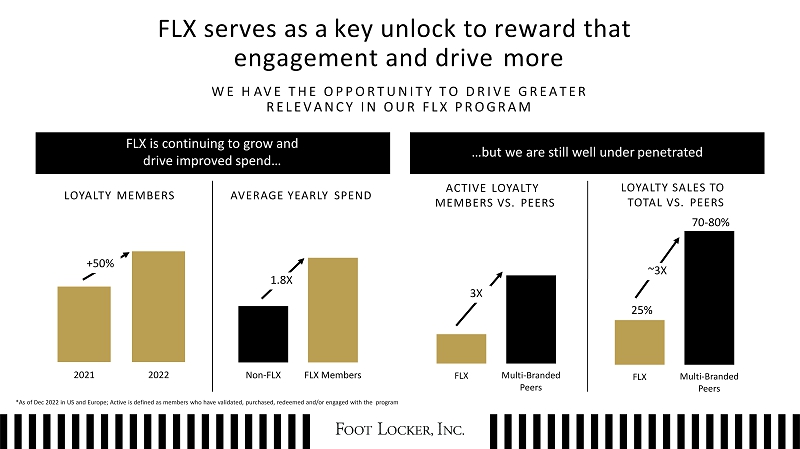
1.8X FLX serves as a key unlock to reward that engagement and drive more W E H A V E T H E O P P O R T U N I T Y T O D R I V E G R E A T E R R E L E V A N C Y I N O U R F L X P R O G R A M FLX is continuing to grow and drive improved spend… …but we are still well under penetrated LOYALTY MEMBERS AVERAGE YEARLY SPEND 2021 2022 Non - FLX FLX Members *As of Dec 2022 in US and Europe; Active is defined as members who have validated, purchased, redeemed and/or engaged with the program ACTIVE LOYALTY MEMBERS VS. PEERS LOYALTY SALES TO TOTAL VS. PEERS 70 - 80% FLX Multi - Br a n d e d Peers FLX Multi - Br a n d e d Peers 25% +50% 1.8X 3X ~3X
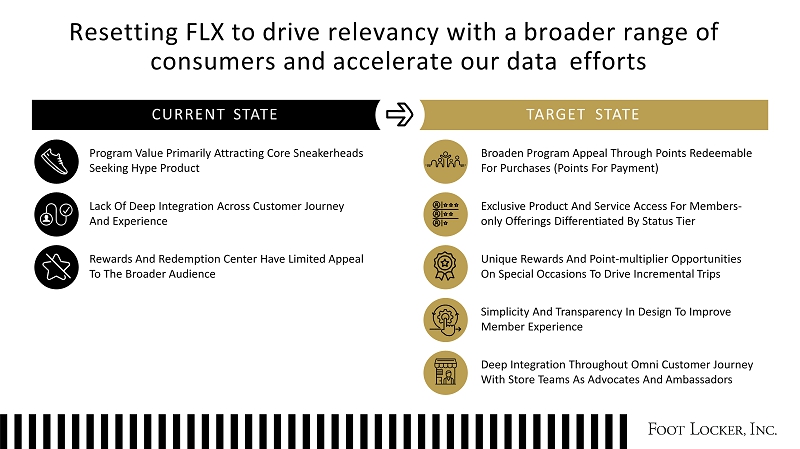
Resetting FLX to drive relevancy with a broader range of consumers and accelerate our data efforts CURRENT STATE TARGET STATE Program Value Primarily Attracting Core Sneakerheads Seeking Hype Product Lack Of Deep Integration Across Customer Journey And Experience Rewards And Redemption Center Have Limited Appeal To The Broader Audience Broaden Program Appeal Through Points Redeemable For Purchases (Points For Payment) Exclusive Product And Service Access For Members - only Offerings Differentiated By Status Tier Unique Rewards And Point - multiplier Opportunities On Special Occasions To Drive Incremental Trips Simplicity And Transparency In Design To Improve Member Experience Deep Integration Throughout Omni Customer Journey With Store Teams As Advocates And Ambassadors
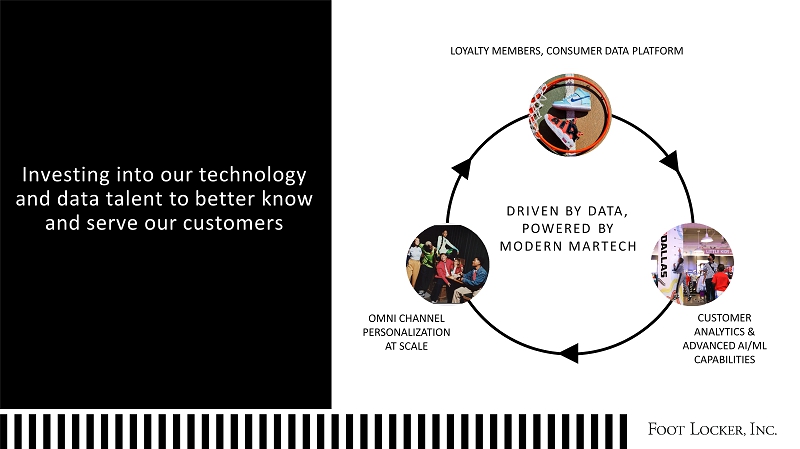
Investing into our technology and data talent to better know and serve our consumer segments OMNI CHANNEL PERSO N ALIZAT I ON AT SCALE CUSTOMER ANALYTICS & ADVANCED AI/ML CAPABILITIES DRIVE N B Y D ATA , POWERED BY M O DER N M A R T EC H LOYALTY MEMBERS, CONSUMER DATA PLATFORM
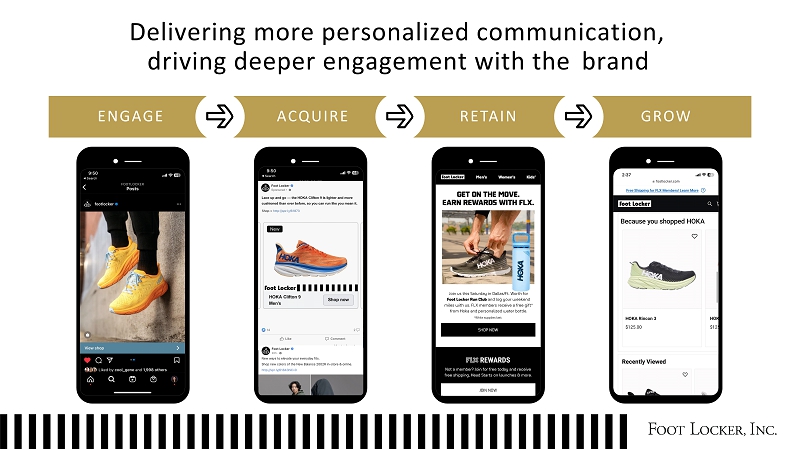
Delivering more personalized communication, driving deeper engagement with the brand E NG A G E AC Q U I R E RE T A I N G R O W
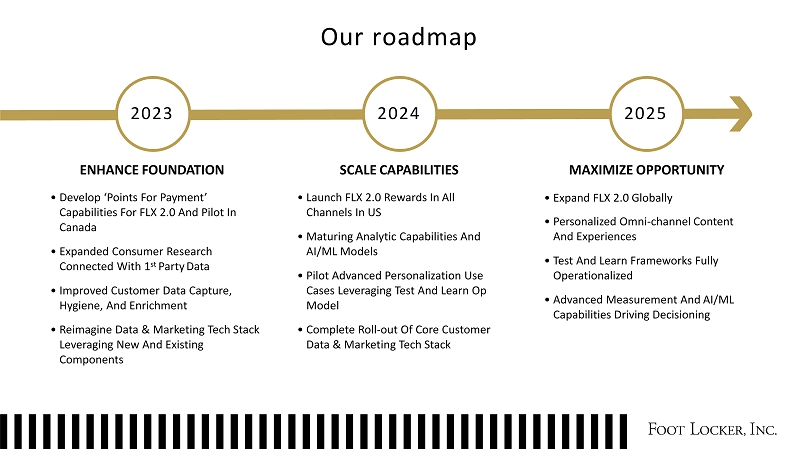
Our roadmap ENHANCE FOUNDATION 2023 2024 2025 SCALE CAPABILITIES MAXIMIZE OPPORTUNITY • Develop ‘Points For Payment’ Capabilities For FLX 2.0 And Pilot In Canada • Expanded Consumer Research Connected With 1 st Party Data • Improved Customer Data Capture, Hygiene, And Enrichment • Reimagine Data & Marketing Tech Stack Leveraging New And Existing Components • Launch FLX 2.0 Rewards In All Channels In US • Maturing Analytic Capabilities And AI/ML Models • Pilot Advanced Personalization Use Cases Leveraging Test And Learn Op Model • Complete Roll - out Of Core Customer Data & Marketing Tech Stack • Expand FLX 2.0 Globally • Personalized Omni - channel Content And Experiences • Test And Learn Frameworks Fully Operationalized • Advanced Measurement And AI/ML Capabilities Driving Decisioning
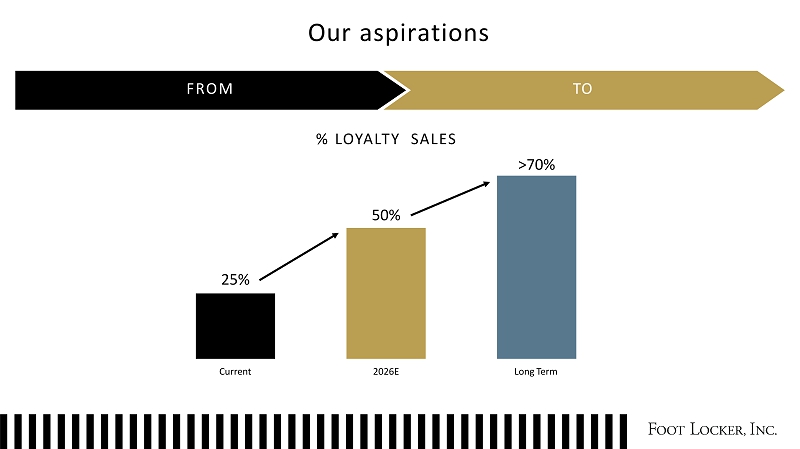
Our aspirations FR O M TO % LOYALTY SALES >70% 50% 25% C u rr e n t 2026E Long Term

BR E A K 1 5 M I N U T E S

S V P , S T R A T E G I C P L A N N I N G & G R O W T H
• S T R A T E G I C I M P E R A T I V E # 4 B e s t - In - C l as s Omni
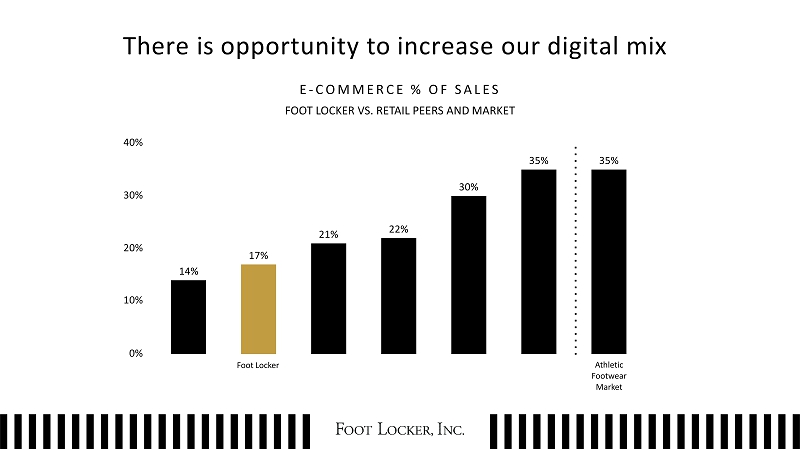
There is opportunity to increase our digital mix E - C O M M E R C E % O F S A L E S FOOT LOCKER VS. RETAIL PEERS AND MARKET 14% 10% 17% 21% 22% 30% 35% 35% 0% 20% 30% 40% Hi b bett Foot Locker Dic k s Genesco JD Sports M a cy's Athletic F ootwear Market
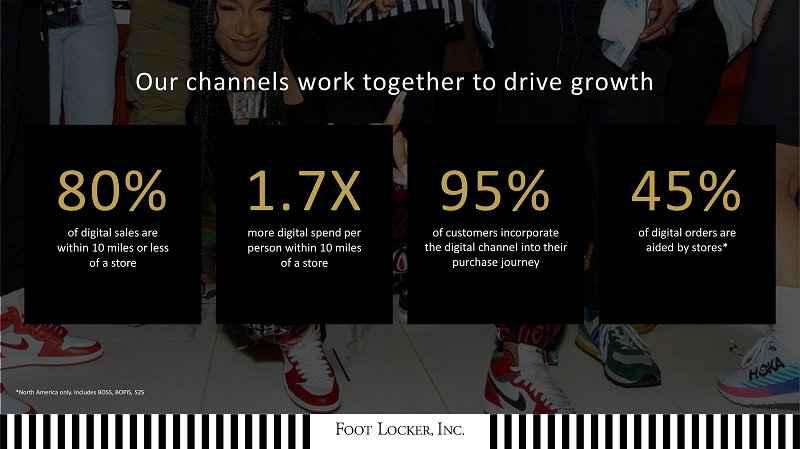
Our channels work together to drive growth 80% of digital sales are within 10 miles or less of a store 1 . 7 X more digital spend per person within 10 miles of a store 95% of consumers incorporate the digital channel into their purchase journey 45% of digital orders are aided by stores* *North America only. Includes BOSS, BOPIS, S2S
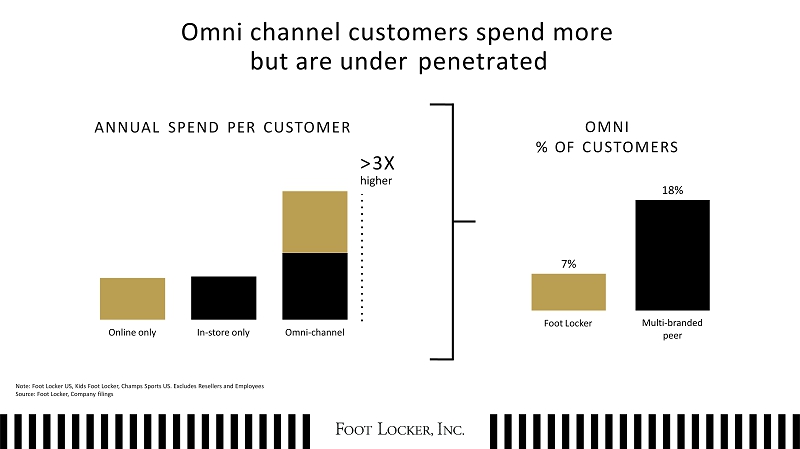
Omni channel customers spend more but are under penetrated Online only In - store only Omni - channel ANNUAL SPEND PER CUSTOMER > 3X higher Note: Foot Locker US, Kids Foot Locker, Champs Sports US. Excludes Resellers and Employees Source: Foot Locker, Company filings OMNI % OF CUSTOMERS 7% 18% Foot Locker Mu l ti - bran d ed peer
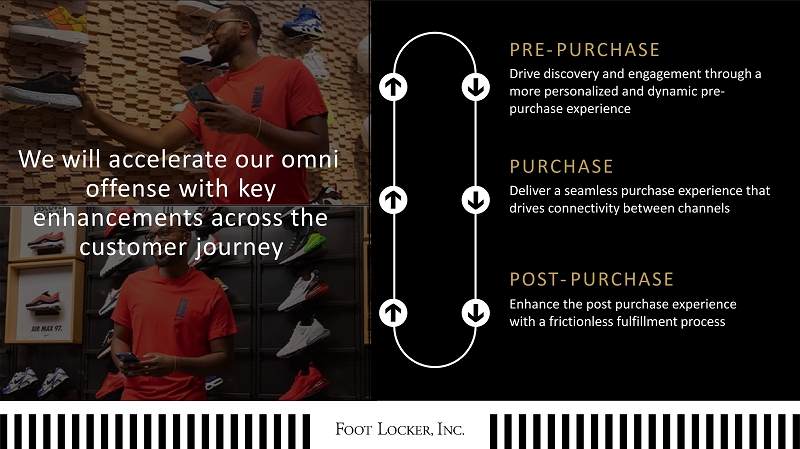
PRE - PURCHASE Drive discovery and engagement through a more personalized and dynamic pre - purchase experience PURCHASE Deliver a seamless purchase experience that drives connectivity between channels POST - PURCHASE Enhance the post purchase experience through frictionless fulfillment process We will accelerate our omni offense with key enhancements across the customer journey
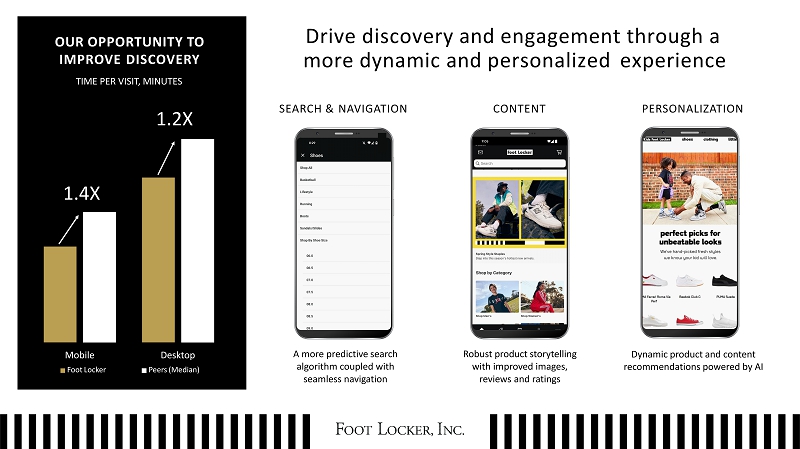
Drive discovery and engagement through a more dynamic and personalized experience A more predictive search algorithm coupled with seamless navigation Robust product storytelling with improved images, reviews and ratings Dynamic product and content recommendations powered by AI SEARCH & NAVIGATION C O NTEN T PERSONALIZATION Mobile Foot Locker Desktop Peers (Median) OUR OPPORTUNITY TO IMPROVE DISCOVERY TIME PER VISIT, MINUTES 1.4X 1.2X
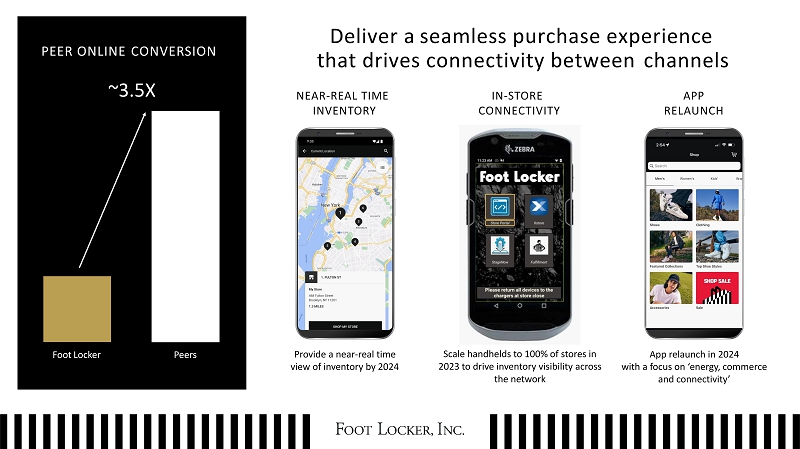
Deliver a seamless purchase experience that drives connectivity between channels Provide a near - real time view of inventory by 2024 Scale handhelds to 100% of stores in 2023 to drive inventory visibility across the network App relaunch in 2024 with a focus on ‘energy, commerce and connectivity’ NEAR - REAL TIME INVENTORY IN - STORE C O NNE CTIVIT Y APP RELA UNC H PEER ONLINE CONVERSION Foot Locker Peers ~3.5X

Enhance the post purchase experience through frictionless fulfillment Accelerate our global BOPIS rollout Scaled seamless return capabilities Easy to use messaging and self - service support FLEXIBLE FULFILLMENT OPTIONS SEAMLES S RETURNS ORDER TRANSPARENCY & COMMUNICATIONS NET PROMOTER SCORE Dig i t al Sto r es ~1.5X
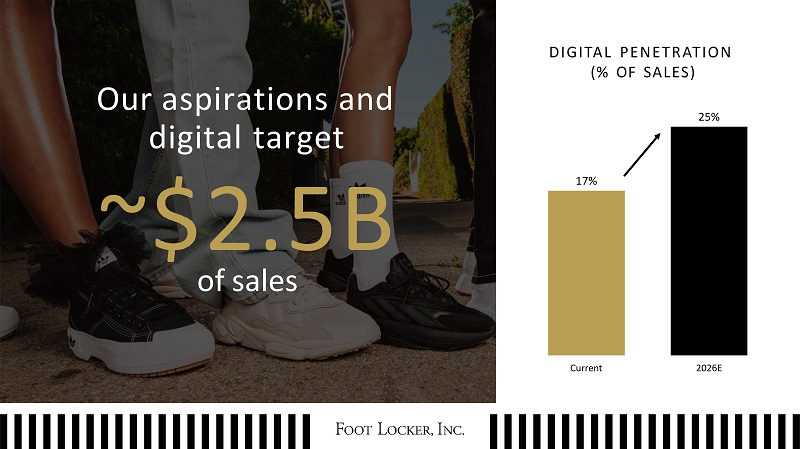
Our aspirations and digital target 17% 25% C u rr e n t 2026E of sales D IGIT A L P E N E T RA TI O N (% OF SALES)
C H I E F O P E R A T I O N S O F F I C E R
• T EC H N O L OG Y ENABLERS SUPPLY CHAIN A N D
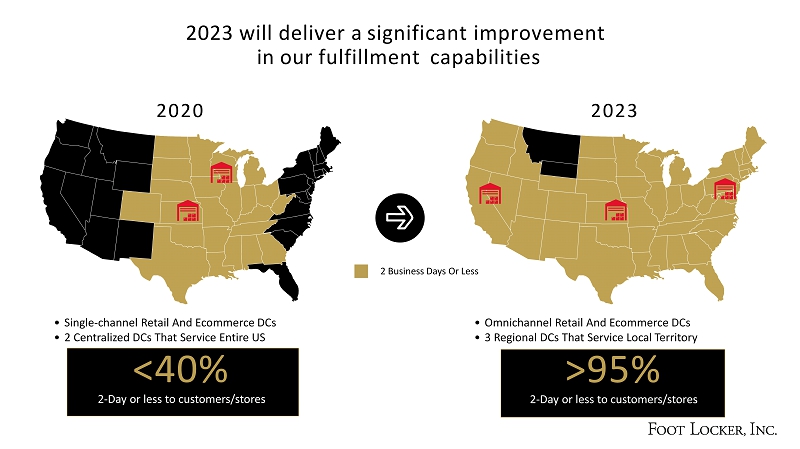
2023 will deliver a significant improvement in our fulfillment capabilities • Single - channel Retail And Ecommerce DCs • 2 Centralized DCs That Service Entire US 2020 2023 • Omnichannel Retail And Ecommerce DCs • 3 Regional DCs That Service Local Territory <40% 2 - Day or less to customers/stores >95% 2 - Day or less to customers/stores 2 Business Days Or Less
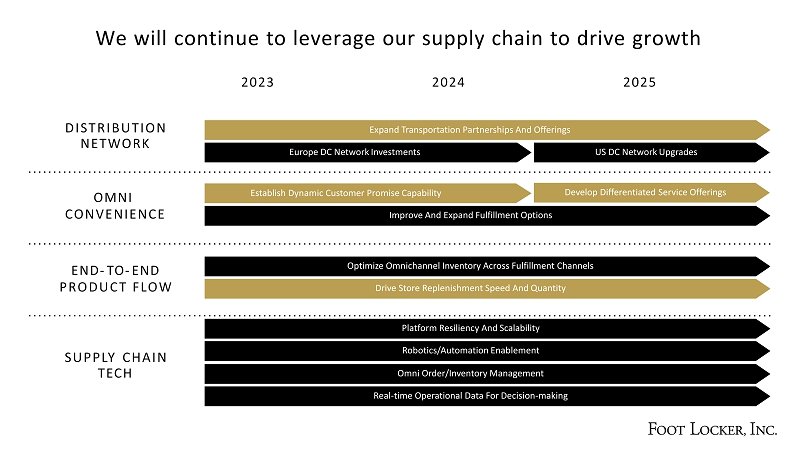
We will continue to leverage our supply chain to drive growth END - TO - END P R O DUC T F LO W S U PP L Y C HA I N TECH DI ST RIBUT I O N NETWORK OMNI CONVENIENCE 2023 2024 2025 Expand Transportation Partnerships And Offerings Europe DC Network Investments US DC Network Upgrades Establish Dynamic Customer Promise Capability Improve And Expand Fulfillment Options Develop Differentiated Service Offerings Drive Store Replenishment Speed And Quantity Optimize Omnichannel Inventory Across Fulfillment Channels Robotics/Automation Enablement Platform Resiliency And Scalability Real - time Operational Data For Decision - making Omni Order/Inventory Management

An investment in our technology underpins our omni acceleration 0.0% 0.7% 1.3% 2.0% 2.6% 2013 2014 2015 2016 2 017 2018 2019 2020 2021 2022 BENCHMARK TECHNOLOGY SPEND AS % OF SALES We have historically underinvested in technology UNDERINVESTMENT 2.5% 2022 2026 % of Sales Tech Expense up by ~$80M > 3% Tech Capex* up by >50% $240 $150 Past 4 years Next 4 years * Includes capitalized IT expense
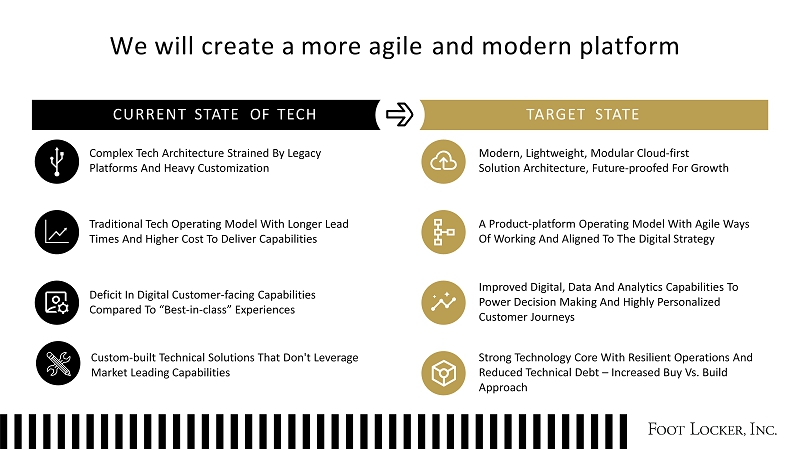
We will create a more agile and modern platform CURRENT STATE OF TECH TARGET STATE Complex Tech Architecture Strained By Legacy Platforms And Heavy Customization Traditional Tech Operating Model With Longer Lead Times And Higher Cost To Deliver Capabilities Deficit In Digital Customer - facing Capabilities Compared To “Best - in - class” Experiences Modern, Lightweight, Modular Cloud - first Solution Architecture, Future - proofed For Growth A Product - platform Operating Model With Agile Ways Of Working And Aligned To The Digital Strategy Improved Digital, Data And Analytics Capabilities To Power Decision Making And Highly Personalized Customer Journeys Strong Technology Core With Resilient Operations And Reduced Technical Debt – Increased Buy Vs. Build Approach Custom - built Technical Solutions That Don't Leverage Market Leading Capabilities Need icon
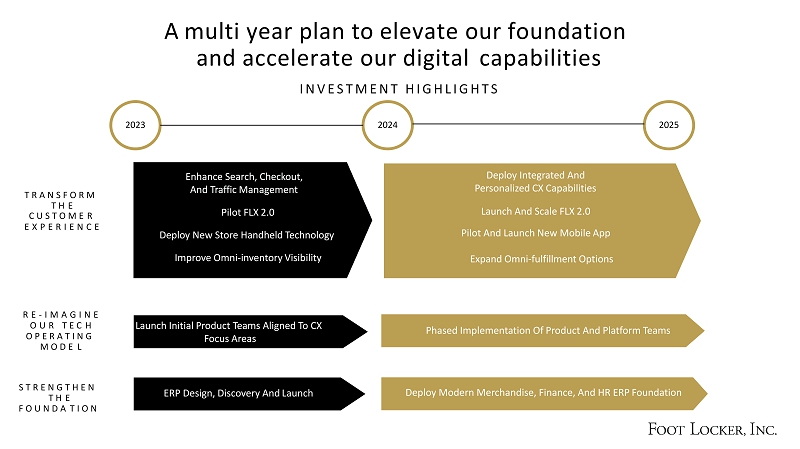
A multi year plan to elevate our foundation and accelerate our digital capabilities I N V E S T M E N T H I G H L I G H T S Phased Implementation Of Product And Platform Teams Deploy Modern Merchandise, Finance, And HR ERP Foundation Launch Initial Product Teams Aligned To CX Focus Areas ERP Design, Discovery And Launch 2023 2024 2025 Enhance Search, Checkout, And Traffic Management Pilot FLX 2.0 Deploy New Store Handheld Technology Deploy Integrated And Personalized CX Capabilities Launch And Scale FLX 2.0 Pilot And Launch New Mobile App T R A N S F O R M T H E C U S T O M E R E X P E R I E N C E R E - I M A G I N E O U R T E C H O P E R A T I N G M O D E L S T R E N G T H E N T H E F O U N D A T I O N Improve Omni - inventory Visibility Expand Omni - fulfillment Options

O F F I C E R F I N A N C I A L I N T E R I M C H I E F A N D F P & A R E L A T I O N S S V P , I N V E S T O R
• • Community • Team Members • Investors STAKEHOLDERS C R E A T E V A L U E F O R A L L
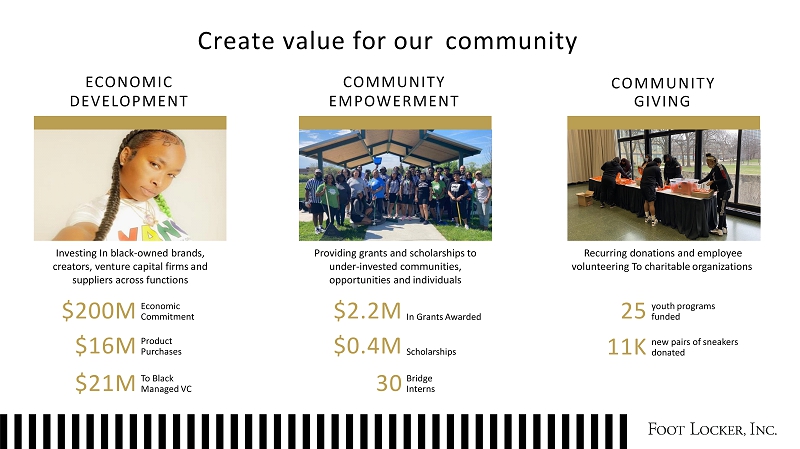
Investing In black - owned brands, creators, venture capital firms and suppliers across functions ECONOMIC DEVELOPMENT COMMUNITY EMPOWERMENT C O MMU NI T Y GIVING Create value for our community Providing grants and scholarships to under - invested communities, opportunities and individuals Recurring donations and employee volunteering To charitable organizations $200M $16M $21M Economic Commitm e nt Product Purchases To Black Managed VC $2 . 2 M $0 . 4 M 30 In Grants Awarded Scholarships Bridge Interns 25 11K youth programs funded new pairs of sneakers donated
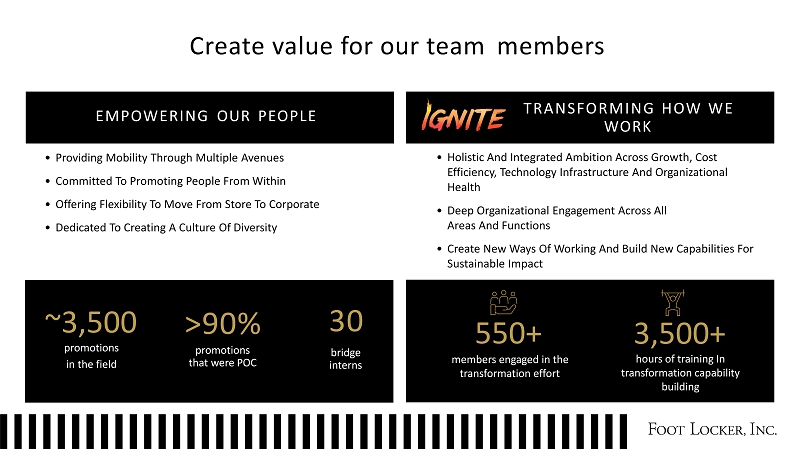
Create value for our team members EMPOWERING OUR PEOPLE T RA NSF O R M I N G HO W W E WORK • Holistic And Integrated Ambition Across Growth, Cost Efficiency, Technology Infrastructure And Organizational Health • Deep Organizational Engagement Across All Areas And Functions • Create New Ways Of Working And Build New Capabilities For Sustainable Impact 550+ members engaged in the transformation effort 3,500+ hours of training In transformation capability building 30 bridge i n ter n s ~ 3,500 promotions in the field >90% promotions that were POC • Providing Mobility Through Multiple Avenues • Committed To Promoting People From Within • Offering Flexibility To Move From Store To Corporate • Dedicated To Creating A Culture Of Diversity
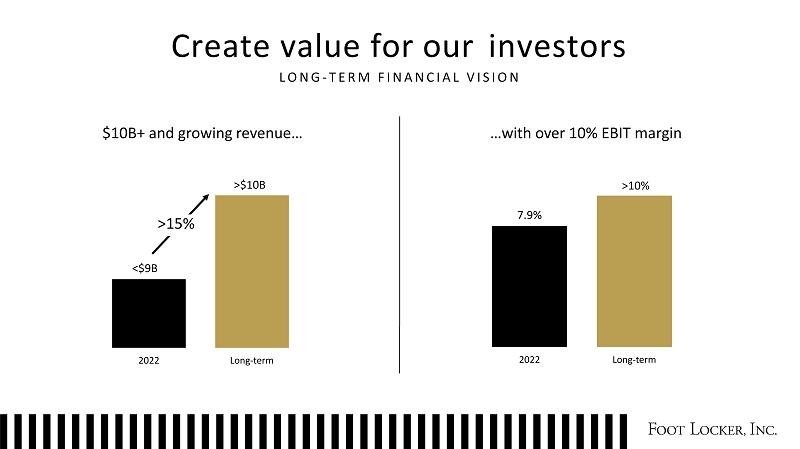
…with over 10% EBIT margin > 10% 7.9% 2022 Long - term Create value for our investors L O N G - T E R M F I N A N C I A L V I S I O N $10B+ and growing revenue… >$10B 2022 Long - term < $9B >15%
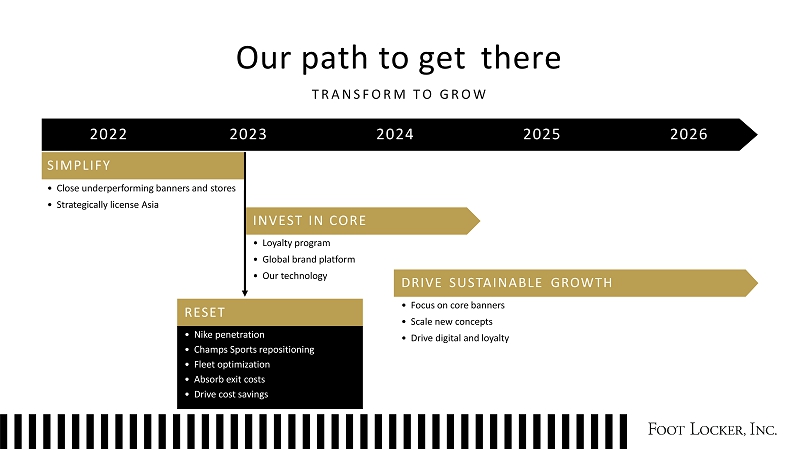
Our path to get there T R A N S F O R M T O G R O W 2022 2023 2024 2025 2026 SIMPLIFY • Close underperforming banners and stores • Strategically license Asia I N VE S T I N C O R E • Loyalty program • Global brand platform • Our technology DRIVE SUSTAINABLE GROWTH • Focus on core banners • Scale new concepts • Drive digital and loyalty • Nike penetration • Champs Sports repositioning • Fleet optimization • Absorb exit costs • Drive cost savings RESET

Simplifying our international operations in Europe SIMPLIFY BENEFITS FINANCIAL IMPACT • Sharpen Focus On Foot Locker Brand In Region • Simplifies Our Overall Operations • Reduced Losses/Margin Accretive ~ $1 0 0 M Top - line Reduction ~$10M Eliminated From Annual Loss >10BPS Company EBIT Margin ~ $2 5 M In Exit Costs Winding Down Sidestep Banner In Europe ~70 Stores Closing ~10 Stores Converting To Foot Locker Process Expected To Be Completed By ~Mid - year 2023
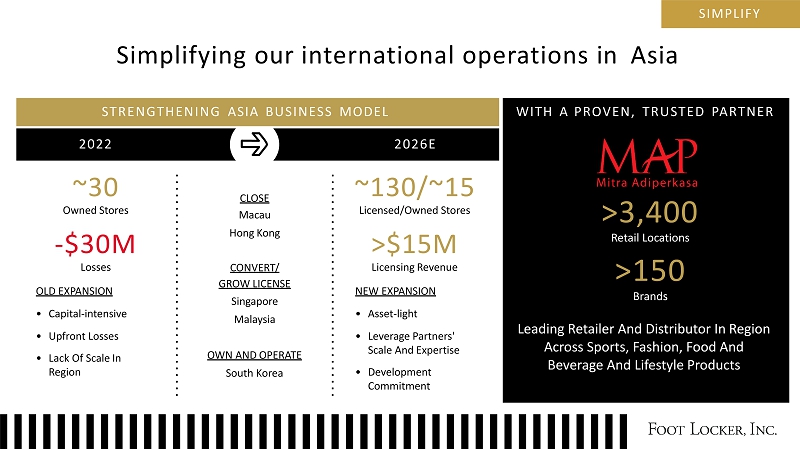
Simplifying our international operations in Asia SIMPLIFY 2022 2026E STRENGTHENING ASIA BUSINESS MODEL ~30 Owned Stores - $3 0 M Losses OLD EXPANSION • Capital - intensive • Upfront Losses • Lack Of Scale In Region CLOSE Macau Hong Kong CONVERT/ GROW LICENSE Si n gapore Malaysia OWN AND OPERATE South Korea ~130 /~ 1 5 Licensed/Owned Stores >$15M Licensing Revenue NEW EXPANSION • Asset - light • Leverage Partners' Scale And Expertise • Deve l opment Commitment WITH A PROVEN, TRUSTED PARTNER >3,400 Retail Locations >150 Brands Leading Retailer And Distributor In Region Across Sports, Fashion, Food And Beverage And Lifestyle Products
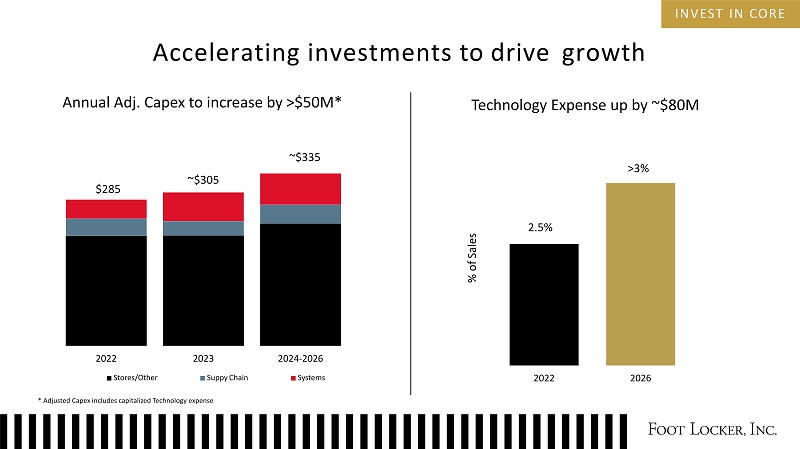
2.5% 2022 2026 % of Sales Accelerating investments to drive growth Annual Adj. Capex to increase by >$50M* Technology Expense up by ~$80M > 3% 2022 2023 2024 - 2026 Stores/Other Suppy Chain * Adjusted Capex includes capitalized Technology expense Sy s te m s $285 ~ $305 ~$335 I N V E S T I N C O R E
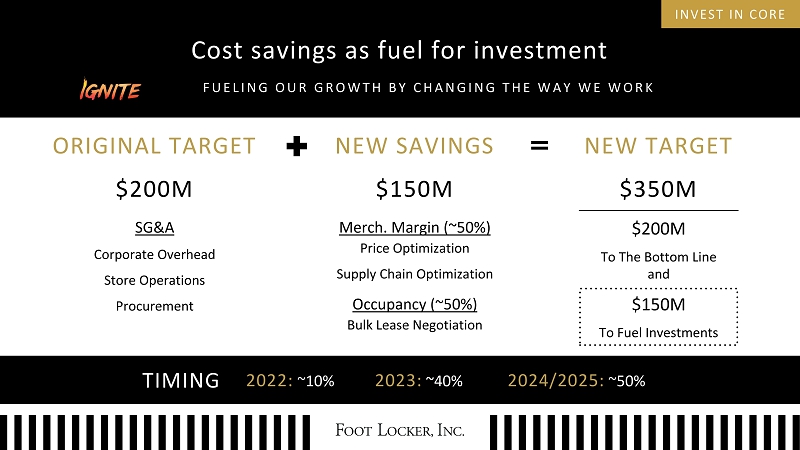
Cost savings as fuel for investment F U E L I N G O U R G R O W T H B Y C H A N G I N G T H E W A Y W E W O R K NEW TARGET $350M ORIGINAL TARGET $200M SG&A Corporate Overhead Store Operations Procurement NEW SAVINGS $150M Merch. Margin (~50%) Price Optimization Supply Chain Optimization $150M To Fuel Investments $200M To The Bottom Line and INVEST IN CORE TIMING 2022: ~10% 2023: ~40% 2024/2025: ~50% Occupancy (~50%) Bulk Lease Negotiation
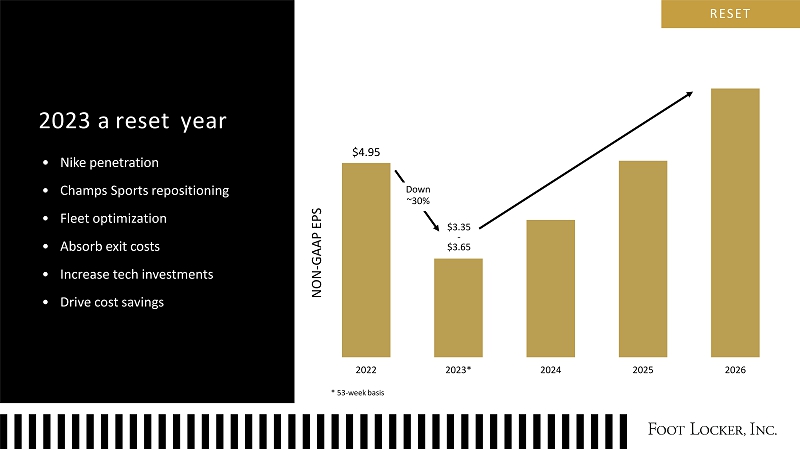
2022 2023* 2024 2 025 2026 2023 a reset year R ESE T • Nike penetration • Champs Sports repositioning • Fleet optimization • Absorb exit costs • Increase tech investments • Drive cost savings $3 . 35 - $3 . 65 Down ~30% NON - GAAP EPS $4. 9 5 * 53 - week basis

R ESE T 2023 sales reset STORE COUNT ~90 ~125 ~40 ~ 25 ~2,480 Down ~230 (Open ~100 / Close ~330) Stores - 9% Average store size +5% Footage - 4% Comps - 3.5% to - 5.5% Sales - 4.5% to - 6.5% (52 - week) - 3.5% to - 5.5% (53 - week) 2,714
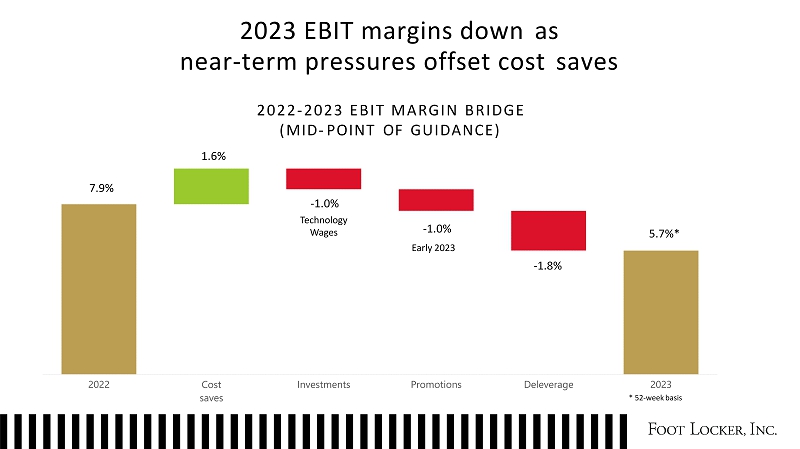
2023 EBIT margins down as near - term pressures offset cost saves 202 2 - 202 3 E BI T MARGI N BRIDG E ( MID - POINT OF GUIDANCE) 1.6% 7. 9% - 1.8% 5.7%* - 1.0% Technol ogy Wages - 1.0% Early 2023 * 52 - week basis
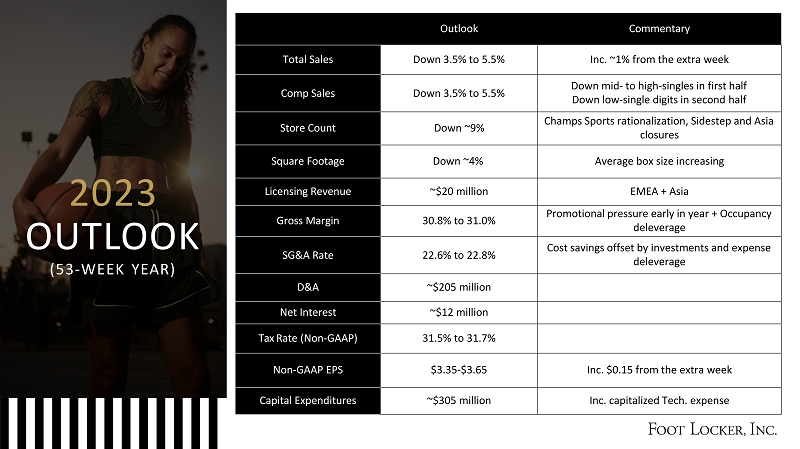
2023 OUTLOOK (53 - WEEK YEAR) Commentary Outlook Inc. ~1% from the extra week Down 3.5% to 5.5% Total Sales Down mid - to high - singles in first half Down low - single digits in second half Down 3.5% to 5.5% Comp Sales Champs Sports rationalization, Sidestep and Asia closures Down ~9% Store Count Average box size increasing Down ~4% Square Footage EMEA + Asia ~$20 million Licensing Revenue Promotional pressure early in year + Occupancy deleverage 30.8% to 31.0% Gross Margin Cost savings offset by investments and expense deleverage 22.6% to 22.8% SG&A Rate ~$205 million D&A ~$12 million Net Interest 31.5% to 31.7% Tax Rate (Non - GAAP) Inc. $0.15 from the extra week $3.35 - $3.65 Non - GAAP EPS Inc. capitalized Tech. expense ~$305 million Capital Expenditures

GROWTH 2024 - 2026 sales growth F OO T A G E CA G R Average store size +6 % Stores - 1% Footage ~5 % Total Foot Locker KFL Champs Sports WSS atmos ~ 5 % ~50% Average sales per foot @ Comps +3 - 4% Sales + 5 - 6 % * * From a 52 - week 2023
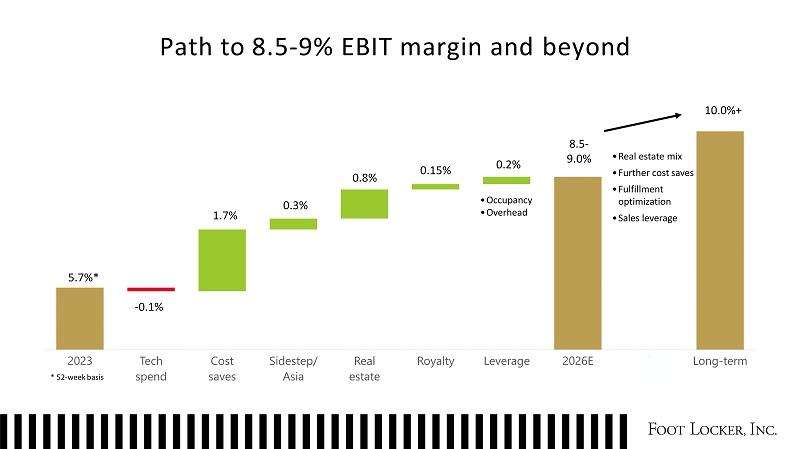
Path to 8.5 - 9% EBIT margin and beyond 1 . 7% 0.3% 0 . 8% 0 . 15% 0 . 2% 8.5 - 9.0% 10.0 % + • Occupancy • Overhead • Real estate mix • Further cost saves • Fulfillment opt imizati on • Sales leverage 5.7%* - 0.1% * 52 - week basis
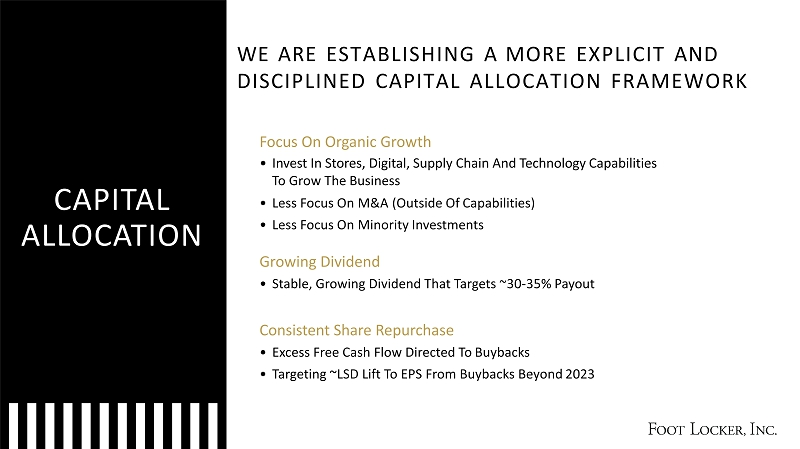
Focus On Organic Growth • Invest In Stores, Digital, Supply Chain And Technology Capabilities To Grow The Business • Less Focus On M&A (Outside Of Capabilities) • Less Focus On Minority Investments Growing Dividend • Stable, Growing Dividend That Targets ~30 - 35% Payout Consistent Share Repurchase • Excess Free Cash Flow Directed To Buybacks • Targeting ~LSD Lift To EPS From Buybacks Beyond 2023 WE ARE ESTABLISHING A MORE EXPLICIT AND DISCIPLINED CAPITAL ALLOCATION FRAMEWORK CAPITAL ALLOCATION
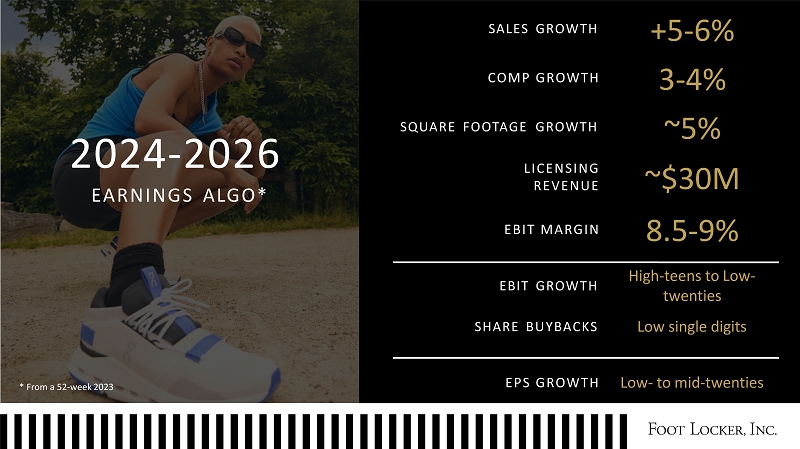
SALES GROWTH C O M P G R OWT H E B I T M A R G I N SQUARE FOOTAGE GROWTH EBIT GROWTH SHARE BUYBACKS E P S G R OWT H High - teens to Low - twenties Low single digits Low - to mid - twenties 2024 - 2026 EARNINGS ALGO* LICEN S I N G REVE N U E +5 - 6% 3 - 4% ~5% ~$30M 8.5 - 9% * From a 52 - week 2023
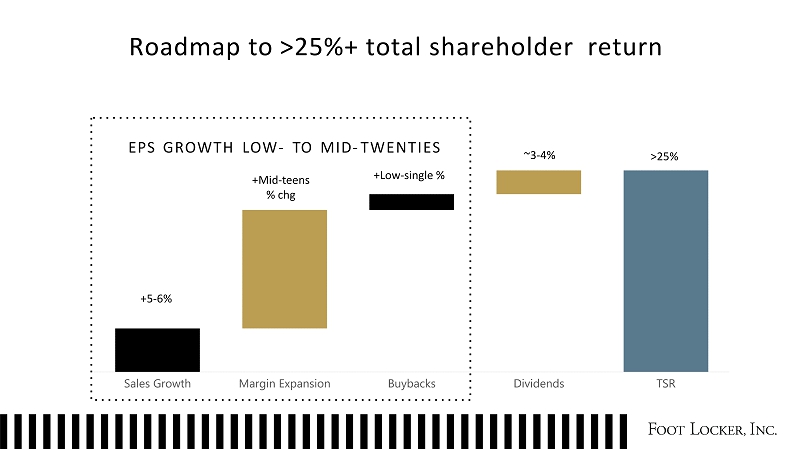
Roadmap to >25%+ total shareholder return +Mi d - tee n s % chg +5 - 6% +Low - single % ~3 - 4% >25% EPS GROWTH LOW - TO MID - TWENTIES
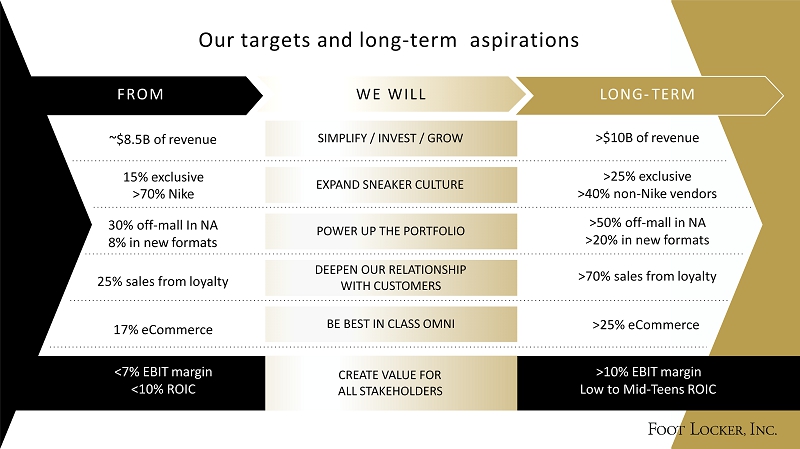
Our targets and long - term aspirations EXPAND SNEAKER CULTURE POWER UP THE PORTFOLIO DEEPEN OUR RELATIONSHIP WITH CUSTOMERS BE BEST IN CLASS OMNI SIMPLIFY / INVEST / GROW FR O M W E W IL L LONG - TERM ~$8.5B of revenue >$10B of revenue 15% exclusive >70% Nike >25% exclusive >40% non - Nike vendors 30% off - mall In NA 8% in new formats >50% off - mall in NA >20% in new formats 25% sales from loyalty >70% sales from loyalty 17% eCommerce >25% eCommerce <7% EBIT margin <10% ROIC >10% EBIT margin Low to Mid - Teens ROIC CREATE VALUE FOR ALL STAKEHOLDERS
•

Customers ‘All Things Sneakers’ Team Members Career Opportunities Communities Investment and Engagement Brand Partners Sustained Growth Investors Attractive & Consistent Returns Foot Locker Unlocks The “Inner Sneakerhead” In All Of Us – Sparking Discovery And Igniting The Power Of Sneaker Culture. FOOT LOCKER VISION
THANK YOU
BR E A K 5 M I N U T E S
•
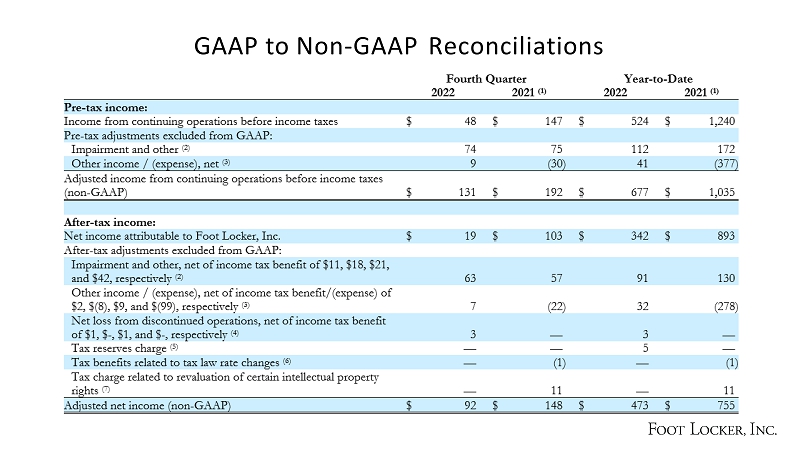
GAAP to Non - GAAP Reconciliations
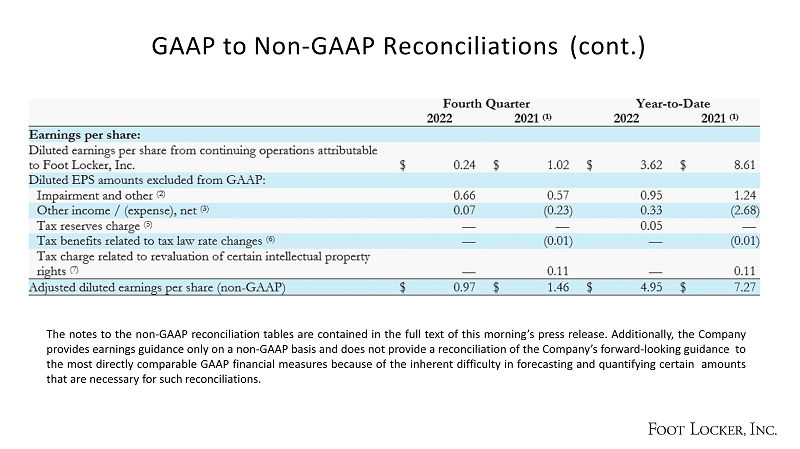
GAAP to Non - GAAP Reconciliations (cont.) The notes to the non - GAAP reconciliation tables are contained in the full text of this morning’s press release . Additionally, the Company provides earnings guidance only on a non - GAAP basis and does not provide a reconciliation of the Company’s forward - looking guidance to the most directly comparable GAAP financial measures because of the inherent difficulty in forecasting and quantifying certain amounts that are necessary for such reconciliations .