The following tables present Tredegar’s net sales and operating profit by segment for the second quarter and first six months of 2004 and 2003:
Net sales (sales less freight) and operating profit from ongoing operations are the measures of sales and operating profit used by the chief operating decision maker of each segment for purposes of assessing performance.
Second-quarter net sales in Film Products were $101.5 million, up 14.8% from $88.4 million in 2003. Operating profit from ongoing operations was $10.9 million, up 7.5% from $10.1 million last year. Volume for the quarter increased 8.6% to 71.2 million pounds from 65.5 million pounds in 2003.
On a sequential basis, net sales, operating profit from ongoing operations and volume in the first quarter of 2004 were $95.9 million, $10.0 million and 69.1 million pounds, respectively.
Film Products has successfully introduced a variety of new elastic diaper laminates and feminine hygiene topsheet products to several global customers, and sales of new packaging and specialty films are increasing. We remain optimistic that near-term opportunities will lead to meaningful profit growth in this business by the end of this year or early 2005.
We continue to invest aggressively to support new global growth opportunities. The ongoing success of The Procter & Gamble Company’s (P&G) new feminine pad topsheet, which was rolled out in Europe and Japan in 2003, is leading to new opportunities in other regions. While current capacity is sufficient to meet near-term demand, Film Products is increasing planned 2004 capital spending from $40 million to $55 million to support additional growth expectations for this product. This increase in capital expenditures is tied to contractual commitments. Capital spending in Film Products in the first six months of 2004 totaled $21.2 million compared with $21.5 million in 2003. More information on capital expenditures is provided in the liquidity and capital resources section beginning on page 20.
Year-to-date net sales in Film Products were $197.4 million versus $181.8 million in 2003. Operating profit from ongoing operations was $20.9 million compared to $24.0 million in 2003. Year-to-date volume increased slightly to 140.3 million pounds from 138.8 million pounds. Prior year results include sales of certain domestic backsheet that were discontinued at the end of the first quarter of 2003.
Second-quarter net sales in Aluminum Extrusions were $109.0 million, up 23% from $88.6 million in 2003. Volume was up 7.7% to 62.0 million pounds from 57.6 million pounds in 2003. Operating profit from ongoing operations increased 70.6% to $8.3 million from $4.9 million in 2003. The profit increase was driven by volume growth, higher selling prices and improved operating efficiencies. Shipments were up in all end markets, with the strongest growth in the commercial building and construction, transportation, and machinery and equipment sectors. Improved operating efficiencies included higher extrusion press productivity, some of which is related to higher volume levels.
Year-to-date net sales in Aluminum Extrusions were $204.2 million, up 17.9% from $173.1 million in 2003. Operating profit from ongoing operations for the six-month period nearly doubled to $12.0 from $6.1 in 2003. Year-to-date volume increased 7.6% to 120.0 million pounds, up from 111.6 million pounds in 2003. Trends on a year-to-date basis are consistent with second quarter results.
Capital expenditures in Aluminum Extrusions totaled $3 million for the first half of 2004 and are expected to be approximately $15 million for the year. Capital expenditures related to ongoing support and continuity is about $10 million annually, or approximately the same level as depreciation ($10.9 million in 2003). Capital expenditures expected in 2004 in excess of ongoing support and continuity is primarily due to the consolidation of some of our Canadian operations, including closing the plant in Aurora, Ontario. We plan to move the Aurora plant’s largest press to the plant in Pickering, Ontario, and invest $8 million to upgrade the press and enlarge the facility. This consolidation is expected to reduce annual operating costs by approximately $2 million.
19
The second-quarter operating loss from ongoing operations at Therics was $2.5 million compared to a loss of $3.3 million in 2003. Therics launched its initial product line earlier this year. Net sales were $120,000 for the quarter, up from $11,000 in the first quarter. The year-to-date operating loss was $5.0 million compared to $6.6 million in 2003. Quarterly operating losses are expected to continue at about the second-quarter level until meaningful sales are achieved.
Liquidity and Capital Resources
Tredegar’s total assets decreased to $716.4 million at June 30, 2004, from $753 million at December 31, 2003. In the first half of 2004, we received tax refunds of about $55 million related to the sale of the venture capital portfolio (see Note 2 on page 5) and used $50 million to repay revolver debt in April 2004. Other significant changes in balance sheet items since December 31, 2003, are summarized below:
| • | Accounts receivable increased by $28.7 million due primarily to seasonal year-end lows in Aluminum Extrusions and higher net sales for all businesses (net sales for the second quarter were up $33.5 million compared to the fourth quarter of 2003, and days sales outstanding remains in the 50-day range in Film Products and 45-day range in Aluminum Extrusions); |
| | |
| • | Income taxes recoverable declined by $58.6 million due primarily to the receipt of the income tax refund related to the sale of the venture capital portfolio; |
| | |
| • | Net property, plant and equipment declined by $4 million due primarily to the $7.1 million asset impairment recognized in the first quarter on the planned shutdown of the aluminum plant in Aurora, Ontario and other asset impairments during the first six months of 2004 in Film Products totaling $2.5 million, partially offset by capital expenditures in excess of depreciation of $8.6 million; and |
| | |
| • | Accounts payable and accrued expenses increased $16.8 million due primarily to the timing of payments, higher raw material costs (resin and aluminum prices are up since the fourth quarter) and higher purchases in support of higher sales volume. |
Cash provided by operating activities was $69.1 million in the first half of 2004 compared with $47.4 million in 2003. The increase is due primarily to the income tax refund, partially offset by higher working capital in the first half of 2004 compared with 2003 due to higher sales.
Cash used in investing activities was $16.4 million in the first half of 2004 compared with $7.5 million in 2003. The change is primarily attributable to proceeds from the sale of corporate assets and property disposals of $7.8 million in the first half of 2004 compared with proceeds from the sale of venture capital investments, net of investments made, of $18.7 million in 2003.
Capital expenditures in the first half of 2004 reflect the normal replacement of machinery and equipment and:
| • | Expansion of production capacity for apertured topsheet films (used in feminine hygiene pads) at our plant in Kerkrade, The Netherlands; |
| | |
| • | Expansion of production capacity for elastic films (used as components in personal care products) at our plant in Lake Zurich, Illinois; |
| | |
| • | Upgrade of production capacity for photopolymer films (used to protect circuit boards during the manufacturing process) at our plant in Lake Zurich, Illinois; |
| | |
| • | Implementation of a new information system in Film Products; |
| | |
| • | Construction of a new films plant in Guangzhou, China; and |
| | |
| • | Expansion of capacity at our films plant in Shanghai, China. |
20
Capital expenditures for all of 2004 are expected of about $55 million in Film Products and about $15 million in Aluminum Extrusions. See the business segment review beginning on page 18 for more information.
Net capitalization and indebtedness as defined under our Credit Agreement as of June 30, 2004 are as follows:
Net Capitalization and Indebtedness as of June 30, 2004
(In Thousands) | |
| |
| Net capitalization: | | | | |
| Cash and cash equivalents | | $ | 19,168 | |
| | |
|
| |
| Debt: | | | | |
| Credit Agreement: | | | | |
| Revolver | | | 14,000 | |
| Term loan | | | 69,375 | |
| Other debt | | | 5,405 | |
| |
|
| |
| Total debt | | | 88,780 | |
| |
|
| |
| Debt net of cash and cash equivalents | | | 69,612 | |
| Shareholders’ equity | | | 448,157 | |
| |
|
| |
| Net capitalization | | $ | 517,769 | |
| |
|
| |
| | | | |
| Indebtedness as defined in Credit Agreement: | | | | |
| Total debt | | $ | 88,780 | |
| Face value of letters of credit | | | 6,722 | |
| |
|
| |
| Indebtedness | | $ | 95,502 | |
| |
|
| |
| | | | | | | |
Under the Credit Agreement, revolving credit borrowings are permitted up to $125 million, and $110 million was unused at June 30, 2004. The credit spread and commitment fees charged on the unused amount under the Credit Agreement at various indebtedness-to-adjusted EBITDA levels are as follows:
Pricing Under Credit Agreement (Basis Points) | |
| |
Indebtedness-to-Adjusted
EBITDA Ratio | | Credit Spread Over LIBOR | | Commitment
Fee | |
| |
Revolver | | Term Loan |
| |
| |
| |
| |
| > 2x but <= 3x | | | 150 | | | | 150 | | | | 30 | �� | |
| > 1x but <= 2x | | | 125 | | | | 125 | | | | 25 | | |
| <= 1x | | | 100 | | | | 100 | | | | 20 | | |
| | |
| | | |
| | | |
| | |
At June 30, 2004, the interest cost on debt under the Credit Agreement was priced at one-month LIBOR plus the applicable credit spread of 125 basis points.
21
The computations of adjusted EBITDA, adjusted EBIT, the leverage ratio and interest coverage ratio as defined in the Credit Agreement are presented below along with the related most restrictive covenants. Adjusted EBITDA and adjusted EBIT as defined in the Credit Agreement are not intended to represent cash flow from operations as defined by GAAP and should not be considered as either an alternative to net income or to cash flow.
Computations of Adjusted EBITDA, Adjusted EBIT, Leverage Ratio and
Interest Coverage Ratio as Defined in Credit Agreement Along with Related Most
Restrictive Covenants
As of June 30, 2004 (In Thousands) |
|
Computations of adjusted EBITDA and adjusted EBIT as defined in
Credit Agreement for the twelve months ended June 30, 2004: | | | | |
| Net income | | $ | 23,342 | |
| Plus: | | | | |
| After-tax losses related to discontinued operations | | | — | |
| Total income tax expense for continuing operations | | | 11,369 | |
| Interest expense | | | 4,520 | |
| Depreciation and amortization expense for continuing operations | | | 33,115 | |
| All non-cash losses and expenses, plus cash losses and expenses not
to exceed $10,000, for continuing operations that are classified as
unusual, extraordinary or which are related to plant shutdowns,
asset impairments and/or restructurings (cash-related before
maximum adjustment of $7,952) | | | 22,246 | |
| Minus: | | | | |
| After-tax income related to discontinued operations | | | (2,947 | ) |
| Total income tax benefits for continuing operations | | | — | |
| Interest income | | | (496 | ) |
| All non-cash gains and income, plus cash gains and income not to
exceed $10,000, for continuing operations that are classified as
unusual, extraordinary or which are related to plant shutdowns,
asset impairments and/or restructurings (cash-related before
maximum adjustment of $13,087) | | | (10,000 | ) |
| Plus or minus, as applicable, pro forma EBITDA adjustments associated
with acquisitions and asset dispositions | | | 118 | |
| |
|
| |
| Adjusted EBITDA as defined in Credit Agreement | | | 81,267 | |
| Less: Depreciation and amortization expense for continuing operations
(including pro forma for acquisitions and asset dispositions) | | | (33,151 | ) |
| |
|
| |
| Adjusted EBIT as defined in Credit Agreement | | $ | 48,116 | |
| |
|
| |
| Computations of leverage and interest coverage ratios as defined in Credit Agreement: | | | | |
| Leverage ratio (indebtedness-to-adjusted EBITDA) | | | 1.18 | x |
| Interest coverage ratio (adjusted EBIT-to-interest expense) | | | 10.65 | x |
| Most restrictive covenants as defined in Credit Agreement: | | | | |
| Maximum permitted aggregate amount of dividends that can be paid
by Tredegar during the term of the Credit Agreement | | $ | 100,000 | |
| Minimum adjusted shareholders’ equity permitted (increases by
50% of net income generated after September 30, 2003) | | | 333,462 | |
| Maximum leverage ratio permitted: | | | | |
| Ongoing | | | 3.00 | x |
| Pro forma for acquisitions | | | 2.50 | x |
| Minimum interest coverage ratio permitted | | | 2.50 | x |
| | | | | | |
22
We believe that we are in compliance with all of our debt covenants. Noncompliance with any one or more of the debt covenants may have an adverse effect on financial condition or liquidity in the event such noncompliance cannot be cured or should we be unable to obtain a waiver from the lenders. Renegotiation of the covenant through an amendment to the Credit Agreement may effectively cure the noncompliance, but may have an effect on financial condition or liquidity depending upon how the covenant is renegotiated.
We believe that existing borrowing availability, our current cash balances and our cash flow from operations will be sufficient to satisfy our working capital, capital expenditure and dividend requirements for the foreseeable future.
Quantitative and Qualitative Disclosures About Market Risk
Tredegar has exposure to the volatility of interest rates, polyethylene and polypropylene resin prices, aluminum ingot and scrap prices, energy prices, foreign currencies and emerging markets. See the section on liquidity and capital resources beginning on page 20 regarding Credit Agreement and interest rate exposures.
Changes in resin prices, and the timing of those changes, could have a significant impact on profit margins in Film Products. Profit margins in Aluminum Extrusions are sensitive to fluctuations in aluminum ingot and scrap prices as well as natural gas prices. There is no assurance of our ability to pass through higher raw material and energy costs to our customers.
Resin costs for Film Products increased 26% in 2003. The changes in the price of low density polyethylene resin shown in the chart below (a primary raw material for Film Products) are generally reflective of the historical price changes of most of the resins that the company purchases.
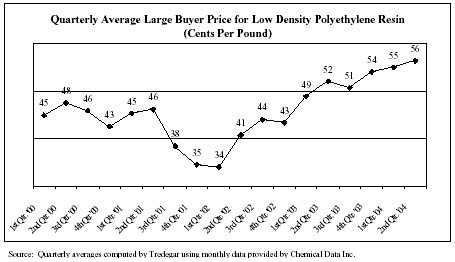
The price of resin is driven by several factors including supply and demand and the price of natural gas, ethane and ethylene. For a portion of the volume in Film Products, our most effective means of mitigating resin price fluctuations is by passing on resin price changes to customers. Some pass-through arrangements are on a time lag, where the impact of movement in resin prices is recovered in the subsequent quarter or quarters. Many of the mechanisms for pass-through with our customers are based on published prices. We estimate that pass-through arrangements have reduced the effects of resin price volatility by about 45% since the third quarter of 2001, with the remaining exposure resulting in a possible impact on quarterly operating profit of as much as $2 million.
23
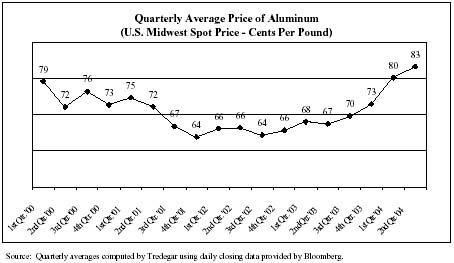
In the normal course of business, we enter into fixed-price forward sales contracts with certain customers for the sale of fixed quantities of aluminum extrusions at scheduled intervals. In order to hedge our exposure to aluminum price volatility (see the chart below) under these fixed-price arrangements, which generally have a duration of not more than 12 months, we enter into a combination of forward purchase commitments and futures contracts to acquire or hedge aluminum, based on the scheduled deliveries.
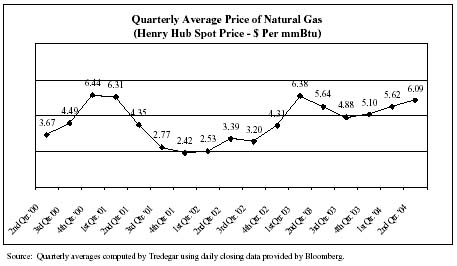
In Aluminum Extrusions, we hedge from time-to-time a portion of our exposure to natural gas price volatility (see the chart below) by entering into fixed-price forward purchase contracts with our natural gas suppliers. During the first quarter of 2004, we had forward contracts with natural gas suppliers covering approximately 65% of our needs with an average fixed price of $5.38 per mmBtu. We had no forward contracts outstanding during the second quarter of 2004. We estimate that, in an unhedged situation, every $1 per mmBtu per month change in the market price of natural gas has a $150,000 impact on the monthly operating profit of Aluminum Extrusions.
24
We sell to customers in foreign markets through our foreign operations and through exports from U.S. plants. The percentage of sales from manufacturing operations related to foreign markets for the first half of 2004 and 2003 are as follows:
Percentage of Net Sales from Manufacturing
Operations Related to Foreign Markets* | |
| |
| | Six Months Ended June 30 | |
| |
| |
| | 2004 | | 2003 | |
| |
| |
| |
| | Exports
From U.S. | | Foreign
Operations | | Exports
From U.S. | | Foreign
Operations | |
| |
| |
| |
| |
| |
| Canada | | | 4 | % | | | 17 | % | | | 4 | % | | | 18 | % | |
| Europe | | | 3 | | | | 12 | | | | 3 | | | | 12 | | |
| Latin America | | | 2 | | | | 2 | | | | 3 | | | | 2 | | |
| Asia | | | 3 | | | | 3 | | | | 3 | | | | 2 | | |
| | |
| | | |
| | | |
| | | |
| | |
| Total | | | 12 | % | | | 34 | % | | | 13 | % | | | 34 | % | |
| | |
| | | |
| | | |
| | | |
| | |
| * | Based on consolidated net sales from manufacturing operations
(excludes Therics and discontinued operations). | |
| | | | | | | | | | | | | | | | | | |
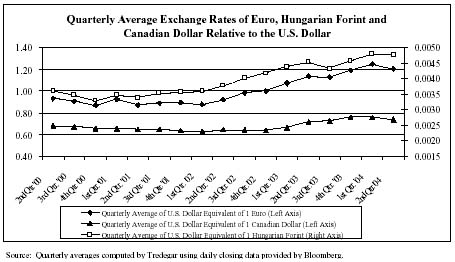
We attempt to match the pricing and cost of our products in the same currency (except in Canada where about 70% of our sales of aluminum extrusions are U.S. Dollar-based) and generally view the volatility of foreign currencies and emerging markets, and the corresponding impact on earnings and cash flow, as part of the overall risk of operating in a global environment. Exports from the U.S. are generally denominated in U.S. Dollars. Our foreign currency exposure on income from foreign operations in Europe primarily relates to the Euro and the Hungarian Forint.
The relatively high percentage of U.S. Dollar-priced sales in Canada is partly due to the shifting of a large portion of the customers previously served by the aluminum extrusions plant in El Campo, Texas, in 2001. The resulting mismatch between the currency denomination of sales and costs causes lower U.S. Dollar translated profits when the Canadian Dollar appreciates since our costs are higher in U.S. Dollar equivalent terms while sales are mostly unaffected (the opposite effect occurs when the Canadian Dollar depreciates in value relative to the U.S. Dollar). We estimate that the appreciation of the Canadian Dollar relative to the U.S. Dollar during the first half of 2004 (up on average by 8.4% in the first half of 2004 compared with 2003 and 1% when comparing June 30, 2004 and 2003 exchange rates) had an adverse impact on the operating profit in Aluminum Extrusions of about $1.4 million compared with 2003. In Film Products, where we have been able to better match the currency of our sales and costs, we estimate that the appreciation of the Euro and Hungarian Forint relative to the U.S. Dollar in the first half of 2004 (up on average by 11.1% and 7.5%, respectively, in the first half of 2004 compared with 2003 and 6% and 12.5%, respectively, when comparing June 30, 2004 and 2003 exchange rates) had a positive impact on the operating profit in Film Products of about $500,000 compared with 2003.
25
We are continuing to review the loading of our aluminum extrusions plants in North America to optimize production mix and minimize cost in light of the increase in the U.S. Dollar equivalent cost structure of our plants in Canada.
Forward-Looking and Cautionary Statements
From time to time, we may make statements that may constitute “forward-looking statements” within the meaning of the “safe-harbor” provisions of the Private Securities Litigation Reform Act of 1995. Such statements are based on our then current expectations and are subject to a number of risks and uncertainties that could cause actual results to differ materially from those addressed in the forward-looking statements. Factors that may cause such a difference include, but are not limited to the following:
General
• | Our future performance is influenced by costs incurred by our operating companies including, for example, the cost of energy and raw materials. There is no assurance that we will be able to offset fully the effects of higher raw material costs through price increases. Further, there is no assurance that cost control efforts will be sufficient to offset any additional future declines in revenue or increases in energy, raw material or other costs. |
| |
• | As part of our business strategy, we expect to pursue acquisitions of businesses or investments that have unique and sustainable technologies, products and services in attractive end markets. The success of this strategy will depend upon our ability to identify, acquire and finance such businesses and to achieve planned synergies and operating results, none of which can be assured. |
Film Products
• | Film Products is highly dependent on sales associated with one customer, P&G. P&G comprised 29% of Tredegar’s net sales in 2003, 33% in 2002 and 31% in 2001. The loss or significant reduction of sales associated with P&G would have a material adverse effect on our business, as would delays in P&G rolling out products utilizing new technologies developed by Tredegar. While we have undertaken efforts to expand our customer base, there can be no assurance that such efforts will be successful, or that they will offset any delay or loss of sales and profits associated with P&G. |
26
| |
• | Growth of Film Products depends on our ability to develop and deliver new products, especially in the personal care market. Personal care products are now being made with a variety of new materials, replacing traditional backsheet and other components. While we have substantial technical resources, there can be no assurance that our new products can be brought to market successfully, or if brought to market successfully, at the same level of profitability and market share of replaced films. A shift in customer preferences away from our technologies, our inability to develop and deliver new profitable products, or delayed acceptance of our new products in domestic or foreign markets, could have a material adverse effect on our business. |
| |
• | Film Products operates in a field where our significant customers and competitors have substantial intellectual property portfolios. The continued success of this business depends on our ability not only to protect our own technologies and trade secrets, but also to develop and sell new products that do not infringe upon existing patents. Although we are not currently involved in any patent litigation, an unfavorable outcome of any such action could have a significant adverse impact on Film Products. |
| |
• | As Film Products expands its personal care business, we have greater credit risk that is inherent in broadening our customer base. |
| |
Aluminum Extrusions |
| |
• | Sales volume and profitability of Aluminum Extrusions is cyclical and highly dependent on economic conditions of end-use markets in the United States and Canada, particularly in the construction, distribution and transportation industries. Our market segments are also subject to seasonal slowdowns during the winter months. From 1992 to the second quarter of 2000, profits in Aluminum Extrusions grew as a result of positive economic conditions in the markets we serve and manufacturing efficiencies. However, a slowdown in these markets in the second half of 2000 resulted in a 13% decline in sales volume and 28% decline in ongoing operating profit compared with the second half of 1999. The aluminum extrusions industry continued to be affected by poor economic conditions in 2001 and 2002. Our sales volume declined 23% and operating profit declined 49% in 2002 compared with 2000. In 2001, our sales volume declined 20% and operating profit declined 52% compared with 2000. The decline in ongoing operating profit during these periods at approximately two to three times the rate of the decline in sales volume illustrates the operating leverage inherent in our operations (fixed operating costs). Moreover, in 2003 higher energy and insurance costs and the appreciation of the Canadian Dollar against the U.S. Dollar had an adverse impact on operating profits. Any benefits associated with cost reductions and productivity improvements may not be sufficient to offset the adverse effects on profitability from pricing and margin pressure and higher bad debts that usually accompany a downturn. |
| |
• | The markets for our products are highly competitive with product quality, service and price being the principal competitive factors. As competitors increase capacity or reduce prices to increase business, there could be pressure to reduce prices to our customers. Aluminum Extrusions is under increasing domestic and foreign competitive pressures, including a growing presence of Chinese and other foreign imports in a number of markets. This competition could result in loss of market share due to a competitor’s ability to produce at lower costs and sell at lower prices. There can be no assurance that we will be able to maintain current margins and profitability. Our continued success and prospects depend on our ability to retain existing customers and participate in overall industry cross-cycle growth. |
27
| |
Therics |
|
• | Therics has incurred losses since inception, and we are unsure when, or if, it will become profitable. We are in the initial stages of commercializing certain orthobiologic products that have received FDA clearances. There can be no assurance that any of these products can be brought to market successfully. |
| |
| The commercialization of new future products will require significant research, development, preclinical and clinical testing, and regulatory approvals. Where potential new products do not advance beyond early product development or do not demonstrate preclinical or clinical efficacy, they will not likely be commercialized. In addition, there can be no assurance that the FDA and other regulatory authorities will clear our products in a timely manner. |
| |
• | Our ability to develop and commercialize products will depend on our ability to internally develop preclinical, clinical, regulatory, manufacturing and sales, distribution and marketing capabilities, or enter into arrangements with third parties to provide those functions. We may not be successful in developing these capabilities or entering into agreements with third parties on favorable terms. To the extent we rely on third parties for these capabilities, our control over such activities may be reduced which could make us dependent upon these parties. The inability to develop or contract for these capabilities would significantly impair our ability to develop and commercialize products and thus our ability to become profitable. |
| |
| Related factors that may impair our ability to develop and commercialize products include our reliance on pre-clinical and clinical data concerning our products and product introductions by competing companies. Likewise, in the event we are unable to manufacture our products efficiently, our ability to commercialize products and thus our operating results will be negatively affected. |
| |
| We are relying to a significant degree on a sales force consisting of independent sales agents for the sale and marketing of our products. Market acceptance of our products, and thus our ability to become profitable, is largely dependent upon the competency of this sales force, whether they perform their duties in line with our expectations and their continued willingness to carry our products. |
| |
• | Our ability to develop and commercialize products will depend on market acceptance of those products. We are dependent upon the willingness of the medical community to learn about and try our products and then switch from currently used products to our products. In the event the community is reluctant or unwilling to utilize our products, our ability to generate profits will be significantly impaired. Commercial success is also dependent upon third party payor acceptance of our products. |
| |
• | Our ability to develop and commercialize certain products is dependent upon sufficient sources of supply for various raw materials. We may not be successful in procuring the types and quantities of raw materials necessary to commercialize certain orthobiologic products, which would significantly impair our ability to become profitable. |
| |
• | Future sales and profits are dependent upon obtaining and maintaining all necessary regulatory approvals. We have received clearances from the FDA for certain products as medical devices, which approvals must be maintained in order to commercialize these products. Similar FDA approval will need to be obtained for any new products in order to market those products. In addition, depending upon where we intend to engage in marketing activities, we may need to obtain the necessary approvals from the regulatory agencies of the applicable jurisdictions. Failure to obtain and maintain the necessary regulatory approvals would significantly impair our ability to market our products and thus our ability to generate profits. Likewise, the marketing of our products and our profit generating capability would be impaired in the event approval of one or more of our products is limited or restricted by the FDA, either in conjunction with or subsequent to approval. |
28
• | We are highly dependent on several principal members of our management and scientific staff. The loss of key personnel (or the inability to recruit key personnel) could have a material adverse effect on Therics’ business and results of operations, and could inhibit product research and development, commercialization and sales and marketing efforts. Failure to retain and recruit executive management in key areas, including sales and marketing and product research and development, could prevent us from achieving our business objectives. |
| |
• | We are dependent upon certain license rights, patents and other proprietary rights. Future success is dependent in part on our ability to maintain and enforce license, patent and other proprietary rights. Complex legal and technical issues define the strength and value of our intellectual property portfolio. While we own or license certain patents, the issuance of a patent does not establish conclusively either validity or enforceability. |
| |
• | The patent positions of biotechnology firms generally are highly uncertain and involve complex legal and factual questions that can determine who has the right to develop a particular product. No clear policy has emerged regarding the breadth of claims covered by biotechnology patents in the U.S. The biotechnology patent situation outside the U.S. is even more uncertain and is currently undergoing review and revision in many countries. Changes in, or different interpretations of, patent laws in the U.S. and other countries might allow others to use our discoveries or to develop and commercialize our products without any compensation to us. |
| |
• | Our business exposes us to potential product liability claims. The testing, manufacturing, marketing and sale of our products subject us to product liability risk, an inherent risk for our industry. A successful product liability action against us may have a material adverse effect on our business. Moreover, present insurance coverage may not be adequate to cover potential future product liability claims. |
29
Item 3. Quantitative and Qualitative Disclosures About Market Risk
See discussion under “Quantitative and Qualitative Disclosures About Market Risk” beginning on page 23.
Item 4. Controls and Procedures.
Pursuant to Rule 13a-15(b) under the Securities Exchange Act of 1934, we carried out an evaluation, with the participation of our management, including our principal executive officer and principal financial officer, of the effectiveness of our disclosure controls and procedures (as defined under Rule 13a-15(e) under the Securities Exchange Act of 1934) as of the end of the period covered by this report. Based upon that evaluation, our principal executive officer and principal financial officer concluded that our disclosure controls and procedures are effective in timely alerting them to material information relating to Tredegar required to be included in our periodic SEC filings.
There has been no change in our internal control over financial reporting during the quarter ended June 30, 2004, that has materially affected, or is reasonably likely to materially affect, our internal control over financial reporting.
30
PART II - | OTHER INFORMATION |
| |
Item 4. | Submission of Matters to a Vote of Security Holders. |
| |
| Tredegar’s Annual Meeting of Shareholders was held on April 29, 2004. The following sets forth the vote results with respect to each of the matters voted upon by shareholders at the meeting: |
| |
(a) | Election of Directors |
| Nominee | | Number of
Votes “For” | | Number of Votes
“Withheld” | |
|
| |
| |
| |
| Donald T. Cowles | | 35,092,113 | | 1,180,017 | |
| Richard W. Goodrum | | 32,472,943 | | 3,799,187 | |
| John D. Gottwald | | 32,681,976 | | 3,590,154 | |
| Thomas G. Slater, Jr. | | 32,489,800 | | 3,782,330 | |
| There were no broker non-votes with respect to the election of directors. |
| |
| The term of office for the following directors continued after the annual meeting and such directors were not up for election at the annual meeting: |
| |
| Austin Brockenbrough, III |
| Phyllis Cothran |
| Floyd D. Gottwald, Jr. |
| William M. Gottwald |
| Norman A. Scher |
| Richard L. Morrill |
| R. Gregory Williams |
| |
(b) | Approval of 2004 Equity Incentive Plan |
| |
| Approval of the Tredegar Corporation 2004 Equity Incentive Plan: |
| Number of Votes
“For” | | Number of Votes
“Against” | | Number of
Abstentions | | Number of
Broker Non-Votes | |
|
| |
| |
| |
| |
| 29,389,818 | | 2,361,780 | | 686,456 | | 3,834,076 | |
31
Item 6. | Exhibits and Reports on Form 8-K. |
| |
(a) | Exhibit Nos. |
| |
| 31.1 | Certification of Norman A. Scher, President and Chief Executive Officer of Tredegar Corporation, pursuant to Rules 13a-14(a) and 15d-14(a) promulgated under the Securities Exchange Act of 1934, as adopted pursuant to Section 302 of the Sarbanes-Oxley Act of 2002. |
| | |
| 31.2 | Certification of D. Andrew Edwards, Vice President, Chief Financial Officer and Treasurer (Principal Financial Officer) of Tredegar Corporation, pursuant to Rules 13a-14(a) and 15d-14(a) promulgated under the Securities Exchange Act of 1934, as adopted pursuant to Section 302 of the Sarbanes-Oxley Act of 2002. |
| | |
| 32.1 | Certification of Norman A. Scher, President and Chief Executive Officer of Tredegar Corporation, pursuant to 18 U.S.C. Section 1350, as adopted pursuant to Section 906 of the Sarbanes-Oxley Act of 2002. |
| | |
| 32.2 | Certification of D. Andrew Edwards, Vice President, Chief Financial Officer and Treasurer (Principal Financial Officer) of Tredegar Corporation, pursuant to 18 U.S.C. Section 1350, as adopted pursuant to Section 906 of the Sarbanes-Oxley Act of 2002. |
| |
(b) | Reports on Form 8-K. |
| |
| On April 21, 2004, we furnished a Form 8-K with respect to our first quarter 2004 earnings press release dated April 21, 2004. On July 21, 2004, we furnished a Form 8-K with respect to our second quarter 2004 earnings press release dated July 21, 2004. |
32
SIGNATURES
Pursuant to the requirements of the Securities Exchange Act of 1934, the Registrant has duly caused this report to be signed on its behalf by the undersigned thereunto duly authorized.
| | Tredegar Corporation | |
| | (Registrant) | |
| | | |
| | | |
Date: | August 4, 2004 | /s/ D. Andrew Edwards | |
| |
| |
| | D. Andrew Edwards | |
| | Vice President, Chief Financial Officer and
Treasurer | |
| | (Principal Financial and Accounting Officer) | |
33