UNITED STATES
SECURITIES AND EXCHANGE COMMISSION
Washington, D.C. 20549
FORM N-CSR
CERTIFIED SHAREHOLDER REPORT OF REGISTERED
MANAGEMENT INVESTMENT COMPANIES
Investment Company Act file number 811-05812
Legg Mason Partners Premium Money Market Trust
(Exact name of registrant as specified in charter)
620 Eighth Avenue, 49th Floor, New York, NY 10018
(Address of principal executive offices) (Zip code)
Robert I. Frenkel, Esq.
Legg Mason & Co., LLC
100 First Stamford Place
Stamford, CT 06902
(Name and address of agent for service)
Registrant’s telephone number, including area code: 1-877-721-1926
Date of fiscal year end: August 31
Date of reporting period: February 29, 2016
| ITEM 1. | REPORT TO STOCKHOLDERS. |
The Semi-Annual Report to Stockholders is filed herewith.

| | |
| Semi-Annual Report | | February 29, 2016 |
WESTERN ASSET
PREMIUM LIQUID
RESERVES

|
| INVESTMENT PRODUCTS: NOT FDIC INSURED • NO BANK GUARANTEE • MAY LOSE VALUE |
Fund objective
The Fund’s investment objective is to provide shareholders with liquidity and as high a level of current income as is consistent with preservation of capital.
Letter from the president

Dear Shareholder,
We are pleased to provide the semi-annual report of Western Asset Premium Liquid Reserves for the six-month reporting period ended February 29, 2016. Please read on for Fund performance information and a detailed look at prevailing economic and market conditions during the Fund’s reporting period.
As always, we remain committed to providing you with excellent service and a full spectrum of investment choices. We also remain committed to supplementing the support you receive from your financial advisor. One way we accomplish this is through our website, www.leggmason.com/individualinvestors. Here you can gain immediate access to market and investment information, including:
| • | | Fund prices and performance, |
| • | | Market insights and commentaries from our portfolio managers, and |
| • | | A host of educational resources. |
We look forward to helping you meet your financial goals.
Sincerely,

Jane Trust, CFA
President and Chief Executive Officer
March 31, 2016
| | |
| II | | Western Asset Premium Liquid Reserves |
Investment commentary
Economic review
The pace of U.S. economic activity was mixed during the six months ended February 29, 2016 (the “reporting period”). Looking back, the U.S. Department of Commerce reported that second quarter 2015 U.S. gross domestic product (“GDP”)i growth was 3.9%. Relatively solid growth was driven by increasing exports, accelerating personal consumption expenditures (“PCE”), declining imports, expanding state and local government spending, and rising nonresidential fixed investment. Third quarter 2015 GDP growth then moderated to 2.0%. Decelerating growth was primarily due to a downturn in private inventory investment and decelerations in exports, PCE, nonresidential fixed investment, state
and local government spending, and residential fixed investment. Finally, the U.S. Department of Commerce’s final reading for fourth quarter 2015 GDP growth — released after the reporting period ended — was 1.4%. Slower growth was attributed to downturns in nonresidential fixed investment and state and local government spending, along with a deceleration in PCE and less export activity.
The U.S. labor market was a tailwind for the economy during the reporting period. When the period began, unemployment was 5.1%, as reported by the U.S. Department of Labor. By February 2016, unemployment was 4.9%, equaling its lowest level since February 2008.
| | |
| Western Asset Premium Liquid Reserves | | III |
Investment commentary (cont’d)
Market review
Q. How did the Federal Reserve Board (“Fed”)ii respond to the economic environment?
A. After an extended period of maintaining the federal funds rateiii at a historically low range between zero and 0.25%, the Fed increased the rate at its meeting on December 16, 2015. This marked the first rate hike since 2006. In particular, the U.S. central bank raised the federal funds rate to a range between 0.25% and 0.50%. In its official statement after the December 2015 meeting, the Fed said, “The stance of monetary policy remains accommodative after this increase, thereby supporting further improvement in labor market conditions and a return to 2 percent inflation….The Committee expects that economic conditions will evolve in a manner that will warrant only gradual increases in the federal funds rate; the federal funds rate is likely to remain, for some time, below levels that are expected to prevail in the longer run.” At its meetings that concluded on January 27, 2016 and March 16, 2016, after the reporting period ended, the Fed kept rates on hold.
Q. Did Treasury yields trend higher or lower during the six months ended February 29, 2016?
A. Short-term Treasury yields edged higher, whereas long-term Treasury yields declined during the reporting period. When the period began, the yield on the two-year Treasury note was 0.74%. Its low for the period was 0.57% on October 14, 2015, and it peaked at 1.09% on December 29, 2015. The yield on the two-year Treasury note ended the period at 0.78%. The yield on the ten-year Treasury note began the period at 2.21%. Its peak of 2.36% occurred on November 9, 2015, and its low of 1.63% occurred on February 11, 2016. The yield on the ten-year Treasury note ended the period at 1.74%.
Q. What factors impacted money market yields during the reporting period?
A. While the Fed raised rates during the reporting period, the yields available from money market securities remained extremely low during the six months ended February 29, 2016.
Performance review
As of February 29, 2016, the seven-day current yield for Western Asset Premium Liquid Reserves was 0.11% and the seven-day effective yield, which reflects compounding, was 0.11%.1
The Fund does not invest directly in securities but instead invests all of its investable assets in an underlying mutual fund, Liquid Reserves Portfolio, which has the same investment objective and strategies, and substantially the same policies as the Fund. Unless otherwise indicated, references to the Fund include the underlying mutual fund, Liquid Reserves Portfolio.
| 1 | The seven-day current yield reflects the amount of income generated by the investment during that seven-day period and assumes that the income is generated each week over a 365-day period. The yield is shown as a percentage of the investment. The seven-day effective yield is calculated similarly to the seven-day current yield but, when annualized, the income earned by an investment in the Fund is assumed to be reinvested. The effective yield typically will be slightly higher than the current yield because of the compounding effect of the assumed reinvestment. |
| | |
| IV | | Western Asset Premium Liquid Reserves |
| | | | | | |
Western Asset Premium Liquid Reserves Yields as of February 29, 2016 (unaudited) |
| Seven-Day Current Yield1 | | | 0.11 | % | | |
| Seven-Day Effective Yield1 | | | 0.11 | % | | |
The performance shown represents past performance. Past performance is no guarantee of future results and current performance may be higher or lower than the performance shown above. Yields will fluctuate. To obtain performance data current to the most recent month-end, please visit our website at www.leggmason.com/individualinvestors.
Absent fee waivers and/or expense reimbursements, the seven-day current yield and the seven-day effective yield would have been -0.01%.
The manager has voluntarily undertaken to limit Fund expenses. Such expense limitations may fluctuate daily and are voluntary and temporary and may be terminated by the manager at any time without notice.
An investment in the Fund is neither insured nor guaranteed by the Federal Deposit Insurance Corporation (“FDIC”) or any other government agency. Although the Fund seeks to preserve the value of your investment at $1.00 per share, it is possible to lose money by investing in the Fund.
As always, thank you for your confidence in our stewardship of your assets.
Sincerely,
Jane Trust, CFA
President and Chief Executive Officer
March 31, 2016
RISKS: An investment in a money market fund is neither insured nor guaranteed by the FDIC or any other government agency. Although the Fund seeks to preserve the value of your investment at one dollar per share, it is still possible to lose money by investing in the Fund. The Fund will be more susceptible to negative events affecting the worldwide financial services sector as a significant portion of its assets may be invested in obligations that are issued or backed by U.S. and non-U.S. banks and other financial services companies. Please see the Fund’s prospectus for a more complete discussion of these and other risks, and the Fund’s investment strategies.
All investments are subject to risk including the possible loss of principal. Past performance is no guarantee of future results.
The information provided is not intended to be a forecast of future events, a guarantee of future results or investment advice. Views expressed may differ from those of the firm as a whole.
| 1 | The seven-day current yield reflects the amount of income generated by the investment during that seven-day period and assumes that the income is generated each week over a 365-day period. The yield is shown as a percentage of the investment. The seven-day effective yield is calculated similarly to the seven-day current yield but, when annualized, the income earned by an investment in the Fund is assumed to be reinvested. The effective yield typically will be slightly higher than the current yield because of the compounding effect of the assumed reinvestment. |
| | |
| Western Asset Premium Liquid Reserves | | V |
Investment commentary (cont’d)
| i | Gross domestic product (“GDP”) is the market value of all final goods and services produced within a country in a given period of time. |
| ii | The Federal Reserve Board (“Fed”) is responsible for the formulation of U.S. policies designed to promote economic growth, full employment, stable prices and a sustainable pattern of international trade and payments. |
| iii | The federal funds rate is the rate charged by one depository institution on an overnight sale of immediately available funds (balances at the Federal Reserve) to another depository institution; the rate may vary from depository institution to depository institution and from day to day. |
| | |
| VI | | Western Asset Premium Liquid Reserves |
Portfolio at a glance† (unaudited)
Liquid Reserves Portfolio
The Fund invests all of its investable assets in Liquid Reserves Portfolio, the investment breakdown of which is shown below.
Investment breakdown (%) as a percent of total investments
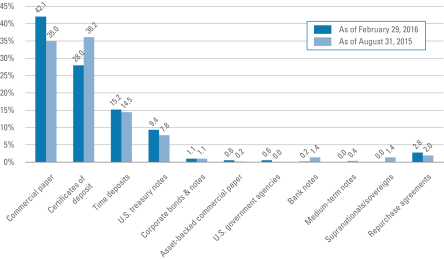
| † | The bar graph above represents the composition of the Portfolio’s investments as of February 29, 2016 and August 31, 2015. The Portfolio is actively managed. As a result, the composition of the Portfolio’s investments is subject to change at any time. |
| | |
| Western Asset Premium Liquid Reserves 2016 Semi-Annual Report | | 1 |
Fund expenses (unaudited)
Example
As a shareholder of the Fund, you may incur two types of costs: (1) transaction costs and (2) ongoing costs, including management fees, service and/or distribution (12b-1) fees and other Fund expenses. This example is intended to help you understand your ongoing costs (in dollars) of investing in the Fund and to compare these costs with the ongoing costs of investing in other mutual funds.
This example is based on an investment of $1,000 invested on September 1, 2015 and held for the six months ended February 29, 2016.
Actual expenses
The table below titled “Based on Actual Total Return” provides information about actual account values and actual expenses. You may use the information provided in this table, together with the amount you invested, to estimate the expenses that you paid over the period. To estimate the expenses you paid on your account, divide your ending account value by $1,000 (for example, an $8,600 ending account value divided by $1,000 = 8.6), then multiply the result by the number under the heading entitled “Expenses Paid During the Period”.
Hypothetical example for comparison purposes
The table below titled “Based on Hypothetical Total Return” provides information about hypothetical account values and hypothetical expenses based on the actual expense ratio and an assumed rate of return of 5.00% per year before expenses, which is not the Fund’s actual return. The hypothetical account values and expenses may not be used to estimate the actual ending account balance or expenses you paid for the period. You may use the information provided in this table to compare the ongoing costs of investing in the Fund and other funds. To do so, compare the 5.00% hypothetical example relating to the Fund with the 5.00% hypothetical examples that appear in the shareholder reports of the other funds.
Please note that the expenses shown in the table below are meant to highlight your ongoing costs only and do not reflect any transactional costs. Therefore, the table is useful in comparing ongoing costs only, and will not help you determine the relative total costs of owning different funds. In addition, if these transaction costs were included, your costs would have been higher.
| | | | | | | | | | | | | | | | | | | | | | | | | | | | | | | | | | | | | | | | | | | | | | | | | | |
| Based on actual total return1 | | | | Based on hypothetical total return1 |
Actual
Total
Return2 | | Beginning
Account
Value | | Ending
Account
Value | | Annualized
Expense
Ratio3 | | Expenses
Paid During
the Period4 | | | | Hypothetical
Annualized
Total Return | | Beginning
Account
Value | | Ending
Account
Value | | Annualized
Expense
Ratio3 | | Expenses
Paid During
the Period4 |
| | | 0.01% | | | | $ | 1,000.00 | | | | $ | 1,000.10 | | | | | 0.33 | % | | | $ | 1.64 | | | | | | | 5.00 | % | | | | $1,000.00 | | | | $ | 1,023.22 | | | | | 0.33 | % | | | $ | 1.66 | |
| 1 | For the six months ended February 29, 2016. |
| 2 | Assumes the reinvestment of all distributions, including returns of capital, if any, at net asset value. Total return is not annualized, as it may not be representative of the total return for the year. Performance figures may reflect fee waivers and/or expense reimbursements. In the absence of fee waivers and/or expense reimbursements, the total return would have been lower. Past performance is no guarantee of future results. |
| 3 | Includes the Fund’s share of Liquid Reserves Portfolio’s allocated expenses. |
| 4 | Expenses (net of fee waivers and/or expense reimbursements) are equal to the Fund’s annualized expense ratio multiplied by the average account value over the period, multiplied by the number of days in the most recent fiscal half-year (182), then divided by 366. |
| | |
| 2 | | Western Asset Premium Liquid Reserves 2016 Semi-Annual Report |
Statement of assets and liabilities (unaudited)
February 29, 2016
| | | | |
| |
| Assets: | | | | |
Investment in Liquid Reserves Portfolio, at value | | $ | 125,819,469 | |
Receivable for Fund shares sold | | | 31,053 | |
Prepaid expenses | | | 11,294 | |
Total Assets | | | 125,861,816 | |
| |
| Liabilities: | | | | |
Investment management fee payable | | | 34,906 | |
Payable for Fund shares repurchased | | | 26,187 | |
Distributions payable | | | 2,926 | |
Trustees’ fees payable | | | 947 | |
Accrued expenses | | | 47,602 | |
Total Liabilities | | | 112,568 | |
| Total Net Assets | | $ | 125,749,248 | |
| |
| Net Assets: | | | | |
Par value (Note 3) | | $ | 1,257 | |
Paid-in capital in excess of par value | | | 125,922,953 | |
Undistributed net investment income | | | 1,878 | |
Accumulated net realized loss on investments allocated from Liquid Reserves Portfolio | | | (176,840) | |
| Total Net Assets | | $ | 125,749,248 | |
| |
| Shares Outstanding | | | 125,737,353 | |
| |
| Net Asset Value | | | $1.00 | |
See Notes to Financial Statements.
| | |
| Western Asset Premium Liquid Reserves 2016 Semi-Annual Report | | 3 |
Statement of operations (unaudited)
For the Six Months Ended February 29, 2016
| | | | |
| |
| Investment Income: | | | | |
Income from Liquid Reserves Portfolio | | $ | 367,808 | |
Allocated expenses from Liquid Reserves Portfolio | | | (115,426) | |
Allocated waiver from Liquid Reserves Portfolio | | | 105,519 | |
Other income | | | 37 | |
Total Investment Income | | | 357,938 | |
| |
| Expenses: | | | | |
Investment management fee (Note 2) | | | 369,228 | |
Service and/or distribution fees (Note 2) | | | 105,494 | |
Transfer agent fees | | | 17,827 | |
Shareholder reports | | | 15,248 | |
Legal fees | | | 12,734 | |
Registration fees | | | 11,622 | |
Audit and tax fees | | | 11,117 | |
Fund accounting fees | | | 3,133 | |
Trustees’ fees | | | 2,498 | |
Insurance | | | 1,844 | |
Miscellaneous expenses | | | 1,116 | |
Total Expenses | | | 551,861 | |
Less: Fee waivers and/or expense reimbursements (Note 2) | | | (215,180) | |
Net Expenses | | | 336,681 | |
| Net Investment Income | | | 21,257 | |
| Net Realized Loss on Investments From Liquid Reserves Portfolio | | | (27,692) | |
| Decrease in Net Assets from Operations | | $ | (6,435) | |
See Notes to Financial Statements.
| | |
| 4 | | Western Asset Premium Liquid Reserves 2016 Semi-Annual Report |
Statements of changes in net assets
| | | | | | | | |
For the Six Months Ended February 29, 2016 (unaudited) and the Year Ended August 31, 2015 | | 2016 | | | 2015 | |
| | |
| Operations: | | | | | | | | |
Net investment income | | $ | 21,257 | | | $ | 32,335 | |
Net realized gain (loss) | | | (27,692) | | | | 27,025 | |
Increase (Decrease) in Net Assets From Operations | | | (6,435) | | | | 59,360 | |
| | |
| Distributions to Shareholders From (Note 1): | | | | | | | | |
Net investment income | | | (21,221) | | | | (32,294) | |
Decrease in Net Assets From Distributions to Shareholders | | | (21,221) | | | | (32,294) | |
| | |
| Fund Share Transactions (Note 3): | | | | | | | | |
Net proceeds from sale of shares | | | 469,042,510 | | | | 2,521,619,124 | |
Reinvestment of distributions | | | 12,459 | | | | 10,089 | |
Cost of shares repurchased | | | (661,677,085) | | | | (2,404,183,990) | |
Increase (Decrease) in Net Assets From Fund Share Transactions | | | (192,622,116) | | | | 117,445,223 | |
Increase (Decrease) in Net Assets | | | (192,649,772) | | | | 117,472,289 | |
| | |
| Net Assets: | | | | | | | | |
Beginning of period | | | 318,399,020 | | | | 200,926,731 | |
End of period* | | $ | 125,749,248 | | | $ | 318,399,020 | |
*Includes undistributed net investment income of: | | | $1,878 | | | | $1,842 | |
See Notes to Financial Statements.
| | |
| Western Asset Premium Liquid Reserves 2016 Semi-Annual Report | | 5 |
Financial highlights
| | | | | | | | | | | | | | | | | | | | | | | | |
For a share of beneficial interest outstanding throughout each year ended August 31, unless otherwise noted: | |
| | | 20161,2 | | | 20151 | | | 20141 | | | 20131 | | | 2012 | | | 2011 | |
| | | | | | |
| Net asset value, beginning of period | | | $1.000 | | | | $1.000 | | | | $1.000 | | | | $1.000 | | | | $1.000 | | | | $1.000 | |
| | | | | | |
| Income (loss) from operations: | | | | | | | | | | | | | | | | | | | | | | | | |
Net investment income3 | | | 0.000 | | | | 0.000 | | | | 0.000 | | | | 0.000 | | | | 0.000 | | | | 0.000 | |
Net realized gain (loss)3 | | | (0.000) | | | | 0.000 | | | | (0.000) | | | | (0.000) | | | | 0.000 | | | | 0.000 | |
Total income from operations3 | | | (0.000) | | | | 0.000 | | | | 0.000 | | | | 0.000 | | | | 0.000 | | | | 0.000 | |
| | | | | | |
| Less distributions from: | | | | | | | | | | | | | | | | | | | | | | | | |
Net investment income3 | | | (0.000) | | | | (0.000) | | | | (0.000) | | | | (0.000) | | | | (0.000) | | | | (0.000) | |
Total distributions3 | | | (0.000) | | | | (0.000) | | | | (0.000) | | | | (0.000) | | | | (0.000) | | | | (0.000) | |
| | | | | | |
| Net asset value, end of period | | | $1.000 | | | | $1.000 | | | | $1.000 | | | | $1.000 | | | | $1.000 | | | | $1.000 | |
Total return4 | | | 0.01 | % | | | 0.01 | % | | | 0.01 | % | | | 0.01 | % | | | 0.01 | % | | | 0.01 | % |
| | | | | | |
| Net assets, end of period (millions) | | | $126 | | | | $318 | | | | $201 | | | | $419 | | | | $445 | | | | $435 | |
| | | | | | |
| Ratios to average net assets: | | | | | | | | | | | | | | | | | | | | | | | | |
Gross expenses5 | | | 0.63 | %6,7 | | | 0.61 | %7 | | | 0.61 | %7 | | | 0.60 | %7 | | | 0.50 | % | | | 0.48 | % |
Net expenses5,8,9 | | | 0.33 | 6 | | | 0.21 | | | | 0.19 | | | | 0.26 | | | | 0.32 | | | | 0.36 | |
Net investment income | | | 0.02 | 6 | | | 0.01 | | | | 0.01 | | | | 0.01 | | | | 0.01 | | | | 0.01 | |
| 1 | Per share amounts have been calculated using the average shares method. |
| 2 | For the six months ended February 29, 2016 (unaudited). |
| 3 | Amount represents less than $0.0005 per share. |
| 4 | Performance figures may reflect fee waivers and/or expense reimbursements. In the absence of fee waivers and/or expense reimbursements, the total return would have been lower. Past performance is no guarantee of future results. Total returns for periods of less than one year are not annualized. |
| 5 | Includes the Fund’s share of Liquid Reserves Portfolio’s allocated expenses. |
| 7 | The gross expenses do not reflect the reduction in the Fund’s management fee by the amount paid by the Fund for its allocable share of the management fee paid by Liquid Reserves Portfolio. |
| 8 | As a result of an expense limitation arrangement, the ratio of expenses, other than interest, brokerage, taxes, extraordinary expenses and acquired fund fees and expenses, to average net assets of the Fund did not exceed 0.45%. This expense limitation arrangement cannot be terminated prior to December 31, 2017 without the Board of Trustees’ consent. Prior to December 31, 2010, the expense limitation was 0.40%. Additional amounts may be voluntarily waived and/or reimbursed from time to time. |
| 9 | Reflects fee waivers and/or expense reimbursements. |
See Notes to Financial Statements.
| | |
| 6 | | Western Asset Premium Liquid Reserves 2016 Semi-Annual Report |
Notes to financial statements (unaudited)
1. Organization and significant accounting policies
Western Asset Premium Liquid Reserves (the “Fund”) is a separate diversified investment series of Legg Mason Partners Premium Money Market Trust (the “Trust”). The Trust, a Maryland statutory trust, is registered under the Investment Company Act of 1940, as amended (the “1940 Act”), as an open-end management investment company. The Fund invests all of its investable assets in Liquid Reserves Portfolio (the “Portfolio”), a separate investment series of Master Portfolio Trust, that has the same investment objective as the Fund.
The financial statements of the Portfolio, including the schedule of investments, are contained elsewhere in this report and should be read in conjunction with the Fund’s financial statements.
The following are significant accounting policies consistently followed by the Fund and are in conformity with U.S. generally accepted accounting principles (“GAAP”). Estimates and assumptions are required to be made regarding assets, liabilities and changes in net assets resulting from operations when financial statements are prepared. Changes in the economic environment, financial markets and any other parameters used in determining these estimates could cause actual results to differ. Subsequent events have been evaluated through the date the financial statements were issued.
(a) Investment valuation. The Fund records its investment in the Portfolio at value. The value of such investment in the Portfolio reflects the Fund’s proportionate interest (0.2% at February 29, 2016) in the net assets of the Portfolio.
GAAP establishes a disclosure hierarchy that categorizes the inputs to valuation techniques used to value assets and liabilities at measurement date. The disclosure and valuation of securities held by the Portfolio are discussed in Note 1(a) of the Portfolio’s Notes to Financial Statements, which are included elsewhere in this report.
(b) Investment transactions and investment income. Net investment income of the Portfolio is allocated pro rata, based on respective ownership interests, among the Fund and other investors in the Portfolio (the “Holders”) at the time of such determination. Gross realized gains and/or losses of the Portfolio are allocated to the Holders in a manner such that, the net asset values per share of each Holder, after each such allocation is closer to the total of all Holders’ net asset values divided by the aggregate number of shares outstanding for all Holders. The Fund also pays certain other expenses which can be directly attributed to the Fund.
(c) Distributions to shareholders. Distributions from net investment income on the shares of the Fund are declared each business day and are paid monthly. Distributions of net realized gains, if any, are declared at least annually. Distributions to shareholders of the Fund are recorded on the ex-dividend date and are determined in accordance with income tax regulations, which may differ from GAAP.
| | |
| Western Asset Premium Liquid Reserves 2016 Semi-Annual Report | | 7 |
Notes to financial statements (unaudited) (cont’d)
(d) Federal and other taxes. It is the Fund’s policy to comply with the federal income and excise tax requirements of the Internal Revenue Code of 1986 (the “Code”), as amended, applicable to regulated investment companies. Accordingly, the Fund intends to distribute its taxable income and net realized gains, if any, to shareholders in accordance with timing requirements imposed by the Code. Therefore, no federal or state income tax provision is required in the Fund’s financial statements.
Management has analyzed the Fund’s tax positions taken on income tax returns for all open tax years and has concluded that as of February 29, 2016, no provision for income tax is required in the Fund’s financial statements. The Fund’s federal and state income and federal excise tax returns for tax years for which the applicable statutes of limitations have not expired are subject to examination by the Internal Revenue Service and state departments of revenue.
(e) Reclassification. GAAP requires that certain components of net assets be reclassified to reflect permanent differences between financial and tax reporting. These reclassifications have no effect on net assets or net asset value per share.
2. Investment management agreement and other transactions with affiliates
Legg Mason Partners Fund Advisor, LLC (“LMPFA”) is the Fund’s and the Portfolio’s investment manager. Western Asset Management Company (“Western Asset”) is the Fund’s and the Portfolio’s subadviser. LMPFA and Western Asset are wholly-owned subsidiaries of Legg Mason, Inc. (“Legg Mason”).
Under the investment management agreement, the Fund pays an investment management fee, calculated daily and monthly, at an annual rate of 0.35% of the Fund’s average daily net assets.
Since the Fund invests all of its investable assets in Liquid Reserves Portfolio, the investment management fee of the Fund will be reduced by the investment management fee allocated to the Fund by Liquid Reserves Portfolio.
LMPFA provides administrative and certain oversight services to the Fund. LMPFA delegates to the subadviser the day-to-day portfolio management of the Fund. For its services, LMPFA pays Western Asset 70% of the net management fee it receives from the Fund.
As a result of an expense limitation arrangement between the Fund and LMPFA, the ratio of expenses other than interest, brokerage, taxes, extraordinary expenses and acquired fund fees and expenses, to average net assets of the Fund did not exceed 0.45%. This expense limitation arrangement cannot be terminated prior to December 31, 2017 without the Board of Trustees’ consent. Additional amounts may be voluntarily waived and/or reimbursed from time to time.
During the six months ended February 29, 2016, fees waived and/or expenses reimbursed amounted to $215,180.
| | |
| 8 | | Western Asset Premium Liquid Reserves 2016 Semi-Annual Report |
LMPFA is permitted to recapture amounts waived and/or reimbursed to the Fund during the same fiscal year if the Fund’s total annual operating expenses have fallen to a level below the expense limitation (“expense cap”) in effect at the time the fees were earned or the expenses incurred. In no case will LMPFA recapture any amount that would result, on any particular business day of the Fund, in the Fund’s total annual operating expenses exceeding the expense cap or any other lower limit then in effect.
Legg Mason Investor Services, LLC, a wholly-owned broker-dealer subsidiary of Legg Mason, serves as the Fund’s sole and exclusive distributor.
The Fund has adopted a Rule 12b-1 shareholder services and distribution plan and under that plan the Fund pays service and/or distribution fees calculated at the annual rate not to exceed 0.10% of the Fund’s average daily net assets. Service and/or distribution fees are accrued daily and paid monthly. For the six months ended February 29, 2016, the service and/or distribution fees paid amounted to $105,494, all of which were voluntarily waived.
All officers and one Trustee of the Trust are employees of Legg Mason or its affiliates and do not receive compensation from the Trust.
3. Shares of beneficial interest
At February 29, 2016, the Trust had an unlimited number of shares of beneficial interest authorized with a par value of $0.00001 per share.
Because the Fund has maintained a $1.00 net asset value per share from inception, the number of shares sold, shares issued on reinvestment of dividends declared, and shares repurchased, is equal to the dollar amount shown in the Statements of Changes in Net Assets for the corresponding fund share transactions.
4. Capital loss carryforward
As of August 31, 2015, the Fund had the following net capital loss carryforward remaining:
| | | | |
| Year of Expiration | | Amount | |
| 8/31/2017 | | $ | (149,148) | |
This amount will be available to offset any future taxable capital gains, except that under applicable tax rules, deferred capital losses, if any, which have no expiration date, must be used first to offset any such gains.
5. Money market fund reform
Under new federal regulations effective on October 14, 2016, the Fund will no longer be allowed to use the special pricing and valuation conventions that currently facilitate a constant share price of $1.00. Instead, on or before that date, the Fund will be required to sell and redeem its shares at prices based on the current market value of the securities it holds, a so-called floating net asset value or floating NAV. Therefore, the share price of the Fund will fluctuate along with changes in the market-based value of fund assets. In addition, no later than that date, the Fund may impose a fee upon the sale of shares or may temporarily suspend the ability to sell shares if the Fund’s liquidity falls below required minimums because of market conditions or other factors.
| | |
| Western Asset Premium Liquid Reserves 2016 Semi-Annual Report | | 9 |
Board approval of management and
subadvisory agreements (unaudited)
At an in-person meeting of the Board of Trustees of Legg Mason Partners Premium Money Market Trust (the “Trust”) held on November 9-10, 2015, the Board, including the Trustees who are not considered to be “interested persons” of the Trust (the “Independent Trustees”) under the Investment Company Act of 1940, as amended (the “1940 Act”), approved for an annual period the continuation of the management agreement (the “Management Agreement”) between the Trust and Legg Mason Partners Fund Advisor, LLC (the “Manager”) with respect to Western Asset Premium Liquid Reserves, a series of the Trust (the “Fund”), and the sub-advisory agreement (the “Sub-Advisory Agreement”) between the Manager and Western Asset Management Company (the “Subadviser”), an affiliate of the Manager, with respect to the Fund.
Background
The Board received extensive information in advance of the meeting from the Manager to assist it in its consideration of the Management Agreement and the Sub-Advisory Agreement and was given the opportunity to ask questions and request additional information from management. In addition, prior to the meeting the Independent Trustees met with their independent legal counsel to discuss and consider the information provided by management and submitted questions to management, and they considered the responses provided. The Board received and considered a variety of information about the Manager and the Subadviser, as well as the management and sub-advisory arrangements for the Fund and other funds overseen by the Board, certain portions of which are discussed below. The Board noted that the Fund is a “feeder fund” in a “master-feeder” structure, whereby, as a feeder fund, the Fund has the same investment objective and policies as the master fund, Liquid Reserves Portfolio (the “Master Fund”), a series of Master Portfolio Trust, and the Fund invests substantially all of its assets in the Master Fund.
The information provided and presentations made to the Board encompassed the Fund and all funds for which the Board has responsibility. The discussion below covers both the advisory and the administrative functions being rendered by the Manager, both of which functions are encompassed by the Management Agreement, as well as the advisory functions rendered by the Subadviser pursuant to the Sub-Advisory Agreement.
Board approval of management agreement and sub-advisory agreement
The Independent Trustees were advised by separate independent legal counsel throughout the process. Prior to voting, the Independent Trustees received a memorandum from their independent legal counsel discussing the legal standards for their consideration of the proposed continuation of the Management Agreement and the Sub-Advisory Agreement. The Independent Trustees also reviewed the proposed continuation of the Management Agreement and the Sub-Advisory Agreement in private sessions with their independent legal counsel at which no representatives of the Manager and Subadviser were present. The Independent Trustees considered the Management Agreement and the Sub-Advisory Agreement separately in the course of their review. In doing so, they noted the respective roles of the Manager and the Subadviser in providing services to the Fund.
| | |
| 10 | | Western Asset Premium Liquid Reserves |
In approving the Management Agreement and Sub-Advisory Agreement, the Board, including the Independent Trustees, considered a variety of factors, including those factors discussed below. No single factor reviewed by the Board was identified by the Board as the principal factor in determining whether to approve the Management Agreement and the Sub-Advisory Agreement. Each Trustee may have attributed different weight to the various factors in evaluating the Management Agreement and the Sub-Advisory Agreement.
Nature, extent and quality of the services under the management agreement and sub-advisory agreement
The Board received and considered information regarding the nature, extent and quality of services provided to the Fund by the Manager and the Subadviser under the Management Agreement and the Sub-Advisory Agreement, respectively, during the past year. The Board noted information received at regular meetings throughout the year related to the services rendered by the Manager in its management of the Fund’s affairs and the Manager’s role in coordinating the activities of the Fund’s other service providers. The Board’s evaluation of the services provided by the Manager and the Subadviser took into account the Board’s knowledge gained as Trustees of funds in the Legg Mason fund complex, including knowledge gained regarding the scope and quality of the investment management and other capabilities of the Manager and the Subadviser, and the quality of the Manager’s administrative and other services. The Board observed that the scope of services provided by the Manager and the Subadviser, and of the undertakings required of the Manager and Subadviser in connection with those services, including maintaining and monitoring their own and the Fund’s compliance programs and cybersecurity programs, had expanded over time as a result of regulatory, market and other developments. The Board also noted that on a regular basis it received and reviewed information from the Manager and the Subadviser regarding the Fund’s compliance policies and procedures established pursuant to Rule 38a-1 under the 1940 Act. The Board also considered the Manager’s and the Subadviser’s risk management processes.
The Board reviewed the qualifications, backgrounds and responsibilities of the Manager’s and the Subadviser’s senior personnel and the team of investment professionals primarily responsible for the day-to-day portfolio management of the Fund. The Board also considered, based on its knowledge of the Manager and its affiliates, the financial resources of Legg Mason, Inc., the parent organization of the Manager and the Subadviser. The Board recognized the importance of having a fund manager with significant resources.
The Board considered the division of responsibilities between the Manager and the Subadviser and the oversight provided by the Manager. The Board also considered the policies and practices of the Manager and the Subadviser regarding the selection of brokers and dealers and the execution of portfolio transactions at the Master Fund level. In addition, management also reported to the Board on, among other things, its business plans and any organizational changes.
| | |
| Western Asset Premium Liquid Reserves | | 11 |
Board approval of management and
subadvisory agreements (unaudited) (cont’d)
The Board received and considered performance information for the Fund as well as for a group of funds (the “Performance Universe”) selected by Lipper, Inc. (currently, Broadridge Financial Solutions, Inc.) (“Lipper”), an independent provider of investment company data. The Board was provided with a description of the methodology Lipper used to determine the similarity of the Fund with the funds included in the Performance Universe. It was noted that while the Board found the Lipper data generally useful they recognized its limitations, including in particular that the data may vary depending on the end date selected. The Board also noted that it had received and discussed with management information throughout the year at periodic intervals and for rolling periods comparing the Fund’s performance against its benchmark and against the Fund’s peers. In addition, the Board considered the Fund’s performance in light of overall financial market conditions.
The information comparing the Fund’s performance to that of its Performance Universe, consisting of all retail funds classified as money market instrument funds by Lipper, showed, among other data, that the Fund’s performance for the 1-, 3- and 5-year periods ended June 30, 2015 was at the median, and its performance for the 10-year period ended June 30, 2015 was above the median. The Board noted the explanations from the Manager and the Subadviser concerning the Fund’s relative performance versus the peer group for the various periods.
The Board concluded that, overall, the nature, extent and quality of services provided (and expected to be provided), including performance, under the Management Agreement and the Sub-Advisory Agreement were sufficient for renewal.
Management fees and expense ratios
The Board reviewed and considered the contractual management fee (the “Contractual Management Fee”) and the actual management fees paid by the Fund to the Manager (the “Actual Management Fee”) in light of the nature, extent and quality of the management and sub-advisory services provided by the Manager and the Subadviser. The Board noted that the Fund’s expense information reflected both management fees and total expenses payable by the Fund as well as management fees and total expenses payable by the Master Fund. The Board also considered that fee waiver and/or expense reimbursement arrangements are currently in place for the Fund. The Board also noted that the compensation paid to the Subadviser is the responsibility and expense of the Manager, not the Fund.
In addition, the Board received and considered information provided by Lipper comparing the Contractual Management Fee and the Actual Management Fee and the Fund’s total actual expenses with those of funds in both the relevant expense group and a broader group of funds, each selected by Lipper. The Board also reviewed information regarding fees charged by the Manager to other U.S. clients investing primarily in an asset class similar to that of the Fund, including, where applicable, separate accounts.
The Manager reviewed with the Board the differences in services provided to these different types of accounts, noting that the Fund is provided with certain administrative services,
| | |
| 12 | | Western Asset Premium Liquid Reserves |
office facilities, and Fund officers (including the Fund’s chief executive, chief financial and chief compliance officers), and that the Manager coordinates and oversees the provision of services to the Fund by other Fund service providers. The Board considered the fee comparisons in light of the differences in management of these different types of accounts.
The Board considered the overall management fee, the fees of the Subadviser and the amount of the management fee retained by the Manager after payment of the subadvisory fee in each case in light of the services rendered for those amounts. The Board also received an analysis of complex-wide management fees provided by the Manager, which, among other things, set out a framework of fees based on asset classes.
The information comparing the Fund’s Contractual and Actual Management Fees as well as its actual total expense ratio to its expense group, consisting of a group of retail no-load funds (including the Fund) classified as money market instrument funds and chosen by Lipper to be comparable to the Fund, showed that the Fund’s Contractual Management Fee was below the median and Actual Management Fee was above the median. The Board noted that the Fund’s actual total expense ratio was above the median. The Board took into account management’s discussion of the Fund’s expenses. The Board also considered that the current limitation on the Fund’s expenses is expected to continue through December 2017.
Taking all of the above into consideration, as well as the factors identified below, the Board determined that the management fee and the subadvisory fee for the Fund were reasonable in light of the nature, extent and quality of the services provided to the Fund under the Management Agreement and the Sub-Advisory Agreement.
Manager profitability
The Board received and considered an analysis of the profitability of the Manager and its affiliates in providing services to the Fund and in providing services to the Master Fund in which the Fund invests. The Board also received profitability information with respect to the Legg Mason fund complex as a whole. In addition, the Board received information with respect to the Manager’s allocation methodologies used in preparing this profitability data. It was noted that the allocation methodologies had been reviewed previously by an outside consultant. The profitability of the Manager and its affiliates was considered by the Board not excessive in light of the nature, extent and quality of the services provided to the Fund and the type of fund it represented.
Economies of scale
The Board received and discussed information concerning whether the Manager realizes economies of scale as the Fund’s assets grow. The Board noted the size of the Fund and that the Fund’s Contractual Management Fee was below the median of the expense group.
The Board determined that the management fee structure for the Fund was reasonable.
| | |
| Western Asset Premium Liquid Reserves | | 13 |
Board approval of management and
subadvisory agreements (unaudited) (cont’d)
Other benefits to the manager and the subadviser
The Board considered other benefits received by the Manager, the Subadviser and their affiliates as a result of their relationship with the Fund, including the opportunity to offer additional products and services to Fund shareholders.
In light of the costs of providing investment management and other services to the Fund and the ongoing commitment of the Manager and the Subadviser to the Fund, the Board considered that the ancillary benefits that the Manager and its affiliates received were reasonable.
* * *
In light of all of the foregoing, the Board determined that the continuation of each of the Management Agreement and Sub-Advisory Agreement would be in the best interests of the Fund’s shareholders and approved the continuation of such agreements for another year.
| | |
| 14 | | Western Asset Premium Liquid Reserves |
Schedule of investments (unaudited)
February 29, 2016
Liquid Reserves Portfolio
| | | | | | | | | | | | | | | | |
| Security | | Rate | | | Maturity
Date | | | Face
Amount | | | Value | |
| Short-Term Investments — 100.4% | | | | | | | | | | | | | | | | |
Asset-Backed Commercial Paper — 0.6% | | | | | | | | | | | | | | | | |
Old Line Funding LLC | | | 0.671 | % | | | 4/4/16 | | | $ | 100,000,000 | | | $ | 99,936,722 | (a)(b) |
Old Line Funding LLC | | | 0.671 | % | | | 4/6/16 | | | | 50,000,000 | | | | 49,966,500 | (a)(b) |
Old Line Funding LLC | | | 0.641 | % | | | 5/16/16 | | | | 75,000,000 | | | | 74,898,667 | (a)(b) |
Old Line Funding LLC | | | 0.641 | % | | | 5/17/16 | | | | 100,000,000 | | | | 99,863,112 | (a)(b) |
Total Asset-Backed Commercial Paper | | | | | | | | | | | | | | | 324,665,001 | |
Bank Notes — 0.2% | | | | | | | | | | | | | | | | |
Bank of America N.A. | | | 0.740 | % | | | 6/7/16 | | | | 112,000,000 | | | | 112,027,272 | |
Certificates of Deposit — 28.1% | | | | | | | | | | | | | | | | |
Bank of Montreal | | | 0.600 | % | | | 4/4/16 | | | | 52,250,000 | | | | 52,254,919 | |
Bank of Montreal | | | 0.600 | % | | | 4/6/16 | | | | 490,000,000 | | | | 490,000,000 | |
Bank of Tokyo-Mitsubishi UFJ NY | | | 0.370 | % | | | 3/4/16 | | | | 100,000,000 | | | | 100,000,000 | |
Bank of Tokyo-Mitsubishi UFJ NY | | | 0.779 | % | | | 3/10/16 | | | | 53,000,000 | | | | 53,002,841 | (c) |
Bank of Tokyo-Mitsubishi UFJ NY | | | 0.500 | % | | | 3/18/16 | | | | 288,000,000 | | | | 288,000,000 | |
Bank of Tokyo-Mitsubishi UFJ NY | | | 0.500 | % | | | 4/5/16 | | | | 25,000,000 | | | | 25,000,000 | |
Bank of Tokyo-Mitsubishi UFJ NY | | | 0.510 | % | | | 4/14/16 | | | | 140,000,000 | | | | 140,000,000 | |
Bank of Tokyo-Mitsubishi UFJ NY | | | 0.690 | % | | | 6/10/16 | | | | 350,000,000 | | | | 350,000,000 | |
BNP Paribas NY Branch | | | 0.350 | % | | | 3/3/16 | | | | 85,000,000 | | | | 85,000,000 | |
Canadian Imperial Bank of Commerce | | | 0.850 | % | | | 8/25/16 | | | | 245,000,000 | | | | 245,000,000 | |
Citibank N.A. | | | 0.530 | % | | | 4/18/16 | | | | 150,000,000 | | | | 150,000,000 | |
Citibank N.A. | | | 0.590 | % | | | 5/16/16 | | | | 100,000,000 | | | | 100,000,000 | |
Citibank N.A. | | | 0.640 | % | | | 6/1/16 | | | | 385,000,000 | | | | 385,000,000 | |
Citibank N.A. | | | 0.630 | % | | | 6/7/16 | | | | 495,000,000 | | | | 495,000,000 | |
Citibank N.A. | | | 0.630 | % | | | 6/13/16 | | | | 350,000,000 | | | | 350,000,000 | |
Credit Agricole | | | 0.670 | % | | | 3/28/16 | | | | 482,000,000 | | | | 482,000,000 | |
Credit Suisse NY | | | 0.620 | % | | | 4/5/16 | | | | 198,425,000 | | | | 198,425,000 | |
DnB NOR Bank ASA | | | 0.400 | % | | | 3/29/16 | | | | 195,000,000 | | | | 195,000,000 | |
Landesbank Hessen-Thuringen | | | 0.300 | % | | | 3/4/16 | | | | 100,000,000 | | | | 100,000,000 | |
Landesbank Hessen-Thuringen | | | 0.610 | % | | | 4/7/16 | | | | 200,000,000 | | | | 200,000,000 | |
Lloyds Bank PLC | | | 0.620 | % | | | 4/6/16 | | | | 190,000,000 | | | | 190,000,000 | |
Lloyds Bank PLC | | | 0.800 | % | | | 6/13/16 | | | | 211,350,000 | | | | 211,350,000 | |
Mitsubishi UFJ Trust & Banking NY | | | 0.510 | % | | | 4/5/16 | | | | 275,000,000 | | | | 275,000,000 | |
Mitsubishi UFJ Trust & Banking NY | | | 0.510 | % | | | 4/7/16 | | | | 100,000,000 | | | | 100,000,000 | |
Mitsubishi UFJ Trust & Banking NY | | | 0.870 | % | | | 7/18/16 | | | | 325,000,000 | | | | 325,000,000 | |
Mizuho Bank Ltd. | | | 0.650 | % | | | 4/18/16 | | | | 145,000,000 | | | | 145,000,000 | |
Mizuho Bank Ltd. | | | 0.660 | % | | | 4/18/16 | | | | 97,000,000 | | | | 96,999,997 | |
Mizuho Bank Ltd. | | | 0.700 | % | | | 6/15/16 | | | | 348,000,000 | | | | 348,000,000 | |
See Notes to Financial Statements.
| | |
| Liquid Reserves Portfolio 2016 Semi-Annual Report | | 15 |
Schedule of investments (unaudited) (cont’d)
February 29, 2016
Liquid Reserves Portfolio
| | | | | | | | | | | | | | | | |
| Security | | Rate | | | Maturity
Date | | | Face
Amount | | | Value | |
Certificates of Deposit — continued | | | | | | | | | | | | | | | | |
Mizuho Bank Ltd. | | | 0.700 | % | | | 6/16/16 | | | $ | 231,750,000 | | | $ | 231,750,000 | |
Mizuho Bank Ltd. | | | 0.700 | % | | | 6/22/16 | | | | 141,000,000 | | | | 140,999,989 | |
Mizuho Bank Ltd. | | | 0.700 | % | | | 6/23/16 | | | | 149,675,000 | | | | 149,675,000 | |
Natixis NY | | | 0.720 | % | | | 5/6/16 | | | | 431,750,000 | | | | 431,750,000 | |
Nordea Bank Finland PLC | | | 0.589 | % | | | 3/9/16 | | | | 195,000,000 | | | | 195,000,000 | (c) |
Norinchukin Bank | | | 0.510 | % | | | 3/18/16 | | | | 100,000,000 | | | | 100,000,000 | |
Norinchukin Bank | | | 0.500 | % | | | 3/22/16 | | | | 194,450,000 | | | | 194,450,000 | |
Norinchukin Bank | | | 0.500 | % | | | 3/24/16 | | | | 100,000,000 | | | | 100,000,000 | |
Norinchukin Bank | | | 0.510 | % | | | 4/6/16 | | | | 195,000,000 | | | | 195,000,000 | |
Norinchukin Bank | | | 0.500 | % | | | 4/8/16 | | | | 184,745,000 | | | | 184,744,027 | |
Norinchukin Bank | | | 0.500 | % | | | 4/22/16 | | | | 125,000,000 | | | | 124,999,099 | |
Norinchukin Bank | | | 0.510 | % | | | 4/27/16 | | | | 500,000,000 | | | | 500,000,000 | |
Norinchukin Bank | | | 0.670 | % | | | 6/2/16 | | | | 490,000,000 | | | | 490,000,000 | |
Norinchukin Bank | | | 0.850 | % | | | 8/8/16 | | | | 27,250,000 | | | | 27,250,000 | |
Norinchukin Bank | | | 0.850 | % | | | 8/24/16 | | | | 100,000,000 | | | | 100,000,000 | |
Oversea-Chinese Banking Corp. Ltd. | | | 0.580 | % | | | 4/26/16 | | | | 127,500,000 | | | | 127,500,000 | |
Rabobank Nederland NY | | | 0.599 | % | | | 3/9/16 | | | | 220,000,000 | | | | 220,000,000 | (c) |
Royal Bank of Canada | | | 0.594 | % | | | 3/10/16 | | | | 78,500,000 | | | | 78,500,897 | (c) |
Royal Bank of Canada | | | 0.591 | % | | | 5/13/16 | | | | 50,000,000 | | | | 50,001,116 | (c) |
Royal Bank of Canada | | | 0.778 | % | | | 7/7/16 | | | | 440,000,000 | | | | 440,000,000 | (c) |
Societe Generale NY | | | 0.850 | % | | | 8/3/16 | | | | 151,350,000 | | | | 151,350,000 | |
Sumitomo Mitsui Banking Corp. | | | 0.670 | % | | | 4/4/16 | | | | 350,000,000 | | | | 350,000,000 | |
Sumitomo Mitsui Banking Corp. | | | 0.670 | % | | | 4/4/16 | | | | 248,250,000 | | | | 248,250,000 | |
Sumitomo Mitsui Banking Corp. | | | 0.500 | % | | | 4/5/16 | | | | 223,000,000 | | | | 222,998,919 | |
Sumitomo Mitsui Banking Corp. | | | 0.938 | % | | | 4/29/16 | | | | 5,000,000 | | | | 4,999,562 | (c) |
Sumitomo Mitsui Banking Corp. | | | 0.850 | % | | | 6/9/16 | | | | 220,000,000 | | | | 220,063,438 | |
Sumitomo Mitsui Banking Corp. | | | 0.860 | % | | | 7/28/16 | | | | 450,000,000 | | | | 450,000,000 | |
Sumitomo Mitsui Banking Corp. | | | 0.850 | % | | | 8/29/16 | | | | 150,000,000 | | | | 150,000,000 | |
Sumitomo Mitsui Trust & Banking Co., Ltd. | | | 0.520 | % | | | 3/17/16 | | | | 182,000,000 | | | | 182,000,000 | |
Sumitomo Mitsui Trust & Banking Co., Ltd. | | | 0.700 | % | | | 3/23/16 | | | | 498,750,000 | | | | 498,750,000 | |
Sumitomo Mitsui Trust & Banking Co., Ltd. | | | 0.470 | % | | | 3/29/16 | | | | 150,000,000 | | | | 150,000,000 | |
Sumitomo Mitsui Trust & Banking Co., Ltd. | | | 0.500 | % | | | 4/5/16 | | | | 150,000,000 | | | | 150,000,000 | |
Sumitomo Mitsui Trust & Banking Co., Ltd. | | | 0.510 | % | | | 4/25/16 | | | | 300,000,000 | | | | 300,000,000 | |
Sumitomo Mitsui Trust & Banking Co., Ltd. | | | 0.700 | % | | | 6/15/16 | | | | 290,000,000 | | | | 290,000,000 | |
Sumitomo Mitsui Trust & Banking Co., Ltd. | | | 0.860 | % | | | 7/29/16 | | | | 100,000,000 | | | | 100,000,000 | |
UBS AG Stamford Branch | | | 0.505 | % | | | 4/25/16 | | | | 50,000,000 | | | | 50,000,000 | |
Wells Fargo Bank N.A. | | | 0.599 | % | | | 3/4/16 | | | | 100,000,000 | | | | 100,000,000 | (c) |
Wells Fargo Bank N.A. | | | 0.580 | % | | | 4/20/16 | | | | 98,000,000 | | | | 97,995,913 | |
See Notes to Financial Statements.
| | |
| 16 | | Liquid Reserves Portfolio 2016 Semi-Annual Report |
Liquid Reserves Portfolio
| | | | | | | | | | | | | | | | |
| Security | | Rate | | | Maturity
Date | | | Face
Amount | | | Value | |
Certificates of Deposit — continued | | | | | | | | | | | | | | | | |
Wells Fargo Bank N.A. | | | 0.630 | % | | | 5/2/16 | | | $ | 375,000,000 | | | $ | 375,000,000 | |
Wells Fargo Bank N.A. | | | 0.850 | % | | | 7/25/16 | | | | 320,000,000 | | | | 320,000,000 | |
Wells Fargo Bank N.A. | | | 0.850 | % | | | 8/22/16 | | | | 98,000,000 | | | | 98,000,000 | |
Wells Fargo Bank N.A. | | | 0.850 | % | | | 8/29/16 | | | | 245,000,000 | | | | 245,000,000 | |
Total Certificates of Deposit | | | | | | | | | | | | | | | 15,011,060,717 | |
Commercial Paper — 42.3% | | | | | | | | | | | | | | | | |
Abbey National Treasury Services PLC | | | 0.641 | % | | | 5/9/16 | | | | 350,000,000 | | | | 349,570,667 | (a) |
Abbey National Treasury Services PLC | | | 0.626 | % | | | 5/31/16 | | | | 190,000,000 | | | | 189,699,826 | (a) |
Abbey National Treasury Services PLC | | | 0.854 | % | | | 8/25/16 | | | | 99,250,000 | | | | 98,835,218 | (a) |
ABN AMRO Funding USA LLC | | | 0.631 | % | | | 4/4/16 | | | | 100,000,000 | | | | 99,940,500 | (a)(b) |
ABN AMRO Funding USA LLC | | | 0.854 | % | | | 8/24/16 | | | | 19,000,000 | | | | 18,921,044 | (a)(b) |
ANZ National International Ltd. | | | 0.330-0.335 | % | | | 3/29/16 | | | | 200,000,000 | | | | 199,948,278 | (a)(b) |
ANZ National International Ltd. | | | 0.844 | % | | | 7/27/16 | | | | 100,000,000 | | | | 99,654,666 | (a)(b) |
ASB Finance Ltd. | | | 0.854 | % | | | 8/3/16 | | | | 97,000,000 | | | | 96,645,007 | (a)(b) |
ASB Finance Ltd. | | | 0.844 | % | | | 8/30/16 | | | | 100,000,000 | | | | 99,575,333 | (a)(b) |
Bank of Nova Scotia | | | 0.653 | % | | | 4/4/16 | | | | 195,000,000 | | | | 195,000,000 | (c) |
Bank of Nova Scotia | | | 0.481 | % | | | 4/6/16 | | | | 485,000,000 | | | | 484,767,200 | (a)(b) |
Bank of Nova Scotia | | | 0.491-0.501 | % | | | 5/11/16 | | | | 525,000,000 | | | | 524,489,688 | (a)(b) |
Bank of Nova Scotia | | | 0.833 | % | | | 7/27/16 | | | | 350,000,000 | | | | 348,805,723 | (a)(b) |
BNP Paribas Fortis Funding | | | 0.280 | % | | | 3/1/16 | | | | 500,000,000 | | | | 500,000,000 | (a) |
BNP Paribas Fortis Funding | | | 0.380 | % | | | 3/2/16 | | | | 300,000,000 | | | | 299,996,833 | (a) |
BNZ International Funding Ltd. | | | 0.609 | % | | | 3/9/16 | | | | 50,000,000 | | | | 50,000,000 | (b)(c) |
BPCE SA | | | 0.757 | % | | | 6/1/16 | | | | 136,000,000 | | | | 135,737,595 | (a)(b) |
BPCE SA | | | 0.707 | % | | | 6/9/16 | | | | 200,000,000 | | | | 199,608,333 | (a)(b) |
Caisse des Depots et Consignations | | | 0.361 | % | | | 3/24/16 | | | | 200,000,000 | | | | 199,954,000 | (a)(d) |
Caisse des Depots et Consignations | | | 0.621 | % | | | 6/20/16 | | | | 440,000,000 | | | | 439,158,868 | (a)(d) |
Chevron Corp. | | | 0.591 | % | | | 4/25/16 | | | | 200,000,000 | | | | 199,819,722 | (a)(b) |
Chevron Corp. | | | 0.591 | % | | | 4/26/16 | | | | 200,000,000 | | | | 199,816,444 | (a)(b) |
Chevron Corp. | | | 0.591 | % | | | 4/27/16 | | | | 200,000,000 | | | | 199,813,167 | (a)(b) |
Commonwealth Bank of Australia | | | 0.779 | % | | | 8/11/16 | | | | 120,000,000 | | | | 120,000,000 | (b)(c) |
Credit Agricole Corporate and Investment Bank | | | 0.310 | % | | | 3/1/16 | | | | 477,810,000 | | | | 477,810,000 | (a) |
Credit Agricole Corporate and Investment Bank | | | 0.732 | % | | | 5/19/16 | | | | 245,000,000 | | | | 244,607,524 | (a) |
Credit Agricole Corporate and Investment Bank | | | 0.702 | % | | | 6/17/16 | | | | 150,000,000 | | | | 149,685,000 | (a) |
Credit Agricole Corporate and Investment Bank | | | 0.884 | % | | | 8/1/16 | | | | 250,000,000 | | | | 249,065,000 | (a) |
Credit Agricole Corporate and Investment Bank | | | 0.884 | % | | | 8/2/16 | | | | 150,000,000 | | | | 149,435,334 | (a) |
Credit Agricole Corporate and Investment Bank | | | 0.884 | % | | | 8/2/16 | | | | 50,000,000 | | | | 49,811,778 | (a) |
Credit Suisse NY | | | 0.531 | % | | | 4/12/16 | | | | 190,000,000 | | | | 189,882,517 | (a) |
Credit Suisse NY | | | 0.802 | % | | | 6/1/16 | | | | 375,000,000 | | | | 374,233,334 | (a) |
See Notes to Financial Statements.
| | |
| Liquid Reserves Portfolio 2016 Semi-Annual Report | | 17 |
Schedule of investments (unaudited) (cont’d)
February 29, 2016
Liquid Reserves Portfolio
| | | | | | | | | | | | | | | | |
| Security | | Rate | | | Maturity
Date | | | Face
Amount | | | Value | |
Commercial Paper — continued | | | | | | | | | | | | | | | | |
Credit Suisse NY | | | 0.702 | % | | | 6/17/16 | | | $ | 350,000,000 | | | $ | 349,264,999 | (a) |
Credit Suisse NY | | | 0.904 | % | | | 7/26/16 | | | | 108,000,000 | | | | 107,603,100 | (a) |
Danske Corp. | | | 0.611 | % | | | 4/1/16 | | | | 200,000,000 | | | | 199,894,944 | (a)(b) |
Danske Corp. | | | 0.611 | % | | | 4/4/16 | | | | 100,000,000 | | | | 99,942,389 | (a)(b) |
Danske Corp. | | | 0.611 | % | | | 4/7/16 | | | | 300,000,000 | | | | 299,811,917 | (a)(b) |
Danske Corp. | | | 0.651 | % | | | 6/9/16 | | | | 150,000,000 | | | | 149,729,166 | (a)(b) |
Danske Corp. | | | 0.651 | % | | | 6/10/16 | | | | 340,000,000 | | | | 339,379,972 | (a)(b) |
Danske Corp. | | | 0.672 | % | | | 6/23/16 | | | | 195,000,000 | | | | 194,586,274 | (a)(b) |
Danske Corp. | | | 0.859 | % | | | 9/1/16 | | | | 135,000,000 | | | | 134,410,050 | (a)(b) |
DBS Bank Ltd. | | | 0.651 | % | | | 3/21/16 | | | | 85,000,000 | | | | 84,969,306 | (a)(b) |
DBS Bank Ltd. | | | 0.661 | % | | | 3/22/16 | | | | 125,000,000 | | | | 124,951,875 | (a)(b) |
DBS Bank Ltd. | | | 0.410 | % | | | 3/29/16 | | | | 150,000,000 | | | | 149,952,166 | (a)(b) |
DBS Bank Ltd. | | | 0.601 | % | | | 4/12/16 | | | | 100,000,000 | | | | 99,930,000 | (a)(b) |
DBS Bank Ltd. | | | 0.480 | % | | | 4/13/16 | | | | 250,000,000 | | | | 249,856,666 | (a)(b) |
DBS Bank Ltd. | | | 0.480 | % | | | 4/14/16 | | | | 130,000,000 | | | | 129,923,733 | (a)(b) |
DnB NOR Bank ASA | | | 0.608 | % | | | 3/8/16 | | | | 185,000,000 | | | | 185,000,000 | (b)(c) |
DnB NOR Bank ASA | | | 0.401 | % | | | 3/29/16 | | | | 400,000,000 | | | | 399,875,555 | (a)(b) |
DnB NOR Bank ASA | | | 0.401 | % | | | 3/29/16 | | | | 200,000,000 | | | | 199,937,778 | (a)(b) |
General Electric Co. | | | 0.450 | % | | | 3/29/16 | | | | 150,000,000 | | | | 149,947,500 | (a) |
General Electric Co. | | | 0.450 | % | | | 3/30/16 | | | | 165,000,000 | | | | 164,940,188 | (a) |
HSBC Bank PLC | | | 1.008 | % | | | 11/18/16 | | | | 38,400,000 | | | | 38,120,533 | (a)(b) |
HSBC USA Inc. | | | 0.491 | % | | | 3/23/16 | | | | 200,000,000 | | | | 199,940,111 | (a)(b) |
ING U.S. Funding LLC | | | 0.370 | % | | | 3/2/16 | | | | 325,000,000 | | | | 324,996,660 | (a) |
ING U.S. Funding LLC | | | 0.521 | % | | | 3/16/16 | | | | 395,000,000 | | | | 394,914,417 | (a) |
ING U.S. Funding LLC | | | 0.521 | % | | | 3/17/16 | | | | 200,000,000 | | | | 199,953,778 | (a) |
ING U.S. Funding LLC | | | 0.611 | % | | | 4/4/16 | | | | 400,000,000 | | | | 399,769,555 | (a) |
ING U.S. Funding LLC | | | 0.606 | % | | | 4/12/16 | | | | 185,000,000 | | | | 184,869,421 | (a) |
ING U.S. Funding LLC | | | 0.521 | % | | | 4/25/16 | | | | 200,000,000 | | | | 199,841,111 | (a) |
JPMorgan Securities LLC | | | 0.521 | % | | | 4/25/16 | | | | 388,500,000 | | | | 388,191,358 | (a) |
JPMorgan Securities LLC | | | 0.854 | % | | | 7/18/16 | | | | 122,000,000 | | | | 121,599,603 | (a) |
JPMorgan Securities LLC | | | 0.854 | % | | | 7/27/16 | | | | 413,000,000 | | | | 411,556,795 | (a) |
Landesbank Hessen-Thuringen | | | 0.370 | % | | | 3/3/16 | | | | 93,000,000 | | | | 92,998,088 | (a)(b) |
Landesbank Hessen-Thuringen | | | 0.501 | % | | | 3/18/16 | | | | 100,000,000 | | | | 99,976,389 | (a)(b) |
Landesbank Hessen-Thuringen | | | 0.481 | % | | | 4/4/16 | | | | 98,000,000 | | | | 97,955,573 | (a)(b) |
Landesbank Hessen-Thuringen | | | 0.611 | % | | | 4/5/16 | | | | 140,000,000 | | | | 139,916,972 | (a)(b) |
Landesbank Hessen-Thuringen | | | 0.854 | % | | | 8/2/16 | | | | 29,000,000 | | | | 28,894,553 | (a)(b) |
Lloyds Bank PLC | | | 0.651 | % | | | 6/13/16 | | | | 390,000,000 | | | | 389,267,665 | (a) |
Lloyds Bank PLC | | | 0.854 | % | | | 7/25/16 | | | | 200,000,000 | | | | 199,310,556 | (a) |
See Notes to Financial Statements.
| | |
| 18 | | Liquid Reserves Portfolio 2016 Semi-Annual Report |
Liquid Reserves Portfolio
| | | | | | | | | | | | | | | | |
| Security | | Rate | | | Maturity
Date | | | Face
Amount | | | Value | |
Commercial Paper — continued | | | | | | | | | | | | | | | | |
Mitsubishi UFJ Trust & Banking NY | | | 0.501 | % | | | 3/24/16 | | | $ | 190,000,000 | | | $ | 189,939,306 | (a)(b) |
Natixis NY | | | 0.300 | % | | | 3/1/16 | | | | 88,538,000 | | | | 88,538,000 | (a) |
Natixis NY | | | 0.752 | % | | | 5/31/16 | | | | 443,000,000 | | | | 442,160,147 | (a) |
Ontario Teachers’ Finance Trust | | | 0.621 | % | | | 4/6/16 | | | | 110,000,000 | | | | 109,931,800 | (a)(b) |
Ontario Teachers’ Finance Trust | | | 0.752 | % | | | 6/27/16 | | | | 50,000,000 | | | | 49,877,083 | (a)(b) |
Ontario Teachers’ Finance Trust | | | 0.844 | % | | | 7/26/16 | | | | 250,000,000 | | | | 249,142,499 | (a)(b) |
Ontario Teachers’ Finance Trust | | | 0.844 | % | | | 7/28/16 | | | | 100,000,000 | | | | 99,652,333 | (a)(b) |
Ontario Teachers’ Finance Trust | | | 0.905 | % | | | 8/26/16 | | | | 97,500,000 | | | | 97,066,125 | (a)(b) |
Ontario Teachers’ Finance Trust | | | 0.905 | % | | | 9/1/16 | | | | 100,000,000 | | | | 99,540,000 | (a)(b) |
Oversea-Chinese Banking Corp. Ltd. | | | 0.651 | % | | | 6/3/16 | | | | 198,750,000 | | | | 198,412,677 | (a) |
Oversea-Chinese Banking Corp. Ltd. | | | 0.631 | % | | | 6/10/16 | | | | 100,000,000 | | | | 99,823,250 | (a) |
Reckitt Benckiser Treasury | | | 0.501 | % | | | 3/1/16 | | | | 153,000,000 | | | | 153,000,000 | (a)(b) |
Reckitt Benckiser Treasury | | | 0.541 | % | | | 3/7/16 | | | | 147,000,000 | | | | 146,986,770 | (a)(b) |
Reckitt Benckiser Treasury | | | 0.803 | % | | | 7/25/16 | | | | 100,000,000 | | | | 99,675,556 | (a)(b) |
Societe Generale | | | 0.300 | % | | | 3/1/16 | | | | 150,000,000 | | | | 150,000,000 | (a)(b) |
Societe Generale | | | 0.400 | % | | | 3/7/16 | | | | 200,000,000 | | | | 199,986,667 | (a)(b) |
Sumitomo Mitsui Banking Corp. | | | 0.506 | % | | | 3/24/16 | | | | 395,000,000 | | | | 394,872,558 | (a)(b) |
Sumitomo Mitsui Trust & Banking Co., Ltd. | | | 0.480 | % | | | 3/17/16 | | | | 50,000,000 | | | | 49,989,333 | (a)(b) |
Sumitomo Mitsui Trust & Banking Co., Ltd. | | | 0.701 | % | | | 3/28/16 | | | | 235,000,000 | | | | 234,876,625 | (a)(b) |
Sumitomo Mitsui Trust & Banking Co., Ltd. | | | 0.701 | % | | | 3/28/16 | | | | 100,000,000 | | | | 99,947,500 | (a)(b) |
Svenska Handelsbanken AB | | | 0.651 | % | | | 6/24/16 | | | | 215,000,000 | | | | 214,553,576 | (a)(b) |
Swedbank AB | | | 0.360 | % | | | 3/2/16 | | | | 350,000,000 | | | | 349,996,500 | (a) |
Toyota Motor Credit Corp. | | | 0.605 | % | | | 3/14/16 | | | | 44,000,000 | | | | 44,000,000 | (c) |
Toyota Motor Credit Corp. | | | 0.605 | % | | | 3/15/16 | | | | 250,000,000 | | | | 250,000,000 | (c) |
Toyota Motor Credit Corp. | | | 0.605 | % | | | 3/16/16 | | | | 250,000,000 | | | | 250,000,000 | (c) |
Toyota Motor Credit Corp. | | | 0.605 | % | | | 3/17/16 | | | | 250,000,000 | | | | 250,000,000 | (c) |
UBS Finance Delaware LLC | | | 0.531 | % | | | 3/2/16 | | | | 300,000,000 | | | | 299,995,583 | (a) |
UBS Finance Delaware LLC | | | 0.531 | % | | | 3/2/16 | | | | 75,000,000 | | | | 74,998,896 | (a) |
UBS Finance Delaware LLC | | | 0.491 | % | | | 4/4/16 | | | | 200,000,000 | | | | 199,907,444 | (a) |
UBS Finance Delaware LLC | | | 0.762 | % | | | 5/31/16 | | | | 1,050,000,000 | | | | 1,047,982,833 | (a) |
UBS Finance Delaware LLC | | | 0.631 | % | | | 6/16/16 | | | | 150,000,000 | | | | 149,719,125 | (a) |
UBS Finance Delaware LLC | | | 0.854 | % | | | 8/2/16 | | | | 114,750,000 | | | | 114,332,756 | (a) |
United Overseas Bank Ltd. | | | 0.651 | % | | | 6/6/16 | | | | 95,000,000 | | | | 94,833,618 | (a)(b) |
United Overseas Bank Ltd. | | | 0.631 | % | | | 6/15/16 | | | | 72,500,000 | | | | 72,365,513 | (a)(b) |
United Overseas Bank Ltd. | | | 0.641 | % | | | 6/16/16 | | | | 195,000,000 | | | | 194,629,067 | (a)(b) |
United Overseas Bank Ltd. | | | 0.641 | % | | | 6/17/16 | | | | 50,000,000 | | | | 49,904,000 | (a)(b) |
United Overseas Bank Ltd. | | | 0.641 | % | | | 6/20/16 | | | | 250,000,000 | | | | 249,506,668 | (a)(b) |
See Notes to Financial Statements.
| | |
| Liquid Reserves Portfolio 2016 Semi-Annual Report | | 19 |
Schedule of investments (unaudited) (cont’d)
February 29, 2016
Liquid Reserves Portfolio
| | | | | | | | | | | | | | | | |
| Security | | Rate | | | Maturity
Date | | | Face
Amount | | | Value | |
Commercial Paper — continued | | | | | | | | | | | | | | | | |
Westpac Banking Corp. | | | 0.585 | % | | | 3/2/16 | | | $ | 87,000,000 | | | $ | 86,999,976 | (b)(c) |
Westpac Banking Corp. | | | 0.589 | % | | | 3/4/16 | | | | 345,000,000 | | | | 345,000,000 | (b)(c) |
Total Commercial Paper | | | | | | | | | | | | | | | 22,552,413,099 | |
Corporate Bonds & Notes — 1.1% | | | | | | | | | | | | | | | | |
ANZ New Zealand International Ltd., Senior Notes | | | 1.125 | % | | | 3/24/16 | | | | 12,930,000 | | | | 12,934,302 | (d) |
BMW Finance NV, Senior Notes | | | 0.896 | % | | | 5/27/16 | | | | 49,400,000 | | | | 49,395,311 | (c) |
GE Capital International Funding Co., Senior Notes | | | 0.964 | % | | | 4/15/16 | | | | 144,000,000 | | | | 144,079,509 | (d) |
ING Bank NV, Senior Notes | | | 4.000 | % | | | 3/15/16 | | | | 97,000,000 | | | | 97,122,480 | (d) |
JPMorgan Chase Bank N.A., Senior Notes | | | 0.612 | % | | | 7/7/16 | | | | 300,000,000 | | | | 300,000,000 | (c) |
Total Corporate Bonds & Notes | | | | | | | | | | | | | | | 603,531,602 | |
Time Deposits — 15.3% | | | | | | | | | | | | | | | | |
BNP Paribas Grand Cayman | | | 0.370 | % | | | 3/1/16 | | | | 50,000,000 | | | | 50,000,000 | |
CIBC Grand Cayman | | | 0.280 | % | | | 3/1/16 | | | | 136,131,000 | | | | 136,131,000 | |
Credit Agricole Grand Cayman | | | 0.310 | % | | | 3/1/16 | | | | 395,000,000 | | | | 395,000,000 | |
DnB NOR Bank ASA | | | 0.290 | % | | | 3/1/16 | | | | 1,000,000,000 | | | | 1,000,000,000 | |
Lloyds Bank PLC | | | 0.270 | % | | | 3/1/16 | | | | 225,000,000 | | | | 225,000,000 | |
Natixis Grand Cayman | | | 0.300 | % | | | 3/1/16 | | | | 875,000,000 | | | | 875,000,000 | |
Nordea Finland Grand Cayman | | | 0.270 | % | | | 3/1/16 | | | | 1,380,000,000 | | | | 1,380,000,000 | |
Skandinaviska Enskilda Cayman | | | 0.290 | % | | | 3/1/16 | | | | 1,600,000,000 | | | | 1,600,000,000 | |
Svenska Handelsbanken Grand Cayman | | | 0.270 | % | | | 3/1/16 | | | | 1,025,000,000 | | | | 1,025,000,000 | |
Swedbank AB | | | 0.290 | % | | | 3/1/16 | | | | 1,470,000,000 | | | | 1,470,000,000 | |
Total Time Deposits | | | | | | | | | | | | | | | 8,156,131,000 | |
U.S. Government Agencies — 0.6% | | | | | | | | | | | | | | | | |
Federal Home Loan Mortgage Corp. (FHLMC) | | | 0.479 | % | | | 4/27/17 | | | | 300,000,000 | | | | 299,929,381 | (c) |
U.S. Treasury Notes — 9.4% | | | | | | | | | | | | | | | | |
U.S. Treasury Notes | | | 0.389 | % | | | 4/30/16 | | | | 525,370,000 | | | | 525,370,807 | (c) |
U.S. Treasury Notes | | | 0.390 | % | | | 7/31/16 | | | | 375,000,000 | | | | 375,001,581 | (c) |
U.S. Treasury Notes | | | 0.373 | % | | | 10/31/16 | | | | 1,025,000,000 | | | | 1,024,923,594 | (c) |
U.S. Treasury Notes | | | 0.394 | % | | | 4/30/17 | | | | 1,180,000,000 | | | | 1,180,024,617 | (c) |
U.S. Treasury Notes | | | 0.397 | % | | | 7/31/17 | | | | 1,435,000,000 | | | | 1,434,704,836 | (c) |
U.S. Treasury Notes | | | 0.488 | % | | | 10/31/17 | | | | 375,000,000 | | | | 374,878,662 | (c) |
U.S. Treasury Notes | | | 0.592 | % | | | 1/31/18 | | | | 100,000,000 | | | | 100,094,817 | (c) |
Total U.S. Treasury Notes | | | | | | | | | | | | | | | 5,014,998,914 | |
See Notes to Financial Statements.
| | |
| 20 | | Liquid Reserves Portfolio 2016 Semi-Annual Report |
Liquid Reserves Portfolio
| | | | | | | | | | | | | | | | |
| Security | | Rate | | | Maturity
Date | | | Face
Amount | | | Value | |
Repurchase Agreements — 2.8% | | | | | | | | | | | | | | | | |
Bank of America Corp. tri-party repurchase agreement dated 2/29/16; Proceeds at maturity — $1,281,085,511; (Fully collateralized by various U.S. government agency obligations and corporate bonds and notes, 0.922% to 7.625% due 5/9/2016 to 2/1/2046; Market value — $1,308,896,860) | | | 0.430 | % | | | 5/10/16 | | | $ | 1,280,000,000 | | | $ | 1,280,000,000 | |
Mitsubishi UFJ Trust & Banking Corp. tri-party repurchase agreement dated 1/6/16; Proceeds at maturity — $150,142,000; (Fully collateralized by various corporate bonds and notes and money market instruments, 0.000% to 7.900% due 3/1/16 to 1/1/49; Market value — $159,320,002) | | | 0.480 | % | | | 5/10/16 | | | | 150,000,000 | | | | 150,000,000 | |
Mitsubishi UFJ Trust & Banking Corp. tri-party repurchase agreement dated 1/6/16; Proceeds at maturity — $75,071,000; (Fully collateralized by municipal bonds, 0.030% to 7.425% due 3/15/16 to 12/1/45; Market value — $78,750,000) | | | 0.480 | % | | | 5/10/16 | | | | 75,000,000 | | | | 75,000,000 | |
Total Repurchase Agreements | | | | 1,505,000,000 | |
Total Investments — 100.4% (Cost — $53,579,756,986#) | | | | 53,579,756,986 | |
Liabilities in Excess of Other Assets — (0.4)% | | | | (215,640,943 | ) |
Total Net Assets — 100.0% | | | $ | 53,364,116,043 | |
| (a) | Rate shown represents yield-to-maturity. |
| (b) | Commercial paper exempt from registration under Section 4(2) of the Securities Act of 1933. This security may be resold in transactions that are exempt from registration, normally to qualified institutional buyers. This security has been deemed liquid pursuant to guidelines approved by the Board of Trustees, unless otherwise noted. |
| (c) | Variable rate security. Interest rate disclosed is as of the most recent information available. |
| (d) | Security is exempt from registration under Rule 144A of the Securities Act of 1933. This security may be resold in transactions that are exempt from registration, normally to qualified institutional buyers. This security has been deemed liquid pursuant to guidelines approved by the Board of Trustees, unless otherwise noted. |
| # | Aggregate cost for federal income tax purposes is substantially the same. |
See Notes to Financial Statements.
| | |
| Liquid Reserves Portfolio 2016 Semi-Annual Report | | 21 |
Statement of assets and liabilities (unaudited)
February 29, 2016
| | | | |
| |
| Assets: | | | | |
Investments, at value | | $ | 53,579,756,986 | |
Cash | | | 519 | |
Interest receivable | | | 20,367,553 | |
Total Assets | | | 53,600,125,058 | |
| |
| Liabilities: | | | | |
Payable for securities purchased | | | 233,985,383 | |
Trustees’ fees payable | | | 66,433 | |
Accrued expenses | | | 1,957,199 | |
Total Liabilities | | | 236,009,015 | |
| Total Net Assets | | $ | 53,364,116,043 | |
| |
| Represented by: | | | | |
| Paid-in-capital | | $ | 53,364,116,043 | |
See Notes to Financial Statements.
| | |
| 22 | | Liquid Reserves Portfolio 2016 Semi-Annual Report |
Statement of operations (unaudited)
For the Six Months Ended February 29, 2016
| | | | |
| |
| Investment Income: | | | | |
Interest | | $ | 105,006,055 | |
| |
| Expenses: | | | | |
Investment management fee (Note 2) | | | 28,041,902 | |
Fund accounting fees | | | 1,572,024 | |
Trustees’ fees | | | 477,954 | |
Legal fees | | | 336,685 | |
Custody fees | | | 227,359 | |
Audit and tax fees | | | 22,465 | |
Miscellaneous expenses | | | 42,547 | |
Total Expenses | | | 30,720,936 | |
Less: Fee waivers and/or expense reimbursements (Note 2) | | | (28,041,902) | |
Net Expenses | | | 2,679,034 | |
| Net Investment Income | | | 102,327,021 | |
| Net Realized Gain on Investments | | | 410,641 | |
| Increase in Net Assets From Operations | | $ | 102,737,662 | |
See Notes to Financial Statements.
| | |
| Liquid Reserves Portfolio 2016 Semi-Annual Report | | 23 |
Statements of changes in net assets
| | | | | | | | |
For the Six Months Ended February 29, 2016 (unaudited)
and the Year Ended August 31, 2015 | | 2016 | | | 2015 | |
| | |
| Operations: | | | | | | | | |
Net investment income | | $ | 102,327,021 | | | $ | 143,882,505 | |
Net realized gain | | | 410,641 | | | | 701,909 | |
Increase in Net Assets From Operations | | | 102,737,662 | | | | 144,584,414 | |
| | |
| Capital Transactions: | | | | | | | | |
Proceeds from contributions | | | 46,576,504,376 | | | | 96,487,778,857 | |
Value of withdrawals | | | (56,856,643,865) | | | | (107,494,184,065) | |
Decrease in Net Assets From Capital Transactions | | | (10,280,139,489) | | | | (11,006,405,208) | |
Decrease in Net Assets | | | (10,177,401,827) | | | | (10,861,820,794) | |
| | |
| Net Assets: | | | | | | | | |
Beginning of period | | | 63,541,517,870 | | | | 74,403,338,664 | |
End of period | | $ | 53,364,116,043 | | | $ | 63,541,517,870 | |
See Notes to Financial Statements.
| | |
| 24 | | Liquid Reserves Portfolio 2016 Semi-Annual Report |
Financial highlights
| | | | | | | | | | | | | | | | | | | | | | | | |
| For the years ended August 31, unless otherwise noted: | |
| | | 20161 | | | 2015 | | | 2014 | | | 2013 | | | 2012 | | | 2011 | |
| | | | | | |
| Net assets, end of period (millions) | | | $53,364 | | | | $63,542 | | | | $74,403 | | | | $73,576 | | | | $61,127 | | | | $38,040 | |
Total return2 | | | 0.19 | % | | | 0.22 | % | | | 0.10 | % | | | 0.17 | % | | | 0.23 | % | | | 0.27 | % |
| | | | | | |
| Ratios to average net assets: | | | | | | | | | | | | | | | | | | | | | | | | |
Gross expenses | | | 0.11 | %3 | | | 0.11 | % | | | 0.11 | % | | | 0.11 | % | | | 0.11 | % | | | 0.11 | % |
Net expenses4,5 | | | 0.01 | 3 | | | 0.01 | | | | 0.10 | | | | 0.10 | | | | 0.10 | | | | 0.10 | |
Net investment income | | | 0.36 | 3 | | | 0.21 | | | | 0.10 | | | | 0.17 | | | | 0.23 | | | | 0.27 | |
| 1 | For the six months ended February 29, 2016 (unaudited). |
| 2 | Performance figures may reflect compensating balance arrangements, fee waivers and/or expense reimbursements. In the absence of compensating balance arrangements, fee waivers and/or expense reimbursements, the total return would have been lower. Past performance is no guarantee of future results. Total returns for periods of less than one year are not annualized. |
| 4 | The investment manager has voluntarily agreed to waive and/or reimburse 0.10% of Portfolio expenses. This arrangement may be reduced or terminated under certain circumstances. Additional amounts may be voluntarily waived and/or reimbursed from time to time. Prior to August 18, 2014, as a result of a voluntary expense limitation arrangement, the ratio of expenses, other than interest, brokerage, taxes, extraordinary expenses and acquired fund fees and expenses, to average net assets of the Portfolio did not exceed 0.10%. |
| 5 | Reflects fee waivers and/or expense reimbursements. |
See Notes to Financial Statements.
| | |
| Liquid Reserves Portfolio 2016 Semi-Annual Report | | 25 |
Notes to financial statements (unaudited)
1. Organization and significant accounting policies
Liquid Reserves Portfolio (the “Portfolio”) is a separate diversified investment series of Master Portfolio Trust (the “Trust”). The Trust, a Maryland statutory trust, is registered under the Investment Company Act of 1940, as amended (the “1940 Act”), as an open-end management investment company. The Declaration of Trust permits the Trustees to issue beneficial interests in the Portfolio. At February 29, 2016, all investors in the Portfolio were funds advised or administered by the manager of the Portfolio and/or its affiliates.
The following are significant accounting policies consistently followed by the Portfolio and are in conformity with U.S. generally accepted accounting principles (“GAAP”). Estimates and assumptions are required to be made regarding assets, liabilities and changes in net assets resulting from operations when financial statements are prepared. Changes in the economic environment, financial markets and any other parameters used in determining these estimates could cause actual results to differ. Subsequent events have been evaluated through the date the financial statements were issued.
(a) Investment valuation. In accordance with Rule 2a-7 under the 1940 Act, money market instruments are valued at amortized cost, which approximates market value. This method involves valuing portfolio securities at their cost and thereafter assuming a constant amortization to maturity of any discount or premium. The Portfolio’s use of amortized cost is subject to its compliance with certain conditions as specified by Rule 2a-7 under the 1940 Act.
The Board of Trustees is responsible for the valuation process and has delegated the supervision of the daily valuation process to the Legg Mason North Atlantic Fund Valuation Committee (the “Valuation Committee”). The Valuation Committee, pursuant to the policies adopted by the Board of Trustees, is responsible for making fair value determinations, evaluating the effectiveness of the Portfolio’s pricing policies, and reporting to the Board of Trustees.
The Portfolio uses valuation techniques to measure fair value that are consistent with the market approach and/or income approach, depending on the type of security and the particular circumstance. The market approach uses prices and other relevant information generated by market transactions involving identical or comparable securities. The income approach uses valuation techniques to discount estimated future cash flows to present value.
GAAP establishes a disclosure hierarchy that categorizes the inputs to valuation techniques used to value assets and liabilities at measurement date. These inputs are summarized in the three broad levels listed below:
| • | | Level 1 — quoted prices in active markets for identical investments |
| • | | Level 2 — other significant observable inputs (including quoted prices for similar investments, interest rates, prepayment speeds, credit risk, etc.) |
| • | | Level 3 — significant unobservable inputs (including the Portfolio’s own assumptions in determining the fair value of investments) |
| | |
| 26 | | Liquid Reserves Portfolio 2016 Semi-Annual Report |
The inputs or methodologies used to value securities are not necessarily an indication of the risk associated with investing in those securities.
The following is a summary of the inputs used in valuing the Portfolio’s assets carried at fair value:
| | | | | | | | | | | | | | | | |
| ASSETS | |
| Description | | Quoted Prices
(Level 1) | | | Other Significant
Observable Inputs
(Level 2) | | | Significant
Unobservable
Inputs
(Level 3) | | | Total | |
| Short-term investments† | | | — | | | $ | 53,579,756,986 | | | | — | | | $ | 53,579,756,986 | |
| † | See Schedule of Investments for additional detailed categorizations. |
(b) Repurchase agreements. The Portfolio may enter into repurchase agreements with institutions that its subadviser has determined are creditworthy. Each repurchase agreement is recorded at cost. Under the terms of a typical repurchase agreement, the Portfolio acquires a debt security subject to an obligation of the seller to repurchase, and of the Portfolio to resell, the security at an agreed-upon price and time, thereby determining the yield during the Portfolio’s holding period. When entering into repurchase agreements, it is the Portfolio’s policy that its custodian or a third party custodian, acting on the Portfolio’s behalf, take possession of the underlying collateral securities, the market value of which, at all times, at least equals the principal amount of the repurchase transaction, including accrued interest. To the extent that any repurchase transaction maturity exceeds one business day, the value of the collateral is marked-to-market and measured against the value of the agreement in an effort to ensure the adequacy of the collateral. If the counterparty defaults, the Portfolio generally has the right to use the collateral to satisfy the terms of the repurchase transaction. However, if the market value of the collateral declines during the period in which the Portfolio seeks to assert its rights or if bankruptcy proceedings are commenced with respect to the seller of the security, realization of the collateral by the Portfolio may be delayed or limited.
(c) Interest income and expenses. Interest income consists of interest accrued and discount earned (including both original issue and market discount adjusted for amortization of premium) on the investments of the Portfolio. Expenses of the Portfolio are accrued daily. The Portfolio bears all costs of its operations other than expenses specifically assumed by the manager.
(d) Method of allocation. Net investment income of the Portfolio is allocated pro rata, based on respective ownership interests, among the Fund and other investors in the Portfolio (the “Holders”) at the time of such determination. Gross realized gains and/or losses of the Portfolio are allocated to the Holders in a manner such that, the net asset values per share of each Holder, after each such allocation is closer to the total of all Holders’ net asset values divided by the aggregate number of shares outstanding for all Holders.
(e) Credit and market risk. Investments in securities that are collateralized by residential real estate mortgages are subject to certain credit and liquidity risks. When market
| | |
| Liquid Reserves Portfolio 2016 Semi-Annual Report | | 27 |
Notes to financial statements (cont’d)
conditions result in an increase in default rates of the underlying mortgages and the foreclosure values of underlying real estate properties are materially below the outstanding amount of these underlying mortgages, collection of the full amount of accrued interest and principal on these investments may be doubtful. Such market conditions may significantly impair the value and liquidity of these investments and may result in a lack of correlation between their credit ratings and values.
(f) Compensating balance arrangements. The Portfolio has an arrangement with its custodian bank whereby a portion of the custodian’s fees is paid indirectly by credits earned on the Portfolio’s cash on deposit with the bank.
(g) Income taxes. The Portfolio is classified as a partnership for federal income tax purposes. As such, each investor in the Portfolio is treated as owner of its proportionate share of the net assets, income, expenses and realized and unrealized gains and losses of the Portfolio. Therefore, no federal income tax provision is required. It is intended that the Portfolio’s assets will be managed so an investor in the Portfolio can satisfy the requirements of Subchapter M of the Internal Revenue Code.
Management has analyzed the Portfolio’s tax positions taken on income tax returns for all open tax years and has concluded that as of February 29, 2016, no provision for income tax is required in the Portfolio’s financial statements. The Portfolio’s federal and state income tax returns for tax years for which the applicable statutes of limitations have not expired are subject to examination by the Internal Revenue Service and state departments of revenue.
(h) Other. Purchases, maturities and sales of money market instruments are accounted for on the date of the transaction. Realized gains and losses are calculated on the identified cost basis.
2. Investment management agreement and other transactions with affiliates
Legg Mason Partners Fund Advisor, LLC (“LMPFA”) is the Portfolio’s investment manager and Western Asset Management Company (“Western Asset”) is the Portfolio’s subadviser. LMPFA and Western Asset are wholly-owned subsidiaries of Legg Mason, Inc. (“Legg Mason”).
Under the investment management agreement, the Portfolio pays an investment management fee, calculated daily and paid monthly, at an annual rate of 0.10% of the Portfolio’s average daily net assets.
LMPFA provides administrative and certain oversight services to the Portfolio. LMPFA delegates to the subadviser the day-to-day portfolio management of the Portfolio. For its services, LMPFA pays Western Asset 70% of the net management fee it receives from the Portfolio.
LMPFA has voluntarily agreed to waive and/or reimburse 0.10% of Portfolio expenses. This arrangement may be reduced or terminated under certain circumstances. Additional amounts may be voluntarily waived and/or reimbursed from time to time.
| | |
| 28 | | Liquid Reserves Portfolio 2016 Semi-Annual Report |
During the six months ended February 29, 2016, fees waived and/or expenses reimbursed amounted to $28,041,902.
LMPFA is permitted to recapture amounts waived and/or reimbursed to the Portfolio during the same fiscal year under certain circumstances.
All officers and one Trustee of the Trust are employees of Legg Mason or its affiliates and do not receive compensation from the Trust.
3. Derivative instruments and hedging activities
During the six months ended February 29, 2016, the Portfolio did not invest in derivative instruments.
4. Money market fund reform
Under new federal regulations effective on October 14, 2016, the Portfolio will no longer be allowed to use the special pricing and valuation conventions that currently facilitate a constant net asset value for the Portfolio. Instead, no later than that date, the Portfolio will be required to price its portfolio securities based on their current market value, which will result in a so-called floating net asset value or floating NAV for the Portfolio. In addition, no later than that date, the Portfolio may impose a fee upon the withdrawal of interests or may temporarily suspend the withdrawal of interests if the Portfolio’s liquidity falls below required minimums because of market conditions or other factors.
| | |
| Liquid Reserves Portfolio 2016 Semi-Annual Report | | 29 |
Board approval of management and
subadvisory agreements (unaudited)
At an in-person meeting of the Board of Trustees of Master Portfolio Trust (the “Trust”) held on November 9-10, 2015, the Board, including the Trustees who are not considered to be “interested persons” of the Trust (the “Independent Trustees”) under the Investment Company Act of 1940, as amended (the “1940 Act”), approved for an annual period the continuation of the management agreement (the “Management Agreement”) between the Trust and Legg Mason Partners Fund Advisor, LLC (the “Manager”) with respect to the Liquid Reserves Portfolio, a series of the Trust (the “Fund”), and the sub-advisory agreement (the “Sub-Advisory Agreement”) between the Manager and Western Asset Management Company (the “Subadviser”), an affiliate of the Manager, with respect to the Fund.
Background
The Board received extensive information in advance of the meeting from the Manager to assist it in its consideration of the Management Agreement and the Sub-Advisory Agreement and was given the opportunity to ask questions and request additional information from management. In addition, prior to the meeting the Independent Trustees met with their independent legal counsel to discuss and consider the information provided by management and submitted questions to management, and they considered the responses provided. The Board received and considered a variety of information about the Manager and the Subadviser, as well as the management and sub-advisory arrangements for the Fund and other funds overseen by the Board, certain portions of which are discussed below. The Board noted that the Fund is a “master fund” in a “master-feeder” structure, whereby each feeder fund has the same investment objective and policies as the Fund and invests substantially all of its assets in the Fund. The information provided and presentations made to the Board encompassed the Fund and all funds for which the Board has responsibility, including the following feeder funds in the Fund (each a “Feeder Fund”): Western Asset Liquid Reserves, a series of Legg Mason Partners Money Market Trust, Western Asset Institutional Liquid Reserves, a series of Legg Mason Partners Institutional Trust, and Western Asset Premium Liquid Reserves, a series of Legg Mason Partners Premium Money Market Trust.
The discussion below covers both the advisory and the administrative functions being rendered by the Manager, both of which functions are encompassed by the Management Agreement, as well as the advisory functions rendered by the Subadviser pursuant to the Sub-Advisory Agreement.
Board approval of management agreement and sub-advisory agreement
The Independent Trustees were advised by separate independent legal counsel throughout the process. Prior to voting, the Independent Trustees received a memorandum from their independent legal counsel discussing the legal standards for their consideration of the proposed continuation of the Management Agreement and the Sub-Advisory Agreement. The Independent Trustees also reviewed the proposed continuation of the Management Agreement and the Sub-Advisory Agreement in private sessions with their independent legal counsel at which no representatives of the Manager and Subadviser were present. The Independent Trustees considered the Management Agreement and the Sub-Advisory
| | |
| 30 | | Liquid Reserves Portfolio |
Agreement separately in the course of their review. In doing so, they noted the respective roles of the Manager and the Subadviser in providing services to the Fund.
In approving the Management Agreement and Sub-Advisory Agreement, the Board, including the Independent Trustees, considered a variety of factors, including those factors discussed below. No single factor reviewed by the Board was identified by the Board as the principal factor in determining whether to approve the Management Agreement and the Sub-Advisory Agreement. Each Trustee may have attributed different weight to the various factors in evaluating the Management Agreement and the Sub-Advisory Agreement.
Nature, extent and quality of the services under the management agreement and sub-advisory agreement
The Board received and considered information regarding the nature, extent and quality of services provided to the Fund by the Manager and the Subadviser under the Management Agreement and the Sub-Advisory Agreement, respectively, during the past year. The Board noted information received at regular meetings throughout the year related to the services rendered by the Manager in its management of the Fund’s affairs and the Manager’s role in coordinating the activities of the Fund’s other service providers. The Board’s evaluation of the services provided by the Manager and the Subadviser took into account the Board’s knowledge gained as Trustees of funds in the Legg Mason fund complex, including knowledge gained regarding the scope and quality of the investment management and other capabilities of the Manager and the Subadviser, and the quality of the Manager’s administrative and other services. The Board observed that the scope of services provided by the Manager and the Subadviser, and of the undertakings required of the Manager and Subadviser in connection with those services, including maintaining and monitoring their own and the Fund’s compliance programs and cybersecurity programs, had expanded over time as a result of regulatory, market and other developments. The Board also noted that on a regular basis it received and reviewed information from the Manager and the Subadviser regarding the Fund’s compliance policies and procedures established pursuant to Rule 38a-1 under the 1940 Act. The Board also considered the Manager’s and the Subadviser’s risk management processes.
The Board reviewed the qualifications, backgrounds and responsibilities of the Manager’s and the Subadviser’s senior personnel and the team of investment professionals primarily responsible for the day-to-day portfolio management of the Fund. The Board also considered, based on its knowledge of the Manager and its affiliates, the financial resources of Legg Mason, Inc., the parent organization of the Manager and the Subadviser. The Board recognized the importance of having a fund manager with significant resources.
The Board considered the division of responsibilities between the Manager and the Subadviser and the oversight provided by the Manager. The Board also considered the policies and practices of the Manager and the Subadviser regarding the selection of brokers and dealers and the execution of portfolio transactions. In addition, management also reported to the Board on, among other things, its business plans and any organizational changes.
| | |
| Liquid Reserves Portfolio | | 31 |
Board approval of management and subadvisory agreements (unaudited) (cont’d)
The Board received and considered performance information for each Feeder Fund as well as for a group of funds (the “Performance Universe”) selected by Lipper, Inc. (currently, Broadridge Financial Solutions, Inc.) (“Lipper”), an independent provider of investment company data. The Board was provided with a description of the methodology Lipper used to determine the similarity of each Feeder Fund with the funds included in the Performance Universe. It was noted that while the Board found the Lipper data generally useful they recognized its limitations, including in particular that the data may vary depending on the end date selected. The Board also noted that it had received and discussed with management information throughout the year at periodic intervals and for rolling periods comparing each Feeder Fund’s performance against its benchmark and against each Feeder Fund’s peers. In addition, the Board considered each Feeder Fund’s performance in light of overall financial market conditions.
| • | | The information comparing Western Asset Liquid Reserves’ performance to that of its Performance Universe, consisting of all funds classified as retail money market instrument funds by Lipper, showed, among other data, that the Feeder Fund’s performance for the 1-, 3- and 5-year periods ended June 30, 2015 was at the median, and its performance for the 10-year period ended June 30, 2015 was above the median. |
| • | | The information comparing Western Asset Institutional Liquid Reserves’ performance to that of its Performance Universe, consisting of all funds classified as institutional money market funds by Lipper, showed, among other data, that the Feeder Fund’s performance for the 1-, 3-, 5- and 10-year periods ended June 30, 2015 was above the median. |
| • | | The information comparing Western Asset Premium Liquid Reserves’ performance to that of its Performance Universe, consisting of all funds classified as retail money market instrument funds by Lipper, showed, among other data, that the Feeder Fund’s performance for the 1-, 3- and 5-year periods ended June 30, 2015 was at the median, and its performance for the 10-year period ended June 30, 2015 was above the median. |
The Board concluded that, overall, the nature, extent and quality of services provided (and expected to be provided), including performance, under the Management Agreement and the Sub-Advisory Agreement were sufficient for renewal.
Management fees and expense ratios
The Board reviewed and considered the contractual management fee and the actual management fees paid by the Fund to the Manager in light of the nature, extent and quality of the management and sub-advisory services provided by the Manager and the Subadviser. The Board also considered that fee waiver and/or expense reimbursement arrangements are currently in place for the Feeder Funds. The Board also noted that the compensation paid to the Subadviser is the responsibility and expense of the Manager, not the Fund.
In addition, the Board received and considered information provided by Lipper comparing each Feeder Fund’s contractual management fee (the “Contractual Management Fee”), the actual management fees paid by each Feeder Fund to the Manager (the “Actual Management Fee”)
| | |
| 32 | | Liquid Reserves Portfolio |
and each Feeder Fund’s total actual expenses with those of funds in both the relevant expense group and a broader group of funds, each selected by Lipper. The Board noted that the Feeder Funds’ assets represented a significant portion of the Fund’s assets. The Board noted that the Feeder Funds’ expense information reflected both management fees and total expenses payable by the Feeder Funds as well as management fees and total expenses payable by the Fund, and therefore was relevant to the Board’s conclusions regarding the Fund’s expenses. The Board also reviewed information regarding fees charged by the Manager to other U.S. clients investing primarily in an asset class similar to that of the Fund, including, where applicable, separate accounts.
The Manager reviewed with the Board the differences in services provided to these different types of accounts, noting that the Fund is provided with certain administrative services, office facilities, and Fund officers (including the Fund’s chief executive, chief financial and chief compliance officers), and that the Manager coordinates and oversees the provision of services to the Fund by other Fund service providers. The Board considered the fee comparisons in light of the differences in management of these different types of accounts.
The Board considered the overall management fee, the fees of the Subadviser and the amount of the management fee retained by the Manager after payment of the subadvisory fee in each case in light of the services rendered for those amounts. The Board also received an analysis of complex-wide management fees provided by the Manager, which, among other things, set out a framework of fees based on asset classes.
The information comparing each Feeder Fund’s Contractual Management Fee and its Actual Management Fee as well as its actual total expense ratio to its expense group, consisting of a group (including the Feeder Fund) of either retail no-load funds classified as money market instrument funds or funds classified as institutional money market funds and chosen by Lipper to be comparable to the Feeder Fund, showed the following:
| • | | For Western Asset Liquid Reserves, the Contractual Management Fee was above the median, the Actual Management Fee was at the median, and the actual total expense ratio was above the median. The Board took into account management’s discussion of the Feeder Fund’s expenses, as well as the master-feeder structure. The Board also considered that the current limitation on the Feeder Fund’s expenses is expected to continue through December 2017. |
| • | | For Western Asset Institutional Liquid Reserves, the Contractual Management Fee was above the median, the Actual Management Fee was below the median, and the actual total expense ratio was below the median. The Board took into account management’s discussion of the Feeder Fund’s expenses, as well as the master-feeder structure. The Board also considered that the current limitation on the Feeder Fund’s expenses is expected to continue through December 2017. |
| • | | For Western Asset Premium Liquid Reserves, the Contractual Management Fee was below the median, the Actual Management Fee was above the median, and the actual |
| | |
| Liquid Reserves Portfolio | | 33 |
Board approval of management and subadvisory agreements (unaudited) (cont’d)
| | total expense ratio was above the median. The Board took into account management’s discussion of the Feeder Fund’s expenses, as well as the master-feeder structure. The Board also considered that the current limitation on the Feeder Fund’s expenses is expected to continue through December 2017. |
Taking all of the above into consideration, as well as the factors identified below, the Board determined that the management fee and the subadvisory fee for the Fund were reasonable in light of the nature, extent and quality of the services provided to the Fund under the Management Agreement and the Sub-Advisory Agreement.
Manager profitability
The Board received and considered an analysis of the profitability of the Manager and its affiliates in providing services to the Fund. The Board also received profitability information with respect to the Legg Mason fund complex as a whole. In addition, the Board received information with respect to the Manager’s allocation methodologies used in preparing this profitability data. It was noted that the allocation methodologies had been reviewed previously by an outside consultant. The profitability of the Manager and its affiliates was considered by the Board not excessive in light of the nature, extent and quality of the services provided to the Fund and the type of fund it represented.
Economies of scale
The Board received and discussed information concerning whether the Manager realizes economies of scale as the Fund’s assets grow.
| • | | The Board noted that the Manager had previously agreed to institute breakpoints in Western Asset Institutional Liquid Reserves’ Contractual Management Fee, reflecting the potential for reducing the Contractual Management Fee as the Feeder Fund grows. The Board considered whether the breakpoint fee structure was a reasonable means of sharing any economies of scale or other efficiencies that might accrue from increases in the Feeder Fund’s asset levels. The Board noted that the Feeder Fund had reached the specified asset levels at which one or more breakpoints to its Contractual Management Fee are triggered. The Board also considered that the Feeder Fund’s Contractual Management Fee is approximately equivalent to the asset-weighted average of management fees paid by the other funds with the same Lipper investment classification/objective at the Feeder Fund’s current asset level and at higher asset levels as well. In addition, the Board considered that the Actual Management Fee was below the median of the expense group. |
| • | | The Board also noted that the Manager had previously agreed to institute breakpoints in Western Asset Liquid Reserves’ Contractual Management Fee, reflecting the potential for reducing the Contractual Management Fee as the Feeder Fund grows. The Board considered whether the breakpoint fee structure was a reasonable means of sharing any economies of scale or other efficiencies that might accrue from increases in the Feeder Fund’s asset levels. The Board noted that the Feeder Fund had not yet reached the |
| | |
| 34 | | Liquid Reserves Portfolio |
| | specified asset levels at which one or more breakpoints to its Contractual Management Fee are triggered. The Board also considered that the Feeder Fund’s Actual Management Fee was at the median of the expense group. |
| • | | The Board also considered the size of Western Asset Premium Liquid Reserves and that its Contractual Management Fee was below the median of its expense group. |
The Board determined that the management fee structure for the Fund was reasonable.
Other benefits to the manager and the subadviser
The Board considered other benefits received by the Manager, the Subadviser and their affiliates as a result of their relationship with the Fund, including the opportunity to offer additional products and services to the Feeder Funds’ shareholders.
In light of the costs of providing investment management and other services to the Fund and the ongoing commitment of the Manager and the Subadviser to the Fund, the Board considered that the ancillary benefits that the Manager and its affiliates received were reasonable.
* * *
In light of all of the foregoing, the Board determined that the continuation of each of the Management Agreement and Sub-Advisory Agreement would be in the best interests of the Fund’s shareholders and approved the continuation of such agreements for another year.
| | |
| Liquid Reserves Portfolio | | 35 |
Western Asset
Premium Liquid Reserves
Trustees
Elliott J. Berv*
Chair
Jane F. Dasher
Mark T. Finn
Stephen R. Gross
Richard E. Hanson, Jr.
Diana R. Harrington
Susan M. Heilbron
Susan B. Kerley
Alan G. Merten
R. Richardson Pettit
Jane Trust**
| * | Effective February 10, 2016, Mr. Berv became Chair. |
| ** | Effective June 1, 2015, Ms. Trust became a Trustee, President and Chief Executive Officer. |
Investment manager
Legg Mason Partners Fund Advisor, LLC
Subadviser
Western Asset Management Company
Distributor
Legg Mason Investor Services, LLC
Custodian
State Street Bank and Trust Company
Transfer agent
Boston Financial Data Services, Inc.
2000 Crown Colony Drive
Quincy, MA 02169
Independent registered public accounting firm
KPMG LLP
345 Park Avenue
New York, NY 10154
Western Asset Premium Liquid Reserves
The Fund is a separate investment series of Legg Mason Partners Premium Money Market Trust, a Maryland statutory trust.
Western Asset Premium Liquid Reserves
Legg Mason Funds
620 Eighth Avenue, 49th Floor
New York, NY 10018
The Fund files its complete schedule of portfolio holdings with the Securities and Exchange Commission (“SEC”) for the first and third quarters of each fiscal year on Form N-Q. The Fund’s Forms N-Q are available on the SEC’s website at www.sec.gov. The Fund’s Forms N-Q may be reviewed and copied at the SEC’s Public Reference Room in Washington D.C., and information on the operation of the Public Reference Room may be obtained by calling 1-800-SEC-0330. To obtain information on Form N-Q, shareholders can call the Fund at 1-877-721-1926 or 1-203-703-6002.
Information on how the Fund voted proxies relating to portfolio securities during the prior 12-month period ended June 30th of each year and a description of the policies and procedures that the Fund uses to determine how to vote proxies related to portfolio transactions are available (1) without charge, upon request, by calling the Fund at 1-877-721-1926 or 1-203-703-6002, (2) on the Fund’s website at www.leggmason.com/individualinvestors and (3) on the SEC’s website at www.sec.gov.
This report is submitted for the general information of the shareholders of Western Asset Premium Liquid Reserves. This report is not authorized for distribution to prospective investors in the Fund unless preceded or accompanied by a current prospectus.
Investors should consider the Fund’s investment objective, risks, charges and expenses carefully before investing. The prospectus contains this and other important information about the Fund. Please read the prospectus carefully before investing.
www.leggmason.com/individualinvestors
© 2016 Legg Mason Investor Services, LLC
Member FINRA, SIPC
Legg Mason Funds Privacy and Security Notice
Your Privacy and the Security of Your Personal Information is Very Important to the Legg Mason Funds
This Privacy and Security Notice (the “Privacy Notice”) addresses the Legg Mason Funds’ privacy and data protection practices with respect to nonpublic personal information the Funds receive. The Legg Mason Funds include any funds sold by the Funds’ distributor, Legg Mason Investor Services, LLC, as well as Legg Mason-sponsored closed-end funds and certain closed-end fund managed or sub-advised by Legg Mason or its affiliates. The provisions of this Privacy Notice apply to your information both while you are a shareholder and after you are no longer invested with the Funds.
The Type of Nonpublic Personal Information the Funds Collect About You
The Funds collect and maintain nonpublic personal information about you in connection with your shareholder account. Such information may include, but is not limited to:
| • | | Personal information included on applications or other forms; |
| • | | Account balances, transactions, and mutual fund holdings and positions; |
| • | | Online account access user IDs, passwords, security challenge question responses; and |
| • | | Information received from consumer reporting agencies regarding credit history and creditworthiness (such as the amount of an individual’s total debt, payment history, etc.). |
How the Funds Use Nonpublic Personal Information About You
The Funds do not sell or share your nonpublic personal information with third parties or with affiliates for their marketing purposes, or with other financial institutions or affiliates for joint marketing purposes, unless you have authorized the Funds to do so. The Funds do not disclose any nonpublic personal information about you except as may be required to perform transactions or services you have authorized or as permitted or required by law. The Funds may disclose information about you to:
| • | | Employees, agents, and affiliates on a “need to know” basis to enable the Funds to conduct ordinary business or comply with obligations to government regulators; |
| • | | Service providers, including the Funds’ affiliates, who assist the Funds as part of the ordinary course of business (such as printing, mailing services, or processing or servicing your account with us) or otherwise perform services on the Funds’ behalf, including companies that may perform marketing services solely for the Funds; |
| • | | The Funds’ representatives such as legal counsel, accountants and auditors; and |
| • | | Fiduciaries or representatives acting on your behalf, such as an IRA custodian or trustee of a grantor trust. |
|
| NOT PART OF THE SEMI-ANNUAL REPORT |
Legg Mason Funds Privacy and Security Notice (cont’d)
Except as otherwise permitted by applicable law, companies acting on the Funds’ behalf are contractually obligated to keep nonpublic personal information the Funds provide to them confidential and to use the information the Funds share only to provide the services the Funds ask them to perform.
The Funds may disclose nonpublic personal information about you when necessary to enforce their rights or protect against fraud, or as permitted or required by applicable law, such as in connection with a law enforcement or regulatory request, subpoena, or similar legal process. In the event of a corporate action or in the event a Fund service provider changes, the Funds may be required to disclose your nonpublic personal information to third parties. While it is the Funds’ practice to obtain protections for disclosed information in these types of transactions, the Funds cannot guarantee their privacy policy will remain unchanged.
Keeping You Informed of the Funds’ Privacy and Security Practices
The Funds will notify you annually of their privacy policy as required by federal law. While the Funds reserve the right to modify this policy at any time they will notify you promptly if this privacy policy changes.
The Funds’ Security Practices
The Funds maintain appropriate physical, electronic and procedural safeguards designed to guard your nonpublic personal information. The Funds’ internal data security policies restrict access to your nonpublic personal information to authorized employees, who may use your nonpublic personal information for Fund business purposes only.
Although the Funds strive to protect your nonpublic personal information, they cannot ensure or warrant the security of any information you provide or transmit to them, and you do so at your own risk. In the event of a breach of the confidentiality or security of your nonpublic personal information, the Funds will attempt to notify you as necessary so you can take appropriate protective steps. If you have consented to the Funds using electronic communications or electronic delivery of statements, they may notify you under such circumstances using the most current email address you have on record with them.
In order for the Funds to provide effective service to you, keeping your account information accurate is very important. If you believe that your account information is incomplete, not accurate or not current, or if you have questions about the Funds’ privacy practices, write the Funds using the contact information on your account statements, email the Funds by clicking on the Contact Us section of the Funds’ website at www.leggmason.com, or contact the Fund at 1-877-721-1926.
|
| NOT PART OF THE SEMI-ANNUAL REPORT |
www.leggmason.com/individualinvestors
© 2016 Legg Mason Investor Services, LLC Member FINRA, SIPC
FDXX010857 4/16 SR16-2733
Not applicable.
| ITEM 3. | AUDIT COMMITTEE FINANCIAL EXPERT. |
Not applicable.
| ITEM 4. | PRINCIPAL ACCOUNTANT FEES AND SERVICES. |
Not applicable.
| ITEM 5. | AUDIT COMMITTEE OF LISTED REGISTRANTS. |
Not applicable.
| ITEM 6. | SCHEDULE OF INVESTMENTS. |
Included herein under Item 1.
| ITEM 7. | DISCLOSURE OF PROXY VOTING POLICIES AND PROCEDURES FOR CLOSED-END MANAGEMENT INVESTMENT COMPANIES. |
Not applicable.
| ITEM 8. | PORTFOLIO MANAGERS OF CLOSED-END MANAGEMENT INVESTMENT COMPANIES. |
Not applicable.
| ITEM 9. | PURCHASES OF EQUITY SECURITIES BY CLOSED-END MANAGEMENT INVESTMENT COMPANY AND AFFILIATED PURCHASERS. |
Not applicable.
| ITEM 10. | SUBMISSION OF MATTERS TO A VOTE OF SECURITY HOLDERS. |
Not applicable.
| ITEM 11. | CONTROLS AND PROCEDURES. |
| | (a) | The registrant’s principal executive officer and principal financial officer have concluded that the registrant’s disclosure controls and procedures (as defined in Rule 30a- 3(c) under the Investment Company Act of 1940, as amended (the “1940 Act”)) are effective as of a date within 90 days of the filing date of this report that includes the disclosure required by this paragraph, based on their evaluation of the disclosure controls and procedures required by Rule 30a-3(b) under the 1940 Act and 15d-15(b) under the Securities Exchange Act of 1934. |
| | (b) | There were no changes in the registrant’s internal control over financial reporting (as defined in Rule 30a-3(d) under the 1940 Act) that occurred during the second fiscal quarter of the period covered by this report that have materially affected, or are likely to materially affect the registrant’s internal control over financial reporting. |
(a) (1) Not applicable.
Exhibit 99.CODE ETH
(a) (2) Certifications pursuant to section 302 of the Sarbanes-Oxley Act of 2002 attached hereto.
Exhibit 99.CERT
(b) Certifications pursuant to Section 906 of the Sarbanes-Oxley Act of 2002 attached hereto.
Exhibit 99.906CERT
SIGNATURES
Pursuant to the requirements of the Securities Exchange Act of 1934 and the Investment Company Act of 1940, the registrant has duly caused this Report to be signed on its behalf by the undersigned, there unto duly authorized.
Legg Mason Partners Premium Money Market Trust
| | |
| By: | | /s/ Jane Trust |
| | Jane Trust |
| | Chief Executive Officer |
| |
| Date: | | April 22, 2016 |
Pursuant to the requirements of the Securities Exchange Act of 1934 and the Investment Company Act of 1940, this report has been signed below by the following persons on behalf of the registrant and in the capacities and on the dates indicated.
| | |
| By: | | /s/ Jane Trust |
| | Jane Trust |
| | Chief Executive Officer |
| |
| Date: | | April 22, 2016 |
| | |
| By: | | /s/ Richard F. Sennett |
| | Richard F. Sennett |
| | Principal Financial Officer |
| |
| Date: | | April 22, 2016 |