Exhibit 99.2
ALLERGAN
Our pursuit. Life’s potential.®
May 2014
Allergan
A Specialist in the Biopharmaceutical
& Medical Device Industries
Forward-Looking Statements
This presentation contains “forward-looking statements,” including statements regarding product acquisition and development, regulatory approvals, market potential, expected growth, efficiencies, and Allergan’s expected, estimated or anticipated future results, including Allergan’s earnings per share and revenue forecasts, among other statements. All forward-looking statements herein are based on Allergan’s current expectations of future events and represent Allergan’s judgment only as of the date of this presentation. If underlying assumptions prove inaccurate or unknown risks or uncertainties materialize, actual results could vary materially from Allergan’s expectations and projections. Therefore, you are cautioned not to rely on any of these forward-looking statements and Allergan expressly disclaims any intent or obligation to update these forward-looking statements except as required to do so by law.
Actual results may differ materially from Allergan’s current expectations based on a number of factors affecting Allergan’s businesses, including changing competitive, market and regulatory conditions; the timing and uncertainty of the results of both the research and development and regulatory processes; domestic and foreign health care and cost containment reforms, including government pricing, tax and reimbursement policies; revisions to regulatory policies related to the approval of competitive generic products; technological advances and patents obtained by competitors; the ability to obtain and maintain adequate protection of intellectual property rights; the performance of new products, including obtaining government approval and consumer and physician acceptance, the continuing acceptance of currently marketed products, and consistency of treatment results among patients; the effectiveness of promotional and advertising campaigns; the potential for negative publicity concerning any of Allergan’s products; the timely and successful implementation of strategic initiatives, including expansion of new or existing products into new markets; the results of any pending or future litigation, investigations or claims; the uncertainty associated with the identification of, and successful consummation, execution and integration of, external corporate development initiatives and strategic partnering transactions; potential difficulties in manufacturing; and Allergan’s ability to obtain and successfully maintain a sufficient supply of products to meet market demand in a timely manner. In addition, matters generally affecting the U.S. and international economies, including consumer confidence and debt levels, changes in interest and currency exchange rates, political uncertainty, international relations, the status of financial markets and institutions, impact of natural disasters or geo-political events and the state of the economy worldwide, may materially affect Allergan’s results.
These and other risks and uncertainties affecting Allergan’s businesses and operations may be found in Allergan’s most recently filed
Annual Report on Form 10-K and any subsequent Quarterly Reports on Form 10-Q, including under the heading “Risk Factors”. These filings, as well as Allergan’s other public filings with the U.S. Securities and Exchange Commission (SEC), can be obtained without charge at the SEC’s web site at www.sec.gov. These SEC filings are also available at Allergan’s web site at www.allergan.com along with copies of Allergan’s press releases and additional information about Allergan. For further information, you can contact the Allergan Investor Relations Department by calling 714 -246-4636.
© 2014 Allergan, Inc. All rights reserved.
ALLERGAN
Our pursuit. Life’s potential.®
® & ™ Marks owned by Allergan, Inc.
JUVÉDERM® is a registered trademark of Allergan Industrie SAS
All other products are registered trademarks of their respective companies
2
Update on Selected Recent Developments
On April 22, 2014, Valeant and Pershing Square proposed an acquisition of Allergan
The proposal consisted of $48.30 / share in cash and 0.83 Valeant shares / Allergan share in stock
On May 10, 2014, the Allergan Board of Directors reviewed Valeant’s unsolicited proposal in consultation with financial and legal advisors
It is the unanimous view of the Allergan Board of Directors that Valeant’s unsolicited proposal substantially undervalues Allergan, creates significant risks and uncertainties for the stockholders of Allergan, and is not in the best interests of the Company and its stockholders
Allergan has a long history of producing consistent growth and delivering solid results through a combination of innovation, execution and discipline
We are confident in our ability to extend our strong track record of innovation, which has yielded unique expertise and insights that drive innovation and value
We do not believe Valeant’s proposal reflects value due to our leading market positions, future growth prospects, and industry-leading research and development efforts. In addition, we do not believe that the Valeant business model is sustainable
Allergan Board of Directors is confident that our plan will create significantly more value than Valeant’s hostile, unsolicited proposal
Allergan management team is best equipped to deliver this value – our track record speaks for itself
ALLERGAN
Our pursuit. Life’s potential.®
3
Highlights of Business
Allergan Now
We have built a pre-eminent specialty pharmaceutical and medical device company based on a track record of innovation and shareholder value creation
#1 or #2 positions in high growth markets, based on premium high quality products
Taking advantage of market dislocation and weakening competitors
Targeted expansion into high value geographies and new specialty areas
Innovation in products and marketing drives our success
Prolific R&D generates products that customers want and make us a market leader
Sophisticated and proprietary sales, support and marketing infrastructure
Allergan in the Future
Our management team is best positioned to drive growth through innovation and operational excellence
Continue to maximize value through market expansion and new market creation
In mid-2013, management and our Board of Directors began working on a plan to further enhance sales and earnings performance
Capitalize on value of critical mass built over past five years
Strong pipeline and continued delivery of product flow driving top line growth
Operational efficiency and leveraging commercial infrastructure accelerating bottom line growth
ALLERGAN
Our pursuit. Life’s potential.®
4
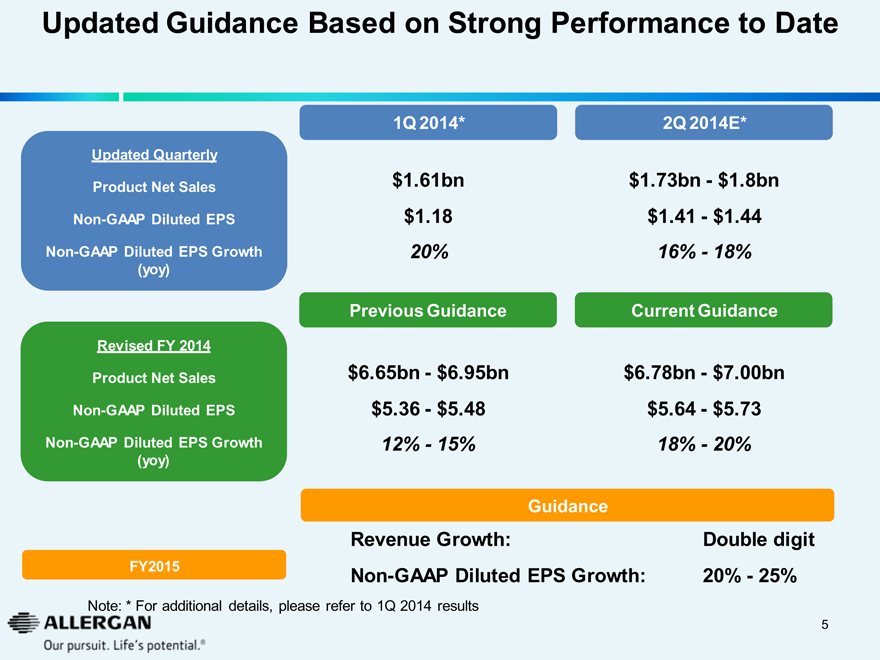
Updated Guidance Based on Strong Performance to Date
1Q 2014* 2Q 2014E*
Updated Quarterly
Product Net Sales $1.61bn $1.73bn - $1.8bn
Non-GAAP Diluted EPS $1.18 $1.41 - $1.44
Non-GAAP Diluted EPS Growth (yoy) 20% 16% - 18%
Previous Guidance Current Guidance
Revised FY 2014
Product Net Sales $6.65bn - $6.95bn $6.78bn - $7.00bn
Non-GAAP Diluted EPS $5.36 - $5.48 $5.64 - $5.73
Non-GAAP Diluted EPS Growth (yoy) 12% - 15% 18% - 20%
Guidance
Revenue Growth: Double digit
FY2015 Non-GAAP Diluted EPS Growth: 20% - 25%
Note: * For additional details, please refer to 1Q 2014 results
ALLERGAN
Our pursuit. Life’s potential. ®
5
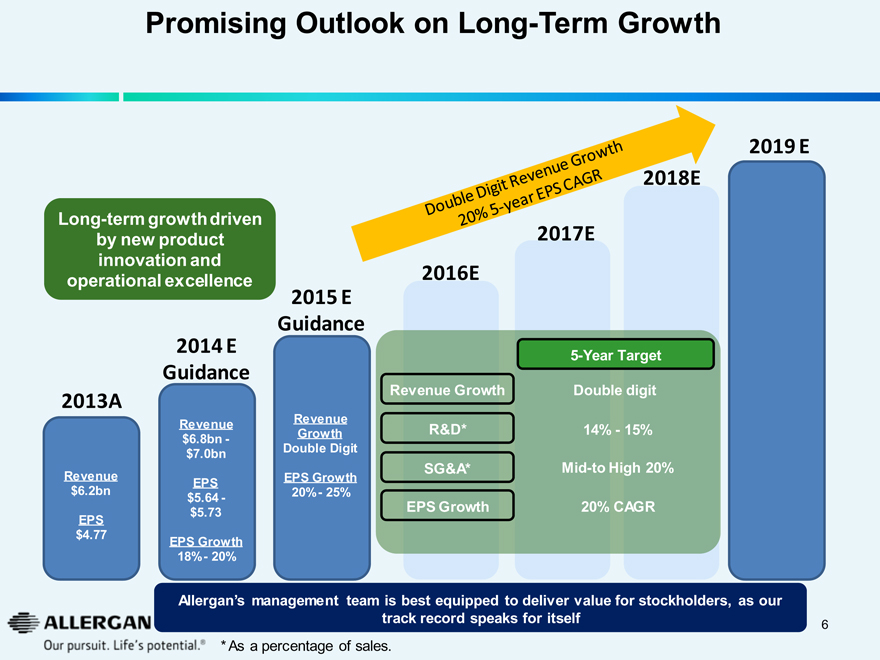
Promising Outlook on Long-Term Growth
Double Digit Revenue Growth 20% 5-year EPS CAGR
Long-term growth driven by new product innovation and operational excellence
2013A 2014 E Guidance 2015 E Guidance 2016E 2017E 2018E 2019 E
Revenue
$6.2bn
EPS
$4.77
Revenue
$6.8bn - $7.0bn
EPS
$5.64 - $5.73
EPS Growth
18% - 20%
Revenue Growth
Double Digit
EPS Growth
20% - 25%
5-Year Target
Revenue Growth Double digit
R&D* 14% - 15%
SG&A* Mid-to High 20%
EPS Growth 20% CAGR
ALLERGAN
Our pursuit. Life’s potential. ®
Allergan’s management team is best equipped to deliver value for stockholders, as our track record speaks for itself
* As a percentage of sales.
6

Introduction to Allergan
ALLERGAN
Our pursuit. Life’s potential. ®
7
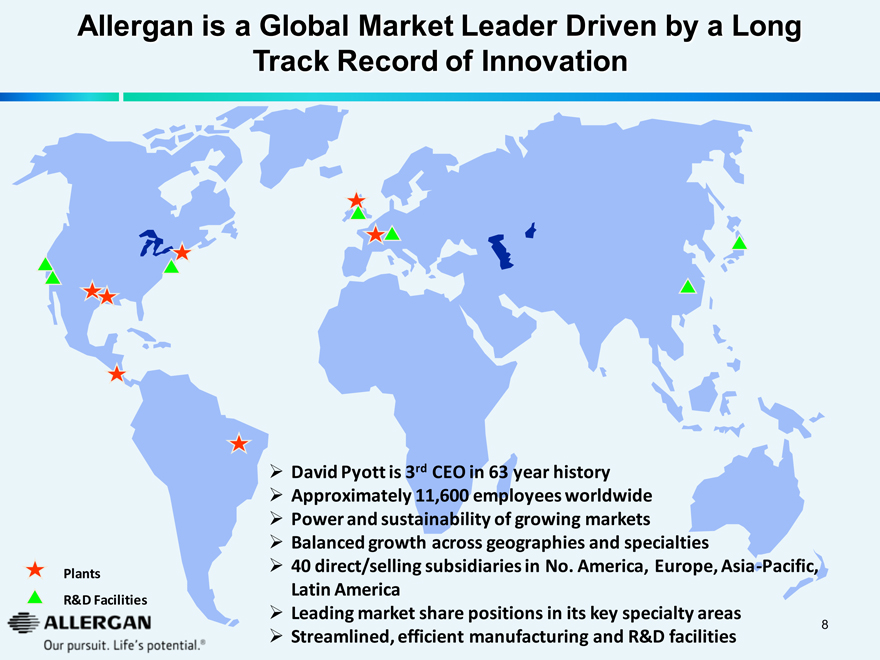
Allergan is a Global Market Leader Driven by a Long Track Record of Innovation
David Pyott is 3rd CEO in 63 year history
Approximately 11,600 employees worldwide
Power and sustainability of growing markets
Balanced growth across geographies and specialties
40 direct/selling subsidiaries in No. America, Europe, Asia-Pacific, Latin America
Leading market share positions in its key specialty areas
Streamlined, efficient manufacturing and R&D facilities
Plants
R&D Facilities
ALLERGAN
Our pursuit. Life’s potential. ®
8
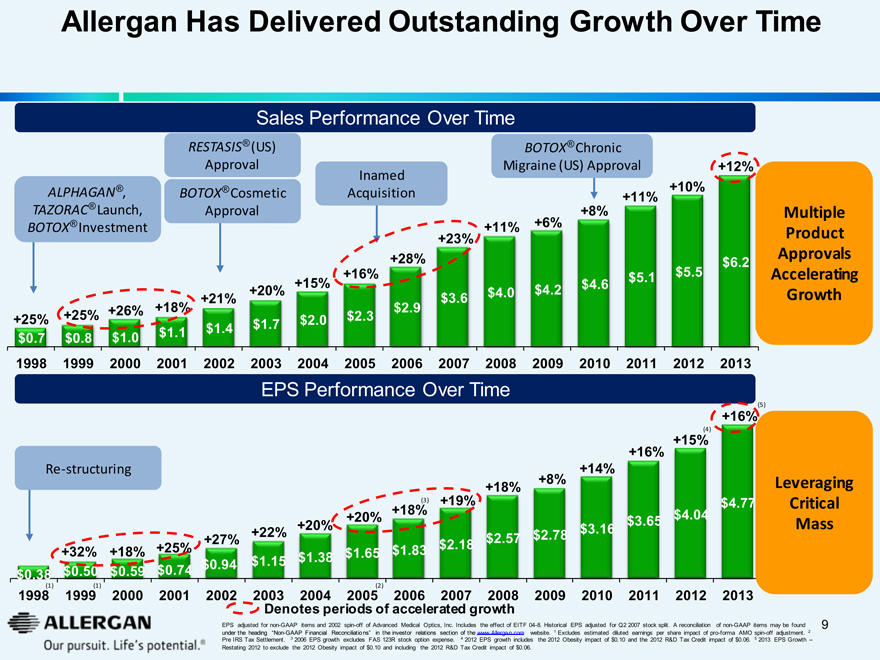
Allergan Has Delivered Outstanding Growth Over Time
Sales Performance Over Time
ALPHAGAN® , TAZORAC® Launch, BOTOX® Investment
RESTASIS® (US) Approval
BOTOX® Cosmetic Approval
Inamed Acquisition
BOTOX® Chronic Migraine (US) Approval
+25% +25% +26% +18% +21% +20% +15% +16% +28% +23% +11% +6% +8% +11% +10% +12%
Multiple Product Approvals Accelerating Growth
$0.7 $0.8 $1.0 $1.1 $1.4 $1.7 $2.0 $2.3 $2.9 $3.6 $4.0 $4.2 $4.6 $5.1 $5.5 $6.2
1998 1999 2000 2001 2002 2003 2004 2005 2006 2007 2008 2009 2010 2011 2012 2013
EPS Performance Over Time
Re-structuring
+32% +18% +25% +27% +22% +20% +20% +18%(3) +19% +18% +8% +14% +16% +15%(4) +16%(5)
$0.38 $0.50 $0.59 $0.74 $0.94 $1.15 $1.38 $1.65 $1.83 $2.18 $2.57 $2.78 $3.16 $3.65 $4.04 $4.77
Leveraging Critical Mass
1998(1) 1999(1) 2000 2001 2002 2003 2004 2005(2) 2006 2007 2008 2009 2010 2011 2012 2013
Denotes periods of accelerated growth
ALLERGAN
Our pursuit. Life’s potential. ®
EPS adjusted for non-GAAP items and 2002 spin-off of Advanced Medical Optics, Inc. Includes the effect of EITF 04-8. Historical EPS adjusted for Q2 2007 stock split. A reconciliation of non-GAAP items may be found under the heading “Non-GAAP Financial Reconciliations” in the investor relations section of the www.Allergan.com website. 1 Excludes estimated diluted earnings per share impact of pro-forma AMO spin-off adjustment. 2 Pre IRS Tax Settlement. 3 2006 EPS growth excludes FAS 123R stock option expense. 4 2012 EPS growth includes the 2012 Obesity impact of $0.10 and the 2012 R&D Tax Credit impact of $0.06. 5 2013 EPS Growth – Restating 2012 to exclude the 2012 Obesity impact of $0.10 and including the 2012 R&D Tax Credit impact of $0.06.
9
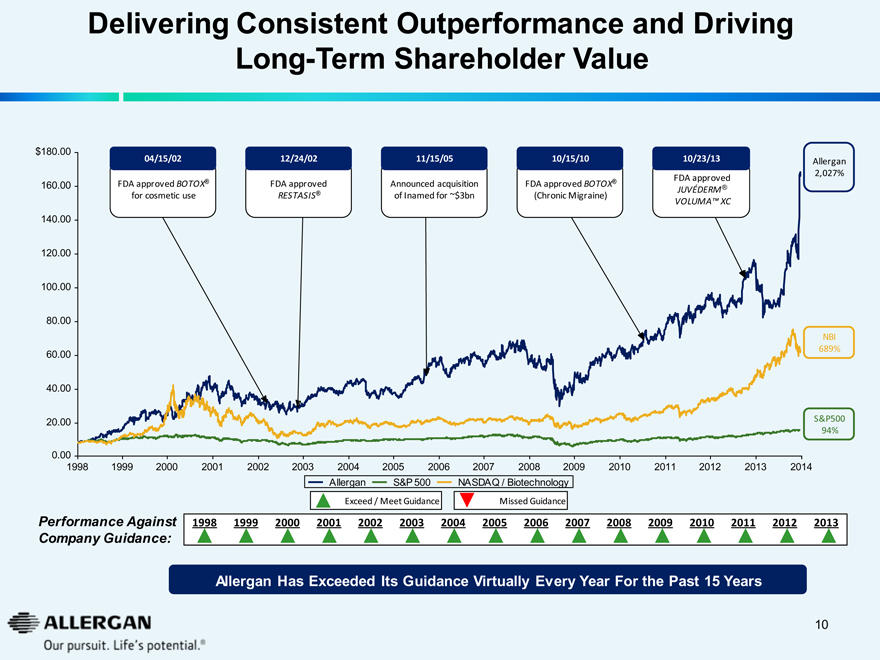
Delivering Consistent Outperformance and Driving
Long-Term Shareholder Value
$180.00
160.00
140.00
120.00
100.00
80.00
60.00
40.00
20.00
0.00
04/15/02
FDA approved BOTOX® for cosmetic use
12/24/02
FDA approved RESTASIS®
11/15/05
Announced acquisition of Inamed for ~$3bn
10/15/10
FDA approved BOTOX® (ChronicMigraine)
10/23/13
FDA approved JUVÉDERM® VOLUMATM XC
Allergan 2,027%
NBI 689%
S&P500 94%
1998 1999 2000 2001 2002 2003 2004 2005 2006 2007 2008 2009 2010 2011 2012 2013 2014
Allergan S&P 500 NASDAQ / Biotechnology
Exceed / Meet Guidance Missed Guidance
Performance Against Company Guidance:
1998 1999 2000 2001 2002 2003 2004 2005 2006 2007 2008 2009 2010 2011 2012 2013
Allergan Has Exceeded Its Guidance Virtually Every Year For the Past 15 Years
ALLERGAN
Our pursuit. Life’s potential.®
10
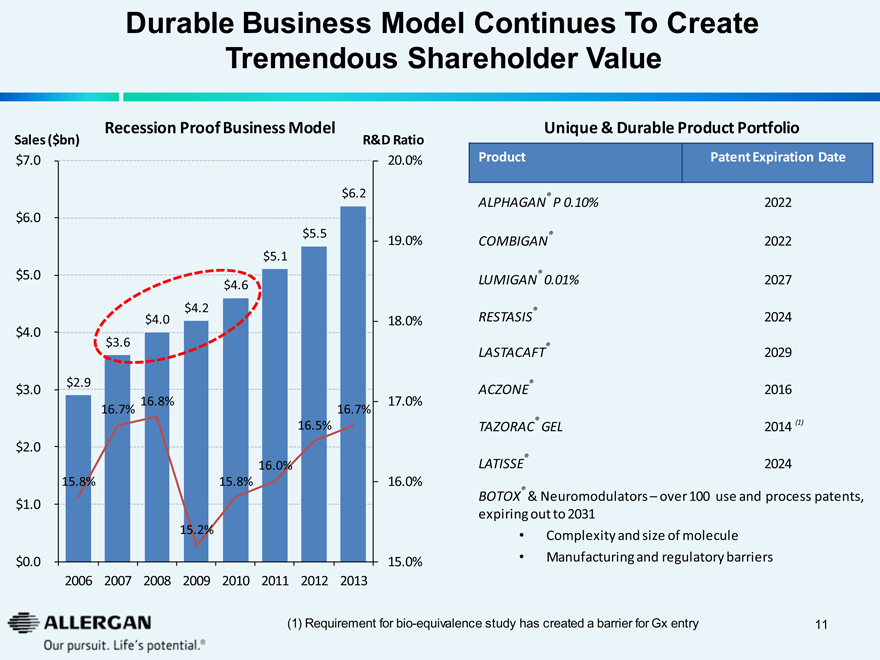
Durable Business Model Continues To Create
Tremendous Shareholder Value
Recession Proof Business Model
Sales ($bn) R&D Ratio
$7.0 20.0%
$6.2
$6.0
$5.5
19.0% $5.1 $5.0 $4.6 $4.2 $4.0
18.0% $4.0 $3.6 $3.0 $2.9
16.8%
17.0%
16.7%
16.7%
16.5%
$2.0
16.0%
15.8%
15.8%
16.0%
$1.0
15.2%
$0.0
15.0%
2006
2007 2008 2009 2010 2011 2012
2013
Unique & Durable Product Portfolio
Product Patent Expiration Date
ALPHAGAN® P 0.10% 2022
COMBIGAN® 2022
LUMIGAN® 0.01% 2027
RESTASIS® 2024
LASTACAFT® 2029
ACZONE® 2016
TAZORAC® GEL 2014(1)
LATISSE® 2024
BOTOX® & Neuromodulators – over 100 use and process patents, expiring out to 2031
Complexity and size of molecule
Manufacturing and regulatory barriers
ALLERGAN
Our pursuit. Life’s potential.®
(1) Requirement for bio-equivalence study has created a barrier for Gx entry
11
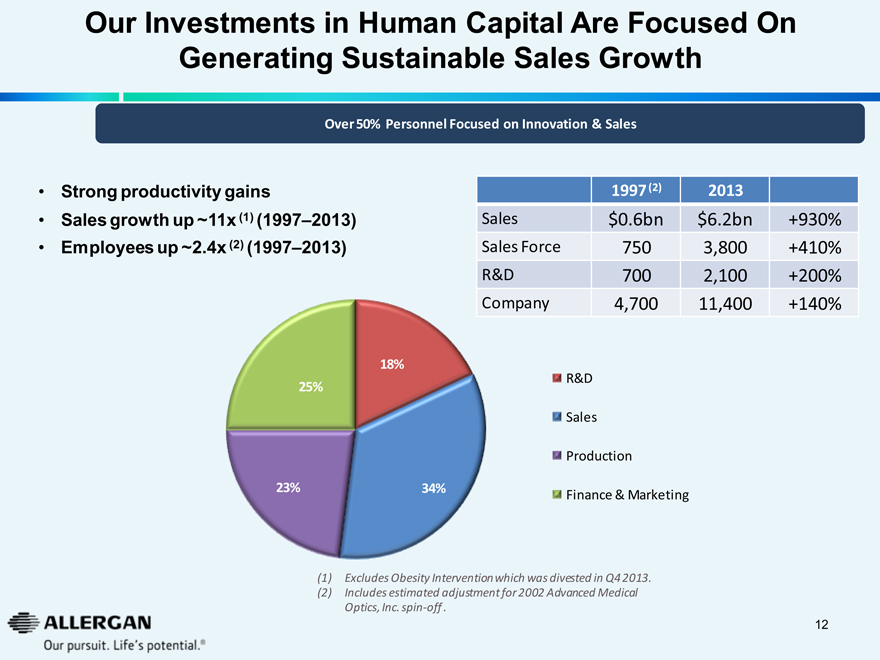
Our Investments in Human Capital Are Focused On
Generating Sustainable Sales Growth
Over 50% Personnel Focused on Innovation & Sales
Strong productivity gains
Sales growth up ~11x (1) (1997–2013)
Employees up ~2.4x (2) (1997–2013)
18%
25%
23%
34%
1997 (2) 2013
Sales $0.6bn $6.2bn +930%
Sales Force 750 3,800 +410%
R&D 700 2,100 +200%
Company 4,700 11,400 +140%
R&D
Sales
Production
Finance & Marketing
(1) Excludes Obesity Intervention which was divested in Q4 2013.
(2) Includes estimated adjustment for 2002 Advanced Medical Optics, Inc. spin-off.
ALLERGAN
Our pursuit. Life’s potential.®
12
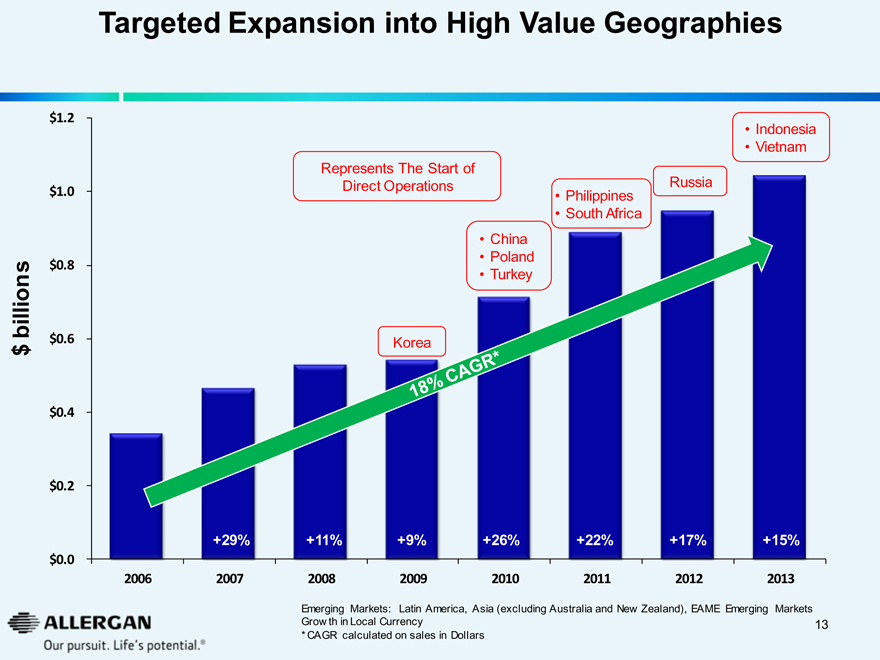
Targeted Expansion into High Value Geographies
$ billion
$1.2 $1.0 $0.8 $0.6 $0.4 $0.2 $0.0
Indonesia
Vietnam
Represents The Start of
Direct Operations Russia
Philippines
South Africa
China
Poland
Turkey
Korea
+29% +11% +9% +26% +22% +17% +15%
2006 2007 2008 2009 2010 2011 2012 2013
18% CAGR*
Emerging Markets: Latin America, Asia (excluding Australia and New Zealand), EAME Emerging Markets Growth in Local Currency
* CAGR calculated on sales in Dollars
ALLERGAN
Our pursuit. Life’s potential. ®
13
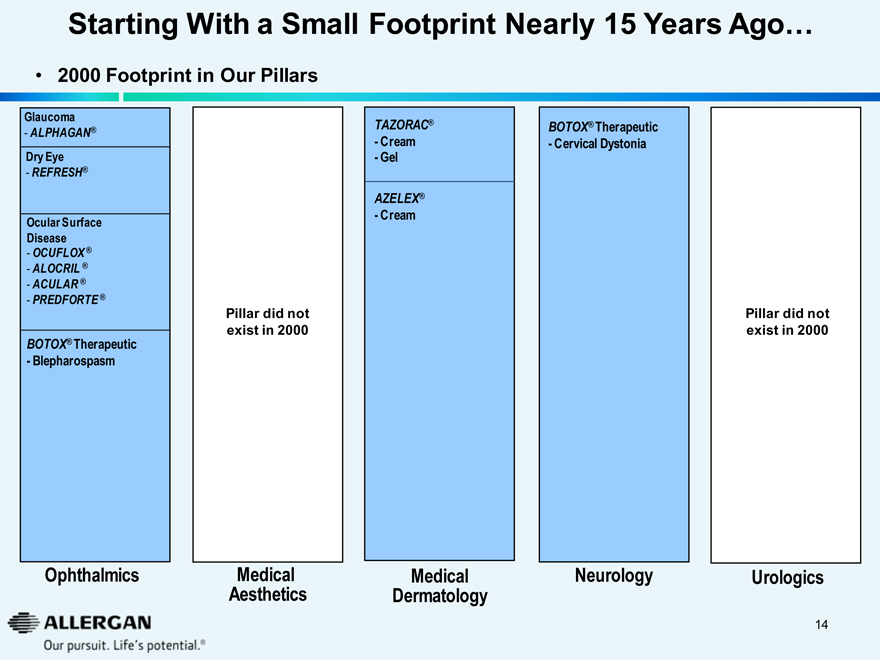
Starting With a Small Footprint Nearly 15 Years Ago…
2000 Footprint in Our Pillars
Glaucoma
- ALPHAGAN®
Dry Eye
- REFRESH®
Ocular Surface
Disease
- OCUFLOX®
- ALOCRIL®
- ACULAR®
- PREDFORTE®
BOTOX® Therapeutic
- Blepharospasm
Ophthalmics
TAZORAC®
- Cream
- Gel
AZELEX®
- Cream
Medical Dermatology
Pillar did not exist in 2000
Medical Aesthetics
BOTOX® Therapeutic
- Cervical Dystonia
Neurology
Pillar did not exist in 2000
Urologics
ALLERGAN
Our pursuit. Life’s potential.®
14
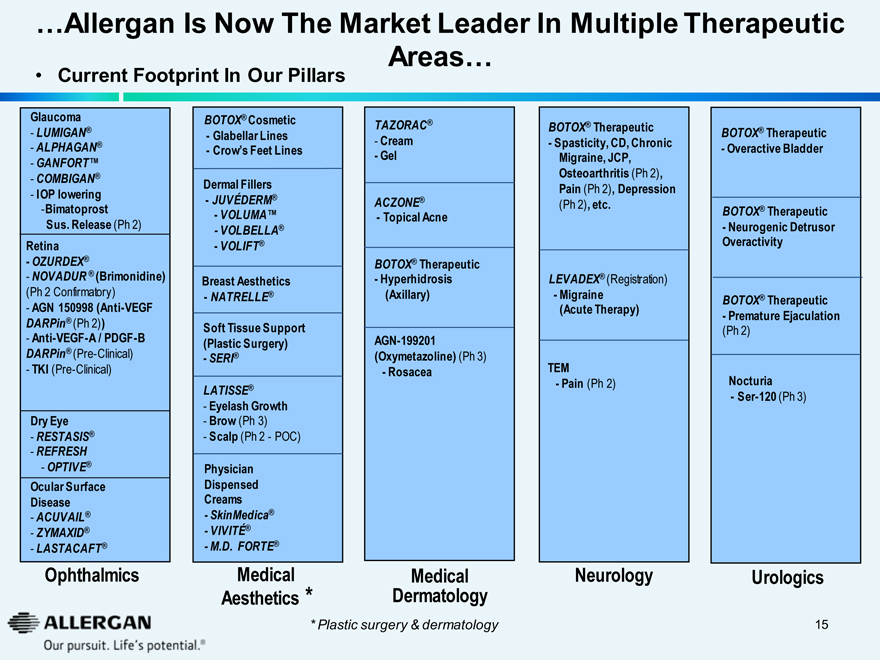
…Allergan Is Now The Market Leader In Multiple Therapeutic Areas…
Current Footprint In Our Pillars
Glaucoma
- LUMIGAN®
- ALPHAGAN®
- GANFORT™
- COMBIGAN®
- IOP lowering
-Bimatoprost Sus. Release (Ph 2)
Retina
- OZURDEX®
- NOVADUR ® (Brimonidine) (Ph 2 Confirmatory)
- AGN 150998 (Anti-VEGF DARPin® (Ph 2))
- Anti-VEGF-A / PDGF-B
DARPin® (Pre-Clinical)
- TKI (Pre-Clinical)
Dry Eye
- RESTASIS®
- REFRESH
- OPTIVE®
Ocular Surface Disease
- ACUVAIL®
- ZYMAXID®
- LASTACAFT®
Ophthalmics
BOTOX® Cosmetic
- Glabellar Lines
- Crow’s Feet Lines
Dermal Fillers
- JUVÉDERM®
- VOLUMA™
- VOLBELLA®
- VOLIFT®
Breast Aesthetics
- NATRELLE®
Soft Tissue Support (Plastic Surgery)
- SERI®
LATISSE®
- Eyelash Growth
- Brow (Ph 3)
- Scalp (Ph 2 - POC)
Physician Dispensed Creams
- SkinMedica®
- VIVITÉ®
- M.D. FORTE®
Medical Aesthetics *
TAZORAC®
- Cream
- Gel
ACZONE®
- Topical Acne
BOTOX® Therapeutic
- Hyperhidrosis (Axillary)
AGN-199201 (Oxymetazoline) (Ph 3)
- Rosacea
Medical Dermatology
BOTOX® Therapeutic
- Spasticity, CD, Chronic Migraine, JCP, Osteoarthritis (Ph 2), Pain (Ph 2), Depression (Ph 2), etc.
LEVADEX® (Registration)
- Migraine (Acute Therapy)
TEM
- Pain (Ph 2)
Neurology
BOTOX® Therapeutic
- Overactive Bladder
BOTOX® Therapeutic
- Neurogenic Detrusor Overactivity
BOTOX® Therapeutic
- Premature Ejaculation (Ph 2)
Nocturia
- Ser-120 (Ph 3)
Urologics
* Plastic surgery & dermatology
ALLERGAN
Our pursuit. Life’s potential.®
15
Allergan Today
16
ALLERGAN
Our pursuit. Life’s potential.®
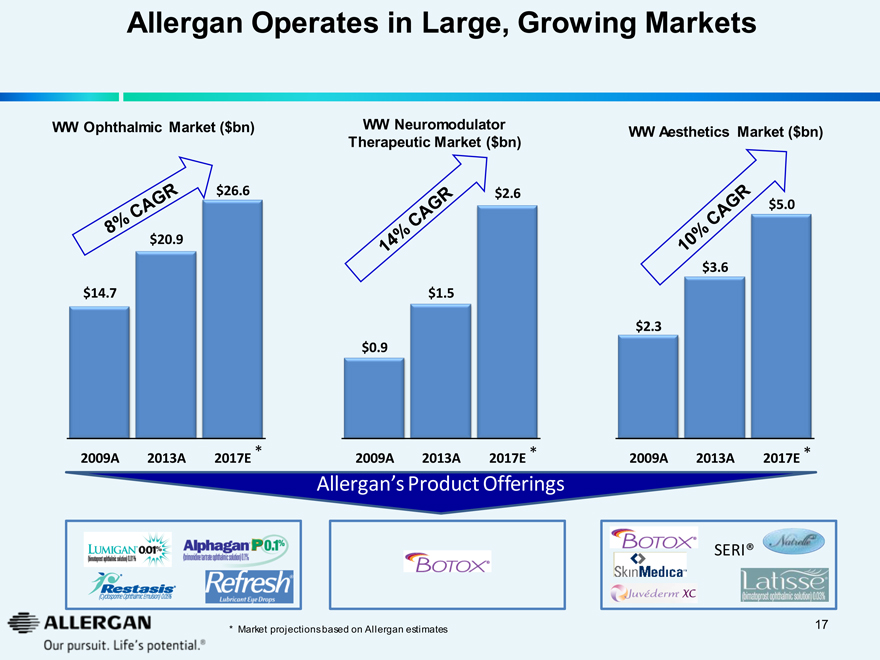
Allergan Operates in Large, Growing Markets
WW Ophthalmic Market ($bn)
8% CAGR
$20.9
$14.7
$26.6
2009A 2013A 2017E *
WW Neuromodulator
Therapeutic Market ($bn)
14% CAGR
$1.5
$0.9
$2.6
2009A 2013A 2017E *
WW Aesthetics Market ($bn)
10% CAGR
$3.6
$2.3
$5.0
2009A 2013A 2017E *
Allergan’s Product Offerings
LUMIGAN 0.01%
(bimataprost ophthalmic solution) 0.01%
RESTASIS®
(Cyclosporine Ophthalmic Emulsion) 0.05%
Alphagan P0.1%
(brimonidine tartrate ophthalmic solution) 0.1%
Refresh Lubricant Eye Drops
Botox
Botox
Skin Medica
Juvederm XC
SERI®
Natrelle
Latisse
(bimataprost ophthalmic solution) 0.03%
* Market projections based on Allergan estimates 17
ALLERGAN
Our pursuit. Life’s potential.®
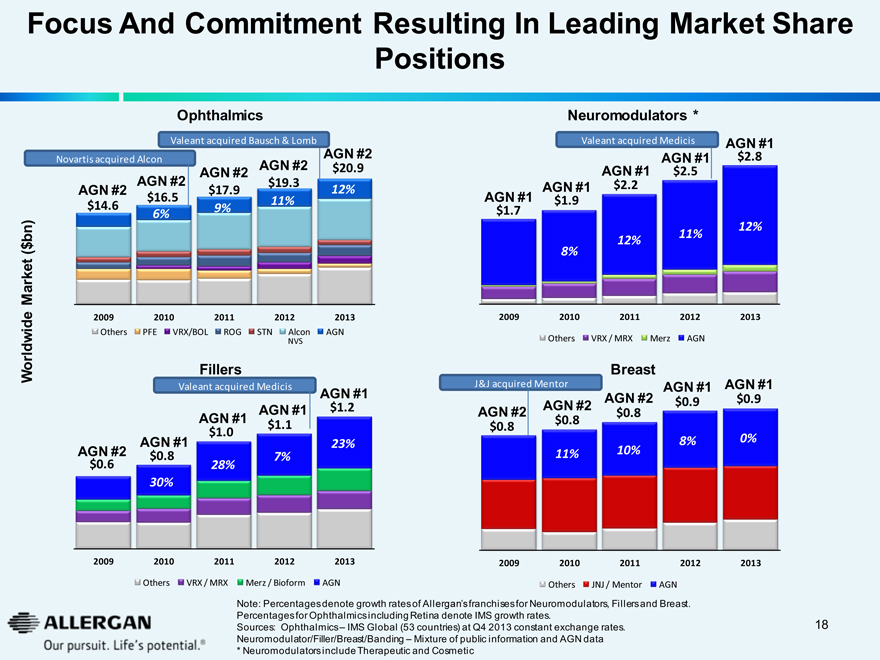
Focus And Commitment Resulting In Leading Market Share Positions
Ophthalmics
Valeant acquired Bausch & Lomb
Novartis acquired Alcon AGN #2 $20.9 12%
AGN #2 $14.6
AGN #2 $19.3 11%
AGN #2 $17.9 9%
AGN #2 $16.5 6%
Worldwide Market ($bn)
2009 2010 2011 2012 2013
Others PFE VRX/BOL ROG STN Alcon NVS AGN
Fillers
Valeant acquired Medicis
AGN #1 $1.2 23%
AGN #1 $1.1 7%
AGN #1 $1.0 28%
AGN #1 $0.8 30%
AGN #2 $0.6
2009 2010 2011 2012 2013
Others VRX/MRX Merz/Bioform AGN
Neuromodulators *
Valeant acquired Medicis
AGN #1 $2.8 12%
AGN #1 $2.5 11%
AGN #1 $2.2 12%
AGN #1 $1.9 8%
AGN #1 $1.7
2009 2010 2011 2012 2013
Others VRX / MRX Merz AGN
Breast
J&J acquired Mentor AGN #1 $0.9 0%
AGN #1 $0.9 8%
AGN #2 $0.8 10%
AGN #2 $0.8 11%
AGN #2 $0.8
2009 2010 2011 2012 2013
Others JNJ / Mentor AGN
Note: Percentages denote growth rates of Allergan’s franchises for Neuromodulators, Fillers and Breast. Percentages for Ophthalmics including Retina denote IMS growth rates.
Sources: Ophthalmics – IMS Global (53 countries) at Q4 2013 constant exchange rates. Neuromodulator/Filler/Breast/Bannding – Mixture of public information and AGN data
* Neuromodulators include Therapeutic and Cosmetic
18
ALLERGAN
Our pursuit. Life’s potential.®
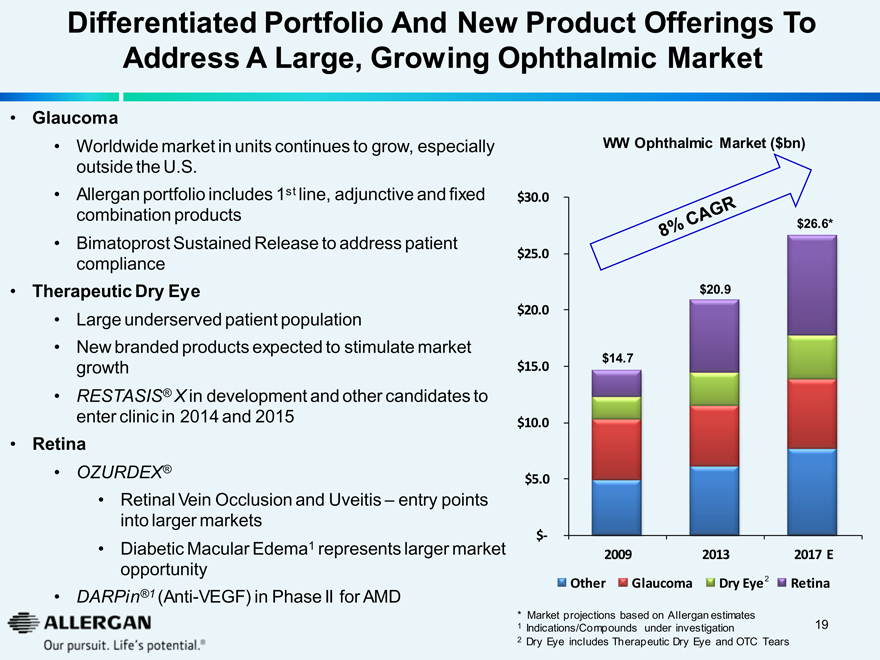
Differentiated Portfolio And New Product Offerings To
Address A Large, Growing Ophthalmic Market
Glaucoma
Worldwide market in units continues to grow, especially outside the U.S.
Allergan portfolio includes 1st line, adjunctive and fixed combination products
Bimatoprost Sustained Release to address patient compliance
Therapeutic Dry Eye
Large underserved patient population
New branded products expected to stimulate market growth
RESTASIS® X in development and other candidates to enter clinic in 2014 and 2015
Retina
OZURDEX®
Retinal Vein Occlusion and Uveitis – entry points into larger markets
Diabetic Macular Edema1 represents larger market opportunity
DARPin®1 (Anti-VEGF) in Phase II for AMD
WW Ophthalmic Market ($bn)
$30.0 8% CAGR
$26.6* $20.9 $14.7
$25.0
$20.0
$15.0
$10.0
$5.0
$-
2009 2013 2017 E
Other Glaucoma Dry Eye 2 Retina
* Market projections based on Allergan estimates
1 Indications/Compounds under investigation
2 Dry Eye includes Therapeutic Dry Eye and OTC Tears
ALLERGAN 19
Our pursuit. Life’s potential.®
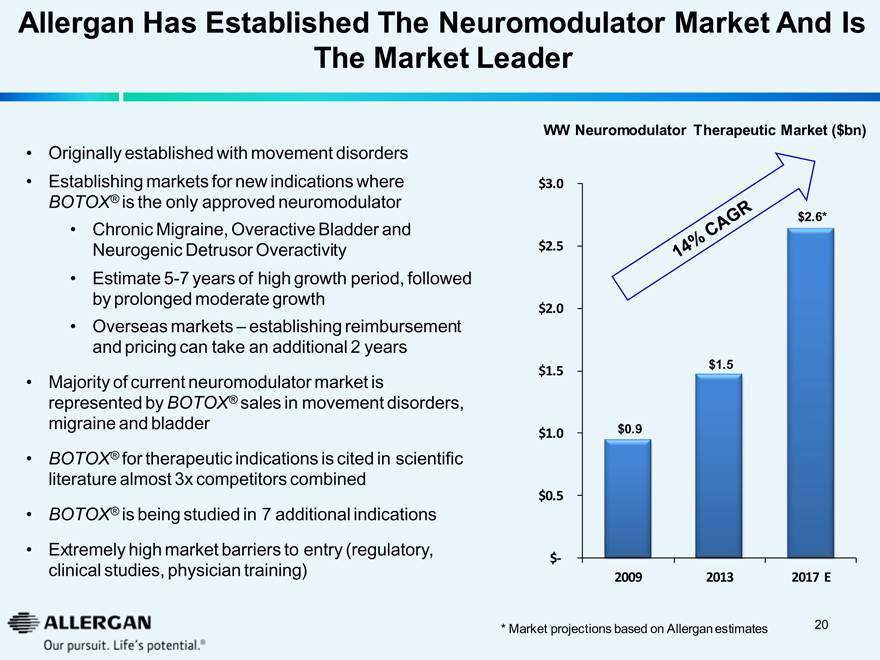
Allergan Has Established The Neuromodulator Market And Is
The Market Leader
Originally established with movement disorders
Establishing markets for new indications where BOTOX® is the only approved neuromodulator
Chronic Migraine, Overactive Bladder and Neurogenic Detrusor Overactivity
Estimate 5-7 years of high growth period, followed by prolonged moderate growth
Overseas markets – establishing reimbursement and pricing can take an additional 2 years
Majority of current neuromodulator market is represented by BOTOX® sales in movement disorders, migraine and bladder
BOTOX® for therapeutic indications is cited in scientific literature almost 3x competitors combined
BOTOX® is being studied in 7 additional indications
Extremely high market barriers to entry (regulatory, clinical studies, physician training)
WW Neuromodulator Therapeutic Market ($bn)
$3.0
14% CAGR $2.6* $1.5 $0.9
$2.5
$2.0
$1.5
$1.0
$0.5
$-
2009 2013 2017 E
* Market projections based on Allergan estimates
ALLERGAN 20
Our pursuit. Life’s potential.®
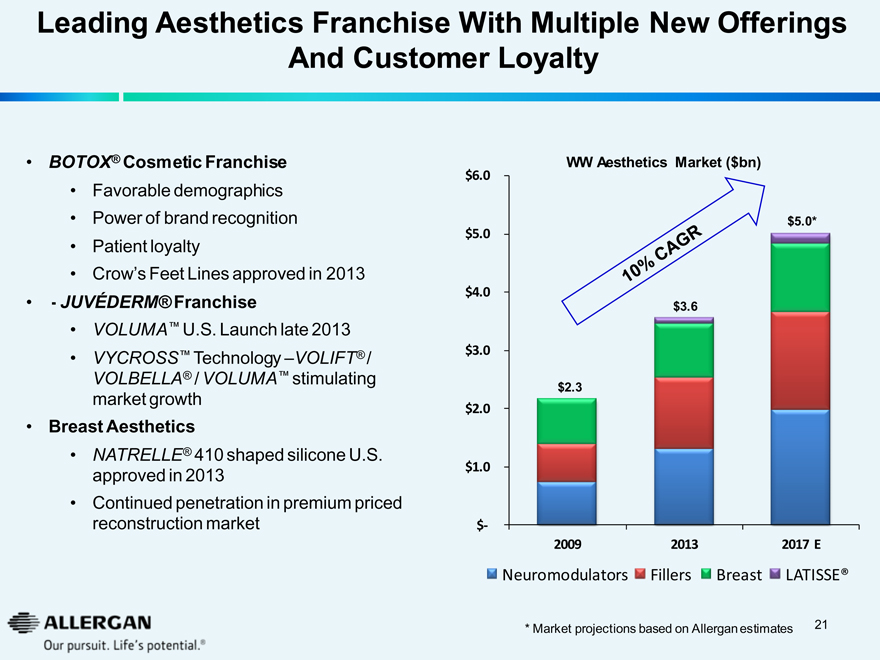
Leading Aesthetics Franchise With Multiple New Offerings
And Customer Loyalty
BOTOX® Cosmetic Franchise
Favorable demographics
Power of brand recognition
Patient loyalty
Crow’s Feet Lines approved in 2013
- JUVÉDERM® Franchise
VOLUMATM U.S. Launch late 2013
VYCROSSTM Technology -VOLIFT® / VOLBELLA® / VOLUMATM stimulating market growth
Breast Aesthetics
NATRELLE® 410 shaped silicone U.S. approved in 2013
Continued penetration in premium priced reconstruction market
WW Aesthetics Market ($bn)
$6.0
10%CAGR
$5.0*
$5.0
$4.0
$3.6
$3.0
$2.3
$2.0
$1.0
$-
2009
2013
2017 E
Neuromodulators
Fillers
Breast
LATISSE®
* Market projections based on Allergan estimates 21
ALLERGAN
Our pursuit. Life’s potential.®
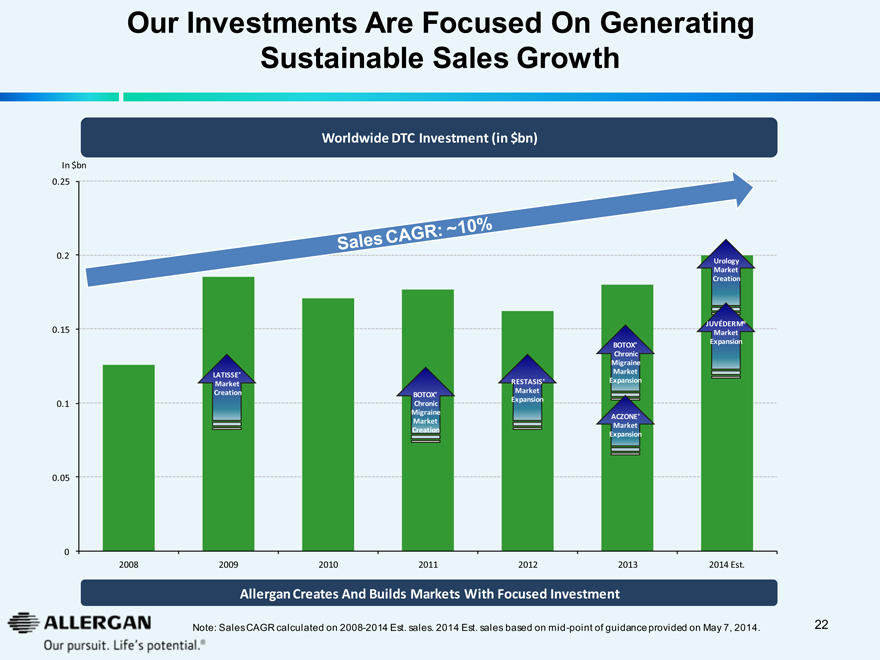
Our Investments Are Focused On Generating
Sustainable Sales Growth
Worldwide DTC Investment (in $bn)
In $bn
0.25
0.2
Urology
Market
Creation
JUVÉDERM®
0.15
Market
BOTOX®
Expansion
Chronic
Migraine
LATISSE®
Market
Market
RESTASIS®
Expansion
Creation
BOTOX®
Market
0.1
Chronic
Expansion
Migraine
ACZONE®
Market
Market
Creation
Expansion
0.05
0
2008
2009
2010
2011
2012
2013
2014 Est.
Allergan Creates And Builds Markets With Focused Investment
Note: Sales CAGR calculated on 2008-2014 Est. sales. 2014 Est. sales based on mid-point of guidance provided on May 7, 2014.
22
ALLERGAN
Our pursuit. Life’s potential.®
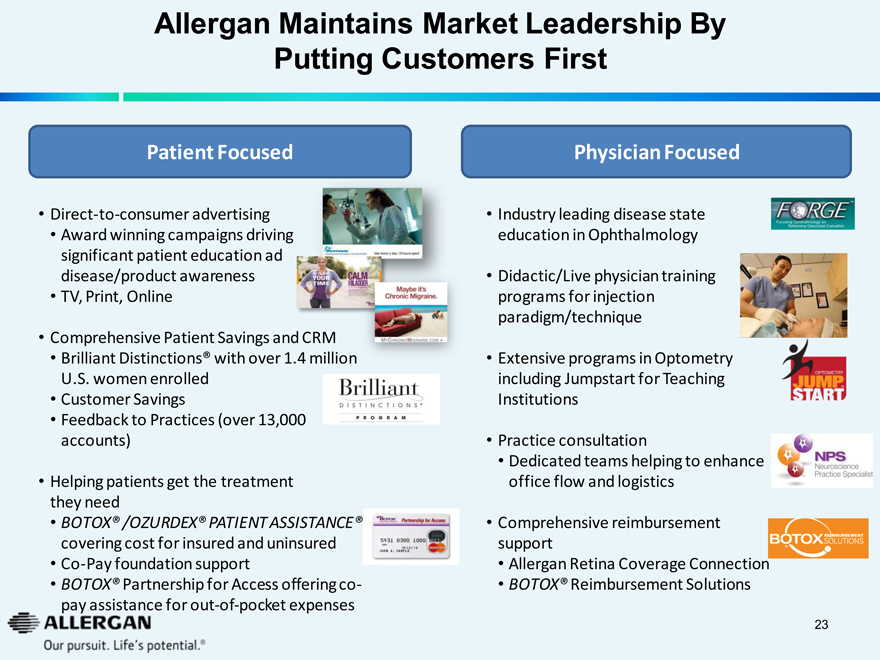
Allergan Maintains Market Leadership By
Putting Customers First
Patient Focused
Direct-to-consumer advertising
Restasis use twice a day 12 hours apart
Award winning campaigns driving significant patient education ad
RECLAIM YOUR TIME
disease/product awareness
CALM YOUR BLADDER
TV, Print, Online
Comprehensive Patient Savings and CRM
Maybe it’s Chronic Migraine.
Brilliant Distinctions® with over 1.4 million
MYCHRONICMIGRAINE.COM
U.S. women enrolled
Customer Savings
Brilliant DISTINCTIONS® PROGRAM
Feedback to Practices (over 13,000 accounts)
Helping patients get the treatment
BOTOX Partnership for Access
they need
5431 0300 1000 0080 MasterCard 12/10
BOTOX® /OZURDEX® PATIENT ASSISTANCE®
JOHN A. SAMPLE
covering cost for insured and uninsured
Co-Pay foundation support
BOTOX® Partnership for Access offering co-pay assistance for out-of-pocket expenses
Physician Focused
Industry leading disease state education in Ophthalmology
FORGETM Focusing Ophthalmology on Reframing Glaucoma Evaluation
Didactic/Live physician training programs for injection paradigm/technique
OPTOMETRY JUMP STARTTM
Extensive programs in Optometry including Jumpstart for Teaching
NPS Neuroscience Practice Specialist
Institutions
Practice consultation
Dedicated teams helping to enhance
BOTOX REIMBURSEMENT SOLUTIONS
office flow and logistics
Comprehensive reimbursement support
Allergan Retina Coverage Connection
BOTOX® Reimbursement Solutions
23
ALLERGAN
Our pursuit. Life’s potential.®
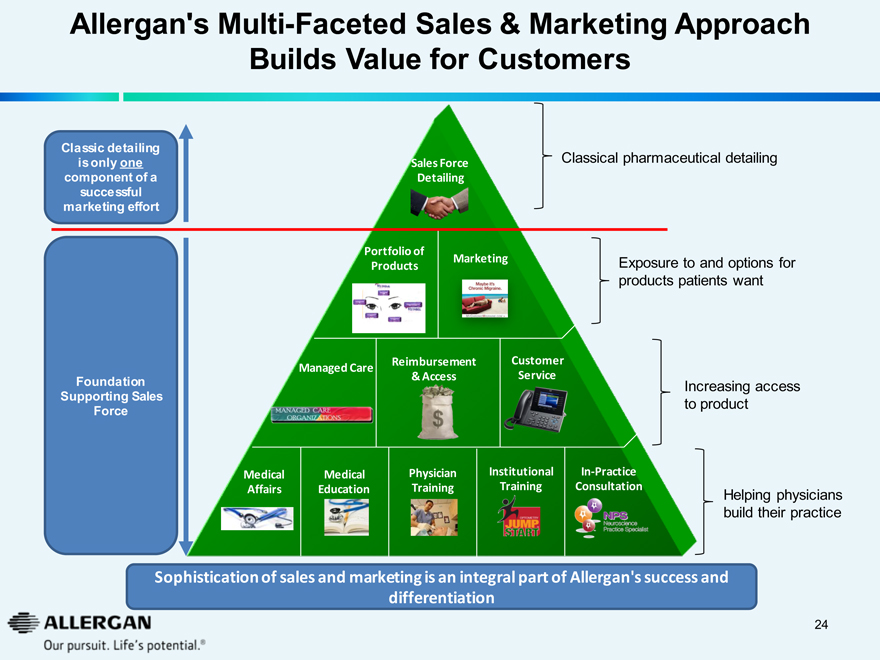
Allergan’s Multi-Faceted Sales & Marketing Approach Builds Value for Customers
Classic detailing
is only one component of a successful marketing effort
Sales Force Detailing
Classical pharmaceutical detailing
Portfolio of Products
Marketing
Exposure to and options for products patients want
Managed Care
MANAGED CARE ORGANIZATIONS
Reimbursement & Access
Customer Service
Foundation Supporting Sales Force
Increasing access to product
Medical Affairs
Medical Education
Physician Training
Institutional Training
OPTOMETRY JUMP START
In-Practice Consultation
NPS Neuroscience Practice Specialist
Helping physicians build their practice
Sophistication of sales and marketing is an integral part of Allergan’s success and differentiation
24
ALLERGAN
Our pursuit. Life’s potential.®
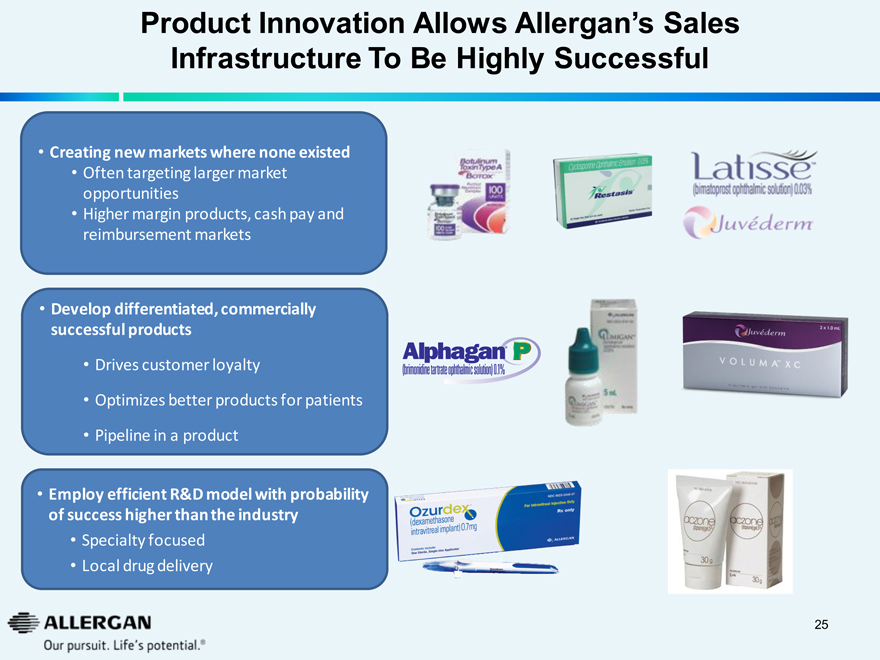
Product Innovation Allows Allergan’s Sales Infrastructure To Be Highly Successful
Creating new markets where none existed
Often targeting larger market opportunities
Higher margin products, cash pay and reimbursement markets
Toxin Type A Botox Cyclosporine Ophthalmic Emulsion 0.05% Restasis Latisse (bimatoprost ophthalmic solution) 0.03% Juvederm
Develop differentiated, commercially successful products
Drives customer loyalty
Optimizes better products for patients
Pipeline in a product
Alphagan P (brimonidine tartrate ophthalmic solution) 0.1% Juvederm VOLUMATM XC
Employ efficient R&D model with probability of success higher than the industry
Specialty focused
Local drug delivery Ozurdex (dexamethason intravitreal implant) 0.7mg aczone 30g
ALLERGAN 25
Our pursuit. Life’s potential.®
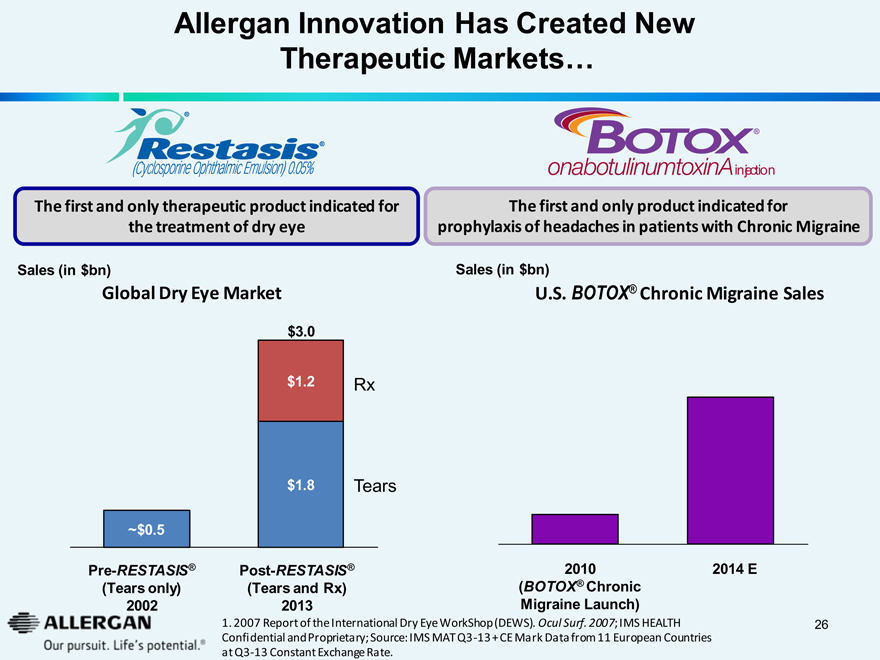
Allergan Innovation Has Created New
Therapeutic Markets…
Restasis®
(Cyclosporine Ophthalmic Emulsion) 0.05%
BOTOX®
onabotulinumtoxinA injection
The first and only therapeutic product indicated for the treatment of dry eye
The first and only product indicated for prophylaxis of headaches in patients with Chronic Migraine
Sales (in $bn)
Sales (in $bn)
Global Dry Eye Market
U.S. BOTOX® Chronic Migraine Sales
$3.0
$1.2
Rx
$1.8
Tears
~$0.5
Pre-RESTASIS®
Post-RESTASIS®
2010
2014 E
(Tears only)
(Tears and Rx)
(BOTOX® Chronic
2002
2013
Migraine Launch)
ALLERGAN
Our pursuit. Life’s potential.®
1. 2007 Report of the International Dry Eye WorkShop (DEWS). Ocul Surf. 2007; IMS HEALTH Confidential and Proprietary; Source: IMS MAT Q3 -13 + CE Mark Data from 11 European Countries at Q3-13 Constant Exchange Rate.
26
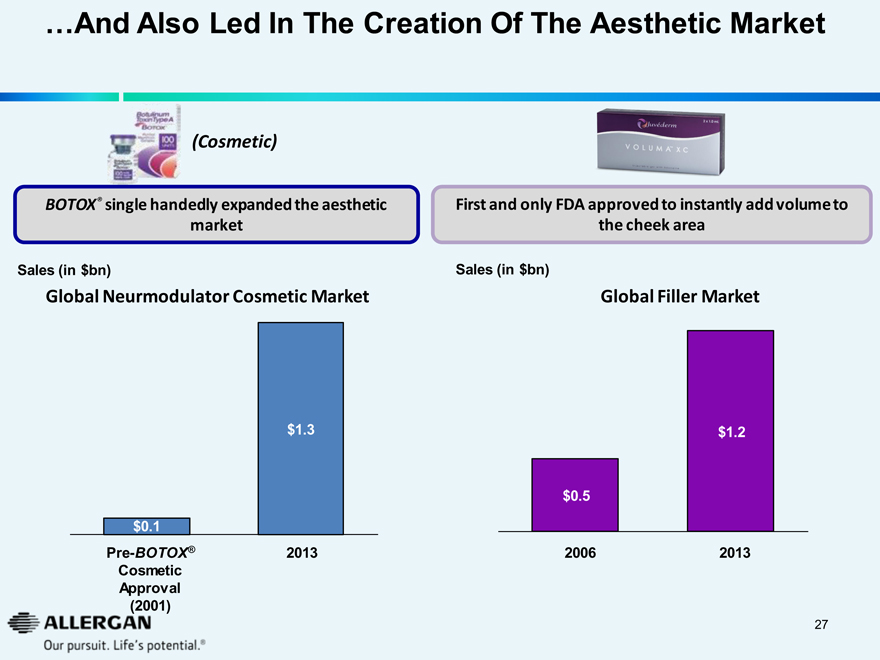
...And Also Led In The Creation Of The Aesthetic Market
Toxin Type A BOTOX (Cosmetic)
BOTOX® single handedly expanded the aesthetic market
Sales (in $bn)
Global Neurmodulator Cosmetic Market
$1.3
$0.1
Pre-BOTOX®
2013
Cosmetic
Approval
(2001)
Juvederm 2x1.0 ml VOLUMATM XC
First and only FDA approved to instantly add volume to the cheek area
Sales (in $bn)
Global Filler Market
$1.2
$0.5
2006
2013
27
ALLERGAN
Our pursuit. Life’s potential.®

Successful “Customer First” Approach
Sustains Market Leadership in Neurotoxins Builds Shares in Fillers
Global Neuromodulator Market Share - Quarterly
100%
80%
60%
40%
20%
0%
Q2-12
Q3-12
Q4-12
Q1-13
Q2-13
Q3-13
Q4-13
BOTOX® / Vistabel®
Dysport® / Azzalure®
(Valeant / Galderma / Ipsen)
others*
Global Fillers Market share - Yearly
40%
30%
20%
10%
0%
Valeant announces Medicis Acquisition 09/03/12, completed 12/11/12
2009
2010
2011
2012
2013
AGN
VRX / MRX / Dermik
GLD
Merz / BioForm
JNJ
others
With Multiple Global And Regional Competitors, Allergan Still Maintains ~80% Market Share
* Others includes Xeomin / Bocouture (Q4-13 share 5.3%), Neuronox / Meditoxin (1.2%), Prosigne / C-BTX-A (1.2%), Botulax (0.8%) and NeuroBloc / Myobloc (0.7%). Products listed are registered trademarks of their respective companies.
ALLERGAN
Our pursuit. Life’s potential. ®
28
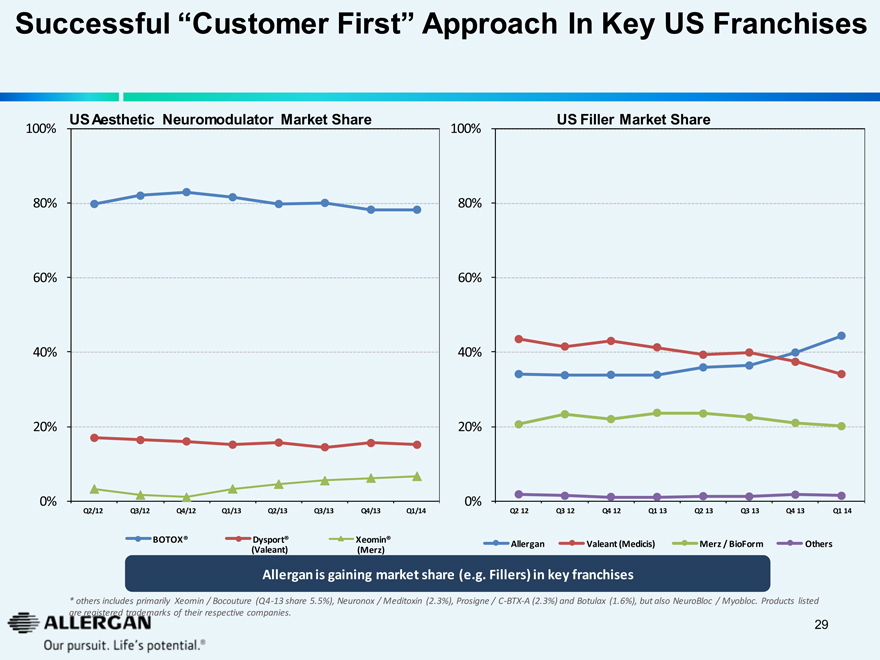
Successful “Customer First” Approach In Key US Franchises
US Aesthetic Neuromodulator Market Share
100%
80%
60%
40%
20%
0%
Q2/12 Q3/12 Q4/12 Q1/13 Q2/13 Q3/13 Q4/13 Q1/14
BOTOX® Dysport® (Valeant) Xeomin® (Merz)
US Filler Market Share
100%
80%
60%
40%
20%
0%
Q2 12 Q3 12 Q4 12 Q1 13 Q2 13 Q3 13 Q4 13 Q1 14
Allergan Valeant (Medicis) Merz / BioForm Others
Allergan is gaining market share (e.g. Fillers) in key franchises
* others includes primarily Xeomin / Bocouture (Q4-13 share 5.5%), Neuronox / Meditoxin (2.3%), Prosigne / C-BTX-A (2.3%) and Botulax (1.6%), but also NeuroBloc / Myobloc. Products listed are registered trademarks of their respective companies.
ALLERGAN
Our pursuit. Life’s potential.®
29
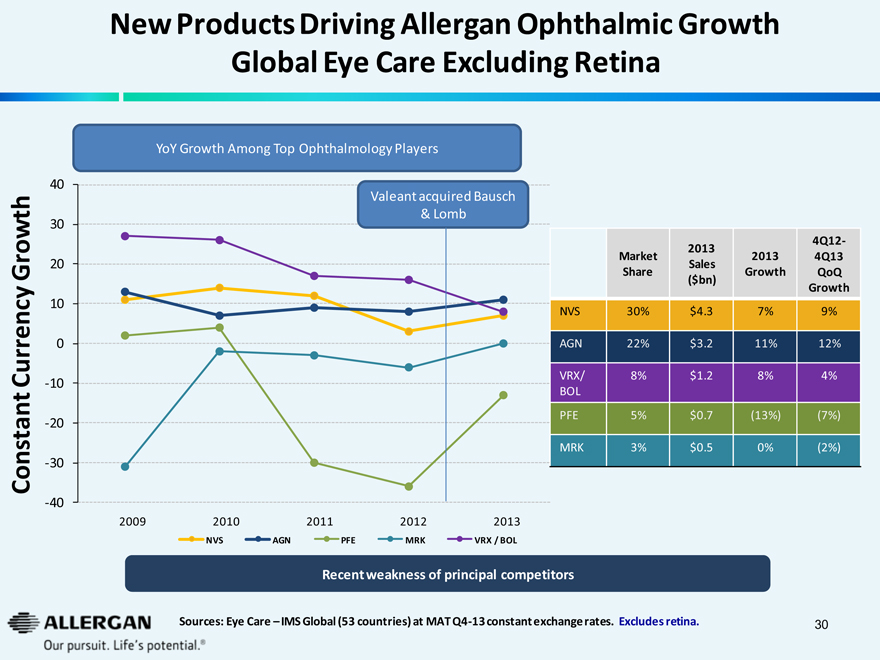
New Products Driving Allergan Ophthalmic Growth Global Eye Care Excluding Retina
YoY Growth Among Top Ophthalmology Players
Valeant acquired Bausch & Lomb
Constant Currency Growth
40
30
20
10
0
-10
-20
-30
-40
2009 2010 2011 2012 2013
NVS AGN PFE MRK VRX / BOL
Market Share 2013 Sales ($bn) 2013 Growth 4Q12-4Q13 QoQ Growth
NVS 30% $4.3 7% 9%
AGN 22% $3.2 11% 12%
VRX/BOL 8% $1.2 8% 4%
PFE 5% $0.7 (13%) (7%)
MRK 3% $0.5 0% (2%)
Recent weakness of principal competitors
Sources: Eye Care - IMS Global (53 countries) at MAT Q4-13 constant exchange rates. Excludes retina.
ALLERGAN
Our pursuit. Life’s potential.®
30
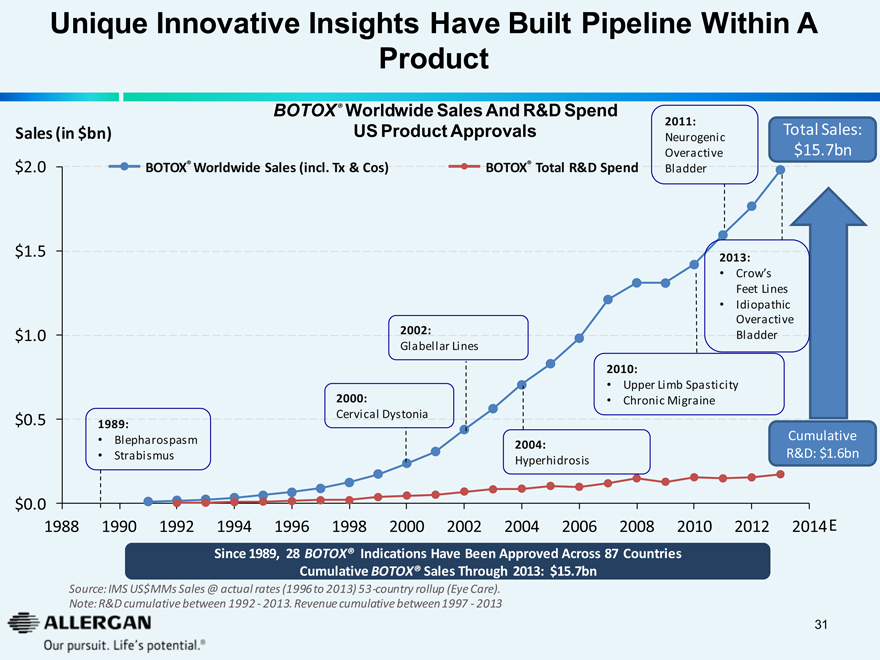
Unique Innovative Insights Have Built Pipeline Within A Product
BOTOX® Worldwide Sales And R&D Spend US Product Approvals
Sales (in $bn)
BOTOX® Worldwide Sales (incl. Tx & Cos)
BOTOX® Total R&D Spend
$2.0
$1.5
$1.0
$0.5
$0.0
1989:
Blepharospasm
Strabismus
2000:
Cervical Dystonia
2002:
Glabellar Lines
2004:
Hyperhidrosis
2010:
Upper Limb Spasticity
Chronic Migraine
2013:
Crow’s Feet Lines
Idiopathic Overactive Bladder
2011:
Neurogenic Overactive Bladder
Total Sales:
$15.7bn
Cumulative R&D: $1.6bn
1988 1990 1992 1994 1996 1998 2000 2002 2004 2006 2008 2010 2012 2014 E
Since 1989, 28 BOTOX® Indications Have Been Approved Across 87 Countries Cumulative BOTOX® Sales Through 2013: $15.7bn
Source: IMS US$MMs Sales @ actual rates (1996 to 2013) 53-country rollup (Eye Care).
Note: R&D cumulative between 1992 - 2013. Revenue cumulative between 1997 - 2013
ALLERGAN
Our pursuit. Life’s potential.®
31
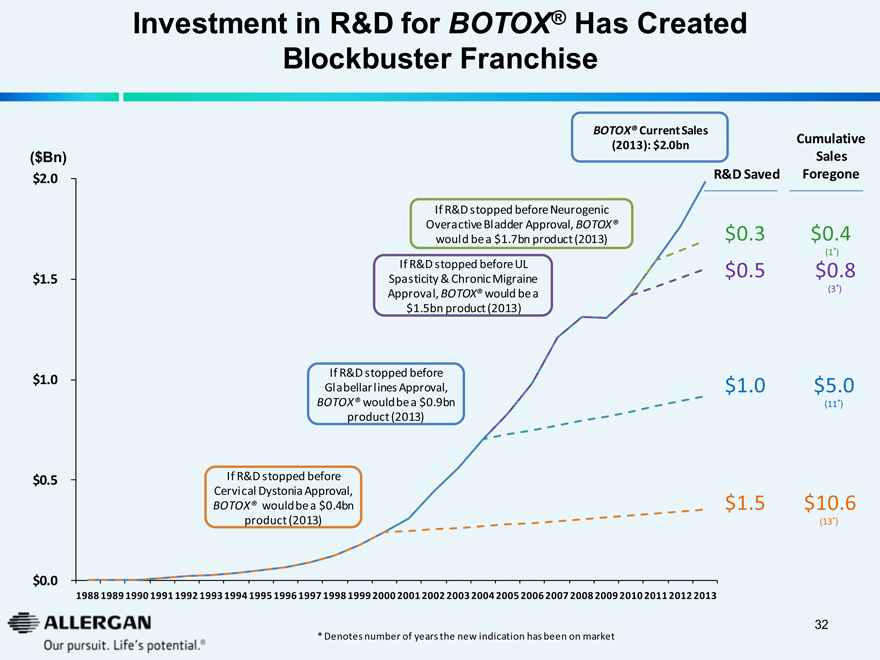
Investment in R&D for BOTOX® Has Created Blockbuster Franchise
($Bn)
$2.0
$1.5
$1.0
$0.5
$0.0
If R&D stopped before Cervical Dystonia Approval, BOTOX® would be a $0.4bn product (2013)
If R&D stopped before Glabellar lines Approval, BOTOX® would be a $0.9bn product (2013)
If R&D stopped before UL Spasticity & Chronic Migraine Approval, BOTOX® would be a $1.5bn product (2013)
If R&D stopped before Neurogenic Overactive Bladder Approval, BOTOX® would be a $1.7bn product (2013)
BOTOX® Current Sales (2013): $2.0bn
R&D Saved
$ 0.3
$ 0.5
$ 1.0
$ 1.5
Cumulative Sales Foregone
$0.4 (1*)
$0.8 (3*)
$5.0 (11*)
$10.6 (13*)
1988 1989 1990 1991 1992 1993 1994 1995 1996 1997 1998 1999 2000 2001 2002 2003 2004 2005 2006 2007 2008 2009 2010 2011 2012 2013
* Denotes number of years the new indication has been on market
ALLERGAN
Our pursuit. Life’s potential.®
32
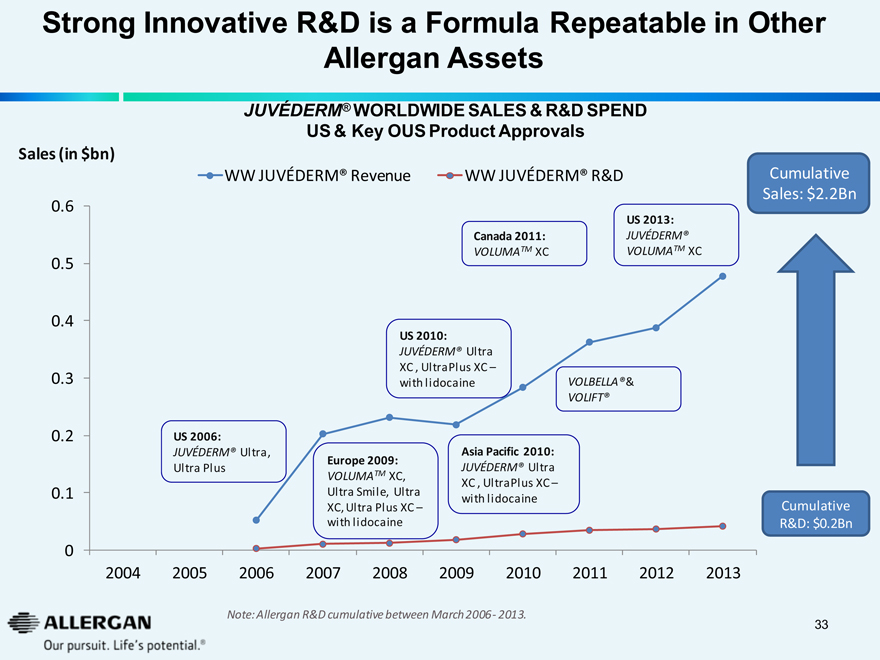
Strong Innovative R&D is a Formula Repeatable in Other Allergan Assets
JUVEDERM® WORLDWIDE SALES & R&D SPEND US & Key OUS Product Approvals
Sales (in $bn)
WW JUVEDERM® Revenue
WW JUVEDERM® R&D
0.6
0.5
0.4
0.3
0.2
0.1
0
US 2006:
JUVEDERM® Ultra, Ultra Plus
Europe 2009:
VOLUMATM XC, Ultra Smile, Ultra XC, Ultra Plus XC - with lidocaine
US 2010:
JUVEDERM® Ultra XC , UltraPlus XC - with lidocaine
Asia Pacific 2010:
JUVEDERM® Ultra XC , UltraPlus XC - with lidocaine
Canada 2011:
VOLUMATM XC
VOLBELLA® & VOLIFT®
US 2013:
JUVEDERM® VOLUMATM XC
Cumulative Sales: $2.2Bn
Cumulative R&D: $0.2Bn
2004 2005 2006 2007 2008 2009 2010 2011 2012 2013
Note: Allergan R&D cumulative between March 2006- 2013.
ALLERGAN
Our pursuit. Life’s potential.®
33
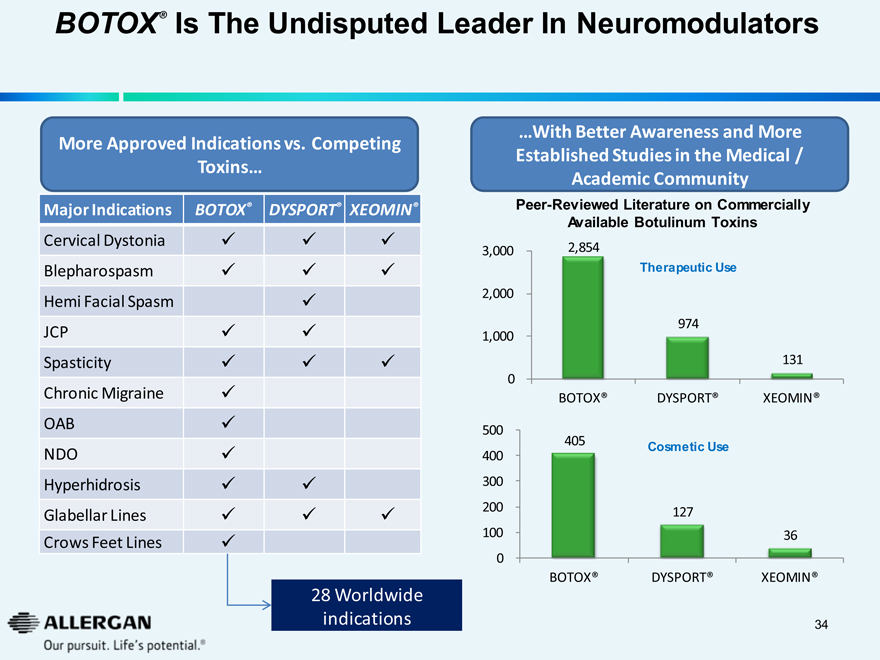
BOTOX® Is The Undisputed Leader In Neuromodulators
More Approved Indications vs. Competing Toxins...
Major Indications BOTOX® DYSPORT® XEOMIN®
Cervical Dystonia
Blepharospasm
Hemi Facial Spasm
JCP
Spasticity
Chronic Migraine
OAB
NDO
Hyperhidrosis
Glabellar Lines
Crows Feet Lines
...With Better Awareness and More Established Studies in the Medical / Academic Community
Peer-Reviewed Literature on Commercially Available Botulinum Toxins
Therapeutic Use
3,000
2,000
1,000
0
2,854
BOTOX®
974
DYSPORT®
131
XEOMIN®
Cosmetic Use
500
400
300
200 100
0
405
BOTOX®
127 DYSPORT®
36
XEOMIN®
28 Worldwide indications
ALLERGAN
Our pursuit. Life’s potential.®
34
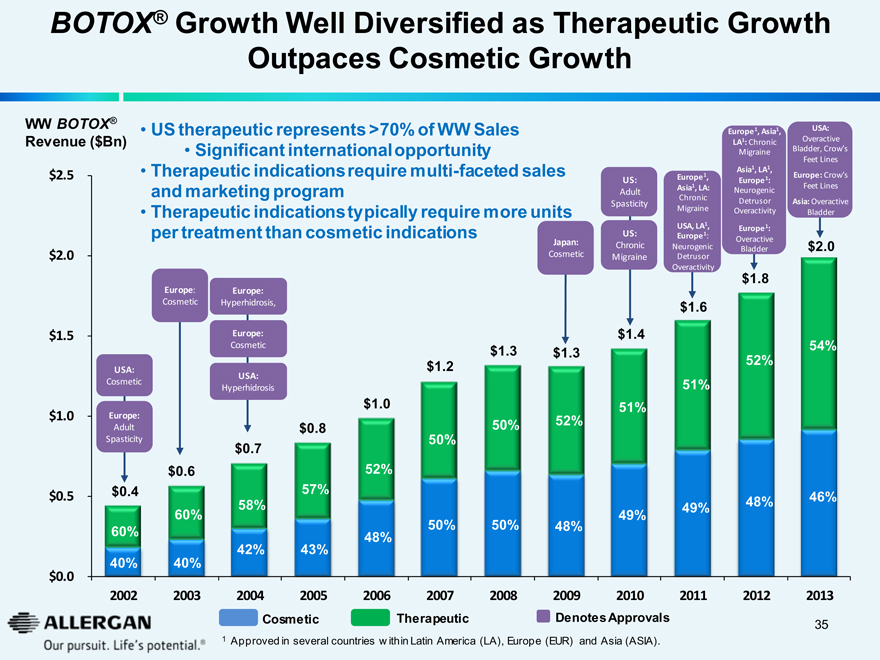
BOTOX® Growth Well Diversified as Therapeutic Growth Outpaces Cosmetic Growth
WW BOTOX®
Revenue ($Bn)
US therapeutic represents >70% of WW Sales
Significant international opportunity
Therapeutic indications require multi-faceted sales and marketing program
Therapeutic indications typically require more units per treatment than cosmetic indications
$2.5 $2.0 $1.5 $1.0 $0.5 $0.0
USA: Cosmetic Europe: Adult Spasticity $0.4 60% 40% 2002
Europe: Cosmetic $0.6 60% 40% 2003
Europe: Hyperhidrosis, Europe: Cosmetic USA: Hyperhidrosis $0.7 58% 42% 2004
$0.8 57% 43% 2005
$1.0 52% 48% 2006
$1.2 50% 50% 2007
$1.3 50% 50% 2008
Japan: Cosmetic $1.3 52% 48% 2009
US: Adult Spasticity US: Chronic Migraine $1.4 51% 49% 2010
Europe1, Asia1, LA: Chronic Migraine USA, LA1, Europe1: Neurogenic Detrusor Overactivity $1.6 51% 49% 2011
Europe1, Asia1, LA1: Chronic Migraine Asia1, LA1, Europe1: Neurogenic Detrusor Overactivity Europe1: Overactive Bladder $1.8 52% 48% 2012
USA: Overactive Bladder, Crow’s Feet Lines Europe: Crow’s Feet Lines Asia: Overactive Bladder $2.0 54% 46% 2013
ALLERGAN
Our pursuit. Life’s potential.®
Cosmetic Therapeutic Denotes Approvals
1 Approved in several countries within Latin America (LA), Europe (EUR) and Asia (ASIA).
35
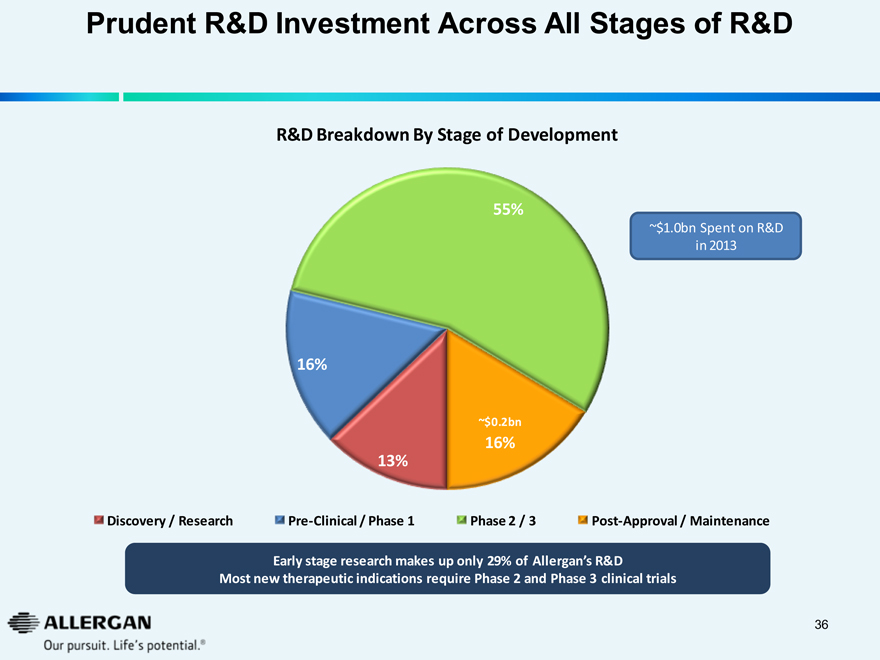
Prudent R&D Investment Across All Stages of R&D
R&D Breakdown By Stage of Development
~$1.0bn Spent on R&D in 2013
55% 16% 13% ~$0.2bn 16%
Discovery / Research Pre-Clinical / Phase 1 Phase 2 / 3 Post-Approval / Maintenance
Early stage research makes up only 29% of Allergan’s R&D
Most new therapeutic indications require Phase 2 and Phase 3 clinical trials
ALLERGAN
Our pursuit. Life’s potential.®
36
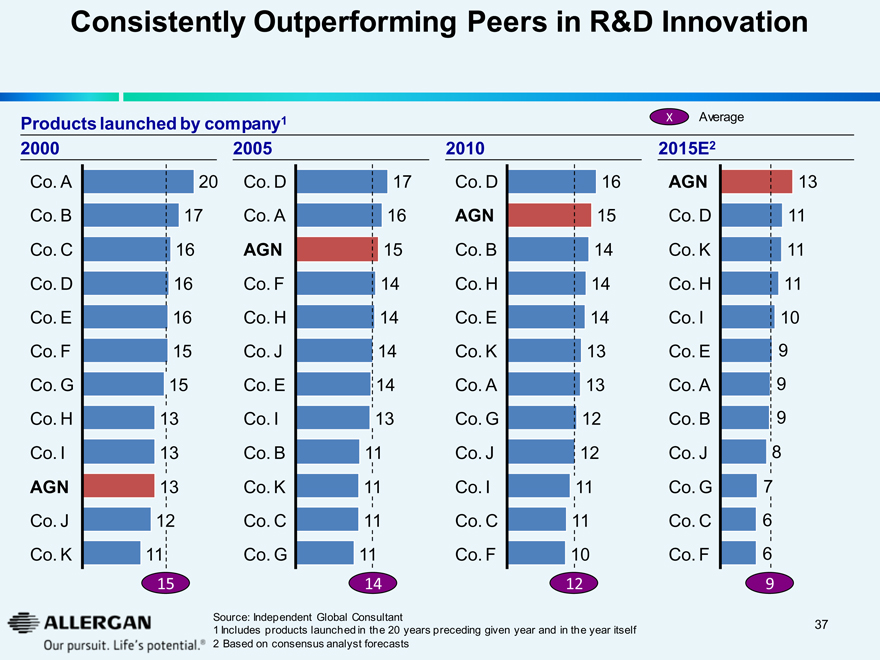
Consistently Outperforming Peers in R&D Innovation
Products launched by company1 X Average
2000 2005 2010 2015E2
Co. A 20 Co. D 17 Co. D 16 AGN 13
Co. B 17 Co. A 16 AGN 15 Co. D 11
Co. C 16 AGN 15 Co. B 14 Co. K 11
Co. D 16 Co. F 14 Co. H 14 Co. H 11
Co. E 16 Co. H 14 Co. E 14 Co. I 10
Co. F 15 Co. J 14 Co. K 13 Co. E 9
Co. G 15 Co. E 14 Co. A 13 Co. A 9
Co. H 13 Co. I 13 Co. G 12 Co. B 9
Co. I 13 Co. B 11 Co. J 12 Co. J 8
AGN 13 Co. K 11 Co. I 11 Co. G 7
Co. J 12 Co. C 11 Co. C 11 Co. C 6
Co. K 11 Co. G 11 Co. F 10 Co. F 6
15 14 12 9
ALLERGAN
Our pursuit. Life’s potential.®
Source: Independent Global Consultant
1 Includes products launched in the 20 years preceding given year and in the year itself
2 Based on consensus analyst forecasts
37
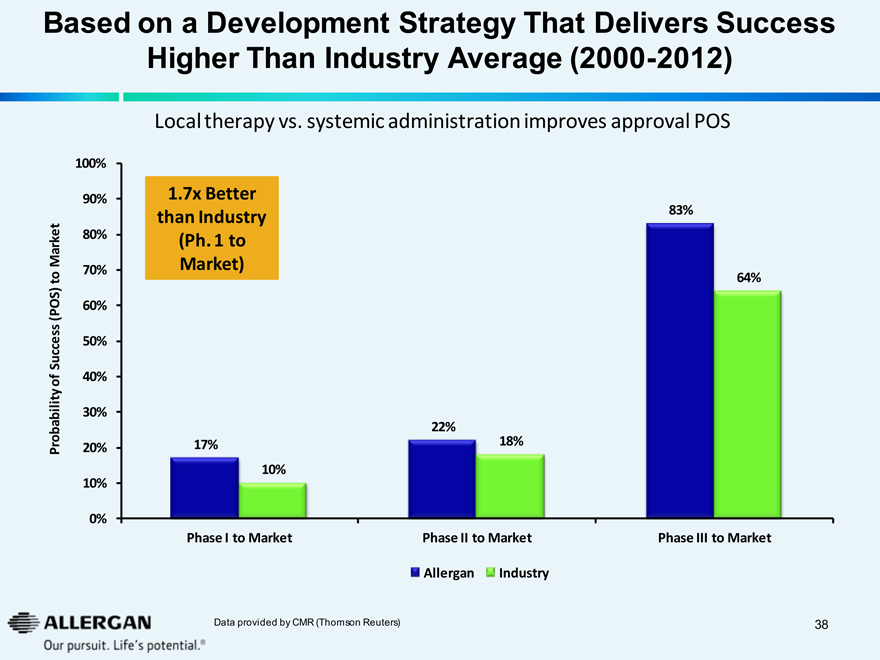
Based on a Development Strategy That Delivers Success Higher Than Industry Average (2000-2012)
Local therapy vs. systemic administration improves approval POS
Probability of Success (POS) to Market
100%
90%
80%
70%
60%
50%
40%
30%
20%
10%
0%
1.7x Better than Industry (Ph. 1 to Market)
17%
10%
22%
18%
83%
64%
Phase I to Market Phase II to Market Phase III to Market
Allergan Industry
ALLERGAN
Our pursuit. Life’s potential.®
Data provided by CMR (Thomson Reuters)
38
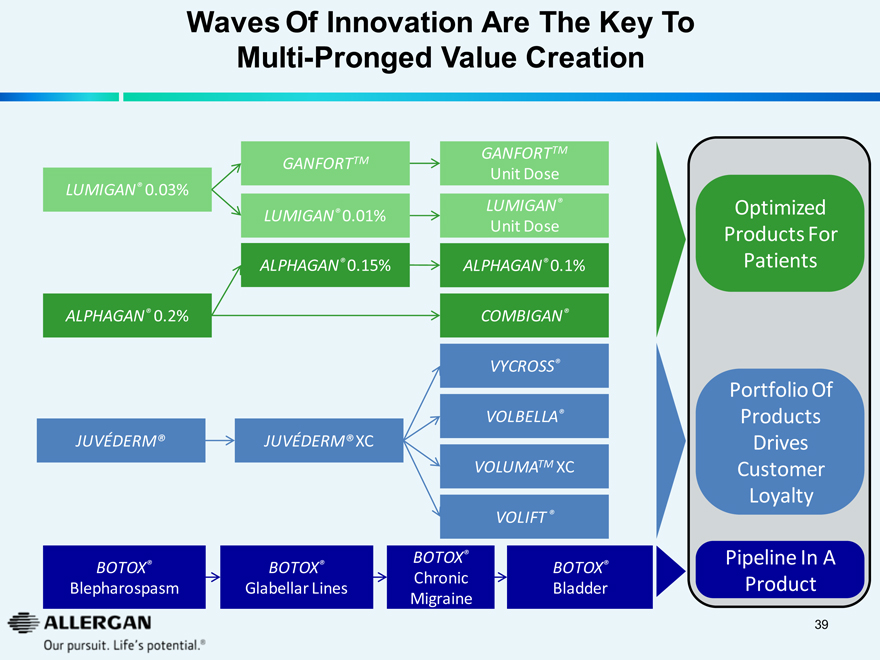
Waves Of Innovation Are The Key To
Multi-Pronged Value Creation
LUMIGAN® 0.03%
ALPHAGAN® 0.2%
JUVÉDERM®
GANFORTTM
LUMIGAN® 0.01%
ALPHAGAN® 0.15%
JUVÉDERM® XC
GANFORTTM
Unit Dose
LUMIGAN®
Unit Dose
ALPHAGAN® 0.1%
COMBIGAN®
VYCROSS®
VOLBELLA®
VOLUMATM XC
VOLIFT®
Optimized Products For Patients
Portfolio Of Products Drives Customer Loyalty
BOTOX® Blepharospasm
BOTOX® Glabellar Lines
BOTOX® Chronic Migraine
BOTOX® Bladder
Pipeline In A Product
ALLERGAN
Our pursuit. Life’s potential.®
39
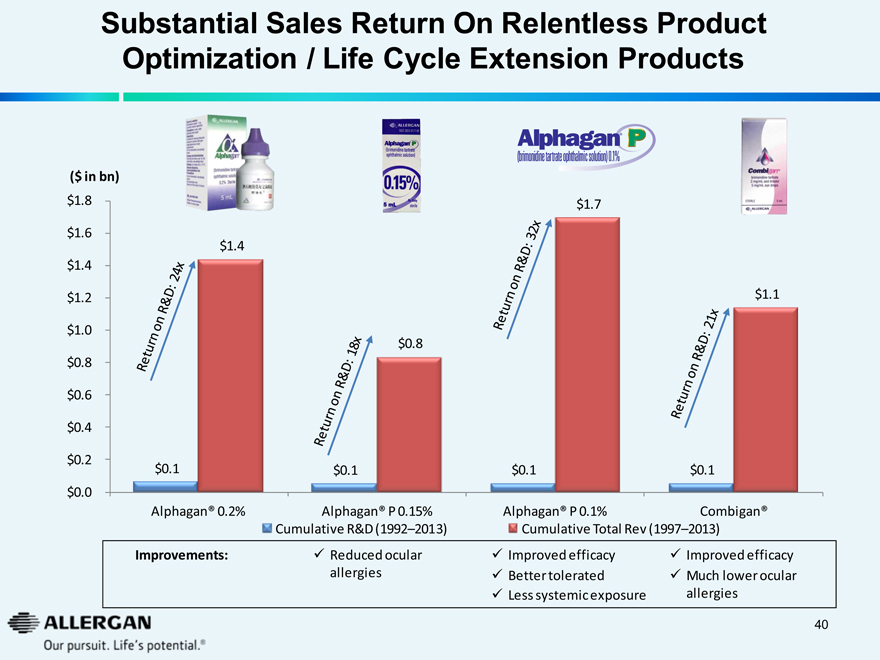
Substantial Sales Return On Relentless Product
Optimization / Life Cycle Extension Products
($ in bn)
$1.8
$1.6
$1.4
$1.2
$1.0
$0.8
$0.6
$0.4
$0.2
$0.0
ALLERGAN
Alphagan®
0.2% Sterile
5 mL
Return on R&D: 24x $0.1 $1.4
ALLERGAN
NDC 0023-9177-05
Alphagan® P
(brimonidine tartrate ophthalmic solution)
0.15% 5 mL Rx Only sterile
Return on R&D: 18x
$0.1 $0.8
Alphagan® P
(brimonidine tartrate ophthalmic solution) 0.1%
Return on R&D: 32x
$0.1
$1.7
Combigan
brimonidine tartrate
2 mg/mL and
5 mg/mL eye drops
STERILE 5 mL
ALLERGAN
Return on R&D: 21x
$0.1 $1.1
Alphagan® 0.2% Alphagan® P 0.15% Alphagan® P 0.1% Combigan®
Cumulative R&D (1992–2013) Cumulative Total Rev (1997–2013)
Improvements:
Reduced ocular allergies
Improved efficacy Better tolerated Less systemic exposure
Improved efficacy
Much lower ocular allergies
ALLERGAN
Our pursuit. Life’s potential.®
40

Value Created Through Investments in
All Pre-Phase III Projects
All currently approved and ongoing development projects required or require pre-phase 3 work
If Allergan were to stop DARPin® development today ...
Sales Return +25x ~$120bn
~$7bn ~$50bn $0.35bn –$0.40bn ~$20bn
Cumulative R&D Spend 1992–2013
Cumulative Sales 1997–2013
2014 – 2024 Potential Additional Sales Associated with R&D Spent
Potential Phase 3 R&D Savings *
Potential Cumulative 10-year DARPin® Sales*
Abandoning pre-phase III projects will be value destructive
ALLERGAN
Our pursuit. Life’s potential.®
Note: All projections based on Allergan estimates.
* R&D investments and potential sales figures exclude Dual DARPin®.
41
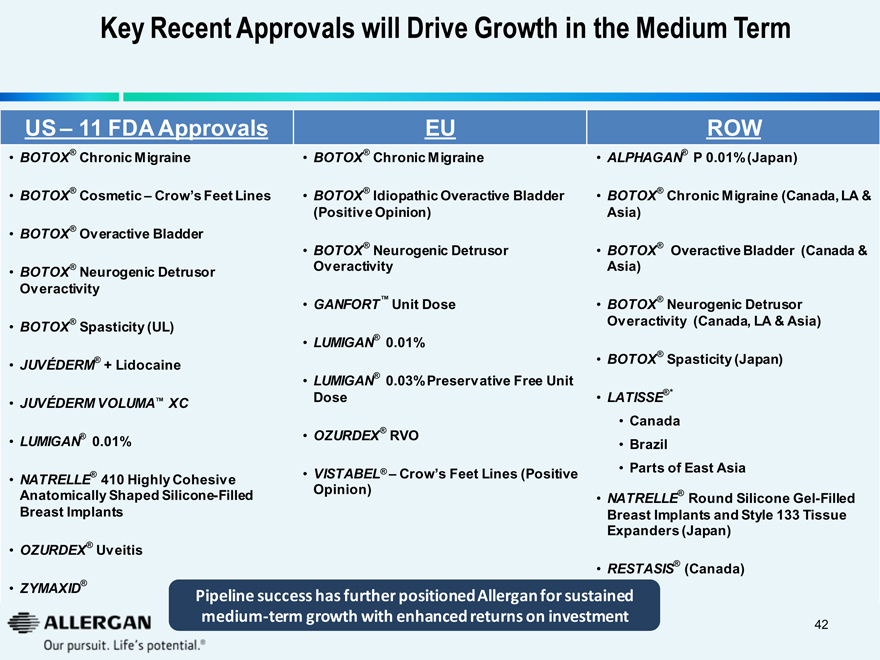
Key Recent Approvals will Drive Growth in the Medium Term
US – 11 FDA Approvals
BOTOX® Chronic Migraine
BOTOX® Cosmetic – Crow’s Feet Lines
BOTOX® Overactive Bladder
BOTOX® Neurogenic Detrusor
Overactivity
BOTOX® Spasticity (UL)
JUVÉDERM® + Lidocaine
JUVÉDERM VOLUMA™ XC
LUMIGAN® 0.01%
NATRELLE® 410 Highly Cohesive
Anatomically Shaped Silicone-Filled
Breast Implants
OZURDEX® Uveitis
ZYMAXID®
EU
BOTOX® Chronic Migraine
BOTOX® Idiopathic Overactive Bladder
(Positive Opinion)
BOTOX® Neurogenic Detrusor
Overactivity
GANFORT™ Unit Dose
LUMIGAN® 0.01%
LUMIGAN® 0.03% Preservative Free Unit Dose
OZURDEX® RVO
VISTABEL® – Crow’s Feet Lines (Positive Opinion)
ROW
ALPHAGAN® P 0.01% (Japan)
BOTOX® Chronic Migraine (Canada, LA & Asia)
BOTOX® Overactive Bladder (Canada & Asia)
BOTOX® Neurogenic Detrusor
Overactivity (Canada, LA & Asia)
BOTOX® Spasticity (Japan)
LATISSE®*
Canada
Brazil
Parts of East Asia
NATRELLE® Round Silicone Gel-Filled Breast Implants and Style 133 Tissue Expanders (Japan)
RESTASIS® (Canada)
Pipeline success has further positioned Allergan for sustained medium-term growth with enhanced returns on investment
ALLERGAN
Our pursuit. Life’s potential.®
42
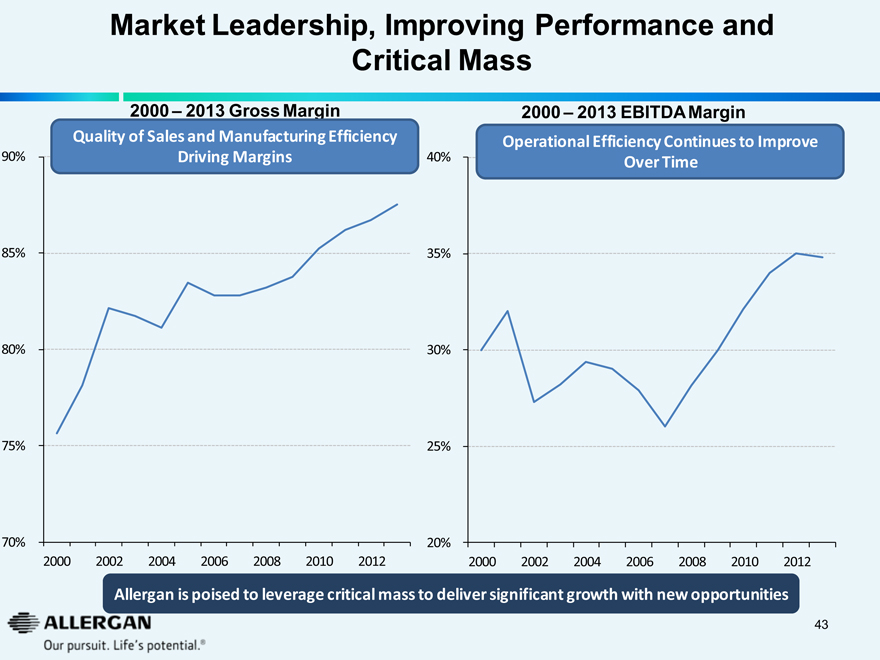
Market Leadership, Improving Performance and Critical Mass
2000 – 2013 Gross Margin
Quality of Sales and Manufacturing Efficiency Driving Margins
90%
85%
80%
75%
70%
2000 2002 2004 2006 2008 2010 2012
2000 – 2013 EBITDA Margin
Operational Efficiency Continues to Improve Over Time
40%
35%
30%
25%
20%
2000 2002 2004 2006 2008 2010 2012
Allergan is poised to leverage critical mass to deliver significant growth with new opportunities
ALLERGAN
Our pursuit. Life’s potential.®
43
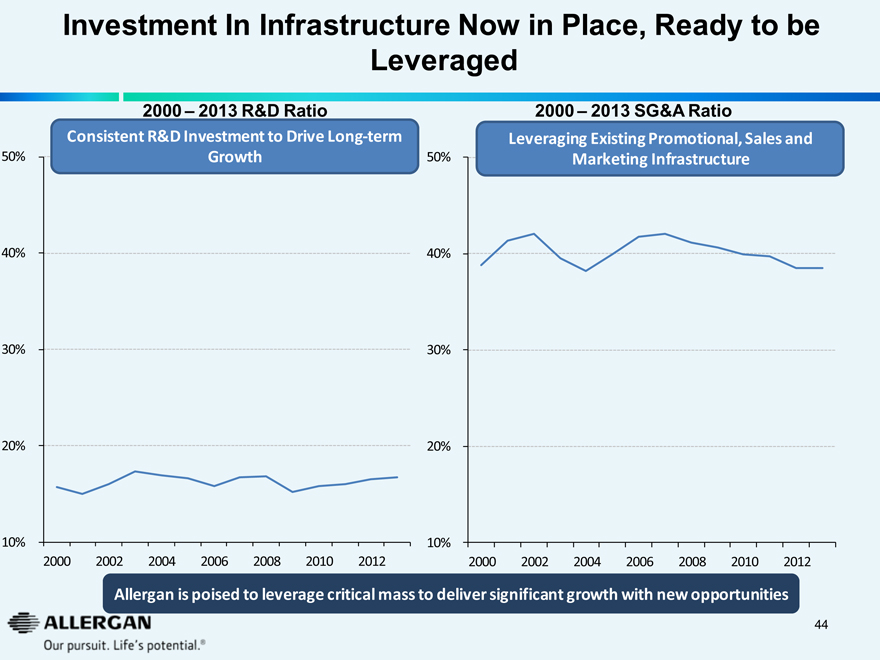
Investment In Infrastructure Now in Place, Ready to be Leveraged
2000 – 2013 R&D Ratio
Consistent R&D Investment to Drive Long-term Growth
50%
40%
30%
20%
10%
2000 2002 2004 2006 2008 2010 2012
2000 – 2013 SG&A Ratio
Leveraging Existing Promotional, Sales and Marketing Infrastructure
50%
40%
30%
20%
10%
2000 2002 2004 2006 2008 2010 2012
Allergan is poised to leverage critical mass to deliver significant growth with new opportunities
ALLERGAN
Our pursuit. Life’s potential.®
44
Allergan Tomorrow
ALLERGAN
Our pursuit. Life’s potential.®
45
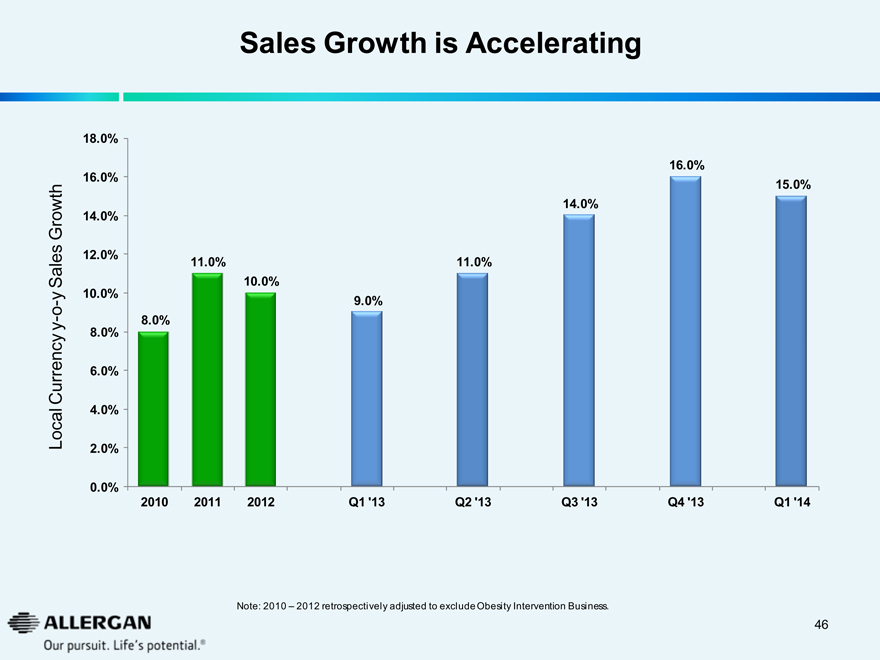
Sales Growth is Accelerating
Local Currency y-o-y Sales Growth
18.0%
16.0%
16.0% 15.0%
14.0% 14.0%
12.0% 11.0% 11.0%
10.0% 10.0% 9.0%
8.0% 8.0%
6.0%
4.0%
2.0%
0.0%
2010 2011 2012 Q1 ‘13 Q2 ‘13 Q3 ‘13 Q4 ‘13 Q1 ‘14
Note: 2010 – 2012 retrospectively adjusted to exclude Obesity Intervention Business.
ALLERGAN
Our pursuit. Life’s potential.®
46
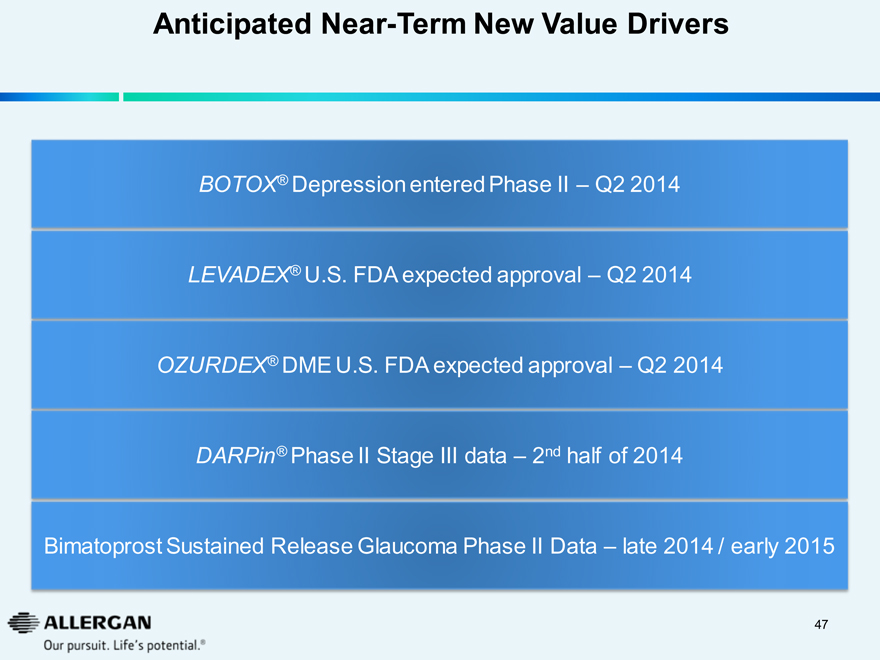
Anticipated Near-Term New Value Drivers
BOTOX® Depression entered Phase II – Q2 2014
LEVADEX® U.S. FDA expected approval – Q2 2014
OZURDEX® DME U.S. FDA expected approval – Q2 2014
DARPin® Phase II Stage III data – 2nd half of 2014
Bimatoprost Sustained Release Glaucoma Phase II Data – late 2014 / early 2015
ALLERGAN
Our pursuit. Life’s potential.®
47
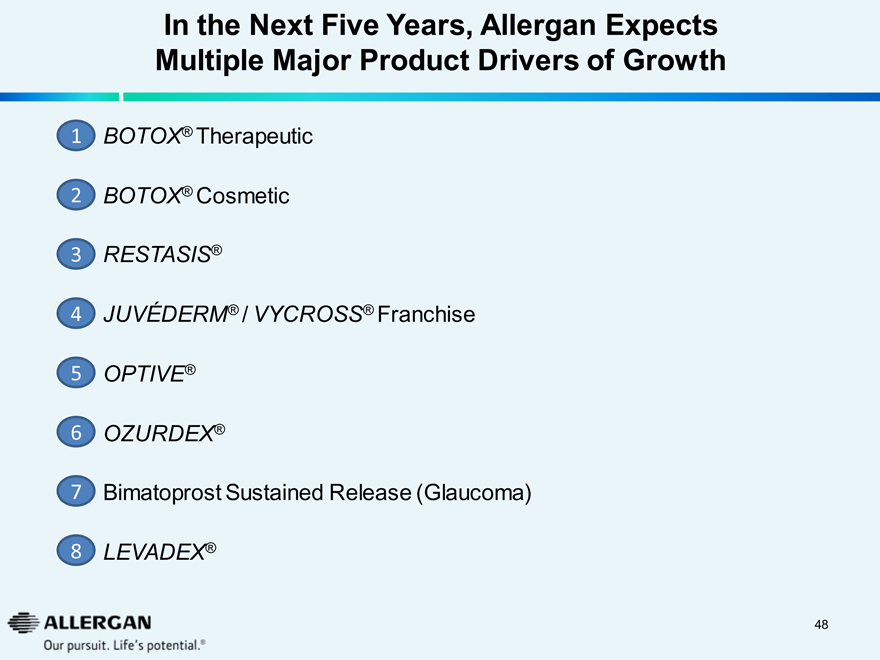
In the Next Five Years, Allergan Expects Multiple Major Product Drivers of Growth
1 BOTOX® Therapeutic
2 BOTOX® Cosmetic
3 RESTASIS®
4 JUVÉDERM® / VYCROSS® Franchise
5 OPTIVE®
6 OZURDEX®
7 Bimatoprost Sustained Release (Glaucoma)
8 LEVADEX®
ALLERGAN
Our pursuit. Life’s potential.®
48
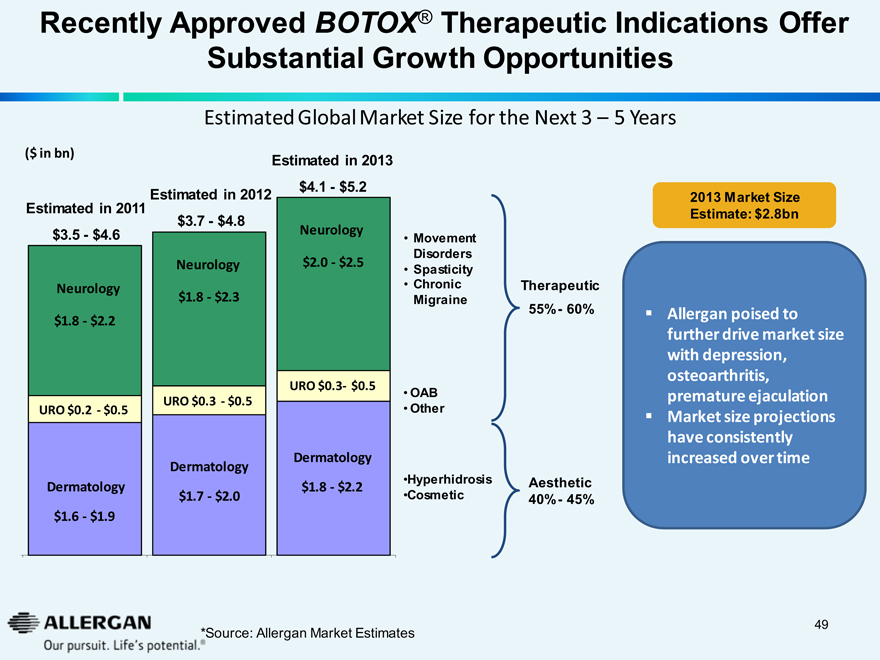
Recently Approved BOTOX® Therapeutic Indications Offer
Substantial Growth Opportunities
Estimated Global Market Size for the Next 3 - 5 Years
($ in bn)
Estimated in 2013
Estimated in 2011
Estimated in 2012
$3.5 - $4.6
$3.7 - $4.8
$4.1 - $5.2
Neurology
Neurology
Neurology
$1.8 - $2.2
$1.8 - $2.3
$2.0 - $2.5
Movement
Disorders
Spasticity
Chronic
Migraine
OAB
Other
Hyperhidrosis
Cosmetic
Therapeutic
55% - 60%
Aesthetic
40% - 45%
URO $0.2 - $0.5
URO $0.3 - $0.5
URO $0.3 - $0.5
Dermatology
Dermatology
Dermatology
$1.6 - $1.9
$1.7 - $2.0
$1.8 - $2.2
2013 Market Size
Estimate: $2.8bn
Allergan poised to further drive market size with depression, osteoarthritis, premature ejaculation
Market size projections have consistently increased over time
*Source: Allergan Market Estimates
ALLERGAN
Our pursuit. Life’s potential.®
49
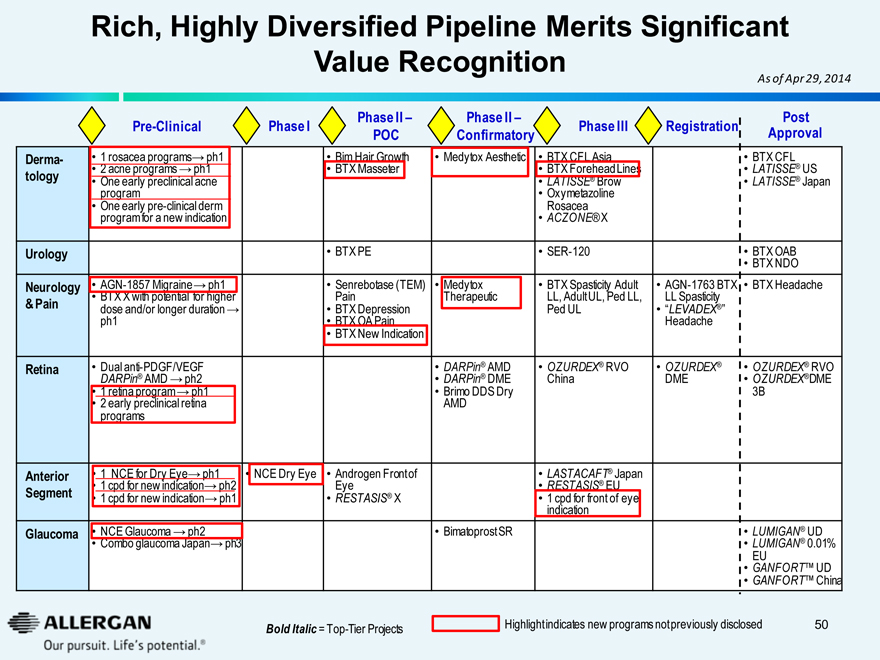
Rich, Highly Diversified Pipeline Merits Significant Value Recognition
As of Apr 29, 2014
Pre-Clinical Phase I Phase II - POC Phase II - Confirmatory Phase III Registration Post Approval
Derma-
tology
1 rosacea programs® ph1
2 acne programs® ph1
One early preclinical acne program
One early pre-clinical derm program for a new indication
Bim Hair Growth
BTX Masseter
Medytox Aesthetic
BTX CFL Asia
BTX Forehead Lines
LATISSE® Brow
Oxymetazoline Rosacea
ACZONE® X
BTX CFL
LATISSE® US
LATISSE® Japan
Urology
BTX PE
SER-120
BTX OAB
BTX NDO
Neurology & Pain
AGN-1857 Migraine® ph1
BTX X with potential for higher
dose and/or longer duration® ph1
Senrebotase (TEM) Pain BTX Depression BTX OA Pain BTX New Indication
Medytox Therapeutic
BTX Spasticity Adult LL, Adult UL, Ped LL, Ped UL
AGN-1763 BTX LL Spasticity “LEVADEX®” Headache
BTX Headache
Retina
Dual anti-PDGF/VEGF DARPin® AMD® ph2 1 retina program® ph1 2 early preclinical retina programs
DARPin® AMD DARPin® DME Brimo DDS Dry AMD
OZURDEX® RVO China
OZURDEX® DME
OZURDEX® RVO OZURDEX®DME 3B
Anterior Segment
1 NCE for Dry Eye® ph1 1 cpd for new indication® ph2 1 cpd for new indication® ph1
NCE Dry Eye
Androgen Front of Eye RESTASIS® X
LASTACAFT® Japan RESTASIS® EU 1 cpd for front of eye indication
Glaucoma NCE Glaucoma® ph2 Combo glaucoma Japan® ph3
Bimatoprost SR
LUMIGAN® UD LUMIGAN® 0.01% EU GANFORT™ UD GANFORT™ China
Bold Italic = Top-Tier Projects
Highlight indicates new programs not previously disclosed
ALLERGAN
Our pursuit. Life’s potential.®
50
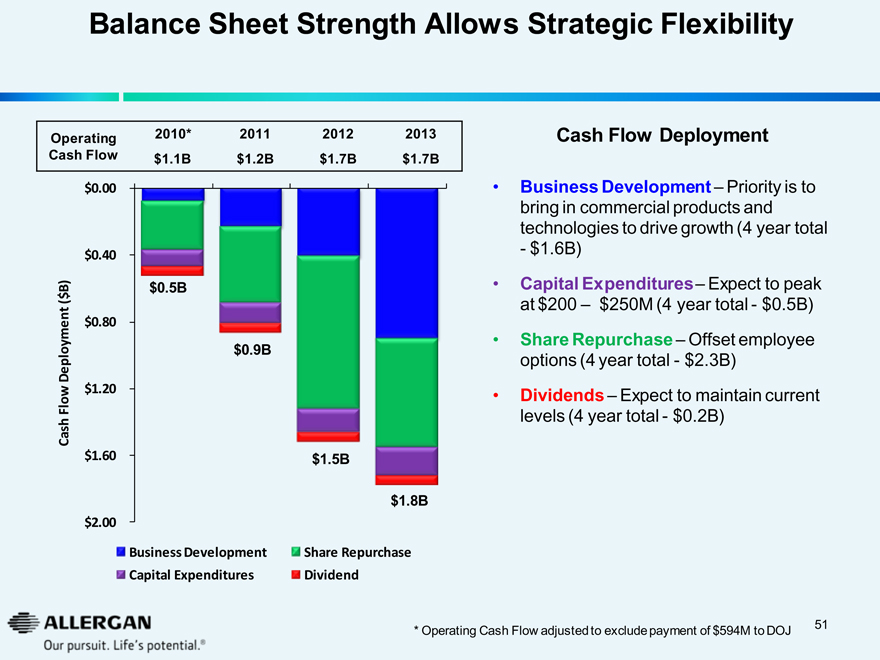
Balance Sheet Strength Allows Strategic Flexibility
Operating 2010* 2011 2012 2013
Cash Flow $1.1B $1.2B $1.7B $1.7B
$0.00
$0.40
$0.80
$1.20
$1.60
$2.00
$0.5B
$0.9B
$1.5B
$1.8B
Cash Flow Deployment ($B)
Business Development
Share Repurchase
Capital Expenditures
Dividend
Cash Flow Deployment
Business Development - Priority is to
bring in commercial products and
technologies to drive growth (4 year total
- $1.6B)
Capital Expenditures - Expect to peak
at $200 - $250M (4 year total - $0.5B)
Share Repurchase - Offset employee
options (4 year total - $2.3B)
Dividends - Expect to maintain current
levels (4 year total - $0.2B)
* Operating Cash Flow adjusted to exclude payment of $594M to DOJ
ALLERGAN
Our pursuit. Life’s potential.®
51
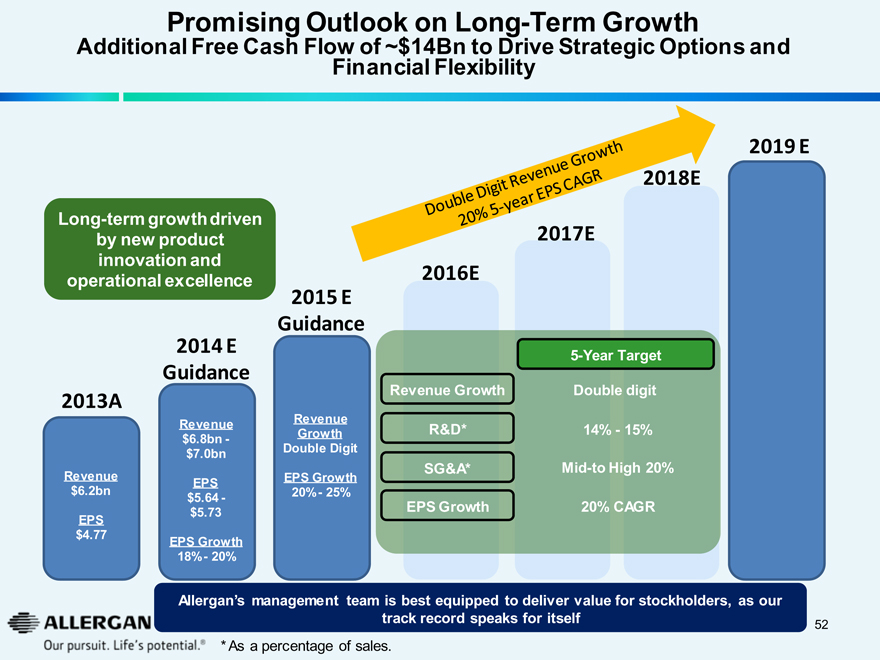
Promising Outlook on Long-Term Growth
Additional Free Cash Flow of ~$14Bn to Drive Strategic Options and Financial Flexibility
Long-term growth driven by new product innovation and operational excellence
2013A
Revenue
$6.2bn
EPS
$4.77
2014 E
Guidance
Revenue
$6.8bn -
$7.0bn
EPS
$5.64 -
$5.73
EPS Growth
18% - 20%
2015 E
Guidance
Revenue
Growth
Double Digit
EPS Growth
20% - 25%
Double Digit Revenue Growth
20% 5-year EPS CAGR
2016E
Revenue Growth
R&D*
SG&A*
EPS Growth
2017E
5-Year Target
Double digit
14% - 15%
Mid-to High 20%
20% CAGR
2018E
2019 E
Allergan’s management team is best equipped to deliver value for stockholders, as our track record speaks for itself
*As a percentage of sales.
ALLERGAN
Our pursuit. Life’s potential.®
52
Allergan in the Future
We have built a pre-eminent specialty pharmaceutical company
Investments over long period yielding consistent flow of regulatory approvals, revenue growth and margin expansion
Consistent delivery of results leading to share price outperformance
Longevity and depth of expertise in our specialties
In mid-2013, management and our Board of Directors began working on a plan to further enhance sales and earnings performance
Poised to leverage critical mass
Operational efficiency and leveraging commercial infrastructure will accelerate bottom line growth
Which has produced an enhanced and attractive outlook
Our management team is best positioned to drive future growth through innovation and operational excellence
Continue to maximize value through market expansion and new market creation
Further increase productivity in clinical development
Optionality of High Peak Revenue R&D Projects
DARPin® / dual DARPin®
Brimonidine Sustained Release - Dry AMD
BOTOX® Depression
Scalp Hair Growth
Bimatoprost Sustained Release (Glaucoma)
ALLERGAN
Our pursuit. Life’s potential.®
53

Reconciliation of Selected Non-GAAP Financial Measures
“GAAP” refers to financial information presented in accordance with generally accepted accounting principles in the
United States.
In this presentation, Allergan included historical non -GAAP financial measures, as defined in Regulation G promulgated by the Securities and Exchange Commission, with respect to estimates for the year ended
December 31, 2013, and the corresponding periods for 1999 through 2012. The information for 2012 and 2011 has been retrospectively adjusted to reflect the obesity intervention unit, which was sold on December 2, 2013, as discontinued operations. Allergan believes that its presentation of historical non -GAAP financial measures provides useful supplementary information to investors. The presentation of historical non -GAAP financial measures is not meant to be considered in isolation from or as a substitute for results prepared in accordance with GAAP.
In this presentation, Allergan reported certain financial measures including “Adjusted Sales”, “Adjusted SG&A”,
“Adjusted R&D”, “Adjusted EPS”, “Proforma Growth” and “Sales Growth at constant exchange rates” as adjusted for
Non-GAAP items. Allergan uses these financial measures to enhance the investor’s overall understanding of the financial performance and prospects for the future of Allergan’s core business activities. Specifically, Allergan believes that a report of these financial measures provides consistency in Allergan’s financial reporting and facilitates the comparison of results of core business operations between its current, past and future periods. Adjusted Sales, Adjusted SG&A, Adjusted R&D, Adjusted EPS, Proforma Growth and Sales Growth are the primary indicators management uses for planning and forecasting in future periods. Allergan also uses Adjusted Sales, Adjusted R&D and Adjusted EPS for evaluating management performance for compensation purposes.
A reconciliation of non -GAAP items may be found under the heading “Non -GAAP Financial Reconciliation” in the investor relations section of the www.Allergan.com website.
ALLERGAN
Our pursuit. Life’s potential.®
54

ALLERGAN
Our pursuit. Life’s potential.®
May 2014
Allergan
A Specialist in the Biopharmaceutical
& Medical Device Industries
55