 July 21, 2014 Allergan A Specialist in the Biopharmaceutical & Medical Device Industries Exhibit 99.2 |
 2 2 Forward-Looking Statements ® & ™ Marks owned by Allergan, Inc. JUVÉDERM ® is a registered trademark of Allergan Industrie SAS All other products are registered trademarks of their respective companies This presentation contains “forward-looking statements,” including statements regarding product acquisition and development, regulatory approvals, market potential, expected growth, operational efficiencies, a proposed offer made by Valeant, and Allergan’s expected, estimated or anticipated future results, including Allergan’s earnings per share and revenue forecasts, among other statements. All forward-looking statements herein are based on Allergan’s current expectations of future events and represent Allergan’s judgment only as of the date of this presentation. If underlying assumptions prove inaccurate or unknown risks or uncertainties materialize, actual results could vary materially from Allergan's expectations and projections. Therefore, you are cautioned not to rely on any of these forward-looking statements and Allergan expressly disclaims any intent or obligation to update these forward-looking statements except as required to do so by law. Actual results may differ materially from Allergan’s current expectations based on a number of factors affecting Allergan’s businesses, including changing competitive, market and regulatory conditions; the timing and uncertainty of the results of both the research and development and regulatory processes; domestic and foreign health care and cost containment reforms, including government pricing, tax and reimbursement policies; revisions to regulatory policies related to the approval of competitive generic products; technological advances and patents obtained by competitors; the ability to obtain and maintain adequate protection of intellectual property rights; the performance of new products, including obtaining government approval and consumer and physician acceptance, the continuing acceptance of currently marketed products, and consistency of treatment results among patients; the effectiveness of promotional and advertising campaigns; the potential for negative publicity concerning any of Allergan’s products; the timely and successful implementation of strategic initiatives, including expansion of new or existing products into new markets; the results of any pending or future litigation, investigations or claims; the uncertainty associated with the identification of, and successful consummation, execution and integration of, external corporate development initiatives and strategic partnering transactions; potential difficulties in manufacturing; and Allergan’s ability to obtain and successfully maintain a sufficient supply of products to meet market demand in a timely manner. In addition, matters generally affecting the U.S. and international economies, including consumer confidence and debt levels, changes in interest and currency exchange rates, political uncertainty, international relations, the status of financial markets and institutions, impact of natural disasters or geo-political events and the state of the economy worldwide, may materially affect Allergan’s results. These and other risks and uncertainties affecting Allergan’s businesses and operations may be found in Allergan’s most recently filed Annual Report on Form 10-K and any subsequent Quarterly Reports on Form 10-Q, including under the heading “Risk Factors”. These filings, as well as Allergan's other public filings with the U.S. Securities and Exchange Commission (SEC), can be obtained without charge at the SEC's web site at www.sec.gov. These SEC filings are also available at Allergan’s web site at www.allergan.com along with copies of Allergan’s press releases and additional information about Allergan. For further information, you can contact the Allergan Investor Relations Department by calling 714-246-4636. © 2014 Allergan, Inc. All rights reserved. |
 3 Allergan Continues to Execute & Deliver Increased Value to Stockholders • Continued strong performance and business momentum • Q2 and Q2 YTD sales growth of 16% (1) driven by strength across nearly all product lines and geographies • Q2 and Q2 YTD EPS (2) growth in excess of 20% • Increase in both Sales & EPS (2) guidance for full year 2014 • Execution of plan to drive further operational efficiencies & create a robust platform for long-term sustainable growth • Streamline SG&A while continuing to focus on revenue growth opportunities • Further enhance R&D productivity • Maintain robust double-digit revenue CAGR over long-term plan • Further enhanced long-term earnings outlook • Additional value from ongoing business development & capital return (1) Represents local currency sales growth (2) Non-GAAP Diluted Earnings per Share |
 4 4 Another Outstanding Quarter Highlights the Strength of Allergan’s Business Model Q2 2014 Guidance (Issued May 7) $1,725M - $1,800M $1.41 - $1.44 16% - 18% Actual Q2 2014 Results $1,827M $1.51 24% Product Net Sales Non-GAAP Diluted EPS Non-GAAP Diluted YOY EPS Growth Strong business momentum continued in 2nd quarter with record dollar sales growth Depth and breadth of contribution made by nearly all therapeutic areas and geographies Leverage of SG&A investments in a thoughtful & disciplined approach |
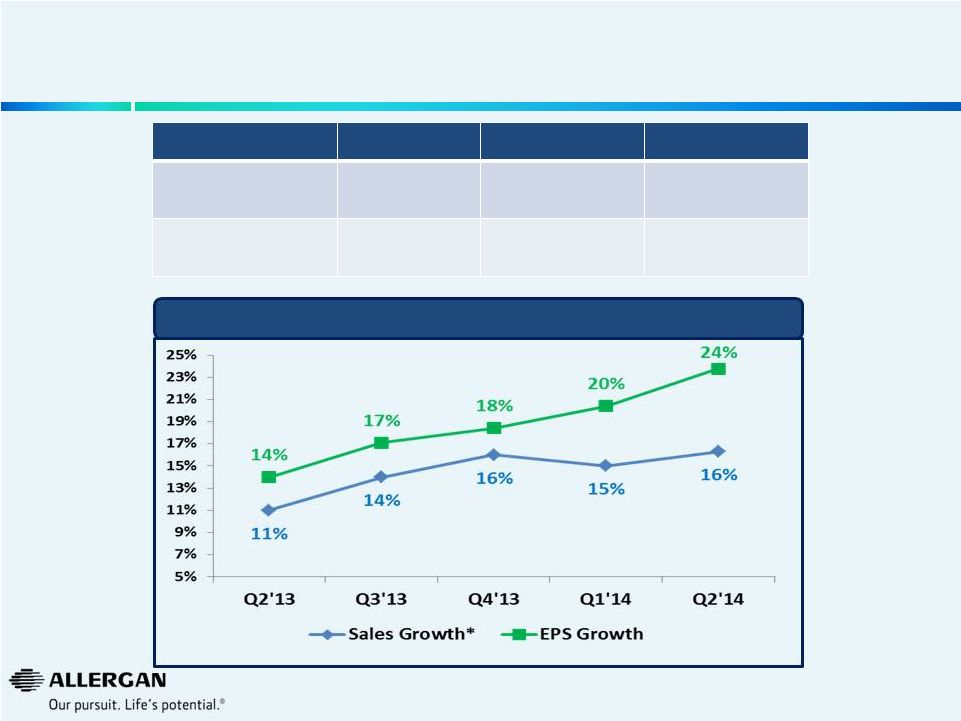 5 5 Strong Business Momentum Continues to Accelerate Sales & EPS Growth * Sales growth in local currency retrospectively adjusted to exclude Obesity Intervention Business. ** 2012 EPS growth includes the 2012 Obesity impact of $0.10 and the 2012 R&D Tax Credit impact of $0.06. 2013 EPS Growth – Restating 2012 to exclude the 2012 Obesity impact of $0.10 and including the 2012 R&D Tax Credit impact of $0.06. FY 2012 FY 2013 YTD Q2 2014 Sales Growth* 10% 12% 16% EPS Growth** 15% 16% 22% Quarterly Sales & EPS Performance |
 Allergan’s 2014 Full Year Earnings Outlook Continues to Improve FY 2014 Product Net Sales Non-GAAP Diluted EPS Non-GAAP Diluted EPS YOY Growth $6.8bn - $7.0bn $5.64 - $5.73 18% - 20% $6.7bn - $7.0bn $5.36 - $5.48 12% - 15% Feb. 5 Guidance May 12 Guidance July 21 Guidance $6.9bn - $7.1bn $5.74 - $5.80 20% - 22% 6 |
 7 Overview of Today’s Plan to Restructure Our Operations & Processes ~13% reduction in workforce Site closures ~1,500 employees & ~250 vacant positions 3 Annual Cost reductions* ~ $475M Our ongoing effort to improve efficiency and productivity will further increase stockholder value * Includes $27M of Gross Margin enhancements |
 8 Driving Sustainable Operational Efficiencies Without Compromising Effectiveness Organization Re-design • Refocusing our resources on the highest yielding initiatives • Right-sizing, adapting and simplifying our structure and processes Selling, General and Administrative (SG&A) • Past strong investments have created critical mass that can now be leveraged Research & Development (R&D) • Heavy concentration on programs already in clinic From 1998 – 2014 Allergan Has Successfully Invested to Create Robust Top and Bottom Line Growth • Launched new markets, products and geographies 16% Sales CAGR 19% EPS CAGR >2,000% Stock Price Appreciation No compromise to our commercial strategy and low impact to our long-term revenue growth targets Maintain strength in our R&D pipeline to bring innovative therapies to patients ~$475M in annual operational efficiencies expected to be realized in 2015 (1) (1) (2) (1) Represents 1998 – 2014 CAGR. 2014 is midpoint of July 21, 2014 guidance. (2) Calculation based on 1998 – July 18, 2014. |
 9 Principles Behind Our Enduring Organization Customer Centricity • DTC spend preserved at 2014 levels in all priority brands DTC spend maintained ~$200M • Sales force maintained in all key areas ~ 94% of sales force remains intact Reductions mainly in breast & glaucoma • Maintain education and training focus Innovation and Pipeline • No changes to Phase 2/3 clinical pharmaceutical R&D programs • Outsource to achieve efficiencies in non-core areas (e.g. data management, global monitoring) Preserve study protocol design and Phase 2B & Phase 3 trials in-house Culture and values • Success continues to be driven by action- oriented culture with a premium placed on generating results • Rewire, right-size and reduce complexity / layers within the organization • Optimize processes and speed of decision making Commercial • Focus resources on highest ROI areas • Preserve customer facing headcount • Reduce complexity and layers within the organization R&D Principles Underpinning Allergan’s Plan Allergan will not compromise our successful business model Maintains a robust platform for long-term sustainable growth |
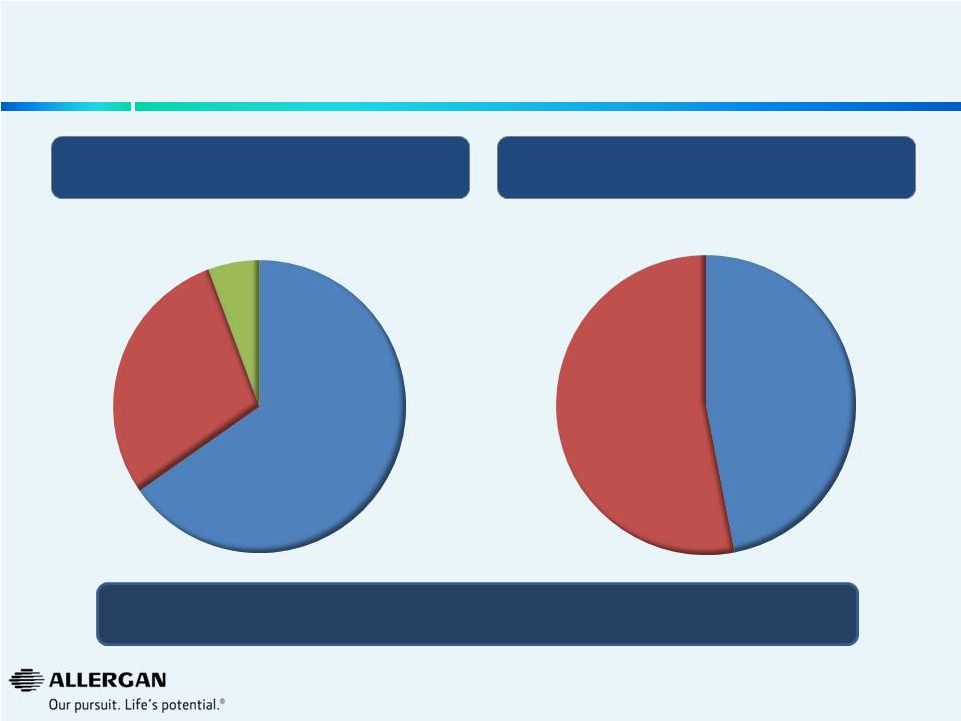 10 10 % of Operational Efficiencies from Headcount Operational Efficiency Mix by P&L Line Item ~$475M Annual Cost Savings To Be Realized in 2015 ~ 13% Reduction in Allergan Workforce (1) Implementation expected to be mostly completed in 2014 with operational efficiencies expected to be fully realized in 2015 and beyond Overview of Operational Efficiencies to be Realized Gross Margin 6% R&D 29% SG&A 65% Non Headcount 53% Headcount 47% (1) As part of the restructuring, Allergan will reduce its workforce by approximately 1,500 employees, or approximately 13 percent of its current global headcount, and eliminate an additional approximately 250 vacant positions |
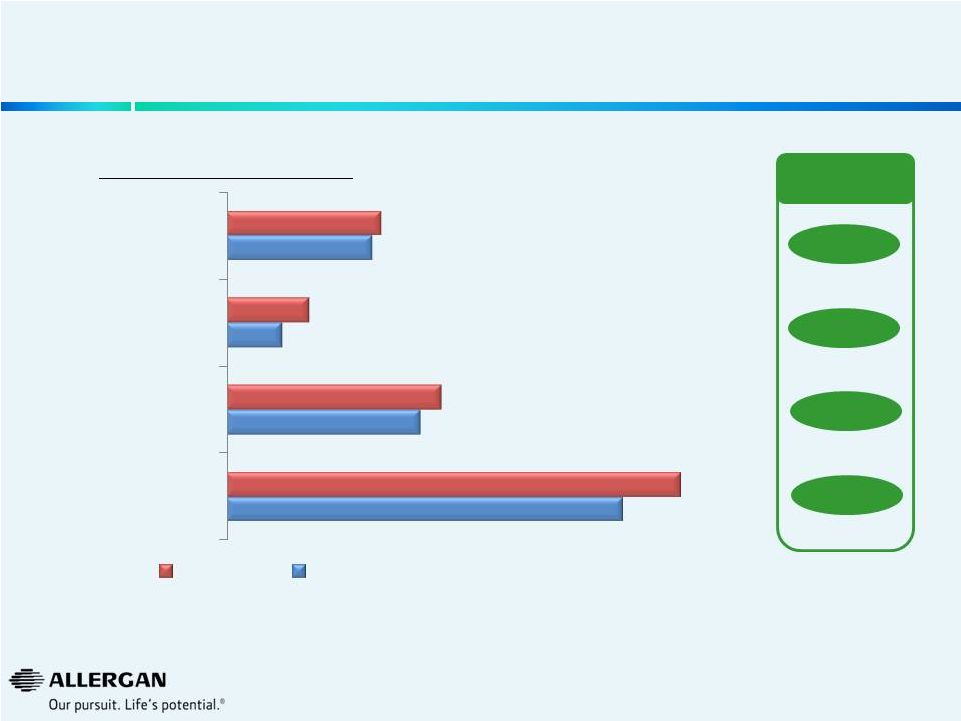 11 Operational Efficiencies Result in a ~13% Reduction in Allergan Workforce (1) As of June 30, 2014. All headcount is rounded. (2) As part of the restructuring, Allergan will reduce its workforce by approximately 1,500 employees, or approximately 13 percent of its current global headcount, and eliminate an additional approximately 250 vacant positions Headcount (#’s are approximate) -6% -33% -10% -13% (1) (2) % Reduction 10,200 5,000 1,450 3,750 11,700 5,550 2,150 4,000 Total Company All Other Functions R&D Sales Force Post Operational Efficiencies Plan Current |
 12 $180M $182M $26M $22M $65M Focus resources on highest value opportunities Streamline organization structure Simplify processes and interfaces Optimize site footprint Enhance strategic sourcing of goods and services I II III IV V $475M Total Operational Efficiencies Five Performance Improvement Levers Drive Further Operational Efficiencies |
 13 13 Streamlining SG&A While Continuing to Focus on Revenue Growth Opportunities Focus resources on highest value opportunities • Invest in key growth drivers (Retina, Facial Aesthetics, RESTASIS ® , BOTOX ® Chronic Migraine & Urology) • Rationalize spend in lower growth franchises (Breast & Glaucoma IOP Drops) • Rebalance resources in favor of customer facing headcount and drive commercial excellence Streamline Organization Structure • Optimize regional marketing structures and commercial support operations • Rationalize global functions (e.g. Market Research & Medical Affairs) • Reduce management layers and increase span of control (company-wide) Simplify Processes & Interfaces • Clarify roles of global, regional and country organizations to speed decision-making • Enhance and expand use of regional shared service centers for high volume transactional services (e.g. Austin, TX, Westport, Ireland) • Reduce number of product promotional cycles and refocus marketing material creation Enhance strategic sourcing of goods and services • Improve procurement of vendor services (e.g. advertising agencies and media buying, market research) 2015 SG&A Operational Efficiencies: ~$310M Optimize site footprint • Close Carlsbad, CA facility acquired in SkinMedica acquisition • Streamline commercial regional headquarter locations (Europe, Asia Pacific, Latin America & Canada) $145M $112M $6M $38M $9M |
 14 14 R&D Project Rationalization & Increased Efficiencies Rationalize Projects $52m Increase Efficiency $86m Outsource non-core functions Consolidate global development sites Right-size organization to align with future R&D budgets Consolidate R&D vendors Refocus discovery on core areas of expertise (e.g. Eye care & Biologics) Cancel 4 current early stage discovery projects Cancel 4 pre-clinical projects with projected approvals dates post 2020 Reduce investment in Breast franchise innovation – no impact pre 2020 |
 15 15 • Focus discovery resources in core areas of expertise (e.g. Eye Care and Biologics) • Focus development activities on high value projects (e.g. Retina, Dry Eye, Fillers and new BOTOX ® indications) • Continue to implement “quick kill” concept • Close Santa Barbara, CA and Medford, MA sites and relocate core activities to other sites • Consolidate development sites to enable scale and operational efficiency and effectiveness (Europe, Asia Pacific) • Improve procurement of vendor services (e.g. Contract Research Organizations (CRO’s)) Total 2015 R&D Operational Efficiencies: ~$138M Further Enhancing R&D Productivity • Outsource select non-core functions (e.g. data management) to ensure flexibility and scalability • Consolidate duplicative activities within R&D (e.g. create centralized vendor management group) • Right-size organization for revised R&D spend Focus resources on highest value opportunities Streamline Organization Structure Simplify Processes & Interfaces Enhance strategic sourcing of goods and services Optimize site footprint • Create single management structure across key R&D functions (e.g. project management, clinical operations) • Integrate R&D IT into Corporate IT $35M $65M $8M $22M $8M |
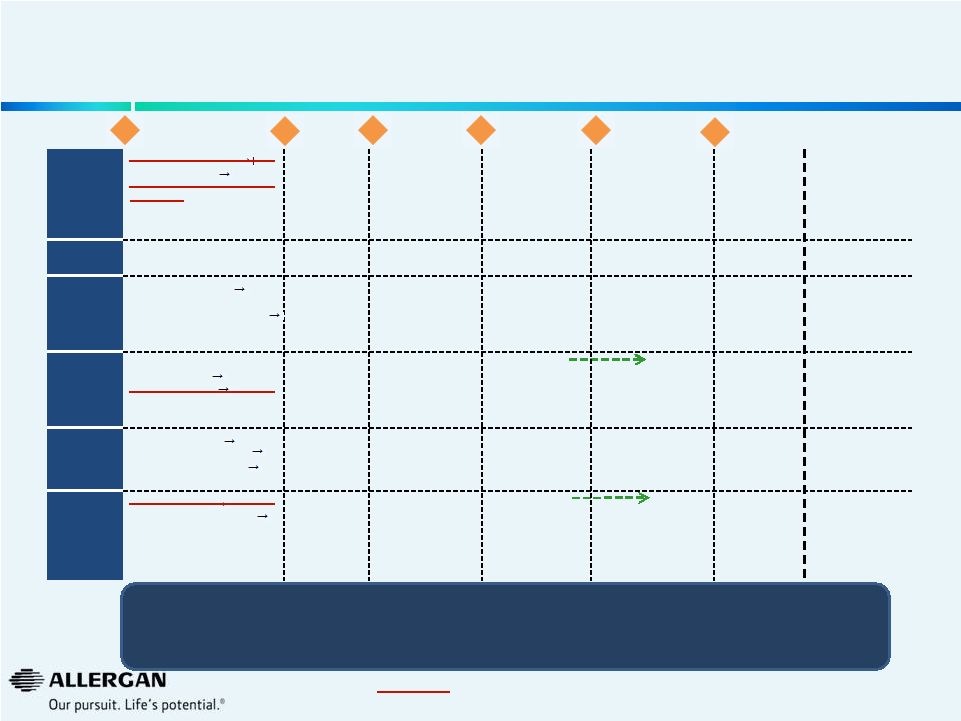 16 16 1 cpd for new indication ph1 Maintain Rich, Highly Diversified Clinical R&D Pipeline Post Approval Pre-Clinical Phase I Phase II – POC Phase II – Confirmatory Phase III Registration Discontinued Allergan remains committed to an industry leading R&D engine Limited number of pre-clinical projects have been cancelled (all with projected approval dates after 2020) 1857 Migraine Derma- tology • 1 rosacea programs ph1 • 2 acne programs ph1 • One early preclinical acne program • One early pre -clinical derm program for a new indication • Bim Hair Growth • BTX Masseter • Medytox Aesthetic • BTX CFL Asia • BTX Forehead Lines • LATISSE ® Brow • Oxymetazoline Rosacea • ACZONE X • BTX CFL • LATISSE ® US • LATISSE ® Japan Urology • BTX PE • SER-120 • BTX OAB • BTX NDO Neurology & Pain • AGN - ph1 • BTX X with potential for higher dose and/or longer duration ph1 • Senrebotase (TEM) Pain • BTX Depression • BTX OA Pain • BTX New Indication • Medytox Therapeutic • BTX Spasticity Adult LL, Adult UL, Ped LL, Ped UL • AGN-1763 BTX LL Spasticity • “ SEMPRANA ® ” Headache • BTX Headache Retina • Dual anti -PDGF/VEGF DARPin ® • 1 retina program ph1 • 2 early preclinical retina programs • DARPin ® AMD • DARPin ® DME • Brimo DDS Dry AMD • OZURDEX ® RVO China • OZURDEX ® DME (Europe) • OZURDEX ® RVO • OZURDEX ® DME 3B Anterior Segment • 1 NCE for Dry Eye ph1 • 1 cpd for new indication • • NCE Dry Eye • Androgen Front of Eye • RESTASIS ® X • LASTACAFT ® Japan • RESTASIS ® EU • 1 cpd for front of eye indication Glaucoma • NCE Glaucoma ph2 • Combo glaucoma Japan ph3 • Bimatoprost SR • LUMIGAN ® UD • LUMIGAN ® 0.01% EU • GANFORT™ UD • GANFORT™ China ® ph2 AMD ph2 |
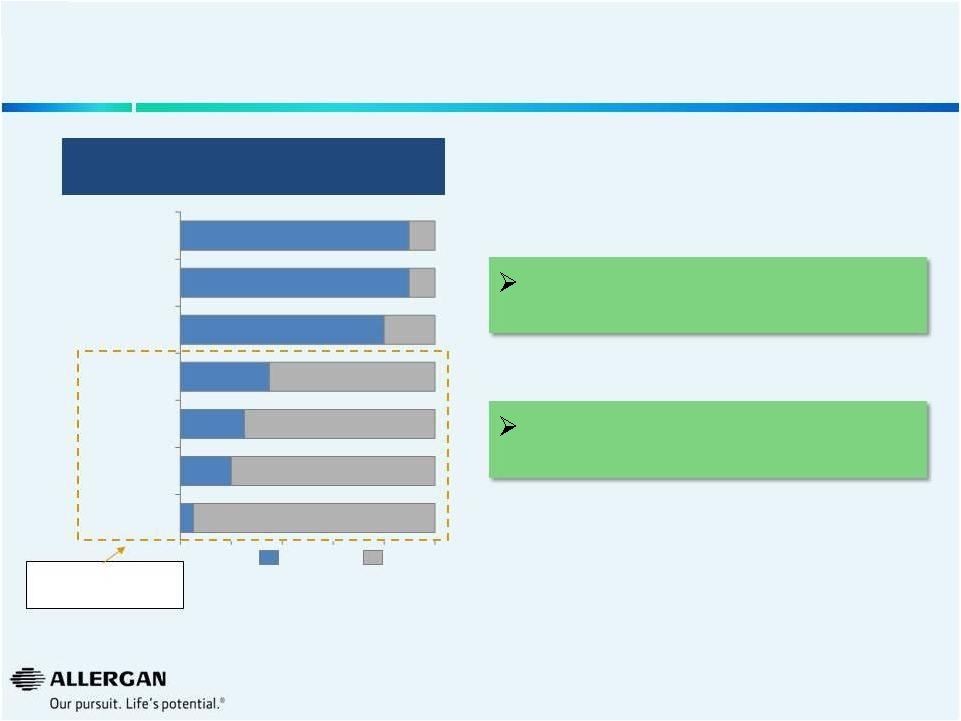 17 17 R&D Outsourcing Will Ensure Flexibility and Scalability Strategic partnering with global CROs for lower overhead & wages Increased Outsourcing Across R&D for More Nimble & Focused Development PharmSci Clin Ops Biostatistics Safety In-house Outsourced Core functions retained in-house Allows flexibility and scale for future R&D spend Data Mgmt Global Monitoring Global Medical Writing Monitoring Writing Medical |
 18 18 Total 2015 Gross Margin Operational Efficiencies: $27M* Further Improvement in Gross Margin Efficiencies • Create a Global Supply Chain organization • Network optimization • Global Procurement • Re-design organization at each site and centre Focus resources on highest value opportunities Streamline Organization Structure Simplify Processes & Interfaces Enhance strategic sourcing of goods and services Optimize site footprint • Manufacturing excellence program • Optimize activity at select sites *~$50M by 2016 primarily due to inventory rollout |
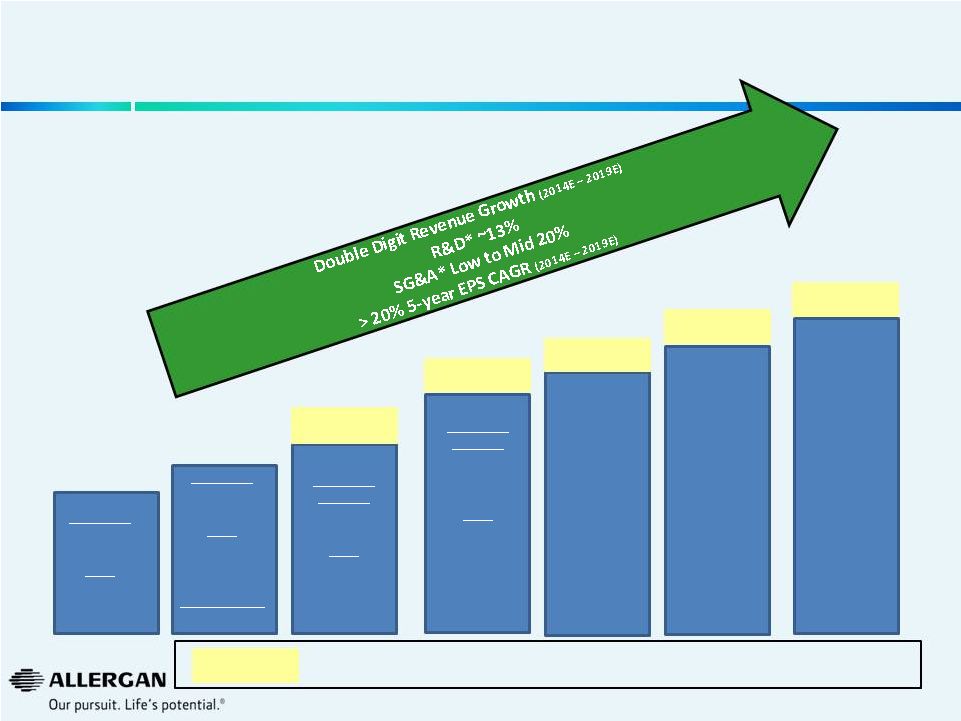
 19 Driving Sustainable Operational Efficiencies Without Compromising Effectiveness No compromise to our commercial strategy and low impact to our long- term revenue growth targets Maintain strength in our R&D pipeline to bring innovative therapies to patients ~$475M in annual operational efficiencies expected to be realized in 2015 Allergan 2014 - 2019 Double-Digit Sales CAGR despite a ~50 b.p. reduction* >20% EPS CAGR 2016 EPS - ~$10.00 Additional free cash flow of ~$18bn** and significant borrowing capacity to drive strategic options and financial flexibility * There was a ~50 basis point reduction in the Sales CAGR (2014E – 2019E) between guidance provided on May 12, 2014 vs. the guidance provided on July 21, 2014. ** 2014 - 2019 |
 20 20 Allergan’s Promising Outlook on Long-Term Organic Growth Driven by New Product Innovation and Operational Excellence 2013A 2014E Guidance 2019E 2015E Guidance Revenue $6.2bn EPS $4.77 2016E Guidance 2017E 2018E * As a percentage of sales. Additional stockholder value generated from strong business momentum & further operational efficiencies Revenue Growth Double Digit EPS ~$10.00 Revenue $6.9 - $7.1bn EPS $5.74 - $5.80 EPS Growth 20% - 22% Revenue Growth Double Digit EPS $8.20 - $8.40 |
 21 Strategic Options Available to Further Increase Stockholder Value • Value from acquisitions • Value from capital return • Stock repurchases • “Special” dividend Additional free cash flow of ~$18bn generated over strategic planning period |
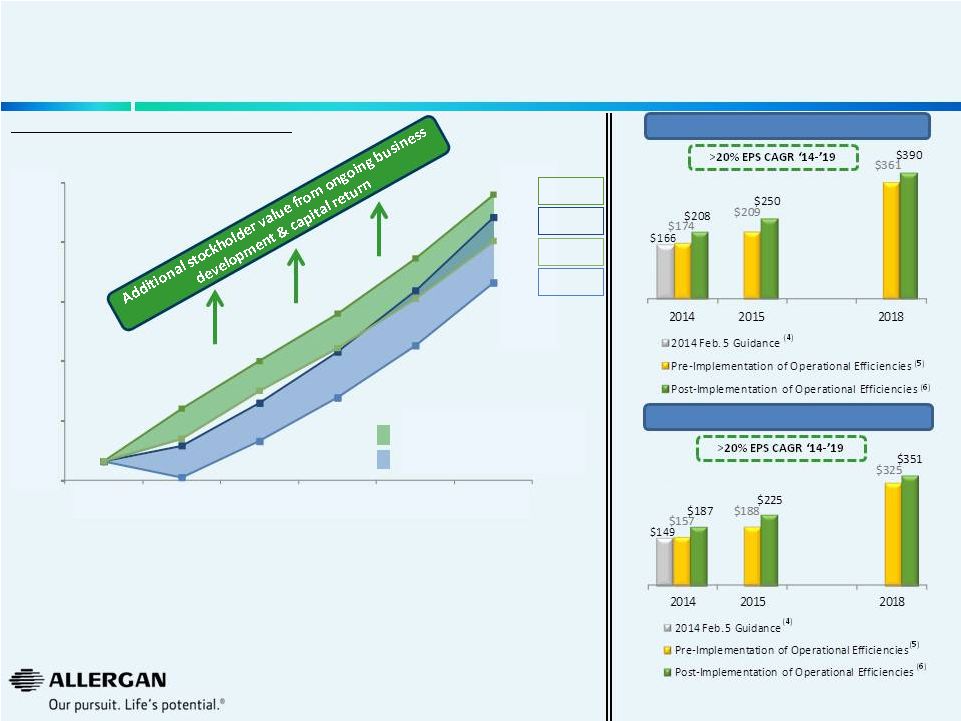 Allergan’s Standalone Performance Continues To Create Significant Near-Term and Long-Term Value for Stockholders (3) Low Estimate - Former High Estimate - Former Low Estimate - Current High Estimate - Current Pre-Operational Efficiencies (2) Post-Operational Efficiencies (1) 22.5x NTM P/E Multiple 25.0x NTM P/E Multiple Future Value Per Share Allergan Low Estimate based on 22.5x NTM P/E High Estimate based on 25.0x NTM P/E $371 $316 $390 $351 150.00 200.00 250.00 300.00 350.00 $400.00 Current 12/31/2014 12/31/2015 12/31/2016 12/31/2017 12/31/2018 Note: Allergan multiple range (as a standalone company) is based on Wall Street Research as of 07/15/14. (1) 2014 based on July 21, 2014 EPS guidance of $5.74- $5.80, 2015 and 2016 based on guidance of $8.20-$8.40 and $10.00, respectively, as stated on July 21, 2014. 2017 – 2019 is implied using 2014-2019 CAGR of >20%. (2) 2014 based on May 12, 2014 EPS guidance of $5.64 -$5.73, 2015 based on guidance of 20% - 25% YOY EPS growth as stated on May 12, 2014 and 2016 – 2019 assumes 20% YOY EPS growth. (3) Current Allergan share price of $165.82 as of 07/17/14. (3) 2014 based on midpoint of EPS guidance issued on Feb. 5, 2014 of $5.36 - $5.48, 2015 assumes 22.5% growth (midpoint of 20% - 25% growth). (4) 2014 based on midpoint of May 12, 2014 EPS guidance of $5.64 -$5.73, 2015 calculated using midpoint of 20% - 25% YOY EPS growth as stated on May 12, 2014 and 2016 – 2019 assumes 20% YOY EPS growth. (5) 2014 based on midpoint of July 21, 2014 EPS guidance of $5.74- $5.80, 2015 based on midpoint of $8.20-$8.40 as stated on July 21, 2014, 2016 based on $10.00 and 2017- 2019 is implied using 2014-2019 CAGR of >20%. 22 |
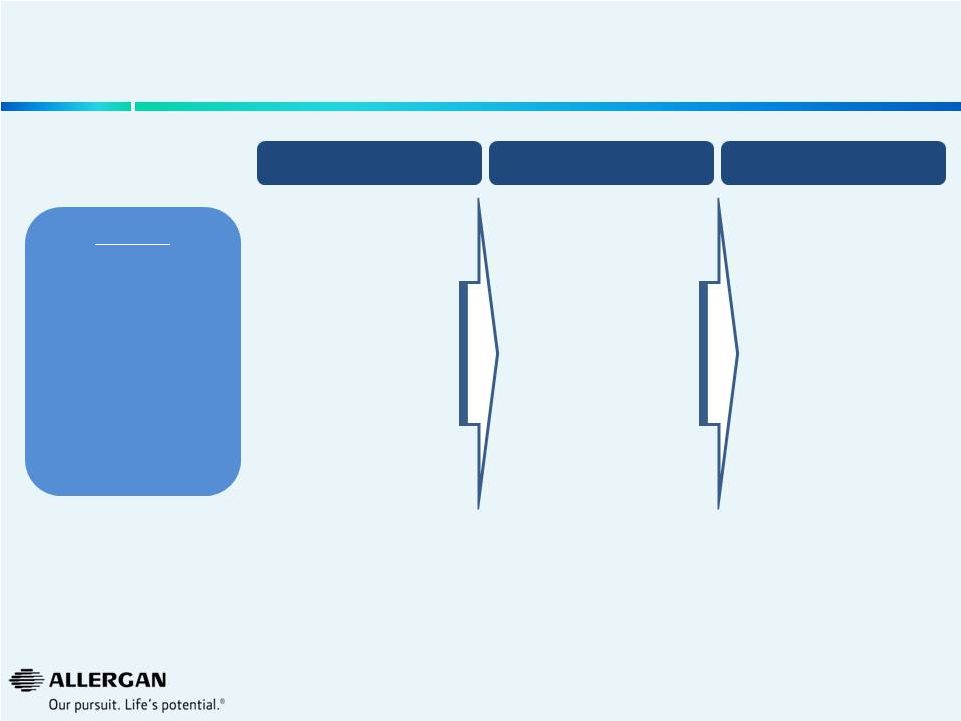
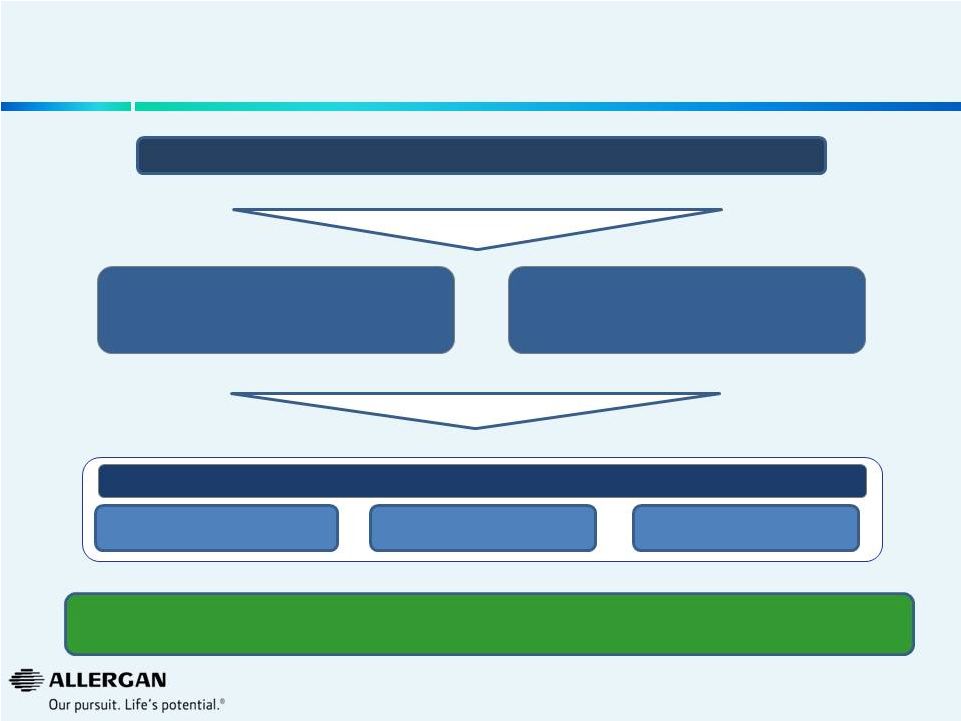
 Value Drivers Available to Standalone Allergan to Further Increase Stockholder Value Potential Future Standalone Stock Price Value from Momentum in the Business Value from Capital Return Value from Pipeline Assets Value from Ongoing Business Development Current Stock Price Value Drivers Available to Allergan: Value from Operational Efficiencies 23 |
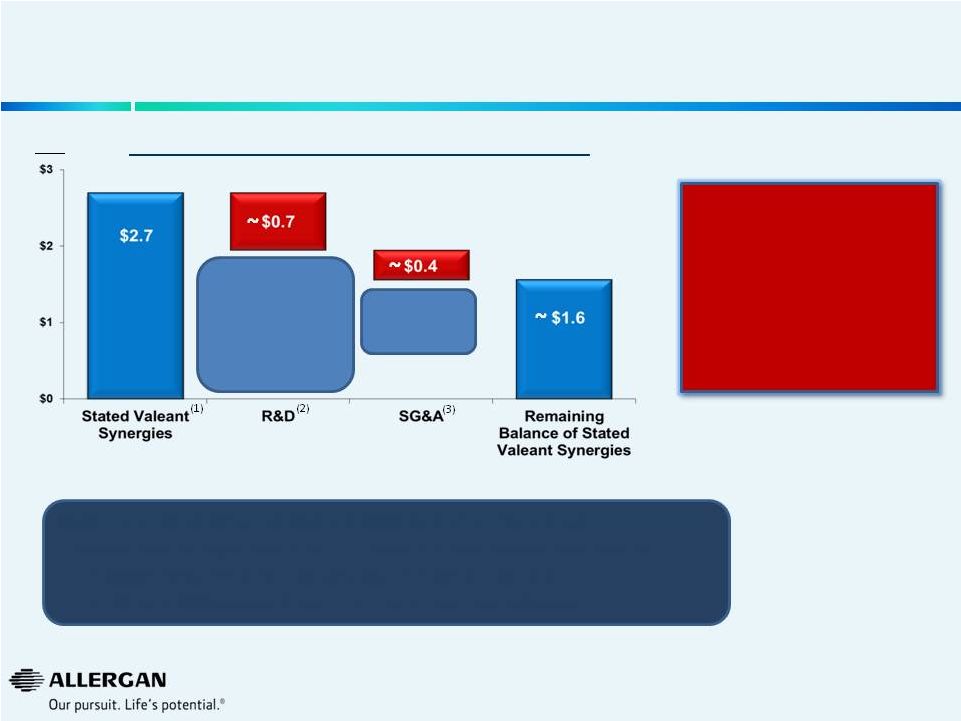 Allergan Actions Have Increased Standalone Value & Significantly Reduced Synergies Available to Valeant Reduction To Proposed Valeant Synergies* Valeant’s purported $2.7bn of R&D and SG&A cuts are unrealistic given: • Valeant’s stated objectives in continuing certain R&D projects post-closing • the SG&A investments required to sustain Allergan’s products • the R&D and SG&A operational efficiencies announced by Allergan Additional spend for R&D programs that Valeant claims to continue post-closing and Operational Efficiencies announced by Allergan Operational Efficiencies announced by Allergan $bn Combination of higher standalone value for Allergan and Pro-forma impact of Valeant’s reduced synergies ($1.1bn), has transferred value from Valeant to Allergan Stockholders 24 * Illustrative for 2015 (1) Valeant SEC filings (2) Programs Valeant claims to continue after potential post closing of transaction. Includes all Phase 3 pharmaceutical programs (including DARPin® & Bimatoprost Sustained Release Implant), BOTOX® Phase 2 & 3 programs, Medytox ®, Late-Stage Filler programs, IIT’s (3) Based on operational efficiencies announced on May 12, 2104 and July 21, 2014 |
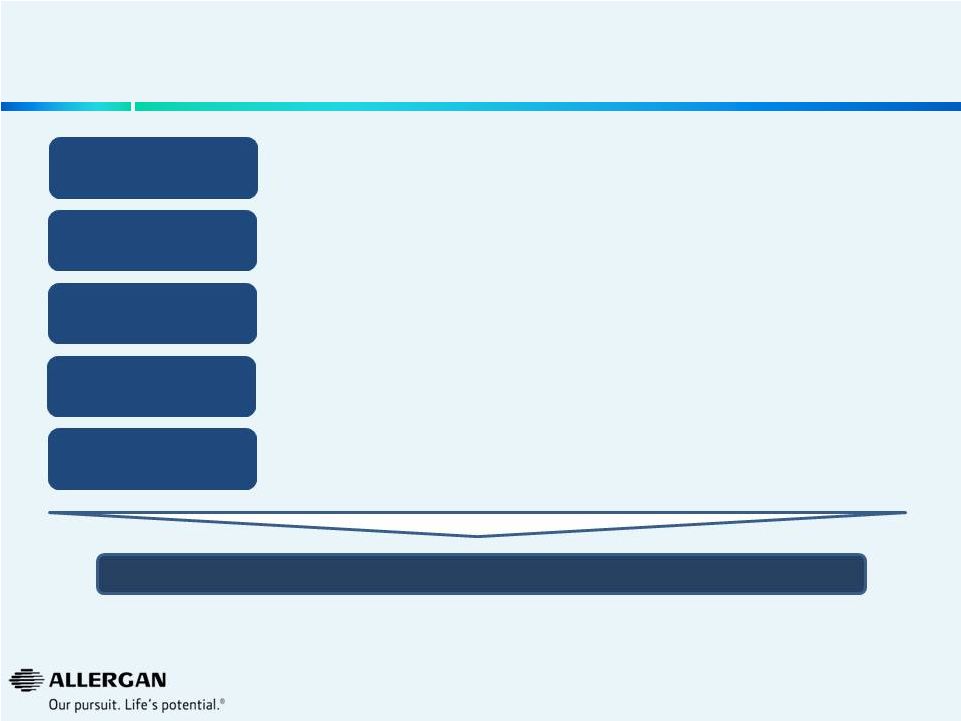
 Allergan Has an Enduring Vision and a Goal to Create an Even Stronger Company Revenue Goal: ~$12bn by 2019 • Double digit sales growth (2014E – 2019E) • >20% EPS CAGR (2014E – 2019E) • Franchise leadership: #1 or #2 in every category Our earnings growth is founded on quality net sales growth In short, our profit comes from serving the needs of physicians and their patients Customer-centric We have a unique employee culture that drives our success Action orientated and flexible with a premium placed on generating results Culture & Values We have an enduring model for the future founded on an R&D pipeline that is informed by our intimate knowledge of our customers and the franchises in which we choose to operate Innovation 25 |
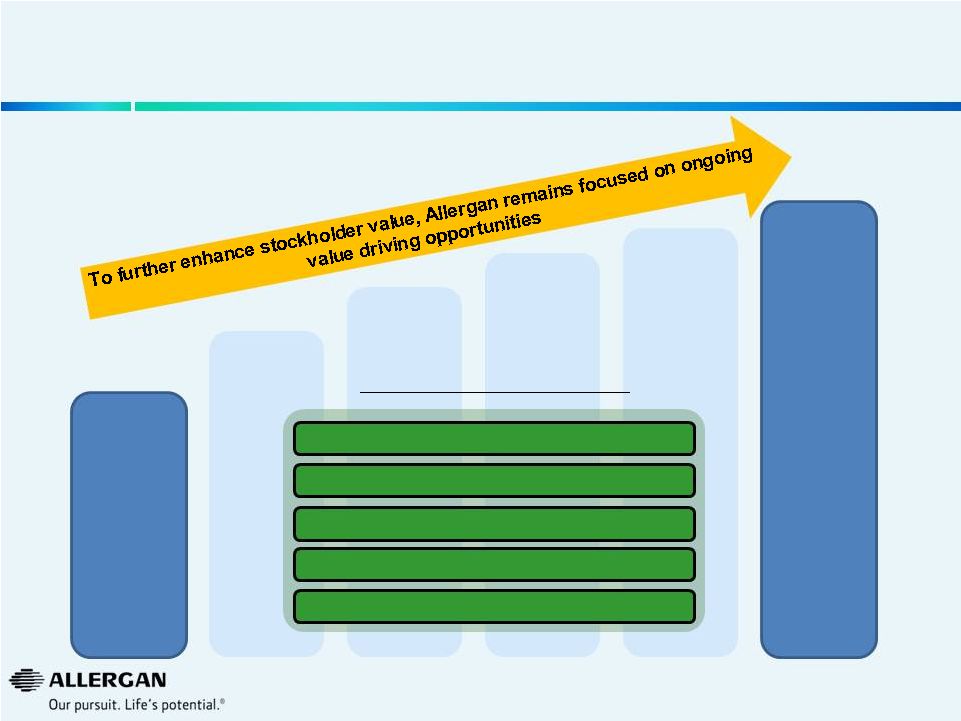
 26 26 Allergan’s promising outlook on long-term growth driven by new product innovation and operational excellence: — Additional free cash flow of ~$18bn to drive strategic options and financial flexibility — 5-year double digit revenue growth and >20% EPS CAGR Investor community has realized an increase in Allergan value as our management team has and will continue to enhance business performance and outlook To further enhance stockholder value, Allergan remains focused on ongoing value driving opportunities Allergan management team best equipped to deliver significant value for stockholders – our track record speaks for itself Conclusions Allergan management and Board of Directors are committed to delivering the highest value for stockholders |
 27 Reconciliation of Selected Non-GAAP Financial Measures “GAAP” refers to financial information presented in accordance with generally accepted accounting principles in the United States. In this presentation, Allergan included historical non-GAAP financial measures, as defined in Regulation G promulgated by the Securities and Exchange Commission, with respect to estimates for the year ended December 31, 2013, and the corresponding periods for 1999 through 2012. The information for 2012 and 2011 has been retrospectively adjusted to reflect the obesity intervention unit, which was sold on December 2, 2013, as discontinued operations. Allergan believes that its presentation of historical non-GAAP financial measures provides useful supplementary information to investors. The presentation of historical non-GAAP financial measures is not meant to be considered in isolation from or as a substitute for results prepared in accordance with GAAP. In this presentation, Allergan reported certain financial measures including “Adjusted Sales”, “Adjusted SG&A”, “Adjusted R&D”, “Adjusted EPS”, “Pro forma Growth” and “Sales Growth at constant exchange rates” as adjusted for Non-GAAP items. Allergan uses these financial measures to enhance the investor’s overall understanding of the financial performance and prospects for the future of Allergan’s core business activities. Specifically, Allergan believes that a report of these financial measures provides consistency in Allergan’s financial reporting and facilitates the comparison of results of core business operations between its current, past and future periods. Adjusted Sales, Adjusted SG&A, Adjusted R&D, Adjusted EPS, Pro forma Growth and Sales Growth are the primary indicators management uses for planning and forecasting in future periods. Allergan also uses Adjusted Sales, Adjusted R&D and Adjusted EPS for evaluating management performance for compensation purposes. A reconciliation of non-GAAP items may be found under the heading “Non-GAAP Financial Reconciliation” in the investor relations section of the www.Allergan.com website. |
 28 28 Important Information Allergan, its directors and certain of its officers and employees are participants in solicitations of Allergan stockholders. Information regarding the names of Allergan's directors and executive officers and their respective interests in Allergan by security holdings or otherwise is set forth in Allergan's proxy statement for its 2014 annual meeting of stockholders, filed with the SEC on March 26, 2014, as supplemented by the proxy information filed with the SEC on April 22, 2014. Additional information can be found in Allergan's Annual Report on Form 10-K for the year ended December 31, 2013, filed with the SEC on February 25, 2014 and its Quarterly Report on Form 10-Q for the quarter ended March 31, 2014, filed with the SEC on May 7, 2014. To the extent holdings of Allergan's securities have changed since the amounts printed in the proxy statement for the 2014 annual meeting of stockholders, such changes have been reflected on Initial Statements of Beneficial Ownership on Form 3 or Statements of Change in Ownership on Form 4 filed with the SEC. These documents are STOCKHOLDERS ARE ENCOURAGED TO READ ANY ALLERGAN SOLICITATION STATEMENT (INCLUDING ANY SUPPLEMENTS THERETO) AND ANY OTHER RELEVANT DOCUMENTS THAT ALLERGAN MAY FILE WITH THE SEC CAREFULLY AND IN THEIR ENTIRETY BECAUSE THEY WILL CONTAIN IMPORTANT INFORMATION. Stockholders will be able to obtain, free of charge, copies of any solicitation statement and any www.sec.gov. www.allergan.com. available free of charge at the SEC’s website at other documents filed by Allergan with the SEC at the SEC's website at www.sec.gov. In addition, copies will also be available at no charge at the Investors section of Allergan's website at |
 July 21, 2014 Allergan A Specialist in the Biopharmaceutical & Medical Device Industries 29 |