 October 27, 2014 Allergan A Specialist in the Biopharmaceutical & Medical Device Industries Exhibit 99.1 |
 Forward-Looking Statements ® & ™ Marks owned by Allergan, Inc. JUVÉDERM ® is a registered trademark of Allergan Industrie SAS All other products are registered trademarks of their respective companies This presentation contains “forward-looking statements,” including statements regarding product acquisition and development, regulatory approvals, market potential, expected growth, operational efficiencies, a proposed offer made by Valeant, and Allergan’s expected, estimated or anticipated future results, including Allergan’s earnings per share and revenue forecasts, among other statements. All forward-looking statements herein are based on Allergan’s current expectations of future events and represent Allergan’s judgment only as of the date of this presentation. If underlying assumptions prove inaccurate or unknown risks or uncertainties materialize, actual results could vary materially from Allergan's expectations and projections. Therefore, you are cautioned not to rely on any of these forward-looking statements and Allergan expressly disclaims any intent or obligation to update these forward-looking statements except as required to do so by law. Actual results may differ materially from Allergan’s current expectations based on a number of factors affecting Allergan’s businesses, including changing competitive, market and regulatory conditions; the timing and uncertainty of the results of both the research and development and regulatory processes; domestic and foreign health care and cost containment reforms, including government pricing, tax and reimbursement policies; revisions to regulatory policies related to the approval of competitive generic products; technological advances and patents obtained by competitors; the ability to obtain and maintain adequate protection of intellectual property rights; the performance of new products, including obtaining government approval and consumer and physician acceptance, the continuing acceptance of currently marketed products, and consistency of treatment results among patients; the effectiveness of promotional and advertising campaigns; the potential for negative publicity concerning any of Allergan’s products; the timely and successful implementation of strategic initiatives, including expansion of new or existing products into new markets; the results of any pending or future litigation, investigations or claims; the uncertainty associated with the identification of, and successful consummation, execution and integration of, external corporate development initiatives and strategic partnering transactions; potential difficulties in manufacturing; and Allergan’s ability to obtain and successfully maintain a sufficient supply of products to meet market demand in a timely manner. In addition, matters generally affecting the U.S. and international economies, including consumer confidence and debt levels, changes in interest and currency exchange rates, political uncertainty, international relations, the status of financial markets and institutions, impact of natural disasters or geo- political events and the state of the economy worldwide, may materially affect Allergan’s results. These and other risks and uncertainties affecting Allergan’s businesses and operations may be found in Allergan’s most recently filed Annual Report on Form 10-K and any subsequent Quarterly Reports on Form 10-Q, including under the heading “Risk Factors”. These filings, as well as Allergan's other public filings with the U.S. Securities and Exchange Commission (SEC), can be obtained without charge at the SEC's web site at www.sec.gov. These SEC filings are also available at Allergan’s web site at www.allergan.com along with copies of Allergan’s press releases and additional information about Allergan. For further information, you can contact the Allergan Investor Relations Department by calling 714-246-4636. © 2014 Allergan, Inc. All rights reserved. 2 |
 Allergan Continues to Execute & Deliver Increased Value to Stockholders (1) Represents local currency sales growth (2) Non-GAAP Diluted Earnings per Share • Continued strong performance and business momentum • Q3 sales growth of 18% (1) driven by strength across nearly all product lines and geographies • Q3 EPS (2) growth of 45% • Increase in both Sales & EPS (2) guidance for full year 2014 • On June 30, 2014 we announced the following R&D Pipeline candidates progressing forward • DARPin® • Bimatoprost Sustained-Release Implant for Glaucoma • OZURDEX® DME approval (U.S.) • On July 21, 2014 we announced a plan to drive further operational efficiencies (~$475M) & create a robust platform for long-term sustainable growth • Additional value from ongoing business development & capital return 3 |
 Another Outstanding Quarter Highlights the Strength of Allergan’s Business Model Q3 2014 Guidance (Issued July 21, 2014) $1,675M - $1,750M 10% - 15% $1.44 - $1.47 17% - 20% Actual Q3 2014 Results $1,791M 18%* $1.78 45% Product Net Sales Non-GAAP Diluted EPS Non-GAAP Diluted YOY EPS Growth Strong business momentum continued in third quarter with record dollar sales growth Depth and breadth of contribution made by nearly all businesses and geographies Leverage of SG&A investments in a thoughtful & disciplined approach Product Net Sales YOY Growth 4 * Represents local currency sales growth |
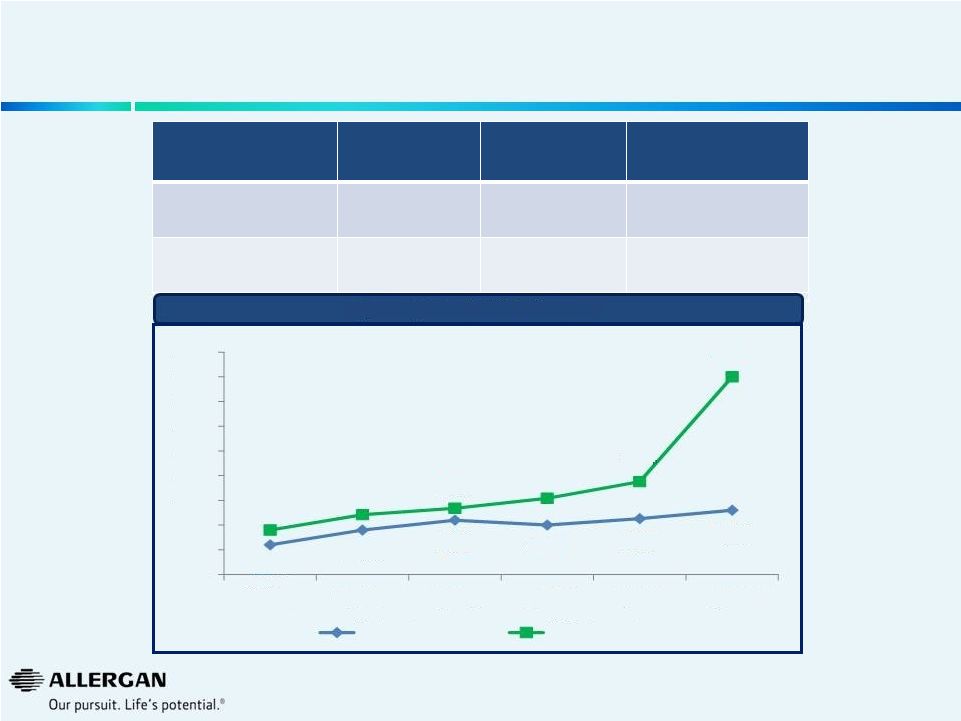 Strong Business Momentum Continues to Accelerate Sales & EPS Growth FY 2012 FY 2013 YTD Q3 2014 Sales Growth (1) 10% 12% 16% EPS Growth (2) 15% 16% 31% Quarterly Sales & EPS Performance 5 11% 14% 16% 15% 16% 18% 14% 17% 18% 20% 24% 45% 5% 10% 15% 20% 25% 30% 35% 40% 45% 50% Q2'13 Q3'13 Q4'13 Q1'14 Q2'14 Q3'14 Sales Growth* EPS Growth (1) Sales growth in local currency retrospectively adjusted to exclude Obesity Intervention Business. (2) 2012 EPS growth includes the 2012 Obesity impact of $0.10 and the 2012 R&D Tax Credit impact of $0.06. 2013 EPS Growth restating 2012 to exclude the 2012 Obesity impact of $0.10 and including the 2012 R&D Tax Credit impact of $0.06. |
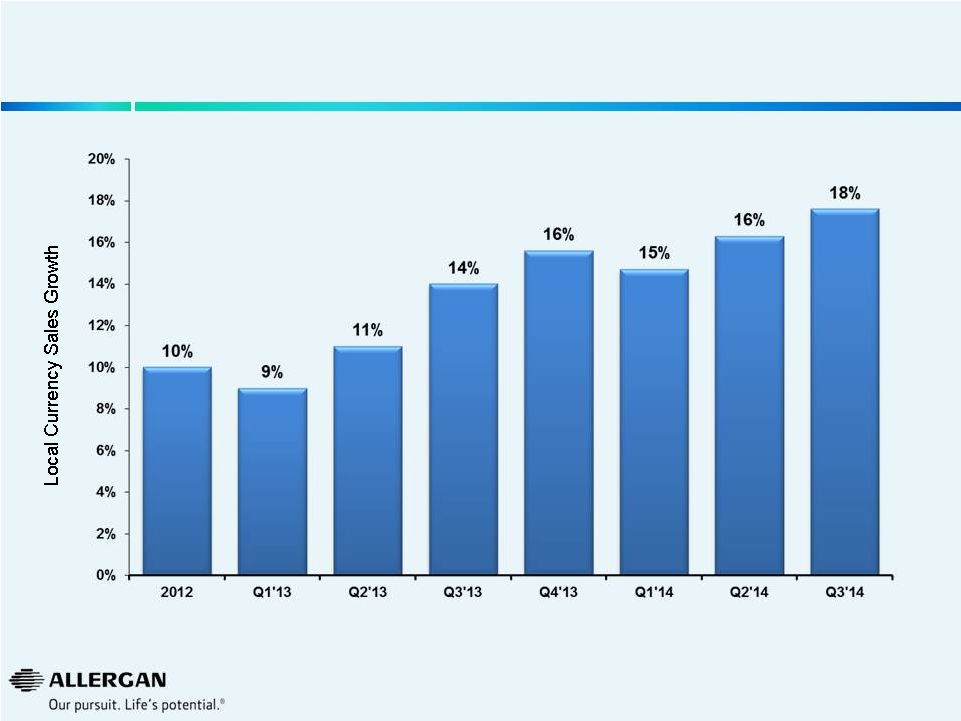 6 * All years exclude sales from the Obesity Intervention business Sales Momentum Continues to Accelerate |
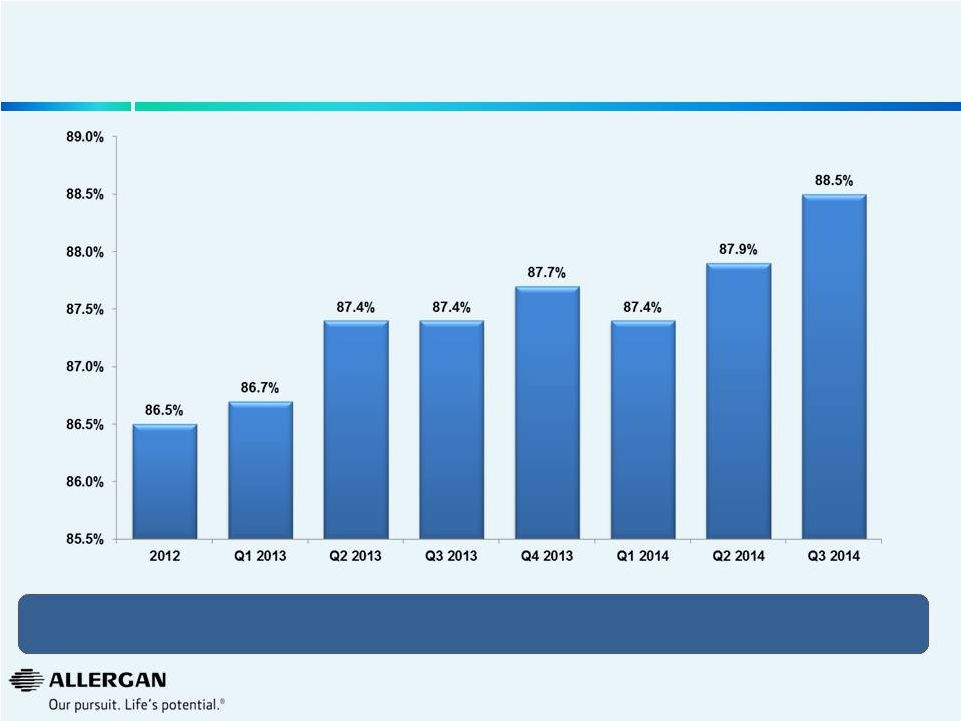 Strong Gross Margins * 7 Record Gross Margin* Driven by Favorable Product Mix and Recently Launched Higher Margin Products / Indications * Gross Margins as a percentage of sales are presented excluding amortization of intangible assets on a non-GAAP basis and exclude the Obesity Intervention business for all years presented. A reconciliation of non-GAAP items may be found under the heading “Non-GAAP Financial Reconciliation” and in the Company’s earnings releases in the Investor Relations section of the www.allergan.com website. |
 FY 2014 Product Net Sales Non-GAAP Diluted EPS Non-GAAP Diluted EPS YOY Growth $6.8bn - $7.0bn $5.64 - $5.73 18% - 20% $6.7bn - $7.0bn $5.36 - $5.48 12% - 15% February 5 Guidance May 12 Guidance July 21 Guidance $6.9bn - $7.1bn $5.74 - $5.80 20% - 22% Allergan’s 2014 Full Year Sales and Earnings Outlook Continues to Improve 8 October 27 Guidance $7.1bn - $7.2bn $6.27 - $6.30 31% - 32% |
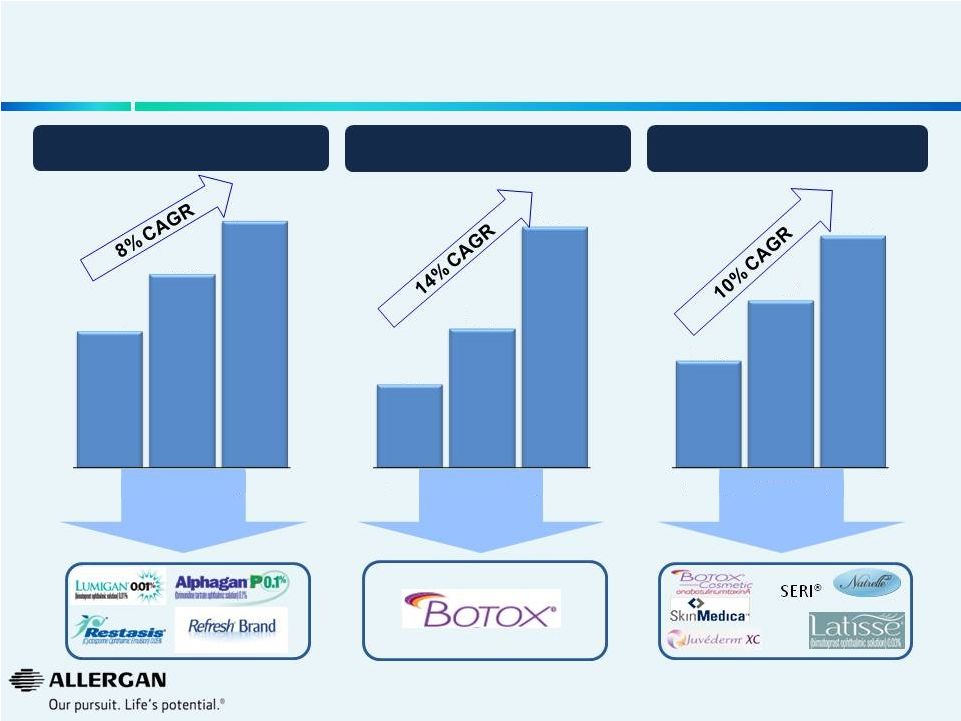 Allergan Operates in Large, Growing Markets Built & Developed by Strategic Investment 9 * Market projections based on Allergan estimates WW Ophthalmic Market ($B) WW Neuromodulator Therapeutic Market ($B) WW Aesthetics Market ($B) $14.7 $20.9 $26.6 2009A 2013A 2017E * $0.9 $1.5 $2.6 2009A 2013A 2017E * $2.3 $3.6 $5.0 2009A 2013A 2017E * |
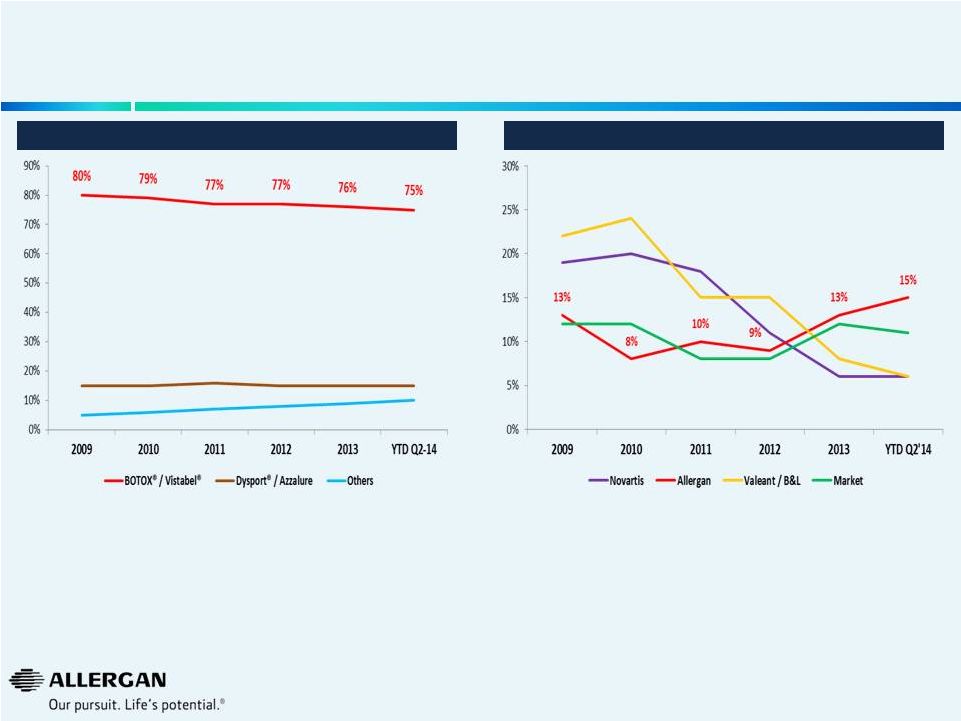 Neuromodulators and Eye Care Growing the Market and Sustaining Market Leadership Positions 10 • Allergan is growing in-line with market @ 10% (Q2’14 YTD) • Maintaining leading market share in rapidly growing therapeutic and cosmetic markets, despite new entrants • Allergan is gaining market share and is currently #2 behind Novartis • Allergan is growing faster than the market Global Eye Care Growth 1 Sources: Mixture of public information (earnings releases, earnings calls, 10K’s, 10Q’s), AGN internal data, syndicated marketing research reports, analyst reports, GuidePoint Global. 1 Excludes retina 2 Includes therapeutic and cosmetic Global Neuromodulator Market Share 2 |
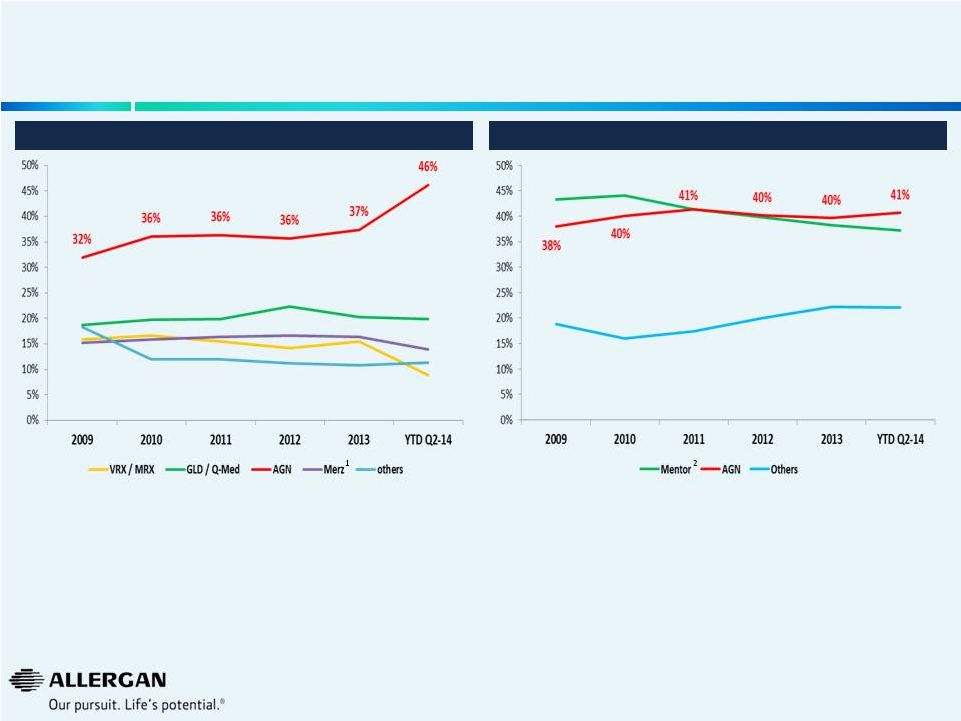 11 • Q2’14 YTD market growth of 3% with Allergan growing 4% • Maintaining market share while emphasizing profitability Global Breast Aesthetics Market Share Global Dermal Facial Fillers Market Share • Q2’14 YTD market growth of 10% with Allergan growing 40% • Rapid market share gains driven by game changing innovation Dermal Facial Fillers and Breast Aesthetics Growing the Market and Building Market Share Sources: Mixture of public information (earnings releases, earnings calls, 10K’s, 10Q’s), AGN internal data, syndicated marketing research reports, analyst reports, GuidePoint Global. Note: Valeant completed the sale of it’s facial injectable businesses to Galderma in July 2014. 1 Merz includes BioForm (pre Merz purchase) and Anteis 2 Mentor owned by J&J and also includes La Perouse Plastie |
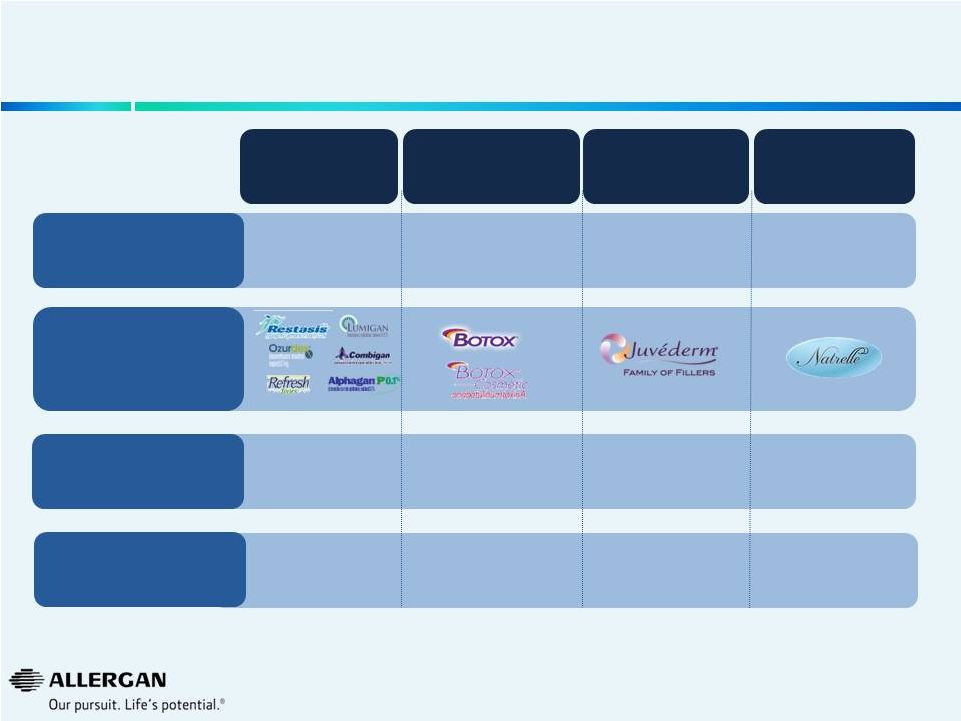 Long-Term Focus and Investment Has Built Global Leading Market Share Positions & Brands 2014 Full Year Allergan Guidance Q2 2014 Allergan $ Market Share Allergan Brands Eye Care Neuromodulators Dermal Facial Fillers Breast Aesthetics ~$3.3B 23% 2 Q2 2014 Allergan Market Position #2 ~$2.2B 76% #1 ~$0.7B 48% #1 ~$0.4B 41% #1 12 1 Mixture of public information (earnings releases, earnings calls, 10K’s, 10Q’s), AGN internal data, syndicated marketing research reports, analyst reports, GuidePoint Global. 2 Excluding Retina 1 1 |
 Allergan operates in large, growing markets built & developed by strategic investment Allergan Continues to Optimize its Business Model 13 Allergan’s sophisticated selling model transcends traditional sales models Allergan has a recipe for building and sustaining leading brands Allergan has a robust R&D pipeline and industry leading R&D productivity |
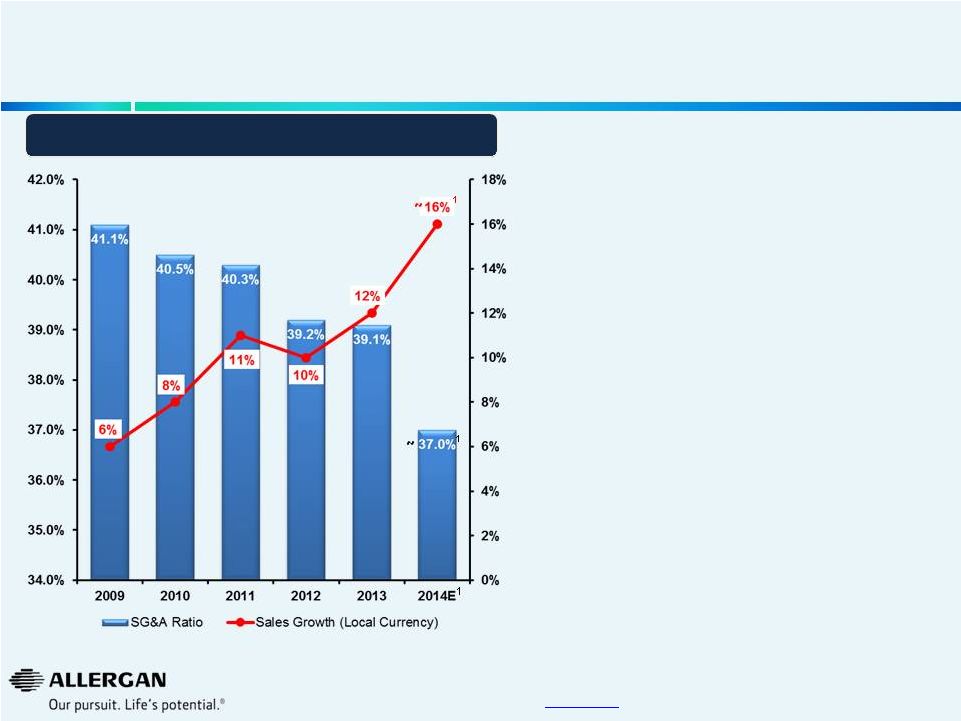 Worldwide SG&A Investment and Sales Growth Our Investments are Focused on Generating Sustainable Sales Growth 14 * Sales CAGR 2009 to 2014E (mid point of Oct. 27, 2014 guidance). 1 2014 estimated sales growth and SG&A as a percentage of sales based on mid-point of guidance provided on October 27, 2014. 2012 excludes Obesity business which was divested in Q4 2013. SG&A has been adjusted for non-GAAP SG&A items for all years presented. A reconciliation of non-GAAP items may be found under the heading “Non- GAAP Financial Reconciliation” in the Investor Relations section of the www.allergan.com website. • Allergan creates and builds markets with focused investments resulting in a sales CAGR of ~11%* • Historically high strategic investments have provided foundation for long-term sales growth • Initial product launch investments significant in 2010-2013 • Targeted expansion into emerging markets • Leveragability of strategic investment in Direct-To-Consumer advertising • Advertising spend for newer products partially offset as optimal levels of advertising effectiveness are reached on existing products • Well established sales force • Ability to grow SG&A @ ~3% through 2019 while continuing to drive double-digit sales growth 1 1 1 ~ ~ |
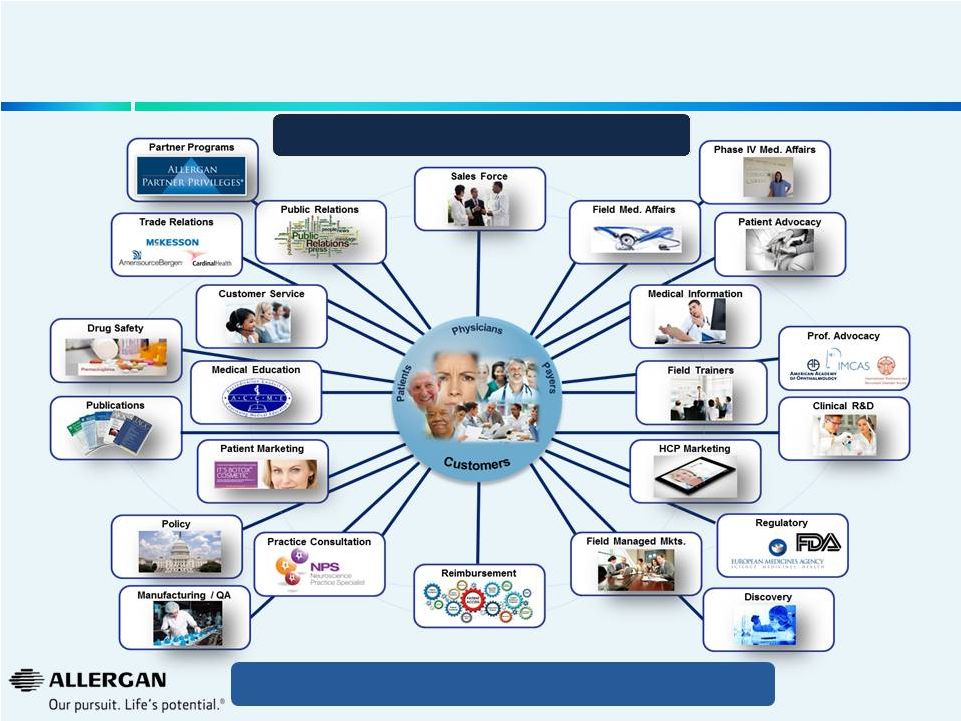 Allergan’s Sophisticated Selling Model Transcends Traditional Sales Models The Allergan Customer Ecosystem 15 Core expense base required to support complex business model |
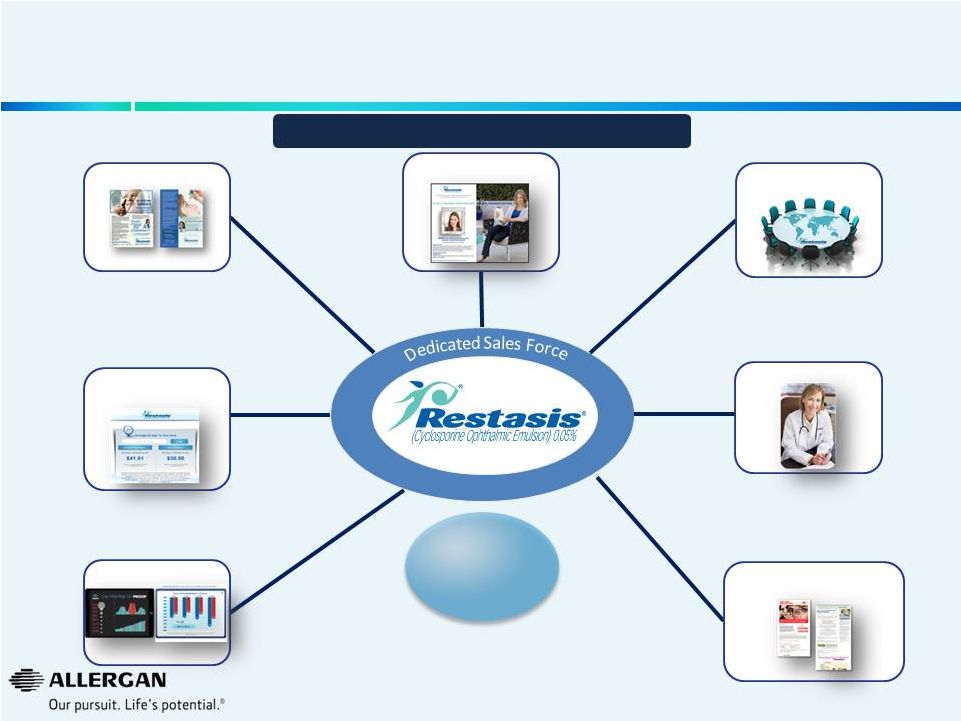 Allergan Has a Recipe for Building and Sustaining Leading Brands - RESTASIS ® Consumer Promotion Professional Promotion Peer-to-peer programs Customer Relationship Management Data Generation Advocacy Reimbursement/ Managed Care The first and only Rx product approved to treat dry eye disease 16 $1B Brand with Double-Digit Sales Growth |
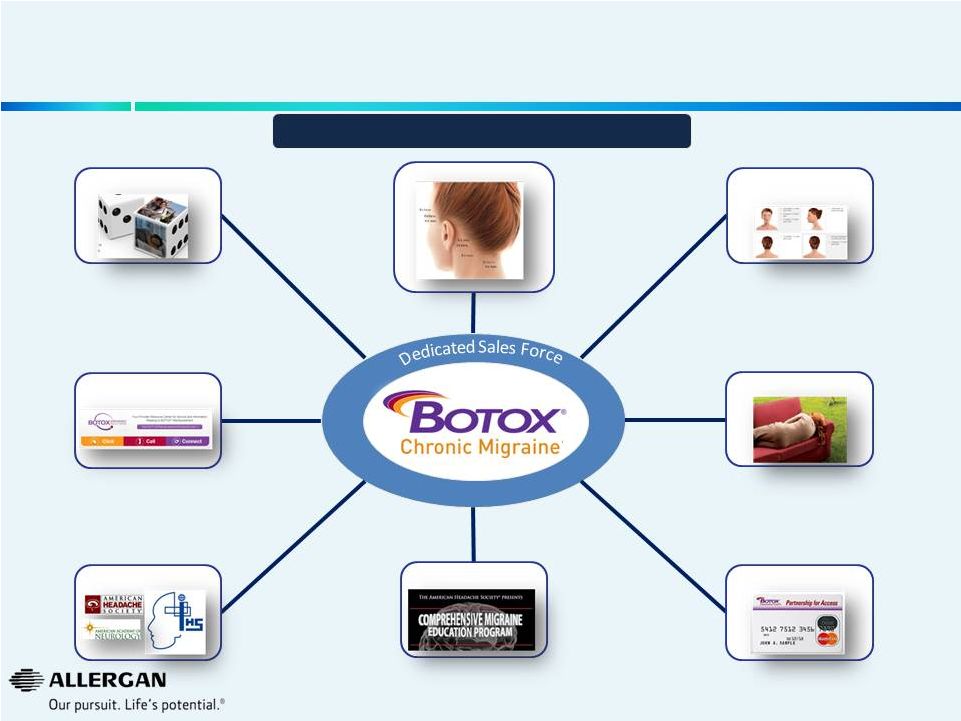 Allergan Has a Recipe for Building and Sustaining Leading Brands – BOTOX ® Chronic Migraine Consumer Promotion Physician Promotion Professional Education / Training Access Advocacy Medical Education Disease Awareness Reimbursement 17 Sales Expected to Double by 2019 |
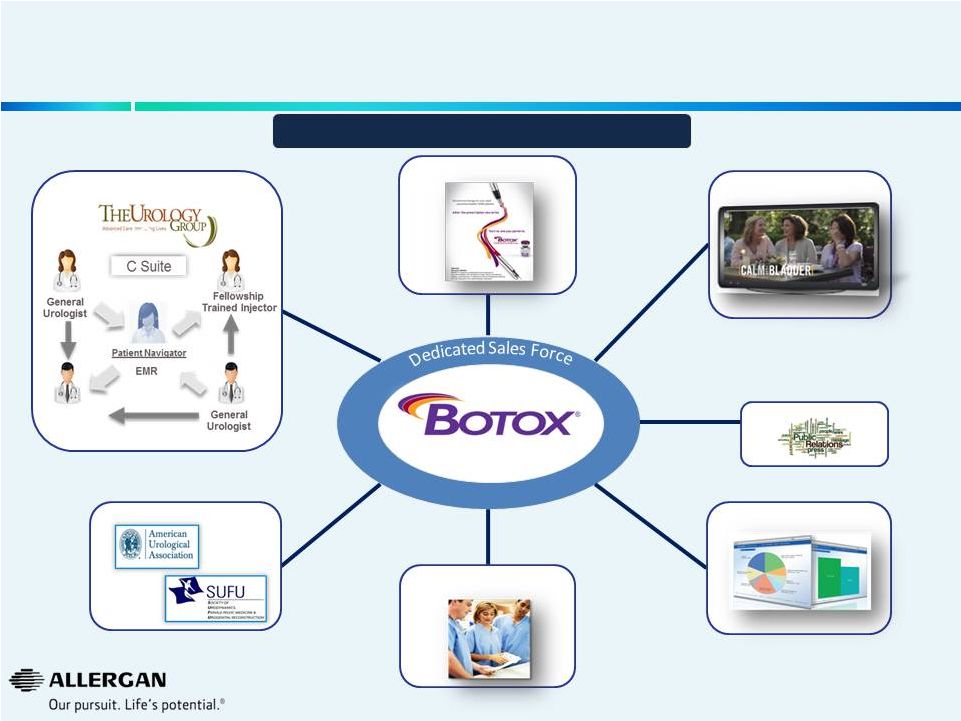 Allergan Has a Recipe for Building and Sustaining Leading Brands – BOTOX ® Urology Physician Promotion Consumer Promotion Access Advocacy Professional Education / Training Urology Practice Consultation PR / Patient Advocacy 18 ~30% Sales CAGR Expected Through 2019* * Sales CAGR 2014E to 2019E. |
 Allergan Has a Recipe for Building and Sustaining Leading Brands – BOTOX ® Cosmetic Consumer Promotion Professional Promotion Injector Training Public Relations Physician Loyalty Program Patient Programs Patient Loyalty Program 19 $1B Brand and Undisputed Market Leader with Robust Growth Potential APC Practice Consulting Services |
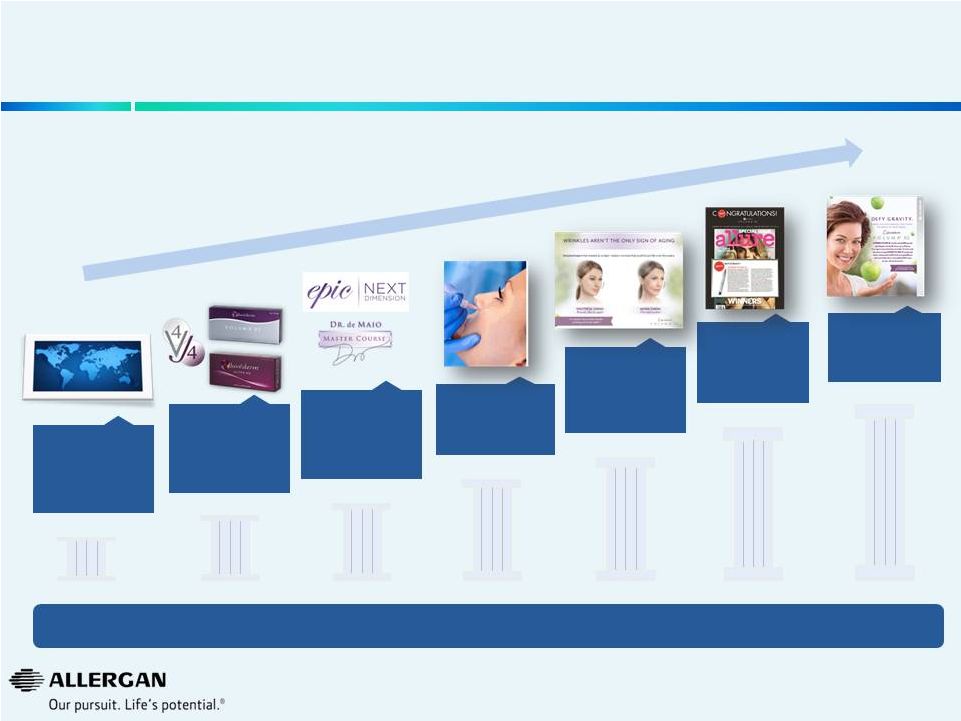 Allergan Has a Recipe for Building Leading Brands– Dedicated Specialty Salesforce Focused introduction to experienced injectors Optimal training paradigm to support filler franchise Creating awareness of etiology of mid- face volume loss Generate buzz and accolades thru PR Patient Education and Awareness thru DTC Learning from other countries’ real world experience Robust expansion of comprehensive hands-on training platform 20 JUVÉDERM VOLUMA XC U.S. ™ |
 US – 12 FDA Approvals EU ROW • BOTOX ® Chronic Migraine • BOTOX ® Cosmetic – Crow’s Feet Lines • BOTOX ® Overactive Bladder • BOTOX ® Neurogenic Detrusor Overactivity • BOTOX ® Spasticity (UL) • JUVÉDERM ® + Lidocaine • JUVÉDERM VOLUMA ™ XC • LUMIGAN ® 0.01% • NATRELLE ® 410 Highly Cohesive Anatomically Shaped Silicone-Filled Breast Implants • OZURDEX ® Uveitis • OZURDEX ® DME • ZYMAXID ® • BOTOX ® Chronic Migraine • BOTOX ® Idiopathic Overactive Bladder (Positive Opinion) • BOTOX ® Neurogenic Detrusor Overactivity • GANFORT ™ Unit Dose • LUMIGAN ® 0.01% • LUMIGAN ® 0.03% Preservative Free Unit Dose • OZURDEX ® RVO • OZURDEX ® DME • VISTABEL ® – Crow’s Feet Lines (Positive Opinion) • ALPHAGAN ® P 0.01% (Japan) • BOTOX ® Chronic Migraine (Canada, LA & Asia) • BOTOX ® Overactive Bladder (Canada & Asia) • BOTOX ® Neurogenic Detrusor Overactivity (Canada, LA & Asia) • BOTOX ® Spasticity (Japan) • LATISSE ® • NATRELLE ® Round Silicone Gel-Filled Breast Implants and Style 133 Tissue Expanders (Japan) • RESTASIS ® (Canada) Many Key Regulatory Approvals Since 2010 Driving Mid-Term and Long-Term Growth 21 • Canada • Brazil • Parts of East Asia |
 Employ efficient R&D model with probability of success higher than the industry • Specialty focused • Local drug delivery Fully integrated R&D Rigorous portfolio review and management Allergan remains committed to an industry leading R&D engine • Pre-operational efficiency plan, we expected $1.5B of R&D investment by 2018 • Post-operational efficiency plan, we now expect $1.5B of R&D investment by 2019 Allergan’s R&D Investment Consistently Fuels the Pipeline 22 |
 Allergan Maintains a Rich, Highly Diversified Clinical R&D Pipeline Post Approval Pre-Clinical Phase I Phase II – POC Phase II – Confirmatory Phase III Registration 23 Discontinued as part of Operational Efficiency Plan 1 rosacea programs ph1 2 acne programs ph1 One early preclinical acne program One early pre -clinical derm program for a new indication AGN-1857 Migraine ph1 BTX CFL LATISSE ® US LATISSE ® Japan BTX OAB BTX NDO BTX Chronic Migraine OZURDEX ® RVO OZURDEX ® DME 3B LUMIGAN ® UD LUMIGAN ® 0.01% EU GANFORT™ UD GANFORT™ China AGN-1763 BTX LL Spasticity • SEMPRANA Headache “ ® ” BTX PE LiRIS ® SER-120 NCE Dry Eye Bimatoprost SR OZURDEX ® RVO China BTX Spasticity Adult LL, Adult UL, Ped LL, Ped UL Androgen Front of Eye RESTASIS ® X Medytox Therapeutic DARPin ® AMD DARPin Brimo DDS Dry AMD ® Bim Hair Growth BTX Masseter Derma- tology • • • • • • • Medytox Aesthetic • JUVEDERM Volbell ® (US) • JUVEDERM Volfit ® (US) • BTX CFL Asia • BTX Forehead Lines • LATISSE ® Brow • Oxymetazoline Rosacea • ACZONE ® X • • • Urology • • • • • Neurology & Pain • • BTX X with potential for higher dose and/or longer duration ph1 • Senrebotase (TEM) Pain • BTX Depression • BTX OA Pain • BTX New Indication • • • • Retina • Dual anti -PDGF/VEGF DARPin ® AMD ph2 • 1 retina program ph1 • 2 early preclinical retina programs • • • • • • Anterior Segment • 1 NCE for Dry Eye ph1 • 1 cpd for new indication ph2 • 1 cpd for new indication ph1 • • • • LASTACAFT ® Japan • RESTASIS ® EU • 1 cpd for front of eye indication Glaucoma • NCE Glaucoma ph2 • Combo glaucoma Japan ph3 • • • • • DME Limited number of pre-clinical projects were cancelled as a result of our operational efficiency plan (all with projected approval dates after 2020) |
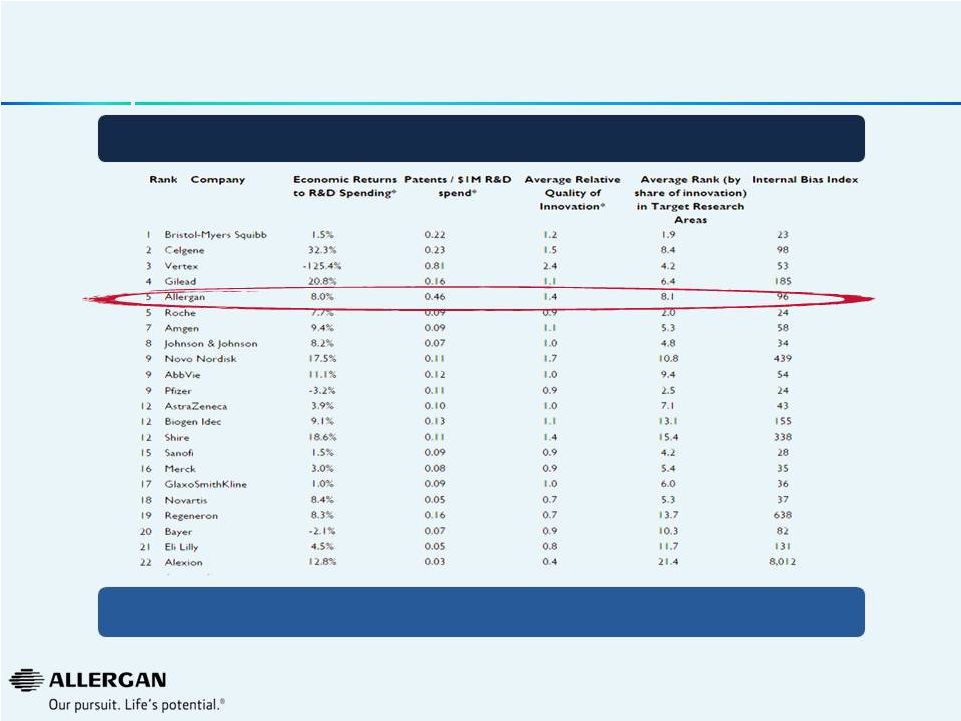 Allergan Has Industry Leading R&D Productivity Allergan Ranked Top 5 in R&D Productivity Source: Bloomberg. AcclaimIP; SSR Health Hidden Pipeline Analysis and assumptions. *Rolling 5-year average. Even among R&D powerhouses, Allergan helps define productivity 24 |
 • BOTOX ® Therapeutic • BOTOX ® Cosmetic • RESTASIS ® • JUVÉDERM ® / VYCROSS ® Franchise • OPTIVE ® • OZURDEX ® • Bimatoprost Sustained Release (Glaucoma)* • SEMPRANA ®* • DARPin ® AMD * (Approval expected at the end of the planning period) In the Next Five Years, Allergan Expects Multiple Major Product Drivers of Growth 25 * Indications / compounds under investigation Limited regulatory approval risk during 5 year planning period |
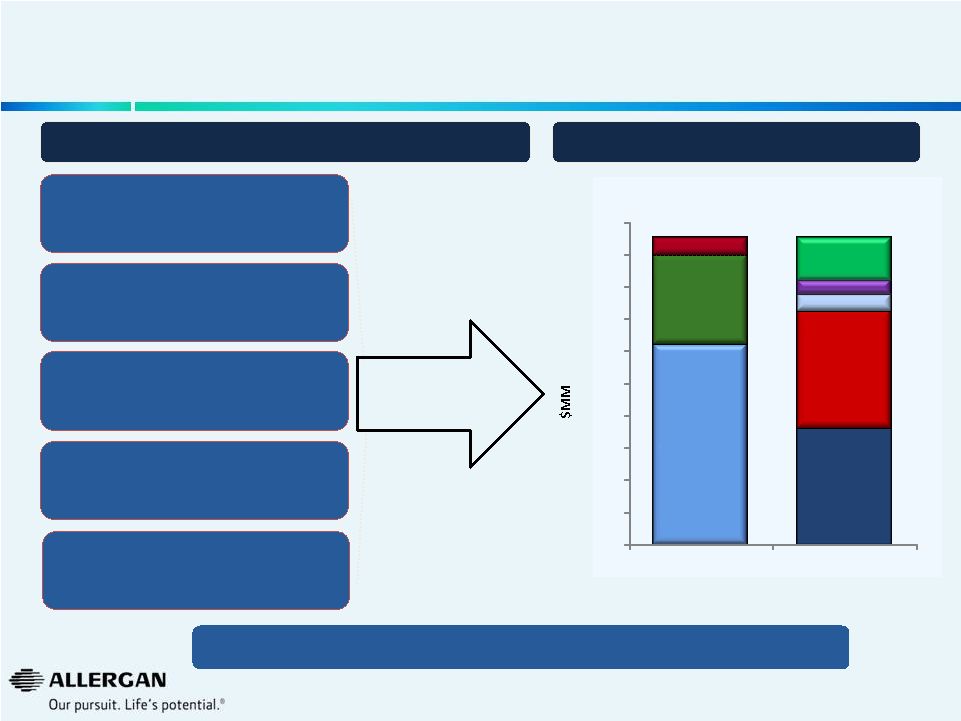 Allergan’s Cost Structure was Optimized Through a Careful Bottoms-Up Build To Save $475M Bottoms-up approach Protect investment in key programs Structured, thoughtful process over several months Maintain sales and profit Optimizing Our Cost Structure Sustainable Source of Savings $475M Reduction By P&L Line Item By Approach 26 Retained core expense base required to support complex business model $0 $50 $100 $150 $200 $250 $300 $350 $400 $450 $500 SG&A $310M Research and Development $138M Gross Margin $27M Focus on High Value O pportunities $180M Streamline Organization $182M Processes $26M Strategic Sourcing $65M Sites $22M |
  Allergan Business Model is Sophisticated and Optimized Allergan’s Formula For Success Blockbuster brands Customer-centric approach Highly experienced management team Investment in sophisticated high-value R&D programs Investment in large, mature markets as well as in emerging markets Emphasis on organic growth Market creation and leadership Sophisticated And Optimized Model 27 |
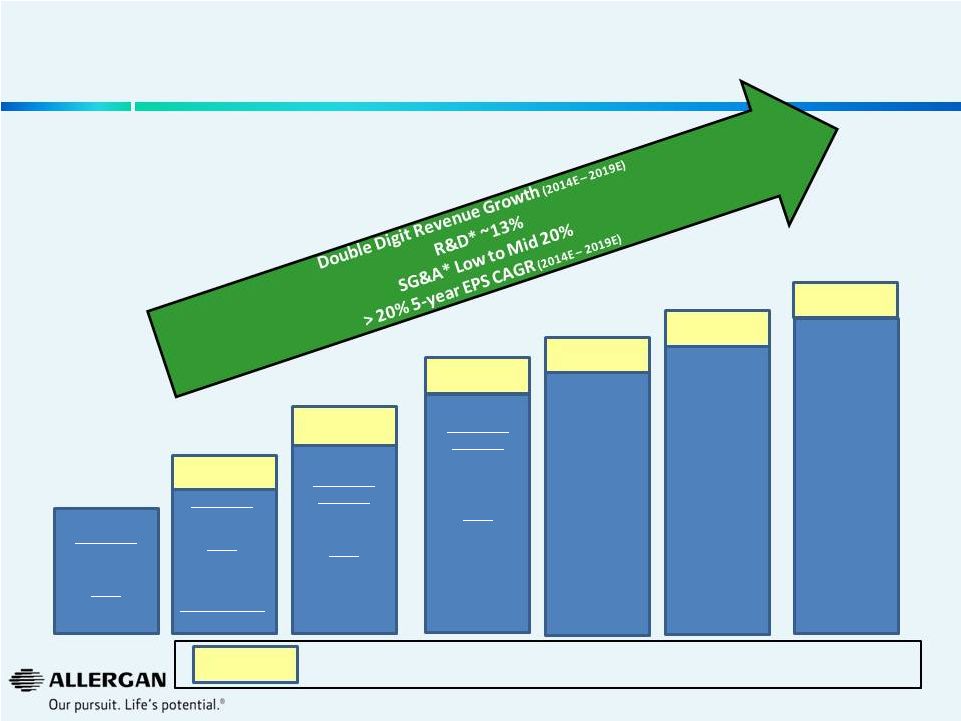 Allergan’s Promising Outlook on Long-Term Organic Growth Driven by New Product Innovation and Operational Excellence 2013A 2014E Guidance 2019E 2015E Guidance Revenue $7.1 - $7.2bn EPS $6.27 - $6.30 EPS Growth 31% - 32% Revenue Growth Double Digit EPS ~$8.60 Revenue $6.2bn EPS $4.77 2016E Guidance 2017E 2018E * As a percentage of sales. Additional stockholder value generated from strong business momentum & further operational efficiencies Revenue Growth Double Digit EPS ~$10.25 28 |
 Strategic Options Available to Further Increase Stockholder Value • Specialty-care focused • Innovative/differentiated products • Strong revenue & earnings growth rate • Leading market share positions • Accretive in 2015 & 2016 • Similar company values • Platform for further acquisitions Additional free cash flow of ~$18bn generated over strategic planning period • Stock repurchases • “Special” dividend Business Development Capital Return 29 |
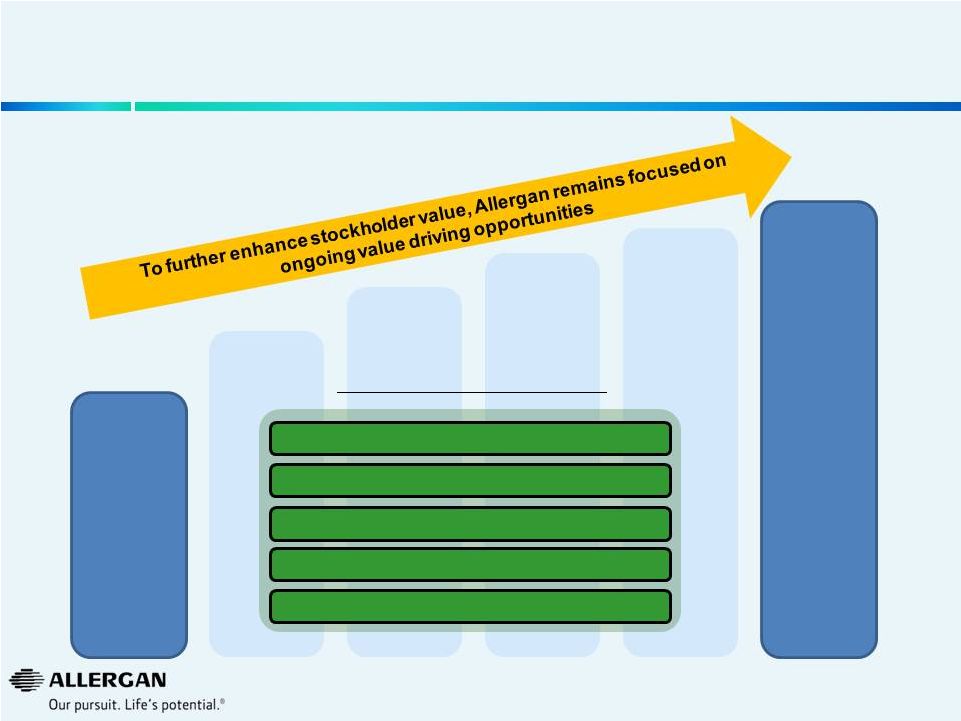 Value Drivers Available to Standalone Allergan to Further Increase Stockholder Value Potential Future Standalone Stock Price Value from Momentum in the Business Value from Capital Return Value from Pipeline Assets Value from Ongoing Business Development Current Stock Price Value Drivers Available to Allergan: Value from Operational Efficiencies 30 |
 Important Information Allergan, its directors and certain of its officers and employees are participants in solicitations of Allergan stockholders. Information regarding the names of Allergan's directors and executive officers and their respective interests in Allergan by security holdings or otherwise is set forth in Allergan's proxy statement for its 2014 annual meeting of stockholders, filed with the SEC on March 26, 2014, as supplemented by the proxy information filed with the SEC on April 22, 2014. Additional information can be found in Allergan's Annual Report on Form 10-K for the year ended December 31, 2013, filed with the SEC on February 25, 2014 and its Quarterly Report on Form 10-Q for the quarter ended June 30, 2014, filed with the SEC on August 5, 2014. To the extent holdings of Allergan's securities have changed since the amounts printed in the proxy statement for the 2014 annual meeting of stockholders, such changes have been reflected on Initial Statements of Beneficial Ownership on Form 3 or Statements of Change in Ownership on Form 4 filed with the SEC. These documents are available free of charge at the SEC’s website at www.sec.gov. STOCKHOLDERS ARE ENCOURAGED TO READ ANY ALLERGAN PROXY STATEMENT (INCLUDING ANY SUPPLEMENTS THERETO) AND ANY OTHER RELEVANT DOCUMENTS THAT ALLERGAN MAY FILE WITH THE SEC CAREFULLY AND IN THEIR ENTIRETY BECAUSE THEY WILL CONTAIN IMPORTANT INFORMATION. Stockholders will be able to obtain, free of charge, copies of any proxy statement and any other documents filed by Allergan with the SEC at the SEC's website at www.sec.gov. In addition, copies will also be available at no charge at the Investors section of Allergan's website at www.allergan.com. 31 |
 Reconciliation of Selected Non-GAAP Financial Measures “GAAP” refers to financial information presented in accordance with generally accepted accounting principles in the United States. In this presentation, Allergan included historical non-GAAP financial measures, as defined in Regulation G promulgated by the Securities and Exchange Commission, with respect to estimates for the year ended December 31, 2013, and the corresponding periods for 1999 through 2012. The information for 2012 and 2011 has been retrospectively adjusted to reflect the obesity intervention unit, which was sold on December 2, 2013, as discontinued operations. Allergan believes that its presentation of historical non-GAAP financial measures provides useful supplementary information to investors. The presentation of historical non-GAAP financial measures is not meant to be considered in isolation from or as a substitute for results prepared in accordance with GAAP. In this presentation, Allergan reported certain financial measures including “Adjusted Sales”, “Adjusted SG&A”, “Adjusted R&D”, “Adjusted EPS”, “Pro forma Growth” and “Sales Growth at constant exchange rates” as adjusted for Non-GAAP items. Allergan uses these financial measures to enhance the investor’s overall understanding of the financial performance and prospects for the future of Allergan’s core business activities. Specifically, Allergan believes that a report of these financial measures provides consistency in Allergan’s financial reporting and facilitates the comparison of results of core business operations between its current, past and future periods. Adjusted Sales, Adjusted SG&A, Adjusted R&D, Adjusted EPS, Pro forma Growth and Sales Growth are the primary indicators management uses for planning and forecasting in future periods. Allergan also uses Adjusted Sales, Adjusted R&D and Adjusted EPS for evaluating management performance for compensation purposes. A reconciliation of non-GAAP items may be found under the heading “Non-GAAP Financial Reconciliation” in the investor relations section of the www.Allergan.com website. 32 |
 October 27, 2014 Allergan A Specialist in the Biopharmaceutical & Medical Device Industries |