| FREE WRITING PROSPECTUS | ||
| FILED PURSUANT TO RULE 433 | ||
| REGISTRATION FILE NO.: 333-172366-03 | ||
 |  |
Free Writing Prospectus
Structural and Collateral Term Sheet
$1,300,950,580
(Approximate Aggregate Cut-off Date Balance of Mortgage Pool)
$1,045,079,000
(Approximate Aggregate Principal Balance of Offered Certificates)
WFRBS Commercial Mortgage Trust 2012-C8
as Issuing Entity
Wells Fargo Commercial Mortgage Securities, Inc.
as Depositor
Wells Fargo Bank, National Association
The Royal Bank of Scotland
Liberty Island Group I LLC
C-III Commercial Mortgage LLC
Basis Real Estate Capital II, LLC
as Sponsors and Mortgage Loan Sellers
Commercial Mortgage Pass-Through Certificates
Series 2012-C8
July 13, 2012
| WELLS FARGO SECURITIES | RBS | |
Co-Lead Manager and Co-Bookrunner | Co-Lead Manager and Co-Bookrunner | |
| Citigroup | ||
| Co-Manager |
STATEMENT REGARDING THIS FREE WRITING PROSPECTUS
The depositor has filed a registration statement (including a prospectus) with the Securities and Exchange Commission (‘‘SEC’’) (SEC File No. 333-172366) for the offering to which this communication relates. Before you invest, you should read the prospectus in the registration statement and other documents the depositor has filed with the SEC for more complete information about the depositor, the issuing entity and this offering. You may get these documents for free by visiting EDGAR on the SEC Web site at www.sec.gov. Alternatively, the depositor, any underwriter, or any dealer participating in the offering will arrange to send you the prospectus after filing if you request it by calling toll free 1-800-745-2063 (8 a.m. – 5 p.m. EST) or by emailing wfs.cmbs@wellsfargo.com.
Nothing in this document constitutes an offer of securities for sale in any other jurisdiction where the offer or sale is not permitted. The information contained herein is preliminary as of the date hereof, supersedes any such information previously delivered to you and will be superseded by any such information subsequently delivered and ultimately by the final prospectus relating to the securities. These materials are subject to change, completion, supplement or amendment from time to time.
STATEMENT REGARDING ASSUMPTIONS AS TO SECURITIES, PRICING ESTIMATES AND OTHER INFORMATION
The attached information contains certain tables and other statistical analyses (the “Computational Materials”) which have been prepared in reliance upon information furnished by the Mortgage Loan Sellers. Numerous assumptions were used in preparing the Computational Materials, which may or may not be reflected herein. As such, no assurance can be given as to the Computational Materials’ accuracy, appropriateness or completeness in any particular context; or as to whether the Computational Materials and/or the assumptions upon which they are based reflect present market conditions or future market performance. The Computational Materials should not be construed as either projections or predictions or as legal, tax, financial or accounting advice. You should consult your own counsel, accountant and other advisors as to the legal, tax, business, financial and related aspects of a purchase of these securities. Any weighted average lives, yields and principal payment periods shown in the Computational Materials are based on prepayment and/or loss assumptions, and changes in such prepayment and/or loss assumptions may dramatically affect such weighted average lives, yields and principal payment periods. In addition, it is possible that prepayments or losses on the underlying assets will occur at rates higher or lower than the rates shown in the attached Computational Materials. The specific characteristics of the securities may differ from those shown in the Computational Materials due to differences between the final underlying assets and the preliminary underlying assets used in preparing the Computational Materials. The principal amount and designation of any security described in the Computational Materials are subject to change prior to issuance. None of Wells Fargo Securities, LLC (“WFS”), RBS Securities Inc. (“RBSSI”), Citigroup Global Markets Inc. or any of their respective affiliates make any representation or warranty as to the actual rate or timing of payments or losses on any of the underlying assets or the payments or yield on the securities. The information in this presentation is based upon management forecasts and reflects prevailing conditions and management’s views as of this date, all of which are subject to change. In preparing this presentation, we have relied upon and assumed, without independent verification, the accuracy and completeness of all information available from public sources or which was provided to us by or on behalf of the Mortgage Loan Sellers or which was otherwise reviewed by us.
This free writing prospectus contains certain forward-looking statements. If and when included in this free writing prospectus, the words “expects”, “intends”, “anticipates”, “estimates” and analogous expressions and all statements that are not historical facts, including statements about our beliefs or expectations, are intended to identify forward-looking statements. Any forward-looking statements are made subject to risks and uncertainties which could cause actual results to differ materially from those stated. Those risks and uncertainties include, among other things, declines in general economic and business conditions, increased competition, changes in demographics, changes in political and social conditions, regulatory initiatives and changes in customer preferences, many of which are beyond our control and the control of any other person or entity related to this offering. The forward-looking statements made in this free writing prospectus are made as of the date stated on the cover. We have no obligation to update or revise any forward-looking statement.
Wells Fargo Securities is the trade name for the capital markets and investment banking services of Wells Fargo & Company and its subsidiaries, including but not limited to Wells Fargo Securities, LLC, a member of NYSE, FINRA, NFA and SIPC; Wells Fargo Institutional Securities, LLC, a member of FINRA and SIPC; and Wells Fargo Bank, N.A. Wells Fargo Securities, LLC carries and provides clearing services for Wells Fargo Institutional Securities, LLC customer accounts.
RBS is a trade name for the investment banking business of RBSSI. Securities, syndicated loan arranging, financial advisory and other investment banking activities are performed by RBSSI and their securities affiliates. Lending, derivatives and other commercial banking activities are performed by The Royal Bank of Scotland plc and their banking affiliates. RBSSI is a member of SIPC, FINRA and the NYSE.
IRS CIRCULAR 230 NOTICE
THIS TERM SHEET IS NOT INTENDED OR WRITTEN TO BE USED, AND CANNOT BE USED, FOR THE PURPOSE OF AVOIDING U.S. FEDERAL, STATE OR LOCAL TAX PENALTIES. THIS TERM SHEET IS WRITTEN AND PROVIDED BY THE DEPOSITOR IN CONNECTION WITH THE PROMOTION OR MARKETING BY THE DEPOSITOR AND THE CO-LEAD BOOKRUNNING MANAGERS OF THE TRANSACTION OR MATTERS ADDRESSED HEREIN. INVESTORS SHOULD SEEK ADVICE BASED ON THEIR PARTICULAR CIRCUMSTANCES FROM AN INDEPENDENT TAX ADVISOR.
IMPORTANT NOTICE REGARDING THE OFFERED CERTIFICATES
The Offered Certificates referred to in these materials and the asset pool backing them are subject to modification or revision (including the possibility that one or more classes of certificates may be split, combined or eliminated at any time prior to issuance or availability of a final prospectus) and are offered on a “when, as and if issued” basis. Prospective investors should understand that, when considering the purchase of the Offered Certificates, a contract of sale will come into being no sooner than the date on which the relevant class of certificates has been priced and the underwriters have confirmed the allocation of certificates to be made to investors; any “indications of interest” expressed by any prospective investor, and any “soft circles” generated by the underwriters, will not create binding contractual obligations for such prospective investors, on the one hand, or the underwriters, the depositor or any of their respective agents or affiliates, on the other hand.
As a result of the foregoing, a prospective investor may commit to purchase certificates that have characteristics that may change, and each prospective investor is advised that all or a portion of the certificates referred to in these materials may be issued without all or certain of the characteristics described in these materials. The underwriters’ obligation to sell certificates to any prospective investor is conditioned on the certificates and the transaction having the characteristics described in these materials. If the underwriters determine that a condition is not satisfied in any material respect, such prospective investor will be notified, and neither the depositor nor the underwriters will have any obligation to such prospective investor to deliver any portion of the Offered Certificates which such prospective investor has committed to purchase, and there will be no liability between the underwriters, the depositor or any of their respective agents or affiliates, on the one hand, and such prospective investor, on the other hand, as a consequence of the non-delivery.
Each prospective investor has requested that the underwriters provide to such prospective investor information in connection with such prospective investor’s consideration of the purchase of the certificates described in these materials. These materials are being provided to each prospective investor for informative purposes only in response to such prospective investor’s specific request. The underwriters described in these materials may from time to time perform investment banking services for, or solicit investment banking business from, any company named in these materials. The underwriters and/or their affiliates or respective employees may from time to time have a long or short position in any security or contract discussed in these materials.
The information contained herein supersedes any previous such information delivered to any prospective investor and will be superseded by information delivered to such prospective investor prior to the time of sale.
IMPORTANT NOTICE RELATING TO AUTOMATICALLY-GENERATED EMAIL DISCLAIMERS
Any legends, disclaimers or other notices that may appear at the bottom of any email communication to which this free writing prospectus is attached relating to (1) these materials not constituting an offer (or a solicitation of an offer), (2) no representation that these materials are accurate or complete and may not be updated or (3) these materials possibly being confidential, are not applicable to these materials and should be disregarded. Such legends, disclaimers or other notices have been automatically generated as a result of these materials having been sent via Bloomberg or another system.
THE INFORMATION IN THIS STRUCTURAL AND COLLATERAL TERM SHEET IS NOT COMPLETE AND MAY BE AMENDED PRIOR TO THE TIME OF SALE. THIS TERM SHEET IS NOT AN OFFER TO SELL THESE SECURITIES AND IT IS NOT A SOLICITATION OF AN OFFER TO BUY THESE SECURITIES IN ANY JURISDICTION WHERE THE OFFER OR SALE IS NOT PERMITTED.
2
| WFRBS Commercial Mortgage Trust 2012-C8 | Certificate Structure |
I. Certificate Structure
Expected Ratings (Fitch/ KBRA / Moody’s)(1) | Approximate Initial Certificate Balance or Notional Amount(2) | Approx. Initial Credit Support(3) | Pass- Trough Rate Description | Weighted Average Life (Years)(4) | Expected Principal Window(4) | Certificate Principal to Value Ratio(5) | Certificate Principal U/W NOI Debt Yield(6) | ||||||||||
| Offered Certificates | |||||||||||||||||
| A-1 | AAA(sf)/AAA(sf)/Aaa(sf) | $97,008,000 | 30.000% | (7) | 2.92 | 9/2012 – 5/2017 | 43.8% | 15.9% | |||||||||
| A-2 | AAA(sf)/AAA(sf)/Aaa(sf) | $187,668,000 | 30.000% | (7) | 4.92 | 5/2017 – 7/2017 | 43.8% | 15.9% | |||||||||
| A-3 | AAA(sf)/AAA(sf)/Aaa(sf) | $439,057,000 | 30.000% | (7) | 9.86 | 3/2022 – 7/2022 | 43.8% | 15.9% | |||||||||
| A-SB | AAA(sf)/AAA(sf)/Aaa(sf) | $96,932,000 | 30.000% | (7) | 7.22 | 7/2017 – 12/2021 | 43.8% | 15.9% | |||||||||
| A-S | AAA(sf)/AAA(sf)/Aaa(sf) | $113,833,000 | 21.250% | (7) | 9.94 | 7/2022 – 7/2022 | 49.3% | 14.1% | |||||||||
| B | AA(sf)/AA(sf)/Aa2(sf) | $66,674,000 | 16.125% | (7) | 9.94 | 7/2022 – 7/2022 | 52.5% | 13.2% | |||||||||
| C | A(sf)/A(sf)/A2(sf) | $43,907,000 | 12.750% | (7) | 9.94 | 7/2022 - 7/2022 | 54.6% | 12.7% | |||||||||
| Non-Offered Certificates | |||||||||||||||||
| X-A | AAA(sf)/AAA(sf)/Aaa(sf) | $1,024,498,000(8) | N/A | Variable(9) | N/A | N/A | N/A | N/A | |||||||||
| X-B | NR/AAA(sf)/Ba3(sf) | $276,452,580(10) | N/A | Variable(11) | N/A | N/A | N/A | N/A | |||||||||
| A-FL | AAA(sf)/AAA(sf)/Aaa(sf)(12) | $90,000,000(13) | 30.000% | LIBOR plus(14) | 9.39 | 12/2021 – 3/2022 | 43.8% | 15.9% | |||||||||
| A-FX | AAA(sf)/AAA(sf)/Aaa(sf)(12) | $0 | 30.000% | (7) | 9.39 | 12/2021 – 3/2022 | 43.8% | 15.9% | |||||||||
| D | BBB+(sf)/BBB+(sf)/Baa1(sf) | $26,019,000 | 10.750% | (7) | 9.94 | 7/2022 – 7/2022 | 55.8% | 12.4% | |||||||||
| E | BBB-(sf)/BBB-(sf)/Baa3(sf) | $45,533,000 | 7.250% | (7) | 9.94 | 7/2022 – 7/2022 | 58.0% | 12.0% | |||||||||
| F | BB(sf)/BB(sf)/Ba2(sf) | $22,767,000 | 5.500% | (7) | 9.94 | 7/2022 – 7/2022 | 59.1% | 11.7% | |||||||||
| G | B(sf)/B(sf)/B2(sf) | $26,019,000 | 3.500% | (7) | 9.94 | 7/2022 – 7/2022 | 60.4% | 11.5% | |||||||||
| H | NR/NR/NR | $45,533,580 | 0.000% | (7) | 10.01 | 7/2022 – 8/2022 | 62.6% | 11.1% | |||||||||
| Notes: | |||
(1) | The expected ratings presented are those of Fitch, Inc. (“Fitch”), Kroll Bond Rating Agency, Inc. (“KBRA”) and Moody’s Investors Service, Inc. (“Moody’s”) which the depositor hired to rate the rated offered certificates. One or more other nationally recognized statistical ratings organizations that were not hired by the depositor may use information they receive pursuant to Rule 17g-5 under the Securities Exchange Act of 1934, as amended (the “Exchange Act”), to rate or provide market reports and/or published commentary related to the offered certificates. We cannot assure you as to what ratings a non-hired nationally recognized statistical ratings organization would assign or that its reports will not express differing, possibly negative, views of the mortgage loans and/or the offered certificates. See “Risk Factors—Risks Related to the Offered Certificates—Ratings of the Certificates Have Substantial Limitations” in the free writing prospectus, dated July 13, 2012 (the “Free Writing Prospectus”). | ||
(2) | The principal balances and notional amounts set forth in the table are approximate. The actual initial principal balances and notional amounts may be larger or smaller depending on the aggregate cut-off date principal balance of the mortgage loans definitively included in the pool of mortgage loans, which aggregate cut-off date principal balance may be as much as 5% larger or smaller than the amount presented in the Free Writing Prospectus. | ||
(3) | The approximate initial credit support with respect to the Class A-1, A-2, A-FL, A-FX, A-3 and A-SB Certificates represents the approximate credit enhancement for the Class A-1, A-2, A-FL, A-FX, A-3 and A-SB Certificates in the aggregate. No class of certificates will provide any credit support to the Class A-FL certificates in respect of any default or termination under the related interest rate swap contract. | ||
(4) | Weighted Average Lives and Expected Principal Windows are calculated based on an assumed prepayment rate of 0% CPR and the “Structuring Assumptions” described on Annex B to the Free Writing Prospectus. | ||
(5) | The Certificate Principal to Value Ratio for each Class of Certificates (other than the Class A-1, A-2, A-FL, A-FX, A-3 and A-SB Certificates) is calculated by dividing the aggregate principal balance of such class of certificates and all classes of certificates senior to such class by the aggregate appraised value of $2,079,075,876 (calculated as described in the Free Writing Prospectus) of the mortgaged properties securing the mortgage loans. The Certificate Principal to Value Ratios for each of the Class A-1, A-2, A-FL, A-FX, A-3 and A-SB Certificates are calculated by dividing the aggregate principal balance of the Class A-1, A-2, A-FL, A-FX, A-3 and A-SB Certificates by such aggregate appraised value. However, excess mortgaged property value associated with a mortgage loan will not be available to offset losses on any other mortgage loan (unless such mortgage loans are cross-collateralized and the cross-collateralization remains in effect). | ||
(6) | The Certificate Principal U/W NOI Debt Yield for each Class of Certificates (other than the Class A-1, A-2, A-FL, A-FX, A-3 and A-SB Certificates) is calculated by dividing the underwritten net operating income for the mortgage pool of $144,364,329 (calculated as described in the Free Writing Prospectus) by the aggregate certificate balance of such class of certificates and all classes of certificates senior to such class of certificates. The Underwritten NOI Debt Yield for each of the Class A-1, A-2, A-FL, A-FX, A-3 and A-SB Certificates is calculated by dividing such mortgage pool underwritten net operating income by the aggregate principal balance of the Class A-1, A-2, A-FL, A-FX, A-3 and A-SB Certificates. However, cash flow from each mortgaged property supports only the related mortgage loan and will not be available to support any other mortgage loan (unless such mortgage loans are cross-collateralized and the cross-collateralization remains in effect). | ||
(7) | The pass-through rates for the Class A-1, A-2, A-FX, A-3, A-SB, A-S, B, C, D, E, F, G and H Certificates and the Class A-FX Regular Interest in each case will be one of the following: (i) a fixed rate per annum, (ii) the WAC Rate (as defined in the Free Writing Prospectus) for the related distribution date, (iii) a variable rate per annum equal to the lesser of (a) a fixed rate and (b) the WAC Rate for the related distribution date or (iv) a variable rate per annum equal to the WAC Rate for the related distribution date minus a specified percentage. | ||
(8) | The Class X-A Certificates are notional amount certificates. The Notional Amount of the Class X-A Certificates will be equal to the aggregate principal balance of the Class A-1, A-2, A-3, A-SB and A-S Certificates and the Class A-FX Regular Interest outstanding from time to time. The Class X-A Certificates will not be entitled to distributions of principal. | ||
(9) | The pass-through rate for the Class X-A Certificates for any distribution date will equal the excess, if any, of (a) the WAC Rate for the related distribution date, over (b) the weighted average of the pass-through rates on the Class A-1, A-2, A-3, A-SB and A-S Certificates and the Class A-FX Regular Interest for the related distribution date, weighted on the basis of their respective aggregate principal balances outstanding immediately prior to that distribution date. | ||
(10) | The Class X-B Certificates are notional amount certificates. The Notional Amount of the Class X-B Certificates will be equal to the aggregate principal balance of the Class B, C, D, E, F, G and H Certificates outstanding from time to time. The Class X-B Certificates will not be entitled to distributions of principal. | ||
(11) | The pass-through rate for the Class X-B Certificates for any distribution date will equal the excess, if any, of (a) the WAC Rate for the related distribution date, over (b) the weighted average of the pass-through rates on the Class B, C, D, E, F, G and H Certificates for the related distribution date, weighted on the basis of their respective aggregate principal balances outstanding immediately prior to that distribution date. | ||
THE INFORMATION IN THIS STRUCTURAL AND COLLATERAL TERM SHEET IS NOT COMPLETE AND MAY BE AMENDED PRIOR TO THE TIME OF SALE. THIS TERM SHEET IS NOT AN OFFER TO SELL THESE SECURITIES AND IT IS NOT A SOLICITATION OF AN OFFER TO BUY THESE SECURITIES IN ANY JURISDICTION WHERE THE OFFER OR SALE IS NOT PERMITTED.
3
| WFRBS Commercial Mortgage Trust 2012-C8 | Certificate Structure |
(12) | The ratings assigned to the Class A-FL Certificates reflect only the receipt of up to the fixed rate of interest at a rate equal to the pass-through rate for the Class A-FX Regular Interest. The ratings of Fitch, KBRA and Moody’s do not address any shortfalls or delays in payment that investors in the Class A-FL Certificates may experience as a result of the conversion of the pass-through rate on Class A-FL Certificates from a floating interest rate to a fixed rate. See “Ratings” in the Private Placement Memorandum. | ||
(13) | The Class A-FL Certificates will evidence a beneficial interest in a grantor trust that includes the Class A-FX Regular Interest and an interest rate swap contract. Under some circumstances, holders of the Class A-FL Certificates may exchange all or a portion of their certificates for a like principal amount of “Class A-FX” Certificates having the same pass-through rate as the Class A-FX Regular Interest. The aggregate principal balance of the Class A-FL Certificates may be adjusted from time to time as a result of such an exchange. The aggregate principal balance of the Class A-FX Certificates and Class A-FL Certificates will at all times equal the aggregate principal balance of the Class A-FX Regular Interest. | ||
(14) | The pass-through rate applicable to the Class A-FL Certificates on each distribution date will be a per annum rate equal to LIBOR plus a specified percentage; provided, however, that under certain circumstances (generally involving a default or termination under the related interest rate swap contract), the pass-through rate applicable to the Class A-FL Certificates may convert to a fixed rate equal to the pass-through rate on the Class A-FX Regular Interest. The initial LIBOR rate will be determined two LIBOR business days prior to the Closing Date, and subsequent LIBOR rates for the Class A-FL Certificates will be determined two LIBOR business days before the start of the related interest accrual period. |
THE INFORMATION IN THIS STRUCTURAL AND COLLATERAL TERM SHEET IS NOT COMPLETE AND MAY BE AMENDED PRIOR TO THE TIME OF SALE. THIS TERM SHEET IS NOT AN OFFER TO SELL THESE SECURITIES AND IT IS NOT A SOLICITATION OF AN OFFER TO BUY THESE SECURITIES IN ANY JURISDICTION WHERE THE OFFER OR SALE IS NOT PERMITTED.
4
| WFRBS Commercial Mortgage Trust 2012-C8 | Transaction Highlights |
II. Transaction Highlights
Mortgage Loan Sellers:
Mortgage Loan Seller | Number of Mortgage Loans | Number of Mortgaged Properties | Aggregate Cut-off Date Balance | % of Cut-off Date Pool Balance | |||||
| Wells Fargo Bank, National Association | 36 | 47 | $631,626,455 | 48.6 | % | ||||
The Royal Bank of Scotland(1) | 24 | 53 | 513,648,577 | 39.5 | |||||
| Liberty Island Group I LLC | 3 | 3 | 66,707,399 | 5.1 | |||||
| C-III Commercial Mortgage LLC | 12 | 14 | 66,654,424 | 5.1 | |||||
| Basis Real Estate Capital II, LLC | 5 | 5 | 22,313,725 | 1.7 | |||||
Total | 80 | 122 | $1,300,950,580 | 100.0 | % | ||||
| (1) The mortgage loan seller referred to herein as The Royal Bank of Scotland is comprised of two affiliated companies: The Royal Bank of Scotland plc and RBS Financial Products Inc. With respect to the mortgage loans being sold for deposit into the trust by The Royal Bank of Scotland: (a) twenty-three (23) mortgage loans, having an aggregate cut-off date principal balance of $410,928,577 and representing 31.6% of the aggregate principal balance of the pool of mortgage loans as of the cut-off date, are being sold for deposit into the trust only by The Royal Bank of Scotland plc and (b) one (1) mortgage loan, having a cut-off date principal balance of $102,720,000 and representing 7.9% of the aggregate principal balance of the pool of mortgage loans as of the cut-off date is being sold for deposit into the trust by The Royal Bank of Scotland plc and RBS Financial Products Inc. |
Loan Pool:
| Cut-off Date Balance: | $1,300,950,580 | |
| Number of Mortgage Loans: | 80 | |
| Average Cut-off Date Balance per Mortgage Loan: | $16,261,882 | |
| Number of Mortgaged Properties: | 122 | |
Average Cut-off Date Balance per Mortgaged Property(1): | $10,663,529 | |
| Weighted Average Mortgage Interest Rate: | 4.920% | |
| Ten Largest Mortgage Loans as % of Cut-off Date Pool Balance: | 53.8% | |
| Weighted Average Original Term to Maturity (months): | 111 | |
| Weighted Average Remaining Term to Maturity (months): | 108 | |
Weighted Average Original Amortization Term (months)(2): | 342 | |
Weighted Average Remaining Amortization Term (months)(2): | 339 | |
Weighted Average Seasoning (months): | 3 | |
(1) Information regarding mortgage loans secured by multiple properties is based on an allocation according to relative appraised values or the allocated loan amounts or property-specific release prices set forth in the related loan documents. With respect to 100 Church Street, Northridge Fashion Center and Town Center at Cobb, loan-to-value ratio, debt service coverage ratio, debt yield and cut-off date balance per square foot calculations include the related pari passu companion loan unless otherwise stated. (2) Excludes any mortgage loan that does not amortize. |
Credit Statistics:
Weighted Average U/W Net Cash Flow DSCR(1): | 1.64x | |
Weighted Average U/W Net Operating Income Debt Yield Ratio(1): | 11.1% | |
Weighted Average Cut-off Date Loan-to-Value Ratio(1): | 63.4% | |
Weighted Average Balloon Loan-to-Value Ratio(1): | 54.1% | |
| % of Mortgage Loans with Additional Subordinate Debt: | 0.0% | |
% of Mortgage Loans with Single Tenants(2): | 12.0% | |
(1) With respect to 100 Church Street, Northridge Fashion Center and Town Center at Cobb, loan-to-value ratio, debt service coverage ratio, debt yield and cut-off date balance per square foot calculations include the related pari passu companion loan unless otherwise stated. (2) Excludes mortgage loans that are secured by multiple single-tenant properties. |
THE INFORMATION IN THIS STRUCTURAL AND COLLATERAL TERM SHEET IS NOT COMPLETE AND MAY BE AMENDED PRIOR TO THE TIME OF SALE. THIS TERM SHEET IS NOT AN OFFER TO SELL THESE SECURITIES AND IT IS NOT A SOLICITATION OF AN OFFER TO BUY THESE SECURITIES IN ANY JURISDICTION WHERE THE OFFER OR SALE IS NOT PERMITTED.
5
| WFRBS Commercial Mortgage Trust 2012-C8 | Transaction Highlights |
Loan Structural Features:
Amortization: Based on the Cut-off Date Balance, 83.7% of the mortgage pool (77 mortgage loans) has scheduled amortization, as follows:
55.7% (69 mortgage loans) requires amortization during the entire loan term
28.0% (8 mortgage loans) provides for an interest-only period followed by an amortization period
Interest-Only: Based on the Cut-off Date Balance, 16.3% of the mortgage pool (3 mortgage loans) provides for interest-only payments during the entire loan term. The Weighted Average Cut-off Date Loan-to-Value Ratio and Weighted Average U/W Net Cash Flow DSCR for those mortgage loans is 60.4% and 2.36x, respectively.
Hard Lockboxes: Based on the Cut-off Date Balance, 70.6% of the mortgage pool (41 mortgage loans) has hard lockboxes in place.
Reserves: The mortgage loans require amounts to be escrowed monthly as follows (excluding any mortgage loans with springing provisions):
| Real Estate Taxes: | 61.7% of the pool | |
| Insurance Premiums: | 46.6% of the pool | |
| Capital Replacements: | 61.2% of the pool | |
| TI/LC: | 41.9% of the pool* | |
* The percentage of Cut-off Date Balance for loans with TI/LC reserves is based on the aggregate principal balance allocable to office, retail, mixed-use and industrial properties. | ||
Call Protection/Defeasance: Based on the Cut-off Date Balance, the mortgage pool has the following call protection and defeasance features:
75.6% of the mortgage pool (64 mortgage loans) features a lockout period, then defeasance only until an open period
24.2% of the mortgage pool (14 mortgage loans) features a lockout period, then the greater of a prepayment premium or yield maintenance until an open period
0.2% of the mortgage pool (2 mortgage loans) features a lockout period, then defeasance or the greater of a prepayment premium or yield maintenance until an open period
Please refer to Annex A-1 to the Free Writing Prospectus for further description of individual loan call protection.
THE INFORMATION IN THIS STRUCTURAL AND COLLATERAL TERM SHEET IS NOT COMPLETE AND MAY BE AMENDED PRIOR TO THE TIME OF SALE. THIS TERM SHEET IS NOT AN OFFER TO SELL THESE SECURITIES AND IT IS NOT A SOLICITATION OF AN OFFER TO BUY THESE SECURITIES IN ANY JURISDICTION WHERE THE OFFER OR SALE IS NOT PERMITTED.
6
| WFRBS Commercial Mortgage Trust 2012-C8 | Issue Characteristics |
III. Issue Characteristics
Securities Offered: | $1,045,079,000 approximate monthly pay, multi-class, commercial mortgage REMIC pass-through certificates consisting of seven classes (Classes A-1, A-2, A-3, A-SB, A-S, B and C), which are offered pursuant to a registration statement filed with the SEC. | |
Mortgage Loan Sellers: | Wells Fargo Bank, National Association (“WFB”); The Royal Bank of Scotland (“RBS”); Liberty Island Group I LLC (“LIG I”); C-III Commercial Mortgage LLC (“CIIICM”); and Basis Real Estate Capital II, LLC (“Basis”). | |
Co-lead Bookrunning Managers: | Wells Fargo Securities, LLC and RBS Securities Inc. | |
Co-Manager: | Citigroup Global Markets Inc. | |
Rating Agencies: | Fitch, Inc., Kroll Bond Rating Agency, Inc. and Moody’s Investors Service, Inc. | |
Master Servicer: | Wells Fargo Bank, National Association | |
Special Servicer: | Rialto Capital Advisors, LLC | |
Certificate Administrator: | Wells Fargo Bank, National Association | |
Trustee: | Deutsche Bank Trust Company Americas | |
Trust Advisor: | Pentalpha Surveillance LLC | |
Cut-off Date: | The Cut-off Date with respect to each mortgage loan is the due date for the monthly debt service payment that is due in August 2012 (or, in the case of any mortgage loan that has its first due date in September 2012, the date that would have been its due date in August 2012 under the terms of that mortgage loan if a monthly debt service payment were scheduled to be due in that month). | |
Expected Closing Date: | On or about August 7, 2012. | |
Determination Dates: | The 11th day of each month (or if that day is not a business day, the next succeeding business day), commencing in September 2012. | |
Distribution Dates: | The fourth business day following the Determination Date in each month, commencing in September 2012. | |
Rated Final Distribution Date: | The Distribution Date in August 2045. | |
Interest Accrual Period: | With respect to any Distribution Date, the calendar month preceding the month in which such Distribution Date occurs. | |
Day Count: | The Offered Certificates will accrue interest on a 30/360 basis. | |
Minimum Denominations: | $10,000 for each Class of Offered Certificates. Investments may also be made in any whole dollar denomination in excess of the applicable minimum denomination. | |
Clean-up Call: | 1% | |
Delivery: | DTC, Euroclear and Clearstream Banking | |
ERISA/SMMEA Status: | Each Class of Offered Certificates is expected to be eligible for exemptive relief under ERISA. No Class of Offered Certificates will be SMMEA eligible. | |
Risk Factors: | THE CERTIFICATES INVOLVE CERTAIN RISKS AND MAY NOT BE SUITABLE FOR ALL INVESTORS. SEE THE “RISK FACTORS” SECTIONS OF THE FREE WRITING PROSPECTUS AND THE PROSPECTUS ATTACHED THERETO. | |
Bond Analytics Information: | The Certificate Administrator is expected to make distribution date statements, CREFC reports and certain supplemental reports (other than confidential information) available to certain financial modeling and data provision services, including Bloomberg L.P., Trepp LLC, Intex Solutions, Inc., Markit Group Limited and BlackRock Financial Management Inc. |
THE INFORMATION IN THIS STRUCTURAL AND COLLATERAL TERM SHEET IS NOT COMPLETE AND MAY BE AMENDED PRIOR TO THE TIME OF SALE. THIS TERM SHEET IS NOT AN OFFER TO SELL THESE SECURITIES AND IT IS NOT A SOLICITATION OF AN OFFER TO BUY THESE SECURITIES IN ANY JURISDICTION WHERE THE OFFER OR SALE IS NOT PERMITTED.
7
| WFRBS Commercial Mortgage Trust 2012-C8 | Characteristics of the Mortgage Pool |
IV. Characteristics of the Mortgage Pool(1)
A. Ten Largest Mortgage Loans
Mortgage Loan Seller | Mortgage Loan Name | City | State | Number of Mortgage Loans / Mortgaged Properties | Mortgage Loan Cut-off Date Balance ($) | % of Cut-off Date Balance (%) | Property Type | Number of SF, Rooms or Pads | Cut-off Date Balance Per SF, Room or Pad ($) | Cut-off Date LTV Ratio (%) | Balloon LTV Ratio (%) | U/W NCF DSCR (x) | U/W NOI Debt Yield (%) | |||||||||||||
| WFB | 100 Church Street | New York | NY | 1 / 1 | $150,000,000 | 11.5% | Office | 1,099,455 | $209 | 58.8% | 50.5% | 1.33x | 9.0% | |||||||||||||
| RBS | Brennan Industrial Portfolio | Various | Various | 1 / 20 | 102,720,000 | 7.9 | Various | 2,355,558 | 44 | 67.0 | 67.0 | 2.36 | 12.3 | |||||||||||||
| WFB | Northridge Fashion Center | Northridge | CA | 1 / 1 | 89,331,381 | 6.9 | Retail | 643,564 | 383 | 66.8 | 55.1 | 1.40 | 9.7 | |||||||||||||
| RBS | Town Center at Cobb | Kennesaw | GA | 1 / 1 | 70,000,000 | 5.4 | Retail | 559,940 | 357 | 62.1 | 53.4 | 1.54 | 10.0 | |||||||||||||
| RBS | BJ’s Portfolio | Various | Various | 1 / 6 | 68,110,000 | 5.2 | Various | 1,129,828 | 60 | 55.9 | 55.9 | 2.40 | 12.1 | |||||||||||||
| WFB | Battelle Campus | Richland | WA | 1 / 1 | 59,896,055 | 4.6 | Office | 340,104 | 176 | 66.0 | 46.5 | 1.18 | 10.2 | |||||||||||||
| RBS | Plaza on Richmond | Houston | TX | 1 / 1 | 44,000,000 | 3.4 | Retail | 193,636 | 227 | 73.3 | 63.0 | 1.35 | 8.7 | |||||||||||||
| RBS | DoubleTree New Orleans | New Orleans | LA | 1 / 1 | 41,954,842 | 3.2 | Hospitality | 367 | 114,318 | 57.3 | 52.9 | 2.07 | 14.8 | |||||||||||||
| WFB | Cole Office Portfolio | Various | Various | 1 / 3 | 41,000,000 | 3.2 | Office | 356,420 | 115 | 51.5 | 51.5 | 2.31 | 12.3 | |||||||||||||
| LIG I | Bank of America Financial Center | Spokane | WA | 1 / 1 | 33,000,000 | 2.5 | Office | 324,165 | 102 | 70.2 | 62.0 | 1.33 | 9.9 | |||||||||||||
| Top Three Total / Weighted Average | 3 / 22 | $342,051,381 | 26.3% | 63.4% | 56.7% | 1.66x | 10.2% | |||||||||||||||||||
| Top Five Total / Weighted Average | 5 / 29 | $480,161,381 | 36.9% | 62.1% | 56.1% | 1.75x | 10.4% | |||||||||||||||||||
| Top Ten Total / Weighted Average | 10 / 36 | $700,012,278 | 53.8% | 62.6% | 55.5% | 1.71x | 10.6% | |||||||||||||||||||
| (1) | With respect to 100 Church Street, Northridge Fashion Center and Town Center at Cobb, Cut-off Date Balance per square foot, rooms or pads, loan-to-value ratio, debt service coverage ratio and debt yield calculations include the related pari passu companion loan (unless otherwise stated) in total debt. |
B. Summary of Pari Passu Split Loan Structure
Property Name | Mortgage Loan Seller | Related Notes in Loan Group (Original Balance) | Holder of Note | Whether Note is Lead Servicing for the Entire Loan Combination | Current Master Servicer for Securitized Note | Current Special Servicer for Loan Combination | |||||
| 100 Church Street | WFB | $150,000,000 | WFRBS 2012-C8 | Yes | Wells Fargo Bank, National Association | Rialto Capital Advisors, LLC | |||||
| WFB | $80,000,000 | (1) | No | N/A | Rialto Capital Advisors, LLC | ||||||
| Northridge Fashion Center | WFB | $91,000,000 | WFRBS 2012-C8 | No | Wells Fargo Bank, National Association | Torchlight Loan Services, LLC | |||||
| WFB | $160,000,000 | WFRBS 2012-C7 | Yes | Wells Fargo Bank, National Association | Torchlight Loan Services, LLC | ||||||
| Town Center at Cobb | RBS | $70,000,000 | WFRBS 2012-C8 | No | Wells Fargo Bank, National Association | Torchlight Loan Services, LLC | |||||
| RBS | $130,000,000 | WFRBS 2012-C7 | Yes | Wells Fargo Bank, National Association | Torchlight Loan Services, LLC |
| (1) | WFB is the holder of the 100 Church Street related pari passu companion loan. |
THE INFORMATION IN THIS STRUCTURAL AND COLLATERAL TERM SHEET IS NOT COMPLETE AND MAY BE AMENDED PRIOR TO THE TIME OF SALE. THIS TERM SHEET IS NOT AN OFFER TO SELL THESE SECURITIES AND IT IS NOT A SOLICITATION OF AN OFFER TO BUY THESE SECURITIES IN ANY JURISDICTION WHERE THE OFFER OR SALE IS NOT PERMITTED.
8
| WFRBS Commercial Mortgage Trust 2012-C8 | Characteristics of the Mortgage Pool |
C. Previous Securitization History(1)
| Loan No. | Mortgage Loan Seller | Mortgage Loan Name | City | State | Property Type | Mortgage Loan or Mortgaged Property Cut-off Date Balance ($) | % of Cut- off Date Balance (%) | Previous Securitization | ||||||||
| 1 | WFB | 100 Church Street | New York | NY | Office | $150,000,000 | 11.5% | WBCMT 2005-WL6A | ||||||||
| 3 | WFB | Northridge Fashion Center | Northridge | CA | Retail | 89,331,381 | 6.9 | GSMS 2001-GL3A | ||||||||
| 4 | RBS | Town Center at Cobb | Kennesaw | GA | Retail | 70,000,000 | 5.4 | MLMT 2007-C1 | ||||||||
| 7 | RBS | Plaza on Richmond | Houston | TX | Retail | 44,000,000 | 3.4 | BSCMS 2005-PWR7 | ||||||||
| 10 | LIG I | Bank of America Financial Center | Spokane | WA | Office | 33,000,000 | 2.5 | GMACC 2003-C3 (part of a portfolio) | ||||||||
| 12 | RBS | US Bank Centre | Cleveland | OH | Office | 21,976,676 | 1.7 | CMAT 1999-C1 | ||||||||
| 19.01 | CIIICM | 7701 Stemmons | Dallas | TX | Office | 8,480,944 | 0.7 | JPMCC 2002-CIB4 | ||||||||
| 20 | WFB | West Slauson Plaza | Ladera Heights | CA | Retail | 15,983,670 | 1.2 | LBUBS 2002-C2 | ||||||||
| 25 | WFB | Laguna Pavilion | Elk Grove | CA | Retail | 11,541,930 | 0.9 | WBCMT 2002-C1 | ||||||||
| 27 | WFB | Orangewood Shadows | Mesa | AZ | Manufactured Housing Community | 10,624,352 | 0.8 | JPMCC 2002-C1 | ||||||||
| 28 | WFB | 249 East Ocean Boulevard | Long Beach | CA | Office | 10,464,767 | 0.8 | GMACC 2003-C1 | ||||||||
| 29 | WFB | Silgan Containers Manufacturing Corp. | Various | Various | Industrial | 9,953,562 | 0.8 | CAREY 2002-1 | ||||||||
| 30 | WFB | Carpenter Plaza | Pittsfield Township | MI | Retail | 9,949,986 | 0.8 | JPMCC 2002-C1 | ||||||||
| 31 | CIIICM | Bay Bridge MHP | Brunswick | ME | Manufactured Housing Community | 9,490,327 | 0.7 | WBCMT 2003-C4 | ||||||||
| 32 | CIIICM | Willowbrook I | Houston | TX | Retail | 9,486,479 | 0.7 | JPMCC 2002-C2 | ||||||||
| 36 | RBS | Peppertree Apartments | North Charleston | SC | Multifamily | 8,991,939 | 0.7 | JPMCC 2001-C1 | ||||||||
| 37 | CIIICM | Athens Town Center | Athens | AL | Retail | 5,844,001 | 0.4 | JPMCC 2002-C1 | ||||||||
| 38 | CIIICM | Cordele Corner | Cordele | GA | Retail | 3,145,278 | 0.2 | GMACC 2001-C1 | ||||||||
| 41 | Basis | Winco Plaza | Medford | OR | Retail | 8,740,370 | 0.7 | MSC 2004-TOP15 | ||||||||
| 44 | RBS | Newport Place Building | Bellevue | WA | Office | 8,080,287 | 0.6 | GECMC 2002-3A | ||||||||
| 45 | RBS | NCR Building | Bellevue | WA | Office | 7,781,017 | 0.6 | GECMC 2002-3A | ||||||||
| 48 | RBS | Creekside Village Apartments | Beaverton | OR | Multifamily | 7,288,958 | 0.6 | JPMCC 2002-CIB5 | ||||||||
| 57 | WFB | North Academy III | Colorado Springs | CO | Retail | 5,978,840 | 0.5 | BSCMS 2002-TOP8 | ||||||||
| 58 | WFB | Storage Direct | Woodbridge | VA | Self Storage | 5,831,534 | 0.4 | MLMT 2002-MW1 | ||||||||
| 65 | RBS | Lakewood Club | Lakewood | OH | Multifamily | 4,068,689 | 0.3 | BACM 2004-1 | ||||||||
| 67 | CIIICM | Bloomfield Medical Village | Bloomfield Township | MI | Office | 3,863,412 | 0.3 | GCCFC 2002-C1 | ||||||||
| 68 | WFB | 1095 Spice Island Drive | Sparks | NV | Industrial | 3,712,689 | 0.3 | BSCMS 2002-TOP8 | ||||||||
| 72 | WFB | Hartsville Crossing | Hartsville | SC | Retail | 3,413,656 | 0.3 | GSMS 2004-GG2 | ||||||||
| 77 | WFB | Woodlawn Manor MHC | Vero Beach | FL | Manufactured Housing Community | 2,230,197 | 0.2 | CSFB 2003-CPN1 | ||||||||
| 79 | CIIICM | Forrest Hollow Estates MHP | Whitehouse | TX | Manufactured Housing Community | 1,375,972 | 0.1 | CSFB 2002-CP5 | ||||||||
| 80 | WFB | Star & Stripes Storage | Goose Creek | SC | Self Storage | 1,347,480 | 0.1 | GECMC 2001-1 | ||||||||
| Total | $585,978,393 | 45.0% | ||||||||||||||
| (1) | The table above represents the most recent securitization with respect to the mortgaged property securing the related mortgage loan, based on information provided by the related borrower or obtained through searches of a third-party database. The information has not otherwise been confirmed by the mortgage loan sellers. |
THE INFORMATION IN THIS STRUCTURAL AND COLLATERAL TERM SHEET IS NOT COMPLETE AND MAY BE AMENDED PRIOR TO THE TIME OF SALE. THIS TERM SHEET IS NOT AN OFFER TO SELL THESE SECURITIES AND IT IS NOT A SOLICITATION OF AN OFFER TO BUY THESE SECURITIES IN ANY JURISDICTION WHERE THE OFFER OR SALE IS NOT PERMITTED.
9
| WFRBS Commercial Mortgage Trust 2012-C8 | Characteristics of the Mortgage Pool |
D. Mortgage Loans with Scheduled Balloon Payments and Related Classes
Class A-1(1) | ||||||||||||||||||||||||||||||||
Loan No. | Mortgage Loan Seller | Mortgage Loan Name | State | Property Type | Mortgage Loan Cut-off Date Balance ($) | % of Cut-off Date Balance (%) | Mortgage Loan Balance at Maturity ($) | % of Class A-1 Certificate Principal Balance (%) | SF/ Rooms/ Pads/ Units | Loan per SF/ Room/ Pad/ Unit | U/W NCF DSCR (x) | U/W NOI Debt Yield (%) | Cut-off Date LTV Ratio (%) | Balloon LTV Ratio (%) | Rem. IO Period (mos.) | Rem. Term to Maturity (mos.) | ||||||||||||||||
| 15 | WFB | Holiday Inn Disneyland | CA | Hospitality | $19,944,076 | 1.5% | $18,130,040 | 18.7% | 255 | $78,212 | 1.69x | 14.3% | 60.8% | 55.3% | 0 | 49 | ||||||||||||||||
| Total/Weighted Average | $19,944,076 | 1.5% | $18,130,040 | 18.7% | 1.69x | 14.3% | 60.8% | 55.3% | 0 | 49 | ||||||||||||||||||||||
(1) The table above presents the mortgage loan whose balloon payment would be applied to pay down the principal balance of the Class A-1 Certificates, assuming a 0% CPR and applying the “Structuring Assumptions” described in the Free Writing Prospectus, including the assumptions that (i) none of the mortgage loans in the pool experience prepayments, defaults or losses; (ii) there are no extensions of maturity dates of any mortgage loans in the pool; and (iii) each mortgage loan in the pool is paid in full on its stated maturity date. Each class of Certificates, including the Class A-1 Certificates, evidences undivided ownership interests in the entire pool of mortgage loans. | ||||||||||||||||||||||||||||||||
Class A-2(1)
| Loan No. | Mortgage Loan Seller | Mortgage Loan Name | State | Property Type | Mortgage Loan Cut-off Date Balance ($) | % of Cut-off Date Balance (%) | Mortgage Loan Balance at Maturity ($) | % of Class A-2 Certificate Principal Balance (%) | SF/ Rooms/ Pads/ Units | Loan per SF/ Room/ Pad/ Unit | U/W NCF DSCR (x) | U/W NOI Debt Yield (%) | Cut-off Date LTV Ratio (%) | Balloon LTV Ratio (%) | Rem. IO Period (mos.) | Rem. Term to Maturity (mos.) | ||||||||||||||||
| 2 | RBS | Brennan Industrial Portfolio | Various | Various | $102,720,000 | 7.9% | $102,720,000 | 54.7% | 2,355,558 | $44 | 2.36x | 12.3% | 67.0% | 67.0% | 59 | 59 | ||||||||||||||||
| 8 | RBS | DoubleTree New Orleans | LA | Hospitality | 41,954,842 | 3.2 | 38,705,590 | 20.6 | 367 | 114,318 | 2.07 | 14.8 | 57.3 | 52.9 | 0 | 59 | ||||||||||||||||
| 19 | CIIICM | Stemmons Office Portfolio | TX | Office | 16,712,448 | 1.3 | 14,087,500 | 7.5 | 340,758 | 49 | 1.47 | 13.9 | 50.9 | 42.9 | 0 | 59 | ||||||||||||||||
| 42 | RBS | Shops at Freedom | NC | Retail | 8,479,523 | 0.7 | 7,804,120 | 4.2 | 180,742 | 47 | 1.54 | 12.0 | 71.9 | 66.1 | 0 | 58 | ||||||||||||||||
| 43 | WFB | Tower Automotive | Various | Industrial | 8,460,970 | 0.7 | 7,159,248 | 3.8 | 465,250 | 18 | 1.49 | 13.7 | 34.8 | 29.4 | 0 | 58 | ||||||||||||||||
| 52 | Basis | Oak Park Ponds Shopping Center | MN | Retail | 6,543,040 | 0.5 | 6,040,810 | 3.2 | 98,157 | 67 | 1.58 | 12.1 | 65.4 | 60.4 | 0 | 59 | ||||||||||||||||
| 53 | WFB | Westcliff Shopping Center | TX | Retail | 6,474,577 | 0.5 | 5,923,942 | 3.2 | 133,071 | 49 | 1.86 | 12.4 | 64.1 | 58.7 | 0 | 57 | ||||||||||||||||
| Total/Weighted Average | $191,345,400 | 14.7% | $182,441,211 | 97.2% | 2.10x | 13.0% | 62.1% | 59.6% | 32 | 59 | ||||||||||||||||||||||
(1) The table above presents the mortgage loans whose balloon payments would be applied to pay down the principal balance of the Class A-2 Certificates, assuming a 0% CPR and applying the “Structuring Assumptions” described in the Free Writing Prospectus, including the assumptions that (i) none of the mortgage loans in the pool experience prepayments, defaults or losses; (ii) there are no extensions of maturity dates of any mortgage loans in the pool; and (iii) each mortgage loan in the pool is paid in full on its stated maturity date. Each class of Certificates, including the Class A-2 Certificates, evidences undivided ownership interests in the entire pool of mortgage loans. | ||||||||||||||||||||||||||||||||
THE INFORMATION IN THIS STRUCTURAL AND COLLATERAL TERM SHEET IS NOT COMPLETE AND MAY BE AMENDED PRIOR TO THE TIME OF SALE. THIS TERM SHEET IS NOT AN OFFER TO SELL THESE SECURITIES AND IT IS NOT A SOLICITATION OF AN OFFER TO BUY THESE SECURITIES IN ANY JURISDICTION WHERE THE OFFER OR SALE IS NOT PERMITTED.
10
| WFRBS Commercial Mortgage Trust 2012-C8 | Characteristics of the Mortgage Pool |
Class A-SB(1) | ||||||||||||||||||||||||||||||||
Loan No. | Mortgage Loan Seller | Mortgage Loan Name | State | Property Type | Mortgage Loan Cut-off Date Balance ($) | % of Cut-off Date Balance (%) | Mortgage Loan Balance at Maturity ($) | % of Class A-SB Certificate Principal Balance (%) | SF/ Rooms/ Pads/ Units | Loan per SF/ Room/ Pad/ Unit | U/W NCF DSCR (x) | U/W NOI Debt Yield (%) | Cut-off Date LTV Ratio (%) | Balloon LTV Ratio (%) | Rem. IO Period (mos.) | Rem. Term to Maturity (mos.) | ||||||||||||||||
| 51 | WFB | Magna International, Inc. | NC | Industrial | $6,954,375 | 0.5% | $5,301,630 | 5.5% | 257,929 | $27 | 1.52x | 14.1% | 50.0% | 38.1% | 0 | 86 | ||||||||||||||||
| Total/Weighted Average | $6,954,375 | 0.5% | $5,301,630 | 5.5% | 1.52x | 14.1% | 50.0% | 38.1% | 0 | 86 | ||||||||||||||||||||||
(1) The table above presents the mortgage loan whose balloon payment would be applied to pay down the principal balance of the Class A-SB Certificates, assuming a 0% CPR and applying the “Structuring Assumptions” described in the Free Writing Prospectus, including the assumptions that (i) none of the mortgage loans in the pool experience prepayments, defaults or losses; (ii) there are no extensions of maturity dates of any mortgage loans in the pool; and (iii) each mortgage loan in the pool is paid in full on its stated maturity date. Each class of Certificates, including the Class A-SB Certificates, evidences undivided ownership interests in the entire pool of mortgage loans. | ||||||||||||||||||||||||||||||||
THE INFORMATION IN THIS STRUCTURAL AND COLLATERAL TERM SHEET IS NOT COMPLETE AND MAY BE AMENDED PRIOR TO THE TIME OF SALE. THIS TERM SHEET IS NOT AN OFFER TO SELL THESE SECURITIES AND IT IS NOT A SOLICITATION OF AN OFFER TO BUY THESE SECURITIES IN ANY JURISDICTION WHERE THE OFFER OR SALE IS NOT PERMITTED.
11
| WFRBS Commercial Mortgage Trust 2012-C8 | Characteristics of the Mortgage Pool |
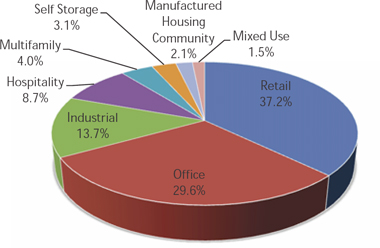
E. Property Type Distribution
| Weighted | Weighted | Weighted | Weighted | |||||||||||||||
| % of Cut- | Average | Average | Weighted | Average | Average | Weighted | ||||||||||||
| Number of | Aggregate Cut- | off Date | Cut-off | Balloon | Average | U/W NOI | U/W NCF | Average | ||||||||||
| Mortgaged | off Date | Balance | Date LTV | LTV Ratio | U/W NCF | Debt | Debt | Mortgage | ||||||||||
| Property Type | Properties | Balance ($)(1) | (%) | Ratio (%) | (%) | DSCR (x) | Yield (%) | Yield (%) | Rate (%) | |||||||||
| Retail | 32 | $484,232,263 | 37.2 | % | 64.3 | % | 54.7 | % | 1.62 | x | 10.7 | % | 10.0 | % | 4.847 | % | ||
| Anchored | 18 | 229,984,524 | 17.7 | 66.7 | 55.7 | 1.53 | 10.7 | 9.7 | 4.777 | |||||||||
| Regional Mall | 2 | 159,331,381 | 12.2 | 64.7 | 54.4 | 1.46 | 9.8 | 9.5 | 4.948 | |||||||||
| Single Tenant | 7 | 58,501,147 | 4.5 | 56.4 | 55.5 | 2.38 | 12.3 | 11.3 | 4.579 | |||||||||
| Unanchored | 3 | 23,515,077 | 1.8 | 59.1 | 48.4 | 1.64 | 12.3 | 11.2 | 5.250 | |||||||||
| Shadow Anchored | 2 | 12,900,134 | 1.0 | 62.1 | 48.3 | 1.69 | 13.0 | 11.9 | 5.327 | |||||||||
| Office | 19 | 385,617,913 | 29.6 | 61.8 | 52.3 | 1.48 | 10.2 | 9.2 | 4.928 | |||||||||
| CBD | 4 | 215,441,443 | 16.6 | 62.4 | 53.5 | 1.34 | 9.4 | 8.4 | 4.752 | |||||||||
| Suburban | 9 | 133,469,806 | 10.3 | 60.1 | 48.8 | 1.60 | 11.3 | 10.2 | 5.235 | |||||||||
| Medical | 3 | 23,033,664 | 1.8 | 63.5 | 52.3 | 1.52 | 10.7 | 9.8 | 5.005 | |||||||||
| Flex | 3 | 13,673,000 | 1.1 | 67.0 | 67.0 | 2.36 | 12.3 | 10.9 | 4.580 | |||||||||
| Industrial | 30 | 178,161,095 | 13.7 | 63.3 | 58.6 | 1.99 | 12.1 | 10.8 | 4.832 | |||||||||
| Warehouse | 11 | 61,816,052 | 4.8 | 55.7 | 49.9 | 1.90 | 12.6 | 11.2 | 4.951 | |||||||||
| Flex | 8 | 50,270,043 | 3.9 | 67.8 | 58.3 | 1.63 | 11.3 | 10.1 | 5.017 | |||||||||
| Manufacturing | 3 | 33,226,000 | 2.6 | 67.0 | 67.0 | 2.36 | 12.3 | 10.9 | 4.580 | |||||||||
| Light Industrial | 8 | 32,849,000 | 2.5 | 67.0 | 67.0 | 2.36 | 12.3 | 10.9 | 4.580 | |||||||||
| Hospitality | 7 | 113,330,419 | 8.7 | 61.3 | 51.0 | 1.77 | 13.8 | 12.3 | 5.133 | |||||||||
| Full Service | 2 | 61,898,918 | 4.8 | 58.4 | 53.7 | 1.95 | 14.6 | 13.0 | 5.037 | |||||||||
| Limited Service | 4 | 37,852,488 | 2.9 | 63.2 | 46.3 | 1.55 | 12.9 | 11.6 | 5.340 | |||||||||
| Extended Stay | 1 | 13,579,013 | 1.0 | 68.9 | 51.6 | 1.61 | 12.7 | 11.3 | 4.990 | |||||||||
| Multifamily | 13 | 52,646,401 | 4.0 | 68.6 | 55.1 | 1.61 | 11.9 | 10.9 | 5.055 | |||||||||
| Garden | 10 | 38,691,203 | 3.0 | 68.0 | 55.5 | 1.63 | 12.0 | 10.9 | 5.026 | |||||||||
| Senior Housing | 1 | 7,288,958 | 0.6 | 68.1 | 51.2 | 1.55 | 11.5 | 11.0 | 5.100 | |||||||||
| Low Rise | 1 | 4,068,689 | 0.3 | 71.4 | 53.4 | 1.63 | 13.0 | 11.4 | 4.970 | |||||||||
| Conventional | 1 | 2,597,551 | 0.2 | 74.2 | 62.1 | 1.35 | 9.8 | 9.2 | 5.500 | |||||||||
| Self Storage | 15 | 39,767,255 | 3.1 | 63.1 | 51.2 | 1.72 | 12.0 | 11.6 | 5.184 | |||||||||
| Self Storage | 15 | 39,767,255 | 3.1 | 63.1 | 51.2 | 1.72 | 12.0 | 11.6 | 5.184 | |||||||||
| Manufactured Housing Community | 5 | 27,217,242 | 2.1 | 66.6 | 55.0 | 1.52 | 10.3 | 10.1 | 5.211 | |||||||||
| Manufactured Housing Community | 5 | 27,217,242 | 2.1 | 66.6 | 55.0 | 1.52 | 10.3 | 10.1 | 5.211 | |||||||||
| Mixed Use | 1 | 19,977,989 | 1.5 | 68.7 | 56.2 | 1.43 | 9.4 | 9.0 | 4.850 | |||||||||
| Office/Retail | 1 | 19,977,989 | 1.5 | 68.7 | 56.2 | 1.43 | 9.4 | 9.0 | 4.850 | |||||||||
| Total/Weighted Average | 122 | $1,300,950,580 | 100.0 | % | 63.4 | % | 54.1 | % | 1.64 | x | 11.1 | % | 10.1 | % | 4.920 | % | ||
| (1) | Because this table presents information relating to the mortgaged properties and not the mortgage loans, (a) the information for mortgage loans secured by more than one mortgaged property (other than through cross-collateralization with other mortgage loans) is based on allocated amounts (allocating the mortgage loan principal balance to each of those properties according to the relative appraised values of the mortgaged properties or the allocated loan amounts or property-specific release prices set forth in the related mortgage loan documents), and (b) the information for each mortgaged property that relates to a mortgage loan that is cross-collateralized with other mortgage loans is based upon the principal balance of that mortgage loan, except that the applicable loan-to-value ratio, debt service coverage ratio or debt yield for each such mortgaged property is based upon the ratio or yield (as applicable) for the aggregate indebtedness evidenced by all loans in the group. On an individual basis, without regard to the cross-collateralization feature, any mortgaged property securing a mortgage loan that is part of a cross-collateralized group of mortgage loans may have a higher loan-to-value ratio, lower debt service coverage ratio and/or lower debt yield than is presented herein. With respect to 100 Church Street, Northridge Fashion Center and Town Center at Cobb, loan-to-value ratio, debt service coverage ratio and debt yield calculations include the related pari passu companion loan (unless otherwise stated) in total debt. |
THE INFORMATION IN THIS STRUCTURAL AND COLLATERAL TERM SHEET IS NOT COMPLETE AND MAY BE AMENDED PRIOR TO THE TIME OF SALE. THIS TERM SHEET IS NOT AN OFFER TO SELL THESE SECURITIES AND IT IS NOT A SOLICITATION OF AN OFFER TO BUY THESE SECURITIES IN ANY JURISDICTION WHERE THE OFFER OR SALE IS NOT PERMITTED.
12
| WFRBS Commercial Mortgage Trust 2012-C8 | Characteristics of the Mortgage Pool |
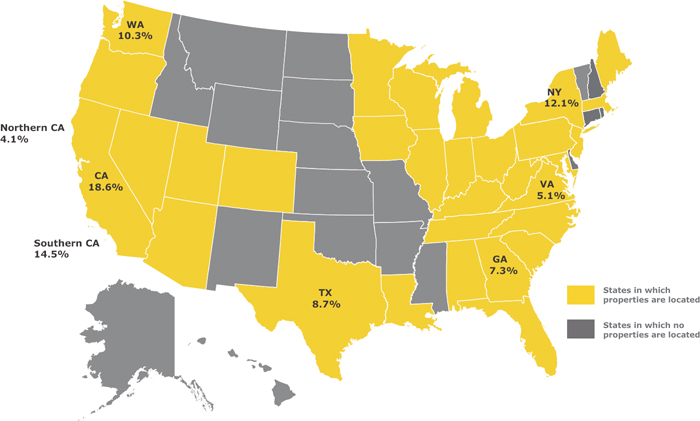
F. Geographic Distribution*
| Weighted | |||||||||||||||||||
| Weighted | Average | Weighted | Weighted | ||||||||||||||||
| Average | Balloon | Weighted | Average | Average | Weighted | ||||||||||||||
| Number of | Aggregate Cut-off | % of Cut- | Cut-off | or ARD | Average | U/W NOI | U/W NCF | Average | |||||||||||
| Mortgaged | Date Balance | off Date | Date LTV | LTV Ratio | U/W NCF | Debt | Debt | Mortgage | |||||||||||
Location(1) | Properties | ($)(2) | Balance | Ratio (%) | (%) | DSCR (x) | Yield (%) | Yield (%) | Rate (%) | ||||||||||
| California | 12 | $ 241,381,008 | 18.6 | % | 65.4 | % | 56.1 | % | 1.60 | x | 10.7 | % | 9.9 | % | 4.992 | % | |||
| Southern | 7 | 188,037,084 | 14.5 | 65.2 | 56.1 | 1.60 | 10.8 | 10.0 | 4.999 | ||||||||||
| Northern | 5 | 53,343,924 | 4.1 | 66.0 | 56.1 | 1.57 | 10.4 | 9.6 | 4.968 | ||||||||||
| New York | 3 | 157,128,029 | 12.1 | 59.1 | 51.0 | 1.37 | 9.2 | 8.5 | 4.679 | ||||||||||
| Washington | 6 | 133,803,574 | 10.3 | 68.4 | 53.7 | 1.30 | 10.0 | 9.1 | 5.240 | ||||||||||
| Texas | 14 | 112,869,600 | 8.7 | 66.1 | 55.2 | 1.51 | 11.2 | 10.3 | 4.960 | ||||||||||
| Georgia | 6 | 95,301,643 | 7.3 | 62.2 | 54.2 | 1.66 | 10.6 | 10.0 | 4.814 | ||||||||||
| Virginia | 6 | 66,441,217 | 5.1 | 64.4 | 51.0 | 1.55 | 11.4 | 10.4 | 4.984 | ||||||||||
Other States(3) | 75 | 494,025,510 | 38.0 | 61.9 | 54.4 | 1.88 | 12.2 | 11.0 | 4.879 | ||||||||||
| Total/ Weighted Average | 122 | $1,300,950,580 | 100.0 | % | 63.4 | % | 54.1 | % | 1.64 | x | 11.1 | % | 10.1 | % | 4.920 | % |
* The Mortgaged Properties are located in 31 states.
| (1) | For purposes of determining whether a mortgaged property is in Northern California or Southern California, Northern California includes areas with zip codes above 93600 and Southern California includes areas with zip codes of 93600 and below. |
| (2) | Because this table presents information relating to the mortgaged properties and not the mortgage loans, (a) the information for mortgage loans secured by more than one mortgaged property (other than through cross-collateralization with other mortgage loans) is based on allocated amounts (allocating the mortgage loan principal balance to each of those properties according to the relative appraised values of the mortgaged properties or the allocated loan amounts or property-specific release prices set forth in the related mortgage loan documents), and (b) the information for each mortgaged property that relates to a mortgage loan that is cross-collateralized with other mortgage loans is based upon the principal balance of that mortgage loan, except that the applicable loan-to-value ratio, debt service coverage ratio or debt yield for each such mortgaged property is based upon the ratio or yield (as applicable) for the aggregate indebtedness evidenced by all loans in the group. On an individual basis, without regard to the cross-collateralization feature, any mortgaged property securing a mortgage loan that is part of a cross-collateralized group of mortgage loans may have a higher loan-to-value ratio, lower debt service coverage ratio and/or lower debt yield than is presented herein. With respect to 100 Church Street, Northridge Fashion Center and Town Center at Cobb, loan-to-value ratio, debt service coverage ratio and debt yield calculations include the related pari passu companion loan (unless otherwise stated) in total debt. |
| (3) | Includes 25 other states. |
THE INFORMATION IN THIS STRUCTURAL AND COLLATERAL TERM SHEET IS NOT COMPLETE AND MAY BE AMENDED PRIOR TO THE TIME OF SALE. THIS TERM SHEET IS NOT AN OFFER TO SELL THESE SECURITIES AND IT IS NOT A SOLICITATION OF AN OFFER TO BUY THESE SECURITIES IN ANY JURISDICTION WHERE THE OFFER OR SALE IS NOT PERMITTED.
13
| WFRBS Commercial Mortgage Trust 2012-C8 | Characteristics of the Mortgage Pool |
G. Characteristics of the Mortgage Pool(1)
| CUT-OFF DATE BALANCE | LOAN PURPOSE | |||||||
| Number of | Number of | |||||||
| Range of Cut-off Date | Mortgage | Aggregate Cut- | % of Cut-off | Mortgage | Aggregate Cut- | % of Cut-off | ||
| Balances ($) | Loans | off Date Balance | Date Balance | Loan Purpose | Loans | off Date Balance | Date Balance | |
| 1,289,118 – 2,000,000 | 4 | $5,759,599 | 0.4% | Refinance | 64 | $980,780,204 | 75.4% | |
| 2,000,001 – 3,000,000 | 4 | 9,476,003 | 0.7 | Acquisition | 16 | 320,170,376 | 24.6 | |
| 3,000,001 – 4,000,000 | 8 | 28,613,757 | 2.2 | Total: | 80 | $1,300,950,580 | 100.0% | |
| 4,000,001 – 5,000,000 | 5 | 22,953,725 | 1.8 | |||||
| 5,000,001 – 6,000,000 | 7 | 40,794,437 | 3.1 | MORTGAGE RATE | ||||
| 6,000,001 – 7,000,000 | 5 | 33,271,813 | 2.6 | Number of | ||||
| 7,000,001 – 8,000,000 | 5 | 36,980,367 | 2.8 | Range of Mortgage Rates | Mortgage | Aggregate Cut- | % of Cut-off | |
| 8,000,001 – 9,000,000 | 7 | 60,637,045 | 4.7 | (%) | Loans | off Date Balance | Date Balance | |
| 9,000,001 – 10,000,000 | 7 | 66,863,896 | 5.1 | 4.250 – 4.500 | 3 | $21,429,635 | 1.6% | |
| 10,000,001 – 15,000,000 | 8 | 94,180,324 | 7.2 | 4.501 – 4.750 | 14 | 526,022,735 | 40.4 | |
| 15,000,001 – 20,000,000 | 7 | 128,052,276 | 9.8 | 4.751 – 5.000 | 23 | 334,774,760 | 25.7 | |
| 20,000,001 – 30,000,000 | 2 | 42,105,062 | 3.2 | 5.001 – 5.250 | 19 | 243,958,784 | 18.8 | |
| 30,000,001 – 50,000,000 | 5 | 191,204,842 | 14.7 | 5.251 – 5.500 | 12 | 63,755,910 | 4.9 | |
| 50,000,001 – 70,000,000 | 3 | 198,006,055 | 15.2 | 5.501 – 5.750 | 7 | 100,753,538 | 7.7 | |
| 70,000,001 – 90,000,000 | 1 | 89,331,381 | 6.9 | 5.751 – 6.000 | 1 | 1,347,480 | 0.1 | |
| 90,000,001 – 150,000,000 | 2 | 252,720,000 | 19.4 | 6.001 – 6.130 | 1 | 8,907,738 | 0.7 | |
| Total: | 80 | $1,300,950,580 | 100.0% | Total: | 80 | $1,300,950,580 | 100.0% | |
| Average: | $16,261,882 | Weighted Average: | 4.920% | |||||
| UNDERWRITTEN NOI DEBT YIELD | ||||||||
| UNDERWRITTEN NOI DEBT SERVICE COVERAGE RATIO | Number of | |||||||
| Number of | Range of U/W NOI | Mortgage | Aggregate Cut- | % of Cut-off | ||||
| Range of U/W NOI | Mortgage | Aggregate Cut- | % of Cut-off | Debt Yields (%) | Loans | off Date Balance | Date Balance | |
| DSCRs (x) | Loans | off Date Balance | Date Balance | 8.6 – 9.0 | 3 | $225,250,000 | 17.3% | |
| 1.27 – 1.30 | 1 | $59,896,055 | 4.6% | 9.1 – 10.0 | 9 | 266,039,946 | 20.4 | |
| 1.31 – 1.40 | 2 | 75,250,000 | 5.8 | 10.1 – 11.0 | 20 | 250,461,524 | 19.3 | |
| 1.41 – 1.50 | 7 | 294,686,835 | 22.7 | 11.1 – 12.0 | 16 | 106,044,547 | 8.2 | |
| 1.51 – 1.60 | 13 | 203,049,081 | 15.6 | 12.1 – 13.0 | 13 | 280,803,669 | 21.6 | |
| 1.61 – 1.70 | 19 | 168,193,167 | 12.9 | 13.1 – 14.0 | 6 | 50,281,047 | 3.9 | |
| 1.71 – 1.80 | 10 | 101,520,846 | 7.8 | 14.1 – 15.0 | 5 | 74,223,433 | 5.7 | |
| 1.81 – 1.90 | 7 | 36,759,030 | 2.8 | 15.1 – 16.0 | 7 | 37,896,428 | 2.9 | |
| 1.91 – 2.00 | 6 | 42,783,018 | 3.3 | 16.1 – 18.5 | 1 | 9,949,986 | 0.8 | |
| 2.01 – 2.25 | 7 | 36,709,006 | 2.8 | Total: | 80 | $1,300,950,580 | 100.0% | |
| 2.26 – 2.50 | 4 | 60,323,555 | 4.6 | Weighted Average: | 11.1% | |||
| 2.51 – 2.70 | 4 | 221,779,986 | 17.0 | |||||
| Total: | 80 | $1,300,950,580 | 100.0% | UNDERWRITTEN NCF DEBT YIELD | ||||
| Weighted Average: | 1.80x | Number of | ||||||
| Range of U/W NCF | Mortgage | Aggregate Cut- | % of Cut-off | |||||
| UNDERWRITTEN NCF DEBT SERVICE COVERAGE RATIO | Debt Yields (%) | Loans | off Date Balance | Date Balance | ||||
| Number of | 8.2 – 9.0 | 8 | $316,901,428 | 24.4% | ||||
| Range of U/W NCF | Mortgage | Aggregate Cut- | % of Cut-off | 9.1 – 10.0 | 24 | 428,157,811 | 32.9 | |
| DSCRs (x) | Loans | off Date Balance | Date Balance | 10.1 – 11.0 | 19 | 220,817,757 | 17.0 | |
| 1.18 – 1.20 | 1 | $59,896,055 | 4.6% | 11.1 – 12.0 | 14 | 192,418,584 | 14.8 | |
| 1.21 – 1.30 | 1 | 20,128,385 | 1.5 | 12.1 – 13.0 | 5 | 51,477,771 | 4.0 | |
| 1.31 – 1.40 | 13 | 413,721,688 | 31.8 | 13.1 – 14.0 | 4 | 56,014,907 | 4.3 | |
| 1.41 – 1.50 | 15 | 145,673,421 | 11.2 | 14.1 – 15.0 | 5 | 25,212,335 | 1.9 | |
| 1.51 – 1.60 | 22 | 244,999,170 | 18.8 | 15.1 – 16.9 | 1 | 9,949,986 | 0.8 | |
| 1.61 – 1.70 | 8 | 81,113,630 | 6.2 | Total: | 80 | $1,300,950,580 | 100.0% | |
| 1.71 – 1.80 | 2 | 5,722,254 | 0.4 | Weighted Average: | 10.1% | |||
| 1.81 – 1.90 | 4 | 19,478,136 | 1.5 | |||||
| 1.91 – 2.00 | 6 | 28,114,298 | 2.2 | |||||
| 2.01 – 2.25 | 4 | 60,323,555 | 4.6 | |||||
| 2.26 – 2.46 | 4 | 221,779,986 | 17.0 | |||||
| Total: | 80 | $1,300,950,580 | 100.0% | |||||
| Weighted Average: | 1.64x | |||||||
| (1) | Information regarding mortgage loans that are cross-collateralized with other mortgage loans is based upon the individual loan balances, except that the applicable loan-to-value ratio, debt service coverage ratio or debt yield for each such mortgage loan is based upon the ratio or yield (as applicable) for the aggregate indebtedness evidenced by all loans in the group. On an individual basis, without regard to the cross-collateralization feature, any mortgage loan that is part of a cross-collateralized group of mortgage loans may have a higher loan-to-value ratio, lower debt service coverage ratio and/or lower debt yield than is presented herein. With respect to 100 Church Street, Northridge Fashion Center and Town Center at Cobb, loan-to-value ratio, debt service coverage ratio and debt yield calculations include the related pari passu companion loan (unless otherwise stated) in total debt. |
THE INFORMATION IN THIS STRUCTURAL AND COLLATERAL TERM SHEET IS NOT COMPLETE AND MAY BE AMENDED PRIOR TO THE TIME OF SALE. THIS TERM SHEET IS NOT AN OFFER TO SELL THESE SECURITIES AND IT IS NOT A SOLICITATION OF AN OFFER TO BUY THESE SECURITIES IN ANY JURISDICTION WHERE THE OFFER OR SALE IS NOT PERMITTED.
14
| WFRBS Commercial Mortgage Trust 2012-C8 | Characteristics of the Mortgage Pool |
| ORIGINAL TERM TO MATURITY | CUT-OFF DATE LOAN-TO-VALUE RATIO | |||||||||||||
| Number of | Number of | |||||||||||||
| Range of Original Terms to | Mortgage | Aggregate Cut- | % of Cut-off | Range of Cut-off Date LTV | Mortgage | Aggregate Cut- | % of Cut-off | |||||||
| Maturity (months) | Loans | off Date Balance | Date Balance | Ratios (%) | Loans | off Date Balance | Date Balance | |||||||
| 60 | 8 | $211,289,477 | 16.2% | 34.8 – 35.0 | 1 | $8,460,970 | 0.7% | |||||||
| 85 – 120 | 71 | 1,000,329,722 | 76.9 | 35.1 – 45.0 | 2 | 15,928,826 | 1.2 | |||||||
| 121 – 128 | 1 | 89,331,381 | 6.9 | 45.1 – 50.0 | 2 | 16,907,937 | 1.3 | |||||||
| Total: | 80 | $1,300,950,580 | 100.0% | 50.1 – 55.0 | 6 | 78,042,350 | 6.0 | |||||||
| Weighted Average: | 111 | 55.1 – 60.0 | 6 | 279,393,739 | 21.5 | |||||||||
| 60.1 – 65.0 | 20 | 234,507,197 | 18.0 | |||||||||||
| REMAINING TERM TO MATURITY | 65.1 – 70.0 | 28 | 445,260,413 | 34.2 | ||||||||||
| Number of | 70.1 – 74.2 | 15 | 222,449,147 | 17.1 | ||||||||||
| Range of Remaining Terms | Mortgage | Aggregate Cut- | % of Cut-off | Total: | 80 | $1,300,950,580 | 100.0% | |||||||
| to Maturity (months) | Loans | off Date Balance | Date Balance | Weighted Average: | 63.4% | |||||||||
| 49 – 60 | 8 | $211,289,477 | 16.2% | |||||||||||
| 85 – 120 | 72 | 1,089,661,104 | 83.8 | BALLOON LOAN-TO-VALUE RATIO | ||||||||||
| Total: | 80 | $1,300,950,580 | 100.0% | Number of | ||||||||||
| Weighted Average: | 108 | Range of Balloon LTV | Mortgage | Aggregate Cut- | % of Cut-off | |||||||||
| Ratios (%) | Loans | off Date Balance | Date Balance | |||||||||||
| ORIGINAL AMORTIZATION TERM | 28.9 – 30.0 | 2 | $18,414,532 | 1.4% | ||||||||||
| Range of Original | Number of | 30.1 – 35.0 | 2 | 15,928,826 | 1.2 | |||||||||
| Amortization Terms | Mortgage | Aggregate Cut- | % of Cut-off | 35.1 – 40.0 | 3 | 19,856,281 | 1.5 | |||||||
| (months) | Loans | off Date Balance | Date Balance | 40.1 – 45.0 | 4 | 33,048,182 | 2.5 | |||||||
| Non-Amortizing | 3 | $211,830,000 | 16.3% | 45.1 – 50.0 | 11 | 130,927,624 | 10.1 | |||||||
| 240 | 5 | 50,989,094 | 3.9 | 50.1 – 55.0 | 28 | 480,469,178 | 36.9 | |||||||
| 241 – 300 | 21 | 196,529,437 | 15.1 | 55.1 – 60.0 | 21 | 352,689,165 | 27.1 | |||||||
| 301 – 360 | 51 | 841,602,049 | 64.7 | 60.1 – 65.0 | 7 | 138,417,268 | 10.6 | |||||||
| Total: | 80 | $1,300,950,580 | 100.0% | 65.1 – 67.0 | 2 | 111,199,523 | 8.5 | |||||||
| Weighted Average:* | 342 | Total: | 80 | $1,300,950,580 | 100.0% | |||||||||
* Excludes the non-amortizing loans. | Weighted Average: | 54.1% | ||||||||||||
REMAINING AMORTIZATION TERM(2) | AMORTIZATION TYPE | |||||||||||||
| Range of Remaining | Number of | Number of | ||||||||||||
| Amortization Terms | Mortgage | Aggregate Cut- | % of Cut-off | Mortgage | Aggregate Cut- | % of Cut-off | ||||||||
| (months) | Loans | off Date Balance | Date Balance | Type of Amortization | Loans | off Date Balance | Date Balance | |||||||
| Non-Amortizing | 3 | $211,830,000 | 16.3% | Amortizing Balloon | 69 | $724,945,580 | 55.7% | |||||||
| 235 – 240 | 5 | 50,989,094 | 3.9 | Interest-only, Amortizing | ||||||||||
| 241 – 300 | 21 | 196,529,437 | 15.1 | Balloon | 8 | 364,175,000 | 28.0 | |||||||
| 301 – 360 | 51 | 841,602,049 | 64.7 | Interest-only, ARD | 2 | 109,110,000 | 8.4 | |||||||
| Total: | 80 | $1,300,950,580 | 100.0% | Interest-only, Balloon | 1 | 102,720,000 | 7.9 | |||||||
| Weighted Average:* | 339 | Total: | 80 | $1,300,950,580 | 100.0% | |||||||||
* Excludes the non-amortizing loans. | ||||||||||||||
(2) The remaining amortization term shown for any mortgage loan that is interest-only for part of its term does not include the number of months in its interest-only period and reflects only the number of months as of the commencement of amortization remaining from the end of such interest-only period. | ORIGINAL TERM OF INTEREST-ONLY PERIOD FOR PARTIAL IO LOANS* | |||||||||||||
| Number of | ||||||||||||||
| Mortgage | Aggregate Cut- | % of Cut-off | ||||||||||||
| IO Term (months) | Loans | off Date Balance | Date Balance | |||||||||||
| 12 | 2 | $36,875,000 | 2.8% | |||||||||||
| LOCKBOXES | 19 – 24 | 4 | 282,000,000 | 21.7 | ||||||||||
| Number of | 25 – 36 | 2 | 45,300,000 | 3.5 | ||||||||||
| Mortgage | Aggregate Cut- | % of Cut-off | Total: | 8 | $364,175,000 | 28.0% | ||||||||
| Type of Lockbox | Loans | off Date Balance | Date Balance | Weighted Average: | 24 | |||||||||
| Hard/Springing Cash | * Excludes non-amortizing loans and amortizing loans that do not provide for a partial interest-only period. | |||||||||||||
| Management | 33 | $720,531,725 | 55.4% | |||||||||||
| Soft/Springing Cash | ||||||||||||||
| Management | 16 | 246,521,501 | 18.9 | SEASONING | ||||||||||
| Hard/Upfront Cash | Number of | |||||||||||||
| Management | 8 | 197,411,109 | 15.2 | Mortgage | Aggregate Cut- | % of Cut-off | ||||||||
| None | 11 | 66,208,886 | 5.1 | Seasoning (months) | Loans | off Date Balance | Date Balance | |||||||
| Springing (Without | 0 | 1 | $44,000,000 | 3.4% | ||||||||||
| Established Account) | 10 | 61,288,081 | 4.7 | 1 – 3 | 73 | 1,110,246,050 | 85.3 | |||||||
| Springing (With | 4 – 6 | 4 | 37,429,073 | 2.9 | ||||||||||
| Established Account) | 2 | 8,989,279 | 0.7 | 10 – 12 | 1 | 19,944,076 | 1.5 | |||||||
| Total: | 80 | $1,300,950,580 | 100.0% | 13 – 16 | 1 | 89,331,381 | 6.9 | |||||||
| Total: | 80 | $1,300,950,580 | 100.0% | |||||||||||
| PREPAYMENT PROVISION SUMMARY | Weighted Average: | 3 | ||||||||||||
| Number of | ||||||||||||||
| Mortgage | Aggregate Cut- | % of Cut-off | ||||||||||||
| Prepayment Provision | Loans | off Date Balance | Date Balance | |||||||||||
| Lockout/Defeasance/Open | 64 | $983,374,294 | 75.6% | |||||||||||
| Lockout/YM%/Open | 14 | 314,540,139 | 24.2 | |||||||||||
| Lockout/YM% or Defeasance/Open | 2 | 3,036,147 | 0.2 | |||||||||||
| Total: | 80 | $1,300,950,580 | 100.0% | |||||||||||
THE INFORMATION IN THIS STRUCTURAL AND COLLATERAL TERM SHEET IS NOT COMPLETE AND MAY BE AMENDED PRIOR TO THE TIME OF SALE. THIS TERM SHEET IS NOT AN OFFER TO SELL THESE SECURITIES AND IT IS NOT A SOLICITATION OF AN OFFER TO BUY THESE SECURITIES IN ANY JURISDICTION WHERE THE OFFER OR SALE IS NOT PERMITTED.
15
| WFRBS Commercial Mortgage Trust 2012-C8 | Certain Terms and Conditions |
V. Certain Terms and Conditions
| Interest Entitlements: | The interest entitlement of each Class of Offered Certificates on each Distribution Date generally will be the interest accrued during the related Interest Accrual Period on the related Certificate Principal Balance or Notional Amount at the related pass-through rate, net of any prepayment interest shortfalls allocated to that Class for such Distribution Date as described below. If prepayment interest shortfalls arise from voluntary prepayments (without special servicer consent) on non-specially serviced mortgage loans during any collection period, the Master Servicer is required to make a compensating interest payment to offset those shortfalls, generally up to an amount equal to the portion of its master servicing fees that accrue at one basis point per annum. The remaining amount of prepayment interest shortfalls will be allocated to reduce the interest entitlement on all Classes of Certificates (other than the Class X-A and Class X-B Certificates), pro rata, based on their respective amounts of accrued interest for the related Distribution Date. If a Class receives less than the entirety of its interest entitlement on any Distribution Date, then the shortfall will be added to its interest entitlement for the next succeeding Distribution Date. Interest entitlements on the Class E, D, C and B Certificates, in that order, may be reduced by certain Trust Advisor expenses. | ||
| Principal Distribution Amount: | The Principal Distribution Amount for each Distribution Date generally will be the aggregate amount of principal received or advanced in respect of the mortgage loans, net of any nonrecoverable advances and interest thereon that are reimbursed to the Master Servicer, the Special Servicer or the Trustee during the related collection period. Nonrecoverable advances and interest thereon are reimbursable from principal collections and advances before reimbursement from other amounts. The Principal Distribution Amount may also be reduced, with a corresponding loss to the Class E, D, C, B and A-S Certificates, then to the Class A-1, A-2, A-3, A-SB Certificates and Class A-FX Regular Interest (with any losses on the Class A-1, A-2, A-3, A-SB Certificates and Class A-FX Regular Interest allocated pro rata according to their respective Certificate Principal Balances immediately prior to that Distribution Date), in that order, in connection with certain Trust Advisor expenses to the extent that interest entitlements on the Class E, D, C and B Certificates are insufficient to absorb the effect of the expense on any particular Distribution Date. | ||
| Distributions: | On each Distribution Date, funds available for distribution from the mortgage loans, net of specified trust fees, expenses and reimbursements will generally be distributed in the following amounts and order of priority (in each case to the extent of remaining available funds): | ||
1. Class A-1, A-2, A-3, A-SB, X-A and X-B Certificates and Class A-FX Regular Interest: To interest on the Class A-1, A-2, A-3, A-SB, X-A and X-B Certificates and the Class A-FX Regular Interest, pro rata, according to their respective interest entitlements. | |||
2. Class A-1, A-2, A-3, A-SB Certificates and Class A-FX Regular Interest: To principal on the Class A-1, A-2, A-3, A-SB Certificates and Class A-FX Regular Interest in the following amounts and order of priority: (i) first, to principal on the Class A-SB Certificates, in an amount equal to the Principal Distribution Amount for such Distribution Date, until their Certificate Principal Balance is reduced to the Class A-SB Planned Principal Balance; (ii) second, to principal on the Class A-1 Certificates until their Certificate Principal Balance is reduced to zero, up to the remainder of the Principal Distribution Amount for such Distribution Date; (iii) third, to principal on the Class A-2 Certificates until their Certificate Principal Balance is reduced to zero, up to the remainder of the Principal Distribution Amount for such Distribution Date; (iv) fourth, to principal on the Class A-FX Regular Interest (and, therefore, to the holders of the Class A-FX and Class A-FL Certificates) until its Principal Balance is reduced to zero, up to the remainder of the Principal Distribution Amount for such Distribution Date; (v) fifth, to principal on the Class A-3 Certificates until their Certificate Principal Balance is reduced to zero, up to the remainder of the Principal Distribution Amount for such Distribution Date; (vi) sixth, to principal on the Class A-SB Certificates until their Certificate Principal Balance is reduced to zero, up to the remainder of the Principal Distribution Amount for such Distribution Date. However, if the Certificate Principal Balance of each and every Class of Principal Balance Certificates other than the Class A-1, A-2, A-3, A-SB Certificates and Class A-FX Regular Interest has been reduced to zero as a result of the allocation of Mortgage Loan losses and expenses and any of the Class A-1, A-2, A-3, A-SB Certificates and Class A-FX Regular Interest remain outstanding, then the Principal Distribution Amount will be distributed on the Class A-1, A-2, A-3, A-SB Certificates and Class A-FX Regular Interest, pro rata, based on their respective outstanding Certificate Principal Balances, until their Certificate Principal Balances have been reduced to zero. |
THE INFORMATION IN THIS STRUCTURAL AND COLLATERAL TERM SHEET IS NOT COMPLETE AND MAY BE AMENDED PRIOR TO THE TIME OF SALE. THIS TERM SHEET IS NOT AN OFFER TO SELL THESE SECURITIES AND IT IS NOT A SOLICITATION OF AN OFFER TO BUY THESE SECURITIES IN ANY JURISDICTION WHERE THE OFFER OR SALE IS NOT PERMITTED.
16
| WFRBS Commercial Mortgage Trust 2012-C8 | Certain Terms and Conditions |
3. Class A-1, A-2, A-3, A-SB Certificates and Class A-FX Regular Interest: To reimburse the holders of the Class A-1, A-2, A-3, A-SB Certificates and Class A-FX Regular Interest (and, therefore, to the holders of the Class A-FX and A-FL Certificates), pro rata, for any previously unreimbursed losses (other than certain Trust Advisor expenses) on the mortgage loans that were previously allocated in reduction of the Certificate Principal Balances of such Classes. | |||
4. Class A-S Certificates: To make distributions on the Class A-S Certificates as follows: (a) first, to interest on the Class A-S Certificates in the amount of the interest entitlement for that Class; (b) next, to the extent of the portion of the Principal Distribution Amount remaining after distributions in respect of principal to each Class with a higher distribution priority (in this case, the Class A-1, A-2, A-3 and A-SB Certificates and Class A-FX Regular Interest), to principal on Class A-S Certificates until their Certificate Principal Balance is reduced to zero; and (c) next, to reimburse the holders of the Class A-S Certificates for any previously unreimbursed losses (other than certain Trust Advisor expenses) on the mortgage loans that were previously allocated to that Class in reduction of its Certificate Principal Balance. | |||
5. Class B Certificates: To make distributions on the Class B Certificates as follows: (a) first, to interest on the Class B Certificates in the amount of the interest entitlement for that Class; (b) next, to the extent of the portion of the Principal Distribution Amount remaining after distributions in respect of principal to each Class with a higher distribution priority (in this case, the Class A-1, A-2, A-3, A-SB and A-S Certificates and Class A-FX Regular Interest), to principal on Class B Certificates until their Certificate Principal Balance is reduced to zero; and (c) next, to reimburse the holders of the Class B Certificates for any previously unreimbursed losses (other than certain Trust Advisor expenses) on the mortgage loans that were previously allocated to that Class in reduction of its Certificate Principal Balance. | |||
6. Class C Certificates: To make distributions on the Class C Certificates as follows: (a) first, to interest on the Class C Certificates in the amount of the interest entitlement for that Class; (b) next, to the extent of the portion of the Principal Distribution Amount remaining after distributions in respect of principal to each Class with a higher distribution priority (in this case, the Class A-1, A-2, A-3, A-SB, A-S and B Certificates and Class A-FX Regular Interest), to principal on Class C Certificates until their Certificate Principal Balance is reduced to zero; and (c) next, to reimburse the holders of the Class C Certificates for any previously unreimbursed losses (other than certain Trust Advisor expenses) on the mortgage loans that were previously allocated to that Class in reduction of its Certificate Principal Balance. | |||
7. After the Class A-1, A-2, A-3, A-SB, A-S, B and C Certificates and Class A-FX Regular Interest are paid all amounts to which they are entitled, the remaining funds available for distribution will be used to pay interest, principal and loss reimbursement amounts (other than certain Trust Advisor expenses) on the Class D, E, F, G and H Certificates sequentially in that order in a manner analogous to the Class C Certificates. | |||
8. Amounts distributed in respect of the Class A-FX Regular Interest will generally be allocated between the Class A-FX and A-FL Certificates in accordance with their class percentage interests. |
THE INFORMATION IN THIS STRUCTURAL AND COLLATERAL TERM SHEET IS NOT COMPLETE AND MAY BE AMENDED PRIOR TO THE TIME OF SALE. THIS TERM SHEET IS NOT AN OFFER TO SELL THESE SECURITIES AND IT IS NOT A SOLICITATION OF AN OFFER TO BUY THESE SECURITIES IN ANY JURISDICTION WHERE THE OFFER OR SALE IS NOT PERMITTED.
17
| WFRBS Commercial Mortgage Trust 2012-C8 | Certain Terms and Conditions |
| Allocation of Yield Maintenance and Prepayment Premiums: | If any yield maintenance charges and prepayment premiums are collected during any particular collection period with respect to any mortgage loan, then on the distribution date corresponding to that collection period, the certificate administrator will pay a portion of the yield maintenance charges and prepayment premiums (net of liquidation fees payable therefrom) in the following manner: (1) pro rata, between (x) the group (the “YM Group A”) of the Class A-1, A-2, A-3, A-SB, A-S and X-A Certificates and the Class A-FX Regular Interest, and (y) the group (the “YM Group B” and, collectively with the YM Group A, the “YM Groups”) of the Class B, C, D, E and X-B Certificates, based upon the aggregate amount of principal distributed to the classes of principal balance certificates in each YM Group for that distribution date, and (2) among the classes of certificates in each YM Group, in the following manner, up to an amount equal to the product of (a) the yield maintenance or prepayment premium allocated to such YM Group, (b) the related Base Interest Fraction (as defined in the Free Writing Prospectus), and (c) a fraction, which in no event may be greater than 1.0, the numerator of which is equal to the amount of principal distributed to the holder(s) of such class for that distribution date, and the denominator of which is the aggregate amount of principal distributed to all the certificates in that YM Group for that distribution date. Any yield maintenance charges or prepayment premium allocated to such YM Group remaining after such distributions will be distributed to the Class X-A and/or Class X-B Certificates, as applicable, in such YM Group. | ||
No prepayment premiums or yield maintenance charges will be distributed to the holders of the Class F, G, H, V or R Certificates. The holders of the Class X-B Certificates will be entitled to all prepayment premiums and yield maintenance charges collected after the Class A-1, A-2, A-3, A-SB, A-S, B, C, D and E Certificates and Class A-FX Regular Interest (and, therefore, the Class A-FX and Class A-FL Certificates) are retired. For a description of when prepayment premiums and yield maintenance charges are generally required on the mortgage loans, see Annex A-1 to the Free Writing Prospectus. See also “Risk Factors – Risks Relating to Enforceability of Yield Maintenance Charges, Prepayment Premiums or Defeasance Provisions” in the prospectus attached to the Free Writing Prospectus. Prepayment premiums and yield maintenance charges will be distributed on each Distribution Date only to the extent they are actually received on the mortgage loans as of the related Determination Date. | |||
| Realized Losses: | The Certificate Principal Balances of the Class A-1, A-2, A-3, A-SB, A-S, B, C, D, E, F, G and H Certificates and the Class A-FX Regular Interest (and, therefore, the Class A-FX and Class A-FL Certificates) will be reduced without distribution on any Distribution Date as a write-off to the extent of any losses realized on the mortgage loans allocated to such Class on such Distribution Date. Such losses (other than certain Trust Advisor expenses) will be applied in the following order, in each case until the related Certificate Principal Balance is reduced to zero: first, to Class H; second, to Class G; third, to Class F; fourth, to Class E; fifth, to Class D; sixth, to Class C; seventh, to Class B; eighth, to Class A-S; and, finally, pro rata, to Classes A-1, A-2, A-3, A-SB and the Class A-FX Regular Interest (and, therefore, to holders of the Class A-FX and the Class A-FL Certificates) based on their outstanding Certificate Principal Balances. Certain Trust Advisor expenses (if not absorbed by reductions of interest entitlements on Classes E, D, C and B Certificates) will be applied as write-offs in a similar manner, except that such write-offs will be applied only to the Class E, D, C, B, and A-S Certificates, in that order, and then to the Class A-1, A-2, A-3 and A-SB Certificates and the Class A-FX Regular Interest pro rata according to their respective Certificate Principal Balances immediately prior to that Distribution Date. The notional amount of the Class X-A Certificates will be reduced by the amount of all losses that are allocated to the Class A-1, A-2, A-3, A-SB or A-S Certificates or Class A-FX Regular Interest as write-offs in reduction of their Certificate Principal Balances. The notional amount of the Class X-B Certificates will be reduced by the amount of all losses that are allocated to the Class B, C, D, E, F, G or H Certificates as write-offs in reduction of their Certificate Principal Balances. | ||
| Debt Service Advances: | The Master Servicer or, if the Master Servicer fails to do so, the Trustee, will be obligated to advance delinquent debt service payments (other than balloon payments, excess interest on ARD loans and default interest) and assumed debt service payments on the mortgage loans (other than the 100 Church Street pari passu companion loan), except to the extent they are deemed non-recoverable from collections on the related mortgage loan. In addition, if an Appraisal Reduction Amount exists for a given mortgage loan, the interest portion of any debt service advance for such mortgage loan will be reduced, which will have the effect of reducing the amount of interest available for distribution to the Certificates in reverse alphabetical order of their Class designations (except that interest payments on the Class A-1, A-2, A-3, A-SB, X-A and X-B Certificates and the Class A-FX Regular Interest would be affected on a pari passu basis). |
THE INFORMATION IN THIS STRUCTURAL AND COLLATERAL TERM SHEET IS NOT COMPLETE AND MAY BE AMENDED PRIOR TO THE TIME OF SALE. THIS TERM SHEET IS NOT AN OFFER TO SELL THESE SECURITIES AND IT IS NOT A SOLICITATION OF AN OFFER TO BUY THESE SECURITIES IN ANY JURISDICTION WHERE THE OFFER OR SALE IS NOT PERMITTED.
18
| WFRBS Commercial Mortgage Trust 2012-C8 | Certain Terms and Conditions |
| Servicing Advances: | The Master Servicer or, if the Master Servicer fails to do so, the Trustee, will be obligated to make servicing advances with respect to each mortgage loan (other than the non-serviced mortgage loans), including the payment of delinquent property taxes, insurance premiums and ground rent, except to the extent that those advances are deemed non-recoverable from collections on the related mortgage loan. | ||
| Appraisal Reduction Amounts: | An Appraisal Reduction Amount generally will be created in the amount, if any, by which the principal balance of a required appraisal loan (which is a mortgage loan with respect to which certain defaults, modifications or insolvency events have occurred as further described in the Free Writing Prospectus) plus other amounts overdue or advanced in connection with such mortgage loan exceeds 90% of the appraised value of the related mortgaged property plus certain escrows and reserves (including letters of credit) held with respect to the mortgage loan. | ||
A mortgage loan will cease to be a required appraisal loan when the same has ceased to be a specially serviced mortgage loan (if applicable), has been brought current for at least three consecutive months and no other circumstances exist that would cause such mortgage loan to be a required appraisal loan. | |||
Appraisal Reduction Amounts will affect the amount of debt service advances on the related mortgage loan. Appraisal Reduction Amounts will also be taken into account in the determination of the identity of the Class whose majority constitutes the “majority subordinate certificateholder” and is entitled to appoint the subordinate class representative. | |||
| Clean-Up Call and Exchange Termination: | On each Distribution Date occurring after the aggregate unpaid principal balance of the mortgage loans is reduced below 1% of the initial aggregate principal balance of the mortgage loans as of the Cut-off Date, certain specified persons will have the option to purchase all of the remaining mortgage loans (and the Trust’s interest in all property acquired through exercise of remedies in respect of any mortgage loan) at the price specified in the Free Writing Prospectus. Exercise of the option will terminate the trust and retire the then-outstanding certificates. | ||
If the aggregate Certificate Principal Balances of each of the Class A-1, A-2, A-3, A-SB, A-S, B, C, D and E Certificates and Class A-FX Regular Interest (and, therefore, the Class A-FX and Class A-FL Certificates) have been reduced to zero, the trust may also be terminated in connection with an exchange of all the then-outstanding certificates, including the Class X-B Certificates, for the mortgage loans and REO properties then remaining in the issuing entity, but all of the holders of those Classes of outstanding certificates would have to voluntarily participate in the exchange. | |||
| Liquidated Loan Waterfall: | Following the liquidation of any loan or property, the net liquidation proceeds generally will be applied (after reimbursement of advances and certain trust fund expenses), first, as a recovery of accrued interest, other than default interest, excess interest and delinquent interest that was not advanced as a result of Appraisal Reduction Amounts, and then as a recovery of principal until all principal has been recovered. Any liquidation proceeds remaining thereafter will be applied as a recovery to delinquent interest that was not advanced as a result of Appraisal Reduction Amounts. | ||
| Majority Subordinate Certificateholder and Subordinate Class Representative: | A subordinate class representative may be appointed by the “majority subordinate certificate-holder”, which will be the holder(s) of a majority of: (a) during a “subordinate control period”, the most subordinate class among the Class F, G and H Certificates that has a Certificate Principal Balance, as notionally reduced by any Appraisal Reduction Amounts allocable to that class, that is at least equal to 25% of its total initial principal balance and (b) during a “collective consultation period”, the most subordinate class among the Class F, G and H Certificates that has a total principal balance, without regard to Appraisal Reduction Amounts, that is at least equal to 25% of its initial Certificate Principal Balance. The majority subordinate certificateholder will have a continuing right to appoint, remove or replace the subordinate class representative in its sole discretion. This right may be exercised at any time and from time to time. See “Servicing of the Mortgage Loans and Administration of the Trust Fund - The Majority Subordinate Certificateholder and the Subordinate Class Representative” in the Free Writing Prospectus. | ||
| Control and Consultation: | The rights of various parties to replace the Special Servicer and approve or consult with respect to major actions of the Special Servicer will vary according to defined periods. A “subordinate control period” will exist when the Class F Certificates have a Certificate Principal Balance, net of any Appraisal Reduction Amounts allocable to that class, that is not less than 25% of the initial principal balance of that class. In general, during a subordinate control period, (i) the subordinate class representative will be entitled to grant or withhold approval of asset status reports prepared, and material servicing actions proposed, by the Special Servicer with respect to the mortgage loans (other than the non-serviced mortgage loans), and (ii) the majority subordinate |
THE INFORMATION IN THIS STRUCTURAL AND COLLATERAL TERM SHEET IS NOT COMPLETE AND MAY BE AMENDED PRIOR TO THE TIME OF SALE. THIS TERM SHEET IS NOT AN OFFER TO SELL THESE SECURITIES AND IT IS NOT A SOLICITATION OF AN OFFER TO BUY THESE SECURITIES IN ANY JURISDICTION WHERE THE OFFER OR SALE IS NOT PERMITTED.
19
| WFRBS Commercial Mortgage Trust 2012-C8 | Certain Terms and Conditions |
certificateholder, or the subordinate class representative on its behalf, will be entitled to terminate and replace the Special Servicer with or without cause, and appoint itself or another person as the successor special servicer. It will be a condition to such appointment that Fitch, KBRA and Moody’s confirm that the appointment would not result in a qualification, downgrade or withdrawal of any of their then-current ratings of certificates. A “collective consultation period” will exist when the Class F Certificates have a Certificate Principal Balance that both (i) as notionally reduced by any Appraisal Reduction Amounts allocable to that class, is less than 25% of its initial principal balance and (ii) without regard to any Appraisal Reduction Amounts allocable to that class, is 25% or more of its initial Certificate Principal Balance. In general, during a collective consultation period, the Special Servicer will be required to consult with each of the subordinate class representative and the Trust Advisor in connection with asset status reports and material special servicing actions with respect to the mortgage loans (other than the non-serviced mortgage loans). A “senior consultation period” will exist when either (i) the Class F certificates have an aggregate principal balance, without regard to any appraisal reduction amounts allocable to that class, that is less than 25% of its initial principal balance or (ii) during such time as the Class F certificates are the most subordinate class of control-eligible certificates that have a then outstanding principal balance, net of appraisal reduction amounts, at least equal to 25% of its initial principal balance, the then majority subordinate certificateholder has irrevocably waived its right to appoint a subordinate class representative and to exercise any of the rights of the majority subordinate certificateholder or cause the exercise of the rights of the subordinate class representative and such rights have not been reinstated to a successor majority subordinate certificateholder as set forth in the pooling and servicing agreement.In general, during a senior consultation period, the Special Servicer must seek to consult with the Trust Advisor in connection with asset status reports and material special servicing actions, and, in general, no subordinate class representative will be recognized or have any right to terminate the Special Servicer or approve, direct or consult with respect to servicing matters. With respect to the 100 Church Street loan combination, the rights of the subordinate class representative described above will be subject to the consultation rights of the holder of the related pari passu companion loan described under “Loan Combinations” below. | |||
With respect to the Northridge Fashion Center mortgage loan and Town Center at Cobb mortgage loan, sometimes referred to herein as the “non-serviced mortgage loans”, the majority subordinate certificateholder under the WFRBS 2012-C7 securitization will be subject to control and consultation periods substantially similar to the above provisions; provided, however, that the occurrence and continuance of a collective consultation period or senior consultation period with respect to the subordinate class representative under this transaction will have no effect on the rights of the subordinate class representative under the WFRBS 2012-C7 securitization. | |||
| Replacement of Special Servicer by General Vote of Certificateholders: | During any “collective consultation period” or “senior consultation period”, the Special Servicer may be terminated and replaced upon the affirmative direction of certificate owners holding not less than 75% of the appraisal-reduced voting rights of all certificates, following a proposal from certificate owners holding not less than 25% of the appraisal-reduced voting rights of all certificates. The certificateholders who initiate a vote on a termination and replacement of the Special Servicer without cause must cause Fitch, KBRA and Moody’s to confirm the then-current ratings of the certificates (or decline to review the matter) and cause the payment of the fees and expenses incurred in the replacement. During a subordinate control period in the WFRBS 2012-C7 transaction, the majority subordinate certificateholder under the WFRBS 2012-C7 securitization has the right to replace the party acting as special servicer with respect to each non-serviced mortgage loan and appoint a successor special servicer for the WFRBS 2012-C7 securitization that will act as special servicer with respect to such non-serviced mortgage loan. | ||
Appraisal Remedy: | Solely for purposes of determining whether a “subordinate control period” is in effect, whenever the Special Servicer obtains an appraisal or updated appraisal under the pooling and servicing agreement, the subordinate class representative with respect to the mortgage loans (other than the non-serviced mortgage loans) will have the right (at its expense) to direct the Special Servicer to hire a qualified appraiser to prepare a second appraisal of the mortgaged property. The Special Servicer must thereafter determine whether, based on its assessment of such second appraisal, any recalculation of the Appraisal Reduction Amount is warranted. The Appraisal Reduction Amount, whether based on the first or the second appraisal, will become effective following the second appraisal, except that the Appraisal Reduction Amount based on the first appraisal shall become effective if the subordinate class representative declines to demand a second appraisal within a specified number of business days, or if a second appraisal is not received within 90 days after the direction of the subordinate class representative. In addition, for the same purposes, if there is a material change in the mortgaged property securing any mortgage loan for which an Appraisal Reduction Amount has been calculated, the majority certificateholder of the Class F, G or |
THE INFORMATION IN THIS STRUCTURAL AND COLLATERAL TERM SHEET IS NOT COMPLETE AND MAY BE AMENDED PRIOR TO THE TIME OF SALE. THIS TERM SHEET IS NOT AN OFFER TO SELL THESE SECURITIES AND IT IS NOT A SOLICITATION OF AN OFFER TO BUY THESE SECURITIES IN ANY JURISDICTION WHERE THE OFFER OR SALE IS NOT PERMITTED.
20
| WFRBS Commercial Mortgage Trust 2012-C8 | Certain Terms and Conditions |
H Certificates will be entitled (at its expense) to present an additional appraisal to the Special Servicer, which will generally be required to recalculate the Appraisal Reduction Amount based upon such additional appraisal. This latter right may not be exercised more frequently than once in any 12-month period for each mortgage loan for which an Appraisal Reduction Amount was calculated and can only be exercised during a subordinate control period or a collective consultation period as further described in the Free Writing Prospectus. | |||
| Sale of Defaulted Assets: | There will be no “fair value” purchase option. Instead, the pooling and servicing agreement will authorize the Special Servicer to sell defaulted mortgage loans (other than the non-serviced mortgage loans) to the highest bidder in a manner generally similar to sales of REO properties. Subject to certain limitations set forth in the related intercreditor agreement, the 100 Church Street mortgage loan may not be sold unless that mortgage loan and the related pari passu companion loan are sold together as one whole loan. The sale of a defaulted loan (other than the non-serviced mortgage loans) for less than par plus accrued interest and certain other fees and expenses owed on the loan will be subject to consent or consultation rights of the subordinate class representative and/or Trust Advisor and, in the case of the 100 Church Street mortgage loan, consultation rights of the holder of the related pari passu companion loan, as described in the Free Writing Prospectus. | ||
Pursuant to the WFRBS 2012-C7 pooling and servicing agreement, the party acting as special servicer with respect to each non-serviced mortgage loan may offer to sell to any person (or may offer to purchase) for cash either non-serviced loan combination during such time as such non-serviced loan combination constitutes a defaulted mortgage loan, and, in connection with any such sale, the special servicer under the WFRBS 2012-C7 securitization is required to sell both the pari passu mortgage loan and related non-serviced pari passu companion loan in any such non-serviced loan combination as a whole loan. | |||
| “As-Is” Appraisals: | Appraisals must be conducted on an “as-is” basis, and must be no more than 9 months old, for purposes of determining Appraisal Reduction Amounts, market value in connection with REO sales, etc. Required appraisals may consist of updates of prior appraisals. Internal valuations by the Special Servicer are permitted if the principal balance of a mortgage loan is less than $2,000,000. | ||
| Trust Advisor: | The Trust Advisor will perform certain review duties that will generally include a limited annual review of and report regarding the Special Servicer to the Certificate Administrator. The review and report generally will be based on: (a) during a collective consultation period or senior consultation period, any asset status reports and additional information delivered to the Trust Advisor by the Special Servicer with respect to any mortgage loan (other than the non-serviced pari passu mortgage loans), and/or (b) during a senior consultation period, in addition to the applicable information described above, a meeting with the Special Servicer to conduct a limited review of the Special Servicer’s operational practices on a platform basis in light of the servicing standard. In addition, during any collective consultation period or senior consultation period, the Special Servicer must seek to consult with the Trust Advisor (in addition to the subordinate class representative during a collective consultation period) in connection with material special servicing actions with respect to specially serviced mortgage loans (other than non-serviced mortgage loans). Furthermore, under certain circumstances, but only during a senior consultation period, the Trust Advisor may recommend the replacement of the Special Servicer, in which case the Certificate Administrator will deliver notice of such recommendation to the certificateholders, and certificateholders with specified percentages of the voting rights may direct the replacement of the Special Servicer at their expense. | ||
| The Trust Advisor may be removed and replaced without cause upon the affirmative direction of certificates owners holding not less than 75% of the appraisal-reduced voting rights of all certificates, following a proposal from certificate owners holding not less than 25% of the appraisal-reduced voting rights of all certificates. The certificateholders who initiate a vote on a termination and replacement of the Trust Advisor without cause must cause Fitch, KBRA and Moody’s to confirm the then-current ratings of the certificates (or decline to review the matter) and cause the payment of the fees and expenses incurred in the replacement. During any “subordinate control period”, the proposed replacement trust advisor will be subject to the subordinate class representative’s consent (such consent not to be unreasonably withheld). If a proposed termination and replacement of the Trust Advisor is not consummated within 180 days following the initial request of the certificateholders who requested a vote, the proposed termination and replacement shall have no further force or effect. The Trust Advisor will be discharged from its duties if and when the Class A-1, A-2, A-FX, A-FL, A-3, A-SB, A-S, B, C, D and E Certificates are retired. |
THE INFORMATION IN THIS STRUCTURAL AND COLLATERAL TERM SHEET IS NOT COMPLETE AND MAY BE AMENDED PRIOR TO THE TIME OF SALE. THIS TERM SHEET IS NOT AN OFFER TO SELL THESE SECURITIES AND IT IS NOT A SOLICITATION OF AN OFFER TO BUY THESE SECURITIES IN ANY JURISDICTION WHERE THE OFFER OR SALE IS NOT PERMITTED.
21
| WFRBS Commercial Mortgage Trust 2012-C8 | Certain Terms and Conditions |
| Certain Fee Offsets: | If a workout fee is earned by the Special Servicer following a loan default, then certain limitations will apply to the collection and retention of a modification fee from the borrower. The modification fee generally must not exceed 1% of the principal balance of the loan as modified. In addition, if the loan re-defaults within a specified period of months and other conditions are satisfied, any subsequent workout or liquidation fee on that loan must be reduced by a portion of the previously-collected modification fee. | ||
| Deal Website: | The Certificate Administrator will be required to maintain a deal website which will include, among other items: (a) summaries of asset status reports prepared by the Special Servicer, (b) inspection reports, (c) appraisals, (d) various “special notices” described in the Free Writing Prospectus, (e) the “Investor Q&A Forum” and (f) a voluntary “Investor Registry”. Investors may access the deal website following execution of a certification and confidentiality agreement. | ||
| Initial Majority Subordinate Certificateholder: | It is expected that RREF CMBS AIV, LP, an affiliate of Rialto Real Estate Fund, LP, will be the initial majority subordinate certificateholder. | ||
| Loan Combinations: | Each of the mortgaged properties identified on Annex A-1 to the Free Writing Prospectus as 100 Church Street, the mortgaged property identified on Annex A-1 to the Free Writing Prospectus as Northridge Fashion Center and the mortgaged property identified on Annex A-1 to the Free Writing Prospectus as Town Center at Cobb secures both a mortgage loan to be included in the trust fund and one other mortgage loan that will not be included in the trust fund, which will be pari passu in right of payment with the trust mortgage loan. With respect to each group of mortgage loans, which we refer to herein as a “loan combination”, only the 100 Church Street loan combination will be principally serviced under the pooling and servicing agreement. The Northridge Fashion Center loan combination and the Town Center at Cobb loan combination will be serviced under the WFRBS 2012-C7 pooling and servicing agreement. | ||
With respect to the 100 Church Street pari passu mortgage loan, the servicing and administration of such loan combination will be conducted according to substantially the same provisions as apply to mortgage loans that are not included in a loan combination, except that the holder of the pari passu companion loan, or a representative thereof, will have rights to certain consultation rights with respect to the servicing of the loan combinations. With respect to the Northridge Fashion Center pari passu mortgage loan and Town Center at Cobb pari passu mortgage loan, the servicing and administration of each related loan combination will be conducted according to substantially the same provisions as apply to mortgage loans that are not included in a loan combination, except that the holder of each of the Northridge Fashion Center mortgage loan and Town Center at Cobb mortgage loan, or a representative thereof, will have certain notice and consultation rights with respect to the related loan combination. As of the closing date, the 100 Church Street pari passu companion loan will be held by the related mortgage loan seller, which will reserve the right to sell the companion loan to a third party at any time (including securitizations). |
THE INFORMATION IN THIS STRUCTURAL AND COLLATERAL TERM SHEET IS NOT COMPLETE AND MAY BE AMENDED PRIOR TO THE TIME OF SALE. THIS TERM SHEET IS NOT AN OFFER TO SELL THESE SECURITIES AND IT IS NOT A SOLICITATION OF AN OFFER TO BUY THESE SECURITIES IN ANY JURISDICTION WHERE THE OFFER OR SALE IS NOT PERMITTED.
22
(THIS PAGE INTENTIONALLY LEFT BLANK)
23
| 100 CHURCH STREET |

THE INFORMATION IN THIS STRUCTURAL AND COLLATERAL TERM SHEET IS NOT COMPLETE AND MAY BE AMENDED PRIOR TO THE TIME OF SALE. THIS TERM SHEET IS NOT AN OFFER TO SELL THESE SECURITIES AND IT IS NOT A SOLICITATION OF AN OFFER TO BUY THESE SECURITIES IN ANY JURISDICTION WHERE THE OFFER OR SALE IS NOT PERMITTED.
24
| 100 CHURCH STREET |
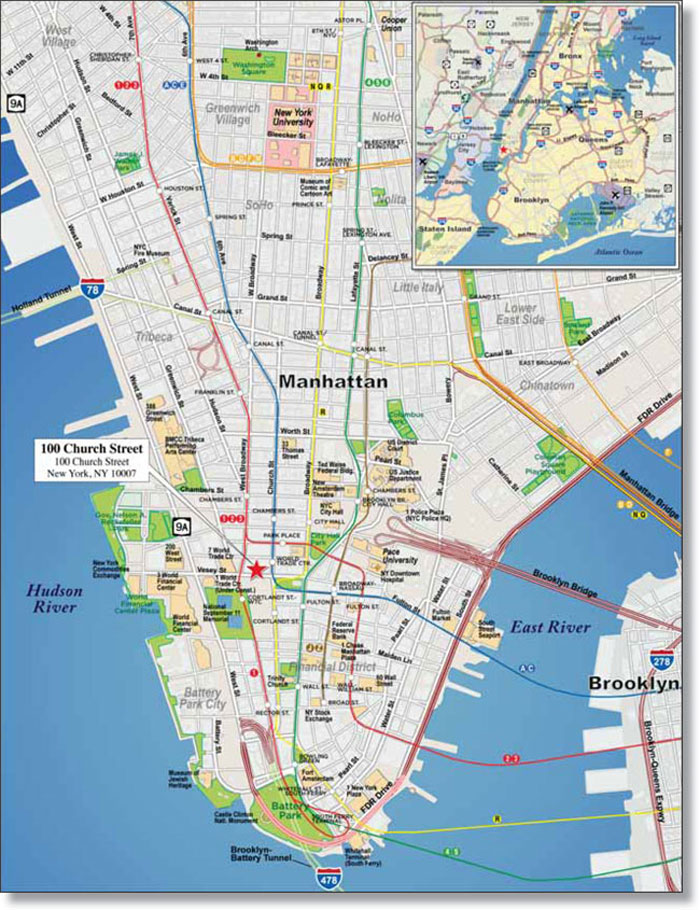
THE INFORMATION IN THIS STRUCTURAL AND COLLATERAL TERM SHEET IS NOT COMPLETE AND MAY BE AMENDED PRIOR TO THE TIME OF SALE. THIS TERM SHEET IS NOT AN OFFER TO SELL THESE SECURITIES AND IT IS NOT A SOLICITATION OF AN OFFER TO BUY THESE SECURITIES IN ANY JURISDICTION WHERE THE OFFER OR SALE IS NOT PERMITTED.
25
| 100 Church Street | |||||||
| Loan Information | Property Information | ||||||
| Mortgage Loan Seller: | Wells Fargo Bank, National Association | Single Asset/Portfolio: | Single Asset | ||||
Credit Assessment (Fitch/KBRA/Moody’s): | NR/NR/NR | Property Type: | Office | ||||
Original Principal Balance(1): | $150,000,000 | Specific Property Type: | CBD | ||||
Cut-off Date Principal Balance(1): | $150,000,000 | Location: | New York, NY | ||||
| % of Initial Pool Balance: | 11.5% | Size: | 1,099,455 SF | ||||
| Loan Purpose: | Refinance | Cut-off Date Principal Balance Per Unit/SF(1): | $209.19 | ||||
| Borrower Name: | 100 Church Fee Owner LLC | ||||||
| Sponsor: | SL Green Realty Corp. | Year Built/Renovated: | 1958/2012 | ||||
| Mortgage Rate: | 4.675% | Occupancy %(7): | 84.4% | ||||
| Note Date: | June 15, 2012 | Occupancy % Source Date: | May 31, 2012 | ||||
| Anticipated Repayment Date: | NAP | Title Vesting: | Fee | ||||
| Maturity Date: | July 1, 2022 | Property Manager: | SLG Management Company LLC | ||||
| IO Period: | 24 months | ||||||
| Loan Term (Original): | 120 months | 3rd Most Recent NOI (As of)(8): | $7,736,015 (12/31/2010) | ||||
| Seasoning: | 1 month | 2nd Most Recent NOI (As of)(8): | $9,417,449 (12/31/2011) | ||||
| Amortization Term (Original): | 360 months | Most Recent NOI (As of)(8): | $12,964,358 (TTM 5/31/2012) | ||||
| Loan Amortization Type: | Interest-only, Amortizing Balloon | ||||||
| Interest Accrual Method: | Actual/360 | U/W Revenues: | $34,666,141 | ||||
| Call Protection: | L(25),D(91),O(4) | U/W Expenses: | $14,014,379 | ||||
| Lockbox Type: | Hard/Springing Cash Management | U/W NOI(8): | $20,651,762 | ||||
Additional Debt(1): | Yes | U/W NCF(8): | $19,040,909 | ||||
Additional Debt Type(1): | Pari Passu | U/W NOI DSCR(1): | 1.45x | ||||
U/W NCF DSCR(1): | 1.33x | ||||||
| Escrows and Reserves: | U/W NOI Debt Yield(1): | 9.0% | |||||
U/W NCF Debt Yield(1): | 8.3% | ||||||
| Type: | Initial | Monthly | Cap (If Any) | As-Is Appraised Value(9): | $391,000,000 | ||
Taxes(2) | $0 | Springing | NAP | As-Is Appraisal Valuation Date: | April 11, 2012 | ||
Insurance(3) | $0 | Springing | NAP | Cut-off Date LTV Ratio(1)(9): | 58.8% | ||
Replacement Reserves(4) | $0 | Springing | $443,256 | LTV Ratio at Maturity or ARD(1)(9): | 50.5% | ||
Tenants Specific Letter of Credit(5) | $39,440,494 | $0 | NAP | ||||
Earnout Letter of Credit(6) | $20,000,000 | $0 | NAP | ||||
| (1) | The 100 Church Street Mortgage Loan Combination, totaling $230,000,000, is comprised of two pari passu components (Notes A-1 and A-2). Note A-1, (the “100 Church Street Mortgage Loan”), had an original balance of $150,000,000, has an outstanding principal balance as of the Cut-off Date of $150,000,000 and will be contributed to the WFRBS 2012-C8 Trust. Note A-2, (the “100 Church Street Pari Passu Companion Mortgage Loan”) had an original balance of $80,000,000 and is expected to be contributed to a future trust. All presented statistical information related to balances per square foot, LTV, DSCR and debt yields are based on the 100 Church Street Mortgage Loan Combination. See also pledge described in “Assumption” below. |
| (2) | Monthly tax deposits are not required as long as no event of default has occurred and is continuing and the borrower has provided the lender with proof of full payment within a timely manner. |
| (3) | Monthly insurance escrows are not required as long as no event of default has occurred and is continuing and the borrower provides satisfactory evidence that the property is insured in accordance with the loan documents. |
| (4) | Monthly deposits of $18,469 will commence July 1, 2014, subject to a cap of $443,256. |
| (5) | The sponsor posted a letter of credit for tenant improvements, leasing commissions and free rent for the following tenants: City of New York, HF Management Services, Interactive Data Corp (“IDC”) and Lenard A. Farber MD, PLLC. See “Letters of Credit” and “IDC TI/LC Guaranty” below for additional information. |
| (6) | The Earnout Letter of Credit will be subject to reduction upon satisfaction of the “Earnout Requirements”, which shall mean either (i) the execution of a lease or lease amendment with the City of New York for the expansion (the “City of New York Expansion”) of their space (on terms set forth in the loan documents and will result in an NOI Debt Yield for the 100 Church Street Mortgage Loan Combination of no less than 9.7% and the Earnout Letter of Credit shall be reduced to zero) or (ii) the Earnout Requirement may be exercised up to six times during the loan term, and shall mean: (a) execution of a lease with any tenant for all or any space that is vacant at any time (any such leased space, an “Earnout Space”) which lease is approved or deemed approved by the lender; and (b) the 100 Church Street property would achieve a minimum NOI Debt Yield for the 100 Church Street Mortgage Loan Combination of no less than 9.7%, taking into account income from the Earnout Space provided that in no event will the borrower be entitled to obtain a reduction of the Earnout Letter of Credit unless such reduction is an amount of at least $2.5 million and in increments of $2.5 million. Upon achieving the Earnout Requirements for any of the available requests, the Earnout Letter of Credit shall be reduced to an amount equal to (x) $230.0 million minus (y) (NOI divided by 0.097). If the Earnout Requirements are not fully achieved during the loan term, the remaining proceeds of the Earnout Letter of Credit may be used to pay down the outstanding loan balance at loan maturity. Assuming the As-Is Appraised Value and the full $20.0 million Earnout Letter of Credit is applied to the balloon balance at maturity, the LTV Ratio for the 100 Church Street Mortgage Loan Combination at Maturity is 45.4%. |
| (7) | IDC is required to take 13,868 square feet of additional space on a to be determined date between April 2013 and April 2014. This space is included in the calculation of occupancy. The City of New York is currently negotiating an expansion into an additional 131,946 square feet, which is not included in the occupancy calculation. |
| (8) | The 100 Church Street property was 41.0% leased at the time of the SL Green Realty Corp acquisition in early 2010. A $22.0 million capital improvement program was implemented to reposition the property, resulting in over 500,000 square feet of leases being executed. As of May 31, 2012, the property is 84.4% leased. |
| (9) | The appraisal presented a “Stabilized Value with the City of New York Expansion” of $429,000,000. Based on the “Stabilized Value with the City of New York Expansion”, the Cut-off Date LTV Ratio is 53.6% and the LTV Ratio at Maturity is 46.0% for the 100 Church Street Mortgage Loan Combination. |
THE INFORMATION IN THIS STRUCTURAL AND COLLATERAL TERM SHEET IS NOT COMPLETE AND MAY BE AMENDED PRIOR TO THE TIME OF SALE. THIS TERM SHEET IS NOT AN OFFER TO SELL THESE SECURITIES AND IT IS NOT A SOLICITATION OF AN OFFER TO BUY THESE SECURITIES IN ANY JURISDICTION WHERE THE OFFER OR SALE IS NOT PERMITTED.
26
| 100 CHURCH STREET |
The Mortgage Loan. The mortgage loan (the “100 Church Street Mortgage Loan Combination”) is evidenced by a single promissory note that is secured by a first mortgage encumbering a 21-story office building, located on the full city block bounded by Church Street, West Broadway, Barclay Street and Park Place in New York, New York (the “100 Church Street Property”). The 100 Church Street Mortgage Loan Combination was originated on June 15, 2012 by Wells Fargo Bank, National Association. The 100 Church Street Mortgage Loan Combination had an original principal balance of $230,000,000 and accrues interest at an interest rate of 4.675% per annum. The 100 Church Street Mortgage Loan Combination had an initial term of 120 months, has a remaining term of 119 months as of the Cut-off Date and requires interest-only payments for the first 24 payments following origination and thereafter will require payments of interest and principal based on a 30-year amortization schedule. The 100 Church Street Mortgage Loan Combination matures on July 1, 2022. The 100 Church Street Mortgage Loan Combination was bifurcated into two pari passu loan notes (Notes A-1 and A-2). Note A-1 (the “100 Church Street Mortgage Loan”) had an original balance of $150,000,000, has an outstanding balance as of the Cut-off Date of $150,000,000 and Note A-2 (the “100 Church Street Pari Passu Companion Mortgage Loan”) had an original principal balance of $80,000,000. Note A-1, but not the related pari passu Note A-2, will be contributed to the WFRBS 2012-C8 Trust. See “Description of the Mortgage Pool – Split Loan Structures – The 100 Church Street Loan Combination” and “Servicing of the Mortgage Loans and Administration of the Trust Fund – Servicing of the Pari Passu Mortgage Loans” in the Free Writing Prospectus. The proceeds of the 100 Church Street Mortgage Loan Combination were used to refinance $139.7 million of existing debt, pay-off a $10.0 million note held by Wells Fargo, National Association, post $59.4 million of letters of credit, pay $3.6 million of closing costs and return approximately $17.3 million of equity to the sponsor.
Following the lockout period, the borrower has the right to defease the 100 Church Street Mortgage Loan Combination in whole, but not in part, on any due date before the scheduled maturity date. In addition, the 100 Church Street Mortgage Loan Combination is prepayable without penalty on or after April 1, 2022.
The Property. The 100 Church Street Property is a 21-story office building containing approximately 1,099,455 rentable square feet, of which 96.7% (1,063,436 square feet) is office space and the remaining 3.3% (36,019 square feet) is ground-floor retail space. The 100 Church Street Property was constructed in 1958 and is nearing completion of an approximate $22.0 million renovation including a complete upgrade of the lobby, full window replacements, elevator modernization, new cooling tower, facade repairs and leasing related capital improvements. As of May 31, 2012, the property was 84.4% leased to approximately 15 tenants.
THE INFORMATION IN THIS STRUCTURAL AND COLLATERAL TERM SHEET IS NOT COMPLETE AND MAY BE AMENDED PRIOR TO THE TIME OF SALE. THIS TERM SHEET IS NOT AN OFFER TO SELL THESE SECURITIES AND IT IS NOT A SOLICITATION OF AN OFFER TO BUY THESE SECURITIES IN ANY JURISDICTION WHERE THE OFFER OR SALE IS NOT PERMITTED.
27
| 100 CHURCH STREET |
The following table presents certain information relating to the tenancies at the 100 Church Street Property:
Major Tenants
| Tenant Name | Credit Rating (Fitch/ Moody’s/ S&P)(1) | Tenant NRSF | % of NRSF | Annual U/W Base Rent PSF | Annual U/W Base Rent | % of Total Annual U/W Base Rent | Lease Expiration Date | ||||||
| Major Tenants | |||||||||||||
City of New York(2) | AA/Aa2/NR | 372,519(3) | 33.9% | $32.45 | $12,087,146(4) | 37.5% | 3/31/2034(5)(6) | ||||||
HF Management Services(7) | NR/NR/NR | 230,394 | 21.0% | $30.00 | $6,912,694(8) | 21.5% | 3/31/2032 | ||||||
| State of New York | NR/Aa2/AA | 89,514 | 8.1% | $33.25 | $2,976,341(9) | 9.2% | 4/30/2021(10) | ||||||
| Centerline Affordable Housing Advisors LLC | NR/NR/NR | 57,945 | 5.3% | $49.17 | $2,849,156 | 8.8% | 12/31/2026 | ||||||
| Interactive Data Corporation | NR/NR/NR | 64,529(11) | 5.9% | $41.90 | $2,703,822 | 8.4% | 11/30/2024 | ||||||
| Niche Media Holdings | NR/NR/NR | 45,419 | 4.1% | $37.00 | $1,680,503 | 5.2% | 4/30/2018 | ||||||
| Total Major Tenants | 860,320 | 78.2% | $33.95 | $29,209,660 | 90.7% | ||||||||
| Non-Major Tenants | 67,242 | 6.1% | $44.51 | $2,992,710 | 9.3% | ||||||||
| Occupied Collateral | 927,562 | 84.4% | $34.72 | $32,202,370 | 100.0% | ||||||||
| Vacant Space | 171,893 | 15.6% | |||||||||||
| Collateral Total | 1,099,455 | 100.0% | |||||||||||
| (1) | Certain ratings are those of the parent company whether or not the parent guarantees the lease. |
| (2) | The City of New York’s space is occupied by The New York City Law Department. The New York City Law Department is responsible for all legal affairs of the City of New York. The New York City Law Department represents the City of New York, the mayor and other elected officials in all affirmative and defensive civil litigation as well as juvenile delinquency prosecutions brought in family court and administrative code enforcement proceedings brought in criminal court. |
| (3) | The City of New York is currently negotiating an expansion into an additional 131,946 square feet, which has been classified as vacant for underwriting purposes. |
| (4) | The Annual U/W Base Rent was derived by averaging the annual contractual rental increases through the lease term. The current in-place rent is $33.33 per square foot. |
| (5) | The City of New York recently executed a lease extension which will commence on November 1, 2013 and expire on March 31, 2034. Under the terms of the lease extension, rent payments are not required from November 1, 2013 until March 31, 2014. Rent payments commence on April 1, 2014 and a $4,708,333 letter of credit is allocated to tenant’s free rent period. |
| (6) | The City of New York has the right to terminate its lease in whole or in part after April 1, 2026 subject to 18 months notice and a payment of unamortized tenant improvements and leasing commissions. The tenant has the option to renew for two consecutive terms in either five- or ten-year increments for any and all space, on a floor-by-floor basis at the then fair market rental value (“FMV”). The tenant has the option to renew any non-contiguous floors on a full floor basis up to a maximum additional term of fifteen years at FMV. |
| (7) | HF Management Services is a non-profit managed care organization that provides healthcare coverage to individuals and families though a variety of government sponsored health insurance programs. |
| (8) | Rent payments are not required from February 1, 2012 through February 28, 2013. Rent payments commence on March 1, 2013 and a $1,430,973 letter of credit is allocated to the tenant’s free rent period. |
| (9) | Annual U/W Base Rent was derived by averaging the annual contractual rental increases through the lease term. The current in-place rent is $29.95 per square foot. |
| (10) | The State of New York has the right to terminate its lease on or by April 30, 2018 with no less than twelve months notice and payment of an approximate $3.5 million termination fee. |
| (11) | IDC is required to take 13,868 square feet of additional space on the eleventh floor (the “IDC Expansion”) on a to be determined date between April 2013 and April 2014. The IDC Expansion is included in Annual U/W Base Rent. Rent payments for 50,661 square feet are not required from April 1, 2013 until September 30, 2013 and rent payments commence on October 1, 2013. A $795,099 letter of credit is allocated to tenant’s free rent period as well as rent that would have been collected assuming the tenant was in possession and paying full rent on the IDC Expansion from the period between June 15, 2012 and April 1, 2013. |
THE INFORMATION IN THIS STRUCTURAL AND COLLATERAL TERM SHEET IS NOT COMPLETE AND MAY BE AMENDED PRIOR TO THE TIME OF SALE. THIS TERM SHEET IS NOT AN OFFER TO SELL THESE SECURITIES AND IT IS NOT A SOLICITATION OF AN OFFER TO BUY THESE SECURITIES IN ANY JURISDICTION WHERE THE OFFER OR SALE IS NOT PERMITTED.
28
| 100 CHURCH STREET |
The following table presents certain information relating to the lease rollover schedule at the 100 Church Street Property:
Lease Expiration Schedule(1)(2)
Year Ending December 31, | No. of Leases Expiring | Expiring NRSF | % of Total NRSF | Cumulative of Total NRSF | Cumulative % of Total NRSF | Annual U/W Base Rent | % of Annual U/W Base Rent | Annual U/W Base Rent PSF(3) | ||||||||
MTM(4) | 1 | 1 | 0.0% | 1 | 0.0% | $0 | 0.0% | $0.00 | ||||||||
| 2012 | 0 | 0 | 0.0% | 1 | 0.0% | $0 | 0.0% | $0.00 | ||||||||
| 2013 | 0 | 0 | 0.0% | 1 | 0.0% | $0 | 0.0% | $0.00 | ||||||||
| 2014 | 0 | 0 | 0.0% | 1 | 0.0% | $0 | 0.0% | $0.00 | ||||||||
| 2015 | 0 | 0 | 0.0% | 1 | 0.0% | $0 | 0.0% | $0.00 | ||||||||
| 2016 | 0 | 0 | 0.0% | 1 | 0.0% | $0 | 0.0% | $0.00 | ||||||||
| 2017 | 1 | 2,799 | 0.3% | 2,800 | 0.3% | $165,141 | 0.5% | $59.00 | ||||||||
| 2018 | 2 | 54,061 | 4.9% | 56,861 | 5.2% | $1,924,207 | 6.0% | $35.59 | ||||||||
| 2019 | 0 | 0 | 0.0% | 56,861 | 5.2% | $0 | 0.0% | $0.00 | ||||||||
| 2020 | 0 | 0 | 0.0% | 56,861 | 5.2% | $0 | 0.0% | $0.00 | ||||||||
| 2021 | 4 | 93,778 | 8.5% | 150,639 | 13.7% | $3,133,848 | 9.7% | $33.42 | ||||||||
| 2022 | 0 | 0 | 0.0% | 150,639 | 13.7% | $0 | 0.0% | $0.00 | ||||||||
| Thereafter | 13 | 776,923 | 70.7% | 927,562 | 84.4% | $26,979,174 | 83.8% | $34.73 | ||||||||
| Vacant | 0 | 171,893 | 15.6% | 1,099,455 | 100.0% | $0 | 0.0% | $0.00 | ||||||||
| Total/Weighted Average | 21 | 1,099,455 | 100.0% | $32,202,370 | 100.0% | $34.72 |
| (1) | Information obtained from the underwritten rent roll. |
| (2) | Certain tenants may have lease termination options that are exercisable prior to the originally stated expiration date of the subject lease and that are not considered in the Lease Expiration Schedule. |
| (3) | Weighted Average Annual U/W Base Rent PSF excludes vacant space. |
| (4) | One square foot is representative of a cellular tower lease. No related rent has been underwritten. |
The following table presents historical occupancy percentages at the 100 Church Street Property:
Historical Occupancy Percentages(1)
12/31/2007 | 12/31/2008 | 12/31/2009 | 12/31/2010 | 12/31/2011 | ||||
| 37% | 39% | 41% | 60% | 71% |
| (1) | Information obtained from borrower financials. |
Historical Average Base Rent (PSF)(1)
12/31/2009(1) | 12/31/2010(2) | 12/31/2011(2) | ||
| $32.73 | $28.00 | $32.62 |
| (1) | The sponsor acquired the property in January 2010, and the previous owner only provided annualized March 2009 financials. Historical average base rent (PSF) figures are based on the borrower’s provided annualized base rental figures and total square footage of 1,099,455. |
| (2) | Historical average base rent (PSF) is based on borrower provided base rental income figures and total square footage of 1,099,455. |
THE INFORMATION IN THIS STRUCTURAL AND COLLATERAL TERM SHEET IS NOT COMPLETE AND MAY BE AMENDED PRIOR TO THE TIME OF SALE. THIS TERM SHEET IS NOT AN OFFER TO SELL THESE SECURITIES AND IT IS NOT A SOLICITATION OF AN OFFER TO BUY THESE SECURITIES IN ANY JURISDICTION WHERE THE OFFER OR SALE IS NOT PERMITTED.
29
| 100 CHURCH STREET |
Operating History and Underwritten Net Cash Flow. The following table presents certain information relating to the historical operating performance and Underwritten Net Cash Flow at the 100 Church Street Property:
Cash Flow Analysis(1)
| 2010 | 2011 | TTM 5/31/2012 | U/W | U/W $ per SF | |||||||
| Base Rent | $18,472,036 | $25,460,507 | $28,371,674 | $32,202,370 | $29.29 | ||||||
| Grossed Up Vacant Space | 0 | 0 | 0 | 5,496,858 | 5.00 | ||||||
| Total Reimbursables | 993,018 | 1,922,275 | 2,389,236 | 2,463,771 | 2.24 | ||||||
| Other Income | 82,640 | 26,213 | 50,423 | 0 | 0.00 | ||||||
| Less Vacancy & Credit Loss | (898,215) | (6,291,874) | (5,948,737) | (5,496,858) | (5.00) | ||||||
| Effective Gross Income | $18,649,479 | $21,117,121 | $24,862,596 | $34,666,141 | $31.53 | ||||||
Total Operating Expenses(2) | $10,913,464 | $11,699,672 | $11,898,238 | $14,014,379 | $12.75 | ||||||
| Net Operating Income | $7,736,015 | $9,417,449 | $12,964,358 | $20,651,762 | $18.78 | ||||||
| TI/LC | 0 | 0 | 0 | 1,389,230 | 1.26 | ||||||
| Capital Expenditures | 0 | 0 | 0 | 221,623 | 0.20 | ||||||
| Net Cash Flow | $7,736,105 | $9,417,449 | $12,964,358 | $19,040,909 | $17.32 | ||||||
NOI DSCR(3) | 0.54x | 0.66x | 0.91x | 1.45x | |||||||
NCF DSCR(3) | 0.54x | 0.66x | 0.91x | 1.33x | |||||||
NOI DY(3) | 3.4% | 4.1% | 5.6% | 9.0% | |||||||
NCF DY(3) | 3.4% | 4.1% | 5.6% | 8.3% |
| (1) | The 100 Church Street Property was 41.0% leased at the time of the sponsor’s acquisition in early 2010. The property was 71.0% leased by year end 2011 and reached the current occupancy of 84.4% in May 2012. |
| (2) | The 100 Church Street Property is subject to an Industrial and Commercial Incentive Program (“ICIP”) tax abatement that started in 2008/2009 and begins phasing down by 20.0% per year beginning in 2017/2018 and the property will be fully assessed by 2021/2022. The appraiser estimates the tax liability will increase by $2.8 million from the 2011/2012 tax liability when the ICIP expires in 2021/2022. The expiration of the ICIP is mitigated by; (i) approximately 70.7% of the net rentable area is currently leased to tenants with leases that extend beyond 2022 and (ii) all of the signed leases at the property are structured as modified gross; therefore, the incremental tax increases will be passed-through to the respective tenants. |
| (3) | DSCRs and debt yields are based on the 100 Church Street Mortgage Loan Combination. |
Appraisal. According to the appraisal dated April 11, 2012, the 100 Street Church Property had an “as-is” appraised value of $391,000,000. The appraisal presented a “Stabilized Value with the City of New York Expansion” of $429,000,000. Based on the “Stabilized Value with the City of New York Expansion”, the Cut-off Date LTV Ratio is 53.6% and the LTV Ratio at Maturity is 46.0% for the 100 Church Street Mortgage Loan Combination.
Environmental Matters. According to the Phase I environmental site assessment dated April 13, 2012, there was no evidence of any recognized environmental conditions.
Market Overview and Competition. According to the appraisal, the 100 Church Street Property is located in the Downtown Manhattan office market and further defined within the Financial District submarket. As of year-end 2011, average submarket asking rent was $39.65 per square foot, which is an increase from year-end 2010 and year-end 2009 when asking rents were reported as $37.31 per square foot and $37.19 per square foot, respectively. As of year-end 2011, the average submarket vacancy was 9.4%, down from 10.8% from year-end 2010.
Competitive Set(1)
100 Church Street (Subject) | 222 Broadway | 4 New York Plaza | One Battery Place | 33 Maiden Lane | 60 Wall Street | |
| Market | New York, NY | New York, NY | New York, NY | New York, NY | New York, NY | New York, NY |
| Distance from Subject | -- | 0.4 miles | 0.3 miles | 0.5 miles | 0.6 miles | 0.7 miles |
| Property Type | CBD Office | CBD Office | CBD Office | CBD Office | CBD Office | CBD Office |
| Year Built/Renovated | 1958/2012 | 1961/NAP | 1968/NAP | 1971/NAP | 1984/NAP | 1988/NAP |
| Total GLA | 1,099,455 SF | 756,138 SF | 1,098,000 SF | 837,052 SF | 617,356 SF | 1,635,841 SF |
| Total Occupancy | 84% | 99% | 95% | 99% | 83% | 100% |
| (1) | Information obtained from appraisal dated April 11, 2012. |
The Borrower. The borrower is 100 Church Fee Owner, LLC, a Delaware limited liability company and a single-purpose entity with two independent directors. Legal counsel to the borrower delivered a non-consolidation opinion in connection with the origination of the 100 Church Street Mortgage Loan Combination. The borrower is owned 100% by SL Green Realty Corp. SL Green Realty Corp. acquired ownership of controlling interest of the borrower through the exercise of its remedies as a mezzanine lender to the predecessor owner. See “Description of the Mortgage Pool - Bankruptcy Issues and Other Proceedings” in the Free Writing Prospectus. SL Green Operating Partnership, L.P. is the guarantor of certain nonrecourse carveouts under the 100 Church Street Mortgage Loan Combination.
THE INFORMATION IN THIS STRUCTURAL AND COLLATERAL TERM SHEET IS NOT COMPLETE AND MAY BE AMENDED PRIOR TO THE TIME OF SALE. THIS TERM SHEET IS NOT AN OFFER TO SELL THESE SECURITIES AND IT IS NOT A SOLICITATION OF AN OFFER TO BUY THESE SECURITIES IN ANY JURISDICTION WHERE THE OFFER OR SALE IS NOT PERMITTED.
30
| 100 CHURCH STREET |
The Sponsor. The sponsor is SL Green Realty Corp., a public real estate investment trust. As of December 31, 2011, SL Green Realty Corp. had interests in 65 Manhattan properties totaling more than 38.7 million square feet. This includes ownership interests in 27.0 million square feet of commercial properties and debt and preferred equity investments secured by 11.7 million square feet of properties. In addition to its Manhattan investments, SL Green Realty Corp. holds interests in 32 suburban commercial properties totaling 7.3 million square feet in Brooklyn, Queens, Long Island, Westchester County, Connecticut and New Jersey. The sponsor is in process of negotiating a deed-in-lieu for a property in which the sponsor is the controlling interest holder and discontinued debt service payments since 2009. See “Description of the Mortgage Pool – Bankruptcy Issues and Other Proceedings” in the Free Writing Prospectus.
Escrows. The loan documents do not require monthly escrows for real estate taxes provided that the following conditions are satisfied: (i) no event of default exists and is continuing and (ii) borrower delivers to the lender satisfactory evidence of payment of taxes before the taxes are delinquent. The loan documents do not require monthly escrows for insurance provided that the following conditions are satisfied: (i) no event of default exists and is continuing and (ii) borrower provides the lender evidence of renewal of the policies and paid receipts for the payment of insurance premiums when due. Monthly replacement reserve escrow payments of $18,469 will commence on July 1, 2014 (subject to a cap of $443,256).
Letters of Credit. The loan documents provide for the 100 Church Street borrower to post a $39,440,494 up-front letter of credit, which encompasses the following: (i) tenant improvements and landlord work ($20,995,000), leasing commissions ($5,990,923), and free rent ($4,708,333) associated with the City of New York’s space; (ii) tenant improvements ($4,737,498), free rent ($1,430,973) and leasing commission ($448,112) associated with HF Management Services’ space; (iii) free and gap rent ($795,099) associated with the IDC’s space; and (iv) leasing commissions ($334,556) associated with Lenard A. Farber MD, PLLC’s space.
In addition, the loan documents provide for the 100 Church Street borrower to post a $20,000,000 letter of credit (the “Earnout Letter of Credit”). The Earnout Letter of Credit will be subject to reduction upon satisfaction of the “Earnout Requirements”, which shall mean either: (i) the execution of a lease or lease amendment with the City of New York for the expansion (the “City of New York Expansion”) of their space (on terms set forth in the loan documents) and will result in an NOI Debt Yield of no less than 9.7% and the Earnout Letter of Credit shall be reduced to zero or (ii) the Earnout Requirement may be exercised up to six times during the loan term, and shall mean: (a) execution of a lease with any tenant for all or any space that is vacant (any such leased space, an “Earnout Space”) whose lease is approved or deemed approved by the lender and (b) the property would achieve a minimum NOI Debt Yield of no less than 9.7%, taking into account income from the Earnout Space provided that in no event will the borrower be entitled to obtain a reduction of the Earnout Letter of Credit unless such reduction is an amount of at least $2,500,000. Upon achieving the Earnout Requirements for any of the available requests, the Earnout Letter of Credit shall be reduced to an amount equal to (x) $230,000,000 minus (y) (NOI divided by 0.097).
In either case of (i) or (ii) of the preceding paragraph, a portion of the Earnout Letter of Credit reduction will be reserved by the lender in the form of cash or a letter of credit, in an amount equal to (a) the outstanding tenant improvements or leasing commissions applicable to the newly-leased space or (b) the amount of abated rent associated with the newly-leased space. If the Earnout Requirements are not fully achieved during the loan term, the remaining proceeds of the Earnout Letter of Credit may be used to pay down the outstanding loan balance at maturity.
IDC TI/LC Guaranty. In lieu of a $481,220 deposit for leasing costs associated with IDC’s expansion on the eleventh floor, the sponsor delivered a guaranty to the lender in an amount equal to $481,220 (the “IDC TI/LC Reserve Funds”). Any funding of the IDC TI/LC Reserve Funds by the borrower will result in the guaranty being reduced by the amount funded by the borrower. Upon payment of all tenant improvement and leasing costs associated with the IDC’s expansion space, the lender will release the remaining portion of the guaranty provided no event of default is continuing.
Lockbox and Cash Management. The 100 Church Street Mortgage Loan Combination requires a lender-controlled lockbox account, which is already in place, and that the tenants be directed to pay their rents directly to such lockbox account. The loan documents also require that all cash revenues and all other monies received by the borrower or the property manager relating to the 100 Church Street Property be deposited into the lockbox account within two business days of receipt.
Upon the occurrence of a Cash Trap Event Period (as defined below) all funds on deposit in the lockbox account will be swept to certain restricted accounts, and if an event of default exists, the lender will have the exclusive control of, and the right to withdraw and apply, the funds in the deposit account to payment of any and all debts, liabilities and obligations of the borrower in such order,
proportion and priority as the lender may determine in its sole discretion.
A “Cash Trap Event Period” will commence upon: (i) the occurrence and continuance of an event of default or (ii) the NOI debt yield is less than 7.7% as tested with respect to each calendar quarter on the date which is forty-five days following the last day of the applicable quarter. A Cash Trap Event Period will expire upon the cure of such event of default, the payment in full of the 100 Church Street Mortgage Loan Combination and all other obligations under the loan documents or the NOI debt yield is at least 7.7% for two (2) consecutive calendar quarters.
Property Management. The 100 Church Street Property is managed by an affiliate of the borrower.
Assumption. The 100 Church Street Mortgage Loan Combination borrower has a four-time right to transfer the 100 Church Street Property with the consent of the lender, provided that no event of default has occurred and is continuing under the 100 Church Street Mortgage Loan Combination and certain other conditions are satisfied, including: (i) payment of an assumption fee of 0.125% of the outstanding principal balance of the 100 Church Street Mortgage Loan Combination for the first transfer and with respect to all subsequent transfers payment of an assumption fee of 0.25% of the then outstanding principal balance of the 100
THE INFORMATION IN THIS STRUCTURAL AND COLLATERAL TERM SHEET IS NOT COMPLETE AND MAY BE AMENDED PRIOR TO THE TIME OF SALE. THIS TERM SHEET IS NOT AN OFFER TO SELL THESE SECURITIES AND IT IS NOT A SOLICITATION OF AN OFFER TO BUY THESE SECURITIES IN ANY JURISDICTION WHERE THE OFFER OR SALE IS NOT PERMITTED.
31
| 100 CHURCH STREET |
Church Street Mortgage Loan Combination; (ii) the proposed transferee and guarantor’s experience and financial strength and credit quality satisfy the lender’s credit review; (iii) rating agency confirmation that the transfer will not result in a downgrade, withdrawal or qualification of the respective ratings from Fitch, KBRA and Moody’s assigned to the Series 2012-C8 Certificates; and (iv) other factors relied upon by the lender in the original underwriting of the 100 Church Street Mortgage Loan Combination. Additionally, transfers of equity interests in the borrower are permitted so long as not less than 49.0% of equity interests in the borrower are owned, directly or indirectly, by sponsor, SL Green Operating Partnership, L.P., a Qualified Transferee (as defined below) or a Permitted Pledge Bank (as defined below) and such party controls the borrower.
A “Qualified Transferee” means an entity which meets certain criteria, including but not limited to: (i) total assets in name or under management in major metropolitan areas in excess of 2 million square feet of gross leasable area exclusive of the 100 Church Street Property; (ii) total assets in name or under management in excess of $600 million; (iii) shareholder’s equity in excess of $250 million; (iv) the lender receives confirmation from Fitch, KBRA and Moody’s that the transfer will not result in a downgrade, withdrawal or qualification of the respective ratings assigned to the Series 2012-C8 Certificates.
A “Permitted Pledge Bank” means a commercial bank or financial institution meeting certain criteria, including but not limited to: (i) total assets in name or under management in excess of $600 million; (ii) shareholder’s equity in excess of $250 million; (iii) is regularly engaged in the business of making commercial real estate loans or owning or operating commercial real estate properties, and (iv) has a long term unsecured debt rating of not less that “A” by Standard & Poors and “A2” by Moody’s.
Partial Release. Not permitted.
Real Estate Substitution. Not permitted.
Subordinate and Mezzanine Indebtedness. Not permitted.
Ground Lease. None.
Terrorism Insurance. The loan documents require that the “all risk” insurance policy required to be maintained by the borrower provides coverage for terrorism in an amount equal to the full replacement cost of the 100 Church Street Property provided that the borrower is not required to annually spend more than $600,000 of the insurance premium that is payable for required property and business interruption/rent loss insurance. The loan documents also require business interruption insurance covering no less than the 18-month period from the occurrence of a casualty event, together with a twelve-month extended period of indemnity.
THE INFORMATION IN THIS STRUCTURAL AND COLLATERAL TERM SHEET IS NOT COMPLETE AND MAY BE AMENDED PRIOR TO THE TIME OF SALE. THIS TERM SHEET IS NOT AN OFFER TO SELL THESE SECURITIES AND IT IS NOT A SOLICITATION OF AN OFFER TO BUY THESE SECURITIES IN ANY JURISDICTION WHERE THE OFFER OR SALE IS NOT PERMITTED.
32
(THIS PAGE INTENTIONALLY LEFT BLANK)
33
| BRENNAN INDUSTRIAL PORTFOLIO |
THE INFORMATION IN THIS STRUCTURAL AND COLLATERAL TERM SHEET IS NOT COMPLETE AND MAY BE AMENDED PRIOR TO THE TIME OF SALE. THIS TERM SHEET IS NOT AN OFFER TO SELL THESE SECURITIES AND IT IS NOT A SOLICITATION OF AN OFFER TO BUY THESE SECURITIES IN ANY JURISDICTION WHERE THE OFFER OR SALE IS NOT PERMITTED.
34
| BRENNAN INDUSTRIAL PORTFOLIO |
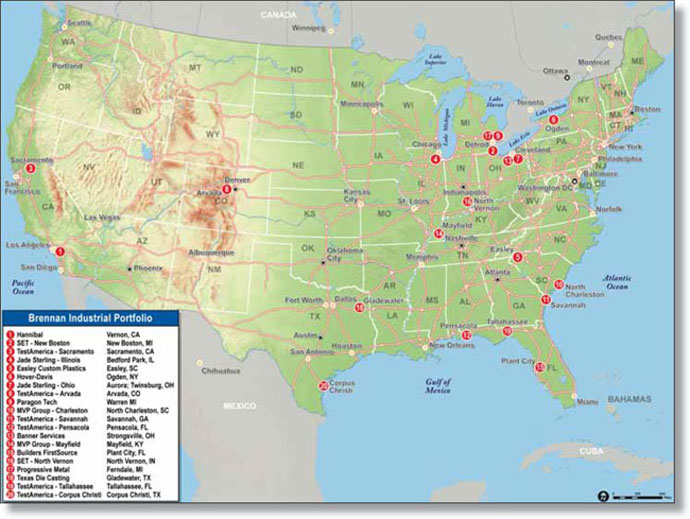
THE INFORMATION IN THIS STRUCTURAL AND COLLATERAL TERM SHEET IS NOT COMPLETE AND MAY BE AMENDED PRIOR TO THE TIME OF SALE. THIS TERM SHEET IS NOT AN OFFER TO SELL THESE SECURITIES AND IT IS NOT A SOLICITATION OF AN OFFER TO BUY THESE SECURITIES IN ANY JURISDICTION WHERE THE OFFER OR SALE IS NOT PERMITTED.
35
Brennan Industrial Portfolio | ||||||||
| Loan Information | Property Information | |||||||
| Mortgage Loan Seller: | The Royal Bank of Scotland | Single Asset/Portfolio: | Portfolio | |||||
| Credit Assessment (Fitch/KBRA/Moody’s): | NR/NR/NR | Property Type: | Various | |||||
| Original Principal Balance: | $102,720,000 | Specific Property Type: | Various - See Table | |||||
| Cut-off Date Principal Balance: | $102,720,000 | Location: | Various - See Table | |||||
| % of Initial Pool Balance: | 7.9% | Size: | 2,355,558 SF | |||||
| Loan Purpose: | Acquisition | Cut-off Date Principal Balance Per Unit/SF: | $43.61 | |||||
Borrower Name(1): | Various | Year Built/Renovated: | Various – See Table | |||||
| Sponsor: | USIP-Brennan Ventures, LLC | Occupancy %: | 100.0% | |||||
| Mortgage Rate: | 4.580% | Occupancy % Source Date: | August 1, 2012 | |||||
| Note Date: | June 29, 2012 | Title Vesting: | Fee | |||||
| Anticipated Repayment Date: | NAP | Property Manager: | Brennan Management, LLC | |||||
| Maturity Date: | July 1, 2017 | |||||||
| IO Period: | 60 months | 3rd Most Recent NOI (As of): | $11,347,486 (12/31/2009) | |||||
| Loan Term (Original): | 60 months | 2nd Most Recent NOI (As of): | $11,511,700 (12/31/2010) | |||||
| Seasoning: | 1 month | Most Recent NOI (As of): | $12,397,154 (12/31/2011) | |||||
| Amortization Term (Original): | NAP | |||||||
| Loan Amortization Type: | Interest-only, Balloon | U/W Revenues: | $13,057,921 | |||||
| Interest Accrual Method: | Actual/360 | U/W Expenses: | $391,738 | |||||
| Call Protection: | L(25),GRTR 1% or YM(31),O(4) | U/W NOI: | $12,666,184 | |||||
| Lockbox Type: | Hard/Springing Cash Management | U/W NCF: | $11,245,523 | |||||
| Additional Debt: | None | U/W NOI DSCR: | 2.66x | |||||
| Additional Debt Type: | NAP | U/W NCF DSCR: | 2.36x | |||||
| U/W NOI Debt Yield: | 12.3% | |||||||
| Escrows and Reserves: | U/W NCF Debt Yield: | 10.9% | ||||||
| As-Is Appraised Value: | $153,225,000 | |||||||
| Type: | Initial | Monthly | Cap (If Any) | As-Is Appraisal Valuation Date: | Various | |||
Taxes(2) | $0 | Springing | NAP | Cut-off Date LTV Ratio: | 67.0% | |||
| Insurance | $9,166 | $9,166 | NAP | LTV Ratio at Maturity or ARD: | 67.0% | |||
Tenant Security Deposits(3) | $3,896,368 | $0 | NAP | |||||
| (1) | The Brennan Industrial Portfolio mortgage loan has twenty borrowing entities: UB (Banner Services), LLC; UB (Builders FirstSource), LLC; UB (Easley Custom Plastics), LLC; UB (Hannibal), LLC; UB (Hover-Davis), LLC; UB (Jade-Illinois), LLC; UB (Jade-Ohio), LLC; UB (MVP-Charleston), LLC; UB (MVP-Mayfield), LLC; UB (Paragon Tech), LLC; UB (Progressive Metal), LLC; UB (SET-New Boston) LLC; UB (SET-North Vernon), LLC; UB (TA-Arvada), LLC; UB (TA-Corpus Christi), LLC; UB (TA-Pensacola), LLC; UB (TA-Savannah), LLC; UB (TA-Tallahassee), LLC; UB (TA-Sacramento), LLC; and UB (Texas Die Casting), LLC (each, a borrowing entity and collectively, the borrower). |
| (2) | The loan documents do not provide for tax escrows provided that: (i) the tenant at each of the Brennan Industrial Portfolio Properties pays all taxes directly (or directly to the borrower); (ii) borrower provides evidence to lender that payments are being made in a timely manner and (iii) no event of default has occurred or is continuing. |
| (3) | Approximately $3.6 million of the security deposits reserved are associated with Hannibal and will be released to the borrower upon receipt by lender of an SNDA which is acceptable in the judgement of the lender. Approximately $300,000 of the security deposits reserved are associated with Hover-Davis and will be held by lender for the entire loan term. |
Mortgage Loan. The mortgage loan (the “Brennan Industrial Portfolio Mortgage Loan”) is evidenced by a promissory note secured by a first mortgage encumbering 20 industrial and office properties (the “Brennan Industrial Portfolio Properties”). The Brennan Industrial Portfolio Mortgage Loan was originated on June 29, 2012 by The Royal Bank of Scotland. The Brennan Industrial Portfolio Mortgage Loan had an original principal balance of $102,720,000, has an outstanding principal balance as of the Cut-Off Date of $102,720,000 and accrues interest at an interest rate of 4.580% per annum. The Brennan Industrial Portfolio Mortgage Loan had an initial term of 60 months, has a remaining term of 59 months as of the Cut-off Date and requires interest-only payments for the duration of the loan. The Brennan Industrial Portfolio Mortgage Loan matures on July 1, 2017. The proceeds of the Brennan Industrial Portfolio Mortgage Loan, together with approximately $55.2 million of new equity from the sponsor, were used to purchase the Brennan Industrial Portfolio Properties for approximately $155.2 million and pay closing costs of approximately $2.7 million.
Following the lockout period, the borrower has the right to prepay the Brennan Industrial Portfolio Mortgage Loan in whole, or in part (see “Partial Release” section below), provided that the borrower pays the greater of a yield maintenance premium or a prepayment premium equal to 1.0% of the principal amount being prepaid. On or after April 1, 2017, the borrower will have the right to voluntarily prepay the Brennan Industrial Portfolio Mortgage Loan in whole or in part (see “Partial Release” section below) without penalty.
The Properties. The Brennan Industrial Portfolio Mortgage Loan is secured by a fee interest in 20 industrial and office properties consisting of 2,355,558 square feet and located in twelve states: Ohio, Florida, South Carolina, California, New York, Illinois, Kentucky, Michigan, Indiana, Colorado, Texas and Georgia. The properties range in size from 14,884 square feet to 429,122 square feet. The Brennan Industrial Portfolio Properties are 100.0% occupied and are comprised solely of single-tenant properties which have a weighted average remaining lease term of 13.4 years. On average, tenants have occupied their respective spaces in the
THE INFORMATION IN THIS STRUCTURAL AND COLLATERAL TERM SHEET IS NOT COMPLETE AND MAY BE AMENDED PRIOR TO THE TIME OF SALE. THIS TERM SHEET IS NOT AN OFFER TO SELL THESE SECURITIES AND IT IS NOT A SOLICITATION OF AN OFFER TO BUY THESE SECURITIES IN ANY JURISDICTION WHERE THE OFFER OR SALE IS NOT PERMITTED.
36
| BRENNAN INDUSTRIAL PORTFOLIO |
Brennan Industrial Portfolio Properties for 24.6 years. The Brennan Industrial Portfolio Properties include a diverse mix of tenants, representing an array of distribution, warehouse, laboratory, manufacturing, assembly and service sectors. Seven of the 20 Brennan Industrial Portfolio Properties are occupied by steel/primary metals tenants, six are occupied by environmental/lab tenants, two are occupied by home products tenants, and the remaining five are occupied by tenants in various other industries.
The following table presents certain information relating to the Brennan Industrial Portfolio Properties:
| Property Name | Location | Specific Property Type | Allocated Cut- off Date Principal Balance | Occupancy | Year Built/ Renovated | Net Rentable Area (SF) | Appraised Value | ||||||
| Hannibal | Vernon, CA | Manufacturing | $28,830,000 | 100.0% | 1930/NAP | 429,122 | $41,000,000 | ||||||
| SET – New Boston | New Boston, MI | Light Industrial | $9,064,000 | 100.0% | 1992/NAP | 254,351 | $13,200,000 | ||||||
| TestAmerica – Sacramento | Sacramento, CA | Flex | $6,921,000 | 100.0% | 1994/NAP | 66,203 | $12,000,000 | ||||||
Jade Sterling – Illinois(1) | Bedford Park, IL | Warehouse | $6,552,000 | 100.0% | Various/Various | 215,389 | $10,500,000 | ||||||
| Easley Custom Plastics | Easley, SC | Light Industrial | $5,842,000 | 100.0% | 1976/NAP | 257,086 | $8,150,000 | ||||||
| Hover-Davis | Ogden, NY | Light Industrial | $5,381,000 | 100.0% | 2000/NAP | 66,100 | $7,000,000 | ||||||
Jade Sterling – Ohio(2) | Aurora, OH | Warehouse | $5,360,000 | 100.0% | Various/Various | 174,511 | $8,500,000 | ||||||
| TestAmerica – Arvada | Arvada, CO | Flex | $4,951,000 | 100.0% | 1984/NAP | 57,966 | $8,350,000 | ||||||
| Paragon Tech | Warren, MI | Light Industrial | $4,808,000 | 100.0% | 1956/1996 | 88,857 | $5,900,000 | ||||||
| MVP Group – Charleston | North Charleston, SC | Warehouse | $4,421,000 | 100.0% | 2001/NAP | 108,000 | $6,950,000 | ||||||
| TestAmerica – Savannah | Savannah, GA | Flex | $4,070,000 | 100.0% | 1988/NAP | 54,284 | $6,500,000 | ||||||
| TestAmerica – Pensacola | Pensacola, FL | Flex | $2,682,000 | 100.0% | 1995/NAP | 21,911 | $4,300,000 | ||||||
| Banner Services | Strongsville, OH | Manufacturing | $2,456,000 | 100.0% | 1987/2008 | 58,450 | $3,675,000 | ||||||
| MVP Group – Mayfield | Mayfield, KY | Light Industrial | $2,251,000 | 100.0% | 1996/2003 | 101,244 | $3,450,000 | ||||||
| Builders FirstSource | Plant City, FL | Light Industrial | $2,205,000 | 100.0% | 1980/2011 | 116,897 | $3,300,000 | ||||||
| SET – North Vernon | North Vernon, IN | Light Industrial | $2,076,000 | 100.0% | 1955/1999 | 117,376 | $3,000,000 | ||||||
| Progressive Metal | Ferndale, MI | Manufacturing | $1,940,000 | 100.0% | 1940/NAP | 58,250 | $2,800,000 | ||||||
| Texas Die Casting | Gladewater, TX | Light Industrial | $1,222,000 | 100.0% | 1982/NAP | 78,177 | $1,850,000 | ||||||
| TestAmerica – Tallahassee | Tallahassee, FL | Flex | $1,088,000 | 100.0% | 1990/NAP | 16,500 | $1,800,000 | ||||||
| TestAmerica – Corpus Christi | Corpus Christi, TX | Flex | $600,000 | 100.0% | 1982/NAP | 14,884 | $1,000,000 | ||||||
| Total/Weighted Average | $102,720,000 | 100.0% | 2,355,558 | $153,225,000 | |||||||||
(1) | The Jade Sterling – Illinois property is comprised of two separate buildings with different addresses. The mortgaged properties are presented as one mortgaged property because as the buildings were appraised together in one report and the single tenant of both buildings is subject to one lease covering both buildings. The mortgaged property located at 5100 West 73rd Street was built in 1956 and was last renovated in 1992. The property located at 7201 South Leamington Avenue was built in 1958 and was last renovated in 2006. |
| (2) | The Jade Sterling – Ohio property is comprised of two separate buildings with different addresses. The mortgaged properties are presented as one as the buildings were appraised together in one report and the single tenant of both buildings is subject to the one lease covering both buildings. The mortgaged property located at 200 Francis D Kenneth Drive in Aurora, Ohio was built in 1982 has not been subsequently renovated. The property located at 2300 East Aurora Road in Twinsburg, Ohio was built in 1975 and was last renovated in 1995. |
THE INFORMATION IN THIS STRUCTURAL AND COLLATERAL TERM SHEET IS NOT COMPLETE AND MAY BE AMENDED PRIOR TO THE TIME OF SALE. THIS TERM SHEET IS NOT AN OFFER TO SELL THESE SECURITIES AND IT IS NOT A SOLICITATION OF AN OFFER TO BUY THESE SECURITIES IN ANY JURISDICTION WHERE THE OFFER OR SALE IS NOT PERMITTED.
37
| BRENNAN INDUSTRIAL PORTFOLIO |
The following table presents certain information relating to the tenancies at the Brennan Industrial Portfolio Properties:
Major Tenants
| Tenant Name | Credit Rating (Fitch/ Moody’s/ S&P) | Tenant NRSF | % of NRSF | Annual U/W Base Rent PSF | Annual U/W Base Rent | % of Total Annual U/W Base Rent | Lease Expiration Date | ||||||
| All Tenants | |||||||||||||
| Hannibal | NR/NR/NR | 429,122 | 18.2% | $9.21 | $3,950,536 | 28.0% | 3/31/2028 | ||||||
| TestAmerica | NR/NR/NR | 231,748 | 9.8% | $12.16 | $2,817,152 | 20.0% | 6/30/2027 | ||||||
| Jade Sterling | NR/NR/NR | 389,900 | 16.6% | $4.19 | $1,633,643 | 11.6% | 4/30/2023 | ||||||
| SET Enterprises | NR/NR/NR | 371,727 | 15.8% | $4.08 | $1,515,385 | 10.7% | 4/30/2026 | ||||||
| MVP Group International | NR/NR/NR | 209,244 | 8.9% | $4.38 | $916,406 | 6.5% | 4/30/2022 | ||||||
| Easley Custom Plastics | NR/NR/NR | 257,086 | 10.9% | $3.09 | $794,745 | 5.6% | 12/31/2031 | ||||||
| Hover-Davis | NR/NR/NR | 66,100 | 2.8% | $11.24 | $742,836 | 5.3% | 6/30/2023 | ||||||
| Paragon Tech | NR/NR/NR | 88,857 | 3.8% | $7.36 | $654,009 | 4.6% | 12/31/2024 | ||||||
| Banner Services | NR/NR/NR | 58,450 | 2.5% | $5.72 | $334,104 | 2.4% | 7/31/2020 | ||||||
| Builders FirstSource | NR/NR/NR | 116,897 | 5.0% | $2.62 | $306,000 | 2.2% | 11/30/2021 | ||||||
| Progressive Metal | NR/NR/NR | 58,250 | 2.5% | $4.58 | $266,901 | 1.9% | 6/30/2020 | ||||||
| Texas Die Casting | NR/NR/NR | 78,177 | 3.3% | $2.17 | $169,711 | 1.2% | 10/1/2027 | ||||||
| Total Tenants- Collateral | 2,355,558 | 100.0% | $5.99 | $14,101,428 | 100.0% | ||||||||
| Occupied Collateral Total | 2,355,558 | 100.0% | $5.99 | $14,101,428 | 100.0% | ||||||||
| Vacant Space | 0 | 0.0% | |||||||||||
| Collateral Total | 2,355,558 | 100.0% | |||||||||||
The following table presents certain information relating to the lease rollover schedule at the Brennan Industrial Portfolio Properties:
Lease Expiration Schedule(1)
Year Ending December 31, | No. of Leases Expiring | Expiring NRSF | % of Total NRSF | Cumulative of Total NRSF | Cumulative % of Total NRSF | Annual U/W Base Rent | Annual U/W Base Rent PSF | |||||||
| MTM | 0 | 0 | 0.0% | 0 | 0.0% | $0 | $0.00 | |||||||
| 2012 | 0 | 0 | 0.0% | 0 | 0.0% | $0 | $0.00 | |||||||
| 2013 | 0 | 0 | 0.0% | 0 | 0.0% | $0 | $0.00 | |||||||
| 2014 | 0 | 0 | 0.0% | 0 | 0.0% | $0 | $0.00 | |||||||
| 2015 | 0 | 0 | 0.0% | 0 | 0.0% | $0 | $0.00 | |||||||
| 2016 | 0 | 0 | 0.0% | 0 | 0.0% | $0 | $0.00 | |||||||
| 2017 | 0 | 0 | 0.0% | 0 | 0.0% | $0 | $0.00 | |||||||
| 2018 | 0 | 0 | 0.0% | 0 | 0.0% | $0 | $0.00 | |||||||
| 2019 | 0 | 0 | 0.0% | 0 | 0.0% | $0 | $0.00 | |||||||
| 2020 | 2 | 116,700 | 5.0% | 116,700 | 5.0% | $601,005 | $5.15 | |||||||
| 2021 | 1 | 116,897 | 5.0% | 233,597 | 9.9% | $306,000 | $2.62 | |||||||
| 2022 | 1 | 209,244 | 8.9% | 442,841 | 18.8% | $916,406 | $4.38 | |||||||
| Thereafter | 8 | 1,912,717 | 81.2% | 2,355,558 | 100.0% | $12,278,017 | $6.42 | |||||||
| Vacant | 0 | 0 | 0.0% | 2,355,558 | 100.0% | $0 | $0.00 | |||||||
| Total/Weighted Average | 12 | 2,355,558 | 100.0% | $14,101,428 | $5.99 |
| (1) | Information obtained from the underwritten rent roll. |
The following table presents historical occupancy percentages at the Brennan Industrial Portfolio Properties:
Historical Occupancy Percentages(1)
12/31/2009 | 12/31/2010 | 12/31/2011 | ||
| 100% | 95% | 100% |
| (1) | Information obtained from borrower rent rolls. |
THE INFORMATION IN THIS STRUCTURAL AND COLLATERAL TERM SHEET IS NOT COMPLETE AND MAY BE AMENDED PRIOR TO THE TIME OF SALE. THIS TERM SHEET IS NOT AN OFFER TO SELL THESE SECURITIES AND IT IS NOT A SOLICITATION OF AN OFFER TO BUY THESE SECURITIES IN ANY JURISDICTION WHERE THE OFFER OR SALE IS NOT PERMITTED.
38
| BRENNAN INDUSTRIAL PORTFOLIO |
Operating History and Underwritten Net Cash Flow. The following table presents certain information relating to the historical operating performance and the Underwritten Net Cash Flow at the Brennan Industrial Portfolio Properties:
Cash Flow Analysis(1)
2009 | 2010 | 2011 | U/W | U/W $ per SF | |||||||
| Base Rent | $11,523,740 | $11,850,043 | $13,569,865 | $14,101,427 | $5.99 | ||||||
| Grossed Up Vacant Space | 0 | 0 | 0 | 0 | 0.00 | ||||||
| Percentage Rent | 0 | 0 | 0 | 0 | 0.00 | ||||||
| Total Reimbursables | 0 | 0 | 1,597 | 0 | 0.00 | ||||||
| Other Income | 0 | 2,296 | 138 | 0 | 0.00 | ||||||
| Less Vacancy & Credit Loss | 0 | 0 | 0 | (1,043,506) | (0.44) | ||||||
| Effective Gross Income | $11,523,740 | $11,852,339 | $13,571,600 | $13,057,921 | $5.54 | ||||||
| Total Operating Expenses | $176,255 | $340,639 | $1,174,446 | $391,738 | $0.17 | ||||||
| Net Operating Income | $11,347,485 | $11,511,700 | $12,397,154 | $12,666,184 | $5.38 | ||||||
| TI/LC | 0 | 0 | 0 | 949,549 | 0.40 | ||||||
| Capital Expenditures | 0 | 0 | 0 | 471,111 | 0.20 | ||||||
| Net Cash Flow | $11,347,485 | $11,511,700 | $12,397,154 | $11,245,523 | $4.77 | ||||||
| NOI DSCR | 2.38x | 2.41x | 2.60x | 2.66x | |||||||
| NCF DSCR | 2.38x | 2.41x | 2.60x | 2.36x | |||||||
| NOI DY | 11.0% | 11.2% | 12.1% | 12.3% | |||||||
| NCF DY | 11.0% | 11.2% | 12.1% | 10.9% | |||||||
| (1) | The increase in NOI in 2011 and in the underwritten NOI was the result of Builder’s FirstSource (2.2% of Annual U/W Base Rent) signing its lease and commencing rental payments in 2011. |
Appraisal. According to the appraisals dated from May 25, 2012 to June 13, 2012, the Brennan Industrial Portfolio Properties had an aggregate “as-is” appraised value of $153,225,000 and an aggregate “go dark” value of $97,875,000.
Environmental Matters. Phase I environmental site assessments were performed from January 26, 2012 to June 22, 2012. The assessments did not contain recommendations to perform Phase II environmental site assessments at any of the Brennan Industrial Portfolio Properties but did recommend the implementation of O&M plans for five properties. Two properties, occupied by Hannibal and Progressive Metals, respectively, were found to have Recognized Environmental Conditions (“REC”) related to the continued presence of two underground coolant storage tanks as well as the historical presence of two underground fuel storage tanks at the Hannibal property that have been remediated but have not as of yet received administrative closure. At the Progressive Metal property, the REC related to an adjoining third-party solvent recovery site that impacted groundwater at the property. Groundwater at the Hannibal property also is impacted by contaminants from a former dry cleaning recycler that had been located on an adjacent third-party property. Neither of the applicable Phase I environmental site assessments recommended that Hannibal or Progressive Metal undertake additional remediation. Hannibal has purchased environmental insurance which provides coverage to the landlord up to $5.0 million with a $100,000 self-insured retention and a policy period of ten years which began on March 20, 2008. The insurance policy was written in the name of the prior owner of the Brennan Industrial Portfolio Properties and was transferred to the borrower upon its purchase of the Brennan Industrial Portfolio Properties. The lender on the Brennan Industrial Portfolio Mortgage Loan is named as an additional insured on the insurance policy. This policy covers known and unknown pre-existing conditions as of March 2008. The new owner of the Brennan Industrial Portfolio Properties is required to conduct a baseline environmental assessment of the Progressive Metal property to qualify for the Michigan statutory defense to liability. The borrowers, pursuant to the terms of the loan documents, have covenanted to complete such baseline environmental assessment within the statutory 45 day period from the date of the acquisition of the Progressive Metal property.
The Borrower. The borrower is comprised of twenty separate single-purpose borrowing entities each with two independent directors. Michael Brennan, Robert Vanecko, Samuel Mandarino, Scott McKibben, Allen Crosswell, Tod Greenwood and Troy MacMane will serve as the guarantors of certain nonrecourse carveouts under the Brennan Industrial Portfolio Mortgage Loan. Certain indirect owners of the borrower are members of the Islamic faith and require a Shari’ah compliant loan structure. See “Risk Factors – Risks Related to the Mortgage Loans – Shari’ah Compliant Loans” and “Description of the Mortgage Pool – Shari’ah Compliant Lending Structure” in the Free Writing Prospectus. In order to facilitate a Shari’ah compliant loan structure, the borrower master leases the Brennan Industrial Portfolio Properties to 20 individual master lessees which are ultimately controlled by the nonrecourse carveout guarantors. Legal counsel to the borrower delivered a non-consolidation opinion in connection with the origination of the Brennan Industrial Portfolio Mortgage Loan.
The Sponsor. USIP-Brennan Ventures, LLC is a joint venture between Brennan Investment Group, Gatehouse Bank (“Gatehouse”), and Arch Street Capital Advisors. Collectively, the managing principals of Brennan Investment Group have invested in over 4,000 properties in more than 60 cities in the United States, Europe and Canada throughout the course of their careers. Currently, Brennan Investment Group manages over 4.5 million square feet of industrial assets. Gatehouse is a public limited company in the United Kingdom, and is majority owned by The Securities House KSCC. Gatehouse serves the Islamic finance sector, both in selected markets globally and specifically in the City of London. Gatehouse focuses its core business activity on private wealth management, real estate investment, treasury products and services, and Shari’ah advisory. Founded in 1982, the Securities House KSCC is a Shari’ah-compliant investment company that is listed on the Kuwait Stock Exchange. Arch Street Capital Advisors assists international investors with their U.S. real estate strategies, including acquisition and joint venture advisory, financing advisory and asset management and disposition services. Arch Street Capital Advisors has advised clients on more than
THE INFORMATION IN THIS STRUCTURAL AND COLLATERAL TERM SHEET IS NOT COMPLETE AND MAY BE AMENDED PRIOR TO THE TIME OF SALE. THIS TERM SHEET IS NOT AN OFFER TO SELL THESE SECURITIES AND IT IS NOT A SOLICITATION OF AN OFFER TO BUY THESE SECURITIES IN ANY JURISDICTION WHERE THE OFFER OR SALE IS NOT PERMITTED.
39
| BRENNAN INDUSTRIAL PORTFOLIO |
$4.0 billion of acquisitions, dispositions and financings. Arch Street Capital Advisors advised Gatehouse on this acquisition and has a participation interest in the venture.
Escrows. The loan documents provide for upfront escrows at closing in the amount of: $9,166 for insurance and $3,896,368 for tenant security deposits related to the tenants Hannibal and Hover-Davis. $3,560,821 million of the security deposits reserved are associated with Hannibal and will be released to the borrower upon receipt by the lender of an SNDA which is acceptable in the judgement of the lender. $335,547 of the security deposits reserved are associated with Hover-Davis and will be held by the lender for the entire loan term. The loan documents do not provide for tax escrows provided that: (i) the tenant at each of the Brennan Industrial Portfolio Properties pays all taxes directly (or directly to the borrower); (ii) borrower provides evidence to the lender that payments are being made in a timely manner; and (iii) no event of default has occurred or is continuing.
Additionally, at closing, approximately $6.6 million of the $155.2 million purchase price was held in escrow at the title company to address any lost rental income and leasing costs associated with any tenants’ monetary defaults or early terminations over a 29-month period from the date of acquisition. At the end of such period, any amounts remaining in such escrow will be paid to the prior owner of the Brennan Industrial Portfolio Properties.
Lockbox and Cash Management. The Brennan Industrial Portfolio Mortgage Loan requires a lender-controlled lockbox account, which is already in place, and that the borrower directs tenants to pay their rents directly to such lockbox account. The loan documents also require that all cash revenues relating to the Brennan Industrial Portfolio Properties and all other monies received by the borrower or the property manager be deposited into the lockbox account within one business day after receipt. Prior to the occurrence of a Cash Management Period (as defined below) all funds on deposit in the lockbox account are swept into the master lessees’ operating account on a daily basis to an account as directed by the borrower. During a Cash Management Period (as defined below), all funds on deposit in the lockbox account will be required to be swept on a daily basis to a cash management account under the control of the lender.
A “Cash Management Period” will commence: (i) if an event of default has occurred and is continuing under the Brennan Industrial Portfolio Mortgage Loan; or (ii) if, as of the last day of any calendar quarter during the term of the Brennan Industrial Portfolio Mortgage Loan, the debt service coverage ratio is less than 1.30x. A Cash Management Period will end either with respect to the matters described in clause (i) above, when such event of default has been cured, and with respect to the matters described in clause (ii) above, when the Brennan Industrial Portfolio Properties have achieved a debt service coverage ratio of at least 1.30x for two consecutive calendar quarters.
Property Management. The Brennan Industrial Portfolio Properties are currently self-managed by an affiliate of the Brennan Industrial Portfolio sponsor.
Assumption. The Brennan Industrial Portfolio Mortgage Loan borrower has the right to transfer all of the Brennan Industrial Portfolio Properties, but not less than all, subject to customary conditions set forth in the loan documents, including but not limited to: (i) no event of default has occurred and is continuing under the Brennan Industrial Portfolio Mortgage Loan; (ii) payment by the borrower of an assumption fee equal to 0.50% of the outstanding principal balance of the Brennan Industrial Portfolio Mortgage Loan; (iii) the borrower has submitted to the lender true, correct and complete copies of any and all information and documents requested; (iv) evidence satisfactory to the lender has been provided showing that the transferee borrower complies with the special purpose entity provisions of the loan documents; and (v) all of the lender’s reasonable costs and expenses have been paid in connection with the transfer.
Partial Release. Following the second anniversary of the issuance of the Series 2012-C8 Certificates, the borrower may obtain the release of an individual property from the lien of mortgage (and the related loan documents) in connection with a partial release upon the satisfaction of certain conditions including without limitation: (i) the property to be released must be the subject of a sale to a bona fide third party purchaser who is not a Restricted Party (as defined below) or an affiliate of a Restricted Party; (ii) the borrower will provide the lender a written request at least 20 days prior to the proposed release date; (iii) no event of default has occurred or is continuing at the time that the release occurs; (iv) payment by the borrower of an amount equal to 120% of the then current allocated loan amount for the individual property to be released, along with any applicable yield maintenance or prepayment premium; (v) the debt service coverage ratio (based on a 4.580% interest rate and a 30-year amortization period) of the remaining properties must not be less than 1.60x, provided that so long as such ratio is greater than 1.30x but less than 1.60x, the borrower may still obtain such release by making an additional payment of principal (x) if net sales proceeds exceed the release amount, in an amount equal to the lesser of (1) 100% of the remaining net sales proceeds or (2) the amount of net sales proceeds necessary to cause the ratio to be less than 1.60x or (y) if the net sales proceeds do not exceed the release amount, in an amount that would cause the ratio to be no less than 1.60x (in each instance together with any applicable yield maintenance premium); and (vi) the remaining properties meet certain loan-to-value ratio requirements designed to comply with REMIC requirements in effect as of the origination of the Brennan Industrial Portfolio Mortgage Loan.
A “Restricted Party” means the borrower, any principal, any guarantor or any master lessee or affiliate thereof under the Brennan Industrial Portfolio Mortgage Loan.
After the lockout period, the borrower may also obtain a release of certain immaterial or non-income producing portions of the Brennan Industrial Portfolio Properties from the lien of the applicable mortgages upon the satisfaction of certain conditions, including but not limited to: (i) no Cash Management Period is continuing; (ii) the non-income producing parcel to be released must be the subject of a sale to a bona fide third party purchaser who is not a Restricted Party (as defined above) or an affiliate of a Restricted Party; (iii) the lender receives written confirmation from Fitch, KBRA and Moody’s as well as an opinion of counsel that the release will not, in and of itself, result in a downgrade, qualification or withdrawal of the then current ratings assigned to any
THE INFORMATION IN THIS STRUCTURAL AND COLLATERAL TERM SHEET IS NOT COMPLETE AND MAY BE AMENDED PRIOR TO THE TIME OF SALE. THIS TERM SHEET IS NOT AN OFFER TO SELL THESE SECURITIES AND IT IS NOT A SOLICITATION OF AN OFFER TO BUY THESE SECURITIES IN ANY JURISDICTION WHERE THE OFFER OR SALE IS NOT PERMITTED.
40
| BRENNAN INDUSTRIAL PORTFOLIO |
class of Series 2012-C8 Certificates; (iv) the borrower must pay to the lender 100% of the net sales proceeds which shall either, at borrower’s election, be deposited into a subaccount as additional security for the loan or be applied towards a prepayment of principal and any applicable yield maintenance or prepayment premium; and (v) the remaining portion of the Brennan Industrial Portfolio Properties meets certain loan-to-value ratio requirements designed to comply with REMIC requirements in effect as of the origination of the Brennan Industrial Portfolio Mortgage Loan.
Real Estate Substitution. The borrower may obtain a release of any individual Brennan Industrial Portfolio property from the lien of the mortgage in connection with a substitution of a different parcel subject to the satisfaction of certain conditions, including without limitation: (i) no event of default has occurred or is continuing; (ii) the allocated loan amount for all properties substituted into the Brennan Industrial Portfolio Mortgage Loan shall not exceed 25.0% of the original principal amount of the Brennan Industrial Portfolio Mortgage Loan; (iii) after giving effect to such substitution, the loan-to-value ratio of the Brennan Industrial Portfolio Properties must not exceed the lesser of the loan-to-value ratio immediately prior to such substitution and 67.0%; (iv) after giving effect to such substitution, the debt service coverage ratio of the Brennan Industrial Portfolio Properties must not be lesser than the greater of the debt service coverage ratio (based on a 4.580% interest rate and a 30-year amortization period) immediately prior to such substitution and 1.60x; (v) the lender receives written confirmation from Fitch, KBRA and Moody’s that the substitution will not, in and of itself, result in a downgrade, qualification or withdrawal of the then current ratings assigned to any class of Series 2012-C8 Certificates; and (vi) at no time will the total number of properties secured by the Brennan Industrial Portfolio Mortgage Loan exceed 25.
Subordinate and Mezzanine Indebtedness. Not permitted.
Ground Lease. None.
Terrorism Insurance. The loan documents require the borrower to maintain insurance coverage for terrorism in an amount equal to the full replacement cost of the Brennan Industrial Portfolio Properties. The loan documents also require business interruption insurance covering no less than the twelve-month period following the occurrence of a casualty event.
THE INFORMATION IN THIS STRUCTURAL AND COLLATERAL TERM SHEET IS NOT COMPLETE AND MAY BE AMENDED PRIOR TO THE TIME OF SALE. THIS TERM SHEET IS NOT AN OFFER TO SELL THESE SECURITIES AND IT IS NOT A SOLICITATION OF AN OFFER TO BUY THESE SECURITIES IN ANY JURISDICTION WHERE THE OFFER OR SALE IS NOT PERMITTED.
41
| NORTHRIDGE FASHION CENTER |
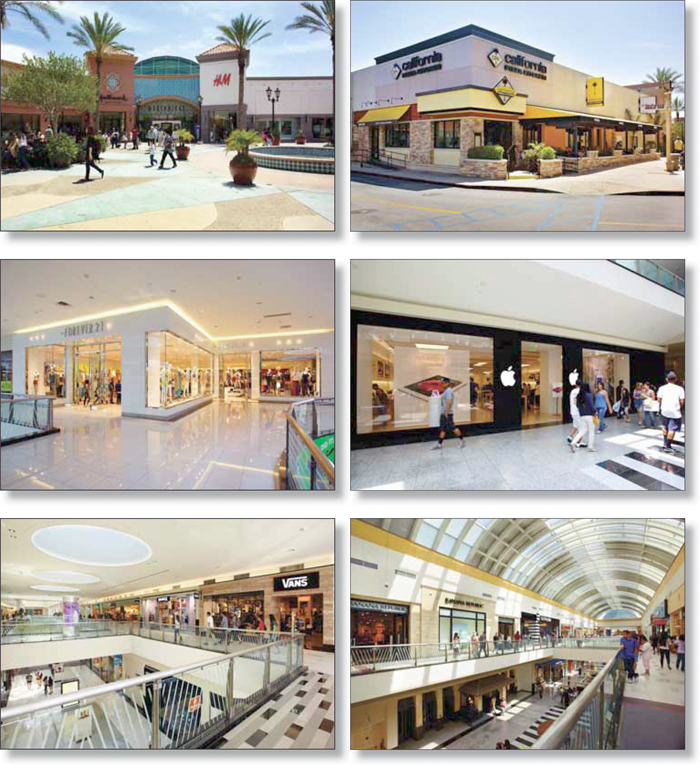
THE INFORMATION IN THIS STRUCTURAL AND COLLATERAL TERM SHEET IS NOT COMPLETE AND MAY BE AMENDED PRIOR TO THE TIME OF SALE. THIS TERM SHEET IS NOT AN OFFER TO SELL THESE SECURITIES AND IT IS NOT A SOLICITATION OF AN OFFER TO BUY THESE SECURITIES IN ANY JURISDICTION WHERE THE OFFER OR SALE IS NOT PERMITTED.
42
| NORTHRIDGE FASHION CENTER |
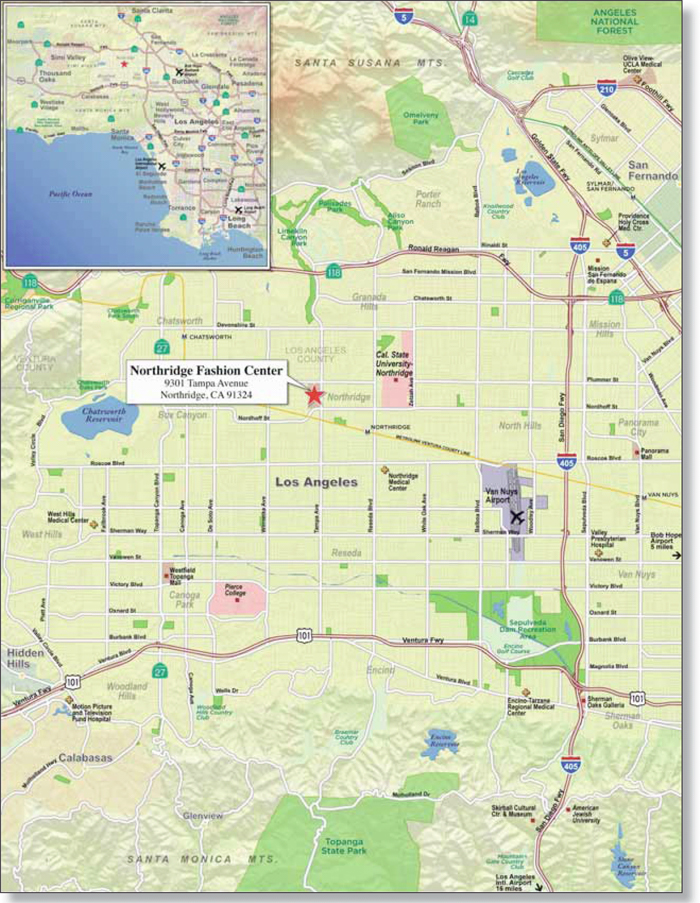
THE INFORMATION IN THIS STRUCTURAL AND COLLATERAL TERM SHEET IS NOT COMPLETE AND MAY BE AMENDED PRIOR TO THE TIME OF SALE. THIS TERM SHEET IS NOT AN OFFER TO SELL THESE SECURITIES AND IT IS NOT A SOLICITATION OF AN OFFER TO BUY THESE SECURITIES IN ANY JURISDICTION WHERE THE OFFER OR SALE IS NOT PERMITTED.
43
| NORTHRIDGE FASHION CENTER |
| Northridge Fashion Center | |||||||
| Loan Information | Property Information | ||||||
| Mortgage Loan Seller: | Wells Fargo Bank, National Association | Single Asset/Portfolio: | Single Asset | ||||
| Credit Assessment (Fitch/KBRA/Moody’s): | NR/NR/NR | Property Type: | Retail | ||||
Original Principal Balance(1): | $91,000,000 | Specific Property Type: | Regional Mall | ||||
Cut-off Date Principal Balance(1): | $89,331,381 | Location: | Northridge, CA | ||||
| % of Initial Pool Balance: | 6.9% | Size: | 643,564 SF | ||||
| Loan Purpose: | Refinance | Cut-off Date Principal Balance Per Unit/SF(1): | $382.86 | ||||
| Borrower Name: | GGP Northridge Fashion Center, LP | ||||||
| Sponsor: | GGPLP Real Estate | Year Built/Renovated: | 1971/1998 | ||||
| Mortgage Rate: | 5.097% | Occupancy %(7): | 90.4% | ||||
| Note Date: | April 1, 2011 | Occupancy % Source Date: | December 31, 2011 | ||||
| Anticipated Repayment Date: | NAP | Title Vesting: | Fee | ||||
| Maturity Date: | December 1, 2021 | Property Manager: | Self-managed | ||||
| IO Period: | None | ||||||
| Loan Term (Original): | 128 months | 3rd Most Recent NOI (As of): | $23,862,383 (12/31/2010) | ||||
| Seasoning: | 16 months | 2nd Most Recent NOI (As of): | $23,781,960 (12/31/2011) | ||||
| Amortization Term (Original): | 360 months | Most Recent NOI (As of): | $23,834,666 (TTM 3/31/2012) | ||||
| Loan Amortization Type: | Amortizing Balloon | ||||||
| Interest Accrual Method: | Actual/360 | U/W Revenues: | $34,291,529 | ||||
| Call Protection: | L(40),D(81),O(7) | U/W Expenses: | $10,395,561 | ||||
| Lockbox Type: | Soft/Springing Cash Management | U/W NOI: | $23,895,969 | ||||
Additional Debt(1): | Yes | U/W NCF: | $22,905,477 | ||||
Additional Debt Type(1): | Pari Passu and Future Mezzanine | U/W NOI DSCR(1): | 1.46x | ||||
U/W NCF DSCR(1): | 1.40x | ||||||
| Escrows and Reserves: | U/W NOI Debt Yield(1): | 9.7% | |||||
U/W NCF Debt Yield(1): | 9.3% | ||||||
| Type: | Initial | Monthly | Cap (If Any) | As-Is Appraised Value: | $369,000,000 | ||
Taxes(2) | $0 | Springing | NAP | As-Is Appraisal Valuation Date: | January 16, 2012 | ||
Insurance(3) | $0 | Springing | NAP | Cut-off Date LTV Ratio(1): | 66.8% | ||
Replacement Reserves(4) | $0 | Springing | $161,976 | LTV Ratio at Maturity or ARD(1): | 55.1% | ||
TI/LC(5) | $169,192 | Springing | $719,880 | ||||
Sports Authority Holdback(6) | $6,279,384 | $0 | NAP | ||||
| (1) | The Northridge Fashion Center Mortgage Loan Combination, totalling $251,000,000, is comprised of two pari passu loan components (Notes A-1 and A-2). Note A-2 (the “Northridge Fashion Center Mortgage Loan”) had an original balance of $91,000,000, has an outstanding principal balance as of the Cut-off Date of $89,331,381 and will be contributed to the WFRBS 2012-C8 Trust. Note A-1 (the “Northridge Fashion Center Companion Mortgage Loan”) had an original balance of $160,000,000 and was contributed to the WFRBS 2012-C7 Trust. All presented statistical information related to balances per square foot, loan-to-value ratio, debt service coverage ratio, and debt yields are based on the Northridge Fashion Center Mortgage Loan Combination. |
| (2) | Monthly tax deposits are not required as long as no event of default has occurred and is continuing and the borrower has provided the lender with proof of full payment within a timely manner. |
| (3) | Monthly insurance escrow requirements are not required as long as no event of default has occurred and is continuing and the borrower provides satisfactory evidence that the mortgaged property is insured in accordance with the loan documents. |
| (4) | Monthly replacement reserve deposits are not required as long as no event of default has occurred or is continuing or the actual debt service coverage ratio for the Northridge Fashion Center Mortgage Loan Combination as defined in the loan documents for any trailing twelve-month period is not less than 1.25x. |
| (5) | Monthly TI/LC reserve deposits are not required as long as no event of default has occurred or is continuing or the actual debt service coverage ratio for the Northridge Fashion Center Mortgage Loan Combination as defined in the loan documents for any trailing twelve-month period is not less than 1.25x. |
| (6) | The borrower made an up-front deposit to pay for tenant improvements associated with the Sports Authority lease. |
| (7) | Occupancy includes Sports Authority, which represents 8.4% of the net rentable square feet and 3.4% of the underwritten base rent. The tenant executed a lease, but is not yet in occupancy. Occupancy does not include 32,889 square feet, which represents 5.1% of the net rentable square feet, leased to Walmart Neighborhood Market (“Walmart”). The terms of the Walmart lease agreement are contingent upon the City of Northridge’s (the “City”) approval of the intended use of the leased premises. Subsequent to receipt of the City’s approval, Walmart is thereafter afforded a 30-day diligence period during which Walmart may terminate its lease without penalty. As of the Cut-off Date, the City has yet to approve the lease and Walmart’s proposed rent was not included in Annual U/W Base Rent. |
The Mortgage Loan. The mortgage loan (the “Northridge Fashion Center Mortgage Loan Combination”) is evidenced by a promissory note that is secured by a first mortgage encumbering a super regional mall located in Northridge, California (the “Northridge Fashion Center Property”). The Northridge Fashion Center Mortgage Loan Combination was originated on April 1, 2011 by Wells Fargo Bank, National Association. The Northridge Fashion Center Mortgage Loan Combination had an original balance of $251,000,000 and accrues interest at an interest rate of 5.097% per annum. The Northridge Fashion Center Mortgage Loan Combination had an initial term of 128 months, has a remaining term of 112 months as of the Cut-off Date and requires payments of interest and principal based on a 30-year amortization schedule. The Northridge Fashion Center Mortgage Loan Combination matures on December 1, 2021. The Northridge Fashion Center Mortgage Loan Combination was bifurcated into two pari passu loan notes (Notes A-1 and A-2).
THE INFORMATION IN THIS STRUCTURAL AND COLLATERAL TERM SHEET IS NOT COMPLETE AND MAY BE AMENDED PRIOR TO THE TIME OF SALE. THIS TERM SHEET IS NOT AN OFFER TO SELL THESE SECURITIES AND IT IS NOT A SOLICITATION OF AN OFFER TO BUY THESE SECURITIES IN ANY JURISDICTION WHERE THE OFFER OR SALE IS NOT PERMITTED.
44
| NORTHRIDGE FASHION CENTER |
Note A-2 (the “Northridge Fashion Center Mortgage Loan”) had an original principal balance of $91,000,000, has an outstanding principal balance as of the Cut-off Date of $89,331,381 and Note A-1 (the “Northridge Fashion Center Pari Passu Companion Mortgage Loan”) had an original principal balance of $160,000,000. Note A-2, but not the related pari passu Note A-1, will be contributed to the WFRBS 2012-C8 Trust. Note A-1 was contributed to the WFRBS 2012-C7 Trust. See “Description of the Mortgage Pool – Split Loan Structures – The Northridge Fashion Center Loan Combination” and “Servicing of the Mortgage Loans and Administration of the Trust Fund – Servicing of the Pari Passu Mortgage Loans” in the Free Writing Prospectus. The proceeds from the Northridge Fashion Center Mortgage Loan Combination were used to refinance existing debt on the Northridge Fashion Center Property of approximately $122.4 million that was securitized in GSMS 2001-GL3A, fund upfront reserves of approximately $6.4 million, pay closing costs of approximately $1.7 million and return approximately $120.4 million of equity to the sponsor.
Following the lockout period, the borrower has the right to defease the Northridge Fashion Center Mortgage Loan Combination in whole, but not in part, on any due date before the scheduled maturity date. In addition, the Northridge Fashion Center Mortgage Loan Combination is prepayable without penalty on or after June 1, 2021.
The Property. The Northridge Fashion Center Property is a two-story super regional mall anchored by Macy’s, Macy’s Men’s & Home, JC Penney and Sears (none of which are part of the collateral) that contains approximately 1.5 million square feet of which 643,564 square feet secures the Northridge Fashion Center Mortgage Loan Combination. The Northridge Fashion Center Property is situated on 38.0 acres and was built in 1971 and substantially rebuilt after the 1994 Northridge earthquake. The Northridge Fashion Center Property was renovated and expanded in 1998, with the addition of a 10-screen stadium seating Pacific Theater among other in-line shops. Parking is provided by 7,067 surface spaces resulting in a parking ratio of 4.62 spaces per every 1,000 square feet of net rentable area. The mall’s mix of in-line tenants includes American Eagle, Banana Republic, Express, Hollister, the Disney Store and Coach. For year-end 2011, comparable in-line sales (tenants occupying less than 10,000 square feet) averaged $506 per square foot. In-line occupancy costs (tenants occupying less than 10,000 square feet) average 14.8% in 2011. As of December 31, 2011, the Northridge Fashion Center Property was 90.4% leased with no tenant comprising more than 5.6% of the total underwritten rent.
THE INFORMATION IN THIS STRUCTURAL AND COLLATERAL TERM SHEET IS NOT COMPLETE AND MAY BE AMENDED PRIOR TO THE TIME OF SALE. THIS TERM SHEET IS NOT AN OFFER TO SELL THESE SECURITIES AND IT IS NOT A SOLICITATION OF AN OFFER TO BUY THESE SECURITIES IN ANY JURISDICTION WHERE THE OFFER OR SALE IS NOT PERMITTED.
45
| NORTHRIDGE FASHION CENTER |
The following table presents certain information relating to the tenancies at the Northridge Fashion Center Property:
Major Tenants
| Tenant Name | Credit Rating (Fitch/ Moody’s/ S&P)(1) | Tenant NRSF | % of NRSF | Annual U/W Base Rent PSF | Annual U/W Base Rent | % of Total Annual U/W Base Rent | Sales PSF(2) | Occupancy Cost(2) | Lease Expiration Date |
| Anchor Tenants – Not Part of Collateral | |||||||||
| Sears | B+/B3/CCC+ | 267,933 | ANCHOR OWNED – NOT PART OF THE COLLATERAL | ||||||
Macy’s | BBB/Baa3/BBB | 189,650 | ANCHOR OWNED – NOT PART OF THE COLLATERAL | ||||||
| Macy’s Men’s & Home | BBB/Baa3/BBB | 185,200 | ANCHOR OWNED – NOT PART OF THE COLLATERAL | ||||||
| JC Penney | BB+/NR/BB- | 181,660 | ANCHOR OWNED – NOT PART OF THE COLLATERAL | ||||||
| Junior Anchor Tenants - Collateral | |||||||||
| Forever 21 | NR/NR/NR | 23,970 | 3.7% | $48.13 | $1,153,676 | 5.6% | $277 | 16.2% | 1/31/2021 |
| Pacific Theatres | NR/NR/NR | 51,000 | 7.9% | $15.50 | $790,500 | 3.9% | (3) | 30.6% | 12/31/2013 |
Sports Authority(4) | NR/NR/B- | 53,936 | 8.4% | $12.98 | $700,089 | 3.4% | NAV | NAV | 1/31/2022 |
| Total Junior Anchor Tenants - Collateral | 128,906 | 20.0% | $20.51 | $2,644,265 | 12.9% | ||||
| Major Tenants - Collateral | |||||||||
| H&M | NR/NR/NR | 19,455 | 3.0% | $30.13 | $586,179 | 2.9% | $348 | 8.4% | 1/31/2020(5)(6) |
| Apple | NR/NR/NR | 7,571 | 1.2% | $56.17 | $425,263 | 2.1% | $3,000 | 2.0% | 1/31/2012(7) |
| Claim Jumper | NR/NR/NR | 11,975 | 1.9% | $35.09 | $420,203 | 2.1% | $468 | 9.0% | 9/30/2018 |
| Victoria’s Secret | BB+/Ba2/BB+ | 10,180 | 1.6% | $41.00 | $417,380 | 2.0% | $699 | 9.7% | 1/31/2017 |
| Yard House | NR/NR/NR | 10,779 | 1.7% | $35.36 | $381,145 | 1.9% | NAV | NAV | 11/30/2022 |
| Old Navy | BBB-/Baa3/BB+ | 21,084 | 3.3% | $18.00 | $379,512 | 1.9% | $327 | 6.1% | 1/31/2015 |
| Express | NR/NR/BB | 10,862 | 1.7% | $32.77 | $355,948 | 1.7% | $296 | 21.1% | 1/31/2017 |
| Gap/Gap Body | BBB-/Baa3/BB+ | 11,735 | 1.8% | $23.42 | $274,834 | 1.3% | $158 | 29.7% | 1/31/2016 |
| Total Major Tenants – Collateral | 103,641 | 16.1% | $31.27 | $3,240,464 | 15.9% | ||||
| Non-Major Tenants - Collateral | 349,262 | 54.3% | $41.65 | $14,547,011 | 71.2% | ||||
| Occupied Collateral Total | 581,809 | 90.4% | $35.12 | $20,431,740 | 100.0% | ||||
| Vacant Space | 61,755 | 9.6% | |||||||
| Collateral Total | 643,564 | 100.0% | |||||||
| (1) | Certain ratings are those of the parent company whether or not the parent guarantees the lease. |
| (2) | Sales and occupancy costs are for the full-year ending December 31, 2011. |
| (3) | Pacific Theatres (10 screens) had sales of $311,945 per screen in the year ending December 31, 2011. |
| (4) | Sports Authority executed a lease and the sponsor already delivered the space and the tenant is expected to take occupancy in October 2012. |
| (5) | If sales do not exceed $7.0 million in the fourth full lease year, the tenant may terminate the lease with 180 days notice. The fourth lease year begins January 1, 2013 and ends December 31, 2013. If the termination option is exercised, the tenant will be required to reimburse the landlord for any unamortized construction allowance. H&M reported year-end 2011 sales of $6.8 million. |
| (6) | If occupancy (leased and open for business) for the non-anchor square footage is less than 85%, H&M has the immediate option to pay rent of 6% of gross sales. Based on year-end 2011 sales, H&M’s annual rent would be $405,665 or $20.85 per square foot. If fewer than three anchor stores cease to remain open and operating for business or if occupancy for the non-anchor square footage is less than 85% and H&M was paying percentage rent for more than twelve months, H&M can terminate its lease immediately. |
| (7) | Apple’s lease expired on January 31, 2012, but Apple is still in occupancy while negotiating a potential lease extension. |
THE INFORMATION IN THIS STRUCTURAL AND COLLATERAL TERM SHEET IS NOT COMPLETE AND MAY BE AMENDED PRIOR TO THE TIME OF SALE. THIS TERM SHEET IS NOT AN OFFER TO SELL THESE SECURITIES AND IT IS NOT A SOLICITATION OF AN OFFER TO BUY THESE SECURITIES IN ANY JURISDICTION WHERE THE OFFER OR SALE IS NOT PERMITTED.
46
| NORTHRIDGE FASHION CENTER |
The following table presents certain information relating to the lease rollover schedule at the Northridge Fashion Center Property:
Lease Expiration Schedule(1)(2)
Year Ending December 31, | No. of Leases Expiring | Expiring NRSF | % of Total NRSF | Cumulative of Total NRSF | Cumulative % of Total NRSF | Annual U/W Base Rent | % of Annual U/W Base Rent | Annual U/W Base Rent PSF(3) |
| MTM | 2 | 5,408 | 0.8% | 5,408 | 0.8% | $77,759 | 0.4% | $14.38 |
| 2012 | 12 | 35,056 | 5.4% | 40,464 | 6.3% | $883,255 | 4.3% | $25.20 |
| 2013 | 29 | 105,153 | 16.3% | 145,617 | 22.6% | $3,067,530 | 15.0% | $29.17 |
| 2014 | 19 | 54,359 | 8.4% | 199,976 | 31.1% | $1,588,722 | 7.8% | $29.23 |
| 2015 | 19 | 53,722 | 8.3% | 253,698 | 39.4% | $2,424,473 | 11.9% | $45.13 |
| 2016 | 22 | 87,454 | 13.6% | 341,152 | 53.0% | $3,346,072 | 16.4% | $38.26 |
| 2017 | 9 | 40,046 | 6.2% | 381,198 | 59.2% | $1,621,489 | 7.9% | $40.49 |
| 2018 | 8 | 28,293 | 4.4% | 409,491 | 63.6% | $1,236,263 | 6.1% | $43.70 |
| 2019 | 7 | 14,601 | 2.3% | 424,092 | 65.9% | $1,084,871 | 5.3% | $74.30 |
| 2020 | 8 | 37,586 | 5.8% | 461,678 | 71.7% | $1,352,541 | 6.6% | $35.99 |
| 2021 | 6 | 34,214 | 5.3% | 495,892 | 77.1% | $1,982,661 | 9.7% | $57.95 |
| 2022 | 6 | 79,225 | 12.3% | 575,117 | 89.4% | $1,502,707 | 7.4% | $18.97 |
| Thereafter | 1 | 6,692 | 1.0% | 581,809 | 90.4% | $263,397 | 1.3% | $39.36 |
| Vacant | 0 | 61,755 | 9.6% | 643,564 | 100.0% | $0 | 0.0% | $0.00 |
| Total/Weighted Average | 148 | 643,564 | 100.0% | $20,431,740 | 100.0% | $35.12 |
| (1) | Information obtained from underwritten rent roll. |
| (2) | Certain tenants may have lease termination options that are exercisable prior to the originally stated expiration date of the subject lease and that are not considered in the Lease Expiration Schedule. |
| (3) | Weighted Average Annual U/W Base Rent PSF excludes vacant space. |
The following table presents historical occupancy percentages at the Northridge Fashion Center Property:
Historical Occupancy Percentages(1)
12/31/2007 | 12/31/2008 | 12/31/2009 | 12/31/2010 | 12/31/2011(2) | |||||
| 96% | 96% | 90% | 83% | 90% | |||||
| (1) | Information obtained from borrower rent rolls. | ||||||||
| (2) | Occupancy includes Sports Authority, which represents 8.4% of the net rentable square feet. The tenant executed a lease, but is not yet in occupancy. | ||||||||
Historical Average Base Rent (PSF)(1)
12/31/2009 | 12/31/2010 | 12/31/2011 | |||
| $30.45 | $30.05 | $30.93 | |||
| (1) | The historical average base rent (PSF) calculations are based on borrower provided base rental income figures and total square footage of 643,564 square feet since 2009. | ||||
THE INFORMATION IN THIS STRUCTURAL AND COLLATERAL TERM SHEET IS NOT COMPLETE AND MAY BE AMENDED PRIOR TO THE TIME OF SALE. THIS TERM SHEET IS NOT AN OFFER TO SELL THESE SECURITIES AND IT IS NOT A SOLICITATION OF AN OFFER TO BUY THESE SECURITIES IN ANY JURISDICTION WHERE THE OFFER OR SALE IS NOT PERMITTED.
47
| NORTHRIDGE FASHION CENTER |
Operating History and Underwritten Net Cash Flow. The following table presents certain information relating to the historical operating performance and the Underwritten Net Cash Flow at the Northridge Fashion Center Property:
Cash Flow Analysis
| 2009 | 2010 | 2011 | TTM 3/31/2012 | U/W | U/W $ per SF | |||||||||||||||||||
| Base Rent | $19,598,085 | $19,336,807 | $19,904,369 | $19,765,438 | $20,431,740 | $31.75 | ||||||||||||||||||
| Grossed Up Vacant Space | 0 | 0 | 0 | 0 | 1,997,749 | 3.10 | ||||||||||||||||||
| Percentage Rent | 522,713 | 608,900 | 754,375 | 871,071 | 754,375 | 1.17 | ||||||||||||||||||
| Total Reimbursables | 8,798,200 | 8,841,376 | 8,496,086 | 8,457,098 | 9,081,552 | 14.11 | ||||||||||||||||||
| Other Income | 4,699,635 | 4,206,407 | 4,023,862 | 4,065,570 | 4,023,862 | 6.25 | ||||||||||||||||||
| Less Vacancy & Credit Loss | (282,890) | (360,451) | 0 | 0 | (1,997,749) | (3.10) | ||||||||||||||||||
| Effective Gross Income | $33,335,743 | $32,633,040 | $33,178,692 | $33,159,177 | $34,291,529 | $53.28 | ||||||||||||||||||
| Total Operating Expenses | $8,437,373 | $8,770,657 | $9,396,732 | $9,324,511 | $10,395,561 | $16.15 | ||||||||||||||||||
| Net Operating Income | $24,898,370 | $23,862,383 | $23,781,960 | $23,834,666 | $23,895,969 | $37.13 | ||||||||||||||||||
| TI/LC | 0 | 0 | 0 | 0 | 848,908 | 1.32 | ||||||||||||||||||
| Capital Expenditures | 0 | 0 | 0 | 0 | 141,584 | 0.22 | ||||||||||||||||||
| Net Cash Flow | $24,898,370 | $23,862,383 | $23,781,960 | $23,834,666 | $22,905,477 | $35.59 | ||||||||||||||||||
NOI DSCR(1) | 1.52x | 1.46x | 1.45x | 1.46x | 1.46x | |||||||||||||||||||
NCF DSCR(1) | 1.52x | 1.46x | 1.45x | 1.46x | 1.40x | |||||||||||||||||||
NOI DY(1) | 10.1% | 9.7% | 9.6% | 9.7% | 9.7% | |||||||||||||||||||
NCF DY(1) | 10.1% | 9.7% | 9.6% | 9.7% | 9.3% | |||||||||||||||||||
| (1) | DSCRs and debt yields are based on the Northridge Fashion Center Mortgage Loan Combination. |
Appraisal. According to the appraisal dated January 26, 2012, the Northridge Fashion Center Property had an “as-is” appraised value of $369,000,000.
Environmental Matters. According to the Phase I environmental site assessment dated March 21, 2011, a subsurface investigation of the Firestone outparcel was recommended to determine the presence or absence of soil and or groundwater contamination. The report also recommended the implementation of an O&M Program in order to safely manage the suspect asbestos containing materials located at the property.
While no Phase II testing was required in connection with loan origination, the Firestone Lease obligates the tenant to maintain the demised premises in compliance with all laws and ordinances relating to tenant’s use. In addition, the loan documents include an environmental indemnity from GGPLP Real Estate, Inc., which had a stated net worth, per their consolidated balance sheet, of approximately $3.0 billion and liquidity of approximately $27.2 million (including cash, short-term accounts receivable and notes receivable) as of December 31, 2010.
Market Overview and Competition. According to the appraisal, the Northridge Fashion Center Property is located in the northwest portion of Los Angeles County in the Northridge District of Los Angeles and is approximately 22 miles northwest of Los Angeles central business district. The population and average household income within a three-mile radius of the Northridge Fashion Center Property are 203,045 and $77,932, respectively.
According to the appraisal, the Northridge Fashion Center Property is located in the San Fernando Valley West retail submarket of Los Angeles, which contains approximately 5.4 million square feet of retail space or approximately 8.2% of the total Los Angeles retail market. The submarket vacancy is 7.0% and reported asking rents were $32.77 per square foot as of the third quarter of 2011.
THE INFORMATION IN THIS STRUCTURAL AND COLLATERAL TERM SHEET IS NOT COMPLETE AND MAY BE AMENDED PRIOR TO THE TIME OF SALE. THIS TERM SHEET IS NOT AN OFFER TO SELL THESE SECURITIES AND IT IS NOT A SOLICITATION OF AN OFFER TO BUY THESE SECURITIES IN ANY JURISDICTION WHERE THE OFFER OR SALE IS NOT PERMITTED.
48
| NORTHRIDGE FASHION CENTER |
The following table presents certain information relating to some comparable retail centers provided in the appraisal for the Northridge Fashion Center Property:
Competitive Set(1)
Northridge Fashion Center (Subject) | Westfield Topanga | Westfield Promenade | Westfield Fashion Square | Fallbrook Center | |
| Market | Northridge, CA | Canoga Park, CA | Woodland Hills, CA | Sherman Oaks, CA | West Hills, CA |
| Distance from Subject | -- | 6.5 miles | 7.0 miles | 11.5 miles | 7.5 miles |
| Property Type | Super Regional Center | Super Regional Center | Regional Center | Super Regional Center | Regional Center |
| Year Built/Renovated | 1971/1998 | 1964/2006 | 1973/2001 | 1961/1996 | 1966/2003 |
| Anchors | Macy’s, Macy’s Men’s & Home, JC Penney, Sears | Macy’s, Sears, Nordstrom, Neiman Marcus, Target | Macy’s, Macy’s Furniture | Macy’s, Bloomingdale’s | Kohl’s, Walmart, Home Depot, Burlington Coat, Target |
| Total GLA | 1,529,628 SF | 1,572,974 SF | 615,400 SF | 862,367 SF | 1,051,920 SF |
| Total Occupancy | 90% | 95% | 85% | 98% | 92% |
| (1) | Information obtained from appraisal dated January 26, 2012. |
The Borrower. The borrower is GGP Northridge Fashion Center, LP, a Delaware limited liability partnership and a single-purpose entity. Legal counsel to the borrower delivered a non-consolidation opinion in connection with the origination of the Northridge Fashion Center Mortgage Loan Combination. GGPLP Real Estate, Inc., the indirect owner of the borrower is the guarantor of certain nonrecourse carveouts under the Northridge Fashion Center Mortgage Loan Combination.
The Sponsor. The borrower, GGP Northridge Fashion Center, LP, is indirectly owned by General Growth Properties, Inc. (“GGP”). GGP is a publically traded REIT that has ownership interests in 135 malls totaling approximately 140 million square feet. GGP entered Chapter 11 bankruptcy proceedings in April 2009 and emerged from bankruptcy protection in November 2010. See “Description of the Mortgage Pool – Bankruptcy Issues and Other Proceedings” in the Free Writing Prospectus.
Escrows. The loan documents do not require monthly escrows for real estate taxes provided the following conditions are met: (i) no Trigger Event (as defined below) exists and is continuing and (ii) borrower provides the lender with satisfactory evidence that all taxes have been and continue to be fully and timely paid prior to the date such taxes would be delinquent. The loan documents do not require monthly escrows for insurance provided the following conditions are met: (i) no event of default exists and is continuing; (ii) the insurance required to be maintained by borrower is maintained pursuant to one or more blanket policies; (iii) borrower provides the lender with satisfactory evidence that all insurance premiums have been and continue to be fully and timely paid, and in any event, at least twenty days prior to the date the policies would, in the absence of payment, expire, lapse, be canceled or the coverage is impaired. The loan documents do not require monthly escrows of replacement reserves as long as a Trigger Event has not occurred or following a Trigger Event Cure. Following the occurrence of a Trigger Event, until the occurrence of a Trigger Event Cure, borrower is required to deposit monthly replacement reserves in an amount equal to $13,498 (subject to a cap of $161,976). The loan documents do not require monthly escrows for tenant improvements and leasing commissions as long as a Trigger Event has not occurred or following a Trigger Event Cure. Following the occurrence of a Trigger Event, until the occurrence of a Trigger Event Cure, borrower is required to deposit monthly payments into the escrow account for tenant improvement and leasing commissions in amount equal to $59,990 (subject to a cap of $719,880). Upon origination, the borrower was required to make an initial deposit of $169,192 into the tenant improvements and leasing commissions reserve fund.
A “Trigger Event” will exist upon the occurrence of an event of default or in the event the actual debt service coverage ratio for any trailing twelve-month period is less than 1.25x. A “Trigger Event Cure” means that the actual debt service coverage ratio is at least 1.25x for two consecutive quarters.
Upon origination, the borrower deposited with the lender $6,279,384 (the “Sports Authority Reserve”) that may be utilized to pay or reimburse borrower for tenant improvement and leasing commission costs and allowances related to (i) the Sports Authority lease or (ii) an acceptable substitute lease for all or a portion of the Sports Authority space that has been approved by the lender, considering the effect of the substitute lease on the projected debt yield, taking into consideration disbursements from the Sports Authority Reserve funds for the payment of the requested tenant improvement allowances and leasing commissions and increases in projected net operating income as a result of the substitute lease, and/or (iii) any space that was previously vacant prior to April 1, 2011, subject to the lender’s reasonable discretion. The borrower is entitled to a release of the remaining amounts on deposit in the Sports Authority Reserve if trailing twelve-month net operating income is not less than $25,100,000 a quarter for two consecutive calendar quarters after origination.
Lockbox and Cash Management. The Northridge Fashion Center Mortgage Loan Combination requires a lender-controlled lockbox account, which is already in place, and that the borrower direct tenants to pay their rents directly to such lockbox account. The loan documents also require that all cash revenues relating to the Northridge Fashion Center Property and all other monies received by the borrower or the property manager be deposited into the lockbox account within five business days after receipt. Other than during a Trigger Event, all excess funds on deposit are distributed to the Northridge Fashion Center borrower.
Property Management. The Northridge Fashion Center Property is currently self-managed by an affiliate of the Northridge Fashion Center sponsor.
THE INFORMATION IN THIS STRUCTURAL AND COLLATERAL TERM SHEET IS NOT COMPLETE AND MAY BE AMENDED PRIOR TO THE TIME OF SALE. THIS TERM SHEET IS NOT AN OFFER TO SELL THESE SECURITIES AND IT IS NOT A SOLICITATION OF AN OFFER TO BUY THESE SECURITIES IN ANY JURISDICTION WHERE THE OFFER OR SALE IS NOT PERMITTED.
49
| NORTHRIDGE FASHION CENTER |
Assumption. The Northridge Fashion Center Mortgage Loan borrower has the right to transfer the Northridge Fashion Center Property and cause an assumption of the loan, provided that no event of default has occurred and is continuing under the Northridge Fashion Center Mortgage Loan Combination and that certain other conditions are satisfied, including: (i) the borrower pays an assumption fee of 0.5% of the outstanding principal balance of the Northridge Fashion Center Mortgage Loan Combination; (ii) the transferee satisfies certain criteria; (iii) transferee assumes the obligations of the borrower under the management agreement or enters into a new management agreement with a manager that satisfies certain criteria; and (iv) the lender receives confirmation from Fitch, KBRA and Moody’s that the transfer will not result in a downgrade, withdrawal or qualification of the respective ratings assigned to the Series 2012-C8 Certificates. Additionally, transfers of equity interests in borrower are permitted so long as not less than 51.0% of equity interests in borrower are owned, directly or indirectly, by Qualified Equityholder (as defined below) and a Qualified Equityholder controls borrower.
A “Qualified Equityholder” means an entity which meets certain criteria, including but not limited to: (i) total assets in name or under management in excess of $600 million; (ii) shareholder’s equity in excess of $250 million; (iii) the lender receives confirmation from Fitch, KBRA and Moody’s that the transfer will not result in a downgrade, withdrawal or qualification of the respective ratings assigned to the Series 2012-C8 Certificates.
Partial Release. The Northridge Fashion Center borrower may obtain a release of certain vacant, non-income producing, unimproved outlots or parcels from the lien of the mortgage upon the satisfaction of certain conditions including without limitation: (i) that no event of default will have occurred and be continuing on the date the borrower delivers notice and on the date of release; (ii) the delivery of a legal opinion to the lender to demonstrate that the release of the related outparcel will satisfy REMIC requirements; and (iii) receipt of written confirmation from Fitch, KBRA and Moody’s that the transfer will not result in a downgrade, withdrawal or qualification of the then-current ratings assigned to the Series 2012-C8 Certificates. These provisions are in addition to the provisions for defeasance described above.
Real Estate Substitution. The Northridge Fashion Center borrower may obtain a release of certain vacant, non-income producing, unimproved outlots or parcels from the lien of the mortgage in connection with a substitution of a different parcel subject to the satisfaction of certain conditions, including without limitation: (i) that no event of default will have occurred and be continuing on the date the borrower delivers notice and on the date of release; (ii) simultaneously with the substitution, the Northridge Fashion Center borrower will be required to acquire the fee simple or leasehold interest to the substitution parcel located at the shopping center of which the substituted parcel is a part, that is at least equal in value to the substituted parcel; (iii) delivery to the lender of an acceptable (as defined in the loan documents) Phase I report and a physical conditions report (if the substitution parcel is improved); (iv) either (x) the loan-to-value ratio immediately after giving effect to such substitution is (a) equal to or less than 125% or (b) the loan-to-value ratio will not increase as a result of such substitution or (y) the delivery of a legal opinion to the lender to demonstrate that the substitution satisfies REMIC requirements.
Subordinate and Mezzanine Indebtedness. There is no existing mezzanine debt related to the Northridge Fashion Center Mortgage Loan Combination, however future mezzanine debt is permitted subject to satisfaction of certain conditions, including: (i) that no event of default has occurred and is continuing; (ii) the lender receives not less than thirty (30) days’ prior written notice; (iii) an intercreditor agreement in form and substance acceptable to Fitch, KBRA and Moody’s and reasonably acceptable to the lender; (iv) the combined debt service coverage ratio is not less than the debt service coverage ratio of Northridge Fashion Center Mortgage Loan Combination at origination; (v) the combined loan-to-value ratio will not be greater than the greater of (a) the loan-to-value ratio at origination and (b) 70%; and (vi) mezzanine loan documents acceptable to Fitch, KBRA and Moody’s and reasonably acceptable to the lender will have been delivered to the lender.
Other Additional Financing. A pledge by a GGP Top-Tier Entity (as defined in the loan agreement) of its indirect (but not direct) interest in borrower and/or any SPE component entity is permitted to a Qualified Pledgee (as defined below) as security for the direct obligations or debt of a GGP Top-Tier Entity to such Qualified Pledgee.
A “Qualified Pledgee” means an entity which meets certain criteria, including but not limited to: (i) total assets in name or under management in excess of $600.0 million; (ii) shareholder’s equity in excess of $250.0 million; (iii) the lender receives confirmation from Fitch, KBRA and Moody’s that the transfer will not result in a downgrade, withdrawal or qualification of the respective ratings assigned to the Series 2012-C8 Certificates.
Ground Lease. None.
Terrorism Insurance. The loan documents require that the “all risk” insurance policy required to be maintained by the borrower provide coverage for terrorism in an amount equal to the full replacement cost of the Northridge Fashion Center Property; provided, however, that borrower shall not be required to spend more than 200% of the costs of a stand-alone policy for terrorism insurance immediately prior to the date of TRIA or similar government backstop is no longer in effect. The loan documents also require business interruption insurance covering no less than the 18-month period following the occurrence of a casualty event, together with an extended period of indemnity, until the income returns to the same level as it was prior to loss or ninety days, whichever comes first.
THE INFORMATION IN THIS STRUCTURAL AND COLLATERAL TERM SHEET IS NOT COMPLETE AND MAY BE AMENDED PRIOR TO THE TIME OF SALE. THIS TERM SHEET IS NOT AN OFFER TO SELL THESE SECURITIES AND IT IS NOT A SOLICITATION OF AN OFFER TO BUY THESE SECURITIES IN ANY JURISDICTION WHERE THE OFFER OR SALE IS NOT PERMITTED.
50
| TOWN CENTER AT COBB |
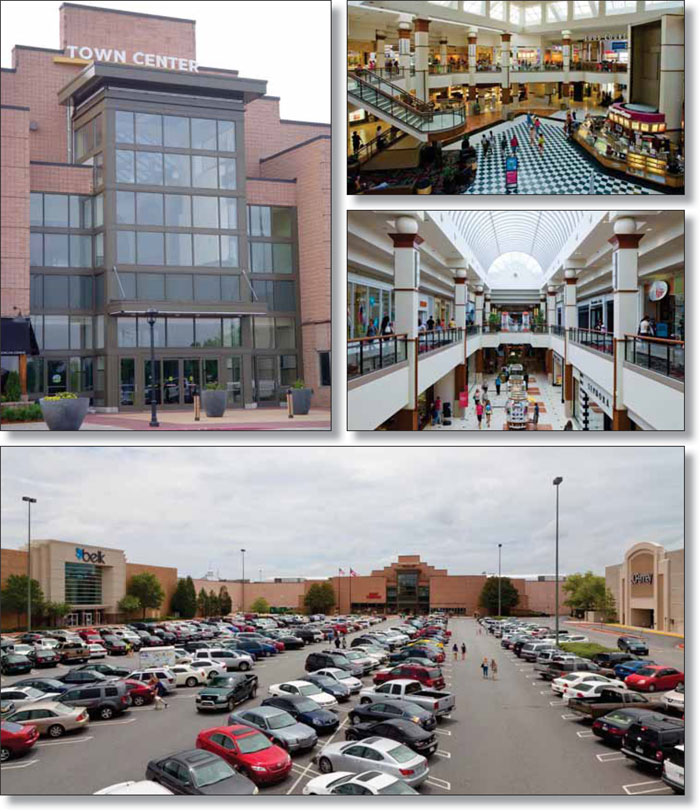
THE INFORMATION IN THIS STRUCTURAL AND COLLATERAL TERM SHEET IS NOT COMPLETE AND MAY BE AMENDED PRIOR TO THE TIME OF SALE. THIS TERM SHEET IS NOT AN OFFER TO SELL THESE SECURITIES AND IT IS NOT A SOLICITATION OF AN OFFER TO BUY THESE SECURITIES IN ANY JURISDICTION WHERE THE OFFER OR SALE IS NOT PERMITTED.
51
| TOWN CENTER AT COBB |
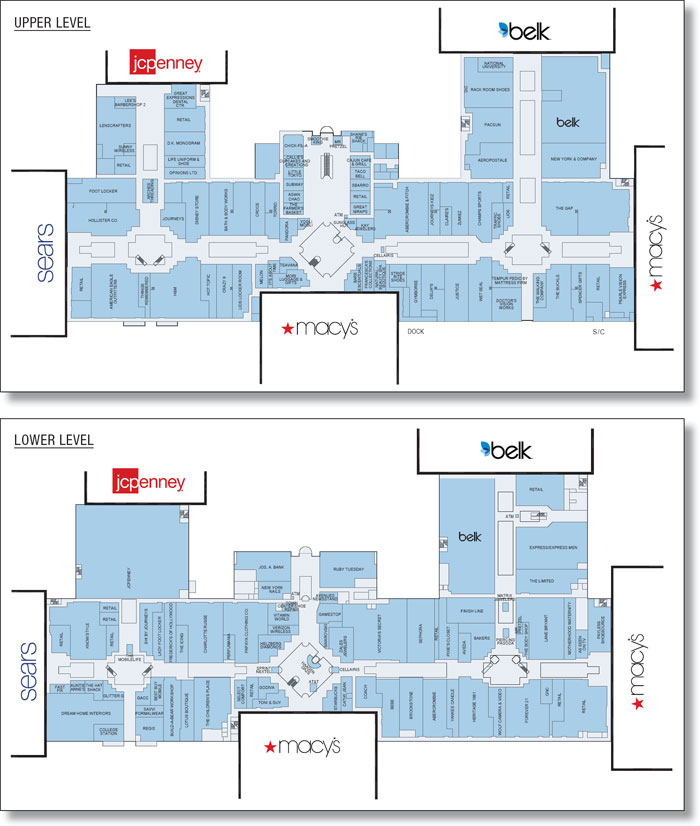
THE INFORMATION IN THIS STRUCTURAL AND COLLATERAL TERM SHEET IS NOT COMPLETE AND MAY BE AMENDED PRIOR TO THE TIME OF SALE. THIS TERM SHEET IS NOT AN OFFER TO SELL THESE SECURITIES AND IT IS NOT A SOLICITATION OF AN OFFER TO BUY THESE SECURITIES IN ANY JURISDICTION WHERE THE OFFER OR SALE IS NOT PERMITTED.
52
| TOWN CENTER AT COBB |
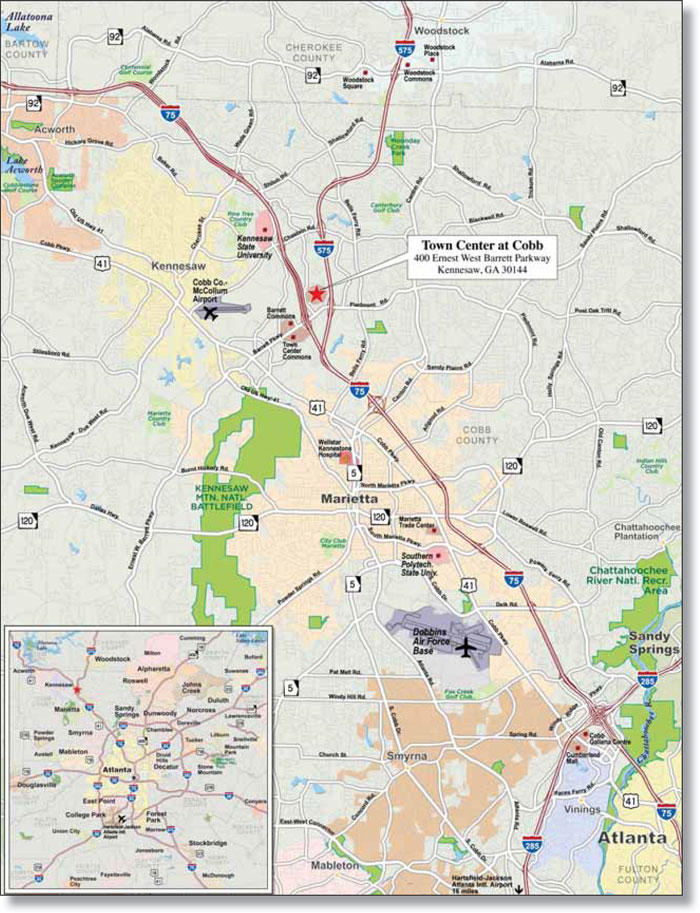
THE INFORMATION IN THIS STRUCTURAL AND COLLATERAL TERM SHEET IS NOT COMPLETE AND MAY BE AMENDED PRIOR TO THE TIME OF SALE. THIS TERM SHEET IS NOT AN OFFER TO SELL THESE SECURITIES AND IT IS NOT A SOLICITATION OF AN OFFER TO BUY THESE SECURITIES IN ANY JURISDICTION WHERE THE OFFER OR SALE IS NOT PERMITTED.
53
| Town Center at Cobb | ||||||||
| Loan Information | Property Information | |||||||
| Mortgage Loan Seller: | The Royal Bank of Scotland | Single Asset/Portfolio: | Single Asset | |||||
| Credit Assessment (Fitch/KBRA/Moody’s): | NR/NR/NR | Property Type: | Retail | |||||
Original Principal Balance(1): | $70,000,000 | Specific Property Type: | Regional Mall | |||||
Cut-off Date Principal Balance(1): | $70,000,000 | Location: | Kennesaw, GA | |||||
| % of Initial Pool Balance: | 5.4% | Size: | 559,940 SF | |||||
| Loan Purpose: | Refinance | Cut-off Date Principal Balance Per Unit/SF: | $357.18 | |||||
| Borrower Name: | Town Center at Cobb, LLC | |||||||
| Sponsor: | Simon Property Group, L.P. | Year Built/Renovated: | 1985/2011 | |||||
| Mortgage Rate: | 4.757% | Occupancy %(3): | 86.5% | |||||
| Note Date: | April 25, 2012 | Occupancy % Source Date: | March 26, 2012 | |||||
| Anticipated Repayment Date: | NAP | Title Vesting: | Fee | |||||
| Maturity Date: | May 1, 2022 | Property Manager: | Simon Management Associates II, LLC | |||||
| IO Period: | 24 months | |||||||
| Loan Term (Original): | 120 months | 3rd Most Recent NOI (As of): | $20,350,467 (12/31/2010) | |||||
| Seasoning: | 3 months | 2nd Most Recent NOI (As of): | $20,497,894 (12/31/2011) | |||||
| Amortization Term (Original): | 360 months | Most Recent NOI (As of): | $20,480,448 (TTM 2/29/2012) | |||||
| Loan Amortization Type: | Interest-only, Amortizing Balloon | |||||||
| Interest Accrual Method: | Actual/360 | U/W Revenues: | $28,320,084 | |||||
| Call Protection: | L(27),D(86),O(7) | U/W Expenses: | $8,297,904 | |||||
| Lockbox Type: | Hard/Springing Cash Management | U/W NOI: | $20,022,180 | |||||
Additional Debt(1): | Yes | U/W NCF: | $19,300,483 | |||||
Additional Debt Type(1): | Pari Passu | U/W NOI DSCR(1): | 1.60x | |||||
U/W NCF DSCR(1): | 1.54x | |||||||
| Escrows and Reserves: | U/W NOI Debt Yield(1): | 10.0% | ||||||
U/W NCF Debt Yield(1): | 9.7% | |||||||
| Type: | Initial | Monthly | Cap (If Any) | As-Is Appraised Value: | $322,000,000 | |||
| Taxes | $900,000 | $112,500 | NAP | As-Is Appraisal Valuation Date: | April 10, 2012 | |||
Insurance(2) | $0 | Springing | NAP | Cut-off Date LTV Ratio(1): | 62.1% | |||
| Replacement Reserves | $0 | $9,400 | $338,400 | LTV Ratio at Maturity or ARD(1): | 53.4% | |||
| TI/LC Reserve | $434,605 | $55,000 | $1,950,000 | |||||
| �� | ||||||||
| (1) | The Town Center at Cobb Mortgage Loan Combination, totalling $200,000,000, is comprised of two pari passu loan components (Notes A-1 and A-2). Note A-1, (the “Town Center at Cobb Pari Passu Companion Mortgage Loan”), had an original balance of $130,000,000 and was contributed to the WFRBS 2012-C7 Trust. Note A-2, (the “Town Center at Cobb Mortgage Loan”), had an original balance of $70,000,000, has an outstanding principal balance as of the Cut-off Date of $70,000,000 and will be contributed to the WFRBS 2012-C8 Trust. All presented statistical information related to balances per square foot, LTV, DSCR and debt yield are based on the Town Center at Cobb Mortgage Loan Combination. |
| (2) | Monthly insurance escrow is springing upon borrower failure to provide evidence of an acceptable blanket insurance policy. |
| (3) | Occupancy excludes temporary and seasonal tenants. For the trailing twelve-month period ending February 29, 2012, the average occupancy, inclusive of these tenants, was 95.4%. |
The Mortgage Loan. The mortgage loan (the “Town Center at Cobb Mortgage Loan Combination”) is evidenced by a promissory note secured by a first mortgage encumbering a regional mall located in Kennesaw, Georgia (the “Town Center at Cobb Property”). The Town Center at Cobb Mortgage Loan Combination was originated on April 25, 2012 by The Royal Bank of Scotland. The Town Center at Cobb Mortgage Loan Combination had an original principal balance of $200,000,000, has an outstanding principal balance as of the Cut-off Date of $200,000,000 and accrues interest at an interest rate of 4.757% per annum. The Town Center at Cobb Mortgage Loan Combination had an initial term of 120 months, has a remaining term of 117 months as of the Cut-off Date, requires interest-only payments for the first 24 payments, and thereafter requires payments of interest and principal based on a 30-year amortization schedule. The Town Center at Cobb Mortgage Loan Combination matures on May 1, 2022. The Town Center at Cobb Mortgage Loan Combination was bifurcated into two notes (Notes A-1 and A-2). Note A-1 (the “Town Center at Cobb Pari Passu Companion Mortgage Loan”) had an original principal balance of $130,000,000 and Note A-2 (the “Town Center at Cobb Mortgage Loan”) had an original principal balance of $70,000,000 and has an outstanding principal balance as of the Cut-off Date of $70,000,000. Note A-1 was contributed to the WFRBS 2012-C7 Trust and Note A-2 will be contributed to WFRBS 2012-C8 Trust. See “Description of the Mortgage Pool – Split Loan Structures – The Town Center at Cobb Loan Combination” and “Servicing of the Mortgage Loans and Administration of the Trust Fund – Servicing of the Pari Passu Mortgage Loans” in the Free Writing Prospectus. At closing, the sponsor of the Town Center at Cobb Mortgage Loan, Simon Property Group, L.P., contributed approximately $82.0 million of new equity, which in conjunction with the proceeds of the Town Center at Cobb Mortgage Loan Combination, was used to refinance existing debt of approximately $280.0 million, pay closing costs of approximately $200,000, and fund upfront reserves of approximately $1.3 million.
THE INFORMATION IN THIS STRUCTURAL AND COLLATERAL TERM SHEET IS NOT COMPLETE AND MAY BE AMENDED PRIOR TO THE TIME OF SALE. THIS TERM SHEET IS NOT AN OFFER TO SELL THESE SECURITIES AND IT IS NOT A SOLICITATION OF AN OFFER TO BUY THESE SECURITIES IN ANY JURISDICTION WHERE THE OFFER OR SALE IS NOT PERMITTED.
54
| TOWN CENTER AT COBB |
Following the lockout period, the borrower will have the right to defease the Town Center at Cobb Mortgage Loan Combination in whole, but not in part, on any due date before the scheduled maturity date. In addition, the Town Center at Cobb Mortgage Loan Combination is prepayable without penalty on or after November 1, 2021.
The Property. The Town Center at Cobb Property is a 1.3 million square foot two-level, regional mall located at the intersection of Interstate 75 and Interstate 575 at Barrett Parkway in Kennesaw, Georgia, approximately 21.5 miles northwest of the Atlanta central business district. The collateral for the Town Center at Cobb Mortgage Loan Combination consists of 559,940 square feet of the larger 1.3 million square foot mall. The Town Center at Cobb Property is anchored by Macy’s, Macy’s Furniture, Sears, JC Penney and Belk. Belk and a portion of the JC Penney space (31,026 square feet) are part of the collateral for the Town Center at Cobb Mortgage Loan while the remaining anchors own their own stores which are not part of the collateral. The non-collateral anchors contribute a small portion (approximately 1.5% of underwritten gross potential revenue) to the underwritten expense reimbursements.
The mall opened in 1985, was expanded in 1996 and was renovated in 2009 and 2011. JC Penney renovated and added 31,026 square feet in 2009. Belk recently funded a renovation of its space and Macy’s recently remodeled its store. As of March 26, 2012, the Town Center at Cobb Property was 86.5% leased by approximately 125 unique non-temporary tenants. In-line stores include Coach, H&M, Sephora, Aeropostale, American Eagle, Hollister, Limited, Forever 21, Victoria’s Secret and more than 115 other retailers and restaurants.
Belk, the only tenant occupying more than 10% of the net rentable square footage of the collateral for the Town Center at Cobb Mortgage Loan Combination, is a mainline department store that is part of a chain of privately owned department stores located primarily in the southern United States.
For the year ended December 31, 2011, tenants had comparable in-line average sales (tenants occupying less than 10,000 square feet) of $403 per square foot and average total mall sales of $393 per square foot. Occupancy costs for tenants occupying less than 10,000 square feet averaged 17.6% for the year ended December 31, 2011.
THE INFORMATION IN THIS STRUCTURAL AND COLLATERAL TERM SHEET IS NOT COMPLETE AND MAY BE AMENDED PRIOR TO THE TIME OF SALE. THIS TERM SHEET IS NOT AN OFFER TO SELL THESE SECURITIES AND IT IS NOT A SOLICITATION OF AN OFFER TO BUY THESE SECURITIES IN ANY JURISDICTION WHERE THE OFFER OR SALE IS NOT PERMITTED.
55
| TOWN CENTER AT COBB |
The following table presents certain information relating to the tenancies at the Town Center at Cobb Property:
Major Tenants
| Tenant Name | Credit Rating (Fitch/ Moody’s/ S&P)(1) | Tenant NRSF | % of NRSF | Annual U/W Base Rent PSF | Annual U/W Base Rent | % of Total Annual U/W Base Rent | Sales PSF(2) | Occupancy Cost(2) | Lease Expiration Date | ||||
Anchor Tenants – Not Part of Collateral(3) | |||||||||||||
| Macy’s | BBB/Baa3/BBB | 238,000 | ANCHOR OWNED – NOT PART OF THE COLLATERAL | ||||||||||
| Macy’s Furniture | BBB/Baa3/BBB | 232,000 | ANCHOR OWNED – NOT PART OF THE COLLATERAL | ||||||||||
| Sears | B+/B3/CCC+ | 170,527 | ANCHOR OWNED – NOT PART OF THE COLLATERAL | ||||||||||
JC Penney(4) | BB+/NR/BB- | 82,000 | ANCHOR OWNED – NOT PART OF THE COLLATERAL | ||||||||||
| Anchor Tenants – Collateral | |||||||||||||
Belk(5)(6) | NR/NR/NR | 128,819 | 23.0% | $5.12 | $660,000 | 4.1% | $136 | 5.0% | 8/31/2022 | ||||
JC Penney(4) | BB+/NR/BB- | 31,026 | 5.5% | $10.50 | $325,773 | 2.0% | NAV | NAV | 10/31/2019 | ||||
| Total Anchor Tenants - Collateral | 159,845 | 28.5% | $6.17 | $985,773 | 6.1% | ||||||||
| Other Major Tenants - Collateral | |||||||||||||
Forever 21(7) | NR/NR/NR | 23,081 | 4.1% | $41.16 | $950,000 | 5.9% | NAV | NAV | 8/1/2022 | ||||
Victoria’s Secret | BB+/Ba2/BB+ | 9,983 | 1.8% | $40.00 | $399,320 | 2.5% | $628 | 9.3% | 1/31/2015 | ||||
| The Gap | BBB-/Baa3/BB+ | 12,796 | 2.3% | $10.00 | $127,960 | 0.8% | $162 | 17.7% | 12/31/2016 | ||||
| Total Other Major Tenants – Collateral | 45,860 | 8.2% | $32.21 | $1,477,280 | 9.2% | ||||||||
| Non-Major Tenants – Collateral | 278,735 | 49.8% | $49.04 | $13,668,194 | 84.7% | ||||||||
Occupied Collateral Total(8) | 484,440 | 86.5% | $33.30 | $16,131,247 | 100.0% | ||||||||
Vacant Space(8) | 75,500 | 13.5% | |||||||||||
| Collateral Total | 559,940 | 100.0% | |||||||||||
| (1) | Certain ratings are those of the parent company whether or not the parent guarantees the lease. |
| (2) | Sales per square foot and occupancy costs are for the full year ended December 31, 2011. |
| (3) | These tenants do not serve as collateral for the Town Center at Cobb Mortgage Loan Combination. However, each is subject to a reciprocal easement agreement and contributes to common area maintenance in an amount equal to approximately 1.5% of underwritten gross potential revenue. |
| (4) | JC Penney renovated and added 31,026 square feet to its anchor space in 2009. JC Penney’s expansion space is part of the collateral for the Town Center at Cobb Mortgage Loan Combination. JC Penney has four 5-year extension options remaining. |
| (5) | Approximately 158,865 square feet of the Belk space is occupied. However, Belk will relinquish two expansion spaces containing 33,046 square feet of in-line space in September 2012, which were not underwritten. Subsequently, 3,000 square feet of this space was leased to a new tenant, Vans, with rental payments scheduled to commence in November 2012. |
| (6) | Belk has two 5-year extension options remaining. Belk has no termination options under the terms of its lease. |
| (7) | Approximately 6,179 square feet of the Forever 21 space is occupied. The tenant executed a lease to expand its existing 6,179 square feet of space to 23,081 square feet. Occupancy of the new space is expected to occur in September 2012. |
| (8) | Occupancy excludes temporary and seasonal tenants. For the trailing twelve-month period ended February 29, 2012, the average occupancy, inclusive of these tenants, was 95.4%. |
THE INFORMATION IN THIS STRUCTURAL AND COLLATERAL TERM SHEET IS NOT COMPLETE AND MAY BE AMENDED PRIOR TO THE TIME OF SALE. THIS TERM SHEET IS NOT AN OFFER TO SELL THESE SECURITIES AND IT IS NOT A SOLICITATION OF AN OFFER TO BUY THESE SECURITIES IN ANY JURISDICTION WHERE THE OFFER OR SALE IS NOT PERMITTED.
56
| TOWN CENTER AT COBB |
The following table presents certain information relating to the lease rollover schedule at Town Center at Cobb Property:
Lease Expiration Schedule(1)(2)
| Year Ending December 31, | No. of Leases Expiring | Expiring NRSF | % of Total NRSF | Cumulative of Total NRSF | Cumulative % of Total NRSF | Annual U/W Base Rent | Annual U/W Base Rent PSF(3) | |||||||
| MTM | 0 | 0 | 0.0% | 0 | 0.0% | $0 | $0.00 | |||||||
| 2012 | 8 | 13,076 | 2.3% | 13,076 | 2.3% | $826,641 | $63.22 | |||||||
| 2013 | 16 | 34,675 | 6.2% | 47,751 | 8.5% | $1,741,488 | $50.22 | |||||||
| 2014 | 13 | 20,237 | 3.6% | 67,988 | 12.1% | $1,231,482 | $60.85 | |||||||
| 2015 | 16 | 56,919 | 10.2% | 124,907 | 22.3% | $2,144,930 | $37.68 | |||||||
| 2016 | 22 | 49,710 | 8.9% | 174,617 | 31.2% | $2,356,506 | $47.41 | |||||||
| 2017 | 16 | 33,971 | 6.1% | 208,588 | 37.3% | $2,076,381 | $61.12 | |||||||
| 2018 | 7 | 18,180 | 3.2% | 226,768 | 40.5% | $872,239 | $47.98 | |||||||
| 2019 | 12 | 59,699 | 10.7% | 286,467 | 51.2% | $1,616,239 | $27.07 | |||||||
| 2020 | 3 | 15,230 | 2.7% | 301,697 | 53.9% | $454,852 | $29.87 | |||||||
| 2021 | 3 | 10,194 | 1.8% | 311,891 | 55.7% | $402,535 | $39.49 | |||||||
| 2022 | 11 | 172,549 | 30.8% | 484,440 | 86.5% | $2,407,954 | $13.96 | |||||||
| Thereafter | 0 | 0 | 0.0% | 484,440 | 86.5% | $0 | $0.00 | |||||||
| Vacant | 0 | 75,500 | 13.5% | 559,940 | 100.0% | $0 | $0.00 | |||||||
| Total/Weighted Average | 127 | 559,940 | 100.0% | 100.0% | $16,131,247 | $33.30 |
| (1) | Information obtained from the underwritten rent roll. | |
| (2) | Certain tenants may have lease termination options that are exercisable prior to the originally stated expiration date of the subject lease and that are not considered in the Lease Expiration Schedule. | |
| (3) | Weighted Average Annual U/W Base Rent PSF excludes vacant space. |
The following table presents historical occupancy percentages at Town Center at Cobb Property:
Historical Occupancy Percentages(1)(2)
12/31/2007 | 12/31/2008 | 12/31/2009 | 12/31/2010 | 12/31/2011 | ||||
| 88% | 87% | 90% | 89% | 88% |
| (1) | Information obtained from the borrower. |
| (2) | Historical occupancy is presented exclusive of temporary tenants. |
Historical Average Base Rent (PSF)(1)
12/31/2009 | 12/31/2010 | 12/31/2011 | ||
| $32.08 | $31.85 | $32.51 |
| (1) | The historical average base rent (PSF) calculations are based on borrower provided base rental income figures and total square footage of 559,940 square feet since 2009. |
Operating History and Underwritten Net Cash Flow. The following table presents certain information relating to the historical operating performance and the Underwritten Net Cash Flow at The Town Center at Cobb Property:
Cash Flow Analysis
| 2009 | 2010 | 2011 | TTM 2/29/2012 | U/W | U/W $ per SF | ||||||||
| Base Rent | $16,168,976 | $15,873,264 | $16,017,442 | $16,076,103 | $16,131,247 | $28.81 | |||||||
| Grossed Up Vacant Space | 0 | 0 | 0 | 0 | 3,829,850 | 6.84 | |||||||
| Percentage Rent | 273,641 | 431,074 | 301,013 | 322,112 | 222,721 | 0.40 | |||||||
| Total Reimbursables | 6,424,607 | 6,295,628 | 6,496,268 | 6,528,204 | 6,197,906 | 11.07 | |||||||
| Other Income | 5,559,909 | 5,674,898 | 5,764,484 | 5,768,055 | 5,768,055 | 10.30 | |||||||
| Less Vacancy & Credit Loss | (253,890) | (81,319) | (55,221) | (39,673) | (3,829,695) | (6.84) | |||||||
| Effective Gross Income | $28,173,243 | $28,193,545 | $28,523,986 | $28,654,801 | $28,320,084 | $50.58 | |||||||
| Total Operating Expenses | $7,878,462 | $7,843,078 | $8,026,092 | $8,174,353 | $8,297,904 | $14.82 | |||||||
| Net Operating Income | $20,294,781 | $20,350,467 | $20,497,894 | $20,480,448 | $20,022,180 | $35.76 | |||||||
| TI/LC | 0 | 0 | 0 | 0 | 609,709 | 1.09 | |||||||
| Capital Expenditures | 0 | 0 | 0 | 0 | 111,988 | 0.20 | |||||||
| Net Cash Flow | $20,294,781 | $20,350,467 | $20,497,894 | $20,480,448 | $19,300,483 | $34.47 | |||||||
NOI DSCR(1) | 1.62x | 1.62x | 1.64x | 1.63x | 1.60x | ||||||||
NCF DSCR(1) | 1.62x | 1.62x | 1.64x | 1.63x | 1.54x | ||||||||
NOI DY(1) | 10.1% | 10.2% | 10.2% | 10.2% | 10.0% | ||||||||
NCF DY(1) | 10.1% | 10.2% | 10.2% | 10.2% | 9.7% |
| (1) | DSCRs and debt yields are based on the Town Center at Cobb Mortgage Loan Combination. |
THE INFORMATION IN THIS STRUCTURAL AND COLLATERAL TERM SHEET IS NOT COMPLETE AND MAY BE AMENDED PRIOR TO THE TIME OF SALE. THIS TERM SHEET IS NOT AN OFFER TO SELL THESE SECURITIES AND IT IS NOT A SOLICITATION OF AN OFFER TO BUY THESE SECURITIES IN ANY JURISDICTION WHERE THE OFFER OR SALE IS NOT PERMITTED.
57
| TOWN CENTER AT COBB |
Appraisal. According to the appraisal dated April 10, 2012, The Town Center at Cobb Property had an “as-is” appraised value of $322,000,000.
Environmental Matters. According to a Phase I environmental site assessment performed by a third party firm, there was no evidence of any recognized environmental conditions at The Town Center at Cobb Property.
Market Overview and Competition. The Town Center at Cobb Property is located in Kennesaw, Georgia, approximately 21.5 miles northwest of the Atlanta central business district. The Town Center at Cobb Property is located in a commercial area between Interstate 75 and Interstate 575 at Barrett Parkway, the primary east-west corridor in the area. Interstate 75 provides the primary connection from the Atlanta central business district to the Town Center at Cobb Property.
Per the appraisal, from 2000 to 2011, within a 10-mile radius (the primary trade area) of the Town Center at Cobb Property, population increased from 540,550 to 636,775, reflecting a 1.5% compounded annual growth rate. Average household income in the primary trade area in 2011 was approximately $86,560, 114.4% of the Atlanta Metropolitan Statistical Area average ($75,648) and 132.3% of the Georgia state average ($65,418).
The appraiser estimated market rent for in-line retail suites under 10,000 square feet to be $44.09 per square foot and used an estimate of $17.00 for in-line retail suites over 10,000 square feet. These rental rates are exclusive of expense recoveries. Additionally, based on an average of comparable properties, the appraiser projected a stabilized vacancy rate of two percent based on historical occupancy at the Town Center at Cobb Property and the occupancy levels of competitive properties.
The following table presents certain information relating to some comparable retail centers provided in the appraisal for The Town Center at Cobb Property:
Competitive Set(1)
The Town Center at Cobb Property (Subject) | The Avenue West Cobb | Cumberland Mall | Phipps Plaza | Lenox Plaza | |
| Market | Kennesaw, GA | Marietta, GA | Atlanta, GA | Atlanta, GA | Atlanta, GA |
| Distance from Subject | –– | 8.5 miles | 12.5 miles | 19.0 miles | 19.0 miles |
| Property Type | Regional Mall | Lifestyle Center | Super Regional Mall | Regional Mall | Super Regional Mall |
| Year Built/Renovated | 1985/2011 | 2003/NAP | 1973/2007 | 1968/1992 | 1959/2007 |
| Anchors | Macy’s, Sears, JC Penney, Belk | Barnes and Noble, Talbot, Loft, Ann Taylor | Costco, Macy’s, Sears | Belk, Nordstrom, Saks Fifth Avenue | Bloomingdale’s, Macy’s, Neiman Marcus |
| Total GLA | 559,940 SF | 257,000 SF | 1,050,000 SF | 818,137 SF | 1,582,405 SF |
| Total Occupancy | 87% | 92% | 95% | 99% | 98% |
| (1) | Information obtained from appraisal dated April 10, 2012. |
The Borrower. The borrower under the Town Center at Cobb Mortgage Loan, Town Center at Cobb, LLC, is a Delaware limited liability company and a single-purpose entity with two independent directors. Legal counsel to the borrower delivered a non-consolidation opinion in connection with the origination of the Town Center at Cobb Mortgage Loan. Simon Property Group, L.P., the indirect owner of the borrowing entity, is the guarantor of certain nonrecourse carveouts under the Town Center at Cobb Mortgage Loan.
The Sponsor. Simon Property Group, L.P. (“SPG”) is a large real estate company in the United States and is publicly traded on the New York Stock Exchange under the symbol SPG. SPG currently owns or has an interest in 337 properties comprising 244 million square feet of gross leasable area in North America, Europe and Asia. SPG employs over 5,500 people in the United States and is headquartered in Indianapolis, Indiana.
Escrows. The borrower funded upfront escrows at closing in the amount of: $900,000 for real estate taxes and $434,605 for tenant improvements and leasing commissions.
The loan documents provide for ongoing monthly escrows in the amount of: $112,500 for real estate taxes (subject to adjustment per the lender’s estimate), $9,400 for replacement reserves (subject to a cap of $338,400), and $55,000 for tenant improvements and leasing commissions (subject to a cap of $1,950,000). No monthly insurance escrow is required so long as (i) no event of default has occurred or is continuing under the Town Center at Cobb Mortgage Loan Combination and (ii) the insurance required to be maintained by the borrower is effected under an acceptable blanket insurance policy.
Lockbox and Cash Management. The Town Center at Cobb Mortgage Loan requires a lender-controlled lockbox account, which is already in place, and that the borrower direct tenants to pay their rents directly to such lockbox account. The loan documents also require that all rents received by the borrower or the property manager be deposited into the lockbox account within two business days after receipt. Prior to the occurrence of a Lockbox Event (as defined below) all funds on deposit in the lockbox account are swept into the property manager’s operating account on a daily basis. During a Lockbox Event all funds on deposit in the lockbox account are swept on a weekly basis (or daily during the continuance of an event of default) to a cash management account under the control of the lender.
A “Lockbox Event” will commence upon any of the following events occurring: (i) the occurrence and continuance of an event of default; (ii) the commencement of any bankruptcy action against the borrower or property manager; or (iii) as of the last day of
THE INFORMATION IN THIS STRUCTURAL AND COLLATERAL TERM SHEET IS NOT COMPLETE AND MAY BE AMENDED PRIOR TO THE TIME OF SALE. THIS TERM SHEET IS NOT AN OFFER TO SELL THESE SECURITIES AND IT IS NOT A SOLICITATION OF AN OFFER TO BUY THESE SECURITIES IN ANY JURISDICTION WHERE THE OFFER OR SALE IS NOT PERMITTED.
58
| TOWN CENTER AT COBB |
any calendar quarter during the Town Center at Cobb Mortgage Loan term, the debt service coverage ratio is less than 1.15x for two consecutive calendar quarters. If a Lockbox Event was triggered by (i) above, the Lockbox Event will end with the acceptance by the lender of a cure of such event of default. If a Lockbox Event was triggered by (ii) above, the Lockbox Event will end upon replacement of the manager by borrower with a Qualified Manager as described in the “Property Management” section below. Finally, if a Lockbox Event is caused by (iii) above, the Lockbox Event will end upon the achievement of a debt service coverage ratio of 1.15x for two consecutive calendar quarters.
Property Management. The Town Center at Cobb Property is currently self-managed by an affiliate of the Town Center at Cobb sponsor.
Assumption. Other than during the period that is 60 days prior to and 60 days following a securitization, the borrower under the Town Center at Cobb Mortgage Loan has the right to transfer the Town Center at Cobb Property, in whole only, without the consent of the lender, subject to certain conditions set forth in the loan documents, including but not limited to: (i) payment of an assumption fee of $300,000; (ii) no event of default has occurred and is continuing under the Town Center at Cobb Mortgage Loan; (iii) evidence satisfactory to Fitch, KBRA and Moody’s has been provided showing that the transferee borrower complies with the special purpose entity provisions of the loan documents; (iv) the lender receives written confirmation from Fitch, KBRA and Moody’s that the assumption will not, in and of itself, result in a downgrade, qualification or withdrawal of the then current ratings assigned to any class of Series 2012-C8 Certificates; and (v) the transferee and all other entities controlled directly or indirectly by principals of the transferee must not have been party to any voluntary or involuntary bankruptcy proceedings within seven years prior to the proposed transfer.
Partial Release. The borrower may obtain a release of certain immaterial or non-income producing portions of the Town Center at Cobb Property from the lien of the mortgage upon the satisfaction of certain conditions, including but not limited to: (i) no event of default has occurred and is continuing; or (ii) either: (x) the ratio of the unpaid principal balance of the Town Center at Cobb Mortgage Loan to the value of the remaining property comprising the collateral must be no greater than 125%; or (y) the borrower must pay down the principal balance of the Town Center at Cobb Mortgage Loan (which prepayment will not be subject to any prepayment penalty of any kind) in an amount equal to the least of the following values: (1) if the released portion of the Town Center at Cobb Property is sold, the net proceeds of an arm’s-length sale; (2) the fair market value of such parcel at the time of release; and (3) an amount such that the ratio of the unpaid principal balance of the Town Center at Cobb Mortgage Loan to the value of the remaining property comprising the collateral does not increase after the transfer, unless the lender receives an opinion of counsel that if the amount in (ii) is not paid, the securitization will not fail to maintain its status as a REMIC as a result of the transfer and release.
Real Estate Substitution. Not permitted.
Subordinate and Mezzanine Indebtedness. Not permitted.
Ground Lease. None.
Terrorism Insurance. The loan documents require that the “all risk” insurance policy required to be maintained by the borrower provide coverage for damage from terrorism in an amount equal to the full replacement cost of the Town Center at Cobb Property as well as business interruption insurance covering no less than the 18-month period following the occurrence of a casualty event, together with a six-month extended period of indemnity.
THE INFORMATION IN THIS STRUCTURAL AND COLLATERAL TERM SHEET IS NOT COMPLETE AND MAY BE AMENDED PRIOR TO THE TIME OF SALE. THIS TERM SHEET IS NOT AN OFFER TO SELL THESE SECURITIES AND IT IS NOT A SOLICITATION OF AN OFFER TO BUY THESE SECURITIES IN ANY JURISDICTION WHERE THE OFFER OR SALE IS NOT PERMITTED.
59
| BJ’S PORTFOLIO |
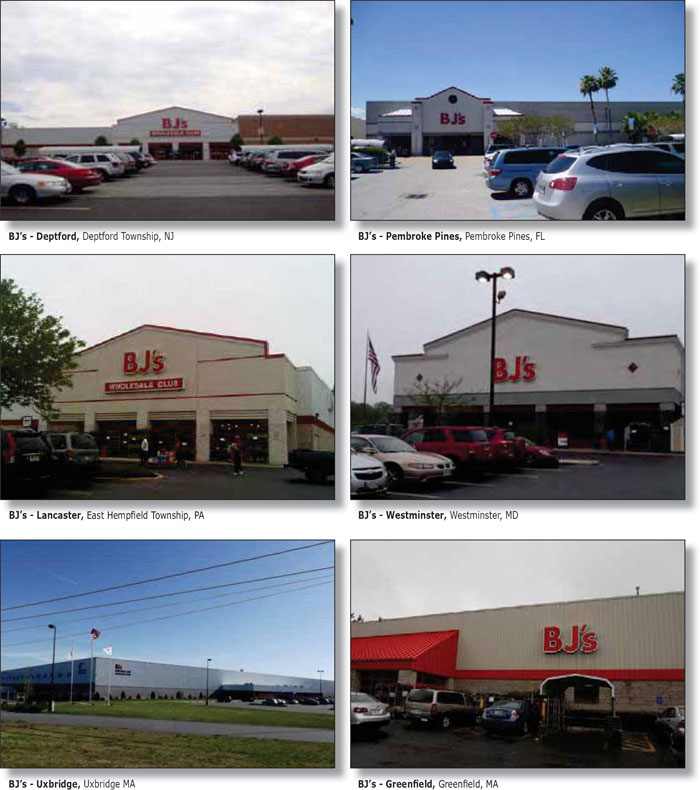
THE INFORMATION IN THIS STRUCTURAL AND COLLATERAL TERM SHEET IS NOT COMPLETE AND MAY BE AMENDED PRIOR TO THE TIME OF SALE. THIS TERM SHEET IS NOT AN OFFER TO SELL THESE SECURITIES AND IT IS NOT A SOLICITATION OF AN OFFER TO BUY THESE SECURITIES IN ANY JURISDICTION WHERE THE OFFER OR SALE IS NOT PERMITTED.
60
| BJ’S PORTFOLIO |
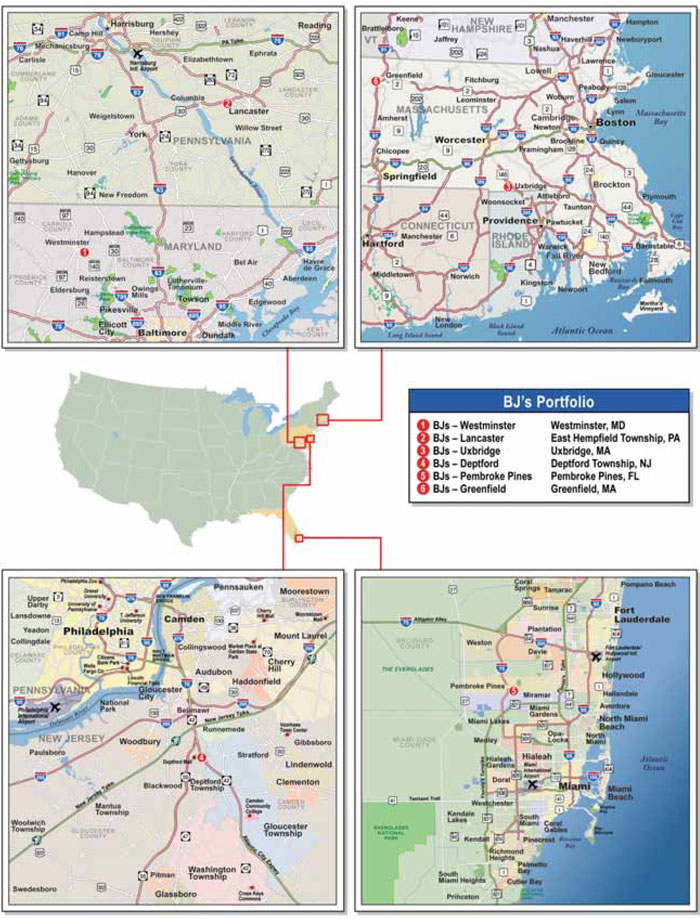
THE INFORMATION IN THIS STRUCTURAL AND COLLATERAL TERM SHEET IS NOT COMPLETE AND MAY BE AMENDED PRIOR TO THE TIME OF SALE. THIS TERM SHEET IS NOT AN OFFER TO SELL THESE SECURITIES AND IT IS NOT A SOLICITATION OF AN OFFER TO BUY THESE SECURITIES IN ANY JURISDICTION WHERE THE OFFER OR SALE IS NOT PERMITTED.
61
| BJ’s Portfolio | ||||||
| Loan Information | Property Information | |||||
| Mortgage Loan Seller: | The Royal Bank of Scotland | Single Asset/Portfolio: | Portfolio | |||
| Credit Assessment (Fitch/KBRA/Moody’s): | NR/NR/NR | Property Type: | Various – See Table | |||
| Original Principal Balance: | $68,110,000 | Specific Property Type: | Various – See Table | |||
| Cut-off Date Principal Balance: | $68,110,000 | Location: | Various – See Table | |||
| % of Initial Pool Balance: | 5.2% | Size: | 1,129,828 SF | |||
| Loan Purpose: | Acquisition | Cut-off Date Principal Balance Per Unit/SF: | $60.28 | |||
| Borrower Name: | Cole BJ Portfolio I, LLC | Year Built/Year Renovated: | Various – See Table | |||
| Sponsor: | Cole Credit Property Trust III, Inc. | Occupancy %: | 100.0% | |||
| Mortgage Rate: | 4.540% | Occupancy % Source Date: | August 1, 2012 | |||
| Note Date: | June 5, 2012 | Title Vesting: | Fee | |||
| Anticipated Repayment Date: | July 1, 2022 | Property Manager: | Cole Realty Advisors, Inc. | |||
| Maturity Date: | July 1, 2042 | |||||
| IO Period: | 120 months | 3rd Most Recent NOI (As of)(5): | NAV | |||
Loan Term (Original)(1): | 120 months | 2nd Most Recent NOI (As of)(5): | NAV | |||
| Seasoning: | 1 month | Most Recent NOI (As of)(5): | NAV | |||
| Amortization Term (Original): | NAP | |||||
| Loan Amortization Type: | Interest-only, ARD | U/W Revenues: | $8,525,379 | |||
| Interest Accrual Method: | Actual/360 | U/W Expenses: | $255,761 | |||
| Call Protection: | L(25),GRTR 1% or YM(91),O(4) | U/W NOI: | $8,269,617 | |||
| Lockbox Type: | Hard/Upfront Cash Management | U/W NCF: | $7,535,229 | |||
| Additional Debt: | None | U/W NOI DSCR: | 2.64x | |||
| Additional Debt Type: | NAP | U/W NCF DSCR: | 2.40x | |||
| U/W NOI Debt Yield: | 12.1% | |||||
| Escrows and Reserves: | U/W NCF Debt Yield: | 11.1% | ||||
| As-Is Appraised Value: | $121,850,000 | |||||
| Type: | Initial | Monthly | Cap (If Any) | As-Is Appraisal Valuation Date: | Various | |
Taxes(2) | $0 | Springing | NAP | Cut-off Date LTV Ratio: | 55.9% | |
Insurance(3) | $0 | Springing | NAP | LTV Ratio at Maturity or ARD: | 55.9% | |
Replacement(4) | $0 | Springing | NAP | |||
TI/LC(4) | $0 | Springing | NAP | |||
| (1) | Represents the loan term from origination through the ARD. The loan term from origination to the maturity date is 360 months. |
| (2) | No reserves for taxes are required so long as (i) no event of default has occurred and is continuing and (ii) the borrower delivers to lender satisfactory evidence of payment of taxes. |
| (3) | No reserves for insurance premiums are required so long as (i) no event of default has occurred and is continuing under the BJ’s Portfolio Mortgage Loan and (ii) insurance coverage of the BJ’s Portfolio Properties is included in a blanket or umbrella policy, subject to lender approval. |
| (4) | No reserves for capital expenditures or tenant improvements and leasing commissions are required so long as no event of default has occurred and is continuing. |
| (5) | Historical financials are not available as the BJ’s Portfolio Properties were acquired by the sponsor in September 2011. |
The Mortgage Loan. The mortgage loan (the “BJ’s Portfolio Mortgage Loan”) is evidenced by a promissory note that is secured by first mortgage liens encumbering five single-tenant retail buildings and one industrial building. The properties securing the BJ’s Portfolio Mortgage Loan are located in Florida, New Jersey, Massachusetts, Pennsylvania and Maryland (the “BJ’s Portfolio Properties”). The BJ’s Portfolio Mortgage Loan was originated on June 5, 2012 by The Royal Bank of Scotland. The BJ’s Portfolio Mortgage Loan had an original principal balance of $68,110,000, has an outstanding principal balance as of the Cut-off Date of $68,110,000, and accrues interest at an interest rate of 4.540% per annum. The BJ’s Portfolio Mortgage Loan had an initial term of 120 months, has a remaining term of 119 months as of the Cut-off Date and requires payments of interest-only through the Anticipated Repayment Date (the “ARD”). The ARD is July 1, 2022, and the final maturity date is July 1, 2042. In the event the BJ’s Portfolio Mortgage Loan is not paid on or before the ARD, the BJ’s Portfolio Mortgage Loan accrues interest at an interest rate equal to 7.540% and has a remaining amortization term of 240 months. The ARD automatically triggers a full cash flow sweep whereby all excess cash flow will be used to pay down the principal balance. The proceeds from the BJ’s Portfolio Mortgage Loan, along with approximately $45.4 million of equity from the sponsor, were used to acquire the BJ’s Portfolio Properties for approximately $113,500,000 and pay closing costs.
Following the lockout period, the borrower has the right to voluntarily prepay the BJ’s Portfolio Mortgage Loan in whole, or in part (see “Partial Release” section below), provided that the borrower pays the greater of a yield maintenance premium or a prepayment premium equal to 1.0% of the principal amount being prepaid. On or after April 1, 2022, the borrower will have the right to voluntarily prepay the BJ’s Mortgage Loan in whole, or in part (see “Partial Release” section below), without penalty.
THE INFORMATION IN THIS STRUCTURAL AND COLLATERAL TERM SHEET IS NOT COMPLETE AND MAY BE AMENDED PRIOR TO THE TIME OF SALE. THIS TERM SHEET IS NOT AN OFFER TO SELL THESE SECURITIES AND IT IS NOT A SOLICITATION OF AN OFFER TO BUY THESE SECURITIES IN ANY JURISDICTION WHERE THE OFFER OR SALE IS NOT PERMITTED.
62
| BJ’S PORTFOLIO |
The BJ’s Portfolio Properties are subject to a 20-year master lease that commenced on September 30, 2011 and expires on September 30, 2031. The lease provides for five 5-year renewal options requiring at least twelve months notice. The lease is structured as triple-net, and the tenant is responsible for maintaining and operating the buildings. The tenant pays all expenses, including taxes, insurance and utilities. The landlord has no obligation to maintain or repair the premises. The lease has no early termination rights subject to standard condemnation and casualty rights.
The Tenant. The BJ’s Portfolio Properties are occupied by a single tenant known as BJ’s Wholesale Club, Inc., an operator of membership warehouse clubs in the Eastern United States. The company currently operates over 195 clubs in 15 states and employs more than 24,000 team members. The company’s warehouse clubs provide food products including frozen foods, fresh meat and dairy products, beverages and more. In addition, the company’s warehouse clubs provide private brand products, as well as various specialty services including optical centers, home improvement services and automobile repair and maintenance services. Additionally, the company offers services, such as auto and home insurance, home improvement, travel services, television and home theater installation, and membership services.
The following table represents certain information relating to the BJ’s Portfolio Properties:
Property Name – Location | Property Type | Allocated Cut- off Date Principal Balance | Occupancy | Year Built/Year Renovated | Net Rentable Area (SF) | Sales PSF(1) | Occupancy Cost(1) | Appraised Value |
BJ’s – Westminster, MD | Retail | $13,977,775 | 100.0% | 2001/NAP | 109,310 | $457 | 3.3% | $23,500,000 |
BJ’s – Lancaster, PA | Retail | $13,620,895 | 100.0% | 1996/NAP | 108,447 | $428 | 3.5% | $22,900,000 |
BJ’s – Uxbridge, MA | Industrial | $12,645,000 | 100.0% | 2006/NAP | 618,000 | NAP | NAP | $28,600,000 |
BJ’s – Deptford, NJ | Retail | $11,003,780 | 100.0% | 1995/NAP | 116,386 | $433 | 2.6% | $18,500,000 |
BJ’s – Pembroke Pines, FL | Retail | $8,446,145 | 100.0% | 1997/NAP | 108,625 | $517 | 1.9% | $14,200,000 |
BJ’s – Greenfield, MA | Retail | $8,416,405 | 100.0% | 1997/NAP | 69,060 | $419 | 3.6% | $14,150,000 |
| Total/Weighted Average | $68,110,000 | 100.0% | 1,129,828 | $121,850,000 | ||||
| (1) | Sales per square foot and occupancy costs are for the trailing twelve-month period ending January 28, 2012. |
The following table presents certain information relating to the tenancies at the BJ’s Portfolio Properties:
Major Tenants
| Tenant Name | Credit Rating (Fitch/Moody’s/ S&P)(1) | Tenant NRSF | % of NRSF | Annual U/W Base Rent PSF | Annual U/W Base Rent | % of Total Annual U/W Base Rent | Lease Expiration Date |
| Major Tenants | |||||||
| BJ’s Wholesale Club, Inc. | NR/B1/B+ | 1,129,828 | 100.0% | $7.94 | $8,974,083 | 100.0% | 9/30/2031 |
| Occupied Collateral Total | 1,129,828 | 100.0% | $7.94 | $8,974,083 | 100.0% | ||
| Vacant Space | 0 | 0.0% | |||||
| Collateral Total | 1,129,828 | 100.0% | |||||
| (1) | Certain ratings are those of the parent company whether or not the parent guarantees the lease. |
THE INFORMATION IN THIS STRUCTURAL AND COLLATERAL TERM SHEET IS NOT COMPLETE AND MAY BE AMENDED PRIOR TO THE TIME OF SALE. THIS TERM SHEET IS NOT AN OFFER TO SELL THESE SECURITIES AND IT IS NOT A SOLICITATION OF AN OFFER TO BUY THESE SECURITIES IN ANY JURISDICTION WHERE THE OFFER OR SALE IS NOT PERMITTED.
63
| BJ’S PORTFOLIO |
Lease Expiration Schedule(1)
Year Ending December 31, | No. of Leases Expiring | Expiring NRSF | % of Total NRSF | Cumulative of Total NRSF | Cumulative % of Total NRSF | Annual U/W Base Rent | Annual U/W Base Rent PSF |
| MTM | 0 | 0 | 0.0% | 0 | 0.0% | $0 | $0.00 |
| 2012 | 0 | 0 | 0.0% | 0 | 0.0% | $0 | $0.00 |
| 2013 | 0 | 0 | 0.0% | 0 | 0.0% | $0 | $0.00 |
| 2014 | 0 | 0 | 0.0% | 0 | 0.0% | $0 | $0.00 |
| 2015 | 0 | 0 | 0.0% | 0 | 0.0% | $0 | $0.00 |
| 2016 | 0 | 0 | 0.0% | 0 | 0.0% | $0 | $0.00 |
| 2017 | 0 | 0 | 0.0% | 0 | 0.0% | $0 | $0.00 |
| 2018 | 0 | 0 | 0.0% | 0 | 0.0% | $0 | $0.00 |
| 2019 | 0 | 0 | 0.0% | 0 | 0.0% | $0 | $0.00 |
| 2020 | 0 | 0 | 0.0% | 0 | 0.0% | $0 | $0.00 |
| 2021 | 0 | 0 | 0.0% | 0 | 0.0% | $0 | $0.00 |
| 2022 | 0 | 0 | 0.0% | 0 | 0.0% | $0 | $0.00 |
| Thereafter | 1 | 1,129,828 | 100.0% | 1,129,828 | 100.0% | $8,974,083 | $7.94 |
| Vacant | 0 | 0 | 0.0% | 1,129,828 | 100.0% | $0 | $0.00 |
| Total/Weighted Average | 1 | 1,129,828 | 100.0% | $8,974,083 | $7.94 |
| (1) | Information obtained from underwritten rent roll. |
The following table presents historical occupancy percentages at the BJ’s Portfolio Properties:
Historical Occupancy Percentages(1)
12/31/2009 | 12/31/2010 | 12/31/2011 | ||
| NAV | NAV | NAV |
| (1) | Historical occupancy figures are not available as the BJ’s Portfolio Properties were acquired by the sponsor in September 2011. |
Operating History and Underwritten Net Cash Flow. The following table presents certain information relating to the Underwritten Net Cash Flow for the BJ’s Portfolio properties:
Cash Flow Analysis(1)
U/W | U/W $ per SF | |
| Gross Potential Rent | $8,974,083 | $7.94 |
| Grossed Up Vacant Space | 0 | 0.00 |
| Percentage Rent | 0 | 0.00 |
| Total Reimbursables | 0 | 0.00 |
| Other Income | 0 | 0.00 |
| Less Vacancy & Credit Loss | (448,704) | (0.40) |
| Effective Gross Income | $8,525,379 | $7.55 |
| Total Operating Expenses | $255,761 | $0.23 |
| Net Operating Income | $8,269,617 | $7.32 |
| TI/LC | 564,914 | 0.50 |
| Capital Expenditures | 169,474 | 0.15 |
| Net Cash Flow | $7,535,229 | $6.67 |
| UW NOI DSCR | 2.64x | |
| UW NCF DSCR | 2.40x | |
| UW NOI DY | 12.1% | |
| UW NCF DY | 11.1% |
| (1) | Historical financials are not available, as the BJ’s Portfolio Properties were acquired by the borrower in September 2011 through a sale-leaseback transaction. |
THE INFORMATION IN THIS STRUCTURAL AND COLLATERAL TERM SHEET IS NOT COMPLETE AND MAY BE AMENDED PRIOR TO THE TIME OF SALE. THIS TERM SHEET IS NOT AN OFFER TO SELL THESE SECURITIES AND IT IS NOT A SOLICITATION OF AN OFFER TO BUY THESE SECURITIES IN ANY JURISDICTION WHERE THE OFFER OR SALE IS NOT PERMITTED.
64
| BJ’S PORTFOLIO |
Environmental Matters. According to the Phase I environmental site assessment reports dated May 4, 2012, no further action was recommended in connection with any recognized environmental conditions at the BJ’s Portfolio Properties.
The Borrower. The borrower is Cole BJ Portfolio I, LLC , a Delaware limited liability company and a single purpose entity and with an independent director. Legal counsel to the borrower delivered a non-consolidation opinion in connection with the origination of the BJ’s Portfolio Mortgage Loan. Cole Credit Property Trust III, Inc., an indirect owner of the borrower, is the guarantor of certain nonrecourse carveouts under the BJ’s Portfolio Mortgage Loan.
The Sponsor. The borrower, Cole BJ Portfolio I, LLC, is indirectly owned by Cole Credit Property Trust III, Inc. (“CCPT III”). CCPT III is a non-traded public real estate investment trust that acquires and operates a diversified portfolio of commercial real estate investments primarily consisting of retail and other single-tenant income producing properties throughout the United States. As of December 31, 2011, CCPT III owned 693 properties, comprised of 32.3 million rentable square feet of single-tenant and multi-tenant retail and commercial space located in 47 states and had total assets of approximately $5.7 billion.
Escrows. No reserves for insurance premiums are required so long as (i) no event of default has occurred and is continuing under the BJ’s Portfolio Mortgage Loan and (ii) insurance coverage of the BJ’s Portfolio Properties is included in a blanket or umbrella policy, subject to the lender’s approval. No reserves for taxes are required so long as (i) no event of default has occurred and is continuing and (ii) the borrower delivers to the lender satisfactory evidence of payment of taxes. Additionally, no reserves for capital expenditures or tenant improvements and leasing commissions are required so long as no event of default has occurred and is continuing.
Lockbox and Cash Management. The BJ’s Portfolio Mortgage Loan requires a lender-controlled lockbox account, which is already in place, and that the borrower direct tenants to pay their rents directly to such lockbox account. The loan documents also require that all cash revenues relating to the BJ’s Portfolio Properties and all other monies received by the borrower or the property manager be deposited into the lockbox account within two business days after receipt. Prior to the occurrence of an event of default, all funds on deposit in the lockbox account are swept to certain restricted and other accounts, and account funds are to be disbursed in the following priority as required by the related loan agreement: (i) first, to a tax reserve account; (ii) second, to an insurance reserve account; (iii) third, to a debt service account for monthly debt service payments; (iv) fourth, to a replacement reserve account; (v) fifth, to a rollover reserve account; (vi) sixth, to borrower in an amount necessary to pay permitted monthly expenses; (vii) seventh, so long as no Cash Management Period (as defined below) is continuing, to a borrower operating account; and (viii) eighth, during a Cash Management Period, all remaining excess cash flow to an excess cash flow reserve account.
A “Cash Management Period” commences upon the earlier of: (i) the occurrence and continuance of an event of default; (ii) the actual debt service coverage ratio at the end of each fiscal quarter is less than 1.65x; (iii) if the tenant goes dark at more than one property; (iv) solely in regards to the retail properties, in the event that the straight average of the sales across all such properties decline below $275 per rentable square foot; (v) in the event of a bankruptcy action with respect to the property manager or the tenant; or (vi) the ARD occurs without full repayment.
Property Management. The BJ’s Portfolio Properties are currently self-managed by an affiliate of the BJ’s Portfolio Mortgage Loan sponsor.
Assumption. Following the second anniversary of the issuance of the Series 2012-C8 Certificates, the BJ’s Portfolio Mortgage Loan borrower has the right to transfer all of the remaining BJ’s Portfolio Properties at once and cause an assumption of the loan, provided that no event of default has occurred and is continuing under the BJ’s Portfolio Mortgage Loan and certain other conditions are satisfied, including, but not limited to: (i) the borrower pays a fee of 0.50% of the outstanding principal balance of the BJ’s Portfolio Mortgage loan for the first such transfer and a fee of 1.0% for each subsequent transfer thereafter; (ii) the lender receives written confirmation from Fitch, KBRA and Moody’s that the assumption will not, in and of itself, result in a downgrade, qualification or withdrawal of the then current ratings assigned to any class of Series 2012-C8 Certificates; (iii) the transferee and all other entities controlled directly or indirectly by principals of the transferee must not have been party to any voluntary or involuntary bankruptcy proceedings, within seven years prior to the proposed transfer; and (iv) the BJ’s Portfolio Properties must continue to be managed by one or more Qualified Managers (as defined below).
A “Qualified Manager” means either (i) Cole Realty Advisors, Inc. or (ii) a person which, in the reasonable judgment of the lender, is a reputable and experienced management organization possessing experience in managing properties similar in size, scope, use and value as the BJ’s Portfolio Properties, provided that the borrower has obtained written confirmation from Fitch, KBRA and Moody’s that the management of the BJ’s Portfolio Properties by such person will not, in and of itself, result in a downgrade, qualification or withdrawal of the then current ratings assigned to any class of Series 2012-C8 Certificates.
THE INFORMATION IN THIS STRUCTURAL AND COLLATERAL TERM SHEET IS NOT COMPLETE AND MAY BE AMENDED PRIOR TO THE TIME OF SALE. THIS TERM SHEET IS NOT AN OFFER TO SELL THESE SECURITIES AND IT IS NOT A SOLICITATION OF AN OFFER TO BUY THESE SECURITIES IN ANY JURISDICTION WHERE THE OFFER OR SALE IS NOT PERMITTED.
65
| BJ’S PORTFOLIO |
A “Restricted Party” means the borrower, any principal or the guarantor under the BJ’s Portfolio Mortgage Loan.
Real Estate Substitution. The borrower may obtain a release of any individual BJ’s Portfolio property, up to an aggregate of two properties, from the lien of the mortgage in connection with a substitution of a different parcel subject to lender consent as well as the satisfaction of certain conditions, including without limitation: (i) no event of default has occurred or is continuing; (ii) after giving effect to such substitution, the loan-to-value ratio of the BJ’s Portfolio Properties must not exceed the loan-to-value ratio immediately prior to such substitution; and (iii) the lender receives written confirmation from Fitch, KBRA and Moody’s that the substitution will not, in and of itself, result in a downgrade, qualification or withdrawal of the then current ratings assigned to any class of Series 2012-C8 Certificates.
Subordinate and Mezzanine Indebtedness. Not permitted.
Ground Lease. None.
Terrorism Insurance. The loan documents require that the borrower maintain insurance against loss for acts of terrorism in an amount equal to the full replacement cost of the BJ’s Portfolio Properties. The loan documents also require business interruption insurance covering no less than the 18-month period following the occurrence of a casualty event, together with an 18-month extended period of indemnity, together with a six-month extended period of indemnity.
THE INFORMATION IN THIS STRUCTURAL AND COLLATERAL TERM SHEET IS NOT COMPLETE AND MAY BE AMENDED PRIOR TO THE TIME OF SALE. THIS TERM SHEET IS NOT AN OFFER TO SELL THESE SECURITIES AND IT IS NOT A SOLICITATION OF AN OFFER TO BUY THESE SECURITIES IN ANY JURISDICTION WHERE THE OFFER OR SALE IS NOT PERMITTED.
66
67
| BATTELLE CAMPUS |
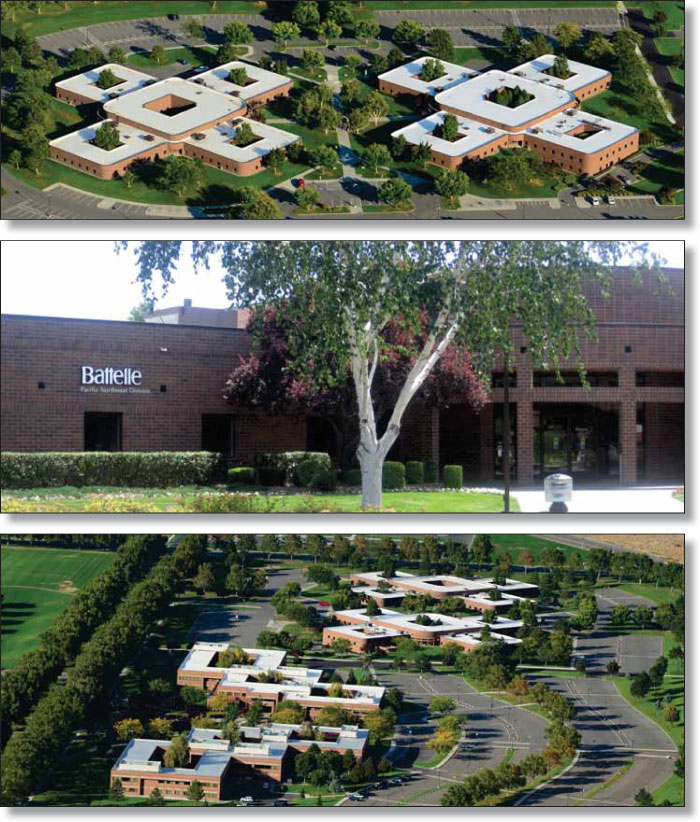
THE INFORMATION IN THIS STRUCTURAL AND COLLATERAL TERM SHEET IS NOT COMPLETE AND MAY BE AMENDED PRIOR TO THE TIME OF SALE. THIS TERM SHEET IS NOT AN OFFER TO SELL THESE SECURITIES AND IT IS NOT A SOLICITATION OF AN OFFER TO BUY THESE SECURITIES IN ANY JURISDICTION WHERE THE OFFER OR SALE IS NOT PERMITTED.
68
| BATTELLE CAMPUS |
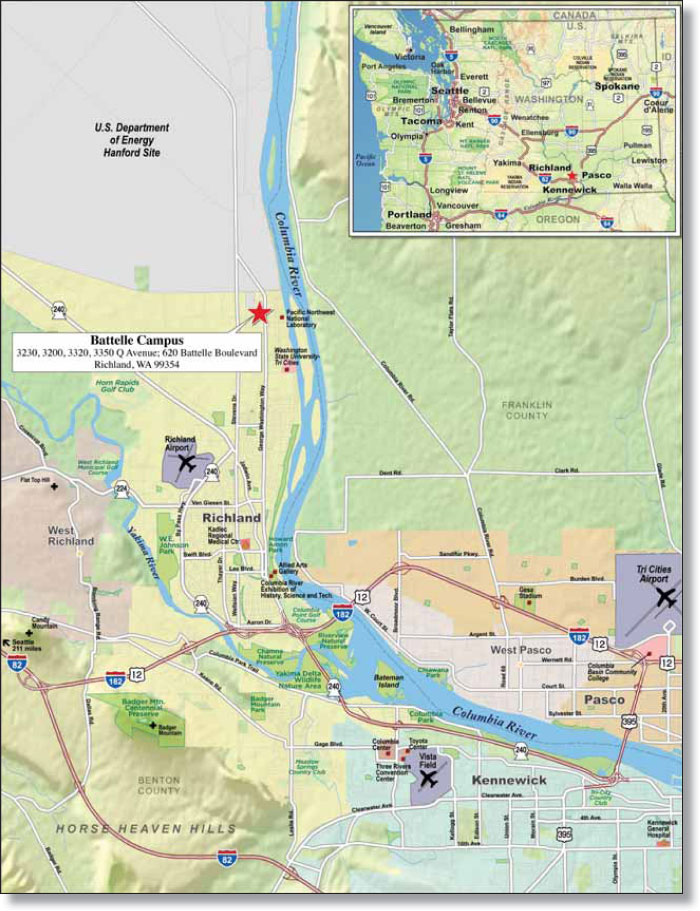
THE INFORMATION IN THIS STRUCTURAL AND COLLATERAL TERM SHEET IS NOT COMPLETE AND MAY BE AMENDED PRIOR TO THE TIME OF SALE. THIS TERM SHEET IS NOT AN OFFER TO SELL THESE SECURITIES AND IT IS NOT A SOLICITATION OF AN OFFER TO BUY THESE SECURITIES IN ANY JURISDICTION WHERE THE OFFER OR SALE IS NOT PERMITTED.
69
| Battelle Campus | |||||||||||
| Loan Information | Property Information | ||||||||||
| Mortgage Loan Seller: | Wells Fargo Bank, National Association | Single Asset/Portfolio: | Single Asset | ||||||||
| Credit Assessment (Fitch/KBRA/Moody’s): | NR/NR/NR | Property Type: | Office | ||||||||
| Original Principal Balance: | $60,000,000 | Specific Property Type: | Suburban | ||||||||
| Cut-off Date Principal Balance: | $59,896,055 | Location: | Richland, WA | ||||||||
| % of Initial Pool Balance: | 4.6% | Size: | 340,104 SF | ||||||||
| Loan Purpose: | Refinance | Cut-off Date Principal Balance Per Unit/SF: | $176.11 | ||||||||
| Borrower Name: | Notus Holdings, LLC | ||||||||||
| Sponsor: | Michael E. Henry | Year Built/Renovated(3): | Various | ||||||||
| Mortgage Rate: | 5.750% | Occupancy %: | 100.0% | ||||||||
| Note Date: | June 25, 2012 | Occupancy % Source Date: | August 1, 2012 | ||||||||
| Anticipated Repayment Date: | NAP | Title Vesting: | Leasehold | ||||||||
| Maturity Date: | July 1, 2022 | Property Manager: | Sigma Management, Inc. | ||||||||
| IO Period: | None | ||||||||||
| Loan Term (Original): | 120 months | 3rd Most Recent NOI (As of): | $6,537,381 (12/31/2009) | ||||||||
| Seasoning: | 1 month | 2nd Most Recent NOI (As of): | $6,672,113 (12/31/2010) | ||||||||
| Amortization Term (Original): | 264 months | Most Recent NOI (As of): | $6,672,107 (12/31/2011) | ||||||||
| Loan Amortization Type: | Amortizing Balloon | ||||||||||
| Interest Accrual Method: | Actual/360 | U/W Revenues: | $10,498,645 | ||||||||
| Call Protection: | L(25),D(91),O(4) | U/W Expenses: | $4,379,094 | ||||||||
| Lockbox Type: | Hard/Upfront Cash Management | U/W NOI: | $6,119,551 | ||||||||
| Additional Debt: | None | U/W NCF: | $5,672,100 | ||||||||
| Additional Debt Type: | NAP | U/W NOI DSCR: | 1.27x | ||||||||
| U/W NCF DSCR: | 1.18x | ||||||||||
| Escrows and Reserves: | U/W NOI Debt Yield: | 10.2% | |||||||||
| U/W NCF Debt Yield: | 9.5% | ||||||||||
| Type: | Initial | Monthly | Cap (If Any) | As-Is Appraised Value: | $90,800,000 | ||||||
| Taxes | $157,069 | $57,866 | NAP | As-Is Appraisal Valuation Date: | May 30, 2012 | ||||||
Insurance(1) | $0 | Springing | NAP | Cut-off Date LTV Ratio: | 66.0% | ||||||
| Replacement Reserves | $0 | $5,183 | NAP | LTV Ratio at Maturity or ARD: | 46.5% | ||||||
Ground Rent(2) | $0 | $5,520 | NAP | ||||||||
| (1) | Monthly insurance escrows are waived as long as no event of default has occurred and is continuing and the borrower provides satisfactory evidence that the Battelle Campus Property is insured in accordance with the loan documents. |
| (2) | Current total annual ground rent is $66,242. $5,520 is a monthly estimate. Ten (10) business days prior to each monthly payment date, the borrower is required to deposit a to-be-determined amount equal to the ground rent payable for that particular month. |
| (3) | The Environmental Technology Building was constructed in 1994; the National Security Building was constructed in 1993; the Information Sciences Building I and II were constructed in 1990 and 1991, respectively; and the User Housing Facility was constructed in 2001. |
The Mortgage Loan. The mortgage loan (the “Battelle Campus Mortgage Loan”) is evidenced by a single promissory note that is secured by a first mortgage encumbering the borrower’s leasehold interest in four office buildings and one multifamily housing complex located in Richland, Washington (the “Battelle Campus Property”). The Battelle Campus Mortgage Loan was originated on June 25, 2012 by Wells Fargo Bank, National Association. The Battelle Campus Mortgage Loan had an original principal balance of $60,000,000, has an outstanding principal balance as of the Cut-off Date of $59,896,055 and accrues interest at an interest rate of 5.750% per annum. The Battelle Campus Mortgage Loan has an initial term of 120 months, a remaining term of 119 months as of the Cut-off Date and requires payments of principal and interest based on a 22-year amortization schedule. The Battelle Campus Mortgage Loan matures on July 1, 2022. The proceeds from the Battelle Campus Mortgage Loan were used to refinance existing debt on the Battelle Campus Property of $59.3 million and pay closing costs.
Following the lockout period, the Battelle Campus Mortgage Loan may be defeased in whole, but not in part, on any due date before the scheduled maturity date. In addition, the Battelle Campus Mortgage Loan is prepayable without penalty on or after April 1, 2022.
The Property. The Battelle Campus Mortgage Loan is secured by the Battelle Campus Mortgage Loan borrower’s leasehold interest in four office buildings and one housing complex located in Richland, Washington. The Battelle Campus Property comprises a total of 340,104 square feet and is 100% leased from the Battelle Campus Mortgage Loan borrower to Battelle Memorial Institute (“Battelle”), a 501(c)(3) charitable trust headquartered in Columbus, Ohio. Battelle currently employs approximately 22,000 employees in over 130 locations worldwide. They are the world’s largest independent research and development organization, managing or co-managing seven national laboratories for the United States Department of Energy (“DOE”) and the United States Department of Homeland Security. The company conducts $6.5 billion in global research and development annually, servicing hundreds of corporations, along with federal, state and local government agencies. Battelle has managed the Pacific Northwest
THE INFORMATION IN THIS STRUCTURAL AND COLLATERAL TERM SHEET IS NOT COMPLETE AND MAY BE AMENDED PRIOR TO THE TIME OF SALE. THIS TERM SHEET IS NOT AN OFFER TO SELL THESE SECURITIES AND IT IS NOT A SOLICITATION OF AN OFFER TO BUY THESE SECURITIES IN ANY JURISDICTION WHERE THE OFFER OR SALE IS NOT PERMITTED.
70
| BATTELLE CAMPUS |
National Laboratory (“PNNL”) since 1965. The Battelle Campus Property is centrally located on 42.3 acres as part of the 300-acre PNNL. The Battelle Campus Property is located within the PNNL and was built in stages for Battelle in support of various projects for the DOE, the Department of Defense, the Department of Homeland Security and the National Nuclear Security Administration. In addition, the Battelle Campus Property is subject to five separate ground leases that expire between 2051 and 2060.
Battelle’s leases are absolute triple-net leases whereby the DOE reimburses Battelle for 100% of its occupancy costs (rent, operating expense reimbursements, including management fees, base building capital improvements and tenant improvements). Under a government contract, Battelle serves as the primary contractor for the management and operation of the DOE’s PNNL. While Battelle is the lessee, the United States Government has deemed the Battelle Campus Property as an approved contractor-leased facility and is fully responsible for ensuring that the funds are available to pay all contractual lease expenses as documented in their contract with Battelle. Under this contract, the Battelle Campus Property is listed as an approved real estate package. The DOE has the ability to terminate Battelle (without cause) as operator of the Battelle Campus Property. Battelle maintains unlimited five-year renewal options on each lease at to be negotiated rents. Battelle must give written notice of its election to extend no later than twelve months prior to the end of the current lease term.
Environmental Technology Building and National Security Building
The Environmental Technology Building, constructed in 1994 as the mirror image of the National Security Building, consists of two stories containing 100,358 square feet. The Environmental Technology Building features secured access in most of the facility. Doors are access-controlled and proximity card readers are used to access high security areas of the building. The National Security Building, constructed in 1993, also consists of two stories containing 100,358 square feet. The National Security Building is separated from the Environmental Technology Building by a fully landscaped pedestrian mall. The National Security Building contains some room configuration differences from the Environmental Technology Building, primarily in the basement. This level is designated “secret” by the United States Department of Defense and features high security access, slab-to-slab walls, and barriers in the fire dampers to prevent uncontrolled access. Additionally, all communication systems for this area are isolated in separated conduit and source connections. In 2007, Battelle spent approximately $3.6 million in additional security upgrades not available in any other facility in the PNNL.
Information Sciences Building I and II
The Information Sciences Building I and II consists of two one-story buildings constructed in 1991, consisting of 50,200 square feet and 60,080 square feet, respectively. The building footprints are identical; however, the Information Sciences Building II has an area below grade of approximately 10,000 square feet. This area is a state of the art computer center that houses the central computing terminal for the Battelle Campus Property and a separate network control room.
User Housing Facility
The User Housing Facility, constructed in 2001, consists of three two-story buildings totaling 29,108 square feet. The buildings, which are all connected, were constructed to provide a place to stay for visiting scientists and graduate students working at the PNNL. The complex contains 81 rooms for rent with three different room styles and prices. Room options include six-, seven- and eight-room suites, single queen rooms and one-bedroom apartments, all with a variety of amenities including kitchens, microwaves, and refrigerators.
The following table presents certain information relating to the Battelle Campus Property:
| Building Name | Square Feet | Annual U/W Base Rent | Annual U/W Base Rent PSF | Year Built/ Renovated | Lease Expiration Date | Ground Lease Expiration Date | |||||||
| Environmental Technology Building and National Security Building | 200,716 | $4,144,785 | $20.65 | 1993/NAP | 9/30/2018 | 9/30/2053 & 9/30/2052 | |||||||
| Information Sciences Building I and II | 110,280 | $2,178,030 | $19.75 | 1990/NAP | 9/30/2017 | 9/30/2051 | |||||||
| User Housing Facility | 29,108 | $349,296 | $12.00 | 2001/NAP | 9/30/2018 | 9/30/2060 | |||||||
| Total/Weighted Average | 340,104 | $6,672,111 | $19.62 | ||||||||||
THE INFORMATION IN THIS STRUCTURAL AND COLLATERAL TERM SHEET IS NOT COMPLETE AND MAY BE AMENDED PRIOR TO THE TIME OF SALE. THIS TERM SHEET IS NOT AN OFFER TO SELL THESE SECURITIES AND IT IS NOT A SOLICITATION OF AN OFFER TO BUY THESE SECURITIES IN ANY JURISDICTION WHERE THE OFFER OR SALE IS NOT PERMITTED.
71
| BATTELLE CAMPUS |
The following table presents certain information relating to the tenant at the Battelle Campus Property:
Major Tenant
| Tenant Name | Credit Rating (Fitch/Moody’s/ S&P)(1) | Tenant NRSF | % of NRSF | Annual U/W Base Rent PSF | Annual U/W Base Rent | % of Total Annual U/W Base Rent | Lease Expiration Date | |||||||
| Major Tenant | ||||||||||||||
| Battelle Memorial Institute | NR/NR/A+ | 340,104 | 100.0% | $19.62 | $6,672,111 | 100.0% | Various(2) | |||||||
| Total Major Tenant | 340,104 | 100.0% | $19.62 | $6,672,111 | 100.0% | |||||||||
| (1) | Certain ratings are those of the parent company whether or not the parent guarantees the lease. |
(2) | 110,280 square feet expires on September 30, 2017 and 229,824 square feet expires on September 30, 2018. |
The following table presents certain information relating to the lease rollover schedule at the Battelle Campus Property:
Lease Expiration Schedule(1)
| Year Ending December 31, | No. of Leases Expiring(2) | Expiring NRSF | % of Total NRSF | Cumulative of Total NRSF | Cumulative % of Total NRSF | Annual U/W Base Rent | Annual U/W Base Rent PSF | ||||||||
| MTM | 0 | 0 | 0.0% | 0 | 0.0% | $0 | $0.00 | ||||||||
| 2012 | 0 | 0 | 0.0% | 0 | 0.0% | $0 | $0.00 | ||||||||
| 2013 | 0 | 0 | 0.0% | 0 | 0.0% | $0 | $0.00 | ||||||||
| 2014 | 0 | 0 | 0.0% | 0 | 0.0% | $0 | $0.00 | ||||||||
| 2015 | 0 | 0 | 0.0% | 0 | 0.0% | $0 | $0.00 | ||||||||
| 2016 | 0 | 0 | 0.0% | 0 | 0.0% | $0 | $0.00 | ||||||||
| 2017 | 2 | 110,280 | 32.4% | 110,280 | 32.4% | $2,178,030 | $19.75 | ||||||||
| 2018 | 3 | 229,824 | 67.6% | 340,104 | 100.0% | $4,494,081 | $19.55 | ||||||||
| 2019 | 0 | 0 | 0.0% | 340,104 | 100.0% | $0 | $0.00 | ||||||||
| 2020 | 0 | 0 | 0.0% | 340,104 | 100.0% | $0 | $0.00 | ||||||||
| 2021 | 0 | 0 | 0.0% | 340,104 | 100.0% | $0 | $0.00 | ||||||||
| 2022 | 0 | 0 | 0.0% | 340,104 | 100.0% | $0 | $0.00 | ||||||||
| Thereafter | 0 | 0 | 0.0% | 340,104 | 100.0% | $0 | $0.00 | ||||||||
| Vacant | 0 | 0 | 0.0% | 340,104 | 100.0% | $0 | $0.00 | ||||||||
| Total/Weighted Average | 5 | 340,104 | 100.0% | $6,672,111 | $19.62 |
(1) | Information obtained from the underwritten rent roll. |
| (2) | There is a separate lease for each of the five buildings at the Battelle Campus Property. |
The following table presents historical occupancy percentages at the Battelle Campus Property:
Historical Occupancy Percentages(1)
12/31/2009 | 12/31/2010 | 12/31/2011 | ||
| 100% | 100% | 100% |
| (1) | Information obtained from the appraisal. |
THE INFORMATION IN THIS STRUCTURAL AND COLLATERAL TERM SHEET IS NOT COMPLETE AND MAY BE AMENDED PRIOR TO THE TIME OF SALE. THIS TERM SHEET IS NOT AN OFFER TO SELL THESE SECURITIES AND IT IS NOT A SOLICITATION OF AN OFFER TO BUY THESE SECURITIES IN ANY JURISDICTION WHERE THE OFFER OR SALE IS NOT PERMITTED.
72
| BATTELLE CAMPUS |
Operating History and Underwritten Net Cash Flow. The following table presents certain information relating to the historical operating performance and the Underwritten Net Cash Flow at the Battelle Campus Property:
Cash Flow Analysis
2009 | 2010 | 2011 | U/W(1) | U/W $ per SF | |||||||
| Base Rent | $6,537,381 | $6,672,112 | $6,672,112 | $6,672,111 | $19.62 | ||||||
| Grossed Up Vacant Space | 0 | 0 | 0 | 0 | 0.00 | ||||||
| Total Reimbursables | 3,143,588 | 4,078,734 | 4,696,519 | 4,160,139 | 12.23 | ||||||
| Other Income | 0 | 0 | 0 | 0 | 0.00 | ||||||
| Less Vacancy & Credit Loss | 0 | 0 | 0 | (333,606) | (0.98) | ||||||
| Effective Gross Income | $9,680,969 | $10,750,846 | $11,368,631 | $10,498,645 | $30.87 | ||||||
| Total Operating Expenses | $3,143,588 | $4,078,733 | $4,696,524 | $4,379,094 | $12.88 | ||||||
| Net Operating Income | $6,537,381 | $6,672,113 | $6,672,107 | $6,119,551 | $17.99 | ||||||
| TI/LC | 0 | 0 | 0 | 385,252 | 1.13 | ||||||
| Capital Expenditures | 0 | 0 | 0 | 62,199 | 0.18 | ||||||
| Net Cash Flow | $6,537,381 | $6,672,113 | $6,672,107 | $5,672,100 | $16.68 | ||||||
| NOI DSCR | 1.36x | 1.39x | 1.39x | 1.27x | |||||||
| NCF DSCR | 1.36x | 1.39x | 1.39x | 1.18x | |||||||
| NOI DY | 10.9% | 11.1% | 11.1% | 10.2% | |||||||
| NCF DY | 10.9% | 11.1% | 11.1% | 9.5% |
(1) | The DOE reimburses Battelle for 100% of its occupancy costs (rent, operating expense reimbursements, including management fees, base building capital improvements and tenant improvements). While Battelle is the lessee, the United States Government has deemed the Battelle Campus Property as an approved contractor-leased facility and is fully responsible for ensuring that the funds are available to pay all contractual lease expenses as documented in their contract with Battelle. Under this contract, the Battelle Campus Property is listed as an approved real estate package. |
Appraisal. According to the appraisal dated May 30, 2012, the Battelle Campus Property had an “as-is” appraised value of $90,800,000. The appraiser also provided a “go dark” appraised value of $48,900,000.
Environmental Matters. According to the Phase I environmental site assessment dated June 4, 2012, there was no evidence of any recognized environmental conditions.
Market Overview and Competition.�� The Battelle Campus Property is located in Richland, Washington, approximately 200 miles southeast of Seattle, in an area called the “Tri-Cities of Washington”, which consists of three cities: Kennewick, Pasco and Richland. According to the 2010 Census, the Tri-Cities area population is approximately 253,340, which is the third largest metropolitan area in the state of Washington after Seattle and Spokane. The DOE has been located in this area since the 1940s. The PNNL is one of only 39 Federally Funded Research and Development Centers (“FFRDCs”). The Battelle Campus Property is located in North Richland on the PNNL campus, which is also known as the Tri-Cities Research District (“TCRD”). The PNNL is one of ten national laboratories funded and managed through the DOE’s Office of Science. The PNNL employs approximately 4,700 people in Richland, 1,200 of which are employed by Battelle as administrative staff and scientists at the Battelle Campus Property. Currently, the 1,700-acre TCRD contains approximately 80 tenants, employs approximately 7,000 people and includes approximately 3.4 million square feet of office, laboratory and light manufacturing space.
According to the appraisal, the North Richland submarket contains approximately 2.0 million square feet of office space. Average rent for office space ranges from $19.00 to $22.50 per square foot on a triple-net basis and average vacancy is estimated to be 3.9%.
Competitive Set(1)
Battelle Campus (Subject) | Salk Office Building | Group Health Medical Building | Crest Building | Jadwin Office Building | ||||||
| Market | Richland, WA | Richland, WA | Kennewick, WA | Kennewick, WA | Richland, WA | |||||
Distance from Subject | -- | 1.5 miles | 10.9 miles | 11.1 miles | 5.1 miles | |||||
Property Type | Office | Office | Office | Office | Office | |||||
Year Built/Renovated | Various | 2011/NAV | 1998/NAV | 2008/NAV | 2005/NAV | |||||
Total GLA | 340,104 SF | 47,712 SF | 30,950 SF | 20,200 SF | 24,000 SF | |||||
Total Occupancy | 100% | 100% | 80% | 100% | 58% |
| (1) | Information obtained from appraisal dated May 30, 2012. |
THE INFORMATION IN THIS STRUCTURAL AND COLLATERAL TERM SHEET IS NOT COMPLETE AND MAY BE AMENDED PRIOR TO THE TIME OF SALE. THIS TERM SHEET IS NOT AN OFFER TO SELL THESE SECURITIES AND IT IS NOT A SOLICITATION OF AN OFFER TO BUY THESE SECURITIES IN ANY JURISDICTION WHERE THE OFFER OR SALE IS NOT PERMITTED.
73
| BATTELLE CAMPUS |
The Borrower. The borrower is Notus Holdings, LLC, a Delaware limited liability company and a single-purpose entity with two independent directors. Legal counsel to the borrower delivered a non-consolidation opinion in connection with the origination of the Battelle Campus Mortgage Loan. The borrower is owned by Notus Investments, LLC, whose sole member is Michael E. Henry, the guarantor of certain nonrecourse carveouts under the Battelle Campus Mortgage Loan.
The Sponsor. The sponsor is Michael E. Henry, who is the sole member of Notus Investments, LLC, which owns a 100% interest in the borrower. Michael E. Henry is also the president and 90.0% owner of Sigma Management, Inc, the property manager. Mr. Henry’s real estate portfolio consists of similar office/lab buildings in the Richland area. Since the 1980’s, Michael E. Henry has been involved with commercial office and laboratory construction projects totaling in excess of 500,000 square feet and specializes in the needs of DOE contracts such as Battelle and Bechtel Corporation. See “Description of the Mortgage Pool – Bankruptcy Issues and Other Proceedings” and “Description of the Mortgage Pool – Litigation Considerations” in the Free Writing Prospectus.
Escrows. The loan documents provide for up-front escrows at closing in the amount of $157,069 for real estate taxes. The loan documents provide for monthly escrows in the amount of $57,866 for real estate taxes (subject to adjustment per the lender’s estimate), $5,183 for replacement reserves and $5,520 for ground rent (current estimate; subject to adjustment for any increases in ground rent). Ongoing monthly insurance escrows are not required as long as no event of default has occurred and is continuing and the borrower provides satisfactory evidence that the property is insured in accordance with the loan documents.
Lockbox and Cash Management. The Battelle Campus Mortgage Loan requires a lender-controlled lockbox account, which is already in place, and that the tenant be directed to pay their rents directly to such lockbox account. The loan documents also require that all cash revenues and all other monies received by the borrower or the property manager relating to the Battelle Campus Property be deposited directly into the lockbox account (excluding management fees and tenant funded alterations to the Battelle Campus Property).
Upon the occurrence of a Cash Trap Event Period (as defined below), all funds on deposit in the lockbox account will be swept to certain restricted accounts, and if an event of default exists, the lender will have the exclusive control of, and the right to withdraw and apply, the funds in the deposit account to payment of any and all debts, liabilities and obligations of the borrower in such order, proportion and priority as the lender may determine in its sole discretion.
A “Cash Trap Event Period” will commence upon: (i) the occurrence and continuance of an event of default or (ii) the failure of the borrower to deliver evidence of Battelle’s lease renewal prior the applicable notice date (one-year prior to lease expiration), for a term of no less than five years, providing no less rent and reimbursements than the last year of the term of the previous lease. A Cash Trap Event Period will expire upon the cure of such event of default, Battelle entering into an acceptable replacement lease (as described above) and continuing to be in physical possession of its space or a replacement tenant entering into an acceptable Replacement Lease. The “Replacement Lease” shall be acceptable to the lender, shall provide no less rent and reimbursements than the last year of the term of the previous lease, and have a term of no less than three years beyond the maturity date. The replacement tenant shall be in actual physical possession of the space and shall be operating the space for at least six months evidenced by an estoppel reasonably acceptable to the lender.
Property Management. The Battelle Campus Property is currently self-managed by Sigma Management, Inc., an affiliate of the Battelle Campus Mortgage Loan sponsor.
Assumption. The Battelle Campus Mortgage Loan borrower has a two-time right to transfer the Battelle Campus Property and cause an assumption of the loan, provided that no event of default has occurred and is continuing under the Battelle Campus Mortgage Loan and that certain other conditions are satisfied, including: (i) the borrower pays an assumption fee of the greater of 1.0% of the outstanding principal balance of the Battelle Campus Mortgage Loan and $15,000; (ii) the transferee satisfies certain criteria; (iii) transferee assumes the obligations of the borrower under the management agreement or enters into a new management agreement with a manager that satisfies certain criteria; and (iv) the lender receives confirmation from Fitch, KBRA and Moody’s that the transfer will not result in a downgrade, withdrawal or qualification of the respective ratings assigned to the Series 2012-C8 Certificates; and (v) other factors relied upon by the lender in the original underwriting of the Battelle Campus Mortgage Loan.
Partial Release. Not Permitted.
Real Estate Substitution. Not Permitted.
Subordinate and Mezzanine Indebtedness. Not Permitted.
Restoration Clause. Each of the Battelle Campus Property building leases contains a restoration clause, under which Battelle is required to restore, at their own expense, each building to the condition existing before alterations or additions were made to the Battelle Campus Property.
Ground Lease. The Battelle Campus Property is subject to five separate ground leases between Battelle, as ground lessor, and the Battelle Campus Mortgage Loan borrower, as ground lessee. The initial ground lease terms began at or around the construction of each building (1990 through 2001) and expire on September 30, 2051 (Information Sciences Building I and II), September 30, 2052 (National Security Building), September 30, 2053 (Environmental Technology Building), and September 30, 2060 (User Housing Facility).
THE INFORMATION IN THIS STRUCTURAL AND COLLATERAL TERM SHEET IS NOT COMPLETE AND MAY BE AMENDED PRIOR TO THE TIME OF SALE. THIS TERM SHEET IS NOT AN OFFER TO SELL THESE SECURITIES AND IT IS NOT A SOLICITATION OF AN OFFER TO BUY THESE SECURITIES IN ANY JURISDICTION WHERE THE OFFER OR SALE IS NOT PERMITTED.
74
| BATTELLE CAMPUS |
After the initial 10-year period set forth in the respective ground leases, rent shall be determined six months prior to the expiration of each 5-year period thereafter by Battelle and Centurion Properties III, LLC (“Centurion”). Failing such agreement, rent shall be determined by a panel of three appraisers. Each of Battelle and Centurion shall appoint one appraiser and the third shall be appointed by the other two appraisers. Annual rent shall be nine (9.0%) percent of fair market value, provided that in no event shall rent increase more than three (3.0%) percent for the Information Sciences Building II, National Security Building, Environmental Technology Building and User Housing Facility; and (5.0%) percent for the Information Sciences Building I per year. Current total annual ground rent is $66,242.
Should Battelle vacate any portion of one of the Battelle Campus Property buildings, ground rent shall be abated accordingly. Less than 25% occupancy results in 25% payment of ground rent, 26% to 50% results in 50% payment of ground rent, 51% to 75% results in 75% payment of ground rent and 76% to 100% results in 100% payment of ground rent.
Purchase Option/Right of First Offer. Battelle, as ground lessor, may, upon receiving notice from the Battelle Campus Mortgage Loan borrower of the Battelle Campus Mortgage Loan borrower’s intent to sell, or at Battelle’s sole discretion, purchase the related Battelle Campus Property building at any of the related ground lease parcels at the then fair market value for such improvements, subject to then existing leases. If the parties cannot agree within the first ninety days after Battelle has given written notice of intent to buy, the fair market value shall be determined by a board of three appraisers.
If Battelle has leased any Battelle Campus Property building continuously for the entire term of the related ground lease, Battelle is entitled to purchase the related Battelle Campus Property building for $1.00 upon the expiration of the related ground lease. . Should Battelle vacate any portion of one of the Battelle Campus Property buildings, it is then obligated to purchase the related Battelle Campus Property building at its then fair market value upon the expiration of the related ground lease. If the Battelle Campus Property building is vacant, fair market value shall be determined based on the Battelle Campus Property building being occupied at fair market rental value.
The Battelle purchase option/ right of first offer is not triggered by a foreclosure or deed-in-lieu transaction, or the related lender’s first subsequent out-conveyance. Nor may such rights be exercised unless and until the Battelle Campus Mortgage Loan has been paid in full.
Terrorism Insurance. The loan documents require that the “all risk” insurance policy required to be maintained by the borrower provide coverage for terrorism in an amount equal to the full replacement cost of the Battelle Campus Property, as well as business interruption insurance covering no less than the 18-month period following the occurrence of a casualty event, together with a six-month extended period of indemnity.
THE INFORMATION IN THIS STRUCTURAL AND COLLATERAL TERM SHEET IS NOT COMPLETE AND MAY BE AMENDED PRIOR TO THE TIME OF SALE. THIS TERM SHEET IS NOT AN OFFER TO SELL THESE SECURITIES AND IT IS NOT A SOLICITATION OF AN OFFER TO BUY THESE SECURITIES IN ANY JURISDICTION WHERE THE OFFER OR SALE IS NOT PERMITTED.
75
| PLAZA ON RICHMOND |
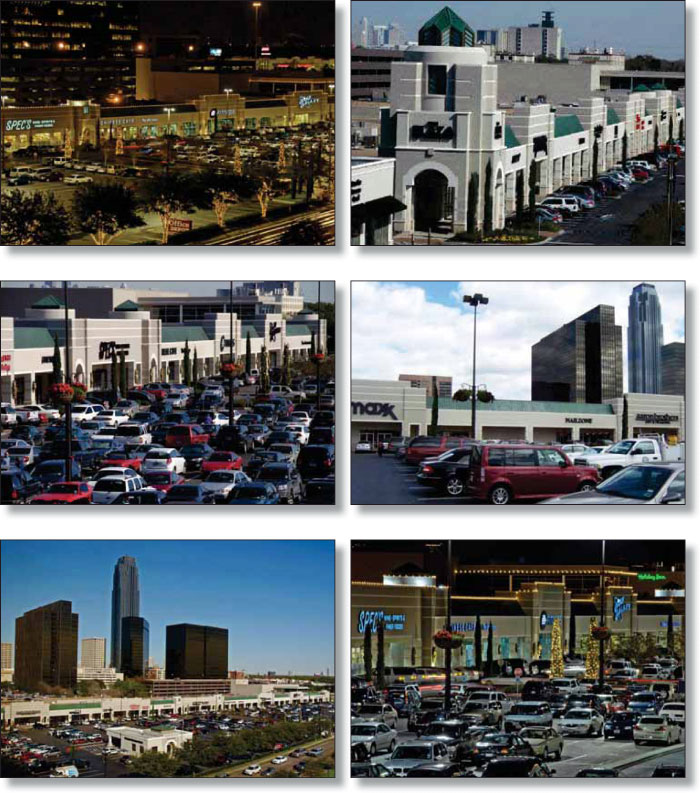
THE INFORMATION IN THIS STRUCTURAL AND COLLATERAL TERM SHEET IS NOT COMPLETE AND MAY BE AMENDED PRIOR TO THE TIME OF SALE. THIS TERM SHEET IS NOT AN OFFER TO SELL THESE SECURITIES AND IT IS NOT A SOLICITATION OF AN OFFER TO BUY THESE SECURITIES IN ANY JURISDICTION WHERE THE OFFER OR SALE IS NOT PERMITTED.
76
| PLAZA ON RICHMOND |
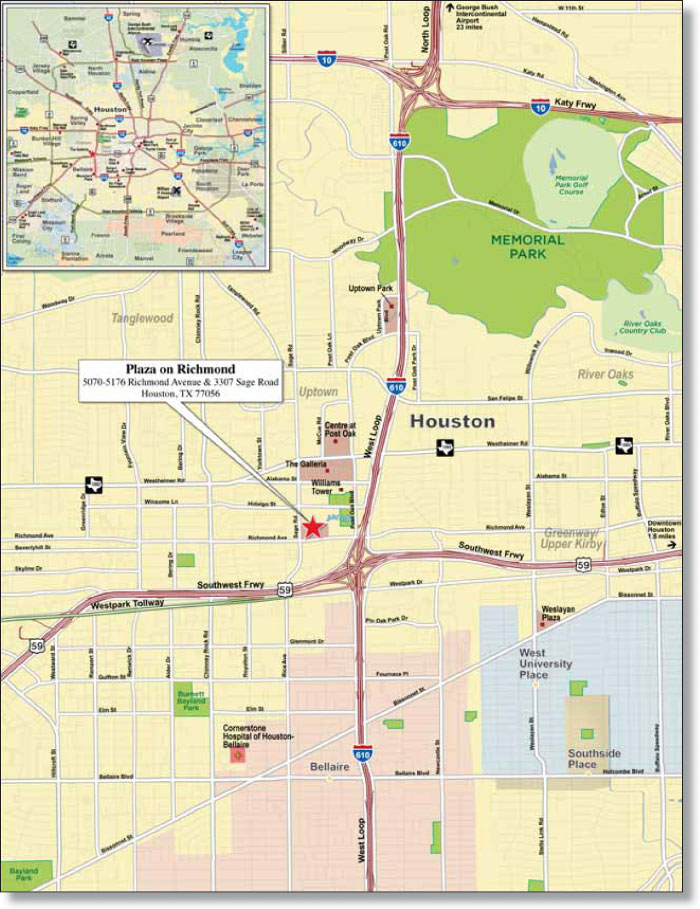
THE INFORMATION IN THIS STRUCTURAL AND COLLATERAL TERM SHEET IS NOT COMPLETE AND MAY BE AMENDED PRIOR TO THE TIME OF SALE. THIS TERM SHEET IS NOT AN OFFER TO SELL THESE SECURITIES AND IT IS NOT A SOLICITATION OF AN OFFER TO BUY THESE SECURITIES IN ANY JURISDICTION WHERE THE OFFER OR SALE IS NOT PERMITTED.
77
| Plaza on Richmond | ||||||||
| Loan Information | Property Information | |||||||
| Mortgage Loan Seller: | The Royal Bank of Scotland | Single Asset/Portfolio: | Single Asset | |||||
| Credit Assessment (Fitch/KBRA/Moody’s): | NR/NR/NR | Property Type: | Retail | |||||
| Original Principal Balance: | $44,000,000 | Specific Property Type: | Anchored | |||||
| Cut-off Date Principal Balance: | $44,000,000 | Location: | Houston, TX | |||||
| % of Initial Pool Balance: | 3.4% | Size: | 193,636 SF | |||||
| Loan Purpose: | Refinance | |||||||
| Borrower Name: | POR, LP | Cut-off Date Principal Balance Per Unit/SF: | $227.23 | |||||
| Sponsor: | Anwar Barbouti | Year Built/Renovated: | 1960/2009 | |||||
| Mortgage Rate: | 4.694% | Occupancy %(3): | 86.1% | |||||
| Note Date: | July 5, 2012 | Occupancy % Source Date: | June 26, 2012 | |||||
| Anticipated Repayment Date: | NAP | Title Vesting: | Fee | |||||
| Maturity Date: | August 1, 2022 | Property Manager: | Greenwich Management Co., Inc. | |||||
| IO Period: | 24 months | |||||||
| Loan Term (Original): | 120 months | 3rd Most Recent NOI (As of): | $2,997,489 (12/31/2010) | |||||
| Seasoning: | 0 months | 2nd Most Recent NOI (As of): | $3,113,089 (12/31/2011) | |||||
| Amortization Term (Original): | 360 months | Most Recent NOI (As of): | $3,126,257 (TTM 3/31/2012) | |||||
| Loan Amortization Type: | Interest-only, Amortizing Balloon | |||||||
| Interest Accrual Method: | Actual/360 | U/W Revenues: | $6,182,144 | |||||
| Call Protection: | L(24),D(92),O(4) | U/W Expenses: | $2,347,972 | |||||
| Lockbox Type: | Hard/Springing Cash Management | U/W NOI: | $3,834,172 | |||||
| Additional Debt: | None | U/W NCF: | $3,696,874 | |||||
| Additional Debt Type: | NAP | U/W NOI DSCR(4) : | 1.40x | |||||
U/W NCF DSCR(4) : | 1.35x | |||||||
| Escrows and Reserves: | U/W NOI Debt Yield: | 8.7% | ||||||
| U/W NCF Debt Yield: | 8.4% | |||||||
| Type: | Initial | Monthly | Cap (If Any) | As-Is Appraised Value: | $60,000,000 | |||
| Taxes | $629,334 | $78,667 | NAP | As-Is Appraisal Valuation Date: | May 7, 2012 | |||
| Insurance | $102,809 | $20,562 | NAP | Cut-off Date LTV Ratio: | 73.3% | |||
| Replacement Reserves | $0 | $3,227 | NAP | LTV Ratio at Maturity or ARD: | 63.0% | |||
| Deferred Maintenance | $0 | $0 | NAP | |||||
Leasing Holdback(1) | $5,000,000 | $0 | NAP | |||||
TI/LC Reserve(2) | $1,000,000 | Springing | NAP | |||||
| (1) | At closing, a $5.0 million holdback was reserved in association with the lease-up of a 26,929 square foot space (the “Former 24 Hour Fitness Space”) at the Plaza on Richmond Property. The $5.0 million will only be released in whole or in part upon satisfaction of the “Earnout Requirements” as defined in the “Escrows” section below. The borrower has a lease out for signature to HH Gregg for the entire Former 24 Hour Fitness Space at a base rent of $19.00 per square foot, 10-year initial term and approximately $10.19 in reimbursements. |
| (2) | $1.0 million of proceeds was funded into a TI/LC reserve at closing for payment of leasing costs. The borrower will be required to fund $8,068 monthly if the balance in the leasing reserve falls below $100,000. Provided that HH Gregg executes a lease with terms including but not limited to: (1) triple net base rent of $19.00 per square foot; (2) a minimum of a 10 year lease term; (3) no tenant improvements and leasing commission payable by borrower required per the lease; (4) tenant having taken occupancy; (5) tenant paying full rent; (6) borrower provides to lender a lease estoppel; and (7) no event of default, lesser of $500,000 or reserve balance of such TI/LC reserve shall be released to the borrower and the remaining reserve amount shall be held to be used for future leasing costs. |
| (3) | Excludes the lease out for signature to a tenant, HH Gregg, which would take the occupancy to 100%. |
| (4) | The underwritten NOI and NCF assumes that the lease out for signature to HH Gregg for the entire Former 24 Hour Fitness Space will be executed with the terms described in footnotes 1 and 2 above. Excluding this lease from the underwriting would result in an U/W NOI DSCR and U/W NCF DSCR of 1.22x and 1.19x, respectively. There is a $5.0 million holdback reserve for this space, as described in footnote 1 above and defined in the “Escrows” section below, which is anticipated to be released to the borrower upon among other things, execution of the HH Gregg lease and satisfaction of the other Earnout Requirements. |
The Mortgage Loan. The mortgage loan (the “Plaza on Richmond Mortgage Loan”) is evidenced by a single promissory note that is secured by a first mortgage encumbering a 193,636 square foot anchored retail center located in the Galleria submarket of Houston, Texas (the “Plaza on Richmond Property”). The Plaza on Richmond Mortgage Loan was originated on July 5, 2012 by The Royal Bank of Scotland. The Plaza on Richmond Mortgage Loan had an original principal balance of $44,000,000, has an outstanding principal balance as of the Cut-off Date of $44,000,000 and accrues interest at an interest rate of 4.694% per annum. The Plaza on Richmond Mortgage Loan had an initial term of 120 months, has a remaining term of 120 months as of the Cut-off Date and requires interest-only payments for the first 24 months following origination and thereafter will require payments of interest and principal based on a 30-year amortization schedule. The Plaza on Richmond Mortgage Loan will mature on August 1, 2022. The proceeds from the Plaza on Richmond Mortgage Loan were used to refinance existing debt of approximately $24.9 million, fund approximately $6.7 million in upfront reserves, pay closing costs of approximately $4.1 million, and return approximately $8.4 million to the sponsor.
THE INFORMATION IN THIS STRUCTURAL AND COLLATERAL TERM SHEET IS NOT COMPLETE AND MAY BE AMENDED PRIOR TO THE TIME OF SALE. THIS TERM SHEET IS NOT AN OFFER TO SELL THESE SECURITIES AND IT IS NOT A SOLICITATION OF AN OFFER TO BUY THESE SECURITIES IN ANY JURISDICTION WHERE THE OFFER OR SALE IS NOT PERMITTED.
78
| PLAZA ON RICHMOND |
Following the lockout period, the borrower has the right to defease the Plaza on Richmond Mortgage Loan in whole, but not in part, on any due date before the scheduled maturity date. In addition, the Plaza on Richmond Mortgage Loan is prepayable without penalty on or after May 1, 2022.
The Property. The Plaza on Richmond Property is a retail community shopping center anchored by 24 Hour Fitness, TJ Maxx and Office Depot and contains approximately 193,636 rentable square feet. The Plaza on Richmond Property was built in 1960, last renovated in 2009 and is located on Richmond Avenue in Houston, Texas. The Plaza on Richmond Property is comprised of one primary building and three outparcel buildings situated on 12.9 acres. The Plaza on Richmond Property was 86.1% leased to 19 tenants as of June 26, 2012. Based on the most recently reported sales figures reported by tenants that report sales, the property’s average sales are $335 per square foot. Access to the Plaza on Richmond Property is provided via four driveways from Richmond Avenue and two from Sage Road. The Plaza on Richmond Property has 686 parking spaces equating to a parking ratio of 3.54 spaces per 1,000 net rentable square feet.
The following table presents certain information relating to the tenancies at the Plaza on Richmond Property:
Major Tenants
| Tenant Name | Credit Rating (Fitch/ Moody’s/ S&P)(1) | Tenant NRSF | % of NRSF | Annual U/W Base Rent PSF | Annual U/W Base Rent | % of Total Annual U/W Base Rent | Sales PSF(2) | Occupancy Cost(2) | Lease Expiration Date | ||
| Major Tenants | |||||||||||
| 24 Hour Fitness | NR/NR/NR | 36,937 | 19.1% | $23.57 | $870,605 | 22.7% | $97 | 24.3% | 10/31/2024 | ||
TJ Maxx(3) | NR/A3/A | 29,273 | 15.1% | $20.03 | $586,314 | 15.3% | $480 | 4.2% | 1/31/2023 | ||
| Golf Galaxy | NR/NR/NR | 15,078 | 7.8% | $21.75 | $327,947 | 8.6% | $300 | 7.2% | 5/31/2015 | ||
| Ulta Salon | NR/NR/NR | 11,871 | 6.1% | $25.85 | $306,865 | 8.0% | $601 | 4.3% | 6/30/2015 | ||
| Office Depot | NR/B2/B- | 17,566 | 9.1% | $16.97 | $298,095 | 7.8% | NAV | NAV | 2/28/2014 | ||
| Total Major Tenants | 110,725 | 57.2% | $21.58 | $2,389,826 | 62.4% | ||||||
| Non-Major Tenants | 55,982 | 28.9% | $25.76 | $1,441,936 | 37.6% | ||||||
| Occupied Collateral | 166,707 | 86.1% | $22.99 | $3,831,762 | 100.0% | ||||||
Vacant Space(4) | 26,929 | 13.9% | |||||||||
| Collateral Total | 193,636 | 100.0% | |||||||||
| (1) | Certain ratings are those of the parent company whether or not the parent guarantees the lease. |
| (2) | Sales and occupancy costs are for the calendar year ended 2011. |
| (3) | The base rent for TJ Maxx was averaged over the loan term due to the tenant being rated investment grade and the lease expiration being beyond the loan term. The current base rent is $19.00 per square foot, however, there is a rent step to $20.90 per square foot on February 1, 2018. |
| (4) | There is a lease out for signature to a tenant, HH Gregg, which would take the occupancy to 100%. |
THE INFORMATION IN THIS STRUCTURAL AND COLLATERAL TERM SHEET IS NOT COMPLETE AND MAY BE AMENDED PRIOR TO THE TIME OF SALE. THIS TERM SHEET IS NOT AN OFFER TO SELL THESE SECURITIES AND IT IS NOT A SOLICITATION OF AN OFFER TO BUY THESE SECURITIES IN ANY JURISDICTION WHERE THE OFFER OR SALE IS NOT PERMITTED.
79
| PLAZA ON RICHMOND |
The following table presents certain information relating to the lease rollover schedule at the Plaza on Richmond Property:
Lease Expiration Schedule(1)(2)
Year Ending December 31, | No. of Leases Expiring | Expiring NRSF | % of Total NRSF | Cumulative of Total NRSF | Cumulative % of Total NRSF | Annual U/W Base Rent | Annual U/W Base Rent PSF(3) |
| MTM | 0 | 0 | 0.0% | 0 | 0.0% | $0 | $0.00 |
| 2012 | 1 | 8,000 | 4.1% | 8,000 | 4.1% | $228,000 | $28.50 |
| 2013 | 3 | 7,548 | 3.9% | 15,548 | 8.0% | $258,903 | $34.30 |
| 2014 | 4 | 29,039 | 15.0% | 44,587 | 23.0% | $582,383 | $20.06 |
| 2015 | 8 | 52,910 | 27.3% | 97,497 | 50.4% | $1,211,057 | $22.89 |
| 2016 | 1 | 3,000 | 1.5% | 100,497 | 51.9% | $94,500 | $31.50 |
| 2017 | 0 | 0 | 0.0% | 100,497 | 51.9% | $0 | $0.00 |
| 2018 | 0 | 0 | 0.0% | 100,497 | 51.9% | $0 | $0.00 |
| 2019 | 0 | 0 | 0.0% | 100,497 | 51.9% | $0 | $0.00 |
| 2020 | 0 | 0 | 0.0% | 100,497 | 51.9% | $0 | $0.00 |
| 2021 | 0 | 0 | 0.0% | 100,497 | 51.9% | $0 | $0.00 |
| 2022 | 0 | 0 | 0.0% | 100,497 | 51.9% | $0 | $0.00 |
| Thereafter | 2 | 66,210 | 34.2% | 166,707 | 86.1% | $1,456,919 | $22.00 |
| Vacant | 0 | 26,929 | 13.9% | 193,636 | 100.0% | $0 | $0.00 |
| Total/Weighted Average | 19 | 193,636 | 100.0% | $3,831,762 | $22.99 |
| (1) | Information obtained from the underwritten rent roll. |
| (2) | Certain tenants may have lease termination options that are exercisable prior to the originally stated expiration date of the subject lease and that are not considered in the Lease Expiration Schedule. |
| (3) | Weighted Average Annual U/W Base Rent PSF excludes vacant space. |
The following table presents historical occupancy percentages at the Plaza on Richmond Property:
Historical Occupancy Percentages(1)
12/31/2009 | 12/31/2010 | 12/31/2011 | ||
| 86% | 86% | 86% | ||
(1) Information obtained from borrower rent rolls. | ||||
Operating History and Underwritten Net Cash Flow. The following table presents certain information relating to the historical operating performance and the Underwritten Net Cash Flow at the Plaza on Richmond Property:
Cash Flow Analysis
2010 | 2011 | TTM 2/29/2012 | U/W | U/W $ per SF | ||||||
| Base Rent | $3,422,873 | $3,497,097 | $3,505,684 | $3,831,762 | $19.79 | |||||
| Grossed Up Vacant Space | 0 | 0 | 0 | 786,058(1) | 4.06 | |||||
| Percentage Rent | 75,178 | 93,682 | 93,682 | 0 | 0.00 | |||||
| Total Reimbursables | 1,719,320 | 1,712,784 | 1,660,919 | 1,841,798 | 9.51 | |||||
| Other Income | 3,203 | 0 | 0 | 0 | 0.00 | |||||
| Less Vacancy & Credit Loss | 0 | 0 | 0 | (277,474)(1) | (1.43) | |||||
| Effective Gross Income | $5,220,574 | $5,303,563 | $5,260,285 | $6,182,144 | $31.93 | |||||
| Total Operating Expenses | $2,223,085 | $2,190,474 | $2,134,028 | $2,347,972 | $12.13 | |||||
Net Operating Income(2) | $2,997,489 | $3,113,089 | $3,126,257 | $3,834,172 | $19.80 | |||||
| TI/LC | 0 | 0 | 0 | 98,571 | 0.51 | |||||
| Capital Expenditures | 0 | 0 | 0 | 38,727 | 0.20 | |||||
| Net Cash Flow | $2,997,489 | $3,113,089 | $3,126,257 | $3,696,874 | $19.09 | |||||
| NOI DSCR | 1.10x | 1.14x | 1.14x | 1.40x | ||||||
| NCF DSCR | 1.10x | 1.14x | 1.14x | 1.35x | ||||||
| NOI DY | 6.8% | 7.1% | 7.1% | 8.7% | ||||||
| NCF DY | 6.8% | 7.1% | 7.1% | 8.4% |
| (1) | The Plaza on Richmond Property has vacant space equal to 13.9% of the net rentable area. The borrower has a lease out for signature to a tenant, HH Gregg, to lease the entire vacant space at the Plaza on Richmond Property. Per the appraisal of the mortgaged property, the Uptown Houston/Galleria retail submarket had a 1.4% vacancy rate as of the first quarter of 2012. After grossing up the vacant space based on the terms of the HH Gregg lease, a 5% vacancy was underwritten on all tenants excluding the TJ Maxx tenant which is an investment grade tenant with a lease term beyond the maturity date. The Plaza on Richmond Property is currently 86.1% leased. Additionally, in order to mitigate potential risks associated with the vacant space, the lender has retained a $5,000,000 Leasing Holdback and a $1,000,000 TI/LC reserve. See “Escrows” below. |
| (2) | The U/W NOI is higher than the historical NOIs due to several factors including but not limited to new leasing, some of which is described above in footnote 1. |
THE INFORMATION IN THIS STRUCTURAL AND COLLATERAL TERM SHEET IS NOT COMPLETE AND MAY BE AMENDED PRIOR TO THE TIME OF SALE. THIS TERM SHEET IS NOT AN OFFER TO SELL THESE SECURITIES AND IT IS NOT A SOLICITATION OF AN OFFER TO BUY THESE SECURITIES IN ANY JURISDICTION WHERE THE OFFER OR SALE IS NOT PERMITTED.
80
| PLAZA ON RICHMOND |
Appraisal. According to the related appraisal, the Plaza on Richmond Property had an “as-is” appraised value of $60,000,000 as of an effective date of May 7, 2012 and an “as-stabilized” appraised value of $61,550,000 as of an effective date of May 7, 2014.
Environmental Matters. According to the Phase I environmental site assessment dated May 17, 2012, there was no evidence of any recognized environmental condition at the Plaza on Richmond Property.
Market Overview and Competition. The Plaza on Richmond Property is located on Richmond Avenue between Sage and Loop 610, approximately eight miles west of Houston’s central business district and about 30 miles southwest of the George Bush Intercontinental Airport. The Plaza on Richmond Property is located in the Uptown Houston/Galleria area of Houston, only one mile south of the Galleria Mall, one of the largest malls in the Houston area. According to the appraisal, the Uptown Houston/Galleria area hosts approximately 200,000 office workers and shoppers each day and more than 22.0 million visitors from around the world each year. According to the appraisal, the 2011 population within a one-, three- and five-mile radius of the Plaza on Richmond Property was 19,729, 206,642 and 505,734, respectively, while 2011 average household income within the same radii was $98,062, $100,289 and $89,870, respectively.
According to the appraisal, the Houston retail market vacancy rate ended the first quarter of 2012 at 6.7% while average base rental rates ended the first quarter of 2012 at $20.48 per square foot. The average vacancy rate in the Uptown Houston/Galleria submarket was 1.4% at the end of the first quarter of 2012 while average base rental rates ended the first quarter of 2012 at $25.50 per square foot.
The following table presents certain information relating to comparable retail centers for the Plaza on Richmond Property:
Competitive Set(1)
Plaza on Richmond (Subject) | Greenway Commons | Post Oak Center | Centre at Post Oak | Uptown Plaza | Uptown Park | |
| Market | Houston, TX | Houston, TX | Houston, TX | Houston, TX | Houston, TX | Houston, TX |
| Distance from Subject | -- | 1.5 miles | 1.3 miles | 1.0 mile | 1.2 miles | 2.2 miles |
| Property Type | Retail | Retail | Retail | Retail | Retail | Retail |
| Year Built/Renovated | 1960/2009 | 2008/NAV | 1960/NAV | 1995/NAV | 2002/NAV | 1999/NAV |
| Total GLA | 193,636 SF | 248,708 SF | 208,000 SF | 183,136 SF | 28,000 SF | 169,112 SF |
| Total Occupancy | 86% | 96% | 98% | 87% | 95% | 96% |
(1) | Information obtained from appraisal dated May 7, 2012. |
The Borrower. The borrower is POR LP, a Delaware limited partnership and a single-purpose entity with two independent directors at the general partner level. Legal counsel to the borrower delivered a non-consolidation opinion in connection with the origination of the Plaza on Richmond Mortgage Loan. Anwar Barbouti is the guarantor of certain nonrecourse carveouts under the Plaza on Richmond Mortgage Loan.
The Sponsor. The sponsor, Anwar Barbouti, has over 15 years of experience in both commercial and residential real estate. Primarily focused on the United Kingdom market, he has participated in the purchase and management of properties for redevelopment, leasing and re-planning. The properties that Mr. Barbouti has managed include residential blocks, investment retail spaces and re-planning extended stay hotels. Mr. Barbouti is the president of Greenwich Management Company in Houston and the director for Hinterhome Properties Limited in London.
Escrows. The loan documents provide for upfront escrows at closing in the amount of $629,334 for real estate taxes, $102,809 for insurance premiums and $1.0 million for outstanding tenant improvements and leasing commissions At closing, a $5.0 million holdback was reserved in association with the lease-up of a 26,929 square foot space (the “Former 24 Hour Fitness Space”) at the Plaza on Richmond Property. The $5.0 million will only be released in whole or in part upon satisfaction of the “Earnout Requirements” including but not limited to the following: (1) a Cash Management Period (as defined under “Lockbox and Cash Management” below) does not currently exist and (2) the following conditions are met: (i) at least 50% of the Former 24 Hour Fitness Space has been re-tenanted pursuant to one or more arm’s length leases with bona fide, independent third-party tenants, which leases must (x) have an initial term of not less than five (5) years and (y) require a base rent of not less than $18.00 per square foot at all times during the term of the applicable lease; (ii) all associated tenant improvement costs and leasing commissions incurred in connection with any such lease(s) have been paid in full and (iii) each of the tenants under such lease(s) has taken occupancy of the space, has commenced the payment of full and unabated base rent and has delivered to lender an estoppel certificate confirming the foregoing and certifying as to such other matters reasonably requested by lender. Upon satisfying the above conditions, the borrower will have a two-time right to request a release of the holdback, in whole or in part, with such amount to be released only if: (1) the lesser of (x) $44.0 million and (y) the amount obtained by dividing (A) the net operating income for the three (3)-month period ending with the most recently completed calendar month, annualized, by (B) 6.22%, and then by (C) 1.30 exceeds (2) the sum of (x) $39.0 million and (y) any amounts already released from holdback.
THE INFORMATION IN THIS STRUCTURAL AND COLLATERAL TERM SHEET IS NOT COMPLETE AND MAY BE AMENDED PRIOR TO THE TIME OF SALE. THIS TERM SHEET IS NOT AN OFFER TO SELL THESE SECURITIES AND IT IS NOT A SOLICITATION OF AN OFFER TO BUY THESE SECURITIES IN ANY JURISDICTION WHERE THE OFFER OR SALE IS NOT PERMITTED.
81
| PLAZA ON RICHMOND |
The loan documents also provide for ongoing escrows in the amount of $78,667 for real estate taxes, $20,662 for insurance and $3,227 for ongoing capital expenditures. The borrower will not be required to make ongoing deposits for outstanding tenant improvements and leasing commissions unless the balance of the tenant improvements and leasing commission reserve falls below $100,000.
Lockbox and Cash Management. The Plaza on Richmond Mortgage Loan requires a lender-controlled lockbox account, which is already in place, and that the borrower direct tenants to pay their rents directly to such lockbox account. The loan documents also require that all cash revenues relating to the Plaza on Richmond Property and all other monies received by the borrower or the property manager be deposited into the lockbox account within one business day after receipt. Prior to the occurrence of a Cash Management Period (as defined below) all funds on deposit in the lockbox account are swept into the borrower’s operating account on a daily basis. During a Cash Management Period all funds on deposit in the lockbox account are swept on a daily basis to a cash management account under the control of the lender.
A “Cash Management Period” will commence: (i) if an event of default has occurred and is continuing under the Plaza on Richmond Mortgage Loan; or (ii) upon the commencement of a Lease Sweep Period (as defined below). A Cash Management Period will end either with respect to the matters described in clause (i) above, when such event of default has been cured, and with respect to the matters described in clause (iii) above, when such Lease Sweep Period has ended.
A “Lease Sweep Period” will commence on the first payment date under the Plaza on Richmond Mortgage Loan following the occurrence of any of the following: (i) the date that is twelve months prior to the end of the term of any Major Lease (as defined below); (ii) the date required under a Major Lease by which the applicable tenant is required to give notice of its exercise of a renewal option thereunder (if such renewal has not been so exercised); (iii) if any Major Lease is surrendered, cancelled or terminated prior to its then current expiration date; (iv) if any tenant under a Major Lease discontinues its business at the premises or gives notice that it intends to discontinue its business; (v) upon the occurrence and continuance of a default under any Major Lease; or (vi) upon the occurrence of an insolvency proceeding by any tenant under a Major Lease.
A Lease Sweep Period will end upon the earliest to occur of: (x) the determination by the lender that sufficient funds have been accumulated in reserve to pay for all anticipated expenses in connection with the re-leasing of the space under the applicable Major Lease that gave rise to the Lease Sweep Period; (y) the date on which $40 for each square foot of space demised under the applicable Major Lease that gave rise to the Lease Sweep Period has been accumulated in reserve or (z) the occurrence of any of the following: (1) with respect to a Lease Sweep Period described in clauses (i), (ii), (iii) or (iv) above, upon the earlier to occur of (a) the date on which the tenant under the applicable Major Lease exercises its renewal or extension option and in the lender’s judgment, sufficient funds have been accumulated in reserve to pay for all associated expenses and (b) the date on which such space has been fully leased pursuant to a replacement lease and all associated expenses have been paid in full; (2) with respect to a Lease Sweep Period caused by clause (v) above, if such a default has been cured and no other default under a Major Lease has occurred for a period of six consecutive months following such cure and (3) with respect to a Lease Sweep Period caused by a matter described in clause (vi) above, if the applicable insolvency proceeding regarding the tenant under the applicable Major Lease has terminated and the applicable Major Lease has been affirmed, assumed, or assigned in accordance with the applicable bankruptcy code.
A “Major Lease” means the 24 Hour Fitness lease, the TJ Maxx Lease and/or any other lease which covers 20,000 rentable square feet or more of the Plaza on Richmond Property.
Property Management. The Plaza on Richmond Property is currently managed by Greenwich Management Co., Inc. According to the management agreement, the property manager is entitled to a base management fee in an amount equal to 3.0% of gross income. The borrower may not surrender, terminate, cancel, extend or renew the management agreement or otherwise replace the manager or enter into any other management agreement without written consent from the lender.
Assumption. The Plaza on Richmond Mortgage Loan borrower has the right to transfer the Plaza on Richmond Property, subject to customary conditions set forth in the loan documents, including but not limited to: (i) no event of default has occurred and is continuing under the Plaza on Richmond Mortgage Loan; (ii) payment by the borrower of an assumption fee equal to 0.50% of the outstanding principal balance of the Plaza on Richmond Mortgage Loan for the first such transfer and assumption and 1.00% of the outstanding principal balance of the Plaza on Richmond Mortgage Loan thereafter; (iii) the borrower has submitted to the lender true, correct and complete copies of any and all information and documents requested; (iv) evidence satisfactory to the lender has been provided showing that the transferee borrower complies with the special purpose entity provisions of the loan documents; (v) the lender receives written confirmation from Fitch, KBRA and Moody’s that the assumption will not, in and of itself, result in a downgrade, qualification or withdrawal of the then current ratings assigned to any class of Series 2012-C8 Certificates; (vi) all of the lender’s reasonable costs and expenses have been paid in connection with the transfer; (vii) replacement guarantors and indemnitors have indicated in writing form and substance their readiness and ability to transfer and assume the Plaza on Richmond Mortgage Loan; and (viii) the manager and proposed management agreement are satisfactory to the lender, Fitch, KBRA and Moody’s.
Partial Release. Not permitted.
Real Estate Substitution. Not permitted.
Subordinate and Mezzanine Indebtedness. Not permitted.
Ground Lease. None.
THE INFORMATION IN THIS STRUCTURAL AND COLLATERAL TERM SHEET IS NOT COMPLETE AND MAY BE AMENDED PRIOR TO THE TIME OF SALE. THIS TERM SHEET IS NOT AN OFFER TO SELL THESE SECURITIES AND IT IS NOT A SOLICITATION OF AN OFFER TO BUY THESE SECURITIES IN ANY JURISDICTION WHERE THE OFFER OR SALE IS NOT PERMITTED.
82
| PLAZA ON RICHMOND |
Terrorism Insurance. The loan documents require that the borrower maintain insurance coverage for terrorism in an amount equal to the full replacement cost of the Plaza on Richmond Property. The loan documents also require business interruption insurance covering no less than the 18-month period following the occurrence of a casualty event, together with a six-month extended period of indemnity.
THE INFORMATION IN THIS STRUCTURAL AND COLLATERAL TERM SHEET IS NOT COMPLETE AND MAY BE AMENDED PRIOR TO THE TIME OF SALE. THIS TERM SHEET IS NOT AN OFFER TO SELL THESE SECURITIES AND IT IS NOT A SOLICITATION OF AN OFFER TO BUY THESE SECURITIES IN ANY JURISDICTION WHERE THE OFFER OR SALE IS NOT PERMITTED.
83
| DOUBLETREE NEW ORLEANS |

THE INFORMATION IN THIS STRUCTURAL AND COLLATERAL TERM SHEET IS NOT COMPLETE AND MAY BE AMENDED PRIOR TO THE TIME OF SALE. THIS TERM SHEET IS NOT AN OFFER TO SELL THESE SECURITIES AND IT IS NOT A SOLICITATION OF AN OFFER TO BUY THESE SECURITIES IN ANY JURISDICTION WHERE THE OFFER OR SALE IS NOT PERMITTED.
84
| DOUBLETREE NEW ORLEANS |
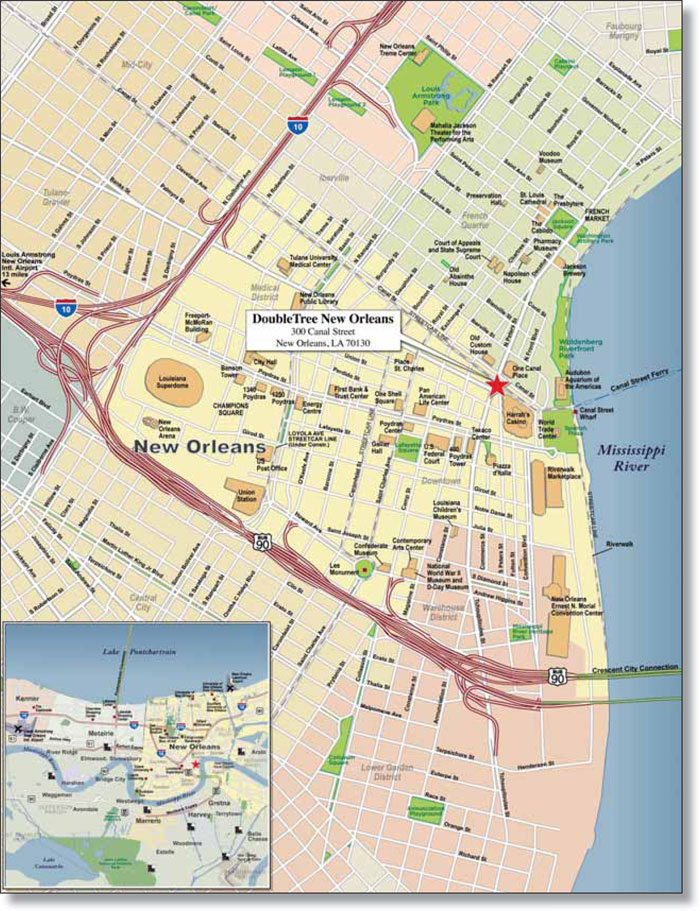
THE INFORMATION IN THIS STRUCTURAL AND COLLATERAL TERM SHEET IS NOT COMPLETE AND MAY BE AMENDED PRIOR TO THE TIME OF SALE. THIS TERM SHEET IS NOT AN OFFER TO SELL THESE SECURITIES AND IT IS NOT A SOLICITATION OF AN OFFER TO BUY THESE SECURITIES IN ANY JURISDICTION WHERE THE OFFER OR SALE IS NOT PERMITTED.
85
| DoubleTree New Orleans | |||||||
Loan Information | Property Information | ||||||
| Mortgage Loan Seller: | The Royal Bank of Scotland | Single Asset/Portfolio: | Single Asset | ||||
| Credit Assessment (Fitch/KBRA/Moody’s): | NR/NR/NR | Property Type: | Hospitality | ||||
| Original Principal Balance: | $42,000,000 | Specific Property Type: | Full Service | ||||
| Cut-off Date Principal Balance: | $41,954,842 | Location: | New Orleans, LA | ||||
| % of Initial Pool Balance: | 3.2% | Size: | 367 rooms | ||||
| Loan Purpose: | Refinance | Cut-off Date Principal | $114,318 | ||||
| Borrower Name: | Canal Street Property, L.L.C. | Balance Per Room: | |||||
| Sponsors: | David R. Burrus; George J. Newton III | Year Built/Renovated: | 1977/2008 | ||||
| Mortgage Rate: | 4.950% | Occupancy %: | 68.3% | ||||
| Note Date: | June 15, 2012 | Occupancy % Source Date: | April 30, 2012 | ||||
| Anticipated Repayment Date: | NAP | Title Vesting: | Fee & Leasehold | ||||
| Maturity Date: | July 1, 2017 | Property Manager: | DoubleTree Management LLC | ||||
| IO Period: | None | ||||||
| Loan Term (Original): | 60 months | 3rd Most Recent NOI (As of): | $4,324,568 (12/31/2010) | ||||
| Seasoning: | 1 month | 2nd Most Recent NOI (As of): | $5,384,177 (12/31/2011) | ||||
| Amortization Term (Original): | 360 months | Most Recent NOI (As of): | $6,455,553 (TTM 4/30/2012) | ||||
| Loan Amortization Type: | Amortizing Balloon | ||||||
| Interest Accrual Method: | Actual/360 | ||||||
| Call Protection: | L(25),D(31),O(4) | U/W Revenues: | $16,274,028 | ||||
| Lockbox Type: | Hard/Springing Cash Management | U/W Expenses: | $10,051,763 | ||||
Additional Debt(1): | Yes | U/W NOI: | $6,222,265 | ||||
Additional Debt Type(1): | Future Mezzanine | U/W NCF: | $5,571,304 | ||||
| U/W NOI DSCR: | 2.31x | ||||||
| U/W NCF DSCR: | 2.07x | ||||||
| Escrows and Reserves: | U/W NOI Debt Yield: | 14.8% | |||||
| Type: | Initial | Monthly | Cap (If Any) | U/W NCF Debt Yield: | 13.3% | ||
| Taxes | $281,305 | $40,186 | NAP | As-Is Appraised Value: | $73,200,000 | ||
| Insurance | $60,287 | $30,144 | NAP | As-Is Appraisal Valuation Date: | May 14, 2012 | ||
FF&E(2) | $400,000 | (2) | NAP | Cut-off Date LTV Ratio: | 57.3% | ||
Ground Rent Reserve(3) | $27,448 | Springing | NAP | LTV Ratio at Maturity or ARD: | 52.9% | ||
| (1) | The loan documents allow mezzanine debt subject to several conditions including: (i) the combined loan-to-value ratio may not exceed 70% and (ii) the combined debt service coverage ratio may not be less than 1.40x. See the “Subordinate and Mezzanine Indebtedness” section below for more detail. |
| (2) | The loan documents provide for an ongoing FF&E reserve for which the monthly escrow requirement is: (i) in year one, one twelfth of the difference between the initially collected $400,000 and 4.0% of the annual gross revenues in the prior year and (ii) thereafter, one twelfth of four percent of the annual gross revenues in the prior year. For the first year, the monthly payment is estimated as $20,833. |
| (3) | The loan documents provide for an ongoing ground rent reserve in an amount that is to be estimated by lender to be sufficient to pay any installment of ground rent under each ground lease (described in the “Ground Lease” section below) at least 30 days before the date that such installment is due. The borrower will not be required to make monthly deposits to the ongoing ground rent reserve provided that: (i) no event of default has occurred or is continuing and (ii) on the closing date, and for the remainder of the term of the DoubleTree New Orleans Mortgage Loan, the borrower has deposited and maintained funds in the reserve sufficient for the payment of two installments of ground rent. On the closing date, the borrower funded two installments of ground rent in furtherance of clause (ii) above. See the “Escrows” and “Ground Lease” sections below for more detail. |
The Mortgage Loan. The mortgage loan (the “DoubleTree New Orleans Mortgage Loan”) is evidenced by a single promissory note that is secured by a first fee and leasehold mortgage encumbering the borrower’s fee interest in a DoubleTree Hotel located in New Orleans, Louisiana (the “DoubleTree New Orleans Property”) and the borrower’s leasehold estate in ancillary collateral. The DoubleTree New Orleans Mortgage Loan was originated on June 15, 2012 by The Royal Bank of Scotland. The DoubleTree New Orleans Mortgage Loan had an original principal balance of $42,000,000, has an outstanding principal balance as of the Cut-off Date of $41,954,842 and accrues interest at an interest rate of 4.950% per annum. The DoubleTree New Orleans Mortgage Loan had an initial term of 60 months, has a remaining term of 59 months as of the Cut-off Date and requires payments of interest and principal based on a 30-year amortization schedule. The DoubleTree New Orleans Mortgage Loan will mature on July 1, 2017. The proceeds from the DoubleTree New Orleans Mortgage Loan were used to refinance approximately $32.5 million of existing debt, pay closing costs, fund upfront reserves of approximately $770,000, and return approximately $7.9 million to the sponsors.
Following the lockout period, the borrower has the right to defease the DoubleTree New Orleans Mortgage Loan in whole, but not in part, on any due date before the scheduled maturity date. In addition, the DoubleTree New Orleans Mortgage Loan is prepayable without penalty on or after April 1, 2017.
THE INFORMATION IN THIS STRUCTURAL AND COLLATERAL TERM SHEET IS NOT COMPLETE AND MAY BE AMENDED PRIOR TO THE TIME OF SALE. THIS TERM SHEET IS NOT AN OFFER TO SELL THESE SECURITIES AND IT IS NOT A SOLICITATION OF AN OFFER TO BUY THESE SECURITIES IN ANY JURISDICTION WHERE THE OFFER OR SALE IS NOT PERMITTED.
86
| DOUBLETREE NEW ORLEANS |
The Property. The DoubleTree New Orleans Mortgage Loan is secured by the borrower’s fee interest in a full service hotel located in New Orleans, Louisiana and the borrower’s leasehold interest in ancillary collateral. The DoubleTree New Orleans Property is a 17-story hotel which has a total of 367 rooms. The hotel site encompasses 0.1 acres and offers additional amenities including approximately 16,000 square feet of meeting space, a full service restaurant and bar, a café, an outdoor swimming pool, a fitness center, a business center and valet parking. The DoubleTree New Orleans Property features standard and suite-style guestroom configurations which are located on levels 3 through 16 of the property, with a penthouse suite on the 17th floor. Each guestroom is outfitted with a work desk, a television and high-speed internet.
Operating History and Underwritten Net Cash Flow. The following table presents certain information relating to the historical operating performance and the Underwritten Net Cash Flow at the DoubleTree New Orleans Property:
Cash Flow Analysis
2010 | 2011 | TTM 4/30/2012 | U/W | U/W $ per Room | ||||||
| Occupancy | 69.0% | 66.2% | 68.3% | 68.3% | ||||||
| ADR | $122.92 | $140.70 | $148.46 | $148.46 | ||||||
| RevPAR | $84.81 | $93.14 | $101.40 | $101.40 | ||||||
| Total Revenue | $14,078,930 | $15,168,775 | $16,274,028 | $16,274,028 | $44,343 | |||||
| Total Department Expenses | 4,348,559 | 4,078,478 | 3,859,165 | 3,859,165 | 10,515 | |||||
| Gross Operating Profit | $9,730,371 | $11,090,297 | $12,414,863 | $10,840,649 | $33,828 | |||||
| Total Undistributed Expenses | 4,566,890 | 4,945,610 | 5,195,025 | 5,348,638 | 14,574 | |||||
| Profit Before Fixed Charges | $5,163,481 | $6,144,687 | $7,219,838 | $7,066,226 | $19,254 | |||||
| Total Fixed Charges | 838,913 | 760,510 | 764,285 | 843,961 | 2,300 | |||||
| Net Operating Income | $4,324,568 | $5,384,177 | $6,455,553 | $6,222,265 | $16,954 | |||||
| FF&E | 0 | 0 | 0 | 650,961 | 1,774 | |||||
| Net Cash Flow | $4,324,568 | $5,384,177 | $6,455,553 | $5,571,304 | $15,181 | |||||
| NOI DSCR | 1.61x | 2.00x | 2.40x | 2.31x | ||||||
| NCF DSCR | 1.61x | 2.00x | 2.40x | 2.07x | ||||||
| NOI DY | 10.3% | 12.8% | 15.4% | 14.8% | ||||||
| NCF DY | 10.3% | 12.8% | 15.4% | 13.3% | ||||||
Appraisal. According to the appraisal dated May 14, 2012, the DoubleTree New Orleans Property had an “as-is” appraised value of $73,200,000.
Environmental Matters. According to the Phase I environmental site assessment dated May 25, 2012, there was no evidence of any recognized environmental condition at the DoubleTree New Orleans Property.
Market Overview and Competition. The DoubleTree New Orleans Property is located in New Orleans, Louisiana near Interstate-10. The hotel is located within the central business district of New Orleans where Canal Street meets the Mississippi River with close access to the Harrah’s Casino and Canal Place, a three-level regional mall. Primary regional access to the area is provided by two major freeways: Interstate-10, located one mile to the northwest and the Pontchartrain Expressway (US-90) located one mile to the south. The DoubleTree New Orleans Property is located five blocks from the 1.1 million square foot Ernest N. Morial Convention Center, the sixth largest convention center in the United States. The DoubleTree New Orleans Property is also within walking distance of the Louisiana Superdome as well as the French Quarter.
The following table presents certain information relating to the DoubleTree New Orleans Property competitive set:
Subject and Market Historical Occupancy, ADR and RevPAR(1)
Competitive Set | DoubleTree Hotel New Orleans | Penetration Factor | |||||||||||||||||
Year | Occupancy | ADR | RevPAR | Occupancy | ADR | RevPAR | Occupancy | ADR | RevPAR | ||||||||||
| 1/31/2012 TTM | 63.1% | $140.37 | $88.63 | 68.3% | $148.48 | $101.48 | 108.2% | 105.8% | 114.5% | ||||||||||
| 1/31/2011 TTM | 60.1% | $133.93 | $80.53 | 67.0% | $134.10 | $89.90 | 111.5% | 100.1% | 111.6% | ||||||||||
| 1/31/2010 TTM | 53.3% | $129.72 | $69.19 | 67.5% | $111.86 | $75.45 | 126.5% | 86.2% | 109.1% | ||||||||||
| (1) | Information obtained from a third party hospitality report dated May 17, 2012. |
The Borrower. The borrowing entity is Canal Street Property, L.L.C., a Delaware limited liability company and a single-purpose entity which has two independent directors. Legal counsel to the borrower delivered a non-consolidation opinion in connection with the origination of the DoubleTree New Orleans Mortgage Loan. David R. Burrus and George J. Newton III are the guarantors of certain nonrecourse carveouts under the DoubleTree New Orleans Mortgage Loan.
THE INFORMATION IN THIS STRUCTURAL AND COLLATERAL TERM SHEET IS NOT COMPLETE AND MAY BE AMENDED PRIOR TO THE TIME OF SALE. THIS TERM SHEET IS NOT AN OFFER TO SELL THESE SECURITIES AND IT IS NOT A SOLICITATION OF AN OFFER TO BUY THESE SECURITIES IN ANY JURISDICTION WHERE THE OFFER OR SALE IS NOT PERMITTED.
87
| DOUBLETREE NEW ORLEANS |
The Sponsors. The DoubleTree New Orleans Property is owned by a single-purpose, bankruptcy-remote entity that is primarily controlled by David R. Burrus and George J. Newton III. David R. Burrus is the founder and Chairman of the Board of Burrus Investment Group, Inc. and has over fifty years of experience in providing equity capital and consultation for various real estate projects. George J. Newton III is the President and Chief Executive Officer of Burrus Investment Group, Inc. and is primarily responsible for acquisitions, structuring, market positioning and asset management and financing of property. Burrus Investment Group, Inc. is headquartered in New Orleans and provides financing, equity capital and consultation for various business ventures and real estate projects.
Escrows. The loan documents provide for upfront escrows at closing in the amount of $281,305 for real estate taxes, $60,287 for insurance premiums, $400,000 for an FF&E reserve, and $27,448 for a ground rent reserve.
The loan documents provide for ongoing monthly escrows in the amount of $40,186 for real estate taxes and $30,144 for insurance. The loan documents also provide for an ongoing FF&E reserve for which the monthly escrow requirement are: (i) in year one, one twelfth of the difference between the initially collected $400,000 and 4.0% of the annual gross revenues in the prior year and (ii) thereafter, one twelfth of four percent of the annual gross revenues in the prior year. For the first year, the monthly payment is estimated as $20,833. Additionally, the loan documents provide for an ongoing ground rent reserve in an amount that is to be estimated by the lender to be sufficient to pay any installment of ground rent under each ground lease (described in the “Ground Lease” section below) at least 30 days before the date that such installment is due. The borrower will not be required to make monthly deposits to the ongoing ground rent reserve provided that: (i) no event of default has occurred or is continuing and (ii) on the closing date, and for the remainder of the term of the DoubleTree New Orleans Mortgage Loan, the borrower has deposited and maintained funds in the reserve sufficient for the payment of two installments of ground rent. On the closing date, the borrower funded two installments of ground rent in furtherance of clause (ii) above.
Lockbox and Cash Management. The DoubleTree New Orleans Mortgage Loan requires a lender-controlled lockbox account, which is already in place. All revenue and credit card receipts payable with respect to the DoubleTree New Orleans Property are initially deposited into a hotel account in which the lender has a first priority security interest. After payment of hotel operating expenses and other amounts required to be paid under the hotel management agreement, the property manager deposits all remaining amounts on a monthly basis into the lockbox account. All funds on deposit in the lockbox account are swept as directed by the borrower into an account designated by the borrower unless a Cash Management Period (as defined below) is in effect, in which case funds are swept on a daily basis to a cash management account under the control of the lender.
A “Cash Management Period” will commence upon: (i) the occurrence and continuation of an event of default under the DoubleTree New Orleans Mortgage Loan; or (ii) if, as of the last day of any calendar quarter during the DoubleTree New Orleans Mortgage Loan term, the debt service coverage ratio is less than 1.15x, and will end, with regard to the circumstances in clause (i), upon the cure of such event of default, or with regard to the circumstances in clause (ii), when the lender has determined that the debt service coverage ratio is at least 1.15x as of the last day of any subsequent calendar quarter.
Property Management. The DoubleTree New Orleans Property is managed by DoubleTree Management LLC which is not an affiliate of the borrower. According to the management agreement for the DoubleTree New Orleans Property, the manager is entitled to 3.0% of gross revenues at the DoubleTree New Orleans Property for each operating year. The base management fee will be increased to 4.0% of gross revenues upon continuing achievement of (i) during the preceding twelve accounting periods, an occupancy rate of at least 60.0% and (ii) the gross operating profit during the preceding twelve accounting periods exceeding $2,900,000. The borrower may not surrender, terminate, cancel, extend or renew the management agreements or otherwise replace the manager or enter into any other management agreements without the prior written consent of the lender.
Assumption. The DoubleTree New Orleans Mortgage Loan borrower will have the right to transfer the DoubleTree New Orleans Property, with the consent of the lender, subject to customary conditions set forth in the loan documents, including but not limited to: (i) payment of an assumption fee of 0.75% of the outstanding principal balance of the DoubleTree New Orleans Mortgage Loan; (ii) no event of default has occurred and is continuing under the DoubleTree New Orleans Mortgage Loan; (iii) the borrower has submitted to the lender true, correct and complete copies of any and all information and documents requested; (iv) evidence has been provided to the lender showing that the transferee borrower complies with the special purpose entity provisions of the loan documents; (v) the lender receives written confirmation from Fitch, KBRA and Moody’s that the assumption will not, in and of itself, result in a downgrade, qualification or withdrawal of the then current ratings assigned to any class of Series 2012-C8 Certificates; (vi) all of the lender’s reasonable costs and expenses have been paid in connection with the transfer; (vii) replacement guarantors and indemnitors have executed and delivered all documents required by the lender and in form and substance required by the lender; (viii) the identity, experience, financial condition and creditworthiness of the transferee borrower and the replacement guarantors and indemnitors are satisfactory to the lender; and (ix) the manager and proposed management agreement are satisfactory to the lender, Fitch, KBRA and Moody’s.
Partial Release. Not permitted.
Real Estate Substitution. Not permitted.
Subordinate and Mezzanine Indebtedness. There is no existing mezzanine debt related to the DoubleTree New Orleans Mortgage Loan, however future mezzanine debt is permitted subject to satisfaction of certain conditions, including: (i) the mezzanine debt must be secured only by a pledge of all or a portion of the direct or indirect equity ownership interests in the borrower or any other collateral that is not collateral for the DoubleTree New Orleans Mortgage Loan; (ii) the mezzanine debt has a term expiring on the maturity date of the DoubleTree New Orleans Mortgage Loan; (iii) an intercreditor agreement in form and substance acceptable to Fitch, KBRA and Moody’s and reasonably acceptable to the lender has been delivered; (iv) the combined debt service coverage ratio is not less than 1.40x; (v) the combined loan-to-value ratio will not be greater than 70.0%; and (vi) the
THE INFORMATION IN THIS STRUCTURAL AND COLLATERAL TERM SHEET IS NOT COMPLETE AND MAY BE AMENDED PRIOR TO THE TIME OF SALE. THIS TERM SHEET IS NOT AN OFFER TO SELL THESE SECURITIES AND IT IS NOT A SOLICITATION OF AN OFFER TO BUY THESE SECURITIES IN ANY JURISDICTION WHERE THE OFFER OR SALE IS NOT PERMITTED.
88
| DOUBLETREE NEW ORLEANS |
lender receives written confirmation from Fitch, KBRA and Moody’s that the mezzanine debt will not, in and of itself, result in a downgrade, qualification or withdrawal of the then current ratings assigned to any class of Series 2012-C8 Certificates.
Ground Lease. The DoubleTree New Orleans Property is subject to two ground leases, each for a parcel of land adjacent to the DoubleTree New Orleans Property. One ground lease encumbers a site which is used as a parking lot for the hotel (“Parking Lot Ground Lease”) (which additional parking is not required to comply with any applicable legal requirements), while the other ground lease encumbers an adjacent site which is subleased to Pinkberry, a frozen yogurt vendor (“Pinkberry Site Ground Lease”).
The Parking Lot Ground Lease is leased by Fred M. Reynoir. The ground lease term began on January 1, 1972 and expires on January 1, 2032. The ground lease agreement does not contain any options to extend the lease. The base ground lease payment was initially $24,000 per annum beginning on January 1, 1972 and continuing for the first five years of the lease. Thereafter, the base ground lease payment has increased subject to consumer price index increases, with the first re-calculation date taking place on January 1, 1977, the second re-calculation date taking place on January 1, 1982, and each subsequent re-calculation date taking place on each subsequent ten-year anniversary of January 1, 1982. The current ground lease payment is $139,686 per annum.
The Pinkberry Site Ground Lease is leased by Joseph J. Velcich. The ground lease term began on January 1, 1970 and expires on January 1, 2030. The ground lease agreement does not contain any options to extend the lease. The base ground lease payment was initially $12,000 per annum beginning on January 1, 1970 and ending December 31, 1971. Thereafter, the base ground lease payment increased to $25,000 for the remainder of the lease term. The site is currently being subleased to Pinkberry who operates the premise as a frozen yogurt store. The sublease commenced in May 2010 and expires on April 30, 2020 with one eight-year renewal option.
The Parking Lot Ground Lease and the Pinkberry Site Ground Lease are ancillary to the primary collateral, and such ground leases do not contain standard mortgagee/financeability requirements (other than notice and cure rights on behalf of any mortgagee).
Terrorism Insurance. The loan documents require that the borrower maintain insurance coverage for damage from terrorism in an amount equal to the full replacement cost of the DoubleTree New Orleans Property, as well as business interruption insurance covering no less than the 18-month period following the occurrence of a casualty event as well as a six-month extended period of indemnity.
THE INFORMATION IN THIS STRUCTURAL AND COLLATERAL TERM SHEET IS NOT COMPLETE AND MAY BE AMENDED PRIOR TO THE TIME OF SALE. THIS TERM SHEET IS NOT AN OFFER TO SELL THESE SECURITIES AND IT IS NOT A SOLICITATION OF AN OFFER TO BUY THESE SECURITIES IN ANY JURISDICTION WHERE THE OFFER OR SALE IS NOT PERMITTED.
89
| COLE OFFICE PORTFOLIO |

THE INFORMATION IN THIS STRUCTURAL AND COLLATERAL TERM SHEET IS NOT COMPLETE AND MAY BE AMENDED PRIOR TO THE TIME OF SALE. THIS TERM SHEET IS NOT AN OFFER TO SELL THESE SECURITIES AND IT IS NOT A SOLICITATION OF AN OFFER TO BUY THESE SECURITIES IN ANY JURISDICTION WHERE THE OFFER OR SALE IS NOT PERMITTED.
90
| COLE OFFICE PORTFOLIO |
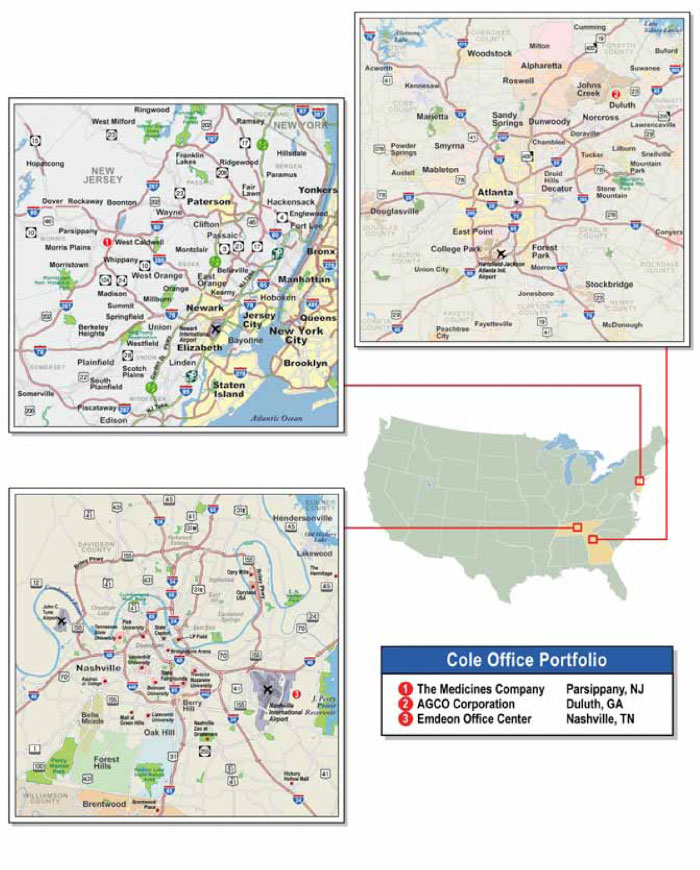
THE INFORMATION IN THIS STRUCTURAL AND COLLATERAL TERM SHEET IS NOT COMPLETE AND MAY BE AMENDED PRIOR TO THE TIME OF SALE. THIS TERM SHEET IS NOT AN OFFER TO SELL THESE SECURITIES AND IT IS NOT A SOLICITATION OF AN OFFER TO BUY THESE SECURITIES IN ANY JURISDICTION WHERE THE OFFER OR SALE IS NOT PERMITTED.
91
| Cole Office Portfolio | ||||||
| Loan Information | Property Information | |||||
| Mortgage Loan Seller: | Wells Fargo Bank, National Association | Single Asset/Portfolio: | Portfolio | |||
| Credit Assessment (Fitch/KBRA/Moody’s): | NR/NR/NR | Property Type: | Office | |||
| Original Principal Balance: | $41,000,000 | Specific Property Type: | Suburban | |||
| Cut-off Date Principal Balance: | $41,000,000 | Location: | Various – See Table | |||
| % of Initial Pool Balance: | 3.2% | Size: | 356,420 SF | |||
| Loan Purpose: | Acquisition | Cut-off Date Principal Balance Per Unit/SF: | $115.03 | |||
Borrower Name(1): | Various | Year Built/Renovated: | Various – See Table | |||
| Sponsor: | Cole Credit Property Trust III, Inc. | Occupancy %: | 100.0% | |||
| Mortgage Rate: | 4.730% | Occupancy % Source Date: | August 1, 2012 | |||
| Note Date: | May 23, 2012 | Title Vesting: | Fee | |||
| Anticipated Repayment Date: | June 1, 2022 | Property Manager: | Cole Realty Advisors, Inc. | |||
| Maturity Date: | June 1, 2032 | |||||
| IO Period: | 120 months | 3rd Most Recent NOI (As of)(3): | NAV | |||
| Loan Term (Original): | 120 months | 2nd Most Recent NOI (As of)(3): | NAV | |||
| Seasoning: | 2 months | Most Recent NOI (As of)(4): | $6,359,818 (Annualized 3/31/2012) | |||
| Amortization Term (Original): | NAP | |||||
| Loan Amortization Type: | Interest-only, ARD | U/W Revenues: | $7,711,515 | |||
| Interest Accrual Method: | Actual/360 | U/W Expenses: | $2,649,772 | |||
Call Protection(2): | L(47),GRTR 1% or YM(69),O(4) | U/W NOI: | $5,061,743 | |||
| Lockbox Type: | Hard/Upfront Cash Management | U/W NCF: | $4,535,129 | |||
| Additional Debt: | None | U/W NOI DSCR: | 2.57x | |||
| Additional Debt Type: | NAP | U/W NCF DSCR: | 2.31x | |||
| U/W NOI Debt Yield: | 12.3% | |||||
| Escrows and Reserves: | None | U/W NCF Debt Yield: | 11.1% | |||
| As-Is Appraised Value: | $79,600,000 | |||||
| As-Is Appraisal Valuation Date: | Various | |||||
| Cut-off Date LTV Ratio: | 51.5% | |||||
| LTV Ratio at Maturity or ARD: | 51.5% | |||||
| (1) | Borrower names are Cole of Duluth GA, LLC; Cole of Parsippany NJ, LLC; and Cole of Nashville TN, LLC. |
| (2) | The yield maintenance premium is calculated based on an amount equal to the greater of (i) 1.0% of the outstanding principal balance and (ii) the excess of the sum of the present values using a discount rate equal to 25 basis points plus a periodic Treasury yield of principal and interest through the maturity date, over the outstanding principal balance. |
| (3) | Historical financials are not available as the properties were acquired by the borrower in 2011 and 2012. |
| (4) | Represents year-to-date annualized as of March 31, 2012 for the Duluth, Georgia and Nashville, Tennessee properties; represents March 2012 annualized for the Parsippany, New Jersey property. |
The Mortgage Loan. The mortgage loan (the “Cole Office Portfolio Mortgage Loan”) is evidenced by a single promissory note that is secured by a first mortgage encumbering three single tenant office buildings in New Jersey, Georgia and Tennessee (the “Cole Office Portfolio Properties”). The Cole Office Portfolio Mortgage Loan was originated on May 23, 2012 by Wells Fargo Bank, National Association. The Cole Office Portfolio Mortgage Loan had an original principal balance of $41,000,000, has an outstanding principal balance as of the Cut-off Date of $41,000,000 and accrues interest at an interest rate of 4.730% per annum. The Cole Office Portfolio Mortgage Loan had an initial term of 120 months, has a remaining term of 118 months as of the Cut-off Date and requires payments of interest only through the Anticipated Repayment Date (“ARD”). The ARD is June 1, 2022, and the final maturity date is June 1, 2032. In the event the Cole Office Portfolio Mortgage Loan is not paid off on or before the ARD, the borrower will be required to make payments of interest only based on an interest rate equal to the greater of (i) the initial mortgage rate plus 5.0% and (ii) the sum of (a) the greater of (x) the offer side on the ARD of the ten-year swap yield (as described in the loan documents) and (y) the treasury rate as of the ARD and (b) 7.85%. The ARD automatically triggers a Cash Trap Event Period (as defined below) whereby all excess cash flow will be used to pay down the principal balance (see “Lockbox and Cash Management”). The proceeds from the Cole Office Portfolio Mortgage Loan were used to recapitalize the borrower’s 2011 and 2012 acquisition of the Cole Office Portfolio Properties, which totaled approximately $80.5 million; in addition, the borrower contributed approximately $39.5 million of equity.
Following the lockout period, the borrower has the right to voluntarily prepay the Cole Office Portfolio Mortgage Loan, in whole or in part, provided that the borrower pays the greater of a yield maintenance premium or a prepayment premium equal to 1.0% of the then outstanding principal balance. In addition, the Cole Office Portfolio Mortgage Loan is prepayable without penalty on or after March 1, 2022.
THE INFORMATION IN THIS STRUCTURAL AND COLLATERAL TERM SHEET IS NOT COMPLETE AND MAY BE AMENDED PRIOR TO THE TIME OF SALE. THIS TERM SHEET IS NOT AN OFFER TO SELL THESE SECURITIES AND IT IS NOT A SOLICITATION OF AN OFFER TO BUY THESE SECURITIES IN ANY JURISDICTION WHERE THE OFFER OR SALE IS NOT PERMITTED.
92
| COLE OFFICE PORTFOLIO |
The Properties. The Cole Office Portfolio Mortgage Loan is secured by three single-tenant office buildings located in Parsippany, New Jersey; Duluth, Georgia; and Nashville, Tennessee, together totaling 356,420 square feet. Two of the properties (Parsippany and Duluth), which represent 84.7% of net rentable area and 87.3% of underwritten base rent, serve as the world headquarters for their respective tenants. As of August 1, 2012, the Cole Office Portfolio Properties were 100.0% occupied with all leases expiring beyond the ARD.
The following table presents certain information relating to the Cole Office Portfolio Properties:
| Property Name – Location | Property Type | Allocated Cut-off Date Principal Balance | Occupancy | Year Built/ Renovated | Net Rentable Area (SF) | Appraised Value | |
| The Medicines Company – Parsippany, NJ | Office | $27,700,000 | 100.0% | 1979/2008 | 176,062 | $52,000,000 | |
| AGCO Corporation – Duluth, GA | Office | $8,600,000 | 100.0% | 1998/NAP | 125,800 | $18,000,000 | |
| Emdeon Business Services – Nashville, TN | Office | $4,700,000 | 100.0% | 2010/NAP | 54,558 | $9,600,000 | |
| Total/Weighted Average | $41,000,000 | 100.0% | 356,420 | $79,600,000 | |||
The following table presents certain information relating to the tenancies at the Cole Office Portfolio Properties:
Major Tenants
| Tenant Name | Credit Rating (Fitch/Moody’s/ S&P)(1) | Tenant NRSF | % of NRSF | Annual U/W Base Rent PSF | Annual U/W Base Rent | % of Total Annual U/W Base Rent | Lease Expiration Date | |
| Major Tenants | �� | |||||||
| The Medicines Company | NR/NR/NR | 176,062(2) | 49.4% | $22.33 | $3,930,777 | 65.3% | 12/5/2023(3) | |
| AGCO Corporation | NR/Ba1/BBB- | 125,800 | 35.3% | $10.50 | $1,320,900 | 22.0% | 7/31/2026(4)(5) | |
| Emdeon Business Services | NR/NR/NR | 54,558 | 15.3% | $14.00 | $763,812(6) | 12.7% | 9/30/2025(7) | |
| Total Major Tenants | 356,420 | 100.0% | $16.88 | $6,015,489 | 100.0% | |||
| Vacant Space | 0 | 0.0% | ||||||
| Collateral Total | 356,420 | 100.0% | ||||||
| (1) | Certain ratings are those of the parent company whether or not the parent guarantees the lease. |
(2) | Includes 43,883 square feet of unfinished space, which is not currently being occupied. A security deposit is in place with a balance of $2.1 million as of March 26, 2012; the balance of the security deposit cannot be reduced below $973,946, which is approximately equal to the underwritten base rent of the unfinished space for one-year ($987,368). The lender has an assignment of this security deposit. In addition, Cole Credit Property Trust III, Inc. guarantees the borrower’s funding of a $1.5 million ($35.00 per square foot) TI obligation for this space once it is built out. |
| (3) | The Medicines Company has two 5-year renewal options at 95.0% of market rent. |
| (4) | Beginning August 1, 2014, AGCO Corporation has a right of first refusal purchase option if the borrower receives a bona fide written purchase offer from any third party. If this purchase option is exercised, the borrower would be required to pay any applicable yield maintenance. |
| (5) | AGCO Corporation has two 10-year extension options at 95.0% of market rent. |
| (6) | Emdeon Business Services has contractual base rental rate increases of 2.5% per year, which were not included in the underwriting. |
| (7) | Emdeon Business Services has two 5-year renewal options. |
THE INFORMATION IN THIS STRUCTURAL AND COLLATERAL TERM SHEET IS NOT COMPLETE AND MAY BE AMENDED PRIOR TO THE TIME OF SALE. THIS TERM SHEET IS NOT AN OFFER TO SELL THESE SECURITIES AND IT IS NOT A SOLICITATION OF AN OFFER TO BUY THESE SECURITIES IN ANY JURISDICTION WHERE THE OFFER OR SALE IS NOT PERMITTED.
93
| COLE OFFICE PORTFOLIO |
The following table presents certain information relating to the lease rollover schedule at the Cole Office Portfolio Properties:
Lease Expiration Schedule(1)
Year Ending December 31, | No. of Leases Expiring | Expiring NRSF | % of Total NRSF | Cumulative of Total NRSF | Cumulative % of Total NRSF | Annual U/W Base Rent | Annual U/W Base Rent PSF | |
| MTM | 0 | 0 | 0.0% | 0 | 0.0% | $0 | $0.00 | |
| 2012 | 0 | 0 | 0.0% | 0 | 0.0% | $0 | $0.00 | |
| 2013 | 0 | 0 | 0.0% | 0 | 0.0% | $0 | $0.00 | |
| 2014 | 0 | 0 | 0.0% | 0 | 0.0% | $0 | $0.00 | |
| 2015 | 0 | 0 | 0.0% | 0 | 0.0% | $0 | $0.00 | |
| 2016 | 0 | 0 | 0.0% | 0 | 0.0% | $0 | $0.00 | |
| 2017 | 0 | 0 | 0.0% | 0 | 0.0% | $0 | $0.00 | |
| 2018 | 0 | 0 | 0.0% | 0 | 0.0% | $0 | $0.00 | |
| 2019 | 0 | 0 | 0.0% | 0 | 0.0% | $0 | $0.00 | |
| 2020 | 0 | 0 | 0.0% | 0 | 0.0% | $0 | $0.00 | |
| 2021 | 0 | 0 | 0.0% | 0 | 0.0% | $0 | $0.00 | |
| 2022 | 0 | 0 | 0.0% | 0 | 0.0% | $0 | $0.00 | |
| Thereafter | 3 | 356,420 | 100.0% | 356,420 | 100.0% | $6,015,489 | $16.88 | |
| Vacant | 0 | 0 | 0.0% | 356,420 | 100.0% | $0 | $0.00 | |
| Total/Weighted Average | 3 | 356,420 | 100.0% | $6,015,489 | $16.88 |
| (1) | Information obtained from the underwritten rent roll. |
Operating History and Underwritten Net Cash Flow. The following table presents certain information relating to the Underwritten Net Cash Flow at the Cole Office Portfolio Properties:
Cash Flow Analysis(1)
Annualized 3/31/2012(2) | U/W | U/W $ per SF | ||||
| Base Rent | $6,487,437 | $6,015,489 | $16.88 | |||
| Grossed Up Vacant Space | 0 | 0 | 0.00 | |||
| Total Reimbursables | 712 | 2,203,330 | 6.18 | |||
| Other Income | 0 | 0 | 0.00 | |||
| Less Vacancy & Credit Loss | 0 | (507,304) | (1.42) | |||
| Effective Gross Income | $6,488,150 | $7,711,515 | $21.64 | |||
| Total Operating Expenses | $128,332 | $2,649,772 | $7.43 | |||
| Net Operating Income | $6,359,818 | $5,061,743 | $14.20 | |||
| TI/LC | 0 | 437,508 | 1.23 | |||
| Capital Expenditures | 0 | 89,105 | 0.25 | |||
| Net Cash Flow | $6,359,818 | $4,535,129 | $12.72 | |||
| NOI DSCR | 3.23x | 2.57x | ||||
| NCF DSCR | 3.23x | 2.31x | ||||
| NOI DY | 15.5% | 12.3% | ||||
| NCF DY | 15.5% | 11.1% |
| (1) | Historical financials are not available as the properties were acquired by the borrower in 2011 and 2012. The collateral consists of three single-tenant properties that are 100% occupied on triple net leases. Occupancy of 91.6% was used for underwriting. |
| (2) | Represents year-to-date annualized as of March 31, 2012 for the Duluth, Georgia and Nashville, Tennessee properties; represents March 2012 annualized for the Parsippany, New Jersey property. |
Appraisal. According to the appraisals dated April 12, 2012 to April 24, 2012, the Cole Office Portfolio Properties had an aggregate “as-is” appraised value of $79,600,000. The appraisers also provided an aggregate “go dark” value of $51,800,000.
Environmental Matters. According to the Phase I environmental site assessments dated August 4, 2011 to January 10, 2012, there is no evidence of recognized environmental conditions at the Cole Office Portfolio Properties.
Market Overview. The Cole Office Portfolio Properties are located in Parsippany, New Jersey; Duluth, Georgia; and Nashville, Tennessee.
The Parsippany, New Jersey property is located approximately 35 miles northwest of the Manhattan central business district and is situated within the Mack-Cali Business Campus. The Mack-Cali Business Campus is home to 17 Class A office properties as well as amenities including hotels, restaurants, banking and a child care center. According to a third party market research report, the property is located within the Parsippany/I-287/Route 10 submarket, which contains a total of 77 Class A buildings (11.9 million square feet with a vacancy rate of 20.6% as of first quarter 2012). The appraisal concluded that rents for comparable properties within the submarket range from $28.80 to $32.00 per square foot on a gross basis (the underwritten base rent for The Medicines Company is $22.33 per square foot with reimbursements of $7.78 per square foot). The property has immediate access to local
THE INFORMATION IN THIS STRUCTURAL AND COLLATERAL TERM SHEET IS NOT COMPLETE AND MAY BE AMENDED PRIOR TO THE TIME OF SALE. THIS TERM SHEET IS NOT AN OFFER TO SELL THESE SECURITIES AND IT IS NOT A SOLICITATION OF AN OFFER TO BUY THESE SECURITIES IN ANY JURISDICTION WHERE THE OFFER OR SALE IS NOT PERMITTED.
94
| COLE OFFICE PORTFOLIO |
transportation arteries (Routes 10 and 202), and is near key regional highways (Interstate 280 and Routes 24 and 46). In addition, public transportation is provided by NJ Transit and provides access to other areas in New Jersey and New York City. The Newark Liberty International Airport is located approximately 24 miles southeast of the property.
The Duluth, Georgia property is located approximately 28 miles northeast of the Atlanta central business district. According to a third party market research report, the property is located within the Duluth/Suwanee/Buford submarket, which contains a total of 563 Class B buildings (8.0 million square feet) with a total vacancy rate of 18.4% as of first quarter 2012. The appraisal concluded that rents for comparable properties in the submarket range from $9.66 to $11.06 per square foot on a net lease basis. Primary access to the area is provided by Interstate 85, and direct access to the property is provided by Duluth Highway and Pleasant Hill Road. The Hartsfield-Jackson Atlanta Airport is located approximately 38 miles south of the property.
The Nashville, Tennessee property is located approximately five miles east of the Nashville central business district. According to a third party market research report, the property is located within the Airport South submarket, which contains a total of 113 Class A and B properties (3.8 million square feet) with a total vacancy rate of 15.6% as of first quarter 2012. The appraisal concluded that rents for comparable properties in the submarket range from $11.54 to $15.55 per square foot on a net lease basis. Primary access to the area is provided by Interstate 24, and direct access to the property is provided by Dobson Pike via Couchville Pike. The Nashville International Airport is located less than one mile northwest of the property.
The Borrower. The borrowers are Cole of Duluth GA, LLC, Cole of Parsippany NJ, LLC and Cole of Nashville TN, LLC, comprised of three Delaware limited liability companies, each of which is a single-purpose entity and has an independent director (collectively the “Cole Office Portfolio Borrower”). Legal counsel to the Cole Office Portfolio Borrower delivered a non-consolidation opinion in connection with the origination of the Cole Office Portfolio Mortgage Loan. Cole Credit Property Trust III, Inc., an indirect owner of the Cole Office Portfolio Borrower, is the guarantor of certain nonrecourse carveouts under the Cole Office Portfolio Mortgage Loan.
The Sponsor. Cole Credit Property Trust III, Inc. (“CCPT III”) is a non-traded public REIT that acquires and operates a diversified portfolio of commercial real estate investments primarily consisting of single-tenant income producing properties throughout the United States. As of December 31, 2011, CCPT III’s portfolio included 693 properties in 47 states totaling 32.3 million square feet with an average occupancy of 99%.
Escrows. None.
Lockbox and Cash Management. The Cole Office Portfolio Mortgage Loan requires a lender-controlled lockbox account, which is already in place, and that the Cole Office Portfolio Borrower direct tenants to pay their rents directly to such lockbox account. The loan documents also require that all cash revenues and all other monies received by the borrower or manager relating to the Cole Office Portfolio Properties be deposited into the lockbox account within two business days after receipt. Prior to the occurrence of a Cash Trap Event Period (as defined below) all funds on deposit in the lockbox account are swept into the borrower’s operating account on a daily basis. During a Cash Trap Event Period, all funds on deposit in the lockbox account are swept to a lender-controlled cash management account each business day (“Excess Cash Flow Subaccount”).
A “Cash Trap Event Period” will commence upon the earlier of: (i) the occurrence and continuance of an event of default; (ii) the actual debt service coverage ratio at the end of any fiscal quarter being less than 1.80x; or (iii) the ARD. A Cash Trap Event Period will expire, with regard to the circumstances in clause (i), upon the cure of such event of default, or with regard to circumstances in clause (ii), (a) the actual debt service coverage ratio being equal to or greater than 1.90x for two consecutive calendar quarters, or (b) the balance of the Excess Cash Flow Subaccount being equal to or greater than $5.0 million. After the ARD, no Cash Trap Event Period will be deemed to expire.
Property Management. The Cole Office Portfolio Properties are currently managed by Cole Realty Advisors, Inc., an affiliate of the borrower.
Assumption. The Cole Office Portfolio Mortgage Loan borrower has a two-time right to transfer all of the Cole Office Portfolio Properties at once, provided that no event of default has occurred and is continuing and certain other conditions are satisfied, including the lender’s reasonable determination that the proposed transferee and guarantor are acceptable in light of certain criteria, including, among other things: (i) experience and financial strength, condition and credit quality; (ii) any decreases in the Cole Office Portfolio Properties’ cash flow resulting from increased real property taxes following the transfer; (iii) requirements that the transferee satisfy the lender’s single purpose entity criteria; and (iv) confirmation received from Fitch, KBRA and Moody’s that the transfer will not result in a downgrade, withdrawal or qualification of the respective ratings then assigned to any of the Series 2012-C8 Certificates. In addition, beginning August 1, 2014, AGCO Corporation has a right of first refusal purchase option if the borrower receives a bona fide written purchase offer from any third party. The right of first refusal is not extinguished by foreclosure; however, the right of first refusal does not apply to foreclosure or deed in lieu of foreclosure.
Partial Release. Following the second anniversary of the issuance of the Series 2012-C8 Certificates, the Cole Office Portfolio Borrower is permitted to release any constituent properties in connection with a partial prepayment equal to 125% of the released property’s allocated loan balance (including the payment of the yield maintenance premium), subject to certain conditions including (i) the debt service coverage ratio with respect to the remaining properties after the release shall be greater than or equal to the greater of (a) the debt service coverage ratio of all the remaining properties encumbered by the Cole Office Portfolio Mortgage Loan immediately prior to the release and (b) 2.20x; (ii) the loan-to-value ratio with respect to the remaining properties shall be no greater than 51.5%; (iii) the NCF debt yield with respect to the remaining properties shall be no less than 11.5%; and (iv) confirmation received from Fitch, KBRA and Moody’s that the transfer will not result in a downgrade, withdrawal or qualification of the respective ratings then assigned to any of the Series 2012-C8 Certificates.
95
| COLE OFFICE PORTFOLIO |
Real Estate Substitution. Not Permitted.
Subordinate and Mezzanine Indebtedness. Not Permitted.
Ground Lease. None.
Terrorism Insurance. The loan documents require that the borrower maintain insurance against loss for acts of terrorism in an amount equal to the full replacement cost of the Cole Office Portfolio Properties; provided, however, that the borrower is not required to pay premiums in excess of 200% of the current year’s stand alone terrorism policy premium. The loan documents also require business interruption insurance covering no less than the 12-month period following the occurrence of a casualty event, together with a 12-month extended period of indemnity.
THE INFORMATION IN THIS STRUCTURAL AND COLLATERAL TERM SHEET IS NOT COMPLETE AND MAY BE AMENDED PRIOR TO THE TIME OF SALE. THIS TERM SHEET IS NOT AN OFFER TO SELL THESE SECURITIES AND IT IS NOT A SOLICITATION OF AN OFFER TO BUY THESE SECURITIES IN ANY JURISDICTION WHERE THE OFFER OR SALE IS NOT PERMITTED.
96
(THIS PAGE INTENTIONALLY LEFT BLANK)
97
| BANK OF AMERICA FINANCIAL CENTER |
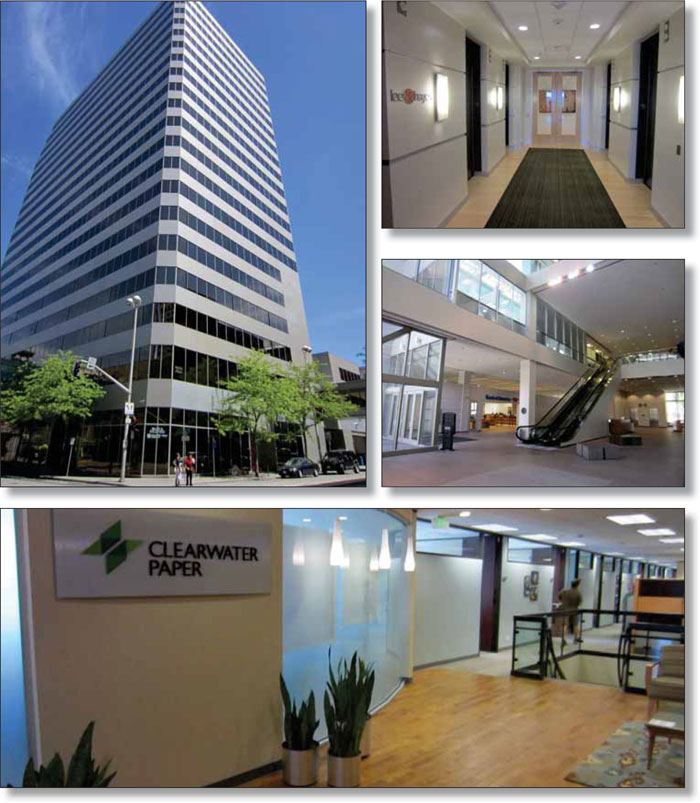
THE INFORMATION IN THIS STRUCTURAL AND COLLATERAL TERM SHEET IS NOT COMPLETE AND MAY BE AMENDED PRIOR TO THE TIME OF SALE. THIS TERM SHEET IS NOT AN OFFER TO SELL THESE SECURITIES AND IT IS NOT A SOLICITATION OF AN OFFER TO BUY THESE SECURITIES IN ANY JURISDICTION WHERE THE OFFER OR SALE IS NOT PERMITTED.
98
| BANK OF AMERICA FINANCIAL CENTER |
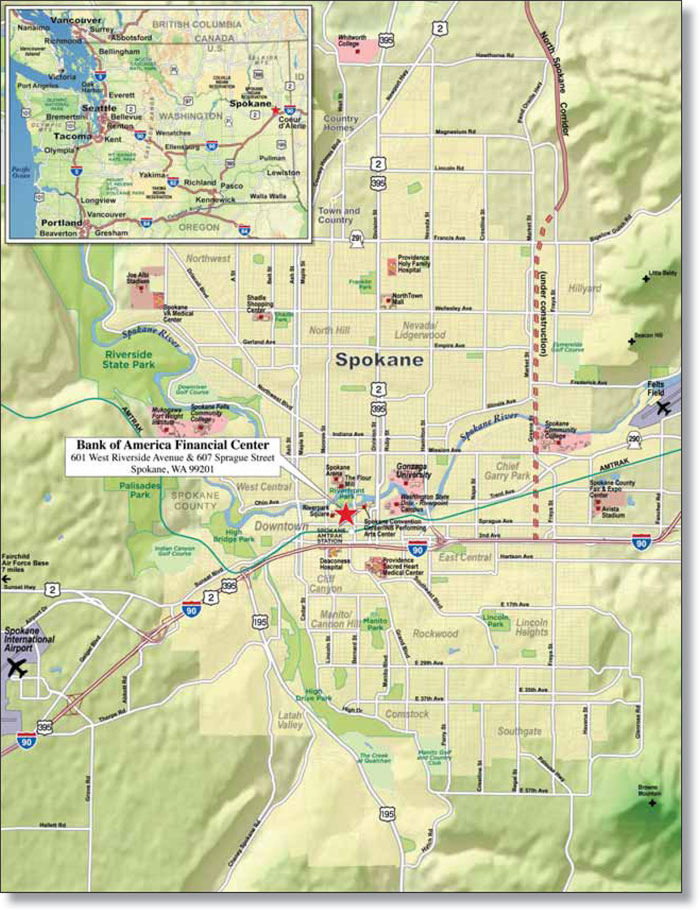
THE INFORMATION IN THIS STRUCTURAL AND COLLATERAL TERM SHEET IS NOT COMPLETE AND MAY BE AMENDED PRIOR TO THE TIME OF SALE. THIS TERM SHEET IS NOT AN OFFER TO SELL THESE SECURITIES AND IT IS NOT A SOLICITATION OF AN OFFER TO BUY THESE SECURITIES IN ANY JURISDICTION WHERE THE OFFER OR SALE IS NOT PERMITTED.
99
| Bank of America Financial Center | |||||||
| Loan Information | Property Information | ||||||
| Mortgage Loan Seller: | Liberty Island Group I LLC | Single Asset/Portfolio: | Single Asset | ||||
| Credit Assessment (Fitch/KBRA/Moody’s): | NR/NR/NR | Property Type: | Office | ||||
| Original Principal Balance: | $33,000,000 | Specific Property Type: | CBD | ||||
| Cut-off Date Principal Balance: | $33,000,000 | Location: | Spokane, WA | ||||
| % of Initial Pool Balance: | 2.5% | Size(1): | 324,165 SF | ||||
| Loan Purpose: | Refinance | Cut-off Date Principal Balance Per Unit/SF: | $101.80 | ||||
| Borrower Name: | 601 W. Riverside LLC | ||||||
| Sponsor: | Unico Investment Group LLC | Year Built/Renovated: | 1981/NAP | ||||
| Mortgage Rate: | 4.860% | Occupancy %: | 90.3% | ||||
| Note Date: | June 15, 2012 | Occupancy % Source Date: | May 31, 2012 | ||||
| Anticipated Repayment Date: | NAP | Title Vesting(2): | Fee | ||||
| Maturity Date: | July 1, 2022 | Property Manager: | Unico Properties LLC | ||||
| IO Period: | 36 months | ||||||
| Loan Term (Original): | 120 months | 3rd Most Recent NOI (As of): | $3,213,753 (12/31/2009) | ||||
| Seasoning: | 1 month | 2nd Most Recent NOI (As of): | $3,413,272 (12/31/2010) | ||||
| Amortization Term (Original): | 360 months | Most Recent NOI (As of): | $3,322,716 (12/31/2011) | ||||
| Loan Amortization Type: | Interest-only, Amortizing Balloon | ||||||
| Interest Accrual Method: | Actual/360 | U/W Revenues: | $6,671,263 | ||||
| Call Protection: | L(25),D(91),O(4) | U/W Expenses: | $3,402,809 | ||||
| Lockbox Type: | Hard/Springing Cash Management | U/W NOI: | $3,268,454 | ||||
| Additional Debt: | None | U/W NCF: | $2,785,444 | ||||
| Additional Debt Type: | NAP | U/W NOI DSCR: | 1.56x | ||||
| U/W NCF DSCR: | 1.33x | ||||||
| Escrows and Reserves: | U/W NOI Debt Yield: | 9.9% | |||||
| U/W NCF Debt Yield: | 8.4% | ||||||
| Type: | Initial | Monthly | Cap (If Any) | As-Is Appraised Value: | $47,000,000 | ||
| Taxes | $217,491 | $43,498 | NAP | As-Is Appraisal Valuation Date: | May 15, 2012 | ||
| Insurance | $61,635 | $6,163 | NAP | Cut-off Date LTV Ratio: | 70.2% | ||
| Replacement Reserves | $7,700 | $7,700 | NAP | LTV Ratio at Maturity or ARD: | 62.0% | ||
| Deferred Maintenance | $337,091 | $0 | NAP | ||||
| TI/LC | $30,750 | $30,750 | $1,350,000 | ||||
| (1) | The rent roll provided by the borrower equals a rentable area of 323,128 square feet. The lender used the leasable area which matched the provided leases totalling 324,165 square feet. In addition, the Bank of America Financial Center Property includes an eight-level parking garage; the parking garage��s square footage is not included in the total square footage. |
| (2) | Approximately 4,608 square feet of the land beneath the parking garage totalling 27,500 square feet is subject to a ground lease. The parking garage, as well as the majority of the land beneath the parking garage, is owned by the Bank of America Financial Center borrower. |
The Mortgage Loan. The mortgage loan (the “Bank of America Financial Center Mortgage Loan”) is evidenced by a single promissory note secured by a first mortgage encumbering a 324,165 square foot office building and an eight-level parking garage, located in Spokane, Washington (the “Bank of America Financial Center Property”). The Bank of America Financial Center Mortgage Loan was originated on June 15, 2012 by Prudential Mortgage Capital Company, LLC. The Bank of America Financial Center Mortgage Loan had an original principal balance of $33,000,000, has an outstanding principal balance as of the Cut-off Date of $33,000,000 and accrues interest at an interest rate of 4.860% per annum. The Bank of America Financial Center Mortgage Loan had an initial term of 120 months, has a remaining term of 119 months as of the Cut-off Date and requires interest-only payments for the first 36 payments following origination and thereafter requires payments of interest and principal based on a 30-year amortization schedule. The Bank of America Financial Center Mortgage Loan matures on July 1, 2022. The proceeds from the Bank of America Financial Center Mortgage Loan were used to refinance an existing first mortgage of approximately $27.2 million and return approximately $5.8 million of equity to the borrower.
Following the lockout period the borrower has the right to defease the Bank of America Financial Center Mortgage Loan in whole, but not in part, on any due date before the scheduled maturity date. In addition, the Bank of America Financial Center Mortgage Loan is prepayable without penalty on or after April 1, 2022.
The Property. The Bank of America Financial Center Property is a 20-story Class A office building and an eight-level parking garage located in the Spokane central business district that is comprised of a 324,165 square feet office tower and a 495 space parking garage. The Bank of America Financial Center borrower’s interest in 4,608 square feet of the land beneath the parking garage totaling 27,500 square feet consists of a leasehold interest pursuant to a long-term ground lease that expires in 2053. The annual payment under the ground lease is $118,680 ($9,890 per month). The Bank of America Financial Center Property was built in 1981 and the borrower has spent approximately $7.6 million in capital improvements and tenant improvements since acquisition.
THE INFORMATION IN THIS STRUCTURAL AND COLLATERAL TERM SHEET IS NOT COMPLETE AND MAY BE AMENDED PRIOR TO THE TIME OF SALE. THIS TERM SHEET IS NOT AN OFFER TO SELL THESE SECURITIES AND IT IS NOT A SOLICITATION OF AN OFFER TO BUY THESE SECURITIES IN ANY JURISDICTION WHERE THE OFFER OR SALE IS NOT PERMITTED.
100
| BANK OF AMERICA FINANCIAL CENTER |
As of May 31, 2012, the Bank of America Financial Center Property was 90.3% occupied with no tenant comprising more than 13.6% of the total square footage.
The following table presents certain information relating to the tenancies at the Bank of America Financial Center Property:
Major Tenants
| Tenant Name | Credit Rating (Fitch/ Moody’s/ S&P)(1) | Tenant NRSF | % of NRSF | Annual U/W Base Rent PSF | Annual U/W Base Rent | % of Total Annual U/W Base Rent | Lease Expiration Date |
| Major Tenants | |||||||
| Lee & Hayes PLLC | NR/NR/NR | 31,679 | 9.8% | $23.50 | $744,457 | 14.0% | 9/30/2018 |
| Clearwater Paper Corporation | NR/Ba2/BB | 31,538 | 9.7% | $22.00 | $693,836 | 13.0% | 9/30/2018 |
| Moss Adams LLP | NR/NR/NR | 22,732 | 7.0% | $19.50 | $443,274 | 8.3% | 7/31/2020 |
| CliftonLarsonAllen, LLP | NR/NR/NR | 19,419 | 6.0% | $21.00 | $407,799 | 7.6% | 5/31/2019 |
Bank of America, NA(2) | A/Baa2/A- | 44,239 | 13.6% | $8.74 | $386,647 | 7.3% | 6/30/2023 |
| Total Major Tenants | 149,607 | 46.2% | $17.89 | $2,676,013 | 50.2% | ||
| Non-Major Tenants | 142,965 | 44.1% | $18.58 | $2,656,274 | 49.8% | ||
| Occupied Collateral | 292,572 | 90.3% | $18.23 | $5,332,287 | 100.0% | ||
| Vacant Space | 31,593 | 9.7% | |||||
| Collateral Total | 324,165 | 100.0% | |||||
| (1) | Certain ratings are those of the parent company whether or not the parent guarantees the lease. |
| (2) | Bank of America leases five separate spaces totalling 44,239 square feet with all leases expiring on June 30, 2023. |
The following table presents certain information relating to the lease rollover schedule at the Bank of America Financial Center Property:
Lease Expiration Schedule(1)(2)
Year Ending December 31, | No. of Leases Expiring(3) | Expiring NRSF | % of Total NRSF | Cumulative of Total NRSF | Cumulative % of Total NRSF | Annual U/W Base Rent | Annual U/W Base Rent PSF(4) |
| MTM | 3 | 3,270 | 1.0% | 3,270 | 1.0% | $20,109 | $6.15 |
| 2012 | 1 | 861 | 0.3% | 4,131 | 1.3% | $15,504 | $18.01 |
| 2013 | 4 | 18,714 | 5.8% | 22,845 | 7.1% | $395,796 | $21.15 |
| 2014 | 1 | 1,757 | 0.5% | 24,602 | 7.6% | $7,379 | $4.20 |
| 2015 | 4 | 31,194 | 9.7% | 55,796 | 17.3% | $662,579 | $21.24 |
| 2016 | 2 | 20,734 | 6.4% | 76,530 | 23.8% | $423,889 | $20.44 |
| 2017 | 3 | 20,101 | 6.2% | 96,631 | 30.0% | $418,325 | $20.81 |
| 2018 | 5 | 85,491 | 26.6% | 182,122 | 56.6% | $1,901,919 | $22.25 |
| 2019 | 1 | 19,419 | 6.0% | 201,541 | 62.6% | $407,799 | $21.00 |
| 2020 | 1 | 22,732 | 7.1% | 224,273 | 69.7% | $443,274 | $19.50 |
| 2021 | 1 | 21,658 | 6.7% | 245,931 | 76.4% | $249,067 | $11.50 |
| 2022 | 0 | 0 | 0.0% | 245,931 | 76.4% | $0 | $0.00 |
| Thereafter | 5 | 44,239 | 13.7% | 290,170 | 90.2% | $386,647 | $8.74 |
| Vacant | 0 | 31,593 | 9.8% | 321,763 | 100.0% | $0 | $0.00 |
| Total/Weighted Average | 31 | 321,763 | 100.0% | $5,332,287 | $18.38 |
(1) | Information obtained from the underwritten rent roll. |
| (2) | Certain tenants may have lease termination options that are exercisable prior to the originally stated expiration date of the subject lease and that are not considered in the Lease Expiration Schedule. |
| (3) | The Lease Expiration Schedule excludes the building conference room (934 square feet) and building management office (1,468 square feet). There is no income attributable to these spaces or lease expiration dates. |
| (4) | Weighted Average Annual U/W Base Rent PSF excludes vacant space. When including the building conference room (934 square feet) and building management office (1,468 square feet) the Annual U/W Base Rent PSF equals $18.23. |
THE INFORMATION IN THIS STRUCTURAL AND COLLATERAL TERM SHEET IS NOT COMPLETE AND MAY BE AMENDED PRIOR TO THE TIME OF SALE. THIS TERM SHEET IS NOT AN OFFER TO SELL THESE SECURITIES AND IT IS NOT A SOLICITATION OF AN OFFER TO BUY THESE SECURITIES IN ANY JURISDICTION WHERE THE OFFER OR SALE IS NOT PERMITTED.
101
| BANK OF AMERICA FINANCIAL CENTER |
The following table presents historical occupancy percentages at the Bank of America Financial Center Property:
Historical Occupancy Percentages(1)
12/31/2009 | 12/31/2010 | 12/31/2011 | ||
| 94% | 95% | 95% |
| (1) | Information obtained from the borrower. |
Operating History and Underwritten Net Cash Flow. The following table presents certain information relating to the historical operating performance and the Underwritten Net Cash Flow at the Bank of America Financial Center Property:
Cash Flow Analysis
2009 | 2010 | 2011 | U/W | U/W $ per SF | ||||||
| Base Rent | $5,091,016 | $5,405,883 | $5,403,656 | $5,960,851 | $18.39 | |||||
| Grossed Up Vacant Space | 0 | 0 | 0 | 659,382 | 2.03 | |||||
| Parking | 607,185 | 590,194 | 586,365 | 586,365 | 1.81 | |||||
| Reimbursements | 615,070 | 617,544 | 696,293 | 714,462 | 2.20 | |||||
| Other Income | 74,404 | 64,613 | 284,117 | 68,967 | 0.21 | |||||
| Less Vacancy & Credit Loss | (91,339) | (27,499) | (448,585) | (659,382) | (2.03) | |||||
| Effective Gross Income | $6,296,336 | $6,650,735 | $6,521,846 | $6,671,263 | $20.58 | |||||
| Total Operating Expenses | $3,082,583 | $3,237,463 | $3,199,130 | $3,402,809 | $10.50 | |||||
| Net Operating Income | $3,213,753 | $3,413,272 | $3,322,716 | $3,268,454 | $10.08 | |||||
TI/LC(1) | 450,035 | 257,217 | 1,500,115 | 390,860 | 1.21 | |||||
| Capital Expenditures | 322,231 | 0 | 10,726 | 92,150 | 0.28 | |||||
| Net Cash Flow | $2,441,487 | $3,156,055 | $1,811,875 | $2,785,444 | $8.59 | |||||
| NOI DSCR | 1.54x | 1.63x | 1.59x | 1.56x | ||||||
| NCF DSCR | 1.17x | 1.51x | 0.87x | 1.33x | ||||||
| NOI DY | 9.7% | 10.3% | 10.1% | 9.9% | ||||||
| NCF DY | 7.4% | 9.6% | 5.5% | 8.4% |
| (1) | Substantial tenant improvement costs were incurred in 2011 due to tenant renewals, allowances, as well as upgrades made to old spaces. |
Appraisal. According to the appraisal dated May 15, 2012, the Bank of America Financial Center Property had an “as-is” appraised value of $47,000,000.
Environmental Matters. According to the Phase I environmental site assessment report dated June 7, 2012, an Asbestos-Containing Material survey was conducted at the Bank of America Financial Center Property in 1997 and asbestos was detected in one area of mastic and vinyl sheeting. These materials are in good condition and can be maintained in place if an Operations and Maintenance (“O&M”) program is developed and implemented. An O&M plan has been implemented by the borrower.
Market Overview and Competition. The Bank of America Financial Center Property is located within the Spokane central business district. According to a third party market research report, the Spokane central business district contains approximately 5.7 million square feet of office space, representing 26.8% of all office space in the greater Spokane area. Of the available office space located in the Spokane central business district, an estimated 19.1% is considered Class A, representing 75.9% of total Class A office space in the greater Spokane area. As of March 31, 2012, the Spokane central business district had an 11.1% vacancy rate and $14.88 per square foot rental rate. Class A office space in the Spokane central business district recorded a 12.6% vacancy rate and $17.93 per square foot rental rate.
According to the appraisal, Spokane County has an estimated 2012 population of approximately 480,541, reflecting an increase of approximately 15.0% from 2000 to 2012. As of 2012, the population within a three-mile radius and five-mile radius of the Bank of America Financial Center Property was approximately 102,943 and 209,524, respectively. The 2012 median household income within a three-mile radius and a five-mile radius of the Bank of America Financial Center Property was approximately $32,994 and $37,612, respectively.
THE INFORMATION IN THIS STRUCTURAL AND COLLATERAL TERM SHEET IS NOT COMPLETE AND MAY BE AMENDED PRIOR TO THE TIME OF SALE. THIS TERM SHEET IS NOT AN OFFER TO SELL THESE SECURITIES AND IT IS NOT A SOLICITATION OF AN OFFER TO BUY THESE SECURITIES IN ANY JURISDICTION WHERE THE OFFER OR SALE IS NOT PERMITTED.
102
| BANK OF AMERICA FINANCIAL CENTER |
Competitive Set(1)
Bank of America Financial Center (Subject) | 601 West 1st Avenue | 601 West Main Avenue | 201 West North River Drive | 41 West Riverside Avenue | 501 N Riverpoint Boulevard | |
| Market | Spokane, WA | Spokane, WA | Spokane, WA | Spokane, WA | Spokane, WA | Spokane, WA |
| Property Type | CBD Office | CBD Office | CBD Office | CBD Office | CBD Office | CBD Office |
| Year Built/Renovated | 1981/NAP | 1982/NAP | 1973/2003 | 1985/NAP | 2004/NAP | 1988/NAP |
| Total GLA | 324,165 SF | 227,300 SF | 173,341 SF | 96,735 SF | 80,445 SF | 75,000 SF |
| Total Occupancy | 90% | 85% | 82% | 88% | 100% | 100% |
| (1) | Information obtained from the appraisal dated May 15, 2012. |
The Borrower. The borrower is 601 W. Riverside LLC, a single member Delaware limited liability company (the “Bank of America Financial Center Borrower”). Legal counsel to the Bank of America Financial Center Borrower delivered a non-consolidation opinion in connection with the origination of the Bank of America Financial Center Mortgage Loan. The Bank of America Financial Center Borrower is 100.0% owned by managing member Unico Northwest Fund II LLC. The managing member of Unico Northwest Fund II LLC is Unico Investment Group, LLC. Unico Northwest Fund II Sponsor LLC owns 24.8% of Unico Northwest Fund II LLC, and the remaining 75.2% is owned by multiple investors of the Unico Northwest Fund II LLC. Unico Office Investors LLC owns 94% of Unico Northwest Funds II Sponsor LLC, and the remaining 6.0% is owned by Unico 2006 LTIP Fund LLC. Unico Investment Group LLC owns 100% of Unico Office Investors LLC. Unico Northwest Fund II Sponsor LLC indirectly owns 24.8% of the Bank of America Financial Center Borrower and Unico Office Investors LLC indirectly owns 23.3% of the Bank of America Financial Center Borrower. Unico Investment Group LLC (“Unico”) is the nonrecourse carveout guarantor. During the loan term, Unico is required to maintain a liquid net worth of at least $3.5 million and an aggregate net worth of at least $35.0 million, excluding any value attributable to its direct or indirect interest in the Bank of America Financial Center Property.
The Sponsor. The sponsor, Unico, is headquartered in Seattle and has been involved in the development, acquisition, and management of real estate for nearly 60 years. Founded in 1953, Unico focuses on office and multifamily assets in the Western United States. As of December 31, 2011, Unico’s portfolio included 72 properties totaling 14.6 million square feet and 1,187 multifamily units in 11 markets.
Escrows. The Bank of America Financial Center Borrower funded upfront escrows at closing in the amount of: $217,491 for real estate taxes, $61,635 for insurance, $7,700 for replacement reserves, $30,750 for tenant improvements and leasing commissions, and $337,091 for deferred maintenance. The Bank of America Financial Center Borrower is required to complete all immediate and short term repairs identified within 90 days of loan closing. The loan documents provide for ongoing monthly escrows in the amount of: $43,498 for real estate taxes, $6,163 for insurance, $7,700 for replacement reserves, and $30,750 for tenant improvements and leasing commissions (subject to a cap of $1,350,000).
Lockbox and Cash Management. The Bank of America Financial Center Mortgage Loan requires a lender-controlled lockbox account, which was established at closing. The tenants have been directed to pay their rents directly to such lockbox account. The loan documents also require that all cash revenues and all other monies received by the Bank of America Financial Center Borrower or the property manager relating to the Bank of America Financial Center Property be deposited into the lockbox account within one business day after receipt. Upon the occurrence of (i) an event of default, or (ii) if the debt service coverage ratio of the Bank of America Financial Center Property for the two most recent calendar quarters is less than 1.10x (a “Sweep Event”), the lender has the right to full access and application of the Bank of America Financial Center Property’s revenue at such time, and in such manner, order and priority, as the lender determines and all funds on deposit in the lockbox account will be swept to certain restricted accounts, and if an event of default or Sweep Event exists, the lender has the exclusive control of, and the right to withdraw and apply, the funds in the deposit account to payment of any and all debts, liabilities and obligations of the Bank of America Financial Center Borrower in such order, proportion and priority as the lender may determine in its sole discretion. The Sweep Event is cured when the debt service coverage ratio of the Bank of America Financial Center Property for the two most recent calendar quarters is at least 1.25x.
Property Management. The Bank of America Financial Center Property is managed by Unico Properties LLC, an affiliate of the Bank of America Financial Center Borrower. The property manager is currently entitled to a base management fee in an amount equal to 3.0% of the gross receipts collected from the Bank of America Financial Center Property. The Bank of America Financial Center lender may terminate the management agreement with 30-days notice upon an event of default by the property manager.
Assumption. The Bank of America Financial Center Mortgage Loan borrower has a two-time right to transfer the Bank of America Financial Center Property with the consent of the lender, provided that no event of default has occurred and is continuing under the Bank of America Financial Center Mortgage Loan and certain other conditions are satisfied, including the lender’s reasonable determination that the proposed transferee and guarantor satisfy the lender’s credit review and underwriting standards taking into consideration (i) experience, financial strength and credit quality; (ii) requirements that the transferee will execute a recourse guaranty and an environmental indemnity; (iii) rating agency confirmation that the transfer will not result in a downgrade, withdrawal or qualification of the respective ratings assigned to the Series 2012-C8 Certificates; (iv) other factors relied upon by the
THE INFORMATION IN THIS STRUCTURAL AND COLLATERAL TERM SHEET IS NOT COMPLETE AND MAY BE AMENDED PRIOR TO THE TIME OF SALE. THIS TERM SHEET IS NOT AN OFFER TO SELL THESE SECURITIES AND IT IS NOT A SOLICITATION OF AN OFFER TO BUY THESE SECURITIES IN ANY JURISDICTION WHERE THE OFFER OR SALE IS NOT PERMITTED.
103
| BANK OF AMERICA FINANCIAL CENTER |
lender in the original underwriting of the Bank of America Financial Center Mortgage Loan; and (v) the Bank of America Financial Center Borrower pays an assumption fee in an amount equal to 1.0% of the then outstanding principal balance of the Bank of America Financial Center Mortgage Loan.
Partial Release. Not permitted.
Real Estate Substitution. Not permitted.
Subordinate and Mezzanine Indebtedness. Not permitted.
Ground Lease. 4,608 square feet of the land totaling 27,500 square feet beneath the parking garage of the Bank of America Financial Center Property is subject to a ground lease with the Bank of America Financial Center Borrower as a successor in interest to Seattle First National Bank, the original lessee. The initial ground lease term began in November 1978 and expires in October 2053. The ground lease agreement does not contain any options to extend the lease.
Terrorism Insurance. The loan documents require that the insurance policy required to be maintained by the Bank of America Financial Center Borrower provide coverage for terrorism in an amount, coverage, and form that is acceptable to the lender, as well as business interruption insurance in amounts sufficient to compensate Bank of America Financial Center Borrower for all rents and profits or income covering no less than the 18-month period following the occurrence of a casualty event, together with a six-month extended period of indemnity.
THE INFORMATION IN THIS STRUCTURAL AND COLLATERAL TERM SHEET IS NOT COMPLETE AND MAY BE AMENDED PRIOR TO THE TIME OF SALE. THIS TERM SHEET IS NOT AN OFFER TO SELL THESE SECURITIES AND IT IS NOT A SOLICITATION OF AN OFFER TO BUY THESE SECURITIES IN ANY JURISDICTION WHERE THE OFFER OR SALE IS NOT PERMITTED.
104
105
| Fair Hill | ||||||||
| Loan Information | Property Information | |||||||
| Mortgage Loan Seller: | The Royal Bank of Scotland | Single Asset/Portfolio: | Single Asset | |||||
| Credit Assessment (Fitch/KBRA/Moody’s): | NR/NR/NR | Property Type: | Retail | |||||
| Original Principal Balance: | $31,250,000 | Specific Property Type: | Anchored | |||||
| Cut-off Date Principal Balance: | $31,250,000 | Location: | Olney, MD | |||||
| % of Initial Pool Balance: | 2.4% | Size: | 110,072 SF | |||||
| Loan Purpose: | Refinance | |||||||
| Borrower Name: | Olney Town Center Properties, L.L.C. | Cut-off Date Principal Balance Per Unit/SF: | $283.91 | |||||
| Sponsor: | Carl M. Freeman Associates, Inc. | Year Built/Renovated: | 1998/2011 | |||||
| Mortgage Rate: | 4.670% | Occupancy %(2): | 98.5% | |||||
| Note Date: | June 26, 2012 | Occupancy % Source Date: | June 1, 2012 | |||||
| Anticipated Repayment Date: | NAP | Title Vesting(3): | Fee & Leasehold | |||||
| Maturity Date: | July 1, 2022 | Property Manager: | Carl M. Freeman Retail L.L.C. | |||||
| IO Period: | 12 months | |||||||
| Loan Term (Original): | 120 months | 3rd Most Recent NOI (As of)(4): | NAV | |||||
| Seasoning: | 1 month | 2nd Most Recent NOI (As of): | $1,651,703 (12/31/2011) | |||||
| Amortization Term (Original): | 360 months | Most Recent NOI (As of): | $2,345,017 (TTM 4/30/2012) | |||||
| Loan Amortization Type: | Interest-only, Amortizing Balloon | |||||||
| Interest Accrual Method: | Actual/360 | U/W Revenues: | $3,914,877 | |||||
| Call Protection: | L(25),GRTR 1% or YM(91),O(4) | U/W Expenses: | $1,215,555 | |||||
| Lockbox Type: | Hard/Springing Cash Management | U/W NOI: | $2,699,322 | |||||
| Additional Debt: | None | U/W NCF: | $2,565,847 | |||||
| Additional Debt Type: | NAP | U/W NOI DSCR: | 1.39x | |||||
| U/W NCF DSCR: | 1.32x | |||||||
| Escrows and Reserves: | U/W NOI Debt Yield: | 8.6% | ||||||
| U/W NCF Debt Yield: | 8.2% | |||||||
| Type: | Initial | Monthly | Cap (If Any) | As-Is Appraised Value: | $44,400,000 | |||
| Taxes | $350,630 | $31,875 | NAP | As-Is Appraisal Valuation Date: | June 2, 2012 | |||
| Insurance | $12,079 | $2,013 | NAP | Cut-off Date LTV Ratio: | 70.4% | |||
| Replacement Reserves | $1,926 | $1,926 | $50,000 | LTV Ratio at Maturity or ARD: | 58.8% | |||
TI/LC Reserve(1) | $1,014,090 | $9,173 | $250,000 | |||||
| Ground Rent Reserve | $26,201 | NAP | NAP | |||||
| (1) | Funds held back at closing are associated with outstanding tenant improvements and leasing commissions and free rent for the TD Bank and Winery at Olney tenants. |
| (2) | Two tenants, TD Bank (2.9% of net rentable area) and Winery at Olney (2.2% of net rentable area), executed leases but have not yet taken occupancy. TD Bank’s lease commenced on June 11, 2012 and rental payments are scheduled to commence at the earlier of the tenant opening for business and December 8, 2012. Winery at Olney’s lease commenced on March 28, 2012, with rental payments scheduled to commence at the earlier of the tenant opening for business and September 29, 2012. The lender has reserved funds associated with outstanding tenant improvements and leasing commissions and free rent for both tenants. Both tenants were underwritten as occupied. |
| (3) | A 10.9 acre portion of the site is encumbered by a long-term ground lease. The ground lease expires on December 31, 2078 with no remaining extension options. |
| (4) | The Fair Hill Property underwent a significant re-development in 2010/2011 during which the Fair Hill Property was not operational. |
The Fair Hill mortgage loan is evidenced by a single promissory note that is guaranteed by an indemnity agreement given by the IDOT Guarantors (as defined below), which indemnity guaranty is secured by a first mortgage encumbering a 110,072 square foot anchored retail center located in Olney, Maryland (the “Fair Hill Property”). The Fair Hill Property is a retail community shopping center anchored by a Harris Teeter grocery store (47.6% net rentable area) and located in Olney, Maryland, approximately 20 miles north of the District of Columbia. The Fair Hill Property was originally constructed in 1998 as a 98,848 square foot shopping center and underwent a substantial re-development from 2010 to 2011 at a cost of approximately $23.3 million. The Fair Hill Property is comprised of one primary building and three outparcel buildings situated on a 13.0 acre site. The Fair Hill Property was 98.5% leased to twenty tenants as of June 1, 2012. A 2.1 acre portion of the Fair Hill Property is owned in fee by the four tenants-in-common (the “IDOT Guarantors”), which collectively own 100% of the membership interests in the borrower, and a 10.9 acre portion of the site is leased by the IDOT Guarantors pursuant to a long-term ground lease which expires on December 31, 2078 with no remaining extension options.
��
THE INFORMATION IN THIS STRUCTURAL AND COLLATERAL TERM SHEET IS NOT COMPLETE AND MAY BE AMENDED PRIOR TO THE TIME OF SALE. THIS TERM SHEET IS NOT AN OFFER TO SELL THESE SECURITIES AND IT IS NOT A SOLICITATION OF AN OFFER TO BUY THESE SECURITIES IN ANY JURISDICTION WHERE THE OFFER OR SALE IS NOT PERMITTED.
106
| FAIR HILL |
The following table presents certain information relating to the tenancies at the Fair Hill Property:
Major Tenants
| Tenant Name | Credit Rating (Fitch/ Moody’s/ S&P)(1) | Tenant NRSF | % of NRSF | Annual U/W Base Rent PSF | Annual U/W Base Rent | % of Total Annual U/W Base Rent | Sales PSF(2) | Occupancy Cost(2) | Lease Expiration Date | ||||
| Major Tenants | |||||||||||||
| Harris Teeter, Inc. | NR/NR/NR | 52,445 | 47.6% | $16.00 | $839,120 | 25.8% | $561 | 4.0% | 4/30/2031 | ||||
TD Bank(3) | AA-/Aaa/AA- | 3,200 | 2.9% | $98.44 | $315,000 | 9.7% | NAV | NAV | 4/30/2032 | ||||
| PNC Bank | A+/A3/A- | 2,400 | 2.2% | $104.17 | $250,000 | 7.7% | NAV | NAV | 4/30/2031 | ||||
| Grill Marx, LLC | NR/NR/NR | 5,525 | 5.0% | $40.31 | $222,712 | 6.9% | $541 | 9.1% | 1/31/2021 | ||||
| The Greene Turtle | NR/NR/NR | 6,787 | 6.2% | $31.78 | $215,691 | 6.6% | $577 | 6.6% | 12/31/2020 | ||||
| Total Major Tenants | 70,357 | 63.9% | $26.19 | $1,842,523 | 56.7% | ||||||||
Non-Major Tenants(4) | 38,115 | 34.6% | $36.92 | $1,407,356 | 43.3% | ||||||||
| Occupied Collateral | 108,472 | 98.5% | $29.96 | $3,249,879 | 100.0% | ||||||||
| Vacant Space | 1,600 | 1.5% | |||||||||||
| Collateral Total | 110,072 | 100.0% | |||||||||||
| (1) | Credit ratings are those of the parent company whether or not the parent guarantees the lease. |
| (2) | Sales and occupancy costs are based on the trailing twelve-month period ending March 31, 2012 for all tenants except for Harris Teeter, for which sales and occupancy costs represent annualized operations from May 1, 2011 to September 30, 2011. |
| (3) | TD Bank (2.9% of net rentable area) has executed a lease but has not yet taken occupancy at the Fair Hill Property. TD Bank’s lease commenced on June 11, 2012 rental payments are scheduled to commence on the earlier of the tenant opening for business or December 8, 2012. All outstanding TI/LC and free rent associated with this tenant have been reserved. The tenant was underwritten as occupied. |
| (4) | Includes a tenant, Winery at Olney (2.2% of net rentable area), who has executed a lease but has not yet taken occupancy. Winery at Olney’s lease commenced on March 28, 2012, with rental payments scheduled to commence at the earlier of the tenant opening for business and September 29, 2012. All outstanding TI/LC and free rent associated with this tenant have been reserved. The tenant was underwritten as occupied. |
The following table presents certain information relating to the lease rollover schedule at the Fair Hill Property:
Lease Expiration Schedule(1)(2)
| Year Ending December 31, | No. of Leases Expiring | Expiring NRSF | % of Total NRSF | Cumulative of Total NRSF | Cumulative % of Total NRSF | Annual U/W Base Rent | Annual U/W Base Rent PSF(3) |
| MTM | 0 | 0 | 0.0% | 0 | 0.0% | $0 | $0.00 |
| 2012 | 1 | 2,400 | 2.2% | 2,400 | 2.2% | $91,200 | $38.00 |
| 2013 | 0 | 0 | 0.0% | 2,400 | 2.2% | $0 | $0.00 |
| 2014 | 1 | 6,760 | 6.1% | 9,160 | 8.3% | $162,240 | $24.00 |
| 2015 | 0 | 0 | 0.0% | 9,160 | 8.3% | $0 | $0.00 |
| 2016 | 2 | 3,590 | 3.3% | 12,750 | 11.6% | $148,711 | $41.42 |
| 2017 | 0 | 0 | 0.0% | 12,750 | 11.6% | $0 | $0.00 |
| 2018 | 0 | 0 | 0.0% | 12,750 | 11.6% | $0 | $0.00 |
| 2019 | 3 | 7,932 | 7.2% | 20,682 | 18.8% | $339,345 | $42.78 |
| 2020 | 2 | 7,987 | 7.3% | 28,669 | 26.0% | $267,603 | $33.50 |
| 2021 | 7 | 19,358 | 17.6% | 48,027 | 43.6% | $740,660 | $38.26 |
| 2022 | 1 | 2,400 | 2.2% | 50,427 | 45.8% | $96,000 | $40.00 |
| Thereafter | 3 | 58,045 | 52.7% | 108,472 | 98.5% | $1,404,120 | $24.19 |
| Vacant | 0 | 1,600 | 1.5% | 110,072 | 100.0% | $0 | $0.00 |
| Total/Weighted Average | 20 | 110,072 | 100.0% | $3,249,879 | $29.96 |
| (1) | Information was obtained from the underwritten rent roll. |
| (2) | Certain tenants may have lease termination options that are exercisable prior to the originally stated expiration date of the subject lease and that are not considered in the Lease Expiration Schedule. |
| (3) | Weighted Average Annual U/W Base Rent PSF excludes vacant space. |
THE INFORMATION IN THIS STRUCTURAL AND COLLATERAL TERM SHEET IS NOT COMPLETE AND MAY BE AMENDED PRIOR TO THE TIME OF SALE. THIS TERM SHEET IS NOT AN OFFER TO SELL THESE SECURITIES AND IT IS NOT A SOLICITATION OF AN OFFER TO BUY THESE SECURITIES IN ANY JURISDICTION WHERE THE OFFER OR SALE IS NOT PERMITTED.
107
| FAIR HILL |
The following table presents historical occupancy percentages at the Fair Hill Property:
Historical Occupancy Percentages(1)
12/31/2009(2) | 12/31/2010(2) | 12/31/2011 | |||
| NAV | NAV | 94% | |||
| (1) | Information obtained from borrower rent rolls. | ||||
| (2) | Historical occupancies for 2009 and 2010 are unavailable as the Fair Hill Property underwent a substantial re-development in 2010/2011 during which the Fair Hill Property was not operational. | ||||
Operating History and Underwritten Net Cash Flow. The following table presents certain information relating to the historical operating performance and the Underwritten Net Cash Flow at the Fair Hill Property:
Cash Flow Analysis(1)
| 2011 | TTM 4/30/2012 | U/W(2) | U/W $ per SF | |||||
| Base Rent | $2,386,152 | $2,854,004 | $3,249,879 | $29.53 | ||||
| Grossed Up Vacant Space | 171,556 | 138,837 | 82,064 | 0.75 | ||||
| Free Rent | (171,043) | (55,915) | 0 | 0.00 | ||||
| Percentage Rent | 0 | 660 | 0 | 0.00 | ||||
| Total Reimbursables | 632,715 | 717,816 | 775,249 | 7.04 | ||||
| Other Income | 8,500 | 13,044 | 13,044 | 0.12 | ||||
| Less Vacancy & Credit Loss | (171,556) | (138,837) | (205,360) | (1.87) | ||||
| Effective Gross Income | $2,856,324 | $3,529,609 | $3,914,877 | $35.57 | ||||
| Total Operating Expenses | $1,204,621 | $1,184,592 | $1,215,555 | $11.04 | ||||
| Net Operating Income | $1,651,703 | $2,345,017 | $2,699,322 | $24.52 | ||||
| TI/LC | 0 | 0 | 110,360 | 1.00 | ||||
| Capital Expenditures | 0 | 0 | 23,115 | 0.21 | ||||
| Net Cash Flow | $1,651,703 | $2,345,017 | $2,565,847 | $23.31 | ||||
| NOI DSCR | 0.85x | 1.21x | 1.39x | |||||
| NCF DSCR | 0.85x | 1.21x | 1.32x | |||||
| NOI DY | 5.3% | 7.5% | 8.6% | |||||
| NCF DY | 5.3% | 7.5% | 8.2% |
| (1) | The Fair Hill Property underwent a full re-development beginning in 2010 and ending in 2011. The Fair Hill Property was not operational in 2010 as a result and no financial statements are available for this time period. | |||||||
| (2) | Underwritten net cash flow is higher than in historical periods due to the recent leases signed by TD Bank and Winery at Olney. Income from these tenants was included in underwriting. | |||||||
THE INFORMATION IN THIS STRUCTURAL AND COLLATERAL TERM SHEET IS NOT COMPLETE AND MAY BE AMENDED PRIOR TO THE TIME OF SALE. THIS TERM SHEET IS NOT AN OFFER TO SELL THESE SECURITIES AND IT IS NOT A SOLICITATION OF AN OFFER TO BUY THESE SECURITIES IN ANY JURISDICTION WHERE THE OFFER OR SALE IS NOT PERMITTED.
108
(THIS PAGE INTENTIONALLY LEFT BLANK)
109
| US Bank Centre | |||||||||||
| Loan Information | Property Information | ||||||||||
| Mortgage Loan Seller: | The Royal Bank of Scotland | Single Asset/Portfolio: | Single Asset | ||||||||
| Credit Assessment (Fitch/KBRA/Moody’s): | NR/NR/NR | Property Type: | Office | ||||||||
| Original Principal Balance: | $22,000,000 | Specific Property Type: | CBD | ||||||||
| Cut-off Date Principal Balance: | $21,976,676 | Location: | Cleveland, OH | ||||||||
| % of Initial Pool Balance: | 1.7% | Size: | 244,861 SF | ||||||||
| Loan Purpose: | Refinance | ||||||||||
| Borrower Name: | Renaissance Center Limited Partnership | Cut-off Date Principal Balance Per Unit/SF: | $89.75 | ||||||||
| Sponsors: | Scott Wolstein; Iris Wolstein; James A. Schoff | Year Built/Renovated: | 1990/NAP | ||||||||
| Mortgage Rate: | 5.010% | Occupancy %(2): | 81.2% | ||||||||
| Note Date: | June 25, 2012 | Occupancy % Source Date: | June 12, 2012 | ||||||||
| Anticipated Repayment Date: | NAP | Title Vesting: | Fee | ||||||||
| Maturity Date: | July 1, 2022 | Property Manager: | Grubb & Ellis | ||||||||
| IO Period: | None | ||||||||||
| Loan Term (Original): | 120 months | 3rd Most Recent NOI (As of): | $2,820,239 (12/31/2010) | ||||||||
| Seasoning: | 1 month | 2nd Most Recent NOI (As of): | $2,265,472 (12/31/2011) | ||||||||
| Amortization Term (Original): | 360 months | Most Recent NOI (As of): | $1,925,107 (TTM 4/30/2012) | ||||||||
| Loan Amortization Type: | Amortizing Balloon | ||||||||||
| Interest Accrual Method: | Actual/360 | U/W Revenues: | $4,687,000 | ||||||||
| Call Protection: | L(25),D(91),O(4) | U/W Expenses: | $2,381,455 | ||||||||
| Lockbox Type: | Hard/Springing Cash Management | U/W NOI: | $2,305,545 | ||||||||
| Additional Debt: | None | U/W NCF: | $2,009,039 | ||||||||
| Additional Debt Type: | NAP | U/W NOI DSCR: | 1.62x | ||||||||
| U/W NCF DSCR: | 1.42x | ||||||||||
| Escrows and Reserves: | U/W NOI Debt Yield: | 10.5% | |||||||||
| U/W NCF Debt Yield: | 9.1% | ||||||||||
| Type: | Initial | Monthly | Cap (If Any) | As-Is Appraised Value: | $29,900,000 | ||||||
| Taxes | $61,694 | $61,694 | NAP | As-Is Appraisal Valuation Date: | May 3, 2012 | ||||||
| Insurance | $39,623 | $3,602 | NAP | Cut-off Date LTV Ratio: | 73.5% | ||||||
| Replacement Reserves | $5,101 | $5,101 | NAP | LTV Ratio at Maturity or ARD: | 60.5% | ||||||
| Deferred Maintenance | $9,875 | $0 | NAP | ||||||||
Outstanding TI/LC Reserve(1) | $1,845,680 | $0 | NAP | ||||||||
| (1) | The Outstanding TI/LC Reserve represents outstanding tenant improvements, leasing commissions and free rent associated with various tenants which have recently expanded or signed new leases at the US Bank Centre Property. |
| (2) | Two tenants, Barnes Wendling (6.0% of net rentable area) and the Department of Education (4.4% of net rentable area), executed leases but have not yet taken occupancy. Both tenants were underwritten as occupied. Both tenants are expected to take occupancy by the end of 2012. All outstanding tenant improvements, leasing commissions and free rent associated with these tenants has been reserved by the lender. |
The US Bank Centre mortgage loan is evidenced by a single promissory note that is secured by a first mortgage encumbering a 244,861 square foot Class A office building located in Cleveland, Ohio (the “US Bank Centre Property”). The US Bank Centre Property is a 16-story Class A office building located in Cleveland, Ohio on the southeast border of the Cleveland central business district. The US Bank Centre Property was constructed in 1990 and features ground level retail space and an attached seven-story parking garage. The US Bank Centre Property was 81.2% leased to sixteen tenants as of June 12, 2012. On-site amenities at the US Bank Centre Property include 24-hour lobby security, a 74-seat amphitheatre and two 75-person meeting rooms.
THE INFORMATION IN THIS STRUCTURAL AND COLLATERAL TERM SHEET IS NOT COMPLETE AND MAY BE AMENDED PRIOR TO THE TIME OF SALE. THIS TERM SHEET IS NOT AN OFFER TO SELL THESE SECURITIES AND IT IS NOT A SOLICITATION OF AN OFFER TO BUY THESE SECURITIES IN ANY JURISDICTION WHERE THE OFFER OR SALE IS NOT PERMITTED.
110
| US BANK CENTRE |
The following table presents certain information relating to the tenancies at the US Bank Centre Property:
Major Tenants
Tenant Name | Credit Rating (Fitch/ Moody’s/ S&P)(1) | Tenant NRSF | % of NRSF | Annual U/W Base Rent PSF | Annual U/W Base Rent | % of Total Annual U/W Base Rent | Lease Expiration Date | |
| Major Tenants | ||||||||
| Cohen & Company, Ltd. | NR/NR/NR | 37,583 | 15.3% | $18.82 | $707,312 | 17.3% | 7/31/2022 | |
| US Bank | AA-/Aa3/A | 33,486 | 13.7% | $20.50 | $686,463 | 16.8% | 7/31/2019 | |
General Services Administration(2) | AAA/Aaa/AA+ | 34,247 | 14.0% | $18.38 | $629,460 | 15.4% | 12/31/2021 | |
| GCA Services Group | NR/NR/NR | 18,423 | 7.5% | $21.50 | $396,095 | 9.7% | 2/28/2015 | |
Department of Education(3) | AAA/Aaa/AA+ | 10,818 | 4.4% | $31.03 | $335,683 | 8.2% | 5/31/2022 | |
| Total Major Tenants | 134,557 | 55.0% | $20.47 | $2,755,013 | 67.3% | |||
Non-Major Tenants(4) | 64,254 | 26.2% | $20.80 | $1,336,586 | 32.7% | |||
| Occupied Collateral | 198,811 | 81.2% | $20.58 | $4,091,599 | 100.0% | |||
| Vacant Space | 46,050 | 18.8% | ||||||
| Collateral Total | 244,861 | 100.0% | ||||||
| (1) | Credit ratings are those of the tenant or parent company whether or not the parent guarantees a lease. |
| (2) | General Services Administration (14.0% of net rentable area) has the right to terminate its lease after December 31, 2017 by providing at least 120 days written notice to the landlord. |
| (3) | The Department of Education (4.4% of net rentable area) has executed a lease but has not yet taken occupancy at the US Bank Centre Property. The tenant was underwritten as occupied and is expected to take occupancy by the end of 2012. The tenant has the right to terminate its lease after July 1, 2017 by providing at least 90 days written notice to the landlord. |
| (4) | Includes a tenant, Barnes Wendling (6.0% of net rentable area), which has executed a lease but has not yet taken occupancy. The tenant was underwritten as occupied and is expected to take occupancy by the end of 2012. |
The following table presents certain information relating to the lease rollover schedule at the US Bank Centre Property:
Lease Expiration Schedule(1)(2)
Year Ending December 31, | No. of Leases Expiring | Expiring NRSF | % of Total NRSF | Cumulative of Total NRSF | Cumulative % of Total NRSF | Annual U/W Base Rent(3) | Annual U/W Base Rent PSF(3) | |
| MTM | 0 | 0 | 0.0% | 0 | 0.0% | $0 | $0.00 | |
| 2012 | 1 | 1,164 | 0.5% | 1,164 | 0.5% | $16,230 | $13.94 | |
| 2013 | 4 | 9,012 | 3.7% | 10,176 | 4.2% | $166,019 | $18.42 | |
| 2014 | 2 | 19,155 | 7.8% | 29,331 | 12.0% | $387,863 | $20.25 | |
| 2015 | 1 | 18,423 | 7.5% | 47,754 | 19.5% | $396,095 | $21.50 | |
| 2016 | 0 | 0 | 0.0% | 47,754 | 19.5% | $0 | $0.00 | |
| 2017 | 2 | 7,075 | 2.9% | 54,829 | 22.4% | $149,008 | $21.06 | |
| 2018 | 0 | 0 | 0.0% | 54,829 | 22.4% | $0 | $0.00 | |
| 2019 | 1 | 35,786 | 14.6% | 90,615 | 37.0% | $773,863 | $21.62 | |
| 2020 | 0 | 0 | 0.0% | 90,615 | 37.0% | $0 | $0.00 | |
| 2021 | 2 | 45,223 | 18.5% | 135,838 | 55.5% | $911,802 | $20.16 | |
| 2022 | 2 | 48,401 | 19.8% | 184,239 | 75.2% | $1,042,995 | $21.55 | |
| Thereafter | 1 | 14,572 | 6.0% | 198,811 | 81.2% | $247,724 | $17.00 | |
| Vacant | 0 | 46,050 | 18.8% | 244,861 | 100.0% | $0 | $0.00 | |
| Total/Weighted Average | 16 | 244,861 | 100.0% | $4,091,599 | $20.58 |
| (1) | Information obtained from the underwritten rent roll. |
| (2) | Certain tenants may have lease termination options that are exercisable prior to the originally stated expiration date of the subject lease and that are not considered in the Lease Expiration Schedule. |
| (3) | Weighted Average Annual U/W Base Rent PSF excludes vacant space. |
THE INFORMATION IN THIS STRUCTURAL AND COLLATERAL TERM SHEET IS NOT COMPLETE AND MAY BE AMENDED PRIOR TO THE TIME OF SALE. THIS TERM SHEET IS NOT AN OFFER TO SELL THESE SECURITIES AND IT IS NOT A SOLICITATION OF AN OFFER TO BUY THESE SECURITIES IN ANY JURISDICTION WHERE THE OFFER OR SALE IS NOT PERMITTED.
111
| US BANK CENTRE |
The following table presents historical occupancy percentages at the US Bank Centre Property:
Historical Occupancy Percentages(1)
12/31/2009 | 12/31/2010 | 12/31/2011(2) | |||
| 86% | 78% | 68% | |||
| (1) | Information obtained from borrower rent rolls. | ||||
| (2) | The significant decrease in occupancy in 2010 and 2011 was primarily caused by the lease expirations of several large tenants, representing a total of 13.3% of net rentable area, from May of 2010 to December of 2010. Subsequently much of this space has been re-leased and the US Bank Centre Property is currently 81.2% leased as of June 12, 2012. | ||||
Operating History and Underwritten Net Cash Flow. The following table presents certain information relating to the historical operating performance and the Underwritten Net Cash Flow at the US Bank Centre Property:
Cash Flow Analysis
2010 | 2011 | TTM 4/30/2012 | U/W(1) | U/W $ per SF | ||||||
| Base Rent | $4,790,789 | $3,934,510 | $3,548,880 | $4,091,599 | $16.71 | |||||
| Grossed Up Vacant Space | 0 | 0 | 0 | 921,000 | 3.76 | |||||
| Percentage Rent | 0 | 0 | 0 | 0 | 0.00 | |||||
| Total Reimbursables | 349,355 | 258,322 | 233,526 | 190,052 | 0.78 | |||||
| Other Income | 306,178 | 413,524 | 405,349 | 405,349 | 1.66 | |||||
| Less Vacancy & Credit Loss | 0 | 0 | 0 | (921,000) | (3.76) | |||||
| Effective Gross Income | $5,446,322 | $4,606,356 | $4,187,755 | $4,687,000 | $19.14 | |||||
| Total Operating Expenses | $2,626,083 | $2,340,884 | $2,262,648 | $2,381,455 | $9.73 | |||||
| Net Operating Income | $2,820,239 | $2,265,472 | $1,925,107 | $2,305,545 | $9.42 | |||||
| TI/LC | 0 | 0 | 0 | 247,534 | 1.01 | |||||
| Capital Expenditures | 0 | 0 | 0 | 48,972 | 0.20 | |||||
| Net Cash Flow | $2,820,239 | $2,265,472 | $1,925,107 | $2,009,039 | $8.20 | |||||
| NOI DSCR | 1.99x | 1.60x | 1.36x | 1.62x | ||||||
| NCF DSCR | 1.99x | 1.60x | 1.36x | 1.42x | ||||||
| NOI DY | 12.8% | 10.3% | 8.8% | 10.5% | ||||||
| NCF DY | 12.8% | 10.3% | 8.8% | 9.1% | ||||||
| (1) | Underwritten NOI is higher than the most recent period due to new leases that were signed in 2012. | |||||||||
THE INFORMATION IN THIS STRUCTURAL AND COLLATERAL TERM SHEET IS NOT COMPLETE AND MAY BE AMENDED PRIOR TO THE TIME OF SALE. THIS TERM SHEET IS NOT AN OFFER TO SELL THESE SECURITIES AND IT IS NOT A SOLICITATION OF AN OFFER TO BUY THESE SECURITIES IN ANY JURISDICTION WHERE THE OFFER OR SALE IS NOT PERMITTED.
112
(THIS PAGE INTENTIONALLY LEFT BLANK)
113
| Riverstone Marketplace | |||||||
| Loan Information | Property Information | ||||||
| Mortgage Loan Seller: | Liberty Island Group I LLC | Single Asset/Portfolio: | Single Asset | ||||
Credit Assessment (Fitch/KBRA/Moody’s): | NR/NR/NR | Property Type: | Retail | ||||
| Original Principal Balance: | $20,150,000 | Specific Property Type: | Anchored | ||||
| Cut-off Date Principal Balance: | $20,128,385 | Location: | Vancouver, WA | ||||
| % of Initial Pool Balance: | 1.5% | Size: | 95,774 SF | ||||
| Loan Purpose: | Acquisition | Cut-off Date Principal | $210.17 | ||||
| Borrower Names: | TUO-Riverstone, LLC | Balance Per Unit/SF: | |||||
| Sponsor: | The Uhlmann Offices, Inc. | Year Built/Renovated: | 2002/2004 | ||||
| Mortgage Rate: | 4.960% | Occupancy %: | 96.7% | ||||
| Note Date: | June 15, 2012 | Occupancy % Source Date: | April 23, 2012 | ||||
| Anticipated Repayment Date: | NAP | Title Vesting: | Fee | ||||
| Maturity Date: | July 1, 2022 | Property Manager: | The Uhlmann Offices, Inc. | ||||
| IO Period: | None | ||||||
| Loan Term (Original): | 120 months | 3rd Most Recent NOI (As of): | $1,726,532 (12/31/2010) | ||||
| Seasoning: | 1 month | 2nd Most Recent NOI (As of): | $1,817,500 (12/31/2011) | ||||
| Amortization Term (Original): | 360 months | Most Recent NOI (As of): | $1,924,206 (YTD Annualized 4/30/2012) | ||||
| Loan Amortization Type: | Amortizing Balloon | ||||||
| Interest Accrual Method: | Actual/360 | U/W Revenues: | $2,398,005 | ||||
| Call Protection: | L(25),D(91),O(4) | U/W Expenses: | $576,268 | ||||
| Lockbox Type: | Hard/Springing Cash Management | U/W NOI: | $1,821,737 | ||||
| Additional Debt: | None | U/W NCF: | $1,682,000 | ||||
| Additional Debt Type: | NAP | U/W NOI DSCR: | 1.41x | ||||
| U/W NCF DSCR: | 1.30x | ||||||
| Escrows and Reserves: | U/W NOI Debt Yield: | 9.1% | |||||
| U/W NCF Debt Yield: | 8.4% | ||||||
| Type: | Initial | Monthly | Cap (If Any) | As-Is Appraised Value: | $27,900,000 | ||
| Taxes | $18,581 | $18,581 | NAP | As-Is Appraisal Valuation Date: | May 16, 2012 | ||
| Insurance | $7,723 | $2,574 | NAP | Cut-off Date LTV Ratio: | 72.1% | ||
| Replacement Reserves | $2,150 | $2,150 | $180,000 | LTV Ratio at Maturity or ARD: | 59.3% | ||
TI/LC(1) | $9,800 | $9,800 | $198,000 | ||||
| Deferred Maintenance | $0 | $0 | NAP | ||||
(1) After September 1, 2021, the Riverstone Marketplace mortgage loan’s required monthly deposit into the leasing reserve account shall increase to $20,000 per month and the cap shall no longer apply. Annual withdrawals from the leasing reserve account during the final three years of the Riverstone Marketplace mortgage loan term may not exceed $100,000 per year, unless such funds are being used for a QFC Grocery (Kroger) renewal.
The Riverstone Marketplace mortgage loan is evidenced by a single promissory note that is secured by a first mortgage encumbering an anchored retail center that contains a total of 95,774 square feet (the “Riverstone Marketplace Property”). The Riverstone Marketplace Property is located off of Highway 14 in Vancouver, Washington, within close proximity to the Portland central business district. As of April 23, 2012, the Riverstone Marketplace Property was 96.7% leased to 22 tenants, including the anchor of the center, QFC Grocery (Kroger). The Riverstone Marketplace Property contains 527 surface parking spaces, resulting in a parking ratio of 5.5 spaces per 1,000 square feet.
THE INFORMATION IN THIS STRUCTURAL AND COLLATERAL TERM SHEET IS NOT COMPLETE AND MAY BE AMENDED PRIOR TO THE TIME OF SALE. THIS TERM SHEET IS NOT AN OFFER TO SELL THESE SECURITIES AND IT IS NOT A SOLICITATION OF AN OFFER TO BUY THESE SECURITIES IN ANY JURISDICTION WHERE THE OFFER OR SALE IS NOT PERMITTED.
114
| RIVERSTONE MARKETPLACE |
The following table presents certain information relating to the tenancies at Riverstone Marketplace Property:
Major Tenants
| Tenant Name | Credit Rating (Fitch/ Moody’s/ S&P) | Tenant NRSF | % of NRSF | Annual U/W Base Rent PSF | Annual U/W Base Rent | % of Total Annual U/W Base Rent | Sales PSF(1) | Occupancy Cost(1) | Lease Expiration Date | ||
| Major Tenants | |||||||||||
| QFC Grocery (Kroger) | NR/NR/NR | 50,226 | 52.4% | $15.00 | $753,390 | 38.3% | $312 | 5.3% | 11/30/2022(2) | ||
| Total Major Tenants | 50,226 | 52.4% | $15.00 | $753,390 | 38.3% | ||||||
| Total Non-Major Tenants | 42,371 | 44.2% | $28.60 | $1,211,926 | 61.7% | ||||||
| Occupied Collateral Total | 92,597 | 96.7% | $21.22 | $1,965,316 | 100.0% | ||||||
| Vacant Space | 3,177 | 3.3% | |||||||||
| Collateral Total | 95,774 | 100.0% | |||||||||
(1) Sales per square foot and occupancy costs are for the twelve months ended on December 31, 2011.
(2) QFC Grocery (Kroger) has six five-year options to renew.
The following table presents certain information relating to the lease rollover schedule at the Riverstone Marketplace Property:
Lease Expiration Schedule(1)(2)
| Year Ending, December 31, | No. of Leases Expiring | Expiring NRSF | % of Total NRSF | Cumulative of Total NRSF | Cumulative % of Total NRSF | Annual U/W Base Rent | Annual U/W Base Rent PSF(3) | |
| MTM | 1 | 1,222 | 1.3% | 1,222 | 1.3% | $32,383 | $26.50 | |
| 2012 | 1 | 1,617 | 1.7% | 2,839 | 3.0% | $36,641 | $22.66 | |
| 2013 | 10 | 15,474 | 16.2% | 18,313 | 19.1% | $460,857 | $29.78 | |
| 2014 | 1 | 875 | 0.9% | 19,188 | 20.0% | $24,990 | $28.56 | |
| 2015 | 4 | 11,059 | 11.5% | 30,247 | 31.6% | $337,361 | $30.51 | |
| 2016 | 2 | 6,651 | 6.9% | 36,898 | 38.5% | $161,846 | $24.33 | |
| 2017 | 1 | 1,587 | 1.7% | 38,485 | 40.2% | $41,268 | $26.00 | |
| 2018 | 1 | 3,886 | 4.1% | 42,371 | 44.2% | $116,580 | $30.00 | |
| 2019 | 0 | 0 | 0.0% | 42,371 | 44.2% | $0 | $0.00 | |
| 2020 | 0 | 0 | 0.0% | 42,371 | 44.2% | $0 | $0.00 | |
| 2021 | 0 | 0 | 0.0% | 42,371 | 44.2% | $0 | $0.00 | |
| 2022 | 1 | 50,226 | 52.4% | 92,597 | 96.7% | $753,390 | $15.00 | |
| Vacant | 0 | 3,177 | 3.3% | 95,774 | 100.0% | $0 | $0.00 | |
| Total/Weighted Average | 22 | 95,774 | 100.0% | $1,965,316 | $21.22 |
| (1) | Information obtained from underwritten rent roll. |
| (2) | Certain tenants may have lease termination options that are exercisable prior to the originally stated expiration date of the subject lease and that are not considered in the Lease Expiration Schedule. |
| (3) | Weighted Average Annual U/W Base Rent PSF excludes vacant space. |
The following table presents information relating to the historical occupancy at the Riverstone Marketplace Property:
Historical Occupancy Percentages(1)
12/31/2009 | 12/31/2010 | 12/31/2011 | ||
| 94% | 94% | 98% | ||
| (1) Information obtained from the borrower. | ||||
THE INFORMATION IN THIS STRUCTURAL AND COLLATERAL TERM SHEET IS NOT COMPLETE AND MAY BE AMENDED PRIOR TO THE TIME OF SALE. THIS TERM SHEET IS NOT AN OFFER TO SELL THESE SECURITIES AND IT IS NOT A SOLICITATION OF AN OFFER TO BUY THESE SECURITIES IN ANY JURISDICTION WHERE THE OFFER OR SALE IS NOT PERMITTED.
115
| RIVERSTONE MARKETPLACE |
Operating History and Underwritten Net Cash Flow. The following table presents certain information relating to the historical operating performance and the Underwritten Net Cash Flow at the Riverstone Marketplace Property:
Cash Flow Analysis
| 2010 | 2011 | YTD Annualized 4/30/2012 | U/W | U/W $ per SF | |||||||
| Base Rent | $1,805,236 | $1,817,689 | $1,888,413 | $1,981,398 | $20.69 | ||||||
| Grossed Up Vacant Space | 0 | 0 | 0 | 92,133 | 0.96 | ||||||
| Total Reimbursables | 301,137 | 342,520 | 292,663 | 509,018 | 5.31 | ||||||
| Other Income | 30,555 | (8,511) | 26,058 | 0 | 0.00 | ||||||
| Less Vacancy & Credit Loss | 0 | 0 | 0 | (184,544) | (1.93) | ||||||
| Effective Gross Income | $2,136,928 | $2,151,698 | $2,201,134 | $2,398,005 | $25.04 | ||||||
| Total Operating Expenses | $410,395 | $334,198 | $282,928 | $576,268 | $6.02 | ||||||
| Net Operating Income | $1,726,532 | $1,817,500 | $1,924,206 | $1,821,737 | $19.02 | ||||||
| TI/LC | 0 | 0 | 0 | 25,859 | 0.27 | ||||||
| Capital Expenditures | 6,261 | 95,512 | 0 | 113,878 | 1.19 | ||||||
| Net Cash Flow | $1,720,271 | $1,721,987 | $1,924,206 | $1,682,000 | $17.56 | ||||||
| NOI DSCR | 1.34x | 1.41x | 1.49x | 1.41x | |||||||
| NCF DSCR | 1.33x | 1.33x | 1.49x | 1.30x | |||||||
| NOI DY | 8.6% | 9.0% | 9.6% | 9.1% | |||||||
| NCF DY | 8.5% | 8.6% | 9.6% | 8.4% |
THE INFORMATION IN THIS STRUCTURAL AND COLLATERAL TERM SHEET IS NOT COMPLETE AND MAY BE AMENDED PRIOR TO THE TIME OF SALE. THIS TERM SHEET IS NOT AN OFFER TO SELL THESE SECURITIES AND IT IS NOT A SOLICITATION OF AN OFFER TO BUY THESE SECURITIES IN ANY JURISDICTION WHERE THE OFFER OR SALE IS NOT PERMITTED.
116
(THIS PAGE INTENTIONALLY LEFT BLANK)
117
| Napa Square | |||||||
Loan Information | Property Information | ||||||
| Mortgage Loan Seller: | Wells Fargo Bank, National Association | Single Asset/Portfolio: | Single Asset | ||||
| Credit Assessment (Fitch/KBRA/Moody’s): | NR/NR/NR | Property Type: | Mixed Use | ||||
| Original Principal Balance: | $20,000,000 | Specific Property Type: | Office/Retail | ||||
Cut-off Date Principal Balance: | $19,977,989 | Location: | Napa, CA | ||||
| % of Initial Pool Balance: | 1.5% | Size: | 65,857 SF | ||||
| Loan Purpose: | Refinance | Cut-off Date Principal Balance Per Unit/SF: | $303.35 | ||||
| Borrower Name: | Napa Square Associates, LLC | ||||||
| Sponsors: | CDI, LLC; Harry Price | Year Built/Renovated: | 2009/NAP | ||||
| Mortgage Rate: | 4.850% | Occupancy %: | 90.0% | ||||
| Note Date: | June 28, 2012 | Occupancy % Source Date: | May 8, 2012 | ||||
| Anticipated Repayment Date: | NAP | Title Vesting: | Fee | ||||
| Maturity Date: | July 1, 2022 | Property Manager: | CDI Development & Realty, Inc. | ||||
| IO Period: | None | ||||||
| Loan Term (Original): | 120 months | 3rd Most Recent NOI (As of)(5): | NAV | ||||
| Seasoning: | 1 month | 2nd Most Recent NOI (As of): | $786,552 (12/31/2010) | ||||
| Amortization Term (Original): | 360 months | Most Recent NOI (As of): | $944,173 (12/31/2011) | ||||
| Loan Amortization Type: | Amortizing Balloon | ||||||
| Interest Accrual Method: | Actual/360 | U/W Revenues: | $2,510,392 | ||||
| Call Protection: | L(25),D(91),O(4) | U/W Expenses: | $627,624 | ||||
| Lockbox Type: | Hard/Springing Cash Management | U/W NOI: | $1,882,768 | ||||
Additional Debt(1): | Yes | U/W NCF: | $1,806,212 | ||||
Additional Debt Type(1): | Pledge | U/W NOI DSCR: | 1.49x | ||||
| U/W NCF DSCR: | 1.43x | ||||||
| Escrows and Reserves: | U/W NOI Debt Yield: | 9.4% | |||||
| U/W NCF Debt Yield: | 9.0% | ||||||
| Type: | Initial | Monthly | Cap (If Any) | As-Is Appraised Value: | $29,100,000 | ||
| Taxes | $91,288 | $22,822 | NAP | As-Is Appraisal Valuation Date: | May 1, 2012 | ||
Insurance(2) | $0 | Springing | NAP | Cut-off Date LTV Ratio: | 68.7% | ||
| Replacement Reserves | $0 | $1,375 | $33,000 | LTV Ratio at Maturity or ARD: | 56.2% | ||
| TI/LC | $250,000 | $11,000 | $250,000 | ||||
Existing TI/LC(3) | $114,860 | $0 | NAP | ||||
Shell Space Reserve(4) | $400,000 | $0 | NAP | ||||
| (1) | CDI, LLC has pledged the entirety of its 49.0% beneficial interest in the related borrower to Wells Fargo Bank, National Association (the “Chadbourne Lender”) as additional security for that certain $11,200,000 loan (the “Chadbourne Loan”) dated October 27, 2005 and secured by two stabilized office buildings located in Fairfield, California. The Napa Square mortgage loan and the Chadbourne Loan are not cross-collateralized or cross-defaulted; however, the Chadbourne Lender’s remedies in event of a default under the Chadbourne Loan may result in an approved change of control in the related borrower. See “Risk Factors – Various Other Securitization-Level Conflicts of Interest May Have an Adverse Effect on Your Offered Certificates” in the Free Writing Prospectus. |
| (2) | Monthly insurance escrows are waived so long as no event of default has occurred and is continuing and the borrower provides satisfactory evidence that the Napa Square Property is insured in accordance with the loan documents. |
| (3) | Represents the remaining balance of tenant improvement work owed to Dickenson Peatman & Fogarty. |
| (4) | Represents a reserve for a 6,604 square foot vacant space in shell condition. This space was underwritten as vacant. |
| (5) | Financials for 2009 are not available as the property was constructed in 2009. |
The Napa Square mortgage loan is evidenced by a single promissory note that is secured by a first mortgage encumbering a mixed use office/retail property located in Napa, California (the “Napa Square Property”). The Napa Square Property contains 65,857 rentable square feet and was built in 2009. It is located in downtown Napa at the corner of 1st Street and Franklin Street, less than a mile east of Highway 29. As of May 8, 2012, the Napa Square Property was 90.0% leased to 13 tenants.
THE INFORMATION IN THIS STRUCTURAL AND COLLATERAL TERM SHEET IS NOT COMPLETE AND MAY BE AMENDED PRIOR TO THE TIME OF SALE. THIS TERM SHEET IS NOT AN OFFER TO SELL THESE SECURITIES AND IT IS NOT A SOLICITATION OF AN OFFER TO BUY THESE SECURITIES IN ANY JURISDICTION WHERE THE OFFER OR SALE IS NOT PERMITTED.
118
NAPA SQUARE
The following table presents certain information relating to the tenancies at the Napa Square Property:
Major Tenants
| Tenant Name | Credit Rating(Fitch/Moody’s/ S&P)(1) | Tenant NRSF | % of NRSF | Annual U/W Base Rent PSF | Annual U/W Base Rent | % of Total Annual U/W Base Rent | Lease Expiration Date |
| Major Tenants - Collateral | |||||||
Dickenson Peatman & Fogarty(2) | NR/NR/NR | 16,183 | 24.6% | $30.55 | $494,454 | 25.3% | 12/31/2021 |
| Wells Fargo Advisors | AA-/A2/A+ | 7,647 | 11.6% | $45.00 | $344,115 | 17.6% | 3/31/2016(3) |
Retirement Capital Strategies(4) | NR/NR/NR | 4,767 | 7.2% | $36.00 | $171,612 | 8.8% | 5/31/2019 |
| Norman Rose Tavern | NR/NR/NR | 4,080 | 6.2% | $33.23 | $135,577 | 7.0% | 12/31/2019 |
| Charles Schwab & Co. | A/A2/A | 3,739 | 5.7% | $36.00 | $134,604 | 6.9% | 5/31/2014 |
| U.S. Bank | AA-/Aa3/A | 3,447 | 5.2% | $36.00 | $124,092 | 6.4% | 6/21/2019 |
| Total Major Tenants - Collateral | 39,863 | 60.5% | $35.23 | $1,404,454 | 72.0% | ||
| Non-Major Tenants | 19,390 | 29.4% | $28.17 | $546,208 | 28.0% | ||
| Occupied Collateral Total | 59,253 | 90.0% | $32.92 | $1,950,662 | 100.0% | ||
| Vacant Space | 6,604 | 10.0% | |||||
| Collateral Total | 65,857 | 100.0% | |||||
| (1) | Certain ratings are those of the parent company whether or not the parent guarantees the lease. |
| (2) | Dickenson Peatman & Fogarty had a total of $321,285 in rent concessions payable by the landlord in 18 monthly installments commencing January 1, 2012 and ending June 1, 2013. At the time the lease was executed, the landlord fully funded the obligation into a third party trust account, and the funds are released to the tenant on a monthly basis. As of July 1, 2012, the outstanding balance on the landlord obligation was $189,596. |
| (3) | Wells Fargo Advisors may terminate its lease on March 31, 2014 with six months notice and payment to landlord of all unamortized TI and LC costs. |
| (4) | Retirement Capital Strategies subleases its entire space to Kuhlmann Associate Financial for a total annual base rent of $186,480 ($39.12 per square foot, expiring May 31, 2019). |
The following table presents certain information relating to the lease rollover schedule at the Napa Square Property:
Lease Expiration Schedule(1)(2)
Year Ending December 31, | No. of Leases Expiring | Expiring NRSF | % of Total NRSF | Cumulative of Total NRSF | Cumulative % of Total NRSF | Annual U/W Base Rent | Annual U/W Base Rent PSF(3) |
| MTM | 0 | 0 | 0.0% | 0 | 0.0% | $0 | $0.00 |
| 2012 | 0 | 0 | 0.0% | 0 | 0.0% | $0 | $0.00 |
| 2013 | 0 | 0 | 0.0% | 0 | 0.0% | $0 | $0.00 |
| 2014 | 3 | 6,365 | 9.7% | 6,365 | 9.7% | $205,020 | $32.21 |
| 2015 | 1 | 1,908 | 2.9% | 8,273 | 12.6% | $47,624 | $24.96 |
| 2016 | 6 | 18,500 | 28.1% | 26,773 | 40.7% | $645,755 | $34.91 |
| 2017 | 1 | 1,370 | 2.1% | 28,143 | 42.7% | $45,204 | $33.00 |
| 2018 | 0 | 0 | 0.0% | 28,143 | 42.7% | $0 | $0.00 |
| 2019 | 5 | 12,294 | 18.7% | 40,437 | 61.4% | $431,281 | $35.08 |
| 2020 | 0 | 0 | 0.0% | 40,437 | 61.4% | $0 | $0.00 |
| 2021 | 1 | 16,183 | 24.6% | 56,620 | 86.0% | $494,454 | $30.55 |
| 2022 | 1 | 2,633 | 4.0% | 59,253 | 90.0% | $81,324 | $30.89 |
| Thereafter | 0 | 0 | 0.0% | 59,253 | 90.0% | $0 | $0.00 |
| Vacant | 0 | 6,604 | 10.0% | 65,857 | 100.0% | $0 | $0.00 |
| Total/Weighted Average | 18 | 65,857 | 100.0% | $1,950,662 | $32.92 |
| (1) | Information obtained from underwritten rent roll. |
| (2) | Certain tenants may have lease termination options that are exercisable prior to the originally stated expiration date of the subject lease and that are not considered in the Lease Expiration Schedule. |
| (3) | Annual U/W Base Rent PSF excludes vacant space. |
119
NAPA SQUARE
The following table presents historical occupancy percentages at the Napa Square Property:
Historical Occupancy Percentages(1)(2)
12/31/2009 | 12/31/2010 | 12/31/2011 | ||
| 48% | 73% | 87% |
| (1) | Information obtained from the borrower. |
| (2) | The Napa Square Property was built in 2009 and was still in its lease-up phase in 2009 and 2010. |
Operating History and Underwritten Net Cash Flow. The following table presents certain information relating to the historical operating performance and the Underwritten Net Cash Flow at the Napa Square Property:
Cash Flow Analysis
| 2010 | 2011 | U/W(1) | U/W $ per SF | ||||
| Base Rent | $983,285 | $1,170,549 | $1,950,662 | $29.62 | |||
| Grossed Up Vacant Space | 0 | 0 | 237,744 | 3.61 | |||
| Percentage Rent | 0 | 0 | 6,840 | 0.10 | |||
| Total Reimbursables | 268,795 | 301,261 | 506,872 | 7.70 | |||
| Other Income | 49,802 | 42,232 | 46,017 | 0.70 | |||
| Less Vacancy & Credit Loss | 0 | 0 | (237,744) | (3.61) | |||
| Effective Gross Income | $1,301,882 | $1,514,042 | $2,510,392 | $38.12 | |||
| Total Operating Expenses | $515,330 | $569,868 | $627,624 | $9.53 | |||
| Net Operating Income | $786,552 | $944,173 | $1,882,768 | $28.59 | |||
| TI/LC | 67,092 | 139,284 | 63,384 | 0.96 | |||
| Capital Expenditures | 15,704 | 15,505 | 13,171 | 0.20 | |||
| Net Cash Flow | $703,756 | $789,384 | $1,806,212 | $27.43 | |||
| NOI DSCR | 0.62x | 0.75x | 1.49x | ||||
| NCF DSCR | 0.56x | 0.62x | 1.43x | ||||
| NOI DY | 3.9% | 4.7% | 9.4% | ||||
| NCF DY | 3.5% | 4.0% | 9.0% |
| (1) | U/W NOI is higher than historical since the Napa Square Property was built in 2009 and was still in its lease-up phase, which also explains why 2009 financials are not available. |
120
121
| Holiday Inn Disneyland | |||||||
| Loan Information | Property Information | ||||||
| Mortgage Loan Seller: | Wells Fargo, National Association | Single Asset/Portfolio: | Single Asset | ||||
Credit Assessment (Fitch/KBRA/Moody’s): | NR/NR/NR | Property Type: | Hospitality | ||||
| Original Principal Balance: | $20,300,000 | Specific Property Type: | Full Service | ||||
| Cut-off Date Principal Balance: | $19,944,076 | Location: | Anaheim, CA | ||||
| % of Initial Pool Balance: | 1.5% | Size: | 255 rooms | ||||
| Loan Purpose: | Acquisition | Cut-off Date Principal Balance Per Unit/Room: | $78,212 | ||||
Borrower Names(1): | 1240 South Walnut, LLC and Urban Commons Anaheim HI, LLC | ||||||
| Sponsors: | Howard Wu, Taylor Woods, Frank W. Yuen | Year Built/Year Renovated: | 1978/2009 | ||||
| Mortgage Rate: | 5.220% | Occupancy %: | 82.4% | ||||
| Note Date: | August 5, 2011 | Occupancy % Source Date: | April 30, 2012 | ||||
| Anticipated Repayment Date: | NAP | Title Vesting: | Fee | ||||
| Maturity Date: | September 1, 2016 | Property Manager: | Brighton Management, LLC | ||||
| IO Period: | None | ||||||
| Loan Term (Original): | 60 months | 3rd Most Recent NOI (As of): | $1,751,900 (12/31/2009) | ||||
| Seasoning: | 11 months | 2nd Most Recent NOI (As of): | $2,964,113 (12/31/2010) | ||||
| Amortization Term (Original): | 300 months | Most Recent NOI (As of): | $2,885,698 (T9 Annualized 4/30/2012) | ||||
| Loan Amortization Type: | Amortizing Balloon | ||||||
| Interest Accrual Method: | Actual/360 | U/W Revenues: | $8,571,454 | ||||
| Call Protection: | L(35),D(21),O(4) | U/W Expenses: | $5,723,540 | ||||
| Lockbox Type: | Soft/Springing Cash Management | U/W NOI: | $2,847,913 | ||||
| Additional Debt: | None | U/W NCF: | $2,463,995 | ||||
| Additional Debt Type: | NAP | U/W NOI DSCR: | 1.96x | ||||
| U/W NCF DSCR: | 1.69x | ||||||
| Escrows and Reserves: | U/W NOI Debt Yield: | 14.3% | |||||
| U/W NCF Debt Yield: | 12.4% | ||||||
| Type: | Initial | Monthly | Cap (If Any) | As-Is Appraised Value: | $32,800,000 | ||
| Taxes | $125,124 | $20,854 | NAP | As-Is Appraisal Valuation Date: | June 4, 2012 | ||
| Insurance | $23,250 | $7,750 | NAP | Cut-off Date LTV Ratio: | 60.8% | ||
| Deferred Maintenance | $15,000 | $0 | NAP | LTV Ratio at Maturity or ARD: | 55.3% | ||
FF&E Reserve(2) | $0 | $30,356 | NAP | ||||
PIP Reserve(3) | $2,113,850 | Springing | NAP | ||||
Seasonality Reserve(4) | $142,129 | Springing | $142,129 | ||||
| (1) | The borrower is comprised of two tenants-in-common (“TIC”). The loan documents permit the one-time transfer of all the interest of 1240 South Walnut, LLC to Urban Commons Anaheim HI, LLC as well as the one-time right to transfer all of the interests of Urban Commons Anaheim HI, LLC to 1240 South Walnut, LLC. The loan documents prohibit additional TIC sponsors. |
| (2) | Monthly payments may be adjusted by the lender to the greater of the then-existing FF&E Reserve monthly deposit or of one-twelfth of 6.0% of the prior year annual gross room revenue. |
| (3) | The remaining balance as of the Cut-off Date is $1,605,594. If at any time, any additional Property Improvement Plan (“PIP”) work is required by the franchisor under the franchise agreement, within15 days after receipt of notice from the franchisor, the sponsor must deposit an amount equal to 125% of the estimated costs to complete the additional PIP work as determined by the lender. |
| (4) | The Seasonality Reserve may be used for the debt service payment due in January, April, September and November for each calendar year. In June of each calendar year, the borrower will deposit with the lender the difference between the then current balance of the Seasonality Reserve and $142,129. |
The Holiday Inn Disneyland mortgage loan is evidenced by a single promissory note secured by a first mortgage encumbering a full-service hotel containing a total of 255 rooms (the “Holiday Inn Disneyland Property”). The Holiday Inn Disneyland Property is located adjacent to Disneyland Park in Anaheim, California. The Holiday Inn Disneyland Property was built in 1978 and underwent a $6.5 million renovation in 2009. All guest rooms offer cable television, pay-per view movies and Nintendo 64, wireless high-speed internet access and floor-to-ceiling windows. Suites offer separated bedroom and living areas, sofa sleeper, refrigerator, microwave and Jacuzzi tubs. The Holiday Inn Disneyland Property’s amenities include a restaurant, a business center, fitness center, outdoor heated pool and Jacuzzi with private cabanas, and 5,400 square feet of meeting space.
THE INFORMATION IN THIS STRUCTURAL AND COLLATERAL TERM SHEET IS NOT COMPLETE AND MAY BE AMENDED PRIOR TO THE TIME OF SALE. THIS TERM SHEET IS NOT AN OFFER TO SELL THESE SECURITIES AND IT IS NOT A SOLICITATION OF AN OFFER TO BUY THESE SECURITIES IN ANY JURISDICTION WHERE THE OFFER OR SALE IS NOT PERMITTED.
122
| HOLIDAY INN DISNEYLAND |
The following table presents certain information relating the historical performance of the Holiday Inn Disneyland Property compared to the performance of a competitive set of properties as provided in a third party hospitality report dated May 17, 2012:
Subject and Market Historical Occupancy, ADR and RevPAR(1)
Competitive Set | Holiday Inn - Disneyland Property | Penetration Factor | ||||||||||||||
Year | Occupancy | ADR | RevPAR | Occupancy | ADR | RevPAR | Occupancy | ADR | RevPAR | |||||||
| 4/30/2012 TTM | 74.7% | $92.49 | $69.06 | 80.4% | $83.75 | $67.33 | 107.7% | 90.6% | 97.5% | |||||||
| 4/30/2011 TTM | 73.1% | $88.46 | $64.70 | 83.9% | $85.23 | $71.54 | 114.8% | 96.3% | 110.6% | |||||||
| 4/30/2010 TTM | 70.2% | $84.73 | $59.48 | 77.5% | $81.28 | $62.98 | 110.4% | 95.9% | 105.9% | |||||||
| (1) | Data provided by a third party hospitality market research report dated May 2012. |
According to the appraisal, the Holiday Inn Disneyland Property is located within the Orange County lodging market. Orange County is the home to Disneyland Resort and Knott’s Berry Farm theme parks, two of the most popular recreational attractions. In 2011, an estimated 42.9 million visitors spent approximately $7.8 billion in Orange County. In addition, there was estimated to be approximately 450,000 additional overnight visitors in Orange County hotels in 2011 compared to 2010. The year-end 2011 overall Orange County lodging market occupancy finished at 71.5%, with an ADR of $122.12, reflecting a RevPAR of $87.31.
The following table presents certain information relating to the historical operating performance and the Underwritten Net Cash Flow at the Holiday Inn Disneyland Property:
Cash Flow Analysis
2009(1) | 2010 | T9 Annualized 4/30/2012(2) | U/W | U/W $ per Room | |||||
| Occupancy | 71.6% | 84.9% | 82.3% | 80.0% | |||||
| ADR | $77.06 | $75.51 | $85.68 | $85.68 | |||||
| RevPAR | $55.15 | $64.12 | $70.54 | $68.54 | |||||
| Total Revenue | 6,354,656 | 8,184,672 | 8,566,321 | 8,571,454 | 33,614 | ||||
| Total Department Expenses | 2,133,166 | 2,737,531 | 3,340,226 | 3,093,200 | 12,130 | ||||
| Gross Operating Profit | $4,221,490 | $5,447,141 | $5,226,095 | $5,478,253 | $21,483 | ||||
| Total Undistributed Expenses | 2,198,929 | 2,185,411 | 1,975,519 | 2,193,320 | 8,601 | ||||
| Profit Before Fixed Charges | $2,022,561 | $3,261,730 | $3,250,576 | $3,284,934 | $12,882 | ||||
| Total Fixed Charges | 270,661 | 297,617 | 364,878 | 437,021 | 1,714 | ||||
| Net Operating Income | $1,751,900 | $2,964,113 | $2,885,698 | $2,847,913 | $11,168 | ||||
| FF&E | 190,640 | 245,540 | 0 | 383,918 | 1,506 | ||||
| Net Cash Flow | $1,561,260 | $2,718,573 | $2,885,698 | $2,463,995 | $9,663 | ||||
| NOI DSCR | 1.20x | 2.04x | 1.98x | 1.96x | |||||
| NCF DSCR | 1.07x | 1.87x | 1.98x | 1.69x | |||||
| NOI DY | 8.8% | 14.9% | 14.5% | 14.3% | |||||
| NCF DY | 7.8% | 13.6% | 14.5% | 12.4% | |||||
| (1) | The property underwent a $6.5 million renovation in 2008 and 2009 and some rooms were not available during the renovation. |
(2) | Operating statements for May, June and July 2011 were unavailable since the borrower only acquired the property in August 2011 and borrower due diligence information was only available through April 2011. However a third party hospitality market research report indicates that the property achieved occupancy of 89.5%, an ADR of $91.42 and RevPAR of $82.25 during May, June and July 2011. A weighted average of the trailing nine-month operating statements and May-July 2011 numbers reported by a third party hospitality market research report equate to occupancy of 82.3%, an ADR of $85.68, and a RevPAR of $70.54 |
THE INFORMATION IN THIS STRUCTURAL AND COLLATERAL TERM SHEET IS NOT COMPLETE AND MAY BE AMENDED PRIOR TO THE TIME OF SALE. THIS TERM SHEET IS NOT AN OFFER TO SELL THESE SECURITIES AND IT IS NOT A SOLICITATION OF AN OFFER TO BUY THESE SECURITIES IN ANY JURISDICTION WHERE THE OFFER OR SALE IS NOT PERMITTED.
123
| WFRBS Commercial Mortgage Trust 2012-C8 | Transaction Contact Information |
VI. Transaction Contact Information
Questions regarding this Structural and Collateral Term Sheet may be directed to any of the following individuals:
| Wells Fargo Securities, LLC | RBS Securities Inc. | ||
| Kara McShane | Tel. (212) 214-5617 | Jeff Wilson | Tel. (203) 897-2900 |
Fax (212) 214-8970 | |||
| Brigid Mattingly | Tel. (312) 269-3062 | Adam Ansaldi | Tel. (203) 897-0881 |
| Fax (312) 658-0140 | Fax (203) 873-3542 | ||
| Matthew Orrino | Tel. (212) 214-5608 | Jim Barnard | Tel. (203) 897-4417 |
| Fax (212) 214-8970 | Fax (203) 873-4310 | ||
THE INFORMATION IN THIS STRUCTURAL AND COLLATERAL TERM SHEET IS NOT COMPLETE AND MAY BE AMENDED PRIOR TO THE TIME OF SALE. THIS TERM SHEET IS NOT AN OFFER TO SELL THESE SECURITIES AND IT IS NOT A SOLICITATION OF AN OFFER TO BUY THESE SECURITIES IN ANY JURISDICTION WHERE THE OFFER OR SALE IS NOT PERMITTED.
124