| FREE WRITING PROSPECTUS | ||
| FILED PURSUANT TO RULE 433 | ||
| REGISTRATION FILE NO.: 333-172366-06 | ||
 |  |
Free Writing Prospectus
Structural and Collateral Term Sheet
$1,231,492,115
(Approximate Aggregate Cut-off Date Balance of Mortgage Pool)
$1,018,342,000
(Approximate Aggregate Principal Balance of Offered Certificates)
WFRBS Commercial Mortgage Trust 2013-C12
as Issuing Entity
Wells Fargo Commercial Mortgage Securities, Inc.
as Depositor
The Royal Bank of Scotland
Wells Fargo Bank, National Association
Liberty Island Group I LLC
C-III Commercial Mortgage LLC
Basis Real Estate Capital II, LLC
NCB, FSB
as Sponsors and Mortgage Loan Sellers
Commercial Mortgage Pass-Through Certificates
Series 2013-C12
February 22, 2013
| WELLS FARGO SECURITIES | RBS | |||
| Co-Lead Manager and | Co-Lead Manager and | |||
| Co-Bookrunner | Co-Bookrunner | |||
Deutsche Bank Securities
Co-Manager
STATEMENT REGARDING THIS FREE WRITING PROSPECTUS
The depositor has filed a registration statement (including a prospectus) with the Securities and Exchange Commission (‘‘SEC’’) (SEC File No. 333-172366) for the offering to which this communication relates. Before you invest, you should read the prospectus in the registration statement and other documents the depositor has filed with the SEC for more complete information about the depositor, the issuing entity and this offering. You may get these documents for free by visiting EDGAR on the SEC Web site at www.sec.gov. Alternatively, the depositor, any underwriter, or any dealer participating in the offering will arrange to send you the prospectus after filing if you request it by calling toll free 1-800-745-2063 (8 a.m. – 5 p.m. EST) or by emailing wfs.cmbs@wellsfargo.com.
Nothing in this document constitutes an offer of securities for sale in any other jurisdiction where the offer or sale is not permitted. The information contained herein is preliminary as of the date hereof, supersedes any such information previously delivered to you and will be superseded by any such information subsequently delivered and ultimately by the final prospectus relating to the securities. These materials are subject to change, completion, supplement or amendment from time to time.
STATEMENT REGARDING ASSUMPTIONS AS TO SECURITIES, PRICING ESTIMATES AND OTHER INFORMATION
The attached information contains certain tables and other statistical analyses (the “Computational Materials”) which have been prepared in reliance upon information furnished by the Mortgage Loan Sellers. Numerous assumptions were used in preparing the Computational Materials, which may or may not be reflected herein. As such, no assurance can be given as to the Computational Materials’ accuracy, appropriateness or completeness in any particular context; or as to whether the Computational Materials and/or the assumptions upon which they are based reflect present market conditions or future market performance. The Computational Materials should not be construed as either projections or predictions or as legal, tax, financial or accounting advice. You should consult your own counsel, accountant and other advisors as to the legal, tax, business, financial and related aspects of a purchase of these securities. Any weighted average lives, yields and principal payment periods shown in the Computational Materials are based on prepayment and/or loss assumptions, and changes in such prepayment and/or loss assumptions may dramatically affect such weighted average lives, yields and principal payment periods. In addition, it is possible that prepayments or losses on the underlying assets will occur at rates higher or lower than the rates shown in the attached Computational Materials. The specific characteristics of the securities may differ from those shown in the Computational Materials due to differences between the final underlying assets and the preliminary underlying assets used in preparing the Computational Materials. The principal amount and designation of any security described in the Computational Materials are subject to change prior to issuance. None of Wells Fargo Securities, LLC (“WFS”), RBS Securities Inc. (“RBSSI”), Deutsche Bank Securities Inc. or any of their respective affiliates make any representation or warranty as to the actual rate or timing of payments or losses on any of the underlying assets or the payments or yield on the securities. The information in this presentation is based upon management forecasts and reflects prevailing conditions and management’s views as of this date, all of which are subject to change. In preparing this presentation, we have relied upon and assumed, without independent verification, the accuracy and completeness of all information available from public sources or which was provided to us by or on behalf of the Mortgage Loan Sellers or which was otherwise reviewed by us.
This free writing prospectus contains certain forward-looking statements. If and when included in this free writing prospectus, the words “expects”, “intends”, “anticipates”, “estimates” and analogous expressions and all statements that are not historical facts, including statements about our beliefs or expectations, are intended to identify forward-looking statements. Any forward-looking statements are made subject to risks and uncertainties which could cause actual results to differ materially from those stated. Those risks and uncertainties include, among other things, declines in general economic and business conditions, increased competition, changes in demographics, changes in political and social conditions, regulatory initiatives and changes in customer preferences, many of which are beyond our control and the control of any other person or entity related to this offering. The forward-looking statements made in this free writing prospectus are made as of the date stated on the cover. We have no obligation to update or revise any forward-looking statement.
Wells Fargo Securities is the trade name for certain capital markets and investment banking services of Wells Fargo & Company and its subsidiaries, including Wells Fargo Securities, LLC, member FINRA and SIPC, and Wells Fargo Bank, National Association.
RBS is a trade name for the investment banking business of RBSSI. Securities, syndicated loan arranging, financial advisory and other investment banking activities are performed by RBSSI and their securities affiliates. Lending, derivatives and other commercial banking activities are performed by The Royal Bank of Scotland plc and their banking affiliates. RBSSI is a member of SIPC, FINRA and the NYSE.
IRS CIRCULAR 230 NOTICE
THIS TERM SHEET IS NOT INTENDED OR WRITTEN TO BE USED, AND CANNOT BE USED, FOR THE PURPOSE OF AVOIDING U.S. FEDERAL, STATE OR LOCAL TAX PENALTIES. THIS TERM SHEET IS WRITTEN AND PROVIDED BY THE DEPOSITOR IN CONNECTION WITH THE PROMOTION OR MARKETING BY THE DEPOSITOR AND THE CO-LEAD BOOKRUNNING MANAGERS OF THE TRANSACTION OR MATTERS ADDRESSED HEREIN. INVESTORS SHOULD SEEK ADVICE BASED ON THEIR PARTICULAR CIRCUMSTANCES FROM AN INDEPENDENT TAX ADVISOR.
IMPORTANT NOTICE REGARDING THE OFFERED CERTIFICATES
The Offered Certificates referred to in these materials and the asset pool backing them are subject to modification or revision (including the possibility that one or more classes of certificates may be split, combined or eliminated at any time prior to issuance or availability of a final prospectus) and are offered on a “when, as and if issued” basis. Prospective investors should understand that, when considering the purchase of the Offered Certificates, a contract of sale will come into being no sooner than the date on which the relevant class of certificates has been priced and the underwriters have confirmed the allocation of certificates to be made to investors; any “indications of interest” expressed by any prospective investor, and any “soft circles” generated by the underwriters, will not create binding contractual obligations for such prospective investors, on the one hand, or the underwriters, the depositor or any of their respective agents or affiliates, on the other hand.
As a result of the foregoing, a prospective investor may commit to purchase certificates that have characteristics that may change, and each prospective investor is advised that all or a portion of the certificates referred to in these materials may be issued without all or certain of the characteristics described in these materials. The underwriters’ obligation to sell certificates to any prospective investor is conditioned on the certificates and the transaction having the characteristics described in these materials. If the underwriters determine that a condition is not satisfied in any material respect, such prospective investor will be notified, and neither the depositor nor the underwriters will have any obligation to such prospective investor to deliver any portion of the Offered Certificates which such prospective investor has committed to purchase, and there will be no liability between the underwriters, the depositor or any of their respective agents or affiliates, on the one hand, and such prospective investor, on the other hand, as a consequence of the non-delivery.
Each prospective investor has requested that the underwriters provide to such prospective investor information in connection with such prospective investor’s consideration of the purchase of the certificates described in these materials. These materials are being provided to each prospective investor for informative purposes only in response to such prospective investor’s specific request. The underwriters described in these materials may from time to time perform investment banking services for, or solicit investment banking business from, any company named in these materials. The underwriters and/or their affiliates or respective employees may from time to time have a long or short position in any security or contract discussed in these materials.
The information contained herein supersedes any previous such information delivered to any prospective investor and will be superseded by information delivered to such prospective investor prior to the time of sale.
IMPORTANT NOTICE RELATING TO AUTOMATICALLY-GENERATED EMAIL DISCLAIMERS
Any legends, disclaimers or other notices that may appear at the bottom of any email communication to which this free writing prospectus is attached relating to (1) these materials not constituting an offer (or a solicitation of an offer), (2) no representation that these materials are accurate or complete and may not be updated or (3) these materials possibly being confidential, are not applicable to these materials and should be disregarded. Such legends, disclaimers or other notices have been automatically generated as a result of these materials having been sent via Bloomberg or another system.
THE INFORMATION IN THIS STRUCTURAL AND COLLATERAL TERM SHEET IS NOT COMPLETE AND MAY BE AMENDED PRIOR TO THE TIME OF SALE. THIS TERM SHEET IS NOT AN OFFER TO SELL THESE SECURITIES AND IT IS NOT A SOLICITATION OF AN OFFER TO BUY THESE SECURITIES IN ANY JURISDICTION WHERE THE OFFER OR SALE IS NOT PERMITTED.
2
| WFRBS Commercial Mortgage Trust 2013-C12 | Certificate Structure |
I. Certificate Structure
Expected Ratings (Fitch/KBRA/S&P)(1) | Approximate Initial Certificate Balance or Notional Amount(2) | Approx. Initial Credit Support(3) | Pass- Through Rate Description | Weighted Average Life (Years)(4) | Expected Principal Window(4) | Certificate Principal to Value Ratio(5) | Certificate Principal U/W NOI Debt Yield(6) | |||
| Offered Certificates | ||||||||||
| A-1 | AAA(sf)/AAA(sf)/AAA(sf) | $63,911,000 | 30.000% | (7) | 2.67 | 04/13 – 01/18 | 35.0% | 17.7% | ||
| A-2 | AAA(sf)/AAA(sf)/AAA(sf) | $142,980,000 | 30.000% | (7) | 4.87 | 01/18 – 03/18 | 35.0% | 17.7% | ||
| A-3 | AAA(sf)/AAA(sf)/AAA(sf) | $165,000,000 | 30.000% | (7) | 9.55 | 04/21 – 01/23 | 35.0% | 17.7% | ||
| A-4 | AAA(sf)/AAA(sf)/AAA(sf) | $298,198,000 | 30.000% | (7) | 9.92 | 01/23 – 03/23 | 35.0% | 17.7% | ||
| A-SB | AAA(sf)/AAA(sf)/AAA(sf) | $101,955,000 | 30.000% | (7) | 7.40 | 03/18 – 12/22 | 35.0% | 17.7% | ||
| A-S | AAA(sf)/AAA(sf)/AAA(sf) | $120,070,000 | 20.250% | (7) | 9.99 | 03/23 – 03/23 | 39.9% | 15.5% | ||
| B | AA-(sf)/AA-(sf)/AA-(sf) | $75,429,000 | 14.125% | (7) | 9.99 | 03/23 – 03/23 | 43.0% | 14.4% | ||
| C | A-(sf)/A-(sf)/A-(sf) | $50,799,000 | 10.000% | (7) | 9.99 | 03/23 – 03/23 | 45.1% | 13.8% | ||
| Non-Offered Certificates | ||||||||||
| X-A | AAA(sf)/AAA(sf)/AAA(sf) | $982,114,000(8) | N/A | Variable(9) | N/A | N/A | N/A | N/A | ||
| X-B | A-(sf)/AAA(sf)/A-(sf) | $126,228,000(10) | N/A | Variable(11) | N/A | N/A | N/A | N/A | ||
| X-C | NR/NR/NR | $81,587,114(12) | N/A | Variable(13) | N/A | N/A | N/A | N/A | ||
A-3FL(14) | AAA(sf)/AAA(sf)/AAA(sf)(15) | $90,000,000(14) | 30.000% | Libor Plus(16) | 9.55 | 04/21 – 01/23 | 35.0% | 17.7% | ||
A-3FX(14) | AAA(sf)/AAA(sf)/AAA(sf) | $0 (14) | 30.000% | (7) | 9.55 | 04/21 – 01/23 | 35.0% | 17.7% | ||
| D | BBB-(sf)/BBB-(sf)/BBB-(sf) | $41,563,000 | 6.625% | (7) | 9.99 | 03/23 – 03/23 | 46.8% | 13.3% | ||
| E | BB(sf)/BB(sf)/BB(sf) | $27,709,000 | 4.375% | (7) | 9.99 | 03/23 – 03/23 | 47.9% | 12.9% | ||
| F | B(sf)/B(sf)/B+(sf) | $16,933,000 | 3.000% | (7) | 9.99 | 03/23 – 03/23 | 48.6% | 12.8% | ||
| G | NR/NR/NR | $36,945,114 | 0.000% | (7) | 9.99 | 03/23 – 03/23 | 50.1% | 12.4% | ||
Notes:
| (1) | The expected ratings presented are those of Fitch, Inc. (“Fitch”), Kroll Bond Rating Agency, Inc. (“KBRA”) and Standard & Poor’s Ratings Services (“S&P”) which the depositor hired to rate the rated offered certificates. One or more other nationally recognized statistical rating organizations that were not hired by the depositor may use information they receive pursuant to Rule 17g-5 under the Securities Exchange Act of 1934, as amended (the “Exchange Act”) or otherwise, to rate or provide market reports and/or published commentary related to the offered certificates. We cannot assure you as to what ratings a non-hired nationally recognized statistical rating organization would assign or that its reports will not express differing, possibly negative, views of the mortgage loans and/or the offered certificates. See “Risk Factors—Risks Related to the Offered Certificates—Risks Related to the Offered Certificates – Ratings on the Certificates Have Substantial Limitations and Ratings” in the free writing prospectus, dated February 22, 2013 (the “Free Writing Prospectus”). |
| (2) | The principal balances and notional amounts set forth in the table are approximate. The actual initial principal balances and notional amounts may be larger or smaller depending on the aggregate cut-off date principal balance of the mortgage loans definitively included in the pool of mortgage loans, which aggregate cut-off date principal balance may be as much as 5% larger or smaller than the amount presented in the Free Writing Prospectus. |
| (3) | The approximate initial credit support with respect to the Class A-1, A-2, A-3, A-3FL, A-3FX, A-4 and A-SB Certificates represents the approximate credit enhancement for the Class A-1, A-2, A-3, A-3FL, A-3FX, A-4 and A-SB Certificates in the aggregate. No class of Certificates will provide any credit support to the Class A-3FL Certificates for any failure by the swap counterparty to make the payment under the related swap contract. |
| (4) | Weighted Average Lives and Expected Principal Windows are calculated based on an assumed prepayment rate of 0% CPR and the “Structuring Assumptions” described on Annex B to the Free Writing Prospectus. |
| (5) | The Certificate Principal to Value Ratio for each Class of Certificates (other than the Class A-1, A-2, A-3, A-3FL, A-3FX, A-4 and A-SB Certificates) is calculated by dividing the aggregate principal balance of such class of certificates and all classes of certificates senior to such class by the aggregate appraised value of $2,459,509,212 (calculated as described in the Free Writing Prospectus) of the mortgaged properties securing the mortgage loans (excluding, with respect to the One South Wacker Drive loan combination, a pro rata portion of the related appraised value allocated to the related companion loan based on its cut-off date principal balance). The Certificate Principal to Value Ratios for each of the Class A-1, A-2, A-3, A-3FL, A-3FX, A-4 and A-SB Certificates are calculated by dividing the aggregate principal balance of the Class A-1, A-2, A-3, A-3FL, A-3FX, A-4 and A-SB Certificates by such aggregate appraised value (excluding, with respect to the One South Wacker Drive loan combination, a pro rata portion of the related appraised value allocated to the related companion loan based on its cut-off date principal balance). However, excess mortgaged property value associated with a mortgage loan will not be available to offset losses on any other mortgage loan (unless such mortgage loans are cross-collateralized and the cross-collateralization remains in effect). |
| (6) | The Certificate Principal U/W NOI Debt Yield for each Class of Certificates (other than the Class A-1, A-2, A-3, A-3FL, A-3FX, A-4 and A-SB Certificates) is calculated by dividing the underwritten net operating income (which excludes, with respect to the One South Wacker Drive loan combination, a pro rata portion of the related underwritten net operating income allocated to the related companion loan based on its cut-off date principal balance) for the mortgage pool of $152,398,895 (calculated as described in the Free Writing Prospectus) by the aggregate certificate balance of such class of certificates and all classes of certificates senior to such class of certificates. The Underwritten NOI Debt Yield for each of the Class A-1, A-2, A-3, A-3FL, A-3FX, A-4 and A-SB Certificates is calculated by dividing such mortgage pool underwritten net operating income (which excludes, with respect to the One South Wacker Drive loan combination, a pro rata portion of the related underwritten net operating income allocated to the related companion loan based on its cut-off date principal balance) by the aggregate principal balance of the Class A-1, A-2, A-3, A-3FL, A-3FX, A-4 and A-SB Certificates. However, cash flow from each mortgaged property supports only the related mortgage loan and will not be available to support any other mortgage loan (unless such mortgage loans are cross-collateralized and the cross-collateralization remains in effect). |
| (7) | The pass-through rates for the Class A-1, A-2, A-3, A-3FX, A-4, A-SB, A-S, B, C, D, E, F and G Certificates and the Class A-3FX Regular Interest in each case will be one of the following: (i) a fixed rate per annum, (ii) the WAC Rate (as defined in the Free Writing Prospectus) for the related distribution date, (iii) a variable rate per annum equal to the lesser of (a) a fixed rate and (b) the WAC Rate for the related distribution date or (iv) a variable rate per annum equal to the WAC Rate for the related distribution date minus a specified percentage. |
| (8) | The Class X-A Certificates are notional amount certificates. The Notional Amount of the Class X-A Certificates will be equal to the aggregate principal balance of the Class A-1, A-2, A-3, A-4, A-SB and A-S Certificates and the Class A-3FX Regular Interest outstanding from time to time. The Class X-A Certificates will not be entitled to distributions of principal. |
| (9) | The pass-through rate for the Class X-A Certificates for any distribution date will be a per annum rate equal to the excess, if any, of (a) the WAC Rate for the related distribution date, over (b) the weighted average of the pass-through rates on the Class A-1, A-2, A-3, A-4, A-SB and A-S Certificates and the Class A-3FX Regular Interest for the related distribution date, weighted on the basis of their respective aggregate principal balances outstanding immediately prior to that distribution date. |
THE INFORMATION IN THIS STRUCTURAL AND COLLATERAL TERM SHEET IS NOT COMPLETE AND MAY BE AMENDED PRIOR TO THE TIME OF SALE. THIS TERM SHEET IS NOT AN OFFER TO SELL THESE SECURITIES AND IT IS NOT A SOLICITATION OF AN OFFER TO BUY THESE SECURITIES IN ANY JURISDICTION WHERE THE OFFER OR SALE IS NOT PERMITTED.
3
| WFRBS Commercial Mortgage Trust 2013-C12 | Certificate Structure |
| (10) | The Class X-B Certificates are notional amount certificates. The Notional Amount of the Class X-B Certificates will be equal to the aggregate principal balance of the Class B and C Certificates outstanding from time to time. The Class X-B Certificates will not be entitled to distributions of principal. |
| (11) | The pass-through rate for the Class X-B Certificates for any distribution date will be a per annum rate equal to the excess, if any, of (a) the WAC Rate for the related distribution date, over (b) the weighted average of the pass-through rates on the Class B and C Certificates for the related distribution date, weighted on the basis of their respective aggregate principal balances outstanding immediately prior to that distribution date. |
| (12) | The Class X-C Certificates are notional amount certificates. The Notional Amount of the Class X-C Certificates will be equal to the aggregate principal balance of the Class E, F and G Certificates outstanding from time to time. The Class X-C Certificates will not be entitled to distributions of principal. |
| (13) | The pass-through rate for the Class X-C Certificates for any distribution date will be a per annum rate equal to the excess, if any, of (a) the WAC Rate for the related distribution date, over (b) the weighted average of the pass-through rates on the Class E, F and G Certificates for the related distribution date, weighted on the basis of their respective aggregate principal balances outstanding immediately prior to that distribution date. |
| (14) | The Class A-3FL Certificates will evidence a beneficial interest in a grantor trust that includes the Class A-3FX Regular Interest and an interest rate swap contract. Under certain circumstances, holders of the Class A-3FL Certificates may exchange all or a portion of their certificates for a like principal amount of Class A-3FX Certificates having the same pass-through rate as the Class A-3FX Regular Interest. The aggregate principal balance of the Class A-3FL Certificates may be adjusted from time to time as a result of such an exchange. The aggregate principal balance of the Class A-3FX Certificates and Class A-3FL Certificates will at all times equal the principal balance of the Class A-3FX Regular Interest. The principal balance of the Class A-3FX Certificates will initially be $0. |
| (15) | The ratings assigned to the Class A-3FL Certificates reflect only the receipt of up to the fixed rate of interest at a rate equal to the applicable pass-through rate for the Class A-3FX Regular Interest. The ratings of Fitch, KBRA and S&P do not address any shortfalls or delays in payments that investors in the Class A-3FL Certificates may experience as a result of the conversion of the pass-through Certificates from a floating interest rate to a fixed rate. |
| (16) | The pass-through rate on the Class A-3FL Certificates will be a per annum rate equal to LIBOR plus a specified percentage; provided, however, that under certain circumstances, the pass-through rate on the Class A-3FL Certificates may convert to the pass-through rate applicable to the Class A-3FX Regular Interest. The initial LIBOR rate will be determined two LIBOR Business Days prior to the Closing Date, and subsequent LIBOR rates for the Class A-3FL Certificates will be determined two LIBOR Business Days before the start of the related interest accrual period. |
THE INFORMATION IN THIS STRUCTURAL AND COLLATERAL TERM SHEET IS NOT COMPLETE AND MAY BE AMENDED PRIOR TO THE TIME OF SALE. THIS TERM SHEET IS NOT AN OFFER TO SELL THESE SECURITIES AND IT IS NOT A SOLICITATION OF AN OFFER TO BUY THESE SECURITIES IN ANY JURISDICTION WHERE THE OFFER OR SALE IS NOT PERMITTED.
4
| WFRBS Commercial Mortgage Trust 2013-C12 | Issue Characteristics |
II. Transaction Highlights
Mortgage Loan Sellers:
Mortgage Loan Seller | Number of Mortgage Loans | Number of Mortgaged Properties | Aggregate Cut-off Date Balance | % of Cut-off Date Pool Balance | ||||||
The Royal Bank of Scotland(1) | 18 | 38 | $551,861,106 | 44.8 | % | |||||
| Wells Fargo Bank, National Association | 28 | 34 | 392,593,464 | 31.9 | ||||||
| Liberty Island Group I LLC | 11 | 11 | 93,211,515 | 7.6 | ||||||
| C-III Commercial Mortgage LLC | 14 | 15 | 80,772,384 | 6.6 | ||||||
| Basis Real Estate Capital II, LLC | 6 | 17 | 57,645,471 | 4.7 | ||||||
NCB, FSB | 23 | 23 | 55,408,173 | 4.5 | ||||||
| Total | 100 | 138 | $1,231,492,115 | 100.0 | % | |||||
(1) The mortgage loan seller referred to herein as The Royal Bank of Scotland is comprised of two affiliated companies: The Royal Bank of Scotland plc and RBS Financial Products Inc. With respect to the mortgage loans being sold for the deposit into the trust by The Royal Bank of Scotland: (a) fifteen (15) of the mortgage loans, having an aggregate cut-off date principal balance of $510,282,589 and representing approximately 41.4% of the aggregate principal balance of the pool of mortgage loans as of the cut-off date, were originated by and are being sold to the trust only by The Royal Bank of Scotland plc and (b) three (3) of the mortgage loans, having a cut-off date principal balance of $41,578,518 and representing approximately 3.4% of the aggregate principal balance of the pool of mortgage loans as of the cut-off date were originated by RBS Financial Products Inc. and are being sold to the trust by RBS Financial Products Inc.
Loan Pool:
| Cut-off Date Balance: | $1,231,492,115 |
| Number of Mortgage Loans: | 100 |
| Average Cut-off Date Balance per Mortgage Loan: | $12,314,921 |
| Number of Mortgaged Properties: | 138 |
Average Cut-off Date Balance per Mortgaged Property(1): | $8,923,856 |
| Weighted Average Mortgage Interest Rate: | 4.394% |
| Ten Largest Mortgage Loans as % of Cut-off Date Pool Balance: | 52.5% |
| Weighted Average Original Term to Maturity or ARD (months): | 113 |
| Weighted Average Remaining Term to Maturity or ARD (months): | 111 |
Weighted Average Original Amortization Term (months)(2): | 344 |
Weighted Average Remaining Amortization Term (months)(2): | 342 |
| Weighted Average Seasoning (months): | 2 |
(1) Information regarding mortgage loans secured by multiple properties is based on an allocation according to relative appraised values or the allocated loan amounts or property-specific release prices set forth in the related loan documents or such other allocation as the related mortgage loan seller deemed appropriate. With respect to One South Wacker Drive, loan-to-value ratio, debt service coverage ratio, debt yield and cut-off date balance per square foot calculations include the related pari passu companion loan unless otherwise stated.
(2) Excludes any mortgage loan that does not amortize.
Credit Statistics:
Weighted Average U/W Net Cash Flow DSCR(1): | 2.05x |
Weighted Average U/W Net Operating Income Debt Yield Ratio(1): | 12.4% |
Weighted Average Cut-off Date Loan-to-Value Ratio(1): | 61.8% |
Weighted Average Balloon or ARD Loan-to-Value Ratio(1): | 53.5% |
% of Mortgage Loans with Additional Subordinate Debt(2): | 2.8% |
% of Mortgage Loans with Single Tenants(3): | 22.8% |
(1) With respect to One South Wacker Drive, loan-to-value ratio, debt service coverage ratio, debt yield and cut-off date balance per square foot calculations include the related pari passu companion loan unless otherwise stated. The information for each mortgaged property that relates to a mortgage loan that is cross-collateralized with other mortgage loans is based upon the principal balance of that mortgage loan, except that the applicable loan-to-value ratio, debt service coverage ratio or debt yield for each such mortgaged property is based upon the ratio or yield (as applicable) for the aggregate indebtedness evidenced by all loans in the group. On an individual basis, without regard to the cross-collateralization feature, any mortgaged property securing a mortgage loan that is part of a cross-collateralized group of mortgage loans may have a higher loan-to-value ratio, lower debt service coverage ratio and/or lower debt yield than is presented herein. Information for residential cooperative mortgage loans is calculated using underwritten net cash flow for the related residential cooperative property which is the projected net cash flow reflected in the most recent appraisal obtained by or otherwise in the possession of the related mortgage loan seller as of the cut-off date, and the loan-to value ratio information for residential cooperative mortgage loans is based upon the appraised value of the residential cooperative property determined as if such residential cooperative property is operated as a residential cooperative. See Annex A-1 to the Free Writing Prospectus. Debt service coverage ratio, debt yield and loan-to-value ratio information takes no account of subordinate debt (whether or not secured by the mortgaged property), if any, that is allowed under the terms of any mortgage loan.
(2) Fifteen (15) of the mortgage loans, each of which are secured by residential cooperative properties, currently have in place subordinate secured lines of credit to the related mortgage borrowers that permit future advances (such loans, collectively, the “Subordinate Coop LOCs”). In addition, one (1) of the mortgage loans, secured by a residential cooperative property known as Plaza West Cooperative Association, Inc., has two (2) corresponding subordinate secured mortgages (collectively, the “Plaza West Subordinate Mortgages”, and, together with the Subordinate Coop LOCs, collectively, the “Subordinate Secured Coop Loans”), neither of which are lines of credit. The Subordinate Secured Coop Loans are not included in the trust. As of February 15, 2013 the aggregate outstanding principal balance of the Subordinate Coop LOCs is $2,772,500. As of December 12, 2012 the aggregate outstanding principal balance of the Plaza West Subordinate Mortgages is $130,347. If fully drawn, the maximum aggregate principal balance of the Subordinate Coop LOCs is $8,950,000. The maximum principal amount of indebtedness available under the Subordinate Coop LOCs ranges between $100,000 and $2,500,000, and the average of such maximum principal amounts is $596,667. The percentage figure expressed as “% of Mortgage loans with Additional Subordinate Debt” does not take into account future subordinate debt (whether or not secured by the mortgaged property), if any, that may be permitted under the terms of any mortgage loan or the Pooling and Servicing Agreement. See “Description of the Mortgage Pool—Subordinate and/or Other Financing” and “—Additional Debt Financing for Mortgage Loans Secured by Residential Cooperatives” in the Free Writing Prospectus.
(3) Excludes mortgage loans that are secured by multiple single tenant properties.
THE INFORMATION IN THIS STRUCTURAL AND COLLATERAL TERM SHEET IS NOT COMPLETE AND MAY BE AMENDED PRIOR TO THE TIME OF SALE. THIS TERM SHEET IS NOT AN OFFER TO SELL THESE SECURITIES AND IT IS NOT A SOLICITATION OF AN OFFER TO BUY THESE SECURITIES IN ANY JURISDICTION WHERE THE OFFER OR SALE IS NOT PERMITTED.
5
| WFRBS Commercial Mortgage Trust 2013-C12 | Issue Characteristics |
Loan Structural Features:
Amortization: Based on the Cut-off Date Pool Balance, 73.1% of the mortgage pool (91 mortgage loans) has scheduled amortization, as follows:
44.4% (82 mortgage loans) requires amortization during the entire loan term
28.7% (9 mortgage loans) provides for an interest-only period followed by an amortization period
Interest-Only: Based on the Cut-off Date Pool Balance, 26.9% of the mortgage pool (9 mortgage loans) provides for interest-only payments during the entire loan term. The Weighted Average Cut-off Date Loan-to-Value Ratio and Weighted Average U/W Net Cash Flow DSCR for those mortgage loans is 60.0% and 2.65x, respectively.
Hard Lockboxes: Based on the Cut-off Date Pool Balance, 50.7% of the mortgage pool (25 mortgage loans) has hard lockboxes in place.
Reserves: The mortgage loans require amounts to be escrowed monthly as follows (excluding any mortgage loans with springing provisions):
| Real Estate Taxes: | 73.2% of the pool |
| Insurance Premiums: | 49.4% of the pool |
| Capital Replacements: | 48.7% of the pool |
| TI/LC: | 51.3% of the pool(1) |
(1) The percentage of Cut-off Date Balance for loans with TI/LC reserves is based on the aggregate principal balance allocable to office, retail, mixed use and industrial properties. | |
Call Protection/Defeasance: Based on the Cut-off Date Pool Balance, the mortgage pool has the following call protection and defeasance features:
65.2% of the mortgage pool (63 mortgage loans) features a lockout period, then defeasance only until an open period
30.3% of the mortgage pool (14 mortgage loans) features a lockout period, then the greater of a prepayment premium or yield maintenance until an open period
4.5% of the mortgage pool (23 mortgage loans) features a period of the greater of a prepayment premium or yield maintenance, then a prepayment premium until an open period
Please refer to Annex A-1 to the Free Writing Prospectus for further description of individual loan call protection.
THE INFORMATION IN THIS STRUCTURAL AND COLLATERAL TERM SHEET IS NOT COMPLETE AND MAY BE AMENDED PRIOR TO THE TIME OF SALE. THIS TERM SHEET IS NOT AN OFFER TO SELL THESE SECURITIES AND IT IS NOT A SOLICITATION OF AN OFFER TO BUY THESE SECURITIES IN ANY JURISDICTION WHERE THE OFFER OR SALE IS NOT PERMITTED.
6
| WFRBS Commercial Mortgage Trust 2013-C12 | Issue Characteristics |
III. Issue Characteristics
| Securities Offered: | $1,018,342,000 approximate monthly pay, multi-class, commercial mortgage REMIC pass-through certificates consisting of eight classes (Classes A-1, A-2, A-3, A-4, A-SB, A-S, B and C), which are offered pursuant to a registration statement filed with the SEC. | |
| Mortgage Loan Sellers: | The Royal Bank of Scotland (“RBS”); Wells Fargo Bank, National Association (“WFB”); Liberty Island Group I LLC (“LIG I”); C-III Commercial Mortgage LLC (“CIIICM”); Basis Real Estate Capital II, LLC (“Basis”); and NCB, FSB (“NCB”). | |
| Co-lead Bookrunning Managers: | Wells Fargo Securities, LLC and RBS Securities Inc. | |
| Co-Manager: | Deutsche Bank Securities Inc. | |
| Rating Agencies: | Fitch, Inc., Kroll Bond Rating Agency, Inc. and Standard & Poor’s Ratings Services | |
| Master Servicers: | Wells Fargo Bank, National Association and NCB, FSB | |
| Special Servicers: | Rialto Capital Advisors, LLC and NCB, FSB | |
| Certificate Administrator: | Wells Fargo Bank, National Association | |
| Trustee: | U.S. Bank National Association | |
| Trust Advisor: | Pentalpha Surveillance LLC | |
| Cut-off Date: | The Cut-off Date with respect to each mortgage loan is the due date for the monthly debt service payment that is due in March 2013 (or, in the case of any mortgage loan that has its first due date in April 2013, the date that would have been its due date in March 2013 under the terms of that mortgage loan if a monthly debt service payment were scheduled to be due in that month). | |
| Expected Closing Date: | On or about March 20, 2013. | |
| Determination Dates: | The 11th day of each month (or if that day is not a business day, the next succeeding business day), commencing in April 2013. | |
| Distribution Dates: | The fourth business day following the Determination Date in each month, commencing in April 2013. | |
| Rated Final Distribution Date: | The Distribution Date in March 2048. | |
| Interest Accrual Period: | With respect to any Distribution Date, the calendar month preceding the month in which such Distribution Date occurs. | |
| Day Count: | The Offered Certificates will accrue interest on a 30/360 basis. | |
| Minimum Denominations: | $10,000 for each Class of Offered Certificates. Investments may also be made in any whole dollar denomination in excess of the applicable minimum denomination. | |
| Clean-up Call: | 1% | |
| Delivery: | DTC, Euroclear and Clearstream Banking | |
| ERISA/SMMEA Status: | Each Class of Offered Certificates is expected to be eligible for exemptive relief under ERISA. No Class of Offered Certificates will be SMMEA eligible. | |
| Risk Factors: | THE CERTIFICATES INVOLVE CERTAIN RISKS AND MAY NOT BE SUITABLE FOR ALL INVESTORS. SEE THE “RISK FACTORS” SECTION OF THE FREE WRITING PROSPECTUS. | |
| Bond Analytics Information: | The Certificate Administrator will be authorized to make distribution date settlements, CREFC reports and certain supplemental reports (other than confidential information) available to certain financial modeling and data provision services, including Bloomberg Financial Markets L.P., Trepp LLC, Intex Solutions, Inc., Markit Group Limited, Interactive Data Corp. and BlackRock Financial Management Inc. |
THE INFORMATION IN THIS STRUCTURAL AND COLLATERAL TERM SHEET IS NOT COMPLETE AND MAY BE AMENDED PRIOR TO THE TIME OF SALE. THIS TERM SHEET IS NOT AN OFFER TO SELL THESE SECURITIES AND IT IS NOT A SOLICITATION OF AN OFFER TO BUY THESE SECURITIES IN ANY JURISDICTION WHERE THE OFFER OR SALE IS NOT PERMITTED.
7
| WFRBS Commercial Mortgage Trust 2013-C12 | Characteristics of the Mortgage Pool |
IV. Characteristics of the Mortgage Pool(1)
A. Ten Largest Mortgage Loans
Mortgage Loan Seller | Mortgage Loan Name | City | State | Number of Mortgage Loans / Mortgaged Properties | Mortgage Loan Cut-off Date Balance ($) | % of Cut- off Date Pool Balance (%) | Property Type | Number of SF, Rooms, Pads or Beds | Cut-off Date Balance Per SF, Room, Pad or Bed ($) | Cut-off Date LTV Ratio (%) | Balloon or ARD LTV Ratio (%) | U/W NCF DSCR (x) | U/W NOI Debt Yield (%) |
| RBS | Grand Beach Hotel | Miami Beach | FL | 1 / 1 | $125,000,000 | 10.2% | Hospitality | 424 | $294,811 | 59.5% | 50.8% | 1.94x | 12.9% |
| RBS | RHP Portfolio II | Various | Various | 1 / 18 | 116,137,000 | 9.4 | Manufactured Housing Community | 2,967 | 39,143 | 73.1 | 62.2 | 1.45 | 8.8 |
| WFB | One South Wacker Drive | Chicago | IL | 1 / 1 | 95,000,000 | 7.7 | Office | 1,193,448 | 138 | 73.0 | 73.0 | 2.40 | 10.0 |
| RBS | Merrill Lynch Office | Hopewell | NJ | 1 / 1 | 74,250,000 | 6.0 | Office | 481,854 | 154 | 54.3 | 54.3 | 2.83 | 13.0 |
| RBS | Hensley & Co. Portfolio | Various | AZ | 1 / 3 | 49,750,000 | 4.0 | Industrial | 577,167 | 86 | 65.5 | 59.9 | 1.41 | 9.1 |
| RBS | Territory Portfolio | Various | NV | 1 / 2 | 44,385,000 | 3.6 | Retail | 289,572 | 153 | 56.2 | 56.2 | 3.10 | 12.7 |
| WFB | Las Vegas Strip Walgreens | Las Vegas | NV | 1 / 1 | 40,000,000 | 3.2 | Retail | 24,721 | 1,618 | 60.6 | 60.6 | 2.11 | 8.5 |
| WFB | Kraft - Three Lakes Drive | Northfield | IL | 1 / 1 | 36,500,000 | 3.0 | Office | 679,109 | 54 | 49.3 | 49.3 | 2.69 | 13.2 |
| WFB | Victoria Mall | Victoria | TX | 1 / 1 | 34,872,435 | 2.8 | Retail | 448,935 | 78 | 64.6 | 47.0 | 1.68 | 12.8 |
| CIIICM | Studio Green Apartments | Newark | DE | 1 / 1 | 30,250,000 | 2.5 | Multifamily | 1,074 | 28,166 | 56.1 | 41.8 | 1.39 | 10.3 |
| Top Three Total/Weighted Average | 3 / 20 | $336,137,000 | 27.3% | 68.0% | 61.0% | 1.90x | 10.7% | ||||||
| Top Five Total/Weighted Average | 5 / 24 | $460,137,000 | 37.4% | 65.5% | 59.8% | 2.00x | 10.9% | ||||||
| Top Ten Total/Weighted Average | 10 / 30 | $646,144,435 | 52.5% | 63.2% | 57.5% | 2.07x | 11.1% | ||||||
| (1) | With respect to One South Wacker Drive, Cut-off Date Balance per square foot, loan-to-value ratio, debt service coverage ratio and debt yield calculations include the related pari passu companion loan (unless otherwise stated) in total debt. With respect to each Mortgage Loan, debt service coverage ratio, debt yield and loan-to-value ratio information takes no account of subordinate debt (whether or not secured by the mortgaged property), if any, that is allowed under the terms of any mortgage loan. |
B. Summary of Pari Passu Split Loan Structures
| Property Name | Mortgage Loan Seller | Related Notes in Loan Group (Original Balance) | Holder of Note | Whether Note is Lead Servicing for the Entire Loan Combination | Current Master Servicer Under Related Securitization PSA | Current Special Servicer Under Related Securitization PSA |
| One South Wacker Drive | WFB | $95,000,000 | WFRBS 2013-C12 | Yes | Wells Fargo Bank, National Association | Rialto Capital Advisors, LLC |
| WFB | $70,000,000 | WFRBS 2013-C11 | No | Wells Fargo Bank, National Association(1) | Midland Loan Services, a Division of PNC Bank, National Association |
| (1) | The One South Wacker Drive pari passu loan combination will be serviced under the WFRBS 2013-C11 pooling and servicing agreement until the closing date, after which such loan combination will be serviced under the pooling and servicing agreement for this transaction. |
THE INFORMATION IN THIS STRUCTURAL AND COLLATERAL TERM SHEET IS NOT COMPLETE AND MAY BE AMENDED PRIOR TO THE TIME OF SALE. THIS TERM SHEET IS NOT AN OFFER TO SELL THESE SECURITIES AND IT IS NOT A SOLICITATION OF AN OFFER TO BUY THESE SECURITIES IN ANY JURISDICTION WHERE THE OFFER OR SALE IS NOT PERMITTED.
8
| WFRBS Commercial Mortgage Trust 2013-C12 | Characteristics of the Mortgage Pool |
C. Previous Securitization History(1)
Loan No. | Mortgage Loan Seller | Mortgage Loan or Mortgaged Property Name | City | State | Property Type | Mortgage Loan or Mortgaged Property Cut-off Date Balance ($) | % of Cut-off Date Pool Balance (%) | Previous Securitization |
| 9 | WFB | Victoria Mall | Victoria | TX | Retail | $34,872,435 | 2.8% | CGCMT 2004-C1 |
| 10 | CIIICM | Studio Green Apartments | Newark | DE | Multifamily | 30,250,000 | 2.5 | Nomura CRE CDO 2007-2 |
| 14 | WFB | Old Oakland | Oakland | CA | Mixed Use | 18,000,000 | 1.5 | PCMT 2003-PWR1 |
| 21 | LIG I | Independence Park | Durham | NC | Industrial | 11,500,000 | 0.9 | WBCMT 2003-C6 |
| 23 | WFB | Santa Barbara Tech Center | Goleta | CA | Office | 10,982,437 | 0.9 | CSFB 2003-CK2 |
| 26 | WFB | Patricia Southway Manor | Houston | TX | Multifamily | 10,324,039 | 0.8 | BACM 2005-3 |
| 29 | LIG I | Travis Park Retail & Garage | San Antonio | TX | Mixed Use | 9,984,987 | 0.8 | GCCFC 2003-C1 |
| 30 | WFB | 3200 Liberty Avenue | North Bergen | NJ | Industrial | 9,984,386 | 0.8 | BSCMS 2005-T18 |
| 36 | WFB | Oak Creek Apartments | Vancouver | WA | Multifamily | 9,000,000 | 0.7 | JPMCC 2003-ML1A |
| 37 | WFB | Pacific Center | Tacoma | WA | Office | 8,974,227 | 0.7 | GCCFC 2003-C1 |
| 38 | WFB | Union Square – Manteca | Manteca | CA | Retail | 8,973,974 | 0.7 | JPMCC 2003-PM1A |
| 40 | LIG I | North Towne Plaza | San Antonio | TX | Retail | 8,800,000 | 0.7 | MSC 2004-IQ7 |
| 41 | NCB, FSB | Parkview Apartments Corp. | Ossining | NY | Multifamily | 8,310,278 | 0.7 | CSFB 2003-CPN1 |
| 42 | LIG I | Woodlands Plaza | Simi Valley | CA | Retail | 7,799,937 | 0.6 | GMACC 1998-C1 |
| 48 | Basis | Walgreens Portfolio | Various | Various | Retail | 6,000,000 | 0.5 | BSCMS 2006-T22 |
| 52 | WFB | SafKeep Self Storage – Del Rey Oaks | Del Rey Oaks | CA | Self Storage | 5,491,677 | 0.4 | MSC 2003-T11 |
| 54 | WFB | Mill Run Office Center | Allentown | PA | Office | 5,488,421 | 0.4 | JPMCC 2003-ML1A |
| 55 | WFB | Nellis Crossing Shopping Center | Las Vegas | NV | Retail | 5,400,000 | 0.4 | LBUBS 2003-C3 |
| 61 | NCB, FSB | Evergreen Owners, Inc. | Jackson Heights | NY | Multifamily | 4,160,482 | 0.3 | FNMA MBS 2002-2 |
| 63 | WFB | Yosemite Crossing | Greenwood Village | CO | Retail | 3,650,000 | 0.3 | BSCMS 2006-T24 |
| 64 | NCB, FSB | 515 East 7th Street Corporation | Brooklyn | NY | Multifamily | 3,490,023 | 0.3 | FNMA MBS 2001-6 |
| 66 | RBS | CVS Cypress | Cypress | CA | Retail | 3,095,168 | 0.3 | COMM 2003-LB1A |
| 67 | RBS | State Tower Building | Syracuse | NY | Office | 3,083,493 | 0.3 | BSCMS 1999-WF2 |
| 70 | NCB, FSB | Salisbury Point Cooperative, Inc. | South Nyack | NY | Multifamily | 2,938,550 | 0.2 | CSFB 2002-CKN2 |
| 76 | NCB, FSB | Maple Court Apartments, Inc. | Jackson Heights | NY | Multifamily | 2,256,778 | 0.2 | FNMA MBS 2002-2 |
| 80 | NCB, FSB | 415 Gramatan Avenue Corporation | Mount Vernon | NY | Multifamily | 2,124,561 | 0.2 | CSFB 2001-CKN5 |
| 82 | NCB, FSB | 417 Riverside Drive, Inc. | New York | NY | Multifamily | 2,002,083 | 0.2 | FNMA MBS 1999-1 |
| 83 | CIIICM | West Prairie MHC | Spokane | WA | Manufactured Housing Community | 1,994,637 | 0.2 | WBCMT 2003-C3 |
| 90 | CIIICM | Superstition MHC | Apache Junction | AZ | Manufactured Housing Community | 1,567,672 | 0.1 | BACM 2003-1 |
| 91 | NCB, FSB | Cherry Lane Owners Corp. | Flushing | NY | Multifamily | 1,566,824 | 0.1 | CSFB 2001-CKN5 |
| 92 | NCB, FSB | Castleton Gardens Owner’s Corp. | Staten Island | NY | Multifamily | 1,563,779 | 0.1 | CSFB 2003-CPN1 |
THE INFORMATION IN THIS STRUCTURAL AND COLLATERAL TERM SHEET IS NOT COMPLETE AND MAY BE AMENDED PRIOR TO THE TIME OF SALE. THIS TERM SHEET IS NOT AN OFFER TO SELL THESE SECURITIES AND IT IS NOT A SOLICITATION OF AN OFFER TO BUY THESE SECURITIES IN ANY JURISDICTION WHERE THE OFFER OR SALE IS NOT PERMITTED.
9
| WFRBS Commercial Mortgage Trust 2013-C12 | Characteristics of the Mortgage Pool |
C. Previous Securitization History (continued)(1)
| Loan No. | Mortgage Loan Seller | Mortgage Loan or Mortgaged Property Name | City | State | Property Type | Mortgage Loan or Mortgaged Property Cut-off Date Balance ($) | % of Cut-off Date Pool Balance (%) | Previous Securitization |
| 93 | CIIICM | Acme Kent Plaza | Kent | OH | Retail | 1,500,000 | 0.1 | WBCMT 2003-C4 |
| 96 | NCB, FSB | Elizabeth Gardens Corp. | Farmingdale | NY | Multifamily | 1,317,223 | 0.1 | FNMA MBS 1999-1 |
| 97 | NCB, FSB | Broad Hollow Owners, Inc. | Amityville | NY | Multifamily | 1,275,905 | 0.1 | CSFB 2002-CKN2 |
| 98 | NCB, FSB | Bleecker & 11th Owners Corp. | New York | NY | Multifamily | 1,173,084 | 0.1 | CSFB 1998-PS2 |
| Total | $248,897,062 | 20.2% | ||||||
| (1) | The table above represents the recent commercial mortgage pass–through securitization with respect to the mortgaged property securing the related mortgage loan, based on information provided by the related borrower or obtained through searches of a third-party database. The information has not otherwise been confirmed by the mortgage loan sellers. |
THE INFORMATION IN THIS STRUCTURAL AND COLLATERAL TERM SHEET IS NOT COMPLETE AND MAY BE AMENDED PRIOR TO THE TIME OF SALE. THIS TERM SHEET IS NOT AN OFFER TO SELL THESE SECURITIES AND IT IS NOT A SOLICITATION OF AN OFFER TO BUY THESE SECURITIES IN ANY JURISDICTION WHERE THE OFFER OR SALE IS NOT PERMITTED.
10
| WFRBS Commercial Mortgage Trust 2013-C12 | Characteristics of the Mortgage Pool |
D. Mortgage Loans with Scheduled Balloon Payments and Related Classes
Class A-2(1) | ||||||||||||||||
| Loan No. | Mortgage Loan Seller | Mortgage Loan Name | State | Property Type | Mortgage Loan Cut-off Date Balance ($) | % of Cut-off Date Pool Balance (%) | Mortgage Loan Balance at Maturity ($) | % of Class A-2 Certificate Principal Balance (%)(2) | SF/ Rooms/ Pads/ Units | Loan per SF/ Room/ Pad/ Unit ($) | U/W NCF DSCR (x) | U/W NOI Debt Yield (%) | Cut-off Date LTV Ratio (%) | Balloon or ARD LTV Ratio (%) | Rem. IO Period (mos.) | Rem. Term to Maturity (mos.) |
| 3 | WFB | One South Wacker Drive | IL | Office | $95,000,000 | 7.7% | $95,000,000 | 66.4% | 1,193,448 | $138 | 2.40x | 10.0% | 73.0% | 73.0% | 58 | 58 |
| 12 | WFB | Sportsman’s Warehouse Portfolio | Various | Retail | 24,800,000 | 2.0 | 24,800,000 | 17.3 | 296,778 | 84 | 2.95 | 12.8 | 54.9 | 54.9 | 60 | 60 |
| 16 | LIG I | Gander Mountain | FL | Retail | 15,250,000 | 1.2 | 13,768,446 | 9.6 | 120,000 | 127 | 2.37 | 15.1 | 47.7 | 43.0 | 0 | 60 |
| 56 | LIG I | Klee Plaza | IL | Mixed Use | 5,392,240 | 0.4 | 4,998,932 | 3.5 | 19,784 | 273 | 1.56 | 11.1 | 73.9 | 68.5 | 0 | 59 |
| Total/Weighted Average | $140,442,240 | 11.4% | $138,567,378 | 96.9% | 2.46x | 11.1% | 67.1% | 66.4% | 50 | 59 | ||||||
(1) The table above presents the mortgage loans whose balloon payments would be applied to pay down the principal balance of the Class A-2 Certificates, assuming a 0% CPR and applying the “Structuring Assumptions” described in the Free Writing Prospectus, including the assumptions that (i) none of the mortgage loans in the pool experience prepayments, defaults or losses; (ii) there are no extensions of maturity dates of any mortgage loans in the pool; and (iii) each mortgage loan in the pool is paid in full on its stated maturity date. Each class of Certificates, including the Class A-2 Certificates, evidences undivided ownership interests in the entire pool of mortgage loans. Debt service coverage ratio, debt yield and loan-to-value ratio information takes no account of subordinate debt (whether or not secured by the mortgaged property), if any, that is allowed under the terms of any mortgage loan. See Annex A-1 to the Free Writing Prospectus. (2) Reflects the percentage equal to the Mortgage Loan Balance at Maturity divided by the initial Class A-2 Certificate Principal Balance. | ||||||||||||||||
THE INFORMATION IN THIS STRUCTURAL AND COLLATERAL TERM SHEET IS NOT COMPLETE AND MAY BE AMENDED PRIOR TO THE TIME OF SALE. THIS TERM SHEET IS NOT AN OFFER TO SELL THESE SECURITIES AND IT IS NOT A SOLICITATION OF AN OFFER TO BUY THESE SECURITIES IN ANY JURISDICTION WHERE THE OFFER OR SALE IS NOT PERMITTED.
11
| WFRBS Commercial Mortgage Trust 2013-C12 | Characteristics of the Mortgage Pool |
Class A-3 and A-3FX Regular Interest(1)(2) | ||||||||||||||||
| Loan No. | Mortgage Loan Seller | Mortgage Loan Name | State | Property Type | Mortgage Loan Cut-off Date Balance ($) | % of Cut-off Date Balance (%) | Mortgage Loan Balance at Maturity ($) | % of Class A-3/ A-3FX RI Certificate Principal Balance (%)(3) | SF/ Rooms/ Pads/ Units | Loan per SF/Room/ Pad/ Unit ($) | U/W NCF DSCR (x) | U/W NOI Debt Yield (%) | Cut-off Date LTV Ratio (%) | Balloon or ARD LTV Ratio (%) | Rem. IO Period (mos.) | Rem. Term to Maturity (mos.) |
| 2 | RBS | RHP Portfolio II | Various | Manufactured Housing Community | $116,137,000 | 9.4% | $98,883,654 | 38.8% | 2,967 | $39,143 | 1.45x | 8.8% | 73.1% | 62.2% | 22 | 118 |
| 6 | RBS | Territory Portfolio | NV | Retail | 44,385,000 | 3.6 | 44,385,000 | 17.4 | 289,572 | 153 | 3.10 | 12.7 | 56.2 | 56.2 | 118 | 118 |
| 9 | WFB | Victoria Mall | TX | Retail | 34,872,435 | 2.8 | 25,394,512 | 10.0 | 448,935 | 78 | 1.68 | 12.8 | 64.6 | 47.0 | 0 | 118 |
| 22 | RBS | Independence Plaza | TX | Retail | 11,217,096 | 0.9 | 8,983,322 | 3.5 | 170,342 | 66 | 2.05 | 14.0 | 72.4 | 58.0 | 0 | 118 |
| 26 | WFB | Patricia Southway Manor | TX | Multifamily | 10,324,039 | 0.8 | 7,622,673 | 3.0 | 492 | 20,984 | 1.77 | 13.3 | 66.4 | 49.1 | 0 | 116 |
| 34 | WFB | Pineview Plaza | UT | Retail | 9,173,439 | 0.7 | 7,367,206 | 2.9 | 94,013 | 98 | 1.70 | 10.7 | 62.2 | 50.0 | 0 | 118 |
| 37 | WFB | Pacific Center | WA | Office | 8,974,227 | 0.7 | 7,219,739 | 2.8 | 94,960 | 95 | 1.78 | 12.6 | 66.0 | 53.1 | 0 | 118 |
| 38 | WFB | Union Square - Manteca | CA | Retail | 8,973,974 | 0.7 | 7,204,505 | 2.8 | 80,304 | 112 | 1.59 | 10.2 | 78.4 | 63.0 | 0 | 118 |
| 39 | WFB | Residence Inn - Waynesboro | VA | Hospitality | 8,838,517 | 0.7 | 6,616,549 | 2.6 | 90 | 98,206 | 1.61 | 12.4 | 67.0 | 50.1 | 0 | 116 |
| 41 | NCB, FSB | Parkview Apartments Corp. | NY | Multifamily | 8,310,278 | 0.7 | 7,057,865 | 2.8 | 202 | 41,140 | 3.44 | 23.4 | 25.5 | 21.6 | 0 | 100 |
| 59 | NCB, FSB | 950 Fifth Avenue Corporation | NY | Multifamily | 4,896,910 | 0.4 | 4,136,438 | 1.6 | 8 | 612,114 | 3.03 | 20.4 | 3.1 | 2.6 | 0 | 102 |
| 60 | LIG I | High Meadow Office | MI | Office | 4,582,854 | 0.4 | 3,380,436 | 1.3 | 58,906 | 78 | 1.41 | 11.8 | 65.5 | 48.3 | 0 | 118 |
| 61 | NCB, FSB | Evergreen Owners, Inc. | NY | Multifamily | 4,160,482 | 0.3 | 3,829,467 | 1.5 | 100 | 41,605 | 2.02 | 12.1 | 33.3 | 30.6 | 0 | 104 |
| 62 | WFB | EZ Storage | MI | Self Storage | 3,885,424 | 0.3 | 2,863,860 | 1.1 | 76,968 | 50 | 1.82 | 12.5 | 65.9 | 48.5 | 0 | 118 |
| 64 | NCB, FSB | 515 East 7th Street Corporation | NY | Multifamily | 3,490,023 | 0.3 | 2,986,526 | 1.2 | 122 | 28,607 | 3.63 | 25.2 | 14.5 | 12.4 | 0 | 97 |
| 67 | RBS | State Tower Building | NY | Office | 3,083,493 | 0.3 | 2,287,746 | 0.9 | 160,488 | 19 | 2.25 | 19.7 | 37.2 | 27.6 | 0 | 117 |
| 70 | NCB, FSB | Salisbury Point Cooperative, Inc. | NY | Multifamily | 2,938,550 | 0.2 | 2,504,928 | 1.0 | 120 | 24,488 | 7.42 | 51.5 | 9.4 | 8.0 | 0 | 101 |
| 73 | NCB, FSB | Sterling Arms Owners Corp. | NY | Multifamily | 2,593,277 | 0.2 | 2,178,869 | 0.9 | 74 | 35,044 | 3.3 | 21.7 | 17.4 | 14.6 | 0 | 102 |
| 75 | WFB | Pinelands Airport Center III | FL | Industrial | 2,291,937 | 0.2 | 1,901,137 | 0.7 | 52,000 | 44 | 1.67 | 12.4 | 67.4 | 55.9 | 0 | 117 |
| 76 | NCB, FSB | Maple Court Apartments, Inc. | NY | Multifamily | 2,256,778 | 0.2 | 1,894,147 | 0.7 | 63 | 35,822 | 3.15 | 20.8 | 16.7 | 14.0 | 0 | 104 |
| 77 | NCB, FSB | The Ridge Owners Corp. | NY | Multifamily | 2,159,628 | 0.2 | 1,866,680 | 0.7 | 42 | 51,420 | 4.08 | 29.9 | 13.1 | 11.3 | 0 | 101 |
| 78 | NCB, FSB | Plaza West Cooperative Association, Inc. | DC | Multifamily | 2,157,729 | 0.2 | 1,822,486 | 0.7 | 53 | 40,712 | 4.85 | 32.7 | 14.4 | 12.1 | 0 | 103 |
| 79 | NCB, FSB | Wellesley Gardens Owners Corp. | NY | Multifamily | 2,148,575 | 0.2 | 1,813,293 | 0.7 | 91 | 23,611 | 6.85 | 45.5 | 9.0 | 7.6 | 0 | 100 |
THE INFORMATION IN THIS STRUCTURAL AND COLLATERAL TERM SHEET IS NOT COMPLETE AND MAY BE AMENDED PRIOR TO THE TIME OF SALE. THIS TERM SHEET IS NOT AN OFFER TO SELL THESE SECURITIES AND IT IS NOT A SOLICITATION OF AN OFFER TO BUY THESE SECURITIES IN ANY JURISDICTION WHERE THE OFFER OR SALE IS NOT PERMITTED.
12
| WFRBS Commercial Mortgage Trust 2013-C12 | Characteristics of the Mortgage Pool |
Class A-3 and A-3FX Regular Interest (continued)(1)(2) | ||||||||||||||||
| Loan No. | Mortgage Loan Seller | Mortgage Loan Name | State | Property Type | Mortgage Loan Cut-off Date Balance ($) | % of Cut-off Date Balance (%) | Mortgage Loan Balance at Maturity ($) | % of Class A-3/ A-3FX RI Certificate Principal Balance (%)(3) | SF/ Rooms/ Pads/ Units | Loan per SF/ Room/ Pad/ Unit ($) | U/W NCF DSCR (x) | U/W NOI Debt Yield (%) | Cut-off Date LTV Ratio (%) | Balloon or ARD LTV Ratio (%) | Rem. IO Period (mos.) | Rem. Term to Maturity (mos.) |
| 80 | NCB, FSB | 415 Gramatan Avenue Corporation | NY | Multifamily | 2,124,561 | 0.2 | 1,966,878 | 0.8 | 52 | 40,857 | 2.53 | 15.5 | 25.6 | 23.7 | 0 | 99 |
| 82 | NCB, FSB | 417 Riverside Drive, Inc. | NY | Multifamily | 2,002,083 | 0.2 | 1,704,230 | 0.7 | 64 | 31,283 | 7.58 | 52.0 | 4.6 | 3.9 | 0 | 99 |
| 84 | NCB, FSB | Capri Gardens Owners Corp. | NY | Multifamily | 1,955,517 | 0.2 | 1,648,315 | 0.6 | 72 | 27,160 | 4.98 | 33.0 | 11.3 | 9.5 | 0 | 101 |
| 86 | NCB, FSB | Waldo Gardens, Inc. | NY | Multifamily | 1,860,412 | 0.2 | 872,259 | 0.3 | 170 | 10,944 | 9.26 | 97.6 | 5.6 | 2.6 | 0 | 101 |
| 87 | NCB, FSB | 317 East 18th Street Owners Corp. | NY | Multifamily | 1,750,000 | 0.1 | 1,750,000 | 0.7 | 29 | 60,345 | 2.91 | 15.7 | 16.1 | 16.1 | 100 | 100 |
| 91 | NCB, FSB | Cherry Lane Owners Corp. | NY | Multifamily | 1,566,824 | 0.1 | 1,333,459 | 0.5 | 71 | 22,068 | 7.15 | 49.3 | 10.0 | 8.5 | 0 | 101 |
| 92 | NCB, FSB | Castleton Gardens Owner’s Corp. | NY | Multifamily | 1,563,779 | 0.1 | 1,325,579 | 0.5 | 52 | 30,073 | 3.7 | 25.0 | 19.8 | 16.8 | 0 | 100 |
| 95 | NCB, FSB | The Knolls Cooperative Section No. 2, Inc. | NY | Multifamily | 1,459,683 | 0.1 | 6,516 | 0.0 | 251 | 5,815 | 18 | 227.9 | 2.5 | 0.0 | 0 | 116 |
| 96 | NCB, FSB | Elizabeth Gardens Corp. | NY | Multifamily | 1,317,223 | 0.1 | 1,132,149 | 0.4 | 78 | 16,887 | 6.85 | 48.5 | 10.9 | 9.4 | 0 | 97 |
| 97 | NCB, FSB | Broad Hollow Owners, Inc. | NY | Multifamily | 1,275,905 | 0.1 | 1,073,036 | 0.4 | 53 | 24,074 | 4.39 | 29.2 | 20.4 | 17.2 | 0 | 104 |
| 98 | NCB, FSB | Bleecker & 11th Owners Corp. | NY | Multifamily | 1,173,084 | 0.1 | 1,010,739 | 0.4 | 35 | 33,517 | 7.59 | 54.4 | 7.6 | 6.6 | 0 | 98 |
| 99 | NCB, FSB | West 239th Owners, Inc. | NY | Multifamily | 1,172,998 | 0.1 | 995,137 | 0.4 | 42 | 27,929 | 3.90 | 26.4 | 11.3 | 9.6 | 0 | 100 |
| 100 | NCB, FSB | Work of Art Loft Corp. | NY | Multifamily | 1,073,872 | 0.1 | 912,146 | 0.4 | 9 | 119,319 | 6.74 | 45.8 | 8.2 | 6.9 | 0 | 99 |
| Total/Weighted Average | $322,147,608 | 26.2% | $269,931,483 | 105.9% | 2.35x | 15.4% | 58.6% | 49.1% | 25 | 115 | ||||||
(1) The table above presents the mortgage loans whose balloon payment would be applied to pay down the principal balance of the Class A-3 Certificates and Class A-3FX Regular Interest, assuming a 0% CPR and applying the “Structuring Assumptions” described in the Free Writing Prospectus, including the assumptions that (i) none of the mortgage loans in the pool experience prepayments, defaults or losses; (ii) there are no extensions of maturity dates of any mortgage loans in the pool; and (iii) each mortgage loan in the pool is paid in full on its stated maturity date. Each class of Certificates, including the Class A-3 and Class A-3FX Regular Interest Certificates, evidences undivided ownership interests in the entire pool of mortgage loans. Debt service coverage ratio, debt yield and loan-to-value ratio information takes no account of subordinate debt (whether or not secured by the mortgaged property), if any, that is allowed under the terms of any mortgage loan. (2) Amounts allocated in respect of the Class A-3FX Regular Interest will be allocated between the Class A-3FX and Class A-3FL Certificates as described in the Free Writing Prospectus. (3) Reflects the percentage equal to the Mortgage Loan Balance at Maturity divided by the initial Class A-3 Certificates and Class A-3FX Regular Interest Principal Balance. See Annex A-1 to the Free Writing Prospectus. | ||||||||||||||||
THE INFORMATION IN THIS STRUCTURAL AND COLLATERAL TERM SHEET IS NOT COMPLETE AND MAY BE AMENDED PRIOR TO THE TIME OF SALE. THIS TERM SHEET IS NOT AN OFFER TO SELL THESE SECURITIES AND IT IS NOT A SOLICITATION OF AN OFFER TO BUY THESE SECURITIES IN ANY JURISDICTION WHERE THE OFFER OR SALE IS NOT PERMITTED.
13
| WFRBS Commercial Mortgage Trust 2013-C12 | Characteristics of the Mortgage Pool |
Class A-SB(1)
| Loan No. | Mortgage Loan Seller | Mortgage Loan Name | State | Property Type | Mortgage Loan Cut-off Date Balance ($) | % of Cut-off Date Balance (%) | Mortgage Loan Balance at Maturity ($) | % of Class A-SB Certificate Principal Balance (%)(2) | SF/ Rooms/ Pads/ Units | Loan per SF/ Room/ Pad/ Unit ($) | U/W NCF DSCR (x) | U/W NOI Debt Yield (%) | Cut-off Date LTV Ratio (%) | Balloon or ARD LTV Ratio (%) | Rem. IO Period (mos.) | Rem. Term to Maturity (mos.) |
| 25 | WFB | Valley Farms Apartments | KY | Multifamily | $10,370,072 | 0.8% | $9,049,045 | 8.9% | 160 | $64,813 | 1.42x | 8.8% | 67.3% | 58.8% | 0 | 82 |
| Total/Weighted Average | $10,370,072 | 0.8% | $9,049,045 | 8.9% | 1.42x | 8.8% | 67.3% | 58.8% | 0 | 82 | ||||||
(1) The table above presents the mortgage loan whose balloon payment would be applied to pay down the principal balance of the Class A-SB Certificates, assuming a 0% CPR and applying the “Structuring Assumptions” described in the Free Writing Prospectus, including the assumptions that (i) none of the mortgage loans in the pool experience prepayments, defaults or losses; (ii) there are no extensions of maturity dates of any mortgage loans in the pool; and (iii) each mortgage loan in the pool is paid in full on its stated maturity date. Each class of Certificates, including the Class A-SB Certificates, evidences undivided ownership interests in the entire pool of mortgage loans. Debt service coverage ratio, debt yield and loan-to-value ratio information takes no account of subordinate debt (whether or not secured by the mortgaged property), if any, that is allowed under the terms of any mortgage loan. See Annex A-1 to the Free Writing Prospectus.
(2) Reflects the percentage equal to the Mortgage Loan Balance at Maturity divided by the initial Class A-SB Certificate Principal Balance.
THE INFORMATION IN THIS STRUCTURAL AND COLLATERAL TERM SHEET IS NOT COMPLETE AND MAY BE AMENDED PRIOR TO THE TIME OF SALE. THIS TERM SHEET IS NOT AN OFFER TO SELL THESE SECURITIES AND IT IS NOT A SOLICITATION OF AN OFFER TO BUY THESE SECURITIES IN ANY JURISDICTION WHERE THE OFFER OR SALE IS NOT PERMITTED.
14
(THIS PAGE INTENTIONALLY LEFT BLANK)
15
| WFRBS Commercial Mortgage Trust 2013-C12 | Characteristics of the Mortgage Pool |
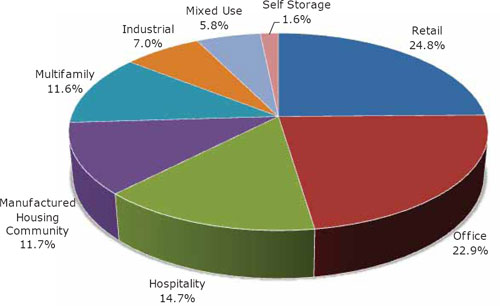
E. Property Type Distribution(1)
| Property Type | Number of Mortgaged Properties | Aggregate Cut- off Date Balance ($) | % of Cut- off Date Balance (%) | Weighted Average Cut-off Date LTV Ratio (%) | Weighted Average Balloon or ARD LTV Ratio (%) | Weighted Average U/W NCF DSCR (x) | Weighted Average U/W NOI Debt Yield (%) | Weighted Average U/W NCF Debt Yield (%) | Weighted Average Mortgage Rate (%) | |||||||
| Retail | 40 | $304,972,411 | 24.8 | % | 63.2 | % | 54.3 | % | 2.06 | x | 11.5 | % | 10.6 | % | 4.220 | % |
| Anchored | 9 | 101,947,858 | 8.3 | 66.5 | 56.5 | 2.09 | 11.5 | 10.6 | 4.177 | |||||||
| Single Tenant | 21 | 101,865,639 | 8.3 | 58.2 | 54.4 | 2.24 | 11.1 | 10.4 | 4.100 | |||||||
| Shadow Anchored | 6 | 49,636,478 | 4.0 | 62.7 | 53.7 | 2.10 | 11.7 | 10.8 | 4.304 | |||||||
| Regional Mall | 1 | 34,872,435 | 2.8 | 64.6 | 47.0 | 1.68 | 12.8 | 11.2 | 4.460 | |||||||
| Unanchored | 3 | 16,650,000 | 1.4 | 71.7 | 57.9 | 1.47 | 9.5 | 8.8 | 4.455 | |||||||
| Office | 13 | 281,536,431 | 22.9 | 61.9 | 57.6 | 2.36 | 11.9 | 10.7 | 4.111 | |||||||
| Suburban | 8 | 156,028,711 | 12.7 | 55.0 | 50.3 | 2.47 | 12.9 | 11.7 | 4.264 | |||||||
| CBD | 5 | 125,507,720 | 10.2 | 70.5 | 66.8 | 2.22 | 10.6 | 9.5 | 3.921 | |||||||
| Hospitality | 7 | 181,038,517 | 14.7 | 61.7 | 50.4 | 1.85 | 12.8 | 11.7 | 4.564 | |||||||
| Full Service | 1 | 125,000,000 | 10.2 | 59.5 | 50.8 | 1.94 | 12.9 | 11.8 | 4.467 | |||||||
| Limited Service | 6 | 56,038,517 | 4.6 | 66.6 | 49.4 | 1.66 | 12.7 | 11.4 | 4.780 | |||||||
| Manufactured Housing Community | 27 | 144,078,454 | 11.7 | 72.4 | 60.8 | 1.45 | 9.1 | 9.0 | 4.542 | |||||||
| Manufactured Housing Community | 27 | 144,078,454 | 11.7 | 72.4 | 60.8 | 1.45 | 9.1 | 9.0 | 4.542 | |||||||
| Multifamily | 32 | 143,106,650 | 11.6 | 46.0 | 37.2 | 2.79 | 20.6 | 20.1 | 4.857 | |||||||
| Cooperative | 23 | 55,408,173 | 4.5 | 15.4 | 13.2 | 4.82 | 36.5 | 36.5 | 5.280 | |||||||
| Garden | 7 | 54,373,111 | 4.4 | 70.3 | 58.0 | 1.57 | 10.6 | 9.7 | 4.407 | |||||||
| Student Housing | 2 | 33,325,366 | 2.7 | 57.4 | 43.2 | 1.41 | 10.4 | 9.7 | 4.886 | |||||||
| Industrial | 8 | 86,001,324 | 7.0 | 65.4 | 57.0 | 1.51 | 10.1 | 9.1 | 4.473 | |||||||
| Warehouse | 4 | 59,734,386 | 4.9 | 66.1 | 59.2 | 1.45 | 9.4 | 8.8 | 4.477 | |||||||
| Flex | 4 | 26,266,937 | 2.1 | 63.8 | 51.9 | 1.65 | 11.5 | 10.0 | 4.466 | |||||||
| Mixed Use | 5 | 70,877,227 | 5.8 | 62.3 | 55.2 | 1.52 | 9.7 | 9.0 | 4.463 | |||||||
| Office/Retail | 2 | 46,500,000 | 3.8 | 63.4 | 55.3 | 1.38 | 9.3 | 8.5 | 4.320 | |||||||
| Parking Garage/Retail | 1 | 9,984,987 | 0.8 | 54.3 | 44.5 | 1.57 | 10.5 | 10.0 | 4.870 | |||||||
| Office/Multifamily | 1 | 9,000,000 | 0.7 | 58.4 | 58.4 | 2.21 | 10.2 | 9.6 | 4.273 | |||||||
| Multifamily/Retail | 1 | 5,392,240 | 0.4 | 73.9 | 68.5 | 1.56 | 11.1 | 10.4 | 5.260 | |||||||
| Self Storage | 6 | 19,881,101 | 1.6 | 62.0 | 51.9 | 2.34 | 12.9 | 12.5 | 4.535 | |||||||
| Self Storage | 6 | 19,881,101 | 1.6 | 62.0 | 51.9 | 2.34 | 12.9 | 12.5 | 4.535 | |||||||
| Total/Weighted Average | 138 | $1,231,492,115 | 100.0 | % | 61.8 | % | 53.5 | % | 2.05 | x | 12.4 | % | 11.5 | % | 4.394 | % |
| (1) | Because this table presents information relating to the mortgaged properties and not the mortgage loans, the information for mortgage loans secured by more than one mortgaged property (other than through cross-collateralization with other mortgage loans) is based on allocated amounts (allocating the mortgage loan principal balance to each of those properties according to the relative appraised values of the mortgaged properties or the allocated loan amounts or property-specific release prices set forth in the related mortgage loan documents or such other allocation as the related mortgage loan seller deemed appropriate). The information for each mortgaged property that relates to a mortgage loan that is cross-collateralized with other mortgage loans is based upon the principal balance of that mortgage loan, except that the applicable loan-to-value ratio, debt service coverage ratio or debt yield for each such mortgaged property is based upon the ratio or yield (as applicable) for the aggregate indebtedness evidenced by all loans in the group. On an individual basis, without regard to the cross-collateralization feature, any mortgaged property securing a mortgage loan that is part of a cross-collateralized group of mortgage loans may have a higher loan-to-value ratio, lower debt service coverage ratio and/or lower debt yield than is presented herein. For mortgaged properties securing residential cooperative mortgage loans, the loan-to-value ratio, debt service coverage ratio or debt yield for each such mortgaged property are calculated using underwritten net cash flow for the related residential cooperative property which is the projected net cash flow reflected in the most recent appraisal obtained by or otherwise in the possession of the related mortgage loan seller as of the cut-off date, and the appraised value of the residential cooperative property determined as if such residential cooperative property is operated as a residential cooperative. With respect to One South Wacker Drive, loan-to-value ratio, debt service coverage ratio and debt yield calculations include the related pari passu companion loan (unless otherwise stated) in total debt. Debt service coverage ratio, debt yield and loan-to-value ratio information takes no account of subordinate debt (whether or not secured by the mortgaged property), if any, that is allowed under the terms of any mortgage loan. See Annex A-1 to the Free Writing Prospectus. |
THE INFORMATION IN THIS STRUCTURAL AND COLLATERAL TERM SHEET IS NOT COMPLETE AND MAY BE AMENDED PRIOR TO THE TIME OF SALE. THIS TERM SHEET IS NOT AN OFFER TO SELL THESE SECURITIES AND IT IS NOT A SOLICITATION OF AN OFFER TO BUY THESE SECURITIES IN ANY JURISDICTION WHERE THE OFFER OR SALE IS NOT PERMITTED.
16
| WFRBS Commercial Mortgage Trust 2013-C12 | Characteristics of the Mortgage Pool |
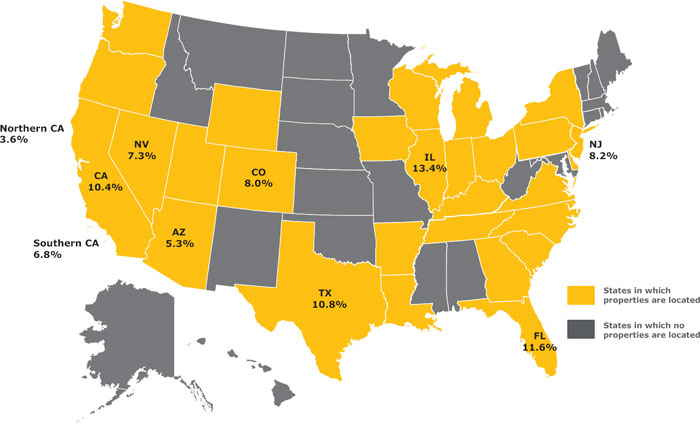
F. Geographic Distribution(1)
Location(2) | Number of Mortgaged Properties | Aggregate Cut-off Date Balance ($)(3) | % of Cut- off Date Balance | Weighted Average Cut- off Date LTV Ratio (%)(3) | Weighted Average Balloon or ARD LTV Ratio (%)(3) | Weighted Average U/W NCF DSCR (x)(3) | Weighted Average U/W NOI Debt Yield (%)(3) | Weighted Average U/W NCF Debt Yield (%)(3) | Weighted Average Mortgage Rate (%)(3) | ||||||||||
| Illinois | 8 | $165,085,240 | 13.4 | % | 67.6 | % | 65.0 | % | 2.28 | x | 10.7 | % | 9.6 | % | 4.003 | % | |||
| Florida | 3 | 142,541,937 | 11.6 | 58.4 | 50.0 | 1.98 | 13.1 | 11.9 | 4.396 | ||||||||||
| Texas | 18 | 133,229,820 | 10.8 | 67.6 | 52.9 | 1.68 | 11.8 | 10.6 | 4.528 | ||||||||||
| California | 13 | 128,071,542 | 10.4 | 62.3 | 51.1 | 1.67 | 10.9 | 10.1 | 4.358 | ||||||||||
| Southern | 8 | 83,305,891 | 6.8 | 63.0 | 51.4 | 1.75 | 10.8 | 10.3 | 4.315 | ||||||||||
| Northern | 5 | 44,765,651 | 3.6 | 61.1 | 50.5 | 1.53 | 11.0 | 9.8 | 4.440 | ||||||||||
| New Jersey | 3 | 101,234,386 | 8.2 | 58.0 | 53.6 | 2.52 | 12.7 | 11.9 | 4.302 | ||||||||||
| Colorado | 13 | 99,113,721 | 8.0 | 69.7 | 59.4 | 1.58 | 9.4 | 9.1 | 4.386 | ||||||||||
| Nevada | 4 | 89,785,000 | 7.3 | 58.6 | 57.9 | 2.58 | 10.8 | 10.4 | 3.917 | ||||||||||
| Arizona | 9 | 65,545,794 | 5.3 | 64.5 | 58.8 | 1.62 | 9.7 | 9.1 | 4.422 | ||||||||||
Other(4) | 67 | 306,884,674 | 24.9 | 56.7 | 45.6 | 2.20 | 15.7 | 14.9 | 4.726 | ||||||||||
| Total/Weighted Average | 138 | $1,231,492,115 | 100.0 | % | 61.8 | % | 53.5 | % | 2.05 | x | 12.4 | % | 11.5 | % | 4.394 | % | |||
| (1) | The Mortgaged Properties are located in 28 states and the District of Columbia. |
| (2) | For purposes of determining whether a mortgaged property is in Northern California or Southern California, Northern California includes areas with zip codes above 93600 and Southern California includes areas with zip codes of 93600 and below. |
| (3) | Because this table presents information relating to the mortgaged properties and not the mortgage loans, the information for mortgage loans secured by more than one mortgaged property (other than through cross-collateralization with other mortgage loans) is based on allocated amounts (allocating the mortgage loan principal balance to each of those properties according to the relative appraised values of the mortgaged properties or the allocated loan amounts or property-specific release prices set forth in the related mortgage loan documents or such other allocation as the related mortgage loan seller deemed appropriate). The information for each mortgaged property that relates to a mortgage loan that is cross-collateralized with other mortgage loans is based upon the principal balance of that mortgage loan, except that the applicable loan-to-value ratio, debt service coverage ratio or debt yield for each such mortgaged property is based upon the ratio or yield (as applicable) for the aggregate indebtedness evidenced by all loans in the group. On an individual basis, without regard to the cross-collateralization feature, any mortgaged property securing a mortgage loan that is part of a cross-collateralized group of mortgage loans may have a higher loan-to-value ratio, lower debt service coverage ratio and/or lower debt yield than is presented herein. For mortgaged properties securing residential cooperative mortgage loans, the loan-to-value ratio, debt service coverage ratio or debt yield for each such mortgaged property are calculated using underwritten net cash flow for the related residential cooperative property which is the projected net cash flow reflected in the most recent appraisal obtained by or otherwise in the possession of the related mortgage loan seller as of the cut-off date, and the appraised value of the residential cooperative property determined as if such residential cooperative property is operated as a residential cooperative. With respect to One South Wacker Drive, loan-to-value ratio, debt service coverage ratio, debt yield and cut-off date balance per square foot calculations include the related pari passu companion loan (unless otherwise stated) in total debt. Debt service coverage ratio, debt yield and loan-to-value ratio information takes no account of subordinate debt (whether or not secured by the mortgaged property), if any, that is allowed under the terms of any mortgage loan. See Annex A-1 to the Free Writing Prospectus. |
| (4) | Includes 20 other states and the District of Columbia. |
THE INFORMATION IN THIS STRUCTURAL AND COLLATERAL TERM SHEET IS NOT COMPLETE AND MAY BE AMENDED PRIOR TO THE TIME OF SALE. THIS TERM SHEET IS NOT AN OFFER TO SELL THESE SECURITIES AND IT IS NOT A SOLICITATION OF AN OFFER TO BUY THESE SECURITIES IN ANY JURISDICTION WHERE THE OFFER OR SALE IS NOT PERMITTED.
17
| WFRBS Commercial Mortgage Trust 2013-C12 | Characteristics of the Mortgage Pool |
G. Characteristics of the Mortgage Pool (1)
| CUT-OFF DATE BALANCE | LOAN PURPOSE | |||||||
Range of Cut-off Date Balances ($) | Number of Mortgage Loans | Aggregate Cut- off Date Balance | % of Cut-off Date Balance | Loan Purpose | Number of Mortgage Loans | Aggregate Cut- off Date Balance | % of Cut-off Date Balance | |
| 576,000 - 1,000,000 | 1 | $576,000 | 0.0% | Refinance | 81 | $654,889,242 | 53.2% | |
| 1,000,001 - 2,000,000 | 19 | 28,518,754 | 2.3 | Acquisition | 19 | 576,602,873 | 46.8 | |
| 2,000,001 - 3,000,000 | 12 | 28,273,118 | 2.3 | Total: | 100 | $1,231,492,115 | 100.0% | |
| 3,000,001 - 4,000,000 | 7 | 23,479,473 | 1.9 | |||||
| 4,000,001 - 5,000,000 | 4 | 18,640,246 | 1.5 | MORTGAGE RATE | ||||
| 5,000,001 - 6,000,000 | 10 | 55,783,879 | 4.5 | Number of | ||||
| 6,000,001 - 7,000,000 | 1 | 7,000,000 | 0.6 | Range of Mortgage Rates | Mortgage | Aggregate Cut- | % of Cut-off | |
| 7,000,001 - 8,000,000 | 5 | 37,645,408 | 3.1 | (%) | Loans | off Date Balance | Date Balance | |
| 8,000,001 - 9,000,000 | 7 | 61,896,997 | 5.0 | 3.700 - 4.500 | 38 | $932,190,109 | 75.7% | |
| 9,000,001 - 10,000,000 | 7 | 67,811,119 | 5.5 | 4.501 - 4.750 | 15 | 84,214,898 | 6.8 | |
| 10,000,001 - 15,000,000 | 9 | 100,943,644 | 8.2 | 4.751 - 5.000 | 13 | 115,796,967 | 9.4 | |
| 15,000,001 - 20,000,000 | 5 | 80,479,043 | 6.5 | 5.001 - 5.250 | 19 | 60,458,364 | 4.9 | |
| 20,000,001 - 30,000,000 | 3 | 74,300,000 | 6.0 | 5.251 - 5.500 | 11 | 31,681,842 | 2.6 | |
| 30,000,001 - 50,000,000 | 6 | 235,757,435 | 19.1 | 5.501 - 5.750 | 2 | 3,817,223 | 0.3 | |
| 70,000,001 - 80,000,000 | 1 | 74,250,000 | 6.0 | 5.751 - 6.000 | 1 | 1,173,084 | 0.1 | |
| 90,000,001 - 100,000,000 | 1 | 95,000,000 | 7.7 | 6.001 - 6.010 | 1 | 2,159,628 | 0.2 | |
| 100,000,001 - 125,000,000 | 2 | 241,137,000 | 19.6 | Total: | 100 | $1,231,492,115 | 100.0% | |
| Total: | 100 | $1,231,492,115 | 100.0% | Weighted Average: | 4.394% | |||
| Average: | $12,314,921 | |||||||
| UNDERWRITTEN NOI DEBT YIELD | ||||||||
| UNDERWRITTEN NOI DEBT SERVICE COVERAGE RATIO | Number of | |||||||
| Number of | Range of U/W NOI | Mortgage | Aggregate Cut- | % of Cut-off | ||||
| Range of U/W NOI | Mortgage | Aggregate Cut- | % of Cut-off | Debt Yields (%) | Loans | off Date Balance | Date Balance | |
| DSCRs (x) | Loans | off Date Balance | Date Balance | 8.3 - 9.0 | 7 | $221,585,590 | 18.0% | |
| 1.34 - 1.40 | 2 | $42,000,000 | 3.4% | 9.1 - 10.0 | 7 | 180,850,000 | 14.7 | |
| 1.41 - 1.50 | 7 | 222,085,590 | 18.0 | 10.1 - 11.0 | 14 | 140,843,738 | 11.4 | |
| 1.51 - 1.60 | 6 | 38,367,672 | 3.1 | 11.1 - 12.0 | 21 | 132,125,287 | 10.7 | |
| 1.61 - 1.70 | 14 | 94,475,820 | 7.7 | 12.1 - 13.0 | 20 | 384,720,181 | 31.2 | |
| 1.71 - 1.80 | 14 | 83,282,840 | 6.8 | 13.1 - 14.0 | 5 | 86,041,135 | 7.0 | |
| 1.81 - 1.90 | 10 | 77,426,344 | 6.3 | 14.1 - 15.0 | 1 | 10,025,000 | 0.8 | |
| 1.91 - 2.00 | 7 | 97,390,923 | 7.9 | 15.1 - 16.0 | 3 | 19,124,561 | 1.6 | |
| 2.01 - 2.25 | 8 | 206,009,646 | 16.7 | 16.1 - 17.0 | 1 | 5,720,000 | 0.5 | |
| 2.26 - 2.50 | 2 | 20,217,096 | 1.6 | 19.1 - 20.0 | 1 | 3,083,493 | 0.3 | |
| 2.51 - 3.00 | 5 | 117,208,054 | 9.5 | 20.1 - 227.9 | 20 | 47,373,130 | 3.8 | |
| 3.01 - 3.50 | 8 | 197,992,243 | 16.1 | Total: | 100 | $1,231,492,115 | 100.0% | |
| 3.51 - 4.00 | 4 | 11,946,801 | 1.0 | Weighted Average: | 12.4% | |||
| 4.01 - 18.00 | 13 | 23,089,086 | 1.9 | |||||
| Total: | 100 | $1,231,492,115 | 100.0% | UNDERWRITTEN NCF DEBT YIELD | ||||
| Weighted Average: | 2.21x | Number of | ||||||
| Range of U/W NCF | Mortgage | Aggregate Cut - | % of Cut-off | |||||
| UNDERWRITTEN NCF DEBT SERVICE COVERAGE RATIO | Debt Yields (%) | Loans | off Date Balance | Date Balance | ||||
| Number of | 8.2 - 9.0 | 13 | $320,135,590 | 26.0% | ||||
| Range of U/W NCF | Mortgage | Aggregate Cut- | % of Cut-off | 9.1 - 10.0 | 16 | 244,885,347 | 19.9 | |
| DSCRs (x) | Loans | off Date Balance | Date Balance | 10.1 - 11.0 | 20 | 125,140,842 | 10.2 | |
| 1.31 - 1.40 | 4 | $90,250,000 | 7.3% | 11.1 - 12.0 | 19 | 363,216,495 | 29.5 | |
| 1.41 - 1.50 | 15 | 255,656,864 | 20.8 | 12.1 - 13.0 | 6 | 92,787,657 | 7.5 | |
| 1.51 - 1.60 | 17 | 89,442,467 | 7.3 | 13.1 - 14.0 | 2 | 25,275,000 | 2.1 | |
| 1.61 - 1.70 | 13 | 136,738,342 | 11.1 | 15.1 - 16.0 | 4 | 12,678,054 | 1.0 | |
| 1.71 - 1.80 | 12 | 95,205,319 | 7.7 | 20.1 - 227.9 | 20 | 47,373,130 | 3.8 | |
| 1.81 - 1.90 | 3 | 16,785,424 | 1.4 | Total: | 100 | $1,231,492,115 | 100.0% | |
| 1.91 - 2.00 | 2 | 132,799,937 | 10.8 | Weighted Average: | 11.5% | |||
| 2.01 - 2.25 | 5 | 67,461,071 | 5.5 | |||||
| 2.26 - 2.50 | 2 | 110,250,000 | 9.0 | |||||
| 2.51 - 3.00 | 5 | 139,424,561 | 11.3 | |||||
| 3.01 - 3.50 | 5 | 62,442,243 | 5.1 | |||||
| 3.51 - 4.00 | 4 | 11,946,801 | 1.0 | |||||
| 4.01 - 18.00 | 13 | 23,089,086 | 1.9 | |||||
| Total: | 100 | $1,231,492,115 | 100.0% | |||||
| Weighted Average: | 2.05x | |||||||
| (1) | Information regarding mortgage loans that are cross-collateralized with other mortgage loans is based upon the individual loan balances, except that the applicable loan-to value ratio, debt service coverage ratio or debt yield for each such mortgage loan is based upon the ratio or yield (as applicable) for the aggregate indebtedness evidenced by all loans in the group. On an individual basis, without regard to the cross-collateralization feature, any mortgage loan that is part of a cross-collateralized group of mortgage loans may have a higher loan-to-value ratio, lower debt service coverage ratio and/or lower debt yield than is presented herein. For mortgaged properties securing residential cooperative mortgage loans, the loan-to-value ratio, debt service coverage ratio or debt yield for each such mortgaged property are calculated using underwritten net cash flow for the related residential cooperative property which is the projected net cash flow reflected in the most recent appraisal obtained by or otherwise in the possession of the related mortgage loan seller as of the cut-off date, and the appraised value of the residential cooperative property determined as if such residential cooperative property is operated as a residential cooperative. With respect to One South Wacker Drive, loan-to-value ratio, debt service coverage ratio and debt yield calculations include the related pari passu companion loan (unless otherwise stated) in total debt. Debt service coverage ratio, debt yield and loan-to-value ratio information takes no account of subordinate debt (whether or not secured by the mortgaged property), if any, that is allowed under the terms of any mortgage loan. |
THE INFORMATION IN THIS STRUCTURAL AND COLLATERAL TERM SHEET IS NOT COMPLETE AND MAY BE AMENDED PRIOR TO THE TIME OF SALE. THIS TERM SHEET IS NOT AN OFFER TO SELL THESE SECURITIES AND IT IS NOT A SOLICITATION OF AN OFFER TO BUY THESE SECURITIES IN ANY JURISDICTION WHERE THE OFFER OR SALE IS NOT PERMITTED.
18
| WFRBS Commercial Mortgage Trust 2013-C12 | Characteristics of the Mortgage Pool |
| ORIGINAL TERM TO MATURITY OR ARD | CUT-OFF DATE LOAN-TO-VALUE RATIO | |||||||||||||
| Number of | Number of | |||||||||||||
| Range of Original Terms to | Mortgage | Aggregate Cut- | % of Cut-off | Range of Cut-off Date LTV | Mortgage | Aggregate Cut- | % of Cut-off | |||||||
| Maturity or ARD (months) | Loans | off Date Balance | Date Balance | Ratios (%) | Loans | off Date Balance | Date Balance | |||||||
| 60 | 4 | $140,442,240 | 11.4% | 2.5 - 35.0 | 23 | $55,408,173 | 4.5% | |||||||
| 84 | 1 | 10,370,072 | 0.8 | 35.1 - 50.0 | 3 | 54,833,493 | 4.5 | |||||||
| 120 | 95 | 1,080,679,803 | 87.8 | 50.1 - 55.0 | 10 | 164,499,561 | 13.4 | |||||||
| Total: | 100 | $1,231,492,115 | 100.0% | 55.1 - 60.0 | 6 | 222,817,437 | 18.1 | |||||||
| Weighted Average: | 113 months | 60.1 - 65.0 | 11 | 129,136,513 | 10.5 | |||||||||
| 65.1 - 70.0 | 28 | 256,585,956 | 20.8 | |||||||||||
| REMAINING TERM TO MATURITY OR ARD | 70.1 - 75.0 | 18 | 339,237,007 | 27.5 | ||||||||||
| Number of | 75.1 - 78.4 | 1 | 8,973,974 | 0.7 | ||||||||||
| Range of Remaining Terms | Mortgage | Aggregate Cut- | % of Cut-off | Total: | 100 | $1,231,492,115 | 100.0% | |||||||
| to Maturity or ARD (months) | Loans | off Date Balance | Date Balance | Weighted Average: | 61.8% | |||||||||
| 58 - 60 | 4 | $140,442,240 | 11.4% | |||||||||||
| 61 - 84 | 1 | 10,370,072 | 0.8 | BALLOON OR ARD LOAN-TO-VALUE RATIO | ||||||||||
| 85 - 120 | 95 | 1,080,679,803 | 87.8 | Number of | ||||||||||
| Total: | 100 | $1,231,492,115 | 100.0% | Range of Balloon or ARD | Mortgage | Aggregate Cut- | % of Cut-off | |||||||
| Weighted Average: | 111 months | LTV Ratios (%) | Loans | off Date Balance | Date Balance | |||||||||
| 0.0 - 35.0 | 25 | $60,486,303 | 4.9% | |||||||||||
ORIGINAL AMORTIZATION TERM(2) | 35.1 - 45.0 | 8 | 95,259,924 | 7.7 | ||||||||||
| Range of Original | Number of | 45.1 - 50.0 | 18 | 203,290,796 | 16.5 | |||||||||
| Amortization Terms | Mortgage | Aggregate Cut- | % of Cut-off | 50.1 - 55.0 | 21 | 320,197,641 | 26.0 | |||||||
| (months) | Loans | off Date Balance | Date Balance | 55.1 - 60.0 | 19 | 225,754,238 | 18.3 | |||||||
| Non-Amortizing | 9 | $331,405,000 | 26.9% | 60.1 - 65.0 | 7 | 226,110,974 | 18.4 | |||||||
| 120 - 180 | 2 | 3,320,096 | 0.3 | 65.1 - 70.0 | 1 | 5,392,240 | 0.4 | |||||||
| 181 - 240 | 2 | 12,019,637 | 1.0 | 70.1 - 73.0 | 1 | 95,000,000 | 7.7 | |||||||
| 241 - 300 | 26 | 220,831,296 | 17.9 | Total: | 100 | $1,231,492,115 | 100.0% | |||||||
| 301 - 360 | 59 | 657,631,042 | 53.4 | Weighted Average: | 53.5% | |||||||||
| 421 - 480 | 2 | 6,285,043 | 0.5 | |||||||||||
| Total: | 100 | $1,231,492,115 | 100.0% | AMORTIZATION TYPE | ||||||||||
Weighted Average(3): | 344 months | Number of | Aggregate Cut- | |||||||||||
(2) The original amortization term shown for any mortgage loan that is interest-only for part of its term does not include the number of months in its interest-only period and reflects only the number of months as of the commencement of amortization remaining from the end of such interest-only period. (3) Excludes the non-amortizing loans. | Mortgage | off Date | % of Cut-off | |||||||||||
| Type of Amortization | Loans | Balance | Date Balance | |||||||||||
| Amortizing Balloon | 78 | $511,746,972 | 41.6% | |||||||||||
Interest-only, Amortizing Balloon Interest-only, Balloon | 8 7 | 303,521,000 217,155,000 | 24.6 17.6 | |||||||||||
| Interest-only, ARD | 2 | 114,250,000 | 9.3 | |||||||||||
| Interest-only, Amortizing ARD | 1 | 49,750,000 | 4.0 | |||||||||||
REMAINING AMORTIZATION TERM(4) | Amortizing ARD | 4 | 35,069,142 | 2.8 | ||||||||||
| Range of Remaining | Number of | Total: | 100 | $1,231,492,115 | 100.0% | |||||||||
| Amortization Terms | Mortgage | Aggregate Cut- | % of Cut-off | |||||||||||
| (months) | Loans | off Date Balance | Date Balance | ORIGINAL TERM OF INTEREST-ONLY PERIOD FOR PARTIAL IO LOANS | ||||||||||
| Non-Amortizing | 9 | $331,405,000 | 26.9% | Number of | ||||||||||
| 116 - 120 | 1 | 1,459,683 | 0.1 | Mortgage | Aggregate Cut- | % of Cut-off | ||||||||
| 121 - 180 | 1 | 1,860,412 | 0.2 | IO Term (months) | Loans | off Date Balance | Date Balance | |||||||
| 181 - 240 | 2 | 12,019,637 | 1.0 | 1 | 2 | $1,584,000 | 0.1% | |||||||
| 241 - 300 | 26 | 220,831,296 | 17.9 | 12 | 1 | 5,300,000 | 0.4 | |||||||
| 301 - 360 | 59 | 657,631,042 | 53.4 | 24 | 2 | 241,137,000 | 19.6 | |||||||
| 421 - 464 | 2 | 6,285,043 | 0.5 | 36 | 1 | 28,500,000 | 2.3 | |||||||
| Total: | 100 | $1,231,492,115 | 100.0% | 60 | 3 | 76,750,000 | 6.2 | |||||||
Weighted Average(5): | 342 months | Total: | 9 | $353,271,000 | 28.7% | |||||||||
| (4) The remaining amortization term shown for any mortgage loan that is interest-only for part of its term does not include the number of months in its interest-only period and reflects only the number of months as of the commencement of amortization remaining from the end of such interest-only period. | Weighted Average: | 33 months | ||||||||||||
| SEASONING | ||||||||||||||
| (5) Excludes the non-amortizing loans. | Number of | |||||||||||||
| Mortgage | Aggregate Cut- | % of Cut-off | ||||||||||||
| LOCKBOXES | Seasoning (months) | Loans | off Date Balance | Date Balance | ||||||||||
| Number of | % of Cut-off | 0 | 36 | $548,955,000 | 44.6% | |||||||||
| Mortgage | Aggregate Cut- | Date | 1 - 3 | 39 | 607,966,385 | 49.4 | ||||||||
| Type of Lockbox | Loans | off Date Balance | Balance | 4 - 6 | 3 | 20,622,240 | 1.7 | |||||||
| Hard/Springing Cash Management | 19 | $472,013,496 | 38.3% | 13 - 23 | 22 | 53,948,490 | 4.4 | |||||||
| Soft/Springing Cash Management | 13 | 228,471,750 | 18.6 | Total: | 100 | $1,231,492,115 | 100.0% | |||||||
| Springing (W/Out Estab. Account) | 18 | 202,334,314 | 16.4 | Weighted Average: | 2 months | |||||||||
| Hard/Upfront Cash Management | 6 | 152,575,366 | 12.4 | |||||||||||
| None | 40 | 150,623,750 | 12.2 | |||||||||||
| Springing (With Estab. Account) | 3 | 16,473,439 | 1.3 | |||||||||||
| Soft/Upfront Cash Management | 1 | 9,000,000 | 0.7 | |||||||||||
| Total: | 100 | $1,231,492,115 | 100.0% | |||||||||||
| PREPAYMENT PROVISION SUMMARY | ||||||||||||||
| Number of | % of Cut- | |||||||||||||
| Mortgage | Aggregate Cut- | off Date | ||||||||||||
| Prepayment Provision | Loans | off Date Balance | Balance | |||||||||||
| Lockout/Defeasance/Open | 63 | $803,525,384 | 65.2% | |||||||||||
| Lockout/YM%/Open | 14 | 372,558,557 | 30.3 | |||||||||||
| YM%/1%/Open | 23 | 55,408,173 | 4.5 | |||||||||||
| Total: | 100 | $1,231,492,115 | 100.0% | |||||||||||
THE INFORMATION IN THIS STRUCTURAL AND COLLATERAL TERM SHEET IS NOT COMPLETE AND MAY BE AMENDED PRIOR TO THE TIME OF SALE. THIS TERM SHEET IS NOT AN OFFER TO SELL THESE SECURITIES AND IT IS NOT A SOLICITATION OF AN OFFER TO BUY THESE SECURITIES IN ANY JURISDICTION WHERE THE OFFER OR SALE IS NOT PERMITTED.
19
| WFRBS Commercial Mortgage Trust 2013-C12 | Certain Terms and Conditions |
V. Certain Terms and Conditions
| Interest Entitlements: | The interest entitlement of each Class of Offered Certificates on each Distribution Date generally will be the interest accrued during the related Interest Accrual Period on the related Certificate Principal Balance or Notional Amount at the related pass-through rate, net of any prepayment interest shortfalls allocated to that Class for such Distribution Date as described below. If prepayment interest shortfalls arise from voluntary prepayments (without special servicer consent) on particular non-specially serviced mortgage loans during any collection period, the applicable Master Servicer is required to make a compensating interest payment to offset those shortfalls, generally up to an amount equal to the portion of its master servicing fees that accrue at one basis point per annum. The remaining amount of prepayment interest shortfalls will be allocated to reduce the interest entitlement on all Classes of Certificates (other than the Class X-A, Class X-B and Class X-C Certificates), pro rata, based on their respective amounts of accrued interest for the related Distribution Date. If a Class receives less than the entirety of its interest entitlement on any Distribution Date, then the shortfall, excluding any shortfall due to prepayment interest shortfalls, will be added to its interest entitlement for the next succeeding Distribution Date. Interest entitlements on the Class D, C and B Certificates, in that order, may be reduced by certain Trust Advisor expenses. | |||||
| Principal Distribution Amount: | The Principal Distribution Amount for each Distribution Date generally will be the aggregate amount of principal received or advanced in respect of the mortgage loans, net of any non-recoverable advances and interest thereon that are reimbursed to the applicable Master Servicer, the applicable Special Servicer or the Trustee during the related collection period. Non-recoverable advances and interest thereon are reimbursable from principal collections and advances before reimbursement from other amounts. The Principal Distribution Amount may also be reduced, with a corresponding loss, to the Class D, C, B and A-S Certificates, then to the Class A-1, A-2, A-3, A-4 and A-SB Certificates and Class A-3FX Regular Interest (and therefore, to the Class A-3FX and A-3FL Certificates) (with any losses on the Class A-1, A-2, A-3, A-4 and A-SB Certificates and Class A-3FX Regular Interest (and therefore, on the Class A-3FX and A-3FL Certificates) allocated pro rata according to their respective Certificate Principal Balances immediately prior to that Distribution Date), in that order, in connection with certain Trust Advisor expenses to the extent that interest entitlements on the Class B, C and D Certificates are insufficient to absorb the effect of the expense on any particular Distribution Date. | |||||
| Distributions: | On each Distribution Date, funds available for distribution from the mortgage loans, net of specified trust fees, expenses and reimbursements will generally be distributed in the following amounts and order of priority (in each case to the extent of remaining available funds): | |||||
| 1. | Class A-1, A-2, A-3, A-4, A-SB, X-A, X-B and X-C Certificates and Class A-3FX Regular Interest: To interest on the Class A-1, A-2, A-3, A-4, A-SB, X-A, X-B and X-C Certificates and Class A-3FX Regular Interest, pro rata, according to their respective interest entitlements. | |||||
THE INFORMATION IN THIS STRUCTURAL AND COLLATERAL TERM SHEET IS NOT COMPLETE AND MAY BE AMENDED PRIOR TO THE TIME OF SALE. THIS TERM SHEET IS NOT AN OFFER TO SELL THESE SECURITIES AND IT IS NOT A SOLICITATION OF AN OFFER TO BUY THESE SECURITIES IN ANY JURISDICTION WHERE THE OFFER OR SALE IS NOT PERMITTED.
20
| WFRBS Commercial Mortgage Trust 2013-C12 | Certain Terms and Conditions |
| 2. | Class A-1, A-2, A-3, A-4 and A-SB Certificates and Class A-3FX Regular Interest: To principal on the Class A-1, A-2, A-3, A-4 and A-SB Certificates (and the Class A-3FX Regular Interest) in the following amounts and order of priority: (i) first, to principal on the Class A-SB Certificates, in an amount up to the Principal Distribution Amount for such Distribution Date until their Certificate Principal Balance is reduced to the Class A-SB Planned Principal Balance; (ii) second, to principal on the Class A-1 Certificates until their Certificate Principal Balance is reduced to zero, up to the remainder of the Principal Distribution Amount for such Distribution Date; (iii) third, to principal on the Class A-2 Certificates until their Certificate Principal Balance is reduced to zero, up to the remainder of the Principal Distribution Amount for such Distribution Date; (iv) fourth, on a pro rata basis, to principal on the Class A-3 Certificates and Class A-3FX Regular Interest (and therefore, to holders of the Class A-3FX and A-3FL Certificates) until their Certificate Principal Balance is reduced to zero, up to the remainder of the Principal Distribution Amount for such Distribution Date; (v) fifth, to principal on the Class A-4 Certificates until their Certificate Principal Balance is reduced to zero, up to the remainder of the Principal Distribution Amount for such Distribution Date; and (vi) sixth, to principal on the Class A-SB Certificates until their Certificate Principal Balance is reduced to zero, up to the remainder of the Principal Distribution Amount for such Distribution Date. However, if the Certificate Principal Balance of each and every Class of Principal Balance Certificates, other than the Class A-1, A-2, A-3, A-4 and A-SB Certificates and Class A-3FX Regular Interest, has been reduced to zero as a result of the allocation of Mortgage Loan losses and expenses and any of the Class A-1, A-2, A-3, A-4 and A-SB Certificates and Class A-3FX Regular Interest remains outstanding, then the Principal Distribution Amount will be distributed on the Class A-1, A-2, A-3, A-4 and A-SB Certificates and Class A-3FX Regular Interest, pro rata, based on their respective outstanding Certificate Principal Balances, until their Certificate Principal Balances have been reduced to zero. | |||||
| 3. | Class A-1, A-2, A-3, A-4 and A-SB Certificates and Class A-3FX Regular Interest: To reimburse the holders of the Class A-1, A-2, A-3, A-4 and A-SB Certificates and the Class A-3FX Regular Interest (and, therefore, to reimburse the holders of the Class A-3FX and A-3FL Certificates), pro rata, for any previously unreimbursed losses (other than certain Trust Advisor expenses) on the mortgage loans that were previously allocated in reduction of the Certificate Principal Balances of such Classes. | |||||
| 4. | Class A-S Certificates: To make distributions on the Class A-S Certificates as follows: (a) first, to interest on Class A-S Certificates in the amount of the interest entitlement for that Class; (b) next, to the extent of the portion of the Principal Distribution Amount remaining after distributions in respect of principal to each Class with a higher distribution priority (in this case, the Class A-1, A-2, A-3, A-4 and A-SB Certificates and Class A-3FX Regular Interest), to principal on the Class A-S Certificates until their Certificate Principal Balance is reduced to zero; and (c) next, to reimburse the holders of the Class A-S Certificates for any previously unreimbursed losses (other than certain Trust Advisor expenses) on the mortgage loans that were previously allocated to that Class in reduction of its Certificate Principal Balance. | |||||
| 5. | Class B Certificates: To make distributions on the Class B Certificates as follows: (a) first, to interest on Class B Certificates in the amount of the interest entitlement for that Class; (b) next, to the extent of the portion of the Principal Distribution Amount remaining after distributions in respect of principal to each Class with a higher distribution priority (in this case, the Class A-1, A-2, A-3, A-4, A-SB and A-S Certificates and Class A-3FX Regular Interest), to principal on the Class B Certificates until their Certificate Principal Balance is reduced to zero; and (c) next, to reimburse the holders of the Class B Certificates for any previously unreimbursed losses (other than certain Trust Advisor expenses) on the mortgage loans that were previously allocated to that Class in reduction of its Certificate Principal Balance. | |||||
| 6. | Class C Certificates: To make distributions on the Class C Certificates as follows: (a) first, to interest on Class C Certificates in the amount of the interest entitlement for that Class; (b) next, to the extent of the portion of the Principal Distribution Amount remaining after distributions in respect of principal to each Class with a higher distribution priority (in this case, the Class A-1, A-2, A-3, A-4, A-SB, A-S and B Certificates and Class A-3FX Regular Interest), to principal on the Class C Certificates until their Certificate Principal Balance is reduced to zero; and (c) next, to reimburse the holders of the Class C Certificates for any previously unreimbursed losses (other than certain Trust Advisor expenses) on the mortgage loans that were previously allocated to that Class in reduction of its Certificate Principal Balance. |
THE INFORMATION IN THIS STRUCTURAL AND COLLATERAL TERM SHEET IS NOT COMPLETE AND MAY BE AMENDED PRIOR TO THE TIME OF SALE. THIS TERM SHEET IS NOT AN OFFER TO SELL THESE SECURITIES AND IT IS NOT A SOLICITATION OF AN OFFER TO BUY THESE SECURITIES IN ANY JURISDICTION WHERE THE OFFER OR SALE IS NOT PERMITTED.
21
| WFRBS Commercial Mortgage Trust 2013-C12 | Certain Terms and Conditions |
| 7. | After the Class A-1, A-2, A-3, A-4, A-SB, A-S, B and C Certificates and Class A-3FX Regular Interest are paid all amounts to which they are entitled, the remaining funds available for distribution will be used to pay interest, principal and loss reimbursement amounts (other than certain Trust Advisor expenses) on the Class D, E, F and G Certificates sequentially in that order in a manner analogous to the Class C Certificates. | |||||
| Amounts distributed in respect of the Class A-3FX Regular Interest will generally be allocated between the Class A-3FX and A-3FL Certificates in accordance with their class percentage interests. | ||||||
Allocation of Yield Maintenance and Prepayment Premiums: | If any yield maintenance charges and prepayment premiums are collected during any particular collection period with respect to any mortgage loan, then on the distribution date corresponding to that collection period, the certificate administrator will pay a portion of the yield maintenance charges and prepayment premiums (net of liquidation fees payable therefrom) in the following manner: (1) pro rata, between the (x) the group (the “YM Group A”) of the Class A-1, A-2, A-3, A-4, A-SB, A-S and X-A Certificates and the Class A-3FX Regular Interest and (y) the group (the “YM Group B” and, collectively with the YM Group A, the “YM Groups”) of the Class B, C, D and X-B Certificates, based upon the aggregate amount of principal distributed to the classes of principal balance certificates (other than the Class A-3FL and Class A-3FX Certificates) and the Class A-3FX Regular Interest in each YM Group for that distribution date, and (2) among the classes of certificates in each YM Group, in the following manner, up to an amount equal to the product of (a) the yield maintenance or prepayment premium allocated to such YM Group, (b) the related Base Interest Fraction (as defined in the Free Writing Prospectus), and (c) a fraction, which in no event may be greater than 1.0, the numerator of which is equal to the amount of principal distributed to the holder(s) of such class or regular interest for that distribution date, and the denominator of which is the aggregate amount of principal distributed to all the certificates and the Class A-3FX Regular Interest in that YM Group for that distribution date. Any yield maintenance charges or prepayment premium allocated to such YM Group remaining after such distributions will be distributed to the Class X-A and/or Class X-B Certificates, as applicable, in such YM Group. | |||||
| No prepayment premiums or yield maintenance charges will be distributed to the holders of the Class E, F, G, X-C, V or R Certificates. The holders of the Class X-B Certificates will be entitled to all prepayment premiums and yield maintenance charges collected after the Class A-1, A-2, A-3, A-4, A-SB, A-S, X-A, B, C and D Certificates and Class A-3FX Regular Interest (and, therefore, the Class A-3FX and A-3FL Certificates) are retired. For a description of when prepayment premiums and yield maintenance charges are generally required on the mortgage loans, see Annex A-1 to the Free Writing Prospectus. See also “Risk Factors – Prepayments and Repurchases of the Mortgage Assets Will Affect the Timing of Your Cash Flow and May Affect Your Yield” in the prospectus attached to the Free Writing Prospectus. Prepayment premiums and yield maintenance charges will be distributed on each Distribution Date only to the extent they are actually received on the mortgage loans as of the related Determination Date. | ||||||
| Realized Losses: | The Certificate Principal Balances of the Class A-1, A-2, A-3, A-4, A-SB, A-S, B, C, D, E, F and G Certificates and Class A-3FX Regular Interest (and, therefore, the Class A-3FX and A-3FL Certificates) will be reduced without distribution on any Distribution Date as a write-off to the extent of any losses realized on the mortgage loans allocated to such Class on such Distribution Date. Such losses (other than certain Trust Advisor expenses) will be applied in the following order, in each case until the related Certificate Principal Balance is reduced to zero: first, to Class G; second, to Class F; third, to Class E; fourth, to Class D; fifth, to Class C; sixth, to Class B; seventh, to Class A-S; and, finally, pro rata, to Classes A-1, A-2, A-3, A-4 and A-SB and the Class A-3FX Regular Interest (and, therefore, to holders of the Class A-3FX and the Class A-3FL Certificates) based on their outstanding Certificate Principal Balances. Certain Trust Advisor expenses (if not absorbed by reductions of interest entitlements on Classes D, C and B Certificates) will be applied as write-offs in a similar manner, except that such write-offs will be applied only to the Class D, C, B, A-S, A-1, A-2, A-3, A-4 and A-SB Certificates and the Class A-3FX Regular Interest (and, therefore, the Class A-3FX and A-3FL Certificates) (with any write-offs on the Class A-1, A-2, A-3, A-4 and A-SB Certificates and the Class A-3FX Regular Interest to be allocated pro rata according to their respective Certificate Principal Balances immediately prior to that Distribution Date). The notional amount of the Class X-A Certificates will be reduced by the amount of all losses that are allocated to the Class A-1, A-2, A-3, A-4, A-SB or A-S Certificates or the Class A-3FX Regular Interest as write-offs in reduction of their Certificate Principal Balances. The notional amount of the Class X-B Certificates will be reduced by the amount of all losses that are allocated to the Class B or C Certificates as write-offs in reduction of their Certificate Principal Balances. The notional amount of the Class X-C Certificates will be reduced by the amount of all losses that are allocated to the Class E, F or G Certificates as write-offs in reduction of their Certificate Principal Balances. | |||||
THE INFORMATION IN THIS STRUCTURAL AND COLLATERAL TERM SHEET IS NOT COMPLETE AND MAY BE AMENDED PRIOR TO THE TIME OF SALE. THIS TERM SHEET IS NOT AN OFFER TO SELL THESE SECURITIES AND IT IS NOT A SOLICITATION OF AN OFFER TO BUY THESE SECURITIES IN ANY JURISDICTION WHERE THE OFFER OR SALE IS NOT PERMITTED.
22
| WFRBS Commercial Mortgage Trust 2013-C12 | Certain Terms and Conditions |
| Debt Service Advances: | The related Master Servicer or, if such Master Servicer fails to do so, the Trustee, will be obligated to advance delinquent debt service payments (other than balloon payments and default interest) and assumed debt service payments on the mortgage loans (including the One South Wacker Drive mortgage loan but not its related pari passu companion loan), except to the extent any such advance is deemed non-recoverable from collections on the related mortgage loan. In addition, if an Appraisal Reduction Amount exists for a given mortgage loan, the interest portion of any debt service advance for such mortgage loan will be reduced, which will have the effect of reducing the amount of interest available for distribution to the Certificates in reverse alphabetical order of their Class designations (except that interest payments on the Class A-1, A-2, A-3, A-4, A-SB, X-A, X-B and X-C Certificates and the Class A-3FX Regular Interest (and, therefore, the Class A-3FX and A-3FL Certificates) would be affected on a pari passu basis). | |||
| Servicing Advances: | Each Master Servicer or, if either Master Servicer fails to do so, the Trustee, will be obligated to make servicing advances with respect to each mortgage loan it services, including the payment of delinquent property taxes, insurance premiums and ground rent, except to the extent that those advances are deemed non-recoverable from collections on the related mortgage loan. | |||
Appraisal Reduction Amounts: | An Appraisal Reduction Amount generally will be created in the amount, if any, by which the principal balance of a required appraisal loan (which is a mortgage loan with respect to which certain defaults, modifications or insolvency events have occurred as further described in the Free Writing Prospectus) plus other amounts overdue or advanced in connection with such mortgage loan exceeds 90% of the appraised value of the related mortgaged property plus certain escrows and reserves (including letters of credit) held with respect to the mortgage loan. | |||
| A mortgage loan will cease to be a required appraisal loan when the same has ceased to be a specially serviced mortgage loan (if applicable), has been brought current for at least three consecutive months and no other circumstances exist that would cause such mortgage loan to be required appraisal loan. | ||||
| Appraisal Reduction Amounts will affect the amount of debt service advances on the related mortgage loan. Appraisal Reduction Amounts will also be taken into account in the determination of the identity of the Class whose majority constitutes the “majority subordinate certificateholder” and is entitled to appoint the subordinate class representative. | ||||
| Clean-Up Call and Exchange Termination: | On each Distribution Date occurring after the aggregate unpaid principal balance of the mortgage loans is reduced below 1% of the initial aggregate principal balance of the mortgage loans as of the Cut-off Date, certain specified persons will have the option to purchase all of the remaining mortgage loans (and the trust’s interest in all property acquired through exercise of remedies in respect of any mortgage loan) at the price specified in the Free Writing Prospectus. Exercise of the option will terminate the trust and retire the then-outstanding certificates. | |||
| If the aggregate Certificate Principal Balances of each of the Class A-1, A-2, A-3, A-4, A-SB, A-S, B, C and D Certificates and Class A-3FX Regular Interest (and, therefore the Class A-3FX and Class A-3FL Certificates) have been reduced to zero, the trust may also be terminated in connection with an exchange of all the then-outstanding certificates, for the mortgage loans and REO properties then remaining in the issuing entity, but all of the holders of those Classes of outstanding certificates would have to voluntarily participate in the exchange. | ||||
| Liquidated Loan Waterfall: | Following the liquidation of any loan or property, the net liquidation proceeds generally will be applied (after reimbursement of advances and certain trust fund expenses), first, as a recovery of accrued interest, other than delinquent interest that was not advanced as a result of Appraisal Reduction Amounts, and then as a recovery of principal until all principal has been recovered. Any liquidation proceeds remaining thereafter will be applied as a recovery of delinquent interest that was not advanced as a result of Appraisal Reduction Amounts. |
THE INFORMATION IN THIS STRUCTURAL AND COLLATERAL TERM SHEET IS NOT COMPLETE AND MAY BE AMENDED PRIOR TO THE TIME OF SALE. THIS TERM SHEET IS NOT AN OFFER TO SELL THESE SECURITIES AND IT IS NOT A SOLICITATION OF AN OFFER TO BUY THESE SECURITIES IN ANY JURISDICTION WHERE THE OFFER OR SALE IS NOT PERMITTED.
23
| WFRBS Commercial Mortgage Trust 2013-C12 | Certain Terms and Conditions |
Majority Subordinate Certificateholder and Subordinate Class Representative: | A subordinate class representative may be appointed by the “majority subordinate certificate-holder”, which will be the holder(s) of a majority of: (a) during a “subordinate control period”, the most subordinate class among the Class E, F and G Certificates that has a Certificate Principal Balance, as notionally reduced by any Appraisal Reduction Amounts allocable to that class, that is at least equal to 25% of its total initial principal balance and (b) during a “collective consultation period”, the most subordinate class among the Class E, F and G Certificates that has a total principal balance, without regard to Appraisal Reduction Amounts, that is at least equal to 25% of its initial Certificate Principal Balance. The majority subordinate certificateholder will have a continuing right to appoint, remove or replace the subordinate class representative in its sole discretion. This right may be exercised at any time and from time to time. See “Servicing of the Mortgage Loans and Administration of the Trust Fund - The Majority Subordinate Certificateholder and the Subordinate Class Representative” in the Free Writing Prospectus. | |||
| Control and Consultation: | The rights of various parties to replace each Special Servicer and approve or consult with respect to major actions of either Special Servicer will vary according to defined periods. A “subordinate control period” will exist as long as the Class E Certificates have a Certificate Principal Balance, net of any Appraisal Reduction Amounts allocable to that class, that is not less than 25% of the initial principal balance of that class (unless a senior consultation period is deemed to occur generally or with respect to a particular mortgage loan, pursuant to clause (ii) of the definition of “senior consultation period”). In general, during a subordinate control period, (i) the subordinate class representative will be entitled to grant or withhold approval of asset status reports prepared, and material servicing actions proposed, by either Special Servicer, and (ii) the majority subordinate certificateholder, or the subordinate class representative on its behalf, will be entitled to terminate and replace each Special Servicer with or without cause, and appoint itself or another person as the applicable successor special servicer. It will be a condition to such appointment that Fitch, KBRA and S&P confirm that the appointment would not result in a qualification, downgrade or withdrawal of any of their then-current ratings of certificates. A “collective consultation period” will exist as long as the Class E Certificates have a Certificate Principal Balance that both (i) as notionally reduced by any Appraisal Reduction Amounts allocable to that class, is less than 25% of its initial principal balance and (ii) without regard to any Appraisal Reduction Amounts allocable to that class, is 25% or more of its initial Certificate Principal Balance (unless a senior consultation period is deemed to occur generally or with respect to a particular mortgage loan, pursuant to clause (ii) of the definition of “senior consultation period”). In general, during a collective consultation period, each Special Servicer will be required to consult with each of the subordinate class representative and the Trust Advisor in connection with asset status reports and material special servicing actions. A “senior consultation period” will exist as long as either (i) the Class E certificates have an aggregate principal balance, without regard to any Appraisal Reduction Amounts allocable to that class, that is less than 25% of its initial principal balance or (ii) during such time as the Class E certificates are the most subordinate class of control-eligible certificates that have a then outstanding principal balance, net of Appraisal Reduction Amounts, at least equal to 25% of its initial principal balance, the then-majority subordinate certificateholder has irrevocably waived its right to appoint a subordinate class representative and to exercise any of the rights of the majority subordinate certificateholder or cause the exercise of the rights of the subordinate class representative and such rights have not been reinstated to a successor majority subordinate certificateholder as set forth in the pooling and servicing agreement. In general, during a senior consultation period, each Special Servicer must seek to consult with the Trust Advisor in connection with asset status reports and material special servicing actions, and, in general, no subordinate class representative will be recognized or have any right to terminate either Special Servicer or approve, direct or consult with respect to servicing matters. Notwithstanding any contrary description set forth above, with respect to the One South Wacker Drive mortgage loan, (a) the subordinate class representative under the WFRBS 2013-C11 pooling and servicing agreement (or, during a senior consultation period under the series 2013-C11 pooling and servicing agreement, the special servicer under such pooling and servicing agreement) or any subsequent holder of the related pari passu companion loan or its representative will have consultation rights with respect to asset status reports and material special servicing actions involving the related loan combination, as provided for in the related intercreditor agreement and as described in the Free Writing Prospectus, and those rights will be in addition to the rights of the subordinate class representative in this transaction described above; and (b) the existence of a subordinate control period, collective consultation period or senior consultation period under the WFRBS 2013-C12 pooling and servicing agreement will not limit the consultation rights of the holder of the related pari passu companion loan. | |||
| In general, loan combination control rights also include the right, in certain circumstances, to direct the replacement of the special servicer for the related loan combination only. |
THE INFORMATION IN THIS STRUCTURAL AND COLLATERAL TERM SHEET IS NOT COMPLETE AND MAY BE AMENDED PRIOR TO THE TIME OF SALE. THIS TERM SHEET IS NOT AN OFFER TO SELL THESE SECURITIES AND IT IS NOT A SOLICITATION OF AN OFFER TO BUY THESE SECURITIES IN ANY JURISDICTION WHERE THE OFFER OR SALE IS NOT PERMITTED.
24
| WFRBS Commercial Mortgage Trust 2013-C12 | Certain Terms and Conditions |
Replacement of Special Servicer by General Vote of Certificateholders: | During any “collective consultation period” or “senior consultation period”, each Special Servicer may be terminated and replaced upon the affirmative direction of certificate owners holding not less than 75% of the appraisal-reduced voting rights of all certificates, following a proposal from certificate owners holding not less than 25% of the appraisal-reduced voting rights of all certificates. The certificateholders who initiate a vote on a termination and replacement of either Special Servicer without cause must cause Fitch, KBRA and S&P to confirm the then-current ratings of the certificates (or decline to review the matter) and cause the payment of the fees and expenses incurred in the replacement. | |||
| Appraisal Remedy: | Solely for purposes of determining whether a “subordinate control period” is in effect, whenever either Special Servicer obtains an appraisal or updated appraisal under the pooling and servicing agreement, the subordinate class representative, with respect to the mortgage loans serviced by such Special Servicer will have the right (at its or their expense) to direct such Special Servicer to hire a qualified appraiser to prepare a second appraisal of the mortgaged property. Such Special Servicer must thereafter determine whether, based on its assessment of such second appraisal, any recalculation of the Appraisal Reduction Amount is warranted. The Appraisal Reduction Amount, whether based on the first or the second appraisal, will become effective following the second appraisal, except that the Appraisal Reduction Amount based on the first appraisal shall become effective if the subordinate class representative declines to demand a second appraisal within a specified number of business days, or if a second appraisal is not received within 90 days after the direction of the subordinate class representative. In addition, for the same purposes, if there is a material change in the mortgaged property securing any mortgage loan for which an Appraisal Reduction Amount has been calculated, the majority certificateholder of the Class E, F or G Certificates or other designed certificateholders will be entitled (at its expense) to present an additional appraisal to such Special Servicer, which will generally be required to recalculate the Appraisal Reduction Amount based upon such additional appraisal. This latter right may not be exercised more frequently than once in any 12-month period for each mortgage loan for which an Appraisal Reduction Amount was calculated and can only be exercised during a subordinate control period or a collective consultation period as further described in the Free Writing Prospectus. | |||
| Sale of Defaulted Assets: | There will be no “fair value” purchase option. Instead, the pooling and servicing agreement will authorize each Special Servicer to sell defaulted mortgage loans serviced by such Special Servicer to the highest bidder in a manner generally similar to sales of REO properties. The sale of a defaulted loan for less than par plus accrued interest and certain other fees and expenses owed on the loan will be subject to consent or consultation rights of the subordinate class representative and/or Trust Advisor, as described in the Free Writing Prospectus. In the case of the One South Wacker Drive loan combination, the related Special Servicer may offer to sell to any person (or may offer to purchase) for cash such loan combination during such times as such loan combination constitutes a defaulted mortgage loan, and, in connection with any such sale, the related Special Servicer will be required to sell both the One South Wacker Drive mortgage loan and the related pari passu companion loan. The subordinate class representative under the WFRBS 2013-C11 pooling and servicing agreement will have consultation rights on behalf of the related trust fund as the holder of the related pari passu companion loan, as described in the Free Writing Prospectus. | |||
| “As-Is” Appraisals: | Appraisals must be conducted on an “as-is” basis, and must be no more than 9 months old, for purposes of determining Appraisal Reduction Amounts, market value in connection with REO sales, etc. Required appraisals may consist of updates of prior appraisals. Internal valuations by the applicable Special Servicer are permitted if the principal balance of a mortgage loan is less than $2,000,000. | |||
| Trust Advisor: | The Trust Advisor will perform certain review duties that will generally include a limited annual review of and report regarding each Special Servicer to the Certificate Administrator. The review and report generally will be based on: (a) during a collective consultation period or senior consultation period, any asset status reports and additional information delivered to the Trust Advisor by either Special Servicer with respect to any mortgage loan serviced by such Special Servicer, and/or (b) during a senior consultation period, in addition to the applicable information described above, a meeting with each Special Servicer to conduct a limited review of each such Special Servicer’s operational practices on a platform basis in light of the servicing standard. In addition, during any collective consultation period or senior consultation period, each Special Servicer must seek to consult with the Trust Advisor (in addition to the subordinate class representative during a collective consultation period) in connection with material special servicing actions with respect to specially serviced mortgage loans serviced by such Special Servicer. Furthermore, under certain circumstances, but only during a senior consultation period, the Trust Advisor may recommend the replacement of either Special Servicer, in which case the Certificate Administrator will deliver notice of such recommendation to the certificateholders, and certificateholders with specified percentages of the voting rights may direct the replacement of such Special Servicer at their expense. |
THE INFORMATION IN THIS STRUCTURAL AND COLLATERAL TERM SHEET IS NOT COMPLETE AND MAY BE AMENDED PRIOR TO THE TIME OF SALE. THIS TERM SHEET IS NOT AN OFFER TO SELL THESE SECURITIES AND IT IS NOT A SOLICITATION OF AN OFFER TO BUY THESE SECURITIES IN ANY JURISDICTION WHERE THE OFFER OR SALE IS NOT PERMITTED.
25
| WFRBS Commercial Mortgage Trust 2013-C12 | Certain Terms and Conditions |
| The Trust Advisor may be removed and replaced without cause upon the affirmative direction of certificates owners holding not less than 75% of the appraisal-reduced voting rights of all certificates, following a proposal from certificate owners holding not less than 25% of the appraisal-reduced voting rights of all certificates. The certificateholders who initiate a vote on a termination and replacement of the Trust Advisor without cause must cause Fitch, KBRA and S&P’s to confirm the then-current ratings of the certificates (or decline to review the matter) and cause the payment of the fees and expenses incurred in the replacement. During any “subordinate control period”, the proposed replacement trust advisor will be subject to the subordinate class representative’s consent (such consent not to be unreasonably withheld). If a proposed termination and replacement of the Trust Advisor is not consummated within 180 days following the initial request of the certificateholders who requested a vote, the proposed termination and replacement shall have no further force or effect. The Trust Advisor generally may be discharged from its duties if and when the Class A-1, A-2, A-3, A-3FL, A-3FX, A-4, A-SB, A-S, B, C and D Certificates are retired. | ||||
| Certain Fee Offsets: | If a workout fee is earned by either Special Servicer following a loan default with respect to any mortgage loan it services, then certain limitations will apply to the collection and retention of a modification fee from the borrower. The modification fee generally must not exceed 1% of the principal balance of the loan as modified. In addition, if the loan re-defaults within a specified period of months and other conditions are satisfied, any subsequent workout or liquidation fee on that loan must be reduced by a portion of the previously-collected modification fee. | |||
| Deal Website: | The Certificate Administrator will be required to maintain a deal website which will include, among other items: (a) summaries of asset status reports prepared by each Special Servicer, (b) inspection reports, (c) appraisals, (d) various “special notices” described in the Free Writing Prospectus, (e) the “Investor Q&A Forum” and (f) a voluntary “Investor Registry”. Investors may access the deal website following execution of a certification and confidentiality agreement. | |||
| Initial Majority Subordinate Certificateholder: | It is expected that RREF II CMBS AIV, LP, an affiliate of Rialto Real Estate Fund, LP, will be the initial majority subordinate certificateholder. | |||
| Loan Combinations: | The mortgaged property identified on Annex A-1 to the Free Writing Prospectus as One South Wacker Drive secures both a mortgage loan to be included in the trust fund and one other mortgage loan that will not be included in the trust fund, which will be pari passu in right of payment with the trust mortgage loan. With respect to such group of mortgage loans, which we refer to herein as a “loan combination”, such loan combination will be serviced under the pooling and servicing agreement related to the WFRBS 2013-C11 transaction until the closing of this transaction, after which time such loan combination will be serviced under the pooling and servicing agreement related to this transaction. |
THE INFORMATION IN THIS STRUCTURAL AND COLLATERAL TERM SHEET IS NOT COMPLETE AND MAY BE AMENDED PRIOR TO THE TIME OF SALE. THIS TERM SHEET IS NOT AN OFFER TO SELL THESE SECURITIES AND IT IS NOT A SOLICITATION OF AN OFFER TO BUY THESE SECURITIES IN ANY JURISDICTION WHERE THE OFFER OR SALE IS NOT PERMITTED.
26
(THIS PAGE INTENTIONALLY LEFT BLANK)
27
| GRAND BEACH HOTEL |
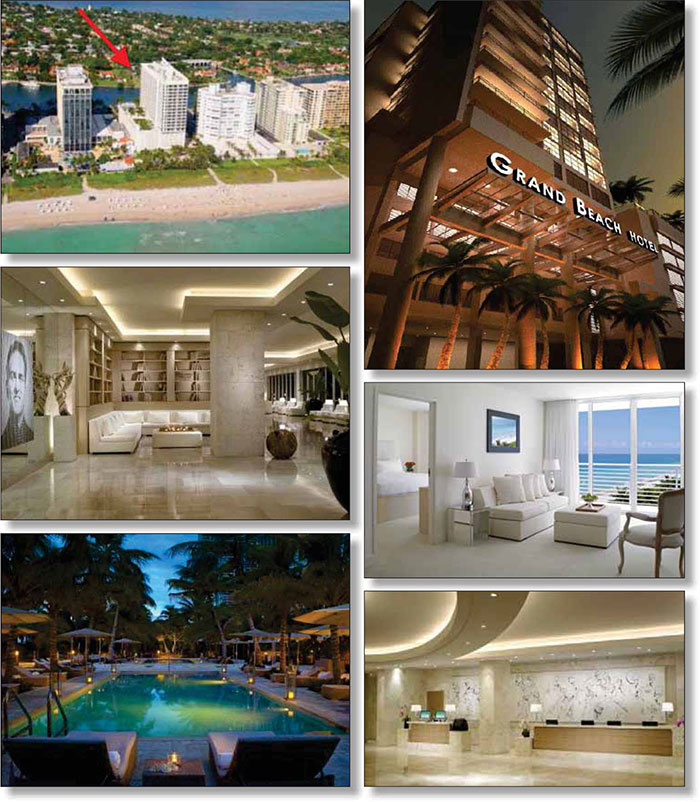
THE INFORMATION IN THIS STRUCTURAL AND COLLATERAL TERM SHEET IS NOT COMPLETE AND MAY BE AMENDED PRIOR TO THE TIME OF SALE. THIS TERM SHEET IS NOT AN OFFER TO SELL THESE SECURITIES AND IT IS NOT A SOLICITATION OF AN OFFER TO BUY THESE SECURITIES IN ANY JURISDICTION WHERE THE OFFER OR SALE IS NOT PERMITTED.
28
| GRAND BEACH HOTEL |
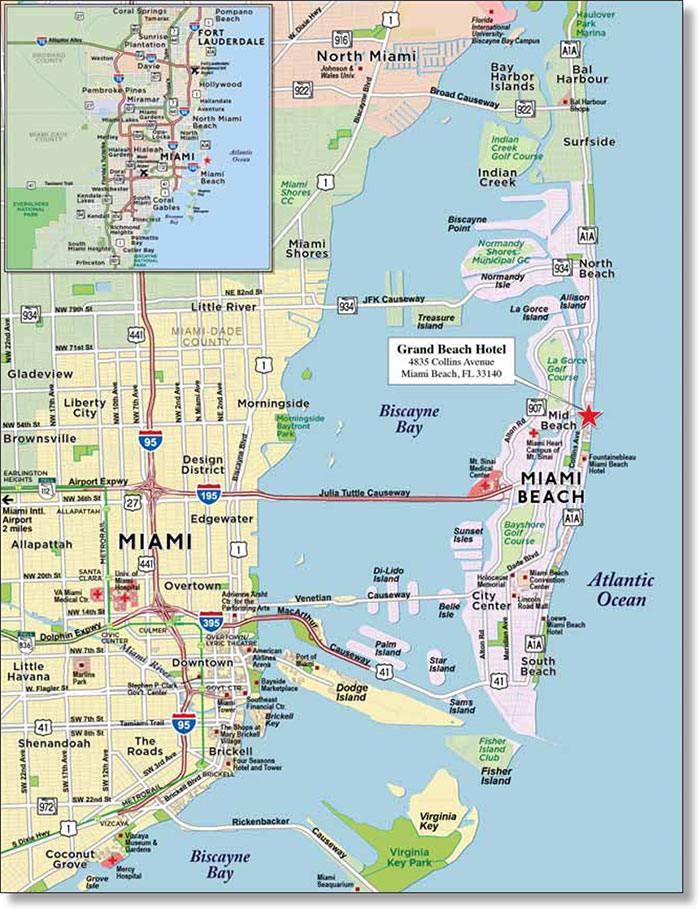
THE INFORMATION IN THIS STRUCTURAL AND COLLATERAL TERM SHEET IS NOT COMPLETE AND MAY BE AMENDED PRIOR TO THE TIME OF SALE. THIS TERM SHEET IS NOT AN OFFER TO SELL THESE SECURITIES AND IT IS NOT A SOLICITATION OF AN OFFER TO BUY THESE SECURITIES IN ANY JURISDICTION WHERE THE OFFER OR SALE IS NOT PERMITTED.
29
| No. 1 – Grand Beach Hotel |
| Loan Information | Property Information | ||||||
| Mortgage Loan Seller: | The Royal Bank of Scotland | Single Asset/Portfolio: | Single Asset | ||||
| Credit Assessment (Fitch/KBRA/S&P): | NR/NR/NR | Property Type: | Hospitality | ||||
| Original Principal Balance: | $125,000,000 | Specific Property Type: | Full Service | ||||
| Cut-off Date Principal Balance: | $125,000,000 | Location: | Miami Beach, FL | ||||
| % of Initial Pool Balance: | 10.2% | Size: | 424 rooms | ||||
| Loan Purpose: | Refinance | Cut-off Date Principal Balance Per Room: | $294,811 | ||||
| Borrower Name: | MB Florida Limited, LLC | Year Built/Renovated: | 2009/NAP | ||||
| Sponsor: | The Murray Group | Title Vesting: | Fee | ||||
| Mortgage Rate: | 4.467% | Property Manager: | Self-managed | ||||
| Note Date: | February 14, 2013 | 4th Most Recent Occupancy (As of)(2): | NAV (12/31/2008) | ||||
| Anticipated Repayment Date: | NAP | 3rd Most Recent Occupancy (As of)(2): | NAV (12/31/2009) | ||||
| Maturity Date: | March 1, 2023 | 2nd Most Recent Occupancy (As of): | 65.3% (12/31/2010) | ||||
| IO Period: | 24 months | Most Recent Occupancy (As of): | 79.2% (12/31/2011) | ||||
| Loan Term (Original): | 120 months | Current Occupancy (As of): | 81.4% (12/31/2012) | ||||
| Seasoning: | 0 months | ||||||
| Amortization Term (Original): | 360 months | Underwriting and Financial Information: | |||||
| Loan Amortization Type: | Interest-only, Amortizing Balloon | ||||||
| Interest Accrual Method: | Actual/360 | 5th Most Recent NOI (As of)(2): | NAV (12/31/2008) | ||||
| Call Protection: | L(24),D(92),O(4) | 4th Most Recent NOI (As of)(2): | NAV (12/31/2009) | ||||
| Lockbox Type: | Hard/Springing Cash Management | 3rd Most Recent NOI (As of): | $10,310,322 (12/31/2010) | ||||
| Additional Debt: | None | 2nd Most Recent NOI (As of): | $18,153,643 (12/31/2011) | ||||
| Additional Debt Type: | NAP | Most Recent NOI (As of): | $19,973,220 (TTM 11/30/2012) | ||||
| U/W Revenues: | $36,480,442 | ||||||
| U/W Expenses: | $20,329,500 | ||||||
| U/W NOI: | $16,150,942 | ||||||
| U/W NCF: | $14,691,725 | ||||||
| U/W NOI DSCR: | 2.13x | ||||||
| U/W NCF DSCR: | 1.94x | ||||||
Escrows and Reserves(1): | U/W NOI Debt Yield: | 12.9% | |||||
| U/W NCF Debt Yield: | 11.8% | ||||||
Type: | Initial | Monthly | Cap (If Any) | As-Is Appraised Value: | $210,000,000 | ||
| Taxes | $570,860 | $114,172 | NAP | As-Is Appraisal Valuation Date: | December 21, 2012 | ||
| Insurance | $307,592 | $141,262 | NAP | Cut-off Date LTV Ratio: | 59.5% | ||
| FF&E | $0 | Springing | $4,236,378 | LTV Ratio at Maturity or ARD: | 50.8% | ||
| (1) | See “Escrows” section. |
| (2) | Historical occupancy and financial data are not available for 2008 and 2009 as the Grand Beach Hotel property was constructed in 2009. |
The Mortgage Loan. The mortgage loan (the “Grand Beach Hotel Mortgage Loan”) is evidenced by a single promissory note that is secured by a first mortgage encumbering a full service hotel located in Miami Beach, Florida (the “Grand Beach Hotel Property”). The Grand Beach Hotel Mortgage Loan was originated on February 14, 2013 by The Royal Bank of Scotland. The Grand Beach Hotel Mortgage Loan had an original principal balance of $125,000,000, has an outstanding principal balance as of the Cut-off Date of $125,000,000 and accrues interest at an interest rate of 4.467% per annum. The Grand Beach Hotel Mortgage Loan had an initial term of 120 months, has a remaining term of 120 months as of the Cut-off Date and requires interest-only payments for the first 24 months following origination and thereafter requires payments of principal and interest based on a 30-year amortization schedule. The Grand Beach Hotel Mortgage Loan matures on March 1, 2023.
Following the lockout period, the borrower has the right to defease the Grand Beach Hotel Mortgage Loan in whole, but not in part, on any due date before December 1, 2022. In addition, the Grand Beach Hotel Mortgage Loan is prepayable without penalty on or after December 1, 2022.
THE INFORMATION IN THIS STRUCTURAL AND COLLATERAL TERM SHEET IS NOT COMPLETE AND MAY BE AMENDED PRIOR TO THE TIME OF SALE. THIS TERM SHEET IS NOT AN OFFER TO SELL THESE SECURITIES AND IT IS NOT A SOLICITATION OF AN OFFER TO BUY THESE SECURITIES IN ANY JURISDICTION WHERE THE OFFER OR SALE IS NOT PERMITTED.
30
| GRAND BEACH HOTEL |
Sources and Uses
| Sources | Uses | |||||||
| Original loan amount | $125,000,000 | 100.0% | Loan payoff | $48,594,936 | 38.9% | |||
| Reserves | 878,452 | 0.7 | ||||||
Closing costs Return of equity | 2,844,349 72,682,263 | 2.3 58.1 | ||||||
| Total Sources | $125,000,000 | 100.0% | Total Uses | $125,000,000 | 100.0% |
The Property. The Grand Beach Hotel Property is a 424-room, 20-story, full service hotel located in Miami Beach, Florida. The Grand Beach Hotel Property was built in 2009 and currently no renovation or further development of the Grand Beach Hotel Property is contemplated. Amenities at the Grand Beach Hotel Property include a business center, 1,740 square feet of meeting space, three outdoor swimming pools and four outdoor whirlpools, a restaurant that serves breakfast, lunch and dinner, a café, a full bar, an exercise room and a gift shop. The Grand Beach Hotel Property offers 312 king guestrooms, 15 queen guestrooms, 48 double guestrooms, 16 one-bedroom suites, 24 two-bedroom suites, eight penthouse suites and one ambassador suite. The standard guestroom offers a studio-suite-style configuration ranging from 410 to 440 square feet, while one- and two-bedroom suites range from 660 to 880 square feet. Most guest rooms feature two full-bathrooms. Each guestroom features a 42-inch flat screen TV, refrigerator, high-speed internet access and work desk. Most guestrooms also feature a private balcony with a view of the Atlantic Ocean, City of Miami Beach or Intercoastal Waterway. The Grand Beach Hotel Property has 557 parking spaces located on levels two through six.
Operating History and Underwritten Net Cash Flow. The following table represents certain information relating to the historical operating performance and the Underwritten Net Cash Flow at the Grand Beach Hotel Property:
Cash Flow Analysis
| 2010 | 2011 | TTM 11/30/2012 | U/W | U/W $ per Room | ||||||
| Occupancy | 65.3% | 79.2% | 80.6% | 77.5% | ||||||
| ADR | $180.28 | $223.41 | $243.11 | $243.11 | ||||||
| RevPAR | $117.72 | $176.94 | $195.95 | $188.41 | ||||||
| Total Revenue | $20,766,982 | $34,969,757 | $38,225,769 | $36,480,442 | $86,039 | |||||
| Total Department Expenses | 4,652,720 | 9,382,535 | 10,061,835 | 9,603,108 | 22,649 | |||||
| Gross Operating Profit | $16,114,262 | $25,587,222 | $28,163,934 | $26,877,334 | $63,390 | |||||
| Total Undistributed Expenses | 4,221,098 | 5,777,665 | 6,259,975 | 7,661,183 | 18,069 | |||||
| Profit Before Fixed Charges | $11,893,164 | $19,809,557 | $21,903,959 | $19,216,151 | $45,321 | |||||
| Total Fixed Charges | 1,582,842 | 1,655,914 | 1,930,739 | 3,065,209 | 7,229 | |||||
| Net Operating Income | $10,310,322 | $18,153,643 | $19,973,220 | $16,150,942 | $38,092 | |||||
| FF&E | 0 | 0 | 0 | 1,459,218 | 3,442 | |||||
| Net Cash Flow | $10,310,322 | $18,153,643 | $19,973,220 | $14,691,725 | $34,650 | |||||
| NOI DSCR | 1.36x | 2.40x | 2.64x | 2.13x | ||||||
| NCF DSCR | 1.36x | 2.40x | 2.64x | 1.94x | ||||||
| NOI DY | 8.2% | 14.5% | 16.0% | 12.9% | ||||||
| NCF DY | 8.2% | 14.5% | 16.0% | 11.8% | ||||||
Appraisal. As of the appraisal valuation date of December 21, 2012, the Grand Beach Hotel Property had an “as-is” appraised value of $210,000,000.
Environmental Matters. According to the Phase I environmental site assessment dated January 9, 2013, there was no evidence of any recognized environmental conditions at the Grand Beach Hotel Property.
Market Overview and Competition. The Grand Beach Hotel Property is located in Miami Beach, Florida approximately 1.7 miles from Interstate 195. The Grand Beach Hotel Property is located approximately 11 miles east of the Miami International Airport. The Miami International Airport serves more than 700,000 domestic and international passengers per week and is currently in the final stages of a $6.2 billion renovation. The Grand Beach Hotel Property benefits from its location approximately 3.6 miles north of South Beach’s Art Deco District, which is a popular tourist destination in Miami Beach. South Beach is characterized by historic hotels, restaurants and nightclubs and is home to the Miami Beach Convention Center. The Miami Beach Convention Center is 1.0 million square feet of meeting, exhibit and pre-function space and underwent a $35.0 million telecommunications infrastructure renovation between 2003 and 2008. The location of the Grand Beach Hotel Property also benefits from numerous demand generators including the Miami Seaquarium, the Vizcaya Museum and Gardens and the Everglades.
THE INFORMATION IN THIS STRUCTURAL AND COLLATERAL TERM SHEET IS NOT COMPLETE AND MAY BE AMENDED PRIOR TO THE TIME OF SALE. THIS TERM SHEET IS NOT AN OFFER TO SELL THESE SECURITIES AND IT IS NOT A SOLICITATION OF AN OFFER TO BUY THESE SECURITIES IN ANY JURISDICTION WHERE THE OFFER OR SALE IS NOT PERMITTED.
31
| GRAND BEACH HOTEL |
The following table presents certain information relating to the Grand Beach Hotel Property’s competitive set:
Subject and Market Historical Occupancy, ADR and RevPAR(1)
Competitive Set | Grand Beach Hotel | Penetration Factor | ||||||||||||||
Year | Occupancy | ADR | RevPAR | Occupancy | ADR | RevPAR | Occupancy | ADR | RevPAR | |||||||
| 10/31/2012 TTM | 77.0% | $261.77 | $201.69 | 81.5% | $244.99 | $199.70 | 105.8% | 93.6% | 99.0% | |||||||
| 10/31/2011 TTM | 76.5% | $238.45 | $182.48 | 81.1% | $218.69 | $177.35 | 106.0% | 91.7% | 97.2% | |||||||
| 10/31/2010 TTM | 66.8% | $231.77 | $154.82 | 64.6% | $177.77 | $114.90 | 96.8% | 76.7% | 74.2% | |||||||
| (1) | Information obtained from a third party hospitality report dated November 19, 2012. According to such third party hospitality report, the competitive set includes the following hotels: Fontainebleau Miami Beach, Renaissance Eden Roc Miami Beach, Courtyard Miami Beach Oceanfront, The Palms Hotel & Spa, Four Points Miami Beach, Loews Miami Beach Hotel, The James Royal Palm, The Perry South Beach and Mondrian South Beach. |
The Borrower. The borrower is MB Florida Limited, LLC, a Delaware limited liability company and a single purpose entity. The borrower’s sole managing member is MB Management Florida, LLC, a Delaware limited liability company and a single purpose entity with two independent directors. Legal counsel to the borrower delivered a non-consolidation opinion in connection with the origination of the Grand Beach Hotel Mortgage Loan. EOI US Property Inc. is the guarantor of certain nonrecourse carveouts under the Grand Beach Hotel Mortgage Loan.
The Sponsor. The loan sponsor is The Murray Group, which was founded by Jacques Gaston Murray. The principals of the Murray Group have reported net worth in excess of $500.0 million. Mr. Murray’s portfolio consists of five hotels. Mr. Murray also previously owned the adjacent Doral Hotel in Miami Beach. Mr. Murray has over 60 years of business experience and is the chairman of London Security Plc., a UK firm specializing in providing fire protection, and Andrews Sykes Group Plc, a UK firm specializing in portable air conditioning and cooling products.
Escrows. The loan documents provide for an upfront escrow at closing in the amount of $570,860 for real estate taxes and $307,592 for insurance premiums. The loan documents also provide for ongoing escrows in the amount of $114,172 for real estate taxes and $141,262 for insurance premiums. After the payment date that occurs in April 2015, the borrower is required to deposit an amount equal to one-twelfth of 4.0% of the annual operating income received over the prior 12-month period for FF&E expenditures, which amount is capped at $4,236,378.
Lockbox and Cash Management. The Grand Beach Hotel Mortgage Loan requires a lender-controlled lockbox account, which is already in place, into which the borrower will cause all credit card receipts to be deposited directly into such lockbox. Prior to the occurrence of a Cash Management Period (as defined below), all funds on deposit in the lockbox account are swept into the borrower’s operating account on a daily basis. During a Cash Management Period, all funds on deposit in the lockbox account are swept to a lender-controlled cash management account each business day.
A “Cash Management Period” will exist upon: (i) the occurrence and continuance of an event of default; (ii) the debt service coverage ratio falling below 1.35x at the end of any calendar quarter; or (iii) if the property manager (if any) is an affiliate of the borrower, the occurrence of a property manager insolvency proceeding. A Cash Management Period will expire upon: (i) with respect to the matters described in clause (i) above, the cure of such event of default; (ii) with respect to the matters described in clause (ii) above, the debt service coverage ratio being at least 1.35x for two consecutive calendar quarters; or (iii) with respect to the matters described in (iii) above, if the applicable insolvency proceeding regarding the property manager has terminated or such property manager is replaced by a replacement property manager acceptable to the lender, Fitch, KBRA and S&P.
Property Management. The Grand Beach Hotel Property is self-managed. There is no formal management agreement in place.
Assumption. The borrower has a one-time right to transfer the Grand Beach Hotel Property and cause an assumption of the Grand Beach Hotel Mortgage Loan, provided that certain conditions are satisfied, including: (i) no event of default has occurred and is continuing; (ii) the lender reasonably determined that the proposed transferee and guarantor satisfy the lender’s credit review and underwriting standards, taking into consideration transferee experience, financial strength and general business standing; and (iii) the lender has received confirmation from Fitch, KBRA and S&P that such assumption will not result in a downgrade, withdrawal or qualification of the then current ratings assigned to the Series 2013-C12 Certificates.
Partial Release. Not permitted.
Real Estate Substitution. Not permitted.
Subordinate and Mezzanine Indebtedness. Not permitted.
Other Additional Financing. Not permitted.
THE INFORMATION IN THIS STRUCTURAL AND COLLATERAL TERM SHEET IS NOT COMPLETE AND MAY BE AMENDED PRIOR TO THE TIME OF SALE. THIS TERM SHEET IS NOT AN OFFER TO SELL THESE SECURITIES AND IT IS NOT A SOLICITATION OF AN OFFER TO BUY THESE SECURITIES IN ANY JURISDICTION WHERE THE OFFER OR SALE IS NOT PERMITTED.
32
| GRAND BEACH HOTEL |
Ground Lease. A portion of the Grand Beach Hotel Property that is collateral for the Grand Beach Hotel Mortgage Loan is leased by the borrower pursuant to a submerged lands lease with the Board of Trustees of the Internal Improvement Trust Fund of the State of Florida. The premises demised under such submerged lands lease are located across Collins Avenue from the Grand Beach Hotel Property and are used as a boat docking facility and helipad. The submerged lands lease is ancillary to the primary collateral. No value was attributed to this parcel in the appraisal of the Grand Beach Hotel Property.
Terrorism Insurance. The loan documents require that the “all risk” insurance policy required to be maintained by the borrower provide coverage for terrorism in an amount equal to the full replacement cost of the Grand Beach Hotel Property, as well as business interruption insurance covering no less than the 18-month period following the occurrence of a casualty event, together with a six-month extended period of indemnity.
THE INFORMATION IN THIS STRUCTURAL AND COLLATERAL TERM SHEET IS NOT COMPLETE AND MAY BE AMENDED PRIOR TO THE TIME OF SALE. THIS TERM SHEET IS NOT AN OFFER TO SELL THESE SECURITIES AND IT IS NOT A SOLICITATION OF AN OFFER TO BUY THESE SECURITIES IN ANY JURISDICTION WHERE THE OFFER OR SALE IS NOT PERMITTED.
33
| RHP PORTFOLIO II |
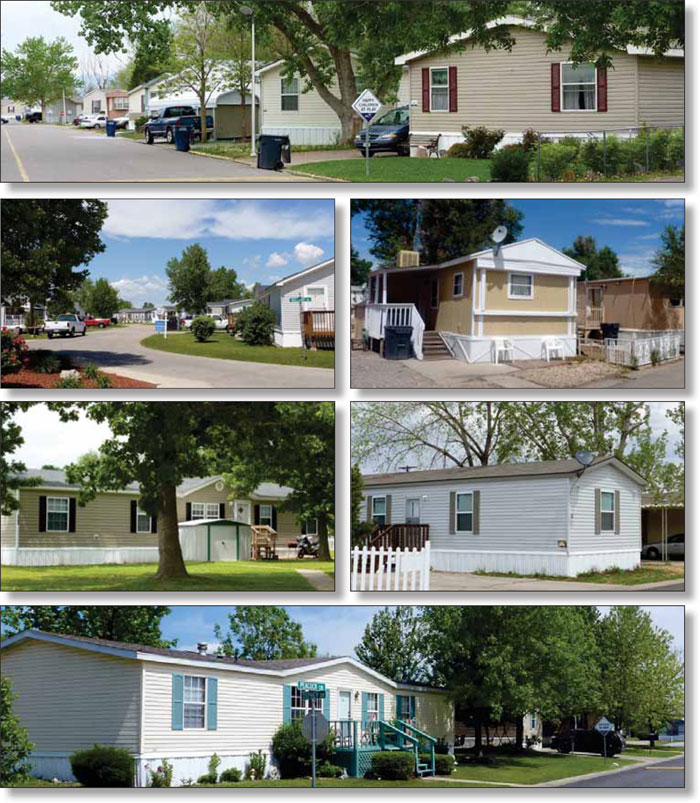
THE INFORMATION IN THIS STRUCTURAL AND COLLATERAL TERM SHEET IS NOT COMPLETE AND MAY BE AMENDED PRIOR TO THE TIME OF SALE. THIS TERM SHEET IS NOT AN OFFER TO SELL THESE SECURITIES AND IT IS NOT A SOLICITATION OF AN OFFER TO BUY THESE SECURITIES IN ANY JURISDICTION WHERE THE OFFER OR SALE IS NOT PERMITTED.
34
| RHP PORTFOLIO II |

THE INFORMATION IN THIS STRUCTURAL AND COLLATERAL TERM SHEET IS NOT COMPLETE AND MAY BE AMENDED PRIOR TO THE TIME OF SALE. THIS TERM SHEET IS NOT AN OFFER TO SELL THESE SECURITIES AND IT IS NOT A SOLICITATION OF AN OFFER TO BUY THESE SECURITIES IN ANY JURISDICTION WHERE THE OFFER OR SALE IS NOT PERMITTED.
35
| No. 2 - RHP Portfolio II | ||||||||
| Loan Information | Property Information | |||||||
| Mortgage Loan Seller: | The Royal Bank of Scotland | Single Asset/Portfolio: | Portfolio | |||||
| Credit Assessment (Fitch/KBRA/S&P): | NR/NR/NR | Property Type: | Manufactured Housing Community | |||||
| Original Principal Balance: | $116,137,000 | Specific Property Type: | Manufactured Housing Community | |||||
| Cut-off Date Principal Balance: | $116,137,000 | Location: | Various – See Table | |||||
| % of Initial Pool Balance: | 9.4% | Size: | 2,967 pads | |||||
| Loan Purpose: | Acquisition | Cut-off Date Principal Balance Per Pad: | $39,143 | |||||
Borrower Name(1): | Various | Year Built/Renovated: | Various – See Table | |||||
| Sponsors: | RHP Properties Inc.; Northstar Realty Finance Corporation | Title Vesting: | Fee | |||||
| Mortgage Rate: | 4.387% | Property Manager: | Newbury Management Company | |||||
| Note Date: | December 6, 2012 | 3rd Most Recent Occupancy (As of): | 81.5% (12/31/2009) | |||||
| Anticipated Repayment Date: | NAP | 2nd Most Recent Occupancy (As of): | 81.8% (12/31/2010) | |||||
| Maturity Date: | January 1, 2023 | Most Recent Occupancy (As of): | 83.6% (12/31/2011) | |||||
| IO Period: | 24 months | Current Occupancy (As of): | 87.1% (11/14/2012) | |||||
| Loan Term (Original): | 120 months | |||||||
| Seasoning: | 2 months | Underwriting and Financial Information: | ||||||
| Amortization Term (Original): | 360 months | |||||||
| Loan Amortization Type: | Interest-only, Amortizing Balloon | 3rd Most Recent NOI (As of): | $9,307,912 (12/31/2010) | |||||
| Interest Accrual Method: | Actual/360 | 2nd Most Recent NOI (As of): | $9,539,197 (12/31/2011) | |||||
| Call Protection: | L(26),GRTR 1% or YM(89),O(5) | Most Recent NOI (As of): | $10,171,398 (TTM 10/31/2012) | |||||
| Lockbox Type: | Soft/Springing Cash Management | |||||||
| Additional Debt: | Yes | U/W Revenues: | $15,184,892 | |||||
| Additional Debt Type: | Future Mezzanine | U/W Expenses: | $4,917,458 | |||||
| U/W NOI: | $10,267,434 | |||||||
| U/W NCF: | $10,090,393 | |||||||
U/W NOI DSCR : | 1.47x | |||||||
Escrows and Reserves(2): | U/W NCF DSCR: | 1.45x | ||||||
| U/W NOI Debt Yield: | 8.8% | |||||||
| Type: | Initial | Monthly | Cap (If Any) | U/W NCF Debt Yield: | 8.7% | |||
| Taxes | $228,972 | $39,673 | NAP | As-Is Appraised Value: | $158,910,000 | |||
| Insurance | $87,687 | $21,922 | NAP | As-Is Appraisal Valuation Date(3): | Various | |||
| Replacement Reserves | $2,319,846 | Springing | $500,000 | Cut-off Date LTV Ratio: | 73.1% | |||
| Deferred Maintenance | $130,154 | $0 | NAP | LTV Ratio at Maturity or ARD: | 62.2% | |||
| (1) | The borrower is comprised of 18 separate limited liability companies. |
| (2) | See “Escrows” section. |
| (3) | The As-Is Appraisal Valuation Dates range from September 16, 2012 to October 16, 2012. |
The Mortgage Loan. The mortgage loan (the “RHP Portfolio II Mortgage Loan”) is evidenced by a single promissory note that is secured by a first mortgage encumbering 18 manufactured housing communities totaling 2,967 pads located in four states (the “RHP Portfolio II Properties”). The RHP Portfolio II Mortgage Loan was originated on December 6, 2012 by The Royal Bank of Scotland. The RHP Portfolio II Mortgage Loan had an original principal balance of $116,137,000, has an outstanding principal balance as of the Cut-off Date of $116,137,000 and accrues interest at an interest rate of 4.387% per annum. The RHP Portfolio II Mortgage Loan had an initial term of 120 months, has a remaining term of 118 months as of the Cut-off Date and requires interest-only payments for the first 24 months following origination and thereafter requires payments of principal and interest based on a 30-year amortization schedule. The RHP Portfolio II Mortgage Loan matures on January 1, 2023.
Following the lockout period (except in the case of the Early Release Properties (as defined below)), the borrower has the right to prepay the RHP Portfolio II Mortgage Loan either in whole or in part, provided that the borrower pays the greater of a yield maintenance premium or a prepayment premium equal to 1.0% of the principal amount being prepaid. In addition, the RHP Portfolio II Mortgage Loan is prepayable without penalty on or after September 1, 2022.
THE INFORMATION IN THIS STRUCTURAL AND COLLATERAL TERM SHEET IS NOT COMPLETE AND MAY BE AMENDED PRIOR TO THE TIME OF SALE. THIS TERM SHEET IS NOT AN OFFER TO SELL THESE SECURITIES AND IT IS NOT A SOLICITATION OF AN OFFER TO BUY THESE SECURITIES IN ANY JURISDICTION WHERE THE OFFER OR SALE IS NOT PERMITTED.
36
| RHP PORTFOLIO II |
Sources and Uses
| Sources | Uses | |||||||
| Original loan amount | $116,137,000 | 76.1% | Purchase price | $148,690,000 | 97.4% | |||
| Equity | 36,551,444 | 23.9 | Reserves | 2,766,659 | 1.8 | |||
| Closing costs | 1,231,785 | 0.8 | ||||||
| Total Sources | $152,688,444 | 100.0% | Total Uses | $152,688,444 | 100.0% |
The Properties. The RHP Portfolio II Mortgage Loan is secured by the fee interest in 18 manufactured housing communities totaling 2,967 pads and located in Colorado, Wyoming, Illinois and Arkansas. The RHP Portfolio II Properties were acquired by the sponsors as a part of a 36 property portfolio in December of 2012. The other 18 properties in the portfolio (“RHP Portfolio I Properties”) are not collateral for the RHP Portfolio II Mortgage Loan and were securitized in the WFRBS 2013-C11 transaction. The RHP Portfolio II Properties’ amenities include playgrounds, basketball courts, RV storage, swimming pools and clubhouses. The RHP Portfolio II Properties were developed between 1951 and 1988 and have an average age of 42 years. Public utilities are provided in all but three of the RHP Portfolio II Properties. Of these three properties, two properties are served by private well water (Wikiup and Inspiration Valley) and one (Oak Grove) is served by a private sewer service.
The following table presents certain information relating to the RHP Portfolio II Properties:
| Property Name – Location | Allocated Cut- off Date Principal Balance | % of Portfolio Cut-off Date Principal Balance | Total Occupancy | Year Built/ Renovated | Pads | Appraised Value | |||||||
| Wikiup – Henderson, CO | $21,997,500 | 18.9% | 97.9% | 1967/NAP | 339 | $30,100,000 | |||||||
| Thornton – Thornton, CO | $11,560,500 | 10.0% | 92.8% | 1969/NAP | 208 | $15,700,000 | |||||||
| Stoneybrook – Greeley, CO | $9,684,500 | 8.3% | 64.8% | 1987/NAP | 429 | $14,300,000 | |||||||
| Villa West – Greeley, CO | $8,689,000 | 7.5% | 78.5% | 1972/NAP | 331 | $12,500,000 | |||||||
| Mallard Lake – Pontoon Beach, IL | $8,686,000 | 7.5% | 89.2% | 1987/NAP | 278 | $10,840,000 | |||||||
| Inspiration Valley – Arvada, CO | $8,502,000 | 7.3% | 90.6% | 1959/NAP | 139 | $11,600,000 | |||||||
| Big Country – Cheyenne, WY | $6,574,500 | 5.7% | 82.9% | 1960/NAP | 246 | $9,420,000 | |||||||
| Mobile Gardens – Denver, CO | $6,242,500 | 5.4% | 97.0% | 1955/NAP | 100 | $8,630,000 | |||||||
| Grand Meadow – Longmont, CO | $5,239,500 | 4.5% | 97.1% | 1965/NAP | 104 | $6,850,000 | |||||||
| Pleasant Grove – Fort Collins, CO | $4,827,000 | 4.2% | 98.2% | 1969/NAP | 112 | $6,870,000 | |||||||
| Hidden Hills – Casper, WY | $4,824,000 | 4.2% | 100.0% | 1971/NAP | 128 | $6,230,000 | |||||||
| Breazeale – Laramie, WY | $4,565,500 | 3.9% | 97.5% | 1960/NAP | 118 | $6,100,000 | |||||||
| Green Valley Village – Casper, WY | $3,876,000 | 3.3% | 98.1% | 1980/NAP | 105 | $5,200,000 | |||||||
| Park Plaza – Gillette, WY | $3,564,000 | 3.1% | 97.5% | 1988/NAP | 79 | $4,790,000 | |||||||
| Commerce Heights – Commerce City, CO | $2,796,000 | 2.4% | 90.4% | 1951/NAP | 52 | $3,600,000 | |||||||
| Englewood – Cheyenne, WY | $2,294,500 | 2.0% | 100.0% | 1984/NAP | 61 | $3,070,000 | |||||||
| Oak Grove – Godfrey, IL | $1,307,000 | 1.1% | 74.0% | 1952/NAP | 73 | $1,710,000 | |||||||
| Oak Glen – Fayetteville, AR | $907,000 | 0.8% | 76.9% | 1967/NAP | 65 | $1,400,000 | |||||||
| Total/Weighted Average | $116,137,000 | 100.0% | 87.1% | 2,967 | $158,910,000 |
The following table presents historical occupancy percentages at the RHP Portfolio II Properties:
Historical Occupancy(1)
12/31/2009 | 12/31/2010 | 12/31/2011 | 11/14/2012 | |||
| 82% | 82% | 84% | 87% | |||
| (1) Information obtained from the borrower. | ||||||
THE INFORMATION IN THIS STRUCTURAL AND COLLATERAL TERM SHEET IS NOT COMPLETE AND MAY BE AMENDED PRIOR TO THE TIME OF SALE. THIS TERM SHEET IS NOT AN OFFER TO SELL THESE SECURITIES AND IT IS NOT A SOLICITATION OF AN OFFER TO BUY THESE SECURITIES IN ANY JURISDICTION WHERE THE OFFER OR SALE IS NOT PERMITTED.
37
| RHP PORTFOLIO II |
Operating History and Underwritten Net Cash Flow. The following table presents certain information relating to the historical operating performance and the Underwritten Net Cash Flow at the RHP Portfolio II Properties:
Cash Flow Analysis
2010 | 2011 | TTM 10/31/2012 | U/W | U/W $ per Pad | ||||||
| Base Rent | $12,037,674 | $12,499,556 | $13,241,891 | $13,554,777 | $4,569 | |||||
| Grossed Up Vacant Space | 0 | 0 | 0 | 1,922,977 | 648 | |||||
| Total Reimbursables | 0 | 0 | 0 | 0 | 0 | |||||
| Other Income | 1,651,210 | 1,755,496 | 1,957,231 | 1,921,053 | 647 | |||||
| Less Vacancy & Credit Loss | (218,916) | (207,571) | (289,971) | (2,213,914)(1) | (746) | |||||
| Effective Gross Income | $13,469,968 | $14,047,481 | $14,909,151 | $15,184,892 | $5,118 | |||||
| Total Operating Expenses | $4,162,056 | $4,508,284 | $4,737,753 | $4,917,458 | $1,657 | |||||
| Net Operating Income | $9,307,912 | $9,539,197 | $10,171,398 | $10,267,434 | $3,461 | |||||
| TI/LC | 0 | 0 | 0 | 0 | 0 | |||||
| Capital Expenditures | 0 | 0 | 0 | 177,041 | 60 | |||||
| Net Cash Flow | $9,307,912 | $9,539,197 | $10,171,398 | $10,090,393 | $3,401 | |||||
| NOI DSCR | 1.34x | 1.37x | 1.46x | 1.47x | ||||||
| NCF DSCR | 1.34x | 1.37x | 1.46x | 1.45x | ||||||
| NOI DY | 8.0% | 8.2% | 8.8% | 8.8% | ||||||
| NCF DY | 8.0% | 8.2% | 8.8% | 8.7% |
| (1) | The underwritten economic vacancy is 18.4%. The RHP Portfolio II Properties were 87.1% physically occupied as of November 14, 2012. |
Appraisal. As of the appraisal valuation dates ranging from September 16, 2012 to October 16, 2012, the RHP Portfolio II Properties had an aggregate “as-is” appraised value of $158,910,000.
Environmental Matters. According to the Phase I environmental site assessments dated from October 8, 2012 to October 10, 2012, there was no evidence of any recognized environmental conditions at the RHP Portfolio II Properties.
The Borrower. The borrower is comprised of 18 separate limited liability companies (collectively referred to herein as the “borrower”), each of which is a single purpose entity and has two independent directors. Legal counsel to the borrower delivered a non-consolidation opinion in connection with the origination of the RHP Portfolio II Mortgage Loan. Ross Partrich, the principal of the borrower, is the guarantor of certain nonrecourse carveouts under the RHP Portfolio II Mortgage Loan.
The Sponsors. The sponsors are RHP Properties Inc. (“RHP”) and Northstar Realty Finance Corporation (“Northstar”). Northstar is a publicly traded REIT (NYSE: NRF) and has approximately $7.0 billion of commercial real estate assets under management as of December 31, 2011. RHP is the nation’s second largest private owner and operator of manufactured housing communities. RHP currently owns and manages a total of 120 communities with over 28,000 housing units located in 21 states, with a combined value of approximately $1.0 billion. Northstar owns 85.0% of the borrower while affiliates of RHP own the remaining 15.0%. Northstar is the managing member of the borrower and Newbury Management Company (owned by Ross Partrich of RHP) is the asset and property manager of the RHP Portfolio II Properties.
Escrows. The loan documents provide for upfront escrows in the amount of $228,972 for real estate taxes, $87,687 for insurance premiums and $130,154 for deferred maintenance. In addition, $2,319,846 was escrowed at loan closing in a lender-controlled account to fund for maintenance, repairs and/or capital expenditures at the RHP Portfolio II Properties.
The loan documents provide for ongoing monthly escrows in the amount of $39,673 for real estate taxes and $21,922 for insurance premiums. Additionally, the loan documents provide for a $12,363 monthly replacement reserve escrow beginning on February 1, 2016. The replacement reserve escrow will be capped at $500,000, exclusive of the initial deposit of $2,319,846.
Lockbox and Cash Management. The RHP Portfolio II Mortgage Loan requires a lender-controlled lockbox account, which is already in place, and the property manager must deposit all revenues into such lockbox account. The loan documents also require that all cash revenues and all other monies received by the borrower or the property manager be deposited into the lockbox account within one business day after receipt. Prior to the occurrence of a Cash Management Period (as defined below), all funds on deposit in the lockbox account are swept into the borrower’s operating account. During a Cash Management Period, all funds on deposit in the lockbox account are swept to a lender-controlled cash management account.
A “Cash Management Period” will commence (i) upon the occurrence and continuance of an event of default or (ii) if the debt service coverage ratio (or at any time when an approved mezzanine loan is outstanding, the Aggregate DSCR (as defined below)) is less than 1.05x. A Cash Management Period will end, with respect to matters in clause (i) above, if the event of default has been cured, or, with respect to matters in clause (ii) above, if the debt service coverage ratio (or at any time when an approved mezzanine loan is outstanding, the Aggregate DSCR) is at least 1.05x for two consecutive calendar quarters.
The “Aggregate DSCR” is the aggregate debt service coverage ratio based on the amortizing debt service under the RHP Portfolio II Mortgage Loan and any approved mezzanine loan that is outstanding.
THE INFORMATION IN THIS STRUCTURAL AND COLLATERAL TERM SHEET IS NOT COMPLETE AND MAY BE AMENDED PRIOR TO THE TIME OF SALE. THIS TERM SHEET IS NOT AN OFFER TO SELL THESE SECURITIES AND IT IS NOT A SOLICITATION OF AN OFFER TO BUY THESE SECURITIES IN ANY JURISDICTION WHERE THE OFFER OR SALE IS NOT PERMITTED.
38
| RHP PORTFOLIO II |
Property Management. The RHP Portfolio II Properties are currently managed by an affiliate of the borrower.
Assumption. The borrower has the right to transfer all of the RHP Portfolio II Properties, subject to conditions in the loan documents, including but not limited to: (i) no event of default has occurred and is continuing and (ii) the lender has received rating agency confirmation from Fitch, KBRA and S&P that the transfer will not result in a downgrade, withdrawal or qualification of the respective ratings assigned to the Series 2013-C12 Certificates.
Partial Release. Following the second anniversary of the closing date of the Series 2013-C12 Certificates (except in the case of Early Release Properties (as defined below)) and in connection with a bona fide third party sale of an individual RHP Portfolio II property or a sale to an affiliate of RHP Properties, Inc. (but not to an affiliate of Northstar or the borrower), the borrower may obtain the release of an individual property from the lien of the RHP Portfolio II Mortgage Loan in connection with a partial release upon the satisfaction of certain conditions including without limitation: (i) payment by the borrower of an amount equal to 120% of the then current allocated loan amount for the individual property to be released, together with applicable yield maintenance premium (or 110% of the allocated loan amount for Early Release Properties); (ii) satisfaction of all applicable REMIC requirements; and (iii) after giving effect to such release, the debt service coverage ratio of the remaining RHP Portfolio II Properties is not less than the greater of (x) the debt service coverage ratio (or Aggregate DSCR if an approved mezzanine loan is outstanding) immediately prior to such release and (y) 1.15x. The debt service coverage ratio will be based upon the underwritten net cash flow of the remaining RHP Portfolio II Properties and the actual debt service constant of the loan at closing.
The “Early Release Properties” can be released at any time and are comprised of the Commerce Heights property, the Oak Grove property and the Oak Glen property.
Real Estate Substitution. At any time before December 6, 2021, the borrower may obtain a release of any individual RHP Portfolio II property from the lien of the mortgage in connection with a substitution of a different property subject to the lender’s consent and the satisfaction of certain conditions, including without limitation: (i) no event of default exists at the time of substitution; (ii) the aggregate allocated loan amount of the properties released during the loan term will not exceed 25% of the original principal balance of the RHP Portfolio II Mortgage Loan; (iii) the fair market value of the new property will not be less than the fair market value of the substituted property both at closing and as of the date of substitution; (iv) the net operating income of the new property is not less than the net operating income of the substituted property both at closing and as of the date of substitution; (v) the lender receives written confirmation from Fitch, KBRA and S&P that such substitution will not result in a qualification, downgrade or withdrawal of the then current ratings assigned to the WFRBS 2013-C12 Certificates; (vi) all REMIC requirements are satisfied; (vii) the number of properties remaining under the RHP Portfolio II Mortgage Loan after giving effect to the substitution must not be less than prior to the substitution; (viii) the substituted properties must not be any of the RHP Portfolio I Properties; and (ix) the geographic diversity of the RHP Portfolio II Properties must not be diminished, in the lender’s discretion, as the result of a substitution.
Subordinate and Mezzanine Indebtedness. Northstar, which indirectly owns 85.0% of the membership interests in the borrower, was granted a preferred equity interest in a parent of the borrower, RHP Western Portfolio Group, LLC. See “Description of the Mortgage Pool – Additional Indebtedness – Additional Financing and Preferred Equity” in the Free Writing Prospectus. Northstar has the ability to convert a portion of its preferred equity in the borrower into a mezzanine loan during the term of the RHP Portfolio II Mortgage Loan subject to certain conditions, including without limitation: (i) the mezzanine debt must be subordinate to the RHP Portfolio II Mortgage Loan and will be secured by the equity interests in the borrower that owns the RHP Portfolio II Properties; (ii) the mezzanine loan must not exceed $31,600,000; (iii) the Aggregate LTV (as defined below) must be no greater than 85.0%; and (iv) the Aggregate DSCR must be no less than 1.15x. Additionally, at Northstar’s option, the mezzanine loan may be alternatively structured as a larger mezzanine loan that is secured by both the equity in the borrower of the RHP Portfolio II Mortgage Loan and the equity interest in the borrower of the mortgage loan secured by the RHP Portfolio I Properties.
The “Aggregate LTV” is the aggregate loan-to-value ratio based on the outstanding balance of the RHP Portfolio II Mortgage Loan and any approved mezzanine loan that is outstanding.
Ground Lease. None.
Terrorism Insurance. The loan documents require that the “all risk” insurance policy required to be maintained by the borrower provide coverage for terrorism in an amount equal to the full replacement cost of the RHP Portfolio II Properties. The loan documents also require business interruption insurance covering no less than the 12-month period following the occurrence of a casualty event.
THE INFORMATION IN THIS STRUCTURAL AND COLLATERAL TERM SHEET IS NOT COMPLETE AND MAY BE AMENDED PRIOR TO THE TIME OF SALE. THIS TERM SHEET IS NOT AN OFFER TO SELL THESE SECURITIES AND IT IS NOT A SOLICITATION OF AN OFFER TO BUY THESE SECURITIES IN ANY JURISDICTION WHERE THE OFFER OR SALE IS NOT PERMITTED.
39
(THIS PAGE INTENTIONALLY LEFT BLANK)
40
| ONE SOUTH WACKER DRIVE |
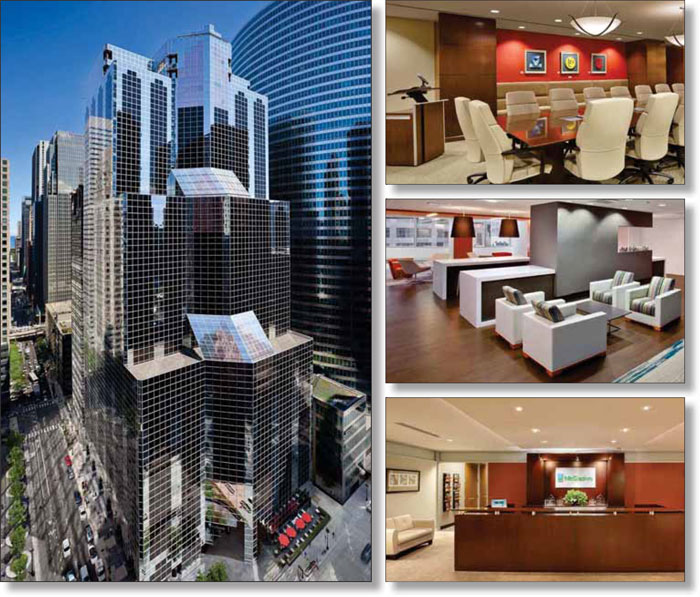
THE INFORMATION IN THIS STRUCTURAL AND COLLATERAL TERM SHEET IS NOT COMPLETE AND MAY BE AMENDED PRIOR TO THE TIME OF SALE. THIS TERM SHEET IS NOT AN OFFER TO SELL THESE SECURITIES AND IT IS NOT A SOLICITATION OF AN OFFER TO BUY THESE SECURITIES IN ANY JURISDICTION WHERE THE OFFER OR SALE IS NOT PERMITTED.
41
| ONE SOUTH WACKER DRIVE |
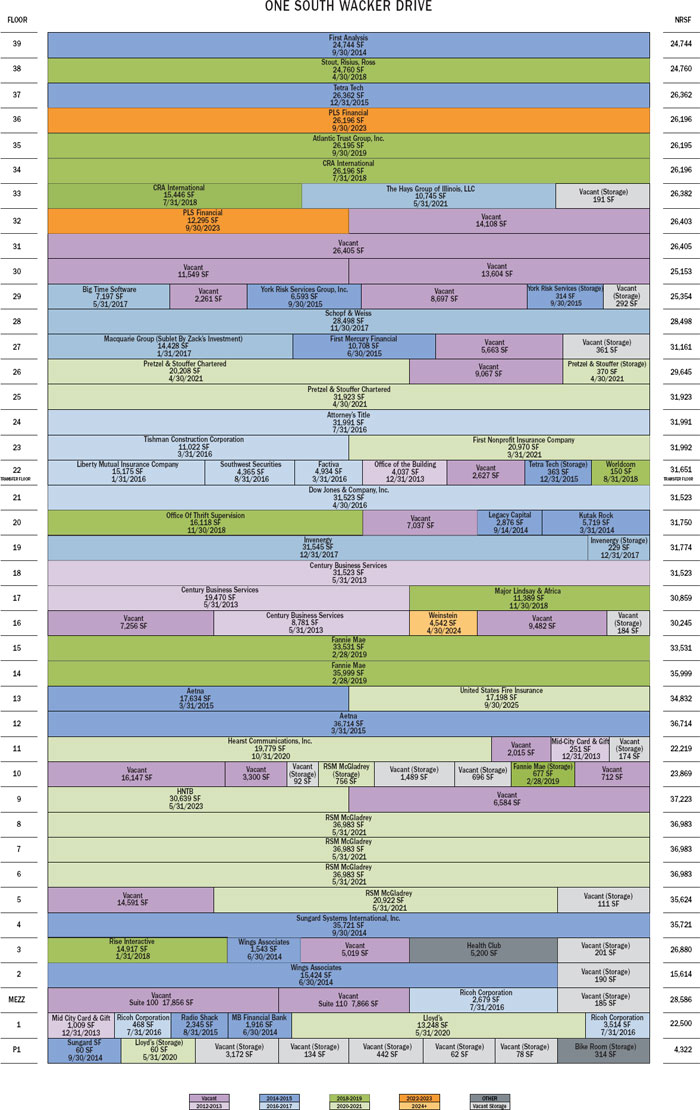
THE INFORMATION IN THIS STRUCTURAL AND COLLATERAL TERM SHEET IS NOT COMPLETE AND MAY BE AMENDED PRIOR TO THE TIME OF SALE. THIS TERM SHEET IS NOT AN OFFER TO SELL THESE SECURITIES AND IT IS NOT A SOLICITATION OF AN OFFER TO BUY THESE SECURITIES IN ANY JURISDICTION WHERE THE OFFER OR SALE IS NOT PERMITTED.
42
| ONE SOUTH WACKER DRIVE |
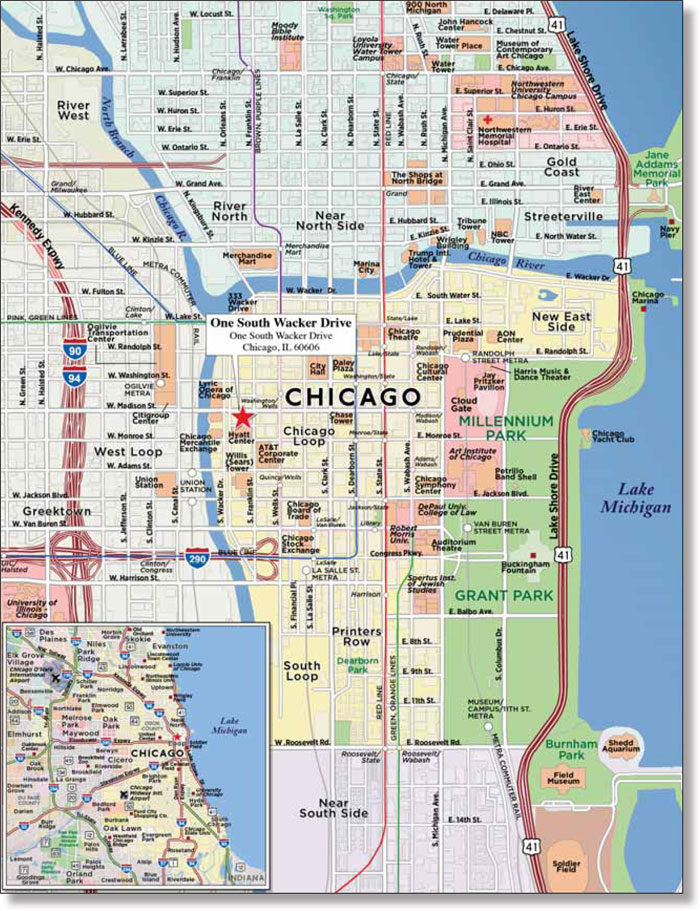
THE INFORMATION IN THIS STRUCTURAL AND COLLATERAL TERM SHEET IS NOT COMPLETE AND MAY BE AMENDED PRIOR TO THE TIME OF SALE. THIS TERM SHEET IS NOT AN OFFER TO SELL THESE SECURITIES AND IT IS NOT A SOLICITATION OF AN OFFER TO BUY THESE SECURITIES IN ANY JURISDICTION WHERE THE OFFER OR SALE IS NOT PERMITTED.
43
| No. 3 - One South Wacker Drive | ||||
| Loan Information | Property Information | |||
| Mortgage Loan Seller: | Wells Fargo Bank, National Association | Single Asset/Portfolio: | Single Asset | |
Credit Assessment (Fitch/KBRA/S&P): | NR/NR/NR | Property Type: | Office | |
Original Principal Balance(1): | $95,000,000 | Specific Property Type: | CBD | |
Cut-off Date Principal Balance(1): | $95,000,000 | Location: | Chicago, IL | |
| % of Initial Pool Balance: | 7.7% | Size: | 1,193,448 SF | |
| Loan Purpose: | Acquisition | Cut-off Date Principal Balance Per Unit/SF(1): | $138.25 | |
| Borrower Name: | 1 South Wacker Financial Associates, LLC | Year Built/Renovated: | 1982/2000 | |
Sponsors(2): | Various | Title Vesting: | Fee | |
| Mortgage Rate: | 3.750% | Property Manager: | Self-managed | |
| Note Date: | December 6, 2012 | 3rd Most Recent Occupancy (As of): | 80.6% (12/31/2009) | |
| Anticipated Repayment Date: | NAP | 2nd Most Recent Occupancy (As of): | 82.8% (12/31/2010) | |
| Maturity Date: | January 1, 2018 | Most Recent Occupancy (As of): | 78.3% (12/31/2011) | |
| IO Period: | 60 months | Current Occupancy (As of)(4): | 82.0% (9/17/2012) | |
| Loan Term (Original): | 60 months | |||
| Seasoning: | 2 months | Underwriting and Financial Information: | ||
| Amortization Term (Original): | NAP | |||
| Loan Amortization Type: | Interest-only, Balloon | 3rd Most Recent NOI (As of): | $16,774,382 (12/31/2010) | |
| Interest Accrual Method: | Actual/360 | 2nd Most Recent NOI (As of): | $9,471,224 (12/31/2011) | |
| Call Protection: | L(26),D(30),O(4) | Most Recent NOI (As of)(5): | $10,640,920 (TTM 8/31/2012) | |
| Lockbox Type: | Hard/Upfront Cash Management | |||
Additional Debt(1): | Yes | |||
Additional Debt Type(1): | Pari Passu | U/W Revenues: | $29,760,653 | |
| U/W Expenses: | $13,298,741 | |||
Escrows and Reserves(3): | U/W NOI(5): | $16,461,911 | ||
| U/W NCF: | $15,050,276 | |||
| Type: | Initial | Monthly | Cap (If Any) | U/W NOI DSCR(1): | 2.62x | |
| Taxes | $4,492,124 | $226,941 | NAP | U/W NCF DSCR(1): | 2.40x | |
| Insurance | $0 | Springing | NAP | U/W NOI Debt Yield(1): | 10.0% | |
| Replacement Reserves | $0 | $19,891 | NAP | U/W NCF Debt Yield(1): | 9.1% | |
| Initial Capital Improvements Reserve | $5,000,000 | $0 | NAP | As-Is Appraised Value: | $226,000,000 | |
| TI/LC | $10,000,000 | Springing | $5,000,000 | As-Is Appraisal Valuation Date: | October 25, 2012 | |
| Rent Concession Reserve | $2,188,982 | $0 | NAP | Cut-off Date LTV Ratio(1): | 73.0% | |
| Tenant Specific TI/LC Reserve | $2,952,312 | $0 | NAP | LTV Ratio at Maturity or ARD(1): | 73.0% | |
| (1) | The One South Wacker Drive Loan Combination, totalling $165,000,000, is comprised of two pari passu notes (Notes A-1 and A-2). Note A-2 had an original balance of $95,000,000, has an outstanding principal balance as of the Cut-off Date of $95,000,000 and will be contributed to the WFRBS 2013-C12 Trust. Note A-1 had an original balance of $70,000,000 and was contributed to the WFRBS 2013-C11 Trust. All presented statistical information related to balances per square foot, loan-to-value ratio, debt service coverage ratio, and debt yields are based on the One South Wacker Drive Loan Combination. |
| (2) | The sponsors are HGGP Capital, LLC; HGGP Capital II, LLC; HGGP Capital III, LLC; HGGP Capital IV, LLC; HGGP Capital V, LLC; HGGP Capital VI, LLC; HGGP Capital VII, LLC and HGGP Capital VIII, LLC, each of which are subsidiaries of Harbor Group International LLC. |
| (3) | See “Escrows” section. |
| (4) | Current Occupancy includes Century Business Services (59,774 square feet or 5.0% of net rentable area), which has given notice that they will not renew their lease upon expiration on May 31, 2013. Occupancy excluding Century Business Services is 77.0%. |
| (5) | See “Cash Flow Analysis” section for detail on the increase from Most Recent NOI to U/W NOI. |
The Mortgage Loan. The mortgage loan (the “One South Wacker Drive Loan Combination”) is evidenced by two pari passu promissory notes (Note A-1 and Note A-2) secured by a first mortgage encumbering a 40-story office building located in the central business district of Chicago, Illinois (the “One South Wacker Drive Property”). The One South Wacker Drive Loan Combination was originated on December 6, 2012 by Wells Fargo Bank, National Association. The One South Wacker Drive Loan Combination had an original balance of $165,000,000, has an outstanding principal balance as of the Cut-off Date of $165,000,000 and accrues interest at an interest rate of 3.750% per annum. The One South Wacker Drive Loan Combination had an initial term of 60 months, has a remaining term of 58 months as of the Cut-off Date and requires interest-only payments through the term of the One South Wacker Drive Loan Combination. The One South Wacker Drive Loan Combination matures on January 1, 2018.
THE INFORMATION IN THIS STRUCTURAL AND COLLATERAL TERM SHEET IS NOT COMPLETE AND MAY BE AMENDED PRIOR TO THE TIME OF SALE. THIS TERM SHEET IS NOT AN OFFER TO SELL THESE SECURITIES AND IT IS NOT A SOLICITATION OF AN OFFER TO BUY THESE SECURITIES IN ANY JURISDICTION WHERE THE OFFER OR SALE IS NOT PERMITTED.
44
| ONE SOUTH WACKER DRIVE |
Note A-2, which represents the controlling interest in the One South Wacker Drive Loan Combination and will be contributed to the WFRBS 2013-C12 Trust, had an original principal balance of $95,000,000 and has an outstanding principal balance as of the Cut-off Date of $95,000,000 (the “One South Wacker Drive Mortgage Loan”). Note A-1 had an original principal balance of $70,000,000 and was contributed to the WFRBS 2013-C11 Trust (the “One South Wacker Drive Companion Loan”). See “Description of the Mortgage Pool – Additional Indebtedness – The One South Wacker Drive Loan Combination” and “The Pooling and Servicing Agreement – Servicing of the Loan Combinations” in the Free Writing Prospectus.
Following the lockout period, the borrower has the right to defease the One South Wacker Drive Loan Combination in whole, but not in part, on any due date before the scheduled maturity date. In addition, the One South Wacker Drive Loan Combination is prepayable without penalty on or after October 1, 2017.
Sources and Uses
| Sources | Uses | |||||||
| Original loan combination amount | $165,000,000 | 65.8% | Purchase price | $221,000,000 | 88.1% | |||
| Sponsor’s new cash contribution | 85,863,324 | 34.2 | Reserves | 24,633,418 | 9.8 | |||
| Closing costs | 5,229,906 | 2.1 | ||||||
| Total Sources | $250,863,324 | 100.0% | Total Uses | $250,863,324 | 100.0% | |||
The Property. The One South Wacker Drive Property is a 40-story, class B+ office building containing approximately 1,193,448 square feet located in the central business district of Chicago, Illinois. Built in 1982 and designed by the architect Helmut Jahn, the One South Wacker Drive Property is situated on a 1.1-acre parcel and includes a 129-space subterranean parking structure. The One South Wacker Drive Property contains 25,179 square feet of retail space, including Lloyd’s, a West Loop restaurant. The One South Wacker Drive Property serves as the headquarters for RSM McGladrey, the fifth largest United States provider of assurance, tax and consulting services. Tenancy also includes a variety of professional services firms and investment-grade rated tenants that make up approximately 21.2% of the net rentable area. In 2012, the borrower began a capital improvement program that will create a new atrium and winter garden, renovate the lobby (including the addition of a building concierge station), and update the elevators, common corridors and restrooms. As of September 17, 2012, the One South Wacker Drive Property was 82.0% leased to 45 tenants.
THE INFORMATION IN THIS STRUCTURAL AND COLLATERAL TERM SHEET IS NOT COMPLETE AND MAY BE AMENDED PRIOR TO THE TIME OF SALE. THIS TERM SHEET IS NOT AN OFFER TO SELL THESE SECURITIES AND IT IS NOT A SOLICITATION OF AN OFFER TO BUY THESE SECURITIES IN ANY JURISDICTION WHERE THE OFFER OR SALE IS NOT PERMITTED.
45
| ONE SOUTH WACKER DRIVE |
The following table presents certain information relating to the tenancies at the One South Wacker Drive Property:
Major Tenants
| Tenant Name | Credit Rating (Fitch/Moody’s/ S&P)(1) | Tenant NRSF | % of NRSF | Annual U/W Base Rent PSF(2) | Annual U/W Base Rent(2) | % of Total Annual U/W Base Rent | Lease Expiration Date | ||||||
| Major Tenants | |||||||||||||
| RSM McGladrey | NR/NR/NR | 132,627 | 11.1% | $16.46 | $2,182,466 | 11.7% | 5/31/2021 | ||||||
| Fannie Mae | AAA/Aaa/AA+(3) | 70,207 | 5.9% | $19.04(4) | $1,337,062(4) | 7.2% | 2/28/2019(5) | ||||||
| Century Business Services | NR/NR/NR | 59,774(6) | 5.0% | $21.67 | $1,295,303(6) | 6.9% | 5/31/2013(7) | ||||||
| CRA International | NR/NR/NR | 41,642 | 3.5% | $26.49 | $1,103,096 | 5.9% | 7/31/2018 | ||||||
| Aetna | A/Baa1/A- | 54,348 | 4.6% | $17.62(8) | $957,612(8) | 5.1% | 3/31/2015 | ||||||
| Pretzel & Stouffer Chartered | NR/NR/NR | 52,501 | 4.4% | $17.57 | $922,366 | 4.9% | 4/30/2021(9) | ||||||
| Dow Jones & Company | BBB+/NR/BBB+ | 31,523 | 2.6% | $23.68(10) | $746,538(10) | 4.0% | 4/30/2016 | ||||||
| Total Major Tenants | 442,622 | 37.1% | $19.30 | $8,544,443 | 45.7% | ||||||||
| Non-Major Tenants | 535,761 | 44.9% | $18.92 | $10,136,685 | 54.3% | ||||||||
| Occupied Collateral Total | 978,383 | 82.0% | $19.09 | $18,681,127 | 100.0% | ||||||||
| Vacant Space | 215,065 | 18.0% | |||||||||||
| Collateral Total | 1,193,448 | 100.0% | |||||||||||
| (1) | Certain ratings are those of the parent company whether or not the parent guarantees the lease. |
| (2) | Annual U/W Base Rent PSF and Annual U/W Base Rent include contractual rent steps through April 2013 and the average rent over the lesser of the lease term or loan term for investment grade rated tenants, unless otherwise noted below. |
| (3) | Ratings are those of the United States whether or not the lease obligations are backed by the full faith and credit of the United States. Fannie Mae was placed into conservatorship of the Federal Housing Finance Agency (“FHFA”) on September 7, 2008, after the global financial crisis. The FHFA will act as the conservator until the agency has been stabilized. |
| (4) | The Annual U/W Base Rent was derived by averaging the annual rent including contractual rental increases through the loan term and assuming the termination option described below is not exercised. The current in-place rent is $17.73 per square foot, resulting in $1,244,770 of annual base rent. |
| (5) | On or after March 1, 2014, Fannie Mae has a one-time right to terminate their lease with 12 months notice and payment of a fee equal to their unamortized leasing costs plus three months base rent. |
| (6) | Major, Lindsey & Africa (11,389 square feet), Weinstein (4,542 square feet) and SKTYII (8,788 square feet) are current sublessees of Century Business Services. Major, Lindsey & Africa and Weinstein (the “Subtenants”) have executed direct leases that will commence June 1, 2013 upon the lease expiration of Century Business Services. The Subtenants have been underwritten based on their direct lease terms and Century Business Services net rentable square footage and applicable Annual U/W Base Rent have been reduced by the Subtenants combined net rentable square feet and Annual U/W Base Rent, respectively. |
| (7) | Century Business Services has given notice that it will not renew its lease and will vacate at lease expiration. |
| (8) | The Annual U/W Base Rent was derived by averaging the annual rent including contractual rental increases through the lease term. The current in-place rent is $17.25 per square foot, resulting in $937,503 of annual base rent. |
| (9) | On or after May 1, 2016, Pretzel & Stouffer has a one-time right to terminate their lease with 12 months notice and payment of a fee equal to $70.00 per square foot ($3,675,070 based on current square footage). The tenant also has a one-time right to terminate on May 1, 2018 with 12 months notice and payment of a fee equal to $40.00 per square foot ($2,100,040 based on current square footage). |
| (10) | The Annual U/W Base Rent was derived by averaging the annual rent including contractual rental increases through the lease term. The current in-place rent is $22.51 per square foot, resulting in $709,499 of annual base rent. |
THE INFORMATION IN THIS STRUCTURAL AND COLLATERAL TERM SHEET IS NOT COMPLETE AND MAY BE AMENDED PRIOR TO THE TIME OF SALE. THIS TERM SHEET IS NOT AN OFFER TO SELL THESE SECURITIES AND IT IS NOT A SOLICITATION OF AN OFFER TO BUY THESE SECURITIES IN ANY JURISDICTION WHERE THE OFFER OR SALE IS NOT PERMITTED.
46
| ONE SOUTH WACKER DRIVE |
The following table presents certain information relating to the lease rollover schedule at the One South Wacker Drive Property:
Lease Expiration Schedule(1)(2)
Year Ending December 31, | No. of Leases Expiring | Expiring NRSF | % of Total NRSF | Cumulative Expiring NRSF | Cumulative % of Total NRSF | Annual U/W Base Rent | Annual U/W Base Rent PSF(3) | ||||||||
| MTM | 0 | 0 | 0.0% | 0 | 0.0% | $0 | $0.00 | ||||||||
| 2013 | 6 | 65,071 | 5.5% | 65,071 | 5.5% | $1,442,743 | $22.17 | ||||||||
| 2014 | 8 | 73,019 | 6.1% | 138,090 | 11.6% | $1,489,907 | $20.40 | ||||||||
| 2015 | 10 | 101,033 | 8.5% | 239,123 | 20.0% | $1,900,652 | $18.81 | ||||||||
| 2016 | 10 | 105,671 | 8.9% | 344,794 | 28.9% | $2,173,454 | $20.57 | ||||||||
| 2017 | 9 | 81,897 | 6.9% | 426,691 | 35.8% | $1,507,508 | $18.41 | ||||||||
| 2018 | 8 | 84,216 | 7.1% | 510,907 | 42.8% | $1,940,060 | $23.04 | ||||||||
| Thereafter | 26 | 467,476 | 39.2% | 978,383 | 82.0% | $8,226,803 | $17.60 | ||||||||
| Vacant | 0 | 215,065 | 18.0% | 1,193,448 | 100.0% | $0 | $0.00 | ||||||||
| Total/Weighted Average | 77 | 1,193,448 | 100.0% | $18,681,127 | $19.09 |
| (1) | Information obtained from the underwritten rent roll. |
| (2) | Certain tenants may have lease termination options that are exercisable prior to the stated expiration date of the subject lease and that are not considered in the Lease Expiration Schedule. |
| (3) | Weighted Average Annual U/W Base Rent PSF excludes vacant space. |
The following table presents historical occupancy percentages at the One South Wacker Drive Property:
Historical Occupancy(1)
12/31/2009 | 12/31/2010 | 12/31/2011 | 9/17/2012 | |||
| 81% | 83% | 78% | 82% |
| (1) | Information obtained from the borrower. |
Operating History and Underwritten Net Cash Flow. The following table presents certain information relating to the historical operating performance and the Underwritten Net Cash Flow at the One South Wacker Drive Property:
Cash Flow Analysis
2010 | 2011 | TTM 8/31/2012 | U/W(1) | U/W $ per SF | ||||||
| Base Rent | $16,438,455 | $16,697,689 | $16,045,787 | $18,681,127 | $15.65 | |||||
| Grossed Up Vacant Space | 0 | 0 | 0 | 3,824,105 | 3.20 | |||||
Tax Reimbursables(1) | 5,723,348 | 1,087,962 | 2,776,665 | 4,809,387 | 4.03 | |||||
| Other Reimbursables | 5,217,786 | 4,602,642 | 5,135,471 | 5,710,138 | 4.78 | |||||
| Other Income | 635,474 | 390,602 | 436,378 | 560,000 | 0.47 | |||||
| Less Vacancy & Credit Loss | (863,285) | (980,520) | (942,006) | (3,824,105)(2) | (3.20) | |||||
| Effective Gross Income | $27,151,778 | $21,798,374 | $23,452,295 | $29,760,653 | $24.94 | |||||
Total Operating Expenses(3) | $10,377,396 | $12,327,150 | $12,811,375 | $13,298,741 | $11.14 | |||||
| Net Operating Income | $16,774,382 | $9,471,224 | $10,640,920 | $16,461,911 | $13.79 | |||||
| TI/LC | 0 | 0 | 0 | 1,172,946 | 0.98 | |||||
| Capital Expenditures | 0 | 0 | 0 | 238,690 | 0.20 | |||||
| Net Cash Flow | $16,774,382 | $9,471,224 | $10,640,920 | $15,050,276 | $12.61 | |||||
NOI DSCR(4) | 2.67x | 1.51x | 1.70x | 2.62x | ||||||
NCF DSCR(4) | 2.67x | 1.51x | 1.70x | 2.40x | ||||||
NOI DY(4) | 10.2% | 5.7% | 6.4% | 10.0% | ||||||
NCF DY(4) | 10.2% | 5.7% | 6.4% | 9.1% |
| (1) | The increase in U/W Effective Gross Income and U/W Net Operating Income from the Net Operating Income for trailing 12 months ending August 31, 2012 and 2011 is primarily attributable to real estate tax reimbursement reconciliation. The decline in Tax Reimbursables from 2010 to 2011 and TTM August 31, 2012 was due to a successful tax expense appeal from the prior owner between 2009 and 2010. This resulted in tenant reimbursement credits totaling approximately $3.0 million. These credits were deducted from the 2011 Tax Reimbursables figure, causing a decrease to 2011 Effective Gross Income and Net Operating Income. Further, the 2010 Tax Reimbursable figure was approximately $1.6 million higher than normal because tenants were billed based on the higher 2009 tax expense. TTM August 31, 2012 Tax Reimbursables were also lower than normal, as the credits were realized in December 2011. Total Reimbursables have been underwritten at a normalized level, reimbursing occupied tenants’ share of underwritten real estate taxes. The remaining increase in Effective Gross Income and Net Operating Income can be attributed to new leasing activity, underwritten rent bumps and free rent periods. All outstanding free rent has been reserved upfront. |
| (2) | The underwritten economic vacancy is 17.0%. The One South Wacker Drive Property was 82.0% physically occupied as of September 17, 2012. Vacancy does not include Century Business Services (59,774 square feet or 5.0% of net rentable area), which has given notice that they will not renew their lease, which expires May 31, 2013. |
| (3) | 2009 real estate tax expense (not shown above) was $7,525,619; 2010 real estate tax expense was $3,813,274; 2011 real estate tax expense was $5,788,750; TTM August 31, 2012 real estate tax expense was $6,180,485; UW real estate tax expense was $6,000,000. |
| (4) | DSCRs and debt yields are based on the One South Wacker Drive Loan Combination on an aggregate basis. |
THE INFORMATION IN THIS STRUCTURAL AND COLLATERAL TERM SHEET IS NOT COMPLETE AND MAY BE AMENDED PRIOR TO THE TIME OF SALE. THIS TERM SHEET IS NOT AN OFFER TO SELL THESE SECURITIES AND IT IS NOT A SOLICITATION OF AN OFFER TO BUY THESE SECURITIES IN ANY JURISDICTION WHERE THE OFFER OR SALE IS NOT PERMITTED.
47
| ONE SOUTH WACKER DRIVE |
Appraisal. As of the appraisal valuation date of October 25, 2012, the One South Wacker Drive Property had an “as-is” appraised value of $226,000,000. The appraisal also presented an “as-stabilized” value of $280,000,000 as of an appraisal valuation date of November 1, 2015.
Environmental Matters. According to the Phase I environmental site assessment dated November 2, 2012, there was no evidence of any recognized environmental conditions at the One South Wacker Drive Property.
Market Overview and Competition. According to the appraisal, the One South Wacker Drive Property is located at the southeast corner of the intersection of South Wacker Drive and West Madison Street in the central business district of Chicago, Illinois. The One South Wacker Drive Property is located two blocks northeast of Union Station, Chicago’s primary commuter train terminal and the only intercity rail terminal in Chicago. Furthermore, Ogilvie Transportation Center, which services three commuter rail (Metra) lines, is located two blocks west of the One South Wacker Drive Property. Metra operates commuter rail service between the Chicago central business district and northeast Illinois. Six of Metra’s 11 routes operate into and out of Union Station with nearly 130,000 passengers passing through the station on an average weekday and more than 42,000 each weekend. The One South Wacker Drive Property is also within walking distance of multiple stops for each of the five Chicago Transit Authority’s Elevated Train Lines. The third phase of “Revive Wacker Drive” reconstruction was recently completed by the City of Chicago at a total cost of approximately $300.0 million. The north-south portion of both Lower and Upper Wacker Drive was completely rebuilt, modernizing and creating safer, nicer and more efficient roadways for all travelers. As of March 2012, the unemployment rate for the Chicago metropolitan statistical area was 8.9%. The 2012 population within a three-mile and five-mile radius of the One South Wacker Drive Property were 334,526 and 794,140, respectively. The average household income within the same three-mile and five-mile radii was $91,189 and $78,406, respectively.
According to the appraisal, the One South Wacker Drive Property is located within the West Loop office submarket, which contains approximately 35.5 million square feet of office space. The submarket vacancy and market rental rate for the West Loop submarket is approximately 13.0% and $35.43 per square foot on a full service gross basis, respectively, as of the second quarter of 2012.
The following table presents certain information relating to comparable office properties for the One South Wacker Drive Property:
Competitive Set(1)
One South Wacker Drive (Subject) | 101 North Wacker Drive | 10, 20 and 30 South Wacker Drive | 311 South Wacker Drive | 123 North Wacker Drive | 191 North Wacker Drive | 300 South Wacker Drive | |
| Location | Chicago, IL | Chicago, IL | Chicago, IL | Chicago, IL | Chicago, IL | Chicago, IL | Chicago, IL |
| Distance from Subject | -- | 0.1 miles | 0.5 miles | 0.6 miles | 0.2 miles | 0.3 miles | 0.6 miles |
| Property Type | Office | Office | Office | Office | Office | Office | Office |
| Year Built/Renovated | 1982/2000 | 1980/NAV | 1983 & 1987/NAV | 1990/NAV | 1986/NAV | 2003/NAV | 1971/NAV |
| Number of Stories | 40 | 24 | 10 & 40 | 65 | 30 | 37 | 35 |
| Total GLA | 1,193,448 SF | 599,503 SF | 2,351,265 SF | 1,276,850 SF | 540,621 SF | 732,000 SF | 512,436 SF |
| Total Occupancy | 82% | 94% | 89% | 92% | 77% | 94% | 87% |
| (1) | Information obtained from the appraisal dated November 1, 2012. |
The Borrower. The borrower is 1 South Wacker Financial Associates, LLC, a Delaware limited liability company and single purpose entity with two independent directors. Legal counsel to the borrower delivered a non-consolidation opinion in connection with the origination of the One South Wacker Drive Loan Combination. Through various entities, Harbor Group International LLC owns 51.0% of the borrower with the remaining 49.0% owned by Clal Insurance Enterprises Holdings Ltd., an Israeli diversified financial services and insurance company. HGGP Capital, LLC; HGGP Capital II, LLC; HGGP Capital III, LLC; HGGP Capital IV, LLC; HGGP Capital V, LLC; HGGP Capital VI, LLC; HGGP Capital VII, LLC and HGGP Capital VIII, LLC (collectively, the “One South Wacker Drive Mortgage Loan Sponsors”) are the indirect owners of the borrower and guarantors of certain nonrecourse carveouts under the One South Wacker Drive Loan Combination.
The Sponsor. The One South Wacker Drive Mortgage Loan Sponsors are subsidiaries of Harbor Group International LLC (“Harbor”). Harbor’s holdings include over 90 properties with a total market value of approximately $3.8 billion, which includes approximately 10.5 million square feet of office, retail and hotel space, as well as approximately 24,500 multifamily units. Excluding the One South Wacker Drive Property, Harbor’s Chicago office portfolio totals approximately 1.9 million square feet across three properties: 2 North LaSalle, 300 South Wacker and the Burnham Center. Beginning in 2005, Harbor had various mortgage loan defaults and restructurings, and is currently in loan modification discussions on other mortgage loans. See “Description of the Mortgage Pool – Default History, Bankruptcy Issues and Other Proceedings” in the Free Writing Prospectus.
THE INFORMATION IN THIS STRUCTURAL AND COLLATERAL TERM SHEET IS NOT COMPLETE AND MAY BE AMENDED PRIOR TO THE TIME OF SALE. THIS TERM SHEET IS NOT AN OFFER TO SELL THESE SECURITIES AND IT IS NOT A SOLICITATION OF AN OFFER TO BUY THESE SECURITIES IN ANY JURISDICTION WHERE THE OFFER OR SALE IS NOT PERMITTED.
48
| ONE SOUTH WACKER DRIVE |
Escrows. The loan documents provide for an upfront escrow at closing in the amount of $4,492,124 for taxes. There are also upfront escrows in the amount of $2,188,982 for rent concessions for the following tenants: PLS Group ($843,820), HNTB ($818,673), Major Lindsey Africa ($167,014), Big Time Software ($137,429), Weinstein ($120,198), The Hays Group ($62,242) and Rise Interactive ($39,606). There is an upfront escrow in the amount of $2,952,312 for existing tenant improvements and leasing costs (“TI/LC”) for the following tenants: HNTB ($1,747,069), RSM McGladrey ($657,221), Stout Risius Ross ($247,600), Major Lindsey Africa ($184,929), Weinstein ($79,286), Southwest Securities ($34,920) and Kutak Rock ($1,287). The loan documents also provide for upfront escrows at closing in the amount of $5,000,000 for a capital improvement program and $10,000,000 for future tenant improvement and leasing costs. Should the TI/LC reserve balance fall below $5,000,000, monthly impounds of $99,454 will commence.
The loan documents provide for monthly deposits of $226,941 for real estate taxes and $19,891 for replacement reserves. The loan documents do not require monthly escrow deposits for insurance provided the following conditions are satisfied: (i) no event of default exists and is continuing; (ii) the liability and casualty policies maintained by the borrower are part of a blanket or umbrella policy approved by the lender; and (iii) the borrower provides the lender with evidence of renewal of the policies and paid receipts for the payment of insurance premiums when due.
Lockbox and Cash Management. The One South Wacker Drive Loan Combination requires a lender-controlled lockbox account, which is already in place, and that the tenants be directed to pay their rents directly to such lockbox account. The loan documents also require that all cash revenues and all other monies received by the borrower or the property manager relating to the One South Wacker Drive Property be deposited into the lockbox account within one business day of receipt. Prior to the occurrence of a Cash Trap Event Period (as defined below), all excess funds on deposit in the lockbox are swept into the borrower’s operating account on a daily basis.
Upon the occurrence of a Cash Trap Event Period all excess funds on deposit in the lockbox account will be swept to certain restricted accounts, and if an event of default exists, the lender will have the exclusive control of, and the right to withdraw and apply, the funds in the deposit account to payment of any and all debts, liabilities and obligations of the borrower in such order, proportion and priority as the lender may determine in its sole discretion.
A “Cash Trap Event Period” will commence upon the earlier of (i) the occurrence and continuance of an event of default or (ii) the NCF debt service coverage ratio (as defined in the loan documents) falling below 1.75x as tested with respect to each calendar quarter. A Cash Trap Event Period will expire upon: (i) in the case of an event of default, the cure of such event of default, or (ii) in the case of the NCF debt service coverage ratio falling below 1.75x, the NCF debt service coverage ratio being at least 1.85x for two consecutive calendar quarters.
Property Management. The One South Wacker Drive Property is managed by an affiliate of the borrower.
Assumption. The borrower has a two-time right to transfer the One South Wacker Drive Property, provided that no event of default has occurred and is continuing and certain other conditions are satisfied, including, but not limited to: (i) the lender’s reasonable determination that the proposed transferee and guarantor satisfy the lender’s credit review and underwriting standards, taking into consideration transferee experience, financial strength and general business standing; (ii) execution of a recourse guaranty and an environmental indemnity by an affiliate of the transferee; and (iii) if requested by the lender, rating agency confirmation from Fitch, KBRA and S&P that the transfer will not result in a downgrade, withdrawal or qualification of the respective ratings assigned to the Series 2013-C12 Certificates, and similar confirmations with respect to the ratings of any securities backed by the One South Wacker Drive Companion Loan.
Partial Release. Not permitted.
Real Estate Substitution. Not permitted.
Subordinate and Mezzanine Indebtedness. Not permitted.
Ground Lease. None.
Terrorism Insurance. The loan documents require that the “all risk” insurance policy required to be maintained by the borrower provide coverage for terrorism in an amount equal to the full replacement cost of the One South Wacker Drive Property. The loan documents also require business interruption insurance covering no less than the 18-month period following the occurrence of a casualty event, together with a six-month extended period of indemnity.
THE INFORMATION IN THIS STRUCTURAL AND COLLATERAL TERM SHEET IS NOT COMPLETE AND MAY BE AMENDED PRIOR TO THE TIME OF SALE. THIS TERM SHEET IS NOT AN OFFER TO SELL THESE SECURITIES AND IT IS NOT A SOLICITATION OF AN OFFER TO BUY THESE SECURITIES IN ANY JURISDICTION WHERE THE OFFER OR SALE IS NOT PERMITTED.
49
| MERRILL LYNCH OFFICE |
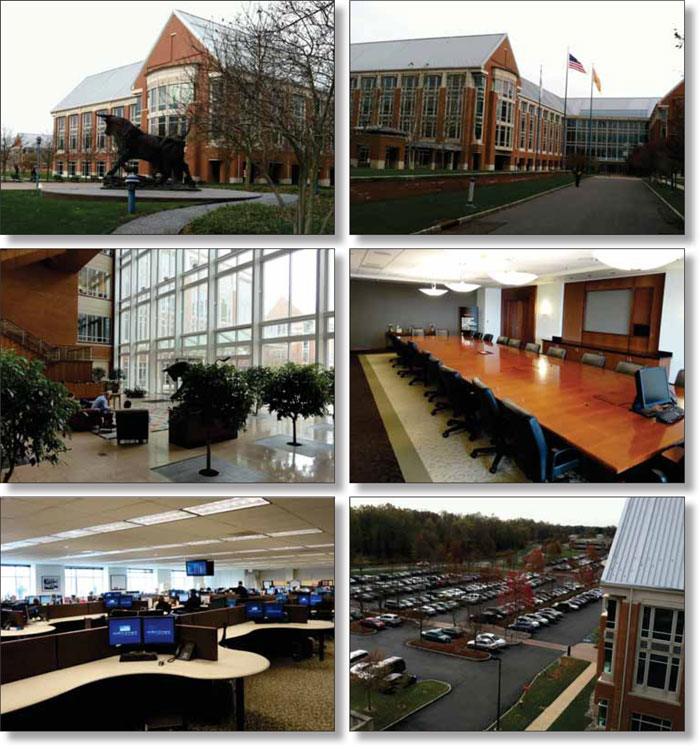
THE INFORMATION IN THIS STRUCTURAL AND COLLATERAL TERM SHEET IS NOT COMPLETE AND MAY BE AMENDED PRIOR TO THE TIME OF SALE. THIS TERM SHEET IS NOT AN OFFER TO SELL THESE SECURITIES AND IT IS NOT A SOLICITATION OF AN OFFER TO BUY THESE SECURITIES IN ANY JURISDICTION WHERE THE OFFER OR SALE IS NOT PERMITTED.
50
| MERRILL LYNCH OFFICE |
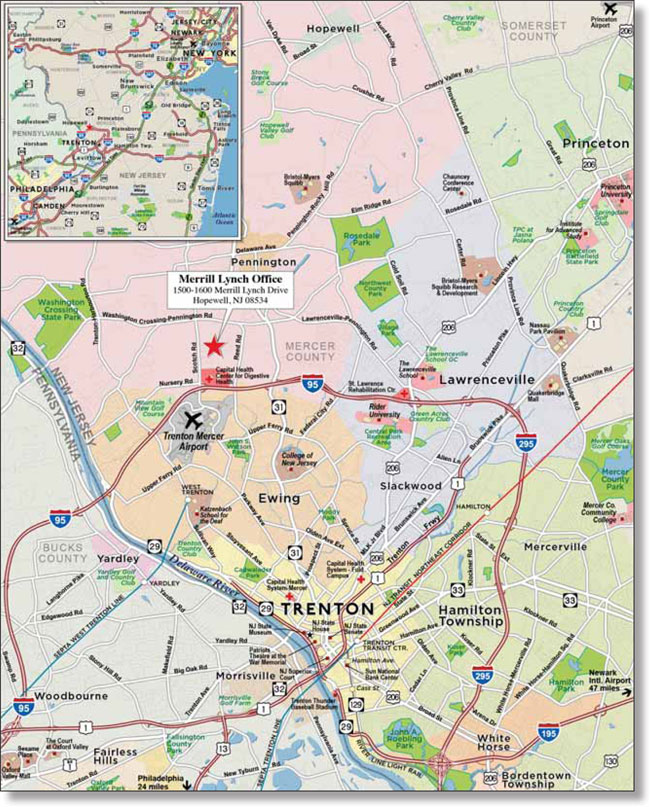
THE INFORMATION IN THIS STRUCTURAL AND COLLATERAL TERM SHEET IS NOT COMPLETE AND MAY BE AMENDED PRIOR TO THE TIME OF SALE. THIS TERM SHEET IS NOT AN OFFER TO SELL THESE SECURITIES AND IT IS NOT A SOLICITATION OF AN OFFER TO BUY THESE SECURITIES IN ANY JURISDICTION WHERE THE OFFER OR SALE IS NOT PERMITTED.
51
| No. 4 – Merrill Lynch Office | ||||||||
| Loan Information | Property Information | |||||||
| Mortgage Loan Seller: | The Royal Bank of Scotland | Single Asset/Portfolio: | Single Asset | |||||
Credit Assessment (Fitch/KBRA/S&P): | NR/NR/NR | Property Type: | Office | |||||
| Original Principal Balance: | $74,250,000 | Specific Property Type: | Suburban | |||||
| Cut-off Date Principal Balance: | $74,250,000 | Location: | Hopewell, NJ | |||||
| % of Initial Pool Balance: | 6.0% | Size: | 481,854 SF | |||||
| Loan Purpose: | Acquisition | Cut-off Date Principal Balance Per Unit/SF: | $154.09 | |||||
| Borrower Name: | Cole of Hopewell Township NJ, LLC | Year Built/Renovated: | 2001/NAP | |||||
| Sponsor: | Cole Credit Property Trust III, Inc. | Title Vesting: | Fee | |||||
| Mortgage Rate: | 4.229% | Property Manager(2): | Cole Realty Advisors, Inc. | |||||
| Note Date: | February 14, 2013 | 3rd Most Recent Occupancy (As of): | 100.0% (12/31/2010) | |||||
| Anticipated Repayment Date: | March 1, 2023 | 2nd Most Recent Occupancy (As of): | 100.0% (12/31/2011) | |||||
| Maturity Date: | March 1, 2043 | Most Recent Occupancy (As of): | 100.0% (12/31/2012) | |||||
| IO Period: | 120 months | Current Occupancy (As of): | 100.0% (3/1/2013) | |||||
| Loan Term (Original): | 120 months | |||||||
| Seasoning: | 0 months | Underwriting and Financial Information: | ||||||
| Amortization Term (Original): | NAP | |||||||
| Loan Amortization Type: | Interest-only, ARD | 3rd Most Recent NOI(3): | NAV | |||||
| Interest Accrual Method: | Actual/360 | 2nd Most Recent NOI(3): | NAV | |||||
| Call Protection: | L(24),GRTR 1% or YM(92),O(4) | Most Recent NOI(3): | N NAV | |||||
| Lockbox Type: | Hard/Springing Cash Management | |||||||
| Additional Debt: | Yes | |||||||
| Additional Debt Type: | Future Mezzanine | U/W Revenues: | $9,944,315 | |||||
| U/W Expenses: | $298,329 | |||||||
| U/W NOI: | $9,645,986 | |||||||
| U/W NCF: | $9,022,297 | |||||||
| U/W NOI DSCR: | 3.03x | |||||||
Escrows and Reserves(1): | U/W NCF DSCR: | 2.83x | ||||||
| U/W NOI Debt Yield: | 13.0% | |||||||
| Type: | Initial | Monthly | Cap (If Any) | U/W NCF Debt Yield: | 12.2% | |||
| Taxes | $0 | Springing | NAP | As-Is Appraised Value: | $136,700,000 | |||
| Insurance | $0 | Springing | NAP | As-Is Appraisal Valuation Date: | November 5, 2012 | |||
| Replacement Reserve | $0 | Springing | NAP | Cut-off Date LTV Ratio: | 54.3% | |||
| TI/LC | $0 | Springing | NAP | LTV Ratio at Maturity or ARD: | 54.3% | |||
(1) | See “Escrows” section. |
| (2) | See “Property Management” section. |
| (3) | Historical financial data is not available as the Merrill Lynch Office property was acquired in a sale-leaseback transaction in 2012. |
The Mortgage Loan. The mortgage loan (the “Merrill Lynch Office Mortgage Loan”) is evidenced by a single promissory note that is secured by a first mortgage encumbering three buildings (the “Merrill Lynch Office Property”) of a larger 12 building office campus for Merrill Lynch located in Hopewell, New Jersey. The Merrill Lynch Office Mortgage Loan was originated on February 14, 2013 by The Royal Bank of Scotland. The Merrill Lynch Office Mortgage Loan had an original principal balance of $74,250,000, has an outstanding principal balance as of the Cut-off Date of $74,250,000 and accrues interest at an interest rate of 4.229% per annum. The Merrill Lynch Office Mortgage Loan had an initial term of 120 months, has a remaining term of 120 months as of the Cut-off Date and requires payments of interest-only through the anticipated repayment date (“ARD”). The ARD is March 1, 2023 and the final maturity date is March 1, 2043. In the event the Merrill Lynch Office Mortgage Loan is not paid in full on or before the ARD, the borrower will be required to make payments of principal and interest based on an interest rate of 7.229% per annum. The ARD automatically triggers a full cash flow sweep whereby all excess cash flow will be used to pay down the principal balance of the Merrill Lynch Office Mortgage Loan.
Following the lockout period, the borrower has the right to prepay the Merrill Lynch Office Mortgage Loan in whole, but not in part, provided that the borrower pays the greater of a yield maintenance premium or a prepayment premium equal to 1.0% of the principal amount being prepaid. In addition, the Merrill Lynch Office Mortgage Loan is prepayable without penalty on or after December 1, 2022.
THE INFORMATION IN THIS STRUCTURAL AND COLLATERAL TERM SHEET IS NOT COMPLETE AND MAY BE AMENDED PRIOR TO THE TIME OF SALE. THIS TERM SHEET IS NOT AN OFFER TO SELL THESE SECURITIES AND IT IS NOT A SOLICITATION OF AN OFFER TO BUY THESE SECURITIES IN ANY JURISDICTION WHERE THE OFFER OR SALE IS NOT PERMITTED.
52
| MERRILL LYNCH OFFICE |
Sources and Uses
| Sources | Uses | |||||||
| Original loan amount | $74,250,000 | 54.5% | Purchase price | $135,000,000 | 99.1% | |||
| Sponsor’s new cash contribution | 61,978,946 | 45.5 | Closing costs | 1,228,946 | 0.9 | |||
| Total Sources | $136,228,946 | 100.0% | Total Uses | $136,228,946 | 100.0% | |||
The Property. The Merrill Lynch Office Property is comprised of three class A office buildings within a larger 12-building office campus for Merrill Lynch Wealth Management, a subsidiary of Bank of America Corporation, and is located in Hopewell, New Jersey. The entire campus, which comprises approximately 1.8 million square feet of office space, was built-to-suit in 2001 for Merrill Lynch Wealth Management. The three buildings serving as collateral for the Merrill Lynch Office Mortgage Loan house the technology, compliance, audit, performance statement, marketing, product development and secure lending teams for Merrill Lynch’s private wealth management group. The Merrill Lynch Office Property is comprised of LEED-certified buildings and is served by amenities including a cafeteria with a cathedral ceiling, a 440-seat meeting room, a day care facility and tennis courts. The entire campus was purchased from the tenant in a sale-leaseback transaction with Fortress Investment Group LLC (“Fortress”). The sponsor of the Merrill Lynch Office Mortgage Loan, Cole Credit Property Trust III, Inc. (“CCPT III”), simultaneously purchased the Merrill Lynch Office Property from Fortress.
The following table presents certain information relating to the tenant at the Merrill Lynch Office Property:
Major Tenant
| Tenant Name | Credit Rating(Fitch/Moody’s/ S&P)(1) | Tenant NRSF | % of NRSF | Annual U/W Base Rent PSF | Annual U/W Base Rent | % of Total Annual U/W Base Rent | Lease Expiration Date |
| Major Tenant | |||||||
| Merrill Lynch, Pierce, Fenner & Smith Inc. | A/Baa2/A- | 481,854 | 100.0% | $22.31 | $10,750,611(2) | 100.0% | 11/30/2024 |
| Collateral Total | 481,854 | 100.0% | $22.31 | $10,750,611 | 100.0% | ||
| (1) | Certain ratings are those of the parent company whether or not the parent guarantees the lease. |
| (2) | The Annual U/W Base Rent represents an average of the tenant’s annual rental obligations during the Merrill Lynch Office Mortgage Loan term. The tenant currently pays an annual base rent of $20.00 per square foot ($9,637,080) and the rent increases by $0.50 per square foot at the end of each calendar year. |
The following table presents certain information relating to the lease rollover schedule at the Merrill Lynch Office Property:
Lease Expiration Schedule(1)
Year Ending December 31, | No. of Leases Expiring | Expiring NRSF | % of Total NRSF | Cumulative Expiring NRSF | Cumulative % of Total NRSF | Annual U/W Base Rent | Annual U/W Base Rent PSF |
| MTM | 0 | 0 | 0.0% | 0 | 0.0% | $0 | $0.00 |
| 2013 | 0 | 0 | 0.0% | 0 | 0.0% | $0 | $0.00 |
| 2014 | 0 | 0 | 0.0% | 0 | 0.0% | $0 | $0.00 |
| 2015 | 0 | 0 | 0.0% | 0 | 0.0% | $0 | $0.00 |
| 2016 | 0 | 0 | 0.0% | 0 | 0.0% | $0 | $0.00 |
| 2017 | 0 | 0 | 0.0% | 0 | 0.0% | $0 | $0.00 |
| 2018 | 0 | 0 | 0.0% | 0 | 0.0% | $0 | $0.00 |
| 2019 | 0 | 0 | 0.0% | 0 | 0.0% | $0 | $0.00 |
| 2020 | 0 | 0 | 0.0% | 0 | 0.0% | $0 | $0.00 |
| 2021 | 0 | 0 | 0.0% | 0 | 0.0% | $0 | $0.00 |
| 2022 | 0 | 0 | 0.0% | 0 | 0.0% | $0 | $0.00 |
| 2023 | 0 | 0 | 0.0% | 0 | 0.0% | $0 | $0.00 |
| Thereafter | 1 | 481,854 | 100.0% | 481,854 | 100.0% | $10,750,611 | $22.31 |
| Vacant | 0 | 0 | 0.0% | 481,854 | 100.0% | $0 | $0.00 |
| Total/Weighted Average | 1 | 481,854 | 100.0% | $10,750,611 | $22.31 |
| (1) | Information obtained from the tenant’s lease. |
THE INFORMATION IN THIS STRUCTURAL AND COLLATERAL TERM SHEET IS NOT COMPLETE AND MAY BE AMENDED PRIOR TO THE TIME OF SALE. THIS TERM SHEET IS NOT AN OFFER TO SELL THESE SECURITIES AND IT IS NOT A SOLICITATION OF AN OFFER TO BUY THESE SECURITIES IN ANY JURISDICTION WHERE THE OFFER OR SALE IS NOT PERMITTED.
53
| MERRILL LYNCH OFFICE |
The following table presents historical occupancy percentages at the Merrill Lynch Office Property:
Historical Occupancy(1)
12/31/2010 | 12/31/2011 | 12/31/2012 | 3/1/2013 | |||
| 100% | 100% | 100% | 100% |
| (1) | The Merrill Lynch Office Property was owner occupied by Merrill Lynch, Pierce, Fenner & Smith Inc. since 2001. |
Operating History and Underwritten Net Cash Flow. The following table presents certain information relating to the Underwritten Net Cash Flow at the Merrill Lynch Office Property:
Cash Flow Analysis(1)
| U/W | U/W $ per SF | ||
| Base Rent | $10,750,611 | $22.31 | |
| Grossed Up Vacant Space | 0 | 0.00 | |
| Total Reimbursables | 0 | 0.00 | |
| Other Income | 0 | 0.00 | |
| Less Vacancy & Credit Loss | (806,296)(2) | (1.67) | |
| Effective Gross Income | $9,944,315 | $20.64 | |
| Total Operating Expenses | $298,329(3) | $0.62 | |
| Net Operating Income | $9,645,986 | $20.02 | |
| TI/LC | 488,770 | 1.01 | |
| Capital Expenditures | 134,919 | 0.28 | |
| Net Cash Flow | $9,022,297 | $18.72 | |
| NOI DSCR | 3.03x | ||
| NCF DSCR | 2.83x | ||
| NOI DY | 13.0% | ||
| NCF DY | 12.2% |
| (1) | No historical financial information was available as the Merrill Lynch Office Property was acquired in November 2012 in a sale-leaseback transaction. |
| (2) | The underwritten economic vacancy is 7.5%. The Merrill Lynch Office Property is currently 100.0% physically occupied as of March 1, 2013. |
| (3) | The only underwritten operating expense is a management fee of 3.0% of Effective Gross Income. All other expenses are paid directly by Merrill Lynch, Pierce, Fenner & Smith Inc. |
Appraisal. As of the appraisal valuation date of November 5, 2012, the Merrill Lynch Office Property had an “as-is” appraised value of $136,700,000. In addition, the appraiser concluded to a hypothetical “go dark” value of $69,600,000.
Environmental Matters. According to the Phase I environmental site assessment dated February 6, 2013, there was no evidence of any recognized environmental conditions at the Merrill Lynch Office Property.
Market Overview and Competition. The Merrill Lynch Office Property is located in Hopewell, New Jersey, in northwest Mercer County, approximately 30 miles northeast of Philadelphia, Pennsylvania and approximately 50 miles southwest of New York City. The Merrill Lynch Office Property is approximately 14 miles southwest of Princeton University and approximately one mile north of the Trenton Mercer Airport. The Merrill Lynch Office Property has access to the south by Interstate 95 and Highway 1 is to the east which provides access to the New Jersey Turnpike and the Garden State Parkway. According to the appraisal, the estimated 2012 population and average household income within a five-mile radius of the Merrill Lynch Office Property were 101,239 and $98,695, respectively.
According to the appraisal, the Merrill Lynch Office Property is located within the Princeton submarket of the Central New Jersey office market. As of the second quarter of 2012, the Central New Jersey office market vacancy rate and average asking gross lease rate were 21.5% and $23.65 per square foot, respectively. As of the second quarter of 2012, the Princeton office submarket vacancy rate and average annual asking full service gross lease rate were 16.6% and $25.47 per square foot, respectively.
THE INFORMATION IN THIS STRUCTURAL AND COLLATERAL TERM SHEET IS NOT COMPLETE AND MAY BE AMENDED PRIOR TO THE TIME OF SALE. THIS TERM SHEET IS NOT AN OFFER TO SELL THESE SECURITIES AND IT IS NOT A SOLICITATION OF AN OFFER TO BUY THESE SECURITIES IN ANY JURISDICTION WHERE THE OFFER OR SALE IS NOT PERMITTED.
54
| MERRILL LYNCH OFFICE |
The following table presents certain information relating to comparable office properties for the Merrill Lynch Office Property:
Competitive Set(1)
Merrill Lynch Office (Subject) | 1 University Square Drive | West Windsor Commons | 504 Carnegie Center | Siemens Office Park - Building 1 | Princeton Corporate Campus | 500-600 Princeton South Corporate Center | ||||||||
| Location | Hopewell, NJ | West Windsor, NJ | West Windsor, NJ | West Windsor, NJ | Iselin, NJ | Princeton, NJ | Ewing, NJ | |||||||
| Distance from Subject | -- | 8.0 miles | 7.0 miles | 7.5 miles | 37.3 miles | 10.0 miles | 1.0 mile | |||||||
| Property Type | Office | Office | Office | Office | Office | Office | Office | |||||||
| Year Built/Renovated | 2001/NAP | 2007/NAP | 1999/NAP | 1991/2007 | 2001/NAP | 2006/2007 | (2) | |||||||
| Number of Stories | 2-4 | 5 | 5 | NAV | NAV | NAV | 3 | |||||||
| Total GLA | 481,854 SF | 353,437 SF | 303,756 SF | 121,990 SF | 239,452 SF | 167,000 SF | 249,988 SF | |||||||
Total Occupancy(3) | 100% | 100% | 100% | 100% | 100% | 100% | 100% |
| (1) | Information obtained from the appraisal dated November 5, 2012. |
| (2) | 500-600 Princeton South Corporate Center was under construction as of January 29, 2013. |
| (3) | Information obtained from the appraisal dated November 5, 2012 and third party market research reports. |
The Borrower. The borrower is Cole of Hopewell Township NJ, LLC, a Delaware limited liability company and single purpose entity with two independent directors. Legal counsel to the borrower delivered a non-consolidation opinion in connection with the origination of the Merrill Lynch Office Mortgage Loan. CCPT III, the loan sponsor, is the guarantor of certain nonrecourse carveouts under the Merrill Lynch Office Mortgage Loan.
The Sponsor. CCPT III is a non-traded public real estate investment trust that acquires and operates a diversified portfolio of commercial real estate investments primarily consisting of retail and other single tenant income producing properties throughout the United States. As of November 30, 2012, CCPT III’s portfolio included 1,975 properties in 47 states totaling 71.3 million square feet with a combined acquisition cost of approximately $11.7 billion.
Escrows. The loan documents provide for no upfront or ongoing escrows. Monthly tax escrows are not required so long as (i) no Cash Management Period (as defined below) has occurred or is continuing and (ii) borrower delivers satisfactory evidence that tax payments are being made in a timely manner. Monthly insurance escrows are not required so long as (i) no Cash Management Period has occurred or is continuing and (ii) the insurance required to be maintained by the borrower is in effect under an acceptable blanket insurance policy. Replacement and TI/LC escrows will spring in the event that a Cash Management Period occurs and will cease to be collected when any such Cash Management Period is cured.
Lockbox and Cash Management. The Merrill Lynch Office Mortgage Loan requires a lender-controlled lockbox account, which is already in place, into which the tenant is directed to pay its rents directly. The loan documents also require that all cash revenues and all other monies received by the borrower or the property manager relating to the Merrill Lynch Office Property be deposited into the lockbox account within two business days of receipt. The funds in the lockbox account is required to be released to the borrower’s operating account unless there is a permitted mezzanine loan outstanding or there is a Cash Management Period continuing, in which case the funds are deposited into a lender-controlled cash management account. Prior to the occurrence of a Cash Management Period, all funds on deposit in the lockbox account are swept to the borrower’s operating account.
Upon the occurrence of a Cash Management Period all excess funds on deposit in the lockbox account will be swept to certain restricted accounts and the lender will have the exclusive control of, and the right to withdraw and apply, the funds in the deposit account to payment of any and all debts, liabilities and obligations of the borrower in such order, proportion and priority as the lender may determine in its sole discretion.
A “Cash Management Period” will commence upon the earlier of (i) the occurrence and continuance of an event of default; (ii) the debt service coverage ratio falling below 2.00x as tested with respect to each fiscal quarter; (iii) the commencement of a Going Dark Period (as defined below); (iv) if manager is an affiliate, a bankruptcy or insolvency proceeding by such manager; (v) the commencement of a bankruptcy or insolvency proceeding by (x) Merrill Lynch, Pierce, Fenner & Smith Inc., (y) its parent (and in connection with a parent bankruptcy the credit rating of the tenant under the Merrill Lynch Lease is BBB or worse) or (z) any other tenant demising the entire Merrill Lynch Office Property or (vi) the Anticipated Repayment Date occurs without repayment in full.
THE INFORMATION IN THIS STRUCTURAL AND COLLATERAL TERM SHEET IS NOT COMPLETE AND MAY BE AMENDED PRIOR TO THE TIME OF SALE. THIS TERM SHEET IS NOT AN OFFER TO SELL THESE SECURITIES AND IT IS NOT A SOLICITATION OF AN OFFER TO BUY THESE SECURITIES IN ANY JURISDICTION WHERE THE OFFER OR SALE IS NOT PERMITTED.
55
| MERRILL LYNCH OFFICE |
A Cash Management Period will end with respect to the matters described in clause (i) above, when such event of default has been cured; with respect to the matters described in clause (ii) above, when a debt service coverage ratio of at least 2.00x has been achieved for two consecutive fiscal quarters; with respect to the matters described in clause (iii) above, when such Going Dark Period has ended as described below; with respect to the matters described in clause (iv) above, the manager has been replaced by a manager meeting certain requirements as set forth in the loan agreement and in the case of the foregoing clause (v)(x), upon the earlier of (a) Merrill Lynch’s acceptance in any applicable bankruptcy proceeding or (b) the execution of one or more new leases approved by lender in accordance with the loan agreement covering the entire Merrill Lynch Office Property and the tenant(s) under such new lease(s) being open for business and are paying unabated rent in full under any applicable lease(s); in the case of the foregoing clause (v)(y), at such time as an amount equal to $17.50 per rentable square foot of the Merrill Lynch Office Property has accumulated on deposit in the tenant improvement and leasing commissions escrow; in the case of the foregoing clause (v)(z), upon the earlier of (a) confirmation in bankruptcy by the respective tenant of the respective lease for the entire Merrill Lynch Office Property or (b) the execution of one or more new leases approved by the lender in accordance with the loan agreement in respect of each portion of the Merrill Lynch Office Property for which such tenant did not confirm the respective lease in bankruptcy and the tenants under such new leases are open for business and are paying unabated rent in full.
A “Going Dark Period” will commence upon the cessation of operating business at more than 25% of any building within the Merrill Lynch Office Property, unless the building is subleased by the tenant and the subtenant has not ceased operating its business in more than 25% of the building. A Going Dark Period will end upon the earlier to occur of: (i) the tenant being in occupancy for six consecutive calendar months or (ii) $25.00 per square foot has accumulated on deposit in the tenant improvement and leasing commissions escrow.
Property Management. The Merrill Lynch Office Property is managed by an affiliate of the sponsor, however such affiliate has designated its management rights to NREM Hopewell Manager, LLC.
Assumption. The borrower has the right to transfer the Merrill Lynch Office Property, after the related lockout period, provided that no event of default has occurred and is continuing and certain other conditions are satisfied, including (i) execution of a recourse guaranty and an environmental indemnity by an affiliate of the transferee; (ii) if requested by the lender, rating agency confirmation from Fitch, KBRA and S&P that the transfer will not result in a downgrade, withdrawal or qualification of the respective ratings assigned to the Series 2013-C12 Certificates; and (iii) the transferee and all other entities controlled directly or indirectly by principals of the transferee must not have been party to any voluntary or involuntary bankruptcy proceedings, within seven years prior to the proposed transfer.
Right of First Refusal or Right of First Offer. Merrill Lynch, Pierce, Fenner & Smith Inc. has a right of first offer (“ROFO”) to purchase the Merrill Lynch Office Property. The ROFO is not extinguished by a foreclosure of the Merrill Lynch Office Property; however, the ROFO does not apply to a foreclosure or deed-in-lieu thereof.
Partial Release. Not permitted
Real Estate Substitution. Not permitted.
Subordinate and Mezzanine Indebtedness. The borrower has the right to incur mezzanine financing subject to the lender’s approval and other customary conditions including (i) no event of default has occurred or is continuing; (ii) the loan-to-value ratio including all debt is not greater than 70.0%; (iii) the debt service coverage ratio including all debt is not less than 1.50x; (iv) the execution of an intercreditor agreement acceptable to the lender; and (v) rating agency confirmation from Fitch, KBRA and S&P that the mezzanine financing will not result in a downgrade, withdrawal or qualification of the respective ratings assigned to the Series 2013-C12 Certificates.
Ground Lease. None.
Terrorism Insurance. The loan documents require that the “all risk” insurance policy required to be maintained by the borrower provides coverage for damage from terrorism in an amount equal to the full replacement cost of the Merrill Lynch Office Property as well as business interruption insurance covering no less than the 18-month period following the occurrence of a casualty event, together with a six-month extended period of indemnity.
THE INFORMATION IN THIS STRUCTURAL AND COLLATERAL TERM SHEET IS NOT COMPLETE AND MAY BE AMENDED PRIOR TO THE TIME OF SALE. THIS TERM SHEET IS NOT AN OFFER TO SELL THESE SECURITIES AND IT IS NOT A SOLICITATION OF AN OFFER TO BUY THESE SECURITIES IN ANY JURISDICTION WHERE THE OFFER OR SALE IS NOT PERMITTED.
56
(THIS PAGE INTENTIONALLY LEFT BLANK)
57
| HENSLEY & CO. PORTFOLIO |
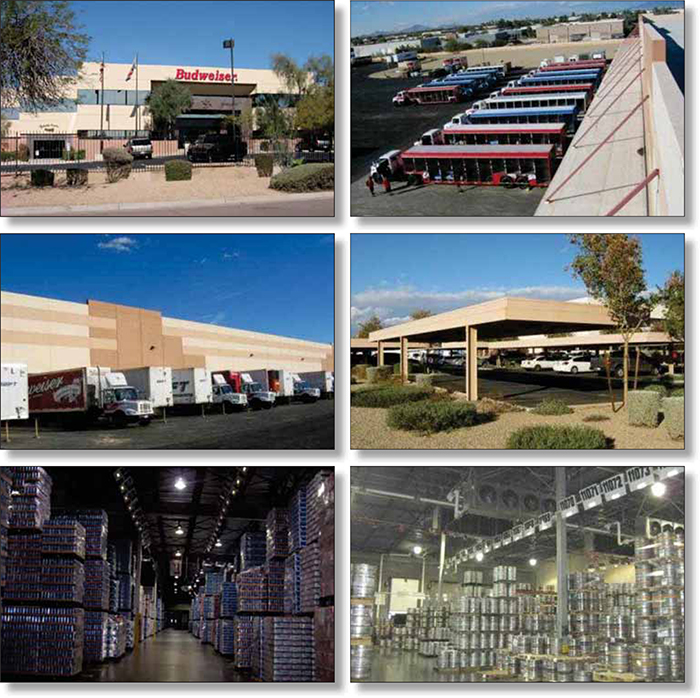
THE INFORMATION IN THIS STRUCTURAL AND COLLATERAL TERM SHEET IS NOT COMPLETE AND MAY BE AMENDED PRIOR TO THE TIME OF SALE. THIS TERM SHEET IS NOT AN OFFER TO SELL THESE SECURITIES AND IT IS NOT A SOLICITATION OF AN OFFER TO BUY THESE SECURITIES IN ANY JURISDICTION WHERE THE OFFER OR SALE IS NOT PERMITTED.
58
| HENSLEY & CO. PORTFOLIO |
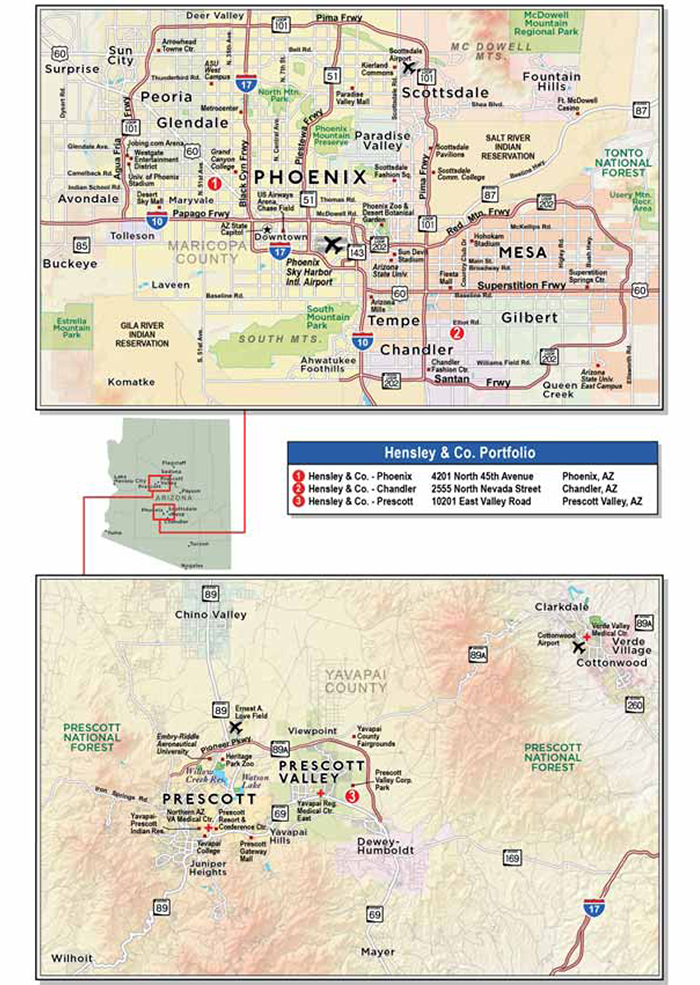
THE INFORMATION IN THIS STRUCTURAL AND COLLATERAL TERM SHEET IS NOT COMPLETE AND MAY BE AMENDED PRIOR TO THE TIME OF SALE. THIS TERM SHEET IS NOT AN OFFER TO SELL THESE SECURITIES AND IT IS NOT A SOLICITATION OF AN OFFER TO BUY THESE SECURITIES IN ANY JURISDICTION WHERE THE OFFER OR SALE IS NOT PERMITTED.
59
| No. 5 – Hensley & Co. Portfolio |
| Loan Information | Property Information | ||||||
| Mortgage Loan Seller: | The Royal Bank of Scotland | Single Asset/Portfolio: | Portfolio | ||||
Credit Assessment (Fitch/KBRA/S&P): | NR/NR/NR | Property Type: | Industrial | ||||
| Original Principal Balance: | $49,750,000 | Specific Property Type: | Warehouse | ||||
| Cut-off Date Principal Balance: | $49,750,000 | Location: | Various – See Table | ||||
| % of Initial Pool Balance: | 4.0% | Size: | 577,167 SF | ||||
| Loan Purpose: | Acquisition | Cut-off Date Principal Balance Per Unit/SF: | $86.20 | ||||
| Borrower Name: | AGNL Hops, L.L.C. | Year Built/Renovated: | Various – See Table | ||||
| Sponsor: | AG Net Lease II Corp. | Title Vesting: | Fee | ||||
| Mortgage Rate: | 4.466% | Property Manager: | Self-managed | ||||
| Note Date: | February 14, 2013 | 3rd Most Recent Occupancy (As of): | 100.0% (12/31/2010) | ||||
| Anticipated Repayment Date: | March 6, 2023 | 2nd Most Recent Occupancy (As of): | 100.0% (12/31/2011) | ||||
| Maturity Date: | March 6, 2043 | Most Recent Occupancy (As of): | 100.0% (12/31/2012) | ||||
| IO Period: | 60 months | Current Occupancy (As of): | 100.0% (3/1/2013) | ||||
| Loan Term (Original): | 120 months | ||||||
| Seasoning: | 0 months | Underwriting and Financial Information: | |||||
| Amortization Term (Original): | 360 months | ||||||
| Loan Amortization Type: | Interest-only, Amortizing ARD | 3rd Most Recent NOI(2): | NAV | ||||
| Interest Accrual Method: | Actual/360 | 2nd Most Recent NOI(2): | NAV | ||||
| Call Protection: | L(24),GRTR 1% or YM(89),O(7) | Most Recent NOI(2): | NAV | ||||
| Lockbox Type: | Hard/Springing Cash Management | ||||||
| Additional Debt: | Yes | U/W Revenues: | $4,667,204 | ||||
| Additional Debt Type: | Future Mezzanine | U/W Expenses: | $140,016 | ||||
| U/W NOI: | $4,527,188 | ||||||
| U/W NCF: | $4,247,985 | ||||||
U/W NOI DSCR : | 1.50x | ||||||
Escrows and Reserves(1): | U/W NCF DSCR: | 1.41x | |||||
| U/W NOI Debt Yield: | 9.1% | ||||||
Type: | Initial | Monthly | Cap (If Any) | U/W NCF Debt Yield: | 8.5% | ||
| Taxes | $0 | Springing | NAP | As-Is Appraised Value: | $76,000,000 | ||
| Insurance | $0 | Springing | NAP | As-Is Appraisal Valuation Date: | February 1, 2013 | ||
| Capital Expense Reserves | $0 | Springing | $1,000,000 | Cut-off Date LTV Ratio: | 65.5% | ||
| TI/LC | $0 | Springing | $2,000,000 | LTV Ratio at Maturity or ARD: | 59.9% | ||
| (1) | See “Escrows” section. |
| (2) | The Hensley & Co. Portfolio properties were previously owner-occupied by Hensley & Co. and a lease was not in place. The borrower acquired the Hensley & Co. Portfolio properties in December 2012 through a sale-leaseback transaction. |
The Mortgage Loan. The mortgage loan (the “Hensley & Co. Portfolio Mortgage Loan”) is evidenced by a single promissory note that is secured by three first priority deeds of trust encumbering three warehouse buildings located in Arizona (the “Hensley & Co. Portfolio Properties”). The Hensley & Co. Portfolio Mortgage Loan was originated on February 14, 2013 by The Royal Bank of Scotland. The Hensley & Co. Portfolio Mortgage Loan had an original principal balance of $49,750,000, has an outstanding principal balance as of the Cut-off Date of $49,750,000 and accrues interest at an interest rate of 4.466% per annum. The Hensley & Co. Portfolio Mortgage Loan had an initial term of 120 months, has a remaining term of 120 months as of the Cut-off Date and requires interest-only payments for the first 60 months following origination and thereafter requires payments of principal and interest based on a 30-year amortization schedule through the Anticipated Repayment Date (“ARD”). The ARD is March 6, 2023 and the final maturity date is March 6, 2043. In the event the Hensley & Co. Portfolio Mortgage Loan is not paid in full on or before the ARD, the Hensley & Co. Portfolio Mortgage Loan will accrue interest at an interest rate equal to the greater of (i) the initial interest rate plus 3.0% or (ii) the treasury rate plus 3.0% per annum and will have a remaining term of 240 months. The occurrence of the ARD automatically triggers a full cash flow sweep whereby all excess cash flow will be used to pay down the principal balance of the Hensley & Co. Portfolio Mortgage Loan.
Following the lockout period, the borrower has the right to prepay the Hensley & Co. Portfolio Mortgage Loan either in whole or in part, provided that the borrower pays the greater of a yield maintenance premium or a prepayment premium equal to 1.0% of the principal amount being prepaid. In addition, the Hensley & Co. Portfolio Mortgage Loan is prepayable without penalty on or after September 6, 2022.
THE INFORMATION IN THIS STRUCTURAL AND COLLATERAL TERM SHEET IS NOT COMPLETE AND MAY BE AMENDED PRIOR TO THE TIME OF SALE. THIS TERM SHEET IS NOT AN OFFER TO SELL THESE SECURITIES AND IT IS NOT A SOLICITATION OF AN OFFER TO BUY THESE SECURITIES IN ANY JURISDICTION WHERE THE OFFER OR SALE IS NOT PERMITTED.
60
| HENSLEY & CO. PORTFOLIO |
Sources and Uses
| Sources | Uses | |||||||
| Original loan amount | $49,750,000 | 64.9% | Purchase price | $76,000,000 | 99.1% | |||
| Sponsor’s new cash contribution | 26,938,888 | 35.1 | Closing costs | 688,888 | 0.9 | |||
| Total Sources | $76,688,888 | 100.0% | Total Uses | $76,688,888 | 100.0% |
The Properties. The Hensley & Co. Portfolio Mortgage Loan is secured by the fee interest in three warehouse properties totaling 577,167 rentable square feet located in Arizona. The Hensley & Co. – Phoenix property, Hensley & Co. – Chandler property and Hensley & Co. – Prescott property are 313,026, 231,805 and 32,336 square feet, respectively. The Hensley & Co. Portfolio Properties consist of approximately 79.1% warehouse space and approximately 20.9% office space. The clear heights of the Hensley & Co. Portfolio Properties range from 22 feet to 32 feet. All of the Hensley & Co. Portfolio Properties are occupied by Hensley & Co. and on average, the tenant has occupied its respective spaces in the Hensley & Co. Portfolio Properties for 14 years. Hensley & Co. is a distributor of more than 700 beverage brands including Anheuser-Busch beers, as well as other imports, craft beers, specialty beverages, energy drinks, water, teas and wine. As of March 1, 2013, the Hensley & Co. Portfolio Properties were 100.0% occupied.
The following table presents certain information relating to the Hensley & Co. Portfolio Properties:
| Property Name – Location | Allocated Cut-off Date Principal Balance | % of Portfolio Cut-off Date Principal Balance | Total Occupancy | Year Built/ Renovated | Net Rentable Area (SF) | Appraised Value |
| Hensley & Co. – Phoenix, AZ | $30,700,000 | 61.7% | 100.0% | 1988/NAP | 313,026 | $47,000,000 |
| Hensley & Co. – Chandler, AZ | $17,360,000 | 34.9% | 100.0% | 2007/NAP | 231,805 | $26,500,000 |
| Hensley & Co. – Prescott, AZ | $1,690,000 | 3.4% | 100.0% | 2003/NAP | 32,336 | $2,500,000 |
| Total/Weighted Average | $49,750,000 | 100.0% | 100.0% | 577,167 | $76,000,000 |
The following table presents certain information relating to the tenant at the Hensley & Co. Portfolio Properties:
Major Tenant
| Tenant Name | Credit Rating(Fitch/Moody’s/ S&P) | Tenant NRSF | % of NRSF | Annual U/W Base Rent PSF | Annual U/W Base Rent | % of Total Annual U/W Base Rent | Lease Expiration Date | |
| Major Tenant | ||||||||
| Hensley & Co. | NR/NR/NR | 577,167 | 100.0% | $8.51 | $4,912,846 | 100.0% | 6/30/2030 | |
| Total Major Tenant | 577,167 | 100.0% | $8.51 | $4,912,846 | 100.0% | |||
THE INFORMATION IN THIS STRUCTURAL AND COLLATERAL TERM SHEET IS NOT COMPLETE AND MAY BE AMENDED PRIOR TO THE TIME OF SALE. THIS TERM SHEET IS NOT AN OFFER TO SELL THESE SECURITIES AND IT IS NOT A SOLICITATION OF AN OFFER TO BUY THESE SECURITIES IN ANY JURISDICTION WHERE THE OFFER OR SALE IS NOT PERMITTED.
61
| HENSLEY & CO. PORTFOLIO |
The following table presents certain information relating to the lease rollover schedule at the Hensley & Co. Portfolio Properties:
Lease Expiration Schedule(1)
Year Ending December 31, | No. of Leases Expiring | Expiring NRSF | % of Total NRSF | Cumulative Expiring NRSF | Cumulative % of Total NRSF | Annual U/W Base Rent | Annual U/W Base Rent PSF | |
| MTM | 0 | 0 | 0.0% | 0 | 0.0% | $0 | $0.00 | |
| 2013 | 0 | 0 | 0.0% | 0 | 0.0% | $0 | $0.00 | |
| 2014 | 0 | 0 | 0.0% | 0 | 0.0% | $0 | $0.00 | |
| 2015 | 0 | 0 | 0.0% | 0 | 0.0% | $0 | $0.00 | |
| 2016 | 0 | 0 | 0.0% | 0 | 0.0% | $0 | $0.00 | |
| 2017 | 0 | 0 | 0.0% | 0 | 0.0% | $0 | $0.00 | |
| 2018 | 0 | 0 | 0.0% | 0 | 0.0% | $0 | $0.00 | |
| 2019 | 0 | 0 | 0.0% | 0 | 0.0% | $0 | $0.00 | |
| 2020 | 0 | 0 | 0.0% | 0 | 0.0% | $0 | $0.00 | |
| 2021 | 0 | 0 | 0.0% | 0 | 0.0% | $0 | $0.00 | |
| 2022 | 0 | 0 | 0.0% | 0 | 0.0% | $0 | $0.00 | |
| 2023 | 0 | 0 | 0.0% | 0 | 0.0% | $0 | $0.00 | |
| Thereafter | 1 | 577,167 | 100.0% | 577,167 | 100.0% | $4,912,846 | $8.51 | |
| Vacant | 0 | 0 | 0.0% | 577,167 | 100.0% | $0 | $0.00 | |
| Total/Weighted Average | 1 | 577,167 | 100.0% | $4,912,846 | $8.51 |
| (1) | Information obtained from the underwritten rent roll. |
The following table presents historical occupancy percentages at the Hensley & Co. Portfolio Properties:
Historical Occupancy(1)
12/31/2010 | 12/31/2011 | 12/31/2012 | 3/1/2013 | |||
| 100% | 100% | 100% | 100% |
| (1) | The Hensley & Co. Portfolio Properties were previously owner-occupied by Hensley & Co. and a lease was not in place. The borrower acquired the Hensley & Co. Portfolio Properties in December 2012 through a sale-leaseback transaction. On average, the tenant has occupied its respective spaces in the Hensley & Co. Portfolio Properties for 14 years. |
Operating History and Underwritten Net Cash Flow. The following table presents certain information relating to the Underwritten Net Cash Flow at the Hensley & Co. Portfolio Properties:
Cash Flow Analysis(1)
| U/W | U/W $ per SF | |||
| Base Rent | $4,912,846 | $8.51 | ||
| Grossed Up Vacant Space | 0 | 0.00 | ||
| Total Reimbursables | 0 | 0.00 | ||
| Other Income | 0 | 0.00 | ||
| Less Vacancy & Credit Loss | (245,642)(2) | (0.43) | ||
| Effective Gross Income | $4,667,204 | $8.09 | ||
| Total Operating Expenses | $140,016 | $0.24 | ||
| Net Operating Income | $4,527,188 | $7.84 | ||
| TI/LC | 192,627 | 0.33 | ||
| Capital Expenditures | 86,575 | 0.15 | ||
| Net Cash Flow | $4,247,985 | $7.36 | ||
| NOI DSCR | 1.50x | |||
| NCF DSCR | 1.41x | |||
| NOI DY | 9.1% | |||
| NCF DY | 8.5% |
| (1) | No historical financial information is available as the sponsor purchased the Hensley & Co. Portfolio Properties in December, 2012. |
| (2) | The underwritten economic vacancy is 5.0%. The Hensley & Co. Portfolio Properties are currently 100.0% physically occupied as of March 1, 2013. |
THE INFORMATION IN THIS STRUCTURAL AND COLLATERAL TERM SHEET IS NOT COMPLETE AND MAY BE AMENDED PRIOR TO THE TIME OF SALE. THIS TERM SHEET IS NOT AN OFFER TO SELL THESE SECURITIES AND IT IS NOT A SOLICITATION OF AN OFFER TO BUY THESE SECURITIES IN ANY JURISDICTION WHERE THE OFFER OR SALE IS NOT PERMITTED.
62
| HENSLEY & CO. PORTFOLIO |
Appraisal. As of the appraisal valuation date of February 1, 2013, the Hensley & Co. Portfolio Properties had an aggregate “as-is” appraised value of $76,000,000. In addition, the appraiser concluded to a hypothetical “go dark” value of $49,950,000.
Environmental Matters. Phase I environmental site assessments were performed on February 4, 2013. The Hensley & Co. – Phoenix property was found to have an a de minimis condition related to two 2,400-gallon storage tanks for waste oil and new oil associated with automotive service, one 10,000-gallon diesel fuel tank and one 6,000-gallon unleaded gasoline tank. The Phase I Report recommended that, since the tenant is responsible for the environmental integrity of the tenant space and, upon lease expiration or shutdown of the facility, an investigation should be performed by the tenant to demonstrate that the storage tanks have not impacted the Hensley & Co. – Phoenix property.
Market Overview. The Hensley & Co. Portfolio Properties are located in Phoenix, Arizona, Chandler, Arizona and Prescott Valley, Arizona.
The Hensley & Co. – Phoenix property is located approximately five miles northwest of the Phoenix central business district. According to the appraisal, the Hensley & Co. – Phoenix property is located within the Phoenix industrial market and Grand Avenue Industrial submarket. The Phoenix industrial market had a vacancy of 11.0% and average asking rents of $7.08 per square foot, on a triple net basis, as of the fourth quarter 2012. The Grand Avenue Industrial submarket had a vacancy of 7.0% and average asking rents of $3.84 per square foot, on a triple net basis, as of the fourth quarter 2012.
The Hensley & Co. – Chandler property is located approximately 16 miles southeast of the Phoenix central business district. According to the appraisal, the Hensley & Co. – Chandler property is located in the Phoenix industrial market and Phoenix submarket. The Phoenix industrial market had a vacancy of 11.0% and average asking rents of $7.08 per square foot, on a triple net basis, as of the fourth quarter 2012. The Phoenix submarket had a vacancy of 12.0% and average asking rents of $7.68 per square foot, on a triple net basis, as of the fourth quarter 2012.
The Hensley & Co. – Prescott Valley property is located approximately seven miles north of Prescott and approximately 96 miles northwest of Phoenix. According to the appraisal, the Hensley & Co. – Prescott Valley property is located in the Phoenix industrial market and is not part of a formal submarket.
The Borrower. The borrower is AGNL Hops, L.L.C., a Delaware limited liability company and a single purpose entity with two independent directors. The borrower is ultimately controlled by AG Net Lease II Corp., the guarantor of certain nonrecourse carveouts under the Hensley & Co. Portfolio Mortgage Loan.
The Sponsor. The loan sponsor is AG Net Lease II Corp (“AG Net Lease”), a subsidiary of Angelo, Gordon & Co. AG Net Lease is a real estate investment firm that focuses on the management, acquisition, financing, disposition, leasing and construction of commercial real estate throughout North America and select international markets. Angelo, Gordon & Co. was founded in 1993 and has acquired over $13.0 billion of properties.
Escrows. The loan documents provide for no upfront escrows. No monthly tax escrow is required so long as (i) no Cash Management Period (as defined below) has occurred or is continuing; (ii) no Lease Sweep Period has occurred or is continuing; and (iii) borrower delivers satisfactory evidence that tax payments are being made in a timely manner. No monthly insurance escrow is required so long as (i) no Cash Management Period has occurred or is continuing; (ii) no Lease Sweep Period has occurred or is continuing; and (iii) the tenant under the Hensley & Co. lease is paying insurance as required under the Hensley & Co. lease. No monthly replacement or tenant improvement and leasing commission reserves are required so long as (i) no Cash Management Period has occurred and is continuing and (ii) no Lease Sweep Period (as defined below) has occurred and is continuing.
Lockbox and Cash Management. The Hensley & Co. Portfolio Mortgage Loan requires a lender-controlled lockbox account, which is already in place, and that the borrower directs tenants to pay their rents directly to such lockbox account. The loan documents also require that all cash revenues and all other monies received by the borrower or the manager be deposited into the lockbox account within one business day after receipt. Prior to the occurrence of a Cash Management Period (as defined below), all funds on deposit in the lockbox account are swept into the borrower’s operating account. During a Cash Management Period, all funds on deposit in the lockbox account are swept to a lender-controlled cash management account.
A “Cash Management Period” will commence: (i) if an event of default has occurred and is continuing; (ii) if the debt service coverage ratio is less than 1.10x; (iii) the commencement of a Lease Sweep Period (as defined below); or (iv) the making of any approved mezzanine loan. A Cash Management Period will end with respect to clause (i) above upon the cure of such event of default; with respect to clause (ii) above, upon the achievement of a debt service coverage ratio of 1.10x for two consecutive calendar quarters; and with respect to clause (iii) above, when such Lease Sweep Period has been closed.
THE INFORMATION IN THIS STRUCTURAL AND COLLATERAL TERM SHEET IS NOT COMPLETE AND MAY BE AMENDED PRIOR TO THE TIME OF SALE. THIS TERM SHEET IS NOT AN OFFER TO SELL THESE SECURITIES AND IT IS NOT A SOLICITATION OF AN OFFER TO BUY THESE SECURITIES IN ANY JURISDICTION WHERE THE OFFER OR SALE IS NOT PERMITTED.
63
| HENSLEY & CO. PORTFOLIO |
A “Lease Sweep Period” will commence on the first payment date under the Hensley & Co. Portfolio Mortgage Loan following the occurrence of any of the following (i) any Major Lease (as defined below) at any of the Hensley & Co. Portfolio Properties is surrendered, cancelled or terminated prior to its then current expiration date; (ii) if any tenant under a Major Lease discontinues its business at the premises or gives notice that it intends to discontinue its business or gives notice that it intends to discontinue its business; (iii) upon the occurrence of an insolvency proceeding by any tenant under a Major Lease. A Lease Sweep Period will end with respect to clause (i) above, on the date on which such space has been fully leased pursuant to a replacement lease and all associated expenses have been paid in full; with respect to clause (ii) above, when the tenant under the Major Lease commences operations again at its premises in accordance with the terms of the Major Lease; and with respect to clause (iii) above, when the applicable insolvency proceeding regarding the tenant under the applicable Major Lease has terminated and the applicable Major Lease has been affirmed, assumed or assigned in accordance with the applicable bankruptcy code.
A “Major Lease” is defined as the Hensley & Co. lease and any other lease entered into which demises more than 20.0% of the rentable area of any of the Hensley & Co. Portfolio Properties.
Property Management. The Hensley & Co. Portfolio Properties are managed by the borrower.
Assumption. The Hensley & Co. Portfolio Mortgage Loan borrower has the right to transfer all, but not less than all, of the Hensley & Co. Portfolio Properties, subject to customary conditions set forth in the loan documents, including but not limited to: (i) no event of default has occurred and is continuing; (ii) the proposed transferee, the property manager and management agreement are satisfactory to the lender and applicable rating agencies; and (iii) the lender has received confirmation from Fitch, KBRA and S&P that such assumption will not result in a downgrade, withdrawal or qualification of the then current ratings assigned to the Series 2013-C12 Certificates.
Partial Release. Following the second anniversary of the issuance of the Series 2013-C12 Certificates, the borrower may obtain the release of an individual property from the lien of the related mortgage in connection with a partial release upon the satisfaction of certain conditions including but not limited to: (i) the release is permitted under the Hensley & Co. lease, which only allows for the sale of an individual property either (a) following an event of default by tenant under such lease or (b) an environmental condition exists at such individual property; (ii) the property to be released must be the subject of a sale to a bona fide third party purchaser who is neither a Restricted Party (as defined below) nor an affiliate of a Restricted Party; (iii) the borrower will provide the lender a written request at least 20 days prior to the proposed release date; (iv) no event of default has occurred or is continuing at the time that the release occurs; (v) payment by the borrower in an amount equal to 110% of the allocated loan amount for the individual property (except with respect to the Prescott Valley property, which release amount shall be equal to 105% of the allocated loan amount) to be released, along with any applicable yield maintenance or prepayment premium; (vi) after such release, the debt service coverage ratio of the remaining properties must not be less than the greater of (x) the debt service coverage ratio immediately preceding such release and (y) 1.60x; and (vii) after such release, the loan-to-value ratio of the remaining properties must not be greater than the lesser of (x) the loan to value ratio immediately preceding such release and (y) 65.0%.
A “Restricted Party” means the borrower, any principal or the guarantor or any affiliate thereof under the Hensley & Co. Portfolio Mortgage Loan.
Real Estate Substitution. Not permitted.
Subordinate and Mezzanine Indebtedness. Future mezzanine debt is permitted subject to satisfaction of certain conditions, including: (i) that no event of default has occurred and is continuing; (ii) an intercreditor agreement in form and substance acceptable to Fitch, KBRA and S&P and reasonably acceptable to the lender; (iii) the Aggregate DSCR (as defined below) is not less than 1.20x; (iv) the Aggregate LTV (as defined below) will not be greater than 72.5%; (v) the debt yield is not less than 8.0%; and (vi) mezzanine loan documents acceptable to Fitch, KBRA and S&P and reasonably acceptable to the lender will have been delivered to the lender.
The “Aggregate DSCR” is the aggregate debt service coverage ratio based on the amortizing debt service under the Hensley & Co. Portfolio Mortgage Loan and any approved mezzanine loan that is outstanding.
The “Aggregate LTV” is the aggregate loan to value ratio based on the outstanding principal balance of the Hensley & Co. Portfolio Mortgage Loan and any approved mezzanine loan that is outstanding.
Ground Lease. None.
Terrorism Insurance. The loan documents require that the “all risk” insurance policy required to be maintained by the borrower provide coverage for terrorism in an amount equal to the full replacement cost of the Hensley & Co. Portfolio Properties. The loan documents also require business interruption insurance covering no less than the 18-month period following the occurrence of a casualty event, together with a six-month extended period of indemnity.
THE INFORMATION IN THIS STRUCTURAL AND COLLATERAL TERM SHEET IS NOT COMPLETE AND MAY BE AMENDED PRIOR TO THE TIME OF SALE. THIS TERM SHEET IS NOT AN OFFER TO SELL THESE SECURITIES AND IT IS NOT A SOLICITATION OF AN OFFER TO BUY THESE SECURITIES IN ANY JURISDICTION WHERE THE OFFER OR SALE IS NOT PERMITTED.
64
(THIS PAGE INTENTIONALLY LEFT BLANK)
65
| TERRITORY PORTFOLIO |

THE INFORMATION IN THIS STRUCTURAL AND COLLATERAL TERM SHEET IS NOT COMPLETE AND MAY BE AMENDED PRIOR TO THE TIME OF SALE. THIS TERM SHEET IS NOT AN OFFER TO SELL THESE SECURITIES AND IT IS NOT A SOLICITATION OF AN OFFER TO BUY THESE SECURITIES IN ANY JURISDICTION WHERE THE OFFER OR SALE IS NOT PERMITTED.
66
| TERRITORY PORTFOLIO |
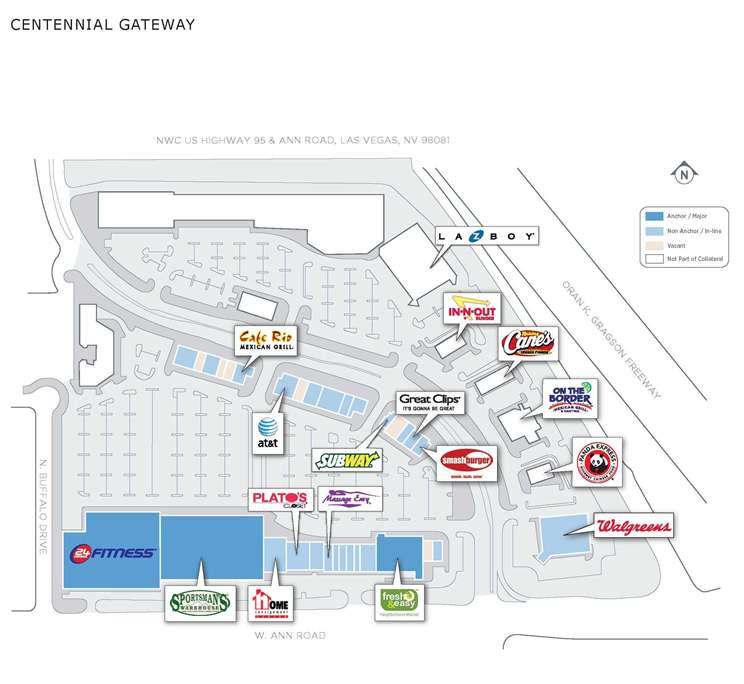
THE INFORMATION IN THIS STRUCTURAL AND COLLATERAL TERM SHEET IS NOT COMPLETE AND MAY BE AMENDED PRIOR TO THE TIME OF SALE. THIS TERM SHEET IS NOT AN OFFER TO SELL THESE SECURITIES AND IT IS NOT A SOLICITATION OF AN OFFER TO BUY THESE SECURITIES IN ANY JURISDICTION WHERE THE OFFER OR SALE IS NOT PERMITTED.
67
| TERRITORY PORTFOLIO |
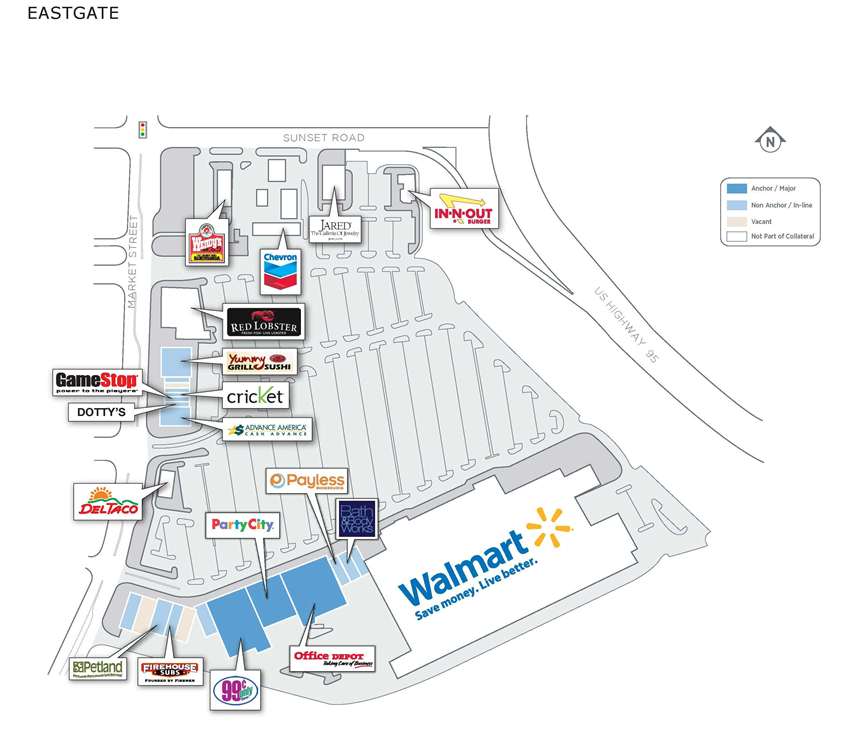
THE INFORMATION IN THIS STRUCTURAL AND COLLATERAL TERM SHEET IS NOT COMPLETE AND MAY BE AMENDED PRIOR TO THE TIME OF SALE. THIS TERM SHEET IS NOT AN OFFER TO SELL THESE SECURITIES AND IT IS NOT A SOLICITATION OF AN OFFER TO BUY THESE SECURITIES IN ANY JURISDICTION WHERE THE OFFER OR SALE IS NOT PERMITTED.
68
| TERRITORY PORTFOLIO |
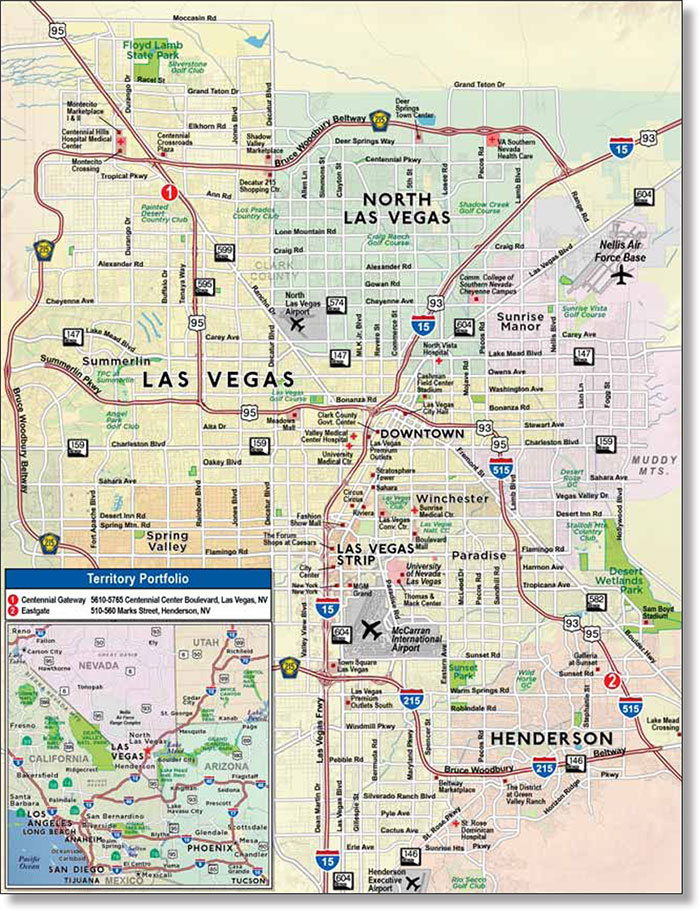
THE INFORMATION IN THIS STRUCTURAL AND COLLATERAL TERM SHEET IS NOT COMPLETE AND MAY BE AMENDED PRIOR TO THE TIME OF SALE. THIS TERM SHEET IS NOT AN OFFER TO SELL THESE SECURITIES AND IT IS NOT A SOLICITATION OF AN OFFER TO BUY THESE SECURITIES IN ANY JURISDICTION WHERE THE OFFER OR SALE IS NOT PERMITTED.
69
| No. 6 – Territory Portfolio | ||||||||||
| Loan Information | Property Information | |||||||||
| Mortgage Loan Seller: | The Royal Bank of Scotland | Single Asset/Portfolio: | Portfolio | |||||||
Credit Assessment (Fitch/KBRA/S&P): | NR/NR/NR | Property Type: | Retail | |||||||
| Original Principal Balance: | $44,385,000 | Specific Property Type: | Various – See Table | |||||||
| Cut-off Date Principal Balance: | $44,385,000 | Location: | Various – See Table | |||||||
| % of Initial Pool Balance: | 3.6% | Size: | 289,572 SF | |||||||
| Loan Purpose: | Acquisition | Cut-off Date Principal Balance Per Unit/SF: | $153.28 | |||||||
| Borrower Names: | Inland Diversified Las Vegas Centennial Gateway, L.L.C.; Inland Diversified Henderson Eastgate, L.L.C. | Year Built/Renovated: | Various/NAP | |||||||
| Sponsor: | Inland Diversified Real Estate Trust, Inc. | Title Vesting: | Fee | |||||||
| Mortgage Rate: | 3.811% | Property Manager: | Self-managed | |||||||
| Note Date: | December 27, 2012 | 3rd Most Recent Occupancy (As of)(2): | 59.3% (12/31/2009) | |||||||
| Anticipated Repayment Date: | NAP | 2nd Most Recent Occupancy (As of)(2): | 62.7% (12/31/2010) | |||||||
| Maturity Date: | January 1, 2023 | Most Recent Occupancy (As of)(2): | 67.7% (12/31/2011) | |||||||
| IO Period: | 120 months | Current Occupancy (As of): | 94.2% (12/27/2012) | |||||||
| Loan Term (Original): | 120 months | |||||||||
| Seasoning: | 2 months | Underwriting and Financial Information: | ||||||||
| Amortization Term (Original): | NAP | |||||||||
| Loan Amortization Type: | Interest-only, Balloon | 3rd Most Recent NOI (As of)(2): | $3,990,365 (12/31/2010) | |||||||
| Interest Accrual Method: | Actual/360 | 2nd Most Recent NOI (As of)(2): | $4,300,054 (12/31/2011) | |||||||
| Call Protection: | L(25),GRTR 1% or YM(91),O(4) | Most Recent NOI (As of): | $5,106,066 (TTM 10/31/2012) | |||||||
| Lockbox Type: | Hard/Springing Cash Management | |||||||||
| Additional Debt: | None | |||||||||
| Additional Debt Type: | NAP | U/W Revenues: | $6,693,564 | |||||||
| U/W Expenses: | $1,068,049 | |||||||||
| U/W NOI: | $5,625,515 | |||||||||
| U/W NCF: | $5,324,102 | |||||||||
| U/W NOI DSCR: | 3.28x | |||||||||
Escrows and Reserves(1): | U/W NCF DSCR: | 3.10x | ||||||||
| U/W NOI Debt Yield: | 12.7% | |||||||||
Type: | Initial | Monthly | Cap (If Any) | U/W NCF Debt Yield: | 12.0% | |||||
| Taxes | $0 | Springing | NAP | As-Is Appraised Value: | $79,000,000 | |||||
| Insurance | $0 | Springing | NAP | As-Is Appraisal Valuation Date: | November 10, 2012 | |||||
| Replacement Reserves | $0 | $0 | NAP | Cut-off Date LTV Ratio: | 56.2% | |||||
| TI/LC | $0 | $0 | NAP | LTV Ratio at Maturity or ARD: | 56.2% | |||||
| (1) | See “Escrows” section. |
| (2) | The low historical occupancy is primarily due to the Centennial Gateway property being completed in 2009 and leased up between 2009 and 2012. The historical occupancy for the Centennial property ranged from 43.4% in 2009 to 95.0% as of December 27, 2012. The historical occupancy for the Eastgate property ranged from 92.3% in 2009 to 92.6% as of December 27, 2012. |
The Mortgage Loan. The mortgage loan (the “Territory Portfolio Mortgage Loan”) is evidenced by a promissory note that is secured by two first priority mortgages encumbering two retail centers located in Las Vegas and Henderson, Nevada (the “Territory Portfolio Properties”). The Territory Portfolio Mortgage Loan was originated on December 27, 2012 by The Royal Bank of Scotland. The Territory Portfolio Mortgage Loan had an original principal balance of $44,385,000, has an outstanding principal balance as of the Cut-off Date of $44,385,000 and accrues interest at a rate of 3.811% per annum. The mortgage loan had an initial term of 120 months, has a remaining term of 118 months as of the Cut-off Date and requires interest-only payments through the term of the Territory Portfolio Mortgage Loan. The Territory Portfolio Mortgage Loan matures on January 1, 2023.
Following the lockout period, the borrower has the right to prepay the Territory Portfolio Mortgage Loan either in whole or in part, provided that the borrower pays the greater of a yield maintenance premium or a prepayment premium equal to 1.0% of the principal amount being prepaid. In addition, the Territory Portfolio Mortgage Loan is prepayable without penalty on or after October 1, 2022.
THE INFORMATION IN THIS STRUCTURAL AND COLLATERAL TERM SHEET IS NOT COMPLETE AND MAY BE AMENDED PRIOR TO THE TIME OF SALE. THIS TERM SHEET IS NOT AN OFFER TO SELL THESE SECURITIES AND IT IS NOT A SOLICITATION OF AN OFFER TO BUY THESE SECURITIES IN ANY JURISDICTION WHERE THE OFFER OR SALE IS NOT PERMITTED.
70
| TERRITORY PORTFOLIO |
Sources and Uses
| Sources | Uses | |||||||
| Original loan amount | $44,385,000 | 54.9% | Purchase price | $80,700,000 | 99.8% | |||
Sponsor’s new cash contribution | 36,450,000 | 45.1 | Closing costs | 135,028 | 0.2 | |||
| Total Sources | $80,835,028 | 100.0% | Total Uses | $80,835,028 | 100.0% | |||
The Properties. The Territory Portfolio Mortgage Loan is secured by the fee interest in two retail properties totaling 289,572 square feet located in Las Vegas and Henderson, Nevada. The Centennial Gateway property is an anchored retail center situated on approximately 18.5 acres of land located at the northwest corner of Ann Road and Centennial Center Boulevard, approximately ¼ mile west of US Highway 95 in Las Vegas, Nevada. The Centennial Gateway property is anchored by Sportsman’s Warehouse, 24 Hour Fitness, Walgreens and Fresh & Easy. The Centennial Gateway property was built in 2008 and was 95.0% leased by 23 tenants as of December 27, 2012. The Centennial Gateway property contains 192,968 square feet of net rentable area. The Eastgate property is a shadow-anchored retail center situated on an approximately 10.8-acre parcel of land located just east of Interstate Highway 515 in Henderson, Nevada. The Eastgate property was developed in 2002 and contains 96,604 square feet of net rentable area. The Eastgate property was 92.6% leased by 18 tenants as of December 27, 2012. The Eastgate property is shadow-anchored by Wal-Mart and other major tenants include Office Depot, 99 Cents Only and Party City.
The following table represents certain information relating to the Territory Portfolio Properties:
| Property Name - Location | Specific Property Type | Allocated Cut-off Date Principal Balance | % of Portfolio Cut-off Date Principal Balance | Total Occupancy | Year Built/ Renovated | Net Rentable Area (SF) | Appraised Value |
| Centennial Gateway - Las Vegas, NV | Anchored | $29,975,000 | 67.5% | 95.0% | 2008/NAP | 192,968 | $52,400,000 |
| Eastgate - Henderson, NV | Shadow Anchored | $14,410,000 | 32.5% | 92.6% | 2002/NAP | 96,604 | $26,600,000 |
| Total/Weighted Average | $44,385,000 | 100.0% | 94.2% | 289,572 | $79,000,000 |
THE INFORMATION IN THIS STRUCTURAL AND COLLATERAL TERM SHEET IS NOT COMPLETE AND MAY BE AMENDED PRIOR TO THE TIME OF SALE. THIS TERM SHEET IS NOT AN OFFER TO SELL THESE SECURITIES AND IT IS NOT A SOLICITATION OF AN OFFER TO BUY THESE SECURITIES IN ANY JURISDICTION WHERE THE OFFER OR SALE IS NOT PERMITTED.
71
| TERRITORY PORTFOLIO |
The following table presents certain information relating to the tenancies at the Territory Portfolio Properties:
Major Tenants
| Tenant Name | Credit Rating (Fitch/ Moody’s/ S&P)(1) | Tenant NRSF | % of NRSF | Annual U/W Base Rent PSF | Annual U/W Base Rent | % of Total Annual U/W Base Rent | Sales PSF(2) | Occupancy Cost(2)(3) | Lease Expiration Date | ||
| Anchor Tenants - Collateral | |||||||||||
24 Hour Fitness(4) | NR/B3/B | 44,619 | 15.4% | $22.74 | $1,014,440 | 16.7% | NAV | NAV | 3/31/2024 | ||
Sportsman’s Warehouse(4) | NR/B2/B | 55,452 | 19.1% | $10.00 | $554,520 | 9.1% | NAV | NAV | 3/31/2017 | ||
Fresh & Easy(4) | A-/Baa1/A- | 13,950 | 4.8% | $24.03 | $335,256 | 5.5% | NAV | NAV | 1/31/2029 | ||
Office Depot(5) | NR/B2/B- | 20,530 | 7.1% | $13.75 | $282,288 | 4.7% | NAV | NAV | 2/28/2017 | ||
99 Cents Only(5) | NR/B2/B | 20,015 | 6.9% | $13.74 | $275,000 | 4.5% | NAV | NAV | 1/31/2018 | ||
Party City(5) | NR/B2/B | 12,500 | 4.3% | $20.53 | $256,625 | 4.2% | $195 | 12.0% | 1/31/2018 | ||
| Total Anchor Tenants – Collateral | 167,066 | 57.7% | $16.27 | $2,718,129 | 44.8% | ||||||
| Other Major Tenants – Collateral | |||||||||||
Walgreens(4) | NR/Baa1/BBB | 14,820 | 5.1% | $38.60 | $572,000 | 9.4% | $112(6) | 34.9%(6) | 6/30/2083 | ||
Dotty’s(4)(5)(7) | NR/NR/NR | 6,628 | 2.3% | $53.71 | $356,019 | 5.9% | NAV | NAV | Various(7) | ||
Home Consignment Center(4) | NR/NR/NR | 10,999 | 3.8% | $24.00 | $263,976 | 4.3% | $72 | 38.3% | 2/28/2018 | ||
| Total Other Major Tenants - Collateral | 32,447 | 11.2% | $36.74 | $1,191,995 | 19.6% | ||||||
| Non-Major Tenants | 73,615 | 25.3% | $29.53 | $2,160,208 | 35.6% | ||||||
| Occupied Collateral Total | 272,678 | 94.2% | $22.26 | $6,070,332 | 100.0% | ||||||
| Vacant Space | 16,894 | 5.8% | |||||||||
| Collateral Total | 289,572 | 100.0% | |||||||||
| (1) | Certain ratings are those of the parent company whether or not the parent guarantees the lease. |
| (2) | Sales and Occupancy Costs are calculated using various 12-month periods based on borrower-provided rent roll. |
| (3) | Occupancy Costs include base rent, reimbursements and percentage rent as applicable. |
| (4) | Tenant is located at the Centennial Gateway property. |
| (5) | Tenant is located at the Eastgate property. |
| (6) | Sales PSF and Occupancy Cost for Walgreens excludes the pharmacy, tobacco products and all beverages. |
| (7) | Dotty’s leases two spaces: Centennial Gateway (3,276 square feet, 2.3% of Annual U/W Base Rent, lease expires June 30, 2028) and Eastgate (3,352 square feet, 3.6% of Annual U/W Base Rent, lease expires September 16, 2018). |
The following table presents certain information relating to the lease rollover schedule at the Territory Portfolio Properties:
Lease Expiration Schedule(1)(2)
Year Ending December 31, | No. of Leases Expiring | Expiring NRSF(1) | % of Total NRSF | Cumulative of Total NRSF | Cumulative % of Total NRSF | Annual U/W Base Rent | Annual U/W Base Rent PSF(3) |
| MTM | 0 | 0 | 0.0% | 0 | 0.0% | $0 | $0.00 |
| 2013 | 1 | 3,498 | 1.2% | 3,498 | 1.2% | $157,275 | $44.96 |
| 2014 | 3 | 5,058 | 1.7% | 8,556 | 3.0% | $154,600 | $30.57 |
| 2015 | 6 | 13,371 | 4.6% | 21,927 | 7.6% | $323,775 | $24.21 |
| 2016 | 7 | 11,504 | 4.0% | 33,431 | 11.5% | $354,916 | $30.85 |
| 2017 | 6 | 86,472 | 29.9% | 119,903 | 41.4% | $1,098,553 | $12.70 |
| 2018 | 8 | 58,541 | 20.2% | 178,444 | 61.6% | $1,395,458 | $23.84 |
| 2019 | 1 | 2,505 | 0.9% | 180,949 | 62.5% | $107,314 | $42.84 |
| 2020 | 2 | 7,010 | 2.4% | 187,959 | 64.9% | $210,594 | $30.04 |
| 2021 | 0 | 0 | 0.0% | 187,959 | 64.9% | $0 | $0.00 |
| 2022 | 3 | 8,054 | 2.8% | 196,013 | 67.7% | $208,560 | $25.90 |
| 2023 | 0 | 0 | 0.0% | 196,013 | 67.7% | $0 | $0.00 |
| Thereafter | 4 | 76,665 | 26.5% | 272,678 | 94.2% | $2,059,288 | $26.86 |
| Vacant | 0 | 16,894 | 5.8% | 289,572 | 100.0% | $0 | $0.00 |
| Total/Weighted Average | 41 | 289,572 | 100.0% | $6,070,332 | $22.26 |
| (1) | Information was obtained from the underwritten rent roll. |
| (2) | Certain tenants may have lease termination options that are exercisable prior to the originally stated expiration date of the subject lease and that are not considered in the Lease Expiration Schedule. |
| (3) | Weighted Average Annual U/W Base Rent PSF excludes vacant space. |
THE INFORMATION IN THIS STRUCTURAL AND COLLATERAL TERM SHEET IS NOT COMPLETE AND MAY BE AMENDED PRIOR TO THE TIME OF SALE. THIS TERM SHEET IS NOT AN OFFER TO SELL THESE SECURITIES AND IT IS NOT A SOLICITATION OF AN OFFER TO BUY THESE SECURITIES IN ANY JURISDICTION WHERE THE OFFER OR SALE IS NOT PERMITTED.
72
| TERRITORY PORTFOLIO |
The following table presents historical occupancy percentages at the Territory Portfolio Properties:
Historical Occupancy(1)(2)
12/31/2009 | 12/31/2010 | 12/31/2011 | 12/27/2012 | |||
| 59% | 63% | 68% | 94% |
| (1) | Information obtained from the borrower rent roll. |
| (2) | The low historical occupancy is primarily due to the Centennial Gateway property being completed in 2009 and leased up between 2009 and 2012. The historical occupancy for the Centennial property ranged from 43.4% in 2009 to 95.0% as of December 27, 2012. The historical occupancy for the Eastgate property ranged from 92.3% in 2009 to 92.6% as of December 27, 2012. |
Operating History and Underwritten Net Cash Flow. The following table presents certain information relating to the historical operating performance and the Underwritten Net Cash Flow at the Territory Portfolio Properties:
Cash Flow Analysis(1)
2010 | 2011 | TTM 10/31/2012 | U/W | U/W $ per SF | ||||||
| Base Rent | $4,153,372 | $4,630,709 | $5,302,259 | $6,070,332 | $20.96 | |||||
| Grossed Up Vacant Space | 0 | 0 | 0 | 446,757 | 1.54 | |||||
| Total Reimbursables | 515,262 | 444,877 | 686,056 | 800,963 | 2.77 | |||||
| Other Income | 269,914 | 187,271 | 125,410 | 35,215 | 0.12 | |||||
| Less Vacancy & Credit Loss | 0 | 0 | 0 | (659,703)(2) | (2.28) | |||||
| Effective Gross Income | $4,938,548 | $5,262,857 | $6,113,725 | $6,693,564 | $23.12 | |||||
| Total Operating Expenses | $948,183 | $962,803 | $1,007,659 | $1,068,049 | $3.69 | |||||
| Net Operating Income | $3,990,365 | $4,300,054 | $5,106,066 | $5,625,515 | $19.43 | |||||
| TI/LC | 0 | 0 | 0 | 217,397 | 0.75 | |||||
| Capital Expenditures | 0 | 0 | 0 | 84,017 | 0.29 | |||||
| Net Cash Flow | $3,990,365 | $4,300,054 | $5,106,066 | $5,324,102 | $18.39 | |||||
| NOI DSCR | 2.33x | 2.51x | 2.98x | 3.28x | ||||||
| NCF DSCR | 2.33x | 2.51x | 2.98x | 3.10x | ||||||
| NOI DY | 9.0% | 9.7% | 11.5% | 12.7% | ||||||
| NCF DY | 9.0% | 9.7% | 11.5% | 12.0% |
| (1) | The underwritten Net Operating Income is higher than historical net operating income due in large part to approximately $401,568 in rental income (4.9% of net rentable area and 6.6% of underwritten Base Rent) from two tenants whose leases began after October 31, 2012, and thus were not fully reflected in the trailing 12-month operating statements as of October 31, 2012. |
| (2) | The underwritten economic vacancy is 6.7%. The Territory Portfolio Properties were 94.2% physically occupied as of December 27, 2012. |
Appraisal. As of the appraisal valuation date of November 10, 2012, the Territory Portfolio Properties had an aggregate “as-is” appraised value of $79,000,000.
Environmental Matters. According to the Phase I environmental site assessments both dated November 6, 2012, there was no evidence of any recognized environmental conditions at either of the Territory Portfolio Properties.
Market Overview and Competition. The Centennial Gateway property is located along US Highway 95 in the Centennial Hills suburb of Las Vegas, Nevada. The Centennial Gateway property is located at the northeast corner of Ann Road and Centennial Center Parkway. The Centennial Gateway property is located approximately 17 miles southeast of the Las Vegas central business district and approximately 20 miles northwest of the McCarran International Airport. Per the appraisal, between 2000 and 2012 the population within a three-mile radius of the Centennial Gateway property increased at an annual compound rate of 9.03%. Within a three- and five-mile radius of the Centennial Gateway property, the 2012 population was 86,652 and 212,935, respectively. The 2012 average household income within a three-mile radius of the Centennial Gateway property was approximately $87,034. The Centennial Gateway property is situated within the Northwest submarket, one of the submarkets which comprise the Las Vegas retail market in Las Vegas, Nevada. According to a third party market research report, the Northwest submarket, containing 9.5 million square feet inclusive of anchor and nonanchor collectively, was 11.7% vacant with an average rental asking rate of $20.91 per square foot, on a triple net basis, as of the second quarter 2012. The Northwest submarket inclusive of anchors has an inventory of 4.4 million square feet, a vacancy of 5.4% and average asking rent of $11.96 on a triple net basis, while the nonachors in the Northwest submarket includes a total of 5.1 million square feet with a vacancy of 17.0% and average asking rent of $20.91 per square foot on a triple net basis.
THE INFORMATION IN THIS STRUCTURAL AND COLLATERAL TERM SHEET IS NOT COMPLETE AND MAY BE AMENDED PRIOR TO THE TIME OF SALE. THIS TERM SHEET IS NOT AN OFFER TO SELL THESE SECURITIES AND IT IS NOT A SOLICITATION OF AN OFFER TO BUY THESE SECURITIES IN ANY JURISDICTION WHERE THE OFFER OR SALE IS NOT PERMITTED.
73
| TERRITORY PORTFOLIO |
The following table presents certain information relating to some comparable retail centers provided in the appraisal for the Centennial Gateway property:
Centennial Gateway Competitive Set(1)
Centennial Gateway (Subject) | Centennial Crossroads Plaza | Montecito Crossing | Wal-Mart Super Center AKA | Aliante Marketplace | |
| Location | Las Vegas, NV | Las Vegas, NV | Las Vegas, NV | Las Vegas, NV | Las Vegas, NV |
| Distance from Subject | -- | 2.4 miles | 2.6 miles | 4.3 miles | 6.2 miles |
| Property Type | Retail | Retail | Retail | Retail | Retail |
| Year Built/Renovated | 2008/NAP | 2002/NAP | 2004/NAP | 2007/NAP | 2007/NAP |
| Anchors | Sportman’s Warehouse, 24 Hour Fitness, Fresh & Easy | Target, Von’s Grocery | Home Goods, PetSmart, Office Depot, Pier 1 Imports | Wal-Mart, Bed Bath & Beyond | Smiths Grocery |
| Total GLA | 192,968 SF | 259,414 SF | 185,522 SF | 358,493 SF | 168,000 SF |
| Total Occupancy | 95% | 96% | 89% | 97% | 85% |
| (1) | Information obtained from the appraisal dated November 10, 2012. |
The Eastgate property is located in the city of Henderson, Nevada, in southeast Clark County, approximately 15 miles southeast of the Las Vegas central business district. The area has multiple national and local retailers along Sunset Street and Marks Street. Per the appraisal, the 2012 population within a three- and five-mile radius of the Eastgate property was 106,359 and 270,430, respectively. The appraiser reports that the Henderson submarket contains 5.1 million square feet with an average vacancy of 10.2% and average rental asking rates of $25.35 per square foot on a triple net basis.
The following table presents certain information relating to some comparable retail centers provided in the appraisal for the Eastgate property:
Eastgate Competitive Set(1)
Eastgate (Subject) | The District- I | Cannery Corner | Tropicana Beltway | Shadow Mountain Marketplace | |
| Location | Henderson, NV | Henderson, NV | North Las Vegas, NV | Las Vegas, NV | Las Vegas, NV |
| Distance from Subject | -- | 5.8 miles | 19.4 miles | 21.5 miles | 22.1 miles |
| Property Type | Retail | Retail | Retail | Retail | Retail |
| Year Built/Renovated | 2002/NAP | 2004/NAP | 2007/NAP | 2004/NAP | 2007/NAP |
| Anchors | Office Depot, 99 Cents Only, Party City | NAP | Lowe’s-Shadow, Sam’s Club-Shadow | PetSmart, Ross Dress For Less, Office Depot, Pier 1 Imports | Wickes, Stein Mart, Best Buy, Walgreens |
| Total GLA | 96,604 SF | 210,253 SF | 44,472 SF | 186,078 SF | 201,764 SF |
| Total Occupancy | 93% | 89% | 81% | 89% | 92% |
| (1) | Information obtained from the appraisal dated November 10, 2012. |
The Borrower. The Territory Portfolio Mortgage Loan has two borrowing entities, Inland Diversified Las Vegas Centennial Gateway, L.L.C. and Inland Diversified Henderson Eastgate, L.L.C. (collectively referred to herein as the “borrower”). Each borrowing entity is a Delaware limited liability company and a single purpose entity with two independent directors. Legal counsel to the borrower delivered a non-consolidation opinion in connection with the origination of the Territory Portfolio Mortgage Loan. Inland Diversified Real Estate Trust, Inc., an indirect owner of each borrowing entity, is the guarantor of certain nonrecourse carveouts under the Territory Portfolio Mortgage Loan.
The Sponsor. Inland Diversified Real Estate Trust, Inc. (“Inland”) is a public, non-listed REIT formed in 2008 and headquartered in Oakbrook, Illinois. Inland focuses on acquiring and developing commercial real estate located in the United States and Canada, as well as the potential acquisition of other REITs or real estate operating companies. As of June 30, 2012, Inland owned 79 retail properties and three office properties collectively totaling 7.2 million square feet and two multifamily properties totaling 420 units.
Escrows. The loan documents provide for no upfront reserves. Monthly tax or insurance escrows are not required so long as no Cash Management Period (as defined below) has occurred or is continuing under the Territory Portfolio Mortgage Loan. No Replacement Reserve is required. The borrower is required to complete deferred maintenance, which is specified in the loan documents, during the six-month period following the origination date, with a possible extension of an additional six-month period so long as the borrower is pursuing the completion of the required work.
THE INFORMATION IN THIS STRUCTURAL AND COLLATERAL TERM SHEET IS NOT COMPLETE AND MAY BE AMENDED PRIOR TO THE TIME OF SALE. THIS TERM SHEET IS NOT AN OFFER TO SELL THESE SECURITIES AND IT IS NOT A SOLICITATION OF AN OFFER TO BUY THESE SECURITIES IN ANY JURISDICTION WHERE THE OFFER OR SALE IS NOT PERMITTED.
74
| TERRITORY PORTFOLIO |
Lockbox and Cash Management. The Territory Portfolio Mortgage Loan requires a lender-controlled lockbox account for the Centennial Gateway property and the Eastgate property, which is already in place, into which the borrower directs tenants to pay their rents directly. The loan documents also require that all rents received by the borrower be deposited into the lockbox account within three business days after receipt thereof. Prior to the occurrence of a Cash Management Period, all funds on deposit in the lockbox account are swept into an account designated by the borrower on a daily basis, however the borrower has no right to make withdrawals from the lockbox account except as specified in the loan documents. Upon the occurrence of a Cash Management Period, all funds on deposit in the lockbox account are swept (on a daily basis) to a cash management account under the control of the lender.
A “Cash Management Period” will commence upon (i) the occurrence and continuance of an event of default or (ii) the commencement of a Lease Sweep Period (as defined below). A Cash Management Period will end either with respect to the matters described in clause (i) above, when such event of default has been cured or, with respect to matters described in clause (ii) above, when such Lease Sweep Period has ended.
A “Lease Sweep Period” will commence on the first payment date following the occurrence of the following: (i) the date that is six months prior to the end of the term of any Major Lease (as defined below); (ii) if any Major Lease is surrendered, cancelled or terminated prior to its then current expiration date; (iii) if any tenant under a Major Lease discontinues its business at the premises or gives notice that it intends to discontinue its business; or (iv) upon the occurrence of an insolvency proceeding by any tenant under a Major Lease.
A Lease Sweep Period will end upon the earliest to occur of (x) $10.00 per square foot has been accumulated in reserve to pay for all anticipated expenses in connection with the re-leasing of the space under the applicable Major Lease that gave rise to the Lease Sweep Period; or (y) the occurrence of any of the following: (1) with respect to a Lease Sweep Period caused by a matter described in clauses (i), (ii) or (iii) above, upon the earlier of (a) the date on which the tenant under the applicable Major Lease exercises its renewal or extension option and all funds listed in clause (x) above have accumulated in reserve and (b) the date on which such space has been fully leased pursuant to a replacement lease and all associated expenses have been paid in full; (2) with respect to a Lease Sweep Period caused by a matter described in clause (iv) above, if the applicable insolvency proceeding regarding the tenant under the applicable Major Lease has terminated and the applicable Major Lease has been affirmed, assumed or assigned in accordance with the applicable bankruptcy code.
A “Major Lease” is defined as each of the Sportsman’s Warehouse and the 24 Hour Fitness USA, Inc. leases.
Property Management. The Territory Portfolio Properties are managed by an affiliate of the borrower.
Assumption. The borrower has the right to transfer both, but not less than both, of the Territory Portfolio Properties subject to certain conditions set forth in the loan documents, including but not limited to: (i) no event of default has occurred and is continuing; (ii) the proposed transferee, property manager and management agreement are satisfactory to the lender and except for certain permitted affiliate transferees, Fitch, KBRA and S&P; and (iii) unless the proposed transferee is a permitted affiliate transferee, the lender receives written confirmation from Fitch, KBRA and S&P that the assumption will not, in and of itself, result in a downgrade, qualification or withdrawal of the then current ratings assigned to any class of Series 2013-C12 Certificates.
Partial Release. On any payment date on or after March 20, 2015, the borrower may obtain the release of an individual property from the lien of the mortgage (and the related loan documents) in connection with a partial release upon the satisfaction of certain conditions including but not limited to: (i) the property to be released must be the subject of a sale to a bona fide third party purchaser; (ii) the borrower will provide the lender written notice at least 20 days prior to the proposed release date; (iii) no event of default has occurred or is continuing at the time that the release occurs; (iv) after such release, the debt service coverage ratio of the remaining property immediately following release must be no less than the greater of (a) DSCR immediately preceding the release and (b) 1.80x; (v) all REMIC requirements are satisfied; and (vi) payment of the greater of (a) 100% of the net sales proceeds of the individual property to be released and (b) 115% of the then current allocated loan amount for the individual property to be released, together with all accrued and unpaid interest.
Real Estate Substitution. Not permitted.
Subordinate and Mezzanine Indebtedness. Not permitted.
Ground Lease. None.
Terrorism Insurance. The loan documents require that the “all risk” insurance policy maintained by the borrower provide coverage for terrorism in an amount equal to the full replacement cost of the Territory Portfolio Properties (provided that such coverage is available) as well as business interruption insurance covering no less than the 18-month period from the date of a casualty event.
THE INFORMATION IN THIS STRUCTURAL AND COLLATERAL TERM SHEET IS NOT COMPLETE AND MAY BE AMENDED PRIOR TO THE TIME OF SALE. THIS TERM SHEET IS NOT AN OFFER TO SELL THESE SECURITIES AND IT IS NOT A SOLICITATION OF AN OFFER TO BUY THESE SECURITIES IN ANY JURISDICTION WHERE THE OFFER OR SALE IS NOT PERMITTED.
75
LAS VEGAS STRIP WALGREENS |
THE INFORMATION IN THIS STRUCTURAL AND COLLATERAL TERM SHEET IS NOT COMPLETE AND MAY BE AMENDED PRIOR TO THE TIME OF SALE. THIS TERM SHEET IS NOT AN OFFER TO SELL THESE SECURITIES AND IT IS NOT A SOLICITATION OF AN OFFER TO BUY THESE SECURITIES IN ANY JURISDICTION WHERE THE OFFER OR SALE IS NOT PERMITTED.
76
LAS VEGAS STRIP WALGREENS |
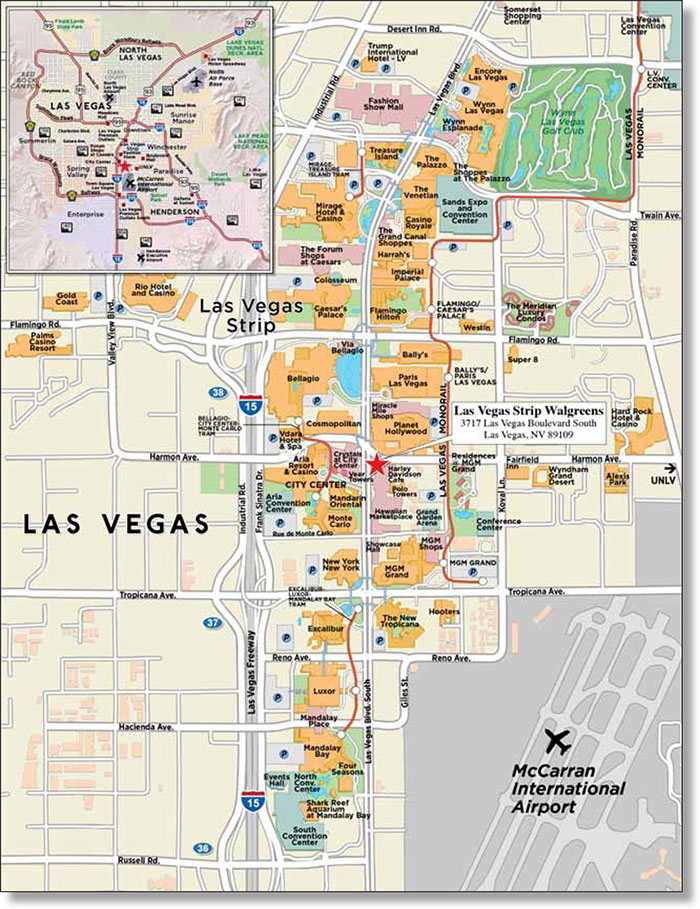
THE INFORMATION IN THIS STRUCTURAL AND COLLATERAL TERM SHEET IS NOT COMPLETE AND MAY BE AMENDED PRIOR TO THE TIME OF SALE. THIS TERM SHEET IS NOT AN OFFER TO SELL THESE SECURITIES AND IT IS NOT A SOLICITATION OF AN OFFER TO BUY THESE SECURITIES IN ANY JURISDICTION WHERE THE OFFER OR SALE IS NOT PERMITTED.
77
| No. 7 - Las Vegas Strip Walgreens | |||||||
| Loan Information | Property Information | ||||||
| Mortgage Loan Seller: | Wells Fargo Bank, National Association | Single Asset/Portfolio: | Single Asset | ||||
Credit Assessment (Fitch/KBRA/S&P): | NR/NR/NR | Property Type: | Retail | ||||
| Original Principal Balance: | $40,000,000 | Specific Property Type: | Single Tenant | ||||
| Cut-off Date Principal Balance: | $40,000,000 | Location: | Las Vegas, NV | ||||
| % of Initial Pool Balance: | 3.2% | Size: | 24,721 SF | ||||
| Loan Purpose: | Acquisition | Cut-off Date Principal Balance Per Unit/SF: | $1,618.06 | ||||
| Borrower Name: | WLGRN (NV) LLC | Year Built/Renovated: | 2012/NAP | ||||
| Sponsor: | Corporate Property Associates 17 – Global Incorporated | Title Vesting: | Fee | ||||
| Mortgage Rate: | 3.955% | Property Manager: | Tenant-managed | ||||
| Note Date: | January 24, 2013 | 3rd Most Recent Occupancy(2): | NAV | ||||
| Anticipated Repayment Date: | February 1, 2023 | 2nd Most Recent Occupancy(2): | NAV | ||||
| Maturity Date: | February 1, 2033 | Most Recent Occupancy(2): | NAV | ||||
| IO Period: | 120 months | Current Occupancy (As of): | 100.0% (3/1/2013) | ||||
| Loan Term (Original): | 120 months | ||||||
| Seasoning: | 1 month | Underwriting and Financial Information: | |||||
| Amortization Term (Original): | NAP | ||||||
| Loan Amortization Type: | Interest-only, ARD | 3rd Most Recent NOI(2): | NAV | ||||
| Interest Accrual Method: | Actual/360 | 2nd Most Recent NOI(2): | NAV | ||||
| Call Protection: | L(25),D(91),O(4) | Most Recent NOI(2): | NAV | ||||
| Lockbox Type: | Springing (Without Established Account) | ||||||
| Additional Debt: | None | ||||||
| Additional Debt Type: | NAP | U/W Revenues: | $3,493,246 | ||||
| U/W Expenses: | $104,797 | ||||||
| U/W NOI: | $3,388,449 | ||||||
| U/W NCF: | $3,383,505 | ||||||
| U/W NOI DSCR: | 2.11x | ||||||
Escrows and Reserves(1): | U/W NCF DSCR: | 2.11x | |||||
| U/W NOI Debt Yield: | 8.5% | ||||||
| Type: | Initial | Monthly | Cap (If Any) | U/W NCF Debt Yield: | 8.5% | ||
| Taxes | $0 | Springing | NAP | As-Is Appraised Value: | $66,000,000 | ||
| Insurance | $0 | Springing | NAP | As-Is Appraisal Valuation Date: | December 5, 2012 | ||
| Replacement Reserves | $0 | Springing | NAP | Cut-off Date LTV Ratio: | 60.6% | ||
| BPS Reserve | $296,339 | $0 | NAP | LTV Ratio at Maturity or ARD: | 60.6% | ||
| (1) | See “Escrows” section. |
| (2) | Historical occupancy and financial data are not available as the Las Vegas Strip Walgreens property was constructed in 2012. |
The Mortgage Loan. The mortgage loan (the “Las Vegas Strip Walgreens Mortgage Loan”) is evidenced by a single promissory note that is secured by a first mortgage encumbering a single tenant retail property located in Las Vegas, Nevada (the “Las Vegas Strip Walgreens Property”). The Las Vegas Strip Walgreens Mortgage Loan was originated on January 24, 2013 by Wells Fargo Bank, National Association. The Las Vegas Strip Walgreens Mortgage Loan had an original principal balance of $40,000,000, has an outstanding principal balance as of the Cut-off Date of $40,000,000 and accrues interest at an interest rate of 3.955% per annum. The Las Vegas Strip Walgreens Mortgage Loan had an initial term of 120 months, has a remaining term of 119 months as of the Cut-off Date and requires payments of interest-only through the Anticipated Repayment Date (“ARD”). The ARD is February 1, 2023, and the final maturity date is February 1, 2033. In the event the Las Vegas Strip Walgreens Mortgage Loan is not paid in full on or before the ARD, the borrower will be required to make payments of principal and interest based on a 30-year amortization schedule and an interest rate equal to 5.000% plus the greater of (i) 3.955% and (ii) the treasury rate. The ARD automatically triggers a Cash Trap Event Period (as defined in the “Lockbox and Cash Management” section) whereby all excess cash flow will be used to pay down the principal balance of the Las Vegas Strip Walgreens Mortgage Loan (see “Lockbox and Cash Management” section).
Following the lockout period, the borrower has the right to defease the Las Vegas Strip Walgreens Mortgage Loan in whole, but not in part, on any due date before the scheduled maturity date. In addition, the Las Vegas Strip Walgreens Mortgage Loan is prepayable without penalty on or after November 1, 2022.
THE INFORMATION IN THIS STRUCTURAL AND COLLATERAL TERM SHEET IS NOT COMPLETE AND MAY BE AMENDED PRIOR TO THE TIME OF SALE. THIS TERM SHEET IS NOT AN OFFER TO SELL THESE SECURITIES AND IT IS NOT A SOLICITATION OF AN OFFER TO BUY THESE SECURITIES IN ANY JURISDICTION WHERE THE OFFER OR SALE IS NOT PERMITTED.
78
LAS VEGAS STRIP WALGREENS |
Sources and Uses(1)
| Sources | Uses | |||||||
| Original loan amount | $40,000,000 | 100.0% | Purchase price | $38,502,797 | 96.3% | |||
| Reserves | 296,339 | 0.7 | ||||||
| Closing costs | 459,563 | 1.1 | ||||||
| Return of equity | 741,301 | 1.9 | ||||||
| Total Sources | $40,000,000 | 100.0% | Total Uses | $40,000,000 | 100.0% | |||
| (1) | The Las Vegas Strip Walgreens Mortgage Loan served to recapitalize the sponsor’s all-cash acquisition of the Las Vegas Strip Walgreens Property in October 2012. The sponsor exercised a purchase option with the developer to purchase the Las Vegas Strip Walgreens Property in an off-market transaction. |
The Property. The Las Vegas Strip Walgreens Property is a single tenant retail property located on the “Strip” in Las Vegas, Nevada, which contains approximately 24,721 square feet and is occupied by Walgreens with a lease expiring February 28, 2111. The Las Vegas Strip Walgreens Property was built in 2012 and is situated on a 0.50-acre site. The Las Vegas Strip Walgreens Property is located within the three-story Harmon Corner retail development (not part of the collateral), which contains a total of approximately 110,000 square feet of retail space as well as a 308-foot-wide electronic billboard. As of March 1, 2013, the Las Vegas Strip Walgreens Property was 100.0% occupied.
The following table presents certain information relating to the tenant at the Las Vegas Strip Walgreens Property:
Major Tenant
| Tenant Name | Credit Rating (Fitch/ Moody’s/S&P) | Tenant NRSF | % of NRSF | Annual U/W Base Rent PSF | Annual U/W Base Rent | % of Total Annual U/W Base Rent | Sales PSF(1) | Occupancy Cost(1) | Lease Expiration Date |
| Major Tenant | |||||||||
| Walgreens | NR/Baa1/BBB | 24,721(2) | 100.0% | $137.06 | $3,388,246 | 100.0% | NAV | NAV | 2/28/2111(3) |
| Total Major Tenant | 24,721 | 100.0% | $137.06 | $3,388,246 | 100.0% | ||||
| (1) | Sales PSF and Occupancy Cost are not available as the Las Vegas Strip Walgreens Property was constructed in 2012. |
| (2) | The square footage shown includes 19,900 square feet of ground floor retail space and 4,821 square feet of mezzanine storage space. Walgreens also has approximately 4,000 square feet of contiguous second-floor retail space, which is not part of the collateral. |
| (3) | Walgreens has the right to terminate its lease on February 28, 2042 and every five years thereafter, upon providing written notice one year prior to each termination option until February 2107. |
The following table presents certain information relating to the lease rollover schedule at the Las Vegas Strip Walgreens Property:
Lease Expiration Schedule(1)
Year Ending December 31, | No. of Leases Expiring | Expiring NRSF | % of Total NRSF | Cumulative Expiring NRSF | Cumulative % of Total NRSF | Annual U/W Base Rent | Annual U/W Base Rent PSF |
| MTM | 0 | 0 | 0.0% | 0 | 0.0% | $0 | $0.00 |
| 2013 | 0 | 0 | 0.0% | 0 | 0.0% | $0 | $0.00 |
| 2014 | 0 | 0 | 0.0% | 0 | 0.0% | $0 | $0.00 |
| 2015 | 0 | 0 | 0.0% | 0 | 0.0% | $0 | $0.00 |
| 2016 | 0 | 0 | 0.0% | 0 | 0.0% | $0 | $0.00 |
| 2017 | 0 | 0 | 0.0% | 0 | 0.0% | $0 | $0.00 |
| 2018 | 0 | 0 | 0.0% | 0 | 0.0% | $0 | $0.00 |
| 2019 | 0 | 0 | 0.0% | 0 | 0.0% | $0 | $0.00 |
| 2020 | 0 | 0 | 0.0% | 0 | 0.0% | $0 | $0.00 |
| 2021 | 0 | 0 | 0.0% | 0 | 0.0% | $0 | $0.00 |
| 2022 | 0 | 0 | 0.0% | 0 | 0.0% | $0 | $0.00 |
| 2023 | 0 | 0 | 0.0% | 0 | 0.0% | $0 | $0.00 |
| Thereafter | 1 | 24,721 | 100.0% | 24,721 | 100.0% | $3,388,246 | $137.06 |
| Vacant | 0 | 0 | 0.0% | 24,721 | 100.0% | $0 | $0.00 |
| Total/Weighted Average | 1 | 24,721 | 100.0% | $3,388,246 | $137.06 |
| (1) | Information obtained from the underwritten rent roll. |
The following table presents historical occupancy percentages at the Las Vegas Strip Walgreens Property:
Historical Occupancy(1)
12/31/2009 | 12/31/2010 | 12/31/2011 | 3/1/2013 | |||
| NAV | NAV | NAV | 100% |
| (1) | Historical occupancies are not available as the Las Vegas Strip Walgreens Property was constructed in 2012. |
THE INFORMATION IN THIS STRUCTURAL AND COLLATERAL TERM SHEET IS NOT COMPLETE AND MAY BE AMENDED PRIOR TO THE TIME OF SALE. THIS TERM SHEET IS NOT AN OFFER TO SELL THESE SECURITIES AND IT IS NOT A SOLICITATION OF AN OFFER TO BUY THESE SECURITIES IN ANY JURISDICTION WHERE THE OFFER OR SALE IS NOT PERMITTED.
79
LAS VEGAS STRIP WALGREENS |
Operating History and Underwritten Net Cash Flow. The following table presents certain information relating to the Underwritten Net Cash Flow at the Las Vegas Strip Walgreens Property:
Cash Flow Analysis(1)
| U/W | U/W $ per SF | |||
| Base Rent | $3,388,246 | $137.06 | ||
| Grossed Up Vacant Space | 0 | 0.00 | ||
| Total Reimbursables | 105,000 | 4.25 | ||
| Other Income | 0 | 0.00 | ||
| Less Vacancy & Credit Loss | 0(2) | 0.00 | ||
| Effective Gross Income | $3,493,246 | $141.31 | ||
| Total Operating Expenses | $104,797 | $4.24 | ||
| Net Operating Income | $3,388,449 | $137.07 | ||
| TI/LC | 0 | 0.00 | ||
| Capital Expenditures | 4,944 | 0.20 | ||
| Net Cash Flow | $3,383,505 | $136.87 | ||
| NOI DSCR | 2.11x | |||
| NCF DSCR | 2.11x | |||
| NOI DY | 8.5% | |||
| NCF DY | 8.5% |
| (1) | Historical financials are not available as the Las Vegas Strip Walgreens Property was constructed in 2012. |
| (2) | No vacancy was underwritten. The Las Vegas Strip Walgreens Property was 100.0% physically occupied as of March 1, 2013. |
Appraisal. As of the appraisal valuation date of December 5, 2012, the Las Vegas Strip Walgreens Property had an “as-is” appraised value of $66,000,000. In addition, the appraiser concluded to a hypothetical “go dark” value of $51,000,000.
Environmental Matters. According to the Phase I environmental assessment dated December 11, 2012, there was no evidence of any recognized environmental conditions at the Las Vegas Strip Walgreens Property.
Market Overview and Competition. The Las Vegas Strip Walgreens Property is located on the northeast corner of Las Vegas Boulevard South and East Harmon Avenue in Las Vegas, Nevada. The Las Vegas Strip Walgreens Property is situated in the center of the Las Vegas “Strip”, southeast of the Bellagio Hotel & Casino, directly south of the Planet Hollywood Resort & Casino, directly east of The Cosmopolitan and the CityCenter development (Aria Resort & Casino, Mandarin Oriental Las Vegas, Vdara Hotel & Spa) and northeast of the Monte Carlo Resort & Casino. The immediate surrounding area is a busy tourist-resort neighborhood with many hotel-casinos lining both sides of Las Vegas Boulevard South. According to the appraisal, the “Strip” is home to approximately 75,000 hotel rooms and approximately 2.3 million square feet of casino floor area.
According to a third party market research report, the Las Vegas Strip Walgreens Property is located within the Central East Las Vegas retail submarket, which has an estimated inventory of 846 buildings totaling approximately 8.5 million square feet. As of year-end 2012, the submarket vacancy was 6.0%, and the submarket experienced positive absorption of approximately 180,000 square feet during 2012. The appraiser concluded a market rent of approximately $140.00 per square foot, on a triple net basis, for the Las Vegas Strip Walgreens Property.
The following table presents certain information relating to comparable retail properties for the Las Vegas Strip Walgreens Property:
Competitive Set(1)
Las Vegas Strip Walgreens (Subject) | Walgreens (Palazzo) | Walgreens (2280 N Las Vegas Blvd) | Walgreens (3025 S Las Vegas Blvd) | Walgreens (3765 S Las Vegas Blvd) | |
| Location | Las Vegas, NV | Las Vegas, NV | Las Vegas, NV | Las Vegas, NV | Las Vegas, NV |
| Distance from Subject | -- | 1.1 miles | 2.8 miles | 1.8 miles | 0.2 miles |
| Property Type | Retail | Retail | Retail | Retail | Retail |
| Year Built/Renovated | 2012/NAP | NAV/NAV | 1996/NAV | 2002/NAV | 1999/NAV |
| Total GLA | 24,721 SF | 23,485 SF | 13,424 SF | 16,016 SF | 19,038 SF |
| Total Occupancy | 100% | 100% | 100% | 100% | 100% |
(1) Information obtained from the appraisal dated December 14, 2012 and third party market research reports.
The Borrower. The borrower is WLGRN (NV) LLC, a single purpose entity with an independent director. Legal counsel to the borrower delivered a non-consolidation opinion in connection with the origination of the Las Vegas Strip Walgreens Mortgage Loan. Corporate Property Associates 17 – Global Incorporated, the indirect owner of the borrower, is the guarantor of certain nonrecourse carveouts under the Las Vegas Strip Walgreens Mortgage Loan.
THE INFORMATION IN THIS STRUCTURAL AND COLLATERAL TERM SHEET IS NOT COMPLETE AND MAY BE AMENDED PRIOR TO THE TIME OF SALE. THIS TERM SHEET IS NOT AN OFFER TO SELL THESE SECURITIES AND IT IS NOT A SOLICITATION OF AN OFFER TO BUY THESE SECURITIES IN ANY JURISDICTION WHERE THE OFFER OR SALE IS NOT PERMITTED.
80
LAS VEGAS STRIP WALGREENS |
The Sponsor. The loan sponsor is Corporate Property Associates 17 – Global Incorporated, a subsidiary of W.P. Carey Inc. (“W.P. Carey”). Founded in 1973, W.P. Carey is a publically traded REIT (NYSE: WPC) that provides long-term sale-leaseback and build-to-suit financing for companies worldwide. The company is the largest owner/manager of net lease assets with a portfolio valued at approximately $14.1 billion, which includes 430 properties totaling 39.1 million square feet with an average occupancy of 98.4%.
Escrows. The loan documents provide for an upfront reserve of $296,339, which represents the outstanding common area maintenance, tenant improvement and leasing commission reimbursement funds due and payable by Walgreens to BPS Partners, LLC, the owner of Harmon Corner (the larger development in which the Las Vegas Strip Walgreens Property is situated). Ongoing monthly reserves for taxes and insurance are not required as long as (i) no event of default exists and is ongoing; (ii) the Walgreens lease is in full force and effect; and (iii) all payments are made in a timely manner. Ongoing monthly replacement reserves are not required as long as Walgreens does not fail to perform necessary capital improvements, as outlined in its lease.
Lockbox and Cash Management. Upon the occurrence of a Cash Trap Event Period (as defined below), the borrower is required to establish a lender-controlled lockbox account and direct the tenant to pay its rent directly to such lockbox account. During a Cash Trap Event Period, all funds on deposit in the lockbox account are swept to a lender-controlled cash management account each business day.
A “Cash Trap Event Period” will commence upon the earlier of (i) the occurrence and continuance of an event of default or (ii) the ARD. A Cash Trap Event Period will expire, with regard to the circumstances in clause (i) only, upon the cure of such event of default. A Cash Trap Event Period triggered by the occurrence of the ARD will not expire.
Property Management. The Las Vegas Strip Walgreens Property is managed by the tenant.
Assumption. The borrower has a two-time right to transfer the Las Vegas Strip Walgreens Property, provided that no event of default has occurred and is continuing and certain other conditions are satisfied, including: (i) the lender’s reasonable determination that the proposed transferee and guarantor satisfy the lender’s credit review and underwriting standards, taking into consideration transferee experience, financial strength and general business standing; (ii) execution of a recourse guaranty and an environmental indemnity by an affiliate of the transferee; and (iii) if requested by the lender, rating agency confirmation from Fitch, KBRA and S&P that the transfer will not result in a downgrade, withdrawal or qualification of the respective ratings assigned to the Series 2013-C12 Certificates.
Right of First Refusal. Walgreens has a right of first refusal (“ROFR”) to purchase the Las Vegas Strip Walgreens Property at any time on or after February 3, 2014. The ROFR is not extinguished by a foreclosure of the Las Vegas Strip Walgreens Property; however, the ROFR does not apply to a foreclosure or deed-in-lieu thereof.
Partial Release. Not permitted.
Real Estate Substitution. Not permitted.
Subordinate and Mezzanine Indebtedness. Not permitted.
Ground Lease. None.
Terrorism Insurance. The loan documents require that the borrower maintain insurance against loss for acts of terrorism in an amount equal to the full replacement cost of the Las Vegas Strip Walgreens Property. The loan documents also require business interruption insurance covering no less than the 18-month period following the occurrence of a casualty event, together with a six-month extended period of indemnity. However, the borrower’s obligation to provide the foregoing coverages shall be suspended to the extent that such coverages are maintained by either (i) the Harmon Corner (the larger development in which the Las Vegas Strip Walgreens Property is located) owner under the declaration of development for Harmon Corner or (ii) Walgreens through third party insurance or self-insurance in accordance with the terms of its lease, provided that (x) no event of default has occurred and is continuing and (y) Walgreens maintains a rating of ‘BBB’ or better from S&P.
THE INFORMATION IN THIS STRUCTURAL AND COLLATERAL TERM SHEET IS NOT COMPLETE AND MAY BE AMENDED PRIOR TO THE TIME OF SALE. THIS TERM SHEET IS NOT AN OFFER TO SELL THESE SECURITIES AND IT IS NOT A SOLICITATION OF AN OFFER TO BUY THESE SECURITIES IN ANY JURISDICTION WHERE THE OFFER OR SALE IS NOT PERMITTED.
81
| KRAFT – THREE LAKES DRIVE |
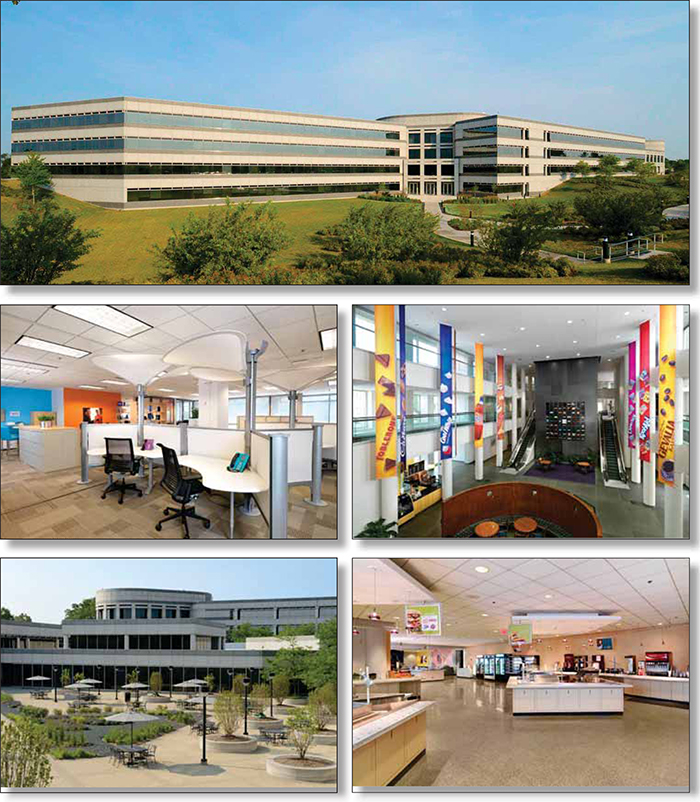
THE INFORMATION IN THIS STRUCTURAL AND COLLATERAL TERM SHEET IS NOT COMPLETE AND MAY BE AMENDED PRIOR TO THE TIME OF SALE. THIS TERM SHEET IS NOT AN OFFER TO SELL THESE SECURITIES AND IT IS NOT A SOLICITATION OF AN OFFER TO BUY THESE SECURITIES IN ANY JURISDICTION WHERE THE OFFER OR SALE IS NOT PERMITTED.
82
| KRAFT – THREE LAKES DRIVE |
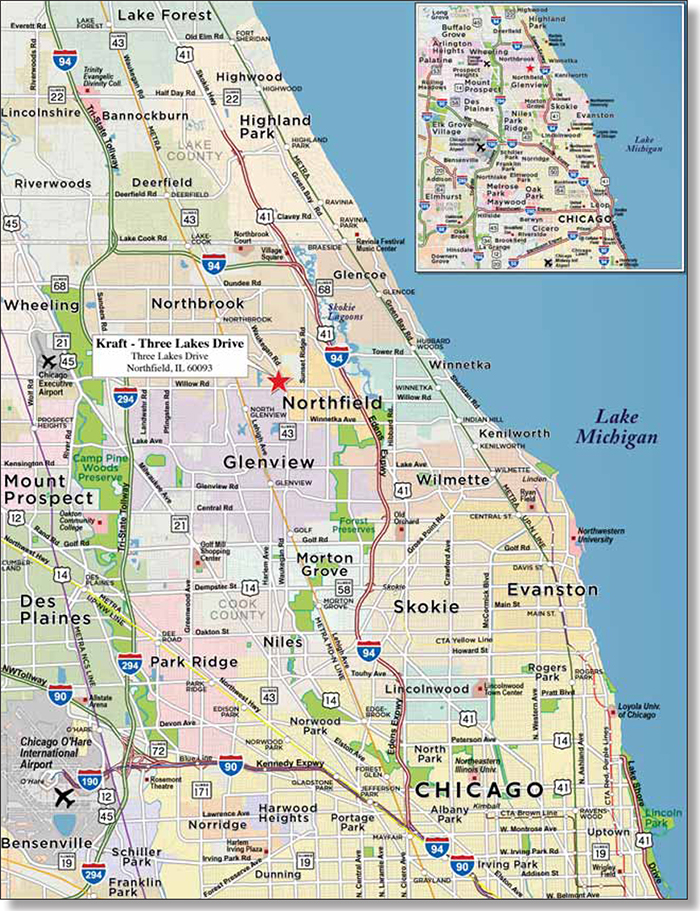
THE INFORMATION IN THIS STRUCTURAL AND COLLATERAL TERM SHEET IS NOT COMPLETE AND MAY BE AMENDED PRIOR TO THE TIME OF SALE. THIS TERM SHEET IS NOT AN OFFER TO SELL THESE SECURITIES AND IT IS NOT A SOLICITATION OF AN OFFER TO BUY THESE SECURITIES IN ANY JURISDICTION WHERE THE OFFER OR SALE IS NOT PERMITTED.
83
| No. 8 - Kraft – Three Lakes Drive | |||||||
| Loan Information | Property Information | ||||||
| Mortgage Loan Seller: | Wells Fargo Bank, National Association | Single Asset/Portfolio: | Single Asset | ||||
Credit Assessment (Fitch/KBRA/S&P): | NR/NR/NR | Property Type: | Office | ||||
| Original Principal Balance: | $36,500,000 | Specific Property Type: | Suburban | ||||
| Cut-off Date Principal Balance: | $36,500,000 | Location: | Northfield, IL | ||||
| % of Initial Pool Balance: | 3.0% | Size: | 679,109 SF | ||||
| Loan Purpose: | Acquisition | Cut-off Date Principal Balance Per Unit/SF: | $53.75 | ||||
| Borrower Name: | KF WPC Owner (IL) LLC | Year Built/Renovated: | 1991/2011 | ||||
| Sponsor: | W.P. Carey Inc. | Title Vesting: | Fee | ||||
| Mortgage Rate: | 4.050% | Property Manager: | Tenant-managed | ||||
| Note Date: | January 11, 2013 | 3rd Most Recent Occupancy (As of)(2): | 100.0% (12/31/2009) | ||||
| Anticipated Repayment Date: | NAP | 2nd Most Recent Occupancy (As of)(2): | 100.0% (12/31/2010) | ||||
| Maturity Date: | February 1, 2023 | Most Recent Occupancy (As of)(2): | 100.0% (12/31/2011) | ||||
| IO Period: | 120 months | Current Occupancy (As of): | 100.0% (3/1/2013) | ||||
| Loan Term (Original): | 120 months | ||||||
| Seasoning: | 1 month | Underwriting and Financial Information: | |||||
| Amortization Term (Original): | NAP | ||||||
| Loan Amortization Type: | Interest-only, Balloon | 3rd Most Recent NOI(2): | NAV | ||||
| Interest Accrual Method: | Actual/360 | 2nd Most Recent NOI(2): | NAV | ||||
| Call Protection: | L(25),D(91),O(4) | Most Recent NOI(2): | NAV | ||||
| Lockbox Type: | Hard/Upfront Cash Management | ||||||
| Additional Debt: | None | ||||||
| Additional Debt Type: | NAP | U/W Revenues: | $12,418,038 | ||||
| U/W Expenses: | $7,598,261 | ||||||
| U/W NOI: | $4,819,777 | ||||||
| U/W NCF: | $4,037,992 | ||||||
| U/W NOI DSCR: | 3.22x | ||||||
| U/W NCF DSCR: | 2.69x | ||||||
Escrows and Reserves(1): | U/W NOI Debt Yield: | 13.2% | |||||
| U/W NCF Debt Yield: | 11.1% | ||||||
| Type: | Initial | Monthly | Cap (If Any) | As-Is Appraised Value: | $74,000,000 | ||
| Taxes | $0 | Springing | NAP | As-Is Appraised Valuation Date: | October 3, 2012 | ||
| Insurance | $0 | Springing | NAP | Cut-off Date LTV Ratio: | 49.3% | ||
| Replacement Reserves | $0 | Springing | NAP | LTV Ratio at Maturity or ARD: | 49.3% | ||
| (1) | See “Escrows” section. |
| (2) | The Kraft – Three Lakes Drive property was previously owner occupied by Kraft Foods Group, Inc. and a lease was not in place. The borrower acquired the Kraft – Three Lakes Drive property in January 2013 through a sale-leaseback transaction. |
The Mortgage Loan. The mortgage loan (the “Kraft – Three Lakes Drive Mortgage Loan”) is evidenced by a single promissory note that is secured by a first mortgage encumbering a single tenant office building located in Northfield, Illinois (the “Kraft – Three Lakes Drive Property”). The Kraft – Three Lakes Drive Mortgage Loan was originated on January 11, 2013 by Wells Fargo Bank, National Association. The Kraft – Three Lakes Drive Mortgage Loan had an original principal balance of $36,500,000, has an outstanding principal balance as of the Cut-off Date of $36,500,000 and accrues interest at an interest rate of 4.050% per annum. The Kraft – Three Lakes Drive Mortgage Loan had an initial term of 120 months, has a remaining term of 119 months as of the Cut-off Date and requires payments of interest-only through the term of the Kraft – Three Lakes Drive Mortgage Loan. The Kraft – Three Lakes Drive Mortgage Loan matures on February 1, 2023.
Following the lockout period, the borrower has the right to defease the Kraft – Three Lakes Drive Mortgage Loan in whole, but not in part, on any due date before the scheduled maturity date. In addition, the Kraft – Three Lakes Drive Mortgage Loan is prepayable without penalty on or after November 1, 2022.
THE INFORMATION IN THIS STRUCTURAL AND COLLATERAL TERM SHEET IS NOT COMPLETE AND MAY BE AMENDED PRIOR TO THE TIME OF SALE. THIS TERM SHEET IS NOT AN OFFER TO SELL THESE SECURITIES AND IT IS NOT A SOLICITATION OF AN OFFER TO BUY THESE SECURITIES IN ANY JURISDICTION WHERE THE OFFER OR SALE IS NOT PERMITTED.
84
| KRAFT – THREE LAKES DRIVE |
Sources and Uses
| Sources | Uses | |||||||
| Original loan amount | $36,500,000 | 50.4% | Purchase price | $72,250,000 | 99.8% | |||
| Sponsor’s new cash contribution | 35,916,902 | 49.6 | Closing costs | 166,902 | 0.2 | |||
| Total Sources | $72,416,902 | 100.0% | Total Uses | $72,416,902 | 100.0% | |||
The Property. The Kraft – Three Lakes Drive Property is a four-story class A single-tenant office building containing approximately 679,109 square feet located in Northfield, Illinois. The Kraft – Three Lakes Drive Property serves as the global headquarters for Kraft Foods Group, Inc. (“Kraft”) and consists of seven wings constructed from marble and granite, with five of the wings constructed in 1990 and the remaining two wings completed in 2003. On-site amenities include a cafeteria, basketball courts, fitness center, employee store and a credit union. The Kraft – Three Lakes Drive Property is situated on 69.9 acres and has a total of 2,337 parking spaces, accounting for a parking ratio of 3.4 spaces per 1,000 square feet of rentable area. As of March 1, 2013, the Kraft – Three Lakes Drive Property was 100.0% occupied by Kraft.
The following table presents certain information relating to the tenant at the Kraft – Three Lakes Drive Property:
Major Tenant
| Tenant Name | Credit Rating (Fitch/Moody’s/ S&P) | Tenant NRSF | % of NRSF | Annual U/W Base Rent PSF | Annual U/W Base Rent | % of Total Annual U/W Base Rent | Lease Expiration Date |
| Major Tenant | |||||||
| Kraft Foods Group, Inc. | NR/Baa2/BBB | 679,109 | 100.0% | $7.36 | $5,000,000 | 100.0% | 10/31/2022(1) |
| Total Major Tenant | 679,109 | 100.0% | $7.36 | $5,000,000 | 100.0% | ||
| (1) | Kraft is responsible for all costs and expenses related to the operation, maintenance, repair and insurance of the Kraft – Three Lakes Drive Property. The lease includes four, five-year renewal options with annual rent as follows: option one: $6,000,000; option two: $6,600,000, and options three and four at fair market rent at the time of renewal. |
The following table presents certain information relating to the lease rollover schedule at the Kraft – Three Lakes Drive Property:
Lease Expiration Schedule(1)
Year Ending December 31, | No. of Leases Expiring | Expiring NRSF | % of Total NRSF | Cumulative Expiring NRSF | Cumulative % of Total NRSF | Annual U/W Base Rent | Annual U/W Base Rent PSF |
| MTM | 0 | 0 | 0.0% | 0 | 0.0% | $0 | $0.00 |
| 2013 | 0 | 0 | 0.0% | 0 | 0.0% | $0 | $0.00 |
| 2014 | 0 | 0 | 0.0% | 0 | 0.0% | $0 | $0.00 |
| 2015 | 0 | 0 | 0.0% | 0 | 0.0% | $0 | $0.00 |
| 2016 | 0 | 0 | 0.0% | 0 | 0.0% | $0 | $0.00 |
| 2017 | 0 | 0 | 0.0% | 0 | 0.0% | $0 | $0.00 |
| 2018 | 0 | 0 | 0.0% | 0 | 0.0% | $0 | $0.00 |
| 2019 | 0 | 0 | 0.0% | 0 | 0.0% | $0 | $0.00 |
| 2020 | 0 | 0 | 0.0% | 0 | 0.0% | $0 | $0.00 |
| 2021 | 0 | 0 | 0.0% | 0 | 0.0% | $0 | $0.00 |
| 2022 | 1 | 679,109 | 100.0% | 679,109 | 100.0% | $5,000,000 | $7.36 |
| 2023 | 0 | 0 | 0.0% | 679,109 | 100.0% | $0 | $0.00 |
| Thereafter | 0 | 0 | 0.0% | 679,109 | 100.0% | $0 | $0.00 |
| Vacant | 0 | 0 | 0.0% | 679,109 | 100.0% | $0 | $0.00 |
| Total/Weighted Average | 1 | 679,109 | 100.0% | $5,000,000 | $7.36 |
| (1) | Information obtained from the underwritten rent roll. |
The following table presents historical occupancy percentages at the Kraft – Three Lakes Drive Property:
Historical Occupancy(1)
12/31/2009 | 12/31/2010 | 12/31/2011 | 3/1/2013 | |||
| 100% | 100% | 100% | 100% | |||
(1) The Kraft – Three Lakes Drive Property was owner occupied by Kraft and has served as its corporate headquarters since 1990. | ||||||
THE INFORMATION IN THIS STRUCTURAL AND COLLATERAL TERM SHEET IS NOT COMPLETE AND MAY BE AMENDED PRIOR TO THE TIME OF SALE. THIS TERM SHEET IS NOT AN OFFER TO SELL THESE SECURITIES AND IT IS NOT A SOLICITATION OF AN OFFER TO BUY THESE SECURITIES IN ANY JURISDICTION WHERE THE OFFER OR SALE IS NOT PERMITTED.
85
| KRAFT – THREE LAKES DRIVE |
Operating History and Underwritten Net Cash Flow. The following table presents certain information relating to the Underwritten Net Cash Flow at the Kraft – Three Lakes Drive Property:
Cash Flow Analysis(1)
| U/W | U/W $ per SF | |||
| Base Rent | $5,000,000 | $7.36 | ||
| Grossed Up Vacant Space | 0 | 0.00 | ||
| Total Reimbursables | 7,768,038 | 11.44 | ||
| Other Income | 0 | 0.00 | ||
| Less Vacancy & Credit Loss | (350,000)(2) | (0.52) | ||
| Effective Gross Income | $12,418,038 | $18.29 | ||
| Total Operating Expenses | $7,598,261 | $11.19 | ||
| Net Operating Income | $4,819,777 | $7.10 | ||
| TI/LC | 614,008 | 0.90 | ||
| Capital Expenditures | 169,777 | 0.25 | ||
| Net Cash Flow | $4,035,992 | $5.94 | ||
| NOI DSCR | 3.22x | |||
| NCF DSCR | 2.69x | |||
| NOI DY | 13.2% | |||
| NCF DY | 11.1% | |||
| (1) Historical financials are not available as the Kraft – Three Lakes Drive Property was previously owner occupied by Kraft and a lease was not in-place. | ||||
| (2) The underwritten economic vacancy is 7.0%. The Kraft – Three Lakes Drive Property was 100.0% physically occupied as of March 1, 2013. | ||||
Appraisal. As of the appraisal valuation date of October 3, 2012, the Kraft – Three Lakes Drive Property had an “as-is” appraised value of $74,000,000. In addition, the appraiser also concluded to a hypothetical “go dark” value of $43,700,000.
Environmental Matters. According to the Phase I environmental assessment dated July 1, 2012, there was no evidence of any recognized environmental conditions at the Kraft – Three Lakes Drive Property.
Market Overview and Competition. The Kraft – Three Lakes Drive Property is located in Northfield, Illinois, approximately 20 miles north of the Chicago central business district and approximately 15 miles northeast of Chicago O’Hare International Airport. The Kraft – Three Lakes Drive Property is situated at the intersection of Willow Road and Waukegan Road and is located less than two miles west of I-94, a major north-south interstate that connects the neighborhood with the Chicago central business district. The surrounding neighborhood consists of primarily single-story and low-rise commercial office buildings and retail shopping centers. The Kraft – Three Lakes Drive Property is located 4.6 miles away from Northbrook Court, a 1.0 million square foot super regional mall anchored by Macy’s, Lord and Taylor and Neiman Marcus. The population within a three-mile and five-mile radius of the Kraft – Three Lakes Drive Property is 71,340 and 233,273, respectively, and the median household income within the same three-mile and five-mile radii is $105,618 and $85,894, respectively.
According to appraisal, the Kraft – Three Lakes Drive Property is located within the North Suburban office market, which comprises approximately 2.5% of the overall Chicago suburban market encompassing 23.8 million square feet in 294 office buildings across approximately 383 square miles. The North Suburban office submarket has the highest concentration of corporate headquarters of the suburban Chicago office submarkets, as many owners and managers of North Suburban companies often live in the immediate surrounding area due to strong upscale residential housing. The appraisal identified a competitive set of 45 office properties totaling approximately 9.5 million square feet and within the competitive set, vacancy is 9.0% and average triple net asking rents are $14.35 per square foot.
The following table presents certain information relating to comparable office properties for the Kraft – Three Lakes Drive Property:
Competitive Set(1)
Kraft – Three Lakes Drive (Subject) | CVS Tower II | Three Parkway North Center | Bannockburn Centre At College Park | 75 Fairway Drive | Park Center at Kemper Lakes | |
| Location | Northfield, IL | Northbrook, IL | Deerfield, IL | Bannockburn, IL | Vernon Hills, IL | Lake Zurich, IL |
| Distance from Subject | -- | 5.1 miles | 7.2 miles | 9.8 miles | 16.0 miles | 17.2 miles |
| Property Type | Office | Office | Office | Office | Office | Office |
| Year Built/Renovated | 1991/2011 | 1980/NAP | 1989/NAP | 1999/NAP | 1996 /NAP | 1983/NAP |
| Number of Stories | 4 | 10 | NAV | 3 | 4 | 3 |
| Total GLA | 679,109 SF | 195,116 SF | 255,407 SF | 257,191 SF | 186,686 SF | 189,092 SF |
| Total Occupancy | 100% | 100% | 71% | 71% | 74% | 100% |
| (1) Information obtained from the appraisal dated January 2, 2013. | ||||||
THE INFORMATION IN THIS STRUCTURAL AND COLLATERAL TERM SHEET IS NOT COMPLETE AND MAY BE AMENDED PRIOR TO THE TIME OF SALE. THIS TERM SHEET IS NOT AN OFFER TO SELL THESE SECURITIES AND IT IS NOT A SOLICITATION OF AN OFFER TO BUY THESE SECURITIES IN ANY JURISDICTION WHERE THE OFFER OR SALE IS NOT PERMITTED.
86
| KRAFT – THREE LAKES DRIVE |
The Borrower. The borrower is KF WPC Owner (IL) LLC, a single purpose entity with two independent directors. Legal counsel to the borrower delivered a non-consolidation opinion in connection with the origination of the Kraft – Three Lakes Drive Mortgage Loan. W.P. Carey Inc. (“W.P. Carey”), the indirect owner of the borrower, is the guarantor of certain nonrecourse carveouts under the Kraft – Three Lakes Drive Mortgage Loan.
The Sponsor. The sponsor, W.P. Carey Inc., is a publically traded REIT (NYSE: WPC) that acquires and operates a diversified portfolio of mostly single tenant corporate and industrial commercial real estate properties throughout the United States. On September 28, 2012 W.P. Carey closed on its conversion to a REIT and merger with its publicly held non-traded affiliate, Corporate Property Associates 15 Incorporated and began trading on the New York Stock Exchange on October 1, 2012. As of January 31, 2012, W.P. Carey’s market capitalization was approximately $3.7 billion.
Escrows. The loan documents do not require monthly escrows for real estate taxes provided the following conditions are met: (i) Kraft pays taxes directly to the appropriate authorities prior to interest or penalties being incurred; (ii) the lease is in full force and effect; and (iii) no monetary or material non-monetary event of default has occurred. The loan documents do not require monthly escrows for insurance provided the following conditions are met: (i) Kraft maintains an insurance policy acceptable to the lender; (ii) the lease is in full force and effect; (iii) no monetary or material non-monetary event of default has occurred and is continuing; (iv) Kraft pays all applicable premiums prior to delinquency; and (v) the borrower provides evidence of renewal policies and if requested by the lender, paid receipts of insurance premiums prior to delinquency. The loan documents do not require monthly escrows for replacement reserves provided the following conditions are met: (i) no monetary or material non-monetary event of default has occurred and is continuing and (ii) Kraft is responsible for any replacements or repairs at the Kraft – Three Lakes Drive Property.
Lockbox and Cash Management. The Kraft – Three Lakes Drive Mortgage Loan requires a lender-controlled lockbox account, which is already in place, and requires that the borrower direct the tenant to pay its rent directly to such lockbox account. The loan documents also require that all cash revenues and all other monies received by the borrower or the manager relating to the Kraft – Three Lakes Drive Property be deposited into the lockbox account within three business days after receipt. Prior to the occurrence of a Cash Trap Event Period (as defined below), all funds on deposit in the lockbox account are swept into the borrower’s operating account on a daily basis. During a Cash Trap Event Period, all funds on deposit in the lockbox account are swept to a lender-controlled cash management account each business day.
A “Cash Trap Event Period” will commence upon the earlier of: (i) the occurrence and continuance of a monetary or material non-monetary event of default; (ii) Kraft being in monetary default under its lease beyond applicable notice and cure periods for 30 days or more; (iii) at any time after January 31, 2021 if Kraft no longer has a senior unsecured debt rating of “BBB” or better by S&P or “Baa2” by Moody’s; (iv) Kraft giving notice that it is terminating its lease for all or any portion of its space; (v) Kraft files for bankruptcy; or (vi) Kraft fails to extend or renew its lease on or prior to April 30, 2022.
A Cash Trap Event Period will expire, with regard to the circumstances in the respective clauses above: (i) upon the cure of such event of default; (ii) Kraft has cured all applicable defaults under its lease; (iii) Kraft has a senior unsecured debt rating of “BBB” or better by S&P and “Baa2” or better by Moody’s; (iv) Kraft has revoked or rescinded all termination or cancellation notices and has re-affirmed its lease as being in full force and effect; (v) Kraft assumes its lease and is paying full, unabated rent; and (vi) Kraft has renewed or extended its lease for a term of no less than five years and annual rent of not less than $7.36 per square foot triple net.
Property Management. The Kraft – Three Lakes Drive Property is managed by the tenant.
Assumption. The borrower has a two-time right to transfer the Kraft – Three Lakes Drive Property, provided that no event of default has occurred and is continuing and certain other conditions are satisfied, including (i) the lender’s reasonable determination that the proposed transferee and guarantor satisfy the lender’s credit review and underwriting standards, taking into consideration transferee experience, financial strength and general business standing; (ii) execution of a recourse guaranty and an environmental indemnity by an affiliate of the transferee; and (iii) if requested by the lender, receipt of rating agency confirmation from Fitch, KBRA and S&P that the transfer will not result in a downgrade, withdrawal or qualification of the respective ratings assigned to the Series 2013-C12 Certificates.
Right of First Refusal or Right of First Offer. Kraft has a right of first offer (“ROFO”) to purchase the Kraft – Three Lakes Drive Property. The ROFO is not extinguished by a foreclosure of the Kraft – Three Lakes Drive Property; however, the ROFO does not apply to a foreclosure or deed-in-lieu thereof.
Purchase Option. At any time during the loan term, if Kraft elects to construct and operate a day care facility for its employees on a four-acre, undeveloped parcel of the Kraft – Three Lakes Drive Property (the “Day Care Parcel”), Kraft has the option to either (i) purchase the Day Care Parcel “as-is” for $1.00 or (ii) sublease the Day Care Parcel for a term not to exceed Kraft’s lease term plus extension options for the right to develop the Day Care Parcel by a third party developer.
Partial Release. If Kraft exercises its right to purchase the Day Care Parcel, the borrower may obtain a release of the Day Care Parcel provided the following conditions are satisfied: (i) no event of default has occurred and is continuing; (ii) the Day Care Parcel will be transferred to Kraft or a person or entity other than the Kraft – Three Lakes Drive borrower; and (iii) the delivery of a legal opinion to the lender to demonstrate the release of the Day Care Parcel will satisfy REMIC requirements.
Real Estate Substitution. Not permitted.
Subordinate and Mezzanine Indebtedness. Not permitted.
THE INFORMATION IN THIS STRUCTURAL AND COLLATERAL TERM SHEET IS NOT COMPLETE AND MAY BE AMENDED PRIOR TO THE TIME OF SALE. THIS TERM SHEET IS NOT AN OFFER TO SELL THESE SECURITIES AND IT IS NOT A SOLICITATION OF AN OFFER TO BUY THESE SECURITIES IN ANY JURISDICTION WHERE THE OFFER OR SALE IS NOT PERMITTED.
87
| KRAFT – THREE LAKES DRIVE |
Ground Lease. None.
Terrorism Insurance. The loan documents require that the borrower maintain insurance against loss for acts of terrorism in an amount equal to the full replacement cost of the Kraft – Three Lakes Drive Property; provided, however, the borrower’s obligation to provide the foregoing insurance is suspended so long as tenant is providing the insurance required under the lease (property, rent loss and liability), tenant is not in default under the lease and tenant maintains a claims-paying ability rating from S&P of BBB- or better. The loan documents also require business interruption insurance covering no less than the 18-month period following the occurrence of a casualty event, together with an 18-month extended period of indemnity.
THE INFORMATION IN THIS STRUCTURAL AND COLLATERAL TERM SHEET IS NOT COMPLETE AND MAY BE AMENDED PRIOR TO THE TIME OF SALE. THIS TERM SHEET IS NOT AN OFFER TO SELL THESE SECURITIES AND IT IS NOT A SOLICITATION OF AN OFFER TO BUY THESE SECURITIES IN ANY JURISDICTION WHERE THE OFFER OR SALE IS NOT PERMITTED.
88
(THIS PAGE INTENTIONALLY LEFT BLANK)
89
(THIS PAGE INTENTIONALLY LEFT BLANK)
90
| VICTORIA MALL |

THE INFORMATION IN THIS STRUCTURAL AND COLLATERAL TERM SHEET IS NOT COMPLETE AND MAY BE AMENDED PRIOR TO THE TIME OF SALE. THIS TERM SHEET IS NOT AN OFFER TO SELL THESE SECURITIES AND IT IS NOT A SOLICITATION OF AN OFFER TO BUY THESE SECURITIES IN ANY JURISDICTION WHERE THE OFFER OR SALE IS NOT PERMITTED.
91
| VICTORIA MALL |
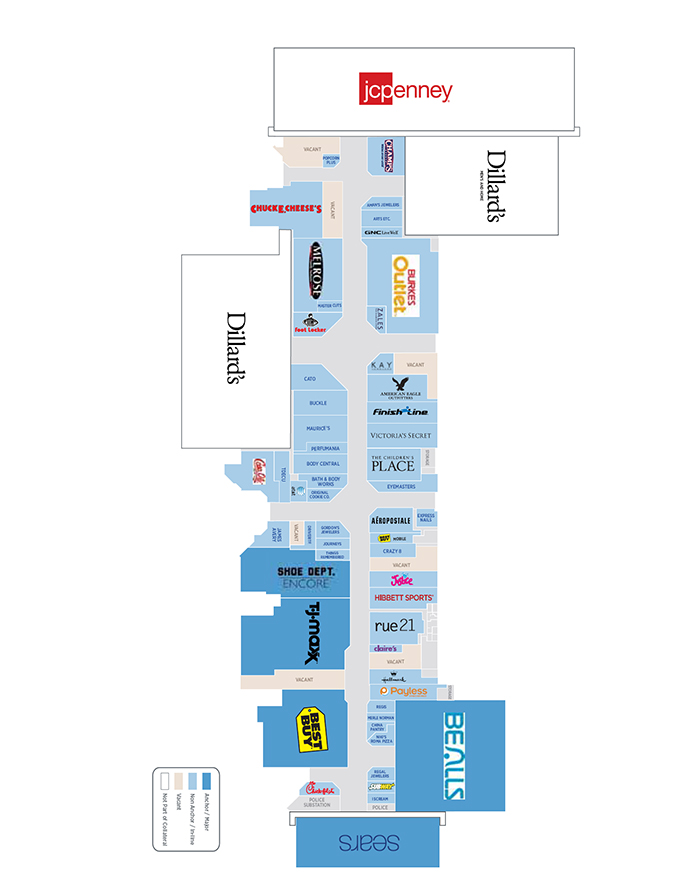
THE INFORMATION IN THIS STRUCTURAL AND COLLATERAL TERM SHEET IS NOT COMPLETE AND MAY BE AMENDED PRIOR TO THE TIME OF SALE. THIS TERM SHEET IS NOT AN OFFER TO SELL THESE SECURITIES AND IT IS NOT A SOLICITATION OF AN OFFER TO BUY THESE SECURITIES IN ANY JURISDICTION WHERE THE OFFER OR SALE IS NOT PERMITTED.
92
| VICTORIA MALL |
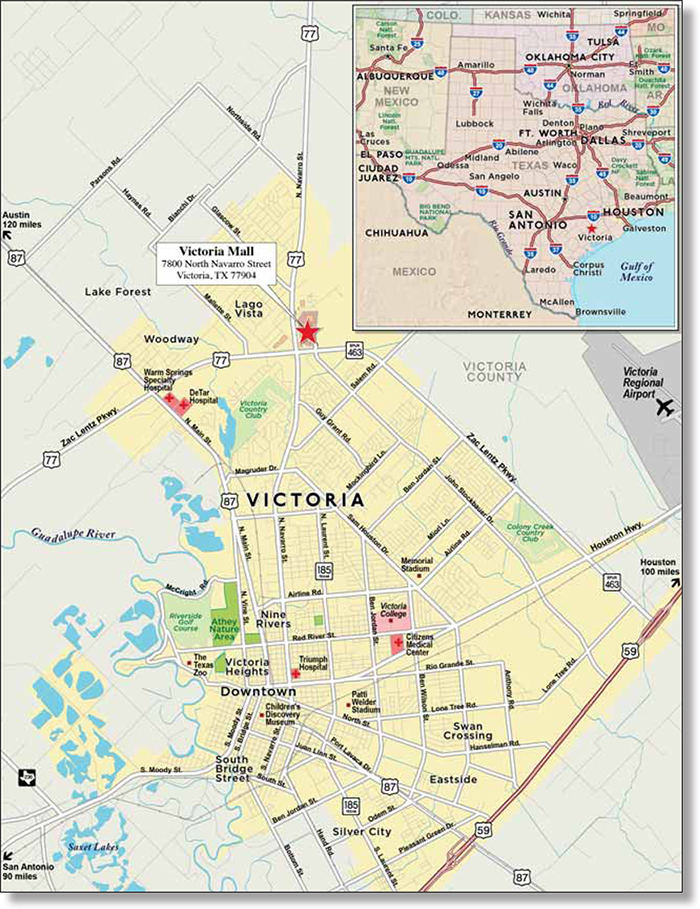
THE INFORMATION IN THIS STRUCTURAL AND COLLATERAL TERM SHEET IS NOT COMPLETE AND MAY BE AMENDED PRIOR TO THE TIME OF SALE. THIS TERM SHEET IS NOT AN OFFER TO SELL THESE SECURITIES AND IT IS NOT A SOLICITATION OF AN OFFER TO BUY THESE SECURITIES IN ANY JURISDICTION WHERE THE OFFER OR SALE IS NOT PERMITTED.
93
| No. 9 - Victoria Mall | ||||||||
| Loan Information | Property Information | |||||||
| Mortgage Loan Seller: | Wells Fargo Bank, National Association | Single Asset/Portfolio: | Single Asset | |||||
| Credit Assessment (Fitch/KBRA/S&P): | NR/NR/NR | Property Type: | Retail | |||||
| Original Principal Balance: | $35,000,000 | Specific Property Type: | Regional Mall | |||||
| Cut-off Date Principal Balance: | $34,872,435 | Location: | Victoria, TX | |||||
| % of Initial Pool Balance: | 2.8% | Size: | 448,935 SF | |||||
| Loan Purpose: | Refinance | Cut-off Date Principal Balance Per Unit/SF: | $77.68 | |||||
| Borrower Name: | Victoria Mall, LP | Year Built/Renovated: | 1981/2005 | |||||
| Sponsor: | James Hull, John Gibson and Barry Storey | Title Vesting: | Fee | |||||
| Mortgage Rate: | 4.460% | Property Manager: | Self-managed | |||||
| Note Date: | December 20, 2012 | 3rd Most Recent Occupancy (As of): | 95.4% (12/31/2009) | |||||
| Anticipated Repayment Date: | NAP | 2nd Most Recent Occupancy (As of): | 87.7% (12/31/2010) | |||||
| Maturity Date: | January 1, 2023 | Most Recent Occupancy (As of): | 94.8% (12/31/2011) | |||||
| IO Period: | None | Current Occupancy (As of): | 93.7% (12/1/2012) | |||||
| Loan Term (Original): | 120 months | |||||||
| Seasoning: | 2 months | Underwriting and Financial Information: | ||||||
| Amortization Term (Original): | 300 months | |||||||
| Loan Amortization Type: | Amortizing Balloon | 3rd Most Recent NOI (As of): | $4,095,305 (12/31/2010) | |||||
| Interest Accrual Method: | 30/360 | 2nd Most Recent NOI (As of): | $3,982,542 (12/31/2011) | |||||
| Call Protection: | L(26),D(90),O(4) | Most Recent NOI (As of): | $4,575,108 (TTM 9/30/2012) | |||||
| Lockbox Type: | Springing (Without Established Account) | |||||||
| Additional Debt: | None | |||||||
| Additional Debt Type: | NAP | U/W Revenues: | $6,519,380 | |||||
| U/W Expenses: | $2,040,673 | |||||||
| U/W NOI: | $4,478,707 | |||||||
| U/W NCF: | $3,913,237 | |||||||
Escrows and Reserves(1): | U/W NOI DSCR: | 1.93x | ||||||
| U/W NCF DSCR: | 1.68x | |||||||
Type: | Initial | Monthly | Cap (If Any) | U/W NOI Debt Yield: | 12.8% | |||
| Taxes | $31,621 | $31,621 | NAP | U/W NCF Debt Yield: | 11.2% | |||
| Insurance | $0 | Springing | NAP | As-Is Appraised Value: | $54,000,000 | |||
| Replacement Reserves | $0 | $14,526 | NAP | As-Is Appraisal Valuation Date: | December 3, 2012 | |||
| TI/LC Reserve | $500,000 | $28,073 | $1,200,000 | Cut-off Date LTV Ratio: | 64.6% | |||
| Renovation Reserve | $1,756,000 | NAP | NAP | LTV Ratio at Maturity or ARD: | 47.0% | |||
| (1) | See “Escrows” section. |
The Mortgage Loan. The mortgage loan (the “Victoria Mall Mortgage Loan”) is evidenced by a single promissory note that is secured by a first mortgage encumbering a regional mall located in Victoria, Texas (the “Victoria Mall Property”). The Victoria Mall Mortgage Loan was originated on December 20, 2012 by Wells Fargo Bank, National Association. The Victoria Mall Mortgage Loan had an original principal balance of $35,000,000, has an outstanding principal balance as of the Cut-off Date of $34,872,435 and accrues interest at an interest rate of 4.460% per annum. The Victoria Mall Mortgage Loan had an initial term of 120 months, has a remaining term of 118 months as of the Cut-off Date and requires payments of principal and interest based on a 25-year amortization schedule. The Victoria Mall Mortgage Loan matures on January 1, 2023.
Following the lockout period, the borrower has the right to defease the Victoria Mall Mortgage Loan in whole, but not in part, on any due date before the scheduled maturity date. In addition, the Victoria Mall Mortgage Loan is prepayable without penalty on or after October 1, 2022.
THE INFORMATION IN THIS STRUCTURAL AND COLLATERAL TERM SHEET IS NOT COMPLETE AND MAY BE AMENDED PRIOR TO THE TIME OF SALE. THIS TERM SHEET IS NOT AN OFFER TO SELL THESE SECURITIES AND IT IS NOT A SOLICITATION OF AN OFFER TO BUY THESE SECURITIES IN ANY JURISDICTION WHERE THE OFFER OR SALE IS NOT PERMITTED.
94
| VICTORIA MALL |
Sources and Uses
| Sources | Uses | |||||||
| Original loan amount | $35,000,000 | 100.0% | Loan payoff(1) | $15,675,202 | 44.8% | |||
| Reserves | 2,287,621 | 6.5 | ||||||
| Closing costs | 180,952 | 0.5 | ||||||
| Return of equity | 16,856,225 | 48.2 | ||||||
| Total Sources | $35,000,000 | 100.0% | Total Uses | $35,000,000 | 100.0% |
| (1) | The Victoria Mall Property was previously securitized in CGCMT 2004-C1. |
The Property. The Victoria Mall Property is a single-level, regional mall that contains approximately 679,502 square feet of which 448,935 square feet secures the Victoria Mall Mortgage Loan. The Victoria Mall Property is anchored by JC Penney (not part of the collateral), Dillard’s and Dillard’s Men’s & More (not part of the collateral), Sears, Beall’s and Cinemark Theatres and is situated on 50.7 acres. The Victoria Mall Property was built in 1981 and renovated in 2005. Parking is provided by 4,026 surface parking spaces, resulting in a parking ratio of 5.9 spaces per every 1,000 square feet of rentable area. The Victoria Mall Property’s mix of junior anchors and in-line tenants includes Best Buy, TJ Maxx, Aeropostale, American Eagle, The Buckle, Victoria Secret and Rue 21. As of November 30, 2012, the Victoria Mall Property was 93.7% leased to 66 tenants.
For the trailing 12-month period ending December 31, 2012, tenants had comparable in-line average sales (tenants occupying less than 10,000 square feet) of $367 per square foot. Occupancy costs for comparable in-line tenants occupying less than 10,000 square feet averaged 7.7% for the trailing 12-month period ending December 31, 2012.
THE INFORMATION IN THIS STRUCTURAL AND COLLATERAL TERM SHEET IS NOT COMPLETE AND MAY BE AMENDED PRIOR TO THE TIME OF SALE. THIS TERM SHEET IS NOT AN OFFER TO SELL THESE SECURITIES AND IT IS NOT A SOLICITATION OF AN OFFER TO BUY THESE SECURITIES IN ANY JURISDICTION WHERE THE OFFER OR SALE IS NOT PERMITTED.
95
| VICTORIA MALL |
The following table presents certain information relating to the tenancies at the Victoria Mall Property:
Major Tenants
| Tenant Name | Credit Rating (Fitch/ Moody’s/ S&P)(1) | Tenant NRSF | % of NRSF | Annual U/W Base Rent PSF | Annual U/W Base Rent | % of Total Annual U/W Base Rent | Sales PSF(2) | Occupancy Cost(2) | Lease Expiration Date | |
| Anchor Tenants – Not Part of Collateral | ||||||||||
| JC Penney | B/B3/B- | 108,483 | ANCHOR OWNED – NOT PART OF THE COLLATERAL | |||||||
| Dillard’s | BB+/Ba3/BB | 71,619 | ANCHOR OWNED – NOT PART OF THE COLLATERAL | |||||||
| Dillard’s Men’s & More | BB+/Ba3/BB | 50,465 | ANCHOR OWNED – NOT PART OF THE COLLATERAL | |||||||
| Anchor Tenants – Collateral | ||||||||||
| Cinemark Theatres | NR/NR/BB- | 43,708 | 9.7% | $14.00 | $611,912 | 11.7% | (3) | 11.1% | 5/31/2021 | |
| Beall’s | NR/NR/NR | 40,451 | 9.0% | $8.41 | $340,000 | 6.5% | $100 | 8.6% | 12/31/2014 | |
| Sears | CCC/B3/CCC+ | 101,443(4) | 22.6% | $2.32 | $235,174 | 4.5% | $130(4) | 2.0%(4) | 10/31/2030(5) | |
| Total Anchor Tenants – Collateral | 185,602 | 41.3% | $6.40 | $1,187,086 | 22.6% | |||||
| Major Tenants - Collateral | ||||||||||
| Best Buy | BB-/Baa2/BB | 22,960 | 5.1% | $11.00 | $252,560 | 4.8% | NAV | NAV | 1/31/2016 | |
| Burke’s Outlet | NR/NR/NR | 20,984 | 4.7% | $8.58 | $180,000 | 3.4% | NAV | NAV | 1/31/2019 | |
| The Buckle | NR/NR/NR | 4,646 | 1.0% | $34.00 | $157,964 | 3.0% | $629 | 5.5% | 1/31/2022 | |
| TJ Maxx | NR/A3/A | 24,074 | 5.4% | $6.50 | $156,481 | 3.0% | NAV | NAV | 5/30/2022 | |
| Shoe Department Encore | NR/NR/NR | 16,528 | 3.7% | $9.32 | $154,000 | 2.9% | $147 | NAV | 1/31/2022(6) | |
| The Children’s Place | NR/NR/NR | 5,895 | 1.3% | $25.70 | $151,500 | 2.9% | $233 | 11.3% | 1/31/2020(7) | |
| Melrose | NR/NR/NR | 11,957 | 2.7% | $12.54 | $150,000 | 2.9% | $144 | 9.0% | 10/31/2022 | |
| Total Major Tenants – Collateral | 107,044 | 23.8% | $11.23 | $1,202,505 | 22.9% | |||||
| Non-Major Tenants – Collateral | 128,219 | 28.6% | $22.28 | $2,856,853 | 54.5% | |||||
| Occupied Collateral Total | 420,865 | 93.7% | $12.47 | $5,246,444 | 100.0% | |||||
| Vacant Space | 28,070 | 6.3% | ||||||||
| Collateral Total | 448,935 | 100.0% | ||||||||
| (1) | Certain ratings are those of the parent company whether or not the parent guarantees the lease. |
| (2) | Sales and Occupancy Costs are for the trailing 12-month period ending December 31, 2012. |
| (3) | Cinemark Theatre operates 12 screens at the Victoria Mall Property and had sales per screen of $502,775 for the 12-month period ending December 31, 2012. |
| (4) | Total square footage includes 18,700 square feet of an auto-service facility. Sales PSF and Occupancy Cost are based on 82,743 square feet. |
| (5) | Sears may terminate its lease at any time with two years prior notice. |
| (6) | If sales do not exceed $1.1 million for any lease year, the tenant may terminate its lease. Shoe Department Encore reported year-end 2012 sales of $2.4 million. |
| (7) | If sales do not exceed $875,000 for the period between August 1, 2012 and July 30, 2013, the tenant may terminate its lease. The Children’s Place reported year-end 2012 sales of $1.4 million. |
THE INFORMATION IN THIS STRUCTURAL AND COLLATERAL TERM SHEET IS NOT COMPLETE AND MAY BE AMENDED PRIOR TO THE TIME OF SALE. THIS TERM SHEET IS NOT AN OFFER TO SELL THESE SECURITIES AND IT IS NOT A SOLICITATION OF AN OFFER TO BUY THESE SECURITIES IN ANY JURISDICTION WHERE THE OFFER OR SALE IS NOT PERMITTED.
96
| VICTORIA MALL |
The following table presents certain information relating to the historical sales and occupancy costs at the Victoria Mall Property:
Historical Sales (PSF) and Occupancy Costs(1)
| Tenant Name | 2009 | 2010 | 2011 | 2012 |
Sears(2) | $120 | $125 | $121 | $130 |
| Cinemark Theatres | (3) | (3) | (3) | (3) |
| Beall’s | $85 | $79 | $86 | $100 |
Best Buy(4) | NAV | NAV | NAV | NAV |
Burke’s Outlet(5) | NAV | NAV | NAV | $66 |
TJ Maxx(6) | NAV | NAV | NAV | NAV |
Total In-line (<10,000 square feet)(7) | $270 | $285 | $322 | $367 |
Occupancy Costs(8) | 10.5% | 9.9% | 8.8% | 7.7% |
| (1) | Historical Sales (PSF) is based on historical statements provided by the borrower. |
| (2) | Sales PSF are based on 82,743 square feet. |
| (3) | Sales per screen for Cinemark Theatre (12 screens) were $418,348, $424,394, $457,876 and $502,775 in 2009, 2010, 2011 and 2012, respectively. |
| (4) | Best Buy is not required to report sales. |
| (5) | Burke’s Outlet took occupancy on June 22, 2011. |
| (6) | Sales and occupancy costs are unavailable as TJ Maxx took occupancy on June 4, 2012. |
| (7) | Represents tenants less than 10,000 square feet who were in occupancy since January 1, 2010, the date which is two years before the end of the trailing 12-month reporting period. |
| (8) | Historical occupancy costs are based on year-end 2012 rent, reimbursements and percentage rent divided by the sales for the respective calendar years. |
The following table presents certain information relating to the lease rollover schedule at Victoria Mall Property:
Lease Expiration Schedule(1)(2)
Year Ending December 31, | No. of Leases Expiring | Expiring NRSF | % of Total NRSF | Cumulative Expiring NRSF | Cumulative % of Total NRSF | Annual U/W Base Rent | Annual U/W Base Rent PSF(3) | ||||||||
| MTM | 16 | 27,313 | 6.1% | 27,313 | 6.1% | $568,828 | $20.83 | ||||||||
| 2013 | 4 | 9,999 | 2.2% | 37,312 | 8.3% | $226,259 | $22.63 | ||||||||
| 2014 | 3 | 41,721 | 9.3% | 79,033 | 17.6% | $387,600 | $9.29 | ||||||||
| 2015 | 7 | 10,200 | 2.3% | 89,233 | 19.9% | $412,203 | $40.41 | ||||||||
| 2016 | 8 | 38,673 | 8.6% | 127,906 | 28.5% | $576,244 | $14.90 | ||||||||
| 2017 | 5 | 10,246 | 2.3% | 138,152 | 30.8% | $184,215 | $17.98 | ||||||||
| 2018 | 5 | 27,464 | 6.1% | 165,616 | 36.9% | $503,460 | $18.33 | ||||||||
| 2019 | 3 | 26,801 | 6.0% | 192,417 | 42.9% | $271,400 | $10.13 | ||||||||
| 2020 | 1 | 5,895 | 1.3% | 198,312 | 44.2% | $151,500 | $25.70 | ||||||||
| 2021 | 5 | 54,857 | 12.2% | 253,169 | 56.4% | $909,947 | $16.59 | ||||||||
| 2022 | 6 | 64,128 | 14.3% | 317,297 | 70.7% | $766,489 | $11.95 | ||||||||
| 2023 | 1 | 2,125 | 0.5% | 319,422 | 71.2% | $53,125 | $25.00 | ||||||||
| Thereafter | 2 | 101,443 | 22.6% | 420,865 | 93.7% | $235,174 | $2.32 | ||||||||
| Vacant | 0 | 28,070 | 6.3% | 448,935 | 100.0% | $0 | $0.00 | ||||||||
| Total/Weighted Average | 66 | 448,935 | 100.0% | $5,246,444 | $12.47 |
| (1) | Information obtained from the underwritten rent roll. |
| (2) | Certain tenants may have lease termination options that are exercisable prior to the originally stated expiration date of the subject lease and that are not considered in the Lease Expiration Schedule. |
| (3) | Weighted Average Annual U/W Base Rent PSF excludes vacant space. |
The following table presents historical occupancy percentages at the Victoria Mall Property:
Historical Occupancy(1)
12/31/2009 | 12/31/2010 | 12/31/2011 | 12/1/2012 | |||
| 95% | 88% | 95% | 94% |
| (1) | Information obtained from the borrower. |
THE INFORMATION IN THIS STRUCTURAL AND COLLATERAL TERM SHEET IS NOT COMPLETE AND MAY BE AMENDED PRIOR TO THE TIME OF SALE. THIS TERM SHEET IS NOT AN OFFER TO SELL THESE SECURITIES AND IT IS NOT A SOLICITATION OF AN OFFER TO BUY THESE SECURITIES IN ANY JURISDICTION WHERE THE OFFER OR SALE IS NOT PERMITTED.
97
| VICTORIA MALL |
Operating History and Underwritten Net Cash Flow. The following table presents certain information relating to the historical operating performance and the Underwritten Net Cash Flow at the Victoria Mall Property:
Cash Flow Analysis
| 2010 | 2011 | TTM 9/30/2012 | U/W | U/W $ per SF | ||||||
| Base Rent | $4,914,626 | $4,592,694 | $5,206,186 | $5,246,444 | $11.69 | |||||
| Grossed Up Vacant Space | 0 | 0 | 0 | 722,084 | 1.61 | |||||
| Percentage Rent | 114,000 | 195,581 | 334,482 | 334,482 | 0.75 | |||||
| Total Reimbursables | 911,463 | 900,466 | 779,945 | 779,945 | 1.74 | |||||
| Other Income | 152,431 | 200,166 | 196,064 | 152,649 | 0.34 | |||||
| Less Vacancy & Credit Loss | 0 | 0 | 0 | (716,223)(1) | (1.60) | |||||
| Effective Gross Income | $6,092,520 | $5,888,907 | $6,516,677 | $6,519,380 | $14.52 | |||||
| Total Operating Expenses | $1,997,215 | $1,906,365 | $1,941,569 | $2,040,673 | $4.55 | |||||
| Net Operating Income | $4,095,375 | $3,982,542 | $4,575,108 | $4,478,707 | $9.98 | |||||
| TI/LC | 0 | 0 | 0 | 391,163 | 0.87 | |||||
| Capital Expenditures | 0 | 0 | 0 | 174,308 | 0.39 | |||||
| Net Cash Flow | $4,095,375 | $3,982,542 | $4,575,108 | $3,913,237 | $8.72 | |||||
| NOI DSCR | 1.76x | 1.71x | 1.97x | 1.93x | ||||||
| NCF DSCR | 1.76x | 1.71x | 1.97x | 1.68x | ||||||
| NOI DY | 11.7% | 11.4% | 13.1% | 12.8% | ||||||
| NCF DY | 11.7% | 11.4% | 13.1% | 11.2% |
| (1) | The underwritten economic vacancy is 12.0%. The Victoria Mall Property was 93.7% physically occupied as of November 30, 2012. |
Appraisal. As of the appraisal valuation date of December 3, 2012, the Victoria Mall Property had an “as-is” appraised value of $54,000,000.
Environmental Matters. According to a Phase I environmental site assessment dated November 14, 2012, there was no evidence of any recognized environmental conditions at the Victoria Mall Property.
Market Overview and Competition. The Victoria Mall Property is located in the northern portion of Victoria, Texas on the northeast corner of US Highway 77 and Loop 463 along the Texas Gulf Coast. The Victoria Mall Property is located approximately 80 miles north of the Corpus Christi central business district, approximately 90 miles southeast of the San Antonio central business district and approximately 100 miles southwest of the Houston central business district.
According to the appraisal, in 2012 the population within a 50-mile radius of the Victoria Mall Property (the primary trade area) was reported as approximately 205,952, representing a 0.2% compounded annual growth rate since 2000. Within the same radius, in 2012 the average household income was reported as $55,093, representing a 1.6% compounded annual growth rate since 2000. Due largely to the Eagle Ford Shale, one of the largest oil and gas developments in the United States, as of year-end 2012 the unemployment rate for Victoria was at 5.8%. The Victoria Mall Property is the only enclosed mall within the primary trade area and the nearest enclosed regional mall is located approximately 117 miles northwest in San Antonio, Texas.
The Borrower. The borrower is Victoria Mall LP, a Georgia limited partnership is a single purpose entity with two independent directors. Legal counsel to the borrower delivered a non-consolidation opinion in connection with the origination of the Victoria Mall Mortgage Loan. James Hull, John Gibson and Barry Storey are the indirect owners of the borrower and are the guarantors of certain nonrecourse carveouts under the Victoria Mall Mortgage Loan.
The Sponsor. The sponsors for the Victoria Mall Mortgage Loan are James Hull, John Gibson and Barry Storey. Together, the guarantors are the principals of Hull Storey Gibson Companies, LLC (“HSG”). HSG is based in Augusta, Georgia and acquires and operates enclosed malls as well as “big box” retail properties throughout the southeast. HSG currently owns 97 retail properties totaling 9.5 million square feet, which includes 16 regional malls totaling 5.5 million square feet. During the past 10 years, the sponsors disclosed affiliates of the borrower were involved in three loan work-outs due to significant vacancies at non-related properties. See “Description of the Mortgage Pool – Default History, Bankruptcy Issues and Other Proceedings” in the Free Writing Prospectus.
THE INFORMATION IN THIS STRUCTURAL AND COLLATERAL TERM SHEET IS NOT COMPLETE AND MAY BE AMENDED PRIOR TO THE TIME OF SALE. THIS TERM SHEET IS NOT AN OFFER TO SELL THESE SECURITIES AND IT IS NOT A SOLICITATION OF AN OFFER TO BUY THESE SECURITIES IN ANY JURISDICTION WHERE THE OFFER OR SALE IS NOT PERMITTED.
98
| VICTORIA MALL |
Escrows. The loan documents provide for upfront escrows at closing in the amount of $31,621 for real estate taxes and $500,000 for tenant improvements and leasing commissions. Additionally, the loan documents provide for an upfront escrow in the amount of $1,756,000, which represents 125% of the estimated costs for the following property renovations that must be completed prior to June, 2014: rear façade and entrances ($400,000), new carpet and flooring ($300,000), electrical and lighting upgrades ($250,000), landscaping ($100,000), parking lot repairs and maintenance ($100,000), general repairs and maintenance ($75,000), sheet rocking ($50,000), painting ($30,000) and a contingency reserve ($100,000).
The loan documents provide for monthly deposits of $31,621 for real estate taxes, $14,526 for replacement reserves and $28,073 for tenant improvements and leasing commissions (subject to a cap of $1,200,000). At any time prior to January 1, 2022, the sponsor can provide a letter of credit in the amount of $2,500,000 in lieu of monthly tenant improvement and leasing commission cash escrow deposits. The loan documents do not require monthly escrow deposits for insurance provided the following conditions are satisfied (i) no event of default exists and is continuing; (ii) the Victoria Mall Property is covered by blanket insurance policies that remain in full force and effect; and (iii) the borrower provides the lender with evidence of renewal of the policies and paid receipts of insurance premiums when due.
Lockbox and Cash Management. Upon the occurrence of a Cash Trap Event Period (as defined below), the Victoria Mall Mortgage Loan requires that a lender-controlled lockbox account will be established and the tenants will be directed to pay their rents directly to such lockbox account. The loan documents also require that upon the occurrence of a Cash Trap Event Period, all cash revenues and other monies received by the borrower or the property manager relating to the Victoria Mall Property be deposited into the lockbox account within one business day of receipt.
A “Cash Trap Event Period” will commence upon the earlier of (i) the occurrence and continuance of an event of default; (ii) the net cash flow debt yield, as defined in the loan agreement, falling below 8.5%; (iii) the borrower has not delivered a letter of credit in the amount of $2,500,000 to fund the tenant improvement and leasing commissions escrow and Sears goes dark, terminates its lease, fails to occupy its premise or provides written notice of its intentions to commence the foregoing; (iv) JC Penney goes dark, fails to occupy its premise or provides written notice of its intentions to commence the foregoing; or (v) Dillard’s goes dark, fails to occupy its premise or provides written notice of its intentions to commence the foregoing.
A Cash Trap Event Period will expire, with respect to clause (i), upon the cure of such event of default; with respect to clause (ii), the net cash flow debt yield being at least 8.5% for two consecutive calendar quarters; with respect to clause (iii), the borrower delivers a letter of credit in the amount of $2,500,000 to fund the tenant improvement and leasing commissions escrow, and a satisfactory replacement tenant is in occupancy, paying full unabated rent and open for business in 100% of the space previously occupied by Sears; with respect to clause (iv), a satisfactory replacement tenant is in occupancy and open for business in no less than 70% of the space previously occupied by JC Penney; and with respect to clause (v) a satisfactory replacement tenant is in occupancy and open for business in 100% of the space previously occupied by Dillard’s.
Property Management. The Victoria Mall Property is managed by an affiliate of the borrower.
Assumption. The borrower has a two-time right to transfer the Victoria Mall Property, provided that no event of default has occurred and is continuing and certain other conditions are satisfied, including, but not limited to: (i) the lender’s reasonable determination that the proposed transferee and guarantor satisfy the lender’s credit review and underwriting standards, taking into consideration transferee experience, financial strength and general business standing; (ii) execution of a recourse guaranty and an environmental indemnity by an affiliate of the transferee; and (iii) if requested by the lender, rating agency confirmation from Fitch, KBRA and S&P that the transfer will not result in a downgrade, withdrawal or qualification of the respective ratings assigned to the Series 2013-C12 Certificates.
Partial Release. In connection with a public dedication to a government authority, the borrower may obtain a release of a certain non-income producing parcel of the Victoria Mall Property from the lien of the mortgage upon the satisfaction of certain conditions, including but not limited to (i) the release of the parcel will not diminish the value of the remaining property; (ii) the remaining property will have available to it all utility and other services for its use, occupancy and operation, which includes access for pedestrian and vehicular ingress and egress to all public roads; (iii) if requested by the lender, a rating agency confirmation from Fitch, KBRA and S&P that the release will not result in a downgrade, withdrawal or qualification of the respective ratings assigned to the Series 2013–C12 Certificates; and (iv) the delivery of a legal opinion to the lender to demonstrate the release of the parcel will satisfy REMIC requirements.
Real Estate Substitution. Not permitted.
Subordinate and Mezzanine Indebtedness. Not permitted.
Ground Lease. None.
Terrorism Insurance. The loan documents require that the “all risk” insurance policy required to be maintained by the borrower provides coverage for damage from terrorism in an amount equal to the full replacement cost of the Victoria Mall Property as well as business interruption insurance covering no less than the 18-month period following the occurrence of a casualty event, together with a six-month extended period of indemnity.
THE INFORMATION IN THIS STRUCTURAL AND COLLATERAL TERM SHEET IS NOT COMPLETE AND MAY BE AMENDED PRIOR TO THE TIME OF SALE. THIS TERM SHEET IS NOT AN OFFER TO SELL THESE SECURITIES AND IT IS NOT A SOLICITATION OF AN OFFER TO BUY THESE SECURITIES IN ANY JURISDICTION WHERE THE OFFER OR SALE IS NOT PERMITTED.
99
| STUDIO GREEN APARTMENTS |
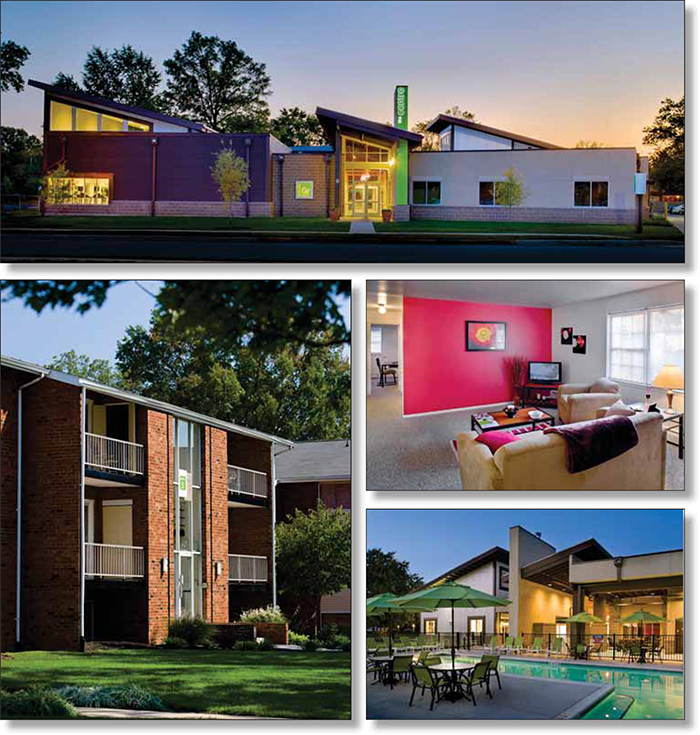
THE INFORMATION IN THIS STRUCTURAL AND COLLATERAL TERM SHEET IS NOT COMPLETE AND MAY BE AMENDED PRIOR TO THE TIME OF SALE. THIS TERM SHEET IS NOT AN OFFER TO SELL THESE SECURITIES AND IT IS NOT A SOLICITATION OF AN OFFER TO BUY THESE SECURITIES IN ANY JURISDICTION WHERE THE OFFER OR SALE IS NOT PERMITTED.
100
| STUDIO GREEN APARTMENTS |
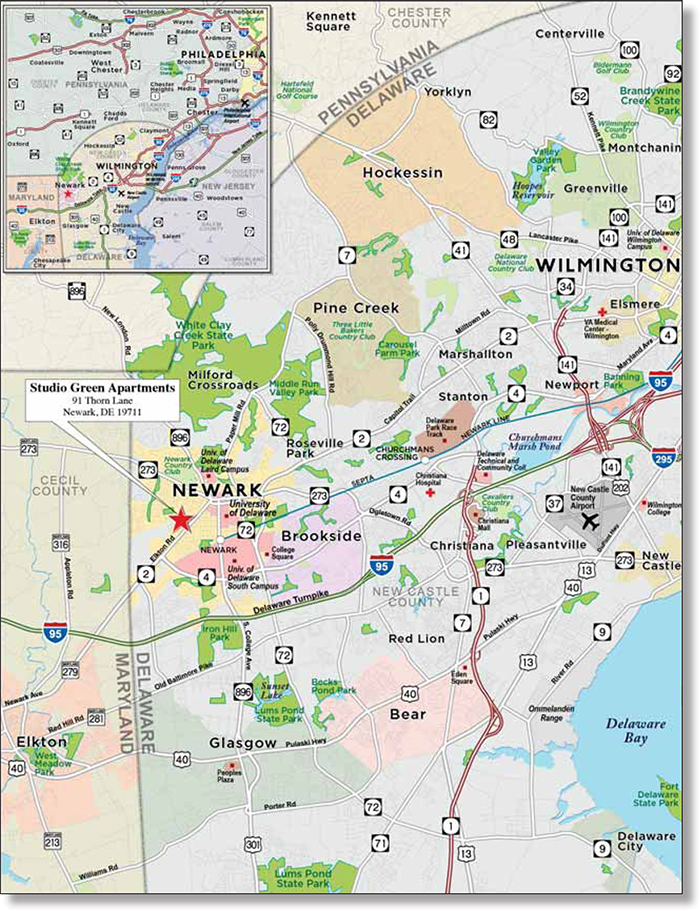
THE INFORMATION IN THIS STRUCTURAL AND COLLATERAL TERM SHEET IS NOT COMPLETE AND MAY BE AMENDED PRIOR TO THE TIME OF SALE. THIS TERM SHEET IS NOT AN OFFER TO SELL THESE SECURITIES AND IT IS NOT A SOLICITATION OF AN OFFER TO BUY THESE SECURITIES IN ANY JURISDICTION WHERE THE OFFER OR SALE IS NOT PERMITTED.
101
| No. 10 – Studio Green Apartments | ||||||||
| Loan Information | Property Information | |||||||
| Mortgage Loan Seller: | C-III Commercial Mortgage LLC | Single Asset/Portfolio: | Single Asset | |||||
Credit Assessment (Fitch/KBRA/S&P): | NR/NR/NR | Property Type: | Multifamily | |||||
| Original Principal Balance: | $30,250,000 | Specific Property Type: | Student Housing | |||||
| Cut-off Date Principal Balance: | $30,250,000 | Location: | Newark, DE | |||||
| % of Initial Pool Balance: | 2.5% | Size: | 1,074 beds | |||||
| Loan Purpose: | Refinance | Cut-off Date Principal Balance Per Bed: | $28,166 | |||||
| Borrower Name: | UDel Holdings, LLC | Year Built/Renovated: | 1967/2010 | |||||
| Sponsor: | Campus Living Property Interests LLC | Title Vesting: | Fee | |||||
| Mortgage Rate: | 4.890% | Property Manager: | Century Campus Housing Management, L.P. | |||||
| Note Date: | February 13, 2013 | 3rd Most Recent Occupancy (As of)(2): | 92.5% (12/31/2010) | |||||
| Anticipated Repayment Date: | NAP | 2nd Most Recent Occupancy (As of)(2): | 82.9% (12/31/2011) | |||||
| Maturity Date: | March 1, 2023 | Most Recent Occupancy (As of)(2): | 89.4% (12/31/2012) | |||||
| IO Period: | None | Current Occupancy (As of)(2): | 92.3% (1/25/2013) | |||||
| Loan Term (Original): | 120 months | |||||||
| Seasoning: | 0 months | Underwriting and Financial Information: | ||||||
| Amortization Term (Original): | 300 months | |||||||
| Loan Amortization Type: | Amortizing Balloon | 3rd Most Recent NOI (As of): | $2,548,236 (12/31/2010) | |||||
| Interest Accrual Method: | Actual/360 | 2nd Most Recent NOI (As of): | $2,355,399 (12/31/2011) | |||||
| Call Protection: | L(24),GRTR 1% or YM(92),O(4) | Most Recent NOI (As of): | $3,162,108 (12/31/2012) | |||||
| Lockbox Type: | Soft/Springing Cash Management | |||||||
| Additional Debt: | None | U/W Revenues: | $7,187,649 | |||||
| Additional Debt Type: | NAP | U/W Expenses: | $4,069,336 | |||||
| U/W NOI: | $3,118,312 | |||||||
| U/W NCF: | $2,908,379 | |||||||
| U/W NOI DSCR: | 1.49x | |||||||
Escrows and Reserves(1): | U/W NCF DSCR: | 1.39x | ||||||
| U/W NOI Debt Yield: | 10.3% | |||||||
| Type: | Initial | Monthly | Cap (If Any) | U/W NCF Debt Yield: | 9.6% | |||
| Taxes | $164,187 | $27,364 | NAP | As-Is Appraised Value: | $53,900,000 | |||
| Insurance | $142,306 | $20,329 | NAP | As-Is Appraisal Valuation Date: | January 2, 2013 | |||
| Replacement Reserve | $17,495 | $17,495 | NAP | Cut-off Date LTV Ratio: | 56.1% | |||
| Deferred Maintenance | $11,875 | $0 | NAP | LTV Ratio at Maturity or ARD: | 41.8% | |||
| (1) | See “Escrows” section. |
| (2) | Occupancy based on number of occupied beds. |
The Mortgage Loan. The mortgage loan (the “Studio Green Apartments Mortgage Loan”) is evidenced by a single promissory note that is secured by a first mortgage encumbering a multifamily property located in Newark, Delaware (the “Studio Green Apartments Property”). The Studio Green Apartments Mortgage Loan was originated on February 13, 2013 by C-III Commercial Mortgage LLC. The Studio Green Apartments Mortgage Loan had an original principal balance of $30,250,000, has an outstanding balance as of the Cut-off Date of $30,250,000 and accrues interest at a rate of 4.890% per annum. The Studio Green Apartments Mortgage Loan had an initial term of 120 months, has a remaining term of 120 months as of the Cut-off Date and requires payments of principal and interest based on a 25-year amortization schedule. The Studio Green Apartments Mortgage Loan matures on March 1, 2023.
Following the lockout period, the borrower has the right to voluntarily prepay the Studio Green Apartments Mortgage Loan in whole, but not in part, provided that the borrower pays the greater of 1% or a yield maintenance premium on the principal amount being paid. In addition, the Studio Green Apartments Mortgage Loan is prepayable without penalty on or after December 1, 2022.
THE INFORMATION IN THIS STRUCTURAL AND COLLATERAL TERM SHEET IS NOT COMPLETE AND MAY BE AMENDED PRIOR TO THE TIME OF SALE. THIS TERM SHEET IS NOT AN OFFER TO SELL THESE SECURITIES AND IT IS NOT A SOLICITATION OF AN OFFER TO BUY THESE SECURITIES IN ANY JURISDICTION WHERE THE OFFER OR SALE IS NOT PERMITTED.
102
| STUDIO GREEN APARTMENTS |
Sources and Uses
| Sources | Uses | ||||||||
| Original loan amount | $30,250,000 | 100.0 | % | Loan payoff(1) | $26,292,278 | 86.9 | % | ||
| Reserves | 335,862 | 1.1 | |||||||
| Closing costs | 201,354 | 0.7 | |||||||
| Return of equity | 3,420,506 | 11.3 | |||||||
| Total Sources | $30,250,000 | 100.0 | % | Total Uses | $30,250,000 | 100.0 | % |
| (1) | A mortgage loan secured by the Studio Green Apartments Property was previously securitized in CSMC 2006-C4. The Studio Green Apartments Mortgage Loan paid off a C-III Commercial Mortgage LLC-originated floating rate loan which was held by Nomura CRE CDO 2007-2. |
The Property. The Studio Green Apartments Property is a 665-unit (1,074 beds) multifamily property located in Newark, Delaware. Based on its tenant mix, the Studio Green Apartments Property primarily constitutes student housing. As of January 25, 2013, 991 (92.3%) of the 1,074 beds were leased. The Studio Green Apartments Property consists of 30 buildings and was constructed in 1967 and renovated in 2010. Amenities at the Studio Green Apartments Property include a swimming pool, an approximately 10,000 square foot leasing office/clubhouse and student center (with an indoor basketball court, exercise/fitness room, yoga studio, business center, billiard area, theatre and lounge) and multiple on-site laundry facilities.
The following table presents certain information relating to the unit mix of the Studio Green Apartments Property:
Apartment Unit Summary(1)
| Unit Type | No. of Units | No. of Beds | % of Total Beds | Average Unit Size (SF) | Average Monthly Rent per Bed | |
| Hydro (2 BR/1 BA) | 121 | 242 | 18.2 | % | 463 | $643 |
| Ener-Green (1 BR/1 BA) | 120 | 120 | 18.0 | % | 378 | $575 |
| Hybrid (1 BR/1 BA) | 118 | 118 | 17.7 | % | 743 | $884 |
| Geo (2 BR/1 BA) | 87 | 174 | 13.1 | % | 378 | $575 |
| Geo Deluxe (2 BR/1 BA) | 46 | 92 | 6.9 | % | 427 | $520 |
| Global (3 BR/2 BA) | 34 | 102 | 5.1 | % | 440 | $533 |
| Hydro Deluxe (2 BR/1 BA) | 29 | 58 | 4.4 | % | 521 | $625 |
| Hybrid Deluxe (1 BR/1 BA) | 26 | 26 | 3.9 | % | 855 | $911 |
| Ener-Green JR (1 BR/1 BA) | 23 | 23 | 3.5 | % | 458 | $804 |
| Eco (Studio/1 BA) | 23 | 23 | 3.5 | % | 484 | $795 |
| Ultra (4 BR/2 BA) | 16 | 64 | 2.4 | % | 377 | $550 |
| Hybrid Jr (1 BR/1 BA) | 12 | 12 | 1.8 | % | 605 | $865 |
| Hydro Jr (2 BR/1 BA) | 10 | 20 | 1.5 | % | 432 | $578 |
| Total/Weighted Average | 665 | 1,074 | 100.0 | % | 498 | $664 |
| (1) Information obtained from the underwritten rent roll. | ||||||
The following table presents historical occupancy percentages at the Studio Green Apartments Property:
Historical Occupancy(1)
12/31/2010(2) | 12/31/2011(3) | 12/31/2012(4) | 1/25/2013(5) | |||
| 93% | 83% | 89% | 92% |
| (1) | Information obtained from the borrower rent roll or borrower-provided occupancy statement. |
| (2) | As of December 31, 2010, based on occupied beds, the Studio Green Apartments Property had an average 12-month occupancy rate of 82.9%. |
| (3) | As of December 31, 2011, based on occupied beds, the Studio Green Apartments Property had an average 12-month occupancy rate of 81.5%. |
| (4) | As of December 31, 2012, based on occupied beds, the Studio Green Apartments Property had an average 12-month occupancy rate of 85.1%. |
| (5) | As of the January 25, 2013 rent roll, based on leased units, the Studio Green Apartments Property had an occupancy rate of 93.9%. |
THE INFORMATION IN THIS STRUCTURAL AND COLLATERAL TERM SHEET IS NOT COMPLETE AND MAY BE AMENDED PRIOR TO THE TIME OF SALE. THIS TERM SHEET IS NOT AN OFFER TO SELL THESE SECURITIES AND IT IS NOT A SOLICITATION OF AN OFFER TO BUY THESE SECURITIES IN ANY JURISDICTION WHERE THE OFFER OR SALE IS NOT PERMITTED.
103
| STUDIO GREEN APARTMENTS |
Operating History and Underwritten Net Cash Flow. The following table represents certain information relating to the historical operating performance and the Underwritten Net Cash Flow at the Studio Green Apartments Property:
Cash Flow Analysis
| 2010 | 2011 | 2012 | U/W | U/W per Bed | ||||||
| Base Rent | $6,145,832 | $5,921,873 | $7,009,655 | $8,079,858 | $7,523 | |||||
| Other Income | 151,364 | 168,383 | 207,712 | 177,994 | 166 | |||||
| Less Vacancy & Credit Loss | 0 | 0 | 0 | (1,070,203)(1) | (996) | |||||
| Effective Gross Income | $6,297,195 | $6,090,256 | $7,217,367 | $7,187,649 | $6,692 | |||||
| Total Operating Expenses | $3,748,959 | $3,734,857 | $4,055,259 | $4,069,336 | $3,789 | |||||
| Net Operating Income | $2,548,237 | $2,355,399 | $3,162,108 | $3,118,312 | $2,903 | |||||
| Capital Expenditures | 137,728 | 236,939 | 113,268 | 209,933 | 195 | |||||
| Net Cash Flow | $2,410,508 | $2,118,460 | $3,048,840 | $2,908,379 | $2,708 | |||||
| NOI DSCR | 1.21x | 1.12x | 1.51x | 1.49x | ||||||
| NCF DSCR | 1.15x | 1.01x | 1.45x | 1.39x | ||||||
| NOI DY | 8.4% | 7.8% | 10.5% | 10.3% | ||||||
| NCF DY | 8.0% | 7.0% | 10.1% | 9.6% | ||||||
(1) | The underwritten economic vacancy is 13.2%. As of January 25, 2013, the occupancy rate for the Studio Green Apartments Property was 92.3% based on occupied beds. |
Appraisal. As of the appraisal valuation date of January 2, 2013, the Studio Green Apartments Property had an “as-is” appraised value of $53,900,000.
Environmental Matters. According to the Phase I environmental site assessment dated December 20, 2012, due to its construction in 1967, suspect asbestos-containing materials and suspect lead-based paint were deemed to potentially be present at the Studio Green Apartments Property. The materials were observed to be in overall good condition with a low potential for disturbance. Operations and Maintenance Programs were prepared and are in place.
Market Overview and Competition. The Studio Green Apartments Property is a multifamily/student housing property located in Newark, Delaware, approximately one mile southwest of the main University of Delaware campus. A majority of the residential single and multifamily complexes in the immediate proximity are rented to students.
According to a third party market research report, the Wilmington, Delaware apartment market in the third quarter 2012 reflected a vacancy of approximately 4.4% with average asking rents of $740 per month for studio units, $867 per month for one-bedroom units, $1,008 per month for two-bedroom units, and $1,200 per month for three-bedroom units. The Studio Green Apartments Property most directly competes with other student housing complexes and traditional apartments in proximity to campus. The other primary competition to the Studio Green Apartments Property is the on-campus dormitories. Single rooms in the on-campus dormitories generally rent for approximately $950 per month and a double occupancy is approximately $750 per month.
THE INFORMATION IN THIS STRUCTURAL AND COLLATERAL TERM SHEET IS NOT COMPLETE AND MAY BE AMENDED PRIOR TO THE TIME OF SALE. THIS TERM SHEET IS NOT AN OFFER TO SELL THESE SECURITIES AND IT IS NOT A SOLICITATION OF AN OFFER TO BUY THESE SECURITIES IN ANY JURISDICTION WHERE THE OFFER OR SALE IS NOT PERMITTED.
104
| STUDIO GREEN APARTMENTS |
The following table presents certain information relating to some comparable multifamily properties provided in the appraisal for the Studio Green Apartments Property:
Competitive Set(1)
Studio Green Apartments (Subject) | University Courtyards | West Knoll | Colonial Garden | Southgate Gardens | University of Delaware (various Residence Halls) | |
| Location | Newark, DE | Newark, DE | Newark, DE | Newark, DE | Newark, DE | Newark, DE |
| Distance to Subject | -- | 1.8 miles | 0.3 miles | 2.5 miles | 1.9 miles | 1.0 mile |
| Property Type | Student Housing | Student Housing | Student Housing | Student Housing | Student Housing | Student Housing |
| Number of Beds | 1,074 | 880 | 140 | 180 | 212 | 7,000 (est.) |
| Average Rent (per bed) | ||||||
| Studio | $795 | NAV | NAV | $675 | NAV | NAV |
| 1BR | $842 | $1,115 | $780 | $803 | $735 | $954 |
| 2BR | $599 | $830 | $513 | $487 | $405 | $859 |
| 3BR | $533 | NAV | NAV | NAV | NAV | NAV |
| 4BR | $550 | $775 | NAV | NAV | NAV | NAV |
| Utilities | Included in rent with cap | Water and sewer included | Paid by tenant | Paid by tenant | Paid by tenant | Included in rent |
| Total Occupancy | 92%(2) | 100% | 99% | 100% | 98% | 98% |
| (1) | Information obtained from the appraisal dated February 1, 2013. |
| (2) | As of January 25, 2013 and is based on occupied beds. |
The Borrower. The borrower is UDel Holdings, LLC, a Delaware limited liability company and a single purpose entity with an independent director. CCHM Management Holdings Corp. (“CCHM Management”) is the guarantor of certain nonrecourse carveouts under the Studio Green Apartments Mortgage Loan.
The Sponsor. The sponsor is Campus Living Property Interests LLC, which is managed and 100.0% owned by CCHM Property Holdings Parent LLC (“CCHM Parent”), CCHM Parent is a subsidiary of Campus Living Land Trust (USA), an Australian managed investment fund controlled by Campus Living Funds Management Limited. Campus Living Funds Management Limited is a registered Australian public company, which is owned by Transfield Property Pty. Limited, a registered Australian proprietary company. Campus Living Villages (the trade name of CCHM Parent) currently manages student housing facilities on or near 50 university campuses totaling approximately 34,000 beds in the United States, Australia, New Zealand and the United Kingdom, with 22 student housing properties in the United States.
Escrows. The loan documents provide for an upfront escrow at closing in the amount of $164,187 for real estate taxes, $142,306 for insurance, $17,495 for replacement reserves and $11,875 for deferred maintenance. The borrower is required to deposit ongoing monthly escrows in the amount of $27,364 for taxes, $20,329 for insurance and an amount equal to $195 per bed ($17,495) every month to fund a replacement reserve.
Lockbox and Cash Management. The Studio Green Apartments Mortgage Loan requires a lender-controlled lockbox account, which is already in place, and require that the borrower and the property manager cause all rents to be deposited into such lockbox. Prior to occurrence of a Triggering Event (as defined below), all funds on deposit in such lockbox account are distributed to the borrower or the property manager.
A “Triggering Event” will exist upon (i) the occurrence and continuance of an event of default or (ii) the NCF debt service coverage ratio falling below 1.15x based on the 12 calendar month period immediately preceding the calculation, with the first calculation based on the 12 calendar month period ending March 31, 2013. A Triggering Event will expire upon (i) the lender’s written waiver of any such triggering event of default or (ii) the date on which the Studio Green Apartments Property achieves a net cash flow debt service coverage ratio of 1.20x based on the 12 calendar month period immediately preceding the calculation.
Property Management. The Studio Green Apartments Property is managed by an affiliate of the borrower.
THE INFORMATION IN THIS STRUCTURAL AND COLLATERAL TERM SHEET IS NOT COMPLETE AND MAY BE AMENDED PRIOR TO THE TIME OF SALE. THIS TERM SHEET IS NOT AN OFFER TO SELL THESE SECURITIES AND IT IS NOT A SOLICITATION OF AN OFFER TO BUY THESE SECURITIES IN ANY JURISDICTION WHERE THE OFFER OR SALE IS NOT PERMITTED.
105
| STUDIO GREEN APARTMENTS |
Transfers. The borrower, only upon the prior written consent of the lender, has the right to transfer the Studio Green Apartments Property and cause an assumption of the Studio Green Apartments Mortgage Loan, provided that no event of default has occurred and is continuing and certain other conditions are satisfied, including: (i) the lender’s reasonable determination that the proposed transferee and its principals satisfy the lender’s credit review and underwriting standards, taking into consideration transferee experience, financial strength, and general business standing; (ii) rating agency confirmation that the transfer will not result in a downgrade, withdrawal or qualification of the respective ratings from Fitch, KBRA and S&P assigned to the Series 2013-C12 Certificates; (iii) a 1.0% assumption fee is paid; and (iv) execution of a recourse guaranty and an environmental indemnity by an affiliate of the transferee.
Notwithstanding the foregoing, the following transfers will not require the lender’s approval: any direct or indirect transfers of interests in CCHM Management and/or CCHM Parent held by entities organized under the laws of a country other than the United States, or a political subdivision thereof (such entities, “Foreign Entities”), and any direct or indirect transfers of interests in any such Foreign Entities that hold interests in CCHM Management or CCHM Parent, in any event, so long as OFAC compliance and single purpose entity requirements are still met.
Partial Release. Not permitted.
Real Estate Substitution. Not permitted.
Subordinate and Mezzanine Indebtedness. Not permitted.
Ground Lease. None.
Terrorism Insurance. The loan documents require that the “all risk” insurance policy required to be maintained by the borrower provide coverage for terrorism in an amount equal to the full replacement cost of the Studio Green Apartments Property, as well as business interruption insurance covering no less than the 18-month period following the occurrence of a casualty event, together with a 12-month extended period of indemnity.
THE INFORMATION IN THIS STRUCTURAL AND COLLATERAL TERM SHEET IS NOT COMPLETE AND MAY BE AMENDED PRIOR TO THE TIME OF SALE. THIS TERM SHEET IS NOT AN OFFER TO SELL THESE SECURITIES AND IT IS NOT A SOLICITATION OF AN OFFER TO BUY THESE SECURITIES IN ANY JURISDICTION WHERE THE OFFER OR SALE IS NOT PERMITTED.
106
(THIS PAGE INTENTIONALLY LEFT BLANK)
107
| No. 11 – Flower Hill West |
| Loan Information | Property Information | |||||
| Mortgage Loan Seller: | The Royal Bank of Scotland | Single Asset/Portfolio: | Single Asset | |||
| Credit Assessment (Fitch/KBRA/S&P): | NR/NR/NR | Property Type: | Mixed Use | |||
| Original Principal Balance: | $28,500,000 | Specific Property Type: | Office/Retail | |||
| Cut-off Date Principal Balance: | $28,500,000 | Location: | Del Mar, CA | |||
| % of Initial Pool Balance: | 2.3% | Size: | 67,695 SF | |||
| Loan Purpose: | Refinance | Cut-off Date Principal Balance Per Unit/SF: | $421.01 | |||
| Borrower Name: | Protea FHW, LLC | Year Built/Renovated: | 2012/NAP | |||
| Sponsor: | Protea Holdings | Title Vesting: | Fee | |||
| Mortgage Rate: | 4.257% | Property Manager: | Self-managed | |||
| Note Date: | January 31, 2013 | 3rd Most Recent Occupancy(1): | NAV | |||
| Anticipated Repayment Date: | NAP | 2nd Most Recent Occupancy(1): | NAV | |||
| Maturity Date: | February 1, 2023 | Most Recent Occupancy(1): | NAV | |||
| IO Period: | 36 months | Current Occupancy (As of)(1): | 96.2% (1/31/2013) | |||
| Loan Term (Original): | 120 months | |||||
| Seasoning: | 1 month | Underwriting and Financial Information: | ||||
| Amortization Term (Original): | 360 months | |||||
| Loan Amortization Type: | Interest-only, Amortizing Balloon | 3rd Most Recent NOI(1): | NAV | |||
| Interest Accrual Method: | Actual/360 | 2nd Most Recent NOI(1): | NAV | |||
| Call Protection: | L(25),D(91),O(4) | Most Recent NOI(1): | NAV | |||
| Lockbox Type: | Hard/Springing Cash Management | |||||
| Additional Debt: | None | U/W Revenues: | $3,037,376 | |||
| Additional Debt Type: | NAP | U/W Expenses: | $681,642 | |||
| U/W NOI: | $2,355,734 | |||||
| U/W NCF: | $2,335,619 | |||||
Escrows and Reserves: | U/W NOI DSCR : | 1.40x | ||||
| U/W NCF DSCR: | 1.39x | |||||
| Type: | Initial | Monthly | Cap (If Any) | U/W NOI Debt Yield: | 8.3% | |
| Taxes | $0 | $25,133 | NAP | U/W NCF Debt Yield: | 8.2% | |
| Insurance | $323 | $1,263 | NAP | As-Is Appraised Value: | $40,900,000 | |
| Replacement Reserves | $621 | $621 | NAP | As-Is Appraisal Valuation Date: | December 15, 2012 | |
| TI/LC Reserve | $840 | $840 | NAP | Cut-off Date LTV Ratio: | 69.7% | |
Tenant Reserve(2) | $2,394,265 | $0 | NAP | LTV Ratio at Maturity or ARD: | 60.6% | |
| (1) | Historical occupancy and financial data is not available as the Flower Hill West property was built in late 2012. The Flower Hill West property is currently 96.2% leased; however, 51.9% of the net rentable area is leased to tenants that have had their respective spaces delivered to them by the borrower, are building out their space, have not yet taken occupancy and are in a free rent period. |
| (2) | The upfront $2,394,265 Tenant Reserve was held back at closing for concessions, leasing commissions and tenant improvements for the following tenants: Whole Foods ($97,500), Sharp Healthcare ($1,737,293), Sun Diego ($355,882), Yogurtland ($88,668) and Planet Beauty ($114,922). |
The Flower Hill West mortgage loan is evidenced by a single promissory note that is secured by a first mortgage encumbering a 67,695 square foot mixed use property located in Del Mar, California (the “Flower Hill West Property”) located approximately 21 miles north of downtown San Diego. The Flower Hill West Property is anchored by Whole Foods and was built in 2012. Parking at the Flower Hill West Property is shared with the adjacent Flower Field East shopping center and consists of both subterranean garage parking and surface parking totaling approximately 919 parking spaces. The parking is shared in common on a non-exclusive basis by all tenants at the Flower Hill West Property and Flower Field East shopping center. As such, a parking count for only the Flower Hill West Property is unavailable. The total parking ratio for the Flower Hill West Property and Flower Field East shopping center is 5.35 per 1,000 square feet. As of January 31, 2013, the Flower Hill West Property was 96.2% leased to five tenants.
Sources and Uses
| Sources | Uses | ||||||||
| Original loan amount | $28,500,000 | 100.0% | Loan payoff | $20,723,484 | 72.7 | % | |||
| Closing costs | 488,641 | 1.7 | |||||||
| Reserves | 2,396,049 | 8.4 | |||||||
| Return of equity | 4,891,826 | 17.2 | |||||||
| Total Sources | $28,500,000 | 100.0% | Total Uses | $28,500,000 | 100.0 | % |
THE INFORMATION IN THIS STRUCTURAL AND COLLATERAL TERM SHEET IS NOT COMPLETE AND MAY BE AMENDED PRIOR TO THE TIME OF SALE. THIS TERM SHEET IS NOT AN OFFER TO SELL THESE SECURITIES AND IT IS NOT A SOLICITATION OF AN OFFER TO BUY THESE SECURITIES IN ANY JURISDICTION WHERE THE OFFER OR SALE IS NOT PERMITTED.
108
| FLOWER HILL WEST |
The following table presents certain information relating to the tenancies at the Flower Hill West Property:
Major Tenants
| Tenant Name | Credit Rating (Fitch/ Moody’s/ S&P)(1) | Tenant NRSF | % of NRSF | Annual U/W Base Rent PSF | Annual U/W Base Rent | % of Total Annual U/W Base Rent | Sales PSF(2) | Occupancy Cost(2) | Lease Expiration Date | |
| Anchor Tenant | ||||||||||
Whole Foods(3) | NR/NR/BBB- | 30,000 | 44.3% | $36.75 | $1,102,500 | 45.5% | NAV | NAV | 1/31/2033 | |
| Total Anchor Tenant | 30,000 | 44.3% | $36.75 | $1,102,500 | 45.5% | |||||
| Non-Major Tenants | ||||||||||
Sharp Healthcare(4)(5) | NR/A2/NR | 29,364 | 43.4% | $33.00 | $969,012 | 40.0% | NAV | NAV | 7/31/2028 | |
Sun Diego(4) | NR/NR/NR | 3,227 | 4.8% | $60.00 | $193,620 | 8.0% | NAV | NAV | 4/30/2023 | |
Yogurtland(4) | NR/NR/NR | 1,256 | 1.9% | $63.00 | $79,128 | 3.3% | NAV | NAV | 1/31/2023 | |
Planet Beauty(4) | NR/NR/NR | 1,260 | 1.9% | $62.40 | $78,624 | 3.2% | NAV | NAV | 1/31/2018 | |
| Total Major Tenants | 35,107 | 51.9% | $37.21 | $1,320,384 | 54.5% | |||||
| Occupied Collateral | 65,107 | 96.2% | $35.79 | $2,422,884 | 100.0% | |||||
| Vacant Space | 2,588 | 3.8% | ||||||||
| Collateral Total | 67,695 | 100.0% | ||||||||
| (1) | Certain ratings are those of the parent company whether or not the parent guarantees the lease. |
| (2) | Sales and Occupancy Cost are not available as the Flower Hill West Property was built in late 2012. |
| (3) | Whole Foods commenced rental payments on February 1, 2013 and is scheduled to open for business on February 27, 2013. |
| (4) | Occupied Collateral includes four tenants, Sharp Healthcare (43.4% of net rentable area, 40.0% of Annual U/W Base Rent), Sun Diego (4.8% of net rentable area, 8.0% of Annual U/W Base Rent), Yogurtland (1.9% of net rentable area, 3.3% of Annual U/W Base Rent) and Planet Beauty (1.9% of net rentable area, 3.2% of Annual U/W Base Rent) which have not yet taken occupancy or begun paying rent. Sharp Healthcare is scheduled to take occupancy by September 1, 2013 and commence rental payments by June 1, 2014. Sun Diego is expected to take occupancy and commence rental payments by May 1, 2013. Planet Beauty and Yogurtland are scheduled to take occupancy and commence rental payments by June 1, 2013. |
| (5) | The borrower has delivered the space to the tenant and the tenant has no termination options during the lease term except under certain circumstances for casualty and condemnation. |
THE INFORMATION IN THIS STRUCTURAL AND COLLATERAL TERM SHEET IS NOT COMPLETE AND MAY BE AMENDED PRIOR TO THE TIME OF SALE. THIS TERM SHEET IS NOT AN OFFER TO SELL THESE SECURITIES AND IT IS NOT A SOLICITATION OF AN OFFER TO BUY THESE SECURITIES IN ANY JURISDICTION WHERE THE OFFER OR SALE IS NOT PERMITTED.
109
| FLOWER HILL WEST |
The following table presents certain information relating to the lease rollover schedule at the Flower Hill West Property:
Lease Expiration Schedule(1)(2)
Year Ending December 31, | No. of Leases Expiring | Expiring NRSF | % of Total NRSF | Cumulative Expiring NRSF | Cumulative % of Total NRSF | Annual U/W Base Rent | Annual U/W Base Rent PSF(3) | |
| MTM | 0 | 0 | 0.0% | 0 | 0.0% | $0 | $0.00 | |
| 2013 | 0 | 0 | 0.0% | 0 | 0.0% | $0 | $0.00 | |
| 2014 | 0 | 0 | 0.0% | 0 | 0.0% | $0 | $0.00 | |
| 2015 | 0 | 0 | 0.0% | 0 | 0.0% | $0 | $0.00 | |
| 2016 | 0 | 0 | 0.0% | 0 | 0.0% | $0 | $0.00 | |
| 2017 | 0 | 0 | 0.0% | 0 | 0.0% | $0 | $0.00 | |
| 2018 | 1 | 1,260 | 1.9% | 1,260 | 1.9% | $78,624 | $62.40 | |
| 2019 | 0 | 0 | 0.0% | 1,260 | 1.9% | $0 | $0.00 | |
| 2020 | 0 | 0 | 0.0% | 1,260 | 1.9% | $0 | $0.00 | |
| 2021 | 0 | 0 | 0.0% | 1,260 | 1.9% | $0 | $0.00 | |
| 2022 | 0 | 0 | 0.0% | 1,260 | 1.9% | $0 | $0.00 | |
| 2023 | 2 | 4,483 | 6.6% | 5,743 | 8.5% | $272,748 | $60.84 | |
| Thereafter | 2 | 59,364 | 87.7% | 65,107 | 96.2% | $2,071,512 | $35.15 | |
| Vacant | 0 | 2,588 | 3.8% | 67,695 | 100.0% | $0 | $0.00 | |
| Total/Weighted Average | 5 | 67,695 | 100.0% | $2,422,884 | $35.79 |
| (1) | Information was obtained from the underwritten rent roll. |
| (2) | Certain tenants may have lease termination options that are exercisable prior to the stated expiration date of the subject lease and that are not considered in the Lease Expiration Schedule. |
| (3) | Weighted Average Annual U/W Base Rent PSF excludes vacant space. |
The following table presents historical occupancy percentages at the Flower Hill West Property:
Historical Occupancy(1)
12/31/2009 | 12/31/2010 | 12/31/2011 | 1/31/2013 | |||
| NAV | NAV | NAV | 96% |
| (1) | Historical occupancy and financial data is not available as the Flower Hill West property was built in late 2012. The Flower Hill West property is currently 96.2% leased; however, 51.9% of the net rentable area is leased to tenants that have had their respective spaces delivered to them by the borrower, are building out their space, have not yet taken occupancy and are in a free rent period. |
Operating History and Underwritten Net Cash Flow. The following table presents certain information relating to the Underwritten Net Cash Flow at the Flower Hill West Property:
Cash Flow Analysis(1)
| U/W | U/W $ per SF | |||
| Base Rent | $2,422,884 | $35.79 | ||
| Grossed Up Vacant Space | 158,386 | 2.34 | ||
| Total Reimbursables | 615,968 | 9.10 | ||
| Other Income | 0 | 0.00 | ||
| Less Vacancy & Credit Loss | (159,862)(2) | (2.36) | ||
| Effective Gross Income | $3,037,376 | $44.87 | ||
| Total Operating Expenses | $681,642 | $10.07 | ||
| Net Operating Income | $2,355,734 | $34.80 | ||
| TI/LC | 9,960 | 0.15 | ||
| Capital Expenditures | 10,154 | 0.15 | ||
| Net Cash Flow | $2,335,619 | $34.50 | ||
| NOI DSCR | 1.40x | |||
| NCF DSCR | 1.39x | |||
| NOI DY | 8.3% | |||
| NCF DY | 8.2% |
| (1) | Historical occupancy and financial data is not available as the Flower Hill West property was built in late 2012. The Flower Hill West property is currently 96.2% leased; however, 51.9% of the net rentable area is leased to tenants that have had their respective spaces delivered to them by the borrower, are building out their space, have not yet taken occupancy and are in a free rent period. |
| (2) | The underwritten economic vacancy is 5.0%. |
THE INFORMATION IN THIS STRUCTURAL AND COLLATERAL TERM SHEET IS NOT COMPLETE AND MAY BE AMENDED PRIOR TO THE TIME OF SALE. THIS TERM SHEET IS NOT AN OFFER TO SELL THESE SECURITIES AND IT IS NOT A SOLICITATION OF AN OFFER TO BUY THESE SECURITIES IN ANY JURISDICTION WHERE THE OFFER OR SALE IS NOT PERMITTED.
110
(THIS PAGE INTENTIONALLY LEFT BLANK)
111
| No. 12 - Sportsman’s Warehouse Portfolio | |||||||
| Loan Information | Property Information | ||||||
| Mortgage Loan Seller: | Wells Fargo Bank, National Association | Single Asset/Portfolio: | Portfolio | ||||
Credit Assessment (Fitch/KBRA/S&P): | NR/NR/NR | Property Type: | Retail | ||||
| Original Principal Balance: | $24,800,000 | Specific Property Type: | Single Tenant | ||||
| Cut-off Date Principal Balance: | $24,800,000 | Location: | Various – See Table | ||||
| % of Initial Pool Balance: | 2.0% | Size: | 296,778 SF | ||||
| Loan Purpose: | Acquisition | Cut-off Date Principal Balance Per Unit/SF: | $83.56 | ||||
| Borrower Name: | Spirit SPE Portfolio 2012-4, LLC | Year Built/Renovated: | Various – See Table | ||||
| Sponsor: | Spirit Realty Capital, Inc. | Title Vesting: | Fee | ||||
| Mortgage Rate: | 3.900% | Property Manager: | Tenant-managed | ||||
| Note Date: | February 8, 2013 | 3rd Most Recent Occupancy (As of): | 100.0% (12/31/2010) | ||||
| Anticipated Repayment Date: | NAP | 2nd Most Recent Occupancy (As of): | 100.0% (12/31/2011) | ||||
| Maturity Date: | March 1, 2018 | Most Recent Occupancy (As of): | 100.0% (12/31/2012) | ||||
| IO Period: | 60 months | Current Occupancy (As of): | 100.0% (3/1/2013) | ||||
| Loan Term (Original): | 60 months | ||||||
| Seasoning: | 0 months | Underwriting and Financial Information: | |||||
| Amortization Term (Original): | NAP | ||||||
| Loan Amortization Type: | Interest-only, Balloon | 3rd Most Recent NOI(5): | NAV | ||||
| Interest Accrual Method: | Actual/360 | 2nd Most Recent NOI(5): | NAV | ||||
| Call Protection: | L(24),D(32),O(4) | Most Recent NOI(5): | NAV | ||||
| Lockbox Type: | Springing (Without Established Account) | ||||||
| Additional Debt: | None | ||||||
| Additional Debt Type: | NAP | U/W Revenues: | $3,303,258 | ||||
| U/W Expenses: | $140,050 | ||||||
| U/W NOI: | $3,163,208 | ||||||
| U/W NCF: | $2,894,878 | ||||||
| U/W NOI DSCR: | 3.23x | ||||||
Escrows and Reserves: | U/W NCF DSCR: | 2.95x | |||||
| U/W NOI Debt Yield: | 12.8% | ||||||
| Type: | Initial | Monthly | Cap (If Any) | U/W NCF Debt Yield: | 11.7% | ||
Taxes(1) | $0 | Springing | NAP | As-Is Appraised Value: | $45,200,000 | ||
Insurance(2) | $0 | Springing | NAP | As-Is Appraisal Valuation Date(6): | Various | ||
Replacement Reserves(3) | $0 | Springing | NAP | Cut-off Date LTV Ratio: | 54.9% | ||
TI/LC(4) | $0 | Springing | NAP | LTV Ratio at Maturity or ARD: | 54.9% | ||
| (1) | Monthly tax escrows are not required as long as no event of default has occurred and is continuing and the borrower delivers to the lender satisfactory evidence of payment of taxes. |
| (2) | Monthly insurance escrows are not required as long as no event of default has occurred and is continuing and the borrower provides satisfactory evidence that the Sportsman’s Warehouse Portfolio Properties are insured in accordance with the loan documents. |
| (3) | Monthly replacement reserves are not required as long as no event of default has occurred and is continuing and the tenant adequately maintains the Sportsman’s Warehouse Portfolio Properties. |
| (4) | Monthly TI/LC reserves are not required as long as no event of default has occurred and is continuing. |
| (5) | The Sportsman’s Warehouse Portfolio Properties were previously owned by Sportsman’s Warehouse, and a lease was not in-place. The borrower acquired the Sportsman’s Warehouse Portfolio Properties in a sale-leaseback transaction. |
| (6) | The As-Is Appraisal Valuation Dates range from December 7, 2012 to December 17, 2012. |
The Sportsman’s Warehouse Portfolio mortgage loan is evidenced by a single promissory note that is secured by a first mortgage encumbering six single tenant retail properties located in Arizona, Colorado, Iowa and Utah (the “Sportsman’s Warehouse Portfolio Properties”). The Sportsman’s Warehouse Portfolio Properties contain a total of approximately 296,778 square feet and were built between 2001 and 2005. As of March 1, 2013, the Sportsman’s Warehouse Portfolio Properties were 100.0% occupied.
Sources and Uses
| Sources | Uses | |||||||
| Original loan amount | $24,800,000 | 54.5% | Purchase price | $45,198,625 | 99.4% | |||
| Sponsor’s new cash contribution | 20,669,855 | 45.5 | Closing costs | 271,230 | 0.6 | |||
| Total Sources | $45,469,855 | 100.0% | Total Uses | $45,469,855 | 100.0% | |||
THE INFORMATION IN THIS STRUCTURAL AND COLLATERAL TERM SHEET IS NOT COMPLETE AND MAY BE AMENDED PRIOR TO THE TIME OF SALE. THIS TERM SHEET IS NOT AN OFFER TO SELL THESE SECURITIES AND IT IS NOT A SOLICITATION OF AN OFFER TO BUY THESE SECURITIES IN ANY JURISDICTION WHERE THE OFFER OR SALE IS NOT PERMITTED.
112
| SPORTSMAN’S WAREHOUSE PORTFOLIO |
The following table presents certain information relating to the Sportsman’s Warehouse Portfolio Properties:
| Property Name – Location | Allocated Cut-off Date Principal Balance | % of Portfolio Cut- off Date Principal Balance | Current Occupancy | Year Built/ Renovated | Net Rentable Area (SF) | Appraised Value | |
| Sportsman’s Warehouse – Thornton, CO | $4,312,566 | 17.4% | 100.0% | 2003/NAP | 51,575 | $7,860,000 | |
| Sportsman’s Warehouse – Midvale, UT | $4,246,726 | 17.1% | 100.0% | 2002/NAP | 50,764 | $7,740,000 | |
| Sportsman’s Warehouse – Mesa, AZ | $4,169,912 | 16.8% | 100.0% | 2005/NAP | 49,947 | $7,600,000 | |
| Sportsman’s Warehouse – Phoenix, AZ | $4,060,177 | 16.4% | 100.0% | 2003/NAP | 48,667 | $7,400,000 | |
| Sportsman’s Warehouse – Ankeny, IA | $4,147,965 | 16.7% | 100.0% | 2003/NAP | 49,667 | $7,560,000 | |
| Sportsman’s Warehouse – Loveland, CO | $3,862,655 | 15.6% | 100.0% | 2001/NAP | 46,158 | $7,040,000 | |
| Total/Weighted Average | $24,800,000 | 100.0% | 100.0% | 296,778 | $45,200,000 | ||
The following table presents certain information relating to the tenant at the Sportsman’s Warehouse Portfolio Properties:
Major Tenant
| Tenant Name | Credit Rating (Fitch/ Moody’s/ S&P) | Tenant NRSF | % of NRSF | Annual U/W Base Rent PSF | Annual U/W Base Rent | % of Total Annual U/W Base Rent | Sales PSF(1) | Occupancy Cost(2) | Lease Expiration Date |
| Major Tenant | |||||||||
Sportsman’s Warehouse(3) | NR/B2/B | 296,778 | 100.0% | $11.92 | $3,538,157 | 100.0% | $295 | 4.2% | 10/31/2027 |
| Total Major Tenant | 296,778 | 100.0% | $11.92 | $3,538,157 | 100.0% | ||||
| (1) | Sales are for the 12-month period ending June 30, 2012. |
| (2) | Occupancy Cost is based on underwritten base rent and reimbursements. The Sportsman’s Warehouse Portfolio Properties were previously owned by Sportsman’s Warehouse, and a lease was not in-place. |
| (3) | Sportsman’s Warehouse has one lease that encompasses all six of the Sportsman’s Warehouse Portfolio Properties. |
The following table presents certain information relating to the historical sales and occupancy costs at the Sportsman’s Warehouse Portfolio Properties:
Historical Sales (PSF) and Occupancy Costs(1)
| Property Name – Location | 2010 | 2011 | TTM 6/30/2012 |
| Sportsman’s Warehouse – Thornton, CO | $232 | $268 | $289 |
| Sportsman’s Warehouse – Midvale, UT | $324 | $364 | $387 |
| Sportsman’s Warehouse – Mesa, AZ | $216 | $261 | $282 |
| Sportsman’s Warehouse – Phoenix, AZ | $251 | $286 | $302 |
| Sportsman’s Warehouse – Loveland, CO | $254 | $287 | $307 |
| Sportsman’s Warehouse – Ankeny, IA | $160 | $193 | $203 |
Occupancy Cost(2) | 5.1% | 4.5% | 4.2% |
| (1) Historical Sales (PSF) is based on historical statements provided by the borrower. | |||
| (2) Occupancy Costs are based on underwritten base rent and reimbursements. The Sportsman’s Warehouse Portfolio Properties were previously owned by Sportsman’s Warehouse, and a lease was not in-place. | |||
THE INFORMATION IN THIS STRUCTURAL AND COLLATERAL TERM SHEET IS NOT COMPLETE AND MAY BE AMENDED PRIOR TO THE TIME OF SALE. THIS TERM SHEET IS NOT AN OFFER TO SELL THESE SECURITIES AND IT IS NOT A SOLICITATION OF AN OFFER TO BUY THESE SECURITIES IN ANY JURISDICTION WHERE THE OFFER OR SALE IS NOT PERMITTED.
113
| SPORTSMAN’S WAREHOUSE PORTFOLIO |
The following table presents certain information relating to the lease rollover schedule at the Sportsman’s Warehouse Portfolio Properties:
Lease Expiration Schedule(1)
Year Ending December 31, | No. of Leases Expiring | Expiring NRSF | % of Total NRSF | Cumulative Expiring NRSF | Cumulative % of Total NRSF | Annual U/W Base Rent | Annual U/W Base Rent PSF |
| MTM | 0 | 0 | 0.0% | 0 | 0.0% | $0 | $0.00 |
| 2013 | 0 | 0 | 0.0% | 0 | 0.0% | $0 | $0.00 |
| 2014 | 0 | 0 | 0.0% | 0 | 0.0% | $0 | $0.00 |
| 2015 | 0 | 0 | 0.0% | 0 | 0.0% | $0 | $0.00 |
| 2016 | 0 | 0 | 0.0% | 0 | 0.0% | $0 | $0.00 |
| 2017 | 0 | 0 | 0.0% | 0 | 0.0% | $0 | $0.00 |
| 2018 | 0 | 0 | 0.0% | 0 | 0.0% | $0 | $0.00 |
| 2019 | 0 | 0 | 0.0% | 0 | 0.0% | $0 | $0.00 |
| 2020 | 0 | 0 | 0.0% | 0 | 0.0% | $0 | $0.00 |
| 2021 | 0 | 0 | 0.0% | 0 | 0.0% | $0 | $0.00 |
| 2022 | 0 | 0 | 0.0% | 0 | 0.0% | $0 | $0.00 |
| 2023 | 0 | 0 | 0.0% | 0 | 0.0% | $0 | $0.00 |
Thereafter(2) | 1 | 296,778 | 100.0% | 296,778 | 100.0% | $3,538,157 | $11.92 |
| Vacant | 0 | 0 | 0.0% | 296,778 | 100.0% | $0 | $0.00 |
| Total/Weighted Average | 1 | 296,778 | 100.0% | $3,358,157 | $11.92 |
| (1) | Information obtained from the underwritten rent roll. |
| (2) | Sportsman’s Warehouse has one lease that encompasses all six of the Sportsman’s Warehouse Portfolio Properties. |
The following table presents historical occupancy percentages at the Sportsman’s Warehouse Portfolio Properties:
Historical Occupancy(1)(2)
12/31/2010 | 12/31/2011 | 12/31/2012 | 3/1/2013 | |||
| 100% | 100% | 100% | 100% | |||
| (1) Information obtained from the borrower. | ||||||
| (2) The Sportsman’s Warehouse Properties were previously owned by Sportsman’s Warehouse and a lease was not in place. | ||||||
Operating History and Underwritten Net Cash Flow. The following table presents certain information relating to the Underwritten Net Cash Flow at the Sportsman’s Warehouse Portfolio Properties:
Cash Flow Analysis(1)
| U/W | U/W $ per SF | |||
| Base Rent | $3,538,157 | $11.92 | ||
| Grossed Up Vacant Space | 0 | 0.00 | ||
| Percentage Rent | 0 | 0.00 | ||
| Total Reimbursables | 118,917 | 0.40 | ||
| Other Income | 0 | 0.00 | ||
| Less Vacancy & Credit Loss | (353,816)(2) | (1.19) | ||
| Effective Gross Income | $3,303,258 | $11.13 | ||
| Total Operating Expenses | $140,050 | $0.47 | ||
| Net Operating Income | $3,163,208 | $10.66 | ||
| TI/LC | 194,136 | 0.65 | ||
| Capital Expenditures | 74,195 | 0.25 | ||
| Net Cash Flow | $2,894,878 | $9.75 | ||
| NOI DSCR | 3.23x | |||
| NCF DSCR | 2.95x | |||
| NOI DY | 12.8% | |||
| NCF DY | 11.7% | |||
| (1) Historical financials are not available as the Sportsman’s Warehouse Portfolio Properties were previously owned by Sportsman’s Warehouse, and a lease was not in-place. | ||||
| (2) The underwritten economic vacancy is 10.0%. The Sportsman’s Warehouse Portfolio Properties were 100.0% physically occupied as of March 1, 2013. | ||||
THE INFORMATION IN THIS STRUCTURAL AND COLLATERAL TERM SHEET IS NOT COMPLETE AND MAY BE AMENDED PRIOR TO THE TIME OF SALE. THIS TERM SHEET IS NOT AN OFFER TO SELL THESE SECURITIES AND IT IS NOT A SOLICITATION OF AN OFFER TO BUY THESE SECURITIES IN ANY JURISDICTION WHERE THE OFFER OR SALE IS NOT PERMITTED.
114
(THIS PAGE INTENTIONALLY LEFT BLANK)
115
| No. 13 – Intercoastal Hotel Portfolio | |||||||||
| Loan Information | Property Information | ||||||||
| Mortgage Loan Seller: | Basis Real Estate Capital II, LLC | Single Asset/Portfolio: | Portfolio | ||||||
Credit Assessment (Fitch/KBRA/S&P): | NR/NR/NR | Property Type: | Hospitality | ||||||
| Original Principal Balance: | $21,000,000 | Specific Property Type: | Limited Service | ||||||
| Cut-off Date Principal Balance: | $21,000,000 | Location: | Various – See Table | ||||||
| % of Initial Pool Balance: | 1.7% | Size: | 284 rooms | ||||||
| Loan Purpose: | Refinance | Cut-off Date Principal Balance Per Room: | $73,944 | ||||||
| Borrower Name: | 42 Hotel Raleigh, LLC, 42 Hotel SLC, LLC and 42 Hotel Tooele, LLC | Year Built/Renovated: | Various – See Table | ||||||
| Sponsor: | Natalie Roberts | Title Vesting: | Fee | ||||||
| Mortgage Rate: | 4.880% | Property Manager: | InterCoastal Property Services, LLC | ||||||
| Note Date: | February 15, 2013 | 3rd Most Recent Occupancy (As of): | 65.8% (12/31/2009) | ||||||
| Anticipated Repayment Date: | NAP | 2nd Most Recent Occupancy (As of): | 71.7% (12/31/2010) | ||||||
| Maturity Date: | March 1, 2023 | Most Recent Occupancy (As of): | 77.4% (12/31/2011) | ||||||
| IO Period: | None | Current Occupancy (As of): | 71.5% (TTM 11/30/2012) | ||||||
| Loan Term (Original): | 120 months | ||||||||
| Seasoning: | 0 months | ||||||||
| Amortization Term (Original): | 300 months | Underwriting and Financial Information: | |||||||
| Loan Amortization Type: | Amortizing Balloon | ||||||||
| Interest Accrual Method: | Actual/360 | 3rd Most Recent NOI (As of): | $2,652,415 (12/31/2010) | ||||||
| Call Protection: | L(24),D(92),O(4) | 2nd Most Recent NOI (As of): | $2,959,602 (12/31/2011) | ||||||
| Lockbox Type: | Hard/Springing Cash Management | Most Recent NOI (As of): | $2,865,252 (TTM 11/30/2012) | ||||||
Additional Debt(1): | Yes | ||||||||
Additional Debt Type(1): | Future Mezzanine | ||||||||
| U/W Revenues: | $7,267,945 | ||||||||
| U/W Expenses: | $4,457,659 | ||||||||
| U/W NOI: | $2,810,286 | ||||||||
| U/W NCF: | $2,519,568 | ||||||||
| U/W NOI DSCR: | 1.93x | ||||||||
| U/W NCF DSCR: | 1.73x | ||||||||
Escrows and Reserves: | U/W NOI Debt Yield: | 13.4% | |||||||
| U/W NCF Debt Yield: | 12.0% | ||||||||
Type: | Initial | Monthly | Cap (If Any) | As-Is Appraised Value: | $31,500,000 | ||||
| Taxes | $105,429 | $18,183 | NAP | As-Is Appraisal Valuation Date: | Various | ||||
| Insurance | $42,251 | $7,042 | NAP | Cut-off Date LTV Ratio: | 66.7% | ||||
| Replacement Reserve | $0 | $24,226 | NAP | LTV Ratio at Maturity or ARD: | 49.6% | ||||
| (1) | Subject to (i) no event of default; (ii) no rating agency downgrades; (iii) LTV shall not exceed 75.0%; and (iv) combined DSCR shall not be less than 1.30x to 1.00x. |
The Intercoastal Hotel Portfolio mortgage loan is evidenced by a single promissory note that is secured by three first mortgages encumbering three limited service hotels containing a total of 284 rooms located in Raleigh, North Carolina, Salt Lake City, Utah and Tooele, Utah (the “Intercoastal Hotel Portfolio Properties”).
Sources and Uses
| Sources | Uses | |||||||
| Original loan amount | $21,000,000 | 80.7% | Loan payoff | $25,326,388 | 97.3% | |||
| Sponsor’s new cash contribution | 5,029,822 | 19.3 | Closing costs | 555,754 | 2.1 | |||
| Reserves | 147,680 | 0.6 | ||||||
| Total Sources | $26,029,822 | 100.0% | Total Uses | $26,029,822 | 100.0% |
THE INFORMATION IN THIS STRUCTURAL AND COLLATERAL TERM SHEET IS NOT COMPLETE AND MAY BE AMENDED PRIOR TO THE TIME OF SALE. THIS TERM SHEET IS NOT AN OFFER TO SELL THESE SECURITIES AND IT IS NOT A SOLICITATION OF AN OFFER TO BUY THESE SECURITIES IN ANY JURISDICTION WHERE THE OFFER OR SALE IS NOT PERMITTED.
116
| INTERCOASTAL HOTEL PORTFOLIO |
The following table presents certain information relating to the Intercoastal Hotel Portfolio Properties:
| Property Name - Location | Specific Property Type | Allocated Cut-off Date Principal Balance | % of Portfolio Cut-off Date Principal Balance | Rooms | Cut-off Date Principal Balance Per Room | Year Built/ Renovated | Appraised Value |
| Hampton Inn Raleigh – Raleigh, NC | Limited Service | $8,624,000 | 41.1% | 128 | $67,375 | 1988/2010 | $13,300,000 |
| Holiday Inn Express SLC – Salt Lake City, UT | Limited Service | $7,956,000 | 37.9% | 92 | $86,478 | 2007/NAP | $11,700,000 |
| Holiday Inn Express Tooele – Tooele, UT | Limited Service | $4,420,000 | 21.0% | 64 | $69,063 | 2006/NAP | $6,500,000 |
| Total/Weighted Average | $21,000,000 | 100.0% | 284 | $73,944 | $31,500,000 |
Hampton Inn Raleigh – Raleigh, North Carolina (41.1% of Portfolio Cut-off Date Principal Balance)
The Hampton Inn Raleigh is a five-story property that contains 128 guestrooms. The property opened in 1988 and is currently undergoing a renovation that is expected to be completed by April 30, 2013. The property’s amenities include a lobby eating area, a 24-hour complimentary business center, a 24-hour shop, free “On the House” hot breakfast with a seven-day menu rotation, free wireless high-speed internet access throughout the hotel, a fitness center and an outdoor swimming pool. All guestrooms include one king-size bed or two double beds, a 32-inch LCD HD TV, an armchair, a work desk and chair, a coffeemaker and high-speed internet access. The Hampton Inn Raleigh property is located off of the Raleigh Beltline I-440, just north of the Raleigh central business district and down the street from the Duke Raleigh Hospital. The City of Raleigh is North Carolina’s state capital, the Raleigh-Durham-Cary combined statistical area has a population of approximately 1.8 million people. Over the past decade, Raleigh/Durham has become a hub for technology, research, and development, as well as a regional distribution hub. The Hampton Inn Raleigh property’s franchise agreement expires in January 2018.
Subject and Market Historical Occupancy, ADR and RevPAR
(Hampton Inn Raleigh – Raleigh, NC)(1)
Competitive Set | Hampton Inn Raleigh | Penetration Factor | ||||||||||||||
Year | Occupancy | ADR | RevPAR | Occupancy | ADR | RevPAR | Occupancy | ADR | RevPAR | |||||||
| 11/30/2012 TTM | 65.2% | $83.16 | $54.24 | 63.9% | $87.79 | $56.12 | 98.0% | 105.6% | 103.5% | |||||||
| 11/30/2011 TTM | 65.9% | $80.24 | $52.87 | 67.5% | $85.33 | $57.63 | 102.5% | 106.3% | 109.0% | |||||||
| 11/30/2010 TTM | 62.0% | $79.63 | $49.38 | 59.9% | $83.12 | $49.81 | 96.6% | 104.4% | 100.9% | |||||||
(1) | Information obtained from a third party hospitality report dated December 19, 2012. |
Holiday Inn Express SLC – Salt Lake City, Utah (37.9% of Portfolio Cut-off Date Principal Balance)
The Holiday Inn Express SLC is a three-story property that contains 92 guestrooms and opened in 2007. The property’s amenities include a 24-hour complimentary business center, a complimentary hot breakfast buffet, free wireless high-speed internet access throughout the hotel, a fitness center, a 300 square foot meeting room on the main floor and an indoor swimming pool. All guestrooms include one king-size bed or two queen-size beds, a 32-inch LCD HD TV, an armchair, a work desk and chair, a microwave, refrigerator and coffeemaker and high-speed internet access. The room count also includes 18 suites. The property is located less than one mile east of the Salt Lake City Airport. Salt Lake City is the capital of Utah, with a metro area estimated 2011 population of over 1.1 million residents according to the U.S. Census Bureau. The Holiday Inn Express SLC property’s franchise agreement expires in May 2018.
Subject and Market Historical Occupancy, ADR and RevPAR
(Holiday Inn Express SLC – Salt Lake City, UT)(1)
Competitive Set | Holiday Inn Express SLC | Penetration Factor | ||||||||||||||
Year | Occupancy | ADR | RevPAR | Occupancy | ADR | RevPAR | Occupancy | ADR | RevPAR | |||||||
| 11/30/2012 TTM | 74.2% | $92.17 | $68.36 | 76.7% | $109.47 | $84.01 | 103.5% | 118.8% | 122.9% | |||||||
| 11/30/2011 TTM | 74.3% | $86.23 | $64.03 | 82.8% | $99.79 | $82.67 | 111.6% | 115.7% | 129.1% | |||||||
| 11/30/2010 TTM | 68.0% | $84.20 | $57.26 | 76.1% | $95.94 | $72.99 | 111.9% | 113.9% | 127.5% | |||||||
(1) | Information obtained from a third party hospitality report dated December 17, 2012. |
THE INFORMATION IN THIS STRUCTURAL AND COLLATERAL TERM SHEET IS NOT COMPLETE AND MAY BE AMENDED PRIOR TO THE TIME OF SALE. THIS TERM SHEET IS NOT AN OFFER TO SELL THESE SECURITIES AND IT IS NOT A SOLICITATION OF AN OFFER TO BUY THESE SECURITIES IN ANY JURISDICTION WHERE THE OFFER OR SALE IS NOT PERMITTED.
117
| INTERCOASTAL HOTEL PORTFOLIO |
Holiday Inn Express Tooele – Tooele, Utah (21.0% of Portfolio Cut-off Date Principal Balance)
The Holiday Inn Express Tooele is a three-story property that contains 64 guestrooms, which includes 14 suites, and opened in 2006. The property’s amenities include a 24-hour complimentary business center, a complimentary hot breakfast buffet, free wireless high-speed internet access throughout the hotel, an outdoor picnic area including a barbeque and an indoor swimming pool. All guestrooms include one king-size bed or two queen-size beds, a 32-inch LCD HD TV, an armchair, a work desk and chair, a microwave, refrigerator and coffeemaker and high-speed internet access. The Holiday Inn Express Tooele property is located in the Salt Lake City MSA, in the suburb of Tooele, approximately 25 miles northeast of the Salt Lake City central business district and approximately 10 miles south of an Interstate 80 exit at the entrance to the town of Tooele. The Holiday Inn Express Tooele property’s franchise agreement expires in May 2018.
Subject and Market Historical Occupancy, ADR and RevPAR
(Holiday Inn Express Tooele – Tooele, UT)(1)
Competitive Set | Holiday Inn Express Tooele | Penetration Factor | ||||||||||||||
Year | Occupancy | ADR | RevPAR | Occupancy | ADR | RevPAR | Occupancy | ADR | RevPAR | |||||||
| 11/30/2012 TTM | 68.4% | $106.84 | $73.10 | 79.1% | $97.65 | $77.20 | 115.5% | 91.4% | 105.6% | |||||||
| 11/30/2011 TTM | 74.3% | $90.48 | $67.25 | 82.2% | $98.30 | $80.85 | 110.7% | 108.7% | 120.2% | |||||||
| 11/30/2010 TTM | 72.3% | $89.87 | $64.93 | 81.0% | $102.18 | $82.73 | 112.0% | 113.7% | 127.4% | |||||||
(1) | Information obtained from a third party hospitality report dated December 17, 2012. |
Operating History and Underwritten Net Cash Flow: The following table presents certain information relating to the historical operating performance and the Underwritten Net Cash Flow for the Intercoastal Hotel Portfolio Properties:
Cash Flow Analysis
| 2010 | 2011 | TTM 11/30/2012 | U/W | U/W $ per Room | ||||||
| Occupancy | 71.7% | 77.4% | 71.5% | 71.5% | ||||||
| ADR | $90.82 | $91.99 | $98.24 | $98.24 | ||||||
| RevPAR | $65.08 | $71.19 | $70.22 | $70.22 | ||||||
| Total Revenue | $6,861,132 | $7,490,206 | $7,384,113 | $7,267,945 | $25,591 | |||||
| Total Department Expenses | 1,673,716 | 1,788,120 | 1,779,187 | 1,748,776 | 6,158 | |||||
| Gross Operating Profit | $5,187,416 | $5,702,086 | $5,604,926 | $5,519,169 | $19,434 | |||||
| Total Undistributed Expenses | 2,257,691 | 2,458,482 | 2,435,870 | 2,399,617 | 8,449 | |||||
| Profit Before Fixed Charges | $2,929,725 | $3,243,604 | $3,169,056 | $3,119,552 | $10,984 | |||||
| Total Fixed Charges | 277,310 | 284,002 | 303,804 | 309,267 | 1,089 | |||||
| Net Operating Income | $2,652,415 | $2,959,602 | $2,865,252 | $2,810,286 | $9,895 | |||||
| FF&E | 274,445 | 299,608 | 295,365 | 290,718 | 1,024 | |||||
| Net Cash Flow | $2,377,970 | $2,659,994 | $2,569,887 | $2,519,568 | $8,872 | |||||
| NOI DSCR | 1.82x | 2.03x | 1.97x | 1.93x | ||||||
| NCF DSCR | 1.63x | 1.83x | 1.77x | 1.73x | ||||||
| NOI DY | 12.6% | 14.1% | 13.6% | 13.4% | ||||||
| NCF DY | 11.3% | 12.7% | 12.2% | 12.0% | ||||||
THE INFORMATION IN THIS STRUCTURAL AND COLLATERAL TERM SHEET IS NOT COMPLETE AND MAY BE AMENDED PRIOR TO THE TIME OF SALE. THIS TERM SHEET IS NOT AN OFFER TO SELL THESE SECURITIES AND IT IS NOT A SOLICITATION OF AN OFFER TO BUY THESE SECURITIES IN ANY JURISDICTION WHERE THE OFFER OR SALE IS NOT PERMITTED.
118
(THIS PAGE INTENTIONALLY LEFT BLANK)
119
| No. 14 - Old Oakland | |||||||
| Loan Information | Property Information | ||||||
| Mortgage Loan Seller: | Wells Fargo Bank, National Association | Single Asset/Portfolio: | Single Asset | ||||
Credit Assessment (Fitch/KBRA/S&P): | NR/NR/NR | Property Type: | Mixed Use | ||||
| Original Principal Balance: | $18,000,000 | Specific Property Type: | Office/Retail | ||||
| Cut-off Date Principal Balance: | $18,000,000 | Location: | Oakland, CA | ||||
| % of Initial Pool Balance: | 1.5% | Size(4): | 166,175 SF | ||||
| Loan Purpose: | Refinance | Cut-off Date Principal Balance Per Unit/SF: | $108.32 | ||||
| Borrower Name: | PSAI Old Oakland Associates, LLC; PSAI Old Oakland Eighth Street Associates, LLC | Year Built/Renovated: | 1868/1987 | ||||
| Sponsor: | Peter B. Sullivan | Title Vesting: | Fee | ||||
| Mortgage Rate: | 4.420% | Property Manager: | CAC Real Estate Management Co., Inc. | ||||
| Note Date: | February 1, 2013 | 3rd Most Recent Occupancy (As of): | 76.6% (12/31/2009) | ||||
| Anticipated Repayment Date: | NAP | 2nd Most Recent Occupancy (As of): | 82.6% (12/31/2010) | ||||
| Maturity Date: | February 1, 2023 | Most Recent Occupancy (As of): | 95.6% (12/31/2011) | ||||
| IO Period: | 60 months | Current Occupancy (As of): | 95.1% (1/2/2013) | ||||
| Loan Term (Original): | 120 months | ||||||
| Seasoning: | 1 month | Underwriting and Financial Information: | |||||
| Amortization Term (Original): | 300 months | ||||||
| Loan Amortization Type: | Interest-only, Amortizing Balloon | 3rd Most Recent NOI (As of): | $1,639,362 (12/31/2010) | ||||
| Interest Accrual Method: | Actual/360 | 2nd Most Recent NOI (As of): | $1,606,792 (12/31/2011) | ||||
| Call Protection: | L(25),D(91),O(4) | Most Recent NOI (As of): | $2,076,080 (12/31/2012) | ||||
| Lockbox Type: | Springing (Without Established Account) | ||||||
Additional Debt(1): | Yes | U/W Revenues: | $4,601,933 | ||||
Additional Debt Type(1): | Future Unsecured | U/W Expenses: | $2,640,048 | ||||
| U/W NOI: | $1,961,884 | ||||||
| U/W NCF: | $1,620,212 | ||||||
U/W NOI DSCR(4): | 1.65x | ||||||
| Escrows and Reserves: | U/W NCF DSCR(4): | 1.36x | |||||
U/W NOI Debt Yield(4): | 10.9% | ||||||
| Type: | Initial | Monthly | Cap (If Any) | U/W NCF Debt Yield(4): | 9.0% | ||
| Taxes | $0 | $51,163 | NAP | As-Is Appraised Value(4): | $33,780,000 | ||
| Insurance | $0 | Springing | NAP | As-Is Appraisal Valuation Date: | December 27, 2012 | ||
| Replacement Reserve | $200,000 | $3,050(2) | $300,000(2) | Cut-off Date LTV Ratio(4): | 53.3% | ||
| TI/LC | $197,000 | $25,000(3) | $500,000(3) | LTV Ratio at Maturity or ARD(4): | 46.9% | ||
(1) | The borrower is permitted to incur unsecured subordinate debt of no greater than $500,000 from one or more of the direct or indirect owners of the borrower. Any and all member loans shall be fully subordinate to the Old Oakland mortgage loan. |
| (2) | Provided the balance of the Replacement Reserve escrow equals $300,000 prior to February 1, 2016 (and $73,000 after February 1, 2016), no default has occurred and is continuing and the Old Oakland property is being adequately maintained, monthly replacement reserves will be suspended |
| (3) | Provided no Cash Trap Event Period or Cash Sweep Period (as defined in the loan documents) exists and the balance of the TI/LC reserve equals $500,000, monthly TI/LC reserves will be suspended. |
| (4) | The As-Is Appraised Value includes $1,150,000 attributed to a public parking lot that may be freely released. The Cut-off Date LTV Ratio and LTV Ratio at Maturity or ARD excluding the public parking lot are 55.2% and 48.6%, respectively. The U/W NOI DSCR and U/W NCF DSCR excluding the public parking lot income are 1.60x and 1.32x, respectively. The U/W NOI Debt Yield and U/W NCF Debt Yield excluding the public parking lot income are 10.6% and 8.7%, respectively. Following defeasance lockout, the release of three parcels currently used for public parking is permitted for no additional consideration, subject to certain conditions, including (i) post-release NCF Debt Yield shall not be less than 9.5% and (ii) the post-release LTV Ratio must not be greater than 55.0%, provided that with respect to clause (i) and clause (ii) above, the borrower may partially defease the Old Oakland mortgage loan as necessary to satisfy such requirements. |
The Old Oakland mortgage loan is evidenced by a single promissory note that is secured by a first mortgage encumbering a mixed use property located in Oakland, California (the “Old Oakland Property”). The Old Oakland Property consists of ten buildings and contains 166,175 square feet, which is comprised of 120,341 square feet of office space, 45,834 square feet of retail space and two parking areas. The Old Oakland Property was built in 1868, became a historic district in 1976 and underwent an extensive renovation and restoration in 1987. Special care was taken to preserve the Victorian interior features such as grand, sweeping staircases, delicate skylights and ornate period moldings. The Old Oakland Property spans two city blocks and is located in the Old Oakland Historic District, proximate to the Oakland central business district. As of January 2, 2013, the Old Oakland Property was 95.1% leased to 49 tenants.
THE INFORMATION IN THIS STRUCTURAL AND COLLATERAL TERM SHEET IS NOT COMPLETE AND MAY BE AMENDED PRIOR TO THE TIME OF SALE. THIS TERM SHEET IS NOT AN OFFER TO SELL THESE SECURITIES AND IT IS NOT A SOLICITATION OF AN OFFER TO BUY THESE SECURITIES IN ANY JURISDICTION WHERE THE OFFER OR SALE IS NOT PERMITTED.
120
| OLD OAKLAND |
Sources and Uses
| Sources | Uses | |||||||
| Original loan amount | $18,000,000 | 100.0% | Loan payoff(1) | $17,549,146 | 97.5% | |||
| Closing costs | 53,854 | 0.3 | ||||||
| Reserves | 397,000 | 2.2 | ||||||
| Total Sources | $18,000,000 | 100.0% | Total Uses | $18,000,000 | 100.0% |
| (1) | The Old Oakland Property was previously securitized in PCMT 2003-PWR1. |
The following table presents certain information relating to the tenancies at the Old Oakland Property:
Major Tenants
| Tenant Name | Credit Rating (Fitch/Moody’s/ S&P)(1) | Tenant NRSF | % of NRSF | Annual U/W Base Rent PSF | Annual U/W Base Rent | % of Total Annual U/W Base Rent | Lease Expiration Date | |
| Major Tenants | ||||||||
| Kaiser Foundation Health | A+/NR/A+ | 16,418 | 9.9% | $20.94 | $343,725 | 8.9% | 2/28/2015 | |
| Lewis, Fineberg, Lee, Renaker | NR/NR/NR | 12,855 | 7.7% | $22.92 | $294,637 | 7.6% | 8/30/2015 | |
| Beeson, Tayer & Bodine | NR/NR/NR | 10,237 | 6.2% | $27.19 | $278,364 | 7.2% | 7/31/2016 | |
Smart & Final(2) | NR/B2/B+ | 19,880 | 12.0% | $11.95 | $237,501 | 6.2% | 4/30/2019 | |
| Casey Family Program | NR/NR/NR | 7,676 | 4.6% | $29.14 | $223,692 | 5.8% | 3/31/2015 | |
| Total Major Tenants | 67,066 | 40.4% | $20.55 | $1,377,919 | 35.8% | |||
| Non-Major Tenants | 90,954 | 54.7% | $27.21 | $2,475,000 | 64.2% | |||
| Occupied Collateral Total | 158,020 | 95.1% | $24.38 | $3,852,919 | 100.0% | |||
| Vacant Space | 8,155 | 4.9% | ||||||
| Collateral Total | 166,175 | 100.0% | ||||||
| (1) | Certain ratings are those of the parent company whether or not the parent guarantees the lease. |
| (2) | Smart & Final has a Right of First Offer (ROFO) to purchase Old Oakland Property if the borrower wishes to market the property for sale; the ROFO is not extinguished by foreclosure; however, the ROFO is not triggered by foreclosure or deed in lieu thereof. As of December 31, 2011, Smart & Final had total sales of $503 per square foot and an occupancy cost of 2.7%. |
THE INFORMATION IN THIS STRUCTURAL AND COLLATERAL TERM SHEET IS NOT COMPLETE AND MAY BE AMENDED PRIOR TO THE TIME OF SALE. THIS TERM SHEET IS NOT AN OFFER TO SELL THESE SECURITIES AND IT IS NOT A SOLICITATION OF AN OFFER TO BUY THESE SECURITIES IN ANY JURISDICTION WHERE THE OFFER OR SALE IS NOT PERMITTED.
121
| OLD OAKLAND |
The following table presents certain information relating to the lease rollover schedule at the Old Oakland Property:
Lease Expiration Schedule(1)(2)
Year Ending December 31, | No. of Leases Expiring | Expiring NRSF | % of Total NRSF | Cumulative Expiring NRSF | Cumulative % of Total NRSF | Annual U/W Base Rent | Annual U/W Base Rent PSF(3) | ||||
MTM(4) | 6 | 9,211 | 5.5% | 9,211 | 5.5% | $175,930 | $19.10 | ||||
| 2013 | 5 | 11,452 | 6.9% | 20,663 | 12.4% | $322,887 | $28.19 | ||||
| 2014 | 6 | 12,285 | 7.4% | 32,948 | 19.8% | $369,479 | $30.08 | ||||
| 2015 | 11 | 53,976 | 32.5% | 86,924 | 52.3% | $1,340,574 | $24.84 | ||||
| 2016 | 8 | 30,518 | 18.4% | 117,442 | 70.7% | $834,103 | $27.33 | ||||
| 2017 | 3 | 9,829 | 5.9% | 127,271 | 76.6% | $250,414 | $25.48 | ||||
| 2018 | 6 | 5,459 | 3.3% | 132,730 | 79.9% | $174,140 | $31.90 | ||||
| 2019 | 3 | 23,014 | 13.8% | 155,744 | 93.7% | $330,768 | $14.37 | ||||
| 2020 | 1 | 2,276 | 1.4% | 158,020 | 95.1% | $54,624 | $24.00 | ||||
| 2021 | 0 | 0 | 0.0% | 158,020 | 95.1% | $0 | $0.00 | ||||
| 2022 | 0 | 0 | 0.0% | 158,020 | 95.1% | $0 | $0.00 | ||||
| 2023 | 0 | 0 | 0.0% | 158,020 | 95.1% | $0 | $0.00 | ||||
| Thereafter | 0 | 0 | 0.0% | 158,020 | 95.1% | $0 | $0.00 | ||||
| Vacant | 0 | 8,155 | 4.9% | 166,175 | 100.0% | $0 | $0.00 | ||||
| Total/Weighted Average | 49 | 166,175 | 100.0% | $3,852,919 | $24.38 | ||||||
| (1) | Information was obtained from the underwritten rent roll. |
| (2) | Certain tenants may have lease termination options that are exercisable prior to the stated expiration date of the subject lease and that are not considered in the Lease Expiration Schedule. |
| (3) | Weighted Average Annual U/W Base Rent PSF excludes vacant space. |
| (4) | Month-to-month tenancy includes a 2,283 square feet (1.4% of Total NRSF) management office, for which no income has been underwritten. |
The following table presents historical occupancy percentages at the Old Oakland Property:
Historical Occupancy(1)
12/31/2009(2) | 12/31/2010 | 12/31/2011 | 1/2/2013 | |||
| 77% | 83% | 96% | 95% | |||
| (1) | Information obtained from the borrower rent rolls. |
| (2) | Three tenants comprising approximately 30.2% of the net rentable square footage vacated between 2009 and 2010. The borrower was unable to accommodate two tenants’ space needs and the third tenant ceased operations and dissolved. The borrower was able to increase occupancy to its current level by 2011. |
Operating History and Underwritten Net Cash Flow. The following table presents certain information relating to the historical operating performance and the Underwritten Net Cash Flow at the Old Oakland Property:
Cash Flow Analysis
2010 | 2011 | 2012 | U/W | U/W $ per SF | |||||
| Base Rent | $3,114,098 | $3,183,972 | $3,716,490 | $3,852,919 | $23.19 | ||||
| Grossed Up Vacant Space | 0 | 0 | 0 | 216,090 | 1.30 | ||||
| Percentage Rent | 0 | 0 | 0 | 0 | 0.00 | ||||
| Total Reimbursables | 531,276 | 517,243 | 504,906 | 556,442 | 3.35 | ||||
| Other Income | 316,503 | 415,264 | 400,633 | 411,026 | 2.47 | ||||
| Less Vacancy & Credit Loss | 0 | 0 | 0 | (434,544)(1) | (2.61) | ||||
| Effective Gross Income | $3,961,878 | $4,116,479 | $4,622,029 | $4,601,933 | $27.69 | ||||
| Total Operating Expenses | $2,322,515 | $2,509,686 | $2,545,949 | $2,640,048 | $15.89 | ||||
| Net Operating Income | $1,639,362 | $1,606,792 | $2,076,080 | $1,961,884 | $11.81 | ||||
| TI/LC | 442,402 | 707,111 | 306,126 | 305,114 | 1.84 | ||||
| Capital Expenditures | 71,322 | 81,513 | 0 | 36,559 | 0.22 | ||||
| Net Cash Flow | $1,125,638 | $818,168 | $1,769,954 | $1,620,212 | $9.75 | ||||
| NOI DSCR | 1.38x | 1.35x | 1.74x | 1.65x | |||||
| NCF DSCR | 0.95x | 0.69x | 1.49x | 1.36x | |||||
| NOI DY | 9.1% | 8.9% | 11.5% | 10.9% | |||||
| NCF DY | 6.3% | 4.5% | 9.8% | 9.0% |
| (1) | The underwritten economic vacancy is 10.7%. The Old Oakland Property was 95.1% physically occupied as of January 2, 2013. |
THE INFORMATION IN THIS STRUCTURAL AND COLLATERAL TERM SHEET IS NOT COMPLETE AND MAY BE AMENDED PRIOR TO THE TIME OF SALE. THIS TERM SHEET IS NOT AN OFFER TO SELL THESE SECURITIES AND IT IS NOT A SOLICITATION OF AN OFFER TO BUY THESE SECURITIES IN ANY JURISDICTION WHERE THE OFFER OR SALE IS NOT PERMITTED.
122
(THIS PAGE INTENTIONALLY LEFT BLANK)
123
| No. 15 - Hilton Garden Inn Lakewood | |||||||
| Loan Information | Property Information | ||||||
| Mortgage Loan Seller: | The Royal Bank of Scotland | Single Asset/Portfolio: | Single Asset | ||||
| Credit Assessment (Fitch/KBRA/S&P): | NR/NR/NR | Property Type: | Hospitality | ||||
| Original Principal Balance: | $17,000,000 | Specific Property Type: | Limited Service | ||||
| Cut-off Date Principal Balance: | $17,000,000 | Location: | Lakewood, NJ | ||||
| % of Initial Pool Balance: | 1.4% | Size: | 110 rooms | ||||
| Loan Purpose: | Refinance | Cut-off Date Principal Balance Per Room: | $154,545 | ||||
| Borrower Name: | Parkway Lodging Realty, L.L.C. | Year Built/Renovated: | 2008/NAP | ||||
| Sponsor: | Hotels Unlimited, Inc. | Title Vesting: | Fee | ||||
| Mortgage Rate: | 4.488% | Property Manager: | Self-managed | ||||
| Note Date: | February 12, 2013 | 3rd Most Recent Occupancy (As of): | 76.9% (12/31/2009) | ||||
| Anticipated Repayment Date: | NAP | 2nd Most Recent Occupancy (As of): | 81.9% (12/31/2010) | ||||
| Maturity Date: | March 1, 2023 | Most Recent Occupancy (As of): | 83.4% (12/31/2011) | ||||
| IO Period: | None | Current Occupancy (As of): | 87.1% (11/30/2012) | ||||
| Loan Term (Original): | 120 months | ||||||
| Seasoning: | 0 months | Underwriting and Financial Information: | |||||
| Amortization Term (Original): | 300 months | ||||||
| Loan Amortization Type: | Amortizing Balloon | ||||||
| Interest Accrual Method: | Actual/360 | 3rd Most Recent NOI (As of): | $2,574,914 (12/31/2010) | ||||
| Call Protection: | L(24),D(92),O(4) | 2nd Most Recent NOI (As of): | $2,399,741 (12/31/2011) | ||||
| Lockbox Type: | Hard/Springing Cash Management | Most Recent NOI (As of): | $2,593,746 (TTM 11/30/2012) | ||||
| Additional Debt: | None | ||||||
| Additional Debt Type: | NAP | U/W Revenues: | $5,101,191 | ||||
| U/W Expenses: | $2,989,028 | ||||||
| U/W NOI: | $2,112,163 | ||||||
| U/W NCF: | $1,927,707 | ||||||
| U/W NOI DSCR: | 1.87x | ||||||
| U/W NCF DSCR: | 1.70x | ||||||
Escrows and Reserves: | U/W NOI Debt Yield: | 12.4% | |||||
| U/W NCF Debt Yield: | 11.3% | ||||||
| Type: | Initial | Monthly | Cap (If Any) | As-Is Appraised Value: | $25,200,000 | ||
| Taxes | $41,138 | $23,774 | NAP | As-Is Appraisal Valuation Date: | January 4, 2013 | ||
| Insurance | $32,000 | $0 | NAP | Cut-off Date LTV Ratio: | 67.5% | ||
| Replacement Reserve | $0 | $14,132 | NAP | LTV Ratio at Maturity or ARD: | 49.5% | ||
The Hilton Garden Inn Lakewood mortgage loan is evidenced by a single promissory note that is secured by a first mortgage encumbering a four-story limited service hotel containing a total of 110 rooms (the “Hilton Garden Inn Lakewood Property”). The Hilton Garden Inn Lakewood Property is located in Lakewood, New Jersey and was built in 2008. All guestrooms include a 32-inch flat-panel TV, a work desk and chair, an armchair with ottoman, bedside tables, an iron and ironing board, high-speed internet, a microwave, coffeemaker and small refrigerator. The Hilton Garden Inn Lakewood Property amenities include an indoor swimming pool and whirlpool, an exercise room, a market pantry, a business center, a guest laundry facility and a bar. Additionally, the Hilton Garden Inn Lakewood Property features a Longhorn Steakhouse, a Ruby Tuesday and a Starbucks. The Longhorn Steakhouse and Ruby Tuesday are leased fee tenants and own their own improvements. The Hilton Garden Inn Lakewood Property’s franchise agreement expires in November, 2027.
Sources and Uses
| Sources | Uses | |||||||
| Original loan amount | $17,000,000 | 100.0% | Loan payoff | $13,681,304 | 80.5% | |||
| Closing costs | 313,568 | 1.8 | ||||||
| Reserves | 73,138 | 0.4 | ||||||
| Return of equity | 2,931,990 | 17.2 | ||||||
| Total Sources | $17,000,000 | 100.0% | Total Uses | $17,000,000 | 100.0% |
THE INFORMATION IN THIS STRUCTURAL AND COLLATERAL TERM SHEET IS NOT COMPLETE AND MAY BE AMENDED PRIOR TO THE TIME OF SALE. THIS TERM SHEET IS NOT AN OFFER TO SELL THESE SECURITIES AND IT IS NOT A SOLICITATION OF AN OFFER TO BUY THESE SECURITIES IN ANY JURISDICTION WHERE THE OFFER OR SALE IS NOT PERMITTED.
124
| HILTON GARDEN INN LAKEWOOD |
The Hilton Garden Inn Lakewood Property is located in Lakewood, New Jersey approximately 70 miles south of New York City, approximately 75 miles east of Philadelphia, approximately 25 miles north of Atlantic City and approximately 23 miles from Six Flags Great Adventure. The Hilton Garden Inn Lakewood Property is located approximately 56 miles to the south of the Newark Liberty International Airport. The Hilton Garden Inn Lakewood Property is located approximately 30 miles from the Joint Base McGuire-Dix-Lakehurst military installation, a major training center for the Army Reserve, Air Force and National Guard. In 2005, Fort Dix Army Reserve Command merged with the two neighboring military bases, McGuire Air Force Base and the Naval Air Engineering Station at Lakehurst to establish the Joint Base McGuire-Dix-Lakehurst. Other demand generators in the area include the Saint Barnabas Health Care System and the second largest industrial park in the state of New Jersey. The industrial park is the corporate headquarters of Blinds-to-Go, J. Knipper and Jesel, Inc. and the international headquarters of Gaming Labs International. Local businesses in the area include Home Depot, Costco, Verizon Wireless and Lowe’s Home Improvement.
The following table presents certain information relating to the historical operating performance and the Underwritten Net Cash Flow at the Hilton Garden Inn Lakewood Property:
Cash Flow Analysis
| 2010 | 2011 | TTM 11/30/2012 | U/W | U/W $ per Room | ||||||
| Occupancy | 81.9% | 83.4% | 87.1% | 78.0% | ||||||
| ADR | $125.93 | $127.50 | $131.55 | $131.55 | ||||||
| RevPAR | $103.17 | $106.34 | $114.57 | $102.61 | ||||||
| Total Revenue | $5,197,517 | $5,228,679 | $5,652,782 | $5,101,191 | $46,374 | |||||
| Total Department Expenses | 1,134,552 | 1,187,736 | 1,333,857 | 1,191,371 | 10,831 | |||||
| Gross Operating Profit | $4,062,965 | $4,040,943 | $4,318,925 | $3,909,820 | $35,544 | |||||
| Total Undistributed Expenses | 1,328,139 | 1,451,710 | 1,491,351 | 1,458,570 | 13,260 | |||||
| Profit Before Fixed Charges | $2,734,826 | $2,589,233 | $2,827,574 | $2,451,250 | $22,284 | |||||
| Total Fixed Charges | 159,912 | 189,492 | 233,828 | 339,087 | 3,083 | |||||
| Net Operating Income | $2,574,914 | $2,399,741 | $2,593,746 | $2,112,163 | $19,201 | |||||
| FF&E | 0 | 0 | 0 | 184,456 | 1,677 | |||||
| Net Cash Flow | $2,574,914 | $2,399,741 | $2,593,746 | $1,927,707 | $17,525 | |||||
| NOI DSCR | 2.27x | 2.12x | 2.29x | 1.87x | ||||||
| NCF DSCR | 2.27x | 2.12x | 2.29x | 1.70x | ||||||
| NOI DY | 15.1% | 14.1% | 15.3% | 12.4% | ||||||
| NCF DY | 15.1% | 14.1% | 15.3% | 11.3% | ||||||
The following table presents certain information relating to the Hilton Garden Inn Lakewood Property’s competitive set:
Property and Market Historical Occupancy, ADR and RevPAR(1)
Competitive Set | Hilton Garden Inn Lakewood | Penetration Factor | |||||||||||||||
Year | Occupancy | ADR | RevPAR | Occupancy | ADR | RevPAR | Occupancy | ADR | RevPAR | ||||||||
| 11/30/2012 TTM | 70.3% | $111.02 | $78.05 | 87.1% | $131.55 | $114.57 | 123.9% | 118.5% | 146.8% | ||||||||
| 11/30/2011 TTM | 63.9% | $113.98 | $72.78 | 83.0% | $127.63 | $105.88 | 129.9% | 112.0% | 145.5% | ||||||||
| 11/30/2010 TTM | 63.8% | $114.44 | $73.00 | 81.5% | $125.71 | $102.44 | 127.8% | 109.8% | 140.3% | ||||||||
| (1) | Information obtained from a third party hospitality report dated December 19, 2012. |
THE INFORMATION IN THIS STRUCTURAL AND COLLATERAL TERM SHEET IS NOT COMPLETE AND MAY BE AMENDED PRIOR TO THE TIME OF SALE. THIS TERM SHEET IS NOT AN OFFER TO SELL THESE SECURITIES AND IT IS NOT A SOLICITATION OF AN OFFER TO BUY THESE SECURITIES IN ANY JURISDICTION WHERE THE OFFER OR SALE IS NOT PERMITTED.
125
| WFRBS Commercial Mortgage Trust 2013-C12 | Transaction Contact Information |
VI. Transaction Contact Information
Questions regarding this Structural and Collateral Term Sheet may be directed to any of the following individuals:
| Wells Fargo Securities, LLC | RBS Securities Inc. | ||
| Brigid Mattingly | Tel. (312) 269-3062 | Jeff Wilson - Trading | Tel. (203) 897-2900 |
| Fax (312) 658-0140 | |||
| A.J. Sfarra | Tel. (212) 214-5613 | Adam Ansaldi | Tel. (203) 897-0881 |
| Fax (212) 214-8970 | Fax (203) 873-3542 | ||
| Alex Wong | Tel. (212) 214-5615 | Jim Barnard | Tel. (203) 897-4417 |
| Fax (212) 214-8970 | Fax (203) 873-4310 | ||
THE INFORMATION IN THIS STRUCTURAL AND COLLATERAL TERM SHEET IS NOT COMPLETE AND MAY BE AMENDED PRIOR TO THE TIME OF SALE. THIS TERM SHEET IS NOT AN OFFER TO SELL THESE SECURITIES AND IT IS NOT A SOLICITATION OF AN OFFER TO BUY THESE SECURITIES IN ANY JURISDICTION WHERE THE OFFER OR SALE IS NOT PERMITTED.
126