| FREE WRITING PROSPECTUS | ||
| FILED PURSUANT TO RULE 433 | ||
REGISTRATION FILE NO.: 333-172366-07 | ||
 |  |
Free Writing Prospectus
Structural and Collateral Term Sheet
$1,469,544,239
(Approximate Aggregate Cut-off Date Balance of Mortgage Pool)
$1,203,199,000
(Approximate Aggregate Principal Balance of Offered Certificates)
WFRBS Commercial Mortgage Trust 2013-C14
as Issuing Entity
Wells Fargo Commercial Mortgage Securities, Inc.
as Depositor
Wells Fargo Bank, National Association
The Royal Bank of Scotland
Liberty Island Group I LLC
Basis Real Estate Capital II, LLC
C-III Commercial Mortgage LLC
as Sponsors and Mortgage Loan Sellers
Commercial Mortgage Pass-Through Certificates
Series 2013-C14
May 13, 2013
| WELLS FARGO SECURITIES | RBS | |
Co-Lead Manager and Co-Bookrunner | Co-Lead Manager and Co-Bookrunner | |
| Deutsche Bank Securities | ||
| Co-Manager | ||
STATEMENT REGARDING THIS FREE WRITING PROSPECTUS
The depositor has filed a registration statement (including a prospectus) with the Securities and Exchange Commission (‘‘SEC’’) (SEC File No. 333-172366) for the offering to which this communication relates. Before you invest, you should read the prospectus in the registration statement and other documents the depositor has filed with the SEC for more complete information about the depositor, the issuing entity and this offering. You may get these documents for free by visiting EDGAR on the SEC Web site at www.sec.gov. Alternatively, the depositor, any underwriter, or any dealer participating in the offering will arrange to send you the prospectus after filing if you request it by calling toll free 1-800-745-2063 (8 a.m. – 5 p.m. EST) or by emailing wfs.cmbs@wellsfargo.com.
Nothing in this document constitutes an offer of securities for sale in any other jurisdiction where the offer or sale is not permitted. The information contained herein is preliminary as of the date hereof, supersedes any such information previously delivered to you and will be superseded by any such information subsequently delivered and ultimately by the final prospectus relating to the securities. These materials are subject to change, completion, supplement or amendment from time to time.
STATEMENT REGARDING ASSUMPTIONS AS TO SECURITIES, PRICING ESTIMATES AND OTHER INFORMATION
The attached information contains certain tables and other statistical analyses (the “Computational Materials”) which have been prepared in reliance upon information furnished by the Mortgage Loan Sellers. Numerous assumptions were used in preparing the Computational Materials, which may or may not be reflected herein. As such, no assurance can be given as to the Computational Materials’ accuracy, appropriateness or completeness in any particular context; or as to whether the Computational Materials and/or the assumptions upon which they are based reflect present market conditions or future market performance. The Computational Materials should not be construed as either projections or predictions or as legal, tax, financial or accounting advice. You should consult your own counsel, accountant and other advisors as to the legal, tax, business, financial and related aspects of a purchase of these securities. Any weighted average lives, yields and principal payment periods shown in the Computational Materials are based on prepayment and/or loss assumptions, and changes in such prepayment and/or loss assumptions may dramatically affect such weighted average lives, yields and principal payment periods. In addition, it is possible that prepayments or losses on the underlying assets will occur at rates higher or lower than the rates shown in the attached Computational Materials. The specific characteristics of the securities may differ from those shown in the Computational Materials due to differences between the final underlying assets and the preliminary underlying assets used in preparing the Computational Materials. The principal amount and designation of any security described in the Computational Materials are subject to change prior to issuance. None of Wells Fargo Securities, LLC (“WFS”), RBS Securities Inc. (“RBSSI”), Deutsche Bank Securities Inc. or any of their respective affiliates make any representation or warranty as to the actual rate or timing of payments or losses on any of the underlying assets or the payments or yield on the securities. The information in this presentation is based upon management forecasts and reflects prevailing conditions and management’s views as of this date, all of which are subject to change. In preparing this presentation, we have relied upon and assumed, without independent verification, the accuracy and completeness of all information available from public sources or which was provided to us by or on behalf of the Mortgage Loan Sellers or which was otherwise reviewed by us.
This free writing prospectus contains certain forward-looking statements. If and when included in this free writing prospectus, the words “expects”, “intends”, “anticipates”, “estimates” and analogous expressions and all statements that are not historical facts, including statements about our beliefs or expectations, are intended to identify forward-looking statements. Any forward-looking statements are made subject to risks and uncertainties which could cause actual results to differ materially from those stated. Those risks and uncertainties include, among other things, declines in general economic and business conditions, increased competition, changes in demographics, changes in political and social conditions, regulatory initiatives and changes in customer preferences, many of which are beyond our control and the control of any other person or entity related to this offering. The forward-looking statements made in this free writing prospectus are made as of the date stated on the cover. We have no obligation to update or revise any forward-looking statement.
Wells Fargo Securities is the trade name for certain capital markets and investment banking services of Wells Fargo & Company and its subsidiaries, including Wells Fargo Securities, LLC, member FINRA and SIPC, and Wells Fargo Bank, National Association.
RBS is a trade name for the investment banking business of RBSSI. Securities, syndicated loan arranging, financial advisory and other investment banking activities are performed by RBSSI and their securities affiliates. Lending, derivatives and other commercial banking activities are performed by The Royal Bank of Scotland plc and their banking affiliates. RBSSI is a member of SIPC, FINRA and the NYSE.
IRS CIRCULAR 230 NOTICE
THIS TERM SHEET IS NOT INTENDED OR WRITTEN TO BE USED, AND CANNOT BE USED, FOR THE PURPOSE OF AVOIDING U.S. FEDERAL, STATE OR LOCAL TAX PENALTIES. THIS TERM SHEET IS WRITTEN AND PROVIDED BY THE DEPOSITOR IN CONNECTION WITH THE PROMOTION OR MARKETING BY THE DEPOSITOR AND THE CO-LEAD BOOKRUNNING MANAGERS OF THE TRANSACTION OR MATTERS ADDRESSED HEREIN. INVESTORS SHOULD SEEK ADVICE BASED ON THEIR PARTICULAR CIRCUMSTANCES FROM AN INDEPENDENT TAX ADVISOR.
IMPORTANT NOTICE REGARDING THE OFFERED CERTIFICATES
The Offered Certificates referred to in these materials and the asset pool backing them are subject to modification or revision (including the possibility that one or more classes of certificates may be split, combined or eliminated at any time prior to issuance or availability of a final prospectus) and are offered on a “when, as and if issued” basis. Prospective investors should understand that, when considering the purchase of the Offered Certificates, a contract of sale will come into being no sooner than the date on which the relevant class of certificates has been priced and the underwriters have confirmed the allocation of certificates to be made to investors; any “indications of interest” expressed by any prospective investor, and any “soft circles” generated by the underwriters, will not create binding contractual obligations for such prospective investors, on the one hand, or the underwriters, the depositor or any of their respective agents or affiliates, on the other hand.
As a result of the foregoing, a prospective investor may commit to purchase certificates that have characteristics that may change, and each prospective investor is advised that all or a portion of the certificates referred to in these materials may be issued without all or certain of the characteristics described in these materials. The underwriters’ obligation to sell certificates to any prospective investor is conditioned on the certificates and the transaction having the characteristics described in these materials. If the underwriters determine that a condition is not satisfied in any material respect, such prospective investor will be notified, and neither the depositor nor the underwriters will have any obligation to such prospective investor to deliver any portion of the Offered Certificates which such prospective investor has committed to purchase, and there will be no liability between the underwriters, the depositor or any of their respective agents or affiliates, on the one hand, and such prospective investor, on the other hand, as a consequence of the non-delivery.
Each prospective investor has requested that the underwriters provide to such prospective investor information in connection with such prospective investor’s consideration of the purchase of the certificates described in these materials. These materials are being provided to each prospective investor for informative purposes only in response to such prospective investor’s specific request. The underwriters described in these materials may from time to time perform investment banking services for, or solicit investment banking business from, any company named in these materials. The underwriters and/or their affiliates or respective employees may from time to time have a long or short position in any security or contract discussed in these materials.
The information contained herein supersedes any previous such information delivered to any prospective investor and will be superseded by information delivered to such prospective investor prior to the time of sale.
IMPORTANT NOTICE RELATING TO AUTOMATICALLY-GENERATED EMAIL DISCLAIMERS
Any legends, disclaimers or other notices that may appear at the bottom of any email communication to which this free writing prospectus is attached relating to (1) these materials not constituting an offer (or a solicitation of an offer), (2) no representation that these materials are accurate or complete and may not be updated or (3) these materials possibly being confidential, are not applicable to these materials and should be disregarded. Such legends, disclaimers or other notices have been automatically generated as a result of these materials having been sent via Bloomberg or another system.
THE INFORMATION IN THIS STRUCTURAL AND COLLATERAL TERM SHEET IS NOT COMPLETE AND MAY BE AMENDED PRIOR TO THE TIME OF SALE. THIS TERM SHEET IS NOT AN OFFER TO SELL THESE SECURITIES AND IT IS NOT A SOLICITATION OF AN OFFER TO BUY THESE SECURITIES IN ANY JURISDICTION WHERE THE OFFER OR SALE IS NOT PERMITTED.
2
| WFRBS Commercial Mortgage Trust 2013-C14 | Certificate Structure |
I. Certificate Structure
| Class | Expected Ratings (Fitch/KBRA/Moody’s)(1) | Approximate Initial Certificate Principal Balance or Notional Amount(2) | Approx. Initial Credit Support(3) | Pass-Through Rate Description | Weighted Average Life (Years)(4) | Expected Principal Window(4) | Certificate Principal to Value Ratio(5) | Certificate Principal U/W NOI Debt Yield(6) | |||||||||||
Offered Certificates | |||||||||||||||||||
| A-1 | AAA(sf)/AAA(sf)/Aaa(sf) | $61,588,000 | 30.000% | (7) | 2.86 | 07/13 – 05/18 | 45.5% | 15.2% | |||||||||||
| A-2 | AAA(sf)/AAA(sf)/Aaa(sf) | $48,158,000 | 30.000% | (7) | 4.98 | 05/18 – 06/18 | 45.5% | 15.2% | |||||||||||
| A-3 | AAA(sf)/AAA(sf)/Aaa(sf) | $110,000,000 | 30.000% | (7) | 7.94 | 05/21 – 05/21 | 45.5% | 15.2% | |||||||||||
| A-4 | AAA(sf)/AAA(sf)/Aaa(sf) | $160,000,000 | 30.000% | (7) | 9.94 | 04/23 – 05/23 | 45.5% | 15.2% | |||||||||||
| A-5 | AAA(sf)/AAA(sf)/Aaa(sf) | $442,741,000 | 30.000% | (7) | 9.94 | 05/23 – 05/23 | 45.5% | 15.2% | |||||||||||
| A-SB | AAA(sf)/AAA(sf)/Aaa(sf) | $116,194,000 | 30.000% | (7) | 7.45 | 06/18 – 04/23 | 45.5% | 15.2% | |||||||||||
A-S(8) | AAA(sf)/AAA(sf)/Aaa(sf) | $108,379,000 | 22.625% | (7) | 9.94 | 05/23 – 05/23 | 50.3% | 13.7% | |||||||||||
B(8) | AA-(sf)/AA-(sf)/Aa3(sf) | $102,868,000 | 15.625% | (7) | 9.94 | 05/23 – 05/23 | 54.9% | 12.6% | |||||||||||
C(8) | A-(sf)/A-(sf)/A3(sf) | $53,271,000 | 12.000% | (7) | 9.94 | 05/23 – 05/23 | 57.2% | 12.1% | |||||||||||
PEX(8) | A-(sf)/A-(sf)/A3(sf) | $264,518,000 | 12.000% | (7) | 9.94 | 05/23 – 05/23 | 57.2% | 12.1% | |||||||||||
| X-A | AAA(sf)/AAA(sf)/Aaa(sf) | $1,137,060,000(9) | N/A | Variable(10) | N/A | N/A | N/A | N/A | |||||||||||
| X-B | A-(sf)/AAA(sf)/A3(sf) | $156,139,000(11) | N/A | Variable(12) | N/A | N/A | N/A | N/A | |||||||||||
Non-Offered Certificates | |||||||||||||||||||
| X-C | NR/NR/NR | $99,194,239(13) | N/A | Variable(14) | N/A | N/A | N/A | N/A | |||||||||||
A-4FL(15) | AAA(sf)/AAA(sf)/Aaa(sf)(16) | $90,000,000(15) | 30.000% | LIBOR Plus(17) | 9.94 | 04/23 – 05/23 | 45.5% | 15.2% | |||||||||||
A-4FX(15) | AAA(sf)/AAA(sf)/Aaa(sf) | $0(15) | 30.000% | (7) | 9.94 | 04/23 – 05/23 | 45.5% | 15.2% | |||||||||||
| D | BBB-(sf)/BBB-(sf)/NR | $77,151,000 | 6.750% | (7) | 10.01 | 05/23 – 06/23 | 60.7% | 11.4% | |||||||||||
| E | BB(sf)/BB(sf)/NR | $25,717,000 | 5.000% | (7) | 10.03 | 06/23 – 06/23 | 61.8% | 11.2% | |||||||||||
| F | B(sf)/B(sf)/NR | $16,532,000 | 3.875% | (7) | 10.03 | 06/23 – 06/23 | 62.5% | 11.1% | |||||||||||
| G | NR/NR/NR | $56,945,239 | 0.000% | (7) | 10.03 | 06/23 – 06/23 | 65.1% | 10.6% | |||||||||||
| Notes: | ||
| (1) | The expected ratings presented are those of Fitch, Inc. (“Fitch”), Kroll Bond Rating Agency, Inc. (“KBRA”) and Moody’s Investors Service, Inc. (“Moody’s”) which the depositor hired to rate the rated offered certificates. One or more other nationally recognized statistical rating organizations that were not hired by the depositor may use information they receive pursuant to Rule 17g-5 under the Securities Exchange Act of 1934, as amended (the “Exchange Act”) or otherwise, to rate or provide market reports and/or published commentary related to the offered certificates. We cannot assure you as to what ratings a non-hired nationally recognized statistical rating organization would assign or that its reports will not express differing, possibly negative, views of the mortgage loans and/or the offered certificates. See “Risk Factors—Risks Related to the Offered Certificates—Risks Related to the Offered Certificates—Ratings on the Certificates Have Substantial Limitations and Ratings” in the free writing prospectus, dated May 13, 2013 (the “Free Writing Prospectus”). | |
| (2) | The principal balances and notional amounts set forth in the table are approximate. The actual initial principal balances and notional amounts may be larger or smaller depending on the aggregate cut-off date principal balance of the mortgage loans definitively included in the pool of mortgage loans, which aggregate cut-off date principal balance may be as much as 5% larger or smaller than the amount presented in the Free Writing Prospectus. | |
| (3) | The approximate initial credit support with respect to the Class A-1, A-2, A-3, A-4, A-4FL, A-4FX, A-5 and A-SB Certificates represents the approximate credit enhancement for the Class A-1, A-2, A-3, A-4, A-4FL, A-4FX, A-5 and A-SB Certificates in the aggregate. No class of Certificates will provide any credit support to the Class A-4FL Certificates for any failure by the swap counterparty to make the payment under the related swap contract. The percentage indicated under the column “Approximate Initial Credit Support” with respect to the Class C Certificates and the Class PEX Certificates represents the approximate credit support for the Class C regular interest which will have an initial outstanding principal balance on the closing date of $53,271,000. | |
| (4) | Weighted Average Lives and Expected Principal Windows are calculated based on an assumed prepayment rate of 0% CPR and the “Structuring Assumptions” described on Annex B to the Free Writing Prospectus. | |
| (5) | The Certificate Principal to Value Ratio for each Class of Certificates (other than the Class A-1, A-2, A-3, A-4, A-4FL, A-4FX, A-5 and A-SB Certificates and other than the Exchangeable Certificates) is calculated by dividing the aggregate principal balance of such class of certificates and all classes of certificates (other than the Exchangeable Certificates), if any, that are senior to such class, by the aggregate appraised value of approximately $2,259,063,496 (calculated as described in the Free Writing Prospectus) of the mortgaged properties securing the mortgage loans (excluding, with respect to each pari passu loan combination, a pro rata portion of the related appraised value allocated to the related companion loan based on its cut-off date principal balance). The Certificate Principal to Value Ratios for each of the Class A-1, A-2, A-3, A-4, A-4FL, A-4FX, A-5 and A-SB Certificates are calculated by dividing the aggregate principal balance of the Class A-1, A-2, A-3, A-4, A-4FL, A-4FX, A-5 and A-SB Certificates by such aggregate appraised value (excluding, with respect to each pari passu loan combination, a pro rata portion of the related appraised value allocated to the related companion loan based on its cut-off date principal balance). The Certificate Principal to Value Ratio for each of the Class A-S, Class B and Class C Certificates is calculated by dividing the aggregate principal balance of the Class A-S regular interest, the Class B regular interest or the Class C regular interest, as applicable, and all other classes of certificates (other than the Exchangeable Certificates) and the regular interests that are senior to such class, by such aggregate appraised value (excluding, with respect to each pari passu loan combination, a pro rata portion of the related appraised value allocated to the related companion loan based on its cut-off date principal balance). The Certificate Principal to Value Ratio of the Class PEX Certificates is equal to the Certificate Principal to Value Ratio of the Class C Certificates. In any event, however, excess mortgaged property value associated with a mortgage loan will not be available to offset losses on any other mortgage loan (unless such mortgage loans are cross-collateralized and the cross-collateralization remains in effect). | |
| (6) | The Certificate Principal U/W NOI Debt Yield for each Class of Certificates (other than the Class A-1, A-2, A-3, A-4, A-4FL, A-4FX, A-5 and A-SB Certificates and other than the Exchangeable Certificates) is calculated by dividing the underwritten net operating income (which excludes, with respect to each pari passu loan combination, a pro rata portion of the related underwritten net operating income allocated to the related companion loan based on its cut-off date principal balance) for the mortgage pool of approximately $156,201,921 (calculated as described in the Free Writing Prospectus) by the aggregate certificate principal balance of such class of certificates and all classes of certificates (other than the Exchangeable Certificates), if any, that are senior to such class of certificates. The Underwritten NOI Debt Yield for each of the Class A-1, A-2, A-3, A-4, A-4FL, A-4FX, A-5 and A-SB Certificates is calculated by dividing such mortgage pool underwritten net operating income (which excludes, with respect to each pari passu loan combination, a pro rata portion of the related underwritten net operating income allocated to the related companion loan based on its cut-off date principal balance) by the aggregate principal balance of the Class A-1, A-2, A-3, A-4, A-4FL, A-4FX, A-5 and A-SB Certificates. The Certificate Principal U/W NOI Debt Yield for each of the Class A-S, Class B and Class C Certificates is calculated by dividing the underwritten net operating income (which excludes, with respect to each pari passu loan combination, a pro rata portion of the related underwritten net operating income allocated to the related companion loan based on its | |
THE INFORMATION IN THIS STRUCTURAL AND COLLATERAL TERM SHEET IS NOT COMPLETE AND MAY BE AMENDED PRIOR TO THE TIME OF SALE. THIS TERM SHEET IS NOT AN OFFER TO SELL THESE SECURITIES AND IT IS NOT A SOLICITATION OF AN OFFER TO BUY THESE SECURITIES IN ANY JURISDICTION WHERE THE OFFER OR SALE IS NOT PERMITTED.
3
| WFRBS Commercial Mortgage Trust 2013-C14 | Certificate Structure |
| cut-off date principal balance) for the mortgage pool of approximately $156,201,921 (calculated as described in the Free Writing Prospectus) by the aggregate principal balance of the Class A-S regular interest, the Class B regular interest or the Class C regular interest, as applicable, and all other classes of certificates (other than the Exchangeable Certificates) and the regular interests that are senior to such class. The Certificate Principal U/W NOI Debt Yield of the Class PEX Certificates is equal to the Certificate Principal U/W NOI Debt Yield for the Class C Certificates. In any event, however, cash flow from each mortgaged property supports only the related mortgage loan and will not be available to support any other mortgage loan (unless such mortgage loans are cross-collateralized and the cross-collateralization remains in effect). | ||
| (7) | The pass-through rates for the Class A-1, A-2, A-3, A-4, A-4FX, A-5, A-SB, A-S, B, C, D, E, F and G Certificates and the Class A-4FX Regular Interest in each case will be one of the following: (i) a fixed rate per annum, (ii) the WAC Rate (as defined in the Free Writing Prospectus) for the related distribution date, (iii) a variable rate per annum equal to the lesser of (a) a fixed rate and (b) the WAC Rate for the related distribution date or (iv) a variable rate per annum equal to the WAC Rate for the related distribution date minus a specified percentage. The Class PEX Certificates will not have a pass-through rate, but will be entitled to receive the sum of the interest distributable on the Class PEX Components. The pass-through rate for the Class A-S Certificates, the Class A-S regular interest and the Class PEX Component A-S will, at all times, be the same. The pass-through rate for the Class B Certificates, the Class B regular interest and the Class PEX Component B will, at all times, be the same. The pass-through rate for the Class C Certificates, the Class C regular interest and the Class PEX Component C will, at all times, be the same. | |
| (8) | The Class A-S, Class B, Class PEX and Class C Certificates are “Exchangeable Certificates”. On the closing date, the upper-tier REMIC of the issuing entity will issue the Class A-S, Class B and Class C regular interests (each a “regular interest”) which will have outstanding principal balances on the closing date of $108,379,000, $102,868,000 and $53,271,000, respectively. The regular interests will be held in a grantor trust for the benefit of the holders of the Class A-S, Class B, Class PEX and Class C Certificates. The Class A-S, Class B, Class PEX and Class C Certificates will, at all times, represent undivided beneficial ownership interests in a grantor trust that will hold those regular interests. Each class of the Class A-S, Class B and Class C Certificates will, at all times, represent an undivided beneficial ownership interest in a percentage of the outstanding certificate principal balance of the regular interest with the same alphabetical class designation. The Class PEX Certificates will, at all times, represent an undivided beneficial ownership interest in the remaining percentages of the outstanding certificate principal balances of the Class A-S, Class B and Class C regular interests and which portions of those regular interests are referred to in this Term Sheet as the Class PEX Component A-S, Class PEX Component B and Class PEX Component C (collectively, the “Class PEX Components”). Following any exchange of Class A-S, Class B and Class C Certificates for Class PEX Certificates or any exchange of Class PEX Certificates for Class A-S, Class B and Class C Certificates as described in the Free Writing Prospectus, the percentage interest of the outstanding certificate principal balances of the Class A-S, Class B and Class C regular interest that is represented by the Class A-S, Class B, Class PEX and Class C Certificates will be increased or decreased accordingly. The initial certificate principal balance of each of the Class A-S, Class B and Class C Certificates shown in the table represents the maximum certificate principal balance of such class without giving effect to any exchange. The initial certificate principal balance of the Class PEX Certificates is equal to the aggregate of the initial certificate principal balance of the Class A-S, Class B and Class C Certificates and represents the maximum certificate principal balance of the Class PEX Certificates that could be issued in an exchange. The certificate principal balances of the Class A-S, Class B and Class C Certificates to be issued on the closing date will be reduced, in required proportions, by an amount equal to the certificate principal balance of the Class PEX Certificates issued on the closing date. Distributions and allocations of payments and losses with respect to the Exchangeable Certificates are described in this Term Sheet under “Allocations and Distributions on the Class A-S, Class B, Class PEX and Class C Certificates” and under “Description of the Offered Certificates—Distributions” in the Free Writing Prospectus. The maximum certificate principal balance of the Class PEX Certificates is set forth in the table but is not included in the certificate principal balance of the certificates set forth on the cover page of this Term Sheet or on the top of the cover page of the Free Writing Prospectus. | |
| (9) | The Class X-A Certificates are notional amount certificates. The Notional Amount of the Class X-A Certificates will be equal to the aggregate principal balance of the Class A-1, A-2, A-3, A-4, A-5, A-SB and A-S Certificates and the Class A-4FX Regular Interest outstanding from time to time (without regard to any exchange of Class A-S, Class B and Class C Certificates for Class PEX Certificates). The Class X-A Certificates will not be entitled to distributions of principal. | |
| (10) | The pass-through rate for the Class X-A Certificates for any distribution date will be a per annum rate equal to the excess, if any, of (a) the WAC Rate for the related distribution date, over (b) the weighted average of the pass-through rates on the Class A-1, A-2, A-3, A-4, A-5, A-SB and A-S Certificates and the Class A-4FX Regular Interest for the related distribution date (without regard to any exchange of Class A-S, Class B and Class C Certificates for Class PEX Certificates), weighted on the basis of their respective aggregate principal balances outstanding immediately prior to that distribution date. | |
| (11) | The Class X-B Certificates are notional amount certificates. The Notional Amount of the Class X-B Certificates will be equal to the aggregate principal balance of the Class B and C Certificates outstanding from time to time (without regard to any exchange of Class A-S, Class B and Class C Certificates for Class PEX Certificates). The Class X-B Certificates will not be entitled to distributions of principal. | |
| (12) | The pass-through rate for the Class X-B Certificates for any distribution date will be a per annum rate equal to the excess, if any, of (a) the WAC Rate for the related distribution date, over (b) the weighted average of the pass-through rates on the Class B and C Certificates for the related distribution date (without regard to any exchange of Class A-S, Class B and Class C Certificates for Class PEX Certificates), weighted on the basis of their respective aggregate principal balances outstanding immediately prior to that distribution date. | |
| (13) | The Class X-C Certificates are notional amount certificates. The Notional Amount of the Class X-C Certificates will be equal to the aggregate principal balance of the Class E, F and G Certificates outstanding from time to time. The Class X-C Certificates will not be entitled to distributions of principal. | |
| (14) | The pass-through rate for the Class X-C Certificates for any distribution date will be a per annum rate equal to the excess, if any, of (a) the WAC Rate for the related distribution date, over (b) the weighted average of the pass-through rates on the Class E, F and G Certificates for the related distribution date, weighted on the basis of their respective aggregate principal balances outstanding immediately prior to that distribution date. | |
| (15) | The Class A-4FL Certificates will evidence a beneficial interest in a grantor trust that includes the Class A-4FX Regular Interest and an interest rate swap contract. Under certain circumstances, holders of the Class A-4FL Certificates may exchange all or a portion of their certificates for a like principal amount of Class A-4FX Certificates having the same pass-through rate as the Class A-4FX Regular Interest. The aggregate principal balance of the Class A-4FL Certificates may be adjusted from time to time as a result of such an exchange. The aggregate principal balance of the Class A-4FX Certificates and Class A-4FL Certificates will at all times equal the principal balance of the Class A-4FX Regular Interest. The principal balance of the Class A-4FX Certificates will initially be $0. | |
| (16) | The ratings assigned to the Class A-4FL Certificates reflect only the receipt of up to the fixed rate of interest at a rate equal to the applicable pass-through rate for the Class A-4FX Regular Interest. The ratings of Fitch, KBRA and Moody’s do not address any shortfalls or delays in payments that investors in the Class A-4FL Certificates may experience as a result of the conversion of the pass-through Certificates from a floating interest rate to a fixed rate. | |
| (17) | The pass-through rate on the Class A-4FL Certificates will be a per annum rate equal to LIBOR plus a specified percentage; provided, however, that under certain circumstances, the pass-through rate on the Class A-4FL Certificates may convert to the pass-through rate applicable to the Class A-4FX Regular Interest. The initial LIBOR rate will be determined two LIBOR Business Days prior to the Closing Date, and subsequent LIBOR rates for the Class A-4FL Certificates will be determined two LIBOR Business Days before the start of the related interest accrual period. |
THE INFORMATION IN THIS STRUCTURAL AND COLLATERAL TERM SHEET IS NOT COMPLETE AND MAY BE AMENDED PRIOR TO THE TIME OF SALE. THIS TERM SHEET IS NOT AN OFFER TO SELL THESE SECURITIES AND IT IS NOT A SOLICITATION OF AN OFFER TO BUY THESE SECURITIES IN ANY JURISDICTION WHERE THE OFFER OR SALE IS NOT PERMITTED.
4
| WFRBS Commercial Mortgage Trust 2013-C14 | Issue Characteristics |
II. Transaction Highlights
Mortgage Loan Sellers:
Mortgage Loan Seller | Number of Mortgage Loans | Number of Mortgaged Properties | Aggregate Cut-off Date Balance | % of Cut-off Date Pool Balance | |||||
| Wells Fargo Bank, National Association | 19 | 19 | $651,211,633 | 44.3% | |||||
The Royal Bank of Scotland(1) | 18 | 35 | 540,706,166 | 36.8 | |||||
| Liberty Island Group I LLC | 8 | 12 | 109,680,784 | 7.5 | |||||
| Basis Real Estate Capital II, LLC | 9 | 14 | 95,907,134 | 6.5 | |||||
C-III Commercial Mortgage LLC | 19 | 19 | 72,038,523 | 4.9 | |||||
| Total | 73 | 99 | $1,469,544,239 | 100.0% | |||||
(1) The mortgage loan seller referred to herein as The Royal Bank of Scotland is comprised of two affiliated companies: The Royal Bank of Scotland plc and RBS Financial Products Inc. With respect to the mortgage loans being sold for the deposit into the trust by The Royal Bank of Scotland: (a) sixteen (16) of the mortgage loans, having an aggregate cut-off date principal balance of $501,056,166 and representing approximately 34.1% of the aggregate principal balance of the pool of mortgage loans as of the cut-off date, were originated by and are being sold to the trust only by The Royal Bank of Scotland plc and (b) two (2) of the mortgage loans, having a cut-off date principal balance of $39,650,000 and representing approximately 2.7% of the aggregate principal balance of the pool of mortgage loans as of the cut-off date were originated by RBS Financial Products Inc. and are being sold to the trust by RBS Financial Products Inc.
Loan Pool:
| Cut-off Date Balance: | $1,469,544,239 |
| Number of Mortgage Loans: | 73 |
| Average Cut-off Date Balance per Mortgage Loan: | $20,130,743 |
| Number of Mortgaged Properties: | 99 |
Average Cut-off Date Balance per Mortgaged Property(1): | $14,843,881 |
| Weighted Average Mortgage Interest Rate: | 4.037% |
| Ten Largest Mortgage Loans as % of Cut-off Date Pool Balance: | 60.8% |
| Weighted Average Original Term to Maturity or ARD (months): | 116 |
| Weighted Average Remaining Term to Maturity or ARD (months): | 115 |
Weighted Average Original Amortization Term (months)(2): | 349 |
Weighted Average Remaining Amortization Term (months)(2): | 349 |
| Weighted Average Seasoning (months): | 1 |
(1) Information regarding mortgage loans secured by multiple properties (other than through cross-collateralization with other mortgage loans) is based on an allocation according to relative appraised values or the allocated loan amounts or property-specific release prices set forth in the related loan documents or such other allocation as the related mortgage loan seller deemed appropriate. With respect to each pari passu loan combination, loan-to-value ratio, debt service coverage ratio, debt yield and cut-off date balance per square foot calculations include the related pari passu companion loan unless otherwise stated.
(2) Excludes any mortgage loan that does not amortize.
Credit Statistics:
Weighted Average U/W Net Cash Flow DSCR(1): | 1.95x |
Weighted Average U/W Net Operating Income Debt Yield Ratio(1): | 10.6% |
Weighted Average Cut-off Date Loan-to-Value Ratio(1): | 65.8% |
Weighted Average Balloon or ARD Loan-to-Value Ratio(1): | 58.0% |
| % of Mortgage Loans with Additional Subordinate Debt: | 0.0% |
% of Mortgage Loans with Single Tenants(2): | 10.3% |
(1) With respect to each pari passu loan combination, loan-to-value ratio, debt service coverage ratio, debt yield and cut-off date balance per square foot calculations include the related pari passu companion loan unless otherwise stated. The information for each mortgaged property that relates to a mortgage loan that is cross-collateralized with other mortgage loans is based upon the principal balance of that mortgage loan, except that the applicable loan-to-value ratio, debt service coverage ratio or debt yield for each such mortgaged property is based upon the ratio or yield (as applicable) for the aggregate indebtedness evidenced by all loans in the group. On an individual basis, without regard to the cross-collateralization feature, any mortgaged property securing a mortgage loan that is part of a cross-collateralized group of mortgage loans may have a higher loan-to-value ratio, lower debt service coverage ratio and/or lower debt yield than is presented herein. Debt service coverage ratio, debt yield and loan-to-value ratio information takes no account of subordinate debt (whether or not secured by the mortgaged property), if any, that is allowed under the terms of any mortgage loan.
(2) Excludes mortgage loans that are secured by multiple single tenant properties.
THE INFORMATION IN THIS STRUCTURAL AND COLLATERAL TERM SHEET IS NOT COMPLETE AND MAY BE AMENDED PRIOR TO THE TIME OF SALE. THIS TERM SHEET IS NOT AN OFFER TO SELL THESE SECURITIES AND IT IS NOT A SOLICITATION OF AN OFFER TO BUY THESE SECURITIES IN ANY JURISDICTION WHERE THE OFFER OR SALE IS NOT PERMITTED.
5
| WFRBS Commercial Mortgage Trust 2013-C14 | Issue Characteristics |
Loan Structural Features:
Amortization: Based on the Cut-off Date Pool Balance, 70.1% of the mortgage pool (68 mortgage loans) has scheduled amortization, as follows:
30.8% (54 mortgage loans) requires amortization during the entire loan term
39.2% (14 mortgage loans) provides for an interest-only period followed by an amortization period
Interest-Only: Based on the Cut-off Date Pool Balance, 29.9% of the mortgage pool (five mortgage loans) provides for interest-only payments during the entire loan term. The Weighted Average Cut-off Date Loan-to-Value Ratio and Weighted Average U/W Net Cash Flow DSCR for those mortgage loans is 60.9% and 2.68x, respectively.
Hard Lockboxes: Based on the Cut-off Date Pool Balance, 59.3% of the mortgage pool (23 mortgage loans) has hard lockboxes in place.
Reserves: The mortgage loans require amounts to be escrowed monthly as follows (excluding any mortgage loans with springing provisions):
| Real Estate Taxes: | 68.2% of the pool |
| Insurance Premiums: | 43.5% of the pool |
| Capital Replacements: | 56.0% of the pool |
| TI/LC: | 33.7% of the pool(1) |
| (1) The percentage of Cut-off Date Balance for loans with TI/LC reserves is based on the aggregate principal balance allocable to office, retail, and mixed use properties. | |
Call Protection/Defeasance: Based on the Cut-off Date Pool Balance, the mortgage pool has the following call protection and defeasance features:
65.4% of the mortgage pool (67 mortgage loans) features a lockout period, then defeasance only until an open period
20.2% of the mortgage pool (4 mortgage loans) features a lockout period, then the greater of a prepayment premium or yield maintenance until an open period
8.4% of the mortgage pool (1 mortgage loan) features a lockout period, then the greater of a prepayment premium or yield maintenance
6.1% of the mortgage pool (1 mortgage loan) features a lockout period, then defeasance or the greater of a prepayment premium or yield maintenance until an open period
Please refer to Annex A-1 to the Free Writing Prospectus for further description of individual loan call protection.
THE INFORMATION IN THIS STRUCTURAL AND COLLATERAL TERM SHEET IS NOT COMPLETE AND MAY BE AMENDED PRIOR TO THE TIME OF SALE. THIS TERM SHEET IS NOT AN OFFER TO SELL THESE SECURITIES AND IT IS NOT A SOLICITATION OF AN OFFER TO BUY THESE SECURITIES IN ANY JURISDICTION WHERE THE OFFER OR SALE IS NOT PERMITTED.
6
| WFRBS Commercial Mortgage Trust 2013-C14 | Issue Characteristics |
III. Issue Characteristics
| Securities Offered: | $1,203,199,000 approximate monthly pay, multi-class, commercial mortgage REMIC pass-through certificates consisting of twelve classes (Classes A-1, A-2, A-3, A-4, A-5, A-SB, A-S, B, C, PEX, X-A and X-B), which are offered pursuant to a registration statement filed with the SEC. | ||
| Mortgage Loan Sellers: | Wells Fargo Bank, National Association (“WFB”); The Royal Bank of Scotland (“RBS”); Liberty Island Group I LLC (“LIG I”); Basis Real Estate Capital II, LLC (“Basis”); and C-III Commercial Mortgage LLC (“CIIICM”). | ||
| Co-lead Bookrunning Managers: | Wells Fargo Securities, LLC and RBS Securities Inc. | ||
| Co-Manager: | Deutsche Bank Securities Inc. | ||
| Rating Agencies: | Fitch, Inc., Kroll Bond Rating Agency, Inc. and Moody’s Investors Service, Inc. | ||
| Master Servicer: | Wells Fargo Bank, National Association | ||
| Special Servicer: | Rialto Capital Advisors, LLC | ||
| Certificate Administrator: | Wells Fargo Bank, National Association | ||
| Trustee: | U.S. Bank National Association | ||
| Trust Advisor: | Pentalpha Surveillance LLC | ||
| Cut-off Date: | The Cut-off Date with respect to each mortgage loan is the due date for the monthly debt service payment that is due in June 2013 (or, in the case of any mortgage loan that has its first due date in July 2013, the date that would have been its due date in June 2013 under the terms of that mortgage loan if a monthly debt service payment were scheduled to be due in that month). | ||
| Expected Closing Date: | On or about June 6, 2013. | ||
| Determination Dates: | The 11th day of each month (or if that day is not a business day, the next succeeding business day), commencing in July 2013. | ||
| Distribution Dates: | The fourth business day following the Determination Date in each month, commencing in July 2013. | ||
| Rated Final Distribution Date: | The Distribution Date in June 2046. | ||
| Interest Accrual Period: | With respect to any Distribution Date, the calendar month preceding the month in which such Distribution Date occurs. | ||
| Day Count: | The Offered Certificates will accrue interest on a 30/360 basis. | ||
| Minimum Denominations: | $10,000 for each Class of Offered Certificates (other than the Class X-A and X-B Certificates) and $1,000,000 for the Class X-A and X-B Certificates. Investments may also be made in any whole dollar denomination in excess of the applicable minimum denomination. | ||
| Clean-up Call: | 1% | ||
| Delivery: | DTC, Euroclear and Clearstream Banking | ||
| ERISA/SMMEA Status: | Each Class of Offered Certificates is expected to be eligible for exemptive relief under ERISA. No Class of Offered Certificates will be SMMEA eligible. | ||
| Risk Factors: | THE CERTIFICATES INVOLVE CERTAIN RISKS AND MAY NOT BE SUITABLE FOR ALL INVESTORS. SEE THE “RISK FACTORS” SECTION OF THE FREE WRITING PROSPECTUS. | ||
| Bond Analytics Information: | The Certificate Administrator will be authorized to make distribution date settlements, CREFC reports and certain supplemental reports (other than confidential information) available to certain financial modeling and data provision services, including Bloomberg Financial Markets L.P., Trepp LLC, Intex Solutions, Inc., Markit Group Limited, Interactive Data Corp. and BlackRock Financial Management Inc. |
THE INFORMATION IN THIS STRUCTURAL AND COLLATERAL TERM SHEET IS NOT COMPLETE AND MAY BE AMENDED PRIOR TO THE TIME OF SALE. THIS TERM SHEET IS NOT AN OFFER TO SELL THESE SECURITIES AND IT IS NOT A SOLICITATION OF AN OFFER TO BUY THESE SECURITIES IN ANY JURISDICTION WHERE THE OFFER OR SALE IS NOT PERMITTED.
7
| WFRBS Commercial Mortgage Trust 2013-C14 | Characteristics of the Mortgage Pool |
IV. Characteristics of the Mortgage Pool(1)
A. Ten Largest Mortgage Loans
Mortgage Loan Seller | Mortgage Loan Name | City | State | Number of Mortgage Loans / Mortgaged Properties | Mortgage Loan Cut-off Date Balance ($) | % of Cut- off Date Pool Balance (%) | Property Type | Number of SF, Rooms, Pads or Beds | Cut-off Date Balance Per SF, Room, Pad or Bed ($) | Cut-off Date LTV Ratio (%) | Balloon or ARD LTV Ratio (%) | U/W NCF DSCR (x) | U/W NOI Debt Yield (%) | ||||||||||||||
| RBS | RHP Portfolio III | Various | Various | 1 / 12 | $128,723,897 | 8.8% | Manufactured Housing Community | 3,321 | $38,761 | 73.7% | 63.5% | 1.40x | 8.2% | ||||||||||||||
| RBS | Midtown I & II | Atlanta | GA | 1 / 1 | 124,300,000 | 8.5 | Office | 794,110 | 157 | 59.2 | 59.2 | 2.92 | 12.0 | ||||||||||||||
| WFB | The Plant San Jose | San Jose | CA | 1 / 1 | 123,000,000 | 8.4 | Retail | 485,895 | 253 | 60.0 | 60.0 | 2.64 | 10.7 | ||||||||||||||
| WFB | White Marsh Mall | Baltimore | MD | 1 / 1 | 110,000,000 | 7.5 | Retail | 702,317 | 271 | 63.3 | 63.3 | 2.66 | 10.3 | ||||||||||||||
| WFB | 301 South College Street | Charlotte | NC | 1 / 1 | 90,000,000 | 6.1 | Office | 988,646 | 177 | 70.0 | 63.5 | 1.80 | 10.6 | ||||||||||||||
| WFB | Cheeca Lodge & Spa | Islamorada | FL | 1 / 1 | 85,000,000 | 5.8 | Hospitality | 214 | 397,196 | 63.4 | 53.7 | 1.89 | 12.2 | ||||||||||||||
| RBS | Cumberland Mall | Atlanta | GA | 1 / 1 | 70,000,000 | 4.8 | Retail | 541,527 | 295 | 63.0 | 63.0 | 2.49 | 9.7 | ||||||||||||||
| WFB | 100 & 150 South Wacker Drive | Chicago | IL | 1 / 1 | 69,000,000 | 4.7 | Office | 1,095,653 | 128 | 66.4 | 60.2 | 1.56 | 10.7 | ||||||||||||||
| WFB | Brambleton Town Center | Ashburn | VA | 1 / 1 | 60,000,000 | 4.1 | Retail | 295,628 | 203 | 68.5 | 57.7 | 1.51 | 9.3 | ||||||||||||||
| RBS | Rehoboth Bay MHC | Rehoboth Beach | DE | 1 / 1 | 33,000,000 | 2.2 | Manufactured Housing Community | 525 | 62,857 | 68.8 | 62.4 | 1.51 | 8.7 | ||||||||||||||
| Top Three Total/Weighted Average | 3 / 14 | $376,023,897 | 25.6% | 64.4% | 60.9% | 2.31x | 10.3% | ||||||||||||||||||||
| Top Five Total/Weighted Average | 5 / 16 | $576,023,897 | 39.2% | 65.1% | 61.8% | 2.30x | 10.3% | ||||||||||||||||||||
| Top Ten Total/Weighted Average | 10 / 21 | $893,023,897 | 60.8% | 65.2% | 60.7% | 2.13x | 10.4% | ||||||||||||||||||||
| (1) | With respect to White Marsh Mall, 301 South College Street, Cumberland Mall and 100 & 150 South Wacker Drive, each of which is part of a pari passu loan combination, Cut-off Date Balance per square foot, loan-to-value ratio, debt service coverage ratio and debt yield calculations include the related pari passu companion loan (unless otherwise stated) in total debt. With respect to each Mortgage Loan, debt service coverage ratio, debt yield and loan-to-value ratio information takes no account of subordinate debt (whether or not secured by the mortgaged property), if any, that is allowed under the terms of any mortgage loan. |
B. Summary of Pari Passu Split Loan Structures
| Property Name | Mortgage Loan Seller | Related Notes in Loan Group (Original Balance) | Holder of Note | Whether Note is Lead Servicing for the Entire Loan Combination | Current Master Servicer Under Related Securitization PSA | Current Special Servicer Under Related Securitization PSA |
| White Marsh Mall | WFB | $110,000,000 | WFRBS 2013-C14 | Yes | Wells Fargo Bank, National Association | Rialto Capital Advisors, LLC |
| WFB | $80,000,000 | (1) | No | TBD | TBD | |
| 301 South College Street | WFB | $90,000,000 | WFRBS 2013-C14 | Yes | Wells Fargo Bank, National Association | Rialto Capital Advisors, LLC |
| WFB | $85,000,000 | WFRBS 2013-C13 | No | Wells Fargo Bank, National Association | LNR Partners, LLC | |
| Cumberland Mall | RBS | $70,000,000 | WFRBS 2013-C14 | (2) | Wells Fargo Bank, National Association | Rialto Capital Advisors, LLC |
| RBS | $90,000,000 | (1) | (2) | TBD | TBD | |
| 100 & 150 South Wacker Drive | WFB | $69,000,000 | WFRBS 2013-C14 | (2) | Wells Fargo Bank, National Association | Rialto Capital Advisors, LLC |
| WFB | $71,000,000 | (1) | (2) | TBD | TBD |
| (1) | The pari passu companion loan is currently held by the mortgage loan seller for the mortgage loan included in the WFRBS 2013-C14 trust. |
| (2) | Each of the Cumberland Mall pari passu loan combination and 100 & 150 South Wacker Drive pari passu loan combination will be serviced under the WFRBS 2013-C14 pooling and servicing agreement until the securitization of the related pari passu companion loan, after which such loan combination will be serviced under the pooling and servicing agreement related to the securitization of that pari passu companion loan. The master servicer and special servicer under the latter pooling and servicing agreement will be identified in a notice, report or statement to holders of the WFRBS 2013-C14 certificates after the securitization of the applicable pari passu companion loan. |
THE INFORMATION IN THIS STRUCTURAL AND COLLATERAL TERM SHEET IS NOT COMPLETE AND MAY BE AMENDED PRIOR TO THE TIME OF SALE. THIS TERM SHEET IS NOT AN OFFER TO SELL THESE SECURITIES AND IT IS NOT A SOLICITATION OF AN OFFER TO BUY THESE SECURITIES IN ANY JURISDICTION WHERE THE OFFER OR SALE IS NOT PERMITTED.
8
| WFRBS Commercial Mortgage Trust 2013-C14 | Characteristics of the Mortgage Pool |
C. Previous Securitization History(1)
| Loan No. | Mortgage Loan Seller | Mortgage Loan or Mortgaged Property Name | City | State | Property Type | Mortgage Loan or Mortgaged Property Cut-off Date Balance ($) | % of Cut-off Date Pool Balance (%) | Previous Securitization |
| 1.01 | RBS | Portside | Jacksonville | FL | Manufactured Housing Community | $43,640,216 | 3.0% | MLCFC 2007-9 |
| 1.02 | RBS | Crescentwood Village | Sandy | UT | Manufactured Housing Community | 18,576,579 | 1.3 | BALL 2007-BMB1 |
| 1.04 | RBS | Riverside (UT) | West Valley City | UT | Manufactured Housing Community | 11,720,937 | 0.8 | MLMT 2008-C1 |
| 1.05 | RBS | Springdale Lake | Belton | MO | Manufactured Housing Community | 11,617,733 | 0.8 | MLMT 2008-C1 |
| 1.06 | RBS | Sundown | Clearfield | UT | Manufactured Housing Community | 10,342,437 | 0.7 | MLMT 2008-C1 |
| 1.07 | RBS | Oak Park Village | Gainesville | FL | Manufactured Housing Community | 7,961,390 | 0.5 | MLMT 2008-C1 |
| 1.08 | RBS | River Oaks | Kansas City | KS | Manufactured Housing Community | 7,489,605 | 0.5 | MLMT 2008-C1 |
| 1.09 | RBS | Riverside (KS) | Lawrence | KS | Manufactured Housing Community | 2,071,436 | 0.1 | MLMT 2008-C1 |
| 1.10 | RBS | Sherwood Acres | Wichita | KS | Manufactured Housing Community | 1,238,439 | 0.1 | MLMT 2008-C1 |
| 1.11 | RBS | Glen Acres | Wichita | KS | Manufactured Housing Community | 1,017,289 | 0.1 | MLMT 2008-C1 |
| 1.12 | RBS | Connie Jean | Jacksonville | FL | Manufactured Housing Community | 958,316 | 0.1 | MLMT 2008-C1 |
| 10 | RBS | Rehoboth Bay MHC | Rehoboth Beach | DE | Manufactured Housing Community | 33,000,000 | 2.2 | CSFB 2003-CPN1 |
| 11.01 | RBS | Brookside | West Jordan | UT | Manufactured Housing Community | 10,615,188 | 0.7 | MLMT 2008-C1 |
| 11.02 | RBS | Overpass Point MHC | Tooele | UT | Manufactured Housing Community | 7,445,375 | 0.5 | MLMT 2008-C1 |
| 11.03 | RBS | Havenwood | Pompano Beach | FL | Manufactured Housing Community | 6,560,775 | 0.4 | MLMT 2008-C1 |
| 11.04 | RBS | The Woodlands | Wichita | KS | Manufactured Housing Community | 3,051,867 | 0.2 | MLMT 2008-C1 |
| 11.05 | RBS | Pine Haven MHC | Blossvale | NY | Manufactured Housing Community | 2,948,663 | 0.2 | MLMT 2008-C1 |
| 19 | Basis | Hilton Norfolk | Norfolk | VA | Hospitality | 16,970,629 | 1.2 | WBCMT 2003-C5 |
| 23 | WFB | Union Square New Hope | New Hope | PA | Mixed Use | 14,500,000 | 1.0 | MSC 2004-HQ3 |
| 26 | RBS | Continental Shopping Plaza - Green Valley | Green Valley | AZ | Retail | 13,875,000 | 0.9 | JPMCC 2003-LN1 |
| 28 | RBS | 808 Broadway | New York | NY | Retail | 12,500,000 | 0.9 | CGCMT 2005-EMG |
| 33.02 | LIG I | South Wales | Amissville | VA | Self Storage | 3,873,995 | 0.3 | CSFB 2002-CKP1 |
| 41 | LIG I | Pines of Newpointe | Virginia Beach | VA | Multifamily | 7,714,859 | 0.5 | WBCMT 2003-C6 |
| 46 | WFB | Meadow Central | Dallas | TX | Office | 6,388,943 | 0.4 | DLJCM 1998-CG1 |
| 48 | CIIICM | Lincoln MHC | Oroville | CA | Manufactured Housing Community | 1,992,487 | 0.1 | LASL 2007-MF5 |
| 49 | CIIICM | Hidden Creek MHC | Hamlin | NY | Manufactured Housing Community | 5,800,000 | 0.4 | JPMCC 2003-CB6 |
| 50 | CIIICM | Colony Plaza | Missouri City | TX | Retail | 5,600,000 | 0.4 | GCCFC 2006-GG7 |
| 52 | CIIICM | Corona Hills Town Center | Corona | CA | Retail | 5,500,000 | 0.4 | CSFB 2003-CPN1 |
THE INFORMATION IN THIS STRUCTURAL AND COLLATERAL TERM SHEET IS NOT COMPLETE AND MAY BE AMENDED PRIOR TO THE TIME OF SALE. THIS TERM SHEET IS NOT AN OFFER TO SELL THESE SECURITIES AND IT IS NOT A SOLICITATION OF AN OFFER TO BUY THESE SECURITIES IN ANY JURISDICTION WHERE THE OFFER OR SALE IS NOT PERMITTED.
9
| WFRBS Commercial Mortgage Trust 2013-C14 | Characteristics of the Mortgage Pool |
C. Previous Securitization History (continued)(1)
| Loan No. | Mortgage Loan Seller | Mortgage Loan or Mortgaged Property Name | City | State | Property Type | Mortgage Loan or Mortgaged Property Cut-off Date Balance ($) | % of Cut-off Date Pool Balance (%) | Previous Securitization |
| 53 | CIIICM | Cimarron MHC | Irving | TX | Manufactured Housing Community | 4,993,674 | 0.3% | WBCMT 2003-C4 |
| 54 | RBS | McGee’s Crossing | Benson | NC | Retail | 4,991,060 | 0.3 | CSFB 2003-C3 |
| 56 | CIIICM | Mizner Place | Wellington | FL | Office | 4,600,000 | 0.3 | WBCMT 2003-C5 |
| 58 | CIIICM | Palm Shadows MHC | Donna | TX | Manufactured Housing Community | 4,494,697 | 0.3 | CSFB 2003-C4 |
| 62 | CIIICM | American Mini Storage Norco | Norco | CA | Self Storage | 3,994,806 | 0.3 | CSFB 2003-C3 |
| 64 | CIIICM | Ramey’s MHC | Salem | VA | Manufactured Housing Community | 3,500,000 | 0.2 | CSFB 2003-C4 |
| 65 | CIIICM | The Store Room | West Palm Beach | FL | Self Storage | 3,250,000 | 0.2 | BACM 2003-2 |
| 67 | CIIICM | Silo Self Storage | Nashville | TN | Self Storage | 2,600,000 | 0.2 | NMCRE 2007-2A |
| 68 | WFB | 160 West 72nd Street | New York | NY | Mixed Use | 2,197,168 | 0.1 | BSCMS 2003-PWR2 |
| 69 | CIIICM | Los Arboles Community | Sahuarita | AZ | Manufactured Housing Community | 2,000,000 | 0.1 | CSFB 2004-C3 |
| 70 | CIIICM | Emerald Lake MHC | Davenport | FL | Manufactured Housing Community | 1,997,552 | 0.1 | MSC 1998-HF1 |
| Total | $313,591,114 | 21.3% | ||||||
| (1) | The table above represents the most recent securitization with respect to the mortgaged property securing the related mortgage loan, based on information provided by the related borrower or obtained through searches of a third-party database. While the above mortgage loans may have been securitized multiple times in prior transactions, mortgage loans are only listed in the above chart if the mortgage loan paid off a mortgage loan in another securitization. The information has not otherwise been confirmed by the mortgage loan sellers. |
THE INFORMATION IN THIS STRUCTURAL AND COLLATERAL TERM SHEET IS NOT COMPLETE AND MAY BE AMENDED PRIOR TO THE TIME OF SALE. THIS TERM SHEET IS NOT AN OFFER TO SELL THESE SECURITIES AND IT IS NOT A SOLICITATION OF AN OFFER TO BUY THESE SECURITIES IN ANY JURISDICTION WHERE THE OFFER OR SALE IS NOT PERMITTED.
10
| WFRBS Commercial Mortgage Trust 2013-C14 | Characteristics of the Mortgage Pool |
D. Mortgage Loans with Scheduled Balloon Payments and Related Classes
Class A-2(1) | ||||||||||||||||||||||||||||||||
| Loan No. | Mortgage Loan Seller | Mortgage Loan Name | State | Property Type | Mortgage Loan Cut-off Date Balance ($) | % of Cut-off Date Pool Balance (%) | Mortgage Loan Balance at Maturity ($) | % of Class A-2 Certificate Principal Balance (%)(2) | SF/ Rooms/ Pads/ Units | Loan per SF/ Room/ Pad/ Unit ($) | U/W NCF DSCR (x) | U/W NOI Debt Yield (%) | Cut-off Date LTV Ratio (%) | Balloon or ARD LTV Ratio (%) | Rem. IO Period (mos.) | Rem. Term to Maturity (mos.) | ||||||||||||||||
| 17 | RBS | HIE Washington Portfolio | WA | Hospitality | $17,472,436 | 1.2% | $15,537,540 | 32.3% | 212 | $82,417 | 1.55x | 12.1% | 64.7% | 57.5% | 0 | 59 | ||||||||||||||||
| 22 | Basis | 540 Atlantic Ave | NY | Office | 15,000,000 | 1.0 | 13,620,059 | 28.3 | 68,932 | 218 | 1.48 | 9.1 | 66.4 | 60.3 | 0 | 60 | ||||||||||||||||
| 42 | RBS | Stor N More | FL | Self Storage | 7,690,300 | 0.5 | 7,017,650 | 14.6 | 130,868 | 59 | 1.91 | 11.5 | 57.1 | 52.1 | 0 | 59 | ||||||||||||||||
| 50 | CIIICM | Colony Plaza | TX | Retail | 5,600,000 | 0.4 | 4,930,588 | 10.2 | 55,022 | 102 | 1.60 | 11.9 | 67.1 | 59.0 | 0 | 60 | ||||||||||||||||
| 59 | CIIICM | Sunrise Pass Estates MHC | CA | Manufactured Housing Community | 4,394,709 | 0.3 | 4,023,888 | 8.4 | 161 | 27,296 | 1.59 | 9.8 | 69.2 | 63.4 | 0 | 59 | ||||||||||||||||
| Total/Weighted Average | $50,157,445 | 3.4% | $45,129,725 | 93.7% | 1.59x | 10.9% | 64.7% | 58.2% | 0 | 59 | ||||||||||||||||||||||
(1) The table above presents the mortgage loans whose balloon payments would be applied to pay down the principal balance of the Class A-2 Certificates, assuming a 0% CPR and applying the “Structuring Assumptions” described in the Free Writing Prospectus, including the assumptions that (i) none of the mortgage loans in the pool experience prepayments, defaults or losses; (ii) there are no extensions of maturity dates of any mortgage loans in the pool; and (iii) each mortgage loan in the pool is paid in full on its stated maturity date. Each class of Certificates, including the Class A-2 Certificates, evidences undivided ownership interests in the entire pool of mortgage loans. Debt service coverage ratio, debt yield and loan-to-value ratio information takes no account of subordinate debt (whether or not secured by the mortgaged property), if any, that is allowed under the terms of any mortgage loan. See Annex A-1 to the Free Writing Prospectus.
(2) Reflects the percentage equal to the Mortgage Loan Balance at Maturity divided by the initial Class A-2 Certificate Principal Balance.
Class A-3(1) | ||||||||||||||||||||||||||||||||
| Loan No. | Mortgage Loan Seller | Mortgage Loan Name | State | Property Type | Mortgage Loan Cut-off Date Balance ($) | % of Cut-off Date Balance (%) | Mortgage Loan Balance at Maturity ($) | % of Class A-3 Certificate Principal Balance (%)(2) | SF/ Rooms/ Pads/ Units | Loan per SF/ Room/ Pad/ Unit ($) | U/W NCF DSCR (x) | U/W NOI Debt Yield (%) | Cut-off Date LTV Ratio (%) | Balloon or ARD LTV Ratio (%) | Rem. IO Period (mos.) | Rem. Term to Maturity (mos.) | ||||||||||||||||
| 4 | WFB | White Marsh Mall | MD | Retail | $110,000,000 | 7.5% | $110,000,000 | 100.0% | 702,317 | $271 | 2.66x | 10.3% | 63.3% | 63.3% | 95 | 95 | ||||||||||||||||
| Total/Weighted Average | $110,000,000 | 7.5% | $110,000,000 | 100.0% | 2.66x | 10.3% | 63.3% | 63.3% | 95 | 95 | ||||||||||||||||||||||
(1) The table above presents the mortgage loans whose balloon payments would be applied to pay down the principal balance of the Class A-3 Certificates, assuming a 0% CPR and applying the “Structuring Assumptions” described in the Free Writing Prospectus, including the assumptions that (i) none of the mortgage loans in the pool experience prepayments, defaults or losses; (ii) there are no extensions of maturity dates of any mortgage loans in the pool; and (iii) each mortgage loan in the pool is paid in full on its stated maturity date. Each class of Certificates, including the Class A-3 Certificates, evidences undivided ownership interests in the entire pool of mortgage loans. Debt service coverage ratio, debt yield and loan-to-value ratio information takes no account of subordinate debt (whether or not secured by the mortgaged property), if any, that is allowed under the terms of any mortgage loan. See Annex A-1 to the Free Writing Prospectus.
(2) Reflects the percentage equal to the Mortgage Loan Balance at Maturity divided by the initial Class A-3 Certificate Principal Balance.
THE INFORMATION IN THIS STRUCTURAL AND COLLATERAL TERM SHEET IS NOT COMPLETE AND MAY BE AMENDED PRIOR TO THE TIME OF SALE. THIS TERM SHEET IS NOT AN OFFER TO SELL THESE SECURITIES AND IT IS NOT A SOLICITATION OF AN OFFER TO BUY THESE SECURITIES IN ANY JURISDICTION WHERE THE OFFER OR SALE IS NOT PERMITTED.
11
| WFRBS Commercial Mortgage Trust 2013-C14 | Characteristics of the Mortgage Pool |
Class A-SB(1) | ||||||||||||||||||||||||||||||||
| Loan No. | Mortgage Loan Seller | Mortgage Loan Name | State | Property Type | Mortgage Loan Cut-off Date Balance ($) | % of Cut-off Date Balance (%) | Mortgage Loan Balance at Maturity ($) | % of Class A-SB Certificate Principal Balance (%)(2) | SF/ Rooms/ Pads/ Units | Loan per SF/ Room/ Pad/ Unit ($) | U/W NCF DSCR (x) | U/W NOI Debt Yield (%) | Cut-off Date LTV Ratio (%) | Balloon or ARD LTV Ratio (%) | Rem. IO Period (mos.) | Rem. Term to Maturity (mos.) | ||||||||||||||||
| 18 | RBS | Residence Inn San Juan Capistrano | CA | Hospitality | $17,150,000 | 1.2% | $14,889,141 | 12.8% | 130 | $131,923 | 1.71x | 11.1% | 70.0% | 60.8% | 0 | 84 | ||||||||||||||||
| Total/Weighted Average | $17,150,000 | 1.2% | $14,889,141 | 12.8% | 1.71x | 11.1% | 70.0% | 60.8% | 0 | 84 | ||||||||||||||||||||||
(1) The table above presents the mortgage loan whose balloon payment would be applied to pay down the principal balance of the Class A-SB Certificates, assuming a 0% CPR and applying the “Structuring Assumptions” described in the Free Writing Prospectus, including the assumptions that (i) none of the mortgage loans in the pool experience prepayments, defaults or losses; (ii) there are no extensions of maturity dates of any mortgage loans in the pool; and (iii) each mortgage loan in the pool is paid in full on its stated maturity date. Each class of Certificates, including the Class A-SB Certificates, evidences undivided ownership interests in the entire pool of mortgage loans. Debt service coverage ratio, debt yield and loan-to-value ratio information takes no account of subordinate debt (whether or not secured by the mortgaged property), if any, that is allowed under the terms of any mortgage loan. See Annex A-1 to the Free Writing Prospectus.
(2) Reflects the percentage equal to the Mortgage Loan Balance at Maturity divided by the initial Class A-SB Certificate Principal Balance.
THE INFORMATION IN THIS STRUCTURAL AND COLLATERAL TERM SHEET IS NOT COMPLETE AND MAY BE AMENDED PRIOR TO THE TIME OF SALE. THIS TERM SHEET IS NOT AN OFFER TO SELL THESE SECURITIES AND IT IS NOT A SOLICITATION OF AN OFFER TO BUY THESE SECURITIES IN ANY JURISDICTION WHERE THE OFFER OR SALE IS NOT PERMITTED.
12
(THIS PAGE INTENTIONALLY LEFT BLANK)
13
| WFRBS Commercial Mortgage Trust 2013-C14 | Characteristics of the Mortgage Pool |
E. Property Type Distribution(1)
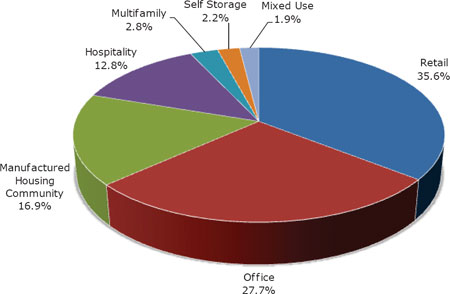
| Property Type | Number of Mortgaged Properties | Aggregate Cut- off Date Balance ($) | % of Cut- off Date Balance (%) | Weighted Average Cut-off Date LTV Ratio (%) | Weighted Average Balloon or ARD LTV Ratio (%) | Weighted Average U/W NCF DSCR (x) | Weighted Average U/W NOI Debt Yield (%) | Weighted Average U/W NCF Debt Yield (%) | Weighted Average Mortgage Rate (%) | ||||||||||
| Retail | 23 | $523,435,039 | 35.6 | % | 64.3 | % | 59.5 | % | 2.20 | x | 10.4 | % | 9.7 | % | 3.929 | % | |||
| Anchored | 13 | 280,055,359 | 19.1 | 64.5 | 57.9 | 2.06 | 10.6 | 9.9 | 4.009 | ||||||||||
| Regional Mall | 2 | 180,000,000 | 12.2 | 63.2 | 63.2 | 2.59 | 10.1 | 9.7 | 3.663 | ||||||||||
| Shadow Anchored | 4 | 38,801,366 | 2.6 | 70.2 | 57.2 | 1.63 | 10.7 | 9.8 | 4.440 | ||||||||||
| Single Tenant | 1 | 12,500,000 | 0.9 | 53.4 | 53.4 | 1.90 | 8.1 | 7.8 | 4.080 | ||||||||||
| Unanchored | 3 | 12,078,315 | 0.8 | 69.4 | 55.8 | 1.60 | 10.4 | 9.5 | 4.264 | ||||||||||
| Office | 12 | 407,229,996 | 27.7 | 64.5 | 58.0 | 2.07 | 11.4 | 10.3 | 3.957 | ||||||||||
| CBD | 5 | 320,272,166 | 21.8 | 63.6 | 59.5 | 2.19 | 11.4 | 10.5 | 3.929 | ||||||||||
| Suburban | 6 | 72,485,556 | 4.9 | 71.6 | 56.1 | 1.49 | 10.1 | 8.9 | 4.121 | ||||||||||
| Single Tenant | 1 | 14,472,274 | 1.0 | 49.9 | 35.6 | 2.38 | 16.1 | 14.7 | 3.750 | ||||||||||
| Manufactured Housing Community | 37 | 247,723,550 | 16.9 | 71.8 | 61.2 | 1.47 | 8.8 | 8.6 | 4.084 | ||||||||||
| Manufactured Housing Community | 37 | 247,723,550 | 16.9 | 71.8 | 61.2 | 1.47 | 8.8 | 8.6 | 4.084 | ||||||||||
| Hospitality | 11 | 188,751,125 | 12.8 | 64.7 | 52.3 | 1.76 | 12.3 | 11.0 | 4.374 | ||||||||||
| Full Service | 2 | 101,970,629 | 6.9 | 63.7 | 52.7 | 1.84 | 12.2 | 10.9 | 4.183 | ||||||||||
| Limited Service | 6 | 49,261,849 | 3.4 | 64.4 | 49.4 | 1.57 | 12.6 | 11.3 | 4.865 | ||||||||||
| Extended Stay | 3 | 37,518,646 | 2.6 | 67.8 | 55.0 | 1.78 | 12.0 | 10.8 | 4.249 | ||||||||||
| Multifamily | 4 | 41,175,927 | 2.8 | 70.3 | 54.9 | 1.55 | 10.2 | 9.5 | 4.155 | ||||||||||
| Garden | 3 | 31,925,927 | 2.2 | 69.0 | 52.6 | 1.56 | 10.4 | 9.7 | 4.182 | ||||||||||
| Student Housing | 1 | 9,250,000 | 0.6 | 74.5 | 62.9 | 1.52 | 9.2 | 8.8 | 4.060 | ||||||||||
| Self Storage | 9 | 32,796,236 | 2.2 | 66.2 | 54.9 | 1.77 | 10.7 | 10.4 | 4.206 | ||||||||||
| Self Storage | 9 | 32,796,236 | 2.2 | 66.2 | 54.9 | 1.77 | 10.7 | 10.4 | 4.206 | ||||||||||
| Mixed Use | 3 | 28,432,366 | 1.9 | 58.8 | 47.0 | 1.72 | 10.9 | 10.0 | 4.140 | ||||||||||
| Office/Retail | 2 | 26,235,199 | 1.8 | 61.5 | 49.1 | 1.61 | 10.3 | 9.4 | 4.139 | ||||||||||
| Multifamily/Retail | 1 | 2,197,168 | 0.1 | 27.0 | 21.6 | 2.94 | 17.6 | 17.1 | 4.150 | ||||||||||
| Total/Weighted Average | 99 | $1,469,544,239 | 100.0 | % | 65.8 | % | 58.0 | % | 1.95 | x | 10.6 | % | 9.9 | % | 4.037 | % | |||
(1) Because this table presents information relating to the mortgaged properties and not the mortgage loans, the information for mortgage loans secured by more than one mortgaged property (other than through cross-collateralization with other mortgage loans) is based on allocated amounts (allocating the mortgage loan principal balance to each of those properties according to the relative appraised values of the mortgaged properties or the allocated loan amounts or property-specific release prices set forth in the related mortgage loan documents or such other allocation as the related mortgage loan seller deemed appropriate). The information for each mortgaged property that relates to a mortgage loan that is cross-collateralized with other mortgage loans is based upon the principal balance of that mortgage loan, except that the applicable loan-to-value ratio, debt service coverage ratio or debt yield for each such mortgaged property is based upon the ratio or yield (as applicable) for the aggregate indebtedness evidenced by all loans in the group. On an individual basis, without regard to the cross-collateralization feature, any mortgaged property securing a mortgage loan that is part of a cross-collateralized group of mortgage loans may have a higher loan-to-value ratio, lower debt service coverage ratio and/or lower debt yield than is presented herein. For mortgaged properties securing residential cooperative mortgage loans, the loan-to-value ratio, debt service coverage ratio or debt yield for each such mortgaged property are calculated using underwritten net cash flow for the related residential cooperative property which is the projected net cash flow reflected in the most recent appraisal obtained by or otherwise in the possession of the related mortgage loan seller as of the cut-off date, and the appraised value of the residential cooperative property determined as if such residential cooperative property is operated as a residential cooperative. With respect to White Marsh Mall, 301 South College Street, Cumberland Mall and 100 & 150 South Wacker Drive, loan-to-value ratio, debt service coverage ratio and debt yield calculations include the related pari passu companion loan (unless otherwise stated) in total debt. Debt service coverage ratio, debt yield and loan-to-value ratio information takes no account of subordinate debt (whether or not secured by the mortgaged property), if any, that is allowed under the terms of any mortgage loan. See Annex A-1 to the Free Writing Prospectus.
THE INFORMATION IN THIS STRUCTURAL AND COLLATERAL TERM SHEET IS NOT COMPLETE AND MAY BE AMENDED PRIOR TO THE TIME OF SALE. THIS TERM SHEET IS NOT AN OFFER TO SELL THESE SECURITIES AND IT IS NOT A SOLICITATION OF AN OFFER TO BUY THESE SECURITIES IN ANY JURISDICTION WHERE THE OFFER OR SALE IS NOT PERMITTED.
14
| WFRBS Commercial Mortgage Trust 2013-C14 | Characteristics of the Mortgage Pool |
F. Geographic Distribution(1)
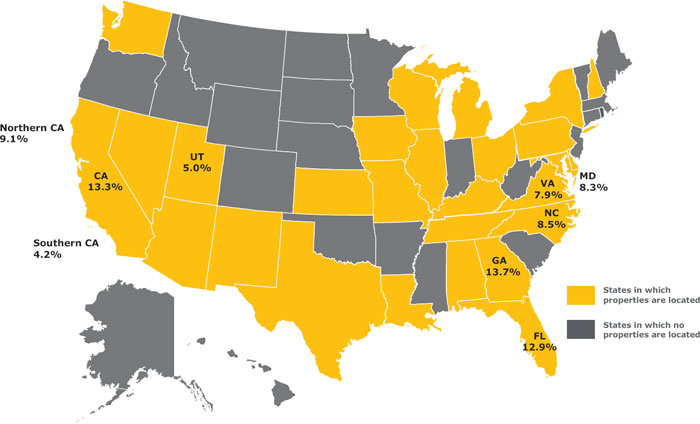
Location(2) | Number of Mortgaged Properties | Aggregate Cut- off Date Balance ($)(3) | % of Cut- off Date Balance | Weighted Average Cut- off Date LTV Ratio (%)(3) | Weighted Average Balloon or ARD LTV Ratio (%)(3) | Weighted Average U/W NCF DSCR (x) (3) | Weighted Average U/W NOI Debt Yield (%)(3) | Weighted Average U/W NCF Debt Yield (%)(3) | Weighted Average Mortgage Rate (%)(3) | ||||||||||
| Georgia | 3 | $200,791,467 | 13.7 | % | 60.9 | % | 60.5 | % | 2.73 | x | 11.2 | % | 10.6 | % | 3.788 | % | |||
| California | 9 | 195,504,938 | 13.3 | 62.1 | 57.6 | 2.29 | 10.8 | 10.1 | 3.942 | ||||||||||
| Northern | 3 | 133,476,872 | 9.1 | 60.3 | 59.0 | 2.55 | 10.7 | 10.2 | 3.833 | ||||||||||
| Southern | 6 | 62,028,066 | 4.2 | 66.1 | 54.8 | 1.71 | 11.0 | 10.0 | 4.178 | ||||||||||
| Florida | 13 | 190,247,799 | 12.9 | 67.8 | 57.2 | 1.67 | 10.5 | 9.7 | 4.126 | ||||||||||
| North Carolina | 5 | 125,280,872 | 8.5 | 69.2 | 60.4 | 1.76 | 10.8 | 10.3 | 4.037 | ||||||||||
| Maryland | 2 | 121,735,199 | 8.3 | 64.1 | 62.7 | 2.53 | 10.1 | 9.7 | 3.715 | ||||||||||
| Virginia | 10 | 115,825,453 | 7.9 | 68.7 | 55.3 | 1.58 | 10.3 | 9.5 | 4.119 | ||||||||||
| Utah | 6 | 73,172,790 | 5.0 | 69.0 | 58.0 | 1.59 | 9.8 | 9.3 | 3.959 | ||||||||||
Other(4) | 51 | 446,985,720 | 30.4 | 66.9 | 56.1 | 1.61 | 10.7 | 9.6 | 4.231 | ||||||||||
| Total/Weighted Average | 99 | $1,469,544,239 | 100.0 | % | 65.8 | % | 58.0 | % | 1.95 | x | 10.6 | % | 9.9 | % | 4.037 | % | |||
(1) The Mortgaged Properties are located in 27 states.
(2) For purposes of determining whether a mortgaged property is in Northern California or Southern California, Northern California includes areas with zip codes above 93600 and Southern California includes areas with zip codes of 93600 and below.
(3) Because this table presents information relating to the mortgaged properties and not the mortgage loans, the information for mortgage loans secured by more than one mortgaged property (other than through cross-collateralization with other mortgage loans) is based on allocated amounts (allocating the mortgage loan principal balance to each of those properties according to the relative appraised values of the mortgaged properties or the allocated loan amounts or property-specific release prices set forth in the related mortgage loan documents or such other allocation as the related mortgage loan seller deemed appropriate). The information for each mortgaged property that relates to a mortgage loan that is cross-collateralized with other mortgage loans is based upon the principal balance of that mortgage loan, except that the applicable loan-to-value ratio, debt service coverage ratio or debt yield for each such mortgaged property is based upon the ratio or yield (as applicable) for the aggregate indebtedness evidenced by all loans in the group. On an individual basis, without regard to the cross-collateralization feature, any mortgaged property securing a mortgage loan that is part of a cross-collateralized group of mortgage loans may have a higher loan-to-value ratio, lower debt service coverage ratio and/or lower debt yield than is presented herein. For mortgaged properties securing residential cooperative mortgage loans, the loan-to-value ratio, debt service coverage ratio or debt yield for each such mortgaged property are calculated using underwritten net cash flow for the related residential cooperative property which is the projected net cash flow reflected in the most recent appraisal obtained by or otherwise in the possession of the related mortgage loan seller as of the cut-off date, and the appraised value of the residential cooperative property determined as if such residential cooperative property is operated as a residential cooperative. With respect to White Marsh Mall, 301 South College Street, Cumberland Mall and 100 & 150 South Wacker Drive, loan-to-value ratio, debt service coverage ratio, debt yield and cut-off date balance per square foot calculations include the related pari passu companion loan (unless otherwise stated) in total debt. Debt service coverage ratio, debt yield and loan-to-value ratio information takes no account of subordinate debt (whether or not secured by the mortgaged property), if any, that is allowed under the terms of any mortgage loan. See Annex A-1 to the Free Writing Prospectus.
(4) Includes 20 other states.
THE INFORMATION IN THIS STRUCTURAL AND COLLATERAL TERM SHEET IS NOT COMPLETE AND MAY BE AMENDED PRIOR TO THE TIME OF SALE. THIS TERM SHEET IS NOT AN OFFER TO SELL THESE SECURITIES AND IT IS NOT A SOLICITATION OF AN OFFER TO BUY THESE SECURITIES IN ANY JURISDICTION WHERE THE OFFER OR SALE IS NOT PERMITTED.
15
| WFRBS Commercial Mortgage Trust 2013-C14 | Characteristics of the Mortgage Pool |
G. Characteristics of the Mortgage Pool(1)
| CUT-OFF DATE BALANCE | LOAN PURPOSE | |||||||
| Number of | Number of | |||||||
| Range of Cut-off Date | Mortgage | Aggregate Cut- | % of Cut-off | Mortgage | Aggregate Cut- | % of Cut-off | ||
| Balances ($) | Loans | off Date Balance | Date Balance | Loan Purpose | Loans | off Date Balance | Date Balance | |
| 1,423,281 - 2,000,000 | 7 | $12,724,774 | 0.9% | Refinance | 57 | $872,602,433 | 59.4% | |
| 2,000,001 - 3,000,000 | 4 | 10,268,911 | 0.7 | Acquisition | 16 | 596,941,806 | 40.6 | |
| 3,000,001 - 4,000,000 | 4 | 14,569,806 | 1.0 | Total: | 73 | $1,469,544,239 | 100.0% | |
| 4,000,001 - 5,000,000 | 8 | 37,046,112 | 2.5 | |||||
| 5,000,001 - 6,000,000 | 4 | 22,400,000 | 1.5 | MORTGAGE RATE | ||||
| 6,000,001 - 7,000,000 | 4 | 26,419,824 | 1.8 | Number of | ||||
| 7,000,001 - 8,000,000 | 4 | 31,134,645 | 2.1 | Range of Mortgage Rates | Mortgage | Aggregate Cut- | % of Cut-off | |
| 8,000,001 - 9,000,000 | 4 | 33,636,932 | 2.3 | (%) | Loans | off Date Balance | Date Balance | |
| 9,000,001 - 10,000,000 | 1 | 9,250,000 | 0.6 | 3.658 - 3.750 | 3 | $194,472,274 | 13.2% | |
| 10,000,001 - 15,000,000 | 12 | 155,147,437 | 10.6 | 3.751 - 4.000 | 11 | 536,886,350 | 36.5 | |
| 15,000,001 - 20,000,000 | 5 | 83,564,459 | 5.7 | 4.001 - 4.250 | 29 | 510,159,883 | 34.7 | |
| 20,000,001 - 30,000,000 | 5 | 109,735,574 | 7.5 | 4.251 - 4.500 | 18 | 150,542,477 | 10.2 | |
| 30,000,001 - 50,000,000 | 2 | 63,621,868 | 4.3 | 4.501 - 4.750 | 6 | 35,753,684 | 2.4 | |
| 50,000,001 - 70,000,000 | 3 | 199,000,000 | 13.5 | 4.751 - 5.000 | 3 | 25,856,508 | 1.8 | |
| 80,000,001 - 90,000,000 | 2 | 175,000,000 | 11.9 | 5.001 - 5.140 | 3 | 15,873,063 | 1.1 | |
| 100,000,001 - 128,723,897 | 4 | 486,023,897 | 33.1 | Total: | 73 | $1,469,544,239 | 100.0% | |
| Total: | 73 | $1,469,544,239 | 100.0% | Weighted Average: | 4.037% | |||
| Average: | $20,130,743 | |||||||
| UNDERWRITTEN NOI DEBT YIELD | ||||||||
| UNDERWRITTEN NOI DEBT SERVICE COVERAGE RATIO | Number of | |||||||
| Number of | Range of U/W NOI | Mortgage | Aggregate Cut- | % of Cut-off | ||||
| Range of U/W NOI | Mortgage | Aggregate Cut- | % of Cut-off | Debt Yields (%) | Loans | off Date Balance | Date Balance | |
| DSCRs (x) | Loans | off Date Balance | Date Balance | 8.1 - 9.0 | 6 | $224,929,704 | 15.3% | |
| 1.42 - 1.50 | 3 | $171,080,964 | 11.6% | 9.1 - 10.0 | 18 | 299,809,748 | 20.4 | |
| 1.51 - 1.60 | 10 | 112,240,641 | 7.6 | 10.1 - 11.0 | 16 | 456,625,423 | 31.1 | |
| 1.61 - 1.70 | 15 | 210,250,059 | 14.3 | 11.1 - 12.0 | 17 | 252,832,935 | 17.2 | |
| 1.71 - 1.80 | 9 | 57,811,895 | 3.9 | 12.1 - 13.0 | 7 | 150,043,841 | 10.2 | |
| 1.81 - 1.90 | 10 | 217,619,369 | 14.8 | 13.1 - 14.0 | 4 | 26,172,429 | 1.8 | |
| 1.91 - 2.00 | 10 | 91,172,256 | 6.2 | 14.1 - 15.0 | 1 | 12,000,000 | 0.8 | |
| 2.01 - 2.25 | 6 | 120,149,084 | 8.2 | 15.1 - 16.0 | 2 | 30,460,717 | 2.1 | |
| 2.26 - 2.50 | 2 | 14,789,812 | 1.0 | 16.1 - 17.0 | 1 | 14,472,274 | 1.0 | |
| 2.51 - 2.75 | 5 | 237,932,991 | 16.2 | 17.1 - 17.6 | 1 | 2,197,168 | 0.1 | |
| 2.76 - 3.00 | 1 | 110,000,000 | 7.5 | Total: | 73 | $1,469,544,239 | 100.0% | |
| 3.01 - 3.09 | 2 | 126,497,168 | 8.6 | Weighted Average: | 10.6% | |||
| Total: | 73 | $1,469,544,239 | 100.0% | |||||
| Weighted Average: | 2.09x | UNDERWRITTEN NCF DEBT YIELD | ||||||
| Number of | ||||||||
| UNDERWRITTEN NCF DEBT SERVICE COVERAGE RATIO | Range of U/W NCF | Mortgage | Aggregate Cut- | % of Cut-off | ||||
| Number of | Debt Yields (%) | Loans | off Date Balance | Date Balance | ||||
| Range of U/W NCF | Mortgage | Aggregate Cut- | % of Cut-off | 7.8 - 8.0 | 4 | $183,580,964 | 12.5% | |
| DSCRs (x) | Loans | off Date Balance | Date Balance | 8.1 - 9.0 | 13 | 303,635,758 | 20.7 | |
| 1.36 - 1.40 | 3 | $171,080,964 | 11.6% | 9.1 - 10.0 | 19 | 298,088,814 | 20.3 | |
| 1.41 - 1.50 | 9 | 119,112,418 | 8.1 | 10.1 - 11.0 | 23 | 461,417,548 | 31.4 | |
| 1.51 - 1.60 | 21 | 324,656,742 | 22.1 | 11.1 - 12.0 | 6 | 143,907,511 | 9.8 | |
| 1.61 - 1.70 | 13 | 96,136,320 | 6.5 | 12.1 - 13.0 | 3 | 36,761,978 | 2.5 | |
| 1.71 - 1.80 | 7 | 124,870,025 | 8.5 | 13.1 - 14.0 | 3 | 25,482,226 | 1.7 | |
| 1.81 - 1.90 | 7 | 129,008,825 | 8.8 | 14.1 - 15.0 | 1 | 14,472,274 | 1.0 | |
| 1.91 - 2.00 | 2 | 10,465,300 | 0.7 | 17.1 | 1 | 2,197,168 | 0.1 | |
| 2.01 - 2.25 | 4 | 41,755,652 | 2.8 | Total: | 73 | $1,469,544,239 | 100.0% | |
| 2.26 - 2.50 | 3 | 92,960,826 | 6.3 | Weighted Average: | 9.9% | |||
| 2.51 - 2.75 | 2 | 233,000,000 | 15.9 | |||||
| 2.76 - 2.94 | 2 | 126,497,168 | 8.6 | |||||
| Total: | 73 | $1,469,544,239 | 100.0% | |||||
| Weighted Average: | 1.95x | |||||||
(1) | Information regarding mortgage loans that are cross-collateralized with other mortgage loans is based upon the individual loan balances, except that the applicable loan-to value ratio, debt service coverage ratio or debt yield for each such mortgage loan is based upon the ratio or yield (as applicable) for the aggregate indebtedness evidenced by all loans in the group. On an individual basis, without regard to the cross-collateralization feature, any mortgage loan that is part of a cross-collateralized group of mortgage loans may have a higher loan-to-value ratio, lower debt service coverage ratio and/or lower debt yield than is presented herein. With respect to White Marsh Mall, 301 South College Street, Cumberland Mall and 100 & 150 South Wacker Drive, loan-to-value ratio, debt service coverage ratio and debt yield calculations include the related pari passu companion loan (unless otherwise stated) in total debt. Debt service coverage ratio, debt yield and loan-to-value ratio information takes no account of subordinate debt (whether or not secured by the mortgaged property), if any, that is allowed under the terms of any mortgage loan. |
THE INFORMATION IN THIS STRUCTURAL AND COLLATERAL TERM SHEET IS NOT COMPLETE AND MAY BE AMENDED PRIOR TO THE TIME OF SALE. THIS TERM SHEET IS NOT AN OFFER TO SELL THESE SECURITIES AND IT IS NOT A SOLICITATION OF AN OFFER TO BUY THESE SECURITIES IN ANY JURISDICTION WHERE THE OFFER OR SALE IS NOT PERMITTED.
16
| WFRBS Commercial Mortgage Trust 2013-C14 | Characteristics of the Mortgage Pool |
| ORIGINAL TERM TO MATURITY OR ARD | CUT-OFF DATE LOAN-TO-VALUE RATIO | |||||||||||||
| Number of | Number of | |||||||||||||
| Range of Original Terms to | Mortgage | Aggregate Cut- | % of Cut-off | Range of Cut-off Date LTV | Mortgage | Aggregate Cut- | % of Cut-off | |||||||
| Maturity or ARD (months) | Loans | off Date Balance | Date Balance | Ratios (%) | Loans | off Date Balance | Date Balance | |||||||
| 60 | 5 | $50,157,445 | 3.4% | 27.0 - 30.0 | 1 | $2,197,168 | 0.1% | |||||||
| 84 | 1 | 17,150,000 | 1.2 | 35.1 - 40.0 | 1 | 8,488,552 | 0.6 | |||||||
| 96 | 1 | 110,000,000 | 7.5 | 45.1 - 50.0 | 1 | 14,472,274 | 1.0 | |||||||
| 120 | 66 | 1,292,236,794 | 87.9 | 50.1 - 55.0 | 3 | 48,972,166 | 3.3 | |||||||
| Total: | 73 | $1,469,544,239 | 100.0% | 55.1 – 60.0 | 5 | 266,783,975 | 18.2 | |||||||
| Weighted Average: | 116 months | 60.1 - 65.0 | 16 | 351,598,429 | 23.9 | |||||||||
| 65.1 - 70.0 | 24 | 423,470,455 | 28.8 | |||||||||||
| REMAINING TERM TO MATURITY OR ARD | 70.1 - 75.0 | 22 | 353,561,222 | 24.1 | ||||||||||
| Number of | Total: | 73 | $1,469,544,239 | 100.0% | ||||||||||
| Range of Remaining Terms | Mortgage | Aggregate Cut- | % of Cut-off | Weighted Average: | 65.8% | |||||||||
| to Maturity or ARD (months) | Loans | off Date Balance | Date Balance | |||||||||||
| 59 - 60 | 5 | $50,157,445 | 3.4% | BALLOON OR ARD LOAN-TO-VALUE RATIO | ||||||||||
| 61 - 84 | 1 | 17,150,000 | 1.2 | Number of | ||||||||||
| 85 - 120 | 67 | 1,402,236,794 | 95.4 | Range of Balloon or ARD | Mortgage | Aggregate Cut- | % of Cut-off | |||||||
| Total: | 73 | $1,469,544,239 | 100.0% | LTV Ratios (%) | Loans | off Date Balance | Date Balance | |||||||
| Weighted Average: | 115 months | 21.6 - 25.0 | 1 | $2,197,168 | 0.1% | |||||||||
| 30.1 - 35.0 | 1 | 8,488,552 | 0.6 | |||||||||||
ORIGINAL AMORTIZATION TERM(2) | 35.1 - 40.0 | 1 | 14,472,274 | 1.0 | ||||||||||
| Range of Original | Number of | 40.1 - 45.0 | 4 | 56,956,551 | 3.9 | |||||||||
| Amortization Terms | Mortgage | Aggregate Cut- | % of Cut-off | 45.1 - 50.0 | 13 | 94,718,270 | 6.4 | |||||||
| (months) | Loans | off Date Balance | Date Balance | 50.1 - 55.0 | 15 | 173,116,245 | 11.8 | |||||||
| Non-Amortizing | 5 | $439,800,000 | 29.9% | 55.1 - 60.0 | 21 | 476,087,811 | 32.4 | |||||||
| 240 | 1 | 12,000,000 | 0.8 | 60.1 - 63.5 | 17 | 643,507,369 | 43.8 | |||||||
| 241 - 300 | 17 | 148,357,761 | 10.1 | Total: | 73 | $1,469,544,239 | 100.0% | |||||||
| 301 - 360 | 50 | 869,386,478 | 59.2 | Weighted Average: | 58.0% | |||||||||
| Total: | 73 | $1,469,544,239 | 100.0% | |||||||||||
Weighted Average(3): | 349 months | AMORTIZATION TYPE | ||||||||||||
| (2) The original amortization term shown for any mortgage loan that is interest-only for part of its term does not include the number of months in its interest-only period and reflects only the number of months as of the commencement of amortization remaining from the end of such interest-only period. | Number of | Aggregate Cut- | ||||||||||||
| Mortgage | off Date | % of Cut-off | ||||||||||||
| Type of Amortization | Loans | Balance | Date Balance | |||||||||||
| (3) Excludes the non-amortizing loans. | Interest-only, Amortizing Balloon | 14 | $576,414,515 | 39.2% | ||||||||||
| Amortizing Balloon | 53 | 438,857,450 | 29.9 | |||||||||||
REMAINING AMORTIZATION TERM(4) | Interest-only, ARD | 3 | 259,800,000 | 17.7 | ||||||||||
| Range of Remaining | Number of | Interest-only, Balloon | 2 | 180,000,000 | 12.2 | |||||||||
| Amortization Terms | Mortgage | Aggregate Cut- | % of Cut-off | Amortizing ARD | 1 | 14,472,274 | 1.0 | |||||||
| (months) | Loans | off Date Balance | Date Balance | Total: | 73 | $1,469,544,239 | 100.0% | |||||||
| Non-Amortizing | 5 | $439,800,000 | 29.9% | |||||||||||
| 240 | 1 | 12,000,000 | 0.8 | ORIGINAL TERM OF INTEREST-ONLY PERIOD FOR PARTIAL IO LOANS | ||||||||||
| 241 - 300 | 17 | 148,357,761 | 10.1 | Number of | ||||||||||
301 - 360 | 50 | 869,386,478 | 59.2 | Mortgage | Aggregate Cut- | % of Cut-off | ||||||||
| Total: | 73 | $1,469,544,239 | 100.0% | IO Term (months) | Loans | off Date Balance | Date Balance | |||||||
Weighted Average(5): | 349 months | 12 | 1 | $10,900,000 | 0.7% | |||||||||
| (4) The remaining amortization term shown for any mortgage loan that is interest-only for part of its term does not include the number of months in its interest-only period and reflects only the number of months as of the commencement of amortization remaining from the end of such interest-only period. | 24 | 8 | 214,168,750 | 14.6 | ||||||||||
| 34 | 2 | 159,345,765 | 10.8 | |||||||||||
| 60 | 3 | 192,000,000 | 13.1 | |||||||||||
| (5) Excludes the non-amortizing loans. | Total: | 14 | $576,414,515 | 39.2% | ||||||||||
| Weighted Average: | 39 months | |||||||||||||
| LOCKBOXES | ||||||||||||||
| Number of | % of Cut-off | SEASONING | ||||||||||||
| Mortgage | Aggregate Cut- | Date | Number of | Aggregate Cut- | ||||||||||
| Type of Lockbox | Loans | off Date Balance | Balance | Mortgage | off Date | % of Cut-off | ||||||||
| Hard/Springing Cash Management | 20 | $590,045,655 | 40.2% | Seasoning (months) | Loans | Balance | Date Balance | |||||||
| Soft/Springing Cash Management | 16 | 289,469,214 | 19.7 | 0 | 23 | $239,646,250 | 16.3% | |||||||
| Hard/Upfront Cash Management | 3 | 282,000,000 | 19.2 | 1 - 2 | 50 | 1,229,897,989 | 83.7 | |||||||
| None | 14 | 119,733,302 | 8.1 | Total: | 73 | $1,469,544,239 | 100.0% | |||||||
| Springing (W/Out Estab. Account) | 18 | 97,696,069 | 6.6 | Weighted Average: | 1 month | |||||||||
| Soft/Upfront Cash Management | 1 | 85,000,000 | 5.8 | |||||||||||
| Springing (With Estab. Account) | 1 | 5,600,000 | 0.4 | |||||||||||
| Total: | 73 | $1,469,544,239 | 100.0% | |||||||||||
| PREPAYMENT PROVISION SUMMARY | ||||||||||||||
| Number of | % of Cut- | |||||||||||||
| Mortgage | Aggregate Cut- | off Date | ||||||||||||
| Prepayment Provision | Loans | off Date Balance | Balance | |||||||||||
| Lockout/Defeasance/Open | 67 | $960,398,474 | 65.4% | |||||||||||
| Lockout/YM%/Open | 4 | 296,145,765 | 20.2 | |||||||||||
| Lockout/YM% | 1 | 123,000,000 | 8.4 | |||||||||||
| Lockout/Defeasance or YM%/Open | 1 | 90,000,000 | 6.1 | |||||||||||
| Total: | 73 | $1,469,544,239 | 100.0% | |||||||||||
THE INFORMATION IN THIS STRUCTURAL AND COLLATERAL TERM SHEET IS NOT COMPLETE AND MAY BE AMENDED PRIOR TO THE TIME OF SALE. THIS TERM SHEET IS NOT AN OFFER TO SELL THESE SECURITIES AND IT IS NOT A SOLICITATION OF AN OFFER TO BUY THESE SECURITIES IN ANY JURISDICTION WHERE THE OFFER OR SALE IS NOT PERMITTED.
17
| WFRBS Commercial Mortgage Trust 2013-C14 | Certain Terms and Conditions |
V. Certain Terms and Conditions
| Interest Entitlements: | The interest entitlement of each Class of Offered Certificates on each Distribution Date generally will be the interest accrued during the related Interest Accrual Period on the related Certificate Principal Balance or Notional Amount at the related pass-through rate, net of any prepayment interest shortfalls allocated to that Class for such Distribution Date as described below. If prepayment interest shortfalls arise from voluntary prepayments (without special servicer consent) on particular non-specially serviced mortgage loans during any collection period, the Master Servicer is required to make a compensating interest payment to offset those shortfalls, generally up to an amount equal to the portion of its master servicing fees that accrue at one basis point per annum. The remaining amount of prepayment interest shortfalls will be allocated to reduce the interest entitlement on all Classes of Certificates (other than the Class X-A, Class X-B and Class X-C Certificates), pro rata, based on their respective amounts of accrued interest for the related Distribution Date (except with respect to the allocation among the Class A-S, Class B, Class PEX and Class C Certificates as described below under “Allocations and Distributions on the Class A-S, B, C and PEX Certificates”). If a Class receives less than the entirety of its interest entitlement on any Distribution Date, then the shortfall, excluding any shortfall due to prepayment interest shortfalls, will be added to its interest entitlement for the next succeeding Distribution Date. Interest entitlements on the Class D, C and B Certificates, in that order, may be reduced by certain Trust Advisor expenses (subject to the discussion below under “Allocations and Distributions on the Class A-S, B, C and PEX Certificates”). |
| Principal Distribution Amount: | The Principal Distribution Amount for each Distribution Date generally will be the aggregate amount of principal received or advanced in respect of the mortgage loans, net of any non-recoverable advances and interest thereon that are reimbursed to the Master Servicer, the Special Servicer or the Trustee during the related collection period. Non-recoverable advances and interest thereon are reimbursable from principal collections and advances before reimbursement from other amounts. The Principal Distribution Amount may also be reduced, with a corresponding loss, to the Class D, C, B and A-S Certificates, then to the Class A-1, A-2, A-3, A-4, A-5 and A-SB Certificates and Class A-4FX Regular Interest (and therefore, to the Class A-4FX and A-4FL Certificates) (with any losses on the Class A-1, A-2, A-3, A-4, A-5 and A-SB Certificates and Class A-4FX Regular Interest (and therefore, on the Class A-4FX and A-4FL Certificates) allocated pro rata according to their respective Certificate Principal Balances immediately prior to that Distribution Date), in that order, in connection with certain Trust Advisor expenses to the extent that interest entitlements on the Class B, C and D Certificates are insufficient to absorb the effect of the expense on any particular Distribution Date, in each case except as discussed below under “Allocations and Distributions on the Class A-S, B, C and PEX Certificates”. |
| Distributions: | On each Distribution Date, funds available for distribution from the mortgage loans, net of specified trust fees, expenses and reimbursements will generally be distributed in the following amounts and order of priority (in each case to the extent of remaining available funds): |
1. Class A-1, A-2, A-3, A-4, A-5, A-SB, X-A, X-B and X-C Certificates and Class A-4FX Regular Interest: To interest on the Class A-1, A-2, A-3, A-4, A-5, A-SB, X-A, X-B and X-C Certificates and Class A-4FX Regular Interest, pro rata, according to their respective interest entitlements. | |
2. Class A-1, A-2, A-3, A-4, A-5 and A-SB Certificates and Class A-4FX Regular Interest: To principal on the Class A-1, A-2, A-3, A-4, A-5 and A-SB Certificates (and the Class A-4FX Regular Interest) in the following amounts and order of priority: (i) first, to principal on the Class A-SB Certificates, in an amount up to the Principal Distribution Amount for such Distribution Date until their Certificate Principal Balance is reduced to the Class A-SB Planned Principal Balance; (ii) second, to principal on the Class A-1 Certificates until their Certificate Principal Balance is reduced to zero, up to the remainder of the Principal Distribution Amount for such Distribution Date; (iii) third, to principal on the Class A-2 Certificates until their Certificate Principal Balance is reduced to zero, up to the remainder of the Principal Distribution Amount for such Distribution Date; (iv) fourth, to principal on the Class A-3 Certificates until their Certificate Principal Balance is reduced to zero, up to the remainder of the Principal Distribution Amount for such Distribution Date; (v) fifth, on a pro rata basis, to principal on the Class A-4 Certificates and Class A-4FX Regular Interest (and therefore, to holders of the Class A-4FX and A-4FL Certificates) until their Certificate Principal Balance is reduced to zero, up to the remainder of the Principal Distribution Amount for such Distribution Date; (vi) sixth, to principal on the Class A-5 Certificates until their Certificate Principal Balance is reduced to zero, up to the remainder of the Principal Distribution Amount for such Distribution Date; and (vii) seventh, to principal on the Class A-SB Certificates until their Certificate Principal Balance is reduced to zero, up to the remainder of the Principal Distribution Amount for such Distribution Date. However, if the Certificate Principal Balance of each and every Class of Principal |
THE INFORMATION IN THIS STRUCTURAL AND COLLATERAL TERM SHEET IS NOT COMPLETE AND MAY BE AMENDED PRIOR TO THE TIME OF SALE. THIS TERM SHEET IS NOT AN OFFER TO SELL THESE SECURITIES AND IT IS NOT A SOLICITATION OF AN OFFER TO BUY THESE SECURITIES IN ANY JURISDICTION WHERE THE OFFER OR SALE IS NOT PERMITTED.
18
| WFRBS Commercial Mortgage Trust 2013-C14 | Certain Terms and Conditions |
Balance Certificates, other than the Class A-1, A-2, A-3, A-4, A-5 and A-SB Certificates and Class A-4FX Regular Interest, has been reduced to zero as a result of the allocation of Mortgage Loan losses and expenses and any of the Class A-1, A-2, A-3, A-4, A-5 and A-SB Certificates and Class A-4FX Regular Interest remains outstanding, then the Principal Distribution Amount will be distributed on the Class A-1, A-2, A-3, A-4, A-5 and A-SB Certificates and Class A-4FX Regular Interest, pro rata, based on their respective outstanding Certificate Principal Balances, until their Certificate Principal Balances have been reduced to zero. | |
3. Class A-1, A-2, A-3, A-4, A-5 and A-SB Certificates and Class A-4FX Regular Interest: To reimburse the holders of the Class A-1, A-2, A-3, A-4, A-5 and A-SB Certificates and the Class A-4FX Regular Interest (and, therefore, to reimburse the holders of the Class A-4FX and A-4FL Certificates), pro rata, for any previously unreimbursed losses (other than certain Trust Advisor expenses) on the mortgage loans that were previously allocated in reduction of the Certificate Principal Balances of such Classes. | |
4. Class A-S regular interest: To make distributions on the Class A-S regular interest as follows: (a) first, to interest on Class A-S regular interest in the amount of the interest entitlement for that Class; (b) next, to the extent of the portion of the Principal Distribution Amount remaining after distributions in respect of principal to each Class with a higher distribution priority (in this case, the Class A-1, A-2, A-3, A-4, A-5 and A-SB Certificates and Class A-4FX Regular Interest), to principal on the Class A-S regular interest until its principal balance is reduced to zero; and (c) next, to reimburse the holders of the Class A-S regular interest for any previously unreimbursed losses (other than certain Trust Advisor expenses) on the mortgage loans that were previously allocated to that Class in reduction of its principal balance. 5. Class B regular interest: To make distributions on the Class B regular interest as follows: (a) first, to interest on Class B regular interest in the amount of the interest entitlement for that Class; (b) next, to the extent of the portion of the Principal Distribution Amount remaining after distributions in respect of principal to each Class with a higher distribution priority (in this case, the Class A-1, A-2, A-3, A-4, A-5 and A-SB Certificates, Class A-S regular interest and Class A-4FX Regular Interest), to principal on the Class B regular interest until its principal balance is reduced to zero; and (c) next, to reimburse the holders of the Class B regular interest for any previously unreimbursed losses (other than certain Trust Advisor expenses) on the mortgage loans that were previously allocated to that Class in reduction of its principal balance. 6. Class C regular interest: To make distributions on the Class C regular interest as follows: (a) first, to interest on Class C regular interest in the amount of the interest entitlement for that Class; (b) next, to the extent of the portion of the Principal Distribution Amount remaining after distributions in respect of principal to each Class with a higher distribution priority (in this case, the Class A-1, A-2, A-3, A-4, A-5 and A-SB Certificates, Class A-S and B regular interests and Class A-4FX Regular Interest), to principal on the Class C regular interest until its principal balance is reduced to zero; and (c) next, to reimburse the holders of the Class C regular interest for any previously unreimbursed losses (other than certain Trust Advisor expenses) on the mortgage loans that were previously allocated to that Class in reduction of its principal balance. | |
7. After the Class A-1, A-2, A-3, A-4, A-5 and A-SB Certificates and Class A-S, B and C regular interests and Class A-4FX Regular Interest are paid all amounts to which they are entitled, the remaining funds available for distribution will be used to pay interest, principal and loss reimbursement amounts (other than certain Trust Advisor expenses) on the Class D, E, F and G Certificates sequentially in that order in a manner analogous to the Class C regular interest. Amounts distributed in respect of the Class A-4FX Regular Interest will generally be allocated between the Class A-4FX and A-4FL Certificates in accordance with their class percentage interests. | |
| Allocations and Distributions on the Class A-S, B, C and PEX Certificates: | On the closing date, the upper-tier REMIC of the issuing entity will issue the Class A-S, Class B and Class C regular interests (each a “regular interest”) which will have outstanding principal balances on the closing date of $108,379,000, $102,868,000 and $53,271,000, respectively. The regular interests will be held in a grantor trust for the benefit of the holders of the Class A-S, B, C and PEX Certificates. The Class A-S, B, C and PEX Certificates will, at all times, represent undivided beneficial ownership interests in a grantor trust that will hold those regular interests. Each class of the Class A-S, B, C and PEX Certificates will, at all times, represent an undivided |
THE INFORMATION IN THIS STRUCTURAL AND COLLATERAL TERM SHEET IS NOT COMPLETE AND MAY BE AMENDED PRIOR TO THE TIME OF SALE. THIS TERM SHEET IS NOT AN OFFER TO SELL THESE SECURITIES AND IT IS NOT A SOLICITATION OF AN OFFER TO BUY THESE SECURITIES IN ANY JURISDICTION WHERE THE OFFER OR SALE IS NOT PERMITTED.
19
| WFRBS Commercial Mortgage Trust 2013-C14 | Certain Terms and Conditions |
| beneficial ownership interest in a percentage of the outstanding principal balance of the regular interest with the same alphabetical class designation. The Class PEX Certificates will, at all times, represent an undivided beneficial ownership interest in the remaining percentages of the outstanding principal balances of the Class A-S, B and C regular interests and which percentage interests are referred to in this Term Sheet as the “Class PEX Component A-S, Class PEX Component B and Class PEX Component C” (collectively, the “Class PEX Components”). Interest, principal, prepayment premiums, yield maintenance charges and voting rights that are allocated to the Class A-S, B or C regular interest will be distributed or allocated, as applicable, as between the Class A-S, B or C Certificates, as applicable, on the one hand, and Class PEX Component A-S, Class PEX Component B or Class PEX Component C, as applicable (and correspondingly, the Class PEX Certificates), on the other hand, pro rata, based on their respective percentage interests in the Class A-S, Class B or Class C regular interest, as applicable. In addition, any losses (including, without limitation, as a result of Trust Advisor expenses) that are allocated to the Class A-S, Class B or Class C regular interest will correspondingly be allocated as between the Class A-S, B or C Certificates, as applicable, on the one hand, and Class PEX Component A-S, Class PEX Component B or Class PEX Component C, as applicable (and correspondingly, the Class PEX Certificates), on the other hand, pro rata, based on their respective percentage interests in the Class A-S, Class B or Class C regular interest, as applicable. For a complete description of the allocations and distributions with respect to the Class A-S regular interest, the Class B regular interest and the Class C regular interest (and correspondingly the Class A-S, B, C and PEX Certificates and the Class PEX Component A-S, Class PEX Component B and Class PEX Component C), see “Description of the Offered Certificates” in the Free Writing Prospectus. See “Material Federal Income Tax Consequences” in the Free Writing Prospectus for a discussion of the tax treatment of the Exchangeable Certificates. | |
Exchanging Certificates through Combination and Recombination: | If you own Class A-S, B and C Certificates, you will be able to exchange them for a proportionate interest in the Class PEX Certificates, and vice versa, as described in the Free Writing Prospectus. You can exchange your Exchangeable Certificates by notifying the Certificate Administrator. If Exchangeable Certificates are outstanding and held by certificateholders, those certificates will receive principal and interest that would otherwise have been payable on the same proportion of certificates exchanged therefor if those certificates were outstanding and held by certificateholders. Any such allocations of principal and interest between classes of Exchangeable Certificates will have no effect on the principal or interest entitlements of any other class of certificates. The Free Writing Prospectus describes the available combinations of Exchangeable Certificates eligible for exchange. |
| Allocation of Yield Maintenance and Prepayment Premiums: | If any yield maintenance charges and prepayment premiums are collected during any particular collection period with respect to any mortgage loan, then on the distribution date corresponding to that collection period, the certificate administrator will pay a portion of the yield maintenance charges and prepayment premiums (net of liquidation fees payable therefrom) in the following manner: (1) pro rata, between (x) the group (the “YM Group A”) of the Class A-1, A-2, A-3, A-4, A-5, A-SB and X-A Certificates and the Class A-4FX Regular Interest and the Class A-S regular interest and (y) the group (the “YM Group B” and, collectively with the YM Group A, the “YM Groups”) of the Class D and X-B Certificates and the Class B and C regular interests, based upon the aggregate amount of principal distributed to the classes of principal balance certificates (other than the Class A-4FL and Class A-4FX Certificates), the Class A-4FX Regular Interest and regular interests, as applicable, in each YM Group for that distribution date, and (2) among the classes of certificates and regular interests in each YM Group, in the following manner, up to an amount equal to the product of (a) the yield maintenance or prepayment premium allocated to such YM Group, (b) the related Base Interest Fraction (as defined in the Free Writing Prospectus), and (c) a fraction, which in no event may be greater than 1.0, the numerator of which is equal to the amount of principal distributed to the holder(s) of such class or regular interest for that distribution date, and the denominator of which is the aggregate amount of principal distributed to all the certificates, the Class A-4FX Regular Interest and the regular interests in that YM Group for that distribution date. Any yield maintenance charges or prepayment premium allocated to such YM Group remaining after such distributions will be distributed to the Class X-A and/or Class X-B Certificates, as applicable, in such YM Group. |
THE INFORMATION IN THIS STRUCTURAL AND COLLATERAL TERM SHEET IS NOT COMPLETE AND MAY BE AMENDED PRIOR TO THE TIME OF SALE. THIS TERM SHEET IS NOT AN OFFER TO SELL THESE SECURITIES AND IT IS NOT A SOLICITATION OF AN OFFER TO BUY THESE SECURITIES IN ANY JURISDICTION WHERE THE OFFER OR SALE IS NOT PERMITTED.
20
| WFRBS Commercial Mortgage Trust 2013-C14 | Certain Terms and Conditions |
| No prepayment premiums or yield maintenance charges will be distributed to the holders of the Class E, F, G, X-C, V or R Certificates. The holders of the Class X-B Certificates will be entitled to all prepayment premiums and yield maintenance charges collected after the Class A-1, A-2, A-3, A-4, A-5, A-SB, A-S, X-A, B, C, PEX and D Certificates and Class A-4FX Regular Interest (and, therefore, the Class A-4FX and A-4FL Certificates) are retired. For a description of when prepayment premiums and yield maintenance charges are generally required on the mortgage loans, see Annex A-1 to the Free Writing Prospectus. See also “Risk Factors – Prepayments and Repurchases of the Mortgage Assets Will Affect the Timing of Your Cash Flow and May Affect Your Yield” in the prospectus attached to the Free Writing Prospectus. Prepayment premiums and yield maintenance charges will be distributed on each Distribution Date only to the extent they are actually received on the mortgage loans as of the related Determination Date. | |
| Realized Losses: | The Certificate Principal Balances of the Class A-1, A-2, A-3, A-4, A-5, A-SB, D, E, F and G Certificates, the Class A-S, B and C regular interests and the Class A-4FX Regular Interest (and, therefore, the Class A-4FX and A-4FL Certificates) will be reduced without distribution on any Distribution Date as a write-off to the extent of any losses realized on the mortgage loans allocated to such Class on such Distribution Date. Such losses (other than certain Trust Advisor expenses) will be applied in the following order, in each case until the related Certificate Principal Balance is reduced to zero: first, to Class G; second, to Class F; third, to Class E; fourth, to Class D; fifth, to Class C; sixth, to Class B; seventh, to Class A-S; and, finally, pro rata, to Classes A-1, A-2, A-3, A-4, A-5 and A-SB and the Class A-4FX Regular Interest (and, therefore, to holders of the Class A-4FX and the Class A-4FL Certificates) based on their outstanding Certificate Principal Balances. Certain Trust Advisor expenses (if not absorbed by reductions of interest entitlements on Classes D, C and B Certificates) will be applied as write-offs in a similar manner, except that such write-offs will be applied only to the Class D, C, B, A-S, A-1, A-2, A-3, A-4, A-5 and A-SB Certificates and the Class A-4FX Regular Interest (and, therefore, the Class A-4FX and A-4FL Certificates) (with any write-offs on the Class A-1, A-2, A-3, A-4, A-5 and A-SB Certificates and the Class A-4FX Regular Interest to be allocated pro rata according to their respective Certificate Principal Balances immediately prior to that Distribution Date). Any realized losses allocated to the Class A-S, B and C regular interests will, in turn, be allocated to the Class A-S, B, C and PEX Certificates as described above in “Allocations and Distributions on the Class A-S, B, C and PEX Certificates”. The notional amount of the Class X-A Certificates will be reduced by the amount of all losses that are allocated to the Class A-1, A-2, A-3, A-4, A-5 or A-SB Certificates or the Class A-S regular interest or the Class A-4FX Regular Interest as write-offs in reduction of their Certificate Principal Balances. The notional amount of the Class X-B Certificates will be reduced by the amount of all losses that are allocated to the Class B or C regular interests as write-offs in reduction of their Certificate Principal Balances. The notional amount of the Class X-C Certificates will be reduced by the amount of all losses that are allocated to the Class E, F or G Certificates as write-offs in reduction of their Certificate Principal Balances. |
| Debt Service Advances: | The Master Servicer or, if the Master Servicer fails to do so, the Trustee, will be obligated to advance delinquent debt service payments (other than balloon payments and default interest) and assumed debt service payments on the mortgage loans (including each pari passu mortgage loan but not its related pari passu companion loan), except to the extent any such advance is deemed non-recoverable from collections on the related mortgage loan. In addition, if an Appraisal Reduction Amount exists for a given mortgage loan, the interest portion of any debt service advance for such mortgage loan will be reduced, which will have the effect of reducing the amount of interest available for distribution to the Certificates in reverse alphabetical order of their Class designations (except that interest payments on the Class A-1, A-2, A-3, A-4, A-5, A-SB, X-A, X-B and X-C Certificates and the Class A-4FX Regular Interest (and, therefore, the Class A-4FX and A-4FL Certificates) would be affected on a pari passu basis). |
| Servicing Advances: | The Master Servicer or, if the Master Servicer fails to do so, the Trustee, will be obligated to make servicing advances with respect to each mortgage loan it services, including the payment of delinquent property taxes, insurance premiums and ground rent, except to the extent that those advances are deemed non-recoverable from collections on the related mortgage loan. After any securitization of the Cumberland Mall or 100 & 150 South Wacker Drive pari passu companion loan, the master servicer under that securitization will have the primary obligation to make any servicing advances with respect to the related loan combination. |
| Appraisal Reduction Amounts: | An Appraisal Reduction Amount generally will be created in the amount, if any, by which the principal balance of a required appraisal loan (which is a mortgage loan with respect to which certain defaults, modifications or insolvency events have occurred as further described in the Free Writing Prospectus) plus other amounts overdue or advanced in connection with such mortgage loan exceeds 90% of the appraised value of the related mortgaged property plus certain escrows and reserves (including letters of credit) held with respect to the mortgage loan. |
| A mortgage loan will cease to be a required appraisal loan when the same has ceased to be a |
THE INFORMATION IN THIS STRUCTURAL AND COLLATERAL TERM SHEET IS NOT COMPLETE AND MAY BE AMENDED PRIOR TO THE TIME OF SALE. THIS TERM SHEET IS NOT AN OFFER TO SELL THESE SECURITIES AND IT IS NOT A SOLICITATION OF AN OFFER TO BUY THESE SECURITIES IN ANY JURISDICTION WHERE THE OFFER OR SALE IS NOT PERMITTED.
21
| WFRBS Commercial Mortgage Trust 2013-C14 | Certain Terms and Conditions |
| specially serviced mortgage loan (if applicable), has been brought current for at least three consecutive months and no other circumstances exist that would cause such mortgage loan to be required appraisal loan. | |
| Appraisal Reduction Amounts will affect the amount of debt service advances on the related mortgage loan. Appraisal Reduction Amounts will also be taken into account in the determination of the identity of the Class whose majority constitutes the “majority subordinate certificateholder” and is entitled to appoint the subordinate class representative. | |
| Clean-Up Call and Exchange Termination: | On each Distribution Date occurring after the aggregate unpaid principal balance of the mortgage loans is reduced below 1% of the initial aggregate principal balance of the mortgage loans as of the Cut-off Date, certain specified persons will have the option to purchase all of the remaining mortgage loans (and the trust’s interest in all property acquired through exercise of remedies in respect of any mortgage loan) at the price specified in the Free Writing Prospectus. Exercise of the option will terminate the trust and retire the then-outstanding certificates. |
| If the aggregate Certificate Principal Balances of each of the Class A-1, A-2, A-3, A-4, A-5, A-SB, A-S, B, C, PEX and D Certificates and Class A-4FX Regular Interest (and, therefore the Class A-4FX and Class A-4FL Certificates) have been reduced to zero, the trust may also be terminated in connection with an exchange of all the then-outstanding certificates, for the mortgage loans and REO properties then remaining in the issuing entity, but all of the holders of those Classes of outstanding certificates would have to voluntarily participate in the exchange. | |
| Liquidated Loan Waterfall: | Following the liquidation of any loan or property, the net liquidation proceeds generally will be applied (after reimbursement of advances and certain trust fund expenses), first, as a recovery of accrued interest, other than delinquent interest that was not advanced as a result of Appraisal Reduction Amounts, and then as a recovery of principal until all principal has been recovered. Any liquidation proceeds remaining thereafter will be applied as a recovery of delinquent interest that was not advanced as a result of Appraisal Reduction Amounts. |
| Majority Subordinate Certificateholder and Subordinate Class Representative: | A subordinate class representative may be appointed by the “majority subordinate certificate-holder”, which will be the holder(s) of a majority of: (a) during a “subordinate control period”, the most subordinate class among the Class E, F and G Certificates that has a Certificate Principal Balance, as notionally reduced by any Appraisal Reduction Amounts allocable to that class, that is at least equal to 25% of its total initial principal balance and (b) during a “collective consultation period”, the most subordinate class among the Class E, F and G Certificates that has a total principal balance, without regard to Appraisal Reduction Amounts, that is at least equal to 25% of its initial Certificate Principal Balance. The majority subordinate certificateholder will have a continuing right to appoint, remove or replace the subordinate class representative in its sole discretion. This right may be exercised at any time and from time to time. See “Servicing of the Mortgage Loans and Administration of the Trust Fund - The Majority Subordinate Certificateholder and the Subordinate Class Representative” in the Free Writing Prospectus. |
| Control and Consultation: | The rights of various parties to replace the Special Servicer and approve or consult with respect to major actions of the Special Servicer will vary according to defined periods. A “subordinate control period” will exist as long as the Class E Certificates have a Certificate Principal Balance, net of any Appraisal Reduction Amounts allocable to that class, that is not less than 25% of the initial principal balance of that class (unless a senior consultation period is deemed to occur generally or with respect to a particular mortgage loan, pursuant to clause (ii) of the definition of “senior consultation period”). In general, during a subordinate control period, (i) the subordinate class representative will be entitled to grant or withhold approval of asset status reports prepared, and material servicing actions proposed, by the Special Servicer, and (ii) the majority subordinate certificateholder, or the subordinate class representative on its behalf, will be entitled to terminate and replace the Special Servicer with or without cause, and appoint itself or another person as the successor special servicer. It will be a condition to such appointment that Fitch, KBRA and Moody’s confirm that the appointment would not result in a qualification, downgrade or withdrawal of any of their then-current ratings of certificates. A “collective consultation period” will exist as long as the Class E Certificates have a Certificate Principal Balance that both (i) as notionally reduced by any Appraisal Reduction Amounts allocable to that class, is less than 25% of its initial principal balance and (ii) without regard to any Appraisal Reduction Amounts allocable to that class, is 25% or more of its initial Certificate Principal Balance (unless a senior consultation period is deemed to occur generally or with respect to a particular mortgage loan, pursuant to clause (ii) of the definition of “senior consultation period”). In general, during a collective consultation period, the Special Servicer will be required to consult with each of the subordinate class representative and the Trust Advisor in connection with asset status reports and material special servicing actions. A “senior consultation period” will exist as long as either (i) the Class E certificates have an aggregate principal balance, without regard to any Appraisal Reduction Amounts allocable to that class, that is less than 25% of its initial principal balance or (ii) during |
THE INFORMATION IN THIS STRUCTURAL AND COLLATERAL TERM SHEET IS NOT COMPLETE AND MAY BE AMENDED PRIOR TO THE TIME OF SALE. THIS TERM SHEET IS NOT AN OFFER TO SELL THESE SECURITIES AND IT IS NOT A SOLICITATION OF AN OFFER TO BUY THESE SECURITIES IN ANY JURISDICTION WHERE THE OFFER OR SALE IS NOT PERMITTED.
22
| WFRBS Commercial Mortgage Trust 2013-C14 | Certain Terms and Conditions |
| such time as the Class E certificates are the most subordinate class of control-eligible certificates that have a then outstanding principal balance, net of Appraisal Reduction Amounts, at least equal to 25% of its initial principal balance, the then-majority subordinate certificateholder has irrevocably waived its right to appoint a subordinate class representative and to exercise any of the rights of the majority subordinate certificateholder or cause the exercise of the rights of the subordinate class representative and such rights have not been reinstated to a successor majority subordinate certificateholder as set forth in the pooling and servicing agreement. In general, during a senior consultation period, the Special Servicer must seek to consult with the Trust Advisor in connection with asset status reports and material special servicing actions, and, in general, no subordinate class representative will be recognized or have any right to terminate the Special Servicer or approve, direct or consult with respect to servicing matters. Notwithstanding any contrary description set forth above, with respect to the White Marsh Mall mortgage loan, the holder of the related pari passu companion loan or its representative (which following a securitization of such pari passu companion loan will include (a) the subordinate class representative under the pooling and servicing agreement for such securitization (or, during a senior consultation period under such pooling and servicing agreement, the special servicer under such pooling and servicing agreement)) will have consultation rights with respect to asset status reports and material special servicing actions involving the related loan combination, as provided for in the related intercreditor agreement and as described in the Free Writing Prospectus, and those rights will be in addition to the rights of the subordinate class representative in this transaction described above; and (b) the existence of a subordinate control period, collective consultation period or senior consultation period under the WFRBS 2013-C14 pooling and servicing agreement will not limit the consultation rights of the holder of the related pari passu companion loan. In addition, notwithstanding any contrary description set forth above, with respect to the 301 South College Street mortgage loan, (a) the subordinate class representative under the WFRBS 2013-C13 pooling and servicing agreement (or, during a senior consultation period under the series 2013-C13 pooling and servicing agreement, the special servicer under such pooling and servicing agreement) or any subsequent holder of the related pari passu companion loan or its representative will have consultation rights with respect to asset status reports and material special servicing actions involving the related loan combination, as provided for in the related intercreditor agreement and as described in the Free Writing Prospectus, and those rights will be in addition to the rights of the subordinate class representative in this transaction described above; and (b) the existence of a subordinate control period, collective consultation period or senior consultation period under the WFRBS 2013-C14 pooling and servicing agreement will not limit the consultation rights of the holder of the related pari passu companion loan. Furthermore, notwithstanding any contrary description set forth above, with respect to the Cumberland Mall mortgage loan and the 100 & 150 South Wacker Drive mortgage loan, in general (a) for as long as the loan combination is serviced under the pooling and servicing agreement for this securitization, the initial holder of the related pari passu companion loan will have control rights that include the right to approve or disapprove various material servicing actions involving the loan combination and the subordinate class representative for this securitization will have the right to be consulted on a non-binding basis with respect to such actions, and (b) in connection with any securitization of the related pari passu companion loan, after which the loan combination will be serviced under the pooling and servicing agreement for that other securitization, that pooling and servicing agreement may grant to a subordinate or controlling class representative or other third party control rights that include the right to approve or disapprove various material servicing actions involving the loan combination but the subordinate class representative for this securitization will nonetheless have the right to be consulted on a non-binding in basis with respect to such actions. For purposes of the servicing of the applicable loan combination, the occurrence and continuance of a collective consultation period or senior consultation period with respect to the subordinate class representative under this securitization will not limit the control or other rights of the initial holder of the pari passu companion loan or of a subordinate or controlling class representative or other third party under any securitization thereof, and any collective consultation period or senior consultation period or similar period under that other securitization will not limit the consultation rights of the subordinate class representative under this securitization. In general, loan combination control rights also include the right, in certain circumstances, to direct the replacement of the special servicer for the related loan combination only. |
THE INFORMATION IN THIS STRUCTURAL AND COLLATERAL TERM SHEET IS NOT COMPLETE AND MAY BE AMENDED PRIOR TO THE TIME OF SALE. THIS TERM SHEET IS NOT AN OFFER TO SELL THESE SECURITIES AND IT IS NOT A SOLICITATION OF AN OFFER TO BUY THESE SECURITIES IN ANY JURISDICTION WHERE THE OFFER OR SALE IS NOT PERMITTED.
23
| WFRBS Commercial Mortgage Trust 2013-C14 | Certain Terms and Conditions |
| Replacement of Special Servicer by General Vote of Certificateholders: | During any “collective consultation period” or “senior consultation period”, the Special Servicer may be terminated and replaced upon the affirmative direction of certificate owners holding not less than 75% of the appraisal-reduced voting rights of all certificates, following a proposal from certificate owners holding not less than 25% of the appraisal-reduced voting rights of all certificates. The certificateholders who initiate a vote on a termination and replacement of the Special Servicer without cause must cause Fitch, KBRA and Moody’s to confirm the then-current ratings of the certificates (or decline to review the matter) and cause the payment of the fees and expenses incurred in the replacement. |
| Appraisal Remedy: | Solely for purposes of determining whether a “subordinate control period” is in effect, whenever the Special Servicer obtains an appraisal or updated appraisal under the pooling and servicing agreement, the subordinate class representative, with respect to the mortgage loans serviced by the Special Servicer will have the right (at its or their expense) to direct the Special Servicer to hire a qualified appraiser to prepare a second appraisal of the mortgaged property. The Special Servicer must thereafter determine whether, based on its assessment of such second appraisal, any recalculation of the Appraisal Reduction Amount is warranted. The Appraisal Reduction Amount, whether based on the first or the second appraisal, will become effective following the second appraisal, except that the Appraisal Reduction Amount based on the first appraisal shall become effective if the subordinate class representative declines to demand a second appraisal within a specified number of business days, or if a second appraisal is not received within 90 days after the direction of the subordinate class representative. In addition, for the same purposes, if there is a material change in the mortgaged property securing any mortgage loan for which an Appraisal Reduction Amount has been calculated, the majority certificateholder of the Class E, F or G Certificates or other designed certificateholders will be entitled (at its expense) to present an additional appraisal to the Special Servicer, which will generally be required to recalculate the Appraisal Reduction Amount based upon such additional appraisal. This latter right may not be exercised more frequently than once in any 12-month period for each mortgage loan for which an Appraisal Reduction Amount was calculated and can only be exercised during a subordinate control period or a collective consultation period as further described in the Free Writing Prospectus. |
| Sale of Defaulted Assets: | There will be no “fair value” purchase option. Instead, the pooling and servicing agreement will authorize the Special Servicer to sell defaulted mortgage loans to the highest bidder in a manner generally similar to sales of REO properties. The sale of a defaulted loan for less than par plus accrued interest and certain other fees and expenses owed on the loan will be subject to consent or consultation rights of the subordinate class representative and/or Trust Advisor, as described in the Free Writing Prospectus. In the case of each of the White Marsh Mall loan combination and the 301 South College Street loan combination, the Special Servicer may offer to sell to any person (or may offer to purchase) for cash such loan combination during such times as such loan combination constitutes a defaulted mortgage loan, and, in connection with any such sale, the related Special Servicer will be required to sell both the related mortgage loan and the related pari passu companion loan. With respect to the White Marsh Mall loan combination, the holder of the related pari passu companion loan or its representative (which following a securitization of such pari passu companion loan will include the subordinate class representative under the pooling and servicing agreement for such securitization) will have consultation rights, as described in the Free Writing Prospectus. With respect to the 301 South College Street loan combination, the subordinate class representative under the WFRBS 2013-C13 pooling and servicing agreement will have consultation rights on behalf of the related trust fund as the holder of the related pari passu companion loan, as described in the Free Writing Prospectus. In the case of the Cumberland Mall mortgage loan and 100 & 150 South Wacker Drive mortgage loan, the sale will be subject to the consent and/or consultation rights of the holders of the related pari passu companion loans, as described in the Free Writing Prospectus. After the securitization of the Cumberland Mall pari passu companion loan or the 100 & 150 South Wacker Drive pari passu companion loan, as applicable, pursuant to the respective intercreditor agreement, the party acting as special servicer with respect to the related loan combination pursuant to the respective pooling and servicing agreement of the related securitization, may offer to sell to any person (or may offer to purchase) for cash such loan combination during such time as such loan combination constitutes a defaulted mortgage loan, and, in connection with any such sale, the applicable special servicer is required to sell both the pari passu mortgage loan and related pari passu companion loan in any such loan combination as a whole loan. The subordinate class representative will have consultation rights as the holder of an interest in the related pari passu mortgage loan, as described in the Free Writing Prospectus. |
| “As-Is” Appraisals: | Appraisals must be conducted on an “as-is” basis, and must be no more than 9 months old, for purposes of determining Appraisal Reduction Amounts, market value in connection with REO sales, etc. Required appraisals may consist of updates of prior appraisals. Internal valuations by the Special Servicer are permitted if the principal balance of a mortgage loan is less than $2,000,000. |
THE INFORMATION IN THIS STRUCTURAL AND COLLATERAL TERM SHEET IS NOT COMPLETE AND MAY BE AMENDED PRIOR TO THE TIME OF SALE. THIS TERM SHEET IS NOT AN OFFER TO SELL THESE SECURITIES AND IT IS NOT A SOLICITATION OF AN OFFER TO BUY THESE SECURITIES IN ANY JURISDICTION WHERE THE OFFER OR SALE IS NOT PERMITTED.
24
| WFRBS Commercial Mortgage Trust 2013-C14 | Certain Terms and Conditions |
| Trust Advisor: | The Trust Advisor will perform certain review duties that will generally include a limited annual review of and report regarding the Special Servicer to the Certificate Administrator. The review and report generally will be based on: (a) during a collective consultation period or senior consultation period, any asset status reports and additional information delivered to the Trust Advisor by the Special Servicer, and/or (b) during a senior consultation period, in addition to the applicable information described above, a meeting with the Special Servicer to conduct a limited review of the Special Servicer’s operational practices on a platform basis in light of the servicing standard. In addition, during any collective consultation period or senior consultation period, the Special Servicer must seek to consult with the Trust Advisor (in addition to the subordinate class representative during a collective consultation period) in connection with material special servicing actions with respect to specially serviced mortgage loans serviced by the Special Servicer. Furthermore, under certain circumstances, but only during a senior consultation period, the Trust Advisor may recommend the replacement of the Special Servicer, in which case the Certificate Administrator will deliver notice of such recommendation to the certificateholders, and certificateholders with specified percentages of the voting rights may direct the replacement of the Special Servicer at their expense. The Trust Advisor may be removed and replaced without cause upon the affirmative direction of certificates owners holding not less than 75% of the appraisal-reduced voting rights of all certificates, following a proposal from certificate owners holding not less than 25% of the appraisal-reduced voting rights of all certificates. The certificateholders who initiate a vote on a termination and replacement of the Trust Advisor without cause must cause Fitch, KBRA and Moody’s to confirm the then-current ratings of the certificates (or decline to review the matter) and cause the payment of the fees and expenses incurred in the replacement. During any “subordinate control period”, the proposed replacement trust advisor will be subject to the subordinate class representative’s consent (such consent not to be unreasonably withheld). If a proposed termination and replacement of the Trust Advisor is not consummated within 180 days following the initial request of the certificateholders who requested a vote, the proposed termination and replacement shall have no further force or effect. The Trust Advisor generally may be discharged from its duties if and when the Class A-1, A-2, A-3, A-4, A-4FL, A-4FX, A-5, A-SB, A-S, B, C, PEX and D Certificates are retired. |
| Certain Fee Offsets: | If a workout fee is earned by the Special Servicer following a loan default with respect to any mortgage loan it services, then certain limitations will apply to the collection and retention of a modification fee from the borrower. The modification fee generally must not exceed 1% of the principal balance of the loan as modified. In addition, if the loan re-defaults within a specified period of months and other conditions are satisfied, any subsequent workout or liquidation fee on that loan must be reduced by a portion of the previously-collected modification fee. |
| Deal Website: | The Certificate Administrator will be required to maintain a deal website which will include, among other items: (a) summaries of asset status reports prepared by the Special Servicer, (b) inspection reports, (c) appraisals, (d) various “special notices” described in the Free Writing Prospectus, (e) the “Investor Q&A Forum” and (f) a voluntary “Investor Registry”. Investors may access the deal website following execution of a certification and confidentiality agreement. |
| Initial Majority Subordinate Certificateholder: | It is expected that RREF II CMBS AIV, LP, an affiliate of Rialto Real Estate Fund, LP, will be the initial majority subordinate certificateholder. |
| Loan Combinations: | The mortgaged properties respectively identified on Annex A-1 to the Free Writing Prospectus as White Marsh Mall, 301 South College Street, Cumberland Mall and 100 & 150 South Wacker Drive each secure both a mortgage loan to be included in the trust fund and one other mortgage loan that will not be included in the trust fund, which will be pari passu in right of payment with the trust mortgage loan. We refer to each such group of mortgage loans herein as a “loan combination”. The White Marsh Mall loan combination will be serviced under the pooling and servicing agreement for this transaction. The 301 South College Street loan combination will be serviced under the pooling and servicing agreement related to the WFRBS 2013-C13 transaction until the closing of this transaction, after which time such loan combination will be serviced under the pooling and servicing agreement related to this transaction. With respect to each of the Cumberland Mall loan combination and the 100 & 150 South Wacker Drive loan combination, such loan combination will be serviced under the pooling and servicing agreement until the securitization of the related pari passu companion loan, after which such loan combination will be serviced under the pooling and servicing agreement related to the securitization of that pari passu companion loan. |
THE INFORMATION IN THIS STRUCTURAL AND COLLATERAL TERM SHEET IS NOT COMPLETE AND MAY BE AMENDED PRIOR TO THE TIME OF SALE. THIS TERM SHEET IS NOT AN OFFER TO SELL THESE SECURITIES AND IT IS NOT A SOLICITATION OF AN OFFER TO BUY THESE SECURITIES IN ANY JURISDICTION WHERE THE OFFER OR SALE IS NOT PERMITTED.
25
| WFRBS Commercial Mortgage Trust 2013-C14 | Certain Terms and Conditions |
As of the closing date, the White Marsh Mall, Cumberland Mall and 100 & 150 South Wacker Drive pari passu companion loans will be held by their related mortgage loan sellers, each of which will reserve the right to sell its respective companion loan subject to the applicable intercreditor agreement. |
THE INFORMATION IN THIS STRUCTURAL AND COLLATERAL TERM SHEET IS NOT COMPLETE AND MAY BE AMENDED PRIOR TO THE TIME OF SALE. THIS TERM SHEET IS NOT AN OFFER TO SELL THESE SECURITIES AND IT IS NOT A SOLICITATION OF AN OFFER TO BUY THESE SECURITIES IN ANY JURISDICTION WHERE THE OFFER OR SALE IS NOT PERMITTED.
26
(THIS PAGE INTENTIONALLY LEFT BLANK)
27
| RHP PORTFOLIO III |
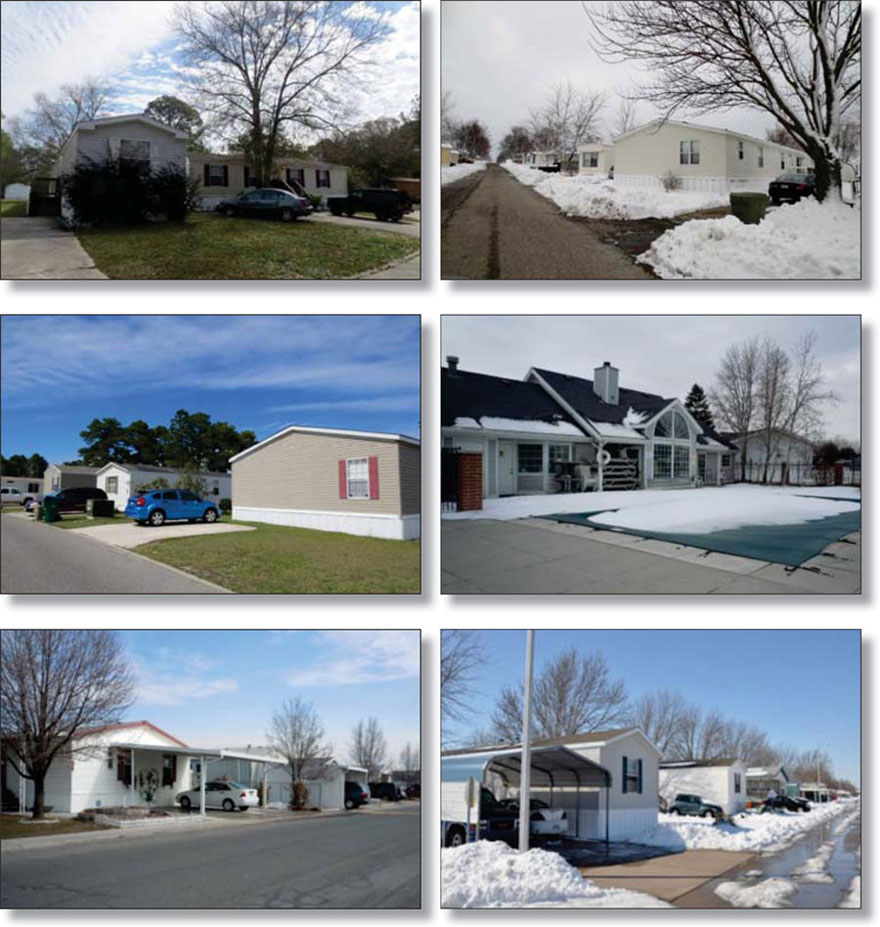
THE INFORMATION IN THIS STRUCTURAL AND COLLATERAL TERM SHEET IS NOT COMPLETE AND MAY BE AMENDED PRIOR TO THE TIME OF SALE. THIS TERM SHEET IS NOT AN OFFER TO SELL THESE SECURITIES AND IT IS NOT A SOLICITATION OF AN OFFER TO BUY THESE SECURITIES IN ANY JURISDICTION WHERE THE OFFER OR SALE IS NOT PERMITTED.
28
| RHP PORTFOLIO III |
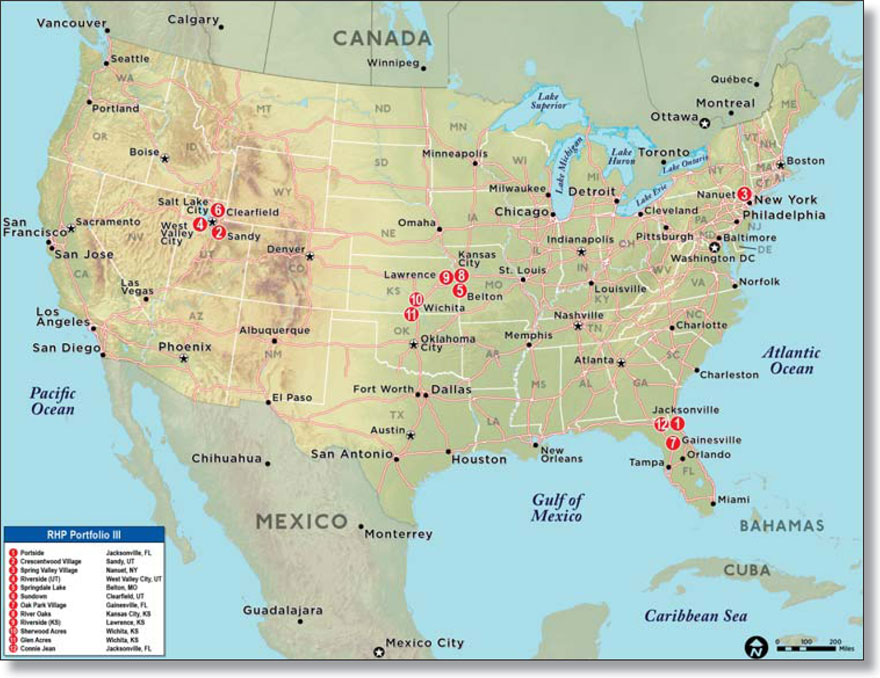
THE INFORMATION IN THIS STRUCTURAL AND COLLATERAL TERM SHEET IS NOT COMPLETE AND MAY BE AMENDED PRIOR TO THE TIME OF SALE. THIS TERM SHEET IS NOT AN OFFER TO SELL THESE SECURITIES AND IT IS NOT A SOLICITATION OF AN OFFER TO BUY THESE SECURITIES IN ANY JURISDICTION WHERE THE OFFER OR SALE IS NOT PERMITTED.
29
| No. 1 - RHP Portfolio III | |||||||
| Loan Information | Property Information | ||||||
| Mortgage Loan Seller: | The Royal Bank of Scotland | Single Asset/Portfolio: | Portfolio | ||||
Credit Assessment (Fitch/KBRA/Moody’s): | NR/NR/NR | Property Type: | Manufactured Housing Community | ||||
| Original Principal Balance: | $128,723,897 | Specific Property Type: | Manufactured Housing Community | ||||
| Cut-off Date Principal Balance: | $128,723,897 | Location: | Various – See Table | ||||
| % of Initial Pool Balance: | 8.8% | Size: | 3,321 pads | ||||
| Loan Purpose: | Acquisition | Cut-off Date Principal Balance Per Pad: | $38,761 | ||||
Borrower Name(1): | Various | Year Built/Renovated: | Various – See Table | ||||
| Sponsors: | RHP Properties Inc.; NorthStar Realty Finance Corporation | Title Vesting: | Fee | ||||
| Mortgage Rate: | 4.011% | Property Manager: | Newbury Management Company | ||||
| Note Date: | April 5, 2013 | 3rd Most Recent Occupancy (As of): | 84.9% (12/31/2010) | ||||
| Anticipated Repayment Date: | NAP | 2nd Most Recent Occupancy (As of): | 85.1% (12/31/2011) | ||||
| Maturity Date: | May 1, 2023 | Most Recent Occupancy (As of): | 84.9% (12/31/2012) | ||||
| IO Period: | 34 months | Current Occupancy (As of): | 85.0% (2/14/2013) | ||||
| Loan Term (Original): | 120 months | ||||||
| Seasoning: | 1 month | Underwriting and Financial Information: | |||||
| Amortization Term (Original): | 360 months | ||||||
| Loan Amortization Type: | Interest-only, Amortizing Balloon | 3rd Most Recent NOI (As of): | $9,792,584 (12/31/2010) | ||||
| Interest Accrual Method: | Actual/360 | 2nd Most Recent NOI (As of): | $10,265,297 (12/31/2011) | ||||
| Call Protection: | L(25),GRTR 1% or YM(90),O(5) | Most Recent NOI (As of): | $10,584,080 (12/31/2012) | ||||
| Lockbox Type: | Soft/Springing Cash Management | ||||||
| Additional Debt: | Yes | U/W Revenues: | $16,802,127 | ||||
| Additional Debt Type: | Future Mezzanine | U/W Expenses: | $6,306,023 | ||||
| U/W NOI: | $10,496,104 | ||||||
| U/W NCF: | $10,330,053 | ||||||
| U/W NOI DSCR: | 1.42x | ||||||
Escrows and Reserves(2): | U/W NCF DSCR: | 1.40x | |||||
| U/W NOI Debt Yield: | 8.2% | ||||||
| Type: | Initial | Monthly | Cap (If Any) | U/W NCF Debt Yield: | 8.0% | ||
| Taxes | $674,551 | $107,877 | NAP | As-Is Appraised Value: | $174,620,000 | ||
| Insurance | $207,060 | $29,580 | NAP | As-Is Appraisal Valuation Date(3): | Various | ||
| Replacement Reserves | $2,828,359 | Springing | $531,360 | Cut-off Date LTV Ratio: | 73.7% | ||
| Deferred Maintenance | $104,575 | $0 | NAP | LTV Ratio at Maturity or ARD: | 63.5% | ||
| (1) | The borrower is comprised of 12 separate limited liability companies. |
| (2) | See “Escrows” section. |
| (3) | The As-Is Appraisal Valuation Dates range from February 27, 2013 to March 6, 2013. |
The Mortgage Loan. The mortgage loan (the “RHP Portfolio III Mortgage Loan”) is evidenced by a single promissory note that is secured by 12 first mortgages encumbering 12 manufactured housing communities totaling 3,321 pads and located in five states (the “RHP Portfolio III Properties”). The RHP Portfolio III Mortgage Loan was originated on April 5, 2013 by The Royal Bank of Scotland. The RHP Portfolio III Mortgage Loan had an original principal balance of $128,723,897, has an outstanding principal balance as of the Cut-off Date of $128,723,897 and accrues interest at an interest rate of 4.011% per annum. The RHP Portfolio III Mortgage Loan had an initial term of 120 months, has a remaining term of 119 months as of the Cut-off Date and requires interest-only payments for the first 34 payments following origination and thereafter requires payments of principal and interest based on a 30-year amortization schedule. The RHP Portfolio III Mortgage Loan matures on May 1, 2023.
Following the lockout period (except in the case of the Early Release Properties (as defined below)), the borrower has the right to prepay the RHP Portfolio III Mortgage Loan in whole or in part, provided that the borrower pays the greater of a yield maintenance premium or a prepayment premium equal to 1.0% of the principal amount being prepaid. In addition, the RHP Portfolio III Mortgage Loan is prepayable without penalty on or after January 1, 2023.
THE INFORMATION IN THIS STRUCTURAL AND COLLATERAL TERM SHEET IS NOT COMPLETE AND MAY BE AMENDED PRIOR TO THE TIME OF SALE. THIS TERM SHEET IS NOT AN OFFER TO SELL THESE SECURITIES AND IT IS NOT A SOLICITATION OF AN OFFER TO BUY THESE SECURITIES IN ANY JURISDICTION WHERE THE OFFER OR SALE IS NOT PERMITTED.
30
| RHP PORTFOLIO III |
Sources and Uses
| Sources | Uses | |||||||
| Original loan amount | $128,723,897 | 74.8% | Purchase price | $165,933,148 | 96.5% | |||
| Sponsor’s new cash contribution | 43,281,318 | 25.2 | Reserves | 3,814,545 | 2.2 | |||
| Closing costs | 2,257,522 | 1.3 | ||||||
| Total Sources | $172,005,215 | 100.0% | Total Uses | $172,005,215 | 100.0% |
The Properties. The RHP Portfolio III Mortgage Loan is secured by the fee interest in 12 manufactured housing communities (“MHC”) totaling 3,321 pads and located in Florida, Utah, New York, Missouri and Kansas. The RHP Portfolio III Properties were acquired by the sponsors as a part of a larger 35-property portfolio in April 2013. The remaining 23 properties in the portfolio (“RHP Portfolio IV Properties” and “RHP Portfolio V Properties”) are not collateral for the RHP Portfolio III Mortgage Loan. The RHP Portfolio III Properties include a range of amenities including playgrounds, basketball courts, RV storage, swimming pools and clubhouses. The RHP Portfolio III Properties were developed between 1954 and 1998 and have an average age of 35 years. Public utilities are provided in all of the RHP Portfolio III Properties.
The following table presents certain information relating to the RHP Portfolio III Properties:
| Property Name – Location | Allocated Cut- off Date Principal Balance | % of Portfolio Cut-off Date Principal Balance | Current Occupancy | Year Built/ Renovated | Pads | Appraised Value | |||||||||||
| Portside - Jacksonville, FL | $43,640,216 | 33.9% | 92.7% | 1982/NAP | 931 | $59,200,000 | |||||||||||
| Crescentwood Village - Sandy, UT | $18,576,579 | 14.4% | 99.3% | 1985/NAP | 273 | $25,200,000 | |||||||||||
| Spring Valley Village - Nanuet, NY | $12,089,520 | 9.4% | 98.5% | 1980/NAP | 136 | $16,400,000 | |||||||||||
| Riverside (UT) - West Valley City, UT | $11,720,937 | 9.1% | 99.5% | 1998/NAP | 200 | $15,900,000 | |||||||||||
| Springdale Lake - Belton, MO | $11,617,733 | 9.0% | 81.5% | 1954/NAP | 443 | $15,760,000 | |||||||||||
| Sundown - Clearfield, UT | $10,342,437 | 8.0% | 94.0% | 1971/NAP | 200 | $14,030,000 | |||||||||||
| Oak Park Village - Gainesville, FL | $7,961,390 | 6.2% | 78.1% | 1972/NAP | 343 | $10,800,000 | |||||||||||
| River Oaks - Kansas City, KS | $7,489,605 | 5.8% | 72.3% | 1976/NAP | 397 | $10,160,000 | |||||||||||
| Riverside (KS) - Lawrence, KS | $2,071,436 | 1.6% | 80.6% | 1969/NAP | 93 | $2,810,000 | |||||||||||
| Sherwood Acres - Wichita, KS | $1,238,439 | 1.0% | 64.5% | 1986/NAP | 110 | $1,680,000 | |||||||||||
| Glen Acres - Wichita, KS | $1,017,289 | 0.8% | 46.6% | 1990/NAP | 133 | $1,380,000 | |||||||||||
| Connie Jean - Jacksonville, FL | $958,316 | 0.7% | 69.4% | 1975/NAP | 62 | $1,300,000 | |||||||||||
| Total/Weighted Average | $128,723,897 | 100.0% | 85.0% | 3,321 | $174,620,000 | ||||||||||||
The following table presents historical occupancy percentages at the RHP Portfolio III Properties:
Historical Occupancy(1)
12/31/2010 | 12/31/2011 | 12/31/2012 | 2/14/2013 | |||
| 84.9% | 85.1% | 84.9% | 85.0% | |||
(1) Information obtained from the borrower. | ||||||
THE INFORMATION IN THIS STRUCTURAL AND COLLATERAL TERM SHEET IS NOT COMPLETE AND MAY BE AMENDED PRIOR TO THE TIME OF SALE. THIS TERM SHEET IS NOT AN OFFER TO SELL THESE SECURITIES AND IT IS NOT A SOLICITATION OF AN OFFER TO BUY THESE SECURITIES IN ANY JURISDICTION WHERE THE OFFER OR SALE IS NOT PERMITTED.
31
| RHP PORTFOLIO III |
Operating History and Underwritten Net Cash Flow. The following table presents certain information relating to the historical operating performance and the Underwritten Net Cash Flow at the RHP Portfolio III Properties:
Cash Flow Analysis
2010 | 2011 | 2012 | U/W | U/W $ per Pad | |||||||
| Base Rent | $13,602,943 | $14,229,030 | $14,738,091 | $15,246,137 | $4,591 | ||||||
| Concessions | (237,731) | (318,089) | (304,291) | (304,291) | (92) | ||||||
| Grossed Up Vacant Space | 0 | 0 | 0 | 2,189,344 | 659 | ||||||
| Total Reimbursables | 0 | 0 | 0 | 0 | 0 | ||||||
| Other Income | 2,009,283 | 2,169,311 | 2,321,594 | 2,321,594 | 699 | ||||||
| Less Vacancy & Credit Loss | (305,335) | (392,959) | (504,073) | (2,650,657)(1) | (798) | ||||||
| Effective Gross Income | $15,069,160 | $15,687,293 | $16,251,321 | $16,802,127 | $5,059 | ||||||
| Total Operating Expenses | $5,276,576 | $5,421,996 | $5,667,241 | $6,306,023 | $1,899 | ||||||
| Net Operating Income | $9,792,584 | $10,265,297 | $10,584,080 | $10,496,104 | $3,161 | ||||||
| TI/LC | 0 | 0 | 0 | 0 | 0 | ||||||
| Capital Expenditures | 0 | 0 | 0 | 166,051 | 50 | ||||||
| Net Cash Flow | $9,792,584 | $10,265,297 | $10,584,080 | $10,330,053 | $3,111 | ||||||
| NOI DSCR | 1.33x | 1.39x | 1.43x | 1.42x | |||||||
| NCF DSCR | 1.33x | 1.39x | 1.43x | 1.40x | |||||||
| NOI DY | 7.6% | 8.0% | 8.2% | 8.2% | |||||||
| NCF DY | 7.6% | 8.0% | 8.2% | 8.0% | |||||||
| (1) The underwritten economic vacancy is 18.3%. The RHP Portfolio III Properties were 85.0% physically occupied as of February 14, 2013. | |||||||||||
Appraisal. As of the appraisal valuation dates ranging from February 27, 2013 to March 6, 2013, the RHP Portfolio III Properties had an aggregate “as-is” appraised value of $174,620,000.
Environmental Matters. According to the Phase I environmental site assessments dated from April 4, 2013 to April 7, 2013, there was no evidence of any recognized environmental conditions at any of the 12 RHP Portfolio III Properties and no Phase II assessments were recommended.
The Borrower. The borrower is comprised of 12 separate limited liability companies, each of which is a single purpose entity and has two independent directors. Legal counsel to the borrower delivered a non-consolidation opinion in connection with the origination of the RHP Portfolio III Mortgage Loan. Ross Partrich, the principal of the borrower, is the guarantor of certain nonrecourse carveouts under the RHP Portfolio III Mortgage Loan.
The Sponsors. The sponsors are NorthStar Realty Finance Corporation (“NorthStar”) and RHP Properties, Inc. NorthStar is a publicly traded REIT (NYSE: NRF) and had approximately $5.7 billion of commercial real estate assets under management as of March 31, 2013. RHP Properties, Inc. is the nation’s second largest private owner and operator of manufactured housing communities. RHP Properties, Inc. currently owns and manages a total of 120 manufactured housing communities with over 25,000 housing units and sites across 21 states, with a combined value of approximately $1.0 billion. NorthStar indirectly owns 97.6% of the borrower while affiliates of RHP Properties, Inc. own the remaining 2.4%. NorthStar is the managing member of the borrower.
Escrows. The loan documents provide for upfront escrows in the amount of $674,551 for real estate taxes, $207,060 for insurance premiums and $104,575 for deferred maintenance. In addition, $2,828,359 was reserved for maintenance, repairs and/or replacements at the RHP Portfolio III Properties over the term of the RHP Portfolio III Mortgage Loan.
The loan documents provide for ongoing monthly escrows in the amount of $107,877 for real estate taxes and $29,580 for insurance premiums. Additionally, the loan documents provide for a $13,838 monthly replacement reserve escrow beginning on May 1, 2016. The replacement reserve escrow will be capped at $531,360, exclusive of the initial deposit of $2,828,359.
Lockbox and Cash Management. The RHP Portfolio III Mortgage Loan requires a lender-controlled lockbox account, which is already in place, and the property manager is obligated to deposit all revenues into such lockbox account. The loan documents also require that all cash revenues and all other monies received by the borrower or the property manager be deposited into the lockbox account within one business day after receipt. Prior to the occurrence of a Cash Management Period (as defined below), all funds on deposit in the lockbox account are swept into the borrower’s operating account. During a Cash Management Period, all funds on deposit in the lockbox account are swept to a lender-controlled cash management account.
A “Cash Management Period” will commence: (i) upon the occurrence of an event of default, or (ii) if the debt service coverage ratio (or at any time when an approved mezzanine loan is outstanding, the Aggregate DSCR (as defined below)) is less than 1.05x. A Cash Management Period will end, with respect to matters in clause (i) above, if the event of default has been cured, or, with respect to matters in clause (ii) above, if the debt service coverage ratio (or at any time when an approved mezzanine loan is outstanding, the Aggregate DSCR) is at least 1.05x for two consecutive quarters.
The “Aggregate DSCR” is the aggregate debt service coverage ratio based on the amortizing debt service under the RHP Portfolio III Mortgage Loan and any approved mezzanine loan that is outstanding.
THE INFORMATION IN THIS STRUCTURAL AND COLLATERAL TERM SHEET IS NOT COMPLETE AND MAY BE AMENDED PRIOR TO THE TIME OF SALE. THIS TERM SHEET IS NOT AN OFFER TO SELL THESE SECURITIES AND IT IS NOT A SOLICITATION OF AN OFFER TO BUY THESE SECURITIES IN ANY JURISDICTION WHERE THE OFFER OR SALE IS NOT PERMITTED.
32
| RHP PORTFOLIO III |
Property Management. The RHP Portfolio III Properties are currently managed by Newbury Management Company, an affiliate of the borrower.
Assumption. The borrower has the right to transfer all of the RHP Portfolio III Properties, subject to customary conditions set forth in the loan documents, including but not limited to: (i) no event of default has occurred, and is continuing and (ii) the lender has received rating agency confirmation from Fitch, KBRA and Moody’s that the transfer will not result in a downgrade, withdrawal or qualification of the respective ratings assigned to the Series 2013-C14 Certificates.
Partial Release. Following the second anniversary of the closing date of the Series 2013-C14 Certificates (except in the case of Early Release Properties (as defined below), which can be released at any time) and in connection with a bona fide third party sale of an individual RHP Portfolio III property or a sale to certain affiliates of the nonrecourse guarantor (but not to an affiliate of NorthStar) at a sale price at least equal to the fair market value determined by an appraisal, the borrower may obtain the release of an individual property from the lien of the RHP Portfolio III Mortgage Loan upon the satisfaction of certain conditions including without limitation: (i) payment by the borrower of an amount equal to 120% of the allocated loan amount for the individual property to be released (or 110% of the allocated loan amount in the case of Early Release Properties) or if the sale is to certain affiliates of the nonrecourse guarantor, then the payment by the borrower must be in an amount equal to the greater of 125% of the allocated loan amount and 100% of the net sale proceeds, regardless of whether the property is an Early Release Property and in each case, together with the applicable yield maintenance premium; (ii) satisfaction of all applicable REMIC requirements; (iii) after giving effect to such release, the debt service coverage ratio of the remaining RHP Portfolio III Properties is not less than the greater of (x) the debt service coverage ratio (or Aggregate DSCR if an approved mezzanine loan is outstanding) immediately prior to such release and (y) 1.15x; and (iv) no event of default has occurred and is continuing. The debt service coverage ratio will be based upon the underwritten net cash flow of the remaining RHP Portfolio III Properties and the actual debt service constant of the loan at closing.
The “Early Release Properties” are the River Oaks, Sherwood Acres and Glen Acres properties, each of which may be released at any time under the conditions described above.
Real Estate Substitution. At any time before May 1, 2022, the borrower may obtain a release of any individual RHP Portfolio III property from the lien of the mortgage in connection with a substitution of a different manufactured housing community property subject to the lender’s consent and the satisfaction of certain conditions, including without limitation: (i) no event of default has occurred and is continuing at the time of substitution; (ii) the aggregate allocated loan amount of the properties released during the loan term will not exceed 25% of the original principal balance of the RHP Portfolio III Mortgage Loan; (iii) the fair market value of the substitute property will not be less than the fair market value of the substituted property both at closing and as of the date of substitution; (iv) the net operating income of the new property is not less than the net operating income of the substituted property both at closing and as of the date of substitution; (v) the lender receives written confirmation from Fitch, KBRA and Moody’s that such substitution will not result in a qualification, downgrade or withdrawal of the then current ratings assigned to the WFRBS 2013-C14 certificates; (vi) all REMIC requirements are satisfied; (vii) the number of properties remaining under the RHP Portfolio III Mortgage Loan after giving effect to the substitution must not be less than prior to the substitution; (viii) the substitute properties must not be any of the RHP Portfolio IV Properties or RHP Portfolio V Properties; (ix) the geographic diversity of the RHP Portfolio III Properties must not be diminished; and (x) payment of a fee equal to 0.25% of the allocated loan amount of the property being released as the result of a substitution.
Subordinate and Mezzanine Indebtedness. NorthStar indirectly owns 97.6% of the membership interests in the borrowers. NorthStar has the ability to convert a portion of its equity in the borrower into a mezzanine loan during the term of the RHP Portfolio III Mortgage Loan subject to certain conditions, including without limitation: (i) the mezzanine debt must be subordinate to the RHP Portfolio III Mortgage Loan and will be secured by the equity interests in the borrowers that own the RHP Portfolio III Properties; (ii) the mezzanine loan must not exceed $19,703,103; (iii) the Aggregate LTV (as defined below) must be no greater than 85%; and (iv) the Aggregate DSCR must be no less than 1.15x. Additionally, at NorthStar’s option, the mezzanine loan may be alternatively structured as a larger mezzanine loan that is secured by the equity in the borrower of the RHP Portfolio III Mortgage Loan and the equity interests in the borrower of the mortgage loan secured by the RHP Portfolio IV Properties and the RHP Portfolio V Properties.
The “Aggregate LTV” is the aggregate loan-to-value ratio based on the outstanding balance of the RHP Portfolio III Mortgage Loan and any approved mezzanine loan that is outstanding.
Ground Lease. None.
Terrorism Insurance. The loan documents require that the “all risk” insurance policy required to be maintained by the borrower provide coverage for terrorism in an amount equal to the full replacement cost of the RHP Portfolio III Properties. The loan documents also require business interruption insurance covering no less than the 12-month period following the occurrence of a casualty event.
THE INFORMATION IN THIS STRUCTURAL AND COLLATERAL TERM SHEET IS NOT COMPLETE AND MAY BE AMENDED PRIOR TO THE TIME OF SALE. THIS TERM SHEET IS NOT AN OFFER TO SELL THESE SECURITIES AND IT IS NOT A SOLICITATION OF AN OFFER TO BUY THESE SECURITIES IN ANY JURISDICTION WHERE THE OFFER OR SALE IS NOT PERMITTED.
33
MIDTOWN I & II |
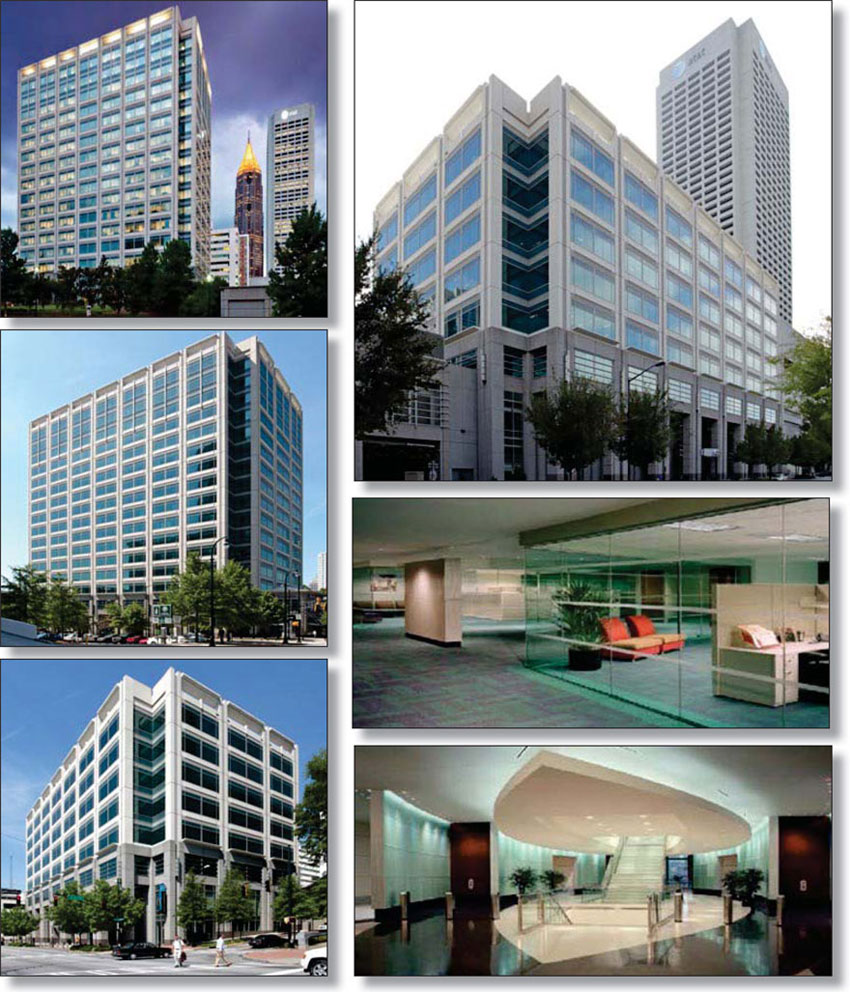
THE INFORMATION IN THIS STRUCTURAL AND COLLATERAL TERM SHEET IS NOT COMPLETE AND MAY BE AMENDED PRIOR TO THE TIME OF SALE. THIS TERM SHEET IS NOT AN OFFER TO SELL THESE SECURITIES AND IT IS NOT A SOLICITATION OF AN OFFER TO BUY THESE SECURITIES IN ANY JURISDICTION WHERE THE OFFER OR SALE IS NOT PERMITTED.
34
MIDTOWN I & II |
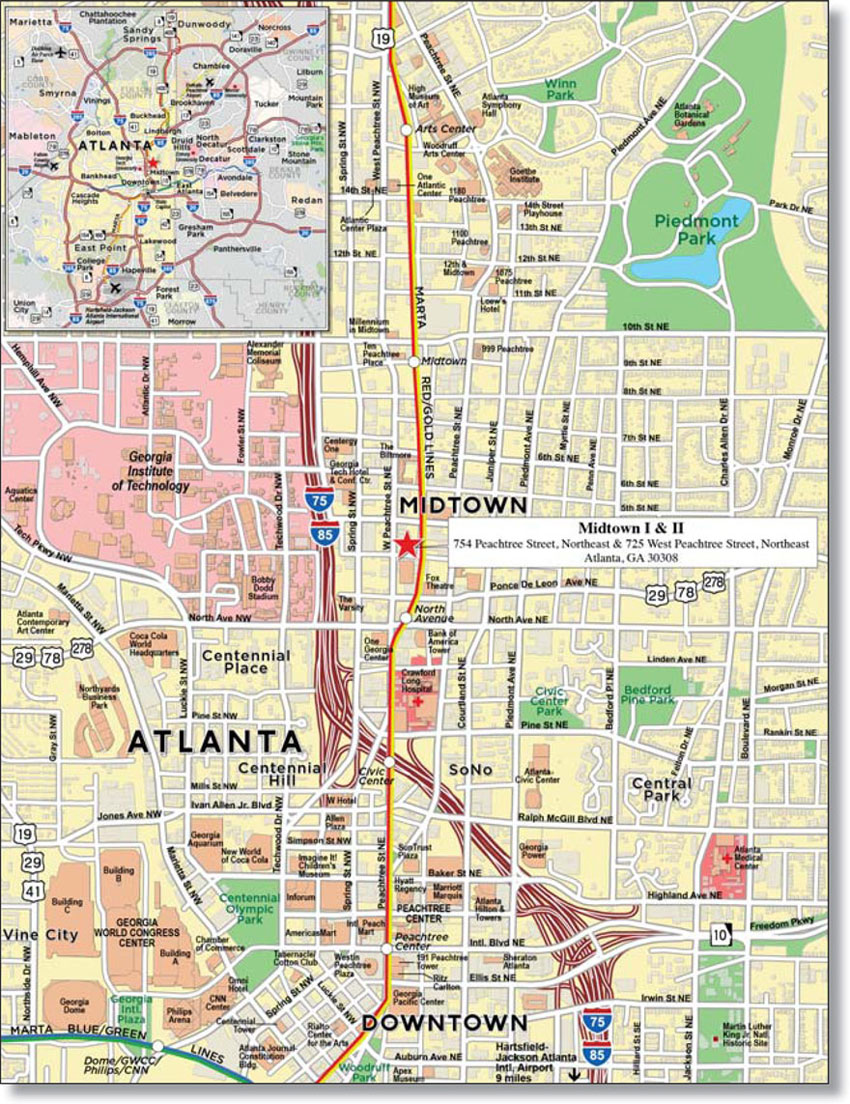
THE INFORMATION IN THIS STRUCTURAL AND COLLATERAL TERM SHEET IS NOT COMPLETE AND MAY BE AMENDED PRIOR TO THE TIME OF SALE. THIS TERM SHEET IS NOT AN OFFER TO SELL THESE SECURITIES AND IT IS NOT A SOLICITATION OF AN OFFER TO BUY THESE SECURITIES IN ANY JURISDICTION WHERE THE OFFER OR SALE IS NOT PERMITTED.
35
| No. 2 – Midtown I & II | |||||||
| Loan Information | Property Information | ||||||
| Mortgage Loan Seller: | The Royal Bank of Scotland | Single Asset/Portfolio: | Single Asset | ||||
Credit Assessment (Fitch/KBRA/Moody’s): | NR/NR/NR | Property Type: | Office | ||||
| Original Principal Balance: | $124,300,000 | Specific Property Type: | CBD | ||||
| Cut-off Date Principal Balance: | $124,300,000 | Location: | Atlanta, GA | ||||
| % of Initial Pool Balance: | 8.5% | Size: | 794,110 SF | ||||
| Loan Purpose: | Acquisition | Cut-off Date Principal Balance Per Unit/SF: | $156.53 | ||||
| Borrower Name: | Cole/Macfarlan of Atlanta GA, LLC | Year Built/Renovated(2): | 2001/NAP | ||||
| Sponsors: | Cole Credit Property Trust III, Inc. and Macfarlan Capital Partners, L.P. | Title Vesting: | Fee | ||||
| Mortgage Rate: | 3.840% | Property Manager: | Cole Realty Advisors, Inc. | ||||
| Note Date: | April 25, 2013 | 3rd Most Recent Occupancy (As of): | 100.0% (12/31/2010) | ||||
| Anticipated Repayment Date: | May 1, 2023 | 2nd Most Recent Occupancy (As of): | 100.0% (12/31/2011) | ||||
| Maturity Date: | May 1, 2043 | Most Recent Occupancy (As of): | 100.0% (12/31/2012) | ||||
| IO Period: | 120 months | Current Occupancy (As of): | 100.0% (6/1/2013) | ||||
| Loan Term (Original): | 120 months | ||||||
| Seasoning: | 1 month | Underwriting and Financial Information: | |||||
| Amortization Term (Original): | NAP | ||||||
| Loan Amortization Type: | Interest-only, ARD | 3rd Most Recent NOI (3): | NAV | ||||
| Interest Accrual Method: | Actual/360 | 2nd Most Recent NOI(3): | NAV | ||||
| Call Protection: | L(25),GRTR 1% or YM(91),O(4) | Most Recent NOI(3): | NAV | ||||
| Lockbox Type: | Hard/Springing Cash Management | ||||||
| Additional Debt: | Yes | ||||||
| Additional Debt Type: | Future Mezzanine | U/W Revenues: | $15,433,600 | ||||
| U/W Expenses: | $463,008 | ||||||
| U/W NOI: | $14,970,592 | ||||||
| U/W NCF: | $14,140,502 | ||||||
Escrows and Reserves(1): | U/W NOI DSCR: | 3.09x | |||||
| U/W NCF DSCR: | 2.92x | ||||||
| Type: | Initial | Monthly | Cap (If Any) | U/W NOI Debt Yield: | 12.0% | ||
| Taxes | $0 | Springing | NAP | U/W NCF Debt Yield: | 11.4% | ||
| Insurance | $0 | Springing | NAP | As-Is Appraised Value: | $210,000,000 | ||
| Replacement Reserves | $0 | Springing | NAP | As-Is Appraisal Valuation Date: | April 1, 2013 | ||
| TI/LC | $0 | Springing | NAP | Cut-off Date LTV Ratio: | 59.2% | ||
| LTV Ratio at Maturity or ARD: | 59.2% | ||||||
(1) See “Escrows” section.
(2) The Midtown I & II Property was built in 2001 and 2002.
(3) Historical financial data is not available as the Midtown I & II Property was acquired in April 2013.
The Mortgage Loan. The mortgage loan (the “Midtown I & II Mortgage Loan”) is evidenced by a single promissory note that is secured by a first mortgage encumbering two class A office towers totaling 794,110 square feet and a nine-level parking deck (the “Midtown I & II Property”) located in Atlanta, Georgia. The Midtown I & II Mortgage Loan was originated on April 25, 2013 by The Royal Bank of Scotland. The Midtown I & II Mortgage Loan had an original principal balance of $124,300,000, has an outstanding principal balance as of the Cut-off Date of $124,300,000 and accrues interest at an interest rate of 3.840% per annum. The Midtown I & II Mortgage Loan had an initial term of 120 months, has a remaining term of 119 months as of the Cut-off Date and requires payments of interest-only through the anticipated repayment date (“ARD”). The ARD is May 1, 2023 and the final maturity date is May 1, 2043. In the event the Midtown I & II Mortgage Loan is not paid in full on or before the ARD, the Midtown I & II Mortgage Loan will accrue interest at an interest rate of 6.840% per annum and will have a remaining term of 240 months. The ARD automatically triggers a full cash flow sweep whereby all excess cash flow will be used to pay down the principal balance of the Midtown I & II Mortgage Loan.
Following the lockout period, the borrower has the right to prepay the Midtown I & II Mortgage Loan either in whole, or in part, provided that the borrower pays the greater of a yield maintenance premium or a prepayment premium equal to 1.0% of the principal amount being prepaid. In addition, the Midtown I & II Mortgage Loan is prepayable without penalty on or after February 1, 2023.
THE INFORMATION IN THIS STRUCTURAL AND COLLATERAL TERM SHEET IS NOT COMPLETE AND MAY BE AMENDED PRIOR TO THE TIME OF SALE. THIS TERM SHEET IS NOT AN OFFER TO SELL THESE SECURITIES AND IT IS NOT A SOLICITATION OF AN OFFER TO BUY THESE SECURITIES IN ANY JURISDICTION WHERE THE OFFER OR SALE IS NOT PERMITTED.
36
MIDTOWN I & II |
Sources and Uses
| Sources | Uses | |||||||
| Original loan amount | $124,300,000 | 55.0% | Purchase price | $205,000,000 | 90.7% | |||
| Sponsor new cash contribution | 101,670,356 | 45.0 | TI/LC | 18,193,912 | 8.1 | |||
| Closing costs | 2,776,444 | 1.2 | ||||||
| Total Sources | $225,970,356 | 100.0% | Total Uses | $225,970,356 | 100.0% |
The Property. The Midtown I & II Property consists of two class A office towers encompassing 794,110 square feet and an adjacent parking deck located in Atlanta, Georgia. The Midtown I & II Property was built-to-suit in 2001 and 2002 for BellSouth Corporation, now part of AT&T Corp., and serves as the regional headquarters for AT&T, Inc. (NYSE: T). The Midtown I & II Property comprises a total of 7.3 acres situated on three blocks and includes a 16-story office tower located at the northwest corner of Peachtree Street and Fourth Street, an eight-story office tower located at the northeast corner of West Peachtree Street and Third Street and a nine-level parking deck located at the northeast corner of West Peachtree Street and Fourth Street. Amenities at the Midtown I & II Property include multiple conference rooms, an auditorium, cafeteria and fitness center. The Midtown I & II Property has a total of 2,459 parking spaces, accounting for a parking ratio of 3.1 spaces per 1,000 square feet of rentable area. As of June 1, 2013, the Midtown I & II Property was 100% occupied by AT&T Corp. on a triple net lease through April 2024 with annual rent increases of 2.0%. AT&T, Inc., the parent company of AT&T Corp., was ranked number 11 in the 2012 Fortune 500 and reported 2012 net income of approximately $7.3 billion as of December 31, 2012.
The following table presents certain information relating to the tenant at the Midtown I & II Property:
Major Tenant
| Tenant Name | Credit Rating (Fitch/Moody’s/ S&P)(1) | Tenant NRSF | % of NRSF | Annual U/W Base Rent PSF | Annual U/W Base Rent(2) | % of Total Annual U/W Base Rent | Lease Expiration Date | |
| Major Tenant | ||||||||
| AT&T Corp. | A/A3/A- | 794,110 | 100.0% | $17.25 | $13,695,071 | 100.0% | 4/30/2024(3) | |
| Collateral Total | 794,110 | 100.0% | $17.25 | $13,695,071 | 100.0% | |||
(1) Certain ratings are those of the parent company whether or not the parent guarantees the lease.
(2) The Annual U/W Base Rent represents an average of the tenant’s annual rental obligations during the Midtown I & II Mortgage Loan term. The tenant currently pays an annual base rental rate of $15.75 per net rentable square foot on a triple net basis and this rate increases at the end of each calendar year in an amount equal to 2.0% of the prior year’s base rent.
(3) AT&T Corp. has three five-year extension options and one four-year, 11-month extension option remaining.
The following table presents certain information relating to the lease rollover schedule at the Midtown I & II Property:
Lease Expiration Schedule(1)
Year Ending December 31, | No. of Leases Expiring | Expiring NRSF | % of Total NRSF | Cumulative Expiring NRSF | Cumulative % of Total NRSF | Annual U/W Base Rent | Annual U/W Base Rent PSF |
| MTM | 0 | 0 | 0.0% | 0 | 0.0% | $0 | $0.00 |
| 2013 | 0 | 0 | 0.0% | 0 | 0.0% | $0 | $0.00 |
| 2014 | 0 | 0 | 0.0% | 0 | 0.0% | $0 | $0.00 |
| 2015 | 0 | 0 | 0.0% | 0 | 0.0% | $0 | $0.00 |
| 2016 | 0 | 0 | 0.0% | 0 | 0.0% | $0 | $0.00 |
| 2017 | 0 | 0 | 0.0% | 0 | 0.0% | $0 | $0.00 |
| 2018 | 0 | 0 | 0.0% | 0 | 0.0% | $0 | $0.00 |
| 2019 | 0 | 0 | 0.0% | 0 | 0.0% | $0 | $0.00 |
| 2020 | 0 | 0 | 0.0% | 0 | 0.0% | $0 | $0.00 |
| 2021 | 0 | 0 | 0.0% | 0 | 0.0% | $0 | $0.00 |
| 2022 | 0 | 0 | 0.0% | 0 | 0.0% | $0 | $0.00 |
| 2023 | 0 | 0 | 0.0% | 0 | 0.0% | $0 | $0.00 |
| Thereafter | 1 | 794,110 | 100.0% | 794,110 | 100.0% | $13,695,071 | $17.25 |
| Vacant | 0 | 0 | 0.0% | 794,110 | 100.0% | $0 | $0.00 |
| Total/Weighted Average | 1 | 794,110 | 100.0% | $13,695,071 | $17.25 | ||
| (1) Information obtained from the tenant’s lease. | |||||||
THE INFORMATION IN THIS STRUCTURAL AND COLLATERAL TERM SHEET IS NOT COMPLETE AND MAY BE AMENDED PRIOR TO THE TIME OF SALE. THIS TERM SHEET IS NOT AN OFFER TO SELL THESE SECURITIES AND IT IS NOT A SOLICITATION OF AN OFFER TO BUY THESE SECURITIES IN ANY JURISDICTION WHERE THE OFFER OR SALE IS NOT PERMITTED.
37
MIDTOWN I & II |
The following table presents historical occupancy percentages at the Midtown I & II Property:
Historical Occupancy(1)
12/31/2010 | 12/31/2011 | 12/31/2012 | 6/1/2013 | |||
| 100.0% | 100.0% | 100.0% | 100.0% | |||
| (1) Information obtained from the borrower. | ||||||
Operating History and Underwritten Net Cash Flow. The following table presents certain information relating to the Underwritten Net Cash Flow at the Midtown I & II Property:
Cash Flow Analysis(1)
| In Place | U/W | U/W $ per SF | ||||
| Base Rent | $12,507,233 | $13,695,071(2) | $17.25 | |||
| Parking Income | 2,213,100 | 2,423,283(2) | 3.05 | |||
| Grossed Up Vacant Space | 0 | 0 | 0.00 | |||
| Total Reimbursables | 0 | 0 | 0.00 | |||
| Other Income | 0 | 0 | 0.00 | |||
| Less Vacancy & Credit Loss | 0 | (684,754)(3) | (0.86) | |||
| Effective Gross Income | $14,720,333 | $15,433,600 | $19.44 | |||
| Total Operating Expenses | $0 | $463,008(4) | $0.58 | |||
| Net Operating Income | $14,720,333 | $14,970,592 | $18.85 | |||
| TI/LC | 0 | 671,268 | 0.85 | |||
| Capital Expenditures | 0 | 158,822 | 0.20 | |||
| Net Cash Flow | $14,720,333 | $14,140,502 | $17.81 | |||
| NOI DSCR | 3.04x | 3.09x | ||||
| NCF DSCR | 3.04X | 2.92x | ||||
| NOI DY | 11.8% | 12.0% | ||||
| NCF DY | 11.8% | 11.4% |
| (1) | Historical information is not available as the Midtown I & II Property was acquired in April 2013. |
| (2) | The base rent and parking income are averaged over the loan term based on the contractual 2% annual increases in the lease. The current base rent and parking rent are $12,507,233 and $2,213,100, respectively. |
| (3) | The underwritten economic vacancy is 5.0%. The Midtown I & II Property was 100% physically occupied as of June 1, 2013. |
| (4) | The only underwritten operating expense is a management fee of 3.0% of Effective Gross Income. All expenses are paid directly by the tenant. |
Appraisal. As of the appraisal valuation date of April 1, 2013, the Midtown I & II Property had an “as-is” appraised value of $210,000,000 and a hypothetical “go dark” value of $99,000,000.
Environmental Matters. According to the Phase I environmental site assessment dated March 25, 2013, there was no evidence of any recognized environmental conditions at the Midtown I & II Property.
Market Overview and Competition. The Midtown I & II Property is located approximately three miles north of the Atlanta central business district, within the Midtown submarket of Atlanta, Fulton County, Georgia. The Midtown I & II Property is accessible by Interstate 85 and Interstate 75 to the west and by Interstate 20 to the south. The Midtown I & II Property is located less than a half mile from the North Avenue Metropolitan Atlanta Rapid Transit Authority rail station. The Midtown I & II Property is less than one mile from the Georgia Institute of Technology, which has a student population of more than 16,000 undergraduate and graduate students. The Midtown I & II Property is located within “Midtown Mile”, a dense, urban area filled with high rise condominiums, offices and hotels. According to the appraisal, the estimated 2013 population and average household income within a five-mile radius of the Midtown I & II Property were 344,499 and $71,557, respectively.
According to the appraisal, the Midtown I & II Property is located within the Midtown submarket of the Atlanta office market. As of the fourth quarter of 2012, the Atlanta class A office market vacancy rate and average asking rate were 19.4% and $22.19 per square foot on a triple net basis, respectively. As of the fourth quarter of 2012, the Midtown office submarket vacancy rate and average asking rate were 17.9% and $24.92 per square foot on a triple net basis, respectively.
THE INFORMATION IN THIS STRUCTURAL AND COLLATERAL TERM SHEET IS NOT COMPLETE AND MAY BE AMENDED PRIOR TO THE TIME OF SALE. THIS TERM SHEET IS NOT AN OFFER TO SELL THESE SECURITIES AND IT IS NOT A SOLICITATION OF AN OFFER TO BUY THESE SECURITIES IN ANY JURISDICTION WHERE THE OFFER OR SALE IS NOT PERMITTED.
38
MIDTOWN I & II |
The following table presents certain information relating to comparable office properties for the Midtown I & II Property:
Competitive Set(1)
Midtown I & II (Subject) | Centergy One | Ten Peachtree Place | 999 Peachtree Street | Ten 10th Street | The Proscenium | Atlantic Center Plaza | ||
| Location | Atlanta, GA | Atlanta, GA | Atlanta, GA | Atlanta, GA | Atlanta, GA | Atlanta, GA | Atlanta, GA | |
| Distance from Subject | -- | 9.5 miles | 0.7 miles | 0.5 miles | 0.7 miles | 0.9 miles | 1.2 miles | |
| Property Type | Office | Office | Office | Office | Office | Office | Office | |
| Year Built/Renovated | 2001/NAP | 2003/NAP | 1990/2002 | 1987/NAP | 2001/NAP | 2001/NAP | 2001/NAP | |
| Number of Stories | 8-16 | 12 | 20 | 28 | 14 | 24 | 23 | |
| Total GLA | 794,110 SF | 486,993 SF | 258,917 SF | 610,220 SF | 410,624 SF | 533,135 SF | 500,953 SF | |
| Total Occupancy | 100% | 97% | 100% | 94% | 64% | 98% | 40% | |
(1) Information obtained from the appraisal dated April 25, 2013.
The Borrower. The borrower, Cole/Macfarlan of Atlanta GA, LLC, is a Delaware limited liability company with at least two independent directors. Legal counsel to the borrower delivered a non-consolidation opinion in connection with the origination of the Midtown I & II Mortgage Loan. Cole Credit Property Trust III, Inc. (“CCPT III”) is the guarantor of certain nonrecourse carveouts under the Midtown I & II Mortgage Loan.
The Sponsor. The Midtown I & II Mortgage Loan sponsors are CCPT III and Macfarlan Capital Partners, L.P. (“Macfarlan”). CCPT III is a non-traded public real estate investment trust that acquires and operates a diversified portfolio of commercial real estate investments primarily consisting of retail and other single tenant income producing properties throughout the United States. As of December 31, 2012, CCPT III owned 1,014 properties, comprised of approximately 43.1 million rentable square feet of single tenant and multi-tenant retail and commercial space located in 47 states and had total assets of approximately $7.5 billion. Macfarlan is a private equity fund located in Dallas, Texas that has a current portfolio of approximately $1.5 billion in real estate investments consisting of approximately 11.0 million square feet of commercial real estate.
Escrows. The loan documents provide for no upfront or ongoing escrows. No monthly tax escrow is required so long as (i) no Cash Management Period (as defined below) has occurred and is continuing, and (ii) the borrower delivers satisfactory evidence that tax payments are being made in a timely manner. No monthly insurance escrow is required so long as (i) no Cash Management Period has occurred and is continuing, and (ii) the insurance required to be maintained by the borrower is effected under an acceptable blanket insurance policy. Replacement reserves and TI/LC escrows will spring in the event that a Cash Management Period occurs and will cease to be collected when any such Cash Management Period ends.
Lockbox and Cash Management. The Midtown I & II Mortgage Loan requires a lender-controlled lockbox account, which is already in place, into which the tenant is directed to pay its rents directly. The loan documents also require that all cash revenues and all other monies received by the borrower or the property manager relating to the Midtown I & II Property be deposited into the lockbox account within two business days of receipt.
Upon the occurrence of a Cash Management Period (as defined below) all excess funds on deposit in the lockbox account will be swept to certain restricted accounts and the lender will have the exclusive control of, and the right to withdraw and apply, the funds in the deposit account to payment of any and all debts, liabilities and obligations of the borrower in such order, proportion and priority as the lender may determine in its sole discretion.
A “Cash Management Period” will commence upon the earlier of: (i) an event of default; (ii) the debt service coverage ratio falling below 1.90x as of the end of each fiscal quarter; (iii) the commencement of a Going Dark Period (as defined below); (iv) the commencement of a bankruptcy or insolvency proceeding with respect to the property manager; (v) the commencement of a bankruptcy or insolvency proceeding with respect to AT&T, Corp.; or (vi) the failure of AT&T, Corp. to extend the term of the lease prior to April 30, 2022. A Cash Management Period will end: with respect to the matters described in clause (i) above, when such event of default has been cured; with respect to the matters described in clause (ii) above, when a debt service coverage ratio of at least 1.90x has been achieved for two consecutive fiscal quarters; with respect to the matters described in clause (iii) above, when such Going Dark Period has ended; with respect to the matters described in clause (iv) above, upon the replacement of the prior manager with a qualified manager, in accordance with the loan documents; with respect to the matters described in clause (v) above, upon the earlier to occur of (a) confirmation in bankruptcy by AT&T, Corp. of the lease related to the Midtown I & II Property or (b) the execution of one or more new leases approved by the lender for the entire portion of the Midtown I & II Property for which AT&T, Corp. did not confirm its lease in bankruptcy and the tenant under such leases opening for business and paying full, unabated rent.
A “Going Dark Period” will commence upon the cessation of operating business at more than 30% of any building within the Midtown I & II Property, unless the building is subleased by the tenant and the subtenant has not ceased operating its business in more than 30% of the building. A Going Dark Period will end upon the earlier to occur of: (i) the tenant being open for business for six consecutive calendar months, and (ii) $20.00 per square foot has accumulated on deposit in the TI/LC escrow.
THE INFORMATION IN THIS STRUCTURAL AND COLLATERAL TERM SHEET IS NOT COMPLETE AND MAY BE AMENDED PRIOR TO THE TIME OF SALE. THIS TERM SHEET IS NOT AN OFFER TO SELL THESE SECURITIES AND IT IS NOT A SOLICITATION OF AN OFFER TO BUY THESE SECURITIES IN ANY JURISDICTION WHERE THE OFFER OR SALE IS NOT PERMITTED.
39
MIDTOWN I & II |
Property Management. The Midtown I & II Property is managed by Cole Realty Advisors, Inc., an affiliate of the borrower.
Assumption. The borrower has the right to transfer the Midtown I & II Property, provided that no event of default has occurred and is continuing and certain other conditions are satisfied, including but not limited to (i) execution of a recourse guaranty and an environmental indemnity by an affiliate of the transferee; (ii) if requested by the lender, rating agency confirmation from Fitch, KBRA and Moody’s that the transfer will not result in a downgrade, withdrawal or qualification of the respective ratings assigned to the Series 2013-C14 Certificates; and (iii) the transferee and all other entities controlled directly or indirectly by principals of the transferee must not have been party to any voluntary or involuntary bankruptcy proceedings, within seven years prior to the proposed transfer.
Partial Release. Not permitted.
Real Estate Substitution. Not permitted.
Subordinate and Mezzanine Indebtedness. The borrower has the right to incur mezzanine financing subject to the lender’s approval and other customary conditions including but not limited to (i) no event of default has occurred and is continuing; (ii) the loan-to-value ratio including all debt is not greater than 70.0%; (iii) the debt service coverage ratio including all debt is not less than 1.50x; (iv) the execution of an intercreditor agreement acceptable to the lender; and (v) rating agency confirmation from Fitch, KBRA and Moody’s that the mezzanine financing will not result in a downgrade, withdrawal or qualification of the respective ratings assigned to the Series 2013-C14 Certificates.
Ground Lease. None.
Terrorism Insurance. The loan documents require that the “all risk” insurance policy required to be maintained by the borrower provides coverage for damage from terrorism in an amount equal to the full replacement cost of the Midtown I & II Property as well as business interruption insurance covering no less than the 18-month period following the occurrence of a casualty event, together with a six-month extended period of indemnity.
THE INFORMATION IN THIS STRUCTURAL AND COLLATERAL TERM SHEET IS NOT COMPLETE AND MAY BE AMENDED PRIOR TO THE TIME OF SALE. THIS TERM SHEET IS NOT AN OFFER TO SELL THESE SECURITIES AND IT IS NOT A SOLICITATION OF AN OFFER TO BUY THESE SECURITIES IN ANY JURISDICTION WHERE THE OFFER OR SALE IS NOT PERMITTED.
40
(THIS PAGE INTENTIONALLY LEFT BLANK)
41
(THIS PAGE INTENTIONALLY LEFT BLANK)
42
THE PLANT SAN JOSE |
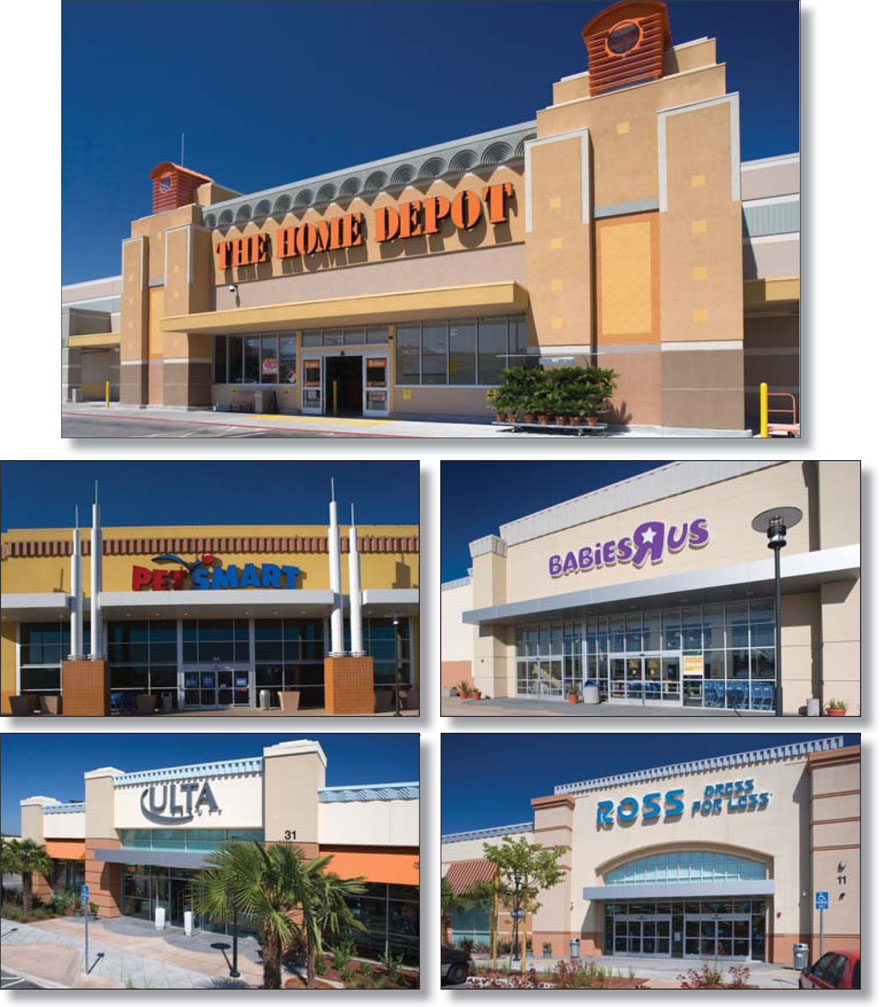
THE INFORMATION IN THIS STRUCTURAL AND COLLATERAL TERM SHEET IS NOT COMPLETE AND MAY BE AMENDED PRIOR TO THE TIME OF SALE. THIS TERM SHEET IS NOT AN OFFER TO SELL THESE SECURITIES AND IT IS NOT A SOLICITATION OF AN OFFER TO BUY THESE SECURITIES IN ANY JURISDICTION WHERE THE OFFER OR SALE IS NOT PERMITTED.
43
THE PLANT SAN JOSE |
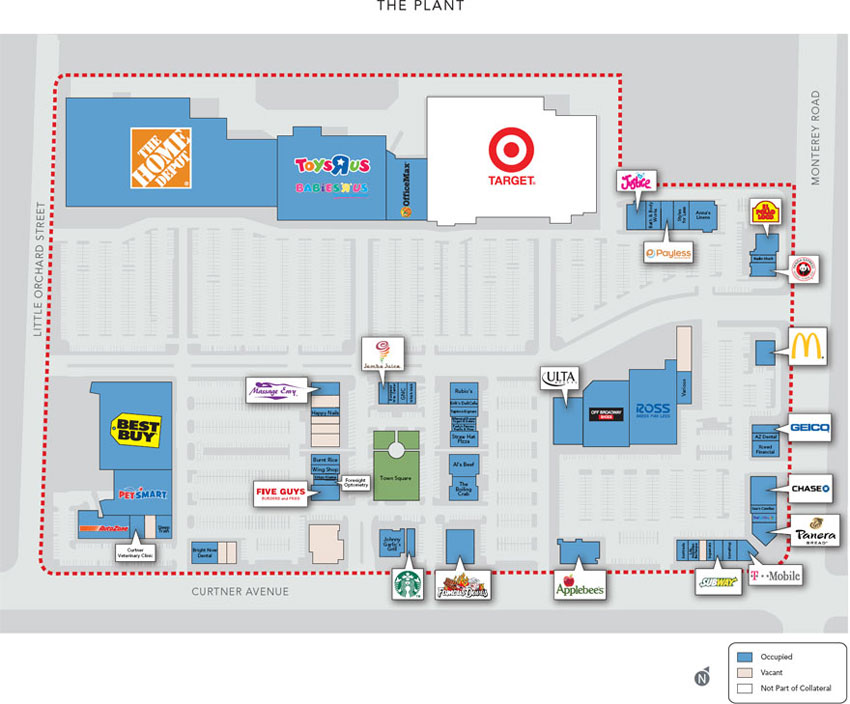
THE INFORMATION IN THIS STRUCTURAL AND COLLATERAL TERM SHEET IS NOT COMPLETE AND MAY BE AMENDED PRIOR TO THE TIME OF SALE. THIS TERM SHEET IS NOT AN OFFER TO SELL THESE SECURITIES AND IT IS NOT A SOLICITATION OF AN OFFER TO BUY THESE SECURITIES IN ANY JURISDICTION WHERE THE OFFER OR SALE IS NOT PERMITTED.
44
THE PLANT SAN JOSE |
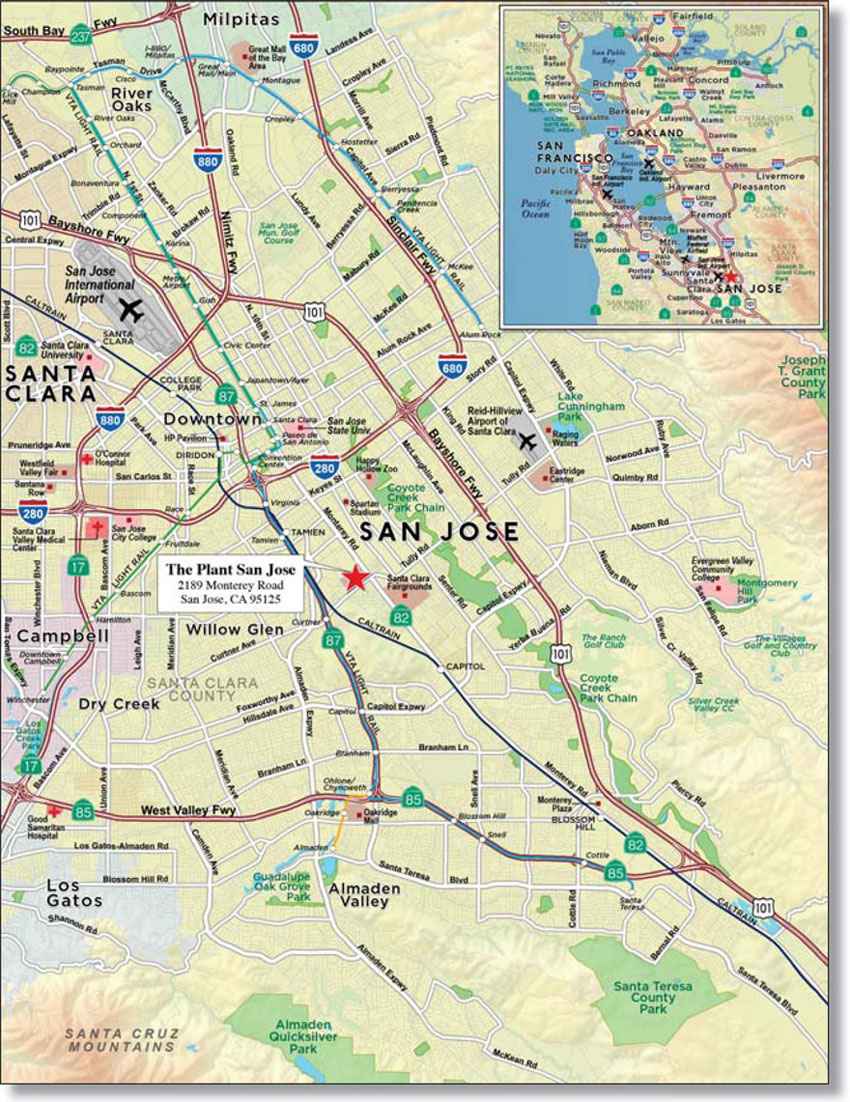
THE INFORMATION IN THIS STRUCTURAL AND COLLATERAL TERM SHEET IS NOT COMPLETE AND MAY BE AMENDED PRIOR TO THE TIME OF SALE. THIS TERM SHEET IS NOT AN OFFER TO SELL THESE SECURITIES AND IT IS NOT A SOLICITATION OF AN OFFER TO BUY THESE SECURITIES IN ANY JURISDICTION WHERE THE OFFER OR SALE IS NOT PERMITTED.
45
| No. 3 – The Plant San Jose | ||||||||||
| Loan Information | Property Information | |||||||||
| Mortgage Loan Seller: | Wells Fargo Bank, National Association | Single Asset/Portfolio: | Single Asset | |||||||
Credit Assessment (Fitch/KBRA/Moody’s): | NR/NR/NR | Property Type: | Retail | |||||||
| Original Principal Balance: | $123,000,000 | Specific Property Type: | Anchored | |||||||
| Cut-off Date Principal Balance: | $123,000,000 | Location: | San Jose, CA | |||||||
| % of Initial Pool Balance: | 8.4% | Size: | 485,895 SF | |||||||
| Loan Purpose: | Acquisition | Cut-off Date Principal Balance Per Unit/SF: | $253.14 | |||||||
| Borrower Name: | Cole MT San Jose CA, LP | Year Built/Renovated: | 2008/NAP | |||||||
| Sponsor: | Cole Credit Property Trust IV, Inc. | Title Vesting: | Fee | |||||||
| Mortgage Rate: | 3.815% | Property Manager: | Self-managed | |||||||
| Note Date: | April 15, 2013 | 3rd Most Recent Occupancy (As of): | 89.9% (12/31/2009) | |||||||
| Anticipated Repayment Date: | May 1, 2023 | 2nd Most Recent Occupancy (As of): | 93.3% (12/31/2010) | |||||||
| Maturity Date: | May 1, 2033 | Most Recent Occupancy (As of): | 95.1% (12/31/2011) | |||||||
| IO Period: | 120 months | Current Occupancy (As of): | 95.6% (12/17/2012) | |||||||
| Loan Term (Original): | 120 months | |||||||||
| Seasoning: | 1 month | Underwriting and Financial Information: | ||||||||
| Amortization Term (Original): | NAP | |||||||||
| Loan Amortization Type: | Interest-only, ARD | 3rd Most Recent NOI (As of): | $11,552,110 (12/31/2010) | |||||||
| Interest Accrual Method: | Actual/360 | 2nd Most Recent NOI (As of): | $12,474,332 (12/31/2011) | |||||||
| Call Protection: | L(48),GRTR 1% or YM(72) | Most Recent NOI (As of): | $12,505,717 (12/31/2012) | |||||||
| Lockbox Type: | Hard/Upfront Cash Management | |||||||||
| Additional Debt: | None | U/W Revenues: | $18,986,162 | |||||||
| Additional Debt Type: | NAP | U/W Expenses: | $5,883,368 | |||||||
| U/W NOI: | $13,102,793 | |||||||||
| U/W NCF: | $12,582,976 | |||||||||
| Escrows and Reserves: | None | U/W NOI DSCR: | 2.75x | |||||||
| U/W NCF DSCR: | 2.64x | |||||||||
| U/W NOI Debt Yield: | 10.7% | |||||||||
| U/W NCF Debt Yield: | 10.2% | |||||||||
| As-Is Appraised Value: | $205,000,000 | |||||||||
| As-Is Appraisal Valuation Date: | February 7, 2013 | |||||||||
| Cut-off Date LTV Ratio: | 60.0% | |||||||||
| LTV Ratio at Maturity or ARD: | 60.0% | |||||||||
The Mortgage Loan. The mortgage loan (“The Plant San Jose Mortgage Loan”) is evidenced by a single promissory note that is secured by a first mortgage encumbering an anchored retail property located in San Jose, California (“The Plant San Jose Property”). The Plant San Jose Mortgage Loan was originated on April 15, 2013 by Wells Fargo Bank, National Association. The Plant San Jose Mortgage Loan had an original principal balance of $123,000,000, has an outstanding principal balance as of the Cut-off Date of $123,000,000 and accrues interest at an interest rate of 3.815% per annum. The Plant San Jose Mortgage Loan had an initial term of 120 months, has a remaining term of 119 months as of the Cut-off Date and requires payments of interest-only through the anticipated repayment date (“ARD”). The ARD is May 1, 2023 and the final maturity date is May 1, 2033. In the event The Plant San Jose Mortgage Loan is not paid off on or before the ARD, the borrower will be required to make payments of principal and interest based on a 30-year amortization schedule and an interest rate equal to the greater of (i) the initial mortgage rate plus 5% and (ii) the sum of (a) the greater of (x) the offer side on the ARD of the 10-year swap yield (as described in the loan documents) and (y) the treasury rate as of the ARD and (b) 5.00%. The ARD automatically triggers a Cash Trap Event Period (as defined below) whereby all excess cash flow will be used to pay down the principal balance of The Plant San Jose Mortgage Loan (see “Lockbox and Cash Management”).
Following the lockout period, the borrower has the right to voluntarily prepay The Plant San Jose Mortgage Loan in whole, but not in part, provided that the borrower pays the greater of a yield maintenance premium or a prepayment premium equal to 1.0% of the then outstanding principal balance.
THE INFORMATION IN THIS STRUCTURAL AND COLLATERAL TERM SHEET IS NOT COMPLETE AND MAY BE AMENDED PRIOR TO THE TIME OF SALE. THIS TERM SHEET IS NOT AN OFFER TO SELL THESE SECURITIES AND IT IS NOT A SOLICITATION OF AN OFFER TO BUY THESE SECURITIES IN ANY JURISDICTION WHERE THE OFFER OR SALE IS NOT PERMITTED.
46
| THE PLANT SAN JOSE |
Sources and Uses
| Sources | Uses | |||||||
| Original loan amount | $123,000,000 | 60.1% | Purchase price | $203,100,000 | 99.2% | |||
| Sponsor’s new cash contribution | 81,826,476 | 39.9 | Closing costs | 1,726,476 | 0.8 | |||
| Total Sources | $204,826,476 | 100.0% | Total Uses | $204,826,476 | 100.0% |
The Property. The Plant San Jose Property is an anchored retail center containing approximately 485,895 square feet and located in San Jose, California. Built in 2008, The Plant San Jose Property consists of 26 one-story buildings situated on a 44.6-acre parcel. The Plant San Jose Property is anchored by Target (not part of the collateral), Home Depot, Toys “R” Us, Best Buy and Ross Dress for Less in addition to in-line space, which includes national tenants such as J.P. Morgan Chase Co., McDonald’s, Starbucks, FedEx Kinko’s and T-Mobile, among others. Parking is provided by 2,967 surface parking spaces, resulting in a parking ratio of 6.1 spaces per 1,000 square feet of rentable area. As of December 17, 2012, The Plant San Jose Property was 95.6% leased to 60 tenants.
The following table presents certain information relating to the tenancies at The Plant San Jose Property:
Major Tenants
| Tenant Name | Credit Rating (Fitch/ Moody’s/ S&P)(1) | Tenant NRSF | % of NRSF | Annual U/W Base Rent PSF(2) | Annual U/W Base Rent(2) | % of Total Annual U/W Base Rent | Sales PSF(3) | Occupancy Cost(3) | Lease Expiration Date | |
| Anchor Tenants – Not Part of Collateral | ||||||||||
| Target | A-/A2/A+ | 137,800 | ANCHOR-OWNED – NOT PART OF THE COLLATERAL | |||||||
| Anchor Tenant – Collateral | ||||||||||
| Home Depot | A-/A3/A- | 141,021 | 29.0% | $28.10(4) | $3,962,981(4) | 28.4% | NAV | NAV | 1/31/2034 | |
| Toys “R” Us | B-/B1/B | 64,850 | 13.3% | $21.00 | $1,361,850 | 9.8% | NAV | NAV | 1/31/2023 | |
| Best Buy | BB-/Baa2/BB | 45,168 | 9.3% | $21.00 | $948,528 | 6.8% | NAV | NAV | 1/31/2018 | |
| Ross Dress for Less | NR/NR/BBB+ | 25,821 | 5.3% | $22.00 | $568,062 | 4.1% | NAV | NAV | 1/31/2019 | |
| Total Anchor Tenant – Collateral | 276,860 | 57.0% | $24.71 | $6,841,421 | 49.0% | |||||
| Major Tenants – Collateral | ||||||||||
| Off Broadway Shoe Warehouse | NR/NR/NR | 20,472 | 4.2% | $24.00 | $491,328 | 3.5% | $143 | 24.4% | 3/7/2018 | |
| PetSmart | NR/NR/BB+ | 20,166 | 4.2% | $24.00 | $483,984 | 3.5% | $194 | 17.6% | 3/31/2023 | |
| Office Max | NR/B1/NR | 18,045 | 3.7% | $24.00 | $433,080 | 3.1% | NAV | NAV | 3/31/2018 | |
| ULTA | NR/NR/NR | 9,852 | 2.0% | $39.36 | $387,775 | 2.8% | NAV | NAV | 4/30/2018 | |
| AutoZone | BBB/Baa2/BBB | 8,384 | 1.7% | $29.70 | $249,005 | 1.8% | NAV | NAV | 2/29/2024 | |
| Total Major Tenants – Collateral | 76,919 | 15.8% | $26.59 | $2,045,172 | 14.7% | |||||
Non-Major Tenants – Collateral(5) | 110,815 | 22.8% | $41.46(5) | $5,061,980 | 36.3% | |||||
| Occupied Collateral Total | 464,594 | 95.6% | $29.02(5) | $13,948,573 | 100.0% | |||||
| Vacant Space | 21,301 | 4.4% | ||||||||
| Collateral Total | 485,895 | 100.0% | ||||||||
(1) Certain ratings are those of the parent company whether or not the parent guarantees the lease.
(2) Unless otherwise noted, Annual U/W Base Rent PSF and Annual U/W Base Rent include contractual rent escalations through March 2014.
(3) Sales PSF and Occupancy Costs are for the trailing 12-month period ending December 31, 2012.
(4) Annual U/W Base Rent PSF and Annual U/W Base Rent are based on the average contractual rent over the loan term. Home Depot is currently paying an annual base rent of $3,384,504 ($24.00 per square foot).
(5) Applebee’s Neighborhood Grill & Bar, Famous Dave’s BBQ and McDonald’s own their buildings and lease pad sites with no attributed square footage and Annual U/W Base Rents of $185,625, $168,764 and $113,190, respectively. The Annual U/W Base Rent PSF for Non-Major Tenants – Collateral and Occupied Collateral Total exclude the Annual U/W Base Rent associated with these pad sites.
THE INFORMATION IN THIS STRUCTURAL AND COLLATERAL TERM SHEET IS NOT COMPLETE AND MAY BE AMENDED PRIOR TO THE TIME OF SALE. THIS TERM SHEET IS NOT AN OFFER TO SELL THESE SECURITIES AND IT IS NOT A SOLICITATION OF AN OFFER TO BUY THESE SECURITIES IN ANY JURISDICTION WHERE THE OFFER OR SALE IS NOT PERMITTED.
47
| THE PLANT SAN JOSE |
The following table presents certain information relating to the historical sales at The Plant San Jose Property:
Historical Sales (PSF)(1)
| Tenant Name | 2010 | 2011 | 2012 |
| Home Depot | NAV | NAV | NAV |
| Toys “R” Us | NAV | NAV | NAV |
| Best Buy | NAV | NAV | NAV |
| Ross Dress for Less | NAV | NAV | NAV |
| Off Broadway Shoe Warehouse | $125 | $140 | $143 |
| PetSmart | $143 | $169 | $194 |
| Office Max | NAV | NAV | NAV |
| ULTA | NAV | NAV | NAV |
| AutoZone | NAV | NAV | NAV |
| (1) Historical Sales (PSF) are based on historical statements provided by the borrower. | |||
The following table presents certain information relating to the lease rollover schedule at The Plant San Jose Property:
Lease Expiration Schedule(1)(2)
Year Ending December 31, | No. of Leases Expiring | Expiring NRSF | % of Total NRSF | Cumulative Expiring NRSF | Cumulative % of Total NRSF | Annual U/W Base Rent | Annual U/W Base Rent PSF(3) |
| MTM | 0 | 0 | 0.0% | 0 | 0.0% | $0 | $0.00 |
| 2013 | 6 | 16,672 | 3.4% | 16,672 | 3.4% | $615,018 | $36.89 |
| 2014 | 2 | 3,678 | 0.8% | 20,350 | 4.2% | $154,476 | $42.00 |
| 2015 | 1 | 1,249 | 0.3% | 21,599 | 4.4% | $44,964 | $36.00 |
| 2016 | 5 | 7,871 | 1.6% | 29,470 | 6.1% | $290,638 | $36.93 |
| 2017 | 3 | 4,003 | 0.8% | 33,473 | 6.9% | $134,686 | $33.65 |
| 2018 | 18 | 129,918 | 26.7% | 163,391 | 33.6% | $3,954,213 | $30.44 |
| 2019 | 2 | 27,071 | 5.6% | 190,462 | 39.2% | $618,312 | $22.84 |
| 2020 | 4 | 12,438 | 2.6% | 202,900 | 41.8% | $437,872 | $35.20 |
| 2021 | 5 | 10,230 | 2.1% | 213,130 | 43.9% | $355,556 | $34.76 |
| 2022 | 4 | 10,074 | 2.1% | 223,204 | 45.9% | $400,207 | $39.73 |
2023(4) | 6 | 91,985 | 18.9% | 315,189 | 64.9% | $2,431,830 | $24.60(4) |
Thereafter(5) | 4 | 149,405 | 30.7% | 464,594 | 95.6% | $4,510,801 | $28.19(5) |
| Vacant | 0 | 21,301 | 4.4% | 485,895 | 100.0% | $0 | $0.00 |
| Total/Weighted Average | 60 | 485,895 | 100.0% | $13,948,573 | $29.02(4)(5) |
(1) Information obtained from the underwritten rent roll.
(2) Certain tenants may have lease termination options that are exercisable prior to the originally stated expiration date of the subject lease and that are not considered in the Lease Expiration Schedule.
(3) Weighted Average Annual U/W Base Rent PSF excludes vacant space.
(4) Includes Famous Dave’s BBQ, which owns its building and leases a pad site with no attributed square footage and an Annual U/W Base Rent of $168,764. The Annual U/W Base Rent PSF excludes the Annual U/W Base Rent associated with this pad site.
(5) Includes Applebee’s Neighborhood Grill & Bar and McDonald’s, which own their buildings and lease pad sites with no attributed square footage and Annual U/W Base Rents of $185,625 and $113,190, respectively. The Annual U/W Base Rent PSF excludes the Annual U/W Base Rent associated with these pad sites.
The following table presents historical occupancy percentages at The Plant San Jose Property:
Historical Occupancy(1)
12/31/2009 | 12/31/2010 | 12/31/2011 | 12/17/2012 | |||
| 89.9% | 93.3% | 95.1% | 95.6% | |||
| (1) Information obtained from the borrower. | ||||||
THE INFORMATION IN THIS STRUCTURAL AND COLLATERAL TERM SHEET IS NOT COMPLETE AND MAY BE AMENDED PRIOR TO THE TIME OF SALE. THIS TERM SHEET IS NOT AN OFFER TO SELL THESE SECURITIES AND IT IS NOT A SOLICITATION OF AN OFFER TO BUY THESE SECURITIES IN ANY JURISDICTION WHERE THE OFFER OR SALE IS NOT PERMITTED.
48
| THE PLANT SAN JOSE |
Operating History and Underwritten Net Cash Flow. The following table presents certain information relating to the historical operating performance and Underwritten Net Cash Flow at The Plant San Jose Property:
Cash Flow Analysis
2010 | 2011 | 2012 | U/W | U/W $ per SF | ||||||
| Base Rent | $13,281,097 | $13,784,152 | $13,862,657 | $13,948,573 | $28.71 | |||||
| Grossed Up Vacant Space | 0 | 0 | 0 | 1,023,823 | 2.11 | |||||
| Total Reimbursables | 3,691,757 | 3,848,857 | 4,098,334 | 5,019,589 | 10.33 | |||||
| Other Income | 137,593 | 25,225 | 44,698 | 18,000 | 0.04 | |||||
| Less Vacancy & Credit Loss | 0 | (113,213) | 0 | (1,023,823)(1) | (2.11) | |||||
| Effective Gross Income | $17,110,447 | $17,545,021 | $18,005,689 | $18,986,162 | $39.07 | |||||
| Total Operating Expenses | $5,558,337 | $5,070,689 | $5,499,972 | $5,883,368 | $12.11 | |||||
| Net Operating Income | $11,552,110 | $12,474,332 | $12,505,717 | $13,102,793 | $26.97 | |||||
| TI/LC | 0 | 0 | 0 | 422,638 | 0.87 | |||||
| Capital Expenditures | 0 | 0 | 0 | 97,179 | 0.20 | |||||
| Net Cash Flow | $11,552,110 | $12,474,332 | $12,505,717 | $12,582,976 | $25.90 | |||||
| NOI DSCR | 2.43x | 2.62x | 2.63x | 2.75x | ||||||
| NCF DSCR | 2.43x | 2.62x | 2.63x | 2.64x | ||||||
| NOI DY | 9.4% | 10.1% | 10.2% | 10.7% | ||||||
| NCF DY | 9.4% | 10.1% | 10.2% | 10.2% | ||||||
| (1) The underwritten economic vacancy is 6.8%. The Plant San Jose Property was 95.6% physically occupied as of December 17, 2012. | ||||||||||
Appraisal. As of the appraisal valuation date of February 7, 2013, The Plant San Jose Property had an “as-is” appraised value of $205,000,000.
Environmental Matters. The Phase I environmental assessment dated January 18, 2013 identified a recognized environmental condition in connection with soil and groundwater contamination related to the site’s prior use as a General Electric engine manufacturing and nuclear fuel development facility from approximately 1948 to 1985. In 2005, General Electric was identified as the responsible party and developed a remediation and risk management plan (“RRMP”), which required that each building at The Plant San Jose Property be constructed with a vapor management system to provide a barrier between the contaminants in the soil and groundwater and the interior of the buildings. The RRMP also restricts any use or extraction of groundwater at the site and that any future site structures be constructed in compliance with the RRMP. The Phase I environmental assessment recommended no further action beyond ongoing compliance with the RRMP.
In connection with the recognized environmental condition, the lender obtained a $25,000,000 environmental insurance policy with a 10-year term. In addition, the loan documents include an environmental indemnity from Cole Credit Property Trust IV, Inc., which had a stated net worth of approximately $249.0 million and liquidity of approximately $13.9 million as of December 31, 2012.
Market Overview and Competition. The Plant San Jose Property is located in San Jose, California, which is the third largest city in California and the 10th largest city in the United States. The Plant San Jose Property is located approximately four miles southeast of the San Jose central business district, eight miles southeast of the San Jose International Airport and approximately 52 miles southeast of the San Francisco central business district. The Plant San Jose Property has exposure to both Monterey Road and Curtner Avenue. Monterey Road is a commercial corridor connecting the immediate area to the San Jose central business district and has a daily traffic count of approximately 31,500 vehicles; Curtner Avenue is an east/west thoroughfare that links the area to SR-87 to the west and US-101 to the east and has a daily traffic count of approximately 33,000 vehicles. According to the appraisal, in 2012, the estimated population within a three-mile and five-mile radius of The Plant San Jose Property was 265,539 and 677,405, respectively. The estimated average household income within the same three-mile and five-mile radii was $83,814 and $88,690, respectively.
According to a third party market research report, The Plant San Jose Property is located within the San Jose Central submarket, which has an estimated inventory of 450 retail properties totaling approximately 3.4 million square feet. As of the first quarter of 2013, the submarket vacancy was 6.5% with an average asking rent of $25.16 per square foot, on a triple net basis.
THE INFORMATION IN THIS STRUCTURAL AND COLLATERAL TERM SHEET IS NOT COMPLETE AND MAY BE AMENDED PRIOR TO THE TIME OF SALE. THIS TERM SHEET IS NOT AN OFFER TO SELL THESE SECURITIES AND IT IS NOT A SOLICITATION OF AN OFFER TO BUY THESE SECURITIES IN ANY JURISDICTION WHERE THE OFFER OR SALE IS NOT PERMITTED.
49
| THE PLANT SAN JOSE |
The following table presents certain information relating to comparable retail properties for The Plant San Jose Property:
Competitive Set(1)
The Plant San Jose (Subject) | San Jose Market Center | Plaza De San Jose | Willow Glen Plaza | Almaden Plaza | Monterey Plaza | |
| Location | San Jose, CA | San Jose, CA | San Jose, CA | San Jose, CA | San Jose, CA | San Jose, CA |
| Distance from Subject | -- | 5.6 miles | 4.2 miles | 2.0 miles | 5.0 miles | 6.3 miles |
| Property Type | Power Center | Power Center | Community Center | Community Center | Power Center | Community Center |
| Year Built/Renovated | 2008/NAP | 2006/NAP | 2005/NAP | 1999/2001 | 1969/1998 | 1990/NAP |
| Total GLA | 485,895 SF | 362,000 SF | 195,000 SF | 95,000 SF | 650,000 SF | 232,680 SF |
| Total Occupancy | 96% | 97% | 96% | 100% | 97% | 91% |
| (1) Information obtained from the appraisal dated February 12, 2013. | ||||||
The Borrower. The borrower is Cole MT San Jose CA, LP, a single purpose entity with two independent directors. Legal counsel to the borrower delivered a non-consolidation opinion in connection with the origination of The Plant San Jose Mortgage Loan. Cole Credit Property Trust IV, Inc. (“CCPT IV”), the indirect owner of the borrower, is the guarantor of certain nonrecourse carveouts under The Plant San Jose Mortgage Loan.
The Sponsor. The sponsor, CCPT IV, is a non-traded public REIT that invests in income-producing retail commercial real estate primarily leased to creditworthy tenants under long-term, net leases. As of February 13, 2013, CCPT IV’s portfolio consisted of 99 properties in 27 states totaling approximately 2.6 million square feet with an average occupancy of 99.1%.
Escrows. None.
Lockbox and Cash Management. The Plant San Jose Mortgage Loan requires a lender-controlled lockbox account, which is already in place, and that the borrower directs the tenants to pay their rents directly to such lockbox account. The loan documents also require that all cash revenues and all other monies received by the borrower or manager relating to The Plant San Jose Property be deposited into the lockbox account within two business days after receipt. Prior to the occurrence of a Cash Trap Event Period (as defined below), all excess funds on deposit in the lockbox account are swept into the borrower’s operating account on a monthly basis. During a Cash Trap Event Period, all funds on deposit in the lockbox account are swept to a lender-controlled cash management account each business day (the “Excess Cash Flow Account”).
A “Cash Trap Event Period” will commence upon the earlier of (i) the occurrence and continuance of an event of default; (ii) the debt service coverage ratio falling below 1.75x at the end of any calendar month or (iii) the ARD. A Cash Trap Event Period will expire, with regard to the circumstances in clause (i), upon the cure of such event of default, or with regard to the circumstances in clause (ii), (a) upon the debt service coverage ratio being equal to or greater than 2.20x for six consecutive calendar months or (b) the balance of the Excess Cash Flow Account being equal to or greater than $16.0 million. A Cash Trap Event Period triggered by the occurrence of the ARD will not expire.
Property Management. The Plant San Jose Property is managed by an affiliate of the sponsor.
Assumption. The borrower has a two-time right to transfer The Plant San Jose Property, provided that no event of default has occurred and is continuing and certain other conditions are satisfied, including (i) the lender’s reasonable determination that the proposed transferee and guarantor satisfy the lender’s credit review and underwriting standards, taking into consideration transferee experience, financial strength and general business standing; (ii) execution of a recourse guaranty and an environmental indemnity by an affiliate of the transferee; and (iii) if requested by the lender, rating agency confirmation from Fitch, KBRA and Moody’s that the transfer will not result in a downgrade, withdrawal or qualification of the respective ratings assigned to the Series 2013-C14 Certificates.
Partial Release. Not permitted.
Real Estate Substitution. Not permitted.
Subordinate and Mezzanine Indebtedness. Not permitted.
Ground Lease. None.
Terrorism Insurance. The loan documents require that the “all risk” insurance policy required to be maintained by the borrower provide coverage for terrorism in an amount equal to the full replacement cost of The Plant San Jose Property; provided however, that the borrower shall not be required to spend more than 200% of the costs of a stand-alone policy for terrorism insurance immediately prior to the date of TRIA or similar government backstop is no longer in effect. The loan documents also require business interruption insurance covering no less than the 18-month period following the occurrence of a casualty event, together with a 12-month extended period of indemnity.
THE INFORMATION IN THIS STRUCTURAL AND COLLATERAL TERM SHEET IS NOT COMPLETE AND MAY BE AMENDED PRIOR TO THE TIME OF SALE. THIS TERM SHEET IS NOT AN OFFER TO SELL THESE SECURITIES AND IT IS NOT A SOLICITATION OF AN OFFER TO BUY THESE SECURITIES IN ANY JURISDICTION WHERE THE OFFER OR SALE IS NOT PERMITTED.
50
(THIS PAGE INTENTIONALLY LEFT BLANK)
51
(THIS PAGE INTENTIONALLY LEFT BLANK)
52
| WHITE MARSH MALL |
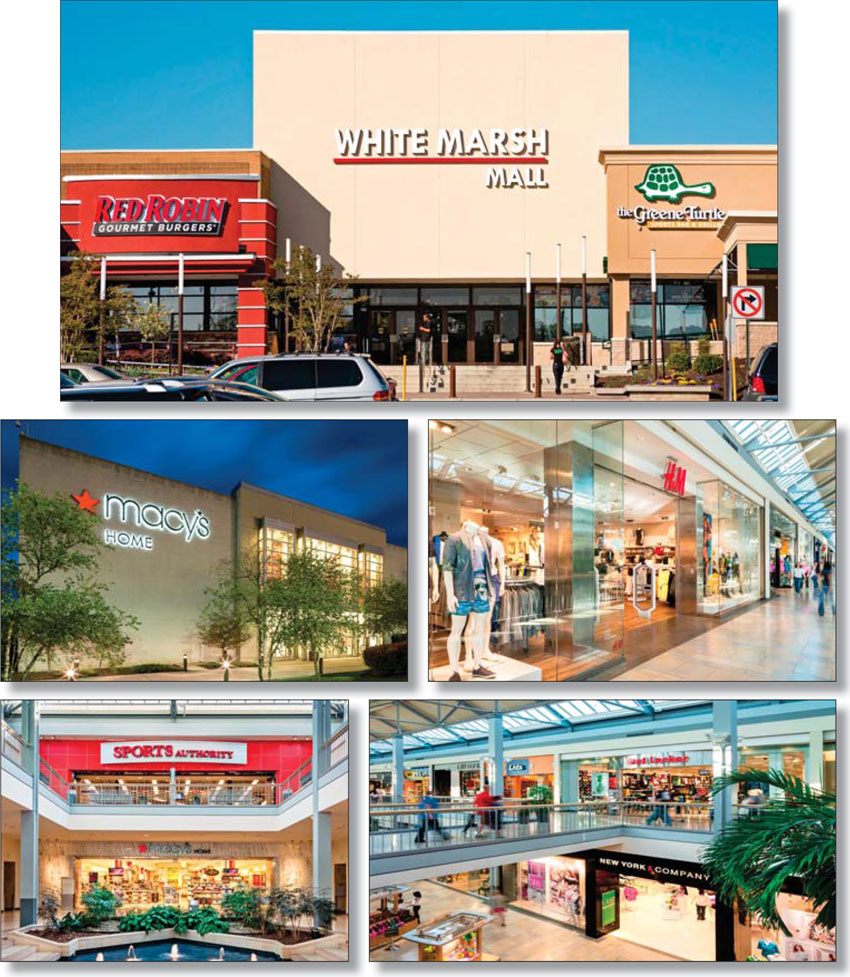
THE INFORMATION IN THIS STRUCTURAL AND COLLATERAL TERM SHEET IS NOT COMPLETE AND MAY BE AMENDED PRIOR TO THE TIME OF SALE. THIS TERM SHEET IS NOT AN OFFER TO SELL THESE SECURITIES AND IT IS NOT A SOLICITATION OF AN OFFER TO BUY THESE SECURITIES IN ANY JURISDICTION WHERE THE OFFER OR SALE IS NOT PERMITTED.
53
| WHITE MARSH MALL |

THE INFORMATION IN THIS STRUCTURAL AND COLLATERAL TERM SHEET IS NOT COMPLETE AND MAY BE AMENDED PRIOR TO THE TIME OF SALE. THIS TERM SHEET IS NOT AN OFFER TO SELL THESE SECURITIES AND IT IS NOT A SOLICITATION OF AN OFFER TO BUY THESE SECURITIES IN ANY JURISDICTION WHERE THE OFFER OR SALE IS NOT PERMITTED.
54
| WHITE MARSH MALL |
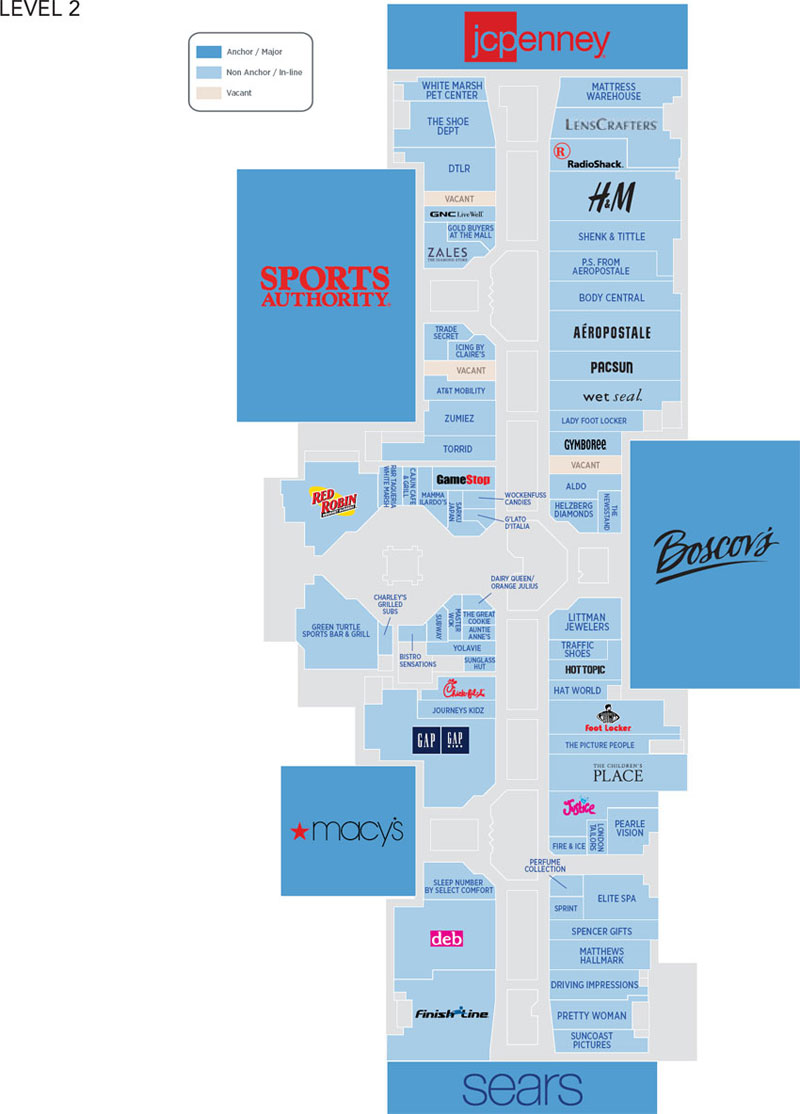
THE INFORMATION IN THIS STRUCTURAL AND COLLATERAL TERM SHEET IS NOT COMPLETE AND MAY BE AMENDED PRIOR TO THE TIME OF SALE. THIS TERM SHEET IS NOT AN OFFER TO SELL THESE SECURITIES AND IT IS NOT A SOLICITATION OF AN OFFER TO BUY THESE SECURITIES IN ANY JURISDICTION WHERE THE OFFER OR SALE IS NOT PERMITTED.
55
| WHITE MARSH MALL |
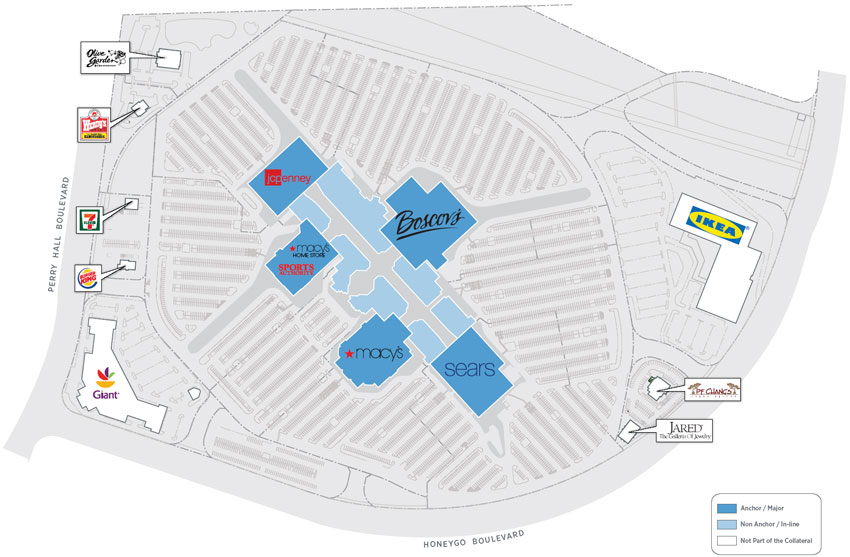
THE INFORMATION IN THIS STRUCTURAL AND COLLATERAL TERM SHEET IS NOT COMPLETE AND MAY BE AMENDED PRIOR TO THE TIME OF SALE. THIS TERM SHEET IS NOT AN OFFER TO SELL THESE SECURITIES AND IT IS NOT A SOLICITATION OF AN OFFER TO BUY THESE SECURITIES IN ANY JURISDICTION WHERE THE OFFER OR SALE IS NOT PERMITTED.
56
| WHITE MARSH MALL |

THE INFORMATION IN THIS STRUCTURAL AND COLLATERAL TERM SHEET IS NOT COMPLETE AND MAY BE AMENDED PRIOR TO THE TIME OF SALE. THIS TERM SHEET IS NOT AN OFFER TO SELL THESE SECURITIES AND IT IS NOT A SOLICITATION OF AN OFFER TO BUY THESE SECURITIES IN ANY JURISDICTION WHERE THE OFFER OR SALE IS NOT PERMITTED.
57
| No. 4 – White Marsh Mall | |||||||
Loan Information | Property Information | ||||||
| Mortgage Loan Seller: | Wells Fargo Bank, National Association | Single Asset/Portfolio: | Single Asset | ||||
Credit Assessment (Fitch/KBRA/Moody’s): | NR/NR/NR | Property Type: | Retail | ||||
Original Principal Balance(1): | $110,000,000 | Specific Property Type: | Regional Mall | ||||
Cut-off Date Principal Balance(1): | $110,000,000 | Location: | Baltimore, MD | ||||
| % of Initial Pool Balance: | 7.5% | Size: | 702,317 SF | ||||
| Loan Purpose: | Refinance | Cut-off Date Principal Balance Per Unit/SF(1): | $270.53 | ||||
| Borrower Name: | White Marsh Mall Holding, LLC; White Marsh Anchor Acquisition, LLC | Year Built/Renovated: | 1981/2012 | ||||
| Sponsors: | GGPLP Real Estate Inc.; White Marsh Mall, LLC | Title Vesting: | Fee | ||||
| Mortgage Rate: | 3.658% | Property Manager: | Self-managed | ||||
| Note Date: | May 1, 2013 | 3rd Most Recent Occupancy (As of): | 90.7% (12/31/2010) | ||||
| Anticipated Repayment Date: | NAP | 2nd Most Recent Occupancy (As of): | 95.1% (12/31/2011) | ||||
| Maturity Date: | May 1, 2021 | Most Recent Occupancy (As of): | 94.9% (12/31/2012) | ||||
| IO Period: | 96 months | Current Occupancy (As of)(3): | 96.6% (2/28/2013) | ||||
| Loan Term (Original): | 96 months | ||||||
| Seasoning: | 1 month | Underwriting and Financial Information: | |||||
| Amortization Term (Original): | NAP | ||||||
| Loan Amortization Type: | Interest-only, Balloon | 3rd Most Recent NOI (As of): | $16,818,921 (12/31/2010) | ||||
| Interest Accrual Method: | Actual/360 | 2nd Most Recent NOI (As of): | $17,065,240 (12/31/2011) | ||||
| Call Protection: | L(25),D(64),O(7) | Most Recent NOI (As of): | $17,253,512 (12/31/2012) | ||||
| Lockbox Type: | Hard/Springing Cash Management | ||||||
Additional Debt(1): | Yes | ||||||
Additional Debt Type(1): | Pari Passu and Future Mezzanine | U/W Revenues: | $27,159,676 | ||||
| U/W Expenses: | $7,664,488 | ||||||
U/W NOI(4): | $19,495,188 | ||||||
| U/W NCF: | $18,715,906 | ||||||
Escrows and Reserves(2): | U/W NOI DSCR(1): | 2.77x | |||||
U/W NCF DSCR(1): | 2.66x | ||||||
Type: | Initial | Monthly | Cap (If Any) | U/W NOI Debt Yield(1): | 10.3% | ||
| Taxes | $0 | Springing | NAP | U/W NCF Debt Yield(1): | 9.9% | ||
| Insurance | $0 | Springing | NAP | As-Is Appraised Value: | $300,000,000 | ||
| Replacement Reserves | $0 | Springing | $140,734 | As-Is Appraisal Valuation Date: | April 11, 2013 | ||
| TI/LC Reserve | $0 | Springing | $335,060 | Cut-off Date LTV Ratio(1): | 63.3% | ||
| Tenants Specific TI/LC Reserve | $1,215,290 | $0 | NAP | LTV Ratio at Maturity or ARD(1): | 63.3% | ||
| (1) | The White Marsh Mall Loan Combination, totalling $190,000,000, is comprised of two pari passu notes (Notes A-1 and A-2). Note A-1 had an original principal balance of $110,000,000, has an outstanding principal balance as of the Cut-off Date of $110,000,000 and will be contributed to the WFRBS 2013-C14 Trust. Note A-2 had an original principal balance of $80,000,000 and is expected to be contributed to a future trust. All statistical information related to balances per square foot, loan-to-value ratios, debt service coverage ratios and debt yields are based on the White Marsh Mall Loan Combination. |
| (2) | See “Escrows” section. |
| (3) | Occupancy includes 24,245 square feet attributed to temporary tenants that were not included in Annual U/W Base Rent. |
| (4) | See “Cash Flow Analysis” section for detail on the increase from Most Recent NOI to U/W NOI. |
The Mortgage Loan. The mortgage loan (the “White Marsh Mall Loan Combination”) is evidenced by two pari passu promissory notes (Note A-1 and Note A-2) secured by a first mortgage encumbering a regional mall located in Baltimore, Maryland (the “White Marsh Mall Property”). The White Marsh Mall Loan Combination was originated on May 1, 2013 by Wells Fargo Bank, National Association. The White Marsh Mall Loan Combination had an original principal balance of $190,000,000, has an outstanding principal balance as of the Cut-off Date of $190,000,000 and accrues interest at an interest rate of 3.658% per annum. The White Marsh Mall Loan Combination had an initial term of 96 months, has a remaining term of 95 months as of the Cut-off Date and requires interest-only payments through the term of the White Marsh Mall Loan Combination. The White Marsh Mall Loan Combination matures on May 1, 2021. See “Description of the Mortgage Pool – Split Loan Structures – The White Marsh Mall Loan Combination” in the Free Writing Prospectus.
Note A-1, which represents the controlling interest in the White Marsh Mall Loan Combination and will be contributed to the WFRBS 2013-C14 Trust, had an original principal balance of $110,000,000 and has an outstanding principal balance as of the Cut-off Date of $110,000,000. Note A-2 had an original principal balance of $80,000,000, is expected to be securitized in a future trust and will represent the non-controlling interest in the White Marsh Mall Loan Combination (the “White Marsh Mall Companion Loan”).
THE INFORMATION IN THIS STRUCTURAL AND COLLATERAL TERM SHEET IS NOT COMPLETE AND MAY BE AMENDED PRIOR TO THE TIME OF SALE. THIS TERM SHEET IS NOT AN OFFER TO SELL THESE SECURITIES AND IT IS NOT A SOLICITATION OF AN OFFER TO BUY THESE SECURITIES IN ANY JURISDICTION WHERE THE OFFER OR SALE IS NOT PERMITTED.
58
| WHITE MARSH MALL |
Following the lockout period, the borrower has the right to defease the White Marsh Mall Loan Combination in whole, but not in part, on any date before November 1, 2020. In addition, the White Marsh Mall Loan Combination is prepayable without penalty on or after November 1, 2020.
Sources and Uses
| Sources | Uses | |||||||
| Original loan combination amount | $190,000,000 | 100.0% | Loan payoff | $179,431,903 | 94.4% | |||
| Reserves | 1,215,290 | 0.6 | ||||||
| Closing costs | 1,351,769 | 0.7 | ||||||
| Return of equity | 8,001,038 | 4.2 | ||||||
| Total Sources | $190,000,000 | 100.0% | Total Uses | $190,000,000 | 100.0% |
The Property. The White Marsh Mall Property is a two-story regional mall located in Baltimore, Maryland that contains approximately 1,168,327 square feet of which 702,317 square feet secures the White Marsh Mall Loan Combination. The White Marsh Mall Property is anchored by three non-collateral anchors (Sears, Macy’s and JC Penney), Boscov’s and Macy’s Home Store. The White Marsh Mall Property is situated on 84.5 acres and was built in 1981 and renovated in 2004 and 2012. Parking is provided by 6,732 surface parking spaces, resulting in a parking ratio of 9.6 spaces per 1,000 square feet of net rentable area. The White Marsh Mall Property’s mix of in-line tenants includes Forever 21, Gap, Victoria’s Secret, American Eagle Outfitters, Express and Bath & Body Works. For the trailing 12-month period ending January 31, 2013, tenants occupying less than 10,000 square feet had comparable in-line sales of $423 per square foot with an average occupancy cost of 14.5%. As of February 28, 2013, the White Marsh Mall Property was 96.6% leased to 146 tenants.
THE INFORMATION IN THIS STRUCTURAL AND COLLATERAL TERM SHEET IS NOT COMPLETE AND MAY BE AMENDED PRIOR TO THE TIME OF SALE. THIS TERM SHEET IS NOT AN OFFER TO SELL THESE SECURITIES AND IT IS NOT A SOLICITATION OF AN OFFER TO BUY THESE SECURITIES IN ANY JURISDICTION WHERE THE OFFER OR SALE IS NOT PERMITTED.
59
| WHITE MARSH MALL |
The following table presents certain information relating to the tenancies at the White Marsh Mall Property:
Major Tenants
| Tenant Name | Credit Rating (Fitch/ Moody’s/ S&P)(1) | Tenant NRSF | % of NRSF | Annual U/W Base Rent PSF(2) | Annual U/W Base Rent(2) | % of Total Annual U/W Base Rent | Sales PSF(3) | Occupancy Cost(3) | Lease Expiration Date | |
| Anchor Tenants – Not Part of Collateral | ||||||||||
| Sears | CCC/B3/CCC+ | 167,000 | ANCHOR OWNED – NOT PART OF THE COLLATERAL | |||||||
| Macy’s | BBB/Baa3/BBB | 162,400 | ANCHOR OWNED – NOT PART OF THE COLLATERAL | |||||||
| JC Penney | B-/Caa1/CCC+ | 136,610 | ANCHOR OWNED – NOT PART OF THE COLLATERAL | |||||||
| Anchor Tenants – Collateral | ||||||||||
| Boscov’s | NR/NR/NR | 197,345 | 28.1% | $3.04 | $600,000 | 3.7% | NAV | NAV | 1/31/2028 | |
| Macy’s Home Store | BBB/Baa3/BBB | 60,000 | 8.5% | $0.00(4) | $0(4) | 0.0% | NAV | NAV | 1/31/2018 | |
| Total Anchor Tenants – Collateral | 257,345 | 36.6% | $2.33 | $600,000 | 3.7% | |||||
| Major Tenants – Collateral | ||||||||||
| Sports Authority | NR/B3/B- | 53,634 | 7.6% | $14.44 | $774,705 | 4.8% | $91 | 21.2% | 1/31/2022 | |
Forever 21(5) | NR/NR/NR | 14,959 | 2.1% | $34.46 | $515,487 | 3.2% | $436 | 12.2% | 8/31/2023 | |
| Gap | BBB-/Baa3/BB+ | 9,295 | 1.3% | $46.08 | $428,305 | 2.6% | $162 | 10.5% | 4/30/2016 | |
| Littman Jewelers | NR/NR/NR | 2,747 | 0.4% | $116.00 | $318,652 | 2.0% | $841 | 17.4% | 9/30/2016 | |
| The Children’s Place | NR/NR/NR | 5,070 | 0.7% | $57.80 | $293,067 | 1.8% | $384 | 15.9% | 1/31/2017 | |
| Disney Store | A/A2/A | 5,200 | 0.7% | $56.12 | $291,826 | 1.8% | $300 | 19.8% | 1/31/2018 | |
| Victoria’s Secret | BB+/Ba1/BB+ | 9,500 | 1.4% | $30.00 | $285,000 | 1.8% | $592 | 10.1% | 1/31/2023 | |
| Green Turtle Sports Bar & Grill | NR/NR/NR | 5,943 | 0.8% | $45.00 | $267,435 | 1.7% | NAV | NAV | 9/30/2022 | |
| Foot Locker | NR/NR/NR | 3,958 | 0.6% | $65.92 | $260,911 | 1.6% | $447 | 15.3% | 1/31/2023 | |
| Buffalo Wild Wings Grill & Bar | NR/NR/NR | 6,791 | 1.0% | $37.00 | $251,267 | 1.6% | $545 | 7.6% | 12/31/2021 | |
| Total Major Tenants – Collateral | 117,097 | 16.7% | $31.48 | $3,686,656 | 22.8% | |||||
Non-Major Tenants - Collateral(6) | 303,766 | 43.3% | $42.58 | $11,902,355 | 73.5% | |||||
Occupied Collateral Total(6) | 678,208 | 96.6% | $24.76 | $16,189,011 | 100.0% | |||||
| Vacant Space | 24,109 | 3.4% | ||||||||
Collateral Total(6) | 702,317 | 100.0% | ||||||||
| (1) | Certain ratings are those of the parent company whether or not the parent guarantees the lease. |
| (2) | Annual U/W Base Rent PSF and Annual U/W Base Rent include contractual rent escalations through May 2014. |
| (3) | Sales PSF and Occupancy Cost represent the trailing 12-month period ending January 31, 2013. |
| (4) | Macy’s Home Store has an annual contractual rent of $1 plus reimbursements; therefore, no rent was underwritten for this tenant. |
| (5) | Forever 21 currently occupies a temporary space containing 4,996 square feet with a lease expiration date of August 31, 2013. The tenant has a signed lease to expand to a 14,959 square foot space. The Sales PSF and Occupancy Cost shown are based on the tenant’s previous space, which contained 6,281 square feet. |
| (6) | Occupancy includes 24,245 square feet attributed to temporary tenants that were not included in the Annual U/W Base Rent. The Annual U/W Base Rent PSF for Non-Major Tenants – Collateral and Occupied Collateral Total excludes the square footage attributed to these tenants. |
THE INFORMATION IN THIS STRUCTURAL AND COLLATERAL TERM SHEET IS NOT COMPLETE AND MAY BE AMENDED PRIOR TO THE TIME OF SALE. THIS TERM SHEET IS NOT AN OFFER TO SELL THESE SECURITIES AND IT IS NOT A SOLICITATION OF AN OFFER TO BUY THESE SECURITIES IN ANY JURISDICTION WHERE THE OFFER OR SALE IS NOT PERMITTED.
60
| WHITE MARSH MALL |
The following table presents certain information relating to the historical sales and occupancy costs at the White Marsh Mall Property:
Historical Sales (PSF) and Occupancy Costs(1)
| Tenant Name | 2010 | 2011 | 2012 | TTM 1/31/2013 |
| Boscov’s | NAV | NAV | NAV | NAV |
| Macy’s Home Store | NAV | NAV | NAV | NAV |
| Sports Authority | $101 | $97 | $97 | $91 |
| Forever 21 | $424 | $452 | $429 | $436 |
| Gap | $206 | $171 | $160 | $162 |
| Littman Jewelers | $1,052 | $1,099 | $852 | $841 |
| The Children’s Place | $371 | $367 | $381 | $384 |
| Disney Store | $311 | $289 | $298 | $300 |
| Victoria’s Secret | $457 | $555 | $583 | $592 |
| Green Turtle Sports Bar & Grill | NAV | NAV | NAV | NAV |
| Foot Locker | $370 | $433 | $446 | $447 |
| Buffalo Wild Wings Grill & Bar | $533 | $534 | $571 | $545 |
| Total In-line (<10,000 square feet) | $392 | $414 | $428 | $423 |
| Occupancy Costs | 15.0% | 14.9% | 14.8% | 14.5% |
| (1) Historical Sales (PSF) and Occupancy Costs are based on historical statements provided by the borrower. | ||||
The following table presents certain information relating to the lease rollover schedule at the White Marsh Mall Property:
Lease Expiration Schedule(1)(2)
Year Ending December 31, | No. of Leases Expiring | Expiring NRSF | % of Total NRSF | Cumulative Expiring NRSF | Cumulative % of Total NRSF | Annual U/W Base Rent | Annual U/W Base Rent PSF(3) | |
MTM(4) | 12 | 20,203 | 2.9% | 20,203 | 2.9% | $73,915 | $153.99 | |
2013(5) | 11 | 8,512 | 1.2% | 28,715 | 4.1% | $249,946 | $38.52 | |
2014(6) | 20 | 40,494 | 5.8% | 69,209 | 9.9% | $1,219,575 | $31.28 | |
2015(7) | 22 | 53,798 | 7.7% | 123,007 | 17.5% | $2,462,319 | $46.64 | |
| 2016 | 19 | 54,665 | 7.8% | 177,672 | 25.3% | $2,565,345 | $46.93 | |
| 2017 | 11 | 37,000 | 5.3% | 214,672 | 30.6% | $1,581,861 | $42.75 | |
| 2018 | 15 | 84,825 | 12.1% | 299,497 | 42.6% | $1,429,013 | $16.85 | |
| 2019 | 6 | 9,741 | 1.4% | 309,238 | 44.0% | $659,275 | $67.68 | |
| 2020 | 3 | 2,825 | 0.4% | 312,063 | 44.4% | $206,912 | $73.24 | |
| 2021 | 9 | 37,355 | 5.3% | 349,418 | 49.8% | $1,482,942 | $39.70 | |
| 2022 | 8 | 71,292 | 10.2% | 420,710 | 59.9% | $1,608,087 | $22.56 | |
| 2023 | 6 | 43,722 | 6.2% | 464,432 | 66.1% | $1,479,019 | $33.83 | |
| Thereafter | 4 | 213,776 | 30.4% | 678,208 | 96.6% | $1,170,802 | $5.48 | |
| Vacant | 0 | 24,109 | 3.4% | 702,317 | 100.0% | $0 | $0.00 | |
| Total/Weighted Average | 146 | 702,317 | 100.0% | $16,189,011 | $24.76 |
| (1) | Information obtained from the underwritten rent roll. |
| (2) | Certain tenants may have lease termination options that are exercisable prior to the originally stated expiration date of the subject lease and that are not considered in the Lease Expiration Schedule. |
| (3) | Weighted Average Annual U/W Base Rent PSF excludes vacant space and square footage attributed to temporary tenants, which were not included in Annual U/W Base Rent. |
| (4) | Includes 11 temporary tenants totaling 19,723 square feet that were not included in Annual U/W Base Rent. The Annual U/W Base Rent PSF does not include the square footage attributed to these tenants. |
| (5) | Includes six temporary tenants totaling 2,023 square feet that were not included in Annual U/W Base Rent. The Annual U/W Base Rent PSF does not include the square footage attributed to these tenants. |
| (6) | Includes seven temporary tenants totaling 1,499 square feet that were not included in Annual U/W Base Rent. The Annual U/W Base Rent PSF does not include the square footage attributed to these tenants. |
| (7) | Includes one temporary tenant totaling 1,000 square feet that was not included in Annual U/W Base Rent. The Annual U/W Base Rent PSF does not include the square footage attributed to this tenant. |
The following table presents historical occupancy percentages at the White Marsh Mall Property:
Historical Occupancy(1)
12/31/2010 | 12/31/2011 | 12/31/2012 | 2/28/2013 | |||
| 90.7% | 95.1% | 94.9% | 96.6% | |||
| (1) Information obtained from the borrower. | ||||||
THE INFORMATION IN THIS STRUCTURAL AND COLLATERAL TERM SHEET IS NOT COMPLETE AND MAY BE AMENDED PRIOR TO THE TIME OF SALE. THIS TERM SHEET IS NOT AN OFFER TO SELL THESE SECURITIES AND IT IS NOT A SOLICITATION OF AN OFFER TO BUY THESE SECURITIES IN ANY JURISDICTION WHERE THE OFFER OR SALE IS NOT PERMITTED.
61
| WHITE MARSH MALL |
Operating History and Underwritten Net Cash Flow. The following table presents certain information relating to the historical operating performance and Underwritten Net Cash Flow at the White Marsh Mall Property:
Cash Flow Analysis
2010 | 2011 | 2012 | U/W(1) | U/W $ per SF | ||||||
| Base Rent | $13,037,744 | $13,081,252 | $13,673,023 | $16,189,011 | $23.05 | |||||
| Grossed Up Vacant Space | 0 | 0 | 0 | 887,676 | 1.26 | |||||
| Percentage Rent | 701,282 | 418,571 | 366,872 | 270,271 | 0.38 | |||||
| Total Reimbursables | 6,959,713 | 7,453,448 | 7,456,890 | 8,067,747 | 11.49 | |||||
| Other Income | 2,902,426 | 3,235,075 | 2,969,607 | 2,632,647 | 3.75 | |||||
| Less Vacancy & Credit Loss | (59,003) | (59,003) | (63,146) | (887,676)(2) | (1.26) | |||||
| Effective Gross Income | $23,542,162 | $24,129,343 | $24,403,246 | $27,159,676 | $38.67 | |||||
| Total Operating Expenses | $6,723,241 | $7,064,102 | $7,149,734 | $7,664,488 | $10.91 | |||||
| Net Operating Income | $16,818,921 | $17,065,240 | $17,253,512 | $19,495,188 | $27.76 | |||||
| TI/LC | 0 | 0 | 0 | 638,819 | 0.91 | |||||
| Capital Expenditures | 0 | 0 | 0 | 140,463 | 0.20 | |||||
| Net Cash Flow | $16,818,921 | $17,065,240 | $17,253,512 | $18,715,906 | $26.65 | |||||
NOI DSCR(3) | 2.39x | 2.42x | 2.45x | 2.77x | ||||||
NCF DSCR(3) | 2.39x | 2.42x | 2.45x | 2.66x | ||||||
NOI DY(3) | 8.9% | 9.0% | 9.1% | 10.3% | ||||||
NCF DY(3) | 8.9% | 9.0% | 9.1% | 9.9% |
| (1) | The increase in U/W NOI compared to historical NOI is attributable to recent leasing activity at the White Marsh Mall Property. 21 tenants accounting for 37.4% of the net rentable area and 16.6% of the underwritten base rent executed new leases in 2012 and 2013. |
| (2) | The underwritten economic vacancy is 5.2%. The White Marsh Mall Property was 96.6% physically occupied as of February 28, 2013. |
| (3) | DSCRs and debt yields are based on the White Marsh Mall Loan Combination. |
Appraisal. As of the appraisal valuation date of April 11, 2013, the White Marsh Mall Property had an “as-is” appraised value of $300,000,000.
Environmental Matters. According to a Phase I environmental site assessment dated April 17, 2013, there was no evidence of any recognized environmental conditions at the White Marsh Mall Property.
Market Overview and Competition. The White Marsh Mall Property is located along the south side of White Marsh Boulevard (Maryland Route 43) in the Middle River-White Marsh area of southeastern Baltimore County. The White Marsh Mall Property is located approximately 12 miles northeast of the Baltimore central business district, approximately 39 miles northeast of the Washington, D.C. central business district and within five miles of the communities of Middle River, White Marsh, Perry Hall, Rosedale and Essex. In addition, the White Marsh Mall Property is situated approximately four miles northeast of the interchange of Interstate 695 and Interstate 95, which provide primary access to the area. According to the appraisal, as of 2012, the estimated population within a five-mile and 10-mile radius of the White Marsh Mall Property was 243,109 and 813,778, respectively. The estimated household income within the same five-mile and 10-mile radii was $66,333 and $64,753, respectively.
According to a third party market research report, the White Marsh Mall Property is located within the Baltimore County East submarket, which has an estimated inventory of 984 retail buildings totaling approximately 5.5 million square feet with a 3.2% vacancy rate, as of the first quarter of 2013. The appraiser concluded to a market rent of $37.04 per square foot, on a triple net basis, for the White Marsh Mall Property.
The following table presents certain information relating to comparable retail properties for White Marsh Mall Property:
Competitive Set(1)
White Marsh Mall (Subject) | Towson Town Center | Hartford Mall | Eastpoint Mall | Marley Station | |
| Location | Baltimore, MD | Towson, MD | Bel Air, MD | Baltimore, MD | Glen Burnie, MD |
| Distance from Subject | -- | 7.3 miles | 11.8 miles | 6.0 miles | 17.5 miles |
| Property Type | Regional Mall | Regional Mall | Regional Mall | Regional Mall | Regional Mall |
| Year Built/Renovated | 1981/2012 | 1959/2008 | 1972/2007 | 1957/1991 | 1987/1996 |
| Anchors | Sears, Macy’s, JC Penney, Boscov’s, Macy’s Home Store | Crate & Barrel, Macy’s, Nordstrom, Nordstrom Rack | Macy’s, Sears | Burlington Coat Factory, JC Penney, Sears, Value City | JC Penney, Macy’s, Sears, Vacant |
| Total GLA | 702,317 SF | 1,050,064 SF | 505,345 SF | 851,314 SF | 1,069,186 SF |
| Total Occupancy | 97% | 98% | 99% | 80% | 86% |
| (1) | Information obtained from the appraisal dated April 26, 2013. |
THE INFORMATION IN THIS STRUCTURAL AND COLLATERAL TERM SHEET IS NOT COMPLETE AND MAY BE AMENDED PRIOR TO THE TIME OF SALE. THIS TERM SHEET IS NOT AN OFFER TO SELL THESE SECURITIES AND IT IS NOT A SOLICITATION OF AN OFFER TO BUY THESE SECURITIES IN ANY JURISDICTION WHERE THE OFFER OR SALE IS NOT PERMITTED.
62
| WHITE MARSH MALL |
The Borrower. The borrower consists of White Marsh Mall Holding, LLC and White Marsh Anchor Acquisition, LLC, each of which is a single purpose entity with an independent director. Legal counsel to the borrower delivered a non-consolidation opinion in connection with the origination of the White Marsh Mall Loan Combination. GGPLP Real Estate Inc. and White Marsh Mall, LLC, the loan sponsors, are the guarantors of certain nonrecourse carveouts under the White Marsh Mall Loan Combination.
The Sponsor. The sponsors are GGPLP Real Estate Inc. (“GGP”) and White Marsh Mall, LLC. GGP is a publically traded REIT that had total assets of approximately $27.4 billion as of September 30, 2012 according to GGP’s 10-Q. GGP’s portfolio had sales of $543 per square foot for comparable tenants with less than 10,000 square feet for the trailing 12-month period ending September 30, 2012. GGP entered Chapter 11 bankruptcy proceedings in April 2009 and emerged from bankruptcy protection in November 2010. See “Risk Factors – The Borrower’s Form of Entity May Cause Special Risks” in the Free Writing Prospectus.
Escrows. Upon origination, the borrower issued a guaranty for $1,215,290 in connection with outstanding tenant improvement allowances for Red Robin Burgers ($328,900), Green Turtle Sports Bar & Grill ($237,720), Buca di Beppo ($225,000), New York & Company ($188,430), Pink ($166,000) and Sleep By Number ($69,240).
The loan documents do not require monthly escrows for real estate taxes provided the following conditions are met: (i) no event of default has occurred and is continuing; (ii) the borrower has provided the lender with proof of full payment within a timely manner; and (iii) a Trigger Event Period (as defined below) does not currently exist. The loan documents do not require monthly escrows for insurance provided the following conditions are met: (i) no event of default has occurred and is continuing; (ii) the insurance required to be maintained by the borrower is maintained pursuant to one or more blanket policies; (iii) the borrower provides the lender with paid receipts satisfactory to the lender that all insurance premiums have been and continue to be fully and timely paid. The loan documents do not require monthly escrows for replacement reserves as long as no Trigger Event Period exists and is continuing. During a Trigger Event Period, the borrower is required to deposit monthly replacement reserves in an amount equal to $11,728 (subject to a cap of $140,734). The loan documents do not require monthly escrows for tenant improvements and leasing commissions as long as no Trigger Event Period exists and is continuing. During a Trigger Event Period, the borrower is required to deposit monthly into the escrow account for tenant improvement and leasing commissions in an amount equal to $27,922 (subject to a cap of $335,060).
A “Trigger Event Period” will commence upon (i) the occurrence and continuance of an event of default or (ii) the debt service coverage ratio for the trailing 12-month period falling below 1.25x at the end of any calendar quarter. A Trigger Event Period will expire upon the cure of such event of default or the actual debt service coverage ratio being equal to or greater than 1.25x for two consecutive calendar quarters.
Lockbox and Cash Management. The White Marsh Mall Loan Combination requires a lender-controlled lockbox account, which is already in place, and that the borrower directs tenants to pay their rents directly into such lockbox account. The loan documents also require that all rents received by the borrower or the property manager be deposited into the lockbox account within five business days of receipt. Prior to the occurrence of a Trigger Event Period, all funds on deposit in the lockbox account are swept into the borrower’s operating account on a daily basis. During a Trigger Event Period, all excess cash flow is swept on a monthly basis (or daily during the continuance of an event of default) to a cash management account under the control of the lender.
Property Management. The White Marsh Mall Property is managed by an affiliate of the sponsor.
Assumption. The borrower has the right to transfer the White Marsh Mall Property, provided that no event of default has occurred and is continuing and certain other conditions are satisfied, including, but not limited to the following: (i) the lender’s reasonable determination that the proposed transferee and guarantor satisfy the lender’s credit review and underwriting standards, taking into consideration transferee experience, financial strength and general business standing, (ii) execution of a recourse guaranty and an environmental indemnity by an affiliate of the transferee, and (iii) if requested by the lender, rating agency confirmation from Fitch, KBRA and Moody’s that the transfer will not result in a downgrade, withdrawal or qualification of the respective ratings assigned to the Series 2013-C14 Certificates, and similar confirmations with respect to the ratings of any securities backed by the White Marsh Mall Companion Loan.
In addition, the loan documents permit equity transfers of direct or indirect equity interests in the borrower or any shareholder, partner, member or non-member manager of the borrower subject to certain conditions, including not less than 50% of equity interests in the borrower being owned by a Qualified Equityholder (as defined below) and controls the borrower.
A “Qualified Equityholder” is defined as General Growth Properties, Inc. or an affiliate, or other institution having total assets in excess of $600 million and capital/statutory surplus in excess of $250 million, or any permitted mezzanine lender or party for whom written confirmation from Fitch, KBRA and Moody’s has been obtained that the transfer to the entity in question will not result in a downgrade, withdrawal or qualification of the then-current ratings assigned to the Series 2013-C14 Certificates, and similar confirmations have been obtained with respect to the ratings of any securities backed by the White Marsh Mall Companion Loan.
Partial Release. The White Marsh Mall borrower may obtain a release of certain vacant, non-income producing, unimproved outlots or parcels from the lien of the mortgage upon the satisfaction of certain conditions including without limitation (i) no event of default will have occurred and be continuing on the date the borrower delivers notice and on the date of release; (ii) the delivery of a legal opinion to the lender to demonstrate that the release of the related outparcel will satisfy REMIC requirements; and (iii) receipt of written confirmation from Fitch, KBRA and Moody’s that the transfer will not result in a downgrade, withdrawal or qualification of the then-current ratings assigned to the Series 2013-C14 Certificates, and similar confirmations with respect to the ratings of any securities backed by the White Marsh Mall Companion Loan.
THE INFORMATION IN THIS STRUCTURAL AND COLLATERAL TERM SHEET IS NOT COMPLETE AND MAY BE AMENDED PRIOR TO THE TIME OF SALE. THIS TERM SHEET IS NOT AN OFFER TO SELL THESE SECURITIES AND IT IS NOT A SOLICITATION OF AN OFFER TO BUY THESE SECURITIES IN ANY JURISDICTION WHERE THE OFFER OR SALE IS NOT PERMITTED.
63
| WHITE MARSH MALL |
Real Estate Substitution. The White Marsh Mall borrower may obtain a release of certain vacant, non-income producing, unimproved outlots or parcels from the lien of the mortgage in connection with a substitution of a different parcel subject to the satisfaction of certain conditions, including without limitation (i) no event of default will have occurred and be continuing on the date the borrower delivers notice and on the date of release; (ii) simultaneously with the substitution, the White Marsh Mall borrower will be required to acquire the fee simple or leasehold interest to the substitution parcel located at the shopping center of which the substituted parcel is a part, that is at least equal in value to the substituted parcel; and (iii) delivery to the lender of an acceptable (as defined in the loan documents) Phase I report and a physical conditions report (if the substitution parcel is improved).
Subordinate and Mezzanine Indebtedness. There is no existing mezzanine debt related to the White Marsh Mall Loan Combination, however future mezzanine debt is permitted subject to satisfaction of certain conditions, including (i) no event of default has occurred and is continuing; (ii) the lender receives no less than 30 days prior written notice; (iii) an intercreditor agreement in form and substance acceptable to Fitch, KBRA, Moody’s and any rating agencies rating securities backed by the White Marsh Mall Companion Loan and reasonably acceptable to the lender; (iv) the combined debt service coverage ratio is not less than the debt service coverage ratio of the White Marsh Mall Loan Combination at origination; (v) the combined loan-to-value ratio will not be greater than 70%; (vi) the total debt service coverage ratio will not be less than 2.64x; and (vii) delivery of mezzanine loan documents reasonably acceptable to the lender and acceptable to Fitch, KBRA, Moody’s and any rating agencies rating securities backed by the White Marsh Mall Companion Loan.
The loan documents permit certain sponsor affiliates (“GGP Top Tier Entities”) to pledge indirect ownership interests to a Qualified Pledgee (an institution having at least $600 million in total assets and $250 million in capital/statutory surplus, and regularly engaged in business of owning or making commercial real estate loans, or otherwise is party for whom rating agency confirmation has been obtained) subject to certain conditions, including: (i) the pledge is given in connection with a credit facility secured by multiple properties for which repayment is not primarily dependent upon property cash flow; and (ii) neither the granting or exercise of remedies related to the pledge shall result in the White Marsh Mall Property’s being managed by a party other than the White Marsh Mall borrower or a Qualified Manager (as defined in the White Marsh Mall Loan Combination documents).
Ground Lease. None.
Terrorism Insurance. The loan documents require that the “all risk” insurance policy required to be maintained by the borrower provide coverage for terrorism in an amount equal to the full replacement cost of the White Marsh Mall Property; provided, however, that the borrower will not be required to spend more than 200% of the costs of a stand-alone policy for terrorism insurance immediately prior to the date of TRIA or similar government backstop is no longer in effect. The loan documents also require business interruption insurance covering no less than the 18-month period following the occurrence of a casualty event, together with an extended period of indemnity, which shall continue for the lesser of (i) the period of time until income returns to the same level as it was prior to loss and (ii) 90 days.
THE INFORMATION IN THIS STRUCTURAL AND COLLATERAL TERM SHEET IS NOT COMPLETE AND MAY BE AMENDED PRIOR TO THE TIME OF SALE. THIS TERM SHEET IS NOT AN OFFER TO SELL THESE SECURITIES AND IT IS NOT A SOLICITATION OF AN OFFER TO BUY THESE SECURITIES IN ANY JURISDICTION WHERE THE OFFER OR SALE IS NOT PERMITTED.
64
(THIS PAGE INTENTIONALLY LEFT BLANK)
65
(THIS PAGE INTENTIONALLY LEFT BLANK)
66
| 301 SOUTH COLLEGE STREET |

THE INFORMATION IN THIS STRUCTURAL AND COLLATERAL TERM SHEET IS NOT COMPLETE AND MAY BE AMENDED PRIOR TO THE TIME OF SALE. THIS TERM SHEET IS NOT AN OFFER TO SELL THESE SECURITIES AND IT IS NOT A SOLICITATION OF AN OFFER TO BUY THESE SECURITIES IN ANY JURISDICTION WHERE THE OFFER OR SALE IS NOT PERMITTED.
67
| 301 SOUTH COLLEGE STREET |
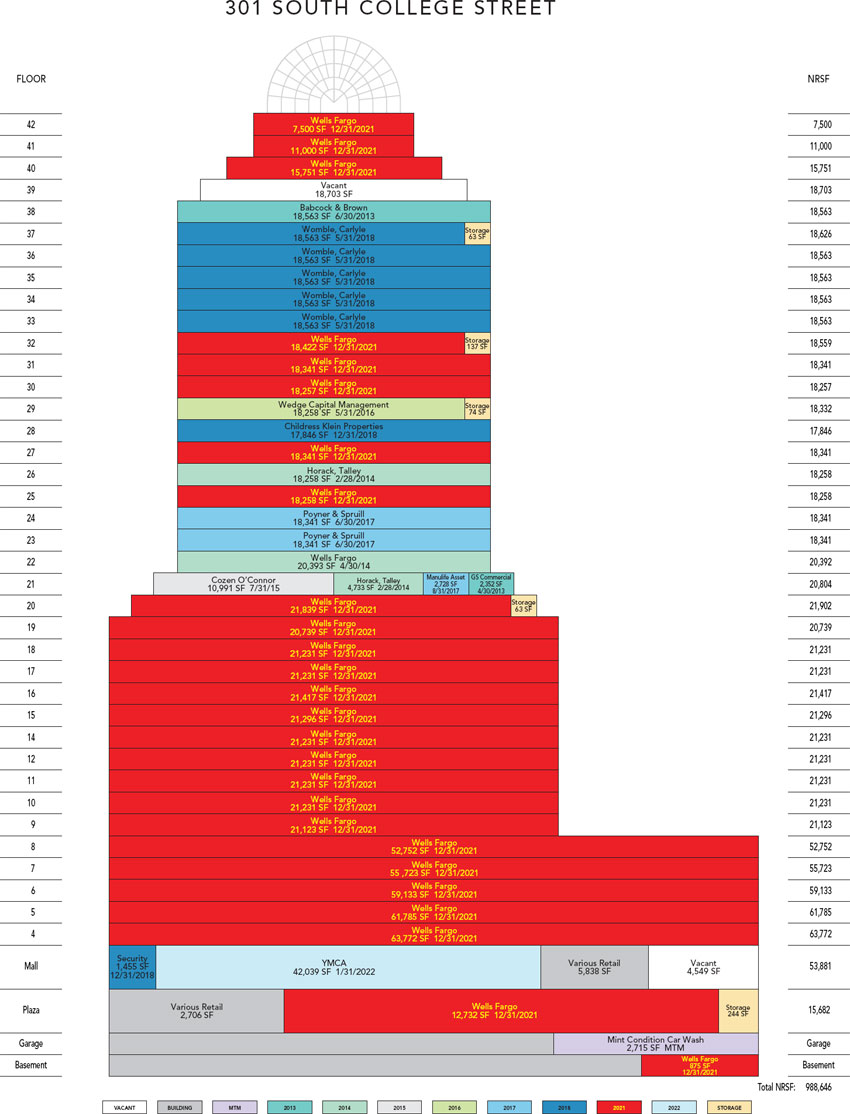
THE INFORMATION IN THIS STRUCTURAL AND COLLATERAL TERM SHEET IS NOT COMPLETE AND MAY BE AMENDED PRIOR TO THE TIME OF SALE. THIS TERM SHEET IS NOT AN OFFER TO SELL THESE SECURITIES AND IT IS NOT A SOLICITATION OF AN OFFER TO BUY THESE SECURITIES IN ANY JURISDICTION WHERE THE OFFER OR SALE IS NOT PERMITTED.
68
| 301 SOUTH COLLEGE STREET |
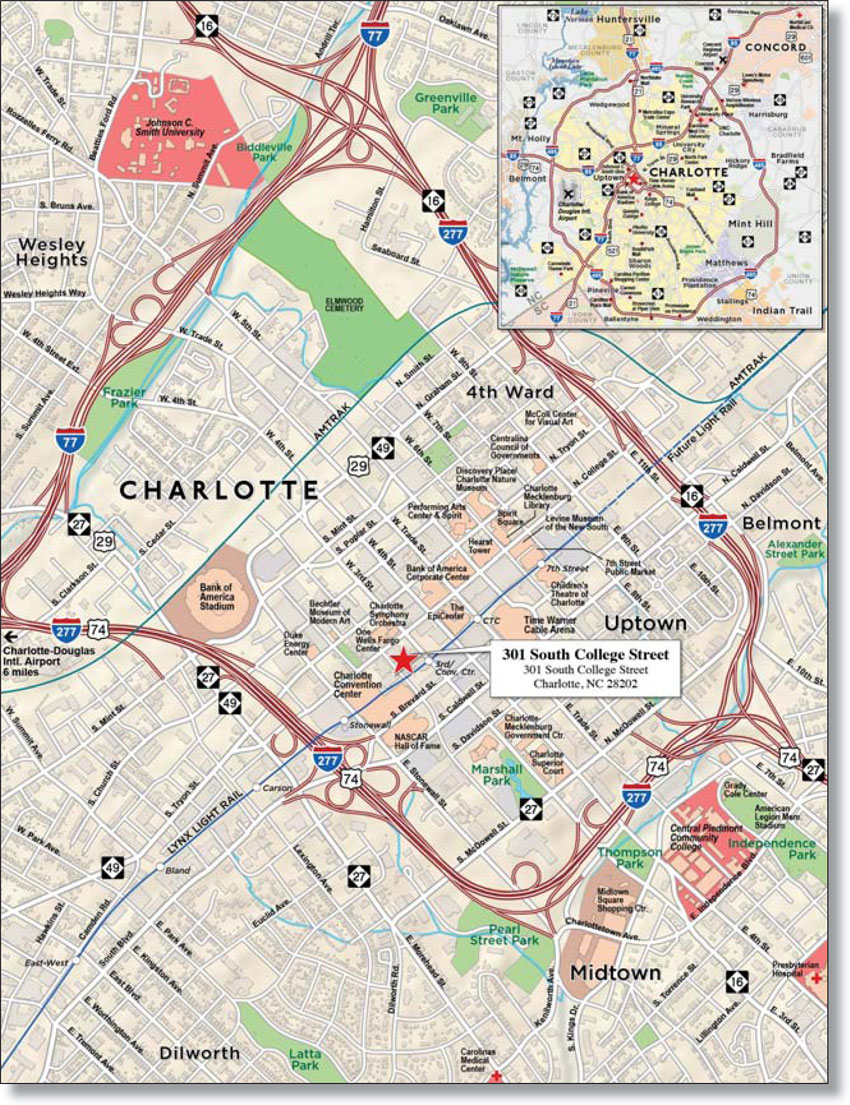
THE INFORMATION IN THIS STRUCTURAL AND COLLATERAL TERM SHEET IS NOT COMPLETE AND MAY BE AMENDED PRIOR TO THE TIME OF SALE. THIS TERM SHEET IS NOT AN OFFER TO SELL THESE SECURITIES AND IT IS NOT A SOLICITATION OF AN OFFER TO BUY THESE SECURITIES IN ANY JURISDICTION WHERE THE OFFER OR SALE IS NOT PERMITTED.
69
| No. 5 - 301 South College Street | |||||||
| Loan Information | Property Information | ||||||
| Mortgage Loan Seller: | Wells Fargo Bank, National Association | Single Asset/Portfolio: | Single Asset | ||||
Credit Assessment (Fitch/KBRA/Moody’s): | NR/NR/NR | Property Type: | Office | ||||
Original Principal Balance(1): | $90,000,000 | Specific Property Type: | CBD | ||||
Cut-off Date Principal Balance(1): | $90,000,000 | Location: | Charlotte, NC | ||||
| % of Initial Pool Balance: | 6.1% | Size: | 988,646 SF | ||||
| Loan Purpose: | Acquisition | Cut-off Date Principal Balance Per Unit/SF(1): | $177.01 | ||||
| Borrower Name: | WF Property Owner, L.P. | Year Built/Renovated: | 1988/2012 | ||||
Sponsors(2): | Various | Title Vesting(4): | Fee/Leasehold | ||||
| Mortgage Rate: | 3.935% | Property Manager: | CK Brokerage Company #2, Limited Partnership | ||||
| Note Date: | April 11, 2013 | 3rd Most Recent Occupancy (As of): | 98.3% (12/31/2010) | ||||
| Anticipated Repayment Date: | NAP | 2nd Most Recent Occupancy (As of): | 97.8% (12/31/2011) | ||||
| Maturity Date: | May 1, 2023 | Most Recent Occupancy (As of): | 97.9% (12/31/2012) | ||||
| IO Period: | 60 months | Current Occupancy (As of): | 97.6% (2/1/2013) | ||||
| Loan Term (Original): | 120 months | ||||||
| Seasoning: | 1 month | Underwriting and Financial Information: | |||||
| Amortization Term (Original): | 360 months | ||||||
| Loan Amortization Type: | Interest-only, Amortizing Balloon | 3rd Most Recent NOI (As of): | $15,467,318 (12/31/2010) | ||||
| Interest Accrual Method: | Actual/360 | 2nd Most Recent NOI (As of): | $16,011,720 (12/31/2011) | ||||
| Call Protection: | L(25),D or GRTR 1% or YM(88),O(7) | Most Recent NOI (As of): | $16,351,093 (12/31/2012) | ||||
| Lockbox Type: | Hard/Upfront Cash Management | ||||||
Additional Debt(1): | Yes | U/W Revenues: | $28,389,920 | ||||
Additional Debt Type(1): | Pari Passu and Future Mezzanine | U/W Expenses: | $9,772,926 | ||||
U/W NOI(5): | $18,616,994 | ||||||
| U/W NCF: | $17,861,574 | ||||||
U/W NOI DSCR(1): | 1.87x | ||||||
Escrows and Reserves(3): | U/W NCF DSCR(1): | 1.80x | |||||
U/W NOI Debt Yield(1): | 10.6% | ||||||
| Type: | Initial | Monthly | Cap (If Any) | U/W NCF Debt Yield(1): | 10.2% | ||
| Taxes | $1,016,861 | $203,373 | NAP | As-Is Appraised Value: | $250,000,000 | ||
| Insurance | $0 | Springing | NAP | As-Is Appraisal Valuation Date: | February 8, 2013 | ||
| Replacement Reserves | $0 | $16,477 | NAP | Cut-off Date LTV Ratio(1): | 70.0% | ||
| Wells Fargo Rollover Reserve | $0 | Springing | NAP | LTV Ratio at Maturity or ARD(1): | 63.5% | ||
| (1) | The 301 South College Street Loan Combination, totalling $175,000,000, is comprised of two pari passu notes (Notes A-1 and A-2). Note A-1 had an original balance of $90,000,000, has an outstanding principal balance as of the Cut-off Date of $90,000,000 and will be contributed to the WFRBS 2013-C14 Trust. Note A-2 had an original balance of $85,000,000 and was contributed to the WFRBS 2013-C13 Trust. All presented statistical information related to balances per square foot, loan-to-value ratios, debt service coverage ratios, and debt yields are based on the 301 South College Street Loan Combination. |
| (2) | The sponsors are Starwood Distressed Opportunity Fund IX-1 U.S., L.P. and Starwood Distressed Opportunity Fund IX Global, L.P., each of which are subsidiaries of Starwood Capital Group. |
| (3) | See “Escrows” section. |
| (4) | See “Ground Lease” section. |
| (5) | See “Cash Flow Analysis” section for detail on the increase from Most Recent NOI to U/W NOI. |
The Mortgage Loan. The mortgage loan (the “301 South College Street Loan Combination”) is evidenced by two pari passu promissory notes (Note A-1 and Note A-2) secured by a first mortgage encumbering a 42-story office building located in the central business district of Charlotte, North Carolina (the “301 South College Street Property”). The 301 South College Street Loan Combination was originated on April 11, 2013 by Wells Fargo Bank, National Association. The 301 South College Street Loan Combination had an original balance of $175,000,000, has an outstanding principal balance as of the Cut-off Date of $175,000,000 and accrues interest at an interest rate of 3.935% per annum. The 301 South College Street Loan Combination had an initial term of 120 months, has a remaining term of 119 months as of the Cut-off Date and requires interest-only payments for the first 60 payments following origination and thereafter requires payments of principal and interest based on a 30-year amortization schedule. The 301 South College Street Loan Combination matures on May 1, 2023.
THE INFORMATION IN THIS STRUCTURAL AND COLLATERAL TERM SHEET IS NOT COMPLETE AND MAY BE AMENDED PRIOR TO THE TIME OF SALE. THIS TERM SHEET IS NOT AN OFFER TO SELL THESE SECURITIES AND IT IS NOT A SOLICITATION OF AN OFFER TO BUY THESE SECURITIES IN ANY JURISDICTION WHERE THE OFFER OR SALE IS NOT PERMITTED.
70
| 301 SOUTH COLLEGE STREET |
Note A-1, which represents the controlling interest in the 301 South College Street Loan Combination and will be contributed to the WFRBS 2013-C14 Trust, had an original principal balance of $90,000,000 and has an outstanding principal balance as of the Cut-off Date of $90,000,000. Note A-2 had an original principal balance of $85,000,000 and was contributed to the WFRBS 2013-C13 Trust (the “301 South College Street Companion Loan”). See “Description of the Mortgage Pool – Split Loan Structures – The 301 South College Street Loan Combination” in the Free Writing Prospectus.
Following the lockout period, the borrower has the right to either (i) defease the 301 South College Street Loan Combination in whole, but not in part, or (ii) voluntarily prepay the 301 South College Street Loan Combination in whole, but not in part, provided the borrower pays the greater of a yield maintenance premium or a prepayment premium equal to 1.0% of the outstanding principal balance. In addition, the 301 South College Street Loan Combination is prepayable without penalty on or after November 1, 2022.
Sources and Uses
| Sources | Uses | |||||||
| Original loan combination amount | $175,000,000 | 70.6 | % | Purchase price | $245,000,000 | 98.9 | % | |
| Sponsor’s new cash contribution | 72,815,121 | 29.4 | Reserves | 1,016,861 | 0.4 | |||
| Closing costs | 1,798,260 | 0.7 | ||||||
| Total Sources | $247,815,121 | 100.0 | % | Total Uses | $247,815,121 | 100.0 | % |
The Property. The 301 South College Street Property is a 42-story, class A office building containing approximately 988,646 square feet located in the central business district of Charlotte, North Carolina. Built in 1988, the 301 South College Street Property is situated on a 2.2-acre parcel and contains approximately 1,081 garage parking spaces. The 301 South College Street Property contains 55,097 square feet of retail space, including the 42,039 square foot Childress Klein YMCA, which features two half-court basketball courts, a five lane indoor heated swimming pool and an on-site fitness bar. Further, the 301 South College Street Property is connected to the 422-room full service Hilton Center City Hotel. The 301 South College Street Property serves as the East Coast headquarters for Wells Fargo, after having served as the headquarters for both First Union Bank and Wachovia Bank prior to their acquisition by Wells Fargo. The 301 South College Street Property houses Wells Fargo’s Securities and Investment Group, Community and Business Banking Groups and Legal Departments. See “Risks Related To Conflicts Of Interest - Interests and Incentives of the Originators, the Sponsors and Their Affiliates May Not Be Aligned With Your Interests” in the Free Writing Prospectus. Other tenants include the two largest law firms headquartered in North Carolina (Womble Carlyle and Poyner Spruill). Over the past nine years, over $25.0 million has been spent on capital improvements, including modernization of the building’s 25 elevators, renovation of the outdoor plaza and replacement of cooling towers. As of February 1, 2013, the 301 South College Street Property was 97.6% leased to 22 tenants.
The following table presents certain information relating to the tenancies at the 301 South College Street Property:
Major Tenants
| Tenant Name | Credit Rating (Fitch/Moody’s/ S&P)(1) | Tenant NRSF | % of NRSF | Annual U/W Base Rent PSF(2) | Annual U/W Base Rent(2) | % of Total Annual U/W Base Rent | Lease Expiration Date | |
| Major Tenants | ||||||||
| Wells Fargo | AA-/Aa3/AA- | 686,834(3) | 69.5% | $22.59(4) | $15,515,832(4) | 68.0% | 12/31/2021(5) | |
| Womble Carlyle | NR/NR/NR | 92,815(6) | 9.4% | $31.15 | $2,891,217 | 12.7% | 5/31/2018 | |
| Poyner Spruill | NR/NR/NR | 36,682 | 3.7% | $26.92 | $987,635 | 4.3% | 6/30/2017 | |
| YMCA | NR/NR/NR | 42,039 | 4.3% | $15.83 | $665,487 | 2.9% | 1/31/2022 | |
| Horack, Talley | NR/NR/NR | 22,991 | 2.3% | $24.98 | $574,326 | 2.5% | 2/28/2014 | |
| Total Major Tenants | 881,361 | 89.1% | $23.41 | $20,634,497 | 90.4% | |||
| Non-Major Tenants | 84,033 | 8.5% | $26.10 | $2,193,082 | 9.6% | |||
| Occupied Collateral Total | 965,394 | 97.6% | $23.65 | $22,827,579 | 100.0% | |||
| Vacant Space | 23,252 | 2.4% | ||||||
| Collateral Total | 988,646 | 100.0% | ||||||
| (1) | Certain ratings are those of the parent company whether or not the parent guarantees the lease. |
| (2) | Annual U/W Base Rent PSF and Annual U/W Base Rent include contractual rent steps through August 2013, unless otherwise noted. |
| (3) | Wells Fargo subleases 3,056 square feet to Fujos on the plaza level. Square footage is shown inclusive of the sublease space. |
| (4) | Wells Fargo’s Annual U/W Base Rent PSF and Annual U/W Base Rent was derived by averaging the annual rent over the lease term on 617,789 square feet of space, which includes a contractual rent increase in January 2017. The current in-place rent is $17.75 per square foot, resulting in approximately $10,964,110 of annual base rent. |
| (5) | 20,392 square feet of the Wells Fargo space is scheduled to expire April 30, 2014. |
| (6) | Womble Carlyle subleases 5,613 square feet to Clarus Properties and 18,563 square feet to Bryan Cave. Square footage is shown inclusive of the sublease space. |
THE INFORMATION IN THIS STRUCTURAL AND COLLATERAL TERM SHEET IS NOT COMPLETE AND MAY BE AMENDED PRIOR TO THE TIME OF SALE. THIS TERM SHEET IS NOT AN OFFER TO SELL THESE SECURITIES AND IT IS NOT A SOLICITATION OF AN OFFER TO BUY THESE SECURITIES IN ANY JURISDICTION WHERE THE OFFER OR SALE IS NOT PERMITTED.
71
| 301 SOUTH COLLEGE STREET |
The following table presents certain information relating to the lease rollover schedule at the 301 South College Street Property:
Lease Expiration Schedule(1)(2)
Year Ending December 31, | No. of Leases Expiring | Expiring NRSF | % of Total NRSF | Cumulative Expiring NRSF | Cumulative % of Total NRSF | Annual U/W Base Rent | Annual U/W Base Rent PSF(3) |
| MTM | 1(4) | 3,331 | 0.3% | 3,331 | 0.3% | $4,616 | $1.39 |
| 2013 | 4 | 22,634 | 2.3% | 25,965 | 2.6% | $586,474 | $25.91 |
| 2014 | 2(5) | 43,757 | 4.4% | 69,722 | 7.1% | $1,103,402 | $25.22 |
| 2015 | 3 | 13,297 | 1.3% | 83,019 | 8.4% | $377,513 | $28.39 |
| 2016 | 2 | 19,006 | 1.9% | 102,025 | 10.3% | $509,755 | $26.82 |
| 2017 | 3 | 39,991 | 4.0% | 142,016 | 14.4% | $1,086,081 | $27.16 |
| 2018 | 4 | 113,838 | 11.5% | 255,854 | 25.9% | $3,468,321 | $30.47 |
| 2019 | 1 | 1,059 | 0.1% | 256,913 | 26.0% | $29,652 | $28.00 |
| 2020 | 0 | 0 | 0.0% | 256,913 | 26.0% | $0 | $0.00 |
| 2021 | 1 | 666,442 | 67.4% | 923,355 | 93.4% | $14,996,278 | $22.50 |
| 2022 | 1 | 42,039 | 4.3% | 965,394 | 97.6% | $665,487 | $15.83 |
| 2023 | 0 | 0 | 0.0% | 965,394 | 97.6% | $0 | $0.00 |
| Thereafter | 0 | 0 | 0.0% | 965,394 | 97.6% | $0 | $0.00 |
| Vacant | 0 | 23,252 | 2.4% | 988,646 | 100.0% | $0 | $0.00 |
| Total/Weighted Average | 22 | 988,646 | 100.0% | $22,827,579 | $23.65 | ||
| (1) Information obtained from the underwritten rent roll. | |||||||
| (2) Certain tenants may have lease termination options that are exercisable prior to the stated expiration date of the subject lease and that are not considered in the Lease Expiration Schedule. | |||||||
| (3) Weighted Average Annual U/W Base Rent PSF excludes vacant space. | |||||||
| (4) Includes one garage lease for 2.715 square feet and 616 square feet of storage leases. | |||||||
| (5) 20,392 square feet of Wells Fargo space is scheduled to expire April 30, 2014. Wells Fargo and two other tenants have scheduled lease expirations in 2014. | |||||||
The following table presents historical occupancy percentages at the 301 South College Street Property:
Historical Occupancy(1)
12/31/2010 | 12/31/2011 | 12/31/2012 | 2/1/2013 | |||
| 98.3% | 97.8% | 97.9% | 97.6% | |||
(1) Information obtained from the borrower. | ||||||
Operating History and Underwritten Net Cash Flow. The following table presents certain information relating to the historical operating performance and the Underwritten Net Cash Flow at the 301 South College Street Property:
Cash Flow Analysis
2010 | 2011 | 2012 | U/W(1) | U/W $ per SF | ||||||
| Base Rent | $19,933,195 | $20,000,221 | $19,964,414 | $22,827,579 | $23.09 | |||||
| Grossed Up Vacant Space | 0 | 0 | 0 | 651,056 | 0.66 | |||||
| Total Reimbursables | 2,367,041 | 3,805,598 | 3,407,546 | 3,407,546 | 3.45 | |||||
| Other Income | 2,547,156 | 2,595,555 | 2,677,671 | 2,677,671 | 2.71 | |||||
| Less Vacancy & Credit Loss | 0 | (275,115) | 0 | (1,173,932)(2) | (1.19) | |||||
| Effective Gross Income | $24,847,393 | $26,126,259 | $26,049,630 | $28,389,920 | $28.72 | |||||
| Total Operating Expenses | $9,380,075 | $10,114,539 | $9,698,537 | $9,772,926 | $9.89 | |||||
| Net Operating Income | $15,467,318 | $16,011,720 | $16,351,093 | $18,616,994 | $18.83 | |||||
| TI/LC | 0 | 0 | 0 | 557,691 | 0.56 | |||||
| Capital Expenditures | 0 | 0 | 0 | 197,729 | 0.20 | |||||
| Net Cash Flow | $15,467,318 | $16,011,720 | $16,351,093 | $17,861,574 | $18.07 | |||||
NOI DSCR(3) | 1.55x | 1.61x | 1.64x | 1.87x | ||||||
NCF DSCR(3) | 1.55x | 1.61x | 1.64x | 1.80x | ||||||
NOI DY(3) | 8.8% | 9.1% | 9.3% | 10.6% | ||||||
NCF DY(3) | 8.8% | 9.1% | 9.3% | 10.2% | ||||||
(1) The increase in U/W Effective Gross Income and U/W Net Operating Income from the Effective Gross Income and Net Operating Income for 2012 is primarily attributable to the Annual U/W Base Rent for Wells Fargo. Wells Fargo’s Annual U/W Base Rent was derived by averaging the annual rent over the lease term for 617,789 square feet of Wells Fargo space, which includes a contractual rent increase in January 2017. The current in-place rent is $17.75 per square foot, resulting in approximately $10,964,110 of annual base rent. Rent for this space was underwritten to $22.27 per square foot, resulting in approximately $13,756,681 of underwritten rent. | ||||||||||
| (2) The underwritten economic vacancy is 5.0%. The 301 South College Street Property was 97.6% physically occupied as of February 1, 2013. | ||||||||||
| (3) DSCRs and debt yields are based on the 301 South College Street Loan Combination. | ||||||||||
THE INFORMATION IN THIS STRUCTURAL AND COLLATERAL TERM SHEET IS NOT COMPLETE AND MAY BE AMENDED PRIOR TO THE TIME OF SALE. THIS TERM SHEET IS NOT AN OFFER TO SELL THESE SECURITIES AND IT IS NOT A SOLICITATION OF AN OFFER TO BUY THESE SECURITIES IN ANY JURISDICTION WHERE THE OFFER OR SALE IS NOT PERMITTED.
72
| 301 SOUTH COLLEGE STREET |
Appraisal. As of the appraisal valuation date of February 8, 2013, the 301 South College Street Property had an “as-is” appraised value of $250,000,000.
Environmental Matters. According to the Phase I environmental site assessment dated January 25, 2013, there was evidence of a recognized environmental condition related to two underground storage tank (“UST”) sites. One 1,000-gallon diesel fuel UST was abandoned in place at the 301 South College Street Property and given a ‘no further action’ status from the North Carolina Department of Environment and Natural Resources. A second 8,000-gallon diesel fuel UST is located onsite and is planned for closure in May of 2013. Documentation was provided that demonstrates that Wells Fargo is the owner of the UST and maintains responsibility for the removal of the UST and any related contamination associated with it. As such, no additional assessment is required.
Market Overview and Competition. According to the appraisal, the 301 South College Street Property is located at the southeast corner of the intersection of South College Street and Martin Luther King Jr. Drive in the central business district of Charlotte, North Carolina. The 301 South College Street Property is located adjacent to Two Wells Fargo Center and Three Wells Fargo Center, creating a corporate campus in an urban setting. The 301 South College Street Property is also located adjacent to a LYNX light rail station, accessible from the 301 South College Street Property lobby, making it one of only three office buildings in Charlotte with direct light rail access. Further, the 301 South College Street Property is connected to the Overstreet Mall retail corridor, which is a series of second floor walkways and pedestrian bridges traversing the Charlotte central business district. The walkways provide shelter from the weather and access to numerous retailers, office buildings, and hotels. Other nearby attractions within one mile include the Duke Energy Corporate Center and Levine Center for the Arts, the NASCAR Hall of Fame, the Time Warner Cable Arena, Bank of America Stadium and the Charlotte Convention Center. As of November 2012, the unemployment rate for the Charlotte metropolitan statistical area was 9.0%. The 2012 population within the Charlotte metropolitan statistical area was approximately 1.8 million and is expected to grow by 1.9% annually from 2012 to 2016. The estimated 2012 average household income within the Charlotte metropolitan statistical area was $69,255.
According to the appraisal, the 301 South College Street Property is located within the Uptown submarket, which contains approximately 15.4 million square feet of office space, approximately 35.8% of the Charlotte office market inventory. The submarket contains approximately 11.5 million square feet of class A space. As of the third quarter of 2012, the Uptown submarket vacancy was approximately 11.2%. The average vacancy rate for class A+ space (301 South College Street, Duke Energy Center, Bank of America Corporate Center, Hearst Tower, Three Wells Fargo Center, One Bank of America Center and Fifth Third Center) was 4.8%, as of the third quarter of 2012. The rental rate for the Uptown class A submarket is approximately $26.80 per square foot, on a full service gross basis, as of the third quarter of 2012.
The following table presents certain information relating to comparable office properties for the 301 South College Street Property:
Competitive Set(1)
301 South College Street (Subject) | 1 Bank of America Center | Bank of America Corporate Center | Fifth Third Center | Bank of America Plaza | Three Wells Fargo Center | Duke Energy Center | |
| Location | Charlotte, NC | Charlotte, NC | Charlotte, NC | Charlotte, NC | Charlotte, NC | Charlotte, NC | Charlotte, NC |
| Distance from Subject | -- | 0.3 miles | 0.4 miles | 0.2 miles | 0.2 miles | 0.1 miles | 0.2 miles |
| Property Type | Office | Office | Office | Office | Office | Office | Office |
| Year Built/Renovated | 1988/2012 | 2010/NAV | 1992/NAV | 1997/NAV | 1974/1992 | 1999/NAV | 2010/NAV |
| Number of Stories | 42 | 32 | 60 | 30 | 40 | 32 | 48 |
| Total GLA | 988,646 SF | 750,000 SF | 1,118,979 SF | 682,836 SF | 866,810 SF | 930,733 SF | 1,300,000 SF |
| Total Occupancy | 98% | 100% | 91% | 83% | 91% | 100% | 99% |
| (1) | Information obtained from the appraisal dated March 5, 2013. |
The Borrower. The borrower is WF Property Owner, L.P., a Delaware limited partnership and single purpose entity with two independent directors. Legal counsel to the borrower delivered a non-consolidation opinion in connection with the origination of the 301 South College Street Loan Combination. The two sponsor entities, which are indirect owners of the borrower, are Starwood Distressed Opportunity Fund IX-1 U.S., L.P. and Starwood Distressed Opportunity Fund IX Global, L.P. (the “301 South College Street Loan Combination Sponsors”), the guarantors of certain nonrecourse carveouts under the 301 South College Street Loan Combination.
The Sponsor. The 301 South College Street Loan Combination Sponsors are subsidiaries of Starwood Capital Group. Starwood Capital Group has invested over $12.0 billion of equity since 1991 in real estate investments of all types. As of September 30, 2012, these investments have included over 2,200 hotels, 67,100 multifamily and condominium units, 36.1 million square feet of office, 24.7 million square feet of retail and 10.4 million square feet of industrial space.
THE INFORMATION IN THIS STRUCTURAL AND COLLATERAL TERM SHEET IS NOT COMPLETE AND MAY BE AMENDED PRIOR TO THE TIME OF SALE. THIS TERM SHEET IS NOT AN OFFER TO SELL THESE SECURITIES AND IT IS NOT A SOLICITATION OF AN OFFER TO BUY THESE SECURITIES IN ANY JURISDICTION WHERE THE OFFER OR SALE IS NOT PERMITTED.
73
| 301 SOUTH COLLEGE STREET |
Escrows. The loan documents provide for an upfront escrow at closing in the amount of $1,016,861 for taxes. The loan documents provide for monthly deposits in an amount equal to one-twelfth of the real estate taxes that will be payable during the following 12 months ($203,373 currently) and $16,477 for replacement reserves. The loan documents do not require monthly escrow deposits for insurance provided the following conditions are satisfied: (i) no event of default exists and is continuing; (ii) the liability and casualty policies maintained by the borrower are part of a blanket or umbrella policy approved by the lender; and (iii) the borrower provides the lender with evidence of renewal of the policies and paid receipts for the payment of insurance premiums when due.
Beginning upon the occurrence of a Cash Trap Event Period (as defined below), and provided no event of default exists, caused by a Wells Fargo Lease Expiration Event (as defined below), all excess cash flow will be swept to the Wells Fargo Rollover Reserve account to be used for tenant improvements and leasing commissions relating to the renewal or releasing of the Wells Fargo space. The excess cash flow shall continue to accumulate until an amount equal to $30.00 per square foot of all terminated space or space being vacated.
A “Wells Fargo Lease Expiration Event” shall mean the expiration of the option to renew the Wells Fargo lease on any portion of its space.
Lockbox and Cash Management. The 301 South College Street Loan Combination requires a lender-controlled lockbox account, which is already in place, and that the tenants be directed to pay their rents directly to such lockbox account. The loan documents also require that all cash revenues and all other monies received by the borrower or the property manager relating to the 301 South College Street Property be deposited into the lockbox account within one business day of receipt. Funds are then swept into a cash management account controlled by the servicer and applied in accordance with cash management agreement. Prior to the occurrence of a Cash Trap Event Period, all excess funds on deposit in the lockbox are swept into the borrower’s operating account on a monthly basis.
Upon the occurrence of a Cash Trap Event Period all excess funds on deposit in the lockbox account will be swept to certain restricted accounts, and if an event of default exists, the lender will have the exclusive control of, and the right to withdraw and apply, the funds in the deposit account to payment of any and all debts, liabilities and obligations of the borrower in such order, proportion and priority as the lender may determine in its sole discretion.
A “Cash Trap Event Period” will commence upon the earlier of (i) the occurrence and continuance of an event of default, or (ii) a Wells Fargo Lease Expiration Event. A Cash Trap Event Period will expire upon: (i) in the case of an event of default, the cure of such event of default, or (ii) in the case of a Wells Fargo Lease Expiration Event, the amount of the Wells Fargo Rollover Reserve totals an amount equal to $30.00 per square foot of all terminated space or space being vacated.
Property Management. The 301 South College Street Property is managed by CK Brokerage Company #2, Limited Partnership, an affiliate of Childress Klein Properties.
Assumption. The borrower has a four-time right to transfer the 301 South College Street Property, provided that no event of default has occurred and is continuing and certain other conditions are satisfied, including, but not limited to: (i) the lender’s reasonable determination that the proposed transferee and guarantor satisfy the lender’s credit review and underwriting standards, taking into consideration transferee experience, financial strength and general business standing; (ii) execution of a recourse guaranty and an environmental indemnity by an affiliate of the transferee; and (iii) if requested by the lender, rating agency confirmation from Fitch, KBRA and Moody’s that the transfer will not result in a downgrade, withdrawal or qualification of the respective ratings assigned to the Series 2013-C14 Certificates, and similar confirmations with respect to the ratings of any securities backed by the 301 South College Street Companion Loan.
Partial Release. Not permitted.
Real Estate Substitution. Not permitted.
Subordinate and Mezzanine Indebtedness. Future mezzanine debt is permitted subject to satisfaction of certain conditions, including: (i) that no event of default has occurred and is continuing; (ii) the holder of the mezzanine debt and any transferees shall satisfy certain financial and/or operational criteria, as outlined in the 301 South College Street Loan Combination documents, or otherwise acceptable to the lender or applicable rating agencies; (iii) an intercreditor agreement in form and substance acceptable to Fitch and Moody’s and reasonably acceptable to the lender; (iv) the NOI debt yield is not less than 10.1%; (v) the aggregate loan-to-value ratio will not be greater than 70.0%; and (vi) mezzanine loan documents are acceptable to Fitch, KBRA and Moody’s and reasonably acceptable to the lender. See “Annex E-2—Exceptions to Representations and Warranties” in the Free Writing Prospectus.
Ground Lease. A portion of the 301 South College Street Property is subject to a ground lease and sub-ground leases. The 301 South College Street borrower owns the fee interest in approximately 91% of the land area and has a sub-sub leasehold interest in the balance of the 301 South College Street Property. The related ground lessor is the North Carolina Railroad Company (a state agency), the lessee/sub-ground lessor is the Norfolk Southern Railway Company, and the sub-ground lessee/sub-sub ground lessor is Southern Region Industry Realty, Inc. The initial ground lease expires on December 31, 2067.
Terrorism Insurance. The loan documents require that the “all risk” insurance policy required to be maintained by the borrower provide coverage for terrorism in an amount equal to the full replacement cost of the 301 South College Street Property. The loan documents also require business interruption insurance covering no less than the 18-month period following the occurrence of a casualty event, together with a six-month extended period of indemnity.
THE INFORMATION IN THIS STRUCTURAL AND COLLATERAL TERM SHEET IS NOT COMPLETE AND MAY BE AMENDED PRIOR TO THE TIME OF SALE. THIS TERM SHEET IS NOT AN OFFER TO SELL THESE SECURITIES AND IT IS NOT A SOLICITATION OF AN OFFER TO BUY THESE SECURITIES IN ANY JURISDICTION WHERE THE OFFER OR SALE IS NOT PERMITTED.
74
(THIS PAGE INTENTIONALLY LEFT BLANK)
75
(THIS PAGE INTENTIONALLY LEFT BLANK)
76
| CHEECA LODGE & SPA |

THE INFORMATION IN THIS STRUCTURAL AND COLLATERAL TERM SHEET IS NOT COMPLETE AND MAY BE AMENDED PRIOR TO THE TIME OF SALE. THIS TERM SHEET IS NOT AN OFFER TO SELL THESE SECURITIES AND IT IS NOT A SOLICITATION OF AN OFFER TO BUY THESE SECURITIES IN ANY JURISDICTION WHERE THE OFFER OR SALE IS NOT PERMITTED.
77
| CHEECA LODGE & SPA |
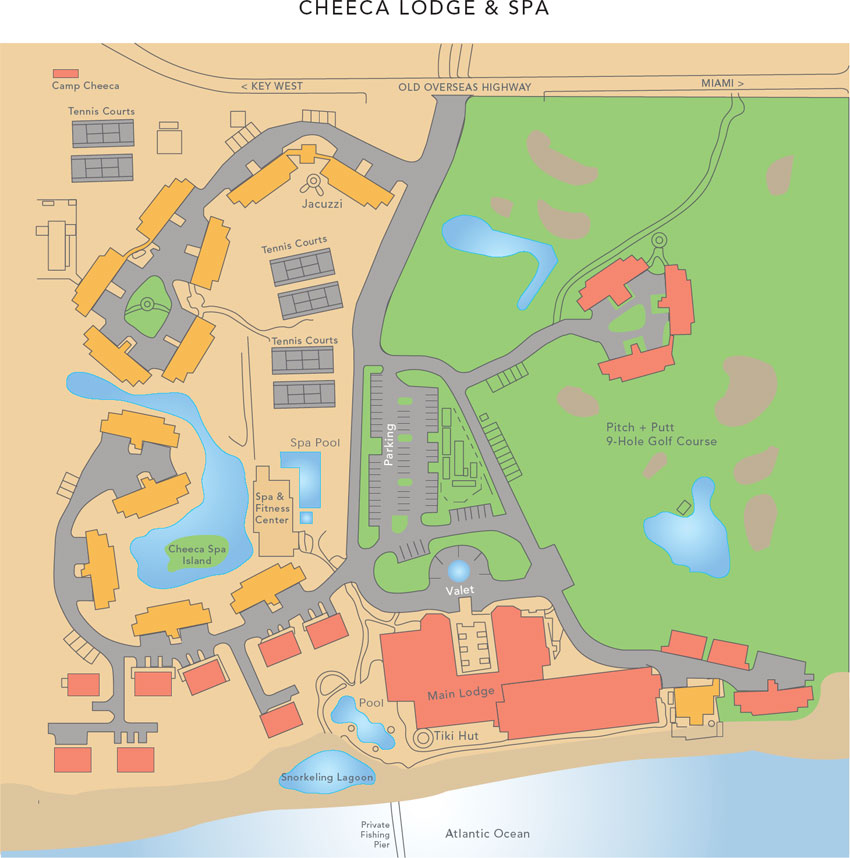
THE INFORMATION IN THIS STRUCTURAL AND COLLATERAL TERM SHEET IS NOT COMPLETE AND MAY BE AMENDED PRIOR TO THE TIME OF SALE. THIS TERM SHEET IS NOT AN OFFER TO SELL THESE SECURITIES AND IT IS NOT A SOLICITATION OF AN OFFER TO BUY THESE SECURITIES IN ANY JURISDICTION WHERE THE OFFER OR SALE IS NOT PERMITTED.
78
| CHEECA LODGE & SPA |
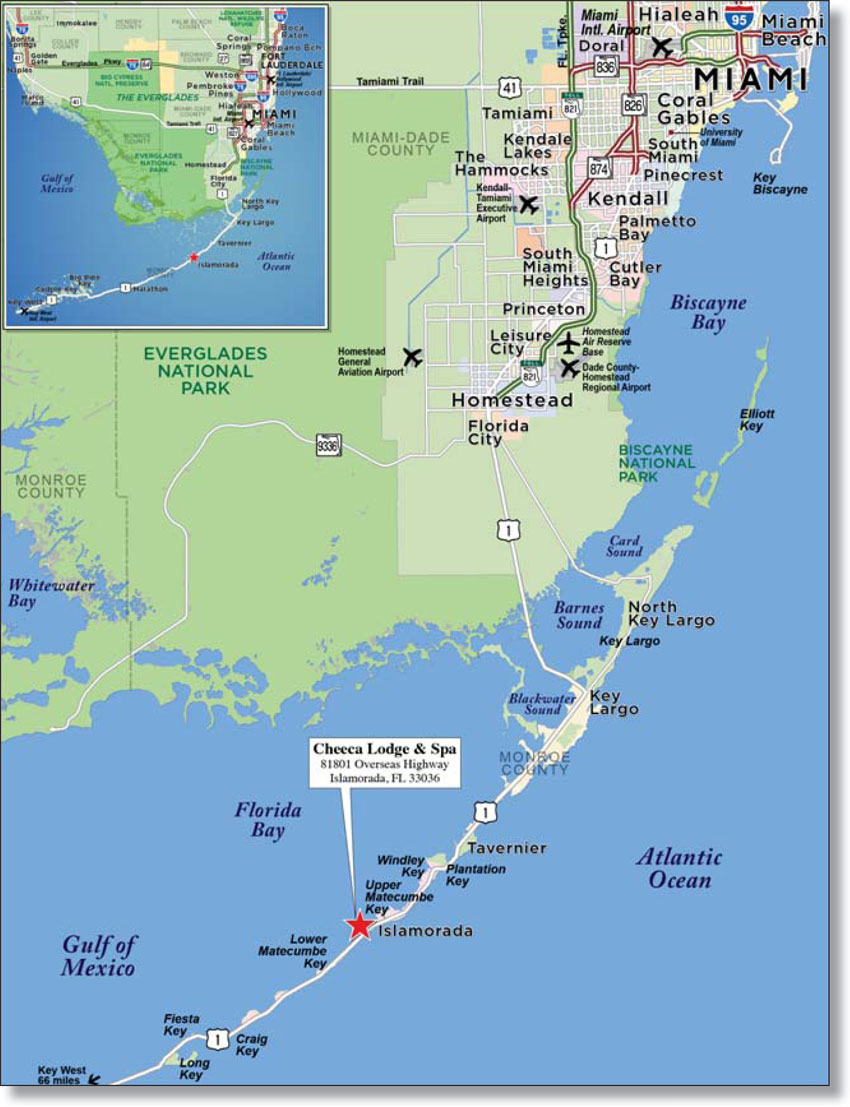
THE INFORMATION IN THIS STRUCTURAL AND COLLATERAL TERM SHEET IS NOT COMPLETE AND MAY BE AMENDED PRIOR TO THE TIME OF SALE. THIS TERM SHEET IS NOT AN OFFER TO SELL THESE SECURITIES AND IT IS NOT A SOLICITATION OF AN OFFER TO BUY THESE SECURITIES IN ANY JURISDICTION WHERE THE OFFER OR SALE IS NOT PERMITTED.
79
| No. 6 – Cheeca Lodge & Spa | ||||||||
| Loan Information | Property Information | |||||||
| Mortgage Loan Seller: | Wells Fargo Bank, National Association | Single Asset/Portfolio: | Single Asset | |||||
| Credit Assessment (Fitch/KBRA/Moody’s): | NR/NR/NR | Property Type: | Hospitality | |||||
| Original Principal Balance: | $85,000,000 | Specific Property Type: | Full Service | |||||
| Cut-off Date Principal Balance: | $85,000,000 | Location: | Islamorada, FL | |||||
| % of Initial Pool Balance: | 5.8% | Size(2): | 214 rooms | |||||
| Loan Purpose: | Refinance | Cut-off Date Principal Balance Per Room(3): | $397,196 | |||||
| Borrower Name: | NWCL LLC; NWCL RM, LLC | Year Built/Renovated: | 1946/2009 | |||||
| Sponsor: | Northwood Investors LLC | Title Vesting(4): | Fee/Leasehold | |||||
| Mortgage Rate: | 4.150% | Property Manager: | Self-managed | |||||
| Note Date: | May 1, 2013 | 3rd Most Recent Occupancy (As of)(5): | 56.7% (12/31/2010) | |||||
| Anticipated Repayment Date: | NAP | 2nd Most Recent Occupancy (As of)(5): | 69.9% (12/31/2011) | |||||
| Maturity Date: | May 1, 2023 | Most Recent Occupancy (As of)(5): | 75.2% (12/31/2012) | |||||
| IO Period: | 24 months | Current Occupancy (As of)(5): | 76.1% (TTM 3/31/2013) | |||||
| Loan Term (Original): | 120 months | |||||||
| Seasoning: | 1 month | Underwriting and Financial Information(6): | ||||||
| Amortization Term (Original): | 360 months | |||||||
| Loan Amortization Type: | Interest-only, Amortizing Balloon | 3rd Most Recent NOI (As of): | $9,443,469 (12/31/2011) | |||||
| Interest Accrual Method: | Actual/360 | 2nd Most Recent NOI (As of): | $9,881,639 (12/31/2012) | |||||
| Call Protection: | L(25),D(91),O(4) | Most Recent NOI (As of): | $10,366,669 (TTM 3/31/2013) | |||||
| Lockbox Type: | Soft/Upfront Cash Management | |||||||
| Additional Debt: | Yes | U/W Revenues: | $34,399,963 | |||||
| Additional Debt Type: | Future Mezzanine | U/W Expenses: | $24,047,405 | |||||
| U/W NOI: | $10,352,558 | |||||||
| U/W NCF: | $9,354,136 | |||||||
| U/W NOI DSCR: | 2.09x | |||||||
Escrows and Reserves(1): | U/W NCF DSCR: | 1.89x | ||||||
| U/W NOI Debt Yield: | 12.2% | |||||||
Type: | Initial | Monthly | Cap (If Any) | U/W NCF Debt Yield: | 11.0% | |||
| Taxes | $251,380 | $41,896 | NAP | As-Is Appraised Value(7): | $134,000,000 | |||
| Insurance | $0 | Springing | NAP | As-Is Appraisal Valuation Date: | April 5, 2013 | |||
| FF&E | $0 | $83,202 | NAP | Cut-off Date LTV Ratio(7): | 63.4% | |||
| Seasonality Reserve | $550,000 | Springing | $550,000 | LTV Ratio at Maturity or ARD: | 53.7% | |||
| (1) | See “Escrows” section. |
| (2) | The Cheeca Lodge & Spa property consists of 117 rooms and 97 third party owned condominium units of which 100.0% are enrolled in a rental management program with the borrower. See “Condo Hotel Units” and “Rental Management Program” below. |
| (3) | The Cut-off Date Principal Balance Per Room is based on the total 214 units at the Cheeca Lodge & Spa property. The Cut-off Date Principal Balance Per Room exclusive of the 97 third party owned units is $726,496. |
| (4) | See “Ground Lease” Section. |
| (5) | Occupancy percentages include third party owned condominium units. |
| (6) | Unless otherwise indicated, all Underwriting and Financial Information includes third party owned condominium units. |
| (7) | The “As-Is Appraised Value” excluding rental income and expenses associated with the third-party owned condominium units is $107,000,000, resulting in a Cut-off Date LTV Ratio of 79.4%. |
The Mortgage Loan. The mortgage loan (the “Cheeca Lodge & Spa Mortgage Loan”) is evidenced by a single promissory note that is secured by a first mortgage encumbering a resort hotel located in Islamorada, Florida (the “Cheeca Lodge & Spa Property”). The Cheeca Lodge & Spa Mortgage Loan was originated on May 1, 2013 by Wells Fargo Bank, National Association. The Cheeca Lodge & Spa Mortgage Loan had an original balance of $85,000,000, has an outstanding balance as of the Cut-off Date of $85,000,000 and accrues interest at an interest rate of 4.150% per annum. The Cheeca Lodge & Spa Mortgage Loan had an initial term of 120 months, has a remaining term of 119 months as of the Cut-off Date and requires interest-only payments for the first 24 payments following origination and thereafter will require payments of principal and interest based on a 30-year amortization schedule. The Cheeca Lodge & Spa Mortgage Loan matures on May 1, 2023.
Following the lockout period, the borrower has the right to defease the Cheeca Lodge & Spa Mortgage Loan in whole, but not in part, on any date before February 1, 2023. In addition, the Cheeca Lodge & Spa Mortgage Loan is prepayable without penalty on or after February 1, 2023.
THE INFORMATION IN THIS STRUCTURAL AND COLLATERAL TERM SHEET IS NOT COMPLETE AND MAY BE AMENDED PRIOR TO THE TIME OF SALE. THIS TERM SHEET IS NOT AN OFFER TO SELL THESE SECURITIES AND IT IS NOT A SOLICITATION OF AN OFFER TO BUY THESE SECURITIES IN ANY JURISDICTION WHERE THE OFFER OR SALE IS NOT PERMITTED.
80
| CHEECA LODGE & SPA |
Sources and Uses
| Sources | Uses | ||||||||
| Original loan amount | $85,000,000 | 100.0% | Loan payoff | $65,000,000 | 76.5% | ||||
| Reserves | 801,380 | 0.9 | |||||||
| Closing costs | 1,095,580 | 1.3 | |||||||
| Return of equity | 18,103,040 | 21.3 | |||||||
| Total Sources | $85,000,000 | 100.0% | Total Uses | $85,000,000 | 100.0% |
The Property. The Cheeca Lodge & Spa Property is a AAA Four Diamond, independent resort hotel situated on approximately 27.6 acres and is comprised of 214 rooms in 32 buildings located in Islamorada, Florida. Included in the 214 rooms are 97 condominium units that are owned by third-party owners (the “Condo Hotel Unit” or the “Condo Hotel Units”). The Condo Hotel Units owners have the option to participate in a rental management program (see “Rental Management Program” below) whereby the borrower may rent the Condo Hotel Units as hotel rooms on behalf of the Condo Hotel Unit owners. The Cheeca Lodge & Spa Property includes 10 one-story beachfront bungalows, 12 two-story villas, three two-story golf course buildings, one single family home and a recently constructed main lodge. Approximately 90.0% of the beachfront units are owned by the borrower and secure the Cheeca Lodge & Spa Mortgage Loan. Amenities at the Cheeca Lodge & Spa Property include approximately 1,200 feet of private beach front, nine-hole Jack Nicklaus par three golf course, spa, two outdoor heated pools, three whirlpools, six tennis courts, two restaurants, sushi bar, lobby bar / lounge, kids club, approximately 525 square foot wooden fishing pier, approximately 2,065 square foot ball room and approximately 5,400 square feet of meeting room space.
The Cheeca Lodge & Spa Property’s guestroom breakdown includes 76 king bed rooms, 73 double queen bed rooms, 59 one-bedroom suites, four two-bedroom suites, one owner’s suite and one presidential suite. Each guest room features pillow-top beds and down comforters, plasma screen televisions equipped with DVD players and cable, wireless internet service and all units have a balcony (64 of the units also have an exterior Jacuzzi on their balcony) with views of the lagoons and gardens, golf course or the Atlantic Ocean. Prior to the borrower’s acquisition, the former owner invested approximately $34.0 million between 2003 through 2008 including upgrades to all guest rooms, landscaping and grounds. Since acquiring the Cheeca Lodge & Spa Property in August 2011, the sponsor invested approximately $1.6 million in upgrades to common area space.
Condo Hotel Units. The 97 Condo Hotel Units are owned by third party owners unaffiliated with the borrower. The units are comprised of 43 one-bedroom units, four two-bedroom suites, 43 units located in two separate villas and seven hotel units within the Cheeca Lodge & Spa Property’s main lodge. The Condo Hotel Unit owners are responsible for the maintenance of their unit and other costs, which would include mortgage payments, insurance, utilities, real estate tax and condominium association fees. The Condo Hotel Unit owners have no ownership interest in any of their respective buildings or common areas.
Rental Management Program. Collateral for the Cheeca Lodge & Spa Mortgage Loan includes rental income generated by the borrower’s management of the Condo Hotel Units on behalf of the Condo Hotel Unit owners. The owners of the Condo Hotel Units have the option of participating in the rental management program through contracts typically ranging between five and 20 years. The Cheeca Lodge & Spa Property is subject to a zoning ordinance, which prohibits the Condo Hotel Unit owners from inhabiting their unit for more than 28 days per year. If an owner elects to participate in the rental management program, the Condo Hotel Unit owner may occupy the unit with sufficient advance notice to the borrower for a maximum of 28 days in any calendar year for no rental fee, subject to resort black-out periods. If a unit owner elects not to participate in the rental management program, and privately rent the Condo Hotel Unit, the unit owner is charged an amenity usage fee (payable to the borrower), which currently averages $312 per day. Per the rental management agreement, the unit owner is entitled to 50% of all room rental revenues after the following expenses (i) sales, occupancy, bed or resort fees; (ii) an administrative fee of 10% payable to the borrower; and (iii) revenue generated from any source other than room revenues. As of June 1, 2013, the participation rate of the Condo Hotel Units owners in the rental management program is 100.0% and has been 100.0% since 2007. See “Risk Factors - Special Risks Associated with the Cheeca Lodge & Spa Property” in the Free Writing Prospectus.
THE INFORMATION IN THIS STRUCTURAL AND COLLATERAL TERM SHEET IS NOT COMPLETE AND MAY BE AMENDED PRIOR TO THE TIME OF SALE. THIS TERM SHEET IS NOT AN OFFER TO SELL THESE SECURITIES AND IT IS NOT A SOLICITATION OF AN OFFER TO BUY THESE SECURITIES IN ANY JURISDICTION WHERE THE OFFER OR SALE IS NOT PERMITTED.
81
| CHEECA LODGE & SPA |
Operating History and Underwritten Net Cash Flow. The following table represents certain information relating to the historical operating performance and the Underwritten Net Cash Flow at the Cheeca Lodge & Spa Property:
Cash Flow Analysis
| 2011 | 2012 | TTM 3/31/2013 | U/W | U/W $ per Room(1) | |||||||
| Occupancy | 69.9% | 75.2% | 76.1% | 76.1% | |||||||
| ADR | $350.99 | $355.86 | $371.45 | $372.76 | |||||||
| RevPAR | $245.43 | $267.60 | $282.50 | $283.49 | |||||||
| Total Revenue | $32,123,118 | $33,180,965 | $34,322,143 | $34,399,963 | $160,747 | ||||||
| Total Department Expenses | 11,108,104 | 10,889,480 | 10,935,952 | 10,949,641 | 51,167 | ||||||
| Gross Operating Profit | $21,015,014 | $22,291,485 | $23,386,191 | $23,450,322 | $109,581 | ||||||
| Total Undistributed Expenses | 9,643,870 | 10,064,915 | 10,629,955 | 10,708,197 | 50,038 | ||||||
| Profit Before Fixed Charges | $11,371,144 | $12,226,570 | $12,756,236 | $12,742,125 | $59,543 | ||||||
| Total Fixed Charges | 1,927,675 | 2,344,931 | 2,389,567 | 2,389,567 | 11,166 | ||||||
| Net Operating Income | $9,443,469 | $9,881,639 | $10,366,669 | $10,352,558 | $48,376 | ||||||
| FF&E | 0 | 0 | 0 | 998,422 | 4,666 | ||||||
| Net Cash Flow | $9,443,469 | $9,881,639 | $10,366,669 | $9,354,136 | $43,711 | ||||||
| NOI DSCR | 1.90x | 1.99x | 2.09x | 2.09x | |||||||
| NCF DSCR | 1.90x | 1.99x | 2.09x | 1.89x | |||||||
| NOI DY | 11.1% | 11.6% | 12.2% | 12.2% | |||||||
| NCF DY | 11.1% | 11.6% | 12.2% | 11.0% | |||||||
| (1) | Based on 214 rooms. |
Appraisal. As of the appraisal valuation date of April 5, 2013, the Cheeca Lodge & Spa Property had an “as-is” appraised value of $134,000,000.
Environmental Matters. According to the Phase I environmental assessment dated April 8, 2013, there was no evidence of any recognized environmental conditions at the Cheeca Lodge & Spa Property; however, the Phase I identified residual contamination from a vacant offsite gas station as a source of potential vapor encroachment to the employee housing and laundry buildings at the mortgaged property, and recommended Tier 2 non-invasive vapor screening be performed. Some remedial investigation and clean-up has been performed and the Florida Department of Environmental Protection has assigned a low priority for the open case. The environmental consultant estimated the maximum remediation cost to be approximately $74,000. The loan documents require the borrower to perform the recommended testing and any necessary remedial work.
Market Overview and Competition. The Cheeca Lodge & Spa Property is located on approximately 27.6 acres along the east side of United States Highway 1 (“Highway 1”) in Islamorada, Florida. Islamorada is accessible via Highway 1 and is located in the Middle Florida Keys (the “Middle Keys”), which is situated between Miami to the north and Key West to the south. The Middle Keys are popular due to the coral reefs in the area. Located approximately 5.7 miles north of the Cheeca Lodge & Spa Property, the John Penekamp Coral Reef State Park is the first underwater state park in the United States. Islamorada is approximately 67.0 miles south of Miami and caters to seasonal international travelers or weekend travelers from the tri-county area of Miami-Dade, Broward and Palm Beach Counties. Promoted as the “Sport Fishing Capital of the World,” Islamorada draws tourists for sport fishing, diving and boating as well as other water sports.
The following table presents certain information relating to the Cheeca Lodge & Spa Property’s competitive set:
Subject and Market Historical Occupancy, ADR and RevPAR(1)
Competitive Set | Cheeca Lodge & Spa | Penetration Factor | |||||||||||||||
Year | Occupancy | ADR | RevPAR | Occupancy | ADR | RevPAR | Occupancy | ADR | RevPAR | ||||||||
| 2/28/2013 TTM | 79.5% | $269.36 | $214.07 | 76.8% | $358.63 | $275.26 | 96.6% | 133.1% | 128.6% | ||||||||
| 2/28/2012 TTM | 78.4% | $251.69 | $197.27 | 70.2% | $348.86 | $244.89 | 89.6% | 138.6% | 124.1% | ||||||||
| 2/28/2011 TTM | 74.7% | $227.20 | $169.66 | 57.0% | $338.50 | $192.92 | 76.3% | 149.0% | 113.7% | ||||||||
| (1) | Information obtained from a third party hospitality research report dated March 19, 2013. |
The Borrower. The borrower consists of NWCL LLC and NWCL RM, LLC, both Delaware limited liability companies and single purpose entities, each with two independent directors. Legal counsel to the borrower delivered a non-consolidation opinion in connection with the origination of the Cheeca Lodge & Spa Mortgage Loan. Northwood Real Estate Partners TE (AIV 1) LP and Northwood Real Estate Partners LP, both owned and controlled by the sponsor are the guarantors of certain nonrecourse carveouts under the Cheeca Lodge & Spa Mortgage Loan.
THE INFORMATION IN THIS STRUCTURAL AND COLLATERAL TERM SHEET IS NOT COMPLETE AND MAY BE AMENDED PRIOR TO THE TIME OF SALE. THIS TERM SHEET IS NOT AN OFFER TO SELL THESE SECURITIES AND IT IS NOT A SOLICITATION OF AN OFFER TO BUY THESE SECURITIES IN ANY JURISDICTION WHERE THE OFFER OR SALE IS NOT PERMITTED.
82
| CHEECA LODGE & SPA |
The Sponsor. The sponsor is Northwood Investors LLC (“Northwood”), a privately held institutional investment advisor that was founded in 2006 by John Kukral, the former President and CEO of Blackstone Real Estate Advisors. Northwood raised approximately $2.8 billion since inception and has over $700.0 million of equity invested in hospitality related transactions including The New York Palace Hotel, The Revere Hotel in Boston and Parrot Key Hotel in Key West, Florida.
Escrows. The loan documents provide for upfront reserves in the amount of $251,380 for real estate taxes and $550,000 for a seasonality reserve. The loan documents also provide for ongoing monthly reserves in the amount of $41,896 for real estate taxes and an ongoing monthly FF&E reserve equal to 4.0% of operating income (excluding the total room revenue from the Condo Hotel Units) for the most recent calendar month. Ongoing monthly reserves for insurance are not required as long as the following conditions are satisfied: (i) no event of default exists and is continuing; (ii) a blanket insurance policy is in full force and effect in accordance with the loan documents; (iii) borrower provides the lender with evidence of renewal of the policies and paid receipts for the payment of insurance premiums when due; and (iv) at the end of any calendar quarter, the Cheeca Lodge & Spa Property’s net cash flow (as defined in the loan documents) for the immediately preceding 12 months is $11,000,000 or higher. If at any time the seasonality reserve is less than $550,000 and the Cheeca Lodge & Spa Property’s net cash flow (as defined in the loan documents) is less than $11,000,000, then on each monthly payment date thereafter, the borrower will be required to deposit all excess cash flow up to $75,000 a month into the seasonality reserve until the total balance of the reserve is equal to $550,000.
Lockbox and Cash Management. The Cheeca Lodge & Spa Mortgage Loan requires a lender-controlled lockbox account, which is already in place, and that the borrower direct the manager to deliver all receipts payable with respect to Cheeca Lodge & Spa Property directly into the lockbox account. The loan documents also require that all revenues received by the borrower or the property manager be deposited into the lockbox account within one business days of receipt. Other than during a Cash Trap Event Period (as defined below), all excess funds on deposit are disbursed to the borrower.
A “Cash Trap Event Period” will commence upon the earlier of (i) the occurrence and continuance of an event of default or (ii) the debt yield being less than 8.25% as of the last day of each calendar quarter during the loan term. A Cash Trap Event Period will expire, with regard to the circumstances in clause (i), upon the cure of such event of default, or with regard to the circumstances in clause (ii), upon the date that the debt yield ratio is greater than 8.50% for two consecutive calendar quarters.
Property Management. The Cheeca Lodge & Spa Property is managed by an affiliate of the borrower.
Assumption. The borrower has a two-time right to transfer the Cheeca Lodge & Spa Property, provided that no event of default has occurred and is continuing and certain other conditions are satisfied, including (i) the lender’s reasonable determination that the proposed transferee and guarantor satisfy the lender’s credit review and underwriting standards, taking into consideration transferee experience, financial strength and general business standing; (ii) execution of a recourse guaranty and an environmental indemnity by an affiliate of the transferee; and (iii) if requested by the lender, rating agency confirmation from Fitch, KBRA and Moody’s that the transfer will not result in a downgrade, withdrawal or qualification of the respective ratings assigned to the Series 2013-C14 Certificates.
Partial Release. Not permitted.
Real Estate Substitution. Not permitted.
Subordinate and Mezzanine Indebtedness. There is no existing mezzanine debt related to the Cheeca Lodge & Spa Mortgage Loan, however future mezzanine debt is permitted subject to satisfaction of certain conditions, including (i) no event of default has occurred and is continuing; (ii) the lender receives no less than 30 days’ prior written notice; (iii) an intercreditor agreement in form and substance acceptable Fitch, KBRA and Moody’s and reasonably acceptable to the lender; (iv) the combined loan-to-value ratio is equal to or less than 65.0%; (v) the aggregate debt yield is not less than 10.0%; (vi) if the permitted mezzanine debt has a floating interest rate, then immediately after closing the combined debt service coverage ratio will be at least 1.25x; and (vii) delivery of mezzanine loan documents acceptable to Fitch, KBRA and Moody’s and reasonably acceptable to the lender.
Preferred Equity. The borrower is permitted to grant preferred equity rights subject to certain conditions, including (i) no event of default has occurred and is continuing; (ii) the combined loan-to-value ratio is equal to or less than 65.0%; (iii) the aggregate debt yield is not less than 10.0%; (iv) the preferred equity holder will satisfy certain qualified institutional lender criteria (as defined in the loan documents); (v) the preferred equity holder will execute documents acceptable to lender including prohibiting against (a) distributions during any Cash Trap Period or during an event of default; (b) changes of control in the borrower or the property without lender’s approval; and (c) if requested by lender, rating agency confirmation from Fitch, KBRA and Moody’s that the transfer will not result in a downgrade, withdrawal or qualification of the respective ratings assigned to the Series 2013-C14 Certificates.
Ground Lease. A portion of the Cheeca Lodge & Spa Property is leased by the borrower pursuant to a submerged lands lease with the Board of Trustees of the Internal Improvement Trust Fund of the State of Florida. The land demised under the submerged land lease is surrounding the pier and totals approximately 22,914 square feet. The submerged land lease expires on December 13, 2016 with a renewal option at the lessor’s option and the annual rental payments are 6.0% of income generated by the leased area, subject to adjustment based on the applicable statute governing the lease. As of the trailing-12 months ending March 2013, the annual payment was $93,092.
THE INFORMATION IN THIS STRUCTURAL AND COLLATERAL TERM SHEET IS NOT COMPLETE AND MAY BE AMENDED PRIOR TO THE TIME OF SALE. THIS TERM SHEET IS NOT AN OFFER TO SELL THESE SECURITIES AND IT IS NOT A SOLICITATION OF AN OFFER TO BUY THESE SECURITIES IN ANY JURISDICTION WHERE THE OFFER OR SALE IS NOT PERMITTED.
83
| CHEECA LODGE & SPA |
Terrorism Insurance. The loan documents require that the “all risk” insurance policy required to be maintained by the borrower provide coverage for terrorism in an amount equal to the full replacement cost of the Cheeca Lodge & Spa Property; provided however, that the borrower will not be required to spend more than 200% of the costs for a stand-alone policy for terrorism insurance immediately prior to the date TRIPRA or similar government backstop is no longer in effect. The loan documents also require business interruption insurance covering no less than the 12-month period following the occurrence of a casualty event, together with a six-month extended period of indemnity.
Windstorm Insurance. The loan documents require excess windstorm insurance and/or an excess windstorm letter of credit for coverage that includes named storms, acceptable to the lender and not less than an amount equal to (i) the maximum available per building under the State of Florida wind program; and (ii) excess wind coverage limits of not less than $54.0 million for the Cheeca Lodge & Spa Property, which will include loss of rents and/or business interruption, with a deductible for the windstorm insurance not greater than five percent of the total insurable value of the Cheeca Lodge & Spa Property; provided, however, that the borrower is permitted to provide less than $54.0 million in excess wind coverage if such coverage is not available at commercially reasonable rates so as long as the borrower provides a letter of credit in an amount which when aggregated with the excess wind coverage equals $54.0 million.
THE INFORMATION IN THIS STRUCTURAL AND COLLATERAL TERM SHEET IS NOT COMPLETE AND MAY BE AMENDED PRIOR TO THE TIME OF SALE. THIS TERM SHEET IS NOT AN OFFER TO SELL THESE SECURITIES AND IT IS NOT A SOLICITATION OF AN OFFER TO BUY THESE SECURITIES IN ANY JURISDICTION WHERE THE OFFER OR SALE IS NOT PERMITTED.
84
(THIS PAGE INTENTIONALLY LEFT BLANK)
85
| CUMBERLAND MALL |
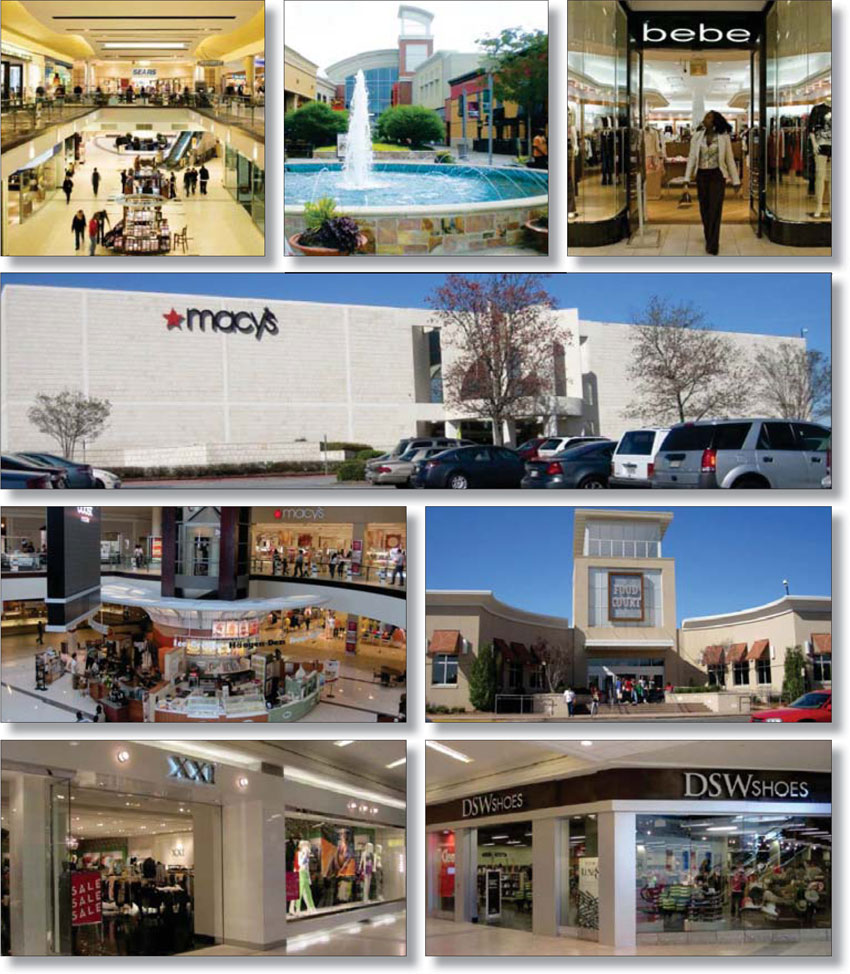
THE INFORMATION IN THIS STRUCTURAL AND COLLATERAL TERM SHEET IS NOT COMPLETE AND MAY BE AMENDED PRIOR TO THE TIME OF SALE. THIS TERM SHEET IS NOT AN OFFER TO SELL THESE SECURITIES AND IT IS NOT A SOLICITATION OF AN OFFER TO BUY THESE SECURITIES IN ANY JURISDICTION WHERE THE OFFER OR SALE IS NOT PERMITTED.
86
| CUMBERLAND MALL |
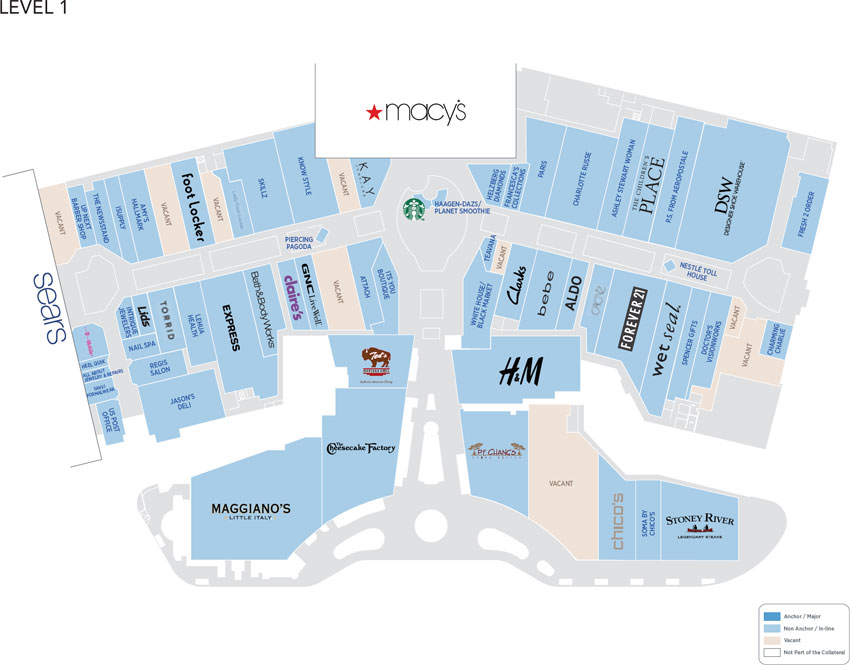
THE INFORMATION IN THIS STRUCTURAL AND COLLATERAL TERM SHEET IS NOT COMPLETE AND MAY BE AMENDED PRIOR TO THE TIME OF SALE. THIS TERM SHEET IS NOT AN OFFER TO SELL THESE SECURITIES AND IT IS NOT A SOLICITATION OF AN OFFER TO BUY THESE SECURITIES IN ANY JURISDICTION WHERE THE OFFER OR SALE IS NOT PERMITTED.
87
| CUMBERLAND MALL |
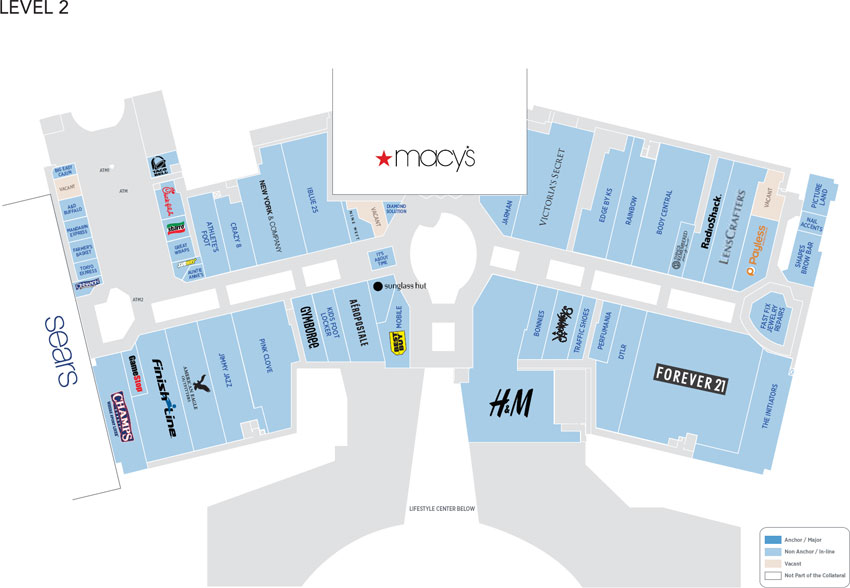
THE INFORMATION IN THIS STRUCTURAL AND COLLATERAL TERM SHEET IS NOT COMPLETE AND MAY BE AMENDED PRIOR TO THE TIME OF SALE. THIS TERM SHEET IS NOT AN OFFER TO SELL THESE SECURITIES AND IT IS NOT A SOLICITATION OF AN OFFER TO BUY THESE SECURITIES IN ANY JURISDICTION WHERE THE OFFER OR SALE IS NOT PERMITTED.
88
| CUMBERLAND MALL |
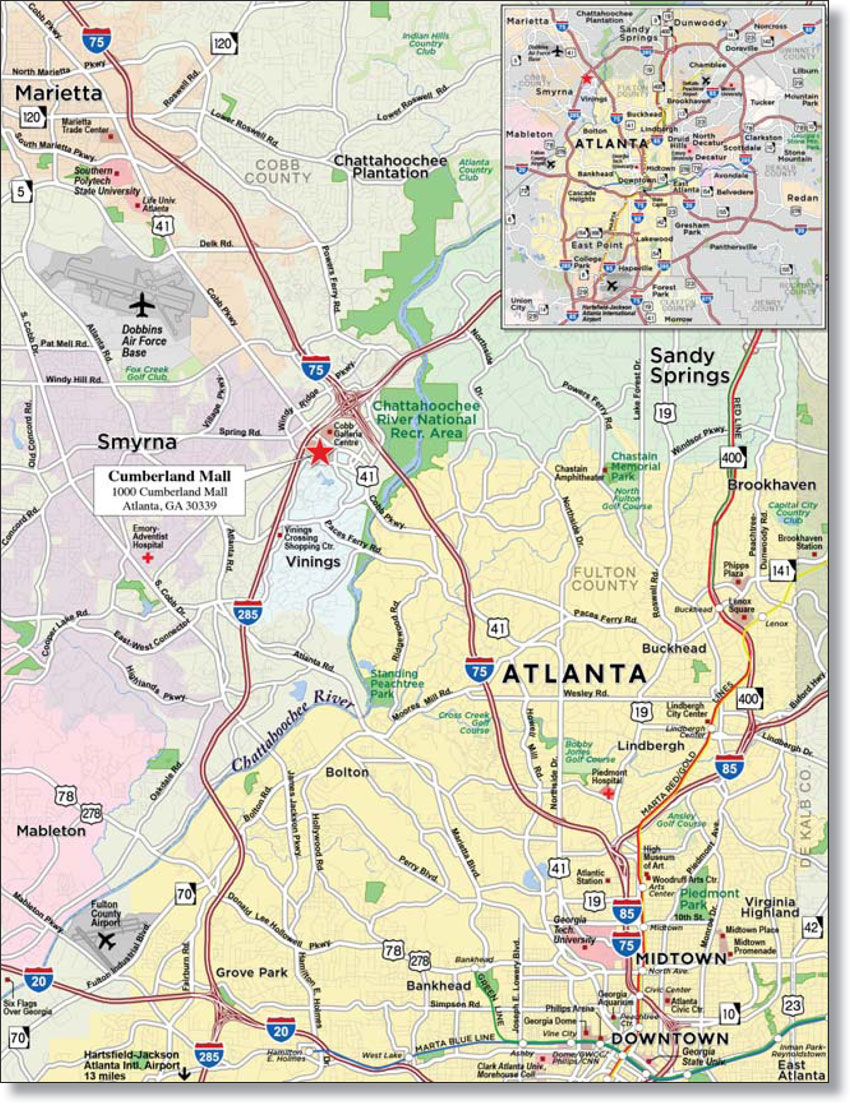
THE INFORMATION IN THIS STRUCTURAL AND COLLATERAL TERM SHEET IS NOT COMPLETE AND MAY BE AMENDED PRIOR TO THE TIME OF SALE. THIS TERM SHEET IS NOT AN OFFER TO SELL THESE SECURITIES AND IT IS NOT A SOLICITATION OF AN OFFER TO BUY THESE SECURITIES IN ANY JURISDICTION WHERE THE OFFER OR SALE IS NOT PERMITTED.
89
| No. 7 - Cumberland Mall | |||||||
| Loan Information | Property Information | ||||||
| Mortgage Loan Seller: | The Royal Bank of Scotland | Single Asset/Portfolio: | Single Asset | ||||
| Credit Assessment (Fitch/KBRA/Moody’s): | NR/NR/NR | Property Type: | Retail | ||||
Original Principal Balance(1): | $70,000,000 | Specific Property Type: | Regional Mall | ||||
Cut-off Date Principal Balance(1): | $70,000,000 | Location: | Atlanta, GA | ||||
| % of Initial Pool Balance: | 4.8% | Size(3): | 541,527 SF | ||||
| Loan Purpose: | Refinance | Cut-off Date Principal Balance Per SF(1): | $295.46 | ||||
| Borrower Name: | Cumberland Mall, LLC | Year Built/Renovated: | 1973/2006 | ||||
| Sponsor: | GGPLP Real Estate, Inc. | Title Vesting: | Fee | ||||
| Mortgage Rate: | 3.670% | Property Manager: | Self-managed | ||||
| Note Date: | April 26, 2013 | 3rd Most Recent Occupancy (As of)(4): | 93.4% (12/31/2010) | ||||
| Anticipated Repayment Date: | NAP | 2nd Most Recent Occupancy (As of)(4): | 93.2% (12/31/2011) | ||||
| Maturity Date: | May 1, 2023 | Most Recent Occupancy (As of)(4): | 95.4% (12/31/2012) | ||||
| IO Period: | 120 months | Current Occupancy (As of)(4): | 94.0% (2/28/2013) | ||||
| Loan Term (Original): | 120 months | ||||||
| Seasoning: | 1 month | Underwriting and Financial Information: | |||||
| Amortization Term (Original): | NAP | ||||||
| Loan Amortization Type: | Interest-only, Balloon | 3rd Most Recent NOI (As of): | $14,487,727 (12/31/2011) | ||||
| Interest Accrual Method: | Actual/360 | 2nd Most Recent NOI (As of): | $15,587,514 (12/31/2012) | ||||
| Call Protection: | L(25),D(91),O(4) | Most Recent NOI (As of): | $15,670,560 (TTM 2/28/2013) | ||||
| Lockbox Type: | Hard/Springing Cash Management | ||||||
Additional Debt(1): | Yes | U/W Revenues: | $21,794,267 | ||||
Additional Debt Type(1): | Pari Passu and Future Mezzanine | U/W Expenses: | $6,312,264 | ||||
| U/W NOI: | $15,482,004 | ||||||
| U/W NCF: | $14,834,376 | ||||||
U/W NOI DSCR(1): | 2.60x | ||||||
Escrows and Reserves(2): | U/W NCF DSCR(1): | 2.49x | |||||
U/W NOI Debt Yield(1): | 9.7% | ||||||
| Type: | Initial | Monthly | Cap (If Any) | U/W NCF Debt Yield(1): | 9.3% | ||
| Taxes | $0 | Springing | NAP | As-Is Appraised Value: | $254,000,000 | ||
| Insurance | $0 | Springing | NAP | As-Is Appraisal Valuation Date: | April 12, 2013 | ||
| Replacement Reserves | $0 | Springing | $135,382 | Cut-off Date LTV Ratio(1): | 63.0% | ||
| TI/LC Reserve | $0 | Springing | $394,118 | LTV Ratio at Maturity or ARD(1): | 63.0% | ||
| (1) | The Cumberland Mall Loan Combination, totalling $160,000,000, is comprised of two pari passu notes (Notes A-1 and A-2). Note A-2 had an original balance of $70,000,000, has an outstanding principal balance as of the Cut-off Date of $70,000,000 and will be contributed to the WFRBS 2013-C14 Trust. Note A-1 had an original balance of $90,000,000 and is expected to be contributed to a future trust. All presented statistical information related to balances per square foot, loan-to-value ratios, debt service coverage ratios, and debt yields are based on the Cumberland Mall Loan Combination. |
| (2) | See “Escrows” section. |
| (3) | The total square footage includes one space totalling 147,409 square feet which is occupied by Costco, which owns its own improvements and is on a ground lease. |
| (4) | Historical and current occupancy includes temporary and seasonal tenants. For the trailing 12-month period ending February 28, 2013, the average occupancy, exclusive of these tenants, was 85.7%. |
The Mortgage Loan. The mortgage loan (the “Cumberland Mall Loan Combination”) is evidenced by two pari passu notes (Note A-1 and Note A-2) secured by a first mortgage encumbering a regional mall located in Atlanta, Georgia (the “Cumberland Mall Property”). The Cumberland Mall Loan Combination was originated on April 26, 2013 by The Royal Bank of Scotland. The Cumberland Mall Loan Combination had an original principal balance of $160,000,000, has an outstanding principal balance as of the Cut-off Date of $160,000,000 and accrues interest at an interest rate of 3.670% per annum. The Cumberland Mall Loan Combination had an initial term of 120 months, has a remaining term of 119 months as of the Cut-off Date and requires interest-only payments through the term of the Cumberland Mall Loan Combination. The Cumberland Mall Loan Combination matures on May 1, 2023.
Note A-2, which represents the non-controlling interest in the Cumberland Mall Loan Combination and will be contributed to the WFRBS 2013-C14 Trust, had an original principal balance of $70,000,000 and has an outstanding principal balance as of the Cut-off Date of $70,000,000. Note A-1 had an original principal balance of $90,000,000, is expected to be contributed to a future trust, and represents the controlling interest in the Cumberland Mall Loan Combination. See “Description of the Mortgage Pool - Split Loan Structures - The Cumberland Mall Loan Combination” and “Servicing of the Mortgage Loans and Administration of the Trust Fund - Additional Matters Relating to the Servicing of the Cumberland Mall Loan Combination and the 100 & 150 South Wacker Drive Loan Combination” in the Free Writing Prospectus.
THE INFORMATION IN THIS STRUCTURAL AND COLLATERAL TERM SHEET IS NOT COMPLETE AND MAY BE AMENDED PRIOR TO THE TIME OF SALE. THIS TERM SHEET IS NOT AN OFFER TO SELL THESE SECURITIES AND IT IS NOT A SOLICITATION OF AN OFFER TO BUY THESE SECURITIES IN ANY JURISDICTION WHERE THE OFFER OR SALE IS NOT PERMITTED.
90
| CUMBERLAND MALL |
Following the lockout period, the borrower will have the right to defease the Cumberland Mall Loan Combination in whole, but not in part, on any due date before February 1, 2023. In addition, the Cumberland Mall Loan Combination is prepayable without penalty on or after February 1, 2023.
Sources and Uses
| Sources | Uses | |||||||
| Original loan combination amount | $160,000,000 | 100.0% | Return of equity(1) | $159,554,512 | 99.7% | |||
| Closing costs | 445,488 | 0.3 | ||||||
| Total Sources | $160,000,000 | 100.0% | Total Uses | $160,000,000 | 100.0% |
| (1) | The proceeds from the Cumberland Mall Loan Combination were used to recapitalize the sponsor’s investment in the Cumberland Mall Property, which was unencumbered from March 2013, when the sponsor paid off a $100 million first mortgage loan until origination of the Cumberland Mall Loan Combination. |
The Property. The Cumberland Mall Property is an approximately 1.0 million square foot, two-level regional mall located approximately 10 miles northwest of the central business district of Atlanta, Georgia. The collateral for the Cumberland Mall Loan Combination consists of 541,527 square feet of the approximately 1.0 million square foot mall. The Cumberland Mall Property is anchored by Macy’s and Sears (neither of which are part of the collateral) and Costco, Forever 21 and H&M. The Cumberland Mall Property was built in 1973 and was renovated and expanded in 2006. As of February 28, 2013, the Cumberland Mall Property was 85.7% occupied by approximately 88 tenants, excluding seasonal and temporary tenants, and 94.0% leased including seasonal and temporary tenants. In-line stores include Victoria’s Secret, Express, New York & Company, Charlotte Russe, Foot Locker, Aeropostale and Vans, among others. The Cumberland Mall Property contains 3,672 surface and garage parking spaces reflecting a parking ratio of 3.53 spaces per 1,000 square feet of gross rentable area.
The following table presents certain information relating to the tenancies at the Cumberland Mall Property:
Major Tenants
| Tenant Name | Credit Rating (Fitch/ Moody’s/ S&P)(1) | Tenant NRSF | % of NRSF | Annual U/W Base Rent PSF(2) | Annual U/W Base Rent(2) | % of Total Annual U/W Base Rent | Sales PSF(3) | Occupancy Cost(3)(4) | Lease Expiration Date | |||||
| Anchor Tenants - Not Part of Collateral | ||||||||||||||
| Macy’s | BBB/Baa3/BBB | 278,000 | ANCHOR OWNED - NOT PART OF THE COLLATERAL | |||||||||||
| Sears | B/B3/CCC+ | 222,575 | ANCHOR OWNED - NOT PART OF THE COLLATERAL | |||||||||||
| Anchor Tenants - Collateral | ||||||||||||||
Costco(5) | A+/A1/A+ | 147,409 | 27.2% | $6.92 | $1,020,800 | 8.2% | NAV | NAV | 11/30/2026 | |||||
| Forever 21 | NR/NR/NR | 25,748 | 4.8% | $24.64 | $634,413 | 5.1% | $176 | 15.6% | 1/31/2019 | |||||
| H&M | NR/NR/NR | 24,655 | 4.6% | $24.63 | $607,254 | 4.9% | $270 | 9.1% | 1/31/2020 | |||||
| Total Anchor Tenants - Collateral | 197,812 | 36.5% | $11.44 | $2,262,467 | 18.2% | |||||||||
| Major Tenants - Collateral | ||||||||||||||
| Maggiano’s Little Italy | NR/NR/NR | 16,375 | 3.0% | $27.50 | $450,312 | 3.6% | $434 | 8.6% | 11/30/2016 | |||||
| The Cheesecake Factory | NR/NR/NR | 11,112 | 2.1% | $35.00 | $388,920 | 3.1% | $866 | 5.3% | 1/31/2027 | |||||
| DSW Shoe Warehouse | NR/Ba1/BBB- | 14,664 | 2.7% | $20.00 | $293,280 | 2.4% | $327 | 11.7% | 1/31/2019 | |||||
| Total Major Tenants - Collateral | 42,151 | 7.8% | $26.87 | $1,132,512 | 9.1% | |||||||||
| Non-Major Tenants - Collateral | 224,299 | 41.4% | $40.27 | $9,031,550 | 72.7% | |||||||||
Occupied Collateral Total(6) | 464,262 | 85.7% | $26.77 | $12,426,529 | 100.0% | |||||||||
| Vacant Space | 77,265 | 14.3% | ||||||||||||
| Collateral Total | 541,527 | 100.0% | ||||||||||||
| (1) | Certain ratings are those of the parent company whether or not the parent guarantees the lease. |
| (2) | Underwritten base rent includes contractual rent steps through December 2013. |
| (3) | Sales and occupancy costs are for the trailing 12-month period ending February 28, 2013. |
| (4) | Occupancy costs include base rent, reimbursements and percentage rent, as applicable. |
| (5) | Costco owns its own improvements and is the lessee under a ground lease with the borrower. |
| (6) | Occupancy excludes temporary and seasonal tenants. For the trailing 12-month period ending February 28, 2013, the average occupancy, inclusive of these tenants, was 94.0%. |
THE INFORMATION IN THIS STRUCTURAL AND COLLATERAL TERM SHEET IS NOT COMPLETE AND MAY BE AMENDED PRIOR TO THE TIME OF SALE. THIS TERM SHEET IS NOT AN OFFER TO SELL THESE SECURITIES AND IT IS NOT A SOLICITATION OF AN OFFER TO BUY THESE SECURITIES IN ANY JURISDICTION WHERE THE OFFER OR SALE IS NOT PERMITTED.
91
| CUMBERLAND MALL |
The following table presents certain information relating to the historical sales and occupancy costs at the Cumberland Mall Property:
Historical Sales (PSF) and Occupancy Costs(1)
| Tenant Name | 2010 | 2011 | 2012 | TTM |
| Costco | NAV | NAV | NAV | NAV |
| Forever 21 | $155 | $185 | $172 | $176 |
| H&M | $213 | $254 | $272 | $270 |
| Maggiano’s Little Italy | $383 | $419 | $436 | $434 |
| DSW Shoe Warehouse | $262 | $293 | $320 | $327 |
| Cheesecake Factory | $754 | $831 | $864 | $866 |
| Victoria’s Secret | $393 | $443 | $447 | $456 |
| Body Central | $208 | $225 | $191 | $190 |
Total In-line (<10,000 square feet)(2) | $381 | $419 | $446 | $446 |
| Occupancy Costs | 13.6% | 13.0% | 13.4% | 13.3% |
| (1) | Historical Sales (PSF) is based on historical statements provided by the borrower. |
| (2) | Represents tenants less than 10,000 square feet who reported sales for two years prior to the trailing 12-month reporting period. |
The following table presents certain information relating to the lease rollover schedule at the Cumberland Mall Property:
Lease Expiration Schedule(1)(2)
Year Ending December 31, | No. of Leases Expiring | Expiring NRSF | % of Total NRSF | Cumulative Expiring NRSF | Cumulative % of Total NRSF | Annual U/W Base Rent | Annual U/W Base Rent PSF(3) | |||||||
| MTM | 2 | 7,641 | 1.4% | 7,641 | 1.4% | $264,055 | $34.56 | |||||||
| 2013 | 4 | 7,927 | 1.5% | 15,568 | 2.9% | $407,633 | $51.42 | |||||||
| 2014 | 11 | 23,621 | 4.4% | 39,189 | 7.2% | $865,378 | $36.64 | |||||||
| 2015 | 15 | 29,137 | 5.4% | 68,326 | 12.6% | $1,329,875 | $45.64 | |||||||
| 2016 | 12 | 59,946 | 11.1% | 128,272 | 23.7% | $1,967,031 | $32.81 | |||||||
| 2017 | 4 | 8,933 | 1.6% | 137,205 | 25.3% | $504,553 | $56.48 | |||||||
| 2018 | 11 | 35,932 | 6.6% | 173,137 | 32.0% | $1,208,848 | $33.64 | |||||||
| 2019 | 7 | 51,227 | 9.5% | 224,364 | 41.4% | $1,432,274 | $27.96 | |||||||
| 2020 | 5 | 36,153 | 6.7% | 260,517 | 48.1% | $1,133,835 | $31.36 | |||||||
| 2021 | 2 | 6,064 | 1.1% | 266,581 | 49.2% | $271,438 | $44.76 | |||||||
| 2022 | 6 | 14,908 | 2.8% | 281,489 | 52.0% | $542,924 | $36.42 | |||||||
| 2023 | 7 | 24,252 | 4.5% | 305,741 | 56.5% | $1,088,965 | $44.90 | |||||||
| Thereafter | 2 | 158,521 | 29.3% | 464,262 | 85.7% | $1,409,720 | $8.89 | |||||||
Vacant(4) | 0 | 77,265 | 14.3% | 541,527 | 100.0% | $0 | $0.00 | |||||||
| Total/Weighted Average | 88 | 541,527 | 100.0% | $12,426,529 | $26.77 |
| (1) | Information obtained from the underwritten rent roll. |
| (2) | Certain tenants may have lease termination options that are exercisable prior to the originally stated expiration date of the subject lease and that are not considered in the Lease Expiration Schedule. |
| (3) | Annual U/W Base Rent PSF excludes vacant space. |
| (4) | Occupancy excludes temporary and seasonal tenants. For the trailing 12-month period ending February 28, 2013, the average occupancy, inclusive of these tenants, was 94.0%. |
The following table presents historical occupancy percentages at the Cumberland Mall Property:
Historical Occupancy(1)(2)
12/31/2010 | 12/31/2011 | 12/31/2012 | 2/28/2013 | |||
| 93.4% | 93.2% | 95.4% | 94.0% |
| (1) | Information obtained from the borrower. |
| (2) | Occupancy includes temporary and seasonal tenants. |
THE INFORMATION IN THIS STRUCTURAL AND COLLATERAL TERM SHEET IS NOT COMPLETE AND MAY BE AMENDED PRIOR TO THE TIME OF SALE. THIS TERM SHEET IS NOT AN OFFER TO SELL THESE SECURITIES AND IT IS NOT A SOLICITATION OF AN OFFER TO BUY THESE SECURITIES IN ANY JURISDICTION WHERE THE OFFER OR SALE IS NOT PERMITTED.
92
| CUMBERLAND MALL |
Operating History and Underwritten Net Cash Flow. The following table presents certain information relating to the historical operating performance and the Underwritten Net Cash Flow at the Cumberland Mall Property:
Cash Flow Analysis
| 2011 | 2012 | TTM 2/28/2013 | U/W | U/W $ per SF | ||||||
| Base Rent | $10,960,506 | $11,973,064 | $11,869,409 | $11,792,116 | $21.78 | |||||
| Grossed Up Vacant Space | 0 | 0 | 0 | 3,398,644 | 6.28 | |||||
| Percentage Rent | 663,605 | 430,941 | 598,337 | 1,195,701(1) | 2.21 | |||||
| Total Reimbursables | 5,342,075 | 5,926,930 | 5,972,110 | 5,598,237 | 10.34 | |||||
| Other Income | 2,921,125 | 3,155,590 | 3,208,213 | 3,208,213 | 5.92 | |||||
| Less Vacancy & Credit Loss | (49,718) | (53,716) | (54,120) | (3,398,644)(2) | (6.28) | |||||
| Effective Gross Income | $19,837,593 | $21,432,809 | $21,593,949 | $21,794,267 | $40.25 | |||||
| Total Operating Expenses | $5,349,866 | $5,845,295 | $5,923,389 | $6,312,264 | $11.66 | |||||
| Net Operating Income | $14,487,727 | $15,587,514 | $15,670,560 | $15,482,004 | $28.59 | |||||
| TI/LC | 0 | 0 | 0 | 539,322 | 1.00 | |||||
| Capital Expenditures | 0 | 0 | 0 | 108,305 | 0.20 | |||||
| Net Cash Flow | $14,487,727 | $15,587,514 | $15,670,560 | $14,834,376 | $27.39 | |||||
NOI DSCR(3) | 2.43x | 2.62x | 2.63x | 2.60x | ||||||
NCF DSCR(3) | 2.43x | 2.62x | 2.63x | 2.49x | ||||||
NOI DY(3) | 9.1% | 9.7% | 9.8% | 9.7% | ||||||
NCF DY(3) | 9.1% | 9.7% | 9.8% | 9.3% |
| (1) | Percentage Rent includes $994,174 of percentage rent in lieu of base rent and $201,527 of percentage overage rent. |
| (2) | The underwritten economic vacancy is 14.2%. The Cumberland Mall Property was 85.7% physically occupied exclusive of seasonal and temporary tenants and 94.0% physically occupied inclusive of seasonal and temporary tenants as of February 28, 2013. |
| (3) | DSCRs and debt yields are based on the Cumberland Mall Loan Combination on an aggregate basis. |
Appraisal. As of the appraisal valuation date of April 12, 2013, the Cumberland Mall Property had an “as-is” appraised value of $254,000,000.
Environmental Matters. According to a Phase I environmental site assessment dated April 18, 2013, there was evidence of a recognized environmental condition at the Cumberland Mall Property related to one 550-gallon underground storage tank (“UST”) and three 10,000 gallon USTs which had earlier been removed. No further action was recommended other than ongoing monitoring.
Market Overview and Competition. The Cumberland Mall Property is located at the southwestern quadrant of Cobb Parkway and Interstate 285 in Atlanta, Georgia, approximately 10 miles northwest of the Atlanta central business district. The Cumberland Mall Property is located across from the Cobb Galleria Centre, which hosts over 350,000 visitors a year. The Cobb Galleria Centre is connected to the Cumberland Mall Property via a covered walkway that crosses over Cobb Parkway. Atlanta has the United States’ third largest concentration of Fortune 500 companies and 75% of Fortune 1000 companies have a presence in the metropolitan area. Fortune 500 companies headquartered in Atlanta include The Home Depot, UPS, Coca-Cola, Delta Air Lines and nine others. Atlanta is one of five United States cities served by three major interstate highways: Interstate 75, Interstate 85 and Interstate 20. According to the appraisal, the Cumberland Mall Property has a primary trade area that encompasses 26 zip codes within the Atlanta metropolitan statistical area. Per the appraisal, 2012 population and average household income for the trade area were reported at 820,248 and $80,209, respectively. In addition, 21.5% of Atlanta households have annual incomes of $100,000 or more.
The appraiser estimated market rent for in-line suites under 10,000 square feet to be $35.26 per square foot on a modified gross basis and used an estimate of $25.00 for in-line suites over 10,000 square feet on a full service gross basis. Additionally, based on an average of comparable properties, the appraiser estimated the local market vacancy rate to be 5.0% within a 20-mile radius.
The following table presents certain information relating to some comparable retail centers provided in the appraisal for the Cumberland Mall Property:
Competitive Set(1)
Cumberland Mall (Subject) | Town Center at Cobb | Arbor Place | Perimeter Mall | Lenox Square | ||||||
| Market | Atlanta, GA | Kennesaw, GA | Douglasville, GA | Atlanta, GA | Atlanta, GA | |||||
| Distance from Subject | –– | 12.7 miles | 24.5 miles | 9.8 miles | 22.8 miles | |||||
| Property Type | Regional Mall | Regional Mall | Regional Mall | Regional Mall | Regional Mall | |||||
| Year Built/Renovated | 1973/2006 | 1986/1998 | 1999/NAV | 1971/2000 | 1959/2007 | |||||
| Anchors | Macy’s, Sears, Costco, Forever 21, H&M | Macy’s, Belk, JC Penney, Sears | Dillard’s, Belk, Macy’s, Sears, JC Penney | Macy’s, Dillard’s, Nordstrom, Von Maur | Macy’s, Bloomingdales, Neiman Marcus | |||||
| Total GLA | 1,041,203 SF | 1,276,000 SF | 1,163,340 SF | 1,574,000 SF | 1,556,000 SF | |||||
| Total Occupancy | 94% | 97% | 97% | 97% | 100% |
| (1) | Information obtained from the borrower’s rent roll and the appraisal dated April 12, 2013. |
THE INFORMATION IN THIS STRUCTURAL AND COLLATERAL TERM SHEET IS NOT COMPLETE AND MAY BE AMENDED PRIOR TO THE TIME OF SALE. THIS TERM SHEET IS NOT AN OFFER TO SELL THESE SECURITIES AND IT IS NOT A SOLICITATION OF AN OFFER TO BUY THESE SECURITIES IN ANY JURISDICTION WHERE THE OFFER OR SALE IS NOT PERMITTED.
93
| CUMBERLAND MALL |
The Borrower. The borrower is Cumberland Mall, LLC, a Delaware limited liability company, a single purpose entity with two independent managers. The borrower is 100% owned by GGPLP Real Estate, Inc. (“GGPLP Real Estate”). Legal counsel to the borrower delivered a non-consolidation opinion in connection with the origination of the Cumberland Mall Mortgage Loan.
The Sponsor. The sponsor is GGPLP Real Estate, which is 100% owned by GGP Limited Partnership, a wholly owned subsidiary of General Growth Properties, Inc. (“GGP”). GGP is a publically traded REIT that had total assets of approximately $27.4 billion as of September 30, 2012 according to GGP’s 10-Q. Over the same time period, GGP’s portfolio had sales of $543 per square foot for comparable tenants with less than 10,000 square feet. GGP entered Chapter 11 bankruptcy proceedings in April 2009 and emerged from bankruptcy protection in November 2010. See “Risk Factors – The Borrower’s Form of Entity May Cause Special Risks” in the Free Writing Prospectus.
Escrows. No monthly tax escrow is required so long as no Cash Management Period (as defined below) has occurred and is continuing under the Cumberland Mall Loan Combination. No monthly insurance escrow is required so long as (i) no Cash Management Period has occurred and is continuing under the Cumberland Mall Loan Combination, and (ii) the insurance required to be maintained by the borrower is effected under an acceptable blanket insurance policy. No monthly replacement reserve or tenant improvement and leasing commissions reserves are required so long as no Cash Management Period has occurred and is continuing. However, GGPLP Real Estate has entered into a separate guaranty agreement in favor of the lender pursuant to which GGPLP Real Estate guarantees certain upcoming tenant improvement and leasing costs in the amount of $832,305.
Lockbox and Cash Management. The Cumberland Mall Loan Combination requires a lender-controlled lockbox account, which is already in place, and that the borrower direct tenants to pay their rents directly to such lockbox account. The loan documents also require that all rents received by the borrower or the property manager be deposited into the lockbox account within two business days after receipt. Prior to the occurrence of a Cash Management Period (as defined below) all funds on deposit in the lockbox account are swept into the property manager’s operating account on a daily basis. During a Cash Management Period, all funds on deposit in the lockbox account are swept on a daily basis to a cash management account under the control of the lender.
A “Cash Management Period” will commence upon either of the following events occurring: (i) the occurrence of an event of default, and (ii) the debt service coverage ratio falling below 1.50x as of the end of any calendar quarter. A Cash Management Period will end with respect to the matters described in clause (i) above, when such event of default has been cured, and with respect to the matters described in clause (ii) above, when a debt service coverage ratio of at least 1.50x has been achieved for two consecutive calendar quarters.
Property Management. The Cumberland Mall Property is managed by an affiliate of the borrower.
Assumption. The borrower has the right to transfer the Cumberland Mall Property, provided that no event of default has occurred and is continuing and certain other conditions are satisfied, including: (i) execution of a recourse guaranty and an environmental indemnity by an affiliate of the transferee; (ii) if requested by the lender, rating agency confirmation from Fitch, KBRA and Moody’s that the transfer will not result in a downgrade, withdrawal or qualification of the respective ratings assigned to the Series 2013-C14 Certificates; and (iii) the lender reasonably determines that the proposed transferee and guarantor satisfy the lender’s credit review and underwriting standards, taking into consideration transferee experience, financial strength and general business standing.
Partial Release. The borrower may obtain a release of certain immaterial, non-income producing portions of the Cumberland Mall Property from the lien of the mortgage upon the satisfaction of certain conditions including but not limited to: (i) no event of default will have occurred and be continuing; (ii) the parcel to be released will be an Acquired Expansion Parcel (as defined below) or will be vacant, non-income-producing and unimproved; (iii) borrower must deliver written evidence to the lender that release will not diminish the value of the remaining property as collateral for the Cumberland Mall Loan Combination; and (iv) an opinion of counsel that the REMIC trust will not fail to maintain its REMIC status due to the partial defeasance.
An “Acquired Expansion Parcel” is a parcel of land that the borrower may acquire as additional collateral for the Cumberland Mall Loan Combination subject to customary conditions set forth in the loan documents, including but not limited to: (i) no event of default has occurred and is continuing; (ii) the borrower has delivered to the lender a copy of the deed or ground lease conveying the borrower’s ownership interest in the expansion parcel; (iii) the borrower must have paid all reasonable out-of-pocket costs and expenses incurred by the lender in connection with the acquisition of the expansion parcel; and (iv) the guarantor will deliver to the lender a reaffirmation of its obligations under the related guaranty agreement under the Cumberland Mall Loan Combination.
Real Estate Substitution. The borrower may obtain a release of one or more portions of the Cumberland Mall Property and acquire a corresponding substitute portion of the Cumberland Mall Property upon the satisfaction of certain conditions including but not limited to: (i) no event of default will have occurred and be continuing; (ii) the exchanged parcel will be an Acquired Expansion Parcel or will be vacant, non-income-producing and unimproved; (iii) not less than thirty days prior to date of substitution, the borrower will deliver to the lender a notice setting forth evidence that the exchanged parcel will not diminish the value of the Cumberland Mall Property as collateral for the loan or otherwise cause any material adverse effect; and (iv) the borrower will ensure that the lender receives all third party reports required under the loan documents and that substitution will not cause collateral for the loan to be non-compliant in regards to zoning or insurance requirements.
Subordinate and Mezzanine Indebtedness. The borrower has the right to incur mezzanine financing subject to the lender’s approval and other customary conditions including: (i) no event of default has occurred and is continuing; (ii) the loan-to-value ratio including all debt is not greater than 63.0%; (iii) the debt service coverage ratio including all debt is not less than 2.47x; (iv) the execution of an intercreditor agreement acceptable to the lender; and (v) receipt of rating agency confirmation from Fitch, KBRA and Moody’s that the mezzanine financing will not result in a downgrade, withdrawal or qualification of the respective ratings assigned to the Series 2013-C14 Certificates.
THE INFORMATION IN THIS STRUCTURAL AND COLLATERAL TERM SHEET IS NOT COMPLETE AND MAY BE AMENDED PRIOR TO THE TIME OF SALE. THIS TERM SHEET IS NOT AN OFFER TO SELL THESE SECURITIES AND IT IS NOT A SOLICITATION OF AN OFFER TO BUY THESE SECURITIES IN ANY JURISDICTION WHERE THE OFFER OR SALE IS NOT PERMITTED.
94
| CUMBERLAND MALL |
Ground Lease. None.
Terrorism Insurance. The loan documents require that the “all risk” insurance policy required to be maintained by the borrower provides coverage for damage from terrorism in an amount equal to the full replacement cost of the Cumberland Mall Property as well as business interruption insurance covering no less than the 18-month period following the occurrence of a casualty event, together with an extended period of indemnity of at least six months.
THE INFORMATION IN THIS STRUCTURAL AND COLLATERAL TERM SHEET IS NOT COMPLETE AND MAY BE AMENDED PRIOR TO THE TIME OF SALE. THIS TERM SHEET IS NOT AN OFFER TO SELL THESE SECURITIES AND IT IS NOT A SOLICITATION OF AN OFFER TO BUY THESE SECURITIES IN ANY JURISDICTION WHERE THE OFFER OR SALE IS NOT PERMITTED.
95
| 100 & 150 SOUTH WACKER DRIVE |
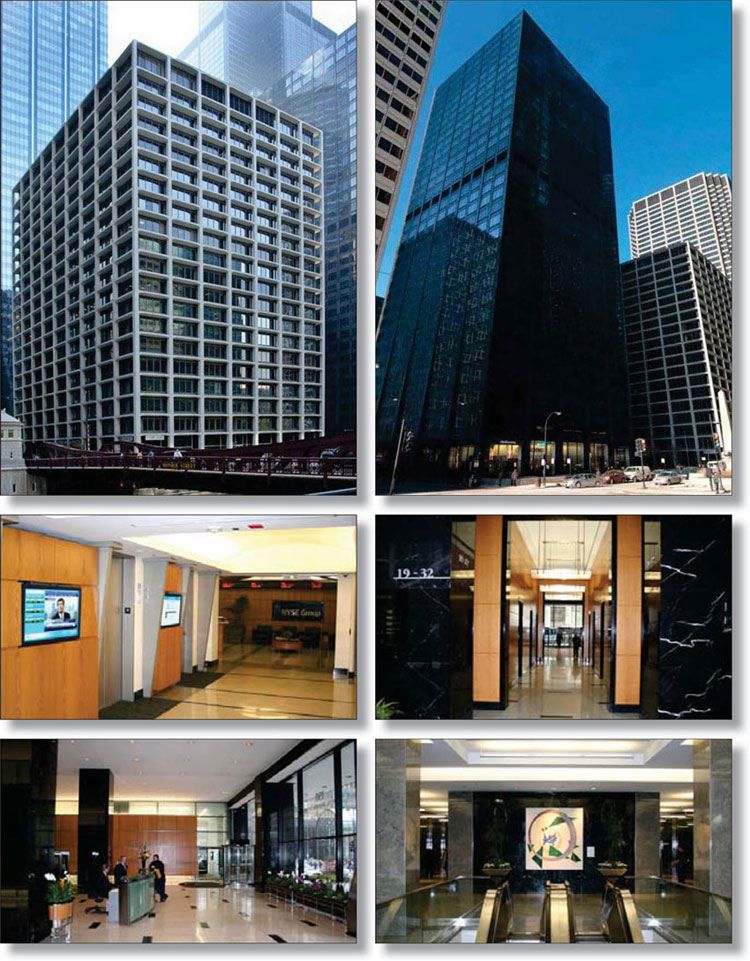
THE INFORMATION IN THIS STRUCTURAL AND COLLATERAL TERM SHEET IS NOT COMPLETE AND MAY BE AMENDED PRIOR TO THE TIME OF SALE. THIS TERM SHEET IS NOT AN OFFER TO SELL THESE SECURITIES AND IT IS NOT A SOLICITATION OF AN OFFER TO BUY THESE SECURITIES IN ANY JURISDICTION WHERE THE OFFER OR SALE IS NOT PERMITTED.
96
| 100 & 150 SOUTH WACKER DRIVE |
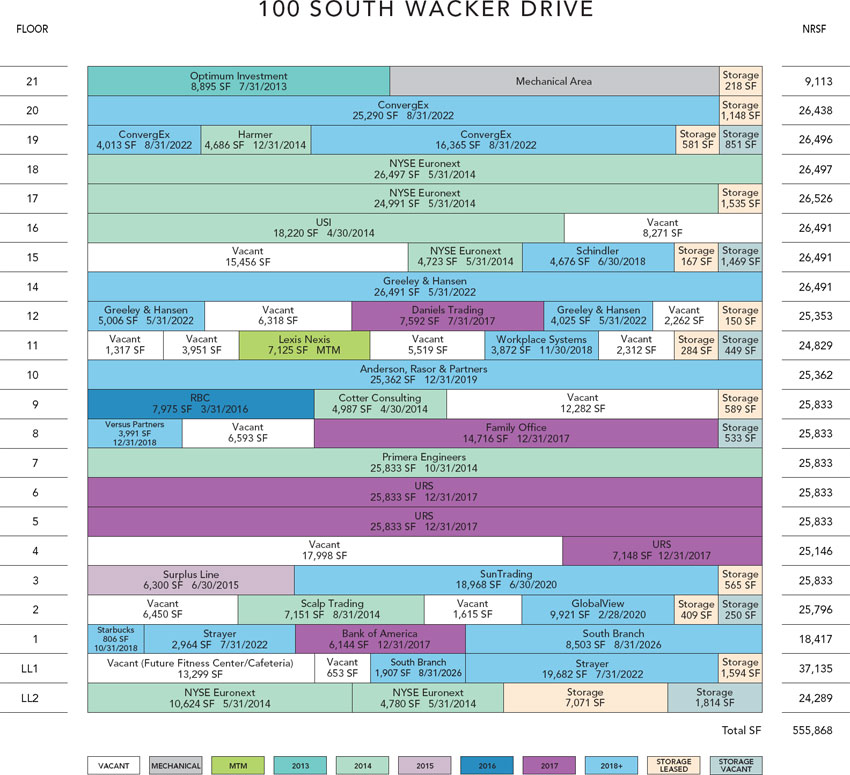
THE INFORMATION IN THIS STRUCTURAL AND COLLATERAL TERM SHEET IS NOT COMPLETE AND MAY BE AMENDED PRIOR TO THE TIME OF SALE. THIS TERM SHEET IS NOT AN OFFER TO SELL THESE SECURITIES AND IT IS NOT A SOLICITATION OF AN OFFER TO BUY THESE SECURITIES IN ANY JURISDICTION WHERE THE OFFER OR SALE IS NOT PERMITTED.
97
| 100 & 150 SOUTH WACKER DRIVE |
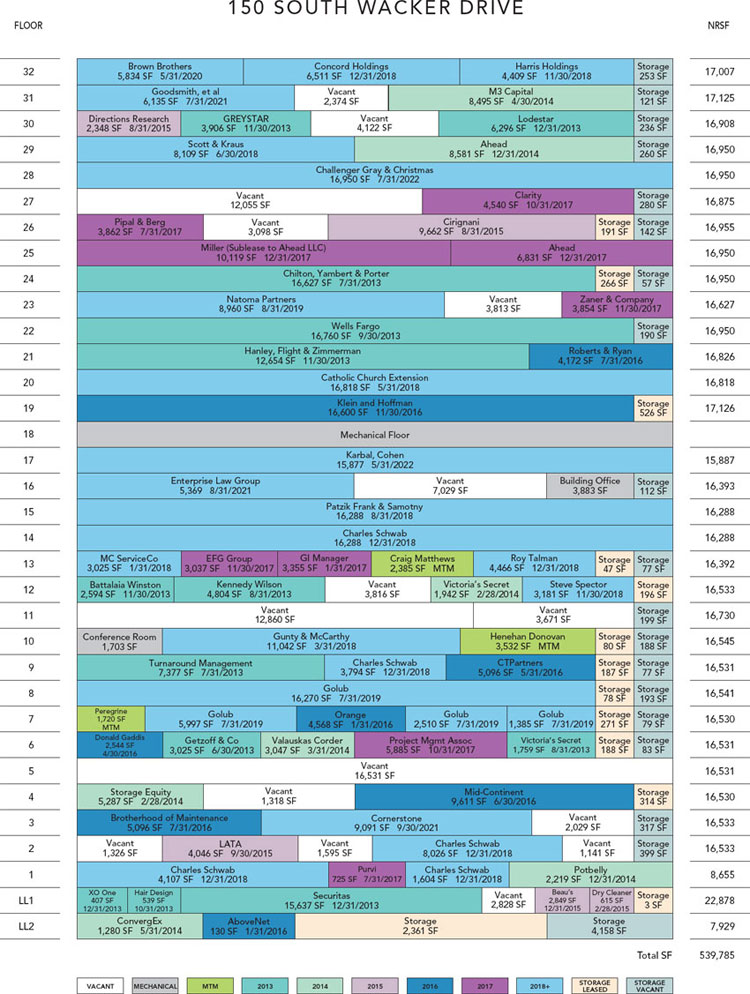
THE INFORMATION IN THIS STRUCTURAL AND COLLATERAL TERM SHEET IS NOT COMPLETE AND MAY BE AMENDED PRIOR TO THE TIME OF SALE. THIS TERM SHEET IS NOT AN OFFER TO SELL THESE SECURITIES AND IT IS NOT A SOLICITATION OF AN OFFER TO BUY THESE SECURITIES IN ANY JURISDICTION WHERE THE OFFER OR SALE IS NOT PERMITTED.
98
| 100 & 150 SOUTH WACKER DRIVE |
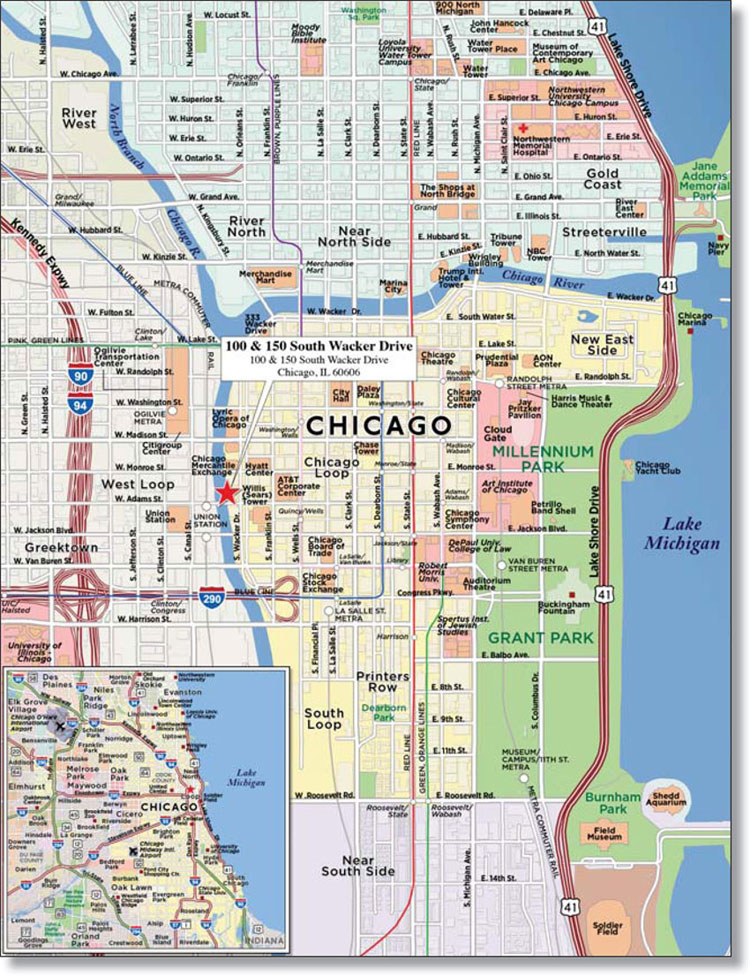
THE INFORMATION IN THIS STRUCTURAL AND COLLATERAL TERM SHEET IS NOT COMPLETE AND MAY BE AMENDED PRIOR TO THE TIME OF SALE. THIS TERM SHEET IS NOT AN OFFER TO SELL THESE SECURITIES AND IT IS NOT A SOLICITATION OF AN OFFER TO BUY THESE SECURITIES IN ANY JURISDICTION WHERE THE OFFER OR SALE IS NOT PERMITTED.
99
| No. 8 – 100 & 150 South Wacker Drive | |||||||
| Loan Information | Property Information | ||||||
| Mortgage Loan Seller: | Wells Fargo Bank, National Association | Single Asset/Portfolio: | Single Asset | ||||
Credit Assessment (Fitch/KBRA/Moody’s): | NR/NR/NR | Property Type: | Office | ||||
Original Principal Balance(1): | $69,000,000 | Specific Property Type: | CBD | ||||
Cut-off Date Principal Balance(1): | $69,000,000 | Location: | Chicago, IL | ||||
| % of Initial Pool Balance: | 4.7% | Size: | 1,095,653 SF | ||||
| Loan Purpose: | Refinance | Cut-off Date Principal Balance Per Unit/SF(1): | $127.78 | ||||
| Borrower Name: | MJH Wacker LLC | Year Built/Renovated(3): | Various/2008 | ||||
| Sponsor: | Marvin J. Herb | Title Vesting: | Fee | ||||
| Mortgage Rate: | 3.963% | Property Manager: | Lincoln Property Company Commercial, Inc. | ||||
| Note Date: | April 30, 2013 | 3rd Most Recent Occupancy (As of): | 83.7% (12/31/2010) | ||||
| Anticipated Repayment Date: | NAP | 2nd Most Recent Occupancy (As of): | 82.4% (12/31/2011) | ||||
| Maturity Date: | May 1, 2023 | Most Recent Occupancy (As of): | 81.0% (12/31/2012) | ||||
| IO Period: | 60 months | Current Occupancy (As of): | 82.0% (4/23/2013) | ||||
| Loan Term (Original): | 120 months | ||||||
| Seasoning: | 1 month | ||||||
| Amortization Term (Original): | 360 months | ||||||
| Loan Amortization Type: | Interest-only, Amortizing Balloon | Underwriting and Financial Information: | |||||
| Interest Accrual Method: | Actual/360 | ||||||
| Call Protection: | L(25),D(91),O(4) | 3rd Most Recent NOI (As of): | $15,168,135 (12/31/2010) | ||||
| Lockbox Type: | Hard/Upfront Cash Management | 2nd Most Recent NOI (As of): | $12,883,576 (12/31/2011) | ||||
Additional Debt(1): | Yes | Most Recent NOI (As of): | $13,807,366 (12/31/2012) | ||||
Additional Debt Type(1): | Pari Passu | ||||||
| U/W Revenues: | $29,126,843 | ||||||
| U/W Expenses: | $14,089,796 | ||||||
U/W NOI(4): | $15,037,047 | ||||||
Escrows and Reserves(2): | U/W NCF: | $12,470,882 | |||||
U/W NOI DSCR(1): | 1.88x | ||||||
| Type: | Initial | Monthly | Cap (If Any) | U/W NCF DSCR(1): | 1.56x | ||
| Taxes | $2,018,032 | $543,317 | NAP | U/W NOI Debt Yield(1): | 10.7% | ||
| Insurance | $60,425 | $6,042 | NAP | U/W NCF Debt Yield(1): | 8.9% | ||
| Replacement Reserves | $0 | $18,261 | NAP | As-Is Appraised Value: | $211,000,000 | ||
| TI/LC | $0 | $100,000 | $5,000,000 | As-Is Appraisal Valuation Date: | March 14, 2013 | ||
| Tenant Specific TI/LC Reserve | $885,587 | $0 | NAP | Cut-off Date LTV Ratio(1): | 66.4% | ||
| Rent Concession Reserve | $394,933 | $0 | NAP | LTV Ratio at Maturity or ARD(1): | 60.2% | ||
| (1) | The 100 & 150 South Wacker Drive Loan Combination, totalling $140,000,000, is comprised of two pari passu notes (Notes A-1 and A-2). Note A-2 had an original balance of $69,000,000, has an outstanding principal balance as of the Cut-off Date of $69,000,000 and will be contributed to the WFRBS 2013-C14 Trust. Note A-1 had an original balance of $71,000,000 and is expected to be contributed to a future trust. All presented statistical information related to balances per square foot, loan-to-value ratios, debt service coverage ratios, and debt yields are based on the 100 & 150 South Wacker Drive Loan Combination. |
| (2) | See “Escrows” section. |
| (3) | The 100 South Wacker Drive property was built in 1961 and the 150 South Wacker Drive property was built in 1971. |
| (4) | See “Cash Flow Analysis” section. |
The Mortgage Loan. The mortgage loan (the “100 & 150 South Wacker Drive Loan Combination”) is evidenced by two pari passu promissory notes (Note A-1 and Note A-2) secured by a first mortgage encumbering two adjacent office buildings located in the central business district of Chicago, Illinois (the “100 & 150 South Wacker Drive Property”). The 100 & 150 South Wacker Drive Loan Combination was originated on April 30, 2013 by Wells Fargo Bank, National Association. The 100 & 150 South Wacker Drive Loan Combination had an original balance of $140,000,000, has an outstanding principal balance as of the Cut-off Date of $140,000,000 and accrues interest at an interest rate of 3.963% per annum. The 100 & 150 South Wacker Drive Loan Combination had an initial term of 120 months, has a remaining term of 119 months as of the Cut-off Date and requires interest-only payments for the first 60 payments following origination and thereafter requires payments of principal and interest based on a 30-year amortization schedule. The 100 & 150 South Wacker Drive Loan Combination matures on May 1, 2023.
THE INFORMATION IN THIS STRUCTURAL AND COLLATERAL TERM SHEET IS NOT COMPLETE AND MAY BE AMENDED PRIOR TO THE TIME OF SALE. THIS TERM SHEET IS NOT AN OFFER TO SELL THESE SECURITIES AND IT IS NOT A SOLICITATION OF AN OFFER TO BUY THESE SECURITIES IN ANY JURISDICTION WHERE THE OFFER OR SALE IS NOT PERMITTED.
100
| 100 & 150 SOUTH WACKER DRIVE |
Note A-2, which will be contributed to the WFRBS 2013-C14 Trust, had an original principal balance of $69,000,000 and has an outstanding principal balance as of the Cut-off Date of $69,000,000. Note A-1 had an original principal balance of $71,000,000, is expected to be securitized in a future trust and will represent the controlling interest in the 100 & 150 South Wacker Drive Loan Combination (the “100 & 150 South Wacker Drive Companion Loan”). See “Description of the Mortgage Pool—Split Loan Structures—The 100 & 150 South Wacker Drive Loan Combination” and “Additional Matters Relating to the Servicing of the Cumberland Mall Loan Combination and the 100 & 150 South Wacker Drive Loan Combination” in the Free Writing Prospectus.
Following the lockout period, the borrower has the right to defease the 100 & 150 South Wacker Drive Loan Combination in whole, but not in part, on any date before February 1, 2023. In addition, the 100 & 150 South Wacker Drive Loan Combination is prepayable without penalty on or after February 1, 2023.
Sources and Uses
| Sources | Uses | |||||||
| Original loan combination amount | $140,000,000 | 100.0% | Loan payoff | $95,249,568 | 68.0% | |||
| Reserves | 3,358,977 | 2.4 | ||||||
| Closing costs | 745,159 | 0.5 | ||||||
| Return of equity | 40,646,296 | 29.0 | ||||||
| Total Sources | $140,000,000 | 100.0% | Total Uses | $140,000,000 | 100.0% | |||
The Property. The 100 & 150 South Wacker Drive Property consists of two adjacent office buildings totaling approximately 1,095,653 square feet situated on 1.9 acres and connected by an underground walkway located in the central business district of Chicago, Illinois. The 100 South Wacker Drive property is a 21-story building that was constructed in 1961 and renovated in 2008 and the 150 South Wacker Drive property is a 32-story building that was constructed in 1971 and renovated in 2008. Ground floor retail includes a 10,410 square foot restaurant, South Branch, which provides indoor and outdoor seating along the Chicago River, as well as a Starbucks, Potbelly’s Sandwich Works and a Charles Schwab branch. The 100 South Wacker Drive building and 150 South Wacker Drive building share a landscaped approximately 38,000 square foot plaza that stretches from Wacker Drive to the Chicago River. The tenants located on the west side of the buildings have panoramic views of the Chicago River and tenants located on the upper floors have views of Chicago’s central business district. As of April 23, 2013, the 100 & 150 South Wacker Drive Property was 82.0% leased to 98 tenants.
THE INFORMATION IN THIS STRUCTURAL AND COLLATERAL TERM SHEET IS NOT COMPLETE AND MAY BE AMENDED PRIOR TO THE TIME OF SALE. THIS TERM SHEET IS NOT AN OFFER TO SELL THESE SECURITIES AND IT IS NOT A SOLICITATION OF AN OFFER TO BUY THESE SECURITIES IN ANY JURISDICTION WHERE THE OFFER OR SALE IS NOT PERMITTED.
101
| 100 & 150 SOUTH WACKER DRIVE |
The following table presents certain information relating to the tenancies at the 100 & 150 South Wacker Drive Property:
Major Tenants
| Tenant Name | Credit Rating (Fitch/Moody’s/ S&P)(1) | Tenant NRSF | % of NRSF | Annual U/W Base Rent PSF | Annual U/W Base Rent | % of Total Annual U/W Base Rent | Lease Expiration Date |
| Major Tenants | |||||||
| NYSE Euronext | NR/A3/A- | 73,552 | 6.7% | $21.85 | $1,607,244 | 9.1% | 5/31/2014 |
| URS Corporation | NR/Baa3/BBB- | 60,938 | 5.6% | $20.52 | $1,250,370 | 7.1% | 12/31/2017(2) |
| ConvergEx | NR/NR/NR | 50,820 | 4.6% | $16.22 | $824,464 | 4.7% | Various(3) |
| Greeley and Hansen | NR/NR/NR | 36,583 | 3.3% | $21.64 | $791,743 | 4.5% | 5/31/2022(4)(5) |
| Strayer University | NR/NR/NR | 22,646 | 2.1% | $24.40 | $552,671 | 3.1% | 7/31/2022 |
| Charles Schwab | A/A2/A | 34,142 | 3.1% | $16.13 | $550,705(6) | 3.1% | 12/31/2018(7) |
| Golub Capital | NR/NR/NR | 26,319 | 2.4% | $20.73 | $545,539 | 3.1% | 7/31/2019 |
| Total Major Tenants | 305,000 | 27.8% | $20.07 | $6,122,737 | 34.8% | ||
| Non-Major Tenants | 593,961 | 54.2% | $19.35 | $11,493,233 | 65.2% | ||
| Occupied Collateral Total | 898,961 | 82.0% | $19.60 | $17,615,970 | 100.0% | ||
| Vacant Space | 196,692 | 18.0% | |||||
| Collateral Total | 1,095,653 | 100.0% | |||||
| (1) | Certain ratings are those of the parent company whether or not the parent guarantees the lease. |
| (2) | URS Corporation may terminate its lease on December 31, 2014 upon providing 12 months written notice and a payment of all unamortized tenant improvement and leasing commission costs. |
| (3) | ConvergEx leases seven spaces; 49,540 square feet with an Annual U/W Base Rent of $15.97 per square foot expires on August 31, 2022 and 1,280 square feet with an Annual U/W Base Rent of $25.95 per square foot expires on May 31, 2014. |
| (4) | Greeley and Hansen may terminate its lease on 4,025 square feet on May 31, 2017 upon providing 12 months written notice and pay a termination fee equal to $31,507 plus four months of direct taxes and expenses and all unamortized abated rent, tenant improvements and leasing commission costs. |
| (5) | 251 square feet of storage space expires on August 31, 2013. No Annual U/W Base Rent was attributed to this space. |
| (6) | Charles Schwab has a 12-month, 50% rent abatement period for 8,026 square feet, which ends on July 31, 2013. Charles Schwab’s annual unabated base rent for the 8,026 square foot space is $144,468. |
| (7) | Charles Schwab may terminate its lease for 5,711 square feet on December 31, 2014 upon providing nine months written notice and payment of a termination fee of $148,228 plus four months base rent and direct expenses and taxes. |
THE INFORMATION IN THIS STRUCTURAL AND COLLATERAL TERM SHEET IS NOT COMPLETE AND MAY BE AMENDED PRIOR TO THE TIME OF SALE. THIS TERM SHEET IS NOT AN OFFER TO SELL THESE SECURITIES AND IT IS NOT A SOLICITATION OF AN OFFER TO BUY THESE SECURITIES IN ANY JURISDICTION WHERE THE OFFER OR SALE IS NOT PERMITTED.
102
| 100 & 150 SOUTH WACKER DRIVE |
The following table presents certain information relating to the lease rollover schedule at the 100 & 150 South Wacker Drive Property:
Lease Expiration Schedule(1)(2)
Year Ending December 31, | No. of Leases Expiring | Expiring NRSF | % of Total NRSF | Cumulative Expiring NRSF | Cumulative % of Total NRSF | Annual U/W Base Rent | Annual U/W Base Rent PSF(4) |
MTM(3) | 12 | 21,951 | 2.0% | 21,951 | 2.0% | $265,243 | $16.21 |
| 2013 | 25 | 103,305 | 9.4% | 125,256 | 11.4% | $1,905,545 | $18.45 |
| 2014 | 25 | 166,420 | 15.2% | 291,676 | 26.6% | $3,506,981 | $21.07 |
| 2015 | 8 | 26,761 | 2.4% | 318,437 | 29.1% | $526,740 | $19.68 |
| 2016 | 12 | 56,447 | 5.2% | 374,884 | 34.2% | $1,067,005 | $18.90 |
| 2017 | 16 | 131,765 | 12.0% | 506,649 | 46.2% | $2,811,851 | $21.34 |
| 2018 | 28 | 122,787 | 11.2% | 629,436 | 57.4% | $2,218,533 | $18.07 |
| 2019 | 11 | 60,641 | 5.5% | 690,077 | 63.0% | $1,247,256 | $20.57 |
| 2020 | 4 | 34,940 | 3.2% | 725,017 | 66.2% | $787,304 | $22.53 |
| 2021 | 3 | 20,595 | 1.9% | 745,612 | 68.1% | $347,044 | $16.85 |
| 2022 | 14 | 141,345 | 12.9% | 886,957 | 81.0% | $2,614,818 | $18.50 |
| 2023 | 0 | 0 | 0.0% | 886,957 | 81.0% | $0 | $0.00 |
| Thereafter | 3 | 12,004 | 1.1% | 898,961 | 82.0% | $317,652 | $26.46 |
| Vacant | 0 | 196,692 | 18.0% | 1,095,653 | 100.0% | $0 | $0.00 |
| Total/Weighted Average | 161 | 1,095,653 | 100.0% | $17,615,970 | $19.60 |
| (1) | Information obtained from the underwritten rent roll. |
| (2) | Certain tenants may have lease termination options that are exercisable prior to the stated expiration date of the subject lease and that are not considered in the Lease Expiration Schedule. |
| (3) | Includes 5,586 square feet of common room office and meeting room space. No Annual U/W Base Rent was attributed to this space. Annual U/W Base Rent PSF excludes common room office and meeting space. |
| (4) | Weighted Average Annual U/W Base Rent PSF excludes vacant space. |
The following table presents historical occupancy percentages at the 100 & 150 South Wacker Drive Property:
Historical Occupancy(1)
12/31/2010 | 12/31/2011 | 12/31/2012 | 4/23/2013 | |||
| 83.7% | 82.4% | 81.0% | 82.0% | |||
| (1) Information obtained from the borrower. | ||||||
Operating History and Underwritten Net Cash Flow. The following table presents certain information relating to the historical operating performance and the Underwritten Net Cash Flow at the 100 & 150 South Wacker Drive Property:
Cash Flow Analysis
2010 | 2011 | 2012 | U/W(1) | U/W $ per SF | ||||||
| Base Rent | $16,653,055 | $16,476,719 | $16,805,001 | $17,615,970 | $16.08 | |||||
| Grossed Up Vacant Space | 0 | 0 | 0 | 3,621,478 | 3.31 | |||||
| Percentage Rent | 0 | 0 | 137,832 | 140,000 | 0.13 | |||||
| Total Reimbursables | 11,021,921 | 10,494,669 | 10,577,589 | 10,715,794 | 9.78 | |||||
| Other Income | 1,383,458 | 1,136,317 | 1,465,467 | 655,036 | 0.60 | |||||
| Less Vacancy & Credit Loss | (319,794) | (775,906) | (1,065,312) | (3,621,435)(2) | (3.31) | |||||
| Effective Gross Income | $28,738,640 | $27,331,799 | $27,920,577 | $29,126,843 | $26.58 | |||||
| Total Operating Expenses | $13,570,505 | $14,448,223 | $14,113,211 | $14,089,796 | $12.86 | |||||
| Net Operating Income | $15,168,135 | $12,883,576 | $13,807,366 | $15,037,047 | $13.72 | |||||
| TI/LC | 0 | 0 | 0 | 2,401,817 | 2.19 | |||||
| Capital Expenditures | 0 | 0 | 0 | 164,348 | 0.15 | |||||
| Net Cash Flow | $15,168,135 | $12,883,576 | $13,807,366 | $12,470,882 | $11.38 | |||||
NOI DSCR(3) | 1.90x | 1.61x | 1.73x | 1.88x | ||||||
NCF DSCR(3) | 1.90x | 1.61x | 1.73x | 1.56x | ||||||
NOI DY(3) | 10.8% | 9.2% | 9.9% | 10.7% | ||||||
NCF DY(3) | 10.8% | 9.2% | 9.9% | 8.9% | ||||||
| (1) The increase in U/W Effective Gross Income from Effective Gross Income and Net Operating Income for 2012 is primarily attributed to tenants’ expiring free rent periods, rent bumps through March 2014 and new leasing. | ||||||||||
| (2) The underwritten economic vacancy is 17.1%. The 100 & 150 South Wacker Drive Property was 82.0% physically occupied as of April 23, 2013. | ||||||||||
| (3) DSCRs and debt yields are based on the 100 & 150 South Wacker Drive Loan Combination. | ||||||||||
THE INFORMATION IN THIS STRUCTURAL AND COLLATERAL TERM SHEET IS NOT COMPLETE AND MAY BE AMENDED PRIOR TO THE TIME OF SALE. THIS TERM SHEET IS NOT AN OFFER TO SELL THESE SECURITIES AND IT IS NOT A SOLICITATION OF AN OFFER TO BUY THESE SECURITIES IN ANY JURISDICTION WHERE THE OFFER OR SALE IS NOT PERMITTED.
103
| 100 & 150 SOUTH WACKER DRIVE |
Appraisal. As of the appraisal valuation date of March 14, 2013, the 100 & 150 South Wacker Drive Property had an “as-is” appraised value of $211,000,000.
Environmental Matters. According to the Phase I environmental site assessment dated March 29, 2013, there was no evidence of any recognized environmental conditions at the 100 & 150 South Wacker Drive Property.
Market Overview and Competition. According to the appraisal, the 100 South Wacker Drive property is located at the southwest corner of South Wacker Drive and West Monroe Street and the 150 South Wacker Drive property is located at the northwest corner of South Wacker Drive and West Adams Street. The 100 & 150 South Wacker Drive Property is located approximately one block east of Union Station, Chicago’s primary commuter train terminal and the only intercity rail terminal in Chicago. Furthermore, Ogilvie Station, which also provides commuter rail service to and from the Chicago suburbs, is located three blocks northwest of the 100 & 150 South Wacker Drive Property. Wacker Drive is a major artery in the Chicago central business district and is divided between two levels: upper and lower Wacker Drive. Upper Wacker Drive is six lanes and is the main vehicular and pedestrian street access, while lower Wacker Drive is primarily restricted to vehicular and truck access. The City of Chicago recently reconstructed Wacker Drive at an estimated cost of $300 million to provide safer, nicer and more efficient roadways for all travelers.
The 100 & 150 South Wacker Drive Property is located along the Chicago River in the West Loop submarket of Chicago’s central business district. The West Loop submarket is the largest in the Chicago central business district and is home to major corporations such as Boeing Corporation’s global headquarters, Deloitte & Touche, Hyatt Corporation’s global headquarters, Pricewaterhouse Coopers and UBS. Historically, the submarket was a secondary office market to the East Loop and Central Loop. However, with the suburbanization of Chicago in the 1960’s and the development of Union and Ogilvie Transportation Center stations as the primary commuter train stations into downtown Chicago, the West Loop east of the Chicago River became the largest office submarket within Chicago. As of September 2012, the unemployment rate for the Chicago metropolitan statistical area was 8.7%, which is a decrease from a reported unemployment rate of 9.7% as of September 2011. The 2012 population within the Chicago metropolitan statistical area was approximately 8.8 million and is expected to grow by 0.5% annually from 2012 to 2016.
According to the appraisal, as of the fourth quarter 2012, the West Loop submarket contained approximately 35.5 million square feet of office space, approximately 28.7% of the Chicago office market inventory. The submarket contains approximately 20.6 million square feet of class A space. The West Loop submarket class A vacancy was approximately 14.1% and the rental rate for class A space within the submarket is approximately $39.59 per square foot, on a full service gross basis.
The following table presents certain information relating to comparable office properties for the 100 & 150 South Wacker Drive Property:
Competitive Set(1)
100 & 150 South Wacker Drive (Subject) | 10 South Riverside Plaza | CDW Plaza | 222 South Riverside Plaza | 1 South Wacker Drive | 125 South Wacker Drive | 200 South Wacker Drive | |
| Location | Chicago, IL | Chicago, IL | Chicago, IL | Chicago, IL | Chicago, IL | Chicago, IL | Chicago, IL |
| Distance from Subject | -- | 0.4 miles | 0.1 miles | 0.3 miles | 0.3 miles | 0.4 miles | 0.5 miles |
| Property Type | Office | Office | Office | Office | Office | Office | Office |
| Year Built/Renovated | 1961 & 1971/2008 | 1965/1999 | 1965/1984 | 1971/2001 | 1974/2005 | 1974/2005 | 1981/NAV |
| Number of Stories | 21 & 32 | 22 | 22 | 35 | 40 | 31 | 40 |
| Total GLA | 1,095,653 SF | 729,000 SF | 705,574 SF | 1,184,400 SF | 1,192,639 SF | 518,276 SF | 754,751 SF |
| Total Occupancy | 82% | 97% | 97% | 90% | 85% | 89% | 93% |
| (1) | Information obtained from the appraisal dated March 14, 2013. |
The Borrower. The borrower is MJH Wacker LLC, a Delaware limited liability company and single purpose entity with two independent directors. Legal counsel to the borrower delivered a non-consolidation opinion in connection with the origination of the 100 & 150 South Wacker Drive Loan Combination. The borrower is owned 95% owned by MJH Realty LLC, which is 100% owned by Marvin J. Herb. MJH Realty LLC is the guarantor of certain nonrecourse carveouts under the 100 & 150 South Wacker Drive Loan Combination.
The Sponsor. The 100 & 150 South Wacker Drive Loan Sponsor is Marvin J. Herb. From 1981 to 2001, Mr. Herb was the owner, Chairman and CEO of Coca Cola Bottling Company of Chicago. In 2001, Mr. Herb sold Coca Cola Bottling Company of Chicago to Coca-Cola Enterprises (NYSE: CCE) for $1.4 billion and approximately 25 million shares of common stock. Mr. Herb owns approximately 5.9 million square feet of commercial real estate in the Chicago and Milwaukee areas.
Escrows. The loan documents provide for an upfront escrow at closing in the amount of $2,018,032 for taxes and $60,425 for insurance premiums. The loan documents also provide for an upfront escrow in the amount of $885,587 for existing tenant improvement and leasing commission obligations associated with the following tenants: Hanley Flight & Zimmerman ($582,639), Charles Schwab ($162,480), Peregrine ($82,005) and Golub Capital ($58,463). In addition, the loan documents provide for an upfront escrow in the amount of $394,933 for rent concessions associated with the following tenants: Hanley Flight & Zimmerman ($295,008), Charles Schwab ($55,140), Peregrine ($22,890) and Golub Capital ($21,895). The loan documents provide for ongoing monthly escrow deposits of $543,317 for taxes, $6,042 for insurance premiums, $18,261 for replacement reserves and $100,000 for tenant improvements and leasing commissions (subject to a cap of $5,000,000).
THE INFORMATION IN THIS STRUCTURAL AND COLLATERAL TERM SHEET IS NOT COMPLETE AND MAY BE AMENDED PRIOR TO THE TIME OF SALE. THIS TERM SHEET IS NOT AN OFFER TO SELL THESE SECURITIES AND IT IS NOT A SOLICITATION OF AN OFFER TO BUY THESE SECURITIES IN ANY JURISDICTION WHERE THE OFFER OR SALE IS NOT PERMITTED.
104
| 100 & 150 SOUTH WACKER DRIVE |
Lockbox and Cash Management. The 100 & 150 South Wacker Drive Loan Combination requires a lender-controlled lockbox account, which is already in place, and that the tenants be directed to pay their rents directly to such lockbox account. The loan documents also require that all cash revenues and all other monies received by the borrower or the property manager relating to the 100 & 150 South Wacker Drive Property be deposited into the lockbox account within one business day of receipt. Funds are then swept into a lender controlled cash management account and applied in accordance with cash management agreement. Prior to the occurrence of a Cash Trap Event Period (as defined below), all excess funds on deposit in the lockbox are swept into the borrower’s operating account on a monthly basis.
Upon the occurrence of a Cash Trap Event Period all excess funds on deposit in the lockbox account will be swept to certain lender-controlled restricted accounts, and if an event of default exists, the lender will have the exclusive control of, and the right to withdraw and apply, the funds in the deposit account to payment of any and all debts, liabilities and obligations of the borrower in such order, proportion and priority as the lender may determine in its sole discretion.
A “Cash Trap Event Period” will commence upon the earlier of (i) the occurrence and continuance of an event of default, or (ii) the NCF debt service coverage ratio (as defined in the loan documents) falling below 1.25x as tested with respect to each calendar quarter. A Cash Trap Event Period will expire upon (a) in the case of an event of default, the cure of such event of default, or (b)
in the case of the NCF debt service coverage ratio falling below 1.25x, the NCF debt service coverage ratio being at least 1.35x for two consecutive calendar quarters.
Property Management. The 100 & 150 South Wacker Drive Property is managed by Lincoln Property Company Commercial, Inc.
Assumption. The borrower has a two-time right to transfer the 100 & 150 South Wacker Drive Property, provided that no event of default has occurred and is continuing and certain other conditions are satisfied, including, but not limited to: (i) the lender’s reasonable determination that the proposed transferee and guarantor satisfy the lender’s credit review and underwriting standards, taking into consideration transferee experience, financial strength and general business standing; (ii) execution of a recourse guaranty and an environmental indemnity by an affiliate of the transferee; and (iii) if requested by the lender, rating agency confirmation from Fitch, KBRA and Moody’s that the transfer will not result in a downgrade, withdrawal or qualification of the respective ratings assigned to the Series 2013-C14 Certificates, and similar confirmations with respect to the ratings of any securities backed by the 100 & 150 South Wacker Drive Companion Loan.
Partial Release. Not permitted.
Real Estate Substitution. Not permitted.
Subordinate and Mezzanine Indebtedness. Not permitted
Ground Lease. None.
Terrorism Insurance. The loan documents require that the “all risk” insurance policy required to be maintained by the borrower provide coverage for terrorism in an amount equal to the full replacement cost of the 100 & 150 South Wacker Drive Property. The loan documents also require business interruption insurance covering no less than the 18-month period following the occurrence of a casualty event, together with a six-month extended period of indemnity.
THE INFORMATION IN THIS STRUCTURAL AND COLLATERAL TERM SHEET IS NOT COMPLETE AND MAY BE AMENDED PRIOR TO THE TIME OF SALE. THIS TERM SHEET IS NOT AN OFFER TO SELL THESE SECURITIES AND IT IS NOT A SOLICITATION OF AN OFFER TO BUY THESE SECURITIES IN ANY JURISDICTION WHERE THE OFFER OR SALE IS NOT PERMITTED.
105
(THIS PAGE INTENTIONALLY LEFT BLANK)
106
| BRAMBLETON TOWN CENTER |
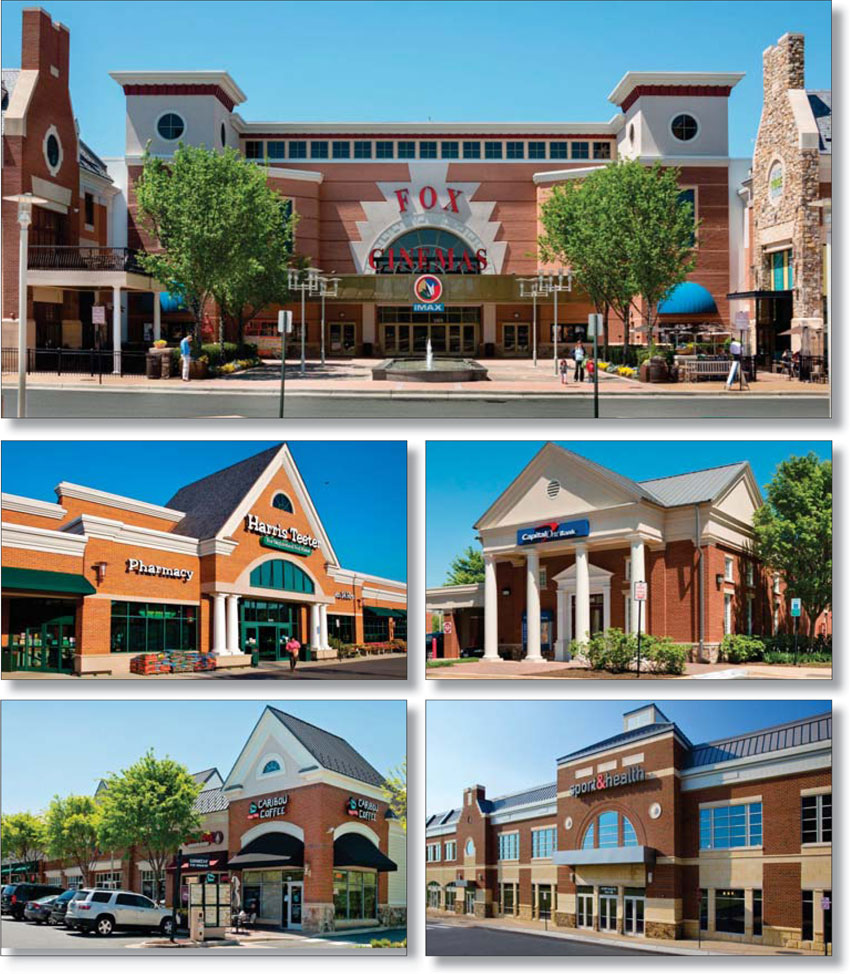
THE INFORMATION IN THIS STRUCTURAL AND COLLATERAL TERM SHEET IS NOT COMPLETE AND MAY BE AMENDED PRIOR TO THE TIME OF SALE. THIS TERM SHEET IS NOT AN OFFER TO SELL THESE SECURITIES AND IT IS NOT A SOLICITATION OF AN OFFER TO BUY THESE SECURITIES IN ANY JURISDICTION WHERE THE OFFER OR SALE IS NOT PERMITTED.
107
| BRAMBLETON TOWN CENTER |
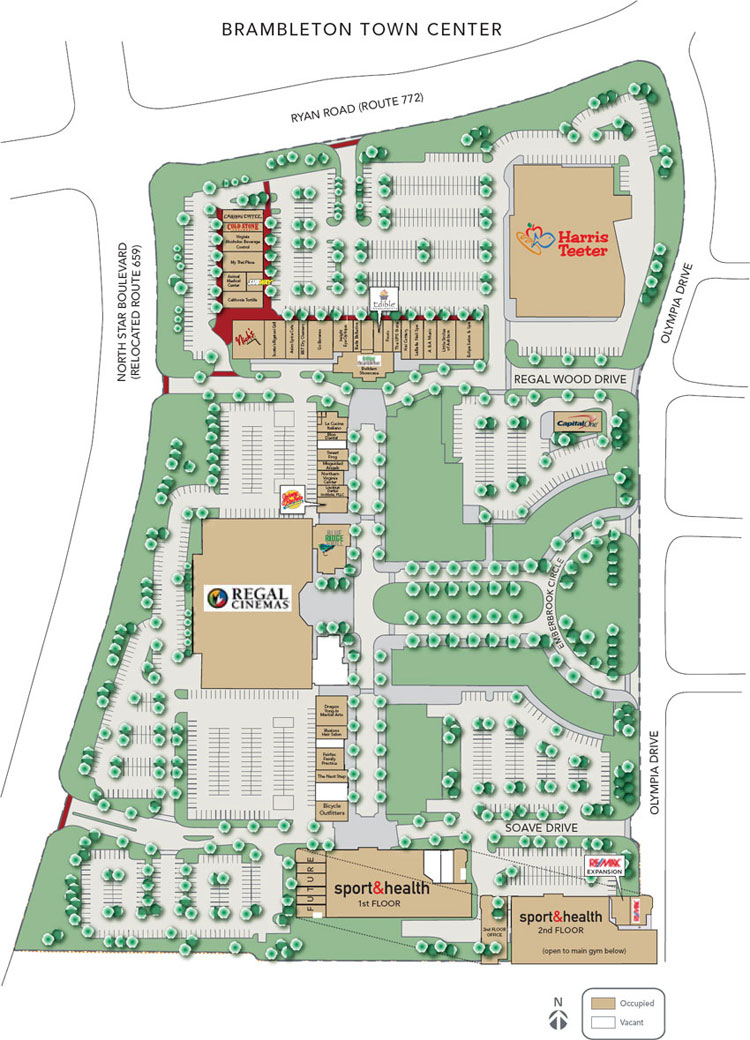
THE INFORMATION IN THIS STRUCTURAL AND COLLATERAL TERM SHEET IS NOT COMPLETE AND MAY BE AMENDED PRIOR TO THE TIME OF SALE. THIS TERM SHEET IS NOT AN OFFER TO SELL THESE SECURITIES AND IT IS NOT A SOLICITATION OF AN OFFER TO BUY THESE SECURITIES IN ANY JURISDICTION WHERE THE OFFER OR SALE IS NOT PERMITTED.
108
| BRAMBLETON TOWN CENTER |
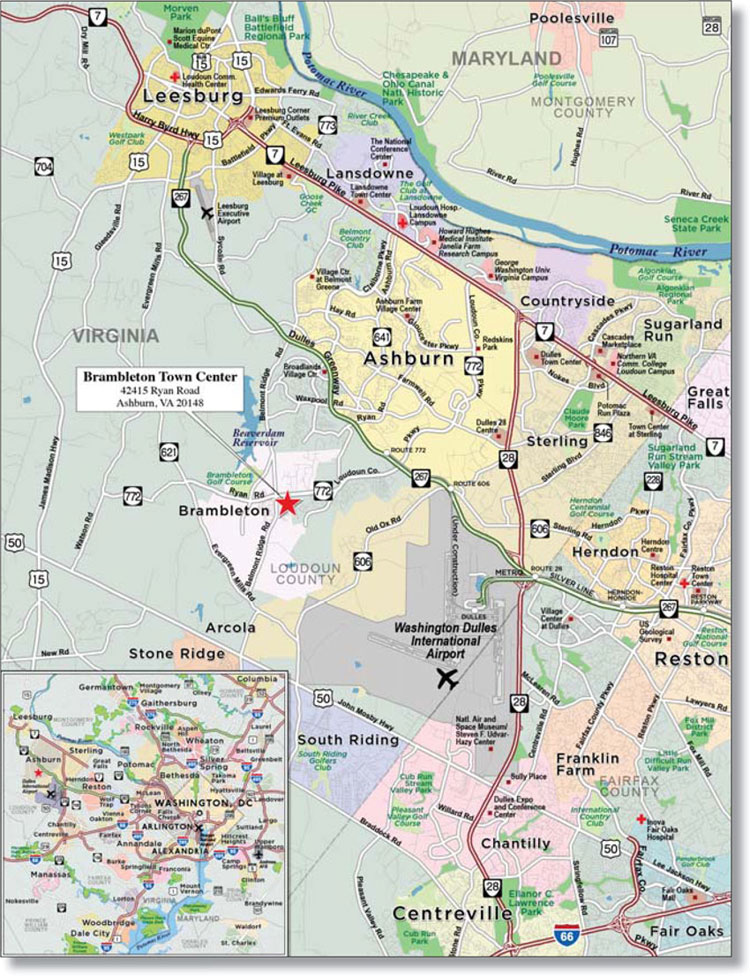
THE INFORMATION IN THIS STRUCTURAL AND COLLATERAL TERM SHEET IS NOT COMPLETE AND MAY BE AMENDED PRIOR TO THE TIME OF SALE. THIS TERM SHEET IS NOT AN OFFER TO SELL THESE SECURITIES AND IT IS NOT A SOLICITATION OF AN OFFER TO BUY THESE SECURITIES IN ANY JURISDICTION WHERE THE OFFER OR SALE IS NOT PERMITTED.
109
| No. 9 – Brambleton Town Center | |||||||
| Loan Information | Property Information | ||||||
| Mortgage Loan Seller: | Wells Fargo Bank, National Association | Single Asset/Portfolio: | Single Asset | ||||
| Credit Assessment (Fitch/KBRA/Moody’s): | NR/NR/NR | Property Type: | Retail | ||||
| Original Principal Balance: | $60,000,000 | Specific Property Type: | Anchored | ||||
| Cut-off Date Principal Balance: | $60,000,000 | Location: | Ashburn, VA | ||||
| % of Initial Pool Balance: | 4.1% | Size: | 295,628 SF | ||||
| Loan Purpose: | Refinance | Cut-off Date Principal Balance Per Unit/SF: | $202.96 | ||||
| Borrower Name: | Brambleton Town Center Associates L.L.C. | Year Built/Renovated: | 2005/NAP | ||||
| Sponsor: | Anthony Soave | Title Vesting: | Fee | ||||
| Mortgage Rate: | 4.000% | Property Manager: | Rappaport Management Company | ||||
| Note Date: | May 1, 2013 | 3rd Most Recent Occupancy (As of): | 90.5% (12/31/2010) | ||||
| Anticipated Repayment Date: | NAP | 2nd Most Recent Occupancy (As of): | 95.5% (12/31/2011) | ||||
| Maturity Date: | May 1, 2023 | Most Recent Occupancy (As of): | 94.6% (12/31/2012) | ||||
| IO Period: | 24 months | Current Occupancy (As of): | 93.1% (2/14/2013) | ||||
| Loan Term (Original): | 120 months | ||||||
| Seasoning: | 1 month | Underwriting and Financial Information: | |||||
| Amortization Term (Original): | 360 months | ||||||
| Loan Amortization Type: | Interest-only, Amortizing Balloon | 3rd Most Recent NOI (As of): | $3,617,425 (12/31/2010) | ||||
| Interest Accrual Method: | Actual/360 | 2nd Most Recent NOI (As of): | $5,238,238 (12/31/2011) | ||||
| Call Protection: | L(25),D(91),O(4) | Most Recent NOI (As of): | $5,912,525 (12/31/2012) | ||||
| Lockbox Type: | Hard/Springing Cash Management | ||||||
| Additional Debt: | None | U/W Revenues: | $7,889,461 | ||||
| Additional Debt Type: | NAP | U/W Expenses: | $2,325,542 | ||||
| U/W NOI: | $5,563,919 | ||||||
| U/W NCF: | $5,190,107 | ||||||
| U/W NOI DSCR: | 1.62x | ||||||
Escrows and Reserves(1): | U/W NCF DSCR: | 1.51x | |||||
| Initial | Monthly | Cap (If Any) | U/W NOI Debt Yield: | 9.3% | |||
| Taxes | $401,710 | $66,952 | NAP | U/W NCF Debt Yield: | 8.7% | ||
| Insurance | $0 | Springing | NAP | As-Is Appraised Value: | $87,600,000 | ||
| Replacement Reserves | $0 | $4,988 | NAP | As-Is Appraisal Valuation Date: | March 22, 2013 | ||
| Rent Concession Reserve | $0 | Springing | NAP | Cut-off Date LTV Ratio: | 68.5% | ||
| Additional Collateral | $2,000,000 | $0 | NAP | LTV Ratio at Maturity or ARD: | 57.7% | ||
(1) | See “Escrows” section. |
The Mortgage Loan. The mortgage loan (the “Brambleton Town Center Mortgage Loan”) is evidenced by a single promissory note that is secured by a first mortgage encumbering an anchored retail property located in Ashburn, Virginia (the “Brambleton Town Center Property”). The Brambleton Town Center Mortgage Loan was originated on May 1, 2013 by Wells Fargo Bank, National Association. The Brambleton Town Center Mortgage Loan had an original principal balance of $60,000,000, has an outstanding principal balance as of the Cut-off Date of $60,000,000 and accrues interest at an interest rate of 4.000% per annum. The Brambleton Town Center Mortgage Loan had an initial term of 120 months, has a remaining term of 119 months as of the Cut-off Date and requires interest-only payments for the first 24 payments following origination and thereafter requires payments of principal and interest based on a 30-year amortization schedule. The Brambleton Town Center Mortgage Loan matures on May 1, 2023.
Following the lockout period, the borrower has the right to defease the Brambleton Town Center Mortgage Loan in whole, but not in part, on any due date before February 1, 2023. In addition, the Brambleton Town Center Mortgage Loan is prepayable without penalty on or after February 1, 2023.
THE INFORMATION IN THIS STRUCTURAL AND COLLATERAL TERM SHEET IS NOT COMPLETE AND MAY BE AMENDED PRIOR TO THE TIME OF SALE. THIS TERM SHEET IS NOT AN OFFER TO SELL THESE SECURITIES AND IT IS NOT A SOLICITATION OF AN OFFER TO BUY THESE SECURITIES IN ANY JURISDICTION WHERE THE OFFER OR SALE IS NOT PERMITTED.
110
| BRAMBLETON TOWN CENTER |
Sources and Uses
| Sources | Uses | |||||||
| Original loan amount | $60,000,000 | 100.0% | Loan payoff | $55,655,366 | 92.8% | |||
| Reserves | 2,401,710 | 4.0 | ||||||
| Closing costs | 433,256 | 0.7 | ||||||
| Return of equity | 1,509,668 | 2.5 | ||||||
| Total Sources | $60,000,000 | 100.0% | Total Uses | $60,000,000 | 100.0% |
The Property. The Brambleton Town Center Property is an anchored retail center containing approximately 295,628 square feet and is located in Ashburn, Virginia. The Brambleton Town Center Property consists of eight buildings situated on 26.2 acres and was constructed in three phases from 2005 to 2011: phase I was constructed in 2005 and includes a Harris Teeter grocery anchor (leased fee) and approximately 66,939 square feet of in-line retail space; phase IIA was constructed in 2007 and includes a 16-screen Regal Cinemas movie theater, approximately 37,950 square feet of in-line retail space and approximately 22,579 square feet of second floor office space; and phase IIB was constructed in 2011 and includes a Sport & Health gym, approximately 4,773 square feet of in-line retail space and approximately 5,873 square feet of second floor office space. Parking is provided by two parking garages and surface parking with a total of 947 parking spaces, resulting in a parking ratio of 7.9 spaces per 1,000 square feet of rentable area. As of February 14, 2013, the Brambleton Town Center Property was 93.1% leased to 44 tenants.
The following table presents certain information relating to the tenancies at the Brambleton Town Center Property:
Major Tenants
| Tenant Name | Credit Rating (Fitch/ Moody’s/ S&P)(1) | Tenant NRSF | % of NRSF | Annual U/W Base Rent PSF | Annual U/W Base Rent | % of Total Annual U/W Base Rent | Sales PSF(2) | Occupancy Cost(2) | Lease Expiration Date | |
| Anchor Tenants | ||||||||||
| Regal Cinemas | NR/NR/NR | 63,514 | 21.5% | $16.00 | $1,016,224 | 17.7% | (3) | 17.0% | 7/31/2027 | |
| Harris Teeter (Leased Fee) | NR/NR/NR | 56,000 | 18.9% | $13.00 | $728,000 | 12.7% | $409 | 4.8% | 10/18/2025 | |
| Brambleton Sport & Health | NR/NR/NR | 38,000 | 12.9% | $16.47 | $626,040 | 10.9% | $108 | 21.3% | 5/31/2020 | |
| Total Anchor Tenants | 157,514 | 53.3% | $15.05 | $2,370,264 | 41.4% | |||||
| Major Tenants | ||||||||||
Brambleton Group(4)(5) | NR/NR/NR | 21,471 | 7.3% | $28.43 | $610,417 | 10.7% | NAP | NAP | Various | |
| Fairfax Family Practice | NR/NR/NR | 12,625 | 4.3% | $25.56 | $322,677 | 5.6% | NAP | NAP | 2/28/2018 | |
| Capital One Bank | A-/Baa1/BBB | (6) | (6) | (6) | $247,250 | 4.3% | NAP | NAP | 9/30/2030 | |
| Blue Ridge Grill | NR/NR/NR | 5,650 | 1.9% | $30.00 | $169,500 | 3.0% | $619 | 5.9% | 11/30/2018 | |
| Total Major Tenants | 39,746 | 13.4% | $27.74(6) | $1,349,844 | 23.6% | |||||
| Non-Major Tenants | 77,983 | 26.4% | $25.79 | $2,010,875 | 35.1% | |||||
| Occupied Collateral Total | 275,243 | 93.1% | $19.92(6) | $5,730,983 | 100.0% | |||||
| Vacant Space | 20,385 | 6.9% | ||||||||
| Collateral Total | 295,628 | 100.0% | ||||||||
(1) | Certain ratings are those of the parent company whether or not the parent guarantees the lease. |
(2) | Sales PSF and Occupancy Costs represent the trailing 12-month period ending December 31, 2012. |
(3) | Regal Cinemas operates 16 screens and reported sales of $467,086 per screen for the trailing 12-month period ending December 31, 2012. |
| (4) | Brambleton Group leases three spaces: 6,421 square feet with an Annual U/W Base Rent PSF of $46.37 and Lease Expiration Date of June 30, 2018; 7,123 square feet with an Annual U/W Base Rent PSF of $25.00 and Lease Expiration Date of December 31, 2016; and 7,927 square feet with an Annual U/W Base Rent PSF of $16.98 and Lease Expiration Date of July 31, 2013. Brambleton Group subleases the 7,927 square foot space to KLNB, LLC and Brambleton Community Association, who occupy 5,316 square feet and 2,611 square feet, respectively, and pay base rent per square foot of $16.85 and $17.23, respectively. The subleases both expire on July 31, 2013, and the total rent paid by the two sublease tenants is equal to the rent paid by Brambleton Group. |
| (5) | Brambleton Group is related to the loan sponsor. |
| (6) | Capital One Bank owns its building and leases a pad site with no attributed square footage. The Annual U/W Base Rent PSF for Total Major Tenants and Occupied Collateral Total excludes the Annual U/W Base Rent associated with this tenant. |
THE INFORMATION IN THIS STRUCTURAL AND COLLATERAL TERM SHEET IS NOT COMPLETE AND MAY BE AMENDED PRIOR TO THE TIME OF SALE. THIS TERM SHEET IS NOT AN OFFER TO SELL THESE SECURITIES AND IT IS NOT A SOLICITATION OF AN OFFER TO BUY THESE SECURITIES IN ANY JURISDICTION WHERE THE OFFER OR SALE IS NOT PERMITTED.
111
| BRAMBLETON TOWN CENTER |
The following table presents certain information relating to the historical sales at the Brambleton Town Center Property:
Historical Sales (PSF)(1)
| Tenant Name | 2010 | 2011 | 2012 |
| Regal Cinemas | (2) | (2) | (2) |
| Harris Teeter (Leased Fee) | $323 | $372 | $409 |
| Brambleton Sport & Health | NAV | $95 | $108 |
| Blue Ridge Grill | NAV | NAV | $619 |
(1) Historical Sales (PSF) are based on historical statements provided by the borrower. | |||
| (2) Regal Cinemas operates 16 screens and reported sales per screen of $569,152, $526,715 and $467,086 for 2010, 2011 and 2012, respectively. | |||
The following table presents certain information relating to the lease rollover schedule at the Brambleton Town Center Property:
Lease Expiration Schedule(1)(2)
Year Ending December 31, | No. of Leases Expiring | Expiring NRSF | % of Total NRSF | Cumulative Expiring NRSF | Cumulative % of Total NRSF | Annual U/W Base Rent | Annual U/W Base Rent PSF(3) |
| MTM | 0 | 0 | 0.0% | 0 | 0.0% | $0 | $0.00 |
| 2013 | 3 | 9,113 | 3.1% | 9,113 | 3.1% | $163,064 | $17.89 |
| 2014 | 4 | 10,280 | 3.5% | 19,393 | 6.6% | $273,252 | $26.58 |
| 2015 | 2 | 7,013 | 2.4% | 26,406 | 8.9% | $139,618 | $19.91 |
| 2016 | 14 | 31,601 | 10.7% | 58,007 | 19.6% | $822,080 | $26.01 |
| 2017 | 7 | 13,838 | 4.7% | 71,845 | 24.3% | $388,613 | $28.08 |
| 2018 | 7 | 35,152 | 11.9% | 106,997 | 36.2% | $1,054,726 | $30.00 |
| 2019 | 1 | 2,724 | 0.9% | 109,721 | 37.1% | $68,100 | $25.00 |
| 2020 | 2 | 41,260 | 14.0% | 150,981 | 51.1% | $712,495 | $17.27 |
| 2021 | 0 | 0 | 0.0% | 150,981 | 51.1% | $0 | $0.00 |
| 2022 | 0 | 0 | 0.0% | 150,981 | 51.1% | $0 | $0.00 |
| 2023 | 1 | 4,748 | 1.6% | 155,729 | 52.7% | $117,560 | $24.76 |
Thereafter(4) | 3 | 119,514 | 40.4% | 275,243 | 93.1% | $1,991,474 | $14.59(4) |
| Vacant | 0 | 20,385 | 6.9% | 295,628 | 100.0% | $0 | $0.00 |
| Total/Weighted Average | 44 | 295,628 | 100.0% | $5,730,983 | $19.92 | ||
| (1) Information obtained from the underwritten rent roll. | |||||||
| (2) Certain tenants may have lease termination options that are exercisable prior to the originally stated expiration date of the subject lease and that are not considered in the Lease Expiration Schedule. | |||||||
| (3) Weighted Average Annual U/W Base Rent PSF excludes vacant space. | |||||||
| (4) Includes Capital One Bank which owns its building and leases a pad site with no attributed square footage. Capital One Bank has an Annual U/W Base Rent of $247,250, which was excluded from the Annual U/W Base Rent PSF calculation. | |||||||
The following table presents historical occupancy percentages at the Brambleton Town Center Property:
Historical Occupancy(1)
12/31/2010 | 12/31/2011 | 12/31/2012 | 2/14/2013 | |||
| 90.5% | 95.5% | 94.6% | 93.1% | |||
| (1) Information obtained from the borrower. | ||||||
THE INFORMATION IN THIS STRUCTURAL AND COLLATERAL TERM SHEET IS NOT COMPLETE AND MAY BE AMENDED PRIOR TO THE TIME OF SALE. THIS TERM SHEET IS NOT AN OFFER TO SELL THESE SECURITIES AND IT IS NOT A SOLICITATION OF AN OFFER TO BUY THESE SECURITIES IN ANY JURISDICTION WHERE THE OFFER OR SALE IS NOT PERMITTED.
112
| BRAMBLETON TOWN CENTER |
Operating History and Underwritten Net Cash Flow. The following table presents certain information relating to the historical operating performance and Underwritten Net Cash Flow at the Brambleton Town Center Property:
Cash Flow Analysis
2010 | 2011 | 2012 | U/W | U/W $ per SF | ||||||
| Base Rent | $4,115,103 | $4,513,928 | $5,592,299 | $5,730,983 | $19.39 | |||||
| Grossed Up Vacant Space | 0 | 0 | 0 | 509,625 | 1.72 | |||||
| Percentage Rent | 152,160 | 1,353,829 | 967,146 | 600,000 | 2.03 | |||||
| Total Reimbursables | 1,308,247 | 1,337,218 | 1,533,451 | 1,608,000 | 5.44 | |||||
| Other Income | 0 | 0 | 0 | 0 | 0.00 | |||||
| Less Vacancy & Credit Loss | 0 | 0 | 0 | (559,147)(1) | (1.89) | |||||
| Effective Gross Income | $5,575,510 | $7,204,975 | $8,092,897 | $7,889,461 | $26.69 | |||||
| Total Operating Expenses | $1,958,085 | $1,966,737 | $2,180,372 | $2,325,542 | $7.87 | |||||
| Net Operating Income | $3,617,425 | $5,238,238 | $5,912,525 | $5,563,919 | $18.82 | |||||
| TI/LC | 0 | 0 | 0 | 328,920 | 1.11 | |||||
| Capital Expenditures | 0 | 0 | 0 | 44,892 | 0.15 | |||||
| Net Cash Flow | $3,617,425 | $5,238,238 | $5,912,525 | $5,190,107 | $17.56 | |||||
| NOI DSCR | 1.05x | 1.52x | 1.72x | 1.62x | ||||||
| NCF DSCR | 1.05x | 1.52x | 1.72x | 1.51x | ||||||
| NOI DY | 6.0% | 8.7% | 9.9% | 9.3% | ||||||
| NCF DY | 6.0% | 8.7% | 9.9% | 8.7% | ||||||
| (1) The underwritten economic vacancy is 9.0%. The Brambleton Town Center Property was 93.1% physically occupied as of February 14, 2013. | ||||||||||
Appraisal. As of the appraisal valuation date of March 22, 2013, the Brambleton Town Center Property had an “as-is” appraised value of $87,600,000.
Environmental Matters. According to the Phase I environmental report dated March 26, 2013, there was no evidence of any recognized environmental conditions at the Brambleton Town Center Property.
Market Overview and Competition. The Brambleton Town Center Property is located in Ashburn, Virginia, approximately 31.8 miles northwest of the Washington, D.C. central business district and approximately 8.9 miles northwest of Dulles International Airport. The property is part of Brambleton, a master-planned community encompassing over 2,000 acres, which includes retail and office space, single-family homes, townhomes, luxury apartments and condominiums and is home to over 2,000 families. Primary access to the area is provided by the Dulles Toll Road (VA Route 267), which provides access to Leesburg, Virginia to the west and Washington, D.C. to the east. According to the appraisal, in 2013, the estimated populations within a three-mile and five-mile radius of the Brambleton Town Center Property were 35,277 and 87,530, respectively. The estimated average household incomes within the same three-mile and five-mile radii were $172,387 and $169,887, respectively.
According to a third party market research report, the Brambleton Town Center Property is located within the Leesburg/West Loudoun submarket, which has an estimated inventory of 335 retail properties totaling approximately 1.9 million square feet. As of the first quarter of 2013, the submarket vacancy was 2.8% with an average asking rent of $27.45 per square foot, on a triple net basis.
The following table presents certain information relating to comparable retail properties for the Brambleton Town Center Property:
Competitive Set(1)
Brambleton Town Center (Subject) | Broadlands Marketplace | Broadlands Village Center | East Gate Marketplace | Shoppes at Ryan Park | South Riding Market Square (Phase I) | |
| Location | Ashburn, VA | Ashburn, VA | Ashburn, VA | Chantilly, VA | Ashburn, VA | South Riding, VA |
| Distance from Subject | -- | 2.9 miles | 4.9 miles | 7.5 miles | 4.6 miles | 5.5 miles |
| Property Type | Retail | Retail | Retail | Retail | Retail | Retail |
| Year Built/Renovated | 2005/NAP | 2007/NAP | 2004/NAP | 2010/NAP | 2006/NAP | 2005/NAP |
| Total GLA | 295,628 SF | 116,882 SF | 159,734 SF | 81,619 SF | 93,548 SF | 259,695 SF |
| Total Occupancy | 93% | 96% | 89% | 77% | 98% | 99% |
| (1) | Information obtained from the appraisal dated April 26, 2013. |
THE INFORMATION IN THIS STRUCTURAL AND COLLATERAL TERM SHEET IS NOT COMPLETE AND MAY BE AMENDED PRIOR TO THE TIME OF SALE. THIS TERM SHEET IS NOT AN OFFER TO SELL THESE SECURITIES AND IT IS NOT A SOLICITATION OF AN OFFER TO BUY THESE SECURITIES IN ANY JURISDICTION WHERE THE OFFER OR SALE IS NOT PERMITTED.
113
| BRAMBLETON TOWN CENTER |
The Borrower. The borrower is Brambleton Town Center Associates L.L.C., a single purpose entity with an independent director. Legal counsel to the borrower delivered a non-consolidation opinion in connection with the origination of the Brambleton Town Center Mortgage Loan. Anthony Soave, the indirect owner of the borrower, is the guarantor of certain nonrecourse carveouts under the Brambleton Town Center Mortgage Loan.
The Sponsor. The loan sponsor is Anthony Soave, who is President, Chief Executive Officer and founder of Soave Enterprises LLC, a Detroit-based holding company that owns and operates a portfolio of businesses involved in real estate, automotive, agriculture and other diversified industries. Soave Real Estate Group, a subsidiary of Soave Enterprises, operates a highly diversified portfolio of real estate holdings including office, retail and industrial properties as well as luxury residential developments.
Escrows. The loan documents provide for an upfront reserve in the amount of $401,710 for real estate taxes in addition to ongoing monthly reserves in an amount equal to $66,952 for real estate taxes and $4,988 for replacement reserves. Ongoing monthly reserves for insurance are not required as long as (i) no event of default has occurred and is continuing; (ii) the Brambleton Town Center Property is insured in accordance with the loan documents; and (iii) the borrower provides the lender with evidence of renewal of the policies and paid receipts for the payment of insurance premiums when due.
In addition, the borrower deposited an amount equal to $2,000,000 into an additional collateral reserve account at closing. These funds will be released to the borrower upon the satisfaction of the following conditions: (i) no event of default has occurred and is continuing; (ii) the Brambleton Town Center Property is at least 94% physically occupied with all tenants open for business and paying rent; and (iii) the net cash flow (as defined in the loan documents) is at least $5,580,000. With regard to satisfying clause (ii), the borrower also has the right to establish a rent concession reserve account, into which an amount equal to any outstanding rent concessions may be deposited. If the preceding conditions are not satisfied by May 1, 2018, the borrower will no longer be entitled to a release of the reserve funds and the servicer may hold the funds as additional collateral for the Brambleton Town Center Mortgage Loan.
Lockbox and Cash Management. The Brambleton Town Center Mortgage Loan requires a lender-controlled lockbox account, which is already in place, and that the borrower directs the tenants to pay their rents directly to such lockbox account. The loan documents also require that all cash revenues and all other monies received by the borrower or manager relating to the Brambleton Town Center Property be deposited into the lockbox account within one business day after receipt. Prior to the occurrence of a Cash Trap Event Period (as defined below), all funds on deposit in the lockbox account are swept into the borrower’s operating account on a daily basis. During a Cash Trap Event Period, all funds on deposit in the lockbox account are swept to a lender-controlled cash management account each business day.
A “Cash Trap Event Period” will commence upon the earlier of (i) the occurrence and continuance of an event of default or (ii) the amortizing debt service coverage ratio falling below 1.25x at the end of any calendar month. A Cash Trap Event Period will expire, with regard to the circumstances in clause (i), upon the cure of such event of default, or with regard to the circumstances in clause (ii), upon the amortizing debt service coverage ratio being equal to or greater than 1.35x for two consecutive calendar quarters.
Property Management. The Brambleton Town Center Property is managed by Rappaport Management Company.
Assumption. The borrower has a two-time right to transfer the Brambleton Town Center Property, provided that no event of default has occurred and is continuing and certain other conditions are satisfied, including (i) the lender’s reasonable determination that the proposed transferee and guarantor satisfy the lender’s credit review and underwriting standards, taking into consideration transferee experience, financial strength and general business standing; (ii) execution of a recourse guaranty and an environmental indemnity by an affiliate of the transferee; and (iii) if requested by the lender, rating agency confirmation from Fitch, KBRA and Moody’s that the transfer will not result in a downgrade, withdrawal or qualification of the respective ratings assigned to the Series 2013-C14 Certificates.
Partial Release. The borrower may obtain a free release of certain vacant, non-income producing, unimproved outlots or parcels from the lien of the mortgage upon the satisfaction of certain conditions including without limitation (i) no event of default will have occurred and be continuing on the date the borrower delivers notice and on the date of release and (ii) the delivery of a legal opinion to the lender to demonstrate that the release of the related outparcel will satisfy REMIC requirements.
Real Estate Substitution. Not permitted.
Subordinate and Mezzanine Indebtedness. Not permitted.
Ground Lease. None.
Terrorism Insurance. The loan documents require that the “all risk” insurance policy required to be maintained by the borrower provide coverage for terrorism in an amount equal to the full replacement cost of the Brambleton Town Center Property. The loan documents also require business interruption insurance covering no less than the 24-month period following the occurrence of a casualty event, together with a six-month extended period of indemnity.
THE INFORMATION IN THIS STRUCTURAL AND COLLATERAL TERM SHEET IS NOT COMPLETE AND MAY BE AMENDED PRIOR TO THE TIME OF SALE. THIS TERM SHEET IS NOT AN OFFER TO SELL THESE SECURITIES AND IT IS NOT A SOLICITATION OF AN OFFER TO BUY THESE SECURITIES IN ANY JURISDICTION WHERE THE OFFER OR SALE IS NOT PERMITTED.
114
(THIS PAGE INTENTIONALLY LEFT BLANK)
115
| REHOBOTH BAY MHC |
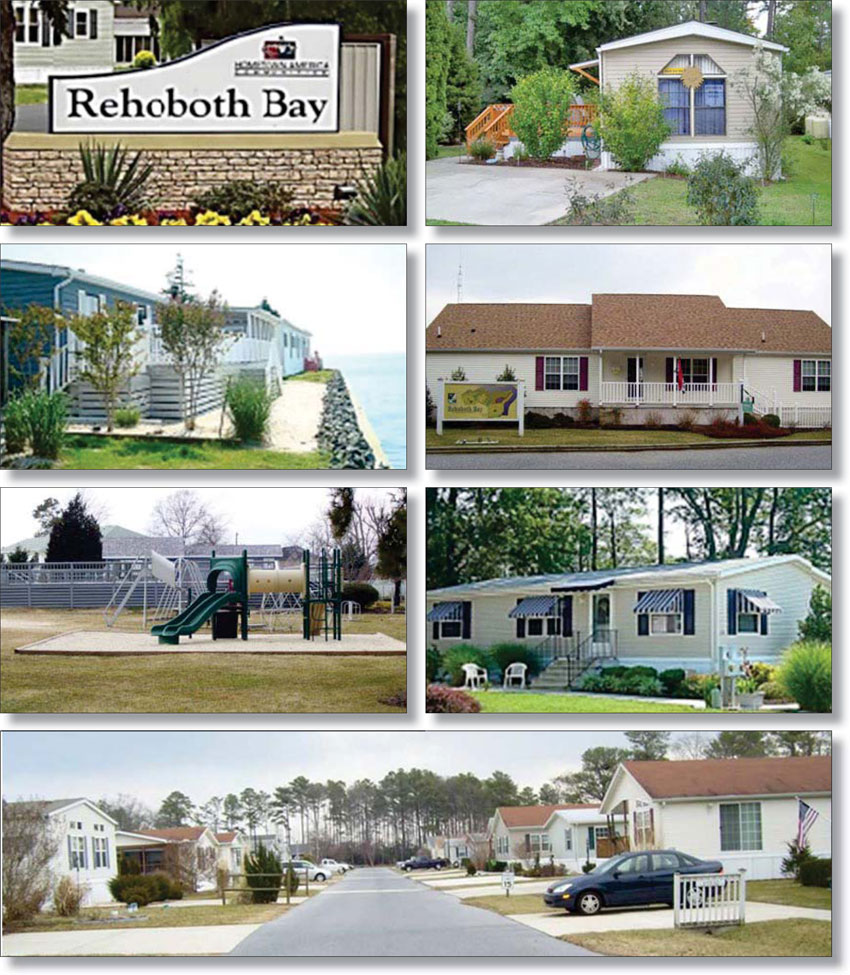
THE INFORMATION IN THIS STRUCTURAL AND COLLATERAL TERM SHEET IS NOT COMPLETE AND MAY BE AMENDED PRIOR TO THE TIME OF SALE. THIS TERM SHEET IS NOT AN OFFER TO SELL THESE SECURITIES AND IT IS NOT A SOLICITATION OF AN OFFER TO BUY THESE SECURITIES IN ANY JURISDICTION WHERE THE OFFER OR SALE IS NOT PERMITTED.
116
| REHOBOTH BAY MHC |
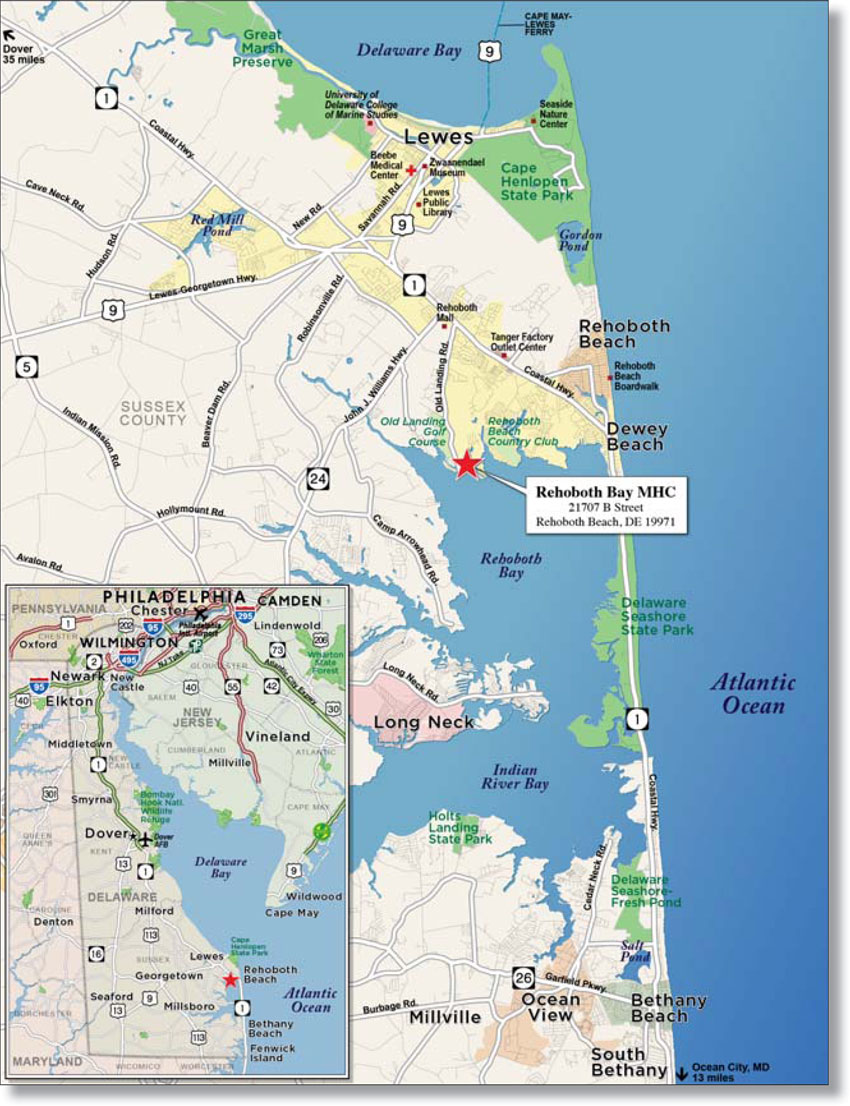
THE INFORMATION IN THIS STRUCTURAL AND COLLATERAL TERM SHEET IS NOT COMPLETE AND MAY BE AMENDED PRIOR TO THE TIME OF SALE. THIS TERM SHEET IS NOT AN OFFER TO SELL THESE SECURITIES AND IT IS NOT A SOLICITATION OF AN OFFER TO BUY THESE SECURITIES IN ANY JURISDICTION WHERE THE OFFER OR SALE IS NOT PERMITTED.
117
| No. 10 - Rehoboth Bay MHC | ||||||||
| Loan Information | Property Information | |||||||
| Mortgage Loan Seller: | The Royal Bank of Scotland | Single Asset/Portfolio: | Single Asset | |||||
| Credit Assessment (Fitch/KBRA/Moody’s): | NR/NR/NR | Property Type: | Manufactured Housing Community | |||||
| Original Principal Balance: | $33,000,000 | Specific Property Type: | Manufactured Housing Community | |||||
| Cut-off Date Principal Balance: | $33,000,000 | Location: | Rehoboth Beach, DE | |||||
| % of Initial Pool Balance: | 2.2% | Size: | 525 pads | |||||
| Loan Purpose: | Refinance | Cut-off Date Principal Balance Per Pad: | $62,857.14 | |||||
| Borrower Name: | Hometown Rehoboth, L.L.C. | Year Built/Renovated(2): | 1970/2012 | |||||
| Sponsor: | Hometown America Corporation | Title Vesting: | Fee | |||||
| Mortgage Rate: | 3.970% | Property Manager: | Self-managed | |||||
| Note Date: | May 3, 2013 | 3rd Most Recent Occupancy (As of): | 98.1% (12/31/2010) | |||||
| Anticipated Repayment Date: | NAP | 2nd Most Recent Occupancy (As of): | 97.9% (12/31/2011) | |||||
| Maturity Date: | June 1, 2023 | Most Recent Occupancy (As of): | 98.4% (12/31/2012) | |||||
| IO Period: | 60 months | Current Occupancy (As of): | 98.9% (3/28/2013) | |||||
| Loan Term (Original): | 120 months | |||||||
| Seasoning: | 0 months | Underwriting and Financial Information: | ||||||
| Amortization Term (Original): | 360 months | |||||||
| Loan Amortization Type: | Interest-only, Amortizing Balloon | 3rd Most Recent NOI (As of): | $2,942,522 (12/31/2011) | |||||
| Interest Accrual Method: | Actual/360 | 2nd Most Recent NOI (As of): | $3,049,974 (12/31/2012) | |||||
| Call Protection: | L(24),D(92),O(4) | Most Recent NOI (As of): | $3,069,904 (TTM 2/28/2013) | |||||
| Lockbox Type: | Hard/Springing Cash Management | |||||||
| Additional Debt: | None | U/W Revenues: | $3,486,156 | |||||
| Additional Debt Type: | NAP | U/W Expenses: | $607,991 | |||||
| U/W NOI: | $2,878,166 | |||||||
| U/W NCF: | $2,845,216 | |||||||
U/W NOI DSCR : | 1.53x | |||||||
Escrows and Reserves(1): | U/W NCF DSCR: | 1.51x | ||||||
| U/W NOI Debt Yield: | 8.7% | |||||||
| Type: | Initial | Monthly | Cap (If Any) | U/W NCF Debt Yield: | 8.6% | |||
| Taxes | $16,069 | $1,607 | NAP | As-Is Appraised Value: | $48,000,000 | |||
| Insurance | $0 | Springing | NAP | As-Is Appraisal Valuation Date: | January 30, 2013 | |||
| Replacement Reserves | $2,746 | $2,746 | NAP | Cut-off Date LTV Ratio: | 68.8% | |||
| Deferred Maintenance | $27,687 | $0 | NAP | LTV Ratio at Maturity or ARD: | 62.4% | |||
| (1) | See “Escrows” section. |
| (2) | The Rehoboth Bay MHC Property was built and renovated in phases between 1970 and 2012. |
The Mortgage Loan. The mortgage loan (the “Rehoboth Bay MHC Mortgage Loan”) is evidenced by a single promissory note that is secured by a first mortgage encumbering a manufactured housing community totaling 525 pads located in Rehoboth Beach, Delaware (the “Rehoboth Bay MHC Property”). The Rehoboth Bay MHC Mortgage Loan was originated on May 3, 2013 by The Royal Bank of Scotland. The Rehoboth Bay MHC Mortgage Loan had an original principal balance of $33,000,000, has an outstanding principal balance as of the Cut-off Date of $33,000,000 and accrues interest at an interest rate of 3.970% per annum. The Rehoboth Bay MHC Mortgage Loan had an initial term of 120 months, has a remaining term of 120 months as of the Cut-off Date and requires interest-only payments for the first 60 payments following origination and thereafter requires payments of principal and interest based on a 30-year amortization schedule. The Rehoboth Bay MHC Mortgage Loan matures on June 1, 2023.
Following the lockout period, the borrower has the right to defease the Rehoboth Bay MHC Mortgage Loan in whole, but not in part, on any due date before March 1, 2023. In addition, the Rehoboth Bay MHC Mortgage Loan is prepayable without penalty on or after March 1, 2023.
THE INFORMATION IN THIS STRUCTURAL AND COLLATERAL TERM SHEET IS NOT COMPLETE AND MAY BE AMENDED PRIOR TO THE TIME OF SALE. THIS TERM SHEET IS NOT AN OFFER TO SELL THESE SECURITIES AND IT IS NOT A SOLICITATION OF AN OFFER TO BUY THESE SECURITIES IN ANY JURISDICTION WHERE THE OFFER OR SALE IS NOT PERMITTED.
118
| REHOBOTH BAY MHC |
Sources and Uses
| Sources | Uses | |||||||
| Original loan amount | $33,000,000 | 100.0% | Return of equity(1) | $32,776,776 | 99.3 | % | ||
| Reserves | 46,502 | 0.1 | ||||||
| Closing costs | 176,722 | 0.5 | ||||||
| Total Sources | $33,000,000 | 100.0% | Total Uses | $33,000,000 | 100.0 | % |
| (1) | The proceeds from the Rehoboth Bay MHC Mortgage Loan were used to recapitalize the sponsor’s investment in the previously unencumbered Rehoboth Bay MHC Property. The sponsor recently paid off one line of credit totalling $21.0 million which were used to retire the Rehoboth Bay MHC Property’s existing debt in March 2013. |
The Property. The Rehoboth Bay MHC Property is a 5-star, 525-pad manufactured housing community located in Rehoboth Beach, Delaware. The Rehoboth Bay MHC Property is situated on 148.2 acres and was built and renovated in phases between 1970 and 2012. The Rehoboth Bay MHC Property includes a range of amenities including an outdoor pool, shuffleboard, tennis courts, RV storage, access to the beach, a 134-slip marina and crabbing pier. Trash removal and water are provided by the Rehoboth Bay MHC Property while municipal-sewer, electricity and cable are paid by the tenants. There are a total of 1,069 parking spaces at the Rehoboth Bay MHC Property accounting for a parking ratio of approximately 2.0 parking spaces per pad.
The following table presents historical occupancy percentages at the Rehoboth Bay MHC Property:
Historical Occupancy(1)
12/31/2010 | 12/31/2011 | 12/31/2012 | 3/28/2013 | |||
| 98.1% | 97.9% | 98.4% | 98.9% | |||
| (1) Information obtained from the borrower. | ||||||
Operating History and Underwritten Net Cash Flow. The following table presents certain information relating to the historical operating performance and the Underwritten Net Cash Flow at the Rehoboth Bay MHC Property:
Cash Flow Analysis
| 2011 | 2012 | TTM 2/28/2013 | U/W | U/W $ per Pad | ||||||
| Base Rent | $3,291,572 | $3,393,185 | $3,414,751 | $3,522,456 | $6,709.44 | |||||
| Concessions | (10,505) | (16,403) | (15,121) | (15,121) | (28.80) | |||||
| Grossed Up Vacant Space | 0 | 0 | 0 | 0 | 0.00 | |||||
| Other Income | 164,463 | 168,626 | 166,854 | 161,536 | 307.69 | |||||
| Less Vacancy & Credit Loss | (54,961) | (41,094) | (36,569) | (182,715)(1) | (348.03) | |||||
| Effective Gross Income | $3,390,569 | $3,504,314 | $3,529,915 | $3,486,156 | $6,640.30 | |||||
| Total Operating Expenses | $448,047 | $454,340 | $460,011 | $607,991 | $1,158.08 | |||||
| Net Operating Income | $2,942,522 | $3,049,974 | $3,069,904 | $2,878,166 | $5,482.22 | |||||
| Capital Expenditures | 0 | 0 | 0 | 32,950 | 62.76 | |||||
| Net Cash Flow | $2,942,522 | $3,049,974 | $3,069,904 | $2,845,216 | $5,419.46 | |||||
| NOI DSCR | 1.56x | 1.62x | 1.63x | 1.53x | ||||||
| NCF DSCR | 1.56x | 1.62x | 1.63x | 1.51x | ||||||
| NOI DY | 8.9% | 9.2% | 9.3% | 8.7% | ||||||
| NCF DY | 8.9% | 9.2% | 9.3% | 8.6% | ||||||
| (1) The underwritten economic vacancy is 5.2%. The Rehoboth Bay MHC Property was 98.9% physically occupied as of March 28, 2013. | ||||||||||
Appraisal. As of the appraisal valuation date of January 30, 2013, the Rehoboth Bay MHC Property had an “as-is” appraised value of $48,000,000.
Environmental Matters. According to the Phase I environmental site assessment dated April 24, 2013, there was no evidence of any recognized environmental conditions at the Rehoboth Bay MHC Property.
Market Overview and Competition. The Rehoboth Bay MHC Property is located on the beach along Rehoboth Bay in Rehoboth, Sussex County, Delaware. Regional access to the local area is provided by Interstate 76 and US 13, which are approximately 80 miles and 38 miles from the Rehoboth Bay MHC Property, respectively. Public transportation is available via public bus service with the nearest bus stop less than two miles from the Rehoboth Bay MHC Property. The 2012 populations within a three- and five-mile radius of the Rehoboth Bay MHC Property were 13,816 and 29,229, respectively. The average household incomes within the same three- and five-mile radii were $77,972 and $71,842, respectively. The unemployment rate for Sussex County was 7.3% in 2011 while the national average was 8.9%. The appraisal identified a competitive set of six manufactured housing communities, and within the competitive set the average vacancy rate was 2.0% with average asking rents of $486 per month.
THE INFORMATION IN THIS STRUCTURAL AND COLLATERAL TERM SHEET IS NOT COMPLETE AND MAY BE AMENDED PRIOR TO THE TIME OF SALE. THIS TERM SHEET IS NOT AN OFFER TO SELL THESE SECURITIES AND IT IS NOT A SOLICITATION OF AN OFFER TO BUY THESE SECURITIES IN ANY JURISDICTION WHERE THE OFFER OR SALE IS NOT PERMITTED.
119
| REHOBOTH BAY MHC |
The Borrower. The borrower is Hometown Rehoboth, L.L.C., a single purpose entity that has at least one independent director. Legal counsel to the borrower delivered a non-consolidation opinion in connection with the origination of the Rehoboth Bay MHC Mortgage Loan. Hometown America, L.L.C., is the guarantor of certain nonrecourse carveouts under the Rehoboth Bay MHC Mortgage Loan.
The Sponsor. The sponsor for the Rehoboth Bay MHC Mortgage Loan is Hometown America Corporation (“Hometown America”). Founded in 1997, Hometown America consists of two divisions; the Hometown America Family Communities and Hometown America Age-Qualified (55+) Communities. Hometown America is a privately held company that owns and operates more than 45 manufactured housing communities in 11 states. As of December 31, 2012, Hometown America had total assets of approximately $823.0 million.
Escrows. The loan documents provide for upfront escrows in the amount of $16,069 for real estate taxes, $27,687 for immediate repairs and $2,746 for replacement reserves. The loan documents provide for ongoing monthly escrows in the amount of $1,607 for real estate taxes and $2,746 for replacement reserves. Monthly insurance escrows are not required so long as (i) insurance maintained by the borrower is in effect under an acceptable blanket insurance policy, and (ii) the borrower provides the lender with evidence of renewal of the policies and paid receipts for the payment of insurance premiums when due.
Lockbox and Cash Management. The Rehoboth Bay MHC Mortgage Loan requires a lender-controlled lockbox account, which is already in place, and the tenants are obligated to deposit all revenues directly into such lockbox account. The loan documents also require that all cash revenues and all other monies received by the borrower or the property manager be deposited into the lockbox account within three business days after receipt. Prior to the occurrence of a Cash Management Period (as defined below), all funds on deposit in the lockbox account are swept into the borrower’s operating account. During a Cash Management Period, all funds on deposit in the lockbox account are swept to a lender-controlled cash management account.
A “Cash Management Period” will commence: (i) upon the occurrence of an event of default, or (ii) if the debt service coverage ratio is less than 1.20x for two consecutive calendar quarters. A Cash Management Period will end, with respect to matters in clause (i) above, if the event of default has been cured, or, with respect to matters in clause (ii) above, if the debt service coverage ratio is at least 1.20x for two consecutive calendar quarters.
Property Management. The Rehoboth Bay MHC Property is managed by an affiliate of the borrower.
Assumption. The borrower has the right to transfer all of the Rehoboth Bay MHC Property, subject to customary conditions set forth in the loan documents, including but not limited to: (i) no event of default has occurred and is continuing, and (ii) the lender has received rating agency confirmation from Fitch, KBRA and Moody’s that the transfer will not result in a downgrade, withdrawal or qualification of the respective ratings assigned to the Series 2013-C14 Certificates.
Partial Release. Not permitted.
Real Estate Substitution. Not permitted.
Subordinate and Mezzanine Indebtedness. Not permitted.
Ground Lease. None.
Terrorism Insurance. The loan documents require that the “all risk” insurance policy required to be maintained by the borrower provide coverage for terrorism in an amount equal to the full replacement cost of the Rehoboth Bay MHC Property. The loan documents also require business interruption insurance covering no less than the 12-month period following the occurrence of a casualty event.
THE INFORMATION IN THIS STRUCTURAL AND COLLATERAL TERM SHEET IS NOT COMPLETE AND MAY BE AMENDED PRIOR TO THE TIME OF SALE. THIS TERM SHEET IS NOT AN OFFER TO SELL THESE SECURITIES AND IT IS NOT A SOLICITATION OF AN OFFER TO BUY THESE SECURITIES IN ANY JURISDICTION WHERE THE OFFER OR SALE IS NOT PERMITTED.
120
(THIS PAGE INTENTIONALLY LEFT BLANK)
121
| No. 11 - RHP Portfolio IV | |||||||
| Loan Information | Property Information | ||||||
| Mortgage Loan Seller: | The Royal Bank of Scotland | Single Asset/Portfolio: | Portfolio | ||||
Credit Assessment (Fitch/KBRA/Moody’s): | NR/NR/NR | Property Type: | Manufactured Housing Community | ||||
| Original Principal Balance: | $30,621,868 | Specific Property Type: | Manufactured Housing Community | ||||
| Cut-off Date Principal Balance: | $30,621,868 | Location: | Various – See Table | ||||
| % of Initial Pool Balance: | 2.1% | Size: | 860 pads | ||||
| Loan Purpose: | Acquisition | Cut-off Date Principal Balance Per Pad: | $35,607 | ||||
Borrower Name(1): | Various | Year Built/Renovated: | Various – See Table | ||||
| Sponsors: | RHP Properties Inc.; NorthStar Realty Finance Corporation | Title Vesting: | Fee | ||||
| Mortgage Rate: | 4.011% | Property Manager: | Newbury Management Company | ||||
| Note Date: | April 5, 2013 | 3rd Most Recent Occupancy (As of): | 82.3% (12/31/2010) | ||||
| Anticipated Repayment Date: | NAP | 2nd Most Recent Occupancy (As of): | 83.0% (12/31/2011) | ||||
| Maturity Date: | May 1, 2023 | Most Recent Occupancy (As of): | 83.3% (12/31/2012) | ||||
| IO Period: | 34 months | Current Occupancy (As of): | 83.1% (2/14/2013) | ||||
| Loan Term (Original): | 120 months | ||||||
| Seasoning: | 1 month | Underwriting and Financial Information: | |||||
| Amortization Term (Original): | 360 months | ||||||
| Loan Amortization Type: | Interest-only, Amortizing Balloon | 3rd Most Recent NOI (As of): | $2,156,764 (12/31/2010) | ||||
| Interest Accrual Method: | Actual/360 | 2nd Most Recent NOI (As of): | $2,293,735 (12/31/2011) | ||||
| Call Protection: | L(25),GRTR 1% or YM(90),O(5) | Most Recent NOI (As of): | $2,513,217 (12/31/2012) | ||||
| Lockbox Type: | Soft/Springing Cash Management | ||||||
| Additional Debt: | Yes | U/W Revenues: | $3,853,722 | ||||
| Additional Debt Type: | Future Mezzanine | U/W Expenses: | $1,352,559 | ||||
| U/W NOI: | $2,501,164 | ||||||
| U/W NCF: | $2,458,164 | ||||||
| U/W NOI DSCR: | 1.42x | ||||||
Escrows and Reserves: | U/W NCF DSCR: | 1.40x | |||||
| U/W NOI Debt Yield: | 8.2% | ||||||
| Type: | Initial | Monthly | Cap (If Any) | U/W NCF Debt Yield: | 8.0% | ||
| Taxes | $115,248 | $18,629 | NAP | As-Is Appraised Value: | $41,540,000 | ||
| Insurance | $42,034 | $6,005 | NAP | As-Is Appraisal Valuation Date(3): | Various | ||
Replacement Reserves(2) | $655,214 | Springing | $137,600 | Cut-off Date LTV Ratio: | 73.7% | ||
| Deferred Maintenance | $41,158 | $0 | NAP | LTV Ratio at Maturity or ARD: | 63.5% | ||
| (1) | The borrower is comprised of five separate limited liability companies. |
| (2) | The loan documents provide for a $3,583 monthly replacement reserve escrow beginning on May 1, 2016. The replacement reserve escrow will be capped at $137,600, exclusive of the initial deposit of $655,214. |
| (3) | The As-Is Appraisal Valuation Dates range from February 27, 2013 to March 6, 2013. |
The mortgage loan is evidenced by a single promissory note that is secured by five first mortgages encumbering five manufactured housing communities totaling 860 pads and located in five states (the “RHP Portfolio IV Properties”). The RHP Portfolio IV Properties were acquired by the sponsors as a part of a larger 35-property portfolio in April 2013. The remaining 30 properties in the portfolio (“RHP Portfolio III Properties” and “RHP Portfolio V Properties”) are not collateral for the mortgage loan. The RHP Portfolio IV Properties include a range of amenities including playgrounds, basketball courts, RV storage, swimming pools and clubhouses. The RHP Portfolio IV Properties were developed between 1940 and 1998 and have an average age of 43 years. Public utilities are provided in all but one of the RHP Portfolio IV Properties, Pine Haven MHC, which has a private septic sewer system.
Sources and Uses
| Sources | Uses | |||||||
| Original loan amount | $30,621,868 | 74.8 | % | Purchase price | $39,473,502 | 97.2 | % | |
| Sponsor’s new cash contribution | 10,326,598 | 25.2 | Reserves | 853,654 | 2.1 | |||
| Closing costs | 421,310 | 1.5 | ||||||
| Total Sources | $40,948,466 | 100.0 | % | Total Uses | $40,948,466 | 100.0 | % |
THE INFORMATION IN THIS STRUCTURAL AND COLLATERAL TERM SHEET IS NOT COMPLETE AND MAY BE AMENDED PRIOR TO THE TIME OF SALE. THIS TERM SHEET IS NOT AN OFFER TO SELL THESE SECURITIES AND IT IS NOT A SOLICITATION OF AN OFFER TO BUY THESE SECURITIES IN ANY JURISDICTION WHERE THE OFFER OR SALE IS NOT PERMITTED.
122
| RHP PORTFOLIO IV |
The following table presents certain information relating to the RHP Portfolio IV Properties:
| Property Name – Location | Allocated Cut- off Date Principal Balance | % of Portfolio Cut-off Date Principal Balance | Current Occupancy | Year Built/ Renovated | Pads | Appraised Value | ||||||||||
| Brookside - West Jordan, UT | $10,615,188 | 34.7 | % | 100.0 | % | 1970/NAP | 170 | $14,400,000 | ||||||||
| Overpass Point MHC - Tooele, UT | $7,445,375 | 24.3 | % | 88.1 | % | 1998/NAP | 193 | $10,100,000 | ||||||||
| Havenwood - Pompano Beach, FL | $6,560,775 | 21.4 | % | 91.7 | % | 1971/NAP | 120 | $8,900,000 | ||||||||
| The Woodlands - Wichita, KS | $3,051,867 | 10.0 | % | 61.1 | % | 1969/NAP | 244 | $4,140,000 | ||||||||
| Pine Haven MHC - Blossvale, NY | $2,948,663 | 9.6 | % | 87.2 | % | 1940/NAP | 133 | $4,000,000 | ||||||||
| Total/Weighted Average | $30,621,868 | 100.0 | % | 83.1 | % | 860 | $41,540,000 | |||||||||
The following table presents historical occupancy percentages at the RHP Portfolio IV Properties:
Historical Occupancy(1)
12/31/2010 | 12/31/2011 | 12/31/2012 | 2/14/2013 | |||
| 82.3% | 83.0% | 83.3% | 83.1% | |||
| (1) Information obtained from the borrower. | ||||||
Operating History and Underwritten Net Cash Flow. The following table presents certain information relating to the historical operating performance and the Underwritten Net Cash Flow at the RHP Portfolio IV Properties:
Cash Flow Analysis
2010 | 2011 | 2012 | U/W | U/W $ per Pad | |||||||
| Base Rent | $3,088,635 | $3,269,037 | $3,415,003 | $3,574,786 | $4,157 | ||||||
| Concessions | (55,943) | (61,603) | (43,598) | (43,598) | (51) | ||||||
| Grossed Up Vacant Space | 0 | 0 | 0 | 584,583 | 680 | ||||||
| Total Reimbursables | 0 | 0 | 0 | 0 | 0 | ||||||
| Other Income | 404,489 | 399,555 | 395,128 | 395,128 | 459 | ||||||
| Less Vacancy & Credit Loss | (87,611) | (61,636) | (70,317) | (657,176)(1) | (764) | ||||||
| Effective Gross Income | $3,349,570 | $3,545,353 | $3,696,216 | $3,853,722 | $4,481 | ||||||
| Total Operating Expenses | $1,192,806 | $1,251,618 | $1,182,999 | $1,352,559 | $1,573 | ||||||
| Net Operating Income | $2,156,764 | $2,293,735 | $2,513,217 | $2,501,164 | $2,908 | ||||||
| TI/LC | 0 | 0 | 0 | 0 | 0 | ||||||
| Capital Expenditures | 0 | 0 | 0 | 43,000 | 50 | ||||||
| Net Cash Flow | $2,156,764 | $2,293,735 | $2,513,217 | $2,458,164 | $2,858 | ||||||
| NOI DSCR | 1.23x | 1.31x | 1.43x | 1.42x | |||||||
| NCF DSCR | 1.23x | 1.31x | 1.43x | 1.40x | |||||||
| NOI DY | 7.0% | 7.5% | 8.2% | 8.2% | |||||||
| NCF DY | 7.0% | 7.5% | 8.2% | 8.0% | |||||||
| (1) The underwritten economic vacancy is 15.6%. The RHP Portfolio IV Properties were 83.1% physically occupied as of February 14, 2013. | |||||||||||
THE INFORMATION IN THIS STRUCTURAL AND COLLATERAL TERM SHEET IS NOT COMPLETE AND MAY BE AMENDED PRIOR TO THE TIME OF SALE. THIS TERM SHEET IS NOT AN OFFER TO SELL THESE SECURITIES AND IT IS NOT A SOLICITATION OF AN OFFER TO BUY THESE SECURITIES IN ANY JURISDICTION WHERE THE OFFER OR SALE IS NOT PERMITTED.
123
| No. 12 – Heron Bay III, IV & Waterway Shoppes | ||||||||||
| Loan Information | Property Information | |||||||||
| Mortgage Loan Seller: | Liberty Island Group I LLC | Single Asset/Portfolio: | Portfolio | |||||||
Credit Assessment (Fitch/KBRA/Moody’s): | NR/NR/NR | Property Type: | Various – See Table | |||||||
| Original Principal Balance: | $23,000,000 | Specific Property Type: | Various – See Table | |||||||
| Cut-off Date Principal Balance: | $22,970,518 | Location: | Coral Springs, FL | |||||||
| % of Initial Pool Balance: | 1.6% | Size: | 130,985 SF | |||||||
| Loan Purpose: | Refinance | Cut-off Date Principal Balance Per Unit/SF: | $175.37 | |||||||
| Borrower Names: | RM-NA HB THREE OFFICE BUILDING, LLC; RM-NA HB FOUR OFFICE BUILDING, LLC; RM-NA HB Waterway Shoppes, LLC | Year Built/Renovated: | Various – See Table | |||||||
| Sponsors: | William D. Matz; Barry Ross | Title Vesting: | Fee | |||||||
| Mortgage Rate: | 4.170% | Property Manager: | Ross Realty Investments, Inc. | |||||||
| Note Date: | April 26, 2013 | 3rd Most Recent Occupancy (As of): | 96.6% (12/31/2010) | |||||||
| Anticipated Repayment Date: | NAP | 2nd Most Recent Occupancy (As of): | 100.0% (12/31/2011) | |||||||
| Maturity Date: | May 1, 2023 | Most Recent Occupancy (As of): | 98.1% (1/31/2013) | |||||||
| IO Period: | None | Current Occupancy (As of): | 98.1% (3/31/2013) | |||||||
| Loan Term (Original): | 120 months | |||||||||
| Seasoning: | 1 month | Underwriting and Financial Information: | ||||||||
| Amortization Term (Original): | 360 months | |||||||||
| Loan Amortization Type: | Amortizing Balloon | 3rd Most Recent NOI (As of): | $2,281,470 (12/31/2011) | |||||||
| Interest Accrual Method: | Actual/360 | 2nd Most Recent NOI (As of): | $2,194,328 (12/31/2012) | |||||||
| Call Protection: | L(25), D(91), O(4) | Most Recent NOI (As of): | $2,287,884 (TTM 3/31/2013) | |||||||
| Lockbox Type: | Soft/Springing Cash Management | |||||||||
| Additional Debt: | None | |||||||||
| Additional Debt Type: | NAP | U/W Revenues: | $3,531,515 | |||||||
| U/W Expenses: | $1,326,014 | |||||||||
| U/W NOI: | $2,205,501 | |||||||||
| U/W NCF: | $2,011,391 | |||||||||
| U/W NOI DSCR: | 1.64x | |||||||||
Escrows and Reserves: | U/W NCF DSCR: | 1.50x | ||||||||
| U/W NOI Debt Yield: | 9.6% | |||||||||
Type: | Initial | Monthly | Cap (If Any) | U/W NCF Debt Yield: | 8.8% | |||||
| Taxes | $297,928 | $37,241 | NAP | As-Is Appraised Value: | $31,750,000 | |||||
| Insurance | $231,733 | $16,552 | NAP | As-Is Appraisal Valuation Date: | February 13, 2013 | |||||
| Replacement Reserves | $2,183 | $2,183 | NAP | Cut-off Date LTV Ratio: | 72.3% | |||||
| TI/LC Reserve | $500,000 | $9,500 | $500,000 | LTV Ratio at Maturity or ARD: | 57.9% | |||||
The Heron Bay III, IV & Waterway Shoppes mortgage loan is evidenced by a single promissory note that is secured by a first mortgage encumbering two office buildings and a retail center located in Coral Springs, Florida (the “Heron Bay III, IV & Waterway Shoppes Properties”). The Heron Bay III, IV & Waterway Shoppes mortgage loan was originated on April 26, 2013 by Prudential Mortgage Capital Company, LLC. The Heron Bay III, IV & Waterway Shoppes Properties consist of two three-story office buildings and a one-story retail center totaling 130,985 square feet and are located in Coral Springs, Florida (the “Heron Bay III, IV Property” and the “Waterway Shoppes Property”, respectively). The Heron Bay III, IV Property contains approximately 90,727 square feet and is situated on approximately 0.9 acres of land located at the intersection of Coral Ridge Drive and Sawgrass Expressway. Built between 2007 and 2008, the Heron Bay III, IV Property was 100.0% leased by 11 tenants as of March 31, 2013. The Waterway Shoppes Property contains approximately 40,258 square feet and is situated on approximately 1.3 acres of land located on the intersection of Coral Ridge Drive and Holmberg Road. Parking at the Heron Bay III, IV & Waterway Shoppes Properties consists of 890 surface parking spaces and 29 handicapped spaces totaling 919 spaces or approximately 7.0 spaces per 1,000 square feet of rentable area. Built in 2006, the Waterway Shoppes Property was 93.9% leased by 20 tenants as of March 31, 2013. In aggregate, the Heron Bay III, IV & Waterway Shoppes Properties were 98.1% occupied by 31 tenants as of March 31, 2013.
THE INFORMATION IN THIS STRUCTURAL AND COLLATERAL TERM SHEET IS NOT COMPLETE AND MAY BE AMENDED PRIOR TO THE TIME OF SALE. THIS TERM SHEET IS NOT AN OFFER TO SELL THESE SECURITIES AND IT IS NOT A SOLICITATION OF AN OFFER TO BUY THESE SECURITIES IN ANY JURISDICTION WHERE THE OFFER OR SALE IS NOT PERMITTED.
124
HERON BAY III, IV & WATERWAY SHOPPES |
Sources and Uses
| Sources | Uses | |||||||
| Original loan amount | $23,000,000 | 97.9 | % | Loan payoff | $22,172,463 | 94.4 | % | |
| Sponsor’s new cash contribution | 493,827 | 2.1 | Reserves | 1,194,775 | 5.1 | |||
| Closing costs | 126,589 | 0.5 | ||||||
| Total Sources | $23,493,827 | 100.0 | % | Total Uses | $23,493,827 | 100.0 | % |
The following table represents certain information relating to the Heron Bay III, IV & Waterway Shoppes Properties:
| Property Name | Allocated Cut-off Date Principal Balance | % of Portfolio Cut-off Date Principal Balance | Occupancy | Year Built/ Renovated | Net Rentable Area (SF) | Appraised Value |
| Heron Bay III, IV | 15,012,228 | 65.4% | 100.0% | 2007-2008/NAP | 90,727 | $20,750,000 |
| Waterway Shoppes | 7,958,290 | 34.6% | 93.9% | 2006/NAP | 40,258 | $11,000,000 |
| Total/Weighted Average | 22,970,518 | 100.0% | 98.1% | 130,985 | $31,750,000 |
The following table presents certain information relating to the tenancies at the Heron Bay III, IV & Waterway Shoppes Properties:
Major Tenants
| Tenant Name | Credit Rating (Fitch/ Moody’s/ S&P)(1) | Tenant NRSF | % of NRSF | Annual U/W Base Rent PSF | Annual U/W Base Rent | % of Total Annual U/W Base Rent | Lease Expiration Date |
| Major Office Tenants | |||||||
| Strayer University | B/B1/B | 15,866 | 12.1% | $26.67 | $423,146 | 15.3% | 8/20/2015 |
| Tenet Healthcare Corp | NR/NR/NR | 15,866 | 12.1% | $21.63 | $343,182 | 12.4% | 10/31/2017 |
| South Broward Hospital District | NR/NR/NR | 10,833 | 8.3% | $17.93 | $194,236 | 7.0% | 6/14/2021 |
| P2P Staffing (Tek) Partners | NR/NR/NR | 10,697 | 8.2% | $18.07 | $193,295 | 7.0% | 3/23/2020 |
| Major Retail Tenants | |||||||
| The Pizza & Pasta Factory | NR/NR/NR | 4,000 | 3.1% | $22.00 | $88,000 | 3.2% | 12/31/2022 |
| Waterways Preschool | NR/NR/NR | 3,187 | 2.4% | $22.59 | $71,994 | 2.6% | 2/28/2017 |
| MD Now | NR/NR/NR | 3,418 | 2.6% | $20.50 | $70,069 | 2.5% | 4/30/2017 |
| Hurricane Wings | NR/NR/NR | 3,249 | 2.5% | $20.60 | $66,929 | 2.4% | 9/30/2015 |
| Total Major Tenants | 67,116 | 51.2% | $21.62 | $1,450,851 | 52.5% | ||
| Non-Major Tenants | 61,423 | 46.9% | $21.37 | $1,312,347 | 47.5% | ||
| Occupied Collateral Total | 128,539 | 98.1% | $21.50 | $2,763,198 | 100.0% | ||
| Vacant Space | 2,446 | 1.9% | |||||
| Collateral Total | 130,985 | 100.0% | |||||
| (1) Certain ratings are those of the parent company whether or not the parent guarantees the lease. | |||||||
THE INFORMATION IN THIS STRUCTURAL AND COLLATERAL TERM SHEET IS NOT COMPLETE AND MAY BE AMENDED PRIOR TO THE TIME OF SALE. THIS TERM SHEET IS NOT AN OFFER TO SELL THESE SECURITIES AND IT IS NOT A SOLICITATION OF AN OFFER TO BUY THESE SECURITIES IN ANY JURISDICTION WHERE THE OFFER OR SALE IS NOT PERMITTED.
125
HERON BAY III, IV & WATERWAY SHOPPES |
The following table presents certain information relating to the lease rollover schedule at the Heron Bay III, IV & Waterway Shoppes Properties:
Lease Expiration Schedule(1)(2)
Year Ending December 31, | No. of Leases Expiring | Expiring NRSF(1) | % of Total NRSF | Cumulative of Total NRSF | Cumulative % of Total NRSF | Annual U/W Base Rent | Annual U/W Base Rent PSF(3) | ||||||||||||||
| MTM | 1 | 1,280 | 1.0 | % | 1,280 | 1.0 | % | $32,000 | $25.00 | ||||||||||||
| 2013 | 0 | 0 | 0.0 | % | 1,280 | 1.0 | % | $0 | $0.00 | ||||||||||||
| 2014 | 3 | 11,523 | 8.8 | % | 12,803 | 9.8 | % | $221,976 | $19.26 | ||||||||||||
| 2015 | 7 | 32,458 | 24.8 | % | 45,261 | 34.6 | % | $728,956 | $22.46 | ||||||||||||
| 2016 | 2 | 7,799 | 6.0 | % | 53,060 | 40.5 | % | $135,027 | $17.31 | ||||||||||||
| 2017 | 13 | 45,935 | 35.1 | % | 98,995 | 75.6 | % | $1,062,371 | $23.13 | ||||||||||||
| 2018 | 2 | 4,014 | 3.1 | % | 103,009 | 78.6 | % | $107,337 | $26.74 | ||||||||||||
| 2019 | 0 | 0 | 0.0 | % | 103,009 | 78.6 | % | $0 | $0.00 | ||||||||||||
| 2020 | 1 | 10,697 | 8.2 | % | 113,706 | 86.8 | % | $193,295 | $18.07 | ||||||||||||
| 2021 | 1 | 10,833 | 8.3 | % | 124,539 | 95.1 | % | $194,236 | $17.93 | ||||||||||||
| 2022 | 1 | 4,000 | 3.1 | % | 128,539 | 98.1 | % | $88,000 | $22.00 | ||||||||||||
| 2023 | 0 | 0 | 0.0 | % | 128,539 | 98.1 | % | $0 | $0.00 | ||||||||||||
| Thereafter | 0 | 0 | 0.0 | % | 128,539 | 98.1 | % | $0 | $0.00 | ||||||||||||
| Vacant | 0 | 2,446 | 1.9 | % | 130,985 | 100.0 | % | $0 | $0.00 | ||||||||||||
| Total/Weighted Average | 130,985 | 100.0 | % | $2,763,198 | $21.50 | ||||||||||||||||
| (1) | Information was obtained from the underwritten rent roll. |
| (2) | Certain tenants may have lease termination options that are exercisable prior to the originally stated expiration date of the subject lease and that are not considered in the Lease Expiration Schedule. |
| (3) | Weighted Average Annual U/W Base Rent PSF excludes vacant space. |
The following table presents historical occupancy percentages at the Heron Bay III, IV & Waterway Shoppes Properties:
Historical Occupancy(1)
12/31/2010 | 12/31/2011 | 1/31/2013 | 3/31/2013 | |||
| 96.6% | 100.0% | 98.1% | 98.1% | |||
| (1) Information obtained from borrower rent rolls. | ||||||
Operating History and Underwritten Net Cash Flow. The following table presents certain information relating to the historical operating performance and the Underwritten Net Cash Flow at the Heron Bay III, IV & Waterway Shoppes Properties:
Cash Flow Analysis
2011 | 2012 | TTM 3/31/2013 | U/W | U/W $ per SF | |||||||
| Base Rent | $2,441,159 | $2,437,779 | $2,434,500 | $2,763,198 | $21.51 | ||||||
| Grossed Up Vacant Space | 0 | 0 | 0 | 53,808 | 0 | ||||||
| Total Reimbursables | 1,087,286 | 1,011,072 | 1,082,389 | 1,254,015 | 9.57 | ||||||
| Other Income | 69,398 | 64,755 | 57,433 | 0 | 0 | ||||||
| Less Vacancy & Credit Loss | 0 | 0 | 0 | (539,506)(1) | (4.12) | ||||||
| Effective Gross Income | $3,597,843 | $3,513,606 | $3,574,322 | $3,531,515 | $26.96 | ||||||
| Total Operating Expenses | $1,316,373 | $1,319,278 | $1,286,438 | $1,326,014 | $10.12 | ||||||
| Net Operating Income | $2,281,470 | $2,194,328 | $2,287,884 | $2,205,501 | $16.84 | ||||||
| TI/LC | 0 | 0 | 0 | 167,913 | 1.28 | ||||||
| Reserves for Replacements | 0 | 0 | 0 | 26,197 | 0.20 | ||||||
| Net Cash Flow | $2,281,470 | $2,194,328 | $2,287,884 | $2,011,391 | $15.36 | ||||||
| NOI DSCR | 1.70x | 1.63x | 1.70x | 1.64x | |||||||
| NCF DSCR | 1.70x | 1.63x | 1.70x | 1.50x | |||||||
| NOI DY | 9.9% | 9.6% | 10.0% | 9.6% | |||||||
| NCF DY | 9.9% | 9.6% | 10.0% | 8.8% | |||||||
| (1) The underwritten economic vacancy is 13.3%. The Heron Bay III, IV & Waterway Shoppes Properties were 98.1% physically occupied as of March 31, 2013. | |||||||||||
THE INFORMATION IN THIS STRUCTURAL AND COLLATERAL TERM SHEET IS NOT COMPLETE AND MAY BE AMENDED PRIOR TO THE TIME OF SALE. THIS TERM SHEET IS NOT AN OFFER TO SELL THESE SECURITIES AND IT IS NOT A SOLICITATION OF AN OFFER TO BUY THESE SECURITIES IN ANY JURISDICTION WHERE THE OFFER OR SALE IS NOT PERMITTED.
126
(THIS PAGE INTENTIONALLY LEFT BLANK)
127
| No. 13 - Brentwood Gateway Office Building | |||||||
| Loan Information | Property Information | ||||||
| Mortgage Loan Seller: | The Royal Bank of Scotland | Single Asset/Portfolio: | Single Asset | ||||
Credit Assessment (Fitch/KBRA/Moody’s): | NR/NR/NR | Property Type: | Office | ||||
| Original Principal Balance: | $22,500,000 | Specific Property Type: | Suburban | ||||
| Cut-off Date Principal Balance: | $22,500,000 | Location: | Los Angeles, CA | ||||
| % of Initial Pool Balance: | 1.5% | Size: | 100,304 SF | ||||
| Loan Purpose: | Refinance | Cut-off Date Principal Balance Per Unit/SF: | $224.32 | ||||
| Borrower Name: | Brentwood Gateway, LLC | Year Built/Renovated: | 1977/1999 | ||||
| Sponsor: | Fred Sands | Title Vesting: | Leasehold | ||||
| Mortgage Rate: | 4.155% | Property Manager: | Vintage Real Estate, LLC | ||||
| Note Date: | May 6, 2013 | 3rd Most Recent Occupancy (As of): | 89.5% (12/31/2010) | ||||
| Anticipated Repayment Date: | NAP | 2nd Most Recent Occupancy (As of): | 86.1% (12/31/2011) | ||||
| Maturity Date: | June 1, 2023 | Most Recent Occupancy (As of): | 97.2% (12/31/2012) | ||||
| IO Period: | None | Current Occupancy (As of): | 100.0% (4/1/2013) | ||||
| Loan Term (Original): | 120 months | ||||||
| Seasoning: | 0 months | Underwriting and Financial Information: | |||||
| Amortization Term (Original): | 360 months | ||||||
| Loan Amortization Type: | Amortizing Balloon | 3rd Most Recent NOI (As of): | $1,507,539 (12/31/2011) | ||||
| Interest Accrual Method: | Actual/360 | 2nd Most Recent NOI (As of): | $2,175,822 (12/31/2012) | ||||
| Call Protection: | L(24),D(92),O(4) | Most Recent NOI (As of): | $2,178,135 (TTM 3/31/2013) | ||||
| Lockbox Type: | Hard/Springing Cash Management | ||||||
| Additional Debt: | None | ||||||
| Additional Debt Type: | NAP | U/W Revenues: | $4,488,153 | ||||
| U/W Expenses: | $2,375,722 | ||||||
| U/W NOI: | $2,112,431 | ||||||
| U/W NCF: | $1,856,168 | ||||||
Escrows and Reserves: | U/W NOI DSCR: | 1.61x | |||||
| U/W NCF DSCR: | 1.41x | ||||||
| Type: | Initial | Monthly | Cap (If Any) | U/W NOI Debt Yield: | 9.4% | ||
| Taxes | $22,309 | $11,155 | NAP | U/W NCF Debt Yield: | 8.2% | ||
| Insurance | $0 | $2,189 | NAP | As-Is Appraised Value: | $30,000,000 | ||
| TI/LC Reserve | $300,000 | $25,494 | $300,000 | As-Is Appraisal Valuation Date: | March 25, 2013 | ||
| Capex | $2,090 | $2,090 | NAP | Cut-off Date LTV Ratio: | 75.0% | ||
| Tenant Reserve | $231,638 | $0 | $NAP | LTV Ratio at Maturity or ARD: | 59.9% | ||
The Brentwood Gateway Office Building mortgage loan is evidenced by a single promissory note that is secured by a first mortgage encumbering a leasehold interest in an 11-story class A suburban office building located in Los Angeles, California (the “Brentwood Gateway Office Building Property”). The Brentwood Gateway Office Building Property is located along San Vicente Boulevard, one-quarter mile from Interstate 405 and approximately 3.5 miles northeast of Santa Monica. The Brentwood Gateway Office Property was built in 1977, underwent renovations in 1999 and contains 100,304 net rentable square feet. Parking at the Brentwood Gateway Office Building Property consists of a four-level parking structure and surface parking, totaling 285 spaces or approximately 2.8 spaces per 1,000 square feet of rentable area. As of April 1, 2013, the Brentwood Gateway Office Building Property was 100.0% leased to 33 tenants.
Sources and Uses
| Sources | Uses | |||||||
| Original loan amount | $22,500,000 | 100.0% | Loan payoff | $10,103,109 | 44.9% | |||
| Reserves | 556,037 | 2.5 | ||||||
| Closing costs | 151,430 | 0.6 | ||||||
| Return of equity | 11,689,425 | 52.0 | ||||||
| Total Sources | $22,500,000 | 100.0% | Total Uses | $22,500,000 | 100.0% | |||
THE INFORMATION IN THIS STRUCTURAL AND COLLATERAL TERM SHEET IS NOT COMPLETE AND MAY BE AMENDED PRIOR TO THE TIME OF SALE. THIS TERM SHEET IS NOT AN OFFER TO SELL THESE SECURITIES AND IT IS NOT A SOLICITATION OF AN OFFER TO BUY THESE SECURITIES IN ANY JURISDICTION WHERE THE OFFER OR SALE IS NOT PERMITTED.
128
BRENTWOOD GATEWAY OFFICE BUILDING |
The following table presents certain information relating to the tenancies at the Brentwood Gateway Office Building Property:
Major Tenants
| Tenant Name | Credit Rating (Fitch/Moody’s/ S&P)(1) | Tenant NRSF | % of NRSF | Annual U/W Base Rent PSF | Annual U/W Base Rent | % of Total Annual U/W Base Rent | Lease Expiration Date | ||||||
| Major Tenants | |||||||||||||
| Vintage Capital Group | NR/NR/NR | 9,479 | 9.4% | $44.28 | $419,730 | 9.8% | 5/31/2021 | ||||||
| Buter, Buzard, Dunaetz | NR/NR/NR | 10,666 | 10.6% | $35.65 | $380,203 | 8.9% | 1/2/2016 | ||||||
| Los Angeles Training | NR/NR/NR | 10,820 | 10.8% | $31.35 | $339,216 | 7.9% | 4/4/2021 | ||||||
| Oaktree Capital Management | A/NR/A- | 5,995 | 6.0% | $46.01 | $275,843 | 6.5% | 4/30/2018 | ||||||
| Armbruster Goldsmith | NR/NR/NR | 5,322 | 5.3% | $47.86 | $254,719 | 6.0% | 7/15/2015 | ||||||
| Allison & Partners | NR/NR/NR | 4,996 | 5.0% | $38.83 | $193,989 | 4.5% | 2/4/2017 | ||||||
| Trial Behavior Consul | NR/NR/NR | 3,816 | 3.8% | $46.35 | $176,872 | 4.1% | 5/31/2015 | ||||||
| Total Major Tenants | 51,094 | 50.9% | $39.94 | $2,040,572 | 47.8% | ||||||||
| Non-Major Tenants | 49,210 | 49.1% | $45.27 | $2,227,525 | 52.2% | ||||||||
| Occupied Collateral Total | 100,304 | 100.0% | $42.55 | $4,268,097 | 100.0% | ||||||||
| Vacant Space | 0 | 0% | |||||||||||
| Collateral Total | 100,304 | 100.0% | |||||||||||
| (1) Certain ratings are those of the parent company whether or not the parent guarantees the lease. | |||||||||||||
The following table presents certain information relating to the lease rollover schedule at the Brentwood Gateway Office Building Property:
Lease Expiration Schedule(1)(2)
Year Ending December 31, | No. of Leases Expiring | Expiring NRSF | % of Total NRSF | Cumulative Expiring NRSF | Cumulative % of Total NRSF | Annual U/W Base Rent | Annual U/W Base Rent PSF | ||||||||
| MTM | 1 | 2,674 | 2.7% | 2,674 | 2.7% | $119,367 | $44.64 | ||||||||
| 2013 | 1 | 2,743 | 2.7% | 5,417 | 5.4% | $118,730 | $43.28 | ||||||||
| 2014 | 4 | 7,228 | 7.2% | 12,645 | 12.6% | $345,176 | $47.76 | ||||||||
| 2015 | 6 | 13,476 | 13.4% | 26,121 | 26.0% | $613,697 | $45.54 | ||||||||
| 2016 | 5 | 20,041 | 20.0% | 46,162 | 46.0% | $796,902 | $39.76 | ||||||||
| 2017 | 7 | 16,856 | 16.8% | 63,018 | 62.8% | $700,170 | $41.54 | ||||||||
| 2018 | 2 | 7,261 | 7.2% | 70,279 | 70.1% | $328,255 | $45.21 | ||||||||
| 2019 | 0 | 0 | 0.0% | 70,279 | 70.1% | $0 | $0.00 | ||||||||
| 2020 | 1 | 1,214 | 1.2% | 71,493 | 71.3% | $57,544 | $47.40 | ||||||||
| 2021 | 3 | 23,506 | 23.4% | 94,999 | 94.7% | $903,261 | $38.43 | ||||||||
| 2022 | 1 | 1,836 | 1.8% | 96,835 | 96.5% | $84,823 | $46.20 | ||||||||
| 2023 | 1 | 2,141 | 2.1% | 98,976 | 98.7% | $128,460 | $60.00 | ||||||||
| Thereafter | 1 | 1,328 | 1.3% | 100,304 | 100.0% | $71,712 | $54.00 | ||||||||
| Vacant | 0 | 0 | 0.0% | 100,304 | 100.0% | $0 | $0.00 | ||||||||
| Total/Weighted Average | 33 | 100,304 | 100.0% | $4,268,097 | $42.55 |
| (1) | Information obtained from the underwritten rent roll. |
| (2) | Certain tenants may have lease termination options that are exercisable prior to the originally stated expiration date of the subject lease and that are not considered in the Lease Expiration Schedule. |
The following table presents historical occupancy percentages at the Brentwood Gateway Office Building Property:
Historical Occupancy(1)
12/31/2010 | 12/31/2011 | 12/31/2012 | 4/1/2013 | |||
| 89.5% | 86.1% | 97.2% | 100.0% |
| (1) | Information obtained from the borrower. |
THE INFORMATION IN THIS STRUCTURAL AND COLLATERAL TERM SHEET IS NOT COMPLETE AND MAY BE AMENDED PRIOR TO THE TIME OF SALE. THIS TERM SHEET IS NOT AN OFFER TO SELL THESE SECURITIES AND IT IS NOT A SOLICITATION OF AN OFFER TO BUY THESE SECURITIES IN ANY JURISDICTION WHERE THE OFFER OR SALE IS NOT PERMITTED.
129
BRENTWOOD GATEWAY OFFICE BUILDING |
Operating History and Underwritten Net Cash Flow. The following table presents certain information relating to the historical operating performance and the Underwritten Net Cash Flow at the Brentwood Gateway Office Building Property:
Cash Flow Analysis
| 2011 | 2012 | TTM 3/31/2013 | U/W | U/W $ per SF | |||||||
| Base Rent | $3,465,994 | $4,041,145 | $4,066,127 | $4,268,097 | $42.55 | ||||||
| Concessions | (341,484) | (120,748) | (100,797) | 0 | 0 | ||||||
| Total Reimbursables | 93,928 | 76,632 | 68,350 | 68,205 | 0.68 | ||||||
| Other Income | 364,994 | 463,683 | 477,074 | 477,074 | 4.76 | ||||||
| Less Vacancy & Credit Loss | (18,404) | (7,560) | (3,706) | (325,223)(1) | (3.24) | ||||||
| Effective Gross Income | $3,565,028 | $4,453,152 | $4,507,048 | $4,488,153 | $44.75 | ||||||
| Total Operating Expenses | $2,057,489 | $2,277,330 | $2,328,913 | $2,375,722 | $23.69 | ||||||
| Net Operating Income | $1,507,539 | $2,175,822 | $2,178,135 | $2,112,431 | $21.06 | ||||||
| TI/LC | 0 | 0 | 0 | 231,187 | 2.30 | ||||||
| Capital Expenditures | 0 | 0 | 0 | 25,076 | 0.25 | ||||||
| Net Cash Flow | $1,507,539 | $2,175,822 | $2,178,135 | $1,856,168 | $18.51 | ||||||
| NOI DSCR | 1.15x | 1.66x | 1.66x | 1.61x | |||||||
| NCF DSCR | 1.15x | 1.66x | 1.66x | 1.41x | |||||||
| NOI DY | 6.7% | 9.7% | 9.7% | 9.4% | |||||||
| NCF DY | 6.7% | 9.7% | 9.7% | 8.2% | |||||||
| (1) | The underwritten economic vacancy is 7.5%. The Brentwood Gateway Office Building Property was 100.0% physically occupied as of April 1, 2013. |
THE INFORMATION IN THIS STRUCTURAL AND COLLATERAL TERM SHEET IS NOT COMPLETE AND MAY BE AMENDED PRIOR TO THE TIME OF SALE. THIS TERM SHEET IS NOT AN OFFER TO SELL THESE SECURITIES AND IT IS NOT A SOLICITATION OF AN OFFER TO BUY THESE SECURITIES IN ANY JURISDICTION WHERE THE OFFER OR SALE IS NOT PERMITTED.
130
(THIS PAGE INTENTIONALLY LEFT BLANK)
131
| No. 14 - Continental Plaza - Columbus | |||||||
| Loan Information | Property Information | ||||||
| Mortgage Loan Seller: | The Royal Bank of Scotland | Single Asset/Portfolio: | Single Asset | ||||
Credit Assessment (Fitch/KBRA/Moody’s): | NR/NR/NR | Property Type: | Office | ||||
| Original Principal Balance: | $22,000,000 | Specific Property Type: | CBD | ||||
| Cut-off Date Principal Balance: | $21,972,166 | Location: | Columbus, OH | ||||
| % of Initial Pool Balance: | 1.5% | Size: | 568,740 SF | ||||
| Loan Purpose: | Acquisition | Cut-off Date Principal Balance Per Unit/SF: | $38.63 | ||||
| Borrower Name: | 180 East Broad, LLC | Year Built/Renovated: | 1974/2009 | ||||
| Sponsor: | The Shidler Group | Title Vesting: | Leasehold | ||||
| Mortgage Rate: | 4.230% | Property Manager: | Continental Realty, Ltd. | ||||
| Note Date: | April 9, 2013 | 3rd Most Recent Occupancy (As of): | 92.6% (12/31/2010) | ||||
| Anticipated Repayment Date: | NAP | 2nd Most Recent Occupancy (As of): | 94.5% (12/31/2011) | ||||
| Maturity Date: | May 1, 2023 | Most Recent Occupancy (As of): | 93.8% (12/31/2012) | ||||
| IO Period: | None | Current Occupancy (As of): | 93.6% (4/9/2013) | ||||
| Loan Term (Original): | 120 months | ||||||
| Seasoning: | 1 month | Underwriting and Financial Information: | |||||
| Amortization Term (Original): | 360 months | ||||||
| Loan Amortization Type: | Amortizing Balloon | 3rd Most Recent NOI (As of): | $4,597,747 (12/31/2010) | ||||
| Interest Accrual Method: | Actual/360 | 2nd Most Recent NOI (As of): | $4,811,959 (12/31/2011) | ||||
| Call Protection: | L(25),D(91),O(4) | Most Recent NOI (As of): | $4,792,891 (12/31/2012) | ||||
| Lockbox Type: | Hard/Springing Cash Management | ||||||
| Additional Debt: | Yes | U/W Revenues: | $9,580,941 | ||||
| Additional Debt Type: | Future Mezzanine | U/W Expenses: | $6,152,106 | ||||
U/W NOI(1): | $3,428,836 | ||||||
| U/W NCF: | $2,749,224 | ||||||
| U/W NOI DSCR: | 2.65x | ||||||
| Escrows and Reserves: | U/W NCF DSCR: | 2.12x | |||||
| U/W NOI Debt Yield: | 15.6% | ||||||
| Type: | Initial | Monthly | Cap (If Any) | U/W NCF Debt Yield: | 12.5% | ||
| Taxes | $574,945 | $95,824 | NAP | As-Is Appraised Value: | $42,400,000 | ||
| Insurance | $25,282 | $8,427 | NAP | As-Is Appraisal Valuation Date: | February 19, 2013 | ||
| Replacement Reserve | $0 | $9,479 | NAP | Cut-off Date LTV Ratio: | 51.8% | ||
| TI/LC Reserve | $0 | $47,395 | $1,706,220 | LTV Ratio at Maturity or ARD: | 41.6% | ||
| Ground Rent Reserve | $108,333 | $108,333 | NAP | ||||
| Tenant Reserve | $1,000,000 | $0 | NAP | ||||
| (1) | See “Cash Flow Analysis” section for detail on the decrease from Most Recent NOI to U/W NOI. |
The Continental Plaza - Columbus mortgage loan is evidenced by a single promissory note that is secured by a first mortgage encumbering the leasehold interest in a 568,740 square foot, 34-story class A office tower located in the central business district of Columbus, Ohio (the “Continental Plaza - Columbus Property”). The Continental Plaza - Columbus Property was built in 1974 and is situated on a 0.83-acre site. The Continental Plaza - Columbus Property was renovated in 2008-2009 with improvements including replacement of water heaters, upgraded elevators, lobby renovations and garage repairs. Major tenants at the Continental Plaza - Columbus Property include Momentive Specialty Chemicals, Ohio Health, Public Utility Commission of Ohio, Glimcher Realty Trust and the Ohio Secretary of State. The Continental Plaza - Columbus Property features ground-floor retail space and an underground parking garage with 89 reserved spaces. The Continental Plaza – Columbus Property has a total of 89 parking spaces, accounting for a parking ratio of 0.2 spaces per 1,000 square feet of rentable area. As of April 9, 2013, the Continental Plaza - Columbus Property was 93.6% leased to 34 tenants.
Sources and Uses
| Sources | Uses | |||||||
| Original loan amount | $22,000,000 | 47.9% | Purchase price | $43,247,860 | 94.2% | |||
Sponsor’s new cash contribution | 23,923,544 | 52.1 | Closing costs | 967,123 | 2.1 | |||
| Reserves | 1,708,560 | 3.7 | ||||||
| Total Sources | $45,923,544 | 100.0% | Total Uses | $45,923,544 | 100.0% |
THE INFORMATION IN THIS STRUCTURAL AND COLLATERAL TERM SHEET IS NOT COMPLETE AND MAY BE AMENDED PRIOR TO THE TIME OF SALE. THIS TERM SHEET IS NOT AN OFFER TO SELL THESE SECURITIES AND IT IS NOT A SOLICITATION OF AN OFFER TO BUY THESE SECURITIES IN ANY JURISDICTION WHERE THE OFFER OR SALE IS NOT PERMITTED.
132
| CONTINENTAL PLAZA - COLUMBUS |
The following table presents certain information relating to the tenancies at the Continental Plaza - Columbus Property:
Major Tenants
| Tenant Name | Credit Rating (Fitch/Moody’s/ S&P)(1) | Tenant NRSF | % of NRSF | Annual U/W Base Rent PSF | Annual U/W Base Rent | % of Total Annual U/W Base Rent | Lease Expiration Date | ||||||
| Major Tenants | |||||||||||||
| Momentive Specialty Chemicals | NR/B3/B- | 126,992 | 22.3% | $17.33 | $2,200,705 | 29.0% | 8/31/2018 | ||||||
| Public Utilities Commission of Ohio | NR/Aa1/AA+ | 107,330 | 18.9% | $15.00 | $1,609,788 | 21.2% | 6/30/2015 | ||||||
| Ohio Office of the Secretary of State | NR/Aa1/AA+ | 51,527 | 9.1% | $15.00 | $772,908 | 10.2% | 6/30/2015 | ||||||
| Ohio Health | NR/NR/NR | 90,120 | 15.8% | $8.00 | $720,960 | 9.5% | 11/30/2017 | ||||||
| Glimcher Realty | NR/Ba3/B+ | 53,450 | 9.4% | $10.00 | $534,500 | 7.0% | 5/31/2018 | ||||||
| Total Major Tenants | 429,419 | 75.5% | $13.60 | $5,838,861 | 76.9% | ||||||||
| Non-Major Tenants | 102,647 | 18.0% | $17.04 | $1,749,143 | 23.1% | ||||||||
| Occupied Collateral Total | 532,066 | 93.6% | $14.26 | $7,588,004 | 100.0% | ||||||||
| Vacant Space | 36,674 | 6.4% | |||||||||||
| Collateral Total | 568,740 | 100.0% | |||||||||||
| (1) | Certain ratings are those of the parent company whether or not the parent guarantees the lease. |
The following table presents certain information relating to the lease rollover schedule at the Continental Plaza - Columbus Property:
Lease Expiration Schedule(1)(2)
Year Ending December 31, | No. of Leases Expiring | Expiring NRSF | % of Total NRSF | Cumulative Expiring NRSF | Cumulative % of Total NRSF | Annual U/W Base Rent | Annual U/W Base Rent PSF(3) | ||||||||
| MTM | 2 | 3,156 | 0.6% | 3,156 | 0.6% | $31,246 | $9.90 | ||||||||
| 2013 | 4 | 3,946 | 0.7% | 7,102 | 1.2% | $110,419 | $27.98 | ||||||||
| 2014 | 3 | 5,719 | 1.0% | 12,821 | 2.3% | $112,162 | $19.61 | ||||||||
| 2015 | 8 | 182,098 | 32.0% | 194,919 | 34.3% | $2,908,596 | $15.97 | ||||||||
| 2016 | 4 | 2,665 | 0.5% | 197,584 | 34.7% | $132,533 | $49.73 | ||||||||
| 2017 | 7 | 112,999 | 19.9% | 310,583 | 54.6% | $1,146,293 | $10.14 | ||||||||
| 2018 | 4 | 183,685 | 32.3% | 494,268 | 86.9% | $2,786,877 | $15.17 | ||||||||
| 2019 | 0 | 0 | 0.0% | 494,268 | 86.9% | $0 | $0.00 | ||||||||
| 2020 | 1 | 35,110 | 6.2% | 529,378 | 93.1% | $359,878 | $10.25 | ||||||||
| 2021 | 0 | 0 | 0.0% | 529,378 | 93.1% | $0 | $0.00 | ||||||||
| 2022 | 0 | 0 | 0.0% | 529,378 | 93.1% | $0 | $0.00 | ||||||||
| 2023 | 0 | 0 | 0.0% | 529,378 | 93.1% | $0 | $0.00 | ||||||||
| Thereafter | 1 | 2,688 | 0.5% | 532,066 | 93.6% | $0 | $0.00 | ||||||||
| Vacant | 0 | 36,674 | 6.4% | 568,740 | 100.0% | $0 | $0.00 | ||||||||
| Total/Weighted Average | 34 | 568,740 | 100.0% | $7,588,004 | $14.26 |
| (1) | Information was obtained from the underwritten rent roll. |
| (2) | Certain tenants may have lease termination options that are exercisable prior to the stated expiration date of the subject lease and that are not considered in the Lease Expiration Schedule. |
| (3) | Weighted Average Annual U/W Base Rent PSF excludes vacant space. |
The following table presents historical occupancy percentages at the Continental Plaza - Columbus Property:
Historical Occupancy(1)
12/31/2010 | 12/31/2011 | 12/31/2012 | 4/9/2013 | |||
| 92.6% | 94.5% | 93.8% | 93.6% | |||
| (1) Information obtained from the borrower rent rolls. | ||||||
THE INFORMATION IN THIS STRUCTURAL AND COLLATERAL TERM SHEET IS NOT COMPLETE AND MAY BE AMENDED PRIOR TO THE TIME OF SALE. THIS TERM SHEET IS NOT AN OFFER TO SELL THESE SECURITIES AND IT IS NOT A SOLICITATION OF AN OFFER TO BUY THESE SECURITIES IN ANY JURISDICTION WHERE THE OFFER OR SALE IS NOT PERMITTED.
133
| CONTINENTAL PLAZA - COLUMBUS |
Operating History and Underwritten Net Cash Flow. The following table presents certain information relating to the historical operating performance and the Underwritten Net Cash Flow at the Continental Plaza - Columbus Property:
Cash Flow Analysis
2010 | 2011 | 2012 | U/W | U/W $ per SF | |||||||
| Base Rent | $7,404,144 | $7,551,491 | $7,525,574 | $7,588,004 | $13.34 | ||||||
| Grossed Up Vacant Space | 0 | 0 | 0 | 629,006 | 1.11 | ||||||
| Total Reimbursables | 1,582,298 | 1,804,118 | 1,838,195 | 1,809,901 | 3.18 | ||||||
| Other Income | 219,856 | 289,442 | 205,780 | 205,780 | 0.36 | ||||||
| Less Vacancy & Credit Loss | 0 | 0 | (38,865) | (651,749)(1) | (1.15) | ||||||
| Effective Gross Income | $9,206,298 | $9,645,051 | $9,530,684 | $9,580,941 | $16.85 | ||||||
| Total Operating Expenses | $4,608,551 | $4,833,092 | $4,737,793 | $6,152,106 | $10.82 | ||||||
| Net Operating Income | $4,597,747 | $4,811,959 | $4,792,891 | $3,428,836(2) | $6.03 | ||||||
| TI/LC | 0 | 0 | 0 | 565,864 | 0.99 | ||||||
| Capital Expenditures | 0 | 0 | 0 | 113,748 | .20 | ||||||
| Net Cash Flow | $4,597,747 | $4,811,959 | $4,792,891 | $2,749,224 | $4.83 | ||||||
| NOI DSCR | 3.55x | 3.71x | 3.70x | 2.65x | |||||||
| NCF DSCR | 3.55x | 3.71x | 3.70x | 2.12x | |||||||
| NOI DY | 20.9% | 21.9% | 21.8% | 15.6% | |||||||
| NCF DY | 20.9% | 21.9% | 21.8% | 12.5% | |||||||
| (1) | The underwritten economic vacancy is 6.5%. The Continental Plaza - Columbus Property was 93.6% physically occupied as of April 9, 2013. |
| (2) | The underwritten net operating income is less than the historical net operating incomes due to the creation of a ground lease immediately prior to the origination of the Continental Plaza - Columbus Mortgage Loan which financed the leasehold interest. The underwritten ground rent, $1.3 million, was not an expense in prior years as there was no ground lease. |
THE INFORMATION IN THIS STRUCTURAL AND COLLATERAL TERM SHEET IS NOT COMPLETE AND MAY BE AMENDED PRIOR TO THE TIME OF SALE. THIS TERM SHEET IS NOT AN OFFER TO SELL THESE SECURITIES AND IT IS NOT A SOLICITATION OF AN OFFER TO BUY THESE SECURITIES IN ANY JURISDICTION WHERE THE OFFER OR SALE IS NOT PERMITTED.
134
(THIS PAGE INTENTIONALLY LEFT BLANK)
135
| No. 15 – Orchard Pointe | |||||||
| Loan Information | Property Information | ||||||
| Mortgage Loan Seller: | Liberty Island Group I LLC | Single Asset/Portfolio: | Single Asset | ||||
Credit Assessment (Fitch/KBRA/Moody’s): | NR/NR/NR | Property Type: | Retail | ||||
| Original Principal Balance: | $21,600,000 | Specific Property Type: | Shadow Anchored | ||||
| Cut-off Date Principal Balance: | $21,574,141 | Location: | Fitchburg, WI | ||||
| % of Initial Pool Balance: | 1.5% | Size: | 114,709 SF | ||||
| Loan Purpose: | Refinance | Cut-off Date Principal Balance Per Unit/SF: | $188.08 | ||||
| Borrower Name: | Orchard Pointe Fitchburg RE, LLC | Year Built/Renovated: | 2008/NAP | ||||
| Sponsor: | Timothy Neitzel | Title Vesting: | Fee | ||||
| Mortgage Rate: | 4.480% | Property Manager: | Payroll Properties | ||||
| Note Date: | April 26, 2013 | 3rd Most Recent Occupancy (As of): | 56.6% (12/31/2010) | ||||
| Anticipated Repayment Date: | NAP | 2nd Most Recent Occupancy (As of): | 73.4% (12/31/2011) | ||||
| Maturity Date: | May 1, 2023 | Most Recent Occupancy (As of): | 78.5% (12/31/2012) | ||||
| IO Period: | None | Current Occupancy (As of): | 100.0% (3/19/2013) | ||||
| Loan Term (Original): | 120 months | ||||||
| Seasoning: | 1 month | Underwriting and Financial Information: | |||||
| Amortization Term (Original): | 360 months | ||||||
| Loan Amortization Type: | Amortizing Balloon | 3rd Most Recent NOI (As of): | $763,970 (12/31/2010) | ||||
| Interest Accrual Method: | Actual/360 | 2nd Most Recent NOI (As of): | $1,187,909 (12/31/2011) | ||||
| Call Protection: | L(25),D(91),O(4) | Most Recent NOI (As of): | $1,381,029 (12/31/2012) | ||||
| Lockbox Type: | Soft/Springing Cash Management | ||||||
| Additional Debt: | Yes | U/W Revenues: | $2,710,633 | ||||
| Additional Debt Type: | Future Mezzanine | U/W Expenses: | $727,700 | ||||
U/W NOI(3): | $1,982,933 | ||||||
| U/W NCF: | $1,885,399 | ||||||
| Escrows and Reserves: | U/W NOI DSCR : | 1.51x | |||||
| U/W NCF DSCR: | 1.44x | ||||||
| Type: | Initial | Monthly | Cap (If Any) | U/W NOI Debt Yield: | 9.2% | ||
| Taxes | $207,055 | $34,509 | NAP | U/W NCF Debt Yield: | 8.7% | ||
| Insurance | $7,746 | $1,937 | NAP | As-Is Appraised Value: | $28,800,000 | ||
| Replacement Reserves | $1,912 | $1,912 | NAP | As-Is Appraisal Valuation Date: | November 2, 2012 | ||
| TI/LC Reserve | $6,500 | $6,500(1) | $95,000 | Cut-off Date LTV Ratio: | 74.9% | ||
Free Rent Escrow(2) | $56,995 | $0 | NAP | LTV Ratio at Maturity or ARD: | 60.6% | ||
| (2) | The borrower is required to make ongoing monthly deposits in the amount of $6,500 to a TI/LC Reserve for the first five years of the loan term and $10,000 for the second five years of the loan term. During the first five years of the loan term, if the balance of funds in the reserve is equal to or greater than $95,000 or during the second five years of the loan term, if the balance of funds in the reserve is equal to or greater than $600,000, then monthly deposits into the TI/LC Reserve will not be required. |
| (3) | A $56,995 Free Rent Escrow was established for Topper’s Pizza at loan closing. The escrow will be released to the borrower on a schedule concurrent with the tenant’s monthly rent abatements. |
| (4) | See “Cash Flow Analysis” section. |
The Orchard Pointe mortgage loan is evidenced by a single promissory note that is secured by a first mortgage encumbering a 114,709 square foot shadow anchored retail property located in Fitchburg, Wisconsin approximately six miles south of Madison (the “Orchard Pointe Property”). The Orchard Pointe mortgage loan was originated on April 26, 2013 by Prudential Mortgage Capital Company, LLC. The Orchard Pointe Property is anchored by Gold’s Gym and an ALDI grocery store. The Orchard Pointe Property was built from 2008 through 2012. Parking at the Orchard Pointe Property is provided by 697 surface spaces, accounting for a total parking ratio of 6.08 parking spaces per 1,000 square feet of rentable area. As of March 19, 2013, the Orchard Pointe Property was 100.0% leased to 18 tenants.
THE INFORMATION IN THIS STRUCTURAL AND COLLATERAL TERM SHEET IS NOT COMPLETE AND MAY BE AMENDED PRIOR TO THE TIME OF SALE. THIS TERM SHEET IS NOT AN OFFER TO SELL THESE SECURITIES AND IT IS NOT A SOLICITATION OF AN OFFER TO BUY THESE SECURITIES IN ANY JURISDICTION WHERE THE OFFER OR SALE IS NOT PERMITTED.
136
| ORCHARD POINTE |
Sources and Uses
| Sources | Uses | |||||||
| Original loan amount | $21,600,000 | 99.3% | Loan payoff | $21,127,918 | 97.1% | |||
| Sponsor’s new cash contribution | 156,337 | 0.7 | Reserves | 280,209 | 1.3 | |||
| Closing costs | 348,210 | 1.6 | ||||||
| Total Sources | $21,756,337 | 100.0% | Total Uses | $21,756,337 | 100.0% |
The following table presents certain information relating to the tenancies at the Orchard Pointe Property:
Major Tenants
| Tenant Name | Credit Rating (Fitch/ Moody’s /S&P) | Tenant NRSF | % of NRSF | Annual U/W Base Rent PSF | Annual U/W Base Rent | % of Total Annual U/W Base Rent | Sales PSF | Occupancy | Lease Expiration Date | |||||||||
| Major Tenants | ||||||||||||||||||
| Gold’s Gym | NR/NR/NR | 45,000 | 39.2% | $17.48 | $786,532 | 36.2% | NAV | NAV | 5/31/2035 | |||||||||
| Firestone | NR/NR/NR | 8,256 | 7.2% | $26.53 | $219,000 | 10.1% | NAV | NAV | 2/29/2028 | |||||||||
| Goodwill | NR/NR/NR | 12,800 | 11.2% | $14.94 | $191,219 | 8.8% | NAV | NAV | 12/31/2022 | |||||||||
| ALDI, Inc. | NR/NR/NR | 16,697 | 14.6% | $11.00 | $183,667 | 8.5% | NAV | NAV | 1/31/2026 | |||||||||
| Buffalo Wild Wings | NR/NR/NR | 6,490 | 5.7% | $27.00 | $175,230 | 8.1% | NAV | MAV | 1/31/2019 | |||||||||
| Total Major Tenants | 89,243 | 77.8% | $17.43 | $1,555,648 | 71.6% | |||||||||||||
| Non-Major Tenants | 25,466 | 22.2% | $21.65(1) | $616,449 | 28.4% | |||||||||||||
| Occupied Collateral Total | 114,709 | 100.0% | $18.37(1) | $2,172,097 | 100.0% | |||||||||||||
| Vacant Space | 0 | 0.0% | ||||||||||||||||
| Collateral Total | 114,709 | 100.0% | ||||||||||||||||
| (1) | Taco Bell owns its building and leases its pad site, which has no attributed square footage. The Annual U/W Base Rent PSF for Non-Major Tenants and Occupied Collateral exclude the Annual U/W Base Rent associated with this pad site. |
THE INFORMATION IN THIS STRUCTURAL AND COLLATERAL TERM SHEET IS NOT COMPLETE AND MAY BE AMENDED PRIOR TO THE TIME OF SALE. THIS TERM SHEET IS NOT AN OFFER TO SELL THESE SECURITIES AND IT IS NOT A SOLICITATION OF AN OFFER TO BUY THESE SECURITIES IN ANY JURISDICTION WHERE THE OFFER OR SALE IS NOT PERMITTED.
137
| ORCHARD POINTE |
The following table presents certain information relating to the lease rollover schedule at the Orchard Pointe Property:
Lease Expiration Schedule(1)(2)
Year Ending December 31, | No. of Leases Expiring | Expiring NRSF | % of Total NRSF | Cumulative Expiring NRSF | Cumulative % of Total NRSF | Annual U/W Base Rent | Annual U/W Base Rent PSF | ||||||||
| MTM | 0 | 0 | 0.0% | 0 | 0.0% | $0 | $0 | ||||||||
| 2013 | 2 | 4,225 | 3.7% | 4,225 | 3.7% | $120,585 | $28.54 | ||||||||
| 2014 | 1 | 5,629 | 4.9% | 9,854 | 8.6% | $107,503 | $19.10 | ||||||||
| 2015 | 1 | 1,161 | 1.0% | 11,015 | 9.6% | $20,538 | $17.69 | ||||||||
| 2016 | 1 | 1,500 | 1.3% | 12,515 | 10.9% | $39,975 | $26.65 | ||||||||
| 2017 | 4 | 6,845 | 6.0% | 19,360 | 16.9% | $124,675 | $18.21 | ||||||||
| 2018 | 1 | 2,421 | 2.1% | 21,781 | 19.0% | $60,525 | $25.00 | ||||||||
| 2019 | 1 | 6,490 | 5.7% | 28,271 | 24.6% | $175,230 | $27.00 | ||||||||
| 2020 | 0 | 0 | 0% | 28,271 | 24.6% | $0 | $0.00 | ||||||||
| 2021 | 1 | 2,060 | 1.8% | 30,331 | 26.4% | $32,960 | $16.00 | ||||||||
| 2022 | 2 | 14,425 | 12.6% | 44,756 | 39.0% | $235,907 | $16.35 | ||||||||
| 2023 | 0 | 0 | 0.0% | 44,756 | 39.0% | $0 | $0.00 | ||||||||
| Thereafter | 4 | 69,953(3) | 61.0% | 114,709 | 100.0% | $1,254,199 | $17.00(3) | ||||||||
| Vacant | 0 | 0 | 0.0% | 114,709 | 100.0% | $0 | $0.00 | ||||||||
| Total/Weighted Average | 18 | 114,709 | 100.0% | $2,172,097 | $18.37(3) | ||||||||||
| (1) | Information was obtained from the underwritten rent roll. |
| (2) | Certain tenants may have lease termination options that are exercisable prior to the stated expiration date of the subject lease and that are not considered in the Lease Expiration Schedule. |
| (3) | Taco Bell owns its building and leases its pad site, which has no attributed square footage. The Weighted Average Annual U/W Base Rent PSF excludes the Annual U/W Base Rent associated with this pad site. |
The following table presents historical occupancy percentages at the Orchard Pointe Property:
Historical Occupancy(1)
12/31/2010 | 12/31/2011 | 12/31/2012 | 3/19/2013 | |||
| 56.6% | 73.4% | 78.5% | 100.0% |
| (1) | Information obtained from the borrower rent rolls. |
Operating History and Underwritten Net Cash Flow. The following table presents certain information relating to the Historical Operating Performance and Underwritten Net Cash Flow at the Orchard Pointe Property:
Cash Flow Analysis
2010 | 2011 | 2012 | U/W(1) | U/W $ per SF | |||||||
| Base Rent | $966,963 | $1,433,856 | $1,564,096 | $2,172,096(2) | $18.94 | ||||||
| Grossed Up Vacant Space | 0 | 0 | 0 | 0 | 0 | ||||||
| Total Reimbursables | 223,428 | 304,853 | 365,471 | 681,202 | 5.94 | ||||||
| Other Income | 1,477 | 35,164 | 13,822 | 0 | 0 | ||||||
| Less Vacancy & Credit Loss | (36,812) | 0 | 0 | (142,665)(3) | (1.24) | ||||||
| Effective Gross Income | $1,155,055 | $1,773,874 | $1,943,389 | $2,710,633 | $23.63 | ||||||
| Total Operating Expenses | $391,085 | $585,965 | $562,360 | $727,700 | $6.34 | ||||||
| Net Operating Income | $763,970 | $1,187,909 | $1,381,029 | $1,982,933 | $17.29 | ||||||
| TI/LC | 0 | 0 | 0 | 74,592 | 0.65 | ||||||
| Reserves for Replacements | 0 | 0 | 0 | 22,942 | 0.20 | ||||||
| Net Cash Flow | $763,970 | $1,187,909 | $1,381,029 | $1,885,399 | $16.44 | ||||||
| NOI DSCR | 0.58x | 0.91x | 1.05x | 1.51x | |||||||
| NCF DSCR | 0.58x | 0.91x | 1.05x | 1.44x | |||||||
| NOI DY | 3.5% | 5.5% | 6.4% | 9.2% | |||||||
| NCF DY | 3.5% | 5.5% | 6.4% | 8.7% |
| (1) | The increase in U/W NOI compared to historical NOI is attributed to recent leasing activity at the Orchard Pointe property. Eight tenants accounting for 26.6% of the net rentable area and 28.6% of the underwritten rent executed new leases in 2012 and 2013. |
| (2) | Taco Bell owns its building and leases its pad site, which has no attributed square footage. The U/W Base Rent includes the rent associated with this pad site. |
| (3) | The underwritten vacancy is 5.0%. The Orchard Pointe Property was 100.0% physically occupied as of March 19, 2013. |
THE INFORMATION IN THIS STRUCTURAL AND COLLATERAL TERM SHEET IS NOT COMPLETE AND MAY BE AMENDED PRIOR TO THE TIME OF SALE. THIS TERM SHEET IS NOT AN OFFER TO SELL THESE SECURITIES AND IT IS NOT A SOLICITATION OF AN OFFER TO BUY THESE SECURITIES IN ANY JURISDICTION WHERE THE OFFER OR SALE IS NOT PERMITTED.
138
| WFRBS Commercial Mortgage Trust 2013-C14 | Transaction Contact Information |
VI. Transaction Contact Information
Questions regarding this Structural and Collateral Term Sheet may be directed to any of the following individuals:
| Wells Fargo Securities, LLC | RBS Securities Inc. | ||
| Brigid Mattingly | Tel. (312) 269-3062 | Jeff Wilson - Trading | Tel. (203) 897-2900 |
| Fax (312) 658-0140 | |||
| A.J. Sfarra | Tel. (212) 214-5613 | Adam Ansaldi | Tel. (203) 897-0881 |
| Fax (212) 214-8970 | Fax (203) 873-3542 | ||
| Alex Wong | Tel. (212) 214-5615 | Jim Barnard | Tel. (203) 897-4417 |
| Fax (212) 214-8970 | Fax (203) 873-4310 | ||
THE INFORMATION IN THIS STRUCTURAL AND COLLATERAL TERM SHEET IS NOT COMPLETE AND MAY BE AMENDED PRIOR TO THE TIME OF SALE. THIS TERM SHEET IS NOT AN OFFER TO SELL THESE SECURITIES AND IT IS NOT A SOLICITATION OF AN OFFER TO BUY THESE SECURITIES IN ANY JURISDICTION WHERE THE OFFER OR SALE IS NOT PERMITTED.
139