| FREE WRITING PROSPECTUS | ||
| FILED PURSUANT TO RULE 433 | ||
| REGISTRATION FILE NO.: 333-172366-10 | ||
 |  |  |
Free Writing Prospectus
Structural and Collateral Term Sheet
$726,643,595
(Approximate Aggregate Cut-off Date Balance of Mortgage Pool)
$642,171,000
(Approximate Aggregate Principal Balance of Offered Certificates)
WFRBS Commercial Mortgage Trust 2013-UBS1
as Issuing Entity
Wells Fargo Commercial Mortgage Securities, Inc.
as Depositor
Wells Fargo Bank, National Association
UBS Real Estate Securities Inc.
Rialto Mortgage Finance, LLC
The Royal Bank of Scotland plc
as Sponsors and Mortgage Loan Sellers
Commercial Mortgage Pass-Through Certificates
Series 2013-UBS1
November 18, 2013
| WELLS FARGO SECURITIES | RBS | UBS INVESTMENT BANK |
Co-Lead Manager and Co-Bookrunner | Co-Lead Manager and Co-Bookrunner | Co-Lead Manager and Co-Bookrunner |
Drexel Hamilton
Co-Manager
Co-Manager
STATEMENT REGARDING THIS FREE WRITING PROSPECTUS
The depositor has filed a registration statement (including a prospectus) with the Securities and Exchange Commission (‘‘SEC’’) (SEC File No. 333-172366) for the offering to which this communication relates. Before you invest, you should read the prospectus in the registration statement and other documents the depositor has filed with the SEC for more complete information about the depositor, the issuing entity and this offering. You may get these documents for free by visiting EDGAR on the SEC Web site at www.sec.gov. Alternatively, the depositor, any underwriter, or any dealer participating in the offering will arrange to send you the prospectus after filing if you request it by calling toll free 1-800-745-2063 (8 a.m. – 5 p.m. EST) or by emailing wfs.cmbs@wellsfargo.com.
Nothing in this document constitutes an offer of securities for sale in any other jurisdiction where the offer or sale is not permitted. The information contained herein is preliminary as of the date hereof, supersedes any such information previously delivered to you and will be superseded by any such information subsequently delivered and ultimately by the final prospectus relating to the securities. These materials are subject to change, completion, supplement or amendment from time to time.
STATEMENT REGARDING ASSUMPTIONS AS TO SECURITIES, PRICING ESTIMATES AND OTHER INFORMATION
The attached information contains certain tables and other statistical analyses (the “Computational Materials”) which have been prepared in reliance upon information furnished by the Mortgage Loan Sellers. Numerous assumptions were used in preparing the Computational Materials, which may or may not be reflected herein. As such, no assurance can be given as to the Computational Materials’ accuracy, appropriateness or completeness in any particular context; or as to whether the Computational Materials and/or the assumptions upon which they are based reflect present market conditions or future market performance. The Computational Materials should not be construed as either projections or predictions or as legal, tax, financial or accounting advice. You should consult your own counsel, accountant and other advisors as to the legal, tax, business, financial and related aspects of a purchase of these securities. Any weighted average lives, yields and principal payment periods shown in the Computational Materials are based on prepayment and/or loss assumptions, and changes in such prepayment and/or loss assumptions may dramatically affect such weighted average lives, yields and principal payment periods. In addition, it is possible that prepayments or losses on the underlying assets will occur at rates higher or lower than the rates shown in the attached Computational Materials. The specific characteristics of the securities may differ from those shown in the Computational Materials due to differences between the final underlying assets and the preliminary underlying assets used in preparing the Computational Materials. The principal amount and designation of any security described in the Computational Materials are subject to change prior to issuance. None of Wells Fargo Securities, LLC (“WFS”), RBS Securities Inc. (“RBSSI”), UBS Securities LLC (“UBS”), Drexel Hamilton, LLC or any of their respective affiliates make any representation or warranty as to the actual rate or timing of payments or losses on any of the underlying assets or the payments or yield on the securities. The information in this presentation is based upon management forecasts and reflects prevailing conditions and management’s views as of this date, all of which are subject to change. In preparing this presentation, we have relied upon and assumed, without independent verification, the accuracy and completeness of all information available from public sources or which was provided to us by or on behalf of the Mortgage Loan Sellers or which was otherwise reviewed by us.
This free writing prospectus contains certain forward-looking statements. If and when included in this free writing prospectus, the words “expects”, “intends”, “anticipates”, “estimates” and analogous expressions and all statements that are not historical facts, including statements about our beliefs or expectations, are intended to identify forward-looking statements. Any forward-looking statements are made subject to risks and uncertainties which could cause actual results to differ materially from those stated. Those risks and uncertainties include, among other things, declines in general economic and business conditions, increased competition, changes in demographics, changes in political and social conditions, regulatory initiatives and changes in customer preferences, many of which are beyond our control and the control of any other person or entity related to this offering. The forward-looking statements made in this free writing prospectus are made as of the date stated on the cover. We have no obligation to update or revise any forward-looking statement.
Wells Fargo Securities is the trade name for certain capital markets and investment banking services of Wells Fargo & Company and its subsidiaries, including Wells Fargo Securities, LLC, member FINRA and SIPC, and Wells Fargo Bank, National Association.
RBS is a trade name for the investment banking business of RBSSI. Securities, syndicated loan arranging, financial advisory and other investment banking activities are performed by RBSSI and their securities affiliates. Lending, derivatives and other commercial banking activities are performed by The Royal Bank of Scotland plc and their banking affiliates. RBSSI is a member of SIPC, FINRA and the NYSE.
IRS CIRCULAR 230 NOTICE
THIS TERM SHEET IS NOT INTENDED OR WRITTEN TO BE USED, AND CANNOT BE USED, FOR THE PURPOSE OF AVOIDING U.S. FEDERAL, STATE OR LOCAL TAX PENALTIES. THIS TERM SHEET IS WRITTEN AND PROVIDED BY THE DEPOSITOR IN CONNECTION WITH THE PROMOTION OR MARKETING BY THE DEPOSITOR AND THE CO-LEAD BOOKRUNNING MANAGERS OF THE TRANSACTION OR MATTERS ADDRESSED HEREIN. INVESTORS SHOULD SEEK ADVICE BASED ON THEIR PARTICULAR CIRCUMSTANCES FROM AN INDEPENDENT TAX ADVISOR.
IMPORTANT NOTICE REGARDING THE OFFERED CERTIFICATES
The Offered Certificates referred to in these materials and the asset pool backing them are subject to modification or revision (including the possibility that one or more classes of certificates may be split, combined or eliminated at any time prior to issuance or availability of a final prospectus) and are offered on a “when, as and if issued” basis. Prospective investors should understand that, when considering the purchase of the Offered Certificates, a contract of sale will come into being no sooner than the date on which the relevant class of certificates has been priced and the underwriters have confirmed the allocation of certificates to be made to investors; any “indications of interest” expressed by any prospective investor, and any “soft circles” generated by the underwriters, will not create binding contractual obligations for such prospective investors, on the one hand, or the underwriters, the depositor or any of their respective agents or affiliates, on the other hand.
As a result of the foregoing, a prospective investor may commit to purchase certificates that have characteristics that may change, and each prospective investor is advised that all or a portion of the certificates referred to in these materials may be issued without all or certain of the characteristics described in these materials. The underwriters’ obligation to sell certificates to any prospective investor is conditioned on the certificates and the transaction having the characteristics described in these materials. If the underwriters determine that a condition is not satisfied in any material respect, such prospective investor will be notified, and neither the depositor nor the underwriters will have any obligation to such prospective investor to deliver any portion of the Offered Certificates which such prospective investor has committed to purchase, and there will be no liability between the underwriters, the depositor or any of their respective agents or affiliates, on the one hand, and such prospective investor, on the other hand, as a consequence of the non-delivery.
Each prospective investor has requested that the underwriters provide to such prospective investor information in connection with such prospective investor’s consideration of the purchase of the certificates described in these materials. These materials are being provided to each prospective investor for informative purposes only in response to such prospective investor’s specific request. The underwriters described in these materials may from time to time perform investment banking services for, or solicit investment banking business from, any company named in these materials. The underwriters and/or their affiliates or respective employees may from time to time have a long or short position in any security or contract discussed in these materials.
The information contained herein supersedes any previous such information delivered to any prospective investor and will be superseded by information delivered to such prospective investor prior to the time of sale.
IMPORTANT NOTICE RELATING TO AUTOMATICALLY-GENERATED EMAIL DISCLAIMERS
Any legends, disclaimers or other notices that may appear at the bottom of any email communication to which this free writing prospectus is attached relating to (1) these materials not constituting an offer (or a solicitation of an offer), (2) no representation that these materials are accurate or complete and may not be updated or (3) these materials possibly being confidential, are not applicable to these materials and should be disregarded. Such legends, disclaimers or other notices have been automatically generated as a result of these materials having been sent via Bloomberg or another system.
THE INFORMATION IN THIS STRUCTURAL AND COLLATERAL TERM SHEET IS NOT COMPLETE AND MAY BE AMENDED PRIOR TO THE TIME OF SALE. THIS TERM SHEET IS NOT AN OFFER TO SELL THESE SECURITIES AND IT IS NOT A SOLICITATION OF AN OFFER TO BUY THESE SECURITIES IN ANY JURISDICTION WHERE THE OFFER OR SALE IS NOT PERMITTED.
2
| WFRBS Commercial Mortgage Trust 2013-UBS1 | Certificate Structure |
I. Certificate Structure
| Class | Expected Ratings (KBRA/Moody’s/S&P)(1) | Approximate Initial Certificate Principal Balance or Notional Amount(2) | Approx. Initial Credit Support(3) | Pass- Through Rate Description | Weighted Average Life (Years)(4) | Expected Principal Window(4) | Certificate Principal to Value Ratio(5) | Certificate Principal U/W NOI Debt Yield(6) | ||||||||
| Offered Certificates | ||||||||||||||||
| A-1 | AAA(sf)/Aaa(sf)/AAA(sf) | $27,667,000 | 30.000% | (7) | 2.67 | 1 – 59 | 41.6% | 16.0% | ||||||||
| A-2 | AAA(sf)/Aaa(sf)/AAA(sf) | $158,816,000 | 30.000% | (7) | 4.95 | 59 – 60 | 41.6% | 16.0% | ||||||||
| A-3 | AAA(sf)/Aaa(sf)/AAA(sf) | $130,000,000 | 30.000% | (7) | 6.93 | 83 – 83 | 41.6% | 16.0% | ||||||||
| A-4 | AAA(sf)/Aaa(sf)/AAA(sf) | $154,507,000 | 30.000% | (7) | 9.89 | 118 – 119 | 41.6% | 16.0% | ||||||||
| A-SB | AAA(sf)/Aaa(sf)/AAA(sf) | $37,660,000 | 30.000% | (7) | 7.52 | 60 – 118 | 41.6% | 16.0% | ||||||||
| A-S | AAA(sf)/Aaa(sf)/AAA(sf) | $47,232,000 | 23.500% | (7) | 9.93 | 119 – 119 | 45.4% | 14.7% | ||||||||
| X-A | AAA(sf)/Aaa(sf)/AAA(sf) | $555,882,000 | (8) | N/A | Variable(9) | N/A | N/A | N/A | N/A | |||||||
| X-B | AAA(sf)/Aa3(sf)/AA-(sf) | $49,957,000 | (10) | N/A | Variable(11) | N/A | N/A | N/A | N/A | |||||||
| B | AA-(sf)/Aa3(sf)/AA-(sf) | $49,957,000 | 16.625% | (7) | 9.93 | 119 – 119 | 49.5% | 13.4% | ||||||||
| C | A-(sf)/A3(sf)/A-(sf) | $36,332,000 | 11.625% | (7) | 9.93 | 119 – 119 | 52.5% | 12.7% | ||||||||
Non-Offered Certificates | ||||||||||||||||
| X-C | NR/NR/NR | $33,607,594 | (12) | N/A | Variable(13) | N/A | N/A | N/A | N/A | |||||||
| D | BBB-(sf)/NR/BBB-(sf) | $33,607,000 | 7.000% | (7) | 9.97 | 119 – 120 | 55.2% | 12.1% | ||||||||
| E | BB(sf)/NR/BB(sf) | $17,258,000 | 4.625% | (7) | 10.01 | 120 – 120 | 56.6% | 11.8% | ||||||||
| F | B(sf)/NR/B+(sf) | $11,808,000 | 3.000% | (7) | 10.01 | 120 – 120 | 57.6% | 11.6% | ||||||||
| G | NR/NR/NR | $21,799,594 | 0.000% | (7) | 10.11 | 120 – 123 | 59.4% | 11.2% | ||||||||
| Notes: | |
| (1) | The expected ratings presented are those of Kroll Bond Rating Agency, Inc. (“KBRA”), Moody’s Investors Service, Inc. (“Moody’s”) and Standard & Poor’s Ratings Services, a Standard & Poor’s Financial Services LLC business (“S&P”), which the depositor hired to rate the rated offered certificates. One or more other nationally recognized statistical ratings organizations, as defined in Section 3(a)(62) of the Securities Exchange Act of 1934, as amended (the “Exchange Act”), that were not hired by the depositor may use information they receive pursuant to Rule 17g-5 under the Securities Exchange Act or otherwise to rate or provide market reports and/or published commentary related to the offered certificates. We cannot assure you as to what ratings a non-hired nationally recognized statistical rating organization would assign or that its reports will not express differing, possibly negative, views of the mortgage loans and/or the offered certificates. See “Risk Factors—Risks Related to the Offered Certificates—Nationally Recognized Statistical Rating Organizations May Assign Different Ratings to the Certificates; Ratings of the Certificates Reflect Only the Views of the Applicable Rating Agencies as of the Dates Such Ratings Were Issued; Ratings May Affect ERISA Eligibility; Ratings May be Downgraded” in the free writing prospectus, dated November 18, 2013 (the “Free Writing Prospectus”). |
| (2) | The principal balances and notional amounts set forth in the table are approximate. The actual initial principal balances and notional amounts may be larger or smaller depending on the aggregate cut-off date principal balance of the mortgage loans definitively included in the pool of mortgage loans, which aggregate cut-off date principal balance may be as much as 5% larger or smaller than the amount presented in the Free Writing Prospectus. |
| (3) | The approximate initial credit support with respect to the Class A-1, A-2, A-3, A-4 and A-SB Certificates represents the approximate credit enhancement for the Class A-1, A-2, A-3, A-4 and A-SB Certificates in the aggregate. |
| (4) | Weighted Average Lives and Expected Principal Windows are calculated based on an assumed prepayment rate of 0% CPR and the “Structuring Assumptions” described on Annex D to the Free Writing Prospectus. |
| (5) | The Certificate Principal to Value Ratio for each of the Class A-S, B, C, D, E, F and G Certificates is calculated by dividing the aggregate principal balance of such class of certificates and all classes of certificates (other than Class X-A, X-B and X-C, which are notional amount certificates and will not have principal balances) senior to such class by the aggregate appraised value of $1,223,441,586 (calculated as described in the Free Writing Prospectus) of the mortgaged properties securing the mortgage loans (excluding, with respect to The Outlet Collection | Jersey Gardens and the Sullivan Center loan combinations, a pro rata portion of the related appraised value allocated to the related companion loan(s) based on its or their cut-off date principal balance). The Certificate Principal to Value Ratios for each of the Class A-1, A-2, A-3, A-4 and A-SB Certificates are calculated by dividing the aggregate principal balance of the Class A-1, A-2, A-3, A-4 and A-SB Certificates by such aggregate appraised value (excluding, with respect to The Outlet Collection | Jersey Gardens and the Sullivan Center loan combinations, a pro rata portion of the related appraised value allocated to the related companion loan(s) based on its or their cut-off date principal balance(s)). However, excess mortgaged property value associated with a mortgage loan will not be available to offset losses on any other mortgage loan (unless such mortgage loans are cross-collateralized and the cross-collateralization remains in effect). |
| (6) | The Certificate Principal U/W NOI Debt Yield for each of the Class A-S, B, C, D, E, F and G Certificates is calculated by dividing the underwritten net operating income (which excludes, with respect to The Outlet Collection | Jersey Gardens and the Sullivan Center loan combinations, a pro rata portion of the related underwritten net operating income allocated to the related companion loan(s) based on its or their cut-off date principal balance(s)) for the mortgage pool of $81,453,931 (calculated as described in the Free Writing Prospectus) by the aggregate principal balance of such class of certificates and all classes of certificates (other than Class X-A, X-B and X-C, which are notional amount certificates and will not have principal balances) senior to such class of certificates. The Certificate Principal U/W NOI Debt Yield for each of the Class A-1, A-2, A-3, A-4 and A-SB Certificates is calculated by dividing such mortgage pool underwritten net operating income (which excludes, with respect to The Outlet Collection | Jersey Gardens and the Sullivan Center loan combinations, a pro rata portion of the related underwritten net operating income allocated to the related companion loan(s) based on its or their cut-off date principal balance(s)) by the aggregate principal balance of the Class A-1, A-2, A-3, A-4 and A-SB Certificates. However, cash flow from each mortgaged property supports only the related mortgage loan and will not be available to support any other mortgage loan (unless such mortgage loans are cross-collateralized and the cross-collateralization remains in effect). |
| (7) | The pass-through rates for the Class A-1, A-2, A-3, A-4, A-SB, A-S, B, C, D, E, F and G Certificates, in each case, will be one of the following: (i) a fixed rate per annum, (ii) the WAC Rate (as defined in the Free Writing Prospectus) for the related distribution date, (iii) a variable rate per annum equal to the lesser of (a) a fixed rate and (b) the WAC Rate for the related distribution date or (iv) a variable rate per annum equal to the WAC Rate for the related distribution date minus a specified percentage. |
| (8) | The Class X-A Certificates are notional amount certificates. The Notional Amount of the Class X-A Certificates will be equal to the aggregate principal balance of the Class A-1, A-2, A-3, A-4, A-SB and A-S Certificates outstanding from time to time. The Class X-A Certificates will not be entitled to distributions of principal. |
| (9) | The pass-through rate for the Class X-A Certificates for any distribution date will be a per annum rate equal to the excess, if any, of (a) the WAC Rate for the related distribution date, over (b) the weighted average of the pass-through rates on the Class A-1, A-2, A-3, A-4, A-SB and A-S Certificates for the |
THE INFORMATION IN THIS STRUCTURAL AND COLLATERAL TERM SHEET IS NOT COMPLETE AND MAY BE AMENDED PRIOR TO THE TIME OF SALE. THIS TERM SHEET IS NOT AN OFFER TO SELL THESE SECURITIES AND IT IS NOT A SOLICITATION OF AN OFFER TO BUY THESE SECURITIES IN ANY JURISDICTION WHERE THE OFFER OR SALE IS NOT PERMITTED.
3
| WFRBS Commercial Mortgage Trust 2013-UBS1 | Certificate Structure |
related distribution date, weighted on the basis of their respective aggregate principal balances outstanding immediately prior to that distribution date. | |
| (10) | The Class X-B Certificates are notional amount certificates. The Notional Amount of the Class X-B Certificates will be equal to the principal balance of the Class B Certificates outstanding from time to time. The Class X-B Certificates will not be entitled to distributions of principal. |
| (11) | The pass-through rate for the Class X-B Certificates for any distribution date will be a per annum rate equal to the excess, if any, of (a) the WAC Rate for the related distribution date, over (b) the pass-through rate on the Class B Certificates for the related distribution date. |
| (12) | The Class X-C Certificates are notional amount certificates. The Notional Amount of the Class X-C Certificates will be equal to the aggregate principal balance of the Class F and G Certificates outstanding from time to time. The Class X-C Certificates will not be entitled to distributions of principal. |
(13) | The pass-through rate for the Class X-C Certificates for any distribution date will be a per annum rate equal to the excess, if any, of (a) the WAC Rate for the related distribution date, over (b) the weighted average of the pass-through rates on the Class F and G Certificates for the related distribution date, weighted on the basis of their respective aggregate principal balances outstanding immediately prior to that distribution date. |
THE INFORMATION IN THIS STRUCTURAL AND COLLATERAL TERM SHEET IS NOT COMPLETE AND MAY BE AMENDED PRIOR TO THE TIME OF SALE. THIS TERM SHEET IS NOT AN OFFER TO SELL THESE SECURITIES AND IT IS NOT A SOLICITATION OF AN OFFER TO BUY THESE SECURITIES IN ANY JURISDICTION WHERE THE OFFER OR SALE IS NOT PERMITTED.
4
| WFRBS Commercial Mortgage Trust 2013-UBS1 | Issue Characteristics |
II. Transaction Highlights
Mortgage Loan Sellers:
Mortgage Loan Seller | Number of Mortgage Loans | Number of Mortgaged Properties | Aggregate Cut-off Date Balance | % of Cut-off Date Pool Balance | ||||||
| Wells Fargo Bank, National Association | 23 | 58 | $351,359,794 | 48.4 | % | |||||
| UBS Real Estate Securities Inc. | 16 | 21 | 181,617,949 | 25.0 | ||||||
| Rialto Mortgage Finance, LLC | 8 | 14 | 109,299,590 | 15.0 | ||||||
The Royal Bank of Scotland plc | 10 | 10 | 84,366,262 | 11.6 | ||||||
| Total | 57 | 103 | $726,643,595 | 100.0 | % | |||||
Loan Pool:
| Cut-off Date Balance: | $726,643,595 |
| Number of Mortgage Loans: | 57 |
| Average Cut-off Date Balance per Mortgage Loan: | $12,748,133 |
| Number of Mortgaged Properties: | 103 |
Average Cut-off Date Balance per Mortgaged Property(1): | $7,054,792 |
| Weighted Average Mortgage Interest Rate: | 4.667% |
| Ten Largest Mortgage Loans as % of Cut-off Date Pool Balance: | 55.0% |
| Weighted Average Original Term to Maturity or ARD (months): | 100 |
| Weighted Average Remaining Term to Maturity or ARD (months): | 99 |
Weighted Average Original Amortization Term (months)(2): | 352 |
Weighted Average Remaining Amortization Term (months)(2): | 351 |
| Weighted Average Seasoning (months): | 1 |
(1) (2) | Information regarding mortgage loans secured by multiple properties is based on an allocation according to relative appraised values or the allocated loan amounts or property-specific release prices set forth in the related loan documents or such other allocation as the related mortgage loan seller deemed appropriate. Excludes any mortgage loan that does not amortize. |
Credit Statistics:
Weighted Average U/W Net Cash Flow DSCR(1): | 1.98x |
Weighted Average U/W Net Operating Income Debt Yield Ratio(1): | 11.2% |
Weighted Average Cut-off Date Loan-to-Value Ratio(1): | 61.0% |
Weighted Average Balloon or ARD Loan-to-Value Ratio(1): | 54.9% |
% of Mortgage Loans with Additional Subordinate Debt(2): | 15.1% |
% of Mortgage Loans with Single Tenants(3): | 3.0% |
| (1) | With respect to The Outlet Collection | Jersey Gardens Mortgage Loan and the Sullivan Center Mortgage Loan, each of which is part of a pari passu loan combination, loan-to-value ratio, debt service coverage ratio, debt yield and cut-off date balance per square foot calculations include the related pari passu companion loan(s) unless otherwise stated. See Annex A-1 to the Free Writing Prospectus. Debt service coverage ratio, debt yield and loan-to-value ratio information takes no account of subordinate debt (whether or not secured by the mortgaged property), if any, that is allowed under the terms of any mortgage loan. |
| (2) | The percentage figure expressed as “% of Mortgage loans with Additional Subordinate Debt” is determined as a percentage of cut-off date principal balance and does not take into account future subordinate debt (whether or not secured by the mortgaged property), if any, that may be permitted under the terms of any mortgage loan or the Pooling and Servicing Agreement. See “Description of the Mortgage Pool—Subordinate and/or Other Financing” in the Free Writing Prospectus. |
| (3) | Excludes mortgage loans that are secured by multiple single tenant properties. |
THE INFORMATION IN THIS STRUCTURAL AND COLLATERAL TERM SHEET IS NOT COMPLETE AND MAY BE AMENDED PRIOR TO THE TIME OF SALE. THIS TERM SHEET IS NOT AN OFFER TO SELL THESE SECURITIES AND IT IS NOT A SOLICITATION OF AN OFFER TO BUY THESE SECURITIES IN ANY JURISDICTION WHERE THE OFFER OR SALE IS NOT PERMITTED.
5
| WFRBS Commercial Mortgage Trust 2013-UBS1 | Issue Characteristics |
Loan Structural Features:
Amortization: Based on the Cut-off Date Pool Balance, 63.1% of the mortgage pool (51 mortgage loans) has scheduled amortization, as follows:
42.1% (39 mortgage loans) requires amortization during the entire loan term
21.0% (12 mortgage loans) provides for an interest-only period followed by an amortization period
Interest-Only: Based on the Cut-off Date Pool Balance, 36.9% of the mortgage pool (6 mortgage loans) provides for interest-only payments during the entire loan term. The Weighted Average Cut-off Date Loan-to-Value Ratio and Weighted Average U/W Net Cash Flow DSCR for those mortgage loans is 51.7% and 2.70x, respectively.
Hard Lockboxes: Based on the Cut-off Date Pool Balance, 44.9% of the mortgage pool (15 mortgage loans) has hard lockboxes in place.
Reserves: The mortgage loans require amounts to be escrowed monthly as follows (excluding any mortgage loans with springing provisions):
| Real Estate Taxes: | 66.4% of the pool | |
| Insurance: | 46.6% of the pool | |
| Capital Replacements: | 67.6% of the pool | |
| TI/LC: | 21.4% of the pool(1) | |
| (1) | The percentage of Cut-off Date Balance for loans with TI/LC reserves is based on the aggregate principal balance allocable to office, retail, industrial, and mixed use properties. | |
Call Protection/Defeasance: Based on the Cut-off Date Pool Balance, the mortgage pool has the following call protection and defeasance features:
96.1% of the mortgage pool (52 mortgage loans) features a lockout period, then defeasance only until an open period
2.7% of the mortgage pool (3 mortgage loans) features a lockout period, then the greater of a prepayment period premium or yield maintenance until an open period
1.3% of the mortgage pool (2 mortgage loans) features a lockout period, then defeasance or the greater of a prepayment premium or yield maintenance until an open period
Please refer to Annex A-1 to the Free Writing Prospectus for further description of individual loan call protection.
THE INFORMATION IN THIS STRUCTURAL AND COLLATERAL TERM SHEET IS NOT COMPLETE AND MAY BE AMENDED PRIOR TO THE TIME OF SALE. THIS TERM SHEET IS NOT AN OFFER TO SELL THESE SECURITIES AND IT IS NOT A SOLICITATION OF AN OFFER TO BUY THESE SECURITIES IN ANY JURISDICTION WHERE THE OFFER OR SALE IS NOT PERMITTED.
6
| WFRBS Commercial Mortgage Trust 2013-UBS1 | Issue Characteristics |
| III. Issue Characteristics | |||
| Securities Offered: | $642,171,000 approximate monthly pay, multi-class, commercial mortgage REMIC pass-through certificates consisting of ten classes (Classes A-1, A-2, A-3, A-4, A-SB, A-S, B, C, X-A and X-B), which are offered pursuant to a registration statement filed with the SEC. | ||
| Mortgage Loan Sellers: | Wells Fargo Bank, National Association (“WFB”); UBS Real Estate Securities Inc. (“UBSRES”), Rialto Mortgage Finance, LLC (“RMF”) and The Royal Bank of Scotland plc (“RBS”). | ||
| Co-lead Bookrunning Managers: | Wells Fargo Securities, LLC; RBS Securities Inc. and UBS Securities LLC. | ||
| Co-Manager: | Drexel Hamilton, LLC | ||
| Rating Agencies: | Kroll Bond Rating Agency, Inc., Moody’s Investors Service, Inc. and Standard & Poor’s Ratings Services, a Standard & Poor’s Financial Services LLC business | ||
| Master Servicer: | Wells Fargo Bank, National Association | ||
| Special Servicer: | CWCapital Asset Management LLC | ||
| Certificate Administrator: | Wells Fargo Bank, National Association | ||
| Trustee: | Deutsche Bank Trust Company Americas | ||
| Trust Advisor: | Park Bridge Lender Services LLC | ||
| Initial Majority Subordinate Certificateholder: | An affiliate of Raith Capital Management, LLC | ||
| Cut-off Date: | The Cut-off Date with respect to each mortgage loan is the due date for the monthly debt service payment that is due in December 2013 (or, in the case of any mortgage loan that has its first due date in January 2014, the date that would have been its due date in December 2013 under the terms of that mortgage loan if a monthly debt service payment were scheduled to be due in that month). | ||
| Expected Closing Date: | On or about December 11, 2013. | ||
| Determination Dates: | The 11th day of each month (or if that day is not a business day, the next succeeding business day), commencing in January 2014. | ||
| Distribution Dates: | The fourth business day following the Determination Date in each month, commencing in January 2014. | ||
| Rated Final Distribution Date: | The Distribution Date in March 2046. | ||
| Interest Accrual Period: | With respect to any Distribution Date, the calendar month preceding the month in which such Distribution Date occurs. | ||
| Day Count: | The Offered Certificates will accrue interest on a 30/360 basis. | ||
| Minimum Denominations: | $10,000 for each Class of Offered Certificates (other than the Class X-A and X-B Certificates) and $1,000,000 for the Class X-A and X-B Certificates. Investments may also be made in any whole dollar denomination in excess of the applicable minimum denomination. | ||
| Clean-up Call: | 1% | ||
| Delivery: | DTC, Euroclear and Clearstream Banking | ||
| ERISA/SMMEA Status: | Each Class of Offered Certificates is expected to be eligible for exemptive relief under ERISA. No Class of Offered Certificates will be SMMEA eligible. | ||
| Risk Factors: | THE CERTIFICATES INVOLVE CERTAIN RISKS AND MAY NOT BE SUITABLE FOR ALL INVESTORS. SEE THE “RISK FACTORS” SECTION OF THE FREE WRITING PROSPECTUS. | ||
| Bond Analytics Information: | The Certificate Administrator will be authorized to make distribution date settlements, CREFC® reports and certain supplemental reports (other than confidential information) available to certain financial modeling and data provision services, including Bloomberg Financial Markets L.P., Trepp LLC, Intex Solutions, Inc., Markit Group Limited, Interactive Data Corp., BlackRock Financial Management, Inc and CMBS.com, Inc. | ||
THE INFORMATION IN THIS STRUCTURAL AND COLLATERAL TERM SHEET IS NOT COMPLETE AND MAY BE AMENDED PRIOR TO THE TIME OF SALE. THIS TERM SHEET IS NOT AN OFFER TO SELL THESE SECURITIES AND IT IS NOT A SOLICITATION OF AN OFFER TO BUY THESE SECURITIES IN ANY JURISDICTION WHERE THE OFFER OR SALE IS NOT PERMITTED.
7
| WFRBS Commercial Mortgage Trust 2013-UBS1 | Characteristics of the Mortgage Pool |
IV. Characteristics of the Mortgage Pool(1)
A. Ten Largest Mortgage Loans
Mortgage Loan Seller | Mortgage Loan Name | City | State | Number of Mortgage Loans / Mortgaged Properties | Mortgage Loan Cut-off Date Balance ($) | % of Cut- off Date Pool Balance (%) | Property Type | Number of SF, Rooms, Pads or Beds | Cut-off Date Balance Per SF, Room, Pad or Bed ($) | Cut-off Date LTV Ratio (%) | Balloon or ARD LTV Ratio (%) | U/W NCF DSCR (x) | U/W NOI Debt Yield (%) | |||||||||||||||
| WFB | The Outlet Collection | Jersey Gardens | Elizabeth | NJ | 1 / 1 | $130,000,000 | 17.9% | Retail | 1,298,801 | $269 | 49.5 | % | 49.5% | 2.84x | 11.5 | % | |||||||||||||
| UBSRES | Sullivan Center | Chicago | IL | 1 / 1 | 75,000,000 | 10.3 | Mixed Use | 943,944 | 120 | 49.6 | 49.6 | 2.80 | 12.2 | |||||||||||||||
| WFB | Ocean Breeze Apartments | Huntington Beach | CA | 1 / 1 | 36,750,000 | 5.1 | Multifamily | 286 | 128,497 | 64.0 | 52.5 | 1.28 | 8.3 | |||||||||||||||
| WFB | Mazza Grandmarc | College Park | MD | 1 / 1 | 34,500,000 | 4.7 | Multifamily | 628 | 54,936 | 67.3 | 61.2 | 1.37 | 8.2 | |||||||||||||||
| WFB | Dollar General Portfolio | Various | Various | 1 / 36 | 28,000,000 | 3.9 | Retail | 348,782 | 80 | 59.7 | 59.7 | 2.12 | 11.5 | |||||||||||||||
| RMF | North County Village | Thornton | CO | 1 / 1 | 22,300,000 | 3.1 | Manufactured Housing Community | 425 | 52,471 | 72.4 | 66.8 | 1.30 | 8.5 | |||||||||||||||
| WFB | Hampton Inn & Suites - Greenville | Greenville | SC | 1 / 1 | 19,706,304 | 2.7 | Hospitality | 115 | 171,359 | 69.1 | 57.2 | 1.83 | 13.2 | |||||||||||||||
| UBSRES | BluePearl Portfolio | Various | Various | 1 / 6 | 18,791,100 | 2.6 | Office | 99,000 | 190 | 48.3 | 48.3 | 3.22 | 14.1 | |||||||||||||||
| RMF | Vantage at Plum Creek | Kyle | TX | 1 / 1 | 18,500,000 | 2.5 | Multifamily | 264 | 70,076 | 74.7 | 68.9 | 1.37 | 9.2 | |||||||||||||||
| RMF | Voss Self Storage | Houston | TX | 1 / 1 | 16,325,000 | 2.2 | Self Storage | 157,366 | 104 | 71.4 | 63.2 | 1.45 | 9.6 | |||||||||||||||
| Top Three Total/Weighted Average | 3 / 3 | $241,750,000 | 33.3% | 51.7 | % | 50.0% | 2.59x | 11.2 | % | |||||||||||||||||||
| Top Five Total/Weighted Average | 5 / 40 | $304,250,000 | 41.9% | 54.2 | % | 52.2% | 2.41x | 10.9 | % | |||||||||||||||||||
| Top Ten Total/Weighted Average | 10 / 50 | $399,872,404 | 55.0% | 57.3 | % | 54.3% | 2.27x | 10.9 | % | |||||||||||||||||||
| Non-Top Ten Total/Weighted Average | 47 / 53 | $326,771,190 | 45.0% | 65.6 | % | 55.7% | 1.62x | 11.6 | % | |||||||||||||||||||
| (1) | With respect to The Outlet Collection | Jersey Gardens Mortgage Loan and the Sullivan Center Mortgage Loan, each of which is part of a pari passu loan combination, Cut-off Date Balance per square foot, loan-to-value ratio, debt service coverage ratio and debt yield calculations include the related pari passu companion loan(s) (unless otherwise stated) in total debt. With respect to each Mortgage Loan, debt service coverage ratio, debt yield and loan-to-value ratio information takes no account of subordinate debt (whether or not secured by the mortgaged property), if any, that is allowed under the terms of any mortgage loan. |
B. Summary of Pari Passu Split Loan Structures
| Property Name | Mortgage Loan Seller | Related Notes in Loan Group (Original Balance) | Holder of Note | Whether Note is Lead Servicing for the Entire Loan Combination | Current Master Servicer Under Related Securitization PSA | Current Special Servicer Under Related Securitization PSA | |||||
The Outlet Collection | Jersey Gardens | WFB | $130,000,000 | WFRBS 2013-UBS1 | (1) | Wells Fargo Bank, National Association | CWCapital Asset Management LLC | |||||
| WFB | $140,000,000 | (2) | (1) | TBD | TBD | ||||||
| WFB | $80,000,000 | (2) | (1) | TBD | TBD | ||||||
| Sullivan Center | UBSRES | $75,000,000 | WFRBS 2013-UBS1 | Yes | Wells Fargo Bank, National Association | CWCapital Asset Management LLC | |||||
| UBSRES | $38,500,000 | (2) | No | TBD | TBD | ||||||
| (1) | The Outlet Collections | Jersey Gardens loan combination will be serviced under the WFRBS 2013-UBS1 pooling and servicing agreement until the securitization of the related controlling pari passu companion loan, after which such loan combination will be serviced under the pooling and servicing agreement related to the securitization of that pari passu companion loan. The master servicer and special servicer under the latter pooling and servicing agreement will be identified in a notice, report or statement to holders of the WFRBS 2013-UBS1 certificates after the securitization of the applicable pari passu companion loan. |
| (2) | The related pari passu companion loan(s) are currently held by the mortgage loan seller for the mortgage loan included in the WFRBS 2013-UBS1 trust. |
THE INFORMATION IN THIS STRUCTURAL AND COLLATERAL TERM SHEET IS NOT COMPLETE AND MAY BE AMENDED PRIOR TO THE TIME OF SALE. THIS TERM SHEET IS NOT AN OFFER TO SELL THESE SECURITIES AND IT IS NOT A SOLICITATION OF AN OFFER TO BUY THESE SECURITIES IN ANY JURISDICTION WHERE THE OFFER OR SALE IS NOT PERMITTED.
8
| WFRBS Commercial Mortgage Trust 2013-UBS1 | Characteristics of the Mortgage Pool |
C. Mortgage Loans with Additional Secured and Mezzanine Financing(1) |
| Loan No. | Mortgage Loan Seller | Mortgage Loan Name | Mortgage Loan Cut-off Date Balance ($) | % of Cut- off Date Balance (%) | Sub Debt Cut- off Date Balance ($) | Mezzanine Debt Cut-off Date Balance ($) | Total Debt Interest Rate (%) | Mortgage Loan U/W NCF DSCR (x) | Total Debt U/W NCF DSCR (x) | Mortgage Loan Cut- off Date U/W NOI Debt Yield (%) | Total Debt Cut-off Date U/W NOI Debt Yield (%) | Mortgage Loan Cut-off Date LTV Ratio (%) | Total Debt Cut-off Date LTV Ratio (%) | |||||||||||
| 2 | UBSRES | Sullivan Center | $75,000,000 | 10.3% | $0 | $56,332,069 | 5.625% | 2.80x | 1.31x | 12.2% | 8.2% | 49.6% | 74.2% | |||||||||||
| 4 | WFB | Mazza Grandmarc | 34,500,000 | 4.7 | 0 | 4,500,000 | 4.940 | 1.37 | 1.09 | 8.2 | 7.2 | 67.3 | 76.0 | |||||||||||
Total/Weighted Average(2) | $109,500,000 | 15.1% | $0 | $60,832,069 | 5.497% | 2.35x | 1.27x | 10.9% | 8.0% | 55.2% | 74.5% | |||||||||||||
| (1) | With respect to the Sullivan Center Mortgage Loan, which is part of a pari passu loan combination, loan-to-value ratio, debt service coverage ratio, debt yield and cut-off date balance per square foot calculations include the pari passu companion loan unless otherwise stated. See Annex A-1 to the Free Writing Prospectus. |
| (2) | All total debt calculations are calculated including the Sullivan Center pari passu companion loan which is not shown in the table above. |
THE INFORMATION IN THIS STRUCTURAL AND COLLATERAL TERM SHEET IS NOT COMPLETE AND MAY BE AMENDED PRIOR TO THE TIME OF SALE. THIS TERM SHEET IS NOT AN OFFER TO SELL THESE SECURITIES AND IT IS NOT A SOLICITATION OF AN OFFER TO BUY THESE SECURITIES IN ANY JURISDICTION WHERE THE OFFER OR SALE IS NOT PERMITTED.
9
| WFRBS Commercial Mortgage Trust 2013-UBS1 | Characteristics of the Mortgage Pool |
D. Previous Securitization History(1) |
| Loan No. | Mortgage Loan Seller | Mortgage Loan or Mortgaged Property Name | City | State | Property Type | Mortgage Loan or Mortgaged Property Cut-off Date Balance ($) | % of Cut-off Date Pool Balance (%) | Previous Securitization | ||||||||
| 1 | WFB | The Outlet Collection | Jersey Gardens | Elizabeth | NJ | Retail | $130,000,000 | 17.9% | BSCMS 2004-T16; GMACC 2004-C2 | ||||||||
| 3 | WFB | Ocean Breeze Apartments | Huntington Beach | CA | Multifamily | 36,750,000 | 5.1 | NASC 1998-D6 | ||||||||
| 6 | RMF | North County Village | Thornton | CO | Manufactured Housing Community | 22,300,000 | 3.1 | CSMC 2007-C1 | ||||||||
| 7 | WFB | Hampton Inn & Suites - Greenville | Greenville | SC | Hospitality | 19,706,304 | 2.7 | CSMC 2007-C1 | ||||||||
| 13.01 | RMF | Walgreens #4573 | Temple Terrace | FL | Retail | 5,100,000 | 0.7 | WBCMT 2005-C17 | ||||||||
| 13.02 | RMF | Walgreens #4482 | Naples | FL | Retail | 4,540,000 | 0.6 | WBCMT 2005-C17 | ||||||||
| 14 | WFB | Whitney Ranch Shopping Center | Henderson | NV | Retail | 13,615,000 | 1.9 | GMACC 2004-C1 | ||||||||
| 15 | WFB | Doctors Medical Park | Silver Spring | MD | Office | 13,500,000 | 1.9 | MSC 2003-IQ6 | ||||||||
| 16 | RBS | Sheraton Denver West | Lakewood | CO | Hospitality | 13,185,676 | 1.8 | MLCFC 2007-5 | ||||||||
| 21 | WFB | Nob Hill Shopping Center | Yakima | WA | Retail | 10,750,000 | 1.5 | LBUBS 2005-C7 | ||||||||
| 24 | UBSRES | Tierra West | Albuquerque | NM | Manufactured Housing Community | 8,699,244 | 1.2 | CSFB 2004-C2 | ||||||||
| 26 | RBS | Residence Inn North Air Force Academy | Colorado Springs | CO | Hospitality | 7,990,689 | 1.1 | CSFB 2005-C3 | ||||||||
| 30 | WFB | Meadowood Market Place | Reno | NV | Retail | 7,000,000 | 1.0 | JPMCC 2004-CB8 | ||||||||
| 31 | UBSRES | South Pointe Village | Albuquerque | NM | Manufactured Housing Community | 6,803,767 | 0.9 | CSFB 2004-C1 | ||||||||
| 34 | UBSRES | Holiday Inn Express - Pineville | Pineville | NC | Hospitality | 6,182,902 | 0.9 | JPMC 2000-C9 | ||||||||
| 35 | WFB | Security Public Storage Oceanside | Oceanside | CA | Self Storage | 6,060,000 | 0.8 | BSCMS 2005-T20 | ||||||||
| 36 | RBS | Courtyard Colorado Springs South | Colorado Springs | CO | Hospitality | 5,743,395 | 0.8 | CSFB 2005-C3 | ||||||||
| 39 | UBSRES | The Columns Apartments | Jacksonville | FL | Multifamily | 5,393,391 | 0.7 | WBCMT 2007-WHL8 | ||||||||
| 43 | WFB | The Towers Office Building | Watsonville | CA | Office | 4,392,894 | 0.6 | MSC 2004-T13 | ||||||||
| 46 | UBSRES | Village Park | Albuquerque | NM | Manufactured Housing Community | 4,030,384 | 0.6 | CSFB 2004-C2 | ||||||||
| 47 | UBSRES | Aztec Village | Albuquerque | NM | Manufactured Housing Community | 3,970,527 | 0.5 | CSFB 2004-C2 | ||||||||
| 49 | WFB | Security Public Storage - Vallejo | Vallejo | CA | Self Storage | 3,300,000 | 0.5 | BSCMS 2005-T20 | ||||||||
| 52 | WFB | Palm Gardens Resort | Harlingen | TX | Manufactured Housing Community | 2,197,443 | 0.3 | BACM 2003-2 | ||||||||
| 54 | UBSRES | Longview Park | Albuquerque | NM | Manufactured Housing Community | 1,556,287 | 0.2 | CSFB 2004-C2 | ||||||||
| Total | $342,767,903 | 47.2% | ||||||||||||||
| (1) | The table above represents the most recent securitization with respect to the mortgaged property securing the related mortgage loan, based on information provided by the related borrower or obtained through searches of a third-party database. While the above mortgage loans may have been securitized multiple times in prior transactions, mortgage loans are only listed in the above chart if the mortgage loan paid off a mortgage loan in another securitization. The information has not otherwise been confirmed by the mortgage loan sellers. |
THE INFORMATION IN THIS STRUCTURAL AND COLLATERAL TERM SHEET IS NOT COMPLETE AND MAY BE AMENDED PRIOR TO THE TIME OF SALE. THIS TERM SHEET IS NOT AN OFFER TO SELL THESE SECURITIES AND IT IS NOT A SOLICITATION OF AN OFFER TO BUY THESE SECURITIES IN ANY JURISDICTION WHERE THE OFFER OR SALE IS NOT PERMITTED.
10
| WFRBS Commercial Mortgage Trust 2013-UBS1 | Characteristics of the Mortgage Pool |
| E. Mortgage Loans with Scheduled Balloon Payments and Related Classes |
Class A-2(1) | |||||||||||||||||
| Loan No. | Mortgage Loan Seller | Mortgage Loan Name | State | Property Type | Mortgage Loan Cut-off Date Balance ($) | % of Cut-off Date Pool Balance (%) | Mortgage Loan Balance at Maturity ($) | % of Class A-2 Certificate Principal Balance (%)(2) | SF/ Rooms/ Beds/ Pads/ Units | Loan per SF /Room/ Beds/ Pad/Unit ($) | U/W NCF DSCR (x) | U/W NOI Debt Yield (%) | Cut-off Date LTV Ratio (%) | Balloon or ARD LTV Ratio (%) | Rem.IO Period (mos.) | Rem. Term to Maturity (mos.) | |
| 2 | UBSRES | Sullivan Center | IL | Mixed Use | $75,000,000 | 10.3% | $75,000,000 | 47.2% | 943,944 | $120 | 2.80x | 12.2% | 49.6% | 49.6% | 59 | 59 | |
| 4 | WFB | Mazza Grandmarc | MD | Multifamily | 34,500,000 | 4.7 | 31,389,119 | 19.8 | 628 | 54,936 | 1.37 | 8.2 | 67.3 | 61.2 | 0 | 60 | |
| 8 | UBSRES | BluePearl Portfolio | Various | Office | 18,791,100 | 2.6 | 18,791,100 | 11.8 | 99,000 | 190 | 3.22 | 14.1 | 48.3 | 48.3 | 59 | 59 | |
| 13 | RMF | Olympia Development Walgreens Portfolio II | FL | Retail | 14,140,000 | 1.9 | 14,140,000 | 8.9 | 46,980 | 301 | 1.42 | 7.3 | 74.9 | 74.9 | 59 | 59 | |
| 33 | WFB | Fairmont Crossing | TX | Mixed Use | 6,191,939 | 0.9 | 5,679,667 | 3.6 | 29,114 | 213 | 1.50 | 9.8 | 74.2 | 68.0 | 0 | 59 | |
| 37 | RMF | Stafford MF Portfolio | MI | Multifamily | 5,600,000 | 0.8 | 5,025,126 | 3.2 | 266 | 21,053 | 1.40 | 11.7 | 61.4 | 55.1 | 0 | 60 | |
| 44 | UBSRES | Holiday Inn Express – McComb | MS | Hospitality | 4,193,846 | 0.6 | 3,791,382 | 2.4 | 69 | 60,780 | 1.68 | 14.5 | 62.6 | 56.6 | 0 | 59 | |
| 45 | WFB | Gander Mountain Tuscaloosa | AL | Retail | 4,094,746 | 0.6 | 3760,673 | 2.4 | 42,310 | 97 | 2.11 | 14.2 | 50.6 | 46.4 | 0 | 59 | |
| Total/Weighted Average | $162,511,631 | 22.4% | $157,577,067 | 99.2% | 2.28x | 11.1% | 57.1% | 55.1% | 39 | 59 | |||||||
(1) | The table above presents the mortgage loan whose balloon payments would be applied to pay down the principal balance of the Class A-2 Certificates, assuming a 0% CPR and applying the “Structuring Assumptions” described in the Free Writing Prospectus, including the assumptions that (i) none of the mortgage loans in the pool experience prepayments, defaults or losses; (ii) there are no extensions of maturity dates of any mortgage loans in the pool; and (iii) each mortgage loan in the pool is paid in full on its stated maturity date. Each class of Certificates, including the Class A-2 Certificates, evidences undivided ownership interests in the entire pool of mortgage loans. Debt service coverage ratio, debt yield and loan-to-value ratio information takes no account of subordinate debt (whether or not secured by the mortgaged property), if any, that is allowed under the terms of any mortgage loan. See Annex A-1 to the Free Writing Prospectus. |
| (2) | Reflects the percentage equal to the Mortgage Loan Balance at Maturity divided by the initial Class A-2 Certificate Principal Balance. |
| Class A-3(1) | |||||||||||||||||
| Loan No. | Mortgage Loan Seller | Mortgage Loan Name | State | Property Type | Mortgage Loan Cut-off Date Balance ($) | % of Cut-off Date Pool Balance (%) | Mortgage Loan Balance at Maturity ($) | % of Class A-3 Certificate Principal Balance (%)(2) | SF/ Rooms/ Beds/ Pads/ Units | Loan per SF /Room/ Beds/ Pad/Unit ($) | U/W NCF DSCR (x) | U/W NOI Debt Yield (%) | Cut-off Date LTV Ratio (%) | Balloon or ARD LTV Ratio (%) | Rem. IO Period (mos.) | Rem. Term to Maturity (mos.) | |
| 1 | WFB | The Outlet Collection | Jersey Gardens | NJ | Retail | $130,000,000 | 17.9% | $130,000,000 | 100.0% | 1,298,801 | $269 | 2.84x | 11.5% | 49.5% | 49.5% | 83 | 83 | |
| Total/Weighted Average | $130,000,000 | 17.9% | $130,000,000 | 100.0% | 2.84x | 11.5% | 49.5% | 49.5% | 83 | 83 | |||||||
(1) | The table above presents the mortgage loan whose balloon payments would be applied to pay down the principal balance of the Class A-3 Certificates, assuming a 0% CPR and applying the “Structuring Assumptions” described in the Free Writing Prospectus, including the assumptions that (i) none of the mortgage loans in the pool experience prepayments, defaults or losses; (ii) there are no extensions of maturity dates of any mortgage loans in the pool; and (iii) each mortgage loan in the pool is paid in full on its stated maturity date. Each class of Certificates, including the Class A-3 Certificates, evidences undivided ownership interests in the entire pool of mortgage loans. Debt service coverage ratio, debt yield and loan-to-value ratio information takes no account of subordinate debt (whether or not secured by the mortgaged property), if any, that is allowed under the terms of any mortgage loan. See Annex A-1 to the Free Writing Prospectus. |
| (2) | Reflects the percentage equal to the Mortgage Loan Balance at Maturity divided by the initial Class A-3 Certificate Principal Balance. |
THE INFORMATION IN THIS STRUCTURAL AND COLLATERAL TERM SHEET IS NOT COMPLETE AND MAY BE AMENDED PRIOR TO THE TIME OF SALE. THIS TERM SHEET IS NOT AN OFFER TO SELL THESE SECURITIES AND IT IS NOT A SOLICITATION OF AN OFFER TO BUY THESE SECURITIES IN ANY JURISDICTION WHERE THE OFFER OR SALE IS NOT PERMITTED.
11
| WFRBS Commercial Mortgage Trust 2013-UBS1 | Characteristics of the Mortgage Pool |
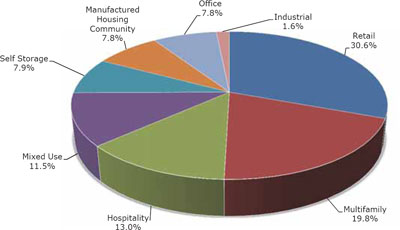
F. Property Type Distribution(1)
| Property Type | Number of Mortgaged Properties | Aggregate Cut- off Date Balance ($) | % of Cut- off Date Balance (%) | Weighted Average Cut-off Date LTV Ratio (%) | Weighted Average Balloon or ARD LTV Ratio (%) | Weighted Average U/W NCF DSCR (x) | Weighted Average U/W NOI Debt Yield (%) | Weighted Average U/W NCF Debt Yield (%) | Weighted Average Mortgage Rate (%) | |
| Retail | 45 | $222,517,246 | 30.6% | 56.2% | 54.5% | 2.37x | 11.1% | 10.6% | 4.302% | |
| Regional Mall | 1 | 130,000,000 | 17.9 | 49.5 | 49.5 | 2.84 | 11.5 | 11.0 | 3.830 | |
| Single Tenant | 40 | 46,234,746 | 6.4 | 63.5 | 63.2 | 1.91 | 10.5 | 10.2 | 5.114 | |
| Anchored | 3 | 39,282,500 | 5.4 | 70.3 | 61.9 | 1.49 | 10.1 | 9.4 | 4.779 | |
| Unanchored | 1 | 7,000,000 | 1.0 | 53.8 | 47.7 | 1.78 | 12.1 | 11.5 | 5.030 | |
| Multifamily | 13 | 143,984,527 | 19.8 | 68.7 | 59.3 | 1.39 | 9.3 | 8.8 | 4.813 | |
| Garden | 12 | 109,484,527 | 15.1 | 69.1 | 58.7 | 1.40 | 9.7 | 9.0 | 5.022 | |
| Student Housing | 1 | 34,500,000 | 4.7 | 67.3 | 61.2 | 1.37 | 8.2 | 8.0 | 4.150 | |
| Hospitality | 10 | 94,184,191 | 13.0 | 66.9 | 54.7 | 1.73 | 13.7 | 12.1 | 5.386 | |
| Limited Service | 8 | 76,455,797 | 10.5 | 66.8 | 54.5 | 1.77 | 13.8 | 12.4 | 5.362 | |
| Full Service | 2 | 17,728,394 | 2.4 | 67.6 | 55.3 | 1.57 | 13.1 | 10.9 | 5.488 | |
| Mixed Use | 3 | 83,391,939 | 11.5 | 51.1 | 50.6 | 2.70 | 12.1 | 11.1 | 4.018 | |
| Office/Retail | 1 | 75,000,000 | 10.3 | 49.6 | 49.6 | 2.80 | 12.2 | 11.2 | 3.950 | |
| Retail/Office | 1 | 6,191,939 | 0.9 | 74.2 | 68.0 | 1.50 | 9.8 | 9.2 | 4.570 | |
| Retail/Multifamily/Office | 1 | 2,200,000 | 0.3 | 36.7 | 36.7 | 2.53 | 13.4 | 12.3 | 4.790 | |
| Self Storage | 9 | 57,669,770 | 7.9 | 70.5 | 60.6 | 1.44 | 9.5 | 9.3 | 5.076 | |
| Self Storage | 9 | 57,669,770 | 7.9 | 70.5 | 60.6 | 1.44 | 9.5 | 9.3 | 5.076 | |
| Manufactured Housing Community | 11 | 57,007,652 | 7.8 | 61.0 | 53.0 | 1.67 | 10.9 | 10.7 | 4.983 | |
| Manufactured Housing Community | 11 | 57,007,652 | 7.8 | 61.0 | 53.0 | 1.67 | 10.9 | 10.7 | 4.983 | |
| Office | 11 | 56,423,944 | 7.8 | 55.7 | 49.9 | 2.19 | 13.1 | 11.7 | 4.643 | |
| Medical | 7 | 32,291,100 | 4.4 | 48.2 | 46.6 | 2.63 | 13.7 | 12.4 | 4.361 | |
| Suburban | 4 | 24,132,844 | 3.3 | 65.8 | 54.3 | 1.61 | 12.4 | 10.7 | 5.019 | |
| Industrial | 1 | 11,464,327 | 1.6 | 62.0 | 46.9 | 1.56 | 12.2 | 11.3 | 5.238 | |
| Warehouse | 1 | 11,464,327 | 1.6 | 62.0 | 46.9 | 1.56 | 12.2 | 11.3 | 5.238 | |
| Total/Weighted Average | 103 | $726,643,595 | 100.0% | 61.0% | 54.9% | 1.98x | 11.2% | 10.5% | 4.667% | |
(1) | Because this table presents information relating to the mortgaged properties and not the mortgage loans, the information for mortgage loans secured by more than one mortgaged property is based on allocated amounts (allocating the mortgage loan principal balance to each of those properties according to the relative appraised values of the mortgaged properties or the allocated loan amounts or property-specific release prices set forth in the related mortgage loan documents or such other allocation as the related mortgage loan seller deemed appropriate). With respect to The Outlet Collection | Jersey Gardens Mortgage Loan and the Sullivan Center Mortgage Loan, loan-to-value ratio, debt service coverage ratio and debt yield calculations include the related pari passu companion loan(s) (unless otherwise stated) in total debt. Debt service coverage ratio, debt yield and loan-to-value ratio information takes no account of subordinate debt (whether or not secured by the mortgaged property) that is allowed under the terms of any mortgage loan. See Annex A-1 to the Free Writing Prospectus. |
THE INFORMATION IN THIS STRUCTURAL AND COLLATERAL TERM SHEET IS NOT COMPLETE AND MAY BE AMENDED PRIOR TO THE TIME OF SALE. THIS TERM SHEET IS NOT AN OFFER TO SELL THESE SECURITIES AND IT IS NOT A SOLICITATION OF AN OFFER TO BUY THESE SECURITIES IN ANY JURISDICTION WHERE THE OFFER OR SALE IS NOT PERMITTED.
12
| WFRBS Commercial Mortgage Trust 2013-UBS1 | Characteristics of the Mortgage Pool |
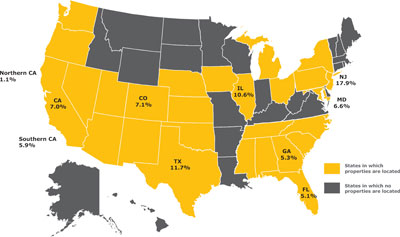
G. Geographic Distribution(1)
Location(2) | Number of Mortgaged Properties | Aggregate Cut- off Date Balance ($)(3) | % of Cut- off Date Balance (%) | Weighted Average Cut-off Date LTV Ratio (%)(3) | Weighted Average Balloon or ARD LTV Ratio (%)(3) | Weighted Average U/W NCF DSCR (x)(3) | Weighted Average U/W NOI Debt Yield (%)(3) | Weighted Average U/W NCF Debt Yield (%)(3) | Weighted Average Mortgage Rate (%)(3) | |
| New Jersey | 1 | $130,000,000 | 17.9% | 49.5% | 49.5% | 2.84x | 11.5% | 11.0% | 3.830% | |
| Texas | 16 | 85,332,625 | 11.7 | 70.7 | 62.4 | 1.48 | 10.0 | 9.6 | 5.058 | |
| Illinois | 2 | 77,204,400 | 10.6 | 49.6 | 49.6 | 2.81 | 12.3 | 11.3 | 3.952 | |
| Colorado | 7 | 51,712,625 | 7.1 | 68.8 | 60.6 | 1.54 | 11.2 | 10.0 | 5.230 | |
| California | 4 | 50,502,894 | 7.0 | 62.1 | 50.7 | 1.37 | 9.2 | 8.9 | 4.967 | |
| Southern | 2 | 42,810,000 | 5.9 | 64.0 | 52.5 | 1.32 | 8.6 | 8.4 | 4.927 | |
| Northern | 2 | 7,692,894 | 1.1 | 51.7 | 40.8 | 1.66 | 12.7 | 11.5 | 5.187 | |
| Maryland | 2 | 48,000,000 | 6.6 | 61.9 | 56.4 | 1.50 | 9.6 | 9.0 | 4.347 | |
| Georgia | 5 | 38,598,734 | 5.3 | 69.1 | 58.8 | 1.77 | 11.1 | 10.2 | 4.841 | |
| Florida | 8 | 36,757,999 | 5.1 | 67.7 | 59.8 | 1.60 | 10.7 | 9.8 | 5.227 | |
Other(4) | 58 | 208,534,317 | 28.7 | 63.5 | 54.8 | 1.80 | 12.2 | 11.3 | 5.025 | |
| Total/Weighted Average | 103 | $726,643,595 | 100.0% | 61.0% | 54.9% | 1.98x | 11.2% | 10.5% | 4.667% | |
| (1) | The Mortgaged Properties are located in 27 states. |
| (2) | For purposes of determining whether a mortgaged property is in Northern California or Southern California, Northern California includes areas with zip codes above 93600 and Southern California includes areas with zip codes of 93600 and below. |
| (3) | Because this table presents information relating to the mortgaged properties and not the mortgage loans, the information for mortgage loans secured by more than one mortgaged property is based on allocated amounts (allocating the mortgage loan principal balance to each of those properties according to the relative appraised values of the mortgaged properties or the allocated loan amounts or property-specific release prices set forth in the related mortgage loan documents or such other allocation as the related mortgage loan seller deemed appropriate). With respect to The Outlet Collection | Jersey Gardens Mortgage Loan and the Sullivan Center Mortgage Loan, loan-to-value ratio, debt service coverage ratio and debt yield calculations include the related pari passu companion loan(s) (unless otherwise stated) in total debt. Debt service coverage ratio, debt yield and loan-to-value ratio information takes no account of subordinate debt (whether or not secured by the mortgaged property), if any, that is allowed under the terms of any mortgage loan. See Annex A-1 to the Free Writing Prospectus. |
| (4) | Includes 19 other states. |
THE INFORMATION IN THIS STRUCTURAL AND COLLATERAL TERM SHEET IS NOT COMPLETE AND MAY BE AMENDED PRIOR TO THE TIME OF SALE. THIS TERM SHEET IS NOT AN OFFER TO SELL THESE SECURITIES AND IT IS NOT A SOLICITATION OF AN OFFER TO BUY THESE SECURITIES IN ANY JURISDICTION WHERE THE OFFER OR SALE IS NOT PERMITTED.
13
| WFRBS Commercial Mortgage Trust 2013-C16 | Characteristics of the Mortgage Pool |
H. Characteristics of the Mortgage Pool(1)
| CUT-OFF DATE BALANCE | LOAN PURPOSE | |||||||||||||||||||||
| Number of | Number of | |||||||||||||||||||||
| Range of Cut-off Date | Mortgage | Aggregate Cut- | % of Cut-off | Mortgage | Aggregate Cut- | % of Cut-off | ||||||||||||||||
| Balances ($) | Loans | off Date Balance | Date Balance | Loan Purpose | Loans | off Date Balance | Date Balance | |||||||||||||||
| 1,175,724 - 2,000,000 | 5 | $7,626,539 | 1.0 | % | Refinance | 42 | $564,229,430 | 77.6 | % | |||||||||||||
| 2,000,001 - 3,000,000 | 3 | 7,322,443 | 1.0 | Acquisition | 15 | 162,414,165 | 22.4 | |||||||||||||||
| 3,000,001 - 4,000,000 | 3 | 10,916,092 | 1.5 | Total: | 57 | $726,643,595 | 100.0 | % | ||||||||||||||
| 4,000,001 - 5,000,000 | 6 | 25,949,246 | 3.6 | |||||||||||||||||||
| 5,000,001 - 6,000,000 | 5 | 27,425,538 | 3.8 | MORTGAGE RATE | ||||||||||||||||||
| 6,000,001 - 7,000,000 | 6 | 38,480,852 | 5.3 | Number of | ||||||||||||||||||
| 7,000,001 - 8,000,000 | 4 | 30,040,072 | 4.1 | Range of Mortgage Rates | Mortgage | Aggregate Cut- | % of Cut-off | |||||||||||||||
| 8,000,001 - 9,000,000 | 2 | 16,799,244 | 2.3 | (%) | Loans | off Date Balance | Date Balance | |||||||||||||||
| 9,000,001 - 15,000,000 | 13 | 162,211,164 | 22.3 | 3.830 - 4.500 | 4 | $258,291,100 | 35.5 | % | ||||||||||||||
| 15,000,001 - 20,000,000 | 4 | 73,322,404 | 10.1 | 4.501 - 4.750 | 3 | 23,901,685 | 3.3 | |||||||||||||||
| 20,000,001 - 30,000,000 | 2 | 50,300,000 | 6.9 | 4.751 - 5.000 | 19 | 186,744,168 | 25.7 | |||||||||||||||
| 30,000,001 - 50,000,000 | 2 | 71,250,000 | 9.8 | 5.001 - 5.250 | 17 | 176,949,865 | 24.4 | |||||||||||||||
| 50,000,001 - 70,000,000 | 1 | 75,000,000 | 10.3 | 5.251 - 5.500 | 7 | 38,385,682 | 5.3 | |||||||||||||||
| 80,000,001 - 130,000,000 | 1 | 130,000,000 | 17.9 | 5.501 - 5.750 | 4 | 21,509,757 | 3.0 | |||||||||||||||
| Total: | 57 | $726,643,595 | 100.0 | % | 5.751 - 5.933 | 3 | 20,861,338 | 2.9 | ||||||||||||||
| Average: | $12,748,133 | Total: | 57 | $726,643,595 | 100.0 | % | ||||||||||||||||
| Weighted Average: | 4.667% | |||||||||||||||||||||
| UNDERWRITTEN NOI DEBT SERVICE COVERAGE RATIO | ||||||||||||||||||||||
| Number of | UNDERWRITTEN NOI DEBT YIELD | |||||||||||||||||||||
| Range of U/W NOI | Mortgage | Aggregate Cut- | % of Cut-off | Number of | ||||||||||||||||||
| DSCRs (x) | Loans | off Date Balance | Date Balance | Range of U/W NOI | Mortgage | Aggregate Cut- | % of Cut-off | |||||||||||||||
| 1.31 - 1.40 | 5 | $113,250,000 | 15.6 | % | Debt Yields (%) | Loans | off Date Balance | Date Balance | ||||||||||||||
| 1.41 - 1.50 | 6 | 68,231,645 | 9.4 | 7.3 - 8.0 | 1 | $14,140,000 | 1.9 | % | ||||||||||||||
| 1.51 - 1.60 | 9 | 57,277,850 | 7.9 | 8.1 - 9.0 | 4 | 108,050,000 | 14.9 | |||||||||||||||
| 1.61 - 1.70 | 6 | 29,807,894 | 4.1 | 9.1 - 10.0 | 8 | 80,401,083 | 11.1 | |||||||||||||||
| 1.71 - 1.80 | 5 | 53,782,492 | 7.4 | 10.1 - 11.0 | 10 | 56,435,904 | 7.8 | |||||||||||||||
| 1.81 - 1.90 | 5 | 23,663,917 | 3.3 | 11.1 - 12.0 | 9 | 203,463,703 | 28.0 | |||||||||||||||
| 1.91 - 2.00 | 5 | 40,471,706 | 5.6 | 12.1 - 13.0 | 11 | 135,278,380 | 18.6 | |||||||||||||||
| 2.01 - 2.25 | 11 | 110,072,244 | 15.1 | 13.1 - 14.0 | 6 | 67,067,260 | 9.2 | |||||||||||||||
| 2.26 - 2.50 | 1 | 4,094,746 | 0.6 | 14.1 - 15.0 | 7 | 55,624,362 | 7.7 | |||||||||||||||
| 2.51 - 3.00 | 2 | 132,200,000 | 18.2 | 15.1 - 15.4 | 1 | 6,182,902 | 0.9 | |||||||||||||||
| 3.01 - 3.46 | 2 | 93,791,100 | 12.9 | Total: | 57 | $726,643,595 | 100.0 | % | ||||||||||||||
| Total: | 57 | $726,643,595 | 100.0 | % | Weighted Average: | 11.2% | ||||||||||||||||
| Weighted Average: | 2.11x | |||||||||||||||||||||
| UNDERWRITTEN NCF DEBT YIELD | ||||||||||||||||||||||
| UNDERWRITTEN NCF DEBT SERVICE COVERAGE RATIO | Number of | |||||||||||||||||||||
| Number of | Range of U/W NCF | Mortgage | Aggregate Cut- | % of Cut-off | ||||||||||||||||||
| Range of U/W NCF | Mortgage | Aggregate Cut- | % of Cut-off | Debt Yields (%) | Loans | off Date Balance | Date Balance | |||||||||||||||
| DSCRs (x) | Loans | off Date Balance | Date Balance | 7.2 - 8.0 | 2 | $48,640,000 | 6.7 | % | ||||||||||||||
| 1.28 - 1.30 | 2 | $59,050,000 | 8.1 | % | 8.1 - 9.0 | 7 | 115,340,921 | 15.9 | ||||||||||||||
| 1.31 - 1.40 | 8 | 95,714,476 | 13.2 | 9.1 - 10.0 | 11 | 83,242,376 | 11.5 | |||||||||||||||
| 1.41 - 1.50 | 9 | 90,316,539 | 12.4 | 10.1 - 11.0 | 11 | 195,573,832 | 26.9 | |||||||||||||||
| 1.51 - 1.60 | 9 | 53,825,399 | 7.4 | 11.1 - 12.0 | 13 | 199,858,884 | 27.5 | |||||||||||||||
| 1.61 - 1.70 | 8 | 53,957,481 | 7.4 | 12.1 - 13.0 | 9 | 44,450,640 | 6.1 | |||||||||||||||
| 1.71 - 1.80 | 4 | 25,625,827 | 3.5 | 13.1 - 13.7 | 4 | 39,536,942 | 5.4 | |||||||||||||||
| 1.81 - 1.90 | 7 | 66,051,570 | 9.1 | Total: | 57 | $726,643,595 | 100.0 | % | ||||||||||||||
| 1.91 - 2.00 | 3 | 20,045,930 | 2.8 | Weighted Average: | 10.5% | |||||||||||||||||
| 2.01 - 2.25 | 3 | 36,065,273 | 5.0 | |||||||||||||||||||
| 2.26 - 2.75 | 1 | 2,200,000 | 0.3 | |||||||||||||||||||
| 2.76 - 3.00 | 2 | 205,000,000 | 28.2 | |||||||||||||||||||
| 3.01 - 3.22 | 1 | 18,791,100 | 2.6 | |||||||||||||||||||
| Total: | 57 | $726,643,595 | 100.0 | % | ||||||||||||||||||
| Weighted Average: | 1.98x | |||||||||||||||||||||
| (1) | With respect to The Outlet Collection | Jersey Gardens Mortgage Loan and Sullivan Center Mortgage Loan, loan-to-value ratio, debt service coverage ratio and debt yield calculations include the related pari passu companion loan(s) (unless otherwise stated) in total debt. Debt service coverage ratio, debt yield and loan-to-value ratio information takes no account of subordinate debt (whether or not secured by the mortgaged property), if any, that is allowed under the terms of any mortgage loan. Debt service coverage ratio, debt yield and loan-to-value ratio information takes no account of subordinate debt (whether or not secured by the mortgaged property), if any, that is allowed under the terms of any mortgage loan. See Annex A-1 to the Free Writing Prospectus. |
THE INFORMATION IN THIS STRUCTURAL AND COLLATERAL TERM SHEET IS NOT COMPLETE AND MAY BE AMENDED PRIOR TO THE TIME OF SALE. THIS TERM SHEET IS NOT AN OFFER TO SELL THESE SECURITIES AND IT IS NOT A SOLICITATION OF AN OFFER TO BUY THESE SECURITIES IN ANY JURISDICTION WHERE THE OFFER OR SALE IS NOT PERMITTED.
14
| WFRBS Commercial Mortgage Trust 2013-UBS1 | Characteristics of the Mortgage Pool |
| ORIGINAL TERM TO MATURITY OR ARD | CUT-OFF DATE LOAN-TO-VALUE RATIO | ||||||||||||||||||||||
| Number of | Number of | ||||||||||||||||||||||
| Range of Original Terms to | Mortgage | Aggregate Cut- | % of Cut-off | Range of Cut-off Date LTV | Mortgage | Aggregate Cut- | % of Cut-off | ||||||||||||||||
| Maturity or ARD (months) | Loans | off Date Balance | Date Balance | Ratios (%) | Loans | off Date Balance | Date Balance | ||||||||||||||||
| 60 | 8 | $162,511,631 | 22.4 | % | 36.7 - 40.0 | 1 | $2,200,000 | 0.3 | % | ||||||||||||||
| 84 | 1 | 130,000,000 | 17.9 | 40.1 - 50.0 | 6 | 243,881,437 | 33.6 | ||||||||||||||||
| 120 | 47 | 423,381,964 | 58.3 | 50.1 - 55.0 | 5 | 27,794,901 | 3.8 | ||||||||||||||||
| 123 | 1 | 10,750,000 | 1.5 | 55.1 - 60.0 | 8 | 55,676,874 | 7.7 | ||||||||||||||||
| Total: | 57 | $726,643,595 | 100.0 | % | 60.1 - 65.0 | 11 | 113,888,095 | 15.7 | |||||||||||||||
| Weighted Average: | 100 months | 65.1 - 70.0 | 6 | 85,407,939 | 11.8 | ||||||||||||||||||
| REMAINING TERM TO MATURITY OR ARD | 70.1 - 75.0 | 19 | 186,294,348 | 25.6 | |||||||||||||||||||
| Number of | 75.1 - 75.2 | 1 | 11,500,000 | 1.6 | |||||||||||||||||||
| Range of Remaining Terms | Mortgage | Aggregate Cut- | % of Cut-off | Total: | 57 | $726,643,595 | 100.0 | % | |||||||||||||||
| to Maturity or ARD (months) | Loans | off Date Balance | Date Balance | Weighted Average: | 61.0% | ||||||||||||||||||
| 59 - 60 | 8 | $162,511,631 | 22.4 | % | |||||||||||||||||||
| 61 - 84 | 1 | 130,000,000 | 17.9 | BALLOON OR ARD LOAN-TO-VALUE RATIO | |||||||||||||||||||
| 85 - 120 | 47 | 423,381,964 | 58.3 | Number of | |||||||||||||||||||
| 121 - 123 | 1 | 10,750,000 | 1.5 | Range of Balloon or ARD | Mortgage | Aggregate Cut- | % of Cut-off | ||||||||||||||||
| Total: | 57 | $726,643,595 | 100.0 | % | LTV Ratios (%) | Loans | off Date Balance | Date Balance | |||||||||||||||
| Weighted Average: | 99 months | 34.5 - 35.0 | 1 | $4,392,894 | 0.6 | % | |||||||||||||||||
ORIGINAL AMORTIZATION TERM(2) | 35.1 - 40.0 | 1 | 2,200,000 | 0.3 | |||||||||||||||||||
| Range of Original | Number of | 40.1 - 45.0 | 5 | 32,397,598 | 4.5 | ||||||||||||||||||
| Amortization Terms | Mortgage | Aggregate Cut- | % of Cut-off | 45.1 - 50.0 | 14 | 278,569,765 | 38.3 | ||||||||||||||||
| (months) | Loans | off Date Balance | Date Balance | 50.1 - 55.0 | 8 | 95,424,989 | 13.1 | ||||||||||||||||
| Interest-Only | 6 | $268,131,100 | 36.9 | % | 55.1 - 60.0 | 12 | 122,717,774 | 16.9 | |||||||||||||||
| 300 | 8 | 57,329,470 | 7.9 | 60.1 - 65.0 | 10 | 100,391,136 | 13.8 | ||||||||||||||||
| 336 | 1 | 11,500,000 | 1.6 | 65.1 - 70.0 | 5 | 76,409,439 | 10.5 | ||||||||||||||||
| 360 | 42 | 389,683,025 | 53.6 | 70.1 - 74.9 | 1 | 14,140,000 | 1.9 | ||||||||||||||||
| Total: | 57 | $726,643,595 | 100.0 | % | Total: | 57 | $726,643,595 | 100.0 | % | ||||||||||||||
Weighted Average(3): | 352 months | Weighted Average: | 54.9% | ||||||||||||||||||||
| (2) | The original amortization term shown for any mortgage loan that is interest-only for part | ||||||||||||||||||||||
| of its term does not include the number of months in its interest-only period and reflects | AMORTIZATION TYPE | ||||||||||||||||||||||
| only the number of months as of the commencement of amortization remaining from the | Number of | Aggregate Cut- | |||||||||||||||||||||
| end of such interest-only period. | Mortgage | off Date | % of Cut-off | ||||||||||||||||||||
| (3) | Excludes the non-amortizing loans. | Type of Amortization | Loans | Balance | Date Balance | ||||||||||||||||||
REMAINING AMORTIZATION TERM(4) | Amortizing Balloon | 39 | $306,229,995 | 42.1 | % | ||||||||||||||||||
| Range of Remaining | Number of | Interest-only, Balloon | 4 | 235,200,000 | 32.4 | ||||||||||||||||||
| Amortization Terms | Mortgage | Aggregate Cut- | % of Cut-off | Interest-only, Amortizing Balloon | 12 | 152,282,500 | 21.0 | ||||||||||||||||
| (months) | Loans | off Date Balance | Date Balance | Interest-only, ARD | 2 | 32,931,100 | 4.5 | ||||||||||||||||
| Interest-Only | 6 | $268,131,100 | 36.9 | % | Total: | 57 | $726,643,595 | 100.0 | % | ||||||||||||||
| 298 - 300 | 8 | 57,329,470 | 7.9 | ||||||||||||||||||||
| 301 - 336 | 1 | 11,500,000 | 1.6 | ORIGINAL TERM OF INTEREST-ONLY PERIOD FOR PARTIAL IO LOANS | |||||||||||||||||||
| 337 - 360 | 42 | 389,683,025 | 53.6 | Number of | |||||||||||||||||||
| Total: | 57 | $726,643,595 | 100.0 | % | Mortgage | Aggregate Cut- | % of Cut-off | ||||||||||||||||
Weighted Average(5): | 351 months | IO Term (months) | Loans | off Date Balance | Date Balance | ||||||||||||||||||
| (4) | The remaining amortization term shown for any mortgage loan that is interest-only for | 12 | 2 | $14,925,000 | 2.1 | % | |||||||||||||||||
| part of its term does not include the number of months in its interest-only period and | 19 - 24 | 2 | 16,700,000 | 2.3 | |||||||||||||||||||
| reflects only the number of months as of the commencement of amortization remaining | 25 - 36 | 3 | 37,825,000 | 5.2 | |||||||||||||||||||
| from the end of such interest-only period. | 37 - 48 | 1 | 14,917,500 | 2.1 | |||||||||||||||||||
| (5) | Excludes the non-amortizing loans. | 49 - 60 | 4 | 67,915,000 | 9.3 | ||||||||||||||||||
| LOCKBOXES | Total: | 12 | $152,282,500 | 21.0 | % | ||||||||||||||||||
| Number of | % of Cut-off | Weighted Average: | 44 months | ||||||||||||||||||||
| Mortgage | Aggregate Cut- | Date | |||||||||||||||||||||
| Type of Lockbox | Loans | off Date Balance | Balance | SEASONING | |||||||||||||||||||
| Hard/Springing Cash Management | 12 | $236,376,324 | 32.5 | % | Number of | ||||||||||||||||||
| Springing (W/Out Estab. Account) | 19 | 206,369,694 | 28.4 | Mortgage | Aggregate Cut- | % of Cut-off | |||||||||||||||||
| Hard/Upfront Cash Management | 3 | 89,678,436 | 12.3 | Seasoning (months) | Loans | off Date Balance | Date Balance | ||||||||||||||||
| None | 16 | 76,795,680 | 10.6 | 0 | 10 | $120,635,000 | 16.6 | % | |||||||||||||||
| Soft/Upfront Cash Management | 2 | 71,250,000 | 9.8 | 1 - 2 | 47 | 606,008,595 | 83.4 | ||||||||||||||||
| Soft/Springing Cash Management | 5 | 46,173,461 | 6.4 | Total: | 57 | $726,643,595 | 100.0 | % | |||||||||||||||
| Total: | 57 | $726,643,595 | 100.0 | % | Weighted Average: | 1 month | |||||||||||||||||
| PREPAYMENT PROVISION SUMMARY | |||||||||||||||||||||||
| Number of | % of Cut- | ||||||||||||||||||||||
| Mortgage | Aggregate Cut- | off Date | |||||||||||||||||||||
| Prepayment Provision | Loans | off Date Balance | Balance | ||||||||||||||||||||
| Lockout/Defeasance/Open | 52 | $697,986,151 | 96.1 | % | |||||||||||||||||||
| Lockout/YM%/Open | 3 | 19,297,443 | 2.7 | ||||||||||||||||||||
| Lockout/Defeasance or YM%/Open | 2 | 9,360,000 | 1.3 | ||||||||||||||||||||
| Total: | 57 | $726,643,595 | 100.0 | % | |||||||||||||||||||
THE INFORMATION IN THIS STRUCTURAL AND COLLATERAL TERM SHEET IS NOT COMPLETE AND MAY BE AMENDED PRIOR TO THE TIME OF SALE. THIS TERM SHEET IS NOT AN OFFER TO SELL THESE SECURITIES AND IT IS NOT A SOLICITATION OF AN OFFER TO BUY THESE SECURITIES IN ANY JURISDICTION WHERE THE OFFER OR SALE IS NOT PERMITTED.
15
| WFRBS Commercial Mortgage Trust 2013-UBS1 | Certain Terms and Conditions |
V. Certain Terms and Conditions
| Interest Entitlements: | The interest entitlement of each Class of Offered Certificates on each Distribution Date generally will be the interest accrued during the related Interest Accrual Period on the related Certificate Principal Balance or Notional Amount at the related pass-through rate, net of any prepayment interest shortfalls allocated to that Class for such Distribution Date as described below. If prepayment interest shortfalls arise from voluntary prepayments (without Special Servicer consent) on particular non-specially serviced mortgage loans during any collection period, the Master Servicer is required to make a compensating interest payment to offset those shortfalls, generally up to an amount equal to the portion of its master servicing fees that accrue at one basis point per annum. The remaining amount of prepayment interest shortfalls will be allocated to reduce the interest entitlement on all Classes of Certificates (other than the Class X-A, X-B and Class X-C Certificates), pro rata, based on their respective amounts of accrued interest for the related Distribution Date. If a Class receives less than the entirety of its interest entitlement on any Distribution Date, then the shortfall, excluding any shortfall due to prepayment interest shortfalls, will be added to its interest entitlement for the next succeeding Distribution Date. Interest entitlements on the Class D, C and B Certificates, in that order, may be reduced by certain Trust Advisor expenses. |
| Principal Distribution Amount: | The Principal Distribution Amount for each Distribution Date generally will be the aggregate amount of principal received or advanced in respect of the mortgage loans, net of any non-recoverable advances and interest thereon that are reimbursed to the Master Servicer, the Special Servicer or the Trustee during the related collection period. Non-recoverable advances and interest thereon are reimbursable from principal collections and advances before reimbursement from other amounts. The Principal Distribution Amount may also be reduced, with a corresponding loss, to the Class D, C, B and A-S Certificates, then to the Class A-1, A-2, A-3, A-4 and A-SB Certificates (with any losses on the Class A-1, A-2, A-3, A-4 and A-SB Certificates allocated pro rata according to their respective Certificate Principal Balances immediately prior to that Distribution Date), in that order, in connection with certain Trust Advisor expenses to the extent that interest entitlements on the Class B, C, and D Certificates are insufficient to absorb the effect of the expense on any particular Distribution Date. |
| Distributions: | On each Distribution Date, funds available for distribution from the mortgage loans, net of specified trust fees, expenses and reimbursements will generally be distributed in the following amounts and order of priority (in each case to the extent of remaining available funds): |
1. Class A-1, A-2, A-3, A-4, A-SB, X-A, X-B and X-C Certificates: To interest on the Class A-1, A-2, A-3, A-4, A-SB, X-A, X-B and X-C Certificates, pro rata, according to their respective interest entitlements. | |
2. Class A-1, A-2, A-3, A-4 and A-SB Certificates: To principal on the Class A-1, A-2, A-3, A-4 and A-SB Certificates in the following amounts and order of priority: (i) first, to principal on the Class A-SB Certificates, in an amount up to the Principal Distribution Amount for such Distribution Date until their Certificate Principal Balance is reduced to the Class A-SB Planned Principal Balance for such Distribution Date; (ii) second, to principal on the Class A-1 Certificates until their Certificate Principal Balance is reduced to zero, up to the remainder of the Principal Distribution Amount for such Distribution Date; (iii) third, to principal on the Class A-2 Certificates until their Certificate Principal Balance is reduced to zero, up to the remainder of the Principal Distribution Amount for such Distribution Date; (iv) fourth, to principal on the Class A-3 Certificates until their Certificate Principal Balance is reduced to zero, up to the remainder of the Principal Distribution Amount for such Distribution Date; (v) fifth, to principal on the Class A-4 Certificates until their Certificate Principal Balance is reduced to zero, up to the remainder of the Principal Distribution Amount for such Distribution Date; and (vi) sixth, to principal on the Class A-SB Certificates until their Certificate Principal Balance is reduced to zero, up to the remainder of the Principal Distribution Amount for such Distribution Date. However, if the Certificate Principal Balance of each and every Class of Principal Balance Certificates, other than the Class A-1, A-2, A-3, A-4 and A-SB Certificates, has been reduced to zero as a result of the allocation of Mortgage Loan losses and expenses and any of the Class A-1, A-2, A-3, A-4 and A-SB Certificates remains outstanding, then the Principal Distribution Amount will be distributed on the Class A-1, A-2, A-3, A-4 and A-SB Certificates, pro rata, based on their respective outstanding Certificate Principal Balances, until their Certificate Principal Balances have been reduced to zero. | |
3. Class A-1, A-2, A-3, A-4 and A-SB Certificates: To reimburse the holders of the Class A-1, A-2, A-3, A-4 and A-SB Certificates, pro rata, for any previously unreimbursed losses (other than certain Trust Advisor expenses) on the mortgage loans that were previously |
THE INFORMATION IN THIS STRUCTURAL AND COLLATERAL TERM SHEET IS NOT COMPLETE AND MAY BE AMENDED PRIOR TO THE TIME OF SALE. THIS TERM SHEET IS NOT AN OFFER TO SELL THESE SECURITIES AND IT IS NOT A SOLICITATION OF AN OFFER TO BUY THESE SECURITIES IN ANY JURISDICTION WHERE THE OFFER OR SALE IS NOT PERMITTED.
16
| WFRBS Commercial Mortgage Trust 2013-UBS1 | Certain Terms and Conditions |
allocated in reduction of the Certificate Principal Balances of such Classes. 4. Class A-S Certificates: To make distributions on the Class A-S Certificates as follows: (a) first, to interest on Class A-S Certificates in the amount of the interest entitlement for that Class; (b) next, to the extent of the portion of the Principal Distribution Amount remaining after distributions in respect of principal to each Class with a higher distribution priority (in this case, the Class A-1, A-2, A-3, A-4 and A-SB Certificates), to principal on the Class A-S Certificates until their Certificate Principal Balance is reduced to zero; and (c) next, to reimburse the holders of the Class A-S Certificates for any previously unreimbursed losses (other than certain Trust Advisor expenses) on the mortgage loans that were previously allocated to that Class in reduction of its Certificate Principal Balance. 5. Class B Certificates: To make distributions on the Class B Certificates as follows: (a) first, to interest on Class B Certificates in the amount of the interest entitlement for that Class; (b) next, to the extent of the portion of the Principal Distribution Amount remaining after distributions in respect of principal to each Class with a higher distribution priority (in this case, the Class A-1, A-2, A-3, A-4, A-SB and A-S Certificates), to principal on the Class B Certificates until their Certificate Principal Balance is reduced to zero; and (c) next, to reimburse the holders of the Class B Certificates for any previously unreimbursed losses (other than certain Trust Advisor expenses) on the mortgage loans that were previously allocated to that Class in reduction of its Certificate Principal Balance. 6. Class C Certificates: To make distributions on the Class C Certificates as follows: (a) first, to interest on Class C Certificates in the amount of the interest entitlement for that Class; (b) next, to the extent of the portion of the Principal Distribution Amount remaining after distributions in respect of principal to each Class with a higher distribution priority (in this case, the Class A-1, A-2, A-3, A-4, A-SB, A-S and B Certificates), to principal on the Class C Certificates until their Certificate Principal Balance is reduced to zero; and (c) next, to reimburse the holders of the Class C Certificates for any previously unreimbursed losses (other than certain Trust Advisor expenses) on the mortgage loans that were previously allocated to that Class in reduction of its Certificate Principal Balance. | |
| 7. After the Class A-1, A-2, A-3, A-4, A-SB, A-S, B and C Certificates are paid all amounts to which they are entitled, the remaining funds available for distribution will be used to pay interest, principal and loss reimbursement amounts (other than certain Trust Advisor expenses) on the Class D, E, F and G Certificates sequentially in that order in a manner analogous to the Class C Certificates. | |
Allocation of Yield Maintenance and Prepayment Premiums: | If any yield maintenance charges and prepayment premiums are collected during any particular collection period with respect to any mortgage loan, then on the distribution date corresponding to that collection period, the certificate administrator will pay a portion of the yield maintenance charges and prepayment premiums (net of liquidation fees payable therefrom) in the following manner: (1) pro rata, between (x) the group (“YM Group A”) of the Class A-1, A-2, A-3, A-4, A-SB, A-S and X-A Certificates and (y) the group (“YM Group B” and, collectively with YM Group A, the “YM Groups”) of Class B, C, D and X-B Certificates, based upon the aggregate amount of principal distributed to the applicable classes of principal balance certificates in each YM Group for that distribution date, and (2) among the classes of certificates and regular interest(s) in each YM Group, in the following manner, up to an amount equal to the product of (a) the yield maintenance or prepayment premium allocated to such YM Group, (b) the related Base Interest Fraction (as defined in the Free Writing Prospectus), and (c) a fraction, which in no event may be greater than 1.0, the numerator of which is equal to the amount of principal distributed to the holder(s) of such class for that distribution date, and the denominator of which is the aggregate amount of principal distributed to all the certificates in that YM Group for that distribution date. Any yield maintenance charges or prepayment premium allocated to such YM Group remaining after such distributions to Principal Balance Certificates described above will be distributed to the Class X-A or Class X-B Certificates as applicable, in such YM Group. |
| No prepayment premiums or yield maintenance charges will be distributed to the holders of the Class X-C, E, F or G Certificates. The holders of the Class X-B Certificates will be entitled to all prepayment premiums and yield maintenance charges collected after the Class A-1, A-2, A-3, A-4, A-SB, A-S, B, C and D Certificates are retired. For a description of when prepayment premiums and yield maintenance charges are generally required on the mortgage loans, see Annex A to the Free Writing Prospectus. See also “Risk Factors—Prepayments and Repurchases of the Mortgage Assets Will Affect the Timing of Your Cash Flow and May Affect Your Yield” in the prospectus |
THE INFORMATION IN THIS STRUCTURAL AND COLLATERAL TERM SHEET IS NOT COMPLETE AND MAY BE AMENDED PRIOR TO THE TIME OF SALE. THIS TERM SHEET IS NOT AN OFFER TO SELL THESE SECURITIES AND IT IS NOT A SOLICITATION OF AN OFFER TO BUY THESE SECURITIES IN ANY JURISDICTION WHERE THE OFFER OR SALE IS NOT PERMITTED.
17
| WFRBS Commercial Mortgage Trust 2013-UBS1 | Certain Terms and Conditions |
| attached to the Free Writing Prospectus. Prepayment premiums and yield maintenance charges will be distributed on each Distribution Date only to the extent they are actually received on the mortgage loans as of the related Determination Date. | |
| Realized Losses: | The Certificate Principal Balances of the Class A-1, A-2, A-3, A-4, A-SB, A-S, B, C, D, E, F and G Certificates will be reduced without distribution on any Distribution Date as a write-off to the extent of any losses realized on the mortgage loans allocated to such Class on such Distribution Date. Such losses (other than certain Trust Advisor expenses) will be applied in the following order, in each case until the related Certificate Principal Balance is reduced to zero: first, to Class G; second, to Class F; third, to Class E; fourth, to Class D; fifth, to Class C; sixth, to Class B; seventh, to Class A-S; and, finally, pro rata, to Classes A-1, A-2, A-3, A-4 and A-SB based on their outstanding Certificate Principal Balances. Certain Trust Advisor expenses (if not absorbed by reductions of interest entitlements on Class D, C and B Certificates) will be applied as write-offs in a similar manner, except that such write-offs will be applied only to the Class D, C, B and A-S Certificates, and the Class A-1, A-2, A-3, A-4 and A-SB Certificates (with any write-offs on the Class A-1, A-2, A-3, A-4 and A-SB Certificates to be allocated pro rata according to their respective Certificate Principal Balances immediately prior to that Distribution Date), in that order. The notional amount of the Class X-A Certificates will be reduced by the amount of all losses that are allocated to the Class A-1, A-2, A-3, A-4, A-SB or A-S Certificates as write-offs in reduction of their Certificate Principal Balances. The notional amount of the Class X-B Certificates will be reduced by the amount of all losses that are allocated to the Class B Certificates as write-offs in reduction of their Certificate Principal Balance. The notional amount of the Class X-C Certificates will be reduced by the amount of all losses that are allocated to the Class F or G Certificates as write-offs in reduction of their Certificate Principal Balances. |
| Debt Service Advances: | The Master Servicer or, if the Master Servicer fails to do so, the Trustee, will be obligated to advance delinquent debt service payments (other than balloon payments and default interest) and assumed debt service payments on the mortgage loans (including each pari passu mortgage loan but not its related pari passu companion loan), except to the extent any such advance is deemed non-recoverable from collections on the related mortgage loan. In addition, if an Appraisal Reduction Amount exists for a given mortgage loan, the interest portion of any debt service advance for such mortgage loan will be reduced, which will have the effect of reducing the amount of interest available for distribution to the Certificates in reverse alphabetical order of their Class designations (except that interest payments on the Class A-1, A-2, A-3, A-4, A-SB, X-A, X-B and X-C Certificates would be affected on a pari passu basis). |
| Servicing Advances: | The Master Servicer or, if the Master Servicer fails to do so, the Trustee, will be obligated to make servicing advances with respect to each mortgage loan it services, including the payment of delinquent property taxes, insurance premiums and ground rent, except to the extent that those advances are deemed non-recoverable from collections on the related mortgage loan. After any securitization of The Outlet Collection | Jersey Gardens controlling pari passu companion loan, the master servicer under that securitization will have the primary obligation to make any servicing advances with respect to the related loan combination. |
| Appraisal Reduction Amounts: | An Appraisal Reduction Amount generally will be created in the amount, if any, by which the principal balance of a required appraisal loan (which is a mortgage loan with respect to which certain defaults, modifications or insolvency events have occurred as further described in the Free Writing Prospectus) plus other amounts overdue or advanced in connection with such mortgage loan exceeds 90% of the appraised value of the related mortgaged property plus certain escrows and reserves (including letters of credit) held with respect to the mortgage loan. |
| A mortgage loan will cease to be a required appraisal loan when the same has ceased to be a specially serviced mortgage loan (if applicable), has been brought current for at least three consecutive months and no other circumstances exist that would cause such mortgage loan to be a required appraisal loan. | |
| Appraisal Reduction Amounts will affect the amount of debt service advances on the related mortgage loan. Appraisal Reduction Amounts will also be taken into account in the determination of the identity of the Class whose majority constitutes the “majority subordinate certificateholder” and is entitled to appoint the subordinate class representative. | |
| Clean-Up Call and Exchange Termination: | On each Distribution Date occurring after the aggregate unpaid principal balance of the mortgage loans is reduced below 1% of the initial aggregate principal balance of the mortgage loans as of the Cut-off Date, certain specified persons will have the option to purchase all of the remaining mortgage loans (and the trust’s interest in all property acquired through exercise of remedies in respect of any mortgage loan) at the price specified in the Free Writing Prospectus. Exercise of |
THE INFORMATION IN THIS STRUCTURAL AND COLLATERAL TERM SHEET IS NOT COMPLETE AND MAY BE AMENDED PRIOR TO THE TIME OF SALE. THIS TERM SHEET IS NOT AN OFFER TO SELL THESE SECURITIES AND IT IS NOT A SOLICITATION OF AN OFFER TO BUY THESE SECURITIES IN ANY JURISDICTION WHERE THE OFFER OR SALE IS NOT PERMITTED.
18
| WFRBS Commercial Mortgage Trust 2013-UBS1 | Certain Terms and Conditions |
| the option will terminate the trust and retire the then-outstanding certificates. | |
| If the aggregate Certificate Principal Balances of each of the Class A-1, A-2, A-3, A-4, A-SB, A-S, B, C and D Certificates have been reduced to zero, the trust may also be terminated in connection with an exchange of all the then-outstanding certificates, for the mortgage loans and REO properties then remaining in the issuing entity, but all of the holders of those Classes of outstanding certificates would have to voluntarily participate in the exchange. | |
| Liquidated Loan Waterfall: | Following the liquidation of any loan or property, the net liquidation proceeds generally will be applied (after reimbursement of advances and certain trust fund expenses), first, as a recovery of accrued interest, other than delinquent interest that was not advanced as a result of Appraisal Reduction Amounts, second, as a recovery of principal until all principal has been recovered, and then as a recovery of delinquent interest that was not advanced as a result of Appraisal Reduction Amounts. Please see “Description of the Offered Certificates—Distributions—Application of Mortgage Loan Collections” in the Free Writing Prospectus. |
| Majority Subordinate Certificateholder and Subordinate Class Representative: | A subordinate class representative may be appointed by the “majority subordinate certificate-holder”, which will be the holder(s) of a majority of: (a) during a “subordinate control period”, the most subordinate class among the Class E, F and G Certificates that has a Certificate Principal Balance, as notionally reduced by any Appraisal Reduction Amounts allocable to that class, that is at least equal to 25% of its total initial principal balance and (b) during a “collective consultation period”, the most subordinate class among the Class E, F and G Certificates that has a total principal balance, without regard to Appraisal Reduction Amounts, that is at least equal to 25% of its initial Certificate Principal Balance. The majority subordinate certificateholder will have a continuing right to appoint, remove or replace the subordinate class representative in its sole discretion. This right may be exercised at any time and from time to time. See “Servicing of the Mortgage Loans and Administration of the Trust Fund—The Majority Subordinate Certificateholder and the Subordinate Class Representative” in the Free Writing Prospectus. |
| Control and Consultation: | The rights of various parties to replace the Special Servicer and approve or consult with respect to major actions of the Special Servicer will vary according to defined periods. A “subordinate control period” will exist as long as the Class E Certificates have a Certificate Principal Balance, net of any Appraisal Reduction Amounts allocable to that class, that is not less than 25% of the initial principal balance of that class (unless a senior consultation period is deemed to occur generally or with respect to a particular mortgage loan, pursuant to clause (ii) of the definition of “senior consultation period”). In general, during a subordinate control period, (i) the subordinate class representative will be entitled to grant or withhold approval of asset status reports prepared, and material servicing actions proposed, by the Special Servicer, and (ii) the majority subordinate certificateholder, or the subordinate class representative on its behalf, will be entitled to terminate and replace the Special Servicer with or without cause, and appoint itself or another person as the successor special servicer (other than with respect to The Outlet Collection | Jersey Gardens loan combination after the securitization of the related controlling pari passu companion loan). It will be a condition to such appointment that KBRA, Moody’s and S&P confirm that the appointment would not result in a qualification, downgrade or withdrawal of any of their then-current ratings of certificates. A “collective consultation period” will exist as long as the Class E Certificates have a Certificate Principal Balance that both (i) as notionally reduced by any Appraisal Reduction Amounts allocable to that class, is less than 25% of its initial principal balance and (ii) without regard to any Appraisal Reduction Amounts allocable to that class, is 25% or more of its initial Certificate Principal Balance (unless a senior consultation period is deemed to occur generally or with respect to a particular mortgage loan, pursuant to clause (ii) of the definition of “senior consultation period”). In general, during a collective consultation period, the Special Servicer will be required to consult with the Trust Advisor (in addition to the subordinate class representative, during a collective consultation period) in connection with asset status reports and material special servicing actions. A “senior consultation period” will exist as long as either (i) the Class E certificates have an aggregate principal balance, without regard to any Appraisal Reduction Amounts allocable to that class, that is less than 25% of its initial principal balance or (ii) during such time as the Class E certificates are the most subordinate class of control-eligible certificates that have a then outstanding principal balance, net of Appraisal Reduction Amounts, at least equal to 25% of its initial principal balance, the then-majority subordinate certificateholder has irrevocably waived its right to appoint a subordinate class representative and to exercise any of the rights of the majority subordinate certificateholder or cause the exercise of the rights of the subordinate class representative and such rights have not been reinstated to a successor majority subordinate certificateholder as set forth in the pooling and servicing agreement. In general, during a senior consultation period, the Special Servicer must seek to consult with the Trust Advisor in connection with asset status reports and material special servicing actions, and, in general, no subordinate class representative will be recognized or have any right to terminate the Special Servicer or approve, direct or consult with respect to servicing matters. |
THE INFORMATION IN THIS STRUCTURAL AND COLLATERAL TERM SHEET IS NOT COMPLETE AND MAY BE AMENDED PRIOR TO THE TIME OF SALE. THIS TERM SHEET IS NOT AN OFFER TO SELL THESE SECURITIES AND IT IS NOT A SOLICITATION OF AN OFFER TO BUY THESE SECURITIES IN ANY JURISDICTION WHERE THE OFFER OR SALE IS NOT PERMITTED.
19
| WFRBS Commercial Mortgage Trust 2013-UBS1 | Certain Terms and Conditions |
Furthermore, notwithstanding any contrary description set forth above, with respect to The Outlet Collection | Jersey Gardens mortgage loan, in general (a) for as long as the loan combination is serviced under the pooling and servicing agreement for this securitization, the initial holder of the related controlling pari passu companion loan will have control rights that include the right to approve or disapprove various material servicing actions involving the loan combination and the subordinate class representative for this securitization and the holder of the related non-controlling pari passu companion loan will each have the right to be consulted on a non-binding basis with respect to such actions, and (b) in connection with any securitization of the related controlling pari passu companion loan, after which the loan combination will be serviced under the pooling and servicing agreement for that other securitization, that pooling and servicing agreement may grant to a subordinate or controlling class representative or other third party control rights that include the right to approve or disapprove various material servicing actions involving the loan combination but the subordinate class representative for this securitization and the holder of the related non-controlling pari passu companion loan will nonetheless each have the right to be consulted on a non-binding in basis with respect to such actions. For purposes of the servicing of the applicable loan combination, the occurrence and continuance of a collective consultation period or senior consultation period with respect to the subordinate class representative under this securitization will not limit the control or other rights of the initial holder of the controlling pari passu companion loan or of a subordinate or controlling class representative or other third party under any securitization thereof, and any collective consultation period or senior consultation period or similar period under that other securitization will not limit the consultation rights of the subordinate class representative under this securitization or of the holder of the related non-controlling pari passu companion loan. In addition, notwithstanding any contrary description set forth above, with respect to the Sullivan Center mortgage loan, the holder of the related pari passu companion loan or its representative (which following a securitization of such pari passu companion loan will include (a) the subordinate class representative under the pooling and servicing agreement for such securitization (or, during a senior consultation period under such pooling and servicing agreement, the special servicer under such pooling and servicing agreement)) will have consultation rights with respect to asset status reports and material special servicing actions involving the related loan combination, as provided for in the related intercreditor agreement and as described in the Free Writing Prospectus, and those rights will be in addition to the rights of the subordinate class representative in this transaction described above; and (b) the existence of a subordinate control period, collective consultation period or senior consultation period under the WFRBS 2013-UBS1 pooling and servicing agreement will not limit the consultation rights of the holder of the related pari passu companion loan. In general, loan combination control rights also include the right, in certain circumstances, to direct the replacement of the applicable special servicer for the related loan combination only. | |
| Replacement of Special Servicer by General Vote of Certificateholders: | During any “collective consultation period” or “senior consultation period”, the Special Servicer may be terminated and replaced upon the affirmative direction of certificate owners holding not less than 75% of the appraisal-reduced voting rights of all certificates, following a proposal from certificate owners holding not less than 25% of the appraisal-reduced voting rights of all certificates. The certificateholders who initiate a vote on a termination and replacement of the Special Servicer without cause must cause KBRA, Moody’s and S&P to confirm the then-current ratings of the certificates (or decline to review the matter) and cause the payment of the fees and expenses incurred in the replacement. |
| Appraisal Remedy: | Solely for purposes of determining whether a “subordinate control period” is in effect, whenever the Special Servicer obtains an appraisal or updated appraisal under the pooling and servicing agreement, the subordinate class representative, with respect to the mortgage loans (other than The Outlet Collection | Jersey Gardens mortgage loan) serviced by the Special Servicer, will have the right (at its or their expense) to direct the Special Servicer to hire a qualified appraiser to prepare a second appraisal of the mortgaged property. The Master Servicer must thereafter determine whether, based on its assessment of such second appraisal, any recalculation of the Appraisal Reduction Amount is warranted. The Appraisal Reduction Amount, whether based on the first or the second appraisal, will become effective following the second appraisal, except that the Appraisal Reduction Amount based on the first appraisal shall become effective if the subordinate class representative declines to demand a second appraisal within a specified number of business days, or if a second appraisal is not received within 90 days after the direction of the subordinate class representative. In addition, for the same purposes, if there is a material change in the mortgaged property securing any mortgage loan for which an Appraisal Reduction Amount has been calculated, the majority certificateholder of the Class E, F or G Certificates or other designed certificateholders will be entitled (at its expense) to present an additional appraisal to the Master Servicer, which will generally be required to recalculate the Appraisal Reduction Amount based upon such additional appraisal. This latter right may not be exercised more frequently than once |
THE INFORMATION IN THIS STRUCTURAL AND COLLATERAL TERM SHEET IS NOT COMPLETE AND MAY BE AMENDED PRIOR TO THE TIME OF SALE. THIS TERM SHEET IS NOT AN OFFER TO SELL THESE SECURITIES AND IT IS NOT A SOLICITATION OF AN OFFER TO BUY THESE SECURITIES IN ANY JURISDICTION WHERE THE OFFER OR SALE IS NOT PERMITTED.
20
| WFRBS Commercial Mortgage Trust 2013-UBS1 | Certain Terms and Conditions |
| in any 12-month period for each mortgage loan for which an Appraisal Reduction Amount was calculated and can only be exercised during a subordinate control period or a collective consultation period as further described in the Free Writing Prospectus. | |
| Sale of Defaulted Assets: | There will be no “fair value” purchase option. Instead, the pooling and servicing agreement will authorize the Special Servicer to sell defaulted mortgage loans serviced by the Special Servicer to the highest bidder in a manner generally similar to sales of REO properties. Subject to certain limitations set forth in the related intercreditor agreement, the Sullivan Center mortgage loan may not be sold unless that mortgage loan and the related pari passu companion loan are sold together as one whole loan. The sale of a defaulted loan (other than the non-serviced mortgage loan) for less than par plus accrued interest and certain other fees and expenses owed on the loan will be subject to consent or consultation rights of the subordinate class representative and/or Trust Advisor and, in the case of the Sullivan Center mortgage loan, consultation rights of the holder of the related pari passu companion loan (which following a securitization of such pari passu companion loan will include the subordinate class representative under the pooling and servicing agreement for such securitization), as described in the Free Writing Prospectus. In the case of The Outlet Collection | Jersey Gardens mortgage loan, the sale will be subject to the consent and/or consultation rights of the holders of the related pari passu companion loans, as described in the Free Writing Prospectus. After the securitization of The Outlet Collection | Jersey Gardens controlling pari passu companion loan, pursuant to the respective intercreditor agreement, the party acting as special servicer with respect to The Outlet Collection | Jersey Gardens loan combination pursuant to the pooling and servicing agreement of that securitization, may offer to sell to any person (or may offer to purchase) for cash such loan combination during such time as such loan combination constitutes a defaulted mortgage loan, and, in connection with any such sale, that special servicer is required to sell both the pari passu mortgage loan and related pari passu companion loans in any such loan combination as a whole loan. The subordinate class representative and the holder of the related non-controlling pari passu companion loan will each have consultation rights as the holder of an interest in the related loan combination, as described in the Free Writing Prospectus. |
| “As-Is” Appraisals: | Appraisals must be conducted on an “as-is” basis, and must be no more than 9 months old, for purposes of determining Appraisal Reduction Amounts, market value in connection with REO sales, etc. Required appraisals may consist of updates of prior appraisals. Internal valuations by the Special Servicer are permitted if the principal balance of a mortgage loan is less than $2,000,000. |
| Trust Advisor: | The Trust Advisor will perform certain review duties that will generally include a limited annual review of and report regarding the Special Servicer to the Certificate Administrator. The review and report generally will be based on: (a) during a collective consultation period or senior consultation period, any asset status reports and additional information delivered to the Trust Advisor by the Special Servicer with respect to any mortgage loan serviced by the Special Servicer, and/or (b) during a senior consultation period, in addition to the applicable information described above, a meeting with the Special Servicer to conduct a limited review of the Special Servicer’s operational practices on a platform basis in light of the servicing standard. In addition, during any collective consultation period or senior consultation period, the Special Servicer must seek to consult with the Trust Advisor (in addition to the subordinate class representative during a collective consultation period) in connection with material special servicing actions with respect to specially serviced mortgage loans serviced by the Special Servicer. Furthermore, under certain circumstances, but only during a senior consultation period, the Trust Advisor may recommend the replacement of the Special Servicer, in which case the Certificate Administrator will deliver notice of such recommendation to the certificateholders, and certificateholders with specified percentages of the voting rights may direct the replacement of the Special Servicer at their expense. Notwithstanding any contrary provision described above, the Trust Advisor will have no rights or duties in connection with The Outlet Collection | Jersey Gardens mortgage loan. The Trust Advisor may be removed and replaced without cause upon the affirmative direction of certificates owners holding not less than 75% of the appraisal-reduced voting rights of all certificates, following a proposal from certificate owners holding not less than 25% of the appraisal-reduced voting rights of all certificates. The certificateholders who initiate a vote on a termination and replacement of the Trust Advisor without cause must cause KBRA, Moody’s and S&P to confirm the then-current ratings of the certificates (or decline to review the matter) and cause the payment of the fees and expenses incurred in the replacement. During any “subordinate control period”, the proposed replacement trust advisor will be subject to the subordinate class representative’s consent (such consent not to be unreasonably withheld). If a proposed termination and replacement of the Trust Advisor is not consummated within 180 days |
THE INFORMATION IN THIS STRUCTURAL AND COLLATERAL TERM SHEET IS NOT COMPLETE AND MAY BE AMENDED PRIOR TO THE TIME OF SALE. THIS TERM SHEET IS NOT AN OFFER TO SELL THESE SECURITIES AND IT IS NOT A SOLICITATION OF AN OFFER TO BUY THESE SECURITIES IN ANY JURISDICTION WHERE THE OFFER OR SALE IS NOT PERMITTED.
21
| WFRBS Commercial Mortgage Trust 2013-UBS1 | Certain Terms and Conditions |
| following the initial request of the certificateholders who requested a vote, the proposed termination and replacement shall have no further force or effect. The Trust Advisor generally may be discharged from its duties if and when the Class A-1, A-2, A-3, A-4, A-SB, A-S, B, C and D Certificates are retired. | |
| Certain Fee Offsets: | If a workout fee is earned by the Special Servicer following a loan default with respect to any mortgage loan that it services, then certain limitations will apply to the collection and retention of a modification fee from the borrower. The modification fee generally must not exceed 1% of the principal balance of the loan as modified. In addition, if the loan re-defaults within a specified period of months and other conditions are satisfied, any subsequent workout or liquidation fee on that loan must be reduced by a portion of the previously-collected modification fee. Furthermore, workout fees, liquidation fees and modification fees collected with respect to any workout, liquidation and/or partial liquidation of a mortgage loan or loan combination that is serviced by the Special Servicer will be subject to an aggregate cap equal to the greater of (i) $1,000,000 and (ii) 1.00% of the stated principal balance of the subject mortgage loan or loan combination. |
| Deal Website: | The Certificate Administrator will be required to maintain a deal website which will include, among other items: (a) summaries of asset status reports prepared by the Special Servicer, (b) inspection reports, (c) appraisals, (d) various “special notices” described in the Free Writing Prospectus, (e) the “Investor Q&A Forum” and (f) a voluntary “Investor Registry”. Investors may access the deal website following execution of a certification and confidentiality agreement. |
| Initial Majority Subordinate Certificateholder: | It is expected that an affiliate of Raith Capital Management, LLC will be the initial majority subordinate certificateholder. |
| Loan Combinations: | Each of the mortgaged properties identified on Annex A-1 to the Free Writing Prospectus as The Outlet Collection | Jersey Gardens and Sullivan Center secure both a mortgage loan to be included in the trust fund and one or more other mortgage loans that will not be included in the trust fund, which will be pari passu in right of payment with the trust mortgage loan. The Sullivan Center loan combination will be serviced under the pooling and servicing agreement for this transaction. The Outlet Collection | Jersey Gardens loan combination will be serviced under the pooling and servicing agreement until the securitization of the related controlling pari passu companion loan, after which such loan combination will be serviced under the pooling and servicing agreement related to the securitization of that controlling pari passu companion loan. As of the closing date, each of The Outlet Collection | Jersey Gardens pari passu companion loans and the Sullivan Center pari passu companion loan will be held by the related mortgage loan seller, which will reserve the right to sell such companion loan to a third party at any time (including securitizations). |
THE INFORMATION IN THIS STRUCTURAL AND COLLATERAL TERM SHEET IS NOT COMPLETE AND MAY BE AMENDED PRIOR TO THE TIME OF SALE. THIS TERM SHEET IS NOT AN OFFER TO SELL THESE SECURITIES AND IT IS NOT A SOLICITATION OF AN OFFER TO BUY THESE SECURITIES IN ANY JURISDICTION WHERE THE OFFER OR SALE IS NOT PERMITTED.
22
(THIS PAGE INTENTIONALLY LEFT BLANK)
23
| THE OUTLET COLLECTION | JERSEY GARDENS |

THE INFORMATION IN THIS STRUCTURAL AND COLLATERAL TERM SHEET IS NOT COMPLETE AND MAY BE AMENDED PRIOR TO THE TIME OF SALE. THIS TERM SHEET IS NOT AN OFFER TO SELL THESE SECURITIES AND IT IS NOT A SOLICITATION OF AN OFFER TO BUY THESE SECURITIES IN ANY JURISDICTION WHERE THE OFFER OR SALE IS NOT PERMITTED.
24
| THE OUTLET COLLECTION | JERSEY GARDENS |
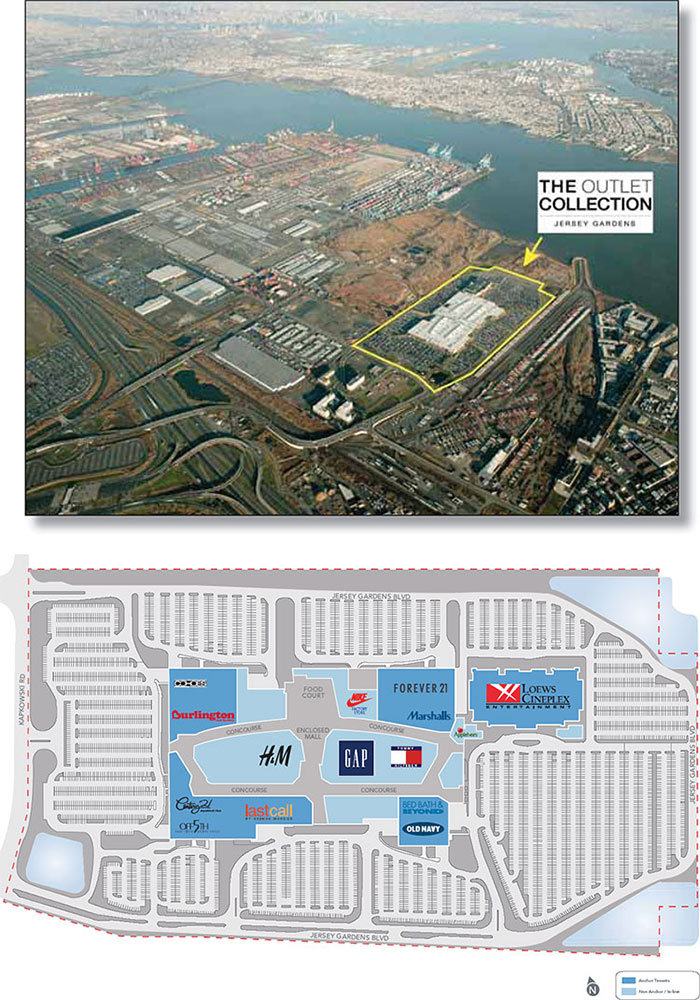
THE INFORMATION IN THIS STRUCTURAL AND COLLATERAL TERM SHEET IS NOT COMPLETE AND MAY BE AMENDED PRIOR TO THE TIME OF SALE. THIS TERM SHEET IS NOT AN OFFER TO SELL THESE SECURITIES AND IT IS NOT A SOLICITATION OF AN OFFER TO BUY THESE SECURITIES IN ANY JURISDICTION WHERE THE OFFER OR SALE IS NOT PERMITTED.
25
| THE OUTLET COLLECTION | JERSEY GARDENS |
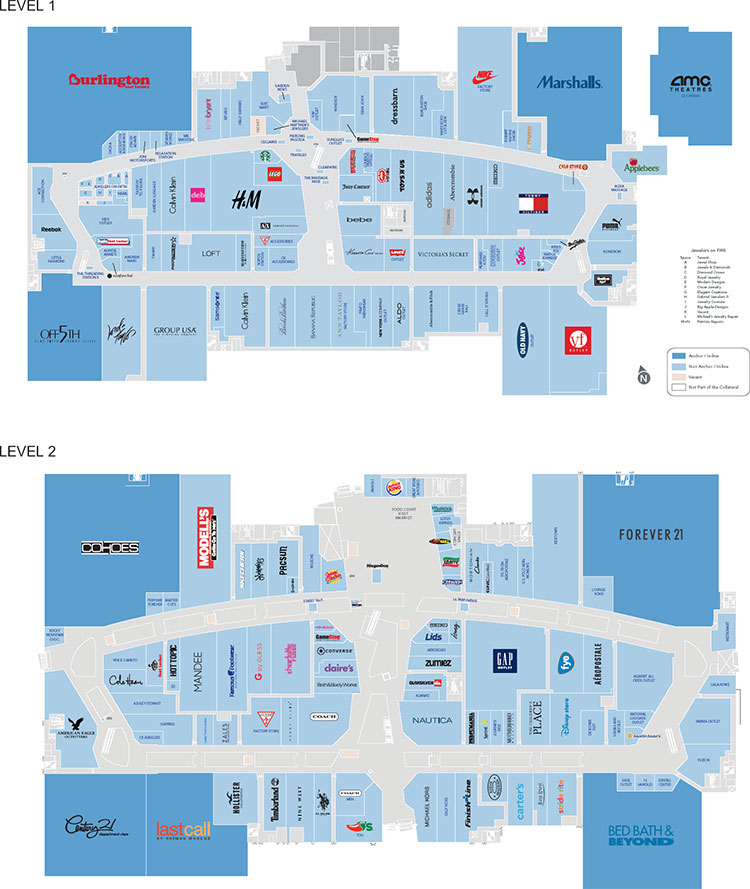
THE INFORMATION IN THIS STRUCTURAL AND COLLATERAL TERM SHEET IS NOT COMPLETE AND MAY BE AMENDED PRIOR TO THE TIME OF SALE. THIS TERM SHEET IS NOT AN OFFER TO SELL THESE SECURITIES AND IT IS NOT A SOLICITATION OF AN OFFER TO BUY THESE SECURITIES IN ANY JURISDICTION WHERE THE OFFER OR SALE IS NOT PERMITTED.
26
| THE OUTLET COLLECTION | JERSEY GARDENS |
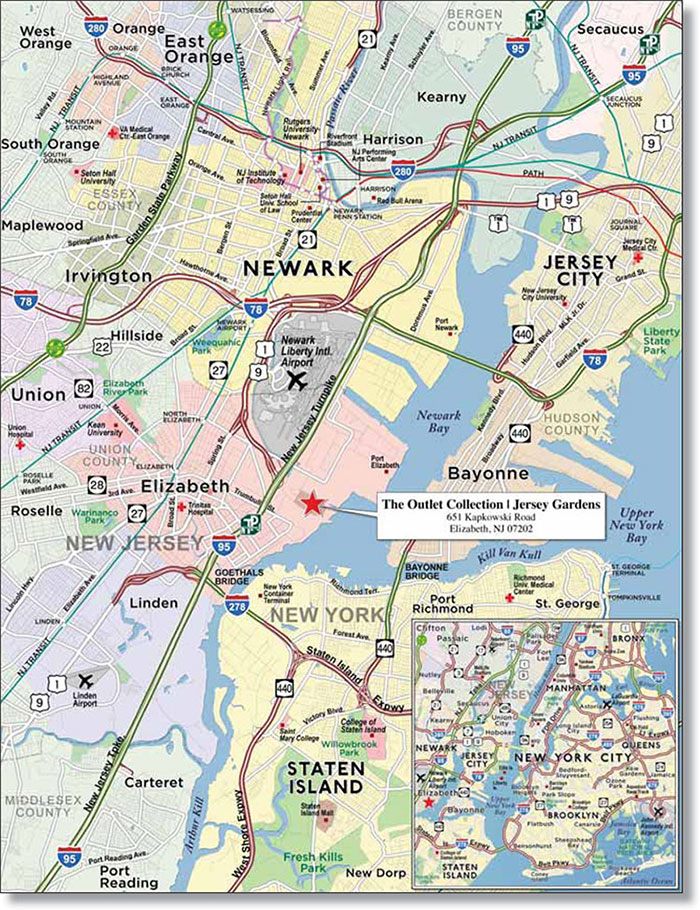
THE INFORMATION IN THIS STRUCTURAL AND COLLATERAL TERM SHEET IS NOT COMPLETE AND MAY BE AMENDED PRIOR TO THE TIME OF SALE. THIS TERM SHEET IS NOT AN OFFER TO SELL THESE SECURITIES AND IT IS NOT A SOLICITATION OF AN OFFER TO BUY THESE SECURITIES IN ANY JURISDICTION WHERE THE OFFER OR SALE IS NOT PERMITTED.
27
| No. 1 – The Outlet Collection | Jersey Gardens |
| Loan Information | Property Information | ||||||
| Mortgage Loan Seller: | Wells Fargo Bank, National Association | Single Asset/Portfolio: | Single Asset | ||||
| Credit Assessment (KBRA/Moody’s/S&P): | BBB/Baa3/NR | Property Type: | Retail | ||||
Original Principal Balance(1): | $130,000,000 | Specific Property Type: | Regional Mall | ||||
Cut-off Date Principal Balance(1): | $130,000,000 | Location: | Elizabeth, NJ | ||||
| % of Initial Pool Balance: | 17.9% | Size: | 1,298,801 SF | ||||
| Loan Purpose: | Refinance | Cut-off Date Principal Balance Per SF(1): | $269.48 | ||||
Borrower Names(2): | N.J. Metromall Urban Renewal, Inc.; JG Elizabeth II, LLC | Year Built/Renovated: | 1999/2013 | ||||
| Sponsor: | Glimcher Properties, LP | Title Vesting(2): | Fee | ||||
| Mortgage Rate: | 3.830% | Property Manager: | Self-managed | ||||
| Note Date: | October 31, 2013 | 3rd Most Recent Occupancy (As of): | 100.0% (12/31/2010) | ||||
| Anticipated Repayment Date: | NAP | 2nd Most Recent Occupancy (As of): | 99.5% (12/31/2011) | ||||
| Maturity Date: | November 1, 2020 | Most Recent Occupancy (As of): | 100.0% (12/31/2012) | ||||
| IO Period: | 84 months | Current Occupancy (As of)(4): | 99.4% (9/25/2013) | ||||
| Loan Term (Original): | 84 months | ||||||
| Seasoning: | 1 month | Underwriting and Financial Information: | |||||
| Amortization Term (Original): | NAP | ||||||
| Loan Amortization Type: | Interest-only, Balloon | 3rd Most Recent NOI (As of): | $34,987,662 (12/31/2011) | ||||
| Interest Accrual Method: | Actual/360 | 2nd Most Recent NOI (As of): | $36,646,383 (12/31/2012) | ||||
| Call Protection: | L(25),D(55),O(4) | Most Recent NOI (As of): | $40,192,421 (TTM 9/30/2013) | ||||
| Lockbox Type: | Hard/Springing Cash Management | ||||||
Additional Debt(1): | Yes | ||||||
Additional Debt Type(1): | Pari Passu | ||||||
| U/W Revenues: | $66,662,980 | ||||||
| U/W Expenses: | $26,424,909 | ||||||
Escrows and Reserves(3): | U/W NOI(5): | $40,238,071 | |||||
| U/W NCF: | $38,650,516 | ||||||
Type: | Initial | Monthly | Cap (If Any) | U/W NOI DSCR(1): | 2.96x | ||
| Taxes | $0 | Springing | NAP | U/W NCF DSCR(1): | 2.84x | ||
| Insurance | $0 | Springing | NAP | U/W NOI Debt Yield(1): | 11.5% | ||
| Replacement Reserves | $0 | Springing | NAP | U/W NCF Debt Yield(1): | 11.0% | ||
| TI/LC Reserve | $0 | Springing | NAP | As-Is Appraised Value: | $707,000,000 | ||
| Ground Lease Reserve | $0 | Springing | NAP | As-Is Appraisal Valuation Date: | October 4, 2013 | ||
| Tenants Specific TI/LC Reserve | $2,593,953 | $0 | NAP | Cut-off Date LTV Ratio(1): | 49.5% | ||
| Rent Concession Reserve | $61,775 | $0 | NAP | LTV Ratio at Maturity or ARD(1): | 49.5% | ||
| (1) | The Outlet Collection | Jersey Gardens Loan Combination, totalling $350,000,000, is comprised of three pari passu notes (Notes A-1, A-2 and A-3). Note A-2 had an original principal balance of $130,000,000, has an outstanding principal balance as of the Cut-off Date of $130,000,000 and will be contributed to the WFRBS 2013-UBS1 Trust. Notes A-1 and A-3 had original principal balances of $140,000,000 and $80,000,000 respectively, and will be contributed to future trusts. All statistical information related to balances per square foot, loan-to-value ratios, debt service coverage ratios and debt yields are based on The Outlet Collection | Jersey Gardens Loan Combination. |
| (2) | See “Ground Lease and Payment in Lieu of Taxes (“PILOT”)” section. |
| (3) | See “Escrows” section.” |
| (4) | Current Occupancy includes 39,940 square feet attributed to temporary tenants. Excluding temporary tenants, Current Occupancy is 96.4%. |
| (5) | See “Cash Flow Analysis” section. |
The Mortgage Loan. The mortgage loan (“The Outlet Collection | Jersey Gardens Loan Combination”) is evidenced by three pari passu promissory notes (“Note A-1”, “Note A-2” and “Note A-3”) secured by a first mortgage encumbering a regional outlet mall located in Elizabeth, New Jersey (“The Outlet Collection | Jersey Gardens Property”). The Outlet Collection | Jersey Gardens Loan Combination was originated on October 31, 2013 by Wells Fargo Bank, National Association. The Outlet Collection | Jersey Gardens Loan Combination had an original principal balance of $350,000,000, has an outstanding principal balance as of the Cut-off Date of $350,000,000 and accrues interest at an interest rate of 3.830% per annum. The Outlet Collection | Jersey Gardens Loan Combination had an initial term of 84 months, has a remaining term of 83 months as of the Cut-off Date and requires interest-only payments through the term of The Outlet Collection | Jersey Gardens Loan Combination. The Outlet Collection | Jersey Gardens Loan Combination matures on November 1, 2020. See “Description of the Mortgage Pool – Split Loan Structures - The Outlet Collection | Jersey Gardens Loan Combination” and “Servicing of the Mortgage Loans and Administration of the Trust Fund - Additional Matters Relating to the Servicing of The Outlet Collection | Jersey Gardens Loan Combination” in the Free Writing Prospectus.
THE INFORMATION IN THIS STRUCTURAL AND COLLATERAL TERM SHEET IS NOT COMPLETE AND MAY BE AMENDED PRIOR TO THE TIME OF SALE. THIS TERM SHEET IS NOT AN OFFER TO SELL THESE SECURITIES AND IT IS NOT A SOLICITATION OF AN OFFER TO BUY THESE SECURITIES IN ANY JURISDICTION WHERE THE OFFER OR SALE IS NOT PERMITTED.
28
| THE OUTLET COLLECTION | JERSEY GARDENS |
Note A-2, which will be contributed to the WFRBS 2013-UBS1 Trust, had an original principal balance of $130,000,000 and has an outstanding principal balance as of the Cut-off Date of $130,000,000. Note A-1, which had an original principal balance of $140,000,000 and represents the controlling interest in The Outlet Collection | Jersey Gardens Loan Combination, and Note A-3, which had an original principal balance of $80,000,000 and represents a non-controlling interest in The Outlet Collection | Jersey Gardens Loan Combination, will each be contributed to future trusts (“The Outlet Collection | Jersey Gardens Companion Loans”). Following the lockout period, the borrower has the right to defease The Outlet Collection | Jersey Gardens Loan Combination in whole, but not in part, on any date before August 1, 2020. In addition, The Outlet Collection | Jersey Gardens Loan Combination is prepayable without penalty on or after August 1, 2020.
Sources and Uses
| Sources | Uses | ||||||||
| Original loan combination amount | $350,000,000 | 100.0% | Loan payoff(1) | $139,231,383 | 39.8 | % | |||
| Reserves | 2,655,728 | 0.8 | |||||||
| Closing costs | 3,402,450 | 1.0 | |||||||
| Return of equity | 204,710,439 | 58.5 | |||||||
| Total Sources | $350,000,000 | 100.0% | Total Uses | $350,000,000 | 100.0 | % |
| (1) | The Outlet Collection | Jersey Gardens Property was previously securitized in BSCMS 2004-T16 and GMACC 2004-C2. |
The Property. The Outlet Collection | Jersey Gardens Property is a two-story regional outlet mall located in Elizabeth, New Jersey that contains approximately 1.3 million square feet, all of which serve as collateral for The Outlet Collection | Jersey Gardens Loan Combination. The Outlet Collection | Jersey Gardens Property is anchored by Loews Theaters, Forever 21, Burlington Coat Factory, Marshalls, Bed Bath & Beyond, Century 21, Cohoes Fashions and Saks Off 5th. The Outlet Collection | Jersey Gardens Property is situated on 98.4 acres and was developed in 1999 by Glimcher Realty Trust (“Glimcher”) for a total cost of $216.3 million and recently renovated in 2013. The sponsor invested approximately $30.0 million in the 2013 renovation, which consisted of remodeling corridors, entrances, restrooms and the food court along with the introduction of brands such as Coach and Tommy Hilfiger. The Outlet Collection | Jersey Gardens Property is the largest outlet mall in New Jersey and the second most visited tourist destination in the state, attracting approximately 18 million shoppers annually from more than 160 countries.
Parking is provided by 5,330 surface parking spaces, resulting in a parking ratio of 4.1 spaces per 1,000 square feet of net rentable area. The Outlet Collection | Jersey Gardens Property boasts a unique mix of over 200 retail and manufacturer outlets, discount and off-price stores, full-price retailers, restaurants and entertainment tenants. Major retailers include Neiman Marcus Last Call, Nike Factory Store, VF Outlet, Old Navy, The Gap Outlet and H&M and for the trailing 12-month period ending June 30, 2013, tenants occupying less than 10,000 square feet had in-line sales of $715 per square foot with an average occupancy cost of 8.8%. For the same time period, gross sales totaled approximately $585.0 million, representing an increase of over 36.2% from 2010. As of September 25, 2013, The Outlet Collection | Jersey Gardens Property was 99.4% leased to 214 tenants (excluding temporary tenants, occupancy was 96.4%).
THE INFORMATION IN THIS STRUCTURAL AND COLLATERAL TERM SHEET IS NOT COMPLETE AND MAY BE AMENDED PRIOR TO THE TIME OF SALE. THIS TERM SHEET IS NOT AN OFFER TO SELL THESE SECURITIES AND IT IS NOT A SOLICITATION OF AN OFFER TO BUY THESE SECURITIES IN ANY JURISDICTION WHERE THE OFFER OR SALE IS NOT PERMITTED.
29
| THE OUTLET COLLECTION | JERSEY GARDENS |
The following table presents certain information relating to the tenancy at The Outlet Collection | Jersey Gardens Property:
Major Tenants
| Tenant Name | Credit Rating (Fitch/ Moody’s/ S&P)(1) | Tenant NRSF | % of NRSF | Annual U/W Base Rent PSF | Annual U/W Base Rent(2) | % of Total Annual U/W Base Rent(2) | Sales PSF(3) | Occupancy Cost(3) | Lease Expiration Date | |||||||||
| Anchor Tenants | ||||||||||||||||||
Loews Theatres | NR/NR/NR | 110,000 | 8.5% | $12.55 | $1,380,119 | 4.4% | $357,401(4) | 24.2% | 12/31/2020 | |||||||||
Forever 21 | NR/NR/NR | 58,879 | 4.5% | $16.98 | $1,000,000 | 3.2% | $275 | 6.2% | 1/31/2021 | |||||||||
Burlington Coat Factory | NR/B3/NR | 80,259 | 6.2% | $12.12 | $972,739 | 3.1% | $249 | 4.9% | 1/31/2015 | |||||||||
Marshalls | NR/A3/A | 49,245 | 3.8% | $15.91 | $783,354 | 2.5% | $397 | 4.6% | 1/31/2015 | |||||||||
Bed Bath & Beyond | NR/NR/BBB+ | 41,225 | 3.2% | $17.47 | $720,000 | 2.3% | NAV | NAV | 1/31/2015 | |||||||||
Century 21 | NR/NR/NR | 33,124 | 2.6% | $17.17 | $568,836 | 1.8% | NAV | NAV | 1/31/2015 | |||||||||
Cohoes Fashions | NR/B3/NR | 58,819 | 4.5% | $7.14 | $420,000 | 1.3% | $167 | 4.3% | 1/1/2015 | |||||||||
Saks Off 5th | NR/NR/NR | 30,463 | 2.3% | $12.00 | $365,551 | 1.2% | NAV | NAV | 11/22/2022 | |||||||||
| Total Anchor Tenants | 462,014 | 35.6% | $13.44 | $6,210,599 | 19.9% | |||||||||||||
| Junior Anchor Tenants | ||||||||||||||||||
| Tommy Hilfiger | NR/NR/NR | 22,878 | 1.8% | $50.00 | $1,143,904 | 3.7% | $920 | 5.4% | 1/31/2023 | |||||||||
Nike Factory Store(5) | NR/A1/AA- | 25,007 | 1.9% | $29.46 | $736,814 | 2.4% | $816 | 3.8% | 12/31/2024 | |||||||||
| H&M | NR/NR/NR | 20,000 | 1.5% | $29.76 | $595,200 | 1.9% | $525 | 5.7% | 1/31/2021 | |||||||||
| Neiman Marcus Last Call | NR/Caa2/B | 27,696 | 2.1% | $17.23 | $477,135 | 1.5% | $388 | 5.0% | 11/30/2014 | |||||||||
| VF Outlet (Macy’s) | BBB/Baa3/BBB | 22,438 | 1.7% | $20.00 | $448,760 | 1.4% | $116 | 17.2% | 8/31/2015 | |||||||||
| Old Navy | BBB-/Baa3/BBB- | 21,536 | 1.7% | $20.00 | $430,720 | 1.4% | $531 | 3.8% | 5/31/2015 | |||||||||
| Group USA | NR/NR/NR | 23,563 | 1.8% | $16.00 | $377,008 | 1.2% | $183 | 9.1% | 12/31/2018 | |||||||||
| The Gap Outlet | BBB-/Baa3/BBB- | 20,515 | 1.6% | $17.01 | $349,010 | 1.1% | $884 | 1.9% | 1/31/2015 | |||||||||
Modell’s Sporting Goods | NR/NR/NR | 21,409 | 1.6% | $13.00 | $278,317 | 0.9% | $235 | 5.5% | 1/31/2017 | |||||||||
| Total Junior Anchor Tenants | 205,042 | 15.8% | $23.59 | $4,836,868 | 15.5% | |||||||||||||
Non-Anchor Tenants(6) | 624,545 | 48.1% | $39.02 | $20,195,567 | 64.6% | |||||||||||||
Occupied Collateral Total(6) | 1,291,601 | 99.4% | $26.37 | $31,243,034 | 100.0% | |||||||||||||
| Vacant Space | 7,200 | 0.6% | ||||||||||||||||
| Collateral Total | 1,298,801 | 100.0% | ||||||||||||||||
| (1) | Certain ratings are those of the parent company whether or not the parent guarantees the lease. |
| (2) | Underwritten base rent includes contractual rent escalations through October 2014 and income from eight tenants, representing approximately 30,764 square feet (2.4% of net rentable area) that either do not have executed leases (leases were out for tenants signature) or were not in occupancy and paying rent on their new space. |
| (3) | Sales PSF and Occupancy Costs represent the trailing 12-month period ending June 30, 2013. Sales PSF and Occupancy Costs do not include utility reimbursement figures, and are not available for tenants who have not reported a full year of sales data. |
| (4) | Sales reflect average sales per screen based on 22 screens. |
| (5) | Nike Factory Store modified their lease in August 2013 to expand by 5,007 square feet and extend the lease term five years. All figures are reflective of the new lease terms. |
| (6) | Includes 39,940 square feet attributed to temporary tenants that were not included in the Annual U/W Base Rent, along with 66,982 square feet attributed to tenants paying a percentage of sales in lieu of base rent, for a total of 106,922 square feet. The Annual U/W Base Rent PSF for Non-Anchor Tenants and Occupied Collateral Total exclude the square footage attributed to these tenants. |
THE INFORMATION IN THIS STRUCTURAL AND COLLATERAL TERM SHEET IS NOT COMPLETE AND MAY BE AMENDED PRIOR TO THE TIME OF SALE. THIS TERM SHEET IS NOT AN OFFER TO SELL THESE SECURITIES AND IT IS NOT A SOLICITATION OF AN OFFER TO BUY THESE SECURITIES IN ANY JURISDICTION WHERE THE OFFER OR SALE IS NOT PERMITTED.
30
| THE OUTLET COLLECTION | JERSEY GARDENS |
The following table presents certain information relating to the historical sales and occupancy costs at The Outlet Collection | Jersey Gardens Property:
Historical Sales (PSF) and Occupancy Costs(1)
| Tenant Name | 2010 | 2011 | 2012 | TTM 6/30/2013 |
| Loews Theatres | NAV | NAV | NAV | $357,401(2) |
| Forever 21 | NAV | $247 | $252 | $275 |
| Burlington Coat Factory | $191 | $198 | $236 | $249 |
| Marshalls | $293 | $314 | $351 | $397 |
| Bed Bath & Beyond | NAV | NAV | NAV | $193 |
| Century 21 | NAV | NAV | NAV | NAV |
| Cohoes Fashions | $150 | $160 | $170 | $167 |
Saks Off 5th | $354 | $374 | NAV | NAV |
Total Anchor(3) | $262 | $321 | $336 | $344 |
Total Anchor Occupancy Costs(3) | 5.3% | 5.4% | 5.4% | 5.9% |
Total Major(4) | $441 | $461 | $471 | $483 |
Total Major Occupancy Costs(4) | 7.8% | 6.1% | 5.7% | 5.6% |
Total In-line (<10,000 square feet)(5) | $625 | $685 | $692 | $715 |
Total In-line Occupancy Costs(5) | 8.8% | 8.0% | 7.6% | 8.8% |
| (1) | Historical Sales (PSF) and Occupancy Costs are based on historical statements provided by the borrower. Occupancy costs do not include utility reimbursements. |
| (2) | Sales reflect average sales per screen based on 22 screens. |
| (3) | Total Anchor Sales PSF and Occupancy Cost include all anchor tenants (except for Loews) listed in the Major Tenants table who reported 12 months of sales figures. |
| (4) | Total Major Tenants (> 10,000 square feet) Sales PSF and Occupancy Cost include in-line tenants greater than 10,000 square feet that have been open for the previous 12-month period, as provided by the borrower. |
| (5) | Total In-Line Tenants (< 10,000 square feet) Sales PSF and Occupancy Cost include in-line tenants less than 10,000 square feet that have been open for the previous 12-month period, as provided by the borrower. |
The following table presents certain information relating to the lease rollover schedule at The Outlet Collection | Jersey Gardens Property:
Lease Expiration Schedule(1)(2)
Year Ending December 31, | No. of Leases Expiring | Expiring NRSF | % of Total NRSF | Cumulative Expiring NRSF | Cumulative % of Total NRSF | Annual U/W Base Rent | % of Annual U/W Base Rent | Annual U/W Base Rent PSF(3) | |||||||||
MTM(4) | 38 | 39,940 | 3.1% | 39,940 | 3.1% | $0 | 0.0% | $0.00 | |||||||||
| 2013 | 6 | 9,140 | 0.7% | 49,080 | 3.8% | $304,640 | 1.0% | $33.46 | |||||||||
| 2014 | 25 | 106,082 | 8.2% | 155,162 | 11.9% | $3,451,861 | 11.0% | $32.54 | |||||||||
| 2015 | 27 | 389,315 | 30.0% | 544,477 | 41.9% | $6,437,350 | 20.6% | $16.93 | |||||||||
| 2016 | 12 | 39,805 | 3.1% | 584,282 | 45.0% | $926,249 | 3.0% | $35.05 | |||||||||
| 2017 | 17 | 98,417 | 7.6% | 682,699 | 52.6% | $2,091,014 | 6.7% | $26.50 | |||||||||
| 2018 | 13 | 49,566 | 3.8% | 732,265 | 56.4% | $1,663,511 | 5.3% | $33.56 | |||||||||
| 2019 | 14 | 57,071 | 4.4% | 789,336 | 60.8% | $1,525,821 | 4.9% | $30.55 | |||||||||
| 2020 | 14 | 156,936 | 12.1% | 946,272 | 72.9% | $2,788,231 | 8.9% | $18.44 | |||||||||
| 2021 | 10 | 138,067 | 10.6% | 1,084,339 | 83.5% | $5,212,731 | 16.7% | $37.76 | |||||||||
| 2022 | 18 | 98,400 | 7.6% | 1,182,739 | 91.1% | $2,507,202 | 8.0% | $29.10 | |||||||||
| 2023 | 12 | 66,055 | 5.1% | 1,248,794 | 96.1% | $2,690,674 | 8.6% | $40.73 | |||||||||
| 2024 | 6 | 42,807 | 3.3% | 1,291,601 | 99.4% | $1,589,114 | 5.1% | $37.12 | |||||||||
| Thereafter | 2 | 0 | 0.0% | 1,291,601 | 99.4% | $54,637 | 0.2% | $0.00 | |||||||||
| Vacant | 0 | 7,200 | 0.6% | 1,298,801 | 100.0% | $0 | 0.0% | $0.00 | |||||||||
| Total/Weighted Average | 214 | 1,298,801 | 100.0% | $31,243,034 | 100.0% | $26.37 |
| (1) | Information obtained from the underwritten rent roll. |
| (2) | Certain tenants may have lease termination options that are exercisable prior to the originally stated expiration date of the subject lease and that are not considered in the Lease Expiration Schedule. |
| (3) | The annual and Total/Weighted Average Annual U/W Base Rent PSF excludes vacant space, Annual U/W Base Rent attributed to tenants paying percentage rent in lieu of base rent and square footage attributed to temporary tenants. These rents were included in the underwritten percentage rent and other income. |
| (4) | Includes 38 temporary tenants. The rent for temporary tenants has been included in the underwritten other income. |
THE INFORMATION IN THIS STRUCTURAL AND COLLATERAL TERM SHEET IS NOT COMPLETE AND MAY BE AMENDED PRIOR TO THE TIME OF SALE. THIS TERM SHEET IS NOT AN OFFER TO SELL THESE SECURITIES AND IT IS NOT A SOLICITATION OF AN OFFER TO BUY THESE SECURITIES IN ANY JURISDICTION WHERE THE OFFER OR SALE IS NOT PERMITTED.
31
| THE OUTLET COLLECTION | JERSEY GARDENS |
The following table presents historical occupancy at The Outlet Collection | Jersey Gardens Property:
Historical Occupancy
12/31/2008(1) | 12/31/2009(1) | 12/31/2010(1) | 12/31/2011(1) | 12/31/2012(1) | 9/25/2013(2) | |||||
| 100.0% | 99.0% | 100.0% | 99.5% | 100.0% | 99.4% |
| (1) | Information obtained from the borrower. |
| (2) | Occupancy includes 39,940 square feet attributed to temporary tenants. As of September 25, 2013, the occupancy excluding temporary tenants was 96.4%. |
The following table presents historical base rent per square foot at The Outlet Collection | Jersey Gardens Property:
Historical Average Base Rent (PSF)(1)
12/31/2010 | 12/31/2011 | 12/31/2012 | 9/30/2013 | |||
| $20.09 | $21.04 | $21.94 | $23.34 |
| (1) | Information obtained from borrower operating statements. The average base rent is based on the gross potential rent divided by the total square footage and does not take into account vacancies, temporary tenants or tenants paying percentage rent in lieu of base rent. |
Operating History and Underwritten Net Cash Flow. The following table presents certain information relating to the historical operating performance and Underwritten Net Cash Flow at The Outlet Collection | Jersey Gardens Property:
Cash Flow Analysis
| 2011 | 2012 | TTM 9/30/2013 | U/W | U/W $ per SF | ||||||||||
| Base Rent | $27,320,757 | $28,491,353 | $30,309,606 | $31,243,034 | $24.06 | |||||||||
| Grossed Up Vacant Space | 0 | 0 | 0 | 250,932 | 0.19 | |||||||||
| Percentage Rent | 4,080,168 | 4,685,424 | 5,802,622 | 6,033,369 | 4.65 | |||||||||
| Total Reimbursables | 20,527,216 | 20,702,521 | 21,192,737 | 23,887,463 | 18.39 | |||||||||
| Other Income | 6,078,270 | 5,765,033 | 6,007,541 | 6,193,001 | 4.77 | |||||||||
| Less Vacancy & Credit Loss | 0 | 0 | (516,500) | (944,819)(1) | (0.73) | |||||||||
| Effective Gross Income | $58,006,411 | $59,644,331 | $62,796,006 | $66,662,980(2) | $51.33 | |||||||||
| Total Operating Expenses | $23,018,749 | $22,997,948 | $22,603,585 | $26,424,909 | $20.35 | |||||||||
| Net Operating Income | $34,987,662 | $36,646,383 | $40,192,421 | $40,238,071(2) | $30.98 | |||||||||
| TI/LC | 0 | 0 | 0 | 1,327,796 | 1.02 | |||||||||
| Capital Expenditures | 0 | 0 | 0 | 259,760 | 0.20 | |||||||||
| Net Cash Flow | $34,987,662 | $36,646,383 | $40,192,421 | $38,650,516 | $29.76 | |||||||||
NOI DSCR(3) | 2.57x | 2.70x | 2.96x | 2.96x | ||||||||||
NCF DSCR(3) | 2.57x | 2.70x | 2.96x | 2.84x | ||||||||||
NOI DY(3) | 10.0% | 10.5% | 11.5% | 11.5% | ||||||||||
NCF DY(3) | 10.0% | 10.5% | 11.5% | 11.0% | ||||||||||
| (1) | The underwritten economic vacancy is 3.0%. The Outlet Collection | Jersey Gardens Property was 99.4% physically occupied as of September 25, 2013. The Outlet Collection | Jersey Gardens Property has maintained a consistent average occupancy of 98.1% since 2002. |
| (2) | The increase in Effective Gross Income and Net Operating Income from the TTM 9/30/2013 to the U/W is due to the inclusion of contractual rent escalations through October 2014 and recent leasing activity, including 30,764 square feet of renewal/expansion leases and some leases that are out for signature. |
| (3) | DSCRs and debt yields are based on The Outlet Collection | Jersey Gardens Loan Combination. |
Appraisal. As of the appraisal valuation date of October 4, 2013, The Outlet Collection | Jersey Gardens Property had an “as-is” appraised value of $707,000,000.
Environmental Matters. According to a Phase I environmental site assessment dated October 8, 2013, there was no evidence of any current recognized environmental conditions at The Outlet Collection | Jersey Gardens Property; however, one historical recognized environmental condition was noted. The Outlet Collection | Jersey Gardens Property was part of the former Elizabeth Landfill, which was utilized by several municipalities in New Jersey. According to the Phase I environmental consultant, all required landfill closure and remediation work has been completed and a “No Further Action Letter” and “Covenant Not to Sue” was issued in 1999. As part of the ongoing monitoring, the Phase I environmental consultant recommended that the engineering controls (cap, leachate drainage system, storm-water drainage system, gas venting system, etc.) and institutional controls continue to be maintained by the New Jersey Department of Environmental Protection.
THE INFORMATION IN THIS STRUCTURAL AND COLLATERAL TERM SHEET IS NOT COMPLETE AND MAY BE AMENDED PRIOR TO THE TIME OF SALE. THIS TERM SHEET IS NOT AN OFFER TO SELL THESE SECURITIES AND IT IS NOT A SOLICITATION OF AN OFFER TO BUY THESE SECURITIES IN ANY JURISDICTION WHERE THE OFFER OR SALE IS NOT PERMITTED.
32
| THE OUTLET COLLECTION | JERSEY GARDENS |
Market Overview and Competition. The Outlet Collection | Jersey Gardens Property is located adjacent to the New Jersey Turnpike, approximately 17 miles southwest of midtown Manhattan and approximately three miles south of Newark International Airport. Regional access is provided by the New Jersey Turnpike, which is traveled by over 250,000 cars daily and provides direct access to The Outlet Collection | Jersey Gardens Property. With a population of more than 125,000, the city of Elizabeth is New Jersey’s fourth largest city and contains most major governmental offices and courts servicing Union County. Elizabeth is also home to Port Newark, the largest industrial seaport in North America, which provides over 150,000 jobs and is the world’s largest containership port and the largest Foreign Trade Zone in the United States. The largest employers in the area include Newark Airport (24,000), Verizon (17,000), Prudential (16,000), and Public Service Electric and Gas Company (11,000).
The Outlet Collection | Jersey Gardens Property provides a shuttle bus to Newark International Airport, which is located directly across the New Jersey Turnpike from The Outlet Collection | Jersey Gardens Property, and that transports over 10,000 monthly riders, including airport employees, local hotel guests and international travelers. The Outlet Collection | Jersey Gardens Property is also easily accessible via public transportation, with two New Jersey Transit train stations and transit buses providing convenient access throughout the trade area. Another demand driver for The Outlet Collection | Jersey Gardens Property has been its location within Elizabeth’s award-winning Urban Enterprise Zone (“UEZ”) program, which offers a reduced 3.5% sales tax (compared to the 7.0% rate charged statewide). The UEZ was named the number one program in the nation by the National Association of State Development Agencies and has provided more than $50.0 million in additional funds for reinvestment in Elizabeth. Further, the state of New Jersey does not charge a sales tax on clothing or shoes, which creates a unique demand driver given The Outlet Collection | Jersey Gardens Property’s proximity to New York City.
According to the appraisal, The Outlet Collection | Jersey Gardens Property’s trade area encompasses a 40-mile radius. As of 2013, the estimated population within a 20-mile and 40-mile radius of The Outlet Collection | Jersey Gardens Property was approximately 10.7 million and 17.0 million, respectively. The estimated household income within the same 20-mile and 40-mile radius was approximately $84,002 and $93,628, respectively. According to a third party market research report, The Outlet Collection | Jersey Gardens Property is located within the Northern New Jersey retail market, which has an estimated inventory of approximately 196.2 million square feet with a 6.1% vacancy rate, as of the third quarter of 2013. The appraiser concluded a market rent of $24.65 per square foot, on a triple net basis, for The Outlet Collection | Jersey Gardens Property.
The following table presents certain information relating to comparable retail properties for The Outlet Collection | Jersey Gardens Property:
Competitive Set(1)
The Outlet Collection | Jersey Gardens (Subject) | Staten Island Mall | Newport Centre | Woodbridge Center | Menlo Park Mall | The Outlets at Bergen Town Center | Woodbury Commons | ||||||||
| Location | Elizabeth, NJ | Staten Island, NY | Jersey City, NJ | Woodbridge, NJ | Edison, NJ | Paramus, NJ | Central Valley, NY | |||||||
| Distance from Subject | -- | 11.0 miles | 12.5 miles | 14.0 miles | 14.5 miles | 26.0 miles | 55.0 miles | |||||||
| Property Type | Regional Mall | Super-Regional Mall | Super-Regional Mall | Super-Regional Mall | Super-Regional Mall | Outlet Center | Outlet Center | |||||||
| Year Built/Renovated | 1999/2013 | 1973/1993 | 1987/2005 | 1971/2003 | 1960/2003 | 1957/1967, 1973, 2007-2011 | 1985/1998 | |||||||
| Anchors | Loews Theatres, Forever 21, Burlington Coat Factory, Marshalls, Bed Bath & Beyond, Century 21, Cohoes Fashions, Off Saks Off 5th | Sears, JC Penney, Macy’s | Sears, JC Penney, Kohl’s, Macy’s | Sears, Macy’s, Lord & Taylor, JC Penney, Boscov’s | Macy’s, Nordstrom, AMC Theater, Workout World | Bloomingdales Outlet, Century 21, Homegoods, Marshall’s Nordstrom Rack, Off 5th, Old Navy, Target, Whole Foods | Neiman Marcus Last Call, Off 5th, Barney’s New York, Polo Ralph Lauren, Eddie Bauer | |||||||
| Total GLA | 1,298,801 SF | 1,274,000 SF | 1,147,000 SF | 1,630,000 SF | 1,243,000 SF | 1,001,916 SF | 848,000 SF | |||||||
| In-line Sales PSF | $715 | NAV | $550 | $450 | $400 | $560 | $1,400 | |||||||
| Total Occupancy | 99% | 94% | 98% | 96% | 92% | 92% | 100% |
| (1) | Information obtained from the appraisal. |
The Borrower. The borrower is NJ Metromall Urban Renewal, Inc. (the fee owner) and JG Elizabeth II, LLC (the leasehold owner), as further detailed in the “Ground Lease and Payment in Lieu of Taxes (“PILOT”)” section, both single purpose entities with two independent directors. Legal counsel to the borrower delivered a non-consolidation opinion in connection with the origination of The Outlet Collection | Jersey Gardens Loan Combination. Glimcher Properties Limited Partnership (“GPLP”), the sponsor, is the guarantor of certain nonrecourse carveouts under The Outlet Collection | Jersey Gardens Loan Combination.
THE INFORMATION IN THIS STRUCTURAL AND COLLATERAL TERM SHEET IS NOT COMPLETE AND MAY BE AMENDED PRIOR TO THE TIME OF SALE. THIS TERM SHEET IS NOT AN OFFER TO SELL THESE SECURITIES AND IT IS NOT A SOLICITATION OF AN OFFER TO BUY THESE SECURITIES IN ANY JURISDICTION WHERE THE OFFER OR SALE IS NOT PERMITTED.
33
| THE OUTLET COLLECTION | JERSEY GARDENS |
The Sponsor. The loan sponsor is GPLP, a subsidiary of Glimcher. Based in Columbus, Ohio, Glimcher was formed in 1994 to continue and expand the operations of The Glimcher Company, initially founded in 1959 by Herbert Glimcher. Glimcher owns and/or manages a total of 27 enclosed regional malls, open-air centers or outlet centers in 14 states aggregating approximately 19.1 million square feet of gross leasable area, which was approximately 95.0% occupied as of September 30, 2013. In 2009 and 2012, Glimcher had ownership interests in two malls that either were the subject of deeds in lieu of foreclosure or were modified following default. See “Description of the Mortgage Pool – Default History, Bankruptcy Issues and Other Proceedings” in the Free Writing Prospectus.
Escrows. The loan documents provide for upfront reserves in the amount of $2,593,953 for unfunded TI/LC costs associated with ten tenants and $61,775 for rent concessions associated with The Gap. The loan documents do not require monthly escrows for real estate taxes provided the following conditions are met: (i) no event of default has occurred and is continuing; (ii) the borrower has provided the lender with timely proof of payment; and (iii) a Cash Trap Event Period (as defined below) does not currently exist. The loan documents do not require monthly escrows for insurance provided (i) no event of default has occurred and is continuing; (ii) the insurance required to be maintained by the borrower is maintained pursuant to one or more blanket policies; and (iii) the borrower provides the lender with timely proof of payment of insurance premiums. The loan documents do not require monthly escrows for replacement reserves as long as no Cash Trap Event Period exists and is continuing. During a Cash Trap Event Period, the borrower is required to deposit monthly replacement reserves in an amount equal to $21,647. The loan documents do not require monthly escrows for tenant improvements and leasing commissions as long as no Cash Trap Event Period exists and is continuing. During a Cash Trap Event Period, the borrower is required to deposit monthly tenant improvement and leasing commission reserves in an amount equal to $52,645. In addition, during a Cash Trap Event Period, the borrower is required to make monthly deposits into a ground rent reserve account in an amount equal to one-twelfth of the estimated annual ground rent payment payable during the next ensuing 12 months.
A “Cash Trap Event Period” will commence upon (i) the occurrence and continuance of an event of default or (ii) the debt service coverage ratio (based on a 30-year amortization term) for the trailing 12-month period falling below 1.25x at the end of any calendar quarter. A Cash Trap Event Period will expire, with regard to the circumstances in clause (i), upon the cure of such event of default, or, with regard to the circumstances in clause (ii), the debt service coverage ratio (based on a 30-year amortization term) being equal to or greater than 1.25x for two consecutive calendar quarters.
Lockbox and Cash Management. The Outlet Collection | Jersey Gardens Loan Combination requires a lender-controlled lockbox account, which is already in place, and that the borrower direct tenants to pay their rents directly into such lockbox account. The loan documents also require that all rents received by the borrower or the property manager be deposited into the lockbox account within one business day of receipt. Prior to the occurrence of a Cash Trap Event Period, all funds on deposit in the lockbox account are swept into the borrower’s operating account on a daily basis. During a Cash Trap Event Period, all excess cash flow is swept on a monthly basis to a cash management account under control of the lender.
Property Management. The Outlet Collection | Jersey Gardens Property is managed by an affiliate of the borrower.
Assumption. The borrower has the two-time right to transfer The Outlet Collection | Jersey Gardens Property, provided that no event of default has occurred and is continuing and certain other conditions are satisfied, including, but not limited to the following: (i) the lender’s reasonable determination that the proposed transferee and guarantor satisfy the lender’s credit review and underwriting standards, taking into consideration transferee experience, financial strength and general business standing; (ii) execution of a recourse guaranty and an environmental indemnity by an affiliate of the transferee; and (iii) if requested by the lender, rating agency confirmation from KBRA, Moody’s and S&P that the transfer will not result in a downgrade, withdrawal or qualification of the respective ratings assigned to the Series 2013-UBS1 Certificates, and similar confirmations with respect to the ratings of any securities backed by The Outlet Collection | Jersey Gardens Companion Loans.
In addition, transfers of equity interests in the borrower are permitted so long as Glimcher owns more than 30.0% of direct or indirect equity interests in GPLP (and controls GPLP) and the borrower or a Qualified Equity Holder (as defined below) owns more than 51.0% of the direct or indirect equity interests in GPLP (and controls GPLP).
A “Qualified Equity Holder” means an entity which meets certain criteria, including but not limited to (i) an affiliate, or other institution having total assets in excess of $600.0 million and is regularly engaged in the business of owning and operating properties similar to The Outlet Collection | Jersey Gardens Property, or (ii) any party for whom written confirmation from KBRA, Moody’s and S&P has been obtained that the transfer to the entity in question will not result in a downgrade, withdrawal or qualification of the then-current ratings assigned to the Series 2013-UBS1 Certificates, and similar confirmations with respect to the ratings of any securities backed by The Outlet Collection | Jersey Gardens Companion Loans.
Partial Release. Not permitted.
Real Estate Substitution. Not permitted.
Subordinate and Mezzanine Indebtedness. Not permitted.
THE INFORMATION IN THIS STRUCTURAL AND COLLATERAL TERM SHEET IS NOT COMPLETE AND MAY BE AMENDED PRIOR TO THE TIME OF SALE. THIS TERM SHEET IS NOT AN OFFER TO SELL THESE SECURITIES AND IT IS NOT A SOLICITATION OF AN OFFER TO BUY THESE SECURITIES IN ANY JURISDICTION WHERE THE OFFER OR SALE IS NOT PERMITTED.
34
| THE OUTLET COLLECTION | JERSEY GARDENS |
Additional Indebtedness. GPLP is permitted to pledge its indirect ownership of the borrower to a “Qualified Pledgee” (generally defined as an entity with $600.0 million in assets under management and shareholder equity of at least $250.0 million), subject to certain conditions, including: (i) no more than 49.0% of equity ownership interest in the borrower may be pledged; (ii) the credit facility must be recourse to GPLP and is secured by a substantial portion of its assets; (iii) the repayment of the credit facility relies substantially on cash flow assets other than The Outlet Collection | Jersey Gardens Property; and (iv) no event of default has occurred or is continuing.
Ground Lease and Payment in Lieu of Taxes (“PILOT”). The Outlet Collection | Jersey Gardens Property is subject to a prior lien for amounts required under a PILOT arrangement with the City of Elizabeth, New Jersey. To accommodate statutory requirements for the PILOT structure, the borrowers are comprised of a fee borrower (NJ Metromall Urban Renewal, Inc.) and an affiliated leasehold borrower (JG Elizabeth, LLC), and the lease payments made by the leasehold borrower to the fee borrower equal the required PILOT payments, and are paid by the fee borrower to US Bank Trust (the “PILOT Lender”), as trustee for the PILOT bondholders. The PILOT Lender has a statutory lien on The Outlet Collection | Jersey Gardens Property that is effectively equivalent in priority and character to a municipal tax lien. If the PILOT payments are not made, the City of Elizabeth has a special assessment lien against The Outlet Collection | Jersey Gardens Property in the same amount as the PILOT payments that are due but not yet paid.
The remaining PILOT obligations during the loan term range from $10,799,250 in 2013 through $12,770,113 in 2020, and the PILOT payments continue until February 1, 2031. The borrower affiliate that owns the adjacent retail site, and/or its tenants are contractually obligated to reimburse the borrower for 22.9% of the PILOT obligation.
Terrorism Insurance. The loan documents require that the “all risk” insurance policy required to be maintained by the borrower provides coverage for terrorism in an amount equal to the full replacement cost of The Outlet Collection | Jersey Gardens Property; provided, however, that the borrower will not be required to spend more than 200% of the cost of property coverage immediately prior to the date that TRIA or a similar government backstop is no longer in effect. The loan documents also require business interruption insurance covering no less than the 24-month period following the occurrence of a casualty event, together with an extended period of indemnity, which shall continue for the lesser of (i) the period of time until income returns to the same level as it was prior to loss and (ii) 12 months.
THE INFORMATION IN THIS STRUCTURAL AND COLLATERAL TERM SHEET IS NOT COMPLETE AND MAY BE AMENDED PRIOR TO THE TIME OF SALE. THIS TERM SHEET IS NOT AN OFFER TO SELL THESE SECURITIES AND IT IS NOT A SOLICITATION OF AN OFFER TO BUY THESE SECURITIES IN ANY JURISDICTION WHERE THE OFFER OR SALE IS NOT PERMITTED.
35
| SULLIVAN CENTER |
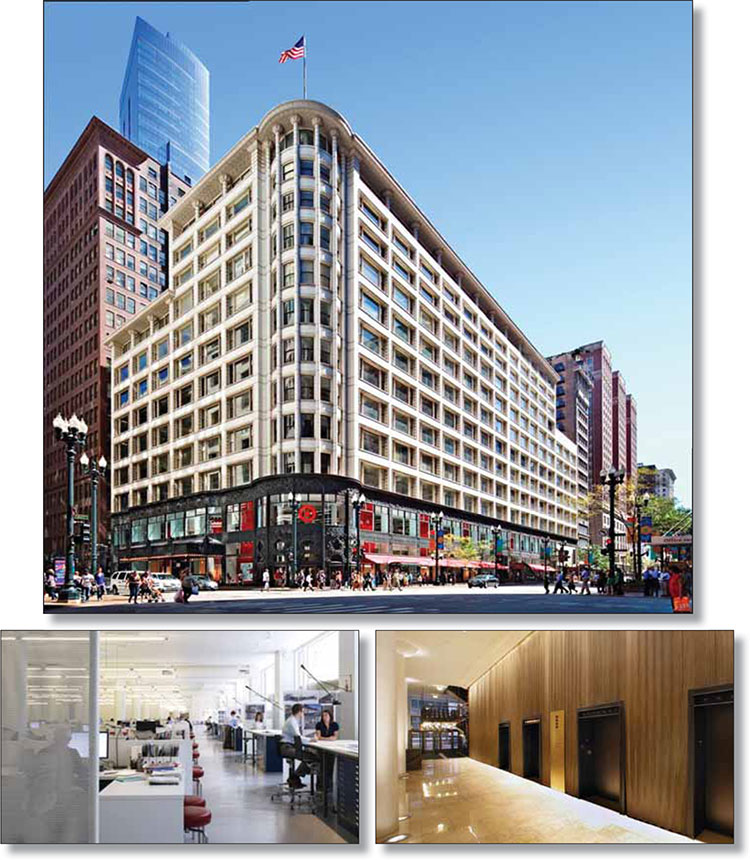
THE INFORMATION IN THIS STRUCTURAL AND COLLATERAL TERM SHEET IS NOT COMPLETE AND MAY BE AMENDED PRIOR TO THE TIME OF SALE. THIS TERM SHEET IS NOT AN OFFER TO SELL THESE SECURITIES AND IT IS NOT A SOLICITATION OF AN OFFER TO BUY THESE SECURITIES IN ANY JURISDICTION WHERE THE OFFER OR SALE IS NOT PERMITTED.
36
| SULLIVAN CENTER |
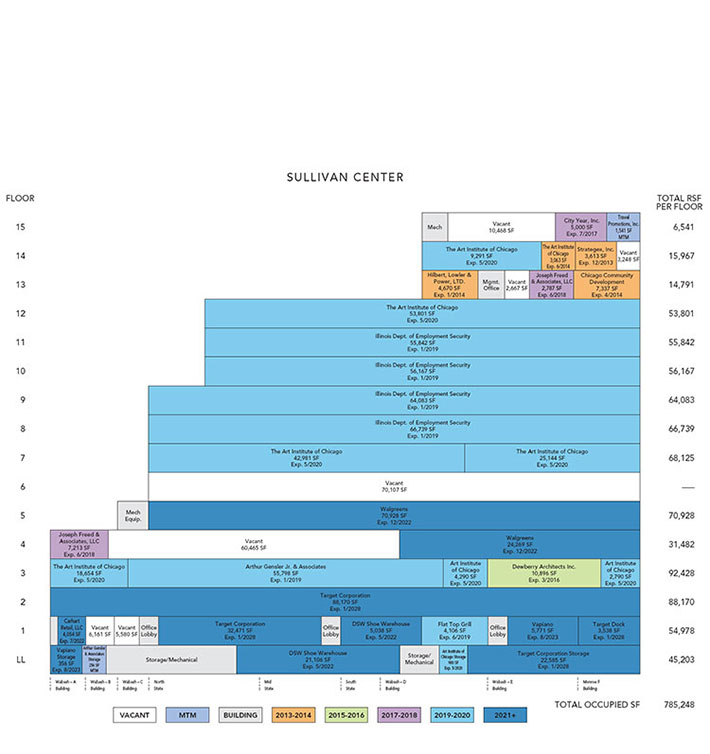
THE INFORMATION IN THIS STRUCTURAL AND COLLATERAL TERM SHEET IS NOT COMPLETE AND MAY BE AMENDED PRIOR TO THE TIME OF SALE. THIS TERM SHEET IS NOT AN OFFER TO SELL THESE SECURITIES AND IT IS NOT A SOLICITATION OF AN OFFER TO BUY THESE SECURITIES IN ANY JURISDICTION WHERE THE OFFER OR SALE IS NOT PERMITTED.
37
| SULLIVAN CENTER |
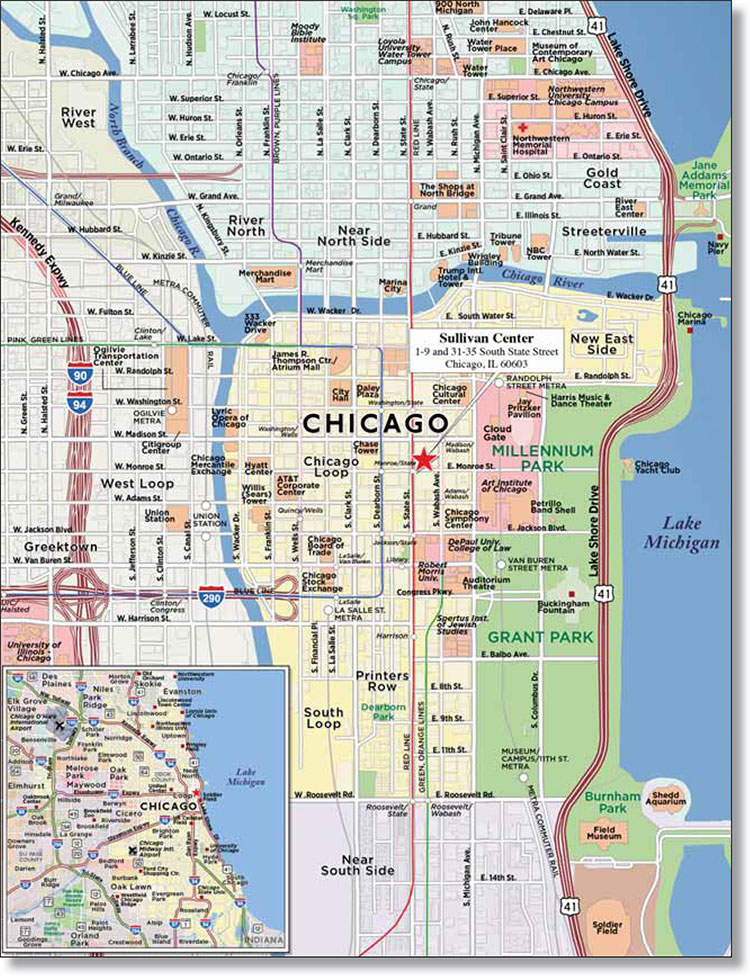
THE INFORMATION IN THIS STRUCTURAL AND COLLATERAL TERM SHEET IS NOT COMPLETE AND MAY BE AMENDED PRIOR TO THE TIME OF SALE. THIS TERM SHEET IS NOT AN OFFER TO SELL THESE SECURITIES AND IT IS NOT A SOLICITATION OF AN OFFER TO BUY THESE SECURITIES IN ANY JURISDICTION WHERE THE OFFER OR SALE IS NOT PERMITTED.
38
(THIS PAGE INTENTIONALLY LEFT BLANK)
39
No. 2 – Sullivan Center | |||||||
| Loan Information | Property Information | ||||||
| Mortgage Loan Seller: | UBS Real Estate Securities, Inc. | Single Asset/Portfolio: | Single Asset | ||||
| Credit Assessment (KBRA/Moody’s/S&P): | NR/NR/NR | Property Type: | Mixed Use | ||||
Original Principal Balance(1): | $75,000,000 | Specific Property Type: | Office/Retail | ||||
Cut-off Date Principal Balance(1): | $75,000,000 | Location: | Chicago, IL | ||||
| % of Initial Pool Balance: | 10.3% | Size: | 943,944 SF | ||||
| Loan Purpose: | Refinance | Cut-off Date Principal Balance Per SF(1): | $120.24 | ||||
| Borrower Name: | One South State PropCo, L.L.C. | Year Built/Renovated: | 1865/2009 | ||||
| Sponsors: | Joseph Freed and Associates LLC; WRT Realty L.P.; Elad Canada Inc. | Title Vesting: | Fee | ||||
| Mortgage Rate: | 3.950% | Property Manager: | Joseph Freed and Associates LLC | ||||
| Note Date: | October 18, 2013 | 3rd Most Recent Occupancy (As of): | 54.2% (12/31/2010) | ||||
| Anticipated Repayment Date: | NAP | 2nd Most Recent Occupancy (As of)(4): | 57.1% (12/31/2011) | ||||
| Maturity Date: | November 6, 2018 | Most Recent Occupancy (As of)(4): | 82.8% (12/31/2012) | ||||
| IO Period: | 60 months | Current Occupancy (As of): | 83.2% (9/1/2013) | ||||
| Loan Term (Original): | 60 months | ||||||
| Seasoning: | 1 month | ||||||
| Amortization Term (Original): | NAP | Underwriting and Financial Information: | |||||
| Loan Amortization Type: | Interest-only, Balloon | ||||||
| Interest Accrual Method: | Actual/360 | 3rd Most Recent NOI (As of)(4): | $7,029,262 (12/31/2011) | ||||
| Call Protection: | L(25),D(31),O(4) | 2nd Most Recent NOI (As of)(4): | $9,077,937 (12/31/2012) | ||||
| Lockbox Type: | Hard/Upfront Cash Management | Most Recent NOI (As of)(4): | $12,877,861 (TTM 7/31/2013) | ||||
Additional Debt(1)(2): | Yes | U/W Revenues: | $23,314,410 | ||||
Additional Debt Type(1)(2): | Pari Passu and Mezzanine | U/W Expenses: | $9,467,544 | ||||
| U/W NOI: | $13,846,865 | ||||||
Escrows and Reserves(3): | U/W NCF: | $12,719,383 | |||||
U/W NOI DSCR(1): | 3.05x | ||||||
Type: | Initial | Monthly | Cap (If Any) | U/W NCF DSCR(5): | 2.80x | ||
| Taxes | $1,316,573 | $329,143 | NAP | U/W NOI Debt Yield(1): | 12.2% | ||
| Insurance | $109,624 | $23,831 | NAP | U/W NCF Debt Yield(5): | 11.2% | ||
| Replacement Reserve | $0 | $19,666 | $1,200,000 | As-Is Appraised Value: | $229,000,000 | ||
| TI/LC Reserve | $34,041 | $0 | NAP | As-Is Appraisal Valuation Date: | September 4, 2013 | ||
| Rollover Reserve | $2,000,000 | $0 | NAP | Cut-off Date LTV Ratio(1): | 49.6% | ||
| Rent Abatement Reserve | $1,197,219 | $0 | NAP | LTV Ratio at Maturity or ARD(1): | 49.6% | ||
| (1) | The Sullivan Center Loan Combination, totalling $113,500,000, is comprised of two pari passu notes (Notes A-1 and A-2). Note A-1 had an original principal balance of $75,000,000, has an outstanding principal balance as of the Cut-off Date of $75,000,000 and will be contributed to the WFRBS 2013-UBS1 Trust. Note A-2 had an original principal balance of $38,500,000, has an outstanding balance of $38,500,000 as of the Cut-off Date, and is expected to be contributed to a future trust. All statistical information related to balances per square foot, loan-to-value ratios, debt service coverage ratios and debt yields are based on the Sullivan Center Loan Combination. |
| (2) | The equity interests in the borrower have been pledged to secure mezzanine indebtedness with a principal balance of $51,716,090 and accrued and unpaid interest of $4,615,978 as of the Cut-off Date (the “Sullivan Center Mezzanine Loan”). See “Subordinate and Mezzanine Indebtedness” section and “Common Control of Equity and Mezzanine Loan” section. |
| (3) | See “Escrows” section. |
| (4) | The increase in NOI from year-end 2011 to the trailing 12 months ended July 31, 2013 and the increase in occupancy from December 31, 2011 to December 31, 2012 is due to new leases being executed in 2012, including Target (15.5% of NRA and 20.3% of total underwritten base rent). |
| (5) | As of the Cut-off Date, taking into account both the Sullivan Center Loan Combination and the Sullivan Center Mezzanine Loan (as defined in the “Subordinate and Mezzanine Indebtedness” section) and based on the current mezzanine loan coupon of 9.000%, the total debt U/W NCF DSCR is 1.31x, the total debt LTV ratio is 74.2%, and the total debt U/W NCF debt yield is 7.5%. |
The Mortgage Loan. The mortgage loan (the “Sullivan Center Loan Combination”) is evidenced by two pari passu notes (“Note A-1” and “Note A-2”) secured by a first mortgage encumbering an office and retail building located in the central business district of Chicago, Illinois (the “Sullivan Center Property”). The Sullivan Center Loan Combination was originated on October 18, 2013 by UBS Real Estate Securities, Inc. The Sullivan Center Loan Combination had an original principal balance of $113,500,000, has an outstanding principal balance as of the Cut-off Date of $113,500,000 and accrues interest at an interest rate of 3.950% per annum. The Sullivan Center Loan Combination had an initial term of 60 months, has a remaining term of 59 months as of the Cut-off Date and requires interest-only payments through the term of the Sullivan Center Loan Combination. The Sullivan Center Loan Combination matures on November 6, 2018. See “Description of the Mortgage Pool – Split Loan Structures – The Sullivan Center Loan Combination” and “Servicing of the Mortgage Loans and Administration of the Trust Fund” in the Free Writing Prospectus.
THE INFORMATION IN THIS STRUCTURAL AND COLLATERAL TERM SHEET IS NOT COMPLETE AND MAY BE AMENDED PRIOR TO THE TIME OF SALE. THIS TERM SHEET IS NOT AN OFFER TO SELL THESE SECURITIES AND IT IS NOT A SOLICITATION OF AN OFFER TO BUY THESE SECURITIES IN ANY JURISDICTION WHERE THE OFFER OR SALE IS NOT PERMITTED.
40
| SULLIVAN CENTER |
Note A-1, which represents the controlling interest in the Sullivan Center Loan Combination and will be contributed to the WFRBS 2013-UBS1 Trust, had an original principal balance of $75,000,000 and has an outstanding principal balance as of the Cut-off Date of $75,000,000. Note A-2 had an original principal balance of $38,500,000, has an outstanding principal balance as of the Cut-off Date of $38,500,000 and is expected to be securitized in a future trust.
Following the lockout period, the borrower has the right to defease the Sullivan Center Loan Combination in whole, but not in part, on any date before August 6, 2018. In addition, the Sullivan Center Loan Combination is prepayable without penalty on or after August 6, 2018.
Sources and Uses(1)
| Sources | Uses | ||||||||
| Original loan amount | $113,500,000 | 97.4% | Loan payoff | $110,567,557 | 94.9 | % | |||
Sponsor’s new cash contribution | 3,034,501 | 2.6 | Reserves | 4,657,457 | 4.0 | ||||
| Closing costs | 1,309,487 | 1.1 | |||||||
| Total Sources | $116,534,501 | 100.0% | Total Uses | $116,534,501 | 100.0 | % |
| (1) | Excludes mezzanine debt that is under common control with the equity in the Sullivan Center Property. See “Subordinate and Mezzanine Indebtedness” section and “Common Control of Equity and Mezzanine Loan” section. |
The Property. The Sullivan Center Property is comprised of a 15-story, 943,944 square foot, mixed-use, national historic landmark redevelopment located in the central business district of Chicago, Illinois. Originally designed by renowned architect Louis Sullivan and constructed in 1865, the Sullivan Center Property was acquired in 2001 by Joseph Freed and Associates LLC (“JFA”). The Sullivan Center Property was the flagship store of retailer Carson Pirie Scott, who vacated the Sullivan Center Property in 2007. JFA subsequently reconfigured the space into retail and office uses and invested approximately $229.0 million ($243 per square foot) in capital improvements, renovations and soft costs from 2001 to 2011. As a result of this large scale rehabilitation project, the Sullivan Center Property was eligible for historic rehabilitation tax credits; see “Historic Tax Credits” section.
The Sullivan Center Property consists of 175,995 square feet (18.6% of net rentable area) of retail space on the subterranean level and first two floors, 743,852 square feet (78.8% of net rentable area) of office space on floors three to 15, and 24,097 square feet (2.6% of net rentable area) of below-grade storage space. The Sullivan Center Property retail portion includes Target, DSW, and Vapiano. Target opened its first City Target store at the Sullivan Center Property in 2012. City Target stores are approximately two-thirds of the size of standard big box Target stores and are designed to attract urban consumers. The City Target store highlights architectural features of the Sullivan Center Property, including the cylindrical rotunda entrance and cast-iron columns, and includes a Pret a Manger coffee and sandwich shop, a pharmacy, groceries, apparel and Chicago-themed merchandise.
Occupying almost a full city block, bordered by State Street, Madison Street, Monroe Street and Wabash Avenue, the Sullivan Center Property is positioned in both size and location to support various office and tenant retail uses. The building offers large floor plates, with the majority of the floors ranging in size from 50,000 to 90,000 square feet. Unique architectural features for which the building is recognized are: the cast iron ornamentation which adorns the first two floors; the large “Chicago windows”; and the cylindrical main entry rotunda which rounds the corner of State and Madison Streets. The Sullivan Center Property achieved the U.S. Green Building LEED Existing Building certification in September 2012. The office space was 80.2% occupied by 12 tenants and the retail space was 93.3% occupied by five tenants; as of September 1, 2013, the Sullivan Center Property was 83.2% leased by 17 tenants.
THE INFORMATION IN THIS STRUCTURAL AND COLLATERAL TERM SHEET IS NOT COMPLETE AND MAY BE AMENDED PRIOR TO THE TIME OF SALE. THIS TERM SHEET IS NOT AN OFFER TO SELL THESE SECURITIES AND IT IS NOT A SOLICITATION OF AN OFFER TO BUY THESE SECURITIES IN ANY JURISDICTION WHERE THE OFFER OR SALE IS NOT PERMITTED.
41
| SULLIVAN CENTER |
The following table presents certain information relating to the tenancy at the Sullivan Center Property:
Major Tenants
| Tenant Name | Credit Rating (Fitch/ Moody’s/ S&P)(1) | Tenant NRSF | % of NRSF | Annual U/W Base Rent PSF | Annual U/W Base Rent | % of Total Annual U/W Base Rent | Lease Expiration Date | ||||||||
| Major Retail Tenants | |||||||||||||||
Target Corporation(2) | A-/A2/A+ | 146,764 | 15.5% | $28.48 | $4,179,115 | 20.3% | 1/31/2028(3) | ||||||||
| DSW | NR/NR/NR | 26,144 | 2.8% | $38.19 | $998,439 | 4.8% | 5/31/2022 | ||||||||
Total Major Retail Tenants | 172,908 | 18.3% | $29.94 | $5,177,554 | 25.1% | ||||||||||
| Major Office Tenants | |||||||||||||||
Illinois Department of Employment Security(4)(5) | NR/NR/NR | 242,831 | 25.7% | $24.47 | $5,942,075 | 28.8% | 1/20/2019(6)(7) | ||||||||
The Art Institute of Chicago(8) | NR/NR/NR | 160,914 | 17.0% | $21.82 | $3,511,411 | 17.0% | 5/31/2020(9)(10) | ||||||||
Walgreen(11) | NR/Baa1/BBB | 95,197 | 10.1% | $26.82 | $2,553,184 | 12.4% | 12/31/2022(12)(13) | ||||||||
| Arthur Gensler Jr. & Associates | NR/NR/NR | 56,054 | 5.9% | $26.43 | $1,481,719 | 7.2% | 1/31/2019(14) | ||||||||
| Total Major Office Tenants | 554,996 | 58.8% | $24.30 | $13,488,388 | 65.4% | ||||||||||
| Non-Major Tenants | 57,344 | 6.1% | $34.06 | $1,952,851 | 9.5% | ||||||||||
| Occupied Collateral Total | 785,248 | 83.2% | $26.26 | $20,618,793 | 100.0% | ||||||||||
| Vacant Space | 158,696 | 16.8% | |||||||||||||
| Collateral Total | 943,944 | 100.0% | |||||||||||||
| (1) | Certain ratings are those of the parent company whether or not the parent guarantees the lease. |
| (2) | Target Corporation is a discount retail chain operating 1,778 stores in 49 states and the District of Columbia as of its fiscal year 2012. |
| (3) | Target Corporation has seven, five-year lease extension options remaining. |
| (4) | The Illinois Department of Employment Security provides unemployment insurance, employment services, and guidance to employed, unemployed, and employers for the state of Illinois. |
| (5) | The borrower is obligated to complete certain tenant improvements for the Illinois Department of Employment Security not to exceed $1,000,000. If the cost of the tenant improvements is less than $1,000,000, any remaining amount is to be applied as a rent abatement. At closing, $1,197,219 was escrowed for any rent abatements due to the Illinois Department of Employment Security. |
| (6) | The Illinois Department of Employment Security has the right to terminate its lease at any time without penalty if the Illinois General Assembly fails to make an appropriation to pay the rent or other obligations of the tenant under the lease. The obligations of the tenant shall also immediately terminate if any federal funding source upon which the tenant is dependent to pay rent or other charges under the lease fails to appropriate or otherwise make available the funds required. |
| (7) | The Illinois Department of Employment Security has five, one-year lease extension options remaining. |
| (8) | The Art Institute of Chicago is comprised of both a museum and the School of the Art Institute of Chicago. |
| (9) | The Art Institute of Chicago has the right to terminate its lease on its entire premises or on certain portions of its premises with 365 days’ notice and payment of a termination fee equal to the unamortized portion of tenant improvements. A 3,063 square foot portion (1.9% net rentable area) of the Art Institute of Chicago leased premises expires on June 30, 2014. |
| (10) | The Art Institute of Chicago has two, five-year lease extension options remaining. |
| (11) | Walgreen is a chain drugstore with 8,385 locations in all 50 states along with several U.S. territories. |
| (12) | Walgreen has the right to terminate its lease on the last day of the 60th full calendar month (December 31, 2014) and the last day of the 90th full calendar month (June 30, 2017) following the rent start date with ten months’ notice and payment of a termination fee equal to the unamortized portion of tenant improvements. |
| (13) | Walgreen has one, five-year lease extension options remaining. |
| (14) | Arthur Gensler Jr. & Associates has a one-time right to terminate its lease on July 31, 2015, with notice provided no later than February 1, 2014 and payment of a termination fee equal to the unamortized portion of tenant improvements, leasing commissions and rent allowances. |
THE INFORMATION IN THIS STRUCTURAL AND COLLATERAL TERM SHEET IS NOT COMPLETE AND MAY BE AMENDED PRIOR TO THE TIME OF SALE. THIS TERM SHEET IS NOT AN OFFER TO SELL THESE SECURITIES AND IT IS NOT A SOLICITATION OF AN OFFER TO BUY THESE SECURITIES IN ANY JURISDICTION WHERE THE OFFER OR SALE IS NOT PERMITTED.
42
| SULLIVAN CENTER |
The following table presents certain information relating to the lease rollover schedule at the Sullivan Center Property:
Lease Expiration Schedule(1)(2)
Year Ending December 31, | No. of Leases Expiring | Expiring NRSF | % of Total NRSF | Cumulative Expiring NRSF | Cumulative % of Total NRSF | Annual U/W Base Rent | % of Annual U/W Base Rent | Annual U/W Base Rent PSF(3) | |||||||||
| MTM | 2 | 1,797 | 0.2% | 1,797 | 0.2% | $37,272 | 0.2% | $20.74 | |||||||||
| 2013 | 1 | 3,613 | 0.4% | 5,410 | 0.6% | $76,921 | 0.4% | $21.29 | |||||||||
| 2014 | 3 | 15,070 | 1.6% | 20,480 | 2.2% | $307,822 | 1.5% | $20.43 | |||||||||
| 2015 | 0 | 0 | 0.0% | 20,480 | 2.2% | $0 | 0.0% | $0.00 | |||||||||
| 2016 | 2 | 10,896 | 1.2% | 31,376 | 3.3% | $305,088 | 1.5% | $28.00 | |||||||||
| 2017 | 1 | 5,000 | 0.5% | 36,376 | 3.9% | $134,300 | 0.7% | $26.86 | |||||||||
| 2018 | 2 | 10,000 | 1.1% | 46,376 | 4.9% | $260,000 | 1.3% | $26.00 | |||||||||
| 2019 | 3 | 302,735 | 32.1% | 349,111 | 37.0% | $7,605,574 | 36.9% | $25.12 | |||||||||
| 2020 | 10 | 157,851 | 16.7% | 506,962 | 53.7% | $3,446,323 | 16.7% | $21.83 | |||||||||
| 2021 | 0 | 0 | 0.0% | 506,962 | 53.7% | $0 | 0.0% | $0.00 | |||||||||
| 2022 | 7 | 125,395 | 13.3% | 632,357 | 67.0% | $3,785,863 | 18.4% | $30.19 | |||||||||
| 2023 | 2 | 6,127 | 0.6% | 638,484 | 67.6% | $480,516 | 2.3% | $78.43 | |||||||||
| Thereafter | 2 | 146,764 | 15.5% | 785,248 | 83.2% | $4,179,115 | 20.3% | $28.48 | |||||||||
| Vacant | 0 | 158,696 | 16.8% | 943,944 | 100.0% | $0 | 0.0% | $0.00 | |||||||||
| Total/Weighted Average | 35 | 943,944 | 100.0% | $20,618,793 | 100.0% | $26.26 | |||||||||||
| (1) | Information obtained from the underwritten rent roll. | |
| (2) | Certain tenants may have lease termination or contraction options that are exercisable prior to the originally stated expiration date of the subject lease and that are not considered in the Lease Expiration Schedule. | |
| (3) | Weighted Average Annual U/W Base Rent PSF excludes vacant space. |
The following table presents historical occupancy percentages at the Sullivan Center Property:
Historical Occupancy
12/31/2008(1)(2) | 12/31/2009(2) | 12/31/2010(2) | 12/31/2011(2) | 12/31/2012(2) | 9/1/2013 | |||||
| 48.5% | 49.7% | 54.2% | 57.1% | 82.8% | 83.2% |
| (1) | The Sullivan Center Property was 100% occupied by Carson Pirie Scott until 2007. Following Carson Pirie Scott’s vacating the Sullivan Center Property, JFA invested approximately $229.0 million ($243 per square foot) to renovate and re-tenant the building, which subsequently led to an increase in occupancy. |
| (2) | Information obtained from the borrower. |
The following table presents historical base rent per square foot at the Sullivan Center Property:
Historical Average Base Rent (PSF)(1)
12/31/2010 | 12/31/2011 | 12/31/2012 | 9/1/2013 | |||
| $13.86 | $14.88 | $17.33 | $20.95 |
| (1) | Information obtained from borrower operating statements. The average base rent is based on the gross potential rent divided by the total square footage and does not take into account vacancies. |
THE INFORMATION IN THIS STRUCTURAL AND COLLATERAL TERM SHEET IS NOT COMPLETE AND MAY BE AMENDED PRIOR TO THE TIME OF SALE. THIS TERM SHEET IS NOT AN OFFER TO SELL THESE SECURITIES AND IT IS NOT A SOLICITATION OF AN OFFER TO BUY THESE SECURITIES IN ANY JURISDICTION WHERE THE OFFER OR SALE IS NOT PERMITTED.
43
| SULLIVAN CENTER |
Operating History and Underwritten Net Cash Flow. The following table presents certain information relating to the historical operating performance and the Underwritten Net Cash Flow at the Sullivan Center Property:
Cash Flow Analysis
| 2011 | 2012 | TTM 7/31/2013 | U/W | U/W $ per SF | ||||||||||
| Base Rent | $14,042,440 | $16,361,646 | $19,777,989 | $20,445,039 | $21.66 | |||||||||
| Rent Steps | 0 | 0 | 0 | 390,305 | 0.41 | |||||||||
| Grossed Up Vacant Space | 0 | 0 | 0 | 4,453,423 | 4.72 | |||||||||
| Total Reimbursables | 412,566 | 1,360,888 | 2,156,351 | 2,372,065 | 2.51 | |||||||||
| Other Income | 0 | 0 | 0 | 107,000 | 0.11 | |||||||||
| Less Vacancy & Credit Loss | (146,280) | (2,811) | (2,811) | (4,453,423)(1) | (4.72) | |||||||||
| Effective Gross Income | $14,308,727 | $17,719,723 | $21,931,529 | $23,314,410 | $24.70 | |||||||||
| Total Operating Expenses | $7,279,465 | $8,641,786 | $9,053,668 | $9,467,544 | $10.03 | |||||||||
| Net Operating Income | $7,029,262 | $9,077,937 | $12,877,861(2) | $13,846,865(2) | $14.67 | |||||||||
| TI/LC | 0 | 0 | 0 | 891,496 | 0.94 | |||||||||
| Capital Expenditures | 0 | 0 | 0 | 235,986 | 0.25 | |||||||||
| Net Cash Flow | $7,029,262 | $9,077,937 | $12,877,861 | $12,719,383 | $13.47 | |||||||||
| NOI DSCR | 1.55x | 2.00x | 2.83x | 3.05x | ||||||||||
| NCF DSCR | 1.55x | 2.00x | 2.83x | 2.80x | ||||||||||
| NOI DY | 6.2% | 8.0% | 11.3% | 12.2% | ||||||||||
| NCF DY | 6.2% | 8.0% | 11.3% | 11.2% | ||||||||||
| (1) | The underwritten economic vacancy is 16.1%. The Sullivan Center Property was 83.2% physically occupied as of September 1, 2013. |
| (2) | The increase in NOI from year-end 2011 to the trailing 12 months ended July 31, 2013 and the increase in occupancy from December 31, 2011 to December 31, 2012 is due to new leases being executed in 2012, including Target (15.5% of net rentable area and 20.3% of total underwritten base rent). |
Appraisal. As of the appraisal valuation date of September 4, 2013, the Sullivan Center Property had an “as-is” appraised value of $229,000,000.
Environmental Matters. According to a Phase I environmental site assessment dated October 10, 2013, there was evidence of a historical recognized environmental condition (“HREC”) at the Sullivan Center Property related to underground storage tanks. Leaking underground storage tank (“LUST”) incidents from 1993 and 2000 were identified at the Sullivan Center Property. The results of prior analytical sampling identified concentrations of petroleum compounds above soil remediation objectives. To address the impact that remains in place, restrictions consisting of the use of the building as an engineered barrier, construction worker caution, and commercial/industrial use were used to eliminate exposure routes. No further remediation letters were issued for the LUST incidents on November 21, 2006. Sampling conducted near the 18,000-gallon tank contained in an underground storage tank vault did not indicate that a release had occurred. The tank was abandoned-in-place on November 30, 2010. Based on available information, it was the environmental firm’s opinion that this represents an HREC. In addition, polychlorinated biphenyl compounds (“PCBs”) containing equipment and fluids are known to have been present at the Sullivan Center Property. However, a majority of mechanical equipment at the Sullivan Center Property has been replaced since 1978 and non-PCB containing hydraulic elevators and escalators were recently installed in connection with redevelopment of the retail spaces. Based on available information, it was the environmental firm’s opinion that this represents a de minimis condition.
Market Overview and Competition. The Sullivan Center Property is located in Chicago, Illinois. Chicago is a major Great Lakes port and is considered the commercial, financial, industrial, and cultural center of the Midwest. According to a market research report, the Chicago metropolitan statistical area had an estimated 2013 population of 9.6 million and average household income of $79,260. The unemployment rate for the Chicago metropolitan statistical area was 9.4% as of March 2013. The Sullivan Center Property is located in the Chicago central business district (“CBD”) within an area known as the loop (the “Loop”), which can be roughly defined as the Chicago River to the north and west, Roosevelt Road to the south and Michigan Avenue to the east. The Loop and surrounding area is an urban mixed-use community featuring office, government, entertainment, shopping, residential and hotels. The Loop comprises the second largest central business district in the United States after New York. The Sullivan Center Property is strategically located along State Street and Wabash Avenue, in the heart of the State Street retail corridor and in close proximity to several educational institutions, such as The Art Institute of Chicago, which also leases space at the Sullivan Center Property, John Marshall Law School, Columbia College, Roosevelt University, DePaul University, and Loyola University, which serve as key tenant demand drivers. The State Street retail corridor is one of Chicago’s premier destination-oriented retail shopping districts and features a historic twelve-story Macy’s flagship store as well as anchors Sears, TJ Maxx, Old Navy, Nordstrom Rack, H&M and Forever 21. Small store occupancy in the State Street retail corridor is in excess of 90%. The immediate neighborhood is comprised of a variety of uses including hotels, retail/commercial, and office with ground-level retail establishments, parking garages, and mixed-use buildings. According to a market research report the estimated 2013 population within a one-, three-, and five-mile radius of the Sullivan Center Property is 70,575, 304,657, and 737,005, respectively, and the average income is $117,937, $105,353, and $89,757, respectively.
According to the appraisal, the Sullivan Center Property is located in the East Loop office submarket. As of the second quarter 2013, the East Loop office submarket consisted of 21.1 million square feet of office space with an overall vacancy of 14.3% and asking rental rates of $31.79 per square foot gross. The Sullivan Center Property is also located within the State Street retail submarket.
THE INFORMATION IN THIS STRUCTURAL AND COLLATERAL TERM SHEET IS NOT COMPLETE AND MAY BE AMENDED PRIOR TO THE TIME OF SALE. THIS TERM SHEET IS NOT AN OFFER TO SELL THESE SECURITIES AND IT IS NOT A SOLICITATION OF AN OFFER TO BUY THESE SECURITIES IN ANY JURISDICTION WHERE THE OFFER OR SALE IS NOT PERMITTED.
44
| SULLIVAN CENTER |
According to the appraisal, ground-level retail rents along State Street range from $50.00 to $100.00 triple net per square foot and ground level vacancy is approximately 5.0%.
The following table presents certain information relating to comparable office properties for the Sullivan Center Property:
Office Competitive Set(1)
Sullivan Center (Subject) | 1 North State Street | 1 North Dearborn | Merchandise Mart- Office | |||||
| Market | Chicago, IL | Chicago, IL | Chicago, IL | Chicago, IL | ||||
| Distance from Subject | -- | 0.1 miles | 0.2 miles | 1.0 mile | ||||
| Property Subtype | CBD Office | CBD Office | CBD Office | CBD Office | ||||
| Year Built/Renovated | 1865/2009 | 1912/NAV | 1905/NAV | 1929/NAV | ||||
| Total Office GLA | 743,852 SF | 713,423 SF | 884,004 SF | 4,000,000 SF | ||||
| Total Office Occupancy | 80% | 79% | 89% | 98% |
| (1) | Information obtained from the borrower’s rent roll and the appraisal. |
The following table presents certain information relating to comparable retail properties for the Sullivan Center Property:
Retail Competitive Set(1)
Sullivan Center (Subject) | 1 North State Street | Palmer House Retail | Block 37 | |||||
| Market | Chicago, IL | Chicago, IL | Chicago, IL | Chicago, IL | ||||
| Distance from Subject | -- | 0.1 miles | 0.0 miles | 0.1 miles | ||||
| Property Subtype | Retail (3 levels) | Multi-level Urban Retail | Ground level Retail | Ground level Retail | ||||
| Year Built/Renovated | 1865/2009 | 1907/NAV | 1925/NAV | 2009/NAV | ||||
| Anchors | Target, DSW | None | Agaci | Anthropolgie, Puma | ||||
| Total Retail GLA | 175,995 SF | 151,861 SF | 52,747 SF | 275,365 SF | ||||
| Total Retail Occupancy | 93% | 100% | 84% | 67% |
| (1) | Information obtained from the borrower’s rent roll and the appraisal. |
Historic Tax Credits. In 2001, The Sherwin-Williams Company (the “HTC Investor Member”) was admitted as a member of One South State Street, L.L.C., the borrower’s sole member (the “Sole Member”), to monetize certain historic rehabilitation tax credits (the “Historic Tax Credits”). As of October 18, 2013, the aggregate amount of the Historic Tax Credits claimed by the HTC Investor Member was $50,491,154. The HTC Investor Member is entitled to a 3.0% per annum preferred return on its capital contributions to the Sole Member, but neither the lender nor any purchaser at a foreclosure sale will be responsible for the payment of such preferred return.
The Historic Tax Credits are subject to recapture in the event of a “disposition” prior to January 1, 2018 (the “HTC Recapture Period Expiration Date”). A “disposition” will occur upon, among other things, a sale or transfer of the Sullivan Center Property (including a transfer upon a foreclosure of the mortgage securing the Sullivan Center Loan Combination), certain equity transfers of direct or indirect interests in the Sullivan Center Property, a condemnation of the Sullivan Center Property or a destruction of the Sullivan Center Property due to casualty. Upon such “disposition” prior to January 1, 2018, the tax liability of the HTC Investor Member will increase by an amount equal to the original aggregate amount of the Historic Tax Credit, multiplied by the applicable recapture percentage (100% during 2013 and decreases by 20% each year).
In the event the HTC Investor Member is unable to claim or recognize the Historic Tax Credits due to the occurrence of a recapture event, One South State Street Investors, L.L.C. (the “Freed Equity Member”), an affiliate of JFA that is controlled by Laurance H. Freed, and the Sole Member are obligated to make payments to the HTC Investor Member in an amount equal to the recaptured Historic Tax Credits. Neither the lender nor any purchaser at a foreclosure sale, however, will be subject to any such obligation. The “loss” of the Historic Tax Credits would likewise have no effect on property taxes. See “Description of the Mortgage Pool – Split Loan Structures – The Sullivan Center Loan Combination” in the Free Writing Prospectus.
The Borrower. The borrower is One South State PropCo, L.L.C., a Delaware limited liability company and a single purpose entity with two independent directors. Legal counsel to the borrower delivered a non-consolidation opinion in connection with the origination of the Sullivan Center Loan Combination. WRT Realty L.P. (“WRT”) and Elad Canada Inc. (“Elad”) are the guarantors of certain nonrecourse carveouts under the Sullivan Center Loan Combination.
One South State Street, L.L.C. is the sole member (the “Sole Member”) of the borrower and the members of the Sole Member are WRT-Elad One South State Equity L.P., a 50-50 joint venture between WRT and Elad (the “WRT-Elad Equity Member”), the Freed Equity Member and the HTC Investor Member. Currently, the HTC Investor Member holds a 99% membership interest in the Sole Member and the Freed Equity Member holds the remaining 1% membership interest in the Sole Member. The WRT-Elad Equity Member does not hold any current ownership interest in the Sole Member; however, the WRT-Elad Equity Member possesses extensive, currently exercisable control rights over the Sole Member and the borrower (including the right to approve any lease, any agreement involving more than $15,000 and a broad range of other ordinary and extraordinary operational and non-operational matters, as well as the right to cause any such action or decision to be taken or adopted by the Sole Member or the borrower). In addition, in the absence of any transfers permitted by the loan documents, on the HTC Recapture Period Expiration Date, the WRT-Elad Equity Member will acquire a majority ownership interest in the Sole Member as described in the “Reallocation of Membership
THE INFORMATION IN THIS STRUCTURAL AND COLLATERAL TERM SHEET IS NOT COMPLETE AND MAY BE AMENDED PRIOR TO THE TIME OF SALE. THIS TERM SHEET IS NOT AN OFFER TO SELL THESE SECURITIES AND IT IS NOT A SOLICITATION OF AN OFFER TO BUY THESE SECURITIES IN ANY JURISDICTION WHERE THE OFFER OR SALE IS NOT PERMITTED.
45
| SULLIVAN CENTER |
Interests on Recapture Period Expiration Date” section. By contrast, notwithstanding its 99% membership interest in the Sole Member, the HTC Investor Member’s primary interest in the Sullivan Center Property consists of its right to claim and recognize the Historic Tax Credits and, accordingly, the HTC Investor Member has no material control rights over the Sole Member (other than with respect to matters that could trigger a recapture of the Historic Tax Credits) and does not participate in the operation of the Sullivan Center Property. Reflective of its limited involvement as an investor of historic rehabilitation tax credits, on the HTC Recapture Period Expiration Date, the HTC Investor Member’s ownership interest in the Sole Member will decrease from its current 99% interest to a de minimis 0.01% interest as described in “Reallocation of Membership Interests on Recapture Period Expiration Date” below.
A number of financings of properties owned by certain affiliates of Laurance H. Freed and JFA, as well as certain affiliates of WRT, have been subject to foreclosures, deeds-in-lieu of foreclosure and discounted pay-offs in the recent past. See “Description of the Mortgage Pool – Default History, Bankruptcy Issues and other Proceedings” in the Free Writing Prospectus. In addition, in connection with a guarantee relating to one such financing, Laurance H. Freed was accused of forgery by Debra Ruderman, his sibling. Further, Amnon Safran, the incoming CEO of Elad, has been indicted in an Israeli court (with other defendants, including a former prime minister of Israel) in connection with a case alleging bribery of officials to allow developers to build more apartments than were originally permitted in the “Holyland” development. See “Description of the Mortgage Pool – Litigation Considerations” in the Free Writing Prospectus.
The Sponsor. WRT and Elad are the sponsors on the Sullivan Center Loan Combination. WRT is the wholly-owned operating partnership of Winthrop Realty Trust (NYSE: FUR), a real estate investment trust engaged in owning and operating real property and real estate related assets through ownership of assets, loans secured by real property and investments in securities of other publicly traded and privately owned real estate companies. As of December 31, 2012, WRT’s portfolio consisted of 23 commercial properties encompassing over 3.5 million square feet and three multifamily properties totaling 784 units. Elad is a Toronto-based company which owns over 2.5 million square feet of office, retail, and industrial space in the U.S. and Canada. Elad develops condominium and multifamily properties in the Toronto and Montreal metro areas.
Reallocation of Membership Interests on HTC Recapture Period Expiration Date. Currently, the HTC Investor Member holds a 99% membership interest in the Sole Member and the Freed Equity Member holds a 1% membership interest in the Sole Member. The WRT-Elad Equity Member has extensive, currently exercisable control rights over the Sole Member, but no present ownership interest in the Sole Member. On the HTC Recapture Period Expiration Date, the HTC Investor Member’s membership interest will decrease to 0.01%, the Freed Equity Member’s membership interest will increase to 23.99%, and the WRT-Elad Equity Member’s membership interest will increase to 76.0%.
Subordinate and Mezzanine Indebtedness. In connection with their investment in the Sullivan Center Property on February 3, 2012, WRT and Elad structured such investment to avoid triggering a recapture of then outstanding Historic Tax Credits. Accordingly, the WRT-Elad Equity Member acquired no current membership interest in the Sole Member – instead it acquired extensive, currently exercisable control rights over the Sole Member and a future membership interest in the Sole Member that vests on the HTC Recapture Period Expiration Date. Concurrently, WRT One South State Lender, L.P. (f/k/a WRT-Elad One South State Lender, L.P. and, prior to the sale by Elad of its interest in such entity to WRT on or about August 21, 2013, a second joint venture between WRT and Elad) (the “WRT Mezzanine Lender”), provided a much needed capital infusion to pay for, among other things, tenant improvements required under Target’s lease pursuant to the “Sullivan Center Mezzanine Loan” in favor of the Sole Member that is secured by a pledge of 100% of the equity interests in the borrower.
The interest rate under the Sullivan Center Mezzanine Loan is 15.0% per annum, of which 9.0% per annum must be paid when due and 6.0% per annum may accrue in the event of insufficient available cash flows to service the debt. As of October 18, 2013, the Sullivan Center Mezzanine Loan had an outstanding principal balance of $51,716,090 and accrued and unpaid interest in the aggregate amount of $4,615,978, all of which amounts were owed to the WRT Mezzanine Lender under its promissory note. Although New Heights Sullivan LLC, an affiliate of JFA and the Freed Equity Member (the “Freed Mezzanine Lender” and, collectively with the WRT Mezzanine Lender, the “Mezzanine Lender”), is also a lender under the Sullivan Center Mezzanine Loan, as of October 18, 2013, the Freed Mezzanine Lender had not made any advances under the Sullivan Center Mezzanine Loan and no amounts were owed to the Freed Mezzanine Lender under its promissory note.
The WRT Mezzanine Lender is currently the agent for the Mezzanine Lender (the “Agent”) and, in such capacity, controls the actions of the Mezzanine Lender under the Sullivan Center Mezzanine Loan. The WRT Mezzanine Lender is wholly-owned and controlled by WRT. However, in connection with the sale of its 50% interest in the WRT Mezzanine Lender to WRT on or about August 21, 2013, an affiliate of Elad retained the right to re-acquire such 50% interest pursuant to an option agreement (the “Elad Mezzanine Loan Purchase Option”).
In the event the Sullivan Center Property generates insufficient cash flows in the future to satisfy all required payments under the Sullivan Center Loan Combination or to support property operations, the Agent or the Mezzanine Lender may make additional advances under the Sullivan Center Mezzanine Loan. Such future funding mechanism affords WRT, JFA and, upon exercise of the Elad Mezzanine Loan Purchase Option, Elad with the means to support the Sullivan Center Property with additional capital infusions when needed. Such mechanism is, as a practical matter, necessary prior to the HTC Recapture Period Expiration Date and the reallocation of membership interests in the Sole Member as described in the “Reallocation of Membership Interests on Recapture Period Expiration Date” section due to the HTC Investor Member’s limited interest in the Sullivan Center Property notwithstanding its 99% membership interest in the Sole Member and the unavailability of ratable contributions by the holders of current ownership interests in the Sole Member as a means for such support.
The Sullivan Center intercreditor agreement fully subordinates the Agent’s and the Mezzanine Lender’s rights to the lender’s rights under the Sullivan Center Loan Combination, and does not provide the Agent or the Mezzanine Lender with certain material
THE INFORMATION IN THIS STRUCTURAL AND COLLATERAL TERM SHEET IS NOT COMPLETE AND MAY BE AMENDED PRIOR TO THE TIME OF SALE. THIS TERM SHEET IS NOT AN OFFER TO SELL THESE SECURITIES AND IT IS NOT A SOLICITATION OF AN OFFER TO BUY THESE SECURITIES IN ANY JURISDICTION WHERE THE OFFER OR SALE IS NOT PERMITTED.
46
| SULLIVAN CENTER |
customary mezzanine lender rights. See “Description of the Mortgage Pool – Split Loan Structures – The Sullivan Center Loan Combination” in the Free Writing Prospectus.
Common Control of Equity and Mezzanine Loan. Pursuant to the terms of the loan documents and the intercreditor agreement, for so long as the Sullivan Center Mezzanine Loan remains outstanding, a common control of the borrower and the Sullivan Center Mezzanine Loan is required to be maintained. A breach of such covenant is an event of default under the Sullivan Center Loan Combination and triggers full recourse liability under the recourse carveout guaranty. See “Description of the Mortgage Pool – Split Loan Structures – The Sullivan Center Loan Combination” in the Free Writing Prospectus.
Escrows. At closing of the Sullivan Center Loan Combination, the borrower was also required to fund tenant improvements and leasing commissions reserve in the amount of $2,000,000. Such reserve is subject to a security interest in favor of the lender, but the funds in such reserve are held by the borrower. The loan documents provide for upfront reserves in the amount of: $1,316,573 for real estate taxes; $109,624 for insurance; $34,041 for tenant improvements and leasing commissions; and $1,197,219 for certain rent abatements due to Illinois Department of Employment Security. The loan documents also provide for ongoing monthly reserves in the amount of $329,143 for real estate taxes; $23,831 for insurance; and $19,666 for replacement reserves.
Lockbox and Cash Management. The Sullivan Center Loan Combination requires a lender-controlled lockbox account, which is in place, and that the tenants are directed to deposit all rents into such lockbox account. The loan documents also require that all rents received by the borrower or the property manager be deposited into the lockbox account within one business day after receipt. All funds on deposit in the lockbox account are to be swept into the cash management account controlled by the lender on a daily basis. After application of funds, provided no event of default has occurred and is continuing, the “excess cash flow” will be deposited into the borrower’s operating account on a monthly basis. Upon the occurrence and during the continuation of an event of default the excess cash flow is swept to a cash management account controlled by the lender.
Property Management. The Sullivan Center Property is managed by an affiliate of the borrower.
Assumption. The borrower has the right to transfer the Sullivan Center Property, subject to certain terms and conditions set forth in the loan documents, including, but not limited to: (i) no event of default has occurred and is continuing and no event of default shall occur as a result of such transfer; (ii) the proposed transferee shall be a single purpose entity and its organizational documents shall be reasonably acceptable to the lender; (iii) the transferee’s sponsor shall have a net worth and liquidity reasonably satisfactory to the lender; (iv) the borrower shall have delivered a new non-consolidation opinion reflecting such transfer reasonably acceptable to the lender; (v) if required by the lender, a rating agency confirmation from KBRA, Moody’s and S&P that such transfer will not result in a downgrade, withdrawal or qualification of the respective ratings assigned to the Series 2013-UBS1 Certificates; and (vi) the Sullivan Center Mezzanine Loan shall have been paid in full.
Partial Release. Not permitted.
Real Estate Substitution. Not permitted.
Terrorism Insurance. The loan documents require that the special form insurance policy required to be maintained by the borrower provides coverage for terrorism in an amount equal to the full replacement cost of the Sullivan Center Property as well as business interruption insurance covering no less than the 18-month period following the occurrence of a casualty event, together with an extended period of indemnity, which shall continue for the lesser of (i) the period of time until income returns to the same level as it was prior to loss and (ii) 12 months.
THE INFORMATION IN THIS STRUCTURAL AND COLLATERAL TERM SHEET IS NOT COMPLETE AND MAY BE AMENDED PRIOR TO THE TIME OF SALE. THIS TERM SHEET IS NOT AN OFFER TO SELL THESE SECURITIES AND IT IS NOT A SOLICITATION OF AN OFFER TO BUY THESE SECURITIES IN ANY JURISDICTION WHERE THE OFFER OR SALE IS NOT PERMITTED.
47
| OCEAN BREEZE APARTMENTS |
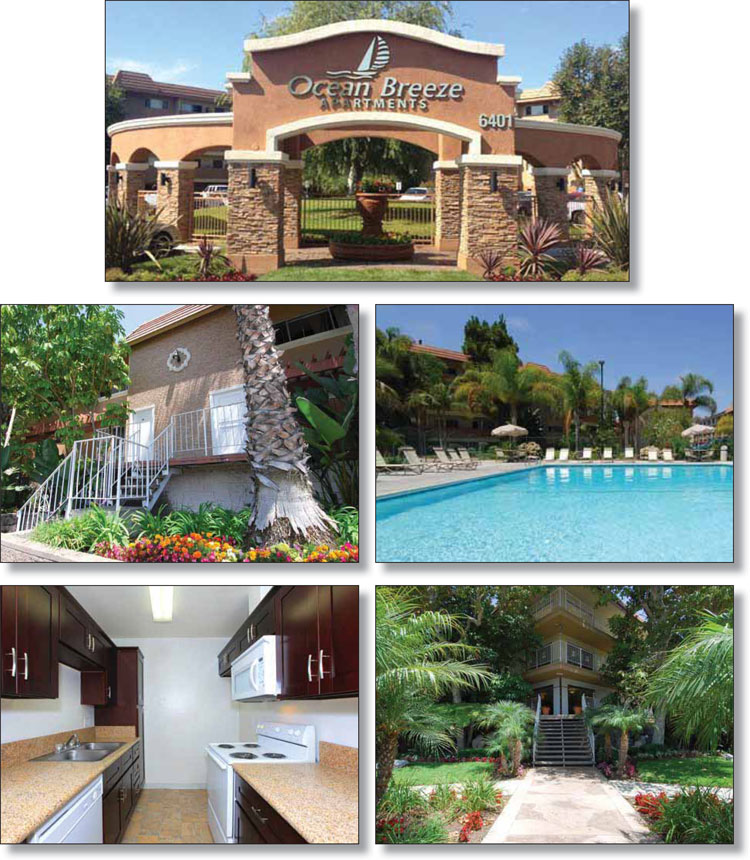
THE INFORMATION IN THIS STRUCTURAL AND COLLATERAL TERM SHEET IS NOT COMPLETE AND MAY BE AMENDED PRIOR TO THE TIME OF SALE. THIS TERM SHEET IS NOT AN OFFER TO SELL THESE SECURITIES AND IT IS NOT A SOLICITATION OF AN OFFER TO BUY THESE SECURITIES IN ANY JURISDICTION WHERE THE OFFER OR SALE IS NOT PERMITTED.
48
| OCEAN BREEZE APARTMENTS |
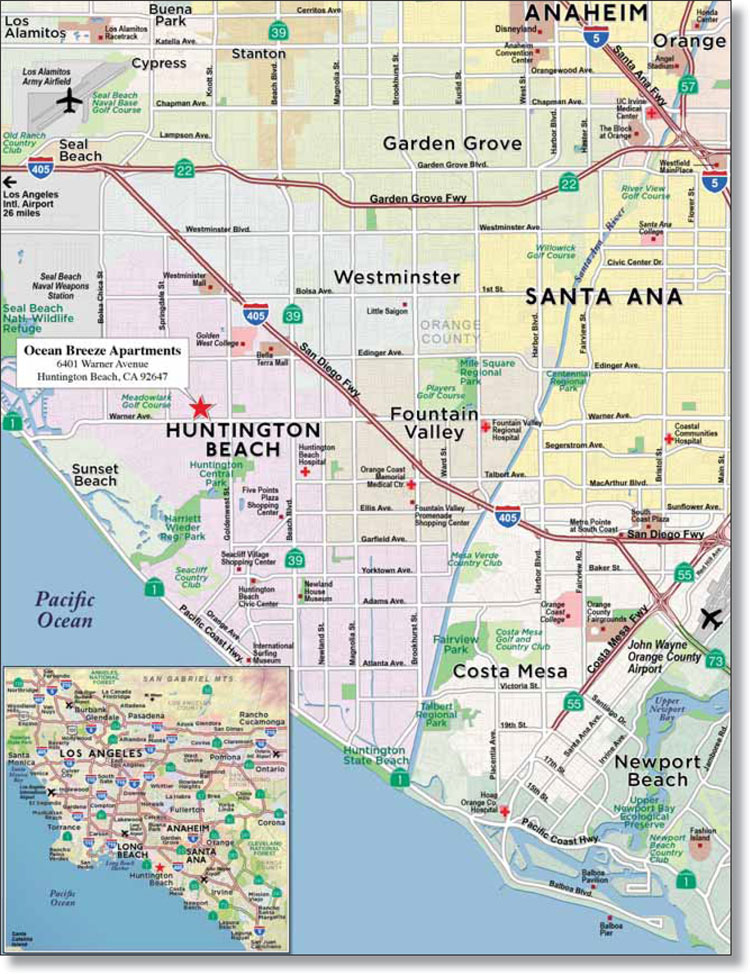
THE INFORMATION IN THIS STRUCTURAL AND COLLATERAL TERM SHEET IS NOT COMPLETE AND MAY BE AMENDED PRIOR TO THE TIME OF SALE. THIS TERM SHEET IS NOT AN OFFER TO SELL THESE SECURITIES AND IT IS NOT A SOLICITATION OF AN OFFER TO BUY THESE SECURITIES IN ANY JURISDICTION WHERE THE OFFER OR SALE IS NOT PERMITTED.
49
| No. 3 – Ocean Breeze Apartments | ||||||
| Loan Information | Property Information | |||||
| Mortgage Loan Seller: | Wells Fargo Bank, National Association | Single Asset/Portfolio: | Single Asset | |||
| Credit Assessment (KBRA/Moody’s/S&P): | NR/NR/NR | Property Type: | Multifamily | |||
| Original Principal Balance: | $36,750,000 | Specific Property Type: | Garden | |||
| Cut-off Date Principal Balance: | $36,750,000 | Location: | Huntington Beach, CA | |||
| % of Initial Pool Balance: | 5.1% | Size: | 286 units | |||
| Loan Purpose: | Refinance | Cut-off Date Principal Balance Per Unit: | $128,497 | |||
| Borrower Name: | Ocean Breeze Apartment Associates, L.P. | Year Built/Renovated: | 1973/2005 | |||
| Sponsors: | Arsalan Gozini; The Gozini Family Trust | Title Vesting: | Fee | |||
| Mortgage Rate: | 4.900% | Property Manager: | Greystar California, Inc. | |||
| Note Date: | November 8, 2013 | 3rd Most Recent Occupancy: | 92.8% (12/31/2010) | |||
| Anticipated Repayment Date: | NAP | 2nd Most Recent Occupancy (As of): | 93.9% (12/31/2011) | |||
| Maturity Date: | December 1, 2023 | Most Recent Occupancy (As of): | 92.4% (12/31/2012) | |||
| IO Period: | None | Current Occupancy (As of): | 94.8% (11/4/2013) | |||
| Loan Term (Original): | 120 months | |||||
| Seasoning: | 0 months | Underwriting and Financial Information: | ||||
| Amortization Term (Original): | 360 months | |||||
| Loan Amortization Type: | Amortizing Balloon | 3rd Most Recent NOI (As of): | $2,990,784 (12/31/2011) | |||
| Interest Accrual Method: | Actual/360 | 2nd Most Recent NOI (As of): | $3,206,127 (12/31/2012) | |||
| Call Protection: | L(24),D(92),O(4) | Most Recent NOI (As of): | $3,249,876 (TTM 9/30/2013) | |||
| Lockbox Type: | Soft/Upfront Cash Management | |||||
Additional Debt(1): | Yes | U/W Revenues: | $4,887,226 | |||
Additional Debt Type(1): | Future Mezzanine | U/W Expenses: | $1,821,779 | |||
| U/W NOI: | $3,065,446 | |||||
| U/W NCF: | $2,993,946 | |||||
| U/W NOI DSCR: | 1.31x | |||||
| U/W NCF DSCR: | 1.28x | |||||
Escrows and Reserves(2): | U/W NOI Debt Yield: | 8.3% | ||||
| U/W NCF Debt Yield: | 8.1% | |||||
Type: | Initial | Monthly | Cap (If Any) | As-Is Appraised Value: | $57,400,000 | |
| Taxes | $71,016 | $23,672 | NAP | As-Is Appraisal Valuation Date: | September 26, 2013 | |
| Insurance | $0 | Springing | NAP | Cut-off Date LTV Ratio: | 64.0% | |
| Replacement Reserve | $0 | $5,958 | NAP | LTV Ratio at Maturity or ARD: | 52.5% | |
| (1) | See “Subordinate and Mezzanine Debt” section. |
| (2) | See “Escrows” section. |
The Mortgage Loan. The mortgage loan (the “Ocean Breeze Apartments Mortgage Loan”) is evidenced by a single promissory note that is secured by a first mortgage encumbering a multifamily property located in Huntington Beach, California (the “Ocean Breeze Apartments Property”). The Ocean Breeze Apartments Mortgage Loan was originated on November 8, 2013 by Wells Fargo Bank, National Association. The Ocean Breeze Apartments Mortgage Loan had an original principal balance of $36,750,000, has an outstanding principal balance as of the Cut-off Date of $36,750,000 and accrues interest at an interest rate of 4.900% per annum. The Ocean Breeze Apartments Mortgage Loan had an initial term of 120 months, has a remaining term of 120 months as of the Cut-off Date and requires payments of principal and interest based on a 30-year amortization schedule. The Ocean Breeze Apartments Mortgage Loan matures on December 1, 2023.
Following the lockout period, the borrower has the right to defease the Ocean Breeze Apartments Mortgage Loan in whole, but not in part, on any day before September 1, 2023. In addition, the Ocean Breeze Apartments Mortgage Loan is prepayable without penalty on or after September 1, 2023.
Sources and Uses
| Sources | Uses | ||||||||
| Original loan amount | $36,750,000 | 100.0% | Loan payoff | $32,329,683 | 88.0 | % | |||
| Reserves | 71,016 | 0.2 | |||||||
| Closing costs | 366,882 | 1.0 | |||||||
| Return of equity | 3,982,419 | 10.8 | |||||||
| Total Sources | $36,750,000 | 100.0% | Total Uses | $36,750,000 | 100.0 | % |
THE INFORMATION IN THIS STRUCTURAL AND COLLATERAL TERM SHEET IS NOT COMPLETE AND MAY BE AMENDED PRIOR TO THE TIME OF SALE. THIS TERM SHEET IS NOT AN OFFER TO SELL THESE SECURITIES AND IT IS NOT A SOLICITATION OF AN OFFER TO BUY THESE SECURITIES IN ANY JURISDICTION WHERE THE OFFER OR SALE IS NOT PERMITTED.
50
| OCEAN BREEZE APARTMENTS |
The Property. The Ocean Breeze Apartments Property is a 286-unit property situated on 7.6 acres and consists of 12, three-story buildings located in Huntington Beach, California. The Ocean Breeze Apartments Property was built in 1973 and renovated in 2005 and consists of 60 one bedroom/one bathroom units, 132 two bedroom/one bathroom units, eight two bedroom/two bathroom units and 86 three bedroom townhome units. The Ocean Breeze Apartments Property has gated access and nightly security. Amenities at the Ocean Breeze Apartments Property include a swimming pool, heated spa, basketball court, playground, barbeque area, fitness center and laundry facilities. The Ocean Breeze Apartments Property provides 367 parking spaces, with 96 tuck-under parking spaces, 239 parking carport spaces and 32 open parking spaces, for a parking ratio of 1.28 per unit. As of November 4, 2013, the Ocean Breeze Apartments Property was 94.8% occupied.
The following table presents certain information relating to the unit mix of the Ocean Breeze Apartments Property:
Unit Mix Summary(1)
| Unit Type | No. of Units | % of Total Units | Average Unit Size (SF) | Average U/W Monthly Rent per Unit | |||
| 1 Bedroom/1 Bathroom | 6 | 2.1 | % | 718 | $1,276 | ||
| 1 Bedroom + Den/1 Bathroom | 54 | 18.9 | % | 800 | $1,319 | ||
| 2 Bedroom/1 Bathroom | 8 | 2.8 | % | 825 | $1,418 | ||
| 2 Bedroom/1 Bathroom | 60 | 21.0 | % | 850 | $1,398 | ||
| 2 Bedroom/1.5 Bathrooms | 64 | 22.4 | % | 900 | $1,412 | ||
| 2 Bedroom + Den/2 Bathroom | 8 | 2.8 | % | 1,100 | $1,707 | ||
| 3 Bedroom Townhome/2.5 Bathrooms | 54 | 18.9 | % | 1,288 | $1,845 | ||
| 3 Bedroom Townhome/2 Bathrooms | 32 | 11.2 | % | 1,440 | $1,894 | ||
| Total/Weighted Average | 286 | 100.0 | % | 1,004 | $1,532 | ||
| (1) | Information obtained from the borrower’s rent roll. |
The following table presents historical occupancy percentages at the Ocean Breeze Apartments Property:
Historical Occupancy
12/31/2010(1) | 12/31/2011(1) | 12/31/2012(1) | 11/4/2013 | |||
| 93.1% | 93.9% | 92.4% | 94.8% |
| (1) | Information obtained from the borrower. |
Operating History and Underwritten Net Cash Flow. The following table presents certain information relating to the historical operating performance and the Underwritten Net Cash Flow at the Ocean Breeze Apartments Property:
Cash Flow Analysis
2011 | 2012 | TTM 9/30/2013 | T-6 9/30/2013 Annualized | U/W | U/W $ per Unit | |||||||||||||
| Base Rent | $4,991,043 | $4,988,502 | $4,929,099 | $4,944,168 | $4,982,916 | $17,423 | ||||||||||||
| Grossed Up Vacant Space | 0 | 0 | 0 | 0 | 270,600 | 946 | ||||||||||||
| Less Concessions | (492,909) | (421,155) | (270,375) | (142,685) | (142,685) | (499) | ||||||||||||
| Other Income | 187,068 | 231,987 | 237,834 | 268,650 | 237,834 | 832 | ||||||||||||
| Less Vacancy & Credit Loss | (28,727) | (50,844) | (53,812) | (67,427) | (461,440)(1) | (1,613) | ||||||||||||
| Effective Gross Income | $4,656,474 | $4,748,490 | $4,842,746 | $5,002,706 | $4,887,226 | $17,088 | ||||||||||||
| Total Operating Expenses | $1,665,691 | $1,542,363 | $1,592,871 | $1,602,609 | $1,821,779 | $6,370 | ||||||||||||
| Net Operating Income | $2,990,784 | $3,206,127 | $3,249,876 | $3,400,097 | $3,065,446 | $10,718 | ||||||||||||
| Replacement Reserves | 0 | 0 | 0 | 0 | 71,500 | 250 | ||||||||||||
| Net Cash Flow | $2,990,784 | $3,206,127 | $3,249,876 | $3,400,097 | $2,993,946 | $10,468 | ||||||||||||
| NOI DSCR | 1.28x | 1.37x | 1.39x | 1.45x | 1.31x | |||||||||||||
| NCF DSCR | 1.28x | 1.37x | 1.39x | 1.45x | 1.28x | |||||||||||||
| NOI DY | 8.1% | 8.7% | 8.8% | 9.3% | 8.3% | |||||||||||||
| NCF DY | 8.1% | 8.7% | 8.8% | 9.3% | 8.1% | |||||||||||||
| (1) | The underwritten economic vacancy is 7.5%. The Ocean Breeze Apartments Property was 94.8% physically occupied as of November 4, 2013. |
THE INFORMATION IN THIS STRUCTURAL AND COLLATERAL TERM SHEET IS NOT COMPLETE AND MAY BE AMENDED PRIOR TO THE TIME OF SALE. THIS TERM SHEET IS NOT AN OFFER TO SELL THESE SECURITIES AND IT IS NOT A SOLICITATION OF AN OFFER TO BUY THESE SECURITIES IN ANY JURISDICTION WHERE THE OFFER OR SALE IS NOT PERMITTED.
51
| OCEAN BREEZE APARTMENTS |
Appraisal. As of the appraisal valuation date of September 26, 2013, the Ocean Breeze Apartments Property had an aggregate “as-is” appraised value of $57,400,000.
Environmental Matters. According to the Phase I environmental site assessment dated October 28, 2013, there was no evidence of any recognized environmental conditions at the Ocean Breeze Apartments Property.
Market Overview and Competition. The Ocean Breeze Apartments Property is located on the northwest corner of Warner Avenue and Edwards Street in Huntington Beach, California. The Ocean Breeze Apartments Property is located within the northwest portion of Orange County and is approximately 35 miles southeast of Los Angeles, 95 miles northwest of San Diego and 11 miles west of John Wayne-Orange County Airport. According to the appraisal, Huntington Beach is the third largest city in terms of population in Orange County and has an estimated population of 194,000 residents. Within a one-, three- and five-mile radius of the Ocean Breeze Apartments Property, the population is 23,857, 162,528 and 407,656, respectively and the average household income within the same radii is $96,136, $96,391 and $90,802, respectively. Access to Ocean Breeze Apartments Property is provided by Interstate 405, which is three miles east of the property and the Pacific Coast Highway, which is less than five miles west of the property and extends along the Pacific coastline. Major employers in Huntington Beach include Boeing, Quicksilver, Cambro Manufacturing, E-trade Mortgage and Huntington Beach Hospital.
The appraisal identified a competitive set of six multifamily properties, which exhibit a range of occupancy rates from 90% to 100% and the appraiser reported an average vacancy rate of 4.4% for multifamily properties within the Huntington Beach submarket as of the second quarter of 2013. The appraiser concluded that monthly market rent is $1,300 for one bedroom/one bathroom units, $1,775 for two bedroom units/two bathroom units and $1,900 for three bedroom/two bathroom units.
The following table presents certain information relating to some comparable multifamily properties for the Ocean Breeze Apartments Property:
Competitive Set(1)
Ocean Breeze Apartments (Subject) | Eaves at Avalon | California Foundation Apartment Homes | Whiffle Tree Apartment Homes | Casa Monterrey | Pacific Shores Apartments | Regency Palms | |
| Location | Huntington Beach, CA | Huntington Beach, CA | Huntington Beach, CA | Huntington Beach, CA | Huntington Beach, CA | Huntington Beach, CA | Huntington Beach, CA |
| Distance to Subject | -- | 0.9 miles | 0.4 miles | 1.4 miles | 0.2 miles | 1.4 miles | 0.9 miles |
| Property Type | Garden | Garden | Garden | Garden | Garden | Garden | Garden |
| Number of Units | 286 | 304 | 232 | 158 | 208 | 263 | 310 |
| Average Rent (per unit) | |||||||
| 1BR | $1,276-$1,319 | $1,475 | $1,415 | $1,150-$1,275 | $1,423 | $1,517 | $1,483 |
| 2BR | $1,418-$1,707 | $1,655-$1,720 | $1,710 | $1,575 | $1,818 | $1,800-$1,913 | $1,545-$1,880 |
| 3BR | $1,845-$1,894 | NAP | NAP | $1,830 | NAP | NAP | NAP |
| Utilities | Paid by tenant | Paid by tenant | Paid by tenant | Water, Trash, Sewer included | Gas included | Paid by tenant | Paid by tenant |
| Total Occupancy | 95% | 94% | 96% | 100% | 90% | 96% | 96% |
| (1) | Information obtained from the appraisal dated October 7, 2013. |
The Borrower. The borrower is Ocean Breeze Apartment Associates, L.P., a single purpose entity with an independent director. Legal counsel to the borrower delivered a non-consolidation opinion in connection with the origination of the Ocean Breeze Apartments Mortgage Loan. Arsalan Gozini as an individual and The Gozini Family Trust are the guarantors of certain nonrecourse carveouts under the Ocean Breeze Apartments Mortgage Loan.
The Sponsors. The sponsors are Arsalan Gozini and The Gozini Family Trust. Mr. Gozini is the President of BH Properties (“BHP”), a commercial real estate firm based in Los Angeles, California. Mr. Gozini has over 20 years of experience and BHP owns a real estate portfolio consisting of over 70 properties across 17 states that include multifamily, industrial, office and retail properties. BHP currently owns eight multifamily properties in the southwest region, which includes two properties in southern California.
Escrows. The loan documents provide for upfront escrows in the amount of $71,016 for real estate taxes. The loan documents provide for ongoing monthly reserves in the amount of $23,672 for real estate taxes and $5,958 for replacement reserves. Ongoing monthly reserves for insurance are not required so long as the Ocean Breeze Apartments Property is covered by an acceptable blanket insurance policy.
Lockbox and Cash Management. The Ocean Breeze Apartments Mortgage Loan requires a lender-controlled lockbox account, which is already in place, and that the borrower or property manager deposit all rents directly into the lockbox account within one business day after receipt. Funds are swept to a cash management account controlled by the lender. Other than during a Cash Trap Event Period (as defined below), all excess funds on deposit in the lockbox account after debt service payments are disbursed to the borrower.
THE INFORMATION IN THIS STRUCTURAL AND COLLATERAL TERM SHEET IS NOT COMPLETE AND MAY BE AMENDED PRIOR TO THE TIME OF SALE. THIS TERM SHEET IS NOT AN OFFER TO SELL THESE SECURITIES AND IT IS NOT A SOLICITATION OF AN OFFER TO BUY THESE SECURITIES IN ANY JURISDICTION WHERE THE OFFER OR SALE IS NOT PERMITTED.
52
| OCEAN BREEZE APARTMENTS |
A “Cash Trap Event Period” will commence upon the earlier of (i) the occurrence and continuance of an event of default and (ii) the amortizing debt service coverage ratio for the trailing 12-month period falling below 1.10x. A Cash Trap Event Period will expire, with regard to circumstances in clause (i), upon the cure of such event of default; and with regards to circumstances in clause (ii), the amortizing debt service coverage ratio is equal to or greater than 1.15x for the two most recent calendar quarters.
Property Management. The Ocean Breeze Apartments Property is managed by Greystar California, Inc.
Assumption. The borrower has a two-time right to transfer the Ocean Breeze Apartments Property, provided that no event of default has occurred and is continuing and certain other conditions are satisfied, including (i) the lender’s reasonable determination that the proposed transferee and guarantor satisfy the lender’s credit review and underwriting standards, taking into consideration transferee experience, financial strength and general business standing; (ii) execution of a recourse guaranty and an environmental indemnity by an affiliate of the transferee; and (iii) if requested by the lender, rating agency confirmation from KBRA, Moody’s and S&P that the transfer will not result in a downgrade, withdrawal or qualification of the respective ratings assigned to the Series 2013-UBS1 Certificates.
Partial Release. Not permitted.
Real Estate Substitution. Not permitted.
Subordinate and Mezzanine Indebtedness. There is no existing mezzanine debt in place related to the Ocean Breeze Apartments Mortgage Loan; however, future mezzanine debt is permitted subject to satisfaction of certain conditions, including: (i) no event of default has occurred and is continuing; (ii) the lender receives no less than 60 days prior written notice; (iii) an intercreditor agreement in form and substance acceptable to KBRA, Moody’s and S&P and reasonably acceptable to the lender; (iv) the combined loan-to-value ratio will not be greater than 70.0%; (v) the combined amortizing net cash flow debt service coverage ratio will not be less than 1.20x; (vi) the combined net cash flow debt yield will not be less than 8.0%; and (vii) mezzanine loan documents acceptable to KBRA, Moody’s and S&P and reasonably acceptable to the lender will have been delivered to the lender.
Ground Lease. None.
Terrorism Insurance. The loan documents require that the “all risk” insurance policy required to be maintained by the borrower provides coverage for terrorism in an amount equal to the full replacement cost of the Ocean Breeze Apartments Property; provided however, if TRIA is discontinued or not renewed, the borrower will not be required to spend any more than 200% of the cost of property coverage immediately prior to TRIA being no longer in effect. The loan documents also require business interruption insurance covering no less than the 18-month period following the occurrence of a casualty event, together with a six-month extended period of indemnity.
THE INFORMATION IN THIS STRUCTURAL AND COLLATERAL TERM SHEET IS NOT COMPLETE AND MAY BE AMENDED PRIOR TO THE TIME OF SALE. THIS TERM SHEET IS NOT AN OFFER TO SELL THESE SECURITIES AND IT IS NOT A SOLICITATION OF AN OFFER TO BUY THESE SECURITIES IN ANY JURISDICTION WHERE THE OFFER OR SALE IS NOT PERMITTED.
53
| MAZZA GRANDMARC |
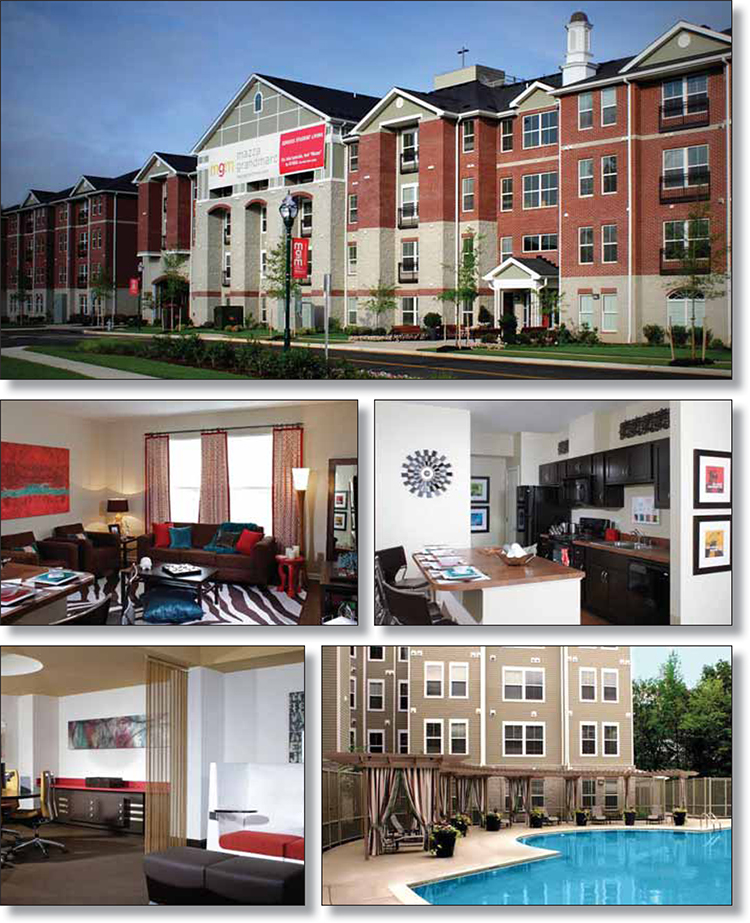
THE INFORMATION IN THIS STRUCTURAL AND COLLATERAL TERM SHEET IS NOT COMPLETE AND MAY BE AMENDED PRIOR TO THE TIME OF SALE. THIS TERM SHEET IS NOT AN OFFER TO SELL THESE SECURITIES AND IT IS NOT A SOLICITATION OF AN OFFER TO BUY THESE SECURITIES IN ANY JURISDICTION WHERE THE OFFER OR SALE IS NOT PERMITTED.
54
| MAZZA GRANDMARC |
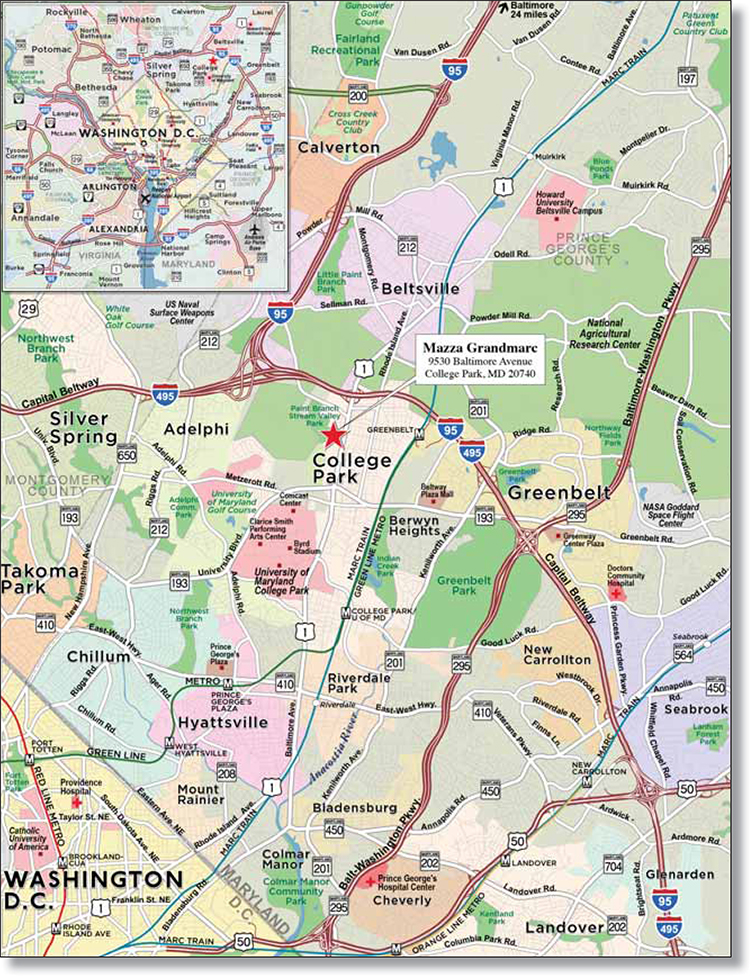
THE INFORMATION IN THIS STRUCTURAL AND COLLATERAL TERM SHEET IS NOT COMPLETE AND MAY BE AMENDED PRIOR TO THE TIME OF SALE. THIS TERM SHEET IS NOT AN OFFER TO SELL THESE SECURITIES AND IT IS NOT A SOLICITATION OF AN OFFER TO BUY THESE SECURITIES IN ANY JURISDICTION WHERE THE OFFER OR SALE IS NOT PERMITTED.
55
| No. 4 – Mazza Grandmarc | ||||||||
| Loan Information | Property Information | |||||||
| Mortgage Loan Seller: | Wells Fargo Bank, National Association | Single Asset/Portfolio: | Single Asset | |||||
| Credit Assessment (KBRA/Moody’s/S&P): | NR/NR/NR | Property Type: | Multifamily | |||||
| Original Principal Balance: | $34,500,000 | Specific Property Type: | Student Housing | |||||
| Cut-off Date Principal Balance: | $34,500,000 | Location: | College Park, MD | |||||
| % of Initial Pool Balance: | 4.7% | Size: | 628 beds | |||||
| Loan Purpose: | Refinance | Cut-off Date Principal Balance Per Bed: | $54,936 | |||||
| Borrower Name: | PCS UMD, LLC | Year Built/Renovated: | 2010/NAP | |||||
| Sponsor: | Starr USA Asset Holdings, LLC | Title Vesting: | Leasehold | |||||
| Mortgage Rate: | 4.150% | Property Manager: | Campus Apartments Management, LLC | |||||
| Note Date: | November 13, 2013 | 3rd Most Recent Occupancy (As of)(3): | 79.4% (12/31/2011) | |||||
| Anticipated Repayment Date: | NAP | 2nd Most Recent Occupancy (As of)(3): | 95.7% (7/31/2012) | |||||
| Maturity Date: | December 1, 2018 | Most Recent Occupancy (As of)(3): | 85.2% (7/31/2013) | |||||
| IO Period: | None | Current Occupancy (As of): | 96.8% (9/12/2013) | |||||
| Loan Term (Original): | 60 months | |||||||
| Seasoning: | 0 months | Underwriting and Financial Information: | ||||||
| Amortization Term (Original): | 360 months | |||||||
| Loan Amortization Type: | Amortizing Balloon | 3rd Most Recent NOI (As of)(4): | NAV | |||||
| Interest Accrual Method: | Actual/360 | 2nd Most Recent NOI (As of): | $2,756,165 (TTM 7/31/2012) | |||||
| Call Protection: | L(24),D(32),O(4) | Most Recent NOI (As of): | $2,138,801 (TTM 7/31/2013) | |||||
| Lockbox Type: | Soft/Upfront Cash Management | |||||||
Additional Debt(1): | Yes | U/W Revenues: | $6,546,047 | |||||
Additional Debt Type(1): | Mezzanine | U/W Expenses: | $3,733,126 | |||||
| U/W NOI: | $2,812,920 | |||||||
| U/W NCF: | $2,750,120 | |||||||
Escrows and Reserves(2): | U/W NOI DSCR(1): | 1.40x | ||||||
U/W NCF DSCR(1): | 1.37x | |||||||
| Type: | Initial | Monthly | Cap (If Any) | U/W NOI Debt Yield(1): | 8.2% | |||
| Taxes | $249,671 | $87,341 | NAP | U/W NCF Debt Yield(1): | 8.0% | |||
| Insurance | $0 | Springing | NAP | As-Is Appraised Value: | $51,300,000 | |||
| Replacement Reserves | $0 | $5,233 | $150,000 | As-Is Appraisal Valuation Date: | September 12, 2013 | |||
| Ground Lease Reserve | $0 | $52,112 | NAP | Cut-off Date LTV Ratio(1): | 67.3% | |||
| Land Use Reserve | $800,000 | $0 | NAP | LTV Ratio at Maturity or ARD(1): | 61.2% | |||
| (1) | See “Subordinate and Mezzanine Indebtedness” section. The equity interests in the Mazza Grandmarc Mortgage Loan borrower have been pledged to secure non-pooled subordinate mezzanine indebtedness with a balance as of the Cut-off Date of $4,500,000. All LTV, DSCR, debt yield and Cut-off Date Balance per bed numbers shown in the chart above are based solely on the $34,500,000 mortgage loan financing. As of the Cut-off Date, the combined U/W NCF DSCR is 1.09x, the combined LTV ratio is 76.0%, and the combined U/W NCF Debt Yield is 7.1%. |
| (2) | See “Escrows” section. |
| (3) | Represents the average occupancy over the preceding 12-month period. |
| (4) | Historical financial statements prior to the trailing 12-month period ending July 31, 2012 are not available, as the Mazza Grandmarc property was built in 2010 and was still undergoing stabilization. |
The Mortgage Loan. The mortgage loan (the “Mazza Grandmarc Mortgage Loan”) is evidenced by a single promissory note that is secured by a first mortgage encumbering a multifamily property located in College Park, Maryland (the “Mazza Grandmarc Property”). The Mazza Grandmarc Mortgage Loan was originated on November 13, 2013 by Wells Fargo Bank, National Association. The Mazza Grandmarc Mortgage Loan had an original principal balance of $34,500,000, has an outstanding principal balance as of the Cut-off Date of $34,500,000 and accrues interest at an interest rate of 4.150% per annum. The Mazza Grandmarc Mortgage Loan had an initial term of 60 months, has a remaining term of 60 months as of the Cut-off Date and requires payments of principal and interest based on a 30-year amortization schedule. The Mazza Grandmarc Mortgage Loan matures on December 1, 2018.
Following the lockout period, the borrower has the right to defease the Mazza Grandmarc Mortgage Loan in whole, but not in part, on any day before September 1, 2018. In addition, the Mazza Grandmarc Mortgage Loan is prepayable without penalty on or after September 1, 2018.
THE INFORMATION IN THIS STRUCTURAL AND COLLATERAL TERM SHEET IS NOT COMPLETE AND MAY BE AMENDED PRIOR TO THE TIME OF SALE. THIS TERM SHEET IS NOT AN OFFER TO SELL THESE SECURITIES AND IT IS NOT A SOLICITATION OF AN OFFER TO BUY THESE SECURITIES IN ANY JURISDICTION WHERE THE OFFER OR SALE IS NOT PERMITTED.
56
| MAZZA GRANDMARC |
Sources and Uses
| Sources | Uses | |||||||
| Original loan amount | $34,500,000 | 84.5% | Loan payoff | $39,320,052 | 95.9% | |||
| Mezzanine loan | 4,500,000 | 11.0 | Reserves | 1,049,671 | 2.6 | |||
| Sponsor’s new cash contribution | 1,843,890 | 4.5 | Closing costs | 625,609 | 1.5 | |||
| Total Sources | $40,843,890 | 100.0% | Total Uses | $40,843,890 | 100.0% |
The Property. The Mazza Grandmarc Property is a four-story student housing multifamily property built in 2010 and located in College Park, Maryland (home of the University of Maryland). The Mazza Grandmarc Property is situated on an 8.9-acre site and comprises 232 units with 628 bedrooms. Amenities at the Mazza Grandmarc Property include a shuttle bus to the University of Maryland campus, outdoor pool, three private study lounges, theatre room, cyber café, tanning booth, fitness center and two elevators. The Mazza Grandmarc Property offers six floor plans ranging from studios to four bedrooms with an average unit size of 1,071 square feet. Unit features at the Mazza Grandmarc Property include fully-equipped kitchens with electric range, garbage disposal and microwave oven; private bathrooms for each bedroom and a full-size washer & dryer in all units. In addition, all units are fully furnished with flat screen televisions, beds, sofas, desks and chairs. The Mazza Grandmarc Property contains a parking structure with 634 spaces, resulting in a parking ratio of 2.7 spaces per unit, or 1.0 space per bedroom. The rental rates at the Mazza Grandmarc Property include parking. As of September 12, 2013, the Mazza Grandmarc Property was 96.8% occupied.
The following table presents certain information relating to the unit mix of the Mazza Grandmarc Property:
Unit Mix Summary(1)
| Unit Type | No. of Units | Total No. of Beds | % of Total Beds | Average Unit Size (SF) | Average U/W Monthly Rent per Bed |
| Studio/1 Bathroom | 1 | 1 | 0.2% | 554 | $1,530 |
| 1 Bedroom/1 Bathroom | 20 | 20 | 3.2% | 596 | $1,654 |
| 2 Bedroom/2 Bathroom | 107 | 214 | 34.1% | 878 | $974 |
| 3 Bedroom/3 Bathroom | 23 | 69 | 11.0% | 1,097 | $916 |
| 4 Bedroom/4 Bathroom | 81 | 324 | 51.6% | 1,446 | $821 |
| Total/Weighted Average | 232 | 628 | 100.0% | 1,072 | $911 |
| (1) | Information obtained from the underwritten rent roll. |
The following table presents historical occupancy percentages at the Mazza Grandmarc Property:
Historical Occupancy
12/31/2011(1)(2) | 7/31/2012(1)(2) | 7/31/2013(1)(2) | 9/12/2013 | |||
| 79.4% | 95.7% | 85.2% | 96.8% |
| (1) | Information obtained from the appraisal. |
| (2) | Represents the average occupancy over the preceding 12-month period. |
THE INFORMATION IN THIS STRUCTURAL AND COLLATERAL TERM SHEET IS NOT COMPLETE AND MAY BE AMENDED PRIOR TO THE TIME OF SALE. THIS TERM SHEET IS NOT AN OFFER TO SELL THESE SECURITIES AND IT IS NOT A SOLICITATION OF AN OFFER TO BUY THESE SECURITIES IN ANY JURISDICTION WHERE THE OFFER OR SALE IS NOT PERMITTED.
57
| MAZZA GRANDMARC |
Operating History and Underwritten Net Cash Flow. The following table presents certain information relating to the historical operating performance and Underwritten Net Cash Flow at the Mazza Grandmarc Property:
Cash Flow Analysis
| TTM 7/31/2012 | TTM 7/31/2013 | U/W | U/W $ per Bed | ||||||||||
| Base Rent | $6,138,305 | $5,727,718 | $6,638,052 | $10,570 | |||||||||
| Grossed Up Vacant Space | 0 | 0 | 228,228 | 363 | |||||||||
| Other Income | 170,196 | 192,900 | 170,200 | 271 | |||||||||
| Less Concessions | (141,514) | (124,793) | (112,788) | (180) | |||||||||
| Less Vacancy & Credit Loss | (25,031) | (73,084) | (377,645)(1) | (601) | |||||||||
| Effective Gross Income | $6,141,956 | $5,722,740 | $6,546,047(2) | $10,424 | |||||||||
| Total Operating Expenses | $3,385,791 | $3,583,939 | $3,733,126 | $5,944 | |||||||||
| Net Operating Income | $2,756,165 | $2,138,801 | $2,812,920(2) | $4,479 | |||||||||
| Capital Expenditures | 0 | 0 | 62,800 | 100 | |||||||||
| Net Cash Flow | $2,756,165 | $2,138,801 | $2,750,120 | $4,379 | |||||||||
| NOI DSCR | 1.37x | 1.06x | 1.40x | ||||||||||
| NCF DSCR | 1.37x | 1.06x | 1.37x | ||||||||||
| NOI DY | 8.0% | 6.2% | 8.2% | ||||||||||
| NCF DY | 8.0% | 6.2% | 8.0% |
| (1) | The underwritten economic vacancy is 5.0%. The Mazza Grandmarc Property was 96.8% physically occupied as of September 12, 2013. |
| (2) | The underwritten Effective Gross Income and Net Operating Income are higher than the trailing 12-month period ending July 31, 2013 due to the increased vacancy during this period. The Mazza Grandmarc Property had an average occupancy rate of 85.2% during the trailing 12-month period ending July 31, 2013 compared to the current occupancy of 96.8% as of September 12, 2013. |
Appraisal. As of the appraisal valuation date of September 12, 2013, the Mazza Grandmarc Property had an “as-is” appraised value of $51,300,000.
Environmental Matters. According to the Phase I environmental site assessment dated September 19, 2013, there was no evidence of any recognized environmental conditions at the Mazza Grandmarc Property.
Market Overview and Competition. The Mazza Grandmarc Property is located in the City of College Park, approximately 10 miles northeast of the Washington, D.C. central business district and 1.5 miles north of the main entrance to the University of Maryland Campus, which had a 2012 total enrollment of 37,247. The Mazza Grandmarc Property is situated approximately one half mile south of Interstate 495 (Capital Beltway), which is a heavily traveled highway that circles Washington, D.C. at a 10-15 mile radius. In addition, a retail corridor is located less than one mile north of the Mazza Grandmarc Property with major retailers including Ikea, Home Depot, Best Buy and Shopper’s Food Warehouse. According to the appraisal, as of September 2013, the estimated population within a one-, three- and five-mile radius of the Mazza Grandmarc Property was 11,214, 105,092 and 373,514, respectively. The estimated average household income within the same one-, three- and five-mile radii was $75,307, $80,104 and $81,349, respectively.
According to a third-party market research report, the Mazza Grandmarc Property is located within the College Park/Greenbelt submarket of the Suburban Maryland apartment market. As of the third quarter of 2013, the submarket reported a total inventory of 26 properties totaling 12,345 units with a 3.9% vacancy rate. The appraiser concluded to the following monthly market rents for the Mazza Grandmarc Property: $1,530 for the studio unit, $1,611 for the one-bedroom units, $977 per bed for the two-bedroom units, $920 per bed for the three-bedroom units and $829 per bed for the four-bedroom units.
THE INFORMATION IN THIS STRUCTURAL AND COLLATERAL TERM SHEET IS NOT COMPLETE AND MAY BE AMENDED PRIOR TO THE TIME OF SALE. THIS TERM SHEET IS NOT AN OFFER TO SELL THESE SECURITIES AND IT IS NOT A SOLICITATION OF AN OFFER TO BUY THESE SECURITIES IN ANY JURISDICTION WHERE THE OFFER OR SALE IS NOT PERMITTED.
58
| MAZZA GRANDMARC |
The following table presents certain information relating to comparable multifamily properties for the Mazza Grandmarc Property:
Competitive Set(1)
| Mazza Grandmarc (Subject) | The Varsity at College Park | The Enclave at 8700 | University View | University View II | University Club Apartments | |
| Location | College Park, MD | College Park, MD | College Park, MD | College Park, MD | College Park, MD | College Park, MD |
| Distance from Subject | -- | 1.4 miles | 1.0 mile | 1.4 miles | 1.4 miles | 1.6 miles |
| Property Type | Student Housing | Student Housing | Student Housing | Student Housing | Student Housing | Student Housing |
| Year Built/Renovated | 2010/NAP | 2011/NAV | 2010/NAV | 2005/NAV | 2010/NAV | 1965/2007 |
| Number of Units | 232 | 259 | 97 | 353 | 154 | 129 |
| Number of Beds | 628 | 901 | 375 | 1,056 | 517 | 181 |
| Average Monthly Rent per Bed | $911 | $980 | $868 | $949 | $928 | $931 |
| Parking Monthly Rent | Included | $125 | $75 | $85 | $85 | $50 |
| Total Occupancy | 97% | 99% | 65% | 100% | 100% | 100% |
| (1) | Information obtained from the appraisal. |
The Borrower. The borrower is PCS UMD, LLC, a limited liability company and a single purpose entity with an independent director. Legal counsel to the borrower delivered a non-consolidation opinion in connection with the origination of the Mazza Grandmarc Mortgage Loan. Starr USA Asset Holdings, LLC, the sponsor and indirect owner of the borrower, is the guarantor of certain nonrecourse carveouts under the Mazza Grandmarc Mortgage Loan.
The Sponsor. The sponsor is Starr USA Asset Holdings, LLC (“Starr”). Starr is a private investment holding company incorporated in 1943, which holds approximately $20.0 billion in assets worldwide. These investments are made through direct investments, publicly traded securities and private equity funds with a focus on financial services, real estate, consumer products and services, retail and energy businesses.
Escrows. The loan documents provide for upfront reserves in an amount equal to $249,671 for real estate taxes and $800,000 for a land use reserve. The funds in the land use reserve relate to (i) costs associated with the extension of Hollywood Road, pursuant to an agreement between the sponsor and the City of College Park ($500,000), and (ii) costs associated with the extension of the Paint Branch Trail System, pursuant to an agreement with the Maryland National Capital Park and Planning Commission ($300,000). The loan documents also provide for ongoing monthly reserves in an amount equal to $87,341 for real estate taxes, $5,233 for replacement reserves (subject to a cap of $150,000, which may be increased if the lender determines the Mazza Grandmarc Property is not being maintained as required) and $52,112 for ground lease payments. Ongoing monthly reserves for insurance are not required as long as (i) no event of default has occurred and is continuing, (ii) the Mazza Grandmarc Property is covered by a blanket insurance policy acceptable by the lender and (iii) the borrower provides the lender with evidence of renewal of the policy and timely proof of payment of insurance premiums.
Lockbox and Cash Management. The Mazza Grandmarc Mortgage Loan requires a lender-controlled lockbox account, which is already in place, and that the borrower and the property manager deposit all cash revenues and all other monies received relating to the Mazza Grandmarc Property into the lockbox account within five business days of receipt. The lockbox account is structured with upfront cash management for the payment of reserves, operating expenses and debt service payments for both the Mazza Grandmarc Mortgage Loan and the Mazza Grandmarc Mezzanine Loan (see “Subordinate and Mezzanine Indebtedness” section). As long as no event of default has occurred and is continuing, all excess funds on deposit in the lockbox account are swept to the borrower’s operating account on a monthly basis. If an event of default has occurred and is continuing, all excess funds on deposit in the lockbox account are swept to a lender-controlled cash management account on a monthly basis until such event of default is cured.
Property Management. The Mazza Grandmarc Property is managed by Campus Apartments Management, LLC.
Assumption. The borrower has a two-time right to transfer the Mazza Grandmarc Property, provided that no event of default has occurred and is continuing and certain other conditions are satisfied, including (i) the lender’s reasonable determination that the proposed transferee and guarantor satisfy the lender’s credit review and underwriting standards, taking into consideration transferee experience, financial strength and general business standing; (ii) execution of a recourse guaranty and an environmental indemnity by an affiliate of the transferee; (iii) if requested by the lender, rating agency confirmation from KBRA, Moody’s and S&P that the transfer will not result in a downgrade, withdrawal or qualification of the respective ratings assigned to the Series 2013-UBS1 Certificates; and (iv) approval by the Mazza Grandmarc Mezzanine Loan lender (to the extent required by and in accordance with the mezzanine loan agreement).
Right of First Refusal. Mazza Family College Park, LLC, the ground lessor (see “Ground Lease” section), has a right of first refusal (“ROFR”) to purchase the Mazza Grandmarc Property. The ROFR is not extinguished by a foreclosure of the Mazza Grandmarc Property; however, the ROFR does not apply to a foreclosure or deed in lieu thereof.
THE INFORMATION IN THIS STRUCTURAL AND COLLATERAL TERM SHEET IS NOT COMPLETE AND MAY BE AMENDED PRIOR TO THE TIME OF SALE. THIS TERM SHEET IS NOT AN OFFER TO SELL THESE SECURITIES AND IT IS NOT A SOLICITATION OF AN OFFER TO BUY THESE SECURITIES IN ANY JURISDICTION WHERE THE OFFER OR SALE IS NOT PERMITTED.
59
| MAZZA GRANDMARC |
Partial Release. The borrower may obtain a release of a certain 1.6-acre vacant, non-income producing, unimproved parcel from the lien of the Mazza Grandmarc Mortgage Loan upon the satisfaction of certain conditions including without limitation (i) the delivery of a legal opinion to the lender to demonstrate that the release of the related parcel will satisfy REMIC requirements and (ii) receipt of written confirmation from KBRA, Moody’s and S&P that the transfer will not result in a downgrade, withdrawal or qualification of the then-current ratings assigned to the Series 2013-UBS1 Certificates.
Real Estate Substitution. Not permitted.
Subordinate and Mezzanine Indebtedness. Commonwealth Annuity and Life Insurance Company (the “Mazza Grandmarc Mezzanine Lender”) has made a $4,500,000 mezzanine loan (the “Mazza Grandmarc Mezzanine Loan”) to Terrapin SH LLC, a limited liability company that owns 100% of the borrower under the Mazza Grandmarc Mortgage Loan, which is secured by a pledge by Terrapin SH LLC of 100% of its limited liability interests in the borrower under the Mazza Grandmarc Mortgage Loan. The Mazza Grandmarc Mezzanine Loan accrues interest at an interest rate of 11.000% per annum and requires payments of principal and interest based on a 30-year amortization schedule. The Mazza Grandmarc Mezzanine Loan matures on December 1, 2018. The rights of the Mazza Grandmarc Mezzanine Lender are further described under “Description of the Mortgage Pool—Subordinate and/or Other Financing—Existing (Secured Financing and Mezzanine and Similar Financing)” in the Free Writing Prospectus.
Ground Lease. The Mazza Grandmarc Property is subject to a ground lease (the “Mazza Grandmarc Ground Lease”) with an expiration date of August 31, 2075 and no extension options. The annual rent payment due under the ground lease is $625,349 with a rent escalation in 2015 and every three years thereafter equal to the greater of (i) 10.872% and (ii) the CPI percentage increase over the trailing three-year period ending with the date that is six months prior to the applicable rent escalation date.
The ground lease includes an option to purchase the land associated with the Mazza Grandmarc Ground Lease at any time during 2018 and every five years thereafter, through the term of the Mazza Grandmarc Ground Lease for a purchase price equal to the greater of (i) $5,500,000 and (ii) the price of the land as determined by a board of three appraisers. In addition, the ground lease includes a right of first refusal to purchase the land associated with the Mazza Grandmarc Ground Lease.
Terrorism Insurance. The loan documents require that the “all risk” insurance policy required to be maintained by the borrower provide coverage for terrorism in an amount equal to the full replacement cost of the Mazza Grandmarc Property. The loan documents also require business interruption insurance covering no less than the 18-month period following the occurrence of a casualty event, together with a six-month extended period of indemnity.
THE INFORMATION IN THIS STRUCTURAL AND COLLATERAL TERM SHEET IS NOT COMPLETE AND MAY BE AMENDED PRIOR TO THE TIME OF SALE. THIS TERM SHEET IS NOT AN OFFER TO SELL THESE SECURITIES AND IT IS NOT A SOLICITATION OF AN OFFER TO BUY THESE SECURITIES IN ANY JURISDICTION WHERE THE OFFER OR SALE IS NOT PERMITTED.
60
(THIS PAGE INTENTIONALLY LEFT BLANK)
61
| DOLLAR GENERAL PORTFOLIO |
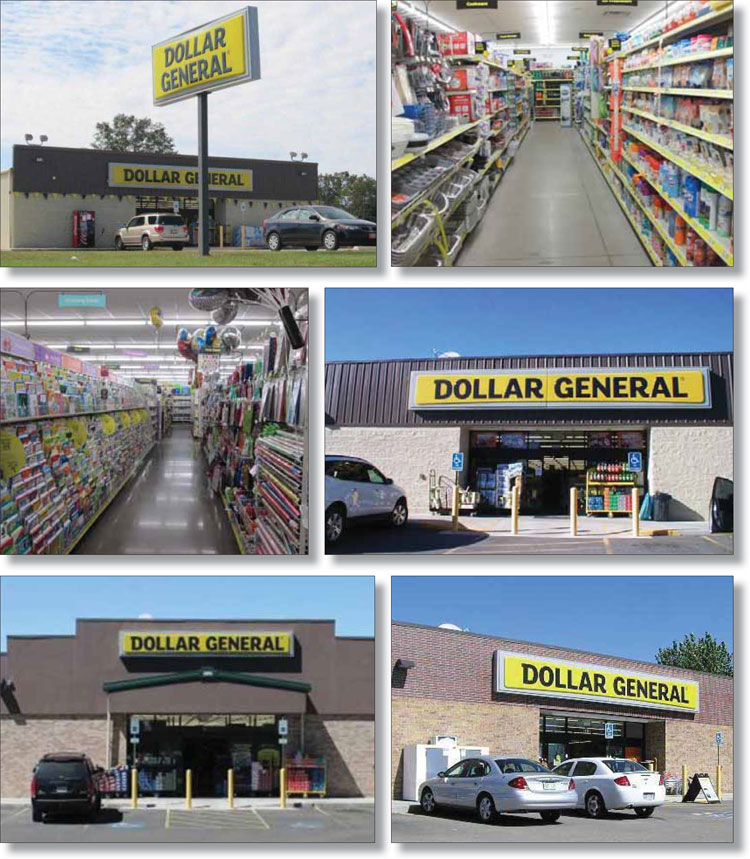
THE INFORMATION IN THIS STRUCTURAL AND COLLATERAL TERM SHEET IS NOT COMPLETE AND MAY BE AMENDED PRIOR TO THE TIME OF SALE. THIS TERM SHEET IS NOT AN OFFER TO SELL THESE SECURITIES AND IT IS NOT A SOLICITATION OF AN OFFER TO BUY THESE SECURITIES IN ANY JURISDICTION WHERE THE OFFER OR SALE IS NOT PERMITTED.
62
| DOLLAR GENERAL PORTFOLIO |
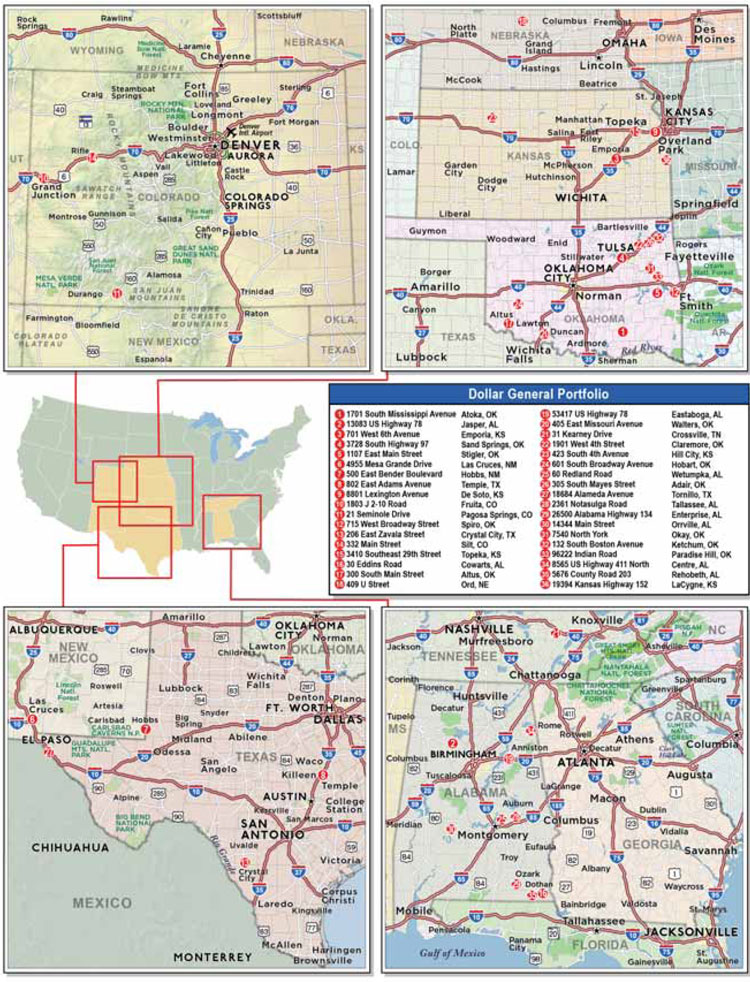
THE INFORMATION IN THIS STRUCTURAL AND COLLATERAL TERM SHEET IS NOT COMPLETE AND MAY BE AMENDED PRIOR TO THE TIME OF SALE. THIS TERM SHEET IS NOT AN OFFER TO SELL THESE SECURITIES AND IT IS NOT A SOLICITATION OF AN OFFER TO BUY THESE SECURITIES IN ANY JURISDICTION WHERE THE OFFER OR SALE IS NOT PERMITTED.
63
| No. 5 – Dollar General Portfolio | |||||||
| Loan Information | Property Information | ||||||
| Mortgage Loan Seller: | Wells Fargo Bank, National Association | Single Asset/Portfolio: | Portfolio | ||||
Credit Assessment (KBRA/Moody’s/S&P): | NR/NR/NR | Property Type: | Retail | ||||
| Original Principal Balance: | $28,000,000 | Specific Property Type: | Single Tenant | ||||
| Cut-off Date Principal Balance: | $28,000,000 | Location: | Various – See Table | ||||
| % of Initial Pool Balance: | 3.9% | Size: | 348,782 SF | ||||
| Loan Purpose: | Acquisition | Cut-off Date Principal Balance Per Unit/SF: | $80.28 | ||||
| Borrower Name: | Spirit SPE DG Portfolio 2013-4, LLC | Year Built/Renovated: | Various – See Table | ||||
| Sponsor: | Spirit Realty Capital, Inc. | Title Vesting: | Fee | ||||
| Mortgage Rate: | 5.230% | Property Manager: | Tenant-managed | ||||
| Note Date: | October 28, 2013 | 3rd Most Recent Occupancy(2): | NAP | ||||
| Anticipated Repayment Date: | NAP | 2nd Most Recent Occupancy(2): | NAP | ||||
| Maturity Date: | November 1, 2023 | Most Recent Occupancy (As of): | 100.0% (12/31/2012) | ||||
| IO Period: | 120 months | Current Occupancy (As of): | 100.0% (12/1/2013) | ||||
| Loan Term (Original): | 120 months | ||||||
| Seasoning: | 1 month | Underwriting and Financial Information: | |||||
| Amortization Term (Original): | NAP | ||||||
| Loan Amortization Type: | Interest-only, Balloon | 3rd Most Recent NOI(2): | NAV | ||||
| Interest Accrual Method: | Actual/360 | 2nd Most Recent NOI(2): | NAV | ||||
| Call Protection: | L(25),D(91),O(4) | Most Recent NOI(2): | NAV | ||||
| Lockbox Type: | Springing (Without Established Account) | ||||||
| Additional Debt: | None | U/W Revenues: | $3,321,602 | ||||
| Additional Debt Type: | NAP | U/W Expenses: | $99,648 | ||||
| U/W NOI: | $3,221,954 | ||||||
| U/W NCF: | $3,152,161 | ||||||
| U/W NOI DSCR: | 2.17x | ||||||
Escrows and Reserves(1): | U/W NCF DSCR: | 2.12x | |||||
| U/W NOI Debt Yield: | 11.5% | ||||||
Type: | Initial | Monthly | Cap (If Any) | U/W NCF Debt Yield: | 11.3% | ||
| Taxes | $0 | Springing | NAP | As-Is Appraised Value: | $46,870,000 | ||
| Insurance | $0 | Springing | NAP | As-Is Appraisal Valuation Date(3): | Various | ||
| Replacement Reserves | $0 | Springing | NAP | Cut-off Date LTV Ratio: | 59.7% | ||
| TI/LC | $0 | Springing | NAP | LTV Ratio at Maturity or ARD: | 59.7% | ||
| (1) | See “Escrows” section. |
| (2) | Occupancy prior to 2012 is not applicable, as the Dollar General Portfolio Properties were built in 2011 and 2012. Historical financial statements are not available, as the sponsor recently acquired the Dollar General Portfolio Properties. |
| (3) | See “Appraisals” section. |
The Mortgage Loan. The mortgage loan (the “Dollar General Portfolio Mortgage Loan”) is evidenced by a single promissory note that is secured by a first mortgage encumbering 36 single tenant retail properties located in eight states (the “Dollar General Portfolio Properties”). The Dollar General Portfolio Mortgage Loan was originated on October 28, 2013 by Wells Fargo Bank, National Association. The Dollar General Portfolio Mortgage Loan had an original principal balance of $28,000,000, has an outstanding principal balance as of the Cut-off Date of $28,000,000 and accrues interest at an interest rate of 5.230% per annum. The Dollar General Portfolio Mortgage Loan had an initial term of 120 months, has a remaining term of 119 months as of the Cut-off Date and requires interest-only payments through the term of the Dollar General Portfolio Mortgage Loan. The Dollar General Portfolio Mortgage Loan matures on November 1, 2023.
Following the lockout period, the borrower has the right to defease the Dollar General Portfolio Mortgage Loan in whole, but not in part, on any day before August 1, 2023. In addition, the Dollar General Portfolio Mortgage Loan is prepayable without penalty on or after August 1, 2023.
Sources and Uses
| Sources | Uses | |||||||||
| Original loan amount | $28,000,000 | 59.5 | % | Purchase price | $47,114,920 | 98.5 | % | |||
| Sponsor’s new cash contribution | 19,838,546 | 41.5 | Closing costs | 723,626 | 1.5 | |||||
| Total Sources | $47,838,546 | 100.0 | % | Total Uses | $47,838,546 | 100.0 | % |
THE INFORMATION IN THIS STRUCTURAL AND COLLATERAL TERM SHEET IS NOT COMPLETE AND MAY BE AMENDED PRIOR TO THE TIME OF SALE. THIS TERM SHEET IS NOT AN OFFER TO SELL THESE SECURITIES AND IT IS NOT A SOLICITATION OF AN OFFER TO BUY THESE SECURITIES IN ANY JURISDICTION WHERE THE OFFER OR SALE IS NOT PERMITTED.
64
| DOLLAR GENERAL PORTFOLIO |
The Properties. The Dollar General Portfolio Mortgage Loan is secured by the fee interests in 36 single tenant retail properties totaling 348,782 rentable square feet and occupied by Dollar General. Built in 2011 and 2012, the Dollar General Portfolio Properties are located in eight states: Oklahoma (12), Alabama (9), Kansas (5), Colorado (3), Texas (3), New Mexico (2), Nebraska (1) and Tennessee (1). None of the Dollar General Portfolio Properties comprises more than 3.8% of the Allocated Cut-off Date Principal Balance of the Dollar General Portfolio Mortgage Loan, and no property accounts for more than 3.9% of the Underwritten Base Rent. The Dollar General Portfolio Properties range in size from 9,002 square feet to 12,480 square feet, and as of December 1, 2013, the Dollar General Portfolio Properties were 100.0% occupied by Dollar General.
As of August 2, 2013, Dollar General is the largest discount retailer in the United States by number of stores with 10,866 locations in 40 states. Dollar General offers private label and national-branded items that are frequently used and replenished, such as food products, health and beauty aids, cleaning supplies, basic apparel, housewares and seasonal items. Dollar General is among the largest retailers of products made by manufacturers such as Proctor & Gamble, Kimberly-Clark, Kellogg’s, General Mills, Nabisco, PepsiCo and Coca-Cola. With approximately 25% of its merchandise priced at $1 or less, Dollar General targets low-, middle- and fixed-income customers who find shopping at its neighborhood stores easier, quicker and more convenient than at its larger competitors. Most of Dollar General’s stores are located in small towns with populations less than 20,000 people that are “off the radar” of larger discount retailers. In 2012, Dollar General achieved total net sales of $16.0 billion ($216 per square foot), representing an 8.2% increase over 2011. Dollar General also realized 4.7% same-store sales growth from 2011 to 2012, representing the company’s 23rd consecutive year of positive same-store sales growth. Over the same period, Dollar General’s operating profit increased 11% to $1.7 billion, and net income increased 24% to $953 million.
THE INFORMATION IN THIS STRUCTURAL AND COLLATERAL TERM SHEET IS NOT COMPLETE AND MAY BE AMENDED PRIOR TO THE TIME OF SALE. THIS TERM SHEET IS NOT AN OFFER TO SELL THESE SECURITIES AND IT IS NOT A SOLICITATION OF AN OFFER TO BUY THESE SECURITIES IN ANY JURISDICTION WHERE THE OFFER OR SALE IS NOT PERMITTED.
65
| DOLLAR GENERAL PORTFOLIO |
The following table presents certain information relating to the Dollar General Portfolio Properties:
| Property Name – Location | Allocated Cut-off Date Principal Balance | % of Portfolio Cut-off Date Principal Balance | Occupancy | Year Built/ Renovated | Net Rentable Area (SF) | Appraised Value | ||||||
| 1701 South Mississippi Avenue – Atoka, OK | $1,073,482 | 3.8% | 100.0% | 2012/NAP | 12,480 | $1,800,000 | ||||||
| 13083 US Highway 78 – Jasper, AL | $936,315 | 3.3% | 100.0% | 2012/NAP | 10,640 | $1,570,000 | ||||||
701 West 6th Avenue – Emporia, KS | $924,388 | 3.3% | 100.0% | 2012/NAP | 10,566 | $1,550,000 | ||||||
| 3728 South Highway 97 – Sand Springs, OK | $900,532 | 3.2% | 100.0% | 2012/NAP | 12,406 | $1,510,000 | ||||||
| 1107 East Main Street – Stigler, OK | $894,569 | 3.2% | 100.0% | 2012/NAP | 9,026 | $1,500,000 | ||||||
| 4955 Mesa Grande Drive – Las Cruces, NM | $870,714 | 3.1% | 100.0% | 2012/NAP | 9,100 | $1,460,000 | ||||||
| 500 East Bender Boulevard – Hobbs, NM | $870,714 | 3.1% | 100.0% | 2012/NAP | 9,026 | $1,460,000 | ||||||
| 802 East Adams Avenue – Temple, TX | $858,786 | 3.1% | 100.0% | 2012/NAP | 9,100 | $1,440,000 | ||||||
| 8801 Lexington Avenue – De Soto, KS | $834,931 | 3.0% | 100.0% | 2012/NAP | 10,640 | $1,400,000 | ||||||
| 1803 J 2-10 Road – Fruita, CO | $834,931 | 3.0% | 100.0% | 2012/NAP | 9,026 | $1,400,000 | ||||||
| 21 Seminole Drive – Pagosa Spring, CO | $834,931 | 3.0% | 100.0% | 2012/NAP | 9,026 | $1,400,000 | ||||||
| 715 West Broadway Street – Spiro, OK | $823,003 | 2.9% | 100.0% | 2012/NAP | 12,480 | $1,380,000 | ||||||
| 206 East Zavala Street – Crystal City, TX | $823,003 | 2.9% | 100.0% | 2012/NAP | 9,100 | $1,380,000 | ||||||
| 332 Main Street – Silt, CO | $823,003 | 2.9% | 100.0% | 2012/NAP | 9,026 | $1,300,000 | ||||||
3410 Southeast 29th Street – Topeka, KS | $805,112 | 2.9% | 100.0% | 2012/NAP | 9,026 | $1,350,000 | ||||||
| 30 Eddins Road – Cowarts, AL | $790,202 | 2.8% | 100.0% | 2011/NAP | 9,026 | $1,325,000 | ||||||
| 300 South Main Street – Altus, OK | $775,293 | 2.8% | 100.0% | 2012/NAP | 9,002 | $1,300,000 | ||||||
| 409 U Street – Ord, NE | $763,365 | 2.7% | 100.0% | 2012/NAP | 10,640 | $1,280,000 | ||||||
| 53417 US Highway 78 – Eastaboga, AL | $760,383 | 2.7% | 100.0% | 2011/NAP | 9,100 | $1,275,000 | ||||||
| 405 East Missouri Avenue – Walters, OK | $745,474 | 2.7% | 100.0% | 2012/NAP | 12,480 | $1,250,000 | ||||||
| 31 Kearney Drive – Crossville, TN | $745,474 | 2.7% | 100.0% | 2011/NAP | 9,026 | $1,250,000 | ||||||
1901 West 4th Street – Claremore, OK | $721,619 | 2.6% | 100.0% | 2012/NAP | 9,100 | $1,210,000 | ||||||
423 South 4th Avenue – Hill City, KS | $715,655 | 2.6% | 100.0% | 2012/NAP | 10,566 | $1,200,000 | ||||||
| 601 South Broadway Avenue – Hobart, OK | $715,655 | 2.6% | 100.0% | 2012/NAP | 10,566 | $1,200,000 | ||||||
| 60 Redland Road – Wetumpka, AL | $715,655 | 2.6% | 100.0% | 2012/NAP | 9,026 | $1,200,000 | ||||||
| 305 South Mayes Street – Adair, OK | $709,691 | 2.5% | 100.0% | 2012/NAP | 9,026 | $1,190,000 | ||||||
| 18684 Alameda Avenue – Tornillo, TX | $697,764 | 2.5% | 100.0% | 2012/NAP | 9,026 | $1,170,000 | ||||||
| 2361 Notasulga Road – Tallassee, AL | $691,800 | 2.5% | 100.0% | 2012/NAP | 9,100 | $1,160,000 | ||||||
| 26500 Alabama Highway 134 – Enterprise, AL | $685,836 | 2.4% | 100.0% | 2011/NAP | 9,026 | $1,150,000 | ||||||
| 7540 North York – Okay, OK | $679,872 | 2.4% | 100.0% | 2012/NAP | 9,100 | $1,140,000 | ||||||
| 14344 Main Street – Orrville, AL | $679,872 | 2.4% | 100.0% | 2012/NAP | 9,026 | $1,140,000 | ||||||
| 132 South Boston Avenue – Ketchum, OK | $673,908 | 2.4% | 100.0% | 2012/NAP | 9,026 | $1,130,000 | ||||||
| 96222 Indian Road – Paradise Hill, OK | $673,908 | 2.4% | 100.0% | 2012/NAP | 9,026 | $1,130,000 | ||||||
| 8565 US Highway 411 North – Centre, AL | $667,945 | 2.4% | 100.0% | 2012/NAP | 9,100 | $1,120,000 | ||||||
| 5676 County Road 203 – Rehobeth, AL | $656,017 | 2.3% | 100.0% | 2011/NAP | 9,100 | $1,100,000 | ||||||
| 19394 Kansas Highway 152 – LaCygne, KS | $626,198 | 2.2% | 100.0% | 2012/NAP | 9,026 | $1,050,000 | ||||||
| Total/Weighted Average | $28,000,000 | 100.0% | 100.0% | 348,782 | $46,870,000 |
THE INFORMATION IN THIS STRUCTURAL AND COLLATERAL TERM SHEET IS NOT COMPLETE AND MAY BE AMENDED PRIOR TO THE TIME OF SALE. THIS TERM SHEET IS NOT AN OFFER TO SELL THESE SECURITIES AND IT IS NOT A SOLICITATION OF AN OFFER TO BUY THESE SECURITIES IN ANY JURISDICTION WHERE THE OFFER OR SALE IS NOT PERMITTED.
66
| DOLLAR GENERAL PORTFOLIO |
The following table presents certain information relating to the tenant at the Dollar General Portfolio Properties:
Major Tenant
| Tenant Name | Credit Rating (Fitch/ Moody’s/ S&P) | Tenant NRSF | % of NRSF | Annual U/W Base Rent PSF | Annual U/W Base Rent | % of Total Annual U/W Base Rent | Sales PSF(1) | Occupancy Cost | Lease Expiration Date | |||
| Major Tenant | ||||||||||||
Dollar General | NR/Baa3/BBB- | 348,782 | 100.0% | $9.52(2) | $3,321,603 | 100.0% | NAV | NAV | Various(2) | |||
| Total Major Tenant | 348,782 | 100.0% | $9.52 | $3,321,603 | 100.0% | |||||||
| (1) | Dollar General is not required to report sales at any of the Dollar General Portfolio Properties. |
| (2) | Dollar General occupies all 36 of the Dollar General Portfolio Properties with Annual U/W Base Rent PSFs ranging from $7.30 to $12.17 and Lease Expiration Dates ranging from May 31, 2026 to September 30, 2027. All 36 leases have at least three five-year extension options remaining. |
The following table presents certain information relating to the lease rollover schedule at the Dollar General Portfolio Properties:
Lease Expiration Schedule(1)
Year Ending December 31, | No. of Leases Expiring | Expiring NRSF | % of Total NRSF | Cumulative Expiring NRSF | Cumulative % of Total NRSF | Annual U/W Base Rent | Annual U/W Base Rent PSF | ||||||||
| MTM | 0 | 0 | 0.0% | 0 | 0.0% | $0 | $0.00 | ||||||||
| 2013 | 0 | 0 | 0.0% | 0 | 0.0% | $0 | $0.00 | ||||||||
| 2014 | 0 | 0 | 0.0% | 0 | 0.0% | $0 | $0.00 | ||||||||
| 2015 | 0 | 0 | 0.0% | 0 | 0.0% | $0 | $0.00 | ||||||||
| 2016 | 0 | 0 | 0.0% | 0 | 0.0% | $0 | $0.00 | ||||||||
| 2017 | 0 | 0 | 0.0% | 0 | 0.0% | $0 | $0.00 | ||||||||
| 2018 | 0 | 0 | 0.0% | 0 | 0.0% | $0 | $0.00 | ||||||||
| 2019 | 0 | 0 | 0.0% | 0 | 0.0% | $0 | $0.00 | ||||||||
| 2020 | 0 | 0 | 0.0% | 0 | 0.0% | $0 | $0.00 | ||||||||
| 2021 | 0 | 0 | 0.0% | 0 | 0.0% | $0 | $0.00 | ||||||||
| 2022 | 0 | 0 | 0.0% | 0 | 0.0% | $0 | $0.00 | ||||||||
| 2023 | 0 | 0 | 0.0% | 0 | 0.0% | $0 | $0.00 | ||||||||
| Thereafter | 36 | 348,782 | 100.0% | 348,782 | 100.0% | $3,321,603 | $9.52 | ||||||||
| Vacant | 0 | 0 | 0.0% | 348,782 | 100.0% | $0 | $0.00 | ||||||||
| Total/Weighted Average | 36 | 348,782 | 100.0% | $3,321,603 | $9.52 |
| (1) | Information obtained from the underwritten rent roll. |
The following table presents historical occupancy percentages at the Dollar General Portfolio Properties:
Historical Occupancy
12/31/2010(1) | 12/31/2011(1) | 12/31/2012(2) | 12/1/2013(2) | |||
| NAP | NAP | 100.0% | 100.0% |
| (1) | Historical occupancy prior to 2012 is not applicable, as the Dollar General Portfolio Properties were built in 2011 and 2012. |
| (2) | Information obtained from the borrower. |
THE INFORMATION IN THIS STRUCTURAL AND COLLATERAL TERM SHEET IS NOT COMPLETE AND MAY BE AMENDED PRIOR TO THE TIME OF SALE. THIS TERM SHEET IS NOT AN OFFER TO SELL THESE SECURITIES AND IT IS NOT A SOLICITATION OF AN OFFER TO BUY THESE SECURITIES IN ANY JURISDICTION WHERE THE OFFER OR SALE IS NOT PERMITTED.
67
| DOLLAR GENERAL PORTFOLIO |
Operating History and Underwritten Net Cash Flow. The following table presents certain information relating to the Underwritten Net Cash Flow at the Dollar General Portfolio Properties:
Cash Flow Analysis(1)
| U/W | U/W $ per SF | |||||
| Base Rent | $3,321,603 | $9.52 | ||||
| Grossed Up Vacant Space | 0 | 0.00 | ||||
| Total Reimbursables | 99,648(2) | 0.29 | ||||
| Less Vacancy & Credit Loss | (99,648)(3) | (0.29) | ||||
| Effective Gross Income | $3,321,602 | $9.52 | ||||
| Total Operating Expenses | $99,648(2) | $0.29 | ||||
| Net Operating Income | $3,221,954 | $9.24 | ||||
| TI/LC | 0 | 0.00 | ||||
| Capital Expenditures | 69,793 | 0.20 | ||||
| Net Cash Flow | $3,152,161 | $9.04 | ||||
| NOI DSCR | 2.17x | |||||
| NCF DSCR | 2.12x | |||||
| NOI DY | 11.5% | |||||
| NCF DY | 11.3% | |||||
| (1) | Historical financial statements are not available, as the sponsor recently acquired the Dollar General Portfolio Properties, which were also built in 2011 and 2012. |
| (2) | Represents a 3.0% underwritten management fee. The Dollar General Portfolio Properties are managed by the tenant with no management agreement in-place. Dollar General is responsible for payment of taxes, insurance and maintenance on all of the Dollar General Portfolio Properties. |
| (3) | The underwritten economic vacancy is 3.0%. The Dollar General Portfolio Properties were 100.0% physically occupied as of December 1, 2013. |
Appraisals. As of the appraisal valuation dates ranging from September 20, 2013 to October 1, 2013 the Dollar General Portfolio Properties had an aggregate “as-is” appraised value of $46,870,000.
Environmental Matters. According to the Phase I environmental site assessments dated from August 26, 2013 to October 1, 2013, there was no evidence of any recognized environmental conditions at any of the Dollar General Portfolio Properties.
The Borrower. The borrower is Spirit SPE DG Portfolio 2013-4,LLC, a limited liability company and single purpose entity. Spirit Realty Capital, Inc., the sponsor and indirect owner of the borrower, is the guarantor of certain nonrecourse carveouts under the Dollar General Portfolio Mortgage Loan.
The Sponsors. The sponsor is Spirit Realty Capital, Inc. (“Spirit”). Founded in 2003, Spirit is a real estate investment trust company headquartered in Scottsdale, Arizona that specializes in single tenant sale/leaseback transactions. As a result of completing a merger with Cole Credit Property Trust II on July 17, 2013, Spirit’s gross real estate investment portfolio is valued at over $7.0 billion and comprises approximately 1,900 properties in 48 states occupied by 383 tenants operating in 18 different industries.
Escrows. Ongoing monthly reserves for real estate taxes are not required as long as (i) no event of default has occurred and is continuing and (ii) the borrower provides the lender with timely proof of full payment. Ongoing monthly reserves for insurance are not required as long as (a) no event of default has occurred and is continuing; (b) the Dollar General Portfolio Properties are covered by an acceptable blanket policy; and (c) the borrower provides the lender with evidence of renewal of the policies and timely proof of payment of the insurance premiums. Ongoing monthly replacement reserves are not required as long as (x) no event of default has occurred and is continuing and (y) the lender determines that the Dollar General Portfolio Properties are adequately maintained. Ongoing monthly reserves for tenant improvements and leasing commissions are not required as long as no event of default has occurred and is continuing.
Lockbox and Cash Management. Upon the occurrence of a Cash Trap Event Period (as defined below), the borrower is required to establish a lender-controlled lockbox account into which the borrower and the tenant are required to deposit all rents within one business day of receipt. During a Cash Trap Event Period, all excess funds on deposit in the lockbox account are swept to a lender-controlled cash flow subaccount.
A “Cash Trap Event Period” will commence upon the earlier of (i) the occurrence and continuance of an event of default; (ii) the date that Dollar General goes dark, fails to occupy or vacates (or gives notice that it will vacate) its leased space at six or more of the Dollar General Portfolio Properties; (iii) the NCF debt yield being less than 9.0% at the end of any calendar month; (iv) Dollar General declaring insolvency; or (v) Dollar General’s failure to achieve a rating of ‘BBB-’ or better by S&P (or ‘Baa3’ or better by Moody’s, if S&P is not available). A Cash Trap Event Period will expire, with regard to circumstances in clause (i), upon the cure of such event of default; with regard to circumstances in clause (ii), upon Dollar General being in occupancy and open for business at all of the Dollar General Portfolio Properties for two consecutive calendar quarters; with regard to circumstances in clause (iii), upon the NCF debt yield being equal to or greater than 9.25% for two consecutive calendar quarters; with regard to circumstances in clause (iv), upon the date that such insolvency proceedings are terminated in a manner satisfactory to the lender; or with regard to
THE INFORMATION IN THIS STRUCTURAL AND COLLATERAL TERM SHEET IS NOT COMPLETE AND MAY BE AMENDED PRIOR TO THE TIME OF SALE. THIS TERM SHEET IS NOT AN OFFER TO SELL THESE SECURITIES AND IT IS NOT A SOLICITATION OF AN OFFER TO BUY THESE SECURITIES IN ANY JURISDICTION WHERE THE OFFER OR SALE IS NOT PERMITTED.
68
| DOLLAR GENERAL PORTFOLIO |
circumstances in clause (v), upon the date that Dollar General is rated ‘BBB-’ or better by S&P (or ‘Baa3’ or better by Moody’s, if S&P is not available).
Property Management. The Dollar General Portfolio Properties are managed by the tenant.
Assumption. The borrower has the right to transfer the Dollar General Portfolio Properties, provided that no event of default has occurred and is continuing and certain other conditions are satisfied, including (i) the lender’s reasonable determination that the proposed transferee and guarantor satisfy the lender’s credit review and underwriting standards, taking into consideration transferee experience, financial strength and general business standing; (ii) execution of a recourse guaranty and an environmental indemnity by an affiliate of the transferee; and (iii) if requested by the lender, rating agency confirmation from KBRA, Moody’s and S&P that the transfer will not result in a downgrade, withdrawal or qualification of the respective ratings assigned to the Series 2013-UBS1 Certificates.
Partial Release. Not permitted.
Real Estate Substitution. Not permitted.
Subordinate and Mezzanine Indebtedness. Not permitted.
Ground Lease. None.
Terrorism Insurance. The loan documents require that the “all risk” insurance policy required to be maintained by the borrower provide coverage for terrorism in an amount equal to the full replacement cost of the Dollar General Portfolio Properties. The loan documents also require business interruption insurance covering no less than the 12-month period following the occurrence of a casualty event, together with a six-month extended period of indemnity; provided, however, that the extended period of indemnity is not required as long as Dollar General maintains business interruption insurance in accordance with the loan documents. At the time of origination, Dollar General maintains business interruption insurance in accordance with the loan documents.
THE INFORMATION IN THIS STRUCTURAL AND COLLATERAL TERM SHEET IS NOT COMPLETE AND MAY BE AMENDED PRIOR TO THE TIME OF SALE. THIS TERM SHEET IS NOT AN OFFER TO SELL THESE SECURITIES AND IT IS NOT A SOLICITATION OF AN OFFER TO BUY THESE SECURITIES IN ANY JURISDICTION WHERE THE OFFER OR SALE IS NOT PERMITTED.
69
| NORTH COUNTY VILLAGE |
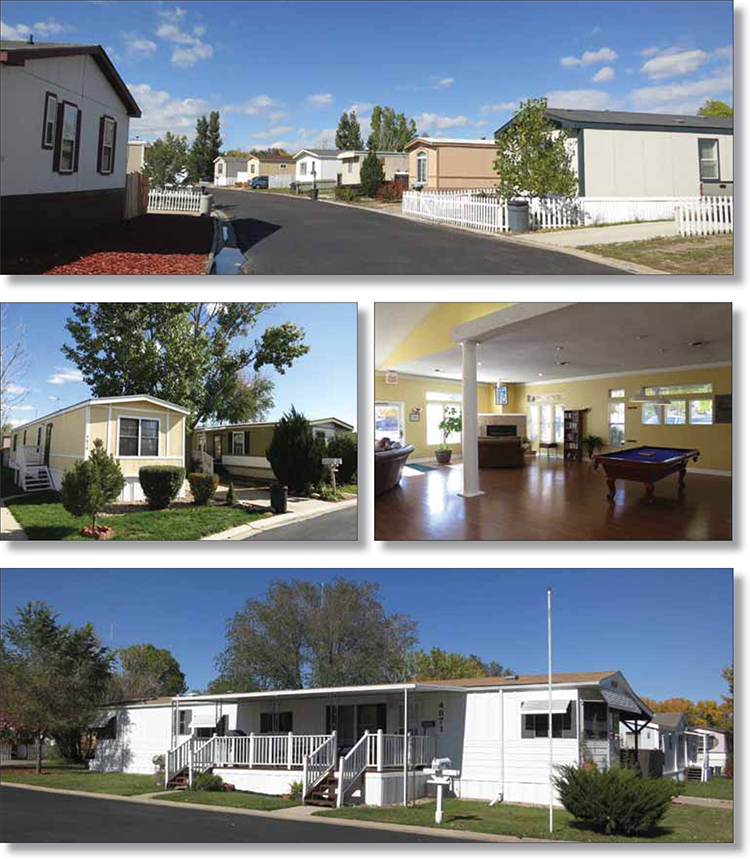
THE INFORMATION IN THIS STRUCTURAL AND COLLATERAL TERM SHEET IS NOT COMPLETE AND MAY BE AMENDED PRIOR TO THE TIME OF SALE. THIS TERM SHEET IS NOT AN OFFER TO SELL THESE SECURITIES AND IT IS NOT A SOLICITATION OF AN OFFER TO BUY THESE SECURITIES IN ANY JURISDICTION WHERE THE OFFER OR SALE IS NOT PERMITTED.
70
| NORTH COUNTY VILLAGE |
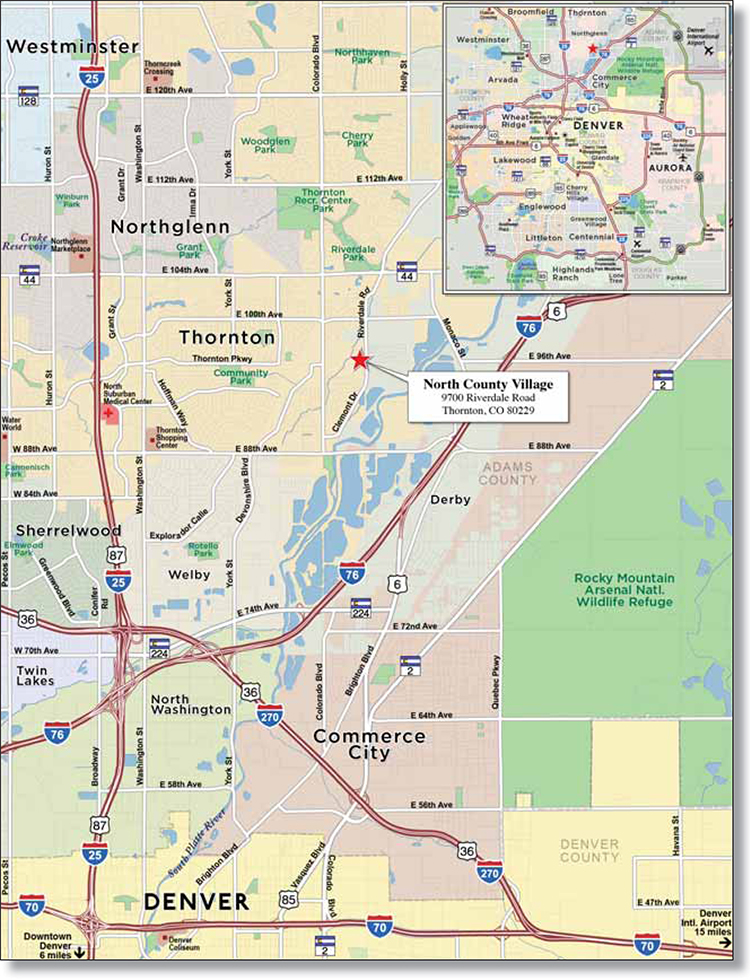
THE INFORMATION IN THIS STRUCTURAL AND COLLATERAL TERM SHEET IS NOT COMPLETE AND MAY BE AMENDED PRIOR TO THE TIME OF SALE. THIS TERM SHEET IS NOT AN OFFER TO SELL THESE SECURITIES AND IT IS NOT A SOLICITATION OF AN OFFER TO BUY THESE SECURITIES IN ANY JURISDICTION WHERE THE OFFER OR SALE IS NOT PERMITTED.
71
| Loan Information | Property Information | ||||||
| Mortgage Loan Seller: | Rialto Mortgage Finance, LLC | Single Asset/Portfolio: | Single Asset | ||||
| Credit Assessment (KBRA/Moody’s/S&P): | NR/NR/NR | Property Type: | Manufactured Housing Community | ||||
| Original Principal Balance: | Specific Property Type: | Manufactured Housing Community | |||||
| Cut-off Date Principal Balance: | Location: | ||||||
| % of Initial Pool Balance: | 3.1% | Size: | |||||
| Loan Purpose: | Cut-off Date Principal Balance Per Pad: | ||||||
| Borrower Name: | Year Built/Renovated: | ||||||
| Sponsors: | Lee M. Kort; Michael H. Scott | Title Vesting: | |||||
| Mortgage Rate: | Property Manager: | ||||||
| Note Date: | November 1, 2013 | 3rd Most Recent Occupancy (As of): | |||||
| Anticipated Repayment Date: | NAP | 2nd Most Recent Occupancy (As of): | |||||
| Maturity Date: | November 6, 2023 | Most Recent Occupancy (As of): | |||||
| IO Period: | Current Occupancy (As of): | ||||||
| Loan Term (Original): | 120 months | ||||||
| Seasoning: | 1 month | Underwriting and Financial Information: | |||||
| Amortization Term (Original): | |||||||
| Loan Amortization Type: | Interest-only, Amortizing Balloon | 3rd Most Recent NOI (As of): | |||||
| Interest Accrual Method: | Actual/360 | 2nd Most Recent NOI (As of): | |||||
| Call Protection: | Most Recent NOI (As of): | ||||||
| Lockbox Type: | Springing (Without Established Account) | ||||||
| Additional Debt: | None | U/W Revenues: | |||||
| Additional Debt Type: | NAP | U/W Expenses: | |||||
| U/W NOI: | |||||||
| U/W NCF: | |||||||
| U/W NOI DSCR: | |||||||
| U/W NCF DSCR: | |||||||
Escrows and Reserves(1): | U/W NOI Debt Yield: | ||||||
| U/W NCF Debt Yield: | |||||||
Type: | Initial | Monthly | Cap (If Any) | As-Is Appraised Value: | |||
| Taxes | $66,626 | $7,932 | NAP | As-Is Appraisal Valuation Date: | |||
| Insurance | $3,122 | NAP | Cut-off Date LTV Ratio: | ||||
| Replacement Reserves | $0 | $1,771 | NAP | LTV Ratio at Maturity or ARD: | |||
| (1) | See “Escrows” section. |
The Mortgage Loan. The mortgage loan (the “North County Village Mortgage Loan”) is evidenced by a single promissory note that is secured by a first mortgageencumbering a 425-pad manufactured housing community located in Thornton, Colorado (the “North County Village Property”). The North County Village Mortgage Loan was originated on November 1, 2013 by Rialto Mortgage Finance, LLC. The North County Village Mortgage Loan had an original principal balance of $22,300,000, has an outstanding principal balance as of the Cut-off Date of $22,300,000 and accrues interest at an interest rate of 5.060% per annum. The North County Village Mortgage Loan had an initial term of 120 months, has a remaining term of 119 months as of the Cut-off Date and requires interest-only payments for the first 60 months following origination and thereafter requires payments of principal and interest based on a 30-year amortization schedule. The North County Village Mortgage Loan matures on November 6, 2023.
Following the lockout period, the borrower has the right to defease the North County Village Mortgage Loan in whole, but not in part, on any due date before August 6, 2023. In addition, the North County Village Mortgage Loan is prepayable without penalty on or after August 6, 2023.
Sources and Uses
| Sources | Uses | |||||||
| Original loan amount | Loan payoff | $13,194,095 | 59.2% | |||||
| Reserves | 86,295 | 0.4 | ||||||
| Closing costs | 124,925 | 0.6 | ||||||
| 8,894,684 | 39.9 | |||||||
| Total Sources | 100.0% | Total Uses | 100.0% |
THE INFORMATION IN THIS STRUCTURAL AND COLLATERAL TERM SHEET IS NOT COMPLETE AND MAY BE AMENDED PRIOR TO THE TIME OF SALE. THIS TERM SHEET IS NOT AN OFFER TO SELL THESE SECURITIES AND IT IS NOT A SOLICITATION OF AN OFFER TO BUY THESE SECURITIES IN ANY JURISDICTION WHERE THE OFFER OR SALE IS NOT PERMITTED.
72
| NORTH COUNTY VILLAGE |
The Property. The North County Village Property is a 425-pad manufactured housing community located in Thornton, Colorado, approximately 13.7 miles north of the Denver central business district. The North County Village Property is an all-age community offering single-wide and double-wide home sites, developed in 1969, and is situated on approximately 69.2 acres. The North County Village Property features asphalt drives, off street parking with one parking space per pad site, and connection to public water and sewer systems. Amenities include a clubhouse/management office, a community room with full kitchen, a billiard table, two swimming pools, two spas, two playgrounds, and a laundry room. The North County Village Property also offers two RV storage areas with a capacity for 42 vehicles. As of October 15, 2013, the North County Village Property was 84.9% occupied.
The following table presents certain information relating to the unit mix of the North County Village Property:
Unit Mix Summary(1)
| Pad Type | No. of Pads | % of Total Pads | Average U/W Monthly Rent per Pad |
| Total/Weighted Average | 100.0% |
| (1) | Information obtained from the underwritten rent roll. |
Historical Occupancy
| (1) | Information obtained from the borrower. |
Operating History and Underwritten Net Cash Flow. The following table presents certain information relating to the historical operating performance and Underwritten Net Cash Flow at the North County Village Property:
Cash Flow Analysis
| U/W | U/W $ per Pad | ||||||||||||||
| Base Rent | $2,360,590 | ||||||||||||||
| Grossed Up Vacant Space | |||||||||||||||
| Concessions | |||||||||||||||
| Other Income | 173,867 | ||||||||||||||
| Less Vacancy & Credit Loss | |||||||||||||||
| Effective Gross Income | |||||||||||||||
| Total Operating Expenses | $536,430 | $1,262 | |||||||||||||
| Net Operating Income | $1,972,586 | $4,467 | |||||||||||||
| Capital Expenditures | |||||||||||||||
| Net Cash Flow | $1,972,586 | ||||||||||||||
| NOI DSCR | 1.17x | 1.29x | 1.36x | 1.31x | |||||||||||
| NCF DSCR | 1.17x | 1.29x | 1.36x | 1.30x | |||||||||||
| NOI DY | |||||||||||||||
| NCF DY |
| (1) | The underwritten economic vacancy is 16.5%. The North County Village Property was 84.9% physically occupied as of October 15, 2013. |
Appraisal. As of the appraisal valuation date of October 11, 2013, the North County Village Property had an “as-is” appraised value of $30,800,000.
Environmental Matters. According to a Phase I environmental assessment dated October 25, 2013, there was no evidence of any recognized environmental conditions at the North County Village Property.
THE INFORMATION IN THIS STRUCTURAL AND COLLATERAL TERM SHEET IS NOT COMPLETE AND MAY BE AMENDED PRIOR TO THE TIME OF SALE. THIS TERM SHEET IS NOT AN OFFER TO SELL THESE SECURITIES AND IT IS NOT A SOLICITATION OF AN OFFER TO BUY THESE SECURITIES IN ANY JURISDICTION WHERE THE OFFER OR SALE IS NOT PERMITTED.
73
| NORTH COUNTY VILLAGE |
Market Overview and Competition. The North County Village Property is located in Thornton, Colorado, approximately 13.7 miles north of the Denver central business district. Thornton is a bedroom community of the Denver-Aurora-Broomfield metropolitan statistical area. The Denver-Aurora-Broomfield metropolitan statistical area has a population of 2.7 million and makes up 51% of the population of Colorado. The Denver-Aurora-Broomfield metropolitan statistical area is the largest population center within a 500-mile radius and serves as the economic hub of the Rocky Mountain region. Denver’s strengths are its concentration of high-tech manufacturing industries, above-average per capita income, strong quality of life factors, major airport, and central geographic location. In addition, according to the appraisal the metro area’s skilled workforce, expansive research base, and growing information technology industries will continue to attract a healthy flow of new residents and growing capital investment. The unemployment rate in the Denver-Aurora-Broomfield metropolitan statistical area was 6.7% as of July 2013, which is below that of the state and national level of 7.1% and 7.4%, respectively. According to a market research report, the 2010 population within a one, three, and five-mile radius is 10,441, 87,575, and 235,143, respectively. According to the appraisal, the 2012 average household income within a one-, three-, and five-mile radius of the North County Village Property is $57,922, $62,169, and $63,728, respectively. According to the appraisal, as of 2013 all-age manufactured housing communities in the Denver-Aurora-Broomfield metropolitan statistical area had an average monthly rental rate of $559 per pad and average occupancy rate of 91.0%.
The following table presents certain information relating to comparable manufactured housing communities for the North County Village Property:
Competitive Set(1)
| Thornton Estates | Pine Lakes Ranch Mobile Home Park | Chapparal Village | Wikiup Mobile Home Park | Commerce Heights | Shady Lane MHC | ||
| Location | Thornton, CO | Thornton, CO | Thornton, CO | Thornton, CO | Henderson, CO | Commerce City, CO | Commerce City, CO |
| Distance to Subject | -- | 1.7 miles | 0.6 miles | 2.0 miles | 3.1 miles | 3.6 miles | 5.9 miles |
| Number of Units | 425 | 208 | 766 | 110 | 339 | 52 | 64 |
| Average Rent (per pad) | $539 | $560 | $586 | $587 | $623 | $450 | $505 |
| Year Built/Renovated | 1986/NAP | 1969/NAP | 1970/NAP | 1971/NAP | 1958/NAP | 1951/NAP | 1948/NAP |
| Total Occupancy | 85% | 93% | 86% | 100% | 99% | 92% | 86% |
| (1) | Information obtained from the appraisal and underwritten rent roll. |
The Borrower. The borrower is North County Village Associates, LLC, a single purpose entity with one independent director in the borrower structure. Lee M. Kort and Michael H. Scott, the owners of the borrower, are the guarantors of certain nonrecourse carveouts under the North County Village Mortgage Loan.
The Sponsor. The sponsors, Lee M. Kort and Michael H. Scott, co-founded the Kort & Scott Real Estate Group, Inc. in 1990. The sponsors have owned and operated manufactured housing communities for 22 years, and currently jointly own and operate 31 manufactured housing communities, which total nearly 6,000 sites, including the North County Village Property. All of the communities within their portfolio are located throughout California, New Mexico, and Colorado. According to a third party mobile home research website, Kort & Scott Real Estate Group are noted as the 25th largest owners of manufactured housing communities throughout the United States. In 2009, the sponsors had ownership interests in a manufactured housing community that was the subject of a foreclosure. See “Description of the Mortgage Pool – Default History, Bankruptcy Issues and Other Proceedings” in the Free Writing Prospectus.
Escrows. The loan documents provide for upfront reserves in the amount of $66,626 for real estate taxes and $19,670 for insurance. The loan documents also provide for ongoing monthly escrow deposits of $7,932 for taxes, $3,122 for insurance and $1,771 for replacement reserves.
Lockbox and Cash Management. Upon the occurrence of a Cash Sweep Event Period, defined below, the North County Village Mortgage Loan requires the borrower to (i) establish a lender-controlled lockbox account and (ii) direct the manager to deliver all receipts payable with respect to the North County Village Property directly into the lockbox account within two business days of receipt. During the continuance of a Cash Sweep Event, (i) all funds deposited in the lender-controlled lockbox account are required to be swept to a cash management account controlled by the lender for application to the obligations of the borrower in connection with the North County Village Mortgage Loan, and (ii) all excess cash flow, if any, will remain with the lender as additional collateral for the North County Village Mortgage Loan. If no Cash Sweep Event Period exists (following the establishment of the lockbox account), the lender is required to furnish a notice to the lockbox bank instructing it to disburse all funds in the lender-controlled lockbox account to an account designated by the borrower at all times that a Cash Sweep Event Period is not continuing.
A “Cash Sweep Event Period” will commence upon the occurrence and continuance of (i) a monetary event of default or (ii) the bankruptcy of either guarantor.
Assumption. The borrower has the right to transfer the North County Village Property, provided that no event of default has occurred and is continuing and certain other conditions are satisfied, including (i) the lender’s reasonable determination that the proposed transferee and guarantor satisfy the lender’s credit review and underwriting standards, taking into consideration transferee experience, financial strength and general business standing; (ii) execution of a recourse guaranty and an environmental indemnity by an affiliate of the transferee; and (iii) if requested by the lender, rating agency confirmation from KBRA, Moody’s, and
THE INFORMATION IN THIS STRUCTURAL AND COLLATERAL TERM SHEET IS NOT COMPLETE AND MAY BE AMENDED PRIOR TO THE TIME OF SALE. THIS TERM SHEET IS NOT AN OFFER TO SELL THESE SECURITIES AND IT IS NOT A SOLICITATION OF AN OFFER TO BUY THESE SECURITIES IN ANY JURISDICTION WHERE THE OFFER OR SALE IS NOT PERMITTED.
74
| NORTH COUNTY VILLAGE |
S&P that the transfer will not result in a downgrade, withdrawal or qualification of the respective ratings assigned to the Series 2013-UBS1 Certificates.
Partial Release. Not permitted.
Real Estate Substitution. Not permitted.
Subordinate and Mezzanine Indebtedness. Not permitted.
Ground Lease. None.
Terrorism Insurance. The loan documents require that the “all risk” insurance policy required to be maintained by the borrower provide coverage for terrorism in an amount equal to the full replacement cost of the North County Village Property. The loan documents also require business interruption insurance covering up to the 18-month period following the occurrence of a casualty event, together with a 12-month extended period of indemnity coverage.
THE INFORMATION IN THIS STRUCTURAL AND COLLATERAL TERM SHEET IS NOT COMPLETE AND MAY BE AMENDED PRIOR TO THE TIME OF SALE. THIS TERM SHEET IS NOT AN OFFER TO SELL THESE SECURITIES AND IT IS NOT A SOLICITATION OF AN OFFER TO BUY THESE SECURITIES IN ANY JURISDICTION WHERE THE OFFER OR SALE IS NOT PERMITTED.
75
| HAMPTON INN & SUITES - GREENVILLE |

THE INFORMATION IN THIS STRUCTURAL AND COLLATERAL TERM SHEET IS NOT COMPLETE AND MAY BE AMENDED PRIOR TO THE TIME OF SALE. THIS TERM SHEET IS NOT AN OFFER TO SELL THESE SECURITIES AND IT IS NOT A SOLICITATION OF AN OFFER TO BUY THESE SECURITIES IN ANY JURISDICTION WHERE THE OFFER OR SALE IS NOT PERMITTED.
76
| HAMPTON INN & SUITES - GREENVILLE |
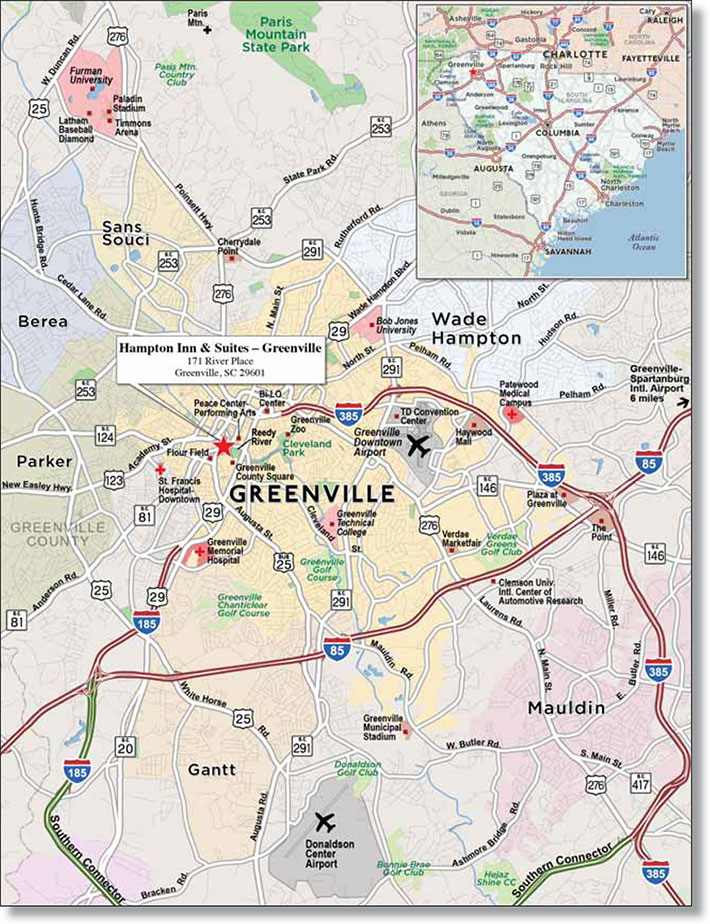
THE INFORMATION IN THIS STRUCTURAL AND COLLATERAL TERM SHEET IS NOT COMPLETE AND MAY BE AMENDED PRIOR TO THE TIME OF SALE. THIS TERM SHEET IS NOT AN OFFER TO SELL THESE SECURITIES AND IT IS NOT A SOLICITATION OF AN OFFER TO BUY THESE SECURITIES IN ANY JURISDICTION WHERE THE OFFER OR SALE IS NOT PERMITTED.
77
| No. 7 – Hampton Inn & Suites - Greenville | |||||||
| Loan Information | Property Information | ||||||
| Mortgage Loan Seller: | Wells Fargo Bank, National Association | Single Asset/Portfolio: | Single Asset | ||||
| Credit Assessment (KBRA/Moody’s/S&P): | NR/NR/NR | Property Type: | Hospitality | ||||
| Original Principal Balance: | $19,750,000 | Specific Property Type: | Limited Service | ||||
| Cut-off Date Principal Balance: | $19,706,304 | Location: | Greenville, SC | ||||
| % of Initial Pool Balance: | 2.7% | Size: | 115 rooms | ||||
| Loan Purpose: | Refinance | Cut-off Date Principal Balance Per Room: | $171,359 | ||||
| Borrower Name: | Greenville RHP Holdings, LLC | Year Built/Renovated: | 2006/NAP | ||||
| Sponsor: | Paul C. Aughtry, III | Title Vesting: | Fee | ||||
| Mortgage Rate: | 5.120% | Property Manager: | Hospitality America, Inc. | ||||
| Note Date: | September 27, 2013 | 3rd Most Recent Occupancy (As of): | 75.4% (12/31/2010) | ||||
| Anticipated Repayment Date: | NAP | 2nd Most Recent Occupancy (As of): | 78.1% (12/31/2011) | ||||
| Maturity Date: | October 1, 2023 | Most Recent Occupancy (As of): | 79.0% (12/31/2012) | ||||
| IO Period: | None | Current Occupancy (As of): | 79.1% (7/31/2013) | ||||
| Loan Term (Original): | 120 months | ||||||
| Seasoning: | 2 months | Underwriting and Financial Information: | |||||
| Amortization Term (Original): | 360 months | ||||||
| Loan Amortization Type: | Amortizing Balloon | 3rd Most Recent NOI (As of): | $1,919,123 (12/31/2011) | ||||
| Interest Accrual Method: | Actual/360 | 2nd Most Recent NOI (As of): | $2,386,171 (12/31/2012) | ||||
| Call Protection: | L(26),D(90),O(4) | Most Recent NOI (As of): | $2,617,125 (TTM 7/31/2013) | ||||
| Lockbox Type: | Springing (Without Established Account) | ||||||
| Additional Debt: | None | ||||||
| Additional Debt Type: | NAP | U/W Revenues: | $6,050,325 | ||||
| U/W Expenses: | $3,447,857 | ||||||
| U/W NOI: | $2,602,468 | ||||||
| U/W NCF: | $2,360,455 | ||||||
| U/W NOI DSCR: | 2.02x | ||||||
| U/W NCF DSCR: | 1.83x | ||||||
Escrows and Reserves(1): | U/W NOI Debt Yield: | 13.2% | |||||
| U/W NCF Debt Yield: | 12.0% | ||||||
Type: | Initial | Monthly | Cap (If Any) | As-Is Appraised Value: | $28,500,000 | ||
| Taxes | $141,785 | $14,178 | NAP | As-Is Appraisal Valuation Date: | August 2, 2013 | ||
| Insurance | $0 | Springing | NAP | Cut-off Date LTV Ratio: | 69.1% | ||
| FF&E | $0 | $20,168 | NAP | LTV Ratio at Maturity or ARD: | 57.2% | ||
| (1) | See “Escrows” section. |
The Mortgage Loan. The mortgage loan (the “Hampton Inn & Suites - Greenville Mortgage Loan”) is evidenced by a single promissory note that is secured by a first mortgage encumbering a limited-service hotel located in Greenville, South Carolina (the “Hampton Inn & Suites - Greenville Property”). The Hampton Inn & Suites - Greenville Mortgage Loan was originated on September 27, 2013 by Wells Fargo Bank, National Association. The Hampton Inn & Suites - Greenville Mortgage Loan had an original principal balance of $19,750,000, has an outstanding principal balance as of the Cut-off Date of $19,706,304 and accrues interest at an interest rate of 5.120% per annum. The Hampton Inn & Suites - Greenville Mortgage Loan had an initial term of 120 months, has a remaining term of 118 months as of the Cut-off Date and requires payments of principal and interest based on a 30-year amortization schedule. The Hampton Inn & Suites - Greenville Mortgage Loan matures on October 1, 2023.
Following the lockout period, the borrower has the right to defease the Hampton Inn & Suites - Greenville Mortgage Loan in whole, but not in part, on any date before July 1, 2023. In addition, the Hampton Inn & Suites - Greenville Mortgage Loan is prepayable without penalty on or after July 1, 2023.
Sources and Uses
| Sources | Uses | ||||||||
| Original loan amount | $19,750,000 | 100.0% | Loan payoff(1) | $9,832,182 | 49.8 | % | |||
| Reserves | 141,785 | 0.7 | |||||||
| Closing costs | 360,607 | 1.8 | |||||||
| Return of equity | 9,415,426 | 47.7 | |||||||
| Total Sources | $19,750,000 | 100.0% | Total Uses | $19,750,000 | 100.0 | % |
| (1) | The Hampton Inn & Suites - Greenville Property was previously securitized in CSMC 2007-C1. |
THE INFORMATION IN THIS STRUCTURAL AND COLLATERAL TERM SHEET IS NOT COMPLETE AND MAY BE AMENDED PRIOR TO THE TIME OF SALE. THIS TERM SHEET IS NOT AN OFFER TO SELL THESE SECURITIES AND IT IS NOT A SOLICITATION OF AN OFFER TO BUY THESE SECURITIES IN ANY JURISDICTION WHERE THE OFFER OR SALE IS NOT PERMITTED.
78
| HAMPTON INN & SUITES - GREENVILLE |
The Property. The Hampton Inn & Suites - Greenville Property consists of a six-story limited service hotel, which was built in 2006 and is located in Greenville, South Carolina. The Hampton Inn & Suites - Greenville Property offers 115 guest rooms, including 63 standard king guest rooms, 19 studio king guestrooms, 28 standard queen guest rooms, one studio queen guest room and four signature suites. Each guest room includes a desk, ergonomic chair, lamps, flat screen television, internet service, mini-refrigerator, microwave and coffee maker. The suites feature an additional television, pull-out sofa and wet bar. Amenities at the Hampton Inn & Suites - Greenville Property include 1,155 square feet of meeting space, complimentary breakfast service, a fitness center, business center and sundry shop. The borrower is the 87.1% member of the condominium regime that owns the fee interest in the air rights of the land located underneath the Hampton Inn & Suites - Greenville Property. The Hampton Inn & Suites - Greenville Property is located above a two-level subterranean parking garage, which is owned by the city. There is a parking agreement in place with the city of Greenville which allows the Hampton Inn & Suites - Greenville Property to rent up to 115 parking spaces on a daily basis. The Hilton franchise agreement expires in July 2027.
Operating History and Underwritten Net Cash Flow. The following table represents certain information relating to the historical operating performance and the Underwritten Net Cash Flow at the Hampton Inn & Suites - Greenville Property:
Cash Flow Analysis
| 2011 | 2012 | TTM 7/31/2013 | U/W | U/W $ per Room | ||||||||||
| Occupancy | 78.1% | 79.0% | 79.1% | 79.1% | ||||||||||
| ADR | $150.16 | $163.82 | $172.75 | $172.75 | ||||||||||
| RevPAR | $117.29 | $129.40 | $136.69 | $136.69 | ||||||||||
| Total Revenue | $5,232,743 | $5,740,608 | $6,050,516 | $6,050,325 | $52,612 | |||||||||
| Total Department Expenses | 1,363,178 | 1,363,223 | 1,374,778 | 1,402,271 | 12,194 | |||||||||
| Gross Operating Profit | $3,869,565 | $4,377,385 | $4,675,738 | $4,648,055 | $40,418 | |||||||||
| Total Undistributed Expenses | 1,766,596 | 1,796,458 | 1,852,044 | 1,835,607 | 15,962 | |||||||||
| Profit Before Fixed Charges | $2,102,969 | $2,580,927 | $2,823,694 | $2,812,448 | $24,456 | |||||||||
| Total Fixed Charges | 183,846 | 194,756 | 206,569 | 209,980 | 1,826 | |||||||||
| Net Operating Income | $1,919,123 | $2,386,171 | $2,617,125 | $2,602,468 | $22,630 | |||||||||
| FF&E | 0 | 0 | 0 | 242,013 | 2,104 | |||||||||
| Net Cash Flow | $1,919,123 | $2,386,171 | $2,617,125 | $2,360,455 | $20,526 | |||||||||
| NOI DSCR | 1.49x | 1.85x | 2.03x | 2.02x | ||||||||||
| NCF DSCR | 1.49x | 1.85x | 2.03x | 1.83x | ||||||||||
| NOI DY | 9.7% | 12.1% | 13.3% | 13.2% | ||||||||||
| NCF DY | 9.7% | 12.1% | 13.3% | 12.0% | ||||||||||
Appraisal. As of the appraisal valuation date of August 2, 2013, the Hampton Inn & Suites - Greenville Property had an “as-is” appraised value of $28,500,000.
Environmental Matters. According to the Phase I environmental assessment dated July 12, 2013, there was no evidence of any recognized environmental conditions at the Hampton Inn & Suites - Greenville Property.
Market Overview and Competition. The Hampton Inn & Suites - Greenville Property is located in Greenville, South Carolina along the Interstate 85 corridor, approximately halfway between Atlanta (approximately 145 miles southwest) and Charlotte (approximately 100 miles northeast). The Greenville Downtown Airport is located approximately four miles east of the Hampton Inn & Suites Greenville Property and is accessible via Interstate 385. The Hampton Inn & Suites - Greenville Property is part of the River Place Development, a 5.5-acre mixed-use development along the Reedy River on the south side of Greenville. The River Place Development features a mix of retail, office, condominiums and apartments. Nearby attractions include (i) the Bi-Lo Center, a 15,000 seat indoor arena and the region’s main venue for major entertainment and sporting events, (ii) Peace Center for Performing Arts, a venue which holds over 300 performances a year (200,000 in annual attendance), (iii) Fluor Field, a baseball facility that is an exact replica of Fenway Park in Boston, which serves as the home of the class A affiliate of the Boston Red Sox and (iv) Falls Park on the Reedy, a $15.0 million regional park with gardens and several waterfalls. The Greenville market also contains approximately 3.1 million square feet of office space and is the North American Headquarters for Hubbell Lighting, Perceptis and Michelin North America. Greenville is also home to offices for BMW, which has a manufacturing facility in nearby Spartanburg and provides 23,000 jobs and contributes an estimated $4.6 billion to South Carolina’s economy. Two of the top five employers in the area are Greenville Health System, a Level I trauma center, and Bon Secours St. Francis Health System, a cancer center which received the American College of Surgeons Commission on Cancer Award. Further, the Greenville area tied for the number two spot on the “Best” portion of Forbes list of “The Best and Worst Cities for Jobs This Fall” as of fall 2013. According to the appraisal, the estimated market segmentation mix at the Hampton Inn & Suites - Greenville Property is 70% commercial, 25% leisure and 5% group.
THE INFORMATION IN THIS STRUCTURAL AND COLLATERAL TERM SHEET IS NOT COMPLETE AND MAY BE AMENDED PRIOR TO THE TIME OF SALE. THIS TERM SHEET IS NOT AN OFFER TO SELL THESE SECURITIES AND IT IS NOT A SOLICITATION OF AN OFFER TO BUY THESE SECURITIES IN ANY JURISDICTION WHERE THE OFFER OR SALE IS NOT PERMITTED.
79
| HAMPTON INN & SUITES - GREENVILLE |
The following table presents certain information relating to the Hampton Inn & Suites - Greenville Property’s competitive set:
Subject and Market Historical Occupancy, ADR and RevPAR(1)
Competitive Set | Hampton Inn & Suites Greenville | Penetration Factor | ||||||||||||||
Year | Occupancy | ADR | RevPAR | Occupancy | ADR | RevPAR | Occupancy | ADR | RevPAR | |||||||
| 8/31/2013 TTM | 74.3% | $126.32 | $93.81 | 79.4% | $174.38 | $138.53 | 107.0% | 138.0% | 147.7% | |||||||
| 8/31/2012 TTM | 68.8% | $118.82 | $81.76 | 78.6% | $158.36 | $124.40 | 114.2% | 133.3% | 152.1% | |||||||
| 8/31/2011 TTM | 67.8% | $111.04 | $75.24 | 76.7% | $148.09 | $113.52 | 113.1% | 133.4% | 150.9% | |||||||
| (1) | Information obtained from a third party hospitality research report dated September 18, 2013. According to such third party hospitality report, the competitive set includes the following hotels: Hyatt Regency Greenville, Holiday Inn Express Greenville Downtown, Hilton Greenville, Embassy Suites Greenville Resort & Conference Center, Westin Poinsett and Courtyard Greenville Downtown. |
The Borrower. The borrower is Greenville RHP Holdings, LLC, a South Carolina limited liability company and a single purpose entity with two independent directors. Paul C. Aughtry, III, the sponsor and managing member of the borrower, is the guarantor of certain nonrecourse carveouts under the Hampton Inn & Suites - Greenville Mortgage Loan.
The Sponsor. The sponsor, Paul C. Aughtry, III, was one of the key individuals involved in the original development of the Hampton Inn & Suites - Greenville Property in 2006 by the Windsor Aughtry Company. The Windsor Aughtry Company is an established residential and commercial real estate company based in Greenville, South Carolina. The firm has developed and managed over 1 million square feet of retail and office parks along with the development of six hotels, with another two in progress. The company’s current hotel portfolio consists of six properties (including the Hampton Inn & Suites Greenville) totaling 796 rooms under the Hampton Inn and Hilton flags.
Escrows. The loan documents provide for upfront reserves in the amount of $141,785 for real estate taxes. The loan documents also provide for ongoing monthly reserves in the amount of $14,178 for real estate taxes. In addition, the loan documents provide for an ongoing monthly FF&E reserve (currently $20,168) equal to the greater of (i) 4.0% of operating income for the preceding fiscal year and (ii) $20,168. Ongoing monthly reserves for insurance are not required as long as the following conditions are satisfied: (i) no event of default has occurred and is continuing; (ii) a blanket insurance policy is in full force and effect in accordance with the loan documents; and (iii) the borrower provides the lender with evidence of timely payment of insurance premiums.
Lockbox and Cash Management. Upon the occurrence of a Cash Trap Event Period (as defined below), the borrower is required to establish a lender-controlled lockbox account into which the borrower and the property manager are required to deposit all receipts payable within one business day of receipt, and all excess funds on deposit in the lockbox account will be swept to a lender-controlled cash flow subaccount monthly.
A “Cash Trap Event Period” will commence upon the earlier of (i) the occurrence and continuance of an event of default or (ii) the
NCF debt yield falling below 8.0% at the end of any calendar quarter. A Cash Trap Event Period will end, with respect to clause (i) above, upon the cure of such event of default and with respect to clause (ii) above, upon the NCF debt yield being equal to or greater than 8.0% for two consecutive calendar quarters.
Property Management. The Hampton Inn & Suites - Greenville is managed by Hospitality America, Inc.
Assumption. The borrower has a two-time right to transfer the Hampton Inn & Suites - Greenville Property, provided that no event of default has occurred and is continuing and certain other conditions are satisfied, including (i) the lender’s reasonable determination that the proposed transferee and guarantor satisfy the lender’s credit review and underwriting standards, taking into consideration transferee experience, financial strength and general business standing; (ii) execution of a recourse guaranty and an environmental indemnity by an affiliate of the transferee; and (iii) if requested by the lender, rating agency confirmation from KBRA, Moody’s and S&P that the transfer will not result in a downgrade, withdrawal or qualification of the respective ratings assigned to the Series 2013-UBS1 Certificates.
Partial Release. Not permitted.
Real Estate Substitution. Not permitted.
Subordinate and Mezzanine Indebtedness. Not permitted.
Ground Lease. None.
Terrorism Insurance. The loan documents require that the “all risk” insurance policy required to be maintained by the borrower provide coverage for terrorism in an amount equal to the full replacement cost of the Hampton Inn & Suites - Greenville Property, as well as business interruption insurance covering no less than the 12-month period following the occurrence of a casualty event, together with a six-month extended period of indemnity.
THE INFORMATION IN THIS STRUCTURAL AND COLLATERAL TERM SHEET IS NOT COMPLETE AND MAY BE AMENDED PRIOR TO THE TIME OF SALE. THIS TERM SHEET IS NOT AN OFFER TO SELL THESE SECURITIES AND IT IS NOT A SOLICITATION OF AN OFFER TO BUY THESE SECURITIES IN ANY JURISDICTION WHERE THE OFFER OR SALE IS NOT PERMITTED.
80
(THIS PAGE INTENTIONALLY LEFT BLANK)
81
| BLUEPEARL PORTFOLIO |
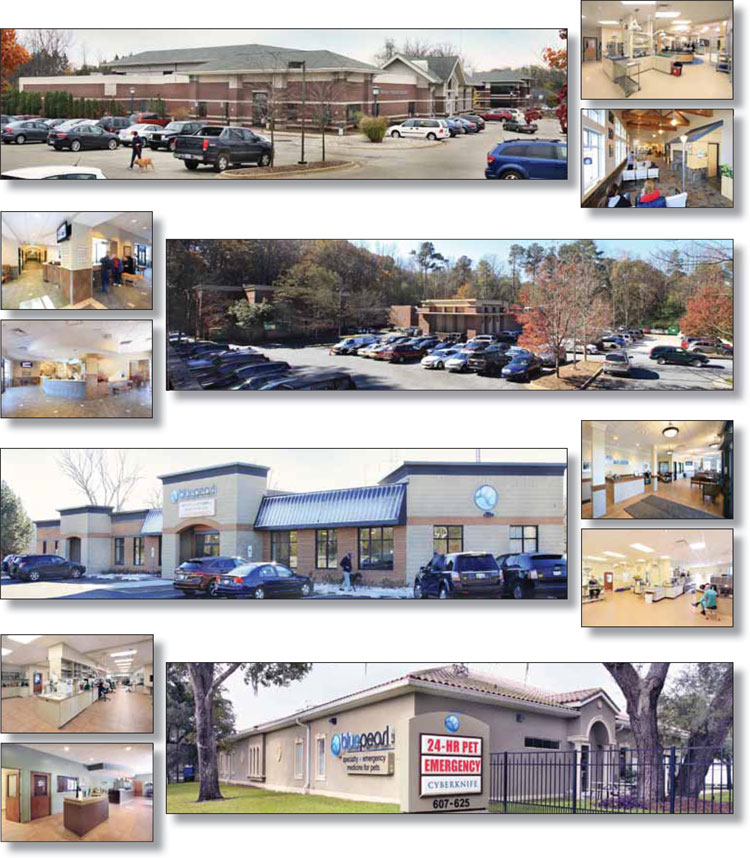
THE INFORMATION IN THIS STRUCTURAL AND COLLATERAL TERM SHEET IS NOT COMPLETE AND MAY BE AMENDED PRIOR TO THE TIME OF SALE. THIS TERM SHEET IS NOT AN OFFER TO SELL THESE SECURITIES AND IT IS NOT A SOLICITATION OF AN OFFER TO BUY THESE SECURITIES IN ANY JURISDICTION WHERE THE OFFER OR SALE IS NOT PERMITTED.
82
| BLUEPEARL PORTFOLIO |
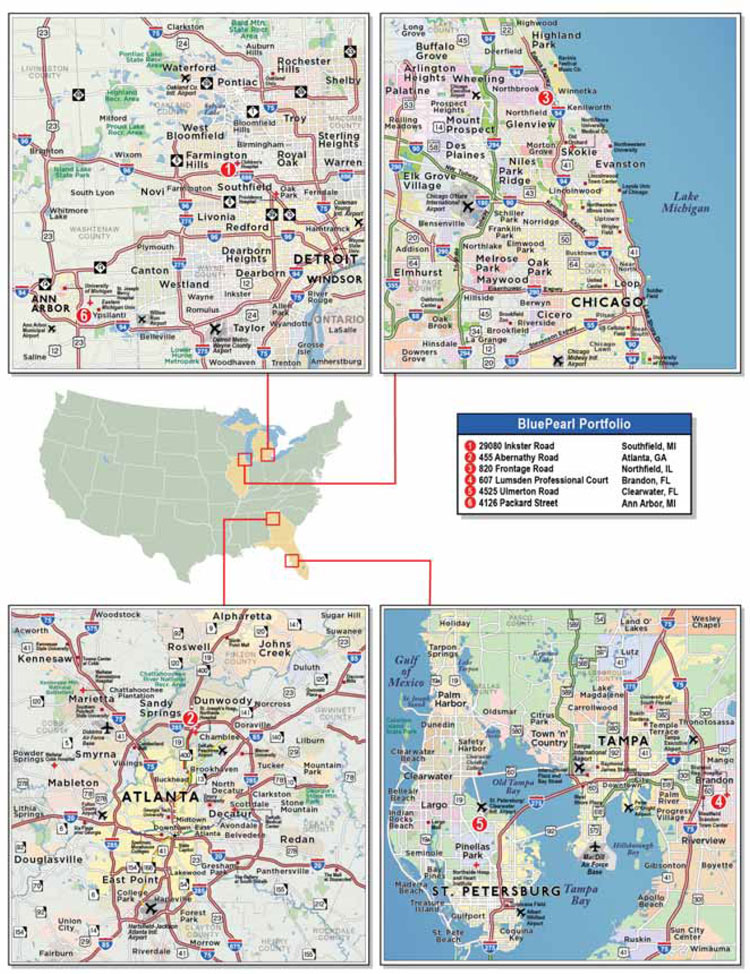
THE INFORMATION IN THIS STRUCTURAL AND COLLATERAL TERM SHEET IS NOT COMPLETE AND MAY BE AMENDED PRIOR TO THE TIME OF SALE. THIS TERM SHEET IS NOT AN OFFER TO SELL THESE SECURITIES AND IT IS NOT A SOLICITATION OF AN OFFER TO BUY THESE SECURITIES IN ANY JURISDICTION WHERE THE OFFER OR SALE IS NOT PERMITTED.
83
| No. 8 – BluePearl Portfolio | |||||||
| Loan Information | Property Information | ||||||
| Mortgage Loan Seller: | UBS Real Estate Securities, Inc. | Single Asset/Portfolio: | Portfolio | ||||
Credit Assessment (KBRA/Moody’s/S&P): | NR/NR/NR | Property Type: | Office | ||||
| Original Principal Balance: | $18,791,100 | Specific Property Type: | Medical | ||||
| Cut-off Date Principal Balance: | $18,791,100 | Location: | Various – See Table | ||||
| % of Initial Pool Balance: | 2.6% | Size: | 99,000 SF | ||||
| Loan Purpose: | Acquisition | Cut-off Date Principal Balance Per SF: | $189.81 | ||||
| Borrower Name: | BP Lessor, LLC | Year Built/Renovated: | Various – See Table | ||||
| Sponsors: | Lexington Realty Trust; Bin Mahfouz Family | Title Vesting: | Fee | ||||
| Mortgage Rate: | 4.010% | Property Manager: | Self-managed | ||||
| Note Date: | October 25, 2013 | 3rd Most Recent Occupancy (As of)(3): | NAV | ||||
| Anticipated Repayment Date: | November 6, 2018 | 2nd Most Recent Occupancy (As of)(3): | NAV | ||||
| Maturity Date: | November 6, 2023 | Most Recent Occupancy (As of)(3): | NAV | ||||
| IO Period: | 60 months | Current Occupancy (As of)(3): | 100.0% (12/1/2013) | ||||
| Loan Term (Original): | 60 months | ||||||
| Seasoning: | 1 month | Underwriting and Financial Information: | |||||
| Amortization Term (Original): | NAP | ||||||
| Loan Amortization Type: | Interest-only, ARD | 3rd Most Recent NOI (As of)(3): | NAV | ||||
| Interest Accrual Method: | Actual/360 | 2nd Most Recent NOI (As of)(3): | NAV | ||||
Call Protection(1): | L(25),D(31),O(4) | Most Recent NOI (As of)(3): | NAV | ||||
| Lockbox Type: | Hard/Springing Cash Management | ||||||
| Additional Debt: | None | ||||||
| Additional Debt Type: | NAP | ||||||
| U/W Revenues: | $2,724,893 | ||||||
| U/W Expenses: | $81,747 | ||||||
Escrows and Reserves(2): | U/W NOI: | $2,643,146 | |||||
| U/W NCF: | $2,456,517 | ||||||
Type: | Initial | Monthly | Cap (If Any) | U/W NOI DSCR: | 3.46x | ||
| Taxes | $0 | Springing | NAP | U/W NCF DSCR: | 3.22x | ||
| Insurance | $0 | Springing | NAP | U/W NOI Debt Yield: | 14.1% | ||
| Replacement Reserves | $0 | Springing | NAP | U/W NCF Debt Yield: | 13.1% | ||
| TI/LC Reserve | $0 | Springing | NAP | As-Is Appraised Value: | $38,910,000 | ||
| Deferred Maintenance | $16,963 | $0 | NAP | As-Is Appraisal Valuation Date(4): | Various | ||
| Major Tenant TI/LC | $0 | Springing | $2,970,000 | Cut-off Date LTV Ratio: | 48.3% | ||
| Northfield Reserve Fund | $0 | Springing | NAP | LTV Ratio at Maturity or ARD: | 48.3% | ||
| (1) | The BluePearl Portfolio Mortgage Loan may be prepaid in part in connection with a Northfield Cash Sweep Event cure in the amount of the allocated loan amount with respect to the 820 W Frontage Road property prior to the expiration of the lockout period, together with a yield maintenance premium. See “The Mortgage Loan” section. |
| (2) | See “Escrows” section. |
| (3) | Historical occupancy and financial data are not available as the BluePearl Portfolio Properties were acquired in a sale-leaseback transaction in October 2013. |
| (4) | As-Is Appraisal Valuation Dates range from September 4, 2013 to September 12, 2013. |
The Mortgage Loan. The mortgage loan (the “BluePearl Portfolio Mortgage Loan”) is evidenced by a single promissory note that is secured by first mortgages encumbering six medical office properties currently operating as veterinary centers located in four states (the “BluePearl Portfolio Properties”). The BluePearl Portfolio Mortgage Loan was originated on October 25, 2013 by UBS Real Estate Securities, Inc. The BluePearl Portfolio Mortgage Loan had an original principal balance of $18,791,100, has an outstanding principal balance as of the Cut-off Date of $18,791,100 and accrues interest at an interest rate of 4.010% per annum. The BluePearl Portfolio Mortgage Loan had an initial term of 60 months, has a remaining term of 59 months as of the Cut-off Date and requires interest-only payments for the 60 months following origination through the Anticipated Repayment Date (“ARD”). The ARD is November 6, 2018, and the final maturity date is November 6, 2023. In the event the BluePearl Portfolio Mortgage Loan is not repaid in full on or before the ARD, the interest rate on the BluePearl Portfolio Mortgage Loan will increase to the greater of (i) the treasury index rate as of the ARD plus 5.000% and (ii) 10.000%. Provided no Northfield Cash Sweep Event (as defined within the “Lockbox and Cash Management” section below) or an event of default under the BluePearl Portfolio Mortgage Loan documents has occurred and is continuing, the ARD automatically triggers a cash flow sweep whereby all excess cash flow (net of scheduled debt service, required reserves and other items required under the BluePearl Portfolio Mortgage Loan documents) will be used first, to pay down the principal balance of the BluePearl Portfolio Mortgage Loan, without premium or penalty, and second, to the payment of any accrued interest (with respect to any interest accrued above the per annum rate of 4.010%).
THE INFORMATION IN THIS STRUCTURAL AND COLLATERAL TERM SHEET IS NOT COMPLETE AND MAY BE AMENDED PRIOR TO THE TIME OF SALE. THIS TERM SHEET IS NOT AN OFFER TO SELL THESE SECURITIES AND IT IS NOT A SOLICITATION OF AN OFFER TO BUY THESE SECURITIES IN ANY JURISDICTION WHERE THE OFFER OR SALE IS NOT PERMITTED.
84
| BLUEPEARL PORTFOLIO |
Following the lockout period, the borrower has the right to defease the BluePearl Portfolio Mortgage Loan in whole or, in connection with a Northfield Cash Sweep Event cure, in part, with respect to the 820 W Frontage Road property, on any date before August 6, 2018. In addition, the BluePearl Portfolio Mortgage Loan may be prepaid in part in connection with a Northfield Cash Sweep Event cure in the amount of the allocated loan amount with respect to the 820 W Frontage Road property prior to the expiration of the lockout period together with a yield maintenance premium. The BluePearl Portfolio Mortgage Loan is prepayable without penalty on or after August 6, 2018.
Sources and Uses
| Sources | Uses | |||||||||
| Original loan amount | $18,791,100 | 46.7 | % | Purchase price | $39,456,027 | 98.1 | % | |||
| Sponsor’s new cash contribution | 21,441,488 | 53.3 | Reserves | 16,963 | 0.0 | |||||
| Closing costs | 759,599 | 1.9 | ||||||||
| Total Sources | $40,232,588 | 100.0 | % | Total Uses | $40,232,588 | 100.0 | % |
The Properties. The BluePearl Portfolio Mortgage Loan is secured by the fee interests in six medical office properties totaling 99,000 square feet and currently operating as veterinary centers located in Florida, Georgia, Illinois and Michigan. As of December 1, 2013, the BluePearl Portfolio Properties were 100.0% master leased by BluePearl Holdings, LLC (“BPH”) for a 20-year term with four, five year renewal options. The master lease is an absolute net lease with BPH responsible for all expenses including taxes, insurance, repair, maintenance and replacement of roof and structure. Initial annual rent is $2,715,581 ($27.43 per square foot) with increases of 3.0% annually on all of the BluePearl Portfolio Properties except for the 29080 Inkster Road property, which base rent escalates 2.0% annually. The initial base rent under the master lease was set based upon market rental levels for the BluePearl Portfolio Properties. The weighted average market rent for the BluePearl Portfolio Properties as concluded in the related appraisals is $27.42 per square foot versus the initial base rent under the master lease of $27.43 per square foot. The weighted average health ratio (total revenues / total rent) for the BluePearl Portfolio Properties is 7.3% based on year one base rent and budgeted revenue for 2013.
BPH, a privately owned community of hospitals that offer emergency and specialty veterinary medicine, is one of the nation’s largest 24-hour emergency pet care providers with 32 locations across 12 states. BPH employs more than 1,350 people, including more than 350 veterinarians. BPH provides veterinary services including cardiology, ophthalmology, orthopedic surgery, dermatology, neurology, oncology and radiology with MRI and CAT scans. All of the BluePearl Portfolio Properties include equipment that can be used interchangeably with humans and were designed with similar considerations to human healthcare in mind, including ease of cleaning and quarantining of infectious diseases. Approximately 88% of the BluePearl Portfolio Properties’ aggregate square footage are located in markets where average household incomes within a five-mile radius are greater than the national average. The two largest buildings included in the BluePearl Portfolio Properties are located in Atlanta, Georgia and Southfield, Michigan where average household incomes within a five-mile radius of the respective properties are $103,321 and $85,923. According to the Bureau of Labor Statistics, in 2011 Americans owned approximately 218 million pets, not including fish, and spent approximately $61.4 billion on them.
In 2012, BPH experienced significant growth with total revenue of approximately $125.6 million and EBITDA of $23.4 million which represents an increase of 26% and 42% over 2011’s performance, respectively. At fiscal year-end 2012, BPH had an average company-level operating margin of 15.9% and a fixed charge coverage ratio (defined as EBITDAR / Interest Expense + Principal + Rent) of 3.1x. Per a BPH financial analysis report prepared by a third party investment advisory firm as of July 22, 2013, BPH’s credit profile is estimated to be comparable to a credit rating agency equivalent for a senior unsecured rating of BBB/Baa2 to BBB-/Baa3. The managing professionals of each of BPH’s facilities are shareholders in the company. Thereby, the incentives of local managers are aligned with those of the overall company.
The following table presents certain information relating to the BluePearl Portfolio Properties:
| Property Name | Location | Allocated Cut-off Date Principal Balance | % of Portfolio Cut-off Date Principal Balance | Occupancy | Year Built/ Renovated | Net Rentable Area (SF) | Appraised Value | ||||||||||
| 29080 Inkster Road | Southfield, MI | $7,527,800 | 40.1 | % | 100.0% | 2005/NAP | 38,000 | $14,800,000 | |||||||||
| 455 Abernathy Road | Atlanta, GA | $6,510,600 | 34.6 | % | 100.0% | 1999/2007 | 32,000 | $12,800,000 | |||||||||
| 820 W Frontage Road | Northfield, IL | $2,204,400 | 11.7 | % | 100.0% | 1964/2013 | 14,000 | $6,300,000 | |||||||||
| 607 Lumsden Professional Court | Brandon, FL | $1,378,400 | 7.3 | % | 100.0% | 2008/NAP | 8,500 | $2,710,000 | |||||||||
| 4525 Ulmerton Road | Clearwater, FL | $818,900 | 4.4 | % | 100.0% | 1977/2008 | 3,000 | $1,610,000 | |||||||||
| 4126 Packard Street | Ann Arbor, MI | $351,000 | 1.9 | % | 100.0% | 1954/2001 | 3,500 | $690,000 | |||||||||
| Total/Weighted Average | $18,791,100 | 100.0 | % | 100.0% | 99,000 | $38,910,000 | |||||||||||
THE INFORMATION IN THIS STRUCTURAL AND COLLATERAL TERM SHEET IS NOT COMPLETE AND MAY BE AMENDED PRIOR TO THE TIME OF SALE. THIS TERM SHEET IS NOT AN OFFER TO SELL THESE SECURITIES AND IT IS NOT A SOLICITATION OF AN OFFER TO BUY THESE SECURITIES IN ANY JURISDICTION WHERE THE OFFER OR SALE IS NOT PERMITTED.
85
| BLUEPEARL PORTFOLIO |
29080 Inkster Road - Southfield, MI (40.1% of Portfolio Cut-off Date Principal Balance)
The 29080 Inkster Road property consists of a 38,000 square foot freestanding medical office building built in 2005 on a 2.9 acre site. Parking is provided by 194 surface parking spaces, which results in a parking ratio of approximately 5.1 spaces per 1,000 square foot of rentable area. The 29080 Inkster Road property is 100.0% occupied by BPH as of December 1, 2013. According to a market research report, the estimated 2013 population within a one-, three-, and five-mile radius of the 29080 Inkster Road property is 7,481, 58,686, and 185,999, respectively and the estimated 2013 average household income within a one-, three-, and five-mile radius of the 29080 Inkster Road property is $64,307, $77,865 and $85,785, respectively.
455 Abernathy Road - Atlanta, GA (34.6% of Portfolio Cut-off Date Principal Balance)
The 455 Abernathy Road property consists of a 32,000 square foot medical office building built in 1999 and renovated in 2007 on a 2.6 acre site. Parking is provided by 110 surface parking spaces, which results in a parking ratio of approximately 3.4 spaces per 1,000 square foot of rentable area. The 455 Abernathy Road property is 100.0% occupied by BPH as of December 1, 2013. According to a market research report, the estimated 2013 population within a one-, three-, and five-mile radius of the 455 Abernathy Road property is 10,945, 90,114, and 206,670, respectively and the estimated 2013 average household income within a one-, three-, and five-mile radius of the 455 Abernathy Road property is $87,881, $93,519, and $103,221, respectively.
820 W Frontage Road - Northfield, IL (11.7% of Portfolio Cut-off Date Principal Balance)
The 820 W Frontage Road property consists of a 14,000 square foot medical office building built in 1964 and renovated in 2013 on a 0.6 acre site. Parking is provided by 55 surface parking spaces, which results in a parking ratio of approximately 3.9 spaces per 1,000 square foot of rentable area. The 820 W Frontage Road property is 100.0% occupied by BPH as of December 1, 2013. According to a market research report, the estimated 2013 population within a one-, three-, and five-mile radius of the 820 West Frontage Road property is 3,129, 57,202 and 191,958, respectively and the estimated 2013 average household income within a one-, three-, and five-mile radius of the 820 West Frontage Road property is $186,524, $184,475 and $156,277, respectively.
607 Lumsden Professional Court - Brandon, FL (7.3% of Portfolio Cut-off Date Principal Balance)
The 607 Lumsden Professional Court property consists of an 8,500 square foot medical office building built in 2008 on a 1.0 acre site. Parking is provided by 42 surface parking spaces, which results in a parking ratio of approximately 4.9 spaces per 1,000 square foot of rentable area. The 607 Lumsden Professional Court property is 100% leased by BPH as of December 1, 2013 and 72% occupied by BPH, with the remaining 28% occupied by a dental practice under a sublease. According to a market research report, the estimated 2013 population within a one-, three-, and five-mile radius of the 607 Lumsden Professional Court property is 10,315, 92,766, and 214,491, respectively and the estimated 2013 average household income within a one-, three-, and five-mile radius of the 607 Lumsden Professional Court property is $60,498, $61,520, and $66,155, respectively.
4525 Ulmerton Road - Clearwater, FL (4.4% of Portfolio Cut-off Date Principal Balance)
The 4525 Ulmerton Road property consists of a 3,000 square foot freestanding medical office building built in 1977 and renovated in 2008 on a 0.4 acre site. Parking is provided by 18 surface parking spaces, which results in a parking ratio of approximately 6.0 spaces per 1,000 square foot of rentable area. The 4525 Ulmerton Road property is 100.0% occupied by BPH as of December 1, 2013. According to a market research report, the estimated 2013 population within a one-, three-, and five-mile radius of the 4525 Ulmerton Road property is 3,718, 56,591, and 182,582, respectively and the estimated 2013 average household income within a one-, three-, and five-mile radius of the 4525 Ulmerton Road property is $55,838, $54,750, and $53,640, respectively.
4126 Packard Street - Ann Arbor, MI (1.9% of Portfolio Cut-off Date Principal Balance)
The 4126 Packard Street property consists of a 3,500 square foot freestanding medical office building built in 1954 and renovated in 2001 on a 0.8 acre site. Parking is provided by 16 surface parking spaces, which results in a parking ratio of approximately 4.6 spaces per 1,000 square foot of rentable area. The 4126 Packard Street property is 100.0% occupied by BPH as of December 1, 2013. According to a market research report, the estimated 2013 population within a one-, three-, and five-mile radius of the 4126 Packard Street property is 13,462, 70,676, and 177,710, respectively and the estimated 2013 average household income within a one-, three-, and five-mile radius of the 4126 Packard Street property is $53,791, $70,140, $69,863, respectively.
The following table presents certain information relating to the tenant at the BluePearl Portfolio Properties:
Major Tenant
| Tenant Name | Credit Rating (Fitch/Moody’s/ S&P) | Tenant NRSF | % of NRSF | Annual U/W Base Rent PSF(1) | Annual U/W Base Rent(1) | % of Total Annual U/W Base Rent | Lease Expiration Date | ||||||
BluePearl Holdings, LLC | NR/NR/NR(2) | 99,000 | 100.0% | $28.15 | $2,786,561 | 100.0% | 10/24/2033 | ||||||
Total Major Tenant | 99,000 | 100.0% | $28.15 | $2,786,561 | 100.0% | ||||||||
| (1) | Annual U/W Base Rent PSF and Annual U/W Base Rent include contractual rent steps through October 1, 2014. |
| (2) | Per a BPH financial analysis report prepared by a third party investment advisory firm as of July 22, 2013, BPH’s credit profile is estimated to be comparable to a credit rating agency equivalent for a senior unsecured rating of BBB/Baa2 to BBB-/Baa3. |
THE INFORMATION IN THIS STRUCTURAL AND COLLATERAL TERM SHEET IS NOT COMPLETE AND MAY BE AMENDED PRIOR TO THE TIME OF SALE. THIS TERM SHEET IS NOT AN OFFER TO SELL THESE SECURITIES AND IT IS NOT A SOLICITATION OF AN OFFER TO BUY THESE SECURITIES IN ANY JURISDICTION WHERE THE OFFER OR SALE IS NOT PERMITTED.
86
| BLUEPEARL PORTFOLIO |
The following table presents certain information relating to the lease rollover schedule at the BluePearl Portfolio Properties:
Lease Expiration Schedule(1)
Year Ending December 31, | No. of Leases Expiring | Expiring NRSF | % of Total NRSF | Cumulative Expiring NRSF | Cumulative % of Total NRSF | Annual U/W Base Rent(2) | Annual U/W Base Rent PSF(2) | |||||||||||
| MTM | 0 | 0 | 0.0% | 0 | 0.0% | $0 | $0.00 | |||||||||||
| 2013 | 0 | 0 | 0.0% | 0 | 0.0% | $0 | $0.00 | |||||||||||
| 2014 | 0 | 0 | 0.0% | 0 | 0.0% | $0 | $0.00 | |||||||||||
| 2015 | 0 | 0 | 0.0% | 0 | 0.0% | $0 | $0.00 | |||||||||||
| 2016 | 0 | 0 | 0.0% | 0 | 0.0% | $0 | $0.00 | |||||||||||
| 2017 | 0 | 0 | 0.0% | 0 | 0.0% | $0 | $0.00 | |||||||||||
| 2018 | 0 | 0 | 0.0% | 0 | 0.0% | $0 | $0.00 | |||||||||||
| 2019 | 0 | 0 | 0.0% | 0 | 0.0% | $0 | $0.00 | |||||||||||
| 2020 | 0 | 0 | 0.0% | 0 | 0.0% | $0 | $0.00 | |||||||||||
| 2021 | 0 | 0 | 0.0% | 0 | 0.0% | $0 | $0.00 | |||||||||||
| 2022 | 0 | 0 | 0.0% | 0 | 0.0% | $0 | $0.00 | |||||||||||
| 2023 | 0 | 0 | 0.0% | 0 | 0.0% | $0 | $0.00 | |||||||||||
| Thereafter | 1 | 99,000 | 100.0% | 99,000 | 100.0% | $2,786,561 | $28.15 | |||||||||||
| Vacant | 0 | 0 | 0.0% | 99,000 | 100.0% | $0 | $0.00 | |||||||||||
| Total/Weighted Average | 1 | 99,000 | 100.0% | $2,786,561 | $28.15 | |||||||||||||
| (1) | Information obtained from the underwritten rent roll. |
| (2) | Annual U/W Base Rent PSF and Annual U/W Base Rent include contractual rent steps through October 1, 2014. |
The following table presents historical occupancy percentages at the BluePearl Portfolio Properties:
Historical Occupancy
2010(1) | 2011(1) | 2012(1) | 12/1/2013(1) | |||
NAV | NAV | NAV | 100.0% |
| (1) | The BluePearl Portfolio Properties were previously owner-occupied by BPH and certain of its affiliates and a lease was not in place. The borrower acquired the BluePearl Portfolio Properties in October 2013 through a sale-leaseback transaction and executed a new lease. |
Underwritten Net Cash Flow. The following table presents certain information relating to the historical operating performance and the Underwritten Net Cash Flow at the BluePearl Portfolio Properties:
Cash Flow Analysis(1)
| U/W | U/W $ per SF | |||||
| Base Rent | $2,715,581 | $27.43 | ||||
| Rent Steps | 70,980 | 0.72 | ||||
| Total Reimbursables | 81,747 | 0.83 | ||||
| Less Vacancy & Credit Loss | (143,415)(2) | (1.45) | ||||
| Effective Gross Income | $2,724,893 | $27.52 | ||||
Total Operating Expenses(3) | $81,747 | $0.83 | ||||
| Net Operating Income | $2,643,146 | $26.70 | ||||
| TI/LC | 151,131 | 1.53 | ||||
| Capital Expenditures | 35,497 | 0.36 | ||||
| Net Cash Flow | $2,456,517 | $24.81 | ||||
| NOI DSCR | 3.46x | |||||
| NCF DSCR | 3.21x | |||||
| NOI DY | 14.1% | |||||
| NCF DY | 13.1% | |||||
| (1) | No historical financial information is available as the BluePearl Portfolio Properties were acquired in a sale-leaseback transaction in October 2013. |
| (2) | The underwritten economic vacancy is 5.0%. The BluePearl Portfolio Properties were 100.0% physically occupied as of December 1, 2013. |
| (3) | The only underwritten operating expense is a management fee of 3.0% of Effective Gross Income which was fully reimbursed. All expenses are paid directly by BPH. |
Appraisal. As of various appraisal valuations dated from September 4, 2013 to September 12, 2013, the BluePearl Portfolio Properties had an aggregate “as-is” appraised value of $38,910,000.
Environmental Matters. According to Phase I environmental assessments dated August 6, 2013, there was no evidence of any recognized environmental conditions at any of the BluePearl Portfolio Properties.
THE INFORMATION IN THIS STRUCTURAL AND COLLATERAL TERM SHEET IS NOT COMPLETE AND MAY BE AMENDED PRIOR TO THE TIME OF SALE. THIS TERM SHEET IS NOT AN OFFER TO SELL THESE SECURITIES AND IT IS NOT A SOLICITATION OF AN OFFER TO BUY THESE SECURITIES IN ANY JURISDICTION WHERE THE OFFER OR SALE IS NOT PERMITTED.
87
| BLUEPEARL PORTFOLIO |
The Borrowers. The borrower is BP Lessor, LLC. The BluePearl Portfolio Mortgage Loan is structured to comply with Sharia law and as such, BP Lessor, LLC, which is owned by a service company unaffiliated with the sponsors, leases the BluePearl Portfolio Properties pursuant to a master lease to BP Lessee, LLC, the master lessee, which is beneficially owned by the Bin Mahfouz family (85.0% interest) and Lexington Realty Trust (15.0% interest). Each of the borrower and BP Lessee, LLC is a single purpose Delaware limited liability company with one independent director. Legal counsel to the borrower delivered a non-consolidation opinion in connection with the origination of the BluePearl Portfolio Mortgage Loan. Lexington Realty Trust, a sponsor of the borrower and master lessee, is the guarantor of certain nonrecourse carveouts under the BluePearl Portfolio Mortgage Loan.
The Sponsor. The sponsors for the BluePearl Portfolio Mortgage Loan are Lexington Realty Trust and the Bin Mahfouz family. Lexington Realty Trust (“Lexington”) is a self-managed and self-administered real estate investment trust that invests in, owns, finances and manages predominantly single-tenant office, industrial and retail properties leased to major corporations throughout the United States and provides investment advisory and asset management services to investors in the single-tenant sector. As of June 30, 2013, Lexington had equity ownership interests of $4.3 billion in real estate assets consisting of approximately 220 consolidated properties located in 41 states. For more than 35 years, Lexington and its predecessor companies have been active investors in net lease properties. Lexington is rated Baa2/BB+ by Moody’s and S&P, respectively, both with a stable outlook.
Escrows. The loan documents provide for upfront escrows in the amount of $16,963 for deferred maintenance.
The loan documents do not require monthly escrow deposits for taxes, insurance, and replacement reserves so long as: (i) no termination or expiration of the BPH lease or any other event which results in the BPH lease no longer being in full force and effect with BPH as the tenant thereunder has occurred; and (ii) no Major Tenant Trigger Event (as defined below) has occurred or is continuing. Monthly escrow deposits will be required for taxes, insurance, and replacement reserves on an individual basis upon BPH failing to pay all taxes when due, failing to maintain insurance as required under the loan documents, or failing to maintain the BluePearl Portfolio Properties as required under its lease, respectively. The loan documents do not require monthly escrow deposits for TI/LC reserves so long as no termination or expiration of the BPH lease or any other event which results in the BPH lease no longer being in full force and effect with BPH as the tenant thereunder has occurred. During the occurrence and continuation of a Major Tenant Trigger Event (as defined below) all Remaining Cash Flow (as defined below) (up to a cap of $2,970,000) will be swept into the Major Tenant TI/LC Reserve Account for the re-tenanting of the BluePearl Portfolio Properties provided that an event of default, the Northfield Cash Sweep Event or the ARD has not occurred. During the occurrence and continuation of a Northfield Cash Sweep Event (as defined below) all Remaining Cash Flow (as defined below) for a period of up to six months will be swept into the Northfield Reserve Account and held as additional collateral.
A “Major Tenant Trigger Event” will occur if: (i) BPH, or a replacement tenant acceptable to lender that, together with its affiliates, leases space comprising 20% or more of either (a) the total rentable square footage of all the properties or (b) total in place base rent of all the properties (a “Major Tenant”), fails to extend or renew its lease upon terms and conditions reasonably acceptable to the lender on or before the date that is 12 months prior to the applicable expiration date under its lease; (ii) a Major Tenant fails to give notice of its election to extend or renew its lease prior to the date the Major Tenant is required under its lease to give notice; (iii) an event of default under a Major Tenant lease beyond applicable grace and/or notice periods has occurred and is continuing; (iv) any bankruptcy or insolvency of a Major Tenant; (v) a Major Tenant lease is terminated; (vi) a Major Tenant “goes dark”, vacates, ceases to occupy or discontinues its operations at 25% or more of its premises leased pursuant to the Major Tenant lease; or (vii) a Major Tenant Credit Profile Event (as defined below) occurs.
A “Major Tenant Credit Profile Event” with respect to a Major Tenant or its lease guarantor, as applicable, will occur if: (i) the EBITDA of the Major Tenant (or if multiple replacement tenants, the combined EBITDA of each such replacement tenant) as of the last day of each fiscal year is less than $18,720,000; (ii) as of the last day of any fiscal quarter, the ratio of the aggregate debt of each Major Tenant to the aggregate EBITDA of each Major Tenant for the period of 12 months ending on such day is greater than 3.00 to 1.00; (iii) as of the last day of any fiscal quarter, the quotient of (A) the aggregate EBITDA of each Major Tenant for the period of 12 months ending on such day less the aggregate amount of capital expenditures of each Major Tenant during such period divided by (B) the Major Tenant interest expense is less than 4.00 to 1.00; or (iv) the failure of the borrower to deliver the financial statements of BPH or a Major Tenant in accordance with the loan documents, after five days written notice is provided to the borrower.
Lockbox and Cash Management. The BluePearl Portfolio Mortgage Loan requires a hard lockbox and springing cash management. The BluePearl Portfolio Mortgage Loan documents require all revenue to be deposited directly into a lockbox account. Prior to the occurrence of a Cash Management Trigger Event (as defined below) all funds in the lockbox account will be released to the borrower. Upon the occurrence and continuation of a Cash Management Trigger Event funds in the lockbox account will be swept daily into a lender controlled cash management account. In the absence of a Northfield Cash Sweep Event,a Cash Sweep Event or a Major Tenant Trigger Event at any time prior to the Anticipated Repayment Date, all funds in the cash management account will be applied by the lender to payments of debt service, required reserves and other items required under the loan documents and the remaining cash flow (“Remaining Cash Flow”) will be released to the borrower. Upon the occurrence and continuation of a Northfield Cash Sweep Event, Remaining Cash Flow for a period of up to six months will be deposited into an 820 W Frontage Road property reserve account. Upon the occurrence and continuation of a Cash Sweep Event, provided that no Major Tenant Trigger Event or Northfield Cash Sweep Event has occurred all Remaining Cash Flow will be held by the lender as additional collateral for the BluePearl Portfolio Mortgage Loan.
A “Cash Management Trigger Event” will commence upon: (i) an event of default; (ii) the bankruptcy or insolvency of the borrower, master lessee, guarantor, or the property manager that is an affiliate of the master lessee; (iii) the DSCR falling below 2.30x; (iv) the occurrence of a Major Tenant Trigger Event or Northfield Cash Sweep Event; or (v) the failure to repay or defease the entire BluePearl Portfolio Mortgage Loan on or prior to the date that is one month prior to the ARD.
THE INFORMATION IN THIS STRUCTURAL AND COLLATERAL TERM SHEET IS NOT COMPLETE AND MAY BE AMENDED PRIOR TO THE TIME OF SALE. THIS TERM SHEET IS NOT AN OFFER TO SELL THESE SECURITIES AND IT IS NOT A SOLICITATION OF AN OFFER TO BUY THESE SECURITIES IN ANY JURISDICTION WHERE THE OFFER OR SALE IS NOT PERMITTED.
88
| BLUEPEARL PORTFOLIO |
A “Cash Sweep Event” will commence upon (i) an event of default; (ii) the bankruptcy or insolvency of the borrower, master lessee, guarantor, or the property manager that is an affiliate of the master lessee; (iii) the DSCR falling below 2.15x; (iv) the occurrence of a Major Tenant Trigger Event or Northfield Cash Sweep Event; or (v) the failure to repay or defease the entire BluePearl Portfolio Mortgage Loan on or prior to the date that is one month prior to the ARD (October 6, 2018).
A “Northfield Cash Sweep Event” will commence upon the occurrence of the date that occurs 120 days following the termination or expiration of one or both of the 820 W Frontage Road property parking leases and remain in effect until the sixth monthly payment date following commencement, unless: (i) the 820 W Frontage Road property has been substituted or its allocated loan amount has been defeased or prepaid; or (ii) the 820 W Frontage Road property has adequate parking in conformance with applicable zoning laws and as reasonably determined by the lender (or 55 parking spaces have been procured through an amendment to one of the existing leases); in each case, prior to such 120th day. The 820 W Frontage Road owner currently leases the land on which 41 of the 55 parking spaces and a turnaround space required to be in compliance with zoning are located from ConEd and Cook County. The leases expire on June 30, 2017 and June 30, 2023, respectively. Additionally, both leases have termination clauses of 90 days and 120 days, respectively.
Property Management. The BluePearl Portfolio Properties are self-managed.
Partial Release. Permitted in connection with defeasance of the 820 W Frontage Road Mortgaged Property or in connection with a Real Estate Substitution (as described below), in each case in connection with a Northfield Cash Sweep Event cure (as described above).
Real Estate Substitution. For so long as the BPH lease is in full force and effect the borrower may obtain a release of up to two of the properties from the lien of the BluePearl Portfolio Mortgage Loan by substituting such property with a medical office property acquired by the borrower, provided among other requirements as described in the loan documents: (i) the aggregate original allocated loan amounts of all released properties does not exceed 35% of the then outstanding principal balance of the BluePearl Portfolio Mortgage Loan and no more than two properties may be substituted; and (ii) the DSCR for the 12 months immediately preceding the date of the substitution with respect to all properties expected to be encumbered by the BluePearl Portfolio Mortgage Loan after the substitution is greater than the greater of (a) 3.21x, and (b) the DSCR for the 12 months immediately preceding the date of substitution for all properties encumbered by the BluePearl Portfolio Mortgage Loan.
Subordinate and Mezzanine Indebtedness. Not permitted.
Ground Lease. None.
Terrorism Insurance. The loan documents require that the “all risk” insurance policy required to be maintained by the borrower provide coverage for terrorism in an amount equal to the full replacement cost of the BluePearl Portfolio Properties. The loan documents also require business interruption insurance covering up to the 12-month period following the occurrence of a casualty event, together with a 12-month extended period of indemnity coverage.
THE INFORMATION IN THIS STRUCTURAL AND COLLATERAL TERM SHEET IS NOT COMPLETE AND MAY BE AMENDED PRIOR TO THE TIME OF SALE. THIS TERM SHEET IS NOT AN OFFER TO SELL THESE SECURITIES AND IT IS NOT A SOLICITATION OF AN OFFER TO BUY THESE SECURITIES IN ANY JURISDICTION WHERE THE OFFER OR SALE IS NOT PERMITTED.
89
| VANTAGE AT PLUM CREEK |
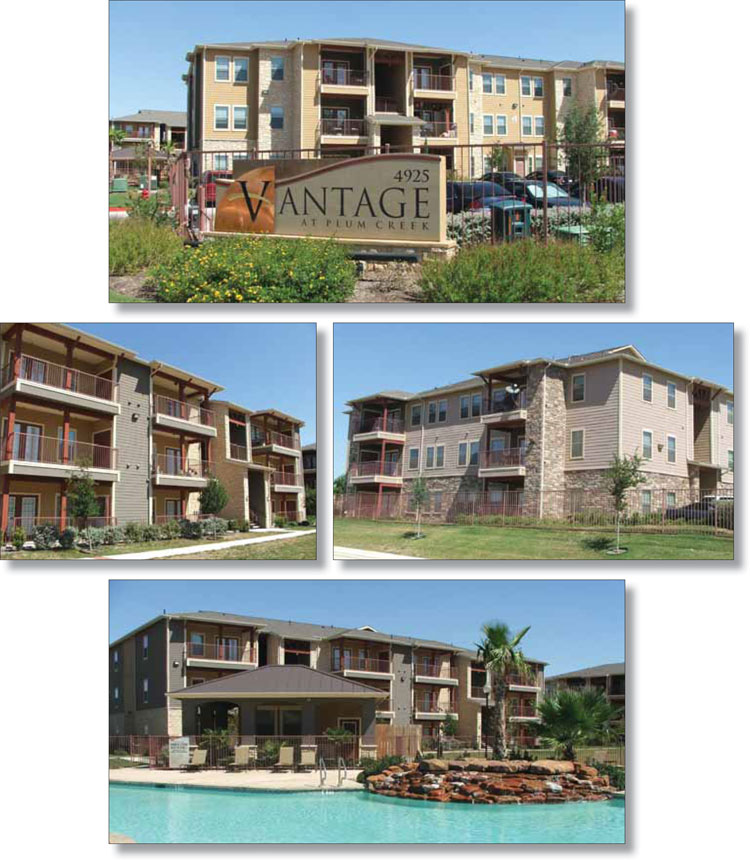
THE INFORMATION IN THIS STRUCTURAL AND COLLATERAL TERM SHEET IS NOT COMPLETE AND MAY BE AMENDED PRIOR TO THE TIME OF SALE. THIS TERM SHEET IS NOT AN OFFER TO SELL THESE SECURITIES AND IT IS NOT A SOLICITATION OF AN OFFER TO BUY THESE SECURITIES IN ANY JURISDICTION WHERE THE OFFER OR SALE IS NOT PERMITTED.
90
| VANTAGE AT PLUM CREEK |

THE INFORMATION IN THIS STRUCTURAL AND COLLATERAL TERM SHEET IS NOT COMPLETE AND MAY BE AMENDED PRIOR TO THE TIME OF SALE. THIS TERM SHEET IS NOT AN OFFER TO SELL THESE SECURITIES AND IT IS NOT A SOLICITATION OF AN OFFER TO BUY THESE SECURITIES IN ANY JURISDICTION WHERE THE OFFER OR SALE IS NOT PERMITTED.
91
| No. 9 – Vantage at Plum Creek | ||||||||
| Loan Information | Property Information | |||||||
| Mortgage Loan Seller: | Rialto Mortgage Finance, LLC | Single Asset/Portfolio: | Single Asset | |||||
| Credit Assessment (KBRA/Moody’s/S&P): | NR/NR/NR | Property Type: | Multifamily | |||||
| Original Principal Balance: | $18,500,000 | Specific Property Type: | ||||||
| Cut-off Date Principal Balance: | $18,500,000 | Location: | Kyle, TX | |||||
| % of Initial Pool Balance: | 2.5% | Size: | 264 units | |||||
| Loan Purpose: | Acquisition | Cut-off Date Principal Balance Per Unit: | $70,076 | |||||
| Borrower Name: | AM Kyle, LLC | Year Built/Renovated: | ||||||
| Sponsors: | Kenneth Lawrence; Michael Novelli | Title Vesting: | Fee | |||||
| Mortgage Rate: | 4.975% | Property Manager: | Ascension Commercial Real Estate, LP | |||||
| Note Date: | November 6, 2013 | 3rd Most Recent Occupancy (As of): | 81.0% (12/31/2010) | |||||
| Anticipated Repayment Date: | NAP | 2nd Most Recent Occupancy (As of): | 90.0% (12/31/2011) | |||||
| Maturity Date: | November 6, 2023 | Most Recent Occupancy (As of): | 97.0% (12/31/2012) | |||||
| IO Period: | 60 months | Current Occupancy (As of): | 94.7% (10/16/2013) | |||||
| Loan Term (Original): | ||||||||
| Seasoning: | 1 month | Underwriting and Financial Information: | ||||||
| Amortization Term (Original): | 360 months | |||||||
| Loan Amortization Type: | Interest-only, Amortizing Balloon | 3rd Most Recent NOI (As of): | $1,557,680 (12/31/2011) | |||||
| Interest Accrual Method: | Actual/360 | 2nd Most Recent NOI (As of): | $1,722,105 (12/31/2012) | |||||
| Call Protection: | L(25),D(91),O(4) | Most Recent NOI (As of): | ||||||
| Lockbox Type: | ||||||||
Additional Debt(1): | Yes | U/W Revenues: | $2,998,042 | |||||
Additional Debt Type(1): | Future Mezzanine | U/W Expenses: | $1,305,162 | |||||
| U/W NOI: | $1,692,880 | |||||||
| U/W NCF: | $1,627,672 | |||||||
| U/W NOI DSCR: | 1.42x | |||||||
| U/W NCF DSCR: | 1.37x | |||||||
Escrows and Reserves(2): | U/W NOI Debt Yield: | 9.2% | ||||||
| U/W NCF Debt Yield: | 8.8% | |||||||
Type: | Cap (If Any) | As-Is Appraised Value: | $24,750,000 | |||||
| Taxes | $416,975 | NAP | As-Is Appraisal Valuation Date: | October 4, 2013 | ||||
| Insurance | $9,595 | NAP | Cut-off Date LTV Ratio: | 74.7% | ||||
| Replacement Reserves | $0 | $5,434 | NAP | LTV Ratio at Maturity or ARD: | 68.9% | |||
(1) See “Subordinate and Mezzanine Indebtedness” section.
(2) See “Escrows” section.
The Mortgage Loan. The mortgage loan (the “Vantage at Plum Creek Mortgage Loan”) is evidenced by a single promissory note that is secured by a first mortgage encumbering a 12 building, 264-unit, class A, garden-style multifamily property located in Kyle, Texas (the “Vantage at Plum Creek Property”). The Vantage at Plum Creek Mortgage Loan was originated on November 6, 2013 by Rialto Mortgage Finance, LLC. The Vantage at Plum Creek Mortgage Loan had an original principal balance of $18,500,000, has an outstanding principal balance as of the Cut-off Date of $18,500,000 and accrues interest at an interest rate of 4.975% per annum. The Vantage at Plum Creek Mortgage Loan had an initial term of 120 months, has a remaining term of 119 months as of the Cut-off Date and requires interest-only payments for the first 60 payments following origination and, thereafter, requires payments of principal and interest based on a 30-year amortization schedule. The Vantage at Plum Creek Mortgage Loan matures on November 6, 2023.
Following the lockout period, the borrower has the right to defease the Vantage at Plum Creek Mortgage Loan in whole, but not in part, on any date before August 6, 2023. In addition, the Vantage at Plum Creek Mortgage Loan is prepayable without penalty on or after August 6, 2023.
Sources and Uses
| Sources | Uses | ||||||||
| Original loan amount | $18,500,000 | 73.6% | % | ||||||
| Sponsor’s new cash contribution | Reserves | ||||||||
| Total Sources | $25,139,221 | 100.0% | Total Uses | $25,139,221 | 100.0 | % |
THE INFORMATION IN THIS STRUCTURAL AND COLLATERAL TERM SHEET IS NOT COMPLETE AND MAY BE AMENDED PRIOR TO THE TIME OF SALE. THIS TERM SHEET IS NOT AN OFFER TO SELL THESE SECURITIES AND IT IS NOT A SOLICITATION OF AN OFFER TO BUY THESE SECURITIES IN ANY JURISDICTION WHERE THE OFFER OR SALE IS NOT PERMITTED.
92
| VANTAGE AT PLUM CREEK |
The Property. The Vantage at Plum Creek Property is a 264-unit, garden-style multifamily property consisting of 12 three-story buildings situated on a 12.4-acre site located in Kyle, Texas, approximately 21.0 miles south of the Austin central business district. Additional buildings at the Vantage at Plum Creek Property include a leasing office/clubhouse, a maintenance building and a pool house. Amenities include a swimming pool, internet café, controlled access gates, business center, covered parking, and picnic and barbeque areas. Unit amenities include nine-foot ceilings, cherry or oak wood cabinetry, wood-plank flooring, ceiling fans, built-in computer niches, washer/dryer connections and patios or balconies. The property contains 371 open parking spaces and 129 covered parking spaces, reflecting an overall parking ratio of 1.9 spaces per unit. As of October 16, 2013, the Vantage at Plum Creek Property was 94.7% leased.
The following table presents certain information relating to the unit mix of the Vantage at Plum Creek Property:
Unit Mix Summary(1)
| Unit Type | No. of Units | % of Total Units | Average Unit Size (SF) | Average Monthly Rent per Unit | ||||||
| 1 Bedroom/1 Bathroom | 24 | 9.1% | $767 | |||||||
| 1 Bedroom/1 Bathroom | 72 | 27.3% | $828 | |||||||
| Total/Weighted Average | 264 | 100.0% | $949 | |||||||
| (1) | Information obtained from the underwritten unit mix. |
The following table presents historical occupancy percentages at the Vantage at Plum Creek Property:
Historical Occupancy
12/31/2010(1) | 12/31/2011(1) | 12/31/2012(1) | 10/16/2013 | |||
| 81.0% | 90.0% | 97.0% | 94.7% |
| (1) | Information obtained from the borrower. |
Operating History and Underwritten Net Cash Flow. The following table presents certain information relating to the historical operating performance and Underwritten Net Cash Flow at the Vantage at Plum Creek Property:
Cash Flow Analysis
| 2011 | 2012 | TTM 8/31/2013 | U/W | U/W $ per Unit | ||||||||||||
| Base Rent | $2,657,772 | $2,717,233 | $2,848,188 | $10,789 | ||||||||||||
| Grossed Up Vacant Space | 0 | 0 | 0 | 152,220 | 577 | |||||||||||
| Concessions | (132,487 | ) | (100,638 | ) | (123,932 | ) | (132,018 | ) | (500 | ) | ||||||
| Other Income | 327,946 | 384,150 | 402,689 | 1,525 | ||||||||||||
| Less Vacancy & Credit Loss | (271,693 | ) | (205,430 | ) | (226,364 | ) | (273,037 | )(1) | (1,034 | ) | ||||||
| Effective Gross Income | $2,581,538 | $2,795,315 | $2,892,934 | $2,998,042 | $11,356 | |||||||||||
| Total Operating Expenses | $1,023,858 | $1,073,209 | $1,099,776 | |||||||||||||
| Net Operating Income | $1,557,680 | $1,722,105 | $1,692,880 | |||||||||||||
| Capital Expenditures | 0 | 0 | 0 | 65,208 | 247 | |||||||||||
| Net Cash Flow | $1,557,680 | $1,722,105 | $1,627,672 | $6,165 | ||||||||||||
| NOI DSCR | 1.31 | x | 1.45 | x | 1.51 | x | 1.42 | x | ||||||||
| NCF DSCR | 1.31 | x | 1.45 | x | 1.51 | x | 1.37 | x | ||||||||
| NOI DY | 8.4 | % | 9.3 | % | 9.7 | % | 9.2 | % | ||||||||
| NCF DY | 8.4 | % | 9.3 | % | 9.7 | % | 8.8 | % |
| (1) | The underwritten economic vacancy is 9.1%. The Vantage at Plum Creek Property was 94.7% physically occupied as of October 16, 2013. |
Appraisal. As of the appraisal valuation date of October 4, 2013, the Vantage at Plum Creek Property had an “as-is” appraised value of $24,750,000.
Environmental Matters. According to a Phase I environmental assessment dated October 8, 2013, there was no evidence of any recognized environmental conditions at the Vantage at Plum Creek Property.
THE INFORMATION IN THIS STRUCTURAL AND COLLATERAL TERM SHEET IS NOT COMPLETE AND MAY BE AMENDED PRIOR TO THE TIME OF SALE. THIS TERM SHEET IS NOT AN OFFER TO SELL THESE SECURITIES AND IT IS NOT A SOLICITATION OF AN OFFER TO BUY THESE SECURITIES IN ANY JURISDICTION WHERE THE OFFER OR SALE IS NOT PERMITTED.
93
| VANTAGE AT PLUM CREEK |
Market Overview and Competition. The Vantage at Plum Creek Property is located in Kyle, Texas, approximately 21.0 miles south of Austin central business district and 62.4 miles north of the San Antonio central business district. Primary regional access is provided by Interstate 35, a major north/south thoroughfare, connecting Austin to the north and San Antonio to the south. The Vantage at Plum Creek Property is located 1.4 miles west of Interstate 35 at the intersection of Kyle Parkway and Cromwell Drive. Kyle Parkway is a heavily trafficked east/west corridor providing access throughout northern Kyle. According to a market research report, the estimated 2013 population and average household income within a one, three, and five-mile radius of the Vantage at Plum Creek Property is 5,277, 30,615, and 53,913 and $76,775, $75,154, and $73,889, respectively. From 2000 to 2013, the population within a five-mile radius grew 18.4% annually and is expected to grow another 4.4% annually through 2018. According to a third party research report, the City of Kyle’s unemployment rate was 4.6% as of June 2013 and has been below 5.0% since August 2012. According to the appraisal, the Vantage at Plum Creek is located in the San Marcos submarket. As of the second quarter of 2013, the San Marcos submarket contained 11,964 units, occupancy of 94.9% and average monthly rent of $1,041.
The following table presents certain information relating to comparable multifamily properties for the Vantage at Plum Creek Property:
Competitive Set(1)
Vantage at Plum Creek (Subject) | The Settlement | Saddle Creek | Trails at Buda Ranch | CG at Onion Creek | Landmark at Double Creek | |||||||
| Location | Kyle, Texas | Kyle, Texas | Kyle, Texas | Buda, Texas | Austin, Texas | Austin, Texas | ||||||
| Distance to Subject | -- | 1.5 miles | 1.3 miles | 3.8 miles | 9.5 miles | 9.7 miles | ||||||
| Property Type | Garden | Garden | Garden | Garden | Garden | Garden | ||||||
| Number of Units | 264 | 396 | 104 | 264 | 300 | 296 | ||||||
| Average Rent (per unit) | ||||||||||||
| 1BR | $845-$875 | $750-$870 | $813 | $805-$855 | $905-$986 | $909-$1,029 | ||||||
| 2BR | $1,007 | $1,150 | $972 | $995 | $1,051-$1,266 | $1,194-$1,464 | ||||||
| 3BR | $1,328 | NAP | $1,118 | $1,180 | $1,360-$1,490 | $1,554-$1,594 | ||||||
| Utilities | Paid by tenant | Paid by tenant | Water and sewer included | Paid by tenant | Paid by tenant | Paid by tenant | ||||||
| Total Occupancy | 95% | 93% | 98% | 96% | 94% | 96% |
(1) Information obtained from the appraisal dated October 4, 2013.
The Borrower. The borrower is AM Kyle, LLC, a single purpose entity with one independent director. Kenneth Lawrence and Michael Novelli, the loan sponsors, are the guarantors of certain nonrecourse carveouts under the Vantage at Plum Creek Mortgage Loan.
The Sponsor. The sponsors, Kenneth Lawrence and Michael Novelli, are the co-founders of Ascension Commercial Real Estate, LP (“Ascension”). Ascension is a Houston-based real estate and property management company with over 7,000 units under ownership and management. Over the past four years, Ascension has renovated over 5,000 units.
Escrows. The loan documents provide for upfront reserves in the amount of $416,975 for real estate taxes and $9,595 for insurance. The loan documents also provide for ongoing monthly escrow deposits of $37,907 for taxes, $4,569 for insurance, and $5,434 for replacement reserves.
Lockbox and Cash Management. Upon the occurrence and continuation of a Cash Management Event (as defined below) the Vantage at Plum Creek Mortgage Loan requires the borrower to (i) establish a lender-controlled lockbox account and (ii) direct the manager to deposit all receipts payable (and other amounts received) with respect to the Vantage at Plum Creek Property directly into the lockbox account within two business days of receipt. The Vantage at Plum Creek Mortgage loan documents also require the borrower to deposit any amounts it receives into the lockbox account within two business days of receipt. Funds in the lockbox account will be transferred to a cash management account and applied by the lender to payments of required reserves, debt service, operating expenses and any other amounts then due under the Vantage at Plum Creek Mortgage loan documents. Prior to a Cash Sweep Event (as defined below) any excess cash flow (“Remaining Cash Flow”) will be released to the borrower daily. During the continuation of a Cash Sweep Event, Remaining Cash Flow will be held as additional collateral for the Vantage at Plum Creek Mortgage Loan.
A “Cash Management Event” will commence upon: (i) the occurrence and continuance of an event of default; (ii) any bankruptcy action of the borrower, guarantor, or property manager; or (iii) the DSCR based on a trailing 12-month basis is below 1.15x. A Cash Management Event will end with respect to the matters described in clause (i) above, when such event of default has been cured, and with respect to the matters described in clause (ii) above, when such bankruptcy petition has been discharged, stayed, or dismissed among other conditions, and with respect to the matters described in clause (iii) above, when the amortizing debt service coverage ratio is at least 1.20x based on a trailing twelve-month basis has been achieved for two consecutive calendar quarters.
A “Cash Sweep Event” will commence upon: (i) the occurrence and continuance of an event of default; (ii) any bankruptcy action of the borrower, guarantor, or the property manager; or (iii) the amortizing DSCR based on a trailing 12-month basis is below 1.10x. A Cash Sweep Event will end with respect to the matters described in clause (i) above, when such event of default has been cured, and with respect to the matters described in clause (ii) above, when such bankruptcy petition has been discharged, stayed, or dismissed among other conditions, and with respect to the matters described in clause (iii) above, when the amortizing debt service coverage ratio is at least 1.15x based on a trailing 12-month basis has been achieved for two consecutive calendar quarters.
Property Management. The Vantage at Plum Creek Property is managed by an affiliate of the borrower.
THE INFORMATION IN THIS STRUCTURAL AND COLLATERAL TERM SHEET IS NOT COMPLETE AND MAY BE AMENDED PRIOR TO THE TIME OF SALE. THIS TERM SHEET IS NOT AN OFFER TO SELL THESE SECURITIES AND IT IS NOT A SOLICITATION OF AN OFFER TO BUY THESE SECURITIES IN ANY JURISDICTION WHERE THE OFFER OR SALE IS NOT PERMITTED.
94
| VANTAGE AT PLUM CREEK |
Assumption. The borrower has the right to transfer the Vantage at Plum Creek Property, provided that no event of default has occurred and is continuing and certain other conditions are satisfied, including (i) the lender’s reasonable determination that the proposed transferee and guarantor satisfy the lender’s credit review and underwriting standards, taking into consideration transferee experience, financial strength and general business standing; (ii) execution of a recourse guaranty and an environmental indemnity by an affiliate of the transferee; and (iii) if requested by the lender, rating agency confirmation from KBRA, Moody’s and S&P that the transfer will not result in a downgrade, withdrawal or qualification of the respective ratings assigned to the Series 2013-UBS1 Certificates.
Partial Release. Not permitted.
Real Estate Substitution. Not permitted.
Preferred Equity. Moriah Kyle, LLC (“Moriah”) invested $6,731,085 with the borrower in exchange for a 10% preferred rate of return. If Moriah’s preferred return is not satisfied, it may exercise buy-sell rights, provided that such rights may not be exercised during the term of the Vantage at Plum Creek Loan without lender consent. During the term of the Vantage at Plum Creek Mortgage Loan, Moriah may exercise rights to replace the management only for cause (as further described in the Vantage at Plum Creek Mortgage Loan documents) or in the event any two of the following three individuals (James Wood, Kenneth Lawrence, and Michael E. Novelli) no longer actively participate in the management of the borrower or Ascension, in each case, subject to lender consent.
Subordinate and Mezzanine Indebtedness. There is no existing mezzanine debt related to the Vantage at Plum Creek Mortgage Loan; however the borrower has the right to incur mezzanine financing subject to customary conditions including: (i) no event of default has occurred and is continuing; (ii) the combined loan-to-value ratio is not greater than 75.0%; (iii) the combined amortizing debt service coverage ratio is not less than 1.25x; (iv) the execution of an intercreditor agreement acceptable to the lender; and (v) receipt of rating agency confirmation from KBRA, Moody’s and S&P that the mezzanine financing will not result in a downgrade, withdrawal or qualification of the respective ratings assigned to the Series 2013-UBS1 Certificates.
Ground Lease. None.
Terrorism Insurance. The loan documents require that the “all risk” insurance policy required to be maintained by the borrower provide coverage for terrorism in an amount equal to the full replacement cost of the Vantage at Plum Creek Property; provided that the loan documents provide that the premium related to terrorism insurance coverage may not exceed $109,654 (200% of the current premium), which cap amount is subject to adjustments based on the Producer Price Index. The loan documents also require business interruption insurance covering up to the 12-month period following the occurrence of a casualty event, together with a six-month extended period of indemnity coverage.
THE INFORMATION IN THIS STRUCTURAL AND COLLATERAL TERM SHEET IS NOT COMPLETE AND MAY BE AMENDED PRIOR TO THE TIME OF SALE. THIS TERM SHEET IS NOT AN OFFER TO SELL THESE SECURITIES AND IT IS NOT A SOLICITATION OF AN OFFER TO BUY THESE SECURITIES IN ANY JURISDICTION WHERE THE OFFER OR SALE IS NOT PERMITTED.
95
| VOSS SELF STORAGE |
THE INFORMATION IN THIS STRUCTURAL AND COLLATERAL TERM SHEET IS NOT COMPLETE AND MAY BE AMENDED PRIOR TO THE TIME OF SALE. THIS TERM SHEET IS NOT AN OFFER TO SELL THESE SECURITIES AND IT IS NOT A SOLICITATION OF AN OFFER TO BUY THESE SECURITIES IN ANY JURISDICTION WHERE THE OFFER OR SALE IS NOT PERMITTED.
96
VOSS SELF STORAGE |

THE INFORMATION IN THIS STRUCTURAL AND COLLATERAL TERM SHEET IS NOT COMPLETE AND MAY BE AMENDED PRIOR TO THE TIME OF SALE. THIS TERM SHEET IS NOT AN OFFER TO SELL THESE SECURITIES AND IT IS NOT A SOLICITATION OF AN OFFER TO BUY THESE SECURITIES IN ANY JURISDICTION WHERE THE OFFER OR SALE IS NOT PERMITTED.
97
| No. 10 – Voss Self Storage | |||||||
| Loan Information | Property Information | ||||||
| Mortgage Loan Seller: | Rialto Mortgage Finance, LLC | Single Asset/Portfolio: | Single Asset | ||||
| Credit Assessment (KBRA/Moody’s/S&P): | NR/NR/NR | Property Type: | Self Storage | ||||
| Original Principal Balance: | $16,325,000 | Specific Property Type: | Self Storage | ||||
| Cut-off Date Principal Balance: | $16,325,000 | Location: | Houston, TX | ||||
| % of Initial Pool Balance: | 2.2% | Size: | 157,366 SF | ||||
| Loan Purpose: | Refinance | Cut-off Date Principal Balance Per SF: | $103.74 | ||||
| Borrower Name: | Community Self Storage IV, LP | Year Built/Renovated: | 2010/NAP | ||||
| Sponsor: | Andrew Gregory | Title Vesting: | Fee | ||||
| Mortgage Rate: | 5.050% | Property Manager: | Andrew Gregory | ||||
| Note Date: | November 1, 2013 | 3rd Most Recent Occupancy (As of): | NAV (12/31/2010) | ||||
| Anticipated Repayment Date: | NAP | 2nd Most Recent Occupancy (As of): | 39.8% (12/31/2011) | ||||
| Maturity Date: | November 6, 2023 | Most Recent Occupancy (As of): | 66.6% (12/31/2012) | ||||
| IO Period: | 36 months | Current Occupancy (As of): | 82.2% (10/14/2013) | ||||
| Loan Term (Original): | 120 months | ||||||
| Seasoning: | 1 month | Underwriting and Financial Information: | |||||
| Amortization Term (Original): | 360 months | ||||||
| Loan Amortization Type: | Interest-only, Amortizing Balloon | 3rd Most Recent NOI (As of): | ($53,701) (12/31/2011) | ||||
| Interest Accrual Method: | Actual/360 | 2nd Most Recent NOI (As of): | $396,161 (12/31/2012) | ||||
| Call Protection: | L(25),D(91),O(4) | Most Recent NOI (As of)(2): | $1,186,083 (TTM 9/30/2013) | ||||
| Lockbox Type: | Springing (Without Established Account) | ||||||
| Additional Debt: | None | U/W Revenues: | $2,505,962 | ||||
| Additional Debt Type: | NAP | U/W Expenses: | $946,364 | ||||
U/W NOI(2): | $1,559,598 | ||||||
| U/W NCF: | $1,535,993 | ||||||
| U/W NOI DSCR: | 1.47x | ||||||
| U/W NCF DSCR: | 1.45x | ||||||
Escrows and Reserves(1): | U/W NOI Debt Yield: | 9.6% | |||||
| U/W NCF Debt Yield: | 9.4% | ||||||
Type: | Initial | Monthly | Cap (If Any) | As-Is Appraised Value: | $22,880,000 | ||
| Taxes | $243,437 | $21,077 | NAP | As-Is Appraisal Valuation Date: | October 9, 2013 | ||
| Insurance | $7,252 | $2,302 | NAP | Cut-off Date LTV Ratio: | 71.4% | ||
| Replacement Reserves | $0 | $1,967 | NAP | LTV Ratio at Maturity or ARD: | 63.2% | ||
| (1) | See “Escrows” section. |
| (2) | See “Cash Flow Analysis” section. |
The Mortgage Loan. The mortgage loan (the “Voss Self Storage Mortgage Loan”) is evidenced by a single promissory note that is secured by a first mortgage encumbering a 1,367 unit (157,366 square feet) self storage facility located in Houston, Texas (the “Voss Self Storage Property”). The Voss Self Storage Mortgage Loan was originated on November 1, 2013 by Rialto Mortgage Finance, LLC. The Voss Self Storage Mortgage Loan had an original principal balance of $16,325,000, has an outstanding principal balance as of the Cut-off Date of $16,325,000 and accrues interest at an interest rate of 5.050% per annum. The Voss Self Storage Mortgage Loan had an initial term of 120 months, has a remaining term of 119 months as of the Cut-off Date and requires interest-only payments for the first 36 payments following origination and, thereafter, requires payments of principal and interest based on a 30-year amortization schedule. The Voss Self Storage Mortgage Loan matures on November 6, 2023.
Following the lockout period, the borrower has the right to defease the Voss Self Storage Mortgage Loan in whole, but not in part, on any day before August 6, 2023. In addition, the Voss Self Storage Mortgage Loan is prepayable without penalty on or after August 6, 2023.
Sources and Uses
| Sources | Uses | ||||||||
| Original loan amount | $16,325,000 | 100.0% | Loan payoff | $9,820,103 | 60.2 | % | |||
| Reserves | 250,689 | 1.5 | |||||||
| Closing costs | 405,950 | 2.5 | |||||||
| Total Sources | $16,325,000 | 100.0% | Total Uses | $16,325,000 | 100.0 | % |
THE INFORMATION IN THIS STRUCTURAL AND COLLATERAL TERM SHEET IS NOT COMPLETE AND MAY BE AMENDED PRIOR TO THE TIME OF SALE. THIS TERM SHEET IS NOT AN OFFER TO SELL THESE SECURITIES AND IT IS NOT A SOLICITATION OF AN OFFER TO BUY THESE SECURITIES IN ANY JURISDICTION WHERE THE OFFER OR SALE IS NOT PERMITTED.
98
VOSS SELF STORAGE |
The Property. The Voss Self Storage Property is a 1,367-unit self storage facility totaling 157,366 rentable square feet located on a 2.0-acre site in Houston, Texas, approximately 12.3 miles west of the Houston central business district. The unit mix consists of 1,133 climate controlled units, 56 non-climate controlled units and 160 wine storage units. Additionally, the improvements include 15 uncovered outdoor storage spaces, three apartment units, a leasing office and retail space located near the entrance. The three apartment units total approximately 3,700 square feet and are located on the fourth floor of the main building; however, one apartment unit is dedicated to the property manager and has been excluded from the net rentable area and unit mix. The leasing office is located on the first floor and is approximately 3,360 square feet. The retail unit totals 1,680 square feet and is currently vacant. Amenities include security gates, keypad entry, video cameras, individual door alarms, exterior lighting and on-site manager. As of October 14, 2013, the Voss Self Storage Property was 77.1% occupied on a per unit basis and 82.2% occupied on a per square foot basis with an average in-place rent of $198 per unit (exclusive of parking, retail and apartment rents).
The following table presents certain information relating to the unit mix of the Voss Self Storage Property:
Unit Mix Summary(1)
| Unit Type | No. of Units | % of Total Units | Average Unit Size (SF) | Average Monthly Rent per Unit | ||||||||
| <=100 SF - Climate Controlled | 727 | 53.2% | 75 | $142 | ||||||||
| <=100 SF - Non-Climate Controlled | 19 | 1.4% | 96 | $145 | ||||||||
| >100 SF - Climate Controlled | 406 | 24.7% | 212 | $306 | ||||||||
| >100 SF - Non-Climate Controlled | 37 | 2.7% | 237 | $313 | ||||||||
| Apartment | 2 | 0.1% | 1,275 | $1,823 | ||||||||
| Parking | 15 | 1.1% | - | $28 | ||||||||
| Retail Space | 1 | 0.1% | 1,680 | - | ||||||||
| Wine Storage | 160 | 11.7% | 11 | $71 | ||||||||
| Total/Weighted Average | 1,367 | 100.0% | 115 | $188 | ||||||||
| (1) | Information obtained from the underwritten unit mix. |
The following table presents historical occupancy percentages at the Voss Self Storage Property:
Historical Occupancy
12/31/2010(1) | 12/31/2011(1) | 12/31/2012(1) | 10/14/2013 | |||
| NAV | 39.8% | 66.6% | 82.2% |
| (1) | Information obtained from the borrower. The Voss Self Storage Property was constructed in 2010 and has been stabilizing operations. |
Operating History and Underwritten Net Cash Flow. The following table presents certain information relating to the historical operating performance and Underwritten Net Cash Flow at the Voss Self Storage Property:
Cash Flow Analysis
| 2011 | 2012 | TTM 9/30/2013 | U/W | U/W $ per SF | |||||||||||
| Base Rent | $620,611 | $1,212,530 | $1,996,266 | $2,515,260(1) | $15.98 | ||||||||||
| Grossed Up Vacant Space | 0 | 0 | 0 | 605,988 | 3.85 | ||||||||||
Other Income(2) | (5,215) | (8,741) | (9,298) | (9,298) | (0.06) | ||||||||||
| Less Vacancy & Credit Loss | 0 | 0 | 0 | (605,988)(3) | (3.85) | ||||||||||
| Effective Gross Income | $615,396 | $1,203,789 | $1,986,968 | $2,505,962 | $15.92 | ||||||||||
| Total Operating Expenses | $669,097 | $807,628 | $713,381 | $946,364 | $6.01 | ||||||||||
| Net Operating Income | ($53,701) | $396,161 | $1,273,587 | $1,559,598 | $9.91 | ||||||||||
| Capital Expenditures | 0 | 0 | 0 | 23,605 | 0.15 | ||||||||||
| Net Cash Flow | ($53,701) | $396,161 | $1,273,587 | $1,535,993 | $9.76 | ||||||||||
| NOI DSCR | (0.05x) | 0.37x | 1.20x | 1.47x | |||||||||||
| NCF DSCR | (0.05x) | 0.37x | 1.20x | 1.45x | |||||||||||
| NOI DY | (0.3%) | 2.4% | 7.8% | 9.6% | |||||||||||
| NCF DY | (0.3%) | 2.4% | 7.8% | 9.4% |
| (1) | The Voss Self Storage Property was constructed in 2010 and has been stabilizing operations. Underwritten Base Rent reflects contractual rents per the underwritten rent roll dated October 14, 2013. |
| (2) | Other Income includes cost of goods sold and truck rental income. |
| (3) | The underwritten economic vacancy is 19.4%. The Voss Self Storage Property was 82.2% physically occupied as of October 14, 2013. |
Appraisal. As of the appraisal valuation date of October 9, 2013, the Voss Self Storage Property had an “as-is” appraised value of $22,880,000.
Environmental Matters. According to a Phase I environmental assessment dated October 16, 2013, there was no evidence of any recognized environmental conditions at the Voss Self Storage Property.
THE INFORMATION IN THIS STRUCTURAL AND COLLATERAL TERM SHEET IS NOT COMPLETE AND MAY BE AMENDED PRIOR TO THE TIME OF SALE. THIS TERM SHEET IS NOT AN OFFER TO SELL THESE SECURITIES AND IT IS NOT A SOLICITATION OF AN OFFER TO BUY THESE SECURITIES IN ANY JURISDICTION WHERE THE OFFER OR SALE IS NOT PERMITTED.
99
VOSS SELF STORAGE |
Market Overview and Competition. The Voss Self Storage Property is located in Houston, Texas, approximately 12.3 miles west of the Houston central business district. According to the appraiser, there are approximately 34 apartment complexes located within a one-mile radius of the Voss Self Storage Property. The property has good access and visibility along South Voss Road, a major six-lane, north-south thoroughfare. The neighborhood is bordered by Interstate 10 to the north, Westpark Tollway to the south, Sam Houston Tollway to the west and Interstate 610 to the east, all of which are major arterial roadways, providing access throughout the Houston-Sugar Land-Baytown metropolitan statistical area. According to a market research report, the estimated 2013 population within a one, three, and five-mile radius of the Voss Self Storage Property is 26,754, 192,194, and 473,728, respectively. The estimated 2013 average household income within a one, three, and five-mile radius of the Voss Self Storage Property is $90,912, $89,640, and $91,474, respectively, which is higher than the Houston-Sugar Land-Baytown metropolitan statistical area average household income of $78,862.
The following table presents certain information relating to some comparable self storage properties for the Voss Self Storage Property:
Competitive Set(1)
| Voss Self Storage (Subject) | CubeSmart | Morningstar Mini Storage | Private Mini Storage | U-Haul | Public Storage | Public Storage | ||||||||
| Location | Houston, TX | Houston, TX | Houston, TX | Houston, TX | Houston, TX | Houston, TX | Houston, TX | |||||||
| Distance to Subject | NAP | 1.5 miles | 1.4 miles | 1.1 miles | 0.3 miles | 1.1 miles | 2.2 miles | |||||||
| Property Type | Self Storage | Self Storage | Self Storage | Self Storage | Self Storage | Self Storage | Self Storage | |||||||
| Number of Units | 1,367 | 587 | 675 | 850 | 557 | 504 | 1,086 | |||||||
| Average Rent (per Unit) | ||||||||||||||
| <=100 SF - Climate Controlled | $142 | $49-$109 | $43-$115 | $60-$333 | $40-$190 | $34-$81 | $44-$111 | |||||||
| <=100SF - Non-Climate Controlled | $145 | NAV | $34-$81 | $38-$90 | $35-$165 | $81 | NAV | |||||||
| >100SF - Climate Controlled | $306 | $115-$179 | $195 | $226 | $290-$380 | NAP | $152-$167 | |||||||
| >100SF - Non-Climate Controlled | $313 | NAV | $120-$170 | $143 | NAP | $105-$417 | NAV | |||||||
| Year Built | 2010 | 2002 | 1995 | 1993 | 1989 | 1977 | 1970 | |||||||
| Total Occupancy | 82% | 90% | 82% | 80% | 85% | 85% | 90% |
| (1) | Information obtained from the appraisal and underwritten unit mix. |
The Borrower. The borrower is Community Self Storage IV, LP, a single purpose entity. Andrew Gregory, the owner of the borrower, is the guarantor of certain nonrecourse carveouts under the Voss Self Storage Mortgage Loan. Andrew Gregory is also the guarantor of certain nonrecourse carveouts under the mortgage loan identified on Annex A-1 to the Free Writing Prospectus as Washington Self Storage, which mortgage loan had an original principal balance of $14,500,000, has an outstanding principal balance as of the Cut-off Date of $14,500,000 and accrues interest at an interest rate of 5.055% per annum.
The Sponsor. The sponsor, Andrew Gregory, is the founder, developer and president of four community self storage properties throughout the greater Houston area totaling 511,669 square feet and has 14 years’ experience in self storage site selection, design, development, construction, operation and management.
Escrows. The loan documents provide for upfront reserves in the amount of $243,437 for real estate taxes and $7,252 for insurance. The loan documents also provide for ongoing monthly escrow deposits of $21,077 for taxes, $2,302 for insurance, and $1,967 for replacement reserves.
Lockbox and Cash Management. Upon the occurrence of a Cash Sweep Event (as defined below) the Voss Self Storage Mortgage Loan requires the borrower to (i) establish a lender-controlled lockbox account and (ii) direct the manager to deliver all receipts payable with respect to the Voss Self Storage Property directly into the lockbox account within one business day of receipt. During the continuance of a Cash Sweep Event, (i) all funds deposited in the lender-controlled lockbox account are required to be swept to a cash management account controlled by the lender for application to the obligations of the borrower in connection with the Voss Self Storage Mortgage Loan, and (ii) all excess cash flow, if any, will remain with the lender as additional collateral for the North County Village Mortgage Loan. If no Cash Sweep Event exist (following the establishment of the lockbox account), the lender is required to furnish a notice to the lock-box bank instructing it to disburse all funds in the lender-controlled lockbox account to an account designated by the borrower at all times that a Cash Sweep Event is not continuing.
A “Cash Sweep Event” will commence upon: (i) the occurrence and continuance of an event of default; (ii) any bankruptcy action of the borrower, guarantor, or manager; or (iii) the amortizing DSCR based on a trailing 12-month basis is below 1.05x.
Property Management. The Voss Self Storage Property is managed by an affiliate of the borrower.
Assumption. The borrower has the right to transfer the Voss Self Storage Property, provided that no event of default has occurred and is continuing and certain other conditions as specified in the loan documents are satisfied, including (i) the lender’s reasonable determination that the proposed transferee and guarantor satisfy the lender’s credit review and underwriting standards, taking into consideration transferee experience, financial strength and general business standing; (ii) execution of a recourse guaranty and an environmental indemnity by an affiliate of the transferee; and (iii) if requested by the lender, rating agency confirmation from KBRA, Moody’s, and S&P that the transfer will not result in a downgrade, withdrawal or qualification of the respective ratings assigned to the Series 2013-UBS1 Certificates.
THE INFORMATION IN THIS STRUCTURAL AND COLLATERAL TERM SHEET IS NOT COMPLETE AND MAY BE AMENDED PRIOR TO THE TIME OF SALE. THIS TERM SHEET IS NOT AN OFFER TO SELL THESE SECURITIES AND IT IS NOT A SOLICITATION OF AN OFFER TO BUY THESE SECURITIES IN ANY JURISDICTION WHERE THE OFFER OR SALE IS NOT PERMITTED.
100
VOSS SELF STORAGE |
Partial Release. Not permitted.
Real Estate Substitution. Not permitted.
Subordinate and Mezzanine Indebtedness. Not permitted.
Ground Lease. None.
Terrorism Insurance. The loan documents require that the “all risk” insurance policy required to be maintained by the borrower provide coverage for terrorism in an amount equal to the full replacement cost of the Voss Self Storage Property. The loan documents also require business interruption insurance covering up to the 12-month period following the occurrence of a casualty event, together with a six-month extended period of indemnity coverage.
THE INFORMATION IN THIS STRUCTURAL AND COLLATERAL TERM SHEET IS NOT COMPLETE AND MAY BE AMENDED PRIOR TO THE TIME OF SALE. THIS TERM SHEET IS NOT AN OFFER TO SELL THESE SECURITIES AND IT IS NOT A SOLICITATION OF AN OFFER TO BUY THESE SECURITIES IN ANY JURISDICTION WHERE THE OFFER OR SALE IS NOT PERMITTED.
101
| No. 11 – Ardmore Commons | ||||||
| Loan Information | Property Information | |||||
| Mortgage Loan Seller: | The Royal Bank of Scotland plc | Single Asset/Portfolio: | Single Asset | |||
| Credit Assessment (KBRA/Moody’s/S&P): | NR/NR/NR | Property Type: | Retail | |||
| Original Principal Balance: | $14,917,500 | Specific Property Type: | Anchored | |||
| Cut-off Date Principal Balance: | $14,917,500 | Location: | Ardmore, OK | |||
| % of Initial Pool Balance: | 2.1% | Size: | 137,897 SF | |||
| Loan Purpose: | Acquisition | Cut-off Date Principal Balance Per SF: | $108.18 | |||
| Borrower Name: | Ardmore Dunhill LLC | Year Built/Renovated: | 2008/2013 | |||
| Sponsor: | William L. Hutchinson | Title Vesting: | Fee | |||
| Mortgage Rate: | 4.815% | Property Manager: | Dunhill Property Management Services, Inc. | |||
| Note Date: | October 28, 2013 | 3rd Most Recent Occupancy (As of): | 76.1% (12/31/2010) | |||
| Anticipated Repayment Date: | NAP | 2nd Most Recent Occupancy (As of): | 94.4% (12/31/2011) | |||
| Maturity Date: | November 1, 2023 | Most Recent Occupancy (As of): | 93.4% (12/31/2012) | |||
| IO Period: | 48 months | Current Occupancy (As of): | 98.4.% (9/25/2013) | |||
| Loan Term (Original): | 120 months | |||||
| Seasoning: | 1 month | Underwriting and Financial Information: | ||||
| Amortization Term (Original): | 360 months | |||||
| Loan Amortization Type: | Interest-only, Amortizing Balloon | 3rd Most Recent NOI (As of): | $1,331,850 (12/31/2011) | |||
| Interest Accrual Method: | Actual/360 | 2nd Most Recent NOI (As of): | $952,914 (12/31/2012) | |||
| Call Protection: | L(25),D(91),O(4) | Most Recent NOI (As of)(1): | $1,336,760 (TTM 7/31/2013) | |||
| Lockbox Type: | Hard/Springing Cash Management | |||||
| Additional Debt: | None | U/W Revenues: | $1,894,375 | |||
| Additional Debt Type: | NAP | U/W Expenses: | $418,173 | |||
U/W NOI(1): | $1,476,202 | |||||
| U/W NCF: | $1,352,466 | |||||
Escrows and Reserves: | U/W NOI DSCR : | 1.57x | ||||
| U/W NCF DSCR: | 1.44x | |||||
Type: | Initial | Monthly | Cap (If Any) | U/W NOI Debt Yield: | 9.9% | |
| Taxes | $102,666 | Springing | NAP | U/W NCF Debt Yield: | 9.1% | |
| Insurance | $21,107 | $2,345 | NAP | As-Is Appraised Value: | $20,000,000 | |
| Deferred Maintenance | $12,563 | NAP | NAP | As-Is Appraisal Valuation Date: | August 17, 2013 | |
| Replacement Reserve | $0 | $2,298 | NAP | Cut-off Date LTV Ratio: | 74.6% | |
| TI/LC Reserve | $0 | $8,044 | $290,000 | LTV Ratio at Maturity or ARD: | 67.2% | |
| (1) | See “Cash Flow Analysis” section. |
The Ardmore Commons Mortgage Loan is evidenced by a single promissory note that is secured by a first mortgage encumbering a 137,897 square foot anchored retail center located in Ardmore, Oklahoma (the “Ardmore Commons Property”). The Ardmore Commons Property is the only power center in Ardmore, Oklahoma, located approximately 90 miles south of Oklahoma City, Oklahoma and 90 miles north of the Dallas/Fort Worth Metroplex. The Ardmore Commons Property is anchored by Stage Stores and Ross Dress for Less, shadow-anchored by Carmike Cinema and Lowe’s Home Improvement and has major tenants including Petco, Dollar Tree, Santa Fe Cattle Co., Hibbett Sports and Rue 21. Containing approximately 137,897 rentable square feet, the Ardmore Commons Property consists of three buildings that were constructed in 2008 and one building that was constructed in 2013. The Ardmore Commons Property is situated on a 15.4-acre lot, located approximately one half-mile east of Interstate 35. The Ardmore Commons Property contains 798 parking spaces reflecting a parking ratio of 5.79 spaces per 1,000 square feet of net rentable area. As of September 25, 2013, the Ardmore Commons Property was 98.4% leased to 22 tenants.
Sources and Uses
| Sources | Uses | |||||||||
| Original loan amount | $14,917,500 | 73.4 | % | Purchase price | $19,897,960 | 97.9 | % | |||
| Sponsor’s new cash contribution | 5,416,317 | 26.6 | Reserves | 136,336 | 0.7 | |||||
| Closing costs | 299,521 | 1.5 | ||||||||
| Total Sources | $20,333,817 | 100.0 | % | Total Uses | $20,333,817 | 100.0 | % |
THE INFORMATION IN THIS STRUCTURAL AND COLLATERAL TERM SHEET IS NOT COMPLETE AND MAY BE AMENDED PRIOR TO THE TIME OF SALE. THIS TERM SHEET IS NOT AN OFFER TO SELL THESE SECURITIES AND IT IS NOT A SOLICITATION OF AN OFFER TO BUY THESE SECURITIES IN ANY JURISDICTION WHERE THE OFFER OR SALE IS NOT PERMITTED.
102
ARDMORE COMMONS |
The following table presents certain information relating to the tenancy at the Ardmore Commons Property:
Major Tenants
| Tenant Name | Credit Rating (Fitch/ Moody’s/ S&P)(1) | Tenant NRSF | % of NRSF | Annual U/W Base Rent PSF(2) | Annual U/W Base Rent(2) | % of Total Annual U/W Base Rent | Sales PSF(3) | Occupancy Cost(3) | Lease Expiration Date | ||||||||||||
| Anchor Tenants | |||||||||||||||||||||
| Stage | NR/NR/NR | 33,000 | 23.9% | $6.00 | $198,000 | 12.0% | $141 | 5.6% | 1/31/2020(4) | ||||||||||||
| Ross Dress for Less, Inc. | NR/NR/A- | 25,000 | 18.1% | $6.00 | $150,000 | 9.1% | $226 | 3.7% | 1/31/2021(5)(6) | ||||||||||||
| Total Anchor Tenants | 58,000 | 42.1% | $6.00 | $348,000 | 21.2% | ||||||||||||||||
| Major Tenants | |||||||||||||||||||||
| Santa Fe Cattle Co. | NR/NR/NR | 5,941 | 4.3% | $35.56 | $211,253 | 12.8% | $457 | 8.2% | 10/31/2027 | ||||||||||||
| Petco | NR/B3/B | 13,775 | 10.0% | $13.35 | $183,896 | 11.2% | $115 | 13.9% | 4/30/2019 | ||||||||||||
| Hibbett Sports | NR/NR/NR | 6,000 | 4.4% | $15.01 | $90,065 | 5.5% | $503 | 3.5% | 1/31/2019 | ||||||||||||
| Dollar Tree | NR/NR/NR | 10,000 | 7.3% | $9.00 | $90,000 | 5.5% | $157 | 7.4% | 3/31/2018 | ||||||||||||
| Total Major Tenants | 35,716 | 25.9% | $16.11 | $575,214 | 35.0% | ||||||||||||||||
| Non-Major Tenants | 41,909 | 30.4% | $17.20 | $720,812 | 43.8% | ||||||||||||||||
| Occupied Collateral | 135,625 | 98.4% | $12.12 | $1,644,026 | 100.0% | ||||||||||||||||
| Vacant Space | 2,272 | 1.6% | |||||||||||||||||||
| Collateral Total | 137,897 | 100.0% | |||||||||||||||||||
| (1) | Certain ratings are those of the parent company whether or not the parent guarantees the lease. |
| (2) | The underwritten base rent includes contractual rent steps through March 2014. |
| (3) | Sales and occupancy costs are for the trailing 12-month period ending December 31,2012. |
| (4) | Stage has four, five-year extension options remaining. |
| (5) | Ross Dress for Less, Inc. has four, five-year extension options remaining. |
| (6) | Ross Dress for Less, Inc. may terminate its lease if sales do not exceed $5,500,000 during the period of March 2013 to February 2014 upon providing six months written notice. Ross Dress for Less, Inc.’s sales for 2012 exceeded $5,500,000. |
THE INFORMATION IN THIS STRUCTURAL AND COLLATERAL TERM SHEET IS NOT COMPLETE AND MAY BE AMENDED PRIOR TO THE TIME OF SALE. THIS TERM SHEET IS NOT AN OFFER TO SELL THESE SECURITIES AND IT IS NOT A SOLICITATION OF AN OFFER TO BUY THESE SECURITIES IN ANY JURISDICTION WHERE THE OFFER OR SALE IS NOT PERMITTED.
103
ARDMORE COMMONS |
The following table presents certain information relating to the lease rollover schedule at the Ardmore Commons Property:
Lease Expiration Schedule(1)(2)
Year Ending December 31, | No. of Leases Expiring | Expiring NRSF | % of Total NRSF | Cumulative Expiring NRSF | Cumulative % of Total NRSF | Annual U/W Base Rent | Annual U/W Base Rent PSF(3) | |||||||
| MTM | 0 | 0 | 0.0% | 0 | 0.0% | $0 | $0.00 | |||||||
| 2013 | 0 | 0 | 0.0% | 0 | 0.0% | $0 | $0.00 | |||||||
| 2014 | 2 | 4,541 | 3.3% | 4,541 | 3.3% | $78,397 | $17.26 | |||||||
| 2015 | 0 | 0 | 0.0% | 4,541 | 3.3% | $0 | $0.00 | |||||||
| 2016 | 5 | 8,398 | 6.1% | 12,939 | 9.4% | $166,131 | $19.78 | |||||||
| 2017 | 0 | 0 | 0.0% | 12,939 | 9.4% | $0 | $0.00 | |||||||
| 2018 | 7 | 27,566 | 20.0% | 40,505 | 29.4% | $359,796 | $13.05 | |||||||
| 2019 | 2 | 19,775 | 14.3% | 60,280 | 43.7% | $273,961 | $13.85 | |||||||
| 2020 | 1 | 33,000 | 23.9% | 93,280 | 67.6% | $198,000 | $6.00 | |||||||
| 2021 | 2 | 29,100 | 21.1% | 122,380 | 88.7% | $213,550 | $7.34 | |||||||
| 2022 | 1 | 3,704 | 2.7% | 126,084 | 91.4% | $58,338 | $15.75 | |||||||
| 2023 | 1 | 3,600 | 2.6% | 129,684 | 94.0% | $84,600 | $23.50 | |||||||
| Thereafter | 1 | 5,941 | 4.3% | 135,625 | 98.4% | $211,253 | $35.56 | |||||||
| Vacant | 0 | 2,272 | 1.6% | 137,897 | 100.0% | $0 | $0.00 | |||||||
| Total/Weighted Average | 22 | 137,897 | 100.0% | $1,644,026 | $12.12 |
| (1) | Information was obtained from the underwritten rent roll. |
| (2) | Certain tenants may have lease termination options that are exercisable prior to the stated expiration date of the subject lease and that are not considered in the Lease Expiration Schedule. |
| (3) | Weighted Average Annual U/W Base Rent PSF excludes vacant space. |
The following table presents historical occupancy percentages at the Ardmore Commons Property:
Historical Occupancy Percentages
12/31/2010(1) | 12/31/2011(1) | 12/31/2012(1) | 9/25/2013 | |||
| 76.1% | 94.4% | 93.4% | 98.4% |
| (1) | Information obtained from borrower rent rolls. |
Operating History and Underwritten Net Cash Flow. The following table presents certain information relating to the historical operating performance and the Underwritten Net Cash Flow at the Ardmore Commons Property:
Cash Flow Analysis
2011 | 2012 | TTM 7/31/2013 | U/W(1) | U/W $ per SF | |||||||||||
| Base Rent | $1,531,477 | $1,488,362 | $1,468,822 | $1,644,026 | $11.92 | ||||||||||
| Grossed Up Vacant Space | 0 | 0 | 0 | 47,439 | 0.34 | ||||||||||
| Total Reimbursables | 198,437 | 271,211 | 293,510 | 328,134 | 2.38 | ||||||||||
| Other Income | 5,521 | 6,813 | 3,316 | 0 | 0.00 | ||||||||||
| Less Vacancy & Credit Loss | 0 | (436,313)(2) | 0 | (125,224)(3) | (0.91) | ||||||||||
| Effective Gross Income | $1,735,435 | $1,330,073 | $1,765,648 | $1,894,375 | $13.74 | ||||||||||
| Total Operating Expenses | $403,585 | $377,159 | $428,888 | $418,173 | $3.03 | ||||||||||
| Net Operating Income | $1,331,850 | $952,914 | $1,336,760 | $1,476,202 | $10.71 | ||||||||||
| TI/LC | 0 | 0 | 0 | 96,157 | 0.70 | ||||||||||
| Capital Expenditures | 0 | 0 | 0 | 27,579 | 0.20 | ||||||||||
| Net Cash Flow | $1,331,850 | $952,914 | $1,336,760 | $1,352,466 | $9.81 | ||||||||||
| NOI DSCR | 1.42x | 1.01x | 1.42x | 1.57x | |||||||||||
| NCF DSCR | 1.42x | 1.01x | 1.42x | 1.44x | |||||||||||
| NOI DY | 8.9% | 6.4% | 9.0% | 9.9% | |||||||||||
| NCF DY | 8.9% | 6.4% | 9.0% | 9.1% | |||||||||||
| (1) | The Underwritten NOI is higher than the NOI in the 2012 and TTM 7/31/13 periods due to an increase in occupancy from new leases and/or lease renewals in 2013. The occupancy increased from 93.4% on December 31, 2012 to 98.4% on September 25, 2013. |
| (2) | Vacancy & Credit Loss were higher in 2012 due to a former tenant, Eatza Pizza, with a lease beginning in 2008, filing for bankruptcy. |
| (3) | The underwritten economic vacancy is 6.2%. The Ardmore Commons Property was 98.4% physically occupied as of September 25, 2013. |
THE INFORMATION IN THIS STRUCTURAL AND COLLATERAL TERM SHEET IS NOT COMPLETE AND MAY BE AMENDED PRIOR TO THE TIME OF SALE. THIS TERM SHEET IS NOT AN OFFER TO SELL THESE SECURITIES AND IT IS NOT A SOLICITATION OF AN OFFER TO BUY THESE SECURITIES IN ANY JURISDICTION WHERE THE OFFER OR SALE IS NOT PERMITTED.
104
(THIS PAGE INTENTIONALLY LEFT BLANK)
105
| No. 12 – Washington Self Storage | |||||||
| Loan Information | Property Information | ||||||
| Mortgage Loan Seller: | Rialto Mortgage Finance, LLC | Single Asset/Portfolio: | Single Asset | ||||
| Credit Assessment (KBRA/Moody’s/S&P): | NR/NR/NR | Property Type: | Self Storage | ||||
| Original Principal Balance: | $14,500,000 | Specific Property Type: | Self Storage | ||||
| Cut-off Date Principal Balance: | $14,500,000 | Location: | Houston, TX | ||||
| % of Initial Pool Balance: | 2.0% | Size: | 157,712 SF | ||||
| Loan Purpose: | Refinance | Cut-off Date Principal Balance Per SF: | $91.94 | ||||
| Borrower Name: | Community Self Storage III, LP | Year Built/Renovated: | 2010/NAP | ||||
Sponsor(1): | Andrew Gregory | Title Vesting: | Fee | ||||
| Mortgage Rate: | 5.055% | Property Manager: | Andrew Gregory | ||||
| Note Date: | November 6, 2013 | 3rd Most Recent Occupancy (As of): | NAV | ||||
| Anticipated Repayment Date: | NAP | 2nd Most Recent Occupancy (As of): | 60.9% (12/31/2011) | ||||
| Maturity Date: | November 6, 2023 | Most Recent Occupancy (As of): | 73.4% (12/31/2012) | ||||
| IO Period: | 36 months | Current Occupancy (As of): | 82.7% (9/30/2013) | ||||
| Loan Term (Original): | 120 months | ||||||
| Seasoning: | 1 month | Underwriting and Financial Information: | |||||
| Amortization Term (Original): | 360 months | ||||||
| Loan Amortization Type: | Interest-only, Amortizing Balloon | 3rd Most Recent NOI (As of): | $517,605 (12/31/2011) | ||||
| Interest Accrual Method: | Actual/360 | 2nd Most Recent NOI (As of): | $792,196 (12/31/2012) | ||||
| Call Protection: | L(25),D(91),O(4) | Most Recent NOI (As of)(2): | $1,086,015 (TTM 9/30/2013) | ||||
| Lockbox Type: | Springing (Without Established Account) | ||||||
| Additional Debt: | None | U/W Revenues: | $2,061,681 | ||||
| Additional Debt Type: | NAP | U/W Expenses: | $806,235 | ||||
U/W NOI(2): | $1,255,445 | ||||||
| U/W NCF: | $1,231,789 | ||||||
| U/W NOI DSCR: | 1.34x | ||||||
| U/W NCF DSCR: | 1.31x | ||||||
Escrows and Reserves: | U/W NOI Debt Yield: | 8.7% | |||||
| U/W NCF Debt Yield: | 8.5% | ||||||
Type: | Initial | Monthly | Cap (If Any) | As-Is Appraised Value: | $19,600,000 | ||
| Taxes | $263,977 | $22,855 | NAP | As-Is Appraisal Valuation Date: | October 9, 2013 | ||
| Insurance | $20,180 | $2,135 | NAP | Cut-off Date LTV Ratio: | 74.0% | ||
| Replacement Reserves | $0 | $1,971 | NAP | LTV Ratio at Maturity or ARD: | 65.6% | ||
| (1) | Andrew Gregory is also the guarantor of certain nonrecourse carveouts under the mortgage loan identified on Annex A-1 to the Free Writing Prospectus as Voss Self Storage, which mortgage loan had an original principal balance of $16,325,000, has an outstanding principal balance as of the Cut-off Date of $16,325,000 and accrues interest at an interest rate of 5.050% per annum. |
| (2) | See “Cash Flow Analysis” section. |
The Washington Self Storage mortgage loan is evidenced by a single promissory note that is secured by a first mortgage encumbering a 157,712 square foot, 1,316-unit self storage property located in Houston, Texas (the “Washington Self Storage Property”). The Washington Self Storage Property unit mix consists of 1,239 climate controlled units, 39 non-climate controlled units, and 18 climate controlled lockers. Additionally, the Washington Self Storage Property improvements include three apartment units, 17 uncovered outdoor storage spaces, one retail unit and a leasing office. The three apartment units total 3,700 square feet and are located on the fourth floor; however, one apartment unit is dedicated to the on-site property manager and has been excluded from the net rentable area and unit mix. The retail unit totals 583 square feet and is currently leased to a dental office. The leasing office is approximately 1,650 square feet and is located on the first floor. Construction on the Washington Self Storage Property started in 2008 and was completed in 2010. Amenities include security gates, keypad entry, video cameras, individual door alarms, and an on-site manager. As of September 30, 2013, the Washington Self Storage Property was 85.6% occupied on a per unit basis and 82.7% occupied on a per square foot basis, with an average in-place rent of $154 per unit (exclusive of parking, retail and apartment rents).
Sources and Uses
| Sources | Uses | |||||||
| Original loan amount | $14,500,000 | 100.0% | Loan payoff | $10,159,004 | 70.1% | |||
| Reserves | 284,157 | 2.0 | ||||||
| Closing costs | 444,217 | 3.1 | ||||||
| Return of equity | 3,612,622 | 24.9 | ||||||
| Total Sources | $14,500,000 | 100.0% | Total Uses | $14,500,000 | 100.0% |
THE INFORMATION IN THIS STRUCTURAL AND COLLATERAL TERM SHEET IS NOT COMPLETE AND MAY BE AMENDED PRIOR TO THE TIME OF SALE. THIS TERM SHEET IS NOT AN OFFER TO SELL THESE SECURITIES AND IT IS NOT A SOLICITATION OF AN OFFER TO BUY THESE SECURITIES IN ANY JURISDICTION WHERE THE OFFER OR SALE IS NOT PERMITTED.
106
| WASHINGTON SELF STORAGE |
The following table presents certain information relating to the unit mix of the Washington Self Storage Property:
Unit Mix Summary(1)
| Unit Type | No. of Units | % of Total Units | Average Unit Size (SF) | Average Monthly Rent per Unit | |||
| <=100 SF - Climate Controlled | 812 | 61.7% | 73 | $98 | |||
| <=100 SF - Non-Climate Controlled | 16 | 1.2% | 91 | $129 | |||
| >100 SF - Climate Controlled | 427 | 32.4% | 205 | $183 | |||
| >100 SF - Non-Climate Controlled | 23 | 1.7% | 227 | $228 | |||
| 25 SF Locker | 18 | 1.4% | 13 | $66 | |||
| Apartment | 2 | 0.2% | 1,800 | $2,175 | |||
| Parking | 17 | 1.3% | 0 | $23 | |||
| Retail Space | 1 | 0.1% | 583 | $1,416 | |||
| Total/Weighted Average | 1,316 | 100.0% | 121(2) | $131 |
| (1) | Information obtained from the underwritten rent roll, excluding one apartment that is dedicated to the on-site property manager. |
| (2) | Weighted Average Average Unit Size excludes Parking units. |
The following table presents historical occupancy percentages at the Washington Self Storage Property:
Historical Occupancy
12/31/2010(1) | 12/31/2011(1) | 12/31/2012(1) | 9/30/2013 | |||
| 42.8% | 60.9% | 73.4% | 82.7% |
| (1) | Information obtained from the borrower. |
Operating History and Underwritten Net Cash Flow. The following table presents certain information relating to the historical operating performance and Underwritten Net Cash Flow at the Washington Self Storage Property:
Cash Flow Analysis
| 2011 | 2012 | TTM 9/13/2013 | U/W | U/W $ per SF | |||||||||||
| Base Rent | $1,085,395 | $1,459,705 | $1,810,623 | $2,067,060 | (1) | $13.11 | |||||||||
| Grossed Up Vacant Space | 0 | 0 | 0 | 425,040 | 2.70 | ||||||||||
Other Income(2) | (1,296) | (8,876) | (5,379) | (5,379) | (0.03) | ||||||||||
| Less Vacancy & Credit Loss | 0 | 0 | 0 | (425,040) | (3) | (2.70) | |||||||||
| Effective Gross Income | $1,084,099 | $1,450,829 | $1,805,243 | $2,061,681 | $13.07 | ||||||||||
| Total Operating Expenses | $566,494 | $658,633 | $719,228 | $806,235 | $5.11 | ||||||||||
| Net Operating Income | $517,605 | $792,196 | $1,086,015 | $1,255,445 | $7.96 | ||||||||||
| Capital Expenditures | 0 | 0 | 0 | 23,657 | 0.15 | ||||||||||
| Net Cash Flow | $517,605 | $792,196 | $1,086,015 | $1,231,789 | $7.81 | ||||||||||
| NOI DSCR | 0.55x | 0.84x | 1.16x | 1.34x | |||||||||||
| NCF DSCR | 0.55x | 0.84x | 1.16x | 1.31x | |||||||||||
| NOI DY | 3.6% | 5.5% | 7.5% | 8.7% | |||||||||||
| NCF DY | 3.6% | 5.5% | 7.5% | 8.5% |
| (1) | The Washington Self Storage Property opened in 2010 and has been stabilizing operations. Underwritten Base Rent reflects contractual rents per the underwritten rent roll dated September 30, 2013 and the underwritten NOI reflects continued stabilization of the Washington Self Storage Property. |
| (2) | Other Income includes costs of goods sold and truck rental income. |
| (3) | The underwritten economic vacancy is 17.1%. The Washington Self Storage Property was 82.7% physically occupied as of September 30, 2013. |
THE INFORMATION IN THIS STRUCTURAL AND COLLATERAL TERM SHEET IS NOT COMPLETE AND MAY BE AMENDED PRIOR TO THE TIME OF SALE. THIS TERM SHEET IS NOT AN OFFER TO SELL THESE SECURITIES AND IT IS NOT A SOLICITATION OF AN OFFER TO BUY THESE SECURITIES IN ANY JURISDICTION WHERE THE OFFER OR SALE IS NOT PERMITTED.
107
| No. 13 – Olympia Development Walgreens Portfolio II | |||||||
| Loan Information | Property Information | ||||||
| Mortgage Loan Seller: | Rialto Mortgage Finance, LLC | Single Asset/Portfolio: | Portfolio | ||||
Credit Assessment (KBRA/Moody’s/S&P): | NR/NR/NR | Property Type: | Retail | ||||
| Original Principal Balance: | $14,140,000 | Specific Property Type: | Single Tenant | ||||
| Cut-off Date Principal Balance: | $14,140,000 | Location: | Various – See Table | ||||
| % of Initial Pool Balance: | 1.9% | Size: | 46,980 SF | ||||
| Loan Purpose: | Refinance | Cut-off Date Principal Balance Per SF: | $300.98 | ||||
| Borrower Names: | Temple Terrace, FL-W, LLC; Naples, FL South-W, LLC; Naples, FL-W, LLC | Year Built/Renovated: | Various – See Table | ||||
| Sponsor: | William Touloumis | Title Vesting: | Fee | ||||
| Mortgage Rate: | 5.020% | Property Manager: | Olympia Development Group, Inc. | ||||
| Note Date: | October 18, 2013 | 3rd Most Recent Occupancy (As of): | 100.0% (12/31/2010) | ||||
| Anticipated Repayment Date: | November 6, 2018 | 2nd Most Recent Occupancy (As of): | 100.0% (12/31/2011) | ||||
| Maturity Date: | November 6, 2023 | Most Recent Occupancy (As of): | 100.0% (12/31/2012) | ||||
| IO Period: | 60 months | Current Occupancy (As of): | 100.0% (12/1/2013) | ||||
| Loan Term (Original): | 60 months | ||||||
| Seasoning: | 1 month | Underwriting and Financial Information: | |||||
| Amortization Term (Original): | 0 months | ||||||
| Loan Amortization Type: | Interest-only, ARD | 3rd Most Recent NOI (As of): | $1,193,994 (12/31/2011) | ||||
| Interest Accrual Method: | Actual/360 | 2nd Most Recent NOI (As of): | $1,195,738 (12/31/2012) | ||||
| Call Protection: | L(25),D(31),O(4) | Most Recent NOI (As of): | $1,196,408 (TTM 7/31/2013) | ||||
| Lockbox Type: | Hard/Springing Cash Management | ||||||
| Additional Debt: | None | ||||||
| Additional Debt Type: | NAP | U/W Revenues: | $1,065,726 | ||||
| U/W Expenses: | $30,998 | ||||||
| U/W NOI: | $1,034,728 | ||||||
Escrows and Reserves: | U/W NCF: | $1,022,983 | |||||
| U/W NOI DSCR: | 1.44x | ||||||
Type: | Initial | Monthly | Cap (If Any) | U/W NCF DSCR: | 1.42x | ||
Taxes(1) | $0 | Springing | NAP | U/W NOI Debt Yield: | 7.3% | ||
| Insurance | $0 | $807 | NAP | U/W NCF Debt Yield: | 7.2% | ||
| Replacement Reserves | $0 | $392 | NAP | As-Is Appraised Value: | $18,880,000 | ||
| TI/LC Reserve | $0 | $587 | NAP | As-Is Appraisal Valuation Date: | Various(3) | ||
| Deferred Maintenance | $9,550 | $0 | NAP | Cut-off Date LTV Ratio: | 74.9% | ||
Critical Tenant TI/LC(2) | $0 | Springing | NAP | LTV Ratio at Maturity or ARD: | 74.9% | ||
| (1) | The borrower will be required to make monthly tax deposits upon the occurrence of (i) an event of default; (ii) Walgreens not being expressly obligated to directly pay all taxes due; (iii) the respective Walgreens lease not being in full force and effect; (iv) Walgreens not paying all taxes prior to the due date; or (v) the borrower not providing the lender with timely proof of payment. |
| (2) | All excess cash flow will be swept into a lender controlled account if: (i) on or prior to 12 months prior to the then applicable date on which Walgreens is permitted to terminate its lease, Walgreens fails to waive its right to terminate its lease, (ii) upon the occurrence and during the continuation of a monetary event of default under the Walgreens lease, (iii) Walgreens is subject to a bankruptcy or insolvency proceeding or (iv) Walgreens is downgraded below investment grade by Fitch, Moody’s or S&P. |
| (3) | The As-Is Appraisal Valuation Dates range from August 26, 2013 to August 30, 2013. |
The Olympia Development Walgreens Portfolio II mortgage loan is evidenced by a single promissory note that is secured by first mortgages encumbering three single tenant retail properties 100.0% leased to Walgreens, located in Naples and Temple Terrace, Florida (the “Olympia Development Walgreens Portfolio II Properties”). The Olympia Development Walgreens Portfolio II Properties contain 46,980 square feet and were built in 1998 and 1999. As of December 1, 2013, the Olympia Development Walgreens Portfolio II Properties were 100.0% occupied by Walgreens.
THE INFORMATION IN THIS STRUCTURAL AND COLLATERAL TERM SHEET IS NOT COMPLETE AND MAY BE AMENDED PRIOR TO THE TIME OF SALE. THIS TERM SHEET IS NOT AN OFFER TO SELL THESE SECURITIES AND IT IS NOT A SOLICITATION OF AN OFFER TO BUY THESE SECURITIES IN ANY JURISDICTION WHERE THE OFFER OR SALE IS NOT PERMITTED.
108
| OLYMPIA DEVELOPMENT WALGREENS PORTFOLIO II |
Sources and Uses
| Sources | Uses | |||||||
| Original loan amount | $14,140,000 | 100.0% | Loan payoff | $10,188,983 | 72.1% | |||
Settlement/payoff costs(1) | 3,629,378 | 25.7 | ||||||
| Reserves | 9,550 | 0.1 | ||||||
| Closing costs | 264,767 | 1.9 | ||||||
| Return of equity | 47,322 | 0.3 | ||||||
| Total Sources | $14,140,000 | 100.0% | Total Uses | $14,140,000 | 100.0% | |||
| (1) | Settlement/payoff costs include a portion of an $11.75 million negotiated settlement amount related the prior bankruptcy of the Safety Harbor Resort & Spa property (which property is not collateral for a mortgage loan included in the WFRBS 2013-UBS1 Trust) (as described under “Description of the Mortgage Pool—Default History, Bankruptcy Issues and Other Proceedings” in the accompanying Free Writing Prospectus.) |
The following table presents certain information relating to the Olympia Development Walgreens Portfolio II Properties:
| Property Name | Location | Allocated Cut-off Date Principal Balance | % of Portfolio Cut-off Date Principal Balance | Occupancy | Year Built/ Renovated | Net Rentable Area (SF) | Appraised Value | |||||||
| Walgreens #4573 | Temple Terrace, FL | $5,100,000 | 36.1% | 100.0% | 1999/NAP | 15,120 | $6,800,000 | |||||||
| Walgreens #4482 | Naples, FL | $4,540,000 | 32.1% | 100.0% | 1998/NAP | 15,930 | $6,070,000 | |||||||
| Walgreens #4958 | Naples, FL | $4,500,000 | 31.8% | 100.0% | 1999/NAP | 15,930 | $6,010,000 | |||||||
| Total/Weighted Average | $14,140,000 | 100.0% | 100.0% | 46,980 | $18,880,000 | |||||||||
The following table presents certain information relating to the major tenant at the Olympia Development Walgreens Portfolio II Properties:
Major Tenant
| Tenant Name | Credit Rating(Fitch/Moody’s/ S&P)(1) | Tenant NRSF | % of NRSF | Annual U/W Base Rent PSF(2) | Annual U/W Base Rent(2) | % of Total Annual U/W Base Rent | Lease Expiration Date | |
| Walgreens | NR/Baa1/BBB | 46,980 | 100.0% | $23.15 | $1,087,476 | 100.0% | Various(3) | |
| Collateral Total | 46,980 | 100.0% | ||||||
| (1) | Certain ratings are those of the parent company whether or not the parent guarantees the lease. |
| (2) | Annual U/W Base Rent PSF and Annual U/W Base Rent include contractual rent decreases through July 1, 2015. |
| (3) | Walgreens is the sole tenant at the three individual Olympia Development Walgreens Portfolio II Properties. The Walgreens #4573, Walgreens #4482, and Walgreens #4958 property leases expire on, June 30, 2029, October 31, 2029, and July 31, 2030, respectively. |
The following table presents certain information relating to the lease rollover schedule at the Olympia Development Walgreens Portfolio II Properties:
Lease Expiration Schedule(1)(2)
Year Ending December 31, | No. of Leases Expiring | Expiring NRSF | % of Total NRSF | Cumulative Expiring NRSF | Cumulative % of Total NRSF | Annual U/W Base Rent | Annual U/W Base Rent PSF | |||||||||
| MTM | 0 | 0 | 0.0% | 0 | 0.0% | $0 | $0.00 | |||||||||
| 2013 | 0 | 0 | 0.0% | 0 | 0.0% | $0 | $0.00 | |||||||||
| 2014 | 0 | 0 | 0.0% | 0 | 0.0% | $0 | $0.00 | |||||||||
| 2015 | 0 | 0 | 0.0% | 0 | 0.0% | $0 | $0.00 | |||||||||
| 2016 | 0 | 0 | 0.0% | 0 | 0.0% | $0 | $0.00 | |||||||||
| 2017 | 0 | 0 | 0.0% | 0 | 0.0% | $0 | $0.00 | |||||||||
| 2018 | 0 | 0 | 0.0% | 0 | 0.0% | $0 | $0.00 | |||||||||
| 2019 | 0 | 0 | 0.0% | 0 | 0.0% | $0 | $0.00 | |||||||||
| 2020 | 0 | 0 | 0.0% | 0 | 0.0% | $0 | $0.00 | |||||||||
| 2021 | 0 | 0 | 0.0% | 0 | 0.0% | $0 | $0.00 | |||||||||
| 2022 | 0 | 0 | 0.0% | 0 | 0.0% | $0 | $0.00 | |||||||||
| 2023 | 0 | 0 | 0.0% | 0 | 0.0% | $0 | $0.00 | |||||||||
| Thereafter | 3 | 46,980 | 100.0% | 46,980 | 100.0% | $1,087,476 | $23.15 | |||||||||
| Vacant | 0 | 0 | 0.0% | 46,980 | 100.0% | $0 | $0.00 | |||||||||
| Total/Weighted Average | 3 | 46,980 | 100.0% | $1,087,476 | $23.15 | |||||||||||
| (1) | Information obtained from the underwritten rent roll. |
| (2) | Certain tenants may have lease termination options that are exercisable prior to the stated expiration date of the subject lease and that are not considered in the Lease Expiration Schedule. |
THE INFORMATION IN THIS STRUCTURAL AND COLLATERAL TERM SHEET IS NOT COMPLETE AND MAY BE AMENDED PRIOR TO THE TIME OF SALE. THIS TERM SHEET IS NOT AN OFFER TO SELL THESE SECURITIES AND IT IS NOT A SOLICITATION OF AN OFFER TO BUY THESE SECURITIES IN ANY JURISDICTION WHERE THE OFFER OR SALE IS NOT PERMITTED.
109
| OLYMPIA DEVELOPMENT WALGREENS PORTFOLIO II |
The following table presents historical occupancy percentages at the Olympia Development Walgreens Portfolio II Properties:
Historical Occupancy
12/31/2010(1) | 12/31/2011(1) | 12/31/2012(1) | 12/1/2013 | |||
| 100.0% | 100.0% | 100.0% | 100.0% |
| (1) | Information obtained from the leases. |
Underwritten Net Cash Flow. The following table presents certain information relating to the historical operating performance and the Underwritten Net Cash Flow at the Olympia Development Walgreens Portfolio II Properties:
Cash Flow Analysis
| 2011 | 2012 | TTM 7/31/2013 | U/W | U/W $ per SF | |||||||||||
| Base Rent | $1,207,985 | $1,207,994 | $1,207,985 | $1,207,985 | $25.71 | ||||||||||
| Rent Steps | 0 | 0 | 0 | (120,509)(1) | (2.57) | ||||||||||
| Total Reimbursables | 0 | 0 | 0 | 0 | 0.00 | ||||||||||
| Less Vacancy & Credit Loss | 0 | 0 | 0 | (21,750)(2) | (0.46) | ||||||||||
| Effective Gross Income | $1,207,985 | $1,207,994 | $1,207,985 | $1,065,726 | $22.68 | ||||||||||
| Total Operating Expenses | $13,990 | $12,256 | $11,577 | $30,998 | $0.66 | ||||||||||
| Net Operating Income | $1,193,994 | $1,195,738 | $1,196,408 | $1,034,728 | $22.02 | ||||||||||
| TI/LC | 0 | 0 | 0 | 7,047 | 0.15 | ||||||||||
| Capital Expenditures | 0 | 0 | 0 | 4,698 | 0.10 | ||||||||||
| Net Cash Flow | $1,193,994 | $1,195,738 | $1,196,408 | $1,022,983 | $21.77 | ||||||||||
| NOI DSCR | 1.66x | 1.66x | 1.66x | 1.44x | |||||||||||
| NCF DSCR | 1.66x | 1.66x | 1.66x | 1.42x | |||||||||||
| NOI DY | 8.4% | 8.5% | 8.5% | 7.3% | |||||||||||
| NCF DY | 8.4% | 8.5% | 8.5% | 7.2% |
| (1) | Rent step-downs include contractual rent decreases through July 1, 2015. The borrower agreed to lower Walgreens rent in exchange for Walgreens increasing its lease terms on each of the Olympia Development Walgreens Portfolio II Properties by 10 years. |
| (2) | The underwritten economic vacancy is 2.0%. The Olympia Development Walgreens Portfolio II Properties were 100.0% physically occupied as of December 1, 2013. |
THE INFORMATION IN THIS STRUCTURAL AND COLLATERAL TERM SHEET IS NOT COMPLETE AND MAY BE AMENDED PRIOR TO THE TIME OF SALE. THIS TERM SHEET IS NOT AN OFFER TO SELL THESE SECURITIES AND IT IS NOT A SOLICITATION OF AN OFFER TO BUY THESE SECURITIES IN ANY JURISDICTION WHERE THE OFFER OR SALE IS NOT PERMITTED.
110
(THIS PAGE INTENTIONALLY LEFT BLANK)
111
| No. 14 – Whitney Ranch Shopping Center | |||||||
| Loan Information | Property Information | ||||||
| Mortgage Loan Seller: | Wells Fargo Bank, National Association | Single Asset/Portfolio: | Single Asset | ||||
Credit Assessment (KBRA/Moody’s/S&P): | NR/NR/NR | Property Type: | Retail | ||||
| Original Principal Balance: | $13,615,000 | Specific Property Type: | Anchored | ||||
| Cut-off Date Principal Balance: | $13,615,000 | Location: | Henderson, NV | ||||
| % of Initial Pool Balance: | 1.9% | Size: | 82,528 SF | ||||
| Loan Purpose: | Refinance | Cut-off Date Principal Balance Per SF: | $164.97 | ||||
| Borrower Name: | 601-699 Whitney Ranch Center, LLC | Year Built/Renovated: | 1992/NAP | ||||
Sponsors(1): | Various | Title Vesting: | Fee | ||||
| Mortgage Rate: | 4.720% | Property Manager: | Sperry Van Ness/DealPoint Merrill Properties Corporation | ||||
| Note Date: | November 1, 2013 | 3rd Most Recent Occupancy (As of): | 87.2% (12/31/2010) | ||||
| Anticipated Repayment Date: | NAP | 2nd Most Recent Occupancy (As of): | 88.9% (12/31/2011) | ||||
| Maturity Date: | November 1, 2023 | Most Recent Occupancy (As of): | 96.7% (12/31/2012) | ||||
| IO Period: | 60 months | Current Occupancy (As of): | 92.1% (11/30/2013) | ||||
| Loan Term (Original): | 120 months | ||||||
| Seasoning: | 1 month | Underwriting and Financial Information: | |||||
| Amortization Term (Original): | 360 months | ||||||
| Loan Amortization Type: | Interest-only, Amortizing Balloon | 3rd Most Recent NOI (As of): | $1,677,196 (12/31/2011) | ||||
| Interest Accrual Method: | Actual/360 | 2nd Most Recent NOI (As of): | $1,613,091 (12/31/2012) | ||||
| Call Protection: | L(25),D(91),O(4) | Most Recent NOI (As of): | $1,635,334 (TTM 8/31/2012) | ||||
| Lockbox Type: | Soft/Springing Cash Management | ||||||
| Additional Debt: | None | ||||||
| Additional Debt Type: | NAP | U/W Revenues: | $2,074,060 | ||||
| U/W Expenses: | $569,882 | ||||||
| U/W NOI: | $1,504,178 | ||||||
| U/W NCF: | $1,378,080 | ||||||
Escrows and Reserves: | U/W NOI DSCR: | 1.77x | |||||
| U/W NCF DSCR: | 1.62x | ||||||
Type: | Initial | Monthly | Cap (If Any) | U/W NOI Debt Yield: | 11.0% | ||
| Taxes | $24,958 | $8,319 | NAP | U/W NCF Debt Yield: | 10.1% | ||
Insurance(2) | $0 | Springing | NAP | As-Is Appraised Value: | $21,600,000 | ||
| Replacement Reserves | $0 | $2,808 | $67,388(3) | As-Is Appraisal Valuation Date: | September 27, 2013 | ||
| TI/LC Reserve | $0 | $7,700 | $100,000(4) | Cut-off Date LTV Ratio: | 63.0% | ||
Ross Leasing Reserve(5) | $0 | Springing | NAP | LTV Ratio at Maturity or ARD: | 57.9% | ||
Hobby Lobby Installation Reserve(6) | $138,359 | $0 | NAP | ||||
| (1) | The sponsors are Roger Miller and Ruth Miller, individually and as trustees of the Roger J. Miller and Ruth Marie Miller Declaration of Trust. |
| (2) | Monthly insurance escrows are not required provided the following conditions are satisfied: (i) no event of default exists and is continuing; (ii) the Whitney Ranch Shopping Center Property is covered under a blanket insurance policy acceptable to the lender; and (iii) the borrower provides evidence of renewal of the policies and proof of timely payment of insurance premiums. |
| (3) | Monthly replacement reserve deposits may continue past the Cap if the lender determines the Whitney Ranch Shopping Center Property is not being maintained as required. |
| (4) | Monthly TI/LC deposits may continue past the Cap if the NCF debt yield is less than 9.5% |
| (5) | If Ross Stores does not exercise its option to extend its lease on or before July 31, 2016, then commencing on August 1, 2016, the borrower will begin monthly deposits of $50,000 subject to a $300,000 cap. |
| (6) | The borrower deposited $138,359, which represents the estimated costs for the installation of a backflow prevention device at the Whitney Ranch Shopping Center Property. |
The Whitney Ranch Shopping Center mortgage loan is evidenced by a single promissory note that is secured by a first mortgage encumbering a 82,528 square foot, anchored retail property located in Henderson, Nevada (the “Whitney Ranch Shopping Center Property”), approximately 16 miles southeast of the Las Vegas central business district. The Whitney Ranch Shopping Center Property was built in 1992 and is part of a larger shopping center that is anchored by non-collateral tenants Target and Hobby Lobby. The Whitney Ranch Shopping Center Property is located directly west across Stephanie Street from the Galleria Mall, a regional mall anchored by Dillard’s, Kohl’s, JC Penney, Dick’s Sporting Goods and Macy’s. Parking at the Whitney Ranch Shopping Center Property is provided by 1,371 surface spaces, resulting in a parking ratio of 5.3 spaces per 1,000 square feet of rentable area. As of November 30, 2013, the Whitney Ranch Shopping Center Property was 92.1% leased to 26 tenants.
THE INFORMATION IN THIS STRUCTURAL AND COLLATERAL TERM SHEET IS NOT COMPLETE AND MAY BE AMENDED PRIOR TO THE TIME OF SALE. THIS TERM SHEET IS NOT AN OFFER TO SELL THESE SECURITIES AND IT IS NOT A SOLICITATION OF AN OFFER TO BUY THESE SECURITIES IN ANY JURISDICTION WHERE THE OFFER OR SALE IS NOT PERMITTED.
112
| WHITNEY RANCH SHOPPING CENTER |
Sources and Uses
| Sources | Uses | |||||||
| Original loan amount | $13,615,000 | 99.7% | Loan payoff(1) | $13,384,365 | 98.0% | |||
| Sponsor’s new cash contribution | 39,986 | 0.3 | Reserves | 163,317 | 1.2 | |||
| Closing costs | 107,304 | 0.8 | ||||||
| Total Sources | $13,654,986 | 100.0% | Total Uses | $13,654,986 | 100.0% |
(1) | The Whitney Ranch Shopping Center Property was previously securitized in GMACC 2004-C1. |
The following table presents certain information relating to the tenancies at the Whitney Ranch Shopping Center Property:
Major Tenants
| Tenant Name | Credit Rating (Fitch/ Moody’s/ S&P)(1) | Tenant NRSF | % of NRSF | Annual U/W Base Rent PSF | Annual U/W Base Rent | % of Total Annual U/W Base Rent | Sales PSF | Occupancy Cost | Lease Expiration Date | |||||||||
| Anchor Tenants – Not Part of Collateral | ||||||||||||||||||
| Target | A-/A2/A+ | 113,997 | ANCHOR OWNED – NOT PART OF THE COLLATERAL | |||||||||||||||
| Hobby Lobby Stores, Inc. | NR/NR/NR | 51,047 | ANCHOR OWNED – NOT PART OF THE COLLATERAL | |||||||||||||||
| Major Tenants | ||||||||||||||||||
| Ross Stores, Inc. | NR/NR/A- | 26,000 | 31.5% | $11.00 | $286,000 | 18.8% | $332(2) | 3.9%(2) | 1/31/2017 | |||||||||
| Silver State Credit Union | NR/NR/NR | 5,690 | 6.9% | $26.85 | $152,785 | 10.1% | NAV | NAV | 10/1/2015 | |||||||||
| AT&T | A/A3/A- | 3,200 | 3.9% | $25.00 | $80,000 | 5.3% | NAV | NAV | 8/31/2017 | |||||||||
| Family Christian Store | NR/NR/NR | 5,000 | 6.1% | $15.45 | $77,250 | 5.1% | $212(3) | 8.2%(3) | 1/31/2018 | |||||||||
| JPMorgan Chase | A+/A2/A | 2,986 | 3.6% | $22.20 | $66,289 | 4.4% | NAV | NAV | 8/31/2014 | |||||||||
| Total Major Tenants | 42,876 | 52.0% | $15.45 | $662,324 | 43.6% | |||||||||||||
| Non-Major Tenants | 33,152 | 40.2% | $19.92(4) | $856,347 | 56.4% | |||||||||||||
| Occupied Collateral Total | 76,028 | 92.1% | $17.40(4) | $1,518,670 | 100.0% | |||||||||||||
| Vacant Space | 6,500 | 7.9% | ||||||||||||||||
| Collateral Total | 82,528 | 100.0% | ||||||||||||||||
(1) | Certain ratings are those of the parent company whether or not the parent guarantees the lease. |
| (2) | Sales PSF and Occupancy Costs for Ross Stores, Inc. are for the trailing 12-month period ending January 2013. |
(3) | Sales PSF and Occupancy Costs for Family Christian Store are for the trailing 12-month period ending December 31, 2012. |
(4) | Annual U/W Base Rent for ground lease tenants is excluded from the Annual U/W Base Rent PSF calculations. |
THE INFORMATION IN THIS STRUCTURAL AND COLLATERAL TERM SHEET IS NOT COMPLETE AND MAY BE AMENDED PRIOR TO THE TIME OF SALE. THIS TERM SHEET IS NOT AN OFFER TO SELL THESE SECURITIES AND IT IS NOT A SOLICITATION OF AN OFFER TO BUY THESE SECURITIES IN ANY JURISDICTION WHERE THE OFFER OR SALE IS NOT PERMITTED.
113
| WHITNEY RANCH SHOPPING CENTER |
The following table presents certain information relating to the lease rollover schedule at the Whitney Ranch Shopping Center Property:
Lease Expiration Schedule(1)(2)
Year Ending December 31, | No. of Leases Expiring | Expiring NRSF | % of Total NRSF | Cumulative Expiring NRSF | Cumulative % of Total NRSF | Annual U/W Base Rent | Annual U/W Base Rent PSF(3) | ||||||||
| MTM | 0 | 0 | 0.0% | 0 | 0.0% | $0 | $0.00 | ||||||||
| 2013 | 0 | 0 | 0.0% | 0 | 0.0% | $0 | $0.00 | ||||||||
| 2014 | 4 | 5,543 | 6.7% | 5,543 | 6.7% | $193,816 | $21.76(4) | ||||||||
| 2015 | 5 | 12,452 | 15.1% | 17,995 | 21.8% | $277,814 | $22.31 | ||||||||
| 2016 | 4 | 5,427 | 6.6% | 23,422 | 28.4% | $134,510 | $24.79 | ||||||||
| 2017 | 8 | 41,236 | 50.0% | 64,658 | 78.3% | $566,328 | $13.73 | ||||||||
| 2018 | 6 | 11,370 | 13.8% | 76,028 | 92.1% | $223,406 | $19.65 | ||||||||
| 2019 | 1 | 0 | 0.0% | 76,028 | 92.1% | $122,796 | $0.00(4) | ||||||||
| 2020 | 0 | 0 | 0.0% | 76,028 | 92.1% | $0 | $0.00 | ||||||||
| 2021 | 0 | 0 | 0.0% | 76,028 | 92.1% | $0 | $0.00 | ||||||||
| 2022 | 0 | 0 | 0.0% | 76,028 | 92.1% | $0 | $0.00 | ||||||||
| 2023 | 0 | 0 | 0.0% | 76,028 | 92.1% | $0 | $0.00 | ||||||||
| Thereafter | 0 | 0 | 0.0% | 76,028 | 92.1% | $0 | $0.00 | ||||||||
| Vacant | 0 | 6,500 | 7.9% | 82,528 | 100.0% | $0 | $0.00 | ||||||||
| Total/Weighted Average | 28 | 82,528 | 100.0% | $1,518,670 | $17.40 |
| (1) | Information was obtained from the underwritten rent roll. |
| (2) | Certain tenants may have lease termination options that are exercisable prior to the originally stated expiration date of the subject lease and that are not considered in the Lease Expiration Schedule. |
| (3) | Weighted Average Annual U/W Base Rent PSF excludes vacant space. |
| (4) | Annual U/W Base Rent for ground lease tenants is excluded from the Annual U/W Base Rent PSF calculations. |
The following table presents historical occupancy percentages at Whitney Ranch Shopping Center Property:
Historical Occupancy
12/31/2010(1) | 12/31/2011(1) | 12/31/2012(1) | 11/30/2013 | |||
| 87.2% | 88.9% | 96.7% | 92.1% | |||
(1) Information obtained from the borrower. | ||||||
Operating History and Underwritten Net Cash Flow. The following table presents certain information relating to the historical operating performance and the Underwritten Net Cash Flow at the Whitney Ranch Shopping Center Property:
Cash Flow Analysis
2011 | 2012 | TTM 8/31/2013 | U/W | U/W $ per SF | |||||||||||||
| Base Rent | $1,673,955 | $1,639,147 | $1,649,801 | $1,518,670 | $18.40 | ||||||||||||
| Grossed Up Vacant Space | 0 | 0 | 0 | 147,420 | 1.79 | ||||||||||||
| Total Reimbursables | 522,395 | 501,177 | 544,928 | 552,806 | 6.70 | ||||||||||||
| Other Income | 3,000 | 2,671 | 2,835 | 2,584 | 0.03 | ||||||||||||
| Less Vacancy & Credit Loss | 0 | 0 | 0 | (147,420)(1) | (1.79) | ||||||||||||
| Effective Gross Income | $2,199,349 | $2,142,995 | $2,197,564 | $2,074,060 | $25.13 | ||||||||||||
| Total Operating Expenses | $522,154 | $529,904 | $562,230 | $569,882 | $6.91 | ||||||||||||
| Net Operating Income | $1,677,196 | $1,613,091 | $1,635,334 | $1,504,178 | $18.23 | ||||||||||||
| TI/LC | 0 | 0 | 0 | 92,404 | 1.12 | ||||||||||||
| Capital Expenditures | 0 | 0 | 0 | 33,695 | 0.41 | ||||||||||||
| Net Cash Flow | $1,677,196 | $1,613,091 | $1,635,334 | $1,378,080 | $16.70 | ||||||||||||
| NOI DSCR | 1.97x | 1.90x | 1.93x | 1.77x | |||||||||||||
| NCF DSCR | 1.97x | 1.90x | 1.93x | 1.62x | |||||||||||||
| NOI DY | 12.3% | 11.8% | 12.0% | 11.0% | |||||||||||||
| NCF DY | 12.3% | 11.8% | 12.0% | 10.1% | |||||||||||||
| (1) | The underwritten economic vacancy is 8.8%. The Whitney Ranch Shopping Center Property was 92.1% physically occupied as of November 30, 2013. |
THE INFORMATION IN THIS STRUCTURAL AND COLLATERAL TERM SHEET IS NOT COMPLETE AND MAY BE AMENDED PRIOR TO THE TIME OF SALE. THIS TERM SHEET IS NOT AN OFFER TO SELL THESE SECURITIES AND IT IS NOT A SOLICITATION OF AN OFFER TO BUY THESE SECURITIES IN ANY JURISDICTION WHERE THE OFFER OR SALE IS NOT PERMITTED.
114
(THIS PAGE INTENTIONALLY LEFT BLANK)
115
| No. 15 – Doctors Medical Park | |||||||
| Loan Information | Property Information | ||||||
| Mortgage Loan Seller: | Wells Fargo Bank, National Association | Single Asset/Portfolio: | Single Asset | ||||
Credit Assessment (KBRA/Moody’s/S&P): | NR/NR/NR | Property Type: | Office | ||||
| Original Principal Balance: | $13,500,000 | Specific Property Type: | Medical | ||||
| Cut-off Date Principal Balance: | $13,500,000 | Location: | Silver Spring, MD | ||||
| % of Initial Pool Balance: | 1.9% | Size: | 89,996 SF | ||||
| Loan Purpose: | Refinance | Cut-off Date Principal Balance Per SF: | $150.01 | ||||
| Borrower Name: | Medical Park Associates, LLLP | Year Built/Renovated: | 1972/1989 | ||||
| Sponsors: | Dr. Stanley Wolf; Roberta Bernstein | Title Vesting: | Fee | ||||
| Mortgage Rate: | 4.850% | Property Manager: | Berlin Real Estate, Inc. | ||||
| Note Date: | November 1, 2013 | 3rd Most Recent Occupancy (As of): | 96.3% (12/31/2010) | ||||
| Anticipated Repayment Date: | NAP | 2nd Most Recent Occupancy (As of): | 94.7% (12/31/2011) | ||||
| Maturity Date: | November 1, 2023 | Most Recent Occupancy (As of): | 97.0% (12/31/2012) | ||||
| IO Period: | 60 months | Current Occupancy (As of): | 96.3% (11/5/2013) | ||||
| Loan Term (Original): | 120 months | ||||||
| Seasoning: | 1 month | Underwriting and Financial Information: | |||||
| Amortization Term (Original): | 360 months | ||||||
| Loan Amortization Type: | Interest-only, Amortizing Balloon | 3rd Most Recent NOI: | $1,732,264 (12/31/2011) | ||||
| Interest Accrual Method: | Actual/360 | 2nd Most Recent NOI: | $1,840,293 (12/31/2012) | ||||
| Call Protection: | L(25),D(91),O(4) | Most Recent NOI: | $2,062,718 (TTM 8/31/2013) | ||||
| Lockbox Type: | None | ||||||
Additional Debt(1): | Yes | U/W Revenues: | $2,955,882 | ||||
Additional Debt Type(1): | Future Unsecured | U/W Expenses: | $1,185,463 | ||||
| U/W NOI: | $1,770,418 | ||||||
| U/W NCF: | $1,552,331 | ||||||
Escrows and Reserves: | U/W NOI DSCR: | 2.07x | |||||
| U/W NCF DSCR: | 1.82x | ||||||
| Type: | Initial | Monthly | Cap (If Any) | U/W NOI Debt Yield: | 13.1% | ||
| Taxes | $76,530 | $19,134 | NAP | U/W NCF Debt Yield: | 11.5% | ||
| Insurance | $7,143 | $893 | NAP | As-Is Appraised Value: | $28,100,000 | ||
| Replacement Reserves | $0 | $2,985 | NAP | As-Is Appraisal Valuation Date: | September 30, 2013 | ||
TI/LC Reserve(2) | $0 | Springing | $150,000 | Cut-off Date LTV Ratio: | 48.0% | ||
| LTV Ratio at Maturity or ARD: | 44.2% | ||||||
| (1) | The borrower has the right to incur unsecured borrower affiliated loan(s) in aggregate not to exceed $250,000, which will be subject to a subordination and standstill agreements acceptable to the lender. |
| (2) | If the amortizing debt service coverage ratio for a trailing 12-month period is less than 1.40x, the borrower must deposit $150,000 into a TI/LC Reserve and if drawn down to less than $75,000, the borrower is required to make monthly TI/LC Reserve deposits of $15,000 until the TI/LC Reserve account balance equals $150,000. |
The Doctors Medical Park mortgage loan is evidenced by a single promissory note that is secured by a first mortgage encumbering three medical office buildings located in Silver Spring, Maryland (the “Doctors Medical Park Property”). The three buildings consist of two, three-story buildings that were constructed in 1972 and 1989 and a one-story, below grade building that was constructed in 1982. The Doctors Medical Park Property is located approximately 10 miles north of the Washington D.C. central business district and approximately 0.8 miles northwest of Holy Cross Hospital, which has approximately 442 beds and approximately 3,200 employees. Holy Cross Hospital is currently undergoing an approximately 234,000 square foot expansion to add additional patient rooms. The Doctors Medical Park Property has 540 parking spaces, resulting in a parking ratio of 6.0 spaces per 1,000 square feet of rentable area. As of November 5, 2013, the Doctors Medical Park Property was 96.3% occupied by 32 tenants.
Sources and Uses
| Sources | Uses | |||||||
| Original loan amount | $13,500,000 | 100.0% | Loan payoff(1) | $8,444,777 | 62.6% | |||
| Reserves | 83,673 | 0.6 | ||||||
| Closing costs | 178,577 | 1.3 | ||||||
| Return of equity | 4,792,973 | 35.5 | ||||||
| Total Sources | $13,500,000 | 100.0% | Total Uses | $13,500,000 | 100.0% |
| (1) | The Doctors Medical Park Property was previously securitized in MSC 2003-IQ6. |
THE INFORMATION IN THIS STRUCTURAL AND COLLATERAL TERM SHEET IS NOT COMPLETE AND MAY BE AMENDED PRIOR TO THE TIME OF SALE. THIS TERM SHEET IS NOT AN OFFER TO SELL THESE SECURITIES AND IT IS NOT A SOLICITATION OF AN OFFER TO BUY THESE SECURITIES IN ANY JURISDICTION WHERE THE OFFER OR SALE IS NOT PERMITTED.
116
| DOCTORS MEDICAL PARK |
The following table presents certain information relating to the tenancy at the Doctors Medical Park Property:
Major Tenants
| Tenant Name | Credit Rating(Fitch/Moody’s/ S&P) | Tenant NRSF | % of NRSF | Annual U/W Base Rent PSF | Annual U/W Base Rent | % of Total Annual U/W Base Rent | Lease Expiration Date | |||||||
| Major Tenants | ||||||||||||||
| Clinical Radiologists | NR/NR/NR | 10,176 | 11.3% | $31.00 | $315,456 | 10.5% | 7/31/2019 | |||||||
| Robert Loeffler, M.D & Jeffrey Abend, M.D. | NR/NR/NR | 7,206 | 8.0% | $38.03 | $274,080 | 9.1% | 6/30/2014 | |||||||
| Holy Cross Hospital of Sil So, Inc. | NR/NR/NR | 6,486 | 7.2% | $31.00 | $201,066 | 6.7% | 5/31/2019 | |||||||
| Harvey N. Mininberg, MD, PA | NR/NR/NR | 4,729 | 5.3% | $36.11 | $170,784 | 5.7% | 9/30/2020 | |||||||
| Fresenius Inc. | NR/NR/NR | 5,141 | 5.7% | $30.77 | $158,172 | 5.3% | 2/29/2024 | |||||||
| Total Major Tenants | 33,738 | 37.5% | $33.18 | $1,119,558 | 37.3% | |||||||||
| Non-Major Tenants | 52,922 | 58.8% | $35.56 | $1,882,066 | 62.7% | |||||||||
| Occupied Collateral | 86,660 | 96.3% | $34.64 | $3,001,624 | 100.0% | |||||||||
| Vacant Space | 3,336 | 3.7% | ||||||||||||
| Collateral Total | 89,996 | 100.0% | ||||||||||||
The following table presents certain information relating to the lease rollover schedule at the Doctors Medical Park Property:
Lease Expiration Schedule(1)
Year Ending December 31, | No. of Leases Expiring | Expiring NRSF | % of Total NRSF | Cumulative Expiring NRSF | Cumulative % of Total NRSF | Annual U/W Base Rent | Annual U/W Base Rent PSF(2) | |
| MTM | 1 | 879 | 1.0% | 879 | 1.0% | $30,765 | $35.00 | |
| 2013 | 2 | 1,651 | 1.8% | 2,530 | 2.8% | $60,336 | $36.55 | |
| 2014 | 7 | 20,490 | 22.8% | 23,020 | 25.6% | $728,005 | $35.53 | |
| 2015 | 3 | 3,450 | 3.8% | 26,470 | 29.4% | $121,260 | $35.15 | |
| 2016 | 4 | 10,699 | 11.9% | 37,169 | 41.3% | $406,200 | $37.97 | |
| 2017 | 6 | 11,457 | 12.7% | 48,626 | 54.0% | $414,144 | $36.15 | |
| 2018 | 2 | 2,331 | 2.6% | 50,957 | 56.6% | $82,308 | $35.31 | |
| 2019 | 6 | 21,218 | 23.6% | 72,175 | 80.2% | $678,822 | $31.99 | |
| 2020 | 1 | 4,729 | 5.3% | 76,904 | 85.5% | $170,784 | $36.11 | |
| 2021 | 0 | 0 | 0.0% | 76,904 | 85.5% | $0 | $0.00 | |
| 2022 | 0 | 0 | 0.0% | 76,904 | 85.5% | $0 | $0.00 | |
| 2023 | 2 | 4,615 | 5.1% | 81,519 | 90.6% | $150,828 | $32.68 | |
| Thereafter | 1 | 5,141 | 5.7% | 86,660 | 96.3% | $158,172 | $30.77 | |
| Vacant | 0 | 3,336 | 3.7% | 89,996 | 100.0% | $0 | $0.00 | |
| Total/Weighted Average | 35 | 89,996 | 100.0% | $3,001,624 | $34.64 |
| (1) | Information obtained from the underwritten rent roll. |
| (2) | Weighted Average Annual U/W Base Rent PSF excludes vacant space. |
The following table presents historical occupancy percentages at the Doctors Medical Park Property:
Historical Occupancy Percentages
12/31/2010(1) | 12/31/2011(1) | 12/31/2012(1) | 11/5/2013 | |||
| 96.3% | 94.7% | 97.0% | 96.3% | |||
(1) Information obtained from the borrower. | ||||||
THE INFORMATION IN THIS STRUCTURAL AND COLLATERAL TERM SHEET IS NOT COMPLETE AND MAY BE AMENDED PRIOR TO THE TIME OF SALE. THIS TERM SHEET IS NOT AN OFFER TO SELL THESE SECURITIES AND IT IS NOT A SOLICITATION OF AN OFFER TO BUY THESE SECURITIES IN ANY JURISDICTION WHERE THE OFFER OR SALE IS NOT PERMITTED.
117
| DOCTORS MEDICAL PARK |
Operating History and Underwritten Net Cash Flow. The following table presents certain information relating to the historical operating performance and the Underwritten Net Cash Flow at the Doctors Medical Park Property:
Cash Flow Analysis
2011 | 2012 | TTM 8/31/2013 | U/W | U/W $ per SF | |||||||
| Base Rent | $2,975,063 | $3,045,768 | $3,159,563 | $3,001,624 | $33.35 | ||||||
| Grossed Up Vacant Space | 0 | 0 | 0 | 116,760 | 1.30 | ||||||
| Total Reimbursables | 93,697 | 104,228 | 94,531 | 86,969 | 0.97 | ||||||
| Other Income | 1,337 | 1,486 | 1,071 | 0 | 0.00 | ||||||
| Less Vacancy & Credit Loss | (199,997) | (186,817) | (120,744) | (249,471)(1) | (2.77) | ||||||
| Effective Gross Income | $2,870,100 | $2,964,665 | $3,134,421 | $2,955,882 | $32.84 | ||||||
| Total Operating Expenses | $1,137,836 | $1,124,372 | $1,071,703 | $1,185,463 | $13.17 | ||||||
| Net Operating Income | $1,732,264 | $1,840,293 | $2,062,718 | $1,770,418 | $19.67 | ||||||
| TI/LC | 0 | 0 | 0 | 182,269 | 2.03 | ||||||
| Capital Expenditures | 0 | 0 | 0 | 35,818 | 0.40 | ||||||
| Net Cash Flow | $1,732,264 | $1,840,293 | $2,062,718 | $1,552,331 | $17.25 | ||||||
| NOI DSCR | 2.03x | 2.15x | 2.41x | 2.07x | |||||||
| NCF DSCR | 2.03x | 2.15x | 2.41x | 1.82x | |||||||
| NOI DY | 12.8% | 13.6% | 15.3% | 13.1% | |||||||
| NCF DY | 12.8% | 13.6% | 15.3% | 11.5% |
| (1) | The underwritten economic vacancy is 8.0%. The Doctors Medical Park Property was 96.3% physically occupied as of November 5, 2013. |
THE INFORMATION IN THIS STRUCTURAL AND COLLATERAL TERM SHEET IS NOT COMPLETE AND MAY BE AMENDED PRIOR TO THE TIME OF SALE. THIS TERM SHEET IS NOT AN OFFER TO SELL THESE SECURITIES AND IT IS NOT A SOLICITATION OF AN OFFER TO BUY THESE SECURITIES IN ANY JURISDICTION WHERE THE OFFER OR SALE IS NOT PERMITTED.
118
(THIS PAGE INTENTIONALLY LEFT BLANK)
119
| WFRBS Commercial Mortgage Trust 2013-UBS1 | Transaction Contact Information |
VI. Transaction Contact Information
Questions regarding this Structural and Collateral Term Sheet may be directed to any of the following individuals:
| Wells Fargo Securities, LLC | RBS Securities Inc. | ||
| Brigid Mattingly | Tel. (312) 269-3062 | Todd Jaeger - Trading | Tel. (203) 897-2900 |
| Fax (312) 658-0140 | |||
| A.J. Sfarra | Tel. (212) 214-5613 | Adam Ansaldi | Tel. (203) 897-0881 |
| Fax (212) 214-8970 | Fax (203) 873-3542 | ||
| Alex Wong | Tel. (212) 214-5615 | Jim Barnard | Tel. (203) 897-4417 |
| Fax (212) 214-8970 | Fax (203) 873-4310 | ||
| UBS Securities LLC | |||
| Kee Chan | Tel. (212) 713-6189 | ||
| Jamarr Delauney | Tel. (212) 713-6189 | ||
| David Schell | Tel. (212) 713-3375 | ||
THE INFORMATION IN THIS STRUCTURAL AND COLLATERAL TERM SHEET IS NOT COMPLETE AND MAY BE AMENDED PRIOR TO THE TIME OF SALE. THIS TERM SHEET IS NOT AN OFFER TO SELL THESE SECURITIES AND IT IS NOT A SOLICITATION OF AN OFFER TO BUY THESE SECURITIES IN ANY JURISDICTION WHERE THE OFFER OR SALE IS NOT PERMITTED.
120