Wells Fargo Commercial Mortgage Securities
Filed: 28 Jan 15, 12:00am
| FREE WRITING PROSPECTUS | ||
| FILED PURSUANT TO RULE 433 | ||
| REGISTRATION FILE NO.: 333-195164-04 | ||
 |
Deutsche Bank Securities Co-Manager | Morgan Stanley Co-Manager |
| Wells Fargo Commercial Mortgage Trust 2015-C26 | Certificate Structure |
Expected Ratings (Fitch/KBRA/Moody’s)(1) | Approximate Initial Certificate Principal Balance or Notional Amount(2) | Approx. Initial Credit Support(3) | Pass-Through Rate Description | Weighted Average Life (Years)(4) | Expected Principal Window(4) | Certificate Principal to Value Ratio(5) | Certificate Principal U/W NOI Debt Yield(6) | |||||||||||
Offered Certificates | ||||||||||||||||||
| A-1 | AAAsf/AAA(sf)/Aaa(sf) | $69,600,000 | 30.000% | (7) | 3.02 | 03/15 - 01/20 | 36.9% | 17.2% | ||||||||||
| A-2 | AAAsf/AAA(sf)/Aaa(sf) | $37,759,000 | 30.000% | (7) | 4.98 | 01/20 - 02/20 | 36.9% | 17.2% | ||||||||||
| A-3 | AAAsf/AAA(sf)/Aaa(sf) | $225,000,000 | 30.000% | (7) | 9.85 | 11/24 – 01/25 | 36.9% | 17.2% | ||||||||||
| A-4 | AAAsf/AAA(sf)/Aaa(sf) | $252,840,000 | 30.000% | (7) | 9.92 | 01/25 – 01/25 | 36.9% | 17.2% | ||||||||||
| A-SB | AAAsf/AAA(sf)/Aaa(sf) | $88,249,000 | 30.000% | (7) | 7.45 | 02/20 – 11/24 | 36.9% | 17.2% | ||||||||||
A-S(8) | AAAsf/AAA(sf)/Aa1(sf) | $76,966,000 | 22.000% | (7) | 9.92 | 01/25 - 01/25 | 41.1% | 15.4% | ||||||||||
| X-A | AAAsf/AAA(sf)/NR | $750,414,000 | (9) | N/A | Variable(10) | N/A | N/A | N/A | N/A | |||||||||
| X-B | NR/AAA(sf)/NR | $138,297,000 | (11) | N/A | Variable(12) | N/A | N/A | N/A | N/A | |||||||||
B(8) | AA-sf/AA-(sf)/Aa3(sf) | $42,090,000 | 17.625% | (7) | 9.97 | 01/25 - 02/25 | 43.4% | 14.6% | ||||||||||
C(8) | A-sf/A-(sf)/NR | $49,306,000 | 12.500% | (7) | 10.01 | 02/25 - 02/25 | 46.1% | 13.8% | ||||||||||
PEX(8) | A-sf/A-(sf)/NR | $168,362,000 | 12.500% | (7) | 9.96 | 01/25 - 02/25 | 46.1% | 13.8% | ||||||||||
Non-Offered Certificates | ||||||||||||||||||
| X-C | BBsf/BB(sf)/NR | $19,242,000 | (13) | N/A | Variable(14) | N/A | N/A | N/A | N/A | |||||||||
| X-D | Bsf/B(sf)/NR | $9,620,000 | (15) | N/A | Variable(16) | N/A | N/A | N/A | N/A | |||||||||
| X-E | NR/NR/NR | $44,496,709 | (17) | N/A | Variable(18) | N/A | N/A | N/A | N/A | |||||||||
| D | BBB-sf/BBB-(sf)/NR | $46,901,000 | 7.625% | (7) | 10.01 | 02/25 - 02/25 | 48.7% | 13.0% | ||||||||||
| E | BBsf/BB(sf)/NR | $19,242,000 | 5.625% | (7) | 10.01 | 02/25 - 02/25 | 49.7% | 12.8% | ||||||||||
| F | Bsf/B(sf)/NR | $9,620,000 | 4.625% | (7) | 10.01 | 02/25 - 02/25 | 50.3% | 12.6% | ||||||||||
| G | NR/NR/NR | $44,496,709 | 0.000% | (7) | 10.01 | 02/25 - 02/25 | 52.7% | 12.0% | ||||||||||
| Notes: | |
| (1) | The expected ratings presented are those of Fitch Ratings, Inc. (“Fitch”), Kroll Bond Rating Agency, Inc. (“KBRA”) and Moody’s Investors Service, Inc. (“Moody’s”) which the depositor hired to rate the offered certificates. One or more other nationally recognized statistical rating organizations that were not hired by the depositor may use information they receive pursuant to Rule 17g-5 under the Securities Exchange Act of 1934, as amended (the “Exchange Act”) or otherwise, to rate or provide market reports and/or published commentary related to the offered certificates. We cannot assure you as to what ratings a non-hired nationally recognized statistical rating organization would assign or that its reports will not express differing, possibly negative, views of the mortgage loans and/or the offered certificates. The ratings of each class of offered certificates address the likelihood of the timely distribution of interest and, except in the case of the Class X-A and Class X-B certificates, the ultimate distribution of principal due on those classes on or before the Rated Final Distribution Date. See “Risk Factors—Risks Related to the Offered Certificates—Ratings of the Certificates Have Substantial Limitations” and “Ratings” in the free writing prospectus, dated January 28, 2015 (the “Free Writing Prospectus”). Fitch, KBRA and Moody’s have informed us that the “sf” designation in their ratings represents an identifier for structured finance product ratings. |
| (2) | The principal balances and notional amounts set forth in the table are approximate. The actual initial principal balances and notional amounts may be larger or smaller depending on the aggregate cut-off date principal balance of the mortgage loans definitively included in the pool of mortgage loans, which aggregate cut-off date principal balance may be as much as 5% larger or smaller than the amount presented in the Free Writing Prospectus. |
| (3) | The approximate initial credit support with respect to the Class A-1, A-2, A-3, A-4 and A-SB Certificates represents the approximate credit enhancement for the Class A-1, A-2, A-3, A-4 and A-SB Certificates in the aggregate. The percentage indicated under the column “Approx. Initial Credit Support” with respect to the Class C Certificates and the Class PEX Certificates represents the approximate credit support for the Class C regular interest, which will have an initial outstanding principal balance on the closing date of $49,306,000. |
| (4) | Weighted Average Lives and Expected Principal Windows are calculated based on an assumed prepayment rate of 0% CPR and the “Structuring Assumptions” described on Annex B to the Free Writing Prospectus. |
| (5) | The Certificate Principal to Value Ratio for each Class of Certificates (other than the Class A-1, A-2, A-3, A-4 and A-SB Certificates and other than the Exchangeable Certificates) is calculated by dividing the aggregate principal balance of such class of certificates and all classes of certificates (other than the Exchangeable Certificates) and regular interests, if any, that are senior to such class, by the aggregate appraised value of approximately $1,825,792,379 (calculated as described in the Free Writing Prospectus) of the mortgaged properties securing the mortgage loans (which excludes, with respect to each pari passu loan combination, a pro rata portion of the related appraised value allocated to the related companion loans based on their cut-off date principal balance). The Certificate Principal to Value Ratios for each of the Class A-1, A-2, A-3, A-4 and A-SB Certificates are calculated by dividing the aggregate principal balance of the Class A-1, A-2, A-3, A-4 and A-SB Certificates by such aggregate appraised value (which excludes, with respect to each pari passu loan combination, a pro rata portion of the related appraised value allocated to the related companion loans based on their cut-off date principal balance). The Certificate Principal to Value Ratio for each of the Class A-S, B and C Certificates is calculated by dividing the aggregate principal balance of the Class A-S regular interest, the Class B regular interest or the Class C regular interest, as applicable, and all other classes of certificates (other than the Exchangeable Certificates) and the regular interests that are senior to such class, by such aggregate appraised value (which excludes, with respect to each pari passu loan combination, a pro rata portion of the related appraised value allocated to the related companion loans based on their cut-off date principal balance). The Certificate Principal to Value Ratio of the Class PEX Certificates is equal to the Certificate Principal to Value Ratio of the Class C Certificates. In any event, however, excess mortgaged property value associated with a mortgage loan will not be available to offset losses on any other mortgage loan (unless such mortgage loans are cross-collateralized and the cross-collateralization remains in effect). |
| (6) | The Certificate Principal U/W NOI Debt Yield for each Class of Certificates (other than the Class A-1, A-2, A-3, A-4 and A-SB Certificates and other than the Exchangeable Certificates) is calculated by dividing the underwritten net operating income (which excludes, with respect to each pari passu loan combination, a pro rata portion of the related underwritten net operating income allocated to the related companion loans based on their cut-off date principal balance) for the mortgage pool of approximately $115,815,966 (calculated as described in the Free Writing Prospectus) by the aggregate certificate principal balance of such class of certificates and all classes of certificates (other than the Exchangeable Certificates) and regular interests, if any, that are senior to such class of certificates. The Certificate Principal U/W NOI Debt Yield for each of the Class A-1, A-2, A-3, A-4 and A-SB Certificates is calculated by dividing such mortgage pool underwritten net operating income (which excludes, with respect to each pari passu loan combination, a pro rata portion of the related underwritten net operating income allocated to the related companion loans based on their cut-off date principal balance) by the aggregate principal balance of the Class A-1, A-2, A-3, A-4 and A-SB Certificates. The Certificate Principal U/W NOI Debt Yield for each of the Class A-S, B and C Certificates is calculated by dividing the underwritten net operating income (which excludes, with respect to each pari passu loan combination, a pro rata portion of the related underwritten net operating income allocated to the related companion loans based on their cut-off date principal balance) for the mortgage pool of approximately $115,815,966 (calculated as described in the Free Writing Prospectus) by the aggregate principal balance of the Class A-S regular interest, the Class B regular interest or the Class C regular interest, as applicable, and all other classes of certificates (other than the Exchangeable Certificates) and the regular interests that are senior to such class. The Certificate Principal U/W NOI Debt Yield of the Class PEX Certificates is equal to |
| Wells Fargo Commercial Mortgage Trust 2015-C26 | Certificate Structure |
| the Certificate Principal U/W NOI Debt Yield for the Class C Certificates. In any event, however, cash flow from each mortgaged property supports only the related mortgage loan and will not be available to support any other mortgage loan (unless such mortgage loans are cross-collateralized and the cross-collateralization remains in effect). | |
| (7) | The pass-through rates for the Class A-1, A-2, A-3, A-4, A-SB, A-S, B, C, D, E, F and G Certificates in each case will be one of the following: (i) a fixed rate per annum, (ii) the weighted average of the net mortgage interest rates on the mortgage loans for the related distribution date, (iii) a variable rate per annum equal to the lesser of (a) a fixed rate and (b) the weighted average of the net mortgage interest rates on the mortgage loans for the related distribution date or (iv) a variable rate per annum equal to the weighted average of the net mortgage interest rates on the mortgage loans for the related distribution date minus a specified percentage. For purposes of the calculation of the weighted average of the net mortgage interest rates on the mortgage loans for each distribution date, the mortgage interest rates will be adjusted as necessary to a 30/360 basis. The Class PEX Certificates will not have a pass-through rate, but will be entitled to receive the sum of the interest distributable on the Class PEX Components. The pass-through rate for the Class A-S Certificates, the Class A-S regular interest and the Class PEX Component A-S will, at all times, be the same. The pass-through rate for the Class B Certificates, the Class B regular interest and the Class PEX Component B will, at all times, be the same. The pass-through rate for the Class C Certificates, the Class C regular interest and the Class PEX Component C will, at all times, be the same. |
| (8) | The Class A-S, B, C and PEX Certificates are “Exchangeable Certificates”. On the closing date, the upper-tier REMIC of the issuing entity will issue the Class A-S, B and C regular interests (each a “regular interest”) which will have outstanding principal balances on the closing date of $76,966,000, $42,090,000 and $49,306,000, respectively. The regular interests will be held in a grantor trust for the benefit of the holders of the Class A-S, B, C and PEX Certificates. The Class A-S, B, C and PEX Certificates will, at all times, represent undivided beneficial ownership interests in a grantor trust that will hold those regular interests. Each class of the Class A-S, B and C Certificates will, at all times, represent an undivided beneficial ownership interest in a percentage of the outstanding certificate principal balance of the regular interest with the same alphabetical class designation. The Class PEX Certificates will, at all times, represent an undivided beneficial ownership interest in the remaining percentages of the outstanding certificate principal balances of the Class A-S, B and C regular interests and which portions of those regular interests are referred to in this Term Sheet as the Class PEX Component A-S, Class PEX Component B and Class PEX Component C (collectively, the “Class PEX Components”). Following any exchange of Class A-S, B and C Certificates for Class PEX Certificates or any exchange of Class PEX Certificates for Class A-S, B and C Certificates as described in the Free Writing Prospectus, the percentage interest of the outstanding certificate principal balances of the Class A-S, B and C regular interest that is represented by the Class A-S, B, C and PEX Certificates will be increased or decreased accordingly. The initial certificate principal balance of each of the Class A-S, B and C Certificates shown in the table represents the maximum certificate principal balance of such class without giving effect to any exchange. The initial certificate principal balance of the Class PEX Certificates is equal to the aggregate of the initial certificate principal balance of the Class A-S, B and C Certificates and represents the maximum certificate principal balance of the Class PEX Certificates that could be issued in an exchange. The certificate principal balances of the Class A-S, B and C Certificates to be issued on the closing date will be reduced, in required proportions, by an amount equal to the certificate principal balance of the Class PEX Certificates issued on the closing date. Distributions and allocations of payments and losses with respect to the Exchangeable Certificates are described in this Term Sheet under “Allocations and Distributions on the Class A-S, B, C and PEX Certificates” and under “Description of the Offered Certificates—Distributions” in the Free Writing Prospectus. The maximum certificate principal balance of the Class PEX Certificates is set forth in the table but is not included in the certificate principal balance of the certificates set forth on the cover page of this Term Sheet or on the top of the cover page of the Free Writing Prospectus. |
| (9) | The Class X-A Certificates are notional amount certificates. The Notional Amount of the Class X-A Certificates will be equal to the aggregate principal balance of the Class A-1, A-2, A-3, A-4 and A-SB Certificates and the Class A-S regular interest outstanding from time to time (without regard to any exchange of Class A-S, B and C Certificates for Class PEX Certificates). The Class X-A Certificates will not be entitled to distributions of principal. |
| (10) | The pass-through rate for the Class X-A Certificates for any distribution date will be a per annum rate equal to the excess, if any, of (a) the weighted average of the net mortgage interest rates on the mortgage loans for the related distribution date, over (b) the weighted average of the pass-through rates on the Class A-1, A-2, A-3, A-4 and A-SB Certificates and the Class A-S regular interest for the related distribution date, weighted on the basis of their respective aggregate principal balances outstanding immediately prior to that distribution date. For purposes of the calculation of the weighted average of the net mortgage interest rates on the mortgage loans for each distribution date, the mortgage interest rates will be adjusted as necessary to a 30/360 basis. |
| (11) | The Class X-B Certificates are notional amount certificates. The Notional Amount of the Class X-B Certificates will be equal to the aggregate principal balance of the Class B and C regular interests and the Class D Certificates outstanding from time to time. The Class X-B Certificates will not be entitled to distributions of principal. |
| (12) | The pass-through rate for the Class X-B Certificates for any distribution date will be a per annum rate equal to the excess, if any, of (a) the weighted average of the net mortgage interest rates on the mortgage loans for the related distribution date, over (b) the weighted average of the pass-through rates on the Class B and C regular interests and the Class D Certificates for the related distribution date, weighted on the basis of their respective aggregate principal balances outstanding immediately prior to that distribution date. For purposes of the calculation of the weighted average of the net mortgage interest rates on the mortgage loans for each distribution date, the mortgage interest rates will be adjusted as necessary to a 30/360 basis. |
| (13) | The Class X-C Certificates are notional amount certificates. The Notional Amount of the Class X-C Certificates will be equal to the principal balance of the Class E Certificates outstanding from time to time. The Class X-C Certificates will not be entitled to distributions of principal. |
| (14) | The pass-through rate for the Class X-C Certificates for any distribution date will be a per annum rate equal to the excess, if any, of (a) the weighted average of the net mortgage interest rates on the mortgage loans for the related distribution date, over (b) the pass-through rate on the Class E Certificates for the related distribution date. For purposes of the calculation of the weighted average of the net mortgage interest rates on the mortgage loans for each distribution date, the mortgage interest rates will be adjusted as necessary to a 30/360 basis. |
| (15) | The Class X-D Certificates are notional amount certificates. The Notional Amount of the Class X-D Certificates will be equal to the principal balance of the Class F Certificates outstanding from time to time. The Class X-D Certificates will not be entitled to distributions of principal. |
| (16) | The pass-through rate for the Class X-D Certificates for any distribution date will be a per annum rate equal to the excess, if any, of (a) the weighted average of the net mortgage interest rates on the mortgage loans for the related distribution date, over (b) the pass-through rate on the Class F Certificates for the related distribution date. For purposes of the calculation of the weighted average of the net mortgage interest rates on the mortgage loans for each distribution date, the mortgage interest rates will be adjusted as necessary to a 30/360 basis. |
| (17) | The Class X-E Certificates are notional amount certificates. The Notional Amount of the Class X-E Certificates will be equal to the principal balance of the Class G Certificates outstanding from time to time. The Class X-E Certificates will not be entitled to distributions of principal. |
| (18) | The pass-through rate for the Class X-E Certificates for any distribution date will be a per annum rate equal to the excess, if any, of (a) the weighted average of the net mortgage interest rates on the mortgage loans for the related distribution date, over (b) the pass-through rate on the Class G Certificates for the related distribution date. For purposes of the calculation of the weighted average of the net mortgage interest rates on the mortgage loans for each distribution date, the mortgage interest rates will be adjusted as necessary to a 30/360 basis. |
| Wells Fargo Commercial Mortgage Trust 2015-C26 | Issue Characteristics |
Mortgage Loan Seller | Number of Mortgage Loans | Number of Mortgaged Properties | Aggregate Cut-off Date Balance | % of Cut-off Date Pool Balance | ||||||||
| Wells Fargo Bank, National Association | 27 | 31 | $339,096,285 | 35.2 | % | |||||||
| Liberty Island Group I LLC | 9 | 10 | 167,148,741 | 17.4 | ||||||||
| Rialto Mortgage Finance, LLC | 15 | 16 | 127,687,269 | 13.3 | ||||||||
| C-III Commercial Mortgage LLC | 18 | 19 | 107,661,190 | 11.2 | ||||||||
| Silverpeak Real Estate Finance LLC | 8 | 12 | 85,142,723 | 8.8 | ||||||||
| Walker & Dunlop Commercial Property Funding I WF, LLC | 3 | 6 | 46,800,000 | 4.9 | ||||||||
| Basis Real Estate Capital II, LLC | 6 | 6 | 45,794,237 | 4.8 | ||||||||
| National Cooperative Bank, N.A. | 16 | 16 | 42,739,265 | 4.4 | ||||||||
Total | 102 | 116 | $962,069,710 | 100.0 | % | |||||||
| Cut-off Date Balance: | $962,069,710 | ||
| Number of Mortgage Loans: | 102 | ||
| Average Cut-off Date Balance per Mortgage Loan: | $9,432,056 | ||
| Number of Mortgaged Properties: | 116 | ||
Average Cut-off Date Balance per Mortgaged Property(1): | $8,293,704 | ||
| Weighted Average Mortgage Interest Rate: | 4.405% | ||
| Ten Largest Mortgage Loans as % of Cut-off Date Pool Balance: | 34.2% | ||
| Weighted Average Original Term to Maturity or ARD (months): | 120 | ||
| Weighted Average Remaining Term to Maturity or ARD (months): | 115 | ||
Weighted Average Original Amortization Term (months)(2): | 352 | ||
Weighted Average Remaining Amortization Term (months)(2): | 348 | ||
| Weighted Average Seasoning (months): | 5 | ||
(1) Information regarding mortgage loans secured by multiple properties is based on an allocation according to relative appraised values or the allocated loan amounts or property-specific release prices set forth in the related loan documents or such other allocation as the related mortgage loan seller deemed appropriate. (2) Excludes any mortgage loan that does not amortize. | |||
Weighted Average U/W Net Cash Flow DSCR(1): | 1.87x | ||
Weighted Average U/W Net Operating Income Debt Yield(1): | 12.0% | ||
Weighted Average Cut-off Date Loan-to-Value Ratio(1): | 65.2% | ||
Weighted Average Balloon or ARD Loan-to-Value Ratio(1): | 55.1% | ||
% of Mortgage Loans with Additional Subordinate Debt(2): | 9.6% | ||
% of Mortgage Loans with Single Tenants(3): | 10.5% | ||
(1) With respect to the JW Marriott New Orleans mortgage loan and the AMCP Portfolio mortgage loan, each of which is part of a pari passu loan combination, loan-to-value ratio, debt service coverage ratio and debt yield calculations include the related pari passu companion loans (unless otherwise stated). The information for each mortgaged property that relates to a mortgage loan that is cross-collateralized with other mortgage loans is based upon the principal balance of that mortgage loan, except that the applicable loan-to-value ratio, debt service coverage ratio, and debt yield for each such mortgaged property is based upon the ratio or yield (as applicable) for the aggregate indebtedness evidenced by all loans in the group. On an individual basis, without regard to the cross-collateralization feature, any mortgaged property securing a mortgage loan that is part of a cross-collateralized group of mortgage loans may have a higher loan-to-value ratio, lower debt service coverage ratio and/or lower debt yield than is presented herein. Information for each residential cooperative mortgage loan is calculated using underwritten net cash flow for the related residential cooperative property which is the projected net cash flow reflected in the most recent appraisal obtained by or otherwise in the possession of the related mortgage loan seller as of the cut-off date, and the loan-to value ratio information for residential cooperative mortgage loans is based upon the appraised value of the residential cooperative property determined as if such residential cooperative property is operated as a residential cooperative. See Annex A-1 and Annex B to the Free Writing Prospectus. Debt service coverage ratio, debt yield and loan-to-value ratio information takes no account of subordinate debt (whether or not secured by the related mortgaged property), if any, that is allowed under the terms of any mortgage loan. (2) Thirteen (13) of the mortgage loans, each of which is secured by a residential cooperative property, currently have in place subordinate secured lines of credit to the related mortgage borrowers that permit future advances (such loans, collectively, the “Subordinate Coop LOCs”). The percentage figure expressed as “% of Mortgage Loans with Additional Subordinate Debt” is determined as a percentage of cut-off date principal balance and does not take into account future subordinate debt (whether or not secured by the mortgaged property), if any, that may be permitted under the terms of any mortgage loan or the Pooling and Servicing Agreement. See “Description of the Mortgage Pool—Subordinate and/or Other Financing” and “—Additional Debt Financing for Mortgage Loans Secured by Residential Cooperatives” in the Free Writing Prospectus. (3) Excludes mortgage loans that are secured by multiple single tenant properties and includes mortgage loans secured by multiple single tenant properties where each property is occupied by the same tenant or tenants that are affiliates of one another. | |||
| Wells Fargo Commercial Mortgage Trust 2015-C26 | Issue Characteristics |
| Real Estate Taxes: | 67.8% of the pool | |
| Insurance: | 44.2% of the pool | |
| Capital Replacements: | 76.1% of the pool | |
| TI/LC: | 61.8% of the pool(1) | |
(1) The percentage of Cut-off Date Balance for loans with TI/LC reserves is based on the aggregate principal balance allocable to loans that include retail, office, industrial and mixed use properties. | ||
| Wells Fargo Commercial Mortgage Trust 2015-C26 | Issue Characteristics |
| Securities Offered: | $841,810,000 approximate monthly pay, multi-class, commercial mortgage REMIC pass-through certificates consisting of eleven classes (Classes A-1, A-2, A-3, A-4, A-SB, A-S, B, C, PEX, X-A and X-B), which are offered pursuant to a registration statement filed with the SEC. | ||
| Mortgage Loan Sellers: | Wells Fargo Bank, National Association (“WFB”); Liberty Island Group I LLC (“LIG I”); Rialto Mortgage Finance, LLC (“RMF”); C-III Capital Partners, LLC (“C-III”); Silverpeak Real Estate Finance LLC (“SPREF”); Walker & Dunlop Commercial Property Funding I WF, LLC (“WDCPF”); Basis Real Estate Capital II, LLC (“Basis”); and National Cooperative Bank, N.A. (“NCB”). | ||
| Sole Lead Bookrunning Manager: | Wells Fargo Securities, LLC | ||
| Co-Managers: | Deutsche Bank Securities Inc. and Morgan Stanley & Co. LLC. | ||
| Rating Agencies: | Fitch Ratings, Inc., Kroll Bond Rating Agency, Inc. and Moody’s Investors Service, Inc. | ||
| Master Servicers: | Wells Fargo Bank, National Association and National Cooperative Bank, N.A. | ||
| Special Servicers: | Midland Loan Services, a Division of PNC Bank, National Association and National Cooperative Bank, N.A. | ||
| Additional Primary Servicer: | Prudential Asset Resources, Inc. | ||
| Certificate Administrator: | Wells Fargo Bank, National Association | ||
| Trustee: | Wilmington Trust, National Association | ||
| Trust Advisor: | Pentalpha Surveillance LLC | ||
Initial Majority Subordinate Certificateholder: | An affiliate of Eightfold Real Estate Capital, L.P. | ||
| Cut-off Date: | The Cut-off Date with respect to each mortgage loan is the due date for the monthly debt service payment that is due in February 2015 (or, in the case of any mortgage loan that has its first due date in March 2015, the date that would have been its due date in February 2015 under the terms of that mortgage loan if a monthly debt service payment were scheduled to be due in that month). | ||
| Expected Closing Date: | On or about February 13, 2015. | ||
| Determination Dates: | The 11th day of each month (or if that day is not a business day, the next succeeding business day), commencing in March 2015. | ||
| Distribution Dates: | The fourth business day following the Determination Date in each month, commencing in March 2015. | ||
| Rated Final Distribution Date: | The Distribution Date in February 2048. | ||
| Interest Accrual Period: | With respect to any Distribution Date, the calendar month preceding the month in which such Distribution Date occurs. | ||
| Day Count: | The Offered Certificates will accrue interest on a 30/360 basis. | ||
| Minimum Denominations: | $10,000 for each Class of Offered Certificates (other than the Class X-A and X-B Certificates) and $1,000,000 for the Class X-A and X-B Certificates. Investments may also be made in any whole dollar denomination in excess of the applicable minimum denomination. | ||
| Clean-up Call: | 1% | ||
| Delivery: | DTC, Euroclear and Clearstream Banking | ||
| ERISA/SMMEA Status: | Each Class of Offered Certificates is expected to be eligible for exemptive relief under ERISA. No Class of Offered Certificates will be SMMEA eligible. | ||
| Risk Factors: | THE CERTIFICATES INVOLVE CERTAIN RISKS AND MAY NOT BE SUITABLE FOR ALL INVESTORS. SEE THE “RISK FACTORS” SECTION OF THE FREE WRITING PROSPECTUS. | ||
| Bond Analytics Information: | The Certificate Administrator will be authorized to make distribution date settlements, CREFC® reports and certain supplemental reports (other than confidential information) available to certain financial modeling and data provision services, including Bloomberg, L.P., Trepp, LLC, Intex Solutions, Inc., Markit Group Limited, Interactive Data Corp., BlackRock Financial Management, Inc and CMBS.com, Inc. |
| Wells Fargo Commercial Mortgage Trust 2015-C26 | Characteristics of the Mortgage Pool |
Mortgage Loan Seller | Mortgage Loan Name | City | State | Number of Mortgage Loans / Mortgaged Properties | Mortgage Loan Cut-off Date Balance ($) | % of Cut- off Date Pool Balance (%) | Property Type | Number of SF, Rooms or Units | Cut-off Date Balance Per SF, Room or Unit ($) | Cut-off Date LTV Ratio (%) | Balloon or ARD LTV Ratio (%) | U/W NCF DSCR (x) | U/W NOI Debt Yield (%) | ||||||||||||||
| LIG I | Chateau on the Lake | Branson | MO | 1 / 1 | $45,943,064 | 4.8% | Hospitality | 301 | $152,635 | 68.0% | 54.7% | 1.99x | 13.4% | ||||||||||||||
| WFB | Trails at Dominion | Houston | TX | 1 / 1 | 40,750,000 | 4.2 | Multifamily | 843 | 48,339 | 76.2 | 69.6 | 1.31 | 8.4 | ||||||||||||||
| WFB | JW Marriott New Orleans | New Orleans | LA | 1 / 1 | 39,896,822 | 4.1 | Hospitality | 496 | 180,984 | 59.0 | 47.2 | 2.07 | 14.2 | ||||||||||||||
| WFB | Broadcom Building | San Jose | CA | 1 / 1 | 35,750,000 | 3.7 | Office | 200,000 | 179 | 65.0 | 59.1 | 1.81 | 11.3 | ||||||||||||||
| SPREF | Aloft Houston by the Galleria | Houston | TX | 1 / 1 | 32,650,000 | 3.4 | Hospitality | 152 | 214,803 | 72.9 | 62.4 | 1.67 | 11.2 | ||||||||||||||
| WFB | Dorel Apartments | Laredo | TX | 1 / 1 | 30,000,000 | 3.1 | Multifamily | 424 | 70,755 | 61.6 | 55.6 | 1.54 | 8.9 | ||||||||||||||
| LIG I | Roseville Square | Roseville | CA | 1 / 1 | 28,000,000 | 2.9 | Retail | 218,309 | 128 | 66.7 | 56.4 | 1.41 | 8.8 | ||||||||||||||
| LIG I | 44 Plaza | Poughkeepsie | NY | 1 / 1 | 26,430,000 | 2.7 | Retail | 167,686 | 158 | 71.4 | 65.2 | 1.36 | 8.9 | ||||||||||||||
| WDCPF | One and Two Summit Square Portfolio | Langhorne | PA | 1 / 2 | 26,000,000 | 2.7 | Various | 139,615 | 186 | 62.7 | 54.2 | 1.41 | 9.8 | ||||||||||||||
| RMF | Creekside Corners | Lithonia | GA | 1 / 1 | 23,500,000 | 2.4 | Multifamily | 444 | 52,928 | 69.8 | 62.6 | 1.34 | 8.7 | ||||||||||||||
| Top Three Total/Weighted Average | 3 / 3 | $126,589,886 | 13.2% | 67.8% | 57.1% | 1.80x | 12.0% | ||||||||||||||||||||
| Top Five Total/Weighted Average | 5 / 5 | $194,989,886 | 20.3% | 68.1% | 58.4% | 1.78x | 11.8% | ||||||||||||||||||||
| Top Ten Total/Weighted Average | 10 / 11 | $328,919,886 | 34.2% | 67.4% | 58.5% | 1.63x | 10.6% | ||||||||||||||||||||
| Non-Top Ten Total/Weighted Average | 92 / 105 | $633,149,823 | 65.8% | 64.1% | 53.4% | 2.00x | 12.8% | ||||||||||||||||||||
| (1) | With respect to the JW Marriott New Orleans mortgage loan, which is part of a pari passu loan combination, Cut-off Date Balance per square foot, loan-to-value ratio, debt service coverage ratio and debt yield calculations include the related pari passu companion loans (unless otherwise stated). With respect to each Mortgage Loan, debt service coverage ratio, debt yield and loan-to-value ratio information takes no account of subordinate debt (whether or not secured by the related mortgaged property), if any, that is allowed under the terms of any mortgage loan. |
| Wells Fargo Commercial Mortgage Trust 2015-C26 | Characteristics of the Mortgage Pool |
| Property Name | Mortgage Loan Seller | Related Notes in Loan Group (Original Balance) | Holder of Note | Whether Note is Lead Servicing for the Entire Loan Combination | Current Master Servicer Under Related Securitization Servicing Agreement | Current Special Servicer Under Related Securitization Servicing Agreement | ||||||
| JW Marriott New Orleans | WFB | $50,000,000 | WFCM 2014-LC18 | Yes | Wells Fargo Bank, National Association | Rialto Capital Advisors, LLC | ||||||
| WFB | $40,000,000 | WFCM 2015-C26 | No | Wells Fargo Bank, National Association | Midland Loan Services | |||||||
| AMCP Portfolio | SPREF | $8,000,000 | WFRBS 2014-C25 | No | Wells Fargo Bank, National Association | CWCapital Asset Management, LLC | ||||||
| SPREF | $16,050,000 | WFCM 2015-C26 | Yes | Wells Fargo Bank, National Association | Midland Loan Services |
| Loan No. | Mortgage Loan Seller | Mortgage Loan Name | Mortgage Loan Cut-off Date Balance ($) | % of Cut-off Date Balance (%) | Sub Debt Cut-off Date Balance ($) | Mezzanine Debt Cut- off Date Balance ($) | Total Debt Interest Rate (%)(2) | Mortgage Loan U/W NCF DSCR (x) | Total Debt U/W NCF DSCR (x) | Mortgage Loan Cut- off Date U/W NOI Debt Yield (%) | Total Debt Cut-off Date U/W NOI Debt Yield (%) | Mortgage Loan Cut-off Date LTV Ratio (%) | Total Debt Cut-off Date LTV Ratio (%) | |||||||||||||||||||
| 8 | LIG I | 44 Plaza | $26,430,000 | 2.7% | $0 | $3,600,000 | 5.052% | 1.36 | x | 1.09 | x | 8.9 | % | 7.8 | % | 71.4 | % | 81.2% | ||||||||||||||
| 21 | WDCPF | Boone Student Housing Portfolio | 15,000,000 | 1.6 | $0 | 2,200,000 | 5.456% | 1.42 | 1.10 | 9.0 | 7.8 | 72.1 | 82.7% | |||||||||||||||||||
| 39 | SPREF | Vermont Village | 9,250,000 | 1.0 | $0 | 750,000 | 5.933% | 1.26 | 1.08 | 8.7 | 8.1 | 72.3 | 78.1% | |||||||||||||||||||
| 69 | LIG I | Montgomery Village(3) | 4,000,000 | 0.4 | $0 | 360,000 | 5.459% | 1.24 | 1.07 | 8.6 | 7.9 | 74.8 | 81.5% | |||||||||||||||||||
| Total/Weighted Average | $54,680,000 | 5.7% | $0 | $6,910,000 | 5.342% | 1.35 | x | 1.09 | x | 8.9 | % | 7.9 | % | 72.0 | % | 81.1% | ||||||||||||||||
| (1) | In addition, thirteen (13) of the mortgage loans, each of which are secured by residential cooperative properties, currently have in place Subordinate Coop LOCs that permit future advances. See “Description of the Mortgage Pool—Subordinate and/or Other Financing” and “—Additional Debt Financing for Mortgage Loans Secured by Residential Cooperatives” in the Free Writing Prospectus. |
| (2) | Total Debt Interest Rate for any specified mortgage loan reflects the weighted average of the interest rates on the respective components of the total debt. |
| (3) | With respect to the Montgomery Village mortgage loan, the Total Debt Interest rate is based on the weighted average of the mortgage loan interest rate and its related mezzanine loan interest rate as of the cut-off date. The mezzanine loan interest rate steps up from 11.000% to 12.500% on August 1, 2015. |
| Wells Fargo Commercial Mortgage Trust 2015-C26 | Characteristics of the Mortgage Pool |
| Loan No. | Mortgage Loan Seller | Mortgage Loan or Mortgaged Property Name | City | State | Property Type | Mortgage Loan or Mortgaged Property Cut-off Date Balance ($) | % of Cut- off Date Pool Balance (%) | Previous Securitization | ||||||||
| 1 | LIG I | Chateau on the Lake | Branson | MO | Hospitality | $45,943,064 | 4.8 | % | BSCMS 2005-T18 | |||||||
| 2 | WFB | Trails at Dominion | Houston | TX | Multifamily | 40,750,000 | 4.2 | ACR 2014-FL2 | ||||||||
| 7 | LIG I | Roseville Square | Roseville | CA | Retail | 28,000,000 | 2.9 | BSCMS 2003-T10 | ||||||||
| 9 | WDCPF | One and Two Summit Square Portfolio | Langhorne | PA | Various | 26,000,000 | 2.7 | JPMCC 2007-CB19 | ||||||||
| 23 | CIIICM | Walgreens Darby | Darby | PA | Retail | 5,510,000 | 0.6 | MSC 2005-HQ6 | ||||||||
| 24 | CIIICM | Walgreens Haverhill | Haverhill | MA | Retail | 5,027,500 | 0.5 | MSC 2005-HQ6 | ||||||||
| 25 | CIIICM | Rite Aid Latham | Latham & Niskayuna | NY | Retail | 2,962,500 | 0.3 | MSC 2005-HQ6 | ||||||||
| 28 | WFB | San Leandro Center | San Leandro | CA | Retail | 11,978,325 | 1.2 | MSC 2005-HQ6 | ||||||||
| 30 | WFB | El Dorado Center | Long Beach | CA | Retail | 10,950,000 | 1.1 | GSMS 2005-GG4 | ||||||||
| 32 | WFB | Westland Multifamily/MHC Portfolio | Various | CA | Various | 10,366,781 | 1.1 | LBUBS 2004-C8 | ||||||||
| 34 | LIG I | Old Marketplace | Sedona | AZ | Retail | 10,000,000 | 1.0 | BSCMS 2005-PWR7 | ||||||||
| 35 | WFB | Tarzana Medical | Tarzana | CA | Office | 9,949,581 | 1.0 | JPMCC 2004-C3 | ||||||||
| 43 | LIG I | Satyr Hill Shopping Center | Parkville | MD | Retail | 8,750,000 | 0.9 | CSMC 2006-C5 | ||||||||
| 47 | SPREF | 24 Hour Fitness | Southlake | TX | Retail | 7,300,000 | 0.8 | MSC 2006-HQ8 | ||||||||
| 56 | WDCPF | Village Shires | Southampton | PA | Retail | 5,800,000 | 0.6 | JPMCC 2005-CB11 | ||||||||
| 58 | WFB | Rombout Village | Beacon | NY | Multifamily | 5,492,529 | 0.6 | BSCMS 2005-PW10 | ||||||||
| 60 | CIIICM | Country Aire MHP | Austin | TX | Manufactured Housing Community | 5,137,228 | 0.5 | GECMC 2005-C2 | ||||||||
| 67 | NCB | 34-15 Properties Ltd. | Jackson Heights | NY | Multifamily | 4,194,173 | 0.4 | CSMC 2006-C1 | ||||||||
| 68 | Basis | Cornerstone Square | Macclenney | FL | Retail | 4,000,000 | 0.4 | JPMCC 2005-LDP2 | ||||||||
| 70 | WFB | Walgreens - Glen Allen | Glen Allen | VA | Retail | 3,790,240 | 0.4 | WBCMT 2005-C18 | ||||||||
| 71 | CIIICM | Meadows of Carson Creek | Del Valle | TX | Manufactured Housing Community | 3,700,000 | 0.4 | GECMC 2005-C3 | ||||||||
| 73 | NCB | 310 Lexington Owners Corp. | New York | NY | Multifamily | 3,600,000 | 0.4 | MSC 2005-IQ10 | ||||||||
| 77 | CIIICM | Silver Spur Ranch MHC | Mesa | AZ | Manufactured Housing Community | 3,092,596 | 0.3 | JPMCC 2005-CB12 | ||||||||
| 78 | NCB | Skyline Terrace Cooperative, Inc. | Staten Island | NY | Multifamily | 2,995,829 | 0.3 | CSMC 2006-C1 | ||||||||
| 79 | WFB | Walgreens - Columbus | Columbus | OH | Retail | 2,900,000 | 0.3 | WBCMT 2005-C17 | ||||||||
| 80 | WFB | Walgreens - Oklahoma | Midwest City | OK | Retail | 2,846,291 | 0.3 | JPMCC 2005-LDP1 | ||||||||
| 82 | WFB | Locksley Self Storage | Auburn | CA | Self Storage | 2,752,000 | 0.3 | BSCMS 2005-PWR7 | ||||||||
| 93 | NCB | 310 West 79th Apartments Corp. | New York | NY | Multifamily | 1,400,000 | 0.1 | CSFB 2005-C3 | ||||||||
| 97 | NCB | 571 Hudson Street Apartment Corp. | New York | NY | Multifamily | 1,196,790 | 0.1 | CSFB 2005-C3 | ||||||||
| 100 | WFB | Lone Star Self Storage | Tyler | TX | Self Storage | 1,096,302 | 0.1 | LBUBS 2004-C8 | ||||||||
| 101 | NCB | 4213 Village Corp. | New York | NY | Multifamily | 998,665 | 0.1 | CSFB 2005-C3 | ||||||||
| 102 | NCB | 438 West 49th Street Owners Corp. | New York | NY | Multifamily | 814,411 | 0.1 | CSFB 2005-C3 | ||||||||
| Total | $279,294,806 | 29.0 | % | |||||||||||||
| Wells Fargo Commercial Mortgage Trust 2015-C26 | Characteristics of the Mortgage Pool |
Class A-2(1) | ||||||||||||||||||||||||||||||||
| Loan No. | Mortgage Loan Seller | Mortgage Loan Name | State | Property Type | Mortgage Loan Cut-off Date Balance ($) | % of Cut- off Date Pool Balance (%) | Mortgage Loan Balance at Maturity ($) | % of Class A- 2 Certificate Principal Balance (%)(2) | SF/ Rooms/ Pads | Loan per SF /Room/ Pad ($) | U/W NCF DSCR (x) | U/W NOI Debt Yield (%) | Cut-off Date LTV Ratio (%) | Balloon or ARD LTV Ratio (%) | Rem. IO Period (mos.) | Rem. Term to Maturity (mos.) | ||||||||||||||||
| 6 | WFB | Dorel Apartments | TX | Multifamily | $30,000,000 | 3.1% | $27,097,888 | 71.8% | 424 | $70,755 | 1.54x | 8.9% | 61.6% | 55.6% | 0 | 60 | ||||||||||||||||
| 62 | Basis | Highland Village Apartments | GA | Multifamily | 4,744,237 | 0.5 | 4,340,897 | 11.5% | 134 | 35,405 | 1.45 | 9.6 | 68.2 | 61.4 | 0 | 59 | ||||||||||||||||
| 69 | LIG I | Montgomery Village | TX | Multifamily | 4,000,000 | 0.4 | 3,789,556 | 10.0% | 192 | 20,833 | 1.24 | 8.6 | 74.8 | 70.8 | 17 | 59 | ||||||||||||||||
| Total/Weighted Average | $38,744,237 | 4.0% | $35,228,341 | 93.3% | 1.50x | 9.0% | 63.8% | 57.9% | 2 | 60 | ||||||||||||||||||||||
(1) The table above presents the mortgage loan(s) whose balloon payments would be applied to pay down the principal balance of the Class A-2 Certificates, assuming a 0% CPR and applying the “Structuring Assumptions” described in the Free Writing Prospectus, including the assumptions that (i) none of the mortgage loans in the pool experience prepayments prior to maturity (or, in the case of an ARD loan, its anticipated repayment date), defaults or losses; (ii) there are no extensions of maturity dates of any mortgage loans in the pool; and (iii) each mortgage loan in the pool is paid in full on its stated maturity date (or, in the case of an ARD loan, its anticipated repayment date). Each Class of Certificates, including the Class A-2 Certificates, evidences undivided ownership interests in the entire pool of mortgage loans. Debt service coverage ratio, debt yield and loan-to-value ratio information takes no account of subordinate debt (whether or not secured by the mortgaged property), if any, that is allowed under the terms of any mortgage loan. See Annex A-1 to the Free Writing Prospectus. (2) Reflects the percentage equal to the Mortgage Loan Balance at Maturity divided by the initial Class A-2 Certificate Principal Balance. |
| Wells Fargo Commercial Mortgage Trust 2015-C26 | Characteristics of the Mortgage Pool |
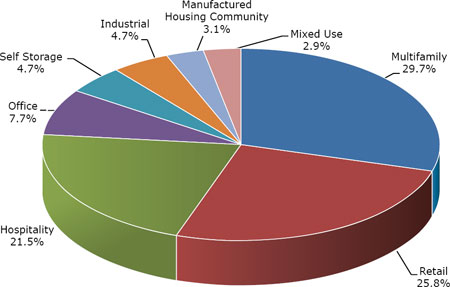
| Property Type | Number of Mortgaged Properties | Aggregate Cut- off Date Balance ($) | % of Cut- off Date Balance (%) | Weighted Average Cut-off Date LTV Ratio (%) | Weighted Average Balloon or ARD LTV Ratio (%) | Weighted Average U/W NCF DSCR (x) | Weighted Average U/W NOI Debt Yield (%) | Weighted Average U/W NCF Debt Yield (%) | Weighted Average Mortgage Rate (%) | ||||||||||
| Multifamily | 39 | $285,709,531 | 29.7 | % | 62.5% | 55.3% | 2.44x | 14.0% | 13.6% | 4.273% | |||||||||
| Garden | 17 | 199,497,790 | 20.7 | 70.6 | 62.5 | 1.43 | 9.0 | 8.5 | 4.325 | ||||||||||
| Cooperative | 15 | 44,236,741 | 4.6 | 15.5 | 13.3 | 7.97 | 41.3 | 41.2 | 3.905 | ||||||||||
| Student Housing | 5 | 36,775,000 | 3.8 | 73.8 | 65.8 | 1.44 | 9.0 | 8.6 | 4.361 | ||||||||||
| Low Rise | 2 | 5,200,000 | 0.5 | 73.2 | 64.5 | 1.37 | 8.8 | 8.7 | 4.800 | ||||||||||
| Retail | 27 | 247,940,109 | 25.8 | 64.7 | 53.4 | 1.47 | 10.8 | 9.9 | 4.561 | ||||||||||
| Anchored | 10 | 151,527,247 | 15.8 | 63.6 | 54.1 | 1.46 | 11.1 | 10.2 | 4.695 | ||||||||||
| Single Tenant | 7 | 30,336,531 | 3.2 | 63.1 | 47.7 | 1.59 | 10.2 | 10.0 | 4.216 | ||||||||||
| Unanchored | 6 | 29,322,214 | 3.0 | 70.0 | 60.2 | 1.51 | 10.5 | 9.4 | 4.612 | ||||||||||
| Shadow Anchored | 3 | 28,204,117 | 2.9 | 63.8 | 45.8 | 1.38 | 10.5 | 9.5 | 4.273 | ||||||||||
| Neighborhood/Community Center | 1 | 8,550,000 | 0.9 | 74.3 | 64.6 | 1.42 | 9.2 | 8.4 | 4.200 | ||||||||||
| Hospitality | 12 | 206,555,012 | 21.5 | 67.2 | 55.0 | 1.86 | 12.6 | 11.2 | 4.374 | ||||||||||
| Limited Service | 9 | 98,797,205 | 10.3 | 68.8 | 57.4 | 1.76 | 11.9 | 10.8 | 4.462 | ||||||||||
| Full Service | 2 | 85,839,886 | 8.9 | 63.8 | 51.2 | 2.03 | 13.8 | 12.0 | 4.246 | ||||||||||
| Extended Stay | 1 | 21,917,921 | 2.3 | 73.3 | 59.4 | 1.68 | 11.2 | 10.2 | 4.480 | ||||||||||
| Office | 4 | 73,599,581 | 7.7 | 66.6 | 56.1 | 1.60 | 10.6 | 9.7 | 4.295 | ||||||||||
| Single Tenant | 1 | 35,750,000 | 3.7 | 65.0 | 59.1 | 1.81 | 11.3 | 10.5 | 4.100 | ||||||||||
| Suburban | 2 | 27,900,000 | 2.9 | 72.8 | 60.1 | 1.38 | 9.4 | 8.4 | 4.542 | ||||||||||
| Medical | 1 | 9,949,581 | 1.0 | 55.3 | 34.0 | 1.44 | 11.9 | 10.8 | 4.300 | ||||||||||
| Self Storage | 12 | 45,621,408 | 4.7 | 70.2 | 57.1 | 1.54 | 9.9 | 9.6 | 4.640 | ||||||||||
| Self Storage | 12 | 45,621,408 | 4.7 | 70.2 | 57.1 | 1.54 | 9.9 | 9.6 | 4.640 | ||||||||||
| Industrial | 9 | 45,609,328 | 4.7 | 63.3 | 53.9 | 1.71 | 11.0 | 10.1 | 4.240 | ||||||||||
| Warehouse | 7 | 34,475,676 | 3.6 | 62.1 | 53.0 | 1.74 | 11.0 | 10.2 | 4.205 | ||||||||||
| Light Industrial | 1 | 6,100,000 | 0.6 | 69.3 | 60.6 | 1.50 | 10.3 | 9.0 | 4.430 | ||||||||||
| Flex | 1 | 5,033,651 | 0.5 | 64.5 | 51.8 | 1.72 | 11.4 | 10.2 | 4.250 | ||||||||||
| Manufactured Housing Community | 10 | 29,484,740 | 3.1 | 69.4 | 57.6 | 1.57 | 9.9 | 9.6 | 4.425 | ||||||||||
| Manufactured Housing Community | 10 | 29,484,740 | 3.1 | 69.4 | 57.6 | 1.57 | 9.9 | 9.6 | 4.425 | ||||||||||
| Mixed Use | 3 | 27,550,000 | 2.9 | 69.2 | 61.8 | 1.51 | 10.0 | 9.4 | 4.771 | ||||||||||
| Retail/Office | 1 | 14,500,000 | 1.5 | 69.0 | 63.0 | 1.69 | 10.8 | 10.1 | 4.350 | ||||||||||
| Office/Retail | 2 | 13,050,000 | 1.4 | 69.5 | 60.4 | 1.30 | 9.0 | 8.6 | 5.238 | ||||||||||
| Total/Weighted Average | 116 | $962,069,710 | 100.0 | % | 65.2% | 55.1% | 1.87x | 12.0% | 11.2% | 4.405% | |||||||||
| (1) | Because this table presents information relating to the mortgaged properties and not the mortgage loans, (a) the information for mortgage loans secured by more than one mortgaged property (other than through cross-collateralization with other mortgage loans) is based on allocated amounts (allocating the mortgage loan principal balance to each of those properties according to the relative appraised values of the mortgaged properties or the allocated loan amounts or property-specific release prices set forth in the related mortgage loan documents or such other allocation as the related mortgage loan seller deemed appropriate), and (b) the information for each mortgaged property that relates to a mortgage loan that is cross-collateralized with other mortgage loans is based upon the principal balance of that mortgage loan, except that the applicable loan-to-value ratio, debt service coverage ratio and debt yield for each such mortgaged property is based upon the ratio or yield (as applicable) for the aggregate indebtedness evidenced by all loans in the group. On an individual basis, without regard to the cross-collateralization feature, any mortgaged property securing a mortgage loan that is part of a cross-collateralized group of mortgage loans may have a higher loan-to-value ratio, lower debt service coverage ratio and/or lower debt yield than is presented herein. For mortgaged properties securing residential cooperative mortgage loans, the debt service coverage ratio or debt yield for each such mortgaged property is calculated using underwritten net cash flow for the related residential cooperative property which is the projected net cash flow reflected in the most recent appraisal obtained by or otherwise in the possession of the related mortgage loan seller as of the cut-off date, and the loan-to-value ratio is calculated based upon the appraised value of the residential cooperative property determined as if such residential cooperative property is operated as a residential cooperative. With respect to the JW Marriott New Orleans mortgage loan and the AMCP Portfolio mortgage loan, each of which is part of a pari passu loan combination, loan-to-value ratio, debt service coverage ratio and debt yield calculations include the related pari passu companion loans (unless otherwise stated). Debt service coverage ratio, debt yield and loan-to-value ratio information takes no account of subordinate debt (whether or not secured by the related mortgaged property) that is allowed under the terms of any mortgage loan. See Annex A-1 to the Free Writing Prospectus. |
| Wells Fargo Commercial Mortgage Trust 2015-C26 | Characteristics of the Mortgage Pool |
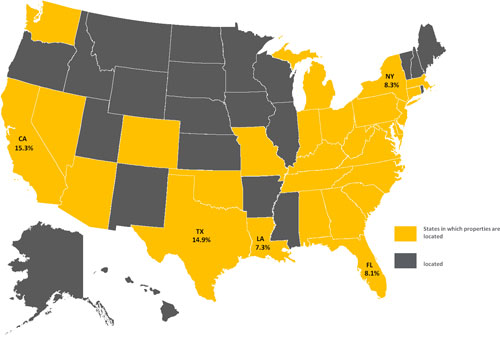
Location(3) | Number of Mortgaged Properties | Aggregate Cut-off Date Balance ($) | % of Cut- off Date Balance (%) | Weighted Average Cut-off Date LTV Ratio (%) | Weighted Average Balloon or ARD LTV Ratio (%) | Weighted Average U/W NCF DSCR (x) | Weighted Average U/W NOI Debt Yield (%) | Weighted Average U/W NCF Debt Yield (%) | Weighted Average Mortgage Rate (%) | |||||||||||||||
California(4) | 15 | $147,447,843 | 15.3 | % | 65.3 | % | 53.3 | % | 1.55x | 10.3 | % | 9.6 | % | 4.232 | % | |||||||||
| Northern | 6 | 105,834,442 | 11.0 | 64.4 | 52.7 | 1.59 | 10.4 | 9.7 | 4.122 | |||||||||||||||
| Southern | 9 | 41,613,401 | 4.3 | 67.8 | 54.8 | 1.46 | 9.9 | 9.4 | 4.513 | |||||||||||||||
| Texas | 12 | 142,904,834 | 14.9 | 70.7 | 62.1 | 1.50 | 9.6 | 9.0 | 4.335 | |||||||||||||||
| New York | 20 | 80,329,241 | 8.3 | 40.6 | 35.9 | 5.02 | 26.8 | 26.5 | 4.106 | |||||||||||||||
| Florida | 9 | 78,309,989 | 8.1 | 70.2 | 61.6 | 1.64 | 10.8 | 9.8 | 4.333 | |||||||||||||||
| Louisiana | 3 | 70,296,822 | 7.3 | 64.9 | 52.9 | 1.81 | 12.2 | 10.7 | 4.296 | |||||||||||||||
Other(5) | 57 | 442,780,980 | 46.0 | 67.0 | 56.1 | 1.58 | 10.9 | 10.1 | 4.571 | |||||||||||||||
| Total/Weighted Average | 116 | $962,069,710 | 100.0 | % | 65.2 | % | 55.1 | % | 1.87x | 12.0 | % | 11.2 | % | 4.405 | % | |||||||||
| (2) | The Mortgaged Properties are located in 28 states. |
| (3) | Because this table presents information relating to the mortgaged properties and not the mortgage loans, (a) the information for mortgage loans secured by more than one mortgaged property (other than through cross-collateralization with other mortgage loans) is based on allocated amounts (allocating the mortgage loan principal balance to each of those properties according to the relative appraised values of the mortgaged properties or the allocated loan amounts or property-specific release prices set forth in the related mortgage loan documents or such other allocation as the related mortgage loan seller deemed appropriate), and (b) the information for each mortgaged property that relates to a mortgage loan that is cross-collateralized with other mortgage loans is based upon the principal balance of that mortgage loan, except that the applicable loan-to-value ratio, debt service coverage ratio and debt yield for each such mortgaged property is based upon the ratio or yield (as applicable) for the aggregate indebtedness evidenced by all loans in the group. On an individual basis, without regard to the cross-collateralization feature, any mortgaged property securing a mortgage loan that is part of a cross-collateralized group of mortgage loans may have a higher loan-to-value ratio, lower debt service coverage ratio and/or lower debt yield than is presented herein. For mortgaged properties securing residential cooperative mortgage loans, the debt service coverage ratio or debt yield for each such mortgaged property is calculated using underwritten net cash flow for the related residential cooperative property which is the projected net cash flow reflected in the most recent appraisal obtained by or otherwise in the possession of the related mortgage loan seller as of the cut-off date, and the loan-to-value ratio is calculated based upon the appraised value of the residential cooperative property determined as if such residential cooperative property is operated as a residential cooperative. With respect to the JW Marriott New Orleans mortgage loan and the AMCP Portfolio mortgage loan, each of which is part of a pari passu loan combination, loan-to-value ratio, debt service coverage ratio and debt yield calculations include the related pari passu companion loans (unless otherwise stated). Debt service coverage ratio, debt yield and loan-to-value ratio information takes no account of subordinate debt (whether or not secured by the related mortgaged property), if any, that is allowed under the terms of any mortgage loan. See Annex A-1 to the Free Writing Prospectus. |
| (4) | For purposes of determining whether a mortgaged property is in Northern California or Southern California, Northern California includes areas with zip codes above 93600 and Southern California includes areas with zip codes of 93600 and below. |
| (5) | Includes 23 other states. |
| Wells Fargo Commercial Mortgage Trust 2015-C26 | Characteristics of the Mortgage Pool |
| CUT-OFF DATE BALANCE | |||
Range of Cut-off Date Balances ($) | Number of Mortgage Loans | Aggregate Cut- off Date Balance | % of Cut-off Date Balance |
| 814,411 - 1,000,000 | 2 | $1,813,075 | 0.2% |
| 1,000,001 - 2,000,000 | 16 | 23,679,496 | 2.5 |
| 2,000,001 - 3,000,000 | 8 | 21,940,296 | 2.3 |
| 3,000,001 - 4,000,000 | 10 | 35,649,400 | 3.7 |
| 4,000,001 - 5,000,000 | 6 | 26,426,122 | 2.7 |
| 5,000,001 - 6,000,000 | 9 | 48,794,382 | 5.1 |
| 6,000,001 - 7,000,000 | 6 | 38,751,414 | 4.0 |
| 7,000,001 - 8,000,000 | 3 | 22,300,000 | 2.3 |
| 8,000,001 - 9,000,000 | 3 | 25,785,238 | 2.7 |
| 9,000,001 - 10,000,000 | 9 | 85,481,403 | 8.9 |
| 10,000,001 - 15,000,000 | 10 | 119,337,360 | 12.4 |
| 15,000,001 - 20,000,000 | 9 | 161,273,715 | 16.8 |
| 20,000,001 - 30,000,000 | 6 | 155,847,921 | 16.2 |
| 30,000,001 -45,943,064 | 5 | 194,989,886 | 20.3 |
| Total: | 102 | $962,069,710 | 100.0% |
| Average: | $9,432,056 | ||
| UNDERWRITTEN NOI DEBT SERVICE COVERAGE RATIO | |||
Range of U/W NOI DSCRs (x) | Number of Mortgage Loans | Aggregate Cut- off Date Balance | % of Cut-off Date Balance |
| 1.30 - 1.40 | 13 | $123,051,376 | 12.8% |
| 1.41 - 1.50 | 13 | 165,935,067 | 17.2 |
| 1.51 - 1.60 | 19 | 158,004,307 | 16.4 |
| 1.61 - 1.70 | 8 | 64,579,759 | 6.7 |
| 1.71 - 1.80 | 8 | 61,667,212 | 6.4 |
| 1.81 - 1.90 | 10 | 136,743,921 | 14.2 |
| 1.91 - 2.00 | 7 | 80,481,702 | 8.4 |
| 2.01 - 2.25 | 6 | 73,891,509 | 7.7 |
| 2.26 - 2.50 | 2 | 52,381,076 | 5.4 |
| 3.01 - 3.50 | 1 | 1,698,759 | 0.2 |
| 3.51 - 4.00 | 2 | 9,742,529 | 1.0 |
| 4.01 - 20.37 | 13 | 33,892,492 | 3.5 |
| Total: | 102 | $962,069,710 | 100.0% |
| Weighted Average: | 2.00x | ||
| UNDERWRITTEN NCF DEBT SERVICE COVERAGE RATIO | |||
Range of U/W NCF DSCRs (x) | Number of Mortgage Loans | Aggregate Cut- off Date Balance | % of Cut-off Date Balance |
| 1.24 - 1.30 | 5 | $49,095,053 | 5.1% |
| 1.31 - 1.40 | 17 | 206,151,612 | 21.4 |
| 1.41 - 1.50 | 18 | 155,136,662 | 16.1 |
| 1.51 - 1.60 | 17 | 133,175,686 | 13.8 |
| 1.61 - 1.70 | 13 | 155,226,339 | 16.1 |
| 1.71 - 1.80 | 5 | 34,379,942 | 3.6 |
| 1.81 - 1.90 | 4 | 68,198,051 | 7.1 |
| 1.91 - 2.00 | 5 | 62,991,509 | 6.5 |
| 2.01 - 2.25 | 2 | 52,381,076 | 5.4 |
| 3.01 - 3.50 | 2 | 7,191,288 | 0.7 |
| 3.51 - 4.00 | 1 | 4,250,000 | 0.4 |
| 4.01 – 20.37 | 13 | 33,892,492 | 3.5 |
| Total: | 102 | $962,069,710 | 100.0% |
| Weighted Average: | 1.87x |
| LOAN PURPOSE | |||
| Loan Purpose | Number of Mortgage Loans | Aggregate Cut- off Date Balance | % of Cut-off Date Balance |
| Refinance | 73 | $606,926,195 | 63.1% |
| Acquisition | 29 | 355,143,514 | 36.9 |
| Total: | 102 | $962,069,710 | 100.0% |
| MORTGAGE RATE | |||
Range of Mortgage Rates (%) | Number of Mortgage Loans | Aggregate Cut- off Date Balance | % of Cut-off Date Balance |
| 3.680 - 3.750 | 2 | $35,300,000 | 3.7% |
| 3.751 - 4.000 | 13 | 43,370,610 | 4.5 |
| 4.001 - 4.250 | 26 | 279,391,759 | 29.0 |
| 4.251 - 4.500 | 31 | 352,246,189 | 36.6 |
| 4.501 - 4.750 | 16 | 155,218,373 | 16.1 |
| 4.751 - 5.000 | 10 | 63,953,598 | 6.6 |
| 5.251 - 5.500 | 3 | 13,820,259 | 1.4 |
| 7.001 - 7.100 | 1 | 18,768,922 | 2.0 |
| Total: | 102 | $962,069,710 | 100.0% |
| Weighted Average: | 4.405% | ||
| UNDERWRITTEN NOI DEBT YIELD | |||
Range of U/W NOI Debt Yields (%) | Number of Mortgage Loans | Aggregate Cut- off Date Balance | % of Cut-off Date Balance |
| 8.1 - 9.0 | 26 | $333,213,828 | 34.6% |
| 9.1 - 10.0 | 15 | 101,746,472 | 10.6 |
| 10.1 - 11.0 | 15 | 133,606,182 | 13.9 |
| 11.1 - 12.0 | 18 | 201,426,137 | 20.9 |
| 12.1 - 13.0 | 6 | 16,870,021 | 1.8 |
| 13.1 - 14.0 | 4 | 71,207,546 | 7.4 |
| 14.1 - 15.0 | 2 | 44,146,822 | 4.6 |
| 15.1 - 16.0 | 1 | 1,698,759 | 0.2 |
| 20.1 - 102.2 | 15 | 58,153,942 | 6.0 |
| Total: | 102 | $962,069,710 | 100.0% |
| Weighted Average: | 12.0% | ||
| UNDERWRITTEN NCF DEBT YIELD | |||
Range of U/W NCF Debt Yields (%) | Number of Mortgage Loans | Aggregate Cut- off Date Balance | % of Cut-off Date Balance |
| 7.8 - 8.0 | 8 | $109,092,700 | 11.3% |
| 8.1 - 9.0 | 26 | 269,248,669 | 28.0 |
| 9.1 - 10.0 | 22 | 183,583,128 | 19.1 |
| 10.1 - 11.0 | 17 | 207,968,123 | 21.6 |
| 11.1 - 12.0 | 6 | 53,966,870 | 5.6 |
| 12.1 - 13.0 | 6 | 74,107,519 | 7.7 |
| 14.1 - 15.0 | 1 | 4,250,000 | 0.4 |
| 15.1 - 16.0 | 1 | 1,698,759 | 0.2 |
| 19.1 - 20.0 | 2 | 24,261,451 | 2.5 |
| 20.1 - 102.2 | 13 | 33,892,492 | 3.5 |
| Total: | 102 | $962,069,710 | 100.0% |
| Weighted Average: | 11.2% | ||
(1) | Information regarding mortgage loans that are cross-collateralized with other mortgage loans is based upon the individual loan balances, except that the applicable loan-to value ratio, debt service coverage ratio and debt yield for each such mortgage loan is based upon the ratio or yield (as applicable) for the aggregate indebtedness evidenced by all loans in the group. On an individual basis, without regard to the cross-collateralization feature, any mortgage loan that is part of a cross-collateralized group of mortgage loans may have a higher loan-to-value ratio, lower debt service coverage ratio and/or lower debt yield than is presented herein. Debt service coverage ratio, debt yield and loan-to-value ratio information takes no account of subordinate debt (whether or not secured by the mortgaged property), if any, that is allowed under the terms of any mortgage loan. For mortgaged properties securing residential cooperative mortgage loans, the debt service coverage ratio or debt yield for each such mortgaged property are calculated using underwritten net cash flow for the related residential cooperative property which is the projected net cash flow reflected in the most recent appraisal obtained by or otherwise in the possession of the related mortgage loan seller as of the cut-off date, and the loan-to-value ratio is calculated based upon the appraised value of the residential cooperative property determined as if such residential cooperative property is operated as a residential cooperative. With respect to the JW Marriott – New Orleans mortgage loan and the AMCP Portfolio mortgage loan, each of which is part of a pari passu loan combination, loan-to-value ratio, debt service coverage ratio and debt yield calculations include the related pari passu companion loans (unless otherwise stated). Debt service coverage ratio, debt yield and loan-to-value ratio information takes no account of subordinate debt (whether or not secured by the related mortgaged property), if any, that is allowed under the terms of any mortgage loan. See Annex A-1 to the Free Writing Prospectus. Prepayment provisions for each mortgage loan reflects the entire life of the loan (from origination to maturity or ARD). |
| Wells Fargo Commercial Mortgage Trust 2015-C26 | Characteristics of the Mortgage Pool |
| ORIGINAL TERM TO MATURITY OR ARD | |||
Range of Original Terms to Maturity or ARD (months) | Number of Mortgage Loans | Aggregate Cut- off Date Balance | % of Cut-off Date Balance |
| 60 | 3 | $38,744,237 | 4.0% |
| 61 - 84 | 1 | 1,097,214 | 0.1 |
| 85 - 120 | 97 | 903,459,337 | 93.9 |
| 121 - 240 | 1 | 18,768,922 | 2.0 |
| Total: | 102 | $962,069,710 | 100.0% |
| Weighted Average: | 120 months | ||
| REMAINING TERM TO MATURITY OR ARD | |||
Range of Remaining Terms to Maturity or ARD (months) | Number of Mortgage Loans | Aggregate Cut- off Date Balance | % of Cut-off Date Balance |
| 53 - 60 | 4 | $57,513,158 | 6.0% |
| 61 - 84 | 1 | 1,097,214 | 0.1 |
| 85 - 120 | 97 | 903,459,337 | 93.9 |
| Total: | 102 | $962,069,710 | 100.0% |
| Weighted Average: | 115 months | ||
ORIGINAL AMORTIZATION TERM(2) | |||
Range of Original Amortization Terms (months) | Number of Mortgage Loans | Aggregate Cut- off Date Balance | % of Cut-off Date Balance |
| Interest-Only | 3 | $9,250,000 | 1.0% |
| 181 - 240 | 5 | 32,692,181 | 3.4 |
| 241 - 300 | 11 | 72,691,770 | 7.6 |
| 301 - 360 | 80 | 842,922,589 | 87.6 |
| 361 - 480 | 3 | 4,513,169 | 0.5 |
| Total: | 102 | $962,069,710 | 100.0% |
Weighted Average(3): | 352 months | ||
(2) The original amortization term shown for any mortgage loan that is interest-only for part of its term does not include the number of months in its interest-only period and reflects only the number of months as of the commencement of amortization remaining from the end of such interest-only period. (3) Excludes the non-amortizing loans. | |||
REMAINING AMORTIZATION TERM(4) | |||
Range of Remaining Amortization Terms (months) | Number of Mortgage Loans | Aggregate Cut- off Date Balance | % of Cut-off Date Balance |
| Interest-Only | 3 | $9,250,000 | 1.0% |
| 113 - 120 | 1 | 18,768,922 | 2.0 |
| 181 - 240 | 5 | 32,692,181 | 3.4 |
| 241 - 300 | 10 | 53,922,848 | 5.6 |
| 301 - 360 | 80 | 842,922,589 | 87.6 |
| 361 – 480 | 3 | 4,513,169 | 0.5 |
| Total: | 102 | $962,069,710 | 100.0% |
Weighted Average(5): | 348 months | ||
(4) The remaining amortization term shown for any mortgage loan that is interest-only for part of its term does not include the number of months in its interest-only period and reflects only the number of months as of the commencement of amortization remaining from the end of such interest-only period. (5) Excludes the non-amortizing loans. | |||
| LOCKBOXES | |||
| Type of Lockbox | Number of Mortgage Loans | Aggregate Cut- off Date Balance | % of Cut-off Date Balance |
| Springing | 53 | $573,698,532 | 59.6% |
| Hard | 12 | 141,305,676 | 14.7 |
| None | 30 | 139,501,898 | 14.5 |
| Soft | 7 | 107,563,603 | 11.2 |
| Total: | 102 | $962,069,710 | 100.0% |
| PREPAYMENT PROVISION SUMMARY | |||
| Prepayment Provision | Number of Mortgage Loans | Aggregate Cut- off Date Balance | % of Cut-off Date Balance |
| Lockout/Defeasance/Open | 74 | $779,328,396 | 81.0% |
| Lockout/GTR YM or 1%/Open | 12 | 104,279,181 | 10.8 |
| GTR YM or 1%/1%/Open | 14 | 38,744,212 | 4.0 |
| Lockout/Defeasance or GTR YM or 1%/Open | 1 | 21,917,921 | 2.3 |
| GTR YM or 1%/Open | 1 | 17,800,000 | 1.9 |
| Total: | 102 | $962,069,710 | 100.0% |
| CUT-OFF DATE LOAN-TO-VALUE RATIO | |||
Range of Cut-off Date LTV Ratios (%) | Number of Mortgage Loans | Aggregate Cut- off Date Balance | % of Cut-off Date Balance |
| 2.6 - 20.0 | 13 | $34,494,212 | 3.6% |
| 25.1 - 30.0 | 1 | 1,097,038 | 0.1 |
| 30.1 - 35.0 | 1 | 5,492,529 | 0.6 |
| 35.1 - 40.0 | 2 | 23,018,922 | 2.4 |
| 45.1 - 50.0 | 1 | 2,900,000 | 0.3 |
| 50.1 - 55.0 | 2 | 5,756,219 | 0.6 |
| 55.1 - 60.0 | 8 | 104,738,192 | 10.9 |
| 60.1 - 65.0 | 10 | 137,085,170 | 14.2 |
| 65.1 - 70.0 | 28 | 267,413,299 | 27.8 |
| 70.1 - 75.0 | 35 | 339,324,129 | 35.3 |
| 75.1 - 76.2 | 1 | 40,750,000 | 4.2 |
| Total: | 102 | $962,069,710 | 100.0% |
| Weighted Average: | 65.2% | ||
BALLOON OR ARD LOAN-TO-VALUE RATIO | |||
| Range of Balloon LTV Ratios (%) | Number of Mortgage Loans | Aggregate Cut- off Date Balance | % of Cut-off Date Balance |
| 2.3 - 20.0 | 13 | $34,494,212 | 3.6% |
| 20.1 - 25.0 | 2 | 19,865,960 | 2.1 |
| 25.1 - 30.0 | 1 | 5,492,529 | 0.6 |
| 30.1 - 35.0 | 1 | 9,949,581 | 1.0 |
| 35.1 - 40.0 | 3 | 23,850,332 | 2.5 |
| 40.1 - 45.0 | 4 | 18,831,759 | 2.0 |
| 45.1 - 50.0 | 12 | 102,789,322 | 10.7 |
| 50.1 - 55.0 | 12 | 110,742,880 | 11.5 |
| 55.1 - 60.0 | 19 | 259,682,260 | 27.0 |
| 60.1 - 65.0 | 24 | 231,830,874 | 24.1 |
| 65.1 - 70.0 | 10 | 140,540,000 | 14.6 |
| 70.1 - 70.8 | 1 | 4,000,000 | 0.4 |
| Total: | 102 | $962,069,710 | 100.0% |
| Weighted Average: | 55.1% | ||
AMORTIZATION TYPE | |||
| Type of Amortization | Number of Mortgage Loans | Aggregate Cut- off Date Balance | % of Cut-off Date Balance |
| Interest-only, Amortizing Balloon | 42 | $509,324,700 | 52.9% |
| Amortizing Balloon | 56 | 427,445,010 | 44.4 |
| Interest-only, Amortizing ARD | 1 | 16,050,000 | 1.7 |
| Interest-only, Balloon | 3 | 9,250,000 | 1.0 |
| Total: | 102 | $962,069,710 | 100.0% |
ORIGINAL TERM OF INTEREST-ONLY PERIOD FOR PARTIAL IO LOANS | |||
| IO Term (months) | Number of Mortgage Loans | Aggregate Cut- off Date Balance | % of Cut-off Date Balance |
| 18 - 24 | 13 | $164,492,700 | 17.1% |
| 25 - 36 | 13 | 98,567,000 | 10.2 |
| 37 - 72 | 17 | 262,315,000 | 27.3 |
| Total: | 43 | $525,374,700 | 54.6% |
| Weighted Average: | 43 months | ||
SEASONING | |||
| Seasoning (months) | Number of Mortgage Loans | Aggregate Cut- off Date Balance | % of Cut-off Date Balance |
| 0 | 28 | $260,900,000 | 27.1% |
| 1 | 49 | 485,286,483 | 50.4 |
| 2 | 21 | 166,371,385 | 17.3 |
| 3 | 3 | 30,742,921 | 3.2 |
| 187 | 1 | 18,768,922 | 2.0 |
| Total: | 102 | $962,069,710 | 100.0% |
| Weighted Average: | 5 months | ||
| Wells Fargo Commercial Mortgage Trust 2015-C26 | Certain Terms and Conditions |
| Interest Entitlements: | The interest entitlement of each Class of Offered Certificates on each Distribution Date generally will be the interest accrued during the related Interest Accrual Period on the related Certificate Principal Balance or Notional Amount at the related pass-through rate, net of any prepayment interest shortfalls allocated to that Class for such Distribution Date as described below. If prepayment interest shortfalls arise from voluntary prepayments (without applicable Special Servicer consent) on particular non-specially serviced mortgage loans during any collection period, the applicable Master Servicer is required to make a compensating interest payment to offset those shortfalls, generally up to an amount equal to the portion of its master servicing fees that accrue at one basis point per annum. The remaining amount of prepayment interest shortfalls will be allocated to reduce the interest entitlement on all Classes of Certificates (other than the Class X-A, X-B, X-C, X-D and X-E Certificates), pro rata, based on their respective amounts of accrued interest for the related Distribution Date (except with respect to the allocation among the Class A-S, B, C and PEX Certificates as described below under “Allocations and Distributions on the Class A-S, B, C and PEX Certificates”). If a Class receives less than the entirety of its interest entitlement on any Distribution Date, then the shortfall, excluding any shortfall due to prepayment interest shortfalls, will be added to its interest entitlement for the next succeeding Distribution Date. Interest entitlements on the Class D Certificates and the Class C and B regular interests, in that order, may be reduced by certain Trust Advisor expenses (subject to the discussion below under “Allocations and Distributions on the Class A-S, B, C and PEX Certificates”). |
Principal Distribution Amount: | The Principal Distribution Amount for each Distribution Date generally will be the aggregate amount of principal received or advanced in respect of the mortgage loans, net of any non-recoverable advances and interest thereon that are reimbursed to the applicable Master Servicer, the applicable Special Servicer or the Trustee during the related collection period. Non-recoverable advances and interest thereon are reimbursable from principal collections and advances before reimbursement from other amounts. The Principal Distribution Amount may also be reduced, with a corresponding loss, to the Class D Certificates and the Class C, B and A-S regular interests, then to the Class A-1, A-2, A-3, A-4 and A-SB Certificates (with any losses on the Class A-1, A-2, A-3, A-4 and A-SB Certificates allocated pro rata according to their respective Certificate Principal Balances immediately prior to that Distribution Date), in that order, in connection with certain Trust Advisor expenses to the extent that interest entitlements on the Class B and C regular interests and the Class D Certificates are insufficient to absorb the effect of the expense on any particular Distribution Date. For a discussion on the allocation of amounts distributable in respect of the Class A-S, B and C regular interests, see “Allocations and Distributions on the Class A-S, B, C and PEX Certificates” below. |
| Distributions: | On each Distribution Date, funds available for distribution from the mortgage loans, net of specified trust fees, expenses and reimbursements will generally be distributed in the following amounts and order of priority (in each case to the extent of remaining available funds): |
1. Class A-1, A-2, A-3, A-4, A-SB, X-A, X-B, X-C, X-D and X-E Certificates: To interest on the Class A-1, A-2, A-3, A-4, A-SB, X-A, X-B, X-C, X-D and X-E Certificates, pro rata, according to their respective interest entitlements. | |
| 2. Class A-1, A-2, A-3, A-4 and A-SB Certificates: To principal on the Class A-1, A-2, A-3, A-4 and A-SB Certificates in the following amounts and order of priority: (i) first, to principal on the Class A-SB Certificates, in an amount up to the Principal Distribution Amount for such Distribution Date until their Certificate Principal Balance is reduced to the Class A-SB Planned Principal Balance for such Distribution Date; (ii) second, to principal on the Class A-1 Certificates until their Certificate Principal Balance is reduced to zero, up to the remainder of the Principal Distribution Amount for such Distribution Date; (iii) third, to principal on the Class A-2 Certificates until their Certificate Principal Balance is reduced to zero, up to the remainder of the Principal Distribution Amount for such Distribution Date; (iv) fourth, to principal on the Class A-3 Certificates until their Certificate Principal Balance is reduced to zero, up to the remainder of the Principal Distribution Amount for such Distribution Date; (v) fifth, to principal on the Class A-4 Certificates until their Certificate Principal Balance is reduced to zero, up to the remainder of the Principal Distribution Amount for such Distribution Date; and (vi) sixth, to principal on the Class A-SB Certificates until their Certificate Principal Balance is reduced to zero, up to the remainder of the Principal Distribution Amount for such Distribution Date. However, if the Certificate Principal Balance of each and every Class of Principal Balance Certificates, other than the Class A-1, A-2, A-3, A-4 and A-SB Certificates, has been reduced to zero as a result of the allocation of Mortgage Loan losses and expenses and any of the Class A-1, A-2, A-3, A-4 and A-SB Certificates remains outstanding, then the Principal Distribution Amount will be distributed on the Class A-1, A-2, A-3, A-4 and A-SB |
| Wells Fargo Commercial Mortgage Trust 2015-C26 | Certain Terms and Conditions |
Certificates, pro rata, based on their respective outstanding Certificate Principal Balances, until their Certificate Principal Balances have been reduced to zero. | |
3. Class A-1, A-2, A-3, A-4 and A-SB Certificates: To reimburse the holders of the Class A-1, A-2, A-3, A-4 and A-SB Certificates, pro rata, for any previously unreimbursed losses (other than certain Trust Advisor expenses) on the mortgage loans that were previously allocated in reduction of the Certificate Principal Balances of such Classes. | |
4. Class A-S regular interest: To make distributions on the Class A-S regular interest as follows: (a) first, to interest on Class A-S regular interest in the amount of the interest entitlement for that Class; (b) next, to the extent of the portion of the Principal Distribution Amount remaining after distributions in respect of principal to each Class with a higher distribution priority (in this case, the Class A-1, A-2, A-3, A-4 and A-SB Certificates), to principal on the Class A-S regular interest until its principal balance is reduced to zero; and (c) next, to reimburse the holders of the Class A-S regular interest for any previously unreimbursed losses (other than certain Trust Advisor expenses) on the mortgage loans that were previously allocated to that Class in reduction of its principal balance. 5. Class B regular interest: To make distributions on the Class B regular interest as follows: (a) first, to interest on Class B regular interest in the amount of the interest entitlement for that Class; (b) next, to the extent of the portion of the Principal Distribution Amount remaining after distributions in respect of principal to each Class with a higher distribution priority (in this case, the Class A-1, A-2, A-3, A-4 and A-SB Certificates and the Class A-S regular interest), to principal on the Class B regular interest until its principal balance is reduced to zero; and (c) next, to reimburse the holders of the Class B regular interest for any previously unreimbursed losses (other than certain Trust Advisor expenses) on the mortgage loans that were previously allocated to that Class in reduction of its principal balance. 6. Class C regular interest: To make distributions on the Class C regular interest as follows: (a) first, to interest on Class C regular interest in the amount of the interest entitlement for that Class; (b) next, to the extent of the portion of the Principal Distribution Amount remaining after distributions in respect of principal to each Class with a higher distribution priority (in this case, the Class A-1, A-2, A-3, A-4 and A-SB Certificates and the Class A-S and B regular interests), to principal on the Class C regular interest until its principal balance is reduced to zero; and (c) next, to reimburse the holders of the Class C regular interest for any previously unreimbursed losses (other than certain Trust Advisor expenses) on the mortgage loans that were previously allocated to that Class in reduction of its principal balance. | |
7. Class D Certificates: To make distributions on the Class D Certificates as follows: (a) first, to interest on Class D Certificates in the amount of the interest entitlement for that Class; (b) next, to the extent of the portion of the Principal Distribution Amount remaining after distributions in respect of principal to each Class with a higher distribution priority (in this case, the Class A-1, A-2, A-3, A-4 and A-SB Certificates and the Class A-S, B and C regular interests), to principal on the Class D Certificates until its principal balance is reduced to zero; and (c) next, to reimburse the holders of the Class D Certificates for any previously unreimbursed losses (other than certain Trust Advisor expenses) on the mortgage loans that were previously allocated to that Class in reduction of its principal balance. | |
8. After the Class A-1, A-2, A-3, A-4 and A-SB Certificates, the Class A-S, B and C regular interests and the Class D Certificates are paid all amounts to which they are entitled, the remaining funds available for distribution will be used to pay interest, principal and loss reimbursement amounts (other than certain Trust Advisor expenses) on the Class E, F and G Certificates sequentially in that order in a manner analogous to the Class D Certificates. | |
| Allocations and Distributions on the Class A-S, B, C and PEX Certificates: | On the closing date, the upper-tier REMIC of the issuing entity will issue the Class A-S, Class B and Class C regular interests (each a “regular interest”) which will have outstanding principal balances on the closing date of $76,966,000, $42,090,000 and $49,306,000, respectively. The regular interests will be held in a grantor trust for the benefit of the holders of the Class A-S, B, C and PEX Certificates. The Class A-S, B, C and PEX Certificates will, at all times, represent undivided beneficial ownership interests in a grantor trust that will hold those regular interests. Each class of the Class A-S, B and C Certificates will, at all times, represent an undivided beneficial ownership interest in a percentage of the outstanding principal balance of the regular |
| Wells Fargo Commercial Mortgage Trust 2015-C26 | Certain Terms and Conditions |
interest with the same alphabetical class designation. The Class PEX Certificates will, at all times, represent an undivided beneficial ownership interest in the remaining percentages of the outstanding principal balances of the Class A-S, B and C regular interests and which percentage interests are referred to in this Term Sheet as the “Class PEX Component A-S, Class PEX Component B and Class PEX Component C” (collectively, the “Class PEX Components”). Interest, principal, prepayment premiums, yield maintenance charges and voting rights that are allocated to the Class A-S, B or C regular interest will be distributed or allocated, as applicable, as between the Class A-S, B or C Certificates, as applicable, on the one hand, and Class PEX Component A-S, Class PEX Component B or Class PEX Component C, as applicable (and correspondingly, the Class PEX Certificates), on the other hand, pro rata, based on their respective percentage interests in the Class A-S, Class B or Class C regular interest, as applicable. In addition, any losses (including, without limitation, as a result of Trust Advisor expenses) that are allocated to the Class A-S, Class B or Class C regular interest will correspondingly be allocated as between the Class A-S, B or C Certificates, as applicable, on the one hand, and Class PEX Component A-S, Class PEX Component B or Class PEX Component C, as applicable (and correspondingly, the Class PEX Certificates), on the other hand, pro rata, based on their respective percentage interests in the Class A-S, Class B or Class C regular interest, as applicable. For a complete description of the allocations and distributions with respect to the Class A-S regular interest, the Class B regular interest and the Class C regular interest (and correspondingly the Class A-S, B, C and PEX Certificates and the Class PEX Component A-S, Class PEX Component B and Class PEX Component C), see “Description of the Offered Certificates” in the Free Writing Prospectus. See “Material Federal Income Tax Consequences” in the Free Writing Prospectus for a discussion of the tax treatment of the Exchangeable Certificates. | |
Exchanging Certificates through Combination and Recombination: | If you own Class A-S, B and C Certificates, you will be able to exchange them for a proportionate interest in the Class PEX Certificates, and vice versa, as described in the Free Writing Prospectus. You can exchange your Exchangeable Certificates by notifying the Certificate Administrator. If Exchangeable Certificates are outstanding and held by certificateholders, those certificates will receive principal and interest that would otherwise have been payable on the same proportion of certificates exchanged therefor if those certificates were outstanding and held by certificateholders. Any such allocations of principal and interest between classes of Exchangeable Certificates will have no effect on the principal or interest entitlements of any other class of certificates. The Free Writing Prospectus describes the available combinations of Exchangeable Certificates eligible for exchange. |
Allocation of Yield Maintenance and Prepayment Premiums: | If any yield maintenance charge or prepayment premium is collected during any particular collection period with respect to any mortgage loan, then on the distribution date corresponding to that collection period, the certificate administrator will pay that yield maintenance charge or prepayment premium (net of liquidation fees payable therefrom) in the following manner: (1) to each of the Class A-1, A-2, A-3, A-4, A-SB and D Certificates and Class A-S, B and C regular interests, the product of (a) such yield maintenance charge or prepayment premium, (b) the related Base Interest Fraction (as defined in the Free Writing Prospectus) for such class or regular interest, and (c) a fraction, the numerator of which is equal to the amount of principal distributed to such class or regular interest for that distribution date, and the denominator of which is the total amount of principal distributed to all Principal Balance Certificates (other than the Exchangeable Certificates) and the Class A-S, B and C regular interests for that distribution date, and (2) to the Class X-A Certificates, the excess, if any, of (a) the product of (i) such yield maintenance charge or prepayment premium and (ii) a fraction, the numerator of which is equal to the amount of principal distributed to the Class A-1, A-2, A-3, A-4, A-SB Certificates and Class A-S regular interest for that distribution date, and the denominator of which is the total amount of principal distributed to all Principal Balance Certificates (other than the Exchangeable Certificates) and the Class A-S, B and C regular interests for that distribution date, over (b) the amount of such yield maintenance charge or prepayment premium distributed to the Class A-1, A-2, A-3, A-4, A-SB Certificates and Class A-S regular interest as described above, and (3) to the Class X-B Certificates, any remaining such yield maintenance charge or prepayment premium not distributed as described above. |
| No prepayment premiums or yield maintenance charges will be distributed to the holders of the Class X-C, X-D, X-E, E, F, G, V or R Certificates. For a description of when prepayment premiums and yield maintenance charges are generally required on the mortgage loans, see Annex A-1 to the Free Writing Prospectus. See also “Risk Factors—Prepayments and Repurchases of the Mortgage Assets Will Affect the Timing of Your Cash Flow and May Affect Your Yield” in the prospectus attached to the Free Writing Prospectus. Prepayment premiums and yield maintenance charges will be distributed on each Distribution Date only to the extent they are actually received on the mortgage loans as of the related Determination Date. |
| Wells Fargo Commercial Mortgage Trust 2015-C26 | Certain Terms and Conditions |
| Realized Losses: | The Certificate Principal Balances of the Class A-1, A-2, A-3, A-4, A-SB, D, E, F and G Certificates, and the Class A-S, B and C regular interests will be reduced without distribution on any Distribution Date as a write-off to the extent of any losses realized on the mortgage loans allocated to such Class or regular interest on such Distribution Date. Such losses (other than certain Trust Advisor expenses) will be applied in the following order, in each case until the related Certificate Principal Balance is reduced to zero: first, to Class G; second, to Class F; third, to Class E; fourth, to Class D; fifth, to the Class C regular interest; sixth, to the Class B regular interest; seventh, to the Class A-S regular interest; and, finally, pro rata, to Classes A-1, A-2, A-3, A-4 and A-SB based on their outstanding Certificate Principal Balances. Certain Trust Advisor expenses (if not absorbed by reductions of interest entitlements on the Class D Certificates and the Class C and B regular interests) will be applied as write-offs in a similar manner, except that such write-offs will be applied only to the Class D Certificates, the Class C, B and A-S regular interests, and the Class A-1, A-2, A-3, A-4 and A-SB Certificates (with any write-offs on the Class A-1, A-2, A-3, A-4 and A-SB Certificates to be allocated pro rata according to their respective Certificate Principal Balances immediately prior to that Distribution Date), in that order. Any realized losses allocated to the Class A-S, B and C regular interests will, in turn, be allocated to the Class A-S, B, C and PEX Certificates as described above in “Allocations and Distributions on the Class A-S, B, C and PEX Certificates”. The notional amount of the Class X-A Certificates will be reduced by the amount of all losses that are allocated to the Class A-1, A-2, A-3, A-4 or A-SB Certificates or the Class A-S regular interest as write-offs in reduction of their Certificate Principal Balances. The notional amount of the Class X-B Certificates will be reduced by the amount of all losses that are allocated to the Class B and C regular interests and the Class D Certificates as write-offs in reduction of their Certificate Principal Balances. The notional amount of the Class X-C Certificates will be reduced by the amount of all losses that are allocated to the Class E Certificates as write-offs in reduction of its Certificate Principal Balance. The notional amount of the Class X-D Certificates will be reduced by the amount of all losses that are allocated to the Class F Certificates as write-offs in reduction of its Certificate Principal Balance. The notional amount of the Class X-E Certificates will be reduced by the amount of all losses that are allocated to the Class G Certificates as write-offs in reduction of its Certificate Principal Balance. |
| Debt Service Advances: | The related Master Servicer or, if such Master Servicer fails to do so, the Trustee, will be obligated to advance delinquent debt service payments (other than balloon payments and default interest) and assumed debt service payments on the mortgage loans (including each pari passu mortgage loan but not its related pari passu companion loans), except to the extent any such advance is deemed non-recoverable from collections on the related mortgage loan. In addition, if an Appraisal Reduction Amount exists for a given mortgage loan, the interest portion of any debt service advance for such mortgage loan will be reduced, which will have the effect of reducing the amount of interest available for distribution to the Certificates in reverse alphabetical order of their Class designations (except that interest payments on the Class A-1, A-2, A-3, A-4, A-SB, X-A, X-B, X-C, X-D and X-E Certificates would be affected on a pari passu basis). |
| Servicing Advances: | The related Master Servicer or, if such Master Servicer fails to do so, the Trustee, will be obligated to make servicing advances with respect to each mortgage loan it services, including the payment of delinquent property taxes, insurance premiums and ground rent, except to the extent that those advances are deemed non-recoverable from collections on the related mortgage loan. The master servicer under the WFCM 2015-LC18 securitization will have the primary obligation to make any servicing advances with respect to the JW Marriott - New Orleans loan combination. |
Appraisal Reduction Amounts: | An Appraisal Reduction Amount generally will be created in the amount, if any, by which the principal balance of a required appraisal loan (which is a mortgage loan with respect to which certain defaults, modifications or insolvency events have occurred as further described in the Free Writing Prospectus) plus other amounts overdue or advanced in connection with such mortgage loan exceeds 90% of the appraised value of the related mortgaged property plus certain escrows and reserves (including letters of credit) held with respect to the mortgage loan. A mortgage loan will cease to be a required appraisal loan when the same has ceased to be a specially serviced mortgage loan (if applicable), has been brought current for at least three consecutive months and no other circumstances exist that would cause such mortgage loan to be a required appraisal loan. Appraisal Reduction Amounts will affect the amount of debt service advances on the related mortgage loan. Appraisal Reduction Amounts will also be taken into account in the determination of the identity of the Class whose majority constitutes the “majority subordinate certificateholder” and is entitled to appoint the subordinate class representative. |
| Wells Fargo Commercial Mortgage Trust 2015-C26 | Certain Terms and Conditions |
Clean-Up Call and Exchange Termination: | On each Distribution Date occurring after the aggregate unpaid principal balance of the mortgage loans is reduced below 1% of the initial aggregate principal balance of the mortgage loans as of the Cut-off Date, certain specified persons will have the option to purchase all of the remaining mortgage loans (and the trust’s interest in all property acquired through exercise of remedies in respect of any mortgage loan) at the price specified in the Free Writing Prospectus. Exercise of the option will terminate the trust and retire the then-outstanding certificates. If the aggregate Certificate Principal Balances of each of the Class A-1, A-2, A-3, A-4, A-SB, PEX and D Certificates and the Class A-S, B and C regular interests have been reduced to zero, the trust may also be terminated in connection with an exchange of all the then-outstanding certificates, for the mortgage loans and REO properties then remaining in the issuing entity, but all of the holders of those Classes of outstanding certificates would have to voluntarily participate in the exchange. |
| Liquidation Loan Waterfall: | Following the liquidation of any loan or property, the net liquidation proceeds generally will be applied (after reimbursement of advances and certain trust fund expenses), first, as a recovery of accrued interest, other than delinquent interest that was not advanced as a result of Appraisal Reduction Amounts, second, as a recovery of principal until all principal has been recovered, and then as a recovery of delinquent interest that was not advanced as a result of Appraisal Reduction Amounts. Please see “Description of the Offered Certificates—Distributions—Application of Mortgage Loan Collections” in the Free Writing Prospectus. |
Majority Subordinate Certificateholder and Subordinate Class Representative: | A subordinate class representative may be appointed by the “majority subordinate certificate-holder”, which will be the holder(s) of a majority of: (a) during a “subordinate control period”, the most subordinate class among the Class E, F and G Certificates that has a Certificate Principal Balance, as notionally reduced by any Appraisal Reduction Amounts allocable to that class, that is at least equal to 25% of its total initial principal balance and (b) during a “collective consultation period”, the most subordinate class among the Class E, F and G Certificates that has a total principal balance, without regard to Appraisal Reduction Amounts, that is at least equal to 25% of its initial Certificate Principal Balance. The majority subordinate certificateholder will have a continuing right to appoint, remove or replace the subordinate class representative in its sole discretion. This right may be exercised at any time and from time to time. See “Servicing of the Mortgage Loans and Administration of the Trust Fund—The Majority Subordinate Certificateholder and the Subordinate Class Representative” in the Free Writing Prospectus. |
| Control and Consultation: | The rights of various parties to replace each Special Servicer and approve or consult with respect to major actions of each Special Servicer will vary according to defined periods. A “subordinate control period” will exist as long as the Class E Certificates have a Certificate Principal Balance, net of any Appraisal Reduction Amounts allocable to that class, that is not less than 25% of the initial principal balance of that class (unless a senior consultation period is deemed to occur generally or with respect to a particular mortgage loan, pursuant to clause (ii) of the definition of “senior consultation period”). In general, during a subordinate control period, (i) the subordinate class representative will be entitled to grant or withhold approval of asset status reports prepared, and material servicing actions proposed, by either Special Servicer, and (ii) the majority subordinate certificateholder, or the subordinate class representative on its behalf, will be entitled to terminate and replace each Special Servicer with or without cause, and appoint itself or another person as the applicable successor special servicer (other than with respect to the JW Marriott New Orleans loan combination). It will be a condition to such appointment that Fitch, KBRA and Moody’s confirm that the appointment would not result in a qualification, downgrade or withdrawal of any of their then-current ratings of certificates. A “collective consultation period” will exist as long as the Class E Certificates have a Certificate Principal Balance that both (i) as notionally reduced by any Appraisal Reduction Amounts allocable to that class, is less than 25% of its initial principal balance and (ii) without regard to any Appraisal Reduction Amounts allocable to that class, is 25% or more of its initial Certificate Principal Balance (unless a senior consultation period is deemed to occur generally or with respect to a particular mortgage loan, pursuant to clause (ii) of the definition of “senior consultation period”). In general, during a collective consultation period, each Special Servicer will be required to consult with the Trust Advisor (in addition to the subordinate class representative, during a collective consultation period) in connection with asset status reports and material special servicing actions. A “senior consultation period” will exist as long as either (i) the Class E certificates have an aggregate principal balance, without regard to any Appraisal Reduction Amounts allocable to that class, that is less than 25% of its initial principal balance or (ii) during such time as the Class E certificates are the most subordinate class of control-eligible certificates that have a then outstanding principal balance, net of Appraisal Reduction Amounts, at least equal to 25% of its initial principal balance, the then-majority subordinate certificateholder has irrevocably waived its right to appoint a subordinate class representative and to exercise any of the rights of the majority subordinate certificateholder or cause the exercise of the rights of the subordinate class representative and such rights have |
| Wells Fargo Commercial Mortgage Trust 2015-C26 | Certain Terms and Conditions |
not been reinstated to a successor majority subordinate certificateholder as set forth in the pooling and servicing agreement. In general, during a senior consultation period, each Special Servicer must seek to consult with the Trust Advisor in connection with asset status reports and material special servicing actions, and, in general, no subordinate class representative will be recognized or have any right to terminate either Special Servicer or approve, direct or consult with respect to servicing matters. With respect to the AMCP Portfolio loan combination, the rights of the subordinate class representative described above will be subject to the consultation rights of each holder of a related pari passu companion loan described under “Loan Combinations” below. Notwithstanding any contrary description set forth above, with respect to the AMCP Portfolio mortgage loan, (a) each holder of a pari passu companion loan in the related loan combination (including any subordinate class representative or special servicer under any securitization of such pari passu companion loan) will have consultation rights with respect to asset status reports and material special servicing actions involving the related loan combination, as provided for in the related intercreditor agreement and as described in the Free Writing Prospectus, and those rights will be in addition to the rights of the subordinate class representative in this transaction described above; and (b) the existence of a subordinate control period, collective consultation period or senior consultation period under the WFCM 2015-C26 pooling and servicing agreement will not limit the consultation rights of the holders of the related pari passu companion loans. Also, notwithstanding any contrary description set forth above, with respect to the JW Marriott New Orleans mortgage loan, in general the related loan combination will be serviced under the WFCM 2014-LC18 pooling and servicing agreement, which grants to the subordinate class representative control rights that include the right to approve or disapprove various material servicing actions involving the loan combination but the subordinate class representative for this securitization will nonetheless have the right to be consulted on a non-binding basis with respect to such actions. For purposes of the servicing of the JW Marriott New Orleans loan combination, the occurrence and continuance of a collective consultation period or senior consultation period with respect to the subordinate class representative under this securitization will not limit the control or other rights of the subordinate class representative under the WFCM 2014-LC18 securitization, and any collective consultation period or senior consultation period or similar period under the WFCM 2014-LC18 securitization will not limit the consultation rights of the subordinate class representative under this securitization. In general, loan combination control rights also include the right, in certain circumstances, to direct the replacement of the applicable special servicer for the related loan combination only. | |
Replacement of Special Servicer by General Vote of Certificateholders: | During any ”collective consultation period” or “senior consultation period”, each Special Servicer may be terminated and replaced upon the affirmative direction of certificate owners holding not less than 75% of the appraisal-reduced voting rights of all certificates, following a proposal from certificate owners holding not less than 25% of the appraisal-reduced voting rights of all certificates. The certificateholders who initiate a vote on a termination and replacement of either Special Servicer without cause must cause Fitch, KBRA and Moody’s to confirm the then-current ratings of the certificates (or decline to review the matter) and cause the payment of the fees and expenses incurred in the replacement. |
| Appraisal Remedy: | Solely for purposes of determining whether a “subordinate control period” is in effect, whenever either Special Servicer obtains an appraisal or updated appraisal under the pooling and servicing agreement, the subordinate class representative, with respect to the mortgage loans serviced by either Special Servicer will have the right (at its or their expense) to direct such Special Servicer to hire a qualified appraiser to prepare a second appraisal of the mortgaged property. The applicable Special Servicer must thereafter determine whether, based on its assessment of such second appraisal, any recalculation of the Appraisal Reduction Amount is warranted. The Appraisal Reduction Amount, whether based on the first or the second appraisal, will become effective following the second appraisal, except that the Appraisal Reduction Amount based on the first appraisal shall become effective if the subordinate class representative declines to demand a second appraisal within a specified number of business days, or if a second appraisal is not received within 90 days after the direction of the subordinate class representative. In addition, for the same purposes, if there is a material change in the mortgaged property securing any mortgage loan for which an Appraisal Reduction Amount has been calculated, the majority certificateholder of the Class E, F or G Certificates or other designated certificateholders will be entitled (at its expense) to present an additional appraisal to such Special Servicer, which will generally be required to recalculate the Appraisal Reduction Amount based upon such additional appraisal. This latter right may not be exercised more frequently than once in any 12-month period for each mortgage loan for which an Appraisal Reduction Amount was calculated and can only be exercised during a subordinate control period or a collective consultation period as further described in the Free Writing Prospectus. |
| Wells Fargo Commercial Mortgage Trust 2015-C26 | Certain Terms and Conditions |
| Sale of Defaulted Assets: | There will be no “fair value” purchase option. Instead, the pooling and servicing agreement will authorize each Special Servicer to sell defaulted mortgage loans serviced by such Special Servicer to the highest bidder in a manner generally similar to sales of REO properties. Subject to certain limitations set forth in the related intercreditor agreement, each loan combination serviced under the WFCM 2015-C26 pooling and servicing agreement may be sold unless that mortgage loan and the related pari passu companion loans are sold together as one whole loan. The sale of a defaulted loan (other than a non-serviced mortgage loan) for less than par plus accrued interest and certain other fees and expenses owed on the loan will be subject to consent or consultation rights of the subordinate class representative and/or Trust Advisor and, in the case of the AMCP Portfolio mortgage loan, consultation rights of the holders of the related pari passu companion loans, as described in the Free Writing Prospectus. In the case of the JW Marriott New Orleans mortgage loan, pursuant to the related intercreditor agreement and the WFCM 2014-LC18 pooling and servicing agreement, the WFCM 2014-LC18 special servicer may offer to sell to any person (or may offer to purchase) for cash the related loan combination during such time as the related pari passu companion loan constitutes a defaulted mortgage loan under the WFCM 2014-LC18 pooling and servicing agreement, and, in connection with any such sale, the WFCM 2014-LC18 special servicer is required to sell both the applicable mortgage loan and the related pari passu companion loan as a whole loan. The subordinate class representative for this securitization will have consultation rights as the holder of an interest in the related pari passu mortgage loan, as described in the Free Writing Prospectus. |
| “As-Is” Appraisals: | Appraisals must be conducted on an “as-is” basis, and must be no more than 9 months old, for purposes of determining Appraisal Reduction Amounts, market value in connection with REO sales, etc. Required appraisals may consist of updates of prior appraisals. Internal valuations by the applicable Special Servicer are permitted if the principal balance of a mortgage loan is less than $2,000,000. |
| Trust Advisor: | The Trust Advisor will perform certain review duties that will generally include a limited annual review of and report regarding each Special Servicer to the Certificate Administrator. The review and report generally will be based on: (a) during a collective consultation period or senior consultation period, any asset status reports and additional information delivered to the Trust Advisor by either Special Servicer with respect to any mortgage loan serviced by such Special Servicer, and/or (b) during a senior consultation period, in addition to the applicable information described above, a meeting with each Special Servicer to conduct a limited review of such Special Servicer’s operational practices on a platform basis in light of the servicing standard. In addition, during any collective consultation period or senior consultation period, each Special Servicer must seek to consult with the Trust Advisor (in addition to the subordinate class representative during a collective consultation period) in connection with material special servicing actions with respect to specially serviced mortgage loans serviced by such Special Servicer. Furthermore, under certain circumstances, but only during a senior consultation period, the Trust Advisor may recommend the replacement of either Special Servicer, in which case the Certificate Administrator will deliver notice of such recommendation to the certificateholders, and certificateholders with specified percentages of the voting rights may direct the replacement of such Special Servicer at their expense. The Trust Advisor may be removed and replaced without cause upon the affirmative direction of certificates owners holding not less than 75% of the appraisal-reduced voting rights of all certificates, following a proposal from certificate owners holding not less than 25% of the appraisal-reduced voting rights of all certificates. The certificateholders who initiate a vote on a termination and replacement of the Trust Advisor without cause must cause Fitch, KBRA and Moody’s to confirm the then-current ratings of the certificates (or decline to review the matter) and cause the payment of the fees and expenses incurred in the replacement. During any “subordinate control period”, the proposed replacement trust advisor will be subject to the subordinate class representative’s consent (such consent not to be unreasonably withheld). If a proposed termination and replacement of the Trust Advisor is not consummated within 180 days following the initial request of the certificateholders who requested a vote, the proposed termination and replacement shall have no further force or effect. The Trust Advisor generally may be discharged from its duties if and when the Class A-1, A-2, A-3, A-4, A-SB, A-S, B, C, PEX and D Certificates are retired. |
| Certain Fee Offsets: | If a workout fee is earned by either Special Servicer following a loan default with respect to any mortgage loan that it services, then certain limitations will apply to the collection and retention of a modification fee from the borrower. The modification fee generally must not exceed 1% of the principal balance of the loan as modified. In addition, if the loan re-defaults within a specified period of months and other conditions are satisfied, any subsequent workout or liquidation fee on that loan must be reduced by a portion of the previously-collected modification fee. Furthermore, workout fees, liquidation fees and modification fees collected with respect to any workout, |
| Wells Fargo Commercial Mortgage Trust 2015-C26 | Certain Terms and Conditions |
| liquidation and/or partial liquidation of a mortgage loan or loan combination that is serviced by a Special Servicer will be subject to an aggregate cap equal to the greater of (i) $1,000,000 and (ii) 1.00% of the stated principal balance of the subject mortgage loan or loan combination. | |
| Deal Website: | The Certificate Administrator will be required to maintain a deal website which will include, among other items: (a) summaries of asset status reports prepared by each Special Servicer, (b) inspection reports, (c) appraisals, (d) various “special notices” described in the Free Writing Prospectus, (e) the “Investor Q&A Forum” and (f) a voluntary “Investor Registry”. Investors may access the deal website following execution of a certification and confidentiality agreement. |
| Initial Majority Subordinate Certificateholder: | It is expected that Eightfold Real Estate Capital Fund III, L.P. or one of its affiliates will be the initial majority subordinate certificateholder. |
| Loan Combinations: | Each of the mortgaged properties identified on Annex A-1 to the Free Writing Prospectus as JW Marriott New Orleans and AMCP Portfolio secure both a mortgage loan to be included in the trust fund and one or more other mortgage loans that will not be included in the trust fund, which will be pari passu in right of payment with the trust mortgage loan. With respect to each group of mortgage loans that we refer to as a “loan combination”, AMCP Portfolio loan combination will be principally serviced under the pooling and servicing agreement. The JW Marriott New Orleans loan combination will be serviced under the pooling and servicing agreement for the WFCM 2014-LC18 securitization. As of the closing date, the pari passu companion loans in such loan combinations will be held by the parties identified above under “IV. Characteristics of the Mortgage Pool—B. Summary of Pari Passu Split Loan Structures”. |
| CHATEAU ON THE LAKE |

| CHATEAU ON THE LAKE |

| No. 1 – Chateau on the Lake | ||||||||
| Loan Information | Property Information | |||||||
| Mortgage Loan Seller: | Liberty Island Group I LLC | Single Asset/Portfolio: | Single Asset | |||||
Credit Assessment (Fitch/KBRA/Moody’s): | NR/NR/NR | Property Type: | Hospitality | |||||
| Original Principal Balance: | $46,000,000 | Specific Property Type: | Full Service | |||||
| Cut-off Date Principal Balance: | $45,943,064 | Location: | Branson, MO | |||||
| % of Initial Pool Balance: | 4.8% | Size: | 301 Rooms | |||||
| Loan Purpose: | Refinance | Cut-off Date Principal Balance Per Room: | $152,635 | |||||
| Borrower Name: | Chateau Lake, LLC | Year Built/Renovated: | 1997/2014 | |||||
| Sponsor: | Revocable Trust of John Q. Hammons | Title Vesting: | Fee | |||||
| Mortgage Rate: | 4.330% | Property Manager: | Self-managed | |||||
| Note Date: | December 11, 2014 | 3rd Most Recent Occupancy (As of)(4): | 50.9% (12/31/2011) | |||||
| Anticipated Repayment Date: | NAP | 2nd Most Recent Occupancy (As of)(4): | 57.3% (12/31/2012) | |||||
| Maturity Date: | January 1, 2025 | Most Recent Occupancy (As of)(4): | 52.9% (12/31/2013) | |||||
| IO Period: | None | Current Occupancy (As of)(4): | 58.4% (10/3/2014) | |||||
| Loan Term (Original): | 120 months | |||||||
| Seasoning: | 1 month | Underwriting and Financial Information: | ||||||
| Amortization Term (Original): | 360 months | |||||||
| Loan Amortization Type: | Amortizing Balloon | 3rd Most Recent NOI (As of)(4): | $6,065,352 (12/31/2012) | |||||
| Interest Accrual Method: | Actual/360 | 2nd Most Recent NOI (As of)(4): | $5,422,486 (12/31/2013) | |||||
Call Protection(1): | L(25),D(91),O(4) | Most Recent NOI (As of)(4): | $6,696,201 (TTM 10/3/2014) | |||||
| Lockbox Type: | Springing (With Established Account) | |||||||
Additional Debt(2): | Yes | |||||||
Additional Debt Type(2): | Future Mezzanine | |||||||
| U/W Revenues: | $18,115,472 | |||||||
| U/W Expenses: | $11,937,316 | |||||||
| U/W NOI: | $6,178,156 | |||||||
Escrows and Reserves(3): | U/W NCF: | $5,453,538 | ||||||
| U/W NOI DSCR: | 2.25x | |||||||
| U/W NCF DSCR: | 1.99x | |||||||
Type: | Initial | Monthly | Cap (If Any) | U/W NOI Debt Yield: | 13.4% | |||
| Taxes | $0 | Springing | NAP | U/W NCF Debt Yield: | 11.9% | |||
| Insurance | $0 | Springing | NAP | As-Is Appraised Value: | $67,600,000 | |||
| FF&E Reserve | $1,581,559 | $60,380 | NAP | As-Is Appraisal Valuation Date: | September 17, 2014 | |||
| Deferred Maintenance | $1,112,500 | $0 | NAP | Cut-off Date LTV Ratio: | 68.0% | |||
| Seasonality Reserve | $837,000 | $93,000 | $837,000 | LTV Ratio at Maturity or ARD: | 54.7% | |||
| (1) | A yield maintenance premium is payable during the defeasance lockout period in connection with the sale of the Chateau on the Lake Property to JD Holdings, LLC. See “Right of First Refusal” section. |
| (2) | See “Subordinate and Mezzanine Indebtedness” section. |
| (3) | See “Escrows” section. |
| (4) | See “Cash Flow Analysis” section. |
| CHATEAU ON THE LAKE |
| Sources | Uses | ||||||||
| Original loan amount | $46,000,000 | 100.0% | Loan payoff(1) | $24,470,455 | 53.2% | ||||
| Reserves | 3,531,059 | 7.7 | |||||||
| Closing costs | 1,538,280 | 3.3 | |||||||
| Return of equity | 16,460,207 | 35.8 | |||||||
| Total Sources | $46,000,000 | 100.0% | Total Uses | $46,000,000 | 100.0% |
| (1) | The Chateau on the Lake Property was securitized in BSCMS 2005-T18. |
2011(1) | 2012(1) | 2013(2) | TTM 10/3/2014(2) | U/W | U/W $ per Room | ||||||||
| Occupancy | 50.9% | 57.3% | 52.9% | 58.4% | 58.4% | ||||||||
| ADR | $159.82 | $157.21 | $157.26 | $154.71 | $154.71 | ||||||||
| RevPAR | $81.32 | $90.08 | $83.12 | $90.28 | $90.28 | ||||||||
| Total Revenue | $15,545,464 | $17,470,695 | $16,345,470 | $18,413,261 | $18,115,472 | $60,184 | |||||||
| Total Department Expenses | 5,839,548 | 6,421,276 | 6,104,048 | 6,669,829 | 6,561,961 | $21,801 | |||||||
| Gross Operating Profit | $9,705,916 | $11,049,419 | $10,241,422 | $11,743,432 | $11,553,511 | $38,384 | |||||||
| Total Undistributed Expenses | 3,969,756 | 4,366,173 | 4,198,578 | 4,463,980 | 4,756,594 | $15,803 | |||||||
| Profit Before Fixed Charges | $5,736,160 | $6,683,246 | $6,042,844 | $7,279,452 | $6,796,917 | $22,581 | |||||||
| Total Fixed Charges | 628,208 | 617,894 | 620,358 | 583,251 | 618,761 | $2,056 | |||||||
| Net Operating Income | $5,107,952 | $6,065,352 | $5,422,486 | $6,696,201 | $6,178,156 | $20,525 | |||||||
| FF&E | 0 | 0 | 0 | 0 | 724,619 | $2,407 | |||||||
| Net Cash Flow | $5,107,952 | $6,065,352 | $5,422,486 | $6,696,201 | $5,453,538 | $18,118 | |||||||
| NOI DSCR | 1.86x | 2.21x | 1.98x | 2.44x | 2.25x | ||||||||
| NCF DSCR | 1.86x | 2.21x | 1.98x | 2.44x | 1.99x | ||||||||
| NOI DY | 11.1% | 13.2% | 11.8% | 14.6% | 13.4% | ||||||||
| NCF DY | 11.1% | 13.2% | 11.8% | 14.6% | 11.9% | ||||||||
| (1) | The increase in occupancy from 2011 to 2012 is primarily due to an increased demand at the Chateau on the Lake Property, resulting from a decrease of available hotel rooms in the area due to tornado damage. The Chateau on the Lake Property was not damaged by the tornado. |
| (2) | The increase in NOI from 2013 to TTM 10/3/2014 is primarily due to an increase in occupancy from 2013 to TTM 10/3/2014 as a result of increased demand in the market. |
| CHATEAU ON THE LAKE |
Competitive Set | Chateau on the Lake | Penetration Factor | |||||||||||||||||
Year | Occupancy | ADR | RevPAR | Occupancy | ADR | RevPAR | Occupancy | ADR | RevPAR | ||||||||||
| 12/31/2014 TTM | 51.4% | $138.73 | $71.34 | 58.5% | $156.89 | $91.83 | 113.8% | 113.1% | 128.7% | ||||||||||
| 12/31/2013 TTM | 48.9% | $135.94 | $66.45 | 53.0% | $157.39 | $83.35 | 108.3% | 115.8% | 125.4% | ||||||||||
| 12/31/2012 TTM | 50.5% | $130.40 | $65.82 | 57.3% | $156.42 | $89.63 | 113.5% | 120.0% | 136.2% | ||||||||||
| (1) | Information obtained from a third party hospitality report dated January 16, 2015. The competitive set includes the following hotels: Tan Tar A Resort Golf Club, Big Cedar Lodge, Lodge of Four Seasons, Radisson Hotel Branson, Hilton Promenade at Branson Landing and Hilton Branson Convention Center. |
| CHATEAU ON THE LAKE |
| TRAILS AT DOMINION |
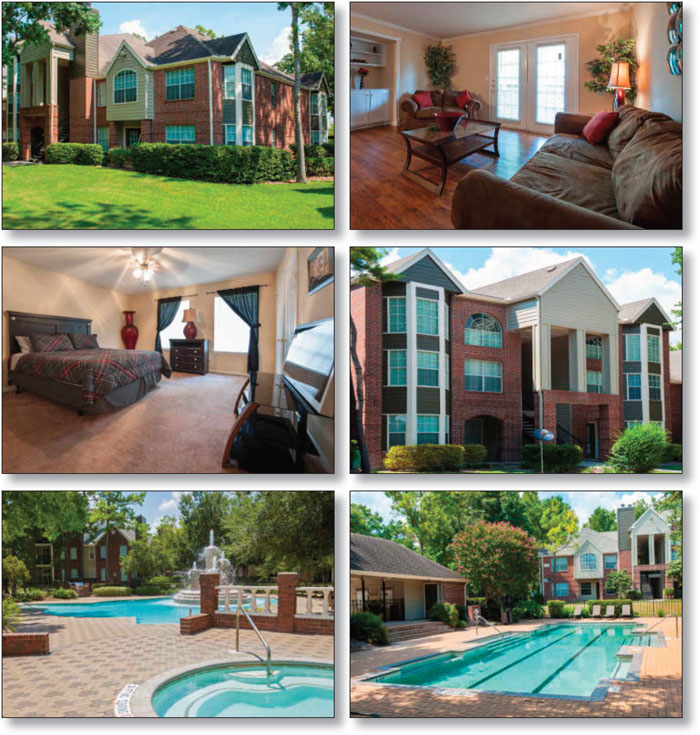
| TRAILS AT DOMINION |
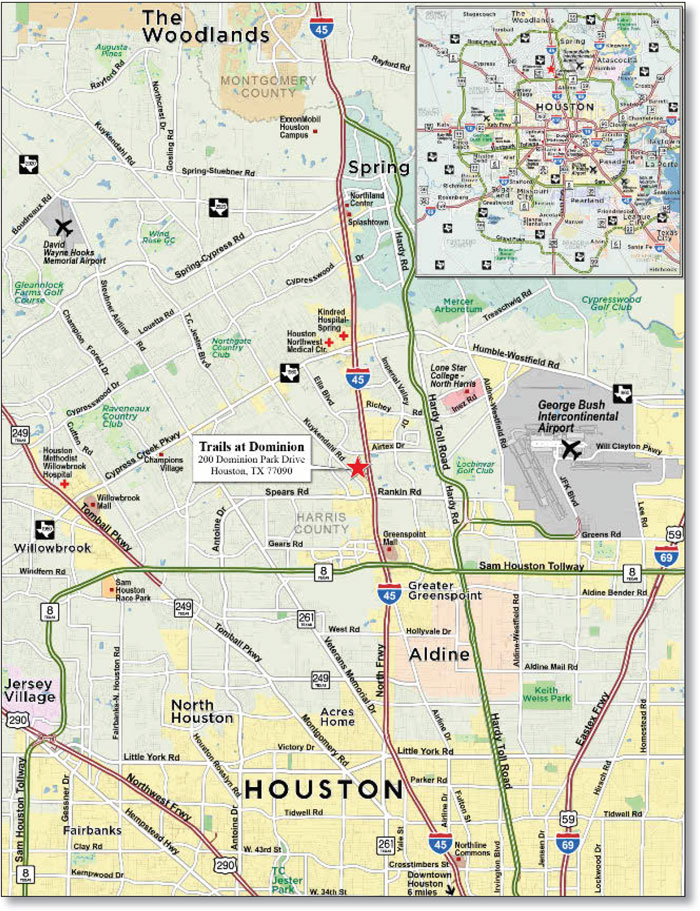
| No. 2 – Trails at Dominion | |||||||
| Loan Information | Property Information | ||||||
| Mortgage Loan Seller: | Well Fargo Bank, National Association | Single Asset/Portfolio: | Single Asset | ||||
| Credit Assessment (Fitch/KBRA/Moody’s): | NR/NR/NR | Property Type: | Multifamily | ||||
| Original Principal Balance: | $40,750,000 | Specific Property Type: | |||||
| Cut-off Date Principal Balance: | $40,750,000 | Location: | Houston, TX | ||||
| % of Initial Pool Balance: | 4.2% | Size: | 843 Units | ||||
| Loan Purpose: | Acquisition | Cut-off Date Principal Balance Per Unit: | $48,339 | ||||
| Borrower Name: | AB-GO Trails At Dominion Park Propco, LLC | Year Built/Renovated: | 1993/NAP | ||||
| Sponsors: | Jeffrey Goldstein; Richard Oller | Title Vesting: | Fee | ||||
| Mortgage Rate: | 4.400% | Property Manager: | Self-managed | ||||
| Note Date: | January 9, 2015 | 3rd Most Recent Occupancy(2): | 94.2% (12/31/2011) | ||||
| Anticipated Repayment Date: | NAP | 2nd Most Recent Occupancy (As of)(2): | 90.8% (12/31/2012) | ||||
| Maturity Date: | January 11, 2025 | Most Recent Occupancy (As of)(2): | 92.7% (12/31/2013) | ||||
| IO Period: | 60 months | Current Occupancy (As of): | 95.7% (11/10/2014) | ||||
| Loan Term (Original): | 120 months | ||||||
| Seasoning: | 1 month | Underwriting and Financial Information: | |||||
| Amortization Term (Original): | 360 months | ||||||
| Loan Amortization Type: | Amortizing Balloon | 3rd Most Recent NOI(3): | $2,356,161 (12/31/2012) | ||||
| Interest Accrual Method: | Actual/360 | 2nd Most Recent NOI (As of)(3): | $3,485,649 (12/31/2013) | ||||
| Call Protection: | L(25),D(90),O(5) | Most Recent NOI (As of): | |||||
| Lockbox Type: | Springing (Without Established Account) | ||||||
| Additional Debt: | None | ||||||
| Additional Debt Type: | NAP | U/W Revenues: | $7,431,457 | ||||
| U/W Expenses: | $3,999,273 | ||||||
| U/W NOI: | $3,432,184 | ||||||
| U/W NCF: | $3,196,144 | ||||||
| U/W NOI DSCR: | 1.40x | ||||||
Escrows and Reserves(1): | U/W NCF DSCR: | 1.31x | |||||
| U/W NOI Debt Yield: | 8.4% | ||||||
Type: | Initial | Monthly | Cap (If Any) | U/W NCF Debt Yield: | 7.8% | ||
| Taxes | $78,909 | $78,909 | NAP | As-Is Appraised Value: | $53,500,000 | ||
| Insurance | $0 | Springing | NAP | As-Is Appraisal Valuation Date: | November 20, 2014 | ||
| Replacement Reserves | $1,169,670 | $19,670 | NAP | Cut-off Date LTV Ratio: | 76.2% | ||
| Deferred Maintenance | $22,450 | NAP | NAP | LTV Ratio at Maturity or ARD: | 69.6% | ||
| (1) | See “Escrows” section. |
| (2) | See “Historical Occupancy” section. |
| (3) | See “Cash Flow Analysis” section. |
| TRAILS AT DOMINION |
| Sources | Uses | |||||||
| Original loan amount | $40,750,000 | 74.9% | Purchase price | $52,500,000 | 96.5% | |||
| Sponsor’s new cash contribution | 13,664,691 | 25.1 | Reserves | 1,271,029 | 2.3 | |||
| Closing costs | 643,662 | 1.2 | ||||||
| Total Sources | $54,414,691 | 100.0% | Total Uses | $54,414,691 | 100.0% |
| (1) | The Trails at Dominion Property was previously securitized in ACR 2014-FL2 with a trust balance of $35.3 million prior to payoff. |
| Unit Type | No. of Units | % of Total Units | Average Unit Size (SF) | Average U/W Monthly Rent per Unit |
| 548 | 804 | |||
| 275 | 1,150 | |||
| 20 | 1,410 | |||
| Total/Weighted Average | 843 | 100.0% | 931 |
| (1) | Information obtained from the appraisal and underwritten rent roll. |
12/31/2011(1) | 12/31/2012(1) | 12/31/2013(1) | 11/10/2014(2) | |||
| 94.2% | 90.8% | 92.7% | 95.7% |
| (1) | Historical Occupancy reflects the economic occupancy obtained from historical operating statements. |
| (2) | Information obtained from the underwritten rent roll. |
| TRAILS AT DOMINION |
2012(1) | 2013(1) | TTM 10/31/2014 | T3 Annualized 10/31/2014 | U/W | U/W $ per Unit(1) | ||||||||||||||
| Base Rent | $6,226,652 | $6,640,984 | $6,947,861 | $7,107,621 | $7,241,737 | $8,590 | |||||||||||||
| Grossed Up Vacant Space | 633,179 | 520,881 | 441,630 | 417,907 | 327,420 | $388 | |||||||||||||
| Concessions | (168,219) | (140,528 | ) | (250,712 | ) | (310,269 | ) | (310,269) | ($368 | ) | |||||||||
| Other Income | 651,492 | 668,482 | 707,223 | 742,349 | 742,349 | $881 | |||||||||||||
| Less Vacancy & Credit Loss | (776,273 | ) | (630,268 | ) | (563,303 | ) | (525,969 | ) | (569,780)(2) | ($676 | ) | ||||||||
| Effective Gross Income | $6,566,829 | $7,059,551 | $7,282,699 | $7,431,640 | $7,431,457 | $8,815 | |||||||||||||
| Total Operating Expenses | $4,210,669 | $3,573,902 | $3,323,028 | $3,699,633 | $3,999,273 | ||||||||||||||
| Net Operating Income | $2,356,161 | $3,485,649 | $3,959,671 | $3,732,007 | $3,432,184 | $4,071 | |||||||||||||
| Capital Expenditures | 0 | 0 | 0 | 0 | 236,040 | $280 | |||||||||||||
| Net Cash Flow | $2,356,161 | $3,485,649 | $3,959,671 | $3,732,007 | $3,196,144 | $3,791 | |||||||||||||
| NOI DSCR | 0.96 | x | 1.42 | x | 1.62 | x | 1.52 | x | 1.40 | x | |||||||||
| NCF DSCR | 0.96 | x | 1.42 | x | 1.62 | x | 1.52 | x | 1.31 | x | |||||||||
| NOI DY | 5.8 | % | 8.6 | % | 9.7 | % | 9.2 | % | 8.4 | % | |||||||||
| NCF DY | 5.8 | % | 8.6 | % | 9.7 | % | 9.2 | % | 7.8 | % |
| (1) | The increase in Effective Gross Income and Net Operating Income from 2012 to 2013 is primarily due to increased occupancy from 90.8% to 92.7%, an increase in Base Rent (approximately $414,000) and decreased expenses (approximately $637,000), as the seller incurred much lower repair and maintenance costs in 2013 and the trailing twelve months ending October 31, 2014. Higher repair and maintenance costs in 2011 and 2012 were a result of unit preparation charges for a number of down units that had been neglected during the economic downturn and prior loan workout. Further, taxes decreased from $1,123,292 to $887,790 as a result of the reduction of a special municipal utility district tax expense. |
| (2) | The underwritten economic vacancy is 6.1%. The Trails at Dominion Property was 95.7% physically occupied as of November 10, 2014. |
| TRAILS AT DOMINION |
| Trails at Dominion (Subject) | The Vanderbilt | The Augusta | Bayou Oaks | Monticello On Cranbrook | Commerce Park | |
| Location | Houston, TX | Houston, TX | Houston, TX | Houston, TX | Houston, TX | Houston, TX |
| Distance to Subject | -- | 0.3 miles | 0.5 miles | 0.6 miles | 0.6 miles | 1.0 miles |
| Property Type | Garden | Garden | Garden | Garden | Garden | Garden |
| Number of Units | 843 | 416 | 212 | 210 | 220 | 354 |
| Average Rent (per unit) | $748 | $825 | $927 | $609 | $682 | $610 |
| 1 Bedroom | $658 | $674 | $835 | $599 | $572 | $586 |
| 2 Bedroom | $857 | $972 | $980 | $679 | $706 | $872 |
| 3 Bedroom | $1,171 | $1367 | NAV | NAV | NAV | NAV |
| Utilities | Not Incl. | Not Incl. | Not Incl. | Not Incl. | Not Incl. | Not Incl. |
| Total Occupancy | 96% | 91% | 98% | 90% | 95% | 95% |
| (1) | Information obtained from the appraisal and underwritten rent roll. |
| TRAILS AT DOMINION |
| JW MARRIOTT NEW ORLEANS |

| JW MARRIOTT NEW ORLEANS |

| No. 3 – JW Marriott New Orleans |
| Loan Information | Property Information | ||||||
| Mortgage Loan Seller: | Wells Fargo Bank, National Association | Single Asset/Portfolio: | Single Asset | ||||
Credit Assessment (Fitch/KBRA/Moody‘s): | NR/NR/NR | Property Type: | Hospitality | ||||
Original Principal Balance(1): | $40,000,000 | Specific Property Type: | Full Service | ||||
Cut-off Date Principal Balance(1): | $39,896,822 | Location: | New Orleans, LA | ||||
| % of Initial Pool Balance: | 4.1% | Size: | 496 rooms | ||||
| Loan Purpose: | Refinance | Cut-off Date Principal Balance Per Room(1): | $180,984 | ||||
| Borrower Name: | Sunstone Canal, LLC | Year Built/Renovated: | 1984/2003 | ||||
| Sponsor: | Sunstone Hotel Partnership, LLC | Title Vesting: | Leasehold | ||||
| Mortgage Rate: | 4.150% | Property Manager: | Marriott Hotel Services, Inc. | ||||
| Note Date: | December 2, 2014 | 3rd Most Recent Occupancy (As of) (4): | 79.7% (12/31/2011) | ||||
| Anticipated Repayment Date: | NAP | 2nd Most Recent Occupancy (As of) (4): | 81.8% (12/31/2012) | ||||
| Maturity Date: | December 11, 2024 | Most Recent Occupancy (As of): | 81.1% (12/31/2013) | ||||
| IO Period: | None | Current Occupancy (As of): | 81.7% (10/31/2014) | ||||
| Loan Term (Original): | 120 months | ||||||
| Seasoning: | 2 months | Underwriting and Financial Information: | |||||
| Amortization Term (Original): | 360 months | ||||||
| Loan Amortization Type: | Amortizing Balloon | 3rd Most Recent NOI (As of)(4): | $10,166,036 (12/31/2012) | ||||
| Interest Accrual Method: | Actual/360 | 2nd Most Recent NOI (As of)(4): | $12,903,001 (12/31/2013) | ||||
| Call Protection: | L(26),D(90),O(4) | Most Recent NOI (As of)(4): | $14,263,420 (TTM 10/31/2014) | ||||
Lockbox Type(2): | Soft/Upfront Cash Management | ||||||
Additional Debt(1): | Yes | ||||||
Additional Debt Type(1): | Pari Passu | U/W Revenues: | $37,611,335 | ||||
| U/W Expenses: | $24,847,358 | ||||||
U/W NOI(4): | $12,763,977 | ||||||
| U/W NCF: | $10,883,410 | ||||||
U/W NOI DSCR(1): | 2.43x | ||||||
Escrows and Reserves(3): | U/W NCF DSCR(1): | 2.07x | |||||
U/W NOI Debt Yield(1): | 14.2% | ||||||
Type: | Initial | Monthly | Cap (If Any) | U/W NCF Debt Yield(1): | 12.1% | ||
| Taxes | $0 | Springing | NAP | As-Is Appraised Value: | $152,200,000 | ||
| Insurance | $0 | Springing | NAP | As-Is Appraisal Valuation Date: | October 22, 2014 | ||
| FF&E | $0 | Springing | NAP | Cut-off Date LTV Ratio(1): | 59.0% | ||
| Deferred Maintenance | $2,321,684 | $0 | NAP | LTV Ratio at Maturity or ARD(1): | 47.2% | ||
| (1) | The JW Marriott New Orleans Loan Combination, with an original principal balance totaling $90,000,000, is comprised of two pari passu notes (Notes A-1 and A-2). The non-controlling Note A-2 had an original principal balance of $40,000,000, has an outstanding principal balance as of the Cut-off Date of $39,896,822 and will be contributed to the WFCM 2015-C26 Trust. The controlling Note A-1 had an original balance of $50,000,000, has an outstanding principal balance as of the Cut-off Date of $49,871,028 and was contributed to the WFCM 2014-LC18 Trust. All statistical information related to the balance per room, loan-to-value ratios, debt service coverage ratios and debt yields are based on the JW Marriott New Orleans Loan Combination. |
| (2) | See “Lockbox and Cash Management“ section. |
| (3) | See “Escrows“ section. |
| (4) | See “Cash Flow Analysis“ section. |
| JW MARRIOTT NEW ORLEANS |
| Sources | Uses | |||||||||
| Original loan amount | $90,000,000 | 100.0 | % | Loan payoff(1) | $39,619,603 | 44.0 | % | |||
| Closing costs | 637,048 | 0.7 | ||||||||
| Reserves | 2,321,684 | 2.6 | ||||||||
| Return of equity | 47,421,665 | 52.7 | ||||||||
| Total Sources | $90,000,000 | 100.0 | % | Total Uses | $90,000,000 | 100.0 | % |
| (1) | The JW Marriott New Orleans Loan Combination is refinancing an existing Wells Fargo Bank, National Association balance sheet loan. |
2011(1) | 2012(1) | 2013(1) | TTM 10/31/2014(1) | U/W | U/W $ per Room | |||||||
| Occupancy | 79.7% | 81.8% | 81.1% | 81.7% | 81.7% | |||||||
| ADR | $154.43 | $168.17 | $185.10 | $192.45 | $192.45 | |||||||
| RevPAR | $123.09 | $137.49 | $150.03 | $157.25 | $157.25 | |||||||
| Total Revenue | $29,746,071 | $32,805,967 | $35,360,956 | $37,611,062 | $37,611,335 | $75,829 | ||||||
| Total Department Expenses | 10,504,357 | 11,303,142 | 11,092,462 | 11,273,502 | 11,273,559 | 22,729 | ||||||
| Gross Operating Profit | $19,241,714 | $21,502,825 | $24,268,494 | $26,337,560 | $26,337,776 | $53,100 | ||||||
| Total Undistributed Expenses | 8,607,022 | 9,221,278 | 9,287,873 | 9,751,122 | 9,751,130 | 19,660 | ||||||
| Profit Before Fixed Charges | $10,634,692 | $12,281,547 | $14,980,621 | $16,586,438 | $16,586,646 | $33,441 | ||||||
| Total Fixed Charges | 2,023,177 | 2,115,511 | 2,077,620 | 2,323,018 | 3,822,669(2) | 7,707 | ||||||
| Net Operating Income | $8,611,515 | $10,166,036 | $12,903,001 | $14,263,420 | $12,763,977 | $25,734 | ||||||
| FF&E | 0 | 0 | 0 | 0 | 1,880,567 | 3,791 | ||||||
| Net Cash Flow | $8,611,515 | $10,166,036 | $12,903,001 | $14,263,420 | $10,883,410 | $21,942 | ||||||
NOI DSCR(3) | 1.64x | 1.94x | 2.46x | 2.72x | 2.43x | |||||||
NCF DSCR(3) | 1.64x | 1.94x | 2.46x | 2.72x | 2.07x | |||||||
NOI DY(3) | 9.6% | 11.3% | 14.4% | 15.9% | 14.2% | |||||||
NCF DY(3) | 9.6% | 11.3% | 14.4% | 15.9% | 12.1% | |||||||
| (1) | Historical Net Operating Income increased year-over-year due to the strengthening New Orleans economy, which resulted in year-over-year ADR growth. |
| (2) | Property taxes in 2015 are still subject to appeal and were underwritten based on the appraiser’s estimated reassessed property tax expense of $2,394,000, which is slightly higher than the current reassessed amount. Property taxes as of the trailing 12-months ending October 31, 2014 were $1,056,999. |
| (3) | DSCRs and debt yields are based on the JW Marriott New Orleans Loan Combination. |
| JW MARRIOTT NEW ORLEANS |
Competitive Set | JW Marriott New Orleans | Penetration Factor | |||||||||||||||
Year | Occupancy | ADR | RevPAR | Occupancy | ADR | RevPAR | Occupancy | ADR | RevPAR | ||||||||
| 9/30/2014 TTM | 70.8% | $180.39 | $127.73 | 81.0% | $192.31 | $155.82 | 114.4% | 106.6% | 122.0% | ||||||||
| 9/30/2013 TTM | 70.3% | $175.51 | $123.46 | 80.7% | $176.16 | $142.23 | 114.8% | 100.4% | 115.2% | ||||||||
| 9/30/2012 TTM | 74.2% | $167.49 | $124.22 | 82.8% | $163.90 | $135.63 | 111.6% | 97.9% | 109.2% | ||||||||
| (1) | Information obtained from a third party hospitality report dated October 18, 2014. The competitive set includes the following hotels: Hotel New Orleans Downtown, InterContinental New Orleans, Royal Sonesta New Orleans, Westin New Orleans Canal Place, Crown Plaza New Orleans French Quarter and Loews New Orleans. |
| JW MARRIOTT NEW ORLEANS |
| BROADCOM BUILDING |

| BROADCOM BUILDING |

| No. 4 – Broadcom Building |
| Loan Information | Property Information | |||||
| Mortgage Loan Seller: | Wells Fargo Bank, National Association | Single Asset/Portfolio: | Single Asset | |||
Credit Assessment (Fitch/KBRA/Moody’s): | NR/NR/NR | Property Type: | Office | |||
| Original Principal Balance: | $35,750,000 | Specific Property Type: | Single Tenant | |||
| Cut-off Date Principal Balance: | $35,750,000 | Location: | San Jose, CA | |||
| % of Initial Pool Balance: | 3.7% | Size: | 200,000 SF | |||
| Loan Purpose: | Acquisition | Cut-off Date Principal Balance Per SF: | $178.75 | |||
| Borrower Name: | Zanker Road Partners, LLC | Year Built/Renovated: | 1990/NAP | |||
| Sponsors: | Robert A. Day and Jerry W. Carlton | Title Vesting: | Fee | |||
| Mortgage Rate: | 4.100% | Property Manager: | Self-managed | |||
| Note Date: | December 30, 2014 | 3rd Most Recent Occupancy (As of): | 100.0% (12/31/2012) | |||
| Anticipated Repayment Date: | NAP | 2nd Most Recent Occupancy (As of): | 100.0% (12/31/2013) | |||
| Maturity Date: | January 11, 2025 | Most Recent Occupancy (As of): | 100.0% (12/31/2014) | |||
| IO Period: | 60 months | Current Occupancy (As of): | 100.0% (2/1/2015) | |||
| Loan Term (Original): | 120 months | |||||
| Seasoning: | 1 month | Underwriting and Financial Information: | ||||
| Amortization Term (Original): | 360 months | |||||
| Loan Amortization Type: | Interest-only, Amortizing Balloon | 3rd Most Recent NOI(2): | NAV | |||
| Interest Accrual Method: | Actual/360 | 2nd Most Recent NOI(2): | NAV | |||
| Call Protection: | L(25),D(91),O(4) | Most Recent NOI(2): | NAV | |||
| Lockbox Type: | Springing (Without Established Account) | |||||
| Additional Debt: | None | |||||
| Additional Debt Type: | NAP | |||||
| U/W Revenues: | $5,072,181 | |||||
| U/W Expenses: | $1,029,860 | |||||
| U/W NOI: | $4,042,321 | |||||
Escrows and Reserves(1): | U/W NCF: | $3,756,271 | ||||
U/W NOI DSCR(3): | 1.95x | |||||
Type: | Initial | Monthly | Cap (If Any) | U/W NCF DSCR(3): | 1.81x | |
| Taxes | $0 | Springing | NAP | U/W NOI Debt Yield(3): | 11.3% | |
| Insurance | $0 | Springing | NAP | U/W NCF Debt Yield(3): | 10.5% | |
| Replacement Reserves | $0 | Springing | NAP | As-Is Appraised Value: | $55,000,000 | |
| Deferred Maintenance | $80,850 | $0 | NAP | As-Is Appraisal Valuation Date: | November 5, 2014 | |
| Broadcom Springing Reserve | $0 | Springing | NAP | Cut-off Date LTV Ratio: | 65.0% | |
| Supplemental Liquidity Reserve | $0 | Springing | NAP | LTV Ratio at Maturity or ARD: | 59.1% | |
| (1) | See “Escrows“ section. |
| (2) | See “Cash Flow Analysis“ section. |
| (3) | Underwritten figures are based on the average rent over the remaining Broadcom lease term. Based on the in-place rent, the U/W NOI DSCR is 1.80x, the U/W NCF DSCR is 1.67x, the U/W NOI Debt Yield is 10.5% and the U/W NCF Debt Yield is 9.7%. |
| BROADCOM BUILDING |
| Sources | Uses | |||||||||
| Original loan amount | $35,750,000 | 64.2 | % | Purchase price | $55,000,000 | 98.7 | % | |||
| Sponsor’s new cash contribution | 19,969,031 | 35.8 | Reserves | 80,850 | 0.1 | |||||
| Closing costs | 638,181 | 1.1 | ||||||||
| Total Sources | $55,719,031 | 100.0 | % | Total Uses | $55,719,031 | 100.0 | % | |||
| Tenant Name | Credit Rating (Fitch/ Moody’s/S&P) | Tenant NRSF | % of NRSF | Annual U/W Base Rent PSF | Annual U/W Base Rent | % of Total Annual U/W Base Rent | Lease Expiration Date |
| Major Tenant | |||||||
| Broadcom Corporation | NR/A2/A- | 200,000 | 100.0% | $21.80(1) | $4,360,000(1) | 100.0% | 5/31/2020(2) |
| Total Major Tenant | 200,000 | 100.0% | $21.80 | $4,360,000 | 100.0% | ||
| Vacant Space | 0 | 0.0% | |||||
| Collateral Total | 200,000 | 100.0% | |||||
| (1) | Broadcom’s in-place annual rent is $4,032,000 ($20.16 per square foot) and increases approximately 3.0% annually. Annual U/W Base Rent PSF and Annual U/W Base Rent are based on the average rent over the remaining Broadcom lease term. |
| (2) | Broadcom has the right to terminate its lease on May 31, 2016 or May 31, 2018 with 12 months’ notice and payment of a termination fee equal to $5,491,235 or $2,469,618, respectively. Broadcom also has one, 10-year lease extension option. |
Year Ending December 31, | No. of Leases Expiring | Expiring NRSF | % of Total NRSF | Cumulative Expiring NRSF | Cumulative % of Total NRSF | Annual U/W Base Rent | Annual U/W Base Rent PSF | |
| MTM | 0 | 0 | 0.0% | 0 | 0.0% | $0 | $0.00 | |
| 2015 | 0 | 0 | 0.0% | 0 | 0.0% | $0 | $0.00 | |
| 2016 | 0 | 0 | 0.0% | 0 | 0.0% | $0 | $0.00 | |
| 2017 | 0 | 0 | 0.0% | 0 | 0.0% | $0 | $0.00 | |
| 2018 | 0 | 0 | 0.0% | 0 | 0.0% | $0 | $0.00 | |
| 2019 | 0 | 0 | 0.0% | 0 | 0.0% | $0 | $0.00 | |
| 2020 | 1 | 200,000 | 100.0% | 200,000 | 100.0% | $4,360,000 | $21.80 | |
| 2021 | 0 | 0 | 0.0% | 200,000 | 100.0% | $0 | $0.00 | |
| 2022 | 0 | 0 | 0.0% | 200,000 | 100.0% | $0 | $0.00 | |
| 2023 | 0 | 0 | 0.0% | 200,000 | 100.0% | $0 | $0.00 | |
| 2024 | 0 | 0 | 0.0% | 200,000 | 100.0% | $0 | $0.00 | |
| 2025 | 0 | 0 | 0.0% | 200,000 | 100.0% | $0 | $0.00 | |
| Thereafter | 0 | 0 | 0.0% | 200,000 | 100.0% | $0 | $0.00 | |
| Vacant | 0 | 0 | 0.0% | 200,000 | 100.0% | $0 | $0.00 | |
| Total/Weighted Average | 1 | 200,000 | 100.0% | $4,360,000 | $21.80 |
| (1) | Information obtained from the underwritten rent roll. |
| (2) | Certain tenants may have lease termination options that are exercisable prior to the originally stated expiration date of the subject lease and that are not considered in the Lease Expiration Schedule. |
| BROADCOM BUILDING |
12/31/2012(1) | 12/31/2013(1) | 12/31/2014(1) | 2/1/2015(2) | |||
| 100.0% | 100.0% | 100.0% | 100.0% |
| (1) | Information based on the lease. |
| (2) | Information obtained from the underwritten rent roll. |
| U/W | U/W $ per SF | |||
| Base Rent | $4,360,000(2) | $21.80 | ||
| Grossed Up Vacant Space | 0 | 0.00 | ||
| Total Reimbursables | 930,181 | 4.65 | ||
| Other Income | 0 | 0.00 | ||
| Less Vacancy & Credit Loss | 218,000(3) | 1.09 | ||
| Effective Gross Income | $5,072,181 | $25.36 | ||
| Total Operating Expenses | $1,029,860 | $5.15 | ||
| Net Operating Income | $4,042,321 | $20.21 | ||
| TI/LC | 246,050 | 1.23 | ||
| Capital Expenditures | 40,000 | 0.20 | ||
| Net Cash Flow | $3,756,271 | $18.78 | ||
| NOI DSCR | 1.95x(4) | |||
| NCF DSCR | 1.81x(4) | |||
| NOI DY | 11.3%(4) | |||
| NCF DY | 10.5%(4) |
| (1) | Historical financial statements are not available as the sponsor acquired the Broadcom Building Property in December 2014. |
| (2) | Broadcom‘s in-place annual rent is $4,032,000 ($20.16 per square foot) and increases approximately 3.0% annually. Annual U/W Base Rent per SF and Annual U/W Base Rent are based on the average over the remaining Broadcom lease term. |
| (3) | The underwritten economic vacancy is 5.0%. The Broadcom Building Property was 100.0% physically occupied as of February 1, 2015. |
| (4) | Underwritten figures are based on the average rent over the remaining Broadcom lease term. Based on the in-place rent, the U/W NOI DSCR is 1.80x, the U/W NCF DSCR is 1.67x, the U/W NOI Debt Yield is 10.5% and the U/W NCF Debt Yield is 9.7%. |
| BROADCOM BUILDING |
Broadcom Building (Subject) | Trimble Research Park | 2701 Orchard Parkway | 3300 Olcott St. | Guadalupe Corporate Center | Champion Station | |
| Location | San Jose, CA | San Jose, CA | San Jose, CA | Santa Clara, CA | San Jose, CA | San Jose, CA |
| Distance from Subject | -- | 1.6 miles | 1.1 miles | 2.8 miles | 1.7 miles | 1.9 miles |
| Property Type | Office | Office | Office | Office | Office | Office |
| Year Built/Renovated | 1990/NAP | 1982/2014 | 1979/2012 | 1979/1983 | 1997/NAP | 1995/2014 |
| Stories | 2 | 2 | 1 | 2 | 4 | 2 |
| Total GLA | 200,000 SF | 137,517 SF | 207,006 SF | 105,664 SF | 110,881 SF | 95,484 SF |
| Total Occupancy | 100% | 100% | 100% | 100% | 100% | 0% |
| (1) | Information obtained from the appraisal. |
| BROADCOM BUILDING |
| ALOFT HOUSTON BY THE GALLERIA |

| ALOFT HOUSTON BY THE GALLERIA |

| No. 5 – Aloft Houston by the Galleria | |||||||
| Loan Information | Property Information | ||||||
| Mortgage Loan Seller: | SPREF | Single Asset/Portfolio: | Single Asset | ||||
Credit Assessment (Fitch/KBRA/Moody’s): | NR/NR/NR | Property Type: | Hospitality | ||||
| Original Principal Balance: | $32,650,000 | Specific Property Type: | Limited Service | ||||
| Cut-off Date Principal Balance: | $32,650,000 | Location: | Houston, TX | ||||
| % of Initial Pool Balance: | 3.4% | Size: | 152 Rooms | ||||
| Loan Purpose: | Acquisition | Cut-off Date Principal Balance Per Room: | $214,803 | ||||
| Borrower Name: | NYTX Hospitality LLC | Year Built/Renovated: | 2009/NAP | ||||
Sponsors(1): | Various | Title Vesting: | Fee | ||||
| Mortgage Rate: | 4.608% | Property Manager: | Merritt Hospitality LLC | ||||
| Note Date: | December 22, 2014 | 3rd Most Recent Occupancy (As of): | NAV | ||||
| Anticipated Repayment Date: | NAP | 2nd Most Recent Occupancy (As of): | 83.6% (T9 12/31/2012) | ||||
| Maturity Date: | January 6, 2025 | Most Recent Occupancy (As of): | 80.5% (12/31/2013) | ||||
| IO Period: | 24 months | Current Occupancy (As of): | 79.5% (9/30/2014) | ||||
| Loan Term (Original): | 120 months | ||||||
| Seasoning: | 1 month | Underwriting and Financial Information: | |||||
| Amortization Term (Original): | 360 months | ||||||
| Loan Amortization Type: | Interest-only, Amortizing Balloon | 3rd Most Recent NOI (As of)(3): | $1,820,756 (T9 12/31/2012) | ||||
| Interest Accrual Method: | Actual/360 | 2nd Most Recent NOI (As of)(3): | $3,279,643 (12/31/2013) | ||||
| Call Protection: | L(25),D(91),O(4) | Most Recent NOI (As of): | $3,782,744 (TTM 9/30/2014) | ||||
| Lockbox Type: | Springing (With Established Account) | ||||||
| Additional Debt: | None | ||||||
| Additional Debt Type: | NAP | ||||||
| U/W Revenues: | $8,105,986 | ||||||
| U/W Expenses: | $4,434,292 | ||||||
| U/W NOI: | $3,671,694 | ||||||
| U/W NCF: | $3,347,455 | ||||||
| U/W NOI DSCR: | 1.83x | ||||||
Escrows and Reserves(2): | U/W NCF DSCR: | 1.67x | |||||
| U/W NOI Debt Yield: | 11.2% | ||||||
| U/W NCF Debt Yield: | 10.3% | ||||||
Type: | Initial | Monthly | Cap (If Any) | As-Renovated Appraised Value(4): | $44,800,000 | ||
| Taxes | $0 | Springing | NAP | As-Renovated Appraisal Valuation Date(4): | July 1, 2015 | ||
| Insurance | $0 | Springing | NAP | Cut-off Date LTV Ratio(4): | 72.9% | ||
| FF&E Reserve | $1,100,000 | $27,020 | NAP | LTV Ratio at Maturity or ARD(4): | 62.4% | ||
| (1) | See “The Sponsors” section. |
| (2) | See “Escrows” section. |
| (3) | See “Cash Flow Analysis” section. The 2012 financials include only 266 days of operation. |
| (4) | The appraiser concluded to an “as-is” appraised value of $42,300,000. The Cut-off Date LTV Ratio based on the “as-is” value is 77.2% and the LTV Ratio at Maturity is 66.1%. |
| ALOFT HOUSTON BY THE GALLERIA |
| Sources | Uses | |||||||||
| Original loan amount | $32,650,000 | 76.6 | % | Purchase price | $40,500,000 | 95.1 | % | |||
| Sponsor’s new cash contribution | 9,954,662 | 23.4 | Reserves | 1,100,000 | 2.6 | |||||
| Closing costs | 1,004,662 | 2.4 | ||||||||
| Total Sources | $42,604,662 | 100.0 | % | Total Uses | $42,604,662 | 100.0 | % |
T9 12/31/2012(1)(2) | 2013(2) | TTM 9/30/2014 | U/W | U/W $ per Room | |||||||
| Occupancy | 83.6% | 80.5% | 79.5% | 79.5% | |||||||
| ADR | $128.95 | $153.14 | $166.00 | $166.00 | |||||||
| RevPAR | $107.83 | $123.28 | $131.94 | $131.94 | |||||||
| Total Revenue | $4,927,414 | $7,609,699 | $8,105,924 | $8,105,986 | $53,329 | ||||||
| Total Department Expenses | 1,319,917 | 1,819,447 | 1,789,046 | 1,789,058 | 11,770 | ||||||
| Gross Operating Profit | $3,607,497 | $5,790,252 | $6,316,878 | $6,316,928 | $41,559 | ||||||
| Total Undistributed Expenses | 1,352,366 | 1,971,338 | 2,045,502 | 2,044,398 | 13,450 | ||||||
| Profit Before Fixed Charges | $2,255,131 | $3,818,914 | $4,271,376 | $4,272,530 | $28,109 | ||||||
| Total Fixed Charges | 434,375 | 539,271 | 488,632 | 600,836 | 3,953 | ||||||
| Net Operating Income | $1,820,756 | $3,279,643 | $3,782,744 | $3,671,694 | $24,156 | ||||||
| FF&E | 0 | 0 | 0 | 324,239 | 2,133 | ||||||
| Net Cash Flow | $1,820,756 | $3,279,643 | $3,782,744 | $3,347,455 | $22,023 | ||||||
| NOI DSCR | 0.91x | 1.63x | 1.88x | 1.83x | |||||||
| NCF DSCR | 0.91x | 1.63x | 1.88x | 1.67x | |||||||
| NOI DY | 5.6% | 10.0% | 11.6% | 11.2% | |||||||
| NCF DY | 5.6% | 10.0% | 11.6% | 10.3% | |||||||
| (1) | 2012 revenue and occupancy includes only 266 days of operation. The borrower was unable to obtain a full year of operating statements for 2012 or prior. Annualized 2012 Net Cash Flow is $2,505,251. |
(2) | The increase in ADR, RevPAR and Net Operating Income from 2012 to 2013 was due to the Aloft Houston by the Galleria Property’s continued stabilization since opening in the third quarter of 2009. |
| ALOFT HOUSTON BY THE GALLERIA |
Competitive Set | Aloft Houston | Penetration Factor | ||||||||||||||||
Year | Occupancy | ADR | RevPAR | Occupancy | ADR | RevPAR | Occupancy | ADR | RevPAR | |||||||||
| 9/30/2014 TTM | 75.8% | $157.22 | $119.25 | 79.5% | $166.00 | $131.93 | 104.9% | 105.6% | 110.6% | |||||||||
| 9/30/2013 TTM | 75.5% | $144.06 | $108.77 | 81.5% | $144.81 | $118.05 | 107.9% | 100.5% | 108.5% | |||||||||
| 9/30/2012 TTM | 75.5% | $132.29 | $99.85 | 82.6% | $124.26 | $102.66 | 109.4% | 93.9% | 102.8% | |||||||||
| (1) | Information obtained from a third party hospitality report dated October 17, 2014. The competitive set includes the following hotels: Hampton Inn Houston near the Galleria, Embassy Suites Houston near the Galleria, Sheraton Hotel Suites Galleria, Sonesta ES Suites Houston, Hotel Indigo Houston @ the Galleria, Hilton Garden Inn Houston Galleria Area, and Courtyard Houston by the Galleria. |
| ALOFT HOUSTON BY THE GALLERIA |
| DOREL APARTMENTS |
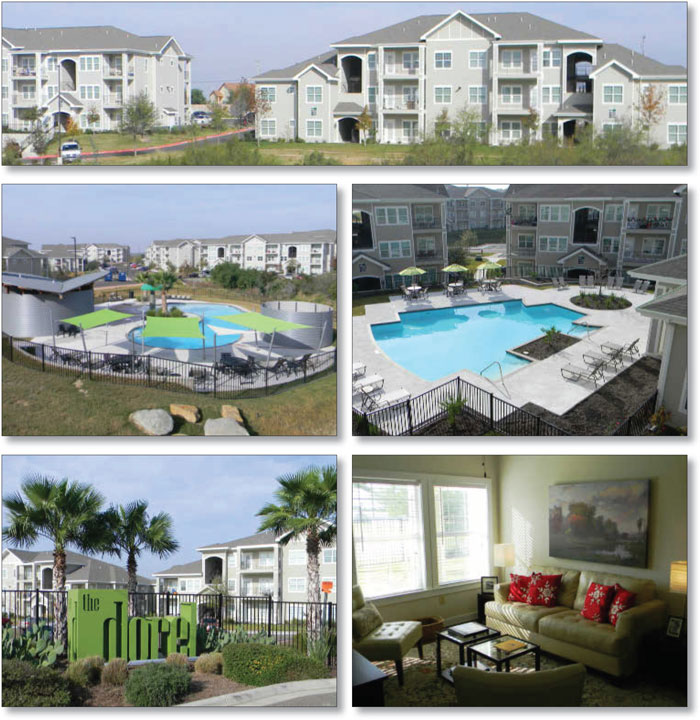
| DOREL APARTMENTS |
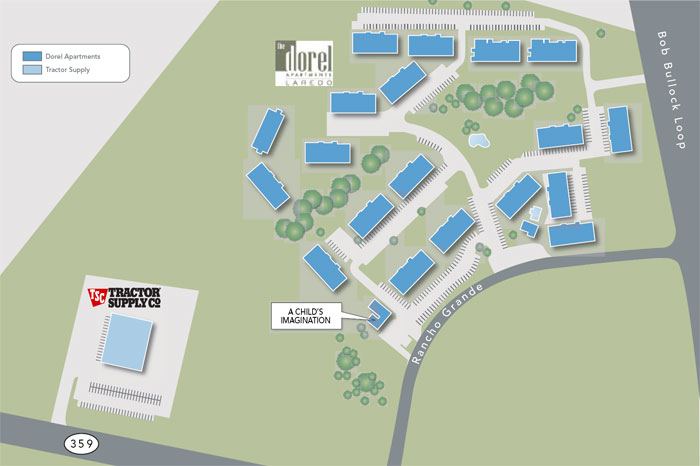
| DOREL APARTMENTS |

| No. 6 – Dorel Apartments | |||||||
| Loan Information | Property Information | ||||||
| Mortgage Loan Seller: | Well Fargo Bank, National Association | Single Asset/Portfolio: | Single Asset | ||||
| Credit Assessment (Fitch/KBRA/Moody’s): | NR/NR/NR | Property Type: | Multifamily | ||||
| Original Principal Balance: | $30,000,000 | Specific Property Type: | Garden | ||||
| Cut-off Date Principal Balance: | $30,000,000 | Location: | Laredo, TX | ||||
| % of Initial Pool Balance: | 3.1% | Size: | 424 Units | ||||
| Loan Purpose: | Refinance | Cut-off Date Principal Balance Per Unit(4): | $70,755 | ||||
| Borrower Name: | Dorel Laredo Holdings II, LLC | Year Built/Renovated: | 2010/2013 | ||||
Sponsors(1): | Various | Title Vesting: | Fee | ||||
| Mortgage Rate: | 3.730% | Property Manager: | Self-managed | ||||
| Note Date: | January 15, 2015 | 3rd Most Recent Occupancy (As of)(5): | 78.5% (12/31/2011) | ||||
| Anticipated Repayment Date: | NAP | 2nd Most Recent Occupancy (As of)(5): | 95.1% (12/31/2012) | ||||
| Maturity Date: | February 11, 2020 | Most Recent Occupancy (As of)(5): | 76.4% (12/31/2013) | ||||
| IO Period: | None | Current Occupancy (As of)(5): | 86.6% (11/18/2014) | ||||
| Loan Term (Original): | 60 months | ||||||
| Seasoning: | 0 months | Underwriting and Financial Information: | |||||
| Amortization Term (Original): | 360 months | ||||||
| Loan Amortization Type: | Amortizing Balloon | 3rd Most Recent NOI (As of)(6): | $1,682,669 (12/31/2012) | ||||
| Interest Accrual Method: | Actual/360 | 2nd Most Recent NOI (As of)(6): | $2,381,511 (12/31/2013) | ||||
| Call Protection: | L(24),D(32),O(4) | Most Recent NOI (As of)(6): | $2,781,075 (T7 Annualized 10/31/2014) | ||||
| Lockbox Type: | Soft/Springing Cash Management | ||||||
Additional Debt(2): | Yes | U/W Revenues: | $4,562,530 | ||||
Additional Debt Type(2): | Future Mezzanine | U/W Expenses: | $1,884,341 | ||||
| U/W NOI: | $2,678,189 | ||||||
| U/W NCF: | $2,567,729 | ||||||
| U/W NOI DSCR: | 1.61x | ||||||
| U/W NCF DSCR: | 1.54x | ||||||
Escrows and Reserves(3): | U/W NOI Debt Yield: | 8.9% | |||||
| U/W NCF Debt Yield: | 8.6% | ||||||
Type: | Initial | Monthly | Cap (If Any) | As-Is Appraised Value: | $48,700,000 | ||
| Taxes | $59,375 | $59,372 | NAP | As-Is Appraisal Valuation Date: | October 29, 2014 | ||
| Insurance | $29,992 | NAP | Cut-off Date LTV Ratio: | 61.6% | |||
| Replacement Reserves | $9,185 | $9,185 | NAP | LTV Ratio at Maturity or ARD: | 55.6% | ||
| (1) | See “Sponsors” section. |
| (2) | See “Subordinate and Mezzanine Indebtedness” section. |
| (3) | See “Escrows” section. |
| (4) | Represents the Cut-off Date Principal Balance for the 424 apartment units only. The Dorel Apartments Property also includes a 19,097 square foot Tractor Supply store with an allocated loan balance of $2,500,000, which results in an allocated Cut-off Date Principal Balance per square foot of $131. The multifamily component has an allocated loan balance of $27,500,000, which results in an allocated Cut-off Date Principal Balance per unit of $64,858. |
| (5) | See “Historical Occupancy” section. The occupancy represents only the multifamily component. The occupancy based on the total square footage at the Dorel Apartments Property was 86.4% as of November 18, 2014. |
| (6) | See “Cash Flow Analysis” section. |
| DOREL APARTMENTS |
| Sources | Uses | |||||||||
| Original loan amount | $30,000,000 | 99.2 | % | Loan payoff(1) | $29,325,884 | 97.0 | % | |||
| Sponsor’s new cash contribution | 228,992 | 0.8 | Reserves | 98,552 | 0.3 | |||||
| Closing costs | 804,556 | 2.7 | ||||||||
| Total Sources | $30,228,992 | 100.0 | % | Total Uses | $30,228,992 | 100.0 | % |
| (1) | The Dorel Apartments Mortgage Loan is refinancing an existing Wells Fargo Bank, National Association balance sheet loan. |
| Property Name | Allocated Cut-off Date Principal Balance | % of Portfolio Cut-off Date Principal Balance | Allocated Appraised Value | Cut-off Date LTV Ratio | Current Occupancy | No. of Units/SF | Loan per Unit/SF | ||||||||||||
Apartments(1) | $27,500,000 | 91.7 | % | $45,300,000 | (1) | 60.7% | (1) | 86.6 | % | 424 | $64,858 | ||||||||
| Tractor Supply | $2,500,000 | 8.3 | % | $3,400,000 | 73.5 | % | 100.0 | % | 19,097 | $131 | |||||||||
| Total/Weighted Average | $30,000,000 | 100.0 | % | $48,700,000 | 61.6 | % | |||||||||||||
| (1) | The 3,200 square foot day care facility is included in the multifamily component. |
| Unit Type | No. of Units | % of Total Units | Average Unit Size (SF) | Average U/W Monthly Rent per Unit |
| 1 Bedroom | 161 | 38.0% | $763 | |
| 2 Bedroom | 240 | 56.6% | 957 | $984 |
| 3 Bedroom | 23 | 5.4% | 1,162 | $1,178 |
| Total/Weighted Average | 100.0% | 852 | $911 |
| (1) | Information obtained from the underwritten rent roll. |
| (2) | The Unit Mix Summary excludes the Tractor Supply and the day care facility. |
12/31/2011(2)(3) | 12/31/2012(2)(4) | 12/31/2013(2)(5) | 11/18/2014(6) | |||
78.5% | 95.1% | 76.4% | 86.6% |
(1) | The Historical Occupancy excludes the Tractor Supply and the day care facility. |
| (2) | Information obtained from the borrower. |
| (3) | Occupancy is calculated based on only the phase I & II units that were complete as of December 31, 2011. Phase II units began coming on-line between July and December 2011. |
| (4) | Occupancy is calculated based on only phase I, II and a portion of phase III units that were complete as of December 31, 2012. Phase III units began coming on-line in October and were completed in December 2013. |
| (5) | Occupancy is calculated based on the phase, I, II and III units with the phase III construction completed in December 2013. |
| (6) | Information obtained from the underwritten rent roll. |
| DOREL APARTMENTS |
2012(1) | 2013(2) | T7 Annualized 10/31/2014(3) | U/W | U/W $ per Unit | ||||||||||||
| Base Rent | $2,201,418 | (4) | $3,454,895 | (4) | (4) | $4,007,340 | $9,451 | |||||||||
| Grossed Up Vacant Space | 0 | 0 | 625,320 | 1,475 | ||||||||||||
| Concessions | (46,085) | ) | ) | (201,872 | ) | (476 | ) | |||||||||
| Other Income | 543,244 | 768,084 | (5) | 1,812 | ||||||||||||
| Less Vacancy & Credit Loss | (97,240 | ) | (259,138 | ) | (687,495 | ) | (636,342 | )(6) | (1,501 | ) | ||||||
| Effective Gross Income | $2,601,337 | $3,829,569 | $4,492,270 | $4,562,530 | $10,761 | |||||||||||
| Total Operating Expenses | $918,668 | $1,448,058 | $1,884,341 | |||||||||||||
| Net Operating Income | $1,682,669 | $2,381,511 | $2,781,075 | $2,678,189 | $6,316 | |||||||||||
| Capital Expenditures | 0 | 0 | 0 | 110,459 | 261 | |||||||||||
| Net Cash Flow | $1,682,669 | $2,567,729 | $6,056 | |||||||||||||
| NOI DSCR | 1.01x | 1.43x | 1.67x | 1.61x | ||||||||||||
| NCF DSCR | 1.01x | 1.43x | 1.67x | 1.54x | ||||||||||||
| NOI DY | 5.6% | 7.9% | 9.3% | 8.9% | ||||||||||||
| NCF DY | 5.6% | 7.9% | 9.3% | 8.6% | ||||||||||||
| (1) | 2012 cash flow primarily represents the 200 units from phases I and II, with 64 units from phase III completed and coming on-line in October, November and December 2012. |
| (2) | 2013 cash flow primarily represents the 200 units from phases I and II and a portion of phase III, which was completed in December 2013. 160 phase III units were completed in 2013 with the final 68 units coming on-line in November and December 2013. |
| (3) | Trailing-twelve month October 31, 2014 Net Operating Income is $2,367,113. The trailing-seven month annualized October 31, 2014 (April through October) historical statement is presented as occupancy reached 87.0% as of April 2014 and this period reflects seven months of operations at greater than 87.0% occupancy. |
| (4) | Historical Base Rent includes the grossed up rent of vacant units, however historical operating statements did not breakout exact figures. |
| (5) | Other Income was underwritten based on the trailing three-months annualized ending October 31, 2014 and also includes $240,000 from the Tractor Supply lease and $51,140 from the A Child’s Imagination, Inc. lease. |
| (6) | The underwritten economic vacancy is 13.7%. The Dorel Apartments Property was 86.6% physically occupied as of November 18, 2014, based on the multifamily component. |
| DOREL APARTMENTS |
| Carmel Apartments | Cienega-Linda Apartments | Lago Del Mar | Shiloh Crossing Apartments | Windsor Place Apartments | ||
| Location | Laredo, TX | Laredo, TX | Laredo, TX | Laredo, TX | Laredo, TX | Laredo, TX |
| Distance to Subject | - | 10.5 miles | 8.6 miles | 8.8 miles | 8.5 miles | 10.9 miles |
| Property Type | Garden | Garden | Garden | Garden | Garden | Garden |
| Number of Units | 424 | 360 | 262 | 266 | 156 | 176 |
| Average Rent (per unit) | $911 | $981 | $1,017 | $935 | $1,010 | $910 |
| 1 Bedroom | $763 | $854 | $919 | $842 | $855 | $751 |
| 2 Bedroom | $984 | $1,005 | $1,017 | $1,060 | $1,063 | $927 |
| 3 Bedroom | $1,178 | $1,154 | $1,167 | $1,239 | $1,210 | $1,097 |
| Utilities | Not Incl. | Not Incl. | Not Incl. | Not Incl. | Not Incl. | Not Incl. |
| Total Occupancy | 87% | 94% | 93% | 96% | 99% | 92% |
| (1) | Information obtained from the appraisal. |
| DOREL APARTMENTS |
| ROSEVILLE SQUARE |
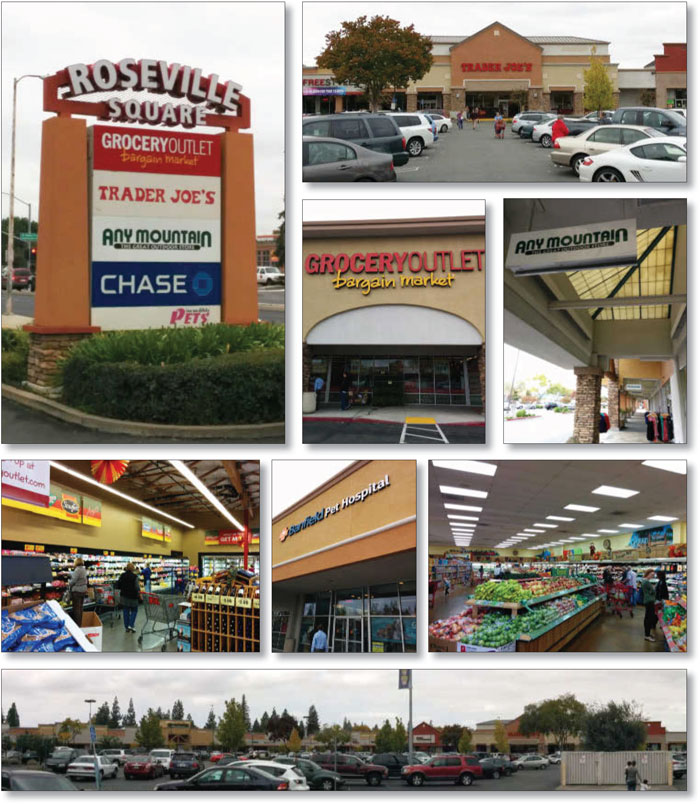
| ROSEVILLE SQUARE |
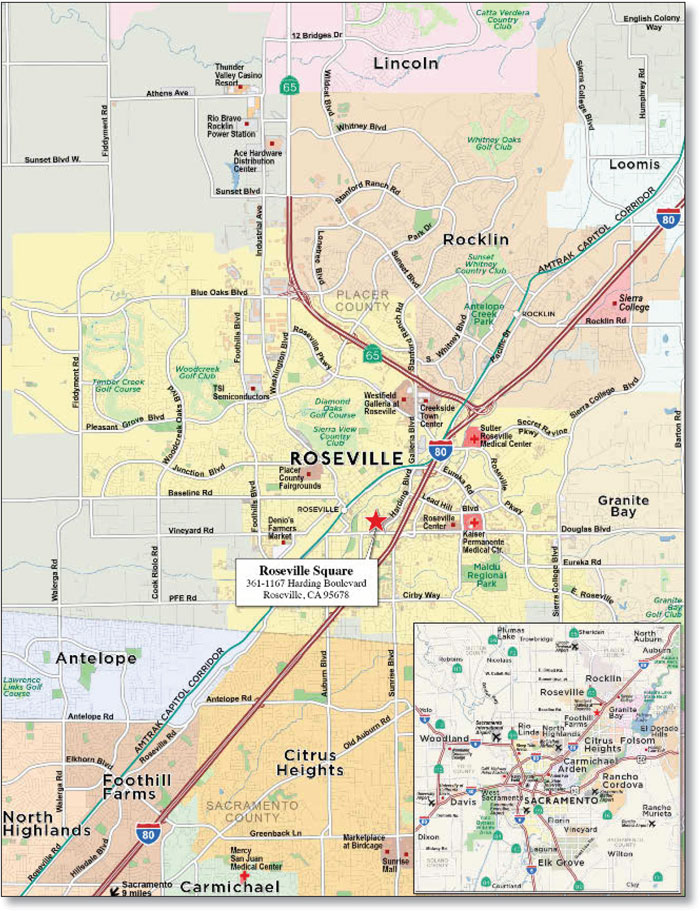
| No. 7 – Roseville Square | |||||||
| Loan Information | Property Information | ||||||
| Mortgage Loan Seller: | Liberty Island Group I LLC | Single Asset/Portfolio: | Single Asset | ||||
Credit Assessment (Fitch/KBRA/Moody’s): | NR/NR/NR | Property Type: | Retail | ||||
| Original Principal Balance: | $28,000,000 | Specific Property Type: | Anchored | ||||
| Cut-off Date Principal Balance: | $28,000,000 | Location: | Roseville, CA | ||||
| % of Initial Pool Balance: | 2.9% | Size: | 218,309 SF | ||||
| Loan Purpose: | Refinance | Cut-off Date Principal Balance Per SF: | $128.26 | ||||
| Borrower Name: | RSS Center, LLC | Year Built/Renovated: | 1962/2014 | ||||
| Sponsor: | Gus Gianulias | Title Vesting: | Fee | ||||
| Mortgage Rate: | 4.130% | Property Manager: | Self-managed | ||||
| Note Date: | January 21, 2015 | 3rd Most Recent Occupancy (As of)(2): | 85.2% (12/31/2011) | ||||
| Anticipated Repayment Date: | NAP | 2nd Most Recent Occupancy (As of)(2): | 71.2% (12/31/2012) | ||||
| Maturity Date: | February 1, 2025 | Most Recent Occupancy (As of): | 72.1% (12/31/2013) | ||||
| IO Period: | 24 months | Current Occupancy (As of): | 74.1% (1/7/2015) | ||||
| Loan Term (Original): | 120 months | ||||||
| Seasoning: | 0 months | Underwriting and Financial Information: | |||||
| Amortization Term (Original): | 360 months | ||||||
| Loan Amortization Type: | Interest-only, Amortizing Balloon | 3rd Most Recent NOI (As of)(3): | $3,063,528 (12/31/2012) | ||||
| Interest Accrual Method: | Actual/360 | 2nd Most Recent NOI (As of)(3): | $2,375,104 (12/31/2013) | ||||
| Call Protection: | L(24),D(92),O(4) | Most Recent NOI (As of): | $2,363,639 (TTM 9/30/2014) | ||||
| Lockbox Type: | Springing (With Established Account) | ||||||
| Additional Debt: | None | ||||||
| Additional Debt Type: | NAP | U/W Revenues: | $3,189,856 | ||||
| U/W Expenses: | $728,698 | ||||||
| U/W NOI: | $2,460,888 | ||||||
| U/W NCF: | $2,295,020 | ||||||
Escrows and Reserve(1): | U/W NOI DSCR: | 1.51x | |||||
| U/W NCF DSCR: | 1.41x | ||||||
Type: | Initial | Monthly | Cap (If Any) | U/W NOI Debt Yield: | 8.8% | ||
| Taxes | $0 | Springing | NAP | U/W NCF Debt Yield: | 8.2% | ||
| Insurance | $0 | Springing | NAP | As-Is Appraised Value: | $42,000,000 | ||
| Replacement Reserves | $4,180 | $4,180 | NAP | As-Is Appraisal Valuation Date: | December 17, 2014 | ||
| TI/LC Reserve | $20,000 | $20,000 | $300,000 | Cut-off Date LTV Ratio: | 66.7% | ||
| Smart & Final Reserve | $2,400,000 | $0 | NAP | LTV Ratio at Maturity or ARD: | 56.4% | ||
| (1) | See “Escrows” section |
| (2) | See “Historical Occupancy” section. |
| (2) | See “Cash Flow Analysis” section |
| Sources | Uses | ||||||||
| Original loan amount | $28,000,000 | 100.0% | Loan payoff | $20,652,637 | 73.8 | % | |||
| Reserves | 2,424,180 | 8.7 | |||||||
| Closing costs | 4,923,183 | 17.6 | |||||||
| Total Sources | $28,000,000 | 100.0% | Total Uses | $28,000,000 | 100.0 | % |
| ROSEVILLE SQUARE |
| Tenant Name | Credit Rating (Fitch/Moody’s/ S&P)(1) | Tenant NRSF | % of NRSF | Annual U/W Base Rent PSF(2) | Annual U/W Base Rent(2) | % of Total Annual U/W Base Rent | Sales PSF(3) | Occupancy Costs(3) | Lease Expiration Date | |||
| Major Tenants | ||||||||||||
| Trader Joe’s | NR/NR/NR | 14,000 | 6.4% | $33.00 | $462,000 | 16.7% | NAV | NAV | 10/31/2017(4) | |||
Sprouts(5) | NR/NR/BB- | 30,133 | 13.8% | $12.00 | $361,596 | 13.1% | NAV | NAV | 5/31/2021(5) | |||
| Rite Aid | BB/B2/B | 20,714 | 9.5% | $16.50 | $341,781 | 12.4% | NAV | NAV | 5/31/2027(6) | |||
| Any Mountain Sports | NR/NR/NR | 13,020 | 6.0% | $11.00 | $143,220 | 5.2% | $97(7) | 11.3%(7) | 4/30/2022(8) | |||
| JPMorgan Chase | A+/A3/A | 6,098 | 2.8% | $22.97 | $140,071 | 5.1% | NAV | NAV | 11/16/2020(9) | |||
| Total Major Tenants | 83,965 | 38.5% | $17.25 | $1,448,668 | 52.4% | |||||||
| Non-Major Tenants | 77,701 | 35.6% | $16.92 | $1,314,430 | 47.6% | |||||||
| Occupied Collateral Total | 161,666 | 74.1% | $17.09 | $2,763,098 | 100.0% | |||||||
| Vacant Space | 56,643 | 25.9% | ||||||||||
| Collateral Total | 218,309(10) | 100.0% | ||||||||||
| (1) | Certain ratings are those of the parent company whether or not the parent company guarantees the lease. |
| (2) | Annual U/W Base Rent PSF and Annual U/W Base Rent include contractual rent steps through May 2015. |
| (3) | Certain tenants are not required to report sales figures under their respective leases. |
| (4) | Trader Joe’s has two, 10-year lease renewal options. |
| (5) | Sprouts subleases its space to Grocery Outlet. The Annual U/W Base Rent PSF, Annual U/W Base Rent and Lease Expiration Date are based on the Sprouts lease terms. Grocery Outlet’s sublease is coterminous with the Sprouts’ lease and requires annual rent payments of $240,000. Sprouts has four, 5-year renewal options. Grocery Outlet, which is currently subleasing the Sprouts space, does not have the right to exercise any renewal options. |
| (6) | Rite Aid has two, 10-year renewal options. |
| (7) | Sales PSF and Occupancy Costs for Any Mountain Sports are based on 2013 sales. |
| (8) | Any Mountain Sports has two, 5-year lease renewal options. Any Mountain Sports may terminate its lease by written notice no later than June 30, 2016 if the trailing-twelve month April 30, 2016 gross sales are equal to or less than $2,200,000. |
| (9) | JPMorgan Chase has three, 5-year renewal options. |
(10) | Collateral Total square footage includes 7,500 square feet attributed to AutoZone which ground leases their space. No square footage was attributed to the 76 Gas Station. |
| ROSEVILLE SQUARE |
Year Ending December 31, | No. of Leases Expiring | Expiring NRSF | % of Total NRSF | Cumulative Expiring NRSF | Cumulative % of Total NRSF | Annual U/W Base Rent | Annual U/W Base Rent PSF(3) | |||||||
| MTM | 1 | 13,874 | 6.4% | 13,874 | 6.4% | $60,000 | $4.32 | |||||||
| 2015 | 2 | 6,314 | 2.9% | 20,188 | 9.2% | $123,089 | $19.49 | |||||||
| 2016 | 8 | 20,555 | 9.4% | 40,743 | 18.7% | $495,165 | $24.09 | |||||||
| 2017 | 3 | 16,785 | 7.7% | 57,528 | 26.4% | $512,928 | $30.56 | |||||||
| 2018 | 1 | 900 | 0.4% | 58,428 | 26.8% | $33,626 | $37.36 | |||||||
| 2019 | 2 | 8,804 | 4.0% | 67,232 | 30.8% | $175,486 | $19.93 | |||||||
| 2020 | 2 | 7,185 | 3.3% | 74,417 | 34.1% | $168,116 | $23.40 | |||||||
| 2021 | 3 | 40,133 | 18.4% | 114,550 | 52.5% | $519,503 | $12.94 | |||||||
| 2022 | 1 | 13,020 | 6.0% | 127,570 | 58.4% | $143,220 | $11.00 | |||||||
| 2023 | 1 | 1,087 | 0.5% | 128,657 | 58.9% | $31,136 | $28.64 | |||||||
| 2024 | 0 | 0 | 0.0% | 128,657 | 58.9% | $0 | $0.00 | |||||||
| 2025 | 1 | 4,795 | 2.2% | 133,452 | 61.1% | $69,048 | $14.40 | |||||||
| Thereafter | 2 | 28,214 | 12.9% | 161,666 | 74.1% | $431,781 | $15.30 | |||||||
| Vacant | 0 | 56,643 | 25.9% | 218,309 | 100.0% | $0 | $0.00 | |||||||
| Total/Weighted Average | 27 | 218,309 | 100.0% | $2,763,098 | $17.09 | |||||||||
| (1) | Information obtained from the underwritten rent roll. |
(2) | Certain tenants may have lease termination options that are exercisable prior to the originally stated expiration date of the subject lease and that are not considered in the Lease Expiration Schedule. |
| (3) | The Annual U/W Base Rent PSF and Total/Weighted Average Annual U/W Base Rent PSF excludes vacant space. |
12/31/2011(1)(2) | 12/31/2012(1)(2) | 12/31/2013(1) | 1/7/2015(3) | |||
| 85.2% | 71.2% | 72.1% | 74.1% |
| (1) | Information obtained from the borrower. |
| (2) | The decrease in occupancy from 2011 to 2012 is primarily due to two larger tenants vacating the Roseville Square Property. The borrower is currently in negotiations to replace 28,000 square feet of the vacant space, however, it was underwritten as vacant. A $2,400,000 reserve (the “Smart & Final Reserve”) was put in place by the lender in connection with this space. |
| (3) | Information obtained from the underwritten rent roll. |
| ROSEVILLE SQUARE |
2012(1) | 2013(1) | TTM 9/30/2014 | U/W | U/W $ per SF | |||||||
| Base Rent | $3,270,922 | $2,626,426 | $2,655,869 | $2,763,098(2) | $12.66 | ||||||
| Grossed Up Vacant Space | 0 | 0 | 0 | 942,029 | 4.32 | ||||||
| Total Reimbursables | 477,545 | 457,925 | 461,335 | 682,641 | 3.13 | ||||||
| Other Income | 10,080 | 14,753 | 157 | 0 | 0.00 | ||||||
| Less Vacancy & Credit Loss | 0 | 0 | 0 | (1,197,911)(3) | (5.49) | ||||||
| Effective Gross Income | $3,758,547 | $3,099,104 | $3,117,362 | $3,189,856 | $14.61 | ||||||
| Total Operating Expenses | $695,018 | $724,000 | $753,722 | $728,968 | $3.34 | ||||||
| Net Operating Income | $3,063,528 | $2,375,104 | $2,363,639 | $2,460,888 | $11.27 | ||||||
| TI/LC | 0 | 0 | 0 | 115,657 | 0.53 | ||||||
| Reserves for Replacements | 0 | 0 | 0 | 50,211 | 0.23 | ||||||
| Net Cash Flow | $3,063,528 | $2,375,104 | $2,363,639 | $2,295,020 | $10.51 | ||||||
| NOI DSCR | 1.88x | 1.46x | 1.45x | 1.51x | |||||||
| NCF DSCR | 1.88x | 1.46x | 1.45x | 1.41x | |||||||
| NOI DY | 10.9% | 8.5% | 8.4% | 8.8% | |||||||
| NCF DY | 10.9% | 8.5% | 8.4% | 8.2% |
| (1) | The decrease in Net Operating Income from 2012 to 2013 is primarily due to two larger tenants vacating the Roseville Square Property. The borrower is currently in negotiations to replace 28,000 square feet of the vacated space. A $2,400,000 reserve (the “Smart & Final Reserve”) was put in place by the lender and will be released to the borrower upon satisfaction of certain conditions set forth in the loan agreement (see “Escrows” section). |
| (2) | U/W Base Rent includes approximately $10,829 in contractual rent increases. |
| (3) | The underwritten economic vacancy is 27.3%. The Roseville Square Property was 74.1% physically occupied as of January 7, 2015. |
| ROSEVILLE SQUARE |
| Roseville Square (Subject) | Rivergate Shopping Center | Riverside Plaza II | Sierra Oaks Plaza | Laguna 99 Shopping Center | Taylor Shopping Center | |
| Market | Roseville, CA | Rancho Cordova, CA | Sacramento, CA | Granite Bay, CA | Elk Grove, CA | Sacramento, CA |
| Distance from Subject | -- | 10.1 miles | 25.4 miles | 3.1 miles | 26.6 miles | 12.5 miles |
| Property Type | Shopping Center | Shopping Center | Shopping Center | Shopping Center | Shopping Center | Shopping Center |
| Year Built/Renovated | 1962/2014 | 1976/2013 | 1979/NAP | 1987/NAP | 1991/NAP | 1980/2004 |
| Anchors | Trader Joe’s, Sprouts, Rite Aid | Smart & Final Extra | Grocery Outlet | Wal-Mart | Wal-Mart | Wal-Mart |
| Total GLA | 218,309 SF | 141,689 SF | 39,430 SF | 45,411 SF | 205,800 SF | 90,077 SF |
| Total Occupancy | 74.1% | 74.0% | 100.0% | 100.0% | 100.0% | 87.0% |
| ROSEVILLE SQUARE |
| 44 PLAZA |
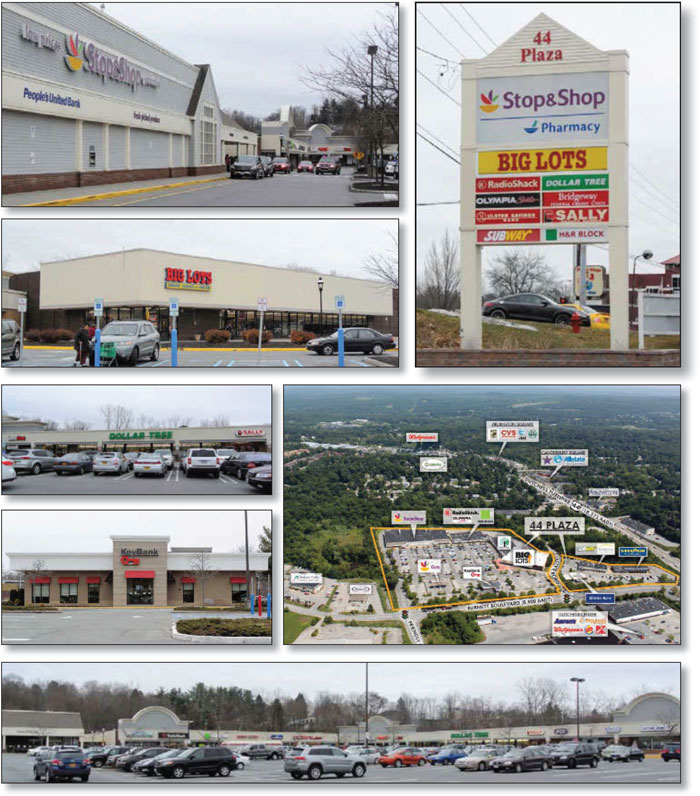
| 44 PLAZA |
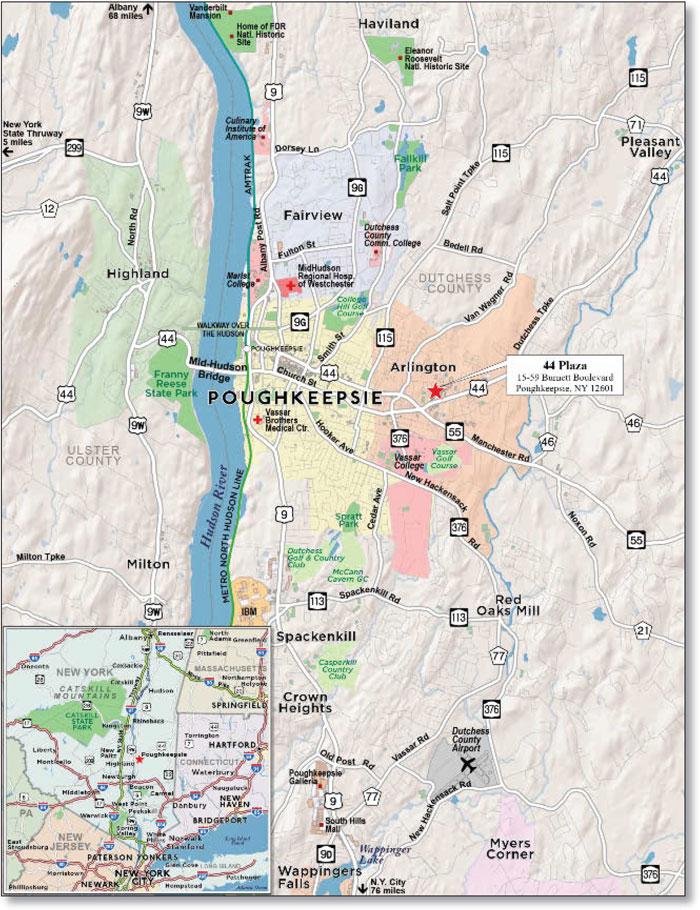
| No. 8 – 44 Plaza | |||||||
| Loan Information | Property Information | ||||||
| Mortgage Loan Seller: | Liberty Island Group I LLC | Single Asset/Portfolio: | Single Asset | ||||
Credit Assessment (Fitch/KBRA/Moody’s): | NR/NR/NR | Property Type: | Retail | ||||
| Original Principal Balance: | $26,430,000 | Specific Property Type: | Anchored | ||||
| Cut-off Date Principal Balance: | $26,430,000 | Location: | Poughkeepsie, NY | ||||
| % of Initial Pool Balance: | 2.7% | Size: | 167,686 SF | ||||
| Loan Purpose: | Acquisition | Cut-off Date Principal Balance Per SF(1): | $157.62 | ||||
| Borrower Name: | Capstone Plaza 44 LLC | Year Built/Renovated: | 1972/2001 | ||||
| Sponsors: | Mitchell D. Adelstein, Brad Gillman, Robert Freidberg | Title Vesting: | Fee | ||||
| Mortgage Rate: | 4.310% | Property Manager: | Self-managed | ||||
| Note Date: | December 31, 2014 | 3rd Most Recent Occupancy (As of): | 94.1% (12/31/2011) | ||||
| Anticipated Repayment Date: | NAP | 2nd Most Recent Occupancy (As of): | 96.6% (12/31/2012) | ||||
| Maturity Date: | January 1, 2025 | Most Recent Occupancy (As of): | 96.1% (12/31/2013) | ||||
| IO Period: | 60 months | Current Occupancy (As of): | 96.1% (11/6/2014) | ||||
| Loan Term (Original): | 120 months | ||||||
| Seasoning: | 1 month | Underwriting and Financial Information: | |||||
| Amortization Term (Original): | 360 months | ||||||
| Loan Amortization Type: | Interest-only, Amortizing Balloon | 3rd Most Recent NOI (As of): | $2,135,628 (12/31/2012) | ||||
| Interest Accrual Method: | Actual/360 | 2nd Most Recent NOI (As of): | $2,280,033 (12/31/2013) | ||||
| Call Protection: | L(25),D(91),O(4) | Most Recent NOI (As of): | $2,350,650 (TTM 10/31/2014) | ||||
| Lockbox Type: | Hard/Springing Cash Management | ||||||
Additional Debt(1): | Yes | ||||||
Additional Debt Type(1): | Mezzanine | U/W Revenues: | $3,866,636 | ||||
| U/W Expenses: | $1,525,053 | ||||||
| U/W NOI: | $2,341,582 | ||||||
| U/W NCF: | $2,139,964 | ||||||
Escrows and Reserve(2): | U/W NOI DSCR(1): | 1.49x | |||||
U/W NCF DSCR(1): | 1.36x | ||||||
Type: | Initial | Monthly | Cap (If Any) | U/W NOI Debt Yield(1): | 8.9% | ||
| Taxes | $155,518 | $51,839 | NAP | U/W NCF Debt Yield(1): | 8.1% | ||
| Insurance | $18,901 | $9,451 | NAP | As-Is Appraised Value: | $37,000,000 | ||
| Replacement Reserves | $2,790 | $2,790 | $100,200 | As-Is Appraisal Valuation Date: | December 1, 2014 | ||
| TI/LC Reserve | $14,000 | $14,000 | $840,000 | Cut-off Date LTV Ratio(1): | 71.4% | ||
| Deferred Maintenance | $22,619 | $0 | NAP | LTV Ratio at Maturity or ARD(1): | 65.2% | ||
| (1) | See “Subordinate and Mezzanine Indebtedness” section. The equity interest in the 44 Plaza Mortgage Loan borrower has been pledged to secure mezzanine indebtedness with a principal balance of $3,600,000 that accrues interest at an interest rate of 10.500% per annum and results in a combined Principal Balance Per SF of $179.08. All LTV, DSCR, Debt Yield and Cut-off date Principal Balance Per SF numbers shown in the chart above are based solely on the 44 Plaza Mortgage Loan. As of the Cut-off Date, the combined LTV Ratio is 81.2%, the combined U/W NCF DSCR is 1.09x, and the combined U/W NCF Debt Yield is 7.1%. |
| (2) | See “Escrows” section. |
| 44 PLAZA |
| Sources | Uses | |||||||
| Original loan amount | $26,430,000 | 75.5% | Purchase price | $34,250,000 | 97.9% | |||
| Sponsor new cash contribution | 4,970,830 | 14.2 | Reserves | 213,828 | 0.6 | |||
| Mezzanine loan amount | 3,600,000 | 10.3 | Closing costs | 537,002 | 1.5 | |||
| Total Sources | $35,000,830 | 100.0% | Total Uses | $35,000,830 | 100.0% |
| Tenant Name | Credit Rating (Fitch/Moody’s/ S&P)(1) | Tenant NRSF | % of NRSF | Annual U/W Base Rent PSF(2) | Annual U/W Base Rent(2) | % of Total Annual U/W Base Rent | Sales PSF | Occupancy Cost | Lease Expiration Date | ||||||
| Major Tenants | |||||||||||||||
| Stop & Shop Supermarket | NR/NR/NR | 69,449 | 41.4% | $21.47 | $1,491,070 | 58.0% | $619(3) | 4.6%(3) | 12/31/2020 | ||||||
| Key Bank | A-/Baa1/BBB+ | 2,838 | 1.7% | $56.38 | $160,000 | 6.2% | NAV | NAV | 7/31/2028 | ||||||
| Big Lots | NR/NR/BBB- | 32,640 | 19.5% | $4.63 | $151,123 | 5.9% | $121(4) | 7.7%(4) | 1/31/2017 | ||||||
| Dollar Tree | NR/NR/NR | 11,100 | 6.6% | $10.50 | $116,550 | 4.5% | NAV | NAV | 9/30/2021 | ||||||
| Goodyear Tire | B/B1/BB- | 8,300 | 4.9% | $13.25 | $110,000 | 4.3% | $200(4) | 8.2%(4) | 1/31/2018 | ||||||
| Total Major Tenants | 124,327 | 74.1% | $16.32 | $2,028,743 | 78.9% | ||||||||||
| Non-Major Tenants | 36,858 | 22.0% | $14.69 | 541,589 | 21.1% | ||||||||||
| Occupied Collateral Total | 161,185 | 96.1% | $15.95 | $2,570,332 | 100.0% | ||||||||||
| Vacant Space | 6,501 | 3.9% | |||||||||||||
| Collateral Total | 167,686 | 100.0% | |||||||||||||
| (1) | Certain ratings are those of the parent company whether or not the parent company guarantees the lease. |
| (2) | Annual U/W Base Rent PSF and Annual U/W Base Rent include contractual rent steps through April 2015. |
| (3) | Sales PSF and Occupancy Costs for Stop & Shop Supermarket are based on the Annual U/W Base Rent and the trailing-twelve month December 31, 2013 sales and reimbursements. |
| (4) | Sales PSF and Occupancy Costs for Big Lots and Goodyear Tire are based on the Annual U/W Base Rent and the trailing-twelve month January 31, 2014 sales and reimbursements. |
| 44 PLAZA |
Year Ending December 31, | No. of Leases Expiring | Expiring NRSF | % of Total NRSF | Cumulative Expiring NRSF | Cumulative % of Total NRSF | Annual U/W Base Rent | Annual U/W Base Rent PSF(3) | ||||||||
| MTM | 0 | 0 | 0.0% | 0 | 0.0% | $0 | $0.00 | ||||||||
| 2015 | 2 | 3,453 | 2.1% | 3,453 | 2.1% | $51,778 | $15.00 | ||||||||
| 2016 | 2 | 2,916 | 1.7% | 6,369 | 3.8% | $57,696 | $19.79 | ||||||||
| 2017 | 5 | 42,399 | 25.3% | 48,768 | 29.1% | $314,297 | $7.41 | ||||||||
| 2018 | 4 | 16,880 | 10.1% | 65,648 | 39.1% | $212,502 | $12.59 | ||||||||
| 2019 | 2 | 3,705 | 2.2% | 69,353 | 41.4% | $56,635 | $15.29 | ||||||||
| 2020 | 2 | 71,384 | 42.6% | 140,737 | 83.9% | $1,511,070 | $21.17 | ||||||||
| 2021 | 1 | 11,100 | 6.6% | 151,837 | 90.5% | $116,550 | $10.50 | ||||||||
| 2022 | 1 | 2,880 | 1.7% | 154,717 | 92.3% | $43,574 | $15.13 | ||||||||
| 2023 | 0 | 0 | 0.0% | 154,717 | 92.3% | $0 | $0.00 | ||||||||
| 2024 | 1 | 630 | 0.4% | 155,347 | 92.6% | $14,490 | $23.00 | ||||||||
| 2025 | 0 | 0 | 0.0% | 155,347 | 92.6% | $0 | $0.00 | ||||||||
| Thereafter | 2 | 5,838 | 3.5% | 161,185 | 96.1% | $191,740 | $32.84 | ||||||||
| Vacant | 0 | 6,501 | 3.9% | 167,686 | 100.0% | $0 | $0.00 | ||||||||
| Total/Weighted Average | 22 | 167,686 | 100.0% | $2,570,332 | $15.95 |
| (1) | Information obtained from the underwritten rent roll. |
| (2) | Certain tenants may have lease termination options that are exercisable prior to the originally stated expiration date of the subject lease and that are not considered in the Lease Expiration Schedule. |
| (3) | The Annual U/W Base Rent PSF and Total/Weighted Average Annual U/W Base Rent PSF excludes vacant space. |
12/31/2011(1) | 12/31/2012(1) | 12/31/2013(1) | 11/6/2014 (2) | |||
| 94.1% | 96.6% | 96.1% | 96.1% |
| (1) | Information obtained from the borrower. |
| (2) | Information obtained from the underwritten rent roll. |
| 2012 | 2013 | TTM 10/31/2014 | U/W | U/W $ per SF | |||||||
| Base Rent | $2,378,409 | $2,462,946 | $2,556,559 | $2,570,332(1) | $15.33 | ||||||
| Grossed Up Vacant Space | 0 | 0 | 0 | 136,521 | 0.81 | ||||||
| Total Reimbursables | 687,717 | 750,237 | 851,810 | 1,363,290 | 8.13 | ||||||
| Other Income | 0 | 11,000 | 0 | 0 | 0.00 | ||||||
| Less Vacancy & Credit Loss | (1,661) | (3,834) | (1,464) | (203,507)(2) | (1.21) | ||||||
| Effective Gross Income | $3,064,465 | $3,220,349 | $3,406,905 | $3,866,636 | $23.06 | ||||||
| Total Operating Expenses | $928,837 | $940,316 | $1,056,255 | $1,525,053 | $9.09 | ||||||
| Net Operating Income | $2,135,628 | $2,280,033 | $2,350,650 | $2,341,582 | $13.96 | ||||||
| TI/LC | 0 | 0 | 0 | 168,081 | 1.00 | ||||||
| Reserves for Replacements | 0 | 0 | 0 | 33,537 | 0.20 | ||||||
| Net Cash Flow | $2,135,628 | $2,280,033 | $2,350,650 | $2,139,964 | $12.76 | ||||||
| NOI DSCR | 1.36x | 1.45x | 1.50x | 1.49x | |||||||
| NCF DSCR | 1.36x | 1.45x | 1.50x | 1.36x | |||||||
| NOI DY | 8.1% | 8.6% | 8.9% | 8.9% | |||||||
| NCF DY | 8.1% | 8.6% | 8.9% | 8.1% |
| (1) | U/W Base Rent includes approximately $7,437 in contractual rent increases. |
| (2) | The underwritten economic vacancy is 5.0%. The 44 Plaza Property was 96.1% physically occupied as of November 6, 2014. |
| 44 PLAZA |
| 44 Plaza (Subject) | Cosentino Commerce Center | Vista Technology Campus | Somers Commons | Hackensack Shopping Center | Wallington Plaza | |
| Market | Poughkeepsie, NY | Commack, NY | Slingerlands, NY | Baldwin Place, NY | Hackensack, NJ | Wallington, NJ |
| Distance from Subject | -- | 69.0 miles | 65.2 miles | 25.5 miles | 55.0 miles | 74.8 miles |
| Property Type | Shopping Center | Shopping Center | Shopping Center | Shopping Center | Shopping Center | Shopping Center |
| Year Built/Renovated | 1972/2001 | 1999/NAP | 2012/NAP | 2002/NAP | 1963/NAP | 1979/NAP |
| Anchors | Stop & Shop, Big Lots, Dollar Tree | Shop Rite | Shop Rite | Stop & Shop | Pathmark | Shop Rite |
| Total GLA | 167,686 SF | 90,000 SF | 65,000 SF | 135,000 SF | 173,887 SF | 84,000 SF |
| Total Occupancy | 96% | 80% | 100% | 77% | 96% | 84% |
| (1) | Information obtained from the appraisal and underwritten rent roll. |
| 44 PLAZA |
ONE AND TWO SUMMIT SQUARE PORTFOLIO |
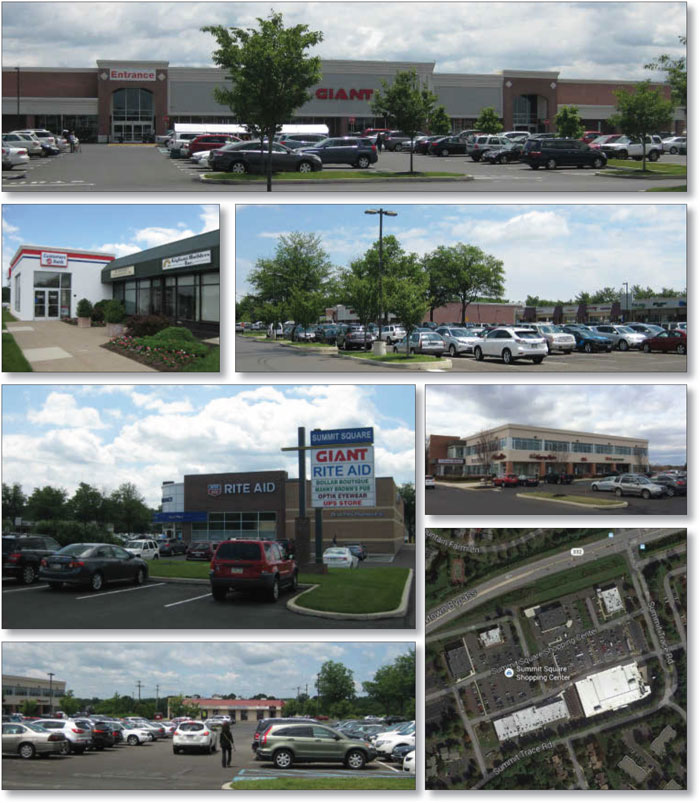
ONE AND TWO SUMMIT SQUARE PORTFOLIO |
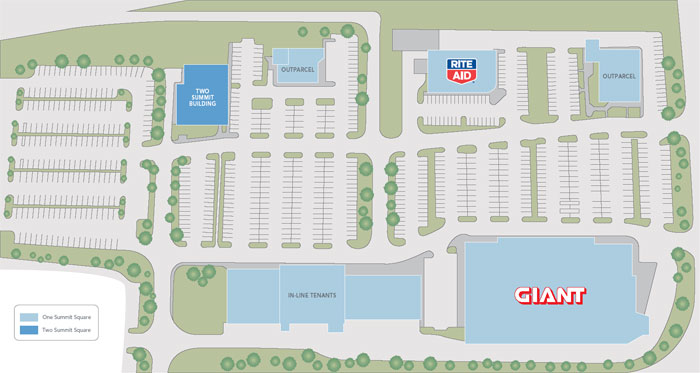
ONE AND TWO SUMMIT SQUARE PORTFOLIO |

| No. 9 - One and Two Summit Square Portfolio | ||||||
| Loan Information | Property Information | |||||
| Mortgage Loan Seller: | Walker & Dunlop Commercial Property Funding, LLC | Single Asset/Portfolio: | Portfolio | |||
Credit Assessment (Fitch/KBRA/Moody’s): | NR/NR/NR | Property Type: | Various-See Table | |||
| Original Principal Balance: | $26,000,000 | Specific Property Type: | Various–See Table | |||
| Cut-off Date Principal Balance: | $26,000,000 | Location: | Langhorne, PA | |||
| % of Initial Pool Balance: | 2.7% | Size: | 139,615 SF | |||
| Loan Purpose: | Refinance | Cut-off Date Principal Balance Per SF: | $186.23 | |||
| Borrower Names: | Summit Square Associates; Two Summit Associates, L.P. | Year Built/Renovated: | Various-See Table | |||
| Sponsors: | Carol Anne Gigliotti; Ronald Gigliotti | Title Vesting: | Fee | |||
| Mortgage Rate: | 4.990% | Property Manager: | Self-managed | |||
| Note Date: | January 12, 2015 | 3rd Most Recent Occupancy (As of): | 90.5% (12/31/2011) | |||
| Anticipated Repayment Date: | NAP | 2nd Most Recent Occupancy (As of): | 93.2% (12/31/2012) | |||
| Maturity Date: | February 1, 2025 | Most Recent Occupancy (As of): | 93.2% (12/31/2013) | |||
| IO Period: | 24 months | Current Occupancy (As of)(2): | 95.2% (12/1/2014) | |||
| Loan Term (Original): | 120 months | |||||
| Seasoning: | 0 months | Underwriting and Financial Information: | ||||
| Amortization Term (Original): | 360 months | |||||
| Loan Amortization Type: | Interest-only, Amortizing Balloon | 3rd Most Recent NOI (As of): | $2,433,169 (12/31/2012) | |||
| Interest Accrual Method: | Actual/360 | 2nd Most Recent NOI (As of): | $2,661,023 (12/31/2013) | |||
| Call Protection: | L(24),D(92),O(4) | Most Recent NOI (As of): | $2,841,801 (TTM 9/30/2014) | |||
| Lockbox Type: | Hard/Upfront Cash Management | |||||
| Additional Debt: | NAP | |||||
| Additional Debt Type: | NAP | |||||
| U/W Revenues: | $3,600,270 | |||||
Escrows and Reserves(1): | U/W Expenses: | $1,043,070 | ||||
Type: | Initial | Monthly | Cap (If Any) | U/W NOI: | $2,557,200 | |
| Taxes | $196,302 | $39,260 | NAP | U/W NCF: | $2,364,400 | |
| Insurance | $24,367 | $4,059 | NAP | U/W NOI DSCR: | 1.53x | |
| Replacement Reserves | $0 | $2,109 | NAP | U/W NCF DSCR: | 1.41x | |
| TI/LC Reserve | $125,317 | $14,050 | NAP | U/W NOI Debt Yield: | 9.8% | |
| Free Rent Reserve | $71,383 | $0 | NAP | U/W NCF Debt Yield: | 9.1% | |
| Additional Collateral | $860,000 | $0 | NAP | As-Is Appraised Value: | $41,500,000 | |
| Environmental Reserve | $2,500 | $0 | NAP | As-Is Appraisal Valuation Date: | November 7, 2014 | |
| Deferred Maintenance | $27,500 | $0 | NAP | Cut-off Date LTV Ratio | 62.7% | |
| Sponsor Litigation Reserve | $125,000 | $0 | NAP | LTV Ratio at Maturity or ARD: | 54.2% | |
| (1) | See “Escrows” section. |
| (2) | Current Occupancy includes the 4,000 square foot Massage Envy tenant. Excluding the Massage Envy tenant, the combined physical occupancy is 92.3%. See chart in “The Properties” section. |
ONE AND TWO SUMMIT SQUARE PORTFOLIO |
| Sources | Uses | ||||||||
| Original loan amount | $26,000,000 | 100.0% | Loan payoff(1) | $23,097,062 | 88.8 | % | |||
| Reserves | 1,432,369 | 5.5 | |||||||
| Closing costs | 710,797 | 2.7 | |||||||
| Return of equity | 759,772 | 2.9 | |||||||
| Total Sources | $26,000,000 | 100.0% | Total Uses | $26,000,000 | 100.0 | % |
| Property Name | Property Type | Specific Property Type | Allocated Cut-off Date Principal Balance | % of Portfolio Cut- off Date Principal Balance | Current Occupancy | Year Built/ Renovated | Net Rentable Area (SF) | ||||||
| One Summit Square | Retail | Anchored | $22,200,000 | 85.4% | 94.3%(1) | 1980/2010 | 118,666 | ||||||
| Two Summit Square | Mixed Use | Retail/Office | $3,800,000 | 14.6% | 100.0% | 2008/NAP | 20,949 | ||||||
| Total/Weighted Average | $26,000,000 | 100.0% | 95.2% | 139,615 | |||||||||
| (1) | Occupancy for the One Summit Square property includes Massage Envy (4,000 square feet; 2.9% NRA). The anticipated lease commencement is April 1, 2015, which is the anticipated date that the landlord will deliver the premises to the tenant. Massage Envy is expected to open during the third quarter of 2015. |
ONE AND TWO SUMMIT SQUARE PORTFOLIO |
| Tenant Name | Credit Rating (Fitch/ Moody’s/S&P)(1) | Tenant NRSF | % of NRSF | Annual U/W Base Rent PSF(2) | Annual U/W Base Rent(2) | % of Total Annual U/W Base Rent | Sales PSF(3) | Occupancy Costs(3) | Lease Expiration Date |
| Anchor Tenant | |||||||||
| Giant Food Stores | BBB/Baa3/BBB | 58,677 | 42.0% | $18.25 | $1,070,855 | 36.2% | NAV | NAV | 9/30/2019(4) |
| Total Anchor Tenants | 58,677 | 42.0% | $18.25 | $1,070,855 | 36.2% | ||||
| Major Tenants | |||||||||
| Customers Bank | NR/NR/NR | 12,175 | 8.7% | $22.05 | $268,477 | 9.1% | NAV | NAV | Various(5) |
| Rite Aid Store 11109 | B/Caa1/B+ | 11,186 | 8.0% | $21.46 | $240,000 | 8.1% | NAV | NAV | 10/30/2029(6) |
| Mt Fuji Japanese Steakhouse | NR/NR/NR | 5,177 | 3.7% | $24.86 | $128,700 | 4.4% | NAV | NAV | 7/31/2019 |
| CMP Junior Deli | NR/NR/NR | 4,000 | 2.9% | $29.85 | $119,400 | 4.0% | NAV | NAV | 4/30/2017 |
Massage Envy(7) | NR/NR/NR | 4,000 | 2.9% | $25.00 | $100,000 | 3.4% | NAV | NAV | 3/31/2025 |
| Einstein/ Noah Bagel Corp. | NR/NR/B+ | 3,083 | 2.2% | $28.41 | $87,595 | 3.0% | NAV | NAV | 11/30/2016 |
| Total Major Tenants | 39,621 | 28.4% | $23.83 | $944,172 | 31.9% | ||||
| Non-Major Tenants | 34,557 | 24.8% | $27.25 | $941,724 | 31.8% | ||||
| Occupied Collateral Total | 132,855 | 95.2% | $22.26 | $2,956,751 | 100.0% | ||||
| Vacant Space | 6,760 | 4.8% | |||||||
| Collateral Total | 139,615 | 100.0% | |||||||
| (1) | Certain ratings are those of the parent company whether or not the parent guarantees the lease. |
| (2) | Annual U/W Base Rent PSF and Annual U/W Base Rent include contractual rent steps through June 2015. |
| (3) | Tenants are not required to report sales figures under their respective leases. |
| (4) | Giant Food Stores has eight, 5-year lease extension options remaining. |
| (5) | Customers Bank is a tenant at both the One Summit Square property and the Two Summit Square property under two separate leases. Its lease at the One Summit Square property encompasses 2,400 square feet, accounts for 1.7% of the net rentable area, 2.8% of the annual underwritten base rent and expires April 30, 2017. Its lease at the Two Summit Square property encompasses 9,775 square feet, accounts for 7.0% of the net rentable area, 6.3% of the annual underwritten base rent and expires May 31, 2017. |
| (6) | Rite Aid can terminate its lease at any time with 180 days’ notice. Such termination would trigger a cash flow sweep under the loan documents. |
| (7) | The Massage Envy lease expiration date is estimated based on a lease commencement of April 1, 2015, the anticipated date that the landlord will deliver the premises to the tenant. Massage Envy is expected to open during the third quarter of 2015. An escrow of $58,333 for gap rent related to the Massage Envy space was collected at closing, equivalent to seven months of base rent. |
Year Ending December 31, | No. of Leases Expiring | Expiring NRSF | % of Total NRSF | Cumulative Expiring NRSF | Cumulative % of Total NRSF | Annual U/W Base Rent | Annual U/W Base Rent PSF(3) | |
| MTM | 0 | 0 | 0.0% | 0 | 0.0% | $0 | $0.00 | |
| 2015 | 2 | 2,770 | 2.0% | 2,770 | 2.0% | $75,836 | $27.38 | |
| 2016 | 4 | 6,983 | 5.0% | 9,753 | 7.0% | $192,835 | $27.61 | |
| 2017 | 5 | 19,365 | 13.9% | 29,118 | 20.9% | $481,899 | $24.89 | |
| 2018 | 4 | 8,590 | 6.2% | 37,708 | 27.0% | $221,537 | $25.79 | |
| 2019 | 7 | 71,918 | 51.5% | 109,626 | 78.5% | $1,421,264 | $19.76 | |
| 2020 | 1 | 800 | 0.6% | 110,426 | 79.1% | $22,496 | $28.12 | |
| 2021 | 2 | 3,643 | 2.6% | 114,069 | 81.7% | $96,036 | $26.36 | |
| 2022 | 0 | 0 | 0.0% | 114,069 | 81.7% | $0 | $0.00 | |
| 2023 | 2 | 3,600 | 2.6% | 117,669 | 84.3% | $104,848 | $29.12 | |
| 2024 | 0 | 0 | 0.0% | 117,669 | 84.3% | $0 | $0.00 | |
| 2025 | 1 | 4,000 | 2.9% | 121,669 | 87.1% | $100,000 | $25.00 | |
| Thereafter | 1 | 11,186 | 8.0% | 132,855 | 95.2% | $240,000 | $21.46 | |
| Vacant | 0 | 6,760 | 4.8% | 139,615 | 100.0% | $0 | $0.00 | |
| Total/Weighted Average | 29 | 139,615 | 100.0% | $2,956,751 | $22.26 |
| (1) | Information obtained from the underwritten aggregate rent roll. |
| (2) | Certain tenants may have lease termination options that are exercisable prior to the originally stated expiration date of the subject lease and that are not considered in the Lease Expiration Schedule. |
| (3) | Weighted Average Annual U/W Base Rent PSF excludes vacant space. |
ONE AND TWO SUMMIT SQUARE PORTFOLIO |
12/31/2011(1) | 12/31/2012(1) | 12/31/2013(1) | 12/1/2014(2)(3) | |||
| 90.5% | 93.2% | 93.2% | 95.2% |
| (1) | Information provided by the borrower. |
| (2) | Information obtained from the underwritten rent roll. |
| (3) | Occupancy for the One Summit Square property includes the Massage Envy (4,000 square feet; 2.9% NRA) tenant. The anticipated lease commencement is April 1, 2015, which is the anticipated date that the landlord will deliver the premises to the tenant. Massage Envy is expected to open during the third quarter of 2015. Excluding Massage Envy the combined physical occupancy is 92.3%. |
| 2012 | 2013 | TTM 9/30/2014 | U/W | U/W $ per SF | ||||||
| Base Rent | $2,695,947 | $2,860,617 | $2,975,613 | $2,956,751 | $21.18 | |||||
| Grossed Up Vacant Space | 0 | 0 | 0 | 189,280 | 1.36 | |||||
| Total Reimbursables | 663,752 | 648,026 | 847,544 | 706,899 | 5.06 | |||||
| Other Income | 49,300 | 92,704 | (1,501) | 19,376 | 0.14 | |||||
| Less Vacancy &Credit Loss | 0 | 0 | 0 | (272,037)(1) | (1.95) | |||||
| Effective Gross Income | 3,408,999 | $ 3,601,347 | $3,821,656 | $3,600,270 | $25.79 | |||||
| Total Operating Expenses | $975,830 | $940,324 | $979,855 | $1,043,070 | $7.47 | |||||
| Net Operating Income | $2,433,169 | $2,661,023 | $2,841,801 | $2,557,200 | $18.32 | |||||
| TI/LC | 0 | 0 | 0 | 168,577 | 1.21 | |||||
| Capital Expenditures | 0 | 0 | 0 | 24,222 | 0.17 | |||||
| Net Cash Flow | $2,433,169 | $2,661,023 | $2,841,801 | $2,364,400 | $16.94 | |||||
| NOI DSCR | 1.45x | 1.59x | 1.70x | 1.53x | ||||||
| NCF DSCR | 1.45x | 1.59x | 1.70x | 1.41x | ||||||
| NOI DY | 9.4% | 10.2% | 10.9% | 9.8% | ||||||
| NCF DY | 9.4% | 10.2% | 10.9% | 9.1% |
| (1) | The underwritten economic vacancy is 7.0%. The One and Two Summit Square Portfolio Properties were 95.2% leased and 92.3% physically occupied as of December 1, 2014. |
ONE AND TWO SUMMIT SQUARE PORTFOLIO |
One and Two Summit Square Portfolio (Subject) | Village Shires Shopping Center | Village at Newtown South | Goodnoes Corner | Village at Newtown | Newtown Shopping Center | |
| Location | Langhorne, PA | Holland, PA | Newtown, PA | Newtown, PA | Newtown, PA | Newtown, PA |
| Distance from Subject | -- | 4.7 miles | 2.4miles | 2.5 miles | 2.5 miles | 3.0 miles |
| Property Type | Various | Retail | Retail | Retail | Retail | Retail |
| Year Built / Renovated | Various | NAV | NAV | NAV | NAV | NAV |
| Anchor | Giant | NAP | PetSmart, Ace Hardware | NAP | McCaffrey’s Food Market | Acme Markets, Staples, Bed Bath & Beyond |
| Total GLA | 139,615 SF | 36,691 SF | 130,059 SF | 63,944 SF | 175,617 SF | 170,754 SF |
| Total Occupancy | 95% | 81% | 98% | 100% | 96% | 100% |
| (1) | Information obtained from the appraisal and underwritten rent roll. |
ONE AND TWO SUMMIT SQUARE PORTFOLIO |
| CREEKSIDE CORNERS |
| CREEKSIDE CORNERS |
| Loan Information | Property Information | ||||||
| Mortgage Loan Seller: | Rialto Mortgage Finance, LLC | Single Asset/Portfolio: | Single Asset | ||||
| Credit Assessment (Fitch/KBRA/Moody’s): | NR/NR/NR | Property Type: | Multifamily | ||||
| Original Principal Balance: | Specific Property Type: | Garden | |||||
| Cut-off Date Principal Balance: | Location: | ||||||
| % of Initial Pool Balance: | 2.4% | Size: | |||||
| Loan Purpose: | Cut-off Date Principal Balance Per Unit: | ||||||
| Borrower Name: | Year Built/Renovated: | ||||||
| Sponsors: | Matthew A. Sharp and J. David Kelsey | Title Vesting: | |||||
| Mortgage Rate: | Property Manager: | Self-managed | |||||
| Note Date: | 3rd Most Recent Occupancy (As of): | ||||||
| Anticipated Repayment Date: | 2nd Most Recent Occupancy (As of): | ||||||
| Maturity Date: | Most Recent Occupancy (As of): | ||||||
| IO Period: | Current Occupancy (As of): | ||||||
| Loan Term (Original): | |||||||
| Seasoning: | Underwriting and Financial Information: | ||||||
| Amortization Term (Original): | |||||||
| Loan Amortization Type: | Interest-only, Amortizing Balloon | 3rd Most Recent NOI (As of): | |||||
| Interest Accrual Method: | Actual/360 | 2nd Most Recent NOI (As of): | |||||
| Call Protection: | Most Recent NOI (As of): | $2,172,197 (TTM 10/31/2014) | |||||
| Lockbox Type: | Springing (without Established Account) | ||||||
Additional Debt(1): | Yes | U/W Revenues: | |||||
Additional Debt Type(1): | Future Mezzanine | U/W Expenses: | |||||
| U/W NOI: | |||||||
| U/W NCF: | |||||||
| U/W NOI DSCR: | |||||||
Escrows and Reserves(2): | U/W NCF DSCR: | ||||||
| U/W NOI Debt Yield: | |||||||
Type: | Initial | Monthly | Cap (If Any) | U/W NCF Debt Yield: | |||
| Taxes | NAP | As-Is Appraised Value: | |||||
| Insurance | Springing | NAP | As-Is Appraisal Valuation Date: | ||||
| Replacement Reserves | NAP | Cut-off Date LTV Ratio: | |||||
| Deferred Maintenance | NAP | LTV Ratio at Maturity or ARD: | |||||
| (1) | See “Subordinate and Mezzanine Indebtedness” section. |
| (2) | See “Escrows” section. |
| Sources | Uses | |||||||||||
| Original loan amount | % | % | ||||||||||
| Closing costs | 174,417 | 0.5 | ||||||||||
| Total Sources | 100.0 | % | Total Uses | 100.0 | % |
| CREEKSIDE CORNERS |
| Unit Type | No. of Units | % of Total Units | Average Unit Size (SF) | Average Monthly U/W Rent per Unit | ||||
| Two Bedroom | 55.0% | 1,102 | $817 | |||||
| Three Bedroom | 7.7% | $974 | ||||||
| Total/Weighted Average | 444 | 100.0% | $775 |
| (1) | Information obtained from the underwritten rent roll. |
| (1) | Information obtained from the borrower. |
| (2) | Information obtained from the underwritten rent roll. |
| U/W | U/W $ per Room(1) | |||||||||||||||
| Base Rent | $4,257,209 | |||||||||||||||
| Grossed Up Vacant Space | 0 | |||||||||||||||
| Concessions | ) | (569,256 | ) | (183,490 | ) | )(1) | ) | |||||||||
| Other Income | 696,008 | 642,924 | ||||||||||||||
| Less Vacancy & Credit Loss | ) | ) | ) | )(2) | ) | |||||||||||
| Effective Gross Income | ||||||||||||||||
| Total Operating Expenses | $2,067,555 | $4,726 | ||||||||||||||
| Net Operating Income | ||||||||||||||||
| Capital Expenditures | ||||||||||||||||
| Net Cash Flow | $2,141,750 | $2,172,197 | ||||||||||||||
| NOI DSCR | x | x | x | x | ||||||||||||
| NCF DSCR | x | x | x | x | ||||||||||||
| NOI DY | % | % | % | % | ||||||||||||
| NCF DY | % | % | % | % | ||||||||||||
| (1) | Historical concessions from 2011 to 2013 are higher due to a change in accounting methodology at the Creekside Corners Property. Beginning January 2014, the accounting changed from modified cash to accrual as such, Base Rent and concessions decreased in 2014 in comparison to prior years. |
| (2) | The underwritten vacancy is 15.3%. The Creekside Corners Property was 91.0% physically occupied as of December 16, 2014. |
| CREEKSIDE CORNERS |
Creekside Corners Property (Subject) | Creekside Crossing | Walden Brook | Ashley Vista | Lexington on the Green | The Retreat at Stonecrest | Wesley Providence | ||||||||
| Location | Lithonia, GA | Lithonia, GA | Lithonia, GA | Lithonia, GA | Lithonia, GA | Lithonia, GA | Lithonia, GA | |||||||
| Distance to Subject | NAP | 0.5 miles | 1.0 mile | 2.3 miles | 2.3 miles | 4.8 miles | 4.5 miles | |||||||
| Property Type | Garden | Garden | Garden | Garden | Garden | Garden | Garden | |||||||
| Number of Units | 444 | 280 | 256 | 312 | 216 | 276 | 579 | |||||||
| Effective Rent (per unit) | $775 | $905 | $848 | $832 | $914 | $798 | $885 | |||||||
| 1 Bedroom | $647-$688 | $785-$935 | $765-$810 | $712-$722 | $830 | $725 | $798-$826 | |||||||
| 2 Bedroom | $801-$834 | $785-$1,030 | $860 | $826-$870 | $932-$945 | $825-$860 | $913-$938 | |||||||
| 3 Bedroom | $974 | $1,130 | $955 | $989 | $1,023 | $995 | $1,163 | |||||||
| Utilities | Paid by tenant | Paid by tenant | Paid by tenant | Paid by tenant | Paid by tenant | Paid by tenant | Paid by tenant | |||||||
| Total Occupancy | 91% | 97% | 93% | 92% | 97% | 94% | 90% |
| (1) | Information obtained from the appraisal and the underwritten rent roll. |
| CREEKSIDE CORNERS |
| No. 11 – Staybridge Suites – North Everett | |||||||
| Loan Information | Property Information | ||||||
| Mortgage Loan Seller: | Wells Fargo Bank, National Association | Single Asset/Portfolio: | Single Asset | ||||
Credit Assessment (Fitch/KBRA/Moody’s): | NR/NR/NR | Property Type: | Hospitality | ||||
| Original Principal Balance: | $22,000,000 | Specific Property Type: | Extended Stay | ||||
| Cut-off Date Principal Balance: | $21,917,921 | Location: | Mukilteo, WA | ||||
| % of Initial Pool Balance: | 2.3% | Size: | 134 Rooms | ||||
| Loan Purpose: | Refinance | Cut-off Date Principal Balance Per Room: | $163,567 | ||||
| Borrower Name: | Mukilteo Hotel SPE, LLC | Year Built/Renovated: | 2010/NAP | ||||
Sponsors(1): | Various | Title Vesting: | Fee | ||||
| Mortgage Rate: | 4.480% | Property Manager: | Self-managed | ||||
| Note Date: | October 29, 2014 | 3rd Most Recent Occupancy (As of): | 80.6% (4/30/2012) | ||||
| Anticipated Repayment Date: | NAP | 2nd Most Recent Occupancy (As of): | 83.4% (4/30/2013) | ||||
| Maturity Date: | November 11, 2024 | Most Recent Occupancy (As of): | 82.6% (4/30/2014) | ||||
| IO Period: | None | Current Occupancy (As of): | 88.1% (11/30/2014) | ||||
| Loan Term (Original): | 120 months | ||||||
| Seasoning: | 3 months | Underwriting and Financial Information: | |||||
| Amortization Term (Original): | 360 months | ||||||
| Loan Amortization Type: | Amortizing Balloon | 3rd Most Recent NOI (As of)(6): | $2,655,153 (TTM 4/30/2013) | ||||
| Interest Accrual Method: | Actual/360 | 2nd Most Recent NOI (As of)(6): | $2,570,292 (TTM 4/30/2014) | ||||
| Call Protection: | L(27), GRTR 1% or YM or D(89),O(4) | Most Recent NOI (As of)(6): | $2,931,012 (TTM 11/30/2014) | ||||
| Lockbox Type: | Springing (Without Established Account) | ||||||
Additional Debt(2): | Yes | ||||||
Additional Debt Type(2): | Future Mezzanine | U/W Revenues: | $5,546,974 | ||||
| U/W Expenses: | $3,082,076 | ||||||
| U/W NOI: | $2,464,898 | ||||||
| U/W NCF: | $2,243,019 | ||||||
| U/W NOI DSCR: | 1.85x | ||||||
Escrows and Reserves: | U/W NCF DSCR: | 1.68x | |||||
| U/W NOI Debt Yield: | 11.2% | ||||||
Type: | Initial | Monthly | Cap (If Any) | U/W NCF Debt Yield: | 10.2% | ||
| Taxes | $30,096 | $10,032 | NAP | As-Is Appraised Value: | $29,900,000 | ||
Insurance(3) | $0 | Springing | NAP | As-Is Appraisal Valuation Date: | September 22, 2014 | ||
| FF&E Reserve | $0 | $18,471(4) | NAP | Cut-off Date LTV Ratio: | 73.3% | ||
PIP Reserve(5) | $0 | Springing | NAP | LTV Ratio at Maturity or ARD: | 59.4% | ||
| (1) | The sponsors are Nizar Damji, Mariyam Damji, Shaiza Damji and Feyrouz Damji Kurji. |
| (2) | Upon substantial completion of the Hotel Expansion (defined below), the borrower may incur mezzanine debt in an amount to pay off any construction loan related to the Hotel Expansion, provided certain provisions are satisfied, including, but not limited to: (i) the combined amortizing net cash flow debt service coverage ratio is not less than 1.35x; (ii) the combined net cash flow debt yield is not less than 10.0%;and (iii) the combined loan-to-value ratio is not greater than 75.0%. |
| (3) | Ongoing monthly reserves for insurance are not required as long as (i) no event of default has occurred and is continuing; (ii) the Staybridge Suites – North Everett Property is covered by an acceptable blanket insurance policy; and (iii) the borrower provides the lender with evidence of renewal of the insurance policies and timely proof of payment of insurance premiums. |
| (4) | Ongoing monthly reserves for FF&E are required in an amount equal to the greater of (i) $18,471 or (ii) one twelfth of 4.0% of room revenue for the prior fiscal year (initially estimated to be $18,471). |
| (5) | If any replacements or alterations to the Staybridge Suites – North Everett Property are required by the franchisor (“PIP Work”), borrower must deposit (within 15 days of receipt of notice from the franchisor) an amount equal to 125% of the estimated costs to complete such PIP Work, as reasonably determined by lender, less any funds in the FF&E reserve at the time of the request. |
| (6) | See “Cash Flow Analysis” section. |
| STAYBRIDGE SUITES – NORTH EVERETT |
| Sources | Uses | |||||||||
| Original loan amount | $22,000,000 | 100.0 | % | Loan payoff(1) | $19,930,000 | 90.6 | % | |||
| Reserves | 30,096 | 0.1 | ||||||||
| Closing costs | 424,019 | 1.9 | ||||||||
| Return of equity | 1,615,885 | 7.3 | ||||||||
| Total Sources | $22,000,000 | 100.0 | % | Total Uses | $22,000,000 | 100.0 | % |
| (1) | The Staybridge Suites – North Everett Property is refinancing an existing Wells Fargo Bank, National Association balance sheet loan. |
Competitive Set | Staybridge Suites – North Everett | Penetration Factor | ||||||||||||||||
Year | Occupancy | ADR | RevPAR | Occupancy | ADR | RevPAR | Occupancy | ADR | RevPAR | |||||||||
| 11/30/2014 TTM | 75.8% | $123.11 | $93.29 | 88.0% | $135.94 | $119.66 | 116.2% | 110.4% | 128.3% | |||||||||
| 11/30/2013 TTM | 72.1% | $120.34 | $86.71 | 79.0% | $132.31 | $104.54 | 109.6% | 109.9% | 120.6% | |||||||||
| 11/30/2012 TTM | 70.1% | $117.09 | $82.05 | 83.4% | $128.18 | $106.93 | 119.1% | 109.5% | 130.3% | |||||||||
| (1) | Information obtained from a third party hospitality report dated December 18, 2014. The competitive set includes: Embassy Suites Seattle North Lynnwood, Residence Inn Seattle North Lynnwood, Holiday Inn Downtown Everett, TownPlace Suites Seattle North Mukilteo, Silver Cloud Inn Mukilteo Waterfront and Hilton Garden Inn Seattle North Everett. |
| STAYBRIDGE SUITES – NORTH EVERETT |
TTM 4/30/2012(1) | TTM 4/30/2013(1) | TTM 4/30/2014(1) | TTM 11/30/2014 | U/W | U/W $ per Room | ||||||||
| Occupancy | 80.6% | 83.4% | 82.6% | 88.1% | 82.0% | ||||||||
| ADR | $123.23 | $129.60 | $132.31 | $135.50 | $135.50 | ||||||||
| RevPAR | $99.29 | $108.08 | $109.28 | $119.34 | $111.11 | ||||||||
| Total Revenue | $4,946,436 | $5,396,028 | $5,448,001 | $5,949,681 | $5,546,974 | $41,395 | |||||||
| Total Department Expenses | 1,026,945 | 1,091,544 | 1,207,725 | 1,226,516 | 1,159,522 | 8,653 | |||||||
| Gross Operating Profit | $3,919,491 | $4,304,484 | $4,240,276 | $4,723,165 | $4,387,452 | $32,742 | |||||||
| Total Undistributed Expenses | 1,313,018 | 1,469,572 | 1,500,058 | 1,624,010 | 1,751,407 | 13,070 | |||||||
| Profit Before Fixed Charges | $2,606,473 | $2,834,912 | $2,740,218 | $3,099,155 | $2,636,045 | $19,672 | |||||||
| Total Fixed Charges | 181,666 | 179,759 | 169,926 | 168,143 | 171,147 | 1,277 | |||||||
| Net Operating Income | $2,424,807 | $2,655,153 | $2,570,292 | $2,931,012(2) | $2,464,898 | $18,395 | |||||||
| FF&E | 0 | 0 | 0 | 0 | 221, 879 | 1,656 | |||||||
| Net Cash Flow | $2,424,807 | $2,655,153 | $2,570,292 | $2,931,012 | $2,243,019 | $16,739 | |||||||
| NOI DSCR | 1.82x | 1.99x | 1.93x | 2.20x | 1.85x | ||||||||
| NCF DSCR | 1.82x | 1.99x | 1.93x | 2.20x | 1.68x | ||||||||
| NOI DY | 11.1% | 12.1% | 11.7% | 13.4% | 11.2% | ||||||||
| NCF DY | 11.1% | 12.1% | 11.7% | 13.4% | 10.2% | ||||||||
| (1) | The borrower’s fiscal year ends on April 30th. |
| (2) | The increase in Net Operating Income for the TTM 11/30/2014 is due to occupancy at the Staybridge Suites – North Everett Property increasing from 82.6% to 88.1% for the TTM 11/30/2014. |
| No. 12 - Tanglewood Apartments | |||||||
| Loan Information | Property Information | ||||||
| Mortgage Loan Seller: | Basis Real Estate Capital II, LLC | Single Asset/Portfolio: | Single Asset | ||||
| Credit Assessment (Fitch/KBRA/Moody’s): | NR/NR/NR | Property Type: | Multifamily | ||||
| Original Principal Balance: | $20,000,000 | Specific Property Type: | Garden | ||||
| Cut-off Date Principal Balance: | $20,000,000 | Location: | Westwego, LA | ||||
| % of Initial Pool Balance: | 2.1% | Size: | 384 Units | ||||
| Loan Purpose: | Refinance | Cut-off Date Principal Balance Per Unit: | $52,083 | ||||
| Borrower Name: | Westwego Community Investors, LLC | Year Built/Renovated: | 1970/2014 | ||||
| Sponsor: | Andrew Schwarz | Title Vesting: | Fee | ||||
| Mortgage Rate: | 4.450% | Property Manager: | Self-managed | ||||
| Note Date: | January 15, 2015 | 3rd Most Recent Occupancy(1): | NAV | ||||
| Anticipated Repayment Date: | NAP | 2nd Most Recent Occupancy(1): | NAV | ||||
| Maturity Date: | February 1, 2025 | Most Recent Occupancy(1): | NAV | ||||
| IO Period: | None | Current Occupancy (As of): | 96.4% (12/18/2014) | ||||
| Loan Term (Original): | 120 months | ||||||
| Seasoning: | 0 months | Underwriting and Financial Information: | |||||
| Amortization Term (Original): | 360 months | ||||||
| Loan Amortization Type: | Amortizing Balloon | 3rd Most Recent NOI: | NAV | ||||
| Interest Accrual Method: | Actual/360 | 2nd Most Recent NOI: | NAV | ||||
| Call Protection: | L(24),D(94),O(2) | Most Recent NOI (As of): | $1,722,741 (TTM 11/30/2014) | ||||
| Lockbox Type: | None | ||||||
| Additional Debt: | None | ||||||
| Additional Debt Type: | NAP | U/W Revenues: | $3,262,902 | ||||
| U/W Expenses: | $1,501,898 | ||||||
| U/W NOI: | $1,761,004 | ||||||
| U/W NCF: | $1,665,004 | ||||||
| U/W NOI DSCR: | 1.46x | ||||||
Escrows and Reserves: | U/W NCF DSCR: | 1.38x | |||||
| U/W NOI Debt Yield: | 8.8% | ||||||
| Type: | Initial | Monthly | Cap (If Any) | U/W NCF Debt Yield: | 8.3% | ||
| Taxes | $24,000 | $6,000 | NAP | As-Is Appraised Value: | $27,300,000 | ||
| Insurance | $259,773 | $32,472 | NAP | As-Is Appraisal Valuation Date: | December 18, 2014 | ||
| Deferred Maintenance | $83,750 | $0 | NAP | Cut-off Date LTV Ratio: | 73.3% | ||
| Replacement Reserves | $0 | $8,281 | NAP | LTV Ratio at Maturity or ARD: | 59.1% | ||
| (1) | The sponsor acquired the Tanglewood Apartments Property vacant in 2010 and spent in excess of $10.7 million on a complete gut renovation, which was completed in early 2014. Historical financial information and historical occupancy information was, therefore, not available prior to the 12-month period ending November 30, 2014. |
| TANGLEWOOD APARTMENTS |
| Sources | Uses | |||||||||
| Original loan amount | % | Loan payoff | % | |||||||
| Reserves | ||||||||||
| Closing costs | 494,510 | 2.5 | ||||||||
| Total Sources | 100.0 | % | Total Uses | 100.0 | % |
| Unit Type | No. of Units | % of Total Units | Average Unit Size (SF) | Average U/W Monthly Rent per Unit |
| 2 Bedroom | 232 | 60.4% | 860 | $733 |
| 3 Bedroom | 80 | 20.8% | 1,012 | $944 |
| Total/Weighted Average | 100.0% |
| (1) | Information obtained from the underwritten rent roll. |
12/31/2011(1) | 12/31/2012(1) | 12/31/2013(1) | 12/18/2014(2) | |||
| NAV | NAV | NAV | 96.4% |
| (1) | The sponsor acquired the Tanglewood Apartments Property in 2010 at 100% vacancy. The Tanglewood Apartments Property underwent a major renovation that was completed in early 2014, after which The Tanglewood Apartments Property quickly leased up. |
| (2) | Information obtained from the underwritten rent roll. |
| (1) | The sponsor acquired the Tanglewood Apartments Property in 2010 when it was 100% vacant. The Tanglewood Apartments Property then underwent a major renovation that was completed in early 2014, after which The Tanglewood Apartments Property quickly leased up. Operating statements are, therefore, not available for calendar years 2012 and 2013. |
| (2) | The underwritten economic vacancy and credit loss is 8.7%. The Tanglewood Apartments Property was 96.4% physically occupied as of December 18, 2014. |
| No. 13 – The Centre at Deane Hill | |||||||
| Loan Information | Property Information | ||||||
| Mortgage Loan Seller: | C-III Commercial Mortgage, LLC | Single Asset/Portfolio: | Single Asset | ||||
| Credit Assessment (Fitch/KBRA/Moody’s): | NR/AAA/aaa (sca.pd) | Property Type: | Retail | ||||
Original Principal Balance(1): | $32,000,000 | Specific Property Type: | Anchored | ||||
| Cut-off Date Principal Balance: | $18,768,922 | Location: | Knoxville, TN | ||||
| % of Initial Pool Balance: | 2.0% | Size: | 389,137 SF | ||||
| Loan Purpose: | Refinance | Cut-off Date Principal Balance Per SF: | $48.23 | ||||
| Borrower Name: | The Centre at Deane Hill, LLC | Year Built/Renovated: | 1997/NAP | ||||
| Sponsors: | David L. Barnhart; E. Andrew Isakson | Title Vesting: | Fee | ||||
| Mortgage Rate: | 7.100% | Property Manager: | Self-managed | ||||
| Note Date: | June 15, 1999 | 3rd Most Recent Occupancy (As of): | 93.0% (12/31/2011) | ||||
| Anticipated Repayment Date: | NAP | 2nd Most Recent Occupancy (As of): | 94.0% (12/31/2012) | ||||
| Maturity Date: | July 1, 2019 | Most Recent Occupancy (As of): | 100.0% (12/31/2013) | ||||
| IO Period: | NAP | Current Occupancy (As of): | 97.0% (11/19/2014) | ||||
| Loan Term (Original): | 240 months | ||||||
| Seasoning: | 187 months | Underwriting and Financial Information: | |||||
| Amortization Term (Original): | 300 months | ||||||
| Loan Amortization Type: | Amortizing Balloon | 3rd Most Recent NOI (As of): | $3,751,305 (12/31/2012) | ||||
| Interest Accrual Method: | 30/360 | 2nd Most Recent NOI (As of): | $4,068,997 (12/31/2013) | ||||
Call Protection(2): | L(60),GRTR 1% or YM(174),O(6) | Most Recent NOI (As of): | $3,878,902 (T-11 Annualized 11/30/2014) | ||||
| Lockbox Type: | None | ||||||
| Additional Debt: | None | ||||||
| Additional Debt Type: | NAP | U/W Revenues: | $5,087,213 | ||||
| U/W Expenses: | $1,171,873 | ||||||
| U/W NOI: | $3,915,340 | ||||||
| U/W NCF: | $3,577,120 | ||||||
| U/W NOI DSCR: | 1.43x | ||||||
Escrows and Reserves: | U/W NCF DSCR: | 1.31x | |||||
| U/W NOI Debt Yield: | 20.9% | ||||||
| Type: | Initial | Monthly | Cap (If Any) | U/W NCF Debt Yield: | 19.1% | ||
| Taxes | $0 | Springing(3) | NAP | As-Is Appraised Value: | $53,500,000 | ||
| Insurance | $0 | Springing(3) | NAP | As-Is Appraisal Valuation Date: | November 29, 2014 | ||
| Replacement Reserves | $0 | $0 | NAP | Cut-off Date LTV Ratio: | 35.3% | ||
| TI/LC Reserve | $0 | $0 | NAP | LTV Ratio at Maturity or ARD: | 21.5% | ||
| (1) | See “Sources and Uses” section. |
| (2) | From origination. |
| (3) | The borrower is required to deposit real estate taxes and insurance reserves upon the occurrence and continuance of an event of default. |
THE CENTRE AT DEANE HILL |
| Sources | Uses | |||||||||
| Original loan amount | $29,650,000 | 92.7 | % | Loan payoff | $28,426,471 | 88.8 | % | |||
Additional funding(1) | 2,350,000 | 7.3 | Closing costs | 319,368 | 1.0 | |||||
| Return of equity | 3,254,161 | 10.2 | ||||||||
| Total Sources | $32,000,000 | 100.0 | % | Total Uses | $32,000,000 | 100.0 | % | |||
| (1) | The related promissory note was dated June 15, 1999. An additional funding was disbursed on July 29, 1999. |
| Tenant Name | Credit Rating (Fitch/ Moody’s/ S&P)(1) | Tenant NRSF | % of NRSF | Annual U/W Base Rent PSF | Annual U/W Base Rent | % of Total Annual U/W Base Rent | Sales PSF(2) | Occupancy Cost(2) | Lease Expiration Date | |
| Anchor Tenants | ||||||||||
| Kohl’s | BBB+/Baa1/BBB | 86,584 | 22.3% | $9.25 | $800,902 | 18.8% | $198 | 5.9% | 2/2/2019 | |
| KVAT Food Stores (dba Food City) | NR/NR/NR | 57,391 | 14.7% | $11.87 | $681,231 | 16.0% | $382(3) | 3.7%(3) | 7/31/2018 | |
| Bed Bath & Beyond | NR/Baa1/A- | 40,000 | 10.3% | $11.25 | $450,000 | 10.5% | $202 | 6.7% | 1/31/2023 | |
| Stein Mart Inc. | NR/NR/NR | 40,000 | 10.3% | $9.50 | $380,000 | 8.9% | $99(4) | 12.0%(4) | 11/30/2017 | |
| PetSmart | NR/NR/BB+ | 26,040 | 6.7% | $11.72 | $305,189 | 7.2% | NAV | NAV | 1/31/2019 | |
| A.C. Moore | NR/NR/NR | 24,049 | 6.2% | $10.40 | $250,000 | 5.9% | NAV | NAV | 7/31/2016 | |
| Buy Buy Baby | NR/Baa1/A- | 25,000 | 6.4% | $7.00 | $175,000 | 4.1% | $324 | 2.4% | 1/31/2023 | |
| Total Anchor Tenants | 299,064 | 76.9% | $10.17 | $3,042,322 | 71.3% | |||||
| Major Tenants | ||||||||||
| Old Navy | BBB-/Baa3/BBB- | 15,000 | 3.9% | $14.00 | $210,000 | 4.9% | $264 | 6.2% | 11/30/2017 | |
| Off Broadway Shoes | NR/NR/NR | 15,000 | 3.9% | $10.65 | $159,750 | 3.7% | $120 | 10.9% | 8/31/2015 | |
| The School Box of Tennessee | NR/NR/NR | 7,225 | 1.9% | $17.00 | $122,825 | 2.9% | $142 | 13.6% | 5/31/2020 | |
| Kirklands | NR/NR/NR | 6,500 | 1.7% | $18.00 | $117,000 | 2.7% | $180 | 11.3% | 1/31/2020 | |
| Dollar Tree | NR/Baa3/NR | 10,280 | 2.6% | $10.50 | $107,940 | 2.5% | NAV | NAV | 8/31/2016 | |
| Total Major Tenants | 54,005 | 13.9% | $13.29 | $717,515 | 16.8% | |||||
| Non-Major Tenants | 24,252 | 6.2% | $20.93 | $507,653 | 11.9% | |||||
| Occupied Collateral Total | 377,321 | 97.0% | $11.31 | $4,267,490 | 100.0% | |||||
| Vacant Space | 11,816 | 3.0% | ||||||||
| Collateral Total | 389,137 | 100.0% | ||||||||
| (1) | Certain ratings are those of the parent company whether or not the parent guarantees the lease. |
| (2) | Sales PSF and Occupancy Cost information is for the trailing 12-months ending December 31, 2013. |
| (3) | Food City sales and occupancy cost information is for the trailing 12-months ending July 31, 2013. |
| (4) | Stein Mart Inc. sales and occupancy cost information is for the 11-month period ending November 30, 2013. |
THE CENTRE AT DEANE HILL |
Year Ending December 31, | No. of Leases Expiring | Expiring NRSF | % of Total NRSF | Cumulative Expiring NRSF | Cumulative % of Total NRSF | Annual U/W Base Rent | Annual U/W Base Rent PSF(3) | ||||
| MTM | 0 | 0 | 0.0% | 0 | 0.0% | $0 | $0.00 | ||||
| 2015 | 2 | 16,208 | 4.2% | 16,208 | 4.2% | $184,514 | $11.38 | ||||
| 2016 | 3 | 36,829 | 9.5% | 53,037 | 13.6% | $397,940 | $10.81 | ||||
| 2017 | 3 | 56,800 | 14.6% | 109,837 | 28.2% | $622,400 | $10.96 | ||||
| 2018 | 4 | 68,437 | 17.6% | 178,274 | 45.8% | $934,070 | $13.65 | ||||
| 2019 | 5 | 120,322 | 30.9% | 298,596 | 76.7% | $1,263,741 | $10.50 | ||||
| 2020 | 2 | 13,725 | 3.5% | 312,321 | 80.3% | $239,825 | $17.47 | ||||
| 2021 | 0 | 0 | 0.0% | 312,321 | 80.3% | $0 | $0.00 | ||||
| 2022 | 0 | 0 | 0.0% | 312,321 | 80.3% | $0 | $0.00 | ||||
| 2023 | 2 | 65,000 | 16.7% | 377,321 | 97.0% | $625,000 | $9.62 | ||||
| 2024 | 0 | 0 | 0.0% | 377,321 | 97.0% | $0 | $0.00 | ||||
| 2025 | 0 | 0 | 0.0% | 377,321 | 97.0% | $0 | $0.00 | ||||
| Thereafter | 0 | 0 | 0.0% | 377,321 | 97.0% | $0 | $0.00 | ||||
| Vacant | 0 | 11,816 | 3.0% | 389,137 | 100.0% | $0 | $0.00 | ||||
| Total/Weighted Average | 21 | 389,137 | 100.0% | $4,267,490 | $11.31 | ||||||
| (1) | Information obtained from the underwritten rent roll. |
| (2) | Certain tenants may have lease termination options that are exercisable prior to the originally stated expiration date of the subject lease and that are not considered in the Lease Expiration Schedule. |
| (3) | Weighted Average Annual U/W Base Rent PSF excludes vacant space. |
12/31/2011(1) | 12/31/2012(1) | 12/31/2013(1) | 11/19/2014(2) | |||
| 93.0% | 94.0% | 100.0% | 97.0% |
| (1) | Information obtained from a third party data provider and the borrower. |
| (2) | Information obtained from the underwritten rent roll. |
2012(1) | 2013(1) | T-11 Ann. 11/30/2014 | U/W | U/W $ per SF | |||||||
| Base Rent | $4,056,330 | $4,401,764 | $4,339,063 | $4,267,490 | $10.97 | ||||||
| Grossed Up Vacant Space | 0 | 0 | 0 | 233,598 | 0.60 | ||||||
| Total Reimbursables | 780,449 | 780,621 | 702,545 | 852,293 | 2.19 | ||||||
| Other Income | 13,135 | 12,991 | 9,762 | 1,500 | 0.00 | ||||||
| Less Vacancy & Credit Loss | 0 | 0 | 0 | (267,669)(2) | (0.69) | ||||||
| Effective Gross Income | $4,849,914 | $5,195,376 | $5,051,370 | $5,087,213 | $13.07 | ||||||
| Total Operating Expenses | $1,098,609 | $1,126,379 | $1,172,468 | $1,171,873 | $3.01 | ||||||
| Net Operating Income | $3,751,305 | $4,068,997 | $3,878,902 | $3,915,340 | $10.06 | ||||||
| TI/LC | 143,750 | 57,500 | 103,169 | 279,850 | 0.72 | ||||||
| Capital Expenditures | 0 | 0 | 0 | 58,371 | 0.15 | ||||||
| Net Cash Flow | $3,607,555 | $4,011,497 | $3,775,733 | $3,577,120 | $9.19 | ||||||
| NOI DSCR | 1.37x | 1.49x | 1.42x | 1.43x | |||||||
| NCF DSCR | 1.32x | 1.46x | 1.38x | 1.31x | |||||||
| NOI DY | 20.0% | 21.7% | 20.7% | 20.9% | |||||||
| NCF DY | 19.2% | 21.4% | 20.1% | 19.1% | |||||||
| (1) | The increase in Net Operating Income and Net Cash Flow from 2012 to 2013 is due to Buy Buy Baby (6.4% of the net rentable area) taking occupancy in December 2012 of the space vacated by Borders in 2011. |
| (2) | The underwritten economic vacancy is 5.0%. The Centre at Deane Hill Property was 97.0% physically occupied as of November 19, 2014. |
| No. 14 – Aspen Creek Apartments | ||||||
| Loan Information | Property Information | |||||
| Mortgage Loan Seller: | Liberty Island Group I LLC | Single Asset/Portfolio: | Single Asset | |||
Credit Assessment (Fitch/KBRA/Moody’s): | NR/NR/NR | Property Type: | Multifamily | |||
| Original Principal Balance: | $18,500,000 | Specific Property Type: | Garden | |||
| Cut-off Date Principal Balance: | $18,500,000 | Location: | Chesterfield Township, MI | |||
| % of Initial Pool Balance: | 1.9% | Size: | 776 units | |||
| Loan Purpose: | Refinance | Cut-off Date Principal Balance Per Unit: | $23,840 | |||
| Borrower Name: | Aspen Creek Apartments Limited Partnership | Year Built/Renovated: | 1979/NAP | |||
| Sponsor: | Matthew Lester | Title Vesting: | Fee | |||
| Mortgage Rate: | 4.180% | Property Manager: | Self-managed | |||
| Note Date: | December 5, 2014 | 3rd Most Recent Occupancy (As of): | 86.3% (12/31/2011) | |||
| Anticipated Repayment Date: | NAP | 2nd Most Recent Occupancy (As of): | 80.7% (12/31/2012) | |||
| Maturity Date: | January 1, 2025 | Most Recent Occupancy (As of): | 87.1% (12/31/2013) | |||
| IO Period: | 36 months | Current Occupancy (As of): | 88.4% (10/31/2014) | |||
| Loan Term (Original): | 120 months | |||||
| Seasoning: | 1 month | Underwriting and Financial Information: | ||||
| Amortization Term (Original): | 360 months | |||||
| Loan Amortization Type: | Interest-only, Amortizing Balloon | 3rd Most Recent NOI (As of)(1): | $2,000,775 (12/31/2012) | |||
| Interest Accrual Method: | Actual/360 | 2nd Most Recent NOI (As of)(1): | $1,781,558 (12/31/2013) | |||
| Call Protection: | L(25),D(91),O(4) | Most Recent NOI (As of)(1): | $2,139,159 (TTM 10/31/2014) | |||
| Lockbox Type: | Springing (Without Established Account) | |||||
| Additional Debt: | None | U/W Revenues: | $5,162,470 | |||
| Additional Debt Type: | NAP | U/W Expenses: | $3,181,814 | |||
| U/W NOI: | $1,980,657 | |||||
| U/W NCF: | $1,747,857 | |||||
| U/W NOI DSCR: | 1.83x | |||||
Escrows and Reserves: | U/W NCF DSCR: | 1.61x | ||||
| U/W NOI Debt Yield: | 10.7% | |||||
Type: | Initial | Monthly | Cap (If Any) | U/W NCF Debt Yield: | 9.4% | |
| Taxes | $110,237 | $36,746 | NAP | As-Is Appraised Value: | $27,300,000 | |
| Insurance | $54,241 | $10,848 | NAP | As-Is Appraisal Valuation Date: | October 23, 2014 | |
| Replacement Reserves | $19,400 | $19,400 | NAP | Cut-off Date LTV Ratio: | 67.8% | |
| Deferred Maintenance | $94,375 | $0 | NAP | LTV Ratio at Maturity or ARD: | 58.9% | |
| (1) | See “Cash Flow Analysis” section. |
| ASPEN CREEK APARTMENTS |
| Sources | Uses | |||||||||
| Original loan amount | $18,500,000 | 100.0 | % | Loan payoff | $17,494,698 | 94.6 | % | |||
| Reserves | 278,253 | 1.5 | ||||||||
| Closing costs | 491,163 | 2.7 | ||||||||
| Return of equity | 235,887 | 1.3 | ||||||||
| Total Sources | $18,500,000 | 100.0 | % | Total Uses | $18,500,000 | 100.0 | % |
| Unit Type | No. of Units | % of Total Units | Average Unit Size (SF) | Average Monthly U/W Rent Per Unit | ||||
| 1 Bedroom/1 Bathroom | 32 | 4.1 | % | 713 | $512 | |||
| 1 Bedroom/1.5 Bathrooms | 96 | 12.4 | % | 859 | $526 | |||
| 2 Bedroom/1.5 Bathrooms | 224 | 28.9 | % | 832 | $556 | |||
| 2 Bedroom/2 Bathroom | 108 | 13.9 | % | 952 | $599 | |||
| Large 2 Bedroom/2 Bathroom | 180 | 23.2 | % | 1,125 | $679 | |||
| 3 Bedroom/2 Bathroom | 40 | 5.2 | % | 1,200 | $747 | |||
| Large 3 Bedroom/2 Bathroom | 96 | 12.4 | % | 1,366 | $850 | |||
| Total/Weighted Average | 776 | 100.0 | % | 1,000 | $630 | |||
| (1) | Information obtained from the appraisal and underwritten rent roll. |
12/31/2011(1)(2) | 12/31/2012(1)(2) | 12/31/2013(1)(2) | 10/31/2014(3) | |||
86.3% | 80.7% | 87.1% | 88.4% |
(1) | Information obtained from the borrower. |
| (2) | See “Cash Flow Analysis” section |
| (3) | Information obtained from the underwritten rent roll. |
2012(1) | 2013(1) | TTM 10/31/2014(1) | U/W | U/W $ per Unit | |||||||
| Base Rent | $4,438,834 | $4,352,646 | $4,811,191 | $5,248,489 | $6,764 | ||||||
| Grossed Up Vacant Space | 0 | 0 | 0 | 672,780 | 867 | ||||||
| Utility Reimbursements | 24,434 | 23,234 | 20,970 | 20,970 | 27 | ||||||
| Other Income | 271,689 | 248,604 | 328,198 | 328,198 | 423 | ||||||
| Less Vacancy & Credit Loss | 10,204 | 2,061 | 2,111 | (1,107,967)(2) | (1,428) | ||||||
| Effective Gross Income | $4,745,161 | $4,626,545 | $5,162,470 | $5,162,470 | $6,653 | ||||||
| Total Operating Expenses | $2,744,386 | $2,844,987 | $3,023,311 | $3,181,814 | $4,100 | ||||||
| Net Operating Income | $2,000,775 | $1,781,558 | $2,139,159 | $1,980,657 | $2,552 | ||||||
| Capital Expenditures | 0 | 0 | 0 | 232,800 | 300 | ||||||
| Net Cash Flow | $2,000,775 | $1,781,558 | $2,139,159 | $1,747,857 | 2,252 | ||||||
| NOI DSCR | 1.85x | 1.64x | 1.98x | 1.83x | |||||||
| NCF DSCR | 1.85x | 1.64x | 1.98x | 1.61x | |||||||
| NOI DY | 10.8% | 9.6% | 11.6% | 10.7% | |||||||
| NCF DY | 10.8% | 9.6% | 11.6% | 9.4% | |||||||
| (1) | The decrease in Net Operating Income from 2012 to 2013 is primarily due to uncharacteristic tenant rollover occurring simultaneously at the Aspen Creek Apartments Property. |
| (2) | The underwritten economic vacancy is 18.7%. The Aspen Creek Apartments Property was 88.8% physically occupied as of October 31, 2014. |
| No. 15 – JCIM Portfolio | ||||||
| Loan Information | Property Information | |||||
| Mortgage Loan Seller: | Liberty Island Group I LLC | Single Asset/Portfolio: | Portfolio | |||
Credit Assessment (Fitch/KBRA/Moody’s): | NR/NR/NR | Property Type: | Industrial | |||
| Original Principal Balance: | $18,450,000 | Specific Property Type: | Warehouse | |||
| Cut-off Date Principal Balance: | $18,425,676 | Location: | Monroe, MI | |||
| % of Initial Pool Balance: | 1.9% | Size: | 535,500 SF | |||
| Loan Purpose: | Acquisition | Cut-off Date Principal Balance Per SF: | $34.41 | |||
| Borrower Names: | MI14 Monroe Revard LLC and MI14 Monroe Frenchtown LLC | Year Built/Renovated(3): | Various | |||
| Sponsor: | Gladstone Commercial Corporation | Title Vesting: | Fee | |||
| Mortgage Rate: | 4.040% | Property Manager: | Self-managed | |||
| Note Date: | December 23, 2014 | 3rd Most Recent Occupancy (As of): | 100.0% (12/31/2011) | |||
| Anticipated Repayment Date: | NAP | 2nd Most Recent Occupancy (As of): | 100.0% (12/31/2012) | |||
| Maturity Date: | January 1, 2025 | Most Recent Occupancy (As of): | 100.0% (12/31/2013) | |||
| IO Period: | NAP | Current Occupancy (As of): | 100.0% (12/18/2014) | |||
| Loan Term (Original): | 120 months | |||||
| Seasoning: | 1 month | |||||
| Amortization Term (Original): | 360 months | Underwriting and Financial Information: | ||||
| Loan Amortization Type: | Amortizing Balloon | |||||
| Interest Accrual Method: | Actual/360 | 3rd Most Recent NOI (As of): | 2,507,682 (12/31/2012) | |||
| Call Protection: | L(25),D(91),O(4) | 2nd Most Recent NOI (As of): | 2,460,336 (12/31/2013) | |||
| Lockbox Type: | Hard/Springing Cash Management | Most Recent NOI (As of): | 2,237,341 (TTM 10/31/2014) | |||
| Additional Debt: | None | |||||
| Additional Debt Type: | NAP | |||||
| U/W Revenues: | $2,830,393 | |||||
| U/W Expenses: | $703,486 | |||||
| U/W NOI: | $2,126,907 | |||||
| U/W NCF: | $1,952,865 | |||||
U/W NOI DSCR : | 2.00x | |||||
Escrows and Reserves: | U/W NCF DSCR: | 1.84x | ||||
| U/W NOI Debt Yield: | 11.5% | |||||
| Type: | Initial | Monthly | Cap (If Any) | U/W NCF Debt Yield: | 10.6% | |
Taxes(1) | $0 | Springing | NAP | As-Is Appraised Value: | $30,900,000 | |
Insurance(1) | $0 | Springing | NAP | As-Is Appraisal Valuation Date: | December 2, 2014 | |
| Deferred Maintenance | $57,990 | $0 | NAP | Cut-off Date LTV Ratio: | 59.6% | |
| TI/LC Reserve | $1,416,892(2) | $0 | NAP | LTV Ratio at Maturity or ARD: | 47.5% | |
| (1) | The borrower is only required to deposit real estate taxes and insurance reserves upon the occurrence and continuance of an event of default. |
| (2) | The borrower received a credit for outstanding tenant improvement allowance from the seller. Those funds were escrowed into the TI/LC Reserve. |
| (3) | The 2200 Revard property was constructed in 2003. The 1833 Frenchtown property was constructed in 2005. The two properties are adjacent and leased to a single tenant, JCIM, LLC. |
| JCIM PORTFOLIO |
| Sources | Uses | |||||||||
| Original loan amount | $18,450,000 | 56.7 | % | Purchase price | $30,750,000 | 94.5 | % | |||
Other sources(1) | 2,315,305(1) | 7.1 | Reserves | 1,474,882 | 4.5 | |||||
| Sponsor new cash contribution | 11,757,229 | 36.2 | Closing costs | 297,652 | 0.9 | |||||
| Total Sources | $32,522,534 | 100.0 | % | Total Uses | $32,522,534 | 100.0 | % |
| (1) | Other sources consist of escrow credits in the amount of $750,000, December 2014 rent and a tenant improvement allowance credit from the seller. |
| Property Name | Allocated Cut-off Date Principal Balance | % of Portfolio Cut-off Date Principal Balance | Property Type | Sub Property Type | Square Feet | Cut-off Date Balance Per SF | Year Built/ Renovated | Appraised Value | ||||||||
| 1883 Frenchtown | $10,852,673 | 58.9% | Industrial | Warehouse | 315,000 | $34.45 | 2005/NAP | $18,200,000 | ||||||||
| 2200 Revard | $7,573,003 | 41.1% | Industrial | Warehouse | 220,500 | $34.34 | 2003/NAP | $12,700,000 | ||||||||
| Total/Weighted Average | 100.0% | $18,425,676 | 535,500 | $34.41 | $30,900,000 |
| Tenant Name | Credit Rating (Fitch/Moody’s/ S&P) | Tenant NRSF | % of NRSF | Annual U/W Base Rent PSF | Annual U/W Base Rent | % of Total Annual U/W Base Rent | Lease Expiration Date | |||||||
| Major Tenant | ||||||||||||||
| JCIM, LLC | NR/NR/NR | 535,500 | 100.0% | $4.25 | $2,275,875 | 100.0% | 8/31/2023(1) | |||||||
| Occupied Collateral Total | 535,500 | 100.0% | $4.25 | $2,275,875 | 100.0% | |||||||||
| (1) | JCIM, LLC has two, 5-year lease extension options. |
Year Ending December 31, | No. of Leases Expiring | Expiring NRSF | % of Total NRSF | Cumulative Expiring NRSF | Cumulative % of Total NRSF | Annual U/W Base Rent | Annual U/W Base Rent PSF | ||||||||
| MTM | 0 | 0 | 0.0% | 0 | 0.0% | $0 | $0.00 | ||||||||
| 2015 | 0 | 0 | 0.0% | 0 | 0.0% | $0 | $0.00 | ||||||||
| 2016 | 0 | 0 | 0.0% | 0 | 0.0% | $0 | $0.00 | ||||||||
| 2017 | 0 | 0 | 0.0% | 0 | 0.0% | $0 | $0.00 | ||||||||
| 2018 | 0 | 0 | 0.0% | 0 | 0.0% | $0 | $0.00 | ||||||||
| 2019 | 0 | 0 | 0.0% | 0 | 0.0% | $0 | $0.00 | ||||||||
| 2020 | 0 | 0 | 0.0% | 0 | 0.0% | $0 | $0.00 | ||||||||
| 2021 | 0 | 0 | 0.0% | 0 | 0.0% | $0 | $0.00 | ||||||||
| 2022 | 0 | 0 | 0.0% | 0 | 0.0% | $0 | $0.00 | ||||||||
| 2023 | 2 | 535,500 | 100.0% | 535,500 | 100.0% | $2,275,875 | $4.25 | ||||||||
| 2024 | 0 | 0 | 0.0% | 535,500 | 100.0% | $0 | $0.00 | ||||||||
| 2025 | 0 | 0 | 0.0% | 535,500 | 100.0% | $0 | $0.00 | ||||||||
| Thereafter | 0 | 0 | 0.0% | 535,500 | 100.0% | $0 | $0.00 | ||||||||
| Vacant | 0 | 0 | 0.0% | 535,500 | 100.0% | $0 | $0.00 | ||||||||
| Total/Weighted Average | 2 | 535,500 | 100.0% | $2,275,875 | $4.25 |
| (1) | Information obtained from the underwritten rent roll. |
| JCIM PORTFOLIO |
12/31/2011(1) | 12/31/2012(1) | 12/31/2013(1) | 12/18/2014(2) | |||
100.0% | 100.0% | 100.0% | 100.0% |
(1) | Information obtained from the borrower. |
| (2) | Information obtained from the underwritten rent roll. |
| 2012 | 2013 | TTM 10/31/2014 | U/W | U/W $ per SF | |||||||
| Base Rent | $2,507,682 | $2,460,336 | $2,237,341 | $2,275,875 | $4.25 | ||||||
| Grossed Up Vacant Space | 0 | 0 | 0 | 0 | 0.00 | ||||||
| Total Reimbursables | 0 | 0 | 0 | 0 | 0.00 | ||||||
| Other Income | 0 | 0 | 0 | 703,486(1) | 1.31 | ||||||
| Less Vacancy & Credit Loss | 0 | 0 | 0 | (148,968)(2) | (0.28) | ||||||
| Effective Gross Income | $2,507,682 | $2,460,336 | $2,237,341 | $2,830,393 | $5.29 | ||||||
| Total Operating Expenses | 0 | 0 | 0 | $703,486(1) | $1.31 | ||||||
| Net Operating Income | $2,507,682 | $2,460,336 | $2,237,341 | $2,126,907 | $3.97 | ||||||
| TI/LC | 0 | 0 | 0 | 93,717 | 0.18 | ||||||
| Capital Expenditures | 0 | 0 | 0 | 80,325 | 0.15 | ||||||
| Net Cash Flow | $2,507,682 | $2,460,336 | $2,237,341 | $1,952,865 | $3.65 | ||||||
| NOI DSCR | 2.36x | 2.32x | 2.11x | 2.00x | |||||||
| NCF DSCR | 2.36x | 2.32x | 2.11x | 1.84x | |||||||
| NOI DY | 13.6% | 13.4% | 12.1% | 11.5% | |||||||
| NCF DY | 13.6% | 13.4% | 12.1% | 10.6% |
| (1) | The tenant operates under an absolute net lease and pays all expenses directly. A 100.0% expense recovery ratio is utilized for presentation purposes only. |
| (2) | The underwritten economic vacancy is 5.0%. The JCIM Portfolio Properties were 100.0% physically occupied as of December 18, 2014. |
| Wells Fargo Commercial Mortgage Trust 2015-C26 | Transaction Contact Information |
| Wells Fargo Securities, LLC | |
| Brigid Mattingly | Tel. (312) 269-3062 |
| Fax (312) 658-0140 | |
| A.J. Sfarra | Tel. (212) 214-5613 |
| Fax (212) 214-8970 | |
| Alex Wong | Tel. (212) 214-5615 |
| Fax (212) 214-8970 |