| FREE WRITING PROSPECTUS | ||
| FILED PURSUANT TO RULE 433 | ||
| REGISTRATION FILE NO.: 333-195164-13 | ||

Free Writing Prospectus
Structural and Collateral Term Sheet
$963,724,520
(Approximate Aggregate Cut-off Date Balance of Mortgage Pool)
$887,831,000
(Approximate Aggregate Principal Balance of Offered Certificates)
Wells Fargo Commercial Mortgage Trust 2015-LC22
as Issuing Entity
Wells Fargo Commercial Mortgage Securities, Inc.
as Depositor
Ladder Capital Finance LLC
Rialto Mortgage Finance, LLC
Wells Fargo Bank, National Association
National Cooperative Bank, N.A.
as Sponsors and Mortgage Loan Sellers
Commercial Mortgage Pass-Through Certificates
Series 2015-LC22
September 8, 2015
WELLS FARGO SECURITIES
Lead Manager and Sole Bookrunner
| Deutsche Bank Securities | Morgan Stanley |
|---|---|
| Co-Manager | Co-Manager |
STATEMENT REGARDING THIS FREE WRITING PROSPECTUS
The depositor has filed a registration statement (including a prospectus) with the Securities and Exchange Commission (’’SEC’’) (SEC File No. 333-195164) for the offering to which this communication relates. Before you invest, you should read the prospectus in the registration statement and other documents the depositor has filed with the SEC for more complete information about the depositor, the issuing entity and this offering. You may get these documents for free by visiting EDGAR on the SEC Web site at www.sec.gov. Alternatively, the depositor, any underwriter, or any dealer participating in the offering will arrange to send you the prospectus after filing if you request it by calling toll free 1-800-745-2063 (8 a.m. – 5 p.m. EST) or by emailing wfs.cmbs@wellsfargo.com.
Nothing in this document constitutes an offer of securities for sale in any jurisdiction where the offer or sale is not permitted. The information contained herein is preliminary as of the date hereof, supersedes any such information previously delivered to you and will be superseded by any such information subsequently delivered and ultimately by the final prospectus relating to the securities. These materials are subject to change, completion, supplement or amendment from time to time.
This free writing prospectus has been prepared by the Underwriters for information purposes only and does not constitute, in whole or in part, a prospectus for the purposes of Directive 2003/71/EC (as amended) and/or Part VI of the Financial Services and Markets Act 2000 as amended or other offering document.
STATEMENT REGARDING ASSUMPTIONS AS TO SECURITIES, PRICING ESTIMATES AND OTHER INFORMATION
The attached information contains certain tables and other statistical analyses (the “Computational Materials”) which have been prepared in reliance upon information furnished by the Mortgage Loan Sellers. Numerous assumptions were used in preparing the Computational Materials, which may or may not be reflected herein. As such, no assurance can be given as to the Computational Materials’ accuracy, appropriateness or completeness in any particular context; or as to whether the Computational Materials and/or the assumptions upon which they are based reflect present market conditions or future market performance. The Computational Materials should not be construed as either projections or predictions or as legal, tax, financial or accounting advice. You should consult your own counsel, accountant and other advisors as to the legal, tax, business, financial and related aspects of a purchase of these securities. Any weighted average lives, yields and principal payment periods shown in the Computational Materials are based on prepayment and/or loss assumptions, and changes in such prepayment and/or loss assumptions may dramatically affect such weighted average lives, yields and principal payment periods. In addition, it is possible that prepayments or losses on the underlying assets will occur at rates higher or lower than the rates shown in the attached Computational Materials. The specific characteristics of the securities may differ from those shown in the Computational Materials due to differences between the final underlying assets and the preliminary underlying assets used in preparing the Computational Materials. The principal amount and designation of any security described in the Computational Materials are subject to change prior to issuance. None of Wells Fargo Securities, LLC, Deutsche Bank Securities Inc. or Morgan Stanley & Co. LLC, or any of their respective affiliates, make any representation or warranty as to the actual rate or timing of payments or losses on any of the underlying assets or the payments or yield on the securities. The information in this presentation is based upon management forecasts and reflects prevailing conditions and management’s views as of this date, all of which are subject to change. In preparing this presentation, we have relied upon and assumed, without independent verification, the accuracy and completeness of all information available from public sources or which was provided to us by or on behalf of the Mortgage Loan Sellers or which was otherwise reviewed by us.
This free writing prospectus contains certain forward-looking statements. If and when included in this free writing prospectus, the words “expects”, “intends”, “anticipates”, “estimates” and analogous expressions and all statements that are not historical facts, including statements about our beliefs or expectations, are intended to identify forward-looking statements. Any forward-looking statements are made subject to risks and uncertainties which could cause actual results to differ materially from those stated. Those risks and uncertainties include, among other things, declines in general economic and business conditions, increased competition, changes in demographics, changes in political and social conditions, regulatory initiatives and changes in customer preferences, many of which are beyond our control and the control of any other person or entity related to this offering. The forward-looking statements made in this free writing prospectus are made as of the date stated on the cover. We have no obligation to update or revise any forward-looking statement.
Wells Fargo Securities is the trade name for the capital markets and investment banking services of Wells Fargo & Company and its subsidiaries, including but not limited to Wells Fargo Securities, LLC, a member of NYSE, FINRA, NFA and SIPC, Wells Fargo Prime Services, LLC, a member of FINRA, NFA and SIPC, and Wells Fargo Bank, N.A. Wells Fargo Securities, LLC and Wells Fargo Prime Services, LLC are distinct entities from affiliated banks and thrifts.
IMPORTANT NOTICE REGARDING THE OFFERED CERTIFICATES
The Offered Certificates referred to in these materials and the asset pool backing them are subject to modification or revision (including the possibility that one or more classes of certificates may be split, combined or eliminated at any time prior to issuance or availability of a final prospectus) and are offered on a “when, as and if issued” basis. Prospective investors should understand that, when considering the purchase of the Offered Certificates, a contract of sale will come into being no sooner than the date on which the relevant class of certificates has been priced and the underwriters have confirmed the allocation of certificates to be made to investors; any “indications of interest” expressed by any prospective investor, and any “soft circles” generated by the underwriters, will not create binding contractual obligations for such prospective investors, on the one hand, or the underwriters, the depositor or any of their respective agents or affiliates, on the other hand.
As a result of the foregoing, a prospective investor may commit to purchase certificates that have characteristics that may change, and each prospective investor is advised that all or a portion of the certificates referred to in these materials may be issued without all or certain of the characteristics described in these materials. The underwriters’ obligation to sell certificates to any prospective investor is conditioned on the certificates and the transaction having the characteristics described in these materials. If the underwriters determine that a condition is not satisfied in any material respect, such prospective investor will be notified, and neither the depositor nor the underwriters will have any obligation to such prospective investor to deliver any portion of the Offered Certificates which such prospective investor has committed to purchase, and there will be no liability between the underwriters, the depositor or any of their respective agents or affiliates, on the one hand, and such prospective investor, on the other hand, as a consequence of the non-delivery.
Each prospective investor has requested that the underwriters provide to such prospective investor information in connection with such prospective investor’s consideration of the purchase of the certificates described in these materials. These materials are being provided to each prospective investor for informative purposes only in response to such prospective investor’s specific request. The underwriters described in these materials may from time to time perform investment banking services for, or solicit investment banking business from, any company named in these materials. The underwriters and/or their affiliates or respective employees may from time to time have a long or short position in any security or contract discussed in these materials.
The information contained herein supersedes any previous such information delivered to any prospective investor and will be superseded by information delivered to such prospective investor prior to the time of sale.
IMPORTANT NOTICE RELATING TO AUTOMATICALLY-GENERATED EMAIL DISCLAIMERS
Any legends, disclaimers or other notices that may appear at the bottom of any email communication to which this free writing prospectus is attached relating to (1) these materials not constituting an offer (or a solicitation of an offer), (2) no representation that these materials are accurate or complete and may not be updated or (3) these materials possibly being confidential, are not applicable to these materials and should be disregarded. Such legends, disclaimers or other notices have been automatically generated as a result of these materials having been sent via Bloomberg or another system.
THE INFORMATION IN THIS STRUCTURAL AND COLLATERAL TERM SHEET IS NOT COMPLETE AND MAY BE AMENDED PRIOR TO THE TIME OF SALE. THIS TERM SHEET IS NOT AN OFFER TO SELL THESE SECURITIES AND IT IS NOT A SOLICITATION OF AN OFFER TO BUY THESE SECURITIES IN ANY JURISDICTION WHERE THE OFFER OR SALE IS NOT PERMITTED.
| 2 |
| Wells Fargo Commercial Mortgage Trust 2015-LC22 | Certificate Structure |
| I. | Certificate | Structure |
| Class | Expected Ratings (Fitch/Moody’s/Morningstar)(1) | Approximate Initial Certificate Principal Balance or Notional Amount(2) | Approx. Initial Credit Support(3) | Pass-Through Rate Description | Weighted Average Life (Years)(4) | Expected Principal Window(4) | Certificate Principal to Value Ratio(5) | Certificate Principal U/W NOI Debt Yield(6) | |||||||||
| Offered Certificates | |||||||||||||||||
| A-1 | AAAsf/Aaa(sf)/AAA | $46,185,000 | 30.000% | (7) | 2.66 | 10/15 - 06/20 | 43.2% | 19.1% | |||||||||
| A-2 | AAAsf/Aaa(sf)/AAA | $23,443,000 | 30.000% | (7) | 4.78 | 06/20 - 08/20 | 43.2% | 19.1% | |||||||||
| A-3 | AAAsf/Aaa(sf)/AAA | $175,000,000 | 30.000% | (7) | 9.78 | 05/25 - 07/25 | 43.2% | 19.1% | |||||||||
| A-4 | AAAsf/Aaa(sf)/AAA | $347,267,000 | (8) | 30.000% | (7) | 9.86 | 07/25 - 09/25 | 43.2% | 19.1% | ||||||||
| A-SB | AAAsf/Aaa(sf)/AAA | $82,712,000 | 30.000% | (7) | 7.34 | 08/20 - 05/25 | 43.2% | 19.1% | |||||||||
| A-S(9) | AAAsf/Aa1(sf)/AAA | $69,870,000 | 22.750% | (7) | 9.96 | 09/25 - 09/25 | 47.7% | 17.3% | |||||||||
| X-A | AAAsf/NR/AAA | $744,477,000 | (10) | N/A | Variable(11) | N/A | N/A | N/A | N/A | ||||||||
| X-B | NR/NR/AAA | $56,619,000 | (12) | N/A | Variable(13) | N/A | N/A | N/A | N/A | ||||||||
| B(9) | AA-sf/NR/AA- | $56,619,000 | 16.875% | (7) | 9.96 | 09/25 - 09/25 | 51.3% | 16.1% | |||||||||
| C(9) | A-sf/NR/A- | $42,162,000 | 12.500% | (7) | 9.96 | 09/25 - 09/25 | 54.0% | 15.3% | |||||||||
| PEX(9) | A-sf/NR/A- | $168,651,000 | 12.500% | (7) | 9.96 | 09/25 - 09/25 | 54.0% | 15.3% | |||||||||
| D | BBB-sf/NR/BBB | $44,573,000 | 7.875% | (7) | 9.96 | 09/25 - 09/25 | 56.9% | 14.5% | |||||||||
| Non-Offered Certificates | |||||||||||||||||
| X-E | BB-sf/NR/AAA | $22,888,000 | (14) | N/A | Variable(15) | N/A | N/A | N/A | N/A | ||||||||
| X-F | B-sf/NR/AAA | $9,637,000 | (16) | N/A | Variable(17) | N/A | N/A | N/A | N/A | ||||||||
| X-G | NR/NR/AAA | $43,368,520 | (18) | N/A | Variable(19) | N/A | N/A | N/A | N/A | ||||||||
| A-4FL | AAAsf/Aaa(sf)/AAA(20) | $347,267,000 | (21)(22) | 30.000% | LIBOR plus [ ](23) | 9.86 | 07/25 - 09/25 | 43.2% | 19.1% | ||||||||
| A-4FX | AAAsf/Aaa(sf)/AAA | $0 | (21)(22) | 30.000% | (7) | 9.86 | 07/25 - 09/25 | 43.2% | 19.1% | ||||||||
| E | BB-sf/NR/BB- | $22,888,000 | 5.500% | (7) | 9.96 | 09/25 - 09/25 | 58.3% | 14.1% | |||||||||
| F | B-sf/NR/B+ | $9,637,000 | 4.500% | (7) | 9.96 | 09/25 - 09/25 | 59.0% | 14.0% | |||||||||
| G | NR/NR/NR | $43,368,520 | 0.000% | (7) | 9.96 | 09/25 - 09/25 | 61.7% | 13.4% | |||||||||
| Notes: | |
| (1) | The expected ratings presented are those of Fitch Ratings, Inc. (“Fitch”), Moody’s Investors Service, Inc. (“Moody’s”) and Morningstar Credit Ratings, LLC (“Morningstar”) which the depositor hired to rate the offered certificates. One or more other nationally recognized statistical rating organizations that were not hired by the depositor may use information they receive pursuant to Rule 17g-5 under the Securities Exchange Act of 1934, as amended (the “Exchange Act”) or otherwise, to rate or provide market reports and/or published commentary related to the offered certificates. We cannot assure you as to what ratings a non-hired nationally recognized statistical rating organization would assign or that its reports will not express differing, possibly negative, views of the mortgage loans and/or the offered certificates. The ratings of each class of offered certificates address the likelihood of the timely distribution of interest and, except in the case of the Class X-A and Class X-B certificates, the ultimate distribution of principal due on those classes on or before the Rated Final Distribution Date. See “Risk Factors—Risks Related to the Offered Certificates—Ratings of the Certificates Have Substantial Limitations” and “Ratings” in the free writing prospectus, expected to be dated September 8, 2015 (the “Free Writing Prospectus”). Fitch and Moody’s have informed us that the “sf” designation in their ratings represents an identifier for structured finance product ratings. |
| (2) | The principal balances and notional amounts set forth in the table are approximate. The actual initial principal balances and notional amounts may be larger or smaller depending on the aggregate cut-off date principal balance of the mortgage loans definitively included in the pool of mortgage loans, which aggregate cut-off date principal balance may be as much as 5% larger or smaller than the amount presented in the Free Writing Prospectus. |
| (3) | The approximate initial credit support with respect to the Class A-1, A-2, A-3, A-4, A-4FL, A-4FX and A-SB Certificates represents the approximate credit enhancement for the Class A-1, A-2, A-3, A-4, A-4FL, A-4FX and A-SB Certificates in the aggregate. The percentage indicated under the column “Approx. Initial Credit Support” with respect to the Class C Certificates and the Class PEX Certificates represents the approximate credit support for the Class C regular interest. |
| (4) | Weighted Average Lives and Expected Principal Windows are calculated based on an assumed prepayment rate of 0% CPR and the “Structuring Assumptions” described on Annex B to the Free Writing Prospectus. |
| (5) | The Certificate Principal to Value Ratio for each Class of Certificates (other than the Class A-1, A-2, A-3, A-4, A-4FL, A-4FX, A-SB and PEX Certificates) is calculated as the product of (a) the weighted average Cut-off Date LTV Ratio for the mortgage loans and (b) a fraction, the numerator of which is the total initial Certificate Balance of such Class of Certificates and all Classes of Principal Balance Certificates (other than the Class PEX Certificates) senior to such Class of Certificates and the denominator of which is the total initial Certificate Balance of all of the Principal Balance Certificates (other than the Class PEX Certificates). The Certificate Principal to Value Ratio for each of the Class A-1, A-2, A-3, A-4, A-4FL, A-4FX and A-SB Certificates is calculated in the aggregate for those Classes as if they were a single Class and is calculated as the product of (a) the weighted average Cut-off Date LTV Ratio for the mortgage loans and (b) a fraction, the numerator of which is the total initial aggregate Certificate Balances of such Classes of Certificates and the denominator of which is the total initial Certificate Balance of all of the Principal Balance Certificates (other than the Class PEX Certificates). The Certificate Principal to Value Ratio of the Class PEX Certificates is equal to the Certificate Principal to Value Ratio of the Class C Certificates. In any event, however, excess mortgaged property value associated with a mortgage loan will not be available to offset losses on any other mortgage loan. |
| (6) | The Certificate Principal U/W NOI Debt Yield for each Class of Certificates (other than the Class A-1, A-2, A-3, A-4, A-4FL, A-4FX, A-SB and PEX Certificates) is calculated as the product of (a) the weighted average U/W NOI Debt Yield for the mortgage loans and (b) a fraction, the numerator of which is the total initial Certificate Balance of all of the Classes of Principal Balance Certificates (other than the Class PEX Certificates) and the denominator of which is the total initial Certificate Balance for such Class of Certificates and all Classes of Principal Balance Certificates (other than the Class PEX Certificates) senior to such Class of Certificates. The Certificate Principal U/W NOI Debt Yield for each of the Class A-1, A-2, A-3, A-4, A-4FL, A-4FX and A-SB Certificates is calculated in the aggregate for those Classes as if they were a single Class and is calculated as the product of (a) the weighted average U/W NOI Debt Yield for the mortgage loans and (b) a fraction, the numerator of which is the total initial Certificate Balance of all of the Classes of Principal Balance Certificates (other than the Class PEX Certificates) and the denominator of which is the total aggregate initial Certificate Balances for the Class A-1, A-2, A-3, A-4, A-4FL, A-4FX and A-SB Certificates. The Certificate Principal U/W NOI Debt Yield of the Class PEX Certificates is equal to the Certificate Principal U/W NOI Debt Yield for the Class C Certificates. In any event, however, cash flow from each mortgaged property supports only the related mortgage loan and will not be available to support any other mortgage loan. |
THE INFORMATION IN THIS STRUCTURAL AND COLLATERAL TERM SHEET IS NOT COMPLETE AND MAY BE AMENDED PRIOR TO THE TIME OF SALE. THIS TERM SHEET IS NOT AN OFFER TO SELL THESE SECURITIES AND IT IS NOT A SOLICITATION OF AN OFFER TO BUY THESE SECURITIES IN ANY JURISDICTION WHERE THE OFFER OR SALE IS NOT PERMITTED.
| 3 |
| Wells Fargo Commercial Mortgage Trust 2015-LC22 | Certificate Structure |
| (7) | The pass-through rates for the Class A-1, A-2, A-3, A-4, A-4FX, A-SB, D, E, F and G Certificates and the Class A-4FX, A-S, B and C regular interests in each case will be one of the following: (i) a fixed rateper annum, (ii) the weighted average of the net mortgage interest rates on the mortgage loans for the related distribution date, (iii) a variable rateper annumequal to the lesser of (a) a fixed rate and (b) the weighted average of the net mortgage interest rates on the mortgage loans for the related distribution date or (iv) a variable rateper annum equal to the weighted average of the net mortgage interest rates on the mortgage loans for the related distribution date minus a specified percentage. For purposes of the calculation of the weighted average of the net mortgage interest rates on the mortgage loans for each distribution date, the mortgage interest rates will be adjusted as necessary to a 30/360 basis. The Class PEX Certificates will not have a pass-through rate, but will be entitled to receive the sum of the interest distributable on the Class PEX Components. The pass-through rate for the Class A-S Certificates, the Class A-S regular interest and the Class PEX Component A-S will, at all times, be the same. The pass-through rate for the Class B Certificates, the Class B regular interest and the Class PEX Component B will, at all times, be the same. The pass-through rate for the Class C Certificates, the Class C regular interest and the Class PEX Component C will, at all times, be the same. |
| (8) | Represents the maximum initial principal balance of the Class A-4 Certificates that will be issued on the closing date. The aggregate initial principal balance of the Class A-4, A-4FL and A-4FX Certificates will be $347,267,000. |
| (9) | The Class A-S, B, C and PEX Certificates are “Exchangeable Certificates”. On the closing date, the upper-tier REMIC of the issuing entity will issue the Class A-S, B and C regular interests (each a “regular interest”) which will have outstanding principal balances on the closing date of $69,870,000, $56,619,000 and $42,162,000, respectively. The regular interests will be held in a grantor trust for the benefit of the holders of the Class A-S, B, C and PEX Certificates. The Class A-S, B, C and PEX Certificates will, at all times, represent undivided beneficial ownership interests in a grantor trust that will hold those regular interests. Each class of the Class A-S, B and C Certificates will, at all times, represent an undivided beneficial ownership interest in a percentage of the outstanding certificate principal balance of the regular interest with the same alphabetical class designation. The Class PEX Certificates will, at all times, represent an undivided beneficial ownership interest in the remaining percentages of the outstanding certificate principal balances of the Class A-S, B and C regular interests and which portions of those regular interests are referred to in this Term Sheet as the Class PEX Component A-S, Class PEX Component B and Class PEX Component C (collectively, the “Class PEX Components”). Following any exchange of Class A-S, B and C Certificates for Class PEX Certificates or any exchange of Class PEX Certificates for Class A-S, B and C Certificates as described in the Free Writing Prospectus, the percentage interest of the outstanding certificate principal balances of the Class A-S, B and C regular interests that is represented by the Class A-S, B, C and PEX Certificates will be increased or decreased accordingly. The initial certificate principal balance of each of the Class A-S, B and C Certificates shown in the table represents the maximum certificate principal balance of such class without giving effect to any exchange. The initial certificate principal balance of the Class PEX Certificates is equal to the aggregate of the initial certificate principal balance of the Class A-S, B and C Certificates and represents the maximum certificate principal balance of the Class PEX Certificates that could be issued in an exchange. The certificate principal balances of the Class A-S, B and C Certificates to be issued on the closing date will be reduced, in required proportions, by an amount equal to the certificate principal balance of the Class PEX Certificates issued on the closing date. Distributions and allocations of payments and losses with respect to the Exchangeable Certificates are described in this Term Sheet under “Allocations and Distributions on the Class A-S, B, C and PEX Certificates” and under “Description of the Offered Certificates—Distributions” in the Free Writing Prospectus. The maximum certificate principal balance of the Class PEX Certificates is set forth in the table but is not included in the certificate principal balance of the certificates set forth on the cover page of this Term Sheet or on the top of the cover page of the Free Writing Prospectus. |
| (10) | The Class X-A Certificates are notional amount certificates. The Notional Amount of the Class X-A Certificates will be equal to the aggregate principal balance of the Class A-1, A-2, A-3, A-4 and A-SB Certificates and the Class A-4FX and A-S regular interests outstanding from time to time (without regard to any exchange of the Class A-S, B and C Certificates for the Class PEX Certificates). The Class X-A Certificates will not be entitled to distributions of principal. |
| (11) | The pass-through rate for the Class X-A Certificates for any distribution date will be aper annum rate equal to the excess, if any, of (a) the weighted average of the net mortgage interest rates on the mortgage loans for the related distribution date, over (b) the weighted average of the pass-through rates on the Class A-1, A-2, A-3, A-4 and A-SB Certificates and the Class A-4FX and A-S regular interests for the related distribution date, weighted on the basis of their respective aggregate principal balances outstanding immediately prior to that distribution date. For purposes of the calculation of the weighted average of the net mortgage interest rates on the mortgage loans for each distribution date, the mortgage interest rates will be adjusted as necessary to a 30/360 basis. |
| (12) | The Class X-B Certificates are notional amount certificates. The Notional Amount of the Class X-B Certificates will be equal to the principal balance of the Class B regular interest outstanding from time to time (without regard to any exchange of the Class A-S, B and C Certificates for the Class PEX Certificates). The Class X-B Certificates will not be entitled to distributions of principal. |
| (13) | The pass-through rate for the Class X-B Certificates for any distribution date will be aper annum rate equal to the excess, if any, of (a) the weighted average of the net mortgage interest rates on the mortgage loans for the related distribution date, over (b) the pass-through rate on the Class B regular interest for the related distribution date. For purposes of the calculation of the weighted average of the net mortgage interest rates on the mortgage loans for each distribution date, the mortgage interest rates will be adjusted as necessary to a 30/360 basis. |
| (14) | The Class X-E Certificates are notional amount certificates. The Notional Amount of the Class X-E Certificates will be equal to the principal balance of the Class E Certificates outstanding from time to time. The Class X-E Certificates will not be entitled to distributions of principal. |
| (15) | The pass-through rate for the Class X-E Certificates for any distribution date will be aper annum rate equal to the excess, if any, of (a) the weighted average of the net mortgage interest rates on the mortgage loans for the related distribution date, over (b) the pass-through rate on the Class E Certificates for the related distribution date. For purposes of the calculation of the weighted average of the net mortgage interest rates on the mortgage loans for each distribution date, the mortgage interest rates will be adjusted as necessary to a 30/360 basis. |
| (16) | The Class X-F Certificates are notional amount certificates. The Notional Amount of the Class X-F Certificates will be equal to the principal balance of the Class F Certificates outstanding from time to time. The Class X-F Certificates will not be entitled to distributions of principal. |
| (17) | The pass-through rate for the Class X-F Certificates for any distribution date will be aper annum rate equal to the excess, if any, of (a) the weighted average of the net mortgage interest rates on the mortgage loans for the related distribution date, over (b) the pass-through rate on the Class F Certificates for the related distribution date. For purposes of the calculation of the weighted average of the net mortgage interest rates on the mortgage loans for each distribution date, the mortgage interest rates will be adjusted as necessary to a 30/360 basis. |
| (18) | The Class X-G Certificates are notional amount certificates. The Notional Amount of the Class X-G Certificates will be equal to the principal balance of the Class G Certificates outstanding from time to time. The Class X-G Certificates will not be entitled to distributions of principal. |
| (19) | The pass-through rate for the Class X-G Certificates for any distribution date will be aper annum rate equal to the excess, if any, of (a) the weighted average of the net mortgage interest rates on the mortgage loans for the related distribution date, over (b) the pass-through rate on the Class G Certificates for the related distribution date. For purposes of the calculation of the weighted average of the net mortgage interest rates on the mortgage loans for each distribution date, the mortgage interest rates will be adjusted as necessary to a 30/360 basis. |
| (20) | The ratings assigned to the Class A-4FL Certificates reflect only the receipt of up to the fixed rate of interest at a rate equal to the pass-through rate for the Class A-4FX regular interest. The ratings of Fitch, Moody’s and Morningstar do not address any shortfalls or delays in payment that investors in the Class A-4FL Certificates may experience as a result of the conversion of the pass-through rate on Class A-4FL Certificates from a floating interest rate to a fixed rate. See “Ratings” in the Private Placement Memorandum. |
| (21) | The aggregate initial principal balance of the Class A-4, A-4FL and A-4FX Certificates will be $347,267,000. The aggregate principal balance of the Class A-4FL and A-4FX Certificates will at all times equal the principal balance of the Class A-4FX regular interest. The maximum initial principal balance of the Class A-4FL certificates is $347,267,000. The principal balance of the Class A-4FX certificates will initially be $0. The maximum initial principal balance of the Class A-4FX regular interest is $347,267,000. |
| (22) | The Class A-4FL Certificates will evidence a beneficial interest in a grantor trust that includes the Class A-4FX regular interest and an interest rate swap contract. Under some circumstances, holders of the Class A-4FL Certificates may exchange all or a portion of their certificates for a like principal amount of Class A-4FX Certificates having the same pass-through rate as the Class A-4FX regular interest. The aggregate principal balance of the Class A-4FL Certificates may be adjusted from time to time as a result of such an exchange. |
| (23) | The pass-through rate applicable to the Class A-4FL Certificates on each distribution date will be aper annum rate equal to LIBOR plus a specified percentage; provided, however, that under certain circumstances (generally involving a default or termination under the related interest rate swap contract), the pass-through rate applicable to the Class A-4FL Certificates may convert to a fixed rate equal to the pass-through rate on the Class A-4FX regular interest. The initial LIBOR rate will be determined two LIBOR business days prior to the Closing Date, and subsequent LIBOR rates for the Class A-4FL Certificates will be determined two LIBOR business days before the start of the related interest accrual period. |
THE INFORMATION IN THIS STRUCTURAL AND COLLATERAL TERM SHEET IS NOT COMPLETE AND MAY BE AMENDED PRIOR TO THE TIME OF SALE. THIS TERM SHEET IS NOT AN OFFER TO SELL THESE SECURITIES AND IT IS NOT A SOLICITATION OF AN OFFER TO BUY THESE SECURITIES IN ANY JURISDICTION WHERE THE OFFER OR SALE IS NOT PERMITTED.
| 4 |
| Wells Fargo Commercial Mortgage Trust 2015-LC22 | Issue Characteristics |
| II. | Transaction Highlights |
Mortgage Loan Sellers:
Mortgage Loan Seller | Number of | Number of | Aggregate Cut-off | % of Cut-off | ||||
| Ladder Capital Finance LLC | 34 | 40 | $414,090,756 | 43.0% | ||||
| Rialto Mortgage Finance, LLC | 31 | 31 | 315,908,869 | 32.8 | ||||
| Wells Fargo Bank, National Association | 24 | 24 | 189,338,905 | 19.6 | ||||
| National Cooperative Bank, N.A. | 11 | 11 | 44,385,989 | 4.6 | ||||
Total | 100 | 106 | $963,724,520 | 100.0% |
Loan Pool:
| Cut-off Date Balance: | $963,724,520 |
| Number of Mortgage Loans: | 100 |
| Average Cut-off Date Balance per Mortgage Loan: | $9,637,245 |
| Number of Mortgaged Properties: | 106 |
| Average Cut-off Date Balance per Mortgaged Property(1): | $9,091,741 |
| Weighted Average Mortgage Interest Rate: | 4.555% |
| Ten Largest Mortgage Loans as % of Cut-off Date Pool Balance: | 45.1% |
| Weighted Average Original Term to Maturity or ARD (months): | 119 |
| Weighted Average Remaining Term to Maturity or ARD (months): | 118 |
| Weighted Average Original Amortization Term (months)(2): | 345 |
| Weighted Average Remaining Amortization Term (months)(2): | 345 |
| Weighted Average Seasoning (months): | 1 |
| (1) | Information regarding mortgage loans secured by multiple properties is based on an allocation according to relative appraised values or the allocated loan amounts or property-specific release prices set forth in the related loan documents or such other allocation as the related mortgage loan seller deemed appropriate. |
| (2) | Excludes any mortgage loan that does not amortize. |
Credit Statistics:
| Weighted Average U/W Net Cash Flow DSCR(1): | 2.07x |
| Weighted Average U/W Net Operating Income Debt Yield(1): | 13.4% |
| Weighted Average Cut-off Date Loan-to-Value Ratio(1): | 61.7% |
| Weighted Average Balloon or ARD Loan-to-Value Ratio(1): | 53.7% |
| % of Mortgage Loans with Additional Subordinate Debt(2): | 17.3% |
| % of Mortgage Loans with Single Tenants(3): | 5.3% |
| (1) | With respect to the 40 Wall Street and Somerset Park Apartments mortgage loans, each of which is part of a loan combination, the loan-to-value ratio, debt service coverage ratio and debt yield calculations include the relatedpari passu companion loans (unless otherwise stated). For mortgaged properties securing residential cooperative mortgage loans, the debt service coverage ratio or debt yield for each such mortgaged property is calculated using underwritten net cash flow for the related residential cooperative property which is the projected net cash flow reflected in the most recent appraisal obtained by or otherwise in the possession of the related mortgage loan seller as of the cut-off date, and the loan-to-value ratio is calculated based upon the appraised value of the residential cooperative property determined as if such residential cooperative property is operated as a residential cooperative. The debt service coverage ratio, debt yield and loan-to-value information do not take into account any subordinate debt (whether or not secured by the mortgaged property), that is allowed under the terms of any mortgage loan. See Annex A-1 and Annex B to the Free Writing Prospectus. |
| (2) | Eight (8) of the mortgage loans, each of which is secured by a residential cooperative property, currently have in place subordinate secured lines of credit to the related mortgage borrowers that permit future advances (such loans, collectively, the “Subordinate Coop LOCs”). The percentage figure expressed as “% of Mortgage Loans with Additional Subordinate Debt” is determined as a percentage of cut-off date principal balance and does not take into account future subordinate debt (whether or not secured by the mortgaged property), if any, that may be permitted under the terms of any mortgage loan or the Pooling and Servicing Agreement. See “Description of the Mortgage Pool—Subordinate and/or Other Financing” and “Additional Debt Financing for Mortgage Loans Secured by Residential Cooperatives” in the Free Writing Prospectus. |
| (3) | Excludes mortgage loans that are secured by multiple single tenant properties and includes mortgage loans secured by multiple single tenant properties where each property is occupied by the same tenant or tenants that are affiliates of one another. |
THE INFORMATION IN THIS STRUCTURAL AND COLLATERAL TERM SHEET IS NOT COMPLETE AND MAY BE AMENDED PRIOR TO THE TIME OF SALE. THIS TERM SHEET IS NOT AN OFFER TO SELL THESE SECURITIES AND IT IS NOT A SOLICITATION OF AN OFFER TO BUY THESE SECURITIES IN ANY JURISDICTION WHERE THE OFFER OR SALE IS NOT PERMITTED.
| 5 |
| Wells Fargo Commercial Mortgage Trust 2015-LC22 | Issue Characteristics |
Loan Structural Features
Amortization:Based on the Cut-off Date Pool Balance, 88.0% of the mortgage pool (89 mortgage loans) has scheduled amortization, as follows:
50.5% (36 mortgage loans) provides for an interest-only period followed by an amortization period; and
37.5% (53 mortgage loans) requires amortization during the entire loan term.
Interest-Only:Based on the Cut-off Date Pool Balance, 12.0% of the mortgage pool (11 mortgage loans) provides for interest-only payments during the entire loan term. The Weighted Average Cut-off Date Loan-to-Value Ratio and Weighted Average U/W Net Cash Flow DSCR for those mortgage loans are 67.6% and 2.19x, respectively.
Hard Lockboxes: Based on the Cut-off Date Pool Balance, 35.2% of the mortgage pool (27 mortgage loans) has hard lockboxes in place.
Reserves: The mortgage loans require amounts to be escrowed monthly as follows (excluding any mortgage loans with springing provisions):
| Real Estate Taxes: | 84.7% of the pool | |
| Insurance: | 54.7% of the pool | |
| Capital Replacements: | 70.3% of the pool | |
| TI/LC: | 57.4% of the pool(1) |
| (1) | The percentage of Cut-off Date Balance for mortgage loans with TI/LC reserves is based on the aggregate principal balance allocable to loans that include retail, office and mixed use properties. |
Call Protection/Defeasance: Based on the Cut-off Date Pool Balance, the mortgage pool had the following call protection and defeasance features:
82.9% of the mortgage pool (73 mortgage loans) features a lockout period, then defeasance only until an open period;
10.1% of the mortgage pool (seven mortgage loans) features a lockout period, then the greater of a prepayment premium or yield maintenance until an open period;
4.2% of the mortgage pool (ten mortgage loans) features no lockout period, but requires the greater of a prepayment premium or yield maintenance, then a prepayment premium until an open period;
1.6% of the mortgage pool (seven mortgage loans) features no lockout period, but requires yield maintenance, then yield maintenance or defeasance until an open period; and
1.2% of the mortgage pool (three mortgage loans) features a lockout period, then defeasance or the greater of a prepayment premium or yield maintenance until an open period.
Please refer to Annex A-1 to the Free Writing Prospectus for further information regarding individual loan call protection.
THE INFORMATION IN THIS STRUCTURAL AND COLLATERAL TERM SHEET IS NOT COMPLETE AND MAY BE AMENDED PRIOR TO THE TIME OF SALE. THIS TERM SHEET IS NOT AN OFFER TO SELL THESE SECURITIES AND IT IS NOT A SOLICITATION OF AN OFFER TO BUY THESE SECURITIES IN ANY JURISDICTION WHERE THE OFFER OR SALE IS NOT PERMITTED.
| 6 |
| Wells Fargo Commercial Mortgage Trust 2015-LC22 | Issue Characteristics |
| III. | Issue Characteristics |
| Securities Offered: | $887,831,000 approximate monthly pay, multi-class, commercial mortgage REMIC pass-through certificates consisting of twelve classes (Classes A-1, A-2, A-3, A-4, A-SB, A-S, B, C, PEX, D, X-A and X-B), which are offered pursuant to a registration statement filed with the SEC. |
| Mortgage Loan Sellers: | Ladder Capital Finance, LLC (“LCF”), Rialto Mortgage Finance, LLC (“RMF”), Wells Fargo Bank, National Association (“WFB”) and National Cooperative Bank, N.A. (“NCB”) |
| Sole Lead Bookrunning Manager: | Wells Fargo Securities, LLC |
| Co-Managers: | Deutsche Bank Securities Inc. and Morgan Stanley & Co. LLC |
| Rating Agencies: | Fitch Ratings, Inc., Moody’s Investors Service, Inc. and Morningstar Credit Ratings, LLC |
| Master Servicers: | Wells Fargo Bank, National Association and National Cooperative Bank, N.A. |
| Special Servicers: | Rialto Capital Advisors, LLC and National Cooperative Bank, N.A. |
| Certificate Administrator: | Wells Fargo Bank, National Association |
| Trustee: | Wilmington Trust, National Association |
| Trust Advisor: | Park Bridge Lender Services, LLC |
| Initial Majority Subordinate Certificateholder: | Rialto CMBS VI, LLC or an affiliate |
| Cut-off Date: | The Cut-off Date with respect to each mortgage loan is the due date for the monthly debt service payment that is due in September 2015 (or, in the case of any mortgage loan that has its first due date in October 2015, the date that would have been its due date in September 2015 under the terms of that mortgage loan if a monthly debt service payment were scheduled to be due in that month). |
| Expected Closing Date: | On or about September 29, 2015. |
| Determination Dates: | The 11th day of each month (or if that day is not a business day, the next succeeding business day), commencing in October 2015. |
| Distribution Dates: | The fourth business day following the Determination Date in each month, commencing in October 2015. |
| Rated Final Distribution Date: | The Distribution Date in September 2058. |
| Interest Accrual Period: | With respect to any Distribution Date, the calendar month immediately preceding the month in which such Distribution Date occurs. |
| Day Count: | The Offered Certificates will accrue interest on a 30/360 basis. |
| Minimum Denominations: | $10,000 for each Class of Offered Certificates (other than the Class X-A and X-B Certificates) and $1,000,000 for the Class X-A and X-B Certificates. Investments may also be made in any whole dollar denomination in excess of the applicable minimum denomination. |
| Clean-up Call: | 1% |
| Delivery: | DTC, Euroclear and Clearstream Banking |
| ERISA/SMMEA Status: | Each Class of Offered Certificates is expected to be eligible for exemptive relief under ERISA. No Class of Offered Certificates will be SMMEA eligible. |
| Risk Factors: | THE CERTIFICATES INVOLVE CERTAIN RISKS AND MAY NOT BE SUITABLE FOR ALL INVESTORS. SEE THE “RISK FACTORS” SECTION OF THE FREE WRITING PROSPECTUS. |
| Bond Analytics Information: | The Certificate Administrator will be authorized to make distribution date settlements, CREFC® reports and certain supplemental reports (other than confidential information) available to certain financial modeling and data provision services, including Bloomberg, L.P., Trepp, LLC, Intex Solutions, Inc., Markit Group Limited, Interactive Data Corp., BlackRock Financial Management, Inc., CMBS.com, Inc. and Thomson Reuters Corporation. |
THE INFORMATION IN THIS STRUCTURAL AND COLLATERAL TERM SHEET IS NOT COMPLETE AND MAY BE AMENDED PRIOR TO THE TIME OF SALE. THIS TERM SHEET IS NOT AN OFFER TO SELL THESE SECURITIES AND IT IS NOT A SOLICITATION OF AN OFFER TO BUY THESE SECURITIES IN ANY JURISDICTION WHERE THE OFFER OR SALE IS NOT PERMITTED.
| 7 |
| Wells Fargo Commercial Mortgage Trust 2015-LC22 | Characteristics of the Mortgage Pool |
IV. Characteristics of the Mortgage Pool(1)
A. Ten Largest Mortgage Loans
| Mortgage Loan Seller | Mortgage Loan Name | City | State | Number of Mortgage Loans / Mortgaged Properties | Mortgage Loan Cut-off Date Balance ($) | % of Cut-off Date Pool Balance (%) | Property Type | Number of SF, Rooms, Units, Beds or Spaces | Cut-off Date Balance Per SF, Room, Unit, Bed or Space ($) | Cut-off Date LTV Ratio (%) | Balloon or ARD LTV Ratio (%) | U/W NCF DSCR (x) | U/W NOI Debt Yield (%) | ||||||||||||||||||
| LCF | 40 Wall Street | New York | NY | 1 / 1 | $94,630,972 | 9.8 | % | Office | 1,165,207 | $137 | 29.5 | % | 21.1 | % | 2.13 | x | 14.2 | % | |||||||||||||
| LCF | The Meadows | Rutherford | NJ | 1 / 1 | 92,000,000 | 9.5 | Office | 603,680 | 152 | 71.9 | 65.9 | 1.53 | 10.2 | ||||||||||||||||||
| RMF | Somerset Park Apartments | Troy | MI | 1 / 1 | 70,000,000 | 7.3 | Multifamily | 2,226 | 80,863 | 72.1 | 72.1 | 1.77 | 8.4 | ||||||||||||||||||
| LCF | Townline Square | Meriden | CT | 1 / 1 | 32,725,000 | 3.4 | Retail | 314,814 | 104 | 72.7 | 62.3 | 1.40 | 9.3 | ||||||||||||||||||
| RMF | Sandpiper Apartments | Las Vegas | NV | 1 / 1 | 30,500,000 | 3.2 | Multifamily | 488 | 62,500 | 74.7 | 65.9 | 1.24 | 8.3 | ||||||||||||||||||
| WFB | West Palm Beach Marriott | West Palm Beach | FL | 1 / 1 | 30,000,000 | 3.1 | Hospitality | 352 | 85,227 | 56.4 | 48.3 | 1.84 | 14.8 | ||||||||||||||||||
| RMF | Shoppes at Wilton | Saratoga Springs | NY | 1 / 1 | 22,500,000 | 2.3 | Retail | 134,710 | 167 | 64.5 | 64.5 | 2.07 | 9.8 | ||||||||||||||||||
| RMF | San Diego Park N’ Fly | San Diego | CA | 1 / 1 | 21,750,000 | 2.3 | Other | 860 | 25,291 | 73.7 | 66.7 | 1.67 | 10.7 | ||||||||||||||||||
| RMF | Hickory Hills East | Great Mills | MD | 1 / 1 | 20,200,000 | 2.1 | Multifamily | 231 | 87,446 | 70.9 | 64.9 | 1.31 | 8.3 | ||||||||||||||||||
| WFB | The Jewelers Mall | Los Angeles | CA | 1 / 1 | 19,950,000 | 2.1 | Mixed Use | 127,556 | 156 | 70.0 | 62.9 | 1.45 | 9.4 | ||||||||||||||||||
| Top Three Total/Weighted Average | 3 / 3 | $256,630,972 | 26.6 | % | 56.3 | % | 51.1 | % | 1.82 | x | 11.2 | % | |||||||||||||||||||
| Top Five Total/Weighted Average | 5 / 5 | $319,855,972 | 33.2 | % | 59.7 | % | 53.6 | % | 1.72 | x | 10.7 | % | |||||||||||||||||||
| Top Ten Total/Weighted Average | 10 / 10 | $434,255,972 | 45.1 | % | 61.5 | % | 55.4 | % | 1.71 | x | 10.8 | % | |||||||||||||||||||
| Non-Top Ten Total/Weighted Average | 90 / 96 | $529,468,548 | 54.9 | % | 62.0 | % | 52.2 | % | 2.37 | x | 15.5 | % | |||||||||||||||||||
| (1) | With respect to the 40 Wall Street and Somerset Park Apartments mortgage loans, each of which is part of a loan combination, the loan-to-value ratio, debt service coverage ratio and debt yield calculations include the relatedpari passu companion loans (unless otherwise stated). |
THE INFORMATION IN THIS STRUCTURAL AND COLLATERAL TERM SHEET IS NOT COMPLETE AND MAY BE AMENDED PRIOR TO THE TIME OF SALE. THIS TERM SHEET IS NOT AN OFFER TO SELL THESE SECURITIES AND IT IS NOT A SOLICITATION OF AN OFFER TO BUY THESE SECURITIES IN ANY JURISDICTION WHERE THE OFFER OR SALE IS NOT PERMITTED.
| 8 |
| Wells Fargo Commercial Mortgage Trust 2015-LC22 | Characteristics of the Mortgage Pool |
B. Summary ofPari Passu Loan Combinations
| Property Name | Mortgage Loan Seller | Related Notes in Loan Group (Original Balance) | Holder of Note | Lead Servicer for the Entire Loan Combination | Current Master Servicer Under Related Securitization Servicing Agreement | Current Special Servicer Under Related Securitization Servicing Agreement | ||||||
| 40 Wall Street | LCF | $95,000,000 | WFCM 2015-LC22 | Yes | Wells Fargo Bank, National Association | Rialto Capital Advisors, LLC | ||||||
| LCF | $60,000,000 | COMM 2015-CCRE24 | No | Wells Fargo Bank, National Association | LNR Partners, LLC | |||||||
| LCF | $5,000,000 | (1) | No | TBD | TBD | |||||||
| Somerset Park Apartments | RMF | $73,500,000 | WFCM 2015-C30 | Yes | Wells Fargo Bank, National Association | CWCapital Asset Management LLC | ||||||
| RMF | $70,000,000 | WFCM 2015-LC22 | No | Wells Fargo Bank, National Association | Rialto Capital Advisors, LLC | |||||||
| RMF | $36,500,000 | (2) | No | TBD | TBD |
| (1) | The relatedpari passu companion loan (Note A-1-B) is currently held by LCF, or an affiliate thereof, and is expected (but not required) to be contributed to one or more future securitizations. No assurance can be provided that the Note A-1-B will not be split further. |
| (2) | The relatedpari passu companion loans (Notes A-1-3 and A-2-3) are currently held by RMF and are expected (but not required) to be contributed to one or more future securitizations. No assurance can be provided that the Notes A-1-3 and A-2-3 will not be split further. |
C. Mortgage Loans with Additional Secured and Mezzanine Financing(1)
| Loan No. | Mortgage Loan Seller | Mortgage Loan Name | Mortgage Loan Cut-off Date Balance ($) | % of Cut-off Date Pool Balance (%) | Sub Debt Cut-off Date Balance ($) | Mezzanine Debt Cut-off Date Balance ($) | Total Debt Interest Rate (%)(2) | Mortgage Loan U/W NCF DSCR (x) | Total Debt U/W NCF DSCR (x) | Mortgage Loan Cut-off Date U/W NOI Debt Yield (%) | Total Debt Cut-off Date U/W NOI Debt Yield (%) | Mortgage Loan Cut-off Date LTV Ratio (%) | Total Debt Cut-off Date LTV Ratio (%) | |||||||||||||
| 2 | LCF | The Meadows | $92,000,000 | 9.5% | $0 | $12,000,000 | 5.294% | 1.53x | 1.24x | 10.2% | 9.0% | 71.9% | 81.3% | |||||||||||||
| 19 | LCF | Hyatt Lisle | 11,716,655 | 1.2 | 0 | 1,248,805 | 5.896 | 1.64 | 1.41 | 15.2 | 13.7 | 52.1 | 57.6 | |||||||||||||
| Total/Weighted Average | $103,716,655 | 10.8% | $0 | $13,248,805 | 5.361% | 1.54x | 1.26x | 10.8% | 9.5% | 69.7% | 78.7% | |||||||||||||||
| (1) | In addition, eight (8) of the mortgage loans, each of which are secured by residential cooperative properties, currently have in place Subordinate Coop LOCs that permit future advances. See “Description of the Mortgage Pool—Subordinate and/or Other Financing” and “—Additional Debt Financing for Mortgage Loans Secured by Residential Cooperatives” in the Free Writing Prospectus. |
| (2) | Total Debt Interest Rate for any specified mortgage loan reflects the weighted average of the interest rates on the respective components of the total debt. |
THE INFORMATION IN THIS STRUCTURAL AND COLLATERAL TERM SHEET IS NOT COMPLETE AND MAY BE AMENDED PRIOR TO THE TIME OF SALE. THIS TERM SHEET IS NOT AN OFFER TO SELL THESE SECURITIES AND IT IS NOT A SOLICITATION OF AN OFFER TO BUY THESE SECURITIES IN ANY JURISDICTION WHERE THE OFFER OR SALE IS NOT PERMITTED.
| 9 |
| Wells Fargo Commercial Mortgage Trust 2015-LC22 | Characteristics of the Mortgage Pool |
D. Previous Securitization History(1)
| Loan No. | Mortgage Loan Seller | Mortgage Loan or Mortgaged Property Name | City | State | Property Type | Mortgage Loan or Mortgaged Property Cut-off Date Balance ($) | % of Cut-off Date Pool Balance (%) | Previous Securitization | |||||||||
| 5 | RMF | Sandpiper Apartments | Las Vegas | NV | Multifamily | $30,500,000 | 3.2 | % | LBUBS 2005-C5 | ||||||||
| 6 | WFB | West Palm Beach Marriott | West Palm Beach | FL | Hospitality | 30,000,000 | 3.1 | MSC 2006-T21 | |||||||||
| 7 | RMF | Shoppes at Wilton | Saratoga Springs | NY | Retail | 22,500,000 | 2.3 | LBUBS 2004-C1 | |||||||||
| 9 | RMF | Hickory Hills East | Great Mills | MD | Multifamily | 20,200,000 | 2.1 | JPMCC 2005-CB13 | |||||||||
| 10 | WFB | The Jewelers Mall | Los Angeles | CA | Mixed Use | 19,950,000 | 2.1 | MSC 2006-T23 | |||||||||
| 14 | WFB | Millburn Mall | Vauxhall | NJ | Retail | 14,700,000 | 1.5 | MLMT 2005-CKI1 | |||||||||
| 20 | LCF | Orchard Grove MHC | Ann Arbor | MI | Manufactured Housing Community | 11,020,000 | 1.1 | CD 2005-CD1 | |||||||||
| 22 | LCF | The Moors at Countryview | Canal Winchester | OH | Multifamily | 10,987,745 | 1.1 | CSFB 2005-C4 | |||||||||
| 23 | LCF | Tiberon Trails | Merrillville | IN | Multifamily | 10,483,176 | 1.1 | MSC 2005-HQ7 | |||||||||
| 25 | LCF | Cushendall Commons | Rock Hill | SC | Multifamily | 10,175,000 | 1.1 | GNR 2010-66 | |||||||||
| 26 | RMF | Montevallo Place Apartments | Alabaster | AL | Multifamily | 10,000,000 | 1.0 | FNA 2014-M12 | |||||||||
| 27 | WFB | Best Western Seven Seas | San Diego | CA | Hospitality | 9,980,981 | 1.0 | BSCMS 2006-PW11 | |||||||||
| 32 | LCF | Alderwood Retail | Lynnwood | WA | Retail | 7,672,287 | 0.8 | GECMC 2005-C3 | |||||||||
| 33 | RMF | Forrest Oaks | Mount Airy | NC | Retail | 7,641,581 | 0.8 | JPMCC 2005-LDP4 | |||||||||
| 43 | WFB | Security Public Storage - Vacaville | Vacaville | CA | Self Storage | 6,400,000 | 0.7 | BSCMS 2005-PW10 | |||||||||
| 50 | LCF | Moulton Plaza | Laguna Niguel | CA | Retail | 5,925,148 | 0.6 | MSC 2005-HQ7 | |||||||||
| 52 | RMF | Bishop Retail | Bishop | CA | Retail | 5,472,213 | 0.6 | MLMT 2005-CK11 | |||||||||
| 53 | LCF | 67 Holly Hills | Greenwich | CT | Office | 5,350,000 | 0.6 | GCCFC 2005-GG5 | |||||||||
| 65 | NCB | Pelican Village | Bonita Springs | FL | Retail | 3,610,000 | 0.4 | BSCMS 2005-PWR8 | |||||||||
| 66 | WFB | Southwood Office | Incline Village | NV | Office | 3,601,436 | 0.4 | GECMC 2005-C4 | |||||||||
| 69 | WFB | Security Public Storage - Roseville | Roseville | CA | Self Storage | 3,500,000 | 0.4 | BSCMS 2005-T20 | |||||||||
| 70 | WFB | Gwinnett Point | Duluth | GA | Retail | 3,496,058 | 0.4 | CD 2006-CD2 | |||||||||
| 72 | WFB | North Bay Self Storage | Petaluma | CA | Self Storage | 3,418,719 | 0.4 | BSCMS 2005-T20 | |||||||||
| 73 | NCB | Patricia Gardens Owners, Inc. | Larchmont | NY | Multifamily | 3,250,000 | 0.3 | MSC 2007-IQ13 | |||||||||
| 75 | LCF | Orange Grove MHP | San Fernando | CA | Manufactured Housing Community | 3,100,000 | 0.3 | CSMC 2006-C2 | |||||||||
| 80 | NCB | 137-05 Franklin Avenue Owners, Inc. | Flushing | NY | Multifamily | 2,200,000 | 0.2 | CSMC 2006-C1 | |||||||||
| 82 | NCB | Palisade Gardens Apartments Corp. | Yonkers | NY | Multifamily | 2,196,961 | 0.2 | CSMC 2006-C1 | |||||||||
| 84 | WFB | Barbizon Building | Hoover | AL | Office | 2,042,723 | 0.2 | LBUBS 2005-C1 | |||||||||
| 88 | NCB | Grand Loft Corp. | New York | NY | Multifamily | 1,740,912 | 0.2 | MSC 2005-IQ10 | |||||||||
THE INFORMATION IN THIS STRUCTURAL AND COLLATERAL TERM SHEET IS NOT COMPLETE AND MAY BE AMENDED PRIOR TO THE TIME OF SALE. THIS TERM SHEET IS NOT AN OFFER TO SELL THESE SECURITIES AND IT IS NOT A SOLICITATION OF AN OFFER TO BUY THESE SECURITIES IN ANY JURISDICTION WHERE THE OFFER OR SALE IS NOT PERMITTED.
| 10 |
| Wells Fargo Commercial Mortgage Trust 2015-LC22 | Characteristics of the Mortgage Pool |
| Loan No. | Mortgage Loan Seller | Mortgage Loan or Mortgaged Property Name | City | State | Property Type | Mortgage Loan or Mortgaged Property Cut-off Date Balance ($) | % of Cut-off Date Pool Balance (%) | Previous Securitization | |||||||||
| 91 | WFB | Country Meadows | Sidney | OH | Manufactured Housing Community | 1,598,097 | 0.2 | MLMT 2005-LC1 | |||||||||
| 93 | NCB | 100 South Ocean Ave. Realty Corp. A/K/A 100 South Ocean Ave. Realty Corporation | Freeport | NY | Multifamily | 1,498,048 | 0.2 | CSMC 2006-C1 | |||||||||
| Total | $274,211,085 | 28.5 | % | ||||||||||||||
| (1) | The table above represents the most recent securitization with respect to the mortgaged property securing the related mortgage loan, based on information provided by the related borrower or obtained through searches of a third-party database. While the above mortgage loans may have been securitized multiple times in prior transactions, mortgage loans are only listed in the above chart if the mortgage loan in this securitization paid off a mortgage loan in another securitization. The information has not otherwise been confirmed by the mortgage loan sellers. |
THE INFORMATION IN THIS STRUCTURAL AND COLLATERAL TERM SHEET IS NOT COMPLETE AND MAY BE AMENDED PRIOR TO THE TIME OF SALE. THIS TERM SHEET IS NOT AN OFFER TO SELL THESE SECURITIES AND IT IS NOT A SOLICITATION OF AN OFFER TO BUY THESE SECURITIES IN ANY JURISDICTION WHERE THE OFFER OR SALE IS NOT PERMITTED.
| 11 |
| Wells Fargo Commercial Mortgage Trust 2015-LC22 | Characteristics of the Mortgage Pool |
E. Mortgage Loans with Scheduled Balloon Payments and Related Classes
Class A-2(1)
| Loan No. | Mortgage Loan Seller | Mortgage Loan Name | State | Property Type | Mortgage Loan Cut-off Date Balance ($) | % of Cut-off Date Pool Balance (%) | Mortgage Loan Balance at Maturity ($) | % of Class A-2 Certificate Principal Balance (%)(2) | Units, Rooms or SF | Loan per Unit, Room or SF ($) | U/W NCF DSCR (x) | U/W NOI Debt Yield (%) | Cut-off Date LTV Ratio (%) | Balloon or ARD LTV Ratio (%) | Rem. IO Period (mos.) | Rem. Term to Maturity (mos.) | ||||||||||||||||
| 25 | LCF | Cushendall Commons | SC | Multifamily | $10,175,000 | 1.1% | $9,667,132 | 41.2% | 168 | $60,565 | 1.29x | 8.1% | 73.9% | 70.2% | 21 | 57 | ||||||||||||||||
| 44 | RMF | Courtyard Memphis East Lenox | TN | Hospitality | 6,293,993 | 0.7 | 5,849,777 | 25.0 | 96 | 65,562 | 2.03 | 15.6 | 74.9 | 69.6 | 0 | 59 | ||||||||||||||||
| 56 | LCF | 219 West 19th Street | NY | Mixed Use | 4,988,478 | 0.5 | 4,587,825 | 19.6 | 24,501 | 204 | 2.83 | 17.7 | 24.9 | 22.9 | 0 | 58 | ||||||||||||||||
| Total/Weighted Average | $21,457,471 | 2.2% | $20,104,733 | 85.8% | 1.87x | 12.5% | 62.8% | 59.0% | 10 | 58 | ||||||||||||||||||||||
| (1) | The table above presents the mortgage loan(s) whose balloon payments would be applied to pay down the principal balance of the Class A-2 Certificates, assuming a 0% CPR and applying the “Structuring Assumptions” described in the Free Writing Prospectus, including the assumptions that (i) none of the mortgage loans in the pool experience prepayments prior to maturity (or, in the case of an ARD loan, its anticipated repayment date), defaults or losses; (ii) there are no extensions of maturity dates of any mortgage loans in the pool; and (iii) each mortgage loan in the pool is paid in full on its stated maturity date (or, in the case of an ARD loan, its anticipated repayment date). Each Class of Certificates, including the Class A-2 Certificates, evidences undivided ownership interests in the entire pool of mortgage loans. Debt service coverage ratio, debt yield and loan-to-value ratio information takes no account of subordinate debt (whether or not secured by the mortgaged property), if any, that is allowed under the terms of any mortgage loan. See Annex A-1 to the Free Writing Prospectus. | |
| (2) | Reflects the percentage equal to the Mortgage Loan Balance at Maturity divided by the initial Class A-2 Certificate Principal Balance. |
THE INFORMATION IN THIS STRUCTURAL AND COLLATERAL TERM SHEET IS NOT COMPLETE AND MAY BE AMENDED PRIOR TO THE TIME OF SALE. THIS TERM SHEET IS NOT AN OFFER TO SELL THESE SECURITIES AND IT IS NOT A SOLICITATION OF AN OFFER TO BUY THESE SECURITIES IN ANY JURISDICTION WHERE THE OFFER OR SALE IS NOT PERMITTED.
| 12 |
(THIS PAGE INTENTIONALLY LEFT BLANK)
THE INFORMATION IN THIS STRUCTURAL AND COLLATERAL TERM SHEET IS NOT COMPLETE AND MAY BE AMENDED PRIOR TO THE TIME OF SALE. THIS TERM SHEET IS NOT AN OFFER TO SELL THESE SECURITIES AND IT IS NOT A SOLICITATION OF AN OFFER TO BUY THESE SECURITIES IN ANY JURISDICTION WHERE THE OFFER OR SALE IS NOT PERMITTED.
| 13 |
| Wells Fargo Commercial Mortgage Trust 2015-LC22 | Characteristics of the Mortgage Pool |
| F. | Property Type Distribution(1) |
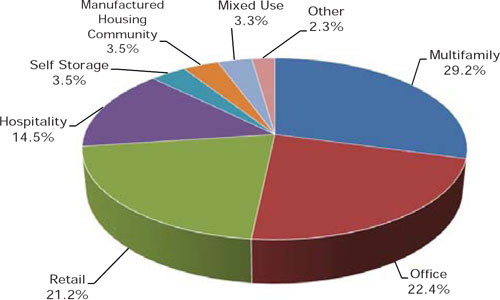
| Property Type | Number of Mortgaged Properties | Aggregate Cut-off Date Balance ($) | % of Cut-off Date Pool Balance (%) | Weighted Average Cut-off Date LTV Ratio (%) | Weighted Average Balloon or ARD LTV Ratio (%) | Weighted Average U/W NCF DSCR (x) | Weighted Average U/W NOI Debt Yield (%) | Weighted Average U/W NCF Debt Yield (%) | Weighted Average Mortgage Rate (%) | |||||||
| Multifamily | 26 | $281,764,593 | 29.2 | % | 64.4 | % | 58.2 | % | 2.90 | x | 17.1 | % | 16.7 | % | 4.559 | % |
| Garden | 13 | 203,338,603 | 21.1 | 71.8 | 65.4 | 1.55 | 9.2 | 8.7 | 4.670 | |||||||
| Cooperative | 10 | 40,775,989 | 4.2 | 22.8 | 19.2 | 11.13 | 64.4 | 64.4 | 3.952 | |||||||
| Townhouse | 1 | 20,200,000 | 2.1 | 70.9 | 64.9 | 1.31 | 8.3 | 8.1 | 4.580 | |||||||
| Student Housing | 2 | 17,450,000 | 1.8 | 67.0 | 58.1 | 1.33 | 8.6 | 8.2 | 4.655 | |||||||
| Office | 7 | 216,125,132 | 22.4 | 52.3 | 44.8 | 1.79 | 11.9 | 11.0 | 4.188 | |||||||
| Suburban | 4 | 102,994,159 | 10.7 | 71.3 | 64.8 | 1.53 | 10.2 | 9.4 | 4.582 | |||||||
| CBD | 1 | 94,630,972 | 9.8 | 29.5 | 21.1 | 2.13 | 14.2 | 13.1 | 3.665 | |||||||
| Medical | 2 | 18,500,000 | 1.9 | 62.8 | 54.3 | 1.46 | 9.7 | 9.0 | 4.671 | |||||||
| Retail | 34 | 204,601,903 | 21.2 | 68.6 | 60.5 | 1.57 | 9.8 | 9.1 | 4.627 | |||||||
| Anchored | 7 | 117,392,921 | 12.2 | 71.8 | 63.3 | 1.56 | 9.7 | 9.0 | 4.588 | |||||||
| Single Tenant | 17 | 45,910,938 | 4.8 | 59.2 | 54.3 | 1.76 | 10.4 | 10.0 | 4.767 | |||||||
| Unanchored | 8 | 26,425,757 | 2.7 | 68.8 | 57.7 | 1.44 | 9.4 | 8.8 | 4.514 | |||||||
| Shadow Anchored | 2 | 14,872,287 | 1.5 | 72.1 | 62.5 | 1.36 | 8.9 | 8.5 | 4.699 | |||||||
| Hospitality | 19 | 139,599,178 | 14.5 | 58.0 | 46.2 | 1.88 | 15.1 | 12.7 | 4.895 | |||||||
| Limited Service | 14 | 74,471,905 | 7.7 | 61.9 | 49.1 | 1.91 | 14.6 | 12.9 | 4.932 | |||||||
| Full Service | 4 | 58,138,055 | 6.0 | 52.3 | 42.1 | 1.87 | 15.9 | 12.5 | 4.835 | |||||||
| Extended Stay | 1 | 6,989,218 | 0.7 | 64.1 | 48.0 | 1.70 | 13.5 | 12.0 | 5.000 | |||||||
| Self Storage | 10 | 33,903,783 | 3.5 | 64.2 | 52.9 | 1.67 | 10.6 | 10.4 | 4.597 | |||||||
| Self Storage | 10 | 33,903,783 | 3.5 | 64.2 | 52.9 | 1.67 | 10.6 | 10.4 | 4.597 | |||||||
| Manufactured Housing Community | 6 | 33,741,454 | 3.5 | 63.4 | 52.0 | 1.96 | 13.1 | 12.8 | 4.598 | |||||||
| Manufactured Housing Community | 6 | 33,741,454 | 3.5 | 63.4 | 52.0 | 1.96 | 13.1 | 12.8 | 4.598 | |||||||
| Mixed Use | 3 | 32,238,478 | 3.3 | 62.1 | 56.1 | 1.64 | 10.5 | 10.1 | 4.669 | |||||||
| Retail/Office/Parking Garage | 1 | 19,950,000 | 2.1 | 70.0 | 62.9 | 1.45 | 9.4 | 9.0 | 4.690 | |||||||
| Retail/Office | 1 | 7,300,000 | 0.8 | 65.8 | 60.3 | 1.33 | 8.5 | 8.2 | 4.620 | |||||||
| Office/Retail | 1 | 4,988,478 | 0.5 | 24.9 | 22.9 | 2.83 | 17.7 | 17.6 | 4.659 | |||||||
| Other | 1 | 21,750,000 | 2.3 | 73.7 | 66.7 | 1.67 | 10.7 | 10.7 | 5.000 | |||||||
| Parking Garage | 1 | 21,750,000 | 2.3 | 73.7 | 66.7 | 1.67 | 10.7 | 10.7 | 5.000 | |||||||
| Total/Weighted Average: | 106 | $963,724,520 | 100.0 | % | 61.7 | % | 53.7 | % | 2.07 | x | 13.4 | % | 12.5 | % | 4.555 | % |
| (1) | Because this table presents information relating to the mortgaged properties and not the mortgage loans, the information for mortgage loans secured by more than one mortgaged property is based on allocated amounts (allocating the mortgage loan principal balance to each of those properties according to the relative appraised values of the mortgaged properties or the allocated loan amounts or property-specific release prices set forth in the related mortgage loan documents or such other allocation as the related mortgage loan seller deemed appropriate). For mortgaged properties securing residential cooperative mortgage loans, the debt service coverage ratio or debt yield for each such mortgaged property is calculated using underwritten net cash flow for the related residential cooperative property which is the projected net cash flow reflected in the most recent appraisal obtained by or otherwise in the possession of the related mortgage loan seller as of the cut-off date and the loan-to-value ratio is calculated based upon the appraised value of the residential cooperative property determined as if such residential cooperative property is operated as a residential cooperative. The debt service coverage ratio, debt yield and loan-to-value information do not take into account any subordinate debt (whether or not secured by the mortgaged property), that is allowed under the terms of any mortgage loan. With respect to the 40 Wall Street and Somerset Park Apartments mortgage loans, each of which is part of a loan combination, the loan-to-value ratio, debt service coverage ratio and debt yield calculations include the relatedpari passu companion loans (unless otherwise stated). See Annex A-1 to the Free Writing Prospectus. |
THE INFORMATION IN THIS STRUCTURAL AND COLLATERAL TERM SHEET IS NOT COMPLETE AND MAY BE AMENDED PRIOR TO THE TIME OF SALE. THIS TERM SHEET IS NOT AN OFFER TO SELL THESE SECURITIES AND IT IS NOT A SOLICITATION OF AN OFFER TO BUY THESE SECURITIES IN ANY JURISDICTION WHERE THE OFFER OR SALE IS NOT PERMITTED.
| 14 |
| Wells Fargo Commercial Mortgage Trust 2015-LC22 | Characteristics of the Mortgage Pool |
| G. | Geographic Distribution(1)(2) |
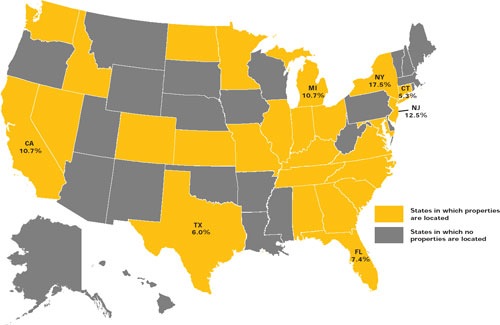
| Location | Number of Mortgaged Properties | Aggregate Cut- off Date Balance ($) | % of Cut-off Date Pool Balance (%) | Weighted Average Cut-off Date LTV Ratio (%) | Weighted Average Balloon or ARD LTV Ratio (%) | Weighted Average U/W NCF DSCR (x) | Weighted Average U/W NOI Debt Yield (%) | Weighted Average U/W NCF Debt Yield (%) | Weighted Average Mortgage Rate (%) | ||||||||
| New York | 16 | $168,295,504 | 17.5 | % | 33.5 | % | 27.4 | % | 4.31 | x | 25.8 | % | 25.1 | % | 3.900 | % | |
| New Jersey | 5 | 120,180,000 | 12.5 | 72.0 | 64.9 | 1.50 | 10.0 | 9.3 | 4.626 | ||||||||
| Michigan | 5 | 102,860,000 | 10.7 | 70.3 | 67.4 | 1.75 | 9.3 | 8.9 | 4.542 | ||||||||
| California | 14 | 102,730,498 | 10.7 | 64.8 | 54.7 | 1.63 | 11.1 | 10.4 | 4.652 | ||||||||
| Southern | 7 | 76,428,343 | 7.9 | 66.0 | 56.5 | 1.61 | 11.2 | 10.4 | 4.725 | ||||||||
| Northern | 7 | 26,302,155 | 2.7 | 61.5 | 49.5 | 1.70 | 10.8 | 10.4 | 4.440 | ||||||||
| Florida | 7 | 71,538,334 | 7.4 | 64.0 | 54.6 | 1.72 | 13.2 | 11.0 | 4.731 | ||||||||
| Texas | 8 | 58,193,709 | 6.0 | 62.6 | 51.2 | 1.87 | 13.6 | 12.5 | 4.781 | ||||||||
| Connecticut | 5 | 50,775,000 | 5.3 | 70.7 | 61.5 | 1.41 | 9.3 | 8.7 | 4.646 | ||||||||
| Other(3) | 46 | 289,151,475 | 30.0 | 67.4 | 57.8 | 1.53 | 10.4 | 9.6 | 4.772 | ||||||||
| Total/Weighted Average | 106 | $963,724,520 | 100.0 | % | 61.7 | % | 53.7 | % | 2.07 | x | 13.4 | % | 12.5 | % | 4.555 | % | |
| (1) | The mortgaged properties are located in 26 states and Puerto Rico. |
| (2) | Because this table presents information relating to the mortgaged properties and not the mortgage loans, the information for mortgage loans secured by more than one mortgaged property is based on allocated amounts (allocating the mortgage loan principal balance to each of those properties according to the relative appraised values of the mortgaged properties or the allocated loan amounts or property-specific release prices set forth in the related mortgage loan documents or such other allocation as the related mortgage loan seller deemed appropriate). For mortgaged properties securing residential cooperative mortgage loans, the debt service coverage ratio or debt yield for each such mortgaged property is calculated using underwritten net cash flow for the related residential cooperative property which is the projected net cash flow reflected in the most recent appraisal obtained by or otherwise in the possession of the related mortgage loan seller as of the cut-off date and the loan-to-value ratio is calculated based upon the appraised value of the residential cooperative property determined as if such residential cooperative property is operated as a residential cooperative. The debt service coverage ratio, debt yield and loan-to-value information do not take into account any subordinate debt (whether or not secured by the mortgaged property), that is allowed under the terms of any mortgage loan. With respect to the 40 Wall Street and Somerset Park Apartments mortgage loans, each of which is part of a loan combination, the loan-to-value ratio, debt service coverage ratio and debt yield calculations include the relatedpari passu companion loans (unless otherwise stated). See Annex A-1 to the Free Writing Prospectus. |
| (3) | Includes 19 other states and Puerto Rico. |
THE INFORMATION IN THIS STRUCTURAL AND COLLATERAL TERM SHEET IS NOT COMPLETE AND MAY BE AMENDED PRIOR TO THE TIME OF SALE. THIS TERM SHEET IS NOT AN OFFER TO SELL THESE SECURITIES AND IT IS NOT A SOLICITATION OF AN OFFER TO BUY THESE SECURITIES IN ANY JURISDICTION WHERE THE OFFER OR SALE IS NOT PERMITTED.
| 15 |
| Wells Fargo Commercial Mortgage Trust 2015-LC22 | Characteristics of the Mortgage Pool |
| H. | Characteristics of the Mortgage Pool(1) |
| CUT-OFF DATE BALANCE | ||||||||
| Range of Cut-off Date Balances ($) | Number of Mortgage Loans | Aggregate Cut- off Date Balance | % of Cut-off Date Pool Balance | |||||
| 695,500 - 1,000,000 | 6 | $4,912,360 | 0.5 | % | ||||
| 1,000,001 - 2,000,000 | 10 | 17,118,455 | 1.8 | |||||
| 2,000,001 - 3,000,000 | 9 | 21,006,197 | 2.2 | |||||
| 3,000,001 - 4,000,000 | 11 | 37,749,807 | 3.9 | |||||
| 4,000,001 - 5,000,000 | 9 | 41,122,525 | 4.3 | |||||
| 5,000,001 - 6,000,000 | 8 | 44,798,329 | 4.6 | |||||
| 6,000,001 - 7,000,000 | 10 | 64,926,537 | 6.7 | |||||
| 7,000,001 - 8,000,000 | 7 | 51,847,277 | 5.4 | |||||
| 8,000,001 - 9,000,000 | 2 | 17,840,000 | 1.9 | |||||
| 9,000,001 - 10,000,000 | 3 | 29,459,790 | 3.1 | |||||
| 10,000,001 - 15,000,000 | 12 | 144,210,933 | 15.0 | |||||
| 15,000,001 - 20,000,000 | 4 | 74,426,340 | 7.7 | |||||
| 20,000,001 - 30,000,000 | 4 | 94,450,000 | 9.8 | |||||
| 30,000,001 - 50,000,000 | 2 | 63,225,000 | 6.6 | |||||
| 50,000,001 - 70,000,000 | 1 | 70,000,000 | 7.3 | |||||
| 90,000,001 - 94,630,972 | 2 | 186,630,972 | 19.4 | |||||
| Total: | 100 | $963,724,520 | 100.0 | % | ||||
| Average: | $9,637,245 | |||||||
| UNDERWRITTEN NOI DEBT SERVICE COVERAGE RATIO | ||||||||
| Range of U/W NOI DSCRs (x) | Number of Mortgage Loans | Aggregate Cut- off Date Balance | % of Cut-off Date Pool Balance | |||||
| 1.20 | 1 | $7,005,075 | 0.7 | % | ||||
| 1.21 - 1.30 | 3 | 19,750,000 | 2.0 | |||||
| 1.31 - 1.40 | 8 | 94,991,688 | 9.9 | |||||
| 1.41 - 1.50 | 9 | 104,127,017 | 10.8 | |||||
| 1.51 - 1.60 | 8 | 68,802,287 | 7.1 | |||||
| 1.61 - 1.70 | 18 | 191,907,779 | 19.9 | |||||
| 1.71 - 1.80 | 4 | 40,091,581 | 4.2 | |||||
| 1.81 - 1.90 | 5 | 84,680,723 | 8.8 | |||||
| 1.91 - 2.00 | 12 | 46,035,706 | 4.8 | |||||
| 2.01 - 2.25 | 11 | 84,585,174 | 8.8 | |||||
| 2.26 - 2.50 | 7 | 157,903,322 | 16.4 | |||||
| 2.51 - 2.75 | 1 | 4,680,000 | 0.5 | |||||
| 2.76 - 3.00 | 2 | 14,969,460 | 1.6 | |||||
| 3.01 - 3.50 | 2 | 7,712,766 | 0.8 | |||||
| 3.51 - 4.00 | 1 | 3,250,000 | 0.3 | |||||
| 4.01 - 74.36 | 8 | 33,231,942 | 3.4 | |||||
| Total: | 100 | $963,724,520 | 100.0 | % | ||||
| Weighted Average: | 2.21x | |||||||
| UNDERWRITTEN NCF DEBT SERVICE COVERAGE RATIO | ||||||||
| Range of U/W NCF DSCRs (x) | Number of Mortgage Loans | Aggregate Cut- off Date Balance | % of Cut-off Date Pool Balance | |||||
| 1.18 - 1.20 | 1 | $7,005,075 | 0.7 | % | ||||
| 1.21 - 1.30 | 9 | 84,066,688 | 8.7 | |||||
| 1.31 - 1.40 | 8 | 98,812,017 | 10.3 | |||||
| 1.41 - 1.50 | 12 | 107,911,467 | 11.2 | |||||
| 1.51 - 1.60 | 16 | 180,240,179 | 18.7 | |||||
| 1.61 - 1.70 | 8 | 77,288,596 | 8.0 | |||||
| 1.71 - 1.80 | 7 | 102,027,319 | 10.6 | |||||
| 1.81 - 1.90 | 8 | 53,718,004 | 5.6 | |||||
| 1.91 - 2.00 | 9 | 24,759,588 | 2.6 | |||||
| 2.01 - 2.25 | 8 | 160,054,044 | 16.6 | |||||
| 2.26 - 2.50 | 2 | 18,658,357 | 1.9 | |||||
| 2.76 - 3.00 | 2 | 8,407,197 | 0.9 | |||||
| 3.01 - 3.50 | 1 | 4,294,047 | 0.4 | |||||
| 3.51 - 4.00 | 1 | 3,250,000 | 0.3 | |||||
| 4.01 - 74.36 | 8 | 33,231,942 | 3.4 | |||||
| Total: | 100 | $963,724,520 | 100.0 | % | ||||
| Weighted Average: | 2.07x | |||||||
| LOAN PURPOSE | ||||||||
| Loan Purpose | Number of Mortgage Loans | Aggregate Cut- off Date Balance | % of Cut-off Date Pool Balance | |||||
| Refinance | 70 | $598,342,199 | 62.1 | % | ||||
| Acquisition | 29 | 363,953,802 | 37.8 | |||||
| Recapitalization | 1 | 1,428,519 | 0.1 | |||||
| Total: | 100 | $963,724,520 | 100.0 | % | ||||
| MORTGAGE RATE | ||||||||
| Range of Mortgage Rates (%) | Number of Mortgage Loans | Aggregate Cut- off Date Balance | % of Cut-off Date Pool Balance | |||||
| 3.665 - 3.750 | 1 | $94,630,972 | 9.8 | % | ||||
| 3.751 - 4.000 | 8 | 39,957,038 | 4.1 | |||||
| 4.001 - 4.250 | 5 | 29,507,670 | 3.1 | |||||
| 4.251 - 4.500 | 14 | 111,103,597 | 11.5 | |||||
| 4.501 - 4.750 | 35 | 445,922,988 | 46.3 | |||||
| 4.751 - 5.000 | 16 | 156,851,608 | 16.3 | |||||
| 5.001 - 5.250 | 16 | 52,465,350 | 5.4 | |||||
| 5.251 - 5.500 | 4 | 26,280,222 | 2.7 | |||||
| 5.501 - 5.733 | 1 | 7,005,075 | 0.7 | |||||
| Total: | 100 | $963,724,520 | 100.0 | % | ||||
| Weighted Average: | 4.555% | |||||||
| UNDERWRITTEN NOI DEBT YIELD | ||||||||
| Range of U/W NOI Debt Yields (%) | Number of Mortgage Loans | Aggregate Cut- off Date Balance | % of Cut-off Date Pool Balance | |||||
| 7.9 - 8.0 | 2 | $12,550,000 | 1.3 | % | ||||
| 8.1 - 9.0 | 15 | 209,655,371 | 21.8 | |||||
| 9.1 - 10.0 | 26 | 221,116,126 | 22.9 | |||||
| 10.1 - 11.0 | 14 | 162,845,998 | 16.9 | |||||
| 11.1 - 12.0 | 5 | 35,588,326 | 3.7 | |||||
| 12.1 - 13.0 | 3 | 22,478,519 | 2.3 | |||||
| 13.1 - 14.0 | 6 | 31,087,704 | 3.2 | |||||
| 14.1 - 15.0 | 6 | 143,198,881 | 14.9 | |||||
| 15.1 - 16.0 | 6 | 37,897,051 | 3.9 | |||||
| 16.1 - 17.0 | 2 | 17,462,377 | 1.8 | |||||
| 17.1 - 18.0 | 4 | 19,962,525 | 2.1 | |||||
| 19.1 - 20.0 | 1 | 3,418,719 | 0.4 | |||||
| 20.1 - 433.8 | 10 | 46,462,924 | 4.8 | |||||
| Total: | 100 | $963,724,520 | 100.0 | % | ||||
| Weighted Average: | 13.4% | |||||||
| UNDERWRITTEN NCF DEBT YIELD | ||||||||
| Range of U/W NCF Debt Yields (%) | Number of Mortgage Loans | Aggregate Cut- off Date Balance | % of Cut-off Date Pool Balance | |||||
| 7.7 - 8.0 | 7 | $81,876,340 | 8.5 | % | ||||
| 8.1 - 9.0 | 23 | 272,358,876 | 28.3 | |||||
| 9.1 - 10.0 | 23 | 240,880,316 | 25.0 | |||||
| 10.1 - 11.0 | 9 | 46,640,289 | 4.8 | |||||
| 11.1 - 12.0 | 5 | 60,978,086 | 6.3 | |||||
| 12.1 - 13.0 | 8 | 48,327,701 | 5.0 | |||||
| 13.1 - 14.0 | 7 | 118,915,950 | 12.3 | |||||
| 14.1 - 15.0 | 2 | 9,924,438 | 1.0 | |||||
| 15.1 - 16.0 | 3 | 20,660,981 | 2.1 | |||||
| 16.1 - 17.0 | 1 | 13,978,357 | 1.5 | |||||
| 17.1 - 18.0 | 2 | 9,282,525 | 1.0 | |||||
| 18.1 - 19.0 | 1 | 3,418,719 | 0.4 | |||||
| 20.1 - 433.8 | 9 | 36,481,942 | 3.8 | |||||
| Total: | 100 | $963,724,520 | 100.0 | % | ||||
| Weighted Average: | 12.5% | |||||||
| (1) | For mortgaged properties securing residential cooperative mortgage loans, the debt service coverage ratio or debt yield for each such mortgaged property is calculated using underwritten net cash flow for the related residential cooperative property which is the projected net cash flow reflected in the most recent appraisal obtained by or otherwise in the possession of the related mortgage loan seller as of the cut-off date and the loan-to-value ratio is calculated based upon the appraised value of the residential cooperative property determined as if such residential cooperative property is operated as a residential cooperative. The debt service coverage ratio, debt yield and loan-to-value information do not take into account any subordinate debt (whether or not secured by the mortgaged property), that is allowed under the terms of any mortgage loan. With respect to the 40 Wall Street and Somerset Park Apartments mortgage loans, each which are part of a loan combination, loan-to-value ratio, debt service coverage ratio and debt yield calculations include the relatedpari passu companion loans (unless otherwise stated). See Annex A-1 to the Free Writing Prospectus. Prepayment provisions for each mortgage loan reflects the entire life of the loan (from origination to maturity or ARD). |
THE INFORMATION IN THIS STRUCTURAL AND COLLATERAL TERM SHEET IS NOT COMPLETE AND MAY BE AMENDED PRIOR TO THE TIME OF SALE. THIS TERM SHEET IS NOT AN OFFER TO SELL THESE SECURITIES AND IT IS NOT A SOLICITATION OF AN OFFER TO BUY THESE SECURITIES IN ANY JURISDICTION WHERE THE OFFER OR SALE IS NOT PERMITTED.
| 16 |
| Wells Fargo Commercial Mortgage Trust 2015-LC22 | Characteristics of the Mortgage Pool |
| ORIGINAL TERM TO MATURITY OR ARD | ||||||||
| Original Terms to Maturity or ARD (months) | Number of Mortgage Loans | Aggregate Cut- off Date Balance | % of Cut-off Date Pool Balance | |||||
| 60 | 3 | $21,457,471 | 2.2 | % | ||||
| 85 - 120 | 97 | 942,267,049 | 97.8 | |||||
| Total: | 100 | $963,724,520 | 100.0 | % | ||||
| Weighted Average: | 119 months | |||||||
| REMAINING TERM TO MATURITY OR ARD | ||||||||
| Range of Remaining Terms to Maturity or ARD (months) | Number of Mortgage Loans | Aggregate Cut- off Date Balance | % of Cut-off Date Pool Balance | |||||
| 57 - 84 | 3 | $21,457,471 | 2.2 | % | ||||
| 85 - 120 | 97 | 942,267,049 | 97.8 | |||||
| Total: | 100 | $963,724,520 | 100.0 | % | ||||
| Weighted Average: | 118 months | |||||||
| ORIGINAL AMORTIZATION TERM(2) | ||||||||
| Range of Original Amortization Terms (months) | Number of Mortgage Loans | Aggregate Cut- off Date Balance | % of Cut-off Date Pool Balance | |||||
| Non-Amortizing | 11 | $115,283,650 | 12.0 | % | ||||
| 240 | 3 | 11,224,931 | 1.2 | |||||
| 241 - 300 | 15 | 189,069,603 | 19.6 | |||||
| 301 - 360 | 70 | 645,946,336 | 67.0 | |||||
| 421 - 480 | 1 | 2,200,000 | 0.2 | |||||
| Total: | 100 | $963,724,520 | 100.0 | % | ||||
| Weighted Average(3): | 345 months | |||||||
| (2) | The original amortization term shown for any mortgage loan that is interest-only for part of its term does not include the number of months in its interest-only period and reflects only the number of months as of the commencement of amortization remaining from the end of such interest-only period. |
| (3) | Excludes the non-amortizing mortgage loans. |
| REMAINING AMORTIZATION TERM(4) | ||||||||
| Range of Remaining Amortization Terms (months) | Number of Mortgage Loans | Aggregate Cut- off Date Balance | % of Cut-off Date Pool Balance | |||||
| Non-Amortizing | 11 | $115,283,650 | 12.0 | % | ||||
| 238 - 240 | 3 | 11,224,931 | 1.2 | |||||
| 241 - 300 | 15 | 189,069,603 | 19.6 | |||||
| 301 - 360 | 70 | 645,946,336 | 67.0 | |||||
| 421 - 480 | 1 | 2,200,000 | 0.2 | |||||
| Total: | 100 | $963,724,520 | 100.0 | % | ||||
| Weighted Average(5): | 345 months | |||||||
| (4) | The remaining amortization term shown for any mortgage loan that is interest-only for part of its term does not include the number of months in its interest-only period and reflects only the number of months as of the commencement of amortization remaining from the end of such interest-only period. |
| (5) | Excludes the non-amortizing mortgage loans. |
| LOCKBOXES | ||||||||
| Type of Lockbox | Number of Mortgage Loans | Aggregate Cut- off Date Balance | % of Cut-off Date Pool Balance | |||||
| Springing (Without Established Account) | 43 | $448,072,249 | 46.5 | % | ||||
| Hard/Upfront Cash Management | 12 | 243,047,675 | 25.2 | |||||
| None | 23 | 112,596,205 | 11.7 | |||||
| Hard/Springing Cash Management | 15 | 95,992,447 | 10.0 | |||||
| Soft/Springing Cash Management | 4 | 36,704,433 | 3.8 | |||||
| Soft/Upfront Cash Management | 2 | 19,483,176 | 2.0 | |||||
| Springing (With Established Account) | 1 | 7,828,334 | 0.8 | |||||
| Total: | 100 | $963,724,520 | 100.0 | % | ||||
| PREPAYMENT PROVISION SUMMARY | ||||||||
| Prepayment Provision | Number of Mortgage Loans | Aggregate Cut- off Date Balance | % of Cut-off Date Pool Balance | |||||
| Lockout/Defeasance/Open | 73 | $798,564,744 | 82.9 | % | ||||
| Lockout/GTR YM or 1%/Open | 7 | 97,370,137 | 10.1 | |||||
| GTR YM or 1%/1%/Open | 10 | 40,775,989 | 4.2 | |||||
| YM/YM or Def/Open | 7 | 15,113,650 | 1.6 | |||||
| Lockout/GTR YM or 1% or Def/Open | 3 | 11,900,000 | 1.2 | |||||
| Total: | 100 | $963,724,520 | 100.0 | % | ||||
| CUT-OFF DATE LOAN-TO-VALUE RATIO | ||||||||
| Range of Cut-off Date LTV Ratios (%) | Number of Mortgage Loans | Aggregate Cut- off Date Balance | % of Cut-off Date Pool Balance | |||||
| 1.2 - 20.0 | 6 | $12,034,982 | 1.2 | % | ||||
| 20.1 - 25.0 | 2 | 7,185,439 | 0.7 | |||||
| 25.1 - 30.0 | 1 | 94,630,972 | 9.8 | |||||
| 30.1 - 35.0 | 4 | 29,962,766 | 3.1 | |||||
| 40.1 - 45.0 | 2 | 24,230,981 | 2.5 | |||||
| 45.1 - 50.0 | 2 | 17,428,163 | 1.8 | |||||
| 50.1 - 55.0 | 3 | 31,167,226 | 3.2 | |||||
| 55.1 - 60.0 | 13 | 85,461,468 | 8.9 | |||||
| 60.1 - 65.0 | 14 | 61,564,006 | 6.4 | |||||
| 65.1 - 70.0 | 23 | 133,065,706 | 13.8 | |||||
| 70.1 - 75.0 | 29 | 457,992,811 | 47.5 | |||||
| 75.1 - 77.3 | 1 | 9,000,000 | 0.9 | |||||
| Total: | 100 | $963,724,520 | 100.0 | % | ||||
| Weighted Average | 61.7% | |||||||
| BALLOON OR ARD LOAN-TO-VALUE RATIO | ||||||||
| Range of Balloon or ARD LTV Ratios (%) | Number of Mortgage Loans | Aggregate Cut- off Date Balance | % of Cut-off Date Pool Balance | |||||
| 0.8 - 20.0 | 7 | $14,231,942 | 1.5 | % | ||||
| 20.1 - 25.0 | 4 | 107,332,217 | 11.1 | |||||
| 25.1 - 30.0 | 2 | 22,250,000 | 2.3 | |||||
| 30.1 - 35.0 | 2 | 15,980,981 | 1.7 | |||||
| 35.1 - 40.0 | 5 | 46,878,838 | 4.9 | |||||
| 40.1 - 45.0 | 4 | 26,696,555 | 2.8 | |||||
| 45.1 - 50.0 | 11 | 70,069,276 | 7.3 | |||||
| 50.1 - 55.0 | 12 | 69,286,536 | 7.2 | |||||
| 55.1 - 60.0 | 14 | 69,875,037 | 7.3 | |||||
| 60.1 - 65.0 | 23 | 198,629,070 | 20.6 | |||||
| 65.1 - 70.0 | 14 | 242,319,068 | 25.1 | |||||
| 70.1 - 72.1 | 2 | 80,175,000 | 8.3 | |||||
| Total: | 100 | $963,724,520 | 100.0 | % | ||||
| Weighted Average | 53.7% | |||||||
| AMORTIZATION TYPE | ||||||||
| Type of Amortization | Number of Mortgage Loans | Aggregate Cut- off Date Balance | % of Cut-off Date Pool Balance | |||||
| Interest-only, Amortizing Balloon | 36 | $486,760,075 | 50.5 | % | ||||
| Amortizing Balloon | 53 | 361,680,795 | 37.5 | |||||
| Interest-only, Balloon | 4 | 100,170,000 | 10.4 | |||||
| Interest-only, ARD | 7 | 15,113,650 | 1.6 | |||||
| Total: | 100 | $963,724,520 | 100.0 | % | ||||
| ORIGINAL TERM OF INTEREST-ONLY PERIOD FOR PARTIAL IO LOANS | ||||||||
| IO Term (months) | Number of Mortgage Loans | Aggregate Cut- off Date Balance | % of Cut-off Date Pool Balance | |||||
| 12 | 4 | $13,685,000 | 1.4 | % | ||||
| 18 | 1 | 7,005,075 | 0.7 | |||||
| 24 | 10 | 136,700,000 | 14.2 | |||||
| 36 | 10 | 111,300,000 | 11.5 | |||||
| 48 | 2 | 41,700,000 | 4.3 | |||||
| 60 | 9 | 176,370,000 | 18.3 | |||||
| Total: | 36 | $486,760,075 | 50.5 | % | ||||
| Weighted Average | 41 months | |||||||
| SEASONING | ||||||||
| Seasoning (months) | Number of Mortgage Loans | Aggregate Cut- off Date Balance | % of Cut-off Date Pool Balance | |||||
| 0 | 35 | $330,263,150 | 34.3 | % | ||||
| 1 | 43 | 333,836,846 | 34.6 | |||||
| 2 | 16 | 260,121,003 | 27.0 | |||||
| 3 | 5 | 35,893,521 | 3.7 | |||||
| 4 | 1 | 3,610,000 | 0.4 | |||||
| Total: | 100 | $963,724,520 | 100.0 | % | ||||
| Weighted Average | 1 month | |||||||
THE INFORMATION IN THIS STRUCTURAL AND COLLATERAL TERM SHEET IS NOT COMPLETE AND MAY BE AMENDED PRIOR TO THE TIME OF SALE. THIS TERM SHEET IS NOT AN OFFER TO SELL THESE SECURITIES AND IT IS NOT A SOLICITATION OF AN OFFER TO BUY THESE SECURITIES IN ANY JURISDICTION WHERE THE OFFER OR SALE IS NOT PERMITTED.
| 17 |
Wells Fargo Commercial Mortgage Trust 2015-LC22 | Certain Terms and Conditions |
V. Certain Terms and Conditions
| Interest Entitlements: | The interest entitlement of each Class of Offered Certificates on each Distribution Date generally will be the interest accrued during the related Interest Accrual Period on the related Certificate Principal Balance or Notional Amount at the related pass-through rate, net of any prepayment interest shortfalls allocated to that Class for such Distribution Date as described below. If prepayment interest shortfalls arise from voluntary prepayments (without applicable Special Servicer consent) on particular non-specially serviced mortgage loans during any collection period, the applicable Master Servicer is required to make a compensating interest payment to offset those shortfalls, generally up to an amount equal to the portion of its master servicing fees that accrue at 0.25 basis pointsper annum. The remaining amount of prepayment interest shortfalls will be allocated to reduce the interest entitlement on all Classes of Certificates (other than the Class X-A, X-B, X-E, X-F and X-G Certificates),pro rata, based on their respective amounts of accrued interest for the related Distribution Date (except with respect to the allocation among the Class A-S, B, C and PEX Certificates as described below under “Allocations and Distributions on the Class A-S, B, C and PEX Certificates”). If a Class receives less than the entirety of its interest entitlement on any Distribution Date, then the shortfall, excluding any shortfall due to prepayment interest shortfalls, will be added to its interest entitlement for the next succeeding Distribution Date. Interest entitlements on the Class E and D Certificates and the Class C and B regular interests, in that order, may be reduced by certain Trust Advisor expenses (subject to the discussion below under “Allocations and Distributions on the Class A-S, B, C and PEX Certificates”). |
| Principal Distribution Amount: | The Principal Distribution Amount for each Distribution Date generally will be the aggregate amount of principal received or advanced in respect of the mortgage loans, net of any non-recoverable advances and interest thereon that are reimbursed to the applicable Master Servicer, the applicable Special Servicer or the Trustee during the related collection period. Non-recoverable advances and interest thereon are reimbursable from principal collections and advances before reimbursement from other amounts. The Principal Distribution Amount may also be reduced, with a corresponding loss, to the Class E and D Certificates and the Class C, B and A-S regular interests, then to the Class A-1, A-2, A-3, A-4 and A-SB Certificates and Class A-4FX regular interest (with any losses on the Class A-1, A-2, A-3, A-4 and A-SB Certificates and Class A-4FX regular interest allocatedpro rataaccording to their respective Certificate Principal Balances immediately prior to that Distribution Date), in that order, in connection with certain Trust Advisor expenses to the extent that interest entitlements on the Class B and C regular interests and the Class D and E Certificates are insufficient to absorb the effect of the expense on any particular Distribution Date. For a discussion on the allocation of amounts distributable in respect of the Class A-S, B and C regular interests, see “Allocations and Distributions on the Class A-S, B, C and PEX Certificates” below. |
| Distributions: | On each Distribution Date, funds available for distribution from the mortgage loans, net of specified trust fees, expenses and reimbursements will generally be distributed in the following amounts and order of priority (in each case to the extent of remaining available funds): |
| 1. Class A-1, A-2, A-3, A-4, A-SB, X-A, X-B, X-E, X-F and X-G Certificates and Class A-4FX regular interest: To interest on the Class A-1, A-2, A-3, A-4, A-SB, X-A, X-B, X-E, X-F and X-G Certificates and the Class A-4FX regular interest,pro rata, according to their respective interest entitlements. | |
| 2. Class A-1, A-2, A-3, A-4 and A-SB Certificates and Class A-4FX regular interest: To principal on the Class A-1, A-2, A-3, A-4 and A-SB Certificates and the Class A-4FX regular interest in the following amounts and order of priority: (i) first, to principal on the Class A-SB Certificates, in an amount up to the Principal Distribution Amount for such Distribution Date until their Certificate Principal Balance is reduced to the Class A-SB Planned Principal Balance for such Distribution Date; (ii) second, to principal on the Class A-1 Certificates until their Certificate Principal Balance is reduced to zero, up to the remainder of the Principal Distribution Amount for such Distribution Date; (iii) third, to principal on the Class A-2 Certificates until their Certificate Principal Balance is reduced to zero, up to the remainder of the Principal Distribution Amount for such Distribution Date; (iv) fourth, to principal on the Class A-3 Certificates until their Certificate Principal Balance is reduced to zero, up to the remainder of the Principal Distribution Amount for such Distribution Date; (v) fifth, on apro rata basis, to principal on the Class A-4 Certificates and the Class A-4FX regular interest until their respective Certificate Principal Balances are reduced to zero, up to the remainder of the Principal Distribution Amount for such Distribution Date; and (vi) sixth, to principal on the Class A-SB Certificates until their Certificate Principal Balance is reduced to zero, up to the remainder of the Principal Distribution Amount for such Distribution Date. However, if the Certificate Principal Balance of each and every Class of Principal Balance Certificates, other than the Class |
THE INFORMATION IN THIS STRUCTURAL AND COLLATERAL TERM SHEET IS NOT COMPLETE AND MAY BE AMENDED PRIOR TO THE TIME OF SALE. THIS TERM SHEET IS NOT AN OFFER TO SELL THESE SECURITIES AND IT IS NOT A SOLICITATION OF AN OFFER TO BUY THESE SECURITIES IN ANY JURISDICTION WHERE THE OFFER OR SALE IS NOT PERMITTED.
| 18 |
Wells Fargo Commercial Mortgage Trust 2015-LC22 | Certain Terms and Conditions |
A-1, A-2, A-3, A-4 and A-SB Certificates and the Class A-4FX regular interest, has been reduced to zero as a result of the allocation of Mortgage Loan losses and expenses and any of the Class A-1, A-2, A-3, A-4 and A-SB Certificates and Class A-4FX regular interest remains outstanding, then the Principal Distribution Amount will be distributed on the Class A-1, A-2, A-3, A-4 and A-SB Certificates and the Class A-4FX regular interest,pro rata, based on their respective outstanding Certificate Principal Balances, until their Certificate Principal Balances have been reduced to zero.
| |
3. Class A-1, A-2, A-3, A-4 and A-SB Certificates and Class A-4FX regular interest: To reimburse the holders of the Class A-1, A-2, A-3, A-4 and A-SB Certificates and the Class A-4FX regular interest,pro rata, for any previously unreimbursed losses (other than certain Trust Advisor expenses) on the mortgage loans that were previously allocated in reduction of the Certificate Principal Balances of such Classes.
| |
4. Class A-S regular interest: To make distributions on the Class A-S regular interest as follows: (a) first, to interest on Class A-S regular interest in the amount of the interest entitlement for that Class; (b) next, to the extent of the portion of the Principal Distribution Amount remaining after distributions in respect of principal to each Class with a higher distribution priority (in this case, the Class A-1, A-2, A-3, A-4 and A-SB Certificates and the Class A-4FX regular interest), to principal on the Class A-S regular interest until its principal balance is reduced to zero; and (c) next, to reimburse the holders of the Class A-S regular interest for any previously unreimbursed losses (other than certain Trust Advisor expenses) on the mortgage loans that were previously allocated to that Class in reduction of its principal balance.
5. Class B regular interest: To make distributions on the Class B regular interest as follows: (a) first, to interest on Class B regular interest in the amount of the interest entitlement for that Class; (b) next, to the extent of the portion of the Principal Distribution Amount remaining after distributions in respect of principal to each Class with a higher distribution priority (in this case, the Class A-1, A-2, A-3, A-4 and A-SB Certificates and the Class A-4FX and A-S regular interests), to principal on the Class B regular interest until its principal balance is reduced to zero; and (c) next, to reimburse the holders of the Class B regular interest for any previously unreimbursed losses (other than certain Trust Advisor expenses) on the mortgage loans that were previously allocated to that Class in reduction of its principal balance.
6. Class C regular interest: To make distributions on the Class C regular interest as follows: (a) first, to interest on Class C regular interest in the amount of the interest entitlement for that Class; (b) next, to the extent of the portion of the Principal Distribution Amount remaining after distributions in respect of principal to each Class with a higher distribution priority (in this case, the Class A-1, A-2, A-3, A-4 and A-SB Certificates and the Class A-4FX, A-S and B regular interests), to principal on the Class C regular interest until its principal balance is reduced to zero; and (c) next, to reimburse the holders of the Class C regular interest for any previously unreimbursed losses (other than certain Trust Advisor expenses) on the mortgage loans that were previously allocated to that Class in reduction of its principal balance.
| |
7. Class D Certificates: To make distributions on the Class D Certificates as follows: (a) first, to interest on Class D Certificates in the amount of the interest entitlement for that Class; (b) next, to the extent of the portion of the Principal Distribution Amount remaining after distributions in respect of principal to each Class with a higher distribution priority (in this case, the Class A-1, A-2, A-3, A-4 and A-SB Certificates and the Class A-4FX, A-S, B and C regular interests), to principal on the Class D Certificates until its principal balance is reduced to zero; and (c) next, to reimburse the holders of the Class D Certificates for any previously unreimbursed losses (other than certain Trust Advisor expenses) on the mortgage loans that were previously allocated to that Class in reduction of its principal balance.
| |
8. After the Class A-1, A-2, A-3, A-4 and A-SB Certificates, the Class A-4FX, A-S, B and C regular interests and the Class D Certificates are paid all amounts to which they are entitled, the remaining funds available for distribution will be used to pay interest, principal and loss reimbursement amounts (other than certain Trust Advisor expenses) on the Class E, F and G Certificates sequentially in that order in a manner analogous to the Class D Certificates.
| |
| Allocations and Distributions on the Class A-S, B, C and | On the closing date, the upper-tier REMIC of the issuing entity will issue the Class A-S, Class B and Class C regular interests (each a “regular interest”) which will have outstanding principal |
THE INFORMATION IN THIS STRUCTURAL AND COLLATERAL TERM SHEET IS NOT COMPLETE AND MAY BE AMENDED PRIOR TO THE TIME OF SALE. THIS TERM SHEET IS NOT AN OFFER TO SELL THESE SECURITIES AND IT IS NOT A SOLICITATION OF AN OFFER TO BUY THESE SECURITIES IN ANY JURISDICTION WHERE THE OFFER OR SALE IS NOT PERMITTED.
| 19 |
Wells Fargo Commercial Mortgage Trust 2015-LC22 | Certain Terms and Conditions |
| PEX Certificates: | balances on the closing date of $69,870,000, $56,619,000 and $42,162,000, respectively. The regular interests will be held in a grantor trust for the benefit of the holders of the Class A-S, B, C and PEX Certificates. The Class A-S, B, C and PEX Certificates will, at all times, represent undivided beneficial ownership interests in a grantor trust that will hold those regular interests. Each class of the Class A-S, B and C Certificates will, at all times, represent an undivided beneficial ownership interest in a percentage of the outstanding principal balance of the regular interest with the same alphabetical class designation. The Class PEX Certificates will, at all times, represent an undivided beneficial ownership interest in the remaining percentages of the outstanding principal balances of the Class A-S, B and C regular interests and which percentage interests are referred to in this Term Sheet as the “Class PEX Component A-S”, “Class PEX Component B” and “Class PEX Component C”, respectively (collectively, the “Class PEX Components”).
Interest, principal, prepayment premiums, yield maintenance charges and voting rights that are allocated to the Class A-S, B or C regular interest will be distributed or allocated, as applicable, as between the Class A-S, B or C Certificates, as applicable, on the one hand, and Class PEX Component A-S, Class PEX Component B or Class PEX Component C, as applicable (and correspondingly, the Class PEX Certificates), on the other hand,pro rata, based on their respective percentage interests in the Class A-S, Class B or Class C regular interest, as applicable. In addition, any losses (including, without limitation, as a result of Trust Advisor expenses) that are allocated to the Class A-S, Class B or Class C regular interest will correspondingly be allocated as between the Class A-S, B or C Certificates, as applicable, on the one hand, and Class PEX Component A-S, Class PEX Component B or Class PEX Component C, as applicable (and correspondingly, the Class PEX Certificates), on the other hand,pro rata, based on their respective percentage interests in the Class A-S, Class B or Class C regular interest, as applicable. For a complete description of the allocations and distributions with respect to the Class A-S regular interest, the Class B regular interest and the Class C regular interest (and correspondingly the Class A-S, B, C and PEX Certificates and the Class PEX Component A-S, Class PEX Component B and Class PEX Component C), see “Description of the Offered Certificates” in the Free Writing Prospectus. See “Material Federal Income Tax Consequences” in the Free Writing Prospectus for a discussion of the tax treatment of the Exchangeable Certificates. |
Exchanging Certificates through Combination and Recombination:
| If you own Class A-S, B and C Certificates, you will be able to exchange them for a proportionate interest in the Class PEX Certificates, and vice versa, as described in the Free Writing Prospectus. You can exchange your Exchangeable Certificates by notifying the Certificate Administrator. If Exchangeable Certificates are outstanding and held by certificateholders, those certificates will receive principal and interest that would otherwise have been payable on the same proportion of certificates exchanged therefor if those certificates were outstanding and held by certificateholders. Any such allocations of principal and interest between classes of Exchangeable Certificates will have no effect on the principal or interest entitlements of any other class of certificates. The Free Writing Prospectus describes the available combinations of Exchangeable Certificates eligible for exchange. |
THE INFORMATION IN THIS STRUCTURAL AND COLLATERAL TERM SHEET IS NOT COMPLETE AND MAY BE AMENDED PRIOR TO THE TIME OF SALE. THIS TERM SHEET IS NOT AN OFFER TO SELL THESE SECURITIES AND IT IS NOT A SOLICITATION OF AN OFFER TO BUY THESE SECURITIES IN ANY JURISDICTION WHERE THE OFFER OR SALE IS NOT PERMITTED.
| 20 |
Wells Fargo Commercial Mortgage Trust 2015-LC22 | Certain Terms and Conditions |
| Allocation of Yield Maintenance and Prepayment Premiums: | If any yield maintenance charge or prepayment premium is collected during any particular collection period with respect to any mortgage loan, then on the distribution date corresponding to that collection period, the certificate administrator will pay that yield maintenance charge or prepayment premium (net of liquidation fees payable therefrom) in the following manner: (1) to each of the Class A-1, A-2, A-3, A-4, A-SB and D Certificates and Class A-4FX, A-S, B and C regular interests, the product of (a) such yield maintenance charge or prepayment premium, (b) the related Base Interest Fraction (as defined in the Free Writing Prospectus) for such class or regular interest, and (c) a fraction, the numerator of which is equal to the amount of principal distributed to such class or regular interest for that distribution date, and the denominator of which is the total amount of principal distributed to all Principal Balance Certificates (other than the Class A-4FX and A-4FL Certificates and the Exchangeable Certificates) and the Class A-4FX, A-S, B and C regular interests for that distribution date, and (2) to the Class X-A Certificates, the excess, if any, of (a) the product of (i) such yield maintenance charge or prepayment premium and (ii) a fraction, the numerator of which is equal to the amount of principal distributed to the Class A-1, A-2, A-3, A-4, A-SB Certificates and Class A-4FX and A-S regular interest for that distribution date, and the denominator of which is the total amount of principal distributed to all Principal Balance Certificates (other than the Class A-4FX and A-4FL Certificates and the Exchangeable Certificates) and the Class A-4FX, A-S, B and C regular interests for that distribution date, over (b) the amount of such yield maintenance charge or prepayment premium distributed to the Class A-1, A-2, A-3, A-4, A-SB Certificates and Class A-4FX and A-S regular interests as described above, and (3) to the Class X-B Certificates, any remaining such yield maintenance charge or prepayment premium not distributed as described above. No prepayment premiums or yield maintenance charges will be distributed to the holders of the Class X-E, X-F, X-G, E, F, G, V or R Certificates. For a description of when prepayment premiums and yield maintenance charges are generally required on the mortgage loans, see Annex A-1 to the Free Writing Prospectus. See also “Risk Factors—Prepayments and Repurchases of the Mortgage Assets Will Affect the Timing of Your Cash Flow and May Affect Your Yield” in the prospectus attached to the Free Writing Prospectus. Prepayment premiums and yield maintenance charges will be distributed on each Distribution Date only to the extent they are actually received on the mortgage loans as of the related Determination Date. |
| Realized Losses: | The Certificate Principal Balances of the Class A-1, A-2, A-3, A-4, A-SB, D, E, F and G Certificates, and the Class A-4FX, A-S, B and C regular interests will be reduced without distribution on any Distribution Date as a write-off to the extent of any losses realized on the mortgage loans allocated to such Class or regular interest on such Distribution Date. Such losses (other than certain Trust Advisor expenses) will be applied in the following order, in each case until the related Certificate Principal Balance is reduced to zero: first, to Class G; second, to Class F; third, to Class E; fourth, to Class D; fifth, to Class C regular interest; sixth, to the Class B regular interest; seventh, to the Class A-S regular interest; and, finally,pro rata, to Classes A-1, A-2, A-3, A-4 and A-SB Certificates and the Class A-4FX regular interest based on their outstanding Certificate Principal Balances. Certain Trust Advisor expenses (if not absorbed by reductions of interest entitlements on the Class E and D Certificates and the Class C and B regular interests) will be applied as write-offs in a similar manner, except that such write-offs will be applied only to the Class E and D Certificates, the Class C, B and A-S regular interests, and the Class A-1, A-2, A-3, A-4 and A-SB Certificates and the Class A-4FX regular interest (with any write-offs on the Class A-1, A-2, A-3, A-4 and A-SB Certificates and the Class A-4FX regular interest to be allocatedpro rata according to their respective Certificate Principal Balances immediately prior to that Distribution Date), in that order. Any realized losses allocated to the Class A-S, B and C regular interests will, in turn, be allocated to the Class A-S, B, C and PEX Certificates as described above in “Allocations and Distributions on the Class A-S, B, C and PEX Certificates”.
The notional amount of the Class X-A Certificates will be reduced by the amount of all losses that are allocated to the Class A-1, A-2, A-3, A-4 or A-SB Certificates or the Class A-4FX or A-S regular interests as write-offs in reduction of their Certificate Principal Balances. The notional amount of the Class X-B Certificates will be reduced by the amount of all losses that are allocated to the Class B regular interest as write-offs in reduction of its Certificate Principal Balance. The notional amount of the Class X-E Certificates will be reduced by the amount of all losses that are allocated to the Class E Certificates as write-offs in reduction of its Certificate Principal Balance. The notional amount of the Class X-F Certificates will be reduced by the amount of all losses that are allocated to the Class F Certificates as write-offs in reduction of its Certificate Principal Balance. The notional amount of the Class X-G Certificates will be reduced by the amount of all losses that are allocated to the Class G Certificates as write-offs in reduction of its Certificate Principal Balance.
|
| Debt Service Advances: | The related Master Servicer or, if such Master Servicer fails to do so, the Trustee, will be obligated to advance delinquent debt service payments (other than balloon payments and default interest) and assumed debt service payments on the mortgage loans (including thepari passu mortgage loan but not its relatedpari passucompanion loans), except to the extent any such advance is deemed non-recoverable from collections on the related mortgage loan. In addition, if an |
THE INFORMATION IN THIS STRUCTURAL AND COLLATERAL TERM SHEET IS NOT COMPLETE AND MAY BE AMENDED PRIOR TO THE TIME OF SALE. THIS TERM SHEET IS NOT AN OFFER TO SELL THESE SECURITIES AND IT IS NOT A SOLICITATION OF AN OFFER TO BUY THESE SECURITIES IN ANY JURISDICTION WHERE THE OFFER OR SALE IS NOT PERMITTED.
| 21 |
Wells Fargo Commercial Mortgage Trust 2015-LC22 | Certain Terms and Conditions |
Appraisal Reduction Amount exists for a given mortgage loan, the interest portion of any debt service advance for such mortgage loan will be reduced, which will have the effect of reducing the amount of interest available for distribution to the Certificates in reverse alphabetical order of their Class designations (except that interest payments on the Class A-1, A-2, A-3, A-4, A-SB, X-A, X-B, X-E, X-F and X-G Certificates and the Class A-4FX regular interest would be affected on apari passu basis).
| |
| Servicing Advances: | The related Master Servicer or, if such Master Servicer fails to do so, the Trustee, will be obligated to make servicing advances with respect to each mortgage loan it services, including the payment of delinquent property taxes, insurance premiums and ground rent, except to the extent that those advances are deemed non-recoverable from collections on the related mortgage loan. The applicable Master Servicer will have the primary obligation to make any servicing advances with respect to the 40 Wall Street loan combination. The master servicer under the WFCM 2015-C30 securitization will have the primary obligation to make any servicing advances with respect to the Somerset Park Apartments loan combination.
|
Appraisal Reduction
| An Appraisal Reduction Amount generally will be created in the amount, if any, by which the principal balance of a required appraisal loan (which is a mortgage loan with respect to which certain defaults, modifications or insolvency events have occurred as further described in the Free Writing Prospectus) plus other amounts overdue or advanced in connection with such mortgage loan exceeds 90% of the appraised value of the related mortgaged property plus certain escrows and reserves (including letters of credit) held with respect to the mortgage loan.
A mortgage loan will cease to be a required appraisal loan when the same has ceased to be a specially serviced mortgage loan (if applicable), has been brought current for at least three consecutive months and no other circumstances exist that would cause such mortgage loan to be a required appraisal loan.
Appraisal Reduction Amounts will affect the amount of debt service advances on the related mortgage loan. Appraisal Reduction Amounts will also be taken into account in the determination of the identity of the Class whose majority constitutes the “majority subordinate certificateholder” and is entitled to appoint the subordinate class representative.
|
Clean-Up Call and Exchange
| On each Distribution Date occurring after the aggregate unpaid principal balance of the mortgage loans is reduced below 1% of the initial aggregate principal balance of the mortgage loans as of the Cut-off Date, certain specified persons will have the option to purchase all of the remaining mortgage loans (and the trust’s interest in all property acquired through exercise of remedies in respect of any mortgage loan) at the price specified in the Free Writing Prospectus. Exercise of the option will terminate the trust and retire the then-outstanding certificates.
If the aggregate Certificate Principal Balances of each of the Class A-1, A-2, A-3, A-4, A-SB, PEX and D Certificates and the Class A-4FX, A-S, B and C regular interests have been reduced to zero, the trust may also be terminated in connection with an exchange of all the then-outstanding certificates, for the mortgage loans and REO properties then remaining in the issuing entity, but all of the holders of those Classes of outstanding certificates would have to voluntarily participate in the exchange.
|
| Liquidation Loan Waterfall: | Following the liquidation of any loan or property, the net liquidation proceeds generally will be applied (after reimbursement of advances and certain trust fund expenses), first, as a recovery of accrued interest, other than delinquent interest that was not advanced as a result of Appraisal Reduction Amounts, second, as a recovery of principal until all principal has been recovered, and then as a recovery of delinquent interest that was not advanced as a result of Appraisal Reduction Amounts. Please see “Description of the Offered Certificates—Distributions—Application of Mortgage Loan Collections” in the Free Writing Prospectus.
|
| Majority Subordinate Certificateholder and Subordinate Class Representative: | A subordinate class representative may be appointed by the “majority subordinate certificate-holder”, which will be the holder(s) of a majority of: (a) during a “subordinate control period”, the most subordinate class among the Class F and G Certificates that has a Certificate Principal Balance, as notionally reduced by any Appraisal Reduction Amounts allocable to that class, that is at least equal to 25% of its total initial principal balance and (b) during a “collective consultation period”, the most subordinate class among the Class F and G Certificates that has a total principal balance, without regard to Appraisal Reduction Amounts, that is at least equal to 25% of its initial Certificate Principal Balance. The majority subordinate certificateholder will have a continuing right to appoint, remove or replace the subordinate class representative in its sole discretion. This right may be exercised at any time and from time to time. See “Servicing of the Mortgage Loans and Administration of the Trust Fund—The Majority Subordinate Certificateholder and the Subordinate Class Representative” in the Free Writing Prospectus.
|
| Control and Consultation: | The rights of various parties to replace each Special Servicer and approve or consult with respect |
THE INFORMATION IN THIS STRUCTURAL AND COLLATERAL TERM SHEET IS NOT COMPLETE AND MAY BE AMENDED PRIOR TO THE TIME OF SALE. THIS TERM SHEET IS NOT AN OFFER TO SELL THESE SECURITIES AND IT IS NOT A SOLICITATION OF AN OFFER TO BUY THESE SECURITIES IN ANY JURISDICTION WHERE THE OFFER OR SALE IS NOT PERMITTED.
| 22 |
Wells Fargo Commercial Mortgage Trust 2015-LC22 | Certain Terms and Conditions |
| to major actions of each Special Servicer will vary according to defined periods. A “subordinate control period” will exist as long as the Class F Certificates have a Certificate Principal Balance, net of any Appraisal Reduction Amounts allocable to that class, that is not less than 25% of the initial principal balance of that class (unless a senior consultation period is deemed to occur generally or with respect to a particular mortgage loan, pursuant to clause (ii) of the definition of “senior consultation period”). In general, during a subordinate control period, (i) the subordinate class representative will be entitled to grant or withhold approval of asset status reports prepared, and material servicing actions proposed, by either Special Servicer, and (ii) the majority subordinate certificateholder, or the subordinate class representative on its behalf, will be entitled to terminate and replace each Special Servicer with or without cause, and appoint itself or another person as the applicable successor special servicer (other than with respect to the Somerset Park Apartments loan combination). It will be a condition to such appointment that Fitch, Moody’s and Morningstar confirm that the appointment would not result in a qualification, downgrade or withdrawal of any of their then-current ratings of certificates. A “collective consultation period” will exist as long as the Class F Certificates have a Certificate Principal Balance that both (i) as notionally reduced by any Appraisal Reduction Amounts allocable to that class, is less than 25% of its initial principal balance and (ii) without regard to any Appraisal Reduction Amounts allocable to that class, is 25% or more of its initial Certificate Principal Balance (unless a senior consultation period is deemed to occur generally or with respect to a particular mortgage loan, pursuant to clause (ii) of the definition of “senior consultation period”). In general, during a collective consultation period, each Special Servicer will be required to consult with the Trust Advisor (in addition to the subordinate class representative, during a collective consultation period) in connection with asset status reports and material special servicing actions (other than with respect to the Somerset Park Apartments loan combination). A “senior consultation period” will exist as long as either (i) the Class F certificates have an aggregate principal balance, without regard to any Appraisal Reduction Amounts allocable to that class, that is less than 25% of its initial principal balance or (ii) during such time as the Class F certificates are the most subordinate class of control-eligible certificates that have a then outstanding principal balance, net of Appraisal Reduction Amounts, at least equal to 25% of its initial principal balance, the then-majority subordinate certificateholder has irrevocably waived its right to appoint a subordinate class representative and to exercise any of the rights of the majority subordinate certificateholder or cause the exercise of the rights of the subordinate class representative and such rights have not been reinstated to a successor majority subordinate certificateholder as set forth in the pooling and servicing agreement. In general, during a senior consultation period, each Special Servicer must seek to consult with the Trust Advisor in connection with asset status reports and material special servicing actions (other than with respect to the Somerset Park Apartments loan combination), and, in general, no subordinate class representative will be recognized or have any right to terminate either Special Servicer or approve, direct or consult with respect to servicing matters. With respect to the 40 Wall Street loan combination, the rights of the subordinate class representative described above will be subject to the consultation rights of the holder of a relatedpari passu companion loan described under “Loan Combinations” below.
Notwithstanding any contrary description set forth above, with respect to the 40 Wall Street mortgage loan, (a) the holder(s) of thepari passu companion loans in the related loan combination (including any subordinate class representative or special servicer under any securitization of any suchpari passu companion loans) will have consultation rights with respect to asset status reports and material servicing actions involving the related loan combination, as provided for in the related intercreditor agreement and as described in the Free Writing Prospectus, and those rights will be in addition to the rights of the subordinate class representative in this transaction described above; and (b) the existence of a subordinate control period, collective consultation period or senior consultation period under the WFCM 2015-LC22 pooling and servicing agreement will not limit the consultation rights of the holder(s) of the relatedpari passu companion loans.
Notwithstanding any contrary description set forth above, with respect to the Somerset Park Apartments mortgage loan, in general the related loan combination will be serviced under the WFCM 2015-C30 pooling and servicing agreement, which grants to the related subordinate class representative control rights that include the right to approve or disapprove various material servicing actions involving the related loan combination, but the subordinate class representative for this securitization will have the right to be consulted on a non-binding basis with respect to such actions. For purposes of the servicing of the Somerset Park Apartments loan combination, the occurrence and continuance of a collective consultation period or senior consultation period with respect to the subordinate class representative under this securitization will not limit the control or other rights of the subordinate class representative under the WFCM 2015-C30 securitization, but any collective consultation period or senior consultation period under the WFCM 2015-C30 securitization will operate to prevent the exercise of the consultation rights of the subordinate class representative hereof. In general, loan combination control rights also include the right, in certain circumstances, to direct the replacement of the applicable special servicer for |
THE INFORMATION IN THIS STRUCTURAL AND COLLATERAL TERM SHEET IS NOT COMPLETE AND MAY BE AMENDED PRIOR TO THE TIME OF SALE. THIS TERM SHEET IS NOT AN OFFER TO SELL THESE SECURITIES AND IT IS NOT A SOLICITATION OF AN OFFER TO BUY THESE SECURITIES IN ANY JURISDICTION WHERE THE OFFER OR SALE IS NOT PERMITTED.
| 23 |
Wells Fargo Commercial Mortgage Trust 2015-LC22 | Certain Terms and Conditions |
the related loan combination only.
| |
Notwithstanding any contrary description set forth above, in the event that, with respect to any mortgage loan, the majority subordinate certificateholder or the subordinate class representative is a borrower, a manager of a related mortgaged property, an affiliate of any borrower or manager of a related mortgaged property, or an agent, principal, partner, member, joint venturer, limited partner, employee, representative, director, trustee, advisor or investor in or of a borrower, a manager of the related mortgaged property or an affiliate of any borrower, the majority subordinate certificateholder and the subordinate class representative will have no right to receive asset status reports, to grant or withhold approval of, or consult with respect to, asset status reports prepared, and material servicing actions proposed, by the applicable Special Servicer, with respect to such mortgage loan.
| |
| Replacement of Special Servicer by General Vote of Certificateholders: | During any “collective consultation period” or “senior consultation period”, each Special Servicer may be terminated and replaced upon the affirmative direction of certificate owners holding not less than 75% of the appraisal-reduced voting rights of all certificates, following a proposal from certificate owners holding not less than 25% of the appraisal-reduced voting rights of all certificates. The certificateholders who initiate a vote on a termination and replacement of either Special Servicer without cause must cause Fitch, Moody’s and Morningstar to confirm the then-current ratings of the certificates (or decline to review the matter) and cause the payment of the fees and expenses incurred in the replacement. |
| Appraisal Remedy: | Solely for purposes of determining whether a “subordinate control period” is in effect, whenever either Special Servicer obtains an appraisal or updated appraisal under the pooling and servicing agreement, the subordinate class representative, with respect to the mortgage loans serviced by either Special Servicer will have the right (at its or their expense) to direct such Special Servicer to hire a qualified appraiser to prepare a second appraisal of the mortgaged property. The applicable Special Servicer must thereafter determine whether, based on its assessment of such second appraisal, any recalculation of the Appraisal Reduction Amount is warranted. The Appraisal Reduction Amount, whether based on the first or the second appraisal, will become effective following the second appraisal, except that the Appraisal Reduction Amount based on the first appraisal shall become effective if the subordinate class representative declines to demand a second appraisal within a specified number of business days, or if a second appraisal is not received within 90 days after the direction of the subordinate class representative. In addition, for the same purposes, if there is a material change in the mortgaged property securing any mortgage loan for which an Appraisal Reduction Amount has been calculated, the majority certificateholder of the Class F or G Certificates or other designated certificateholders will be entitled (at its expense) to present an additional appraisal to such Special Servicer, which will generally be required to recalculate the Appraisal Reduction Amount based upon such additional appraisal. This latter right may not be exercised more frequently than once in any 12-month period for each mortgage loan for which an Appraisal Reduction Amount was calculated and can only be exercised during a subordinate control period or a collective consultation period as further described in the Free Writing Prospectus.
|
| Sale of Defaulted Assets: | There will be no “fair value” purchase option. Instead, the pooling and servicing agreement will authorize each Special Servicer to sell defaulted mortgage loans serviced by such Special Servicer to the highest bidder in a manner generally similar to sales of REO properties. In the case of the 40 Wall Street mortgage loan, pursuant to the related intercreditor agreement and the pooling and servicing agreement, if the special servicer offers to sell to any person (or offers to purchase) for cash such mortgage loan during such time as the related loan combination constitutes a defaulted mortgage loan under the pooling and servicing agreement and related intercreditor agreement, then, in connection with any such sale, the special servicer is required to sell both the applicable mortgage loan and the relatedpari passucompanion loans as a single whole loan. The sale of a defaulted loan (other than the Somerset Park Apartments mortgage loan) for less than par plus accrued interest and certain other fees and expenses owed on the loan will be subject to consent or consultation rights of the subordinate class representative and/or Trust Advisor and, in the case of the 40 Wall Street loan combination, consultation rights of the holder(s) of the relatedpari passucompanion loans, as described in the Free Writing Prospectus.
In the case of the Somerset Park Apartments mortgage loan, pursuant to the related intercreditor agreement and the WFCM 2015-C30 pooling and servicing agreement, the WFCM 2015-C30 special servicer may offer to sell to any person (or may offer to purchase) for cash the related loan combination during such time as the relatedpari passucompanion loan constitutes a defaulted mortgage loan under the WFCM 2015-C30 pooling and servicing agreement, and, in connection with any such sale, the WFCM 2015-C30 special servicer is required to sell both the applicable mortgage loan and the relatedpari passucompanion loans as a whole loan. The subordinate class representative for this securitization will have consultation rights as the holder |
THE INFORMATION IN THIS STRUCTURAL AND COLLATERAL TERM SHEET IS NOT COMPLETE AND MAY BE AMENDED PRIOR TO THE TIME OF SALE. THIS TERM SHEET IS NOT AN OFFER TO SELL THESE SECURITIES AND IT IS NOT A SOLICITATION OF AN OFFER TO BUY THESE SECURITIES IN ANY JURISDICTION WHERE THE OFFER OR SALE IS NOT PERMITTED.
| 24 |
Wells Fargo Commercial Mortgage Trust 2015-LC22 | Certain Terms and Conditions |
of an interest in the relatedpari passumortgage loan, as described in the Free Writing Prospectus.
| |
“As-Is” Appraisals:
| Appraisals must be conducted on an “as-is” basis, and must be no more than 9 months old, for purposes of determining Appraisal Reduction Amounts, market value in connection with REO sales, etc. Required appraisals may consist of updates of prior appraisals. Internal valuations by the applicable Special Servicer are permitted if the principal balance of a mortgage loan is less than $2,000,000.
|
| Trust Advisor: | The Trust Advisor will perform certain review duties that will generally include a limited annual review of and report regarding each Special Servicer to the Certificate Administrator. The review and report generally will be based on: (a) during a collective consultation period or senior consultation period, any asset status reports and additional information delivered to the Trust Advisor by either Special Servicer with respect to any mortgage loan serviced by such Special Servicer, and/or (b) during a senior consultation period, in addition to the applicable information described above, a meeting with each Special Servicer to conduct a limited review of such Special Servicer’s operational practices on a platform basis in light of the servicing standard. In addition, during any collective consultation period, any senior consultation period or, (only with respect to any excluded loan), any subordinate control period, each Special Servicer must seek to consult with the Trust Advisor (in addition to the subordinate class representative during a collective consultation period) in connection with material special servicing actions with respect to specially serviced mortgage loans serviced by such Special Servicer. Furthermore, under certain circumstances, but only during a senior consultation period, the Trust Advisor may recommend the replacement of a Special Servicer, in which case the Certificate Administrator will deliver notice of such recommendation to the certificateholders, and certificateholders with specified percentages of the voting rights may direct the replacement of such Special Servicer at their expense.
The Trust Advisor may be removed and replaced without cause upon the affirmative direction of certificates owners holding not less than 75% of the appraisal-reduced voting rights of all certificates, following a proposal from certificate owners holding not less than 25% of the appraisal-reduced voting rights of all certificates. The certificateholders who initiate a vote on a termination and replacement of the Trust Advisor without cause must cause Fitch, Moody’s and Morningstar to confirm the then-current ratings of the certificates (or decline to review the matter) and cause the payment of the fees and expenses incurred in the replacement. During any “subordinate control period”, the proposed replacement trust advisor will be subject to the subordinate class representative’s consent (such consent not to be unreasonably withheld). If a proposed termination and replacement of the Trust Advisor is not consummated within 180 days following the initial request of the certificateholders who requested a vote, the proposed termination and replacement shall have no further force or effect. The Trust Advisor generally may be discharged from its duties if and when the Class A-1, A-2, A-3, A-4, A-4FL, A-4FX, A-SB, A-S, B, C, PEX, D and E Certificates are retired.
|
| Certain Fee Offsets: | If a workout fee is earned by either Special Servicer following a loan default with respect to any mortgage loan that it services, then certain limitations will apply to the collection and retention of a modification fee from the borrower. The modification fee generally must not exceed 1% of the principal balance of the loan as modified. In addition, if the loan re-defaults within a specified period of months and other conditions are satisfied, any subsequent workout or liquidation fee on that loan must be reduced by a portion of the previously-collected modification fee. Furthermore, workout fees, liquidation fees and modification fees collected with respect to any workout, liquidation and/or partial liquidation of a mortgage loan or loan combination that is serviced by a Special Servicer will be subject to an aggregate cap equal to the greater of (i) $1,000,000 and (ii) 1.00% of the stated principal balance of the subject mortgage loan or loan combination. |
| Deal Website: | The Certificate Administrator will be required to maintain a deal website which will include, among other items: (a) summaries of asset status reports prepared by each Special Servicer, (b) inspection reports, (c) appraisals, (d) various “special notices” described in the Free Writing Prospectus, (e) the “Investor Q&A Forum” and (f) a voluntary “Investor Registry”. Investors may access the deal website following execution of a certification and confidentiality agreement. |
| Initial Majority Subordinate Certificateholder: | It is expected that Rialto CMBS VI, LLC or an affiliate will be the initial majority subordinate certificateholder.
|
| Loan Combinations: | Each of the mortgaged properties identified on Annex A-1 to the Free Writing Prospectus as 40 Wall Street and Somerset Park Apartments secures both a mortgage loan to be included in the trust fund and one or more other mortgage loans that will not be included in the trust fund, which |
THE INFORMATION IN THIS STRUCTURAL AND COLLATERAL TERM SHEET IS NOT COMPLETE AND MAY BE AMENDED PRIOR TO THE TIME OF SALE. THIS TERM SHEET IS NOT AN OFFER TO SELL THESE SECURITIES AND IT IS NOT A SOLICITATION OF AN OFFER TO BUY THESE SECURITIES IN ANY JURISDICTION WHERE THE OFFER OR SALE IS NOT PERMITTED.
| 25 |
Wells Fargo Commercial Mortgage Trust 2015-LC22 | Certain Terms and Conditions |
will bepari passuin right of payment with the trust mortgage loan. The 40 Wall Street loan combination will be principally serviced under the pooling and servicing agreement. The Somerset Park Apartments loan combination will be principally serviced under the pooling and servicing agreement for the WFCM 2015-C30 securitization.
As of the closing date, thepari passu companion loans in such loan combinations will be held by the parties identified above under “IV. Characteristics of the Mortgage Pool—B. Summary ofPari Passu Loan Combinations”. |
THE INFORMATION IN THIS STRUCTURAL AND COLLATERAL TERM SHEET IS NOT COMPLETE AND MAY BE AMENDED PRIOR TO THE TIME OF SALE. THIS TERM SHEET IS NOT AN OFFER TO SELL THESE SECURITIES AND IT IS NOT A SOLICITATION OF AN OFFER TO BUY THESE SECURITIES IN ANY JURISDICTION WHERE THE OFFER OR SALE IS NOT PERMITTED.
| 26 |
(THIS PAGE INTENTIONALLY LEFT BLANK)
THE INFORMATION IN THIS STRUCTURAL AND COLLATERAL TERM SHEET IS NOT COMPLETE AND MAY BE AMENDED PRIOR TO THE TIME OF SALE. THIS TERM SHEET IS NOT AN OFFER TO SELL THESE SECURITIES AND IT IS NOT A SOLICITATION OF AN OFFER TO BUY THESE SECURITIES IN ANY JURISDICTION WHERE THE OFFER OR SALE IS NOT PERMITTED.
| 27 |
| 40 WALL STREET |

THE INFORMATION IN THIS STRUCTURAL AND COLLATERAL TERM SHEET IS NOT COMPLETE AND MAY BE AMENDED PRIOR TO THE TIME OF SALE. THIS TERM SHEET IS NOT AN OFFER TO SELL THESE SECURITIES AND IT IS NOT A SOLICITATION OF AN OFFER TO BUY THESE SECURITIES IN ANY JURISDICTION WHERE THE OFFER OR SALE IS NOT PERMITTED.
| 28 |
| 40 WALL STREET |

THE INFORMATION IN THIS STRUCTURAL AND COLLATERAL TERM SHEET IS NOT COMPLETE AND MAY BE AMENDED PRIOR TO THE TIME OF SALE. THIS TERM SHEET IS NOT AN OFFER TO SELL THESE SECURITIES AND IT IS NOT A SOLICITATION OF AN OFFER TO BUY THESE SECURITIES IN ANY JURISDICTION WHERE THE OFFER OR SALE IS NOT PERMITTED.
| 29 |
| No. 1 – 40 Wall Street | ||||||||
| Loan Information | Property Information | |||||||
| Mortgage Loan Seller: | Ladder Capital Finance LLC | Single Asset/Portfolio: | Single Asset | |||||
| Credit Assessment (Fitch/Moody’s/Morningstar): | BBB-/NR/AAA | Property Type: | Office | |||||
| Original Principal Balance(1): | $95,000,000 | Specific Property Type: | CBD | |||||
| Cut-off Date Principal Balance(1): | $94,630,972 | Location: | New York, NY | |||||
| % of Initial Pool Balance: | 9.8% | Size: | 1,165,207 SF | |||||
| Loan Purpose: | Refinance | Cut-off Date Principal Balance Per SF(1): | $136.78 | |||||
| Borrower Name: | 40 Wall Street LLC | Year Built/Renovated: | 1929/1995 | |||||
| Sponsor: | Donald J. Trump | Title Vesting: | Leasehold | |||||
| Mortgage Rate: | 3.665% | Property Manager: | Self-managed | |||||
| Note Date: | July 2, 2015 | 3rd Most Recent Occupancy (As of)(3): | 58.9% (12/31/2012) | |||||
| Anticipated Repayment Date: | NAP | 2nd Most Recent Occupancy (As of)(3): | 76.4% (12/31/2013) | |||||
| Maturity Date: | July 6, 2025 | Most Recent Occupancy (As of)(3): | 80.6% (12/31/2014) | |||||
| IO Period: | None | Current Occupancy (As of)(3): | 95.0% (5/19/2015) | |||||
| Loan Term (Original): | 120 months | |||||||
| Seasoning: | 2 months | Underwriting and Financial Information: | ||||||
| Amortization Term (Original): | 300 months | |||||||
| Loan Amortization Type: | Amortizing Balloon | 3rd Most Recent NOI (As of)(4): | $14,754,335 (12/30/2013) | |||||
| Interest Accrual Method: | Actual/360 | 2nd Most Recent NOI (As of)(4): | $10,685,306 (12/30/2014) | |||||
| Call Protection: | L(26),D(90),O(4) | Most Recent NOI (As of)(4): | $10,293,751 (TTM 3/31/2015) | |||||
| Lockbox Type: | Hard/Upfront Cash Management | |||||||
| Additional Debt(1): | Yes | |||||||
| Additional Debt Type(1): | Pari Passu | |||||||
| U/W Revenues: | $43,165,470 | |||||||
| U/W Expenses: | $20,600,765 | |||||||
| U/W NOI(4): | $22,564,706 | |||||||
| U/W NCF(4): | $20,800,023 | |||||||
| Escrows and Reserves(2): | U/W NOI DSCR(1): | 2.31x | ||||||
| U/W NCF DSCR(1): | 2.13x | |||||||
| Type: | Initial | Monthly | Cap (If Any) | U/W NOI Debt Yield(1): | 14.2% | |||
| Taxes | $1,515,525 | $505,175 | NAP | U/W NCF Debt Yield(1): | 13.1% | |||
| Insurance | $0 | Springing | NAP | As-Is Appraised Value: | $540,000,000 | |||
| Replacement Reserves | $0 | Springing | NAP | As-Is Appraisal Valuation Date: | June 1, 2015 | |||
| TI/LC Reserve | $0 | Springing | NAP | Cut-off Date LTV Ratio(1): | 29.5% | |||
| Ground Rent Reserve | $0 | Springing | NAP | LTV Ratio at Maturity or ARD(1): | 21.1% | |||
| (1) | The 40 Wall Street Loan Combination, totaling $160,000,000, is comprised of fourpari passunotes (Notes A-1-A, A-1-B, A-2 and A-3). The controlling Note A-1-A and non-controlling Note A-2 have an aggregate original balance of $95,000,000, have an aggregate outstanding principal balance of $94,630,972 as of the Cut-off Date and will be contributed to the WFCM 2015-LC22 Trust. The non-controlling Note A-3 had an original principal balance of $60,000,000 and was contributed to the COMM 2015-CCRE24 Trust. The non-controlling Note A-1-B had an original principal balance of $5,000,000 and will be initially held by Ladder Capital Finance LLC or an affiliate and is expected (but not required) to be contributed to a future securitization. All statistical information related to balances per square foot, loan-to-value ratios, debt service coverage ratios and debt yields are based on the 40 Wall Street Loan Combination. |
| (2) | See “Escrows” section. |
| (3) | See “Historical Occupancy” section. |
| (4) | See “Cash Flow Analysis” section. |
THE INFORMATION IN THIS STRUCTURAL AND COLLATERAL TERM SHEET IS NOT COMPLETE AND MAY BE AMENDED PRIOR TO THE TIME OF SALE. THIS TERM SHEET IS NOT AN OFFER TO SELL THESE SECURITIES AND IT IS NOT A SOLICITATION OF AN OFFER TO BUY THESE SECURITIES IN ANY JURISDICTION WHERE THE OFFER OR SALE IS NOT PERMITTED.
| 30 |
| 40 WALL STREET |
The Mortgage Loan.The mortgage loan is part of a loan combination (the “40 Wall Street Loan Combination”) that is evidenced by fourpari passu promissory notes (Notes A-1-A, A-1-B, A-2 and A-3) secured by a first mortgage encumbering the leasehold interest in an office building located in New York, New York (the “40 Wall Street Property”). The 40 Wall Street Loan Combination was originated on July 2, 2015 by Ladder Capital Finance I LLC. The 40 Wall Street Loan Combination had an original principal balance of $160,000,000, has an outstanding principal balance as of the Cut-off Date of $159,378,480 and accrues interest at an interest rate of 3.665%per annum. The 40 Wall Street Loan Combination had an initial term of 120 months, has a remaining term of 118 months as of the Cut-off Date and requires payments of principal and interest based on a 25-year amortization schedule. The 40 Wall Street Loan Combination matures on July 6, 2025. See “Description of the Mortgage Pool—Loan Combinations—The 40 Wall Street Loan Combination” in the Free Writing Prospectus.
The controlling Note A-1-A and non-controlling Note A-2, which will be contributed to the WFCM 2015-LC22 Trust, had an aggregate original principal balance of $95,000,000 and had an aggregate outstanding principal balance as of the Cut-off Date of $94,630,972. The non-controlling Note A-3, which had an original principal balance of $60,000,000, was contributed to the COMM 2015-CCRE24 Trust. The non-controlling Note A-1-B, which had an original principal balance of $5,000,000, will initially be held by Ladder Capital Finance LLC or an affiliate and is expected (but not required) to be contributed to a future securitization. The non-controlling Notes A-1-B and A-3 are referred to herein as the “40 Wall Street Companion Loans”.
Following the lockout period, the borrower has the right to defease the 40 Wall Street Loan Combination in whole, but not in part, on any date before April 6, 2025. In addition, the 40 Wall Street Loan Combination is prepayable without penalty on or after April 6, 2025.
Pari Passu Note Summary
| Original Balance | Cut-off Date Balance | Note Holder | Controlling Piece | ||
| Note A-1-A | $75,000,000 | $74,708,662 | WFCM 2015-LC22 | Yes | |
| Note A-1-B | $5,000,000 | $4,980,577 | LCF | No | |
| Note A-2 | $20,000,000 | $19,922,310 | WFCM 2015-LC22 | No | |
| Note A-3 | $60,000,000 | $59,766,930 | COMM 2015-CCRE24 | No | |
| Total | $160,000,000 | $159,378,480 |
Sources and Uses
| Sources | Uses | |||||||
| Original loan combination amount | $160,000,000 | 94.4% | Loan payoff | $160,331,517 | 94.6% | |||
| Sponsor’s new cash contribution | 9,514,109 | 5.6 | Reserves(1) | 2,330,751 | 1.4 | |||
| Closing costs | 6,851,841 | 4.0 | ||||||
| Total Sources | $169,514,109 | 100.0% | Total Uses | $169,514,109 | 100.0% |
| (1) | Reserves include a $815,226 payment reserve that has since been released |
The Property.The 40 Wall Street Property is a 63-story Class A, multi-tenant, office building that was constructed in 1929 and most recently renovated in 1995 with ongoing capital investment, including approximately $6.0 million between 2009 and 2014. The 40 Wall Street Property is located on Wall Street between Nassau Street and Williams Street. The 40 Wall Street Property totals 1,165,207 square feet and is comprised of 1,118,416 square feet of office space, 240 square feet of storage space and 46,551 square feet of retail space. Office floor plates at the 40 Wall Street Property range from 3,591 square feet to 38,828 square feet and offer views of Wall Street, downtown Manhattan and the New York Harbor. The 40 Wall Street Property has approximately 150 feet of frontage along Wall Street and 203 feet of frontage along Pine Street. Additionally, the 40 Wall Street Property is located within five blocks of the 2, 3, 4, 5, M, J, Z and R trains. The three largest tenants at the 40 Wall Street Property occupy a total of 21.2% of the net rentable area and account for 19.8% of U/W Base Rent. No other tenant at the 40 Wall Street Property occupies more than 6.0% of net rentable area or accounts for more than 5.5% of U/W Base Rent.
Approximately 8.9% of the net rentable area is occupied by four tenants rated at least Baa2 by Moody’s or BBB by S&P (“Investment Grade Tenants”), including Duane Reade, Telstra Inc., Euroclear Bank SA, and UBS Financial Services. Investment Grade Tenants have a weighted average remaining lease term of 11.5 years and all tenants (excluding month-to-month tenants) have a remaining lease term of approximately 12.7 years. As of May 19, 2015, the 40 Wall Street Property was 95.0% leased and the office space (91.5% of U/W Base Rent) was approximately 95.0% leased.
THE INFORMATION IN THIS STRUCTURAL AND COLLATERAL TERM SHEET IS NOT COMPLETE AND MAY BE AMENDED PRIOR TO THE TIME OF SALE. THIS TERM SHEET IS NOT AN OFFER TO SELL THESE SECURITIES AND IT IS NOT A SOLICITATION OF AN OFFER TO BUY THESE SECURITIES IN ANY JURISDICTION WHERE THE OFFER OR SALE IS NOT PERMITTED.
| 31 |
| 40 WALL STREET |
The following table presents certain information relating to the tenancy at the 40 Wall Street Property:
Major Tenants
| Tenant Name | Credit Rating (Fitch/Moody’s /S&P)(1) | Tenant NRSF | % of NRSF | Annual U/W Base Rent PSF(2) | Annual U/W Base Rent(2) | % of Total Annual U/W Base Rent | Lease Expiration Date |
| Major Tenants | |||||||
| Green Ivy | NR/NR/NR | 86,350 | 7.4% | $30.00 | $2,590,320 | 6.5% | 11/30/2061 |
| Countrywide Insurance Company | NR/NR/NR | 82,302 | 7.1% | $25.00 | $2,057,550 | 5.2% | 8/31/2021(3) |
| Duane Reade(4) | NR/Baa2/BBB | 77,810(4) | 6.7% | $40.93(5) | $3,184,403(5) | 8.0% | Various(4)(6) |
| Haks Engineering & Land Surveyors | NR/NR/NR | 69,916 | 6.0% | $30.80 | $2,153,747 | 5.4% | 3/31/2029(7) |
| Weidlinger Associates Inc | NR/NR/NR | 61,082 | 5.2% | $27.00 | $1,649,214 | 4.2% | 1/31/2033(8) |
| Total Major Tenants | 377,460 | 32.4% | $30.83 | $11,635,234 | 29.4% | ||
| Non-Major Tenants | 729,751 | 62.6% | $38.27 | $27,924,721 | 70.6% | ||
| Occupied Collateral Total | 1,107,211 | 95.0% | $35.73 | $39,559,955 | 100.0% | ||
| Vacant Space | 57,996 | 5.0% | |||||
| Collateral Total | 1,165,207 | 100.0% | |||||
| (1) | Certain ratings are those of the parent company whether or not the parent guarantees the lease. |
| (2) | Annual U/W Base Rent PSF and Annual U/W Base Rent include contractual rent steps through July 1, 2016 totaling $2,914,486. |
| (3) | Countrywide Insurance Company has two, five-year renewal options. |
| (4) | Duane Reade occupies 54,500 square feet of office space on the 21st and 22nd floors under a lease that commenced on October 1, 2012 and expires March 31, 2028 with a current underwritten rent of $29.78 per square foot. Duane Reade also occupies 23,310 square feet of retail space under a lease that commenced on July 6, 2011 and expires January 31, 2032 with a current underwritten rent of $67.00 per square foot. |
| (5) | The Annual U/W Base Rent PSF and Annual U/W Base Rent for Duane Reade represent the tenant’s average rent over the lease term. The tenant’s current average in-place rent is $36.43 per square foot or $2,834,250. |
| (6) | Duane Reade has the right to terminate the lease for its 54,500 square feet of office space effective March 31, 2018 with payment of a termination fee of $2,932,476 ($53.81 per square foot) and effective March 31, 2023 with payment of a termination fee of $535,917 ($9.83 per square foot). |
| (7) | Haks Engineering & Land Surveyors (“Haks”) has one, five-year renewal option. Additionally, Haks has a termination right effective March 1, 2024 with 12 months’ notice and payment of a termination fee of $2,110,746 ($30.19 per square foot). |
| (8) | Weidlinger Associates Inc (“Weidlinger”) has one, five-year renewal option. |
THE INFORMATION IN THIS STRUCTURAL AND COLLATERAL TERM SHEET IS NOT COMPLETE AND MAY BE AMENDED PRIOR TO THE TIME OF SALE. THIS TERM SHEET IS NOT AN OFFER TO SELL THESE SECURITIES AND IT IS NOT A SOLICITATION OF AN OFFER TO BUY THESE SECURITIES IN ANY JURISDICTION WHERE THE OFFER OR SALE IS NOT PERMITTED.
| 32 |
| 40 WALL STREET |
The following table presents certain information relating to the lease rollover schedule at the 40 Wall Street Property:
Lease Expiration Schedule(1)(2)
| Year Ending December 31, | No. of Leases Expiring | Expiring NRSF | % of Total NRSF | Cumulative Expiring NRSF | Cumulative % of Total NRSF | Annual U/W Base Rent | Annual U/W Base Rent PSF(3) | |||||||
| MTM | 1 | 1,900 | 0.2% | 1900 | 0.2% | $48,000 | $25.26 | |||||||
| 2015 | 0 | 0 | 0.0% | 1,900 | 0.2% | $0 | $0.00 | |||||||
| 2016 | 3 | 31,152 | 2.7% | 33,052 | 2.8% | $982,462 | $31.54 | |||||||
| 2017 | 8 | 77,838 | 6.7% | 110,890 | 9.5% | $3,054,550 | $39.24 | |||||||
| 2018 | 4 | 26,049 | 2.2% | 136,939 | 11.8% | $1,260,876 | $48.40 | |||||||
| 2019 | 1 | 5,433 | 0.5% | 142,372 | 12.2% | $222,318 | $40.92 | |||||||
| 2020 | 10 | 62,499 | 5.4% | 204,871 | 17.6% | $2,403,241 | $38.45 | |||||||
| 2021 | 5 | 107,752 | 9.2% | 312,623 | 26.8% | $3,002,784 | $27.87 | |||||||
| 2022 | 13 | 150653 | 12.9% | 463,276 | 39.8% | $5,013,978 | $33.28 | |||||||
| 2023 | 4 | 36,184 | 3.1% | 499,460 | 42.9% | $1,535,963 | $42.45 | |||||||
| 2024 | 2 | 8,786 | 0.8% | 508,246 | 43.6% | $354,653 | $40.37 | |||||||
| 2025 | 6 | 37,297 | 3.2% | 545,543 | 46.8% | $1,472,991 | $39.49 | |||||||
| Thereafter | 23 | 561,668 | 48.2% | 1,107,211 | 95.0% | $20,208,136 | $35.98 | |||||||
| Vacant | 0 | 57,996 | 5.0% | 1,165,207 | 100.0% | $0 | $0.00 | |||||||
| Total/Weighted Average | 80 | 1,165,207 | 100.0% | $39,559,955 | $35.73 |
| (1) | Information obtained from the underwritten rent roll. |
| (2) | Certain tenants may have lease termination or contraction options that are exercisable prior to the originally stated expiration date of the subject lease and that are not considered in the Lease Expiration Schedule. |
| (3) | Weighted Average Annual U/W Base Rent PSF excludes vacant space. |
The following table presents historical occupancy percentages at the 40 Wall Street Property:
Historical Occupancy
12/31/2012(1)(2) | 12/31/2013(1)(2) | 12/31/2014(1)(2)(3) | 5/19/2015(2)(3)(4) | |||
| 58.9% | 76.4% | 80.6% | 95.0% |
| (1) | Information obtained from the borrower. |
| (2) | The increase in occupancy from 2012 to 2013 Occupancy is due to 218,282 square feet from 10 new leases. The increase in occupancy from 2014 to 5/19/2015 is due to 145,740 square feet from 15 new leases, which will commence in 2015. |
| (3) | Information obtained from the underwritten rent roll. |
| (4) | Dean & DeLuca has signed a lease for 18,500 square feet space which is currently master leased by The Trump Corporation at the same rent until the landlord’s work is completed and Dean & DeLuca or another tenant reasonably acceptable to lender on similar economic terms as agreed with Dean & DeLuca commences payment of full, unabated rents. |
THE INFORMATION IN THIS STRUCTURAL AND COLLATERAL TERM SHEET IS NOT COMPLETE AND MAY BE AMENDED PRIOR TO THE TIME OF SALE. THIS TERM SHEET IS NOT AN OFFER TO SELL THESE SECURITIES AND IT IS NOT A SOLICITATION OF AN OFFER TO BUY THESE SECURITIES IN ANY JURISDICTION WHERE THE OFFER OR SALE IS NOT PERMITTED.
| 33 |
| 40 WALL STREET |
Operating History and Underwritten Net Cash Flow. The following table presents certain information relating to the historical operating performance and the underwritten net cash flow at the 40 Wall Street Property:
Cash Flow Analysis
| 2012 | 2013(1) | 2014(1) | TTM 3/31/2015(2) | U/W(2) | % of U/W Effective Gross Income | U/W $ per SF | |||||||||
| Base Rent | $22,916,462 | $28,462,549 | $26,125,497 | $26,040,716 | $39,559,955(3) | 91.6% | $33.95 | ||||||||
| Grossed Up Vacant Space | 0 | 0 | 0 | 0 | 2,789,925 | 6.5 | 2.39 | ||||||||
| Total Reimbursables | 2,709,593 | 1,712,481 | 644,801 | 352,596 | 436,932(4) | 1.0 | 0.37 | ||||||||
| Other Income | 2,376,014 | 2,804,827 | 2,833,531 | 2,764,084 | 3,168,584(4) | 7.3 | 2.72 | ||||||||
| Less Vacancy & Credit Loss | 0 | 0 | 0 | 0 | (2,789,925)(5) | (6.5) | (2.39) | ||||||||
| Effective Gross Income | $28,002,069 | $32,979,857 | $29,603,829 | $29,157,396 | $43,165,470 | 100.0% | $37.05 | ||||||||
| Total Operating Expenses | $19,117,824 | $18,225,522 | $18,918,523 | $18,863,645 | $20,600,765(4) | 47.7% | $17.68 | ||||||||
| Net Operating Income | $8,884,245 | $14,754,335 | $10,685,306 | $10,293,751 | $22,564,706 | 52.3% | $19.37 | ||||||||
| TI/LC | 0 | 0 | 0 | 0 | 1,473,381 | 3.4 | 1.26 | ||||||||
| Capital Expenditures | 0 | 0 | 0 | 0 | 291,302 | 0.7 | 0.25 | ||||||||
| Net Cash Flow | $8,884,245 | $14,754,335 | $10,685,306 | $10,293,751 | $20,800,023 | 48.2% | $17.85 | ||||||||
| NOI DSCR | 0.91x | 1.51x | 1.09x | 1.05x | 2.31x | ||||||||||
| NCF DSCR | 0.91x | 1.51x | 1.09x | 1.05x | 2.13x | ||||||||||
| NOI DY | 5.6% | 9.3% | 6.7% | 6.5% | 14.2% | ||||||||||
| NCF DY | 5.6% | 9.3% | 6.7% | 6.5% | 13.1% |
| (1) | The decline in Base Rent from 2013 to 2014 is due to free rent associated with10 new leases totaling218,282 square feet. |
| (2) | The increase in U/W Net Operating Income over TTM 3/31/2015 Net Operating Income is due in part to approximately $350,153 in straight line rents for investment grade tenants, $2,914,486 in underwritten contractual rent steps through July 2016, newly signed leases contributing approximately $3.5 million in U/W Base Rent and the expiration of approximately $6.5 million in free rent. |
| (3) | U/W Base Rent includes $2,914,486 of contractual rent increases through July 1, 2016 and $350,153 in straight line rent averaging for investment-grade rated tenants. |
| (4) | The increase in Total Reimbursables, Other Income and Total Operating Expenses from TTM 3/31/2015 to U/W is primarily due to the recent leasing activity noted in footnote (1) above. |
| (5) | The underwritten economic vacancy is 6.5%. The 40 Wall Street Property was 95.0% leased as of May 19, 2015. |
Appraisal. As of the appraisal valuation date of June 1, 2015, the 40 Wall Street Property had an “as-is” appraised value of $540,000,000.
Environmental Matters. According to a Phase I environmental site assessment dated June 3, 2015, there was no evidence of any recognized environmental conditions at the 40 Wall Street Property.
Market Overview and Competition.The 40 Wall Street Property is located in the downtown New York market within the Financial East office submarket. As of the first quarter of 2015, downtown Class A office inventory was comprised of approximately 52.8 million square feet of office space with a vacancy rate of 12.9% and downtown Class B office inventory was comprised of 26.8 million square feet of office space with a vacancy rate of 6.5%. Specifically, Class A office inventory within the Financial East office submarket was comprised of approximately 23.4 million square feet of office space with a vacancy rate of 11.8% and Class B office inventory within the Financial East submarket was comprised of 10.9 million square feet of office space with a vacancy rate of 6.5%. As of first quarter 2015, Class A and Class B Financial East office submarket rental rates were $55.88 per square foot gross and $43.27 per square foot gross, respectively. The appraiser analyzed a set of six directly competitive properties within the immediate competitive area of the 40 Wall Street Property and concluded an office market rental range of $40.00 to $57.50 per square foot gross (with expenses reimbursed by tenants over a base-year stop). Underwritten weighted average office rents at the 40 Wall Street Property are currently $35.73 per square foot gross, below the appraisal’s concluded office market rent for the 40 Wall Street Property of $47.41 per square foot gross.
THE INFORMATION IN THIS STRUCTURAL AND COLLATERAL TERM SHEET IS NOT COMPLETE AND MAY BE AMENDED PRIOR TO THE TIME OF SALE. THIS TERM SHEET IS NOT AN OFFER TO SELL THESE SECURITIES AND IT IS NOT A SOLICITATION OF AN OFFER TO BUY THESE SECURITIES IN ANY JURISDICTION WHERE THE OFFER OR SALE IS NOT PERMITTED.
| 34 |
| 40 WALL STREET |
The following table presents certain information relating to comparable properties to the 40 Wall Street Property:
Competitive Set(1)
40 Wall Street (Subject) | 14 Wall Street | 111 Broadway | 120 Broadway | 123 William Street | 100 Church Street | 233 Broadway | |
| Location | New York, NY | New York, NY | New York, NY | New York, NY | New York, NY | New York, NY | New York, NY |
| Distance from Subject | -- | 0.1 miles | 0.1 miles | 0.1 miles | 0.2 miles | 0.5 miles | 0.5 miles |
| Property Type | Office | Office | Office | Office | Office | Office | Office |
| Year Built/Renovated | 1929/1995 | 1912/NAV | 1905/1989 | 1915/NAV | 1957/NAV | 1958/2014 | 1913/2002 |
| Stories | 63 | 37 | 21 | 41 | 27 | 21 | 57 |
| Office GLA | 1,165,207 SF | 1,049,292 SF | 460,000 SF | 1,855,542 SF | 550,000 SF | 1,079,644 SF | 935,633 SF |
| Total Occupancy | 95% | 89% | 90% | 94% | 96% | 100% | 97% |
| (1) | Information obtained from the appraisal and a third party market research report. |
The Borrower.The borrower is 40 Wall Street LLC, a single purpose entity whose managing member has two independent directors. Legal counsel to the borrower delivered a non-consolidation opinion in connection with the origination of the 40 Wall Street Loan Combination. Donald J. Trump is the guarantor of certain nonrecourse carveouts and property expenses under the 40 Wall Street Loan Combination.
The Sponsor.The sponsor of the 40 Wall Street Loan Combination is Donald J. Trump.Through various ownership entities, Mr. Trump owns a 100% indirect interest in the borrower. Mr. Trump has over 40 years’ experience in the real estate industry. Mr. Trump’s developments include Trump Tower, located along Fifth Avenue, 40 Wall Street, Trump World Tower (located across from the United Nations in Manhattan), the Trump International Hotel & Tower on Central Park West in Manhattan, the 92-story Trump International Hotel & Tower in Chicago, and Trump Park Avenue (located at 59th Street and Park Avenue in Manhattan). Mr. Trump has also been involved in golf course developments, and he owns interests in the 1290 Avenue of the Americas office building in Manhattan and 555 California Street (formerly known as the Bank of America Tower) in San Francisco. See “Description of the Mortgage Pool-Default History, Bankruptcy Issues and Other Proceedings” in the Free Writing Prospectus.
Escrows.The loan documents provide for upfront reserves in the amount of $1,515,525 for real estate taxes, $1,430,115 for outstanding tenant improvements and leasing commissions, $137,500 for ground rent, and $8,000 for required repairs. The loan documents require monthly deposit reserves of $505,175 for real estate taxes, $74,826 for insurance premiums, $24,275 for replacement reserves, $122,066 for tenant improvements and leasing commissions, and $137,500 for ground rent.
In lieu of upfront and monthly deposits into the insurance, replacement, tenant improvements and leasing commissions, ground rent and required repair reserve accounts, the sponsor has provided a personal guaranty which is capped at $26,000,000 in the aggregate (except with respect to lease termination payments, ground lease payments, and insurance premiums, none of which are subject to the cap). Additionally, such guaranty covers approximately $6,950,875 in free rent.
Lockbox and Cash Management.The 40 Wall Street Loan Combination requires a lender-controlled lockbox account, which is already in place, and that the borrower direct tenants to pay their rents directly into such lockbox account. The loan documents also require that all rents received by the borrower or the property manager must be deposited within one business day of receipt into the lockbox account. Funds deposited into the lockbox account are required to be swept on a daily basis into a lender-controlled deposit account, where the funds are required to be disbursed in accordance with the loan agreement and cash management agreement. Upon a Sweep Event Period (as defined below), excess cash flow will be collected by the lender.
A “Sweep Event Period” will commence upon any of the following: (i) an event of default under the loan or management agreement or (ii) the amortizing debt service coverage ratio falling below 1.35x as of end of any calendar quarter. A Sweep Event Period will be cured, with regard to clause (i), upon the cure of such event of default or, if caused by an event of default under the management agreement, the replacement by the borrower of the manager in accordance with the loan documents, and with regard to clause (ii), upon the amortizing debt service coverage ratio being equal to or greater than 1.40x for two consecutive calendar quarters.
Property Management. The 40 Wall Street Property is managed by an affiliate of the borrower.
Assumption. The borrower has a one-time right to transfer the 40 Wall Street Property provided that certain conditions are satisfied, including (i) no event of default has occurred and is continuing; (ii) the transferee is a qualified transferee as described in the loan documents reasonably acceptable to the lender based upon, among other things, the lender reasonably determining that the proposed transferee and guarantor satisfy the lender’s credit review and proposed transferee and guarantor have an aggregate net worth and liquidity reasonably acceptable to the lender; (iii) the lender has received confirmation from Fitch, Moody’s and Morningstar that such assumption will not result in a downgrade, withdrawal or qualification of the respective ratings assigned to the Series 2015-LC22 Certificates and similar confirmations from each rating agency rating any securities backed by any 40 Wall Street Companion Loans with respect to the ratings of such securities, and (iv) transferee experience.
Partial Release. Not permitted.
THE INFORMATION IN THIS STRUCTURAL AND COLLATERAL TERM SHEET IS NOT COMPLETE AND MAY BE AMENDED PRIOR TO THE TIME OF SALE. THIS TERM SHEET IS NOT AN OFFER TO SELL THESE SECURITIES AND IT IS NOT A SOLICITATION OF AN OFFER TO BUY THESE SECURITIES IN ANY JURISDICTION WHERE THE OFFER OR SALE IS NOT PERMITTED.
| 35 |
| 40 WALL STREET |
Real Estate Substitution.Not permitted.
Subordinate and Mezzanine Indebtedness.Not permitted.
Ground Lease. The 40 Wall Street Property is subject to a ground lease with 40 Wall Street Holdings Corp. and New Scandic Wall Limited Partnership. The 40 Wall Street Property ground lease, dated November 30, 1995, expires on April 30, 2059 and has two consecutive renewal options. The first renewal option has a 67.5 year term expiring October 31, 2126. The second renewal option has an 80 year and two month term expiring December 31, 2206. The current annual ground rent payment for the 40 Wall Street Property ground lease is $1,650,000 through December 31, 2017. Effective January 1, 2018 the annual ground rent payment for the 40 Wall Street Property ground lease will be $1,815,000 through December 31, 2019. Effective January 1, 2020 the annual ground rent payment for the 40 Wall Street Property ground lease will be $2,315,000 through December 31, 2022. Effective January 1, 2023 the annual ground rent payment for the 40 Wall Street Property ground lease will be $2,546,500 through December 31, 2027. Effective January 1, 2028 the annual ground rent payment for the 40 Wall Street Property ground lease will be $2,801,150 through December 31, 2032. Effective January 1, 2033, the ground rent will reset through December 31, 2057 to the greater of (a) 6.0% of the value of the land (considered as vacant and unimproved, but with the right to construct a 900,000 square feet building for (i) office purposes and (ii) retail (A) where legally permissible on the ground floor and (B) elsewhere in the 40 Wall Street Property where it existed at any time during the 5 year period prior to the applicable date of valuation, and otherwise free and clear of all liens and encumbrances) or (b) 85.0% of the net rent payable in the immediately preceding 12-month period. The next adjustment is thereafter not scheduled to occur until January 1, 2058. The average annual ground lease rent payable over the loan term is $2,114,096.See “Description of the Mortgage Pool—Certain Terms of the Mortgage Loans—Encumbered Interests” in the Free Writing Prospectus.
Terrorism Insurance. The loan documents require that the “all risk” insurance policy required to be maintained by the borrower provides coverage for terrorism in an amount equal to the full replacement cost of the 40 Wall Street Property. The loan documents also require business interruption insurance covering no less than the 18-month period following the occurrence of a casualty event, together with a 12-month extended period of indemnity.
THE INFORMATION IN THIS STRUCTURAL AND COLLATERAL TERM SHEET IS NOT COMPLETE AND MAY BE AMENDED PRIOR TO THE TIME OF SALE. THIS TERM SHEET IS NOT AN OFFER TO SELL THESE SECURITIES AND IT IS NOT A SOLICITATION OF AN OFFER TO BUY THESE SECURITIES IN ANY JURISDICTION WHERE THE OFFER OR SALE IS NOT PERMITTED.
| 36 |
(THIS PAGE INTENTIONALLY LEFT BLANK)
THE INFORMATION IN THIS STRUCTURAL AND COLLATERAL TERM SHEET IS NOT COMPLETE AND MAY BE AMENDED PRIOR TO THE TIME OF SALE. THIS TERM SHEET IS NOT AN OFFER TO SELL THESE SECURITIES AND IT IS NOT A SOLICITATION OF AN OFFER TO BUY THESE SECURITIES IN ANY JURISDICTION WHERE THE OFFER OR SALE IS NOT PERMITTED.
| 37 |
| THE MEADOWS |

THE INFORMATION IN THIS STRUCTURAL AND COLLATERAL TERM SHEET IS NOT COMPLETE AND MAY BE AMENDED PRIOR TO THE TIME OF SALE. THIS TERM SHEET IS NOT AN OFFER TO SELL THESE SECURITIES AND IT IS NOT A SOLICITATION OF AN OFFER TO BUY THESE SECURITIES IN ANY JURISDICTION WHERE THE OFFER OR SALE IS NOT PERMITTED.
| 38 |
| THE MEADOWS |
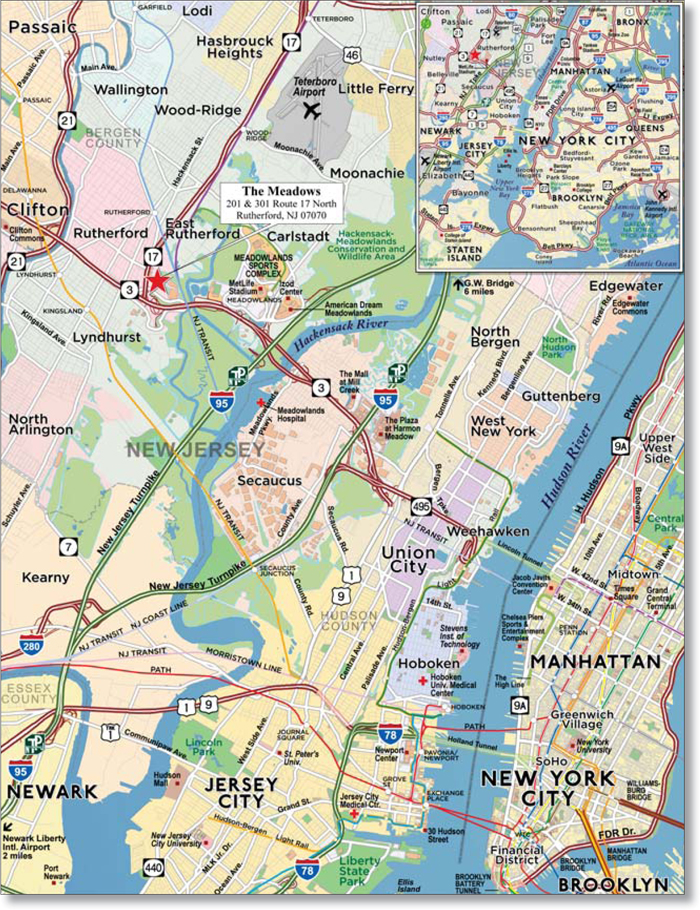
THE INFORMATION IN THIS STRUCTURAL AND COLLATERAL TERM SHEET IS NOT COMPLETE AND MAY BE AMENDED PRIOR TO THE TIME OF SALE. THIS TERM SHEET IS NOT AN OFFER TO SELL THESE SECURITIES AND IT IS NOT A SOLICITATION OF AN OFFER TO BUY THESE SECURITIES IN ANY JURISDICTION WHERE THE OFFER OR SALE IS NOT PERMITTED.
| 39 |
| No. 2 - The Meadows | |||||||
| Loan Information | Property Information | ||||||
| Mortgage Loan Seller: | Ladder Capital Finance LLC | Single Asset/Portfolio: | Single Asset | ||||
| Credit Assessment (Fitch/Moody’s/Morningstar): | NR/NR/NR | Property Type: | Office | ||||
| Original Principal Balance: | $92,000,000 | Specific Property Type: | Suburban | ||||
| Cut-off Date Principal Balance: | $92,000,000 | Location: | Rutherford, NJ | ||||
| % of Initial Pool Balance: | 9.5% | Size: | 603,680 SF | ||||
| Loan Purpose: | Acquisition | Cut-off Date Principal Balance Per SF: | $152.40 | ||||
| Borrower Name: | Meadows Landmark LLC | Year Built/Renovated(3): | 1981/2014 | ||||
| Sponsor: | Yisroel Gluck | Title Vesting: | Fee | ||||
| Mortgage Rate: | 4.582% | Property Manager: | Self-managed | ||||
| Note Date: | August 14, 2015 | 3rd Most Recent Occupancy (As of)(4): | 80.0% (12/31/2012) | ||||
| Anticipated Repayment Date: | NAP | 2nd Most Recent Occupancy (As of)(4): | 70.0% (12/31/2013) | ||||
| Maturity Date: | September 6, 2025 | Most Recent Occupancy (As of)(4): | 84.0% (12/31/2014) | ||||
| IO Period: | 60 months | Current Occupancy (As of)(4): | 91.2% (8/14/2015) | ||||
| Loan Term (Original): | 120 months | ||||||
| Seasoning: | 0 months | Underwriting and Financial Information: | |||||
| Amortization Term (Original): | 360 months | ||||||
| Loan Amortization Type: | Interest-only, Amortizing Balloon | 3rd Most Recent NOI (As of): | $4,327,984 (12/31/2013) | ||||
| Interest Accrual Method: | Actual/360 | 2nd Most Recent NOI (As of): | $5,028,541 (12/31/2014) | ||||
| Call Protection: | L(24),D(93),O(3) | Most Recent NOI (As of)(5): | $4,710,072 (TTM 6/30/2015) | ||||
| Lockbox Type: | Hard/Upfront Cash Management | ||||||
| Additional Debt(1): | Yes | U/W Revenues: | $16,311,018 | ||||
| Additional Debt Type(1): | Mezzanine | U/W Expenses: | $6,935,220 | ||||
| U/W NOI(5): | $9,375,797 | ||||||
| Escrows and Reserves(2): | U/W NCF(5): | $8,624,027 | |||||
| U/W NOI DSCR(1): | 1.66x | ||||||
| Type: | Initial | Monthly | Cap (If Any) | U/W NCF DSCR(1): | 1.53x | ||
| Taxes | $527,929 | $175,976 | NAP | U/W NOI Debt Yield(1): | 10.2% | ||
| Insurance | $37,255 | $12,418 | NAP | U/W NCF Debt Yield(1): | 9.4% | ||
| Replacement Reserves | $0 | $12,577 | NAP | As-Is Appraised Value: | $128,000,000 | ||
| TI/LC Reserve | $3,327,131 | $50,291 | NAP | As-Is Appraisal Valuation Date: | July 27, 2015 | ||
| Free Rent Reserve | $2,656,030 | $0 | NAP | Cut-off Date LTV Ratio(1): | 71.9% | ||
| Deferred Maintenance | $411,813 | $0 | NAP | LTV Ratio at Maturity or ARD(1): | 65.9% | ||
| (1) | See “Subordinate and Mezzanine Indebtedness” section. The equity interest in the borrower has been pledged to secure mezzanine indebtedness with an original principal balance of $12,000,000. All LTV, DSCR, debt yield and Cut-off Date Principal Balance Per SF numbers shown in the chart above are based solely on The Meadows Mortgage Loan. As of the Cut-off Date, the combined LTV Ratio is 81.3%, the combined underwritten NCF DSCR is 1.24x, and the combined underwritten NCF Debt Yield is 8.3%. |
| (2) | See “Escrows” section. |
| (3) | Originally constructed in two phases between 1981 and 1984. |
| (4) | See “Historical Occupancy” section. |
| (5) | See “Cash Flow Analysis” section. |
The Mortgage Loan. The mortgage loan ( “The Meadows Mortgage Loan”) is evidenced by a single promissory note that is secured by a first mortgage encumbering two Class A office buildings in Rutherford, New Jersey ( “The Meadows Property”). The Meadows Mortgage Loan was originated on August 14, 2015 by Ladder Capital Finance LLC. The Meadows Mortgage Loan had an original principal balance of $92,000,000, has an outstanding principal balance as of the Cut-off Date of $92,000,000 and accrues interest at an interest rate of 4.582%per annum. The Meadows Mortgage Loan had an initial term of 120 months, has a remaining term of 120 months as of the Cut-off Date and requires interest-only payments for the first 60 payments following origination and, thereafter, requires payments of principal and interest based on a 30-year amortization schedule. The Meadows Mortgage Loan matures on September 6, 2025.
Following the lockout period, the borrower has the right to defease The Meadows Mortgage Loan in whole, but not in part, on any payment date before July 6, 2025. In addition, The Meadows Mortgage Loan is prepayable without penalty on or after July 6, 2025.
THE INFORMATION IN THIS STRUCTURAL AND COLLATERAL TERM SHEET IS NOT COMPLETE AND MAY BE AMENDED PRIOR TO THE TIME OF SALE. THIS TERM SHEET IS NOT AN OFFER TO SELL THESE SECURITIES AND IT IS NOT A SOLICITATION OF AN OFFER TO BUY THESE SECURITIES IN ANY JURISDICTION WHERE THE OFFER OR SALE IS NOT PERMITTED.
| 40 |
| THE MEADOWS |
Sources and Uses
| Sources | Uses | |||||||
| Original loan amount | $92,000,000 | 68.2% | Purchase price | $125,200,000 | 92.9% | |||
| Mezzanine loan | 12,000,000 | 8.9 | Reserves | 6,960,157 | 5.2 | |||
| Sponsor’s new cash contribution | 27,202,010 | 20.2 | Closing costs | 2,668,983 | 2.0 | |||
| Seller Credits(1) | 3,627,130 | 2.7 | ||||||
| Total Sources | $134,829,140 | 100.0% | Total Uses | $134,829,140 | 100.0% |
| (1) | The seller provided credits of approximately $3.6 million for outstanding free rent, tenant improvements and leasing obligations. |
The Property. The Meadows Property is a 603,680 square foot class A office property comprised of two adjacent buildings, located on an 8.9-acre parcel in Rutherford, New Jersey. The Meadows Property is located in the Borough of Rutherford, immediately east of Route 17, north of Route 3 and two miles northwest of the Route 3/Interstate 95 interchange. The Meadows Property features floor plates of approximately 25,000 to 26,500 square feet, and each building is served by four elevators. Amenities offered at The Meadows Property include a cafeteria, conference center, fitness center with locker rooms, full time security patrols and an onsite daycare center. The Meadows Property was originally built in two phases between 1981 and 1984, and in 2014, the seller spent approximately $4.5 million to renovate The Meadows Property. The renovations included parking lot improvements, landscape improvements, garage repairs, common area improvements, elevator upgrades and roof replacement. The Meadows Property is located approximately 2.0 miles from the New Jersey Turnpike, 6.0 miles from the Lincoln Tunnel and 7.0 miles from the Garden State Parkway. The Meadows Property features 1,353 surface and structured parking spaces and 946 surface spaces located on two adjacent parcels through an easement agreement for a total of 2,299 parking spaces resulting in a parking ratio of 3.8 spaces per 1,000 rentable square feet. As of August 14, 2015, The Meadows Property was 91.2% leased.
The following table presents certain information relating to the tenancy at The Meadows Property:
Major Tenants
| Tenant Name | Credit Rating (Fitch/Moody’s/ S&P)(1) | Tenant NRSF | % of NRSF | Annual U/W Base Rent PSF(2) | Annual U/W Base Rent(2) | % of Total Annual U/W Base Rent | Lease Expiration Date | |||||||
| Major Tenants | ||||||||||||||
| Malo Consulting NJ, LLC(3) | NR/NR/NR | 85,668 | 14.2% | $30.24 | $2,590,630 | 16.8% | 5/31/2024 | |||||||
| Shiseido Americas Corp(4) | NR/A2/A- | 53,040 | 8.8% | $29.32(5) | $1,555,108(5) | 10.1% | 12/31/2026(6) | |||||||
| Sony Music Entertainment(7) | BB-/Ba1/BBB- | 53,040 | 8.8% | $27.37(8) | $1,451,669(8) | 9.4% | 9/30/2025(9) | |||||||
| SGS North America, INC. | NR/A3/NR | 36,920 | 6.1% | $25.47 | $940,352 | 6.1% | 3/31/2025 | |||||||
| Berkley Insurance Company | A/A2/A+ | 18,769 | 3.1% | $24.99 | $469,012 | 3.0% | 3/31/2025 | |||||||
| Total Major Tenants | 247,437 | 41.0% | $28.32 | $7,006,772 | 45.5% | |||||||||
| Non-Major Tenants | 303,294 | 50.2% | $27.67 | $8,392,044 | 54.5% | |||||||||
| Occupied Collateral Total | 550,731 | 91.2% | $27.96 | $15,398,817 | 100.0% | |||||||||
| Vacant Space | 52,949 | 8.8% | ||||||||||||
| Collateral Total | 603,680 | 100.0% | ||||||||||||
| (1) | Certain ratings are those of the parent company whether or not the parent guarantees the lease. |
| (2) | Annual U/W Base Rent PSF and Annual U/W Base Rent include contractual rent steps through June 2, 2016 totaling $165,794. |
| (3) | Malo Consulting NJ, LLC (“Malo”) has a rent credit of $6,247 through May 31, 2024. A reserve is in place for this rent abatement equal to 47 months of the rent abatement which will not be released until the last 47 months of the Malo lease term. |
| (4) | Shiseido Americas Corp (“Shiseido”) has two free rent periods that run from September 30, 2015 through May 31, 2016 and January 31, 2021 through May 31, 2021 with respect to expansion space. A reserve is in place for this rent abatement. |
| (5) | The Annual U/W Base Rent PSF and Annual U/W Base Rent for Shiseido represent the tenant’s average rent over its lease term. The tenant’s current in-place rent is $26.43 per square foot or $1,401,582. |
| (6) | Shiseido has the right to terminate upon 12 months’ notice on December 31, 2021. Under the terms of its lease, Shiseido must pay a termination fee in the amount of $2,304,206 multiplied by a fraction, the numerator of which is the rentable square feet of space on the Shiseido leased premises that is being terminated, and the denominator of which is 53,040 square feet. |
| (7) | Sony Music Entertainment (“Sony”) has two free rent periods. The first free rent period, for 39,200 square feet, runs from September 1, 2015 through September 30, 2015. The second free rent period, for 13,840 square feet, runs from September 1, 2015 through February 29, 2016. A reserve is in place for both rent abatements. |
| (8) | The Annual U/W Base Rent PSF and Annual U/W Base Rent for Sony represent the tenant’s average rent over its lease term. The tenant’s current in-place rent is $24.75 per square foot or $1,312,740. |
| (9) | Sony has the right to terminate 13,840 square feet of its currently leased premises on February 28, 2021 with 12 months’ notice and payment of a termination fee of $775,007. In addition, Sony has the right to terminate 39,200 square feet of its currently leased premises on September 30, 2022 with 12 months’ notice and payment of a termination fee of $1,096,013. |
THE INFORMATION IN THIS STRUCTURAL AND COLLATERAL TERM SHEET IS NOT COMPLETE AND MAY BE AMENDED PRIOR TO THE TIME OF SALE. THIS TERM SHEET IS NOT AN OFFER TO SELL THESE SECURITIES AND IT IS NOT A SOLICITATION OF AN OFFER TO BUY THESE SECURITIES IN ANY JURISDICTION WHERE THE OFFER OR SALE IS NOT PERMITTED.
| 41 |
| THE MEADOWS |
The following table presents certain information relating to the lease rollover schedule at The Meadows Property:
Lease Expiration Schedule(1)(2)
| Year Ending December 31, | No. of Leases Expiring | Expiring NRSF | % of Total NRSF | Cumulative Expiring NRSF | Cumulative % of Total NRSF | Annual U/W Base Rent | Annual U/W Base Rent PSF(3) | |||||||
| MTM | 8 | 23 | 0.0% | 23 | 0.0% | $2,500 | $108.70 | |||||||
| 2015 | 5 | 17,212 | 2.9% | 17,235 | 2.9% | $527,428 | $30.64 | |||||||
| 2016 | 6 | 28,930 | 4.8% | 46,165 | 7.6% | $698,076 | $24.13 | |||||||
| 2017 | 7 | 14,454 | 2.4% | 60,619 | 10.0% | $450,612 | $31.18 | |||||||
| 2018 | 8 | 45,126 | 7.5% | 105,745 | 17.5% | $1,324,554 | $29.35 | |||||||
| 2019 | 16 | 60,462 | 10.0% | 166,207 | 27.5% | $1,557,553 | $25.76 | |||||||
| 2020 | 9 | 44,887 | 7.4% | 211,094 | 35.0% | $1,216,127 | $27.09 | |||||||
| 2021 | 4 | 10,386 | 1.7% | 221,480 | 36.7% | $368,232 | $35.45 | |||||||
| 2022 | 0 | 0 | 0.0% | 221,480 | 36.7% | $0 | $0.00 | |||||||
| 2023 | 2 | 28,089 | 4.7% | 249,569 | 41.3% | $783,104 | $27.88 | |||||||
| 2024 | 11 | 100,675 | 16.7% | 350,244 | 58.0% | $2,990,716 | $29.71 | |||||||
| 2025 | 9 | 132,245 | 21.9% | 482,489 | 79.9% | $3,498,098 | $26.45 | |||||||
| Thereafter | 5 | 68,242 | 11.3% | 550,731 | 91.2% | $1,981,817 | $29.04 | |||||||
| Vacant | 0 | 52,949 | 8.8% | 603,680 | 100.0% | $0 | $0.00 | |||||||
| Total/Weighted Average | 90 | 603,680 | 100.0% | $15,398,817 | $27.96 |
| (1) | Information obtained from the underwritten rent roll. |
| (2) | Certain tenants may have lease termination options that are exercisable prior to the stated expiration date of the subject lease and that are not considered in the Lease Expiration Schedule. |
| (3) | Weighted Average Annual U/W Base Rent PSF excludes vacant space. |
The following table presents historical occupancy percentages at The Meadows Property:
Historical Occupancy
12/31/2012(1) | 12/31/2013(1) | 12/31/2014(1) | 8/14/2015(2)(3) | |||
| 80.0% | 70.0% | 84.0% | 91.2% |
| (1) | Information obtained from the borrower. |
| (2) | Information obtained from the underwritten rent roll. |
| (3) | The increase in occupancy from 12/31/2014 to 8/14/2015 is due to the execution of 11 new leases totaling 78,024 square feet representing 12.9% of the net rentable area. |
Operating History and Underwritten Net Cash Flow.The following table presents certain information relating to the historical operating performance and Underwritten Net Cash Flow at The Meadows Property:
Cash Flow Analysis
| 2013 | 2014 | TTM 6/30/2015(1) | U/W(1) | % of U/W Effective Gross Income | U/W $ per SF | ||||||||
| Base Rent | $9,326,517 | $10,194,777 | $9,851,366 | $15,398,817(2) | 94.4% | $25.51 | |||||||
| Grossed Up Vacant Space | 0 | 0 | 0 | 1,469,335 | 9.0 | 2.43 | |||||||
| Total Reimbursables | 1,003,549 | 1,005,537 | 1,368,773 | 1,006,609 | 6.2 | 1.67 | |||||||
| Other Income | 214,078 | 411,512 | 223,733 | 223,733 | 1.4 | 0.37 | |||||||
| Less Vacancy & Credit Loss | 0 | 0 | 0 | (1,787,476)(3) | (11.0) | (2.96) | |||||||
| Effective Gross Income | $10,544,144 | $11,611,826 | $11,443,872 | $16,311,018 | 100.0% | $27.02 | |||||||
| Total Operating Expenses | $6,216,160 | $6,583,285 | $6,733,800 | $6,935,220 | 42.5% | $11.49 | |||||||
| Net Operating Income | $4,327,984 | $5,028,541 | $4,710,072 | $9,375,797 | 57.5% | $15.53 | |||||||
| TI/LC | 0 | 0 | 0 | 600,850 | 3.7 | $1.00 | |||||||
| Capital Expenditures | 0 | 0 | 0 | 150,920 | 0.9 | $0.25 | |||||||
| Net Cash Flow | $4,327,984 | $5,028,541 | $4,710,072 | $8,624,027 | 52.9% | $14.29 | |||||||
| NOI DSCR | 0.77x | 0.89x | 0.83x | 1.66x | |||||||||
| NCF DSCR | 0.77x | 0.89x | 0.83x | 1.53x | |||||||||
| NOI DY | 4.7% | 5.5% | 5.1% | 10.2% | |||||||||
| NCF DY | 4.7% | 5.5% | 5.1% | 9.4% |
| (1) | The increase in Net Operating Income from TTM 6/30/2015 to U/W is due to: (i) $1.25 million in annual rent under new leases signed since June 30, 2015; (ii) $500,000 in partial year adjustments for leases signed between January and June 2015; (iii) the expiration of approximately $3.2 million in free rent; and (iv) the increases as described in footnote (2) below. |
| (2) | U/W Base Rent includes $165,794 of contractual rent steps through June 2, 2016 and $292,456 in straight line average rent increases for certain investment-grade tenants through the lease expiration date. |
| (3) | The underwritten economic vacancy is 10.0%. The Meadows Property was 91.2% physically leased as of August 14, 2015. |
THE INFORMATION IN THIS STRUCTURAL AND COLLATERAL TERM SHEET IS NOT COMPLETE AND MAY BE AMENDED PRIOR TO THE TIME OF SALE. THIS TERM SHEET IS NOT AN OFFER TO SELL THESE SECURITIES AND IT IS NOT A SOLICITATION OF AN OFFER TO BUY THESE SECURITIES IN ANY JURISDICTION WHERE THE OFFER OR SALE IS NOT PERMITTED.
| 42 |
| THE MEADOWS |
Appraisal.As of the appraisal valuation date of July 27, 2015, The Meadows Property had an “as-is” appraised value of $128,000,000.
Environmental Matters.According to a Phase I environmental assessment dated August 4, 2015, there was no evidence of any recognized environmental conditions at The Meadows Property.
Market Overview and Competition. The Meadows Property is located in Rutherford, Bergen County, New Jersey in the Meadowlands office submarket approximately 6 miles from the Lincoln Tunnel. The Meadows Property is located approximately 2 miles from the New Jersey Turnpike and 6 miles from the Garden State Parkway. According to the appraisal, Bergen County, which is part of Bergen-Hudson-Passaic metropolitan statistical area, had a 2015 estimated population of 934,529 and an unemployment rate of 5.3% as of March 2015. The unemployment rate of Bergen County is 150 basis points lower than the unemployment rate of the State of New Jersey and 10 basis points lower than the national unemployment rate. The 2015 estimated median household income within a one-mile radius of The Meadows Property was $79,901 while the 2015 estimated average household income within the same radius was $98,730.
According to the appraisal, as of the first quarter of 2015, the Meadowlands office submarket reported an inventory of 5.4 million square feet of office space with a vacancy of 22.5% and an average rental rate of $25.09 per square foot gross which compares to the Northern New Jersey office submarket inventory of 97.6 million square feet with a vacancy of 23.6% and an average rental rate of $25.31 per square foot gross. Overall, The Meadows Property’s competitive set consists of over 1.5 million square feet of class A office properties that report a weighted average occupancy of 91.9%, with the majority of the competitive set reporting occupancy levels in excess of 95.0%. The appraiser analyzed a set of five directly competitive properties within the immediate competitive area of The Meadows Property and concluded an office market rental range of $23.00 to $35.00 per square foot gross. The underwritten weighted average office rents for The Meadows Property was $27.96 per square foot gross, which is slightly above the appraisers concluded office market rent for The Meadows Property of $27.75 per square foot gross.
The following table presents certain information relating to comparable office properties for The Meadows Property:
Competitive Set(1)
| The Meadows (Subject) | Metropolitan Center | Park 80 West Plaza I | Park 80 West Plaza II | Glenpointe Centre East | Glenpointe Centre West | |||||||
| Location | Rutherford, NJ | East Rutherford, NJ | Saddle Brook, NJ | Saddle Brook, NJ | Teaneck, NJ | Teaneck, NJ | ||||||
| Distance from Subject | -- | 3.1 miles | 8.6 miles | 8.6 miles | 8.9 miles | 9.0 miles | ||||||
| Property Type | Office | Office | Office | Office | Office | Office | ||||||
| Year Built/Renovated | 1981/2014 | 1986/NAV | 1972/NAV | 1980/NAV | 1983/NAV | 1984/NAV | ||||||
| Number of Stories | 12 | 15 | 6 | 10 | 7 | 7 | ||||||
| Total NRA | 603,680 SF | 465,000 SF | 243,630 SF | 264,000SF | 240,000 SF | 330,000 SF | ||||||
| Total Occupancy | 91.2% | 100.0% | 57.0% | 97.0% | 97.0% | 99.0% |
| (1) | Information obtained from the appraisal. |
The Borrower.The borrower is Meadows Landmark LLC a single purpose entity with two independent directors. Legal counsel to the borrower delivered a non-consolidation opinion in connection with the origination of The Meadows Mortgage Loan. Yisroel Gluck is the guarantor of certain nonrecourse carveouts under The Meadows Mortgage Loan.
The Sponsor.The sponsor is Yisroel Gluck. Yisroel Gluck is the founder and president of American Landmark Properties, Ltd. (“ALP”). Mr. Gluck has over thirty years of experience specializing in acquisition, development, rehabilitation and financing of real estate. As a real estate entrepreneur, Mr. Gluck has concentrated primarily on the conception and implementation of rehabilitation and renovation programs for office/industrial properties. The most notable of ALP’s prior holdings was the 108-story Willis Tower in downtown Chicago, which was sold to Blackstone for $1.3 billion. See “Description of the Mortgage Pool-Default History, Bankruptcy Issues and Other Proceedings” in the Free Writing Prospectus.
Escrows.The loan documents provide for upfront reserves in the amount of $527,929 for real estate taxes, $37,255 for insurance premiums, $3,327,131 for unfunded tenant improvement and leasing commissions obligations as of origination, $2,656,030 for certain rent abatements and $411,813 for deferred maintenance. The loan documents also provide for ongoing monthly reserves in the amount of $175,976 for real estate taxes, $12,418 for insurance premiums, $12,577 for replacement reserves, and $50,291 for tenant improvements and leasing commissions.
Lockbox and Cash Management.The Meadows Mortgage Loan requires a lender-controlled lockbox account, which is already in place, and that the borrower direct tenants to pay their rents directly into such lockbox account. The loan documents also require that in the event the borrower or property manager receive any rents, such rents must, within one business day, be deposited into the lockbox account. Funds deposited into the lockbox account are required to be swept on a daily basis into a lender-controlled deposit account, where the funds are required to be disbursed in accordance with the loan agreement. During a Cash Sweep Event Period (as defined below), excess cash flow will be swept to a lender-controlled account and held as additional security for The Meadows Mortgage Loan.
A “Cash Sweep Event Period” will commence upon any of the following: (i) an event of default under the loan agreement; (ii) an event of default under the property management agreement; (iii) a Cash Sweep Significant Tenant Trigger Event (as defined below)
THE INFORMATION IN THIS STRUCTURAL AND COLLATERAL TERM SHEET IS NOT COMPLETE AND MAY BE AMENDED PRIOR TO THE TIME OF SALE. THIS TERM SHEET IS NOT AN OFFER TO SELL THESE SECURITIES AND IT IS NOT A SOLICITATION OF AN OFFER TO BUY THESE SECURITIES IN ANY JURISDICTION WHERE THE OFFER OR SALE IS NOT PERMITTED.
| 43 |
| THE MEADOWS |
or (iv) the amortizing debt service coverage ratio (including the aggregate amount of scheduled interest (and, if applicable, principal) payable under The Meadows Mezzanine Loan (as defined below)) falls below 1.10x as of any date of determination by the lender. A Cash Sweep Event Period will be cured: with regard to clause (i) or (ii), upon the cure of such event of default; with regard to clause (iii), upon a Cash Sweep Significant Tenant Trigger Event Cure (as defined below); and with regard to clause (iv), upon the amortizing combined debt service coverage ratio being equal to or greater than 1.15x for two consecutive calendar quarters.
A “Cash Sweep Significant Tenant Trigger Event” occurs upon the date (i) on which any Significant Tenant (Malo Consulting, Sony, Shiseido or a tenant which leases more than 10% of the net rentable square footage or constitutes more than 10% of the total annual rents) (a) vacates, surrenders or ceases to conduct its normal business operations at its demised premises or otherwise “goes dark” or (b) gives the borrower or the property manager notice of intent to vacate, surrender or cease to conduct its normal business operations at its demised premises or otherwise “go dark”, (ii) on which any Significant Tenant (or such Significant Tenant’s parent company) becomes insolvent or a debtor in any bankruptcy action or (iii) that is twelve months prior to the expiration date of the lease for any Significant Tenant.
A “Cash Sweep Significant Tenant Trigger Event Cure” will occur on: with regard to (i)(a) above, the date on which (a)(1) the applicable Significant Tenant has reopened for business and paid full, unabated rent under its lease for one calendar quarter, and (2) the borrower has delivered to the lender an estoppel certificate from the Significant Tenant certifying, among other things, the lease is in full force and effect, or (b) the delivery to and acceptance by lender of one or more replacement leases, in accordance with the loan agreement, where the tenant is in occupancy and paying full rent; with regard to (i)(b) above, the date on which (a) the applicable Significant Tenant has (1) irrevocably revoked or rescinded any such notice and (2) been open for business and conducted normal business operations at its demised premises and paid full, unabated rent under its lease, for two consecutive quarters following such revocation or rescission in each case, and (b) the borrower has delivered to the lender an estoppel certificate from the Significant Tenant certifying, among other things, that the lease is in full force and effect; with regard to (ii) above, the date on which the applicable Significant Tenant or Significant Tenant’s parent company becomes solvent to the lender’s satisfaction for two consecutive calendar quarters or is no longer a debtor in any bankruptcy, as applicable, and affirms its lease in bankruptcy court; and with regard to (iii) above, the date on which (a) the applicable Significant Tenant has irrevocably elected in writing to renew or extended its lease pursuant to its terms as to all of its demised premises and the borrower has delivered to the lender either an estoppel certificate from the Significant Tenant or other evidence sufficient to the lender’s satisfaction, in either event, confirming that (A) all of the obligations of the borrower, as landlord under such renewed or extended lease, have been completed and paid for, (B) any improvements described in such lease renewal or extension have been constructed in accordance therewith and have been accepted by such tenant, and (C) such tenant is not then entitled to any concession or rebate of rent or other charges from time to time due and payable under such lease, or (b) the delivery to and acceptance by the lender of one or more replacement leases, in accordance with the loan agreement, where the tenant is in occupancy and paying full rent.
Property Management.The Meadows Property is managed by an affiliate of the borrower.
Assumption.The borrower has the right to transfer The Meadows Property, provided that no event of default has occurred and is continuing and certain other conditions are satisfied, including, but not limited to: (i) the lender’s reasonable determination that the proposed transferee and guarantor satisfy the lender’s credit review and underwriting standards, taking into consideration transferee’s experience, financial strength and general business standing; (ii) execution of a non-recourse carveout guaranty and an environmental indemnity by an affiliate of the transferee; (iii) transferee assuming all of the obligations of the borrower under the Mortgage Loan and (iv) rating agency confirmation from Fitch, Moody’s, and Morningstar that the transfer will not result in a downgrade, withdrawal or qualification of the respective ratings assigned to the Series 2015-LC22 Certificates.
Partial Release.Not permitted.
Real Estate Substitution.Not permitted.
Subordinate and Mezzanine Indebtedness.Meadows Mezzanine Finance, LLC (the “The Meadows Mezzanine Lender”) has made a $12,000,000 mezzanine loan (the “The Meadows Mezzanine Loan”) to Meadows Mezz LLC, a Delaware limited liability company that is the sole member of the borrower under The Meadows Mortgage Loan. The Meadows Mezzanine Loan accrues interest at an interest rate of 10.750%per annum and requires payments of interest only. The Meadows Mezzanine Loan matures on September 6, 2025. The rights of The Meadows Mezzanine Lender are further described under “Description of the Mortgage Pool–Subordinate and/or Other Financing–Existing (Secured Financing and Mezzanine and Similar Financing)” in the Free Writing Prospectus.
Ground Lease.None.
Terrorism Insurance.The loan documents require that the “all risk” insurance policy required to be maintained by the borrower provide coverage for terrorism in an amount equal to the full replacement cost of The Meadows Property. The loan documents also require business interruption insurance covering no less than the 18-month period following the occurrence of a casualty event, together with a 12-month extended period of indemnity.
THE INFORMATION IN THIS STRUCTURAL AND COLLATERAL TERM SHEET IS NOT COMPLETE AND MAY BE AMENDED PRIOR TO THE TIME OF SALE. THIS TERM SHEET IS NOT AN OFFER TO SELL THESE SECURITIES AND IT IS NOT A SOLICITATION OF AN OFFER TO BUY THESE SECURITIES IN ANY JURISDICTION WHERE THE OFFER OR SALE IS NOT PERMITTED.
| 44 |
(THIS PAGE INTENTIONALLY LEFT BLANK)
THE INFORMATION IN THIS STRUCTURAL AND COLLATERAL TERM SHEET IS NOT COMPLETE AND MAY BE AMENDED PRIOR TO THE TIME OF SALE. THIS TERM SHEET IS NOT AN OFFER TO SELL THESE SECURITIES AND IT IS NOT A SOLICITATION OF AN OFFER TO BUY THESE SECURITIES IN ANY JURISDICTION WHERE THE OFFER OR SALE IS NOT PERMITTED.
| 45 |
(THIS PAGE INTENTIONALLY LEFT BLANK)
THE INFORMATION IN THIS STRUCTURAL AND COLLATERAL TERM SHEET IS NOT COMPLETE AND MAY BE AMENDED PRIOR TO THE TIME OF SALE. THIS TERM SHEET IS NOT AN OFFER TO SELL THESE SECURITIES AND IT IS NOT A SOLICITATION OF AN OFFER TO BUY THESE SECURITIES IN ANY JURISDICTION WHERE THE OFFER OR SALE IS NOT PERMITTED.
| 46 |
| SOMERSET PARK APARTMENTS |
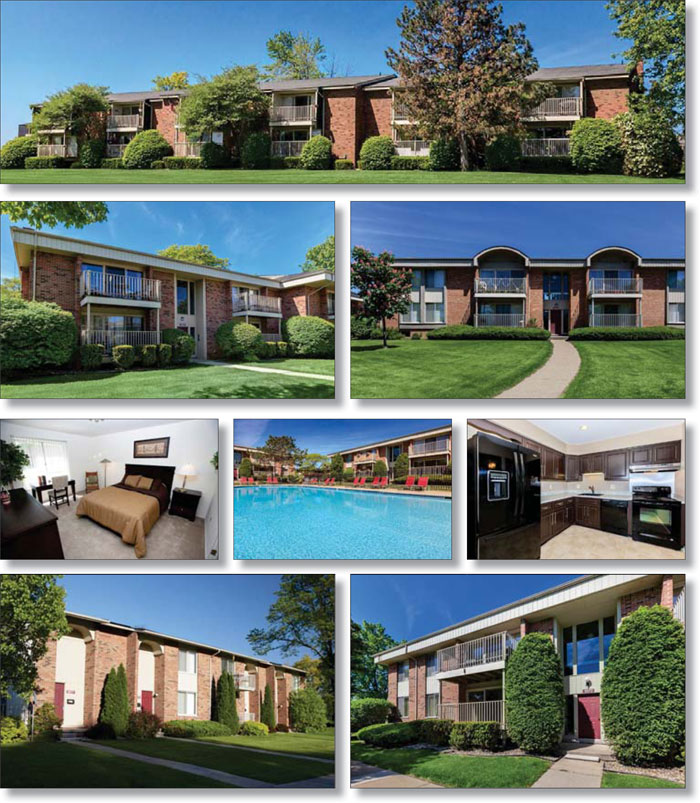
THE INFORMATION IN THIS STRUCTURAL AND COLLATERAL TERM SHEET IS NOT COMPLETE AND MAY BE AMENDED PRIOR TO THE TIME OF SALE. THIS TERM SHEET IS NOT AN OFFER TO SELL THESE SECURITIES AND IT IS NOT A SOLICITATION OF AN OFFER TO BUY THESE SECURITIES IN ANY JURISDICTION WHERE THE OFFER OR SALE IS NOT PERMITTED.
| 47 |
| SOMERSET PARK APARTMENTS |
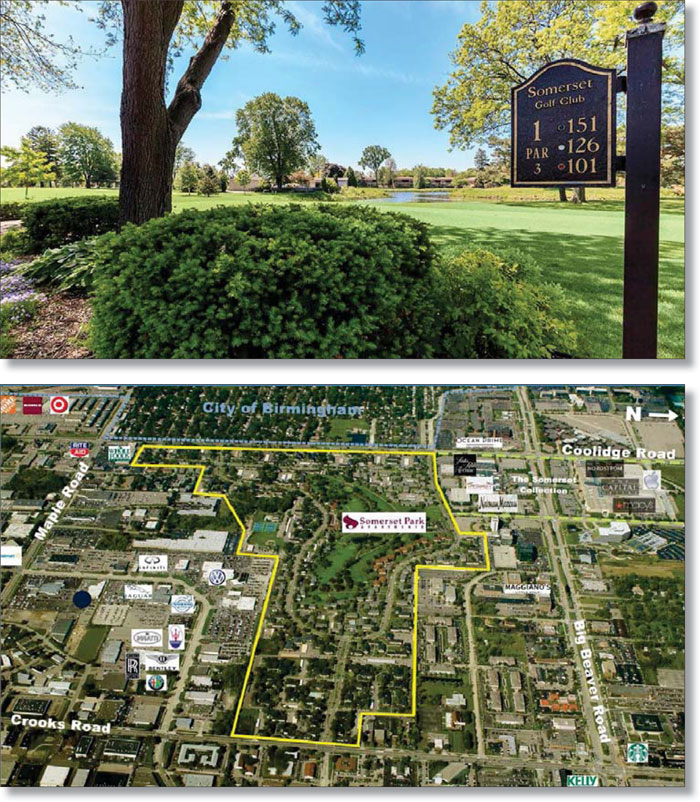
THE INFORMATION IN THIS STRUCTURAL AND COLLATERAL TERM SHEET IS NOT COMPLETE AND MAY BE AMENDED PRIOR TO THE TIME OF SALE. THIS TERM SHEET IS NOT AN OFFER TO SELL THESE SECURITIES AND IT IS NOT A SOLICITATION OF AN OFFER TO BUY THESE SECURITIES IN ANY JURISDICTION WHERE THE OFFER OR SALE IS NOT PERMITTED.
| 48 |
| SOMERSET PARK APARTMENTS |

THE INFORMATION IN THIS STRUCTURAL AND COLLATERAL TERM SHEET IS NOT COMPLETE AND MAY BE AMENDED PRIOR TO THE TIME OF SALE. THIS TERM SHEET IS NOT AN OFFER TO SELL THESE SECURITIES AND IT IS NOT A SOLICITATION OF AN OFFER TO BUY THESE SECURITIES IN ANY JURISDICTION WHERE THE OFFER OR SALE IS NOT PERMITTED.
| 49 |
| No. 3 – Somerset Park Apartments | |||||||
| Loan Information | Property Information | ||||||
| Mortgage Loan Seller: | Rialto Mortgage Finance, LLC | Single Asset/Portfolio: | Single Asset | ||||
Credit Assessment (Fitch/Moody’s/Morningstar): | NR/NR/NR | Property Type: | Multifamily | ||||
| Original Principal Balance(1): | $70,000,000 | Specific Property Type: | Garden | ||||
| Cut-off Date Principal Balance(1): | $70,000,000 | Location: | Troy, MI | ||||
| % of Initial Pool Balance: | 7.3% | Size: | 2,226 Units | ||||
| Loan Purpose: | Acquisition | Cut-off Date Principal Balance Per Unit(1): | $80,863 | ||||
| Borrower Names(2): | Various | Year Built/Renovated: | 1964/2015 | ||||
| Sponsors: | Marc S. Solomon; Mark S. Rosen | Title Vesting: | Fee | ||||
| Mortgage Rate: | 4.550% | Property Manager: | Self-managed | ||||
| Note Date: | June 30, 2015 | 3rdMost Recent Occupancy (As of): | 88.6% (12/31/2012) | ||||
| Anticipated Repayment Date: | NAP | 2ndMost Recent Occupancy (As of): | 85.2% (12/31/2013) | ||||
| Maturity Date: | July 6, 2025 | Most Recent Occupancy (As of): | 89.0% (12/31/2014) | ||||
| IO Period: | 120 months | Current Occupancy (As of): | 93.2% (8/11/2015) | ||||
| Loan Term (Original): | 120 months | ||||||
| Seasoning: | 2 months | Underwriting and Financial Information: | |||||
| Amortization Term (Original): | NAP | ||||||
| Loan Amortization Type: | Interest-only, Balloon | 3rdMost Recent NOI (As of): | $13,621,953 (12/31/2013) | ||||
| Interest Accrual Method: | Actual/360 | 2ndMost Recent NOI (As of): | $14,090,070 (12/31/2014) | ||||
| Call Protection: | L(26),D(87),O(7) | Most Recent NOI (As of): | $14,747,617 (TTM 5/31/2015) | ||||
| Lockbox Type: | Springing (Without Established Account) | ||||||
| Additional Debt(1): | Yes | U/W Revenues: | $24,789,739 | ||||
| Additional Debt Type(1): | Pari Passu;Future Mezzanine | U/W Expenses: | $9,759,082 | ||||
| U/W NOI: | $15,030,657 | ||||||
| U/W NCF: | $14,719,017 | ||||||
| U/W NOI DSCR(1): | 1.81x | ||||||
| Escrows and Reserves(3): | U/W NCF DSCR(1): | 1.77x | |||||
| U/W NOI Debt Yield(1): | 8.4% | ||||||
| Type: | Initial | Monthly | Cap (If Any) | U/W NCF Debt Yield(1): | 8.2% | ||
| Taxes | $672,715 | $106,780 | NAP | As-Stabilized Appraised Value(4): | $249,750,000 | ||
| Insurance | $0 | Springing | NAP | As-Stabilized Appraisal Valuation Date(4): | May 20, 2016 | ||
| Replacement Reserves | $26,500,000 | $46,375 | NAP | Cut-off Date LTV Ratio(1)(4): | 72.1% | ||
| Environmental Reserve | $1,875 | $0 | NAP | LTV Ratio at Maturity or ARD(1)(4): | 72.1% | ||
| (1) | The Somerset Park Apartments Loan Combination, totaling $180,000,000, is comprised of sixpari passu notes (Notes A-1-1, A-1-2, A-1-3, A-2-1, A-2-2 and A-2-3). The non-controlling Notes A-1-2 and A-2-2 had a combined original principal balance of $70,000,000, have a combined outstanding principal balance as of the Cut-Off Date of $70,000,000 and will be contributed to the WFCM 2015-LC22 Trust. The controlling Notes A-1-1 and A-2-1 have a combined original principal balance of $73,500,000 and were contributed to the WFCM 2015-C30 Trust. The remaining non-controlling Notes A-1-3 and A-2-3 had a combined original principal balance of $36,500,000, are currently held by Rialto Mortgage Finance, LLC and are expected to be contributed to a future trust or trusts. All statistical financial information related to the balances per unit, loan-to-value ratios, debt service coverage ratios and debt yields are based on the Somerset Park Apartments Loan Combination. |
| (2) | See “The Borrowers” section. |
| (3) | See “Escrows” section. |
| (4) | The As-Stabilized Appraised Value assumes the completion of $14.6 million of capital improvements as of May 20, 2016. An upfront replacement reserve of $26.5 million is in place. The appraiser concluded to an “as-is” appraised value of $227,500,000. The Cut-off Date LTV Ratio and LTV Ratio at Maturity based on the “as-is” value are both 79.1%. |
The Mortgage Loan. The mortgage loan is part of a loan combination (the “Somerset Park Apartments Loan Combination”) that is evidenced by sixpari passu promissory notes (the A-1-1, A-1-2, A-1-3, A-2-1, A-2-2 and A-2-3 notes) secured by a first mortgage encumbering a garden-style multifamily property located in Troy, Michigan (the “Somerset Park Apartments Property”). The Somerset Park Apartments Loan Combination was originated on June 30, 2015 by Rialto Mortgage Finance, LLC. The Somerset Park Apartments Loan Combination had an original principal balance of $180,000,000, has an outstanding principal balance as of the Cut-off Date of $180,000,000 and accrues interest at an interest rate of 4.550%per annum. The Somerset Park Apartments Loan Combination had an initial term of 120 months, has a remaining term of 118 months as of the Cut-off Date and requires payments of interest-only through the term of the Somerset Park Apartments Loan Combination. The Somerset Park Apartments Loan Combination matures on July 6, 2025.
The non-controlling Notes A-1-2 and A-2-2, which will be contributed to the WFCM 2015-LC22 Trust, had an aggregate original principal balance of $70,000,000, and have an aggregate outstanding balance as of the Cut-Off Date of $70,000,000. Notes A-1-1, A-1-3, A-2-1 and A-2-3 (the “Somerset Park Apartments Companion Loans”) are not included in the WFCM 2015-LC22 Trust. The controlling Notes A-1-1 and A-2-1, which were contributed to the WFCM 2015-C30 Trust, had an aggregate original principal balance
THE INFORMATION IN THIS STRUCTURAL AND COLLATERAL TERM SHEET IS NOT COMPLETE AND MAY BE AMENDED PRIOR TO THE TIME OF SALE. THIS TERM SHEET IS NOT AN OFFER TO SELL THESE SECURITIES AND IT IS NOT A SOLICITATION OF AN OFFER TO BUY THESE SECURITIES IN ANY JURISDICTION WHERE THE OFFER OR SALE IS NOT PERMITTED.
| 50 |
| SOMERSET PARK APARTMENTS |
of $73,500,000. The non-controlling Notes A-1-3 and A-2-3, which are currently held by Rialto Mortgage Finance, LLC and are expected to be contributed to a future trust or trusts, had an aggregate original principal balance of $36,500,000. See “Description of the Mortgage Pool – Loan Combinations-The Somerset Park Apartments Loan Combination” in the Free Writing Prospectus. The lender provides no assurances that each of the Notes A-1-3 and A-2-3 will not be split further.
Following the lockout period, the borrowers have the right to defease the Somerset Park Apartments Loan Combination in whole, but not in part, on any date prior to January 6, 2025. In addition, the Somerset Park Apartments Loan Combination is prepayable without penalty on or after January 6, 2025.
Sources and Uses
| Sources | Uses | |||||||
| Original loan combination amount | $180,000,000 | 73.2% | Purchase price | $216,000,000 | 87.8% | |||
| Sponsors’ new cash contribution | 65,943,738 | 26.8 | Reserves | 27,174,590 | 11.0 | |||
| Closing costs | 2,769,148 | 1.1 | ||||||
| Total Sources | $245,943,738 | 100.0% | Total Uses | $245,943,738 | 100.0% |
The Property.The Somerset Park Apartments Property is a 2,226-unit garden-style multifamily property consisting of 158 two-story residential buildings situated on approximately 290.0 acres and located in Troy, Michigan. The Somerset Park Apartments Property is located 20 miles northwest of the Detroit central business district and adjacent to Somerset Collection, an upscale, luxury super-regional mall with more than 180 specialty stores. The Somerset Park Apartments Property was constructed from 1964 to 1970 and features 594 one-bedroom units, 1,500 two-bedroom units (including townhomes) and 132 three-bedroom units (including townhomes). The one-bedroom units have floor plans ranging from 700 to 1,100 square feet and average 860 square feet; the two-bedroom units have floor plans ranging from 850 to 1,600 square feet and average 1,172 square feet; the three-bedroom units have floor plans ranging from 924 to 1,800 square feet and average 1,674 square feet; the two-bedroom townhomes have floor plans ranging from 1,276 to 1,550 square feet and average 1,456 square feet and the three-bedroom townhomes have floor plans totaling 1,600 square feet. Overall, unit sizes range from 700 square feet to 1,800 square feet, with an average unit size of 1,124 square feet. Community amenities consist of a nine-hole golf course, a 16-acre park, a 2.5-mile walking path, five swimming pools with sun decks, a fitness center, eight tennis courts, a sand volleyball court, a basketball court, a softball field, cross-county skiing trails, a children’s playground, a leasing office and an activities center. Unit amenities include fully equipped kitchens, ceramic tiled baths, large closets, private patios/balconies, covered parking, ceiling fans, individual alarm systems, and washer/dryer connections. Selected units feature private entrances and walk-in closets. The Somerset Park Apartments Property contains 4,166 surface and carport parking spaces, reflecting an overall parking ratio of 1.9 spaces per unit. As of August 11, 2015, the Somerset Park Apartments Property was 93.2% occupied.
Following the acquisition of the Somerset Park Apartments Property, the borrowers plan to invest $14.6 million by June 2016 and $34.2 million ($15,364 per unit) in total in the Somerset Park Apartments Property for unit interior renovations, the addition of washer and dryers to each unit and the conversion of the two-bedroom/one bathroom units to two-bedroom/two bathroom units. Additional planned renovations include replacement of all unit windows and updates to all common hallways. Renovations are also planned for the common amenities, including updating the leasing office and activities buildings. Interior unit renovations will take place initially in currently vacant units; the currently occupied units will be renovated thereafter as they turn over, and are expected to be completed within five years.
The following table presents certain information relating to the unit mix of the Somerset Park Apartments Property:
Unit Mix Summary(1)
| Unit Type | No. of Units | % of Total Units | Average Unit Size (SF) | Average U/W Monthly Rent per Unit |
| 1 Bedroom / 1 Bath | 594 | 26.7% | 860 | $815 |
| 2 Bedroom / 1 Bath | 1,022 | 45.9% | 1,072 | $942 |
| 2 Bedroom / 2 Bath | 424 | 19.0% | 1,420 | $1,117 |
| 2 Bedroom / 1.5 Bath Townhouse | 54 | 2.4% | 1,474 | $1,291 |
| 3 Bedroom / 2 Bath | 112 | 5.0% | 1,709 | $1,490 |
| 3 Bedroom / 2.5 Bath Townhouse | 20 | 0.9% | 1,600 | $1,517 |
| Total/Weighted Average | 2,226 | 100.0% | 1,128 | $983 |
| (1) | Information obtained from the underwritten rent roll. |
The following table presents historical occupancy percentages at the Somerset Park Apartments Property:
Historical Occupancy
12/31/2012(1) | 12/31/2013(1) | 12/31/2014(1) | 8/11/2015(2) |
| 88.6% | 85.2% | 89.0% | 93.2% |
| (1) | Information obtained from the borrowers. |
| (2) | Information obtained from the underwritten rent roll. |
Operating History and Underwritten Net Cash Flow.The following table presents certain information relating to the historical operating performance and underwritten net cash flow at the Somerset Park Apartments Property:
THE INFORMATION IN THIS STRUCTURAL AND COLLATERAL TERM SHEET IS NOT COMPLETE AND MAY BE AMENDED PRIOR TO THE TIME OF SALE. THIS TERM SHEET IS NOT AN OFFER TO SELL THESE SECURITIES AND IT IS NOT A SOLICITATION OF AN OFFER TO BUY THESE SECURITIES IN ANY JURISDICTION WHERE THE OFFER OR SALE IS NOT PERMITTED.
| 51 |
| SOMERSET PARK APARTMENTS |
Cash Flow Analysis
| 2012 | 2013 | 2014 | TTM 5/31/2015 | U/W(1) | % of U/W Effective Gross Income | U/W $ per Unit | |
| Base Rent | $23,527,795 | $24,671,362 | $25,619,513 | $26,164,959 | $23,671,212 | 95.5% | $10,634 |
| Grossed Up Vacant Space | 0 | 0 | 0 | 0 | 2,584,442 | 10.4 | 1,161 |
| Concessions | 0 | 0 | 0 | 0 | 0 | 0.0 | 0 |
| Other Income | 1,029,576 | 1,072,722 | 1,116,409 | 1,203,420 | 1,203,420 | 4.9 | 541 |
| Less Vacancy & Credit Loss | (3,148,730) | (3,238,295) | (3,280,155) | (3,302,927) | (2,669,335)(2) | (10.8) | (1,199) |
| Effective Gross Income | $21,408,641 | $22,505,789 | $23,455,767 | $24,065,452 | $24,789,739 | 100.0% | $11,136 |
| Total Operating Expenses | $8,411,600 | $8,883,836 | $9,365,697 | $9,317,835 | $9,759,082 | 39.4% | $4,384 |
| Net Operating Income | $12,997,041 | $13,621,953 | $14,090,070 | $14,747,617 | $15,030,657 | 60.6% | $6,752 |
| Capital Expenditures | 0 | 0 | 0 | 0 | 311,640 | 1.3 | 140 |
| Net Cash Flow | $12,997,041 | $13,621,953 | $14,090,070 | $14,747,617 | $14,719,017 | 59.4% | $6,612 |
| NOI DSCR | 1.56x | 1.64x | 1.69x | 1.77x | 1.81x | ||
| NCF DSCR | 1.56x | 1.64x | 1.69x | 1.77x | 1.77x | ||
| NOI DY | 7.2% | 7.6% | 7.8% | 8.2% | 8.4% | ||
| NCF DY | 7.2% | 7.6% | 7.8% | 8.2% | 8.2% |
| (1) | Underwritten cash flows are based on the June 1, 2015 rent roll with a 90.2% physical occupancy. The Somerset Park Apartments Property was 93.2% physically occupied as of August 11, 2015. |
| (2) | The underwritten economic vacancy is 10.2%. The Somerset Park Apartments Property was 93.2% physically occupied as of August 11, 2015. |
Appraisal.As of the appraisal valuation date of May 20, 2015, the Somerset Park Apartments Property had an “as-is” appraised value of $227,500,000. The appraiser also concluded to an “as-stabilized” value of $249,750,000 with an “as-stabilized” valuation date of May 20, 2016. The “as-stabilized” valuation assumes that $14.6 million in renovations are completed by May 2016. $26.5 million of the $34.2 million in aggregate budgeted renovation costs was reserved upfront.
Environmental Matters.According to a Phase I environmental assessment dated June 2, 2015, there was no evidence of any recognized environmental conditions at the Somerset Park Apartments Property.
Market Overview and Competition.The Somerset Park Apartments Property is located in Troy, Michigan, approximately 20.0 miles northwest of the Detroit central business district. The Detroit metropolitan statistical area’s population of 4.3 million accounts for approximately 43.4% of the state of Michigan. Land uses surrounding the Somerset Park Apartments Property consist of retail and commercial developments along the Big Beaver Road corridor (the primary commercial artery for the neighborhood) interspersed with residential development. The Somerset Collection, located directly adjacent to the Somerset Park Apartments Property, is a super-regional mall containing approximately 1.5 million square feet with more than 180 stores and is anchored by Neiman Marcus, Saks Fifth Avenue, Nordstrom and Macy’s. The area’s largest automobile corridor, the Troy Motor Mall, is located just south of the Somerset Park Apartments Property and offers domestic and import brands as well as luxury brands such as Rolls Royce, Bentley, Bugatti and Lamborghini. Additional retailers are located along Big Beaver Road, the primary commercial corridor in the area, including freestanding and in-line retail, bank branches, and restaurants. Big Beaver Road is also a significant office corridor for the area, with approximately half of the 13.0 million square feet of office space found within the Troy office market. Primary regional access to the neighborhood is provided by Interstate 75, located approximately 1.6 miles east of the Somerset Park Apartments Property. Interstate 75 is the primary north/south freeway through the Detroit metropolitan statistical area and connects to Interstate 696, which is the primary east/west freeway through the northern suburbs of Detroit. Lastly, the Somerset Park Apartments Property is situated two blocks south of Big Beaver Road, the primary east/west commercial thoroughfare through Troy. The estimated 2015 population within a one-, three-, and five-mile radius of the Somerset Park Apartments Property is 8,471, 89,070, and 242,570, respectively, and the average household income within the same radii is $84,985, $100,794, and $98,333, respectively.
According to a third party market research report, the Somerset Park Apartments Property is located in the Detroit multifamily market and the Troy/Birmingham multifamily submarket. As of fourth quarter 2014, the Detroit multifamily market contained 214,301 units, with a 3.0% vacancy rate, and average monthly asking rent of $901 per unit. As of fourth quarter 2014, the Troy/Birmingham multifamily submarket contained 8,748 units, with a 2.0% vacancy rate, and average monthly asking rent of $1,137 per unit.
THE INFORMATION IN THIS STRUCTURAL AND COLLATERAL TERM SHEET IS NOT COMPLETE AND MAY BE AMENDED PRIOR TO THE TIME OF SALE. THIS TERM SHEET IS NOT AN OFFER TO SELL THESE SECURITIES AND IT IS NOT A SOLICITATION OF AN OFFER TO BUY THESE SECURITIES IN ANY JURISDICTION WHERE THE OFFER OR SALE IS NOT PERMITTED.
| 52 |
| SOMERSET PARK APARTMENTS |
The following table presents certain information relating to comparable multifamily properties for the Somerset Park Apartments Property:
Competitive Set(1)
| Somerset Park Apartments (Subject) | Eagles Landing of Troy | Village Green of Troy | Charter Square Apartments | Buckingham Square Apartments | Amber Creek Village | |
| Location | Troy, MI | Troy, MI | Troy, MI | Troy, MI | Troy, MI | Troy, MI |
| Distance to Subject | - | 3.0 miles | 2.6 miles | 1.9 miles | 4.4 miles | 2.1 miles |
| Property Type | Garden | Garden | Mid-Rise | Garden | Garden | Garden |
| Number of Units | 2,226 | 544 | 168 | 492 | 146 | 91 |
| Average Rent (per unit) | ||||||
| Studio | NAP | NAP | NAP | NAP | NAP | $695-$745 |
| 1BR | $813 | $775-$915 | $850 | $780-$825 | $865-$955 | $795-$895 |
| 2BR | $942-$1,294 | $835-$1,000 | $890-$975 | $885-$910 | $985-$1,280 | $895-$1,345 |
| 3BR | $1,484-$1,510 | NAP | NAP | $1,119-$1,130 | $1,525 | NAP |
| Utilities | Paid by Tenant | Paid by Tenant | Paid by Tenant | Paid by Tenant | Paid by Tenant | Paid by Tenant |
| Total Occupancy | 93% | 97% | 99% | 98% | 98% | 99% |
| (1) | Information obtained from the appraisal and underwritten rent roll. |
The Borrowers.The borrowers, Troy Apts I, LLC, Troy Apts II, LLC, Troy Apts III, LLC and Troy Apts IV, LLC, are tenant-in-common borrowers, each structured as a single purpose entity with two independent directors. Legal counsel to the borrowers delivered a non-consolidation opinion in connection with the origination of the Somerset Park Apartments Loan Combination. Marc S. Solomon and Mark S. Rosen are the guarantors of certain nonrecourse carveouts under the Somerset Park Apartments Loan Combination.
The Sponsors.The sponsors, Marc S. Solomon and Mark S. Rosen, are founders and principals of The Solomon Organization. Mr. Solomon has over 40 years of commercial real estate experience and has participated in commercial real estate transactions in excess of $2.0 billion as a principal. Mr. Rosen, a principal of The Solomon Organization, has over 30 years of commercial real estate experience and has served as a past president of the New Jersey Apartment Association. The Solomon Organization owns and manages over 12,000 multifamily units in Connecticut, Michigan, New Jersey, New York and Pennsylvania.
Escrows.The loan documents provide for upfront escrows in the amount of$672,715 for real estate taxes, $1,875 for an environmental reserve and $26,500,000 for a capital expenditure reserve. The loan documents also provide for ongoing monthly reserves in the amount of $106,780 for real estate taxes and $46,375 for replacement reserves. The loan documents do not require monthly escrows for insurance provided that (i) no event of default has occurred and is continuing; (ii) the Somerset Park Apartments Property is insured via an acceptable blanket insurance policy; and (iii) the borrowers provide the lender with evidence of renewal of the insurance policies and timely proof of payment of the insurance premiums when due.
The $26.5 million upfront capital expenditure reserve will be used for unit interior renovations ($13,680,000), the addition of washer and dryers to each unit ($6,100,000) and the conversion of the two-bedroom/one bathroom units to two-bedroom/two-bathroom units ($3,350,000). Additional renovations include replacement of all unit windows and updates to all common hallways. Improvements are also planned for the common amenities, including updating the leasing office and activities buildings. The borrowers plan to spend approximately $34.2 million ($15,364 per unit) on the renovation, of which $14.6 million is expected to be completed by June 2016. Funds in the capital expenditure reserve will be released as renovations are completed until a balance of $5.0 million is reached, which will not be released to the borrowers until the $26.5 million in capital improvements are completed and the Somerset Park Apartments Property achieves a net operating income debt yield of at least 8.75% based on the trailing twelve months performance.
Lockbox and Cash Management.Upon the occurrence and continuance of a Cash Management Trigger Event (as defined below), the Somerset Park Apartments Loan Combination requires the borrowers to establish a lender-controlled lockbox account. The loan documents also require that all revenues received by the borrowers or the property manager be deposited into the lockbox account within five business days of receipt. Other than during a Cash Sweep Event (as defined below), all excess funds on deposit are disbursed to the borrowers.
A “Cash Management Trigger Event” will commence upon the occurrence of (i) an event of default; or (ii) any bankruptcy action of any of the borrowers, the guarantors or the property manager. A Cash Management Trigger Event will end with respect to clause (i), when such event of default has been cured, and with respect to clause (ii), when such bankruptcy petition has been discharged, stayed, or dismissed, within 90 days for the borrowers or guarantors and 120 days for the property manager, among other conditions. The bankruptcy of the property manager may also be cured by the borrowers replacing the property manager with a qualified manager acceptable to the lender.
A “Cash Sweep Event” will commence upon the occurrence of (i) an event of default; or (ii) any bankruptcy action of any of the borrowers, the guarantors, or the property manager. A Cash Sweep Event will end with respect to clause (i), when such event of default has been cured, and with respect to clause (ii), when such bankruptcy petition has been discharged, stayed, or dismissed, within 90 day for the borrowers or guarantors and 120 days for the property manager, among other conditions. The bankruptcy of the property manager may also be cured by the borrowers replacing the property manager with a qualified manager acceptable to the lender.
Property Management.The Somerset Park Apartments Property is managed by an affiliate of the borrowers.
THE INFORMATION IN THIS STRUCTURAL AND COLLATERAL TERM SHEET IS NOT COMPLETE AND MAY BE AMENDED PRIOR TO THE TIME OF SALE. THIS TERM SHEET IS NOT AN OFFER TO SELL THESE SECURITIES AND IT IS NOT A SOLICITATION OF AN OFFER TO BUY THESE SECURITIES IN ANY JURISDICTION WHERE THE OFFER OR SALE IS NOT PERMITTED.
| 53 |
| SOMERSET PARK APARTMENTS |
Assumption.The borrowers have the right to transfer the Somerset Park Apartments Property, provided that no event of default has occurred and is continuing and certain other conditions are satisfied, including, but not limited to (i) the lender’s reasonable determination that the proposed transferee and guarantor satisfy the lender’s credit review and underwriting standards, taking into consideration transferee experience, financial strength and general business standing; (ii) execution of a recourse guaranty and an environmental indemnity by an affiliate of the transferee; and (iii) if requested by the lender, rating agency confirmation from Fitch, Moody’s and Morningstar that the transfer will not result in a downgrade, withdrawal or qualification of the respective ratings assigned to the Series 2015-LC22 Certificates and similar confirmations from each rating agency rating securities backed by the Somerset Park Apartments Companion Loans.
Partial Release.Not permitted.
Real Estate Substitution.Not permitted.
Ground Lease. None.
Subordinate and Mezzanine Indebtedness.Provided no event of default has occurred and is continuing, the borrowers have the right to incur mezzanine financing subject to the satisfaction of certain conditions, including, but not limited to (i) the execution of an intercreditor agreement in form and substance acceptable to the lender and each of Fitch, Moody’s and Morningstar; (ii) the combined loan-to-value ratio is not greater than 75.0%; (iii) the combined debt service coverage ratio is not less than 1.25x; and (iv) the lender receives rating agency confirmation from Fitch, Moody’s and Morningstar that the mezzanine financing will not result in a downgrade, withdrawal or qualification of the respective ratings assigned to the Series 2015-LC22 Certificates.
Terrorism Insurance.The loan documents require that the “all risk” insurance policy required to be maintained by the borrowers provide coverage for terrorism in an amount equal to the full replacement cost of the Somerset Park Apartments Property, as well as business interruption insurance covering no less than the 18-month period following the occurrence of a casualty event, together with a 12-month extended period of indemnity.
THE INFORMATION IN THIS STRUCTURAL AND COLLATERAL TERM SHEET IS NOT COMPLETE AND MAY BE AMENDED PRIOR TO THE TIME OF SALE. THIS TERM SHEET IS NOT AN OFFER TO SELL THESE SECURITIES AND IT IS NOT A SOLICITATION OF AN OFFER TO BUY THESE SECURITIES IN ANY JURISDICTION WHERE THE OFFER OR SALE IS NOT PERMITTED.
| 54 |
(THIS PAGE INTENTIONALLY LEFT BLANK)
THE INFORMATION IN THIS STRUCTURAL AND COLLATERAL TERM SHEET IS NOT COMPLETE AND MAY BE AMENDED PRIOR TO THE TIME OF SALE. THIS TERM SHEET IS NOT AN OFFER TO SELL THESE SECURITIES AND IT IS NOT A SOLICITATION OF AN OFFER TO BUY THESE SECURITIES IN ANY JURISDICTION WHERE THE OFFER OR SALE IS NOT PERMITTED.
| 55 |
(THIS PAGE INTENTIONALLY LEFT BLANK)
THE INFORMATION IN THIS STRUCTURAL AND COLLATERAL TERM SHEET IS NOT COMPLETE AND MAY BE AMENDED PRIOR TO THE TIME OF SALE. THIS TERM SHEET IS NOT AN OFFER TO SELL THESE SECURITIES AND IT IS NOT A SOLICITATION OF AN OFFER TO BUY THESE SECURITIES IN ANY JURISDICTION WHERE THE OFFER OR SALE IS NOT PERMITTED.
| 56 |
| TOWNLINE SQUARE |
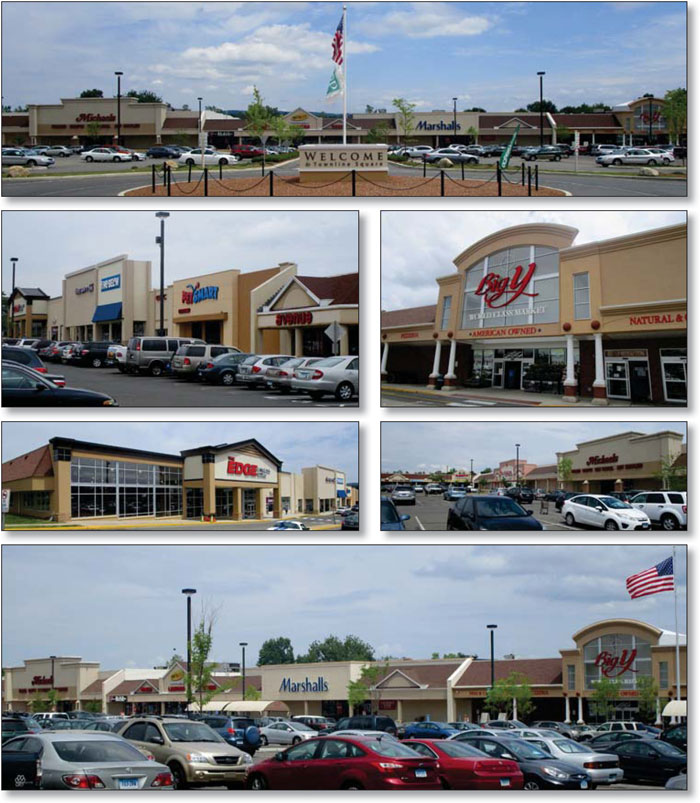
THE INFORMATION IN THIS STRUCTURAL AND COLLATERAL TERM SHEET IS NOT COMPLETE AND MAY BE AMENDED PRIOR TO THE TIME OF SALE. THIS TERM SHEET IS NOT AN OFFER TO SELL THESE SECURITIES AND IT IS NOT A SOLICITATION OF AN OFFER TO BUY THESE SECURITIES IN ANY JURISDICTION WHERE THE OFFER OR SALE IS NOT PERMITTED.
| 57 |
| TOWNLINE SQUARE |
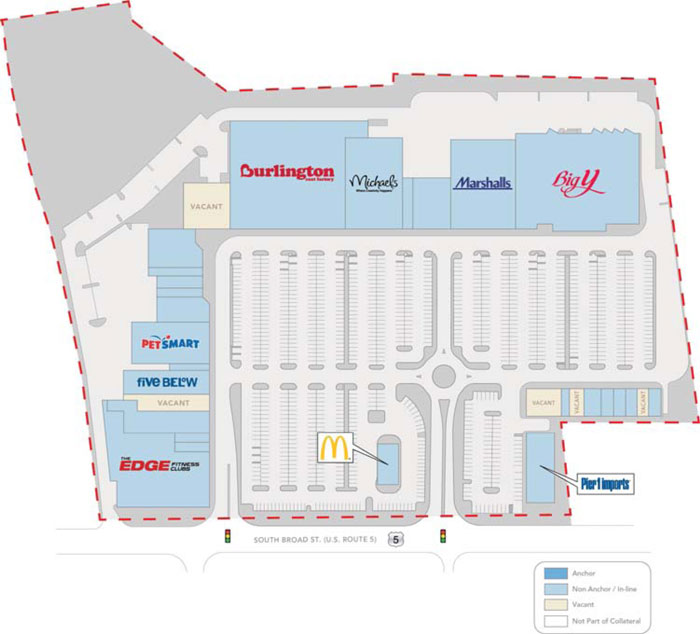
THE INFORMATION IN THIS STRUCTURAL AND COLLATERAL TERM SHEET IS NOT COMPLETE AND MAY BE AMENDED PRIOR TO THE TIME OF SALE. THIS TERM SHEET IS NOT AN OFFER TO SELL THESE SECURITIES AND IT IS NOT A SOLICITATION OF AN OFFER TO BUY THESE SECURITIES IN ANY JURISDICTION WHERE THE OFFER OR SALE IS NOT PERMITTED.
| 58 |
| TOWNLINE SQUARE |
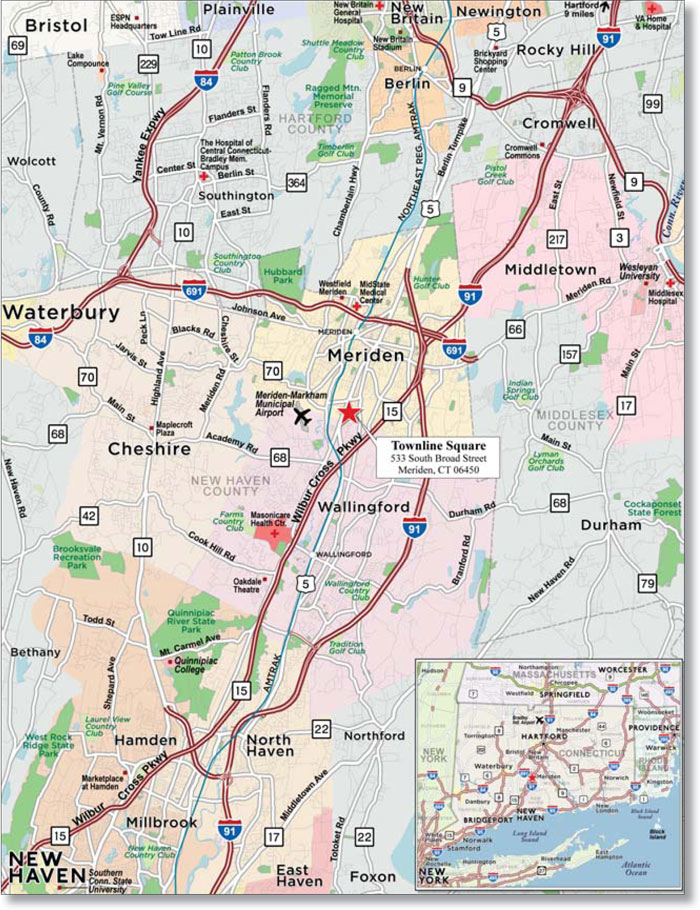
THE INFORMATION IN THIS STRUCTURAL AND COLLATERAL TERM SHEET IS NOT COMPLETE AND MAY BE AMENDED PRIOR TO THE TIME OF SALE. THIS TERM SHEET IS NOT AN OFFER TO SELL THESE SECURITIES AND IT IS NOT A SOLICITATION OF AN OFFER TO BUY THESE SECURITIES IN ANY JURISDICTION WHERE THE OFFER OR SALE IS NOT PERMITTED.
| 59 |
| No. 4 – Townline Square |
| Loan Information | Property Information | ||||||
| Mortgage Loan Seller: | Ladder Capital Finance LLC | Single Asset/Portfolio: | Single Asset | ||||
| Credit Assessment (Fitch/Moody’s/Morningstar): | NR/NR/NR | Property Type: | Retail | ||||
| Original Principal Balance: | $32,725,000 | Specific Property Type: | Anchored | ||||
| Cut-off Date Principal Balance: | $32,725,000 | Location: | Meriden, CT | ||||
| % of Initial Pool Balance: | 3.4% | Size: | 314,814 SF | ||||
| Loan Purpose: | Acquisition | Cut-off Date Principal Balance Per SF: | $103.95 | ||||
| Borrower Name: | TLS Group LLC | Year Built/Renovated: | 1989/2014 | ||||
| Sponsor: | Chaim T. Nash | Title Vesting: | Fee | ||||
| Mortgage Rate: | 4.642% | Property Manager: | Hampton Management Inc. | ||||
| Note Date: | August 24, 2015 | 3rd Most Recent Occupancy (As of)(2): | 73.9% (12/31/2012) | ||||
| Anticipated Repayment Date: | NAP | 2nd Most Recent Occupancy (As of)(2): | 72.7% (12/31/2013) | ||||
| Maturity Date: | September 6, 2025 | Most Recent Occupancy (As of)(2): | 95.3% (12/31/2014) | ||||
| IO Period: | 24 months | Current Occupancy (As of)(2): | 91.4% (7/20/2015) | ||||
| Loan Term (Original): | 120 months | ||||||
| Seasoning: | 0 months | Underwriting and Financial Information: | |||||
| Amortization Term (Original): | 360 months | ||||||
| Loan Amortization Type: | Interest-only, Amortizing Balloon | ||||||
| Interest Accrual Method: | Actual/360 | 3rdMost Recent NOI (As of)(3): | $1,872,551 (12/31/2013) | ||||
| Call Protection: | L(24),D(93),O(3) | 2ndMost Recent NOI (As of)(3): | $2,326,716 (12/31/2014) | ||||
| Lockbox Type: | Hard/Upfront Cash Management | Most Recent NOI (As of)(3): | $3,014,754 (TTM 6/30/2015) | ||||
| Additional Debt: | No | ||||||
| Additional Debt Type: | NAP | ||||||
| U/W Revenues: | $4,837,140 | ||||||
| U/W Expenses: | $1,799,128 | ||||||
| Escrows and Reserves(1): | U/W NOI(3): | $3,038,012 | |||||
| U/W NCF(3): | $2,831,570 | ||||||
| Type: | Initial | Monthly | Cap (If Any) | U/W NOI DSCR | 1.50x | ||
| Taxes | $69,222 | $69,222 | NAP | U/W NCF DSCR: | 1.40x | ||
| Insurance | $32,538 | $10,846 | NAP | U/W NOI Debt Yield: | 9.3% | ||
| Replacement Reserves | $0 | $6,559 | NAP | U/W NCF Debt Yield: | 8.7% | ||
| TI/LC Reserve | $500,000 | $9,182 | $830,556 | As-Is Appraised Value: | $45,000,000 | ||
| Deferred Maintenance | $18,750 | $0 | NAP | As-Is Appraisal Valuation Date: | July 10, 2015 | ||
| Jersey Mike’s Reserve | $31,400 | $0 | NAP | Cut-off Date LTV Ratio: | 72.7% | ||
| Michael’s Reserve | $24,328 | $0 | NAP | LTV Ratio at Maturity or ARD: | 62.3% | ||
| |||||||
| (1) | See “Escrows” section. |
| (2) | See “Historical Occupancy” section. |
| (3) | See “Cash Flow Analysis” section. |
The Mortgage Loan.The mortgage loan (the “Townline Square Mortgage Loan”) is evidenced by a single promissory note that is secured by a first mortgage encumbering an anchored retail center located in Meriden, Connecticut (the “Townline Square Property”). The Townline Square Mortgage Loan was originated on August 24, 2015 by Ladder Capital Finance LLC. The Townline Square Mortgage Loan had an original principal balance of $32,725,000, has an outstanding principal balance as of the Cut-off Date of $32,725,000 and accrues interest at an interest rate of 4.642%per annum. The Townline Square Mortgage Loan had an initial term of 120 months, has a remaining term of 120 months as of the Cut-off Date, and requires interest-only payments for the first 24 payments following origination and, thereafter, requires payments of principal and interest based on a 30-year amortization schedule. The Townline Square Mortgage Loan matures on September 6, 2025.
Following the lockout period, the borrower has the right to defease the Townline Square Mortgage Loan in whole, but not in part, on any date before July 6, 2025. In addition, the Townline Square Mortgage Loan is prepayable without penalty on or after July 6, 2025.
THE INFORMATION IN THIS STRUCTURAL AND COLLATERAL TERM SHEET IS NOT COMPLETE AND MAY BE AMENDED PRIOR TO THE TIME OF SALE. THIS TERM SHEET IS NOT AN OFFER TO SELL THESE SECURITIES AND IT IS NOT A SOLICITATION OF AN OFFER TO BUY THESE SECURITIES IN ANY JURISDICTION WHERE THE OFFER OR SALE IS NOT PERMITTED.
| 60 |
| TOWNLINE SQUARE |
Sources and Uses
| Sources | Uses | |||||||
| Original loan amount | $32,725,000 | 72.6% | Purchase price | $43,992,169 | 97.6% | |||
| Sponsor’s new cash contribution | 12,371,858 | 27.4 | Reserves | 676,238 | 1.5 | |||
| Closing costs | 428,451 | 1.0 | ||||||
| Total Sources | $45,096,858 | 100.0% | Total Uses | $45,096,858 | 100.0% |
The Property.The Townline Square Property is an anchored retail center located in Meriden, Connecticut, approximately 24.0 miles south of Hartford and 17.9 miles northeast of New Haven. Built in 1989 and renovated in 2014, the Townline Square Property is situated on a 29.4-acre parcel and is anchored by Burlington Coat Factory, Big Y Foods, Edge Fitness and Marshall’s. The Townline Square Property consists of four buildings including two, multi-tenant retail strips, a building occupied by Pier 1 Imports and one pad site that is ground leased to McDonalds. The Townline Square Property contains 1,201 parking spaces, resulting in a parking ratio of 3.8 spaces per 1,000 square feet of rentable area. As of July 20, 2015, the Townline Square Property was 91.4% occupied by 26 tenants.
The following table presents certain information relating to the tenancy at the Townline Square Property:
Major Tenants
| Tenant Name | Credit Rating (Fitch/Moody’s/ S&P)(1) | Tenant NRSF | % of NRSF | Annual U/W Base Rent PSF(2) | Annual U/W Base Rent(2) | % of Total Annual U/W Base Rent | Sales PSF(3) | Occupancy Cost(3) | Lease Expiration Date |
| Anchor Tenants | |||||||||
| Big Y Foods | NR/NR/NR | 54,983 | 17.5% | $12.50 | $687,312 | 21.2% | $251 | 7.0% | 12/31/2031 |
| Edge Fitness | NR/NR/NR | 33,340 | 10.6% | $9.00 | $300,060 | 9.3% | NAV | NAV | 7/31/2029 |
| Burlington Coat Factory | NR/Ba3/B+ | 61,713 | 19.6% | $4.76 | $293,565 | 9.1% | $111 | 9.0% | 5/31/2019(4) |
| Marshall’s | NR/A3+/A+ | 27,000 | 8.6% | $9.50 | $256,500 | 7.9% | $245 | 5.9% | 1/31/2020(5) |
| Total Anchor Tenants | 177,036 | 56.2% | $8.68 | $1,537,437 | 47.4% | ||||
| Major Tenants | |||||||||
| Michael’s | NR/B2/B+ | 24,186 | 7.7% | $12.25 | $296,279 | 9.1% | $143 | 12.1% | 2/28/2018(6) |
| Petsmart | NR/B1/B+ | 13,000 | 4.1% | $14.00 | $182,000 | 5.6% | NAV | NAV | 3/31/2024(7) |
| Total Major Tenants | 37,186 | 11.8% | $12.86 | $478,279 | 14.8% | ||||
| Non-Major Tenants | 73,585 | 23.4% | $16.67 | $1,226,800 | 37.8% | ||||
| Occupied Collateral Total | 287,807 | 91.4% | $11.27 | $3,242,516 | 100.0% | ||||
| Vacant Space | 27,007 | 8.6% | |||||||
| Collateral Total | 314,814 | 100.0% | |||||||
| (1) | Certain ratings are those of the parent company whether or not the parent guarantees the lease. |
| (2) | Annual U/W Base Rent PSF and Annual U/W Base Rent include contractual rent steps through March 2016 totaling $9,643. |
| (3) | Sales PSF and Occupancy Cost are for the trailing 12-month period ending December 31, 2014, unless otherwise noted. |
| (4) | Burlington Coat Factory can terminate its lease with 18-months’ notice. Burlington Coat Factory has three, 5-year lease renewal options. |
| (5) | Marshall’s has one, 5-year lease renewal option. |
| (6) | Michael’s has two, 5-year lease renewal options. |
| (7) | PetSmart has three, 5-year lease renewal options. |
THE INFORMATION IN THIS STRUCTURAL AND COLLATERAL TERM SHEET IS NOT COMPLETE AND MAY BE AMENDED PRIOR TO THE TIME OF SALE. THIS TERM SHEET IS NOT AN OFFER TO SELL THESE SECURITIES AND IT IS NOT A SOLICITATION OF AN OFFER TO BUY THESE SECURITIES IN ANY JURISDICTION WHERE THE OFFER OR SALE IS NOT PERMITTED.
| 61 |
| TOWNLINE SQUARE |
The following table presents certain information relating to the lease rollover schedule at the Townline Square Property:
Lease Expiration Schedule(1)(2)
| Year Ending December 31, | No. of Leases Expiring | Expiring NRSF | % of Total NRSF | Cumulative Expiring NRSF | Cumulative % of Total NRSF | Annual U/W Base Rent | % of Annual U/W Base Rent | Annual U/W Base Rent PSF(3) | ||||||||
| MTM | 0 | 0 | 0.0% | 0 | 0.0% | $0 | 0.0% | $0.00 | ||||||||
| 2015 | 1 | 2,640 | 0.8% | 2,640 | 0.8% | $55,440 | 1.7% | $21.00 | ||||||||
| 2016 | 3 | 15,875 | 5.0% | 18,515 | 5.9% | $290,329 | 9.0% | $18.29 | ||||||||
| 2017 | 2 | 4,103 | 1.3% | 22,618 | 7.2% | $76,471 | 2.4% | $18.64 | ||||||||
| 2018 | 3 | 26,842 | 8.5% | 49,460 | 15.7% | $351,677 | 10.8% | $13.10 | ||||||||
| 2019 | 5 | 79,506 | 25.3% | 128,966 | 41.0% | $584,512 | 18.0% | $7.35 | ||||||||
| 2020 | 5 | 34,028 | 10.8% | 162,994 | 51.8% | $380,625 | 11.7% | $11.19 | ||||||||
| 2021 | 0 | 0 | 0.0% | 162,994 | 51.8% | $0 | 0.0% | $0.00 | ||||||||
| 2022 | 0 | 0 | 0.0% | 162,994 | 51.8% | $0 | 0.0% | $0.00 | ||||||||
| 2023 | 1 | 9,088 | 2.9% | 172,082 | 54.7% | $92,698 | 2.9% | $10.20 | ||||||||
| 2024 | 3 | 22,295 | 7.1% | 194,377 | 61.7% | $309,245 | 9.5% | $13.87 | ||||||||
| 2025 | 1 | 1,507 | 0.5% | 195,884 | 62.2% | $31,647 | 1.0% | $21.00 | ||||||||
| Thereafter | 3 | 91,923 | 29.2% | 287,807 | 91.4% | $1,069,872 | 33.0% | $11.64 | ||||||||
| Vacant | 0 | 27,007 | 8.6% | 314,814 | 100.0% | $0 | 0.00% | $0 | ||||||||
| Total/Weighted Average | 27 | 314,814 | 100.0% | $3,242,516 | 100.0% | $11.27 |
| (1) | Information obtained from the underwritten rent roll. |
| (2) | Certain tenants may have lease termination options that are exercisable prior to the originally stated expiration date of the subject lease and that are not considered in the Lease Expiration Schedule. |
| (3) | Weighted Average Annual U/W Base Rent PSF excludes vacant space. |
The following table presents historical occupancy percentages at the Townline Square Property:
Historical Occupancy
12/31/2012(1) | 12/31/2013(1)(2) | 12/31/2014(1)(2) | 7/20/2015(2)(3)(4) |
| 73.9% | 72.7% | 95.3% | 91.4% |
| (1) | Information obtained from the borrower. |
| (2) | The increase in occupancy from 2013 to 2014 was due to the execution of 10 leases totaling 83,436 square feet, representing 26.5% of the net rentable area, since 2013, including 31,309 square feet in 2014 and 2015. |
| (3) | Information obtained from the underwritten rent roll. |
| (4) | Actual occupancy at the Townline Square Property is 95.8%, however, two tenants plan to vacate their space. Such tenant’s space that is currently occupied was underwritten as vacant. |
THE INFORMATION IN THIS STRUCTURAL AND COLLATERAL TERM SHEET IS NOT COMPLETE AND MAY BE AMENDED PRIOR TO THE TIME OF SALE. THIS TERM SHEET IS NOT AN OFFER TO SELL THESE SECURITIES AND IT IS NOT A SOLICITATION OF AN OFFER TO BUY THESE SECURITIES IN ANY JURISDICTION WHERE THE OFFER OR SALE IS NOT PERMITTED.
| 62 |
| TOWNLINE SQUARE |
Operating History and Underwritten Net Cash Flow. The following table presents certain information relating to the historical operating performance and the underwritten net cash flow at the Townline Square Property:
Cash Flow Analysis
| 2013(1) | 2014(1) | TTM 6/30/15(1) | U/W | % of U/W Effective Gross Income | U/W $ per SF | ||||||||
| Base Rent | $2,431,847 | $2,939,369 | $3,386,267 | $3,242,516(2) | 67.0% | $10.30 | |||||||
| Grossed Up Vacant Space | 0 | 0 | 0 | 441,147 | 9.1 | 1.40 | |||||||
| Total Reimbursables | 1,058,836 | 1,177,340 | 1,620,390 | 1,696,234 | 35.1 | 5.39 | |||||||
| Other Income | 4,569 | 7,207 | 3,844 | 60,000(3) | 1.2 | 0.19 | |||||||
| Less Vacancy & Credit Loss | 0 | 0 | 0 | (602,757)(4) | (12.5) | (1.91) | |||||||
| Effective Gross Income | $3,495,252 | $4,123,916 | $5,010,501 | $4,837,140 | 100.0% | $15.37 | |||||||
| Total Operating Expenses | $1,622,701 | $1,797,200 | $1,995,747 | $1,799,128 | 37.2% | 5.71 | |||||||
| Net Operating Income | $1,872,551 | $2,326,716 | $3,014,754 | $3,038,012 | 62.8% | $9.65 | |||||||
| TI/LC | 0 | 0 | 0 | 143,479 | 3.0 | 0.46 | |||||||
| Capital Expenditures | 0 | 0 | 0 | 62,963 | 1.3 | 0.20 | |||||||
| Net Cash Flow | $1,872,551 | $2,326,716 | $3,014,754 | $2,831,570 | 58.5% | $8.99 | |||||||
| NOI DSCR | 0.93x | 1.15x | 1.49x | 1.50x | |||||||||
| NCF DSCR | 0.93x | 1.15x | 1.49x | 1.40x | |||||||||
| NOI DY | 5.7% | 7.1% | 9.2% | 9.3% | |||||||||
| NCF DY | 5.7% | 7.1% | 9.2% | 8.7% |
| (1) | The increase in Net Operating Income from 2013 to U/W is due in part to the execution of 10 leases totaling 83,436 square feet since 2013 including 31,309 square feet in 2014 and 2015. |
| (2) | U/W Base Rent includes contractual rent steps through March 2016 totaling $9,643. |
| (3) | The increase in Other Income from TTM 6/30/2015 to U/W is due to certain solar power income generated at the Townline Square Property. Solar income is generated through the solar panels installed on the roof which came on line in April 2015. The borrower has agreements in place with the utility company to sell them renewal energy credits and they will effectively become the local utility company and can charge back tenants for electrical expense. The solar income has the potential to reach $66,000 per year. The U/W Other Income is based on the appraisal. |
| (4) | The underwritten economic vacancy is 11.2%. As of July 20, 2015, the Townline Square Property was 95.8% occupied; however, Panera and Sleepy’s plan to vacate their space and as a result the Townline Square Property was underwritten at 91.4% physical occupancy. |
Appraisal.As of the appraisal valuation date of July 10, 2015, the Townline Square Property had an “as-is” appraised value of $45,000,000.
Environmental Matters. According to a Phase I environmental site assessment dated July 21, 2015, there was no evidence of any recognized environmental conditions at the Townline Square Property.
Market Overview and Competition.The Townline Square Property is located approximately 24.0 miles south of Hartford and 17.9 miles northeast of New Haven, in Meridian, Connecticut within the Southern Corridor of Meriden on the east side of South Broad Street (US Route 5) and north of CT Route 15. Access to the Townline Square Property’s neighborhood is provided via US Route 5. According to the appraisal, the average daily traffic count in front of the Townline Square Property is approximately 16,100 vehicles. There are commercial properties located south, west, and north of the Townline Square Property, including Silver Commons Plaza to the west and Kohl’s Plaza (anchored by Kohl’s and Aldi’s) to the south. The Townline Square Property is located within the New Haven-Milford metropolitan statistical area (“MSA”). Since 2012, total employment within the MSA has risen by an average of 1.2% annually. The 2015 estimated population within a three- and five-mile radius of the Townline Square Property was 63,037 and 115,497, respectively. The 2015 estimated median household income within a five-mile radius of the Townline Square Property was $62,699 while the estimated average household income for the same area was $83,082.
According to a third party research report, the Townline Square Property is in the New Haven Metro retail market and is considered a Class A neighborhood retail center. As of the first quarter of 2015, the New Haven Metro retail market reported a vacancy rate of 13.2% and average rent of $17.00 per square foot gross as of the first quarter of 2015. As of July 20, 2015, the Townline Square Property had an underwritten vacancy of 8.6% and average rent of $11.27 per square foot gross.
THE INFORMATION IN THIS STRUCTURAL AND COLLATERAL TERM SHEET IS NOT COMPLETE AND MAY BE AMENDED PRIOR TO THE TIME OF SALE. THIS TERM SHEET IS NOT AN OFFER TO SELL THESE SECURITIES AND IT IS NOT A SOLICITATION OF AN OFFER TO BUY THESE SECURITIES IN ANY JURISDICTION WHERE THE OFFER OR SALE IS NOT PERMITTED.
| 63 |
| TOWNLINE SQUARE |
The following table presents certain information relating to comparable properties to the Townline Square Property:
Competitive Set(1)
Townline (Subject) | Kohl’s Plaza | Staples Plaza | Stop & Shop Center | Wallingford Fair Shopping Center | Lowe’s Plaza | |
| Location | Meriden, CT | Wallingford, CT | Wallingford, CT | Wallingford, CT | Wallingford, CT | Meriden, CT |
| Distance from Subject | -- | 0.2 miles | 0.5 miles | 1.9 miles | 2.0 miles | 3.5 miles |
| Property Type | Retail | Retail | Retail | Retail | Retail | Retail |
| Year Built/Renovated | 1989/2014 | 1996,2000/NAP | 1960/1994 | 1989/NAP | 1999/NAP | 1985/NAP |
| Anchors | Burlington Coat Factory, Big Y Foods, Edge Fitness, Marshall’s | Kohl’s, Aldi, Sally Beauty Supply | Dollar Tree, Staples | Stop & Shop | Hallmark Cards, PETCO, Radio Shack, ShopRite | Lowe’s |
| Total GLA | 314,814 SF | 159,603 SF | 97,374 SF | 97,675 SF | 116,000 SF | 119,237 SF |
| Total Occupancy | 91% | 97% | 91% | 100% | 76% | 100% |
| (1) | Information obtained from the appraisal. |
The Borrower.The borrower, TLS Group LLC, is a Delaware limited liability company and single purpose entity with one independent director. Chaim T. Nash is the guarantor of certain nonrecourse carveouts under the Townline Square Mortgage Loan.
The Sponsors.The sponsor, Chaim T. Nash, is the CEO and Founder of PCS Wireless. PCS Wireless is a re-manufacturer and distributor of mobile devices including phones, tablets, accessories, and other wireless equipment. Founded in 2001, PCS Wireless is a privately held company that is headquartered in Florham Park, New Jersey and the firm has local representation in more than 20 countries. See “Description of the Mortgage Pool-Default History, Bankruptcy Issues and Other Proceedings” in the Free Writing Prospectus.
Escrows.The loan documents provide for upfront reserves in the amount of $500,000 for tenant improvements and leasing commissions (“TI/LC”), $69,222 for real estate taxes, $32,538 for insurance premiums, $18,750 for deferred maintenance, $31,400 for landlord obligations related to the Jersey Mike’s lease, and $24,328 reserve for landlord obligations related to the Michael’s Stores lease. The loan documents require monthly deposit reserve of $69,222 for real estate taxes, $10,846 for insurance premiums, $6,559 for replacement reserves, and $9,182 for TI/LCs.
Lockbox and Cash Management.The Townline Square Mortgage Loan requires a lender-controlled lockbox account, which is already in place, and that the borrower direct tenants to pay their rents directly into such lockbox account. The loan documents also require that any rent received by the borrower or property manager must be deposited within one business day of receipt into the lockbox account. Funds deposited into the lockbox account are required to be swept on a daily basis into a lender-controlled deposit account, where the funds are required to be disbursed in accordance with the loan agreement. During a Cash Sweep Event Period (as defined below), excess cash flow will be swept to a lender controlled account and held as additional security for the Townline Square Mortgage Loan.
A “Cash Sweep Event Period” will commence upon any of the following: (i) an event of default under the loan agreement; (ii) an event of default under the property management agreement; (iii) a Cash Sweep Significant Tenant Trigger Event (as defined below); or (iv) the amortizing debt service coverage ratio falls below 1.10x as of any date of determination by the lender. A Cash Sweep Event Period will be cured: with regard to clause (i) or (ii), upon the cure of such event of default; with regard to clause (iii), upon a Cash Sweep Significant Tenant Trigger Event Cure (as defined below); and with regard to clause (iv), upon the amortizing debt service coverage ratio being equal to or greater than 1.25x for two consecutive calendar quarters.
A “Cash Sweep Significant Tenant Trigger Event” occurs upon the date on which (i) any Significant Tenant (as defined below) (a) vacates, surrenders or ceases to conduct its normal business operations at substantially all of its demised premises or otherwise “goes dark” or (b) gives the borrower or property manager notice of intent to vacate, surrender or cease to conduct its normal business operations at substantially all of its demised premises or otherwise “go dark”, or (ii) any Significant Tenant (or such Significant Tenant’s parent company) becomes insolvent or a debtor in any bankruptcy action.
A “Cash Sweep Significant Tenant Trigger Event Cure” will occur on: with regard to (i)(a) above, the date on which (a)(1) the applicable Significant Tenant has (A) reopened for business and (B) paid full, unabated rent under its lease, for two consecutive quarters, and (2) the borrower has delivered to the lender an estoppel certificate from the Significant Tenant certifying the lease is in full force and effect, or (b) the delivery to and acceptance by lender of one or more replacement leases where the tenant is in occupancy and paying full rent; with regard to (i)(b) above, the date on which (a) the applicable Significant Tenant has (1) irrevocably revoked or rescinded any such notice and (2)(A) been open for business and conducted normal business operations at substantially all of its demised premises and (B) paid full, unabated rent under its lease, for two consecutive calendar quarters following such revocation or rescission in each case, and (b) the borrower has delivered to the lender an estoppel certificate from the Significant Tenant certifying the lease is in full force and effect; with regard to (ii) above, the date on which (a) either (1) the applicable Significant Tenant has (I) irrevocably assumed its lease pursuant to a final non-appealable order of a court of competent jurisdiction and (II) (A) has been open for business and conducted normal business operations at substantially all of its demised premises and (B) has paid full, unabated rent under its lease, for two consecutive calendar quarters following such irrevocable assumption, or (2) (I) the applicable Significant Tenant’s lease has been irrevocably assumed and assigned by such Significant
THE INFORMATION IN THIS STRUCTURAL AND COLLATERAL TERM SHEET IS NOT COMPLETE AND MAY BE AMENDED PRIOR TO THE TIME OF SALE. THIS TERM SHEET IS NOT AN OFFER TO SELL THESE SECURITIES AND IT IS NOT A SOLICITATION OF AN OFFER TO BUY THESE SECURITIES IN ANY JURISDICTION WHERE THE OFFER OR SALE IS NOT PERMITTED.
| 64 |
| TOWNLINE SQUARE |
Tenant to a replacement tenant acceptable to lender pursuant to a final non-appealable order of a court of competent jurisdiction and (II) such replacement tenant (A) has been open for business and conducted normal business operations at substantially all of its demised premises and (B) has paid full, unabated rent under its lease, for two consecutive quarters following such irrevocable assumption and assignment, and (b) lender has received an estoppel certificate certifying, among other things, the foregoing and reaffirming the lease as being in full force and effect, to lender’s satisfaction in each case.
A “Significant Tenant” means (i) Burlington Coat Factory, (ii) Big Y Foods, (iii) Edge Fitness, or (iv) any successor or assign of any of the foregoing.
Property Management. The Townline Square Property is managed by Hampton Management Inc.
Assumption.The borrower has the one-time right to transfer the Townline Square Property, provided that certain conditions are satisfied, including (i) the lender’s reasonable determination that the proposed transferee and guarantor satisfy the lender’s credit review and underwriting standards, taking into consideration transferee’s experience, financial strength and general business standing; (ii) execution of a non-recourse carveout guaranty and an environmental indemnity by an affiliate of the transferee acceptable to the lender; (iii) the transferee assuming all of the obligations of the borrower under the Townline Square Mortgage Loan and (iii) rating agency confirmation from Fitch, Moody’s and Morningstar that the transfer will not result in a downgrade, withdrawal or qualification of the respective ratings assigned to the Series 2015-LC22 Certificates.
Partial Release. Not permitted.
Real Estate Substitution. Not permitted.
Subordinate and Mezzanine Indebtedness. Not permitted.
Ground Lease. None.
Terrorism Insurance. The loan documents require that the “all risk” insurance policy required to be maintained by the borrower provides coverage for terrorism in an amount equal to the full replacement cost of the Townline Square Property. The loan documents also require business interruption insurance covering no less than the 12-month period following the occurrence of a casualty event, together with a six-month extended period of indemnity.
THE INFORMATION IN THIS STRUCTURAL AND COLLATERAL TERM SHEET IS NOT COMPLETE AND MAY BE AMENDED PRIOR TO THE TIME OF SALE. THIS TERM SHEET IS NOT AN OFFER TO SELL THESE SECURITIES AND IT IS NOT A SOLICITATION OF AN OFFER TO BUY THESE SECURITIES IN ANY JURISDICTION WHERE THE OFFER OR SALE IS NOT PERMITTED.
| 65 |
| SANDPIPER APARTMENTS |
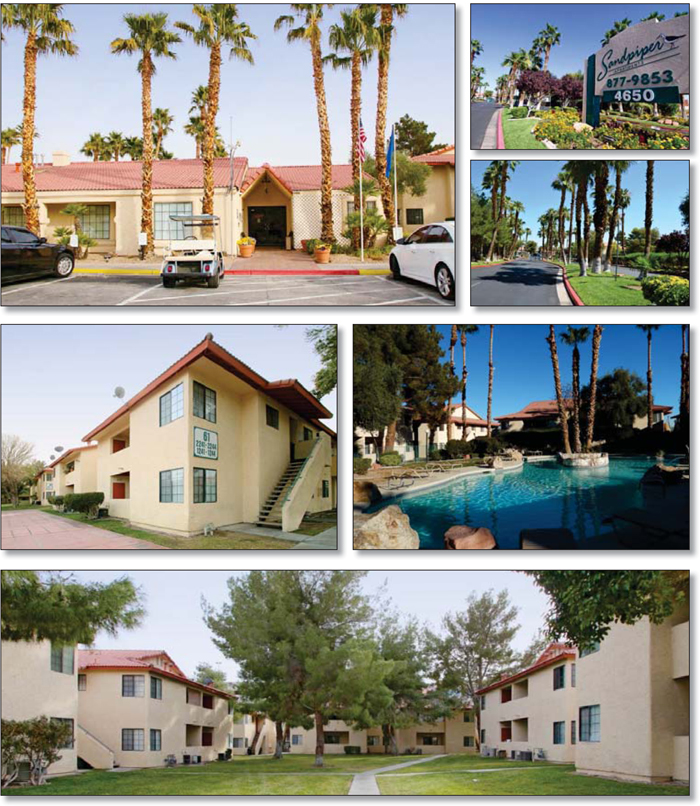
THE INFORMATION IN THIS STRUCTURAL AND COLLATERAL TERM SHEET IS NOT COMPLETE AND MAY BE AMENDED PRIOR TO THE TIME OF SALE. THIS TERM SHEET IS NOT AN OFFER TO SELL THESE SECURITIES AND IT IS NOT A SOLICITATION OF AN OFFER TO BUY THESE SECURITIES IN ANY JURISDICTION WHERE THE OFFER OR SALE IS NOT PERMITTED.
| 66 |
| SANDPIPER APARTMENTS |
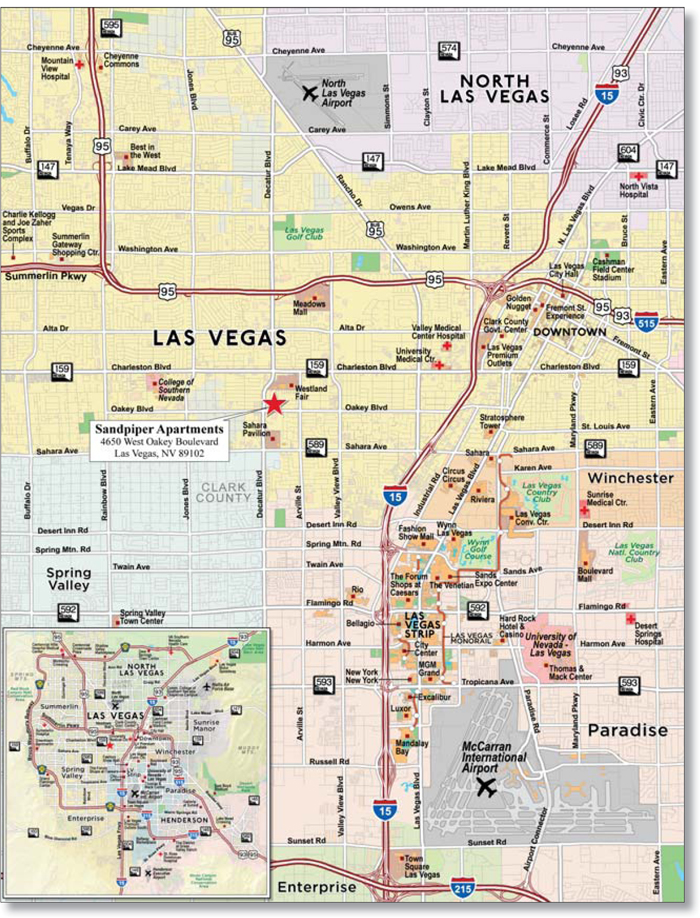
THE INFORMATION IN THIS STRUCTURAL AND COLLATERAL TERM SHEET IS NOT COMPLETE AND MAY BE AMENDED PRIOR TO THE TIME OF SALE. THIS TERM SHEET IS NOT AN OFFER TO SELL THESE SECURITIES AND IT IS NOT A SOLICITATION OF AN OFFER TO BUY THESE SECURITIES IN ANY JURISDICTION WHERE THE OFFER OR SALE IS NOT PERMITTED.
| 67 |
| No. 5 – Sandpiper Apartments | |||||||
| Loan Information | Property Information | ||||||
| Mortgage Loan Seller: | Rialto Mortgage Finance, LLC | Single Asset/Portfolio: | Single Asset | ||||
| Credit Assessment (Fitch/Moody’s/Morningstar): | NR/NR/NR | Property Type: | Multifamily | ||||
| Original Principal Balance: | $30,500,000 | Specific Property Type: | Garden | ||||
| Cut-off Date Principal Balance: | $30,500,000 | Location: | Las Vegas, NV | ||||
| % of Initial Pool Balance: | 3.2% | Size: | 488 Units | ||||
| Loan Purpose: | Refinance | Cut-off Date Principal Balance Per Unit: | $62,500 | ||||
| Borrower Name: | APEX 2015, LLC | Year Built/Renovated: | 1987/2015 | ||||
| Sponsor: | Malik Zaman | Title Vesting: | Fee | ||||
| Mortgage Rate: | 4.850% | Property Manager: | Self-managed | ||||
| Note Date: | July 10, 2015 | 3rdMost Recent Occupancy (As of): | 84.9% (12/31/2012) | ||||
| Anticipated Repayment Date: | NAP | 2ndMost Recent Occupancy (As of): | 89.4% (12/31/2013) | ||||
| Maturity Date: | July 6, 2025 | Most Recent Occupancy (As of): | 92.9% (12/31/2014) | ||||
| IO Period: | 36 months | Current Occupancy (As of): | 95.9% (6/1/2015) | ||||
| Loan Term (Original): | 120 Months | ||||||
| Seasoning: | 2 months | Underwriting and Financial Information: | |||||
| Amortization Term (Original): | 360 months | ||||||
| Loan Amortization Type: | Interest-only, Amortizing Balloon | 3rdMost Recent NOI (As of): | $2,080,524 (12/31/2013) | ||||
| Interest Accrual Method: | Actual/360 | 2ndMost Recent NOI (As of): | $2,357,432 (12/31/2014) | ||||
| Call Protection: | L(24),GRTR 1% or YM(92),O(4) | Most Recent NOI (As of): | $2,395,987 (TTM 5/31/2015) | ||||
| Lockbox Type: | Springing (Without Established Account) | ||||||
| Additional Debt: | None | U/W Revenues: | $4,163,386 | ||||
| Additional Debt Type: | NAP | U/W Expenses: | $1,640,463 | ||||
| U/W NOI: | $2,522,923 | ||||||
| U/W NCF: | $2,385,795 | ||||||
| U/W NOI DSCR: | 1.31x | ||||||
| Escrows and Reserves(1): | U/W NCF DSCR: | 1.24x | |||||
| U/W NOI Debt Yield: | 8.3% | ||||||
| Type: | Initial | Monthly | Cap (If Any) | U/W NCF Debt Yield: | 7.8% | ||
| Taxes | $86,380 | $16,453 | NAP | As-Is Appraised Value: | $40,820,000 | ||
| Insurance | $7,174 | $6,833 | NAP | As-Is Appraisal Valuation Date: | June 3, 2015 | ||
| Replacement Reserves | $0 | $11,427 | NAP | Cut-off Date LTV Ratio: | 74.7% | ||
| Deferred Maintenance | $68,375 | $0 | NAP | LTV Ratio at Maturity or ARD: | 65.9% | ||
| (1) | See “Escrows” section. |
The Mortgage Loan. The mortgage loan (the “Sandpiper Apartments Mortgage Loan”) is evidenced by a single promissory note that is secured by a first mortgage encumbering a garden-style multifamily property located in Las Vegas, Nevada (the “Sandpiper Apartments Property”). The Sandpiper Apartments Mortgage Loan was originated on July 10, 2015 by Rialto Mortgage Finance, LLC. The Sandpiper Apartments Mortgage Loan had an original principal balance of $30,500,000, has an outstanding principal balance as of the Cut-off Date of $30,500,000 and accrues interest at an interest rate of 4.850%per annum. The Sandpiper Apartments Mortgage Loan had an initial term of 120 months, has a remaining term of 118 months as of the Cut-off Date and requires interest-only payments for the first 36 payments following origination and, thereafter, requires payments of principal and interest based on a 30-year amortization schedule. The Sandpiper Apartments Mortgage Loan matures on July 6, 2025.
Following the lockout period, the borrower has the right to prepay the Sandpiper Apartments Mortgage Loan in whole, but not in part, provided that the borrower pays the greater of a yield maintenance premium or a prepayment premium equal to 1.0% of the principal amount being prepaid, on any date prior to April 6, 2025. In addition, the Sandpiper Apartments Mortgage Loan is prepayable without penalty on or after April 6, 2025.
Sources and Uses
| Sources | Uses | |||||||
| Original loan amount | $30,500,000 | 100.0% | Loan payoff | $29,815,647 | 97.8% | |||
| Reserves | 161,930 | 0.5 | ||||||
| Closing costs | 401,195 | 1.3 | ||||||
| Return of equity | 121,228 | 0.4 | ||||||
| Total Sources | $30,500,000 | 100.0% | Total Uses | $30,500,000 | 100.0% |
THE INFORMATION IN THIS STRUCTURAL AND COLLATERAL TERM SHEET IS NOT COMPLETE AND MAY BE AMENDED PRIOR TO THE TIME OF SALE. THIS TERM SHEET IS NOT AN OFFER TO SELL THESE SECURITIES AND IT IS NOT A SOLICITATION OF AN OFFER TO BUY THESE SECURITIES IN ANY JURISDICTION WHERE THE OFFER OR SALE IS NOT PERMITTED.
| 68 |
| SANDPIPER APARTMENTS |
The Property.The Sandpiper Apartments Property is a 488-unit, garden-style multifamily property consisting of 61 residential buildings situated on 20.2 acres located in Las Vegas, Nevada. Built in 1987 and renovated in 2015, the Sandpiper Apartments Property is located approximately three miles west of the Las Vegas Strip. Common area amenities feature a controlled vehicle access gate, club house/leasing office, three pools with spas, four tennis courts, tanning beds, a fully equipped fitness center and covered parking. Unit features and amenities include fully equipped kitchens, in-unit washer/dryers, private balconies or patios, walk-in closets and central HVAC. Since the acquisition of the Sandpiper Apartments Property in 2005, a total of $616,000 ($1,262 per unit) in capital improvements have been completed, which included water heater and appliance replacements, installation of new carpeting and vinyl flooring, resurfacing of tennis courts and swimming pools, and exterior painting and stucco repairs. The Sandpiper Apartments Property contains 488 covered carport spaces and 562 surface parking spaces for a total of 1,050 parking spaces, reflecting an overall parking ratio of 2.2 spaces per unit. As of June 1, 2015, the Sandpiper Apartments Property was 95.9% occupied.
The following table presents certain information relating to the unit mix of the Sandpiper Apartments Property:
Unit Mix Summary(1)
| Unit Type | No. of Units | % of Total Units | Average Unit Size (SF) | Average U/W Monthly Rent per Unit |
| 2 bedroom / 2 bath | 248 | 50.8% | 1,050 | $780 |
| 1 bedroom / 1 bath | 240 | 49.2% | 750 | $664 |
| Total/Weighted Average | 488 | 100.0% | 902 | $723 |
| (1) | Information obtained from the underwritten rent roll. |
The following table presents historical occupancy percentages at the Sandpiper Apartments Property:
Historical Occupancy
12/31/2012(1) | 12/31/2013(1) | 12/31/2014(1) | 6/1/2015(2) | |||
| 84.9% | 89.4% | 92.9% | 95.9% |
| (1) | Information obtained from the borrower. |
| (2) | Information obtained from the underwritten rent roll. |
Operating History and Underwritten Net Cash Flow.The following table presents certain information relating to the historical operating performance and underwritten net cash flow at the Sandpiper Apartments Property:
Cash Flow Analysis
| 2012 | 2013 | 2014 | TTM 5/31/2015 | U/W | % of U/W Effective Gross Income | U/W $ per Unit | |||||||||
| Base Rent | $3,383,132 | $3,523,990 | $3,773,705 | $3,819,941 | $4,052,304 | 97.3% | $8,304 | ||||||||
| Grossed Up Vacant Space | 0 | 0 | 0 | 0 | 187,440 | 4.5 | 384 | ||||||||
| Concessions | 0 | 0 | 0 | 0 | 0 | 0.0 | 0 | ||||||||
| Other Income(1) | 106,152 | 125,543 | 165,533 | 171,354 | 145,000 | 3.5 | 297 | ||||||||
| Less Vacancy & Credit Loss | 0 | 0 | 0 | 0 | (221,358)(2) | (5.3) | (454) | ||||||||
| Effective Gross Income | $3,489,284 | $3,649,533 | $3,939,238 | $3,991,294 | $4,163,386 | 100.0% | $8,532 | ||||||||
| Total Operating Expenses | $1,489,236 | $1,569,009 |
$1,581,805 | $1,595,308 | $1,640,463 | 39.4 | $3,362 | ||||||||
| Net Operating Income | $2,000,048 | $2,080,524 | $2,357,432 | $2,395,987 | $2,522,923 | 60.6% | $5,170 | ||||||||
| Capital Expenditures | 0 | 0 | 0 | 0 | 137,128 | 3.3 | 281 | ||||||||
| Net Cash Flow | $2,000,048 | $2,080,524 | $2,357,432 | $2,395,987 | $2,385,795 | 57.3% | $4,889 | ||||||||
| NOI DSCR | 1.04x | 1.08x | 1.22x | 1.24x | 1.31x | ||||||||||
| NCF DSCR | 1.04x | 1.08x | 1.22x | 1.24x | 1.24x | ||||||||||
| NOI DY | 6.6% | 6.8% | 7.7% | 7.9% | 8.3% | ||||||||||
| NCF DY | 6.6% | 6.8% | 7.7% | 7.9% | 7.8% |
| (1) | Other Income includes retained security deposits, late charges, clean-up fees, pet fees and credit check fees. |
| (2) | The underwritten economic vacancy is 5.2%. The Sandpiper Apartments Property was 95.9% occupied as of June 1, 2015. |
Appraisal.As of the appraisal valuation date of June 3, 2015, the Sandpiper Apartments Property had an “as-is” appraised value of $40,820,000.
THE INFORMATION IN THIS STRUCTURAL AND COLLATERAL TERM SHEET IS NOT COMPLETE AND MAY BE AMENDED PRIOR TO THE TIME OF SALE. THIS TERM SHEET IS NOT AN OFFER TO SELL THESE SECURITIES AND IT IS NOT A SOLICITATION OF AN OFFER TO BUY THESE SECURITIES IN ANY JURISDICTION WHERE THE OFFER OR SALE IS NOT PERMITTED.
| 69 |
| SANDPIPER APARTMENTS |
Environmental Matters.According to a Phase I environmental assessment dated June 4, 2015, there was no evidence of any recognized environmental conditions at the Sandpiper Apartments Property.
Market Overview and Competition.The Sandpiper Apartments Property is located in Las Vegas, Nevada, which is the largest metropolitan area in Nevada. The Sandpiper Apartments Property is located approximately three miles west of the Las Vegas Strip, a major employment center consisting of casino resort hotels, entertainment venues, shopping destinations and restaurants. Access to the Las Vegas metropolitan statistical area is provided by Interstate 15 (located two miles west of the Sandpiper Apartments Property), which also provides access to the Los Angeles metro area approximately 270 miles to the southwest. Regional access is provided via Route 95/Interstate 515 on the north side of Las Vegas and Route 215 on the south side of Las Vegas. The immediate area surrounding the Sandpiper Apartments Property is served by South Decatur Boulevard and West Sahara Avenue. The immediate area around the Sandpiper Apartments Property contains mixed-uses with multifamily, single family and commercial developments. The composition of development in the immediate area is estimated to be 40% multifamily, 50% retail, 9% office and 1% industrial. Within a two-mile radius of the Sandpiper Apartments Property there are 10 strip retail centers with approximately 1.5 million square feet of retail space mostly located along South Decatur Boulevard. A Walmart Supercenter and Lowes Home Improvement anchored retail center is located immediately north of the Sandpiper Apartments Property. The Sandpiper Apartments Property is located in the Clark County Unified School district offering K-12 public schooling. The main campus of the University of Nevada Las Vegas (UNLV) is located approximately 4.8 miles southeast of the Sandpiper Apartments Property. The 2015 estimated population within a one-, three-, and five-mile radius of the Sandpiper Apartments Property was 22,269, 165,825, and 471,701 respectively, and the 2015 estimated average household income within the same radii was $48,471, $50,817 and $50,497, respectively.
According to a third party market research report, the Sandpiper Apartments Property is located in the Las Vegas multifamily market and the West Las Vegas multifamily submarket. As of the first quarter of 2015, the Las Vegas multifamily market contained 165,685 units with a vacancy rate of 6.6%, and an average monthly market rent of $782 per unit. The West Las Vegas multifamily submarket contained 21,482 units with a vacancy rate of 5.6%, and an average rental rate of $698 per unit.
The following table presents certain information relating to some comparable multifamily properties for the Sandpiper Apartments Property:
Competitive Set(1)
| Sandpiper Apartments Property | Tiffany Place | Alpine Village | Indian Hills | The Arbors on Decatur | Villas at Painted Desert | Shelter Cove | |
| Location | Las Vegas, NV | Las Vegas, NV | Las Vegas, NV | Las Vegas, NV | Las Vegas, NV | Las Vegas, NV | Las Vegas, NV |
| Distance to Subject | -- | 2.0 miles | 1.2 miles | 0.9 miles | 0.9 miles | 1.0 mile | 1.1 miles |
| Property Type | Garden | Garden | Garden | Garden | Garden | Garden
| Garden |
| Number of Units | 488 | 182 | 324 | 484 | 216 | 240 | 304 |
| Average Monthly Rent (per unit) | |||||||
| 1BR | $664 | $760 | $620 | $695 | $662 | NAP | $640-$720 |
| 2BR | $780 | $895 | $765-$890 | $791 | $785 | $721-$859 | $836 |
| 3BR | NAP | $995 | $965-$1,025 | NAP | $930 | NAP | NAP |
| Townhouse | NAP | NAP | NAP | NAP | NAP | $721-$859 | NAP |
| Total Occupancy | 96% | 98% | 97% | 94% | 93% | 96% | 98% |
| (1) | Information obtained from the appraisal and underwritten rent roll. |
The Borrower.The borrower is APEX 2015, LLC, a single purpose entity with two independent directors. Legal counsel to the borrower delivered a non-consolidation opinion in connection with the origination of the Sandpiper Apartments Mortgage Loan. The borrower is 100% owned by Hillcrest Court Apartments L.P., which is owned by Malik Zahman, Roohi Zaman and Zaman Property Management, Inc., which is owned by Malik Zaman. Malik Zaman is the guarantor of certain nonrecourse carveouts under the Sandpiper Apartments Mortgage Loan.
The Sponsor.The sponsor, Malik Zaman, has 37 years of real estate experience and is the founder and President of Apple Management, Inc. and Zaman Property Management, Inc. Mr. Zaman has a real estate portfolio consisting of four multifamily properties, plus multiple single family homes containing 688 units. Mr. Zaman’s portfolio properties are located in Southern California and Nevada. Mr. Zaman manages 37 employees including on-site property managers, leasing agents, maintenance personnel and corporate office workers.
Escrows.The loan documents provide for upfront escrows in the amount of $86,380 for real estate taxes, $68,375 for deferred maintenance and $7,174 for insurance premiums. The loan documents also provide for ongoing monthly reserves in the amount of $16,453 for real estate taxes, $6,833 for insurance premiums and $11,427 for replacement reserves.
Lockbox and Cash Management.Upon the occurrence and continuance of a Cash Management Trigger Event (as defined below), the Sandpiper Apartments Mortgage Loan requires the borrower to establish a lender-controlled lockbox account. The loan documents also require that after the occurrence of a Cash Management Trigger Event all revenues received by the borrower or the property manager be deposited into the lockbox account within three business days of receipt. Other than during a Cash Sweep Event (as defined below), all excess funds on deposit are disbursed to the borrower.
A “Cash Management Trigger Event” will commence upon the occurrence of (i) an event of default; (ii) any bankruptcy action of the borrower, guarantor or the property manager; or (iii) any date the amortizing debt service coverage ratio based on the trailing 12-month period immediately preceding the date of such determination is less than 1.15x. A Cash Management Trigger Event will end
THE INFORMATION IN THIS STRUCTURAL AND COLLATERAL TERM SHEET IS NOT COMPLETE AND MAY BE AMENDED PRIOR TO THE TIME OF SALE. THIS TERM SHEET IS NOT AN OFFER TO SELL THESE SECURITIES AND IT IS NOT A SOLICITATION OF AN OFFER TO BUY THESE SECURITIES IN ANY JURISDICTION WHERE THE OFFER OR SALE IS NOT PERMITTED.
| 70 |
| SANDPIPER APARTMENTS |
with respect to clause (i), when such event of default has been cured, with respect to clause (ii), when such bankruptcy petition has been discharged, stayed, or dismissed within 30 days for borrower or guarantor and 120 days for the property manager, among other conditions and with respect to clause (iii), once the amortizing debt service coverage ratio based upon the trailing 12-month period immediately preceding the date of such determination is greater than 1.15x for two consecutive quarters. The bankruptcy of the property manager may also be cured by the borrower replacing the property manager with a qualified manager acceptable to the lender.
A “Cash Sweep Event” will commence upon the occurrence of (i) an event of default; (ii) any bankruptcy action of the borrower, guarantor, or the property manager; or (iii) any date the amortizing debt service coverage ratio based on the trailing 12-month period immediately preceding the date of such determination is less than 1.10x. A Cash Sweep Event will end with respect to clause (i), when such event of default has been cured, with respect to clause (ii), when such bankruptcy petition has been discharged, stayed, or dismissed, within 30 days for the borrower or guarantor and 120 days for the property manager, among other conditions, and with respect to clause (iii), once the amortizing debt service coverage ratio based upon the trailing 12-month period immediately preceding the date of such determination is greater than 1.10x for two consecutive quarters. The bankruptcy of the property manager may also be cured by the borrower replacing the property manager with a qualified manager acceptable to the lender.
Property Management.The Sandpiper Apartments Property is managed by an affiliate of the borrower.
Assumption.The borrower has a right to transfer the Sandpiper Apartments Property 30 days after securitization or six months after the origination date, provided that no event of default has occurred and is continuing and certain other conditions are satisfied, including (i) the lender’s reasonable determination that the proposed transferee and guarantor satisfy the lender’s credit review and underwriting standards, taking into consideration transferee experience, financial strength and general business standing; (ii) execution of a recourse guaranty and an environmental indemnity by an affiliate of the transferee; and (iii) if requested by the lender, rating agency confirmation from Fitch, Moody’s and Morningstar that the transfer will not result in a downgrade, withdrawal or qualification of the respective ratings assigned to the Series 2015-LC22 Certificates.
Partial Release.Not permitted.
Real Estate Substitution.Not permitted.
Subordinate and Mezzanine Indebtedness.Not permitted.
Ground Lease.None
Terrorism Insurance.The loan documents require that the “all risk” insurance policy required to be maintained by the borrower provides coverage for terrorism in an amount equal to the full replacement cost of the Sandpiper Apartments Property, as well as business interruption insurance covering no less than the 18-month period following the occurrence of a casualty event, together with a six-month extended period of indemnity.
THE INFORMATION IN THIS STRUCTURAL AND COLLATERAL TERM SHEET IS NOT COMPLETE AND MAY BE AMENDED PRIOR TO THE TIME OF SALE. THIS TERM SHEET IS NOT AN OFFER TO SELL THESE SECURITIES AND IT IS NOT A SOLICITATION OF AN OFFER TO BUY THESE SECURITIES IN ANY JURISDICTION WHERE THE OFFER OR SALE IS NOT PERMITTED.
| 71 |
WEST PALM BEACH MARRIOTT |

THE INFORMATION IN THIS STRUCTURAL AND COLLATERAL TERM SHEET IS NOT COMPLETE AND MAY BE AMENDED PRIOR TO THE TIME OF SALE. THIS TERM SHEET IS NOT AN OFFER TO SELL THESE SECURITIES AND IT IS NOT A SOLICITATION OF AN OFFER TO BUY THESE SECURITIES IN ANY JURISDICTION WHERE THE OFFER OR SALE IS NOT PERMITTED.
| 72 |
WEST PALM BEACH MARRIOTT |
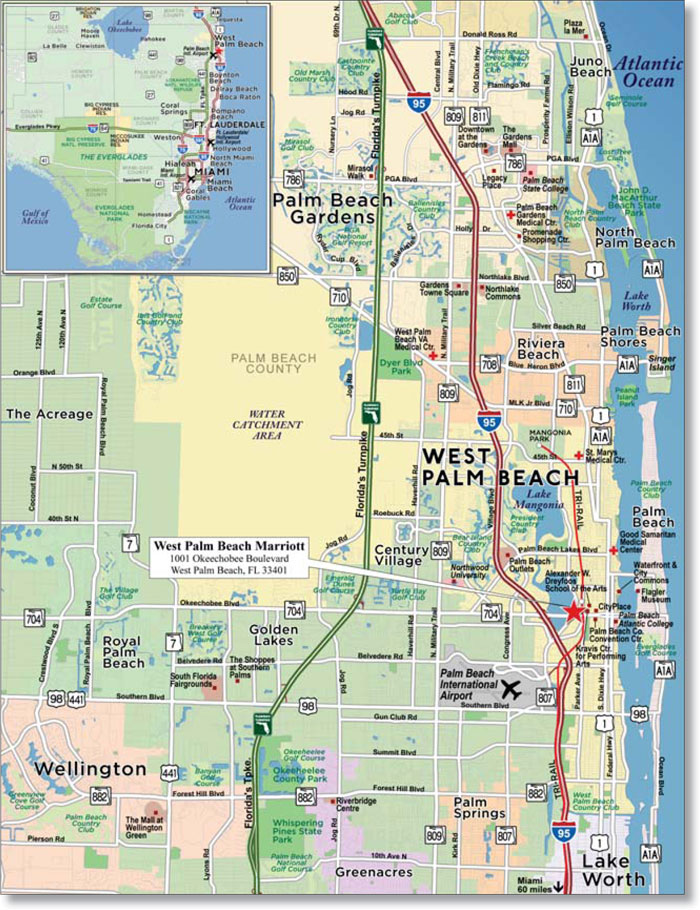
THE INFORMATION IN THIS STRUCTURAL AND COLLATERAL TERM SHEET IS NOT COMPLETE AND MAY BE AMENDED PRIOR TO THE TIME OF SALE. THIS TERM SHEET IS NOT AN OFFER TO SELL THESE SECURITIES AND IT IS NOT A SOLICITATION OF AN OFFER TO BUY THESE SECURITIES IN ANY JURISDICTION WHERE THE OFFER OR SALE IS NOT PERMITTED.
| 73 |
| No. 6 – West Palm Beach Marriott | ||||||
| Loan Information | Property Information | |||||
| Mortgage Loan Seller: | Wells Fargo Bank, National Association | Single Asset/Portfolio: | Single Asset | |||
Credit Assessment (Fitch/Moody’s/Morningstar): | NR/NR/NR | Property Type: | Hospitality | |||
| Original Principal Balance: | $30,000,000 | Specific Property Type: | Full Service | |||
| Cut-off Date Principal Balance: | $30,000,000 | Location: | West Palm Beach, FL | |||
| % of Initial Pool Balance: | 3.1% | Size: | 352 Rooms | |||
| Loan Purpose: | Refinance | Cut-off Date Principal Balance Per Room: | $85,227 | |||
| Borrower Name: | PBM Properties, LLC | Year Built/Renovated: | 1981/2015 | |||
| Sponsor: | Terrapin Limited Holdings, LLC | Title Vesting(3): | Fee & Leasehold | |||
| Mortgage Rate: | 4.575% | Property Manager: | Self-managed | |||
| Note Date: | July 31, 2015 | 3rdMost Recent Occupancy (As of): | 69.5% (12/31/2012) | |||
| Anticipated Repayment Date: | NAP | 2ndMost Recent Occupancy (As of): | 78.6% (12/31/2013) | |||
| Maturity Date: | August 11, 2025 | Most Recent Occupancy (As of): | 78.5% (12/31/2014) | |||
| IO Period: | 24 months | Current Occupancy (As of): | 78.1% (5/31/2015) | |||
| Loan Term (Original): | 120 months | |||||
| Seasoning: | 1 month | Underwriting and Financial Information: | ||||
| Amortization Term (Original): | 360 months | |||||
| Loan Amortization Type: | Interest-only, Amortizing Balloon | 3rdMost Recent NOI (As of): | $3,260,197 (12/31/2013) | |||
| Interest Accrual Method: | Actual/360 | 2ndMost Recent NOI (As of): | $3,769,780 (12/31/2014) | |||
| Call Protection: | L(25),D(91),O(4) | Most Recent NOI (As of): | $4,634,400 (TTM 5/31/2015) | |||
| Lockbox Type: | None | |||||
| Additional Debt(1): | Yes | |||||
| Additional Debt Type(1): | Unsecured | U/W Revenues: | $21,009,236 | |||
| U/W Expenses: | $16,576,584 | |||||
| U/W NOI: | $4,432,651 | |||||
| U/W NCF: | $3,382,189 | |||||
| U/W NOI DSCR: | 2.41x | |||||
| U/W NCF DSCR: | 1.84x | |||||
| Escrows and Reserves(2): | U/W NOI Debt Yield: | 14.8% | ||||
| U/W NCF Debt Yield: | 11.3% | |||||
| Type: | Initial | Monthly | Cap (If Any) | As-Is Appraised Value: | $53,200,000 | |
| Taxes | $0 | Springing | NAP | As-Is Appraisal Valuation Date: | June 29, 2015 | |
| Insurance | $0 | Springing | NAP | Cut-off Date LTV Ratio: | 56.4% | |
| FF&E Reserve | $0 | Springing | NAP | LTV Ratio at Maturity or ARD: | 48.3% | |
| (1) | See “Subordinate and Mezzanine Indebtedness” section. |
| (2) | See “Escrows” section. |
| (3) | See “Ground Lease” section. |
The Mortgage Loan. The mortgage loan (the “West Palm Beach Marriott Mortgage Loan”) is evidenced by a single promissory note secured by a first mortgage encumbering the fee interest in a full service hotel located in West Palm Beach, Florida (the “West Palm Beach Marriott Property”). The West Palm Beach Marriott Mortgage Loan was originated on July 31, 2015 by Wells Fargo Bank, National Association. The West Palm Beach Marriott Mortgage Loan had an original principal balance of $30,000,000, has an outstanding principal balance as of the Cut-off Date of $30,000,000 and accrues interest at an interest rate of 4.575%per annum. The West Palm Beach Marriott Mortgage Loan had an initial term of 120 months, has a remaining term of 119 months as of the Cut-off Date and requires interest-only payments for the first 24 payments following origination and, thereafter, payments of principal and interest based on a 30-year amortization schedule. The West Palm Beach Marriott Mortgage Loan matures on August 11, 2025.
Following the lockout period, the borrower has the right to defease the West Palm Beach Marriott Mortgage Loan in whole, but not in part, on any date before May 11, 2025. In addition, the West Palm Beach Marriott Mortgage Loan is prepayable without penalty on or after May 11, 2025.
THE INFORMATION IN THIS STRUCTURAL AND COLLATERAL TERM SHEET IS NOT COMPLETE AND MAY BE AMENDED PRIOR TO THE TIME OF SALE. THIS TERM SHEET IS NOT AN OFFER TO SELL THESE SECURITIES AND IT IS NOT A SOLICITATION OF AN OFFER TO BUY THESE SECURITIES IN ANY JURISDICTION WHERE THE OFFER OR SALE IS NOT PERMITTED.
| 74 |
WEST PALM BEACH MARRIOTT |
Sources and Uses
| Sources | Uses | |||||||
| Original loan amount | $30,000,000 | 100.0% | Loan payoff(1) | $28,005,028 | 93.4% | |||
| Reserves | 0 | 0.0 | ||||||
| Closing costs | 514,971 | 1.7 | ||||||
| Return of equity | 1,480,000 | 4.9 | ||||||
| Total Sources | $30,000,000 | 100.0% | Total Uses | $30,000,000 | 100.0% |
| (1) | The West Palm Beach Marriott Property was previously securitized in the MSC 2006-T21 transaction. |
The Property.The West Palm Beach Marriott Property is a 352-room, 10-story, full-service hotel located in West Palm Beach, Florida, within the West Palm Beach central business district. Built in 1981 and renovated in 2012, the West Palm Beach Marriott Property’s guestroom configuration includes 178 standard king guestrooms, 163 double queen guestrooms, nine junior suites, one executive suite and one presidential suite. Each guestroom features a flat screen television, dresser, work desk and chair, nightstands and a lounge chair. Concierge level guestrooms are provided access to the concierge lounge which offers complimentary breakfast, hors d’oeuvres, dessert and Wi-Fi. Amenities at the West Palm Beach Marriott Property include approximately 16,300 square feet of meeting space (including approximately 1,720 square feet of outdoor courtyard and tent space), an outdoor swimming pool, a fitness center, a business center, an airport shuttle, guest laundry, Starbucks and the Bistro Ten Zero One full-service restaurant, which serves breakfast, lunch and dinner. The West Palm Beach Marriott Property also features 360 surface parking spaces, equating to a parking ratio of 1.0 space per room.
The West Palm Beach Marriott Property has been updated, with approximately $5.6 million ($15,982 per key) invested between 2010 and 2014, which included guestroom renovations, restaurant refresh, chiller cooler tower replacement and boiler replacement. The borrower is planning to complete an additional, $3.0 million ($8,523 per key) renovation to upgrade the guestrooms during the fall of 2015. In lieu of a franchise agreement, the West Palm Beach Marriott Property is subject to a management agreement with Marriott Hotel Services, Inc. (“Marriott”), which expires in May 2023 with one 10-year renewal option. In the event that the borrower or guarantor no longer has the right to operate the West Palm Beach Marriott Property as a Marriott franchise, the West Palm Beach Marriott Mortgage Loan will become full-recourse to the borrower and guarantor.
Operating History and Underwritten Net Cash Flow.The following table presents certain information relating to the historical operating performance and the underwritten net cash flow at the West Palm Beach Marriott Property:
Cash Flow Analysis
2013 | 2014 | TTM 5/31/2015 | U/W | % of U/W Total Revenue | U/W $ per Room | ||||||||
| Occupancy | 78.6% | 78.5% | 78.1% | 76.0% | |||||||||
| ADR | $136.35 | $148.63 | $156.15 | $156.15 | |||||||||
| RevPAR | $107.15 | $116.63 | $122.03 | $118.67 | |||||||||
| Total Revenue | $19,220,843 | $20,521,911 | $21,435,724 | $21,009,236 | 100.0% | $59,685 | |||||||
| Total Department Expenses | 8,595,511 | 8,848,313 | 8,796,782 | 8,634,838 | 41.1 | 24,531 | |||||||
| Gross Operating Profit | $10,625,332 | $11,673,598 | $12,638,942 | $12,374,398 | 58.9% | $35,155 | |||||||
| Total Undistributed Expenses | 6,238,785 | 6,657,286 | 6,751,433 | 6,664,831 | 31.7 | 18,934 | |||||||
| Profit Before Fixed Charges | $4,386,547 | $5,016,312 | $5,887,509 | $5,709,566 | 27.2% | $16,220 | |||||||
| Total Fixed Charges | 1,126,350 | 1,246,532 | 1,253,109 | 1,276,915 | 6.1 | 3,628 | |||||||
| Net Operating Income | $3,260,197(1) | $3,769,780(1) | $4,634,400(1) | $4,432,651 | 21.1% | $12,593 | |||||||
| FF&E | 0 | 0 | 0 | 1,050,462 | 5.0 | 2,984 | |||||||
| Net Cash Flow | $3,260,197 | $3,769,780 | $4,634,400 | $3,382,189 | 16.1% | $9,608 | |||||||
| NOI DSCR | 1.77x | 2.05x | 2.52x | 2.41x | |||||||||
| NCF DSCR | 1.77x | 2.05x | 2.52x | 1.84x | |||||||||
| NOI DY | 10.9% | 12.6% | 15.4% | 14.8% | |||||||||
| NCF DY | 10.9% | 12.6% | 15.4% | 11.3% | |||||||||
| (1) | Each of the increases in NOI in 2014 and TTM 5/31/2015 was due to increases in ADR. |
The Appraisal.As of the appraisal valuation date of June 29, 2015, the West Palm Beach Marriott Property had an “as-is” appraised value of $53,200,000.
Environmental Matters.According to the Phase I environmental site assessment dated July 2, 2015, there was no evidence of any recognized environmental conditions at the West Palm Beach Marriott Property
Market Overview and Competition.The West Palm Beach Marriott Property is located in the central business district of West Palm Beach, Florida. Per the appraisal, the city of West Palm Beach has undergone extensive gentrification and revitalization and numerous office, governmental, retail and residential projects have been recently completed in the downtown area. In August 2014, the city of West Palm Beach was named by a nationally-recognized publication as the number one city in Florida for business growth
THE INFORMATION IN THIS STRUCTURAL AND COLLATERAL TERM SHEET IS NOT COMPLETE AND MAY BE AMENDED PRIOR TO THE TIME OF SALE. THIS TERM SHEET IS NOT AN OFFER TO SELL THESE SECURITIES AND IT IS NOT A SOLICITATION OF AN OFFER TO BUY THESE SECURITIES IN ANY JURISDICTION WHERE THE OFFER OR SALE IS NOT PERMITTED.
| 75 |
WEST PALM BEACH MARRIOTT |
and careers, which outpaced Orlando, Fort Lauderdale and Miami. Per the appraisal, several key factors spurring the desirability of downtown West Palm Beach include the ease of access to the downtown area, proximity to West Palm Beach International Airport (2.8 miles southwest of the West Palm Beach Marriott Property), commuter rail service including a centrally located downtown Tri Rail and Amtrak station, abundant and inexpensive parking and a variety of shopping, dining and entertainment outlets.
The West Palm Beach Marriott Property is situated on Okeechobee Boulevard, one of the city’s main thoroughfares, connecting to the Atlantic Ocean to the east and Interstate 95 to the west. The West Palm Beach Marriott Property benefits from its location adjacent to the Kravis Center for the Performing Arts, the Alexander W. Dreyfoos School of the Arts and the Palm Beach Convention Center and being within walking distance to City Place, a mixed-use development which features a variety of restaurants and retail stores and is anchored by Macy’s, Muvico Parisian 20 & IMAX theater and a Publix grocery store. In addition, the city of West Palm Beach completed the Waterfront and City Commons project in early 2010 for a reported cost of $30.0 million, which stretches over half-a-mile and encompasses 12.5 acres along the Intracoastal Waterway at the east-end of Clematis Street.
The South Florida region is home to four Fortune 500 corporations (World Fuel Services, AutoNation, Office Depot and Ryder System) and a number of Fortune 1000 companies. According to a third party government agency, the South Florida region gained approximately 91,800 jobs over the 12-month period ending March 2015, representing a 3.8% increase during the 12-month period; South Florida outpaced the national average employment growth, which increased 2.3% over the same period. The largest private employers in West Palm Beach are Publix Supermarkets, Inc. (12,000 employees), Tenant Healthcare Corp. (6,100 employees) and Comcast (4,000 employees). The largest customers at the West Palm Beach Marriott Property include General Dynamics, Net Jets, Jet Aviation, Atlantic Aviation, Flight Safety International, Wells Fargo, Bank of America, PricewaterhouseCoopers and Goldman Sachs. The demand segmentation at the West Palm Beach Marriott Property is 75% transient and 25% meeting and group. A third party hospitality research report identified a competitive set of five hospitality properties, which contain 978 rooms and exhibited an average occupancy, ADR and RevPAR of 82.2%, $122.81 and $100.98, respectively, for the trailing 12-month period ending June 30, 2015.
The following table presents certain information relating to the West Palm Beach Marriott Property’s competitive set:
Subject and Market Historical Occupancy, ADR and RevPAR(1)
Competitive Set |
West Palm Beach Marriott |
Penetration Factor | |||||||||||||||||
Year | Occupancy | ADR | RevPAR | Occupancy | ADR | RevPAR | Occupancy | ADR | RevPAR | ||||||||||
| 6/30/2015 TTM | 82.2% | $122.81 | $100.98 | 78.3% | $155.40 | $121.62 | 95.2% | 126.5% | 120.4% | ||||||||||
| 6/30/2014 TTM | 80.7% | $112.26 | $90.56 | 77.6% | $143.64 | $111.47 | 96.2% | 128.0% | 123.1% | ||||||||||
| 6/30/2013 TTM | 78.0% | $101.66 | $79.28 | 71.4% | $135.69 | $96.82 | 91.5% | 133.5% | 122.1% | ||||||||||
| (1) | Information obtained from a third party hospitality research report dated July 17, 2015. The competitive set includes: Hilton Palm Beach Airport, Embassy Suites West Palm Beach Central, Holiday Inn Palm Beach Airport, Doubletree Hotel West Palm Beach Airport and Hyatt Place West Palm Beach Downtown. |
The Borrower.The borrower is PBM Properties, LLC, a Delaware limited liability company and a single purpose entity with one independent director. Legal counsel to the borrower provided a non-consolidation opinion in connection with the origination of the West Palm Beach Marriott Mortgage Loan. Terrapin Limited Holdings, LLC is the guarantor of certain nonrecourse carveouts under the West Palm Beach Marriott Mortgage Loan. In lieu of a nonrecourse carveout for losses related to the breach of any representation, warranty, covenant or indemnification provisions in the West Palm Beach Marriott loan documents concerning environmental laws or hazardous substances, the borrower obtained a $1,000,000 environmental insurance policy that has a 10-year term with three-year tail.
The Sponsor.The sponsor is Terrapin Limited Holdings, LLC, a subsidiary of JWM Family Enterprises, L.P. (“JWMFE”). JWMFE owns 16 hotels, of which all are operated by Marriott International, Inc., and is primarily owned by J.W. Marriott Jr, the executive chairman of Marriott International, Inc. Marriott International, Inc. owns, operates or manages more than 4,200 properties in 79 countries and territories and reported revenues of nearly $14.0 billion in the fiscal year 2014.
Escrows.Ongoing monthly reserves for real estate taxes are not required as long as real estate taxes are being paid in accordance with the Marriott management agreement and ongoing monthly reserves for insurance are not required as long as insurance coverage of the West Palm Beach Marriott Property is being properly maintained in accordance with the Marriott management agreement. The Marriott management agreement requires monthly FF&E reserve equal to 5.0% of gross revenues and funds are held with Marriott and used in accordance with the Marriott management agreement. If at any time the FF&E reserve is not held by Marriott in accordance with the management agreement, the borrower must establish an FF&E reserve with the lender in an amount determined by the lender in its reasonable discretion.
Lockbox and Cash Management.None.
Property Management.The West Palm Beach Marriott Property is managed by an affiliate of the borrower.
Assumption.The borrower has a two-time right to transfer the West Palm Beach Marriott Property provided that certain conditions are satisfied, including (i) no event of default has occurred and is continuing; (ii) the lender reasonably determines that the proposed transferee and guarantor satisfy the lender’s credit review and underwriting standards, taking into consideration transferee experience, financial strength and general business standing; and (iii) if required by the lender, receipt of confirmation from Fitch,
THE INFORMATION IN THIS STRUCTURAL AND COLLATERAL TERM SHEET IS NOT COMPLETE AND MAY BE AMENDED PRIOR TO THE TIME OF SALE. THIS TERM SHEET IS NOT AN OFFER TO SELL THESE SECURITIES AND IT IS NOT A SOLICITATION OF AN OFFER TO BUY THESE SECURITIES IN ANY JURISDICTION WHERE THE OFFER OR SALE IS NOT PERMITTED.
| 76 |
WEST PALM BEACH MARRIOTT |
Moody’s and Morningstar that such assumption will not result in a downgrade, withdrawal or qualification of the respective ratings assigned to the Series 2015-LC22 Certificates.
Right of First Offer.The property manager, a Marriott-related affiliate, has a 30 day period to negotiate the purchase terms (“ROFO”) of the West Palm Beach Marriott Property prior to the property being offered for sale to a third party. The ROFO is not extinguished by foreclosure or deed-in-lieu thereof, but the management agreement provides that a foreclosure or deed-in-lieu thereof by any mortgagor does not trigger the ROFO.
Partial Release.Not permitted.
Real Estate Substitution.Not permitted.
Subordinate and Mezzanine Indebtedness.The borrower has existing unsecured subordinate debt in the amount of $16,500,000 owed to an affiliate. The unsecured subordinate debt accrues at a variable rate equal to the one year LIBOR rate plus 80 basis points (currently 1.77%) and is payable from excess cash flow after all property expenses, reserves, and debt service payments have been made. A subordination and standstill agreement was obtained from the related sponsor.
Ground Lease.The borrower has a leasehold interest, along with a license for 15 parking spaces, in a portion of an adjacent parking lot owned by the City of West Pam Beach, Florida. The parking lease is rent-free and expires May 31, 2097. The subject parking spaces are not required for zoning compliance or operations, and were not otherwise included either in the appraisal or in the West Palm Beach Marriott Loan underwriting.
Terrorism Insurance.The loan documents require that the “all risk” insurance policy required to be maintained by the borrower provide coverage for terrorism in an amount equal to the full replacement cost of the West Palm Beach Marriott Property. The loan documents also require business interruption insurance covering no less than the 18-month period following the occurrence of a casualty event, together with a six-month extended period of indemnity.
Windstorm Insurance.The loan documents require windstorm insurance covering the full replacement cost of the West Palm Beach Marriott Property during the loan term. At the time of origination, the West Palm Beach Marriott Property has windstorm insurance coverage.
THE INFORMATION IN THIS STRUCTURAL AND COLLATERAL TERM SHEET IS NOT COMPLETE AND MAY BE AMENDED PRIOR TO THE TIME OF SALE. THIS TERM SHEET IS NOT AN OFFER TO SELL THESE SECURITIES AND IT IS NOT A SOLICITATION OF AN OFFER TO BUY THESE SECURITIES IN ANY JURISDICTION WHERE THE OFFER OR SALE IS NOT PERMITTED.
| 77 |
(THIS PAGE INTENTIONALLY LEFT BLANK)
THE INFORMATION IN THIS STRUCTURAL AND COLLATERAL TERM SHEET IS NOT COMPLETE AND MAY BE AMENDED PRIOR TO THE TIME OF SALE. THIS TERM SHEET IS NOT AN OFFER TO SELL THESE SECURITIES AND IT IS NOT A SOLICITATION OF AN OFFER TO BUY THESE SECURITIES IN ANY JURISDICTION WHERE THE OFFER OR SALE IS NOT PERMITTED.
| 78 |
| SHOPPES AT WILTON |
![[Graphic]](https://capedge.com/proxy/FWP/0001539497-15-001423/img018_v1.jpg)
THE INFORMATION IN THIS STRUCTURAL AND COLLATERAL TERM SHEET IS NOT COMPLETE AND MAY BE AMENDED PRIOR TO THE TIME OF SALE. THIS TERM SHEET IS NOT AN OFFER TO SELL THESE SECURITIES AND IT IS NOT A SOLICITATION OF AN OFFER TO BUY THESE SECURITIES IN ANY JURISDICTION WHERE THE OFFER OR SALE IS NOT PERMITTED.
| 79 |
| SHOPPES AT WILTON |
![[Graphic]](https://capedge.com/proxy/FWP/0001539497-15-001423/img019_v1.jpg)
THE INFORMATION IN THIS STRUCTURAL AND COLLATERAL TERM SHEET IS NOT COMPLETE AND MAY BE AMENDED PRIOR TO THE TIME OF SALE. THIS TERM SHEET IS NOT AN OFFER TO SELL THESE SECURITIES AND IT IS NOT A SOLICITATION OF AN OFFER TO BUY THESE SECURITIES IN ANY JURISDICTION WHERE THE OFFER OR SALE IS NOT PERMITTED.
| 80 |
| SHOPPES AT WILTON |
![[Graphic]](https://capedge.com/proxy/FWP/0001539497-15-001423/img020_v1.jpg)
THE INFORMATION IN THIS STRUCTURAL AND COLLATERAL TERM SHEET IS NOT COMPLETE AND MAY BE AMENDED PRIOR TO THE TIME OF SALE. THIS TERM SHEET IS NOT AN OFFER TO SELL THESE SECURITIES AND IT IS NOT A SOLICITATION OF AN OFFER TO BUY THESE SECURITIES IN ANY JURISDICTION WHERE THE OFFER OR SALE IS NOT PERMITTED.
| 81 |
| No. 7 – Shoppes at Wilton |
| Loan Information | Property Information | |||||||||
| Mortgage Loan Seller: | Rialto Mortgage Finance, LLC | Single Asset/Portfolio: | Single Asset | |||||||
| Credit Assessment (Fitch/Moody’s/Morningstar): | NR/NR/NR | Property Type: | Retail | |||||||
| Original Principal Balance: | $22,500,000 | Specific Property Type: | Anchored | |||||||
| Cut-off Date Principal Balance: | $22,500,000 | Location: | Saratoga Springs, NY | |||||||
| % of Initial Pool Balance: | 2.3% | Size: | 134,710 SF | |||||||
| Loan Purpose: | Refinance | Cut-off Date Principal Balance Per SF: | $167.03 | |||||||
| Borrower Name: | The Shoppes at Wilton, L.L.C. | Year Built/Renovated: | 2002/NAP | |||||||
| Sponsor: | E. Stanley Kroenke | Title Vesting: | Fee | |||||||
| Mortgage Rate: | 4.390% | Property Manager: | Self-managed | |||||||
| Note Date: | August 26, 2015 | 3rdMost Recent Occupancy (As of): | 96.0% (12/31/2012) | |||||||
| Anticipated Repayment Date: | NAP | 2ndMost Recent Occupancy (As of): | 100.0% (12/31/2013) | |||||||
| Maturity Date: | September 6, 2025 | Most Recent Occupancy (As of): | 100.0% (12/31/2014) | |||||||
| IO Period: | 120 months | Current Occupancy (As of): | 100.0% (6/30/2015) | |||||||
| Loan Term (Original): | 120 months | |||||||||
| Seasoning: | 0 months | Underwriting and Financial Information: | ||||||||
| Amortization Term (Original): | NAP | |||||||||
| Loan Amortization Type: | Interest-only, Balloon | 3rdMost Recent NOI (As of): | $2,238,068 (12/31/2013) | |||||||
| Interest Accrual Method: | Actual/360 | 2ndMost Recent NOI (As of): | $2,303,094 (12/31/2014) | |||||||
| Call Protection: | L(23),GRTR 1% or YM(93),O(4) | Most Recent NOI (As of): | $2,301,214 (TTM 5/31/2015) | |||||||
| Lockbox Type: | Springing (Without Established Account) | |||||||||
| Additional Debt: | None | U/W Revenues: | $3,114,215 | |||||||
| Additional Debt Type: | NAP | U/W Expenses: | $901,643 | |||||||
| U/W NOI: | $2,212,573 | |||||||||
| U/W NCF: | $2,077,037 | |||||||||
| U/W NOI DSCR: | 2.20x | |||||||||
| Escrows and Reserves:(1) | U/W NCF DSCR: | 2.07x | ||||||||
| U/W NOI Debt Yield: | 9.8% | |||||||||
| Type: | Initial | Monthly | Cap (If Any) | U/W NCF Debt Yield: | 9.2% | |||||
| Taxes | $0 | Springing | NAP | As-Is Appraised Value: | $34,900,000 | |||||
| Insurance | $0 | Springing | NAP | As-Is Appraisal Valuation Date: | June 17, 2015 | |||||
| Replacement Reserves | $0 | Springing | NAP | Cut-off Date LTV Ratio: | 64.5% | |||||
| TI/LC Reserve | $0 | Springing | $505,163(1) | LTV Ratio at Maturity or ARD: | 64.5% | |||||
| (1) | See “Escrows” section. |
The Mortgage Loan. The mortgage loan (the “Shoppes at Wilton Mortgage Loan”) is evidenced by a single promissory note that is secured by a first mortgage encumbering an anchored retail property located in Saratoga Springs, New York (the “Shoppes at Wilton Property”). The Shoppes at Wilton Mortgage Loan was originated on August 26, 2015 by Rialto Mortgage Finance, LLC. The Shoppes at Wilton Mortgage Loan had an original principal balance of $22,500,000, has an outstanding principal balance as of the Cut-off Date of $22,500,000 and accrues interest at an interest rate of 4.3900%per annum. The Shoppes at Wilton Mortgage Loan had an initial term of 120 months, has a remaining term of 120 months as of the Cut-off Date and requires interest-only payments through the term of the Shoppes at Wilton Mortgage Loan. The Shoppes at Wilton Mortgage Loan matures on September 6, 2025.
Following the lockout period, the borrower has the right to prepay the Shoppes at Wilton Mortgage Loan in whole, but not in part, on any date before June 6, 2025 provided that the borrower pays the greater of a yield maintenance premium or a prepayment premium equal to 1.0% of the then outstanding principal balance. In addition, the Shoppes at Wilton Mortgage Loan is prepayable without penalty on or after June 6, 2025.
Sources and Uses
| Sources | Uses | |||||||
| Original loan amount | $22,500,000 | 99.2% | Loan payoff | $22,378,494 | 98.7% | |||
| Sponsor’s new cash contribution | 174,667 | 0.8 | Closing costs | 296,173 | 1.3 | |||
| Total Sources | $22,674,667 | 100.0% | Total Uses | $22,674,667 | 100.0% |
THE INFORMATION IN THIS STRUCTURAL AND COLLATERAL TERM SHEET IS NOT COMPLETE AND MAY BE AMENDED PRIOR TO THE TIME OF SALE. THIS TERM SHEET IS NOT AN OFFER TO SELL THESE SECURITIES AND IT IS NOT A SOLICITATION OF AN OFFER TO BUY THESE SECURITIES IN ANY JURISDICTION WHERE THE OFFER OR SALE IS NOT PERMITTED.
| 82 |
| SHOPPES AT WILTON |
The Property.The Shoppes at Wilton Property is an anchored retail center containing approximately 134,710 square feet located in Saratoga Springs, New York. Built in 2002, the Shoppes at Wilton Property consists of five, one-story buildings situated on a 17.6-acre parcel. The Shoppes at Wilton Property is anchored by Best Buy, TJ Maxx and Bed Bath & Beyond and the remaining tenant base includes a mix of national, regional, and local retailers. National and regional tenants comprise 89.3% of the net rentable area and, along with the anchor tenants, include Pier 1, Five Below, EMS Sports, Panera Bread, Famous Footwear, Moe’s Southwest Grill, Scottrade, Sally Beauty Supply, Wild Birds Unlimited, and State Farm. The remaining local inline tenants collectively occupy 10.7% of the net rentable area and include a furniture store, fitness center, restaurant, and beauty salon. In addition, there is a 10,000 square foot pad site ground leased to TGI Friday’s with a 5,950 square foot leasehold improvement that was constructed by TGI Friday’s in 2003. Parking is provided via 713 surface parking spaces, resulting in a parking ratio of 5.3 spaces per 1,000 square feet of rentable area. As of June, 30, 2015, the Shoppes at Wilton Property was 100.0%leased to 23 tenants, including TGI Friday’s.
The following table presents certain information relating to the tenancies at the Shoppes at Wilton Property:
Major Tenants
| Tenant Name | Credit Rating (Fitch/ Moody’s/ S&P)(1) | Tenant NRSF | % of NRSF | Annual U/W Base Rent PSF(2) | Annual U/W Base Rent(2) | % of Total Annual U/W Base Rent | Sales PSF(3) | Occupancy Cost(3) | Lease Expiration Date | |
| Anchor Tenant | ||||||||||
| Best Buy | NR/Baa2/BB | 30,038 | 22.3% | $16.00 | $480,608 | 18.7% | NAV | NAV | 1/31/2019(4) | |
| TJ Maxx | NR/A3/A+ | 28,000 | 20.8% | $12.50 | 350,000 | 13.7% | $376 | 4.7% | 4/30/2023(5) | |
| Bed Bath & Beyond | NR/Baa1/A- | 18,430 | 13.7% | $14.00 | 258,020 | 10.1% | NAV | NAV | 1/31/2019(6) | |
| Total Anchor Tenant | 76,468 | 56.8% | $14.24 | $1,088,628 | 42.5% | |||||
| Major Tenants | ||||||||||
| Pier 1 | NR/B1/B+ | 9,450 | 7.0% | $19.78 | $186,921 | 7.3% | $190 | 12.8% | 2/28/2018(7) | |
| Five Below | NR/NR/NR | 7,800 | 5.8% | $14.50 | $113,100 | 4.4% | NAV | NAV | 1/31/2021(8) | |
| Total Major Tenants | 17,250 | 12.8% | $17.39 | $300,021 | 11.7% | |||||
| Non-Major Tenants(9) | 40,992 | 30.4% | $28.67(9) | $1,175,169(9) | 45.8% | |||||
| Occupied Collateral Total | 134,710 | 100.0% | $19.03 | $2,563,818 | 100.0% | |||||
| Vacant Space | 0 | 0.0% | ||||||||
| Collateral Total | 134,710 | 100.0% | ||||||||
| (1) | Certain ratings are those of the parent company whether or not the parent guarantees the lease. |
| (2) | Annual U/W Base Rent PSF and Annual U/W Base Rent include contractual rent escalations through August 2016 totaling $14,598. |
| (3) | Sales PSF and Occupancy Costs are for the trailing 12-month period ending December 31, 2014. |
| (4) | Best Buy has three, 5-year renewal options. |
| (5) | TJ Maxx has two, 5-year renewal options. |
| (6) | Bed Bath & Beyond has four, 5-year renewal options. |
| (7) | Pier 1 has three, 5-year renewal options. |
| (8) | Five Below has two, 5-year renewal options. |
| (9) | Non-major tenants include a 10,000 square foot pad site ground leased to TGI Friday’s with a 5,950 square foot leasehold improvement owned by the tenant. Since TGI Friday’s owns its own improvements, no square footage is attributed to the tenant but the Annual U/W Base Rent of $128,304 is included. The Annual U/W Base Rent PSF excluding the TGI Friday’s rent is $25.54. |
The following table presents certain information relating to the historical sales at the Shoppes at Wilton Property:
Historical Sales (PSF)(1)
| Tenant Name | 2013 | 2014 |
| TJ Maxx | $368 | $368 |
| Average Total In-line (<10,000 square feet) | NAV | $323 |
| Occupancy Costs | NAV | 9.5% |
| (1) | Historical Sales (PSF) are based on historical statements provided by the borrower. |
THE INFORMATION IN THIS STRUCTURAL AND COLLATERAL TERM SHEET IS NOT COMPLETE AND MAY BE AMENDED PRIOR TO THE TIME OF SALE. THIS TERM SHEET IS NOT AN OFFER TO SELL THESE SECURITIES AND IT IS NOT A SOLICITATION OF AN OFFER TO BUY THESE SECURITIES IN ANY JURISDICTION WHERE THE OFFER OR SALE IS NOT PERMITTED.
| 83 |
| SHOPPES AT WILTON |
The following table presents certain information relating to the lease rollover schedule at the Shoppes at Wilton Property:
Lease Expiration Schedule(1)(2)
| Year Ending December 31, | No. of Leases Expiring | Expiring NRSF | % of Total NRSF | Cumulative Expiring NRSF | Cumulative % of Total NRSF | Annual U/W Base Rent | Annual U/W Base Rent PSF(3) |
| MTM | 0 | 0 | 0.0% | 0 | 0.0% | $0 | $0.00 |
| 2015 | 0 | 0 | 0.0% | 0 | 0.0% | $0 | $0.00 |
| 2016 | 2 | 3,811 | 2.8% | 3,811 | 2.8% | $84,802 | $22.25 |
| 2017 | 2 | 3,042 | 2.3% | 6,853 | 5.1% | $80,221 | $26.37 |
| 2018(4) | 9 | 25,679 | 19.1% | 32,532 | 24.1% | $753,375 | $29.34(4) |
| 2019 | 3 | 49,668 | 36.9% | 82,200 | 61.0% | $766,228 | $15.43 |
| 2020 | 1 | 6,500 | 4.8% | 88,700 | 65.8% | $164,125 | $25.25 |
| 2021 | 1 | 7,800 | 5.8% | 96,500 | 71.6% | $113,100 | $14.50 |
| 2022 | 1 | 1,102 | 0.8% | 97,602 | 72.5% | $27,500 | $24.95 |
| 2023 | 1 | 28,000 | 20.8% | 125,602 | 93.2% | $350,000 | $12.50 |
| 2024 | 2 | 4,108 | 3.0% | 129,710 | 96.3% | $99,467 | $24.21 |
| 2025 | 1 | 5,000 | 3.7% | 134,710 | 100.0% | $125,000 | $25.00 |
| Thereafter | 0 | 0 | 0.0% | 134,710 | 100.0% | $0 | $0.00 |
| Vacant | 0 | 0 | 0.0% | 134,710 | 100.0% | $0 | $0.00 |
| Total/Weighted Average | 23 | 134,710 | 100.0% | $2,563,818 | $19.03 |
| (1) | Information obtained from the underwritten rent roll. |
| (2) | Certain tenants may have lease termination options that are exercisable prior to the originally stated expiration date of the subject lease and that are not considered in the Lease Expiration Schedule. |
| (3) | Weighted Average Annual U/W Base Rent PSF excludes vacant space. |
| (4) | There is a 10,000 square foot pad site ground leased to TGI Friday’s with a 5,950 square foot leasehold improvement owned by the tenant. Since TGI Friday’s owns its own improvements, no square footage is attributed to the tenant but the tenant’s rent of $128,304 is included in the Annual U/W Base Rent. The Annual U/W Base Rent PSF excluding the TGI Friday’s rent is $24.34. |
The following table presents historical occupancy percentages at the Shoppes at Wilton Property:
Historical Occupancy
2012(1) | 2013(1) | 2014(1) | TTM 6/30/2015(2) | |||
| 96.0% | 100.0% | 100.0% | 100.0% |
| (1) | Information obtained from the borrower. |
| (2) | Information obtained from the underwritten rent roll. |
Operating History and Underwritten Net Cash Flow. The following table presents certain information relating to the historical operating performance and underwritten net cash flow at the Shoppes at Wilton Property:
Cash Flow Analysis
| 2013 | 2014 | TTM 5/31/2015 | U/W | % of Total Effective Gross Income | U/W $ per SF | ||||||||
| Base Rent | $2,409,360 | $2,468,629 | $2,486,686 | $2,549,219 | 81.9% | $18.92 | |||||||
| Rent Steps | 0 | 0 | 0 | 14,598 | 0.5 | 0.11 | |||||||
| Grossed Up Vacant Space | 0 | 0 | 0 | 0 | 0.0 | 0.00 | |||||||
| Total Reimbursables | 688,783 | 691,811 | 682,223 | 714,303 | 22.9 | 5.30 | |||||||
| Other Income | 3,316 | 0 | 0 | 0 | 0.0 | 0.00 | |||||||
| Less Vacancy & Credit Loss | 0 | 0 | 0 | (163,906)(1) | (5.3) | (1.22) | |||||||
| Effective Gross Income | $3,101,459 | $3,160,440 | $3,168,909 | $3,114,215 | 100.0% | $23.12 | |||||||
| Total Operating Expenses | $863,391 | $857,346 | $867,695 | $901,643 | 29.0% | $6.69 | |||||||
| Net Operating Income | $2,238,068 | $2,303,094 | $2,301,214 | $2,212,573 | 71.0% | $16.42 | |||||||
| TI/LC | 0 | 0 | 0 | 115,330 | 3.7 | 0.86 | |||||||
| Capital Expenditures | 0 | 0 | 0 | 20,207 | 0.6 | 0.15 | |||||||
| Net Cash Flow | $2,238,068 | $2,303,094 | $2,301,214 | $2,077,037 | 66.7% | $15.42 | |||||||
| NOI DSCR | 2.23x | 2.29x | 2.29x | 2.20x | |||||||||
| NCF DSCR | 2.23x | 2.29x | 2.29x | 2.07x | |||||||||
| NOI DY | 9.9% | 10.2% | 10.2% | 9.8% | |||||||||
| NCF DY | 9.9% | 10.2% | 10.2% | 9.2% |
| (1) | The underwritten economic vacancy is 5.0%. The Shoppes at Wilton Property was 100.0% physically occupied as of June 30, 2015. |
Appraisal.As of the appraisal valuation date of June 17, 2015, the Shoppes at Wilton Property had an “as-is” appraised value of $34,900,000.
THE INFORMATION IN THIS STRUCTURAL AND COLLATERAL TERM SHEET IS NOT COMPLETE AND MAY BE AMENDED PRIOR TO THE TIME OF SALE. THIS TERM SHEET IS NOT AN OFFER TO SELL THESE SECURITIES AND IT IS NOT A SOLICITATION OF AN OFFER TO BUY THESE SECURITIES IN ANY JURISDICTION WHERE THE OFFER OR SALE IS NOT PERMITTED.
| 84 |
| SHOPPES AT WILTON |
Environmental Matters.According to a Phase I environmental assessment dated June 23, 2015, there was no evidence of any recognized environmental conditions at the Shoppes at Wilton Property.
Market Overview and Competition.The Shoppes at Wilton Property is located in Saratoga Springs, New York, within the Albany-Schenectady-Troy metropolitan statistical area. According to the Bureau of Labor Statistics, the unemployment rate for the metropolitan statistical area was 4.6% as of March 2015 as compared to New York State’s unemployment rate of 5.8%. The Shoppes at Wilton Property is located approximately three miles northeast of the Sarasota Springs central business district. Regional access is provided by Interstate 87, a major north/south thoroughfare, which provides access to the Albany central business district and accessibility to the Shoppes at Wilton Property via Highway 50. The Shoppes at Wilton Property is located along State Highway 50, a major surface street in the neighborhood, and serves as the primary retail and commercial corridor in the neighborhood. The neighborhood surrounding the Shoppes at Wilton Property includes a mix of commercial and residential uses. Commercial development is primarily concentrated along State Highway 50, consisting of approximately 2.0 million square feet of retail space within one-mile of the Shoppes at Wilton Property. Notable retailers in the area include Walmart, Target, BJ’s Wholesale, Lowe’s, Home Depot, Kohl’s, and Price Chopper. In addition, Wilton Mall is located across the street from the Shoppes at Wilton Property, which is anchored by Sears, JC Penney, Dick’s Sporting Goods, and Bon-Ton. Residential uses are primarily located along secondary arterials and include single-family and multifamily uses. The 2015 estimated population within a one, three, and five mile radius of the Shoppes at Wilton Property was 2,415, 24,500, and 43,012, respectively, and the 2015 estimated average household income within the same radii was $98,681 $99,154, and $93,228, respectively. In comparison, the 2015 estimated average household income for the metropolitan statistical area and New York State was $80,071 and $84,769, respectively.
According to a third party market research report, the Shoppes at Wilton Property is located within the Saratoga County retail submarket, which contains approximately 13.4 million square feet of retail space. As of first quarter 2015, the submarket vacancy rate was 3.4%, with an average asking rent of $14.90 per square foot.
According to a third party market research report, the Shoppes at Wilton Property is located within the Saratoga Springs micro-market, which contains approximately 4.7 million square feet of retail space. As of first quarter 2015, the micro-market vacancy rate was 1.9%, with an average asking rental rate of $18.80 per square foot.
Competitive Set(1)
Shoppes at (Subject) | Shopper’s World | Village Plaza | Bay Towne Plaza | Eastview Commons | The Center at Lenox | Sanford Farm Shopping Center | |
| Location | Saratoga Springs, NY | Clifton Park, NY | Granville, NY | Webster, NY | Victor, NY | Lenox, MA | Amsterdam, NY |
| Distance from Subject | -- | 18.9 miles | 38.2 miles | 225 miles | 210 miles | 77.7 miles | 30.8 miles |
| Property Type | Retail Center | Shopping Center | Shopping Center | Shopping Center | Shopping Center | Shopping Center | Shopping Center |
| Year Built/Renovated | 2002/NAP | 1989/NAP | 1960/NAP | 1990/NAP | 1999/NAP | 1974/2004 | 1995 |
| Total GLA | 134,710 SF | 233,969 SF | 45,872 SF | 284,717 SF | 195,878 SF | 194,500 SF | 102,425 SF |
| Total Occupancy | 100% | 60% | 100% | 72% | 98% | 59% | 97% |
(1) Information obtained from the appraisal.
The Borrower.The borrower is The Shoppes at Wilton, L.L.C., a single purpose entity with two independent directors. E. Stanley Kroenke is the guarantor of certain nonrecourse carveouts under the Shoppes at Wilton Mortgage Loan.
The Sponsor.The sponsor, E. Stanley Kroenke, is chairman, co-founder, and owner of THF Realty, a real estate development firm. Mr. Kroenke holds real estate interests in shopping center, office building, industrial and warehouse properties, sports stadiums and storage facilities across the United States. Mr. Kroenke owns 235 properties totaling approximately 37.6 million square feet. Mr. Kroenke’s current and former board and trustee memberships include Wal-Mart Stores, Inc., Central Bancompany, Boone County National Bank and Community Investments Partnerships of St. Louis. Mr. Kroenke also owns the Denver Nuggets of the NBA, the Colorado Avalanche of the NHL, the St. Louis Rams of the NFL, and is the largest shareholder in Arsenal of the English Premier League. According to a letter from Mr. Kroenke’s accounting firm dated March 19, 2015, Mr. Kroenke has a current net worth and liquidity in excess of $100.0 million and $20.0 million, respectively.
Escrows.No ongoing monthly escrows are required for real estate taxes or insurance so long as no Cash Management Trigger Event or Cash Sweep Event (as defined below) has occurred and is continuing under the loan documents. The loan documents require springing monthly reserves in the amount of $1,684 for replacement reserves and $9,611 for tenant improvement and leasing commissions (subject to a cap of $505,163).
In the event a Cash Management Trigger Event or Cash Sweep Event has occurred, the borrower is required to make monthly deposits: (i) for the payment of real estate taxes in an amount equal to one-twelfth of the amount that the lender estimates will be necessary to pay taxes over the then succeeding 12-month period; (ii) for the payment of insurance in an amount equal to one-twelfth of the amount that the lender estimates will be necessary to pay insurance premiums over the then succeeding 12-month period; and (iii) in addition to the monthly tenant improvement and leasing commissions reserve, an amount equal to all extraordinary lease payments amounts.
Lockbox and Cash Management.Upon the occurrence and continuance of a Cash Management Trigger Event, the borrower is required to establish a lender-controlled lockbox account and cause all rents to be directly deposited into such lockbox account. The loan documents also require that all revenues received by the borrower or the property manager be deposited into the lockbox
THE INFORMATION IN THIS STRUCTURAL AND COLLATERAL TERM SHEET IS NOT COMPLETE AND MAY BE AMENDED PRIOR TO THE TIME OF SALE. THIS TERM SHEET IS NOT AN OFFER TO SELL THESE SECURITIES AND IT IS NOT A SOLICITATION OF AN OFFER TO BUY THESE SECURITIES IN ANY JURISDICTION WHERE THE OFFER OR SALE IS NOT PERMITTED.
| 85 |
| SHOPPES AT WILTON |
account within five business days of receipt. Other than during a Cash Sweep Event, all excess funds on deposit are disbursed to the borrower.
A “Cash Management Trigger Event” and “Cash Sweep Event” will commence (i) if an event of default has occurred or is continuing; (ii) upon the occurrence of a bankruptcy action of the borrower, the guarantor or the property manager; (iii) with respect to a Cash Management Trigger Event, a Cash Management DSCR Trigger Event (as defined below); or (iv) with respect to a Cash Sweep Event, a Cash Sweep DSCR Trigger Event (as defined below). A Cash Management Trigger Event and Cash Sweep Event will end with respect to clause (i), when such event of default has been cured; with respect to clause (ii), when such bankruptcy petition has been discharged, stayed, or dismissed within 60 days for borrower and guarantor and within 120 days for property managers, among other conditions; with respect to clause (iii), once the debt service coverage ratio based on the trailing 12-month period immediately preceding the date of such determination is greater than 1.15x for two consecutive quarters; and with respect to clause (iv), once the debt service coverage ratio based on the trailing 12-month period immediately preceding the date of such determination is greater than 1.10x for two consecutive quarters, among other conditions.
A “Cash Management DSCR Trigger Event” occurs upon any date the debt service coverage ratio based on the trailing 12-month period immediately preceding the date of such determination is less than 1.15x.
A “Cash Sweep DSCR Trigger Event” occurs upon any date the debt service coverage ratio, based on the trailing 12-month period immediately preceding the date of such determination, is less than 1.10x; provided that a Cash Sweep DSCR Trigger Event will not be deemed to have occurred if within five days of written notification to the borrower of the lender’s determination of the debt service coverage ratio, the borrower delivers to the lender one or more Master Leases (as defined below) that results in a minimum debt service coverage ratio of 1.25x for the Shoppes at Wilton Property.
A “Master Lease” is a lease agreement between the borrower, as landlord, and the guarantor, as tenant, that (i) is for a term of 10 or more years, (ii) is subordinate to the loan documents, and (iii) contains terms and conditions reasonably acceptable to the lender. The Master Lease may not be amended without prior consent of the lender, can be terminated only if no event of default exists and upon satisfaction of: (a) as of the date of the Master Lease termination date, the debt service coverage ratio is not less than 1.25x for two consecutive quarters without including rent from the Master Lease, or (b) at the time of termination, the borrower deposits with the lender an amount equal to cash flow that would have been swept into the excess cash flow account, among other conditions. There are no Master Leases currently in effect.
Property Management.The Shoppes at Wilton Property is managed by an affiliate of the borrower.
Assumption.The borrower has the right to transfer the Shoppes at Wilton Property one year after the origination date, provided that no event of default has occurred and is continuing and certain other conditions are satisfied, including (i) the lender’s reasonable determination that the proposed transferee and guarantor satisfy the lender’s credit review and underwriting standards, taking into consideration transferee experience, financial strength and general business standing; (ii) execution of a recourse guaranty and an environmental indemnity by an affiliate of the transferee; and (iii) if requested by the lender, a rating agency confirmation from Fitch, Moody’s and Morningstar that the transfer will not result in a downgrade, withdrawal or qualification of the respective ratings assigned to the Series 2015-LC22 Certificates.
Partial Release.Not permitted.
Real Estate Substitution.Not permitted.
Subordinate and Mezzanine Indebtedness.Not permitted.
Ground Lease.None.
Terrorism Insurance.The loan documents require that the “all risk” insurance policy required to be maintained by the borrower provide coverage for terrorism in an amount equal to the full replacement cost of the Shoppes at Wilton Property, as well as business income insurance covering no less than the 12-month period following the occurrence of a casualty event, together with a six-month extended period of indemnity.
THE INFORMATION IN THIS STRUCTURAL AND COLLATERAL TERM SHEET IS NOT COMPLETE AND MAY BE AMENDED PRIOR TO THE TIME OF SALE. THIS TERM SHEET IS NOT AN OFFER TO SELL THESE SECURITIES AND IT IS NOT A SOLICITATION OF AN OFFER TO BUY THESE SECURITIES IN ANY JURISDICTION WHERE THE OFFER OR SALE IS NOT PERMITTED.
| 86 |
(THIS PAGE INTENTIONALLY LEFT BLANK)
THE INFORMATION IN THIS STRUCTURAL AND COLLATERAL TERM SHEET IS NOT COMPLETE AND MAY BE AMENDED PRIOR TO THE TIME OF SALE. THIS TERM SHEET IS NOT AN OFFER TO SELL THESE SECURITIES AND IT IS NOT A SOLICITATION OF AN OFFER TO BUY THESE SECURITIES IN ANY JURISDICTION WHERE THE OFFER OR SALE IS NOT PERMITTED.
| 87 |
| SAN DIEGO PARK AND FLY |
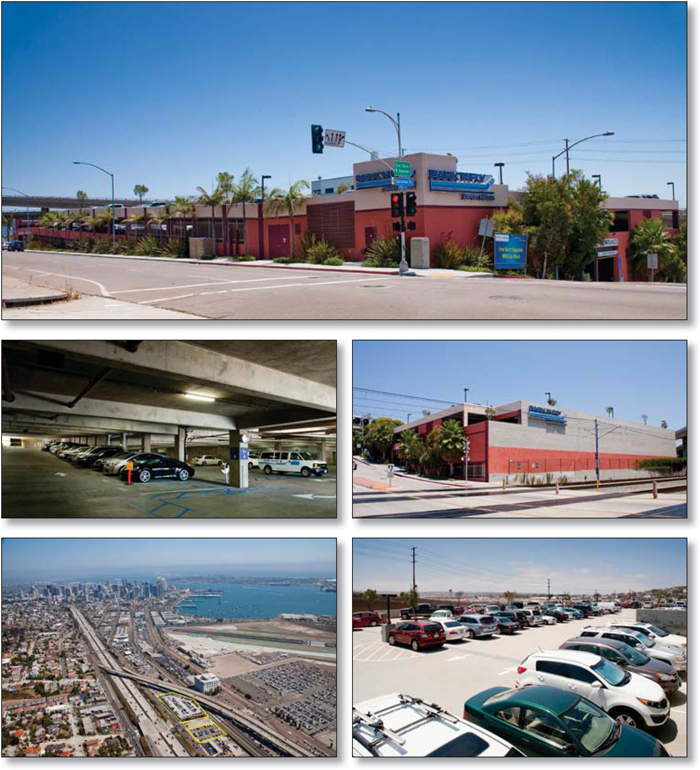
THE INFORMATION IN THIS STRUCTURAL AND COLLATERAL TERM SHEET IS NOT COMPLETE AND MAY BE AMENDED PRIOR TO THE TIME OF SALE. THIS TERM SHEET IS NOT AN OFFER TO SELL THESE SECURITIES AND IT IS NOT A SOLICITATION OF AN OFFER TO BUY THESE SECURITIES IN ANY JURISDICTION WHERE THE OFFER OR SALE IS NOT PERMITTED.
| 88 |
| SAN DIEGO PARK AND FLY |
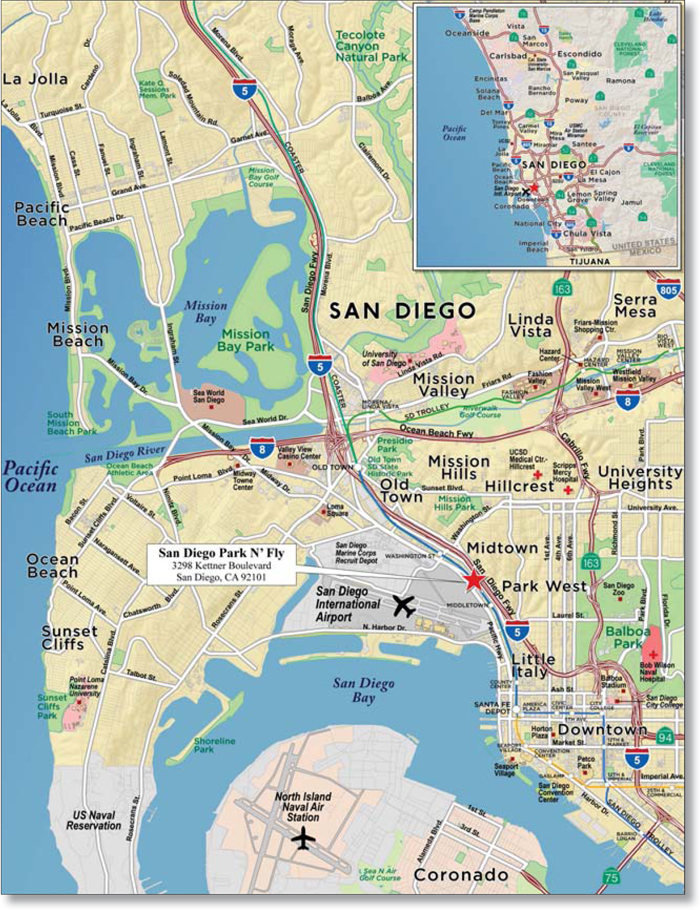
THE INFORMATION IN THIS STRUCTURAL AND COLLATERAL TERM SHEET IS NOT COMPLETE AND MAY BE AMENDED PRIOR TO THE TIME OF SALE. THIS TERM SHEET IS NOT AN OFFER TO SELL THESE SECURITIES AND IT IS NOT A SOLICITATION OF AN OFFER TO BUY THESE SECURITIES IN ANY JURISDICTION WHERE THE OFFER OR SALE IS NOT PERMITTED.
| 89 |
| No.8 – San Diego Park N’ Fly |
| Loan Information | Property Information | |||||
| Mortgage Loan Seller: | Rialto Mortgage Finance, LLC | Single Asset/Portfolio: | Single Asset | |||
| Credit Assessment (Fitch/Moody’s/Morningstar): | NR/NR/NR | Property Type: | Other | |||
| Original Principal Balance: | $21,750,000 | Specific Property Type: | Parking Garage | |||
| Cut-off Date Principal Balance: | $21,750,000 | Location: | San Diego, CA | |||
| % of Initial Pool Balance: | 2.3% | Size: | 860 Spaces | |||
| Loan Purpose: | Acquistion | Cut-off Date Principal Balance Per Space: | $25,291 | |||
| Borrower Names: | LR San Diego Wallypark, LLC and LR San Diego Parking Operator, LLC | Year Built/Renovated: | 2005/NAP | |||
| Sponsor: | L&R Investment Company | Title Vesting: | Fee | |||
| Mortgage Rate: | 5.000% | Property Manager: | Self-managed | |||
| Note Date: | August 28, 2015 | 3rd Most Recent Occupancy(3): | NAV | |||
| Anticipated Repayment Date: | NAP | 2nd Most Recent Occupancy(3): | NAV | |||
| Maturity Date: | September 6, 2025 | Most Recent Occupancy(3): | NAV | |||
| IO Period: | 48 months | Current Occupancy (As of)(3): | 100.0% (9/1/2015) | |||
| Loan Term (Original): | 120 months | |||||
| Seasoning: | 0 months | Underwriting and Financial Information(4): | ||||
| Amortization Term (Original): | 360 months | |||||
| Loan Amortization Type: | Interest-only, Amortizing Balloon | 3rd Most Recent NOI(4): | NAV | |||
| Interest Accrual Method: | Actual/360 | 2nd Most Recent NOI(4): | NAV | |||
| Call Protection: | L(24),D(92),O(4) | Most Recent NOI(4): | NAV | |||
| Lockbox Type: | Springing (Without Established Account) | |||||
| Additional Debt(1): | Yes | U/W Revenues: | $4,729,355 | |||
| Additional Debt Type(1): | Future Mezzanine | U/W Expenses: | $2,394,691 | |||
| U/W NOI: | $2,334,664 | |||||
| U/W NCF: | $2,334,664 | |||||
| U/W NOI DSCR: | 1.67x | |||||
| Escrows and Reserves(2): | U/W NCF DSCR: | 1.67x | ||||
| U/W NOI Debt Yield: | 10.7% | |||||
| Type: | Initial | Monthly | Cap (If Any) | U/W NCF Debt Yield: | 10.7% | |
| Taxes | $0 | $23,974 | NAP | As-Complete Appraised Value(5): | $29,500,000 | |
| Insurance | $0 | Springing | NAP | As-Complete Appraisal Valuation Date(5): | December 23, 2015 | |
| Replacement Reserves | $1,250,000 | $0 | NAP | Cut-off Date LTV Ratio(6): | 73.7% | |
| Lease Termination | $750,000 | $0 | NAP | LTV Ratio at Maturity or ARD(6): | 66.7% | |
| (1) | See “Subordinate and Mezzanine Indebtedness” section. |
| (2) | See “Escrows” section. |
| (3) | See “Historical Occupancy” section. The borrower executed a 15-year master lease at closing. |
| (4) | See “Cash Flow Analysis” section. |
| (5) | The appraiser concluded an “As-Is” appraised value of $27,000,000 as of June 23, 2015. An “As-Complete” value of $29,500,000 was concluded as of December 23, 2015 which assumes an investment of $1,250,000 for capital improvements and $750,000 for the Park N’ Fly lease termination fee, both of which were reserved up front. |
| (6) | Cut-off Date LTV Ratio and LTV Ratio at Maturity or ARD are based on the As-Complete Appraised Value. The Cut-off Date LTV Ratio and LTV Ratio at Maturity or ARD based on the “as-is” value are 80.6% and 72.8%, respectively. |
The Mortgage Loan. The mortgage loan (the “San Diego Park N’ Fly Mortgage Loan”) is evidenced by a single promissory note that is secured by a first mortgage encumbering a five-level parking structure containing 785 garage spaces and 75 surface spaces located in San Diego, California (the “San Diego Park N’ Fly Property”). The San Diego Park N’ Fly Mortgage Loan was originated on August 28, 2015 by Rialto Mortgage Finance, LLC. The San Diego Park N’ Fly Mortgage Loan had an original principal balance of $21,750,000, has an outstanding principal balance as of the Cut-off Date of $21,750,000 and accrues interest at an interest rate of 5.000%per annum. The San Diego Park N’ Fly Mortgage Loan had an initial term of 120 months, has a remaining term of 120 months as of the Cut-off Date and requires interest-only payments for the first 48 payments following origination and, thereafter, requires payments of principal and interest based on a 30-year amortization schedule. The San Diego Park N’ Fly Mortgage Loan matures on September 6, 2025.
Following the lockout period, the borrowers have the right to defease the San Diego Park N’ Fly Mortgage Loan in whole, but not in part, on any date before June 6, 2025. In addition, the San Diego Park N’ Fly Loan is prepayable without penalty on or after June 6, 2025.
THE INFORMATION IN THIS STRUCTURAL AND COLLATERAL TERM SHEET IS NOT COMPLETE AND MAY BE AMENDED PRIOR TO THE TIME OF SALE. THIS TERM SHEET IS NOT AN OFFER TO SELL THESE SECURITIES AND IT IS NOT A SOLICITATION OF AN OFFER TO BUY THESE SECURITIES IN ANY JURISDICTION WHERE THE OFFER OR SALE IS NOT PERMITTED.
| 90 |
| SAN DIEGO PARK N’ FLY |
Sources and Uses
| Sources | Uses | |||||||
| Original loan amount | $21,750,000 | 74.2% | Purchase price | $27,000,000 | 92.1% | |||
| Sponsor’s new cash contribution | 7,562,324 | 25.8 | Reserves | 2,000,000 | 6.8 | |||
| Closing costs | 312,324 | 1.1 | ||||||
| Total Sources | $29,312,324 | 100.0% | Total Uses | $29,312,324 | 100.0% |
The Property.The San Diego Park N’ Fly Property is comprised of a five-level parking structure totaling 282,158 square feet that was constructed in 2005 and contains 860 spaces (785 garage spaces and 75 surface spaces located directly across the street from the main parking structure). The two parcels collectively encompass 1.8 acres on either side of Sassafras Street and are located adjacent to the San Diego International Airport.
Prior to the borrowers’ acquisition of the San Diego Park N’ Fly Property, the property was operated under a lease with Park N’ Fly. In connection with the acquisition of the San Diego Park N’ Fly Property and the closing of the San Diego Park N’ Fly Mortgage Loan, the borrowers terminated the Park N’ Fly lease for a $750,000 termination fee. The Fee Borrower (as defined in “The Borrower” section) entered into a 15-year absolute triple-net master lease that expires on August 28, 2030 with the Leasehold Borrower (as defined in “The Borrower” section) (the “WallyPark Lease”), and commenced parking operations at the San Diego Park N’ Fly Property. The WallyPark Lease requires that the Leasehold Borrower make annual lease payments of $2.33 millionper annum to the Fee Borrower and such lease payments have been guaranteed by L&R Investment Company, the non-recourse carveout guarantor. L&R Investment Company is in the process of rebranding the San Diego Park N’ Fly Property into a WallyPark Airport parking facility and the borrowers have reserved $1.25 million to be used to complete capital improvements consisting of installing revenue control equipment ($300,000), new signage ($250,000), acquisition of six new shuttle buses ($228,000) plus WallyPark wraps for each shuttle ($42,000), interior and exterior painting ($225,000), re-striping and re-paving ($150,000), renovation of two bathrooms ($30,000) and renovation of two elevator cabs ($25,000). The daily parking rates at the San Diego Park N’ Fly Property will range from $15 per day to $21 per day based on use of valet service ($21 per day) and covered self-parking ($18 per day) or uncovered self-parking ($15 per day). The San Diego Park N’ Fly Property operates 365 days a year, 24 hours a day, offers valet assisted parking, car wash services, luggage assistance, complimentary online reservations, and a membership program for frequent users.
The following table presents historical occupancy percentages at the San Diego Park N’ Fly Property:
Historical Occupancy
| 2012(1) | 2013(1) | 2014(1) | 9/1/2015(2) | |||
| NAV | NAV | NAV | 100.0% |
| (1) | Historical occupancy was not available as part of the sponsor’s acquisition of the San Diego Park N’ Fly Property. |
| (2) | The borrower executed a 15-year master lease at closing. |
THE INFORMATION IN THIS STRUCTURAL AND COLLATERAL TERM SHEET IS NOT COMPLETE AND MAY BE AMENDED PRIOR TO THE TIME OF SALE. THIS TERM SHEET IS NOT AN OFFER TO SELL THESE SECURITIES AND IT IS NOT A SOLICITATION OF AN OFFER TO BUY THESE SECURITIES IN ANY JURISDICTION WHERE THE OFFER OR SALE IS NOT PERMITTED.
| 91 |
| SAN DIEGO PARK N’ FLY |
Underwritten Net Cash Flow.The following table presents certain information relating to the underwritten net cash flow at the San Diego Park N’ Fly Property:
Cash Flow Analysis(1)
| Operating Budget | Appraisal | U/W | % of U/W Effective Gross Income | U/W $ per Space(1) | |||||||
| Base Rent | $4,692,858 | $5,500,550 | $5,500,550 | 116.3% | $6,396 | ||||||
| Grossed Up Vacant Space | 0 | 0 | 0 | 0.0 | 0 | ||||||
| Other Income(2) | 65,888 | 80,000 | 65,888 | 1.4 | 77 | ||||||
| Less Vacancy & Credit Loss | 0 | (837,083) | (837,083)(3) | (17.7) | (973) | ||||||
| Effective Gross Income | $4,758,746 | $4,743,467 | $4,729,355 | 100.0% | $5,499 | ||||||
| Total Operating Expenses | $2,359,597 | $2,411,740 | $2,394,691 | 50.6% | $2,785 | ||||||
| Net Operating Income | $2,399,149 | $2,331,727 | $2,334,664 | 49.4% | $2,715 | ||||||
| Capital Expenditures | 0 | 0 | 0 | 0.0 | 0 | ||||||
| Net Cash Flow | $2,399,149 | $2,331,727 | $2,334,664 | 49.4% | $2,715 | ||||||
| NOI DSCR | 1.71x | 1.66x | 1.67x | ||||||||
| NCF DSCR | 1.71x | 1.66x | 1.67x | ||||||||
| NOI DY | 11.0% | 10.7% | 10.7% | ||||||||
| NCF DY | 11.0% | 10.7% | 10.7% |
| (1) | Historical cash flows were not available as part of the sponsor’s acquisition of the San Diego Park N’ Fly Property. The sponsor’s operating budget, the appraiser’s cash flows and the underwritten cash flows are all based on the sponsor’s experience operating two airport parking facilities at the San Diego International Airport for the last 10 years. |
| (2) | Other Income includes car wash revenue and miscellaneous income. |
| (3) | The underwritten economic vacancy is 17.7%. The San Diego Park N’ Fly Property is 100.0% master leased and guaranteed by the sponsor as of September 1, 2015. |
Appraisal.The San Diego Park N’ Fly Property concluded an “as-complete” appraised value of $29,500,000 as of December 23, 2015 which assumes the completion of $1,250,000 in capital improvements and payment of the $750,000 Park N’ Fly lease termination fee, both of which were reserved upfront. As of the appraisal valuation date of June 23, 2015, the San Diego Park N’ Fly Property had an “as-is” appraised value of $27,000,000.
Environmental Matters.According to a Phase I environmental assessment dated August 10, 2015, there was no evidence of any recognized environmental conditions at the San Diego Park N’ Fly Property.
Market Overview and Competition.The San Diego Park N’ Fly Property is located in San Diego, California, within the San Diego-Carlsbad-San Marco metropolitan statistical area and adjacent to the San Diego International Airport. According to the appraiser, the major economic demand generators in San Diego include defense, manufacturing, and biotechnology sectors. Home to 16 naval and military locations, San Diego has the largest military complex in the United States. The defense sector represents five out of the top 10 largest employers within the region and collectively employs approximately 120,000 active service members. According to the Bureau of Labor Statistics, the unemployment rate for the San Diego metropolitan statistical area was 5.1% as of March 2015. In comparison, California’s unemployment rate was 6.5% and the national unemployment rate was 5.5% as of the same period. The San Diego Park N’ Fly Property is located two miles north of the San Diego central business district on the southwest and the northwest corners of Kettner Boulevard and Sassafras Street. Primary access to the area is provided by Interstate 5 and Interstate 8. The San Diego Park N’ Fly Property is located between on-/off-ramp access to Interstate 5, accessible approximately one-half mile north and south. Interstate 5 generally spans in a northwest/southeast direction, providing direct access to the San Diego central business district to the south and intersecting with Interstate 8 approximately three miles north. Interstate 8 generally spans in an east/west direction, providing access to San Diego’s northeastern suburbs. The San Diego Park N’ Fly Property is located adjacent to the San Diego International Airport.
The following table presents certain information relating to some comparable airport parking properties for the San Diego Park N’ Fly Property:
Competitive Set(1)
| San Diego Park N’ Fly Property | Aladdin Parking | Laurel Street Parking | Park & Go | San Diego Park Shuttle & Fly | San Diego International Airport | Aladdin Expansion Lot | |
| Location | San Diego, CA | San Diego, CA | San Diego, CA | San Diego, CA | San Diego, CA | San Diego, CA | San Diego, CA |
| Distance to Terminal | 2.0 miles | 1.5 miles | 1.5 miles | 1.7 miles | 2.0 miles | - | 1.6 miles |
| Property Type | Parking | Parking | Parking | Parking | Parking | Parking | Parking |
| Number of Units | 860 | 2,000 | 600 | 400 | 300 | 7,200 | 500 |
| Daily Rate (per vehicle) | |||||||
| Valet | $21 | $22 | $16 | NAP | $13 | $38 | NAV |
| Daily (Covered) | $18 | $17 | $10 | NAP | NAP | NAV | $17 |
| Daily (Un-Covered) | $15 | $15 | $10 | $12 | $13 | $13-$30 | $15 |
| Total Leased | NAV | 80% | 95% | 80% | 75% | NAV | NAV |
| (1) | Information obtained from the appraisal. |
THE INFORMATION IN THIS STRUCTURAL AND COLLATERAL TERM SHEET IS NOT COMPLETE AND MAY BE AMENDED PRIOR TO THE TIME OF SALE. THIS TERM SHEET IS NOT AN OFFER TO SELL THESE SECURITIES AND IT IS NOT A SOLICITATION OF AN OFFER TO BUY THESE SECURITIES IN ANY JURISDICTION WHERE THE OFFER OR SALE IS NOT PERMITTED.
| 92 |
| SAN DIEGO PARK N’ FLY |
The Borrowers.The borrowers, LR San Diego Wallypark, LLC (the “Fee Borrower”) and LR San Diego Parking Operator, LLC (the “Leasehold Borrower”), are single purpose entities with one independent director. L&R Investment Company is the guarantor of certain nonrecourse carveouts under The San Diego Park N’ Fly Mortgage Loan and is the guarantor of the WallyPark Lease.
The Sponsor.The sponsor, L&R Investment Company, an affiliate of L&R Group of Companies (the “L&R Companies”), is a privately held organization comprised of three divisions including Joe’s Auto Parks, Joe’s Airport Parking and Wallypark. The L&R Companies owns, manages, operates and develops parking properties throughout the United States. The L&R Companies provide on-site management services at multi-level and surface facilities for several major markets of the parking industry. The L&R Companies own and/or manage parking operations at over 100 locations in the United States including 12 off-airport parking properties located adjacent to major United States airports. The Wallypark division is one of the principal providers of parking and transportation services to the traveling public and L&R Auto Parks, Inc. (DBA Joe’s Auto Parks) provides parking services principally in California (Los Angeles and San Diego), but also operates a large owned parking garage in Orlando, Florida. The L&R Companies is controlled by Stuart Rubin, the Managing Partner and Chief Executive Officer.
Escrows.The loan documents provide for upfront reserves in the amount of $1,250,000 for replacement reserves and $750,000 for the fee due to terminate the Park N’ Fly lease, which was released at closing. The $1,250,000 upfront replacement reserve is for completion of capital improvements consisting of installing revenue control equipment ($300,000), new signage ($250,000), acquisition of six new shuttle buses ($228,000) plus WallyPark wraps for each shuttle ($42,000), interior and exterior painting ($225,000), re-striping and re-paving ($150,000), renovation of two bathrooms ($30,000) and renovation of two elevator cabs ($25,000). The loan documents also provide for an ongoing monthly reserve in the amount of $23,974 for real estate taxes. Ongoing collections for insurance premiums are waived as long as the San Diego Park N’ Fly Property is insured under an acceptable blanket policy.
Lockbox and Cash Management.Upon the occurrence and continuance of a Cash Management Trigger Event (as defined below), the San Diego Park N’ Fly Mortgage Loan requires the borrowers to establish a lender-controlled lockbox account. The loan documents also require that from and after a Cash Management Trigger Event, all revenues received by the borrowers or the property manager from the WallyPark Lease or parking revenue received at the San Diego Park N’ Fly Property are required to be deposited into the lockbox account within five business days of receipt. Other than during a Cash Sweep Event Period (as defined below), all excess funds on deposit are disbursed to the borrowers.
A “Cash Management Trigger Event” will commence (i) upon the occurrence of an event of default which continues for five days; (ii) upon the occurrence of any bankruptcy action of either of the borrowers, the guarantor or the property manager; (iii) the Leasehold’s Borrower’s failure to make any payments of rent when due and payable under the WallyPark Lease; or (iv) if an approved mezzanine loan is outstanding. A Cash Management Trigger Event will end with respect to clause (i), when such event of default has been cured, with respect to clause (ii), when such bankruptcy petition has been discharged, stayed, or dismissed within 60 days for borrowers or guarantor and 120 days for the property manager, among other conditions and with respect to clause (iii) if the Leasehold Borrower pays to the Fee Borrower all outstanding rental payments under the WallyPark Lease and timely payments are made for three consecutive months. The bankruptcy of the property manager may also be cured by the borrowers replacing the property manager with a qualified manager acceptable to the lender.
A “Cash Sweep Event” will commence upon the occurrence of (i) an event of default which continues for five days; or (ii) any bankruptcy action of the borrowers, the guarantor, or the property manager. A Cash Sweep Event will end with respect to clause (i), when such event of default has been cured, and with respect to clause (ii), when such bankruptcy petition has been discharged, stayed, or dismissed, within 60 days for the borrowers or the guarantor and 120 days for the property manager, among other conditions. The bankruptcy of the property manager may also be cured by the borrowers replacing the property manager with a qualified manager acceptable to the lender.
Property Management.The San Diego Park N’ Fly Property is managed by an affiliate of the borrowers.
Assumption.The borrowers have the right to transfer the San Diego Park N’ Fly Property upon the earlier of one year after the origination date or 60 days after securitization, provided that no event of default has occurred and is continuing and certain other conditions are satisfied, including (i) the lender’s reasonable determination that the proposed transferee and guarantor satisfy the lender’s credit review and underwriting standards, taking into consideration transferee experience, financial strength and general business standing; (ii) execution of a recourse guaranty and an environmental indemnity by an affiliate of the transferee; and (iii) if requested by the lender, rating agency confirmation from Fitch, Moody’s and Morningstar that the transfer will not result in a downgrade, withdrawal or qualification of the respective ratings assigned to the Series 2015-LC22 Certificates.
Partial Release.Not permitted.
Real Estate Substitution.Not permitted.
Subordinate and Mezzanine Indebtedness.The borrowers have the right to incur mezzanine financing subject to the satisfaction of certain conditions including (i) the execution of an intercreditor agreement in form and substance acceptable to the lender and each of Fitch, Moody’s and Morningstar; (ii) the combined loan-to value ratio is not greater than 73.7%; (iii) the combined debt service coverage ratio is not less than 1.65x; (iv) the combined debt yield of no less than 10.7%; and (v) receipt of rating agency confirmations from Fitch, Moody’s and Morningstar that the mezzanine financing will not result in a downgrade, withdrawal or qualification of the respective ratings assigned to the Series 2015-LC22 Certificates.
Ground Lease.None.
THE INFORMATION IN THIS STRUCTURAL AND COLLATERAL TERM SHEET IS NOT COMPLETE AND MAY BE AMENDED PRIOR TO THE TIME OF SALE. THIS TERM SHEET IS NOT AN OFFER TO SELL THESE SECURITIES AND IT IS NOT A SOLICITATION OF AN OFFER TO BUY THESE SECURITIES IN ANY JURISDICTION WHERE THE OFFER OR SALE IS NOT PERMITTED.
| 93 |
| SAN DIEGO PARK N’ FLY |
Terrorism Insurance.The loan documents require that the “all risk” insurance policy required to be maintained by the borrowers provides coverage for terrorism in an amount equal to the full replacement cost of the San Diego Park N’ Fly Property, as well as business interruption insurance covering no less than the 12-month period following the occurrence of a casualty event, together with a 6-month extended period of indemnity.
Earthquake Insurance.The loan documents do not require earthquake insurance. The seismic report dated August 5, 2015 indicated a probable maximum loss of 9.0%
THE INFORMATION IN THIS STRUCTURAL AND COLLATERAL TERM SHEET IS NOT COMPLETE AND MAY BE AMENDED PRIOR TO THE TIME OF SALE. THIS TERM SHEET IS NOT AN OFFER TO SELL THESE SECURITIES AND IT IS NOT A SOLICITATION OF AN OFFER TO BUY THESE SECURITIES IN ANY JURISDICTION WHERE THE OFFER OR SALE IS NOT PERMITTED.
| 94 |
(THIS PAGE INTENTIONALLY LEFT BLANK)
THE INFORMATION IN THIS STRUCTURAL AND COLLATERAL TERM SHEET IS NOT COMPLETE AND MAY BE AMENDED PRIOR TO THE TIME OF SALE. THIS TERM SHEET IS NOT AN OFFER TO SELL THESE SECURITIES AND IT IS NOT A SOLICITATION OF AN OFFER TO BUY THESE SECURITIES IN ANY JURISDICTION WHERE THE OFFER OR SALE IS NOT PERMITTED.
| 95 |
| HICKORY HILLS EAST |
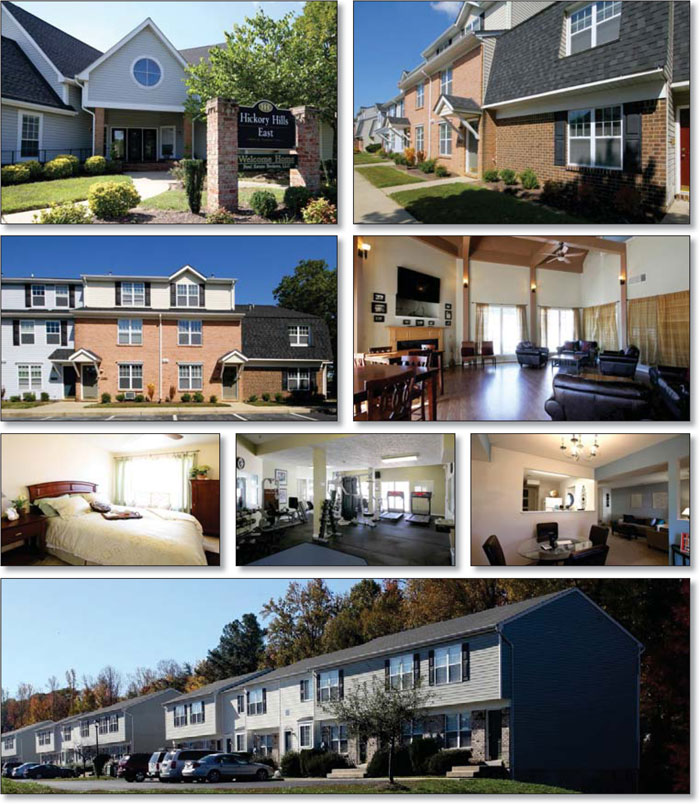
THE INFORMATION IN THIS STRUCTURAL AND COLLATERAL TERM SHEET IS NOT COMPLETE AND MAY BE AMENDED PRIOR TO THE TIME OF SALE. THIS TERM SHEET IS NOT AN OFFER TO SELL THESE SECURITIES AND IT IS NOT A SOLICITATION OF AN OFFER TO BUY THESE SECURITIES IN ANY JURISDICTION WHERE THE OFFER OR SALE IS NOT PERMITTED.
| 96 |
| HICKORY HILLS EAST |
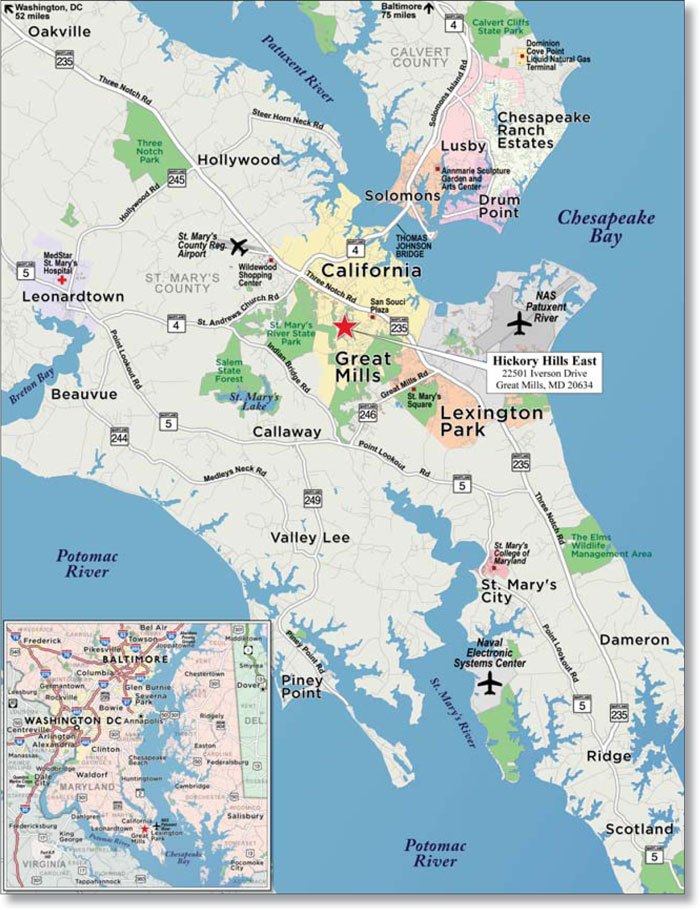
THE INFORMATION IN THIS STRUCTURAL AND COLLATERAL TERM SHEET IS NOT COMPLETE AND MAY BE AMENDED PRIOR TO THE TIME OF SALE. THIS TERM SHEET IS NOT AN OFFER TO SELL THESE SECURITIES AND IT IS NOT A SOLICITATION OF AN OFFER TO BUY THESE SECURITIES IN ANY JURISDICTION WHERE THE OFFER OR SALE IS NOT PERMITTED.
| 97 |
| No. 9 – Hickory Hills East | ||||||||
| Loan Information | Property Information | |||||||
| Mortgage Loan Seller: | Rialto Mortgage Finance, LLC | Single Asset/Portfolio: | Single Asset | |||||
| Credit Assessment (Fitch/Moody’s/Morningstar): | NR/NR/NR | Property Type: | Multifamily | |||||
| Original Principal Balance: | $20,200,000 | Specific Property Type: | Townhouse | |||||
| Cut-off Date Principal Balance: | $20,200,000 | Location: | Great Mills, MD | |||||
| % of Initial Pool Balance: | 2.1% | Size: | 231 Units | |||||
| Loan Purpose: | Refinance | Cut-off Date Principal Balance Per Unit: | $87,446 | |||||
| Borrower Name: | Hickory Hills East, L.L.C. | Year Built/Renovated: | 1993/2011 | |||||
| Sponsor: | Barrett Penan | Title Vesting: | Fee | |||||
| Mortgage Rate: | 4.580% | Property Manager: | Self-managed | |||||
| Note Date: | July 31, 2015 | 3rdMost Recent Occupancy (As of)(3): | 87.5% (12/31/2012) | |||||
| Anticipated Repayment Date: | NAP | 2ndMost Recent Occupancy (As of)(3): | 88.3% (12/31/2013) | |||||
| Maturity Date: | August 6, 2025 | Most Recent Occupancy (As of)(3): | 88.5% (12/31/2014) | |||||
| IO Period: | 60 months | Current Occupancy (As of)(3): | 97.8% (7/24/2015) | |||||
| Loan Term (Original): | 120 months | |||||||
| Seasoning: | 1 month | Underwriting and Financial Information: | ||||||
| Amortization Term (Original): | 360 months | |||||||
| Loan Amortization Type: | Interest-only, Amortizing Balloon | 3rdMost Recent NOI (As of): | $1,544,762 (12/31/2013) | |||||
| Interest Accrual Method: | Actual/360 | 2ndMost Recent NOI (As of): | $1,578,989 (12/31/2014) | |||||
| Call Protection: | L(25),D(90),O(5) | Most Recent NOI (As of): | $1,638,380 (TTM 6/30/2015) | |||||
| Lockbox Type: | Springing (Without Established Account) | |||||||
| Additional Debt(1): | Yes | |||||||
| Additional Debt Type(1): | Future Mezzanine | U/W Revenues: | $2,912,291 | |||||
| U/W Expenses: | $1,227,972 | |||||||
| U/W NOI: | $1,684,319 | |||||||
| U/W NCF: | $1,626,569 | |||||||
| Escrows and Reserves(2): | U/W NOI DSCR: | 1.36x | ||||||
| U/W NCF DSCR: | 1.31x | |||||||
| Type: | Initial | Monthly | Cap (If Any) | U/W NOI Debt Yield: | 8.3% | |||
| Taxes | $0 | $17,851 | NAP | U/W NCF Debt Yield: | 8.1% | |||
| Insurance | $10,570 | $5,033 | NAP | As-Is Appraised Value: | $28,500,000 | |||
| Replacement Reserves | $0 | $4,813 | NAP | As-Is Appraisal Valuation Date: | July 8, 2015 | |||
| Renovation | $500,000 | $0 | NAP | Cut-off Date LTV Ratio: | 70.9% | |||
| Deferred Maintenance | $3,500 | $0 | NAP | LTV Ratio at Maturity or ARD: | 64.9% | |||
| (1) | See “Subordinate and Mezzanine Indebtedness” section. |
| (2) | See “Escrows” section. |
| (3) | See “Historical Occupancy” section. |
The Mortgage Loan. The mortgage loan (the “Hickory Hills East Mortgage Loan”) is evidenced by a single promissory note that is secured by a first mortgage encumbering a multifamily property located in Great Mills, Maryland (the “Hickory Hills East Property”). The Hickory Hills East Mortgage Loan was originated on July 31, 2015 by Rialto Mortgage Finance, LLC. The Hickory Hills East Mortgage Loan had an original principal balance of $20,200,000, has an outstanding principal balance as of the Cut-off Date of $20,200,000 and accrues interest at an interest rate of 4.5800%per annum. The Hickory Hills East Mortgage Loan had an initial term of 120 months, has a remaining term of 119 months as of the Cut-off Date and requires interest-only payments for the first 60 payments following origination and, thereafter, requires payments of principal and interest based on a 30-year amortization schedule. The Hickory Hills East Mortgage Loan matures on August 6, 2025.
Following the lockout period, the borrower has the right to defease the Hickory Hills East Mortgage Loan in whole, but not in part, on any date before April 6, 2025. In addition, the Hickory Hills East Mortgage Loan is prepayable without penalty on or after April 6, 2025.
THE INFORMATION IN THIS STRUCTURAL AND COLLATERAL TERM SHEET IS NOT COMPLETE AND MAY BE AMENDED PRIOR TO THE TIME OF SALE. THIS TERM SHEET IS NOT AN OFFER TO SELL THESE SECURITIES AND IT IS NOT A SOLICITATION OF AN OFFER TO BUY THESE SECURITIES IN ANY JURISDICTION WHERE THE OFFER OR SALE IS NOT PERMITTED.
| 98 |
| HICKORY HILLS EAST |
Sources and Uses
| Sources | Uses | |||||||
| Original loan amount | $20,200,000 | 100.0% | Loan payoff | $17,569,327 | 87.0% | |||
| Reserves | 514,070 | 2.5 | ||||||
| Closing costs | 654,080 | 3.2 | ||||||
| Return of equity | 1,462,522 | 7.2 | ||||||
| Total Sources | $20,200,000 | 100.0% | Total Uses | $20,200,000 | 100.0% |
The Property.The Hickory Hills East Property is a townhouse-style multifamily property situated on approximately 27.4 acres and is comprised of 19 buildings containing 231 units located in Great Mills, Maryland. The improvements were constructed in two phases between 1993 and 1999 and unit composition includes 48 studio units, 48 one-bedroom units, 127 two-bedroom units and eight three-bedroom units. Common area amenities at the Hickory Hills East Property include a swimming pool, clubhouse, fitness center, walking trail, dog park, playground, and laundry facilities. Unit features and amenities include a combination of central and wall unit heating and air systems, carpet and vinyl flooring, hot water heater, electric range/oven, microwave, refrigerator, dishwasher, garbage disposal and washer/dryer connections (excluding studio apartments). There are 32 units that contain a lower level walk-out basement. According to the sponsor, approximately $707,000 ($3,061 per unit) has been invested in the Hickory Hills East Property since 2007, which included renovations to all of the apartment units developed in Phase I (168 units) where units received new kitchen cabinets, granite countertops, appliances, bathroom vanities, hardware, flooring and windows. Other capital improvements at the Hickory Hills East Property included roof, gutter and downspout replacements, and parking lot sealcoating and striping. The borrower plans to invest an additional $500,000 on improvements at the Hickory Hills East Property including 35 unit renovations, the addition of 16 carports, and other common area upgrades which include improvements to the model unit, clubhouse, fitness center, pool, landscaping, signage, branding and website work to be completed within six months of the origination date. The Hickory Hills East Property contains 460 surface parking spaces and 14 carports for a total of 474 parking spaces, reflecting an overall parking ratio of 2.1 spaces per unit. As of July 24, 2015, the Hickory Hills East Property was 97.8% occupied.
The following table presents certain information relating to the unit mix of the Hickory Hills East Property:
Apartment Unit Summary(1)
| Unit Type | No. of Units | % of Total Units | Average Unit Size (SF) | Average U/W Monthly Rent per Unit |
| Studio | 48 | 20.8% | 384 | $840 |
| 1 Bedroom / 1 Bath | 48 | 20.8% | 740 | $964 |
| 2 Bedroom / 1 Bath | 6 | 2.6% | 768 | $1,061 |
| 2 Bedroom / 1.5 Bath | 16 | 6.9% | 896 | $1,090 |
| 2 Bedroom / 1.5 Bath | 26 | 11.3% | 924 | $1,123 |
| 2 Bedroom / 2 Bath | 31 | 13.4% | 1,056 | $1,124 |
| 2 Bedroom / 2 Bath | 16 | 6.9% | 1,124 | $1,111 |
| 2 Bedroom / 2 Bath | 24 | 10.4% | 1,344 | $1,195 |
| 2 Bedroom / 2 Bath | 8 | 3.5% | 1,344 | $1,245 |
| 3 Bedroom / 1.5 Bath | 8 | 3.5% | 1,084 | $1,155 |
| Total/Weighted Average | 231 | 100.0% | 863 | $1,039 |
| (1) | Information obtained from the underwritten rent roll. |
The following table presents historical occupancy percentages at the Hickory Hills East Property:
Historical Occupancy
12/31/2012(1)(2) | 12/31/2013(1)(2) | 12/31/2014(1)(2) | 7/24/2015(3) | |||
| 87.5% | 88.3% | 88.5% | 97.8% |
| (1) | According to the sponsor, historical occupancy was below current occupancy as two new apartment projects came online in 2012 and offered concession packages. The Hickory Hills East Property is now operating in line with its competitive set. |
| (2) | Information obtained from the borrower. |
| (3) | Information obtained from the underwritten rent roll. |
THE INFORMATION IN THIS STRUCTURAL AND COLLATERAL TERM SHEET IS NOT COMPLETE AND MAY BE AMENDED PRIOR TO THE TIME OF SALE. THIS TERM SHEET IS NOT AN OFFER TO SELL THESE SECURITIES AND IT IS NOT A SOLICITATION OF AN OFFER TO BUY THESE SECURITIES IN ANY JURISDICTION WHERE THE OFFER OR SALE IS NOT PERMITTED.
| 99 |
| HICKORY HILLS EAST |
Operating History and Underwritten Net Cash Flow.The following table presents certain information relating to the historical operating performance and underwritten net cash flow at the Hickory Hills East Property:
Cash Flow Analysis
| 2013 | 2014 | TTM 6/30/2015 | U/W | % of U/W Effective Gross Income | U/W $ per Room | |||||||||
| Base Rent | $2,527,575 | $2,574,704 | $2,607,305 | $2,826,348 | 97.0% | $12,235 | ||||||||
| Grossed Up Vacant Space | 0 | 0 | 0 | 69,600 | 2.4 | 301 | ||||||||
| Concessions | 0 | 0 | 0 | 0 | 0.0 | 0 | ||||||||
| Other Income(1) | 445,162 | 420,176 | 411,579 | 408,249 | 14.0 | 1,767 | ||||||||
| Less Vacancy & Credit Loss | (103,187) | (189,538) | (198,660) | (391,906)(2) | (13.5) | (1,697) | ||||||||
| Effective Gross Income | $2,869,549 | $2,805,342 | $2,820,224 | $2,912,291 | 100.0% | $12,607 | ||||||||
| Total Operating Expenses | $1,324,787 | $1,226,354 | $1,181,844 | $1,227,972 | 42.2% | $5,316 | ||||||||
| Net Operating Income | $1,544,762 | $1,578,989 | $1,638,380 | $1,684,319 | 57.8% | $7,291 | ||||||||
| Capital Expenditures | 0 | 0 | 0 | 57,750 | 2.0 | 250 | ||||||||
| Net Cash Flow | $1,544,762 | $1,578,989 | $1,638,380 | $1,626,569 | 55.9% | $7,041 | ||||||||
| NOI DSCR | 1.25x | 1.27x | 1.32x | 1.36x | ||||||||||
| NCF DSCR | 1.25x | 1.27x | 1.32x | 1.31x | ||||||||||
| NOI DY | 7.6% | 7.8% | 8.1% | 8.3% | ||||||||||
| NCF DY | 7.6% | 7.8% | 8.1% | 8.1% | ||||||||||
| (1) | Other Income includes storage unit rent, washer & dryer rent, tech package, trash valet and miscellaneous fees. |
| (2) | The underwritten economic vacancy is 13.5%. The Hickory Hills East Property was 97.8% occupied as of July 24, 2015. |
Appraisal.As of the appraisal valuation date of July 8, 2015, the Hickory Hills East Property had an “as-is” appraised value of $28,500,000.
Environmental Matters.According to a Phase I environmental assessment dated July 16, 2015, there was no evidence of any recognized environmental conditions at the Hickory Hills East Property.
Market Overview and Competition.The Hickory Hills East Property is located in Great Mills, Maryland, which lies north of Lexington Park in central St. Mary’s County. St. Mary’s County is located in Southern Maryland on a peninsula and is bordered by the Patuxent River, Potomac River, and Chesapeake Bay. St. Mary’s County, Maryland, comprises the California-Lexington Park, Maryland metropolitan statistical area and is also included in the Washington-Baltimore-Arlington, DC-MD-VA-WV-PA combined statistical area. While outside of the Washington, D.C. metropolitan statistical area, Washington, D.C. is the closest major city to the Hickory Hills East Property. The Washington, D.C. metropolitan statistical area is the seventh most populous metropolitan area in the nation. The District of Columbia, which is the nation’s capital, sits on the northeast bank of the Potomac River and contains approximately 61.0 square miles of land. Three Notch Road (Route 235), which is just north of the Hickory Hills East Property, is the primary thoroughfare through St. Mary’s County, and is the primary retail node. The neighborhood has access via a combination of state routes and local roads. The local area contains a mix of commercial and residential development. Commercial development is concentrated along Three Notch Road and Great Mills Road and includes neighborhood shopping centers, fast food and sit down restaurants, gas stations, and other freestanding retailers. Residential development comprises a mix of single-family detached homes and multi-family dwellings. The 2014 estimated population within a one-, three-, and five-mile radius of the Hickory Hills East Property was 6,978, 27,437 and 49,477 respectively, and the 2014 estimated average household income within the same radius was $97,451, $92,840 and $98,040, respectively.
According to a third party market research report, the Hickory Hills East Property is located in the suburban Maryland multifamily market and the St. Mary’s County multifamily submarket. As of the first quarter of 2015, the suburban Maryland multifamily market contained 156,761 units with a vacancy rate of 3.7%, and an average monthly market rent of $1,427 per unit. The St. Mary’s County multifamily submarket contained 4,458 units with an average vacancy rate of 2.3%, and an average monthly rental rate of $1,004 per unit.
THE INFORMATION IN THIS STRUCTURAL AND COLLATERAL TERM SHEET IS NOT COMPLETE AND MAY BE AMENDED PRIOR TO THE TIME OF SALE. THIS TERM SHEET IS NOT AN OFFER TO SELL THESE SECURITIES AND IT IS NOT A SOLICITATION OF AN OFFER TO BUY THESE SECURITIES IN ANY JURISDICTION WHERE THE OFFER OR SALE IS NOT PERMITTED.
| 100 |
| HICKORY HILLS EAST |
The following table presents certain information relating to some comparable multifamily properties for the Hickory Hills East Property:
Competitive Set(1)
| Hickory Hills East Property | Greens at Hilton Run | Villas at Greenview | St. Mary’s Landing | Spyglass at Cedar Cove | Wildewood | Park Villas | ||||||||
| Location | Great Mills | Lexington Park | Great Mills | Lexington Park | Lexington Park | California | Lexington | |||||||
| Distance to Subject | - | 3.3 miles | 0.3 miles | 2.3 miles | 5.4 miles | 2.1 miles | 2.6 miles | |||||||
| Property Type | Townhouse | Garden | Townhouse | Townhouse | Garden | Garden | Garden | |||||||
| Number of Units | 231 | 328 | 160 | 358 | 152 | 365 | 144 | |||||||
| Average Monthly Rent (per unit) | ||||||||||||||
| Studio | $840 | NAP | NAP | $795-$860 | $1,049-$1,099 | NAP | NAP | |||||||
| 1BR | $964 | $1,081-$1,116 | NAP | $980-$1,030 | $1,099-$1,159 | $1,020-$1,145 | $1,020-$1,040 | |||||||
| 2BR | $1,061-$1,245 | $1,083-$1,204 | $1,275-$1,445 | $1,045-$1,135 | $1,179-$1,380 | $1,110-$1,255 | $1,220,-$1,240 | |||||||
| 3BR | $1,155 | $1,301-$1,346 | $1,390-$1,535 | $1,140-$1,240 | NAP | $1,280-$1,365 | NAP | |||||||
| Total Occupancy | 98% | 92% | 94% | 99% | 95% | 96% | 97% |
| (1) | Information obtained from the appraisal and underwritten rent roll. |
The Borrower.The borrower is Hickory Hills East, L.L.C., a single purpose entity with one independent director. Barrett Penan is the guarantor of certain nonrecourse carveouts under the Hickory Hills East Mortgage Loan.
The Sponsor.The sponsor, Barrett Penan, has developed residential projects ranging from $2.5 million to $25.0 million in value. Mr. Penan has also developed commercial and shopping center properties, lodging properties, and condominium conversion/new construction projects. Mr. Penan is the chairman and co-founder of BAF Associates, Inc., a real estate investment and development company established in 1990. See “Description of the Mortgage Pool-Default History, Bankruptcy Issues and Other Proceedings” in the Free Writing Prospectus.
Escrows.The loan documents provide for upfront reserves in the amount of $10,570 for insurance, $3,500 for deferred maintenance and $500,000 for upgrades at the Hickory Hills East Property including renovations to 35 units, the addition of 16 carports, and other common area upgrades (model unit, clubhouse, fitness center, pool, landscaping, signage, branding and website work) that are required to be completed within six months of the note date. The loan documents also provide for ongoing monthly reserves in the amount of $17,851 for real estate taxes, $5,033 for insurance, and $4,813 for replacement reserves.
Lockbox and Cash Management.Upon the occurrence and continuance of a Cash Management Trigger Event (as defined below), the Hickory Hills East Mortgage Loan requires the borrower to establish a lender-controlled lockbox account. The loan documents also require that after the occurrence of a Cash Management Trigger Event, all revenues received by the borrower or the property manager be deposited into the lockbox account within one business day of receipt. Other than during a Cash Sweep Event Period (as defined below), all excess funds on deposit are disbursed to the borrower.
A “Cash Management Trigger Event” will commence upon the occurrence of (i) an event of default; (ii) any bankruptcy action of the borrower, guarantor or the property manager; or (iii) a Cash Management DSCR Trigger Event (as defined below). A Cash Management Trigger Event will end with respect to clause (i), when such event of default has been cured, with respect to clause (ii), when such bankruptcy petition has been discharged, stayed, or dismissed within 30 days for borrower or guarantor and 120 days for the property manager, among other conditions, and with respect to clause (iii), once the amortizing debt service coverage ratio based upon the trailing 12-month period immediately preceding the date of such determination is greater than 1.10x for two consecutive calendar quarters. The bankruptcy of the property manager may also be cured by the borrower replacing the property manager with a qualified manager acceptable to the lender.
A “Cash Management DSCR Trigger Event” occurs upon any date the amortizing debt service coverage ratio based on the trailing 12-month period immediately preceding the date of such determination is less than 1.10x.
A “Cash Sweep Event” will commence upon the occurrence of (i) an event of default; (ii) any bankruptcy action of the borrower, guarantor, or the property manager; or (iii) a Cash Sweep DSCR Trigger Event (as defined below). A Cash Sweep Event will end with respect to clause (i), when such event of default has been cured, with respect to clause (ii), when such bankruptcy petition has been discharged, stayed, or dismissed, within 30 days for the borrower or guarantor and 120 days for the property manager, among other conditions, and with respect to clause (iii), once the amortizing debt service coverage ratio based upon the trailing 12-month period immediately preceding the date of such determination is greater than 1.10x for two consecutive quarters. The bankruptcy of the property manager may also be cured by the borrower replacing the property manager with a qualified manager acceptable to the lender.
A “Cash Sweep DSCR Trigger Event” occurs upon any date the amortizing debt service coverage ratio based on the trailing 12-month period immediately preceding the date of such determination is less than 1.10x.
Property Management.The Hickory Hills East Property is managed by an affiliate of the borrower.
Assumption.The borrower has a right to transfer the Hickory Hills East Property one year after the origination date, provided that no event of default has occurred and is continuing and certain other conditions are satisfied, including (i) the lender’s reasonable determination that the proposed transferee and guarantor satisfy the lender’s credit review and underwriting standards, taking into consideration transferee experience, financial strength and general business standing; (ii) execution of a recourse guaranty and an environmental indemnity by an affiliate of the transferee; and (iii) if requested by the lender, rating agency confirmation from Fitch,
THE INFORMATION IN THIS STRUCTURAL AND COLLATERAL TERM SHEET IS NOT COMPLETE AND MAY BE AMENDED PRIOR TO THE TIME OF SALE. THIS TERM SHEET IS NOT AN OFFER TO SELL THESE SECURITIES AND IT IS NOT A SOLICITATION OF AN OFFER TO BUY THESE SECURITIES IN ANY JURISDICTION WHERE THE OFFER OR SALE IS NOT PERMITTED.
| 101 |
| HICKORY HILLS EAST |
Moody’s and Morningstar that the transfer will not result in a downgrade, withdrawal or qualification of the respective ratings assigned to the Series 2015-LC22 Certificates.
Partial Release.Not permitted.
Real Estate Substitution.Not permitted.
Subordinate and Mezzanine Indebtedness.The borrower has the right to incur mezzanine financing subject to the satisfaction of certain conditions including (i) the execution of an intercreditor agreement in form and substance acceptable to the lender and each of Fitch, Moody’s and Morningstar; (ii) the combined loan-to-value ratio is not greater than 70.9%; (iii) the combined amortizing debt service coverage ratio is not less than 1.30x; and (iv) receipt of rating agency confirmations from Fitch, Moody’s and Morningstar that the mezzanine financing will not result in a downgrade, withdrawal or qualification of the respective ratings assigned to the Series 2015-LC22 Certificates.
Ground Lease.None.
Terrorism Insurance.The loan documents require that the “all risk” insurance policy required to be maintained by the borrower provides coverage for terrorism in an amount equal to the full replacement cost of the Hickory Hills East Property, as well as business interruption insurance covering no less than the 12-month period following the occurrence of a casualty event, together with a 6-month extended period of indemnity.
THE INFORMATION IN THIS STRUCTURAL AND COLLATERAL TERM SHEET IS NOT COMPLETE AND MAY BE AMENDED PRIOR TO THE TIME OF SALE. THIS TERM SHEET IS NOT AN OFFER TO SELL THESE SECURITIES AND IT IS NOT A SOLICITATION OF AN OFFER TO BUY THESE SECURITIES IN ANY JURISDICTION WHERE THE OFFER OR SALE IS NOT PERMITTED.
| 102 |
(THIS PAGE INTENTIONALLY LEFT BLANK)
THE INFORMATION IN THIS STRUCTURAL AND COLLATERAL TERM SHEET IS NOT COMPLETE AND MAY BE AMENDED PRIOR TO THE TIME OF SALE. THIS TERM SHEET IS NOT AN OFFER TO SELL THESE SECURITIES AND IT IS NOT A SOLICITATION OF AN OFFER TO BUY THESE SECURITIES IN ANY JURISDICTION WHERE THE OFFER OR SALE IS NOT PERMITTED.
| 103 |
| THE JEWELERS MALL |
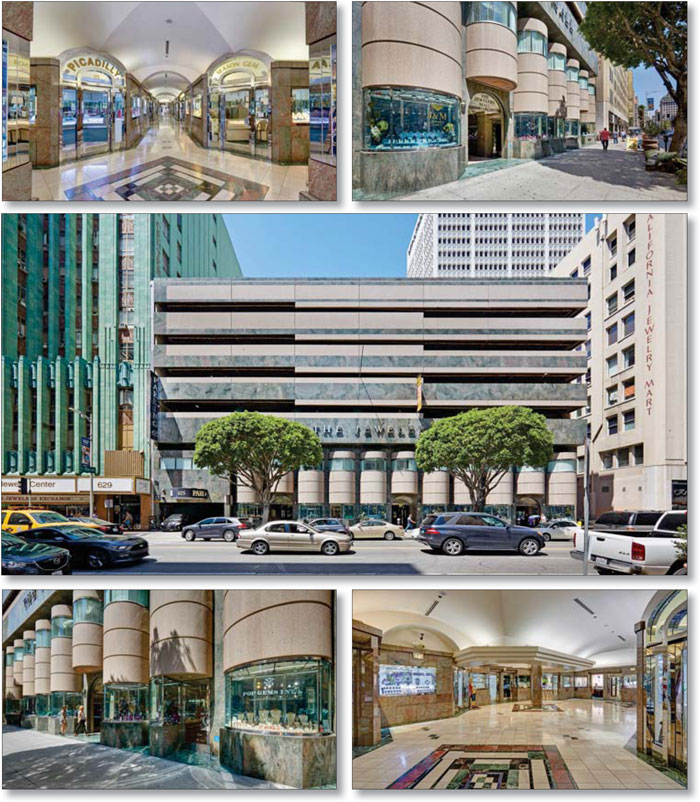
THE INFORMATION IN THIS STRUCTURAL AND COLLATERAL TERM SHEET IS NOT COMPLETE AND MAY BE AMENDED PRIOR TO THE TIME OF SALE. THIS TERM SHEET IS NOT AN OFFER TO SELL THESE SECURITIES AND IT IS NOT A SOLICITATION OF AN OFFER TO BUY THESE SECURITIES IN ANY JURISDICTION WHERE THE OFFER OR SALE IS NOT PERMITTED.
| 104 |
| THE JEWELERS MALL |
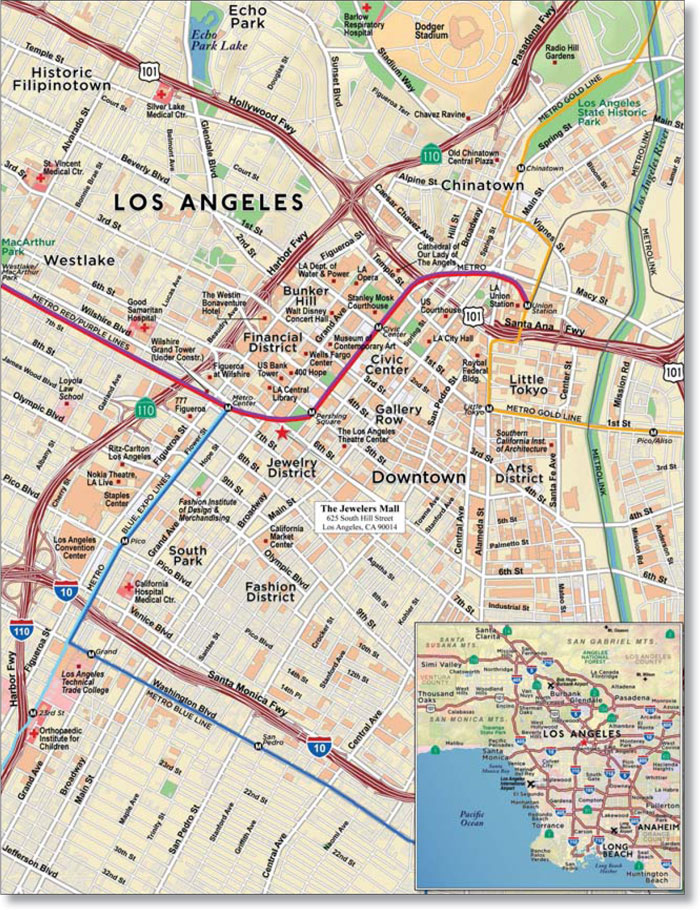
THE INFORMATION IN THIS STRUCTURAL AND COLLATERAL TERM SHEET IS NOT COMPLETE AND MAY BE AMENDED PRIOR TO THE TIME OF SALE. THIS TERM SHEET IS NOT AN OFFER TO SELL THESE SECURITIES AND IT IS NOT A SOLICITATION OF AN OFFER TO BUY THESE SECURITIES IN ANY JURISDICTION WHERE THE OFFER OR SALE IS NOT PERMITTED.
| 105 |
| No. 10 – The Jewelers Mall | ||||||
| Loan Information | Property Information | |||||
| Mortgage Loan Seller: | Wells Fargo Bank, National Association | Single Asset/Portfolio: | Single Asset | |||
Credit Assessment (Fitch/Moody’s/Morningstar): | NR/NR/NR | Property Type: | Mixed Use | |||
| Original Principal Balance: | $19,950,000 | Specific Property Type: | Retail/Office/Parking Garage | |||
| Cut-off Date Principal Balance: | $19,950,000 | Location: | Los Angeles, CA | |||
| % of Initial Pool Balance: | 2.1% | Size: | 127,556 SF | |||
| Loan Purpose: | Refinance | Cut-off Date Principal Balance Per SF: | $156.40 | |||
| Borrower Name: | Marmar Properties, LP | Year Built/Renovated: | 1989/NAP | |||
| Sponsor(1): | Various | Title Vesting: | Fee | |||
| Mortgage Rate: | 4.690% | Property Manager: | Self-managed | |||
| Note Date: | August 31, 2015 | 3rdMost Recent Occupancy (As of): | 87.9% (12/31/2012) | |||
| Anticipated Repayment Date: | NAP | 2ndMost Recent Occupancy (As of): | 87.4% (12/31/2013) | |||
| Maturity Date: | September 11, 2025 | Most Recent Occupancy (As of): | 89.1% (12/31/2014) | |||
| IO Period: | 48 months | Current Occupancy (As of)(3): | 98.7% (8/15/2015) | |||
| Loan Term (Original): | 120 months | |||||
| Seasoning: | 0 months | Underwriting and Financial Information: | ||||
| Amortization Term (Original): | 360 months | |||||
| Loan Amortization Type: | Interest-only, Amortizing Balloon | 3rdMost Recent NOI (As of): | $1,846,816 (12/31/2013) | |||
| Interest Accrual Method: | Actual/360 | 2ndMost Recent NOI (As of): | $1,836,121 (12/31/2014) | |||
| Call Protection: | L(24),D(92),O(4) | Most Recent NOI (As of): | $1,819,769 (TTM 6/30/2015) | |||
| Lockbox Type: | Springing (Without Established Account) | |||||
| Additional Debt: | No | |||||
| Additional Debt Type: | NAP | U/W Revenues: | $2,758,993 | |||
| U/W Expenses: | $892,771 | |||||
| U/W NOI: | $1,866,222 | |||||
| U/W NCF: | $1,802,851 | |||||
| Escrows and Reserves(2): | U/W NOI DSCR: | 1.50x | ||||
| U/W NCF DSCR: | 1.45x | |||||
| Type: | Initial | Monthly | Cap (If Any) | U/W NOI Debt Yield: | 9.4% | |
| Taxes | $109,776 | $18,296 | NAP | U/W NCF Debt Yield: | 9.0% | |
| Insurance | $20,352 | $1,696 | NAP | As-Is Appraised Value: | $28,500,000 | |
| Immediate Repairs | $68,750 | $0 | NAP | As-Is Appraisal Valuation Date: | June 16, 2015 | |
| Replacement Reserves | $0 | $512 | $18,432 | Cut-off Date LTV Ratio: | 70.0% | |
| TI/LC Reserve | $60,000 | Springing | $60,000 | LTV Ratio at Maturity or ARD: | 62.9% | |
| (1) | See “The Sponsors” section. |
| (2) | See “Escrows” section. |
| (3) | See “Historical Occupancy” section. |
The Mortgage Loan.The mortgage loan (“The Jewelers Mall Mortgage Loan”) is evidenced by a single promissory note that is secured by a first mortgage encumbering a mixed use center located in Los Angeles, California (“The Jewelers Mall Property”). The Jewelers Mall Mortgage Loan was originated on August 31, 2015 by Wells Fargo Bank, National Association. The Jewelers Mall Mortgage Loan had an original principal balance of $19,950,000, has an outstanding principal balance as of the Cut-off Date of $19,950,000 and accrues interest at an interest rate of 4.690%per annum. The Jewelers Mall Mortgage Loan had an initial term of 120 months, has a remaining term of 120 months as of the Cut-off Date and requires interest-only payments for the first 48 payments following origination, and thereafter, requires payments of principal and interest based on a 30-year amortization schedule. The Jewelers Mall Mortgage Loan matures on September 11, 2025.
Following the lockout period, the borrower has the right to defease The Jewelers Mall Mortgage Loan in whole, but not in part, on any date before June 11, 2025. In addition, The Jewelers Mall Mortgage Loan is prepayable without penalty on or after June 11, 2025.
THE INFORMATION IN THIS STRUCTURAL AND COLLATERAL TERM SHEET IS NOT COMPLETE AND MAY BE AMENDED PRIOR TO THE TIME OF SALE. THIS TERM SHEET IS NOT AN OFFER TO SELL THESE SECURITIES AND IT IS NOT A SOLICITATION OF AN OFFER TO BUY THESE SECURITIES IN ANY JURISDICTION WHERE THE OFFER OR SALE IS NOT PERMITTED.
| 106 |
| THE JEWELERS MALL |
Sources and Uses
| Sources | Uses | |||||||
| Original loan amount | $19,950,000 | 92.5% | Loan payoff(1) | $21,057,274 | 97.7% | |||
| Sponsor’s new cash contribution | 1,606,117 | 7.5 | Reserves | 258,878 | 1.2 | |||
| Closing costs | 239,965 | 1.1 | ||||||
| Total Sources | $21,556,117 | 100.0% | Total Uses | $21,556,117 | 100.0% |
| (1) | The Jewelers Mall Property was previously securitized in the MSC 2006-T23 transaction. |
The Property.The Jewelers Mall Property is a 127,556 square foot, seven-story mixed use building located in Los Angeles, California. The building is comprised of 10,384 square feet of ground floor retail space, 19,194 square feet of office space located on the basement level and second floor, and a five-story parking garage (located on floors three through seven) containing 261 parking spaces and totaling 97,978 square feet. The ground floor retail space consists of a main arcade and three ancillary corridors with private jewelry stores lining both sides of each hall. Built in 1989, The Jewelers Mall Property is situated on a 0.4 acre site and is located within the jewelry district area of downtown Los Angeles (the “Jewelry District”). The Jewelry District encompasses a four block by three block area bounded by 5th Street to the northeast, 8th Street to the southwest, Olive Street to the northwest and Broadway to the southeast. As previously mentioned, The Jewelers Mall Property contains 261 parking spaces, resulting in a parking ratio of 8.8 spaces per 1,000 square feet of rentable area. The parking garage comprises 25.7% of the underwritten effective gross income and 76.8% of the net rentable area at The Jewelers Mall Property. The parking lease with the Parking Network extends through June 2016, and the sponsor is currently in negotiations to renew the lease.
As of August 15, 2015, The Jewelers Mall Property was 98.7% occupied by 110 tenants (94.3% occupied excluding the parking component) with no tenant accounting for more than 4.2% of the underwritten base rent or 1.3% of the net rentable area. Excluding the parking component, The Jewelers Mall Property has maintained an average occupancy of 89.3% since 2010.
The following table presents certain information relating to the lease rollover schedule at The Jewelers Mall Property:
Lease Expiration Schedule(1)(2)
| Year Ending December 31, | No. of Leases Expiring | Expiring NRSF | % of Total NRSF | Cumulative Expiring NRSF | Cumulative % of Total NRSF | Annual U/W Base Rent | Annual U/W Base Rent PSF(3) |
| MTM | 8 | 1,800 | 1.4% | 1,800 | 1.4% | $49,155 | $27.31 |
| 2015 | 11 | 2,119 | 1.7% | 3,919 | 3.1% | $114,450 | $54.02 |
| 2016(4) | 32 | 105,685 | 82.9% | 109,604 | 85.9% | $682,549 | $88.56 |
| 2017 | 17 | 3,907 | 3.1% | 113,510 | 89.0% | $314,320 | $80.46 |
| 2018 | 23 | 5,705 | 4.5% | 119,215 | 93.5% | $420,051 | $73.64 |
| 2019 | 7 | 2,927 | 2.3% | 122,142 | 95.8% | $252,904 | $86.40 |
| 2020 | 11 | 3,090 | 2.4% | 125,232 | 98.2% | $215,559 | $69.76 |
| 2021 | 0 | 0 | 0.0% | 125,232 | 98.2% | $0 | $0.00 |
| 2022 | 0 | 0 | 0.0% | 125,232 | 98.2% | $0 | $0.00 |
| 2023 | 0 | 0 | 0.0% | 125,232 | 98.2% | $0 | $0.00 |
| 2024 | 0 | 0 | 0.0% | 125,232 | 98.2% | $0 | $0.00 |
| 2025 | 0 | 0 | 0.0% | 125,232 | 98.2% | $0 | $0.00 |
| Thereafter | 2 | 629 | 0.5% | 125,861 | 98.7% | $0 | $0.00 |
| Vacant | 0 | 1,695 | 1.3% | 127,556 | 100.0% | $0 | $0.00 |
| Total/Weighted Average | 111 | 127,556 | 100.0% | $2,048,988 | $16.28 |
| (1) | Information obtained from the underwritten rent roll. |
| (2) | Certain tenants may have lease termination options that are exercisable prior to the originally stated expiration date of the subject lease and that are not considered in the Lease Expiration Schedule. |
| (3) | Annual U/W Base Rent PSF excludes vacant space. |
| (4) | 2016 includes the Parking Network lease, which accounts for 97,978 square feet and expires in June 2016. Revenue associated with such parking lease was not included in underwritten base rent (see “Cash Flow Analysis” below). The Annual U/W Base Rent PSF for 2016 excludes the square footage attributed to the parking lease. |
The following table presents historical occupancy percentages at The Jewelers Mall Property:
Historical Occupancy
12/31/2012(1)(2) | 12/31/2013(1)(2) | 12/31/2014(1)(2) | 8/15/2015(3)(4) | |||
| 87.9% | 87.4% | 89.1% | 98.7% |
| (1) | Historical Occupancy is calculated using the retail and office space, totaling 29,578 square feet, and excludes the 97,978 square feet of parking space. |
| (2) | Information obtained from the borrower. |
| (3) | Information obtained from the underwritten rent roll. |
| (4) | Excluding the 97,978 square feet of parking space, the occupancy as of August 15, 2015 was 94.3%. |
THE INFORMATION IN THIS STRUCTURAL AND COLLATERAL TERM SHEET IS NOT COMPLETE AND MAY BE AMENDED PRIOR TO THE TIME OF SALE. THIS TERM SHEET IS NOT AN OFFER TO SELL THESE SECURITIES AND IT IS NOT A SOLICITATION OF AN OFFER TO BUY THESE SECURITIES IN ANY JURISDICTION WHERE THE OFFER OR SALE IS NOT PERMITTED.
| 107 |
| THE JEWELERS MALL |
Operating History and Underwritten Net Cash Flow.The following table presents certain information relating to the historical operating performance and underwritten net cash flow at The Jewelers Mall Property:
Cash Flow Analysis
| 2013 | 2014 | TTM 6/30/2015 | U/W | % of Effective Gross Income | U/W $ per SF | ||||||||
| Base Rent | $1,898,528 | $1,926,872 | $1,929,720 | $2,173,359(1) | 78.8% | $17.04 | |||||||
| Grossed Up Vacant Space | 0 | 0 | 0 | 11,307 | 0.4 | 0.09 | |||||||
| Parking Income | 709,400 | 710,315 | 710,005 | 710,005 | 25.7 | 5.57 | |||||||
| Less Vacancy & Credit Loss | 0 | 0 | 0 | (135,678)(2) | (4.9) | (1.06) | |||||||
| Effective Gross Income | $2,607,928 | $2,637,187 | $2,639,725 | $2,758,993 | 100.0% | $21.63 | |||||||
| Total Operating Expenses | $761,112 | $801,066 | $819,956 | $892,771 | 32.4% | $7.00 | |||||||
| Net Operating Income | $1,846,816 | $1,836,121 | $1,819,769 | $1,866,222 | 67.6% | $14.63 | |||||||
| TI/LC | 0 | 0 | 0 | 57,455 | 2.1 | 0.45 | |||||||
| Capital Expenditures | 0 | 0 | 0 | 5,916 | 0.2 | 0.05 | |||||||
| Net Cash Flow | $1,846,816 | $1,836,121 | $1,819,769 | $1,802,851 | 65.3% | $14.13 | |||||||
| NOI DSCR | 1.49x | 1.48x | 1.47x | 1.50x | |||||||||
| NCF DSCR | 1.49x | 1.48x | 1.47x | 1.45x | |||||||||
| NOI DY | 9.3% | 9.2% | 9.1% | 9.4% | |||||||||
| NCF DY | 9.3% | 9.2% | 9.1% | 9.0% |
| (1) | U/W Base Rent includes contractual rent steps through August 2016, totaling $44,085. |
| (2) | The underwritten economic vacancy is 6.2%. As of August 15, 2015, the physical occupancy at The Jewelers Mall Property, inclusive and exclusive of the parking garage, was 98.7% and 94.3%, respectively. |
Appraisal.As of the appraisal valuation date of June 16, 2015, The Jewelers Mall Property had an “as-is” appraised value of $28,500,000.
Environmental Matters.According to the Phase I environmental assessment dated June 26, 2015, there was no evidence of any recognized environmental conditions at The Jewelers Mall Property.
Market Overview and Competition.The Jewelers Mall Property is located at the northwest corner of the intersection of Hill Street and 6th Street, within the Jewelry District of Downtown Los Angeles, and is approximately 17.5 miles northwest of the Los Angeles International Airport. According to the appraisal, Los Angeles has the world’s 21st largest economy and is the largest county in the United States in terms of population, totaling over 10.0 million residents. The Jewelry District is located in the Historic Core area, which served as the original financial district of Los Angeles and the city’s retail corridor. The passage of the Adaptive Reuse Ordinance in 1999 sufficiently changed building codes and allowed these historic buildings to be converted into residential use. This revitalization is eliminating vacant office space inventory and, with the significant growth in the residential housing market, retailers are expected to benefit from increased demand over the near term.
According to the appraisal, the Jewelry District is the second largest jewelry district in the United States (trailing New York City), and with more than 5,000 retailers, has estimated annual sales of nearly $3.0 billion. According to the appraisal, jewelry related businesses continue to be attracted to the core of the district, which has brought a number of restaurants and cafés to serve the industry and visitors. According to the appraisal, the concentration of jewelry industry uses in the district also provides for numerous related services, including testing laboratories, courier and delivery companies providing specialized service to the industry, jewelry appraisers, and travel agencies specializing in flights to other international jewelry centers.
According to the appraisal, the Jewelry District and surrounding area is densely developed and The Jewelers Mall Property is one of the few buildings in the area that has onsite parking. Further, the pace of residential development has eliminated many of the surface parking lots nearby and added to the demand for parking. According to the appraisal, The Jewelers Mall Property’s parking garage benefits from its location along Hill Street, the lack of parking inventory in the market and the increase in residential units in the market.
According to a third party market research report, the 2015 estimated population within a one-, three- and five-mile radius of The Jewelers Mall Property was 55,714, 502,268 and 1,224,399, respectively, and the estimated average household income within the same radii was $51,009, $43,668 and $49,857, respectively. Additionally, as of June 16, 2015 the Jewelry District submarket reported a total inventory of approximately 1.1 million square feet with a 7.4% vacancy rate. Average asking rental rates varied widely due to age, quality and visibility of spaces. The appraiser concluded to the following market rents for select spaces at The Jewelers Mall Property, all on a gross basis: $240.00 per square foot for the retail stores along the main arcade; $180.00 per square foot for the retail stores located along the second corridor; $90.00 per square foot for the retail stores located along the third and fourth corridors; $42.00 per square foot for second floor office space; and $30.00 per square foot for basement office space.
THE INFORMATION IN THIS STRUCTURAL AND COLLATERAL TERM SHEET IS NOT COMPLETE AND MAY BE AMENDED PRIOR TO THE TIME OF SALE. THIS TERM SHEET IS NOT AN OFFER TO SELL THESE SECURITIES AND IT IS NOT A SOLICITATION OF AN OFFER TO BUY THESE SECURITIES IN ANY JURISDICTION WHERE THE OFFER OR SALE IS NOT PERMITTED.
| 108 |
| THE JEWELERS MALL |
The following table presents certain information relating to some comparable retail properties for The Jewelers Mall Property:
Competitive Set(1)
The Jewelers Mall (Subject) | Los Angeles International Jewelry Center | Western Jewelry Mart | California Jewelry Mart | Los Angeles Jewelry Center | St. Vincent Jewelry Center | |
| Location | Los Angeles, CA | Los Angeles, CA | Los Angeles, CA | Los Angeles, CA | Los Angeles, CA | Los Angeles, CA |
| Distance from Subject | -- | 0.1 miles | 0.1 miles | 0.1 miles | 0.1 miles | 0.1 miles |
| Property Type | Mixed Use | Mixed Use | Mixed Use | Mixed Use | Mixed Use | Mixed Use |
| Year Built/Renovated | 1989/NAP | 1981/NAP | 1913/NAP | 1910/NAP | 1930/NAP | 1903/NAP |
| Total GLA | 127,556 SF | 369,853 SF | 109,882 SF | 150,319 SF | 90,000 SF | 235,000 SF |
| Total Occupancy | 98.7% | 95% | 92% | 96% | 100% | 85% |
| (1) | Information obtained from the appraisal and underwritten rent roll. |
The Borrowers.The borrower is Marmar Properties, LP, a California limited partnership and single purpose entity. Iraj Arasheben, Mozaffar Afshar, and Michael Shabtai serve as the guarantors of certain nonrecourse carveouts under The Jewelers Mall Mortgage Loan.
The Sponsors.The sponsors are Iraj Arasheben, Mozaffar Afshar, and Michael Shabtai. The sponsors have been investing in and managing income producing commercial real estate properties since 1988. Mr. Arasheben and Mr. Afshar have also operated in the jewelry business for the past 24 years and 39 years, respectively, and their jewelry businesses are based in The Jewelers Mall Property. Mr. Shabtai is currently in the process of mediating outstanding litigation. See “Description of the Mortgage Pool – Litigation Considerations” in the Free Writing Prospectus.
Escrows.The loan documents provide for upfront reserves of $109,776 for real estate taxes, $20,352 for insurance premiums, $68,750 for immediate repairs and $60,000 for outstanding tenant improvements and leasing commissions (“TI/LCs”). Ongoing monthly reserves are required in an amount equal to $18,296 for real estate taxes, $1,696 for insurance premiums and $512 for replacement reserves (subject to a cap of $18,432). Ongoing monthly reserves are required in an amount equal to $3,840 for TI/LCs, in the event that the TI/LC reserve is less than $30,000 (subject to a cap of $60,000).
Lockbox and Cash Management.Upon the occurrence and continuance of a Cash Trap Event Period (as defined below), The Jewelers Mall Mortgage Loan requires the borrower to establish a lender-controlled lockbox account and the property manager to direct tenants to pay their rents directly into such lockbox account. During a Cash Trap Event Period, all excess funds on deposit in the lockbox account are swept to a lender-controlled subaccount on a monthly basis.
A “Cash Trap Event Period” will commence upon the earlier of (i) the occurrence and continuance of an event of default; or (ii) the amortizing debt service coverage ratio falling below 1.15x at the end of any calendar month. A Cash Trap Event Period will expire with regard to clause (i), upon the cure of such event of default; and with regard to clause (ii), upon the date that the amortizing debt service coverage ratio is greater than or equal to 1.20x for one calendar quarter.
Property Management. The Jewelers Mall Property is managed by an affiliate of the borrower.
Assumption.The borrower has a two-time right to transfer The Jewelers Mall Property, provided that no event of default has occurred and is continuing and certain other conditions are satisfied, including, but not limited to the following: (i) the lender’s reasonable determination that the proposed transferee and guarantor satisfy the lender’s credit review and underwriting standards, taking into consideration the transferee’s experience, financial strength and general business standing; (ii) execution of a recourse guaranty and an environmental indemnity by an affiliate of the transferee; and (iii) if requested by the lender, rating agency confirmation from Fitch, Moody’s and Morningstar that the transfer will not result in a downgrade, withdrawal or qualification of the respective ratings assigned to the Series 2015-LC22 Certificates.
Partial Release.Not permitted.
Real Estate Substitution.Not permitted.
Subordinate and Mezzanine Indebtedness.Not permitted.
Ground Lease.None.
Terrorism Insurance.The loan documents require that the “all risk” insurance policy required to be maintained by the borrower provide coverage for terrorism in an amount equal to the full replacement cost of The Jewelers Mall Property, as well as business interruption insurance covering no less than the 12-month period following the occurrence of a casualty event, together with a six-month extended period of indemnity.
Earthquake Insurance.A seismic report dated June 26, 2015 determined that the probable maximum loss at The Jewelers Mall Property was 12.0%. Earthquake insurance is not required.
THE INFORMATION IN THIS STRUCTURAL AND COLLATERAL TERM SHEET IS NOT COMPLETE AND MAY BE AMENDED PRIOR TO THE TIME OF SALE. THIS TERM SHEET IS NOT AN OFFER TO SELL THESE SECURITIES AND IT IS NOT A SOLICITATION OF AN OFFER TO BUY THESE SECURITIES IN ANY JURISDICTION WHERE THE OFFER OR SALE IS NOT PERMITTED.
| 109 |
| No. 11 – Schulman Crossing Power Center | ||||||
| Loan Information | Property Information | |||||
| Mortgage Loan Seller: | Wells Fargo Bank, National Association | Single Asset/Portfolio: | Single Asset | |||
Credit Assessment (Fitch/Moody’s/Morningstar): | NR/NR/NR | Property Type: | Retail | |||
| Original Principal Balance: | $19,500,000 | Specific Property Type: | Anchored | |||
| Cut-off Date Principal Balance: | $19,476,340 | Location: | Garden City, KS | |||
| % of Initial Pool Balance: | 2.0% | Size: | 203,131 SF | |||
| Loan Purpose: | Refinance | Cut-off Date Principal Balance Per SF: | $95.88 | |||
| Borrower Name: | GC Schulman LLC | Year Built/Renovated: | 2014/NAP | |||
| Sponsors: | John Collett; Michael E. Robbe; Michael D. Smith; Tyler C. Covington | Title Vesting: | Fee | |||
| Mortgage Rate: | 4.420% | Property Manager: | Self-managed | |||
| Note Date: | August 7, 2015 | 3rd Most Recent Occupancy(3): | NAV | |||
| Anticipated Repayment Date: | NAP | 2ndMost Recent Occupancy(3): | NAV | |||
| Maturity Date: | August 11, 2025 | Most Recent Occupancy(3): | NAV | |||
| IO Period: | 0 months | Current Occupancy (As of)(3): | 95.6% (7/27/2015) | |||
| Loan Term (Original): | 120 months | |||||
| Seasoning: | 1 month | Underwriting and Financial Information: | ||||
| Amortization Term (Original): | 360 months | |||||
| Loan Amortization Type: | Amortizing Balloon | 3rd Most Recent NOI(4): | NAV | |||
| Interest Accrual Method: | Actual/360 | 2nd Most Recent NOI(4): | NAV | |||
| Call Protection: | L(25),D(91),O(4) | Most Recent NOI (As of)(4): | $1,420,048 (Annualized YTD 6/30/2015) | |||
| Lockbox Type: | Springing (Without Established Account) | |||||
| Additional Debt: | None | U/W Revenues: | $3,040,240 | |||
| Additional Debt Type: | NAP | U/W Expenses: | $1,340,362 | |||
| U/W NOI: | $1,699,878 | |||||
| Escrows and Reserves: | U/W NCF: | $1,557,955 | ||||
| U/W NOI DSCR: | 1.45x | |||||
| Type: | Initial | Monthly | Cap (If Any) | U/W NCF DSCR: | 1.33x | |
| Taxes | $27,184 | $6,795 | NAP | U/W NOI Debt Yield: | 8.7% | |
| Insurance | $0 | $4,318 | NAP | U/W NCF Debt Yield: | 8.0% | |
| Replacement Reserve | $0 | $2,540 | $130,000 | As-Stabilized Appraised Value(5): | $26,000,000 | |
| TI/LC Reserve | $0 | $9,167 | $675,000 | As-Stabilized Appraisal Valuation Date(5): | August 1, 2016 | |
| Rent Concession Reserve(1) | $150,479 | $0 | NAP | Cut-off Date LTV Ratio(5): | 74.9% | |
| Tenant Specific TI/LC Reserve(2) | $766,146 | $0 | NAP | LTV Ratio at Maturity or ARD(5): | 60.5% | |
| (1) | The Rent Concession Reserve represents the amount of future rent credits or abatements for Buffalo Wild Wings ($29,058), Osaka Steak & Suishi House ($20,548), United Wireless ($6,364), Nail Style ($3,421), Cricket ($5,311), RUE21 ($57,157), and Dollar Tree ($28,618). |
| (2) | The Tenant Specific TI/LC Reserve consists of $116,146 related to outstanding TI/LCs and $650,000 for landlord build-out obligations. |
| (3) | See “Historical Occupancy” section. |
| (4) | See “Cash Flow Analysis” section. |
| (5) | The appraiser concluded to an “as-is” appraised value of $25,000,000 as of July 15, 2015. The Cut-off Date LTV Ratio and the LTV Ratio at Maturity or ARD based on the “as-is” value is 77.9% and 62.9%, respectively. |
The Schulman Crossing Power Center mortgage loan is evidenced by a single promissory note that is secured by a first mortgage encumbering a 203,131 square foot anchored retail center (the “Schulman Crossing Power Center Property”) located in Garden City, Kansas, approximately 212.0 miles west of Wichita, Kansas. The Schulman Crossing Power Center Property is located on a 21.4-acre site, was completed in 2014, and is comprised of four one-story buildings. The Schulman Crossing Power Center Property benefits from a diverse mix of national tenants and is anchored by Hobby Lobby, Dick’s Sporting Goods, Ross Dress for Less and TJ Maxx and is shadow anchored by Menards and an adjacent Sam’s Club (neither shadow anchor is part of the collateral). The Schulman Crossing Power Center Property includes 910 surface parking spaces resulting in a parking ratio of 4.5 spaces per 1,000 square feet of rentable area.
The Schulman Crossing Power Center Property is located along Highway 83 in Garden City, Kansas, approximately 2.7 miles east of downtown Garden City. The Schulman Crossing Power Center Property is located in the Highway 83 retail corridor, the city and trade area’s primary commercial district, which includes Walmart, Target, Home Depot, Sam’s Club, Sears, JC Penney, and Menards in addition to the Schulman Crossing Power Center Property. Based on the Highway 83 retail corridor’s tenancy and accessibility, the appraiser concluded to a trade area radius of 50.0 miles for the Schulman Crossing Power Center Property. Garden City, and the Highway 83 retail corridor specifically, is one of the largest retail markets in southwest Kansas, from Wichita (approximately 212.0 miles east) to Colorado Springs (approximately 263.0 miles west). Additionally, the Schulman Crossing Power Center Property benefits from its proximity to Garden City Community College, located approximately 0.8 miles to the southwest, which consists of
THE INFORMATION IN THIS STRUCTURAL AND COLLATERAL TERM SHEET IS NOT COMPLETE AND MAY BE AMENDED PRIOR TO THE TIME OF SALE. THIS TERM SHEET IS NOT AN OFFER TO SELL THESE SECURITIES AND IT IS NOT A SOLICITATION OF AN OFFER TO BUY THESE SECURITIES IN ANY JURISDICTION WHERE THE OFFER OR SALE IS NOT PERMITTED.
| 110 |
| SCHULMAN CROSSING POWER CENTER |
approximately 2,000 students and over 400 faculty members. The 2014 estimated population within a 25- and 50-mile radius of the Schulman Crossing Power Center Property was 39,587 and 101,376, respectively, and the estimated average household income within the same radii was $63,249 and $63,945, respectively. As of July 27, 2015, the Foothill Park Place Property was 95.6% occupied by 16 tenants.
Sources and Uses
| Sources | Uses | |||||||
| Original loan amount | $19,500,000 | 100.0% | Loan payoff | $17,320,490 | 88.8% | |||
| Reserves | 943,809 | 4.8 | ||||||
| Closing costs | 187,339 | 1.0 | ||||||
| Return of equity | 1,048,362 | 5.4 | ||||||
| Total Sources | $19,500,000 | 100.0% | Total Uses | $19,500,000 | 100.0% |
The following table presents certain information relating to the tenancies at the Schulman Crossing Power Center Property:
Major Tenants
| Tenant Name | Credit Rating (Fitch/ Moody’s/ S&P)(1) | Tenant NRSF | % of NRSF | Annual U/W Base Rent PSF(2) | Annual U/W Base Rent(2) | % of Total Annual U/W Base Rent | Sales PSF(4) | Occupancy Cost(4) | Lease Expiration Date |
| Anchor Tenant – Collateral | |||||||||
| Hobby Lobby | NR/NR/NR | 55,000 | 27.1% | $6.70 | $368,500 | 19.8% | NAV | NAV | 9/30/2029 |
| Dick’s Sporting Goods | NR/NR/NR | 35,000 | 17.2% | $10.00 | $350,000 | 18.8% | NAV | NAV | 1/31/2025 |
| Ross Dress For Less | NR/A3/A- | 22,000 | 10.8% | $9.75 | $214,500 | 11.5% | NAV | NAV | 1/31/2025 |
| TJ Maxx | NR/A2/A+ | 24,000 | 11.8% | $8.50 | $204,000 | 11.0% | NAV | NAV | 10/31/2024 |
| Total Anchor Tenant – Collateral | 136,000 | 67.0% | $8.36 | $1,137,000 | 61.2% | ||||
| Major Tenant – Collateral | |||||||||
| Petco | NR/B2/B | 12,500 | 6.2% | $12.25 | $153,125 | 8.2% | NAV | NAV | 1/31/2025 |
| Ulta | NR/NR/NR | 10,000 | 4.9% | $11.00 | $110,000 | 5.9% | NAV | NAV | 10/31/2024 |
| Dollar Tree | NR/Ba2/BB | 9,800 | 4.8% | $10.00 | $98,000 | 5.3% | NAV | NAV | 9/30/2025 |
| Rue 21(3) | NR/B3/B- | 7,000 | 3.4% | $12.50 | $87,500 | 4.7% | NAV | NAV | 1/31/2026 |
| Total Major Tenant – Collateral | 39,300 | 19.3% | $11.42 | $448,625 | 24.1% | ||||
| Other Tenants – Collateral | 18,899 | 9.3% | $14.41 | $272,387 | 14.7% | ||||
| Occupied Collateral Total | 194,199 | 95.6% | $9.57 | $1,858,013 | 100.0% | ||||
| Vacant Space | 8,932 | 4.4% | |||||||
| Collateral Total | 203,131 | 100.0% | |||||||
| (1) | Certain ratings are those of the parent company whether or not the parent guarantees the lease. |
| (2) | Six tenants consisting of 21,199 square feet (10.4% of the NRSF and 15.0% of Annual U/W Base Rent) have executed leases but have not yet commenced rent payments. The landlord has turned these spaces over to the tenants but they are currently completing their buildout and all are expected to open for business and begin paying rent on or before November 24, 2015. The associated rent concessions and abatements were reserved at origination including an additional two months of rent for each tenant beyond the date they are expected to commence rent payments. |
| (3) | Rue 21 has opened for business but is currently in its free rent period and will commence paying rent on January 25, 2016. All rent concessions were reserved at origination in addition to monthly rental payments through March 25, 2016, two months beyond the tenant’s rent payment commencement date. |
| (4) | No tenants are required to report sales. |
THE INFORMATION IN THIS STRUCTURAL AND COLLATERAL TERM SHEET IS NOT COMPLETE AND MAY BE AMENDED PRIOR TO THE TIME OF SALE. THIS TERM SHEET IS NOT AN OFFER TO SELL THESE SECURITIES AND IT IS NOT A SOLICITATION OF AN OFFER TO BUY THESE SECURITIES IN ANY JURISDICTION WHERE THE OFFER OR SALE IS NOT PERMITTED.
| 111 |
| SCHULMAN CROSSING POWER CENTER |
The following table presents certain information relating to the lease rollover schedule at the Schulman Crossing Power Center Property:
Lease Expiration Schedule(1)(2)
| Year Ending December 31, | No. of Leases Expiring | Expiring NRSF | % of Total NRSF | Cumulative Expiring NRSF | Cumulative % of Total NRSF | Annual U/W Base Rent | Annual U/W Base Rent PSF(3) |
| MTM | 0 | 0 | 0.0% | 0 | 0.0% | $0 | $0.00 |
| 2015 | 0 | 0 | 0.0% | 0 | 0.0% | $0 | $0.00 |
| 2016 | 0 | 0 | 0.0% | 0 | 0.0% | $0 | $0.00 |
| 2017 | 0 | 0 | 0.0% | 0 | 0.0% | $0 | $0.00 |
| 2018 | 0 | 0 | 0.0% | 0 | 0.0% | $0 | $0.00 |
| 2019 | 1 | 2,000 | 1.0% | 2,000 | 1.0% | $25,500 | $12.75 |
| 2020 | 5 | 8,699 | 4.3% | 10,699 | 5.3% | $126,337 | $14.52 |
| 2021 | 0 | 0 | 0.0% | 10,699 | 5.3% | $0 | $0.00 |
| 2022 | 1 | 4,000 | 2.0% | 14,699 | 7.2% | $46,000 | $11.50 |
| 2023 | 0 | 0 | 0.0% | 14,699 | 7.2% | $0 | $0.00 |
| 2024 | 2 | 34,000 | 16.7% | 48,699 | 24.0% | $314,000 | $9.24 |
| 2025 | 5 | 83,500 | 41.1% | 132,199 | 65.1% | $890,175 | $10.66 |
| Thereafter | 2 | 62,000 | 30.5% | 194,199 | 95.6% | $456,000 | $7.35 |
| Vacant | 0 | 8,932 | 4.4% | 203,131 | 100.0% | $0 | $0.00 |
| Total/Weighted Average | 16 | 203,131 | 100.0% | 0 | 0 | $1,858,013 | $9.57 |
| (1) | Information obtained from the underwritten rent roll. |
| (2) | Certain tenants may have lease termination options that are exercisable prior to the originally stated expiration date of the subject lease and that are not considered in the Lease Expiration Schedule. |
| (3) | Annual U/W Base Rent PSF excludes vacant space. |
The following table presents historical occupancy percentages at the Schulman Crossing Power Center Property:
Historical Occupancy
| 12/31/2012(1) | 12/31/2013(1) | 12/31/2014(1) | 7/27/2015(2) | |||
| NAV | NAV | NAV | 95.6% |
| (1) | Historical occupancy prior to 2015 is not available, as the Schulman Crossing Power Center Property was not constructed until 2014. |
| (2) | Information obtained from the underwritten rent roll. |
Operating History and Underwritten Net Cash Flow.The following table presents certain information relating to the historical operating performance and underwritten net cash flow at the Schulman Crossing Power Center Property:
Cash Flow Analysis
| Annualized YTD 6/30/2015 | U/W | % of Effective Gross Income | U/W $ per SF | ||||||
| Base Rent | $1,447,826 | $1,858,013(1) | 61.1% | $9.15 | |||||
| Grossed Up Vacant Space | 0 | 142,912 | 4.7 | 0.70 | |||||
| Percentage Rent | 0 | 0 | 0.0 | 0.00 | |||||
| Total Reimbursables | 236,910 | 1,182,228 | 38.9 | 5.82 | |||||
| Other Income | 0 | 0 | 0.0 | 0.00 | |||||
| Less Vacancy & Credit Loss | 0 | (142,912)(2) | (4.7) | (0.70) | |||||
| Effective Gross Income | $1,684,736 | $3,040,240 | 100.0% | $14.97 | |||||
| Total Operating Expenses | $264,688 | $1,340,362 | 44.1% | $6.60 | |||||
| Net Operating Income | $1,420,048 | $1,699,878 | 55.9% | $8.37 | |||||
| TI/LC | 0 | 121,610 | 4.0 | 0.60 | |||||
| Capital Expenditures | 0 | 20,313 | 0.7 | 0.10 | |||||
| Net Cash Flow | $1,420,048 | $1,557,955 | 51.2% | $7.67 | |||||
| NOI DSCR | 1.21x | 1.45x | |||||||
| NCF DSCR | 1.21x | 1.33x | |||||||
| NOI DY | 7.3% | 8.7% | |||||||
| NCF DY | 7.3% | 8.0% |
| (1) | The increase in Base Rent from Annualized YTD 6/30/2015 to U/W was attributed to six tenants consisting of 21,199 square feet (10.4% of net rentable area and 15.0% of Base Rent) that have executed leases but have not yet commenced rental payments. The landlord has turned these spaces over to the tenants but they are currently completing their buildout and all are expected to begin paying rent on or before November 24, 2015. Additionally, Rue 21 has opened for business but is currently in their free rent period and will commence paying rent on January 25, 2016. |
| (2) | The underwritten economic vacancy is 7.1%. The Schulman Crossing Power Center Property was 95.6% physically occupied as of July 27, 2015. |
THE INFORMATION IN THIS STRUCTURAL AND COLLATERAL TERM SHEET IS NOT COMPLETE AND MAY BE AMENDED PRIOR TO THE TIME OF SALE. THIS TERM SHEET IS NOT AN OFFER TO SELL THESE SECURITIES AND IT IS NOT A SOLICITATION OF AN OFFER TO BUY THESE SECURITIES IN ANY JURISDICTION WHERE THE OFFER OR SALE IS NOT PERMITTED.
| 112 |
(THIS PAGE INTENTIONALLY LEFT BLANK)
THE INFORMATION IN THIS STRUCTURAL AND COLLATERAL TERM SHEET IS NOT COMPLETE AND MAY BE AMENDED PRIOR TO THE TIME OF SALE. THIS TERM SHEET IS NOT AN OFFER TO SELL THESE SECURITIES AND IT IS NOT A SOLICITATION OF AN OFFER TO BUY THESE SECURITIES IN ANY JURISDICTION WHERE THE OFFER OR SALE IS NOT PERMITTED.
| 113 |
| No. 12 – Birchwood Glen Owners Corp. | ||||||
| Loan Information | Property Information | |||||
| Mortgage Loan Seller: | National Cooperative Bank, N.A. | Single Asset/Portfolio: | Single Asset | |||
Credit Assessment (Fitch/Moody’s/Morningstar): | NR/NR/NR | Property Type: | Multifamily | |||
| Original Principal Balance: | $19,000,000 | Specific Property Type: | Cooperative | |||
| Cut-off Date Principal Balance: | $19,000,000 | Location: | Holtsville, NY | |||
| % of Initial Pool Balance: | 2.0% | Size: | 363 units | |||
| Loan Purpose: | Refinance | Cut-off Date Principal Balance Per Unit: | $52,341.60 | |||
| Borrower: | Birchwood Glen Owners Corp. | Year Built/Renovated: | 1971/NAV | |||
| Sponsor(1): | NAP | Title Vesting: | Fee | |||
| Mortgage Rate: | 3.98% | Property Manager: | FPS Phase II LLC | |||
| Note Date: | July 28, 2015 | 3rd Most Recent Occupancy (As of)(5): | NAP | |||
| Anticipated Repayment Date: | NAP | 2nd Most Recent Occupancy (As of)(5): | NAP | |||
| Maturity Date: | August 1, 2025 | Most Recent Occupancy (As of)(5): | NAP | |||
| IO Period: | 36 months | Current Occupancy (As of)(5): | 95.0% (5/26/2015) | |||
| Loan Term (Original): | 120 months | |||||
| Seasoning: | 1 month | Underwriting and Financial Information: | ||||
| Amortization Term (Original): | 360 months | |||||
| Loan Amortization Type: | Interest-only, Amortizing Balloon | 3rd Most Recent NOI (As of)(6): | NAP | |||
| Interest Accrual Method: | Actual/360 | 2nd Most Recent NOI (As of)(6): | NAP | |||
| Call Protection: | GRTR 1% or YM(83),1%(33),O(4) | Most Recent NOI (As of)(6): | NAP | |||
| Lockbox Type: | None | |||||
| Additional Debt(2): | Yes | U/W Revenues(7): | $8,160,350 | |||
| Additional Debt Type(2): | Subordinate | U/W Expenses(7): | $2,830,712 | |||
| U/W NOI(7): | $5,329,638 | |||||
| U/W NCF(7): | $5,329,638 | |||||
| U/W NOI DSCR(7): | 4.91x | |||||
| U/W NCF DSCR(7): | 4.91x | |||||
| U/W NOI Debt Yield(7): | 28.1% | |||||
| U/W NCF Debt Yield(7): | 28.1% | |||||
| Escrows and Reserves: | As-Is Appraised Value(8): | $62,580,000 | ||||
| As-Is Appraisal Valuation Date(8): | May 26, 2015 | |||||
| Type: | Initial | Monthly | Cap (If Any) | Cut-off Date LTV Ratio(8): | 30.4% | |
| Taxes(3) | $0 | Springing | NAP | LTV Ratio at Maturity or ARD(8): | 26.3% | |
| Insurance(4) | $0 | Springing | NAP | Coop-Rental Value(9) | $71,100,000 | |
| Replacement Reserve | $0 | $0 | NAP | Coop-LTV as Rental(9) | 26.7% | |
| (1) | The property (the “Birchwood Glen Property”) securing the Birchwood Glen mortgage loan (as defined below) is owned by the borrower, which is a cooperative housing corporation. No individual or entity (other than the borrower) has recourse obligations with respect to such mortgage loan, including pursuant to any guaranty or environmental indemnity. |
| (2) | The Birchwood Glen Property also secures a subordinate, second-priority, line-of-credit mortgage (currently held by National Cooperative Bank, N.A.) with an original principal amount of $1,000,000 (the “Subordinate LOC”). The Subordinate LOC is co-terminus with the Birchwood Glen Owners Corp. mortgage loan and bears interest at a variable rateper annum equal to the greater of (A) 3.90% or (B) the 30-day LIBOR rate plus 3.75%. As of the Cut-off Date, no advances have been made under the Subordinate LOC. The proceeds of the Subordinate LOC are used to pay extraordinary non-recurring expenses associated with the Birchwood Glen Property. |
| (3) | Upon the borrower’s failure to provide evidence of payment of real estate taxes or upon the occurrence of an event of default under the loan documents, the borrower is required to deposit, concurrently with each monthly loan payment, an amount equal to one-twelfth of the estimated annual real estate tax payments. |
| (4) | Upon the occurrence of an event of default under the loan documents or non-payment of any insurance premium resulting in the issuance of a policy cancellation, the borrower is required to deposit, concurrently with each monthly loan payment, an amount equal to one-twelfth of the annual insurance premiums. |
| (5) | Historical Occupancy is not reported as all units are owned by tenant-shareholders; they are therefore considered occupied as the tenant-shareholders are responsible for paying the maintenance charges on the respective units. The “Current Occupancy” reflects the vacancy assumption in the related appraisal for purposes of determining the appraised value of the Birchwood Glen Property as a multifamily rental property (i.e., the Coop - Rental Value). Additionally, the Current Occupancy “As of” date reflects the appraisal valuation date for the Birchwood Glen Property. |
| (6) | The Most Recent NOI, 2nd Most Recent NOI and 3rdMost Recent NOI are “NAP.” Residential cooperatives are not-for-profit entities that set maintenance fees to cover current expenses and plan for future capital needs. A residential cooperative can increase or decrease maintenance fees according to its anticipated expenses and level of cash reserves. The historical NOI figures are not representative of the cash flow generated by the Birchwood Glen Property if it were operated as a multifamily rental property. |
| (7) | U/W Revenues, U/W Expenses, U/W NOI, and U/W NCF are derived from the appraisal. See “Cash Flow Analysis” section. |
| (8) | For purposes of determining the Cut-off Date LTV Ratio and the LTV Ratio at Maturity or ARD, the As-Is Appraised Value of the Birchwood Glen Property is the appraised value assuming the Birchwood Glen Property is operated as a residential cooperative and, in general, equals the sum of (i) the gross sellout value of all cooperative units, based in part on various comparable sales of cooperative apartment units in the market, plus (ii) the amount of the underlying debt encumbering the residential cooperative property. The comparable sales considered in the appraiser’s estimates of gross sellout values may have occurred at properties where the cooperative entity’s underlying mortgage debt per cooperative unit was substantially more or less than that at the Birchwood Glen Property. The appraiser generally made no adjustments to the comparable sales statistics to account for any such differences, although monthly unit maintenance obligations may have been considered. |
| (9) | The Coop-Rental Value of the Birchwood Glen Property is the appraised value of the Birchwood Glen Property assuming the Birchwood Glen Property is operated as a multifamily rental property, and in general, is derived by applying an appropriate capitalization rate (as determined by the appraiser) to the U/W NCF for the Birchwood Glen Property. |
The mortgage loan (the “Birchwood Glen Mortgage Loan”) is evidenced by a single promissory note that is secured by a first mortgage encumbering a multifamily residential cooperative apartment building located in Holtsville, New York. The Birchwood Glen
THE INFORMATION IN THIS STRUCTURAL AND COLLATERAL TERM SHEET IS NOT COMPLETE AND MAY BE AMENDED PRIOR TO THE TIME OF SALE. THIS TERM SHEET IS NOT AN OFFER TO SELL THESE SECURITIES AND IT IS NOT A SOLICITATION OF AN OFFER TO BUY THESE SECURITIES IN ANY JURISDICTION WHERE THE OFFER OR SALE IS NOT PERMITTED.
| 114 |
| BIRCHWOOD GLEN OWNERS CORP. |
Property is a 363-unit, garden-style housing cooperative consisting of 20 two-story, walk-up apartment buildings which were constructed in 1971 and converted to a cooperative ownership in 1988. The Birchwood Glen Property is situated on approximately 41.9 acres located in the hamlet of Holtsville, Town of Brookhaven, Suffolk County, New York. Property amenities include a community building, a manager’s office/maintenance building, a wastewater treatment plant, an in-ground swimming pool and a wading pool, an asphalt paved basketball court, tennis courts, and a playground. The Birchwood Glen Property contains 650 surface parking spaces. The cooperative is 100% sold to shareholders.
Sources and Uses
| Sources | Uses | |||||||
| Original loan amount | $19,000,000 | 100.0% | Loan payoff | $16,849,920 | 88.7% | |||
| Closing costs | 208,128 | 1.1 | ||||||
| Proceeds to Borrower | 1,941,952 | 10.2 | ||||||
| Total Sources | $19,000,000 | 100.0% | Total Uses | $19,000,000 | 100.0% | |||
The following table presents certain information relating to the unit mix of the Birchwood Glen Property:
Unit Mix Summary(1)
| Unit Type | No. of Units | % of Total Units |
Average Unit | Total Net SF | ||||
| 1 Bedroom | 204 | 56.2% | 700 | 142,800 | ||||
| 2 Bedroom | 135 | 37.2% | 850 | 114,750 | ||||
| 3 Bedroom | 24 | 6.6% | 1,100 | 26,400 | ||||
| Total/Weighted Average | 363 | 100.0% | 782 | 283,950 | ||||
| (1) | Information obtained from the appraisal. |
The following table presents historical occupancy percentages at the Birchwood Glen Property:
Historical Occupancy(1)
| 12/31/2012 | 12/31/2013 | 12/31/2014 | 5/26/2015 | |||
| NAP | NAP | NAP | 95.0% |
| (1) | Occupancy reported reflects the vacancy assumption in the related appraisal for purposes of determining the appraised value of the Birchwood Glen Property as a multifamily rental property(i.e., the Coop - Rental Value) as of the appraisal valuation date. Historical Occupancy is not reported as all units are owned by a tenant-shareholder; they are therefore considered occupied since the tenant-shareholder is responsible for the payment of maintenance charges on its respective units. |
THE INFORMATION IN THIS STRUCTURAL AND COLLATERAL TERM SHEET IS NOT COMPLETE AND MAY BE AMENDED PRIOR TO THE TIME OF SALE. THIS TERM SHEET IS NOT AN OFFER TO SELL THESE SECURITIES AND IT IS NOT A SOLICITATION OF AN OFFER TO BUY THESE SECURITIES IN ANY JURISDICTION WHERE THE OFFER OR SALE IS NOT PERMITTED.
| 115 |
| BIRCHWOOD GLEN OWNERS CORP. |
Operating History and Underwritten Net Cash Flow. The following table presents certain information relating to the underwritten net cash flow at the Birchwood Glen Property:
Cash Flow Analysis(1)
| U/W |
% of U/W Effective Gross Income | U/W $ per Unit | ||||
| Gross Potential Rent | $8,547,840 | 104.70 | $23,548 | |||
| Laundry Income | 42,000 | 0.5 | 116 | |||
| Less Vacancy & Credit Loss(2) | (429,490) | (5.3) | (1,183) | |||
| Effective Gross Income | $8,160,350 | 100.0% | $22,480 | |||
| Total Operating Expenses | $2,830,712 | 34.7% | $7,798 | |||
| Net Operating Income | $5,329,638 | 65.3% | $14,682 | |||
| Net Cash Flow | $5,329,638 | 65.3% | $14,682 | |||
| NOI DSCR | 4.91x | |||||
| NCF DSCR | 4.91x | |||||
| NOI DY | 28.1% | |||||
| NCF DY | 28.1% |
| (1) | Residential cooperatives are not-for-profit entities that set maintenance fees to cover current expenses and plan for future capital needs. A residential cooperative’s board of directors can increase or decrease maintenance fees according to its anticipated expenses and level of cash reserves. Therefore, historical Net Operating Income figures are not representative of the cash flow generated by the property if it were to be operated as a multifamily rental property and are therefore not presented. The U/W Net Cash Flow and the U/W Net Operating Income for a residential cooperative property is the projected net cash flow reflected in an appraisal and, in general, equals projected operating income at the property assuming such property is operated as a rental property with rents and other income set at the prevailing market rates, reduced by underwritten property operating expenses, a market-rate vacancy assumption and projected replacement reserves – in each case as determined by the appraiser. However, the projected net cash flow used in such determinations may differ materially from the scheduled monthly maintenance payments from the tenant-shareholders upon which residential cooperatives depend. |
| (2) | The vacancy reported reflects the vacancy assumption in the related appraisal for purposes of determining the appraised value of the Birchwood Glen Property as a multifamily rental property (i.e., the Coop - Rental Value). |
THE INFORMATION IN THIS STRUCTURAL AND COLLATERAL TERM SHEET IS NOT COMPLETE AND MAY BE AMENDED PRIOR TO THE TIME OF SALE. THIS TERM SHEET IS NOT AN OFFER TO SELL THESE SECURITIES AND IT IS NOT A SOLICITATION OF AN OFFER TO BUY THESE SECURITIES IN ANY JURISDICTION WHERE THE OFFER OR SALE IS NOT PERMITTED.
| 116 |
(THIS PAGE INTENTIONALLY LEFT BLANK)
THE INFORMATION IN THIS STRUCTURAL AND COLLATERAL TERM SHEET IS NOT COMPLETE AND MAY BE AMENDED PRIOR TO THE TIME OF SALE. THIS TERM SHEET IS NOT AN OFFER TO SELL THESE SECURITIES AND IT IS NOT A SOLICITATION OF AN OFFER TO BUY THESE SECURITIES IN ANY JURISDICTION WHERE THE OFFER OR SALE IS NOT PERMITTED.
| 117 |
| No. 13 – El Sol Del Rio Apartments | ||||||||
| Loan Information | Property Information | |||||||
| Mortgage Loan Seller: | Rialto Mortgage Finance, LLC | Single Asset/Portfolio: | Single Asset | |||||
| Credit Assessment (Fitch/ Moody’s/Morningstar): | NR/NR/NR | Property Type: | Multifamily | |||||
| Original Principal Balance: | $16,000,000 | Specific Property Type: | Garden Style | |||||
| Cut-off Date Principal Balance: | $16,000,000 | Location: | Houston, TX | |||||
| % of Initial Pool Balance: | 1.7% | Size: | 424 Units | |||||
| Loan Purpose: | Acquisition | Cut-off Date Principal Balance Per Unit: | $37,736 | |||||
| Borrower Name: | JSN Apartments, LLC | Year Built/Renovated: | 1982 / 2009 | |||||
| Sponsor: | Ajay Gupta | Title Vesting: | Fee | |||||
| Mortgage Rate: | 4.570% | Property Manager: | Self-managed | |||||
| Note Date: | August 11, 2015 | 3rdMost Recent Occupancy (As of): | 87.2% (12/31/2012) | |||||
| Anticipated Repayment Date: | NAP | 2ndMost Recent Occupancy (As of): | 91.8% (12/31/2013) | |||||
| Maturity Date: | August 6, 2025 | Most Recent Occupancy (As of): | 92.4% (12/31/2014) | |||||
| IO Period: | 60 months | Current Occupancy (As of): | 94.1% (7/18/2015) | |||||
| Loan Term (Original): | 120 Months | |||||||
| Seasoning: | 1 month | Underwriting and Financial Information: | ||||||
| Amortization Term (Original): | 360 months | |||||||
| Loan Amortization Type: | Interest-only, Amortizing Balloon | 3rd Most Recent NOI (As of): | $1,308,903 (12/31/2013) | |||||
| Interest Accrual Method: | Actual/360 | 2nd Most Recent NOI (As of): | $1,506,205 (12/31/2014) | |||||
| Call Protection: | L(25),D(90),O(5) | Most Recent NOI (As of): | $1,589,292 (TTM 6/30/2015) | |||||
| Lockbox Type: | Springing (Without Established Account) | |||||||
| Additional Debt: | None | U/W Revenues: | $3,491,660 | |||||
| Additional Debt Type: | NAP | U/W Expenses: | $1,800,864 | |||||
| U/W NOI: | $1,690,796 | |||||||
| U/W NCF: | $1,584,796 | |||||||
| U/W NOI DSCR: | 1.72x | |||||||
| Escrows and Reserves: | U/W NCF DSCR: | 1.62x | ||||||
| U/W NOI Debt Yield: | 10.6% | |||||||
| Type: | Initial | Monthly | Cap (If Any) | U/W NCF Debt Yield: | 9.9% | |||
| Taxes | $230,418 | $27,431 | NAP | As-Is Appraised Value: | $21,570,000 | |||
| Insurance | $37,335 | $8,889 | NAP | As-Is Appraisal Valuation Date: | June 30, 2015 | |||
| Replacement Reserves | $500,000 | $8,833 | NAP | Cut-off Date LTV Ratio: | 74.2% | |||
| Deferred Maintenance | $15,381 | $0 | NAP | LTV Ratio at Maturity or ARD: | 68.0% | |||
The El Sol Del Rio Apartments mortgage loan is evidenced by a single promissory note that is secured by a first mortgage encumbering a garden-style multifamily property containing 424 units located in Houston, Texas (the “El Sol Del Rio Apartments Property”). The El Sol Del Rio Apartments Property is located within the Houston metropolitan statistical area with a 2015 population of approximately 6.5 million, accounting for approximately 23.9% of the population of the state of Texas. The El Sol Del Rio Apartments Property consists of 24 two- and three-story buildings which were constructed in 1982 and renovated in 2009. The El Sol Del Rio Apartment Property is situated on 12.4 acres and located approximately 18.0 miles west from the Houston central business district. Local access to the El Sol Del Rio Apartments Property is provided via Bellaire Boulevard and Sugarland Howell Road. Community amenities at the El Sol Del Rio Apartments Property include controlled access gates, a clubhouse, three swimming pools, a sports court, children’s play area, picnic and grilling areas, and three laundry facilities. All units include a fully equipped kitchen, wood flooring in living areas, walk-in closets, a patio/balcony, ceiling fans, and washer/dryer connections. According to the sponsor, recent capital improvements of $4.7 million included interior renovations, roof repairs, HVAC repairs, boiler repairs, clubhouse/office repairs, fencing/landscape repairs, stairs/railing repairs, asphalt/parking lot repairs, pool/playground repair, painting and exterior work. As of July 18, 2015, the El Sol Del Rio Apartments Property was 94.1% occupied.
Sources and Uses
| Sources | Uses | |||||||
| Original loan amount | $16,000,000 | 74.4% | Purchase Price | $20,250,000 | 94.2% | |||
| Sponsor’s new cash contribution | 5,497,493 | 25.6 | Reserves | 783,135 | 3.6 | |||
| Closing costs | 464,358 | 2.2 | ||||||
| Total Sources | $21,497,493 | 100.0% | Total Uses | $21,497,493 | 100.0% |
THE INFORMATION IN THIS STRUCTURAL AND COLLATERAL TERM SHEET IS NOT COMPLETE AND MAY BE AMENDED PRIOR TO THE TIME OF SALE. THIS TERM SHEET IS NOT AN OFFER TO SELL THESE SECURITIES AND IT IS NOT A SOLICITATION OF AN OFFER TO BUY THESE SECURITIES IN ANY JURISDICTION WHERE THE OFFER OR SALE IS NOT PERMITTED.
| 118 |
| EL SOL DEL RIO APARTMENTS |
The following table presents certain information relating to the unit mix of the El Sol Del Rio Apartments Property:
Apartment Unit Summary(1)
| Unit Type | No. of Units | % of Total Units | Average Unit Size (SF) | Average U/W Monthly Rent per Unit |
| 1 bedroom/1 bathroom (A1) | 36 | 8.5% | 539 | $583 |
| 1 bedroom/1 bathroom (A2) | 36 | 8.5% | 539 | $568 |
| 1 bedroom/1 bathroom (A3) | 32 | 7.5% | 539 | $540 |
| 1 bedroom/1 bathroom (B1) | 16 | 3.8% | 661 | $627 |
| 1 bedroom/1 bathroom (B2) | 16 | 3.8% | 661 | $602 |
| 1 bedroom/ 1 bathroom (B3) | 16 | 3.8% | 661 | $585 |
| 1 bedroom/1 bathroom (C1) | 36 | 8.5% | 687 | $643 |
| 1 bedroom/1 bathroom (C2) | 36 | 8.5% | 687 | $628 |
| 1 bedroom/1 bathroom (C3) | 36 | 8.5% | 687 | $618 |
| 2 bedroom/1 bathroom (D1) | 24 | 5.7% | 853 | $797 |
| 2 bedroom/1 bathroom (D2) | 24 | 5.7% | 853 | $776 |
| 2 bedroom/1 bathroom (D3) | 24 | 5.7% | 853 | $753 |
| 2 bedroom/1 bathroom (E1) | 24 | 5.7% | 960 | $928 |
| 2 bedroom/2 bathroom (E2) | 24 | 5.7% | 960 | $900 |
| 1 bedroom/1 bathroom (F1) | 36 | 8.5% | 812 | $750 |
| 2 bedroom/2 bathroom (G1) | 8 | 1.9% | 1,107 | $991 |
| Total/Weighted Average | 424 | 100.0% | 725 | $685 |
| (1) | Information obtained from the underwritten rent roll. |
The following table presents historical occupancy percentages at the El Sol Del Rio Apartments Property:
Historical Occupancy
12/31/2012(1) | 12/31/2013(1) | 12/31/2014(1) | 7/18/2015(2) | |||
| 87.2% | 91.8% | 92.4% | 94.1% |
| (1) | Information obtained from the borrower. |
| (2) | Information obtained from the underwritten rent roll. |
Operating History and Underwritten Net Cash Flow.The following table presents certain information relating to the historical operating performance and underwritten net cash flow at the El Sol Del Rio Apartments Property:
Cash Flow Analysis
| 2013 | 2014 | TTM 6/30/2015 | U/W | % of U/W Effective Gross Income | U/W $ per Room | |||||||||
| Base Rent | $3,002,411 | $3,159,818 | $3,308,124 | $3,258,600 | 93.3% | $7,685 | ||||||||
| Grossed Up Vacant Space | 0 | 0 | 0 | 242,244 | 6.9 | 571 | ||||||||
| Concessions | 0 | 0 | 0 | 0 | 0.0 | 0 | ||||||||
| Other Income(1) | 305,121 | 333,540 | 346,988 | 346,988 | 9.9 | 818 | ||||||||
| Less Vacancy & Credit Loss | (247,400) | (240,707) | (278,446) | (356,172)(2) | (10.2) | (840) | ||||||||
| Effective Gross Income | $3,060,132 | $3,252,651 | $3,376,666 | $3,491,660 | 100.0% | $8,235 | ||||||||
| Total Operating Expenses | $1,751,229 | $1,746,446 | $1,787,374 | $1,800,864 | 51.6% | $4,247 | ||||||||
| Net Operating Income | $1,308,903 | $1,506,205 | $1,589,292 | $1,690,796 | 48.4% | $3,988 | ||||||||
| Capital Expenditures | 0 | 0 | 0 | 106,000 | 3.0 | 250 | ||||||||
| Net Cash Flow | $1,308,903 | $1,506,205 | $1,589,292 | $1,584,796 | 45.4% | $3,738 | ||||||||
| NOI DSCR | 1.33x | 1.54x | 1.62x | 1.72x | ||||||||||
| NCF DSCR | 1.33x | 1.54x | 1.62x | 1.62x | ||||||||||
| NOI DY | 8.2% | 9.4% | 9.9% | 10.6% | ||||||||||
| NCF DY | 8.2% | 9.4% | 9.9% | 9.9% | ||||||||||
| (1) | Other Income includes late fees, application fees, reserved/covered parking fees, month-to-month charges, NSF fees and miscellaneous income. |
| (2) | The underwritten economic vacancy is 10.2%. The El Sol Del Rio Apartments Property was 94.1% occupied as of July 18, 2015. |
THE INFORMATION IN THIS STRUCTURAL AND COLLATERAL TERM SHEET IS NOT COMPLETE AND MAY BE AMENDED PRIOR TO THE TIME OF SALE. THIS TERM SHEET IS NOT AN OFFER TO SELL THESE SECURITIES AND IT IS NOT A SOLICITATION OF AN OFFER TO BUY THESE SECURITIES IN ANY JURISDICTION WHERE THE OFFER OR SALE IS NOT PERMITTED.
| 119 |
| No. 14 – Millburn Mall | ||||||||
| Loan Information | Property Information | |||||||
| Mortgage Loan Seller: | Wells Fargo Bank, National Association | Single Asset/Portfolio: | Single Asset | |||||
Credit Assessment (Fitch/Moody’s/Morningstar): | NR/NR/NR | Property Type: | Retail | |||||
| Original Principal Balance: | $14,700,000 | Specific Property Type: | Anchored | |||||
| Cut-off Date Principal Balance: | $14,700,000 | Location: | Vauxhall, NJ | |||||
| % of Initial Pool Balance: | 1.5% | Size: | 71,033 SF | |||||
| Loan Purpose: | Refinance | Cut-off Date Principal Balance Per SF: | $206.95 | |||||
| Borrower Name: | Millburn Mall Holdings LLC | Year Built/Renovated: | 1962/2014 | |||||
| Sponsor(1): | David Lichtenstein | Title Vesting: | Fee | |||||
| Mortgage Rate: | 4.570% | Property Manager: | Self-managed | |||||
| Note Date: | August 31, 2015 | 3rdMost Recent Occupancy (As of): | 93.9% (12/31/2012) | |||||
| Anticipated Repayment Date: | NAP | 2ndMost Recent Occupancy (As of): | 94.5% (12/31/2013) | |||||
| Maturity Date: | September 11, 2025 | Most Recent Occupancy (As of): | 98.3% (12/31/2014) | |||||
| IO Period: | 24 months | Current Occupancy (As of): | 97.1% (7/31/2015) | |||||
| Loan Term (Original): | 120 months | |||||||
| Seasoning: | 0 months | |||||||
| Amortization Term (Original): | 360 months | Underwriting and Financial Information: | ||||||
| Loan Amortization Type: | Interest-only, Amortizing Balloon | |||||||
| Interest Accrual Method: | Actual/360 | 3rd Most Recent NOI (As of): | $1,336,957 (12/31/2013) | |||||
| Call Protection: | L(24),D(92),O(4) | 2nd Most Recent NOI (As of): | $1,395,769 (12/31/2014) | |||||
| Lockbox Type: | Springing (Without Established Account) | Most Recent NOI (As of): | $1,469,231 (TTM 5/31/2015) | |||||
| Additional Debt: | None | |||||||
| Additional Debt Type: | NAP | |||||||
| U/W Revenues: | $2,266,938 | |||||||
| U/W Expenses: | $870,576 | |||||||
| U/W NOI: | $1,396,362 | |||||||
| U/W NCF: | $1,318,110 | |||||||
| Escrows and Reserves: | U/W NOI DSCR: | 1.55x | ||||||
| U/W NCF DSCR: | 1.46x | |||||||
| Type: | Initial | Monthly | Cap (If Any) | U/W NOI Debt Yield: | 9.5% | |||
| Taxes | $51,204 | $25,602 | NAP | U/W NCF Debt Yield: | 9.0% | |||
| Insurance(2) | $0 | Springing | NAP | As-Is Appraised Value: | $19,600,000 | |||
| Deferred Maintenance | $20,375 | $0 | NAP | As-Is Appraisal Valuation Date: | April 6, 2015 | |||
| Replacement Reserve | $0 | $1,184 | NAP | Cut-off Date LTV Ratio: | 75.0% | |||
| TI/LC Reserve | $0 | $0 | NAP | LTV Ratio at Maturity or ARD: | 64.2% | |||
| (1) | Affiliates of David Lichtenstein filed for Chapter 11 bankruptcy protection in 2009, and the bankruptcy case was closed in 2012; there is ongoing litigation related to the bankruptcy filing. In addition, affiliates of Mr. Lichtenstein have been involved in 12 prior mortgage defaults involving multifamily and commercial real estate projects. See “Description of the Mortgage Pool – Default History, Bankruptcy Issues, and Other Proceedings” in the Free Writing Prospectus. |
| (2) | Ongoing monthly reserves for insurance are not required so long as (i) no event of default has occurred and is continuing; (ii) the Millburn Mall Property is insured by an acceptable blanket insurance policy; and (iii) the borrower provides the lender with evidence of renewal of the insurance policies and timely proof of payment of insurance premiums. |
The Millburn Mall mortgage loan is evidenced by a single promissory note that is secured by a first mortgage encumbering a 71,033 square foot anchored retail center (the “Millburn Mall Property”) located in Vauxhaull, New Jersey, which is situated approximately 15.9 miles west of Hoboken, New Jersey. The Millburn Mall Property is located on a 5.1-acre site, was constructed in 1962 and most recently renovated in 2014, and is comprised of two multi-tenant buildings and one outparcel anchored by Walgreens and Staples. Other major tenants include ConnectOne Bank, Bottle Crown and Five Guys. Approximately 54.9% of the underwritten base rent is from tenants that have occupied their space for over 10 years.
The Millburn Mall Property includes 221 surface parking spaces resulting in a parking ratio of 3.1 spaces per 1,000 square feet of net rentable area. The 2014 population within a one-, three- and five-mile radius of the Millburn Mall Property was 18,859, 164,681 and 516,165, respectively, while the 2014 estimated average household income within the same radii was $128,945, $114,124 and $95,041, respectively. As of July 31, 2015, the Millburn Mall Property was 97.1% occupied by 25 tenants.
THE INFORMATION IN THIS STRUCTURAL AND COLLATERAL TERM SHEET IS NOT COMPLETE AND MAY BE AMENDED PRIOR TO THE TIME OF SALE. THIS TERM SHEET IS NOT AN OFFER TO SELL THESE SECURITIES AND IT IS NOT A SOLICITATION OF AN OFFER TO BUY THESE SECURITIES IN ANY JURISDICTION WHERE THE OFFER OR SALE IS NOT PERMITTED.
| 120 |
| MILLBURN MALL |
Sources and Uses
| Sources | Uses | |||||||
| Original loan amount | $14,700,000 | 72.7% | Loan payoff(1) | $19,971,148 | 98.7% | |||
| Sponsor’s new cash contribution | 5,525,822 | 27.3 | Reserves | 71,579 | 0.4 | |||
| Closing costs | 183,094 | 0.9 | ||||||
| Total Sources | $20,225,822 | 100.0% | Total Uses | $20,225,822 | 100.0% |
| (1) | The Millburn Mall Property was previously securitized in the MLMT 2005-CKI1 transaction. |
The following table presents certain information relating to the tenancy at the Millburn Mall Property:
Major Tenants
| Tenant Name | Credit Rating (Fitch/ Moody’s/ S&P)(1) | Tenant NRSF | % of NRSF | Annual U/W Base Rent PSF(2) | Annual U/W Base Rent(2) | % of Total Annual U/W Base Rent | Sales PSF(3) | Occupancy Cost(3) | Lease Expiration Date | |||||||||
| Anchor Tenant – Collateral | ||||||||||||||||||
| Walgreens | NR/Baa2/BBB | 21,112 | 29.7% | $30.25(4) | $638,623(4) | 36.7% | NAV | NAV | 7/31/2027(5) | |||||||||
| Staples | BBB-/Baa2/BBB- | 20,700 | 29.1% | $19.25 | $398,475 | 22.9% | NAV | NAV | 3/31/2017(6) | |||||||||
| Total Anchor Tenant – Collateral | 41,812 | 58.9% | $24.80 | $1,037,098 | 59.7% | |||||||||||||
| Major Tenant – Collateral | ||||||||||||||||||
| ConnectOne Bank | NR/NR/NR | 2,260 | 3.2% | $35.75 | $80,795 | 4.6% | NAV | NAV | 1/31/2020(7) | |||||||||
| Bottle Crown | NR/NR/NR | 2,500 | 3.5% | $32.00 | $80,000 | 4.6% | NAV | NAV | 9/30/2016(8) | |||||||||
| Five Guys | NR/NR/NR | 2,000 | 2.8% | $36.00 | $72,000 | 4.1% | NAV | NAV | 8/31/2022(9) | |||||||||
| Kicks N Stick Sport Apparel | NR/NR/NR | 2,042 | 2.9% | $31.11 | $63,530 | 3.7% | NAV | NAV | 1/31/2018 | |||||||||
| Total Major Tenant – Collateral | 8,802 | 12.4% | $33.67 | $296,325 | 17.0% | |||||||||||||
| Other Tenants – Collateral | 18,392 | 25.9% | $22.02 | $405,032 | 23.3% | |||||||||||||
| Occupied Collateral Total | 69,006 | 97.1% | $25.19 | $1,738,455 | 100.0% | |||||||||||||
| Vacant Space | 2,027 | 2.9% | ||||||||||||||||
| Collateral Total | 71,033 | 100.0% | ||||||||||||||||
| (1) | Certain Ratings are those of the parent company whether or not the parent guarantees the lease. |
| (2) | Annual U/W Base Rent PSF and Annual U/W Base Rent include contractual rent steps through April 2016 totaling $2,693. |
| (3) | Most tenants are not required to report sales. |
| (4) | The Annual U/W Base Rent and Annual U/W Base Rent PSF for Walgreens represent the tenant’s average rent through the remaining loan term. |
| (5) | Walgreens has one, 5-year renewal option. |
| (6) | Staples has three, 5-year renewal options. |
| (7) | ConnectOne Bank has one, 5-year renewal option. |
| (8) | Bottle Crown has one, 5-year renewal option. |
| (9) | Five Guys has two, 5-year renewal options. |
THE INFORMATION IN THIS STRUCTURAL AND COLLATERAL TERM SHEET IS NOT COMPLETE AND MAY BE AMENDED PRIOR TO THE TIME OF SALE. THIS TERM SHEET IS NOT AN OFFER TO SELL THESE SECURITIES AND IT IS NOT A SOLICITATION OF AN OFFER TO BUY THESE SECURITIES IN ANY JURISDICTION WHERE THE OFFER OR SALE IS NOT PERMITTED.
| 121 |
| MILLBURN MALL |
The following table presents certain information relating to the lease rollover schedule at the Millburn Mall Property:
Lease Expiration Schedule(1)(2)
| Year Ending December 31, | No. of Leases Expiring | Expiring NRSF | % of Total NRSF | Cumulative Expiring NRSF | Cumulative % of Total NRSF | Annual U/W Base Rent | Annual U/W Base Rent PSF(3) |
| MTM(4) | 1 | 580 | 0.8% | 580 | 0.8% | $0 | $0.00 |
| 2015 | 0 | 0 | 0.0% | 580 | 0.8% | $0 | $0.00 |
| 2016 | 5 | 3,913 | 5.5% | 4,493 | 6.3% | $107,901 | $27.57 |
| 2017 | 3 | 22,183 | 31.2% | 26,676 | 37.6% | $444,992 | $20.06 |
| 2018 | 2 | 4,642 | 6.5% | 31,318 | 44.1% | $88,730 | $19.11 |
| 2019 | 4 | 3,208 | 4.5% | 34,526 | 48.6% | $91,975 | $28.67 |
| 2020 | 6 | 7,488 | 10.5% | 42,014 | 59.1% | $201,032 | $26.85 |
| 2021 | 1 | 1,900 | 2.7% | 43,914 | 61.8% | $38,000 | $20.00 |
| 2022 | 1 | 2,000 | 2.8% | 45,914 | 64.6% | $72,000 | $36.00 |
| 2023 | 0 | 0 | 0.0% | 45,914 | 64.6% | $0 | $0.00 |
| 2024 | 0 | 0 | 0.0% | 45,914 | 64.6% | $0 | $0.00 |
| 2025 | 1 | 1,980 | 2.8% | 47,894 | 67.4% | $55,202 | $27.88 |
| Thereafter | 1 | 21,112 | 29.7% | 69,006 | 97.1% | $638,623 | $30.25 |
| Vacant | 0 | 2,027 | 2.9% | 71,033 | 100.0% | $0 | $0.00 |
| Total/Weighted Average | 25 | 71,033 | 100.0% | 0 | 0 | $1,738,455 | $25.19 |
| (1) | Information obtained from the underwritten rent roll. |
| (2) | Certain tenants may have lease termination options that are exercisable prior to the originally stated expiration date of the subject lease and that are not considered in the Lease Expiration Schedule. |
| (3) | Weighted Average Annual U/W Base Rent PSF excludes vacant space. |
| (4) | MTM includes a management office comprising 580 square feet that does not have an in-place lease. |
The following table presents historical occupancy percentages at the Millburn Mall Property:
Historical Occupancy
12/31/2012(1) | 12/31/2013(1) | 12/31/2014(1) | 7/31/2015(2) | |||
| 93.9% | 94.5% | 98.3% | 97.1% |
| (1) | Information obtained from the borrower. |
| (2) | Information obtained from the underwritten rent roll. |
Operating History and Underwritten Net Cash Flow. The following table presents certain information relating to the underwritten net cash flow at the Millburn Mall Property:
Cash Flow Analysis
| 2013 | 2014 | TTM | U/W | % of U/W | U/W $ | ||||||||
| Base Rent | $1,559,641 | $1,641,475 | $1,701,631 | $1,738,455(1) | 76.7% | $24.47 | |||||||
| Grossed Up Vacant Space | 0 | 0 | 0 | 40,540 | 1.8 | 0.57 | |||||||
| Total Reimbursables | 462,656 | 493,923 | 494,212 | 594,683 | 26.2 | 8.37 | |||||||
| Other Income | 180 | 1,150 | 3,767 | 0 | 0.0 | 0.00 | |||||||
| Less Vacancy and Credit Loss | (3,283) | (3,431) | 1,279 | (106,740)(2) | (4.7) | (1.50) | |||||||
| Effective Gross Income | $2,019,194 | $2,133,117 | $2,200,887 | $2,266,938 | 100.0% | $31.91 | |||||||
| Total Operating Expenses | $682,237 | $737,348 | $731,657 | $870,576 | 38.4% | $12.26 | |||||||
| Net Operating Income | $1,336,957 | $1,395,769 | $1,469,231 | $1,396,362 | 61.6% | $19.66 | |||||||
| TI/LC | 0 | 0 | 0 | 64,045 | 2.8 | 0.90 | |||||||
| Capital Expenditures | 0 | 0 | 0 | 14,207 | 0.6 | 0.20 | |||||||
| Net Cash Flow | $1,336,957 | $1,395,769 | $1,469,231 | $1,318,110 | 58.1% | $18.56 | |||||||
| NOI DSCR | 1.48x | 1.55x | 1.63x | 1.55x | |||||||||
| NCF DSCR | 1.48x | 1.55x | 1.63x | 1.46x | |||||||||
| NOI DY | 9.1% | 9.5% | 10.0% | 9.5% | |||||||||
| NCF DY | 9.1% | 9.5% | 10.0% | 9.0% |
| (1) | The underwritten base rent includes rent steps through April 2016 totaling $2,693. |
| (2) | The underwritten economic vacancy is 6.0%. The Millburn Mall Property was 97.1% physically occupied as of July 31, 2015. |
THE INFORMATION IN THIS STRUCTURAL AND COLLATERAL TERM SHEET IS NOT COMPLETE AND MAY BE AMENDED PRIOR TO THE TIME OF SALE. THIS TERM SHEET IS NOT AN OFFER TO SELL THESE SECURITIES AND IT IS NOT A SOLICITATION OF AN OFFER TO BUY THESE SECURITIES IN ANY JURISDICTION WHERE THE OFFER OR SALE IS NOT PERMITTED.
| 122 |
(THIS PAGE INTENTIONALLY LEFT BLANK)
THE INFORMATION IN THIS STRUCTURAL AND COLLATERAL TERM SHEET IS NOT COMPLETE AND MAY BE AMENDED PRIOR TO THE TIME OF SALE. THIS TERM SHEET IS NOT AN OFFER TO SELL THESE SECURITIES AND IT IS NOT A SOLICITATION OF AN OFFER TO BUY THESE SECURITIES IN ANY JURISDICTION WHERE THE OFFER OR SALE IS NOT PERMITTED.
| 123 |
| No. 15 – Home Depot Tacoma |
| Loan Information | Property Information | ||||||
| Mortgage Loan Seller: | Wells Fargo Bank, National Association | Single Asset/Portfolio: | Single Asset | ||||
| Credit Assessment (Fitch/Moody’s/Morningstar): | NR/NR/NR | Property Type: | Retail | ||||
| Original Principal Balance: | $14,250,000 | Specific Property Type: | Single Tenant | ||||
| Cut-off Date Principal Balance: | $14,250,000 | Location: | Tacoma, WA | ||||
| % of Initial Pool Balance: | 1.5% | Size: | 117,064 SF | ||||
| Loan Purpose: | Acquisition | Cut-off Date Principal Balance Per SF: | $121.73 | ||||
| Borrower Name: | Tacoma Home Improvement DST | Year Built/Renovated: | 2000/NAP | ||||
| Sponsor: | Inland Private Capital Corporation | Title Vesting: | Fee | ||||
| Mortgage Rate: | 4.230% | Property Manager: | Self-managed | ||||
| Note Date: | July 28, 2015 | 3rdMost Recent Occupancy (As of): | 100.0% (12/31/2012) | ||||
| Anticipated Repayment Date: | NAP | 2ndMost Recent Occupancy (As of): | 100.0% (12/31/2013) | ||||
| Maturity Date: | August 11, 2025 | Most Recent Occupancy (As of): | 100.0% (12/31/2014) | ||||
| IO Period: | 36 months | Current Occupancy (As of): | 100.0% (9/1/2015) | ||||
| Loan Term (Original): | 120 months | ||||||
| Seasoning: | 1 month | Underwriting and Financial Information: | |||||
| Amortization Term (Original): | 360 months | ||||||
| Loan Amortization Type: | Interest-only, Amortizing Balloon | 3rdMost Recent NOI(4): | NAV | ||||
| Interest Accrual Method: | Actual/360 | 2ndMost Recent NOI(4): | NAV | ||||
| Call Protection: | L(25),GRTR 1% or YM(91),O(4) | Most Recent NOI(4): | NAV | ||||
| Lockbox Type: | Springing (Without Established Account) | ||||||
| Additional Debt(1): | Yes | U/W Revenues: | $2,158,752 | ||||
| Additional Debt Type(1): | Future Unsecured | U/W Expenses: | $355,164 | ||||
| U/W NOI: | $1,803,588 | ||||||
| U/W NCF: | $1,734,852 | ||||||
| Escrows and Reserves: | U/W NOI DSCR | 2.15x | |||||
| U/W NCF DSCR: | 2.07 | ||||||
| Type: | Initial | Monthly | Cap (If Any) | U/W NOI Debt Yield: | 12.7% | ||
| Taxes(2) | $0 | Springing | NAP | U/W NCF Debt Yield: | 12.2% | ||
| Insurance(3) | $0 | Springing | NAP | As-Is Appraised Value: | $33,000,000 | ||
| Deferred Maintenance | $586,831 | $0 | NAP | As-Is Appraisal Valuation Date: | July 7, 2015 | ||
| Replacement Reserves | $0 | $0 | NAP | Cut-off Date LTV Ratio: | 43.2% | ||
| TI/LC | $486,383 | $0 | NAP | LTV Ratio at Maturity or ARD: | 37.6% | ||
| (1) | The borrower is permitted to incur future unsecured debt in an aggregate amount up to $1,282,500, subject to the satisfaction of certain conditions, including, but not limited to: (i) the unsecured debt is subordinate to the Home Depot Tacoma mortgage loan; (ii) the unsecured debt payments are only permitted out of excess cash flow; and (iii) the unsecured debt must be without a maturity date. |
| (2) | Ongoing monthly reserves for taxes are not required so long as (i) no event of default has occurred and is continuing; (ii) Home Depot is in occupancy and has not given notice to terminate its lease, has not defaulted on its lease, and has not filed for bankruptcy; (iii) Home Depot maintains a credit rating of BBB or better by S&P; (iv) Home Depot gives notice to renew its lease by January 31, 2025; and (v) Home Depot provides the lender with timely proof of payment. |
| (3) | Ongoing monthly reserves for insurance are not required so long as (i) no event of default has occurred and is continuing; (ii) Home Depot is in occupancy and has not given notice to terminate its lease, has not defaulted on its lease, has not filed for bankruptcy; (iii) Home Depot maintains a credit rating of BBB or better by S&P; (iv) Home Depot gives notice to renew its lease by January 31, 2025; (v) the Home Depot Tacoma Property is insured by an acceptable blanket insurance policy; and (vi) the borrower provides the lender with evidence of renewal of the insurance policies and timely proof of payment of insurance premiums. |
| (4) | See “Cash Flow Analysis” section. |
The Home Depot Tacoma mortgage loan is evidenced by a single promissory note that is secured by a first mortgage encumbering a 117,064 square foot, single tenant retail building located in Tacoma, Washington (the “Home Depot Tacoma Property”), approximately 35.7 miles southwest of the Seattle central business district. Constructed in 2000, the Home Depot Tacoma Property was built to suit for Home Depot U.S.A., Inc. (“Home Depot”) and is 100.0% occupied by the tenant. The Home Depot Tacoma Property is comprised of a one-story building that contains approximately 117,064 square feet and 19,960 square feet of outdoor garden selling space, which is not included in the net rentable area. Additionally, the Home Depot Tacoma Property includes four grade-level overhead loading doors and four dock high overhead loading doors. Home Depot is the world’s largest home improvement specialty retailer with 2,270 stores, of which 1,977 stores are located in the United States. Home Depot (NYSE: HD) is rated A, A2, and A by Fitch, Moody’s and S&P, respectively. As of the second quarter of 2015, Home Depot reported revenues of $24.8 billion, a 4.3% increase over the second quarter of 2014.
The Home Depot Tacoma Property features 542 parking spaces resulting in a parking ratio of 4.6 spaces per 1,000 square feet of net rentable area. The 2015 population within a one-, three-, and five-mile radius of the Home Depot Tacoma Property was 10,310, 134,331, and 259,870, respectively, while the estimated 2015 average household income within the same radii was $55,789, $64,896, and $64,135, respectively. As of September 1, 2015, the Home Depot Tacoma Property was 100.0% occupied by Home Depot.
THE INFORMATION IN THIS STRUCTURAL AND COLLATERAL TERM SHEET IS NOT COMPLETE AND MAY BE AMENDED PRIOR TO THE TIME OF SALE. THIS TERM SHEET IS NOT AN OFFER TO SELL THESE SECURITIES AND IT IS NOT A SOLICITATION OF AN OFFER TO BUY THESE SECURITIES IN ANY JURISDICTION WHERE THE OFFER OR SALE IS NOT PERMITTED.
| 124 |
| HOME DEPOT TACOMA |
Sources and Uses
| Sources | Uses | |||||||
| Original loan amount | $14,250,000 | 42.0% | Purchase price | $32,755,503 | 96.5% | |||
| Sponsor’s new cash contribution | $19,689,687 | 58.0 | Reserves | 1,073,214 | 3.2 | |||
| Closing costs | 110,970 | 00.3 % | ||||||
| Total Sources | $33,939,687 | 100.0% | Total Uses | $33,939,687 | 100.0% |
The following table presents certain information relating to the tenant at the Home Depot Tacoma Property:
Major Tenants
| Tenant Name | Credit Rating (Fitch/ Moody’s/ S&P) | Tenant NRSF | % of NRSF | Annual U/W Base Rent PSF | Annual U/W Base Rent | % of Total Annual U/W Base Rent | Sales PSF(1) | Occupancy Cost(1) | Lease Expiration Date |
| Major Tenant | |||||||||
| Home Depot | A/A2/A | 117,064 | 100.0% | $16.93 | $1,981,969 | 100.0% | NAV | NAV | 1/31/2026(2) |
| Total Major Tenant | 117,064 | 100.0% | $16.93 | $1,981,969 | 100.0% | ||||
| Vacant Space | 0 | 0.0% | |||||||
| Collateral Total | 117,064 | 100.0% | |||||||
| (1) | Home Depot is not required to report sales. |
| (2) | Home Depot has six, 5-year renewal options. |
The following table presents certain information relating to the lease rollover schedule at the Home Depot Tacoma Property:
Lease Expiration Schedule(1)
| Year Ending December 31, | No. of Leases Expiring | Expiring NRSF | % of Total NRSF | Cumulative Expiring NRSF | Cumulative % of Total NRSF | Annual U/W Base Rent | Annual U/W Base Rent PSF |
| MTM | 0 | 0 | 0.0% | 0 | 0.0% | $0 | $0.00 |
| 2015 | 0 | 0 | 0.0% | 0 | 0.0% | $0 | $0.00 |
| 2016 | 0 | 0 | 0.0% | 0 | 0.0% | $0 | $0.00 |
| 2017 | 0 | 0 | 0.0% | 0 | 0.0% | $0 | $0.00 |
| 2018 | 0 | 0 | 0.0% | 0 | 0.0% | $0 | $0.00 |
| 2019 | 0 | 0 | 0.0% | 0 | 0.0% | $0 | $0.00 |
| 2020 | 0 | 0 | 0.0% | 0 | 0.0% | $0 | $0.00 |
| 2021 | 0 | 0 | 0.0% | 0 | 0.0% | $0 | $0.00 |
| 2022 | 0 | 0 | 0.0% | 0 | 0.0% | $0 | $0.00 |
| 2023 | 0 | 0 | 0.0% | 0 | 0.0% | $0 | $0.00 |
| 2024 | 0 | 0 | 0.0% | 0 | 0.0% | $0 | $0.00 |
| 2025 | 0 | 0 | 0.0% | 0 | 0.0% | $0 | $0.00 |
| Thereafter | 1 | 117,064 | 100.0% | 117,064 | 100.0% | $1,981,969 | $16.93 |
| Vacant | 0 | 0 | 0.0% | 117,064 | 100.0% | $0 | $0.00 |
| Total/Weighted Average | 1 | 117,064 | 100.0% | $1,981,969 | $16.93 |
| (1) | Information obtained from the underwritten rent roll. |
The following table presents historical occupancy percentages at the Home Depot Tacoma Property:
Historical Occupancy
12/31/2012(1) | 12/31/2013(1) | 12/31/2014(1) | 9/1/2015(2) | |||
| 100.0% | 100.0% | 100.0% | 100.0% |
| (1) | Information obtained from the Home Depot lease. |
| (2) | Information obtained from the underwritten rent roll. |
THE INFORMATION IN THIS STRUCTURAL AND COLLATERAL TERM SHEET IS NOT COMPLETE AND MAY BE AMENDED PRIOR TO THE TIME OF SALE. THIS TERM SHEET IS NOT AN OFFER TO SELL THESE SECURITIES AND IT IS NOT A SOLICITATION OF AN OFFER TO BUY THESE SECURITIES IN ANY JURISDICTION WHERE THE OFFER OR SALE IS NOT PERMITTED.
| 125 |
| HOME DEPOT TACOMA |
Underwritten Net Cash Flow. The following table presents certain information relating to the underwritten net cash flow at the Home Depot Tacoma Property:
Cash Flow Analysis(1)
| U/W | % of Effective Gross Income | U/W $ per SF | |||||
| Base Rent | $1,981,969 | 91.8% | $16.93 | ||||
| Grossed Up Vacant Space | 0 | 0.0 | 0.00 | ||||
| Total Reimbursables | 275,882 | 12.8 | 2.36 | ||||
| Other Income | 0 | 0.0 | 0.00 | ||||
| Less Vacancy & Free Rent | (99,098)(2) | (4.6) | (0.85) | ||||
| Effective Gross Income | $2,158,752 | 100% | $18.44 | ||||
| Total Operating Expenses | $355,164 | 16.5% | $3.03 | ||||
| Net Operating Income | $1,803,588 | 83.5% | $15.41 | ||||
| TI/LC | 45,323 | 2.1 | 0.39 | ||||
| Capital Expenditures | 23,413 | 1.1 | 0.20 | ||||
| Net Cash Flow | $1,734,852 | 80.4% | $14.82 | ||||
| NOI DSCR | 2.15x | ||||||
| NCF DSCR | 2.07x | ||||||
| NOI DY | 12.7% | ||||||
| NCF DY | 12.2% | ||||||
| (1) | Historical financials are not available, as the borrower recently acquired the Home Depot Tacoma Property and historical information was not provided by the seller. |
| (2) | The underwritten economic vacancy is 5.0%. The Home Depot Tacoma Property was 100.0% physically occupied as of September 1, 2015. |
THE INFORMATION IN THIS STRUCTURAL AND COLLATERAL TERM SHEET IS NOT COMPLETE AND MAY BE AMENDED PRIOR TO THE TIME OF SALE. THIS TERM SHEET IS NOT AN OFFER TO SELL THESE SECURITIES AND IT IS NOT A SOLICITATION OF AN OFFER TO BUY THESE SECURITIES IN ANY JURISDICTION WHERE THE OFFER OR SALE IS NOT PERMITTED.
| 126 |
| Wells Fargo Commercial Mortgage Trust 2015-LC22 | Transaction Contact Information |
VI. Transaction Contact Information
Questions regarding this Structural and Collateral Term Sheet may be directed to any of the following individuals:
| Wells Fargo Securities, LLC | |
| Brigid Mattingly | Tel. (312) 269-3062 |
| Fax (312) 658-0140 | |
| A.J. Sfarra | Tel. (212) 214-5613 |
| Fax (212) 214-8970 | |
| Alex Wong | Tel. (212) 214-5615 |
| Fax (212) 214-8970 |
THE INFORMATION IN THIS STRUCTURAL AND COLLATERAL TERM SHEET IS NOT COMPLETE AND MAY BE AMENDED PRIOR TO THE TIME OF SALE. THIS TERM SHEET IS NOT AN OFFER TO SELL THESE SECURITIES AND IT IS NOT A SOLICITATION OF AN OFFER TO BUY THESE SECURITIES IN ANY JURISDICTION WHERE THE OFFER OR SALE IS NOT PERMITTED.
| 127 |