| FREE WRITING PROSPECTUS | ||
| FILED PURSUANT TO RULE 433 | ||
| REGISTRATION FILE NO.: 333-206677-06 | ||

Free Writing Prospectus
Structural and Collateral Term Sheet
$1,022,879,610
(Approximate Initial Pool Balance)
$883,512,000
(Approximate Aggregate Certificate Balance of Offered Certificates)
Wells Fargo Commercial Mortgage Trust 2016-C35
as Issuing Entity
Wells Fargo Commercial Mortgage Securities, Inc.
as Depositor
Rialto Mortgage Finance, LLC
Barclays Bank PLC
Wells Fargo Bank, National Association
UBS Real Estate Securities Inc.
C-III Commercial Mortgage LLC
National Cooperative Bank, N.A.
Basis Real Estate Capital II, LLC
as Sponsors and Mortgage Loan Sellers
Commercial Mortgage Pass-Through Certificates
Series 2016-C35
July 11, 2016
| WELLS FARGO SECURITIES | BARCLAYS | UBS SECURITIES LLC |
Co-Lead Manager and Joint Bookrunner
|
Co-Lead Manager and Joint Bookrunner
|
Co-Lead Manager and Joint Bookrunner
|
Academy Securities Co-Manager | Societe Generale Co-Manager |
STATEMENT REGARDING THIS FREE WRITING PROSPECTUS
The depositor has filed a registration statement (including a prospectus) with the Securities and Exchange Commission (‘‘SEC’’) (SEC File No. 333-206677) for the offering to which this communication relates. Before you invest, you should read the prospectus in the registration statement and other documents the depositor has filed with the SEC for more complete information about the depositor, the issuing entity and this offering. You may get these documents for free by visiting EDGAR on the SEC Web site at www.sec.gov. Alternatively, the depositor, any underwriter, or any dealer participating in the offering will arrange to send you the prospectus after filing if you request it by calling toll free 1-800-745-2063 (8 a.m. – 5 p.m. EST) or by emailing wfs.cmbs@wellsfargo.com.
Nothing in this document constitutes an offer of securities for sale in any jurisdiction where the offer or sale is not permitted. The information contained herein is preliminary as of the date hereof, supersedes any such information previously delivered to you and will be superseded by any such information subsequently delivered and ultimately by the final prospectus relating to the securities. These materials are subject to change, completion, supplement or amendment from time to time.
This free writing prospectus has been prepared by the underwriters for information purposes only and does not constitute, in whole or in part, a prospectus for the purposes of Directive 2003/71/EC (as amended) and/or Part VI of the Financial Services and Markets Act 2000, as amended, or other offering document.
STATEMENT REGARDING ASSUMPTIONS AS TO SECURITIES, PRICING ESTIMATES AND OTHER INFORMATION
The attached information contains certain tables and other statistical analyses (the “Computational Materials”) which have been prepared in reliance upon information furnished by the Mortgage Loan Sellers. Numerous assumptions were used in preparing the Computational Materials, which may or may not be reflected herein. As such, no assurance can be given as to the Computational Materials’ accuracy, appropriateness or completeness in any particular context; or as to whether the Computational Materials and/or the assumptions upon which they are based reflect present market conditions or future market performance. The Computational Materials should not be construed as either projections or predictions or as legal, tax, financial or accounting advice. You should consult your own counsel, accountant and other advisors as to the legal, tax, business, financial and related aspects of a purchase of these securities. Any weighted average lives, yields and principal payment periods shown in the Computational Materials are based on prepayment and/or loss assumptions, and changes in such prepayment and/or loss assumptions may dramatically affect such weighted average lives, yields and principal payment periods. In addition, it is possible that prepayments or losses on the underlying assets will occur at rates higher or lower than the rates shown in the attached Computational Materials. The specific characteristics of the securities may differ from those shown in the Computational Materials due to differences between the final underlying assets and the preliminary underlying assets used in preparing the Computational Materials. The principal amount and designation of any security described in the Computational Materials are subject to change prior to issuance. None of Wells Fargo Securities, LLC, Barclays Capital Inc., UBS Securities LLC, Academy Securities, Inc., SG Americas Securities, LLC or any of their respective affiliates, make any representation or warranty as to the actual rate or timing of payments or losses on any of the underlying assets or the payments or yield on the securities. The information in this presentation is based upon management forecasts and reflects prevailing conditions and management’s views as of this date, all of which are subject to change. In preparing this presentation, we have relied upon and assumed, without independent verification, the accuracy and completeness of all information available from public sources or which was provided to us by or on behalf of the Mortgage Loan Sellers or which was otherwise reviewed by us.
This free writing prospectus contains certain forward-looking statements. If and when included in this free writing prospectus, the words “expects”, “intends”, “anticipates”, “estimates” and analogous expressions and all statements that are not historical facts, including statements about our beliefs or expectations, are intended to identify forward-looking statements. Any forward-looking statements are made subject to risks and uncertainties which could cause actual results to differ materially from those stated. Those risks and uncertainties include, among other things, declines in general economic and business conditions, increased competition, changes in demographics, changes in political and social conditions, regulatory initiatives and changes in customer preferences, many of which are beyond our control and the control of any other person or entity related to this offering. The forward-looking statements made in this free writing prospectus are made as of the date stated on the cover. We have no obligation to update or revise any forward-looking statement.
Wells Fargo Securities is the trade name for the capital markets and investment banking services of Wells Fargo & Company and its subsidiaries, including but not limited to Wells Fargo Securities, LLC, a member of NYSE, FINRA, NFA and SIPC, Wells Fargo Prime Services, LLC, a member of FINRA, NFA and SIPC, and Wells Fargo Bank, N.A. Wells Fargo Securities, LLC and Wells Fargo Prime Services, LLC are distinct entities from affiliated banks and thrifts.
IMPORTANT NOTICE REGARDING THE OFFERED CERTIFICATES
The information herein is preliminary and may be supplemented or amended prior to the time of sale. Prospective investors should understand that, when considering the purchase of the Offered Certificates, a contract of sale will come into being no sooner than the date on which the relevant class of certificates has been priced and the investor has otherwise taken all actions the investor must take to become committed to purchase the Offered Certificates, and the investor has therefore entered into a contract of sale. Any “indications of interest” expressed by any prospective investor, and any “soft circles” generated by the underwriters, prior to the time of sale, will not create binding contractual obligations for such prospective investors, on the one hand, or the underwriters, the depositor or any of their respective agents or affiliates, on the other hand.
In addition, the Offered Certificates referred to in these materials and the asset pool backing them are subject to modification or revision (including the possibility that one or more classes of certificates may be split, combined or eliminated at any time prior to issuance or availability of a final prospectus) and are offered on a “when, as and if issued” basis. As a result of the foregoing, a prospective investor may commit to purchase certificates that have characteristics that may change, and each prospective investor is advised that all or a portion of the certificates referred to in these materials may be issued without all or certain of the characteristics described in these materials. The underwriters’ obligation to sell certificates to any prospective investor is conditioned on the certificates and the transaction having the characteristics described in these materials. If the underwriters determine that a condition is not satisfied in any material respect, such prospective investor will be notified, and neither the depositor nor the underwriters will have any obligation to such prospective investor to deliver any portion of the Offered Certificates which such prospective investor has committed to purchase, and there will be no liability between the underwriters, the depositor or any of their respective agents or affiliates, on the one hand, and such prospective investor, on the other hand, as a consequence of the non-delivery.
The underwriters described in these materials may from time to time perform investment banking services for, or solicit investment banking business from, any company named in these materials. The underwriters and/or their affiliates or respective employees may from time to time have a long or short position in any security or contract discussed in these materials.
The information contained herein supersedes any previous such information delivered to any prospective investor and will be superseded by information delivered to such prospective investor prior to the time of sale.
IMPORTANT NOTICE RELATING TO AUTOMATICALLY-GENERATED EMAIL DISCLAIMERS
Any legends, disclaimers or other notices that may appear at the bottom of any email communication to which this free writing prospectus is attached relating to (1) these materials not constituting an offer (or a solicitation of an offer), (2) any representation that these materials are accurate or complete and may not be updated or (3) these materials possibly being confidential, are not applicable to these materials and should be disregarded. Such legends, disclaimers or other notices have been automatically generated as a result of these materials having been sent via Bloomberg or another system.
THE INFORMATION IN THIS STRUCTURAL AND COLLATERAL TERM SHEET IS NOT COMPLETE AND MAY BE AMENDED PRIOR TO THE TIME OF SALE. THIS TERM SHEET IS NOT AN OFFER TO SELL THESE SECURITIES AND IT IS NOT A SOLICITATION OF AN OFFER TO BUY THESE SECURITIES IN ANY JURISDICTION WHERE THE OFFER OR SALE IS NOT PERMITTED.
| 2 |
| Wells Fargo Commercial Mortgage Trust 2016-C35 | Certificate Structure |
I. Certificate Structure
| Class | Expected Ratings (Fitch/KBRA/Moody’s)(1) | Approximate Initial Certificate Balance or Notional Amount(2) |
Approx. Initial | Pass-Through Rate Description | Weighted Average Life (Years)(4) | Expected Principal Window(4) | Certificate Principal to Value Ratio(5) | Certificate Principal U/W NOI Debt Yield(6) | |||||||
| Offered Certificates | |||||||||||||||
| A-1 | AAAsf/AAA(sf)/Aaa(sf) | $47,834,000 | 30.000% | (7) | 2.54 | 08/16 – 02/21 | 42.7% | 17.9% | |||||||
| A-2 | AAAsf/AAA(sf)/Aaa(sf) | $58,672,000 | 30.000% | (7) | 4.81 | 02/21 – 06/21 | 42.7% | 17.9% | |||||||
| A-3 | AAAsf/AAA(sf)/Aaa(sf) | $265,000,000 | 30.000% | (7) | 9.76 | 10/25 – 06/26 | 42.7% | 17.9% | |||||||
| A-4 | AAAsf/AAA(sf)/Aaa(sf) | $277,377,000 | 30.000% | (7) | 9.88 | 06/26 – 06/26 | 42.7% | 17.9% | |||||||
| A-SB | AAAsf/AAA(sf)/Aaa(sf) | $67,132,000 | 30.000% | (7) | 7.12 | 06/21 – 10/25 | 42.7% | 17.9% | |||||||
| A-S | AAAsf/AAA(sf)/Aa2(sf) | $69,045,000 | 23.250% | (7) | 9.90 | 06/26 – 07/26 | 46.8% | 16.3% | |||||||
| X-A | AAAsf/AAA(sf)/NR | $785,060,000(8) | N/A | Variable(9) | N/A | N/A | N/A | N/A | |||||||
| X-B | NR/AAA(sf)/NR | $98,452,000(10) | N/A | Variable(11) | N/A | N/A | N/A | N/A | |||||||
| B | AA-sf/AA-(sf)/NR | $49,865,000 | 18.375% | (7) | 9.96 | 07/26 – 07/26 | 49.8% | 15.3% | |||||||
| C | A-sf/A-(sf)/NR | $48,587,000 | 13.625% | (7) | 9.96 | 07/26 – 07/26 | 52.7% | 14.5% | |||||||
| Non-Offered Certificates | |||||||||||||||
| X-D | BBB-sf/BBB-(sf)/NR | $56,258,000(12) | N/A | Variable(13) | N/A | N/A | N/A | N/A | |||||||
| D | BBB-sf/BBB-(sf)/NR | $56,258,000 | 8.125% | (7) | 9.96 | 07/26 – 07/26 | 56.1% | 13.6% | |||||||
| E | BBsf/BB(sf)/NR | $21,736,000 | 6.000% | (7) | 9.96 | 07/26 – 07/26 | 57.4% | 13.3% | |||||||
| F | Bsf/B(sf)/NR | $11,508,000 | 4.875% | (7) | 9.96 | 07/26 – 07/26 | 58.1% | 13.2% | |||||||
| G | NR/NR/NR | $49,865,609 | 0.000% | (7) | 9.96 | 07/26 – 07/26 | 61.0% | 12.5% | |||||||
| Notes: | |||||||||||||||
| (1) | The expected ratings presented are those of Fitch Ratings, Inc. (“Fitch”), Kroll Bond Rating Agency, Inc. (“KBRA”) and Moody’s Investors Service, Inc. (“Moody’s”) which the depositor hired to rate the offered certificates. One or more other nationally recognized statistical rating organizations that were not hired by the depositor may use information they receive pursuant to Rule 17g-5 under the Securities Exchange Act of 1934, as amended (the “Exchange Act”) or otherwise, to rate or provide market reports and/or published commentary related to the offered certificates. We cannot assure you as to what ratings a non-hired nationally recognized statistical rating organization would assign or that its reports will not express differing, possibly negative, views of the mortgage loans and/or the offered certificates. The ratings of each class of offered certificates address the likelihood of the timely distribution of interest and, except in the case of the Class X-A, X-B and X-D certificates, the ultimate distribution of principal due on those classes on or before the Rated Final Distribution Date. See “Risk Factors—Other Risks Relating to the Certificates—Nationally Recognized Statistical Rating Organizations May Assign Different Ratings to the Certificates; Ratings of the Certificates Reflect Only the Views of the Applicable Rating Agencies as of the Dates Such Ratings Were Issued; Ratings May Affect ERISA Eligibility; Ratings May Be Downgraded” and “Ratings” in the Preliminary Prospectus, expected to be dated July 11, 2016 (the “Preliminary Prospectus”). Fitch, KBRA and Moody’s have informed us that the “sf” designation in their ratings represents an identifier for structured finance product ratings. | ||||||||||||||
| (2) | The certificate balances and notional amounts set forth in the table are approximate. The actual initial certificate balances and notional amounts may be larger or smaller depending on the initial pool balance of the mortgage loans definitively included in the pool of mortgage loans, which aggregate cut-off date balance may be as much as 5% larger or smaller than the amount presented in the Preliminary Prospectus. | ||||||||||||||
| (3) | The approximate initial credit support with respect to the Class A-1, A-2, A-3, A-4 and A-SB Certificates represents the approximate credit enhancement for the Class A-1, A-2, A-3, A-4 and A-SB Certificates in the aggregate. | ||||||||||||||
| (4) | Weighted Average Lives and Expected Principal Windows are calculated based on an assumed prepayment rate of 0% CPR and the “Structuring Assumptions” described under “Yield and Maturity Considerations—Weighted Average Life” in the Preliminary Prospectus. | ||||||||||||||
| (5) | The Certificate Principal to Value Ratio for each Class of Certificates (other than the Class A-1, A-2, A-3, A-4 and A-SB Certificates) is calculated as the product of (a) the weighted average Cut-off Date LTV Ratio for the mortgage loans and (b) a fraction, the numerator of which is the total initial Certificate Balance of such Class of Certificates and all Classes of Principal Balance Certificates senior to such Class of Certificates and the denominator of which is the total initial Certificate Balance of all of the Principal Balance Certificates. The Certificate Principal to Value Ratio for each of the Class A-1, A-2, A-3, A-4 and A-SB Certificates is calculated in the aggregate for those Classes as if they were a single Class and is calculated as the product of (a) the weighted average Cut-off Date LTV Ratio for the mortgage loans and (b) a fraction, the numerator of which is the total initial aggregate Certificate Balances of such Classes of Certificates and the denominator of which is the total initial Certificate Balance of all of the Principal Balance Certificates. In any event, however, excess mortgaged property value associated with a mortgage loan will not be available to offset losses on any other mortgage loan. | ||||||||||||||
| (6) | The Certificate Principal U/W NOI Debt Yield for each Class of Certificates (other than the Class A-1, A-2, A-3, A-4 and A-SB Certificates) is calculated as the product of (a) the weighted average U/W NOI Debt Yield for the mortgage loans and (b) a fraction, the numerator of which is the total initial Certificate Balance of all of the Classes of Principal Balance Certificates and the denominator of which is the total initial Certificate Balance for such Class of Certificates and all Classes of Principal Balance Certificates senior to such Class of Certificates. The Certificate Principal U/W NOI Debt Yield for each of the Class A-1, A-2, A-3, A-4 and A-SB Certificates is calculated in the aggregate for those Classes as if they were a single Class and is calculated as the product of (a) the weighted average U/W NOI Debt Yield for the mortgage loans and (b) a fraction, the numerator of which is the total initial Certificate Balance of all of the Classes of Principal Balance Certificates and the denominator of which is the total aggregate initial Certificate Balances for the Class A-1, A-2, A-3, A-4 and A-SB Certificates. In any event, however, cash flow from each mortgaged property supports only the related mortgage loan and will not be available to support any other mortgage loan. | ||||||||||||||
| (7) | The pass-through rates for the Class A-1, A-2, A-3, A-4, A-SB, A-S, B, C, D, E, F and G Certificates in each case will be one of the following: (i) a fixed rateper annum, (ii) a variable rate per annum equal to the weighted average of the net mortgage interest rates on the mortgage loans for the related distribution date, (iii) a variable rateper annumequal to the lesser of (a) a fixed rate and (b) the weighted average of the net mortgage interest rates on the mortgage loans for the related distribution date or (iv) a variable rateper annum equal to the weighted average of the net mortgage interest rates on the mortgage loans for the related distribution date minus a specified percentage. For purposes of the calculation of the weighted average of the net mortgage interest rates on the mortgage loans for each distribution date, the mortgage interest rates will be adjusted as necessary to a 30/360 basis. | ||||||||||||||
| (8) | The Class X-A Certificates are notional amount certificates. The Notional Amount of the Class X-A Certificates will be equal to the aggregate Certificate Balance of the Class A-1, A-2, A-3, A-4, A-SB and A-S Certificates outstanding from time to time. The Class X-A Certificates will not be entitled to distributions of principal. | ||||||||||||||
THE INFORMATION IN THIS STRUCTURAL AND COLLATERAL TERM SHEET IS NOT COMPLETE AND MAY BE AMENDED PRIOR TO THE TIME OF SALE. THIS TERM SHEET IS NOT AN OFFER TO SELL THESE SECURITIES AND IT IS NOT A SOLICITATION OF AN OFFER TO BUY THESE SECURITIES IN ANY JURISDICTION WHERE THE OFFER OR SALE IS NOT PERMITTED.
| 3 |
| Wells Fargo Commercial Mortgage Trust 2016-C35 | Certificate Structure |
| (9) | The pass-through rate for the Class X-A Certificates for any distribution date will be aper annum rate equal to the excess, if any, of (a) the weighted average of the net mortgage interest rates on the mortgage loans for the related distribution date, over (b) the weighted average of the pass-through rates on the Class A-1, A-2, A-3, A-4, A-SB and A-S Certificates for the related distribution date, weighted on the basis of their respective Certificate Balances outstanding immediately prior to that distribution date. For purposes of the calculation of the weighted average of the net mortgage interest rates on the mortgage loans for each distribution date, the mortgage interest rates will be adjusted as necessary to a 30/360 basis. |
| (10) | The Class X-B Certificates are notional amount certificates. The Notional Amount of the Class X-B Certificates will be equal to the aggregate Certificate Balance of the Class B and C Certificates outstanding from time to time. The Class X-B Certificates will not be entitled to distributions of principal. |
| (11) | The pass-through rate for the Class X-B Certificates for any distribution date will be aper annum rate equal to the excess, if any, of (a) the weighted average of the net mortgage interest rates on the mortgage loans for the related distribution date, over (b) the weighted average of the pass-through rates on the Class B and Class C Certificates for the related distribution date, weighted on the basis of their respective aggregate Certificate Balances outstanding immediately prior to that distribution date. For purposes of the calculation of the weighted average of the net mortgage interest rates on the mortgage loans for each distribution date, the mortgage interest rates will be adjusted as necessary to a 30/360 basis. |
| (12) | The Class X-D Certificates are notional amount certificates. The Notional Amount of the Class X-D Certificates will be equal to the Certificate Balance of the Class D Certificates outstanding from time to time. The Class X-D Certificates will not be entitled to distributions of principal. |
| (13) | The pass-through rate for the Class X-D Certificates for any distribution date will be a per annum rate equal to the excess, if any, of (a) the weighted average of the net mortgage interest rates on the mortgage loans for the related distribution date, over (b) the pass-through rate on the Class D Certificates for the related distribution date. For purposes of the calculation of the weighted average of the net mortgage interest rates on the mortgage loans for each distribution date, the mortgage interest rates will be adjusted as necessary to a 30/360 basis. |
THE INFORMATION IN THIS STRUCTURAL AND COLLATERAL TERM SHEET IS NOT COMPLETE AND MAY BE AMENDED PRIOR TO THE TIME OF SALE. THIS TERM SHEET IS NOT AN OFFER TO SELL THESE SECURITIES AND IT IS NOT A SOLICITATION OF AN OFFER TO BUY THESE SECURITIES IN ANY JURISDICTION WHERE THE OFFER OR SALE IS NOT PERMITTED.
| 4 |
| Wells Fargo Commercial Mortgage Trust 2016-C35 | Transaction Highlights |
II. Transaction Highlights
Mortgage Loan Sellers:
Mortgage Loan Seller | Number of | Number of | Aggregate Cut-off | % of Initial | ||||
| Rialto Mortgage Finance, LLC | 23 | 26 | $360,697,241 | 35.3% | ||||
| Barclays Bank PLC | 15 | 34 | 225,917,698 | 22.1 | ||||
| Wells Fargo Bank, National Association | 22 | 23 | 160,699,617 | 15.7 | ||||
| UBS Real Estate Securities Inc. | 13 | 20 | 134,776,231 | 13.2 | ||||
| C-III Commercial Mortgage LLC | 14 | 22 | 58,646,837 | 5.7 | ||||
| National Cooperative Bank, N.A. | 11 | 11 | 57,777,140 | 5.6 | ||||
| Basis Real Estate Capital II, LLC | 4 | 4 | 24,364,845 | 2.4 | ||||
Total | 102 | 140 | $1,022,879,610 | 100.0% |
Loan Pool:
| Initial Pool Balance: | $1,022,879,610 |
| Number of Mortgage Loans: | 102 |
| Average Cut-off Date Balance per Mortgage Loan: | $10,028,231 |
| Number of Mortgaged Properties: | 140 |
| Average Cut-off Date Balance per Mortgaged Property(1): | $7,306,283 |
| Weighted Average Mortgage Interest Rate: | 4.765% |
| Ten Largest Mortgage Loans as % of Initial Pool Balance: | 40.4% |
| Weighted Average Original Term to Maturity (months): | 117 |
| Weighted Average Remaining Term to Maturity (months): | 116 |
| Weighted Average Original Amortization Term (months)(2): | 351 |
| Weighted Average Remaining Amortization Term (months)(2): | 350 |
| Weighted Average Seasoning (months): | 1 |
| (1) | Information regarding mortgage loans secured by multiple properties is based on an allocation according to relative appraised values or the allocated loan amounts or property-specific release prices set forth in the related loan documents or such other allocation as the related mortgage loan seller deemed appropriate. |
| (2) | Excludes any mortgage loan that does not amortize. |
Credit Statistics:
| Weighted Average U/W Net Cash Flow DSCR(1): | 2.02x |
| Weighted Average U/W Net Operating Income Debt Yield(1): | 12.5% |
| Weighted Average Cut-off Date Loan-to-Value Ratio(1): | 61.0% |
| Weighted Average Balloon Loan-to-Value Ratio(1): | 52.9% |
| % of Mortgage Loans with Additional Subordinate Debt(2): | 8.0% |
| % of Mortgage Loans with Single Tenants(3): | 9.9% |
| (1) | With respect to any mortgage loan that is part of a whole loan, loan-to-value ratio, debt service coverage ratio and debt yield calculations include the relatedpari passucompanion loan(s) but exclude any related subordinate companion loan(s) (unless otherwise stated). For mortgaged properties securing residential cooperative mortgage loans, the debt service coverage ratio or debt yield for each such mortgaged property is calculated using underwritten net cash flow for the related residential cooperative property which is the projected net cash flow reflected in the most recent appraisal obtained by or otherwise in the possession of the related mortgage loan seller as of the cut-off date, and the loan-to-value ratio, excluding the University Towers Owners Corp. mortgage loan, is calculated based upon the appraised value of the residential cooperative property determined as if such residential cooperative property is operated as a residential cooperative. The loan-to-value ratio for the University Towers Owners Corp. mortgage loan is calculated based on the appraised value of the residential cooperative property determined as if such residential cooperative property is operated as a market rate multifamily rental property. The debt service coverage ratio, debt yield and loan-to-value ratio information do not take into account any subordinate debt (whether or not secured by the related mortgaged property), that currently exists or is allowed under the terms of any mortgage loan. See “Description of the Mortgage Pool—Mortgage Pool Characteristics” in the Preliminary Prospectus and Annex A-1 to the Preliminary Prospectus. |
| (2) | Seven (7) of the mortgage loans, each of which is secured by a residential cooperative property, currently have in place subordinate secured lines of credit to the related mortgage borrowers that permit future advances (such loans, collectively, the “Subordinate Coop LOCs”) and/or subordinate mortgages to the related mortgage borrowers, the proceeds of which have been fully advanced. The percentage figure expressed as “% of Mortgage Loans with Additional Subordinate Debt” is determined as a percentage of the initial pool balance and does not take into account any future subordinate debt (whether or not secured by the mortgaged property), if any, that may be permitted under the terms of any mortgage loan or the pooling and servicing agreement. See “Description of the Mortgage Pool—Additional Indebtedness—Other Unsecured Indebtedness” and “Description of the Mortgage Pool—Additional Debt Financing for Mortgage Loans Secured by Residential Cooperatives”. |
| (3) | Excludes mortgage loans that are secured by multiple single tenant properties. |
THE INFORMATION IN THIS STRUCTURAL AND COLLATERAL TERM SHEET IS NOT COMPLETE AND MAY BE AMENDED PRIOR TO THE TIME OF SALE. THIS TERM SHEET IS NOT AN OFFER TO SELL THESE SECURITIES AND IT IS NOT A SOLICITATION OF AN OFFER TO BUY THESE SECURITIES IN ANY JURISDICTION WHERE THE OFFER OR SALE IS NOT PERMITTED.
| 5 |
| Wells Fargo Commercial Mortgage Trust 2016-C35 | Transaction Highlights |
Loan Structural Features:
Amortization:Based on the Initial Pool Balance, 81.5% of the mortgage pool (94 mortgage loans) has scheduled amortization, as follows:
46.4% (62 mortgage loans) requires amortization during the entire loan term; and
35.0% (32 mortgage loans) provides for an interest-only period followed by an amortization period.
Interest-Only:Based on the Initial Pool Balance, 18.5% of the mortgage pool (8 mortgage loans) provides for interest-only payments during the entire loan term. The Weighted Average Cut-off Date Loan-to-Value Ratio and Weighted Average U/W Net Cash Flow DSCR for those mortgage loans are 50.4% and 2.69x, respectively.
Hard Lockboxes: Based on the Initial Pool Balance, 38.6% of the mortgage pool (24 mortgage loans) have hard lockboxes in place.
Reserves:The mortgage loans require amounts to be escrowed monthly as follows (excluding any mortgage loans with springing provisions):
| Real Estate Taxes: | 75.2% of the pool |
| Insurance: | 42.4% of the pool |
| Capital Replacements: | 71.5% of the pool |
| TI/LC: | 52.0% of the pool(1) |
| (1) | The percentage of Initial Pool Balance for mortgage loans with TI/LC reserves is based on the aggregate principal balance allocable to loans that include retail, office, mixed use and industrial properties. |
Call Protection/Defeasance: Based on the Initial Pool Balance, the mortgage pool has the following call protection and defeasance features:
76.8% of the mortgage pool (79 mortgage loans) features a lockout period, then defeasance only until an open period;
16.7% of the mortgage pool (11 mortgage loans) features a lockout period, then the greater of a prepayment premium or yield maintenance until an open period;
5.6% of the mortgage pool (11 mortgage loans) features no lockout period, but requires the greater of a prepayment premium or yield maintenance, then a prepayment premium until an open period; and
0.9% of the mortgage pool (1 mortgage loan) features no lockout period, but requires the greater of a prepayment premium or yield maintenance until an open period.
Please refer to Annex A-1 to the Preliminary Prospectus for further information regarding individual loan call protection.
THE INFORMATION IN THIS STRUCTURAL AND COLLATERAL TERM SHEET IS NOT COMPLETE AND MAY BE AMENDED PRIOR TO THE TIME OF SALE. THIS TERM SHEET IS NOT AN OFFER TO SELL THESE SECURITIES AND IT IS NOT A SOLICITATION OF AN OFFER TO BUY THESE SECURITIES IN ANY JURISDICTION WHERE THE OFFER OR SALE IS NOT PERMITTED.
| 6 |
| Wells Fargo Commercial Mortgage Trust 2016-C35 | Issue Characteristics |
| III. | Issue Characteristics |
| Securities Offered: | $883,512,000 approximate monthly pay, multi-class, commercial mortgage REMIC pass-through certificates consisting of ten classes (Classes A-1, A-2, A-3, A-4, A-SB, A-S, B, C, X-A and X-B), which are offered pursuant to a registration statement filed with the SEC (such classes of certificates, the “Offered Certificates”). | |
| Mortgage Loan Sellers: | Rialto Mortgage Finance, LLC (“RMF”), Barclays Bank PLC (“Barclays”), Wells Fargo Bank, National Association (“WFB”), UBS Real Estate Securities Inc. (“UBSRES”), C-III Commercial Mortgage LLC (“CIIICM”), National Cooperative Bank, N.A. (“NCB”) and Basis Real Estate Capital II, LLC (“Basis”). | |
| Joint Bookrunners and Co-Lead Managers: | Wells Fargo Securities, LLC, Barclays Capital Inc. and UBS Securities LLC | |
| Co-Managers: | Academy Securities Inc. and SG Americas Securities, LLC | |
| Rating Agencies: | Fitch Ratings, Inc., Kroll Bond Rating Agency, Inc. and Moody’s Investors Service, Inc. | |
| Master Servicers: | Wells Fargo Bank, National Association and National Cooperative Bank, N.A. | |
| Special Servicers: | CWCapital Asset Management LLC and National Cooperative Bank, N.A. | |
| Certificate Administrator: | Wells Fargo Bank, National Association | |
| Trustee: | Wilmington Trust, National Association | |
| Operating Advisor: | Pentalpha Surveillance LLC | |
| Asset Representations Reviewer: | Pentalpha Surveillance LLC | |
| Initial Majority Controlling Class Certificateholder: | BIG Real Estate Fund I, L.P. | |
| Cut-off Date: | The Cut-off Date with respect to each mortgage loan is the due date for the monthly debt service payment that is due in July 2016 (or, in the case of any mortgage loan that has its first due date in August 2016, the date that would have been its due date in July 2016 under the terms of that mortgage loan if a monthly debt service payment were scheduled to be due in that month). | |
| Expected Closing Date: | On or about July 28, 2016. | |
| Determination Dates: | The 11th day of each month (or if that day is not a business day, the next succeeding business day), commencing in August 2016. | |
| Distribution Dates: | The fourth business day following the Determination Date in each month, commencing in August 2016. | |
| Rated Final Distribution Date: | The Distribution Date in July 2048. | |
| Interest Accrual Period: | With respect to any Distribution Date, the calendar month immediately preceding the month in which such Distribution Date occurs. | |
| Day Count: | The Offered Certificates will accrue interest on a 30/360 basis. | |
| Minimum Denominations: | $10,000 for each Class of Offered Certificates (other than the Class X-A and X-B Certificates) and $1,000,000 for the Class X-A and X-B Certificates. Investments may also be made in any whole dollar denomination in excess of the applicable minimum denomination. | |
| Clean-up Call: | 1% | |
| Delivery: | DTC, Euroclear and Clearstream Banking | |
| ERISA/SMMEA Status: | Each Class of Offered Certificates is expected to be eligible for exemptive relief under ERISA. No Class of Offered Certificates will be SMMEA eligible. | |
| Risk Factors: | THE CERTIFICATES INVOLVE CERTAIN RISKS AND MAY NOT BE SUITABLE FOR ALL INVESTORS. SEE THE “RISK FACTORS” SECTION OF THE PRELIMINARY PROSPECTUS. | |
| Bond Analytics Information: | The Certificate Administrator will be authorized to make distribution date statements, CREFC® reports and certain supplemental reports (other than confidential information) available to certain financial modeling and data provision services, including Bloomberg, L.P., Trepp, LLC, Intex Solutions, Inc., Markit Group Limited, Interactive Data Corp., BlackRock Financial Management, Inc., CMBS.com, Inc. and Thomson Reuters Corporation. |
THE INFORMATION IN THIS STRUCTURAL AND COLLATERAL TERM SHEET IS NOT COMPLETE AND MAY BE AMENDED PRIOR TO THE TIME OF SALE. THIS TERM SHEET IS NOT AN OFFER TO SELL THESE SECURITIES AND IT IS NOT A SOLICITATION OF AN OFFER TO BUY THESE SECURITIES IN ANY JURISDICTION WHERE THE OFFER OR SALE IS NOT PERMITTED.
| 7 |
| Wells Fargo Commercial Mortgage Trust 2016-C35 | Characteristics of the Mortgage Pool |
IV. Characteristics of the Mortgage Pool(1)
A. Ten Largest Mortgage Loans
| Mortgage Loan Seller | Mortgage Loan Name | City | State | Number of Mortgage Loans / Mortgaged Properties | Mortgage Loan Cut-off Date Balance ($) | % of Initial Pool Balance (%) | Property Type | Number of SF/Rooms/ Units | Cut-off Date Balance Per SF/Room/ Unit | Cut-off Date LTV Ratio (%) | Balloon LTV Ratio (%) | U/W NCF DSCR (x) | U/W NOI Debt Yield (%) |
| RMF | Epps Bridge Centre | Athens | GA | 1 / 1 | $64,500,000 | 6.3% | Retail | 336,554 | $192 | 66.8% | 66.8% | 1.66x | 8.2% |
| Barclays | The Mall at Rockingham Park | Salem | NH | 1 / 1 | 60,000,000 | 5.9 | Retail | 540,867 | 263 | 28.8 | 28.8 | 4.14 | 17.4 |
| RMF | Kroger (Roundy’s) Distribution Center | Oconomowoc | WI | 1 / 1 | 59,500,000 | 5.8 | Industrial | 1,093,756 | 70 | 69.5 | 61.3 | 1.44 | 9.0 |
| RMF | Marriott Indianapolis North | Indianapolis | IN | 1 / 1 | 53,838,334 | 5.3 | Hospitality | 315 | 170,915 | 58.8 | 44.8 | 1.55 | 12.7 |
| Barclays | Mall at Turtle Creek | Jonesboro | AR | 1 / 1 | 41,947,448 | 4.1 | Retail | 329,398 | 218 | 55.2 | 45.1 | 1.57 | 10.6 |
| UBSRES | In-Rel 8 | Various | Various | 1 / 8 | 32,460,442 | 3.2 | Various | 1,478,687 | 62 | 69.5 | 64.1 | 1.68 | 12.2 |
| WFB | River Park Shopping Center | Napa | CA | 1 / 1 | 25,750,000 | 2.5 | Retail | 108,639 | 237 | 64.4 | 57.4 | 1.37 | 8.7 |
| NCB | University Towers Owners Corp. | New Haven | CT | 1 / 1 | 25,600,000 | 2.5 | Multifamily | 238 | 107,563 | 44.3 | 36.8 | 2.32 | 14.1 |
| UBSRES | DoubleTree Overland Park | Overland Park | KS | 1 / 1 | 25,000,000 | 2.4 | Hospitality | 356 | 70,225 | 62.5 | 46.3 | 1.66 | 13.6 |
| Barclays | ExchangeRight Net Leased Portfolio 12 | Various | Various | 1 / 19 | 24,850,000 | 2.4 | Various | 243,830 | 102 | 52.8 | 52.8 | 2.28 | 11.3 |
| Top Three Total/Weighted Average | 3 / 3 | $184,000,000 | 18.0% | 55.3% | 52.6% | 2.40x | 11.5% | ||||||
| Top Five Total/Weighted Average | 5 / 5 | $279,785,782 | 27.4% | 55.9% | 50.0% | 2.11x | 11.6% | ||||||
| Top Ten Total/Weighted Average | 10 / 35 | $413,446,223 | 40.4% | 57.0% | 50.7% | 2.03x | 11.7% | ||||||
| Non-Top Ten Total/Weighted Average | 92 / 105 | $609,433,386 | 59.6% | 63.7% | 54.3% | 2.01x | 13.1% | ||||||
| (1) | With respect to any mortgage loan that is part of a whole loan, Cut-off Date Balance Per SF/Room/Unit, loan-to-value ratio, debt service coverage ratio and debt yield calculations include the relatedpari passu companion loan(s) but exclude any related subordinate companion loan(s) (unless otherwise stated). With respect to each mortgage loan, debt service coverage ratio, debt yield and loan-to-value ratio information do not take into account of subordinate debt (whether or not secured by the related mortgaged property), if any, that currently exists or is allowed under the terms of such mortgage loan. |
THE INFORMATION IN THIS STRUCTURAL AND COLLATERAL TERM SHEET IS NOT COMPLETE AND MAY BE AMENDED PRIOR TO THE TIME OF SALE. THIS TERM SHEET IS NOT AN OFFER TO SELL THESE SECURITIES AND IT IS NOT A SOLICITATION OF AN OFFER TO BUY THESE SECURITIES IN ANY JURISDICTION WHERE THE OFFER OR SALE IS NOT PERMITTED.
| 8 |
| Wells Fargo Commercial Mortgage Trust 2016-C35 | Characteristics of the Mortgage Pool |
B. Summary of thePari PassuWhole Loans
| Property Name | Mortgage Loan Seller | Note(s) | Related Notes in Loan Group (Original Balance) | Holder of Note | Lead Servicer for | Current Master Servicer Under Related Securitization Servicing Agreement | Current Special Servicer Under Related Securitization Servicing Agreement |
| The Mall at Rockingham Park | Barclays / Société Générale | A-1-A, A-2-A, B-1, B-2 | $162,000,000 | BBSG 2016-MRP | Yes | Wells Fargo Bank, National Association | Torchlight Loan Services LLC. |
| Barclays | A-1-B | $60,000,000 | WFCM 2016-C35 | No | Wells Fargo Bank, National Association | CWCapital Asset Management LLC | |
| Société Générale | A-2-B | $40,000,000 | (1) | No | TBD | TBD | |
| Kroger (Roundy’s) Distribution Center | RMF | A-1 | $59,500,000 | WFCM 2016-C35 | Yes | Wells Fargo Bank, National Association | CWCapital Asset Management LLC |
| RMF | A-2 | $17,000,000 | (2) | No | TBD | TBD | |
| Mall at Turtle Creek | Barclays | A-1 | $42,000,000 | WFCM 2016-C35 | Yes | Wells Fargo Bank, National Association | CWCapital Asset Management LLC |
| Barclays | A-2 | $29,860,000 | (3) | No | TBD | TBD | |
| In-Rel 8 | UBSRES | A-1 | $60,000,000 | BACM 2016-UBS10 | Yes | Wells Fargo Bank, National Association | Rialto Capital Advisors, LLC |
| UBSRES | A-2, A-3 | $32,500,000 | WFCM 2016-C35 | No | Wells Fargo Bank, National Association | CWCapital Asset Management LLC | |
| Pinnacle II | WFB | A-1 | $40,000,000 | (4) | Yes(5) | TBD | TBD |
| WFB | A-2 | $20,000,000 | WFCM 2016-C35 | No(5) | Wells Fargo Bank, National Association | CWCapital Asset Management LLC | |
| WFB | A-3 | $27,000,000 | (4) | No(5) | TBD | TBD |
| (1) | The relatedpari passu companion loan Note A-2-B is currently held by an affiliate of Société Générale and is expected to be contributed to the SGCMS 2016-C5 Trust. No assurance can be provided that the Note A-2-B will not be split further. |
| (2) | The relatedpari passu companion loan Note A-2 is currently held by an affiliate of RMF and is expected to be contributed to a future securitization. No assurance can be provided that the Note A-2 will not be split further. |
| (3) | The relatedpari passu companion loan Note A-2 is currently held by an affiliate of Barclays and is expected to be contributed to a future securitization. No assurance can be provided that the Note A-2 will not be split further. |
| (4) | The related controllingpari passu companion loan (Note A-1) and non-controllingpari passu companion loan (Note A-3) are each currently held by WFB and are expected to be contributed to one or more future securitizations. No assurance can be provided that Note A-1 or Note A-3 will not be split further. |
| (5) | The Pinnacle II whole loan is initially expected to be serviced under the WFCM 2016-C35 pooling and servicing agreement until the securitization of the related controllingpari passucompanion loan (Note A-1) (the “Servicing Shift Securitization Date”), after which the Pinnacle II whole loan will be serviced under the pooling and servicing agreement related to the securitization of the related controllingpari passu companion loan (Note A-1) (the “Servicing Shift PSA”). The master servicer and special servicer under the Servicing Shift PSA will be identified in a notice, report or statement to holders of the WFCM 2016-C35 certificates after the securitization of the related controllingpari passu companion loan. |
C. Mortgage Loans with Additional Secured and Mezzanine Financing(1)
| Loan No. | Mortgage Loan Seller | Mortgage Loan Name | Mortgage Loan Cut-off Date Balance ($) | % of Initial Pool Balance (%) | Subordinate Debt Cut-off Date Balance ($) | Mezzanine Debt Cut-off Date Balance ($) | Total Debt Interest Rate (%)(2) | Mortgage Loan U/W NCF DSCR (x)(3) | Total Debt U/W NCF DSCR (x) | Mortgage Loan Cut-off Date U/W NOI Debt Yield (%)(3) | Total Debt Cut-off Date U/W NOI Debt Yield (%) | Mortgage Loan Cut-off Date LTV Ratio (%)(3) | Total Debt Cut-off Date LTV Ratio (%) |
| 2 | Barclays | The Mall at Rockingham Park | $60,000,000 | 5.9% | $119,500,000 | NAP | 4.040% | 4.14x | 2.25x | 17.4% | 9.5% | 28.8% | 53.0% |
| Total/Weighted Average | $60,000,000 | 5.9% | $119,500,000 | NAP | 4.040% | 4.14x | 2.25x | 17.4% | 9.5% | 28.8% | 53.0% | ||
| (1) | In addition, seven (7) of the mortgage loans, each of which is secured by a residential cooperative property, currently have in place Subordinate Coop LOCs, that permit future advances, and/or subordinate mortgages to the related mortgage borrowers, the proceeds of which have been fully advanced. See “Description of the Mortgage Pool—Additional Indebtedness—Other Unsecured Indebtedness” and “Description of the Mortgage Pool—Additional Debt Financing for Mortgage Loans Secured by Residential Cooperatives” in the Preliminary Prospectus. |
| (2) | Total Debt Interest Rate for any specified mortgage loan reflects the weighted average of the interest rates on the respective components of the total debt. |
| (3) | With respect to The Mall at Rockingham Park mortgage loan, which is part of a whole loan, the loan-to-value ratio, debt service coverage ratio and debt yield calculations include the related pari passu companion loan(s). |
THE INFORMATION IN THIS STRUCTURAL AND COLLATERAL TERM SHEET IS NOT COMPLETE AND MAY BE AMENDED PRIOR TO THE TIME OF SALE. THIS TERM SHEET IS NOT AN OFFER TO SELL THESE SECURITIES AND IT IS NOT A SOLICITATION OF AN OFFER TO BUY THESE SECURITIES IN ANY JURISDICTION WHERE THE OFFER OR SALE IS NOT PERMITTED.
| 9 |
| Wells Fargo Commercial Mortgage Trust 2016-C35 | Characteristics of the Mortgage Pool |
D. Previous Securitization History(1)
| Loan No. | Mortgage Loan Seller | Mortgage Loan or Mortgaged Property Name | City | State | Property Type | Mortgage Loan or Mortgaged Property Cut-off Date Balance ($) | % of Initial Pool Balance (%) | Previous Securitization |
| 2 | Barclays | The Mall at Rockingham Park | Salem | NH | Retail | $60,000,000 | 5.9% | WBCMT 2007-C31 |
| 3 | RMF | Kroger (Roundy’s) Distribution Center | Oconomowoc | WI | Industrial | 59,500,000 | 5.8 | JPMCC 2005-LDP4 |
| 4 | RMF | Marriott Indianapolis North | Indianapolis | IN | Hospitality | 53,838,334 | 5.3 | COMM 2006-C7 |
| 5 | Barclays | Mall at Turtle Creek | Jonesboro | AR | Retail | 41,947,448 | 4.1 | GCCFC 2006-GG7 |
| 6.02 | UBSRES | Chase Tower | Lexington | KY | Office | 7,158,843 | 0.7 | MLMT 2005-MKB2 |
| 10.01 | Barclays | Kroger - Hamilton | Hamilton | OH | Retail | 5,100,000 | 0.5 | MLMT 2007-C1 |
| 12 | WFB | San Fernando Value Square | Sylmar | CA | Retail | 23,600,000 | 2.3 | WBCMT 2006-C28 |
| 14 | WFB | Pinnacle II | Burbank | CA | Office | 20,000,000 | 2.0 | GSMS 2006-GG8 |
| 19 | Basis | North Park Shopping Center | Austin | TX | Retail | 13,875,000 | 1.4 | BSCMS 2006-PW13 |
| 24 | UBSRES | Shellmound Office Building | Emeryville | CA | Office | 12,343,286 | 1.2 | JPMCC 2006-LDP7 |
| 26.02 | CIIICM | Belter Shopping Center | Greensburg | IN | Retail | 2,170,000 | 0.2 | JPMCC 2004-C1 |
| 27 | WFB | So Cal Self Storage - Pasadena, CA | Pasadena | CA | Self Storage | 11,500,000 | 1.1 | GSMS 2006-GG8 |
| 36 | Barclays | Arrowhead Creekside Medical Office | Glendale | AZ | Office | 8,200,000 | 0.8 | GSMS 2007-GG10 |
| 40 | RMF | Hilton Garden Inn W. I65 Airport Blvd. | Mobile | AL | Hospitality | 7,475,805 | 0.7 | WFRBS 2011-C4 |
| 41 | WFB | East Street Trading Center | Frederick | MD | Industrial | 7,421,231 | 0.7 | MSC 2006-HQ10 |
| 42 | RMF | Solon Place Apartments | Waxahachie | TX | Multifamily | 7,320,000 | 0.7 | BACM 2006-2 |
| 46 | WFB | Captive Plastics Warehouse | Bettendorf | IA | Industrial | 6,049,208 | 0.6 | COMM 2006-C7 |
| 48 | UBSRES | Taylor Park Townhomes | Taylor | MI | Multifamily | 5,992,270 | 0.6 | BSCMS 2006-PW13 |
| 50 | Barclays | Rangeline Self-Storage | Theodore | AL | Self Storage | 5,725,396 | 0.6 | JPMCC 2006-LDP7 |
| 52 | WFB | Courtyard Orlando East - UCF | Orlando | FL | Hospitality | 5,586,623 | 0.5 | BSCMS 2006-PW12 |
| 53 | NCB | Fairfield Views Inc. a/k/a Fairfield Views, Inc. | Bronx | NY | Multifamily | 5,491,405 | 0.5 | CSMC 2006-C4 |
| 58 | Barclays | Kenny Centre | Columbus | OH | Retail | 5,000,000 | 0.5 | MSDWC 2001-TOP3 |
| 62 | RMF | Bienville Towers Apartments | Baton Rouge | LA | Multifamily | 4,900,000 | 0.5 | MSC 2006-HQ9 |
| 64 | RMF | Lake Mead Gateway Plaza | Henderson | NV | Retail | 4,800,000 | 0.5 | MSC 2006-IQ11 |
| 65 | UBSRES | Quality Inn Olympic National Park | Sequim | WA | Hospitality | 4,600,000 | 0.4 | MLMT 2007-C1 |
| 69 | WFB | Rimrock Plaza | Billings | MT | Retail | 3,664,000 | 0.4 | CD 2006-CD3 |
| 70 | UBSRES | Park Hill Apartments | Wayne | MI | Multifamily | 3,495,347 | 0.3 | BSCMS 2006-PW13 |
| 72 | WFB | South Pointe Crossing | Terre Haute | IN | Retail | 3,288,804 | 0.3 | BSCMS 2006-PW12 |
| 80 | WFB | Canyon Springs Retail Building | Riverside | CA | Retail | 2,244,949 | 0.2 | MSC 2006-T23 |
| 84 | WFB | Brighton Manor Apartments | Clute | TX | Multifamily | 2,000,451 | 0.2 | CSMC 2007-C3 |
| 88 | WFB | 168 Marco Way | South San Francisco | CA | Mixed Use | 1,895,358 | 0.2 | MSC 2006-T23 |
| 90 | WFB | Mission Plaza | Mission | TX | Retail | 1,735,000 | 0.2 | BSCMS 2006-PW12 |
| 91 | CIIICM | Kimberly Pines MHP | Decatur | AL | MHC | 1,696,857 | 0.2 | LASL 2006-MF4 |
| 92 | NCB | Ipswich House, Inc. | Great Neck | NY | Multifamily | 1,692,583 | 0.2 | CSMC 2006-C4 |
| 93 | CIIICM | Trinity Colonial Hills MHP | Houston | TX | MHC | 1,596,693 | 0.2 | LASL 2007-MF5 |
| 94 | CIIICM | Trinity Windfern MHP | Houston | TX | MHC | 1,596,693 | 0.2 | COLNY 2014-1 |
| 95 | Barclays | Walgreens Columbia | Columbia | SC | Retail | 1,588,808 | 0.2 | MSC 2006-HQ8 |
| 100 | WFB | Thompson Thrift Building | Terre Haute | IN | Office | 1,320,504 | 0.1 | BSCMS 2006-PW12 |
| Total | $417,410,894 | 40.8% |
| (1) | The table above represents the most recent securitization with respect to the mortgaged property securing the related mortgage loan, based on information provided by the related borrower or obtained through searches of a third-party database. While loans secured by the above mortgaged properties may have been securitized multiple times in prior transactions, mortgage loans in this securitization are only listed in the above chart if the mortgage loan paid off a loan in another securitization. The information has not otherwise been confirmed by the mortgage loan sellers. |
THE INFORMATION IN THIS STRUCTURAL AND COLLATERAL TERM SHEET IS NOT COMPLETE AND MAY BE AMENDED PRIOR TO THE TIME OF SALE. THIS TERM SHEET IS NOT AN OFFER TO SELL THESE SECURITIES AND IT IS NOT A SOLICITATION OF AN OFFER TO BUY THESE SECURITIES IN ANY JURISDICTION WHERE THE OFFER OR SALE IS NOT PERMITTED.
| 10 |
| Wells Fargo Commercial Mortgage Trust 2016-C35 | Characteristics of the Mortgage Pool |
E. Mortgage Loans with Scheduled Balloon Payments and Related Classes
| Class A-2(1) | ||||||||||||||||
| Loan No. | Mortgage Loan Seller | Mortgage Loan Name | State | Property Type | Mortgage Loan Cut-off Date Balance ($) | % of Initial Pool Balance (%) | Balloon Balance ($) | % of Class A-2 Certificate Balance (%)(2) | SF/ Rooms | Loan per SF/ Room ($)(3) | U/W NCF DSCR (x)(3) | U/W NOI Debt Yield (%)(3) | Cut-off Date LTV Ratio (%)(3) | Balloon LTV Ratio (%)(3) | Rem. IO Period (mos.) | Rem. Term to Maturity (mos.) |
| 6 | UBSRES | In-Rel 8 | Various | Various | $32,460,442 | 3.2% | $29,940,928 | 51.0% | 1,478,687 | $62 | 1.68x | 12.2% | 69.5% | 64.1% | 0 | 59 |
| 17 | Barclays | Stone Manor | PA | Office | 14,813,000 | 1.4 | 13,856,614 | 23.6 | 121,535 | 122 | 1.74 | 11.6 | 73.0 | 68.3 | 11 | 59 |
| 32 | Barclays | Hilton Home2 Suites Pittsburgh | PA | Hospitality | 9,248,858 | 0.9 | 8,625,985 | 14.7 | 79 | 117,074 | 1.59 | 11.9 | 65.1 | 60.7 | 0 | 55 |
| Total/Weighted Average | $56,522,299 | 5.5% | $52,423,528 | 89.4% | 1.68x | 12.0% | 69.7% | 64.6% | 3 | 58 | ||||||
(1)The table above presents the mortgage loan(s) whose balloon payments would be applied to pay down the principal balance of the Class A-2 Certificates, assuming a 0% CPR and applying the “Structuring Assumptions” described in the Preliminary Prospectus, including the assumptions that (i) none of the mortgage loans in the pool experience prepayments prior to maturity, defaults or losses; (ii) there are no extensions of maturity dates of any mortgage loans in the pool; and (iii) each mortgage loan in the pool is paid in full on its stated maturity date. Each Class of Certificates evidences undivided ownership interests in the entire pool of mortgage loans. Debt service coverage ratio, debt yield and loan-to-value ratio information do not take into account subordinate debt (whether or not secured by the related mortgaged property), if any, that currently exists or is allowed under the terms of any mortgage loan. See Annex A-1 to the Preliminary Prospectus. (2)Reflects the percentage equal to the Balloon Balance divided by the initial Class A-2 Certificate Balance. (3)With respect to the In-Rel 8 mortgage loan, which is part of a whole loan, the Loan per SF/Room, loan-to-value ratio, debt service coverage ratio and debt yield calculations include the relatedpari passu companion loan(s). | ||||||||||||||||
THE INFORMATION IN THIS STRUCTURAL AND COLLATERAL TERM SHEET IS NOT COMPLETE AND MAY BE AMENDED PRIOR TO THE TIME OF SALE. THIS TERM SHEET IS NOT AN OFFER TO SELL THESE SECURITIES AND IT IS NOT A SOLICITATION OF AN OFFER TO BUY THESE SECURITIES IN ANY JURISDICTION WHERE THE OFFER OR SALE IS NOT PERMITTED.
| 11 |
| Wells Fargo Commercial Mortgage Trust 2016-C35 | Characteristics of the Mortgage Pool |
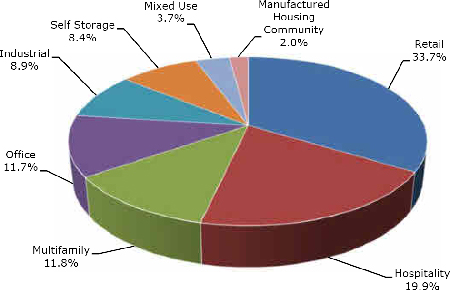
F. Property Type Distribution(1)
| Property Type | Number of Mortgaged Properties | Aggregate Cut-off Date Balance ($) | % of Initial Pool Balance (%) | Weighted Average Cut- off Date LTV Ratio (%) | Weighted Average Balloon LTV Ratio (%) | Weighted Average U/W NCF DSCR (x) | Weighted Average U/W NOI Debt Yield (%) | Weighted Average U/W NCF Debt Yield (%) | Weighted Average Mortgage Rate (%) | |||
| Retail | 48 | $344,577,324 | 33.7% | 57.4% | 52.3% | 2.03x | 11.0% | 10.5% | 4.594% | |||
| Anchored | 10 | 161,109,054 | 15.8 | 66.0 | 61.0 | 1.53 | 9.0 | 8.4 | 4.580 | |||
| Regional Mall | 2 | 101,947,448 | 10.0 | 39.7 | 35.5 | 3.08 | 14.6 | 14.1 | 4.344 | |||
| Unanchored | 12 | 44,082,066 | 4.3 | 67.0 | 58.0 | 1.45 | 10.4 | 9.4 | 4.990 | |||
| Single Tenant | 19 | 24,138,808 | 2.4 | 51.2 | 50.9 | 2.32 | 11.8 | 11.3 | 4.682 | |||
| Shadow Anchored | 5 | 13,299,949 | 1.3 | 69.5 | 58.7 | 1.38 | 9.7 | 9.1 | 5.193 | |||
| Hospitality | 19 | 203,075,378 | 19.9 | 62.5 | 49.6 | 1.75 | 13.6 | 12.0 | 5.194 | |||
| Full Service | 4 | 95,771,483 | 9.4 | 60.8 | 46.7 | 1.70 | 13.7 | 12.0 | 5.215 | |||
| Limited Service | 12 | 83,854,897 | 8.2 | 64.0 | 51.6 | 1.82 | 13.7 | 12.1 | 5.161 | |||
| Extended Stay | 3 | 23,448,999 | 2.3 | 63.6 | 54.4 | 1.73 | 13.0 | 11.8 | 5.228 | |||
| Multifamily | 24 | 120,744,491 | 11.8 | 48.4 | 40.6 | 3.76 | 21.6 | 21.2 | 4.474 | |||
| Cooperative | 11 | 57,777,140 | 5.6 | 26.9 | 22.3 | 6.21 | 33.8 | 33.8 | 4.057 | |||
| Garden | 11 | 51,905,665 | 5.1 | 67.7 | 56.8 | 1.56 | 10.8 | 9.9 | 4.828 | |||
| Low Rise | 1 | 6,200,000 | 0.6 | 72.5 | 64.0 | 1.34 | 9.0 | 8.5 | 4.850 | |||
| Student Housing | 1 | 4,861,685 | 0.5 | 66.6 | 55.5 | 1.26 | 8.5 | 8.3 | 5.170 | |||
| Office | 16 | 119,361,658 | 11.7 | 66.3 | 58.5 | 1.66 | 11.2 | 9.8 | 4.709 | |||
| Suburban | 8 | 65,784,025 | 6.4 | 69.5 | 59.7 | 1.54 | 11.6 | 10.0 | 4.820 | |||
| CBD | 4 | 40,822,634 | 4.0 | 60.5 | 55.9 | 1.87 | 10.7 | 9.8 | 4.439 | |||
| Medical | 4 | 12,755,000 | 1.2 | 68.6 | 61.2 | 1.56 | 10.4 | 9.4 | 5.001 | |||
| Industrial | 4 | 90,720,439 | 8.9 | 70.3 | 61.3 | 1.48 | 9.6 | 9.1 | 4.715 | |||
| Warehouse | 2 | 65,549,208 | 6.4 | 69.0 | 60.5 | 1.43 | 9.0 | 9.0 | 4.806 | |||
| Flex | 2 | 25,171,231 | 2.5 | 73.7 | 63.2 | 1.60 | 10.9 | 9.7 | 4.480 | |||
| Self Storage | 15 | 85,979,300 | 8.4 | 66.7 | 59.1 | 1.56 | 9.3 | 9.1 | 4.765 | |||
| Self Storage | 15 | 85,979,300 | 8.4 | 66.7 | 59.1 | 1.56 | 9.3 | 9.1 | 4.765 | |||
| Mixed Use | 4 | 37,788,284 | 3.7 | 70.5 | 60.3 | 1.49 | 10.6 | 9.7 | 5.068 | |||
| Medical Office/Retail | 1 | 21,725,376 | 2.1 | 73.6 | 61.2 | 1.27 | 8.8 | 8.5 | 5.320 | |||
| Office/Industrial | 1 | 7,500,000 | 0.7 | 68.8 | 60.3 | 1.67 | 12.8 | 10.3 | 4.570 | |||
| Office/Retail | 1 | 6,667,550 | 0.7 | 69.5 | 64.1 | 1.68 | 12.2 | 10.8 | 4.930 | |||
| Industrial/Other | 1 | 1,895,358 | 0.2 | 44.8 | 36.5 | 2.72 | 17.8 | 16.8 | 4.640 | |||
| Manufactured Housing Community | 10 | 20,632,735 | 2.0 | 68.3 | 57.2 | 1.61 | 10.8 | 10.5 | 5.117 | |||
| Manufactured Housing Community | 10 | 20,632,735 | 2.0 | 68.3 | 57.2 | 1.61 | 10.8 | 10.5 | 5.117 | |||
| Total/Weighted Average: | 140 | 1,022,879,610 | 100.0% | 61.0% | 52.9% | 2.02x | 12.5% | 11.7% | 4.765% | |||
| (1) | Because this table presents information relating to the mortgaged properties and not the mortgage loans, the information for mortgage loans secured by more than one mortgaged property is based on allocated amounts (allocating the mortgage loan balance to each of those properties according to the relative appraised values of the mortgaged properties or the allocated loan amounts or property-specific release prices set forth in the related mortgage loan documents or such other allocation as the related mortgage loan seller deemed appropriate). For mortgaged properties securing residential cooperative mortgage loans, the debt service coverage ratio or debt yield for each such mortgaged property is calculated using underwritten net cash flow for the related residential cooperative property which is the projected net cash flow reflected in the most recent appraisal obtained by or otherwise in the possession of the related mortgage loan seller as of the cut-off date and the loan-to-value ratio, excluding the University Towers Owners Corp. mortgage loan, is calculated based upon the appraised value of the residential cooperative property determined as if such residential cooperative property is operated as a residential cooperative. The loan-to-value ratio for the University Towers Owners Corp. mortgage loan is calculated based on the appraised value of the residential cooperative property determined as if such residential cooperative property is operated as a market rate multifamily rental property. With respect to any mortgage loan that is part of a whole loan, the loan-to-value ratio, debt service coverage ratio and debt yield calculations include the relatedpari passu companion loan(s) but exclude any related subordinate companion loan(s) (unless otherwise stated). With respect to each mortgage loan, debt service coverage ratio, debt yield and loan-to-value ratio information do not take into account of any subordinate debt (whether or not secured by the related mortgaged property) that currently exists or is allowed under the terms of such mortgage loan. See Annex A-1 to the Preliminary Prospectus. |
THE INFORMATION IN THIS STRUCTURAL AND COLLATERAL TERM SHEET IS NOT COMPLETE AND MAY BE AMENDED PRIOR TO THE TIME OF SALE. THIS TERM SHEET IS NOT AN OFFER TO SELL THESE SECURITIES AND IT IS NOT A SOLICITATION OF AN OFFER TO BUY THESE SECURITIES IN ANY JURISDICTION WHERE THE OFFER OR SALE IS NOT PERMITTED.
| 12 |
| Wells Fargo Commercial Mortgage Trust 2016-C35 | Characteristics of the Mortgage Pool |
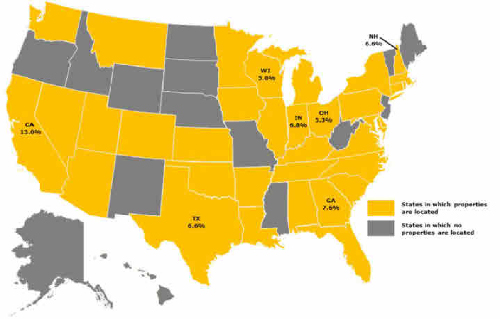
G. Geographic Distribution(1)(2)
| Location | Number of Mortgaged Properties | Aggregate Cut-off Date Balance ($) | % of Initial Pool Balance (%) | Weighted Average Cut- off Date LTV Ratio (%) | Weighted Average Balloon LTV Ratio (%) | Weighted Average U/W NCF DSCR (x) | Weighted Average U/W NOI Debt Yield (%) | Weighted Average U/W NCF Debt Yield (%) | Weighted Average Mortgage Rate (%) |
| California | 12 | $138,743,593 | 13.6% | 60.4% | 53.4% | 1.73x | 10.4% | 9.6% | 4.437% |
| Southern | 7 | 80,244,949 | 7.8 | 59.6 | 53.4 | 1.84 | 10.7 | 9.9 | 4.473 |
| Northern | 5 | 58,498,644 | 5.7 | 61.5 | 53.4 | 1.57 | 10.0 | 9.1 | 4.387 |
| Georgia | 5 | 77,691,573 | 7.6 | 66.8 | 64.6 | 1.66 | 9.0 | 8.5 | 4.791 |
| Indiana | 10 | 69,947,642 | 6.8 | 59.9 | 46.3 | 1.55 | 12.5 | 11.2 | 5.362 |
| Texas | 12 | 67,784,834 | 6.6 | 69.0 | 57.7 | 1.48 | 10.6 | 9.4 | 4.901 |
| New Hampshire | 2 | 67,260,000 | 6.6 | 33.2 | 32.1 | 3.82 | 16.5 | 16.0 | 4.166 |
| Wisconsin | 1 | 59,500,000 | 5.8 | 69.5 | 61.3 | 1.44 | 9.0 | 9.0 | 4.800 |
| Ohio | 12 | 53,992,798 | 5.3 | 63.8 | 55.3 | 1.96 | 13.0 | 11.7 | 4.768 |
| Other(3) | 86 | 487,959,170 | 47.7 | 61.8 | 52.7 | 2.13 | 13.8 | 12.9 | 4.829 |
| Total/Weighted Average | 140 | $1,022,879,610 | 100.0% | 61.0% | 52.9% | 2.02x | 12.5% | 11.7% | 4.765% |
| (1) | The mortgaged properties are located in 35 states. |
| (2) | Because this table presents information relating to the mortgaged properties and not the mortgage loans, the information for mortgage loans secured by more than one mortgaged property is based on allocated amounts (allocating the mortgage loan balance to each of those properties according to the relative appraised values of the mortgaged properties or the allocated loan amounts or property-specific release prices set forth in the related mortgage loan documents or such other allocation as the related mortgage loan seller deemed appropriate). For mortgaged properties securing residential cooperative mortgage loans, the debt service coverage ratio or debt yield for each such mortgaged property is calculated using underwritten net cash flow for the related residential cooperative property, which is the projected net cash flow reflected in the most recent appraisal obtained by or otherwise in the possession of the related mortgage loan seller as of the cut-off date, and the loan-to-value ratio, excluding the University Towers Owners Corp. mortgage loan, is calculated based upon the appraised value of the residential cooperative property determined as if such residential cooperative property is operated as a residential cooperative. The loan-to-value ratio for the University Towers Owners Corp. mortgage loan is calculated based on the appraised value of the residential cooperative property determined as if such residential cooperative property is operated as a market rate multifamily rental property. With respect to any mortgage loan that is part of a whole loan, the loan-to-value ratio, debt service coverage ratio and debt yield calculations include the relatedpari passu companion loan(s) but exclude any related subordinate companion loan(s) (unless otherwise stated). With respect to each mortgage loan, debt service coverage ratio, debt yield and loan-to-value ratio information do not take into account of any subordinate debt (whether or not secured by the related mortgaged property) that currently exists or is allowed under the terms of such mortgage loan. See Annex A-1 to the Preliminary Prospectus. |
| (3) | Includes 28 other states. |
THE INFORMATION IN THIS STRUCTURAL AND COLLATERAL TERM SHEET IS NOT COMPLETE AND MAY BE AMENDED PRIOR TO THE TIME OF SALE. THIS TERM SHEET IS NOT AN OFFER TO SELL THESE SECURITIES AND IT IS NOT A SOLICITATION OF AN OFFER TO BUY THESE SECURITIES IN ANY JURISDICTION WHERE THE OFFER OR SALE IS NOT PERMITTED.
| 13 |
| Wells Fargo Commercial Mortgage Trust 2016-C35 | Characteristics of the Mortgage Pool |
| H. | Characteristics of the Mortgage Pool(1) |
CUT-OFF DATE BALANCE
| Number of | |||||||||
| Range of Cut-off Date | Mortgage | Aggregate Cut- | % of Initial | ||||||
| Balances ($) | Loans | off Date Balance | Pool Balance | ||||||
| 1,200,000 - 2,000,000 | 18 | $29,173,346 | 2.9 | % | |||||
| 2,000,001 - 3,000,000 | 8 | 18,238,140 | 1.8 | ||||||
| 3,000,001 - 4,000,000 | 9 | 30,466,541 | 3.0 | ||||||
| 4,000,001 - 5,000,000 | 11 | 52,502,996 | 5.1 | ||||||
| 5,000,001 - 6,000,000 | 9 | 50,412,314 | 4.9 | ||||||
| 6,000,001 - 7,000,000 | 4 | 24,508,790 | 2.4 | ||||||
| 7,000,001 - 8,000,000 | 5 | 36,957,814 | 3.6 | ||||||
| 8,000,001 - 9,000,000 | 6 | 51,113,481 | 5.0 | ||||||
| 9,000,001 - 10,000,000 | 2 | 19,248,858 | 1.9 | ||||||
| 10,000,001 - 15,000,000 | 14 | 173,275,731 | 16.9 | ||||||
| 15,000,001 - 20,000,000 | 3 | 53,750,000 | 5.3 | ||||||
| 20,000,001 - 30,000,000 | 7 | 170,985,376 | 16.7 | ||||||
| 30,000,001 - 50,000,000 | 2 | 74,407,890 | 7.3 | ||||||
| 50,000,001 - 64,500,000 | 4 | 237,838,334 | 23.3 | ||||||
| Total: | 102 | $1,022,879,610 | 100.0 | % | |||||
| Average: | $10,028,231 | ||||||||
UNDERWRITTEN NOI DEBT SERVICE COVERAGE RATIO
| Number of | |||||||||
| Range of U/W NOI | Mortgage | Aggregate Cut- | % of Initial | ||||||
| DSCRs (x) | Loans | off Date Balance | Pool Balance | ||||||
| 1.24 - 1.30 | 3 | $13,736,685 | 1.3 | % | |||||
| 1.31 - 1.40 | 9 | 96,735,487 | 9.5 | ||||||
| 1.41 - 1.50 | 14 | 145,726,972 | 14.2 | ||||||
| 1.51 - 1.60 | 8 | 51,457,979 | 5.0 | ||||||
| 1.61 - 1.70 | 9 | 114,240,391 | 11.2 | ||||||
| 1.71 - 1.80 | 12 | 177,586,130 | 17.4 | ||||||
| 1.81 - 1.90 | 6 | 46,406,845 | 4.5 | ||||||
| 1.91 - 2.00 | 9 | 112,952,741 | 11.0 | ||||||
| 2.01 - 2.50 | 15 | 147,667,946 | 14.4 | ||||||
| 2.51 - 3.00 | 5 | 18,604,670 | 1.8 | ||||||
| 3.01 - 3.50 | 2 | 11,078,027 | 1.1 | ||||||
| 3.51 - 23.57 | 10 | 86,685,736 | 8.5 | ||||||
| Total: | 102 | $1,022,879,610 | 100.0 | % | |||||
| Weighted Average: | 2.15x | ||||||||
UNDERWRITTEN NCF DEBT SERVICE COVERAGE RATIO
| Number of | |||||||||
| Range of U/W NCF | Mortgage | Aggregate Cut- | % of Initial | ||||||
| DSCRs (x) | Loans | off Date Balance | Pool Balance | ||||||
| 1.20 | 2 | $13,800,000 | 1.3 | % | |||||
| 1.21 - 1.30 | 8 | 59,167,061 | 5.8 | ||||||
| 1.31 - 1.40 | 18 | 159,577,861 | 15.6 | ||||||
| 1.41 - 1.50 | 9 | 100,178,825 | 9.8 | ||||||
| 1.51 - 1.60 | 14 | 203,632,738 | 19.9 | ||||||
| 1.61 - 1.70 | 8 | 149,256,472 | 14.6 | ||||||
| 1.71 - 1.80 | 10 | 77,603,579 | 7.6 | ||||||
| 1.81 - 1.90 | 2 | 6,130,000 | 0.6 | ||||||
| 1.91 - 2.00 | 7 | 52,923,574 | 5.2 | ||||||
| 2.01 - 2.50 | 9 | 90,561,569 | 8.9 | ||||||
| 2.51 - 3.00 | 4 | 17,870,789 | 1.7 | ||||||
| 3.01 - 3.50 | 1 | 5,491,405 | 0.5 | ||||||
| 3.51 - 23.57 | 10 | 86,685,736 | 8.5 | ||||||
| Total: | 102 | $1,022,879,610 | 100.0 | % | |||||
| Weighted Average: | 2.02x | ||||||||
LOAN PURPOSE
| Number of | |||||||||
| Mortgage | Aggregate Cut- | % of Initial | |||||||
| Loan Purpose | Loans | off Date Balance | Pool Balance | ||||||
| Refinance | 76 | $816,662,223 | 79.8 | % | |||||
| Acquisition | 26 | 206,217,387 | 20.2 | ||||||
| Total: | 102 | $1,022,879,610 | 100.0 | % | |||||
| MORTGAGE RATE |
| Number of | |||||||||
| Range of Mortgage Rates | Mortgage | Aggregate Cut- | % of Initial | ||||||
| (%) | Loans | off Date Balance | Pool Balance | ||||||
| 3.520 - 3.750 | 4 | $16,941,405 | 1.7 | % | |||||
| 3.751 - 4.000 | 5 | 13,735,736 | 1.3 | ||||||
| 4.001 - 4.250 | 5 | 128,600,000 | 12.6 | ||||||
| 4.251 - 4.500 | 7 | 79,629,697 | 7.8 | ||||||
| 4.501 - 4.750 | 20 | 222,657,537 | 21.8 | ||||||
| 4.751 - 5.000 | 25 | 314,916,925 | 30.8 | ||||||
| 5.001 - 5.250 | 17 | 88,846,747 | 8.7 | ||||||
| 5.251 - 5.500 | 14 | 141,019,534 | 13.8 | ||||||
| 5.501 - 5.750 | 4 | 14,835,172 | 1.5 | ||||||
| 5.751 - 5.950 | 1 | 1,696,857 | 0.2 | ||||||
| Total: | 102 | $1,022,879,610 | 100.0 | % | |||||
| Weighted Average: | 4.765% | ||||||||
UNDERWRITTEN NOI DEBT YIELD
| Number of | |||||||||
| Range of U/W NOI | Mortgage | Aggregate Cut- | % of Initial | ||||||
| Debt Yields (%) | Loans | off Date Balance | Pool Balance | ||||||
| 8.1 - 9.0 | 16 | $265,855,965 | 26.0 | % | |||||
| 9.1 - 10.0 | 17 | 139,628,905 | 13.7 | ||||||
| 10.1 - 11.0 | 15 | 124,390,399 | 12.2 | ||||||
| 11.1 - 12.0 | 12 | 113,430,521 | 11.1 | ||||||
| 12.1 - 13.0 | 8 | 124,984,912 | 12.2 | ||||||
| 13.1 - 14.0 | 10 | 79,290,672 | 7.8 | ||||||
| 14.1 - 15.0 | 5 | 44,787,070 | 4.4 | ||||||
| 15.1 - 16.0 | 2 | 14,142,731 | 1.4 | ||||||
| 16.1 - 17.0 | 1 | 5,000,000 | 0.5 | ||||||
| 17.1 - 18.0 | 3 | 70,695,358 | 6.9 | ||||||
| 18.1 - 19.0 | 2 | 6,811,909 | 0.7 | ||||||
| 19.1 - 20.0 | 1 | 1,588,808 | 0.2 | ||||||
| 20.1 - 127.3 | 10 | 32,272,358 | 3.2 | ||||||
| Total: | 102 | $1,022,879,610 | 100.0 | % | |||||
| Weighted Average: | 12.5% | ||||||||
UNDERWRITTEN NCF DEBT YIELD
| Number of | |||||||||
| Range of U/W NCF | Mortgage | Aggregate Cut- | % of Initial | ||||||
| Debt Yields (%) | Loans | off Date Balance | Pool Balance | ||||||
| 7.9 - 8.0 | 4 | $82,175,000 | 8.0 | % | |||||
| 8.1 - 9.0 | 27 | 313,244,922 | 30.6 | ||||||
| 9.1 - 10.0 | 16 | 130,832,189 | 12.8 | ||||||
| 10.1 - 11.0 | 17 | 189,162,989 | 18.5 | ||||||
| 11.1 - 12.0 | 10 | 111,386,940 | 10.9 | ||||||
| 12.1 - 13.0 | 5 | 32,471,446 | 3.2 | ||||||
| 13.1 - 14.0 | 4 | 15,628,108 | 1.5 | ||||||
| 14.1 - 15.0 | 3 | 36,609,582 | 3.6 | ||||||
| 15.1 - 16.0 | 1 | 1,320,504 | 0.1 | ||||||
| 16.1 - 17.0 | 3 | 70,695,358 | 6.9 | ||||||
| 18.1 - 19.0 | 3 | 12,666,835 | 1.2 | ||||||
| 20.1 - 127.3 | 9 | 26,685,736 | 2.6 | ||||||
| Total: | 102 | $1,022,879,610 | 100.0 | % | |||||
| Weighted Average: | 11.7% | ||||||||
| (1) | For mortgaged properties securing residential cooperative mortgage loans, the debt service coverage ratio or debt yield for each such mortgaged property is calculated using underwritten net cash flow for the related residential cooperative property, which is the projected net cash flow reflected in the most recent appraisal obtained by or otherwise in the possession of the related mortgage loan seller as of the cut-off date, and the loan-to-value ratio, excluding the University Towers Owners Corp. mortgage loan, is calculated based upon the appraised value of the residential cooperative property determined as if such residential cooperative property is operated as a residential cooperative. The loan-to-value ratio for the University Towers Owners Corp. mortgage loan is calculated based on the appraised value of the residential cooperative property determined as if such residential cooperative property is operated as a market rate multifamily rental property. With respect to any mortgage loan that is part of a whole loan, the loan-to-value ratio, debt service coverage ratio and debt yield calculations include the relatedpari passu companion loan(s) but exclude any related subordinate companion loan(s) (unless otherwise stated). With respect to each mortgage loan, debt service coverage ratio, debt yield and loan-to-value ratio information do not take into account any subordinate debt (whether or not secured by the related mortgaged property), that currently exists or is allowed under the terms of such mortgage loan. See Annex A-1 to the Preliminary Prospectus. Prepayment provisions for each mortgage loan reflects the entire life of the loan (from origination to maturity). |
THE INFORMATION IN THIS STRUCTURAL AND COLLATERAL TERM SHEET IS NOT COMPLETE AND MAY BE AMENDED PRIOR TO THE TIME OF SALE. THIS TERM SHEET IS NOT AN OFFER TO SELL THESE SECURITIES AND IT IS NOT A SOLICITATION OF AN OFFER TO BUY THESE SECURITIES IN ANY JURISDICTION WHERE THE OFFER OR SALE IS NOT PERMITTED.
| 14 |
| Wells Fargo Commercial Mortgage Trust 2016-C35 | Characteristics of the Mortgage Pool |
ORIGINAL TERM TO MATURITY
| Number of | |||||||||
| Original Terms to | Mortgage | Aggregate Cut- | % of Initial | ||||||
| Maturity(months) | Loans | off Date Balance | Pool Balance | ||||||
| 60 | 3 | $56,522,299 | 5.5 | % | |||||
| 120 | 99 | 966,357,310 | 94.5 | ||||||
| Total: | 102 | $1,022,879,610 | 100.0 | % | |||||
| Weighted Average: | 117 months | ||||||||
REMAINING TERM TO MATURITY
| Number of | |||||||||
| Range of Remaining Terms | Mortgage | Aggregate Cut- | % of Initial | ||||||
| to Maturity (months) | Loans | off Date Balance | Pool Balance | ||||||
| 55 - 60 | 3 | $56,522,299 | 5.5 | % | |||||
| 61 - 120 | 99 | 966,357,310 | 94.5 | ||||||
| Total: | 102 | $1,022,879,610 | 100.0 | % | |||||
| Weighted Average: | 116 months | ||||||||
ORIGINAL AMORTIZATION TERM(2)
| Original | Number of | ||||||||
| Amortization Terms | Mortgage | Aggregate Cut- | % of Initial | ||||||
| (months) | Loans | off Date Balance | Pool Balance | ||||||
| Non-Amortizing | 8 | $189,650,000 | 18.5 | % | |||||
| 300 | 11 | 128,859,868 | 12.6 | ||||||
| 360 | 82 | 701,169,741 | 68.5 | ||||||
| 480 | 1 | 3,200,000 | 0.3 | ||||||
| Total: | 102 | $1,022,879,610 | 100.0 | % | |||||
| Weighted Average(3): | 351 months | ||||||||
| (2) | The original amortization term shown for any mortgage loan that is interest-only for part of its term does not include the number of months in its interest-only period and reflects only the number of months as of the commencement of amortization remaining from the end of such interest-only period. |
| (3) | Excludes the non-amortizing mortgage loans. |
REMAINING AMORTIZATION TERM(4)
| Range of Remaining | Number of | ||||||||
| Amortization Terms | Mortgage | Aggregate Cut- | % of Initial | ||||||
| (months) | Loans | off Date Balance | Pool Balance | ||||||
| Non-Amortizing | 8 | $189,650,000 | 18.5 | % | |||||
| 291 - 300 | 11 | 128,859,868 | 12.6 | ||||||
| 301 - 360 | 82 | 701,169,741 | 68.5 | ||||||
| 361 - 480 | 1 | 3,200,000 | 0.3 | ||||||
| Total: | 102 | $1,022,879,610 | 100.0 | % | |||||
| Weighted Average(5): | 350 months | ||||||||
| (4) | The remaining amortization term shown for any mortgage loan that is interest-only for part of its term does not include the number of months in its interest-only period and reflects only the number of months as of the commencement of amortization remaining from the end of such interest-only period. |
| (5) | Excludes the non-amortizing mortgage loans. |
LOCKBOXES
| Number of | |||||||||
| Mortgage | Aggregate Cut- | % of Initial | |||||||
| Type of Lockbox | Loans | off Date Balance | Pool Balance | ||||||
| Springing | 53 | $494,553,576 | 48.3 | % | |||||
| Hard/Springing Cash Management | 20 | 349,469,681 | 34.2 | ||||||
| None | 23 | 102,425,907 | 10.0 | ||||||
| Hard/Upfront Cash Management | 4 | 45,843,823 | 4.5 | ||||||
| Soft/Springing Cash Management | 2 | 30,586,623 | 3.0 | ||||||
| Total: | 102 | $1,022,879,610 | 100.0 | % | |||||
PREPAYMENT PROVISION SUMMARY
| Number of | |||||||||
| Mortgage | Aggregate Cut- | % of Initial | |||||||
| Prepayment Provision | Loans | off Date Balance | Pool Balance | ||||||
| Lockout / Def / Open | 79 | $785,096,919 | 76.8 | % | |||||
| Lockout / GRTR 1% or YM / Open | 11 | 171,015,778 | 16.7 | ||||||
| GRTR 1% or YM / 1% / Open | 11 | 57,777,140 | 5.6 | ||||||
| GRTR 1% or YM / Open | 1 | 8,989,773 | 0.9 | ||||||
| Total: | 102 | $1,022,879,610 | 100.0 | % | |||||
CUT-OFF DATE LOAN-TO-VALUE RATIO
| Number of | |||||||||
| Range of Cut-off Date LTV | Mortgage | Aggregate Cut- | % of Initial | ||||||
| Ratios (%) | Loans | off Date Balance | Pool Balance | ||||||
| 3.5 - 20.0 | 9 | $26,685,736 | 2.6 | % | |||||
| 20.1 - 25.0 | 1 | 5,491,405 | 0.5 | ||||||
| 25.1 - 30.0 | 2 | 61,588,808 | 6.0 | ||||||
| 40.1 - 45.0 | 2 | 27,495,358 | 2.7 | ||||||
| 45.1 - 50.0 | 2 | 6,320,504 | 0.6 | ||||||
| 50.1 - 55.0 | 7 | 54,667,067 | 5.3 | ||||||
| 55.1 - 60.0 | 8 | 157,361,571 | 15.4 | ||||||
| 60.1 - 65.0 | 15 | 122,291,511 | 12.0 | ||||||
| 65.1 - 70.0 | 31 | 366,767,204 | 35.9 | ||||||
| 70.1 - 75.0 | 25 | 194,210,446 | 19.0 | ||||||
| Total: | 102 | $1,022,879,610 | 100.0 | % | |||||
| Weighted Average: | 61.0% | ||||||||
BALLOON LOAN-TO-VALUE RATIO
| Number of | |||||||||
| Range of Balloon LTV | Mortgage | Aggregate Cut- | % of Initial | ||||||
| Ratios (%) | Loans | off Date Balance | Pool Balance | ||||||
| 2.7 - 20.0 | 10 | $32,177,140 | 3.1 | % | |||||
| 20.1 - 25.0 | 1 | 1,588,808 | 0.2 | ||||||
| 25.1 - 30.0 | 1 | 60,000,000 | 5.9 | ||||||
| 30.1 - 35.0 | 1 | 1,320,504 | 0.1 | ||||||
| 35.1 - 40.0 | 3 | 30,784,162 | 3.0 | ||||||
| 40.1 - 45.0 | 6 | 84,374,517 | 8.2 | ||||||
| 45.1 - 50.0 | 13 | 137,332,476 | 13.4 | ||||||
| 50.1 - 55.0 | 17 | 122,523,021 | 12.0 | ||||||
| 55.1 - 60.0 | 22 | 170,847,673 | 16.7 | ||||||
| 60.1 - 65.0 | 21 | 260,088,309 | 25.4 | ||||||
| 65.1 - 68.3 | 7 | 121,843,000 | 11.9 | ||||||
| Total: | 102 | $1,022,879,610 | 100.0 | % | |||||
| Weighted Average: | 52.9% | ||||||||
AMORTIZATION TYPE
| Number of | |||||||||
| Mortgage | Aggregate Cut- | % of Initial | |||||||
| Type of Amortization | Loans | off Date Balance | Pool Balance | ||||||
| Amortizing Balloon | 62 | $475,056,360 | 46.4 | % | |||||
| Interest-only, Amortizing Balloon | 32 | 358,173,250 | 35.0 | ||||||
| Interest-only, Balloon | 8 | 189,650,000 | 18.5 | ||||||
| Total: | 102 | $1,022,879,610 | 100.0 | % | |||||
ORIGINAL TERM OF INTEREST-ONLY PERIOD FOR PARTIAL IO LOANS
| Number of | |||||||||
| Mortgage | Aggregate Cut- | % of Initial | |||||||
| IO Terms (months) | Loans | off Date Balance | Pool Balance | ||||||
| 12 | 8 | $80,898,000 | 7.9% | ||||||
| 24 | 8 | 49,680,250 | 4.9 | ||||||
| 36 | 12 | 178,725,000 | 17.5 | ||||||
| 48 | 2 | 33,070,000 | 3.2 | ||||||
| 60 | 2 | 15,800,000 | 1.5 | ||||||
| Total: | 32 | $358,173,250 | 35.0% | ||||||
| Weighted Average: | 31 months | ||||||||
SEASONING
| Number of | |||||||||
| Mortgage | Aggregate Cut- | % of Initial | |||||||
| Seasoning (months) | Loans | off Date Balance | Pool Balance | ||||||
| 0 | 31 | $299,665,000 | 29.3% | ||||||
| 1 | 37 | 487,677,331 | 47.7 | ||||||
| 2 | 21 | 162,624,123 | 15.9 | ||||||
| 3 | 4 | 20,683,635 | 2.0 | ||||||
| 4 | 3 | 15,671,380 | 1.5 | ||||||
| 5 | 2 | 18,048,858 | 1.8 | ||||||
| 6 | 1 | 1,588,808 | 0.2 | ||||||
| 7 | 2 | 10,910,893 | 1.1 | ||||||
| 9 | 1 | 6,009,582 | 0.6 | ||||||
| Total: | 102 | $1,022,879,610 | 100.0% | ||||||
| Weighted Average: | 1 month | ||||||||
THE INFORMATION IN THIS STRUCTURAL AND COLLATERAL TERM SHEET IS NOT COMPLETE AND MAY BE AMENDED PRIOR TO THE TIME OF SALE. THIS TERM SHEET IS NOT AN OFFER TO SELL THESE SECURITIES AND IT IS NOT A SOLICITATION OF AN OFFER TO BUY THESE SECURITIES IN ANY JURISDICTION WHERE THE OFFER OR SALE IS NOT PERMITTED.
| 15 |
| Wells Fargo Commercial Mortgage Trust 2016-C35 | Certain Terms and Conditions |
| V. | Certain Terms and Conditions |
| Interest Entitlements: | The interest entitlement of each Class of Offered Certificates on each Distribution Date generally will be the interest accrued during the related Interest Accrual Period on the related Certificate Balance or Notional Amount at the related pass-through rate, net of any prepayment interest shortfalls allocated to that Class for such Distribution Date as described below. If prepayment interest shortfalls arise from voluntary prepayments (without applicable Master Servicer consent) on particular non-specially serviced loans during any collection period, the applicable Master Servicer is required to make a compensating interest payment to offset those shortfalls, generally up to an amount equal to the portion of its master servicing fees that accrue at 0.25 basis pointsper annum. The remaining amount of prepayment interest shortfalls will be allocated to reduce the interest entitlement on all Classes of Certificates,pro rata, based on their respective amounts of accrued interest for the related Distribution Date. If a Class receives less than the entirety of its interest entitlement on any Distribution Date, then the shortfall (excluding any shortfall due to prepayment interest shortfalls), together with interest thereon, will be added to its interest entitlement for the next succeeding Distribution Date. | |
| Principal Distribution Amount: | The Principal Distribution Amount for each Distribution Date generally will be the aggregate amount of principal received or advanced in respect of the mortgage loans, net of any non-recoverable advances and interest thereon and workout-delayed reimbursement amounts that are reimbursed to the applicable Master Servicer, the applicable Special Servicer or the Trustee during the related collection period. Non-recoverable advances and interest thereon are reimbursable from principal collections and advances before reimbursement from other amounts. Workout-delayed reimbursement amounts are reimbursable from principal collections. | |
| Distributions: | On each Distribution Date, funds available for distribution from the mortgage loans, net of specified trust fees, expenses and reimbursements will generally be distributed in the following amounts and order of priority (in each case to the extent of remaining available funds): | |
| 1. | Class A-1, A-2, A-3, A-4, A-SB, X-A, X-B and X-D Certificates: To interest on the Class A-1, A-2, A-3, A-4, A-SB, X-A, X-B and X-D Certificates,pro rata, according to their respective interest entitlements. | |
| 2. | Class A-1, A-2, A-3, A-4 and A-SB Certificates: To principal on the Class A-1, A-2, A-3, A-4 and A-SB Certificates in the following amounts and order of priority: (i) first, to principal on the Class A-SB Certificates, in an amount up to the Principal Distribution Amount for such Distribution Date until their Certificate Balance is reduced to the Class A-SB Planned Principal Balance for such Distribution Date; (ii) second, to principal on the Class A-1 Certificates until their Certificate Balance is reduced to zero, up to the remainder of the Principal Distribution Amount for such Distribution Date; (iii) third, to principal on the Class A-2 Certificates until their Certificate Balance is reduced to zero, up to the remainder of the Principal Distribution Amount for such Distribution Date; (iv) fourth, to principal on the Class A-3 Certificates, until their Certificate Balance is reduced to zero, up to the remainder of the Principal Distribution Amount for such Distribution Date; (v) fifth, to principal on the Class A-4 Certificates until their Certificate Balance is reduced to zero, up to the remainder of the Principal Distribution Amount for such Distribution Date; and (vi) sixth, to principal on the Class A-SB Certificates until their Certificate Balance is reduced to zero, up to the remainder of the Principal Distribution Amount for such Distribution Date. However, if the Certificate Balance of each and every Class of Principal Balance Certificates, other than the Class A-1, A-2, A-3, A-4 and A-SB Certificates, has been reduced to zero as a result of the allocation of Mortgage Loan losses and expenses and any of the Class A-1, A-2, A-3, A-4 and A-SB Certificates remains outstanding, then the Principal Distribution Amount will be distributed to the Class A-1, A-2, A-3, A-4 and A-SB Certificates,pro rata, based on their respective outstanding Certificate Balances, until their Certificate Balances have been reduced to zero. | |
| 3. | Class A-1, A-2, A-3, A-4 and A-SB Certificates: To reimburse the holders of the Class A-1, A-2, A-3, A-4 and A-SB Certificates,pro rata, on the basis of previously allocated unreimbursed losses, for any previously unreimbursed losses (plus interest thereon) on the mortgage loans that were previously allocated in reduction of the Certificate Balances of such Classes. | |
THE INFORMATION IN THIS STRUCTURAL AND COLLATERAL TERM SHEET IS NOT COMPLETE AND MAY BE AMENDED PRIOR TO THE TIME OF SALE. THIS TERM SHEET IS NOT AN OFFER TO SELL THESE SECURITIES AND IT IS NOT A SOLICITATION OF AN OFFER TO BUY THESE SECURITIES IN ANY JURISDICTION WHERE THE OFFER OR SALE IS NOT PERMITTED.
| 16 |
| Wells Fargo Commercial Mortgage Trust 2016-C35 | Certain Terms and Conditions |
4. | Class A-S Certificates: To make distributions on the Class A-S Certificates as follows: (a) first, to interest on the Class A-S Certificates in the amount of the interest entitlement for that Class; (b) next, to the extent of the portion of the Principal Distribution Amount remaining after distributions in respect of principal to each Class with a higher distribution priority (in this case, the Class A-1, A-2, A-3, A-4 and A-SB Certificates), to principal on the Class A-S Certificates until their Certificate Balance is reduced to zero; and (c) next, to reimburse the holders of the Class A-S Certificates for any previously unreimbursed losses (plus interest thereon) on the mortgage loans that were previously allocated to that Class in reduction of their Certificate Balance. | |
| 5. | Class B Certificates: To make distributions on the Class B Certificates as follows: (a) first, to interest on the Class B Certificates in the amount of the interest entitlement for that Class; (b) next, to the extent of the portion of the Principal Distribution Amount remaining after distributions in respect of principal to each Class with a higher distribution priority (in this case, the Class A-1, A-2, A-3, A-4, A-SB and A-S Certificates), to principal on the Class B Certificates until their Certificate Balance is reduced to zero; and (c) next, to reimburse the holders of the Class B Certificates for any previously unreimbursed losses (plus interest thereon) on the mortgage loans that were previously allocated to that Class in reduction of their Certificate Balance. | |
| 6. | Class C Certificates: To make distributions on the Class C Certificates as follows: (a) first, to interest on the Class C Certificates in the amount of the interest entitlement for that Class; (b) next, to the extent of the portion of the Principal Distribution Amount remaining after distributions in respect of principal to each Class with a higher distribution priority (in this case, the Class A-1, A-2, A-3, A-4, A-SB, A-S and B Certificates), to principal on the Class C Certificates until their Certificate Balance is reduced to zero; and (c) next, to reimburse the holders of the Class C Certificates for any previously unreimbursed losses (plus interest thereon) on the mortgage loans that were previously allocated to that Class in reduction of their Certificate Balance. | |
| 7. | After the Class A-1, A-2, A-3, A-4, A-SB, A-S, B and C Certificates are paid all amounts to which they are entitled, the remaining funds available for distribution will be used to pay interest, principal and loss reimbursement amounts on the Class D, E, F and G Certificates sequentially in that order in a manner analogous to the Class C Certificates. |
| Allocation of Yield Maintenance and Prepayment Premiums: | If any yield maintenance charge or prepayment premium is collected during any particular collection period with respect to any mortgage loan, then on the Distribution Date corresponding to that collection period, the certificate administrator will pay that yield maintenance charge or prepayment premium (net of liquidation fees payable therefrom) in the following manner: (1) to each of the Class A-1, A-2, A-3, A-4, A-SB, A-S, B, C and D Certificates, the product of (a) such yield maintenance charge or prepayment premium, (b) the related Base Interest Fraction (as defined in the Preliminary Prospectus) for such Class, and (c) a fraction, the numerator of which is equal to the amount of principal distributed to such Class for that Distribution Date, and the denominator of which is the total amount of principal distributed to all Principal Balance Certificates for that Distribution Date, and (2) to the Class X-A Certificates, the excess, if any, of (a) the product of (i) such yield maintenance charge or prepayment premium and (ii) a fraction, the numerator of which is equal to the amount of principal distributed to the Class A-1, A-2, A-3, A-4, A-SB and A-S Certificates for that Distribution Date, and the denominator of which is the total amount of principal distributed to all Principal Balance Certificates for that Distribution Date, over (b) the amount of such yield maintenance charge or prepayment premium distributed to the Class A-1, A-2, A-3, A-4, A-SB and A-S Certificates as described above, and (3) to the Class X-B Certificates, any remaining yield maintenance charge or prepayment premium not distributed as described above. No prepayment premiums or yield maintenance charges will be distributed to the holders of the Class X-D, E, F, G or R Certificates. For a description of when prepayment premiums and yield maintenance charges are generally required on the mortgage loans, see Annex A-1 to the Preliminary Prospectus. See also “Risk Factors—Risks Relating to the Mortgage Loans—Risks Relating to Enforceability of Yield Maintenance Charges, Prepayment Premiums or Defeasance Provisions” and “Risk Factors—Other Risks Relating to the Certificates—Your Yield May Be Affected by Defaults, Prepayments and Other Factors” in the Preliminary Prospectus. Prepayment premiums and yield maintenance charges will be distributed on each Distribution Date only to the extent they are actually received on the mortgage loans as of the related Determination Date. | |
| Realized Losses: | The Certificate Balances of the Class A-1, A-2, A-3, A-4, A-SB, A-S, B, C, D, E, F and G Certificates, will be reduced without distribution on any Distribution Date as a write-off to the extent of any losses realized on the mortgage loans allocated to such Class on such Distribution Date. Such losses will be applied in the following order, in each case until the related Certificate Balance is reduced to zero: first, to the Class G Certificates; second, to the Class F Certificates; third, to the Class E Certificates; fourth, to the Class D Certificates; fifth, to the Class C Certificates; sixth, to the Class B Certificates; seventh, to the Class A-S Certificates; | |
THE INFORMATION IN THIS STRUCTURAL AND COLLATERAL TERM SHEET IS NOT COMPLETE AND MAY BE AMENDED PRIOR TO THE TIME OF SALE. THIS TERM SHEET IS NOT AN OFFER TO SELL THESE SECURITIES AND IT IS NOT A SOLICITATION OF AN OFFER TO BUY THESE SECURITIES IN ANY JURISDICTION WHERE THE OFFER OR SALE IS NOT PERMITTED.
| 17 |
| Wells Fargo Commercial Mortgage Trust 2016-C35 | Certain Terms and Conditions |
and, finally,pro rata, to the Class A-1, A-2, A-3, A-4 and A-SB Certificates based on their outstanding Certificate Balances.
The notional amount of the Class X-A Certificates will be reduced by the amount of all losses that are allocated to the Class A-1, A-2, A-3, A-4, A-SB or A-S Certificates as write-offs in reduction of their Certificate Balances. The notional amount of the Class X-B Certificates will be reduced by the amount of all losses that are allocated to the Class B or C Certificates as write-offs in reduction of their Certificate Balances. The notional amount of the Class X-D Certificates will be reduced by the amount of all losses that are allocated to the Class D Certificates as write-offs in reduction of their Certificate Balance.
| ||
| P&I Advances: | Each Master Servicer or, if such Master Servicer fails to do so, the Trustee, will be obligated to advance delinquent debt service payments with respect to the mortgage loans it services (other than balloon payments and default interest) and assumed debt service payments on mortgage loans with delinquent balloon payments (excluding any related companion loan), except to the extent any such advance is deemed non-recoverable from collections on the related mortgage loan. In addition, if an Appraisal Reduction Amount exists for a given mortgage loan, the interest portion of any P&I advance for such mortgage loan will be reduced, which will have the effect of reducing the amount of interest available for distribution to the Certificates in reverse alphabetical order of their Class designations (except that interest payments on the Class A-1, A-2, A-3, A-4, A-SB, X-A, X-B and X-D Certificates would be affected on apari passu basis).
| |
| Servicing Advances: | Each Master Servicer or, if such Master Servicer fails to do so, the Trustee, will be obligated to make servicing advances with respect to each mortgage loan it services, including the payment of delinquent property taxes, insurance premiums and ground rent, except to the extent that those advances are deemed non-recoverable from collections on the related mortgage loan. The applicable Master Servicer or the Trustee, as applicable, will have the primary obligation to make any required servicing advances with respect to the Kroger (Roundy’s) Distribution Center whole loan and Mall at Turtle Creek whole loan. The servicer or trustee, as applicable, under the BBSG 2016-MRP securitization will have the primary obligation to make any required servicing advances with respect to The Mall at Rockingham Park whole loan. The master servicer or trustee, as applicable, under the BACM 2016-UBS10 securitization will have the primary obligation to make any required servicing advances with respect to the In-Rel 8 whole loan. Prior to the Servicing Shift Securitization Date, the applicable Master Servicer under the WFCM 2016-C35 securitization is expected to have the primary obligation to make any servicing advances with respect to the Pinnacle II whole loan. After Servicing Shift Securitization Date, the master servicer under the Servicing Shift PSA will have the primary obligation to make any servicing advances with respect to the Pinnacle II loan combination. The Special Servicers will have no obligation to make servicing advances but may do so in an emergency situation.
| |
Appraisal Reduction Amounts and Collateral Deficiency Amounts:
| An Appraisal Reduction Amount generally will be created in the amount, if any, by which the principal balance of a required appraisal loan (which is a mortgage loan with respect to which certain defaults, modifications or insolvency events have occurred as further described in the Preliminary Prospectus) plus other amounts overdue or advanced in connection with such mortgage loan exceeds 90% of the appraised value of the related mortgaged property plus certain escrows and reserves (including letters of credit) held with respect to the mortgage loan. With respect to any whole loan, any Appraisal Reduction Amount will be allocated first to the related subordinate companion loan, if any, and then to the related mortgage loan and the relatedpari passu companion loan(s).
A mortgage loan will cease to be a required appraisal loan when the same has ceased to be a specially serviced loan (if applicable), has been brought current for at least three consecutive months and no other circumstances exist that would cause such mortgage loan to be a required appraisal loan.
A Collateral Deficiency Amount will exist with respect to any mortgage loan that is modified into an AB loan structure and remains a corrected mortgage loan and will generally equal the excess of (i) the stated principal balance of such AB modified loan (taking into account the related junior note(s) and anypari passu notes included therein), over (ii) the sum of (in the case of a whole loan, solely to the extent allocable to the subject mortgage loan) (x) the appraised value of the related mortgaged property plus (y) any capital or additional collateral contributed by the related borrower at the time the loan became an AB modified loan plus (z) certain escrows or reserves (including letters of credit) in addition to any amounts set forth in the immediately preceding clause (y)) held with respect to the mortgage loan.
A Cumulative Appraisal Reduction Amount with respect to any mortgage loan will be the sum of any Appraisal Reduction Amount and any Collateral Deficiency Amount.
Cumulative Appraisal Reduction Amounts will affect the amount of debt service advances in respect of the related mortgage loan. Cumulative Appraisal Reduction Amounts will also be taken into account in the determination of the identity of the Class whose majority constitutes the “majority controlling class certificateholder” and is entitled to appoint the directing certificateholder. | |
THE INFORMATION IN THIS STRUCTURAL AND COLLATERAL TERM SHEET IS NOT COMPLETE AND MAY BE AMENDED PRIOR TO THE TIME OF SALE. THIS TERM SHEET IS NOT AN OFFER TO SELL THESE SECURITIES AND IT IS NOT A SOLICITATION OF AN OFFER TO BUY THESE SECURITIES IN ANY JURISDICTION WHERE THE OFFER OR SALE IS NOT PERMITTED.
| 18 |
| Wells Fargo Commercial Mortgage Trust 2016-C35 | Certain Terms and Conditions |
Clean-Up Call and Exchange Termination:
| On each Distribution Date occurring after the aggregate unpaid principal balance of the mortgage loans is reduced below 1% of the initial aggregate principal balance of the mortgage loans as of the Cut-off Date, certain specified persons will have the option to purchase all of the remaining mortgage loans (and the trust’s interest in all property acquired through exercise of remedies in respect of any mortgage loan) at the price specified in the Preliminary Prospectus. Exercise of the option will terminate the trust and retire the then-outstanding certificates.
If the aggregate Certificate Balances of each of the Class A-1, A-2, A-3, A-4, A-SB, A-S, B, C and D Certificates have been reduced to zero, the trust may also be terminated in connection with an exchange of all the then-outstanding certificates (other than the Class R Certificates) for the mortgage loans and REO properties then remaining in the issuing entity, but all of the holders of those Classes of outstanding certificates would have to voluntarily participate in the exchange.
| |
| Liquidation Loan Waterfall: | Following the liquidation of any loan or property, the net liquidation proceeds generally will be applied (after reimbursement of advances and certain trust fund expenses), first, as a recovery of accrued interest, other than delinquent interest that was not advanced as a result of Appraisal Reduction Amounts or Collateral Deficiency Amounts, second, as a recovery of principal until all principal has been recovered, and then as a recovery of delinquent interest that was not advanced as a result of Appraisal Reduction Amounts or Collateral Deficiency Amounts. Please see “Description of the Certificates—Distributions—Application Priority of Mortgage Loan Collections or Whole Loan Collections” in the Preliminary Prospectus. | |
Majority Controlling Class Certificateholder and Directing Certificateholder: | A directing certificateholder may be appointed by the “majority controlling class certificate-holder”, which will be the holder(s) of a majority of the “controlling class”, which means the most subordinate class among the Class E, F and G Certificates that has a Certificate Balance, as notionally reduced by any Cumulative Appraisal Reduction Amounts allocable to that class, that is at least equal to 25% of its total initial Certificate Balance; provided that if at any time the Certificate Balances of the Principal Balance Certificates (other than the Class E, F and G Certificates) have been reduced to zero as a result of principal payments on the mortgage loans, then the “controlling class” will be the most subordinate class of Class E, F and G Certificates that has a Certificate Balance greater than zero without regard to any Cumulative Appraisal Reduction Amounts. The majority controlling class certificateholder will have a continuing right to appoint, remove or replace the directing certificateholder in its sole discretion. This right may be exercised at any time and from time to time. See “Pooling and Servicing Agreement—The Directing Certificateholder” in the Preliminary Prospectus. | |
| Control and Consultation: | The rights of various parties to replace each Special Servicer and approve or consult with respect to major actions of each Special Servicer will vary according to defined periods.
A “Control Termination Event” occurs if the Class E Certificates have a Certificate Balance, net of any Cumulative Appraisal Reduction Amounts allocable to that Class, that is less than 25% of the initial Certificate Balance of that Class or, while the Class E Certificates are the controlling class, the majority (by Certificate Balance) of the holders of the Class E Certificates irrevocably waived its right, in writing, to exercise any of the rights of the majority controlling class certificateholder and such rights have not been reinstated to a successor majority controlling class certificateholder.
A “Consultation Termination Event” occurs if the Class E Certificates have a Certificate Balance, without regard to any Cumulative Appraisal Reduction Amounts allocable to that Class, that is less than 25% of the initial Certificate Balance of that Class or, while the Class E Certificates are the controlling class, the majority (by Certificate Balance) of the holders of the Class E Certificates irrevocably waived its right, in writing, to exercise any of the rights of the majority controlling class certificateholder and such rights have not been reinstated to a successor majority controlling class certificateholder.
If no Control Termination Event has occurred and is continuing, except with respect to the Excluded Loans (as defined below), (i) the directing certificateholder will be entitled to grant or withhold approval of asset status reports prepared, and material servicing actions proposed, by each Special Servicer, and (ii) the directing certificateholder will be entitled to terminate and replace each Special Servicer with or without cause, and appoint itself or another person as the successor special servicer. It will be a condition to such appointment that Fitch, KBRA and Moody’s (and any Rating Agency rating any securities backed by any pari passu companion loan(s) serviced under this transaction) confirm that the appointment would not result in a qualification, downgrade or withdrawal of any of their then-current ratings of certificates (and any certificates backed by any pari passu companion loan(s) serviced under this transaction).
If a Control Termination Event has occurred and is continuing but no Consultation Termination Event has occurred and is continuing, each Special Servicer will be required to consult with the directing certificateholder (other than with respect to Excluded Loans) and the Operating Advisor in connection with asset status reports and material special servicing actions. | |
THE INFORMATION IN THIS STRUCTURAL AND COLLATERAL TERM SHEET IS NOT COMPLETE AND MAY BE AMENDED PRIOR TO THE TIME OF SALE. THIS TERM SHEET IS NOT AN OFFER TO SELL THESE SECURITIES AND IT IS NOT A SOLICITATION OF AN OFFER TO BUY THESE SECURITIES IN ANY JURISDICTION WHERE THE OFFER OR SALE IS NOT PERMITTED.
| 19 |
| Wells Fargo Commercial Mortgage Trust 2016-C35 | Certain Terms and Conditions |
If a Consultation Termination Event has occurred and is continuing, each Special Servicer must seek to consult with the Operating Advisor in connection with asset status reports and material special servicing actions, and, in general, no directing certificateholder will be recognized or have any right to terminate the Special Servicers or approve, direct or consult with respect to servicing matters.
With respect to the Kroger (Roundy’s) Distribution Center mortgage loan and the Mall at Turtle Creek mortgage loan, the rights of the directing certificateholder described above will be subject to the consultation rights of the holder of the relatedpari passu companion loan(s) as described below.
Notwithstanding any contrary description set forth above, with respect to the Kroger (Roundy’s) Distribution Center mortgage loan and the Mall at Turtle Creek mortgage loan, the holder of thepari passu companion loan(s) in the related whole loan (or its representative, including any directing certificateholder under any securitization of suchpari passucompanion loan(s)) will have consultation rights with respect to asset status reports and material special servicing actions involving the related whole loan, as provided for in the related intercreditor agreement and as described in the Preliminary Prospectus, and those rights will be in addition to the rights of the directing certificateholder in this transaction described above.
For purposes of the servicing of the Kroger (Roundy’s) Distribution Center whole loan and the Mall at Turtle Creek whole loan, the occurrence and continuance of a Control Termination Event or Consultation Termination Event under this securitization will not limit the consultation and other rights of the holder of thepari passu companion loan(s).
Notwithstanding any contrary description set forth above, with respect to The Mall at Rockingham Park mortgage loan, in general the related whole loan will be serviced under the BBSG 2016-MRP trust and servicing agreement, which grants the related directing certificateholder (or equivalent) control rights that may include the right to approve or disapprove various material servicing actions involving the related whole loan. The directing certificateholder for this securitization (so long as no Consultation Termination Event has occurred and is occurring) will have the right to be consulted on a non-binding basis with respect to such actions, provided that such rights will only be exercisable upon and during the termination of a subordinate control period under the BBSG 2016-MRP trust and servicing agreement. For purposes of the servicing of The Mall at Rockingham Park whole loan, the occurrence and continuance of a Control Termination Event or Consultation Termination Event under this securitization will not limit the control or other rights of the directing certificateholder (or equivalent) under the BBSG 2016-MRP securitization.
Also, notwithstanding any contrary description set forth above, with respect to the In-Rel 8 mortgage loan, in general the related whole loan will be serviced under the BACM 2016-UBS10 pooling and servicing agreement, which grants the related directing certificateholder control rights that may include the right to approve or disapprove various material servicing actions involving the related whole loan, but the directing certificateholder for this securitization (so long as no Consultation Termination Event has occurred and is occurring) will nonetheless have the right to be consulted on a non-binding basis with respect to such actions. For purposes of the servicing of the In-Rel 8 whole loan, the occurrence and continuance of a Control Termination Event or Consultation Termination Event under this securitization will not limit the control or other rights of the directing certificateholder under the BACM 2016-UBS10 securitization.
Also, notwithstanding any contrary description set forth above, with respect to the Pinnacle II mortgage loan, in general, the Pinnacle II whole loan will be serviced (i) prior to the Servicing Shift Securitization Date, under the WFCM 2016-C35 pooling and servicing agreement, and (ii) after the Servicing Shift Securitization Date, under the Servicing Shift PSA, each of which grants, or is expected to grant, to the related controlling noteholder control rights that include the right to approve or disapprove various material servicing actions involving the Pinnacle II whole loan, but the directing certificateholder for this securitization will nonetheless have the right to be consulted on a nonbinding basis with respect to such actions. For purposes of the servicing of the Pinnacle II whole loan, the occurrence and continuance of a Control Termination Event or Consultation Termination Event under this securitization will not limit the control or other rights of the controlling noteholder of the Pinnacle II whole loan. The securitization of the related controllingpari passu companion loan will not limit the consultation rights of the directing certificateholder under this securitization.
Notwithstanding any contrary description set forth above, in the event that, with respect to any mortgage loan, the majority controlling class certificateholder or the directing certificateholder is (i) a borrower, a mortgagor or a manager of a mortgaged property, or the holder of a mezzanine loan that has accelerated the related mezzanine loan or commenced foreclosure or enforcement proceedings against the equity collateral pledged to secure the related mezzanine loan or any affiliate thereof, (ii) with respect to borrower, a mortgagor, a manager of a Mortgaged Property or a mezzanine lender that has accelerated the related mezzanine loan or commenced foreclosure or enforcement proceedings against the equity collateral pledged to | ||
THE INFORMATION IN THIS STRUCTURAL AND COLLATERAL TERM SHEET IS NOT COMPLETE AND MAY BE AMENDED PRIOR TO THE TIME OF SALE. THIS TERM SHEET IS NOT AN OFFER TO SELL THESE SECURITIES AND IT IS NOT A SOLICITATION OF AN OFFER TO BUY THESE SECURITIES IN ANY JURISDICTION WHERE THE OFFER OR SALE IS NOT PERMITTED.
| 20 |
| Wells Fargo Commercial Mortgage Trust 2016-C35 | Certain Terms and Conditions |
secure the related mezzanine loan, (x) any other person controlling or controlled by or under common control with such borrower, mortgagor, manager or mezzanine lender, as applicable, or (y) any other person owning, directly or indirectly, 25% or more of the beneficial interests in such borrower, mortgagor, manager or mezzanine lender (each, a “borrower party”), the majority controlling class certificateholder and the directing certificateholder will have no right to receive asset status reports or such other information as may be specified in the pooling and servicing agreement, to grant or withhold approval of, or consult with respect to, asset status reports prepared, and material servicing actions proposed, by the applicable Special Servicer, with respect to such mortgage loan, and such mortgage loan will be referred to as an “Excluded Loan”.
In addition, notwithstanding any contrary description set forth above, in the event that, with respect to any mortgage loan, a controlling class certificateholder is a borrower party, such controlling class certificateholder will have no right to receive asset status reports or such other information as may be specified in the pooling and servicing agreement with respect to such mortgage loan, and such controlling class certificateholder will be referred to as an “excluded controlling class holder”. | ||
Replacement of Special Servicer by General Vote of Certificateholders: | If a Control Termination Event has occurred and is continuing, the applicable Special Servicer may be removed and replaced without cause upon the affirmative direction of certificate owners holding not less than 66-2/3% of a certificateholder quorum, following a proposal from certificate owners holding not less than 25% of the appraisal-reduced voting rights of all Certificates. The certificateholders who initiate a vote on a termination and replacement of the applicable Special Servicer without cause must cause Fitch, KBRA and Moody’s to confirm the then-current ratings of the certificates (or decline to review the matter) and cause the payment of the fees and expenses incurred in the replacement. If no Control Termination Event has occurred and is continuing, either Special Servicer may be replaced by the directing certificateholder, subject to Fitch, KBRA and Moody’s (and any Rating Agency rating any securities backed by any pari passu companion loan(s) serviced under this transaction) confirming the then-current ratings of the Certificates (and any certificates backed by any pari passucompanion loans serviced under this transaction) or declining to review the matter. | |
| Excluded Special Servicer: | In the event that, with respect to any mortgage loan, a Special Servicer is a borrower party, such Special Servicer will be required to resign as special servicer of such mortgage loan (referred to as an “excluded special servicer loan”). If no Control Termination Event has occurred and is continuing, the directing certificateholder will be entitled to appoint (and may replace with or without cause) a separate special servicer that is not a borrower party (referred to as an “excluded special servicer”) with respect to such excluded special servicer loan unless such excluded special servicer loan is also an excluded loan. Otherwise, upon resignation of the applicable Special Servicer with respect to an excluded special servicer loan, such resigning Special Servicer will be required to appoint the excluded special servicer. | |
| Appraisal Remedy: | If the Class of Certificates comprising the controlling class loses its status as controlling class because of the application of an Appraisal Reduction Amount or Collateral Deficiency Amount, the holders of a majority of the Voting Rights of such Class may require the applicable Special Servicer to order a second appraisal for any mortgage loan in respect of which an Appraisal Reduction Amount or Collateral Deficiency Amount has been applied. Such Special Servicer must thereafter determine whether, based on its assessment of such second appraisal, any recalculation of the Appraisal Reduction Amount or Collateral Deficiency Amount is warranted. Such Class will not be able to exercise any direction, control, consent and/or similar rights of the controlling class unless and until reinstated as the controlling class through such determination; and pending such determination, the rights of the controlling class will be exercised by the control eligible certificates (which may only be any one of Class E, F and G), if any, that would be the controlling class taking into account the subject appraisal reduction amount. | |
| Sale of Defaulted Assets: | There will be no “fair value” purchase option. Instead, the pooling and servicing agreement will authorize each Special Servicer to sell defaulted mortgage loans serviced by such Special Servicer to the highest bidder in a manner generally similar to sales of REO properties.
The sale of a defaulted loan (other than with respect toThe Mall at Rockingham Park whole loan, the In-Rel 8 whole loan and the Pinnacle II whole loan) for less than par plus accrued interest and certain other fees and expenses owed on the loan will be subject to consent or consultation rights of the directing certificateholder and/or Operating Advisor and, in the case of the Kroger (Roundy’s) Distribution Center whole loan and the Mall at Turtle Creek whole loan, consultation rights of the holders of the relatedpari passu companion loan(s), as described in the Preliminary Prospectus.
In the case of the Kroger (Roundy’s) Distribution Center whole loan and the Mall at Turtle Creek whole loan, pursuant to the related intercreditor agreement and the pooling and servicing agreement, if the applicable Special Servicer offers to sell to any person (or offers to purchase) for cash such mortgage loan during such time as the related whole loan constitutes a defaulted mortgage loan, then in connection with any such sale, the applicable Special Servicer is | |
THE INFORMATION IN THIS STRUCTURAL AND COLLATERAL TERM SHEET IS NOT COMPLETE AND MAY BE AMENDED PRIOR TO THE TIME OF SALE. THIS TERM SHEET IS NOT AN OFFER TO SELL THESE SECURITIES AND IT IS NOT A SOLICITATION OF AN OFFER TO BUY THESE SECURITIES IN ANY JURISDICTION WHERE THE OFFER OR SALE IS NOT PERMITTED.
| 21 |
| Wells Fargo Commercial Mortgage Trust 2016-C35 | Certain Terms and Conditions |
| required to sell both the mortgage loan and the relatedpari passu companion loan(s) as a single whole loan
In the case of The Mall at Rockingham Park mortgage loan, pursuant to the BBSG 2016-MRP trust and servicing agreement and the related intercreditor agreement, as applicable, the BBSG 2016-MRP special servicer may offer to sell to any person (or may offer to purchase) for cash the related whole loan during such time as the related companion loan constitutes a defaulted mortgage loan under the BBSG 2016-MRP trust and servicing agreement, and, in connection with any such sale, the BBSG 2016-MRP special servicer is required to sell both the mortgage loan and the relatedpari passu companion loan(s) and subordinate companion loans as a whole loan. The directing certificateholder for this securitization will have consultation rights as the holder of an interest in the related mortgage loan, as described in the Preliminary Prospectus.
In the case of the In-Rel 8 mortgage loan, pursuant to the BACM 2016-UBS10 pooling and servicing agreement and the related intercreditor agreement, as applicable, the BACM 2016-UBS10 special servicer may offer to sell to any person (or may offer to purchase) for cash the related whole loan during such time as the related companion loan constitutes a defaulted mortgage loan under the BACM 2016-UBS10 pooling and servicing agreement, and, in connection with any such sale, the BACM 2016-UBS10 special servicer is required to sell both the mortgage loan and the relatedpari passu companion loan(s) as a whole loan. The directing certificateholder for this securitization will have consultation rights as the holder of an interest in the related mortgage loan, provided that such rights will only be exercisable upon and during the termination of a subordinate control period under the BBSG 2016-MRP trust and servicing agreement, as described in the Preliminary Prospectus.
In the case of the Pinnacle II mortgage loan, prior to the Servicing Shift Securitization Date, pursuant to the related intercreditor agreement and the WFCM 2016-C35 pooling and servicing agreement, the applicable Special Servicer may, at the direction or upon the advice of the holder of the controllingpari passu companion loan, offer to sell to any person (or may offer to purchase) for cash the Pinnacle II whole loan during such time as the Pinnacle II mortgage loan constitutes a defaulted mortgage loan under the WFCM 2016-C35 pooling and servicing agreement, and, in connection with any such sale, the applicable Special Servicer is required to sell both the applicable mortgage loan and the relatedpari passu companion loans as a whole loan. After the Servicing Shift Securitization Date, pursuant to the related intercreditor agreement, the party acting as special servicer with respect to the Pinnacle II whole loan pursuant to the Servicing Shift PSA, may offer to sell to any person (or may offer to purchase) for cash such loan, and, in connection with any such sale, such special servicer is required to sell both the Pinnacle II mortgage loan and the relatedpari passu companion loans as a whole loan. The directing certificateholder for this securitization will have consultation rights as the holder of an interest in the related mortgage loan, as described in the Preliminary Prospectus.
| ||
| “As-Is” Appraisals: | Appraisals must be conducted on an “as-is” basis, and must be no more than 9 months old, for purposes of determining Appraisal Reduction Amounts and market value in connection with REO sales. Required appraisals may consist of updates of prior appraisals. Internal valuations by the applicable Special Servicer are permitted if the principal balance of a mortgage loan is less than $2,000,000.
| |
| Operating Advisor: | The Operating Advisor will perform certain review duties if a Control Termination Event has occurred and is continuing, which will generally include a limited annual review of, and the delivery of a report regarding, certain actions of each Special Servicer with respect to the resolution and/or liquidation of specially serviced loans to the Certificate Administrator. The review and report generally will be based on any asset status reports and additional information delivered to the Operating Advisor by each Special Servicer. In addition, if a Control Termination Event has occurred and is continuing, each Special Servicer must seek to consult with the Operating Advisor (in addition to the directing certificateholder if no Consultation Termination Event has occurred and is continuing) in connection with material special servicing actions with respect to specially serviced loans serviced by such Special Servicer. Furthermore, under certain circumstances, but only if a Consultation Termination Event has occurred and is continuing, the Operating Advisor may recommend the replacement of a Special Servicer, in which case the Certificate Administrator will deliver notice of such recommendation to the certificateholders, and certificateholders with specified percentages of the voting rights may direct the replacement of such Special Servicer at their expense.
If a Consultation Termination Event has occurred and is continuing, the Operating Advisor may be removed and replaced without cause upon the affirmative direction of certificate owners holding not less than 75% of the appraisal-reduced voting rights of all Principal Balance Certificates, following a proposal from certificate owners holding not less than 25% of the appraisal-reduced voting rights of all certificates. The certificateholders who initiate a vote on a termination and replacement of the Operating Advisor without cause must cause Fitch, KBRA and Moody’s to confirm the then-current ratings of the certificates (or decline to review the matter) and cause the payment of the fees and expenses incurred in the replacement. The Operating Advisor generally may be discharged from its duties if and when the Class A-1, A-2, A-3, A-4, A-SB, A-S, B, C and D Certificates are retired. | |
THE INFORMATION IN THIS STRUCTURAL AND COLLATERAL TERM SHEET IS NOT COMPLETE AND MAY BE AMENDED PRIOR TO THE TIME OF SALE. THIS TERM SHEET IS NOT AN OFFER TO SELL THESE SECURITIES AND IT IS NOT A SOLICITATION OF AN OFFER TO BUY THESE SECURITIES IN ANY JURISDICTION WHERE THE OFFER OR SALE IS NOT PERMITTED.
| 22 |
| Wells Fargo Commercial Mortgage Trust 2016-C35 | Certain Terms and Conditions |
| Asset Representations Reviewer: | The Asset Representations Reviewer will be required to review certain delinquent mortgage loans after a specified delinquency threshold has been exceeded (an “Asset Review Trigger”) and the required percentage of certificateholders vote to direct a review of such delinquent loans. An Asset Review Trigger will occur when either (1) mortgage loans with an aggregate outstanding principal balance of 25.0% or more of the aggregate outstanding principal balance of all of the mortgage loans (including any REO loans (or a portion of any REO loan in the case of a whole loan) held by the issuing entity as of the end of the applicable collection period are delinquent loans or (2) at least 15 mortgage loans are delinquent loans as of the end of the applicable collection period and the outstanding principal balance of such delinquent loans in the aggregate constitutes at least 20.0% of the aggregate outstanding principal balance of all of the mortgage loans (including any REO loans (or a portion of any REO loan in the case of a whole loan)) held by the issuing entity as of the end of the applicable collection period. See “Pooling and Servicing Agreement—The Asset Representations Reviewer—Asset Review” in the Preliminary Prospectus.
The Asset Representations Reviewer may be terminated and replaced without cause. Upon (i) the written direction of certificateholders evidencing not less than 25% of the voting rights (without regard to the application of any Appraisal Reduction Amounts) requesting a vote to terminate and replace the Asset Representations Reviewer with a proposed successor Asset Representations Reviewer that is an eligible asset reviewer, and (ii) payment by such holders to the certificate administrator of the reasonable fees and expenses to be incurred by the certificate administrator in connection with administering such vote, the certificate administrator will promptly provide notice to all certificateholders and the Asset Representations Reviewer of such request by posting such notice on its internet website, and by mailing such notice to all certificateholders and the Asset Representations Reviewer. Upon the written direction of certificateholders evidencing at least 75% of a certificateholder quorum (without regard to the application of any Appraisal Reduction Amounts), the Trustee will terminate all of the rights and obligations of the Asset Representations Reviewer under the pooling and servicing agreement by written notice to the Asset Representations Reviewer, and the proposed successor Asset Representations Reviewer will be appointed. See “Pooling and Servicing Agreement—The Asset Representations Reviewer” in the Preliminary Prospectus.
| |
Dispute Resolution Provisions: | The mortgage loan sellers will be subject to the dispute resolution provisions set forth in the pooling and servicing agreement to the extent those provisions are triggered with respect to any mortgage loan sold to the depositor by a mortgage loan seller and such mortgage loan seller will be obligated under the related mortgage loan purchase agreement to comply with all applicable provisions and to take part in any mediation or arbitration proceedings that may result.
Generally, in the event that a Repurchase Request (as defined in the Preliminary Prospectus) is not “Resolved” (as defined below) within 180 days after the related mortgage loan seller receives such Repurchase Request, then the enforcing servicer will be required to send a notice to the “Initial Requesting Certificateholder” (if any) and the Certificate Administrator indicating the enforcing servicer’s intended course of action with respect to the Repurchase Request. If (a) the enforcing servicer’s intended course of action with respect to the Repurchase Request does not involve pursuing further action to exercise rights against the related mortgage loan seller with respect to the Repurchase Request and the Initial Requesting Certificateholder, if any, or any other certificateholder or certificate owner wishes to exercise its right to refer the matter to mediation (including nonbinding arbitration) or arbitration, or (b) the enforcing servicer’s intended course of action is to pursue further action to exercise rights against the related mortgage loan seller with respect to the Repurchase Request but the Initial Requesting Certificateholder, if any, or any other certificateholder or certificate owner does not agree with the dispute resolution method selected by the enforcing servicer, then the Initial Requesting Certificateholder, if any, or such other certificateholder or certificate owner may deliver a written notice to the applicable Special Servicer indicating its intent to exercise its right to refer the matter to either mediation or arbitration.
| |
| “Resolved” means, with respect to a Repurchase Request, (i) that the related Material Defect has been cured, (ii) the related mortgage loan has been repurchased in accordance with the related mortgage loan purchase agreement, (iii) a mortgage loan has been substituted for the related mortgage loan in accordance with the related mortgage loan purchase agreement, (iv) the applicable mortgage loan seller makes a Loss of Value Payment (as defined in the Preliminary Prospectus), (v) a contractually binding agreement is entered into between the enforcing servicer, on behalf of the issuing entity, and the related mortgage loan seller that settles the related mortgage loan seller’s obligations under the related mortgage loan purchase agreement, or (vi) the related mortgage loan is no longer property of the issuing entity as a result of a sale or other disposition in accordance with the pooling and servicing agreement. See “Pooling and Servicing Agreement—Dispute Resolution Provisions” in the Preliminary Prospectus. | ||
THE INFORMATION IN THIS STRUCTURAL AND COLLATERAL TERM SHEET IS NOT COMPLETE AND MAY BE AMENDED PRIOR TO THE TIME OF SALE. THIS TERM SHEET IS NOT AN OFFER TO SELL THESE SECURITIES AND IT IS NOT A SOLICITATION OF AN OFFER TO BUY THESE SECURITIES IN ANY JURISDICTION WHERE THE OFFER OR SALE IS NOT PERMITTED.
| 23 |
| Wells Fargo Commercial Mortgage Trust 2016-C35 | Certain Terms and Conditions |
| Investor Communications: | The certificate administrator is required to include on any Form 10–D any request received from a certificateholder to communicate with other certificateholders related to certificateholders exercising their rights under the terms of the pooling and servicing agreement. Any certificateholder wishing to communicate with other certificateholders regarding the exercise of its rights under the terms of the Pooling and Servicing Agreement will be able to deliver a written request signed by an authorized representative of the requesting investor to the certificate administrator. | |
| Certain Fee Offsets: | If a workout fee is earned by a Special Servicer following a loan default with respect to any mortgage loan that it services, then certain limitations will apply based on modification fees paid by the borrower. The modification fee generally must not exceed 1% of the principal balance of the loan as modified in any 12-month period. In addition, if the loan re-defaults, any subsequent workout fee on that loan must be reduced by a portion of the modification fees paid by the borrower in the previous 12-months. Likewise, liquidation fees collected in connection with a liquidation or partial liquidation of a mortgage loan must be reduced by a portion of the modification fees paid by the borrower in the previous 12 months. | |
| Deal Website: | The Certificate Administrator will be required to maintain a deal website which will include, among other items: (a) summaries of asset status reports prepared by each Special Servicer, (b) inspection reports, (c) appraisals, (d) various “special notices” described in the Preliminary Prospectus, (e) the “Investor Q&A Forum” and (f) a voluntary “Investor Registry”. Investors may access the deal website following execution of a certification and confidentiality agreement. | |
Initial Majority Controlling Class Certificateholder: | It is expected that BIG Real Estate Fund I, L.P. will be the initial majority controlling class certificateholder. | |
| Whole Loans: | The mortgaged properties identified on Annex A-1 to the Preliminary Prospectus as The Mall at Rockingham Park, Kroger (Roundy’s) Distribution Center, Mall at Turtle Creek, In-Rel 8 and Pinnacle II secure both a mortgage loan to be included in the trust fund and one or more other mortgage loans that will not be included in the trust fund, which will bepari passuor subordinate in right of payment with the mortgage loan included in the trust fund. We refer to each such group of mortgage loans as a “whole loan”. The Kroger (Roundy’s) Distribution Center whole loan and the Mall at Turtle Creek whole loan will be principally serviced under the pooling and servicing agreement for this securitization. The Mall at Rockingham whole loan will be principally serviced under the trust and servicing agreement for the BBSG 2016-MRP securitization. The In-Rel 8 whole loan will be principally serviced under the pooling and servicing agreement for the BACM 2016-UBS10 securitization. It is expected that prior to the Servicing Shift Securitization Date, the Pinnacle II whole loan will be serviced under the pooling and servicing agreement for this securitization, and after the Servicing Shift Securitization Date, the Pinnacle II whole loan will be serviced under the Servicing Shift PSA.
As of the closing date, the companion loan in such whole loan will be held by the party identified above under “IV. Characteristics of the Mortgage Pool—B. Summary of thePari PassuWhole Loans”. | |
THE INFORMATION IN THIS STRUCTURAL AND COLLATERAL TERM SHEET IS NOT COMPLETE AND MAY BE AMENDED PRIOR TO THE TIME OF SALE. THIS TERM SHEET IS NOT AN OFFER TO SELL THESE SECURITIES AND IT IS NOT A SOLICITATION OF AN OFFER TO BUY THESE SECURITIES IN ANY JURISDICTION WHERE THE OFFER OR SALE IS NOT PERMITTED.
| 24 |
(THIS PAGE INTENTIONALLY LEFT BLANK)
THE INFORMATION IN THIS STRUCTURAL AND COLLATERAL TERM SHEET IS NOT COMPLETE AND MAY BE AMENDED PRIOR TO THE TIME OF SALE. THIS TERM SHEET IS NOT AN OFFER TO SELL THESE SECURITIES AND IT IS NOT A SOLICITATION OF AN OFFER TO BUY THESE SECURITIES IN ANY JURISDICTION WHERE THE OFFER OR SALE IS NOT PERMITTED.
| 25 |
(THIS PAGE INTENTIONALLY LEFT BLANK)
THE INFORMATION IN THIS STRUCTURAL AND COLLATERAL TERM SHEET IS NOT COMPLETE AND MAY BE AMENDED PRIOR TO THE TIME OF SALE. THIS TERM SHEET IS NOT AN OFFER TO SELL THESE SECURITIES AND IT IS NOT A SOLICITATION OF AN OFFER TO BUY THESE SECURITIES IN ANY JURISDICTION WHERE THE OFFER OR SALE IS NOT PERMITTED.
| 26 |
| EPPS BRIDGE CENTRE |
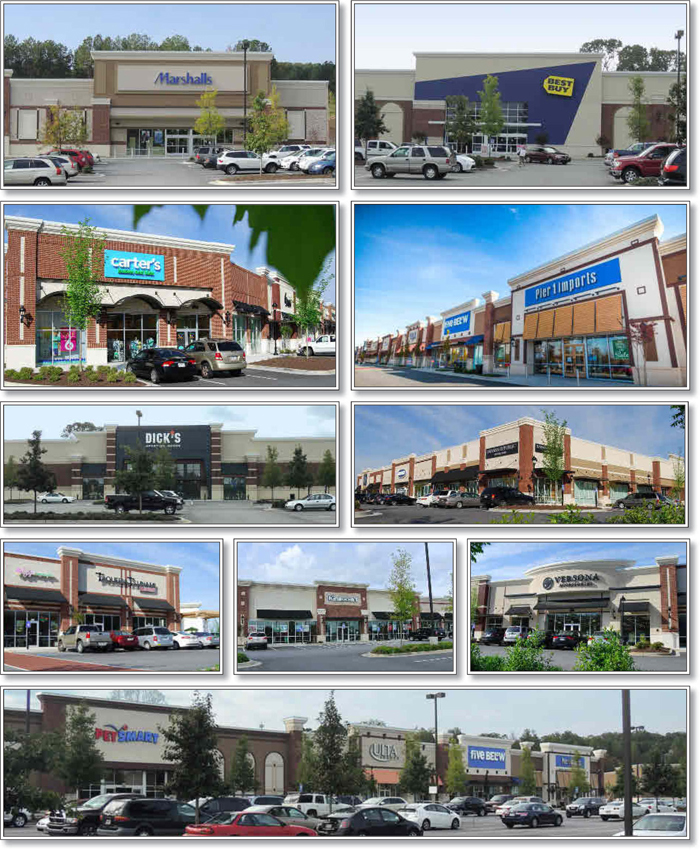
THE INFORMATION IN THIS STRUCTURAL AND COLLATERAL TERM SHEET IS NOT COMPLETE AND MAY BE AMENDED PRIOR TO THE TIME OF SALE. THIS TERM SHEET IS NOT AN OFFER TO SELL THESE SECURITIES AND IT IS NOT A SOLICITATION OF AN OFFER TO BUY THESE SECURITIES IN ANY JURISDICTION WHERE THE OFFER OR SALE IS NOT PERMITTED.
| 27 |
| EPPS BRIDGE CENTRE |
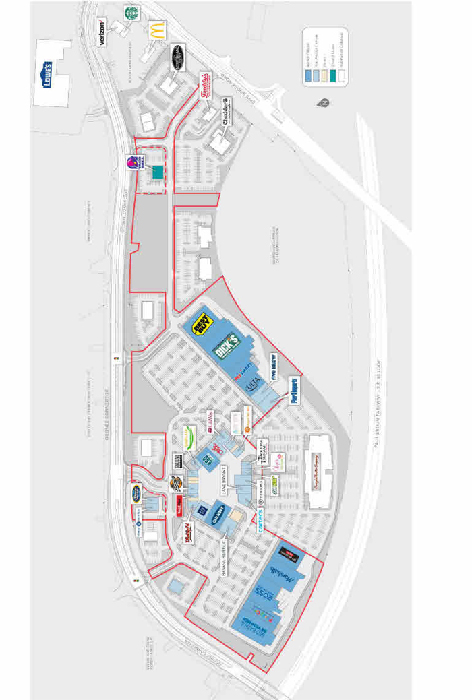
THE INFORMATION IN THIS STRUCTURAL AND COLLATERAL TERM SHEET IS NOT COMPLETE AND MAY BE AMENDED PRIOR TO THE TIME OF SALE. THIS TERM SHEET IS NOT AN OFFER TO SELL THESE SECURITIES AND IT IS NOT A SOLICITATION OF AN OFFER TO BUY THESE SECURITIES IN ANY JURISDICTION WHERE THE OFFER OR SALE IS NOT PERMITTED.
| 28 |
| EPPS BRIDGE CENTRE |
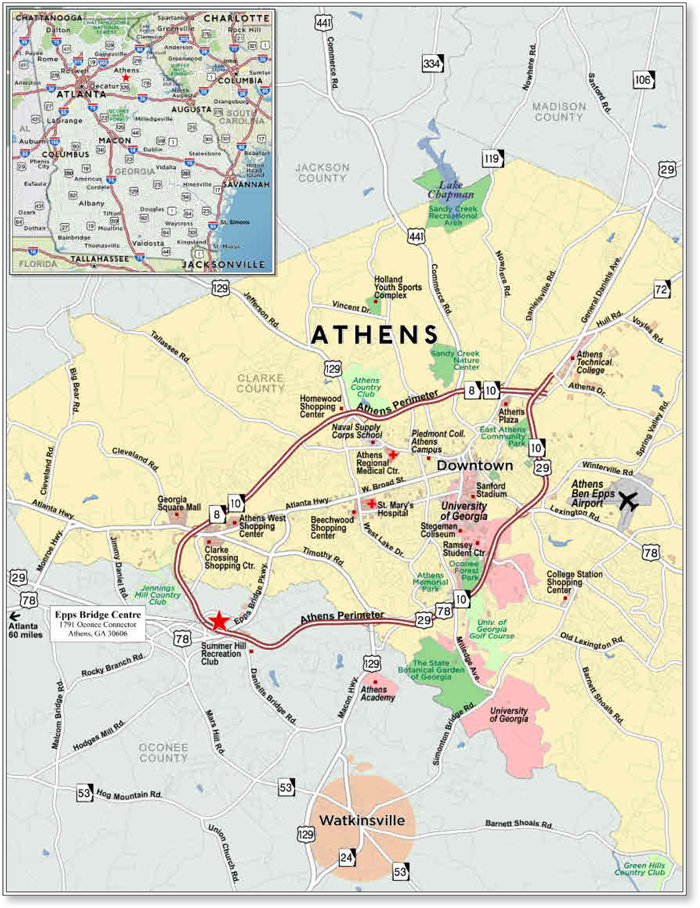
THE INFORMATION IN THIS STRUCTURAL AND COLLATERAL TERM SHEET IS NOT COMPLETE AND MAY BE AMENDED PRIOR TO THE TIME OF SALE. THIS TERM SHEET IS NOT AN OFFER TO SELL THESE SECURITIES AND IT IS NOT A SOLICITATION OF AN OFFER TO BUY THESE SECURITIES IN ANY JURISDICTION WHERE THE OFFER OR SALE IS NOT PERMITTED.
| 29 |
| No. 1 – Epps Bridge Centre | ||||||||
| Loan Information | Property Information | |||||||
| Mortgage Loan Seller: | Rialto Mortgage Finance, LLC | Single Asset/Portfolio: | Single Asset | |||||
| Credit Assessment (Fitch/KBRA/Moody’s): | NR/NR/NR | Property Type: | Retail | |||||
| Original Principal Balance: | $64,500,000 | Specific Property Type: | Anchored | |||||
| Cut-off Date Balance: | $64,500,000 | Location: | Athens, GA | |||||
| % of Initial Pool Balance: | 6.3% | Size: | 336,554 SF | |||||
| Loan Purpose: | Refinance | Cut-off Date Balance Per SF: | $191.65 | |||||
| Borrower Name: | Epps Bridge Centre Property Company, LLC | Year Built/Renovated: | 2013/NAP | |||||
| Sponsor: | E. Stanley Kroenke | Title Vesting: | Fee | |||||
| Mortgage Rate: | 4.710% | Property Manager: | Self-managed | |||||
| Note Date: | June 3, 2016 | 4th Most Recent Occupancy(2): | NAV | |||||
| Anticipated Repayment Date: | NAP | 3rd Most Recent Occupancy (As of)(2): | 60.9% (12/31/2013) | |||||
| Maturity Date: | June 6, 2026 | 2nd Most Recent Occupancy (As of)(2): | 74.6% (12/31/2014) | |||||
| IO Period: | 120 months | Most Recent Occupancy (As of)(2): | 87.2% (12/31/2015) | |||||
| Loan Term (Original): | 120 months | Current Occupancy (As of)(2): | 97.5% (4/15/2016) | |||||
| Seasoning: | 1 month | |||||||
| Amortization Term (Original): | NAP | Underwriting and Financial Information: | ||||||
| Loan Amortization Type: | Interest-only, Balloon | 4th Most Recent NOI (As of)(3): | $562,349 (12/31/2013) | |||||
| Interest Accrual Method: | Actual/360 | 3rd Most Recent NOI (As of)(3): | $3,633,408 (12/31/2014) | |||||
| Call Protection: | L(23),GRTR 1% or YM(93),O(4) | 2nd Most Recent NOI (As of)(3): | $4,308,116 (12/31/2015) | |||||
| Lockbox Type: | Springing | Most Recent NOI (As of): | $4,709,439 (TTM 5/31/2016) | |||||
| Additional Debt: | None | |||||||
| Additional Debt Type: | NAP | U/W Revenues: | $6,601,605 | |||||
| U/W Expenses: | $1,314,961 | |||||||
| U/W NOI(3): | $5,286,644 | |||||||
| U/W NCF(3): | $5,118,367 | |||||||
| U/W NOI DSCR: | 1.72x | |||||||
| Escrows and Reserves(1): | U/W NCF DSCR: | 1.66x | ||||||
| U/W NOI Debt Yield: | 8.2% | |||||||
| Type: | Initial | Monthly | Cap (If Any) | U/W NCF Debt Yield: | 7.9% | |||
| Taxes | $0 | Springing | NAP | As-Is Appraised Value: | $96,500,000 | |||
| Insurance | $0 | Springing | NAP | As-Is Appraisal Valuation Date: | April 26, 2016 | |||
| Replacement Reserves | $0 | Springing | NAP | Cut-off Date LTV Ratio: | 66.8% | |||
| TI/LC Reserve | $0 | Springing | $1,090,439 | LTV Ratio at Maturity or ARD: | 66.8% | |||
| (1) | See “Escrows” section. |
| (2) | See “Historical Occupancy” section. |
| (3) | See “Cash Flow Analysis” section. |
The Mortgage Loan. The mortgage loan (the “Epps Bridge Centre Mortgage Loan”) is evidenced by a single promissory note that is secured by a first mortgage encumbering an anchored retail property located in Athens, Georgia (the “Epps Bridge Centre Property”). The Epps Bridge Centre Mortgage Loan was originated on June 3, 2016 by Rialto Mortgage Finance, LLC. The Epps Bridge Centre Mortgage Loan had an original principal balance of $64,500,000, has an outstanding principal balance as of the Cut-off Date of $64,500,000 and accrues interest at an interest rate of 4.710%per annum. The Epps Bridge Centre Mortgage Loan had an initial term of 120 months, has a remaining term of 119 months as of the Cut-off Date and requires interest-only payments through the term of the Epps Bridge Centre Mortgage Loan. The Epps Bridge Centre Mortgage Loan matures on June 6, 2026.
Following the lockout period, the borrower has the right to voluntarily prepay the Epps Bridge Centre Mortgage Loan in whole, but not in part, on any date before March 6, 2026 provided that the borrower pays the greater of a yield maintenance premium or a prepayment premium equal to 1.0% of the then outstanding principal balance. In addition, the Epps Bridge Centre Mortgage Loan is prepayable without penalty on or after March 6, 2026.
THE INFORMATION IN THIS STRUCTURAL AND COLLATERAL TERM SHEET IS NOT COMPLETE AND MAY BE AMENDED PRIOR TO THE TIME OF SALE. THIS TERM SHEET IS NOT AN OFFER TO SELL THESE SECURITIES AND IT IS NOT A SOLICITATION OF AN OFFER TO BUY THESE SECURITIES IN ANY JURISDICTION WHERE THE OFFER OR SALE IS NOT PERMITTED.
| 30 |
| EPPS BRIDGE CENTRE |
Sources and Uses
| Sources | Uses | |||||||
| Original loan amount | $64,500,000 | 100.0% | Loan payoff | $49,322,837 | 76.5% | |||
| Closing costs | 434,544 | 0.7 | ||||||
| Return of equity | 14,742,619 | 22.9 | ||||||
| Total Sources | $64,500,000 | 100.0% | Total Uses | $64,500,000 | 100.0% |
The Property.The Epps Bridge Centre Property is an anchored retail center containing approximately 336,554 square feet of retail space and located in Athens, Georgia. Built between 2013 and 2015, the Epps Bridge Centre Property consists of seven, one-story buildings situated on a 39.6-acre parcel. The Epps Bridge Centre Property is anchored by Dick’s Sporting Goods, Best Buy, Marshall’s, Ross Dress for Less, and Bed Bath & Beyond and junior anchored by PetSmart, Ulta, Off Broadway, Party City, Kinnucan’s, and Old Navy. Additionally, the Epps Bridge Centre Property is anchored by a non-collateral movie theater operated by Georgia Theatre Company, which contains 60,000 square feet and 16 screens. Additional non-collateral out parcels at the Epps Bridge Centre Property include Cheddar’s restaurant, Freddy’s Restaurant, and Bone Island Grillhouse. Parking is provided via 1,321 surface parking spaces, resulting in a parking ratio of 3.9 spaces per 1,000 square feet of rentable area. As of April 15, 2016, the Epps Bridge Centre Property was 97.5%leased to 33 tenants (and 96.8% physically occupied). See “Historical Occupancy” section.
The following table presents certain information relating to the tenancies at the Epps Bridge Centre Property:
Major Tenants
| Tenant Name | Credit Rating (Fitch/ Moody’s/ S&P)(1) | Tenant NRSF | % of NRSF | Annual U/W Base Rent PSF(2) | Annual U/W Base Rent(2) | % of Total Annual U/W Base Rent | Sales PSF(3) | Occupancy Cost(3) | Lease Expiration Date |
| Anchor Tenants – Not Part of Collateral | |||||||||
| Georgia Theatre Company | NR/NR/NR | 60,000 | ANCHOR-OWNED – NOT PART OF THE COLLATERAL | ||||||
| Anchor Tenants – Collateral | |||||||||
| Dick’s Sporting Goods | NR/NR/NR | 50,000 | 14.9% | $12.95 | $647,500 | 11.7% | NAV | NAV | 1/31/2024(4) |
| Best Buy | BBB-/Baa1/BB+ | 30,000 | 8.9% | $13.05 | $391,500 | 7.1% | $967 | 1.7% | 1/31/2025(5) |
| Ross Dress for Less | NR/A3/A- | 25,000 | 7.4% | $13.45 | $336,250 | 6.1% | NAV | NAV | 1/31/2027(6) |
| Bed Bath & Beyond | NR/Baa1/BBB+ | 24,000 | 7.1% | $13.75 | $330,000 | 6.0% | NAV | NAV | 1/31/2026(7) |
| Marshall’s | NR/A2/A+ | 26,000 | 7.7% | $9.50 | $247,000 | 4.5% | $266 | 4.6% | 8/31/2023(8) |
| Total Anchor Tenants – Collateral | 155,000 | 46.1% | $12.60 | $1,952,250 | 35.3% | ||||
| Major Tenants – Collateral | |||||||||
| PetSmart | NR/B1/B+ | 18,178 | 5.4% | $16.85 | $306,299 | 5.5% | NAV | NAV | 1/31/2024(9) |
| Off Broadway | NR/NR/NR | 18,000 | 5.3% | $14.25 | $256,500 | 4.6% | NAV | NAV | 1/31/2024(10) |
| Party City | NR/B3/NR | 15,000 | 4.5% | $15.83 | $237,450 | 4.3% | NAV | NAV | 1/31/2026(11) |
| Ulta | NR/NR/NR | 10,047 | 3.0% | $23.50 | $236,105 | 4.3% | $768 | 3.5% | 9/30/2023(12) |
| Kinnucan’s | NR/NR/NR | 10,800 | 3.2% | $21.20 | $228,960 | 4.1% | $425 | 6.0% | 8/31/2024(13) |
| Old Navy | BB+/Baa2/BB+ | 15,326 | 4.6% | $15.00 | $229,890 | 4.2% | $378 | 4.9% | 8/31/2023(14) |
| Total Major Tenants – Collateral | 87,351 | 26.0% | $17.12 | $1,495,204 | 27.0% | ||||
| Outparcel / Non-Major Tenants – Collateral(15) | 85,803 | 25.5% | $24.32 | $2,086,553 | 37.7% | ||||
| Occupied Collateral Total | 328,154 | 97.5% | $16.86 | $5,534,006 | 100.0% | ||||
| Vacant Space | 8,400 | 2.5% | |||||||
| Collateral Total | 336,554 | 100.0% | |||||||
| (1) | Certain ratings are those of the parent company whether or not the parent guarantees the lease. |
| (2) | Annual U/W Base Rent PSF and Annual U/W Base Rent include contractual rent escalations totaling $14,748 through August 2017. |
| (3) | Sales PSF and Occupancy Costs are for the trailing 12-month period ending December 31, 2015. |
| (4) | Dick’s Sporting Goods has four, 5-year renewal options. |
| (5) | Best Buy has four, 5-year lease renewal options. |
| (6) | Ross Dress for Less has four, 5-year lease renewal options. |
| (7) | Bed Bath & Beyond has four, 5-year lease renewal options. |
| (8) | Marshall’s has four, 5-year lease renewal options. |
| (9) | PetSmart has four, 5-year lease renewal options. |
| (10) | Off Broadway has three, 5-year lease renewal options. |
| (11) | Party City has three, 5-year lease renewal options. |
| (12) | Ulta has two, 5-year lease renewal options. |
| (13) | Kinnucan’s has two, 5-year lease renewal options. |
| (14) | Old Navy has two, 5-year lease renewal options. |
| (15) | Taco Bell executed a ground lease with a lease commencement date of November 7, 2016. Taco Bell’s square footage is not attributed to square footage for the Epps Bridge Centre Property and is not included in Tenant NRSF and % of NRSF but the Annual U/W Base Rent of $85,000 is included. The % of Total Annual U/W Base Rent, Annual U/W Base Rent and Annual U/W Base Rent PSF for Outparcel / Non- Major Tenants – Collateral and Occupied Collateral Total include the Annual U/W Base Rent associated with the Taco Bell pad site. |
THE INFORMATION IN THIS STRUCTURAL AND COLLATERAL TERM SHEET IS NOT COMPLETE AND MAY BE AMENDED PRIOR TO THE TIME OF SALE. THIS TERM SHEET IS NOT AN OFFER TO SELL THESE SECURITIES AND IT IS NOT A SOLICITATION OF AN OFFER TO BUY THESE SECURITIES IN ANY JURISDICTION WHERE THE OFFER OR SALE IS NOT PERMITTED.
| 31 |
| EPPS BRIDGE CENTRE |
The following table presents certain information relating to the lease rollover schedule at the Epps Bridge Centre Property:
Lease Expiration Schedule(1)(2)
| Year Ending December 31, | No. of Leases Expiring | Expiring NRSF | % of Total NRSF | Cumulative Expiring NRSF | Cumulative% of Total NRSF | Annual U/W Base Rent | % of Total Annual U/W Base Rent | Annual U/W Base Rent PSF(3) |
| MTM | 0 | 0 | 0.0% | 0 | 0.0% | $0 | 0.0% | $0.00 |
| 2016 | 0 | 0 | 0.0% | 0 | 0.0% | $0 | 0.0% | $0.00 |
| 2017 | 0 | 0 | 0.0% | 0 | 0.0% | $0 | 0.0% | $0.00 |
| 2018 | 4 | 19,869 | 5.9% | 19,869 | 5.9% | $391,233 | 7.1% | $19.69 |
| 2019 | 5 | 16,500 | 4.9% | 36,369 | 10.8% | $409,704 | 7.4% | $24.83 |
| 2020 | 2 | 3,600 | 1.1% | 39,969 | 11.9% | $106,896 | 1.9% | $29.69 |
| 2021 | 3 | 7,107 | 2.1% | 47,076 | 14.0% | $186,375 | 3.4% | $26.22 |
| 2022 | 0 | 0 | 0.0% | 47,076 | 14.0% | $0 | 0.0% | $0.00 |
| 2023 | 8 | 79,100 | 23.5% | 126,176 | 37.5% | $1,349,339 | 24.4% | $17.06 |
| 2024 | 6 | 107,978 | 32.1% | 234,154 | 69.6% | $1,710,259 | 30.9% | $15.84 |
| 2025 | 1 | 30,000 | 8.9% | 264,154 | 78.5% | $391,500 | 7.1% | $13.05 |
| 2026 | 2 | 39,000 | 11.6% | 303,154 | 90.1% | $567,450 | 10.3% | $14.55 |
| Thereafter(4) | 2 | 25,000 | 7.4% | 328,154 | 97.5% | $421,250 | 7.6% | $16.85 |
| Vacant | 0 | 8,400 | 2.5% | 336,554 | 100.0% | $0 | 0.0% | $0.00 |
| Total/Weighted Average | 33 | 336,554 | 100.0% | $5,534,006 | 100.0% | $16.86 |
| (1) | Information obtained from the underwritten rent roll. |
| (2) | Certain tenants may have lease termination options that are exercisable prior to the originally stated expiration date of the subject lease and that are not considered in the Lease Expiration Schedule. |
| (3) | Weighted Average Annual U/W Base Rent PSF excludes vacant space. |
| (4) | Taco Bell executed a ground lease with a lease commencement date of November 7, 2016. Taco Bell’s square footage is not attributed to square footage for the Epps Bridge Centre Property and is not included in Expiring NRSF and % of Total NRSF but the Annual U/W Base Rent of $85,000 is included. The Annual U/W Base Rent PSF, % of Total Annual U/W Base Rent and Annual U/W Base Rent PSF include the Annual U/W Base Rent associated with the Taco Bell pad site. |
The following table presents historical occupancy percentages at the Epps Bridge Centre Property:
Historical Occupancy
12/31/2012(1) | 12/31/2013(1)(2) | 12/31/2014(1)(2) | 12/31/2015(1)(2) | 4/15/2016(3) |
| NAV | 60.9% | 74.6% | 87.2% | 97.5% |
| (1) | The Epps Bridge Centre Property was constructed in phases between 2013 and 2015. |
| (2) | Information obtained from the borrower. |
| (3) | Information obtained from the underwritten rent roll. Occupancy as of April 15, 2016 includes Wok’s Up (2,400 square feet) and Taco Bell (subject to a ground lease) each of which are completing the build out of their spaces and are expected to take occupancy in July and November 2016, respectively. Excluding Wok’s Up and Taco Bell, occupancy at the Epps Bridge Centre Property is 96.8%. |
Operating History and Underwritten Net Cash Flow. The following table presents certain information relating to the historical operating performance and underwritten net cash flow at the Epps Bridge Centre Property:
Cash Flow Analysis
| 2013(1) | 2014(1) | 2015(1) | TTM 5/31/2016(1) | U/W(1) | % of U/W Effective Gross Income | U/W $ per SF | |||||||
| Base Rent | $746,756 | $3,823,587 | $4,437,032 | $4,819,448 | $5,519,259 | 83.6% | $16.40 | ||||||
| Rent Steps | 0 | 0 | 0 | 0 | 14,748 | 0.2 | 0.04 | ||||||
| Grossed Up Vacant Space | 0 | 0 | 0 | 0 | 205,200 | 3.1 | 0.61 | ||||||
| Total Reimbursables | 105,603 | 726,706 | 864,433 | 911,748 | 1,206,513 | 18.3 | 3.58 | ||||||
| Other Income | 0 | 315 | 885 | 0 | 0 | 0.0 | 0.00 | ||||||
| Less Vacancy & Credit Loss | 0 | 0 | 0 | 0 | (344,114)(2) | (5.2) | (1.02) | ||||||
| Effective Gross Income | $852,358 | $4,550,608 | $5,302,350 | $5,731,196 | $6,601,605 | 100.0% | $19.62 | ||||||
| Total Operating Expenses | $290,010 | $917,200 | $994,234 | $1,021,758 | $1,314,961 | 19.9% | $3.91 | ||||||
| |||||||||||||
| Net Operating Income | $562,349 | $3,633,408 | $4,308,116 | $4,709,439 | $5,286,644 | 80.1% | $15.71 | ||||||
| TI/LC | 0 | 0 | 0 | 0 | 134,622 | 2.0 | 0.40 | ||||||
| Capital Expenditures | 0 | 0 | 0 | 0 | 33,655 | 0.5 | 0.10 | ||||||
| Net Cash Flow | $562,349 | $3,633,408 | $4,308,116 | $4,709,439 | $5,118,367 | 77.5% | $15.21 | ||||||
| NOI DSCR | 0.18x | 1.18x | 1.40x | 1.53x | 1.72x | ||||||||
| NCF DSCR | 0.18x | 1.18x | 1.40x | 1.53x | 1.66x | ||||||||
| NOI DY | 0.9% | 5.6% | 6.7% | 7.3% | 8.2% | ||||||||
| NCF DY | 0.9% | 5.6% | 6.7% | 7.3% | 7.9% |
| (1) | The Epps Bridge Centre Property was constructed in phases between 2013 and 2015, resulting in increased rental collections. |
| (2) | The underwritten economic vacancy is 5.0%. The Epps Bridge Centre Property was 97.5% physically occupied as of April 15, 2016 (which includes Wok’s Up (2,400 square feet) and Taco Bell (subject to a ground lease) each of which are completing the build out of their spaces and are expected to take occupancy in July and November 2016, respectively). |
THE INFORMATION IN THIS STRUCTURAL AND COLLATERAL TERM SHEET IS NOT COMPLETE AND MAY BE AMENDED PRIOR TO THE TIME OF SALE. THIS TERM SHEET IS NOT AN OFFER TO SELL THESE SECURITIES AND IT IS NOT A SOLICITATION OF AN OFFER TO BUY THESE SECURITIES IN ANY JURISDICTION WHERE THE OFFER OR SALE IS NOT PERMITTED.
| 32 |
| EPPS BRIDGE CENTRE |
Appraisal.As of the appraisal valuation date of April 26, 2016, the Epps Bridge Centre Property had an “as-is” appraised value of $96,500,000.
Environmental Matters.According to a Phase I environmental assessment dated April 11, 2016, there was no evidence of any recognized environmental conditions at the Epps Bridge Centre Property.
Market Overview and Competition.The Epps Bridge Centre Property is located in Athens, Georgia, within the Athens-Clarke County metropolitan statistical area in Oconee County, Georgia. Athens is located approximately 72.6 miles northeast of Atlanta’s central business district. The metropolitan statistical area serves as an employment, cultural, and business center for surrounding counties and is home to the University of Georgia, Athens Regional Medical Center, Island Apparel and St. Mary’s Hospital. The University of Georgia (“UGA”), located approximately 7.2 miles east of the Epps Bridge Centre Property, is the largest employer within the metropolitan statistical area. Founded in 1785, UGA directly employs approximately 10,000 people and its enrollment as of fall 2015 was 36,130 students. The Epps Bridge Centre Property is located approximately nine miles southwest of the Athens central business district near the intersection of U.S. Highway 78/Highway 316 and Loop 10 (Athens Bypass). The Epps Bridge Centre Property’s neighborhood consists primarily of commercial and residential development. Commercial uses within the neighborhood are located along Atlanta Highway/Broad Street, which traverses the neighborhood east to west and intersects with major thoroughfares and Loop 10. Georgia Square Mall is a super-regional mall located approximately three miles northwest of the Epps Bridge Centre Property and is anchored by a Belk, JCPenney, Macy’s, and Sears. The area immediately surrounding the Epps Bridge Centre Property represents the latest area of retail development within Athens and contains big-box retail, anchored and unanchored shopping centers, and freestanding restaurants. Notable tenants within the immediate area include a Lowe’s, Walmart Supercenter, Kohl’s, Home Depot, and Kroger. The sponsor is under contract to purchase approximately 50 acres directly across the Oconee Connector from the Epps Bridge Centre Property. In March 2016 the land in question was re-zoned to accommodate approximately 370,000 square feet of additional retail development, designated by the sponsor as Epps Bridge Centre II and III. Residential development within the neighborhood consists primarily of single-family homes with multifamily improvements interspersed throughout. According to the appraisal, the 2016 estimated population within a one-, three- and five-mile radius of the Epps Bridge Centre Property is 2,742, 28,161 and 76,411, respectively, and the 2016 estimated average household income within the same radii is $79,368, $79,419 and $66,876, respectively.
According to a third-party market research report, the Epps Bridge Centre Property is located within the Athens MSA retail market, which had an estimated inventory of 10.2 million square feet as of the first quarter 2016. The Athens MSA retail market had an overall vacancy rate of 7.1% as of the first quarter 2016, with an average asking rental rate of $11.74 per square foot on a triple net basis. According to a third-party market research report, the Epps Bridge Centre Property is located within the Oconee County retail submarket, which had an estimated inventory of 1.7 million square feet as of the first quarter 2016. The Oconee County retail submarket had an overall vacancy rate of 5.6% as of the first quarter 2016, with an average asking rental rate of $20.29 per square foot on a triple net basis.
The following table presents certain information relating to comparable retail properties for Epps Bridge Centre Property:
Competitive Set(1)
| Property Name/ Location | Year Built/ Renovated | Anchor Tenants | Total GLA (SF) | Total Occupancy | Distance from Subject | Annual Base Rent PSF | Lease Type |
Epps Village
Athens, GA
| 2000/NAP | Kroger | 90,346 | 95.0% | 1.8 miles | $17.00- $20.00 | NNN |
| Markets at Epps Bridge Athens, GA | 2006/NAP | Ashley Furniture, Trader Joe’s, Harbor Freight | 116,000 | 95.0% | 0.6 miles | $22.00 | NNN |
Beechwood Promenade Athens, GA | 1961/2005 | SteinMart, The Fresh Market, TJMaxx, Georgia Theatre Company, U.S. Post Office | 290,426 | 95.0% | 5.2 miles | $20.00-$30.00 | NNN |
Alps Village Athens, GA | 1965/2005 | Kroger, Kinnucan Enterprises, Pet Supplies Plus, Office Max, | 152,668 | 91.0% | 5.3 miles | $20.00-$25.00 | NNN |
Athens Promenade Athens, GA | 2000/NAP | Barnes & Noble, Bed Bath & Beyond, Rugged Wearhouse, Party City | 144,147 | 72.0% | 1.7 miles | $15.00-$18.00 | NNN |
| (1) | Information obtained from the appraisal dated June 3, 2016. |
The Borrower.The borrower is Epps Bridge Centre Property Company, LLC, a single purpose Delaware limited liability company with two independent directors. Legal counsel to the borrower delivered a non-consolidation opinion in connection with the origination of the Epps Bridge Centre Mortgage Loan. The borrower is wholly owned by Epps Bridge Centre Holding Company, LLC, which is equally owned by Oconee 316 Associates, LLC and TKG Epps Bridge Investor, LLC. Oconee 316 Associates, LLC is wholly owned by Frank M. Bishop, and TKG Epps Bridge Investor, LLC is wholly owned by E. Stanley Kroenke. E. Stanley Kroenke is the guarantor of certain nonrecourse carveouts under the Epps Bridge Centre Mortgage Loan. Frank M. Bishop, an indirect owner of the borrower, has an option to purchase all of the direct or indirect interests of E. Stanley Kroenke in and to the borrower and any
THE INFORMATION IN THIS STRUCTURAL AND COLLATERAL TERM SHEET IS NOT COMPLETE AND MAY BE AMENDED PRIOR TO THE TIME OF SALE. THIS TERM SHEET IS NOT AN OFFER TO SELL THESE SECURITIES AND IT IS NOT A SOLICITATION OF AN OFFER TO BUY THESE SECURITIES IN ANY JURISDICTION WHERE THE OFFER OR SALE IS NOT PERMITTED.
| 33 |
| EPPS BRIDGE CENTRE |
restricted party set forth in the organizational documents of the borrower, provided that no event of default has occurred and is continuing and certain other conditions are satisfied, including (i) the legal structure of the borrower and the single purpose nature and bankruptcy remoteness of the borrower continue; (ii) Frank M. Bishop has direct or indirect control of the borrower; and (iii) the replacement guarantors have delivered a replacement guaranty and replacement environmental indemnity agreement.
The Sponsor.The sponsor, E. Stanley Kroenke, is chairman, co-founder, and owner of THF Realty, a real estate development firm. Mr. Kroenke holds real estate interests in shopping centers, office building, industrial and warehouse properties, sports stadiums and storage facilities across the United States. Mr. Kroenke owns 247 properties totaling approximately 39.1 million square feet. Mr. Kroenke’s current and former board and trustee memberships include Wal-Mart Stores, Inc., Central Bancompany, Boone County National Bank and Community Investments Partnerships of St. Louis. Mr. Kroenke also owns the Denver Nuggets of the NBA, the Colorado Avalanche of the NHL, the Los Angeles Rams of the NFL, and is the largest shareholder in Arsenal of the English Premier League.
Escrows.No ongoing monthly escrows are required for real estate taxes, insurance premiums, replacement reserves or tenant improvement and leasing commissions so long as no Cash Management Trigger Event (as defined below), Bishop Buyout Trigger Event (as defined below) or Cash Sweep Event (as defined below) has occurred and is continuing under the Epps Bridge Centre Mortgage Loan documents.
In the event a Cash Management Trigger Event, Cash Sweep Event or Bishop Buyout Trigger Event has occurred, the borrower is required to make monthly deposits: (i) for the payment of real estate taxes in an amount equal to one-twelfth of the amount that the lender estimates will be necessary to pay taxes over the then succeeding 12-month period and for the payment of insurance in an amount equal to one-twelfth of the amount that the lender estimates will be necessary to pay for the renewal of insurance coverage; (ii) $2,805 for replacement reserves; and (iii) $11,218 for tenant improvements and leasing commissions (subject to a cap of $1,090,439). If a Cash Management Trigger Event and a Cash Sweep Event are in effect, in addition to the monthly tenant improvements and leasing commissions reserve, the Epps Bridge Centre Mortgage Loan documents require the borrower to deposit all extraordinary lease payments into a lender controlled reserve account.
Lockbox and Cash Management.Upon the occurrence and continuance of a Cash Management Trigger Event or a Bishop Buyout Trigger Event, the borrower is required to establish a lender-controlled lockbox account and instruct tenants to deposit rents into such lockbox account. The Epps Bridge Centre Mortgage Loan documents also require that all revenues received by the borrower or the property manager be deposited into the lockbox account within one business days of receipt. Pursuant to the Epps Bridge Centre Mortgage Loan documents, all excess funds on deposit will be applied as follows: (a) if a Cash Sweep Event (as defined below) is not in effect, to the borrower; and (b) if a Cash Sweep Event is in effect due to the existence of a Critical Tenant Trigger Event (as defined below) to the Critical Tenant TI/LC account until the applicable Critical Tenant Trigger Event cure has occurred. If a Cash Sweep Event is in effect and a Critical Tenant Trigger Event is not in effect then funds will be applied to the excess cash flow account.
A “Cash Management Trigger Event” will commence (i) if an event of default has occurred or is continuing; (ii) upon the occurrence of a bankruptcy action of the borrower, the guarantor or the property manager; (iii) on any date that the debt service coverage ratio based on the trailing 12-month period immediately preceding the date of such determination is less than 1.15x; or (iv) upon a Critical Tenant Trigger Event. A Cash Management Trigger Event will end with respect to clause (i), when such event of default has been cured; with respect to clause (ii), when such bankruptcy petition has been discharged, stayed, or dismissed within 60 days for the borrower and guarantor and within 120 days for the property manager, among other conditions or, with respect to a bankruptcy action of the manager, the borrower replaces the property manager with a qualified property manager acceptable to the lender; with respect to clause (iii), once the debt service coverage ratio based on the trailing 12-month period is greater than 1.15x for two consecutive calendar quarters, among other conditions; and with respect to clause (iv), on the date on which the applicable Critical Tenant Trigger Event cure has occurred.
A “Cash Sweep Event” will commence (i) if an event of default has occurred or is continuing; (ii) upon the occurrence of a bankruptcy action of the borrower, the guarantor or the property manager; (iii) a Cash Sweep DSCR Trigger Event (as defined below); or (iv) a Critical Tenant Trigger Event. A Cash Sweep Event will end with respect to clause (i), when such event of default has been cured; with respect to clause (ii), when such bankruptcy petition has been discharged, stayed, or dismissed within 60 days for borrower and guarantor and within 120 days for property managers, among other conditions or, with respect to a bankruptcy action of the manager, the borrower replaces the property manager with a qualified property manager acceptable to the lender; with respect to clause (iii), once the debt service coverage ratio based on the trailing 12-month period is greater than 1.10x for two consecutive calendar quarters, among other conditions; and with respect to clause (iv) the date on which the applicable Critical Tenant Trigger Event cure has occurred.
A “Cash Sweep DSCR Trigger Event” occurs upon any date the debt service coverage ratio, based on the trailing 12-month period immediately preceding the date of such determination, is less than 1.10x. Provided that a Bishop Buyout Trigger Event (as defined below) has not occurred, a Cash Sweep DSCR Trigger Event will not be deemed to have occurred if, within five days of the debt service coverage ratio that triggered the cash sweep, the borrower delivers to lender one or more Master Leases (as defined below) that result in a minimum debt service coverage ratio of 1.25x for the Epps Bridge Centre Mortgage Loan.
A “Critical Tenant Trigger Event” occurs if (i) Dick’s Sporting Goods, Best Buy Stores, Ross Dress for Less, or Bed Bath & Beyond, and each of their respective successors and/or assigns (each, a “Critical Tenant”) gives notice of its intention to not extend or renew its lease; (ii) on or prior to 12 months prior to its lease expiration date any Critical Tenant fails to give notice of its election to renew its lease; (iii) on or prior to any date by which a Critical Tenant is required under its lease to notify the borrower or its election to renew its lease, such Critical Tenant fails to give notice; (iv) an event of default under a Critical Tenant lease; (v) a bankruptcy action of any Critical Tenant occurs; (vi) any Critical Tenant discontinues its normal business operations; or (vii) if any Critical Tenant
THE INFORMATION IN THIS STRUCTURAL AND COLLATERAL TERM SHEET IS NOT COMPLETE AND MAY BE AMENDED PRIOR TO THE TIME OF SALE. THIS TERM SHEET IS NOT AN OFFER TO SELL THESE SECURITIES AND IT IS NOT A SOLICITATION OF AN OFFER TO BUY THESE SECURITIES IN ANY JURISDICTION WHERE THE OFFER OR SALE IS NOT PERMITTED.
| 34 |
| EPPS BRIDGE CENTRE |
is downgraded below “BBB-” or the equivalent by any credit rating agency; provided, however, that a Critical Tenant Trigger Event will not occur so long as a Bishop Buyout Trigger Event has not occurred. A Critical Tenant Trigger Event will end (a) with respect to clause (i), (ii) or (iii) on the date that (1) a Critical Tenant lease extension is executed and delivered by the borrower along with related tenant improvement costs, leasing commissions and other material costs and expenses have been deposited into the critical tenant improvements and leasing commissions account; or (2) a Critical Tenant Space Re-tenanting Event (as defined below) has occurred; (b) with respect to clause (iv), upon a cure of the applicable event of default; (c) with respect to clause (v), upon the affirmation that the Critical Tenant is actually paying all rents and other amounts due under its lease; (d) with respect to clause (vi), when the Critical Tenant re-commences its normal business operations or a Critical Tenant Space Re-tenanting Event has occurred; or (e) with respect to clause (vii), the credit rating of the Critical Tenant is no longer rated less than a “BBB-” or the equivalent by any credit agency.
A “Critical Tenant Space Re-tenanting Event” means the date each of the following conditions have been satisfied: (i) the Critical Tenant space has been leased to one or more replacement tenants for a term of at least ten (10) years and on terms that are acceptable to the lender; (ii) all tenant improvement costs, leasing commissions and other material costs and expenses relating to the re-letting of the space have been paid in full; and (iii) the related tenant(s) are conducting normal business operations at the Critical Tenant space.
A “Bishop Buyout Trigger Event” means a transfer resulting from Frank M. Bishop exercising his option to purchase all of the direct or indirect interests of E. Stanley Kroenke in and to the borrower and any restricted party set forth in the organizational documents of the borrower, provided that no event of default has occurred and is continuing and certain other conditions are satisfied, including (i) the legal structure of the borrower and the single purpose nature and bankruptcy remoteness of the borrower continue; (ii) Frank M. Bishop has direct or indirect control of the borrower; and (iii) the replacement guarantors have delivered a replacement guaranty and replacement environmental indemnity agreement.
A “Master Lease” is a lease agreement between the borrower, as landlord, and the current guarantor (E. Stanley Kroenke), as tenant, that (i) is for a term of ten or more years, (ii) is subordinate to the Epps Bridge Centre Mortgage Loan documents, and (iii) contains terms and conditions reasonably acceptable to the lender. The Master Lease may not be amended without prior consent of the lender, can be terminated only if no event of default exists and upon satisfaction of either of the following conditions: (a) as of the Master Lease termination date, the debt service coverage ratio is not less than 1.25x for two consecutive calendar quarters without including rent from the Master Lease, or (b) at the time of termination, the borrower deposits with the lender an amount equal to cash flow that would have been swept into the excess cash flow account, among other conditions. There are no Master Leases currently in effect.
Property Management.The Epps Bridge Centre Property is managed by an affiliate of the borrower.
Assumption.The borrower has the right to transfer the Epps Bridge Centre Property one year after origination provided that no event of default has occurred and is continuing and certain other conditions are satisfied, including (i) the lender’s reasonable determination that the proposed transferee and guarantor satisfy the lender’s credit review and underwriting standards, taking into consideration transferee experience, financial strength and general business standing; (ii) execution of a recourse guaranty and an environmental indemnity by an affiliate of the transferee; and (iii) if requested by the lender, rating agency confirmation from Fitch, KBRA and Moody’s that the transfer will not result in a downgrade, withdrawal or qualification of the respective ratings assigned to the Series 2016-C35 Certificates.
Partial Release.Not permitted.
Real Estate Substitution.Not permitted.
Subordinate and Mezzanine Indebtedness.Not permitted.
Ground Lease.None.
Terrorism Insurance.The Epps Bridge Centre Mortgage Loan documents require that the “all risk” insurance policy required to be maintained by the borrowers provide coverage for terrorism in an amount equal to the full replacement cost of the Epps Bridge Centre Property, as well as business interruption insurance covering no less than the 24-month period following the occurrence of a casualty event, together with a 6-month extended period of indemnity.
THE INFORMATION IN THIS STRUCTURAL AND COLLATERAL TERM SHEET IS NOT COMPLETE AND MAY BE AMENDED PRIOR TO THE TIME OF SALE. THIS TERM SHEET IS NOT AN OFFER TO SELL THESE SECURITIES AND IT IS NOT A SOLICITATION OF AN OFFER TO BUY THESE SECURITIES IN ANY JURISDICTION WHERE THE OFFER OR SALE IS NOT PERMITTED.
| 35 |
(THIS PAGE INTENTIONALLY LEFT BLANK)
THE INFORMATION IN THIS STRUCTURAL AND COLLATERAL TERM SHEET IS NOT COMPLETE AND MAY BE AMENDED PRIOR TO THE TIME OF SALE. THIS TERM SHEET IS NOT AN OFFER TO SELL THESE SECURITIES AND IT IS NOT A SOLICITATION OF AN OFFER TO BUY THESE SECURITIES IN ANY JURISDICTION WHERE THE OFFER OR SALE IS NOT PERMITTED.
| 36 |
THE MALL AT ROCKINGHAM PARK
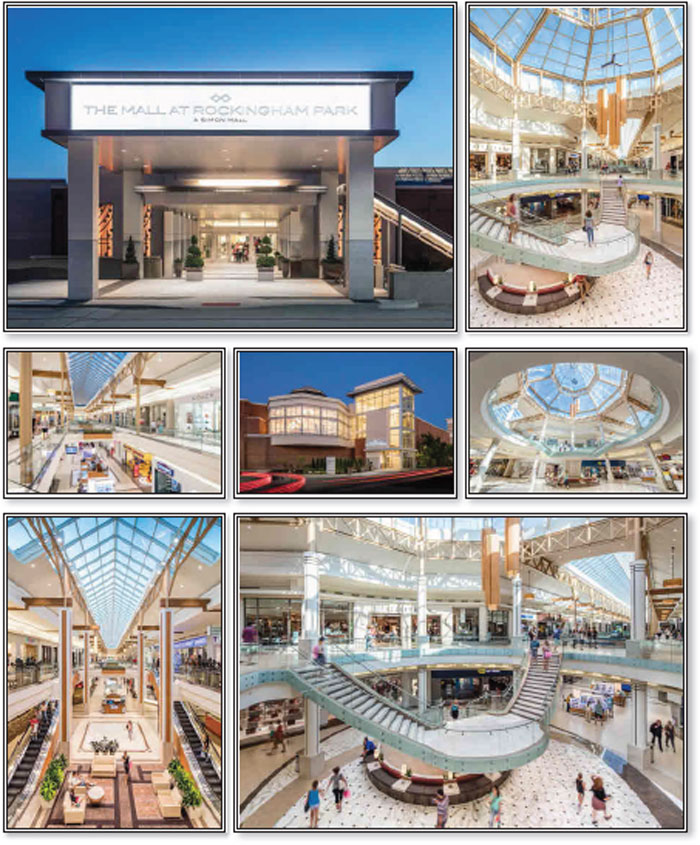
THE INFORMATION IN THIS STRUCTURAL AND COLLATERAL TERM SHEET IS NOT COMPLETE AND MAY BE AMENDED PRIOR TO THE TIME OF SALE. THIS TERM SHEET IS NOT AN OFFER TO SELL THESE SECURITIES AND IT IS NOT A SOLICITATION OF AN OFFER TO BUY THESE SECURITIES IN ANY JURISDICTION WHERE THE OFFER OR SALE IS NOT PERMITTED.
| 37 |
THE MALL AT ROCKINGHAM PARK
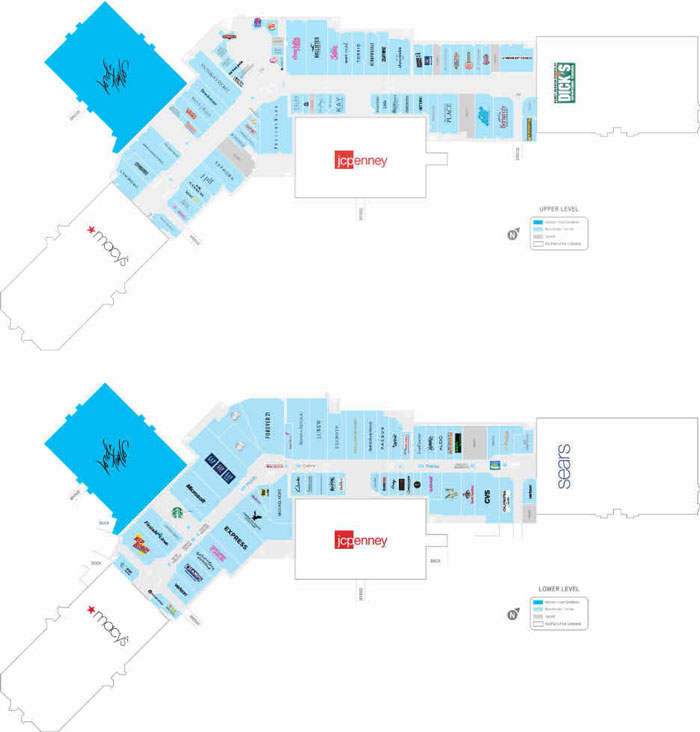
THE INFORMATION IN THIS STRUCTURAL AND COLLATERAL TERM SHEET IS NOT COMPLETE AND MAY BE AMENDED PRIOR TO THE TIME OF SALE. THIS TERM SHEET IS NOT AN OFFER TO SELL THESE SECURITIES AND IT IS NOT A SOLICITATION OF AN OFFER TO BUY THESE SECURITIES IN ANY JURISDICTION WHERE THE OFFER OR SALE IS NOT PERMITTED.
| 38 |
THE MALL AT ROCKINGHAM PARK

THE INFORMATION IN THIS STRUCTURAL AND COLLATERAL TERM SHEET IS NOT COMPLETE AND MAY BE AMENDED PRIOR TO THE TIME OF SALE. THIS TERM SHEET IS NOT AN OFFER TO SELL THESE SECURITIES AND IT IS NOT A SOLICITATION OF AN OFFER TO BUY THESE SECURITIES IN ANY JURISDICTION WHERE THE OFFER OR SALE IS NOT PERMITTED.
| 39 |
| No. 2 – The Mall at Rockingham Park | |||||||
| Loan Information | Property Information | ||||||
| Mortgage Loan Seller: | Barclays Bank PLC | Single Asset/Portfolio: | Single Asset | ||||
Credit Assessment (Fitch/KBRA/Moody’s): | BBB+/AAA/A1(sca.pd) | Property Type: | Retail | ||||
| Original Principal Balance(1): | $60,000,000 | Specific Property Type: | Regional Mall | ||||
| Cut-off Date Balance(1): | $60,000,000 | Location: | Salem, NH | ||||
| % of Initial Pool Balance: | 5.9% | Size(5): | 540,867 SF | ||||
| Loan Purpose: | Refinance | Cut-off Date Balance Per SF(1)(5): | $263.47 | ||||
| Borrower Name: | Mall at Rockingham, LLC | Year Built/Renovated: | 1991/2015 | ||||
| Sponsors(2): | Mayflower Realty LLC, Series B; Institutional Mall Investors | Title Vesting: | Fee & Leasehold | ||||
| Mortgage Rate: | 4.040% | Property Manager: | Self-managed | ||||
| Note Date: | June 1, 2016 | 4th Most Recent Occupancy (As of)(6): | 99.0% (12/31/2012) | ||||
| Anticipated Repayment Date: | NAP | 3rd Most Recent Occupancy (As of)(6): | 97.6% (12/31/2013) | ||||
| Maturity Date: | June 1, 2026 | 2ndMost Recent Occupancy (As of)(6): | 98.0% (12/31/2014) | ||||
| IO Period: | 120 months | Most Recent Occupancy (As of)(6): | 98.5% (12/31/2015) | ||||
| Loan Term (Original): | 120 months | Current Occupancy (As of)(6): | 97.1% (4/20/2016) | ||||
| Seasoning: | 1 month | ||||||
| Amortization Term (Original): | NAP | Underwriting and Financial Information: | |||||
| Loan Amortization Type: | Interest-only, Balloon | ||||||
| Interest Accrual Method: | Actual/360 | 4th Most Recent NOI (As of): | $23,262,212 (12/31/2013) | ||||
| Call Protection: | L(25),D(88),O(7) | 3rd Most Recent NOI (As of): | $24,343,844 (12/31/2014) | ||||
| Lockbox Type: | Hard/Springing Cash Management | 2nd Most Recent NOI (As of): | $24,789,355 (12/31/2015) | ||||
| Additional Debt(1)(3): | Yes | Most Recent NOI (As of): | $25,222,850 (TTM 3/31/2016) | ||||
| Additional Debt Type(1)(3): | Pari Passuand Subordinate Debt | ||||||
| U/W Revenues: | $35,602,427 | ||||||
| U/W Expenses: | $10,756,845 | ||||||
| U/W NOI: | $24,845,582 | ||||||
| U/W NCF: | $24,191,133 | ||||||
| U/W NOI DSCR(1): | 4.26x | ||||||
| Escrows and Reserves(4): | U/W NCF DSCR(1): | 4.14x | |||||
| U/W NOI Debt Yield(1): | 17.4% | ||||||
| Type: | Initial | Monthly | Cap (If Any) | U/W NCF Debt Yield(1): | 17.0% | ||
| Taxes | $0 | Springing | NAP | As-Is Appraised Value: | $494,000,000 | ||
| Insurance | $0 | Springing | NAP | As-Is Appraisal Valuation Date: | April 28, 2016 | ||
| Replacement Reserves | $0 | Springing | $270,432 | Cut-off Date LTV Ratio(1): | 28.8% | ||
| TI/LC Reserve | $0 | Springing | $1,081,728 | LTV Ratio at Maturity or ARD(1): | 28.8% | ||
| (1) | The Mall at Rockingham Park Whole Loan (as defined below), with an aggregate original principal balance of $262,000,000, is comprised of four seniorpari passunotes with an aggregate original principal balance of $142,500,000 (Note A-1-A, Note A-2-A, Note A-1-B and Note A-2-B) and two subordinate notes with an aggregate original principal balance of $119,500,000 (Note B-1 and Note B-2). The non-controlling seniorpari passu Note A-1-B had an original principal balance of $60,000,000, has a Cut-off Date Balance of $60,000,000 and will be contributed to the WFCM 2016-C35 Trust. Two of the senior notes, Note A-1-A and Note A-2-A, with an aggregate outstanding Cut-off Date Balance of $42,500,000, and the two subordinate notes with an aggregate outstanding Cut-off Date Balance of $119,500,000, for an aggregate Cut-off Date Balance of $162,000,000, were contributed to the BBSG 2016-MRP Trust and represent the controlling notes of The Mall at Rockingham Park Whole Loan. The remaining note, seniorpari passu non-controlling Note A-2-B, which had an original principal balance of $40,000,000, is held by Société Générale, and is expected to be contributed to the SGCMS 2016-C5 Trust. All statistical information related to balances per square foot, loan-to-value ratios, debt service coverage ratios and debt yields are calculated off of the total outstanding Cut-off Date Balance of the four seniorpari passu notes with an aggregate original principal balance of $142,500,000. The Cut-off Date LTV Ratio, U/W NCF DSCR and U/W NOI Debt Yield based on the aggregate Cut-off Date Balance of the senior notes and junior notes totaling $262,000,000 are 53.0%, 2.25x and 9.5%, respectively. Further, unless otherwise specifically noted, all numerical information, including references to square footage, height, occupancy, leases, net rentable area, appraised value, loan-to-value ratios, underwritten net operating income, underwritten net cash flow or similar terms with respect to The Mall at Rockingham Park Property (as defined below) or the tenants therein excludes the approximately 484,723 square feet of retail space that is not collateral for The Mall at Rockingham Park Whole Loan. |
| (2) | The Sponsor, Mayflower Realty LLC, Series B is a joint-venture between Simon Property Group, L.P. and the Canadian Pension Plan Investment Board. |
| (3) | See “Other Indebtedness” section. |
| (4) | See “Escrows” section. |
| (5) | Size represents the square footage that serves as collateral for The Mall at Rockingham Park Whole Loan. The total size of The Mall at Rockingham Park is 1,025,590 square feet. See “Major Tenants” section. |
| (6) | See “Historical Occupancy” section. |
THE INFORMATION IN THIS STRUCTURAL AND COLLATERAL TERM SHEET IS NOT COMPLETE AND MAY BE AMENDED PRIOR TO THE TIME OF SALE. THIS TERM SHEET IS NOT AN OFFER TO SELL THESE SECURITIES AND IT IS NOT A SOLICITATION OF AN OFFER TO BUY THESE SECURITIES IN ANY JURISDICTION WHERE THE OFFER OR SALE IS NOT PERMITTED.
| 40 |
THE MALL AT ROCKINGHAM PARK
The Mortgage Loan.The mortgage loan (“The Mall at Rockingham Park Mortgage Loan”) is part of a whole loan (“The Mall at Rockingham Park Whole Loan”) evidenced by six promissory notes (Note A-1-A, Note A-2-A, Note A-1-B, Note A-2-B, Note B-1 and Note B-2) that are secured by a first lien deed of trust on the borrower’s leasehold interest and the fee interest owned by an affiliate of the borrower in a regional mall located in Salem, New Hampshire of which 540,867 square feet (“The Mall at Rockingham Park Property”) serves as collateral for The Mall at Rockingham Park Whole Loan. The Mall at Rockingham Park Whole Loan was co-originated on June 1, 2016 by Barclays Bank PLC and Société Générale. The Mall at Rockingham Park Whole Loan had an original principal balance of $262,000,000, has an outstanding principal balance as of the Cut-off Date of $262,000,000 and accrues interest at an interest rate of 4.040%per annum. The Mall at Rockingham Park Whole Loan had an initial term of 120 months, has a remaining term of 119 months as of the Cut-off Date and requires interest-only payments through the term of The Mall at Rockingham Park Whole Loan. The Mall at Rockingham Park Whole Loan matures on June 1, 2026.
The Mall at Rockingham Park Mortgage Loan, evidenced by Note A-1-B, had an original principal balance of $60,000,000, has an outstanding principal balance as of the Cut-off Date of $60,000,000 and represents a seniorpari passu non-controlling interest in The Mall at Rockingham Park Whole Loan. Two seniorparipassu notes (Note A-1-A and Note A-2-A) and two subordinate notes (Note B-1 and Note B-2), with an aggregate original principal balance of $162,000,000 were contributed to the BBSG 2016-MRP Trust. Note A-1-A will represent the controlling interest in The Mall at Rockingham Park Whole Loan. The remaining non-controlling seniorpari passu Note A-2-B, which had an original principal balance of $40,000,000 and is held by Société Générale, is expected to be contributed to the SGCMS 2016-C5 Trust. The lender provides no assurances that any non-securitized notes will not be split further. The relationship between the holders of The Mall at Rockingham Park Whole Loan will be governed by a co-lender agreement as described under “Description of the Mortgage Pool—The Whole Loans—The Non-Serviced Whole Loans—The Mall at Rockingham Park Whole Loan” in the Preliminary Prospectus.
Following the lockout period, the borrower has the right to defease The Mall at Rockingham Park Whole Loan in whole, but not in part, on any date before December 1, 2025. In addition, The Mall at Rockingham Park Whole Loan is prepayable without penalty on or after December 1, 2025. The lockout period will expire on the earlier to occur of (i) two years after the closing date of the securitization that includes the last note to be securitized and (ii) July 1, 2019.
Note Summary
| Notes | Original Balance | Note Holder | Controlling Interest | |
| A-1-A(1)(2) | $25,500,000 | BBSG 2016-MRP | Yes | |
| A-2-A(1)(2) | $17,000,000 | BBSG 2016-MRP | Yes | |
| A-1-B | $60,000,000 | WFCM 2016-C35 | No | |
| A-2-B(3) | $40,000,000 | SGCMS 2016-C5 | No | |
| B-1(1)(2) | $71,700,000 | BBSG 2016-MRP | Yes | |
| B-2(1)(2) | $47,800,000 | BBSG 2016-MRP | Yes | |
| Total | $262,000,000 |
| (1) | Note A-1-A, Note A-2-A, Note B-1 and Note B-2 were contributed to the BBSG 2016-MRP Trust. |
| (2) | The Mall at Rockingham Park Whole Loan is expected to be serviced and administered pursuant to the trust and servicing agreement that was entered into in connection with the BBSG 2016-MRP Trust. |
| (3) | Note A-2-B is expected to be contributed to the SGCMS 2016-C5 Trust. |
THE INFORMATION IN THIS STRUCTURAL AND COLLATERAL TERM SHEET IS NOT COMPLETE AND MAY BE AMENDED PRIOR TO THE TIME OF SALE. THIS TERM SHEET IS NOT AN OFFER TO SELL THESE SECURITIES AND IT IS NOT A SOLICITATION OF AN OFFER TO BUY THESE SECURITIES IN ANY JURISDICTION WHERE THE OFFER OR SALE IS NOT PERMITTED.
| 41 |
THE MALL AT ROCKINGHAM PARK
The Mall at Rockingham Park Whole Loan(1)
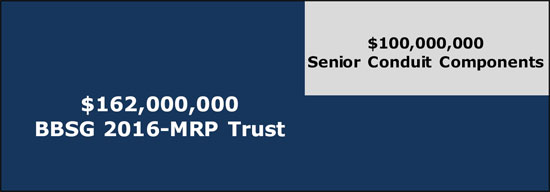
| (1) | The Mall at Rockingham Park Whole Loan consists of the following notes: (i) Notes A-1-A, A-2-A, B-1, and B-2, with an aggregate Cut-off Date Balance of $162,000,000, that were contributed to the BBSG 2016-MRP Trust, (ii) Note A-1-B, with a Cut-off Date Balance of $60,000,000, which will be contributed to the WFCM 2016-C35 Trust and (iii) Note A-2-B, which is held by Société Générale, has a Cut-off Date Balance of $40,000,000, and is expected to be contributed to the SGCMS 2016-C5 Trust. The two seniorpari passu notes that were contributed to the BBSG 2016-MRP Trust (Notes A-1-A and A-2-A) arepari passu in right of payment with each other and Note A-1-B and Note A-2-B, have an aggregate Cut-off Date Balance of $42,500,000, and are senior in right of payment to Note B-1 and Note B-2, which have an aggregate Cut-off Date Balance of $119,500,000. See “The Mortgage Loan” herein for additional information. |
Sources and Uses
| Sources | Uses | |||||||
| Original whole loan amount | $262,000,000 | 100.0% | Loan payoff(1) | $261,256,417 | 99.7% | |||
| Closing costs | 612,922 | 0.2 | ||||||
| Return of equity | 130,662 | 0.1 | ||||||
| Total Sources | $262,000,000 | 100.0% | Total Uses | $262,000,000 | 100.0% |
| (1) | The Mall at Rockingham Park Property was previously securitized in the WBCMT 2007-C31 transaction. |
The Property.The Mall at Rockingham Park Property consists of the fee and leasehold interest in a two-story, regional mall located in Salem, New Hampshire off of Exit 1 on Interstate 93 north, approximately 2.0 miles north of the Massachusetts border and approximately 35.0 miles northwest of downtown Boston. Built in 1991, The Mall at Rockingham Park Property contains approximately 1,025,590 square feet of retail space, of which 540,867 square feet serves as collateral for The Mall at Rockingham Park Whole Loan.
Non-collateral anchor tenants include Macy’s, J.C. Penney, Sears and Dick’s Sporting Goods (which subleases the second floor from Sears). The Lord & Taylor anchor is owned by the sponsors and is collateral for The Mall at Rockingham Park Whole Loan. Based on 2015 year-end sales estimates by the sponsor, the Macy’s and J.C. Penney anchor tenants each outperform their respective chain’s national averages on both a total sales and sales per square feet basis. The Dick’s Sporting Goods signed their sublease with Sears in 2015 and recently opened in October 2015. Sales estimates for the approximately three months of operation are $5.0 million.
The Mall at Rockingham Park Property, when combined with the space associated with the non-collateral anchor tenants, features approximately 134 tenants, including well known retailers such as Apple ($23,730 sales per square foot based on a selling space of 5,429 square feet), Aldo ($460 sales per square foot), Coach ($480 sales per square foot), Express/Express Men ($442 sales per square foot), Forever 21 ($399 sales per square foot), Kids Footlocker ($708 sales per square foot), Lush Fresh Handmade Cosmetics ($2,569 sales per square foot), GameStop ($881 sales per square foot), GNC ($910 sales per square foot), Microsoft ($1,560 sales per square foot), Pink ($933 sales per square foot), Sephora ($1,095 sales per square foot), Michael Kors ($452 sales per square foot), Sunglass Hut ($2,484 sales per square foot) and Finish Line ($657 sales per square foot).
As of the trailing 12-month period ending March 2016, total reported sales were approximately $389.9 million, which includes 2015 year-end sales estimates for all non-owned anchor tenants. Excluding Apple, The Mall at Rockingham Park Property generated comparable inline sales per square foot of $501, with occupancy costs of 17.8% (including Apple, comparable inline sales per square foot were $937, with an occupancy cost of 9.6%). Since 2010, total inline sales excluding Apple have increased from $127.6 million to $158.8 million, representing an increase of 24.4%. As of the trailing 12-month period ending March 2016, Apple reported $23,730 sales per square foot (based on 5,429 square feet of selling space versus total square footage of 10,448) and total sales of approximately $128.8 million. According to the sponsor, the Apple store at The Mall at Rockingham Park Property is one of the highest grossing Apple stores in the United States.
Since 2015, The Mall at Rockingham Park Property has added eight new tenants totaling 12,551 square feet. In addition, leases for Journey Kidz and Think Geek, are currently out for signature, but were not included in the underwritten cash flow. Since 2015, there have been renewals totaling 30,961 square feet from tenants such as Charlotte Russe, Talbots, Main Street Grille and Diamond Jewelers. As of April 20, 2016, The Mall at Rockingham Park Property, when combined with the space associated with the non-collateral anchor tenants, was approximately 98.5% occupied including all anchor tenants, temporary tenants and tenants with executed leases that are not yet open and operating.The Mall at Rockingham Park was approximately 97.1% occupied including all owned collateral anchors, temporary tenants and tenants with executed leases that are not yet open and operating. Since 2006, The Mall at Rockingham Park Property, when combined with the space associated with the non-collateral anchor tenants has maintained
THE INFORMATION IN THIS STRUCTURAL AND COLLATERAL TERM SHEET IS NOT COMPLETE AND MAY BE AMENDED PRIOR TO THE TIME OF SALE. THIS TERM SHEET IS NOT AN OFFER TO SELL THESE SECURITIES AND IT IS NOT A SOLICITATION OF AN OFFER TO BUY THESE SECURITIES IN ANY JURISDICTION WHERE THE OFFER OR SALE IS NOT PERMITTED.
| 42 |
THE MALL AT ROCKINGHAM PARK
an average occupancy of approximately 99.2% including all anchors and temporary tenants, with no year-end occupancy rate falling below 98.3%.
In 2015, the Simon Property Group spent approximately $15.4 million performing structural and cosmetic renovations. Structural updates included the addition and enclosure of the dining pavilion entrance, the addition of an elevator, new site landscaping and handicap parking (all of which are associated with the updated entrance). Cosmetic updates included upgrades to the other mall entrances, adding new mall signage, installing new sidewalk lighting, accent lighting, new flooring throughout the common areas, restroom upgrades and a completely redesigned dining pavilion seating area.
The following table presents certain information relating to the tenancy at The Mall at Rockingham Park Property:
Major Tenants
| Tenant Name | Credit Rating (Fitch/ Moody’s/ S&P)(1) | Tenant NRSF | % of NRSF(2) | Annual U/W Base Rent PSF(3) | Annual U/W Base Rent(3) | % of Total Annual U/W Base Rent | Sales PSF(4) | Occupancy Cost(4) | Lease Expiration Date |
| Anchor Tenants – Non-Collateral | |||||||||
| Macy’s | BBB/Baa2/BBB | 162,990 | ANCHOR OWNED – NON-COLLATERAL | $287 | NAP | NAP | |||
| Sears | CC/Caa1/CCC+ | 121,727(5) | $199(6) | NAP | NAP | ||||
| J.C. Penney | B/B3/B | 121,106 | $122 | NAP | NAP | ||||
| Dick’s Sporting Goods | NR/NR/NR | 78,900 | $63(7) | NAP | NAP | ||||
| Total Anchor Tenants – Non- Collateral | 484,723 | ||||||||
| Anchor Tenant - Collateral | |||||||||
| Lord & Taylor | NR/NR/NR | 158,594 | 29.3% | $4.73 | $750,000 | 3.7% | $106(8) | 6.7% | 3/31/2027(10) |
| Total Anchor Tenants – Collateral | 158,594 | 29.3% | $4.73 | $750,000 | 3.7% | ||||
| Major Tenants > 10,000 sq. ft. – Collateral | |||||||||
| Apple | NR/Aa1/AA+ | 10,448 | 1.9% | $65.00 | $679,120 | 3.4% | $23,730(9) | 0.4% | 1/31/2024(11) |
| Forever 21 | NR/NR/NR | 11,414 | 2.1% | $44.96 | $513,145 | 2.6% | $399 | 12.9% | 6/30/2024 |
| Pottery Barn | NR/NR/NR | 10,122 | 1.9% | $35.00 | $354,270 | 1.8% | $344 | 10.2% | 1/31/2017 |
Total Major Tenants > 10,000 sq. ft. – Collateral | 31,984 | 5.9% | $48.35 | $1,546,535 | 7.7% | ||||
| Non-Major Tenants – Collateral | 317,860 | 58.8% | $55.93 | $17,777,122 | 88.6% | ||||
| Occupied Collateral Total | 508,438 | 94.0% | $39.48 | $20,073,657 | 100.0% | ||||
| Vacant Space(12) | 32,429 | 6.0% | |||||||
| Collateral Total | 540,867 | 100.0% | |||||||
| (1) | Certain ratings are those of the parent company whether or not the parent guarantees the lease. |
| (2) | % of NRSF is based on The Mall at Rockingham Park Property collateral square footage of 540,867, which excludes all non-collateral anchor tenants. |
| (3) | Annual U/W Base Rent includes base rent and contractual rent steps through May 2017 equal to $343,639. |
| (4) | All Sales PSF and Occupancy Cost information presented herein are based upon information provided by the borrower. Sales PSF figures are 2015 year-end estimates for non-collateral anchor tenants and the reported sales for all the collateral tenants are as of the trailing 12-month period ending March 2016. |
| (5) | Sears has a total Tenant NRSF of 200,627, but subleases 78,900 square feet to Dick’s Sporting Goods. |
| (6) | Sears Sales PSF represent a selling space of approximately 100,314 square feet on the first floor. The remainder of the space is used as office and storage. |
| (7) | Dick’s Sporting Goods Sales PSF represent the period from October 16, 2015, when it opened for business, to year-end 2015. |
| (8) | According to the borrower, Lord & Taylor merchandises approximately two-thirds of its space and the remaining space is used for storage and office space. Sales PSF reflects two-thirds of Lord & Taylor’s total square feet. Sales PSF for Lord & Taylor’s entire space is equal to $71 PSF. |
| (9) | Apple Sales PSF represent a selling space of 5,429 square feet, the remaining space is utilized as storage and other non-retail uses. Sales PSF for Apple’s entire space is equal to approximately $12,330 PSF. |
| (10) | Lord & Taylor has three, ten-year lease renewal options. |
| (11) | Apple has one, five-year lease renewal option. |
| (12) | Vacant Space includes temporary tenants totaling 16,823 square feet. |
THE INFORMATION IN THIS STRUCTURAL AND COLLATERAL TERM SHEET IS NOT COMPLETE AND MAY BE AMENDED PRIOR TO THE TIME OF SALE. THIS TERM SHEET IS NOT AN OFFER TO SELL THESE SECURITIES AND IT IS NOT A SOLICITATION OF AN OFFER TO BUY THESE SECURITIES IN ANY JURISDICTION WHERE THE OFFER OR SALE IS NOT PERMITTED.
| 43 |
THE MALL AT ROCKINGHAM PARK
The following table presents certain information relating to the historical sales and occupancy costs at The Mall at Rockingham Park Property:
Historical Sales (PSF) and Occupancy Costs(1)(2)(3)
| Tenant | 2012 | 2013 | 2014 | 2015 | TTM March 2016 | TTM March 2016 Occupancy Cost |
| Non – Collateral Anchors(4) | ||||||
| Sears(5)(6) | $157 | $164 | $153 | $199 | $199 | NAP |
| Macy’s(5) | $284 | $292 | $296 | $287 | $287 | NAP |
| J.C. Penney(5) | $132 | $112 | $116 | $122 | $122 | NAP |
| Dick’s Sporting Goods(5) | NAP | NAP | NAP | $63(9) | $63(9) | NAP |
| Collateral Anchor | ||||||
| Lord & Taylor(7)(8) | NAV | $143 | $111 | $108 | $106 | 6.7% |
| Top 15 Non-Anchor Tenants | ||||||
| Forever 21(10) | $539 | $541 | $386 | $386 | $399 | 12.9% |
| Apple | $36,781(12) | $36,486(12) | $95,001(11) | $33,685(11) | $23,730(12) | 0.4% |
| Pottery Barn | $368 | $388 | $372 | $341 | $344 | 10.2% |
| Express/Express Men | $508 | $494 | $475 | $434 | $442 | 18.0% |
| The Gap/Gap Kids/Gap Body | $219 | $198 | $160 | $131 | $271 | 16.6% |
| Microsoft(13) | NAV | $907 | $1,510 | $1,797 | $1,560 | 8.7% |
| American Eagle Outfitters | $420 | $379 | $365 | $415 | $421 | 12.2% |
| Victoria’s Secret | $902 | $761 | $634 | $666 | $689 | 13.1% |
| Abercrombie & Fitch | $278 | $244 | $234 | $225 | $225 | 33.3% |
| Banana Republic | $295 | $282 | $262 | $235 | $232 | 24.5% |
| Hollister Co. | $361 | $350 | $316 | $328 | $332 | 27.9% |
| CVS | $372 | $361 | $328 | $297 | $298 | 25.3% |
| Charlotte Russe | $368 | $434 | $439 | $360 | $381 | 22.6% |
| J. Crew | $216 | $193 | $196 | $198 | $203 | 10.1% |
| Men’s Wearhouse & Tux | $465 | $454 | $485 | $486 | $477 | 14.9% |
| Comparable Inline Sales PSF | $1,226 | $1,207 | $2,331 | $1,121 | $937 | |
| Comparable Inline Sales (Excluding Apple) PSF | $476 | $452 | $453 | $482 | $501 | |
| Total In-Line Occupancy Costs | 6.8% | 7.0% | 3.6% | 7.7% | 9.6% | |
| Total In-Line Occupancy Costs (Excluding Apple) | 17.6% | 18.7% | 18.7% | 17.8% | 17.8% |
| (1) | Historical Sales (PSF) and Occupancy Costs were provided by the borrower. |
| (2) | Historical Sales (PSF) are based on leased square footage during each given period as some tenants listed may have expanded or contracted their leased square footage during such given time period. |
| (3) | Historical Sales (PSF) and Occupancy Costs reflect those tenants who reported sales for three consecutive years. Historical Sales (PSF) and Occupancy Costs for Non – Collateral Anchors represent borrower estimated figures. |
| (4) | TTM March 2016 Sales (PSF) for Anchor Tenants represent borrower estimated sales figures as of year-end 2015, except for Lord & Taylor who reported sales as of TTM March 2016. |
| (5) | These tenants are not collateral for The Mall at Rockingham Park Whole Loan. |
| (6) | Sears 2015 and TTM March 2016 Sales (PSF) are based on a selling space of approximately 100,314 square feet on the first floor. 2012 – 2014 Sales (PSF) are based on the total square footage of 200,627. |
| (7) | 2012 Sales (PSF) for Lord & Taylor are unavailable as Lord & Taylor opened for business at The Mall at Rockingham Park in 2012. |
| (8) | According to the borrower, Lord & Taylor uses approximately two-thirds of its space for selling merchandise and the remaining space is used for storage and office space. Sales PSF reflects two-thirds of Lord & Taylor’s total square feet. Sales PSF for Lord & Taylor’s entire space is equal to $71 PSF. |
| (9) | Dick’s Sporting Goods Sales (PSF) represent the period from October 16, 2015, when they opened for business, to year-end 2015. |
| (10) | Forever21 expanded from 5,580 square feet to 11,414 square feet in 2014. |
| (11) | A contributing factor in the drop in Sales PSF between 2014 to 2015 and 2015 to TTM March 2016 is possibly a result of Apple amending its sales accounting methodology. Apple amended the way in which the company accounted for bulk purchases to resellers and ceased to report these bulk sales. |
| (12) | Apple Sales PSF represent a selling space of 5,429 square feet, the remaining space is utilized as storage and other non-retail uses. Sales PSF for Apple’s entire space is equal to approximately $12,330 PSF. |
| (13) | Microsoft took occupancy of its space in 2013, therefore 2012 Sales (PSF) are unavailable. |
THE INFORMATION IN THIS STRUCTURAL AND COLLATERAL TERM SHEET IS NOT COMPLETE AND MAY BE AMENDED PRIOR TO THE TIME OF SALE. THIS TERM SHEET IS NOT AN OFFER TO SELL THESE SECURITIES AND IT IS NOT A SOLICITATION OF AN OFFER TO BUY THESE SECURITIES IN ANY JURISDICTION WHERE THE OFFER OR SALE IS NOT PERMITTED.
| 44 |
THE MALL AT ROCKINGHAM PARK
The following table presents certain information relating to the lease rollover schedule at The Mall at Rockingham Park Property:
Lease Expiration Schedule(1)(2)(3)
| Year Ending December 31, | No. of Leases Expiring | Expiring NRSF | % of Total NRSF | Cumulative Expiring NRSF | Cumulative % of Total NRSF | Annual U/W Base Rent | Annual U/W Base Rent PSF(5) |
| MTM | 5 | 5,470 | 1.0% | 5,470 | 1.0% | $387,019 | $70.75 |
| 2016 | 5 | 6,747 | 1.2% | 12,217 | 2.3% | $422,266 | $62.59 |
| 2017 | 23 | 77,380 | 14.3% | 89,597 | 16.6% | $3,462,538 | $44.75 |
| 2018 | 20 | 55,355 | 10.2% | 144,952 | 26.8% | $3,144,070 | $56.80 |
| 2019 | 12 | 25,392 | 4.7% | 170,344 | 31.5% | $1,476,319 | $58.14 |
| 2020 | 11 | 19,387 | 3.6% | 189,731 | 35.1% | $1,064,389 | $54.90 |
| 2021 | 8 | 16,717 | 3.1% | 206,448 | 38.2% | $930,554 | $55.67 |
| 2022 | 11 | 27,525 | 5.1% | 233,973 | 43.3% | $1,585,539 | $57.60 |
| 2023 | 10 | 22,450 | 4.2% | 256,423 | 47.4% | $1,826,166 | $81.34 |
| 2024 | 11 | 61,052 | 11.3% | 317,475 | 58.7% | $3,151,994 | $51.63 |
| 2025 | 5 | 10,408 | 1.9% | 327,883 | 60.6% | $985,668 | $94.70 |
| 2026 | 4 | 16,261 | 3.0% | 344,144 | 63.6% | $687,670 | $42.29 |
| Thereafter | 3 | 164,294 | 30.4% | 508,438 | 94.0% | $949,465 | $5.78 |
| Vacant(4) | 0 | 32,429 | 6.0% | 540,867 | 100.0% | $0 | $0.00 |
| Total/Weighted Average | 128 | 540,867 | 100.0% | $20,073,657 | $39.48 |
| (1) | Information obtained from the underwritten rent roll and includes collateral tenants and square footage only. |
| (2) | Certain tenants may have lease termination options that are exercisable prior to the originally stated expiration date of the subject lease and that are not considered in the Lease Expiration Schedule. |
| (3) | Includes executed leases that have not yet commenced as of April 20, 2016. |
| (4) | Vacant and Expiring NRSF include temporary tenants totaling 16,823 square feet. |
| (5) | Weighted Average Annual U/W Base Rent PSF excludes the vacant space. |
The following table presents historical occupancy percentages at The Mall at Rockingham Park Property:
Historical Occupancy(1)(2)
12/31/2012(3) | 12/31/2013(3) | 12/31/2014(3) | 12/31/2015(3) | 4/20/2016(4) |
| 99.0% | 97.6% | 98.0% | 98.5% | 97.1% |
| (1) | Information excludes the non-collateral anchor tenants. |
| (2) | Including the non-collateral anchor tenants, The Mall at Rockingham Park had a historical occupancy of 99.5%, 98.7%, 98.9% and 99.2% in 2012, 2013, 2014 and 2015, respectively. The current occupancy as of April 20, 2016 inclusive of all anchor tenants, temporary tenants and tenants with executed leases that are not yet open and operating, is 98.5%. |
| (3) | Information obtained from the borrower. |
| (4) | Information obtained from the underwritten rent roll. Occupancy as of April 20, 2016 includes two tenants who have filed for bankruptcy, Aeropostale and PacSun, occupying 6,873 square feet in total. Excluding these two tenants, The Mall at Rockingham Park Property (inclusive of the non-collateral anchor tenants) occupancy would be 97.8% and The Mall at Rockingham Park Property occupancy would be 95.8%. See “Cash Flow Analysis” section. |
THE INFORMATION IN THIS STRUCTURAL AND COLLATERAL TERM SHEET IS NOT COMPLETE AND MAY BE AMENDED PRIOR TO THE TIME OF SALE. THIS TERM SHEET IS NOT AN OFFER TO SELL THESE SECURITIES AND IT IS NOT A SOLICITATION OF AN OFFER TO BUY THESE SECURITIES IN ANY JURISDICTION WHERE THE OFFER OR SALE IS NOT PERMITTED.
| 45 |
THE MALL AT ROCKINGHAM PARK
Operating History and Underwritten Net Cash Flow.The following table presents certain information relating to the historical operating performance and underwritten net cash flow at The Mall at Rockingham Park Property:
Cash Flow Analysis
| 2013 | 2014 | 2015 | TTM 3/31/2016 | U/W | % of U/W Effective Gross Income | U/W $ per SF | |||||||||
| Base Rent | $18,567,737 | $19,523,154 | $19,901,705 | $19,886,757 | $20,073,653(3) | 56.4% | $37.11 | ||||||||
| Grossed up Vacant Space | 0 | 0 | 0 | 0 | 1,402,536 | 3.9 | 2.59 | ||||||||
| Percentage Rent(1) | 251,675 | 203,917 | 215,365 | 222,098 | 176,062 | 0.5 | 0.33 | ||||||||
| Total Reimbursables | 12,497,800 | 13,043,578 | 13,398,219 | 13,501,545 | 13,861,068 | 38.9 | 25.63 | ||||||||
| Other Income(2) | 2,615,161 | 2,101,132 | 2,048,257 | 2,121,528 | 2,162,096 | 6.1 | 4.00 | ||||||||
| Less Vacancy & Credit Loss | 0 | 0 | 0 | 0 | (2,072,989)(4) | (5.8) | (3.83) | ||||||||
| Effective Gross Income | $33,932,373 | $34,871,781 | $35,563,546 | $35,731,928 | $35,602,427 | 100.0% | $65.82 | ||||||||
| Total Operating Expenses | $10,670,161 | $10,527,937 | $10,774,191 | $10,509,078 | $10,756,845 | 30.2% | $19.89 | ||||||||
| Net Operating Income | $23,262,212 | $24,343,844 | $24,789,355 | $25,222,850 | $24,845,582 | 69.8% | $45.94 | ||||||||
| TI/LC | 0 | 0 | 0 | 0 | 540,867 | 1.5 | 1.00 | ||||||||
| Capital Expenditures | 0 | 0 | 0 | 0 | 113,583 | 0.3 | 0.21 | ||||||||
| Net Cash Flow | $23,262,212 | $24,343,844 | $24,789,355 | $25,222,850 | $24,191,133 | 67.9% | $44.73 | ||||||||
| NOI DSCR(5) | 3.99x | 4.17x | 4.25x | 4.32x | 4.26x | ||||||||||
| NCF DSCR(5) | 3.99x | 4.17x | 4.25x | 4.32x | 4.14x | ||||||||||
| NOI DY(5) | 16.3% | 17.1% | 17.4% | 17.7% | 17.4% | ||||||||||
| NCF DY(5) | 16.3% | 17.1% | 17.4% | 17.7% | 17.0% |
| (1) | Percentage Rent was underwritten to in-place breakpoints and percentage rents based on sales for the trailing 12-month period ending March 2016. |
| (2) | Historical and TTM 3/31/2016 Other Income includes income from temporary tenant, storage, sponsorships, participation/media-Simon Brand Ventures marketing, miscellaneous, marketing, other rent and specialty leasing income. U/W Other Income is based on the 2016 budgeted amount of $280,646 and marketing income recoveries based on the 4/20/2016 rent roll totaling $558,923 (including $19,790 and $4,124 for Aeropostale and PacSun, respectively). |
| (3) | U/W Base Rent includes rent steps through May 2017 totaling $343,639 and also includes $337,114 of base rent from Aeropostale and PacSun. |
| (4) | Aeropostale and Pacsun are included in the underwriting for occupancy purposes, but are removed in the Vacancy & Credit Loss. The U/W economic vacancy is 5.5%, however, The Mall at Rockingham Park Property was 97.1% occupied as of April 20, 2016. |
| (5) | The debt service coverage ratios and debt yields are calculated off of the total of The Mall at Rockingham Park seniorpari passu notes totaling $142,500,000. |
Appraisal. As of the appraisal valuation date of April 28, 2016, The Mall at Rockingham Park Property had an “as-is” appraised value of $494,000,000.
Environmental Matters.According to the Phase I environmental site assessment dated May 2, 2016, there was no evidence of any recognized environmental conditions at The Mall at Rockingham Park Property.
Market Overview and Competition.The Mall at Rockingham Park Property is located in southern Rockingham County, within the northwest portion of theBoston-Cambridge-Newton Massachusetts-New Hampshire metropolitan statistical area. The Boston metropolitan statistical area spans across the eastern portion of Massachusetts and encompasses five counties in Massachusetts, as well as Strafford and Rockingham, which are situated in New Hampshire. Encompassing approximately 4,913 square miles, the Boston metropolitan statistical area accounts for 44.7% of Massachusetts’ total land area and 20.8% of Massachusetts and New Hampshire’s combined land area. With a current population of more than 4.7 million, the Boston metropolitan statistical area grew at a compound annual rate of 0.8% from 2005 through 2015. According to the US Bureau of Labor Statistics, unemployment in the Boston metropolitan statistical area was reported at 4.2% as of year-end 2015, which is lower than the state unemployment rate of 4.7% and the national unemployment rate of 5.3%. According to a third party research firm, Boston metropolitan statistical area’s 2015 average household income was $104,885, which is 37.1% higher than the national average of $76,502. According to the appraisal, the three largest employment sectors within the Boston metropolitan statistical area are education and health services, professional and business services and transportation and utilities. The region is home to ten Fortune 500 companies, as well as some of the top ranked hospitals and universities in the country. The Mall at Rockingham Park Property is approximately 35.0 miles northwest of downtown Boston, 18.0 miles southeast of Manchester and 37 miles south of Concord (the state capital of New Hampshire). The two most populous counties in New Hampshire are Rockingham County and neighboring Hillsborough County, each accounting for 22.4% and 30.4% of the population, respectively.
Upon entering New Hampshire via Interstate 93, The Mall at Rockingham Park Property is located off of the first exit. Per New Hampshire’s Department of Transportation and Bureau of Traffic, Interstate 93 has an annual traffic count that averages approximately 38 million vehicles per year (approximately 104,409 vehicles per day). The Mall at Rockingham Park Property benefits from its location approximately 2.0 miles north of the Massachusetts border and close proximity to the city of Boston, as New Hampshire is one of five states in the U.S. that offers tax free shopping to its residents. According to the appraisal, The Mall at Rockingham Park Property has a primary trade area consisting of a ten-mile radius that contains 471,265 people, with an average household income of $89,874 as of 2015.
According to the appraisal, The Mall at Rockingham Park Property’s primary competitors include Pheasant Lane Mall, Mall of New Hampshire, Northshore Mall, Burlington Mall, Merrimack Premium Outlets and Fox Run Mall. Pheasant Lane Mall, is anchored by J.C. Penney, Macy’s, Sears, Target and Dick’s Sporting Goods. On a comparative basis The Mall at Rockingham Park’s Macy’s and Sears outperform those at Pheasant Lane Mall on both a gross and per square foot basis. Pheasant Lane Mall is located approximately 17 miles west of The Mall at Rockingham Park Property, falling outside of the primary trade area and is not as easily accessible from the greater Boston area. The Mall of New Hampshire, located in Manchester, New Hampshire, which is the closest regional mall to The
THE INFORMATION IN THIS STRUCTURAL AND COLLATERAL TERM SHEET IS NOT COMPLETE AND MAY BE AMENDED PRIOR TO THE TIME OF SALE. THIS TERM SHEET IS NOT AN OFFER TO SELL THESE SECURITIES AND IT IS NOT A SOLICITATION OF AN OFFER TO BUY THESE SECURITIES IN ANY JURISDICTION WHERE THE OFFER OR SALE IS NOT PERMITTED.
| 46 |
THE MALL AT ROCKINGHAM PARK
Mall at Rockingham Park Property, exhibits in-line sales of approximately $340 per square foot as of year-end 2015, approximately $161 less than The Mall at Rockingham Park Property, when excluding Apple sales. According to a third party research report, The Mall of New Hampshire has a property grade of B, compared to The Mall at Rockingham Park Property, which has a property grade rating of A+.
Northshore Mall and Burlington Mall are both located in Massachusetts, between 24.0 to 29.0 miles south of The Mall at Rockingham Park Property. There are no sales tax benefits for New Hampshire residents that shop at Massachusetts malls. Merrimack Premium Outlets is an outlet center that opened in 2012 and currently includes outlet tenants such as Saks Fifth Avenue and Bloomingdale’s Outlet, among others. Merrimack Premium Outlets is located approximately 14.0 miles west of The Mall at Rockingham Park Property, outside of The Mall at Rockingham Park’s trade area. The Mall at Rockingham Park Property performs better on a per square foot sales basis in comparison to the Merrimack Premium Outlets. Fox Run Mall, located approximately 31.0 miles northeast from The Mall at Rockingham Park Property, is outside of the trade area and resides on the border near Maine.
According to the appraisal, in February 2015, a portion of the Rockingham Park site, which is adjacent to The Mall at Rockingham Park Property, was sold to the owner of Tuscan Brands, a local operator of Tuscan Market and Restaurant locations in Salem, New Hampshire and Burlington, Massachusetts. Subsequent to acquiring the site, Tuscan Brands proposed to build a mixed-use development to be known as Tuscan Village. The project would include approximately 250 luxury rental units, 63 townhouse condominium units, 356,000 square feet of retail space including restaurants and entertainment uses, a 45,000 square foot organic grocery store, a 65,000 square foot theatre, and a 15,000 square foot bowling alley. The project would also include a new 38,000 square foot automobile sales facility and a four-story, 160-room business class hotel. According to a third-party market research report, there are only three projects totaling approximately 363,000 square feet proposed for The Mall at Rockingham Park’s North Merrimac River Valley submarket. All three of these projects are in the initial planning phases. The third party research report figures do not include the proposed Tuscan Village project located directly opposite The Mall at Rockingham Park Property and the proposed Woodmont Commons project located in Londonderry, New Hampshire as it falls outside of the Boston metropolitan statistical area.
The following table presents certain information relating to comparable retail properties for The Mall at Rockingham Park Property:
Competitive Set(1)
The Mall at Rockingham Park (Subject) | Pheasant Lane Mall | Mall of New Hampshire | Northshore Mall | Burlington Mall | Merrimack Premium Outlets | Fox Run Mall | |
| Location | Salem, NH | Nashua, NH | Manchester, NH | Peabody, MA | Burlington, MA | Merrimack, NH | Newington, NH |
| Distance from Subject | -- | 17.0 miles | 16.0 miles | 24.0 miles | 29.0 miles | 14.0 miles | 31.0 miles |
| Property Type | Regional Mall | Regional Mall | Regional Mall | Regional Mall | Regional Mall | Outlet Center | Regional Mall |
| Year Built/Renovated | 1991/2015 | 1986/2011 | 1977/1998 | 1958/1993 | 1968/1996 | 2012/NAP | 1983/2000 |
| Anchors | J.C. Penney, Macy’s, Sears, Lord & Taylor Dick’s Sporting Goods | J.C. Penney, Macy’s, Sears, Target, Dick’s Sporting Goods | J.C. Penney, Sears, Macy’s | Macy’s, J.C. Penney, Nordstrom, Sears, Macy’s Men & Furniture | Macy’s, Lord & Taylor, Sears, Crate & Barrel, Nordstrom | Saks Fifth Avenue, Bloomingdales Outlet | Macy’s, J.C. Penney, Sears |
| Total GLA | 1,025,590 SF(2) | 972,249 SF | 811,310 SF | 1,579,820 SF | 1,317,061 SF | 408,996 SF | 599,098 SF |
| Inline Sales PSF | $501(3) | $500 | $340 | $525 | $600 | $450 | $460 |
| Total Occupancy | 98.5%(4) | 98.0% | 98.0% | 98.0% | 98.0% | 100.0% | 89.0% |
| (1) | Information obtained from the appraisal and underwritten rent roll. |
| (2) | Total GLA includes non-collateral anchor tenants comprising 484,723 square feet. |
| (3) | Inline Sales PSF excludes Apple sales. Inclusive of Apple, Inline Sales PSF for the trailing 12-month period ending March 2016 at The Mall at Rockingham Park Property were $937. |
| (4) | The Mall at Rockingham Park Property Total Occupancy of 98.5% is as of April 20, 2016, and includes non-collateral anchor, owned collateral anchor, and temporary tenants. |
The Borrower.The borrowing entity, Mall at Rockingham, LLC, is a Delaware limited liability company and special purpose entity. Legal counsel to the borrower delivered a non-consolidation opinion in connection with the origination. Mayflower Realty LLC, Series B is the guarantor of certain nonrecourse carveouts under The Mall at Rockingham Park Whole Loan. Liabilities under the guaranty are capped at $52,400,000.
The Sponsors.The sponsors of The Mall at Rockingham Park Mortgage Loan are Mayflower Realty LLC, Series B and Institutional Mall Investors. The Mall at Rockingham Park Property is jointly-owned by Mayflower Realty LLC, Series B (50%) and Institutional Mall Investors (50%). Simon Property Group, L.P. and The Canada Pension Plan Investment Board hold an approximate 56% and 44% stake, respectively, in Mayflower Realty LLC, Series B.
Simon Property Group, L.P. (“Simon”), the operating partnership of Simon Property Group, Inc., is a publicly traded (S&P 100; NYSE: SPG) real estate investment trust headquartered in Indianapolis, Indiana focused on retail real estate ownership, management and development. Simon owns or retains an interest in 231 retail real estate properties comprising 191.4 million square feet in North America, Europe and Asia. Simon’s portfolio was 96.1% occupied and generated tenant sales of $620 per square foot as of December 31, 2015. According to its consolidated balance sheet dated December 31, 2015, Simon reported cash and cash equivalents of approximately $701.1 million and total equity of approximately $70.3 billion. Simon has sponsored other real estate projects over the last 10 years that have been the subject of mortgage loan defaults, foreclosure proceedings and deed-in-lieu of
THE INFORMATION IN THIS STRUCTURAL AND COLLATERAL TERM SHEET IS NOT COMPLETE AND MAY BE AMENDED PRIOR TO THE TIME OF SALE. THIS TERM SHEET IS NOT AN OFFER TO SELL THESE SECURITIES AND IT IS NOT A SOLICITATION OF AN OFFER TO BUY THESE SECURITIES IN ANY JURISDICTION WHERE THE OFFER OR SALE IS NOT PERMITTED.
| 47 |
THE MALL AT ROCKINGHAM PARK
foreclosure. See“Description of the Mortgage Pool—Non-Recourse Carveout Limitations” and“Description of the Mortgage Pool—Loan Purpose; Default History, Bankruptcy Issues and Other Proceedings” in the Preliminary Prospectus.
The Canada Pension Plan Investment Board (“CPPIB”) is a professional investment management organization that invests the assets of CPPIB not currently needed to pay pension, disability and survivor benefits. As of March 31, 2016, CPPIB had $278.9 billion in total assets.
Institutional Mall Investors (“IMI”) is a co-investment venture owned by an affiliate of Miller Capital Advisory, Inc. (“MCA”) and California Public Employees’ Retirement System (“CalPERS”), the nation’s largest public pension fund. MCA serves as investment manager for IMI. IMI is a core-oriented investment platform focused on high quality, market dominant and fashion-oriented retail properties. The IMI portfolio features some of the largest regional and super-regional shopping centers in the United States. As of March 31, 2016, the portfolio included approximately 19.7 million square feet of gross leasable retail area and over 1.3 million square feet of prime office space. CalPERS has approximately $294.1 billion in total market value as of June 10, 2016 provides retirement benefit services to more than 1.8 million California state, public school and local public agency employees, retirees and their families and health benefit services to approximately 1.4 million members.
Escrows.Pursuant to The Mall at Rockingham Park Whole Loan documents, monthly escrows for real estate taxes, insurance premiums (unless insurance is being maintained under a blanket policy), capital expenditures, and tenant improvements and leasing commissions are only required during an event of default or during a Reserve Trigger Event (as defined below).
Following the occurrence and during the continuance of a Reserve Trigger Event or an event of default under The Mall at Rockingham Park Whole Loan documents, the borrower is required to escrow on each payment date: (i) one-twelfth of the taxes that the lender estimates will be payable during the next ensuing 12 months; (ii) one-twelfth of the insurance premiums that the lender estimates will be payable for the renewal of the coverage afforded by the policies upon the expiration thereof (unless insurance is being maintained under a blanket policy); (iii) $11,268 (approximately $0.25 per square foot annually) for capital expenditures and such reserve will be capped at 24 monthly payments ($270,432); and (iv) $45,072 (approximately $1.00 per square foot annually) for tenant improvements and leasing commissions and such reserve will be capped at 24 monthly payments ($1,081,728).
A “Reserve Trigger Event” will commence upon the debt service coverage ratio as calculated under The Mall at Rockingham Park Whole Loan documents being less than 1.25x for two consecutive quarters; and will end if the debt service coverage ratio as calculated under The Mall at Rockingham Park Whole Loan documents is at least equal to 1.25x for two consecutive quarters.
Lockbox and Cash Management.The borrower is required to maintain a deposit account, in which the lender will have a security interest, with respect to The Mall at Rockingham Park Property. The borrower is required to deliver to all new tenants at The Mall at Rockingham Park Property a written notice instructing that all rents under leases at The Mall at Rockingham Park Property are to be delivered by such tenants directly to the deposit account. So long as no Lockbox Event (as defined below) has occurred and is continuing, the borrower will have access to the funds deposited into the deposit account and may utilize the deposit account as its operating account. Upon the occurrence and during the continuance of a Lockbox Event, the borrower will have no further access to the funds in the deposit account, and such funds (less any minimum balance required under The Mall at Rockingham Park Whole Loan documents, not to exceed $25,000) will be swept into the cash management account on each Wednesday, or if such Wednesday is not a business day, the preceding business day and applied and disbursed in accordance with The Mall at Rockingham Park Whole Loan documents.
A “Lockbox Event” will commence upon, (i) an event of default under The Mall at Rockingham Park Whole Loan documents, (ii) any bankruptcy action of the borrower, (iii) a bankruptcy action of the property manager if the property manager is a borrower affiliate and provided the property manager is not replaced within 60 days with a qualified manager or (iv) the debt service coverage ratio as calculated under The Mall at Rockingham Park Whole Loan is less than 1.20x for two consecutive quarters. A Lockbox Event will end upon the occurrence of the applicable Lockbox Termination Event (as defined below).
A “Lockbox Termination Event” will mean, with respect to clause (i) of the definition of Lockbox Event, the lender accepting the cure of such event of default, with respect to clause (ii) of the definition of Lockbox Event, the borrower replaces the property manager with an acceptable replacement manager within 60 days or the bankruptcy action is discharged or dismissed within 90 days, or with respect to clause (iii) of the definition of Lockbox Event, the debt service coverage ratio as calculated under The Mall at Rockingham Park Whole Loan is greater than or equal to 1.20x for two consecutive quarters based on the trailing four calendar quarter period; provided that, (a) no other event of default has occurred and be continuing, (b) the borrower may not cure a Lockbox Event for more than a total of five times during the loan term, and (c) the borrower has paid all of the reimbursable trust expenses.
Property Management. The Mall at Rockingham Park Property is managed by an affiliate of the borrower
Assumption.The borrower has, at anytime (other than during the of earlier of twelve months after loan closing or 60 days after securitization of The Mall at Rockingham Park Whole Loan), the right to transfer The Mall at Rockingham Park Property or more than 50.0% of the aggregate interests in the borrower, provided that no event of default exists under The Mall at Rockingham Park Whole Loan documents and certain other conditions are satisfied, including, but not limited to: either (a) that the transfer is not a prohibited transfer under The Mall at Rockingham Park Whole Loan documents or (b) that the proposed transferee will have been approved by the lender, which may be conditioned upon rating agency confirmation that the transfer will not result in a downgrade, withdrawal or qualification of the respective ratings assigned to the Series 2016-C35 Certificates or similar ratings confirmations from each rating agency rating any securities backed by any The Mall at Rockingham Park Companion Loans with respect to the ratings of such securities.
Partial Release.Not permitted.
Real Estate Substitution.Not permitted.
THE INFORMATION IN THIS STRUCTURAL AND COLLATERAL TERM SHEET IS NOT COMPLETE AND MAY BE AMENDED PRIOR TO THE TIME OF SALE. THIS TERM SHEET IS NOT AN OFFER TO SELL THESE SECURITIES AND IT IS NOT A SOLICITATION OF AN OFFER TO BUY THESE SECURITIES IN ANY JURISDICTION WHERE THE OFFER OR SALE IS NOT PERMITTED.
| 48 |
THE MALL AT ROCKINGHAM PARK
Subordinate and Mezzanine Indebtedness. See “Other Indebtedness” below.
Other Indebtedness.The Mall at Rockingham Park Whole Loan includes six promissory notes (Note A-1-A, Note A-2-A, Note A-1-B, Note A-2-B, Note B-1 and Note B-2) with an aggregate original principal balance of $262,000,000, and an outstanding aggregate principal balance as of the Cut-off Date of $262,000,000. The two subordinate notes (Note B-1 and Note B-2) have an aggregate original principal balance of $119,500,000 and an aggregate outstanding principal balance as of the Cut-off Date of $119,500,000. Two seniorpari passu notes (Note A-1-A and Note A-2-A) and two subordinate notes (Note B-1 and Note B-2) with an original aggregate principal balance $162,000,000, and an aggregate outstanding principal balance as of the Cut-off Date of $162,000,000, were contributed to the BBSG 2016-MRP Trust.
Ground Lease.Pursuant to a ground lease dated as of March 1, 2007 between the borrower and Rocksal Mall L.L.C., a direct 100% member of the borrower (the “Fee Owner”), the borrower ground leases portions of The Mall at Rockingham Park Property from the Fee Owner. The ground lease expires on March 1, 2057 and has an annual ground lease payment of $10. The Fee Owner has not signed any of The Mall at Rockingham Park Whole Loan documents as a co-borrower, but has executed the mortgage pledging its fee interest in The Mall at Rockingham Park Property.
Terrorism Insurance.The Mall at Rockingham Park Whole Loan documents require that the “all risk” insurance policy required to be maintained by the borrower provide coverage for terrorism in an amount equal to the full replacement cost of The Mall at Rockingham Park Property, or if the terrorism risk insurance program reauthorization act is no longer in effect and such policies contain an exclusion for acts of terrorism, the borrower will be required to obtain, to the extent available, a stand-alone policy that provides the same coverage as the policies would have if such exclusion did not exist; provided, however, (A) in such event the borrower will not be required to pay annual premiums in excess of the Terrorism Cap (as defined below) in order to obtain the terrorism coverage, and (B) that such stand-alone policy may have a deductible that is reasonable for such stand-alone policies with respect to properties similar to The Mall at Rockingham Park Property and reasonable for the geographic region where The Mall at Rockingham Park Property is located, so long as in no event may such deductible exceed $5,000,000.
“Terrorism Cap” means an amount equal to two times the then-current annual insurance premiums payable by the borrower for the policies insuring only The Mall at Rockingham Park Property (excluding the wind, flood and earthquake components of such insurance premiums) on a stand-alone basis.
THE INFORMATION IN THIS STRUCTURAL AND COLLATERAL TERM SHEET IS NOT COMPLETE AND MAY BE AMENDED PRIOR TO THE TIME OF SALE. THIS TERM SHEET IS NOT AN OFFER TO SELL THESE SECURITIES AND IT IS NOT A SOLICITATION OF AN OFFER TO BUY THESE SECURITIES IN ANY JURISDICTION WHERE THE OFFER OR SALE IS NOT PERMITTED.
| 49 |
KROGER (ROUNDY’S) DISTRIBUTION CENTER

THE INFORMATION IN THIS STRUCTURAL AND COLLATERAL TERM SHEET IS NOT COMPLETE AND MAY BE AMENDED PRIOR TO THE TIME OF SALE. THIS TERM SHEET IS NOT AN OFFER TO SELL THESE SECURITIES AND IT IS NOT A SOLICITATION OF AN OFFER TO BUY THESE SECURITIES IN ANY JURISDICTION WHERE THE OFFER OR SALE IS NOT PERMITTED.
| 50 |
KROGER (ROUNDY’S) DISTRIBUTION CENTER
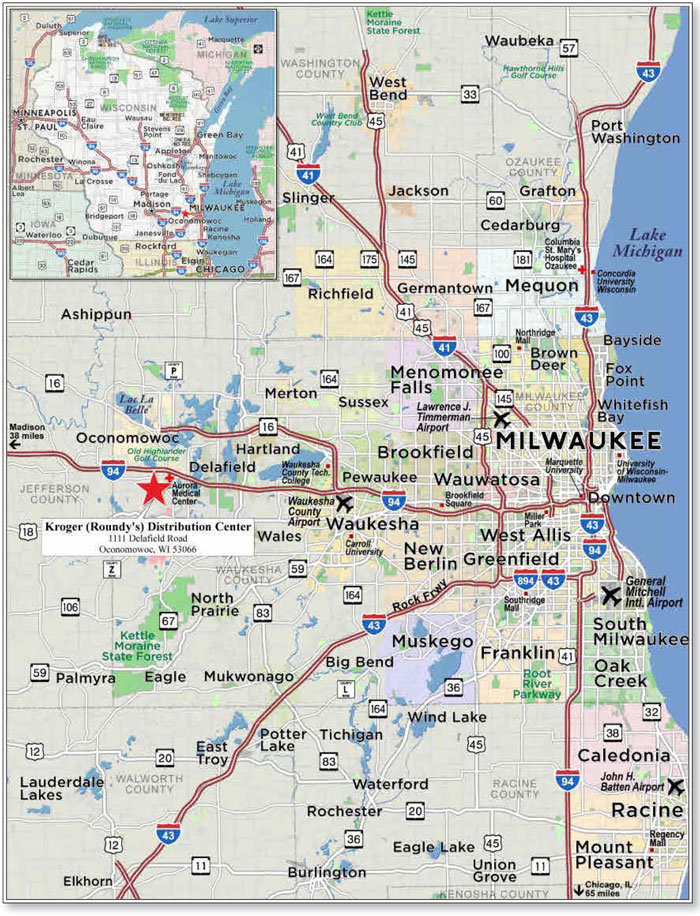
THE INFORMATION IN THIS STRUCTURAL AND COLLATERAL TERM SHEET IS NOT COMPLETE AND MAY BE AMENDED PRIOR TO THE TIME OF SALE. THIS TERM SHEET IS NOT AN OFFER TO SELL THESE SECURITIES AND IT IS NOT A SOLICITATION OF AN OFFER TO BUY THESE SECURITIES IN ANY JURISDICTION WHERE THE OFFER OR SALE IS NOT PERMITTED.
| 51 |
| No. 3 - Kroger (Roundy’s) Distribution Center | |||||||
| Loan Information | Property Information | ||||||
| Mortgage Loan Seller: | Rialto Mortgage Finance, LLC | Single Asset/Portfolio: | Single Asset | ||||
| Credit Assessment (Fitch/KBRA/Moody’s): | NR/NR/NR | Property Type: | Industrial | ||||
| Original Principal Balance(1): | $59,500,000 | Specific Property Type: | Warehouse | ||||
| Cut-off Date Balance(1): | $59,500,000 | Location: | Oconomowoc, WI | ||||
| % of Initial Pool Balance: | 5.8% | Size: | 1,093,756 SF | ||||
| Loan Purpose: | Refinance | Cut-off Date Balance Per SF(1): | $69.94 | ||||
| Borrower Name: | Pabst Farms-RDC, LLC | Year Built/Renovated: | 2004/NAP | ||||
| Sponsor: | Peter Paul Bell | Title Vesting: | Fee | ||||
| Mortgage Rate: | 4.800% | Property Manager: | Tenant-managed | ||||
| Note Date: | May 24, 2016 | 4thMost Recent Occupancy (As of): | 100.0% (12/31/2012) | ||||
| Anticipated Repayment Date: | NAP | 3rdMost Recent Occupancy (As of): | 100.0% (12/31/2013) | ||||
| Maturity Date: | June 6, 2026 | 2ndMost Recent Occupancy (As of): | 100.0% (12/31/2014) | ||||
| IO Period: | 36 months | Most Recent Occupancy (As of): | 100.0% (12/31/2015) | ||||
| Loan Term (Original): | 120 months | Current Occupancy (As of): | 100.0% (7/1/2016) | ||||
| Seasoning: | 1 month | ||||||
| Amortization Term (Original): | 360 months | Underwriting and Financial Information: | |||||
| Loan Amortization Type: | Interest-only, Amortizing Balloon | ||||||
| Interest Accrual Method: | Actual/360 | 4thMost Recent NOI (As of): | $6,839,328 (12/31/2013) | ||||
| Call Protection: | L(25),D(88),O(7) | 3rdMost Recent NOI (As of): | $6,839,328 (12/31/2014) | ||||
| Lockbox Type: | Springing | 2ndMost Recent NOI (As of): | $6,839,328 (12/31/2015) | ||||
| Additional Debt(1): | Yes | Most Recent NOI (As of): | $6,839,328 (TTM 3/31/2016) | ||||
| Additional Debt Type(1): | Pari Passu | ||||||
| U/W Revenues: | $6,918,772 | ||||||
| U/W Expenses: | $0 | ||||||
| U/W NOI: | $6,918,772 | ||||||
| U/W NCF: | $6,918,772 | ||||||
| U/W NOI DSCR(1): | 1.44x | ||||||
| Escrows and Reserves (2): | U/W NCF DSCR(1): | 1.44x | |||||
| U/W NOI Debt Yield(1): | 9.0% | ||||||
| Type: | Initial | Monthly | Cap (If Any) | U/W NCF Debt Yield(1): | 9.0% | ||
| Taxes | $0 | Springing | NAP | As-Is Appraised Value: | $110,000,000 | ||
| Insurance | $0 | Springing | NAP | As-Is Appraisal Valuation Date: | April 6, 2016 | ||
| Replacement Reserves | $0 | Springing | NAP | Cut-off Date LTV Ratio(1): | 69.5% | ||
| TI/LC Reserve | $0 | $0 | NAP | LTV Ratio at Maturity or ARD(1): | 61.3% | ||
| (1) | The Kroger (Roundy’s) Distribution Center Whole Loan (as defined below), with an aggregate original principal balance of $76,500,000, is comprised of twopari passu notes (Notes A-1 and A-2). The controlling Note A-1 had an original principal balance of $59,500,000, has an outstanding principal balance as of the Cut-off Date of $59,500,000 and will be contributed to the WFCM 2016-C35 Trust. The non-controlling Note A-2 had an original balance of $17,000,000 and is expected to be contributed to a future trust or trusts. All statistical financial information related to balances per square foot, loan-to-value ratios, debt service coverage ratios and debt yields are based on the Kroger (Roundy’s) Distribution Center Whole Loan. |
| (2) | See “Escrows” section. |
The Mortgage Loan. The mortgage loan (the “Kroger (Roundy’s) Distribution Center Mortgage Loan”) is part of a whole loan (the “Kroger (Roundy’s) Distribution Center Whole Loan”) that is evidenced by twopari passu promissory notes (Notes A-1 and A-2) and secured by a first mortgage encumbering a distribution warehouse property located in Oconomowoc, Wisconsin (the “Kroger (Roundy’s) Distribution Center Property”). The Kroger (Roundy’s) Distribution Center Whole Loan was originated on May 24, 2016 by Rialto Mortgage Finance, LLC. The Kroger (Roundy’s) Distribution Center Whole Loan had an original principal balance of $76,500,000, has an outstanding principal balance as of the Cut-off Date of $76,500,000 and accrues interest at an interest rate of 4.800%per annum. The Kroger (Roundy’s) Distribution Center Whole Loan had an initial term of 120 months, has a remaining term of 119 months as of the Cut-off Date and requires interest-only payments for the first 36 months following origination and, thereafter, requires payments of principal and interest based on a 30-year amortization schedule. The Kroger (Roundy’s) Distribution Center Whole Loan matures on June 6, 2026.
THE INFORMATION IN THIS STRUCTURAL AND COLLATERAL TERM SHEET IS NOT COMPLETE AND MAY BE AMENDED PRIOR TO THE TIME OF SALE. THIS TERM SHEET IS NOT AN OFFER TO SELL THESE SECURITIES AND IT IS NOT A SOLICITATION OF AN OFFER TO BUY THESE SECURITIES IN ANY JURISDICTION WHERE THE OFFER OR SALE IS NOT PERMITTED.
| 52 |
KROGER (ROUNDY’S) DISTRIBUTION CENTER
Note A-1, which will be contributed to the WFCM 2016-C35 Trust, had an original principal balance of $59,500,000, an outstanding principal balance as of the Cut-off Date of $59,500,000 and represents the controlling interest. The non-controlling Note A-2, with an original principal balance of $17,000,000, referred to herein as the “Kroger (Roundy’s) Distribution Center Companion Loan” is expected to be contributed to a future trust or trusts. The lender provides no assurances that any non-securitized note will not be split further. See “Description of the Mortgage Pool—The Whole Loans—The Serviced Whole Loans—The Kroger (Roundy’s) Distribution Center Whole Loan” in the Preliminary Prospectus.
Pari Passu Note Summary
| Original Balance | Note Holder | Controlling Interest | ||
| Note A-1 | $59,500,000 | WFCM 2016-C35 | Yes | |
| Note A-2 | $17,000,000 | Rialto Mortgage Finance, LLC(1) | No | |
| Total | $76,500,000 |
| (1) | Note A-2 is currently held by an affiliate of Rialto Mortgage Finance, LLC and is expected to be contributed to one or more future trusts. |
Following the lockout period, the borrower has the right to defease the Kroger (Roundy’s) Distribution Center Whole Loan in whole, but not in part, on any date before December 6, 2025. In addition, the Kroger (Roundy’s) Distribution Center Whole Loan is prepayable without penalty on or after December 6, 2025.
Sources and Uses
| Sources | Uses | |||||||
| Original whole loan amount | $76,500,000 | 100.0% | Loan payoff | $60,400,000 | 79.0% | |||
| Membership buyout(1) | 6,300,000 | 8.2 | ||||||
| Closing costs | 539,926 | 0.7 | ||||||
| Return of equity | 9,260,074 | 12.1 | ||||||
| Total Sources | $76,500,000 | 100.0% | Total Uses | $76,500,000 | 100.0% |
| (1) | $6.3 million was used to buy out sponsor-related entities which owned a leasehold interest in the Kroger (Roundy’s) Distribution Center Property. The ground lease was terminated at origination. |
The Property. The Kroger (Roundy’s) Distribution Center Property is a single-tenant, industrial warehouse and distribution facility located in Oconomowoc, Wisconsin. The Kroger (Roundy’s) Distribution Center Property was built to suit for Roundy’s Inc. (“Roundy’s”), a regional supermarket grocery store chain that was acquired by The Kroger Company (“Kroger”) in December 2015. Roundy’s was founded in 1872 in Milwaukee, Wisconsin, and has grown to 151 total stores in Wisconsin and the greater Chicago region under four Roundy’s banners: Pick ‘n Save, Copps, Metro Market, and Mariano’s. Roundy’s employed approximately 22,000 associates, and had revenues of approximately $3.9 billion as of the fiscal year ending January 3, 2015. Roundy’s merged with Kroger in December 2015 and operates its stores as a wholly owned subsidiary of Kroger. The improvements were constructed in 2004 and consist of three buildings totaling 1,093,756 square feet situated on a 111.7-acre site. The main building is an approximately 1.1 million square foot distribution center representing approximately 98.3% of the total net rentable area. The other two buildings consist of an 18,722 square foot maintenance facility in the rear of the main building and a 200 square foot truck entrance guardhouse located at the secure entrance to the loading dock area. The distribution center consists of four primary sections: dry storage (53.1% of net rentable area), refrigerated storage (27.6% of net rentable area), frozen storage (15.1% of net rentable area), and office space (4.2% of net rentable area). The clear height is 37’ in the dry storage area, 34’ in the cooler and freezer storage areas, and 24’ in the dock staging area. Bay sizes are 39’6” x 58’10”, and are designed to support 11’ wide aisles. There are 126 dock high overhead doors with levelers and one drive-up ramp. The main office/employees’ services space is located in the center of the building totaling 39,827 square feet of space, with the majority of the office space located on the second floor. The Kroger (Roundy’s) Distribution Center Property has an additional 91,000 square feet available to accommodate expansion capacity. There are 409 regular and 16 handicapped parking spaces, resulting in a parking ratio of 2.6 spaces per 1,000 square feet of rentable area. Additionally, there are 317 tractor trailer parking spaces located on the south side of the main building, of which 64 are electric spaces. As of July 1, 2016, the Kroger (Roundy’s) Distribution Center Property was 100.0% occupied. Roundy’s lease at the Kroger (Roundy’s) Distribution Center Property runs through December 31, 2030 and has five, 5-year lease renewal options thereafter.
THE INFORMATION IN THIS STRUCTURAL AND COLLATERAL TERM SHEET IS NOT COMPLETE AND MAY BE AMENDED PRIOR TO THE TIME OF SALE. THIS TERM SHEET IS NOT AN OFFER TO SELL THESE SECURITIES AND IT IS NOT A SOLICITATION OF AN OFFER TO BUY THESE SECURITIES IN ANY JURISDICTION WHERE THE OFFER OR SALE IS NOT PERMITTED.
| 53 |
KROGER (ROUNDY’S) DISTRIBUTION CENTER
The following table presents certain information relating to the tenancy at the Kroger (Roundy’s) Distribution Center Property:
Major Tenants
| Tenant Name | Credit Rating (Fitch/Moody’s/ S&P)(1) | Tenant NRSF | % of NRSF | Annual U/W Base Rent PSF(2) | Annual U/W Base Rent | % of Total Annual U/W Base Rent | Lease Expiration Date |
| Major Tenants | |||||||
| Roundy’s Inc. | BBB/Baa1/BBB | 1,093,756 | 100.0% | $6.25 | $6,839,328 | 100.0% | 12/31/2030(2) |
| Occupied Collateral Total | 1,093,756 | 100.0% | $6.25 | $6,839,328 | 100.0% | ||
| Vacant Space | 0 | 0.0% | |||||
| Collateral Total | 1,093,756 | 100.0% | |||||
| (1) | Certain ratings are those of the parent company, Kroger. Kroger does not guarantee the lease. |
| (2) | Roundy’s Inc. has five, 5-year lease renewal options remaining. |
The following table presents certain information relating to the lease rollover schedule at the Kroger (Roundy’s) Distribution Center Property:
Lease Expiration Schedule(1)
| Year Ending December 31, | No. of Leases Expiring | Expiring NRSF | % of Total NRSF | Cumulative Expiring NRSF | Cumulative% of Total NRSF | Annual U/W Base Rent | % of Total Annual U/W Base Rent | Annual U/W Base Rent PSF |
| MTM | 0 | 0 | 0.0% | 0 | 0.0% | $0 | 0.0% | $0.00 |
| 2016 | 0 | 0 | 0.0% | 0 | 0.0% | $0 | 0.0% | $0.00 |
| 2017 | 0 | 0 | 0.0% | 0 | 0.0% | $0 | 0.0% | $0.00 |
| 2018 | 0 | 0 | 0.0% | 0 | 0.0% | $0 | 0.0% | $0.00 |
| 2019 | 0 | 0 | 0.0% | 0 | 0.0% | $0 | 0.0% | $0.00 |
| 2020 | 0 | 0 | 0.0% | 0 | 0.0% | $0 | 0.0% | $0.00 |
| 2021 | 0 | 0 | 0.0% | 0 | 0.0% | $0 | 0.0% | $0.00 |
| 2022 | 0 | 0 | 0.0% | 0 | 0.0% | $0 | 0.0% | $0.00 |
| 2023 | 0 | 0 | 0.0% | 0 | 0.0% | $0 | 0.0% | $0.00 |
| 2024 | 0 | 0 | 0.0% | 0 | 0.0% | $0 | 0.0% | $0.00 |
| 2025 | 0 | 0 | 0.0% | 0 | 0.0% | $0 | 0.0% | $0.00 |
| 2026 | 0 | 0 | 0.0% | 0 | 0.0% | $0 | 0.0% | $0.00 |
| Thereafter | 1 | 1,093,756 | 100.0% | 1,093,756 | 100.0% | $6,839,328 | 100.0% | $6.25 |
| Vacant | 0 | 0 | 0.0% | 1,093,756 | 100.0% | $0 | 0.0% | $0.00 |
| Total/Weighted Average | 1 | 1,093,756 | 100.0% | $6,839,328 | 100.0% | $6.25 |
| (1) | Information obtained from the underwritten rent roll. |
The following table presents historical occupancy percentages at the Kroger (Roundy’s) Distribution Center Property:
Historical Occupancy
12/31/2012(1) | 12/31/2013(1) | 12/31/2014(1) | 12/31/2015(1) | 7/1/2016(2) |
| 100.0% | 100.0% | 100.0% | 100.0% | 100.0% |
| (1) | Information obtained from the borrower. |
| (2) | Information obtained from the underwritten rent roll. |
THE INFORMATION IN THIS STRUCTURAL AND COLLATERAL TERM SHEET IS NOT COMPLETE AND MAY BE AMENDED PRIOR TO THE TIME OF SALE. THIS TERM SHEET IS NOT AN OFFER TO SELL THESE SECURITIES AND IT IS NOT A SOLICITATION OF AN OFFER TO BUY THESE SECURITIES IN ANY JURISDICTION WHERE THE OFFER OR SALE IS NOT PERMITTED.
| 54 |
KROGER (ROUNDY’S) DISTRIBUTION CENTER
Operating History and Underwritten Net Cash Flow.The following table presents certain information relating to the historical operating performance and underwritten net cash flow at the Kroger (Roundy’s) Distribution Center Property:
Cash Flow Analysis
| 2013 | 2014 | 2015 | TTM 3/31/2016 | U/W | % of U/W Effective Gross Income | U/W $ per SF | |||||||||
| Base Rent | $6,839,328 | $6,839,328 | $6,839,328 | $6,839,328 | $6,839,328 | 98.9% | $6.25 | ||||||||
| Straight Line Rent | 0 | 0 | 0 | 0 | 79,444 | 1.1 | 0.07 | ||||||||
| Grossed Up Vacant Space | 0 | 0 | 0 | 0 | 0 | 0.0 | 0.00 | ||||||||
| Total Reimbursables | 0 | 0 | 0 | 0 | 0 | 0.0 | 0.00 | ||||||||
| Other Income | 0 | 0 | 0 | 0 | 0 | 0.0 | 0.00 | ||||||||
| Less Vacancy & Credit Loss | 0 | 0 | 0 | 0 | 0 | 0.0 | 0.00 | ||||||||
| Effective Gross Income | $6,839,328 | $6,839,328 | $6,839,328 | $6,839,328 | $6,918,772 | 100.0% | $6.33 | ||||||||
| Total Operating Expenses | $0 | $0 | $0 | $0 | $0 | 0.0% | $0.00 | ||||||||
| Net Operating Income | $6,839,328 | $6,839,328 | $6,839,328 | $6,839,328 | $6,918,772 | 100.0% | $6.33 | ||||||||
| TI/LC | 0 | 0 | 0 | 0 | 0 | 0.0 | 0.00 | ||||||||
| Capital Expenditures | 0 | 0 | 0 | 0 | 0 | 0.0 | 0.00 | ||||||||
| Net Cash Flow | $6,839,328 | $6,839,328 | $6,839,328 | $6,839,328 | $6,918,772 | 100.0% | $6.33 | ||||||||
| NOI DSCR(1) | 1.42x | 1.42x | 1.42x | 1.42x | 1.44x | ||||||||||
| NCF DSCR(1) | 1.42x | 1.42x | 1.42x | 1.42x | 1.44x | ||||||||||
| NOI DY(1) | 8.9% | 8.9% | 8.9% | 8.9% | 9.0% | ||||||||||
| NCF DY(1) | 8.9% | 8.9% | 8.9% | 8.9% | 9.0% |
| (1) | The debt service coverage ratios and debt yields are based on the Kroger (Roundy’s) Distribution Center Whole Loan. |
Appraisal.As of the appraisal valuation date of April 6, 2016, the Kroger (Roundy’s) Distribution Center Property had an “as-is” appraised value of $110,000,000.
Environmental Matters.According to a Phase I environmental assessment dated April 15, 2016, there was no evidence of any recognized environmental conditions at the Kroger (Roundy’s) Distribution Center Property.
Market Overview and Competition. The Kroger (Roundy’s) Distribution Center Property is located in Oconomowoc, Wisconsin, within the Milwaukee-Waukesha-West Allis, WI metropolitan statistical area. Oconomowoc is situated approximately 32.0 miles west of Milwaukee and 50.0 miles east of Madison, Wisconsin. According to the appraisal, the estimated 2015 population for the metropolitan statistical area was approximately 1.6 million. The metropolitan statistical area is a center for advanced manufacturing, electronic commerce, financial services, food and beverage producers, printing, and green technologies. The metropolitan statistical area is home to six Fortune 500 companies, including Johnson Controls, Inc., Northwestern Mutual, Manpower Group, Kohl’s Corp., Rockwell Automation and Harley-Davidson, Inc.
Regional access to the Kroger (Roundy’s) Distribution Center Property’s neighborhood is provided by Interstate 94, which connects Oconomowoc to both Milwaukee (approximately 32.0 miles east) and Madison (approximately 50.1 miles west). The Kroger (Roundy’s) Distribution Center Property is located less than 2.0 miles from Interstate 94 at the intersection of State Highway 67 (Summit Avenue) and Delafield Road. The Kroger (Roundy’s) Distribution Center Property is situated within the Pabst Farms master-planned community, a 1,500-acre, mixed-use development, which includes 1.5 million square feet of retail space, 5.0 million square feet of business, office and healthcare space, over 700 single family homes and townhomes, and 360 acres of civic uses, open space, and recreational trails. According to the appraisal, the 2016 estimated population within a one-, three-, and five-mile radius of the Kroger (Roundy’s) Distribution Center Property is 405, 9,823, and 38,442, respectively, while the 2016 estimated average household income within the same radii is $124,130, $107,059, and $104,580, respectively.
According to a third-party market research report, the Kroger (Roundy’s) Distribution Center Property is located within the Milwaukee industrial market, which consisted of approximately 321.8 million square feet as of the first quarter of 2016, with an overall vacancy rate of 6.4%. The average rental rate for the overall market in the first quarter of 2016 was $4.42 per square foot. The market’s year-to-date net absorption was 321,658 square feet. Year-to-date deliveries totaled 434,682 square feet among five buildings.
According to a third-party market research report, the Kroger (Roundy’s) Distribution Center Property is located within the Waukesha County industrial submarket, which consisted of approximately 77.2 million square feet of industrial space as of the first quarter of 2016. The submarket’s vacancy rate was 3.7% for the first quarter of 2016. The average rental rate for the overall market in the first quarter of 2016 was $5.23 per square foot on a triple net basis. The submarket’s year-to-date net absorption totaled 183,061 square feet and year-to-date deliveries totaled 92,340 square feet among one building.
THE INFORMATION IN THIS STRUCTURAL AND COLLATERAL TERM SHEET IS NOT COMPLETE AND MAY BE AMENDED PRIOR TO THE TIME OF SALE. THIS TERM SHEET IS NOT AN OFFER TO SELL THESE SECURITIES AND IT IS NOT A SOLICITATION OF AN OFFER TO BUY THESE SECURITIES IN ANY JURISDICTION WHERE THE OFFER OR SALE IS NOT PERMITTED.
| 55 |
KROGER (ROUNDY’S) DISTRIBUTION CENTER
The following table presents certain information relating to comparable industrial properties for the Kroger (Roundy’s) Distribution Center Property:
Competitive Set(1)
| Property Name/Location | Year Built/ Renovated | Property Sub-Type | Total SF | Occupancy | Distance to Subject | Clear Height (ft.) | Dock Doors | Rent PSF | Lease Type |
Kroger (Roundy’s) Oconomowoc, WI | 2004/NAP | Warehouse | 1,093,756 | 100.0% | -- | 24-40 | 137 | $6.25 | NNN |
| 4220 South Kildare Avenue, Chicago, IL | 1954/NAP | Cold Storage | 600,846 | 100.0% | 126 miles | 15-35 | 110 | $10.00-$10.02 | NNN |
Rupari Food Services, 15600 Wentworth Avenue, South Holland, IL | 1991/NAP | Cold Storage | 138,540 | 100.0% | 144 miles | 19-40 | 13 | $10.39 | Absolute Net |
Core-Mark, 1035 Nathan Lane North, | 1975/NAP | Cold Storage | 241,298 | 100.0% | 323 miles | 27 | 16 | $5.27 | NNN |
| 6800 Santa Fe Drive, Hodgkins, IL | 1974/2009 | Cold Storage | 938,482 | 100.0% | 125 miles | 33 | 125 | $8.35-$9.17 | NNN |
8424 W. 47th Street, Lyons, IL | 1974/1978 | Cold Storage | 313,517 | 80.0% | 121 miles | 24 | 38 | $9.00-$10.22 | NNN |
Cold Storage Warehouse 600-615 East Brook Drive, Arlington Heights, IL | 1993/2005 | Cold Storage | 186,954 | 100.0% | 114 miles | 15-32 | 23 | $7.57 | NNN |
| (1) | Information obtained from the appraisal. |
The Borrower.The borrower is Pabst Farms-RDC, LLC, a Wisconsin limited liability company and a single purpose entity with two independent directors. Legal counsel to the borrower delivered a non-consolidation opinion in connection with the origination of the Kroger (Roundy’s) Distribution Center Whole Loan. Peter Paul Bell is the guarantor of certain nonrecourse carveouts under the Kroger (Roundy’s) Distribution Center Whole Loan.
The Sponsor.The sponsor, Peter Paul Bell, is chairman of First Realty Company, a family-owned, full service real estate firm founded in 1856 in Chicago, Illinois. Mr. Bell has managed over 4,000 multi-family units as well as several million square feet of retail, office, and business park assets. Mr. Bell leads Pabst Farms Development, Inc. as the master land planner and developer of Pabst Farms, the 1,500-acre master-planned, mixed-use development on which the Kroger (Roundy’s) Distribution Center Property is located. According to his real estate owned schedule dated December 31, 2015, Mr. Bell reported current ownership in three hotel properties, one multifamily property, one student housing property, two industrial properties, and four land developments totaling 2,394 acres.
Escrows.Monthly real estate tax reserves are not required so long as (i) no event of default exists, (ii) the Critical Tenant (as defined below) is required under its lease to pay taxes and the Critical Tenant is paying real estate taxes directly to the appropriate public office, and (iii) the borrower has delivered evidence to lender that real estate taxes have been paid in full. Monthly insurance reserves are not required so long as (i) no event of default exists, (ii) the Critical Tenant is required under its lease to maintain the insurance policies and pay the premiums and the Critical Tenant is maintaining insurance on the Kroger (Roundy’s) Distribution Center Property and paying the insurance premiums directly to the insurer, (iii) all insurance required under the Kroger (Roundy’s) Distribution Center Mortgage Loan documents is being maintained, and (iv) the borrower has delivered evidence to lender of payment of insurance premiums within ten (10) days of payment. Monthly replacement reserves are not required so long as (i) no event of default exists, (ii) the Critical Tenant is obligated to repair and maintain the Kroger (Roundy’s) Distribution Center Property in good repair, and (iii) if requested by lender, the borrower provides evidence that the Critical Tenant is repairing and maintaining the Kroger (Roundy’s) Distribution Center Property.
In the event any of the conditions to waive the monthly escrows are not satisfied, the borrower is required to make monthly deposits: (i) for the payment of real estate taxes in an amount equal to one-twelfth of the amount that the lender estimates will be necessary to pay taxes over the then succeeding 12-month period and for the payment of insurance in an amount equal to one-twelfth of the amount that the lender estimates will be necessary to pay insurance premiums over the then succeeding 12-month period; and (ii) of $9,115 for replacement reserves.
Lockbox and Cash Management.Upon the occurrence and continuance of a Cash Management Trigger Event (as defined below), the borrower is required to establish a lender-controlled lockbox account. The loan documents also require that all revenues received by the borrower or the property manager be deposited into the lockbox account within two business days of receipt. All excess funds on deposit will be applied as follows (a) if a Cash Sweep Event (as defined below) period is not in effect, to the borrower; or (b) if a Cash Sweep Event is in effect due to the existence of a Critical Tenant Trigger Event (as defined below) to the Critical Tenant TI/LC account until the applicable Critical Tenant Trigger Event cure has occurred. If a Cash Sweep Event is in effect and clause (b) is not applicable, then excess funds will be applied to the excess cash flow account.
THE INFORMATION IN THIS STRUCTURAL AND COLLATERAL TERM SHEET IS NOT COMPLETE AND MAY BE AMENDED PRIOR TO THE TIME OF SALE. THIS TERM SHEET IS NOT AN OFFER TO SELL THESE SECURITIES AND IT IS NOT A SOLICITATION OF AN OFFER TO BUY THESE SECURITIES IN ANY JURISDICTION WHERE THE OFFER OR SALE IS NOT PERMITTED.
| 56 |
KROGER (ROUNDY’S) DISTRIBUTION CENTER
A “Cash Management Trigger Event” and “Cash Sweep Event” will commence upon the occurrence of (i) an event of default or (ii) a Critical Tenant Trigger Event. A Cash Management Trigger and Cash Sweep Event will end with respect to clause (i), upon a cure of the event of default and with respect to clause (ii), upon a cure of the Critical Tenant Trigger Event.
A “Critical Tenant Trigger Event” will commence upon the occurrence of (i) Roundy’s (the “Critical Tenant”) and/or a replacement tenant pursuant to a Critical Tenant Space Re-tenanting Event (as defined below) giving notice of its intention to not extend or renew its lease; (ii) on or prior to 12 months prior to the then applicable expiration date under its lease, the Critical Tenant failing to give notice of its election to renew its lease; (iii) on or prior to the date by which the Critical Tenant is required under its lease to notify the borrower of its election to renew its lease, the Critical Tenant failing to give such notice; (iv) an event of default under the Critical Tenant lease; (v) a bankruptcy action of the Critical Tenant; (vi) if the Critical Tenant ceases to occupy or discontinues its normal business operations at its leased premises (other than a temporary cessation of business operations for permitted renovations or necessary repairs); or (vii) The Kroger Co. no longer being in control of the Critical Tenant, or any other entity controlling the Critical Tenant being downgraded below “BBB-” (or the equivalent) by any credit rating agency.
A Critical Tenant Trigger Event will end with respect to clause (i), (ii) or (iii) on the date that (1) a Critical Tenant lease extension is executed and delivered by the borrower and the Critical Tenant and all tenant improvement costs, leasing commissions and other material costs and related expenses have been satisfied or an amount sufficient to cover any such costs and expenses as reasonably determined by the lender have been deposited into the Critical Tenant TI/LC account, or (2) a Critical Tenant Space Re-tenanting Event (as defined below) has occurred, with respect to clause (iv), a cure of the event of default under the Critical Tenant lease, with respect to clause (v), the affirmation of the Critical Tenant lease in the applicable bankruptcy proceeding, provided that the Critical Tenant is actually paying all rents and other amounts due under its lease, with respect to clause (vi), the Critical Tenant re-commences its normal business operations at its leased premises or a Critical Tenant Space Re-tenanting Event has occurred and with respect to clause (vii), the credit rating of The Kroger Co. or any other entity controlling the Critical Tenant is subsequently raised such that its credit rating is no longer rated less than “BBB-” (or the equivalent) by any credit rating agency.
A “Critical Tenant Space Re-tenanting Event” will commence upon the date that (i) the Critical Tenant space has been leased to one or more replacement tenants for a term of at least five years (with a term that does not expire earlier than two years after the stated maturity date); (ii) all tenant improvement costs, leasing commissions and other material costs and expenses relating to the re-letting of the Critical Tenant space have been paid in full; and (iii) the related tenant(s) are conducting normal business operations at the Critical Tenant space.
Property Management.The Kroger (Roundy’s) Distribution Center Property is managed by the tenant.
Assumption.The borrower has the right to transfer the Kroger (Roundy’s) Distribution Center Property provided that no event of default has occurred and is continuing and certain other conditions are satisfied, including, (i) the lender’s reasonable determination that the proposed transferee and guarantor satisfy the lender’s credit review and underwriting standards, taking into consideration transferee experience, financial strength and general business standing; (ii) execution of a recourse guaranty and an environmental indemnity by an affiliate of the transferee; and (iii) if requested by the lender, rating agency confirmation from Fitch, KBRA and Moody’s that the transfer will not result in a downgrade, withdrawal or qualification of the respective ratings assigned to the Series 2016-C35 Certificates and similar confirmations from each rating agency rating any securities backed by any Kroger (Roundy’s) Distribution Center Companion Loan with respect to the ratings of such securities.
Right of First Refusal.Roundy’s has a right of first refusal to purchase the entire Kroger (Roundy’s) Distribution Center Property if the lender elects to sell the entire Kroger (Roundy’s) Distribution Center Property to a third party; provided that this right will not apply to a successor mortgagor through a foreclosure, deed-in lieu of foreclosure or any other enforcement action (but will apply to subsequent purchasers of the leased premises).
Partial Release.Not permitted.
Real Estate Substitution.Not permitted.
Subordinate and Mezzanine Indebtedness.Not permitted.
Ground Lease.None.
Terrorism Insurance.The Kroger (Roundy’s) Distribution Center Mortgage Loan documents require that the “all risk” insurance policy required to be maintained by the borrower provide coverage for terrorism in an amount equal to the full replacement cost of the Kroger (Roundy’s) Distribution Center Property. The Kroger (Roundy’s) Distribution Center Mortgage Loan documents also require business interruption insurance covering no less than the 12-month period following the occurrence of a casualty event, together with a six-month extended period of indemnity.
THE INFORMATION IN THIS STRUCTURAL AND COLLATERAL TERM SHEET IS NOT COMPLETE AND MAY BE AMENDED PRIOR TO THE TIME OF SALE. THIS TERM SHEET IS NOT AN OFFER TO SELL THESE SECURITIES AND IT IS NOT A SOLICITATION OF AN OFFER TO BUY THESE SECURITIES IN ANY JURISDICTION WHERE THE OFFER OR SALE IS NOT PERMITTED.
| 57 |
MARRIOTT INDIANAPOLIS NORTH |

THE INFORMATION IN THIS STRUCTURAL AND COLLATERAL TERM SHEET IS NOT COMPLETE AND MAY BE AMENDED PRIOR TO THE TIME OF SALE. THIS TERM SHEET IS NOT AN OFFER TO SELL THESE SECURITIES AND IT IS NOT A SOLICITATION OF AN OFFER TO BUY THESE SECURITIES IN ANY JURISDICTION WHERE THE OFFER OR SALE IS NOT PERMITTED.
| 58 |
MARRIOTT INDIANAPOLIS NORTH |

THE INFORMATION IN THIS STRUCTURAL AND COLLATERAL TERM SHEET IS NOT COMPLETE AND MAY BE AMENDED PRIOR TO THE TIME OF SALE. THIS TERM SHEET IS NOT AN OFFER TO SELL THESE SECURITIES AND IT IS NOT A SOLICITATION OF AN OFFER TO BUY THESE SECURITIES IN ANY JURISDICTION WHERE THE OFFER OR SALE IS NOT PERMITTED.
| 59 |
| No. 4 – Marriott Indianapolis North | ||||||||
| Loan Information | Property Information | |||||||
| Mortgage Loan Seller: | Rialto Mortgage Finance, LLC | Single Asset/Portfolio: | Single Asset | |||||
| Credit Assessment (Fitch/KBRA/Moody’s): | NR/NR/NR | Property Type: | Hospitality | |||||
| Original Principal Balance: | $54,000,000 | Specific Property Type: | Full Service | |||||
| Cut-off Date Balance: | $53,838,334 | Location: | Indianapolis, IN | |||||
| % of Initial Pool Balance: | 5.3% | Size: | 315 Rooms | |||||
| Loan Purpose: | Refinance | Cut-off Date Balance Per Room: | $170,915 | |||||
| Borrower Name: | Columbia Properties Indianapolis, L.P. | Year Built/Renovated: | 1998/2016 | |||||
| Sponsors: | Columbia Sussex Corporation; CSC Holdings, LLC | Title Vesting:
| Fee | |||||
| Mortgage Rate: | 5.450% | Property Manager: | Self-managed | |||||
| Note Date: | April 13, 2016 | 4thMost Recent Occupancy (As of): | 62.2% (12/31/2012) | |||||
| Anticipated Repayment Date: | NAP | 3rdMost Recent Occupancy (As of): | 61.0% (12/31/2013) | |||||
| Maturity Date: | May 6, 2026 | 2ndMost Recent Occupancy (As of): | 62.3% (12/31/2014) | |||||
| IO Period: | None | Most Recent Occupancy (As of): | 66.8% (12/31/2015) | |||||
| Loan Term (Original): | 120 months | Current Occupancy (As of): | 63.8% (4/30/2016) | |||||
| Seasoning: | 2 months | |||||||
| Amortization Term (Original): | 300 months | Underwriting and Financial Information: | ||||||
| Loan Amortization Type: | Amortizing Balloon | 4thMost Recent NOI (As of): | $5,853,484 (12/31/2013) | |||||
| Interest Accrual Method: | Actual/360 | 3rdMost Recent NOI (As of): | $6,166,769 (12/31/2014) | |||||
| Call Protection: | L(26),D(90),O(4) | 2ndMost Recent NOI (As of): | $7,354,818 (12/31/2015) | |||||
| Lockbox Type: | Hard/Springing Cash Management | Most Recent NOI (As of): | $7,025,002 (TTM 4/30/2016) | |||||
| Additional Debt: | None | |||||||
| Additional Debt Type: | NAP | U/W Revenues: | $18,186,073 | |||||
| U/W Expenses: | $11,336,757 | |||||||
| U/W NOI: | $6,849,317 | |||||||
| U/W NCF: | $6,121,874 | |||||||
| U/W NOI DSCR: | 1.73x | |||||||
| Escrows and Reserves(1): | U/W NCF DSCR: | 1.55x | ||||||
| U/W NOI Debt Yield: | 12.7% | |||||||
| Type: | Initial | Monthly | Cap (If Any) | U/W NCF Debt Yield: | 11.4% | |||
| Taxes | $47,062 | $44,821 | NAP | As-Complete Appraised Value(2): | $91,600,000 | |||
| Insurance | $23,207 | $5,526 | NAP | As-Complete Appraisal Valuation Date(2): | November 30, 2016 | |||
| FF&E | $0 | $77,240 | NAP | Cut-off Date LTV Ratio(2): | 58.8% | |||
| PIP Reserve | $7,500,000 | $0 | NAP | LTV Ratio at Maturity or ARD(2): | 44.8% | |||
| (1) | See “Escrows” section. |
| (2) | The appraiser concluded to an “as-complete” value of $91,600,000 as of November 30, 2016, which assumes the completion of a property improvement plan for which $7,500,000 was reserved. The Cut-off Date LTV Ratio and LTV Ratio at Maturity or ARD are calculated based on the “as-complete” appraised value. The appraiser also concluded to an “as-is” value of $79,600,000 as of February 29, 2016. The Cut-off Date LTV Ratio and LTV Ratio at Maturity or ARD based on the “as-is” appraised value are 67.6% and 51.5%, respectively. |
The Mortgage Loan. The mortgage loan (the “Marriott Indianapolis North Mortgage Loan”) is evidenced by a single promissory note that is secured by a first mortgage encumbering the fee interest in a full service hotel property located in Indianapolis, Indiana (the “Marriott Indianapolis North Property”). The Marriott Indianapolis North Mortgage Loan was originated on April 13, 2016 by Rialto Mortgage Finance, LLC. The Marriott Indianapolis North Mortgage Loan had an original principal balance of $54,000,000, has an outstanding principal balance as of the Cut-off Date of $53,838,334 and accrues interest at an interest rate of 5.450%per annum. The Marriott Indianapolis North Mortgage Loan had an initial term of 120 months, has a remaining term of 118 months as of the Cut-off Date and requires payments of principal and interest based on a 25-year amortization schedule. The Marriott Indianapolis North Mortgage Loan matures on May 6, 2026.
Following the lockout period, the borrower has the right to defease the Marriott Indianapolis North Mortgage Loan in whole, but not in part, on any date before February 6, 2026. In addition, the Marriott Indianapolis North Mortgage Loan is prepayable without penalty on or after February 6, 2026.
THE INFORMATION IN THIS STRUCTURAL AND COLLATERAL TERM SHEET IS NOT COMPLETE AND MAY BE AMENDED PRIOR TO THE TIME OF SALE. THIS TERM SHEET IS NOT AN OFFER TO SELL THESE SECURITIES AND IT IS NOT A SOLICITATION OF AN OFFER TO BUY THESE SECURITIES IN ANY JURISDICTION WHERE THE OFFER OR SALE IS NOT PERMITTED.
| 60 |
MARRIOTT INDIANAPOLIS NORTH |
Sources and Uses
| Sources | Uses | |||||||
| Original loan amount | $54,000,000 | 100.0% | Loan payoff(1) | $45,517,027 | 84.3% | |||
| Reserves | 7,570,269 | 14.0 | ||||||
| Closing costs | 558,593 | 1.0 | ||||||
| Return of equity | 354,111 | 0.7 | ||||||
| Total Sources | $54,000,000 | 100.0% | Total Uses | $54,000,000 | 100.0% |
| (1) | The Marriott Indianapolis North Property was previously securitized in the COMM 2006-C7 transaction. |
The Property.The Marriott Indianapolis North Property is a 315-room, 11-story, full service hotel located in the Keystone Crossing market of Indianapolis, Indiana, approximately 12 miles north of downtown Indianapolis. The Marriott Indianapolis North Property is situated on a 7.4-acre site and was originally developed in 1998, with the most recent renovations completed in 2016.
Amenities at the Marriott Indianapolis North Property include an indoor swimming pool, fitness center, business center and gift shop. The hotel features the Lobby Lounge, which is located on the north side of the lobby and is open for dinner, as well as Bistro 33, a restaurant situated to the west of the Lobby Lounge, and offers contemporary American cuisine. The Concierge Lounge is located on the 11th floor and serves as an exclusive lounge for members of Marriott’s rewards program. A dedicated business center is located adjacent to the pre-function meeting space, and provides office-support services to guests. The Marriott Indianapolis North Property features approximately 21,366 square feet of meeting space, which is housed within the one-story commercial section on the eastern side of the building. The Marriott Indianapolis North Property has 465 parking spaces resulting in a parking ratio of 1.5 spaces per room.
The guestroom mix includes 198 king rooms, 93 double/double rooms, 20 junior suites, and 4 presidential suites. Guestrooms are located on all levels of the 11-story guestroom tower. Guestrooms have either one king bed or two double beds and feature a standard package that includes a dresser with television set, work desk with chair, armchair with ottoman and/or sofa, coffeemaker, iron and ironing board and high-speed internet. Junior suites feature an L-shaped configuration with a king bed, with additional amenities including larger seating areas with pullout couches. The presidential suites feature two rooms with separate sleeping and living areas, small kitchenettes and larger seating areas with pullout couches. The 8th, 9th, 10th, and 11th floors are designated as concierge levels.
The borrower renovated the Marriott Indianapolis North Property in 2007, spending approximately $1.5 million ($4,709 per room) on building and FF&E improvements, which included a soft goods renovation. Since 2008, the borrower has invested approximately $1.6 million ($5,066 per room) in additional capital expenditures and upgrades to the Marriott Indianapolis North Property. In April 2016, the borrower executed a 20-year renewal of the franchise agreement with Marriott International, Inc., which required a property improvement plan (the “PIP”) for the Marriott Indianapolis North Property. The PIP has an estimated total cost of $8.0 million ($25,397 per room) with room renovations accounting for approximately $5.4 million ($17,000 per room) of the renovation. To date, the borrower has self-funded approximately $2.0 million toward the application of construction costs and purchase of FF&E. A $7.5 million PIP reserve was established at origination to fund the remaining expected PIP renovation costs. According to the borrower, management’s plan is to take 16 guest rooms offline every week for the 20-week period of May 16, 2016 to October 9, 2016. It is estimated to take two weeks to renovate each 16 room block, which would result in 32 rooms being offline at any one time. This renovation schedule is not expected to significantly affect performance as the highest occupancy in any month for the hotel in the trailing twelve month period ending April 30, 2016 period was 80.3%. Renovations of the public areas of the Marriott Indianapolis North Property are expected to be completed by January 2017. The franchise agreement with Marriott International, Inc. expires on April 12, 2036.
THE INFORMATION IN THIS STRUCTURAL AND COLLATERAL TERM SHEET IS NOT COMPLETE AND MAY BE AMENDED PRIOR TO THE TIME OF SALE. THIS TERM SHEET IS NOT AN OFFER TO SELL THESE SECURITIES AND IT IS NOT A SOLICITATION OF AN OFFER TO BUY THESE SECURITIES IN ANY JURISDICTION WHERE THE OFFER OR SALE IS NOT PERMITTED.
| 61 |
MARRIOTT INDIANAPOLIS NORTH |
Operating History and Underwritten Net Cash Flow.The following table presents certain information relating to the historical operating performance and underwritten net cash flow at the Marriott Indianapolis North Property:
Cash Flow Analysis
| 2013 | 2014 | 2015 | TTM 4/30/2016 | U/W | % of U/W Total Revenue | U/W $ per Room | |||||||||
| Occupancy | 61.0% | 62.3% | 66.8% | 63.8% | 63.8% | ||||||||||
| ADR | $135.35 | $142.71 | $149.35 | $149.29 | $149.29 | ||||||||||
| RevPAR | $82.56 | $88.84 | $99.84 | $95.21 | $95.21 | ||||||||||
| Rooms Revenue | $9,492,068 | $10,214,587 | $11,479,193 | $10,946,368 | $10,946,368 | 60.2% | $34,750 | ||||||||
| F&B Revenue | 6,154,267 | 6,496,560 | 6,895,668 | 7,071,482 | 7,071,482 | 38.9 | 22,449 | ||||||||
| Other Revenue | 224,913 | 203,661 | 203,099 | 168,223 | 168,223 | 0.9 | 534 | ||||||||
| Total Revenue | $15,871,248 | $16,914,808 | $18,577,960 | $18,186,073 | $18,186,073 | 100.0% | $57,734 | ||||||||
| Total Department Expenses | 5,178,017 | 5,596,823 | 5,889,739 | 5,947,197 | 5,947,197 | 32.7 | 18,880 | ||||||||
| Gross Operating Profit | $10,693,231 | $11,317,985 | $12,688,222 | $12,238,876 | $12,238,876 | 67.3% | $38,854 | ||||||||
| Total Undistributed Expenses | 4,129,254 | 4,398,461 | 4,695,444 | 4,570,774 | 4,700,759 | 25.8 | 14,923 | ||||||||
| Profit Before Fixed Charges | $6,563,977 | $6,919,524 | $7,992,778 | $7,668,102 | $7,538,117 | 41.4% | $23,931 | ||||||||
| Total Fixed Charges | 710,493 | 752,755 | 637,960 | 643,100 | 688,801 | 3.8 | 2,187 | ||||||||
| Net Operating Income | $5,853,484 | $6,166,769 | $7,354,818 | $7,025,002 | $6,849,317 | 37.7% | $21,744 | ||||||||
| FF&E | 634,850 | 676,592 | 743,118 | 714,818 | 727,443 | 4.0 | 2,309 | ||||||||
| Net Cash Flow | $5,218,634 | $5,490,176 | $6,611,700 | $6,310,184 | $6,121,874 | 33.7% | $19,435 | ||||||||
| NOI DSCR | 1.48x | 1.56x | 1.86x | 1.77x | 1.73x | ||||||||||
| NCF DSCR | 1.32x | 1.39x | 1.67x | 1.59x | 1.55x | ||||||||||
| NOI DY | 10.9% | 11.5% | 13.7% | 13.0% | 12.7% | ||||||||||
| NCF DY | 9.7% | 10.2% | 12.3% | 11.7% | 11.4% | ||||||||||
Appraisal.As of the appraisal valuation date of February 29, 2016, the Marriott Indianapolis North Property had an “as-is” appraised value of $79,600,000. The appraiser concluded to an “as-complete” value as of November 30, 2016 of $91,600,000, which assumes the completion of the PIP, currently in process, for which $7,500,000 was reserved. The appraiser also concluded to an “as-stabilized” appraised value of $105,300,000 with an “as-stabilized” valuation date of November 30, 2019.
Environmental Matters.According to a Phase I environmental assessment dated March 2, 2016, there was no evidence of any recognized environmental conditions at the Marriott Indianapolis North Property.
Market Overview and Competition.The Marriott Indianapolis North Property is located in Indianapolis, Indiana, which is the largest city in Indiana. The 2015 estimated population for the Indianapolis metropolitan statistical area was approximately 2.0 million. The metropolitan statistical area benefits from an economic base that is driven by the advanced manufacturing, education, and healthcare sectors. Indiana University-Purdue University Indianapolis (“IUPUI”) (approximately 13.3 miles southwest) is one of eight campuses of Indiana University. The IUPUI downtown campus is part of the economic triangle that links Bloomington and West Lafayette to Indianapolis and offers more than 255 degree programs provided by 17 different schools. Indiana University Health (“IU Health”) is the largest employer in Indianapolis, with 31 Indiana University hospitals, primary care, outpatient, radiology, urgent care, occupational care and emergency care and lab facilities in the city. The metropolitan statistical area’s largest employers include St. Vincent Health, IU Health, Eli Lilly & Company, Community Health, Wal-Mart, Marsh Supermarkets, IUPUI, City of Indianapolis/Marion County, Kroger, and FedEx Express. Indianapolis is served by four interstates, six railroads, an international airport, and a foreign trade zone. Indianapolis International Airport is located approximately 30.5 miles southwest of the Marriott Indianapolis North Property.
The Marriott Indianapolis North Property is situated on the northeastern edge of the city of Indianapolis within the Keystone Crossing submarket, approximately 12.0 miles north of downtown Indianapolis. The Keystone Crossing submarket is a suburban office and retail submarket in Indianapolis, which features access to major expressways, high-end retail amenities, restaurants, and residential neighborhoods. Primary regional access through the area is provided by Interstate 465 (“I-465”), Interstate 70 (“I-70”), and Interstate 65 (“I-65”). I-465, located just north of the Marriott Indianapolis North Property, is a 53-mile loop encircling the central business district of Indianapolis and connecting with I-70 and I-65. The Marriott Indianapolis North Property is situated approximately 0.11 miles southwest of I-465. According to the appraisal, the Keystone Crossing submarket, one of Indianapolis’ largest suburban office submarkets, consists of approximately 5.3 million square feet of office space. Businesses and entities in the area include State Farm Insurance, Yellow Page Group, DeVry University, Southern Wine & Spirits of Indiana, Inc., United Healthcare, Arlington / Roe & Company, Inc., Indiana Railroad, LLC, Wells Fargo Advisors, LLC, UBS, and Smart Travel. The Fashion Mall at Keystone is located approximately 0.5 miles southwest of the Marriott Indianapolis North Property and is anchored by Nordstrom and Saks Fifth Avenue and features over 100 high-end retailers, including Burberry, Coach, Tiffany & Co., Kate Spade, Louis Vuitton, Tory Burch, Tesla Motors, The Apple Store, Restoration Hardware, Crate & Barrel, West Elm, and Pottery Barn, among others. Restaurants located near the Marriott Indianapolis North Property include Seasons 52, Sullivan’s, P.F. Chang’s, TGI Friday’s, and Maggiano’s.
THE INFORMATION IN THIS STRUCTURAL AND COLLATERAL TERM SHEET IS NOT COMPLETE AND MAY BE AMENDED PRIOR TO THE TIME OF SALE. THIS TERM SHEET IS NOT AN OFFER TO SELL THESE SECURITIES AND IT IS NOT A SOLICITATION OF AN OFFER TO BUY THESE SECURITIES IN ANY JURISDICTION WHERE THE OFFER OR SALE IS NOT PERMITTED.
| 62 |
MARRIOTT INDIANAPOLIS NORTH |
The following table presents certain information relating to the Marriott Indianapolis North Property’s competitive set:
Subject and Market Historical Occupancy, ADR and RevPAR(1)
| Competitive Set | Marriott Indianapolis North | Penetration Factor | |||||||||||||||
| Year | Occupancy | ADR | RevPAR | Occupancy | ADR | RevPAR | Occupancy | ADR | RevPAR | ||||||||
| 4/30/2016 TTM | 67.0% | $132.29 | $88.62 | 63.6% | $150.23 | $95.54 | 94.9% | 113.6% | 107.8% | ||||||||
| 4/30/2015 TTM | 67.7% | $122.31 | $82.75 | 64.5% | $148.42 | $95.69 | 95.3% | 121.3% | 115.6% | ||||||||
| 4/30/2014 TTM | 66.0% | $112.29 | $74.14 | 60.8% | $139.15 | $84.62 | 92.1% | 123.9% | 114.1% | ||||||||
| (1) | Information obtained from a third party hospitality research report dated May 17, 2016. The competitive set includes the following hotels: Sheraton Hotel Indianapolis @ Keystone Crossing, Renaissance Indianapolis North Hotel, Embassy Suites Indianapolis North, Holiday Inn Indianapolis Carmel, and the closed Hilton Indianapolis North. |
The Borrower.The borrower is Columbia Properties Indianapolis, L.P., an Ohio limited partnership and a single purpose entity with two independent directors. Legal counsel to the borrower delivered a non-consolidation opinion in connection with the origination of the Marriott Indianapolis North Mortgage Loan. Columbia Sussex Corporation and CSC Holdings, LLC are the guarantors of certain nonrecourse carveouts under the Marriott Indianapolis North Mortgage Loan on a joint and several basis.
The Sponsors.The sponsors are Columbia Sussex Corporation (“Columbia Sussex”) and CSC Holdings, LLC, a Kentucky corporation and an Ohio limited liability company, respectively. Founded in 1972, Columbia Sussex has owned and operated hospitality properties for more than 40 years. As of February 2016, Columbia Sussex owned and managed a total of 38 hospitality assets with over 12,600 rooms, including 28 hotels with over 9,200 rooms operated under Marriott-affiliated brands. Columbia Sussex currently operates properties under the JW Marriott, Courtyard by Marriott, Renaissance, Hilton, DoubleTree by Hilton and Westin flags. Columbia Sussex has prior defaults, foreclosures and deeds in lieu of foreclosure. For additional information regarding the sponsor, see “Description of the Mortgage Pool-Litigation and Other Considerations” and “Description of the Mortgage Pool—Loan Purpose; Default History, Bankruptcy Issues and Other Proceedings” in the Preliminary Prospectus.
Escrows.The Marriott Indianapolis North Mortgage Loan documents provided for upfront escrows in the amount of $47,062 for real estate taxes, $23,207 for insurance premiums, and $7,500,000 for a PIP Reserve. The Marriott Indianapolis North Mortgage Loan documents also provide for monthly escrows in the amount of $44,821 for real estate taxes, $5,526 for insurance premiums and $77,240 for 2016 FF&E reserves. After 2016, the monthly FF&E reserves will be an amount equal to the greater of (a) one-twelfth of 5.0% of gross income and (b) the aggregate amount, if any, required to be reserved under the management agreement and the franchise agreement.
Lockbox and Cash Management.The Marriott Indianapolis North Mortgage Loan requires the borrower to establish a lender-controlled lockbox account, which is already in place, and to direct all tenants to pay their rents and all credit card companies under merchant agreements to pay receipts directly into such lockbox account. All checks and cash (to the extent such cash amounts exceed $50,000) received from hotel patrons by the borrower or the property manager are required to be deposited into the lockbox account within two business days of receipt. Prior to a Cash Management Trigger Event (as described below), all funds on deposit in the lockbox account are disbursed to the borrower. During the occurrence and continuance of a Cash Management Trigger Event, funds in the lockbox are transferred daily into the cash management account, where they are applied in accordance with the Marriott Indianapolis North Mortgage Loan documents. All excess cash flow will be applied as follows: (i) to the excess cash flow subaccount following the occurrence and continuance of a Cash Sweep Event (as defined below); and (ii) if no Cash Sweep Event is continuing, funds are swept to the borrower account.
A “Cash Management Trigger Event” will commence upon the occurrence of (i) an event of default; (ii) any bankruptcy action of the borrower, guarantor or property manager; or (iii) a Cash Management DSCR Trigger Event (as defined below). A Cash Management Trigger Event will end, with respect to clause (i), when such event of default has been cured or waived; with respect to clause (ii), when such bankruptcy petition has been discharged, stayed, or dismissed within 30 days of such filing among other conditions for the borrower or guarantor and within 120 days for the property manager or, if applicable, when the borrower has replaced the property manager with a qualified property manager acceptable to the lender; and with respect to clause (iii), once the trailing 12-month amortizing net operating income debt service coverage ratio (based on the then current amortization schedule) is greater than 1.25x for two consecutive calendar quarters, among other conditions.
A “Cash Management DSCR Trigger Event” occurs upon any date the amortizing net operating income debt service coverage ratio based on the trailing 12-month period immediately preceding the date of such determination, is less than 1.20x.
A “Cash Sweep Event” will commence upon the occurrence of (i) an event of default; (ii) any bankruptcy action of borrower, guarantor or property manager; or (iii) a Cash Sweep DSCR Trigger Event (as defined below). A Cash Sweep Event will expire, with respect to clause (i) when such event of default has been cured or waived; with respect to clause (ii), when such bankruptcy petition has been discharged, stayed, or dismissed within 30 days of such filing among other conditions for the borrower or guarantor and within 120 days for the property manager or, if applicable, when the borrower has replaced the property manager with a qualified property manager acceptable to the lender; and with respect to clause (iii), once the trailing 12-month amortizing net operating income debt service coverage ratio is greater than 1.15x for two consecutive calendar quarters, among other conditions. A cure of any Cash Sweep Event may occur no more than two times during the term of the Marriott Indianapolis North Mortgage Loan.
A “Cash Sweep DSCR Trigger Event” occurs upon any date the amortizing net operating income debt service coverage ratio based on the trailing 12-month period immediately preceding the date of such determination, is less than 1.10x.
Property Management.The Marriott Indianapolis North Property is managed by an affiliate of the borrower.
THE INFORMATION IN THIS STRUCTURAL AND COLLATERAL TERM SHEET IS NOT COMPLETE AND MAY BE AMENDED PRIOR TO THE TIME OF SALE. THIS TERM SHEET IS NOT AN OFFER TO SELL THESE SECURITIES AND IT IS NOT A SOLICITATION OF AN OFFER TO BUY THESE SECURITIES IN ANY JURISDICTION WHERE THE OFFER OR SALE IS NOT PERMITTED.
| 63 |
MARRIOTT INDIANAPOLIS NORTH |
Assumption.The borrower has the right to transfer the Marriott Indianapolis North Property, provided that no event of default has occurred and is continuing and certain other conditions are satisfied, including (i) the lender’s reasonable determination that the proposed transferee and guarantor satisfy the lender’s credit review and underwriting standards, taking into consideration transferee experience, financial strength and general business standing; (ii) execution of a recourse guaranty and an environmental indemnity by an affiliate of the transferee; and (iii) if requested by the lender, rating agency confirmation from Fitch, KBRA and Moody’s that the transfer will not result in a downgrade, withdrawal or qualification of the respective ratings assigned to the Series 2016-C35 Certificates.
Partial Release.Not permitted.
Real Estate Substitution.Not permitted.
Subordinate and Mezzanine Indebtedness.Not permitted.
Ground Lease.None.
Terrorism Insurance.The Marriott Indianapolis North Mortgage Loan documents require that the “all risk” insurance policy required to be maintained by the borrower provide coverage for terrorism equal to the full replacement cost of the Marriott Indianapolis North Property, as well as business interruption insurance covering no less than the 18-month period following the occurrence of a casualty event, together with a 12-month extended period of indemnity.
THE INFORMATION IN THIS STRUCTURAL AND COLLATERAL TERM SHEET IS NOT COMPLETE AND MAY BE AMENDED PRIOR TO THE TIME OF SALE. THIS TERM SHEET IS NOT AN OFFER TO SELL THESE SECURITIES AND IT IS NOT A SOLICITATION OF AN OFFER TO BUY THESE SECURITIES IN ANY JURISDICTION WHERE THE OFFER OR SALE IS NOT PERMITTED.
| 64 |
(THIS PAGE INTENTIONALLY LEFT BLANK)
THE INFORMATION IN THIS STRUCTURAL AND COLLATERAL TERM SHEET IS NOT COMPLETE AND MAY BE AMENDED PRIOR TO THE TIME OF SALE. THIS TERM SHEET IS NOT AN OFFER TO SELL THESE SECURITIES AND IT IS NOT A SOLICITATION OF AN OFFER TO BUY THESE SECURITIES IN ANY JURISDICTION WHERE THE OFFER OR SALE IS NOT PERMITTED.
| 65 |
(THIS PAGE INTENTIONALLY LEFT BLANK)
THE INFORMATION IN THIS STRUCTURAL AND COLLATERAL TERM SHEET IS NOT COMPLETE AND MAY BE AMENDED PRIOR TO THE TIME OF SALE. THIS TERM SHEET IS NOT AN OFFER TO SELL THESE SECURITIES AND IT IS NOT A SOLICITATION OF AN OFFER TO BUY THESE SECURITIES IN ANY JURISDICTION WHERE THE OFFER OR SALE IS NOT PERMITTED.
| 66 |
| MALL AT TURTLE CREEK |
THE INFORMATION IN THIS STRUCTURAL AND COLLATERAL TERM SHEET IS NOT COMPLETE AND MAY BE AMENDED PRIOR TO THE TIME OF SALE. THIS TERM SHEET IS NOT AN OFFER TO SELL THESE SECURITIES AND IT IS NOT A SOLICITATION OF AN OFFER TO BUY THESE SECURITIES IN ANY JURISDICTION WHERE THE OFFER OR SALE IS NOT PERMITTED.
| 67 |
| MALL AT TURTLE CREEK |
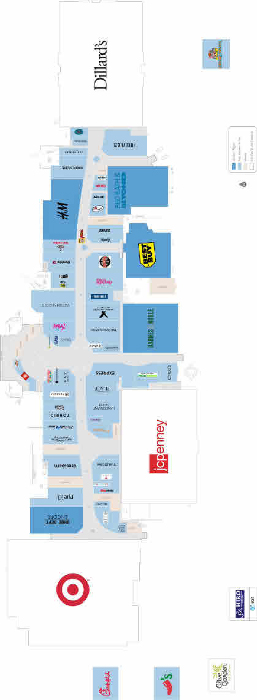
THE INFORMATION IN THIS STRUCTURAL AND COLLATERAL TERM SHEET IS NOT COMPLETE AND MAY BE AMENDED PRIOR TO THE TIME OF SALE. THIS TERM SHEET IS NOT AN OFFER TO SELL THESE SECURITIES AND IT IS NOT A SOLICITATION OF AN OFFER TO BUY THESE SECURITIES IN ANY JURISDICTION WHERE THE OFFER OR SALE IS NOT PERMITTED.
| 68 |
| MALL AT TURTLE CREEK |
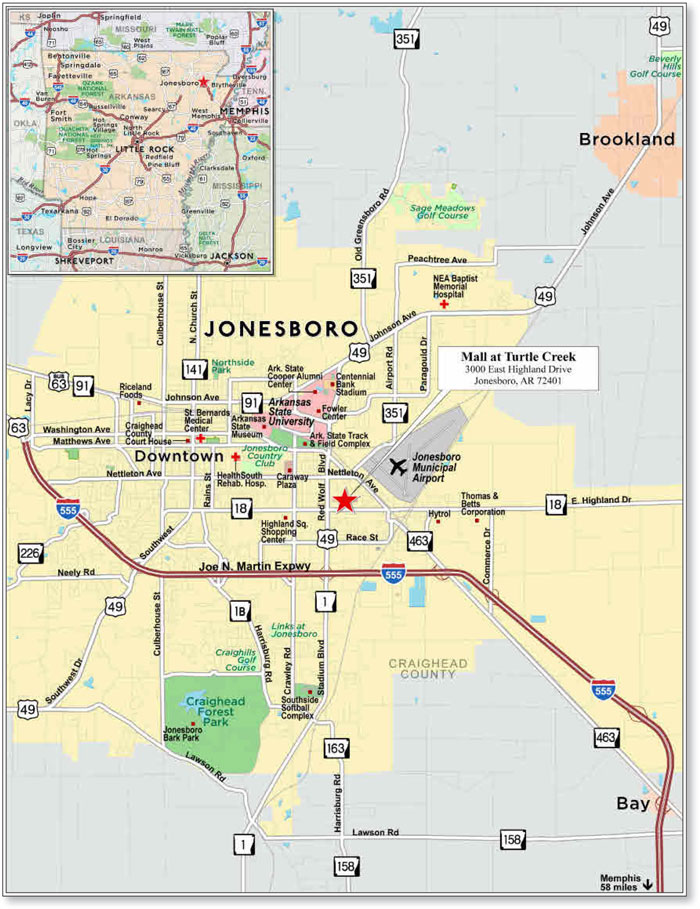
THE INFORMATION IN THIS STRUCTURAL AND COLLATERAL TERM SHEET IS NOT COMPLETE AND MAY BE AMENDED PRIOR TO THE TIME OF SALE. THIS TERM SHEET IS NOT AN OFFER TO SELL THESE SECURITIES AND IT IS NOT A SOLICITATION OF AN OFFER TO BUY THESE SECURITIES IN ANY JURISDICTION WHERE THE OFFER OR SALE IS NOT PERMITTED.
| 69 |
| No. 5 – Mall at Turtle Creek | |||||||
| Loan Information | Property Information | ||||||
| Mortgage Loan Seller: | Barclays Bank PLC | Single Asset/Portfolio: | Single Asset | ||||
Credit Assessment (Fitch/KBRA/Moody’s): | NR/NR/NR | Property Type: | Retail | ||||
| Original Principal Balance(1): | $42,000,000 | Specific Property Type: | Regional Mall | ||||
| Cut-off Date Balance(1): | $41,947,448 | Location: | Jonesboro, AR | ||||
| % of Initial Pool Balance: | 4.1% | Size: | 329,398 SF | ||||
| Loan Purpose: | Refinance | Cut-off Date Balance Per SF(1): | $217.88 | ||||
| Borrower Name: | RPI Turtle Creek Mall, LLC | Year Built/Renovated: | 2006/NAP | ||||
| Sponsor: | Rouse Properties, LP | Title Vesting: | Fee | ||||
| Mortgage Rate: | 4.780% | Property Manager: | Self-managed | ||||
| Note Date: | June 2, 2016 | 4thMost Recent Occupancy (As of)(3): | 91.6% (12/31/2012) | ||||
| Anticipated Repayment Date: | NAP | 3rdMost Recent Occupancy (As of)(3): | 91.9% (12/31/2013) | ||||
| Maturity Date: | June 6, 2026 | 2ndMost Recent Occupancy (As of)(3): | 89.3% (12/31/2014) | ||||
| IO Period: | None | Most Recent Occupancy (As of)(3): | 91.2% (12/31/2015) | ||||
| Loan Term (Original): | 120 months | Current Occupancy (As of)(3): | 90.8% (4/1/2016) | ||||
| Seasoning: | 1 month | ||||||
| Amortization Term (Original): | 360 months | Underwriting and Financial Information: | |||||
| Loan Amortization Type: | Amortizing Balloon | ||||||
| Interest Accrual Method: | Actual/360 | 4thMost Recent NOI (As of): | $7,101,050 (12/31/2013) | ||||
| Call Protection: | L(25),D(91),O(4) | 3rdMost Recent NOI (As of): | $7,045,122 (12/31/2014) | ||||
| Lockbox Type: | Hard/Springing Cash Management | 2ndMost Recent NOI (As of): | $7,147,241 (12/31/2015) | ||||
| Additional Debt(1): | Yes | Most Recent NOI (As of)(4): | $7,260,314 (TTM 3/31/2016) | ||||
| Additional Debt Type(1): | Pari Passu | ||||||
| U/W Revenues: | $9,992,279 | ||||||
| U/W Expenses: | $2,364,573 | ||||||
| Escrows and Reserves(2): | U/W NOI(4): | $7,627,706 | |||||
| U/W NCF: | $7,084,199 | ||||||
| Type: | Initial | Monthly | Cap (If Any) | U/W NOI DSCR(1): | 1.69x | ||
| Taxes | $443,810 | $49,312 | NAP | U/W NCF DSCR(1): | 1.57x | ||
| Insurance | $0 | Springing | NAP | U/W NOI Debt Yield(1): | 10.6% | ||
| Replacement Reserves | $0 | $6,862 | $82,350 | U/W NCF Debt Yield(1): | 9.9% | ||
| TI/LC Reserve | $0 | $41,175 | $988,194 | As-Is Appraised Value: | $130,000,000 | ||
| Outstanding TI/LC Reserve | $2,907,450 | $0 | NAP | As-Is Appraisal Valuation Date: | April 5, 2016 | ||
| Free Rent Reserve | $151,667 | $0 | NAP | Cut-off Date LTV Ratio(1): | 55.2% | ||
| Bed, Bath & Beyond Reserve | $2,900,000 | $0 | NAP | LTV Ratio at Maturity or ARD(1): | 45.1% | ||
| (1) | The Mall at Turtle Creek Whole Loan (as defined below), with an original principal balance of $71,860,000, is comprised of twopari passu notes (Notes A-1 and A-2). The controlling Note A-1 had an original principal balance of $42,000,000, has an outstanding principal balance of $41,947,448 as of the Cut-off Date and will be contributed to the WFCM 2016-C35 Trust. The non-controlling Note A-2 had an original principal balance of $29,860,000 and is expected to be contributed to one or more future trusts. All statistical financial information related to balances per square foot, loan-to-value ratios, debt service coverage ratios and debt yields are based on the Mall at Turtle Creek Whole Loan. |
| (2) | See “Escrows” section. |
| (3) | See “Historical Occupancy” section. |
| (4) | See “Cash Flow Analysis” section. |
The Mortgage Loan.The mortgage loan (the “Mall at Turtle Creek Mortgage Loan”) is part of a whole loan (the “Mall at Turtle Creek Whole Loan”) that is evidenced by two promissory notes (Notes A-1 and A-2) secured by a first mortgage encumbering a regional mall located in Jonesboro, Arkansas (the “Mall at Turtle Creek Property”). The Mall at Turtle Creek Whole Loan was originated on June 2, 2016 by Barclays Bank PLC. The Mall at Turtle Creek Whole Loan had an original principal balance of $71,860,000, has an outstanding principal balance as of the Cut-off Date of $71,770,086 and accrues interest at an interest rate of 4.780%per annum. The Mall at Turtle Creek Whole Loan had an initial term of 120 months, has a remaining term of 119 months as of the Cut-off Date and requires payments of principal and interest based on a 30-year amortization schedule through the term of the Mall at Turtle Creek Whole Loan. The Mall at Turtle Creek Whole Loan matures on June 6, 2026.
The Mall at Turtle Creek Mortgage Loan, evidenced by the controlling Note A-1, will be contributed to the WFCM 2016-C35 Trust, had an original principal balance of $42,000,000 and has an outstanding principal balance as of the Cut-off Date of $41,947,448. The non-controlling Note A-2 had an original principal balance of $29,860,000, is currently held by Barclays Bank PLC and is expected to be contributed to one or more future trusts. The lender provides no assurances that any non-securitizedpari passunote will not be split further. See “Description of the Mortgage Pool—The Whole Loans—The Serviced Whole Loans—The Mall at Turtle Creek Whole Loan” in the Preliminary Prospectus.
THE INFORMATION IN THIS STRUCTURAL AND COLLATERAL TERM SHEET IS NOT COMPLETE AND MAY BE AMENDED PRIOR TO THE TIME OF SALE. THIS TERM SHEET IS NOT AN OFFER TO SELL THESE SECURITIES AND IT IS NOT A SOLICITATION OF AN OFFER TO BUY THESE SECURITIES IN ANY JURISDICTION WHERE THE OFFER OR SALE IS NOT PERMITTED.
| 70 |
| MALL AT TURTLE CREEK |
Note Summary
| Notes | Original Balance | Note Holder | Controlling Interest | |
| A-1 | $42,000,000 | WFCM 2016-C35 Trust | Yes | |
| A-2 | $29,860,000 | Barclays Bank PLC | No | |
| Total | $71,860,000 |
Following the lockout period, the borrower has the right to defease the Mall at Turtle Creek Whole Loan in whole, but not in part, on any date before March 6, 2026. In addition, the Mall at Turtle Creek Whole Loan is prepayable without penalty on or after March 6, 2026.
Sources and Uses
| Sources | Uses | |||||||
| Original whole loan amount | $71,860,000 | 89.1% | Loan payoff(1) | $73,699,346 | 91.4% | |||
| Sponsor’s new cash contribution(2) | 8,784,412 | 10.9 | Reserves(2) | 6,402,927 | 7.9 | |||
| Closing costs | 542,139 | 0.7 | ||||||
| Total Sources | $80,644,412 | 100.0% | Total Uses | $80,644,412 | 100.0% |
| (1) | The Mall at Turtle Creek Mortgaged Property was previously securitized in the GCCFC 2006-GG7 transaction. |
| (2) | Subsequent to the Mall at Turtle Creek Whole Loan funding, $2.9 million initially held in escrow was released to the borrower after Bed, Bath & Beyond exercised its renewal option. |
The Property.The Mall at Turtle Creek Property is a single-story regional mall totaling 693,597 square feet, of which 329,398 square feet serves as collateral (the “Mall at Turtle Creek Mortgaged Property”) for the Mall at Turtle Creek Whole Loan, located in Jonesboro, Arkansas. Constructed in 2006, the Mall at Turtle Creek Property is anchored by Dillard’s, JCPenney and Target, all of which are not collateral for the Mall at Turtle Creek Whole Loan. Junior anchors at the property include Bed, Bath & Beyond, Best Buy, Barnes & Noble, Shoe Department Encore and H&M (which recently executed a new lease). Some other notable inline tenants at the Mall at Turtle Creek Property include Forever 21, Express, Victoria’s Secret and Charlotte Russe. There are also three tenants, Chuck E. Cheese’s, Chili’s Grill & Bar and Chick-Fil-A, that are located on outparcels which pay ground rent.
In 2012, an affiliate of the sponsor purchased the Mall at Turtle Creek Mortgaged Property and an adjacent strip center for a total purchase price of approximately $96.3 million. The estimated allocated purchase price to the Mall at Turtle Creek Mortgaged Property is approximately $89.9 million. Since acquisition, the sponsor has invested approximately $2.3 million in tenant improvements at the Mall at Turtle Creek Mortgaged Property. The sponsor will invest an additional $2.9 million at the Mall at Turtle Creek Mortgaged Property for outstanding tenant improvements and leasing commissions, which have been reserved. In addition to the approximately $8.8 million of fresh equity contributed by the sponsor to refinance the prior the loan, the sponsor had an estimated all-in equity contribution of approximately $26.8 million at the time of funding the Mall at Turtle Creek Whole Loan. Subsequent to the Mall at Turtle Creek Whole Loan funding, $2.9 million initially held in escrow, was released to the borrower after the tenant, Bed, Bath & Beyond, exercised its renewal option. According to the appraisal, the Mall at Turtle Creek Property is the only enclosed mall within a 75.0 mile radius. The closest mall to the north is located in Cape Girardeau, Missouri, approximately 150 miles away. The next closest Dillard’s and Target are located approximately 75.0 miles from the property and the next closest JCPenney is located 44 miles from the property. Additionally, the Mall at Turtle Creek Property is located near local and regional arteries as a result of being located on East Highland Drive, a main thorough-fare in Jonesboro and Route 49. According to the appraisal, within the immediate vicinity of the Mall at Turtle Creek Property, there is an average annual daily traffic count of approximately 43,000 cars.
Including non-collateral anchors, total occupancy at the Mall at Turtle Creek Mortgaged Property has averaged 95.7% since 2012 and has not fallen below 94.9% during that same time period. Since 2015, approximately 89,000 square feet of new leases, relocations and expansions have been signed, in addition to approximately 69,000 square feet of renewals. New tenancies include H&M, Forever 21, Torrid and Foot Locker. The Mall at Turtle Creek Property is home to the first and only H&M in the state of Arkansas. Of the 27 tenants who have lease expirations in 2016, 20 have signed renewals and management is in renewal negotiations with six remaining tenants.
As of the trailing 12-month period ending March 2016 (“TTM March 2016”), the Mall at Turtle Creek Property reported total sales of approximately $160.8 million, which encompasses the tenants who report sales and sponsor estimated sales figures for non-collateral anchor tenants and junior anchors. TTM March 2016 comparable inline sales per square foot at the Mall at Turtle Creek Property were $349, up from $328 per square foot in 2013. According to the appraisal, the Mall at Turtle Creek Property comparable inline sales per square foot figure is in line with southeast mall average of $347 per square foot. Simultaneously, the occupancy cost has decreased from 15.2% in 2013 to 11.7% as of TTM March 2016. Sponsor estimated 2015 anchor tenant sales were $22.0 million ($268 per square foot), $27.0 million ($173 per square foot) and $35.0 million ($277 per square foot) for JCPenney, Dillard’s and Target, respectively. According to the appraisal, JCPenney and Dillard’s are outperforming chain-wide sales PSF averages by approximately 223.4% and 132.4%, respectively. According to the appraisal, Target is considered to be in line with its chain-wide sales per square foot average of $303. As of April 1, 2016, the Mall at Turtle Creek Property was 95.6% leased by 64 tenants. Excluding temporary tenants, the occupancy is 95.3%.
THE INFORMATION IN THIS STRUCTURAL AND COLLATERAL TERM SHEET IS NOT COMPLETE AND MAY BE AMENDED PRIOR TO THE TIME OF SALE. THIS TERM SHEET IS NOT AN OFFER TO SELL THESE SECURITIES AND IT IS NOT A SOLICITATION OF AN OFFER TO BUY THESE SECURITIES IN ANY JURISDICTION WHERE THE OFFER OR SALE IS NOT PERMITTED.
| 71 |
| MALL AT TURTLE CREEK |
The following table presents certain information relating to the tenancy at the Mall at Turtle Creek Property:
Major Tenants
| Tenant Name | Credit Rating (Fitch/ Moody’s/ S&P)(1) | Tenant NRSF | % of NRSF | Annual U/W Base Rent PSF(2) | Annual U/W Base Rent(2) | % of Total Annual U/W Base Rent | Sales PSF(3) | Occupancy Cost(3) | Lease Expiration Date |
| Anchor Tenants – Not Part of Collateral | |||||||||
| Dillard’s | BBB-/Baa3/BBB- | 155,648 | |||||||
| Target | A-/A2/A | 126,483 | ANCHOR OWNED – NOT PART OF THE COLLATERAL | ||||||
| JCPenney | B+/B3/B | 82,068 | |||||||
| Major Tenants – Collateral | |||||||||
| Barnes & Noble | NR/NR/NR | 26,080 | 7.9% | $13.42 | $350,000 | 5.5% | $211 | 6.4% | 1/31/2021(4) |
| Bed, Bath & Beyond | NR/Baa1/BBB+ | 25,000 | 7.6% | $12.00 | $300,000 | 4.7% | $200 | 6.0% | 1/31/2022(5) |
| H&M | NR/NR/NR | 20,000 | 6.1% | $13.00 | $260,000 | 4.1% | NAV(6) | NAV(6) | 10/31/2026(7) |
| Shoe Department Encore | NR/NR/NR | 13,319 | 4.0% | $14.45 | $192,459 | 3.0% | $141 | 13.3% | 10/31/2023(8) |
| Best Buy | BBB-/Baa1/BB+ | 21,500 | 6.5% | $4.75 | $102,125 | 1.6% | $837 | 1.0% | 1/31/2020(9) |
| Total Major Tenants – Collateral | 105,899 | 32.1% | $11.37 | $1,204,584 | 18.9% | ||||
| Non-Major Tenants – Collateral | 193,188 | 58.6% | $26.69 | $5,155,414 | 81.1% | ||||
| Occupied Collateral Total | 299,087 | 90.8% | $21.26 | $6,359,998 | 100.0% | ||||
| Vacant Space | 30,311 | 9.2% | |||||||
| Collateral Total | 329,398 | 100.0% | |||||||
| (1) | Certain ratings are those of the parent company whether or not the parent guarantees the lease. |
| (2) | Annual U/W Base Rent PSF and Annual U/W Base Rent include contractual rent steps through May 2017, totaling $123,839. |
| (3) | Sales PSF and Occupancy Cost are for the trailing 12-month period ending March 31, 2016 except for Barnes & Noble, Bed, Bath & Beyond and Best Buy which are based on year end 2015 sponsor sales estimates. |
| (4) | Barnes & Noble has two, 5-year lease renewal options remaining after exercising its first 5-year lease renewal option for a renewal term that commenced May 2016. |
| (5) | Bed, Bath & Beyond has five, 5-year lease renewal options remaining after exercising its first 5-year lease renewal option for a renewal term that commences February 2017. The renewal rental rate of $12.50 per square foot is greater than the current underwritten rent of $12.00 per square foot. |
| (6) | H&M Sales PSF and Occupancy Cost are not available as H&M’s lease is expected to commence October 2016. |
| (7) | H&M has executed its lease, but is not currently in occupancy as it builds out its space. The tenant is expected to take occupancy in October 2016 with an outside date of January 2017 at which point the tenant is expected to begin paying full unabated rent. The amount of $151,667 has been reserved at origination for this gap rent period. H&M has three, 5-year lease renewal options. In addition, H&M may terminate the lease if its gross sales do not equal or exceed $3,000,000 in the fourth full year of the lease term (2020) by providing 180 days’ written notice and payment of 50% of the unamortized amount of the construction allowance actually paid to the tenant as of the termination date, amortized on a straight line basis without interest over 10 years from the lease commencement date. |
| (8) | Shoe Department Encore may terminate its lease if sales are less than $1,650,000 in the fifth lease year (2018) upon 60 days’ written notice and payment of 65% of the construction allowance which remains unamortized as of the effective date of such termination. |
| (9) | Best Buy has five, 5-year lease renewal options. |
THE INFORMATION IN THIS STRUCTURAL AND COLLATERAL TERM SHEET IS NOT COMPLETE AND MAY BE AMENDED PRIOR TO THE TIME OF SALE. THIS TERM SHEET IS NOT AN OFFER TO SELL THESE SECURITIES AND IT IS NOT A SOLICITATION OF AN OFFER TO BUY THESE SECURITIES IN ANY JURISDICTION WHERE THE OFFER OR SALE IS NOT PERMITTED.
| 72 |
| MALL AT TURTLE CREEK |
The following table presents certain information relating to the historical sales and occupancy costs at the Mall at Turtle Creek Mortgaged Property:
Historical Sales (PSF) and Occupancy Costs
| Tenant Name | 2013 | 2014 | 2015 | TTM March 2016 | Current Occupancy Cost(1) |
| Barnes & Noble(2) | $211 | $211 | $211 | $211 | 6.4% |
| Bed, Bath & Beyond(2) | $200 | $200 | $200 | $200 | 6.0% |
| Shoe Department Encore | $29(3) | $139 | $143 | $141 | 13.3% |
| Best Buy(2) | $837 | $837 | $837 | $837 | 1.0% |
| Comparable Inline Sales PSF | $328 | $320 | $351 | $349 | 11.7% |
| (1) | Current Occupancy Cost is based on TTM March 2016 sales. |
| (2) | Historical Sales (PSF) and Occupancy Costs are based on sponsor sales estimates. |
| (3) | Shoe Department Encore’s lease commenced November 2013. |
The following table presents certain information relating to the lease rollover schedule at the Mall at Turtle Creek Mortgaged Property:
Lease Expiration Schedule(1)(2)
| Year Ending December 31, | No. of Leases Expiring | Expiring NRSF | % of Total NRSF | Cumulative Expiring NRSF | Cumulative % of Total NRSF | Annual U/W Base Rent | % of Total Annual U/W Base Rent | Annual U/W Base Rent PSF(3) |
| MTM | 6 | 13,553 | 4.1% | 13,553 | 4.1% | $431,636 | 6.8% | $31.85 |
| 2016 | 0 | 0 | 0.0% | 13,553 | 4.1% | $0 | 0.0% | $0.00 |
| 2017 | 9 | 33,593 | 10.2% | 47,146 | 14.3% | $857,449 | 13.5% | $25.52 |
| 2018 | 3 | 13,721 | 4.2% | 60,867 | 18.5% | $296,611 | 4.7% | $21.62 |
| 2019 | 5 | 7,702 | 2.3% | 68,569 | 20.8% | $298,718 | 4.7% | $38.78 |
| 2020 | 2 | 23,604 | 7.2% | 92,173 | 28.0% | $141,008 | 2.2% | $5.97 |
| 2021 | 9 | 51,461 | 15.6% | 143,634 | 43.6% | $943,790 | 14.8% | $18.34 |
| 2022(4) | 5 | 41,911 | 12.7% | 185,545 | 56.3% | $798,460 | 12.6% | $19.05 |
| 2023 | 2 | 19,583 | 5.9% | 205,128 | 62.3% | $295,940 | 4.7% | $15.11 |
| 2024 | 1 | 500 | 0.2% | 205,628 | 62.4% | $63,654 | 1.0% | $127.31 |
| 2025 | 5 | 33,073 | 10.0% | 238,701 | 72.5% | $678,821 | 10.7% | $20.52 |
| 2026 | 14 | 60,386 | 18.3% | 299,087 | 90.8% | $1,553,910 | 24.4% | $25.73 |
| Thereafter | 0 | 0 | 0.0% | 299,087 | 90.8% | $0 | 0.0% | $0.00 |
| Vacant | 0 | 30,311 | 9.2% | 329,398 | 100.0% | $0 | 0.0% | $0.00 |
| Total/Weighted Average | 61 | 329,398 | 100.0% | $6,359,998 | 100.0% | $21.26 |
| (1) | Information obtained from the underwritten rent roll. |
| (2) | Certain tenants may have lease termination options that are exercisable prior to the originally stated expiration date of the subject lease and that are not considered in the Lease Expiration Schedule. |
| (3) | Weighted Average Annual U/W Base Rent PSF excludes vacant space. |
| (4) | Subsequent to the Mall at Turtle Creek Whole Loan funding, Bed, Bath & Beyond exercised its first 5-year lease renewal option for a renewal term that commences February 2017 and expires January 2022. The original and underwritten lease expiration was January 2017. The Lease Expiration Schedule reflects a January 2022 lease expiration. |
The following table presents historical occupancy percentages at the Mall at Turtle Creek Mortgaged Property:
Historical Occupancy(1)
12/31/2012(2) | 12/31/2013(2) | 12/31/2014(2) | 12/31/2015(2) | 4/1/2016(3) | |||||
| 91.6% | 91.9% | 89.3% | 91.2% | 90.8% |
| (1) | Historical Occupancy figures represent collateral square footage only and include temporary tenants. Excluding temporary tenants, Historical Occupancy is 91.6%, 90.1%, 87.8%, 89.0% and 90.0% for the trailing 12-month periods ending 12/31/2012, 12/31/2013, 12/31/2014, 12/31/2015 and 4/1/2016, respectively. |
| (2) | Information obtained from the borrower. |
| (3) | Information obtained from the underwritten rent roll. Current occupancy includes H&M (20,000 square feet), Gamble Home Furnishings (5,351 square feet) and Journeys Kidz (1,600 square feet), each of which has an executed lease but is not currently in occupancy as the tenants are building out their respective spaces and Charley’s Grilled Subs (576 square feet) that has a lease out for signature which is expected to be executed in July 2016. H&M is expected to take occupancy in October 2016 with an outside date of January 2017. $151,667 has been reserved at origination that reflects 7 months of gap rent for H&M. Gamble Home Furnishings and Journeys Kidz are expected to open in July 2016. Excluding H&M, Gamble Home Furnishings, Journeys Kidz and Charley’s Grilled Subs, current occupancy is 82.4%. |
THE INFORMATION IN THIS STRUCTURAL AND COLLATERAL TERM SHEET IS NOT COMPLETE AND MAY BE AMENDED PRIOR TO THE TIME OF SALE. THIS TERM SHEET IS NOT AN OFFER TO SELL THESE SECURITIES AND IT IS NOT A SOLICITATION OF AN OFFER TO BUY THESE SECURITIES IN ANY JURISDICTION WHERE THE OFFER OR SALE IS NOT PERMITTED.
| 73 |
| MALL AT TURTLE CREEK |
Operating History and Underwritten Net Cash Flow.The following table presents certain information relating to the historical operating performance and underwritten net cash flow at the Mall at Turtle Creek Mortgaged Property:
Cash Flow Analysis
| 2013 | 2014 | 2015 | TTM 3/31/2016 | U/W | % of U/W Effective Gross Income | U/W $ per SF | |||||||||
| Base Rent | $5,414,435 | $5,403,670 | $5,289,753 | $5,367,043(1) | $6,297,765(1)(2) | 63.0% | $19.12 | ||||||||
| Grossed Up Vacant Space | 0 | 0 | 0 | 0 | 1,286,999 | 12.9 | 3.91 | ||||||||
| Percentage Rent | 100,027 | 213,161 | 226,567 | 264,566 | 91,514 | 0.9 | 0.28 | ||||||||
| Total Reimbursables | 2,301,778 | 2,411,823 | 2,406,467 | 2,417,574 | 2,448,120 | 24.5 | 7.43 | ||||||||
| % in Lieu | 591,541 | 341,378 | 238,864 | 186,422 | 62,233 | 0.6 | 0.19 | ||||||||
| Specialty Leasing | 494,795 | 589,504 | 670,928 | 692,439 | 692,439 | 6.9 | 2.10 | ||||||||
| Other Income | 322,590 | 413,418 | 367,370 | 400,208 | 400,208 | 4.0 | 1.21 | ||||||||
| Less Vacancy & Credit Loss | (66,964) | (95,861) | 3,698 | (23,746) | (1,286,999)(3) | (12.9) | (3.91) | ||||||||
| Effective Gross Income | $9,158,203 | $9,277,093 | $9,203,647 | $9,304,506 | $9,992,279 | 100.0% | $30.33 | ||||||||
| Total Operating Expenses | $2,057,152 | $2,231,971 | $2,056,405 | $2,044,191 | $2,364,573 | 23.7% | $7.18 | ||||||||
| Net Operating Income | $7,101,050 | $7,045,122 | $7,147,241 | $7,260,314 | $7,627,706 | 76.3% | $23.16 | ||||||||
| TI/LC | 0 | 0 | 0 | 0 | 494,097 | 4.9 | 1.50 | ||||||||
| Capital Expenditures | 0 | 0 | 0 | 0 | 49,410 | 0.5 | 0.15 | ||||||||
| Net Cash Flow | $7,101,050 | $7,045,122 | $7,147,241 | $7,260,314 | $7,084,199 | 70.9% | $21.51 | ||||||||
| NOI DSCR | 1.57x | 1.56x | 1.58x | 1.61x | 1.69x | ||||||||||
| NCF DSCR | 1.57x | 1.56x | 1.58x | 1.61x | 1.57x | ||||||||||
| NOI DY | 9.9% | 9.8% | 10.0% | 10.1% | 10.6% | ||||||||||
| NCF DY | 9.9% | 9.8% | 10.0% | 10.1% | 9.9% |
| (1) | The majority of the increase in Base Rent from TTM 3/31/2016 to U/W is due to recently executed leases with new tenants. Since July 2015 the sponsor executed seven leases with new tenants totaling 46,557 square feet and $938,935 of UW Base Rent. |
| (2) | U/W Base Rent includes contractual rent increases through May 2017, totaling $123,839. |
| (3) | The underwritten economic vacancy is 11.4%. The Mall at Turtle Creek Mortgaged Property was 90.8% physically occupied as of April 1, 2016. |
Appraisal.As of the appraisal valuation date of April 5, 2016, the Mall at Turtle Creek Mortgaged Property had an “as-is” appraised value of $130,000,000.
Environmental Matters.According to the Phase I environmental assessment dated April 12, 2016, there was no evidence of any recognized environmental conditions at the Mall at Turtle Creek Mortgaged Property.
Market Overview and Competition.The Mall at Turtle Creek Property is located at the corner of East Highland Drive and Route 49. Both thoroughfares provide local access, but Route 49 provides north/south access, running from northern Arkansas all the way down to Gulfport, Mississippi. Route 49 provides access to Interstate 555 and Interstate 55. The Mall at Turtle Creek Property is located approximately 125 miles northeast of the Little Rock central business district and approximately 70.0 miles northwest of the Memphis central business district. The Mall at Turtle Creek Property is located proximate to the intersection of Route 49 and Route 18, and according to the appraisal, has an approximate average annual daily traffic count of 43,000 cars. Further, the Mall at Turtle Creek Property is located approximately two miles away from the Jonesboro Municipal Airport. The area around the Mall at Turtle Creek Property is also served by the Jonesboro Economic Transit System.
Jonesboro is the fifth largest city in Arkansas, and according to the appraisal, is one of the fastest growing cities within the state. The three largest economic drivers in Jonesboro are agriculture, manufacturing and medical facilities. Arkansas State University (“ASU”) is located approximately two miles from the Mall at Turtle Creek Property and has an enrollment of over 13,000 undergraduates and approximately 160 fields of study. There are two medical systems, NEA Baptist Memorial Hospital (“NEA”) and St. Bernard’s Regional Medical Center, located proximate to the Mall at Turtle Creek Property. NEA recently moved to a new 770,000 square foot facility approximately four miles away from the Mall at Turtle Creek Property. St. Bernard’s is the largest employer in Jonesboro. Other top employers in the area are ASU, Wal-Mart Stores Inc., Nestle USA, Frito-Lay Inc., Unilever and Riceland Foods. Additionally, five hotels are either in the planning stage or are being developed within four miles of the Mall at Turtle Creek Property. According to the appraisal, youth sports create a large draw to Jonesboro and hotels are almost always fully occupied during tournaments.
According to the appraisal, the 2015 population within a forty- (the Mall at Turtle Creek Property’s primary trade area) and fifty-mile radius of the Mall at Turtle Creek Property was 254,575 and 356,025, respectively. According to the appraisal, the average household income within the same forty- and fifty-mile radii was $51,324 and $50,977, respectively. According to the appraisal, population has increased at a compound annual rate of approximately 0.5% between 2000 and 2015 for the forty-mile radius.
According to the appraisal, primary competitors include Oak Court Mall and Wolfchase Galleria, the closest of which is approximately 75.0 miles from the Mall at Turtle Creek Property. Highland Square Shopping Center (Kmart anchored), Caraway Mall (Sears Auto Center anchored), Benard Court (Hobby Lobby and Ashley Furniture anchored) and Caraway Shopping Plaza (Hastings, Old Navy, Save-A-Lot and Petco anchored) are considered to be local competitors with typical community center tenancy. There is no anchor overlap among the Mall at Turtle Creek Property and the local competition. According to the appraisal, there are no significant retail development projects underway in Jonesboro. The Mall at Turtle Creek Property is the only enclosed mall within a 75.0 mile radius.
THE INFORMATION IN THIS STRUCTURAL AND COLLATERAL TERM SHEET IS NOT COMPLETE AND MAY BE AMENDED PRIOR TO THE TIME OF SALE. THIS TERM SHEET IS NOT AN OFFER TO SELL THESE SECURITIES AND IT IS NOT A SOLICITATION OF AN OFFER TO BUY THESE SECURITIES IN ANY JURISDICTION WHERE THE OFFER OR SALE IS NOT PERMITTED.
| 74 |
| MALL AT TURTLE CREEK |
The following table presents certain information relating to some comparable retail properties for the Mall at Turtle Creek Property:
Competitive Set(1)
Mall at | Oak Court Mall | Wolfchase Galleria | Highland Square Shopping Center | Caraway Mall(2) | Bernard Court | Caraway Shopping Plaza | |
| Location | Jonesboro, AR | Memphis, TN | Memphis, TN | Jonesboro, AR | Jonesboro, AR | Jonesboro, AR | Jonesboro, AR |
| Distance from Subject | -- | 75.0 miles | 86.0 miles | 1.0 miles | 1.0 miles | 1.3 miles | 1.3 miles |
| Property Type | Regional Mall | Regional Mall | Super Regional Mall | Community Center | Community Center | Community Center | Community Center |
| Year Built/Renovated | 2006/NAP | 1988/1995 | 1996/NAP | 1980/NAP | 1967/1989 | 1993/NAP | 1969/2002 |
| Anchors | Dillard’s, Target, JCPenney | Dillard’s, Macy’s | Dillard’s, Macy’s, JCPenney, Sears | Kmart | Sears Appliance Center | Hobby Lobby, Ashley Furniture | Hastings, Old Navy, Save-A-Lot, Petco |
| Total GLA | 693,597 SF(3) | 723,010 SF | 1,152,196 SF | 219,344 SF | 371,325 SF | 128,134 SF | 161,486 SF |
| Inline Sales PSF | $349(4) | $300 | $400 | NAV | NAV | NAV | NAV |
| Total Occupancy | 95.6%(5) | 99.0% | 95.0% | 96.0% | 100.0% | 61.0% | 86.0% |
| (1) | Information obtained from the appraisal and underwritten rent roll. |
| (2) | Caraway Mall is an anchored retail center whose tenancy includes a small Sears Appliance Center, Buckle, Dollar Tree and Hallmark Gold Crown. |
| (3) | Total GLA includes non-collateral anchor tenants. |
| (4) | Represents comparable inline sales per square foot as of trailing 12-month period ending March 2016. |
| (5) | Total occupancy includes the three non-collateral anchor tenants. Excluding the three non-collateral anchor tenants, occupancy at the Mall at Turtle Creek Property is 90.8% as of April 1, 2016. |
The Borrower.The borrower is RPI Turtle Creek Mall, LLC, a Delaware limited liability company, a single purpose entity with two independent directors. Legal counsel to the borrower delivered a non-consolidation opinion in connection with the origination of the Mall at Turtle Creek Whole Loan. Rouse Properties, LP, is the guarantor of certain nonrecourse carveouts under the Mall at Turtle Creek Whole Loan.
The Sponsor.The sponsor is Rouse Properties, LP (“Rouse”). Rouse is a publicly traded real estate investment trust headquartered in New York, New York. Rouse has a portfolio of properties, which includes 35 malls in 21 states encompassing approximately 24 million square feet of retail space. As of December 31, 2015, Rouse had total assets of approximately $2.5 billion and total equity of $534.5 million. Rouse announced that it has been acquired by an affiliate of Brookfield Asset Management Inc. (“Brookfield”). The indirect owner of the borrower and the sponsor (which is the carve-out guarantor) is a publically traded REIT into which certain properties (not including the mortgaged property) were spun off in connection with the April 2009 bankruptcy filing of General Growth Properties, Inc., which emerged from bankruptcy in November 2010. See also“Description of the Mortgage Pool—Loan Purpose; Default History, Bankruptcy Issues and Other Proceedings” in the Preliminary Prospectus.
Escrows.The loan documents provide for upfront reserves of (i) $443,810 for taxes, (ii) $2,907,450 for outstanding tenant improvement and leasing commission obligations, including those related to H&M ($1,790,000), Victoria’s Secret ($407,450), Bath & Body Works ($225,000), Gearhead Outfitters ($200,000), Torrid ($145,000) and Spencer’s Gifts ($140,000) and (iii) $151,667 for gap rent related to H&M.
Additionally, a $2,900,000 Bed, Bath & Beyond reserve fund has been escrowed which will be disbursed to the borrower, provided no event of default under the loan documents has occurred and is continuing and upon a Bed, Bath & Beyond Renewal Event (defined herein). Among other conditions, a “Bed, Bath & Beyond Renewal Event” will have occurred when the following requirements have been satisfied: (i) Bed, Bath & Beyond has renewed or extended its lease upon terms that are provided under its lease (including a five-year renewal at an annual base rent equal to $312,500); or (ii) the borrower re-leased all or a portion of the Bed, Bath & Beyond lease space (i.e., the space demised pursuant to the Bed, Bath and Beyond lease) with an acceptable replacement lease pursuant to the terms and provisions of the loan documents. Subsequent to the Mall at Turtle Creek Whole Loan funding, the $2,900,000 initially held in escrow was released to the borrower after Bed, Bath & Beyond exercised its renewal option at terms consistent with the loan documents.
Ongoing monthly reserves are required in an amount equal to (i) $49,312 for taxes, (ii) $6,862 (subject to a cap of $82,350) for replacement reserves and (iii) $41,175 (subject to a cap of $988,194) for tenant improvements and leasing commissions. The loan documents do not require monthly escrows for insurance provided (x) no event of default under the loan documents has occurred and is continuing, (y) the Mall at Turtle Creek Mortgaged Property is insured via an acceptable blanket or umbrella insurance policy that meets the requirements set forth in the loan documents and (z) the borrower provides the lender with evidence of renewal of the policies and timely proof of payment of the insurance premiums when due.
Lockbox and Cash Management.The Mall at Turtle Creek Whole Loan requires a lender-controlled hard lockbox account, which is already in place, and into which the borrower and property manager direct all tenants to directly pay rents. The loan documents also require that the borrower or property manager, if any, to, deposit into the lockbox account no later than three business days after receipt (i) prior to a Trigger Event (as defined below), all rents from permanent leases and all forfeited security deposits received by the borrower and property manager, if any, and (ii) following a Trigger Event, all gross income from operations, all forfeited security deposits and all other revenue of any kind from the Mall at Turtle Creek Mortgaged Property received by the borrower or the property manager, if any. Prior to the occurrence of a Trigger Event, all funds on deposit in the lockbox account are to be disbursed to the borrower. During a Trigger Event, all cash flow is to be swept to a lender-controlled cash management account. During a Low DSCR Period (as defined below), all excess funds in the cash management account are to be swept to a lender controlled sub-account.
THE INFORMATION IN THIS STRUCTURAL AND COLLATERAL TERM SHEET IS NOT COMPLETE AND MAY BE AMENDED PRIOR TO THE TIME OF SALE. THIS TERM SHEET IS NOT AN OFFER TO SELL THESE SECURITIES AND IT IS NOT A SOLICITATION OF AN OFFER TO BUY THESE SECURITIES IN ANY JURISDICTION WHERE THE OFFER OR SALE IS NOT PERMITTED.
| 75 |
| MALL AT TURTLE CREEK |
However, upon the occurrence and continuance of a Trigger Event caused solely by the debt service coverage ratio being less than 1.30x at the end of any trailing 12-month period, the borrower may (but will not be obligated to), in borrower’s sole discretion, cure such Trigger Event by posting (x) cash and/or (y) an evergreen letter of credit in form and substance reasonably acceptable to the lender, in an aggregate amount equal to the amount by which the Mall at Turtle Creek Whole Loan would have to be partially prepaid in order for the debt service coverage ratio to equal 1.30x, and such deposit of cash or provision of a letter of credit will cure such Trigger Event caused by the existence and continuance of the debt service coverage ratio being less than 1.30x, provided that when the debt service coverage ratio continues to be tested as of the end of each calendar quarter and with respect to such calculations, the borrower will be given credit against the outstanding balance of the Mall at Turtle Creek Whole Loan for any such cash deposited or the face amount of any such letter of credit.
A “Trigger Event” will commence upon the earlier of (i) the occurrence of an event of default; or (ii) the debt service coverage ratio being less than 1.30x at the end of any trailing 12-month period. A Trigger Event will expire, with regard to clause (i), upon the cure of such event of default; and with regard to clause (ii), the debt service coverage ratio being equal to or greater than 1.30x for two consecutive calendar quarters.
A “Low DSCR Period” will commence on the last day of the second consecutive calendar quarter for which the debt service coverage ratio is less than 1.20x and ends on the last day of any two consecutive calendar quarters thereafter for each of which the debt service coverage ratio is greater than or equal to 1.20x.
Property Management. The Mall at Turtle Creek Mortgaged Property is managed by an affiliate of the borrower.
Assumption.The borrower has right to transfer the Mall at Turtle Creek Mortgaged Property, provided that certain conditions are satisfied, including (i) no event of default has occurred and is continuing; (ii) the identity, experience (demonstrated expertise in owning and operating properties in size, class and operation to the Mall at Turtle Creek Mortgaged Property), financial condition and credit worthiness of transferee and guarantor, as evidenced by financial statement and other information is satisfactory to lender, (iii) rating agency confirmation from Fitch, KBRA and Moody’s that the transfer will not result in a downgrade, withdrawal or qualification of the respective ratings assigned to the Series 2016-C35 Certificates or similar ratings confirmations from each rating agency rating any securities backed by any Mall at Turtle Creek companion loan with respect to the ratings of such securities.
Partial Release.Not Permitted.
Real Estate Substitution.Not permitted.
Subordinate and Mezzanine Indebtedness.See “Other Indebtedness” below.
Other Indebtedness.The loan documents permit certain sponsor affiliates to pledge direct or indirect ownership interests to a qualified pledgee (an institution having in excess of $250.0 million in total assets and $60.0 million in capital/statutory surplus, and regularly engaged in business of owning or making commercial real estate loans or commercial loans secured by a pledge of interests in a mortgage borrower or owning and operating commercial properties, or otherwise is party for whom rating agency confirmation has been obtained) subject to certain conditions, including: (i) a pledge is given in connection with an operating debt facility, a corporate facility, a line of credit or other similar financing transaction credit facility secured by multiple properties for which repayment is not primarily dependent upon property cash flow; and (ii) the exercise of any remedies available under the pledge will not result in a change of manager unless the replacement manager is a qualified manager as defined in the loan documents.
Ground Lease.None.
Terrorism Insurance.The loan documents require that the “all risk” or “special form” insurance policy required to be maintained by the borrower provide coverage for terrorism in an amount equal to the full replacement cost of the Mall at Turtle Creek Mortgaged Property, as well as business interruption insurance for a period covering no less than the 18-month period following the occurrence of a casualty event, together with a 12-month extended period of indemnity. If TRIPRA is no longer in effect, the borrower will be obligated to maintain coverage for such insurance against foreign and domestic acts of terrorism or similar acts of sabotage; however the cost of such coverage may not exceed an amount equal to two times the annual premium for a separate “special form” or “all risks” policy basis.
THE INFORMATION IN THIS STRUCTURAL AND COLLATERAL TERM SHEET IS NOT COMPLETE AND MAY BE AMENDED PRIOR TO THE TIME OF SALE. THIS TERM SHEET IS NOT AN OFFER TO SELL THESE SECURITIES AND IT IS NOT A SOLICITATION OF AN OFFER TO BUY THESE SECURITIES IN ANY JURISDICTION WHERE THE OFFER OR SALE IS NOT PERMITTED.
| 76 |
(THIS PAGE INTENTIONALLY LEFT BLANK)
THE INFORMATION IN THIS STRUCTURAL AND COLLATERAL TERM SHEET IS NOT COMPLETE AND MAY BE AMENDED PRIOR TO THE TIME OF SALE. THIS TERM SHEET IS NOT AN OFFER TO SELL THESE SECURITIES AND IT IS NOT A SOLICITATION OF AN OFFER TO BUY THESE SECURITIES IN ANY JURISDICTION WHERE THE OFFER OR SALE IS NOT PERMITTED.
| 77 |
IN-REL 8
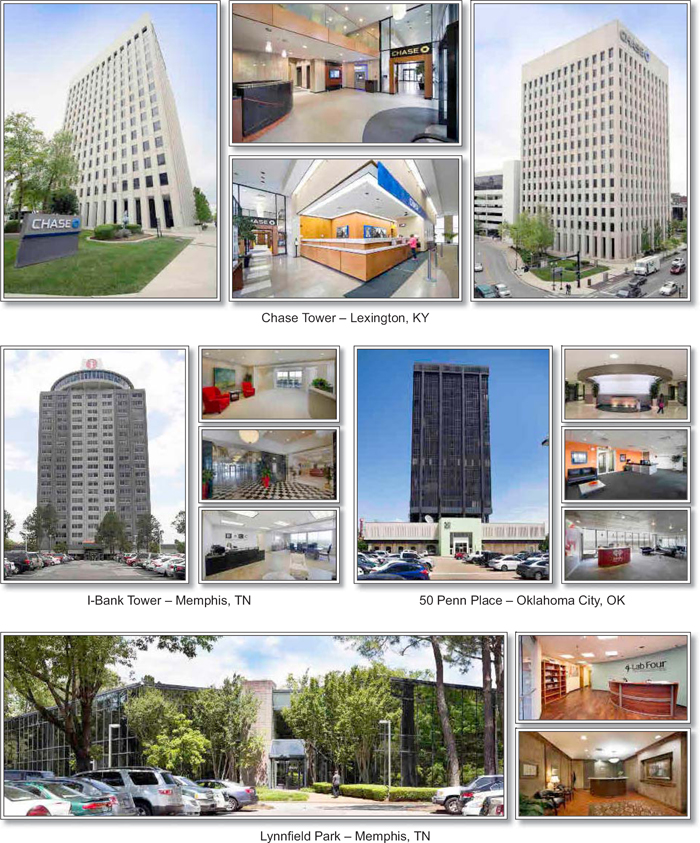
THE INFORMATION IN THIS STRUCTURAL AND COLLATERAL TERM SHEET IS NOT COMPLETE AND MAY BE AMENDED PRIOR TO THE TIME OF SALE. THIS TERM SHEET IS NOT AN OFFER TO SELL THESE SECURITIES AND IT IS NOT A SOLICITATION OF AN OFFER TO BUY THESE SECURITIES IN ANY JURISDICTION WHERE THE OFFER OR SALE IS NOT PERMITTED.
| 78 |
IN-REL 8

THE INFORMATION IN THIS STRUCTURAL AND COLLATERAL TERM SHEET IS NOT COMPLETE AND MAY BE AMENDED PRIOR TO THE TIME OF SALE. THIS TERM SHEET IS NOT AN OFFER TO SELL THESE SECURITIES AND IT IS NOT A SOLICITATION OF AN OFFER TO BUY THESE SECURITIES IN ANY JURISDICTION WHERE THE OFFER OR SALE IS NOT PERMITTED.
| 79 |
| No. 6 – In-Rel 8 | ||||||
| Loan Information | Property Information | |||||
| Mortgage Loan Seller: | UBS Real Estate Securities Inc. | Single Asset/Portfolio: | Portfolio | |||
| Credit Assessment (Fitch/KBRA/Moody’s): | NR/NR/NR | Property Type: | Various – See Table | |||
| Original Principal Balance(1): | $32,500,000 | Specific Property Type: | Various – See Table | |||
| Cut-off Date Balance(1): | $32,460,442 | Location: | Various – See Table | |||
| % of Initial Pool Balance: | 3.2% | Size: | 1,478,687 SF | |||
| Loan Purpose: | Refinance | Cut-off Date Balance Per SF(1): | $62.48 | |||
| Borrower Names(2): | Various | Year Built/Renovated: | Various – See Table | |||
| Sponsors: | Charles Stein; Dennis Udwin | Title Vesting(4): | Various | |||
| Mortgage Rate: | 4.930% | Property Manager: | Self-managed | |||
| Note Date: | May 9, 2016 | 4thMost Recent Occupancy (As of)(5): | 76.7% (12/31/2012) | |||
| Anticipated Repayment Date: | NAP | 3rdMost Recent Occupancy (As of): | 79.3% (12/31/2013) | |||
| Maturity Date: | June 6, 2021 | 2ndMost Recent Occupancy (As of): | 79.7% (12/31/2014) | |||
| IO Period: | None | Most Recent Occupancy (As of): | 81.2% (12/31/2015) | |||
| Loan Term (Original): | 60 months | Current Occupancy (As of): | 83.2% (4/1/2016) | |||
| Seasoning: | 1 month | |||||
| Amortization Term (Original): | 360 months | Underwriting and Financial Information: | ||||
| Loan Amortization Type: | Amortizing Balloon | |||||
| Interest Accrual Method: | Actual/360 | 4thMost Recent NOI (As of): | $8,529,918 (12/31/2013) | |||
| Call Protection: | L(25),D(31),O(4) | 3rdMost Recent NOI (As of): | $8,729,265 (12/31/2014) | |||
| Lockbox Type: | Hard/Springing Cash Management | 2ndMost Recent NOI (As of)(6): | $9,499,908 (12/31/2015) | |||
| Additional Debt(1): | Yes | Most Recent NOI (As of)(6): | $9,786,472 (TTM 3/31/2016) | |||
| Additional Debt Type(1): | Pari Passu | |||||
| U/W Revenues: | $18,900,650 | |||||
| Escrows and Reserves(3): | U/W Expenses: | $7,628,148 | ||||
| U/W NOI: | $11,272,502 | |||||
| Type: | Initial | Monthly | Cap (If Any) | U/W NCF: | $9,942,409 | |
| Taxes | $749,640 | $121,769 | NAP | U/W NOI DSCR(1): | 1.91x | |
| Insurance | $0 | Springing | NAP | U/W NCF DSCR(1): | 1.68x | |
| Replacement Reserve | $0 | $18,487 | NAP | U/W NOI Debt Yield(1): | 12.2% | |
| TI/LC Reserve | $500,000 | $92,418 | $1,500,000 | U/W NCF Debt Yield(1): | 10.8% | |
| Material Tenant Rollover Reserve | $4,000,000 | $62,500 | (3) | As-Is Appraised Value(7): | $132,985,000 | |
| Unfunded Obligations Reserve | $436,926 | $0 | NAP | As-Is Appraisal Valuation Date: | Various | |
| Ground Rent Reserve | $72,000 | Springing | NAP | Cut-off Date LTV Ratio(1): | 69.5% | |
| Deferred Maintenance | $834,096 | $0 | NAP | LTV Ratio at Maturity or ARD(1): | 64.1% | |
| (1) | The In-Rel 8 Whole Loan (as defined below), totaling $92,500,000, is comprised of threepari passu notes (Note A-1, Note A-2 and Note A-3). The non-controlling Note A-2 and Note A-3 had an original aggregate balance of $32,500,000, have an outstanding aggregate principal balance as of the Cut-off Date of $32,460,442 and will be contributed to the WFCM 2016-C35 Trust. The controlling Note A-1 had an original principal balance of $60,000,000 and was contributed to the BACM 2016-UBS10 Trust. All presented statistical financial information related to balances per square foot, loan-to-value ratios, debt service coverage ratios and debt yields are based on the In-Rel 8 Whole Loan. |
| (2) | See “The Borrowers” section. |
| (3) | See “Escrows” section. |
| (4) | The Center Point property is secured by both a fee and leasehold interest. See “Ground Lease” section. |
| (5) | See “Historical Occupancy” section. |
| (6) | See “Cash Flow Analysis” section. |
| (7) | The Chase Tower property includes 0.46 acres of excess land with a concluded fee-simple interest value of $310,000. Excluding the excess land, the as-is appraised value for the In-Rel 8 Properties (as defined below) is $132,675,000. The excess land is considered part of the collateral. See “The Properties” section. |
The Mortgage Loan.The mortgage loan (the “In-Rel 8 Mortgage Loan”) is part of a whole loan (the “In-Rel 8 Whole Loan”) evidenced by threepari passu promissory notes (Note A-1, Note A-2 and Note A-3) secured by a first mortgage encumbering four office properties, three retail shopping centers and one mixed use property located in Tennessee, Oklahoma, Kentucky, Alabama, Georgia and Florida (the “In-Rel 8 Properties”). The In-Rel 8 Whole Loan was originated on May 9, 2016 by UBS Real Estate Securities Inc. The In-Rel 8 Whole Loan had an original principal balance of $92,500,000, has an outstanding principal balance as of the Cut-off Date of $92,387,411 and accrues interest at an interest rate of 4.930%per annum. The In-Rel 8 Whole Loan had an initial term of 60 months, has a remaining term of 59 months as of the Cut-off Date and requires payments of principal and interest based on a 30-year amortization schedule. The In-Rel 8 Whole Loan matures on June 6, 2021.
Note A-2 and Note A-3, which will be contributed to the WFCM 2016-C35 Trust and represent the non-controlling interests, had an original aggregate principal balance of $32,500,000 and have an outstanding aggregate principal balance as of the Cut-off Date of $32,460,442. The controlling Note A-1 (the “In-Rel 8 Companion Loan”) had an original principal balance of $60,000,000 and was contributed to the BACM 2016-UBS10 Trust. See “Description of the Mortgage Pool—The Whole Loans—The Non-Serviced Whole Loans—The In-Rel 8 Whole Loan” in the Preliminary Prospectus.
THE INFORMATION IN THIS STRUCTURAL AND COLLATERAL TERM SHEET IS NOT COMPLETE AND MAY BE AMENDED PRIOR TO THE TIME OF SALE. THIS TERM SHEET IS NOT AN OFFER TO SELL THESE SECURITIES AND IT IS NOT A SOLICITATION OF AN OFFER TO BUY THESE SECURITIES IN ANY JURISDICTION WHERE THE OFFER OR SALE IS NOT PERMITTED.
| 80 |
IN-REL 8
Note Summary
| Notes | Original Balance | Note Holder | Controlling Interest | |
| A-1 | $60,000,000 | BACM 2016-UBS10 | Yes | |
| A-2 | $20,000,000 | WFCM 2016-C35 | No | |
| A-3 | $12,500,000 | WFCM 2016-C35 | No | |
| Total | $92,500,000 |
Following the lockout period, the borrowers have the right to defease the In-Rel 8 Whole Loan in whole or in part (see “Partial Release” section) on any date before March 6, 2021. In addition, the In-Rel 8 Whole Loan is prepayable without penalty on or after March 6, 2021.
Sources and Uses
| Sources | Uses | |||||||
| Original whole loan amount | $92,500,000 | 100.0% | Loan payoff(1) | $60,895,553 | 65.8% | |||
| Reserves | 6,592,662 | 7.1 | ||||||
| Closing costs | 1,491,566 | 1.6 | ||||||
| Return of equity | 23,520,219 | 25.4 | ||||||
| Total Sources | $92,500,000 | 100.0% | Total Uses | $92,500,000 | 100.0% |
| (1) | The Chase Tower property was previously securitized in the MLMT 2005-MKB2 transaction. |
The Properties.The In-Rel 8 Properties consist of four office properties, one mixed use office/retail property, and three retail centers located in Tennessee (two properties), Kentucky (one property), Oklahoma (one property), Florida (two properties), Alabama (one property), and Georgia (one property). The In-Rel 8 Properties total 1,478,687 square feet and are leased to 255 tenants pursuant to approximately 286 different leases. The office properties, totaling 844,442 square feet, range in size from 50,155 square feet to 280,829 square feet, with an average of 211,111 square feet. The mixed use property, 50 Penn Place, totaling 320,957 square feet, consists of 178,732 square feet (55.7% of the net rentable area) of office space, 134,555 square feet (41.9% of property net rentable area) of retail space and 7,670 square feet (2.4% of property net rentable area) of storage space. The retail properties, totaling 313,288 square feet, range in size from 35,937 square feet to 148,275 square feet, with an average of 104,429 square feet.
The In-Rel 8 Properties were purchased by the borrowers, or their affiliates, on various dates from January 1998 to December 2015, for a total purchase price of approximately $78.8 million. In addition, the sponsors spent approximately $19.9 million ($13.48 per square foot) in capital expenditures and tenant improvements and leasing commissions for a total cost basis of approximately $98.7 million ($66.77 per square foot). The In-Rel 8 Properties range in occupancy from 75.2% to 100.0%. As of April 1, 2016, the In-Rel 8 Properties were 83.2% occupied by 255 tenants.
The sponsors were involved in a foreclosure at the Center Point property in 2011 due to a major tenant filing for bankruptcy. The sponsors repurchased the Center Point property from the special servicer in 2013. See“Description of the Mortgage Pool—Loan Purpose; Default History, Bankruptcy Issues and Other Proceedings” in the Preliminary Prospectus.
The following table presents certain information relating to the In-Rel 8 Properties:
| Property Name – Location | Property Type/ Subtype | Allocated Cut-off Date Whole Loan Balance | % of Portfolio Cut-off Date Balance | Occupancy | Year Built/ Renovated | Net Rentable Area (SF) | As-Is Appraised Value | Allocated Cut-off Date Whole Loan LTV |
| Lynnfield Park – Memphis, TN | Office/Suburban | $20,450,078 | 22.1% | 83.5% | 1974/2012 | 280,829 | $28,800,000 | 71.0% |
| Chase Tower – Lexington, KY | Office/CBD | $20,375,169 | 22.1% | 85.2% | 1973/2012 | 237,892 | $27,810,000(1) | 73.3% |
| 50 Penn Place – Oklahoma City, OK | Mixed Use/Office/Retail | $18,976,874 | 20.5% | 75.2% | 1974/2012 | 320,957 | $26,600,000 | 71.3% |
| I-Bank Tower – Memphis, TN | Office/Suburban | $17,878,212 | 19.4% | 79.4% | 1967/2012 | 275,566 | $29,575,000 | 60.5% |
| 4100 Okeechobee – West Palm Beach, FL | Office/Suburban | $5,093,792 | 5.5% | 100.0% | 1971/2013 | 50,155 | $6,900,000 | 73.8% |
| Center Point – Center Point, AL(2) | Retail/Anchored | $3,595,618 | 3.9% | 94.7% | 1990/NAP | 148,275 | $5,100,000 | 70.5% |
| Bainbridge Mall – Bainbridge, GA | Retail/Anchored | $3,221,075 | 3.5% | 82.4% | 1975/NAP | 129,076 | $4,300,000 | 74.9% |
| Plantation Merch. Mart – Plantation, FL | Retail/Unanchored | $2,796,592 | 3.0% | 100.0% | 1987/NAP | 35,937 | $3,900,000 | 71.7% |
| Total/Weighted Average | $92,387,411 | 100.0% | 83.2% | 1,478,687 | $132,985,000 | 69.5% |
| (1) | The Chase Tower property includes 0.46 acres of excess land with a concluded fee-simple interest value of $310,000. Excluding the excess land, the as-is appraised value for the Chase Tower property is $27,500,000. The excess land is part of the collateral. |
| (2) | The Center Point property is secured by both a fee and leasehold interest. |
THE INFORMATION IN THIS STRUCTURAL AND COLLATERAL TERM SHEET IS NOT COMPLETE AND MAY BE AMENDED PRIOR TO THE TIME OF SALE. THIS TERM SHEET IS NOT AN OFFER TO SELL THESE SECURITIES AND IT IS NOT A SOLICITATION OF AN OFFER TO BUY THESE SECURITIES IN ANY JURISDICTION WHERE THE OFFER OR SALE IS NOT PERMITTED.
| 81 |
IN-REL 8
The following table presents certain information relating to the tenancy at the In-Rel 8 Properties:
Major Tenants
| Tenant Name | Credit Rating (Fitch/ Moody’s/ S&P)(1) | Tenant NRSF | % of NRSF | Annual U/W Base Rent PSF(2) | Annual U/W Base Rent(2) | % of Total Annual U/W Base Rent | Lease Expiration Date |
| Major Tenants | |||||||
| First Tennessee Bank National(3) | BBB-/Baa3/BBB- | 138,812 | 9.4% | $17.00 | $2,359,804 | 13.1% | 7/31/2018 |
| JP Morgan Chase Bank(4) | A+/A3/A- | 52,197 | 3.5% | $26.17 | $1,366,013 | 7.6% | 11/30/2017 |
| ChildNet, Inc.(5) | NR/NR/NR | 50,155 | 3.4% | $19.27 | $966,675 | 5.4% | 6/30/2019 |
| Independent Bank(6) | NR/NR/NR | 40,666 | 2.8% | $16.25 | $660,823 | 3.7% | 9/30/2021 |
| Fayette County Attorney(4) | NR/NR/NR | 42,120 | 2.8% | $15.58 | $656,247 | 3.6% | 6/30/2023 |
| McBrayer, McGinnis, Leslie & Kirkland, PLLC(4) | NR/NR/NR | 37,641 | 2.5% | $15.75 | $592,784 | 3.3% | 4/30/2027(7) |
| RELX Inc.(8) | NR/NR/NR | 24,629 | 1.7% | $16.00 | $394,064 | 2.2% | 7/31/2019 |
| Clear Channel Broadcasting, Inc./IHeartMedia + Entertainment, Inc.(8) | NR/NR/CCC | 26,628 | 1.8% | $14.59 | $388,503 | 2.2% | 8/31/2025 |
| Food Giant(9) | NR/NR/NR | 54,172 | 3.7% | $3.74 | $202,603 | 1.1% | 8/31/2019 |
| Belk, Inc.(10) | NR/NR/B+ | 40,800 | 2.8% | $1.75 | $71,400 | 0.4% | 8/22/2018 |
| Total Major Tenants | 507,820 | 34.3% | $15.08 | $7,658,915 | 42.5% | ||
| Non-Major Tenants | 722,172 | 48.8% | $14.36 | $10,372,650 | 57.5% | ||
| Occupied Collateral Total | 1,229,992 | 83.2% | $14.66 | $18,031,565 | 100.0% | ||
| Vacant Space | 248,695 | 16.8% | |||||
| Collateral Total | 1,478,687 | 100.0% | |||||
| (1) | Certain ratings are those of the parent company whether or not the parent guarantees the lease. |
| (2) | Annual U/W Base Rent PSF and Annual U/W Base Rent include contractual rent steps through May 2017 totaling approximately $348,703. |
| (3) | Located at the Lynnfield Park property, First Tennessee Bank National subleases 36,571 square feet of its space to six separate tenants on subleases expiring July 31, 2018 at a weighted average current rental rate of $14.03 PSF. Annual U/W Base Rent for this space was underwritten to First Tennessee Bank National’s lease of $17.00 PSF. |
| (4) | Located at the Chase Tower property. |
| (5) | Located at the 4100 Okeechobee property. |
| (6) | Located at the I-Bank Tower property. |
| (7) | McBrayer, McGinnis, Leslie & Kirkland, PLLC has a one-time lease termination option effective April 30, 2023 with notice provided no later than October 31, 2021 and payment of a termination fee of $305,469. |
| (8) | Located at the 50 Penn Place property. |
| (9) | Located at the Center Point property. |
| (10) | Located at the Bainbridge Mall property. |
The following table presents certain information relating to the lease rollover schedule at the In-Rel 8 Properties:
Lease Expiration Schedule(1)(2)
| Year Ending December 31, | No. of Leases Expiring | Expiring NRSF | % of Total NRSF | Cumulative Expiring NRSF | Cumulative % of Total NRSF | Annual U/W Base Rent | % of Total Annual U/W Base Rent | Annual U/W Base Rent PSF(3) |
| MTM | 58 | 58,853 | 4.0% | 58,853 | 4.0% | $886,866 | 4.9% | $15.07 |
| 2016 | 23 | 39,020 | 2.6% | 97,873 | 6.6% | $668,836 | 3.7% | $17.14 |
| 2017 | 60 | 160,640 | 10.9% | 258,513 | 17.5% | $3,072,267 | 17.0% | $19.13 |
| 2018 | 48 | 288,088 | 19.5% | 546,601 | 37.0% | $4,128,769 | 22.9% | $14.33 |
| 2019 | 36 | 238,257 | 16.1% | 784,858 | 53.1% | $3,169,912 | 17.6% | $13.30 |
| 2020 | 26 | 117,523 | 7.9% | 902,381 | 61.0% | $1,469,713 | 8.2% | $12.51 |
| 2021 | 17 | 126,612 | 8.6% | 1,028,993 | 69.6% | $1,710,514 | 9.5% | $13.51 |
| 2022 | 6 | 30,402 | 2.1% | 1,059,395 | 71.6% | $592,132 | 3.3% | $19.48 |
| 2023 | 2 | 42,120 | 2.8% | 1,101,515 | 74.5% | $656,247 | 3.6% | $15.58 |
| 2024 | 3 | 21,841 | 1.5% | 1,123,356 | 76.0% | $161,314 | 0.9% | $7.39 |
| 2025 | 2 | 46,628 | 3.2% | 1,169,984 | 79.1% | $511,903 | 2.8% | $10.98 |
| 2026 | 1 | 20,455 | 1.4% | 1,190,439 | 80.5% | $355,917 | 2.0% | $17.40 |
| Thereafter | 4 | 39,553 | 2.7% | 1,229,992 | 83.2% | $647,174 | 3.6% | $16.36 |
| Vacant | 0 | 248,695 | 16.8% | 1,478,687 | 100.0% | $0 | 0.0% | $0.00 |
| Total/Weighted Average | 286 | 1,478,687 | 100.0% | $18,031,565 | 100.0% | $14.66 |
| (1) | Information obtained from the underwritten rent roll. |
| (2) | Certain tenants may have lease termination or contraction options that are exercisable prior to the originally stated expiration date of the subject lease and that are not considered in the Lease Expiration Schedule. |
| (3) | Weighted Average Annual U/W Base Rent PSF excludes vacant space. |
THE INFORMATION IN THIS STRUCTURAL AND COLLATERAL TERM SHEET IS NOT COMPLETE AND MAY BE AMENDED PRIOR TO THE TIME OF SALE. THIS TERM SHEET IS NOT AN OFFER TO SELL THESE SECURITIES AND IT IS NOT A SOLICITATION OF AN OFFER TO BUY THESE SECURITIES IN ANY JURISDICTION WHERE THE OFFER OR SALE IS NOT PERMITTED.
| 82 |
IN-REL 8
The following table presents historical occupancy percentages at the In-Rel 8 Properties:
Historical Occupancy
12/31/2012(1)(2) | 12/31/2013(1) | 12/31/2014(1) | 12/31/2015(1) | 4/1/2016(3) | ||||
| 76.7% | 79.3% | 79.7% | 81.2% | 83.2% |
| (1) | Information obtained from the borrowers. |
| (2) | 2012 occupancy excludes the Chase Tower property and the Center Point property as they were acquired in December 2012 and January 2013, respectively. |
| (3) | Information obtained from the underwritten rent roll. |
Operating History and Underwritten Net Cash Flow. The following table presents certain information relating to the historical operating performance and the underwritten net cash flow at the In-Rel 8 Properties:
Cash Flow Analysis
| 2013 | 2014 | 2015(1) | TTM 3/31/2016(1) | U/W | % of U/W Effective Gross Income | U/W $ per SF | |||||||||
| Base Rent | $15,894,802 | $16,243,061 | $16,417,162(2) | $16,627,475(2) | $18,161,565(2) | 96.1% | $12.28 | ||||||||
| Grossed Up Vacant Space | 0 | 0 | 0 | 0 | 3,779,521 | 20.0 | 2.56 | ||||||||
| Total Reimbursables | 351,828 | 458,112 | 472,642 | 463,200 | 315,069 | 1.7 | 0.21 | ||||||||
| Other Income | 172,895 | 181,899 | 460,508 | 432,511 | 547,268 | 2.9 | 0.37 | ||||||||
| Less Vacancy & Credit Loss | 0 | 0 | 0 | 0 | (3,902,771)(3) | (20.6) | (2.64) | ||||||||
| Effective Gross Income | $16,419,525 | $16,883,072 | $17,350,312 | $17,523,186 | $18,900,650 | 100.0% | $12.78 | ||||||||
| Total Operating Expenses | $7,889,607 | $8,153,807 | $7,850,403 | $7,736,714 | $7,628,148 | 40.4% | $5.16 | ||||||||
| Net Operating Income | $8,529,918 | $8,729,265 | $9,499,908 | $9,786,472 | $11,272,502 | 59.6% | $7.62 | ||||||||
| TI/LC | 0 | 0 | 0 | 0 | 1,059,804 | 5.6 | 0.72 | ||||||||
| Capital Expenditures | 52,176 | 115,494 | 91,323 | 91,323 | 270,290 | 1.4 | 0.18 | ||||||||
| Net Cash Flow | $8,477,742 | $8,613,771 | $9,408,585 | $9,695,149 | $9,942,409 | 52.6% | $6.72 | ||||||||
| NOI DSCR(4) | 1.44x | 1.48x | 1.61x | 1.66x | 1.91x | ||||||||||
| NCF DSCR(4) | 1.43x | 1.46x | 1.59x | 1.64x | 1.68x | ||||||||||
| NOI DY(4) | 9.2% | 9.4% | 10.3% | 10.6% | 12.2% | ||||||||||
| NCF DY(4) | 9.2% | 9.3% | 10.2% | 10.5% | 10.8% |
| (1) | The I-Bank Tower property was acquired in December 2015. Due to the transfer of ownership, both the 2015 and the TTM 3/31/2016 historical cash flows for the I-Bank Tower property are as of 8/31/2015 annualized over a period of eight months. |
| (2) | U/W Base Rent includes contractual rent steps through May 2017 totaling approximately $348,703 and $130,000 of percentage rent attributed to Belk, Inc. and Variety Wholesalers.U/W Base Rent also includes Cypress Semiconductor leasing 20,455 square feet of space expiring April 30, 2026 with a current annual rent of $355,917 ($17.40 per square foot). Both the 2015 and the TTM 3/31/2016 historical cash flows include a 12-month rent credit of $31,044 per month for First Tennessee Bank National, which expired in December 2015. U/W Base Rent reflects First Tennessee Bank National’s current unabated rent. |
| (3) | The underwritten economic vacancy is 17.5%. The In-Rel 8 Properties were 83.2% occupied as of April 1, 2016. |
| (4) | The debt service coverage ratios and debt yields are based on the In-Rel 8 Whole Loan. |
Appraisal. As of the appraisal valuation dates ranging from March 19, 2016 to April 5, 2016, the In-Rel 8 Properties had an “as-is” appraised value of $132,985,000. The Chase Tower property includes 0.46 acres of excess land with a concluded fee-simple interest value of $310,000. Excluding the excess land, the as-is appraised value for the In-Rel 8 Properties is $132,675,000. The excess land is considered part of the collateral.
Environmental Matters. According to the Phase I environmental site assessments dated April 8, 2016, there was no evidence of any recognized environmental conditions at the In-Rel 8 Properties.
Market Overview and Competition.The In-Rel 8 Properties are comprised of four office properties, one mixed use office/retail property and three retail centers across six states and seven different markets, listed below by descending allocated principal balance as of the Cut-off Date.
THE INFORMATION IN THIS STRUCTURAL AND COLLATERAL TERM SHEET IS NOT COMPLETE AND MAY BE AMENDED PRIOR TO THE TIME OF SALE. THIS TERM SHEET IS NOT AN OFFER TO SELL THESE SECURITIES AND IT IS NOT A SOLICITATION OF AN OFFER TO BUY THESE SECURITIES IN ANY JURISDICTION WHERE THE OFFER OR SALE IS NOT PERMITTED.
| 83 |
IN-REL 8
The following table presents certain information relating to the In-Rel 8 Properties:
| Property Name – Location | Property Type/ Subtype | Allocated Cut-off Date Whole Loan Balance | Estimated 2016 Population (5-mile Radius)(1) | Estimated 2016 Average Household Income (5-mile Radius)(1) | Average Submarket Vacancy(1) |
| Lynnfield Park – Memphis, TN | Office/Suburban | $20,450,078 | 222,280 | $70,753 | 9.8% |
| Chase Tower – Lexington, KY | Office/CBD | $20,375,169 | 230,730 | $63,846 | 8.1% |
| 50 Penn Place – Oklahoma City, OK | Mixed Use/Office/Retail | $18,976,874 | 208,995 | $61,146 | 6.2%/3.7%(2) |
| I-Bank Tower – Memphis, TN | Office/Suburban | $17,878,212 | 240,561 | $64,606 | 9.8% |
| 4100 Okeechobee – West Palm Beach, FL | Office/Suburban | $5,093,792 | 261,968 | $58,164 | 11.1% |
| Center Point – Center Point, AL | Retail/Anchored | $3,595,618 | 95,451 | $61,762 | 9.0% |
| Bainbridge Mall – Bainbridge, GA | Retail/Anchored | $3,221,075 | 16,517 | $49,389 | 4.1%(3) |
| Plantation Merch. Mart – Plantation, FL | Retail/Unanchored | $2,796,592 | 433,674 | $60,013 | 5.0% |
| (1) | Information obtained from third party market research reports unless otherwise indicated. |
| (2) | 50 Penn Place is a mixed use property with 55.7% of property net rentable area (“NRA”) comprised of office space, 41.9% of property NRA comprised of retail space, and 2.4% of property NRA comprised of storage space. The average submarket office vacancy as of March 31, 2016 is 6.2% and the average submarket retail vacancy as of March 31, 2016 is 3.7%. |
| (3) | Information obtained from the appraisal. |
The Borrowers.The borrowers, Lynnfield Office Project, LLC and White Station Building, LLC (each a Tennessee limited liability company), Bainbridge Mall, LLC and 4100 Okeechobee Building Owner, LLC (each a Florida limited liability company), Chase Tower Building Owner, LLC, 50 Penn Building Owner, LLC, Braswell Building Owner, LLC and Center Point Center Owner, LLC (each a Delaware limited liability company) and Plantation Merchandise Mart, Inc. (a Florida corporation), are each single purpose entities with two independent directors. Legal counsel to the borrowers delivered a non-consolidation opinion in connection with the origination of the In-Rel 8 Whole Loan. Charles Stein and Dennis Udwin are the guarantors of certain nonrecourse carveouts under the In-Rel 8 Whole Loan.
The Sponsors.The sponsors of the In-Rel 8 Whole Loan are Charles Stein and Dennis Udwin. Mr. Stein is a founding principal of In-Rel Properties, a privately held, vertically integrated real estate investment and management firm founded in 1984. In-Rel Properties currently manages approximately 3.0 million square feet consisting primarily of office and retail properties in Florida, Georgia, Tennessee, Kentucky and Oklahoma. Mr. Stein is responsible for the company’s treasury functions, financial and tax planning and sourcing and underwriting of new transactions, and is a member of the company’s investment committee. Mr. Udwin is also a founding principal of In-Rel Properties and oversees In-Rel Properties’ leasing, property management and construction functions, as well as due diligence on new acquisitions. The sponsors were involved in a foreclosure and loan modification in 2011 and 2014, respectively. See “Description of the Mortgage Pool—Loan Purpose; Default History, Bankruptcy Issues and Other Proceedings” in the Preliminary Prospectus.
Escrows.The loan documents provide for upfront reserves in the amount of $749,640 for real estate taxes; $500,000 in the form of a letter of credit for tenant improvements and leasing commissions (“TI/LC”); $834,096 for deferred maintenance; $4,000,000 in the form of a letter of credit for material tenant reserves (“Material Tenant Rollover Reserve”); $436,926 for unfunded obligations under the Cypress Semiconductor ($410,234), Pollan Dobbs PLLC ($6,400), Randstad General Partner US ($12,792) and Southern Diversified, Inc. ($7,500) leases; and $72,000 for ground rent payable under the Ground Lease (see “Ground Lease” section). Additionally, the loan documents provide for ongoing monthly escrows in the amount of $121,769 for real estate taxes, $18,487 for replacement reserves, $92,418 for TI/LC (subject to a cap of $1,500,000), and $62,500 for Material Tenant Rollover Reserve provided that such monthly deposits are only required on each monthly payment date commencing in July 2016 and continuing through and including October 2017. During a Material Tenant Trigger Event (as defined below), all excess cash flow is required to be deposited into the Material Tenant Rollover Reserve to be held by the lender as additional security for the In Rel-8 Whole Loan provided that the aggregate amount deposited in the Material Tenant Rollover Reserve solely as the result of a Non-Renewal Event (as defined below) may not exceed with respect to First Tennessee Bank National and/or JP Morgan Chase Bank (“JPM”) an amount equal to (x) $20.00 multiplied by (y) the square footage of the applicable Material Tenant (as defined below) space not subject to an extension, renewal, or re-leasing of its leased premises. So long as no event of default exists, funds held in the Material Tenant Rollover Reserve are required to be used in connection with TI/LC expenses incurred with respect to the Material Tenant space.
The loan documents do not require monthly escrows for insurance provided (i) no event of default has occurred and is continuing; (ii) the In-Rel 8 Properties are insured under an acceptable blanket insurance policy; and (iii) the borrowers provide the lender with evidence of renewal of the policies and timely proof of payment of the insurance premiums. The loan documents do not require monthly escrows for ground rent payable under the Ground Lease provided (i) funds on deposit in such ground rent reserve account equal or exceed an amount equal to all rent due under the Ground Lease for the immediately succeeding six months; and (ii) all rent required to be paid pursuant to the Ground Lease has been timely paid in full when due.
A “Material Tenant Trigger Event” will commence upon the earlier of (i) on or prior to the Material Tenant’s earliest lease extension date and the date that is 12 months prior to the then-applicable expiration date of any Material Tenant’s lease, such Material Tenant failing to extend or renew such lease upon terms and conditions set forth in such Material Tenant’s lease (or otherwise as acceptable to the lender); (ii) an event of default under any Material Tenant’s lease occurring; (iii) a Material Tenant or lease guarantor of a Material Tenant’s lease becoming insolvent or a debtor in any bankruptcy action; (iv) any Material Tenant’s lease being terminated or no longer being in full force or effect; (v) a retail Material Tenant “going dark,” or any Material Tenant vacating, ceasing to occupy or discontinuing its operations at all of its Material Tenant space at the In-Rel 8 Properties; or (vi) a Non-Renewal Event. A Material Tenant Trigger Event will end, in regard to clause (i), when the Material Tenant has entered into a renewal of all of its leased premises in accordance with the requirements of the loan documents or certain re-leasing conditions have been satisfied with respect to the Material Tenant space; in regard to clause (ii), when the applicable event of default has been cured; in regard to clause (iii),
THE INFORMATION IN THIS STRUCTURAL AND COLLATERAL TERM SHEET IS NOT COMPLETE AND MAY BE AMENDED PRIOR TO THE TIME OF SALE. THIS TERM SHEET IS NOT AN OFFER TO SELL THESE SECURITIES AND IT IS NOT A SOLICITATION OF AN OFFER TO BUY THESE SECURITIES IN ANY JURISDICTION WHERE THE OFFER OR SALE IS NOT PERMITTED.
| 84 |
IN-REL 8
when the Material Tenant’s lease is unconditionally affirmed in the applicable bankruptcy and the Material Tenant is paying full unabated rent or, if applicable, the guarantor’s bankruptcy has been discharged or dismissed with no material adverse effect on guarantor’s ability to perform under the lease guaranty; in regard to clause (iv), when certain re-leasing conditions have been satisfied with respect to the Material Tenant space; in regard to clause (v), when the applicable Material Tenant re-commences its operations at its leased premises, or certain re-leasing conditions have been satisfied with respect to the Material Tenant space; or in regard to clause (vi), when the Non-Renewal Event is cured.
“Material Tenant” means (i) First Tennessee Bank National, (ii) Food Giant, (iii) JPM, (iv) ChildNet, Inc., (v) Belk, Inc. or (vi) any tenant leasing space (a) comprising greater than or equal to 25.0% of (x) the total rentable square footage at the relevant individual property or (y) the total in-place base rent from such individual property and (b) not less than 35,000 aggregate square footage at the relevant individual property.
A “Non-Renewal Event” will commence if (i) First Tennessee Bank National and/or JPM gives written notice of its intention to not extend or renew or its intention to terminate its Material Tenant lease for the entire Material Tenant space; (ii) on or prior to the Material Tenant’s earliest lease extension date and the date that is 12 months prior to the then-applicable expiration date under its Material Tenant’s lease, First Tennessee Bank National and/or JPM fails to extend or renew such lease upon terms and conditions set forth in such Material Tenant’s lease (or otherwise as acceptable to the lender) for the entire Material Tenant space; or (iii) on or prior to the earliest date that First Tennessee Bank National and/or JPM is required to notify the borrowers of its election to extend or renew such Material Tenant lease for the entire Material Tenant space, such Material Tenant fails to provide such notice. A Non-Renewal Event will continue until, with regard to clause (i), the revocation or rescission by First Tennessee Bank National and/or JPM, as applicable, of all termination or cancellation notices with respect to its Material Tenant lease or certain re-leasing conditions have been satisfied with respect to the Material Tenant space, or with regard to clauses (ii) and (iii), the Material Tenant has entered into an extension of all of its leased premises in accordance with the requirements of the loan documents or certain re-leasing conditions have been satisfied with respect to the Material Tenant space.
Lockbox and Cash Management.The In-Rel 8 Whole Loan requires a lender-controlled lockbox account, which is already in place, and that the borrowers direct tenants to pay their rents directly into such lockbox account. The loan documents also require that all rents received by the borrowers or the property manager be deposited into the lockbox account within two business days of receipt. Prior to the occurrence of a Trigger Period (as defined below), all cash flow is distributed to the borrowers. During a Trigger Period, all cash flow is swept to a lender-controlled cash management account; however if a Trigger Period is in effect due to a Material Tenant Trigger Event, excess funds are swept to the Material Tenant Rollover Reserve.
A “Trigger Period” will commence upon the occurrence or commencement of (i) an event of default; (ii) any bankruptcy action involving the borrowers, the guarantors, or the property manager; (iii) the debt service coverage ratio based on the trailing 12-month period falling below 1.15x; (iv) a Material Tenant Trigger Event; or (v) any indictment for fraud or misappropriation of funds by the borrowers, the sole member of the borrowers, the managing member of the borrowers, the guarantors or the property manager or any officer or director thereof. A Trigger Period will end, with regard to clause (i), upon the cure of such event of default and acceptance of such cure by the lender; with regard to clause (ii), upon the filing being discharged, stayed or dismissed within 90 days for the borrowers or the guarantors, or within 120 days for the manager; with regard to clause (iii), upon the debt service coverage ratio based on the trailing 12-month period being at least 1.20x for two consecutive calendar quarters; with regard to clause (iv), upon the Material Tenant Trigger Event being cured; or with regard to clause (v), a cure is only available with respect to the property manager, when the borrowers replace the property manager pursuant to the terms and provisions specified in the In-Rel 8 Whole Loan documents.
A “Cash Sweep Period” will commence upon the occurrence or commencement of (i) an event of default; (ii) any bankruptcy action involving the borrowers, the guarantors, or the property manager; or (iii) the debt service coverage ratio based on the trailing 12-month period falling below 1.15x. A Cash Sweep Period will end, in regard to clause (i), upon the cure of such event of default and acceptance of such cure by the lender; in regard to clause (ii), upon the filing being discharged, stayed or dismissed within 90 days for the borrowers or the guarantors, or within 120 days for the manager; or with respect to clause (iii), upon the debt service coverage ratio based on the trailing 12-month period being at least 1.20x for two consecutive calendar quarters.
Property Management. The In-Rel 8 Properties are managed by affiliates of the borrowers.
Assumption. The borrowers have the right to transfer the In-Rel 8 Properties, provided that no event of default has occurred and is continuing and certain other conditions are satisfied, including, but not limited to, (i) the lender’s reasonable determination that the proposed transferee and guarantor satisfy the lender’s credit review and underwriting standards, taking into consideration transferee experience, financial strength and general business standing; (ii) execution of a recourse guaranty and an environmental indemnity by an affiliate of the transferee; and (iii) if requested by the lender, rating agency confirmation from Fitch, KBRA and Moody’s that the transfer will not result in a downgrade, withdrawal or qualification of the respective rating agency assigned to the Series 2016-C35 Certificates and similar confirmations from each rating agency rating any security backed by the In-Rel 8 Companion Loan with respect to the ratings of such securities.
Partial Release. The borrowers may obtain the release of an outparcel (as specified in the In-Rel 8 Whole Loan documents), provided no event of default has occurred, upon (i) the borrowers providing written request at least 30 days’ in advance, (ii) the borrowers satisfying certain outparcel release conditions as set forth in the In-Rel 8 Whole Loan documents within 90 days of such written request, and (iii) the loan-to-value ratio after the release of the applicable outparcel is less than or equal to 125%. No underwritten income was attributed to the outparcel.
Real Estate Substitution.Not permitted.
Subordinate and Mezzanine Indebtedness.Not permitted.
THE INFORMATION IN THIS STRUCTURAL AND COLLATERAL TERM SHEET IS NOT COMPLETE AND MAY BE AMENDED PRIOR TO THE TIME OF SALE. THIS TERM SHEET IS NOT AN OFFER TO SELL THESE SECURITIES AND IT IS NOT A SOLICITATION OF AN OFFER TO BUY THESE SECURITIES IN ANY JURISDICTION WHERE THE OFFER OR SALE IS NOT PERMITTED.
| 85 |
IN-REL 8
Ground Lease.The Center Point property is leased to Center Point Associates, L.L.C., an Alabama limited liability company, pursuant to a 50-year ground lease with Najwa S. Bateh, expiring on December 10, 2039 with three ten-year renewal options remaining, which will fully extend the lease to December 31, 2069 (the “Ground Lease”). Ground rent is reset every ten years with a current annual rent of $144,000. The next rent adjustment is scheduled to occur in December 2019 at $172,800 per annum. Upon maturity of the In-Rel 8 Whole Loan, there will be approximately 48 years remaining on the Ground Lease based on the fully extended ground lease.
Terrorism Insurance. The loan documents require that the “all risk” insurance policy required to be maintained by the borrowers provides coverage for terrorism in an amount equal to the full replacement cost of the In Rel-8 Properties. The loan documents also require business interruption insurance covering no less than the 12-month period following the occurrence of a casualty event, together with a six-month extended period of indemnity.
Windstorm Insurance. The loan documents require windstorm insurance covering the full replacement cost of the In-Rel 8 Properties during the loan term. At the time of closing, the In-Rel 8 Properties have windstorm insurance coverage.
THE INFORMATION IN THIS STRUCTURAL AND COLLATERAL TERM SHEET IS NOT COMPLETE AND MAY BE AMENDED PRIOR TO THE TIME OF SALE. THIS TERM SHEET IS NOT AN OFFER TO SELL THESE SECURITIES AND IT IS NOT A SOLICITATION OF AN OFFER TO BUY THESE SECURITIES IN ANY JURISDICTION WHERE THE OFFER OR SALE IS NOT PERMITTED.
| 86 |
(THIS PAGE INTENTIONALLY LEFT BLANK)
THE INFORMATION IN THIS STRUCTURAL AND COLLATERAL TERM SHEET IS NOT COMPLETE AND MAY BE AMENDED PRIOR TO THE TIME OF SALE. THIS TERM SHEET IS NOT AN OFFER TO SELL THESE SECURITIES AND IT IS NOT A SOLICITATION OF AN OFFER TO BUY THESE SECURITIES IN ANY JURISDICTION WHERE THE OFFER OR SALE IS NOT PERMITTED.
| 87 |
RIVER PARK SHOPPING CENTER
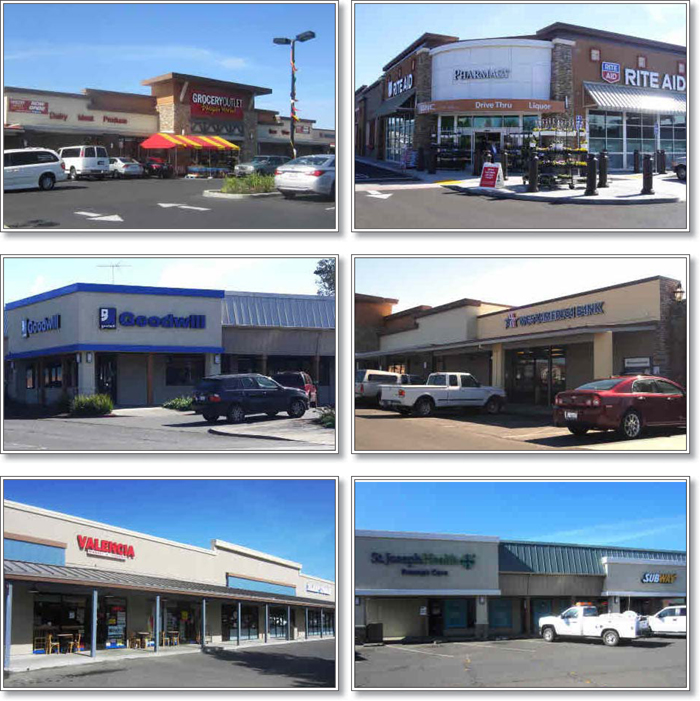
THE INFORMATION IN THIS STRUCTURAL AND COLLATERAL TERM SHEET IS NOT COMPLETE AND MAY BE AMENDED PRIOR TO THE TIME OF SALE. THIS TERM SHEET IS NOT AN OFFER TO SELL THESE SECURITIES AND IT IS NOT A SOLICITATION OF AN OFFER TO BUY THESE SECURITIES IN ANY JURISDICTION WHERE THE OFFER OR SALE IS NOT PERMITTED.
| 88 |
RIVER PARK SHOPPING CENTER
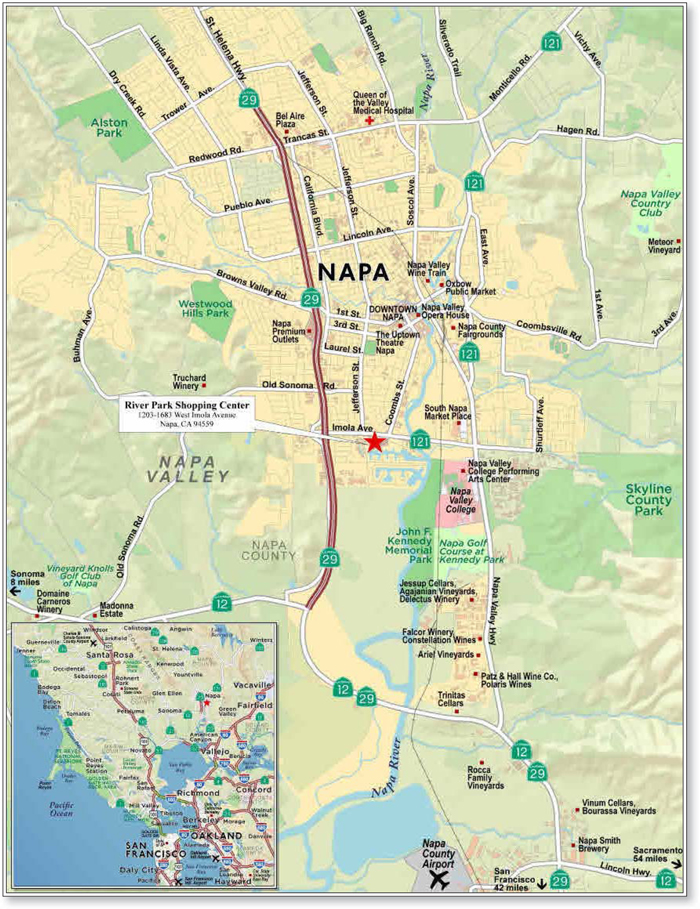
THE INFORMATION IN THIS STRUCTURAL AND COLLATERAL TERM SHEET IS NOT COMPLETE AND MAY BE AMENDED PRIOR TO THE TIME OF SALE. THIS TERM SHEET IS NOT AN OFFER TO SELL THESE SECURITIES AND IT IS NOT A SOLICITATION OF AN OFFER TO BUY THESE SECURITIES IN ANY JURISDICTION WHERE THE OFFER OR SALE IS NOT PERMITTED.
| 89 |
| No. 7 – River Park Shopping Center | |||||||
| Loan Information | Property Information | ||||||
| Mortgage Loan Seller: | Wells Fargo Bank, National Association | Single Asset/Portfolio: | Single Asset | ||||
Credit Assessment (Fitch/KBRA/Moody’s): | NR/NR/NR | Property Type: | Retail | ||||
| Original Principal Balance: | $25,750,000 | Specific Property Type: | Anchored | ||||
| Cut-off Date Balance: | $25,750,000 | Location: | Napa, CA | ||||
| % of Initial Pool Balance: | 2.5% | Size: | 108,639 SF | ||||
| Loan Purpose: | Refinance | Cut-off Date Balance Per SF: | $237.02 | ||||
| Borrower Name: | Imola Cabot Partners, LLC | Year Built/Renovated: | 1972/2015 | ||||
| Sponsors: | Carl E. Best; The Carl and Janet Best Trust | Title Vesting: | Fee | ||||
| Mortgage Rate: | 4.240% | Property Manager: | Self-managed | ||||
| Note Date: | June 22, 2016 | 4thMost Recent Occupancy (As of)(2): | 77.4% (12/31/2012) | ||||
| Anticipated Repayment Date: | NAP | 3rdMost Recent Occupancy (As of)(2): | 82.6% (12/31/2013) | ||||
| Maturity Date: | July 11, 2026 | 2ndMost Recent Occupancy (As of)(2): | 75.6% (12/31/2014) | ||||
| IO Period: | 48 months | Most Recent Occupancy (As of)(2): | 93.9% (12/31/2015) | ||||
| Loan Term (Original): | 120 months | Current Occupancy (As of): | 86.8% (6/1/2016) | ||||
| Seasoning: | 0 months | ||||||
| Amortization Term (Original): | 360 months | Underwriting and Financial Information: | |||||
| Loan Amortization Type: | Interest-only, Amortizing Balloon | ||||||
| Interest Accrual Method: | Actual/360 | 4thMost Recent NOI (As of)(3): | $1,042,545 (12/31/2013) | ||||
| Call Protection: | L(36),GRTR 1% or YM(77),O(7) | 3rdMost Recent NOI (As of)(3): | $667,780 (Annualized 5 12/31/2014) | ||||
| Lockbox Type: | Springing | 2ndMost Recent NOI (As of)(3): | $1,216,868 (12/31/2015) | ||||
| Additional Debt: | None | Most Recent NOI (As of)(3): | $1,353,742 (TTM 3/31/2016) | ||||
| Additional Debt Type: | NAP | ||||||
| U/W Revenues(3): | $2,989,174 | ||||||
| U/W Expenses: | $755,428 | ||||||
| U/W NOI: | $2,233,746 | ||||||
| U/W NCF: | $2,082,662 | ||||||
| Escrows and Reserves(1): | U/W NOI DSCR: | 1.47x | |||||
| U/W NCF DSCR: | 1.37x | ||||||
| Type: | Initial | Monthly | Cap (If Any) | U/W NOI Debt Yield: | 8.7% | ||
| Taxes | $147,395 | $29,479 | NAP | U/W NCF Debt Yield: | 8.1% | ||
| Insurance | $0 | Springing | NAP | As-Is Appraised Value: | $40,000,000 | ||
| Replacement Reserves | $0 | $2,716 | $65,183 | As-Is Appraisal Valuation Date: | May 18, 2016 | ||
| TI/LC Reserve | $0 | $7,242 | $250,000 | Cut-off Date LTV Ratio: | 64.4% | ||
| Outstanding TI/LC Reserve | $131,789 | $0 | NAP | LTV Ratio at Maturity or ARD: | 57.4% | ||
| (1) | See “Escrows” section. |
| (2) | See “Historical Occupancy” section. |
| (3) | See “Cash Flow Analysis” section. |
The Mortgage Loan.The mortgage loan (the “River Park Shopping Center Mortgage Loan”) is evidenced by a single promissory note that is secured by a first mortgage encumbering an anchored retail center located in Napa, California (the “River Park Shopping Center Property”). The River Park Shopping Center Mortgage Loan was originated on June 22, 2016 by Wells Fargo Bank, National Association. The River Park Shopping Center Mortgage Loan had an original principal balance of $25,750,000, has an outstanding principal balance as of the Cut-off Date of $25,750,000 and accrues interest at an interest rate of 4.240%per annum. The River Park Shopping Center Mortgage Loan had an initial term of 120 months, has a remaining term of 120 months as of the Cut-off Date and requires interest-only payments for the first 48 payments following origination and, thereafter, requires payments of principal and interest based on a 30-year amortization schedule. The River Park Shopping Center Mortgage Loan matures on July 11, 2026.
Following the lockout period, the borrower has the right to prepay the River Park Shopping Center Mortgage Loan in whole, but not in part, on any date before January 11, 2026, provided that the borrower pays the greater of a yield maintenance premium or a prepayment premium equal to 1.0% of the principal amount being prepaid. In addition, the River Park Shopping Center Mortgage Loan is prepayable without penalty on or after January 11, 2026.
THE INFORMATION IN THIS STRUCTURAL AND COLLATERAL TERM SHEET IS NOT COMPLETE AND MAY BE AMENDED PRIOR TO THE TIME OF SALE. THIS TERM SHEET IS NOT AN OFFER TO SELL THESE SECURITIES AND IT IS NOT A SOLICITATION OF AN OFFER TO BUY THESE SECURITIES IN ANY JURISDICTION WHERE THE OFFER OR SALE IS NOT PERMITTED.
| 90 |
RIVER PARK SHOPPING CENTER
Sources and Uses
| Sources | Uses | |||||||
| Original loan amount | $25,750,000 | 100.0% | Loan payoff | $24,237,408 | 94.1% | |||
| Reserves | 279,184 | 1.1 | ||||||
| Closing costs | 306,352 | 1.2 | ||||||
| Return of equity | 927,056 | 3.6 | ||||||
| Total Sources | $25,750,000 | 100.0% | Total Uses | $25,750,000 | 100.0% | |||
The Property. The River Park Shopping Center Property is an anchored retail property containing 108,639 square feet and located in Napa, California, approximately 1.6 miles south of downtown Napa. Built in 1972, the River Park Shopping Center Property is situated on a 10.4-acre site and is comprised of six retail buildings consisting of two large in-line buildings and four pad buildings. The River Park Shopping Center Property is anchored by Rite Aid and Grocery Outlet and includes a mix of local, regional and national retailers. Founded in 1946, Grocery Outlet is one of the fastest growing “extreme value” grocery retailers in the U.S., according to a regional publication, with more than 240 locations across California, Idaho, Nevada, Oregon, Pennsylvania and Washington. The grocer Fresh & Easy previously occupied a non-collateral pad site within the River Park Shopping Center Property, however the tenant vacated in 2015 following the company filing bankruptcy in September 2013. The sponsors acquired the River Park Shopping Center Property in July 2014 for approximately $22.7 million and performed a significant renovation totaling approximately $7.3 million ($67 per square foot) to lease up and reposition the River Park Shopping Center Property including the relocation of Rite Aid from an in-line location to a new build-to-suit freestanding store (with a drive-thru pharmacy lane), re-tenanting the Rite Aid space with Grocery Outlet, modernizing the building exteriors and signs, raising rooflines and redesigning storefronts. The sponsors have a total cost basis of approximately $30.0 million. The River Park Shopping Center Property features 475 surface parking spaces, resulting in a parking ratio of 4.4 spaces per 1,000 square feet of rentable area. As of June 1, 2016, the River Park Shopping Center Property was 86.8% occupied by 28 tenants.
The following table presents certain information relating to the tenancies at the River Park Shopping Center Property:
Major Tenants
| Tenant Name | Credit Rating (Fitch/Moody’s /S&P)(1) | Tenant NRSF | % of NRSF | Annual U/W Base Rent PSF(2) | Annual U/W Base Rent(2) | % of Total Annual U/W Base Rent | Sales PSF(3) | Occupancy Cost(3) | Lease Expiration Date |
| Anchor Tenants | |||||||||
| Rite Aid | B/B2/B | 17,340 | 16.0% | $29.26 | $507,375 | 20.9% | $356 | 9.7% | 1/31/2036(4) |
| Grocery Outlet | NR/NR/NR | 17,640 | 16.2% | $19.27 | $340,000 | 14.0% | NAV | NAV | 4/30/2026(5) |
| Total Anchor Tenants | 34,980 | 32.2% | $24.22 | $847,375 | 34.9% | ||||
| Major Tenants | |||||||||
| Goodwill | NR/NR/NR | 6,096 | 5.6% | $30.00 | $182,880 | 7.5% | NAV | NAV | 6/30/2025(6) |
| Sleep Train | NR/NR/NR | 4,692 | 4.3% | $35.00 | $164,220 | 6.8% | NAV | NAV | 6/30/2025(7) |
| Sweeney’s Sports | NR/NR/NR | 4,561 | 4.2% | $33.00 | $150,513 | 6.2% | $413 | 9.3% | 7/31/2024(8) |
| Total Major Tenants | 15,349 | 14.1% | $32.42 | $497,613 | 20.5% | ||||
| Non-Major Tenants | 43,991 | 40.5% | $24.57 | $1,081,077 | 44.6% | ||||
| Occupied Collateral Total | 94,320 | 86.8% | $25.72 | $2,426,065 | 100.0% | ||||
| Vacant Space | 14,319 | 13.2% | |||||||
| Collateral Total | 108,639 | 100.0% | |||||||
| (1) | Certain ratings are those of the parent company, whether or not the parent guarantees the lease. |
| (2) | The Annual U/W Base Rent PSF and Annual U/W Base Rent include contractual rent steps through January 2017 totaling $16,707. |
| (3) | Sales PSF and Occupancy Cost are for the trailing 12-month period ending December 31, 2015. |
| (4) | Rite Aid has five, five-year lease renewal options. |
| (5) | Grocery Outlet has four, five-year lease renewal options. |
| (6) | Goodwill has two, five-year lease renewal options. |
| (7) | Sleep Train has two, five-year lease renewal options. |
| (8) | Sweeney’s Sports has two, five-year lease renewal options. |
THE INFORMATION IN THIS STRUCTURAL AND COLLATERAL TERM SHEET IS NOT COMPLETE AND MAY BE AMENDED PRIOR TO THE TIME OF SALE. THIS TERM SHEET IS NOT AN OFFER TO SELL THESE SECURITIES AND IT IS NOT A SOLICITATION OF AN OFFER TO BUY THESE SECURITIES IN ANY JURISDICTION WHERE THE OFFER OR SALE IS NOT PERMITTED.
| 91 |
RIVER PARK SHOPPING CENTER
The following table presents certain information relating to the lease rollover schedule at the River Park Shopping Center Property:
Lease Expiration Schedule(1)(2)
| Year Ending December 31, | No. of Leases Expiring | Expiring NRSF | % of Total NRSF | Cumulative Expiring NRSF | Cumulative % of Total NRSF | Annual U/W Base Rent | % of Total Annual U/W Base Rent | Annual U/W Base Rent PSF(3) | |||||||||
| MTM | 1 | 980 | 0.9% | 980 | 0.9% | $19,288 | 0.8% | $19.68 | |||||||||
| 2016 | 4 | 6,287 | 5.8% | 7,267 | 6.7% | $140,702 | 5.8% | $22.38 | |||||||||
| 2017 | 7 | 7,314 | 6.7% | 14,581 | 13.4% | $217,597 | 9.0% | $29.75 | |||||||||
| 2018 | 1 | 750 | 0.7% | 15,331 | 14.1% | $20,858 | 0.9% | $27.81 | |||||||||
| 2019 | 1 | 2,919 | 2.7% | 18,250 | 16.8% | $89,475 | 3.7% | $30.65 | |||||||||
| 2020 | 3 | 10,767 | 9.9% | 29,017 | 26.7% | $143,288 | 5.9% | $13.31 | |||||||||
| 2021 | 0 | 0 | 0.0% | 29,017 | 26.7% | $0 | 0.0% | $0.00 | |||||||||
| 2022 | 0 | 0 | 0.0% | 29,017 | 26.7% | $0 | 0.0% | $0.00 | |||||||||
| 2023 | 0 | 0 | 0.0% | 29,017 | 26.7% | $0 | 0.0% | $0.00 | |||||||||
| 2024 | 2 | 5,576 | 5.1% | 34,593 | 31.8% | $178,771 | 7.4% | $32.06 | |||||||||
| 2025 | 4 | 18,311 | 16.9% | 52,904 | 48.7% | $577,370 | 23.8% | $31.53 | |||||||||
| 2026 | 2 | 18,516 | 17.0% | 71,420 | 65.7% | $366,280 | 15.1% | $19.78 | |||||||||
| Thereafter | 3 | 22,900 | 21.1% | 94,320 | 86.8% | $672,436 | 27.7% | $29.36 | |||||||||
| Vacant | 0 | 14,319 | 13.2% | 108,639 | 100.0% | $0 | 0.0% | $0.00 | |||||||||
| Total/Weighted Average | 28 | 108,639 | 100.0% | $2,426,065 | 100.0% | $25.72 | |||||||||||
| (1) | Information obtained from the underwritten rent roll. |
| (2) | Certain tenants may have lease termination or contraction options that are exercisable prior to the originally stated expiration date of the subject lease and that are not considered in the Lease Expiration Schedule. |
| (3) | Weighted Average Annual U/W Base Rent PSF excludes vacant space. |
The following table presents historical occupancy percentages at the River Park Shopping Center Property:
Historical Occupancy
12/31/2012(1)(2)
| 12/31/2013(1)(2)
| 12/31/2014(1)(3)
| 12/31/2015(1)(3)
| 6/1/2016(4)
| ||||
| 77.4% | 82.6% | 75.6% | 93.9% | 86.8% |
| (1) | Information obtained from the borrower. |
| (2) | Precedes the sponsors’ ownership. Following the sponsors’ acquisition in July 2014, the sponsors commenced a $7.3 million renovation to reposition the River Park Shopping Center Property. |
| (3) | The decline in occupancy in 2014 was primarily due to the $7.3 million renovation at the River Park Shopping Center Property. In 2015 the sponsors executed five new leases representing 32.0% of the net rentable area. |
| (4) | Information obtained from the underwritten rent roll. |
THE INFORMATION IN THIS STRUCTURAL AND COLLATERAL TERM SHEET IS NOT COMPLETE AND MAY BE AMENDED PRIOR TO THE TIME OF SALE. THIS TERM SHEET IS NOT AN OFFER TO SELL THESE SECURITIES AND IT IS NOT A SOLICITATION OF AN OFFER TO BUY THESE SECURITIES IN ANY JURISDICTION WHERE THE OFFER OR SALE IS NOT PERMITTED.
| 92 |
RIVER PARK SHOPPING CENTER
Operating History and Underwritten Net Cash Flow.The following table presents certain information relating to the historical operating performance and the underwritten net cash flow at the River Park Shopping Center Property:
Cash Flow Analysis
| 2013(1) | Annualized 5 12/31/2014(2) | 2015 | TTM 3/31/2016 | U/W | % of U/W Effective Gross Income | U/W $ per SF | |||||||||
| Base Rent | $1,306,535 | $1,293,286 | $1,389,934 | $1,623,435(4) | $2,426,065(4) | 81.2% | $22.33 | ||||||||
| Grossed Up Vacant Space | 0 | 0 | 0 | 0 | 324,432 | 10.9 | 2.99 | ||||||||
| Percentage Rent | 109,445 | (107,841) | 97,501 | 12,540 | 0 | 0.0 | 0.00 | ||||||||
| Total Reimbursables | 296,792 | 276,548 | 428,222 | 443,594 | 563,109 | 18.8 | 5.18 | ||||||||
| Other Income | 0 | 0 | 278 | 278 | 0 | 0.0 | 0.00 | ||||||||
| Less Vacancy & Credit Loss | 0 | 0 | 0 | 0 | (324,432)(5) | (10.9) | (2.99) | ||||||||
| Effective Gross Income | $1,712,772 | $1,461,994 | $1,915,934 | $2,079,847 | $2,989,174 | 100.0% | $27.51 | ||||||||
| Total Operating Expenses | $670,227 | $794,214 | $699,066 | $726,105 | $755,428 | 25.3% | $6.95 | ||||||||
| Net Operating Income | $1,042,545 | $667,780(3) | $1,216,868 | $1,353,742 | $2,233,746 | 74.7% | $20.56 | ||||||||
| TI/LC | 0 | 0 | 0 | 0 | 118,492 | 4.0 | 1.09 | ||||||||
| Capital Expenditures | 0 | 0 | 0 | 0 | 32,592 | 1.1 | 0.30 | ||||||||
| Net Cash Flow | $1,042,545 | $667,780 | $1,216,868 | $1,353,742 | $2,082,662 | 69.7% | $19.17 | ||||||||
| NOI DSCR | 0.69x | 0.44x | 0.80x | 0.89x | 1.47x | ||||||||||
| NCF DSCR | 0.69x | 0.44x | 0.80x | 0.89x | 1.37x | ||||||||||
| NOI DY | 4.0% | 2.6% | 4.7% | 5.3% | 8.7% | ||||||||||
| NCF DY | 4.0% | 2.6% | 4.7% | 5.3% | 8.1% |
| (1) | Precedes the sponsors’ ownership. Following the sponsors’ acquisition in July 2014, the sponsors commenced a $7.3 million renovation to reposition the River Park Shopping Center Property. |
| (2) | Financial information was only available for the months following the sponsors’ acquisition of the River Park Shopping Center Property as the prior owner did not provide 2014 financials. |
| (3) | The Net Operating Income declined in 2014 due to the River Park Shopping Center Property undergoing an approximate $7.3 million renovation. |
| (4) | U/W BaseRent is higher than TTM 3/31/2016 primarily due to Grocery Outlet’s rent of $340,000 commencing in April 2016, recent leasing activity with only partial year rents being included in the TTM 3/31/2016 period accounting for $408,050 of the increase and contractual rent steps through January 2017 totaling $16,707. |
| (5) | The underwritten economic vacancy is 11.8%. As of June 1, 2016, the River Park Shopping Center Property was 86.8% physically occupied by 28 tenants. |
Appraisal.As of the appraisal valuation date of May 18, 2016, the River Park Shopping Center Property had an “as-is” appraised value of $40,000,000.
Environmental Matters.According to the Phase I environmental assessment dated May 16, 2016, there was no evidence of any recognized environmental conditions at the River Park Shopping Center Property.
Market Overview and Competition.The River Park Shopping Center Property is located in Napa, California, just south of the downtown area. Primary access to the neighborhood is provided by Highway 29, the north-south roadway running through Napa Valley and American Canyon leading to Highway 12 and Interstate 80. The River Park Shopping Center Property is located in a predominantly residential oriented neighborhood with supporting retail uses. Commercial uses in the vicinity include retail, automotive, neighborhood and community shopping centers, fast food and sit down restaurants, a movie theater, a new Hampton Inn hotel, along with scattered lodging and office uses. Downtown Napa, where several city and county offices are located, is located approximately 1.6 miles to the north of the River Park Shopping Center Property. Numerous vineyards and wineries are located along Highway 29 and the Silverado Trail. According to the appraisal, the estimated 2016 population within a one-, three- and five-mile radius of the River Park Shopping Center Property is 13,654, 60,897 and 91,038, respectively, and median household income within the same radii is $62,650, $62,606 and $68,005, respectively.
According to a third party market research report, the River Park Shopping Center Property is located within the Napa County submarket of the North Bay/Santa Rosa retail market. As of the first quarter of 2016, the Napa County submarket reported total inventory of 787 properties totaling approximately 6.2 million square feet with net absorption of approximately 117,000 square feet. During the same period, the Napa County submarket exhibited a 2.8% vacancy rate and average asking rate $33.99 per square foot on a triple net basis.
THE INFORMATION IN THIS STRUCTURAL AND COLLATERAL TERM SHEET IS NOT COMPLETE AND MAY BE AMENDED PRIOR TO THE TIME OF SALE. THIS TERM SHEET IS NOT AN OFFER TO SELL THESE SECURITIES AND IT IS NOT A SOLICITATION OF AN OFFER TO BUY THESE SECURITIES IN ANY JURISDICTION WHERE THE OFFER OR SALE IS NOT PERMITTED.
| 93 |
RIVER PARK SHOPPING CENTER
The following table presents certain information relating to comparable retail leases for the River Park Shopping Center Property:
Comparable Leases(1)
| Property Name/Location | Year Built/ Renovated | Total GLA (SF) | Total Occupancy | Distance from Subject | Tenant Name | Lease Date/Term | Lease Area (SF) | Annual Base Rent PSF | Lease Type |
| Grape Yard / Napa, CA | 1975/NAV | 36,296 | 94% | 2.8 miles | Napa Raeset | April 2015/ 5 Yrs | 2,413 | $25.80 | NNN |
| Coombs Retail / Napa, CA | 1950/NAV | 7,795 | 50% | 1.0 miles | NAV | June 2016 / 5 Yrs | 3,900 | $33.00 | NNN |
| Napa Century Center / Napa, CA | 2015/NAV | 270,000 | 100% | 1.0 miles | Forge | December 2016 / 5 Yrs | 3,600 | $39.00 | NNN |
| Canyon Plaza / Canyon, CA | 2000/NAV | 46,288 | 100% | 8.7 miles | Pediatric Dentist | January 2015 / 5 Yrs | 1,650 | $30.00 | MG |
| Retail Property / Napa, CA | 1963/NAV | 2,600 | 100% | 1.3 miles | Post Office | July 2015 / 3 Yrs | 2,600 | $52.80 | FSG |
| Young Building / Napa, CA | 1920/NAV | 25,000 | 73% | 1.1 miles | Mendelson Vineyard | November 2015 / 10 Yrs | 3,200 | $30.00 | NNN |
| (1) | Information obtained from the appraisal and a third party market research report. |
The Borrower.The borrower is Imola Cabot Partners, LLC, a Delaware limited liability company and single purpose entity. Carl E. Best and The Carl and Janet Best Trust are the guarantors of certain nonrecourse carveouts under the River Park Shopping Center Mortgage Loan.
The Sponsors.The loan sponsors are Carl E. Best and The Carl and Janet Best Trust. Mr. Best is a principal of Best Development Group LLC and a Partner for Pacific Development Group. Mr. Best’s real estate portfolio includes ownership in seven retail properties totaling approximately 509,460 square feet, inclusive of the River Park Shopping Center Property. Mr. Best was involved in a prior bankruptcy and deed in lieu. See “Description of the Mortgage Pool–Loan Purpose; Default History, Bankruptcy Issues and Other Proceedings” in the Preliminary Prospectus.
Escrows.The loan documents provide for an upfront escrow at closing in the amount of $147,395 for real estate taxes and $131,789 for outstanding tenant improvements and leasing commissions (TI/LCs) related to the Grocery Outlet ($67,154) and Queen of the Valley ($64,635) leases. The loan documents provide for ongoing monthly escrows of $29,479 for real estate taxes, $7,242 for TI/LCs (capped at $250,000) and $2,716 for replacement reserves (capped at $65,183 provided no event of default has occurred and is continuing and the borrower adequately maintains the River Park Shopping Center Property as determined by the lender).
The loan documents do not require monthly deposits for insurance premiums as long as (i) no event of default has occurred and is continuing; (ii) the River Park Shopping Center Property is insured via an acceptable blanket insurance policy; and (iii) the borrower provides the lender with timely proof of payment of insurance premiums.
Lockbox and Cash Management.Upon the occurrence of a Cash Trap Event Period (as defined below), the borrower will be required to establish a lender-controlled lockbox account and direct all tenants to deposit all rents directly into such lockbox account. Additionally, all revenues and other monies received by the borrower or property manager relating to the River Park Shopping Center Property will be deposited into the lockbox account. During a Cash Trap Event Period, all excess funds in the lockbox account are swept to a lender-controlled subaccount.
A “Cash Trap Event Period” will commence upon the earlier of (i) the occurrence and continuance of an event of default; (ii) the occurrence of a Major Tenant Event Period (as defined below); or (iii) the amortizing debt service coverage ratio being less than 1.15x (based on two consecutive calendar quarters annualized) at the end of any calendar quarter. A Cash Trap Event Period will end, with respect to clause (i), upon the cure of such event of default; with respect to clause (ii), upon a Major Tenant Event Period Cure (as defined below); or with respect to clause (iii), upon the amortizing debt service coverage ratio being equal to or greater than 1.20x (based on two consecutive calendar quarters annualized) for two consecutive calendar quarters.
A “Major Tenant Event Period” will occur upon the earlier of (a) Grocery Outlet failing to renew its lease at least six months prior to the lease expiration on terms reasonably acceptable to the lender; or (b) Grocery Outlet, Rite Aid or any replacement tenant (I) terminating its lease or its lease failing to be in full force and effect, (II) defaulting under its lease, (III) filing for bankruptcy or becoming insolvent or (IV) going dark, vacating or otherwise failing to be in occupancy.
A “Major Tenant Event Period Cure” will occur with respect to clause (a) above, Grocery Outlet renewing its lease; with respect to clause (b)(I), any applicable default being cured and the applicable lease being in full force and effect for two consecutive calendar quarters; with respect to clause (b)(II) above, the subject default being cured and no other default under the applicable lease occurring for two consecutive quarters following such cure; with respect to clause (b)(III) above, the bankruptcy or insolvency proceedings being terminated and the applicable lease being affirmed; with respect to clause (b)(IV) above, either (y) the applicable tenant resuming normal business operations for two consecutive calendar quarters or (z) $350,000 being swept to a reserve account if the related Major Tenant Event Period is caused by one tenant or $700,000 being swept to a reserve account if the related Major Tenant Event Period is caused by two tenants; and with respect to clauses (a), (b)(I), (b)(II), (b)(III) and (b)(IV) above, upon the lender receiving satisfactory evidence that the Grocery Outlet, Rite Aid or any replacement tenant’s spaces, as applicable, have been
THE INFORMATION IN THIS STRUCTURAL AND COLLATERAL TERM SHEET IS NOT COMPLETE AND MAY BE AMENDED PRIOR TO THE TIME OF SALE. THIS TERM SHEET IS NOT AN OFFER TO SELL THESE SECURITIES AND IT IS NOT A SOLICITATION OF AN OFFER TO BUY THESE SECURITIES IN ANY JURISDICTION WHERE THE OFFER OR SALE IS NOT PERMITTED.
| 94 |
RIVER PARK SHOPPING CENTER
leased to one or more satisfactory replacement tenants on terms and conditions acceptable to the lender and such replacement tenants are in occupancy, open for business and paying full, unabated rent with all applicable tenant improvement costs and leasing commissions having been paid.
Property Management.The River Park Shopping Center Property is managed by an affiliate of the borrower.
Assumption.The borrower has a two-time right to transfer the River Park Shopping Center Property, provided that certain conditions are satisfied, including (i) no event of default has occurred and is continuing; (ii) the lender’s reasonable determination that the proposed transferee and guarantor satisfy the lender’s credit review and underwriting standards, taking into consideration transferee experience, financial strength and general business standing; and (iii) if requested by the lender, rating agency confirmation from Fitch, KBRA and Moody’s that the transfer will not result in a downgrade, withdrawal or qualification of the respective ratings assigned to the Series 2016-C35 Certificates.
Partial Release.Not permitted.
Real Estate Substitution.Not permitted.
Subordinate and Mezzanine Indebtedness.Not permitted.
Ground Lease.None.
Terrorism Insurance.The loan documents require that the “all risk” insurance policy required to be maintained by the borrower provide coverage for terrorism in an amount equal to the full replacement cost of the River Park Shopping Center Property. The loan documents also require business interruption insurance covering no less than the 12-month period following the occurrence of a casualty event, together with a six-month extended period of indemnity.
Earthquake Insurance. The loan documents do not require earthquake insurance. The seismic report indicated a probable maximum loss of 16.0%.
THE INFORMATION IN THIS STRUCTURAL AND COLLATERAL TERM SHEET IS NOT COMPLETE AND MAY BE AMENDED PRIOR TO THE TIME OF SALE. THIS TERM SHEET IS NOT AN OFFER TO SELL THESE SECURITIES AND IT IS NOT A SOLICITATION OF AN OFFER TO BUY THESE SECURITIES IN ANY JURISDICTION WHERE THE OFFER OR SALE IS NOT PERMITTED.
| 95 |
UNIVERSITY TOWERS OWNERS CORP.
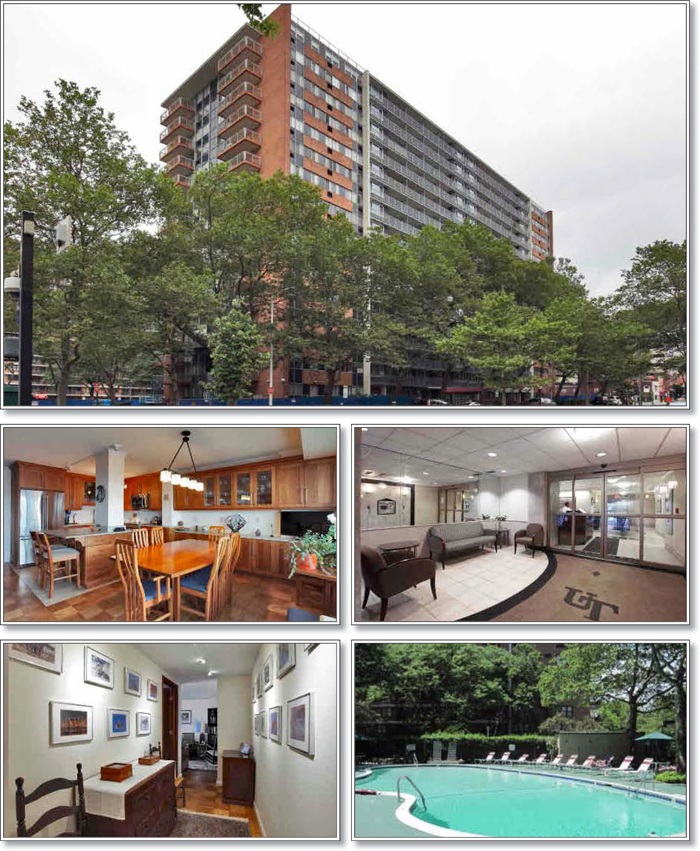
THE INFORMATION IN THIS STRUCTURAL AND COLLATERAL TERM SHEET IS NOT COMPLETE AND MAY BE AMENDED PRIOR TO THE TIME OF SALE. THIS TERM SHEET IS NOT AN OFFER TO SELL THESE SECURITIES AND IT IS NOT A SOLICITATION OF AN OFFER TO BUY THESE SECURITIES IN ANY JURISDICTION WHERE THE OFFER OR SALE IS NOT PERMITTED.
| 96 |
UNIVERSITY TOWERS OWNERS CORP.
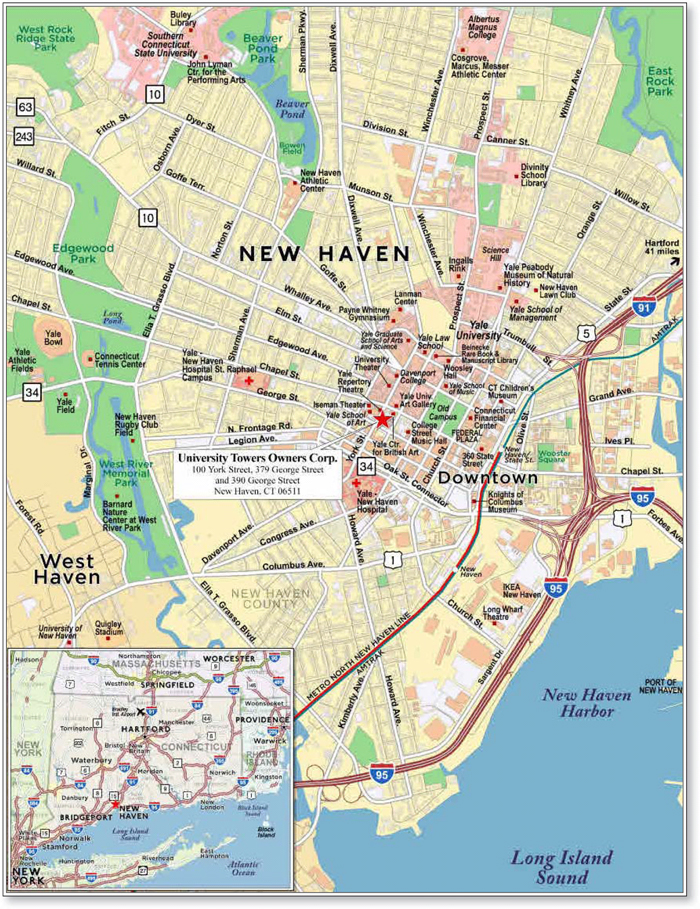
THE INFORMATION IN THIS STRUCTURAL AND COLLATERAL TERM SHEET IS NOT COMPLETE AND MAY BE AMENDED PRIOR TO THE TIME OF SALE. THIS TERM SHEET IS NOT AN OFFER TO SELL THESE SECURITIES AND IT IS NOT A SOLICITATION OF AN OFFER TO BUY THESE SECURITIES IN ANY JURISDICTION WHERE THE OFFER OR SALE IS NOT PERMITTED.
| 97 |
| No. 8 – University Towers Owners Corp. | |||||||
| Loan Information | Property Information | ||||||
| Mortgage Loan Seller: | National Cooperative Bank, N.A. | Single Asset/Portfolio: | Single Asset | ||||
| Credit Assessment (Fitch/KBRA/Moody’s): | NR/NR/A2(sca.pd) | Property Type: | Multifamily | ||||
| Original Principal Balance: | $25,600,000 | Specific Property Type: | Cooperative | ||||
| Cut-off Date Balance: | $25,600,000 | Location: | New Haven, CT | ||||
| % of Initial Pool Balance: | 2.5% | Size: | 238 Units | ||||
| Loan Purpose: | Refinance | Cut-off Date Balance Per Unit: | $107,563 | ||||
| Borrower Name: | University Towers Owners Corp. | Year Built/Renovated: | 1958/2004 | ||||
| Sponsor(1): | NAP | Title Vesting: | Fee | ||||
| Mortgage Rate: | 4.500% | Property Manager: | Owens, Renz & Lee Co., Inc. | ||||
| Note Date: | June 27, 2016 | 4th Most Recent Occupancy(4): | NAP | ||||
| Anticipated Repayment Date: | NAP | 3rd Most Recent Occupancy(4): | NAP | ||||
| Maturity Date: | July 1, 2026 | 2nd Most Recent Occupancy(4): | NAP | ||||
| IO Period: | 12 months | Most Recent Occupancy(4): | NAP | ||||
| Loan Term (Original): | 120 months | Current Occupancy (As of)(4): | 96.6% (3/14/2016) | ||||
| Seasoning: | 0 months | ||||||
| Amortization Term (Original): | 360 months | Underwriting and Financial Information: | |||||
| Loan Amortization Type: | Interest-only, Amortizing Balloon | ||||||
| Interest Accrual Method: | Actual/360 | 4th Most Recent NOI(5): | NAP | ||||
| Call Protection: | GRTR 1% or YM(113),1%(3),O(4) | 3rd Most Recent NOI(5): | NAP | ||||
| Lockbox Type: | None | 2nd Most Recent NOI(5): | NAP | ||||
| Additional Debt(2): | None | Most Recent NOI(5): | NAP | ||||
| Additional Debt Type(2): | NAP | ||||||
| U/W Revenues(6): | $6,171,234 | ||||||
| U/W Expenses(6): | $2,553,701 | ||||||
| U/W NOI(6): | $3,617,533 | ||||||
| U/W NCF(6): | $3,617,533 | ||||||
| U/W NOI DSCR(6): | 2.32x | ||||||
| U/W NCF DSCR(6): | 2.32x | ||||||
| U/W NOI Debt Yield(6): | 14.1% | ||||||
| U/W NCF Debt Yield(6): | 14.1% | ||||||
| Escrows and Reserves(3): | As-Is Appraised Value(7): | $57,800,000 | |||||
| As-Is Appraisal Valuation Date(7): | March 14, 2016 | ||||||
| Type: | Initial | Monthly | Cap (If Any) | Cut-off Date LTV Ratio(7): | 44.3% | ||
| Taxes | $51,801 | $51,801 | NAP | LTV Ratio at Maturity or ARD(7): | 36.8% | ||
| Insurance | $82,953 | $6,913 | NAP | Coop-Rental Value(7): | $57,800,000 | ||
| Deferred Maintenance | $8,450,000 | $0 | NAP | Coop-LTV as Rental(7): | 44.3% | ||
| (1) | The University Towers Owners Corp. Property (as defined below) is owned by the borrower, which is a cooperative housing corporation. No individual or entity (other than the borrower) has recourse obligations with respect to the loan, including pursuant to any guaranty or environmental indemnity. |
| (2) | See” Subordinate and Mezzanine Indebtedness” section. |
| (3) | See “Escrows” section. |
| (4) | See “Historical Occupancy” section. |
| (5) | See “Cash Flow Analysis” section. |
| (6) | The U/W NCF and the U/W NOI for the University Towers Owners Corp. Property is the projected net cash flow reflected in the appraisal and, in general, equals projected operating income at the property assuming such property is operated as a rental property with rents and other income set at the prevailing market rates, reduced by underwritten property operating expenses, a market-rate vacancy assumption and projected replacement reserves – in each case as determined by the appraiser. However, the projected net cash flow used in such determinations may differ materially from the scheduled monthly maintenance payments from the tenant-shareholders upon which residential cooperatives depend. Accordingly, U/W Revenues, U/W Expenses, U/W NOI and U/W NCF are derived from the appraisal. |
| (7) | The As-Is Appraised Value, Cut-off Date LTV Ratio, LTV Ratio at Maturity or ARD and Coop-LTV as Rental are based on the Coop-Rental Value which assumes the University Towers Owners Corp. Property is operated as a multifamily rental property. The University Towers Owners Corp. Property was not valued as a residential cooperative. The As-Is Appraised Value and the Coop-Rental Value for the University Towers Owners Corp. Property are derived by applying an appropriate capitalization rate (as determined by the appraiser) to the underwritten net cash flow for the property, and making an adjustment to decrease such capitalized value by $7,992,666 to reflect the cost of completing replacement renovations. |
The Mortgage Loan.The mortgage loan (the “University Towers Owners Corp. Mortgage Loan”) is evidenced by a single promissory note that is secured by a first mortgage encumbering a multifamily residential cooperative building located in New Haven, Connecticut (the “University Towers Owners Corp. Property”). The University Towers Owners Corp. Mortgage Loan was originated on June 27, 2016 by National Cooperative Bank, N.A. The University Towers Corp. Mortgage Loan has an original principal balance of $25,600,000, an outstanding principal balance as of the Cut-off Date of $25,600,000, and accrues interest at a rate of 4.500%per annum. The University Towers Owners Corp. Mortgage Loan has an initial term of 120 months, has a remaining term of 120 months as of the Cut-off Date and requires payments of interest-only for the first 12 payments following origination and, thereafter, requires payments of principal and interest based on a 30-year amortization schedule. The University Towers Owners Corp. Mortgage Loan matures on July 1, 2026.
THE INFORMATION IN THIS STRUCTURAL AND COLLATERAL TERM SHEET IS NOT COMPLETE AND MAY BE AMENDED PRIOR TO THE TIME OF SALE. THIS TERM SHEET IS NOT AN OFFER TO SELL THESE SECURITIES AND IT IS NOT A SOLICITATION OF AN OFFER TO BUY THESE SECURITIES IN ANY JURISDICTION WHERE THE OFFER OR SALE IS NOT PERMITTED.
| 98 |
UNIVERSITY TOWERS OWNERS CORP.
The University Towers Owners Corp. Mortgage Loan is prepayable at any time in whole, but not in part, provided that such prepayment is accompanied by a prepayment premium in an amount equal to (i) if the prepayment occurs prior to December 31, 2025, the greater of (A) 1.0% of the outstanding principal balance of the note at the time of the prepayment or (B) a yield maintenance charge and (ii) if the prepayment occurs between December 31, 2025 and March 30, 2026, 1.0% of the outstanding principal balance of the note at the time of the prepayment. The University Towers Owners Corp. Mortgage Loan is prepayable at par on or after March 31, 2026.
Sources and Uses
| Sources | Uses | |||||||
| Original loan amount | $25,600,000 | 98.3% | Loan Payoff | $16,963,014 | 65.1% | |||
| Sponsor’s new cash contribution | 445,158 | 1.7 | Reserves | 8,584,754 | 33.0 | |||
| Closing costs | 497,390 | 1.9 | ||||||
| Total Sources | $26,045,158 | 100.0% | Total Uses | $26,045,158 | 100.0% |
The Property.The University Towers Owners Corp. Property consists of a high-rise residential cooperative apartment building and a two-story garage located in New Haven, Connecticut. The residential portion of the University Towers Owners Corp. Property, which was constructed in 1958 and converted to cooperative ownership in 1981, consists of a 16-story high-rise elevator apartment building and appurtenant cellar space. There are 238 residential cooperative units (all of which are owned by tenant-shareholders of the borrower) located on floors 3 through 16, comprised of 70 studio apartments, 92 one-bedroom apartments, 54 two-bedroom apartments and 22 three-bedroom apartments.The University Towers Owners Corp. Property also contains 13 medical office tenants located on floors 1 and 2. The medical offices, which are used for professional office and clinical-type medical office space, are owned by the borrower and 100.0% leased to third-parties.
The residential apartment building that comprises a portion of the University Towers Owners Corp. Property is located on the northwest corner of the intersection of York Street and George Street, and the two-story parking garage that comprises a portion of the University Towers Owners Corp. Property is located on the southeast corner of the intersection of George Street and Park Street (diagonally across the street from the residential apartment building) in New Haven, Connecticut. The Yale/New Haven Children’s Hospital is located approximately 2 blocks south of the University Towers Owners Corp. Property and the main Yale University Campus is located approximately 1.1 mile northeast of the University Towers Owners Corp. Property.
The University Towers Owners Corp. Property features an outdoor in-ground pool, storage units for use by the residential cooperative shareholders, management office, laundry room, community room and janitorial room. Parking is provided via 91 on-site striped surface parking spaces and a covered parking garage (owned by the borrower and part of the University Towers Owners Corp. Property) that provides an additional 151 parking spaces for a total of 242 parking spaces resulting in a parking ratio of approximately 1.0 space per unit.
The borrower implemented a major façade restoration project that includes window/door and curtain wall replacement in two phases, Phase I and Phase II. Phase I renovations were completed in 2015. Phase II of the renovations, which will be conducted by the same company that completed the work for Phase I, is funded in part with the proceeds from the University Towers Owners Corp. Mortgage Loan (see “Escrows” section).
The following table presents certain information relating to the residential unit mix of the University Towers Owners Corp. Property:
Unit Mix Summary(1)
| Unit Type | No. of Units | % of Total Units | Unit Size (SF)(2) | Total Net SF |
| Studio | 70 | 29.4% | 416 | 29,148 |
| 1 Bedroom | 92 | 38.7% | 773 | 71,114 |
| 2 Bedroom | 54 | 22.7% | 974 | 52,578 |
| 3 Bedroom | 22 | 9.2% | 1,270 | 27,940 |
| Total/Weighted Average | 238 | 100.0% | 760 | 180,780 |
| (1) | Information obtained from the appraisal and legally required offering materials related to the sale of the cooperative units. |
| (2) | Unit sizes are reflective of average sizes for each of the respective unit types. |
THE INFORMATION IN THIS STRUCTURAL AND COLLATERAL TERM SHEET IS NOT COMPLETE AND MAY BE AMENDED PRIOR TO THE TIME OF SALE. THIS TERM SHEET IS NOT AN OFFER TO SELL THESE SECURITIES AND IT IS NOT A SOLICITATION OF AN OFFER TO BUY THESE SECURITIES IN ANY JURISDICTION WHERE THE OFFER OR SALE IS NOT PERMITTED.
| 99 |
UNIVERSITY TOWERS OWNERS CORP.
The following table presents historical occupancy percentages at the University Towers Owners Corp. Property:
Historical Occupancy
12/31/2012(1) | 12/31/2013(1) | 12/31/2014(1) | 12/31/2015(1) | 3/14/2016(2) |
| NAP | NAP | NAP | NAP | 96.6% |
| (1) | Historical occupancy is not reported as all units are owned by tenant-shareholders. |
| (2) | Occupancy reported as of March 14, 2016 reflects the vacancy assumption in the related appraisal for purposes of determining the appraised value of the University Towers Owners Corp. Property as a multifamily rental property(i.e., the Coop - Rental Value) as of the appraisal valuation date. |
Operating History and Underwritten Net Cash Flow.The following table presents certain information relating to underwritten net cash flow at the University Towers Owners Corp. Property:
Cash Flow Analysis(1)
| U/W | % of U/W Effective Gross Income | U/W $ per Unit | ||||
| Gross Rental Income | $5,673,600 | 91.9% | $23,839 | |||
| Commercial Office Income | 552,465 | 9.0 | 2,321 | |||
| Parking Income | 150,000 | 2.4 | 630 | |||
| Laundry Income | 15,000 | 0.2 | 63 | |||
| Less Vacancy & Credit Loss(2) | (219,831) | (3.6) | (924) | |||
| Effective Gross Income | $6,171,234 | 100.0% | $25,930 | |||
| Total Operating Expenses | $2,553,701 | 41.4% | $10,730 | |||
| Net Operating Income | $3,617,533 | 58.6% | $15,200 | |||
| Net Cash Flow | $3,617,533 | 58.6% | $15,200 | |||
| NOI DSCR | 2.32x | |||||
| NCF DSCR | 2.32x | |||||
| NOI DY | 14.1% | |||||
| NCF DY | 14.1% |
| (1) | Residential cooperatives are generally organized and operated as not-for-profit entities that set maintenance fees to cover current expenses and plan for future capital needs. The U/W Net Cash Flow and the U/W Net Operating Income for the University Towers Owners Corp. Property is the projected net cash flow reflected in the appraisal and, in general, equals projected operating income at the property assuming such property is operated as a rental property with rents and other income set at the prevailing market rates, reduced by underwritten property operating expenses, a market-rate vacancy assumption and projected replacement reserves – in each case as determined by the appraiser. However, the projected net cash flow used in such determinations may differ materially from the scheduled monthly maintenance payments from the tenant-shareholders upon which residential cooperatives depend. |
| (2) | The vacancy reported reflects the vacancy assumption in the related appraisal for purposes of determining the appraised value of the University Towers Owners Corp. Property as a multifamily rental property. |
Appraisal.As of the appraisal valuation date of September 1, 2016, the University Towers Owners Corp. Property had a “prospective as complete” appraised value of $65,800,000 and as of March 14, 2016 an “as-is” appraised value of $57,800,000. The “as-is” appraised value is derived by applying an appropriate capitalization rate (as determined by the appraiser) to the underwritten net cash flow, and reflecting appropriate adjustments to decrease such capitalized value by approximately $8.0 million to reflect the cost of completing the replacement renovations.
Environmental Matters.The University Towers Owners Corp. Property is currently undergoing a facade restoration project that includes window/door and curtain wall replacement. Prior to the commencement of the facade restoration project, the borrower engaged Hygenix, Inc. (“Hygenix”), to investigate the presence of Polychlorinated Biphenyls (“PCBs”) at the exterior building surfaces. Samplings conducted by Hygenix in 2009, 2013, and 2014 identified PCBs in the window/door caulk, glazing, and exterior curtain wall with some results indicating PCBs in excess of the United States Environmental Protection Agency (“USEPA”) limit of 50 parts per million (“PPM”). The soils surrounding the University Towers Owners Corp. Property were also tested and found to have elevated levels of PCBs. The source of the PCBs in the soil were likely from runoff of rainwater coming into contact with building materials containing PCBs. Based on sample results, the location and extent of the PCB contamination is limited to caulk, glazing, exterior stucco/concrete, and surficial soil at the base of the residential apartment building.
PCB remediation has been underway pursuant to a clean-up plan approved by USEPA. A Post Remediation Indoor Air Sampling Plan recently was submitted to the USEPA and is pending approval. The Phase I environmental site assessment recommended no further actions in this matter other than to continue the PCB remediation including the daily continuous air monitoring as part of the on-going facade restoration capital improvement project. Abatement Industries Group (“AIG”) is currently completing the remediation work required by the cleanup plan, under the supervision of Hygenix.
THE INFORMATION IN THIS STRUCTURAL AND COLLATERAL TERM SHEET IS NOT COMPLETE AND MAY BE AMENDED PRIOR TO THE TIME OF SALE. THIS TERM SHEET IS NOT AN OFFER TO SELL THESE SECURITIES AND IT IS NOT A SOLICITATION OF AN OFFER TO BUY THESE SECURITIES IN ANY JURISDICTION WHERE THE OFFER OR SALE IS NOT PERMITTED.
| 100 |
UNIVERSITY TOWERS OWNERS CORP.
At loan closing the lender obtained an Environmental Liability insurance policy with Great American E & S Insurance Company (rated “A+” by S&P, “A1” by Moody’s and “A+:IX” by A.M. Best Company), naming the lender as an additional named insured, with a policy limit of $10.0 million per incident and in the aggregate, a self-insured retention of $250,000 and a policy coverage period that extends coverage for 3 years following the maturity date of the University Towers Owners Corp. Mortgage Loan. The policy premium has been paid in full. See “Description of the Mortgage Pool—Environmental Considerations” in the Preliminary Prospectus.
Market Overview and Competition.The University Towers Owners Corp. Property is located in New Haven, Connecticut, and is situated in the southern portion of New Haven County. The City of New Haven has access to Interstate 95, which provides access to the Connecticut coastline, Rhode Island, eastern Massachusetts, New York City and Interstate 91 (which leads northward into Massachusetts, Vermont and the Canadian border). Interstate 95 is a north/south artery that provides access to all major roadways, bridges and tunnels serving the New York metropolitan area. Bus and train service is available to provide public transportation throughout New Haven County and Connecticut.
The area immediately surrounding the University Towers Owners Corp. Property is developed with a stable residential community that consists of single and multifamily dwellings, apartment buildings, mixed-use properties and local commercial and office uses. New Haven is home to Yale University, which is located approximately 1.1 miles northeast of the University Towers Owners Corp. Property. Yale University is currently New Haven’s largest employer. Yale University is planning many new developments, including the construction of new undergraduate housing and new academic facilities. Recent Yale University developments include a new sculpture and art building along Howe Street, a new high-rise building on York Street, a parking garage behind Ingalis Park, ongoing renovation of the existing colleges and the renovation of the Yale Art Gallery’s Kahn Building.
Along with Yale University, healthcare (hospitals and biotechnology), professional services (legal, architectural, marketing, and engineering), financial services and retail trade form the base of New Haven’s economy. New Haven is also home to Southern Connecticut State University, Albertus Magnus College and Gateway Community College.
The University Towers Owners Corp. Property is located in the New Haven Harborside submarket of the New Haven market. According to a third-party market research report, the New Haven Harborside submarket reported a 2.2% vacancy rate as of the first quarter of 2016 and the New Haven market reported a 2.1% vacancy rate as of the first quarter of 2016. The submarket has the lowest apartment vacancy rate among the 79 U.S. metro areas tracked by a third-party research agency.
The following table presents certain information relating to comparable multifamily properties for the University Towers Owners Corp. Property:
Competitive Set(1)
| Location | Distance to Subject | Property Type | Number of Units | Studio | 1 BR | 2 BR | 3 BR | Overall Average Rent Per Unit | Total Occupancy | |
| University Towers Owners Corp. (Subject) | New Haven, CT | - | High-Rise | 238 | $1,400 | $1,900 | $2,400 | $3,200 | $2,225 | 96.6%(2) |
| New Haven Towers | New Haven, CT | 0.04 miles | High-Rise | 600 | $1,295 | $1,795 | $2,150 | $2,850 | $2,023 | 95.8% |
| Taft Apartments | New Haven, CT | 0.3 miles | High-Rise | 194 | $1,400 | $1,900 | $2,400 | - | $1,900 | NAV |
| The Novella | New Haven, CT | 0.3 miles | Mid-Rise | NAV | $1,450 | $1,850 | $2,600 | - | $1,967 | NAV |
| College & Crown Apartments | New Haven, CT | 0.2 miles | Mid-Rise | NAV | $1,475 | $2,100 | $2,550 | - | $2,042 | NAV |
| 18 Nash Street | New Haven, CT | 1.7 miles | Garden | NAV | - | - | - | $2,850 | $2,850 | NAV |
| Cambridge Oxford Apartments | New Haven, CT | 0.1 miles | Mid-Rise | 84 | - | - | - | $3,525 | $3,525 | 100.0% |
| The Eli Apartments | New Haven, CT | 0.6 miles | High-Rise | NAV | - | - | - | $3,695 | $3,695 | NAV |
| (1) | Information obtained from the appraisal and a third party report. |
| (2) | See “Historical Occupancy” section. |
The Borrower.The borrower is University Towers Owners Corp., which is a cooperative housing corporation organized under the laws of the State of Connecticut. The borrower filed bankruptcy in 1999 for the limited purpose of effectuating a renegotiation of a financially burdensome master lease between the borrower, as lessor, and the cooperative sponsor, as lessee. In April 2002, The United States Bankruptcy Court for the District of Connecticut found in favor of the borrower. See “Description of the Mortgage Pool—Default History, Bankruptcy Issues and Other Proceedings”in the Preliminary Prospectus.
The Sponsor.The University Towers Owners Corp. Property is owned in fee simple by the borrower. No individual or entity (other than the borrower) has recourse obligations with respect to the University Towers Owners Corp. Mortgage Loan, including pursuant to any guaranty or environmental indemnity.
Escrows.The loan documents provide for upfront escrows in the amount of $82,953 for insurance premiums and $51,801 for real estate taxes. The lender will be collecting monthly deposits of $51,801 for real estate taxes and $6,913 for insurance premium for the term of the loan. The collateral security agreement for capital improvements (the “CSA”) establishes a collateral security account
THE INFORMATION IN THIS STRUCTURAL AND COLLATERAL TERM SHEET IS NOT COMPLETE AND MAY BE AMENDED PRIOR TO THE TIME OF SALE. THIS TERM SHEET IS NOT AN OFFER TO SELL THESE SECURITIES AND IT IS NOT A SOLICITATION OF AN OFFER TO BUY THESE SECURITIES IN ANY JURISDICTION WHERE THE OFFER OR SALE IS NOT PERMITTED.
| 101 |
UNIVERSITY TOWERS OWNERS CORP.
in the total amount of $8,838,537, consisting of three components: (i) a deposit at closing in the amount of $8,020,342; (ii) 12 monthly deposits commencing on August 1,,2016 each in the amount of $32,378; and (iii) a post-closing deposit received on June 29, 2016, in the amount of $429,658. Pursuant to the terms of the CSA, funds on account in the collateral security account are available for disbursement to the borrower in connection with the performance of certain specified capital improvement work at the University Towers Owners Corp. Property. Upon completion of the specified capital improvement work, any funds remaining in the collateral security account are disbursed to the borrower for deposit into the borrower’s general operating and reserve account, which is not controlled by the lender.
Lockbox and Cash Management.None.
Property Management.The University Towers Owners Corp. Property is managed by Owens, Renz & Lee Co., Inc.
Assumption.Not permitted.
Partial Release.Not permitted.
Real Estate Substitution.Not permitted.
Subordinate and Mezzanine Indebtedness.See “Additional Debt Financing For Mortgage Loans Secured by Residential Cooperatives” in the Preliminary Prospectus. In addition, National Cooperative Bank, N.A., the applicable master servicer of the University Towers Owners Corp. Loan, will be permitted to waive the enforcement of the “due-on-encumbrance” clause in the related mortgage instrument to permit subordinate debt secured by the University Towers Owners Corp. Property, subject to the satisfaction of various conditions and subject to certain parameters set forth in the Pooling and Servicing Agreement.
Ground Lease.None.
Terrorism Insurance.The loan documents require that the “all risk” insurance policy required to be maintained by the borrower provide coverage for terrorism in an amount equal to the full replacement cost of the University Towers Owners Corp. Property, as well as business income insurance covering no less than the 12-month period following the occurrence of a casualty event.
THE INFORMATION IN THIS STRUCTURAL AND COLLATERAL TERM SHEET IS NOT COMPLETE AND MAY BE AMENDED PRIOR TO THE TIME OF SALE. THIS TERM SHEET IS NOT AN OFFER TO SELL THESE SECURITIES AND IT IS NOT A SOLICITATION OF AN OFFER TO BUY THESE SECURITIES IN ANY JURISDICTION WHERE THE OFFER OR SALE IS NOT PERMITTED.
| 102 |
(THIS PAGE INTENTIONALLY LEFT BLANK)
THE INFORMATION IN THIS STRUCTURAL AND COLLATERAL TERM SHEET IS NOT COMPLETE AND MAY BE AMENDED PRIOR TO THE TIME OF SALE. THIS TERM SHEET IS NOT AN OFFER TO SELL THESE SECURITIES AND IT IS NOT A SOLICITATION OF AN OFFER TO BUY THESE SECURITIES IN ANY JURISDICTION WHERE THE OFFER OR SALE IS NOT PERMITTED.
| 103 |
| DoubleTree Overland Park |
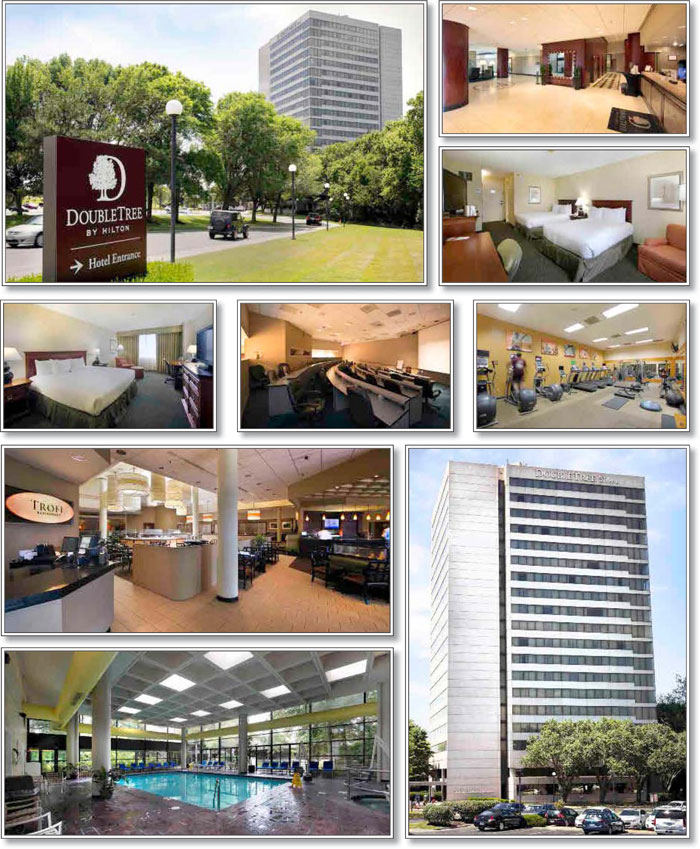
THE INFORMATION IN THIS STRUCTURAL AND COLLATERAL TERM SHEET IS NOT COMPLETE AND MAY BE AMENDED PRIOR TO THE TIME OF SALE. THIS TERM SHEET IS NOT AN OFFER TO SELL THESE SECURITIES AND IT IS NOT A SOLICITATION OF AN OFFER TO BUY THESE SECURITIES IN ANY JURISDICTION WHERE THE OFFER OR SALE IS NOT PERMITTED.
| 104 |
| DoubleTree Overland Park |
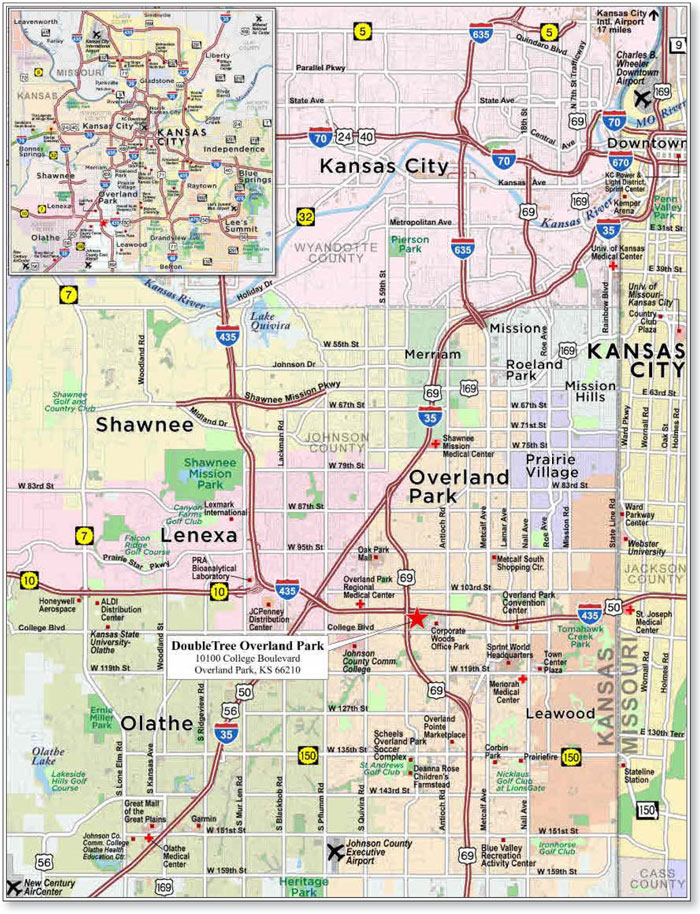
THE INFORMATION IN THIS STRUCTURAL AND COLLATERAL TERM SHEET IS NOT COMPLETE AND MAY BE AMENDED PRIOR TO THE TIME OF SALE. THIS TERM SHEET IS NOT AN OFFER TO SELL THESE SECURITIES AND IT IS NOT A SOLICITATION OF AN OFFER TO BUY THESE SECURITIES IN ANY JURISDICTION WHERE THE OFFER OR SALE IS NOT PERMITTED.
| 105 |
| No. 9 – DoubleTree Overland Park | ||||||||
| Loan Information | Property Information | |||||||
| Mortgage Loan Seller: | UBS Real Estate Securities Inc. | Single Asset/Portfolio: | Single Asset | |||||
| Credit Assessment (Fitch/KBRA/Moody’s): | NR/NR/NR | Property Type: | Hospitality | |||||
| Original Principal Balance: | $25,000,000 | Specific Property Type: | Full Service | |||||
| Cut-off Date Balance: | $25,000,000 | Location: | Overland Park, KS | |||||
| % of Initial Pool Balance: | 2.4% | Size: | 356 Rooms | |||||
| Loan Purpose: | Refinance | Cut-off Date Balance Per Room: | $70,225 | |||||
| Borrower Names: | Overland Park Golf, LLC; Overland Park Hotel, LLC | Year Built/Renovated: | 1982/2016 | |||||
| Sponsor: | Hotel Resort Properties, LLLP | Title Vesting: | Fee | |||||
| Mortgage Rate: | 4.731% | Property Manager: | DT Management LLC | |||||
| Note Date: | June 16, 2016 | 4thMost Recent Occupancy (As of): | 62.9% (12/31/2012) | |||||
| Anticipated Repayment Date: | NAP | 3rdMost Recent Occupancy (As of): | 63.2% (12/31/2013) | |||||
| Maturity Date: | July 6, 2026 | 2ndMost Recent Occupancy (As of): | 66.8% (12/31/2014) | |||||
| IO Period: | None | Most Recent Occupancy (As of): | 67.2% (12/31/2015) | |||||
| Loan Term (Original): | 120 months | Current Occupancy (As of): | 66.4% (4/30/2016) | |||||
| Seasoning: | 0 months | |||||||
| Amortization Term (Original): | 300 months | Underwriting and Financial Information: | ||||||
| Loan Amortization Type: | Amortizing Balloon | |||||||
| Interest Accrual Method: | Actual/360 | 4thMost Recent NOI (As of): | $3,033,665 (12/31/2013) | |||||
| Call Protection: | L(24),D(93),O(3) | 3rdMost Recent NOI (As of): | $3,182,500 (12/31/2014) | |||||
| Lockbox Type: | Soft/Springing Cash Management | 2ndMost Recent NOI (As of): | $3,428,270 (12/31/2015) | |||||
| Additional Debt: | None | Most Recent NOI (As of): | $3,378,286 (TTM 4/30/2016) | |||||
| Additional Debt Type: | NAP | |||||||
| U/W Revenues: | $13,974,006 | |||||||
| U/W Expenses: | $10,582,740 | |||||||
| U/W NOI: | $3,391,266 | |||||||
| U/W NCF: | $2,832,306 | |||||||
| Escrows and Reserves(1): | U/W NOI DSCR: | 1.99x | ||||||
| U/W NCF DSCR: | 1.66x | |||||||
| Type: | Initial | Monthly | Cap (If Any) | U/W NOI Debt Yield: | 13.6% | |||
| Taxes | $219,155 | $65,225 | NAP | U/W NCF Debt Yield: | 11.3% | |||
| Insurance | $0 | Springing | NAP | As-Is Appraised Value: | $40,000,000 | |||
| FF&E Reserve | $0 | $46,580 | NAP | As-Is Appraisal Valuation Date: | May 18, 2016 | |||
| PIP Reserve | $5,634,893 | $0 | NAP | Cut-off Date LTV Ratio: | 62.5% | |||
| Seasonality Reserve | $159,000 | $53,000 | NAP | LTV Ratio at Maturity or ARD: | 46.3% | |||
| (1) | See “Escrows” section. |
The Mortgage Loan. The mortgage loan (the “DoubleTree Overland Park Mortgage Loan”) is evidenced by a single promissory note secured by a first mortgage encumbering the fee interest in a full service hotel located in Overland Park, Kansas (the “DoubleTree Overland Park Property”). The DoubleTree Overland Park Mortgage Loan was originated on June 16, 2016 by UBS Real Estate Securities Inc. The DoubleTree Overland Park Mortgage Loan had an original principal balance of $25,000,000, has an outstanding principal balance as of the Cut-off Date of $25,000,000 and accrues interest at an interest rate of 4.731%per annum. The DoubleTree Overland Park Mortgage Loan had an initial term of 120 months, has a remaining term of 120 months as of the Cut-off Date and requires payments of principal and interest based on a 25-year amortization schedule. The DoubleTree Overland Park Mortgage Loan matures on July 6, 2026.
Following the lockout period, the borrowers have the right to defease the DoubleTree Overland Park Mortgage Loan in whole, but not in part, on any date before April 7, 2026. In addition, the DoubleTree Overland Park Mortgage Loan is prepayable without penalty on or after April 7, 2026.
THE INFORMATION IN THIS STRUCTURAL AND COLLATERAL TERM SHEET IS NOT COMPLETE AND MAY BE AMENDED PRIOR TO THE TIME OF SALE. THIS TERM SHEET IS NOT AN OFFER TO SELL THESE SECURITIES AND IT IS NOT A SOLICITATION OF AN OFFER TO BUY THESE SECURITIES IN ANY JURISDICTION WHERE THE OFFER OR SALE IS NOT PERMITTED.
| 106 |
| DoubleTree Overland Park |
Sources and Uses
| Sources | Uses | |||||||
| Original loan amount | $25,000,000 | 87.3% | Loan payoff | $22,324,266 | 77.9% | |||
| Sponsor’s new cash contribution | 3,652,778 | 12.7 | Reserves | 6,013,048 | 21.0 | |||
| Closing costs | 315,464 | 1.1 | ||||||
| Total Sources | $28,652,778 | 100.0% | Total Uses | $28,652,778 | 100.0% |
The Property.The DoubleTree Overland Park Property is a 19-story, 356-room, full service hotel located in Overland Park, Kansas. Built in 1982 and situated on a 14.9-acre site, the DoubleTree Overland Park Property features 181 king guestrooms, 158 double guestrooms, and 17 suites including seven conference suites. Each guestroom features a 42-inch flat-screen HDTV, Sweet Dreams mattress and luxury bedding, an executive work area with high-speed internet access, mini-bar, coffee maker and in-room safe. Suites also contain a separate seating area with sofa bed, mini-fridge and wet bar. The DoubleTree Overland Park Property offers 25,094 square feet of indoor and outdoor meeting space with room for up to 1,000 guests, 9,000 square feet of ballroom space, an indoor pool, whirlpool, sauna, fitness center, racquetball court, business center, room service, a full service restaurant, and a lounge. The DoubleTree Overland Park Property features 620 surface level parking spaces, resulting in a parking ratio of 1.7 spaces per room.
Since 2014, the sponsor has completed approximately $485,531 of an approximately $6.1 million ($17,192 per room) property improvement plan (“PIP”), for which approximately $5.6 million was reserved at origination in the form of a letter of credit. The sponsor expects to use approximately $3.1 million of the reserved funds for PIP work related to public spaces and common areas during the remainder of 2016 and approximately $2.5 million of the reserved funds for PIP work related to guestrooms and guestroom corridors in phases throughout 2017 and early 2018. The franchise agreement with Hilton Hotels Corp. expires on August 31, 2032.
The following table presents certain information relating to the historical operating performance and the underwritten net cash flow at the DoubleTree Overland Park Property:
Cash Flow Analysis
| 2013 | 2014 | 2015 | TTM 4/30/2016 | U/W | % of U/W Total Revenue | U/W $ per Room | ||||||||
| Occupancy | 63.2% | 66.8% | 67.2% | 66.4% | 66.4% | |||||||||
| ADR | $101.89 | $107.24 | $114.98 | $116.97 | $116.97 | |||||||||
| RevPAR | $65.17 | $71.68 | $77.27 | $77.72 | $77.72 | |||||||||
| Room Revenue | $8,468,006 | $9,314,562 | $10,040,645 | $10,126,878 | $10,126,878 | 72.5% | $28,446 | |||||||
| F&B Revenue | 3,772,713 | 3,592,084 | 3,684,581 | 3,593,346 | 3,593,346 | 25.7 | 10,094 | |||||||
| Other Revenue | 230,832 | 233,985 | 259,604 | 253,782 | 253,782 | 1.8 | 713 | |||||||
| Total Revenue | $12,471,551 | $13,140,631 | $13,984,830 | $13,974,006 | $13,974,006 | 100.0% | $39,253 | |||||||
| Total Department Expenses | 4,435,052 | 4,543,553 | 4,498,136 | 4,470,465 | 4,349,981 | 31.1 | 12,219 | |||||||
| Gross Operating Profit | $8,036,499 | $8,597,078 | $9,486,694 | $9,503,541 | $9,624,025 | 68.9% | $27,034 | |||||||
| Total Undistributed Expenses | 4,384,386 | 4,687,553 | 5,118,730 | 5,175,473 | 5,274,229 | 37.7 | 14,815 | |||||||
| Profit Before Fixed Charges | $3,652,113 | $3,909,525 | $4,367,964 | $4,328,068 | $4,349,796 | 31.1% | $12,219 | |||||||
| Total Fixed Charges | 618,448 | 727,025 | 939,694 | 949,782 | 958,530 | 6.9 | 2,693 | |||||||
| Net Operating Income | $3,033,665 | $3,182,500 | $3,428,270 | $3,378,286 | $3,391,266 | 24.3% | $9,526 | |||||||
| FF&E | 498,862 | 525,625 | 559,392 | 558,959 | 558,959 | 4.0 | 1,570 | |||||||
| Net Cash Flow | $2,534,803 | $2,656,875 | $2,868,878 | $2,819,326 | $2,832,306 | 20.3% | $7,956 | |||||||
| NOI DSCR | 1.78x | 1.86x | 2.01x | 1.98x | 1.99x | |||||||||
| NCF DSCR | 1.48x | 1.56x | 1.68x | 1.65x | 1.66x | |||||||||
| NOI DY | 12.1% | 12.7% | 13.7% | 13.5% | 13.6% | |||||||||
| NCF DY | 10.1% | 10.6% | 11.5% | 11.3% | 11.3% | |||||||||
The Appraisal.As of the appraisal valuation date of May 18, 2016, the DoubleTree Overland Park Property had an “as-is” appraised value of $40,000,000.
Environmental Matters. According to a Phase I environmental assessment dated May 31, 2016, there was no evidence of any recognized environmental conditions at the DoubleTree Overland Park Property.
Market Overview and Competition.The DoubleTree Overland Park Property is located in Overland Park, the second largest city in Kansas, approximately 17.0 miles southwest of the Kansas City central business district. The DoubleTree Overland Park Property is situated along College Boulevard, one of the primary east-west thoroughfares in the area, providing access to major retail and other commercial development and less than one mile from major access highways. The DoubleTree Overland Park Property is located at the entrance to Corporate Woods Office Park, a 29-building, 2.1 million square foot institutional-quality office park. Other major office developments include Black and Veatch (600,000 square feet) and the world headquarters for Sprint (380,202 square feet). In
THE INFORMATION IN THIS STRUCTURAL AND COLLATERAL TERM SHEET IS NOT COMPLETE AND MAY BE AMENDED PRIOR TO THE TIME OF SALE. THIS TERM SHEET IS NOT AN OFFER TO SELL THESE SECURITIES AND IT IS NOT A SOLICITATION OF AN OFFER TO BUY THESE SECURITIES IN ANY JURISDICTION WHERE THE OFFER OR SALE IS NOT PERMITTED.
| 107 |
| DoubleTree Overland Park |
addition, the neighborhood has approximately 10.0 million square feet of retail space including Oak Park Mall (3.5 miles northwest; 1,542,679 square feet), Metcalf South Shopping Center (4.4 miles northeast; 597,700 square feet) and Regency Park Shopping Center (4.0 miles northeast; 201,974 square feet).
Regional demand is generated by a variety of sources and industries, including health care, retail trade, professional and technical services, finance/insurance and information technology. Overland Park is the headquarters for companies such as Sprint, YRC Worldwide, Black & Veatch, Waddell & Reed, Ferrellgas, Ash Grove Cement Company, and Compass Minerals. The largest employers in the Kansas City metropolitan statistical area are Cerner Corp. (9,850 employees), HCA Midwest Health System (9,394 employees), Saint Luke’s Health System (8,914 employees), and Sprint (7,500 employees). According to the appraisal, the 2015 market mix of the DoubleTree Overland Park Property was 63% commercial, 27% meeting and group, and 10% leisure. The DoubleTree Overland Park Property also serves as an overflow hotel for the Overland Park Convention Center (2.7 miles east), a 60,000 square foot exhibition hall that hosts 330 events each year on average. A third party hospitality research report identified seven competitive hospitality properties, containing 1,649 rooms, which exhibited average occupancy, ADR, and RevPAR of 65.1%, $120.29, and $78.28, respectively, for the trailing 12-month period ending April 30, 2016.
The following table presents certain information relating to the DoubleTree Overland Park Property’s competitive set:
Subject and Market Historical Occupancy, ADR and RevPAR(1)
Competitive Set | DoubleTree Overland Park | Penetration Factor | |||||||
Year | Occupancy | ADR | RevPAR | Occupancy | ADR | RevPAR | Occupancy | ADR | RevPAR |
| 4/30/2016 TTM | 65.1% | $120.29 | $78.28 | 66.4% | $116.97 | $77.72 | 102.1% | 97.2% | 99.3% |
| 4/30/2015 TTM | 66.6% | $112.64 | $74.97 | 68.0% | $108.94 | $74.04 | 102.1% | 96.7% | 98.8% |
| 12/31/2014 | 65.0% | $111.62 | $72.53 | 66.8% | $107.24 | $71.68 | 102.9% | 96.1% | 98.8% |
| (1) | Information obtained from a third party hospitality research report dated May 17, 2016. The competitive set includes: Crown Plaza Kansas City Overland Park, Marriott Overland Park, Holiday Inn & Suites Overland Park West, Courtyard Kansas City Overland Park, Hyatt Place Kansas City Overland Park Metcalf, Holiday Inn & Suites Overland Park Convention Center, and Sheraton Hotel Overland Park & Conference Center. |
The Borrowers.The borrowers are Overland Park Golf, LLC and Overland Park Hotel, LLC, each a Delaware limited liability company structured as tenants-in-common, each with one independent director. Legal counsel to the borrowers delivered a non-consolidation opinion in connection with the origination of the DoubleTree Overland Park Mortgage Loan. Hotel Resort Properties, LLLP is the guarantor of certain nonrecourse carveouts under the DoubleTree Overland Park Mortgage Loan.
The Sponsor.The sponsor is Hotel Resort Properties, LLLP, a Florida limited liability limited partnership wholly owned by Edwin Llwyd Ecclestone, Jr. and Diana Lynn Ecclestone. Mr. Ecclestone developed the PGA National Resort in Palm Beach Gardens, a community with over 5,300 homes, four PGA National Golf Courses, and a 339-room PGA National Resort and Spa in a 140,000 square foot shopping center.
Escrows.The loan documents provide for upfront escrows in the amount of $219,155 for real estate taxes, $5,634,893 for PIP renovations, and $159,000 for a seasonality reserve. The loan documents also provide for ongoing monthly reserves in the amount of $65,225 for real estate taxes, $46,580 for FF&E reserves, and the applicable Seasonality Reserve Monthly Deposit (as defined below). In addition, on each payment date during the continuance of a Future PIP Trigger Event (as defined below), the borrowers will be required to deposit with the lender all excess cash flow up to an amount equal to 125.0% of the estimated cost of any future additional PIP work as required by the manager pursuant to the management agreement or by the franchisor pursuant to any franchise agreement. The loan documents do not require monthly deposits for insurance premiums as long as (i) no event of default has occurred or is continuing; (ii) the DoubleTree Overland Park Property is insured via an acceptable blanket insurance policy; and (iii) the borrowers provide the lender with timely proof of payment of insurance premiums.
The “Seasonality Reserve Monthly Deposit” is equal to $53,000 on each payment date occurring in August, September and October during 2016 followed by (i) an amount equal to the aggregate amount of monthly net cash flow shortfall of the most recent March trailing 12-month period through February, less (ii) funds currently in the seasonality reserve, divided by (iii) six, on each payment date occurring in May, June, July, August, September and October. Each year, the seasonality reserve will be recalculated in March based on the most recent trailing 12-month period through February.
A “Future PIP Trigger Event” will commence upon (i) if a franchise agreement is in effect, (a) the franchisor’s notice of nonrenewal of the franchise agreement; (b) the date that is two months prior to the then applicable expiration date under the franchise agreement; (c) the occurrence and continuance of an event of default by the borrowers or franchisor under the franchise agreement; or (d) any bankruptcy action involving the franchisor; or (ii) if a franchise agreement is not in effect, (a) the manager’s notice of nonrenewal of the management agreement; (b) the occurrence and continuance of an event of default by the borrowers or manager under the management agreement; or (c) any bankruptcy action involving the manager. A Future PIP Trigger Event will end upon (i) the borrowers having entered into a renewal of the management or franchise agreement extending five years or more beyond July 6, 2026 or a replacement management agreement or franchise agreement acceptable to the lender; and (ii) the borrowers having completed all future PIP work under any future PIP or deposited funds into the future PIP reserve such that the balance exceeds an amount equal to 125.0% of the estimated cost of any future PIP work.
Lockbox and Cash Management.The DoubleTree Overland Park Mortgage Loan is structured with a soft lockbox and springing cash management. The borrowers are required to cause all amounts payable to be paid directly into such lockbox account where the funds will be distributed to the borrowers on each business day prior to a Cash Sweep Event (as defined below). Upon the
THE INFORMATION IN THIS STRUCTURAL AND COLLATERAL TERM SHEET IS NOT COMPLETE AND MAY BE AMENDED PRIOR TO THE TIME OF SALE. THIS TERM SHEET IS NOT AN OFFER TO SELL THESE SECURITIES AND IT IS NOT A SOLICITATION OF AN OFFER TO BUY THESE SECURITIES IN ANY JURISDICTION WHERE THE OFFER OR SALE IS NOT PERMITTED.
| 108 |
| DoubleTree Overland Park |
termination of the management agreement and the failure to enter into a replacement full service management agreement in accordance with the provisions of the loan documents, the borrowers will be required to cause all revenues from the DoubleTree Overland Park Property to be paid directly into the lockbox account. During a Cash Sweep Event, all funds in the lockbox account will be swept to a lender-controlled cash management account. Notwithstanding the foregoing, for so long as the management agreement remains in effect (or a replacement thereof is entered into in accordance with provisions of the DoubleTree Overland Park Mortgage Loan documents), the amounts required to be deposited into the lockbox account by the borrowers and the manager will be equal to all amounts payable or distributable to the borrowers pursuant to the management agreement and the borrowers are required to cause the manager to deposit such amounts directly into the lockbox account.
A “Cash Sweep Event” will commence upon (i) the occurrence and continuance of an event of default; (ii) any bankruptcy action involving the borrowers, the guarantor, or the manager; (iii) the debt service coverage ratio falling below 1.20x for the 12 months immediately preceding the date of determination; (iv) any indictment for fraud or misappropriation of funds by any affiliated manager or any officer or director thereof; (v) the occurrence and continuance of an event of default under the management agreement or the DoubleTree Overland Park Property is self-managed and the borrowers have not engaged an independent third party manager acceptable to the lender; or (vi) the occurrence of a Future PIP Trigger Event. A Cash Sweep Event will end with respect to clause (i), upon the cure of such event of default; with respect to clause (ii), upon the filing being discharged, stayed or dismissed within 90 days for the borrowers or the guarantor, or within 180 days for the manager; with respect to clause (iii), upon the debt service coverage ratio being at least 1.25x for two consecutive calendar quarters; with respect to clauses (iv) and (v), upon the borrowers engaging a qualified manager pursuant to a management agreement or the borrowers replacing the manager with a qualified manager pursuant to a replacement management agreement; and with respect to clause (vi), upon the Future PIP Trigger Event being cured.
Property Management.The DoubleTree Overland Park Property is managed by DT Management LLC, a DoubleTree by Hilton entity.
Assumption.The borrowers have a right to transfer the DoubleTree Overland Park Property provided that certain conditions are satisfied, including (i) no event of default has occurred and is continuing; (ii) the lender reasonably determines that the proposed transferee and guarantor satisfy the lender’s credit review and underwriting standards, taking into consideration transferee experience, financial strength and general business standing; and (iii) the lender has received confirmation from Fitch, KBRA and Moody’s that such assumption will not result in a downgrade, withdrawal or qualification of the respective ratings assigned to the Series 2016-C35 Certificates.
Partial Release.Not permitted.
Real Estate Substitution.Not permitted.
Subordinate and Mezzanine Indebtedness.Not permitted.
Ground Lease.None.
Terrorism Insurance.The DoubleTree Overland Park Mortgage Loan documents require that the “all risk” insurance policy required to be maintained by the borrowers provide coverage for terrorism in an amount equal to the full replacement cost of the DoubleTree Overland Park Property. The DoubleTree Overland Park Mortgage Loan documents also require business interruption insurance covering no less than the 12-month period following the occurrence of a casualty event, together with a six-month extended period of indemnity.
THE INFORMATION IN THIS STRUCTURAL AND COLLATERAL TERM SHEET IS NOT COMPLETE AND MAY BE AMENDED PRIOR TO THE TIME OF SALE. THIS TERM SHEET IS NOT AN OFFER TO SELL THESE SECURITIES AND IT IS NOT A SOLICITATION OF AN OFFER TO BUY THESE SECURITIES IN ANY JURISDICTION WHERE THE OFFER OR SALE IS NOT PERMITTED.
| 109 |
EXCHANGERIGHT NET LEASED PORTFOLIO 12 |
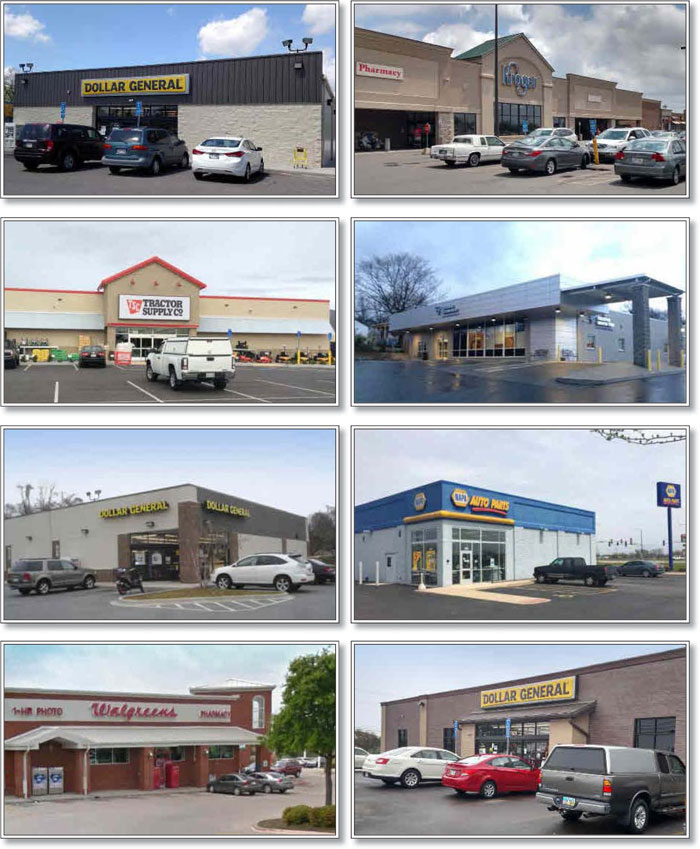
THE INFORMATION IN THIS STRUCTURAL AND COLLATERAL TERM SHEET IS NOT COMPLETE AND MAY BE AMENDED PRIOR TO THE TIME OF SALE. THIS TERM SHEET IS NOT AN OFFER TO SELL THESE SECURITIES AND IT IS NOT A SOLICITATION OF AN OFFER TO BUY THESE SECURITIES IN ANY JURISDICTION WHERE THE OFFER OR SALE IS NOT PERMITTED.
| 110 |
EXCHANGERIGHT NET LEASED PORTFOLIO 12 |
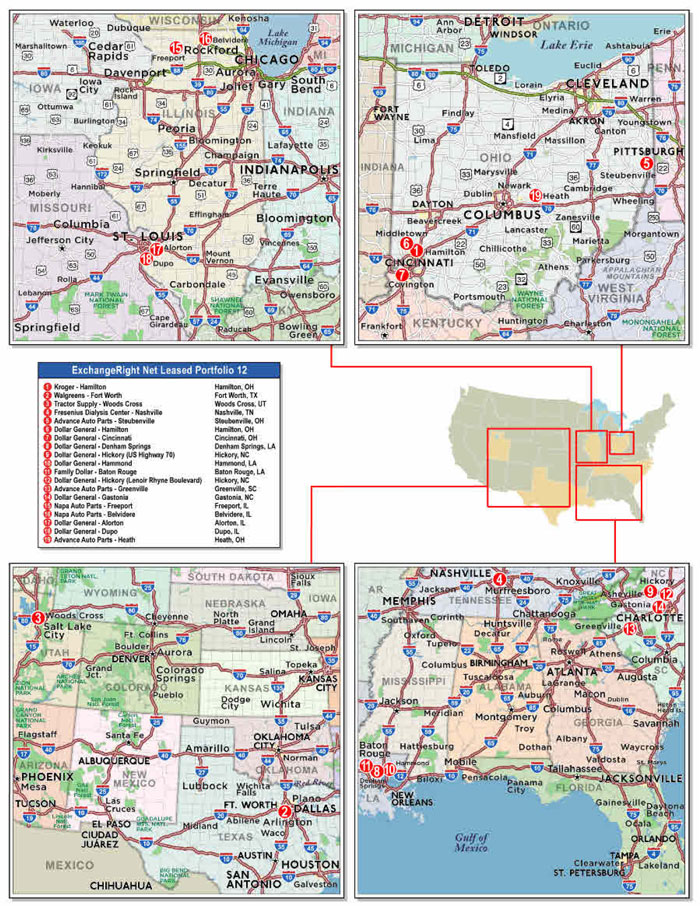
THE INFORMATION IN THIS STRUCTURAL AND COLLATERAL TERM SHEET IS NOT COMPLETE AND MAY BE AMENDED PRIOR TO THE TIME OF SALE. THIS TERM SHEET IS NOT AN OFFER TO SELL THESE SECURITIES AND IT IS NOT A SOLICITATION OF AN OFFER TO BUY THESE SECURITIES IN ANY JURISDICTION WHERE THE OFFER OR SALE IS NOT PERMITTED.
| 111 |
| No. 10 – ExchangeRight Net Leased Portfolio 12 | |||||||
| Loan Information | Property Information | ||||||
| Mortgage Loan Seller: | Barclays Bank PLC | Single Asset/Portfolio: | Portfolio | ||||
| Credit Assessment (Fitch/KBRA/Moody’s): | NR/NR/NR | Property Type(3): | Various | ||||
| Original Principal Balance: | $24,850,000 | Specific Property Type(3): | Various | ||||
| Cut-off Date Balance: | $24,850,000 | Location(3): | Various | ||||
| % of Initial Pool Balance: | 2.4% | Size: | 243,830 SF | ||||
| Loan Purpose: | Acquisition | Cut-off Date Balance Per SF: | $101.92 | ||||
| Borrower Name(1): | ExchangeRight Net Leased Portfolio 12 DST | Year Built/Renovated(3): | Various | ||||
| Sponsors: | David Fisher; Joshua Ungerecht; Warren Thomas | Title Vesting: | Fee | ||||
| Mortgage Rate: | 4.659% | Property Manager: | Self-managed | ||||
| Note Date: | May 10, 2016 | 4thMost Recent Occupancy(4): | NAV | ||||
| Anticipated Repayment Date: | NAP | 3rdMost Recent Occupancy(4): | NAV | ||||
| Maturity Date: | May 6, 2026 | 2ndMost Recent Occupancy(4): | NAV | ||||
| IO Period: | 120 months | Most Recent Occupancy(4): | NAV | ||||
| Loan Term (Original): | 120 months | Current Occupancy (As of)(4): | 100.0% (7/1/2016) | ||||
| Seasoning: | 2 months | ||||||
| Amortization Term (Original): | NAP | Underwriting and Financial Information: | |||||
| Loan Amortization Type: | Interest-only, Balloon | ||||||
| Interest Accrual Method: | Actual/360 | 4thMost Recent NOI(5): | NAV | ||||
| Call Protection: | L(26),D(90),O(4) | 3rdMost Recent NOI(5): | NAV | ||||
| Lockbox Type: | Hard/Springing Cash Management | 2ndMost Recent NOI(5): | NAV | ||||
| Additional Debt: | None | Most Recent NOI(5): | NAV | ||||
| Additional Debt Type: | NAP | ||||||
| U/W Revenues: | $3,432,150 | ||||||
| U/W Expenses: | $635,601 | ||||||
| U/W NOI: | $2,796,549 | ||||||
| Escrows and Reserves(2): | U/W NCF: | $2,677,969 | |||||
| U/W NOI DSCR: | 2.38x | ||||||
| Type: | Initial | Monthly | Cap (If Any) | U/W NCF DSCR: | 2.28x | ||
| Taxes | $36,332 | $21,494 | NAP | U/W NOI Debt Yield: | 11.3% | ||
| Insurance | $0 | Springing | NAP | U/W NCF Debt Yield: | 10.8% | ||
| Replacement Reserves | $0 | $1,762 | NAP | As-Is Appraised Value: | $47,040,000 | ||
| TI/LC Reserve | $0 | Springing | NAP | As-Is Appraisal Valuation Date: | Various | ||
| Deferred Maintenance | $91,028 | $0 | NAP | Cut-off Date LTV Ratio(6): | 52.8% | ||
| Declaration Deposit Reserve | $95,106 | $0 | NAP | LTV Ratio at Maturity or ARD(6): | 52.8% | ||
(1) See “The Borrowers” section.
| (2) | See “Escrows” section. |
| (3) | See “The Mortgage Loan” section. |
| (4) | See “Historical Occupancy” section. |
| (5) | See “Cash Flow Analysis” section. |
| (6) | See “Appraisal” section. The appraisals were dated from January 28, 2016 to May 3, 2016. |
The Mortgage Loan. The mortgage loan (the “ExchangeRight Net Leased Portfolio 12 Mortgage Loan”) is evidenced by a single promissory note that is secured by a first mortgage encumbering 18 single-tenant retail properties and one medical office property located in Illinois, Louisiana, North Carolina, Ohio, South Carolina, Tennessee, Texas and Utah (the “ExchangeRight Net Leased Portfolio 12 Properties”). The ExchangeRight Net Leased Portfolio 12 Mortgage Loan was originated on May 10, 2016 by Barclays Bank PLC. The ExchangeRight Net Leased Portfolio 12 Mortgage Loan had an original principal balance of $24,850,000, has an outstanding principal balance as of the Cut-off Date of $24,850,000 and accrues interest at an interest rate of 4.659%per annum. The ExchangeRight Net Leased Portfolio 12 Mortgage Loan had an initial term of 120 months, has a remaining term of 118 months as of the Cut-off Date and requires interest-only payments through the term of the ExchangeRight Net Leased Portfolio 12 Mortgage Loan. The ExchangeRight Net Leased Portfolio 12 Mortgage Loan matures on May 6, 2026.
Following the lockout period, the borrower has the right to defease the ExchangeRight Net Leased Portfolio 12 Mortgage Loan in whole, but not in part, on any date before February 6, 2026. In addition, the ExchangeRight Net Leased Portfolio 12 Mortgage Loan is prepayable without penalty on or after February 6, 2026.
THE INFORMATION IN THIS STRUCTURAL AND COLLATERAL TERM SHEET IS NOT COMPLETE AND MAY BE AMENDED PRIOR TO THE TIME OF SALE. THIS TERM SHEET IS NOT AN OFFER TO SELL THESE SECURITIES AND IT IS NOT A SOLICITATION OF AN OFFER TO BUY THESE SECURITIES IN ANY JURISDICTION WHERE THE OFFER OR SALE IS NOT PERMITTED.
| 112 |
EXCHANGERIGHT NET LEASED PORTFOLIO 12 |
Sources and Uses
| Sources | Uses | |||||||
| Original loan amount | $24,850,000 | 52.3% | Purchase price(1) | $46,457,381 | 97.8% | |||
| Sponsor’s new cash contribution | 22,673,619 | 47.7 | Closing costs | 843,773 | 1.8 | |||
| Reserves | 222,465 | 0.5 | ||||||
| Total Sources | $47,523,619 | 100.0% | Total Uses | $47,523,619 | 100.0% |
| (1) | A portion of the ExchangeRight Net Leased Portfolio 12 Mortgage Loan proceeds were used to unencumber 11 of the 19 properties that served as collateral under the Sponsor’s line of credit facilities and were purchased between January 2016 and May 2016. |
The Properties. The ExchangeRight Net Leased Portfolio 12 Properties comprise 18 single-tenant retail properties and one single-tenant medical office property totaling 243,830 square feet located in Illinois (4 properties), Louisiana (3 properties), North Carolina (3 properties), Ohio (5 properties), South Carolina (1 property), Tennessee (1 property), Texas (1 property) and Utah (1 property). Built between 1966 and 2016, the ExchangeRight Net Leased Portfolio 12 Properties range in size from 4,904 square feet to 77,154 square feet. The sponsor acquired the ExchangeRight Net Leased Portfolio 12 Properties between January 2016 and May 2016 for a combined purchase price of approximately $46.5 million. As of July 1, 2016, the ExchangeRight Net Leased Portfolio 12 Properties were 100.0% occupied.
The ExchangeRight Net Leased Portfolio 12 Properties are comprised of nationally recognized credit-tenants, such as Dollar General, Kroger, Tractor Supply, Walgreens, Advance Auto Parts and Fresenius Dialysis Center. Of the 19 ExchangeRight Net Leased Portfolio 12 Properties, 15 are occupied by investment-grade tenants accounting for approximately 79.2% of the underwritten rent. All of the leases within the ExchangeRight Net Leased Portfolio 12 are either directly signed with the tenant’s parent company or are guaranteed by the tenant’s parent company. The ExchangeRight Net Leased Portfolio 12 Properties have an average remaining lease term of approximately 12.7 years and if utilizing the fully extended lease maturity dates, the average remaining lease term for the ExhangeRight Net Leased Portfolio 12 Properties is approximately 33.7 years. Leases representing approximately 90.5% of the net rentable area and 91.3% of the underwritten base rent expire after the ExchangeRight Net Leased Portfolio 12 Mortgage Loan maturity date. Excluding the Kroger – Hamilton property, no single property within the ExchangeRight Net Leased Portfolio 12 accounts for more than 12.2% of the underwritten rent or 9.0% of the net rentable area.
The largest property, Kroger – Hamilton, comprises approximately 77,154 square feet (31.6% of the total net rentable area) and $630,620 of the underwritten base rent (21.2% of total underwritten net rental income). The Kroger – Hamilton property is 100.0% occupied by, Kroger, which anchors a shopping center in Hamilton, Ohio, a suburb of Cincinnati. As of the fiscal year ending in October 2015, Kroger achieved sales of approximately $38.1 million (approximately $494 PSF), which figure excludes fuel sales, resulting in a 2.5% occupancy cost. The store is expected to undergo a tenant funded renovation. The renovations will add online ordering capabilities (ClickList), a health clinic and a liquor store. The Kroger store is expected to be fully operational while undergoing the renovations, which are expected to be completed in 2017.
The following table presents certain information relating to the ExchangeRight Net Leased Portfolio 12 Properties:
| Tenant Name | City, State | Specific Property Type | Allocated Cut-off Date Balance | % of Portfolio Cut-off Date Balance | Occupancy | Year Built/ Renovated | Net Rentable Area (SF) | Appraised Value(1) | |
| Kroger | Hamilton, Ohio | Single Tenant | $5,100,000 | 20.5% | 100.0% | 2006/NAP | 77,154 | $10,320,000 | |
| Walgreens | Fort Worth, Texas | Single Tenant | $3,295,000 | 13.3% | 100.0% | 2003/NAP | 14,490 | $6,000,000 | |
| Tractor Supply | Woods Cross, Utah | Single Tenant | $2,450,000 | 9.9% | 100.0% | 2015/NAP | 21,930 | $4,730,000 | |
| Fresenius Dialysis Center | Nashville, Tennessee | Medical | $2,300,000 | 9.3% | 100.0% | 1966/2015 | 8,790 | $4,425,000 | |
| Advance Auto Parts | Steubenville, Ohio | Single Tenant | $1,030,000 | 4.1% | 100.0% | 2015/NAP | 6,889 | $1,875,000 | |
| Dollar General | Hamilton, Ohio | Single Tenant | $975,000 | 3.9% | 100.0% | 2012/NAP | 9,100 | $1,780,000 | |
| Dollar General | Cincinnati, Ohio | Single Tenant | $860,000 | 3.5% | 100.0% | 2012/NAP | 9,026 | $1,570,000 | |
| Dollar General | Hickory, North Carolina | Single Tenant | $820,000 | 3.3% | 100.0% | 2011/NAP | 9,002 | $1,575,000 | |
| Dollar General | Denham Springs, Louisiana | Single Tenant | $820,000 | 3.3% | 100.0% | 2015/NAP | 9,026 | $1,600,000 | |
| Dollar General | Hammond, Louisiana | Single Tenant | $820,000 | 3.3% | 100.0% | 2013/NAP | 9,026 | $1,500,000 | |
| Family Dollar | Baton Rouge, Louisiana | Single Tenant | $820,000 | 3.3% | 100.0% | 2016/NAP | 9,327 | $1,500,000 | |
| Dollar General | Hickory, North Carolina | Single Tenant | $795,000 | 3.2% | 100.0% | 2012/NAP | 9,002 | $1,450,000 | |
| Advance Auto Parts | Greenville, South Carolina | Single Tenant | $790,000 | 3.2% | 100.0% | 2011/NAP | 7,000 | $1,450,000 | |
| Dollar General | Gastonia, North Carolina | Single Tenant | $745,000 | 3.0% | 100.0% | 2012/NAP | 9,100 | $1,360,000 | |
| Napa Auto Parts | Freeport, Illinois | Single Tenant | $735,000 | 3.0% | 100.0% | 2011/NAP | 4,938 | $1,340,000 | |
| Napa Auto Parts | Belvidere, Illinois | Single Tenant | $735,000 | 3.0% | 100.0% | 2011/NAP | 4,904 | $1,340,000 | |
| Dollar General | Alorton, Illinois | Single Tenant | $645,000 | 2.6% | 100.0% | 2011/NAP | 9,026 | $1,175,000 | |
| Dollar General | Dupo, Illinois | Single Tenant | $560,000 | 2.3% | 100.0% | 2010/NAP | 9,100 | $1,025,000 | |
| Advance Auto Parts | Heath, Ohio | Single Tenant | $555,000 | 2.2% | 100.0% | 1997/2011 | 7,000 | $1,025,000 | |
| Total/Weighted Average | $24,850,000 | 100.0% | 100.0% | 243,830 | $47,040,000 | ||||
| (1) | In addition, each appraisal provides a “go dark” value for each related ExchangeRight Net Leased Portfolio 12 Property. In the aggregate, the ExchangeRight Net Leased Portfolio Properties have a “go dark” value of $25,520,000. |
THE INFORMATION IN THIS STRUCTURAL AND COLLATERAL TERM SHEET IS NOT COMPLETE AND MAY BE AMENDED PRIOR TO THE TIME OF SALE. THIS TERM SHEET IS NOT AN OFFER TO SELL THESE SECURITIES AND IT IS NOT A SOLICITATION OF AN OFFER TO BUY THESE SECURITIES IN ANY JURISDICTION WHERE THE OFFER OR SALE IS NOT PERMITTED.
| 113 |
EXCHANGERIGHT NET LEASED PORTFOLIO 12 |
The following table presents certain information relating to the tenancies at the ExchangeRight Net Leased Portfolio 12 Properties:
Major Tenants
| Tenant Name | Credit Rating (Fitch/ Moody’s/ S&P)(1) | Tenant NRSF | % of NRSF | Annual U/W Base Rent PSF(2) | Annual U/W Base Rent(2) | % of Total Annual U/W Base Rent | Lease Expiration Date |
| Major Tenants | |||||||
| Dollar General | NR/Baa2/BBB | 81,408 | 33.4% | $12.85(3) | $1,045,935(3) | 35.2% | Various(4) |
| Kroger | BBB/Baa1/BBB | 77,154 | 31.6% | $8.17�� | $630,620 | 21.2% | 12/31/2026 |
| Tractor Supply | NR/NR/NR | 21,930 | 9.0% | $16.52 | $362,250 | 12.2% | 10/31/2030 |
| Walgreens | BBB/Baa2/BBB | 14,490 | 5.9% | $19.67 | $285,000 | 9.6% | 6/30/2028(5) |
| Advance Auto Parts | NR/Baa2/BBB- | 20,889 | 8.6% | $13.20 | $275,817 | 9.3% | Various(6) |
| Total Major Tenants | 215,871 | 88.5% | $12.04 | $2,599,622 | 87.5% | ||
| Non-Major Tenants | 27,959 | 11.5% | $13.33 | $372,578 | 12.5% | ||
| Occupied Collateral Total | 243,830 | 100.0% | $12.19 | $2,972,200 | 100.0% | ||
| Vacant Space | 0 | 0.0% | |||||
| Collateral Total | 243,830 | 100.0% | |||||
| (1) | Certain ratings are those of the parent company whether or not the parent guarantees the lease. |
| (2) | Annual U/W Base Rent PSF and Annual U/W Base Rent include average straight-line rent for Dollar General – Cincinnati, Dollar General – Hammond, Dollar General – Hamilton and Fresenius Dialysis Center – Nashville properties. |
| (3) | Annual U/W Base Rent PSF and Annual U/W Base Rent include average straight-line rent for Dollar General – Cincinnati, Dollar General – Hammond and Dollar General – Hamilton. The current aggregate annual contract rent is $315,023 and $11.60 per square foot. The current underwritten rent is $318,210 and $11.72 per square foot. |
| (4) | Dollar General is a tenant at nine different properties and leases 9,100 square feet at the Dollar General - Hamilton property under a lease expiring on November 30, 2028; 9,026 square feet at the Dollar General - Cincinnati property under a lease expiring on July 31, 2028; 9,002 square feet at the Dollar General – Hickory (US Highway 70) property under a lease expiring on September 30, 2026; 9,026 square feet at the Dollar General – Denham Springs property under a lease expiring on June 30, 2030; 9,026 square feet at the Dollar General – Hammond property under a lease expiring on April 30, 2028; 9,002 square feet at the Dollar General – Hickory (Lenoir Rhyne Boulevard) under a lease expiring on February 28, 2027; 9,100 square feet at the Dollar General – Gastonia property under a lease expiring on May 31, 2027; 9,026 square feet at the Dollar General – Alorton property under a lease expiring on November 30, 2026 and 9,100 square feet at the Dollar General – Dupo property under a lease expiring on March 31, 2025. |
| (5) | Walgreens at the Walgreens – Fort Worth property has the right to terminate the lease upon 6 months’ notice to the borrower, effective as of June 30, 2028, which is after the maturity date of the ExchangeRight Net Leased Portfolio 12 Mortgage Loan, and every 5 years thereafter, until the lease expires on June 30, 2073. |
| (6) | Advance Auto Parts is a tenant at three different properties and leases 6,889 square feet at the Advance Auto Parts – Steubenville property under a lease expiring on July 31, 2030; 7,000 square feet at the Advance Auto Parts – Greenville property under a lease expiring on December 31, 2025 and 7,000 square feet at the Advance Auto Parts – Heath property under a lease expiring on December 31, 2025. |
The following table presents certain information relating to the available historical sales at the ExchangeRight Net Leased Portfolio 12 Properties:
Historical Sales (PSF)(1)
| Tenant Name | 2013 | 2014 | 2015 |
| Kroger – Hamilton(2)(3) | $36,573,799 | $36,716,453 | $38,083,151 |
| Walgreens – Fort Worth | NAV | NAV | $1,829,529 |
| Advance Auto Parts – Heath | $2,037,946 | NAV | NAV |
| (1) | Available sales were provided by the seller and sponsors. |
| (2) | Kroger – Hamilton sales are as of each fiscal year ending in October. |
| (3) | Historical Sales (PSF) for the Kroger – Hamilton property exclude fuel sales. |
THE INFORMATION IN THIS STRUCTURAL AND COLLATERAL TERM SHEET IS NOT COMPLETE AND MAY BE AMENDED PRIOR TO THE TIME OF SALE. THIS TERM SHEET IS NOT AN OFFER TO SELL THESE SECURITIES AND IT IS NOT A SOLICITATION OF AN OFFER TO BUY THESE SECURITIES IN ANY JURISDICTION WHERE THE OFFER OR SALE IS NOT PERMITTED.
| 114 |
EXCHANGERIGHT NET LEASED PORTFOLIO 12 |
The following table presents certain information relating to the lease rollover schedule at the ExchangeRight Net Leased Portfolio 12 Properties:
Lease Expiration Schedule(1)(2)
| Year Ending December 31, | No. of Leases Expiring | Expiring NRSF | % of Total NRSF | Cumulative Expiring NRSF | Cumulative % of Total NRSF | Annual U/W Base Rent | % of Total Annual U/W Base Rent | Annual U/W Base Rent PSF |
| MTM | 0 | 0 | 0.0% | 0 | 0.0% | $0 | 0.0% | $0.00 |
| 2016 | 0 | 0 | 0.0% | 0 | 0.0% | $0 | 0.0% | $0.00 |
| 2017 | 0 | 0 | 0.0% | 0 | 0.0% | $0 | 0.0% | $0.00 |
| 2018 | 0 | 0 | 0.0% | 0 | 0.0% | $0 | 0.0% | $0.00 |
| 2019 | 0 | 0 | 0.0% | 0 | 0.0% | $0 | 0.0% | $0.00 |
| 2020 | 0 | 0 | 0.0% | 0 | 0.0% | $0 | 0.0% | $0.00 |
| 2021 | 0 | 0 | 0.0% | 0 | 0.0% | $0 | 0.0% | $0.00 |
| 2022 | 0 | 0 | 0.0% | 0 | 0.0% | $0 | 0.0% | $0.00 |
| 2023 | 0 | 0 | 0.0% | 0 | 0.0% | $0 | 0.0% | $0.00 |
| 2024 | 0 | 0 | 0.0% | 0 | 0.0% | $0 | 0.0% | $0.00 |
| 2025 | 3 | 23,100 | 9.5% | 23,100 | 9.5% | $259,077 | 8.7% | $11.22 |
| 2026 | 3 | 95,182 | 39.0% | 118,282 | 48.5% | $1,018,994 | 34.3% | $10.71 |
| Thereafter | 13 | 125,548 | 51.5% | 243,830 | 100.0% | $1,694,130 | 57.0% | $13.49 |
| Vacant | 0 | 0 | 0.0% | 243,830 | 100.0% | $0 | 0.0% | $0.00 |
| Total/Weighted Average | 19 | 243,830 | 100.0% | $2,972,200 | 100.0% | $12.19 |
| (1) | Information obtained from the underwritten rent roll. |
| (2) | Certain tenants may have lease termination options that are exercisable prior to the originally stated expiration date of the subject lease and that are not considered in the Lease Expiration Schedule. |
The following table presents historical occupancy percentages at the ExchangeRight Net Leased Portfolio 12 Properties:
Historical Occupancy
12/31/2012(1) | 12/31/2013(1) | 12/31/2014(1) | 12/31/2015(1) | 7/1/2016(2) |
| NAV | NAV | NAV | NAV | 100.0% |
| (1) | The sellers of the ExchangeRight Net Leased Portfolio 12 Properties were unable to provide historical occupancy information to the borrower, the buyer. |
| (2) | Information obtained from the underwritten rent roll. |
THE INFORMATION IN THIS STRUCTURAL AND COLLATERAL TERM SHEET IS NOT COMPLETE AND MAY BE AMENDED PRIOR TO THE TIME OF SALE. THIS TERM SHEET IS NOT AN OFFER TO SELL THESE SECURITIES AND IT IS NOT A SOLICITATION OF AN OFFER TO BUY THESE SECURITIES IN ANY JURISDICTION WHERE THE OFFER OR SALE IS NOT PERMITTED.
| 115 |
EXCHANGERIGHT NET LEASED PORTFOLIO 12 |
Operating History and Underwritten Net Cash Flow. The following table presents certain information relating to the underwritten net cash flow at the ExchangeRight Net Leased Portfolio 12 Properties:
Cash Flow Analysis(1)
| U/W | % of U/W Effective Gross Income | U/W $ per SF | |
| Base Rent | $2,972,200(2) | 86.6% | $12.19 |
| Grossed Up Vacant Space | 0 | 0.0 | 0.00 |
| Total Reimbursables | 566,958(3) | 16.5 | 2.33 |
| Other Income | 0 | 0.0 | 0.00 |
| Less Vacancy & Free Rent | (107,008)(4) | (3.1) | (0.44) |
| Effective Gross Income | $3,432,150 | 100.0% | $14.08 |
| Total Operating Expenses | $635,601 | 18.5% | $2.61 |
| Net Operating Income | $2,796,549 | 81.5% | $11.47 |
| TI/LC | 93,323 | 2.7 | 0.38 |
| Capital Expenditures | 25,257 | 0.7 | 0.10 |
| Net Cash Flow | $2,677,969 | 78.0% | $10.98 |
| NOI DSCR | 2.38x | ||
| NCF DSCR | 2.28x | ||
| NOI DY | 11.3% | ||
| NCF DY | 10.8% |
| (1) | Historical cash flows are unavailable as the ExchangeRight Net Leased Portfolio 12 Properties were acquired by the sponsors between January 2016 and May 2016, for a combined purchase price of approximately $46.5 million. The sellers of the ExchangeRight Net Leased Portfolio 12 Properties were unable to provide historical operating statements to the borrower, the buyer. |
| (2) | U/W Base Rent includes the average straight-line rent for Dollar General – Cincinnati, Dollar General – Hammond, Dollar General – Hamilton and Fresenius Dialysis Center – Nashville properties, totalling $603,678. |
| (3) | Total Reimbursables are underwritten based on tenant leases and discussions with the borrower. Five of the properties have no reimbursements as the tenants pay expenses directly, whereas the remaining 14 properties reimburse either property taxes, insurance or operating expenses or some combination of the three. |
| (4) | The underwritten economic vacancy is 3.0%. A 5% vacancy factor was underwritten for all properties except for eight properties (Walgreens – Fort Worth, Dollar General – Hamilton, Dollar General – Cincinnati, Dollar General – Hammond, Dollar General – Gastonia, Dollar General – Denham Springs, Advance Auto Parts – Steubenville and Fresenius Dialysis Center – Nashville) that are occupied by an investment grade tenant with approximately 11 years remaining on the initial lease term and a fully extended expiration date of 2041 or later. The ExchangeRight Net Leased Portfolio 12 Properties are 100.0% occupied as of July 1, 2016. |
Appraisal. The ExchangeRight Net Leased Portfolio 12 Properties were valued individually, with the individual values reflecting a cumulative “as-is” appraised value of $47,040,000. The appraisals were dated from January 28, 2016 to May 3, 2016. Additionally, since the ExchangeRight Net Leased Portfolio 12 Properties are single tenant, each appraisal had a corresponding dark value. The ExchangeRight Net Leased Portfolio 12 Properties have a cumulative “dark” appraised value of $25,520,000.
Environmental Matters. According to the Phase I environmental site assessment dated as of January 25, 2016, there was evidence of a recognized environmental condition (“REC”) at the Kroger - Hamilton property. Prior to redevelopment in 2006, the Kroger – Hamilton property had been used for safe manufacturing for more than 90 years that generated hazardous waste. The site was sampled, and following remediation pursuant to the Ohio Voluntary Action Program, it was approved for No Further Action status subject to an activity use limitation restricting future development to industrial and commercial purposes and prohibiting use of groundwater for potable and non-potable purposes. The Phase I environmental site assessment ruled out any potential for indoor vapor intrusion and recommended no further action. See “Description of the Mortgage Pool—Mortgage Pool Characteristics—Environmental Considerations” in the Preliminary Prospectus.
The Borrower.The borrower is ExchangeRight Net Leased Portfolio 12 DST, a Delaware statutory trust. At loan origination, the ExchangeRight Net Leased Portfolio 12 Properties were conveyed and assumed from ExchangeRight Net Leased Portfolio 12, LLC to and by ExchangeRight Net Leased Portfolio 12 DST. There is one independent director for the borrowing entity and one independent director of the master lessee. Legal counsel to the borrower delivered a non-consolidation opinion in connection with the origination of the ExchangeRight Net Leased Portfolio 12 Mortgage Loan. David Fisher, Joshua Ungerecht and Warren Thomas are the guarantors of certain nonrecourse carveouts under the ExchangeRight Net Leased Portfolio 12 Mortgage Loan. See“Description of the Mortgage Pool—Mortgage Pool Characteristics—Delaware Statutory Trusts” in the Preliminary Prospectus.
The ExchangeRight Net Leased Portfolio 12 DST has master leased the ExchangeRight Net Leased Portfolio 12 Properties to a master lessee affiliated with the sponsors. The master lessee is structured as a special purpose entity. The master lessee’s interest in the master lease and all rents are assigned to the lender. The sponsors have a 100% ownership in the master lessee. The master lease is subordinate to the ExchangeRight Net Leased Portfolio 12 Mortgage Loan.
The Sponsors.The sponsors are David Fisher, Joshua Ungerecht and Warren Thomas, all of whom are managing members of ExchangeRight Real Estate LLC (“ExchangeRight”). ExchangeRight has more than $400.0 million of assets and more than 2.0 million
THE INFORMATION IN THIS STRUCTURAL AND COLLATERAL TERM SHEET IS NOT COMPLETE AND MAY BE AMENDED PRIOR TO THE TIME OF SALE. THIS TERM SHEET IS NOT AN OFFER TO SELL THESE SECURITIES AND IT IS NOT A SOLICITATION OF AN OFFER TO BUY THESE SECURITIES IN ANY JURISDICTION WHERE THE OFFER OR SALE IS NOT PERMITTED.
| 116 |
EXCHANGERIGHT NET LEASED PORTFOLIO 12 |
square feet under management. ExchangeRight has more than 156 investment-grade retail and Class B/B+ multifamily properties located across 27 states. Mr. Thomas was involved in a foreclosure in 2013. See“Description of the Mortgage Pool—Loan Purpose; Default History, Bankruptcy Issues and Other Proceedings” in the Preliminary Prospectus.
Escrows. The loan documents provide for upfront reserves in the amount of $36,332 for real estate taxes; $91,028 for deferred maintenance and $95,106 for a declaration deposit, which amount can be used to cover the cost of obligations under a reciprocal easement agreement relating to the Kroger – Hamilton property. Additionally, the loan documents require monthly deposits of an amount equal to one-twelfth of the estimated annual real estate taxes (currently equates to $21,494), one-twelfth of the insurance premiums that the lender estimates will be payable for the renewal of the coverage afford by the policies upon the expiration thereof (insurance is currently being maintained under a blanket policy) and $1,762 for replacement reserves. If an event of default has occurred and is continuing, the borrower is required to deposit $14,475 and any sum or termination fee payable to the borrower on a monthly basis into the TI/LC reserve.
Lockbox and Cash Management. The ExchangeRight Net Leased Portfolio 12 Mortgage Loan requires a lender-controlled hard lockbox account, which is already in place. The borrower and property manager are required to direct all tenants to pay rents directly into such lockbox account. The loan documents also require that all rents received by the borrower or property manager be deposited into the lockbox account within two business day of receipt. During a Cash Sweep Period (as defined below), funds deposited into the lockbox account are required to be swept on a daily basis into a cash management account controlled by the lender.
A “Cash Sweep Period” will mean each period commencing on the occurrence of a Cash Sweep Event (as defined below) and continuing upon the earlier of (i) the next occurring payment date following the related Cash Sweep Event Cure (as defined below) or (ii) payment in full of all principal and interest on the ExchangeRight Net Leased Portfolio 12 Mortgage Loan and all other amounts due payable under the loan documents or defeasance of the ExchangeRight Net Leased Portfolio 12 Mortgage Loan.
A “Cash Sweep Event” will mean the occurrence of: (i) an event of default; (ii) a debt service coverage ratio for the ExchangeRight Net Leased Portfolio 12 Mortgage Loan of less than 1.45x as of the date of determination; (iii) a Kroger Trigger Event (as defined below); (iv) a Kroger Renewal Trigger Event (as defined below); or (v) a Qualified Transfer Trigger Event (as defined below).
A “Cash Sweep Event Cure” will mean with respect to clause: (i) above, the acceptance by the lender of a cure of such event of default; with respect to clause (ii) above, the achievement of a debt service coverage ratio greater than or equal to 1.45x for two consecutive calendar quarters; with respect to clause (iii) above, if the occurrence of Kroger Trigger Event Cure (as defined below) or the achievement of amounts on deposit in the excess cash reserve account as a result of a Kroger Trigger Event equaling or exceeding $1,543,080 (“Kroger Cap”); with respect to clause (iv) above, the occurrence of a Kroger Renewal Trigger Event Cure (as defined below) or the achievement of the amounts on deposit in the excess cash reserve account solely as a result of a Kroger Renewal Trigger Event equaling or exceeding $771,540 (“Kroger Renewal Trigger Event Cap”); or with respect to clause (v) above, the occurrence of a Qualified Transfer Trigger Event Cure (as defined below); provided, however, that such cure is subject to, (i) the absence of a continuing event of default and (ii) the borrower’s payment of all of lender’s reasonable expenses incurred in connection with such Cash Sweep Event Cure, including attorney’s fees and expenses.
A “Kroger Trigger Event” will mean the occurrence of (i) Kroger goes dark, vacates or gives notice to vacate its space; (ii) Kroger is delinquent on its rent payments by more than 90 days; or (iii) Kroger goes bankrupt.
A “Kroger Trigger Event Cure” will mean the occurrence of (i) the borrower providing evidence satisfactory to the lender that Kroger has resumed occupancy and is operating out of all its space; (ii) the borrower providing evidence satisfactory to the lender that Kroger is current in all of its monetary obligations under its lease; (iii) the borrower providing evidence satisfactory to the lender that the Kroger lease has been assumed without alteration of its material terms or that Kroger is no longer the subject to the jurisdiction of the bankruptcy court; or (iv) the borrower entering into a replacement lease approved by the lender satisfying the requirements as set in the loan documents.
A “Kroger Renewal Trigger Event” will mean the occurrence of the date 12 months prior to the earlier of: (i) the maturity date or (ii) the expiration date of the Kroger lease.
A “Kroger Renewal Trigger Event Cure” will mean the occurrence of: (i)(a) Kroger renewing for a term of not less than five years at economic terms materially similar to the current economic terms, but in no event less than 90.0% of the current economic terms and (b) the lender receiving an updated tenant estoppels certificate confirming the renewal and renewal terms, the Kroger lease is in full effect, Kroger is in physical occupancy and that there is no default by borrower under the Kroger lease; or (ii) the borrower entering into a replacement lease approved by the lender satisfying the requirements as set in the loan documents.
A “Qualified Transfer Trigger Event” will mean the date that is 36 months prior to the maturity date.
A “Qualified Transfer Trigger Event Cure” will mean the occurrence of a Qualified Transfer (as defined below), provided that the Approved Transferee (as defined below) (i) maintains a minimum net worth of at least $200.0 million and total assets of at least $400.0 million; (ii) executes and delivers to lender a full recourse guaranty guaranteeing payment of the entire amount of the ExchangeRight Net Leased Portfolio 12 Mortgage Loan; (iii) owns no less than 100.0% of the legal and beneficial ownership interests in the borrower and master lessee; (iv) is not a Delaware statutory trust; and (v) causes the borrower to convert to a limited liability company.
THE INFORMATION IN THIS STRUCTURAL AND COLLATERAL TERM SHEET IS NOT COMPLETE AND MAY BE AMENDED PRIOR TO THE TIME OF SALE. THIS TERM SHEET IS NOT AN OFFER TO SELL THESE SECURITIES AND IT IS NOT A SOLICITATION OF AN OFFER TO BUY THESE SECURITIES IN ANY JURISDICTION WHERE THE OFFER OR SALE IS NOT PERMITTED.
| 117 |
EXCHANGERIGHT NET LEASED PORTFOLIO 12 |
A “Qualified Transfer” will mean, at any time following the date six months from the origination date, the transfer of all outstanding ownership interests in the borrower in one or a series of transactions to an Approved Transferee and the replacement of the guarantor as the person who controls the borrower, provided the terms and conditions set forth in the loan documents are satisfied.
An “Approved Transferee” will mean (i) an eligible financial institution or (ii) any person who meets the requirements as set in the loan documents, is regularly engaged in the business of owning or operating commercial properties, owns interests in or operates at least five properties with a minimum of 750,000 square feet and has a total assets of at least $100.0 million.
Property Management.The ExchangeRight Net Leased Portfolio 12 Properties are managed by an affiliate of the borrower.
Assumption.The borrower is permitted to transfer the ExchangeRight Net Leased Portfolio 12 Properties, provided that certain conditions are satisfied, including (i) that no event of default has occurred and is continuing; (ii) that the lender has reasonably determined that the proposed transferee and guarantor satisfy the lender’s credit review and underwriting standards, taking into consideration transferee experience, financial strength and general business standing; (iii) the delivery of a REMIC opinion, an insolvency opinion and other opinions required by the lender; and (iv) that the lender has received confirmation from Fitch, KBRA and Moody’s that such assumption will not result in a downgrade, withdrawal or qualification of the respective ratings assigned to the Series 2016-C35 Certificates. If such transfer is a permitted transfer as set forth in the loan documents, the borrower is not required to receive lender consent and fulfill the aforementioned provisions.
Right of First Refusal. The sole tenants at the Walgreens – Fort Worth property and the Tractor Supply – Woods Cross property each have a right of first refusal (“ROFR”) with respect to offers to purchase their respective properties. The tenants, Walgreens and Tractor Supply, agreed in a subordination, nondisturbance and attornment agreement that such right of first refusal is waived in the case of foreclosure or deed in lieu. The sole tenant at Family Dollar – Baton Rouge property has a ROFR with respect to offers to purchase its property, which right does not apply to a foreclosure, deed in lieu or a similar conveyance resulting from a lender exercising its remedies under a mortgage encumbering the Family Dollar – Baton Rouge property.
Partial Release.Not permitted.
Real Estate Substitution.Not permitted.
Subordinate and Mezzanine Indebtedness.Not permitted.
Ground Lease. None.
Terrorism Insurance.The loan documents require that the “all risk” insurance policy required to be maintained by the borrower provide coverage for terrorism in an amount equal to the full replacement cost of the ExchangeRight Net Leased Portfolio 12 Properties. The loan documents also require business interruption insurance covering no less than the 12-month period following the occurrence of a casualty event, together with a three-month extended period of indemnity.
THE INFORMATION IN THIS STRUCTURAL AND COLLATERAL TERM SHEET IS NOT COMPLETE AND MAY BE AMENDED PRIOR TO THE TIME OF SALE. THIS TERM SHEET IS NOT AN OFFER TO SELL THESE SECURITIES AND IT IS NOT A SOLICITATION OF AN OFFER TO BUY THESE SECURITIES IN ANY JURISDICTION WHERE THE OFFER OR SALE IS NOT PERMITTED.
| 118 |
(THIS PAGE INTENTIONALLY LEFT BLANK)
THE INFORMATION IN THIS STRUCTURAL AND COLLATERAL TERM SHEET IS NOT COMPLETE AND MAY BE AMENDED PRIOR TO THE TIME OF SALE. THIS TERM SHEET IS NOT AN OFFER TO SELL THESE SECURITIES AND IT IS NOT A SOLICITATION OF AN OFFER TO BUY THESE SECURITIES IN ANY JURISDICTION WHERE THE OFFER OR SALE IS NOT PERMITTED.
| 119 |
| No. 11 – Barber Self Storage | |||||||
| Loan Information | Property Information | ||||||
| Mortgage Loan Seller: | Rialto Mortgage Finance, LLC | Single Asset/Portfolio: | Single Asset | ||||
| Credit Assessment (Fitch/KBRA/Moody’s): | NR/NR/NR | Property Type: | Self Storage | ||||
| Original Principal Balance: | $24,460,000 | Specific Property Type: | Self Storage | ||||
| Cut-off Date Balance: | $24,460,000 | Location: | Virginia Beach, VA | ||||
| % of Initial Pool Balance: | 2.4% | Size: | 390,380 SF | ||||
| Loan Purpose: | Acquisition | Cut-off Date Balance Per SF: | $62.66 | ||||
| Borrower Name: | Prime Group Virginia Beach, LLC | Year Built/Renovated: | 2008/NAP | ||||
| Sponsors(1): | Robert Morgan; Robert Moser | Title Vesting: | Fee | ||||
| Mortgage Rate: | 4.810% | Property Manager: | Self-managed | ||||
| Note Date: | June 17, 2016 | 4th Most Recent Occupancy: | NAV | ||||
| Anticipated Repayment Date: | NAP | 3rd Most Recent Occupancy (As of): | 96.4% (12/31/2013) | ||||
| Maturity Date: | July 6, 2026 | 2nd Most Recent Occupancy (As of): | 91.1% (12/31/2014) | ||||
| IO Period: | 36 months | Most Recent Occupancy (As of): | 96.9% (12/31/2015) | ||||
| Loan Term (Original): | 120 Months | Current Occupancy (As of): | 99.6% (6/7/2016) | ||||
| Seasoning: | 0 months | ||||||
| Amortization Term (Original): | 360 months | Underwriting and Financial Information: | |||||
| Loan Amortization Type: | Interest-only, Amortizing Balloon | 4th Most Recent NOI (As of)(4): | $1,520,938 (12/31/2013) | ||||
| Interest Accrual Method: | Actual/360 | 3rd Most Recent NOI (As of)(4): | $1,756,103 (12/31/2014) | ||||
| Call Protection(2): | L(24),D(92),O(4) | 2nd Most Recent NOI (As of)(4): | $2,282,865 (12/31/2015) | ||||
| Lockbox Type: | Springing | Most Recent NOI (As of): | $2,345,267 (TTM 4/30/2016) | ||||
| Additional Debt(2): | Yes | ||||||
| Additional Debt Type(2): | Future Mezzanine | U/W Revenues: | $2,727,799 | ||||
| U/W Expenses: | $647,112 | ||||||
| U/W NOI: | $2,080,687 | ||||||
| U/W NCF: | $2,061,168 | ||||||
| U/W NOI DSCR: | 1.35x | ||||||
| U/W NCF DSCR: | 1.34x | ||||||
| Escrows and Reserves: | U/W NOI Debt Yield: | 8.5% | |||||
| U/W NCF Debt Yield: | 8.4% | ||||||
| Type: | Initial | Monthly | Cap (If Any) | As-Is Appraised Value: | $35,120,000 | ||
| Taxes | $31,082 | $14,801 | NAP | As-Is Appraisal Valuation Date: | May 10, 2016 | ||
| Insurance | $24,372 | $2,579 | NAP | Cut-off Date LTV Ratio: | 69.6% | ||
| Replacement Reserves(3) | $0 | $1,627 | NAP | LTV Ratio at Maturity or ARD: | 61.4% | ||
| (1) | Affiliates of Robert Morgan and Robert Moser were involved in prior foreclosures and one deed-in-lieu of foreclosure. See “Description of the Mortgage Pool – Loan Purpose; Default History, Bankruptcy Issues and Other Proceedings” in the Preliminary Prospectus. |
| (2) | Future mezzanine debt is permitted subject to the satisfaction of certain conditions, including (i) the execution of an intercreditor agreement in form and substance acceptable to the lender; (ii) the combined loan-to-value ratio is not greater than 70.0%; (iii) the combined amortizing debt service coverage ratio is not less than 1.35x; and (iv) receipt of rating agency confirmations from Fitch, KBRA and Moody’s that the mezzanine financing will not result in a downgrade, withdrawal or qualification of the respective ratings assigned to the Series 2016-C35 Certificates. |
| (3) | The Barber Self Storage mortgage loan documents provide for the release of a portion of the Retention Pond Parcel (as defined below) in connection with a sale of such parcel, provided that any proceeds from such sale are required to be deposited into the Replacement Reserve account. In connection with a transfer of such parcel to an affiliate, an amount equal to the value attributed to such parcel pursuant to an updated appraisal is required to be deposited into the Replacement Reserve account. No value was attributed to this parcel in the appraisal and the lender did not consider this parcel in underwriting the loan. |
| (4) | See “Cash Flow Analysis” section. |
The Barber Self Storage mortgage loan is evidenced by a single promissory note that is secured by a first mortgage encumbering a 809-unit, 390,380 square feet self-storage facility comprised of 18 one-story buildings located in Virginia Beach, Virginia (the “Barber Self Storage Property”),approximately eight miles southeast of the Virginia Beach central business district. The improvements were constructed in phases between 2008 and 2014, and are situated on a 51.1-acre site, which includes an unimproved 21.7-acre parcel that is currently zoned for residential use (the “Retention Pond Parcel”), a portion of which is used as a retention pond for the storm water runoff generated by the improvements on the 29.4 acre parcel. Amenities at the Barber Self Storage Property include a leasing office and on-site management team, electronic security gate with keypad entry, perimeter fencing, and 24-hour video surveillance. The Barber Self Storage Property consists of 195 climate controlled units (24.1% of units), 214 standard non-climate controlled units (26.5% of units), and 400 large non-climate controlled units (49.4% of units). The large non-climate controlled units range in size from 495 square feet to 2,200 square feet and are typically utilized by contractors and small businesses for equipment storage. The Barber Self Storage Property also generates revenue from 154 outside RV/boat parking spaces. As of the June 7, 2016 rent roll, the Barber Self Storage Property was 99.6% occupied.
THE INFORMATION IN THIS STRUCTURAL AND COLLATERAL TERM SHEET IS NOT COMPLETE AND MAY BE AMENDED PRIOR TO THE TIME OF SALE. THIS TERM SHEET IS NOT AN OFFER TO SELL THESE SECURITIES AND IT IS NOT A SOLICITATION OF AN OFFER TO BUY THESE SECURITIES IN ANY JURISDICTION WHERE THE OFFER OR SALE IS NOT PERMITTED.
| 120 |
| BARBER SELF STORAGE |
Sources and Uses
| Sources | Uses | |||||||
| Original loan amount | $24,460,000 | 77.8% | Purchase price | $30,600,000 | 97.3% | |||
| Sponsor’s new cash contribution | 6,989,689 | 22.2 | Reserves | 55,455 | 0.2 | |||
| Closing costs | 794,234 | 2.5 | ||||||
| Total Sources | $31,449,689 | 100.0% | Total Uses | $31,449,689 | 100.0% |
The following table presents historical occupancy percentages at the Barber Self Storage Property:
Historical Occupancy
12/31/2012 | 12/31/2013(1) | 12/31/2014(1) | 12/31/2015(1) | 6/7/2016(2) |
| NAV | 96.4% | 91.1% | 96.9% | 99.6% |
| (1) | Information obtained from the borrower. |
| (2) | Information obtained from the underwritten rent roll. |
Operating History and Underwritten Net Cash Flow.The following table presents certain information relating to the historical operating performance and underwritten net cash flow at the Barber Self Storage Property:
Cash Flow Analysis
| 2013(1) | 2014(1) | 2015(1) | TTM 4/30/2016 | U/W | % of U/W | U/W $ per SF | ||||||||
| Base Rent | $1,694,330 | $1,955,072 | $2,509,570 | $2,583,987 | $2,599,236 | 95.3% | $6.66 | |||||||
| Grossed Up Vacant Space | 0 | 0 | 0 | 0 | 16,740 | 0.6 | 0.04 | |||||||
| Concessions | 0 | 0 | 0 | 0 | 0 | 0.0 | 0.00 | |||||||
| Other Income(2) | 207,817 | 210,617 | 235,997 | 243,666 | 243,666 | 8.9 | 0.62 | |||||||
| Less Vacancy & Credit Loss | 0 | 0 | 0 | 0 | (131,843)(3) | (4.8) | (0.34) | |||||||
| Effective Gross Income | $1,902,147 | $2,165,689 | $2,745,567 | $2,827,653 | $2,727,799 | 100.0% | $6.99 | |||||||
| Total Operating Expenses(4) | $381,210 | $409,586 | $462,702 | $482,386 | $647,112 | 23.7% | $1.66 | |||||||
| ||||||||||||||
| Net Operating Income | $1,520,938 | $1,756,103 | $2,282,865 | $2,345,267 | $2,080,687 | 76.3% | $5.33 | |||||||
| Capital Expenditures | 0 | 0 | 0 | 0 | 19,519 | 0.7 | 0.05 | |||||||
| Net Cash Flow | $1,520,938 | $1,756,103 | $2,282,865 | $2,345,267 | $2,061,168 | 75.6% | $5.28 | |||||||
| NOI DSCR | 0.99x | 1.14x | 1.48x | 1.52x | 1.35x | |||||||||
| NCF DSCR | 0.99x | 1.14x | 1.48x | 1.52x | 1.34x | |||||||||
| NOI DY | 6.2% | 7.2% | 9.3% | 9.6% | 8.5% | |||||||||
| NCF DY | 6.2% | 7.2% | 9.3% | 9.6% | 8.4% |
| (1) | The Barber Self Storage Property was built in phases between 2008 and 2014, resulting in increased rental collections. |
| (2) | Other Income includes administrative fees, late fees, vehicle rental income, retail sales, and parking income from 154 outdoor parking spaces used for RVs and automobiles. |
| (3) | The underwritten economic vacancy is 5.0%. The Barber Self Storage Property was 99.6% physically occupied as of June 7, 2016. |
| (4) | The Barber Self Storage Property benefits from a 50% reduction of the property’s storm water bill because the property maintains a retention pond. The underwritten operating expenses consider this reduction. |
The following table presents certain information relating to some comparable self storage properties for the Barber Self Storage Property:
Competitive Set(1)
Barber Self | My Storage | Allsafe Self Storage | Harpers Road Storage Center | Security Plus Self Storage | AAAA Self Storage | |
| Location | Virginia Beach, VA | Virginia Beach, VA | Virginia Beach, VA | Virginia Beach, VA | Virginia Beach, VA | Virginia Beach, VA |
| Distance from Subject | -- | 0.2 miles | 1.9 miles | 2.4 miles | 3.0 miles | 2.7 miles |
| Property Type | Self Storage | Self Storage | Self Storage | Self Storage | Self Storage | Self Storage |
| Year Built/Renovated | 2008/NAP | 2007/NAV | 2001/NAV | 2003/NAV | 1988/NAV | 2001/NAV |
| Total Units | 809 | 814 | 500 | 239 | 706 | 889 |
| Total Occupancy | 99.0% | NAV | 96.0% | 91.0% | 87.0% | 83.0% |
| (1) | Information obtained from the appraisal. |
THE INFORMATION IN THIS STRUCTURAL AND COLLATERAL TERM SHEET IS NOT COMPLETE AND MAY BE AMENDED PRIOR TO THE TIME OF SALE. THIS TERM SHEET IS NOT AN OFFER TO SELL THESE SECURITIES AND IT IS NOT A SOLICITATION OF AN OFFER TO BUY THESE SECURITIES IN ANY JURISDICTION WHERE THE OFFER OR SALE IS NOT PERMITTED.
| 121 |
| No. 12 – San Fernando Value Square | |||||||||
| Loan Information | Property Information | ||||||||
| Mortgage Loan Seller: | Wells Fargo Bank, National Association | Single Asset/Portfolio: | Single Asset | ||||||
Credit Assessment (Fitch/KBRA/Moody’s): | NR/NR/NR | Property Type: | Retail | ||||||
| Original Principal Balance: | $23,600,000 | Specific Property Type: | Anchored | ||||||
| Cut-off Date Balance: | $23,600,000 | Location: | Sylmar, CA | ||||||
| % of Initial Pool Balance: | 2.3% | Size: | 118,611 SF | ||||||
| Loan Purpose: | Refinance | Cut-off Date Balance Per SF: | $198.97 | ||||||
| Borrower Name: | The SFVS Company LLC | Year Built/Renovated: | 1987/NAP | ||||||
| Sponsors: | Dorian Bilak; Sara V. Dumont | Title Vesting: | Fee | ||||||
| Mortgage Rate: | 4.100% | Property Manager: | Self-managed | ||||||
| Note Date: | June 13, 2016 | 4th Most Recent Occupancy (As of): | 100.0% (12/31/2012) | ||||||
| Anticipated Repayment Date: | NAP | 3rd Most Recent Occupancy (As of): | 100.0% (12/31/2013) | ||||||
| Maturity Date: | July 11, 2026 | 2nd Most Recent Occupancy (As of): | 100.0% (12/31/2014) | ||||||
| IO Period: | 24 months | Most Recent Occupancy (As of): | 100.0% (12/31/2015) | ||||||
| Loan Term (Original): | 120 months | Current Occupancy (As of): | 100.0% (4/30/2016) | ||||||
| Seasoning: | 0 months | ||||||||
| Amortization Term (Original): | 360 months | Underwriting and Financial Information: | |||||||
| Loan Amortization Type: | Interest-only, Amortizing Balloon | ||||||||
| Interest Accrual Method: | Actual/360 | 4thMost Recent NOI (As of): | $2,168,829 (12/31/2013) | ||||||
| Call Protection: | L(24),D(92),O(4) | 3rdMost Recent NOI (As of): | $2,325,155 (12/31/2014) | ||||||
| Lockbox Type: | Springing | 2ndMost Recent NOI (As of): | $2,521,449 (12/31/2015) | ||||||
| Additional Debt: | None | Most Recent NOI (As of): | $2,456,883 (TTM 4/30/2016) | ||||||
| Additional Debt Type: | NAP | ||||||||
| U/W Revenues: | $3,433,145 | ||||||||
| U/W Expenses: | $1,184,500 | ||||||||
| U/W NOI: | $2,248,645 | ||||||||
| U/W NCF: | $2,096,935 | ||||||||
| Escrows and Reserves: | U/W NOI DSCR: | 1.64x | |||||||
| U/W NCF DSCR: | 1.53x | ||||||||
| Type: | Initial | Monthly | Cap (If Any) | U/W NOI Debt Yield: | 9.5% | ||||
| Taxes | $109,646 | $27,412 | NAP | U/W NCF Debt Yield: | 8.9% | ||||
| Insurance(1) | $0 | Springing | NAP | As-Is Appraised Value: | $42,600,000 | ||||
| Replacement Reserve | $0 | $2,184 | NAP | As-Is Appraisal Valuation Date: | April 24, 2016 | ||||
| TI/LC Reserve | $0 | $0 | NAP | Cut-off Date LTV Ratio: | 55.4% | ||||
| Sam’s Club Reserve(2) | $0 | Springing | NAP | LTV Ratio at Maturity or ARD: | 46.8% | ||||
| (1) | Ongoing reserves for insurance premiums are not required as long as (i) no event of default has occurred and is continuing; (ii) the San Fernando Value Square Property (as defined below) is insured via an acceptable blanket insurance policy; and (iii) the borrower provides the lender with evidence of renewal of the insurance policies and timely proof of payment of insurance premiums. |
| (2) | Upon the occurrence of the lender not receiving evidence that the Sam’s Club space has been leased to either Sam’s Club or satisfactory replacement tenants on terms and conditions acceptable to the lender by July 11, 2021, the borrower is required to deposit $750,000 in the Sam’s Club Reserve on August 11, 2021 or deposit monthly payments of $12,500 for 60 months beginning on August 11, 2021. |
The San Fernando Value Square mortgage loan is evidenced by a single promissory note that is secured by a first mortgage encumbering an 118,611 square foot anchored retail center (the “San Fernando Value Square Property”) located in Sylmar, California, approximately 21.6 miles northwest of the Los Angeles central business district. Built in 1987, the San Fernando Value Square Property is anchored by Sam’s Club (representing 90.1% of the net rentable area and 70.3% of the underwritten base rent) and consists of seven one-story buildings located on a 10.2-acre site. Additionally, the San Fernando Value Square Property is shadow anchored by an 114,423 square foot Home Depot. The San Fernando Value Square Property includes 700 surface parking spaces resulting in a parking ratio of 5.9 spaces per 1,000 square feet of rentable area. As of April 30, 2016, the San Fernando Value Square Property was 100.0% occupied by 12 tenants.
The San Fernando Value Square Property is situated at the intersection of Ronald Reagan Freeway (Route 118) and Foothills Freeway (I-210), which provide primary access to the neighborhood. According to the appraisal, the estimated 2015 population within a three- and five-mile radius of the San Fernando Value Square Property was 185,292 and 347,599, respectively, while the estimated 2015 average household income within the same radii was $65,260 and $70,272, respectively. According to a third party market research report, the San Fernando Value Square Property is located within the Eastern San Fernando Valley (“ESFV”) submarket of the Los Angeles retail market. As of the first quarter of 2016, the ESFV submarket reported total inventory of 1,660 properties totaling approximately 17.0 million square feet. During the same period, the ESFV submarket exhibited a 7.1% vacancy rate and average asking rate $23.94 per square foot on a triple net basis.
THE INFORMATION IN THIS STRUCTURAL AND COLLATERAL TERM SHEET IS NOT COMPLETE AND MAY BE AMENDED PRIOR TO THE TIME OF SALE. THIS TERM SHEET IS NOT AN OFFER TO SELL THESE SECURITIES AND IT IS NOT A SOLICITATION OF AN OFFER TO BUY THESE SECURITIES IN ANY JURISDICTION WHERE THE OFFER OR SALE IS NOT PERMITTED.
| 122 |
| SAN FERNANDO VALUE SQUARE |
Sources and Uses
| Sources | Uses | |||||||
| Original loan amount | $23,600,000 | 100.0% | Loan payoff(1) | $20,613,484 | 87.3% | |||
| Closing costs | 364,562 | 1.5 | ||||||
| Reserves | 109,646 | 0.5 | ||||||
| Return of equity | 2,512,308 | 10.6 | ||||||
| Total Sources | $23,600,000 | 100.0% | Total Uses | $23,600,000 | 100.0% |
| (1) | The San Fernando Value Square Property was previously securitized in the WBCMT 2006-C28 transaction. |
The following table presents certain information relating to the tenancies at the San Fernando Value Square Property:
Major Tenants
| Tenant Name | Credit Rating (Fitch/Moody’s/S&P)(1) | Tenant NRSF | % of NRSF | Annual U/W Base Rent PSF(2) | Annual U/W Base Rent(2) | % of Total Annual U/W Base Rent | Sales PSF(3) | Occupancy Cost(3) | Lease Expiration Date |
| Anchor Tenants | |||||||||
| Sam’s Club | AA/Aa2/AA | 106,911 | 90.1% | $15.99 | $1,709,892 | 70.3% | $1,040 | 2.4% | 11/1/2026(4) |
| Total Anchor Tenants | 106,911 | 90.1% | $15.99 | $1,709,892 | 70.3% | ||||
| Major Tenants | |||||||||
| McDonald’s | BBB+/Baa1/BBB+ | (5) | 0.0% | (5) | $89,588 | 3.7% | NAV | NAV | 11/20/2018(6) |
| General Wireless | NR/NR/NR | 2,500 | 2.1% | $29.77 | $74,415 | 3.1% | NAV | NAV | 6/30/2017(7)(8) |
| EZ-Dental | NR/NR/NR | 1,955 | 1.6% | $37.80 | $73,899 | 3.0% | NAV | NAV | 8/15/2021(9) |
| El Pollo Loco | NR/NR/NR | (10) | 0.0% | (10) | $72,000 | 3.0% | (10) | 2.3% | 1/24/2024(11) |
| Total Major Tenants | 4,455 | 3.8% | $69.56(12) | $309,902 | 12.7% | ||||
| Non-Major Tenants | 7,245(13) | 6.1% | $56.89(13) | $412,154 | 16.9% | ||||
| Occupied Collateral Total | 118,611 | 100.0% | $20.50(14) | $2,431,948 | 100.0% | ||||
| Vacant Space | 0 | 0.0% | |||||||
| Collateral Total | 118,611 | 100.0% | |||||||
| (1) | Certain ratings are those of the parent company, whether or not the parent guarantees the lease. |
| (2) | Annual U/W Base Rent PSF and Annual U/W Base Rent include contractual rent steps through December 2016 totaling $3,519. |
| (3) | Sales PSF and Occupancy Cost are for the trailing 12-month period ending December 31, 2015. |
| (4) | Sam’s Club has four, 5-year lease renewal options. |
| (5) | McDonald’s is subject to a ground lease. The net rentable area of McDonald’s improvements is 5,400 square feet, which results in an Annual U/W Base Rent PSF of $16.59. |
| (6) | McDonald’s has two, 5-year lease renewal options. |
| (7) | General Wireless has the right to terminate its lease with 60 days’ notice if annual sales are less than $400,000. |
| (8) | General Wireless has one, 5-year lease renewal option. |
| (9) | EZ-Dental has two, 5-year lease renewal options. |
| (10) | El Pollo Loco is subject to a ground lease. The net rentable area of El Pollo Loco’s improvements is 2,250 square feet, which results in an Annual U/W Base Rent PSF of $32.00. Additionally, El Pollo Loco’s sales for the trailing 12-month period ending December 31, 2015 were $3,177,513 or $1,412 per square foot of improved space. |
| (11) | El Pollo Loco has two, 10-year lease renewal options. |
| (12) | McDonald’s and El Pollo Loco are subject to ground leases and have no attributable square footage. Excluding the Annual U/W Base Rent associated with these two ground leased spaces, the Total Major Tenants’ Annual U/W Base Rent PSF is $33.29. |
| (13) | There are two ground leased spaces included in the Non-Major Tenants’ annual underwritten base rent to which there is no attributable square footage, representing a combined $120,783 in Annual U/W Base Rent. Excluding the Annual U/W Base Rent associated with these two ground leases spaces, the Non-Major Tenants’ Annual U/W Base Rent PSF is $40.22. |
| (14) | The Occupied Collateral Total Annual U/W Base Rent PSF excluding the Annual U/W Base Rent for the four ground leased spaces (McDonald’s, El Pollo Loco, KFC, and Taco Bell) is $18.12. |
THE INFORMATION IN THIS STRUCTURAL AND COLLATERAL TERM SHEET IS NOT COMPLETE AND MAY BE AMENDED PRIOR TO THE TIME OF SALE. THIS TERM SHEET IS NOT AN OFFER TO SELL THESE SECURITIES AND IT IS NOT A SOLICITATION OF AN OFFER TO BUY THESE SECURITIES IN ANY JURISDICTION WHERE THE OFFER OR SALE IS NOT PERMITTED.
| 123 |
| SAN FERNANDO VALUE SQUARE |
The following table presents certain information relating to the lease rollover schedule at the San Fernando Value Square Property:
Lease Expiration Schedule(1)(2)
| Year Ending December 31, | No. of Leases Expiring | Expiring NRSF | % of Total NRSF | Cumulative Expiring NRSF | Cumulative % of Total NRSF | Annual U/W Base Rent | % of Total Annual U/W Base Rent | Annual U/W Base Rent PSF(3) |
| MTM | 0 | 0 | 0.0% | 0 | 0.0% | $0 | 0.0% | $0.00 |
| 2016 | 0 | 0 | 0.0% | 0 | 0.0% | $0 | 0.0% | $0.00 |
| 2017 | 2 | 3,950 | 3.3% | 3,950 | 3.3% | $128,271 | 5.3% | $32.47 |
| 2018 | 2 | 1,575 | 1.3% | 5,525 | 4.7% | $141,799 | 5.8% | $90.03(4) |
| 2019 | 2 | 1,450 | 1.2% | 6,975 | 5.9% | $124,700 | 5.1% | $86.00(5) |
| 2020 | 1 | 0 | 0.0% | 6,975 | 5.9% | $64,627 | 2.7% | $0.00(6) |
| 2021 | 2 | 3,150 | 2.7% | 10,125 | 8.5% | $128,743 | 5.3% | $40.87 |
| 2022 | 0 | 0 | 0.0% | 10,125 | 8.5% | $0 | 0.0% | $0.00 |
| 2023 | 1 | 1,575 | 1.3% | 11,700 | 9.9% | $61,916 | 2.5% | $39.31 |
| 2024 | 1 | 0 | 0.0% | 11,700 | 9.9% | $72,000 | 3.0% | $0.00(7) |
| 2025 | 0 | 0 | 0.0% | 11,700 | 9.9% | $0 | 0.0% | $0.00 |
| 2026 | 1 | 106,911 | 90.1% | 118,611 | 100.0% | $1,709,892 | 70.3% | $15.99 |
| Thereafter | 0 | 0 | 0.0% | 118,611 | 100.0% | $0 | 0.0% | $0.00 |
| Vacant | 0 | 0 | 0.0% | 118,611 | 100.0% | $0 | 0.0% | $0.00 |
| Total/Weighted Average | 12 | 118,611 | 100.0% | $2,431,948 | 100.0% | $20.50 |
| (1) | Information obtained from the underwritten rent roll. |
| (2) | Certain tenants may have lease termination options that are exercisable prior to the stated expiration date of the subject lease and that are not considered in the Lease Expiration Schedule. |
| (3) | Weighted Average Annual U/W Base Rent PSF excludes vacant space. |
| (4) | Two leases expire in 2018, including a McDonald’s that operates subject to a ground lease and has no attributed underwritten square feet. Including the ground leased square footage of the improvements, the Weighted Average Annual U/W Base Rent PSF would be $20.33. |
| (5) | Two leases expire in 2019, including a Taco Bell that operates subject to a ground lease and has no attributed underwritten square feet. Including the ground leased square footage of the improvements, the Weighted Average Annual U/W Base Rent PSF would be $32.39. |
| (6) | The KFC, subject to a ground lease, is the only tenant with a lease expiring in 2020 and has no has no attributed underwritten square feet. Including the ground leased square footage of the improvements, the Weighted Average Annual U/W Base Rent PSF would be $26.93. |
| (7) | The El Pollo Loco, subject to a ground lease, is the only tenant with a lease expiring in 2024 and has no has no attributed underwritten square feet. Including the ground leased square footage of the improvements, the Weighted Average Annual U/W Base Rent PSF would be $32.00. |
The following table presents historical occupancy percentages at the San Fernando Value Square Property:
Historical Occupancy
12/31/2012(1) | 12/31/2013(1) | 12/31/2014(1) | 12/31/2015(1) | 4/30/2016(2) |
| 100.0% | 100.0% | 100.0% | 100.0% | 100.0% |
| (1) | Information obtained from the borrower. |
| (2) | Information obtained from the underwritten rent roll. |
Operating History and Underwritten Net Cash Flow. The following table presents certain information relating to the historical operating performance and underwritten net cash flow at the San Fernando Value Square Property:
Cash Flow Analysis
| 2013 | 2014 | 2015 | TTM | U/W | % of U/W Effective Gross Income | U/W $ per SF | |||||||
| Base Rent | $2,295,859 | $2,397,256 | $2,437,343 | $2,460,568 | $2,359,990(1) | 68.7% | $19.90 | ||||||
| Grossed Up Vacant Space | 0 | 0 | 0 | 0 | 71,958 | 2.1 | 0.61 | ||||||
| Percentage Rent | $53,958 | 64,302 | 38,971 | 23,325 | 38,971 | 1.1 | 0.33 | ||||||
| Total Reimbursables | 851,155 | 948,724 | 1,183,950 | 1,114,574 | 1,032,480 | 30.1 | 8.70 | ||||||
| Other Income | 4,440 | 1,519 | 1,703 | 5,760 | 1,703 | 0.0 | 0.01 | ||||||
| Less Vacancy and Credit Loss | 0 | 0 | 0 | 0 | (71,958)(2) | (2.1) | (0.61) | ||||||
| Effective Gross Income | $3,205,413 | $3,411,802 | $3,661,967 | $3,604,227 | $3,433,145 | 100.0% | $28.94 | ||||||
| Total Operating Expenses | $1,036,584 | $1,086,647 | $1,140,518 | $1,147,345 | $1,184,500 | 34.5% | $9.99 | ||||||
| |||||||||||||
| Net Operating Income | $2,168,829 | $2,325,155 | $2,521,449 | $2,456,883 | $2,248,645 | 65.5% | $18.96 | ||||||
| TI/LC | 0 | 0 | 0 | 0 | 127,988 | 3.7 | 1.08 | ||||||
| Capital Expenditures | 0 | 0 | 0 | 0 | 23,722 | 0.7 | 0.20 | ||||||
| Net Cash Flow | $2,168,829 | $2,325,155 | $2,521,449 | $2,456,883 | $2,096,935 | 61.1% | $17.68 | ||||||
| NOI DSCR | 1.58x | 1.70x | 1.84x | 1.80x | 1.64x | ||||||||
| NCF DSCR | 1.58x | 1.70x | 1.84x | 1.80x | 1.53x | ||||||||
| NOI DY | 9.2% | 9.9% | 10.7% | 10.4% | 9.5% | ||||||||
| NCF DY | 9.2% | 9.9% | 10.7% | 10.4% | 8.9% |
| (1) | U/W Base Rent includes contractual rent steps through December 2016 totaling $3,519. |
| (2) | The underwritten economic vacancy is 3.0%. The San Fernando Value Square Property was 100.0% physically occupied as of April 30, 2016. |
THE INFORMATION IN THIS STRUCTURAL AND COLLATERAL TERM SHEET IS NOT COMPLETE AND MAY BE AMENDED PRIOR TO THE TIME OF SALE. THIS TERM SHEET IS NOT AN OFFER TO SELL THESE SECURITIES AND IT IS NOT A SOLICITATION OF AN OFFER TO BUY THESE SECURITIES IN ANY JURISDICTION WHERE THE OFFER OR SALE IS NOT PERMITTED.
| 124 |
| SAN FERNANDO VALUE SQUARE |
The following table presents certain information relating to some comparable retail leases for the San Fernando Value Square Property:
Comparable Leases(1)
| Property Name/ Location | Year Built/ Renovated | Anchor Tenants | Total GLA (SF) | Total Occupancy | Distance from Subject | Tenant Name | Lease Date / Term | Lease Area (SF) | Annual Base Rent PSF | Lease Type |
50-88 E. Orangethorpe Ave. Anaheim, CA | 1967/NAP | Walmart | 102,812 | 100% | 50.8 miles | Walmart | September 2010 / NAV | 100,322 | $14.40 | NNN |
7910 Katella Ave. Stanton, CA | 1996/NAP | Food 4 Less | 81,000 | 100% | 51.4 miles | Food 4 Less | December 2006 / 20 Yrs | 80,500 | $15.00 | NNN |
777-803 Truman St. San Fernando, CA | 2014/NAP | NAV | 9,000 | 86% | 2.0 miles | Pacific Western Bank | July 2015 / 2 Yrs | 3,800 | $30.00 | NNN |
2010-2040 Glenoaks Blvd. San Fernando, CA | 1973/NAP | NAV | 12,980 | 92% | 1.9 miles | T-Mobile | July 2015 / 5 Yrs | 2,100 | $28.56 | NNN |
12900-12902 Foothill Blvd. San Fernando, CA | 1961/NAP | NAV | 35,634 | 100% | 0.2 miles | Tutti Fruitti | August 2013 / 5 Yrs | 1,000 | $36.00 | NNN |
| (1) | Information obtained from a third party report. |
THE INFORMATION IN THIS STRUCTURAL AND COLLATERAL TERM SHEET IS NOT COMPLETE AND MAY BE AMENDED PRIOR TO THE TIME OF SALE. THIS TERM SHEET IS NOT AN OFFER TO SELL THESE SECURITIES AND IT IS NOT A SOLICITATION OF AN OFFER TO BUY THESE SECURITIES IN ANY JURISDICTION WHERE THE OFFER OR SALE IS NOT PERMITTED.
| 125 |
| No. 13 - Eagle Square |
| Loan Information | Property Information | ||||||
| Mortgage Loan Seller: | Rialto Mortgage Finance, LLC | Single Asset/Portfolio: | Single Asset | ||||
| Credit Assessment (Fitch/KBRA/Moody’s): | NR/NR/NR | Property Type: | Mixed Use | ||||
| Original Principal Balance: | $21,750,000 | Specific Property Type: | Office/Retail | ||||
| Cut-off Date Balance: | $21,725,376 | Location: | Providence, RI | ||||
| % of Initial Pool Balance: | 2.1% | Size: | 105,724 SF | ||||
| Loan Purpose: | Refinance | Cut-off Date Balance Per SF: | $205.49 | ||||
| Borrower Names(1): | The New England Expedition - Providence Retail, LLC; Eagle Square Realty Investments, LLC | Year Built/Renovated: | 1866/2004 | ||||
| Sponsors(2): | Barry E. Feldman; Gregory M. Feldman | Title Vesting: | Fee | ||||
| Mortgage Rate: | 5.320% | Property Manager: | Self-managed | ||||
| Note Date: | May 25, 2016 | 4thMost Recent Occupancy (As of) | 71.6% (12/31/2012) | ||||
| Anticipated Repayment Date: | NAP | 3rdMost Recent Occupancy (As of): | 77.1% (12/31/2013) | ||||
| Maturity Date: | June 6, 2026 | 2ndMost Recent Occupancy (As of): | 77.1% (12/31/2014) | ||||
| IO Period: | None | Most Recent Occupancy (As of)(7): | 74.8% (12/31/2015) | ||||
| Loan Term (Original): | 120 months | Current Occupancy (As of)(7): | 89.5% (5/11/2016) | ||||
| Seasoning: | 1 month | ||||||
| Amortization Term (Original): | 360 months | Underwriting and Financial Information: | |||||
| Loan Amortization Type: | Amortizing Balloon | 4thMost Recent NOI (As of): | $1,440,893 (12/31/2013) | ||||
| Interest Accrual Method: | Actual/360 | 3rdMost Recent NOI (As of): | $1,421,939 (12/31/2014) | ||||
| Call Protection: | L(25),D(91),O(4) | 2ndMost Recent NOI (As of): | $1,481,143 (12/31/2015) | ||||
| Lockbox Type(3): | Hard/Springing Cash Management | Most Recent NOI (As of)(8): | $1,433,868 (TTM 4/30/2016) | ||||
| Additional Debt: | None | ||||||
| Additional Debt Type: | NAP | U/W Revenues: | $2,802,492 | ||||
| U/W Expenses: | $892,756 | ||||||
| U/W NOI(8): | $1,909,737 | ||||||
| Escrows and Reserves: | U/W NCF(8): | $1,844,838 | |||||
| U/W NOI DSCR: | 1.31x | ||||||
| Type: | Initial | Monthly | Cap (If Any) | U/W NCF DSCR: | 1.27x | ||
| Taxes(4) | $0 | Springing | NAP | U/W NOI Debt Yield: | 8.8% | ||
| Insurance(5) | $0 | Springing | NAP | U/W NCF Debt Yield: | 8.5% | ||
| Replacement Reserves | $0 | $1,322 | NAP | As-Is Appraised Value: | $29,500,000 | ||
| TI/LC Reserve | $0 | $3,084 | $148,014 | As-Is Appraisal Valuation Date: | May 9, 2016 | ||
| Deferred Maintenance | $4,500 | $0 | NAP | Cut-off Date LTV Ratio: | 73.6% | ||
| Tenant Specific Reserve(6) | $478,312 | $0 | NAP | LTV Ratio at Maturity or ARD: | 61.2% | ||
| (1) | The borrowers, The New England Expedition - Providence Retail, LLC and Eagle Square Realty Investments, LLC, jointly and severally own the Eagle Square Property (as defined below) as tenants-in-common. The tenants-in-common have waived their right to partition during the term of the Eagle Square mortgage loan. See “Description of the Mortgage Pool – Mortgage Pool Characteristics – Tenancies in Common” in the Preliminary Prospectus. |
| (2) | The Eagle Square mortgage loan is full recourse to Barry E. Feldman in the event of any termination or expiration of one of the four Veteran’s Health Administration leases during the term of the Eagle Square mortgage loan or if the U/W NOI on a trailing 12-month basis or the projected U/W NOI on a 12-month forward looking basis falls below $1.9 million. |
| (3) | The Eagle Square mortgage loan will be in a cash flow sweep until such time that the VA Eye Clinic and the VA Administration tenants, each with lease expiration dates of October 31, 2016, execute their respective lease extensions. |
| (4) | Ongoing monthly reserves for taxes are not required as long as no event of default exists and the borrower is paying its portion of taxes to a trustee for the condominium association. |
| (5) | Ongoing monthly reserves for insurance are not required as long as the Eagle Square Property (as defined below) is insured under an acceptable blanket policy. |
| (6) | The Tenant Specific Reserve includes a $178,312 rent escrow for the VA Physical Therapy Clinic, which has a lease start date of October 1, 2016 and a $300,000 lease rollover reserve for the VA Eye Clinic and the VA Administration. |
| (7) | See “Historical Occupancy” section. |
| (8) | See “Cash Flow Analysis” section. |
The Eagle Square mortgage loan is evidenced by a single promissory note that is secured by a first mortgage encumbering 105,724 square feet of a mixed use property located in Providence, Rhode Island (the “Eagle Square Property”), approximately 1.6 miles west of the Providence central business district. The Eagle Square Property was constructed in 1866 and renovated in 2004. The Eagle Square Property is part of a larger development known as the Eagle Square Commons, a 270,000 square foot condominium complex featuring ten buildings ranging from one to four stories, comprised of twelve mixed use office, retail and residential condominium units. The Eagle Square Property consists of ground level retail and office spaces in nine buildings, one second floor office space in one of the nine buildings and a bank kiosk and comprises five of the 12 condominium units in the condominium association. The Eagle Square Property’s voting share in the condominium association is approximately 50.02%, which gives the borrower majority votes and control over the association. The borrower is responsible for the maintenance of its units, payment of its units’ limited common areas expenses, and payment of its share of all of the expenses.
THE INFORMATION IN THIS STRUCTURAL AND COLLATERAL TERM SHEET IS NOT COMPLETE AND MAY BE AMENDED PRIOR TO THE TIME OF SALE. THIS TERM SHEET IS NOT AN OFFER TO SELL THESE SECURITIES AND IT IS NOT A SOLICITATION OF AN OFFER TO BUY THESE SECURITIES IN ANY JURISDICTION WHERE THE OFFER OR SALE IS NOT PERMITTED.
| 126 |
EAGLE SQUARE
The largest tenant at the Eagle Square Property is the Veteran’s Health Administration (the “VA”) with multiple leases totaling 42,098 square feet, representing 39.8% of the net rentable area. In addition to the VA, there are two other U.S. General Services Administration tenants at the Eagle Square Property which are the Armed Services Recruiting Office and the U.S. Coast Guard Recruiting Office. The Eagle Square Property serves as an ancillary location of the Providence VA Medical Center (the “Medical Center”) which is located approximately 0.8 miles north of the of the Eagle Square Property. The Medical Center offers a broad range of services in medicine, surgery, and behavioral sciences. A shuttle service provides transportation Monday through Friday between the Medical Center and the Eagle Square Property. The VA at the Eagle Square Property houses the Medical Center’s Human Resources Department, Eye Clinic, Audiology Clinic, and Physical Therapy Clinic. The VA operates the nation’s largest integrated health care system, with more than 1,700 hospitals, clinics, and other facilities. The Medical Center has a staff of approximately 1,038 full time employees, including 150 board certified physicians and has academic affiliations with Brown University’s Alpert Medical School, The Harvard School of Dental Medicine, and University of Rhode Island’s College of Pharmacy.
Approximately 50.8% of the net rentable area at the Eagle Square Property is occupied by office tenants while the remaining 38.6% are retail tenants. The retail tenants at the Eagle Square Property include national and regional tenants such as Dunkin Donuts, Subway, H&R Block, Verizon, T-Mobile, and Santander Bank. Parking is provided via 418 parking spaces on the Eagle Square Property plus an additional 60 parking spaces pursuant to a parking agreement with a neighboring church for a total of 478 spaces resulting in a combined parking ratio of 4.5 spaces per 1000 square feet of net rentable area. As of May 11, 2016, the Eagle Square Property was 89.5% leased to 19 tenants.
Sources and Uses
| Sources | Uses | |||||||
| Original loan amount | $21,750,000 | 100.0% | Loan payoff | $17,809,306 | 81.9% | |||
| Reserves | 482,812 | 2.2 | ||||||
| Closing costs | 612,570 | 2.8 | ||||||
| Return of equity | 2,845,312 | 13.1 | ||||||
| Total Sources | $21,750,000 | 100.0% | Total Uses | $21,750,000 | 100.0% |
The following table presents certain information relating to the tenancies at the Eagle Square Property:
Major Tenants
| Tenant Name | Credit Rating (Fitch/Moody’s /S&P)(1) | Tenant NRSF | % of NRSF | Annual U/W Base Rent PSF | Annual U/W Base Rent | % of Total Annual U/W Base Rent | Lease Expiration Date |
| Major Tenants | |||||||
| VA Physical Therapy Clinic(2) | AAA/Aaa/AA+ | 15,500 | 14.7% | $32.55 | $504,525 | 22.5% | 9/30/2021(3) |
| VA Eye Clinic | AAA/Aaa/AA+ | 10,000 | 9.5% | $24.20 | $242,000 | 10.8% | 10/31/2016(4) |
| VA Audiology Clinic | AAA/Aaa/AA+ | 6,898 | 6.5% | $28.10 | $193,834 | 8.6% | 3/31/2021(5) |
| VA Administration | AAA/Aaa/AA+ | 9,700 | 9.2% | $19.80 | $192,060 | 8.6% | 10/31/2016(6) |
| Rainbow Shops | NR/NR/NR | 7,558 | 7.1% | $22.00 | $166,276 | 7.4% | 1/31/2020 |
| Mad Rag | NR/NR/NR | 5,200 | 4.9% | $17.00 | $88,400 | 3.9% | 7/31/2022(7) |
| Total Major Tenants | 54,856 | 51.9% | $25.29 | $1,387,095 | 61.9% | ||
| Non-Major Tenants | 39,749 | 37.6% | $21.48 | $853,834 | 38.1% | ||
| Occupied Collateral Total | 94,605 | 89.5% | $23.69 | $2,240,928 | 100.0% | ||
| Vacant Space | 11,119 | 10.5% | |||||
| Collateral Total | 105,724 | 100.0% | |||||
| (1) | Certain ratings are those of the parent company and the U.S. federal government whether or not the parent or the U.S. federal government, as applicable, guarantees the lease. |
| (2) | The VA Physical Therapy Clinic has executed a new lease with a lease commencement date of October 1, 2016. The VA Physical Therapy Clinic has taken possession of its space and is in the process of building out improvements. A $178,312 reserve was taken at origination as a rent escrow. |
| (3) | The VA Physical Therapy Clinic has one, 5-year lease renewal option and may terminate its lease with at least 90 days’ prior written notice following September 30, 2021. |
| (4) | The VA Eye Clinic has one, 1-year lease renewal option remaining. The tenant has verbally notified borrower of its intent to exercise this option. The tenant has the right to terminate its lease at any time with 60 days’ written notice. |
| (5) | The VA Audiology Clinic may terminate its lease anytime with at least 90 days’ prior written notice. |
| (6) | The VA Administration may terminate its lease anytime with at least 60 days’ prior written notice. |
| (7) | Mad Rag has two, 5-year lease renewal options. |
THE INFORMATION IN THIS STRUCTURAL AND COLLATERAL TERM SHEET IS NOT COMPLETE AND MAY BE AMENDED PRIOR TO THE TIME OF SALE. THIS TERM SHEET IS NOT AN OFFER TO SELL THESE SECURITIES AND IT IS NOT A SOLICITATION OF AN OFFER TO BUY THESE SECURITIES IN ANY JURISDICTION WHERE THE OFFER OR SALE IS NOT PERMITTED.
| 127 |
EAGLE SQUARE
The following table presents certain information relating to the lease rollover schedule at the Eagle Square Property:
Lease Expiration Schedule(1)(2)
| Year Ending December 31, | No. of Leases Expiring | Expiring NRSF | % of Total NRSF | Cumulative Expiring NRSF | Cumulative % of Total NRSF | Annual U/W Base Rent | % of Total Annual U/W Base Rent | Annual U/W Base Rent PSF(3) |
| MTM | 0 | 0 | 0.0% | 0 | 0.00% | $0 | 0.0% | $0.00 |
| 2016 | 3 | 21,268 | 20.1% | 21,268 | 20.1% | $453,560 | 20.2% | $21.33 |
| 2017 | 3 | 6,820 | 6.5% | 28,088 | 26.6% | $157,750 | 7.0% | $23.13 |
| 2018 | 4 | 11,062 | 10.5% | 39,150 | 37.0% | $204,620 | 9.1% | $18.50 |
| 2019 | 3 | 8,500 | 8.0% | 47,650 | 45.1% | $171,450 | 7.7% | $20.17 |
| 2020 | 5 | 16,857 | 15.9% | 64,507 | 61.0% | $411,790 | 18.4% | $24.43 |
| 2021 | 2 | 22,398 | 21.2% | 86,905 | 82.2% | $698,359 | 31.2% | $31.18 |
| 2022 | 1 | 5,200 | 4.9% | 92,105 | 87.1% | $88,400 | 3.9% | $17.00 |
| 2023 | 1 | 2,500 | 2.4% | 94,605 | 89.5% | $55,000 | 2.5% | $22.00 |
| 2024 | 0 | 0 | 0.0% | 94,605 | 89.5% | $0 | 0.0% | $0.00 |
| 2025 | 0 | 0 | 0.0% | 94,605 | 89.5% | $0 | 0.0% | $0.00 |
| 2026 | 0 | 0 | 0.0% | 94,605 | 89.5% | $0 | 0.0% | $0.00 |
| Thereafter | 0 | 0 | 0.0% | 94,605 | 89.5% | $0 | 0.0% | $0.00 |
| Vacant | 0 | 11,119 | 10.5% | 105,724 | 100.0% | $0 | 0.0% | $0.00 |
| Total/Weighted Average | 22 | 105,724 | 100.0% | $2,240,928 | 100.0% | $23.69 |
| (1) | Information obtained from the underwritten rent roll. |
| (2) | Certain tenants may have lease termination options that are exercisable prior to the stated expiration date of the subject lease and that are not considered in the Lease Expiration Schedule. |
| (3) | Weighted Average Annual U/W Base Rent PSF excludes vacant space. |
The following table presents historical occupancy percentages at the Eagle Square Property:
Historical Occupancy
12/31/2012(1) | 12/31/2013(1) | 12/31/2014(1) | 12/31/2015(1)(2) | 5/11/2016(2)(3) | ||||
| 71.6% | 77.1% | 77.1% | 74.8% | 89.5% |
| (1) | Information obtained from the borrower. |
| (2) | The increase in occupancy is due to the VA Physical Therapy Clinic (14.7% of the net rentable area) has executed a new lease with a lease commencement date of October 1, 2016. The VA Physical Therapy Clinic has taken possession of its space and is in the process of building out improvements. A $178,312 reserve was taken as a rent escrow at origination. |
| (3) | Information obtained from underwritten rent roll. |
Operating History and Underwritten Net Cash Flow.The following table presents certain information relating to the historical operating performance and underwritten net cash flow at the Eagle Square Property:
Cash Flow Analysis
| 2013 | 2014 | 2015 | TTM 4/30/2016(1) | U/W(1) | % of U/W Effective Gross Income | U/W $ per SF | |||||||||
| Base Rent | $1,642,191 | $1,669,868 | $1,736,002 | $1,749,560 | $2,245,497 | 80.1% | $21.24 | ||||||||
| Grossed Up Vacant Space | 0 | 0 | 0 | 0 | 249,103 | 8.9 | 2.36 | ||||||||
| Total Reimbursables | 493,282 | 521,435 | 541,192 | 471,351 | 575,219 | 20.5 | 5.44 | ||||||||
| Other Income | 54,863 | 63,641 | 64,625 | 65,313 | 66,462 | 2.4 | 0.63 | ||||||||
| Less Vacancy & Credit Loss | 0 | 0 | 0 | 0 | (333,788)(2) | (11.9) | (3.16) | ||||||||
| Effective Gross Income | $2,190,336 | $2,254,943 | $2,341,818 | $2,286,223 | $2,802,492 | 100.0% | $26.51 | ||||||||
| Total Operating Expenses | $749,443 | $833,004 | $860,675 | $852,355 | $892,756 | 31.9% | $8.44 | ||||||||
| Net Operating Income | $1,440,893 | $1,421,939 | $1,481,143 | $1,433,868 | $1,909,737 | 68.1% | $18.06 | ||||||||
| TI/LC | 0 | 0 | 0 | 0 | 55,383 | 2.0 | 0.52 | ||||||||
| Capital Expenditures | 0 | 0 | 0 | 0 | 9,515 | 0.3 | 0.09 | ||||||||
| Net Cash Flow | $1,440,893 | $1,421,939 | $1,481,143 | $1,433,868 | $1,844,838 | 65.8% | $17.45 | ||||||||
| NOI DSCR | 0.99x | 0.98x | 1.02x | 0.99x | 1.31x | ||||||||||
| NCF DSCR | 0.99x | 0.98x | 1.02x | 0.99x | 1.27x | ||||||||||
| NOI DY | 6.6% | 6.5% | 6.8% | 6.6% | 8.8% | ||||||||||
| NCF DY | 6.6% | 6.5% | 6.8% | 6.6% | 8.5% |
| (1) | The increase from the trailing twelve month period ending April 30, 2016 figures to the U/W figures is a result of the VA Physical Therapy Clinic signing a new lease with a lease start date of October 1, 2016. The VA Physical Therapy Clinic has taken possession of its space and is in the process of building out improvements. A $178,312 reserve was taken as a rent escrow at closing. |
| (2) | The underwritten economic vacancy is 10.9%. The Eagle Square Property was 89.5% leased and 74.8% physically occupied as of May 11, 2016. The lease for the VA Physical Therapy Clinic (14.7% pf the net rentable area) commences on October 1, 2016. |
THE INFORMATION IN THIS STRUCTURAL AND COLLATERAL TERM SHEET IS NOT COMPLETE AND MAY BE AMENDED PRIOR TO THE TIME OF SALE. THIS TERM SHEET IS NOT AN OFFER TO SELL THESE SECURITIES AND IT IS NOT A SOLICITATION OF AN OFFER TO BUY THESE SECURITIES IN ANY JURISDICTION WHERE THE OFFER OR SALE IS NOT PERMITTED.
| 128 |
EAGLE SQUARE
The following table presents certain information relating to comparable retail and office properties for the Eagle Square Property:
Competitive Set(1)
| Property Name/Location | Year Built/ Renovated | Total Occupancy | Distance from Subject | Tenant Name | Lease Term | Lease Area (SF) | Annual Base Rent PSF | NNN/MG/ FSG |
8230 Post Rd North Kingstown, RI | 1950 | 100% | 20.3 miles | Kingstown Pizza | 5 Yrs | 1,380 | $23.91 | NNN |
| 399 Bald Hill Rd Warwick, RI | 1985 | 71% | 9.6 miles | Plato’s Closet | 5 Yrs | 58,089 | $20.00 | NNN |
727 East Ave Pawtucket, RI | 1986 | 100% | 4.1 miles | Antonios Pizza | 10 Yrs | 17,963 | $27.72 | Mod Gross |
6670 Post Rd North Kingstown, RI | 2002 | 100% | 18.0 miles | AT&T | 3 Yrs | 5,120 | $22.71 | NNN |
1800 Post Rd Warwick, RI | 1969/2000 | 85% | 7.6 miles | AT&T | 5 Yrs | 128,051 | $22.00 | NNN |
1 Empire Plz Providence, RI | 1981 | 25% | 1.2 miles | GSA | NAV | 115,000 | $22.95 | Mod Gross |
260 W. Exchange St Providence, RI | 1909/1999 | 90% | 1.1 miles | Matter Communications | 5 Yrs | 150,000 | $23.40 | Mod Gross |
235 Promenade St Providence, RI | 1872/2005 | 96% | 1.3 miles | Caretracker, Inc. | 5 Yrs | 233,573 | $22.90 | Mod Gross |
| 40 Westminster St Providence, RI | 1970 | 89% | 2.0 miles | Ernst & Young | 10 Yrs | 330,449 | $23.00 | Mod Gross |
1 Financial Plz Providence, RI | 1974 | 91% | 2.0 miles | AJK, LLC | 5 Yrs | 322,402 | $28.00 | Mod Gross |
| (1) | Information obtained from the appraisal. |
THE INFORMATION IN THIS STRUCTURAL AND COLLATERAL TERM SHEET IS NOT COMPLETE AND MAY BE AMENDED PRIOR TO THE TIME OF SALE. THIS TERM SHEET IS NOT AN OFFER TO SELL THESE SECURITIES AND IT IS NOT A SOLICITATION OF AN OFFER TO BUY THESE SECURITIES IN ANY JURISDICTION WHERE THE OFFER OR SALE IS NOT PERMITTED.
| 129 |
| No. 14 – Pinnacle II | |||||||
| Loan Information | Property Information | ||||||
| Mortgage Loan Seller: | Wells Fargo Bank, National Association | Single Asset/Portfolio: | Single Asset | ||||
| Credit Assessment (Fitch/KBRA/Moody’s): | NR/NR/NR | Property Type: | Office | ||||
| Original Principal Balance(1): | $20,000,000 | Specific Property Type: | CBD | ||||
| Cut-off Date Balance(1): | $20,000,000 | Location: | Burbank, CA | ||||
| % of Initial Pool Balance: | 2.0% | Size: | 230,000 SF | ||||
| Loan Purpose: | Refinance | Cut-off Date Balance Per SF(1): | $378.26 | ||||
| Borrower Name: | P2 Hudson MC Partners, LLC | Year Built/Renovated: | 2005/NAP | ||||
| Sponsors: | Hudson Pacific Properties, L.P.; M David Paul Development, LLC | Title Vesting: | Fee | ||||
| Mortgage Rate: | 4.300% | Property Manager: | Self-managed | ||||
| Note Date: | June 7, 2016 | 4th Most Recent Occupancy (As of): | 100.0% (12/31/2012) | ||||
| Anticipated Repayment Date: | NAP | 3rd Most Recent Occupancy (As of): | 100.0% (12/31/2013) | ||||
| Maturity Date: | June 11, 2026 | 2nd Most Recent Occupancy (As of): | 100.0% (12/31/2014) | ||||
| IO Period: | 120 months | Most Recent Occupancy (As of): | 100.0% (12/31/2015) | ||||
| Loan Term (Original): | 120 months | Current Occupancy (As of): | 100.0% (7/1/2016) | ||||
| Seasoning: | 1 month | ||||||
| Amortization Term (Original): | NAP | Underwriting and Financial Information: | |||||
| Loan Amortization Type: | Interest-only, Balloon | ||||||
| Interest Accrual Method: | Actual/360 | 4th Most Recent NOI(5): | NAV | ||||
| Call Protection: | L(36),GRTR 1% or YM(80),O(4) | 3rd Most Recent NOI (As of): | $7,882,478 (12/31/2014) | ||||
| Lockbox Type: | Hard/Upfront Cash Management | 2nd Most Recent NOI (As of): | $7,794,991 (12/31/2015) | ||||
| Additional Debt(1): | Yes | Most Recent NOI (As of): | $7,572,595 (TTM 3/31/2016) | ||||
| Additional Debt Type(1): | Pari Passu | ||||||
| U/W Revenues: | $11,664,912 | ||||||
| U/W Expenses: | $3,645,672 | ||||||
| U/W NOI: | $8,019,240 | ||||||
| U/W NCF: | $7,423,010 | ||||||
| U/W NOI DSCR(1): | 2.11x | ||||||
| Escrows and Reserves: | U/W NCF DSCR(1): | 1.96x | |||||
| U/W NOI Debt Yield(1): | 9.2% | ||||||
| Type: | Initial | Monthly | Cap (If Any) | U/W NCF Debt Yield(1): | 8.5% | ||
| Taxes | $370,935 | $123,645 | NAP | As-Is Appraised Value: | $142,000,000 | ||
| Insurance(2) | $0 | Springing | NAP | As-Is Appraisal Valuation Date: | May 5, 2016 | ||
| Replacement Reserves(3) | $0 | Springing | $138,000 | Cut-off Date LTV Ratio(1): | 61.3% | ||
| Excess Cash Flow (Warner Brothers Springing TI)(4) | $0 | (4) | (4) | LTV Ratio at Maturity or ARD(1): | 61.3% | ||
| (1) | The Pinnacle II Whole Loan (as defined below), which had an original principal balance of $87,000,000, is comprised of three pari passu notes (Notes A-1, A-2 and A-3). The non-controlling Note A-2 had an original principal balance of $20,000,000, has an outstanding principal balance of $20,000,000 as of the Cut-Off Date and will be contributed to the WFCM 2016-C35 Trust. The controlling Note A-1 had an original principal balance of $40,000,000 and the non-controlling A-3 note had an original principal balance of $27,000,000, and both are expected to be contributed to future trusts. All statistical financial information related to balances per square foot, loan-to-value ratios, debt service coverage ratios and debt yields are based on the Pinnacle II Whole Loan. The lender provides no assurances that any non-securitized pari passu note will not be split further. |
| (2) | Ongoing reserves for insurance premiums are not required as long as (i) no event of default has occurred and is continuing; (ii) the Pinnacle II Property (as defined below) is insured via an acceptable blanket insurance policy; and (iii) the borrower provides the lender with evidence of renewal of the insurance policies and timely proof of payment of insurance premiums. |
| (3) | Upon the occurrence of a Cash Trap Event Period (as defined below) or if the lender determines the borrower is not adequately maintaining the Pinnacle II Property, ongoing monthly replacement reserves of $3,833 will be required, subject to a cap of $138,000. |
| (4) | A “Cash Trap Event Period” will commence upon the earlier of (i) the occurrence and continuance of an event of default; (ii) the amortizing debt service coverage ratio falling below 1.30x at the end of any calendar month; (iii) Warner Brothers (as defined below) has “Gone Dark” (as defined below); (iv) Warner Brothers vacating or otherwise failing to occupy its premises; (v) Warner Brothers failing to exercise its lease extension option at least 18 months prior to lease expiration or (vi) Warner Brothers filing for bankruptcy or a similar insolvency proceeding. A Cash Trap Event Period will end, with respect to clause (i), upon the cure of such event of default; with respect to clause (ii), upon the amortizing debt service coverage ratio being equal to or greater than 1.35x for two consecutive calendar quarters; with respect to clause (iii), upon the earlier of (a) Warner Brothers re-occupying more than 65.0% of the net rentable area for 180 consecutive days or (b) the amount on deposit in the excess cash flow reserve equaling $9.2 million; with respect to clause (iv), upon the earliest of (x) the Warner Brothers lease being renewed or extended, (y) the borrower re-leasing the space to an acceptable replacement tenant and the replacement tenant commencing rent payments or (z) the amount on deposit in the excess cash flow reserve equaling $9.2 million; with respect to clause (v), upon the earlier of (a) the Warner Brothers’ lease being renewed or (b) the amount on deposit in the excess cash flow reserve equaling $9.2 million; and with respect to clause (vi), upon the earlier of (x) the bankruptcy or insolvency proceedings being terminated and the Warner Brothers’ lease being affirmed or (y) the amount on deposit in the excess cash flow reserve equaling $9.2 million. |
| (5) | Historical financial information was not provided prior to 2014, as one of the sponsors purchased a majority interest in the Pinnacle II Property in 2013 and is now managing the Pinnacle II Property through an affiliated company. |
The Pinnacle II mortgage loan is part of a whole loan (the “Pinnacle II Whole Loan”) that is evidenced by three promissory notes (Notes A-1, A-2 and A-3) secured by a first mortgage encumbering the fee interest in a 230,000 square foot, six-story, class A, single-tenant office building located in Burbank, California (the “Pinnacle II Property”), approximately 11.3 miles northwest of the
THE INFORMATION IN THIS STRUCTURAL AND COLLATERAL TERM SHEET IS NOT COMPLETE AND MAY BE AMENDED PRIOR TO THE TIME OF SALE. THIS TERM SHEET IS NOT AN OFFER TO SELL THESE SECURITIES AND IT IS NOT A SOLICITATION OF AN OFFER TO BUY THESE SECURITIES IN ANY JURISDICTION WHERE THE OFFER OR SALE IS NOT PERMITTED.
| 130 |
| PINNACLE II |
Los Angeles, California central business district. Constructed in 2005 by the borrower, the Pinnacle II Property is situated on a 1.5-acre site and features 683 underground parking spaces, resulting in a parking ratio of 3.0 spaces per 1,000 square feet of rentable area. The Pinnacle II Property is part of an entertainment and media campus in Burbank, situated on a larger 4.3-acre site along with the 390,000 square foot Pinnacle I, a multi-tenant office property also built by the sponsors in 2002. The Pinnacle II Property has been 100.0% leased to Warner Brothers Entertainment Inc. (“Warner Brothers”) since construction and is conveniently located approximately two blocks from the 142-acre Warner Brothers Studios, the company’s headquarters since 1928. Combined with the 32-acre Warner Brothers Ranch located 0.9 miles from the Pinnacle II Property, Warner Brothers offers 35 soundstages (including one of the world’s tallest stages with an in-ground tank capable of holding more than two million gallons of water) and 15 back lot locations. The Pinnacle II Property houses the Warner Brothers’ Technology Solutions staff.
According to the appraisal, the 2015 estimated population within a one-, three- and five-mile radius of the Pinnacle II Property was 18,019, 191,728 and 645,328, respectively, while the 2015 estimated average household income within the same radii was $96,217, $88,976 and $84,324, respectively. As of July 1, 2016 the Pinnacle II Property was 100.0% occupied by Warner Brothers. According to the appraisal, the Pinnacle II Property is located in the Media District micro-market, the Burbank submarket and the “Tri-Cities” (Burbank, Glendale and Pasadena) market. According to a third-party market research report, as of first quarter 2016, the Burbank class A market contained a total inventory of 45 buildings totaling approximately 7.3 million square feet exhibiting a vacancy rate of approximately 12.4% and an average asking rental rate of $38.66 per square foot full service gross. Excluding a 498,386 square foot building (The Tower) that is still in lease-up after the sole tenant vacated, the submarket vacancy rate is 6.6%. According to the appraisal, the Burbank Media District micro-market contained a total inventory of 19 buildings totaling approximately 3.7 million square feet exhibiting a vacancy rate of approximately 14.7% and an average asking rental rate of $40.11 to $42.06 per square foot full service gross as of first quarter of 2016. Excluding The Tower, micro-market vacancy rate is 6.2%.
Note Summary(1)
| Notes | Original Balance | Note Holder | Controlling Interest | |
| A-1 | $40,000,000 | Wells Fargo Bank, National Association | Yes | |
| A-2 | $20,000,000 | WFCM 2016-C35 | No | |
| A-3 | $27,000,000 | Wells Fargo Bank, National Association | No | |
| Total | $87,000,000 |
| (1) | The lender provides no assurances that any non-securitized pari passu note will not be split further. |
Sources and Uses
| Sources | Uses | |||||||
| Original whole loan | $87,000,000 | 99.6% | Loan payoff(1) | $86,203,966 | 98.6% | |||
| Sponsor’s new cash contribution | 390,399 | 0.4 | Reserves | 370,935 | 0.4 | |||
| Closing costs | 815,497 | 0.9 | ||||||
| Total Sources | $87,390,399 | 100.0% | Total Uses | $87,390,399 | 100.0% | |||
| (1) | The Pinnacle II Property was previously securitized in the GSMS 2006-GG8 transaction. The loan payoff amount also includes an approximate $4.9 million B-note. |
The following table presents certain information relating to the tenancy at the Pinnacle II Property:
Major Tenant
| Tenant Name | Credit Rating (Fitch/ Moody’s/ S&P)(1) | Tenant NRSF | % of NRSF | Annual U/W Base Rent PSF(2) | Annual U/W Base Rent | % of Total Annual U/W Base Rent | Lease Expiration Date |
| Major Tenant | |||||||
| Warner Brothers Entertainment Inc(3) | BBB+/Baa2/BBB | 230,000 | 100.0% | $42.00 | $9,659,219 | 100.0% | 12/31/2021(4) |
| Total Major Tenant | 230,000 | 100.0% | $42.00 | $9,659,219 | 100.0% | ||
| Occupied Collateral Total | 230,000 | 100.0% | $42.00 | $9,659,219 | 100.0% | ||
| Vacant Space | 0 | 0.0% | |||||
| Collateral Total | 230,000 | 100.0% | |||||
| (1) | Certain ratings are those of the parent company Time Warner Inc. Time Warner Inc. does not guarantee the lease. |
| (2) | Annual U/W Base Rent PSF and Annual U/W Base Rent reflect the average rent over the lease term. The current base rent PSF is $39.56 ($9,099,396 annually). |
| (3) | Warner Brothers subleases 40,165 square feet (17.5% of net rentable area) to the CW Television Network, a 50/50 joint venture between Warner Brothers and CBS Corporation, for $2,094,794 annually ($52.15 per square foot, full-service gross). The sublease expiration is coterminous with the primary lease expiration date of December 31, 2021. Annual U/W Base Rent for this space was underwritten to Warner Brothers’ primary average lease rate of $42.00 per square foot, modified gross. |
| (4) | Warner Brothers has either one, 10-year or two, 5-year lease renewal options. |
THE INFORMATION IN THIS STRUCTURAL AND COLLATERAL TERM SHEET IS NOT COMPLETE AND MAY BE AMENDED PRIOR TO THE TIME OF SALE. THIS TERM SHEET IS NOT AN OFFER TO SELL THESE SECURITIES AND IT IS NOT A SOLICITATION OF AN OFFER TO BUY THESE SECURITIES IN ANY JURISDICTION WHERE THE OFFER OR SALE IS NOT PERMITTED.
| 131 |
| PINNACLE II |
The following table presents certain information relating to the lease rollover schedule at the Pinnacle II Property:
Lease Expiration Schedule(1)
| Year Ending December 31, | No. of Leases Expiring | Expiring NRSF | % of Total NRSF | Cumulative Expiring NRSF | Cumulative % of Total NRSF | Annual U/W Base Rent | % of Total Annual U/W Base Rent | Annual U/W Base Rent PSF |
| MTM | 0 | 0 | 0.0% | 0 | 0.0% | $0 | 0.0% | $0.00 |
| 2016 | 0 | 0 | 0.0% | 0 | 0.0% | $0 | 0.0% | $0.00 |
| 2017 | 0 | 0 | 0.0% | 0 | 0.0% | $0 | 0.0% | $0.00 |
| 2018 | 0 | 0 | 0.0% | 0 | 0.0% | $0 | 0.0% | $0.00 |
| 2019 | 0 | 0 | 0.0% | 0 | 0.0% | $0 | 0.0% | $0.00 |
| 2020 | 0 | 0 | 0.0% | 0 | 0.0% | $0 | 0.0% | $0.00 |
| 2021 | 1 | 230,000 | 100.0% | 230,000 | 100.0% | $9,659,219(2) | 100.0% | $42.00(2) |
| 2022 | 0 | 0 | 0.0% | 230,000 | 100.0% | $0 | 0.0% | $0.00 |
| 2023 | 0 | 0 | 0.0% | 230,000 | 100.0% | $0 | 0.0% | $0.00 |
| 2024 | 0 | 0 | 0.0% | 230,000 | 100.0% | $0 | 0.0% | $0.00 |
| 2025 | 0 | 0 | 0.0% | 230,000 | 100.0% | $0 | 0.0% | $0.00 |
| 2026 | 0 | 0 | 0.0% | 230,000 | 100.0% | $0 | 0.0% | $0.00 |
| Thereafter | 0 | 0 | 0.0% | 230,000 | 100.0% | $0 | 0.0% | $0.00 |
| Vacant | 0 | 0 | 0.0% | 230,000 | 100.0% | $0 | 0.0% | $0.00 |
| Total/Weighted Average | 1 | 230,000 | 100.0% | $9,659,219(2) | 100.0% | $42.00(2) |
| (1) | Information obtained from the underwritten rent roll. |
| (2) | Annual U/W Base Rent PSF and Annual U/W Base Rent reflect the average rent over the lease term. The current base rent PSF is $39.56 ($9,099,396 annually). |
The following table presents historical occupancy percentages at the Pinnacle II Property:
Historical Occupancy
12/31/2012(1) | 12/31/2013(1) | 12/31/2014(1) | 12/31/2015(1) | 7/1/2016(2) |
| 100.0% | 100.0% | 100.0% | 100.0% | 100.0% |
| (1) | Information obtained from the lease. |
| (2) | Information obtained from the underwrittenrent roll. |
Operating History and Underwritten Net Cash Flow. The following table presents certain information relating to the historical operating performance and underwritten net cash flow at the Pinnacle II Property:
Cash Flow Analysis(1)
| 2014 | 2015 | TTM 3/31/2016 | U/W | % of U/W Effective Gross Income | U/W $ per SF | |||||||
| Base Rent | $8,795,391 | $8,949,200 | $8,988,325 | $9,659,219(2) | 82.8% | $42.00 | ||||||
| Grossed Up Vacant Space | 0 | 0 | 0 | 0 | 0.0 | 0.00 | ||||||
| Total Reimbursables | 1,389,367 | 1,411,333 | 1,211,984 | 1,309,053 | 11.2 | 5.69 | ||||||
| Other Income | 1,329,897 | 1,076,098 | 1,035,764 | 1,295,511 | 11.1 | 5.63 | ||||||
| Less Vacancy & Credit Loss | 0 | 0 | 0 | (598,872)(3) | (5.1) | (2.60) | ||||||
| Effective Gross Income | $11,514,655 | $11,436,631 | $11,236,073 | $11,664,912 | 100.0% | $50.72 | ||||||
| Total Operating Expenses | $3,632,177 | $3,641,640 | $3,663,478 | $3,645,672 | 31.3% | $15.85 | ||||||
| Net Operating Income | $7,882,478 | $7,794,991 | $7,572,595 | $8,019,240 | 68.7% | $34.87 | ||||||
| TI/LC | 0 | 0 | 0 | 550,230 | 4.7 | 2.39 | ||||||
| Capital Expenditures | 0 | 0 | 0 | 46,000 | 0.4 | 0.20 | ||||||
| Net Cash Flow | $7,882,478 | $7,794,991 | $7,572,595 | $7,423,010 | 63.6% | 32.27 | ||||||
| NOI DSCR(4) | 2.08x | 2.06x | 2.00x | 2.11x | ||||||||
| NCF DSCR(4) | 2.08x | 2.06x | 2.00x | 1.96x | ||||||||
| NOI DY(4) | 9.1% | 9.0% | 8.7% | 9.2% | ||||||||
| NCF DY(4) | 9.1% | 9.0% | 8.7% | 8.5% |
| (1) | Historical financial information was not provided prior to 2014, as one of the sponsors purchased a majority interest in the Pinnacle II Property in 2013 and is now managing the Pinnacle II Property through an affiliated company. |
| (2) | U/W Base Rent reflects the average rent over the lease term. The current base rent is $9,099,396 annually ($39.56 per square foot). |
| (3) | The underwritten economic vacancy is 6.2%. The Pinnacle II Property was 100.0% physically occupied as of July 1, 2016. |
| (4) | The debt service coverage ratios and debt yields are based on the Pinnacle II Whole Loan. |
THE INFORMATION IN THIS STRUCTURAL AND COLLATERAL TERM SHEET IS NOT COMPLETE AND MAY BE AMENDED PRIOR TO THE TIME OF SALE. THIS TERM SHEET IS NOT AN OFFER TO SELL THESE SECURITIES AND IT IS NOT A SOLICITATION OF AN OFFER TO BUY THESE SECURITIES IN ANY JURISDICTION WHERE THE OFFER OR SALE IS NOT PERMITTED.
| 132 |
| PINNACLE II |
The following table presents certain information relating to comparable office leases for the Pinnacle II:
Comparable Leases(1)
| Property Name/Location | Year Built/ Renovated | Number of Stories | Total GLA (SF) | Total Occupancy | Distance from Subject | Tenant Name | Lease Date/Term | Lease Area (SF) | Annual Base Rent PSF | Lease Type |
| Burbank Studios Burbank, CA | 1956/NAV | 3 | 114,943 | 37.3% | <0.1 mile | NAV | 1st Qtr 2015 / 10.0 Yrs | 108,000 | $36.00 | NNN |
| The Tower Burbank, CA | 1969/NAV | 32 | 498,386 | 30.4% | 0.5 miles | NAV | 1st Qtr 2016 / 10.0 Yrs | 37,370 | $39.00 | FSG |
| Legacy Media Tower Burbank, CA | 1986/NAV | 10 | 150,755 | 96.3% | 0.5 miles | NAV | 2nd Qtr 2016 / 5.4 Yrs | 1,900 | $39.00 | FSG |
| The Pinnacle I Burbank, CA | 2002/NAV | 6 | 393,776 | 95.1% | <0.1 mile | NAV | 4th Qtr 2015 / 10.8 Yrs | 75,214 | $42.00 | FSG |
Central Park at Toluca Lake Burbank, CA | 1985/NAV | 15 | 249,000 | 81.8% | 0.2 miles | NAV | 1st Qtr 2016 / 5 Yrs | 3,898 | $42.60 | FSG |
| Business Arts Plaza Burbank, CA | 1985/NAV | 8 | 152,469 | 71.4% | 0.4 miles | NAV | 2nd Qtr 2016 / 5 Yrs | 60,000 | $38.40 | FSG |
| The Pointe – Phase I Burbank, CA | 2009/NAV | 14 | 480,645 | 93.2% | 0.4 miles | NAV | NAV | NAV | $46.20 | FSG |
| (1) | Information obtained from the appraisal and third-party market research reports. |
THE INFORMATION IN THIS STRUCTURAL AND COLLATERAL TERM SHEET IS NOT COMPLETE AND MAY BE AMENDED PRIOR TO THE TIME OF SALE. THIS TERM SHEET IS NOT AN OFFER TO SELL THESE SECURITIES AND IT IS NOT A SOLICITATION OF AN OFFER TO BUY THESE SECURITIES IN ANY JURISDICTION WHERE THE OFFER OR SALE IS NOT PERMITTED.
| 133 |
| No. 15 – Berkshire Corporate Center | |||||||
| Loan Information | Property Information | ||||||
| Mortgage Loan Seller: | Barclays Bank PLC | Single Asset/Portfolio: | Single Asset | ||||
Credit Assessment (Fitch/KBRA/Moody’s): | NR/NR/NR | Property Type: | Industrial | ||||
| Original Principal Balance: | $17,750,000 | Specific Property Type: | Flex | ||||
| Cut-off Date Balance: | $17,750,000 | Location: | Plymouth, MN | ||||
| % of Initial Pool Balance: | 1.7% | Size(5): | 243,993 SF | ||||
| Loan Purpose: | Acquisition | Cut-off Date Balance Per SF: | $72.75 | ||||
| Borrower Names(1): | Berkshire Promenade LLC; Berkshire Equities LLC | Year Built/Renovated: | 1969/2001 | ||||
| Sponsors: | William Felton; Matthew Felton | Title Vesting: | Fee | ||||
| Mortgage Rate: | 4.250% | Property Manager: | Self-managed | ||||
| Note Date: | June 17, 2016 | 4thMost Recent Occupancy(6): | NAV | ||||
| Anticipated Repayment Date: | NAP | 3rdMost Recent Occupancy(6): | NAV | ||||
| Maturity Date: | July 6, 2026 | 2ndMost Recent Occupancy (As of)(6): | 100.0% (12/31/2014) | ||||
| IO Period: | 36 months | Most Recent Occupancy (As of)(6): | 100.0% (12/31/2015) | ||||
| Loan Term (Original): | 120 months | Current Occupancy (As of)(6): | 90.8% (6/2/2016) | ||||
| Seasoning: | 0 months | ||||||
| Amortization Term (Original): | 360 months | Underwriting and Financial Information: | |||||
| Loan Amortization Type: | Interest-only, Amortizing Balloon | ||||||
| Interest Accrual Method: | Actual/360 | 4thMost Recent NOI(7): | NAV | ||||
| Call Protection: | L(24),D(92),O(4) | 3rdMost Recent NOI (As of)(7): | $1,985,989 (12/31/2014) | ||||
| Lockbox Type: | Springing | 2ndMost Recent NOI (As of)(7): | $2,016,735 (12/31/2015) | ||||
| Additional Debt(2): | Yes | Most Recent NOI (As of)(7): | $2,081,056 (TTM 3/31/2016) | ||||
| Additional Debt Type(2): | Future Mezzanine | ||||||
| U/W Revenues: | $2,984,140 | ||||||
| U/W Expenses: | $936,461 | ||||||
| U/W NOI: | $2,047,679 | ||||||
| Escrows and Reserves: | U/W NCF: | $1,797,911 | |||||
| U/W NOI DSCR: | 1.95x | ||||||
| Type: | Initial | Monthly | Cap (If Any) | U/W NCF DSCR: | 1.72x | ||
| Taxes | $84,525 | $42,263 | NAP | U/W NOI Debt Yield: | 11.5% | ||
| Insurance(3) | $0 | Springing | NAP | U/W NCF Debt Yield: | 10.1% | ||
| Replacement Reserves | $0 | $3,064 | $183,840 | As-Is Appraised Value: | $24,150,000 | ||
| TI/LC Reserve | $0 | $11,533 | $830,376 | As-Is Appraisal Valuation Date: | April 28, 2016 | ||
| Immediate Repairs Reserve(4) | $269,664 | $0 | NAP | Cut-off Date LTV Ratio: | 73.5% | ||
| Roof Repair Reserve | $5,000 | $0 | NAP | LTV Ratio at Maturity or ARD: | 64.0% | ||
| (1) | The borrowers, Berkshire Promenade LLC and Berkshire Equities LLC jointly and severally own the Berkshire Corporate Center Property (as defined below) as tenants-in-common. The tenants-in-common have waived their right to partition during the term of the Berkshire Corporate Center mortgage loan. See “Description of the Mortgage Pool—Mortgage Pool Characteristics—Tenancies in Common; Crowd Funding” in the Preliminary Prospectus. |
| (2) | The borrowers are permitted to incur future mezzanine financing provided that no event of default has occurred or is continuing and upon a sale of the property and assumption of the loan, provided that (i) the mezzanine loan is subordinate to the mortgage loan, (ii) lender approval has been obtained, (iii) the mezzanine loan when combined with the mortgage loan has a maximum LTV of 75.0%, (iv) the mezzanine loan when combined with the mortgage loan has a minimum debt service coverage ratio of 1.45x and (v) the mezzanine loan when combined with the mortgage loan has a minimum debt yield of 10.0%. |
| (3) | Ongoing monthly reserves for insurance are not required as long as (i) the Berkshire Corporate Center Property is insured by an acceptable blanket insurance policy; (ii) the borrower provides the lender with evidence of renewal of the insurance policies and timely proof of payment of insurance premiums; and (iii) no event of default has occurred and is continuing. |
| (4) | The Immediate Repairs Reserve is comprised of $19,664 in minor deferred maintenance and $250,000 in parking lot and sidewalk repairs. |
| (5) | Size excludes 1,098 square feet of mechanical space. |
| (6) | See “Historical Occupancy” section. |
| (7) | See “Cash Flow Analysis” section. |
The Berkshire Corporate Center mortgage loan is evidenced by a single promissory note that is secured by a first mortgage encumbering the borrower’s fee interest in a single-story industrial flex building totaling 243,993 square feet located in Plymouth, Minnesota (the “Berkshire Corporate Center Property”), approximately 11.0 miles west of the Minneapolis central business district. The Berkshire Corporate Property is comprised of approximately 59.6% office space, 34.8% tech/lab/clean room space and 5.5% warehouse/storage space. Constructed in 1969 and renovated in 2001, the Berkshire Corporate Center Property is situated on an 18.7-acre site. The Berkshire Corporate Center Property has 913 parking spaces resulting in a parking ratio of 3.7 spaces per 1,000 square feet of rentable area. The Berkshire Corporate Center Property benefits from its frontage on Interstate 494. According to the appraisal, the 2016 estimated population within a one-, three- and five-mile radius of the Berkshire Corporate Center Property was 3,134, 63,840 and 160,544, respectively; while the 2016 estimated median household income within the same radii was $69,338, $80,018 and $76,795, respectively. As of June 2, 2016, the Berkshire Corporate Center Property was 90.8% occupied by four tenants.
THE INFORMATION IN THIS STRUCTURAL AND COLLATERAL TERM SHEET IS NOT COMPLETE AND MAY BE AMENDED PRIOR TO THE TIME OF SALE. THIS TERM SHEET IS NOT AN OFFER TO SELL THESE SECURITIES AND IT IS NOT A SOLICITATION OF AN OFFER TO BUY THESE SECURITIES IN ANY JURISDICTION WHERE THE OFFER OR SALE IS NOT PERMITTED.
| 134 |
BERKSHIRE CORPORATE CENTER |
According to a third-party market research report, the Berkshire Corporate Center Property is located in the Northwest industrial submarket of Minneapolis, which, as of the first quarter of 2016, contained a total inventory of approximately 76.7 million square feet. As of the first quarter of 2016 the Northwest Industrial submarket reported a vacancy rate of 7.0% and an average asking rental rate of $6.34 per square foot exclusive of expense pass through.
Sources and Uses
| Sources | Uses | |||||||
| Original loan amount | $17,750,000 | 72.8% | Purchase price(1) | $23,200,000 | 95.1% | |||
| Sponsor’s new cash contribution | 6,645,634 | 27.2 | Closing costs | 836,445 | 3.4 | |||
| Reserves | 359,189 | 1.5 | ||||||
| Total Sources | $24,395,634 | 100.0% | Total Uses | $24,395,634 | 100.0% |
| (1) | The Purchase Price excludes a $250,000 seller credit for parking lot and sidewalk repairs that were escrowed at closing. |
The following table presents certain information relating to the tenancies at the Berkshire Corporate Center Property:
Major Tenants
| Tenant Name | Credit Rating (Fitch/ Moody’s/ S&P)(1) | Tenant NRSF | % of NRSF | Annual U/W Base Rent PSF(2) | Annual U/W Base Rent(2) | % of Total Annual U/W Base Rent | Lease Expiration Date |
| Major Tenants | |||||||
| Greatbatch, Ltd. | NR/Caa1/B+ | 122,821 | 50.3% | $9.23 | $1,133,638 | 51.9% | 1/31/2022(3)(4) |
| Covidien | NR/NR/A | 50,159 | 20.6% | $10.58 | $530,682 | 24.3% | 7/31/2020(5)(6) |
| VAA, LLC | NR/NR/NR | 34,352 | 14.1% | $9.98 | $342,864 | 15.7% | 4/30/2022(7) |
| Zayo Enterprise Networks | NR/NR/NR | 14,192 | 5.8% | $12.33 | $174,987 | 8.0% | 1/31/2018(8) |
| Total Major Tenants | 221,524 | 90.8% | $9.85 | $2,182,171 | 100.0% | ||
| Occupied Collateral Total | 221,524 | 90.8% | $9.85 | $2,182,171 | 100.0% | ||
| Vacant Space | 22,469 | 9.2% | |||||
| Collateral Total | 243,993 | 100.0% | |||||
| (1) | Certain ratings are those of the parent company whether or not the parent guarantees the lease. |
| (2) | Annual U/W Base Rent PSF and Annual U/W Base Rent include contractual rent steps through April 2017 totaling $54,021. |
| (3) | Greatbatch, Ltd. has one, 5-year lease renewal option. |
| (4) | Greatbatch, Ltd. has two termination options. Greatbatch, Ltd. may terminate its lease effective January 31, 2019 provided it has delivered notice on or before February 1, 2018 or effective January 31, 2021 provided it has delivered notice on or before February 1, 2020. Upon such termination, the tenant is required to pay to the landlord a termination fee equal to the unamortized transaction costs, including leasing commissions as of the applicable termination date, using an 8.0% interest factor in addition to an additional two months of base rent and the tenant’s pro-rata share of operating expenses for the two months immediately preceding the applicable termination date. The termination fee is estimated at approximately $463,000 for the first option and $355,000 for the second option. Additionally, If Greatbatch, Ltd. were to exercise its termination options, there would be an excess cash flow sweep commencing upon the earlier of (i) the date that is 12 months prior to the lease expiration date and (ii) the date upon which Greatbatch Ltd. provides notice to terminate the lease until the amount deposited reaches $1,000,000. At the borrower’s option, they may also deposit $1,000,000 into the GreatBatch reserve account in lieu of depositing excess cash flow. |
| (5) | Covidien has one, 5-year lease renewal option. |
| (6) | Covidien has the right to terminate its lease on July 31, 2017 provided that, (i) the tenant must provide written notice to landlord no later than October 31, 2016, (ii) the tenant must not be in default of the provisions under its lease and (iii) the tenant must pay a termination fee of $927,907. |
| (7) | VAA, LLC has one, 3-year lease renewal option. |
| (8) | Zayo Enterprise Networks has one, 5-year lease renewal option. |
THE INFORMATION IN THIS STRUCTURAL AND COLLATERAL TERM SHEET IS NOT COMPLETE AND MAY BE AMENDED PRIOR TO THE TIME OF SALE. THIS TERM SHEET IS NOT AN OFFER TO SELL THESE SECURITIES AND IT IS NOT A SOLICITATION OF AN OFFER TO BUY THESE SECURITIES IN ANY JURISDICTION WHERE THE OFFER OR SALE IS NOT PERMITTED.
| 135 |
BERKSHIRE CORPORATE CENTER |
The following table presents certain information relating to the lease rollover schedule at the Berkshire Corporate Center Property:
Lease Expiration Schedule(1)(2)
| Year Ending December 31, | No. of Leases Expiring | Expiring NRSF | % of Total NRSF | Cumulative Expiring NRSF | Cumulative % of Total NRSF | Annual U/W Base Rent | % of Total Annual U/W Base Rent | Annual U/W Base Rent PSF(3) |
| MTM | 0 | 0 | 0.0% | 0 | 0.0% | $0 | 0.0% | $0.00 |
| 2016 | 0 | 0 | 0.0% | 0 | 0.0% | $0 | 0.0% | $0.00 |
| 2017 | 0 | 0 | 0.0% | 0 | 0.0% | $0 | 0.0% | $0.00 |
| 2018 | 1 | 14,192 | 5.8% | 14,192 | 5.8% | $174,987 | 8.0% | $12.33 |
| 2019 | 0 | 0 | 0.0% | 14,192 | 5.8% | $0 | 0.0% | $0.00 |
| 2020 | 1 | 50,159 | 20.6% | 64,351 | 26.4% | $530,682 | 24.3% | $10.58 |
| 2021 | 0 | 0 | 0.0% | 64,351 | 26.4% | $0 | 0.0% | $0.00 |
| 2022 | 2 | 157,173 | 64.4% | 221,524 | 90.8% | $1,476,502 | 67.7% | $9.39 |
| 2023 | 0 | 0 | 0.0% | 221,524 | 90.8% | $0 | 0.0% | $0.00 |
| 2024 | 0 | 0 | 0.0% | 221,524 | 90.8% | $0 | 0.0% | $0.00 |
| 2025 | 0 | 0 | 0.0% | 221,524 | 90.8% | $0 | 0.0% | $0.00 |
| 2026 | 0 | 0 | 0.0% | 221,524 | 90.8% | $0 | 0.0% | $0.00 |
| Thereafter | 0 | 0 | 0.0% | 221,524 | 90.8% | $0 | 0.0% | $0.00 |
| Vacant | 0 | 22,469 | 9.2% | 243,993 | 100.0% | $0 | 0.0% | $0.00 |
| Total/Weighted Average | 4 | 243,993 | 100.0% | $2,182,171 | 100.0% | $9.85 |
| (1) | Information obtained from the underwritten rent roll. |
| (2) | Certain tenants may have lease termination options that are exercisable prior to the originally stated expiration date of the subject lease and that are not considered in the Lease Expiration Schedule. |
| (3) | Weighted Average Annual U/W Base Rent PSF excludes vacant space. |
The following table presents historical occupancy percentages at the Berkshire Corporate Center Property:
Historical Occupancy
12/31/2012(1) | 12/31/2013(1) | 12/31/2014(2) | 12/31/2015(2) | 6/2/2016(3)(4) |
| NAV | NAV | 100.0% | 100.0% | 90.8% |
| (1) | Historical occupancy information prior to 2014 is unavailable as the seller did not provide them to the borrower. |
| (2) | Information obtained from the borrower. |
| (3) | Information obtained from the underwritten rent roll. |
| (4) | The Berkshire Corporate Center Property was 100.0% occupied as of June 2, 2016; however, Open Access Technology International (9.2% of the net rentable area) gave notice of its intention to vacate once their lease expires in June 2017 and was considered vacant for underwriting purposes. |
THE INFORMATION IN THIS STRUCTURAL AND COLLATERAL TERM SHEET IS NOT COMPLETE AND MAY BE AMENDED PRIOR TO THE TIME OF SALE. THIS TERM SHEET IS NOT AN OFFER TO SELL THESE SECURITIES AND IT IS NOT A SOLICITATION OF AN OFFER TO BUY THESE SECURITIES IN ANY JURISDICTION WHERE THE OFFER OR SALE IS NOT PERMITTED.
| 136 |
BERKSHIRE CORPORATE CENTER |
Operating History and Underwritten Net Cash Flow. The following table presents certain information relating to the historical operating performance and the underwritten net cash flow at the Berkshire Corporate Center Property:
Cash Flow Analysis(1)
| 2014 | 2015 | TTM 3/31/2016 | U/W | % of U/W Effective Gross Income | U/W $ per SF | |
| Base Rent | $2,027,730 | $2,052,080 | $2,107,790 | $2,182,171 | 73.1% | $8.94 |
| Grossed Up Vacant Space | 0 | 0 | 0 | 213,457 | 7.2 | 0.87 |
| Total Reimbursables | 905,972 | 902,592 | 898,050 | 880,414 | 29.5 | 3.61 |
| Less Vacancy & Credit Loss | 0 | 0 | 0 | (291,902)(2) | (9.8) | (1.20) |
| Effective Gross Income | $2,933,702 | $2,954,672 | $3,005,840 | $2,984,140 | 100.0% | $12.23 |
| Total Operating Expenses | $947,713 | $937,937 | $924,784 | $936,461 | 31.4% | $3.84 |
| Net Operating Income | $1,985,989 | $2,016,735 | $2,081,056 | $2,047,679 | 68.6% | $8.39 |
| TI/LC | 0 | 0 | 0 | 213,004 | 7.1 | 0.87 |
| Capital Expenditures | 0 | 0 | 0 | 36,764 | 1.2 | 0.15 |
| Net Cash Flow | $1,985,989 | $2,016,735 | $2,081,056 | $1,797,911 | 60.2% | $7.37 |
| NOI DSCR | 1.90x | 1.92x | 1.99x | 1.95x | ||
| NCF DSCR | 1.90x | 1.92x | 1.99x | 1.72x | ||
| NOI DY | 11.2% | 11.4% | 11.7% | 11.5% | ||
| NCF DY | 11.2% | 11.4% | 11.7% | 10.1% |
| (1) | Historical cash flows prior to 2014 are unavailable as the seller did not provide them to the borrower. |
| (2) | The underwritten economic vacancy is 8.9%. The Berkshire Corporate Center Property is 100.0% occupied as of June 2, 2016; however, Open Access Technology International (9.2% of the net rentable area) gave notice of its intention to vacate once their lease expires in June 2017 and was considered vacant for underwriting purposes. |
The following table presents certain information relating to comparable industrial, flex leases for the Berkshire Corporate Center Property:
Comparable Leases(1)
| Property Name/Location | Year Built | Total GLA (SF) | Percent Office | Total Occupancy | Distance from Subject | Tenant Name | Lease Date / Term | Lease Area (SF) | Annual Base Rent PSF | Lease Type |
8701 Brooklyn Blvd Brooklyn Park, MN | 2007 | 103,964 | 42.0% | 100% | 9.2 miles | Symmetry Solutions | March 2010 / 7.0 Yrs | 11,024 | $10.20 | Net |
Golden Hills Business Park II Golden Valley, MN | 1999 | 80,289 | 87.0% | 100% | 6.2 miles | Viertevo | January 2014 / 11.0 Yrs | 19,016 | $10.00 | Net |
Plymouth Technology Park Plymouth, MN | 1999 | 205,494 | 73.4% | 96% | 3.6 miles | Sterilmed | April 2014 / 5.0 Yrs | 37,144 | $9.25 | Net |
Twin Lakes Business Park IV Brooklyn Center, MN | 2012 | 89,997 | 27.0% | 100% | 8.4 miles | Confidential | May 2013 / 8.5 Yrs | 27,340 | $9.69 | Net |
Shutterfly Facility Shakopee, MN | 2013 | 217,622 | 26.5% | 100% | 21.4 miles | Shutterfly | July 2014 / 10.0 Yrs | 217,622 | $9.50 | Net |
Bryant Lake Business Center Eden Prairie, MN | 1985 | 171,519 | 88.0% | 100% | 10.4 miles | Howmedica | October 2014 / 5.1 Yrs | 2,800 | $11.00 | Net |
12400 Whitewater Drive Minnetonka, MN | 1984 | 61,138 | 100.0% | 58% | 8.9 miles | Milestone Systems | September 2010 / 6.0 Yrs | 12,987 | $13.04 | Net |
Plymouth Corporate Center Plymouth, MN | 1974 | 628,436 | 82.0% | 100% | 0.8 miles | Confidential | February 2013 / 5.0 Yrs | 44,541 | $10.25 | Net |
| (1) | Information obtained from the appraisal. |
THE INFORMATION IN THIS STRUCTURAL AND COLLATERAL TERM SHEET IS NOT COMPLETE AND MAY BE AMENDED PRIOR TO THE TIME OF SALE. THIS TERM SHEET IS NOT AN OFFER TO SELL THESE SECURITIES AND IT IS NOT A SOLICITATION OF AN OFFER TO BUY THESE SECURITIES IN ANY JURISDICTION WHERE THE OFFER OR SALE IS NOT PERMITTED.
| 137 |
Wells Fargo Commercial Mortgage Trust 2016-C35 | Transaction Contact Information |
VI. Transaction Contact Information
Questions regarding this Structural and Collateral Term Sheet may be directed to any of the following individuals:
| Wells Fargo Securities, LLC | |
| Brigid Mattingly | Tel. (312) 269-3062 |
| A.J. Sfarra | Tel. (212) 214-5613 |
| Alex Wong | Tel. (212) 214-5615 |
| Barclays Capital Inc. | |
| Daniel Vinson | Tel. (212) 528-8224 |
| Brian Wiele | Tel. (212) 412-5780 |
| Brian La Belle | Tel. (212) 526-1809 |
| UBS Securities LLC | |
| David Schell | Tel. (212) 713-3375 |
| Nicholas Galeone | Tel. (212) 713-8832 |
| Siho Ham | Tel. (212) 713-1278 |
THE INFORMATION IN THIS STRUCTURAL AND COLLATERAL TERM SHEET IS NOT COMPLETE AND MAY BE AMENDED PRIOR TO THE TIME OF SALE. THIS TERM SHEET IS NOT AN OFFER TO SELL THESE SECURITIES AND IT IS NOT A SOLICITATION OF AN OFFER TO BUY THESE SECURITIES IN ANY JURISDICTION WHERE THE OFFER OR SALE IS NOT PERMITTED.
| 138 |