| FREE WRITING PROSPECTUS | ||
| FILED PURSUANT TO RULE 433 | ||
| REGISTRATION FILE NO.: 333-206677-07 | ||
 |
|  |

Free Writing Prospectus
Structural and Collateral Term Sheet
$870,557,680
(Approximate Initial Pool Balance)
$729,853,000
(Approximate Aggregate Certificate Balance of Offered Certificates)
Wells Fargo Commercial Mortgage Trust 2016-BNK1
as Issuing Entity
Wells Fargo Commercial Mortgage Securities, Inc.
as Depositor
Wells Fargo Bank, National Association
Bank of America, National Association
Morgan Stanley Mortgage Capital Holdings LLC
as Sponsors and Mortgage Loan Sellers
Commercial Mortgage Pass-Through Certificates
Series 2016-BNK1
August 1, 2016
| WELLS FARGO SECURITIES | BofA MERRILL LYNCH | MORGAN STANLEY |
Co-Lead Manager and Joint Bookrunner | Co-Lead Manager and Joint Bookrunner | Co-Lead Manager and Joint Bookrunner |
Academy Securities Co-Manager | Drexel Hamilton Co-Manager |
STATEMENT REGARDING THIS FREE WRITING PROSPECTUS
The depositor has filed a registration statement (including a prospectus) with the Securities and Exchange Commission (‘‘SEC’’) (SEC File No. 333-206677) for the offering to which this communication relates. Before you invest, you should read the prospectus in the registration statement and other documents the depositor has filed with the SEC for more complete information about the depositor, the issuing entity and this offering. You may get these documents for free by visiting EDGAR on the SEC Web site at www.sec.gov. Alternatively, the depositor, any underwriter, or any dealer participating in the offering will arrange to send you the prospectus after filing if you request it by calling toll free 1-800-745-2063 (8 a.m. – 5 p.m. EST) or by emailing wfs.cmbs@wellsfargo.com.
Nothing in this document constitutes an offer of securities for sale in any jurisdiction where the offer or sale is not permitted. The information contained herein is preliminary as of the date hereof, supersedes any such information previously delivered to you and will be superseded by any such information subsequently delivered and ultimately by the final prospectus relating to the securities. These materials are subject to change, completion, supplement or amendment from time to time.
This free writing prospectus has been prepared by the underwriters for information purposes only and does not constitute, in whole or in part, a prospectus for the purposes of Directive 2003/71/EC (as amended) and/or Part VI of the Financial Services and Markets Act 2000, as amended, or other offering document.
STATEMENT REGARDING ASSUMPTIONS AS TO SECURITIES, PRICING ESTIMATES AND OTHER INFORMATION
The attached information contains certain tables and other statistical analyses (the “Computational Materials”) which have been prepared in reliance upon information furnished by the Mortgage Loan Sellers. Numerous assumptions were used in preparing the Computational Materials, which may or may not be reflected herein. As such, no assurance can be given as to the Computational Materials’ accuracy, appropriateness or completeness in any particular context; or as to whether the Computational Materials and/or the assumptions upon which they are based reflect present market conditions or future market performance. The Computational Materials should not be construed as either projections or predictions or as legal, tax, financial or accounting advice. You should consult your own counsel, accountant and other advisors as to the legal, tax, business, financial and related aspects of a purchase of these securities. Any weighted average lives, yields and principal payment periods shown in the Computational Materials are based on prepayment and/or loss assumptions, and changes in such prepayment and/or loss assumptions may dramatically affect such weighted average lives, yields and principal payment periods. In addition, it is possible that prepayments or losses on the underlying assets will occur at rates higher or lower than the rates shown in the attached Computational Materials. The specific characteristics of the securities may differ from those shown in the Computational Materials due to differences between the final underlying assets and the preliminary underlying assets used in preparing the Computational Materials. The principal amount and designation of any security described in the Computational Materials are subject to change prior to issuance. None of Wells Fargo Securities, LLC, Merrill Lynch, Pierce, Fenner & Smith Incorporated, Morgan Stanley & Co. LLC, Academy Securities, Inc., Drexel Hamilton, LLC or any of their respective affiliates, make any representation or warranty as to the actual rate or timing of payments or losses on any of the underlying assets or the payments or yield on the securities. The information in this presentation is based upon management forecasts and reflects prevailing conditions and management’s views as of this date, all of which are subject to change. In preparing this presentation, we have relied upon and assumed, without independent verification, the accuracy and completeness of all information available from public sources or which was provided to us by or on behalf of the Mortgage Loan Sellers or which was otherwise reviewed by us.
This free writing prospectus contains certain forward-looking statements. If and when included in this free writing prospectus, the words “expects”, “intends”, “anticipates”, “estimates” and analogous expressions and all statements that are not historical facts, including statements about our beliefs or expectations, are intended to identify forward-looking statements. Any forward-looking statements are made subject to risks and uncertainties which could cause actual results to differ materially from those stated. Those risks and uncertainties include, among other things, declines in general economic and business conditions, increased competition, changes in demographics, changes in political and social conditions, regulatory initiatives and changes in customer preferences, many of which are beyond our control and the control of any other person or entity related to this offering. The forward-looking statements made in this free writing prospectus are made as of the date stated on the cover. We have no obligation to update or revise any forward-looking statement.
Wells Fargo Securities is the trade name for the capital markets and investment banking services of Wells Fargo & Company and its subsidiaries, including but not limited to Wells Fargo Securities, LLC, a member of NYSE, FINRA, NFA and SIPC, Wells Fargo Prime Services, LLC, a member of FINRA, NFA and SIPC, and Wells Fargo Bank, N.A. Wells Fargo Securities, LLC and Wells Fargo Prime Services, LLC are distinct entities from affiliated banks and thrifts.
IMPORTANT NOTICE REGARDING THE OFFERED CERTIFICATES
The information herein is preliminary and may be supplemented or amended prior to the time of sale. In addition, the Offered Certificates referred to in these materials and the asset pool backing them are subject to modification or revision (including the possibility that one or more classes of certificates may be split, combined or eliminated at any time prior to issuance or availability of a final prospectus) and are offered on a “when, as and if issued” basis.
The underwriters described in these materials may from time to time perform investment banking services for, or solicit investment banking business from, any company named in these materials. The underwriters and/or their affiliates or respective employees may from time to time have a long or short position in any security or contract discussed in these materials.
The information contained herein supersedes any previous such information delivered to any prospective investor and will be superseded by information delivered to such prospective investor prior to the time of sale.
IMPORTANT NOTICE RELATING TO AUTOMATICALLY-GENERATED EMAIL DISCLAIMERS
Any legends, disclaimers or other notices that may appear at the bottom of any email communication to which this free writing prospectus is attached relating to (1) these materials not constituting an offer (or a solicitation of an offer), (2) any representation that these materials are accurate or complete and may not be updated or (3) these materials possibly being confidential, are not applicable to these materials and should be disregarded. Such legends, disclaimers or other notices have been automatically generated as a result of these materials having been sent via Bloomberg or another system.
THE INFORMATION IN THIS STRUCTURAL AND COLLATERAL TERM SHEET IS NOT COMPLETE AND MAY BE AMENDED PRIOR TO THE TIME OF SALE. THIS TERM SHEET IS NOT AN OFFER TO SELL THESE SECURITIES AND IT IS NOT A SOLICITATION OF AN OFFER TO BUY THESE SECURITIES IN ANY JURISDICTION WHERE THE OFFER OR SALE IS NOT PERMITTED.
2
Wells Fargo Commercial Mortgage Trust 2016-BNK1 | Certificate Structure |
| I. | Certificate Structure |
| Class | Expected Ratings (Fitch/KBRA/Moody’s/S&P)(1) | Approximate Initial Certificate Balance or Notional Amount(2) |
Approx. Initial Credit Support(3) | Pass-Through Rate Description | Weighted Average Life (Years)(4) | Expected Principal Window(4) | Certificate Principal to Value Ratio(5) | Certificate Principal U/W NOI Debt Yield(6) | ||||||
| Offered Certificates | ||||||||||||||
| A-1 | AAAsf/AAA(sf)/Aaa(sf)/AAA(sf) | $36,136,000 | 30.000% | (7) | 2.87 | 09/16 – 08/21 | 38.9% | 17.5% | ||||||
| A-2 | AAAsf/AAA(sf)/Aaa(sf)/AAA(sf) | $230,000,000 | 30.000% | (7) | 9.73 | 09/25 – 06/26 | 38.9% | 17.5% | ||||||
| A-3 | AAAsf/AAA(sf)/Aaa(sf)/AAA(sf) | $267,018,000 | 30.000% | (7) | 9.89 | 06/26 – 07/26 | 38.9% | 17.5% | ||||||
| A-SB | AAAsf/AAA(sf)/Aaa(sf)/AAA(sf) | $45,766,000 | 30.000% | (7) | 7.09 | 08/21 – 09/25 | 38.9% | 17.5% | ||||||
| A-S | AAAsf/AAA(sf)/Aa2(sf)/AAA(sf) | $67,197,000 | 21.875% | (7) | 9.92 | 07/26 – 08/26 | 43.4% | 15.7% | ||||||
| X-A | AAAsf/AAA(sf)/Aaa(sf)/AAA(sf) | $578,920,000(8) | N/A | Variable(9) | N/A | N/A | N/A | N/A | ||||||
| X-B | A-sf/AAA(sf)/NR/A-(sf) | $150,933,000(10) | N/A | Variable(11) | N/A | N/A | N/A | N/A | ||||||
| B | AA-sf/AA-(sf)/NR/AA-(sf) | $44,452,000 | 16.500% | (7) | 9.99 | 08/26 – 08/26 | 46.4% | 14.7% | ||||||
| C | A-sf/A-(sf)/NR/A-(sf) | $39,284,000 | 11.750% | (7) | 9.99 | 08/26 – 08/26 | 49.1% | 13.9% | ||||||
| Non-Offered Certificates | ||||||||||||||
| X-D | BBB-sf/BBB-(sf)/NR/NR | $39,284,000(12) | N/A | Variable(13) | N/A | N/A | N/A | N/A | ||||||
| X-E | BB-sf/BB-(sf)/NR/NR | $18,608,000(14) | N/A | Variable(15) | N/A | N/A | N/A | N/A | ||||||
| X-F | B-sf/B-(sf)/NR/NR | $8,271,000(16) | N/A | Variable(17) | N/A | N/A | N/A | N/A | ||||||
| X-G | NR/NR/NR/NR | $31,013,795(18) | N/A | Variable(19) | N/A | N/A | N/A | N/A | ||||||
| D | BBB-sf/BBB-(sf)/NR/NR | $39,284,000 | 7.000% | (7) | 9.99 | 08/26 – 08/26 | 51.7% | 13.2% | ||||||
| E | BB-sf/BB-(sf)/NR/NR | $18,608,000 | 4.750% | (7) | 9.99 | 08/26 – 08/26 | 52.9% | 12.9% | ||||||
| F | B-sf/B-(sf)/NR/NR | $8,271,000 | 3.750% | (7) | 9.99 | 08/26 – 08/26 | 53.5% | 12.7% | ||||||
| G | NR/NR/NR/NR | $31,013,795 | 0.000% | (7) | 10.79 | 08/26 – 07/31 | 55.6% | 12.2% | ||||||
| Non-Offered Eligible Vertical Interest | ||||||||||||||
| RRI Interest | NR/NR/NR/NR | $43,527,883 | N/A | WAC(20) | 9.44 | 09/16 - 07/31 | N/A | N/A | ||||||
| Notes: | |
| (1) | The expected ratings presented are those of Fitch Ratings, Inc. (“Fitch”), Kroll Bond Rating Agency, Inc. (“KBRA”), Moody’s Investors Service, Inc. (“Moody’s”) and S&P Global Ratings (“S&P”), which the depositor hired to rate the Offered Certificates. One or more other nationally recognized statistical rating organizations that were not hired by the depositor may use information they receive pursuant to Rule 17g-5 under the Securities Exchange Act of 1934, as amended (the “Exchange Act”) or otherwise, to rate or provide market reports and/or published commentary related to the Offered Certificates. We cannot assure you as to what ratings a non-hired nationally recognized statistical rating organization would assign or that its reports will not express differing, possibly negative, views of the mortgage loans and/or the Offered Certificates. The ratings of each Class of Offered Certificates address the likelihood of the timely distribution of interest and, except in the case of the Class X-A and X-B certificates, the ultimate distribution of principal due on those Classes on or before the Rated Final Distribution Date. See “Risk Factors—Other Risks Relating to the Certificates—Nationally Recognized Statistical Rating Organizations May Assign Different Ratings to the Certificates; Ratings of the Certificates Reflect Only the Views of the Applicable Rating Agencies as of the Dates Such Ratings Were Issued; Ratings May Affect ERISA Eligibility; Ratings May Be Downgraded” and “Ratings” in the Preliminary Prospectus, expected to be dated August 1, 2016 (the “Preliminary Prospectus”). Fitch, KBRA, Moody’s and S&P have informed us that the “sf” designation in their ratings represents an identifier for structured finance product ratings. |
| (2) | The certificate balances and notional amounts set forth in the table are approximate. The actual initial certificate balances and notional amounts may be larger or smaller depending on the initial pool balance of the mortgage loans definitively included in the pool of mortgage loans, which aggregate cut-off date balance may be as much as 5% larger or smaller than the amount presented in the Preliminary Prospectus. |
| (3) | The approximate initial credit support with respect to the Class A-1, A-2, A-3 and A-SB Certificates represents the approximate credit enhancement for the Class A-1, A-2, A-3 and A-SB Certificates in the aggregate. The RRI Interest only provides credit support to the limited extent that losses incurred on the underlying mortgage loans are allocated to it, on the one hand, and to the Offered Certificates and the Non-Offered Certificates, on the other hand,pro rata, in accordance with their respective Percentage Allocation Entitlements. |
| (4) | Weighted Average Lives and Expected Principal Windows are calculated based on an assumed prepayment rate of 0% CPR and the “Structuring Assumptions” described under “Yield and Maturity Considerations—Weighted Average Life” in the Preliminary Prospectus. |
| (5) | The Certificate Principal to Value Ratio for each Class of Certificates (other than the Class A-1, A-2, A-3 and A-SB Certificates) is calculated as the product of (a) the weighted average Cut-off Date LTV Ratio for the mortgage loans and (b) a fraction, the numerator of which is the total initial Certificate Balance of such Class of Certificates and all Classes of Principal Balance Certificates senior to such Class of Certificates and the denominator of which is the total initial Certificate Balance of all of the Principal Balance Certificates (other than the RRI Interest). The Certificate Principal to Value Ratio for each of the Class A-1, A-2, A-3 and A-SB Certificates is calculated in the aggregate for those Classes as if they were a single Class and is calculated as the product of (a) the weighted average Cut-off Date LTV Ratio for the mortgage loans and (b) a fraction, the numerator of which is the total initial aggregate Certificate Balances of such Classes of Certificates and the denominator of which is the total initial Certificate Balance of all of the Principal Balance Certificates (other than the RRI Interest). In any event, however, excess mortgaged property value associated with a mortgage loan will not be available to offset losses on any other mortgage loan. |
| (6) | The Certificate Principal U/W NOI Debt Yield for each Class of Certificates (other than the Class A-1, A-2, A-3 and A-SB Certificates) is calculated as the product of (a) the weighted average U/W NOI Debt Yield for the mortgage loans and (b) a fraction, the numerator of which is the total initial Certificate Balance of all of the Classes of Principal Balance Certificates (other than the RRI Interest) and the denominator of which is the total initial Certificate Balance for such Class of Certificates and all Classes of Principal Balance Certificates senior to such Class of Certificates. The Certificate Principal U/W NOI Debt Yield for each of the Class A-1, A-2, A-3 and A-SB Certificates is calculated in the aggregate for those Classes as if they were a single Class and is calculated as the product of (a) the weighted average U/W NOI Debt Yield for the mortgage loans and (b) a fraction, the numerator of which is the total initial Certificate Balance of all of the Classes of Principal Balance Certificates (other than the RRI Interest) and the denominator of which is the total aggregate initial Certificate Balances for the Class A-1, A-2, A-3 and A-SB Certificates. In any event, however, cash flow from each mortgaged property supports only the related mortgage loan and will not be available to support any other mortgage loan. |
| (7) | The pass-through rates for the Class A-1, A-2, A-3, A-SB, A-S, B, C, D, E, F and G Certificates in each case will be one of the following: (i) a fixed rateper annum, (ii) a variable rate per annum equal to the weighted average of the net mortgage interest rates on the mortgage loans for the related distribution date, (iii) a variable rateper annum equal to the lesser of (a) a fixed rate and (b) the weighted average of the net mortgage interest rates on the mortgage loans for the related distribution date or (iv) a variable rateper annum equal to the weighted average of the net mortgage interest rates on the mortgage loans for the related distribution date minus a specified percentage. For purposes of the calculation of the weighted average of the net mortgage interest rates on the mortgage loans for each distribution date, the mortgage interest rates will be adjusted as necessary to a 30/360 basis. |
THE INFORMATION IN THIS STRUCTURAL AND COLLATERAL TERM SHEET IS NOT COMPLETE AND MAY BE AMENDED PRIOR TO THE TIME OF SALE. THIS TERM SHEET IS NOT AN OFFER TO SELL THESE SECURITIES AND IT IS NOT A SOLICITATION OF AN OFFER TO BUY THESE SECURITIES IN ANY JURISDICTION WHERE THE OFFER OR SALE IS NOT PERMITTED.
3
| Wells Fargo Commercial Mortgage Trust 2016-BNK1 | Certificate Structure |
| (8) | The Class X-A Certificates are notional amount certificates. The Notional Amount of the Class X-A Certificates will be equal to the aggregate Certificate Balance of the Class A-1, A-2, A-3 and A-SB Certificates outstanding from time to time. The Class X-A Certificates will not be entitled to distributions of principal. |
| (9) | The pass-through rate for the Class X-A Certificates for any distribution date will be aper annum rate equal to the excess, if any, of (a) the weighted average of the net mortgage interest rates on the mortgage loans for the related distribution date, over (b) the weighted average of the pass-through rates on the Class A-1, A-2, A-3 and A-SB Certificates for the related distribution date, weighted on the basis of their respective Certificate Balances outstanding immediately prior to that distribution date. For purposes of the calculation of the weighted average of the net mortgage interest rates on the mortgage loans for each distribution date, the mortgage interest rates will be adjusted as necessary to a 30/360 basis. |
| (10) | The Class X-B Certificates are notional amount certificates. The Notional Amount of the Class X-B Certificates will be equal to the aggregate Certificate Balance of the Class A-S, B and C Certificates outstanding from time to time. The Class X-B Certificates will not be entitled to distributions of principal. |
| (11) | The pass-through rate for the Class X-B Certificates for any distribution date will be aper annum rate equal to the excess, if any, of (a) the weighted average of the net mortgage interest rates on the mortgage loans for the related distribution date, over (b) the weighted average of the pass-through rates on the Class A-S, B and C Certificates for the related distribution date, weighted on the basis of their respective Certificate Balances outstanding immediately prior to that distribution date. For purposes of the calculation of the weighted average of the net mortgage interest rates on the mortgage loans for each distribution date, the mortgage interest rates will be adjusted as necessary to a 30/360 basis. |
| (12) | The Class X-D Certificates are notional amount certificates. The Notional Amount of the Class X-D Certificates will be equal to the Certificate Balance of the Class D Certificates outstanding from time to time. The Class X-D Certificates will not be entitled to distributions of principal. |
| (13) | The pass-through rate for the Class X-D Certificates for any distribution date will be aper annum rate equal to the excess, if any, of (a) the weighted average of the net mortgage interest rates on the mortgage loans for the related distribution date, over (b) the pass-through rate on the Class D Certificates for the related distribution date. For purposes of the calculation of the weighted average of the net mortgage interest rates on the mortgage loans for each distribution date, the mortgage interest rates will be adjusted as necessary to a 30/360 basis. |
| (14) | The Class X-E Certificates are notional amount certificates. The Notional Amount of the Class X-E Certificates will be equal to the Certificate Balance of the Class E Certificates outstanding from time to time. The Class X-E Certificates will not be entitled to distributions of principal. |
| (15) | The pass-through rate for the Class X-E Certificates for any distribution date will be aper annum rate equal to the excess, if any, of (a) the weighted average of the net mortgage interest rates on the mortgage loans for the related distribution date, over (b) the pass-through rate on the Class E Certificates for the related distribution date. For purposes of the calculation of the weighted average of the net mortgage interest rates on the mortgage loans for each distribution date, the mortgage interest rates will be adjusted as necessary to a 30/360 basis. |
| (16) | The Class X-F Certificates are notional amount certificates. The Notional Amount of the Class X-F Certificates will be equal to the Certificate Balance of the Class F Certificates outstanding from time to time. The Class X-F Certificates will not be entitled to distributions of principal. |
| (17) | The pass-through rate for the Class X-F Certificates for any distribution date will be aper annum rate equal to the excess, if any, of (a) the weighted average of the net mortgage interest rates on the mortgage loans for the related distribution date, over (b) the pass-through rate on the Class F Certificates for the related distribution date. For purposes of the calculation of the weighted average of the net mortgage interest rates on the mortgage loans for each distribution date, the mortgage interest rates will be adjusted as necessary to a 30/360 basis. |
| (18) | The Class X-G Certificates are notional amount certificates. The Notional Amount of the Class X-G Certificates will be equal to the Certificate Balance of the Class G Certificates outstanding from time to time. The Class X-G Certificates will not be entitled to distributions of principal. |
| (19) | The pass-through rate for the Class X-G Certificates for any distribution date will be aper annum rate equal to the excess, if any, of (a) the weighted average of the net mortgage interest rates on the mortgage loans for the related distribution date, over (b) the pass-through rate on the Class G Certificates for the related distribution date. For purposes of the calculation of the weighted average of the net mortgage interest rates on the mortgage loans for each distribution date, the mortgage interest rates will be adjusted as necessary to a 30/360 basis. |
| (20) | The effective interest rate for the RRI Interest will be the weighted average of the net mortgage interest rates on the mortgage loans for the related distribution date. |
THE INFORMATION IN THIS STRUCTURAL AND COLLATERAL TERM SHEET IS NOT COMPLETE AND MAY BE AMENDED PRIOR TO THE TIME OF SALE. THIS TERM SHEET IS NOT AN OFFER TO SELL THESE SECURITIES AND IT IS NOT A SOLICITATION OF AN OFFER TO BUY THESE SECURITIES IN ANY JURISDICTION WHERE THE OFFER OR SALE IS NOT PERMITTED.
4
| Wells Fargo Commercial Mortgage Trust 2016-BNK1 | Transaction Highlights |
| II. | Transaction Highlights |
Mortgage Loan Sellers:
Mortgage Loan Seller | Number of | Number of | Aggregate Cut-off | % of Initial | |||||
| Wells Fargo Bank, National Association | 15 | 15 | $302,740,928 | 34.8 | % | ||||
| Bank of America, National Association | 15 | 21 | 268,752,809 | 30.9 | |||||
| Morgan Stanley Mortgage Capital Holdings LLC | 9 | 9 | 219,063,942 | 25.2 | |||||
| Wells Fargo Bank, National Association/Bank of America, National Association(1) | 1 | 1 | 80,000,000 | 9.2 | |||||
Total | 40 | 46 | $870,557,680 | 100.0 | % | ||||
| (1) | One mortgage loan identified on Annex A-1 as The Shops at Crystals, representing approximately 9.2% of the aggregate principal balance of the pool of mortgage loans as of the cut-off date, is part of a whole loan that was co-originated by Wells Fargo Bank, National Association, Bank of America, National Association and JPMorgan Chase Bank, National Association. Wells Fargo Bank, National Association is acting as loan seller and originator with respect to Notes A-3-B-2, A-3-B-3, B-3-B-2 and B-3-B-3, with an aggregate outstanding principal balance as of the cut-off date of $40,000,000. Bank of America, National Association is acting as loan seller and originator with respect to Notes A-2-B-2, A-2-B-3, B-2-B-2 and B-2-B-3, with an aggregate outstanding principal balance as of the cut-off date of $40,000,000. |
Loan Pool:
| Initial Pool Balance: | $870,557,680 |
| Number of Mortgage Loans: | 40 |
| Average Cut-off Date Balance per Mortgage Loan: | $21,763,942 |
| Number of Mortgaged Properties: | 46 |
| Average Cut-off Date Balance per Mortgaged Property(1): | $18,925,167 |
| Weighted Average Mortgage Interest Rate: | 4.289% |
| Ten Largest Mortgage Loans as % of Initial Pool Balance: | 58.7% |
| Weighted Average Original Term to Maturity or ARD (months): | 120 |
| Weighted Average Remaining Term to Maturity or ARD (months): | 119 |
| Weighted Average Original Amortization Term (months)(2): | 345 |
| Weighted Average Remaining Amortization Term (months)(2): | 344 |
| Weighted Average Seasoning (months): | 1 |
| (1) | Information regarding mortgage loans secured by multiple properties is based on an allocation according to relative appraised values or the allocated loan amounts or property-specific release prices set forth in the related loan documents or such other allocation as the related mortgage loan seller deemed appropriate. |
| (2) | Excludes any mortgage loan that does not amortize. |
Credit Statistics:
| Weighted Average U/W Net Cash Flow DSCR(1): | 2.35x |
| Weighted Average U/W Net Operating Income Debt Yield(1): | 12.2% |
| Weighted Average Cut-off Date Loan-to-Value Ratio(1): | 55.6% |
| Weighted Average Balloon or ARD Loan-to-Value Ratio(1): | 48.9% |
| % of Mortgage Loans with Additional Subordinate Debt(2): | 18.4% |
| % of Mortgage Loans with Single Tenants(3): | 25.8% |
| (1) | With respect to any mortgage loan that is part of a whole loan, loan-to-value ratio, debt service coverage ratio and debt yield calculations include the relatedpari passucompanion loan(s) but exclude any related subordinate companion loan(s) (unless otherwise stated). The debt service coverage ratio, debt yield and loan-to-value ratio information do not take into account any subordinate debt (whether or not secured by the related mortgaged property), that currently exists or is allowed under the terms of any mortgage loan. The information for each mortgaged property that relates to a mortgage loan that is cross-collateralized or cross-defaulted with one or more other mortgage loans is based upon the principal balance of that mortgage loan, except that the applicable loan-to-value ratio, debt service coverage ratio, and debt yield for each such mortgage loan is based upon the ratio or yield (as applicable) for the aggregate indebtedness evidenced by all loans in the group (without regard to any limitation on the amount of indebtedness secured by any mortgaged property in such cross-collateralized group). On an individual basis, without regard to the cross-collateralization feature, any mortgage loan that is part of a cross-collateralized group of mortgage loans may have a higher loan-to-value ratio, lower debt service coverage ratio and/or lower debt yield than is presented herein. See “Description of the Mortgage Pool—Mortgage Pool Characteristics” in the Preliminary Prospectus and Annex A-1 to the Preliminary Prospectus. |
| (2) | The percentage figure expressed as “% of Mortgage Loans with Additional Subordinate Debt” is determined as a percentage of the initial pool balance and does not take into account any future subordinate debt (whether or not secured by the mortgaged property), if any, that may be permitted under the terms of any mortgage loan or the pooling and servicing agreement. See “Description of the Mortgage Pool—Additional Indebtedness—Other Unsecured Indebtedness”. |
| (3) | Excludes mortgage loans that are secured by multiple single tenant properties. |
THE INFORMATION IN THIS STRUCTURAL AND COLLATERAL TERM SHEET IS NOT COMPLETE AND MAY BE AMENDED PRIOR TO THE TIME OF SALE. THIS TERM SHEET IS NOT AN OFFER TO SELL THESE SECURITIES AND IT IS NOT A SOLICITATION OF AN OFFER TO BUY THESE SECURITIES IN ANY JURISDICTION WHERE THE OFFER OR SALE IS NOT PERMITTED.
5
| Wells Fargo Commercial Mortgage Trust 2016-BNK1 | Transaction Highlights |
Loan Structural Features:
Amortization:Based on the Initial Pool Balance, 62.5% of the mortgage pool (28 mortgage loans) has scheduled amortization, as follows:
33.6% (18 mortgage loans) requires amortization during the entire loan term; and
28.9% (10 mortgage loans) provides for an interest-only period followed by an amortization period.
Interest-Only:Based on the Initial Pool Balance, 37.5% of the mortgage pool (12 mortgage loans) provides for interest-only payments during the entire loan term. The Weighted Average Cut-off Date Loan-to-Value Ratio and Weighted Average U/W Net Cash Flow DSCR for those mortgage loans are 47.2% and 3.38x, respectively.
Hard Lockboxes: Based on the Initial Pool Balance, 57.7% of the mortgage pool (15 mortgage loans) have hard lockboxes in place.
Reserves: The mortgage loans require amounts to be escrowed monthly as follows (excluding any mortgage loans with springing provisions):
| Real Estate Taxes: | 64.2% of the pool |
| Insurance: | 23.1% of the pool |
| Capital Replacements: | 43.9% of the pool |
| TI/LC: | 36.3% of the pool(1) |
| (1) | The percentage of Initial Pool Balance for mortgage loans with TI/LC reserves is based on the aggregate principal balance allocable to loans that include office, retail, industrial and mixed-use properties. |
Call Protection/Defeasance: Based on the Initial Pool Balance, the mortgage pool has the following call protection and defeasance features:
63.7% of the mortgage pool (26 mortgage loans) features a lockout period, then defeasance only until an open period;
18.9% of the mortgage pool (four mortgage loans) features a lockout period, then the greater of a prepayment premium or yield maintenance or defeasance until an open period; and
17.4% of the mortgage pool (10 mortgage loans) features a lockout period, then the greater of a prepayment premium or yield maintenance until an open period.
Please refer to Annex A-1 and the footnotes related thereto to the Preliminary Prospectus for further information regarding individual loan call protection.
THE INFORMATION IN THIS STRUCTURAL AND COLLATERAL TERM SHEET IS NOT COMPLETE AND MAY BE AMENDED PRIOR TO THE TIME OF SALE. THIS TERM SHEET IS NOT AN OFFER TO SELL THESE SECURITIES AND IT IS NOT A SOLICITATION OF AN OFFER TO BUY THESE SECURITIES IN ANY JURISDICTION WHERE THE OFFER OR SALE IS NOT PERMITTED.
6
| Wells Fargo Commercial Mortgage Trust 2016-BNK1 | Issue Characteristics |
| III. | Issue Characteristics |
| Securities Offered: | $729,853,000 approximate monthly pay, multi-class, commercial mortgage REMIC pass-through certificates consisting of nine classes (Classes A-1, A-2, A-3, A-SB, A-S, B, C, X-A and X-B), which are offered pursuant to a registration statement filed with the SEC (such classes of certificates, the “Offered Certificates”). |
| Mortgage Loan Sellers: | Wells Fargo Bank, National Association (“WFB”), Bank of America, National Association (“BANA”) and Morgan Stanley Mortgage Capital Holdings LLC (“MSMCH”). |
| Joint Bookrunners and Co-Lead Managers: | Wells Fargo Securities, LLC, Merrill Lynch, Pierce, Fenner & Smith Incorporated, Morgan Stanley & Co. LLC |
| Co-Managers: | Academy Securities Inc. and Drexel Hamilton, LLC |
| Rating Agencies: | Fitch Ratings, Inc., Kroll Bond Rating Agency, Inc., Moody’s Investors Service, Inc. and S&P Global Ratings |
| Master Servicer: | Wells Fargo Bank, National Association |
| Special Servicer: | Rialto Capital Advisors, LLC |
| Certificate Administrator: | Wells Fargo Bank, National Association |
| Trustee: | Wilmington Trust, National Association |
| Operating Advisor: | Park Bridge Lender Services LLC |
| Asset Representations Reviewer: | Park Bridge Lender Services LLC |
| U.S. Credit Risk Retention: | For a discussion on the manner in which the credit risk retention requirements, if they were in effect, would be addressed by Wells Fargo Bank, National Association, as the retaining sponsor, see “Credit Risk Retention” in the Preliminary Prospectus. |
| EU Risk Retention: | For a discussion of the manner in which each of Wells Fargo Bank, National Association, Bank of America, National Association and Morgan Stanley Bank, N.A. will covenant and represent to each other, the issuing entity and the trustee to retain a material net economic interest in the securitization for the purpose of the EU risk retention requirements and due diligence requirements, see “EU Securitization Risk Retention Requirements” in the Preliminary Prospectus. |
| Risk Retention Consultation Party: | Wells Fargo Bank, National Association |
| Initial Majority Controlling Class Certificateholder: | RREF III Debt AIV, LP or another affiliate of Rialto Capital Advisors, LLC. |
| Cut-off Date: | The Cut-off Date with respect to each mortgage loan is the due date for the monthly debt service payment that is due in August 2016 (or, in the case of any mortgage loan that has its first due date in September 2016, the date that would have been its due date in August 2016 under the terms of that mortgage loan if a monthly debt service payment were scheduled to be due in that month). |
| Expected Closing Date: | On or about August 18, 2016. |
| Determination Dates: | The 11th day of each month (or if that day is not a business day, the next succeeding business day), commencing in September 2016. |
| Distribution Dates: | The fourth business day following the Determination Date in each month, commencing in September 2016. |
| Rated Final Distribution Date: | The Distribution Date in August 2049. |
| Interest Accrual Period: | With respect to any Distribution Date, the calendar month immediately preceding the month in which such Distribution Date occurs. |
| Day Count: | The Offered Certificates will accrue interest on a 30/360 basis. |
| Minimum Denominations: | $10,000 for each Class of Offered Certificates (other than the Class X-A and X-B Certificates) and $1,000,000 for the Class X-A and X-B Certificates. Investments may also be made in any whole dollar denomination in excess of the applicable minimum denomination. |
THE INFORMATION IN THIS STRUCTURAL AND COLLATERAL TERM SHEET IS NOT COMPLETE AND MAY BE AMENDED PRIOR TO THE TIME OF SALE. THIS TERM SHEET IS NOT AN OFFER TO SELL THESE SECURITIES AND IT IS NOT A SOLICITATION OF AN OFFER TO BUY THESE SECURITIES IN ANY JURISDICTION WHERE THE OFFER OR SALE IS NOT PERMITTED.
7
| Wells Fargo Commercial Mortgage Trust 2016-BNK1 | Issue Characteristics |
| Clean-up Call: | On each Distribution Date occurring after the aggregate unpaid principal balance of the mortgage loans is less than (or in the case of clause (ii) below, less than or equal to) the greater of (i) 1.0% of the principal balance as of the cut-off date or (ii) if the South Main Shopping Center Mortgage Loan is an asset of the trust fund, the sum of the outstanding principal balance of the South Main Shopping Center Mortgage Loan on any date of determination and 1.0% of the principal balance as of the cut-off date, however, this termination right will not be exercisable at the percentage threshold specified in clause (ii) above earlier than the Distribution Date in September 2026. |
| Delivery: | DTC, Euroclear and Clearstream Banking |
| ERISA/SMMEA Status: | Each Class of Offered Certificates is expected to be eligible for exemptive relief under ERISA. No Class of Offered Certificates will be SMMEA eligible. |
| Risk Factors: | THE CERTIFICATES INVOLVE CERTAIN RISKS AND MAY NOT BE SUITABLE FOR ALL INVESTORS. SEE THE “RISK FACTORS” SECTION OF THE PRELIMINARY PROSPECTUS. |
| Bond Analytics Information: | The Certificate Administrator will be authorized to make distribution date statements, CREFC® reports and certain supplemental reports (other than confidential information) available to certain financial modeling and data provision services, including Bloomberg, L.P., Trepp, LLC, Intex Solutions, Inc., Markit Group Limited, Interactive Data Corp., BlackRock Financial Management, Inc., CMBS.com, Inc. and Thomson Reuters Corporation. |
THE INFORMATION IN THIS STRUCTURAL AND COLLATERAL TERM SHEET IS NOT COMPLETE AND MAY BE AMENDED PRIOR TO THE TIME OF SALE. THIS TERM SHEET IS NOT AN OFFER TO SELL THESE SECURITIES AND IT IS NOT A SOLICITATION OF AN OFFER TO BUY THESE SECURITIES IN ANY JURISDICTION WHERE THE OFFER OR SALE IS NOT PERMITTED.
8
| Wells Fargo Commercial Mortgage Trust 2016-BNK1 | Characteristics of the Mortgage Pool |
| IV. | Characteristics of the Mortgage Pool(1) |
| A. | Ten Largest Mortgage Loans |
| Mortgage Loan Seller | Mortgage Loan Name | City | State | Number of Mortgage Loans / Mortgaged Properties | Mortgage Loan Cut-off Date Balance ($) | % of Initial Pool Balance (%) | Property Type | Number of SF/Rooms | Cut-off Date Balance Per SF/Room | Cut-off Date LTV Ratio (%) | Balloon or ARD LTV Ratio (%) | U/W NCF DSCR (x) | U/W NOI Debt Yield (%) | |
| WFB/BANA | The Shops at Crystals | Las Vegas | NV | 1 / 1 | $80,000,000 | 9.2% | Retail | 262,327 | $1,459 | 34.8% | 34.8% | 3.28x | 12.9 | % |
| MSMCH | Vertex Pharmaceuticals HQ | Boston | MA | 1 / 1 | 80,000,000 | 9.2 | Office | 1,133,723 | 375 | 35.5 | 35.5 | 6.28 | 17.9 | |
| BANA | One Stamford Forum | Stamford | CT | 1 / 1 | 71,387,864 | 8.2 | Office | 504,471 | 218 | 48.4 | 36.1 | 1.55 | 12.0 | |
| WFB | Renaissance Dallas | Dallas | TX | 1 / 1 | 60,000,000 | 6.9 | Hospitality | 514 | 116,732 | 50.5 | 46.1 | 2.16 | 15.8 | |
| WFB | Pinnacle II | Burbank | CA | 1 / 1 | 40,000,000 | 4.6 | Office | 230,000 | 378 | 61.3 | 61.3 | 1.96 | 9.2 | |
| WFB | Brewers Hill | Baltimore | MD | 1 / 1 | 40,000,000 | 4.6 | Mixed Use | 382,213 | 105 | 69.0 | 60.1 | 1.40 | 9.7 | |
| BANA | Simon Premium Outlets | Various | Various | 1 / 3 | 37,399,290 | 4.3 | Retail | 782,765 | 134 | 46.8 | 37.5 | 2.55 | 16.3 | |
| WFB | One Penn Center | Philadelphia | PA | 1 / 1 | 35,000,000 | 4.0 | Office | 689,966 | 99 | 74.7 | 66.0 | 1.26 | 9.2 | |
| MSMCH | Hilton Long Island Huntington | Melville | NY | 1 / 1 | 35,000,000 | 4.0 | Hospitality | 305 | 114,754 | 66.9 | 57.2 | 2.08 | 15.0 | |
| MSMCH | Aurora Office Building | Aurora | CO | 1 / 1 | 32,600,000 | 3.7 | Office | 183,529 | 178 | 67.4 | 56.9 | 1.80 | 11.3 | |
| Top Three Total/Weighted Average | 3 / 3 | $231,387,864 | 26.6% | 39.2% | 35.4% | 3.78x | 14.4 | % | ||||||
| Top Five Total/Weighted Average | 5 / 5 | $331,387,864 | 38.1% | 43.9% | 40.5% | 3.27x | 14.0 | % | ||||||
| Top Ten Total/Weighted Average | 10 / 12 | $511,387,154 | 58.7% | 51.3% | 45.7% | 2.76x | 13.4 | % | ||||||
| Non-Top Ten Total/Weighted Average | 30 / 34 | $359,170,526 | 41.3% | 61.7% | 53.5% | 1.76x | 10.6 | % | ||||||
| (1) | With respect to any mortgage loan that is part of a whole loan, Cut-off Date Balance Per SF/Room, loan-to-value ratio, debt service coverage ratio and debt yield calculations include the relatedpari passu companion loan(s) but exclude any related subordinate companion loan(s) (unless otherwise stated). With respect to each mortgage loan, debt service coverage ratio, debt yield and loan-to-value ratio information do not take into account of subordinate debt (whether or not secured by the related mortgaged property), if any, that currently exists or is allowed under the terms of such mortgage loan. The information for each mortgaged property that relates to a mortgage loan that is cross-collateralized or cross-defaulted with other mortgage loans is based upon the principal balance of that mortgage loan, except that the applicable loan-to-value ratio, debt service coverage ratio and debt yield for each such mortgage loan is based upon the ratio or yield (as applicable) for the aggregate indebtedness evidenced by all loans in the group (without regard to any limitation on the amount of indebtedness secured by any mortgaged property in such cross-collateralized group). |
THE INFORMATION IN THIS STRUCTURAL AND COLLATERAL TERM SHEET IS NOT COMPLETE AND MAY BE AMENDED PRIOR TO THE TIME OF SALE. THIS TERM SHEET IS NOT AN OFFER TO SELL THESE SECURITIES AND IT IS NOT A SOLICITATION OF AN OFFER TO BUY THESE SECURITIES IN ANY JURISDICTION WHERE THE OFFER OR SALE IS NOT PERMITTED.
9
| Wells Fargo Commercial Mortgage Trust 2016-BNK1 | Characteristics of the Mortgage Pool |
| B. | Summary of the Whole Loans |
| Property Name | Related Mortgage Loan Seller | Note(s) | Related Notes in Loan Group (Original Balance) | Holder of Note | Lead Servicer for the Entire Whole loan | Current Master Servicer Under Related Securitization Servicing Agreement | Current Special Servicer Under Related Securitization Servicing Agreement |
| The Shops at Crystals(1) | JPMCB/BANA/WFB | (2) | $132,700,000 | SHOPS 2016-CSTL | Yes | Key Bank National Association | Aegon USA Realty Advisors, LLC |
| WFB/BANA | (3) | $80,000,000 | WFCM 2016-BNK1 | No | Wells Fargo Bank, National Association | Rialto Capital Advisors, LLC | |
| JPMCB | A-1-B-1 & B-1-B-1 | $50,000,000 | JPMCC 2016-JP2 | No | Wells Fargo Bank, National Association | LNR Partners, LLC | |
| JPMCB | A-1-B-2 & B-1-B-2 | $50,000,000 | DBJPM 2016-C3(4) | No | Midland Loan Services, a Division of PNC Bank, National Association | Midland Loan Services, a Division of PNC Bank, National Association | |
| BANA | A-2-B-1 & B-2-B-1 | $35,000,000 | (5) | No | TBD | TBD | |
| WFB | A-3-B-1 & B-3-B-1 | $35,000,000 | (6) | No | TBD | TBD | |
| Vertex Pharmaceuticals HQ | MSMCH | A-1 | $80,000,000 | WFCM 2016-BNK1 | Yes | Wells Fargo Bank, National Association | Rialto Capital Advisors, LLC |
| MSMCH | A-2-1 | $40,000,000 | (7) | No | TBD | TBD | |
| MSMCH | A-2-2 | $30,000,000 | (7) | No | TBD | TBD | |
| MSMCH | A-2-3 | $10,000,000 | (7) | No | TBD | TBD | |
| MSMCH | A-3 | $80,000,000 | (7) | No | TBD | TBD | |
| MSMCH | A-4 | $57,500,000 | (7) | No | TBD | TBD | |
| CGMRC | A-5 | $30,000,000 | (7) | No | TBD | TBD | |
| CGMRC | A-6 | $75,000,000 | (7) | No | TBD | TBD | |
| CGMRC | A-7 | $22,500,000 | (7) | No | TBD | TBD | |
| One Stamford Forum | BANA | A-1 | $71,500,000 | WFCM 2016-BNK1 | Yes | Wells Fargo Bank, National Association | Rialto Capital Advisors, LLC |
| BANA | A-2 | $38,500,000 | (8) | No | TBD | TBD | |
| Pinnacle II | WFB | A-1 | $40,000,000 | WFCM 2016-BNK1 | Yes | Wells Fargo Bank, National Association | Rialto Capital Advisors, LLC |
| WFB | A-2 | $20,000,000 | WFCM 2016-C35 | No | Wells Fargo Bank, National Association | CWCapital Asset Management LLC | |
| WFB | A-3 | $27,000,000 | (9) | No | TBD | TBD | |
| Simon Premium Outlets | BANA | A-1 | $37,500,000 | WFCM 2016-BNK1 | Yes | Wells Fargo Bank, National Association | Rialto Capital Advisors, LLC |
| BANA | A-2 | $35,000,000 | (10) | No | TBD | TBD | |
| BANA | A-3 | $32,500,000 | (10) | No | TBD | TBD | |
| One Penn Center | WFB | A-1 | $35,000,000 | WFCM 2016-BNK1 | Yes | Wells Fargo Bank, National Association | Rialto Capital Advisors, LLC |
| WFB | A-2 | $33,000,000 | (11) | No | TBD | TBD | |
| FedEx - Atlanta, GA | BANA | A-1 | $14,200,000 | WFCM 2016-BNK1 | Yes | Wells Fargo Bank, National Association | Rialto Capital Advisors, LLC |
| CGMRC | A-2 | $14,200,000 | CGCMT 2016-P4 | No | Wells Fargo Bank, National Association | CWCapital Asset Management LLC | |
| FedEx - West Palm Beach, FL | BANA | A-1 | $11,837,500 | WFCM 2016-BNK1 | Yes | Wells Fargo Bank, National Association | Rialto Capital Advisors, LLC |
| CGMRC | A-2 | $11,837,500 | CGCMT 2016-P4 | No | Wells Fargo Bank, National Association | CWCapital Asset Management LLC | |
| FedEx - Fife, WA | BANA | A-1 | $20,125,000 | WFCM 2016-BNK1 | Yes | Wells Fargo Bank, National Association | Rialto Capital Advisors, LLC |
| CGMRC | A-2 | $20,125,000 | CGCMT 2016-P4 | No | Wells Fargo Bank, National Association | CWCapital Asset Management LLC | |
| FedEx - Boulder, CO | BANA | A-1 | $9,225,000 | WFCM 2016-BNK1 | Yes | Wells Fargo Bank, National Association | Rialto Capital Advisors, LLC |
| CGMRC | A-2 | $9,225,000 | CGCMT 2016-P4 | No | Wells Fargo Bank, National Association | CWCapital Asset Management LLC |
THE INFORMATION IN THIS STRUCTURAL AND COLLATERAL TERM SHEET IS NOT COMPLETE AND MAY BE AMENDED PRIOR TO THE TIME OF SALE. THIS TERM SHEET IS NOT AN OFFER TO SELL THESE SECURITIES AND IT IS NOT A SOLICITATION OF AN OFFER TO BUY THESE SECURITIES IN ANY JURISDICTION WHERE THE OFFER OR SALE IS NOT PERMITTED.
10
| Wells Fargo Commercial Mortgage Trust 2016-BNK1 | Characteristics of the Mortgage Pool |
| (1) | The Shops at Crystals whole loan also includes nine junior companion loans with an aggregate original principal balance of $167,300,000, which were contributed to the SHOPS 2016-CSTL securitization. Such junior companion loans are not reflected in the “Related Notes in Loan Group” column. |
| (2) | Consists of two tranches of threepari passu promissory notes each, three subordinatepari passu promissory notes (the “C Notes”), three subordinatepari passupromissory notes (the “D Notes”) and three subordinatepari passupromissory notes (the “E Notes”). The controlling Note A-1-A and non-controlling Note A-2-A and Note A-3-A have an aggregate original balance of $112,000,000 and the subordinate non-controlling Note B-1-A, Note B-2-A and Note B-3-A have an aggregate original balance of $20,700,000 and were contributed to the SHOPS 2016-CSTL Trust. |
| (3) | Consists of fourpari passu promissory notes and four subordinatepari passu promissory notes. The non-controlling Note A-2-B-2, Note A-2-B-3, Note A-3-B-2 and Note A-3-B-3 have an aggregate original balance of $67,488,000 and the subordinate non-controlling Note B-2-B-2, Note B-2-B-3, Note B-3-B-2 and Note B-3-B-3 have an aggregate original balance of $12,512,000. |
| (4) | The DBJPM 2016-C3 securitization transaction has not yet closed. However, based on a publicly available preliminary prospectus for the DBJPM 2016-C3 securitization transaction, it is expected that the non-controlling Note A-1-B-2 and the subordinate non-controlling Note B-1-B-2 will be included in that transaction by JPMorgan Chase Bank, National Association (“JPMCB”), and that transaction will close prior to this transaction. |
| (5) | The non-controlling Note A-2-B-1 and the subordinate non-controlling Note B-2-B-1 are held by BANA and are expected to be contributed to one or more future securitizations. No assurance can be provided that the Note A-2-B-1 or Note B-2-B-1 will not be split further. |
| (6) | The non-controlling Note A-3-B-1 and the subordinate non-controlling Note B-3-B-1 are held by WFB and are expected to be contributed to one or more future securitizations. No assurance can be provided that the Note A-3-B-1 or Note B-3-B-1 will not be split further. |
| (7) | The relatedpari passu Note A-2-1, Note A-2-2, Note A-2-3, Note A-3 and Note A-4 are currently held by an affiliate of MSMCH and are expected to be contributed to one or more future securitization. The relatedpari passu Note A-5, Note A-6 and Note A-7 are currently held by an affiliate of Citigroup Mortgage Realty Capital (“CGMRC”) or an affiliate and are expected to be contributed to one or more future securitization No assurance can be provided that the Note A-2-1, A-2-2, A-2-3, Note A-3, Note A-4, Note A-5, Note A-6 or Note A-7 will not be split further. |
| (8) | The relatedpari passu Note A-2 is currently held by BANA and is expected to be contributed to a future securitization. No assurance can be provided that the Note A-2 will not be split further. |
| (9) | The relatedpari passu Note A-3 is currently held by WFB and is expected to be contributed to a future securitization. No assurance can be provided that the Note A-3 will not be split further. |
| (10) | The relatedpari passu Note A-2 and Note A-3 are currently held by BANA and are expected to be contributed to a future securitization. No assurance can be provided that the Note A-2 or Note A-3 will not be split further. |
| (11) | The relatedpari passu Note A-2 is currently held by WFB and is expected to be contributed to a future securitization. No assurance can be provided that the Note A-2 will not be split further. |
| C. Mortgage Loans with Additional Secured and Mezzanine Financing |
| Loan No. | Mortgage Loan Seller | Mortgage Loan Name | Mortgage Loan Cut-off Date Balance ($) | % of Initial Pool Balance (%) | Subordinate Debt Cut-off Date Balance ($) | Mezzanine Debt Cut-off Date Balance ($) | Total Debt Interest Rate (%)(1) | Mortgage Loan U/W NCF DSCR (x)(2) | Total Debt U/W NCF DSCR (x) | Mortgage Loan Cut-off Date U/W NOI Debt Yield (%)(2) | Total Debt Cut-off Date U/W NOI Debt Yield (%) | Mortgage Loan Cut-off Date LTV Ratio (%)(2) | Total Debt Cut-off Date LTV Ratio (%) |
| 1 | WFB/BANA | The Shops at Crystals | $80,000,000 | 9.2% | $167,300,000 | NAP | 3.744% | 3.28x | 2.28x | 12.9% | 9.0% | 34.8% | 50.0% |
| 2 | MSMCH | Vertex Pharmaceuticals HQ | 80,000,000 | 9.2 | NAP | $195,000,000 | 3.530% | 6.28 | 3.42 | 17.9 | 12.3 | 35.5 | 51.8 |
| Total/Weighted Average | $160,000,000 | 18.4% | $167,300,000 | $195,000,000 | 3.637% | 4.78x | 2.85x | 15.4% | 10.7% | 35.2% | 50.9% | ||
| (1) | Total Debt Interest Rate for any specified mortgage loan reflects the weighted average of the interest rates on the respective components of the total debt. |
| (2) | With respect to The Shops at Crystals mortgage loan and the Vertex Pharmaceuticals HQ mortgage loan, which are each part of a whole loan, the loan-to-value ratio, debt service coverage ratio and debt yield calculations include the relatedpari passu companion loan(s). |
THE INFORMATION IN THIS STRUCTURAL AND COLLATERAL TERM SHEET IS NOT COMPLETE AND MAY BE AMENDED PRIOR TO THE TIME OF SALE. THIS TERM SHEET IS NOT AN OFFER TO SELL THESE SECURITIES AND IT IS NOT A SOLICITATION OF AN OFFER TO BUY THESE SECURITIES IN ANY JURISDICTION WHERE THE OFFER OR SALE IS NOT PERMITTED.
11
| Wells Fargo Commercial Mortgage Trust 2016-BNK1 | Characteristics of the Mortgage Pool |
| D. | Previous Securitization History(1) |
| Loan No. | Mortgage Loan Seller | Mortgage Loan or Mortgaged Property Name | City | State | Property Type | Mortgage Loan or Mortgaged Property Cut-off Date Balance ($) | % of Initial Pool Balance (%) | Previous Securitization |
| 3 | BANA | One Stamford Forum | Stamford | CT | Office | $71,387,864 | 8.2% | BACM 2006-3 |
| 4 | WFB | Renaissance Dallas | Dallas | TX | Hospitality | 60,000,000 | 6.9 | MLCFC 2007-5 |
| 5 | WFB | Pinnacle II | Burbank | CA | Office | 40,000,000 | 4.6 | GSMS 2006-GG8 |
| 6 | WFB | Brewers Hill | Baltimore | MD | Mixed Use | 40,000,000 | 4.6 | JPMCC 2006-CB17 |
| 7 | BANA | Simon Premium Outlets | Various | Various | Retail | 37,399,290 | 4.3 | JPMCC 2006-CB16 |
| 8 | WFB | One Penn Center | Philadelphia | PA | Office | 35,000,000 | 4.0 | LBUBS 2006-C6 |
| 10 | MSMCH | Aurora Office Building | Aurora | CO | Office | 32,600,000 | 3.7 | CD 2006-CD3 |
| 11 | WFB | 633 Third Avenue - Retail Condo | New York | NY | Retail | 32,000,000 | 3.7 | MSC 2006-HQ10 |
| 12 | BANA | Riverside University Village | Riverside | CA | Retail | 29,013,042 | 3.3 | MLMT 2005-CIP1 |
| 16 | MSMCH | 420 East Third Street | Los Angeles | CA | Mixed Use | 19,000,000 | 2.2 | PFP 2014-1 |
| 17 | MSMCH | Courtyard Marriott - Baldwin Park | Baldwin Park | CA | Hospitality | 18,979,809 | 2.2 | MSC 2011-C3 |
| 18 | WFB | Homewood Suites Del Mar | San Diego | CA | Hospitality | 18,736,233 | 2.2 | GCCFC 2006-GG7 |
| 20 | BANA | La Crosse Industrial | La Crosse | WI | Industrial | 15,806,702 | 1.8 | MLCFC 2006-1 |
| 21 | WFB | Southland Terrace Shopping Center | Louisville | KY | Retail | 14,000,000 | 1.6 | JPMCC 2006-LDP8 |
| 27 | BANA | Dallas MHC Portfolio | Various | TX | Manufactured Housing Community | 9,900,000 | 1.1 | CFCRE 2011-C2 |
| 28 | WFB | So Cal Self Storage - Rancho Santa Margarita | Rancho Santa Margarita | CA | Self Storage | 9,500,000 | 1.1 | GSMS 2006-GG8 |
| 30 | BANA | Brewster Business Park | Brewster | NY | Industrial | 8,490,251 | 1.0 | BACM 2006-4 |
| 31 | WFB | Bonanza Square | Las Vegas | NV | Retail | 6,591,503 | 0.8 | MLCFC 2006-3 |
| 32 | BANA | Lakeview and Creek Run Business Park | Columbus | OH | Industrial | 6,542,268 | 0.8 | COMM 2012-CR3 |
| 33 | WFB | So Cal Self Storage - Camarillo | Camarillo | CA | Self Storage | 6,500,000 | 0.7 | GMACC 2002-C2 |
| 36 | WFB | SPS Frederick | Frederick | MD | Self Storage | 5,081,563 | 0.6 | MSC 2006-T23 |
| 40.02 | BANA | North Cannon Storage Center | Kannapolis | NC | Self Storage | 1,402,944 | 0.2 | CMLT 2008-LS1 |
| Total | $517,931,469 | 59.5% |
| (1) | The table above represents the most recent securitization with respect to the mortgaged property securing the related mortgage loan, based on information provided by the related borrower or obtained through searches of a third-party database. While loans secured by the above mortgaged properties may have been securitized multiple times in prior transactions, mortgage loans in this securitization are only listed in the above chart if the mortgage loan paid off a loan in another securitization. The information has not otherwise been confirmed by the mortgage loan sellers. |
THE INFORMATION IN THIS STRUCTURAL AND COLLATERAL TERM SHEET IS NOT COMPLETE AND MAY BE AMENDED PRIOR TO THE TIME OF SALE. THIS TERM SHEET IS NOT AN OFFER TO SELL THESE SECURITIES AND IT IS NOT A SOLICITATION OF AN OFFER TO BUY THESE SECURITIES IN ANY JURISDICTION WHERE THE OFFER OR SALE IS NOT PERMITTED.
12
(THIS PAGE INTENTIONALLY LEFT BLANK)
THE INFORMATION IN THIS STRUCTURAL AND COLLATERAL TERM SHEET IS NOT COMPLETE AND MAY BE AMENDED PRIOR TO THE TIME OF SALE. THIS TERM SHEET IS NOT AN OFFER TO SELL THESE SECURITIES AND IT IS NOT A SOLICITATION OF AN OFFER TO BUY THESE SECURITIES IN ANY JURISDICTION WHERE THE OFFER OR SALE IS NOT PERMITTED.
13
| Wells Fargo Commercial Mortgage Trust 2016-BNK1 | Characteristics of the Mortgage Pool |
| E. | Property Type Distribution(1) |
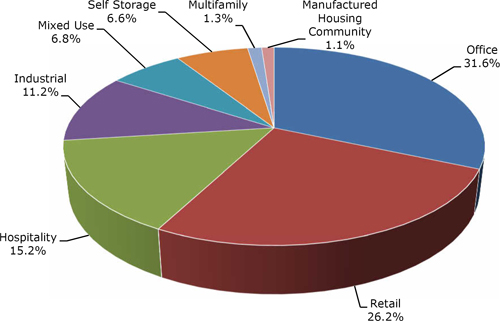
| Property Type | Number of Mortgaged Properties | Aggregate Cut-off Date Balance ($) | % of Initial Pool Balance (%) | Weighted Average Cut-off Date LTV Ratio (%) | Weighted Average Balloon or ARD LTV Ratio (%) | Weighted Average U/W NCF DSCR (x) | Weighted Average U/W NOI Debt Yield (%) | Weighted Average U/W NCF Debt Yield (%) | Weighted Average Mortgage Rate (%) | ||
| Office | 6 | $274,817,864 | 31.6% | 53.0% | 47.0% | 2.97x | 12.7% | 12.0% | 4.094% | ||
| CBD | 4 | 226,387,864 | 26.0 | 50.2 | 45.0 | 3.25 | 13.2 | 12.4 | 4.051 | ||
| Suburban | 2 | 48,430,000 | 5.6 | 66.2 | 56.7 | 1.65 | 10.7 | 9.7 | 4.296 | ||
| Retail | 12 | 227,651,163 | 26.2 | 50.1 | 43.6 | 2.30 | 12.0 | 11.2 | 4.214 | ||
| Anchored | 6 | 174,484,545 | 20.0 | 50.1 | 45.4 | 2.34 | 11.1 | 10.5 | 4.164 | ||
| Outlet Center | 3 | 37,399,290 | 4.3 | 46.8 | 37.5 | 2.55 | 16.3 | 15.0 | 4.168 | ||
| Unanchored | 2 | 10,800,000 | 1.2 | 69.3 | 56.4 | 1.28 | 9.0 | 8.4 | 5.103 | ||
| Single Tenant | 1 | 4,967,328 | 0.6 | 36.4 | 0.2 | 1.31 | 18.1 | 16.3 | 4.380 | ||
| Hospitality | 4 | 132,716,042 | 15.2 | 59.6 | 51.7 | 2.04 | 14.8 | 12.5 | 4.587 | ||
| Full Service | 2 | 95,000,000 | 10.9 | 56.5 | 50.2 | 2.13 | 15.5 | 12.9 | 4.437 | ||
| Select Service | 1 | 18,979,809 | 2.2 | 65.4 | 53.9 | 1.83 | 13.3 | 11.8 | 5.000 | ||
| Extended Stay | 1 | 18,736,233 | 2.2 | 69.1 | 56.9 | 1.78 | 12.7 | 11.4 | 4.930 | ||
| Industrial | 9 | 97,726,721 | 11.2 | 60.2 | 55.6 | 2.03 | 10.8 | 10.0 | 4.520 | ||
| Warehouse Distribution | 5 | 66,887,500 | 7.7 | 56.5 | 56.5 | 2.27 | 10.3 | 10.0 | 4.390 | ||
| Flex | 4 | 30,839,221 | 3.5 | 68.1 | 53.7 | 1.51 | 11.9 | 10.0 | 4.802 | ||
| Mixed Use | 2 | 59,000,000 | 6.8 | 64.3 | 54.7 | 1.58 | 10.4 | 9.3 | 4.239 | ||
| Office/Self Storage | 1 | 40,000,000 | 4.6 | 69.0 | 60.1 | 1.40 | 9.7 | 8.3 | 4.300 | ||
| Office/Retail | 1 | 19,000,000 | 2.2 | 54.3 | 43.3 | 1.96 | 12.0 | 11.4 | 4.110 | ||
| Self Storage | 9 | 57,561,757 | 6.6 | 58.1 | 52.2 | 1.88 | 10.1 | 9.9 | 4.553 | ||
| Self Storage | 9 | 57,561,757 | 6.6 | 58.1 | 52.2 | 1.88 | 10.1 | 9.9 | 4.553 | ||
| Multifamily | 1 | 11,184,133 | 1.3 | 67.4 | 53.0 | 1.80 | 10.6 | 9.9 | 3.700 | ||
| Garden | 1 | 11,184,133 | 1.3 | 67.4 | 53.0 | 1.80 | 10.6 | 9.9 | 3.700 | ||
| Manufactured Housing Community | 3 | 9,900,000 | 1.1 | 73.8 | 64.8 | 1.52 | 9.5 | 9.3 | 4.600 | ||
| Manufactured Housing Community | 3 | 9,900,000 | 1.1 | 73.8 | 64.8 | 1.52 | 9.5 | 9.3 | 4.600 | ||
| Total/Weighted Average: | 46 | $870,557,680 | 100.0% | 55.6% | 48.9% | 2.35x | 12.2% | 11.3% | 4.289% | ||
| (1) | Because this table presents information relating to the mortgaged properties and not the mortgage loans, (a) the information for mortgage loans secured by more than one mortgaged property (other than through cross-collateralization with other mortgage loans) is based on allocated amounts (allocating the mortgage loan principal balance to each of those properties according to the relative appraised values of the mortgaged properties or the allocated loan amounts or property-specific release prices set forth in the related mortgage loan documents or such other allocation as the related mortgage loan seller deemed appropriate), and (b) the information for each mortgaged property that relates to a mortgage loan that is cross-collateralized or cross-defaulted with other mortgage loans is based upon the principal balance of that mortgage loan, except that the applicable loan-to-value ratio, debt service coverage ratio and debt yield for each such mortgage loan is based upon the ratio or yield (as applicable) for the aggregate indebtedness evidenced by all loans in the group (without regard to any limitation on the amount of indebtedness secured by any mortgaged property in such cross-collateralized group). On an individual basis, without regard to the cross-collateralization feature, any mortgage loan that is part of a cross-collateralized group of mortgage loans may have a higher loan-to-value ratio, lower debt service coverage ratio and/or lower debt yield than is presented herein. With respect to any mortgage loan that is part of a whole loan, the loan-to-value ratio, debt service coverage ratio and debt yield calculations include the relatedpari passucompanion loan(s) but exclude any related subordinate companion loan(s) (unless otherwise stated). With respect to each mortgage loan, debt service coverage ratio, debt yield and loan-to-value ratio information do not take into account of any subordinate debt (whether or not secured by the related mortgaged property) that currently exists or is allowed under the terms of such mortgage loan. See Annex A-1 to the Preliminary Prospectus. |
THE INFORMATION IN THIS STRUCTURAL AND COLLATERAL TERM SHEET IS NOT COMPLETE AND MAY BE AMENDED PRIOR TO THE TIME OF SALE. THIS TERM SHEET IS NOT AN OFFER TO SELL THESE SECURITIES AND IT IS NOT A SOLICITATION OF AN OFFER TO BUY THESE SECURITIES IN ANY JURISDICTION WHERE THE OFFER OR SALE IS NOT PERMITTED.
14
| Wells Fargo Commercial Mortgage Trust 2016-BNK1 | Characteristics of the Mortgage Pool |
| F. | Geographic Distribution(1)(2) |
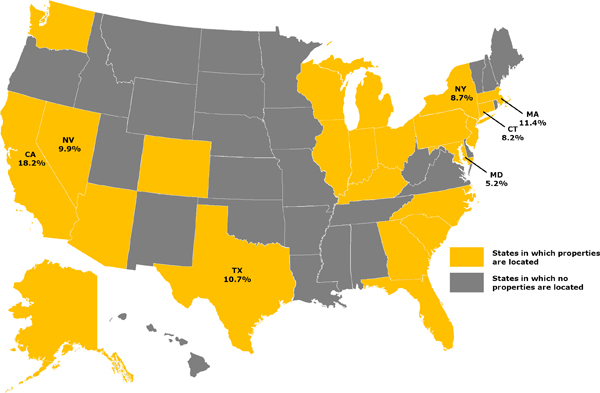
| Location | Number of Mortgaged Properties | Aggregate Cut-off Date Balance ($) | % of Initial Pool Balance (%) | Weighted Average Cut-off Date LTV Ratio (%) | Weighted Average Balloon or ARD LTV Ratio (%) | Weighted Average U/W NCF DSCR (x) | Weighted Average U/W NOI Debt Yield (%) | Weighted Average U/W NCF Debt Yield (%) | Weighted Average Mortgage Rate (%) | |
| California | 9 | $158,196,412 | 18.2% | 59.9% | 51.8% | 1.82x | 11.0% | 10.2% | 4.584% | |
| Southern | 8 | 153,229,084 | 17.6 | 60.6 | 53.5 | 1.84 | 10.8 | 10.0 | 4.590 | |
| Northern | 1 | 4,967,328 | 0.6 | 36.4 | 0.2 | 1.31 | 18.1 | 16.3 | 4.380 | |
| Massachusetts | 2 | 99,233,921 | 11.4 | 37.7 | 35.9 | 5.56 | 17.6 | 17.3 | 3.064 | |
| Texas | 7 | 93,580,000 | 10.7 | 57.8 | 51.1 | 1.89 | 13.4 | 11.4 | 4.468 | |
| Nevada | 2 | 86,591,503 | 9.9 | 36.3 | 35.5 | 3.19 | 13.0 | 12.4 | 3.775 | |
| New York | 3 | 75,490,251 | 8.7 | 66.3 | 60.3 | 1.79 | 11.1 | 9.9 | 4.477 | |
| Connecticut | 1 | 71,387,864 | 8.2 | 48.4 | 36.1 | 1.55 | 12.0 | 10.8 | 4.900 | |
| Maryland | 2 | 45,081,563 | 5.2 | 67.2 | 58.2 | 1.43 | 9.8 | 8.5 | 4.337 | |
| Other(3) | 20 | 240,996,167 | 27.7 | 62.8 | 55.0 | 1.83 | 11.0 | 10.1 | 4.468 | |
| Total/Weighted Average | 46 | $870,557,680 | 100.0% | 55.6% | 48.9% | 2.35x | 12.2% | 11.3% | 4.289% |
| (1) | The mortgaged properties are located in 23 states. |
| (2) | Because this table presents information relating to the mortgaged properties and not the mortgage loans, (a) the information for mortgage loans secured by more than one mortgaged property (other than through cross-collateralization with other mortgage loans) is based on allocated amounts (allocating the mortgage loan principal balance to each of those properties according to the relative appraised values of the mortgaged properties or the allocated loan amounts or property-specific release prices set forth in the related mortgage loan documents or such other allocation as the related mortgage loan seller deemed appropriate), and (b) the information for each mortgaged property that relates to a mortgage loan that is cross-collateralized or cross-defaulted with other mortgage loans is based upon the principal balance of that mortgage loan, except that the applicable loan-to-value ratio, debt service coverage ratio and debt yield for each such mortgage loan is based upon the ratio or yield (as applicable) for the aggregate indebtedness evidenced by all loans in the group (without regard to any limitation on the amount of indebtedness secured by any mortgaged property in such cross-collateralized group). On an individual basis, without regard to the cross-collateralization feature, any mortgage loan that is part of a cross-collateralized group of mortgage loans may have a higher loan-to-value ratio, lower debt service coverage ratio and/or lower debt yield than is presented herein. With respect to any mortgage loan that is part of a whole loan, the loan-to-value ratio, debt service coverage ratio and debt yield calculations include the relatedpari passucompanion loan(s) but exclude any related subordinate companion loan(s) (unless otherwise stated). With respect to each mortgage loan, debt service coverage ratio, debt yield and loan-to-value ratio information do not take into account of any subordinate debt (whether or not secured by the related mortgaged property) that currently exists or is allowed under the terms of such mortgage loan. See Annex A-1 to the Preliminary Prospectus. |
| (3) | Includes 16 other states. |
THE INFORMATION IN THIS STRUCTURAL AND COLLATERAL TERM SHEET IS NOT COMPLETE AND MAY BE AMENDED PRIOR TO THE TIME OF SALE. THIS TERM SHEET IS NOT AN OFFER TO SELL THESE SECURITIES AND IT IS NOT A SOLICITATION OF AN OFFER TO BUY THESE SECURITIES IN ANY JURISDICTION WHERE THE OFFER OR SALE IS NOT PERMITTED.
15
| Wells Fargo Commercial Mortgage Trust 2016-BNK1 | Characteristics of the Mortgage Pool |
| G. | Characteristics of the Mortgage Pool(1) |
| CUT-OFF DATE BALANCE | |||||
| Range of Cut-off Date Balances ($) | Number of Mortgage Loans | Aggregate Cut- off Date Balance | % of Initial Pool Balance | ||
| 2,884,226 - 3,000,000 | 1 | $2,884,226 | 0.3% | ||
| 3,000,001 - 4,000,000 | 1 | 3,791,577 | 0.4 | ||
| 4,000,001 - 5,000,000 | 2 | 9,467,328 | 1.1 | ||
| 5,000,001 - 6,000,000 | 2 | 11,065,864 | 1.3 | ||
| 6,000,001 - 8,000,000 | 4 | 25,933,771 | 3.0 | ||
| 8,000,001 - 9,000,000 | 1 | 8,490,251 | 1.0 | ||
| 9,000,001 - 10,000,000 | 3 | 28,625,000 | 3.3 | ||
| 10,000,001 - 15,000,000 | 8 | 99,421,722 | 11.4 | ||
| 15,000,001 - 20,000,000 | 5 | 88,352,744 | 10.1 | ||
| 20,000,001 - 30,000,000 | 2 | 49,138,042 | 5.6 | ||
| 30,000,001 - 50,000,000 | 7 | 251,999,290 | 28.9 | ||
| 50,000,001 - 70,000,000 | 1 | 60,000,000 | 6.9 | ||
| 70,000,001 - 80,000,000 | 3 | 231,387,864 | 26.6 | ||
| Total: | 40 | $870,557,680 | 100.0% | ||
| Average: | $21,763,942 | ||||
| UNDERWRITTEN NOI DEBT SERVICE COVERAGE RATIO | |||||
| Range of U/W NOI DSCRs (x) | Number of Mortgage Loans | Aggregate Cut- off Date Balance | % of Initial Pool Balance | ||
| 1.34 - 1.40 | 2 | $18,620,090 | 2.1% | ||
| 1.41 - 1.50 | 5 | 89,310,370 | 10.3 | ||
| 1.51 - 1.60 | 3 | 31,270,251 | 3.6 | ||
| 1.61 - 1.70 | 5 | 104,388,264 | 12.0 | ||
| 1.71 - 1.80 | 2 | 74,272,089 | 8.5 | ||
| 1.81 - 1.90 | 1 | 3,791,577 | 0.4 | ||
| 1.91 - 2.00 | 4 | 76,520,366 | 8.8 | ||
| 2.01 - 2.50 | 13 | 194,860,383 | 22.4 | ||
| 2.51 - 3.00 | 3 | 117,524,290 | 13.5 | ||
| 3.01 - 4.00 | 1 | 80,000,000 | 9.2 | ||
| 4.01 - 6.31 | 1 | 80,000,000 | 9.2 | ||
| Total: | 40 | $870,557,680 | 100.0% | ||
| Weighted Average: | 2.52x | ||||
| UNDERWRITTEN NCF DEBT SERVICE COVERAGE RATIO | |||||
| Range of U/W NCF DSCRs (x) | Number of Mortgage Loans | Aggregate Cut- off Date Balance | % of Initial Pool Balance | ||
| 1.25 - 1.30 | 2 | $41,300,000 | 4.7% | ||
| 1.31 - 1.40 | 7 | 122,437,161 | 14.1 | ||
| 1.41 - 1.50 | 2 | 21,370,251 | 2.5 | ||
| 1.51 - 1.75 | 7 | 146,753,652 | 16.9 | ||
| 1.76 - 2.00 | 8 | 150,834,021 | 17.3 | ||
| 2.01 - 2.25 | 6 | 128,575,805 | 14.8 | ||
| 2.26 - 2.50 | 5 | 61,887,500 | 7.1 | ||
| 2.51 - 3.00 | 1 | 37,399,290 | 4.3 | ||
| 3.01 - 6.28 | 2 | 160,000,000 | 18.4 | ||
| Total: | 40 | $870,557,680 | 100.0% | ||
| Weighted Average: | 2.35x | ||||
| LOAN PURPOSE | |||
| Loan Purpose | Number of Mortgage Loans | Aggregate Cut- off Date Balance | % of Initial Pool Balance |
| Refinance | 25 | $600,353,316 | 69.0% |
| Acquisition | 14 | 190,204,364 | 21.8 |
| Recapitalization(2) | 1 | 80,000,000 | 9.2 |
| Total: | 40 | $870,557,680 | 100.0% |
| MORTGAGE RATE | |||
| Range of Mortgage Rates (%) | Number of Mortgage Loans | Aggregate Cut- off Date Balance | % of Initial Pool Balance |
| 2.798 - 3.500 | 1 | $80,000,000 | 9.2% |
| 3.501 - 4.000 | 2 | 91,184,133 | 10.5 |
| 4.001 - 4.250 | 10 | 170,358,293 | 19.6 |
| 4.251 - 4.500 | 10 | 252,951,630 | 29.1 |
| 4.501 - 4.750 | 7 | 61,048,397 | 7.0 |
| 4.751 - 5.000 | 7 | 193,423,650 | 22.2 |
| 5.001 - 5.250 | 2 | 15,291,577 | 1.8 |
| 5.251 - 5.320 | 1 | 6,300,000 | 0.7 |
| Total: | 40 | $870,557,680 | 100.0% |
| Weighted Average: | 4.289% | ||
| UNDERWRITTEN NOI DEBT YIELD | |||
| Range of U/W NOI Debt Yields (%) | Number of Mortgage Loans | Aggregate Cut- off Date Balance | % of Initial Pool Balance |
| 7.2 - 8.0 | 1 | $32,000,000 | 3.7% |
| 8.1 - 9.0 | 4 | 43,000,090 | 4.9 |
| 9.1 - 10.0 | 9 | 174,720,251 | 20.1 |
| 10.1 - 11.0 | 9 | 110,050,463 | 12.6 |
| 11.1 - 12.0 | 6 | 156,586,143 | 18.0 |
| 12.1 - 13.0 | 3 | 104,720,535 | 12.0 |
| 13.1 - 14.0 | 1 | 18,979,809 | 2.2 |
| 14.1 - 15.0 | 3 | 48,133,771 | 5.5 |
| 15.1 - 16.0 | 1 | 60,000,000 | 6.9 |
| 16.1 - 17.0 | 1 | 37,399,290 | 4.3 |
| 17.1 - 18.0 | 1 | 80,000,000 | 9.2 |
| 18.1 | 1 | 4,967,328 | 0.6 |
| Total: | 40 | $870,557,680 | 100.0% |
| Weighted Average: | 12.2% | ||
| UNDERWRITTEN NCF DEBT YIELD | |||
| Range of U/W NCF Debt Yields (%) | Number of Mortgage Loans | Aggregate Cut- off Date Balance | % of Initial Pool Balance |
| 7.0 - 8.0 | 2 | $67,000,000 | 7.7% |
| 8.1 - 9.0 | 9 | 151,820,340 | 17.4 |
| 9.1 - 10.0 | 6 | 86,903,877 | 10.0 |
| 10.1 - 11.0 | 10 | 187,841,152 | 21.6 |
| 11.1 - 12.0 | 5 | 67,049,888 | 7.7 |
| 12.1 - 14.0 | 5 | 187,575,805 | 21.5 |
| 14.1 - 16.0 | 1 | 37,399,290 | 4.3 |
| 16.1 - 17.0 | 1 | 4,967,328 | 0.6 |
| 17.1 - 17.8 | 1 | 80,000,000 | 9.2 |
| Total: | 40 | $870,557,680 | 100.0% |
| Weighted Average: | 11.3% | ||
(1) Information regarding mortgage loans that are cross-collateralized or cross-defaulted with other mortgage loans is based upon the individual loan balances, except that the applicable loan-to-value ratio, debt service coverage ratio and debt yield for each such mortgage loan is based upon the ratio or yield (as applicable) for the aggregate indebtedness evidenced by all loans in the group (without regard to any limitation on the amount of indebtedness secured by any mortgaged property in such cross-collateralized group). On an individual basis, without regard to the cross-collateralization feature, any mortgage loan that is part of a cross-collateralized group of mortgage loans may have a higher loan-to-value ratio, lower debt service coverage ratio and/or lower debt yield than is presented herein. With respect to any mortgage loan that is part of a whole loan, the loan-to-value ratio, debt service coverage ratio and debt yield calculations include the relatedpari passu companion loan(s) but exclude any related subordinate companion loan(s) (unless otherwise stated). With respect to each mortgage loan, debt service coverage ratio, debt yield and loan-to-value ratio information do not take into account any subordinate debt (whether or not secured by the related mortgaged property), that currently exists or is allowed under the terms of such mortgage loan. See Annex A-1 to the Preliminary Prospectus. Prepayment provisions for each mortgage loan reflects the entire life of the loan (from origination to maturity). (2) In April 2016, The Shops at Crytals whole loan sponsor acquired the related mortgaged property in an all-cash transaction for approximately $1.1 billion. In June 2016, the Mortgage Loan proceeds were used to recapitalize the joint venture and return equity to affiliates of The Shops at Crystals mortgage loan sponsors.
|
THE INFORMATION IN THIS STRUCTURAL AND COLLATERAL TERM SHEET IS NOT COMPLETE AND MAY BE AMENDED PRIOR TO THE TIME OF SALE. THIS TERM SHEET IS NOT AN OFFER TO SELL THESE SECURITIES AND IT IS NOT A SOLICITATION OF AN OFFER TO BUY THESE SECURITIES IN ANY JURISDICTION WHERE THE OFFER OR SALE IS NOT PERMITTED.
16
| Wells Fargo Commercial Mortgage Trust 2016-BNK1 | Characteristics of the Mortgage Pool |
| ORIGINAL TERM TO MATURITY OR ARD | ||||
| Original Terms to Maturity or ARD (months) | Number of Mortgage Loans | Aggregate Cut- off Date Balance | % of Initial Pool Balance | |
| 120 | 39 | $864,257,680 | 99.3% | |
| 180 | 1 | 6,300,000 | 0.7 | |
| Total: | 40 | $870,557,680 | 100.0% | |
| Weighted Average: | 120 months | |||
| REMAINING TERM TO MATURITY OR ARD | ||||
| Range of Remaining Terms to Maturity or ARD (months) | Number of Mortgage Loans | Aggregate Cut- off Date Balance | % of Initial Pool Balance | |
| 109 - 120 | 39 | $864,257,680 | 99.3% | |
| 121 - 179 | 1 | 6,300,000 | 0.7 | |
| Total: | 40 | $870,557,680 | 100.0% | |
| Weighted Average: | 119 months | |||
| ORIGINAL AMORTIZATION TERM(3) | ||||
| Original Amortization Terms (months) | Number of Mortgage Loans | Aggregate Cut- off Date Balance | % of Initial Pool Balance | |
| Non-Amortizing | 12 | $326,387,500 | 37.5% | |
| 120 | 1 | 4,967,328 | 0.6 | |
| 300 | 3 | 116,207,607 | 13.3 | |
| 360 | 24 | 422,995,244 | 48.6 | |
| Total: | 40 | $870,557,680 | 100.0% | |
| Weighted Average(4): | 345 months | |||
(3) The original amortization term shown for any mortgage loan that is interest-only for part of its term does not include the number of months in its interest-only period and reflects only the number of months as of the commencement of amortization remaining from the end of such interest-only period. (4) Excludes the non-amortizing mortgage loans. | ||||
| REMAINING AMORTIZATION TERM(5) | ||||
| Range of Remaining Amortization Terms (months) | Number of Mortgage Loans | Aggregate Cut- off Date Balance | % of Initial Pool Balance | |
| Non-Amortizing | 12 | $326,387,500 | 37.5% | |
| 119 - 120 | 1 | 4,967,328 | 0.6 | |
| 121 - 300 | 3 | 116,207,607 | 13.3 | |
| 301 - 360 | 24 | 422,995,244 | 48.6 | |
| Total: | 40 | $870,557,680 | 100.0% | |
| Weighted Average(6): | 344 months | |||
(5) The remaining amortization term shown for any mortgage loan that is interest-only for part of its term does not include the number of months in its interest-only period and reflects only the number of months as of the commencement of amortization remaining from the end of such interest-only period. (6) Excludes the non-amortizing mortgage loans. | ||||
| LOCKBOXES | ||||
| Type of Lockbox | Number of Mortgage Loans | Aggregate Cut- off Date Balance | % of Initial Pool Balance | |
| Hard/Springing Cash Management | 11 | $384,244,714 | 44.1% | |
| Springing | 17 | 265,347,101 | 30.5 | |
| Hard/Upfront Cash Management | 4 | 118,500,000 | 13.6 | |
| Soft/Springing Cash Management | 3 | 63,900,000 | 7.3 | |
| None | 5 | 38,565,864 | 4.4 | |
| Total: | 40 | $870,557,680 | 100.0% | |
| PREPAYMENT PROVISION SUMMARY | ||||
| Prepayment Provision | Number of Mortgage Loans | Aggregate Cut- off Date Balance | % of Initial Pool Balance | |
| Lockout / Def / Open(7) | 26 | $554,485,965 | 63.7% | |
| Lockout / GRTR 1% or YM / Open | 10 | 151,112,038 | 17.4 | |
| Lockout / GRTR 1% or YM or Def / Open | 3 | 84,959,677 | 9.8 | |
| Lockout / GRTR 0.5% or YM or Def / Open | 1 | 80,000,000 | 9.2 | |
| Total: | 40 | $870,557,680 | 100.0% | |
| (7) With respect to the Aurora Office Building mortgage loan, the mortgage loan documents permit prepayment in part during the lockout period, together with payment of a yield maintenance premium, in order to avoid triggering a cash management event caused by a decline in the debt service coverage ratio or debt yield. | ||||
| CUT-OFF DATE LOAN-TO-VALUE RATIO | ||||
| Range of Cut-off Date LTV Ratios (%) | Number of Mortgage Loans | Aggregate Cut- off Date Balance | % of Initial Pool Balance | |
| 34.8 - 35.0 | 1 | $80,000,000 | 9.2% | |
| 35.1 - 40.0 | 2 | 84,967,328 | 9.8 | |
| 40.1 - 45.0 | 1 | 5,984,302 | 0.7 | |
| 45.1 - 50.0 | 2 | 108,787,154 | 12.5 | |
| 50.1 - 55.0 | 10 | 164,060,566 | 18.8 | |
| 55.1 - 60.0 | 1 | 9,500,000 | 1.1 | |
| 60.1 - 65.0 | 7 | 150,441,321 | 17.3 | |
| 65.1 - 70.0 | 8 | 172,500,175 | 19.8 | |
| 70.1 - 74.7 | 8 | 94,316,834 | 10.8 | |
| Total: | 40 | $870,557,680 | 100.0% | |
| Weighted Average: | 55.6% | |||
| BALLOON OR ARD LOAN-TO-VALUE RATIO | |||
| Range of Balloon or ARD LTV Ratios (%) | Number of Mortgage Loans | Aggregate Cut- off Date Balance | % of Initial Pool Balance |
| 0.2 - 30.0 | 1 | $4,967,328 | 0.6% |
| 30.1 - 35.0 | 2 | 85,984,302 | 9.9 |
| 35.1 - 40.0 | 3 | 188,787,154 | 21.7 |
| 40.1 - 45.0 | 3 | 30,673,066 | 3.5 |
| 45.1 - 50.0 | 3 | 104,819,744 | 12.0 |
| 50.1 - 55.0 | 10 | 121,343,020 | 13.9 |
| 55.1 - 60.0 | 12 | 165,583,067 | 19.0 |
| 60.1 - 65.0 | 4 | 121,900,000 | 14.0 |
| 65.1 - 67.6 | 2 | 46,500,000 | 5.3 |
| Total: | 40 | $870,557,680 | 100.0% |
| Weighted Average: | 48.9% | ||
| AMORTIZATION TYPE | |||||
| Type of Amortization | Number of Mortgage Loans | Aggregate Cut- off Date Balance | % of Initial Pool Balance | ||
| Amortizing Balloon | 17 | $287,192,852 | 33.0% | ||
| Interest-only, Amortizing Balloon | 10 | 252,010,000 | 28.9 | ||
| Interest-only, Balloon | 11 | 246,387,500 | 28.3 | ||
| Interest-only, ARD | 1 | 80,000,000 | 9.2 | ||
| Fully Amortizing | 1 | 4,967,328 | 0.6 | ||
| Total: | 40 | $870,557,680 | 100.0% | ||
ORIGINAL TERM OF INTEREST-ONLY PERIOD FOR PARTIAL IO LOANS | |||||
| IO Terms (months) | Number of Mortgage Loans | Aggregate Cut- off Date Balance | % of Initial Pool Balance | ||
| 24 | 4 | $84,980,000 | 9.8% | ||
| 36 | 5 | 107,030,000 | 12.3 | ||
| 60 | 1 | 60,000,000 | 6.9 | ||
| Total: | 10 | $252,010,000 | 28.9% | ||
| Weighted Average: | 38 months | ||||
SEASONING | |||||
| Seasoning (months) | Number of Mortgage Loans | Aggregate Cut- off Date Balance | % of Initial Pool Balance | ||
| 0 | 6 | $215,600,000 | 24.8% | ||
| 1 | 16 | 332,437,381 | 38.2 | ||
| 2 | 11 | 221,382,759 | 25.4 | ||
| 3 | 5 | 56,317,795 | 6.5 | ||
| 5 | 1 | 29,013,042 | 3.3 | ||
| 11 | 1 | 15,806,702 | 1.8 | ||
| Total: | 40 | $870,557,680 | 100.0% | ||
| Weighted Average: | 1 month | ||||
THE INFORMATION IN THIS STRUCTURAL AND COLLATERAL TERM SHEET IS NOT COMPLETE AND MAY BE AMENDED PRIOR TO THE TIME OF SALE. THIS TERM SHEET IS NOT AN OFFER TO SELL THESE SECURITIES AND IT IS NOT A SOLICITATION OF AN OFFER TO BUY THESE SECURITIES IN ANY JURISDICTION WHERE THE OFFER OR SALE IS NOT PERMITTED.
17
| Wells Fargo Commercial Mortgage Trust 2016-BNK1 | Certain Terms and Conditions |
| V. | Certain Terms and Conditions |
| Allocation Between the RRI Interest and the Non-Retained Certificates: | Amounts available for distributions to the holders of the Certificates (including the RRI Interest) will be allocated between amounts available for distribution to the holders of the RRI Interest, on the one hand, and to all other Certificates, referred to herein as the “Non-Retained Certificates”, on the other hand. The portion of such amount allocable to (a) the RRI Interest will at all times be the product of such amount multiplied by 5% and (b) the Non-Retained Certificates will at all times be the product of such amount multiplied by 95% (each, the respective “Percentage Allocation Entitlement”). | |
| Interest Entitlements: | The interest entitlement of each Class of Non-Retained Certificates on each Distribution Date generally will be the interest accrued during the related Interest Accrual Period on the related Certificate Balance or Notional Amount at the related pass-through rate, net of any prepayment interest shortfalls allocated to that Class for such Distribution Date as described below. If prepayment interest shortfalls arise from voluntary prepayments (without Master Servicer consent) on particular non-specially serviced loans during any collection period, the Master Servicer is required to make a compensating interest payment to offset those shortfalls, generally up to an amount equal to the portion of its master servicing fees that accrue at 0.25 basis pointsper annum. The remaining amount of prepayment interest shortfalls will be allocatedbetween the RRI Interest, on one hand, and the Non-Retained Certificates, on the other hand, in accordance with their respective Percentage Allocation Entitlements. The prepayment interest shortfalls allocated to the Non-Retained Certificates (other than the Class V and Class R Certificates) will be allocated among such Classes of Certificates entitled to interest, on apro ratabasis, based on their respective amounts of accrued interest for the related Distribution Date,to reduce the interest entitlement on each such Class of Certificates. If a Class receives less than the entirety of its interest entitlement on any Distribution Date, then the shortfall (excluding any shortfall due to prepayment interest shortfalls), together with interest thereon, will be added to its interest entitlement for the next succeeding Distribution Date. | |
| Aggregate Principal Distribution Amount: | The Aggregate Principal Distribution Amount for each Distribution Date generally will be the aggregate amount of principal received or advanced in respect of the mortgage loans, net of any non-recoverable advances and interest thereon and workout-delayed reimbursement amounts that are reimbursed to the Master Servicer, the Special Servicer or the Trustee during the related collection period. Non-recoverable advances and interest thereon are reimbursable from principal collections and advances before reimbursement from other amounts. Workout-delayed reimbursement amounts are reimbursable from principal collections. TheNon-Retained Certificates will be entitled to the portion of the Aggregate Principal Distribution Amount equal to their Percentage Allocation Entitlement, which is referred to herein as the “Principal Distribution Amount”. | |
| Subordination, Allocation of Losses and Certain Expenses | The chart below describes the manner in which the payment rights of certain Classes of Non-Retained Certificates will be senior or subordinate, as the case may be, to the payment rights of other Classes of Non-Retained Certificates. The chart also shows the allocation between the RRI Interest and the Non-Retained Certificates and the corresponding entitlement to receive principal and/or interest of certain Classes of Non-Retained Certificates (other than excess interest that accrues on each mortgage loan that has an anticipated repayment date) on any distribution date in descending order. It also shows the manner in which losses are allocated between the RRI Interest and the Non-Retained Certificates and the manner in which the Non-Retained Certificate allocations are further allocated to certain Classes of those Certificates in ascending order (beginning with the Non-Offered Certificates, other than the Class V and Class R certificates and the RRI Interest) to reduce the balance of each such class to zero; provided that no principal payments or mortgage loan losses will be allocated to the Class X-A, Class X-B, Class X-D, Class X-E, Class X-F, Class X-G, Class R or Class V Certificates, although principal payments and losses may reduce the notional amounts of the Class X-A, Class X-B, Class X-D, Class X-E, Class X-F and Class X-G certificates and, therefore, the amount of interest they accrue. |
THE INFORMATION IN THIS STRUCTURAL AND COLLATERAL TERM SHEET IS NOT COMPLETE AND MAY BE AMENDED PRIOR TO THE TIME OF SALE. THIS TERM SHEET IS NOT AN OFFER TO SELL THESE SECURITIES AND IT IS NOT A SOLICITATION OF AN OFFER TO BUY THESE SECURITIES IN ANY JURISDICTION WHERE THE OFFER OR SALE IS NOT PERMITTED.
18
| Wells Fargo Commercial Mortgage Trust 2016-BNK1 | Certain Terms and Conditions |
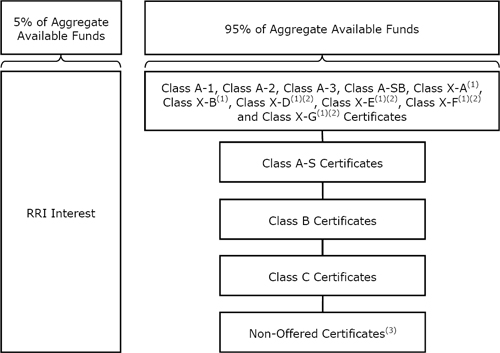 |
| (1) | The Class X-A, Class X-B, Class X-D, Class X-E, Class X-F and Class X-G Certificates are interest-only certificates. |
| (2) | The Class X-D, Class X-E, Class X-F and Class X-G Certificates are Non-Offered Certificates. |
| (3) | Other than the Class X-D, Class X-E, Class X-F, Class X-G, Class R and Class V Certificates and the RRI Interest. |
| Distributions: | On each Distribution Date, funds available for distribution from the mortgage loans, net of specified trust fees, expenses and reimbursements that are allocable to the Non-Retained Certificates will generally be distributed in the following amounts and order of priority (in each case to the extent of remaining available funds): | ||
| 1. | Class A-1, A-2, A-3, A-SB, X-A, X-B, X-D, X-E, X-F and X-G Certificates: To interest on the Class A-1, A-2, A-3, A-SB, X-A, X-B, X-D, X-E, X-F and X-G Certificates, pro rata, according to their respective interest entitlements. | ||
| 2. | Class A-1, A-2, A-3 and A-SB Certificates: To principal on the Class A-1, A-2, A-3 and A-SB Certificates in the following amounts and order of priority: (i) first, to principal on the Class A-SB Certificates, in an amount up to the Principal Distribution Amount for such Distribution Date until their Certificate Balance is reduced to the Class A-SB Planned Principal Balance for such Distribution Date; (ii) second, to principal on the Class A-1 Certificates until their Certificate Balance is reduced to zero, up to the remainder of the Principal Distribution Amount for such Distribution Date; (iii) third, to principal on the Class A-2 Certificates until their Certificate Balance is reduced to zero, up to the remainder of the Principal Distribution Amount for such Distribution Date; (iv) fourth, to principal on the Class A-3 Certificates, until their Certificate Balance is reduced to zero, up to the remainder of the Principal Distribution Amount for such Distribution Date; and (v) fifth, to principal on the Class A-SB Certificates until their Certificate Balance is reduced to zero, up to the remainder of the Principal Distribution Amount for such Distribution Date. However, if the Certificate Balance of each and every Class of Principal Balance Certificates, other than the Class A-1, A-2, A-3 and A-SB Certificates and the RRI Interest, has been reduced to zero as a result of the allocation of Mortgage Loan losses and expenses and any of the Class A-1, A-2, A-3 and A-SB Certificates remains outstanding, then the Principal Distribution Amount will be distributed to the Class A-1, A-2, A-3 and A-SB Certificates, pro rata, based on their respective outstanding Certificate Balances, until their Certificate Balances have been reduced to zero. | ||
| 3. | Class A-1, A-2, A-3 and A-SB Certificates: To reimburse the holders of the Class A-1, A-2, A-3 and A-SB Certificates, pro rata, on the basis of previously allocated unreimbursed losses, for any previously unreimbursed losses (plus interest thereon) on the mortgage loans that were previously allocated in reduction of the Certificate Balances of such Classes. | ||
THE INFORMATION IN THIS STRUCTURAL AND COLLATERAL TERM SHEET IS NOT COMPLETE AND MAY BE AMENDED PRIOR TO THE TIME OF SALE. THIS TERM SHEET IS NOT AN OFFER TO SELL THESE SECURITIES AND IT IS NOT A SOLICITATION OF AN OFFER TO BUY THESE SECURITIES IN ANY JURISDICTION WHERE THE OFFER OR SALE IS NOT PERMITTED.
19
| Wells Fargo Commercial Mortgage Trust 2016-BNK1 | Certain Terms and Conditions |
| 4. | Class A-S Certificates: To make distributions on the Class A-S Certificates as follows: (a) first, to interest on the Class A-S Certificates in the amount of the interest entitlement for that Class; (b) next, to the extent of the portion of the Principal Distribution Amount remaining after distributions in respect of principal to each Class with a higher distribution priority (in this case, the Class A-1, A-2, A-3 and A-SB Certificates), to principal on the Class A-S Certificates until their Certificate Balance is reduced to zero; and (c) next, to reimburse the holders of the Class A-S Certificates for any previously unreimbursed losses (plus interest thereon) on the mortgage loans that were previously allocated to that Class in reduction of their Certificate Balance. | ||
| 5. | Class B Certificates: To make distributions on the Class B Certificates as follows: (a) first, to interest on the Class B Certificates in the amount of the interest entitlement for that Class; (b) next, to the extent of the portion of the Principal Distribution Amount remaining after distributions in respect of principal to each Class with a higher distribution priority (in this case, the Class A-1, A-2, A-3, A-SB and A-S Certificates), to principal on the Class B Certificates until their Certificate Balance is reduced to zero; and (c) next, to reimburse the holders of the Class B Certificates for any previously unreimbursed losses (plus interest thereon) on the mortgage loans that were previously allocated to that Class in reduction of their Certificate Balance. | ||
| 6. | Class C Certificates: To make distributions on the Class C Certificates as follows: (a) first, to interest on the Class C Certificates in the amount of the interest entitlement for that Class; (b) next, to the extent of the portion of the Principal Distribution Amount remaining after distributions in respect of principal to each Class with a higher distribution priority (in this case, the Class A-1, A-2, A-3, A-SB, A-S and B Certificates), to principal on the Class C Certificates until their Certificate Balance is reduced to zero; and (c) next, to reimburse the holders of the Class C Certificates for any previously unreimbursed losses (plus interest thereon) on the mortgage loans that were previously allocated to that Class in reduction of their Certificate Balance. | ||
| 7. | After the Class A-1, A-2, A-3, A-SB, A-S, B and C Certificates are paid all amounts to which they are entitled, the remaining funds available for distribution will be used to pay interest, principal and loss reimbursement amounts on the Class D, E, F and G Certificates sequentially in that order in a manner analogous to the Class C Certificates. | ||
| Allocation of Yield Maintenance and Prepayment Premiums: | If any yield maintenance charge or prepayment premium is collected during any particular collection period with respect to any mortgage loan, then on the Distribution Date corresponding to that collection period, the certificate administrator will pay that yield maintenance charge or prepayment premium (net of liquidation fees payable therefrom) in the following manner: (x)(1) to each of the Class A-1, A-2, A-3, A-SB, A-S, B, C and D Certificates, the product of (a) the Non-Retained Certificates’ Percentage Allocation Entitlement of the yield maintenance charge or prepayment premium, (b) the related Base Interest Fraction (as defined in the Preliminary Prospectus) for such Class, and (c) a fraction, the numerator of which is equal to the amount of principal distributed to such Class for that Distribution Date, and the denominator of which is the total amount of principal distributed to all Principal Balance Certificates (other than the RRI Interest) for that Distribution Date, and (2) to the Class X-A Certificates, the excess, if any, of (a) the product of (i) the Non-Retained Certificates’ Percentage Allocation Entitlement of such yield maintenance charge or prepayment premium and (ii) a fraction, the numerator of which is equal to the amount of principal distributed to the Class A-1, A-2, A-3 and A-SB Certificates for that Distribution Date, and the denominator of which is the total amount of principal distributed to all Principal Balance Certificates (other than the RRI Interest) for that Distribution Date, over (b) the amount of such yield maintenance charge or prepayment premium distributed to the Class A-1, A-2, A-3 and A-SB Certificates as described above, and (3) to the Class X-B Certificates, any remaining portion of the Non-Retained Percentage of such yield maintenance charge or prepayment premium not distributed as described above,and (y) to the RRI Interest, its Percentage Allocation Entitlement of the yield maintenance charge or prepayment premium.
No prepayment premiums or yield maintenance charges will be distributed to the holders of the Class X-D, X-E, X-F, X-G, E, F, G, V or R Certificates. For a description of when prepayment premiums and yield maintenance charges are generally required on the mortgage loans, see Annex A-1 to the Preliminary Prospectus. See also “Risk Factors—Risks Relating to the Mortgage Loans—Risks Relating to Enforceability of Yield Maintenance Charges, Prepayment Premiums or Defeasance Provisions” and “Risk Factors—Other Risks Relating to the Certificates—Your Yield May Be Affected by Defaults, Prepayments and Other Factors” in the Preliminary Prospectus. Prepayment premiums and yield maintenance charges will be distributed on each Distribution Date only to the extent they are actually received on the mortgage loans as of the related Determination Date.
|
THE INFORMATION IN THIS STRUCTURAL AND COLLATERAL TERM SHEET IS NOT COMPLETE AND MAY BE AMENDED PRIOR TO THE TIME OF SALE. THIS TERM SHEET IS NOT AN OFFER TO SELL THESE SECURITIES AND IT IS NOT A SOLICITATION OF AN OFFER TO BUY THESE SECURITIES IN ANY JURISDICTION WHERE THE OFFER OR SALE IS NOT PERMITTED.
20
| Wells Fargo Commercial Mortgage Trust 2016-BNK1 | Certain Terms and Conditions |
| Realized Losses: | The Certificate Balances of the Class A-1, A-2, A-3, A-SB, A-S, B, C, D, E, F and G Certificates, will be reduced without distribution on any Distribution Date as a write-off to the extent of the Non-Retained Certificates’ Percentage Allocation Entitlement of any losses realized on the mortgage loans allocated to such Class on such Distribution Date. Such losses will be applied in the following order, in each case until the related Certificate Balance is reduced to zero: first, to the Class G Certificates; second, to the Class F Certificates; third, to the Class E Certificates; fourth, to the Class D Certificates; fifth, to the Class C Certificates; sixth, to the Class B Certificates; seventh, to the Class A-S Certificates; and, finally, pro rata, to the Class A-1, A-2, A-3 and A-SB Certificates based on their outstanding Certificate Balances.
The notional amount of the Class X-A Certificates will be reduced by the amount of all losses that are allocated to the Class A-1, A-2, A-3 or A-SB Certificates as write-offs in reduction of their Certificate Balances. The notional amount of the Class X-B Certificates will be reduced by the amount of all losses that are allocated to the Class A-S, B or C Certificates as write-offs in reduction of their Certificate Balance. The notional amount of the Class X-D Certificates will be reduced by the amount of all losses that are allocated to the Class D Certificates as write-offs in reduction of their Certificate Balance. The notional amount of the Class X-E Certificates will be reduced by the amount of all losses that are allocated to the Class E Certificates as write-offs in reduction of their Certificate Balance. The notional amount of the Class X-F Certificates will be reduced by the amount of all losses that are allocated to the Class F Certificates as write-offs in reduction of their Certificate Balance. The notional amount of the Class X-G Certificates will be reduced by the amount of all losses that are allocated to the Class G Certificates as write-offs in reduction of their Certificate Balance. |
| P&I Advances: | The Master Servicer or, if the Master Servicer fails to do so, the Trustee, will be obligated to advance delinquent debt service payments (other than balloon payments, excess interest and default interest) and assumed debt service payments on mortgage loans with delinquent balloon payments (excluding any related companion loan), except to the extent any such advance is deemed non-recoverable from collections on the related mortgage loan. In addition, if an Appraisal Reduction Amount exists for a given mortgage loan, the interest portion of any P&I advance for such mortgage loan will be reduced, which will have the effect of reducing the amount of interest available for distribution to the Certificates, which with respect to the Non-Retained Certificates will be applied in reverse alphabetical order of their Class designations (except that interest payments on the Class A-1, A-2, A-3, A-SB, X-A, X-B, X-D, X-E, X-F and X-G Certificates would be affected on a pari passu basis). |
| Servicing Advances: | The Master Servicer or, if the Master Servicer fails to do so, the Trustee, will be obligated to make servicing advances, including the payment of delinquent property taxes, insurance premiums and ground rent, except to the extent that those advances are deemed non-recoverable from collections on the related mortgage loan. The Master Servicer or the Trustee, as applicable, will have the primary obligation to make any required servicing advances with respect to the Serviced Whole Loans. The servicer or trustee, as applicable, under the SHOPS 2016-CSTL securitization will have the primary obligation to make any required servicing advances with respect to The Shops at Crystals whole loan. The Special Servicer will have no obligation to make servicing advances but may do so in an emergency situation. |
Appraisal Reduction Amounts and | An Appraisal Reduction Amount generally will be created in the amount, if any, by which the principal balance of a required appraisal loan (which is a mortgage loan with respect to which certain defaults, modifications or insolvency events have occurred as further described in the Preliminary Prospectus) plus other amounts overdue or advanced in connection with such mortgage loan exceeds 90% of the appraised value of the related mortgaged property plus certain escrows and reserves (including letters of credit) held with respect to the mortgage loan. With respect to any whole loan, any Appraisal Reduction Amount will be allocated first to the related subordinate companion loan, if any, and then to the related mortgage loan and the related pari passu companion loan(s).
A mortgage loan will cease to be a required appraisal loan when the same has ceased to be a specially serviced loan (if applicable), has been brought current for at least three consecutive months and no other circumstances exist that would cause such mortgage loan to be a required appraisal loan.
A Collateral Deficiency Amount will exist with respect to any mortgage loan that is modified into an AB loan structure and remains a corrected mortgage loan and will generally equal the excess of (i) the stated principal balance of such AB modified loan (taking into account the related junior note(s) and any pari passu notes included therein), over (ii) the sum of (in the case of a whole loan, solely to the extent allocable to the subject mortgage loan) (x) the appraised value of the related mortgaged property plus (y) any capital or additional collateral contributed by the related borrower at the time the loan became an AB modified loan plus (z) certain escrows or reserves (including letters of credit) in addition to any amounts set forth in the immediately preceding clause (y)) held with respect to the mortgage loan.
A Cumulative Appraisal Reduction Amount with respect to any mortgage loan will be the sum of |
THE INFORMATION IN THIS STRUCTURAL AND COLLATERAL TERM SHEET IS NOT COMPLETE AND MAY BE AMENDED PRIOR TO THE TIME OF SALE. THIS TERM SHEET IS NOT AN OFFER TO SELL THESE SECURITIES AND IT IS NOT A SOLICITATION OF AN OFFER TO BUY THESE SECURITIES IN ANY JURISDICTION WHERE THE OFFER OR SALE IS NOT PERMITTED.
21
| Wells Fargo Commercial Mortgage Trust 2016-BNK1 | Certain Terms and Conditions |
any Appraisal Reduction Amount and any Collateral Deficiency Amount.
Appraisal Reduction Amounts will affect the amount of debt service advances in respect of the related mortgage loan. Appraisal Reduction Amounts will also be taken into account in the determination of the identity of the Class whose majority constitutes the “majority controlling class certificateholder” and is entitled to appoint the directing certificateholder. | |
Clean-Up Call and Exchange Termination: | On each Distribution Date occurring after the aggregate unpaid principal balance of the mortgage loans isless than (or in the case of clause (ii) below, less than or equal to) the greater of (i) 1.0% of the principal balance as of the Cut-off Date or (ii) if the South Main Shopping Center Mortgage Loan is an asset of the trust fund, the sum of the outstanding principal balance of theSouth Main Shopping Center Mortgage Loan on any date of determination and 1.0% of the principal balance as of the Cut-off Date, however, this termination right will not be exercisable at the percentage threshold specified in clause (ii) above earlier than the Distribution Date in September 2026,certain specified persons will have the option to purchase all of the remaining mortgage loans (and the trust’s interest in all property acquired through exercise of remedies in respect of any mortgage loan) at the price specified in the Preliminary Prospectus. Exercise of the option will terminate the trust and retire the then-outstanding certificates.
If the aggregate Certificate Balances of each of the Class A-1, A-2, A-3, A-SB, A-S, B, C and D Certificates have been reduced to zero, the trust may also be terminated in connection with an exchange of all the then-outstanding certificates (other than the Class R Certificates and the RRI Interest) for the mortgage loans and REO properties then remaining in the issuing entity, subject to payment of a price specified in the Preliminary Prospectus, but all of the holders of those outstanding Classes (other than the Class R Certificates and the RRI Interest) of outstanding certificates would have to voluntarily participate in the exchange.
|
| Liquidation Loan Waterfall: | Following the liquidation of any loan or property, the net liquidation proceeds generally will be applied (after reimbursement of advances and certain trust fund expenses), first, as a recovery of accrued interest, other than delinquent interest that was not advanced as a result of Appraisal Reduction Amounts, second, as a recovery of principal until all principal has been recovered, and then as a recovery of delinquent interest that was not advanced as a result of Appraisal Reduction Amounts. Please see “Description of the Certificates—Distributions—Application Priority of Mortgage Loan Collections or Whole Loan Collections” in the Preliminary Prospectus. |
| Majority Controlling Class Certificateholder and Directing Certificateholder: | A directing certificateholder may be appointed by the “majority controlling class certificate-holder”, which will be the holder(s) of a majority of the “controlling class”, which means the most subordinate class among the Class F and G Certificates that has a Certificate Balance, as notionally reduced by any Cumulative Appraisal Reduction Amounts allocable to that class, that is at least equal to 25% of its total initial Certificate Balance; provided that if at any time the Certificate Balances of the Principal Balance Certificates (other than the Class F and G Certificates) have been reduced to zero as a result of principal payments on the mortgage loans, then the “controlling class” will be the most subordinate class of Class F and G Certificates that has a Certificate Balance greater than zero without regard to any Cumulative Appraisal Reduction Amounts. The majority controlling class certificateholder will have a continuing right to appoint, remove or replace the directing certificateholder in its sole discretion. This right may be exercised at any time and from time to time. See “Pooling and Servicing Agreement—The Directing Certificateholder” in the Preliminary Prospectus. |
| Control and Consultation: | The rights of various parties to replace the Special Servicer and approve or consult with respect to major actions of the Special Servicer will vary according to defined periods.
A “Control Termination Event” occurs if the Class F Certificates have a Certificate Balance, net of any Cumulative Appraisal Reduction Amounts allocable to that Class, that is less than 25% of the initial Certificate Balance of that Class or, while the Class F Certificates are the controlling class, the majority (by Certificate Balance) of the holders of the Class F Certificates irrevocably waived its right, in writing, to exercise any of the rights of the majority controlling class certificateholder and such rights have not been reinstated to a successor majority controlling class certificateholder.
A “Consultation Termination Event” occurs if the Class F Certificates have a Certificate Balance, without regard to any Cumulative Appraisal Reduction Amounts allocable to that Class, that is less than 25% of the initial Certificate Balance of that Class or, while the Class F Certificates are the controlling class, the majority (by Certificate Balance) of the holders of the Class F Certificates irrevocably waived its right, in writing, to exercise any of the rights of the majority controlling class certificateholder and such rights have not been reinstated to a successor majority controlling class certificateholder.
If no Control Termination Event has occurred and is continuing, except with respect to the Excluded Loans (as defined below) as to such party, (i) the directing certificateholder will be entitled to grant or withhold approval of asset status reports prepared, and material servicing actions proposed, by the Special Servicer, and (ii) the directing certificateholder will be entitled |
THE INFORMATION IN THIS STRUCTURAL AND COLLATERAL TERM SHEET IS NOT COMPLETE AND MAY BE AMENDED PRIOR TO THE TIME OF SALE. THIS TERM SHEET IS NOT AN OFFER TO SELL THESE SECURITIES AND IT IS NOT A SOLICITATION OF AN OFFER TO BUY THESE SECURITIES IN ANY JURISDICTION WHERE THE OFFER OR SALE IS NOT PERMITTED.
22
| Wells Fargo Commercial Mortgage Trust 2016-BNK1 | Certain Terms and Conditions |
to terminate and replace the Special Servicer with or without cause, and appoint itself or another person as the successor special servicer. It will be a condition to such appointment that Fitch, KBRA, Moody’s and S&P (and any Rating Agency rating any securities backed by anypari passu companion loan(s) serviced under this transaction) confirm that the appointment would not result in a qualification, downgrade or withdrawal of any of their then-current ratings of certificates (and any certificates backed by anypari passu companion loan(s) serviced under this transaction).
If a Control Termination Event has occurred and is continuing but no Consultation Termination Event has occurred and is continuing, the Special Servicer will be required to consult with the directing certificateholder (other than with respect to Excluded Loans as to such party) and the Operating Advisor in connection with asset status reports and material special servicing actions.
If a Consultation Termination Event has occurred and is continuing, the Special Servicer must seek to consult with the Operating Advisor in connection with asset status reports and material special servicing actions, and, in general, no directing certificateholder will be recognized or have any right to terminate the Special Servicer or approve, direct or consult with respect to servicing matters.
With respect to the Vertex Pharmaceuticals HQ mortgage loan, the One Stamford Forum mortgage loan, the Pinnacle II mortgage loan, the Simon Premium Outlets mortgage loan, the One Penn Center mortgage loan, the FedEx - Atlanta, GA mortgage loan, the FedEx - West Palm Beach, FL mortgage loan, the FedEx - Fife, WA mortgage loan and the FedEx - Boulder, CO mortgage loan, the rights of the directing certificateholder described above will be subject to the consultation rights of the holder of the relatedpari passu companion loan(s) as described below.
Notwithstanding any contrary description set forth above, with respect to the mortgage loans relating to the Serviced Whole Loans, the holder of thepari passu companion loan(s) in the related Serviced Whole Loan (or its representative, including any directing certificateholder under any securitization of suchpari passu companion loan(s)) will have consultation rights with respect to asset status reports and material special servicing actions involving the related whole loan, as provided for in the related intercreditor agreement and as described in the Preliminary Prospectus, and those rights will be in addition to the rights of the directing certificateholder in this transaction described above.
For purposes of the servicing of the Serviced Whole Loans, the occurrence and continuance of a Control Termination Event or Consultation Termination Event under this securitization will not limit the consultation and other rights of the holder of thepari passu companion loan(s).
Notwithstanding any contrary description set forth above, with respect to The Shops at Crystals mortgage loan, in general the related whole loan will be serviced under the SHOPS 2016-CSTL trust and servicing agreement, which grants the related directing certificateholder (or equivalent) control rights that may include the right to approve or disapprove various material servicing actions involving the related whole loan. The directing certificateholder for this securitization (so long as no Consultation Termination Event has occurred and is occurring) will have the right to be consulted on a non-binding basis with respect to such actions. For purposes of the servicing of The Shops at Crystals whole loan, the occurrence and continuance of a Control Termination Event or Consultation Termination Event under this securitization will not limit the control or other rights of the directing certificateholder (or equivalent) under the SHOPS 2016-CSTL securitization.
Notwithstanding any contrary description set forth above, in the event that, with respect to any mortgage loan, (i) with respect to the directing certificateholder, the majority controlling class certificateholder or the directing certificateholder or (ii) with respect to the risk retention consultation party, the risk retention consultation party or the holder of the majority of the RRI Interest, in either case, is (i) a borrower, a mortgagor or a manager of a mortgaged property, or the holder of a mezzanine loan that has accelerated the related mezzanine loan or commenced foreclosure or enforcement proceedings against the equity collateral pledged to secure the related mezzanine loan or any affiliate thereof, (ii) with respect to borrower, a mortgagor, a manager of a Mortgaged Property or a mezzanine lender that has accelerated the related mezzanine loan or commenced foreclosure or enforcement proceedings against the equity collateral pledged to secure the related mezzanine loan, (x) any other person controlling or controlled by or under common control with such borrower, mortgagor, manager or mezzanine lender, as applicable, or (y) any other person owning, directly or indirectly, 25% or more of the beneficial interests in such borrower, mortgagor, manager or mezzanine lender (each, a “borrower party”), the majority controlling class certificateholder and the directing certificateholder will have no right to receive asset status reports or such other information as may be specified in the pooling and servicing agreement, to grant or withhold approval of, or consult with respect to, asset status reports prepared, and material servicing actions proposed, by the Special Servicer, with respect to such mortgage loan, and such mortgage loan will be referred to as an “Excluded Loan” as to such party. |
THE INFORMATION IN THIS STRUCTURAL AND COLLATERAL TERM SHEET IS NOT COMPLETE AND MAY BE AMENDED PRIOR TO THE TIME OF SALE. THIS TERM SHEET IS NOT AN OFFER TO SELL THESE SECURITIES AND IT IS NOT A SOLICITATION OF AN OFFER TO BUY THESE SECURITIES IN ANY JURISDICTION WHERE THE OFFER OR SALE IS NOT PERMITTED.
23
Wells Fargo Commercial Mortgage Trust 2016-BNK1 | Certain Terms and Conditions |
| In addition, notwithstanding any contrary description set forth above, in the event that, with respect to any mortgage loan, a controlling class certificateholder is a borrower party, such controlling class certificateholder will have no right to receive asset status reports or such other information as may be specified in the pooling and servicing agreement with respect to such mortgage loan, and such controlling class certificateholder will be referred to as an “excluded controlling class holder”. | ||
| Risk Retention Consultation Party: | A risk retention consultation party may be appointed by the holder or holders of more than 50% of the RRI Interest, by Certificate Balance. The majority RRI Interest holder will have a continuing right to appoint, remove or replace the risk retention consultation party in its sole discretion. This right may be exercised at any time and from time to time. Except with respect to an Excluded Loan as to such party, the risk retention consultation party will be entitled to consult with the Special Servicer, upon request of the risk retention consultation party, with respect to certain material servicing actions proposed by the Special Servicer. | |
| Replacement of Special Servicer by General Vote of Certificateholders: | If a Control Termination Event has occurred and is continuing, the Special Servicer may be removed and replaced without cause upon the affirmative direction of certificate owners holding not less than 66-2/3% of a certificateholder quorum, following a proposal from certificate owners holding not less than 25% of the appraisal-reduced voting rights of all Certificates. The certificateholders who initiate a vote on a termination and replacement of the Special Servicer without cause must cause Fitch, KBRA, Moody’s and S&P to confirm the then-current ratings of the certificates (or decline to review the matter) and cause the payment of the fees and expenses incurred in the replacement. If no Control Termination Event has occurred and is continuing, the Special Servicer may be replaced by the directing certificateholder, subject to Fitch, KBRA, Moody’s and S&P (and any Rating Agency rating any securities backed by anypari passu companion loan(s) serviced under this transaction) confirming the then-current ratings of the Certificates (and any certificates backed by any pari passucompanion loans serviced under this transaction) or declining to review the matter. | |
| Excluded Special Servicer: | In the event that, with respect to any mortgage loan, the Special Servicer is a borrower party, the Special Servicer will be required to resign as special servicer of such mortgage loan (referred to as an “excluded special servicer loan”). If no Control Termination Event has occurred and is continuing, the directing certificateholder will be entitled to appoint (and may replace with or without cause) a separate special servicer that is not a borrower party (referred to as an “excluded special servicer”) with respect to such excluded special servicer loan unless such excluded special servicer loan is also an excluded loan. Otherwise, upon resignation of the Special Servicer with respect to an excluded special servicer loan, such resigning Special Servicer will be required to appoint the excluded special servicer. | |
| Appraisal Remedy: | If the Class of Certificates comprising the controlling class loses its status as controlling class because of the application of an Appraisal Reduction Amount or Collateral Deficiency Amount, the holders of a majority of the voting rights of such Class may require the Special Servicer to order a second appraisal for any mortgage loan in respect of which an Appraisal Reduction Amount or Collateral Deficiency Amount has been applied. The Special Servicer must thereafter determine whether, based on its assessment of such second appraisal, any recalculation of the Appraisal Reduction Amount or Collateral Deficiency Amount is warranted, and if so warranted, the Master Servicer will recalculate such Appraisal Reduction Amount or Collateral Deficiency Amount. Such Class will not be able to exercise any direction, control, consent and/or similar rights of the controlling class unless and until reinstated as the controlling class through such determination; and pending such determination, the rights of the controlling class will be exercised by the control eligible certificates (which may only be any one of Class F and G), if any, that would be the controlling class taking into account the subject appraisal reduction amount. | |
| Sale of Defaulted Assets: | There will be no “fair value” purchase option. Instead, the pooling and servicing agreement will authorize the Special Servicer to sell defaulted mortgage loans to the highest bidder in a manner generally similar to sales of REO properties. The sale of a defaulted loan (other than with respect The Shops at Crystals whole loan) for less than par plus accrued interest and certain other fees and expenses owed on the loan will be subject to consent or consultation rights of the directing certificateholder and/or Operating Advisor and, in the case of the Serviced Whole Loans, consultation rights of the holders of the relatedpari passu companion loan(s), as described in the Preliminary Prospectus. In the case of the Serviced Whole Loans, pursuant to the related intercreditor agreement and the pooling and servicing agreement, if the Special Servicer offers to sell to any person (or offers to purchase) for cash such mortgage loan during such time as the related whole loan constitutes a defaulted mortgage loan, then in connection with any such sale, the Special Servicer is required to sell both the mortgage loan and the relatedpari passu companion loan(s) as a single whole loan In the case of The Shops at Crystals whole loan, pursuant to the SHOPS 2016-CSTL trust and |
THE INFORMATION IN THIS STRUCTURAL AND COLLATERAL TERM SHEET IS NOT COMPLETE AND MAY BE AMENDED PRIOR TO THE TIME OF SALE. THIS TERM SHEET IS NOT AN OFFER TO SELL THESE SECURITIES AND IT IS NOT A SOLICITATION OF AN OFFER TO BUY THESE SECURITIES IN ANY JURISDICTION WHERE THE OFFER OR SALE IS NOT PERMITTED.
24
Wells Fargo Commercial Mortgage Trust 2016-BNK1 | Certain Terms and Conditions |
| servicing agreement and the related intercreditor agreement, as applicable, the SHOPS 2016-CSTL special servicer may offer to sell to any person (or may offer to purchase) for cash the related whole loan during such time as the related companion loan constitutes a defaulted mortgage loan under the SHOPS 2016-CSTL trust and servicing agreement, and, in connection with any such sale, the SHOPS 2016-CSTL special servicer is required to sell both the mortgage loan and the relatedpari passu companion loan(s) and subordinate companion loans as a whole loan. The directing certificateholder for this securitization will have consultation rights as the holder of an interest in the related mortgage loan, as described in the Preliminary Prospectus. | ||
| “As-Is” Appraisals: | Appraisals must be conducted on an “as-is” basis, and must be no more than 9 months old, for purposes of determining Appraisal Reduction Amounts and market value in connection with REO sales. Required appraisals may consist of updates of prior appraisals. Internal valuations by the Special Servicer are permitted if the principal balance of a mortgage loan is less than $2,000,000. | |
| Operating Advisor: | The Operating Advisor will perform certain review duties if a Control Termination Event has occurred and is continuing, which will generally include a limited annual review of, and the delivery of a report regarding, certain actions of the Special Servicer with respect to the resolution and/or liquidation of specially serviced loans to the Certificate Administrator. The review and report generally will be based on any asset status reports and additional information delivered to the Operating Advisor by the Special Servicer. In addition, if a Control Termination Event has occurred and is continuing, the Special Servicer must seek to consult with the Operating Advisor (in addition to the directing certificateholder if no Consultation Termination Event has occurred and is continuing) in connection with material special servicing actions with respect to specially serviced loans serviced by the Special Servicer. Furthermore, under certain circumstances, but only if a Consultation Termination Event has occurred and is continuing, the Operating Advisor may recommend the replacement of the Special Servicer, in which case the Certificate Administrator will deliver notice of such recommendation to the certificateholders, and certificateholders with specified percentages of the voting rights may direct the replacement of the Special Servicer at their expense. If a Consultation Termination Event has occurred and is continuing, the Operating Advisor may be removed and replaced without cause upon the affirmative direction of certificate owners holding not less than 75% of the appraisal-reduced voting rights of all Principal Balance Certificates, following a proposal from certificate owners holding not less than 25% of the appraisal-reduced voting rights of all certificates. The certificateholders who initiate a vote on a termination and replacement of the Operating Advisor without cause must cause Fitch, KBRA, Moody’s and S&P to confirm the then-current ratings of the certificates (or decline to review the matter) and cause the payment of the fees and expenses incurred in the replacement. The Operating Advisor generally may be discharged from its duties if and when the Class A-1, A-2, A-3, A-SB, A-S, B, C, D and E Certificates are retired. | |
| Asset Representations Reviewer: | The Asset Representations Reviewer will be required to review certain delinquent mortgage loans after a specified delinquency threshold has been exceeded (an “Asset Review Trigger”) and the required percentage of certificateholders vote to direct a review of such delinquent loans. An Asset Review Trigger will occur when either (1) mortgage loans with an aggregate outstanding principal balance of 25.0% or more of the aggregate outstanding principal balance of all of the mortgage loans (including any REO loans (or a portion of any REO loan in the case of a whole loan) held by the issuing entity as of the end of the applicable collection period are delinquent loans or (2) at least 15 mortgage loans are delinquent loans as of the end of the applicable collection period and the outstanding principal balance of such delinquent loans in the aggregate constitutes at least 20.0% of the aggregate outstanding principal balance of all of the mortgage loans (including any REO loans (or a portion of any REO loan in the case of a whole loan)) held by the issuing entity as of the end of the applicable collection period. See “Pooling and Servicing Agreement—The Asset Representations Reviewer—Asset Review” in the Preliminary Prospectus. The Asset Representations Reviewer may be terminated and replaced without cause. Upon (i) the written direction of certificateholders evidencing not less than 25% of the voting rights (without regard to the application of any Appraisal Reduction Amounts) requesting a vote to terminate and replace the Asset Representations Reviewer with a proposed successor Asset Representations Reviewer that is an eligible asset reviewer, and (ii) payment by such holders to the certificate administrator of the reasonable fees and expenses to be incurred by the certificate administrator in connection with administering such vote, the certificate administrator will promptly provide notice to all certificateholders and the Asset Representations Reviewer of such request by posting such notice on its internet website, and by mailing such notice to all certificateholders and the Asset Representations Reviewer. Upon the written direction of certificateholders evidencing at least 75% of a certificateholder quorum (without regard to the application of any Appraisal Reduction Amounts), the Trustee will terminate all of the rights and obligations of the Asset Representations Reviewer under the pooling and servicing agreement by written notice to the Asset Representations Reviewer, and the proposed successor Asset Representations Reviewer will be appointed. See “Pooling and |
THE INFORMATION IN THIS STRUCTURAL AND COLLATERAL TERM SHEET IS NOT COMPLETE AND MAY BE AMENDED PRIOR TO THE TIME OF SALE. THIS TERM SHEET IS NOT AN OFFER TO SELL THESE SECURITIES AND IT IS NOT A SOLICITATION OF AN OFFER TO BUY THESE SECURITIES IN ANY JURISDICTION WHERE THE OFFER OR SALE IS NOT PERMITTED.
25
Wells Fargo Commercial Mortgage Trust 2016-BNK1 | Certain Terms and Conditions |
| Servicing Agreement—The Asset Representations Reviewer” in the Preliminary Prospectus. | ||
| Dispute Resolution Provisions: | The mortgage loan sellers will be subject to the dispute resolution provisions set forth in the pooling and servicing agreement to the extent those provisions are triggered with respect to any mortgage loan sold to the depositor by a mortgage loan seller and such mortgage loan seller will be obligated under the related mortgage loan purchase agreement to comply with all applicable provisions and to take part in any mediation or arbitration proceedings that may result. Generally, in the event that a Repurchase Request (as defined in the Preliminary Prospectus) is not “Resolved” (as defined below) within 180 days after the related mortgage loan seller receives such Repurchase Request, then the enforcing servicer will be required to send a notice to the “Initial Requesting Certificateholder” (if any) and the Certificate Administrator indicating the enforcing servicer’s intended course of action with respect to the Repurchase Request. If (a) the enforcing servicer’s intended course of action with respect to the Repurchase Request does not involve pursuing further action to exercise rights against the related mortgage loan seller with respect to the Repurchase Request and the Initial Requesting Certificateholder, if any, or any other certificateholder or certificate owner wishes to exercise its right to refer the matter to mediation (including nonbinding arbitration) or arbitration, or (b) the enforcing servicer’s intended course of action is to pursue further action to exercise rights against the related mortgage loan seller with respect to the Repurchase Request but the Initial Requesting Certificateholder, if any, or any other certificateholder or certificate owner does not agree with the dispute resolution method selected by the enforcing servicer, then the Initial Requesting Certificateholder, if any, or such other certificateholder or certificate owner may deliver a written notice to the Special Servicer indicating its intent to exercise its right to refer the matter to either mediation or arbitration.
“Resolved” means, with respect to a Repurchase Request, (i) that the related Material Defect has been cured, (ii) the related mortgage loan has been repurchased in accordance with the related mortgage loan purchase agreement, (iii) a mortgage loan has been substituted for the related mortgage loan in accordance with the related mortgage loan purchase agreement, (iv) the applicable mortgage loan seller has made a Loss of Value Payment (as defined in the Preliminary Prospectus), (v) a contractually binding agreement is entered into between the enforcing servicer, on behalf of the issuing entity, and the related mortgage loan seller that settles the related mortgage loan seller’s obligations under the related mortgage loan purchase agreement, or (vi) the related mortgage loan is no longer property of the issuing entity as a result of a sale or other disposition in accordance with the pooling and servicing agreement. See “Pooling and Servicing Agreement—Dispute Resolution Provisions” in the Preliminary Prospectus. | |
| Investor Communications: | The certificate administrator is required to include on any Form 10–D any request received from a certificateholder to communicate with other certificateholders related to certificateholders exercising their rights under the terms of the pooling and servicing agreement. Any certificateholder wishing to communicate with other certificateholders regarding the exercise of its rights under the terms of the Pooling and Servicing Agreement will be able to deliver a written request signed by an authorized representative of the requesting investor to the certificate administrator. | |
| Certain Fee Offsets: | If a workout fee is earned by the Special Servicer following a loan default with respect to any mortgage loan that it services, then certain limitations will apply based on modification fees paid by the borrower. The modification fee generally must not exceed 1% of the principal balance of the loan as modified in any 12-month period. In addition, if the loan re-defaults, any subsequent workout fee on that loan must be reduced by a portion of the modification fees paid by the borrower in the previous 12-months. Likewise, liquidation fees collected in connection with a liquidation or partial liquidation of a mortgage loan must be reduced by a portion of the modification fees paid by the borrower in the previous 12 months. | |
| Deal Website: | The Certificate Administrator will be required to maintain a deal website which will include, among other items: (a) summaries of asset status reports prepared by the Special Servicer, (b) inspection reports, (c) appraisals, (d) various “special notices” described in the Preliminary Prospectus, (e) the “Investor Q&A Forum” and (f) a voluntary “Investor Registry”. Investors may access the deal website following execution of a certification and confidentiality agreement. | |
| Initial Majority Controlling Class Certificateholder: | It is expected that RREF III Debt AIV, LP or another affiliate of Rialto Capital Advisors, LLC will be the initial majority controlling class certificateholder. | |
| Whole Loans: | The mortgaged properties identified on Annex A-1 to the Preliminary Prospectus as The Shops at Crystals, Vertex Pharmaceuticals HQ, One Stamford Forum, Pinnacle II, Simon Premium Outlets, One Penn Center, FedEx - Atlanta, GA, FedEx - West Palm Beach, FL, FedEx - Fife, WA and FedEx - Boulder, CO secure both a mortgage loan to be included in the trust fund and one or more other mortgage loans that will not be included in the trust fund, which will bepari |
THE INFORMATION IN THIS STRUCTURAL AND COLLATERAL TERM SHEET IS NOT COMPLETE AND MAY BE AMENDED PRIOR TO THE TIME OF SALE. THIS TERM SHEET IS NOT AN OFFER TO SELL THESE SECURITIES AND IT IS NOT A SOLICITATION OF AN OFFER TO BUY THESE SECURITIES IN ANY JURISDICTION WHERE THE OFFER OR SALE IS NOT PERMITTED.
26
| Wells Fargo Commercial Mortgage Trust 2016-BNK1 | Certain Terms and Conditions |
passuor subordinate in right of payment with the mortgage loan included in the trust fund. We refer to each such group of mortgage loans as a “whole loan”. The Vertex Pharmaceuticals HQ whole loan, the One Stamford Forum whole loan, the Pinnacle II whole loan, the Simon Premium Outlets whole loan, the One Penn Center whole loan, the FedEx - Atlanta, GA whole loan, the FedEx - West Palm Beach, FL whole loan, the FedEx - Fife, WA whole loan and the FedEx - Boulder, CO whole loan are collectively referred to as the “Serviced Whole Loans” and will be principally serviced under the pooling and servicing agreement for this securitization. The Shops at Crystals whole loan will be principally serviced under the trust and servicing agreement for the SHOPS 2016-CSTL securitization. As of the closing date, the companion loan in such whole loan will be held by the party identified above under “IV. Characteristics of the Mortgage Pool—B. Summary of the Whole Loans”. |
THE INFORMATION IN THIS STRUCTURAL AND COLLATERAL TERM SHEET IS NOT COMPLETE AND MAY BE AMENDED PRIOR TO THE TIME OF SALE. THIS TERM SHEET IS NOT AN OFFER TO SELL THESE SECURITIES AND IT IS NOT A SOLICITATION OF AN OFFER TO BUY THESE SECURITIES IN ANY JURISDICTION WHERE THE OFFER OR SALE IS NOT PERMITTED.
27
| THE SHOPS AT CRYSTALS |

THE INFORMATION IN THIS STRUCTURAL AND COLLATERAL TERM SHEET IS NOT COMPLETE AND MAY BE AMENDED PRIOR TO THE TIME OF SALE. THIS TERM SHEET IS NOT AN OFFER TO SELL THESE SECURITIES AND IT IS NOT A SOLICITATION OF AN OFFER TO BUY THESE SECURITIES IN ANY JURISDICTION WHERE THE OFFER OR SALE IS NOT PERMITTED.
28
| THE SHOPS AT CRYSTALS |
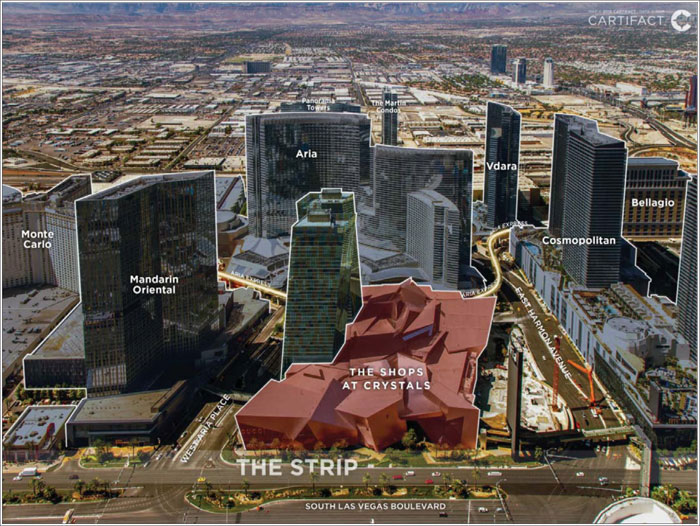
THE INFORMATION IN THIS STRUCTURAL AND COLLATERAL TERM SHEET IS NOT COMPLETE AND MAY BE AMENDED PRIOR TO THE TIME OF SALE. THIS TERM SHEET IS NOT AN OFFER TO SELL THESE SECURITIES AND IT IS NOT A SOLICITATION OF AN OFFER TO BUY THESE SECURITIES IN ANY JURISDICTION WHERE THE OFFER OR SALE IS NOT PERMITTED.
29
| THE SHOPS AT CRYSTALS |
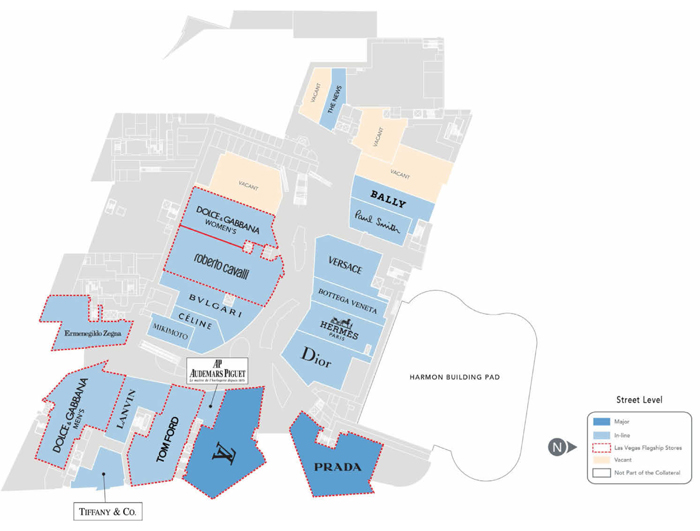
THE INFORMATION IN THIS STRUCTURAL AND COLLATERAL TERM SHEET IS NOT COMPLETE AND MAY BE AMENDED PRIOR TO THE TIME OF SALE. THIS TERM SHEET IS NOT AN OFFER TO SELL THESE SECURITIES AND IT IS NOT A SOLICITATION OF AN OFFER TO BUY THESE SECURITIES IN ANY JURISDICTION WHERE THE OFFER OR SALE IS NOT PERMITTED.
30
| THE SHOPS AT CRYSTALS |
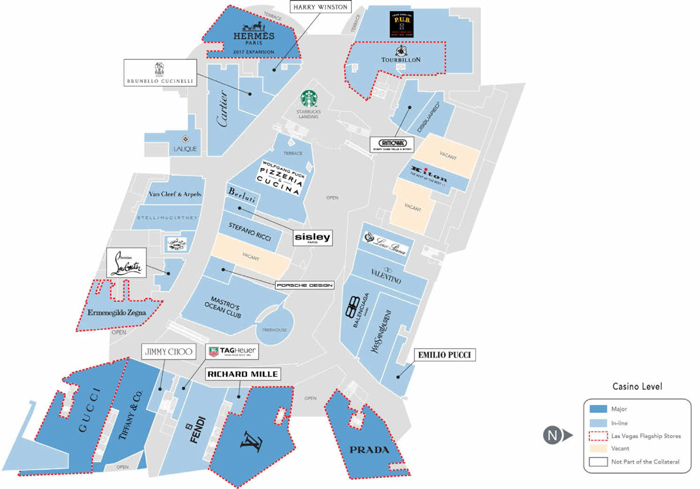
THE INFORMATION IN THIS STRUCTURAL AND COLLATERAL TERM SHEET IS NOT COMPLETE AND MAY BE AMENDED PRIOR TO THE TIME OF SALE. THIS TERM SHEET IS NOT AN OFFER TO SELL THESE SECURITIES AND IT IS NOT A SOLICITATION OF AN OFFER TO BUY THESE SECURITIES IN ANY JURISDICTION WHERE THE OFFER OR SALE IS NOT PERMITTED.
31
| THE SHOPS AT CRYSTALS |
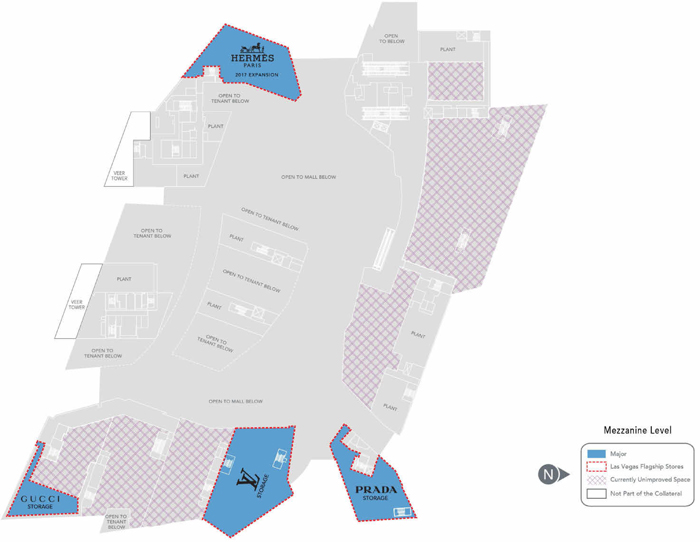
THE INFORMATION IN THIS STRUCTURAL AND COLLATERAL TERM SHEET IS NOT COMPLETE AND MAY BE AMENDED PRIOR TO THE TIME OF SALE. THIS TERM SHEET IS NOT AN OFFER TO SELL THESE SECURITIES AND IT IS NOT A SOLICITATION OF AN OFFER TO BUY THESE SECURITIES IN ANY JURISDICTION WHERE THE OFFER OR SALE IS NOT PERMITTED.
32
| THE SHOPS AT CRYSTALS |
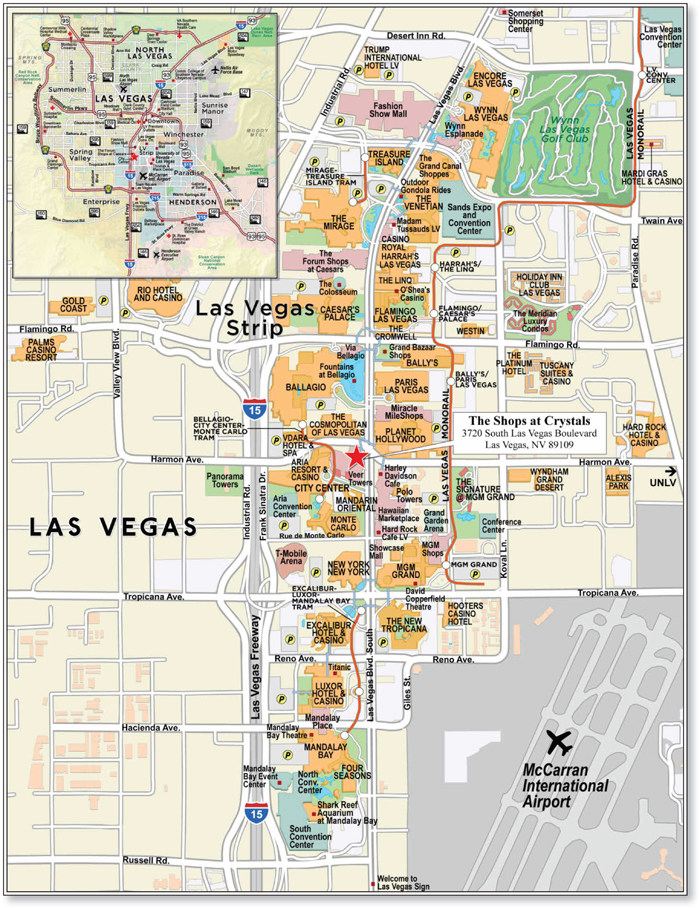
THE INFORMATION IN THIS STRUCTURAL AND COLLATERAL TERM SHEET IS NOT COMPLETE AND MAY BE AMENDED PRIOR TO THE TIME OF SALE. THIS TERM SHEET IS NOT AN OFFER TO SELL THESE SECURITIES AND IT IS NOT A SOLICITATION OF AN OFFER TO BUY THESE SECURITIES IN ANY JURISDICTION WHERE THE OFFER OR SALE IS NOT PERMITTED.
33
| No. 1 – The Shops at Crystals | |||||||
| Loan Information | Property Information | ||||||
| Mortgage Loan Seller: | Wells Fargo Bank, National Association / Bank of America, N.A. | Single Asset/Portfolio: | Single Asset | ||||
Credit Assessment (Fitch/KBRA/Moody’s/S&P): | AAA/AA-/A2(sca.pd)/AA- | Property Type: | Retail | ||||
| Original Principal Balance(1): | $80,000,000 | Specific Property Type: | Anchored | ||||
| Cut-off Date Balance(1): | $80,000,000 | Location: | Las Vegas, NV | ||||
| % of Initial Pool Balance: | 9.2% | Size: | 262,327 SF | ||||
| Loan Purpose: | Recapitalization | Cut-off Date Balance Per SF(1): | $1,458.87 | ||||
| Borrower Name: | The Crystals Las Vegas, LLC | Year Built/Renovated: | 2009/NAP | ||||
| Sponsors(2): | Simon Property Group, L.P.; Invesco Advisers Inc. | Title Vesting: | Fee | ||||
| Mortgage Rate: | 3.744% | Property Manager: | Self-managed | ||||
| Note Date: | June 9, 2016 | 4thMost Recent Occupancy (As of): | 90.5% (12/31/2012) | ||||
| Anticipated Repayment Date: | NAP | 3rdMost Recent Occupancy (As of): | 95.7% (12/31/2013) | ||||
| Maturity Date: | July 1, 2026 | 2ndMost Recent Occupancy (As of): | 93.8% (12/31/2014) | ||||
| IO Period: | 120 months | Most Recent Occupancy (As of): | 91.0% (12/31/2015) | ||||
| Loan Term (Original): | 120 months | Current Occupancy (As of)(6): | 87.6% (4/21/2016) | ||||
| Seasoning: | 1 month | ||||||
| Amortization Term (Original): | None | Underwriting and Financial Information: | |||||
| Loan Amortization Type: | Interest-only, Balloon | ||||||
| Interest Accrual Method: | Actual/360 | 4thMost Recent NOI (As of): | $34,351,614 (12/31/2012) | ||||
| Call Protection(3): | L(25),D(88),O(7) | 3rdMost Recent NOI (As of): | $40,054,352 (12/31/2013) | ||||
| Lockbox Type: | Hard/Springing Cash Management | 2ndMost Recent NOI (As of): | $43,642,314 (12/31/2014) | ||||
| Additional Debt(1)(4): | Yes | Most Recent NOI (As of): | $46,376,811 (12/31/2015) | ||||
| Additional Debt Type(1)(4): | Pari Passu and Subordinate Debt | ||||||
| U/W Revenues: | $64,805,737 | ||||||
| U/W Expenses: | $15,337,868 | ||||||
| U/W NOI: | $49,467,869 | ||||||
| U/W NCF: | $47,610,240 | ||||||
| U/W NOI DSCR(1): | 3.41x | ||||||
| Escrows and Reserves(5): | U/W NCF DSCR(1): | 3.28x | |||||
| U/W NOI Debt Yield(1): | 12.9% | ||||||
| Type: | Initial | Monthly | Cap (If Any) | U/W NCF Debt Yield(1): | 12.4% | ||
| Taxes | $0 | Springing | NAP | As-Is Appraised Value: | $1,100,000,000 | ||
| Insurance | $0 | Springing | NAP | As-Is Appraisal Valuation Date: | April 26, 2016 | ||
| Replacement Reserves | $0 | Springing | $104,931 | Cut-off Date LTV Ratio(1): | 34.8% | ||
| TI/LC Reserve | $0 | Springing | $4,440,000 | LTV Ratio at Maturity or ARD(1): | 34.8% | ||
| (1) | The Shops at Crystals Whole Loan (as defined below), which had an original principal balance of $550,000,000, is comprised of The Shops at Crystals Senior Notes (as defined below) totaling $382,700,000 and The Shops at Crystals Subordinate Companion Loans (as defined below) totaling $167,300,000. The non-controlling The Shops at Crystals Mortgage Loan (as defined below) had an original principal balance of $80,000,000, has an outstanding principal balance of $80,000,000 as of the Cut-off Date and will be contributed to the WFCM 2016-BNK1 Trust. All statistical financial information related to balances per square foot, loan-to-value ratios, debt service coverage ratios and debt yields are based on The Shops at Crystals Senior Notes. The Cut-off Date LTV Ratio, U/W NCF DSCR and U/W NCF DY based on The Shops at Crystals Whole Loan are 50.0%, 2.28x and 8.7%, respectively. |
| (2) | See “The Sponsors” section. |
| (3) | The defeasance lockout period will be at least 25 payment dates beginning with and including the first payment date of August 1, 2016. Defeasance of The Shops at Crystals Whole Loan is permitted after the date that is the earlier to occur of (i) two years after the closing date of the securitization that includes the last note to be securitized, and (ii) August 1, 2019. The assumed lockout period of 25 payments is based on the expected WFCM 2016-BNK1 Trust closing date in August 2016. |
| (4) | See “Subordinate and Mezzanine Indebtedness” section. |
| (5) | See “Escrows” section. |
| (6) | See “Historical Occupancy” section. |
The Mortgage Loan. The mortgage loan (“The Shops at Crystals Mortgage Loan”) is part of a whole loan ( “The Shops at Crystals Whole Loan”) evidenced by (i) two tranches of senior loans, each comprised of 11pari passu notes (“The Shops at Crystals Senior Notes”), and (ii) three subordinate loans, each comprised of threepari passu notes ( “The Shops at Crystals Subordinate Companion Loans”), secured by the fee interest in a luxury shopping center located in Las Vegas, Nevada ( “The Shops at Crystals Property”). The Shops at Crystals Whole Loan was co-originated on June 9, 2016 by Wells Fargo Bank, National Association, Bank of America, N.A. and JPMorgan Chase Bank, National Association. The Shops at Crystals Whole Loan had an original principal balance of $550,000,000, has an outstanding principal balance as of the Cut-off Date of $550,000,000 and accrues interest at an interest rate of 3.744%per annum. The Shops at Crystals Whole Loan had an initial term of 120 months, has a remaining term of 119 months as of the Cut-off Date and requires payments of interest only through the term of The Shops at Crystals Mortgage Loan. The Shops at Crystals Whole Loan matures on July 1, 2026.
THE INFORMATION IN THIS STRUCTURAL AND COLLATERAL TERM SHEET IS NOT COMPLETE AND MAY BE AMENDED PRIOR TO THE TIME OF SALE. THIS TERM SHEET IS NOT AN OFFER TO SELL THESE SECURITIES AND IT IS NOT A SOLICITATION OF AN OFFER TO BUY THESE SECURITIES IN ANY JURISDICTION WHERE THE OFFER OR SALE IS NOT PERMITTED.
34
| THE SHOPS AT CRYSTALS |
The Shops at Crystals Mortgage Loan, evidenced by four notes from each of the two tranches of The Shops at Crystals Senior Notes (Notes A-2-B-2, A-2-B-3, A-3-B-2, A-3-B-3, B-2-B-2, B-2-B-3, B-3-B-2 and B-3-B-3), which will be contributed to the WFCM 2016-BNK1 Trust, had an original principal balance of $80,000,000, has an outstanding principal balance as of the Cut-off Date of $80,000,000 and represents a seniorpari passu non-controlling interest in The Shops at Crystals Whole Loan. Six of the seniorpari passu notes (three from each of the two tranches of The Shops at Crystals Senior Notes) and The Shops at Crystals Subordinate Companion Loans, which were contributed to the SHOPS 2016-CSTL Trust, had an original aggregate principal balance of $300,000,000 and include Note A-1-A, which represents the controlling interest in The Shops at Crystals Whole Loan. Two notes from The Shops at Crystals Senior Notes (Notes A-1-B-1 and B-1-B-1), which had an original principal balance of $50,000,000, were contributed to the JPMCC 2016-JP2 Trust. Two notes from The Shops at Crystals Senior Notes (Notes A-1-B-2 and B-1-B-2), which had an original principal balance of $50,000,000, are currently held by JPMorgan Chase Bank, National Association and are expected to be contributed to the DBJPM 2016-C3 Trust. The remaining non-controlling notes from The Shops at Crystals Senior Notes, which had an aggregate original principal balance of $70,000,000, are currently held by Wells Fargo Bank, National Association and Bank of America, N.A. and are expected to be contributed to future securitization trusts. The lender provides no assurances that any non-securitized notes will not be split further. See “Description of the Mortgage Pool—The Whole Loans—The Non-Serviced Whole Loan—The Shops at Crystals Whole Loan” in the Preliminary Prospectus.
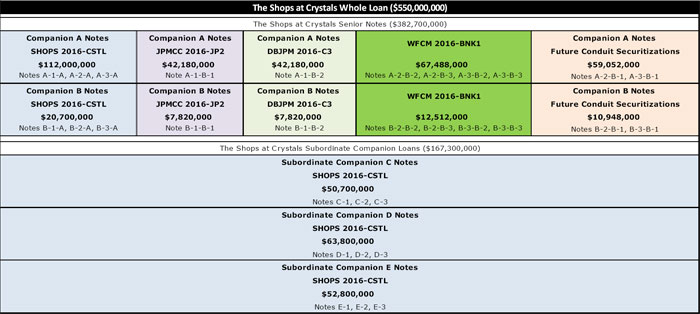
Following the lockout period, on any date before January 1, 2026, the borrower has the right to defease The Shops at Crystals Whole Loan in whole, but not in part. In addition, The Shops at Crystals Whole Loan is prepayable without penalty on or after January 1, 2026. The lockout period will expire on the earlier to occur of (i) two years after the closing date of the securitization that includes the last note to be securitized and (ii) August 1, 2019.
Sources and Uses
| Sources | Uses | |||||||
| Original whole loan amount | $550,000,000 | 100.0% | Closing costs | $1,952,902 | 0.4% | |||
| Return of equity | 548,047,098 | 99.6 | ||||||
| Total Sources | $550,000,000 | 100.0% | Total Uses | $550,000,000 | 100.0% |
The Property.The Shops at Crystals Property consists of the fee interest in an approximately 262,327 square foot, luxury shopping center located in the CityCenter development in the heart of the Las Vegas strip. Developed in 2009, The Shops at Crystals Property is highly visible and easily accessible with 374 feet of frontage along the Strip. The Shops at Crystals Property is attached to the Aria Resort & Casino, accessible via the ARIA Express Tram from the Bellagio Resort & Casino and the Monte Carlo, and adjacent to the Mandarin Oriental, The Cosmopolitan and the Vdara Hotel & Spa. The Shops at Crystals Property also forms the base of the twin, 37-story, 674-unit Veer Towers luxury condominium. CityCenter is an approximately 18 million square foot development and the largest retail district to receive LEED+ Gold Core & Shell certification from the United States Green Building Council. The development is situated on the west side of Las Vegas Boulevard and was developed by MGM Resorts International and Dubai World.
The Shops at Crystals Property features a collection of luxury brands. Tenants occupying 10,000 or more square feet include Louis Vuitton, Gucci, Prada and Tiffany & Co., which collectively comprise approximately 22.6% of the property’s net rentable area. The Shops at Crystals Property also serves, or will serve (in the case of the Hermès expansion), as the Las Vegas flagship location for nine of the tenants (Louis Vuitton, Gucci, Tom Ford, Prada, Roberto Cavalli, Ermenegildo Zegna, Dolce & Gabbana, Tourbillon and Hermès). Approximately 41.7% of 2015 sales and 33.6% of net rentable area comes from investment grade tenants including LVMH (parent company of Bulgari, Celine, Christian Dior, Emilio Pucci, Fendi, Loro Piana, Louis Vuitton and TAG Heuer), Kering (parent
THE INFORMATION IN THIS STRUCTURAL AND COLLATERAL TERM SHEET IS NOT COMPLETE AND MAY BE AMENDED PRIOR TO THE TIME OF SALE. THIS TERM SHEET IS NOT AN OFFER TO SELL THESE SECURITIES AND IT IS NOT A SOLICITATION OF AN OFFER TO BUY THESE SECURITIES IN ANY JURISDICTION WHERE THE OFFER OR SALE IS NOT PERMITTED.
35
| THE SHOPS AT CRYSTALS |
company of Yves Saint Laurent, Bottega Veneta, Balenciaga, Gucci and Stella McCartney), JAB Holdings (parent company of Bally and Jimmy Choo), Tiffany & Co. and Luxottica (parent company of Ilori).
As of April 21, 2016, The Shops at Crystals Property was approximately 87.6% leased by 50 tenants (excluding the Hermès expansion space). Hermès has executed a new lease to relocate from its 4,582 square foot space on the first floor to 13,507 square feet of space across two floors, effective December 1, 2017. Inclusive of the second floor expansion space, The Shops at Crystals Property was 88.2% leased as of April 21, 2016. The Shops at Crystals Property reported 2015 aggregate sales of approximately $317.8 million ($1,330 per square foot). Based on underwritten gross rent and 2015 total sales, the 2015 occupancy cost was 19.2%. Total sales per square foot have increased by approximately 9.4% from 2012 to 2015, and net operating income has increased by approximately 35.0% during the same period.
The following table presents certain information relating to the tenancy at The Shops at Crystals Property:
Major Tenants
| Tenant Name | Credit Rating (Fitch/Moody’s/ S&P)(1) | Tenant NRSF | % of NRSF | Annual U/W Base Rent PSF | Annual U/W Base Rent(2) | % of Total Annual U/W Base Rent | Sales PSF(3) | Occupancy Cost(3)(4) | Lease Expiration Date |
| Major Tenants | |||||||||
| Louis Vuitton | NR/NR/A+ | 22,745 | 8.7% | $192.57 | $4,380,010(5) | 9.5% | $2,140 | 9.0% | 12/31/2019 |
| Prada | NR/NR/NR | 15,525 | 5.9% | $243.45 | $3,779,524 | 8.2% | $729 | 33.4% | 12/31/2019 |
| Ermenegildo Zegna | NR/NR/NR | 9,926 | 3.8% | $277.46 | $2,754,064 | 6.0% | $685 | 40.5% | 12/31/2020 |
| Tiffany & Co. | BBB+/Baa2/BBB+ | 10,000 | 3.8% | $220.00 | $2,200,000 | 4.8% | $1,450 | 15.2% | 1/31/2024(6) |
| Tom Ford | NR/NR/NR | 7,693 | 2.9% | $275.55 | $2,119,775 | 4.6% | $1,654 | 16.7% | 12/31/2019 |
| Gucci | NR/NR/BBB | 10,952 | 4.2% | $166.45 | $1,822,983 | 4.0% | $1,380 | 12.1% | 12/31/2025 |
| Total Major Tenants | 76,841 | 29.3% | $221.97 | $17,056,356 | 37.0% | ||||
| Non-Major Tenants | 153,068 | 58.4% | $190.04 | $29,089,390 | 63.0% | ||||
| Occupied Collateral Total | 229,909 | 87.6% | $200.71 | $46,145,746 | 100.0% | ||||
| Vacant Space | 32,418 | 12.4% | |||||||
| Collateral Total | 262,327 | 100.0% | |||||||
| (1) | Certain ratings are those of the parent company whether or not the parent company guarantees the lease. |
| (2) | Annual U/W Base Rent includes contractual rent increases through May 2017 totaling $939,332. |
| (3) | Sales PSF and Occupancy Costs are for the trailing 12-month period ending December 31, 2015. |
| (4) | Occupancy Costs are calculated based on Annual U/W Base Rent divided by tenant sales. |
| (5) | Represents percentage rent in lieu of base rent, based on 2015 sales. |
| (6) | Tiffany & Co. has the right to terminate its lease if annual gross sales for 2016 are less than $30.0 million. Tiffany & Co. reported gross sales of approximately $14.5 million for the trailing 12-month period ending December 31, 2015. |
THE INFORMATION IN THIS STRUCTURAL AND COLLATERAL TERM SHEET IS NOT COMPLETE AND MAY BE AMENDED PRIOR TO THE TIME OF SALE. THIS TERM SHEET IS NOT AN OFFER TO SELL THESE SECURITIES AND IT IS NOT A SOLICITATION OF AN OFFER TO BUY THESE SECURITIES IN ANY JURISDICTION WHERE THE OFFER OR SALE IS NOT PERMITTED.
36
| THE SHOPS AT CRYSTALS |
The following table presents certain information relating to the historical sales and occupancy costs at The Shops at Crystals Property:
Historical Tenant Sales (PSF) and Occupancy Costs(1)
| Historical Tenant Sales (PSF) | Current Occupancy Cost(2) | |||
| Tenant Name | 2013 | 2014 | 2015 | |
| Louis Vuitton | $2,084 | $2,151 | $2,140 | 9.0% |
| Prada | $1,102 | $943 | $729 | 33.4% |
| Ermenegildo Zegna | $769 | $787 | $685 | 40.5% |
| Tiffany & Co. | $1,593 | $1,863 | $1,450 | 15.2% |
| Tom Ford | $1,661 | $1,714 | $1,654 | 16.7% |
| Gucci | $1,704 | $1,580 | $1,380 | 12.1% |
| Tenants <10,000 Square Feet | ||||
| Comparable Sales PSF | $1,110 | $1,277 | $1,270 | |
| Occupancy Cost(2) | 20.1% | 20.3% | 19.9% | |
| Tenants >10,000 Square Feet | ||||
| Comparable Sales PSF | $1,673 | $1,680 | $1,513 | |
| Occupancy Cost(2) | 13.5% | 14.1% | 17.0% | |
| All Tenants | ||||
| Comparable Sales PSF | $1,246 | $1,378 | $1,279 | |
| Occupancy Cost(2) | 18.2% | 18.6% | 19.2% | |
| (1) | Historical Tenant Sales (PSF) and Occupancy Costs obtained from the underwritten rent roll. |
| (2) | Occupancy Costs are based on underwritten rent divided by tenant sales for the given year. |
The following table presents certain information relating to the lease rollover schedule at The Shops at Crystals Property:
Lease Expiration Schedule(1)(2)
| Year Ending December 31, | No. of Leases Expiring | Expiring NRSF | % of Total NRSF | Cumulative Expiring NRSF | Cumulative % of Total NRSF | Annual U/W Base Rent | % of Total Annual U/W Base Rent | Annual U/W Base Rent PSF(3) |
| MTM | 0 | 0 | 0.0% | 0 | 0.0% | $0 | 0.0% | $0.00 |
| 2016 | 1 | 1,949 | 0.7% | 1,949 | 0.7% | $104,775 | 0.2% | $53.76 |
| 2017 | 0 | 0 | 0.0% | 1,949 | 0.7% | $0 | 0.0% | $0.00 |
| 2018 | 5 | 12,359 | 4.7% | 14,308 | 5.5% | $2,899,100 | 6.3% | $234.57 |
| 2019 | 9 | 69,021 | 26.3% | 83,329 | 31.8% | $15,221,420 | 33.0% | $220.53 |
| 2020(4) | 11 | 45,909 | 17.5% | 129,238 | 49.3% | $10,280,922 | 22.3% | $223.94 |
| 2021 | 4 | 18,448 | 7.0% | 147,686 | 56.3% | $2,017,846 | 4.4% | $109.38 |
| 2022 | 3 | 6,560 | 2.5% | 154,246 | 58.8% | $1,709,609 | 3.7% | $260.61 |
| 2023 | 3 | 9,061 | 3.5% | 163,307 | 62.3% | $2,617,389 | 5.7% | $288.86 |
| 2024 | 10 | 47,908 | 18.3% | 211,215 | 80.5% | $7,488,292 | 16.2% | $156.31 |
| 2025 | 1 | 10,952 | 4.2% | 222,167 | 84.7% | $1,822,983 | 4.0% | $166.45 |
| 2026 | 2 | 3,160 | 1.2% | 225,327 | 85.9% | $800,000 | 1.7% | $253.16 |
| Thereafter | 1 | 4,582 | 1.7% | 229,909 | 87.6% | $1,183,409 | 2.6% | $258.27 |
| Vacant | 0 | 32,418 | 12.4% | 262,327 | 100.0% | $0 | 0.0% | $0.00 |
| Total/Weighted Average | 50 | 262,327 | 100.0% | $46,145,746 | 100.0% | $200.71 |
| (1) | Information obtained from the underwritten rent roll. |
| (2) | Certain tenants may have lease termination or contraction options that are exercisable prior to the originally stated expiration date of the subject lease and that are not considered in the Lease Expiration Schedule. |
| (3) | Weighted Average Annual U/W Base Rent PSF excludes vacant space. |
| (4) | Includes a concierge desk for Aria Resort & Casino (250 square feet), which has no Annual U/W Base Rent. |
THE INFORMATION IN THIS STRUCTURAL AND COLLATERAL TERM SHEET IS NOT COMPLETE AND MAY BE AMENDED PRIOR TO THE TIME OF SALE. THIS TERM SHEET IS NOT AN OFFER TO SELL THESE SECURITIES AND IT IS NOT A SOLICITATION OF AN OFFER TO BUY THESE SECURITIES IN ANY JURISDICTION WHERE THE OFFER OR SALE IS NOT PERMITTED.
37
| THE SHOPS AT CRYSTALS |
The following table presents historical occupancy percentages at The Shops at Crystals Property:
Historical Occupancy(1)
12/31/2012 | 12/31/2013 | 12/31/2014 | 12/31/2015 | 4/21/2016(2)(3) | ||||
| 90.5% | 95.7% | 93.8% | 91.0% | 87.6% |
| (1) | Information obtained from the underwrittenrent roll. |
| (2) | Current occupancy includes DSquared2 (2,200 square feet) and Berluti (960 square feet), which have executed leases but are not yet in occupancy. |
| (3) | Hermes has executed a new lease to relocate from its current 4,582 square foot space on the first floor to 13,507 square feet of space across two floors, effective December 1, 2017. Inclusive of the second floor expansion space, The Shops at Crystals Property was 88.2% leased as of April 21, 2016. |
Operating History and Underwritten Net Cash Flow. The following table presents certain information relating to the historical operating performance and underwritten net cash flow at The Shops at Crystals Property:
Cash Flow Analysis
| 2012 | 2013 | 2014 | 2015 | U/W | % of U/W Effective Gross Income | U/W $ per SF | ||||||||
| Base Rent | $34,796,623 | $40,421,000 | $44,060,423 | $46,579,251 | $46,145,746 | 71.2% | $175.91 | |||||||
| Grossed Up Vacant Space | 0 | 0 | 0 | 0 | 5,578,700 | 8.6 | 21.27 | |||||||
| Total Reimbursables | 17,200,255 | 16,849,275 | 17,624,637 | 17,570,608 | 17,100,944 | 26.4 | 65.19 | |||||||
| Other Income | 1,013,823 | 925,597 | 1,148,318 | 1,530,859 | 1,559,047 | 2.4 | 5.94 | |||||||
| Less Vacancy & Credit Loss | 39,611 | (95,577) | (187,033) | (477,517) | (5,578,700)(2) | (8.6) | (21.27) | |||||||
| Effective Gross Income | $53,050,312 | $58,100,295 | $62,646,345 | $65,203,201 | $64,805,737 | 100.0% | 247.04 | |||||||
| Total Operating Expenses | $18,698,698 | $18,045,943 | $19,004,031 | $18,826,390 | $15,337,868 | 23.7% | $58.47 | |||||||
| Net Operating Income | $34,351,614(1) | $40,054,352(1) | $43,642,314 | $46,376,811 | $49,467,869 | 76.3% | $188.57 | |||||||
| TI/LC | 0 | 0 | 0 | 0 | 1,815,657 | 2.8 | 6.92 | |||||||
| Capital Expenditures | 0 | 0 | 0 | 0 | 41,972 | 0.1 | 0.16 | |||||||
| Net Cash Flow | $34,351,614 | $40,054,352 | $43,642,314 | $46,376,811 | $47,610,240 | 73.5% | $181.49 | |||||||
| NOI DSCR(3) | 2.36x | 2.76x | 3.00x | 3.19x | 3.41x | |||||||||
| NCF DSCR(3) | 2.36x | 2.76x | 3.00x | 3.19x | 3.28x | |||||||||
| NOI DY(3) | 9.0% | 10.5% | 11.4% | 12.1% | 12.9% | |||||||||
| NCF DY(3) | 9.0% | 10.5% | 11.4% | 12.1% | 12.4% |
| (1) | The increase in Net Operating Income from 2012 to 2013 was due to an increase in occupancy and contractual rent steps. |
| (2) | The underwritten economic vacancy is 10.8%. The Shops at Crystals Property was 87.6% physically occupied as of April 21, 2016. |
| (3) | Based on The Shops at Crystals Senior Notes totaling $382,700,000. |
Appraisal.As of the appraisal valuation date of April 26, 2016, The Shops at Crystals Property had an “as-is” appraised value of $1,100,000,000.
Environmental Matters.According to the Phase I environmental report dated February 5, 2016, there was no evidence of any recognized environmental conditions at The Shops at Crystals Property.
Market Overview and Competition.The Shops at Crystals Property is situated in the CityCenter development in the heart of the Las Vegas strip. According to the appraisal, the Las Vegas market has rebounded since the financial crisis and retail spending continues to increase as visitor spending becomes more diversified from its historical gaming focus. According to a third party research report, non-gaming revenues have increased from 42.1% of Las Vegas revenues in 1990 to 63.1% in 2015. According to the appraisal, retail spending also reached an all-time high of approximately $42.7 billion in 2015. Retail spending was the third largest non-gaming expenditure after accommodations and food and beverage, at an average of approximately $123 per person for the year. Additionally, Las Vegas experienced a record volume of approximately 42.3 million visitors in 2015, and total 2016 visitations through February 2016 increased from the record level during the same period in 2015 by approximately 3.8%.
THE INFORMATION IN THIS STRUCTURAL AND COLLATERAL TERM SHEET IS NOT COMPLETE AND MAY BE AMENDED PRIOR TO THE TIME OF SALE. THIS TERM SHEET IS NOT AN OFFER TO SELL THESE SECURITIES AND IT IS NOT A SOLICITATION OF AN OFFER TO BUY THESE SECURITIES IN ANY JURISDICTION WHERE THE OFFER OR SALE IS NOT PERMITTED.
38
| THE SHOPS AT CRYSTALS |
The following table presents certain information relating to competitive properties for The Shops at Crystals Property:
Competitive Properties(1)
| Property | Year Built/ Renovated | Total GLA (SF) | Est. Sales PSF | Occupancy | Distance | Major/Anchor Tenants |
| The Shops at Crystals (Subject) | 2009/NAP | 262,327 | $1,279 | 88% | -- | Louis Vuitton, Prada, Ermenegildo Zegna, Tom Ford, Gucci |
| Fashion Show Mall | 1981/2003 | 1,890,000 | $900-$1,000 | 93% | 1.3 miles | Macy’s, Dillard’s, Saks Fifth Avenue, Neiman Marcus, Macy’s |
| Grand Canal Shoppes | 1999/2007 | 806,000 | $900,$1,100 | 95% | 1.1 miles | Barneys New York, Burberry, Canali, Dooney & Bourke, Armani |
| Forum Shops at Caesars | 1992/2004 | 650,000 | $1,500-$1,700 | 100% | 0.8 miles | Apple, Marc Jacobs, Christian Louboutin, Montblanc, Hugo Boss |
| Miracle Mile Shops | 2000/2016 | 500,000 | $825-$875 | 94% | Adjacent | H&M, Guess, bebe, BCBG MAXAZRIA, LOFT |
| Bellagio Shops | 1998/NAP | NAV | NAV | 100% | 0.3 miles | Bottega Veneta, Fendi, Gucci, Chanel, Valentino, Prada |
| (1) | Information obtained from the appraisal and underwritten rent roll. |
The Borrower.The borrower is The Crystals Las Vegas, LLC, a Delaware limited liability company and single purpose entity with two independent directors. Legal counsel to the borrower delivered a non-consolidation opinion in connection with the origination of The Shops at Crystals Whole Loan. The nonrecourse carveout guarantors are Simon Property Group, L.P. and ICRE REIT Holdings. The liability of the guarantors under the nonrecourse carve-out provisions in the loan documents is capped at $110.0 million plus reasonable collection costs. See “Description of the Mortgage Pool–Certain Terms of the Mortgage Loans—Non-Recourse Obligations” in the Preliminary Prospectus.
The Sponsors.The loan sponsors are Simon Property Group, L.P. and Invesco Advisors Inc. (“Invesco”). Simon Property Group, L.P. is an affiliate of Simon Property Group, Inc. (“SPG”). SPG was founded in 1960 and is headquartered in Indianapolis, Indiana. SPG (NYSE: SPG, rated A2/A by Moody’s and S&P) is an S&P 100 company and the largest public real estate company in the world. SPG currently owns or has an interest in 231 retail real estate properties in North America, Europe and Asia comprising 191 million square feet. SPG is also the sponsor of the borrowers under the mortgage loan identified on Annex A-1 as Simon Premium Outlets. Invesco, a Maryland real estate investment trust, is an affiliate of Invesco, Ltd., a publicly traded independent global investment management firm. Simon has sponsored other real estate projects over the last 10 years that have been the subject of mortgage loan defaults, foreclosure proceedings and deeds-in-lieu of foreclosure. See “Description of the Mortgage Pool—Default History, Bankruptcy Issues and Other Proceedings” in the Preliminary Prospectus.
Escrows.No upfront escrows were collected at origination.
Ongoing reserves for taxes are not required as long as (i) there is no event of default; (ii) no DSCR Reserve Trigger Event (as defined below) exists; and (iii) the borrower (a) pays all taxes prior to the assessment of any late payment penalty and the date that such taxes become delinquent or (b) upon request, provides the lender with satisfactory evidence of such payment of taxes.
Ongoing reserves for insurance are not required as long as (i) no event of default exists and (ii) the borrower provides satisfactory evidence that the property is insured under an acceptable blanket policy.
Ongoing replacement reserves are not required as long as no DSCR Reserve Trigger Event or event of default exists. Following the occurrence and during the continuance of a DSCR Reserve Trigger Event or an event of default, the borrower is required to deposit $4,372 per month ($0.20 per square foot annually) for replacement reserves. The reserve is subject to a cap of $104,931 ($0.40 per square foot).
Ongoing reserves for tenant improvements and leasing commissions(“TI/LC”) are waived in the event that the borrower delivers either (i) a guaranty from the guarantors for all monthly deposits to the TI/LC reserve required by the loan documents with the related liabilities of the guarantors capped at the TI/LC Reserve Cap (as defined below) plus all of the reasonable out-of-pocket costs and expenses in enforcing such guaranty; or (ii) the borrower delivers a letter of credit in the amount of the TI/LC Reserve Cap,provided that the borrower does not have the right to deliver such guaranty or letter of credit if an event of default is continuing. The guarantors delivered a guaranty of TI/LC reserves on the origination date. In the event that the borrower has not delivered such guaranty or letter of credit, the borrower is required to deposit $185,000 per month (approximately $8.46 per square foot annually) for TI/LC reserves. The TI/LC reserve is subject to a cap of $4,440,000 (“TI/LC Reserve Cap”) (approximately $16.93 per square foot).
A “DSCR Reserve Trigger Event” means the debt service coverage ratio for The Shops at Crystals Whole Loan based on the trailing four calendar quarter period immediately preceding the date of determination is less than 1.60x for two consecutive calendar
THE INFORMATION IN THIS STRUCTURAL AND COLLATERAL TERM SHEET IS NOT COMPLETE AND MAY BE AMENDED PRIOR TO THE TIME OF SALE. THIS TERM SHEET IS NOT AN OFFER TO SELL THESE SECURITIES AND IT IS NOT A SOLICITATION OF AN OFFER TO BUY THESE SECURITIES IN ANY JURISDICTION WHERE THE OFFER OR SALE IS NOT PERMITTED.
39
| THE SHOPS AT CRYSTALS |
quarters. A DSCR Reserve Trigger Event will be cured upon the debt service coverage ratio for The Shops at Crystals Whole Loan being equal to or greater than 1.60x for two consecutive calendar quarters.
Lockbox and Cash Management.The Shops at Crystal Whole Loan requires a lender-controlled lockbox account, which is already in place, and that the borrower direct tenants to pay their rents directly into such lockbox account. The loan documents also require that all rents received by the borrower or the property manager be deposited into the lockbox account within two business days of receipt. Prior to the occurrence of a Cash Trap Event Period (as defined below), all cash flow is distributed to the borrower. During a Cash Trap Event Period, all cash flow is swept to a lender-controlled cash management account.
A “Cash Trap Event Period” means the occurrence of: (i) an event of default; (ii) any bankruptcy or insolvency action of the borrower, (iii) any bankruptcy or insolvency action of the property manager if the property manager is affiliated with the borrower (providedthat the property manager is not replaced within 60 days with a qualified manager); or (iv) the date that the debt service coverage ratio for The Shops at Crystals Whole Loan based on the trailing four calendar quarter period immediately preceding the date of determination is less than 1.30x for two consecutive calendar quarters (a “DSCR Trigger Event”).
A Cash Trap Event Period may be cured (a) if the Cash Trap Event Period is caused solely by the occurrence of a DSCR Trigger Event, the achievement of a debt service coverage ratio of 1.30x or greater for two consecutive calendar quarters based upon the trailing four calendar quarter period immediately preceding the date of determination; (b) if the Cash Trap Event Period is caused solely by clause (i) above, by the acceptance of the lender of a cure of such event of default, provided that the lender has not accelerated the loan, moved for a receiver or commenced foreclosure proceedings; or (c) if the Cash Trap Event Period is caused solely by clause (iii) above, if the borrower replaces the property manager or such bankruptcy or insolvency action is discharged or dismissed without any adverse consequences to the property or the loan. The cures in this paragraph are also subject to the following conditions: (i) no event of default shall have occurred and be continuing; (ii) the borrower pays all of the lender’s reasonable out-of-pocket expenses incurred in connection with curing such Cash Trap Event Period including reasonable attorney’s fees and expenses; and (iii) the borrower may not cure a Cash Trap Event Period (x) more than a total of five times in the aggregate during the term of the loan or (y) triggered by a bankruptcy or insolvency action of the borrower.
Property Management.The Shops at Crystals Property is managed by an affiliate of the borrower.
Assumption.The borrower has the right to transfer The Shops at Crystals Propertyprovided that certain conditions are satisfied, including (i) no event of default has occurred and is continuing; (ii) in the event that in connection with such transfer, the manager will not thereafter continue to manage The Shops at Crystals Property, then a replacement management agreement with a qualified manager must be executed acceptable to lender; (iii) the transferee must not have been a party to any bankruptcy action within the previous seven years and there is no material litigation or regulatory action pending against the transferee unreasonable to lender; and (iv) the transferee is a qualified transferee meeting the requirements set forth in the loan documents or the lender receives rating agency confirmation that the sale and assumption will not result in a downgrade, withdrawal or qualification of the respective ratings assigned to the Series 2016-BNK1 certificates and similar confirmations from each rating agency rating any securities backed by any of The Shops at Crystals Companion Loans with respect to the ratings of such securities.
Partial Release.Not permitted.
Real Estate Substitution.Not permitted.
Subordinate and Mezzanine Indebtedness. The Shops at Crystals Whole Loan includes three subordinate loans, each comprised of threepari passu notes, with an aggregate original principal balance of $167,300,000 that were contributed to the SHOPS 2016-CSTL transaction. See “Description of the Mortgage Pool – The Whole Loan – The Non-Serviced Whole Loan – The Shops at Crystals Whole Loan” in the Preliminary Prospectus.
Ground Lease. None.
Terrorism Insurance.The loan documents require that the “all risk” insurance policy required to be maintained by the borrower provide coverage for terrorism in an amount equal to the full replacement cost of The Shops at Crystals Property. The loan documents also require business interruption insurance covering no less than the 24-month period following the occurrence of a casualty event, together with a 365-day extended period of indemnity. Should the policy contain an exclusion for acts of terrorism, the loan documents require the borrower to obtain to the extent available a stand-alone policy providing the same coverage as previously in place prior to the exclusion, with a premium cap of two times the then current annual insurance premiums for the policy insuring The Shops at CrystalsProperty only (excluding the wind and flood components of the premiums) on a stand-alone basis, with a deductible no greater than $5,000,000.
THE INFORMATION IN THIS STRUCTURAL AND COLLATERAL TERM SHEET IS NOT COMPLETE AND MAY BE AMENDED PRIOR TO THE TIME OF SALE. THIS TERM SHEET IS NOT AN OFFER TO SELL THESE SECURITIES AND IT IS NOT A SOLICITATION OF AN OFFER TO BUY THESE SECURITIES IN ANY JURISDICTION WHERE THE OFFER OR SALE IS NOT PERMITTED.
40
(THIS PAGE INTENTIONALLY LEFT BLANK)
THE INFORMATION IN THIS STRUCTURAL AND COLLATERAL TERM SHEET IS NOT COMPLETE AND MAY BE AMENDED PRIOR TO THE TIME OF SALE. THIS TERM SHEET IS NOT AN OFFER TO SELL THESE SECURITIES AND IT IS NOT A SOLICITATION OF AN OFFER TO BUY THESE SECURITIES IN ANY JURISDICTION WHERE THE OFFER OR SALE IS NOT PERMITTED.
41
(THIS PAGE INTENTIONALLY LEFT BLANK)
THE INFORMATION IN THIS STRUCTURAL AND COLLATERAL TERM SHEET IS NOT COMPLETE AND MAY BE AMENDED PRIOR TO THE TIME OF SALE. THIS TERM SHEET IS NOT AN OFFER TO SELL THESE SECURITIES AND IT IS NOT A SOLICITATION OF AN OFFER TO BUY THESE SECURITIES IN ANY JURISDICTION WHERE THE OFFER OR SALE IS NOT PERMITTED.
42
VERTEX PHARMACEUTICALS HQ
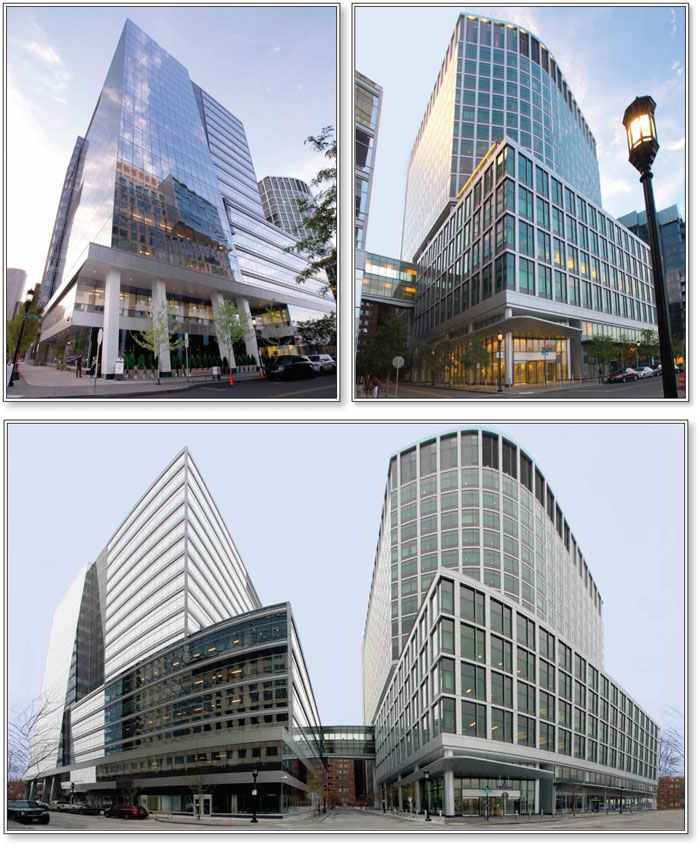
THE INFORMATION IN THIS STRUCTURAL AND COLLATERAL TERM SHEET IS NOT COMPLETE AND MAY BE AMENDED PRIOR TO THE TIME OF SALE. THIS TERM SHEET IS NOT AN OFFER TO SELL THESE SECURITIES AND IT IS NOT A SOLICITATION OF AN OFFER TO BUY THESE SECURITIES IN ANY JURISDICTION WHERE THE OFFER OR SALE IS NOT PERMITTED.
43
VERTEX PHARMACEUTICALS HQ
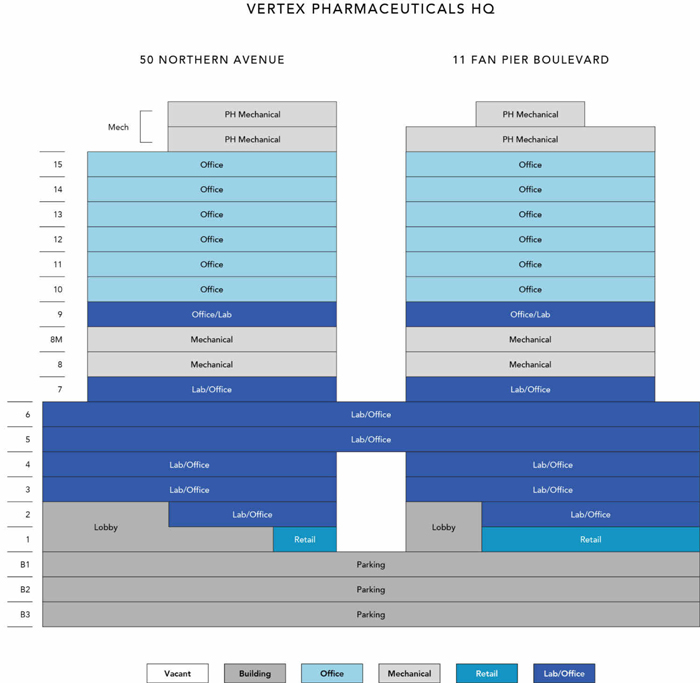
THE INFORMATION IN THIS STRUCTURAL AND COLLATERAL TERM SHEET IS NOT COMPLETE AND MAY BE AMENDED PRIOR TO THE TIME OF SALE. THIS TERM SHEET IS NOT AN OFFER TO SELL THESE SECURITIES AND IT IS NOT A SOLICITATION OF AN OFFER TO BUY THESE SECURITIES IN ANY JURISDICTION WHERE THE OFFER OR SALE IS NOT PERMITTED.
44
VERTEX PHARMACEUTICALS HQ
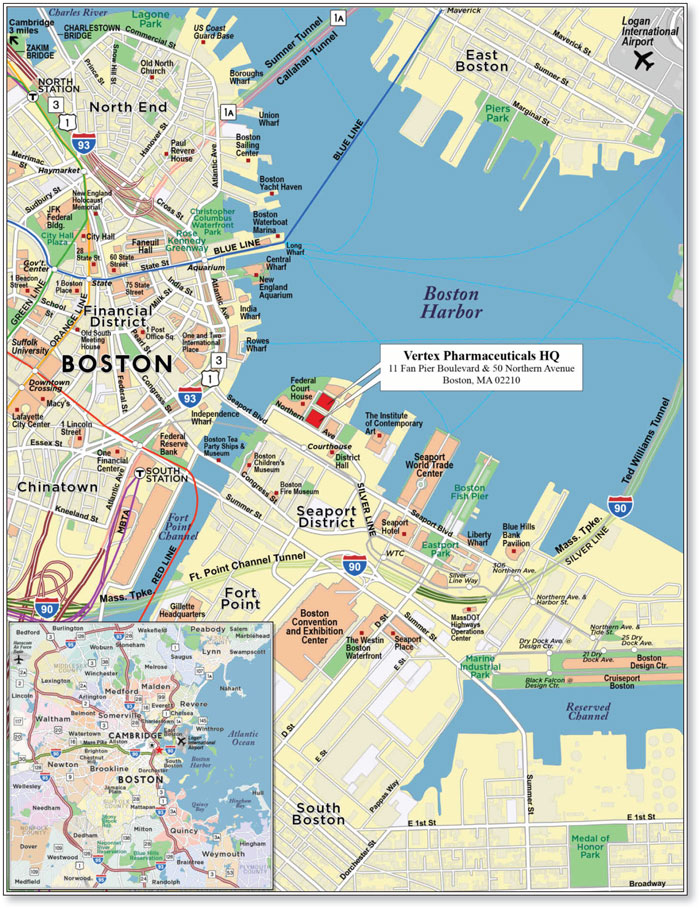
THE INFORMATION IN THIS STRUCTURAL AND COLLATERAL TERM SHEET IS NOT COMPLETE AND MAY BE AMENDED PRIOR TO THE TIME OF SALE. THIS TERM SHEET IS NOT AN OFFER TO SELL THESE SECURITIES AND IT IS NOT A SOLICITATION OF AN OFFER TO BUY THESE SECURITIES IN ANY JURISDICTION WHERE THE OFFER OR SALE IS NOT PERMITTED.
45
| No. 2 – Vertex Pharmaceuticals HQ | ||||||||
| Loan Information | Property Information | |||||||
| Mortgage Loan Seller: | Morgan Stanley Mortgage Capital Holdings LLC | Single Asset/Portfolio: | Single Asset | |||||
| Credit Assessment (Fitch/KBRA/Moody’s/S&P): | A-/A/Aa2(sca.pd)/BB- | Property Type: | Office | |||||
| Original Principal Balance(1): | $80,000,000 | Specific Property Type: | CBD | |||||
| Cut-off Date Balance(1): | $80,000,000 | Location: | Boston, MA | |||||
| % of Initial Pool Balance: | 9.2% | Size: | 1,133,723 SF | |||||
| Loan Purpose: | Refinance | Cut-off Date Balance Per SF(1): | $374.87 | |||||
| Borrower Name: | SNH Seaport LLC | Year Built/Renovated: | 2013/NAP | |||||
| Sponsor: | Senior Housing Properties Trust | Title Vesting: | Fee | |||||
| Mortgage Rate(2): | 2.79817647% | Property Manager: | The RMR Group LLC | |||||
| Note Date: | July 15, 2016 | 4thMost Recent Occupancy(6): | NAV | |||||
| Anticipated Repayment Date: | August 6, 2026 | 3rdMost Recent Occupancy(6): | NAV | |||||
| Maturity Date: | November 6, 2028 | 2ndMost Recent Occupancy (As of): | 100.0% (12/31/2014) | |||||
| IO Period: | 120 months | Most Recent Occupancy (As of): | 99.6% (12/31/2015) | |||||
| Loan Term (Original): | 120 months | Current Occupancy (As of): | 99.9% (4/30/2016) | |||||
| Seasoning: | 0 months | |||||||
| Amortization Term (Original): | NAP | Underwriting and Financial Information: | ||||||
| Loan Amortization Type(2): | Interest-only, ARD | |||||||
| Interest Accrual Method: | Actual/360 | 4thMost Recent NOI(7): | NAV | |||||
| Call Protection(3): | L(24),GRTR 0.5% or YM or D(89),O(7) | 3rdMost Recent NOI(7): | NAV | |||||
| Lockbox Type: | Hard/Springing Cash Management | 2ndMost Recent NOI (As of)(7): | $43,928,033 (12/31/2014) | |||||
| Additional Debt(1)(4): | Yes | Most Recent NOI (As of)(7): | $70,924,928 (12/31/2015) | |||||
| Additional Debt Type(1)(4): | Pari Passu; Mezzanine | |||||||
| U/W Revenues: | $93,423,532 | |||||||
| U/W Expenses: | $17,361,124 | |||||||
| U/W NOI(7): | $76,062,408 | |||||||
| U/W NCF(7): | $75,778,977 | |||||||
| U/W NOI DSCR(1): | 6.31x | |||||||
| Escrows and Reserves(5): | U/W NCF DSCR(1): | 6.28x | ||||||
| U/W NOI Debt Yield(1): | 17.9% | |||||||
| Type: | Initial | Monthly | Cap (If Any) | U/W NCF Debt Yield(1): | 17.8% | |||
| Taxes | $0 | Springing | NAP | As-Is Appraised Value: | $1,198,000,000 | |||
| Insurance | $0 | Springing | NAP | As-Is Appraisal Valuation Date: | June 3, 2016 | |||
| Replacement Reserve | $0 | $0 | NAP | Cut-off Date LTV Ratio(1): | 35.5% | |||
| TI/LC Reserve | $0 | $0 | NAP | LTV Ratio at Maturity or ARD(1): | 35.5% | |||
| (1) | The Vertex Pharmaceuticals HQ Whole Loan (as defined below), with an original principal balance of $425,000,000, is comprised of ninepari passu senior notes. The controlling Note A-1 had an original principal balance of $80,000,000, has an outstanding principal balance of $80,000,000 as of the Cut-off Date and will be contributed to the WFCM 2016-BNK1 Trust. The remaining eight non-controlling notes, which had an aggregate original principal balance of $345,000,000, are expected to be contributed to future trusts. All statistical information related to balances per square foot, loan-to-value ratios, debt service coverage ratios and debt yields are based on the Vertex Pharmaceuticals HQ Whole Loan. The Cut-off Date LTV Ratio, U/W NCF DSCR, U/W NOI DSCR, U/W NCF Debt Yield and U/W NOI Debt Yield based on the combined Vertex Pharmaceuticals HQ Whole Loan and Vertex Pharmaceuticals HQ Mezzanine Loan (as defined under “Subordinate and Mezzanine Indebtedness” section) aggregate principal amount of $620.0 million are 51.8%, 3.42x, 3.43x, 12.2% and 12.3%, respectively (based on the initial interest rates under the Vertex Pharmaceuticals HQ Whole Loan and Vertex Pharmaceuticals HQ Mezzanine Loan). |
| (2) | The interest rate will increase to the Adjusted Interest Rate (as defined below) after the ARD as described below under “The Mortgage Loan”. Interest at the Adjusted Interest Rate is payable currently. After the ARD and provided no event of default has occurred and is continuing under the Vertex Pharmaceuticals HQ Whole Loan documents, all excess cash flow with respect to the Mortgaged Property is required to be applied to prepay the Vertex Pharmaceuticals HQ Whole Loan and the Vertex Pharmaceuticals HQ Mezzanine Loan on apro rata basis. Such excess cash flow is paid after payment of interest on the Vertex Pharmaceuticals HQ Whole Loan, including interest at the Adjusted Interest Rate, and (unless there is an event of default under the Vertex Pharmaceuticals HQ Whole Loan) interest on the Vertex Pharmaceuticals HQ Mezzanine Loan at the Mezzanine Adjusted Interest Rate (as defined below under “Subordinate and Mezzanine Indebtedness”). |
| (3) | The defeasance lockout period will be at least 24 payment dates beginning with and including the first payment date of September 6, 2016. Prepayment with payment of a prepayment fee equal to the greater of 0.5% or the yield maintenance premium is permitted after August 6, 2018. Defeasance of the Vertex Pharmaceuticals HQ Whole Loan is permitted on or after the date that is the earlier to occur of (i) two years after the closing date of the securitization that includes the last note to be securitized, and (ii) January 15, 2020. The assumed lockout period of 24 payments is based on the expected WFCM 2016-BNK1 Trust closing date in August 2016. |
| (4) | See “Subordinate and Mezzanine Indebtedness” section. |
| (5) | See “Escrows” section. |
| (6) | See “Historical Occupancy” section. |
| (7) | See “Cash Flow Analysis” section. |
THE INFORMATION IN THIS STRUCTURAL AND COLLATERAL TERM SHEET IS NOT COMPLETE AND MAY BE AMENDED PRIOR TO THE TIME OF SALE. THIS TERM SHEET IS NOT AN OFFER TO SELL THESE SECURITIES AND IT IS NOT A SOLICITATION OF AN OFFER TO BUY THESE SECURITIES IN ANY JURISDICTION WHERE THE OFFER OR SALE IS NOT PERMITTED.
46
VERTEX PHARMACEUTICALS HQ
The Mortgage Loan.The mortgage loan (the “Vertex Pharmaceuticals HQ Mortgage Loan”) is part of a whole loan (the “Vertex Pharmaceuticals HQ Whole Loan”) that is evidenced by ninepari passu senior promissory notes secured by a first lien mortgage encumbering an office complex located in Boston, Massachusetts (the “Vertex Pharmaceuticals HQ Property”). The Vertex Pharmaceuticals HQ Whole Loan was co-originated on July 15, 2016 by Morgan Stanley Bank, N.A. and Citigroup Global Markets Realty Corp. The Vertex Pharmaceuticals HQ Whole Loan had an original principal balance of $425,000,000, has an outstanding principal balance as of the Cut-off Date of $425,000,000 and accrues interest at an interest rate of 2.79817647%per annum(the “Initial Interest Rate”). The Vertex Pharmaceuticals HQ Whole Loan had an initial term of 120 months, has a remaining term of 120 months as of the Cut-off Date and requires interest-only payments through the anticipated repayment date (“ARD”). The ARD is August 6, 2026 and the final maturity date is November 6, 2028. In the event the Vertex Pharmaceuticals HQ Whole Loan is not repaid in full on or before the ARD, the interest rate will increase to a rate equal to the sum of (1) the Initial Interest Rate, plus (2) the product of (A) the quotient of (x) the Initial Interest Rate divided by (y) 3.530%, multiplied by (B) the difference between (x) the Aggregate Extended Interest Rate (as defined below), minus (y) 3.530% (the “Adjusted Interest Rate”). The Aggregate Extended Interest Rate is equal to the greater of (i) 6.530% or (ii) the sum of (1) the then effective U.S. swap rate for a swap terminating on the then effective maturity date plus (2) five percent (5.000%). All interest, including interest accrued at the excess of the Adjusted Interest Rate over the Initial Interest Rate is required to be paid currently on each monthly payment date through the final maturity date. If the Vertex Pharmaceuticals HQ Whole Loan is not repaid in full on or prior to the ARD, from and after the occurrence of the ARD and provided no event of default under the Vertex Pharmaceuticals HQ Whole Loan has occurred and is continuing, all excess cash flow is required to be applied to repay the principal balance of the Vertex Pharmaceuticals HQ Whole Loan and Vertex Pharmaceuticals HQ Mezzanine Loan (as defined below) on apro ratabasis, based on their respective principal balances. Such excess cash flow is paid only after payment of interest on the Vertex Pharmaceuticals HQ Whole Loan, including interest at the Adjusted Interest Rate, and (unless there is an event of default under the Vertex Pharmaceuticals HQ Whole Loan) interest on the Vertex Pharmaceuticals HQ Mezzanine Loan at the Mezzanine Adjusted Interest Rate (as defined below under “Subordinate and Mezzanine Indebtedness”). See “Description of the Mortgage Pool—Certain Terms of the Mortgage Loans—ARD Loans” and “Description of the Mortgage Pool—The Whole Loans—The Serviced Pari Passu Whole Loans—The Vertex Pharmaceuticals HQ Whole Loan” in the Preliminary Prospectus.
The Vertex Pharmaceuticals HQ Mortgage Loan, evidenced by the controlling Note A-1, which will be contributed to the WFCM 2016-BNK1 Trust, had an original principal balance of $80,000,000 and has an outstanding principal balance as of the Cut-off Date of $80,000,000. The remaining non-controlling notes (the “Vertex Pharmaceuticals HQ Companion Loans”), which had an aggregate original principal balance of $345,000,000, are expected to be contributed to future trusts. The lender provides no assurances that any non-securitized notes will not be split further.
Note Summary
| Notes | Original Balance | Note Holder(1) | Controlling Interest | |
| A-1 | $80,000,000 | WFCM 2016-BNK1 | Yes | |
| A-2-1, A-2-2, A-2-3, A-3, A-4 | $217,500,000 | MSBNA | No | |
| A-5, A-6, A-7 | $127,500,000 | CGMRC | No | |
| Total | $425,000,000 |
| (1) | MSBNA – “Morgan Stanley Bank, N.A.”; CGMRC – “Citigroup Global Markets Realty Corp.” |
Following the lockout period, the borrower has the right to defease the Vertex Pharmaceuticals HQ Whole Loan in whole, but not in part, on any date before February 6, 2026. The borrower has the right to prepay the Vertex Pharmaceuticals HQ Whole Loan in whole, but not in part, with payment of the greater of 0.5% of the outstanding principal balance and the yield maintenance premium after August 6, 2018. In addition, the Vertex Pharmaceuticals HQ Whole Loan is prepayable without penalty on or after February 6, 2026. In connection with any such prepayment, the Vertex Pharmaceuticals HQ Mezzanine Loan is required to also be prepaid in full. The defeasance lockout period will expire on the earlier to occur of (i) two years after the closing date of the securitization that includes the last note to be securitized and (ii) January 15, 2020.
THE INFORMATION IN THIS STRUCTURAL AND COLLATERAL TERM SHEET IS NOT COMPLETE AND MAY BE AMENDED PRIOR TO THE TIME OF SALE. THIS TERM SHEET IS NOT AN OFFER TO SELL THESE SECURITIES AND IT IS NOT A SOLICITATION OF AN OFFER TO BUY THESE SECURITIES IN ANY JURISDICTION WHERE THE OFFER OR SALE IS NOT PERMITTED.
47
VERTEX PHARMACEUTICALS HQ
Sources and Uses
| Sources | Uses | |||||||
| Original mortgage loan amount | $425,000,000 | 68.5% | Return of equity(1) | $616,022,218 | 99.4% | |||
| Mezzanine loan | 195,000,000 | 31.5 | Closing costs | 3,977,782 | 0.6 | |||
| Total Sources | $620,000,000 | 100.0% | Total Uses | $620,000,000 | 100.0% |
| (1) | The sponsor, Senior Housing Properties Trust, acquired the Vertex Pharmaceuticals HQ Property in 2014 for a purchase price of $1,125,420,000 in part by using proceeds from its unsecured revolving credit facility. The sponsor has informed the lender that it expects to use proceeds of the Vertex Pharmaceuticals HQ Whole Loan to repay a portion of the outstanding borrowings under the unsecured revolving credit facility and for general business purposes. Following the repayment, there will be approximately $900.0 million available under the sponsor’s unsecured revolving credit facility. |
The Property.The Vertex Pharmaceuticals HQ Property consists of the fee interest in a two-building, 15-story, class A headquarters office complex totaling 1,133,723 square feet, located in the master-planned Fan Pier mixed use development in the Seaport District of Boston, Massachusetts. The Fan Pier development is a live-work-play development that features over 3.0 million square feet of office, retail, hotel and residential buildings, multiple public parks, restaurants, access to Boston’s HarborWalk and the Institute of Contemporary Art. The Fan Pier development also features the Fan Pier Marina, a professionally managed, six-acre marina with deep-water access, as well as water taxi access to Logan International Airport. The Vertex Pharmaceuticals HQ Property features floor plates of approximately 40,000 square feet on the lab floors (floors 2-8) and floor plates of approximately 28,000 square feet on the office floors (floors 9-15). The Vertex Pharmaceuticals HQ Property features flexible floor plates that can accommodate full floor or multi-tenant users, laboratory and research space, floor to ceiling glass exteriors and exterior signage. Both buildings that comprise the Vertex Pharmaceuticals HQ Property, 11 Fan Pier Boulevard and 50 Northern Avenue, have achieved LEED Gold certification. The two buildings that comprise the Vertex Pharmaceuticals HQ Property are connected via a skybridge between the 5th and 6th floors. Parking at the Vertex Pharmaceuticals HQ Property is provided by a 3-level, 740-space subterranean parking garage, resulting in a parking ratio of 0.65 spaces per 1,000 square feet of net rentable area. As of April 30, 2016, the Vertex Pharmaceuticals HQ Property was 99.9% leased to ten tenants.
The Vertex Pharmaceuticals HQ Property was constructed in 2013 as a built-to-suit headquarters for Vertex Pharmaceuticals Incorporated (“Vertex Pharmaceuticals”), which leases 100.0% of the Vertex Pharmaceuticals HQ Property’s office, lab, storage and mechanical space. The sponsor invested approximately $161.6 million ($149.30 per square foot) for Vertex Pharmaceuticals’ initial tenant improvement allowance. In addition, Vertex Pharmaceuticals subsequently invested a reported $75.0 million ($69.29 per square foot) to convert the lower floors of the towers to lab space. Vertex Pharmaceuticals’ leases run through December 31, 2028, each with one, ten-year extension option at fair market rent remaining. Vertex Pharmaceuticals is focused on developing and commercializing therapies for the treatment of cystic fibrosis and currently has two marketed medicines to treat cystic fibrosis: ORKAMBI and KALYDECO. ORKAMBI was approved by the United States Food and Drug Administration (“FDA”) in July 2015 and the European Commission in November 2015 for the treatment of patients with cystic fibrosis twelve years of age and older. KALYDECO was approved in 2012 by the FDA and European Commission as a treatment for patients with cystic fibrosis six years of age and older. In addition, Vertex Pharmaceuticals has other development programs in the field of cystic fibrosis, as well as other early- and mid-stage development programs in the areas of oncology, pain and neurology.
The Vertex Pharmaceuticals HQ Property features 49,906 square feet of ground floor retail and associated storage space leased to a variety of tenants, including Frank Anthony’s, a gourmet market and specialty grocer, Babbo Pizzeria, an Italian restaurant and pizzeria, b.good, a health-conscious fast-food chain restaurant, Leader Bank, a retail bank branch, Starbucks and Bright Horizons Children’s Center, a daycare and preschool.
Below is a summary of Vertex Pharmaceuticals’ occupied space at the Vertex Pharmaceuticals HQ Property.
Vertex Pharmaceuticals Leased Space(1)
| Building | Office NRSF | Lab NRSF | Mechanical NRSF | Storage NRSF | Total Vertex Leased NRSF |
| 50 Northern Avenue | 211,685 | 253,800 | 87,752 | 2,868 | 556,105 |
| 11 Fan Pier Boulevard | 217,462 | 222,870 | 76,984 | 8,996 | 526,312 |
| Total | 429,147 | 476,670 | 164,736 | 11,864 | 1,082,417 |
| (1) | Included in Vertex Pharmaceuticals’ net rentable square feet is approximately 164,736 square feet of mechanical space located on the eighth floor and penthouse areas. According to the appraisal, it is a market standard that lab tenants pay full rent for all mechanical areas. Were the subject converted to a multi-tenant office use in the future, the Vertex Pharmaceuticals HQ Property’s net rentable area would most likely be reduced by the amount of the mechanical areas. Vertex Pharmaceuticals currently pays $62.50 per square foot for its office, lab and mechanical space and $25.00 per square foot for its storage space. |
THE INFORMATION IN THIS STRUCTURAL AND COLLATERAL TERM SHEET IS NOT COMPLETE AND MAY BE AMENDED PRIOR TO THE TIME OF SALE. THIS TERM SHEET IS NOT AN OFFER TO SELL THESE SECURITIES AND IT IS NOT A SOLICITATION OF AN OFFER TO BUY THESE SECURITIES IN ANY JURISDICTION WHERE THE OFFER OR SALE IS NOT PERMITTED.
48
VERTEX PHARMACEUTICALS HQ
The following table presents certain information relating to the tenancy at the Vertex Pharmaceuticals HQ Property:
Major Tenants
| Tenant Name | Credit Rating (Fitch/Moody’s/S&P) | Tenant NRSF | % of NRSF | Annual U/W Base Rent PSF(1) | Annual U/W Base Rent(1) | % of Total Annual U/W Base Rent | Lease Expiration Date |
| Major Tenant | |||||||
| Vertex Pharmaceuticals | NR/NR/NR | 1,082,417 | 95.5% | $67.06 | $72,588,588 | 96.6% | 12/31/2028(2) |
| Total Major Tenants | 1,082,417 | 95.5% | $67.06 | $72,588,588 | 96.6% | ||
| Non-Major Tenants(3) | 49,906 | 4.4% | $51.44 | $2,567,035 | 3.4% | ||
| Occupied Total | 1,132,323 | 99.9% | $66.37 | $75,155,622 | 100.0% | ||
| Vacant Space | 1,400 | 0.1% | |||||
| Collateral Total | 1,133,723 | 100.0% | |||||
| (1) | Annual U/W Base Rent PSF and Annual U/W Base Rent for Vertex Pharmaceuticals include $5,382,425 ($4.97 per square foot) of underwritten rent steps, which represent the straight line rent increases in the Vertex Pharmaceuticals leases through the loan term. In addition, Annual U/W Base Rent PSF and Annual U/W Base Rent include $227,225 ($4.55 per square foot) of underwritten rent steps for Non-Major Tenants. |
| (2) | Vertex Pharmaceuticals has one 10-year lease extension option remaining on each of its two leases at fair market rent, each exercisable with 20 months’ written notice. |
| (3) | Non-Major Tenants are comprised of first floor retail space tenants, and include 7,300 square feet (0.6% of net rentable area) master leased by an affiliate of the original developer of the Vertex Pharmaceuticals HQ Property to an affiliate of the borrower, which represents approximately 0.7% of Annual U/W Base Rent. |
The following table presents certain information relating to the lease rollover schedule at the Vertex Pharmaceuticals HQ Property:
Lease Expiration Schedule(1)(2)
| Year Ending December 31, | No. of Leases Expiring | Expiring NRSF | % of Total NRSF | Cumulative Expiring NRSF | Cumulative % of Total NRSF | Annual U/W Base Rent | % of Total Annual U/W Base Rent | Annual U/W Base Rent PSF(3) |
| MTM | 0 | 0 | 0.0% | 0 | 0.0% | $0 | 0.0% | $0.00 |
| 2016 | 0 | 0 | 0.0% | 0 | 0.0% | $0 | 0.0% | $0.00 |
| 2017 | 0 | 0 | 0.0% | 0 | 0.0% | $0 | 0.0% | $0.00 |
| 2018 | 0 | 0 | 0.0% | 0 | 0.0% | $0 | 0.0% | $0.00 |
| 2019 | 0 | 0 | 0.0% | 0 | 0.0% | $0 | 0.0% | $0.00 |
| 2020 | 0 | 0 | 0.0% | 0 | 0.0% | $0 | 0.0% | $0.00 |
| 2021 | 0 | 0 | 0.0% | 0 | 0.0% | $0 | 0.0% | $0.00 |
| 2022 | 0 | 0 | 0.0% | 0 | 0.0% | $0 | 0.0% | $0.00 |
| 2023 | 0 | 0 | 0.0% | 0 | 0.0% | $0 | 0.0% | $0.00 |
| 2024 | 2 | 8,793 | 0.8% | 8,793 | 0.8% | $548,470 | 0.7% | $62.38 |
| 2025 | 4 | 14,047 | 1.2% | 22,840 | 2.0% | $705,607 | 0.9% | $50.23 |
| 2026 | 1 | 2,746 | 0.2% | 25,586 | 2.3% | $151,030 | 0.2% | $55.00 |
| Thereafter | 2 | 1,106,737 | 97.6% | 1,132,323 | 99.9% | $73,750,515 | 98.1% | $66.64 |
| Vacant | 0 | 1,400 | 0.1% | 1,133,723 | 100.0% | $0 | 0.0% | $0.00 |
| Total/Weighted Average | 9 | 1,133,723 | 100.0% | $75,155,622 | 100.0% | $66.37 |
| (1) | Information obtained from the underwritten rent roll. |
| (2) | Certain tenants may have lease termination or contraction options that are exercisable prior to the originally stated expiration date of the subject lease and that are not considered in the Lease Expiration Schedule. |
| (3) | Weighted Average Annual U/W Base Rent PSF excludes vacant space. |
The following table presents historical occupancy percentages at the Vertex Pharmaceuticals HQ Property:
Historical Occupancy
12/31/2012(1) | 12/31/2013(1) | 12/31/2014(2) | 12/31/2015(2) | 4/30/2016(3) |
| NAV | NAV | 100.0% | 99.6% | 99.9% |
| (1) | The Vertex Pharmaceuticals HQ Property was constructed in 2013 and as such, historical occupancy prior to 2014 is not available. |
| (2) | Information obtained from the borrower. Historical occupancy includes vacant retail space that was master leased to an affiliate of the borrower, comprising 23,723 square feet as of 12/31/2014 and 10,046 square feet as of 12/31/2015. |
| (3) | Information obtained from the underwritten rent roll. Includes 7,300 square feet (0.6% of the net rentable area) of vacant retail space that is master leased to an affiliate of the borrower. |
THE INFORMATION IN THIS STRUCTURAL AND COLLATERAL TERM SHEET IS NOT COMPLETE AND MAY BE AMENDED PRIOR TO THE TIME OF SALE. THIS TERM SHEET IS NOT AN OFFER TO SELL THESE SECURITIES AND IT IS NOT A SOLICITATION OF AN OFFER TO BUY THESE SECURITIES IN ANY JURISDICTION WHERE THE OFFER OR SALE IS NOT PERMITTED.
49
VERTEX PHARMACEUTICALS HQ
Operating History and Underwritten Net Cash Flow. The following table presents certain information relating to the historical operating performance and the underwritten net cash flow at the Vertex Pharmaceuticals HQ Property:
Cash Flow Analysis(1)
| 2014 | 2015 | U/W | % of U/W Effective Gross Income | U/W $ per SF | ||||||
| Base Rent | $43,822,419 | (2) | $68,315,712 | (2) | $75,155,622 | (2) | 80.4% | $66.29 | ||
| Grossed Up Vacant Space | 0 | 0 | 0 | 0.0 | 0.00 | |||||
| Total Reimbursables(3) | 8,044,479 | 15,865,672 | 16,894,457 | 18.1 | 14.90 | |||||
| Parking Income | 2,194,452 | 3,998,740 | 3,710,112 | 4.0 | 3.27 | |||||
| Less Vacancy & Credit Loss | 0 | 0 | (2,336,660) | (4) | (2.5) | (2.06) | ||||
| Effective Gross Income | $54,061,350 | $88,180,123 | $93,423,532 | 100.0% | $82.40 | |||||
| Total Operating Expenses | $10,133,318 | $17,255,195 | $17,361,124 | 18.6% | $15.31 | |||||
| Net Operating Income | $43,928,033 | $70,924,928 | $76,062,408 | 81.4% | $67.09 | |||||
| TI/LC | 0 | 0 | 0 | 0.0 | 0.00 | |||||
| Capital Expenditures | 0 | 0 | 283,431 | 0.3 | 0.25 | |||||
| Net Cash Flow | $43,928,033 | $70,924,928 | $75,778,977 | 81.1% | $66.84 | |||||
| NOI DSCR(5) | 3.64x | 5.88x | 6.31x | |||||||
| NCF DSCR(5) | 3.64x | 5.88x | 6.28x | |||||||
| NOI DY(5) | 10.3% | 16.7% | 17.9% | |||||||
| NCF DY(5) | 10.3% | 16.7% | 17.8% |
| (1) | The Vertex Pharmaceuticals HQ Property was constructed in 2013 and as such, historical financials prior to 2014 are not available. |
| (2) | The increase in 2015 Base Rent over 2014 Base Rent is due primarily to Vertex Pharmaceuticals not being in full occupancy of and paying rent for all of its space until the end of 2014. The increase in U/W Base Rent over 2015 Base Rent is primarily due to underwritten rent steps of$5,382,425 ($4.97 per square foot), which represent the straight line rent increases in the Vertex Pharmaceuticals lease through the loan term, and $227,225 ($4.55 per square foot) of underwritten rent steps through May 2017 for non-major tenants. U/W Base Rent includes $524,323 (0.7% of total U/W Base Rent) of rent attributable to the master lease. |
| (3) | Total Reimbursables include, among other things, reimbursements for real estate taxes. Vertex Pharmaceuticals currently benefits from a tax increment financing program (the “TIF Program”), which expires June 30, 2018. The TIF Program may be revoked or reduced prior to such expiration date if Vertex does not satisfy certain employment expansion obligations. The TIF Program has been estimated to provide a tax savings to Vertex Pharmaceuticals of approximately $9,000,000 from its inception in 2011 to its anticipated expiration date. U/W Net Cash Flow assumes full real estate taxes are due and are fully reimbursed by Vertex Pharmaceuticals. |
| (4) | The underwritten economic vacancy is 2.5%. As of April 30, 2016, the Vertex Pharmaceuticals HQ Property was 99.9% leased. |
| (5) | The debt service coverage ratios and debt yields are based on the Vertex Pharmaceuticals HQ Whole Loan and the Initial Interest Rate. |
Appraisal.As of the appraisal valuation date of June 3, 2016, the Vertex Pharmaceuticals HQ Property had an “as-is” appraised value of $1,198,000,000.
Environmental Matters. The Phase I environmental site assessment dated June 10, 2016 reported that the groundwater beneath the Vertex Pharmaceuticals HQ Property exceeded the United States Environmental Protection Agency (“EPA”) National Pollution Discharge Elimination System limits for certain metals (cyanide, antimony, copper, lead, iron, and zinc). There is currently an installed groundwater treatment system designed to manage the condition per EPA guidance and as such, the condition is considered a controlled recognized environmental condition. In the event that the guarantor does not have a long-term unsecured debt rating of at least “BBB-” by Fitch and S&P and “Baa3” by Moody’s, the borrower is required to obtain an environmental impairment liability insurance policy as described in (and subject to the limitations described in) the Preliminary Prospectus under “Description of the Mortgage Pool—Environmental Considerations.”
Market Overview and Competition.The Vertex Pharmaceuticals HQ Property is located in the Seaport District of downtown Boston, Massachusetts overlooking Boston Harbor. The Seaport District has benefitted from infrastructure improvements stemming from the completion of Boston’s decades-long “Big Dig” project that concluded in 2007. The Big Dig project converted Interstate 93 from an elevated highway to an underground tunnel through the Boston central business district, and included the construction of the Ted Williams Tunnel which connects Interstate 90 to Logan International under the Seaport District and Boston Harbor. With the conversion of Interstate 93 to an underground tunnel, access from the Boston central business district over the Fort Point Channel to the Seaport District was improved. The Vertex Pharmaceuticals HQ Property benefits from easy access to mass transit, located a block from the Silver Line Courthouse T Station, an approximately 15 minute walk from South Station, and an approximately 10 minute drive from Boston Logan Airport. Attractions in the Seaport District include the Boston Convention and Exhibition Center, the Seaport Boston Hotel & World Trade Center, the Institute of Contemporary Art/Boston and the Blue Hills Bank Pavilion amphitheater.
According to the appraisal, the Vertex Pharmaceuticals HQ Property is located in the Seaport office submarket, which contains 8.7 million square feet of office space, and is part of the greater Boston central business district office market, which includes 66.6 million square feet of office space, as of the first quarter 2016. Recent corporate relocations to the Seaport office submarket include PricewaterhouseCoopers, which executed a 333,000 square foot lease for and relocated over 2,500 employees to its recently completed building in Seaport Square; Goodwin Procter LLP, which committed to a large built-to-suit office project totaling 378,000 square feet that is anticipated to bring over 800 employees to the submarket; and General Electric, which announced plans to move its corporate headquarters from Connecticut to the Seaport District in Boston and plans to relocate approximately 800 jobs to the area. According to the appraisal, as of the fourth quarter 2015, the Seaport office submarket exhibited a vacancy rate of 6.4% with asking class A rents of $63.47 per square foot on a triple net basis, compared to a vacancy rate of 8.4% and asking class A rents of $58.58 per square foot on a triple net basis for the central business district office market as a whole.
THE INFORMATION IN THIS STRUCTURAL AND COLLATERAL TERM SHEET IS NOT COMPLETE AND MAY BE AMENDED PRIOR TO THE TIME OF SALE. THIS TERM SHEET IS NOT AN OFFER TO SELL THESE SECURITIES AND IT IS NOT A SOLICITATION OF AN OFFER TO BUY THESE SECURITIES IN ANY JURISDICTION WHERE THE OFFER OR SALE IS NOT PERMITTED.
50
VERTEX PHARMACEUTICALS HQ
The following table presents certain information relating to comparable office leases for the Vertex Pharmaceuticals HQ Property:
Comparable Leases(1)
| Property Name/Location | Year Built | Total GLA (SF) | Total Occupancy | Distance from Subject | Tenant Name | Lease Date/Term | Lease Area (SF) | Annual Base Rent PSF | Lease Type |
Pier IV Boston, MA | 2018 | 376,555 | NAV | 0.2 miles | Confidential | July 2018 / 15.5 Yrs | 200,000 | $50.00 | NNN |
675 West Kendall Street Cambridge, MA | 2004 | 302,919 | 100% | 2.3 miles | Alnylam Pharmaceuticals | May 2018 / 15.0 Yrs | 295,000 | $67.00 | NNN |
60 Binney Street Cambridge, MA | 2016 | 530,478 | 98% | 2.3 miles | Bluebird Bio | Jan. 2017 / 10.3 Yrs | 267,278 | $72.50 | NNN |
320 Bent Street Cambridge, MA | 2001 | 184,405 | 100% | 2.8 miles | Momenta Pharmaceuticals | Sept. 2016 / 10.0 Yrs | 105,000 | $68.00 | NNN |
100-110 Northern Avenue Boston, MA | 2016 | 516,000 | 64% | 0.2 miles | Goodwin Procter | July 2016 / 16.5 Yrs | 378,000 | $53.00 | NNN |
| 125 High Street Boston, MA | 1990 | 980,347 | 86% | 0.4 miles | Wells Fargo | Jan. 2016 / 15.0 Yrs | 150,816 | $37.00 | NNN |
| 101 Seaport Boulevard Boston, MA | 2015 | 439,058 | 92% | 0.1 miles | PwC | Nov. 2015 / 15.0 Yrs | 333,000 | $39.00 | NNN |
| (1) | Information obtained from the appraisal. |
The Borrower.The borrower is SNH Seaport LLC, a single purpose Delaware limited liability company entity with two independent directors. Legal counsel to the borrower delivered a non-consolidation opinion in connection with the origination of the Vertex Pharmaceuticals HQ Whole Loan. Senior Housing Properties Trust is the guarantor of certain nonrecourse carveouts under the Vertex Pharmaceuticals HQ Whole Loan.
The Sponsor.The sponsor is Senior Housing Properties Trust, a publicly traded REIT, which owns independent living and assisted living communities, continuing care retirement communities, nursing homes, wellness centers and medical office, clinic and biotech laboratory buildings located throughout the United States, with a focus on owning triple net leased properties. As of March 31, 2016, Senior Housing Properties Trust owned 428 properties in 43 states and Washington, D.C.
Escrows.No upfront reserves were required with respect to the Vertex Pharmaceuticals HQ Whole Loan.
During the continuance of a Cash Management Sweep Period (as defined below), the borrower is required to deposit on each monthly payment date (i) an amount equal to one-twelfth of the taxes the lender estimates will be payable in the next 12 months and (ii) an amount equal to one-twelfth of the insurance premiums the lender estimates will be payable in the next 12 months;provided that the requirement to deposit insurance premiums will be suspended if the borrower provides satisfactory evidence to the lender that the insurance coverage required by the Vertex Pharmaceuticals HQ Whole Loan documents is being provided under acceptable blanket insurance policies and the insurance premiums for such policies have been prepaid for not less than one year in advance (or for policies delivered at loan origination, such shorter period as such policies are in effect).
During the continuance of a Cash Management Sweep Period, all excess cash flow, after payment of interest on the Vertex Pharmaceuticals HQ Whole Loan and, unless there is an event of default under the Vertex Pharmaceuticals HQ Whole Loan, interest on the Vertex Pharmaceuticals HQ Mezzanine Loan (including interest at the Mezzanine Adjusted Interest Rate), required reserve deposits and approved operating expenses, is required to be deposited into and held in a cash trap subaccount (the “Cash Trap Funds”);provided, that during a Cash Management Sweep Period resulting solely from the occurrence of a Vertex Lease Event (as defined below), all Cash Trap Funds in excess of $75.0 million are required to be released to the borrower. In addition, during a Cash Management Sweep Period resulting solely from the occurrence of a Vertex Lease Event, the borrower may obtain a release of the Cash Trap Funds upon delivery to the lender of either (i) a letter of credit meeting the requirements of the Vertex Pharmaceuticals HQ Whole Loan documents, or (ii) in the event that the guarantor, Senior Housing Properties Trust, possesses a long-term unsecured debt rating of at least “BBB-” by Fitch and S&P and “Baa3” by Moody’s, an additional guaranty, in each case, in an amount equal to the portion of the Cash Trap Funds requested to be released;provided that the right to provide an additional guaranty is conditioned upon the borrower delivering a new non-consolidation opinion and such other legal opinions as may be reasonably requested by lender in connection with the additional guaranty. Following the ARD, provided no event of default is continuing under the Vertex Pharmaceuticals HQ Whole Loan, Cash Trap Funds are required to be applied to prepay the principal of the Vertex Pharmaceuticals HQ Whole Loan and the Vertex Pharmaceuticals HQ Mezzanine Loan (see “Subordinate and Mezzanine Indebtedness” section),pro rata, based on their respective outstanding principal balances.
Lockbox and Cash Management.The Vertex Pharmaceuticals HQ Whole Loan is structured with a lender-controlled lockbox, which is already in place. The Vertex Pharmaceuticals HQ Whole Loan documents require the borrower to direct all tenants to pay rent directly into such lockbox account, and also require that all rents received by the borrower or the property manager be deposited into the lockbox account within one business day of receipt. Prior to the occurrence of a Cash Management Sweep Period, all funds in the lockbox account are distributed to the borrower. During a Cash Management Sweep Period, all funds in the lockbox account are swept to a lender-controlled cash management account and applied as provided in the loan documents.
A “Cash Management Sweep Period” means a period:
(a) commencing upon an event of default under the Vertex Pharmaceuticals HQ Whole Loan documents and ending at such time as such event of default has been cured;
THE INFORMATION IN THIS STRUCTURAL AND COLLATERAL TERM SHEET IS NOT COMPLETE AND MAY BE AMENDED PRIOR TO THE TIME OF SALE. THIS TERM SHEET IS NOT AN OFFER TO SELL THESE SECURITIES AND IT IS NOT A SOLICITATION OF AN OFFER TO BUY THESE SECURITIES IN ANY JURISDICTION WHERE THE OFFER OR SALE IS NOT PERMITTED.
51
VERTEX PHARMACEUTICALS HQ
(b) commencing upon an event of default under the Vertex Pharmaceuticals HQ Mezzanine Loan and ending at such time as such event of default has been cured;
(c) commencing upon a Vertex Lease Event and ending at such time as (i) no monetary or material non-monetary defaults or breaches by Vertex Pharmaceuticals exist under the Vertex Pharmaceuticals lease, or (ii) the borrower enters into one or more replacement leases with tenants reasonably approved by the lender, which new leases result in a combined debt yield on the Vertex Pharmaceuticals HQ Whole Loan and the Vertex Pharmaceuticals HQ Mezzanine Loan (the “Vertex Combined Debt Yield”) of at least 10% for two consecutive calendar quarters (a “Vertex Re-Leasing Event”) tested as of the end of each calendar quarter;
(d) commencing when, as of the last day of any calendar quarter from and after a Vertex Re-Leasing Event, the Vertex Combined Debt Yield is less than 8.5%, until such time as the Vertex Combined Debt Yield is at least 8.5% for two consecutive calendar quarters; or
(e) commencing from and after the occurrence of the ARD with respect to the Vertex Pharmaceuticals HQ Whole Loan and ending on the maturity date.
A “Vertex Lease Event” means any monetary or material non-monetary default or breach by Vertex Pharmaceuticals under the lease between the borrower and Vertex Pharmaceuticals (as the same may be amended, modified, supplemented, extended, replaced and/or restated from time to time in accordance with the Vertex Pharmaceuticals HQ Whole Loan documents) beyond any applicable notice and cure periods contained in such lease.
Property Management. The Vertex Pharmaceuticals HQ Property is managed by The RMR Group LLC, an affiliate of the borrower.
Assumption.The borrower has the right to transfer the Vertex Pharmaceuticals HQ Property provided that certain conditions are satisfied,inter alia (i) no event of default is continuing; (ii) the transferee is either (x) a qualified transferee as described in the loan documents or (y) another entity reasonably acceptable to the lender (which may be conditioned upon the lender’s receipt of written confirmation from each rating agency rating the Series WFCM 2016-BNK1 Certificates and any securities backed by any Vertex Pharmaceuticals HQ Companion Loans that such transfer will not result in a downgrade, withdrawal or qualification of the respective ratings assigned to the Series WFCM 2016-BNK1 Certificates and any such securities); (iii) the replacement guarantor is reasonably acceptable to the lender and during the loan term maintains a net worth not less than $500.0 million and liquid assets not less than $25.0 million; and (iv) simultaneously with such transfer there shall be a permitted assumption of the Vertex Pharmaceuticals HQ Mezzanine Loan or the Vertex Pharmaceuticals HQ Mezzanine Loan shall be repaid in full.
Partial Release. Not permitted.
Real Estate Substitution.Not permitted.
Subordinate and Mezzanine Indebtedness.Morgan Stanley Mortgage Capital Holdings LLC and Citigroup Global Markets Realty Corp. have made a $195,000,000 mezzanine loan (the “Vertex Pharmaceuticals HQ Mezzanine Loan”) to SNH Mez LLC, the sole member of the borrower under the Vertex Pharmaceuticals HQ Whole Loan, which is currently held by a third party investor. The Vertex Pharmaceuticals HQ Mezzanine Loan accrues interest at an interest rate of 5.125% (“the Mezzanine Initial Interest Rate”)per annumprior to its anticipated repayment date, accrues interest based on the same formula as the Vertex Pharmaceuticals HQ Whole Loan (except based on the Mezzanine Initial Interest Rate, rather than the Initial Interest Rate) (the “Mezzanine Adjusted Interest Rate”) on and after its anticipated repayment date, payable currently, and requires payments of interest only until its anticipated repayment date. On and after the ARD, the Vertex Pharmaceuticals HQ Mezzanine Loan is entitled to itspro ratashare of Cash Trap Funds as described above under “Escrows”. The Vertex Pharmaceuticals HQ Mezzanine Loan has the same anticipated repayment date and stated maturity date as the Vertex Pharmaceuticals HQ Whole Loan.
Ground Lease.None.
Terrorism Insurance. The loan documents require that the “all risk” insurance policy required to be maintained by the borrower provides coverage for terrorism in an amount equal to the full replacement cost of the Vertex Pharmaceuticals HQ Property. The loan documents also require business interruption insurance covering no less than the 24-month period following the occurrence of a casualty event, together with a 12-month extended period of indemnity.
THE INFORMATION IN THIS STRUCTURAL AND COLLATERAL TERM SHEET IS NOT COMPLETE AND MAY BE AMENDED PRIOR TO THE TIME OF SALE. THIS TERM SHEET IS NOT AN OFFER TO SELL THESE SECURITIES AND IT IS NOT A SOLICITATION OF AN OFFER TO BUY THESE SECURITIES IN ANY JURISDICTION WHERE THE OFFER OR SALE IS NOT PERMITTED.
52
(THIS PAGE INTENTIONALLY LEFT BLANK)
THE INFORMATION IN THIS STRUCTURAL AND COLLATERAL TERM SHEET IS NOT COMPLETE AND MAY BE AMENDED PRIOR TO THE TIME OF SALE. THIS TERM SHEET IS NOT AN OFFER TO SELL THESE SECURITIES AND IT IS NOT A SOLICITATION OF AN OFFER TO BUY THESE SECURITIES IN ANY JURISDICTION WHERE THE OFFER OR SALE IS NOT PERMITTED.
53
(THIS PAGE INTENTIONALLY LEFT BLANK)
THE INFORMATION IN THIS STRUCTURAL AND COLLATERAL TERM SHEET IS NOT COMPLETE AND MAY BE AMENDED PRIOR TO THE TIME OF SALE. THIS TERM SHEET IS NOT AN OFFER TO SELL THESE SECURITIES AND IT IS NOT A SOLICITATION OF AN OFFER TO BUY THESE SECURITIES IN ANY JURISDICTION WHERE THE OFFER OR SALE IS NOT PERMITTED.
54
| ONE STAMFORD FORUM |
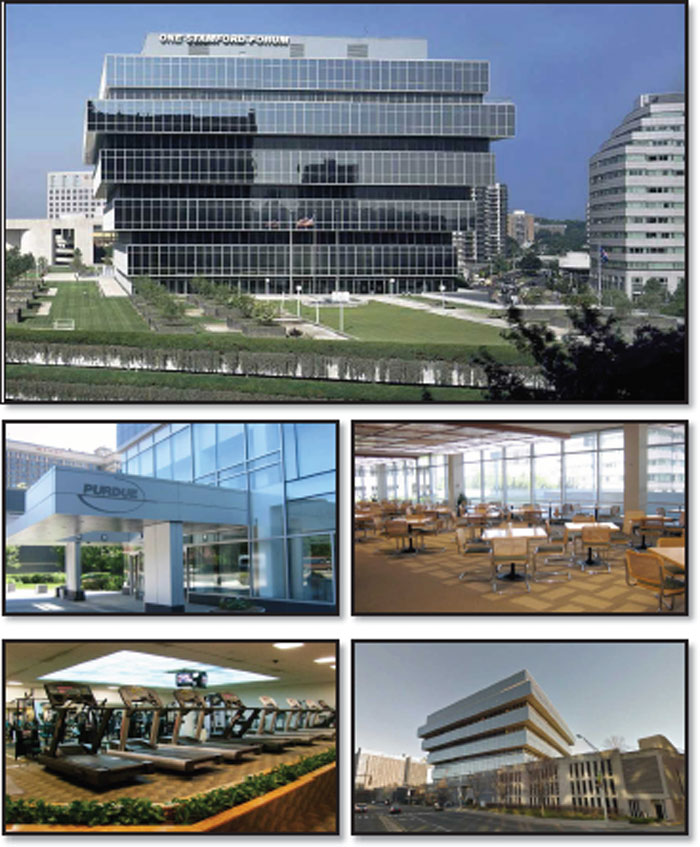
THE INFORMATION IN THIS STRUCTURAL AND COLLATERAL TERM SHEET IS NOT COMPLETE AND MAY BE AMENDED PRIOR TO THE TIME OF SALE. THIS TERM SHEET IS NOT AN OFFER TO SELL THESE SECURITIES AND IT IS NOT A SOLICITATION OF AN OFFER TO BUY THESE SECURITIES IN ANY JURISDICTION WHERE THE OFFER OR SALE IS NOT PERMITTED.
55
| ONE STAMFORD FORUM |
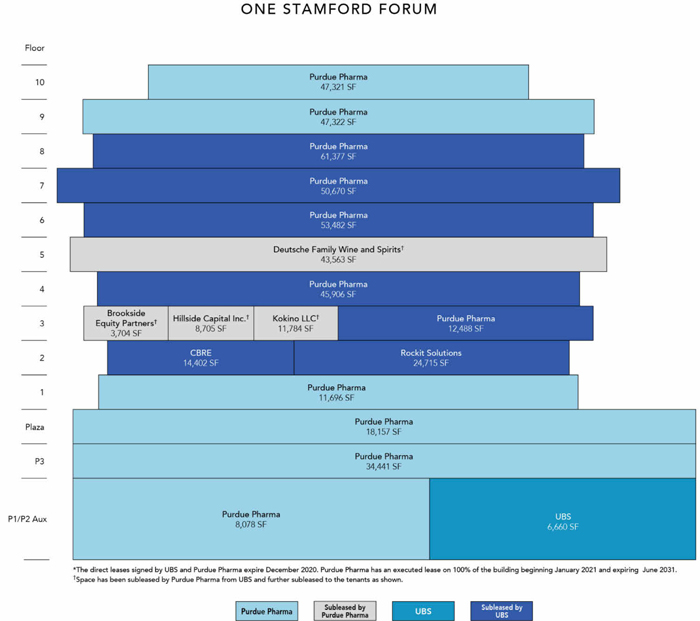
THE INFORMATION IN THIS STRUCTURAL AND COLLATERAL TERM SHEET IS NOT COMPLETE AND MAY BE AMENDED PRIOR TO THE TIME OF SALE. THIS TERM SHEET IS NOT AN OFFER TO SELL THESE SECURITIES AND IT IS NOT A SOLICITATION OF AN OFFER TO BUY THESE SECURITIES IN ANY JURISDICTION WHERE THE OFFER OR SALE IS NOT PERMITTED.
56
| ONE STAMFORD FORUM |
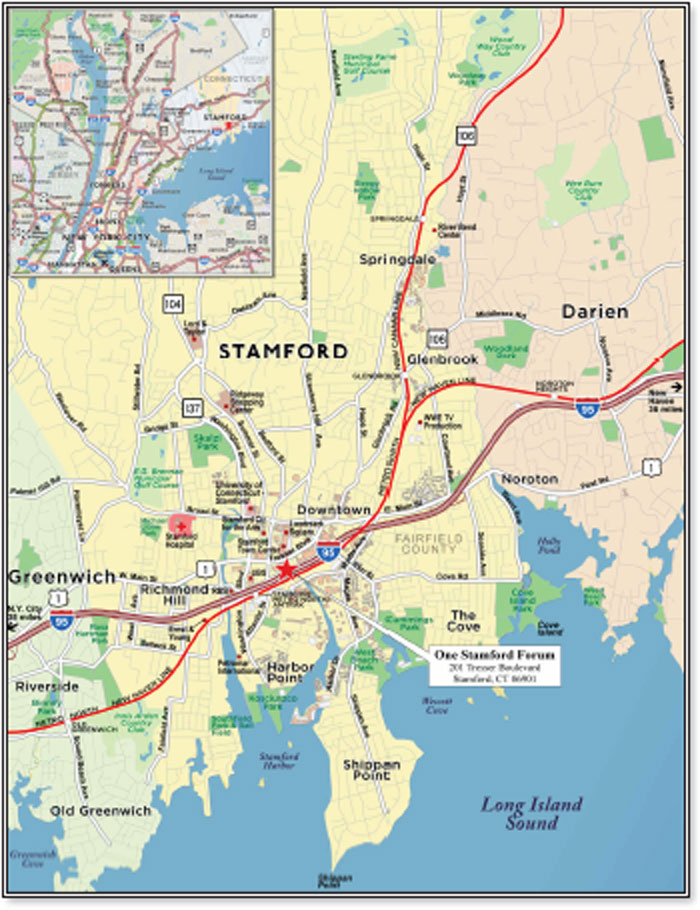
THE INFORMATION IN THIS STRUCTURAL AND COLLATERAL TERM SHEET IS NOT COMPLETE AND MAY BE AMENDED PRIOR TO THE TIME OF SALE. THIS TERM SHEET IS NOT AN OFFER TO SELL THESE SECURITIES AND IT IS NOT A SOLICITATION OF AN OFFER TO BUY THESE SECURITIES IN ANY JURISDICTION WHERE THE OFFER OR SALE IS NOT PERMITTED.
57
| No. 3 – One Stamford Forum | ||||||
| Loan Information | Property Information | |||||
| Mortgage Loan Seller: | Bank of America, N.A | Single Asset/Portfolio: | Single Asset | |||
| Credit Assessment (Fitch/KBRA/Moody’s/S&P): | NR/NR/NR/NR | Property Type: | Office | |||
| Original Principal Balance(1): | $71,500,000 | Specific Property Type: | CBD | |||
| Cut-off Date Balance(1): | $71,387,864 | Location: | Stamford, CT | |||
| % of Initial Pool Balance: | 8.2% | Size: | 504,471 SF | |||
| Loan Purpose: | Refinance | Cut-off Date Balance Per SF(1): | $217.71 | |||
| Borrower Name: | One Stamford Realty L.P. | Year Built/Renovated: | 1973 /2000 | |||
| Sponsors(2): | Various | Title Vesting(5): | Fee | |||
| Mortgage Rate: | 4.900% | Property Manager: | Self-managed | |||
| Note Date: | June 28, 2016 | 4thMost Recent Occupancy (As of): | 100.0% (12/31/2012) | |||
| Anticipated Repayment Date: | NAP | 3rdMost Recent Occupancy (As of): | 100.0% (12/31/2013) | |||
| Maturity Date: | July 1, 2026 | 2ndMost Recent Occupancy (As of): | 100.0% (12/31/2014) | |||
| IO Period: | None | Most Recent Occupancy (As of): | 100.0% (12/31/2015) | |||
| Loan Term (Original): | 120 months | Current Occupancy (As of): | 100.0% (5/31/2016) | |||
| Seasoning: | 1 month | |||||
| Amortization Term (Original): | 300 months | Underwriting and Financial Information: | ||||
| Loan Amortization Type: | Amortizing, Balloon | |||||
| Interest Accrual Method: | Actual/360 | 4thMost Recent NOI (As of): | $14,011,203 (12/31/2013) | |||
| Call Protection(3): | L(25),GRTR 1% or YM or D(88),O(7) | 3rdMost Recent NOI (As of): | $14,057,626 (12/31/2014) | |||
| Lockbox Type: | Hard/Springing Cash Management | 2ndMost Recent NOI (As of): | $14,083,466 (12/31/2015) | |||
| Additional Debt(1): | Yes | Most Recent NOI (As of): | $14,414,125 (TTM 3/31/2016) | |||
| Additional Debt Type(1): | Pari Passu | |||||
| U/W Revenues: | $21,891,930 | |||||
| U/W Expenses: | $8,706,883 | |||||
| U/W NOI: | $13,185,047 | |||||
| U/W NCF: | $11,825,136 | |||||
| U/W NOI DSCR(1): | 1.73x | |||||
| Escrows and Reserves(4): | U/W NCF DSCR(1): | 1.55x | ||||
| U/W NOI Debt Yield(1): | 12.0% | |||||
| Type: | Initial | Monthly | Cap (If Any) | U/W NCF Debt Yield(1): | 10.8% | |
| Taxes | $230,359 | $230,359 | NAP | As-Is Appraised Value: | $227,000,000 | |
| Insurance | $58,814 | $19,605 | NAP | As-Is Appraisal Valuation Date: | May 2, 2016 | |
| Immediate Repair Reserve | $15,188 | $0 | NAP | Cut-off Date LTV Ratio(1): | 48.4% | |
| Replacement Reserve | $0 | $0 | NAP | LTV Ratio at Maturity or ARD(1): | 36.1% | |
| (1) | The One Stamford Forum Whole Loan (as defined below), which had an original principal balance of $110,000,000, is comprised of twopari passu notes (Notes A-1 and A-2). The controlling Note A-1 had an original balance of $71,500,000, has an outstanding principal balance of $71,387,864 as of the Cut-off Date and will be contributed to the WFCM 2016-BNK1 Trust. The non-controlling Note A-2 had an original principal balance of $38,500,000 and is expected to be contributed to one or more future securitization trusts. All statistical information related to balances per square foot, loan-to-value ratios, debt service coverage ratios and debt yields are based on the One Stamford Forum Whole Loan. |
| (2) | See “The Sponsors” section. |
| (3) | The defeasance lockout period will be at least 25 payment dates beginning with and including the first payment date of August 1, 2016. Defeasance of the One Stamford Forum Whole Loan is permitted on or after the date that is the earlier to occur of (i) two years after the closing date of the securitization that includes the last note to be securitized, and (ii) August 1, 2020. The assumed lockout period of 25 payments is based on the expected WFCM 2016-BNK1 Trust closing date in August 2016. |
| (4) | See “Escrows” section. |
| (5) | See “Ground Lease” section. |
The Mortgage Loan.The mortgage loan (the “One Stamford Forum Mortgage Loan”) is a part of a whole loan (the “One Stamford Forum Whole Loan”) that is evidenced by twopari passu promissory notes (Notes A-1 and A-2) secured by a first mortgage encumbering a class A office building located in Stamford, Connecticut (the “One Stamford Forum Property”). The One Stamford Forum Whole Loan was originated on June 28, 2016 by Bank of America, N.A. The One Stamford Forum Whole Loan had an original principal balance of $110,000,000, has an outstanding principal balance as of the Cut-off Date of $109,827,482 and accrues interest at an interest rate of 4.900%per annum. The One Stamford Forum Whole Loan had an initial term of 120 months, has a remaining term of 119 months as of the Cut-off Date and requires principal and interest payments based on a 25-year amortization schedule through the term of the One Stamford Forum Whole Loan. The One Stamford Forum Whole Loan matures on July 1, 2026.
The One Stamford Forum Mortgage Loan is evidenced by the controlling Note A-1, which will be contributed to the WFCM 2016-BNK1 Trust, had an original principal balance of $71,500,000 and has an outstanding principal balance of $71,387,864 as of the Cut-off Date. The non-controlling Note A-2, which had an original principal balance of $38,500,000, referred to herein as the “One Stamford Forum Companion Loan”, is expected to be contributed to one or more future securitization trusts. The lender provides no assurances that any non-securitizedpari passunote will not be split further. See “Description of the Mortgage Pool—The Whole Loans—The Serviced Pari Passu Whole Loans—The One Stamford Forum Whole Loan” in the Preliminary Prospectus.
THE INFORMATION IN THIS STRUCTURAL AND COLLATERAL TERM SHEET IS NOT COMPLETE AND MAY BE AMENDED PRIOR TO THE TIME OF SALE. THIS TERM SHEET IS NOT AN OFFER TO SELL THESE SECURITIES AND IT IS NOT A SOLICITATION OF AN OFFER TO BUY THESE SECURITIES IN ANY JURISDICTION WHERE THE OFFER OR SALE IS NOT PERMITTED.
58
| ONE STAMFORD FORUM |
Pari Passu Note Summary
| Original Balance | Note Holder | Controlling Piece | |
| Note A-1 | $71,500,000 | WFCM 2016-BNK1 | Yes |
| Note A-2 | $38,500,000 | Bank of America, N.A. | No |
| Total | $110,000,000 |
Following the lockout period, the borrower has the right to prepay the One Stamford Forum Whole Loan in whole, but not in part, on any date before or on December 31, 2025 provided that the borrower pays the greater of (i) a prepayment premium equal to 1.0% of the principal amount being prepaid and (ii) the yield maintenance premium, or that the borrower defeases the loan. In addition, the One Stamford Forum Whole Loan is prepayable without penalty after December 31, 2025.
Sources and Uses
| Sources | Uses | |||||||
| Original Whole Loan Amount | $110,000,000 | 100.0% | Loan Payoff(1) | $106,275,830 | 96.6% | |||
| Reserves | 304,361 | 0.3 | ||||||
| Closing costs | 1,798,846 | 1.6 | ||||||
| Return of equity | 1,620,963 | 1.5 | ||||||
| Total Sources | $110,000,000 | 100.0% | Total Uses | $110,000,000 | 100.0% |
| (1) | The One Stamford Forum Property was previously securitized in the BACM 2006-3 transaction. |
The Property.The One Stamford Forum Property consists of the fee and leasehold interest in a 13-story, class A office tower totaling 504,471 square feet located in Stamford, Connecticut. Constructed in 1973 and renovated in 2000, the One Stamford Forum Property is situated on a 6.1-acre site. The first three levels of the One Stamford Forum Property house the garage containing 1,103 spaces, the lobby, print shop, a 3,000 square foot fitness center with full locker rooms, a 100-seat auditorium, conference rooms and office and storage space. The next level above (Plaza Level) houses the full-service cafeteria, convenience store, library and additional office space, and also opens out to five acres of outdoor landscaped areas accessible to building tenants. The remaining upper levels contain office space with the top two floors of the building open to one another in the center with a 3,600 square foot atrium open to rooftop skylights. The One Stamford Forum Property was originally built in 1973 as the headquarters for GTE Financial. In 1999, the sponsors purchased the property for $77.0 million and subsequently invested approximately $44.4 million to renovate the property, bringing their cost basis to $124.5 million.
The One Stamford Forum Property has been 100.0% leased since 2006 and is currently 100.0% leased to two tenants, UBS Group AG (“UBS”) and Purdue Pharma L.P. (“Purdue Pharma”), on leases both expiring in December 2020. Purdue Pharma has signed a subsequent lease on the entire building’s square footage beginning January 2021 through June 2031 with a six and a half year lease-renewal option, and as such, the One Stamford Forum Property will remain fully leased without interruption for at least five years beyond the One Stamford Forum Whole Loan term.
UBS leases 337,456 square feet (66.9% of net rentable area) and is not currently occupying its space, however, UBS is continuing its rental obligations and has subleased a total of 330,796 square feet to Purdue Pharma (291,679 square feet), Rockit Solutions (25,075 square feet) and CBRE (14,042 square feet), with 6,660 square feet currently not being utilized. The subleases are coterminous with UBS’ lease. UBS previously had a large presence in Stamford, but in addition to subleasing out its space at the One Stamford Forum Property, UBS has vacated its Stamford headquarters building at 677 Washington Boulevard and relocated to approximately 120,000 square feet at 600 Washington Boulevard.
Purdue Pharma leases 167,015 square feet (33.1% of net rentable area) in addition to the 291,679 square feet it subleases from UBS. Of its subleased space, Purdue Pharma further subleases space to W.J. Deutsch & Sons Ltd (43,563 square feet), Kokino LLC (11,784 square feet), Hillside Capital Incorporated (8,705 square feet) and Brookside Equity Partners (3,704 square feet). The remaining 58,394 square feet that Purdue Pharma subleases are currently not being utilized. Purdue Pharma uses the One Stamford Forum Property as its corporate headquarters. Purdue Pharma is affiliated with the One Stamford Forum Mortgage Loan borrower.
Purdue Pharma is a privately-held pharmaceutical company founded by physicians in 1952 which has grown to approximately 1,500 employees, and engaged in the research, development, production, sales, and licensing of prescription and over-the-counter medicines and hospital products across the following categories: pain and central nervous system, laxatives, antiseptics and dietary supplements. Purdue Pharma is known for pioneering research in pain and introducing medications with abuse-deterrent properties. Purdue Pharma owns or licenses the patents to a number of prescription drugs, most notably OxyContin. OxyContin is an extended-release opioid brand. In 2014, the global opioid market was valued at an estimate $34.9 billion, with North America being the largest market accounting for approximately 65% of revenue share.
THE INFORMATION IN THIS STRUCTURAL AND COLLATERAL TERM SHEET IS NOT COMPLETE AND MAY BE AMENDED PRIOR TO THE TIME OF SALE. THIS TERM SHEET IS NOT AN OFFER TO SELL THESE SECURITIES AND IT IS NOT A SOLICITATION OF AN OFFER TO BUY THESE SECURITIES IN ANY JURISDICTION WHERE THE OFFER OR SALE IS NOT PERMITTED.
59
| ONE STAMFORD FORUM |
The following table presents certain information relating to the tenancy at the One Stamford Forum Property:
Major Tenants
| Tenant Name | Credit Rating (Fitch/Moody’s/ S&P) | Tenant NRSF | % of NRSF | Annual U/W Base Rent PSF | Annual U/W Base Rent | % of Total Annual U/W Base Rent | Lease Expiration Date |
| Major Tenants | |||||||
| UBS(1) | A/Ba1/A- | 337,456 | 66.9% | $44.47 | $15,005,700 | 67.5% | 12/31/2020 |
| Purdue Pharma(2) | NAP/NAP/NAP | 167,015 | 33.1% | $43.26 | $7,224,325 | 32.5% | 12/31/2020(3) |
| Occupied Collateral Total | 504,471 | 100.0% | $44.07 | $22,230,025 | 100.0% | ||
| Vacant Space | 0 | 0.0% | |||||
| Collateral Total | 504,471 | 100.0% | |||||
| (1) | UBS does not currently occupy any of its space but continues to pay rent pursuant to its lease. UBS has subleased a total of 330,796 square feet to PurduePharma (291,679 square feet), Rockit Solutions (25,075 square feet) and CBRE (14,042 square feet) through the term of its lease. The remaining 6,660 square feet is not subleased by UBS and is currently not being utilized. |
| (2) | Purdue Pharma is subleasing a portion of its subleased space from UBS to W.J. Deutsch & Sons Ltd (43,563 square feet) through March 31, 2037 and to Brookside Equity Partners (3,704 square feet), Hillside Capital Incorporated (8,705square feet) and Kokino LLC (11,784 square feet) through September 27, 2021. 58,394 square feet of Purdue Pharma’s subleased space is currently not being utilized. |
| (3) | Purdue Pharma has an executed lease on 100.0% of the net rentable area at the One Stamford Forum Property beginning January 2021 through June 2031 at an average initial rent of $46.46 per square foot with a six and a half year lease-renewal option. |
Lease Expiration Schedule(1)
| Year Ending December 31, | No. of Leases Expiring | Expiring NRSF | % of Total NRSF | Cumulative Expiring NRSF | Cumulative % of Total NRSF | Annual U/W Base Rent | % of Total Annual U/W Base Rent | Annual U/W Base Rent PSF |
| MTM | 0 | 0 | 0.0% | 0 | 0.0% | $0 | 0.0% | $0.00 |
| 2016 | 0 | 0 | 0.0% | 0 | 0.0% | $0 | 0.0% | 0.00 |
| 2017 | 0 | 0 | 0.0% | 0 | 0.0% | $0 | 0.0% | 0.00 |
| 2018 | 0 | 0 | 0.0% | 0 | 0.0% | $0 | 0.0% | 0.00 |
| 2019 | 0 | 0 | 0.0% | 0 | 0.0% | $0 | 0.0% | 0.00 |
| 2020(2) | 0 | 0 | 0.0% | 0 | 0.0% | $0 | 0.0% | 0.00 |
| 2021 | 0 | 0 | 0.0% | 0 | 0.0% | $0 | 0.0% | 0.00 |
| 2022 | 0 | 0 | 0.0% | 0 | 0.0% | $0 | 0.0% | 0.00 |
| 2023 | 0 | 0 | 0.0% | 0 | 0.0% | $0 | 0.0% | 0.00 |
| 2024 | 0 | 0 | 0.0% | 0 | 0.0% | $0 | 0.0% | 0.00 |
| 2025 | 0 | 0 | 0.0% | 0 | 0.0% | $0 | 0.0% | 0.00 |
| 2026 | 0 | 0 | 0.0% | 0 | 0.0% | $0 | 0.0% | 0.00 |
| Thereafter(2) | 1 | 504,471 | 100.0% | 504,471 | 100.0% | $23,437,611 | 100.0% | $46.46 |
| Vacant | 0 | 0 | 0.0% | 504,471 | 100.0% | $0 | 0.0% | 0.00 |
| Total/Weighted Average | 1 | 504,471 | 100.0% | $23,437,611 | 100.0% | $46.46 |
| (1) | Information obtained from the tenant leases. |
| (2) | The One Stamford Forum Property is currently 100.0% leased to two tenants, UBS and Purdue Pharma, on leases both expiring in December 2020. Purdue Pharma has signed a subsequent lease on the entire building’s square footage beginning January 2021 through June 2031 with a six and a half year lease-renewal option. |
The following table presents historical occupancy percentages at the One Stamford Forum Property:
Historical Occupancy
| 12/31/2012(1) | 12/31/2013(1) | 12/31/2014(1) | 12/31/2015(1) | 5/31/2016(2) | |||||
| 100.0% | 100.0% | 100.0% | 100.0% | 100.0% |
| (1) | Information obtained from the borrower. |
| (2) | Information obtained from the underwritten rent roll. |
THE INFORMATION IN THIS STRUCTURAL AND COLLATERAL TERM SHEET IS NOT COMPLETE AND MAY BE AMENDED PRIOR TO THE TIME OF SALE. THIS TERM SHEET IS NOT AN OFFER TO SELL THESE SECURITIES AND IT IS NOT A SOLICITATION OF AN OFFER TO BUY THESE SECURITIES IN ANY JURISDICTION WHERE THE OFFER OR SALE IS NOT PERMITTED.
60
| ONE STAMFORD FORUM |
Operating History and Underwritten Net Cash Flow. The following table presents certain information relating to the historical operating performance and the underwritten net cash flow at the One Stamford Forum Property:
Cash Flow Analysis
| 2013 | 2014 | 2015 | TTM 3/31/2016 | U/W | % of U/W Effective Gross Income | U/W $ per SF | ||||||||||||||||
| Base Rent | $20,659,134 | $20,659,134 | $20,659,134 | $21,051,857 | $22,230,025 | 101.5 | % | $44.07 | ||||||||||||||
| Total Reimbursables(1) | 2,239,776 | 1,572,030 | 1,833,926 | 1,784,562 | 2,094,342 | 9.6 | 4.15 | |||||||||||||||
| Less Vacancy & Credit Loss(2) | 0 | 0 | 0 | 0 | (2,432,437 | ) | -11.1 | (4.82 | ) | |||||||||||||
| Effective Gross Income | $22,898,910 | $22,231,164 | $22,493,060 | $22,836,419 | $21,891,930 | 100.0 | % | $43.40 | ||||||||||||||
| �� | ||||||||||||||||||||||
| Total Operating Expenses | $8,887,707 | $8,173,538 | $8,409,594 | $8,422,294 | $8,706,883 | 39.8 | % | $17.26 | ||||||||||||||
| Net Operating Income | $14,011,203 | $14,057,626 | $14,083,466 | $14,414,125 | $13,185,047 | 60.2 | % | $26.14 | ||||||||||||||
| TI/LC | 0 | 0 | 0 | 0 | 1,233,793 | 5.6 | 2.45 | |||||||||||||||
| Capital Expenditures | 0 | 0 | 0 | 0 | 126,118 | 0.6 | 0.25 | |||||||||||||||
| Net Cash Flow | $14,011,203 | $14,057,626 | $14,083,466 | $14,414,125 | $11,825,136 | 54.0 | % | $23.44 | ||||||||||||||
| NOI DSCR(3) | 1.83x | 1.84x | 1.84x | 1.89x | 1.73x | |||||||||||||||||
| NCF DSCR(3) | 1.83x | 1.84x | 1.84x | 1.89x | 1.55x | |||||||||||||||||
| NOI DY(3) | 12.8% | 12.8% | 12.8% | 13.1% | 12.0% | |||||||||||||||||
| NCF DY(3) | 12.8% | 12.8% | 12.8% | 13.1% | 10.8% | |||||||||||||||||
| (1) | U/W Reimbursables are based on tenant leases and include budgeted tenant electric charges of $561,838 and an adjustment for a 3.0% management fee (the One Stamford Forum Property is currently managed by an affiliate of the borrower). |
| (2) | The underwritten economic vacancy is 10.9%. The One Stamford Forum Property is currently 100.0% leased through June 2031. |
| (3) | The debt service coverage ratios and debt yields are based on the One Stamford Forum Whole Loan. |
Appraisal.As of the appraisal valuation date of May 2, 2016, the One Stamford Forum Property had an “as-is” appraised value of $227,000,000.
Environmental Matters. According to a Phase I environmental site assessment dated May 5, 2016, there was no evidence of any recognized environmental conditions at the One Stamford Forum Property.
Market Overview and Competition.The One Stamford Forum Property is located in Stamford, Connecticut. The City of Stamford has a downtown core area with a major transportation hub, approximately 7.7 million square feet of office space, Stamford Town Center, an 860,000 square foot super-regional mall, and several high-density residential projects. It is also supported by a suburban area and several major throughways including Interstate 95 connecting to midtown Manhattan 40 miles southwest, Route 137 (Washington Boulevard) connecting to Westchester County to the north and Tresser Boulevard (Route 1) running along the south shore of Connecticut parallel to Interstate 95.
Current major developments under construction in the area include a waterfront redevelopment known as Harbor Point that will contain over 2,360 residential units and 500,000 square feet of commercial space, the $450 million expansion and renovation of Stamford Hospital, a planned 648-unit multifamily property located across the street from the One Stamford Forum Property expected to open in early 2018, and Atlantic Station, a mixed-use development comprised of 650 multifamily units and approximately 54,000-69,000 square feet of retail space located just west of the One Stamford Forum Property on Tresser Boulevard.
The One Stamford Forum Property is located at the intersection of Tresser Boulevard and Canal Street. In addition to the offerings of Stamford’s core commercial area located just a few blocks northwest, immediate local amenities include dining and retail options in the Stamford Town Center located across Tresser Boulevard, and a full-service Marriott hotel across Canal Street. The Stamford Metro North/Amtrak station is two blocks from the One Stamford Forum Property, providing mass transit access along stops from New Haven south to New York City (55 minutes) and from Boston south to Philadelphia and Washington, D.C. According to the appraisal, the 2016 population within a three- and five- mile radius of the One Stamford Forum Property was 126,607 and 173,495, respectively; 2016 average household income within the same radii was $131,200 and $151,166, respectively.
According to the appraiser, the One Stamford Forum Property is located in the broader Stamford Central Business District Office Market which includes approximately 9.7 million square feet of office space with a vacancy of 23.8% and an average rent per square foot of $43.55 as of the first quarter of 2016. Within the submarket, the appraiser determined the competitive set to be comprised of 13 Class A office buildings containing approximately 3.7 million square feet (inclusive of the Stamford Office Forum Property), which exhibited an overall vacancy of 8.6% at an average base rent of $51.21 as of the first quarter of 2016.
THE INFORMATION IN THIS STRUCTURAL AND COLLATERAL TERM SHEET IS NOT COMPLETE AND MAY BE AMENDED PRIOR TO THE TIME OF SALE. THIS TERM SHEET IS NOT AN OFFER TO SELL THESE SECURITIES AND IT IS NOT A SOLICITATION OF AN OFFER TO BUY THESE SECURITIES IN ANY JURISDICTION WHERE THE OFFER OR SALE IS NOT PERMITTED.
61
| ONE STAMFORD FORUM |
The following table presents certain information relating to comparable office leases to the One Stamford Forum Property:
Comparable Leases(1)
| Property Name/Location | Year Built/ Renovated | Total GLA (SF) | Total Occupancy | Distance from Subject | Tenant Name | Lease Date/Term | Lease Area (SF) | Annual Base Rent PSF | TI’s |
Stamford Towers 680 Washington Blvd
| 1989/NAP | 133,000 | 87% | 0.4 miles | Bank of Ireland NGKF | Apr-16/10.8 Yrs Jan-15/11.0 Yrs | 20,217 10,634 | $43 $40 | $60 $0 |
One Stamford Plaza 263 Tresser Blvd
| 1986/NAP | 214,136 | 99% | 0.2 miles | Towers Watson Lascaux Resource Capital Regus Plc | Oct-15/1.0 Yrs Sept-15/5.4 Yrs Apr-15/5.3 Yrs | 68,234 2,697 19,450 | $42 $50 $47 | $0 $45 $22 |
400 Atlantic 400 Atlantic Street
| 1980/2007 | 501,448 | 77% | 315 feet | BTG Pactual | Nov-15/11.0 Yrs | 36,782
| $48 | $50 |
1055 Washington Blvd 1055 Washington Blvd
| 1987/NAP | 178,000 | 84% | 0.5 miles | Robinson & Cole LLP | Sept-15/11.1 Yrs | 28,466 | $38 | $58 |
RBS 600 Washington Blvd
| 2009/NAP | 500,000 | 100% | 0.5 miles | UBS | May-15/10.0 Yrs | 119,216 | $57 | $20 |
| (1) | Information obtained from the appraisal. |
The Borrower.The borrower is One Stamford Realty L.P., a single purpose Delaware limited partnership, with a general partner that is a special purpose entity with two independent directors. Legal counsel to the borrower delivered a non-consolidation opinion in connection with the origination of the One Stamford Forum Whole Loan. Beacon Company (Delaware), BRJ Fiduciary Management LLC, as Trustee under Trust Agreement dated November 5, 1974, and Rosebay Medical Company L.P., individually and collectively, are the guarantor of certain nonrecourse carveouts under the One Stamford Forum Whole Loan.
The Sponsors.The sponsors are Beacon Company (Delaware) (“Beacon”), BRJ Fiduciary Management LLC, as Trustee under Trust Agreement dated November 5, 1974 (“BRJ”), and Rosebay Medical Company L.P. (“Rosebay”). Each of Beacon, BRJ and Rosebay are ultimately owned by or for the benefit of members of the Sackler family. Arthur, Mortimer and Raymond Sackler were the original founders of Purdue Pharma and the Sackler family continues to own 100% of the company. The family’s net worth has been conservatively estimated at approximately $14 billion.
Escrows.The loan documents provide for upfront reserves in the amount of $230,359 for real estate taxes, $58,814 for property insurance premiums and $15,188 for required repairs. The loan documents provide for ongoing monthly reserves in the amount equal to one-twelfth of the estimated annual real estate taxes due (initially estimated at $230,359) and ongoing monthly reserves in the amount equal to one-twelfth of the estimated annual insurance premiums due (initially estimated at $19,605). Monthly deposits for insurance premiums can be waived by the lender should the One Stamford Forum Property be covered by an acceptable blanket insurance policy.
Lockbox and Cash Management.The One Stamford Forum Whole Loan requires a lender-controlled lockbox account, which is already in place. The borrower has directed the tenants to pay rent directly into such lockbox account. Prior to the occurrence of a Cash Sweep Period (as defined below), all funds are required to be distributed to the borrower. During a Cash Sweep Period, all funds are required to be swept to a lender-controlled cash management account.
A “Cash Sweep Period” will commence upon (i) Purdue Pharma vacating, giving notice to vacate, or ceasing to occupy 50.0% or more of the net rentable area at the One Stamford Forum Property for a continuous 60 days (other than as a result of force majeure); (ii) any bankruptcy action of Purdue Pharma; or (iii) Purdue Pharma defaulting in rent (including failure to pay real estate taxes and property insurance premiums). A Cash Sweep Period will end upon, as it relates to clause (i) or (ii), Purdue Pharma’s vacated space being leased to one or more acceptable replacement tenant(s) and the replacement tenant(s) being in occupancy and paying full rent with no outstanding tenant improvement or leasing costs; or, as it relates to clause (iii), such default being cured.
Property Management. The One Stamford Forum Property is self-managed by the borrower.
Assumption.Following the date which is six months from the origination date, the borrower has the right to transfer the One Stamford Forum Property provided that certain conditions are satisfied, including (i) no event of default has occurred and is continuing; (ii) the lender reasonably determines that the proposed transferee and guarantor satisfy the lender’s credit review and underwriting standards, taking into consideration the transferee’s experience, financial strength and general business standing; and (iii) the lender has received confirmation from Fitch, KBRA, Moody’s and S&P that such assumption will not result in a downgrade, withdrawal or qualification of the respective ratings assigned to the Series 2016-BNK1 certificates and similar confirmations from each rating agency rating any securities backed by any One Stamford Forum Companion Loans with respect to the ratings of such securities.
Right of First Offer. Pursuant to its lease commencing January 2021, Purdue Pharma has a right of first offer to purchase the property upon any sale;provided that such right of first offer does not apply to a foreclosure and does not apply during the term of the One Stamford Forum Whole Loan.
THE INFORMATION IN THIS STRUCTURAL AND COLLATERAL TERM SHEET IS NOT COMPLETE AND MAY BE AMENDED PRIOR TO THE TIME OF SALE. THIS TERM SHEET IS NOT AN OFFER TO SELL THESE SECURITIES AND IT IS NOT A SOLICITATION OF AN OFFER TO BUY THESE SECURITIES IN ANY JURISDICTION WHERE THE OFFER OR SALE IS NOT PERMITTED.
62
| ONE STAMFORD FORUM |
Partial Release. Not permitted.
Real Estate Substitution.Not permitted.
Subordinate and Mezzanine Indebtedness.None.
Ground Lease.The One Stamford Forum Mortgage Loan borrower is the owner of the fee interest in the land and improvements, and is also the owner of landlord and tenant’s interest in two ground leases with respect to the One Stamford Forum Property and has mortgaged its fee and lease interests to the lender as security for the One Stamford Forum Mortgage Loan. Pursuant to the mortgage granted to the lender by the One Stamford Forum Mortgage Loan borrower, the ground leases are subject and subordinate to the One Stamford Forum Mortgage Loan documents.
Terrorism Insurance. The loan documents require that the “all risk” insurance policy required to be maintained by the borrowers provide coverage for terrorism in an amount equal to the full replacement cost of the One Stamford Forum Property, as well as business interruption insurance with no time limitation, and includes an extended period of indemnity of 360 days to provide continuing coverage after the One Stamford Forum Property has been repaired.
THE INFORMATION IN THIS STRUCTURAL AND COLLATERAL TERM SHEET IS NOT COMPLETE AND MAY BE AMENDED PRIOR TO THE TIME OF SALE. THIS TERM SHEET IS NOT AN OFFER TO SELL THESE SECURITIES AND IT IS NOT A SOLICITATION OF AN OFFER TO BUY THESE SECURITIES IN ANY JURISDICTION WHERE THE OFFER OR SALE IS NOT PERMITTED.
63
| RENAISSANCE DALLAS |

THE INFORMATION IN THIS STRUCTURAL AND COLLATERAL TERM SHEET IS NOT COMPLETE AND MAY BE AMENDED PRIOR TO THE TIME OF SALE. THIS TERM SHEET IS NOT AN OFFER TO SELL THESE SECURITIES AND IT IS NOT A SOLICITATION OF AN OFFER TO BUY THESE SECURITIES IN ANY JURISDICTION WHERE THE OFFER OR SALE IS NOT PERMITTED.
64
| RENAISSANCE DALLAS |
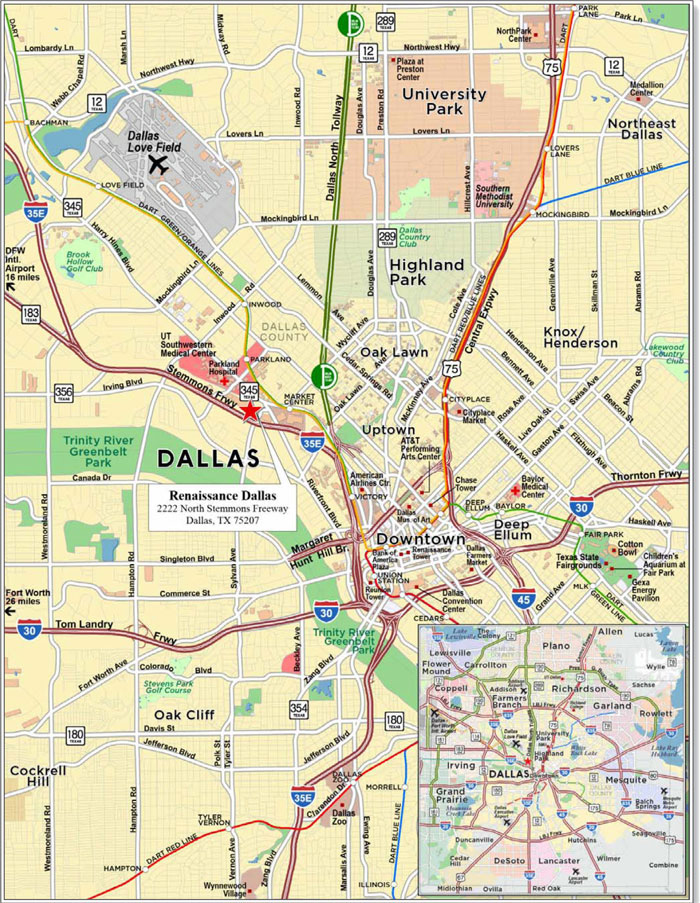
THE INFORMATION IN THIS STRUCTURAL AND COLLATERAL TERM SHEET IS NOT COMPLETE AND MAY BE AMENDED PRIOR TO THE TIME OF SALE. THIS TERM SHEET IS NOT AN OFFER TO SELL THESE SECURITIES AND IT IS NOT A SOLICITATION OF AN OFFER TO BUY THESE SECURITIES IN ANY JURISDICTION WHERE THE OFFER OR SALE IS NOT PERMITTED.
65
| No. 4 – Renaissance Dallas | |||||||
| Loan Information | Property Information | ||||||
| Mortgage Loan Seller: | Wells Fargo Bank, National Association | Single Asset/Portfolio: | Single Asset | ||||
| Credit Assessment (Fitch/KBRA/Moody’s/S&P): | NR/NR/NR/NR | Property Type: | Hospitality | ||||
| Original Principal Balance: | $60,000,000 | Specific Property Type: | Full Service | ||||
| Cut-off Date Balance: | $60,000,000 | Location: | Dallas, TX | ||||
| % of Initial Pool Balance: | 6.9% | Size: | 514 rooms | ||||
| Loan Purpose: | Refinance | Cut-off Date Balance Per Room: | $116,732 | ||||
| Borrower Name: | Deep Elem Real Estate, LLC | Year Built/Renovated: | 1983/2015 | ||||
| Sponsor: | Thomas Point Ventures, L.P. | Title Vesting(2): | Leasehold | ||||
| Mortgage Rate: | 4.400% | Property Manager: | Self-managed | ||||
| Note Date: | June 1, 2016 | 4thMost Recent Occupancy (As of): | 62.8% (12/31/2012) | ||||
| Anticipated Repayment Date: | NAP | 3rdMost Recent Occupancy (As of): | 61.1% (12/31/2013) | ||||
| Maturity Date: | June 11, 2026 | 2ndMost Recent Occupancy (As of): | 58.4% (12/31/2014) | ||||
| IO Period: | 60 months | Most Recent Occupancy (As of): | 63.5% (12/31/2015) | ||||
| Loan Term (Original): | 120 months | Current Occupancy (As of): | 65.7% (5/30/2016) | ||||
| Seasoning: | 2 months | ||||||
| Amortization Term (Original): | 360 months | Underwriting and Financial Information: | |||||
| Loan Amortization Type: | Interest-only, Amortizing Balloon | ||||||
| Interest Accrual Method: | Actual/360 | 4thMost Recent NOI (As of)(3): | $4,392,339 (12/31/2013) | ||||
| Call Protection: | L(26),D(90),O(4) | 3rdMost Recent NOI (As of)(3): | $5,305,162 (12/31/2014) | ||||
| Lockbox Type: | Springing | 2ndMost Recent NOI (As of)(3): | $9,765,389 (12/31/2015) | ||||
| Additional Debt: | None | Most Recent NOI (As of): | $10,135,122 (TTM 5/30/2016) | ||||
| Additional Debt Type: | NAP | ||||||
| U/W Revenues: | $34,611,583 | ||||||
| U/W Expenses: | $25,107,534 | ||||||
| U/W NOI: | $9,504,049 | ||||||
| U/W NCF: | $7,773,470 | ||||||
| U/W NOI DSCR: | 2.64x | ||||||
| U/W NCF DSCR: | 2.16x | ||||||
| Escrows and Reserves(1): | U/W NOI Debt Yield: | 15.8% | |||||
| U/W NCF Debt Yield: | 13.0% | ||||||
| Type: | Initial | Monthly | Cap (If Any) | As-Is Appraised Value: | $118,800,000 | ||
| Taxes | $0 | Springing | NAP | As-Is Appraisal Valuation Date: | March 17, 2016 | ||
| Insurance | $0 | Springing | NAP | Cut-off Date LTV Ratio: | 50.5% | ||
| FF&E Reserve | $0 | Springing | NAP | LTV Ratio at Maturity or ARD: | 46.1% | ||
| (1) | See “Escrows” section. |
| (2) | See “Ground Lease” section. |
| (3) | See “Cash Flow Analysis” section. |
The Mortgage Loan. The mortgage loan (the “Renaissance Dallas Mortgage Loan”) is evidenced by a single promissory note secured by a first mortgage encumbering the leasehold interest in a full-service hotel located in Dallas, Texas (the “Renaissance Dallas Property”). The Renaissance Dallas Mortgage Loan was originated on June 1, 2016 by Wells Fargo Bank, National Association. The Renaissance Dallas Mortgage Loan had an original principal balance of $60,000,000, has an outstanding principal balance as of the Cut-off Date of $60,000,000 and accrues interest at an interest rate of 4.400%per annum. The Renaissance Dallas Mortgage Loan had an initial term of 120 months, has a remaining term of 118 months as of the Cut-off Date and requires interest-only payments for the first 60 payments following origination and, thereafter, requires payments of principal and interest based on a 30-year amortization schedule. The Renaissance Dallas Mortgage Loan matures on June 11, 2026.
Following the lockout period, the borrower has the right to defease the Renaissance Dallas Mortgage Loan in whole, but not in part, on any date before March 11, 2026. In addition, the Renaissance Dallas Mortgage Loan is prepayable without penalty on or after March 11, 2026.
THE INFORMATION IN THIS STRUCTURAL AND COLLATERAL TERM SHEET IS NOT COMPLETE AND MAY BE AMENDED PRIOR TO THE TIME OF SALE. THIS TERM SHEET IS NOT AN OFFER TO SELL THESE SECURITIES AND IT IS NOT A SOLICITATION OF AN OFFER TO BUY THESE SECURITIES IN ANY JURISDICTION WHERE THE OFFER OR SALE IS NOT PERMITTED.
66
| RENAISSANCE DALLAS |
Sources and Uses
| Sources | Uses | |||||||
| Original loan amount | $60,000,000 | 100.0% | Loan payoff(1) | $39,591,944 | 66.0% | |||
| Closing costs | 713,416 | 1.2 | ||||||
| Return of equity | 19,694,640 | 32.8 | ||||||
| Total Sources | $60,000,000 | 100.0% | Total Uses | $60,000,000 | 100.0% |
| (1) | The Renaissance Dallas Property was previously securitized in the MLCFC 2007-5 transaction. |
The Property.The Renaissance Dallas Property is a 29-story full-service hotel comprising 514 guestrooms located in Dallas, Texas, approximately 4.0 miles northwest of the central business district. Situated on a 6.1-acre parcel, the Renaissance Dallas Property was built in 1983 and renovated in 2007-2008 (major guestroom renovation), 2010 (addition of restaurant concept and renovation of the lobby and great room) and 2013-2015. The most recent 2013-2015 renovation was completed at a cost of approximately $37.7 million and added approximately 27,000 square feet of meeting and event space, including the Grand Ballroom (15,921 square feet), City View event space (6,120 square feet) and City View Terrace (5,080 square feet), as well as the parking garage. The Renaissance Dallas Property contains 178 king guestrooms, 234 queen/queen guestrooms, 72 queen standard guestrooms and 30 suites. The Renaissance Dallas Property contains 17 meeting and event spaces on floors two through four totaling approximately 53,000 square feet, including two outdoor terraces totaling 6,640 square feet, that offer panoramic views of the Dallas skyline. Amenities at the Renaissance Dallas Property include a fitness center, business center, rooftop outdoor swimming pool, sundry shop and valet parking. In addition, the Renaissance Dallas Property is home to Asador, a 120-seat, full-service farm-to-table restaurant, as well as a lobby bar and 27th-floor club lounge. The Renaissance Dallas Property contains a total of 624 surface and garage parking spaces, accounting for a parking ratio of 1.2 spaces per room. The demand segmentation for the Renaissance Dallas Property is 25% corporate, 50% group and 25% leisure. In lieu of a franchise agreement, the Renaissance Dallas Property is subject to a management agreement with Renaissance Hotel Management Company, L.L.C., which expires in July 2026 with three 10-year renewal options. In the event that the borrower or guarantor no longer has the right to operate the Renaissance Dallas Property as a Renaissance franchise, the Renaissance Dallas Mortgage Loan will become full-recourse to the borrower and guarantor.
The following table presents certain information relating to the historical operating performance and the underwritten net cash flow at the Renaissance Dallas Property:
Cash Flow Analysis
| 2013(1) | 2014(1) | 2015(1) | TTM 5/30/2016 | U/W | % of U/W Total Revenue | U/W $ per Room | |||||||||
| Occupancy | 61.1% | 58.4% | 63.5% | 65.7% | 65.7% | ||||||||||
| ADR | $125.47 | $137.78 | $156.17 | $156.93 | $156.93 | ||||||||||
| RevPAR | $77.36 | $80.53 | $99.09 | $103.08 | $103.08 | ||||||||||
| Room Revenue | $14,513,188 | $15,107,347 | $18,590,284 | $19,391,826 | $19,339,719 | 55.9% | $37,626 | ||||||||
| F&B Revenue | 6,449,181 | 8,265,138 | 14,113,590 | 14,296,864 | 14,296,864 | 41.3 | 27,815 | ||||||||
| Parking Revenue | 0 | 0 | 0 | 0 | 0 | 0.0 | 0 | ||||||||
| Other Revenue | 1,050,956 | 1,261,159 | 927,530 | 1,147,913 | 975,000 | 2.8 | 1,897 | ||||||||
| Total Revenue | $22,013,325 | $24,633,644 | $33,631,404 | $34,836,603 | $34,611,583 | 100.0% | $67,338 | ||||||||
| Total Department Expenses | 9,503,874 | 10,461,165 | 13,087,389 | 13,122,183 | 13,267,059 | 38.3 | 25,811 | ||||||||
| Gross Operating Profit | $12,509,451 | $14,172,479 | $20,544,015 | $21,714,420 | $21,344,523 | 61.7% | $41,526 | ||||||||
| Total Undistributed Expenses | 6,870,172 | 7,829,196 | 9,494,558 | 10,159,959 | 10,108,347 | 29.2 | 19,666 | ||||||||
| Profit Before Fixed Charges | $5,639,279 | $6,343,283 | $11,049,457 | $11,554,461 | $11,236,176 | 32.5% | $21,860 | ||||||||
| Total Fixed Charges | 1,246,940 | 1,038,121 | 1,284,068 | 1,419,339 | 1,732,127 | 5.0 | 3,370 | ||||||||
| Net Operating Income | $4,392,339 | $5,305,162 | $9,765,389 | $10,135,122 | $9,504,049 | 27.5% | $18,490 | ||||||||
| FF&E | 0 | 0 | 0 | 0 | 1,730,579 | 5.0 | 3,367 | ||||||||
| Net Cash Flow | $4,392,339 | $5,305,162 | $9,765,389 | $10,135,122 | $7,773,470 | 22.5% | $15,123 | ||||||||
| NOI DSCR | 1.22x | 1.47x | 2.71x | 2.81x | 2.64x | ||||||||||
| NCF DSCR | 1.22x | 1.47x | 2.71x | 2.81x | 2.16x | ||||||||||
| NOI DY | 7.3% | 8.8% | 16.3% | 16.9% | 15.8% | ||||||||||
| NCF DY | 7.3% | 8.8% | 16.3% | 16.9% | 13.0% | ||||||||||
| (1) | The increase in Net Operating Income from 2013 to 2014 and from 2014 to 2015 was due to the 2013-2015 renovation, which added approximately 27,000 square feet of meeting and event space to the Renaissance Dallas Property, increasing F&B Revenue and group-related room nights. |
Appraisal.As of the appraisal valuation date of March 17, 2016, the Renaissance Dallas Property had an “as-is” appraised value of $118,800,000.
Environmental Matters. According to a Phase I environmental assessment dated March 25, 2016, there was no evidence of any recognized environmental conditions at the Renaissance Dallas Property.
THE INFORMATION IN THIS STRUCTURAL AND COLLATERAL TERM SHEET IS NOT COMPLETE AND MAY BE AMENDED PRIOR TO THE TIME OF SALE. THIS TERM SHEET IS NOT AN OFFER TO SELL THESE SECURITIES AND IT IS NOT A SOLICITATION OF AN OFFER TO BUY THESE SECURITIES IN ANY JURISDICTION WHERE THE OFFER OR SALE IS NOT PERMITTED.
67
| RENAISSANCE DALLAS |
Market Overview and Competition.The Renaissance Dallas Property is located in Dallas, Texas, approximately 4.0 miles northwest of the central business district and just north of Interstate 35 East. According to the appraisal, primary access to the surrounding neighborhood is provided by Highway 75, Woodall Rogers Freeway, Interstate 45, Interstate 35 East, Interstate 30 and Dallas North Tollway. Land uses within the neighborhood consist of a mixture of residential, commercial, office, industrial and medical, and within a 1.5-mile radius of the Renaissance Dallas Property, there is approximately 7.3 million square feet of office space with a 91.9% occupancy rate. The Renaissance Dallas Property is located approximately one mile southeast of the Southwestern Medical Center, a 390-acre medical complex with more than 30,000 employees and approximately 2.2 million outpatient visits per year. Adjacent to the Renaissance Dallas Property is Dallas Market Center, a five million square foot wholesale trade center that attracts more than 200,000 buyers each year from all 50 states and more than 85 countries. In addition, the Renaissance Dallas Property is located approximately 2.5 miles northwest of the West End Entertainment District and 2.0 miles northwest of Victory Park, which is home to the American Airlines Center (home to the National Basketball Association’s Dallas Mavericks and National Hockey League’s Dallas Stars), House of Blues, various retail and restaurant outlets and approximately 620,000 square feet of office space. As of 2016, the estimated population within a three- and five-mile radius of the Renaissance Dallas Property was 131,762 and 341,128, respectively, and the average household income within the same radii was $96,684 and $94,215, respectively.
The following table presents certain information relating to the Renaissance Dallas Property’s competitive sets:
Subject and Market Historical Occupancy, ADR and RevPAR(1)
(Transient Competitive Set)
Competitive Set | Renaissance Dallas | Penetration Factor | |||||||
Year | Occupancy | ADR | RevPAR | Occupancy | ADR | RevPAR | Occupancy | ADR | RevPAR |
| 2/29/2016 TTM | 73.0% | $116.66 | $85.15 | 63.9% | $155.44 | $99.36 | 87.6% | 133.2% | 116.7% |
| 2/28/2015 TTM | 71.0% | $110.31 | $78.28 | 59.3% | $144.43 | $85.70 | 83.6% | 130.9% | 109.5% |
| 2/28/2014 TTM | 70.5% | $101.04 | $71.27 | 60.2% | $125.47 | $75.51 | 85.3% | 124.2% | 106.0% |
| (1) | Information obtained from a third party hospitality research report dated March 18, 2016. The transient competitive set includes Crowne Plaza Dallas Market Center, Doubletree Dallas Market Center, Embassy Suites Dallas Market Center and Sheraton Hotel Suites Market Center Dallas. |
Subject and Market Historical Occupancy, ADR and RevPAR(1)
(Group Competitive Set)
Competitive Set | Renaissance Dallas | Penetration Factor | |||||||
Year | Occupancy | ADR | RevPAR | Occupancy | ADR | RevPAR | Occupancy | ADR | RevPAR |
| 2/29/2016 TTM | 62.7% | $153.51 | $96.18 | 63.9% | $155.44 | $99.36 | 102.0% | 101.3% | 103.3% |
| 2/28/2015 TTM | 62.0% | $147.13 | $91.15 | 59.3% | $144.43 | $85.70 | 95.8% | 98.2% | 94.0% |
| 2/28/2014 TTM | 57.8% | $145.74 | $84.26 | 60.2% | $125.47 | $75.51 | 104.1% | 86.1% | 89.6% |
| (1) | Information obtained from a third party hospitality research report dated March 18, 2016. The group competitive set includes Sheraton Hotel Dallas, Hyatt Regency Dallas, Fairmont Dallas, Hilton Anatole, Marriott Dallas City Center and The Adolphus Hotel. |
The Borrower.The borrower is Deep Elem Real Estate, LLC, a Delaware limited liability company with one independent director. Legal counsel to the borrower delivered a non-consolidation opinion in connection with the origination of the Renaissance Dallas Mortgage Loan. Thomas Point Ventures, L.P. is the guarantor of certain nonrecourse carveouts under the Renaissance Dallas Mortgage Loan. In lieu of a nonrecourse carveout under the Renaissance Dallas Mortgage Loan for losses related to the breach of any representation, warranty, covenant or indemnification provision in the loan documents concerning environmental laws or hazardous substances, the borrower obtained a $1,000,000 environmental insurance policy that has a 10-year term with three-year tail.
The Sponsor.The sponsor is Thomas Point Ventures, L.P., a subsidiary of JWM Family Enterprises, L.P. (“JWMFE”). JWMFE owns 16 hotels, all of which are operated by Marriott International, Inc. Marriott International owns, operates or manages nearly 4,500 properties in 87 countries and territories and reported revenues of more than $14.0 billion in fiscal year 2015.
Escrows.Ongoing reserves for real estate taxes are not required as long as such taxes are paid in accordance with the management agreement. Ongoing reserves for insurance are not required as long as insurance premiums are paid as required by the management agreement. The Marriott management agreement requires an annual FF&E reserve equal to 5.0% of gross revenues and funds are held with Marriott and used in accordance with the Marriott management agreement. If at any time the FF&E reserve is not held by Marriott in accordance with the management agreement, the borrower must establish an FF&E reserve with the lender in an amount determined by the lender in its reasonable discretion.
Lockbox and Cash Management.Upon the occurrence and continuance of a Marriott Termination Event (as defined below), the Renaissance Dallas Mortgage Loan requires that the borrower establish a lender-controlled lockbox account and all rents shall be deposited into such lockbox account. Prior to the occurrence of a Cash Trap Event Period (as defined below), all cash flow is distributed to the borrower. During a Cash Trap Event Period, all funds are swept through a lender-controlled cash management account.
THE INFORMATION IN THIS STRUCTURAL AND COLLATERAL TERM SHEET IS NOT COMPLETE AND MAY BE AMENDED PRIOR TO THE TIME OF SALE. THIS TERM SHEET IS NOT AN OFFER TO SELL THESE SECURITIES AND IT IS NOT A SOLICITATION OF AN OFFER TO BUY THESE SECURITIES IN ANY JURISDICTION WHERE THE OFFER OR SALE IS NOT PERMITTED.
68
| RENAISSANCE DALLAS |
A “Marriott Termination Event” will occur if (i) an affiliate of Marriott International, Inc. is no longer the manager of the Renaissance Dallas Property; or (ii) the property manager is in default under the management agreement, or the management agreement is no longer in effect.
A “Cash Trap Event Period” will commence upon (i) the occurrence and continuance of an event of default; or (ii) the amortizing net cash flow debt service coverage ratio falling below 1.40x at the end of any calendar quarter. A Cash Trap Event Period will end with respect to clause (i), upon the cure of such event of default; and with respect to clause (ii), upon the amortizing net cash flow debt service coverage ratio being greater than 1.40x for two consecutive calendar quarters.
Property Management.The Renaissance Dallas Property is managed by an affiliate of the borrower.
Assumption.The borrower has a two-time right to transfer the Renaissance Dallas Propertyprovided that certain conditions are satisfied, including (i) no event of default has occurred and is continuing; (ii) the lender reasonably determines that the proposed transferee and guarantor satisfy the lender’s credit review and underwriting standards, taking into consideration transferee experience, financial strength and general business standing; and (iii) the lender has received confirmation from Fitch, KBRA, Moody’s and S&P that such assumption will not result in a downgrade, withdrawal or qualification of the respective ratings assigned to the Series 2016-BNK1 certificates.
Right of First Offer.The property manager, Renaissance Hotel Management Company, L.L.C., has a 30 day period to negotiate the purchase terms (“ROFO”) of the Renaissance Dallas Property prior to the property being offered for sale to a third party. The ROFO is not extinguished by foreclosure or deed-in-lieu thereof, but the management agreement provides that a foreclosure or deed-in-lieu thereof by any mortgagor does not trigger the ROFO.
Partial Release.Not permitted.
Real Estate Substitution.Not permitted.
Subordinate and Mezzanine Indebtedness.Not permitted.
Ground Lease.The Renaissance Dallas Property is subject to a ground lease with a fixed annual ground rent payment of $23,720 and expiration date of April 30, 2062.
Terrorism Insurance.The loan documents require that the “all risk” insurance policy required to be maintained by the borrower provide coverage for terrorism in an amount equal to the full replacement cost of the Renaissance Dallas Property. The loan documents also require business interruption insurance covering no less than the 18-month period following the occurrence of a casualty event, together with a six-month extended period of indemnity.
THE INFORMATION IN THIS STRUCTURAL AND COLLATERAL TERM SHEET IS NOT COMPLETE AND MAY BE AMENDED PRIOR TO THE TIME OF SALE. THIS TERM SHEET IS NOT AN OFFER TO SELL THESE SECURITIES AND IT IS NOT A SOLICITATION OF AN OFFER TO BUY THESE SECURITIES IN ANY JURISDICTION WHERE THE OFFER OR SALE IS NOT PERMITTED.
69
(THIS PAGE INTENTIONALLY LEFT BLANK)
THE INFORMATION IN THIS STRUCTURAL AND COLLATERAL TERM SHEET IS NOT COMPLETE AND MAY BE AMENDED PRIOR TO THE TIME OF SALE. THIS TERM SHEET IS NOT AN OFFER TO SELL THESE SECURITIES AND IT IS NOT A SOLICITATION OF AN OFFER TO BUY THESE SECURITIES IN ANY JURISDICTION WHERE THE OFFER OR SALE IS NOT PERMITTED.
70
| PINNACLE II |
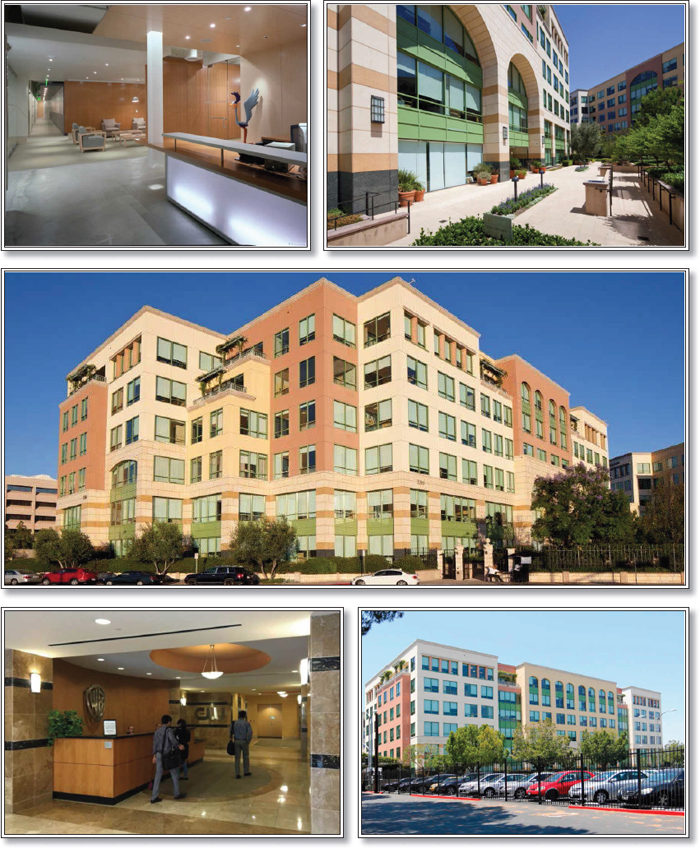
THE INFORMATION IN THIS STRUCTURAL AND COLLATERAL TERM SHEET IS NOT COMPLETE AND MAY BE AMENDED PRIOR TO THE TIME OF SALE. THIS TERM SHEET IS NOT AN OFFER TO SELL THESE SECURITIES AND IT IS NOT A SOLICITATION OF AN OFFER TO BUY THESE SECURITIES IN ANY JURISDICTION WHERE THE OFFER OR SALE IS NOT PERMITTED.
71
| PINNACLE II |
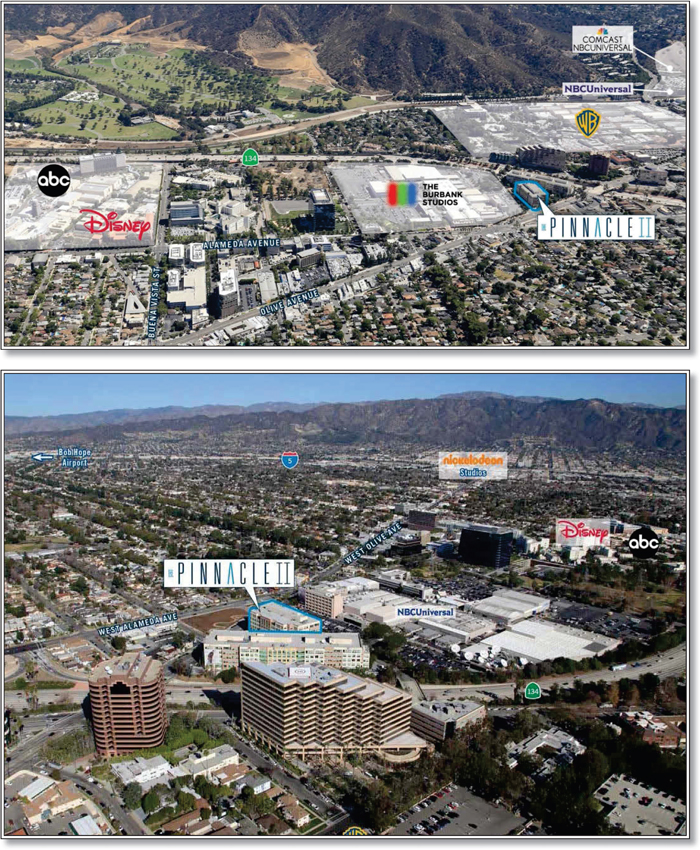
THE INFORMATION IN THIS STRUCTURAL AND COLLATERAL TERM SHEET IS NOT COMPLETE AND MAY BE AMENDED PRIOR TO THE TIME OF SALE. THIS TERM SHEET IS NOT AN OFFER TO SELL THESE SECURITIES AND IT IS NOT A SOLICITATION OF AN OFFER TO BUY THESE SECURITIES IN ANY JURISDICTION WHERE THE OFFER OR SALE IS NOT PERMITTED.
72
| PINNACLE II |
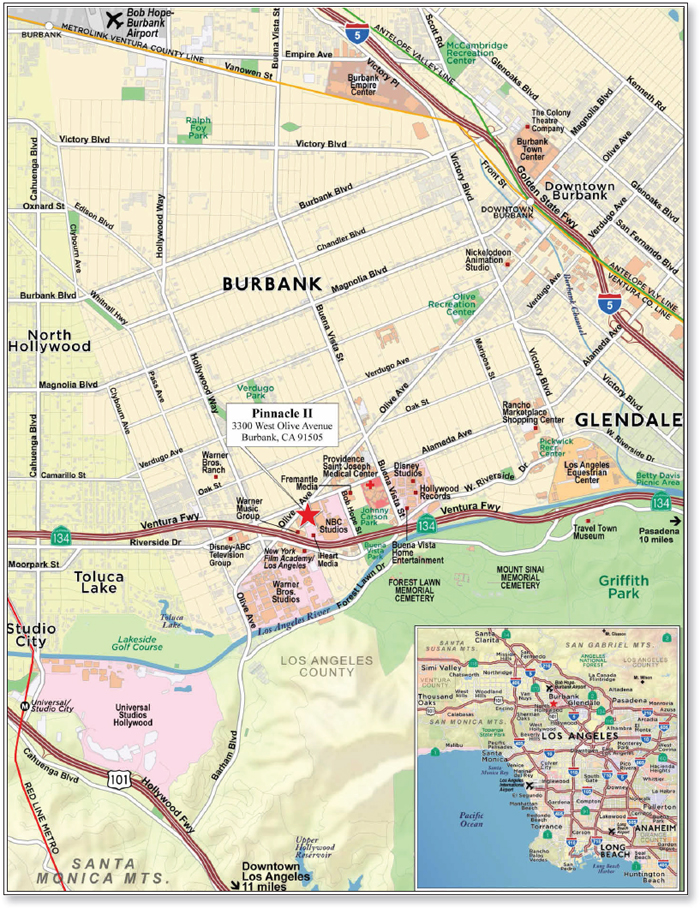
THE INFORMATION IN THIS STRUCTURAL AND COLLATERAL TERM SHEET IS NOT COMPLETE AND MAY BE AMENDED PRIOR TO THE TIME OF SALE. THIS TERM SHEET IS NOT AN OFFER TO SELL THESE SECURITIES AND IT IS NOT A SOLICITATION OF AN OFFER TO BUY THESE SECURITIES IN ANY JURISDICTION WHERE THE OFFER OR SALE IS NOT PERMITTED.
73
| No. 5 – Pinnacle II | |||||||
| Loan Information | Property Information | ||||||
| Mortgage Loan Seller: | Wells Fargo Bank, National Association | Single Asset/Portfolio: | Single Asset | ||||
| Credit Assessment (Fitch/KBRA/Moody’s/S&P): | NR/NR/NR/NR | Property Type: | Office | ||||
| Original Principal Balance(1): | $40,000,000 | Specific Property Type: | CBD | ||||
| Cut-off Date Balance(1): | $40,000,000 | Location: | Burbank, CA | ||||
| % of Initial Pool Balance: | 4.6% | Size: | 230,000 SF | ||||
| Loan Purpose: | Refinance | Cut-off Date Balance Per SF(1): | $378.26 | ||||
| Borrower Name: | P2 Hudson MC Partners, LLC | Year Built/Renovated: | 2005/NAP | ||||
| Sponsors: | Hudson Pacific Properties, L.P.; M. David Paul Development, LLC | Title Vesting: | Fee | ||||
| Mortgage Rate: | 4.300% | Property Manager: | Self-managed | ||||
| Note Date: | June 7, 2016 | 4thMost Recent Occupancy (As of): | 100.0% (12/31/2012) | ||||
| Anticipated Repayment Date: | NAP | 3rdMost Recent Occupancy (As of): | 100.0% (12/31/2013) | ||||
| Maturity Date: | June 11, 2026 | 2ndMost Recent Occupancy (As of): | 100.0% (12/31/2014) | ||||
| IO Period: | 120 months | Most Recent Occupancy (As of): | 100.0% (12/31/2015) | ||||
| Loan Term (Original): | 120 months | Current Occupancy (As of): | 100.0% (8/1/2016) | ||||
| Seasoning: | 2 months | ||||||
| Amortization Term (Original): | NAP | Underwriting and Financial Information: | |||||
| Loan Amortization Type: | Interest-only, Balloon | ||||||
| Interest Accrual Method: | Actual/360 | 4thMost Recent NOI(3): | NAV | ||||
| Call Protection: | L(36),GRTR 1% or YM(80),O(4) | 3rdMost Recent NOI (As of): | $7,882,478 (12/31/2014) | ||||
| Lockbox Type: | Hard/Upfront Cash Management | 2ndMost Recent NOI (As of): | $7,794,991 (12/31/2015) | ||||
| Additional Debt(1): | Yes | Most Recent NOI (As of): | $7,572,595 (TTM 3/31/2016) | ||||
| Additional Debt Type(1): | Pari Passu | ||||||
| U/W Revenues: | $11,664,912 | ||||||
| U/W Expenses: | $3,645,672 | ||||||
| U/W NOI: | $8,019,240 | ||||||
| U/W NCF: | $7,423,010 | ||||||
| U/W NOI DSCR(1): | 2.11x | ||||||
| U/W NCF DSCR(1): | 1.96x | ||||||
| Escrows and Reserves(2): | U/W NOI Debt Yield(1): | 9.2% | |||||
| U/W NCF Debt Yield(1): | 8.5% | ||||||
| Type: | Initial | Monthly | Cap (If Any) | As-Is Appraised Value: | $142,000,000 | ||
| Taxes | $370,935 | $123,645 | NAP | As-Is Appraisal Valuation Date: | May 5, 2016 | ||
| Insurance | $0 | Springing | NAP | Cut-off Date LTV Ratio(1): | 61.3% | ||
| Replacement Reserves | $0 | Springing | (2) | LTV Ratio at Maturity or ARD(1): | 61.3% | ||
| (1) | The Pinnacle II Whole Loan (as defined below), which had an original principal balance of $87,000,000, is comprised of threepari passu notes (Notes A-1, A-2 and A-3). The controlling Note A-1 had an original principal balance of $40,000,000, has an outstanding principal balance of $40,000,000 as of the Cut-Off Date and will be contributed to the WFCM 2016-BNK1 Trust. The non-controlling Note A-2 had an original principal balance of $20,000,000 and is expected to be contributed to the WFCM 2016-C35 Trust; and the non-controlling Note A-3 had an original principal balance of $27,000,000 and is expected to be contributed to a future securitization trust. All statistical financial information related to balances per square foot, loan-to-value ratios, debt service coverage ratios and debt yields are based on the Pinnacle II Whole Loan. The lender provides no assurances that any non-securitizedpari passu note will not be split further. |
| (2) | See “Escrows” section. |
| (3) | Historical financial information was not provided prior to 2014, as one of the sponsors purchased a majority interest in the Pinnacle II Property in 2013 and is now managing the Pinnacle II Property through an affiliated company. |
The Mortgage Loan.The mortgage loan (the “Pinnacle II Mortgage Loan”) is part of a whole loan (the “Pinnacle II Whole Loan”) that is evidenced by threepari passu promissory notes (Notes A-1, A-2 and A-3) secured by a first mortgage encumbering the fee interest in a class A office building located in Burbank, California (the “Pinnacle II Property”). The Pinnacle II Whole Loan was originated on June 7, 2016 by Wells Fargo Bank, National Association. The Pinnacle II Whole Loan had an original principal balance of $87,000,000, has an outstanding principal balance as of the Cut-off Date of $87,000,000 and accrues interest at an interest rate of 4.300%per annum. The Pinnacle II Whole Loan had an initial term of 120 months, has a remaining term of 118 months as of the Cut-off Date and requires payments of interest only through the term of the Pinnacle II Whole Loan. The Pinnacle II Whole Loan matures on June 11, 2026. See “Description of the Mortgage Pool—The Whole Loans – The Serviced Pari Passu Whole Loans – the Pinnacle II Whole Loan” and “Pooling and Servicing Agreement” in the Preliminary Prospectus.
The Pinnacle II Mortgage Loan, evidenced by the controlling Note A-1, which will be contributed to the WFCM 2016-BNK1 Trust, had an original principal balance of $40,000,000 and has an outstanding principal balance as of the Cut-off Date of $40,000,000. The non-controlling Note A-2, which had an original principal balance of $20,000,000, is expected to be contributed to the WFCM 2016-C35 Trust. The non-controlling Note A-3, which had an original principal balance of $27,000,000, is expected to be contributed to a future securitization trust. Each of the mortgage loans evidenced by Notes A-2 and A-3 are referred to herein as the “Pinnacle II Companion Loans”. The lender provides no assurances that any non-securitizedpari passu note will not be split further.
THE INFORMATION IN THIS STRUCTURAL AND COLLATERAL TERM SHEET IS NOT COMPLETE AND MAY BE AMENDED PRIOR TO THE TIME OF SALE. THIS TERM SHEET IS NOT AN OFFER TO SELL THESE SECURITIES AND IT IS NOT A SOLICITATION OF AN OFFER TO BUY THESE SECURITIES IN ANY JURISDICTION WHERE THE OFFER OR SALE IS NOT PERMITTED.
74
| PINNACLE II |
Note Summary
| Notes | Original Balance | Note Holder | Controlling Interest | |
| A-1 | $40,000,000 | WFCM 2016-BNK1 | Yes | |
| A-2 | $20,000,000 | WFCM 2016-C35 | No | |
| A-3 | $27,000,000 | Wells Fargo Bank, National Association | No | |
| Total | $87,000,000 |
Sources and Uses
| Sources | Uses | ||||||||
| Original whole loan | $87,000,000 | 99.6 | % | Loan payoff(1) | $86,203,966 | 98.6% | |||
| Sponsor’s new cash contribution | 390,399 | 0.4 | Reserves | 370,935 | 0.4 | ||||
| Closing costs | 815,497 | 0.9 | |||||||
| Total Sources | $87,390,399 | 100.0 | % | Total Uses | $87,390,399 | 100.0% | |||
| (1) | The Pinnacle II Property was previously securitized in the GSMS 2006-GG8 transaction. The loan payoff amount also includes a $4.9 million B-note. |
The Property.The Pinnacle II Property is a 230,000 square foot, six-story, class A, single-tenant office building located in Burbank, California. Built by the sponsors in 2005, the Pinnacle II Property is situated on a 1.5-acre site and is part of a larger 4.3-acre entertainment and media campus. The Pinnacle II Property is situated adjacent to Pinnacle I (not part of the collateral), a 393,776 square foot multi-tenant office property that is approximately 95.0% leased to entertainment industry tenants, and was also built by the sponsors in 2002. The Pinnacle II Property has been 100.0% leased to Warner Brothers Entertainment Inc. (“Warner Brothers”) since construction and is located approximately two blocks from the 142-acre Warner Brothers Studios, the company’s headquarters since 1928. Combined with the 32-acre Warner Brothers Ranch located a half-mile from the Pinnacle II Property, Warner Brothers offers 35 soundstages (including one of the world’s tallest stages with an in-ground tank capable of holding more than two million gallons of water) and 15 back lot locations. Warner Brothers’ parent company, Time Warner Inc., reported 2015 total revenue of approximately $28.1 billion, of which Warner Brothers accounted for approximately $13.0 billion, or 46.2%. The Pinnacle II Property houses the Warner Brothers Technology Solutions staff. The Pinnacle II Property contains 683 underground parking spaces, resulting in a parking ratio of 3.0 spaces per 1,000 square feet of rentable area. As of August 1, 2016 the Pinnacle II Property was 100.0% occupied by Warner Brothers.
The following table presents certain information relating to the tenancy at the Pinnacle II Property:
Major Tenant
| Tenant Name | Credit Rating (Fitch/ Moody’s/ S&P)(1) | Tenant NRSF | % of NRSF | Annual U/W Base Rent PSF(2) | Annual U/W Base Rent(2) | % of Total Annual U/W Base Rent | Lease Expiration Date |
| Major Tenant | |||||||
| Warner Brothers(3) | BBB+/Baa2/BBB | 230,000 | 100.0% | $42.00 | $9,659,219 | 100.0% | 12/31/2021(4) |
| Total Major Tenant | 230,000 | 100.0% | $42.00 | $9,659,219 | 100.0% | ||
| Occupied Collateral Total | 230,000 | 100.0% | $42.00 | $9,659,219 | 100.0% | ||
| Vacant Space | 0 | 0.0% | |||||
| Collateral Total | 230,000 | 100.0% | |||||
| (1) | Ratings shown are those of the parent company Time Warner Inc. Time Warner Inc. does not guarantee the lease. |
| (2) | Annual U/W Base Rent PSF and Annual U/W Base Rent reflect the average rent over the lease term. The current base rent PSF is $39.56 ($9,099,396 annually). |
| (3) | Warner Brothers subleases 40,165 square feet (17.5% of net rentable area) to the CW Television Network, a 50/50 joint venture between Warner Brothers and CBS Corporation, for $2,094,794 annually ($52.15 per square foot, full-service gross). The sublease expiration is coterminous with the primary lease expiration date of December 31, 2021. Annual U/W Base Rent for this space was underwritten to Warner Brothers’ primary average lease rate of $42.00 per square foot, modified gross. |
| (4) | Warner Brothers has either one, 10-year or two, 5-year lease renewal options at 92.5% of market rent. |
THE INFORMATION IN THIS STRUCTURAL AND COLLATERAL TERM SHEET IS NOT COMPLETE AND MAY BE AMENDED PRIOR TO THE TIME OF SALE. THIS TERM SHEET IS NOT AN OFFER TO SELL THESE SECURITIES AND IT IS NOT A SOLICITATION OF AN OFFER TO BUY THESE SECURITIES IN ANY JURISDICTION WHERE THE OFFER OR SALE IS NOT PERMITTED.
75
| PINNACLE II |
The following table presents certain information relating to the lease rollover schedule at the Pinnacle II Property:
Lease Expiration Schedule(1)
| Year Ending December 31, | No. of Leases Expiring | Expiring NRSF | % of Total NRSF | Cumulative Expiring NRSF | Cumulative % of Total NRSF | Annual U/W Base Rent | % of Total Annual U/W Base Rent | Annual U/W Base Rent PSF |
| MTM | 0 | 0 | 0.0% | 0 | 0.0% | $0 | 0.0% | $0.00 |
| 2016 | 0 | 0 | 0.0% | 0 | 0.0% | $0 | 0.0% | $0.00 |
| 2017 | 0 | 0 | 0.0% | 0 | 0.0% | $0 | 0.0% | $0.00 |
| 2018 | 0 | 0 | 0.0% | 0 | 0.0% | $0 | 0.0% | $0.00 |
| 2019 | 0 | 0 | 0.0% | 0 | 0.0% | $0 | 0.0% | $0.00 |
| 2020 | 0 | 0 | 0.0% | 0 | 0.0% | $0 | 0.0% | $0.00 |
| 2021 | 1 | 230,000 | 100.0% | 230,000 | 100.0% | $9,659,219(2) | 100.0% | $42.00(2) |
| 2022 | 0 | 0 | 0.0% | 230,000 | 100.0% | $0 | 0.0% | $0.00 |
| 2023 | 0 | 0 | 0.0% | 230,000 | 100.0% | $0 | 0.0% | $0.00 |
| 2024 | 0 | 0 | 0.0% | 230,000 | 100.0% | $0 | 0.0% | $0.00 |
| 2025 | 0 | 0 | 0.0% | 230,000 | 100.0% | $0 | 0.0% | $0.00 |
| 2026 | 0 | 0 | 0.0% | 230,000 | 100.0% | $0 | 0.0% | $0.00 |
| Thereafter | 0 | 0 | 0.0% | 230,000 | 100.0% | $0 | 0.0% | $0.00 |
| Vacant | 0 | 0 | 0.0% | 230,000 | 100.0% | $0 | 0.0% | $0.00 |
| Total/Weighted Average | 1 | 230,000 | 100.0% | $9,659,219(2) | 100.0% | $42.00(2) |
| (1) | Information obtained from the underwritten rent roll. |
| (2) | Annual U/W Base Rent PSF and Annual U/W Base Rent reflect the average rent over the lease term. The current base rent PSF is $39.56 ($9,099,396 annually). |
The following table presents historical occupancy percentages at the Pinnacle II Property:
Historical Occupancy
12/31/2012(1) | 12/31/2013(1) | 12/31/2014(1) | 12/31/2015(1) | 8/1/2016(2) | ||||
| 100.0% | 100.0% | 100.0% | 100.0% | 100.0% |
| (1) | Information obtained from the lease. |
| (2) | Information obtained from the underwrittenrent roll. |
Operating History and Underwritten Net Cash Flow. The following table presents certain information relating to the historical operating performance and underwritten net cash flow at the Pinnacle II Property:
Cash Flow Analysis(1)
| 2014 | 2015 | TTM 3/31/2016 | U/W | % of U/W Effective Gross Income | U/W $ per SF | |
| Base Rent | $8,795,391 | $8,949,200 | $8,988,325 | $9,659,219(2) | 82.8% | $42.00 |
| Grossed Up Vacant Space | 0 | 0 | 0 | 0 | 0.0 | 0.00 |
| Total Reimbursables | 1,389,367 | 1,411,333 | 1,211,984 | 1,309,053 | 11.2 | 5.69 |
| Other Income | 1,329,897 | 1,076,098 | 1,035,764 | 1,295,511 | 11.1 | 5.63 |
| Less Vacancy & Credit Loss | 0 | 0 | 0 | (598,872)(3) | (5.1) | (2.60) |
| Effective Gross Income | $11,514,655 | $11,436,631 | $11,236,073 | $11,664,912 | 100.0% | $50.72 |
| Total Operating Expenses | $3,632,177
| $3,641,640
| $3,663,478
| $3,645,672
| 31.3%
| $15.85
|
| Net Operating Income | $7,882,478 | $7,794,991 | $7,572,595 | $8,019,240 | 68.7% | $34.87 |
| TI/LC | 0 | 0 | 0 | 550,230 | 4.7 | 2.39 |
| Capital Expenditures | 0 | 0 | 0 | 46,000 | 0.4 | 0.20 |
| Net Cash Flow | $7,882,478 | $7,794,991 | $7,572,595 | $7,423,010 | 63.6% | 32.27 |
| NOI DSCR(4) | 2.08x | 2.06x | 2.00x | 2.11x | ||
| NCF DSCR(4) | 2.08x | 2.06x | 2.00x | 1.96x | ||
| NOI DY(4) | 9.1% | 9.0% | 8.7% | 9.2% | ||
| NCF DY(4) | 9.1% | 9.0% | 8.7% | 8.5% |
| (1) | Historical financial information was not provided prior to 2014, as one of the sponsors purchased a majority interest in the Pinnacle II Property in 2013 and is now managing the Pinnacle II Property through an affiliated company. |
| (2) | U/W Base Rent reflects the average rent over the lease term. The current base rent is $9,099,396 annually ($39.56 per square foot). |
| (3) | The underwritten economic vacancy is 6.2%. The Pinnacle II Property was 100.0% physically occupied as of August 1, 2016. |
| (4) | The debt service coverage ratios and debt yields are based on the Pinnacle II Whole Loan. |
THE INFORMATION IN THIS STRUCTURAL AND COLLATERAL TERM SHEET IS NOT COMPLETE AND MAY BE AMENDED PRIOR TO THE TIME OF SALE. THIS TERM SHEET IS NOT AN OFFER TO SELL THESE SECURITIES AND IT IS NOT A SOLICITATION OF AN OFFER TO BUY THESE SECURITIES IN ANY JURISDICTION WHERE THE OFFER OR SALE IS NOT PERMITTED.
76
| PINNACLE II |
Appraisal. As of the appraisal valuation date of May 5, 2016, the Pinnacle II Property had an “as-is” appraised value of $142,000,000.
Environmental Matters. According to the Phase I environmental site assessment dated May 16, 2016, there was no evidence of any recognized environmental conditions at the Pinnacle II Property.
Market Overview and Competition.The Pinnacle II Property is located in the southwest portion of the city of Burbank, California, approximately 11.3 miles northwest of the Los Angeles central business district, in the area known as the “Media District”. In addition to its close proximity to the interstate network, Burbank is situated at the convergence of 14 local and express bus lines, making it the third most active Metropolitan Transit Authority bus transfer center in Los Angeles County. Burbank is referred to as the “media capital of the world” and is home to Warner Brothers, Walt Disney Company and NBC Studios. According to the appraisal, the 2015 estimated population within a one-, three- and five-mile radius of the Pinnacle II Property was 18,019, 191,728 and 645,328, respectively; while the 2015 estimated average household income within the same radii was $96,217, $88,976 and $84,324, respectively.
According to the appraisal, the Pinnacle II Property is located in the Media District micro-market of the Burbank office submarket. According to a third-party market research report, as of the first quarter of 2016, the Burbank class A office submarket contained a total inventory of 45 buildings totaling approximately 7.3 million square feet with a 12.4% vacancy rate. Excluding a 498,386 square foot building (“The Tower”) that is still in lease-up after the sole tenant vacated, the submarket vacancy rate is approximately 6.6%. Since 1996, the Burbank class A submarket has reported an average occupancy rate of 89.5%. According to the appraisal, for the same period, the Burbank Media District micro-market contained a total inventory of 3.2 million square feet with a 17.6% vacancy rate. Excluding The Tower, the micro-market vacancy rate is approximately 8.0%. The appraiser concluded to a market rent for the Pinnacle II Property of $42.00 per square foot with 3.0% annual escalations.
The following table presents certain information relating to comparable office leases for the Pinnacle II Property:
Comparable Leases(1)
| Property Name/Location | Year Built/ Renovated | Number of Stories | Total GLA (SF) | Total Occupancy | Distance from Subject | Tenant Name | Lease Date/Term | Lease Area (SF) | Annual Base Rent PSF | Lease Type |
| Burbank Studios Burbank, CA | 1956/NAV | 3 | 114,943 | 37.3% | <0.1 mile | NAV | 1stQtr 2015 / 10.0 Yrs | 108,000 | $36.00 | NNN |
| The Tower Burbank, CA | 1969/NAV | 32 | 498,386 | 30.4% | 0.5 miles | NAV | 1stQtr 2016 / 10.0 Yrs | 37,370 | $39.00 | FSG |
| Legacy Media Tower Burbank, CA | 1986/NAV | 10 | 150,755 | 96.3% | 0.5 miles | NAV | 2ndQtr 2016 / 5.4 Yrs | 1,900 | $39.00 | FSG |
| The Pinnacle I Burbank, CA | 2002/NAV | 6 | 393,776 | 95.1% | <0.1 mile | NAV | 4thQtr 2015 / 10.8 Yrs | 75,214 | $42.00 | FSG |
Central Park at Toluca Lake Burbank, CA | 1985/NAV | 15 | 249,000 | 81.8% | 0.2 miles | NAV | 1stQtr 2016 / 5 Yrs | 3,898 | $42.60 | FSG |
| Business Arts Plaza Burbank, CA | 1985/NAV | 8 | 152,469 | 71.4% | 0.4 miles | NAV | 2ndQtr 2016 / 5 Yrs | 60,000 | $38.40 | FSG |
| The Pointe – Phase I Burbank, CA | 2009/NAV | 14 | 480,645 | 93.2% | 0.4 miles | NAV | NAV | NAV | $46.20 | FSG |
| (1) | Information obtained from the appraisal and third-party market research reports. |
The Borrower.The borrower is P2 Hudson MC Partners, LLC, a Delaware limited liability company and single purpose entity with two independent directors. Legal counsel to the borrower delivered a non-consolidation opinion in connection with the origination of the Pinnacle II Whole Loan. Hudson MC Partners, LLC is the guarantor of certain nonrecourse carveouts under the Pinnacle II Whole Loan.
The Sponsors. The sponsors are Hudson Pacific Properties, L.P. (“Hudson Pacific”) and M. David Paul Development, LLC (“M. David Paul”). Founded in 2006, Hudson Pacific is a vertically integrated real estate company focused on acquiring, repositioning, developing and operating high quality office and state-of-the-art media and entertainment properties in select west coast markets. Hudson Pacific has assembled a commercial real estate portfolio totaling approximately 17.0 million square feet in submarkets throughout Northern and Southern California and the Pacific Northwest. Founded in 1967, M. David Paul has engaged in development and acquisition activities focused in the Los Angeles area. M. David Paul, along with its sister companies, Worthe Real Estate Group and Krismar Construction, own and operate a portfolio of 24 commercial real estate properties totaling approximately 5.3 million square feet, including six office buildings totaling 2.3 million square feet in the Burbank Media District submarket, accounting for approximately 60.9% of the total submarket inventory.
Escrows.The loan documents provide for an upfront escrow at closing in the amount of $370,935 for real estate taxes. The loan documents provide for ongoing monthly reserves of $123,645 for real estate taxes. Ongoing reserves for insurance premiums are not required as long as (i) no event of default has occurred and is continuing; (ii) the Pinnacle II Property is insured via an acceptable blanket insurance policy; and (iii) the borrower provides the lender with evidence of renewal of the insurance policies and timely proof of payment of insurance premiums. Upon the occurrence of a Cash Trap Event Period (as defined below), ongoing
THE INFORMATION IN THIS STRUCTURAL AND COLLATERAL TERM SHEET IS NOT COMPLETE AND MAY BE AMENDED PRIOR TO THE TIME OF SALE. THIS TERM SHEET IS NOT AN OFFER TO SELL THESE SECURITIES AND IT IS NOT A SOLICITATION OF AN OFFER TO BUY THESE SECURITIES IN ANY JURISDICTION WHERE THE OFFER OR SALE IS NOT PERMITTED.
77
| PINNACLE II |
monthly replacement reserves of $3,833 will be required, subject to a cap of $138,000 provided no event of default has occurred and is continuing and the lender determines the Pinnacle II Property is being adequately maintained.
Lockbox and Cash Management. The Pinnacle II Whole Loan requires a lender-controlled lockbox account, which is already in place and that the borrower directs all tenants to pay their rents directly to such lockbox account. The loan documents also require that all rents received by the borrower or the property manager be deposited into the lockbox account. Prior to the occurrence of a Cash Trap Event Period (as defined below), all excess funds are distributed to the borrower. During a Cash Trap Event Period, all excess cash flow is required to be swept to a lender-controlled cash management account.
A “Cash Trap Event Period” will commence upon the earlier of (i) the occurrence and continuance of an event of default; (ii) the amortizing debt service coverage ratio falling below 1.30x at the end of any calendar month; (iii) Warner Brothers going dark in 35.0% or more of its space; (iv) Warner Brothers vacating or otherwise failing to occupy its premises; (v) Warner Brothers failing to exercise its lease extension option at least 18 months prior to lease expiration or (vi) Warner Brothers filing for bankruptcy or a similar insolvency proceeding. A Cash Trap Event Period will end, with respect to clause (i), upon the cure of such event of default; with respect to clause (ii), upon the amortizing debt service coverage ratio being equal to or greater than 1.35x for two consecutive calendar quarters; with respect to clause (iii), upon the earlier of (a) Warner Brothers re-occupying more than 65.0% of the net rentable area for 180 consecutive days or (b) the amount on deposit in the excess cash flow reserve equaling $9.2 million; with respect to clause (iv), upon the earliest of (x) the Warner Brothers lease being renewed or extended, (y) the borrower releasing the space to an acceptable replacement tenant and the replacement tenant commencing rent payments or (z) the amount on deposit in the excess cash flow reserve equaling $9.2 million; with respect to clause (v), upon the earlier of (a) the Warner Brothers lease being renewed or (b) the amount on deposit in the excess cash flow reserve equaling $9.2 million (provided that the borrower is required to deposit an amount equal to (1) $40 per square foot for all non-renewed space, minus (2) the aggregate amount on deposit at the end of the 18-month notice period); and with respect to clause (vi), upon the earlier of (x) the bankruptcy or insolvency proceedings being terminated or the Warner Brothers lease being affirmed or (y) the amount on deposit in the excess cash flow reserve equaling $9.2 million.
Property Management. The Pinnacle II Property is managed by an affiliate of the borrower.
Assumption.The borrower has a two-time right to transfer the Pinnacle II Property provided that certain conditions are satisfied, including (i) no event of default has occurred and is continuing; (ii) the lender has reasonably determined that the proposed transferee and guarantor satisfy the lender’s credit review and underwriting standards, taking into consideration transferee experience, financial strength and general business standing; and (iii) if requested by lender, rating agency confirmation from Fitch, KBRA, Moody’s and S&P that such assumption will not result in a downgrade, withdrawal or qualification of the respective ratings assigned to the Series 2016-BNK1 certificates and similar confirmations from each rating agency rating any securities backed by any Pinnacle II Companion Loans with respect to the ratings of such securities.
Right of First Offer.Warner Brothers has a right of first offer (“ROFO”) to purchase the Pinnacle II Property if the borrower decides to market the building for sale. The ROFO is not extinguished by foreclosure; however, the ROFO does not apply to foreclosure or deed in lieu thereof.
Partial Release. Provided no event of default has occurred and is continuing, the borrower has the right to transfer and obtain a free release of excess development rights related to the Pinnacle II Property.
Real Estate Substitution.Not permitted.
Subordinate and Mezzanine Indebtedness.None.
Ground Lease. None.
Terrorism Insurance.The loan documents require that the “all risk” insurance policy required to be maintained by the borrower provide coverage for terrorism in an amount equal to the full replacement cost of the Pinnacle II Property, as well as business interruption insurance covering no less than the 24-month period following the occurrence of a casualty event, together with a six-month extended period of indemnity.
Earthquake Insurance. The loan documents do not require earthquake insurance. The seismic report indicated a probable maximum loss of 10%.
THE INFORMATION IN THIS STRUCTURAL AND COLLATERAL TERM SHEET IS NOT COMPLETE AND MAY BE AMENDED PRIOR TO THE TIME OF SALE. THIS TERM SHEET IS NOT AN OFFER TO SELL THESE SECURITIES AND IT IS NOT A SOLICITATION OF AN OFFER TO BUY THESE SECURITIES IN ANY JURISDICTION WHERE THE OFFER OR SALE IS NOT PERMITTED.
78
(THIS PAGE INTENTIONALLY LEFT BLANK)
THE INFORMATION IN THIS STRUCTURAL AND COLLATERAL TERM SHEET IS NOT COMPLETE AND MAY BE AMENDED PRIOR TO THE TIME OF SALE. THIS TERM SHEET IS NOT AN OFFER TO SELL THESE SECURITIES AND IT IS NOT A SOLICITATION OF AN OFFER TO BUY THESE SECURITIES IN ANY JURISDICTION WHERE THE OFFER OR SALE IS NOT PERMITTED.
79
(THIS PAGE INTENTIONALLY LEFT BLANK)
THE INFORMATION IN THIS STRUCTURAL AND COLLATERAL TERM SHEET IS NOT COMPLETE AND MAY BE AMENDED PRIOR TO THE TIME OF SALE. THIS TERM SHEET IS NOT AN OFFER TO SELL THESE SECURITIES AND IT IS NOT A SOLICITATION OF AN OFFER TO BUY THESE SECURITIES IN ANY JURISDICTION WHERE THE OFFER OR SALE IS NOT PERMITTED.
80
| BREWERS HILL |
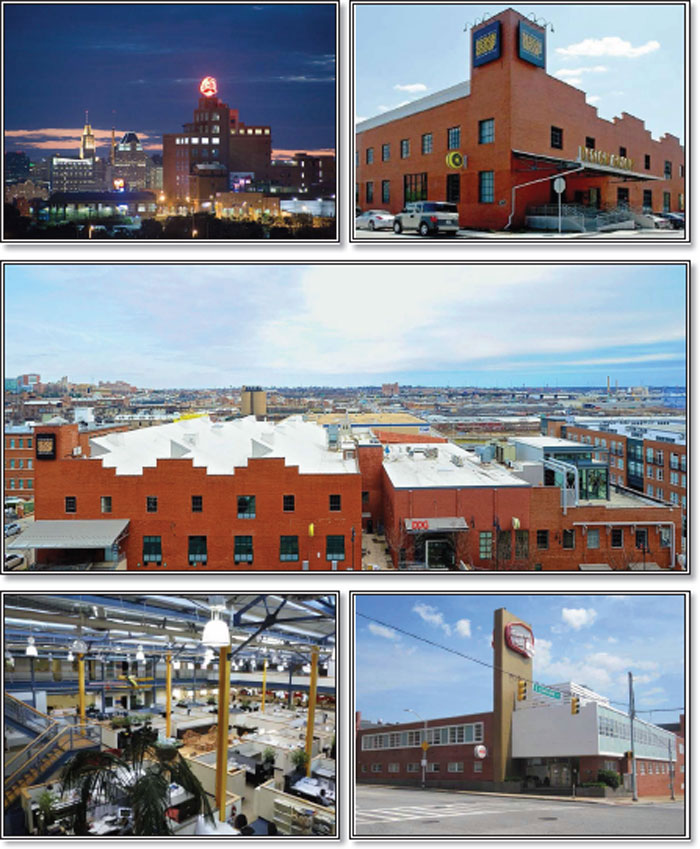
THE INFORMATION IN THIS STRUCTURAL AND COLLATERAL TERM SHEET IS NOT COMPLETE AND MAY BE AMENDED PRIOR TO THE TIME OF SALE. THIS TERM SHEET IS NOT AN OFFER TO SELL THESE SECURITIES AND IT IS NOT A SOLICITATION OF AN OFFER TO BUY THESE SECURITIES IN ANY JURISDICTION WHERE THE OFFER OR SALE IS NOT PERMITTED.
81
| BREWERS HILL |
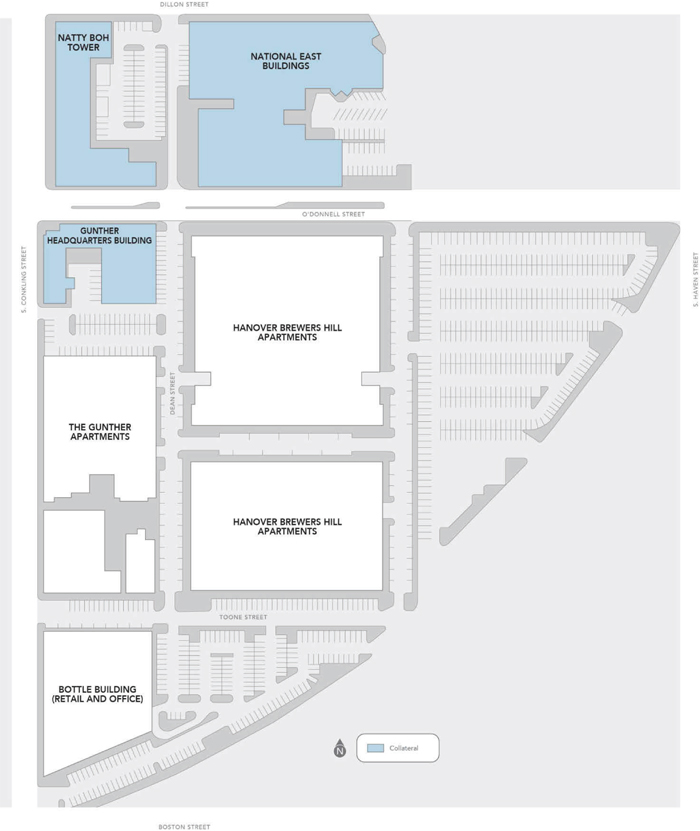
THE INFORMATION IN THIS STRUCTURAL AND COLLATERAL TERM SHEET IS NOT COMPLETE AND MAY BE AMENDED PRIOR TO THE TIME OF SALE. THIS TERM SHEET IS NOT AN OFFER TO SELL THESE SECURITIES AND IT IS NOT A SOLICITATION OF AN OFFER TO BUY THESE SECURITIES IN ANY JURISDICTION WHERE THE OFFER OR SALE IS NOT PERMITTED.
82
| BREWERS HILL |
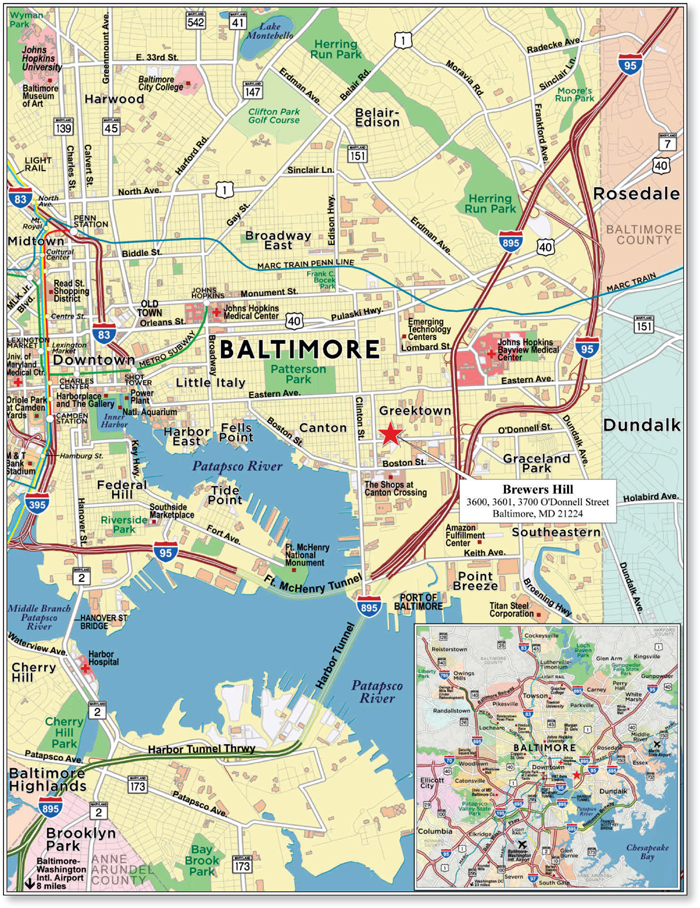
THE INFORMATION IN THIS STRUCTURAL AND COLLATERAL TERM SHEET IS NOT COMPLETE AND MAY BE AMENDED PRIOR TO THE TIME OF SALE. THIS TERM SHEET IS NOT AN OFFER TO SELL THESE SECURITIES AND IT IS NOT A SOLICITATION OF AN OFFER TO BUY THESE SECURITIES IN ANY JURISDICTION WHERE THE OFFER OR SALE IS NOT PERMITTED.
83
| No. 6 – Brewers Hill | |||||||
| Loan Information | Property Information | ||||||
| Mortgage Loan Seller: | Wells Fargo Bank, National Association | Single Asset/Portfolio: | Single Asset | ||||
Credit Assessment (Fitch/KBRA/Moody’s/S&P): | NR/NR/NR/NR | Property Type: | Mixed Use | ||||
| Original Principal Balance: | $40,000,000 | Specific Property Type: | Office/Self Storage | ||||
| Cut-off Date Balance: | $40,000,000 | Location: | Baltimore, MD | ||||
| % of Initial Pool Balance: | 4.6% | Size: | 382,213 SF | ||||
| Loan Purpose: | Refinance | Cut-off Date Balance Per SF: | $104.65 | ||||
| Borrower Names: | Gunther Headquarters LLC; NB3601 LLC; National East LLC | Year Built/Renovated: | 1885/2005 | ||||
| Sponsor: | D.W. Wells Obrecht | Title Vesting: | Fee | ||||
| Mortgage Rate: | 4.300% | Property Manager: | Self-managed | ||||
| Note Date: | July 7, 2016 | 4thMost Recent Occupancy (As of): | 96.7% (12/31/2012) | ||||
| Anticipated Repayment Date: | NAP | 3rdMost Recent Occupancy (As of): | 96.3% (12/31/2013) | ||||
| Maturity Date: | July 11, 2026 | 2ndMost Recent Occupancy (As of): | 95.9% (12/31/2014) | ||||
| IO Period: | 36 months | Most Recent Occupancy (As of): | 96.1% (12/31/2015) | ||||
| Loan Term (Original): | 120 months | Current Occupancy (As of): | 92.6% (6/1/2016) | ||||
| Seasoning: | 1 month | ||||||
| Amortization Term (Original): | 360 months | Underwriting and Financial Information: | |||||
| Loan Amortization Type: | Interest-only, Amortizing Balloon | ||||||
| Interest Accrual Method: | Actual/360 | 4thMost Recent NOI (As of): | $4,756,040 (12/31/2013) | ||||
| Call Protection: | L(25),D(91),O(4) | 3rdMost Recent NOI (As of)(2): | $4,819,340 (12/31/2014) | ||||
| Lockbox Type: | Soft/Springing Cash Management | 2ndMost Recent NOI (As of)(2): | $3,636,583 (12/31/2015) | ||||
| Additional Debt: | None | Most Recent NOI (As of): | $3,840,279 (TTM 4/30/2016) | ||||
| Additional Debt Type: | NAP | ||||||
| U/W Revenues: | $6,258,979 | ||||||
| U/W Expenses: | $2,360,834 | ||||||
| U/W NOI: | $3,898,144 | ||||||
| U/W NCF: | $3,334,842 | ||||||
| Escrows and Reserves(1): | U/W NOI DSCR: | 1.64x | |||||
| U/W NCF DSCR: | 1.40x | ||||||
| Type: | Initial | Monthly | Cap (If Any) | U/W NOI Debt Yield: | 9.7% | ||
| Taxes | $53,116 | $53,118 | NAP | U/W NCF Debt Yield: | 8.3% | ||
| Insurance | $0 | Springing | NAP | As-Is Appraised Value: | $58,000,000 | ||
| Replacement Reserves | $0 | $6,370 | NAP | As-Is Appraisal Valuation Date: | May 26, 2016 | ||
| TI/LC Reserve | $1,500,000 | $48,000 | NAP | Cut-off Date LTV Ratio: | 69.0% | ||
| Cigna TI/LC Reserve | $331,511 | $0 | NAP | LTV Ratio at Maturity or ARD: | 60.1% | ||
| (1) | See “Escrows” section. |
| (2) | See “Cash Flow Analysis” section. |
The Mortgage Loan. The mortgage loan (the “Brewers Hill Mortgage Loan”) is evidenced by a singlepromissory note secured by a first mortgage encumbering a mixed use property located in Baltimore, Maryland (the “Brewers Hill Property”). The Brewers Hill Mortgage Loan was originated on July 7, 2016 by Wells Fargo Bank, National Association. The Brewers Hill Mortgage Loan had an original principal balance of $40,000,000, has an outstanding principal balance as of the Cut-off Date of $40,000,000 and accrues interest at an interest rate of 4.300%per annum. The Brewers Hill Mortgage Loan had an initial term of 120 months, has a remaining term of 119 months as of the Cut-off Date and requires interest-only payments for the first 36 payments following origination and, thereafter, requires payments of principal and interest based on a 30-year amortization schedule. The Brewers Hill Mortgage Loan matures on July 11, 2026.
Following the lockout period, the borrower has the right to defease the Brewers Hill Mortgage Loan in whole, but not in part, on any date before April 11, 2026. In addition, the Brewers Hill Mortgage Loan is prepayable without penalty on or after April 11, 2026.
THE INFORMATION IN THIS STRUCTURAL AND COLLATERAL TERM SHEET IS NOT COMPLETE AND MAY BE AMENDED PRIOR TO THE TIME OF SALE. THIS TERM SHEET IS NOT AN OFFER TO SELL THESE SECURITIES AND IT IS NOT A SOLICITATION OF AN OFFER TO BUY THESE SECURITIES IN ANY JURISDICTION WHERE THE OFFER OR SALE IS NOT PERMITTED.
84
| BREWERS HILL |
Sources and Uses
| Sources | Uses | |||||||
| Original loan amount | $40,000,000 | 100.0% | Loan payoff(1) | $35,970,161 | 89.9% | |||
| Reserves | 1,884,627 | 4.7 | ||||||
| Closing costs | 892,304 | 2.2 | ||||||
| Return of equity | 1,252,908 | 3.1 | ||||||
| Total Sources | $40,000,000 | 100.0% | Total Uses | $40,000,000 | 100.0% | |||
| (1) | The Brewers Hill Property was previously securitized in the JPMCC 2006-CB17 transaction. |
The Property.The Brewers Hill Property is a mixed use office/self storage complex totaling 382,213 square feet situated on a 6.2-acre parcel located within the Canton neighborhood of Baltimore, Maryland, approximately 2.9 miles southeast of the central business district. The Brewers Hill Property comprises 11 adjacent buildings which represent the adaptive reuse of the original National Brewery and Gunther Brewery complexes which were constructed in phases from 1885 to 1966 and underwent a complete renovation in 2005. The Brewers Hill Property is situated within a larger 27.0-acre planned unit development that also includes three multifamily buildings totaling 782 units and 237,000 square feet of retail space (not part of the collateral). In total, investment grade tenants (Cigna-Healthspring (“Cigna”) and AOL Advertising (based on its parent company, Verizon)) account for approximately 38.1% of the net rentable area and 53.6% of the underwritten base rent at the Brewers Hill Property. The Brewers Hill Property features 530 surface parking spaces resulting in a parking ratio of 1.4 spaces per 1,000 feet of rentable area. As of June 1, 2016, the Brewers Hill Property was 92.6% occupied by 22 tenants (28 leases).
The Brewers Hill Property includes three components: Natty Boh Tower (183,561 square feet; 48.0% of the net rentable area), National East (157,390 square feet; 41.2% of the net rentable area) and the Gunther Headquarters building (41,262 square feet; 10.8% of the net rentable area). The Natty Boh Tower consists of five connected brick buildings ranging in height from three to nine stories containing approximately 183,561 square feet; seven floors of the Natty Boh Tower are leased to Canton Self Storage, which contains 748 self-storage units (managed by CubeSmart) and reported 95.9% occupancy as of May 2016. The National East section of the complex includes four interconnected buildings that range from one to three stories and contain approximately 157,390 square feet. Approximately 25,489 square feet of the National East buildings consist of flex/storage space with the remainder used for office use. Major tenants of the National East office space include AOL Advertising, Cigna and Development Design Group (“DDG”). The Gunther Headquarters building consists of a one and two-story former brewery building containing approximately 41,262 square feet and is fully leased to Cigna.
The following table presents certain information relating to the Brewers Hill Property:
| Property Name | Specific Property Type(1) | Number of Buildings(1) | Number of Stories(1) | Net Rentable Area (SF)(1) | Storage/Flex Net Rentable Area (SF)(1) | Office Net Rentable Area (SF)(1) | Office % of NRSF(1) | Largest Tenant Name |
| Natty Boh Tower | Office/Self Storage | 5 | 3-9 | 183,561 | 112,000 | 71,561 | 39.0% | Canton Self Storage |
| National East | Office/Storage | 4 | 1-3 | 157,390 | 25,489 | 131,901 | 83.8% | Cigna |
| Gunther Headquarters | Office | 2 | 1-2 | 41,262 | 0 | 41,262 | 100.0% | Cigna |
| Total/Weighted Average | 11 | 382,213 | 137,489 | 244,724 | 64.0% |
| (1) | Information obtained from the appraisal. |
THE INFORMATION IN THIS STRUCTURAL AND COLLATERAL TERM SHEET IS NOT COMPLETE AND MAY BE AMENDED PRIOR TO THE TIME OF SALE. THIS TERM SHEET IS NOT AN OFFER TO SELL THESE SECURITIES AND IT IS NOT A SOLICITATION OF AN OFFER TO BUY THESE SECURITIES IN ANY JURISDICTION WHERE THE OFFER OR SALE IS NOT PERMITTED.
85
| BREWERS HILL |
The following table presents certain information relating to the tenancies at the Brewers Hill Property:
Major Tenants
| Tenant Name | Credit Rating (Fitch/Moody’s/ S&P)(1) | Tenant NRSF | % of NRSF | Annual U/W Base Rent PSF(2) | Annual U/W Base Rent(2) | % of Total Annual U/W Base Rent | Lease Expiration Date |
| Major Tenants | |||||||
| Cigna(3) | BBB+/Baa1/A | 98,897(3) | 25.9% | $20.93(3) | $2,070,219(3) | 37.2% | Various(4)(5) |
| AOL Advertising | A-/Baa1/BBB+ | 46,587 | 12.2% | $19.62 | $914,168 | 16.4% | 6/30/2022(6) |
| Canton Self Storage(7) | NR/NR/NR | 112,000 | 29.3% | $5.66 | $634,312 | 11.4% | 5/31/2045 |
| DDG | NR/NR/NR | 22,985 | 6.0% | $19.99 | $459,413 | 8.3% | 12/31/2024(8) |
| AECOM | NR/NR/NR | 7,155 | 1.9% | $22.28 | $159,413 | 2.9% | 5/31/2019 |
| Total Major Tenants | 287,624 | 75.3% | $14.73 | $4,237,526 | 76.1% | ||
| Non-Major Tenants | 66,411 | 17.4% | $20.02 | $1,329,394 | 23.9% | ||
| Occupied Collateral Total | 354,035 | 92.6% | $15.72 | $5,566,919 | 100.0% | ||
| Vacant Space | 28,178 | 7.4% | |||||
| Collateral Total | 382,213 | 100.0% | |||||
| (1) | Certain ratings are those of the parent company whether or not the parent company guarantees the lease. |
| (2) | Annual U/W Base Rent PSF and Annual U/W Base Rent include contractual rent steps through December 2016 totaling $169,077. |
| (3) | Cigna subleases 4,770 square feet (1.2% of the net rentable area) to Blispay and 2,342 square feet (0.6%% of the net rentable area) to Coastal Lending on subleases expiring in June 2017 and November 2019, respectively. The aggregate sublease rent for both tenants of $153,654 ($21.60 per square foot) was underwritten as compared to Cigna’s direct lease rent for the subleased space of $194,300 ($27.32 per square foot). Cigna also subleases 25,017 square feet (6.5% of the net rentable area) from GES Exposition Services expiring in April 2019. The sublease rent of $408,276 ($16.32 per square foot) was underwritten as compared to GES Exposition Services’ direct lease rent of $479,826 ($19.18 per square foot). Cigna’s square footage and Annual U/W Base Rent presented above reflect all leased and subleased space. |
| (4) | Cigna leases multiple suites under multiple leases with 4,770 square feet (1.2% of the net rentable area) in the Natty Boh Tower expiring in June 2017; 25,017 square feet (6.5% of the net rentable area) in National East expiring in April 2019; and 69,110 square feet (18.1% of the net rentable area) in the Gunther Headquarters, Natty Boh Tower and National East expiring in November 2019. |
| (5) | Cigna has two, five-year lease extension options. |
| (6) | AOL Advertising has the option to terminate its lease effective June 30, 2020 with required notice by September 30, 2019 and a termination fee of approximately $477,643. |
| (7) | Canton Self Storage is owned by an affiliate of the sponsor. The sponsor personally guarantees the lease. |
| (8) | DDG has the option to terminate its lease effective December 31, 2021 with required notice by March 31, 2021 and a termination fee of approximately $383,524. |
THE INFORMATION IN THIS STRUCTURAL AND COLLATERAL TERM SHEET IS NOT COMPLETE AND MAY BE AMENDED PRIOR TO THE TIME OF SALE. THIS TERM SHEET IS NOT AN OFFER TO SELL THESE SECURITIES AND IT IS NOT A SOLICITATION OF AN OFFER TO BUY THESE SECURITIES IN ANY JURISDICTION WHERE THE OFFER OR SALE IS NOT PERMITTED.
86
| BREWERS HILL |
The following table presents certain information relating to the lease rollover schedule at the Brewers Hill Property:
Lease Expiration Schedule(1)(2)
Year Ending December 31, | No. of Leases Expiring | Expiring NRSF | % of Total NRSF | Cumulative Expiring NRSF | Cumulative % of Total NRSF | Annual U/W Base Rent | % of Total Annual U/W Base Rent | Annual U/W Base Rent PSF(3) |
| MTM | 0 | 0 | 0.0% | 0 | 0.0% | $0 | 0.0% | $0.00 |
| 2016 | 0 | 0 | 0.0% | 0 | 0.0% | $0 | 0.0% | $0.00 |
| 2017 | 5 | 17,436 | 4.6% | 17,436 | 4.6% | $387,340 | 7.0% | $22.21 |
| 2018 | 3 | 7,158 | 1.9% | 24,594 | 6.4% | $149,481 | 2.7% | $20.88 |
| 2019 | 10 | 118,524 | 31.0% | 143,118 | 37.4% | $2,363,360 | 42.5% | $19.94 |
| 2020 | 4 | 18,072 | 4.7% | 161,190 | 42.2% | $405,451 | 7.3% | $22.44 |
| 2021 | 2 | 6,503 | 1.7% | 167,693 | 43.9% | $141,300 | 2.5% | $21.73 |
| 2022 | 1 | 46,587 | 12.2% | 214,280 | 56.1% | $914,168 | 16.4% | $19.62 |
| 2023 | 0 | 0 | 0.0% | 214,280 | 56.1% | $0 | 0.0% | $0.00 |
| 2024 | 2 | 27,755 | 7.3% | 242,035 | 63.3% | $571,508 | 10.3% | $20.59 |
| 2025 | 0 | 0 | 0.0% | 242,035 | 63.3% | $0 | 0.0% | $0.00 |
| 2026 | 0 | 0 | 0.0% | 242,035 | 63.3% | $0 | 0.0% | $0.00 |
| Thereafter | 1 | 112,000 | 29.3% | 354,035 | 92.6% | $634,312 | 11.4% | $5.66 |
| Vacant | 0 | 28,178 | 7.4% | 382,213 | 100.0% | $0 | 0.0% | $0.00 |
| Total/Weighted Average | 28 | 382,213 | 100.0% | $5,566,919 | 100.0% | $15.72 |
| (1) | Information obtained from the underwritten rent roll. |
| (2) | Certain tenants may have lease termination options that are exercisable prior to the originally stated expiration date of the subject lease and that are not considered in the Lease Expiration Schedule. |
| (3) | Weighted Average Annual U/W Base Rent PSF excludes vacant space. |
The following table presents historical occupancy percentages at the Brewers Hill Property:
Historical Occupancy
12/31/2012(1) | 12/31/2013(1) | 12/31/2014(1) | 12/31/2015(1) | 6/1/2016(2) |
| 96.7% | 96.3% | 95.9% | 96.1% | 92.6% |
| (1) | Information obtained from the borrower. |
| (2) | Information obtained from the underwrittenrent roll. |
Operating History and Underwritten Net Cash Flow. The following table presents certain information relating to the historical operating performance and underwritten net cash flow at the Brewers Hill Property:
Cash Flow Analysis
| 2013 | 2014 | 2015 | TTM 4/30/2016 | U/W | % of U/W Effective Gross Income | U/W $ per SF | |||||||||
| Base Rent | $5,730,956 | $5,865,884 | $5,161,714 | $5,474,497 | $5,566,919(2) | 88.9% | $14.56 | ||||||||
| Grossed Up Vacant Space | 0 | 0 | 0 | 0 | 353,698 | 5.7 | 0.93 | ||||||||
| Total Reimbursables | 780,573 | 732,070 | 653,782 | 641,069 | 614,111 | 9.8 | 1.61 | ||||||||
| Other Income | 0 | 0 | 0 | 0 | 77,948(3) | 1.2 | 0.20 | ||||||||
| Less Vacancy & Credit Loss | 0 | 0 | 0 | 0 | (353,698)(4) | (5.7) | (0.93) | ||||||||
| Effective Gross Income | $6,511,530 | $6,597,954 | $5,815,496 | $6,115,566 | $6,258,979 | 100.0% | $16.38 | ||||||||
| Total Operating Expenses | $1,755,490 | $1,778,614 | $2,178,913 | $2,275,287 | $2,360,834 | 37.7% | $6.18 | ||||||||
| Net Operating Income | $4,756,040 | $4,819,340(1) | $3,636,583(1) | $3,840,279 | $3,898,144 | 62.3% | $10.20 | ||||||||
| TI/LC | 0 | 0 | 0 | 0 | 486,860 | 7.8 | 1.27 | ||||||||
| Capital Expenditures | 0 | 0 | 0 | 0 | 76,443 | 1.2 | 0.20 | ||||||||
| Net Cash Flow | $4,756,040 | $4,819,340 | $3,636,583 | $3,840,279 | $3,334,842 | 53.3% | $8.73 | ||||||||
| NOI DSCR | 2.00x | 2.03x | 1.53x | 1.62x | 1.64x | ||||||||||
| NCF DSCR | 2.00x | 2.03x | 1.53x | 1.62x | 1.40x | ||||||||||
| NOI DY | 11.9% | 12.0% | 9.1% | 9.6% | 9.7% | ||||||||||
| NCF DY | 11.9% | 12.0% | 9.1% | 9.6% | 8.3% |
| (1) | Net Operating Income decreased from 2014 to 2015 primarily due to down time related to DDG relocating to another suite and AOL Advertising moving into the former DDG space. |
| (2) | U/W Base Rent includes contractual rent steps through December 2016 totaling $169,077. |
| (3) | U/W Other Income includes rent related to wireless antennas. |
| (4) | The underwritten economic vacancy is 6.0%. The Brewers Hill Property was 92.6% physically occupied as of June 1, 2016. |
Appraisal.As of the appraisal valuation date of May 26, 2016, the Brewers Hill Property had an “as-is” appraised value of $58,000,000.
THE INFORMATION IN THIS STRUCTURAL AND COLLATERAL TERM SHEET IS NOT COMPLETE AND MAY BE AMENDED PRIOR TO THE TIME OF SALE. THIS TERM SHEET IS NOT AN OFFER TO SELL THESE SECURITIES AND IT IS NOT A SOLICITATION OF AN OFFER TO BUY THESE SECURITIES IN ANY JURISDICTION WHERE THE OFFER OR SALE IS NOT PERMITTED.
87
| BREWERS HILL |
Environmental Matters.According to the Phase I environmental report dated March 8, 2016, there was no evidence of any recognized environmental conditions at the Brewers Hill Property.
Market Overview and Competition.The Brewers Hill Property is located at the northeast and southeast quadrants of O’Donnell Street and S. Conkling Street within the Brewers Hill area in eastern Baltimore City, Maryland. Regional access is provided by major thoroughfares which link surrounding suburban communities to downtown Baltimore including Interstate 83 to the north, the Baltimore-Washington Parkway (Interstate 295) and Interstate 95 to the south and Maryland Route 40 from the east and west. The Brewers Hill and adjacent Canton area is a waterfront community that was historically an industrial area that has undergone significant urban renewal with mixed-use development including residential and retail uses. The Brewers Hill Property is located approximately 2.0 miles east of the Harbor East neighborhood (home to the Legg Mason global headquarters, the Johns Hopkins Carey School of Business and the Four Seasons Baltimore), approximately 2.9 miles southeast of the central business district and 5.9 miles southeast of Johns Hopkins University. Johns Hopkins University and the Johns Hopkins Health System are the largest private employers in the Baltimore metropolitan statistical area with approximately 52,226 employees. The Johns Hopkins Bayview Medical Center is located approximately 1.5 miles northeast of the Brewers Hill Property, which is a primary demand generator for employment, office space and housing in the local area. Founded in 1773, the Johns Hopkins Bayview Medical Center is one of six member institutions in the Johns Hopkins Health System and one of the oldest, continuous health care institutions on the East Coast. Since 1984, approximately $600.0 million has been invested in the Johns Hopkins Bayview Medical Center to transform and modernize the campus.
The Brewers Hill Property is part of the $220.0 million Brewers Hill planned unit development, which is a mixed-use project containing approximately 27.0 acres and includes approximately 500,000 square feet of office space, 237,000 square feet of retail space, 50,000 square feet of flex space, as well as three apartment projects totaling 782 units. The Brewers Hill Property is located across the street from the Shops at Canton Crossing, a retail center anchored by Target and Harris Teeter and featuring several restaurants, including On The Border, Chick-Fil-A and Red Robin. The 2015 population within a one-, three- and five-mile radius of the Brewers Hill Property was 25,998, 171,501 and 466,625, respectively, while the 2015 average household income for the same radii was $78,321, $64,241 and $57,675, respectively.
According to a third party market research report, the Brewers Hill Property is located in the Baltimore Southeast office submarket within the Baltimore office market. As of the second quarter of 2016, the Baltimore Southeast office submarket was comprised of 445 buildings totaling approximately 9.4 million square feet and reported a 4.6% vacancy rate and average asking gross rent of $23.44 per square foot. Further, the micro market located within a one-mile radius of the Brewers Hill Property was comprised of 147 buildings totaling approximately 2.4 million square feet and reported a 2.9% direct vacancy rate as of the second quarter of 2016.
The following table presents certain information relating to comparable office leases for the Brewers Hill Property:
Comparable Leases(1)
| Property Name/Location | Year Built/ Renovated | Stories | Total GLA (SF) | Total Occupancy | Distance from Subject | Tenant Name | Lease Date/Term | Lease Area (SF) | Annual Base Rent PSF | Lease Type |
Foundry on Fort Ave Baltimore, MD | 1900/2003 | 4 | 62,048 | 90% | 3.0 miles | Exponential Interactive | March 2016 / 3.0 Yrs | 3,346 | $23.29 | MG |
McHenry Row II Baltimore, MD | 1921/2014 | 4 | 140,000 | 82% | 2.9 miles | Maryland Automobile Insurance Fund | May 2015 / 15.0 Yrs | 60,000 | $23.95 | MG |
The Warehouse at Baltimore, MD | 1905/1991 | 8 | 350,000 | 86% | 3.4 miles | Wolters Kluwer | March 2015 / 7.0 Yrs | 33,000 | $21.75 | MG |
South Harbor Baltimore, MD | 1920/2002 | 3 | 47,410 | 100% | 3.2 miles | Cyberspa, LLC | February 2015 / 5.4 Yrs | 4,000 | $19.50 | MG |
Swann’s Warf Baltimore, MD | 1850/1986 | 2 | 10,000 | 100% | 1.6 miles | Vaccinogen, Inc. | February 2015 / 3.4 Yrs | 10,000 | $20.75 | MG |
The Can Company Baltimore, MD | 1895/2014 | 4 | 206,992 | 100% | 0.9 miles | Confidential | October 2014 / 10.0 Yrs | 111,004 | $25.75 | MG |
| (1) | Information obtained from the appraisal and a third party market report. |
The Borrowers.The borrowers are Gunther Headquarters LLC, NB3601 LLC and National East LLC, each a Maryland limited liability company and a single purpose entity with one independent director. Legal counsel to the borrowers delivered a non-consolidation opinion in connection with the origination of the Brewers Hill Mortgage Loan. D.W. Wells Obrecht is the guarantor of certain nonrecourse carveouts under the Brewers Hill Mortgage Loan.
The Sponsor.The sponsor is D.W. Wells Obrecht. Mr. Obrecht owns Obrecht Commercial Real Estate Group which was the master developer of the Brewer Hill planned unit development which contains approximately 2.0 million square feet of commercial, retail and residential space. Mr. Obrecht has a net worth in excess of $47.0 million.
THE INFORMATION IN THIS STRUCTURAL AND COLLATERAL TERM SHEET IS NOT COMPLETE AND MAY BE AMENDED PRIOR TO THE TIME OF SALE. THIS TERM SHEET IS NOT AN OFFER TO SELL THESE SECURITIES AND IT IS NOT A SOLICITATION OF AN OFFER TO BUY THESE SECURITIES IN ANY JURISDICTION WHERE THE OFFER OR SALE IS NOT PERMITTED.
88
| BREWERS HILL |
Escrows.The loan documents provide for upfront reserves of $53,116 for real estate taxes, $1.5 million for tenant improvements and leasing commissions (“TI/LCs”) and $331,511 for outstanding TI/LCs related to the Cigna lease. The loan documents also provide for ongoing monthly reserves of $53,118 for real estate taxes; $6,370 for replacement reserves; and $48,000 for TI/LCs for the first three years of the Brewers Hill Mortgage Loan term and, thereafter, monthly deposits of $40,000 are required upon the balance of the TI/LCs reserve falling below $1.0 million. The loan documents do not require monthly escrows for insurance premiums as long as (i) no event of default has occurred and is continuing; (ii) the Brewers Hill Property is insured under an acceptable blanket insurance policy; and (iii) the borrower provides the lender with evidence of renewal of the policies and timely proof of the payment of insurance premiums.
Lockbox and Cash Management.The Brewers Hill Mortgage Loan requires a lender-controlled lockbox account, which is already in place, and the borrower and property manager are required to deposit all rents directly into such lockbox account within two business days of receipt. Prior to the occurrence of a Cash Trap Event Period (as defined below), all funds on deposit in the lockbox account are required to be disbursed to the borrower. Upon the occurrence of a Cash Trap Event Period, the borrowers or manager are required to cause all rents to be deposited directly into such lockbox account and all excess funds in the lockbox account will be swept to a lender-controlled subaccount.
A “Cash Trap Event Period” will commence upon (i) the occurrence and continuance of an event of default; (ii) the amortizing debt service coverage ratio being less than 1.15x at the end of any calendar month; or (iii) Cigna failing to renew its lease or leases at least 12 months prior to expiration for at least 26,000 square feet and the projected amortizing debt service coverage ratio based on the expiration of such non-renewed lease or leases is less than 1.25x. A Cash Trap Event Period will end, with respect to clause (i), upon the cure of such event of default; with respect to clause (ii), upon the amortizing debt service coverage ratio being at least 1.25x for two consecutive calendar quarters; and with respect to clause (iii), (a) upon the lender receiving evidence that Cigna has exercised its renewal options or (b), with respect to any space occupied by Cigna at origination, upon the lender receiving evidence that the Cigna space has been leased to one or more an acceptable replacement tenants, and such tenants are open for business and paying full, unabated rent.
Property Management.The Brewers Hill Office Property is managed by an affiliate of the borrower.
Assumption.The borrower has the two-time right to transfer the Brewers Hill Property,provided that certain conditions are satisfied, including (i) no event of default has occurred and is continuing; (ii) the lender has reasonably determined that the proposed transferee and guarantor satisfy the lender’s credit review and underwriting standards, taking into consideration the transferee’s experience, financial strength and general business standing; and (iii) if required by the lender, rating agency confirmation from Fitch, KBRA, Moody’s and S&P that the transfer will not result in a downgrade, withdrawal or qualification of the respective ratings assigned to the Series 2016-BNK1 certificates.
Partial Release.Not permitted.
Real Estate Substitution.Not permitted.
Subordinate and Mezzanine Indebtedness. Not permitted.
Ground Lease. None.
Terrorism Insurance.The loan documents require that the “all risk” insurance policy required to be maintained by the borrower provide coverage for terrorism in an amount equal to the full replacement cost of the Brewers Hill Property, as well as business interruption insurance covering no less than the 18-month period following the occurrence of a casualty event, together with a six-month extended period of indemnity.
THE INFORMATION IN THIS STRUCTURAL AND COLLATERAL TERM SHEET IS NOT COMPLETE AND MAY BE AMENDED PRIOR TO THE TIME OF SALE. THIS TERM SHEET IS NOT AN OFFER TO SELL THESE SECURITIES AND IT IS NOT A SOLICITATION OF AN OFFER TO BUY THESE SECURITIES IN ANY JURISDICTION WHERE THE OFFER OR SALE IS NOT PERMITTED.
89
(THIS PAGE INTENTIONALLY LEFT BLANK)
THE INFORMATION IN THIS STRUCTURAL AND COLLATERAL TERM SHEET IS NOT COMPLETE AND MAY BE AMENDED PRIOR TO THE TIME OF SALE. THIS TERM SHEET IS NOT AN OFFER TO SELL THESE SECURITIES AND IT IS NOT A SOLICITATION OF AN OFFER TO BUY THESE SECURITIES IN ANY JURISDICTION WHERE THE OFFER OR SALE IS NOT PERMITTED.
90
| SIMON PREMIUM OUTLETS |
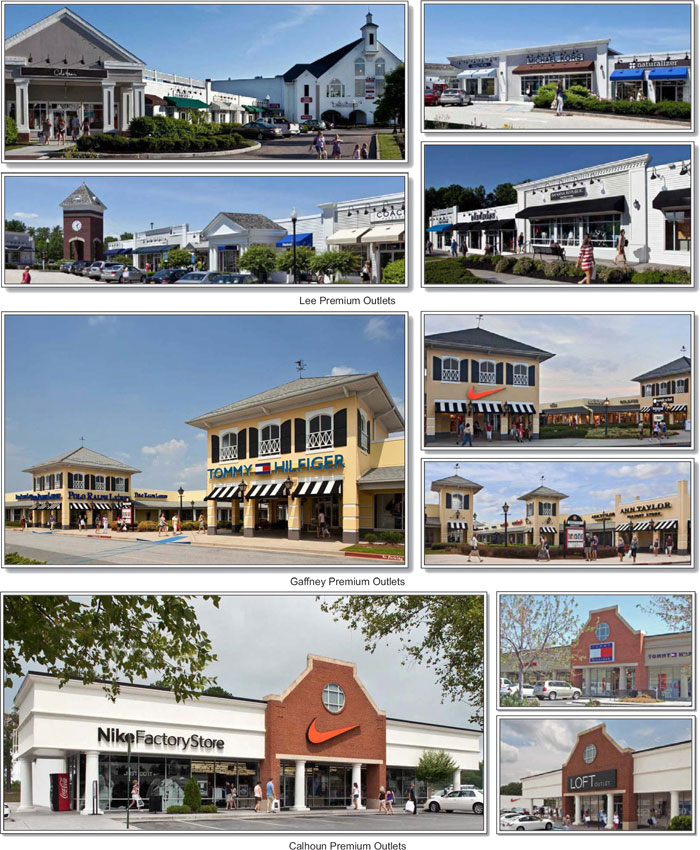
THE INFORMATION IN THIS STRUCTURAL AND COLLATERAL TERM SHEET IS NOT COMPLETE AND MAY BE AMENDED PRIOR TO THE TIME OF SALE. THIS TERM SHEET IS NOT AN OFFER TO SELL THESE SECURITIES AND IT IS NOT A SOLICITATION OF AN OFFER TO BUY THESE SECURITIES IN ANY JURISDICTION WHERE THE OFFER OR SALE IS NOT PERMITTED.
91
| SIMON PREMIUM OUTLETS |
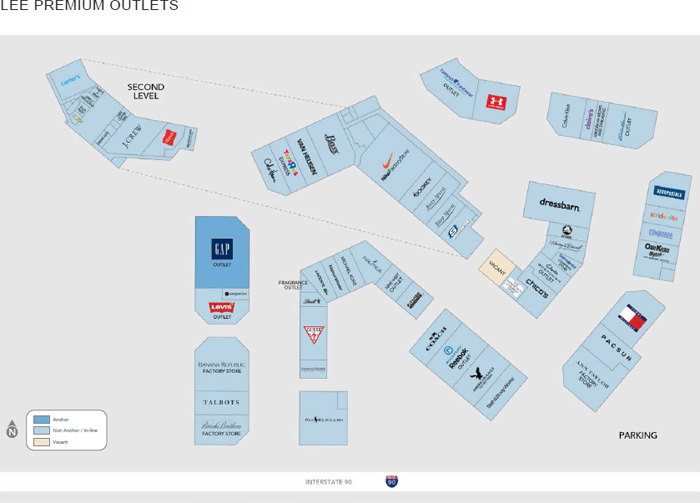
THE INFORMATION IN THIS STRUCTURAL AND COLLATERAL TERM SHEET IS NOT COMPLETE AND MAY BE AMENDED PRIOR TO THE TIME OF SALE. THIS TERM SHEET IS NOT AN OFFER TO SELL THESE SECURITIES AND IT IS NOT A SOLICITATION OF AN OFFER TO BUY THESE SECURITIES IN ANY JURISDICTION WHERE THE OFFER OR SALE IS NOT PERMITTED.
92
| SIMON PREMIUM OUTLETS |
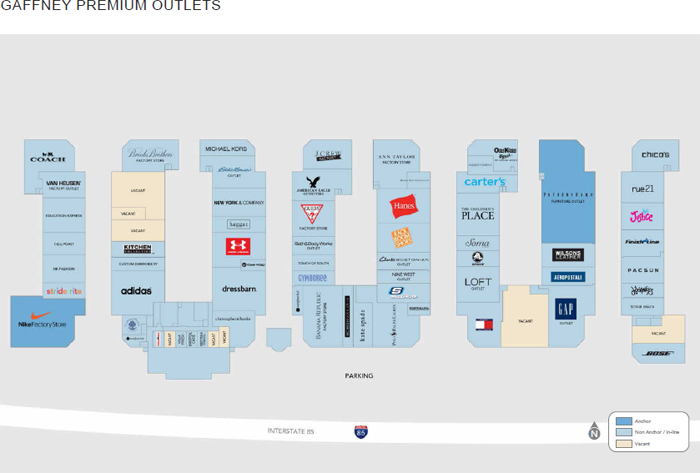
THE INFORMATION IN THIS STRUCTURAL AND COLLATERAL TERM SHEET IS NOT COMPLETE AND MAY BE AMENDED PRIOR TO THE TIME OF SALE. THIS TERM SHEET IS NOT AN OFFER TO SELL THESE SECURITIES AND IT IS NOT A SOLICITATION OF AN OFFER TO BUY THESE SECURITIES IN ANY JURISDICTION WHERE THE OFFER OR SALE IS NOT PERMITTED.
93
| SIMON PREMIUM OUTLETS |
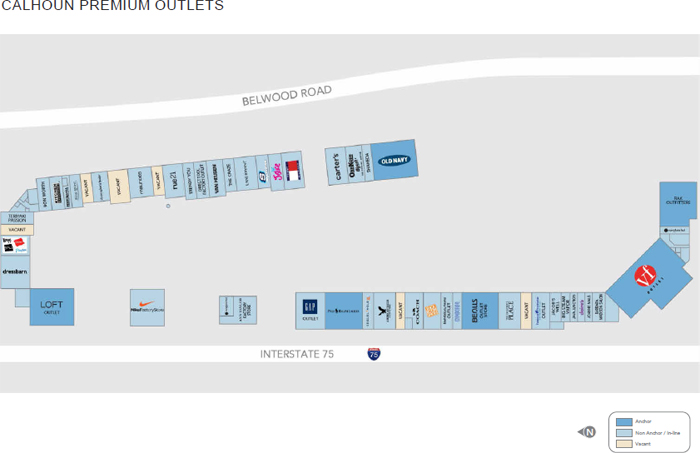
THE INFORMATION IN THIS STRUCTURAL AND COLLATERAL TERM SHEET IS NOT COMPLETE AND MAY BE AMENDED PRIOR TO THE TIME OF SALE. THIS TERM SHEET IS NOT AN OFFER TO SELL THESE SECURITIES AND IT IS NOT A SOLICITATION OF AN OFFER TO BUY THESE SECURITIES IN ANY JURISDICTION WHERE THE OFFER OR SALE IS NOT PERMITTED.
94
| SIMON PREMIUM OUTLETS |
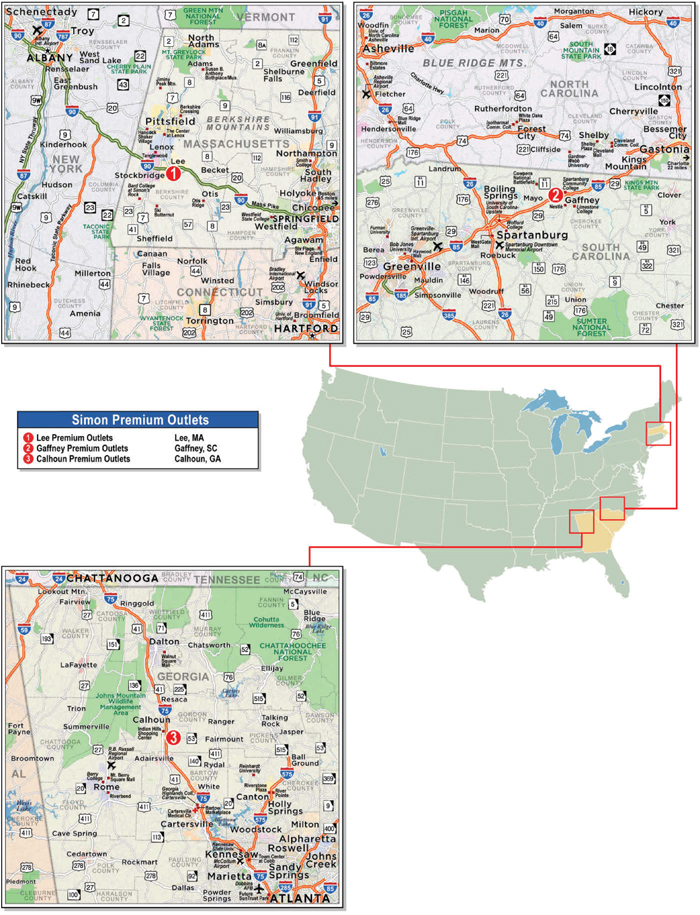
THE INFORMATION IN THIS STRUCTURAL AND COLLATERAL TERM SHEET IS NOT COMPLETE AND MAY BE AMENDED PRIOR TO THE TIME OF SALE. THIS TERM SHEET IS NOT AN OFFER TO SELL THESE SECURITIES AND IT IS NOT A SOLICITATION OF AN OFFER TO BUY THESE SECURITIES IN ANY JURISDICTION WHERE THE OFFER OR SALE IS NOT PERMITTED.
95
| No. 7 – Simon Premium Outlets | ||||||||
| Loan Information | Property Information | |||||||
| Mortgage Loan Seller: | Bank of America, N.A. | Single Asset/Portfolio: | Portfolio | |||||
| Credit Assessment (Fitch/KBRA/Moody’s/S&P): | NR/BBB-/NR/A- | Property Type: | Retail | |||||
| Original Principal Balance(1): | $37,500,000 | Specific Property Type: | Outlet Center | |||||
| Cut-off Date Balance(1): | $37,399,290 | Location: | Various – See Table | |||||
| % of Initial Pool Balance: | 4.3% | Size: | 782,765 SF | |||||
| Loan Purpose: | Refinance | Cut-off Date Balance Per SF(1): | $133.78 | |||||
| Borrower Names(2): | Various | Year Built/Renovated: | Various – See Table | |||||
| Sponsor(3): | Simon Property Group, L.P. | Title Vesting: | Fee | |||||
| Mortgage Rate: | 4.168% | Property Manager: | Self-managed | |||||
| Note Date: | June 1, 2016 | 4thMost Recent Occupancy (As of): | 94.7% (12/31/2012) | |||||
| Anticipated Repayment Date: | NAP | 3rdMost Recent Occupancy (As of): | 95.4% (12/31/2013) | |||||
| Maturity Date: | June 1, 2026 | 2ndMost Recent Occupancy(As of): | 96.4% (12/31/2014) | |||||
| IO Period: | 0 months | Most Recent Occupancy (As of): | 95.1% (12/31/2015) | |||||
| Loan Term (Original): | 120 months | Current Occupancy (As of): | 93.7% (5/19/2016) | |||||
| Seasoning: | 2 months | |||||||
| Amortization Term (Original): | 360 months | Underwriting and Financial Information: | ||||||
| Loan Amortization Type: | Amortizing, Balloon | |||||||
| Interest Accrual Method: | Actual/360 | 4thMost Recent NOI (As of): | $16,529,975 (12/31/2013) | |||||
| Call Protection(4): | L(26),D(87),O(7) | 3rdMost Recent NOI (As of): | $17,379,729 (12/31/2014) | |||||
| Lockbox Type: | Hard/Springing Cash Management | 2ndMost Recent NOI (As of): | $17,863,226 (12/31/2015) | |||||
| Additional Debt(1): | Yes | Most Recent NOI (As of): | $18,457,410 (TTM 3/31/2016) | |||||
| Additional Debt Type(1): | Pari Passu | |||||||
| U/W Revenues: | $24,497,300 | |||||||
| U/W Expenses: | $7,416,196 | |||||||
| U/W NOI: | $17,081,104 | |||||||
| U/W NCF: | $15,675,535 | |||||||
| Escrows and Reserves(5): | U/W NOI DSCR(1): | 2.78x | ||||||
| U/W NCF DSCR(1): | 2.55x | |||||||
| Type: | Initial | Monthly | Cap (If Any) | U/W NOI Debt Yield(1): | 16.3% | |||
| Taxes | $0 | Springing | NAP | U/W NCF Debt Yield(1): | 15.0% | |||
| Insurance | $0 | Springing | NAP | As-Is Appraised Value: | $223,700,000 | |||
| Replacement Reserves | $0 | Springing | $391,383 | As-Is Appraisal Valuation Date(6): | Various | |||
| TI/LC Reserve | $0 | Springing | $3,522,443 | Cut-off Date LTV Ratio(1): | 46.8% | |||
| Deferred Maintenance | $0 | $0 | NAP | LTV Ratio at Maturity or ARD(1): | 37.5% | |||
| (1) | The Simon Premium Outlets Whole Loan (as defined below), which had an original principal balance of $105,000,000, is comprised of threepari passu notes (Notes A-1, A-2 and A-3). The controlling Note A-1 had an original balance of $37,500,000, has an outstanding principal balance of $37,399,290 as of the Cut-off Date and will be contributed to the WFCM 2016-BNK1 Trust. The non-controlling Note A-2, which had an original principal balance of $35,000,000, and non-controlling Note A-3, which had an original principal balance of $32,500,000, are expected to be contributed to one or more future securitization trusts. All statistical information related to balances per square foot, loan-to-value ratios, debt service coverage ratios and debt yields are based on the Simon Premium Outlets Whole Loan. |
| (2) | The borrowers are Calhoun Outlets LLC, Gaffney Outlets LLC and Lee Outlets LLC. |
| (3) | See “The Sponsor” section. |
| (4) | The defeasance lockout period will be at least 26 payment dates beginning with and including the first payment date of July 1, 2016. Defeasance of the Simon Premium Outlets Whole Loan is permitted after the date that is the earlier of (i) two years after the closing date of the securitization that includes the last note to be securitized and (ii) December 1, 2019. The assumed lockout period of 26 payments is based on the expected WFCM 2016-BNK1 Trust closing date in August 2016. |
| (5) | See “Escrows” section. |
| (6) | See “Appraisal” section. |
The Mortgage Loan. The mortgage loan (the “Simon Premium Outlets Mortgage Loan”) is a part of a whole loan (the “Simon Premium Outlets Whole Loan”) evidenced by threepari passu promissory notes (Notes A-1, A-2 and A-3) and secured by a first mortgage encumbering three outlet centers: Lee Premium Outlets located in Lee, Massachusetts (the “Lee Premium Outlets Property”), Gaffney Premium Outlets located in Gaffney, South Carolina (the “Gaffney Premium Outlets Property”) and Calhoun Premium Outlets located in Calhoun, Georgia (the “Calhoun Premium Outlets Property”) (collectively, the “Simon Premium Outlets Properties”). The Simon Premium Outlets Whole Loan was originated on June 1, 2016 by Bank of America, N.A., had an original principal balance of $105,000,000, has an outstanding principal balance as of the Cut-off Date of $104,718,012 and accrues interest at an interest rate of 4.168%per annum. The Simon Premium Outlets Whole Loan had an initial term of 120 months, has a remaining term of 118 months as of the Cut-off Date and requires principal and interest payments based on a 30-year amortization schedule through the term of the Simon Premium Outlets Whole Loan. The Simon Premium Outlets Whole Loan matures on June 1, 2026.
THE INFORMATION IN THIS STRUCTURAL AND COLLATERAL TERM SHEET IS NOT COMPLETE AND MAY BE AMENDED PRIOR TO THE TIME OF SALE. THIS TERM SHEET IS NOT AN OFFER TO SELL THESE SECURITIES AND IT IS NOT A SOLICITATION OF AN OFFER TO BUY THESE SECURITIES IN ANY JURISDICTION WHERE THE OFFER OR SALE IS NOT PERMITTED.
96
| SIMON PREMIUM OUTLETS |
The Simon Premium Outlets Mortgage Loan is evidenced by the controlling Note A-1, will be contributed to the WFCM 2016-BNK1 Trust, had an original principal balance of $37,500,000 and has an outstanding principal balance of $37,399,290 as of the Cut-off Date. The non-controlling Note A-2, with an original principal balance of $35,000,000, and the non-controlling Note A-3, with an original principal balance of $32,500,000 (together, the “Simon Premium Outlets Companion Loan”), are expected to be contributed to one or more future securitization trusts. The lender provides no assurances that any non-securitizedpari passunote will not be split further. See “Description of the Mortgage Pool—The Whole Loans—The Serviced Pari Passu Whole Loans—Simon Premium Outlets Whole Loan” in the Preliminary Prospectus.
Pari Passu Note Summary
| Original Balance | Note Holder | Controlling Piece | |
| Note A-1 | $37,500,000 | WFCM 2016-BNK1 | Yes |
| Note A-2 | $35,000,000 | Bank of America, N.A. | No |
| Note A-3 | $32,500,000 | Bank of America, N.A. | No |
| Total | $105,000,000 |
During the lockout period, the borrower has the right to prepay the Simon Premium Outlets Whole Loan in part to obtain the release of the Gaffney Premium Outlets Property and/or the Calhoun Premium Outlets Property,provided that such prepayment is in the amount of 120.0% of the allocated loan amount for the applicable property and is accompanied by a yield maintenance charge (see ”Partial Release” section); following the lockout period, the borrower has the right to defease the Simon Premium Outlets Whole Loan in whole, or in part for the release of the Gaffney Premium Outlets Property and/or the Calhoun Premium Outlets Property, on any date before or on November 1, 2025. In addition, the Simon Premium Outlets Whole Loan is prepayable without penalty after November 1, 2025.
Sources and Uses(1)
| Sources | Uses | |||||||
| Original whole loan amount | $105,000,000 | 100.0% | Loan payoff(1) | $102,360,551 | 97.5% | |||
| Closing costs | 592,456 | 0.6 | ||||||
| Return of equity | 2,046,993 | 1.9 | ||||||
| Total Sources | $105,000,000 | 100.0% | Total Uses | $105,000,000 | 100.0% |
| (1) | The Simon Premium Outlets Properties were previously securitized in the JPMCC 2006-CB16 transaction. |
The Properties.The Simon Premium Outlets Properties are secured by the fee interest in three cross-defaulted outlet properties totaling 782,765 square feet located in Lee, Massachusetts, Gaffney, South Carolina and Calhoun, Georgia. The Simon Premium Outlets Properties were 93.7% leased as of May 19, 2016 and generated total sales of approximately $215.9 million for the trailing-twelve month period ended March 2016, which was an approximate $1.1 million increase over 2015 sales.
The Lee Premium Outlets Property contains 224,825 square feet and is situated on a 104.8-acre parcel. The center was constructed in 1997 and consists of ten one-story buildings and one two-story building flanking a central village “Main Street” and includes a central food court. There are 1,098 surface parking spaces. The top three tenants by size at the Lee Premium Outlets Property are Gap Outlet (12,113 square feet), Nike Factory Store (9,966 square feet) and Banana Republic Factory Store (8,756 square feet). No other tenant comprises more than 3.5% of the net rentable area. The Lee Premium Outlets Property is 97.8% occupied and had inline sales of $401 per square foot for the trailing twelve months ended March 31, 2016, resulting in an occupancy cost of 11.9%. Net operating income for the trailing twelve months ended March 2016 was $8,128,469, resulting in an operating margin of 73.3%.
The Gaffney Premium Outlets Property contains 303,877 square feet and is situated on a 46.7-acre parcel. The center was constructed in 1996 and consists of five buildings, a food court and playground. There are 1,522 surface parking spaces. The top three tenants by size at the Gaffney Premium Outlets Property are Pottery Barn Furniture Outlet (18,286 square feet), Nike Factory Store (11,620 square feet) and Gap Outlet (8,970 square feet) with no other tenant comprising more than 2.8% of the net rentable area. The Gaffney Premium Outlets Property is also shadow anchored by a first-run movie theater known as The Big E. The Gaffney Premium Outlets Property is 90.5% occupied and had inline sales of $282 per square foot for the trailing twelve months ended March 31, 2016, resulting in an occupancy cost of 10.6%. Net operating income for the trailing twelve months ended March 2016 was $6,321,315, resulting in an operating margin of 69.9%.
The Calhoun Premium Outlets Property contains 254,063 square feet and is situated on a 27.7-acre parcel. The center was constructed in 1992 and consists of five buildings. There are 1,380 surface parking spaces. The top three tenants by size at the Calhoun Premium Outlets Property are V.F. Factory Outlet (26,000 square feet), LOFT Outlet (12,000 square feet) and Old Navy (12,000 square feet), with no other tenant comprising more than 4.6% of the net rentable area. The Calhoun Premium Outlets Property is 93.9% occupied and had inline sales of $233 per square foot for the trailing twelve months ended March 31, 2016, resulting in an occupancy cost of 9.1%. Net operating income for the trailing twelve months ended March 2016 was $4,007,626, resulting in an operating margin of 75.3%.
THE INFORMATION IN THIS STRUCTURAL AND COLLATERAL TERM SHEET IS NOT COMPLETE AND MAY BE AMENDED PRIOR TO THE TIME OF SALE. THIS TERM SHEET IS NOT AN OFFER TO SELL THESE SECURITIES AND IT IS NOT A SOLICITATION OF AN OFFER TO BUY THESE SECURITIES IN ANY JURISDICTION WHERE THE OFFER OR SALE IS NOT PERMITTED.
97
| SIMON PREMIUM OUTLETS |
The following table presents certain information relating to the Simon Premium Outlets Properties:
Property Name Location | Allocated Cut- off Date Balance | % of Portfolio Cut-off Date Balance | Occupancy(1) | Year Built/ Renovated | Net Rentable Area (SF) (2) | Appraised Value | Allocated LTV |
Lee Premium Outlets Property Lee, MA | $53,854,978 | 51.4% | 97.8% | 1997/NAP | 224,825 | $115,000,000 | 46.8% |
Gaffney Premium Outlets Property Gaffney, SC | $31,415,404 | 30.0% | 90.5% | 1996/NAP | 303,877 | $67,200,000 | 46.7% |
Calhoun Premium Outlets Property Calhoun, GA | $19,447,631 | 18.6% | 93.9% | 1992/NAP | 254,063 | $41,500,000 | 46.9% |
| Total/Weighted Average | $104,718,012 | 100.0% | 93.7% | 782,765 | $223,700,000 | 46.8% |
| (1) | Information obtained from the May 19, 2016 rent roll. |
| (2) | Information obtained from the underwritten rent roll. |
The following table presents certain information relating to the tenancies at each of the Simon Premium Outlets Properties:
Major Tenants
| Tenant Name | Credit Rating Moody’s/ | Tenant NRSF | % of NRSF | Annual U/W Base Rent PSF | Annual U/W Base Rent | % of Total Annual U/W Base Rent | Sales PSF(2) | Occupancy Cost(2) | Lease Expiration Date | |
| Lee Premium Outlets Property | ||||||||||
| Major Tenants | ||||||||||
| Eddie Bauer Outlet | NR/NR/NR | 6,127 | 2.7% | $53.04 | $325,007 | 4.7% | $411 | 17.3% | 1/31/2025 | |
| Dress Barn(3) | NR/NR/NR | 7,781 | 3.5% | $40.29 | $313,467 | 4.5% | $197 | 22.4% | MTM | |
| Gap Outlet | BB+/Baa2/BB+ | 12,113 | 5.4% | $23.90 | $289,523 | 4.2% | $363 | 11.3% | 6/30/2017 | |
| Brooks Brothers Factory Store | NR/NR/NR | 4,960 | 2.2% | $49.42 | $245,107 | 3.5% | $492 | 14.2% | 3/31/2025 | |
| J. Crew Factory Store | NR/B2/B- | 6,988 | 3.1% | $35.00 | $244,580 | 3.5% | $456 | 11.8% | 1/31/2018 | |
| Total Major Tenants | 37,969 | 16.9% | $37.34 | $1,417,684 | 20.5% | |||||
| Non-Major Tenants | 174,719 | 77.7% | $31.51 | $5,505,582 | 79.5% | $401 | 11.9% | |||
| Occupied Collateral Total | 212,688 | 94.6% | $32.55 | $6,923,266 | 100.0% | |||||
| Vacant Space | 12,137 | 5.4% | ||||||||
| Collateral Total | 224,825 | 100.0% | ||||||||
| Gaffney Premium Outlets Property | ||||||||||
| Major Tenants | ||||||||||
| Pottery Barn Furniture Outlet | NR/NR/NR | 18,286 | 6.0% | $13.00 | $237,718 | 4.2% | $406 | 7.8% | 1/31/2020 | |
| Gap Outlet | BB+/Baa2/BB+ | 8,970 | 3.0% | $25.06 | $224,746 | 4.0% | $272 | 15.1% | 7/31/2019 | |
| Tommy Hilfiger(4) | NR/NR/NR | 6,225 | 2.0% | $32.64 | $203,184 | 3.6% | $259 | 12.7% | MTM | |
| Banana Republic Factory Store | BB+/Baa2/BB+ | 8,584 | 2.8% | $22.80 | $195,690 | 3.5% | $245 | 10.5% | 5/31/2019 | |
| The Children’s Place | NR/NR/NR | 6,547 | 2.2% | $29.22 | $191,303 | 3.4% | $250 | 15.5% | 1/31/2017 | |
| Total Major Tenants | 48,612 | 16.0% | $21.65 | $1,052,641 | 18.6% | |||||
| Non-Major Tenants | 226,494 | 74.5% | $20.39 | $4,617,711 | 81.4% | $282 | 10.6% | |||
| Occupied Collateral Total | 275,106 | 90.5% | $20.61 | $5,670,352 | 100.0% | |||||
| Vacant Space | 28,771 | 9.5% | ||||||||
| Collateral Total | 303,877 | 100.0% | ||||||||
| Calhoun Premium Outlets Property | ||||||||||
| Major Tenants | ||||||||||
| V.F. Factory Outlet | NR/A3/A | 26,000 | 10.2% | $16.53 | $429,780 | 10.4% | $142 | 12.0% | 9/30/2020 | |
| Old Navy(5) | BB+/Baa2/BB+ | 12,000 | 4.7% | $20.00 | $239,976 | 5.8% | $373 | 5.4% | MTM | |
| Gap Outlet | BB+/Baa2/BB+ | 7,890 | 3.1% | $25.59 | $201,867 | 4.9% | $208 | 17.2% | 4/30/2020 | |
| Loft Outlet | NR/NR/NR | 12,000 | 4.7% | $16.31 | $195,720 | 4.7% | $111 | 20.3% | 10/31/2017 | |
| American Eagle Outfitters | NR/NR/NR | 6,000 | 2.4% | $26.53 | $159,181 | 3.9% | NAV | NAV | 4/30/2024 | |
| Total Major Tenants | 63,890 | 25.1% | $19.20 | $1,226,524 | 29.7% | |||||
| Non-Major Tenants | 169,722 | 66.8% | $17.11 | $2,903,291 | 70.3% | $233 | 9.1% | |||
| Occupied Collateral Total | 233,612 | 92.0% | $17.68 | $4,129,815 | 100.0% | |||||
| Vacant Space | 20,451 | 8.0% | ||||||||
| Collateral Total | 254,063 | 100.0% | ||||||||
| (1) | Certain ratings are those of the parent company whether or not the parent guarantees the lease. |
| (2) | Sales PSF and Occupancy Cost are based on the trailing 12-month period ending March 31, 2016, as provided by the sponsor and only include tenants reporting comparable sales. Non-Major Tenant Sales PSF and Occupancy Cost as shown represent the respective in-line sales and resulting occupancy cost, which may include Major Tenants listed above. |
| (3) | Dress Barn currently has a lease out for signature with renewal terms of 5 years at an annual rent of $50.00 per square foot. |
| (4) | Tommy Hilfiger currently has committed to renewal terms of 5 years at an annual rent of $33.37 per square foot. |
| (5) | Old Navy currently has a lease out for signature with renewal terms of 5 years at an annual rent of $47.36 per square foot. |
THE INFORMATION IN THIS STRUCTURAL AND COLLATERAL TERM SHEET IS NOT COMPLETE AND MAY BE AMENDED PRIOR TO THE TIME OF SALE. THIS TERM SHEET IS NOT AN OFFER TO SELL THESE SECURITIES AND IT IS NOT A SOLICITATION OF AN OFFER TO BUY THESE SECURITIES IN ANY JURISDICTION WHERE THE OFFER OR SALE IS NOT PERMITTED.
98
| SIMON PREMIUM OUTLETS |
The following table presents certain information relating to the lease rollover schedule at the Simon Premium Outlets Properties:
Lease Expiration Schedule(1)(2)
| Year Ending December 31 | No. of Leases Expiring | Expiring NRSF | % of Total NRSF | Cumulative Expiring NRSF | Cumulative % of Total NRSF | Annual U/W Base Rent | % of Total Annual U/W Base Rent | Annual U/W Base Rent PSF(3) |
| Simon Premium Outlets Properties | ||||||||
| MTM | 13 | 63,892 | 8.2% | 63,892 | 8.2% | $1,307,320 | 7.8% | $20.46 |
| 2016 | 15 | 57,953 | 7.4% | 121,845 | 15.6% | 785,843 | 4.7% | 13.56 |
| 2017 | 33 | 135,086 | 17.3% | 256,931 | 32.8% | 3,020,835 | 18.1% | 22.36 |
| 2018 | 29 | 109,195 | 13.9% | 366,126 | 46.8% | 2,814,286 | 16.8% | 25.77 |
| 2019 | 19 | 84,680 | 10.8% | 450,806 | 57.6% | 2,139,436 | 12.8% | 25.26 |
| 2020 | 11 | 79,190 | 10.1% | 529,996 | 67.7% | 1,649,171 | 9.9% | 20.83 |
| 2021 | 13 | 59,656 | 7.6% | 589,652 | 75.3% | 1,049,800 | 6.3% | 17.60 |
| 2022 | 12 | 42,961 | 5.5% | 632,613 | 80.8% | 1,226,086 | 7.3% | 28.54 |
| 2023 | 7 | 24,969 | 3.2% | 657,582 | 84.0% | 700,791 | 4.2% | 28.07 |
| 2024 | 6 | 23,509 | 3.0% | 681,091 | 87.0% | 602,843 | 3.6% | 25.64 |
| 2025 | 8 | 31,874 | 4.1% | 712,965 | 91.1% | 1,207,321 | 7.2% | 37.88 |
| 2026 | 3 | 8,441 | 1.1% | 721,406 | 92.2% | 219,701 | 1.3% | 26.03 |
| Thereafter | 0 | 0 | 0.0% | 721,406 | 92.2% | 0 | 0.0% | 0.00 |
| Vacant | 0 | 61,359 | 7.8% | 782,765 | 100.0% | 0 | 0.0% | 0.00 |
| Total/Weighted Average | 169 | 782,765 | 100.0% | $16,723,432 | 100.0% | $23.18 | ||
| Lee Premium Outlets Property | ||||||||
| MTM | 1 | 7,781 | 3.5% | 7,781 | 3.5% | $313,467 | 4.5% | $40.29 |
| 2016 | 2 | 1,737 | 0.8% | 9,518 | 4.2% | 42,000 | 0.6% | 24.18 |
| 2017 | 11 | 51,633 | 23.0% | 61,151 | 27.2% | 1,453,874 | 21.0% | 28.16 |
| 2018 | 11 | 36,633 | 16.3% | 97,784 | 43.5% | 1,284,740 | 18.6% | 35.07 |
| 2019 | 11 | 46,107 | 20.5% | 143,891 | 64.0% | 1,208,963 | 17.5% | 26.22 |
| 2020 | 2 | 4,563 | 2.0% | 148,454 | 66.0% | 161,716 | 2.3% | 35.44 |
| 2021 | 2 | 6,202 | 2.8% | 154,656 | 68.8% | 175,574 | 2.5% | 28.31 |
| 2022 | 5 | 16,188 | 7.2% | 170,844 | 76.0% | 564,508 | 8.2% | 34.87 |
| 2023 | 4 | 13,102 | 5.8% | 183,946 | 81.8% | 486,640 | 7.0% | 37.14 |
| 2024 | 1 | 1,742 | 0.8% | 185,688 | 82.6% | 64,701 | 0.9% | 37.14 |
| 2025 | 6 | 26,373 | 11.7% | 212,061 | 94.3% | 1,124,446 | 16.2% | 42.64 |
| 2026 | 1 | 627 | 0.3% | 212,688 | 94.6% | 42,636 | 0.6% | 68.00 |
| Thereafter | 0 | 0 | 0.0% | 212,688 | 94.6% | 0 | 0.0% | 0.00 |
| Vacant | 0 | 12,137 | 5.4% | 224,825 | 100.0% | 0 | 0.0% | 0.00 |
| Total/Weighted Average | 57 | 224,825 | 100.0% | $6,923,266 | 100.0% | $32.55 | ||
| Gaffney Premium Outlets Property | ||||||||
| MTM | 6 | 25,801 | 8.5% | 25,801 | 8.5% | $464,912 | 8.2% | $18.02 |
| 2016 | 7 | 32,356 | 10.6% | 58,157 | 19.1% | 503,477 | 8.9% | 15.56 |
| 2017 | 16 | 48,353 | 15.9% | 106,510 | 35.1% | 1,008,281 | 17.8% | 20.85 |
| 2018 | 7 | 34,632 | 11.4% | 141,142 | 46.4% | 782,547 | 13.8% | 22.60 |
| 2019 | 5 | 27,373 | 9.0% | 168,515 | 55.5% | 671,252 | 11.8% | 24.52 |
| 2020 | 4 | 32,728 | 10.8% | 201,243 | 66.2% | 575,160 | 10.1% | 17.57 |
| 2021 | 7 | 24,202 | 8.0% | 225,445 | 74.2% | 513,908 | 9.1% | 21.23 |
| 2022 | 6 | 23,013 | 7.6% | 248,458 | 81.8% | 585,403 | 10.3% | 25.44 |
| 2023 | 3 | 11,867 | 3.9% | 260,325 | 85.7% | 214,151 | 3.8% | 18.05 |
| 2024 | 3 | 10,567 | 3.5% | 270,892 | 89.1% | 255,772 | 4.5% | 24.20 |
| 2025 | 0 | 0 | 0.0% | 270,892 | 89.1% | 0 | 0.0% | 0.00 |
| 2026 | 1 | 4,214 | 1.4% | 275,106 | 90.5% | 95,489 | 1.7% | 22.66 |
| Thereafter | 0 | 0 | 0.0% | 275,106 | 90.5% | 0 | 0.0% | 0.00 |
| Vacant | 0 | 28,771 | 9.5% | 303,877 | 100.0% | 0 | 0.0% | 0.00 |
| Total/Weighted Average | 65 | 303,877 | 100.0% | $5,670,352 | 100.0% | $20.61 | ||
| Calhoun Premium Outlets Property | ||||||||
| MTM | 6 | 30,310 | 11.9% | 30,310 | 11.9% | $528,942 | 12.8% | $17.45 |
| 2016 | 6 | 23,860 | 9.4% | 54,170 | 21.3% | 240,366 | 5.8% | 10.07 |
| 2017 | 6 | 35,100 | 13.8% | 89,270 | 35.1% | 558,680 | 13.5% | 15.92 |
| 2018 | 11 | 37,930 | 14.9% | 127,200 | 50.1% | 746,999 | 18.1% | 19.69 |
| 2019 | 3 | 11,200 | 4.4% | 138,400 | 54.5% | 259,221 | 6.3% | 23.14 |
| 2020 | 5 | 41,899 | 16.5% | 180,299 | 71.0% | 912,295 | 22.1% | 21.77 |
| 2021 | 4 | 29,252 | 11.5% | 209,551 | 82.5% | 360,317 | 8.7% | 12.32 |
| 2022 | 1 | 3,760 | 1.5% | 213,311 | 84.0% | 76,174 | 1.8% | 20.26 |
| 2023 | 0 | 0 | 0.0% | 213,311 | 84.0% | 0 | 0.0% | 0.00 |
| 2024 | 2 | 11,200 | 4.4% | 224,511 | 88.4% | 282,369 | 6.8% | 25.21 |
| 2025 | 2 | 5,501 | 2.2% | 230,012 | 90.5% | 82,875 | 2.0% | 15.07 |
| 2026 | 1 | 3,600 | 1.4% | 233,612 | 92.0% | 81,576 | 2.0% | 22.66 |
| Thereafter | 0 | 0 | 0.0% | 233,612 | 92.0% | 0 | 0.0% | 0.00 |
| Vacant | 0 | 20,451 | 8.0% | 254,063 | 100.0% | 0 | 0.0% | 0.00 |
| Total/Weighted Average | 47 | 254,063 | 100.0% | $4,129,815 | 100.0% | $17.68 | ||
| (1) | Information obtained from the underwritten rent roll. |
| (2) | Certain tenants may have lease termination options that are exercisable prior to the originally stated expiration date of the subject lease and that are not considered in the Lease Expiration Schedule. |
| (3) | Weighted Average Annual U/W Base Rent PSF excludes vacant space. |
THE INFORMATION IN THIS STRUCTURAL AND COLLATERAL TERM SHEET IS NOT COMPLETE AND MAY BE AMENDED PRIOR TO THE TIME OF SALE. THIS TERM SHEET IS NOT AN OFFER TO SELL THESE SECURITIES AND IT IS NOT A SOLICITATION OF AN OFFER TO BUY THESE SECURITIES IN ANY JURISDICTION WHERE THE OFFER OR SALE IS NOT PERMITTED.
99
| SIMON PREMIUM OUTLETS |
The following table presents historical occupancy percentages at the Simon Premium Outlets Properties:
Historical Occupancy(1)
12/31/2012 | 12/31/2013 | 12/31/2014 | 12/31/2015 | 5/19/2016 |
| 94.7% | 95.4% | 96.4% | 95.1% | 93.7% |
| (1) | Information obtained from the borrower. |
Operating History and Underwritten Net Cash Flow. The following table presents certain information relating to the historical operating performance and underwritten net cash flow at the Simon Premium Outlets Properties:
Cash Flow Analysis
| 2012 | 2013 | 2014 | 2015 | TTM 3/31/2016 | U/W | % of U/W Effective Gross Income | U/W $ per SF | |||||||||
| Base Rent | $15,354,367 | $15,844,111 | $16,164,930 | $16,373,361 | $16,759,878(1) | $16,723,433 | 68.3% | $21.36 | ||||||||
| Grossed Up Vacant Space | 0 | 0 | 0 | 0 | 0 | 2,166,253 | 8.8 | 2.77 | ||||||||
| Percentage Rent | 367,032 | 473,692 | 559,467 | 462,372 | 474,221 | 503,811 | 2.1 | 0.64 | ||||||||
| Total Reimbursables | 6,310,260 | 6,906,907 | 7,419,714 | 7,615,381 | 7,832,547 | 7,512,165 | 30.7 | 9.60 | ||||||||
| Other Income(2) | 468,139 | 380,979 | 399,321 | 395,684 | 403,351 | 406,347 | 1.7 | 0.52 | ||||||||
| Less Vacancy & Credit Loss(3) | (20,079) | 18,560 | (15,784) | (7,003) | (7,455) | (2,814,709) | -11.5 | (3.60) | ||||||||
| Effective Gross Income | $22,479,719 | $23,624,249 | $24,527,648 | $24,839,795 | $25,462,542 | $24,497,300 | 100.0% | $31.30 | ||||||||
| Total Operating Expenses | $6,946,469 | $7,094,274 | $7,147,919 | $6,976,569 | $7,005,132 | $7,416,196 | 30.3% | $9.47 | ||||||||
| Net Operating Income | $15,533,250 | $16,529,975 | $17,379,729 | $17,863,226 | $18,457,410 | $17,081,104 | 69.7% | $21.82 | ||||||||
| TI/LC | 0 | 0 | 0 | 0 | 0 | 1,194,140 | 4.9 | 1.53 | ||||||||
| Capital Expenditures | 0 | 0 | 0 | 0 | 0 | 211,429 | 0.9 | 0.27 | ||||||||
| Net Cash Flow | $15,533,250 | $16,529,975 | $17,379,729 | $17,863,226 | $18,457,410 | $15,675,535 | 64.0% | $20.03 | ||||||||
| NOI DSCR | 2.53x | 2.69x | 2.83x | 2.91x | 3.01x | 2.78x | ||||||||||
| NCF DSCR | 2.53x | 2.69x | 2.83x | 2.91x | 3.01x | 2.55x | ||||||||||
| NOI DY | 14.8% | 15.8% | 16.6% | 17.1% | 17.6% | 16.3% | ||||||||||
| NCF DY | 14.8% | 15.8% | 16.6% | 17.1% | 17.6% | 15.0% |
| (1) | Base Rent is underwritten based on signed leases and the in-place rent roll as of March 31, 2016 with contractual rent steps taken through June 2017. |
| (2) | Other income includes rental income from temporary tenants, sponsorships and media, beverage case rent, ATM rent and other miscellaneous income. |
| (3) | The underwritten economic vacancy is 10.5%. The Simon Premium Outlets Properties were 93.7% leased as of May 19, 2016. |
Appraisals. As of the appraisal valuation dates ranging between April 1, 2016 and April 14, 2016, the Simon Premium Outlets Properties had an aggregate “as-is” appraised value of $223,700,000.
Environmental Matters. According to the Phase I environmental assessments dated April 21, 2016, there was no evidence of any recognized environmental conditions at any of the Simon Premium Outlets Properties.
Market Overview and Competition.The Simon Premium Outlets Properties are located in Lee, Massachusetts, Gaffney, South Carolina and Calhoun, Georgia. Each property benefits from its location along major thoroughfares in expansive trade areas near multiple major metropolitan markets.
Lee, Massachusetts
The Lee Premium Outlets Property is located at 50 Water Street in Lee, Massachusetts, along US Route 20, just south of its intersection with Interstate 90 (Massachusetts Turnpike) and approximately 30 miles west of Interstate 91. The traffic count passing the Lee Premium Outlets Property on Interstate 90 is estimated at 55,000 vehicles daily. Albany, New York is approximately 30 miles west and Springfield, Massachusetts and Hartford, Connecticut are within approximately an hour’s drive of the Lee Premium Outlets Property.
Lee is located in the central portion of the Pittsfield, Massachusetts core-based statistical area at the foot of the Berkshire Hills and the Taconic Mountain Range in the Berkshires of Massachusetts. The Berkshires are a year-round tourist destination for hiking, camping and skiing and benefits from regional job growth. The area is home to the Norman Rockwell Museum, the Canyon Ranch Resort and Tanglewoood Music Center. Visitor spending in Berkshire County totaled $425.8 million in 2014. Pittsfield’s economy is driven by education and healthcare (25.1% of employment), leisure and hospitality (14.8% of employment) and retail (13.4% of employment). According to the appraisal, the 2015 population within a 15-, 30- and 45-mile radius of the Lee Premium Outlets Property was 91,815, 351,951 and 1,866,842, respectively, and the 2015 average household income within the same radii was $76,485, $80,025 and $80,828, respectively.
THE INFORMATION IN THIS STRUCTURAL AND COLLATERAL TERM SHEET IS NOT COMPLETE AND MAY BE AMENDED PRIOR TO THE TIME OF SALE. THIS TERM SHEET IS NOT AN OFFER TO SELL THESE SECURITIES AND IT IS NOT A SOLICITATION OF AN OFFER TO BUY THESE SECURITIES IN ANY JURISDICTION WHERE THE OFFER OR SALE IS NOT PERMITTED.
100
| SIMON PREMIUM OUTLETS |
The nearest competitive outlet center is Wrentham Premium Outlets in Wrentham, Massachusetts (66 miles east), which is also owned by the sponsor, with the next closest outlet center 73 miles north. According to the appraiser, there are no new planned outlet centers in the immediate area.
Gaffney, South Carolina
The Gaffney Premium Outlets Property is located at 1 Factory Shops Boulevard in Gaffney, South Carolina, at the intersection of Interstate 85 (at Exit 90) and SC-105 (Hyatt Street) and approximately 18 miles east of Interstate 26. The traffic count passing the Gaffney Premium Outlets Property on Interstate 85 is estimated at 55,000 vehicles daily. Gaffney’s central business district is approximately 3.5 miles east of the Gaffney Premium Outlets Property. Spartanburg and Greenville are southwest approximately 20 miles and 50 miles, respectively, and Charlotte, North Carolina is approximately 55 miles east of the Gaffney Premium Outlets Property.
Gaffney is the primary city in Cherokee County and the county seat, and located in the Greenville-Spartanburg-Anderson combined statistical area. The adjacent Spartanburg metropolitan statistical area exerts a strong economic influence on the area. Spartanburg’s economy is driven by manufacturing (20.5% of employment) with the notable corporate presence of BMW, Michelin and Adidas, health services and education (18.1% of employment) with the Spartanburg Regional Healthcare System, Mary Black Health System, University of South Carolina – Upstate and seven other institutions of higher learning, and retail (12.6% of employment). According to the appraisal, the 2015 population within a 15-, 30- and 45-mile radius of the Gaffney Premium Outlets Property was 153,876, 608,584 and 1,794,169, respectively, and the 2015 average household income within the same radii was $52,198, $55,069 and $62,898, respectively.
The nearest competitive outlet centers are Charlotte Premium Outlets in Charlotte, North Carolina (45 miles east) and Concord Mills, in Concord, NC (60 miles northeast), both owned and operated by the sponsor, and Asheville Outlets in Asheville, North Carolina (60 miles northeast). According to the appraiser, there are no new planned outlet centers in the immediate area.
Calhoun, Georgia
The Calhoun Premium Outlets Property is located at 455 Belwood Road in Calhoun, Georgia, just south of the interchange of Highway 53 and Interstate 75 (running parallel to U.S. Highway 41). The traffic count passing the Calhoun Premium Outlets Property on Interstate 75 is estimated at 61,000 vehicles daily. Calhoun’s central business district is approximately 2.5 miles north of the Calhoun Premium Outlets Property. Chattanooga, Tennessee is approximately 45 miles northwest and Atlanta, Georgia is approximately 55 miles southeast of the Calhoun Premium Outlets Property.
Calhoun is located in Gordon County and is the county seat. The Gordon County area economy is driven by manufacturing (24.0% of employment), retail (13.3% of employment) and health services and education (11.8% of employment). The major employers in the Gordon County area include Engineered Floors, LLC, Floyd Healthcare Management, Inc. and Mohawk Carpet Distribution LP. According to the appraisal, the 2015 population within a 15-, 30- and 45-mile radius of the Calhoun Premium Outlets Property was 91,304, 564,725 and 1,958,101, respectively, and the 2015 average household income within the same radii was $54,536, $60,508 and $79,190, respectively.
The nearest competitive outlet centers are The Outlet Shoppes Atlanta in Woodstock, Georgia (33 miles southeast) and North Georgia Premium Outlets in Dawsonville, Georgia (50 miles east), which is also owned and operated by the sponsor. According to the appraiser, there are no new planned outlet centers in the immediate area.
The Borrowers. The borrowers are Calhoun Outlets LLC, Gaffney Outlets LLC and Lee Outlets LLC, each a Delaware limited liability company and single purpose entity and each with two independent directors. Legal counsel to the borrower delivered a non-consolidation opinion in connection with the origination of the Simon Premium Outlets Whole Loan. Simon Property Group, L.P., is the guarantor of certain nonrecourse carveouts under the Simon Premium Outlets Whole Loan.
The Sponsor. The sponsor is Simon Property Group, L.P., the operating partnership of Simon Property Group, Inc. (“Simon”). Simon is a publicly traded self-administered and self-managed real estate investment trust (NYSE: SPG) focused on retail property ownership and management. Simon is one of the largest publicly traded owners, operators and developers of retail assets in the United States. As of December 31, 2015, Simon owned or had an interest in 209 properties consisting of 108 malls, 71 Premium Outlet-branded centers, 14 Mills-branded centers, four lifestyle centers and twelve other retail properties in 37 states and Puerto Rico containing an aggregate of approximately 184 million square feet of gross leasable area. Simon’s Premium Outlets generally contain a wide variety of designer and manufacturer stores located in open-air centers and range in size from approximately 150,000 to 870,000 square feet and are generally located within close proximity to major metropolitan areas and/or tourist destinations. The sponsor is also a sponsor of the borrower under the mortgage loan identified on Annex A-1 as The Shops at Crystals.
The liability of the guarantor under the nonrecourse carve-out provisions in the loan documents is capped at $21.0 million plus reasonable collection costs. See “Description of the Mortgage Pool – Certain Terms of the Mortgage Loans—Non-Recourse Carveout Limitations” in the Preliminary Prospectus.
Simon has sponsored other real estate projects over the last 10 years that have been the subject of mortgage loan defaults, foreclosure proceedings and deed-in-lieu of foreclosure. See “Description of the Mortgage Pool—Loan Purpose; Default History, Bankruptcy Issues and Other Proceedings” in the Preliminary Prospectus.
THE INFORMATION IN THIS STRUCTURAL AND COLLATERAL TERM SHEET IS NOT COMPLETE AND MAY BE AMENDED PRIOR TO THE TIME OF SALE. THIS TERM SHEET IS NOT AN OFFER TO SELL THESE SECURITIES AND IT IS NOT A SOLICITATION OF AN OFFER TO BUY THESE SECURITIES IN ANY JURISDICTION WHERE THE OFFER OR SALE IS NOT PERMITTED.
101
| SIMON PREMIUM OUTLETS |
Escrows.During a Springing Reserve Period (as defined below), the loan documents require (i) ongoing monthly reserves in the amount of $16,308 for replacement reserves, capped at $391,383; (ii) ongoing monthly reserves in the amount of $97,846 for leasing reserves, capped at $3,522,443; (iii) ongoing monthly reserves in the amount equal to one-twelfth of the estimated annual real estate taxes due; and (iv) ongoing monthly reserves in the amount equal to one-twelfth of the estimated annual insurance premiums due, except if lender has waived the requirement in the event that the Simon Premium Outlets Properties are covered by an acceptable blanket insurance policy.
A “Springing Reserve Period” will commence upon the debt service coverage ratio for the preceding four calendar quarters being less than 1.35x for two consecutive calendar quarters and will expire upon the debt service coverage ratio for the preceding four calendar quarters being equal to or greater than 1.35x for two consecutive calendar quarters.
Lockbox and Cash Management.The Simon Premium Outlets Whole Loan requires a lender-controlled lockbox account, which is already in place. The borrower has directed the tenants to pay rent directly into such lockbox account. The loan documents also require that all rents received by the borrower or property manager be deposited into the lockbox account within two business days of receipt. Prior to the occurrence of a Cash Sweep Period (as defined below), all funds are required to be distributed to the borrower. During a Cash Sweep Period, all funds are required to be swept to a lender-controlled cash management account.
A “Cash Sweep Period” will commence upon (i) the occurrence and continuance of an event of default; (ii) the debt service coverage ratio for the preceding four calendar quarters being less than 1.25x for two consecutive calendar quarters; or (iii) the assets of the manager or guarantor being subject to a bankruptcy action. A Cash Sweep Period will expire, with regard to clause (i), upon the cure of such event of default; and with regard to clause (ii), upon the debt service coverage ratio for the preceding four calendar quarters being equal to or greater than 1.25x for two consecutive calendar quarters; and with regard to clause (iii), upon the manager or guarantor being replaced with a qualified manager or replacement guarantor meeting the requirements set forth in the loan documents.
Property Management.The Simon Premium Outlets Properties are managed by Simon Management Associates, LLC, an affiliate of the borrower.
Assumption. The borrower has the right to transfer the Simon Premium Outlets Properties provided that certain conditions are satisfied, including (i) no event of default has occurred and is continuing; (ii) in the event that in connection with such transfer, the manager will not thereafter continue to manage the Simon Premium Outlets Properties, then a replacement management agreement with a qualified manager must be executed acceptable to lender; (iii) the transferee must not have been a party to any bankruptcy action within the seven years prior and there is not material litigation or regulatory action pending against the transferee unreasonable to lender; and (iv) the transferee is a qualified transferee meeting the requirements set forth in the loan documents or the lender receiving rating agency confirmation that the sale and assumption will not result in a downgrade, withdrawal or qualification of the respective ratings assigned to the Series 2016-BNK1 certificates and similar confirmations from each rating agency rating any securities backed by any Simon Premium Outlets Companion Loan with respect to the ratings of such securities.
Partial Release.During the lockout period, the borrower is permitted to partially release either or both of the Gaffney Premium Outlets Property and the Calhoun Premium Outlets Property in connection with a partial prepayment, subject to certain conditions including (i) no occurrence and continuance of any event of default; (ii) the debt service coverage ratio with respect to the remaining property being no less than the greater of 2.55x and the debt service coverage ratio for the preceding four calendar quarters prior to the release; (iii) the release not causing the WFCM 2016-BNK1 transaction to fail to qualify as a REMIC trust; and (iv) payment of (a) 120.0% of the allocated loan amount for the Gaffney Premium Outlets Property and/or the Calhoun Premium Outlets Property (if any such property is the released property) and (b) a yield maintenance charge.
Following the lockout period, the borrower is permitted to partially release either or both of the Gaffney Premium Outlets Property and the Calhoun Premium Outlets Property in connection with a partial defeasance, subject to certain conditions including (i) no occurrence and continuance of any event of default; (ii) the principal balance of the Simon Premium Outlets Whole Loan being reduced by 120.0% of the allocated loan amount for the Gaffney Premium Outlets Property and the Calhoun Premium Outlets Property (if any such property is the released property); (iii) the debt service coverage ratio with respect to the remaining Property being no less than the greater of 2.55x and the debt service coverage ratio for the preceding four calendar quarters prior to the release; (iv) the lender receiving rating agency confirmation from Fitch, KBRA, Moody’s and S&P that the release will not result in a downgrade, withdrawal or qualification of the respective ratings assigned to the Series 2016-BNK1 certificates and similar confirmations from each rating agency rating any securities backed by any Simon Premium Outlets Companion Loan with respect to the ratings of such securities; and (v) the lender receiving a legal opinion that the release satisfies REMIC requirements.
Real Estate Substitution.Not permitted.
Subordinate and Mezzanine Indebtedness.None.
Ground Lease. None.
Terrorism Insurance. The loan documents require that the “all risk” insurance policy required to be maintained by the borrower provide coverage for terrorism in an amount equal to the full replacement cost of the Simon Premium Outlets Properties, as well as business interruption insurance on an actual loss sustained basis with no time limitation, and includes an extended period of indemnity of 365 days to provide continuing coverage after the Simon Premium Outlets Properties have been repaired. In the event the Terrorism Risk Insurance Program Reauthorization Act is not in effect and the policy contains an exclusion for acts of terrorism,
THE INFORMATION IN THIS STRUCTURAL AND COLLATERAL TERM SHEET IS NOT COMPLETE AND MAY BE AMENDED PRIOR TO THE TIME OF SALE. THIS TERM SHEET IS NOT AN OFFER TO SELL THESE SECURITIES AND IT IS NOT A SOLICITATION OF AN OFFER TO BUY THESE SECURITIES IN ANY JURISDICTION WHERE THE OFFER OR SALE IS NOT PERMITTED.
102
| SIMON PREMIUM OUTLETS |
the loan documents require the borrower to obtain to the extent available a stand-alone policy providing the same coverage as previously in place prior to the exclusion, with a premium cap of two times the then current annual insurance premiums for the policy insuring the Simon Premium Outlets Properties only (excluding the wind and flood components of the premiums) on a stand-alone basis, with a deductible no greater than $5,000,000.
THE INFORMATION IN THIS STRUCTURAL AND COLLATERAL TERM SHEET IS NOT COMPLETE AND MAY BE AMENDED PRIOR TO THE TIME OF SALE. THIS TERM SHEET IS NOT AN OFFER TO SELL THESE SECURITIES AND IT IS NOT A SOLICITATION OF AN OFFER TO BUY THESE SECURITIES IN ANY JURISDICTION WHERE THE OFFER OR SALE IS NOT PERMITTED.
103
| ONE PENN CENTER |
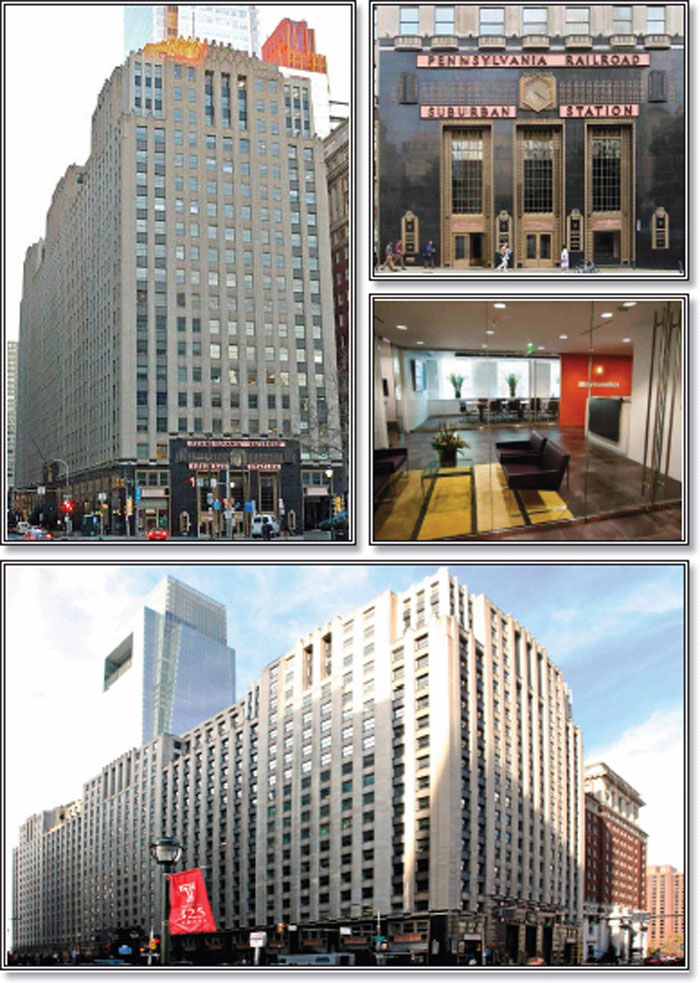
THE INFORMATION IN THIS STRUCTURAL AND COLLATERAL TERM SHEET IS NOT COMPLETE AND MAY BE AMENDED PRIOR TO THE TIME OF SALE. THIS TERM SHEET IS NOT AN OFFER TO SELL THESE SECURITIES AND IT IS NOT A SOLICITATION OF AN OFFER TO BUY THESE SECURITIES IN ANY JURISDICTION WHERE THE OFFER OR SALE IS NOT PERMITTED.
104
| ONE PENN CENTER |

THE INFORMATION IN THIS STRUCTURAL AND COLLATERAL TERM SHEET IS NOT COMPLETE AND MAY BE AMENDED PRIOR TO THE TIME OF SALE. THIS TERM SHEET IS NOT AN OFFER TO SELL THESE SECURITIES AND IT IS NOT A SOLICITATION OF AN OFFER TO BUY THESE SECURITIES IN ANY JURISDICTION WHERE THE OFFER OR SALE IS NOT PERMITTED.
105
| No. 8 – One Penn Center | |||||||
| Loan Information | Property Information | ||||||
| Mortgage Loan Seller: | Wells Fargo Bank, National Association | Single Asset/Portfolio: | Single Asset | ||||
Credit Assessment (Fitch/KBRA/Moody’s/S&P): | NR/NR/NR/NR | Property Type: | Office | ||||
| Original Principal Balance(1): | $35,000,000 | Specific Property Type: | CBD | ||||
| Cut-off Date Balance(1): | $35,000,000 | Location: | Philadelphia, PA | ||||
| % of Initial Pool Balance: | 4.0% | Size: | 689,966 SF | ||||
| Loan Purpose: | Refinance | Cut-off Date Balance Per SF(1): | $98.56 | ||||
| Borrower Name: | One Penn Associates, L.P. | Year Built/Renovated: | 1930/1987 | ||||
| Sponsor: | Henry Gross | Title Vesting: | Fee | ||||
| Mortgage Rate: | 4.900% | Property Manager: | Self-managed | ||||
| Note Date: | July 19, 2016 | 4th Most Recent Occupancy (As of): | 84.1% (12/31/2012) | ||||
| Anticipated Repayment Date: | NAP | 3rd Most Recent Occupancy (As of): | 83.9% (12/31/2013) | ||||
| Maturity Date: | August 11, 2026 | 2ndMost Recent Occupancy (As of): | 90.4% (12/31/2014) | ||||
| IO Period: | 36 months | Most Recent Occupancy (As of)(4): | 87.6% (12/31/2015) | ||||
| Loan Term (Original): | 120 months | Current Occupancy (As of)(4): | 78.3% (6/1/2016) | ||||
| Seasoning: | 0 months | ||||||
| Amortization Term (Original): | 360 months | Underwriting and Financial Information: | |||||
| Loan Amortization Type: | Interest-only, Amortizing Balloon | ||||||
| Interest Accrual Method: | Actual/360 | 4thMost Recent NOI (As of): | $6,321,285 (12/31/2013) | ||||
| Call Protection(2): | L(24),D(91),O(5) | 3rdMost Recent NOI (As of): | $6,883,148 (12/31/2014) | ||||
| Lockbox Type: | Hard/Upfront Cash Management | 2ndMost Recent NOI (As of): | $7,223,379 (12/31/2015) | ||||
| Additional Debt(1): | Yes | Most Recent NOI (As of): | $6,859,582 (TTM 4/30/2016) | ||||
| Additional Debt Type(1): | Pari Passu | ||||||
| U/W Revenues: | $12,747,817 | ||||||
| U/W Expenses: | $6,458,819 | ||||||
| U/W NOI: | $6,288,997 | ||||||
| Escrows and Reserves(3): | U/W NCF: | $5,437,749 | |||||
| U/W NOI DSCR(1): | 1.45x | ||||||
| Type: | Initial | Monthly | Cap (If Any) | U/W NCF DSCR(1): | 1.26x | ||
| Taxes | $582,019 | $116,404 | NAP | U/W NOI Debt Yield(1): | 9.2% | ||
| Insurance | $0 | Springing | NAP | U/W NCF Debt Yield(1): | 8.0% | ||
| Replacement Reserves | $0 | $14,374 | NAP | As-Is Appraised Value: | $91,000,000 | ||
| TI/LC | $3,000,000 | $150,000 | $3,000,000 | As-Is Appraisal Valuation Date: | May 31, 2016 | ||
| Outstanding TI/LC Reserve | $592,858 | $0 | NAP | Cut-off Date LTV Ratio(1): | 74.7% | ||
| Rent Concession Reserve | $224,304 | $0 | NAP | LTV Ratio at Maturity or ARD(1): | 66.0% | ||
| (1) | The One Penn Center Whole Loan (as defined below), which had an original principal balance of $68,000,000, is comprised of twopari passu notes (Notes A-1 and A-2). The controlling Note A-1 had an original principal balance of $35,000,000, has an outstanding principal balance of $35,000,000 as of the Cut-Off Date and will be contributed to the WFCM 2016-BNK1 Trust. The non-controlling Note A-2 had an original principal balance of $33,000,000 and is expected to be contributed to a future trust. All statistical financial information related to balances per square foot, loan-to-value ratios, debt service coverage ratios and debt yields are based on the One Penn Center Whole Loan. The lender provides no assurances that any non-securitized pari passu note will not be split further. |
| (2) | The defeasance lockout period will be at least 24 payment dates beginning with and including the first payment date of September 11, 2016. Defeasance of the One Penn Center Whole Loan is permitted on or after the date that is the earlier to occur of (i) two years after the closing date of the securitization that includes the last note to be securitized, and (ii) September 11, 2020. The assumed lockout period of 24 payments is based on the expected WFCM 2016-BNK1 Trust closing date in August 2016. |
| (3) | See “Escrows” section. |
| (4) | See “Historical Occupancy” section. |
The Mortgage Loan. The mortgage loan (the “One Penn Center Mortgage Loan”) is part of a whole loan (the “One Penn Center Whole Loan”) that is evidenced by twopari passu promissory notes (Note A-1 and Note A-2) secured by a first mortgage encumbering an office building located in Philadelphia, Pennsylvania (the “One Penn Center Property”). The One Penn Center Whole Loan was originated on July 19, 2016 by Wells Fargo Bank, National Association. The One Penn Center Whole Loan had an original principal balance of $68,000,000, has an outstanding principal balance as of the Cut-off Date of $68,000,000 and accrues interest at an interest rate of 4.900%per annum. The One Penn Center Whole Loan had an initial term of 120 months, has a remaining term of 120 months as of the Cut-off Date and requires interest-only payments for the first 36 payments following origination and, thereafter, requires payments of principal and interest based on a 30-year amortization schedule. The One Penn Center Whole Loan matures on August 11, 2026.
Note A-1, which will be contributed to the WFCM 2016-BNK1 Trust, had an original principal balance of $35,000,000, has an aggregate outstanding principal balance as of the Cut-off Date of $35,000,000 and represents the controlling interest in the One Penn Center Whole Loan. The non-controlling Note A-2, which had an original principal balance of $33,000,000, referred to herein as the “One Penn Center Companion Loan”, is expected to be contributed to a future securitization trust. The lender provides no
THE INFORMATION IN THIS STRUCTURAL AND COLLATERAL TERM SHEET IS NOT COMPLETE AND MAY BE AMENDED PRIOR TO THE TIME OF SALE. THIS TERM SHEET IS NOT AN OFFER TO SELL THESE SECURITIES AND IT IS NOT A SOLICITATION OF AN OFFER TO BUY THESE SECURITIES IN ANY JURISDICTION WHERE THE OFFER OR SALE IS NOT PERMITTED.
106
| ONE PENN CENTER |
assurances that any non-securitizedpari passu note will not be split further. See “Description of the Mortgage Pool—The Whole Loans—The Serviced Pari Passu Whole Loans—The One Penn Center Whole Loan” in the Preliminary Prospectus.
Note Summary
| Notes | Original Balance | Note Holder | Controlling Interest | |
| A-1 | $35,000,000 | WFCM 2016-BNK1 | Yes | |
| A-2 | $33,000,000 | Wells Fargo Bank, National Association | No | |
| Total | $68,000,000 |
Following the lockout period, the borrower has the right to defease the One Penn Center Whole Loan in whole, but not in part, on any date before April 11, 2026. In addition, the One Penn Center Whole Loan is prepayable without penalty on or after April 11, 2026. The lockout period will expire on the earlier to occur of (i) two years after the closing date of the securitization that includes the last note to be securitized and (ii) September 11, 2020.
Sources and Uses
| Sources | Uses | |||||||
| Original whole loan amount | $68,000,000 | 95.6% | Loan payoff(1) | $66,263,703 | 93.2% | |||
| Sponsor’s new cash contribution | 3,125,497 | 4.4 | Reserves | 4,399,181 | 6.2 | |||
| Closing costs | 462,613 | 0.7 | ||||||
| Total Sources | $71,125,497 | 100.0% | Total Uses | $71,125,497 | 100.0% | |||
| (1) | The One Penn Center Property was previously securitized in the LBUBS 2006-C6 transaction. |
The Property. The One Penn Center Property is a 20-story, class B office tower totaling approximately 689,966 square feet located in the central business district of Philadelphia, Pennsylvania. Built in 1930 and renovated in 1987, the amenities at the One Penn Center Property include a Walgreens and a National Penn Bank branch located on the first floor and outdoor decks and terraces located on the 20thfloor. Since acquiring the One Penn Center Property in 2002, the sponsor has invested approximately $23.7 million ($34.40 per square foot) to modernize the building, including upgrades to the common areas, elevator cabs, façade restorations, as well as HVAC and LED lighting updates. The One Penn Center Property features a diverse tenant roster comprising 92 tenants with the three largest tenants, Philadelphia Works, Inc. (“Philadelphia Works”), United States Government – SEC (rated AAA, Aaa and AA+ by Fitch, Moody’s and S&P, respectively) and Phelan Hallinan & Schmieg, LLP, representing only 22.5% of the combined net rentable area and no other tenant representing more than 3.1% of the net rentable area or 3.9% of the underwritten annual base rent. The One Penn Center Property is located directly atop the Southeastern Pennsylvania Transportation Authority’s (“SEPTA”) Suburban Station, the main commuter rail hub in the city, and has direct interior access to the station. Suburban Station experiences approximately 50,000 daily commuters and serves as the main transportation hub for the downtown office market. Over the past 10 years, the One Penn Center Property has averaged 88.6% occupancy; however, in April 2016 a tenant occupying approximately 70,000 square feet (10.1% of the net rentable area) vacated. As of June 1, 2016, the One Penn Center Property was 78.3% occupied by 92 tenants subject to 101 leases.
THE INFORMATION IN THIS STRUCTURAL AND COLLATERAL TERM SHEET IS NOT COMPLETE AND MAY BE AMENDED PRIOR TO THE TIME OF SALE. THIS TERM SHEET IS NOT AN OFFER TO SELL THESE SECURITIES AND IT IS NOT A SOLICITATION OF AN OFFER TO BUY THESE SECURITIES IN ANY JURISDICTION WHERE THE OFFER OR SALE IS NOT PERMITTED.
107
| ONE PENN CENTER |
The following table presents certain information relating to the tenancies at the One Penn Center Property:
Major Tenants
| Tenant Name | Credit Rating (Fitch/Moody’s/ S&P)(1) | Tenant NRSF | % of NRSF | Annual U/W Base Rent PSF(2) | Annual U/W Base Rent(2) | % of Total Annual U/W Base Rent | Lease Expiration Date |
| Major Tenants | |||||||
| Philadelphia Works | NR/NR/NR | 74,155 | 10.7% | $23.00 | $1,705,565 | 14.0% | 12/31/2020(3) |
| United States Government – SEC | AAA/Aaa/AA+ | 44,765 | 6.5% | $19.26 | $862,006 | 7.1% | 4/10/2024(4) |
| Phelan Hallinan & Schmieg, LLP | NR/NR/NR | 35,989 | 5.2% | $23.80 | $856,538 | 7.0% | 1/31/2020 |
| McElroy Deutsch Mulvaney & Carpenter LLP | NR/NR/NR | 21,130 | 3.1% | $22.50 | $475,425 | 3.9% | 10/31/2021 |
| American Heart Association | NR/NR/NR | 16,880 | 2.4% | $25.50 | $430,440 | 3.5% | 5/31/2019 |
| Qtc Management, Inc. | NR/NR/NR | 19,879 | 2.9% | $21.50 | $427,398 | 3.5% | 3/31/2017 |
| Naulty, Scaricamazza & McDevitt | NR/NR/NR | 16,361 | 2.4% | $22.50 | $368,123 | 3.0% | 7/31/2021 |
| Total Major Tenants | 229,159 | 33.2% | $22.37 | $5,125,496 | 42.1% | ||
| Non-Major Tenants | 311,216 | 45.1% | $22.62 | $7,040,380 | 57.9% | ||
| Occupied Collateral Total | 540,375 | 78.3% | $22.51 | $12,165,876 | 100.0% | ||
| Vacant Space | 149,591 | 21.7% | |||||
| Collateral Total | 689,966 | 100.0% | |||||
| (1) | Certain ratings are those of the parent company whether or not the parent guarantees the lease. |
| (2) | Annual U/W Base Rent PSF and Annual U/W Base Rent include contractual rent steps through June 2017 totaling $187,309. |
| (3) | Philadelphia Works may terminate its lease if funding allocated to the tenant for the fiscal year has been eliminated or reduces by more than 50.0% from its 2013 funding level of approximately $40.0 million. Philadelphia Works is required to provide six months’ notice in November with the termination effective the following May and a termination fee equal to $1.3 million if the lease termination notice is provided in November 2016; $950,000 if the lease termination notice is provided in November 2017; $650,000 if the lease termination notice is provided in November 2018; and $350,000 if the lease termination notice is provided in November 2019. |
| (4) | The United States Government – SEC may terminate its lease at any point after April 10, 2021 with 90 days’ notice. |
The following table presents certain information relating to the lease rollover schedule at the One Penn Center Property:
Lease Expiration Schedule(1)(2)
| Year Ending December 31, | No. of Leases Expiring | Expiring NRSF | % of Total NRSF | Cumulative Expiring NRSF | Cumulative % of Total NRSF | Annual U/W Base Rent | % of Total Annual U/W Base Rent | Annual U/W Base Rent PSF(3) | |
| MTM | 7 | 4,969 | 0.7% | 4,969 | 0.7% | $88,127 | 0.7% | $17.74 | |
| 2016 | 12 | 33,646 | 4.9% | 38,615 | 5.6% | $747,888 | 6.1% | $22.23 | |
| 2017 | 12 | 46,037 | 6.7% | 84,652 | 12.3% | $1,031,771 | 8.5% | $22.41 | |
| 2018 | 12 | 52,245 | 7.6% | 136,897 | 19.8% | $1,134,440 | 9.3% | $21.71 | |
| 2019 | 17 | 87,291 | 12.7% | 224,188 | 32.5% | $2,081,346 | 17.1% | $23.84 | |
| 2020 | 12 | 134,596 | 19.5% | 358,784 | 52.0% | $3,099,703 | 25.5% | $23.03 | |
| 2021 | 15 | 86,027 | 12.5% | 444,811 | 64.5% | $1,968,877 | 16.2% | $22.89 | |
| 2022 | 8 | 20,052 | 2.9% | 464,863 | 67.4% | $450,218 | 3.7% | $22.45 | |
| 2023 | 1 | 13,039 | 1.9% | 477,902 | 69.3% | $275,000 | 2.3% | $21.09 | |
| 2024 | 2 | 48,981 | 7.1% | 526,883 | 76.4% | $963,190 | 7.9% | $19.66 | |
| 2025 | 0 | 0 | 0.0% | 526,883 | 76.4% | $0 | 0.0% | $0.00 | |
| 2026 | 1 | 3,492 | 0.5% | 530,375 | 76.9% | $80,316 | 0.7% | $23.00 | |
| Thereafter | 2 | 10,000 | 1.4% | 540,375 | 78.3% | $245,000 | 2.0% | $24.50 | |
| Vacant | 0 | 149,591 | 21.7% | 689,966 | 100.0% | $0 | 0.0% | $0.00 | |
| Total/Weighted Average | 101 | 689,966 | 100.0% | $12,165,876 | 100.0% | $22.51 | |||
| (1) | Information obtained from the underwritten rent roll. |
| (2) | Certain tenants may have lease termination options that are exercisable prior to the stated expiration date of the subject lease and that are not considered in the Lease Expiration Schedule. |
| (3) | Weighted Average Annual U/W Base Rent PSF excludes vacant space. |
THE INFORMATION IN THIS STRUCTURAL AND COLLATERAL TERM SHEET IS NOT COMPLETE AND MAY BE AMENDED PRIOR TO THE TIME OF SALE. THIS TERM SHEET IS NOT AN OFFER TO SELL THESE SECURITIES AND IT IS NOT A SOLICITATION OF AN OFFER TO BUY THESE SECURITIES IN ANY JURISDICTION WHERE THE OFFER OR SALE IS NOT PERMITTED.
108
| ONE PENN CENTER |
The following table presents historical occupancy percentages at the One Penn Center Property:
Historical Occupancy
12/31/2012(1) | 12/31/2013(1) | 12/31/2014(1) | 12/31/2015(1)(2) | 6/1/2016(2)(3) |
| 84.1% | 83.9% | 90.4% | 87.6% | 78.3% |
| (1) | Information obtained from the borrower. |
| (2) | Occupancy decreased from 2015 to June 1, 2016 due to a tenant occupying approximately 70,000 square feet (10.1% of the net rentable area) vacating in April 2016. |
| (3) | Information obtained from the underwritten rent roll. |
Operating History and Underwritten Net Cash Flow.The following table presents certain information relating to the historical operating performance and the underwritten net cash flow at the One Penn Center Property:
Cash Flow Analysis
| 2013 | 2014 | 2015 | TTM 4/30/2016 | U/W | % of U/W Effective Gross Income | U/W $ per SF | |
| Base Rent | $12,552,105 | $12,827,504 | $13,421,832 | $13,071,350 | $12,165,876(1) | 95.4% | $17.63 |
| Grossed Up Vacant Space | 0 | 0 | 0 | 0 | 3,467,500 | 27.2 | 5.03 |
| Free Rent Adjustment | (208,176) | (51,492) | (504,324) | (516,555) | 0 | 0.0 | 0.00 |
| Total Reimbursables | 656,404 | 420,744 | 535,181 | 659,273 | 476,693 | 3.7 | 0.69 |
| Other Income | 177,241 | 377,751 | 97,432 | 108,563 | 105,248 | 0.8 | 0.15 |
| Less Vacancy & Credit Loss | 0 | 0 | 0 | 0 | (3,467,500)(2) | (27.2) | (5.03) |
| Effective Gross Income | $13,177,574 | $13,574,507 | $13,550,121 | $13,322,631 | $12,747,817 | 100.0 | $18.48 |
| Total Operating Expenses | $6,856,289 | $6,691,359 | $6,326,742 | $6,463,049 | $6,458,819 | 50.7% | $9.36 |
|
|
|
|
|
|
| |
| Net Operating Income | $6,321,285 | $6,883,148 | $7,223,379 | $6,859,582 | $6,288,997 | 49.3% | $9.11 |
| TI/LC | 0 | 0 | 0 | 0 | 678,757 | 5.3 | 0.98 |
| Capital Expenditures | 0 | 0 | 0 | 0 | 172,492 | 1.4 | 0.25 |
| Net Cash Flow | $6,321,285 | $6,883,148 | $7,223,379 | $6,859,582 | $5,437,749 | 42.7% | $7.88 |
| NOI DSCR(3) | 1.46x | 1.59x | 1.67x | 1.58x | 1.45x | ||
| NCF DSCR(3) | 1.46x | 1.59x | 1.67x | 1.58x | 1.26x | ||
| NOI DY(3) | 9.3% | 10.1% | 10.6% | 10.1% | 9.2% | ||
| NCF DY(3) | 9.3% | 10.1% | 10.6% | 10.1% | 8.0% |
| (1) | U/W Base Rent includes include contractual rent steps through June 2017 totaling $187,309. |
| (2) | The underwritten economic vacancy is 22.2%. The One Penn Center Property was 78.3% physically occupied as of June 1, 2016. |
| (3) | The debt service coverage ratios and debt yields are based on the One Penn Center Whole Loan. |
Appraisal.As of the appraisal valuation date of May 31, 2016, the One Penn Center Property had an “as-is” appraised value of $91,000,000.
Environmental Matters.According to the Phase I environmental site assessment dated June 3, 2016, there was no evidence of any recognized environmental conditions at the One Penn Center Property.
Market Overview and Competition. The One Penn Center Property is located on JFK Boulevard on the block between 16th and 17th Street in the Philadelphia, Pennsylvania central business district (the “Philadelphia CBD”). The Philadelphia CBD is identified as Center City Philadelphia which is concentrated around City Hall at the intersection of Broad and Market Streets. Center City Philadelphia is a diverse and dynamic area containing office, residential, retail, hotel, governmental, medical and private club uses, cultural attractions and the hub for local mass transportation. The One Penn Center Property is located directly atop the Suburban Station, the main commuter rail hub in the city, which experiences approximately 50,000 daily commuters as the transportation hub for the West of Broad office submarket. The Philadelphia International Airport is located approximately 7.6 miles southwest of the One Penn Center Property.
According to the appraisal, a well-educated population and favorable cost of doing business, as compared to New York and Washington, D.C., has attracted a number of large corporations to the Philadelphia metropolitan statistical area as exhibited by eleven Fortune 500 corporations calling the region home, including Comcast Corporation (“Comcast”), DowDuPont and Lincoln National. Comcast is the largest cable company in the United States and is one of the region’s largest employers. Comcast is in the process of building an approximately $1.2 billion, 59-story office building totaling approximately 1.5 million square feet next to its current headquarters, which is located across 17th Street from the One Penn Center Property. The building, known as the Comcast Innovation and Technology Center, is expected to be completed in 2018 and contain approximately 1.3 million square feet of office space to be completely occupied by Comcast and a Four Seasons hotel on the top floors. City Hall, which is located approximately 0.3 miles east of the One Penn Center Property, was recently enhanced by the opening of the approximately $50.0 million Dilworth Park, including enhanced public spaces, water fountains, better transit access and numerous other features.
According to the appraisal, the One Penn Center Property is located in the West of Broad submarket of the Philadelphia CBD office market which, as of the first quarter of 2016, contained approximately 27.8 million square feet (68.9% of the Philadelphia CBD office market). For that same period, the West of Broad submarket reported an overall vacancy rate of 8.6% and average asking rent of$29.51 per square foot, gross.
THE INFORMATION IN THIS STRUCTURAL AND COLLATERAL TERM SHEET IS NOT COMPLETE AND MAY BE AMENDED PRIOR TO THE TIME OF SALE. THIS TERM SHEET IS NOT AN OFFER TO SELL THESE SECURITIES AND IT IS NOT A SOLICITATION OF AN OFFER TO BUY THESE SECURITIES IN ANY JURISDICTION WHERE THE OFFER OR SALE IS NOT PERMITTED.
109
| ONE PENN CENTER |
The following table presents certain information relating to comparable office leases for the One Penn Center Property:
Comparable Leases(1)
| Property Name/Location | Year Built/ Renovated | Stories | Total GLA (SF) | Total Occupancy | Distance from Subject | Tenant Name | Lease Date/Term | Lease Area (SF) | Annual Base Rent PSF | Lease Type |
One South Broad Philadelphia, PA | 1932/NAP | 24 | 463,988 | 93% | 0.4 miles | Sidecar | March 2016/ 4.0 Yrs | 15,550 | $25.00 | MG |
123 S. Broad Street Philadelphia, PA | 1928/1989 | 30 | 882,586 | 96% | 0.5 miles | Committee of Seventy | March 2016 / 7.3 Yrs | 2,663 | $23.25 | MG |
100 N. 20th Street Philadelphia, PA | 1980/NAP | 5 | 92,125 | 94% | 0.4 miles | Bayada Home Healthcare | September 2015/ 5.2 Yrs | 6,245 | $21.50 | MG |
1515 Market Street Philadelphia, PA | 1960/2007 | 20 | 502,213 | 96% | 0.2 miles | Pembroke Consulting | June 2015 / 7.0 Yrs | 1,327 | $26.00 | MG |
Four Penn Center Philadelphia, PA | 1964/2001 | 20 | 522,600 | 86% | 0.2 miles | Parsons Brinckerhoff | May 2015/ 5.0 Yrs | 11,817 | $25.00 | MG |
Four Penn Center Philadelphia, PA | 1964/2001 | 20 | 522,600 | 86% | 0.2 miles | Ansa Assuncao | May 2015 / 7.5 Yrs | 13,002 | $24.50 | MG |
| (1) | Information obtained from the appraisal and a third party market report. |
The Borrower.The borrower is One Penn Associates, L.P., a Delaware limited partnership and single purpose entity with one independent director. Legal counsel to the borrower delivered a non-consolidation opinion in connection with the origination of the One Penn Center Whole Loan. The H. Gross Family, LP is the guarantor of certain nonrecourse carveouts under the One Penn Center Whole Loan.
The Sponsor.The sponsor is Henry Gross, who controls the H. Gross Family, LP. Mr. Gross is the CEO of RealEx Capital, which, since its inception in 1974, has actively developed, invested in and managed a diverse array of real estate investments. H. Gross Family, LP holds a real estate portfolio (excluding the One Penn Center Property) comprised of an 187,000 square foot biomedical research building, a single-tenant industrial flex building, an office-warehouse R&D building and an apartment unit that has a combined value of approximately $248.3 million.
Escrows.The loan documents provide for an upfront escrow at closing in the amount of $582,019 for real estate taxes, $3.0 million for tenant improvements and leasing commissions (“TI/LCs”), $592,858 for TI/LCs associated with five tenants, and $224,304 for rent concessions related to ten tenants. The loan documents provide for ongoing monthly escrows of $116,404 for real estate taxes, $14,374 for replacement reserves and $150,000 for TI/LCs upon the balance of the reserve falling below $3.0 million. The loan documents do not require monthly deposits for insurance premiums as long as (i) no event of default has occurred or is continuing; (ii) the One Penn Center Property is insured via an acceptable blanket insurance policy; and (iii) the borrower provides the lender with timely proof of payment of insurance premiums.
Lockbox and Cash Management.The One Penn Center Whole Loan requires a lender-controlled lockbox account, which is already in place, and that the borrower directs all tenants to pay their rents directly to such lockbox account. The loan documents also require that all rents received by the borrower or the property manager be deposited into the lockbox account within one business day of receipt. Prior to the occurrence of Cash Trap Event Period (as defined below), all funds are required to be distributed to the borrower. During a Cash Trap Event Period, all excess cash flow is required to be swept to a lender-controlled cash management account.
A “Cash Trap Event Period” will commence upon the earlier of (i) the occurrence and continuance of an event of default or (ii) the amortizing debt service coverage ratio being less than 1.15x. A Cash Trap Event Period will end, with respect to clause (i), upon the cure of such event of default; or, with respect to clause (ii), upon the amortizing debt service coverage ratio being at least 1.15x for two consecutive calendar quarters.
Property Management.The One Penn Center Property is managed by an affiliate of the borrower.
Assumption.The borrower has a two-time right to transfer the One Penn Center Property,provided that certain other conditions are satisfied, including, but not limited to: (i) no event of default has occurred and is continuing; (ii) the lender’s reasonable determination that the proposed transferee and guarantor satisfy the lender’s credit review and underwriting standards, taking into consideration transferee experience, financial strength and general business standing; and (iii) if requested by the lender, rating agency confirmation from Fitch, KBRA, Moody’s and S&P that the transfer will not result in a downgrade, withdrawal or qualification of the respective ratings assigned to the Series 2016-BNK1 certificates and similar confirmations from each rating agency rating any securities backed by the One Penn Center Companion Loan with respect to the ratings of such securities.
Partial Release.Not permitted.
Real Estate Substitution.Not permitted.
Subordinate and Mezzanine Indebtedness.Not permitted.
Ground Lease.None.
Terrorism Insurance.The loan documents require that the “all risk” insurance policy required to be maintained by the borrower provide coverage for terrorism in an amount equal to the full replacement cost of the One Penn Center Property, as well as business interruption insurance covering no less than the 18-month period following the occurrence of a casualty event, together with a six-month extended period of indemnity.
THE INFORMATION IN THIS STRUCTURAL AND COLLATERAL TERM SHEET IS NOT COMPLETE AND MAY BE AMENDED PRIOR TO THE TIME OF SALE. THIS TERM SHEET IS NOT AN OFFER TO SELL THESE SECURITIES AND IT IS NOT A SOLICITATION OF AN OFFER TO BUY THESE SECURITIES IN ANY JURISDICTION WHERE THE OFFER OR SALE IS NOT PERMITTED.
110
(THIS PAGE INTENTIONALLY LEFT BLANK)
THE INFORMATION IN THIS STRUCTURAL AND COLLATERAL TERM SHEET IS NOT COMPLETE AND MAY BE AMENDED PRIOR TO THE TIME OF SALE. THIS TERM SHEET IS NOT AN OFFER TO SELL THESE SECURITIES AND IT IS NOT A SOLICITATION OF AN OFFER TO BUY THESE SECURITIES IN ANY JURISDICTION WHERE THE OFFER OR SALE IS NOT PERMITTED.
111
| HILTON LONG ISLAND HUNTINGTON |

THE INFORMATION IN THIS STRUCTURAL AND COLLATERAL TERM SHEET IS NOT COMPLETE AND MAY BE AMENDED PRIOR TO THE TIME OF SALE. THIS TERM SHEET IS NOT AN OFFER TO SELL THESE SECURITIES AND IT IS NOT A SOLICITATION OF AN OFFER TO BUY THESE SECURITIES IN ANY JURISDICTION WHERE THE OFFER OR SALE IS NOT PERMITTED.
112
| HILTON LONG ISLAND HUNTINGTON |
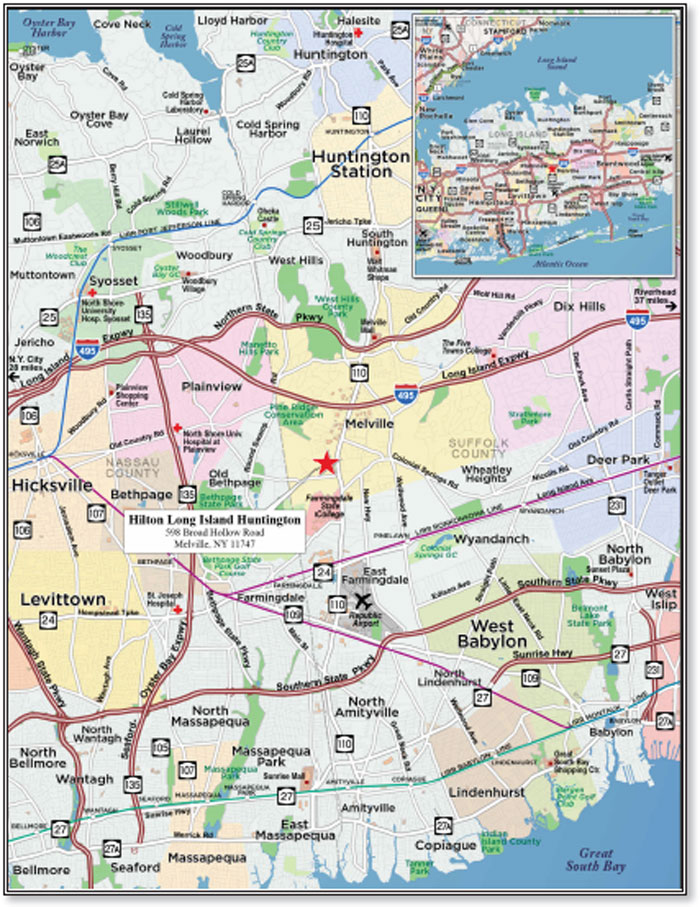
THE INFORMATION IN THIS STRUCTURAL AND COLLATERAL TERM SHEET IS NOT COMPLETE AND MAY BE AMENDED PRIOR TO THE TIME OF SALE. THIS TERM SHEET IS NOT AN OFFER TO SELL THESE SECURITIES AND IT IS NOT A SOLICITATION OF AN OFFER TO BUY THESE SECURITIES IN ANY JURISDICTION WHERE THE OFFER OR SALE IS NOT PERMITTED.
113
| No. 9 – Hilton Long Island Huntington | ||||||||
| Loan Information | Property Information | |||||||
| Mortgage Loan Seller: | Morgan Stanley Mortgage Capital Holdings LLC | Single Asset/Portfolio: | Single Asset | |||||
| Credit Assessment (Fitch/KBRA/Moody’s/S&P): | NR/NR/NR/NR | Property Type: | Hospitality | |||||
| Original Principal Balance: | $35,000,000 | Specific Property Type: | Full Service | |||||
| Cut-off Date Balance: | $35,000,000 | Location: | Melville, NY | |||||
| % of Initial Pool Balance: | 4.0% | Size: | 305 Rooms | |||||
| Loan Purpose: | Acquisition | Cut-off Date Balance Per Room: | $114,754 | |||||
| Borrower Name: | Blue Pearl Hospitality LLC | Year Built/Renovated: | 1988/2013 | |||||
| Sponsor: | Naveen Shah | Title Vesting: | Fee | |||||
| Mortgage Rate: | 4.500% | Property Manager: | Yashodhar Management Co., LLC | |||||
| Note Date: | July 20, 2016 | 4thMost Recent Occupancy (As of): | 64.3% (12/31/2012) | |||||
| Anticipated Repayment Date: | NAP | 3rdMost Recent Occupancy (As of): | 75.3% (12/31/2013) | |||||
| Maturity Date: | August 1, 2026 | 2ndMost Recent Occupancy (As of): | 72.1% (12/31/2014) | |||||
| IO Period: | 24 months | Most Recent Occupancy (As of): | 76.5% (12/31/2015) | |||||
| Loan Term (Original): | 120 months | Current Occupancy (As of): | 78.5% (4/30/2016) | |||||
| Seasoning: | 0 months | |||||||
| Amortization Term (Original): | 360 months | Underwriting and Financial Information: | ||||||
| Loan Amortization Type: | Interest-only, Amortizing Balloon | |||||||
| Interest Accrual Method: | Actual/360 | 4thMost Recent NOI (As of)(2): | $4,091,660 (12/31/2013) | |||||
| Call Protection: | L(24),D(89),O(7) | 3rdMost Recent NOI (As of)(2): | $5,160,408 (12/31/2014) | |||||
| Lockbox Type: | Springing | 2ndMost Recent NOI (As of): | $5,285,969 (12/31/2015) | |||||
| Additional Debt: | No | Most Recent NOI (As of): | $5,344,924 (TTM 4/30/2016) | |||||
| Additional Debt Type: | NAP | |||||||
| U/W Revenues: | $20,787,543 | |||||||
| U/W Expenses: | $15,525,844 | |||||||
| U/W NOI: | $5,261,699 | |||||||
| U/W NCF: | $4,436,708 | |||||||
| U/W NOI DSCR: | 2.47x | |||||||
| Escrows and Reserves(1): | U/W NCF DSCR: | 2.08x | ||||||
| U/W NOI Debt Yield: | 15.0% | |||||||
| Type: | Initial | Monthly | Cap (If Any) | U/W NCF Debt Yield: | 12.7% | |||
| Taxes | $334,631 | $83,658 | NAP | As-Is Appraised Value: | $52,300,000 | |||
| Insurance | $0 | Springing | NAP | As-Is Appraisal Valuation Date: | May 11, 2016 | |||
| FF&E Reserve | $0 | $68,724 | NAP | Cut-off Date LTV Ratio: | 66.9% | |||
| PIP Reserve | $231,450 | $0 | NAP | LTV Ratio at Maturity or ARD: | 57.2% | |||
| (1) | See “Escrows” section. |
| (2) | See “Cash Flow Analysis” section. |
The Mortgage Loan. The mortgage loan (the “Hilton Long Island Huntington Mortgage Loan”) is evidenced by a single promissory note secured by a first mortgage encumbering the fee interest in a full service hotel located in Melville, New York (the “Hilton Long Island Huntington Property”). The Hilton Long Island Huntington Mortgage Loan was originated on July 20, 2016 by Morgan Stanley Bank, N.A. The Hilton Long Island Huntington Mortgage Loan had an original principal balance of $35,000,000, has an outstanding principal balance as of the Cut-off Date of $35,000,000 and accrues interest at an interest rate of 4.500%per annum. The Hilton Long Island Huntington Mortgage Loan had an initial term of 120 months, has a remaining term of 120 months as of the Cut-off Date and requires interest-only payments for the first 24 payments following origination and, thereafter, requires payments of principal and interest based on a 30-year amortization schedule. The Hilton Long Island Huntington Mortgage Loan matures on August 1, 2026.
Following the lockout period, the borrower has the right to defease the Hilton Long Island Huntington Mortgage Loan in whole, but not in part, on any date before February 1, 2026. In addition, the Hilton Long Island Huntington Mortgage Loan is prepayable without penalty on or after February 1, 2026.
THE INFORMATION IN THIS STRUCTURAL AND COLLATERAL TERM SHEET IS NOT COMPLETE AND MAY BE AMENDED PRIOR TO THE TIME OF SALE. THIS TERM SHEET IS NOT AN OFFER TO SELL THESE SECURITIES AND IT IS NOT A SOLICITATION OF AN OFFER TO BUY THESE SECURITIES IN ANY JURISDICTION WHERE THE OFFER OR SALE IS NOT PERMITTED.
114
| HILTON LONG ISLAND HUNTINGTON |
Sources and Uses
| Sources | Uses | |||||||
| Original loan amount | $35,000,000 | 65.3% | Purchase price | $52,250,000 | 97.5% | |||
| Sponsor’s new cash contribution | 18,573,730 | 34.7 | Reserves | 566,081 | 1.1 | |||
| Closing costs | 757,649 | 1.4 | ||||||
| Total Sources | $53,573,730 | 100.0% | Total Uses | $53,573,730 | 100.0% |
The Property.The Hilton Long Island Huntington Property is a five-story, 305-room, full service hotel located in Melville, New York, 37.2 miles east of the New York City central business district. Built in 1988 and extensively renovated between 2012 and 2013, the Hilton Long Island Huntington Property features 130 king guestrooms, 163 double/double guestrooms and 12 full suites. Each guestroom features a flat screen television, a refrigerator, a coffeemaker and an in-room safe. The Hilton Long Island Huntington Property offers 24,662 square feet of meeting space, an outdoor pool, a tennis court, a walking track, a volleyball court, an indoor pool including a whirlpool, a fitness center, a business center, a grab-and-go snack outlet, a concierge lounge, a car rental desk and two restaurants (Basil’s Bistro and Masterson’s). The Hilton Long Island Huntington Property includes 718 surface level parking spaces, equating to a parking ratio of 2.4 spaces per room.
The renovations since 2011 have cost approximately $19.3 million ($63,235 per room) and have included renovations to all guestrooms and public spaces. The borrower is required to complete an approximately $231,450 franchisor-mandated property improvement plan (“PIP”) renovation, which generally must be completed by 2016-2017, the amount for which was reserved at loan closing, that will include repairs and replacements with respect to guestrooms, guest bathrooms, common areas, meeting space, and the exterior. According to the appraisal, the 2015 market mix of the Hilton Long Island Huntington Property was 50% commercial, 25% meeting and group, and 25% leisure. The Hilton Long Island Huntington Property has operated under the Hilton Worldwide affiliation since March 1990 and the current franchise agreement with Hilton Worldwide expires in July 2036.
Operating History and Underwritten Net Cash Flow. The following table presents certain information relating to the historical operating performance and the underwritten net cash flow at the Hilton Long Island Huntington Property:
Cash Flow Analysis
| 2013 | 2014 | 2015 | TTM 4/30/2016 | U/W | % of U/W Total Revenue | U/W $ per Room | |||||||||
| Occupancy | 75.3% | 72.1% | 76.5% | 78.5% | 78.5% | ||||||||||
| ADR | $141.88 | $154.62 | $153.72 | $151.69 | $151.69 | ||||||||||
| RevPAR | $106.84 | $111.51 | $117.66 | $119.03 | $119.03 | ||||||||||
| Room Revenue | $11,816,029 | $12,331,850 | $13,012,637 | $13,228,523 | $13,250,543 | 63.7% | $43,444 | ||||||||
| F&B Revenue | 7,229,020 | 7,029,079 | 7,080,041 | 7,006,166 | 7,189,000 | 34.6 | 23,570 | ||||||||
| Other Revenue | 314,971 | 323,248 | 361,193 | 348,341 | 348,000 | 1.7 | 1,141 | ||||||||
| Total Revenue | $19,360,020 | $19,684,177 | $20,453,871 | $20,583,030 | $20,787,543 | 100.0% | $68,156 | ||||||||
| Total Department Expenses | 7,843,243 | 7,495,164 | 7,315,334 | 7,332,452 | 7,524,916 | 36.2 | 24,672 | ||||||||
| Gross Operating Profit | $11,516,777 | $12,189,013 | $13,138,537 | $13,250,578 | $13,262,627 | 63.8% | $43,484 | ||||||||
| Total Undistributed Expenses | 5,502,889 | 5,721,166 | 6,064,200 | 6,070,880 | 6,108,184 | 29.4 | 20,027 | ||||||||
| Profit Before Fixed Charges | $6,013,888 | $6,467,847 | $7,074,337 | $7,179,698 | $7,154,443 | 34.4% | $23,457 | ||||||||
| Total Fixed Charges | 1,922,228 | 1,307,439 | 1,788,368 | 1,834,774 | 1,892,744 | 9.1 | 6,206 | ||||||||
| Net Operating Income | $4,091,660(1) | $5,160,408(1) | $5,285,969 | $5,344,924 | $5,261,699 | 25.3% | $17,251 | ||||||||
| FF&E | 0 | 0 | 0 | 0 | 824,991 | 4.0 | 2,705 | ||||||||
| Net Cash Flow | $4,091,660 | $5,160,408 | $5,285,969 | $5,344,924 | $4,436,708 | 21.3% | $14,547 | ||||||||
| NOI DSCR | 1.92x | 2.42x | 2.48x | 2.51x | 2.47x | ||||||||||
| NCF DSCR | 1.92x | 2.42x | 2.48x | 2.51x | 2.08x | ||||||||||
| NOI DY | 11.7% | 14.7% | 15.1% | 15.3% | 15.0% | ||||||||||
| NCF DY | 11.7% | 14.7% | 15.1% | 15.3% | 12.7% | ||||||||||
| (1) | Net Operating Income between 2013 and 2014 increased mostly due to a one-time real estate tax refund in the amount of $792,551.59. |
The Appraisal.As of the appraisal valuation date of May 11, 2016, the Hilton Long Island Huntington Property had an “as-is” appraised value of $52,300,000. In addition, the appraisal for the Hilton Long Island Huntington Property set forth an “as-stabilized” appraised value of $57,200,000 as of June 1, 2019.
Environmental Matters. According to a Phase I environmental assessment dated May 27, 2016, there was no evidence of any recognized environmental conditions at the Hilton Long Island Huntington Property.
Market Overview and Competition.The Hilton Long Island Huntington Property is located in Melville, New York, part of the greater town of Huntington in Suffolk County, and is approximately 37.2 miles east of the New York City central business district. The Hilton Long Island Huntington Property is situated along State Route 110, one of the primary thoroughfares in the area, and connects to Interstate 495, also known as the Long Island Expressway, providing primary regional access through the central Long
THE INFORMATION IN THIS STRUCTURAL AND COLLATERAL TERM SHEET IS NOT COMPLETE AND MAY BE AMENDED PRIOR TO THE TIME OF SALE. THIS TERM SHEET IS NOT AN OFFER TO SELL THESE SECURITIES AND IT IS NOT A SOLICITATION OF AN OFFER TO BUY THESE SECURITIES IN ANY JURISDICTION WHERE THE OFFER OR SALE IS NOT PERMITTED.
115
| HILTON LONG ISLAND HUNTINGTON |
Island region. The Hilton Long Island Huntington Property is served by the John F. Kennedy International Airport, approximately 18.0 miles southwest of the Hilton Long Island Huntington Property, the LaGuardia Airport, approximately 20.0 miles northwest of the Hilton Long Island Huntington Property, and MacArthur Airport, located approximately 15.0 miles to the east.
The city of Melville contains numerous Class A and B office parks. Some specific businesses and entities in the area include New York Life Insurance Company, the U.S. Postal Service, Wells Fargo and Farmingdale State College. Restaurants located near the Hilton Long Island Huntington Property include the Melting Pot, Subway, Moe’s Southwest Grill and the Refuge.
The Hilton Long Island Huntington Property benefits from its reasonably close proximity to New York City to the west and beach towns to the east. State and county parks, many of which offer swimming and ice skating, are located across the island. The Fire Island National Seashore on Fire Island is a 21-mile barrier island that offers seashore attractions, tent camping, swimming, surf fishing, hiking, boating, and tours of the Sunken Forest and the Otis Pike National Wilderness Area. Further to the east on Long Island are North Fork and the Hamptons.
The largest employers in the Suffolk County metropolitan statistical area are North Shore-LIJ Health System Foundation (46,840 employees), Roman Catholic Diocese of Rockville Centre (17,000 employees), Stony Brook University (14,534 employees), and Long Island Jewish Medical Center (12,529 employees). A third party hospitality research report identified four competitive hospitality properties, containing 1,061 rooms, which exhibited average occupancy, ADR, and RevPAR of 63.0%, $143.17, and $90.25, respectively, for the trailing 12-month period ending April 30, 2016.
The following table presents certain information relating to the Hilton Long Island Huntington Property’s competitive set:
Subject and Market Historical Occupancy, ADR and RevPAR(1)
Competitive Set | Hilton Long Island Huntington | Penetration Factor | |||||||
Year | Occupancy | ADR | RevPAR | Occupancy | ADR | RevPAR | Occupancy | ADR | RevPAR |
| 4/30/2016 TTM | 63.0% | $143.17 | $90.25 | 77.5% | $153.76 | $119.23 | 123.0% | 107.4% | 132.1% |
| 4/30/2015 TTM | 62.3% | $140.86 | $87.59 | 72.3% | $154.34 | $111.61 | 116.1% | 109.7% | 127.4% |
| 4/30/2014 TTM | 63.4% | $137.07 | $86.91 | 73.0% | $145.08 | $105.92 | 115.1% | 105.8% | 121.9% |
| (1) | Information obtained from a third party hospitality research report dated May 17, 2016. The competitive set includes: Holiday Inn Plainview Long Island, UPSKY Long Island Hotel, Marriott Melville Long Island and Hyatt Regency Long Island. |
The Borrower.The borrower is Blue Pearl Hospitality LLC, a Delaware limited liability company and special purpose entity with one independent director. Legal counsel to the borrower delivered a non-consolidation opinion in connection with the origination of the Hilton Long Island Huntington Loan. Naveen Shah is the guarantor of certain nonrecourse carveouts under the Hilton Long Island Huntington Loan. The sole member of the borrower is comprised of over 100 equity owners.
The Sponsor.The sponsor is Naveen Shah, the president and CEO of Navika Group of Companies. Navika Group of Companies was founded in 2005 to acquire, own and manage income-generating real estate domestically. Its current portfolio includes 49 full and limited service hotels under various flags such as Marriott, Hilton, IHG, Wyndham and Best Western, as well as ten office buildings, shopping complexes and recreational assets.
Escrows.The loan documents provide for upfront reserves in the amount of $334,631 for real estate taxes and $231,450 for planned PIP renovations. The loan documents also provide for ongoing monthly reserves for real estate taxes in an amount equal to one-twelfth of the real estate taxes the lender estimates will be payable in the next 12 months and for ongoing monthly FF&E reserves in an amount equal to the greater of (x) the amount (if any) required by the franchisor under the franchise agreement and (y) one-twelfth of 4.0% of operating income for the preceding calendar year (currently $68,724). In addition, if, at any time, the franchisor requires additional PIP work under the franchise agreement, the borrower will be required to deposit an amount equal to 125.0% of the estimated cost of any additional PIP work. The loan documents do not require monthly deposits for insurance premiums as long as (i) no event of default is continuing; (ii) the Hilton Long Island Huntington Property is insured via an acceptable blanket insurance policy; and (iii) the borrower provides the lender with timely proof of payment of insurance premiums.
Lockbox and Cash Management.Upon the occurrence of a Cash Sweep Event Period (as defined below), the borrower is required to establish a lender-controlled lockbox account. The loan documents require that the borrower and manager direct all rents and credit card receipts to be deposited directly into such lockbox account. In addition, the borrower and manager will be required to deposit any amounts received by the borrower or manager into such lockbox account within one business day following receipt. Following the occurrence of a Cash Sweep Event Period, all cash flow is required to be swept to a lender-controlled cash management account and applied as provided in the loan documents.
A “Cash Sweep Event Period” will commence upon (i) the occurrence of an event of default; (ii) the amortizing debt service coverage ratio falling below 1.20x for six consecutive calendar months; (iii) the date that is one year prior to the expiration date of the franchise agreement if by such date (a) the franchise agreement has not been renewed or extended; and (b) the amount then on deposit in the FF&E reserve equals less than $3,050,000; (iv) the franchisor providing notice of an uncured default under the franchise agreement or notice that the Hilton Long Island Huntington Property is not being operated and maintained in accordance with the franchisor’s standards, resulting in the borrower not being in good standing with the franchisor, and such default is not cured within 30 days of such notice; and/or (v) a termination of the franchise agreement. A Cash Sweep Event Period will end with respect to clause (i), if no event of default exists; with respect to clause (ii), upon the amortizing debt service coverage ratio being at least 1.20x for six consecutive calendar months; with respect to clause (iii), upon (x) a renewal or extension of the term of the franchise agreement to the satisfaction of the lender, or (y) the borrower entering into a replacement franchise agreement substantially in the same form and substance as the existing franchise agreement or otherwise reasonably acceptable to the lender,
THE INFORMATION IN THIS STRUCTURAL AND COLLATERAL TERM SHEET IS NOT COMPLETE AND MAY BE AMENDED PRIOR TO THE TIME OF SALE. THIS TERM SHEET IS NOT AN OFFER TO SELL THESE SECURITIES AND IT IS NOT A SOLICITATION OF AN OFFER TO BUY THESE SECURITIES IN ANY JURISDICTION WHERE THE OFFER OR SALE IS NOT PERMITTED.
116
| HILTON LONG ISLAND HUNTINGTON |
with a franchisor acceptable to the lender (a “Replacement Franchise Cure”); with respect to clause (iv), upon the cure of the default under the franchise agreement; and with respect to clause (v), upon a Replacement Franchise Cure.
Property Management.The Hilton Long Island Huntington Property is managed by Yashodhar Management Co., LLC.
Assumption.The borrower has a two-time right to transfer the Hilton Long Island Huntington Property provided that certain conditions are satisfied, including (i) no event of default has occurred and is continuing; (ii) the lender reasonably approves the proposed transferee, taking into consideration transferee experience, financial strength and general business standing; (iii) an affiliate of the transferee reasonably acceptable to the lender executes a recourse guaranty and environmental indemnity in form and substance identical to the existing guaranty and environmental indemnity; and (iv) if required by the lender, the lender has received confirmation from Fitch, KBRA, Moody’s and S&P that such assumption will not result in a downgrade, withdrawal or qualification of the respective ratings assigned to the Series 2016-BNK1 certificates.
Partial Release.Not permitted.
Real Estate Substitution.Not permitted.
Subordinate and Mezzanine Indebtedness.Not permitted.
Ground Lease.None.
Terrorism Insurance.The loan documents require that the “all risk” insurance policy required to be maintained by the borrower provide coverage for terrorism in an amount determined by lender in its reasonable business judgment, but in no event more than the sum of the full replacement cost of the Hilton Long Island Huntington Property, and twelve months’ business interruption insurance.
Windstorm Insurance.The loan documents require windstorm insurance covering the full replacement cost of the Hilton Long Island Huntington Property during the loan term, subject to a deductible of not more than 5.0% of total insurable value per loss. At the time of loan closing, the Hilton Long Island Huntington Property had windstorm insurance coverage.
THE INFORMATION IN THIS STRUCTURAL AND COLLATERAL TERM SHEET IS NOT COMPLETE AND MAY BE AMENDED PRIOR TO THE TIME OF SALE. THIS TERM SHEET IS NOT AN OFFER TO SELL THESE SECURITIES AND IT IS NOT A SOLICITATION OF AN OFFER TO BUY THESE SECURITIES IN ANY JURISDICTION WHERE THE OFFER OR SALE IS NOT PERMITTED.
117
| AURORA OFFICE BUILDING |
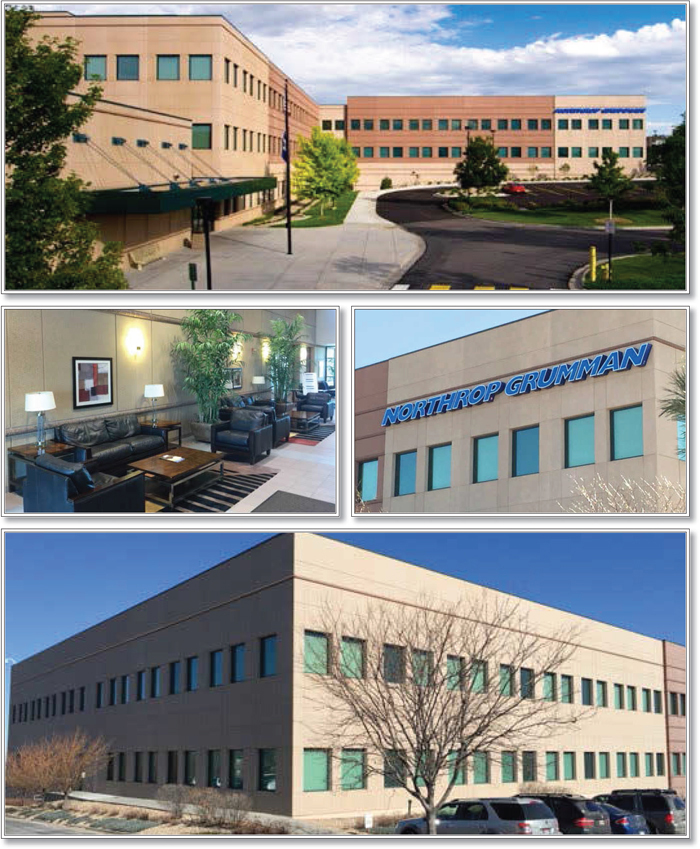
THE INFORMATION IN THIS STRUCTURAL AND COLLATERAL TERM SHEET IS NOT COMPLETE AND MAY BE AMENDED PRIOR TO THE TIME OF SALE. THIS TERM SHEET IS NOT AN OFFER TO SELL THESE SECURITIES AND IT IS NOT A SOLICITATION OF AN OFFER TO BUY THESE SECURITIES IN ANY JURISDICTION WHERE THE OFFER OR SALE IS NOT PERMITTED.
118
| AURORA OFFICE BUILDING |

THE INFORMATION IN THIS STRUCTURAL AND COLLATERAL TERM SHEET IS NOT COMPLETE AND MAY BE AMENDED PRIOR TO THE TIME OF SALE. THIS TERM SHEET IS NOT AN OFFER TO SELL THESE SECURITIES AND IT IS NOT A SOLICITATION OF AN OFFER TO BUY THESE SECURITIES IN ANY JURISDICTION WHERE THE OFFER OR SALE IS NOT PERMITTED.
119
| No. 10 – Aurora Office Building | |||||||
| Loan Information | Property Information | ||||||
| Mortgage Loan Seller: | Morgan Stanley Mortgage Capital Holdings LLC | Single Asset/Portfolio: | Single Asset | ||||
| Credit Assessment (Fitch/KBRA/Moody’s/S&P): | NR/NR/NR/NR | Property Type: | Office | ||||
| Original Principal Balance: | $32,600,000 | Specific Property Type: | Suburban | ||||
| Cut-off Date Balance: | $32,600,000 | Location: | Aurora, CO | ||||
| % of Initial Pool Balance: | 3.7% | Size: | 183,529 SF | ||||
| Loan Purpose: | Refinance | Cut-off Date Balance Per SF: | $177.63 | ||||
| Borrower Name: | NRFC Denver Holdings LLC | Year Built/Renovated: | 1997/2016 | ||||
| Sponsor: | NRFC NNN Holdings, LLC | Title Vesting: | Fee | ||||
| Mortgage Rate: | 4.080% | Property Manager: | Self-managed | ||||
| Note Date: | July 8, 2016 | 4thMost Recent Occupancy (As of): | 100.0% (12/31/2012) | ||||
| Anticipated Repayment Date: | NAP | 3rdMost Recent Occupancy (As of): | 100.0% (12/31/2013) | ||||
| Maturity Date: | August 1, 2026 | 2ndMost Recent Occupancy (As of): | 100.0% (12/31/2014) | ||||
| IO Period: | 24 months | Most Recent Occupancy (As of): | 100.0% (12/31/2015) | ||||
| Loan Term (Original): | 120 months | Current Occupancy (As of): | 100.0% (8/1/2016) | ||||
| Seasoning: | 0 months | ||||||
| Amortization Term (Original): | 360 months | Underwriting and Financial Information: | |||||
| Loan Amortization Type: | Interest-only, Amortizing Balloon | ||||||
| Interest Accrual Method: | Actual/360 | 4thMost Recent NOI(2): | NAV | ||||
| Call Protection: | L(24),D(92),O(4) | 3rdMost Recent NOI (As of): | $3,545,905 (12/31/2013) | ||||
| Lockbox Type: | Hard/Springing Cash Management | 2ndMost Recent NOI (As of): | $3,611,122 (12/31/2014) | ||||
| Additional Debt: | None | Most Recent NOI (As of): | $3,674,709 (12/31/2015) | ||||
| Additional Debt Type: | NAP | ||||||
| U/W Revenues: | $3,730,158 | ||||||
| U/W Expenses: | $55,952 | ||||||
| U/W NOI: | $3,674,206 | ||||||
| U/W NCF: | $3,391,571 | ||||||
| Escrows and Reserves(1): | U/W NOI DSCR: | 1.95x | |||||
| U/W NCF DSCR: | 1.80x | ||||||
| Type: | Initial | Monthly | Cap (If Any) | U/W NOI Debt Yield: | 11.3% | ||
| Taxes | $0 | Springing | NAP | U/W NCF Debt Yield: | 10.4% | ||
| Insurance | $0 | Springing | NAP | As-Is Appraised Value: | $48,400,000 | ||
| Replacement Reserve | $0 | $1,529 | NAP | As-Is Appraisal Valuation Date: | June 6, 2016 | ||
| Rollover Reserve | $0 | $45,833 | $3,000,000 | Cut-off Date LTV Ratio: | 67.4% | ||
| Unfunded TI/LC Obligations | $4,904,605 | $0 | NAP | LTV Ratio at Maturity or ARD: | 56.9% | ||
| (1) | See “Escrows” section. |
| (2) | Historical financials prior to 2013 are not available as they were not provided by the borrower. |
The Mortgage Loan.The mortgage loan (the “Aurora Office Building Mortgage Loan”) is evidenced by a single promissory note secured by a first mortgage encumbering a suburban office building located in Aurora, Colorado (the “Aurora Office Building Property”). The Aurora Office Building Mortgage Loan was originated on July 8, 2016 by Morgan Stanley Bank, N.A. The Aurora Office Building Mortgage Loan had an original principal balance of $32,600,000, has an outstanding principal balance as of the Cut-off Date of $32,600,000 and accrues interest at an interest rate of 4.080%per annum. The Aurora Office Building Mortgage Loan had an initial term of 120 months, has a remaining term of 120 months as of the Cut-off Date and requires interest-only payments for the first 24 payments following origination and, thereafter, requires payments of principal and interest based on a 30-year amortization schedule. The Aurora Office Building Mortgage Loan matures on August 1, 2026.
Following the lockout period, the borrower has the right to defease the Aurora Office Building Mortgage Loan in whole, but not in part, on any date before May 1, 2026. In addition, the Aurora Office Building Mortgage Loan is prepayable without penalty on or after May 1, 2026.
THE INFORMATION IN THIS STRUCTURAL AND COLLATERAL TERM SHEET IS NOT COMPLETE AND MAY BE AMENDED PRIOR TO THE TIME OF SALE. THIS TERM SHEET IS NOT AN OFFER TO SELL THESE SECURITIES AND IT IS NOT A SOLICITATION OF AN OFFER TO BUY THESE SECURITIES IN ANY JURISDICTION WHERE THE OFFER OR SALE IS NOT PERMITTED.
120
| AURORA OFFICE BUILDING |
Sources and Uses
| Sources | Uses | |||||||
| Original loan amount | $32,600,000 | 92.0% | Loan payoff(1) | $30,046,236 | 84.8% | |||
| Sponsor’s new cash contribution | 2,835,306 | 8.0 | Reserves | 4,904,605 | 13.8 | |||
| Closing costs | 484,465 | 1.4 | ||||||
| Total Sources | $35,435,306 | 100.0% | Total Uses | $35,435,306 | 100.0% |
| (1) | The Aurora Office Building Property was previously securitized in the CD 2006-CD3 transaction. |
The Property.The Aurora Office Building Property is a 183,529 square foot, three-story, single-tenant suburban office building located in Aurora, Colorado. The Aurora Office Building Property was constructed in phases, with the original three-story building, comprising 108,240 square feet, constructed in 1997 as a built-to-suit office for TRW, Inc. (“TRW”) and a three-story expansion building, comprising 75,289 square feet, constructed in 2005. The Aurora Office Building Property is 100.0% leased to Northrop Grumman Systems Corporation (“Northrop Grumman Systems”), a subsidiary of Northrop Grumman Corporation (“Northrop Grumman”). TRW was acquired by Northrop Grumman in 2002 and the Aurora Office Building Property has been continuously occupied by Northrop Grumman since the acquisition. Northrop Grumman is a leading global security company providing systems, products and solutions in autonomous systems, cyber, strike, and logistics and modernization to government and commercial customers worldwide. Northrop Grumman had revenues of approximately $23.5 billion in its fiscal year 2015 and employs approximately 65,000 people across three business sectors: aerospace systems, mission systems and technology services.
The Aurora Office Building Property features a 351-seat auditorium, 18,000 square feet of raised floor data center space, substantial fiber optic and data connectivity, high security features, uninterrupted power supply (UPS) systems and extensive HVAC systems to support the data center space. There are 558 parking spaces, for a parking ratio of 3.0 per 1,000 square feet, at the Aurora Office Building Property. The borrower is in the process of completing tenant improvements, including an HVAC replacement project, that is expected to cost an estimated $1.3 million. The loan documents provide for an upfront reserve of approximately $4.9 million, which represents all of the sponsor’s remaining tenant improvement and leasing commission obligations associated with the specified replacement projects as well as other tenant allowances due to the tenant (see “Escrows” section). After the completion of the specified replacement projects, the remaining tenant improvement and leasing commission funds may be used to fund other tenant improvements requested by the tenant. It is anticipated that any such funds may be used to partially fund an approximately $9.5 million ($51.76 per square foot) remodeling and modernization of the Aurora Office Building Property by Northrop Grumman Systems; however, internal approvals for such remodeling and modernization have not yet been obtained by the tenant, and there is no assurance that such approvals will be obtained or such remodeling and modernization plan will be implemented.
The following table presents certain information relating to the tenancy at the Aurora Office Building Property:
Major Tenant
| Tenant Name | Credit Rating (Fitch/Moody’s/S&P)(1) | Tenant NRSF | % of NRSF | Annual U/W Base Rent PSF(2) | Annual U/W Base Rent(2) | % of Total Annual U/W Base Rent | Lease Expiration Date |
| Major Tenant | |||||||
| Northrop Grumman Systems | BBB+/Baa1/BBB+ | 183,529 | 100.0% | $21.48 | $3,943,084 | 100.0% | 11/30/2022(3) |
| Total Major Tenants | 183,529 | 100.0% | $21.48 | $3,943,084 | 100.0% | ||
| Vacant Space | 0 | 0.0% | |||||
| Collateral Total | 183,529 | 100.0% | |||||
| (1) | Certain ratings are those of the parent company Northrop Grumman. Northrop Grumman does not guarantee the lease. |
| (2) | Annual U/W Base Rent PSF and Annual U/W Base Rent include $254,151 of contractual rent steps, which represent the net present value of rent steps through the loan term. |
| (3) | Northrop Grumman Systems has two, five-year lease renewal options. |
THE INFORMATION IN THIS STRUCTURAL AND COLLATERAL TERM SHEET IS NOT COMPLETE AND MAY BE AMENDED PRIOR TO THE TIME OF SALE. THIS TERM SHEET IS NOT AN OFFER TO SELL THESE SECURITIES AND IT IS NOT A SOLICITATION OF AN OFFER TO BUY THESE SECURITIES IN ANY JURISDICTION WHERE THE OFFER OR SALE IS NOT PERMITTED.
121
| AURORA OFFICE BUILDING |
The following table presents certain information relating to the lease rollover schedule at the Aurora Office Building Property:
Lease Expiration Schedule(1)
| Year Ending December 31, | No. of Leases Expiring | Expiring NRSF | % of Total NRSF | Cumulative Expiring NRSF | Cumulative % of Total NRSF | Annual U/W Base Rent | % of Total Annual U/W Base Rent | Annual U/W Base Rent PSF |
| MTM | 0 | 0 | 0.0% | 0 | 0.0% | $0 | 0.0% | $0.00 |
| 2016 | 0 | 0 | 0.0% | 0 | 0.0% | $0 | 0.0% | $0.00 |
| 2017 | 0 | 0 | 0.0% | 0 | 0.0% | $0 | 0.0% | $0.00 |
| 2018 | 0 | 0 | 0.0% | 0 | 0.0% | $0 | 0.0% | $0.00 |
| 2019 | 0 | 0 | 0.0% | 0 | 0.0% | $0 | 0.0% | $0.00 |
| 2020 | 0 | 0 | 0.0% | 0 | 0.0% | 0 | 0.0% | $0.00 |
| 2021 | 0 | 0 | 0.0% | 0 | 0.0% | $0 | 0.0% | $0.00 |
| 2022 | 1 | 183,529 | 100.0% | 183,529 | 100.0% | $3,943,084 | 100.0% | $21.48 |
| 2023 | 0 | 0 | 0.0% | 183,529 | 100.0% | $0 | 0.0% | $0.00 |
| 2024 | 0 | 0 | 0.0% | 183,529 | 100.0% | $0 | 0.0% | $0.00 |
| 2025 | 0 | 0 | 0.0% | 183,529 | 100.0% | $0 | 0.0% | $0.00 |
| 2026 | 0 | 0 | 0.0% | 183,529 | 100.0% | $0 | 0.0% | $0.00 |
| Thereafter | 0 | 0 | 0.0% | 183,529 | 100.0% | $0 | 0.0% | $0.00 |
| Vacant | 0 | 0 | 0.0% | 183,529 | 100.0% | $0 | 0.0% | $0.00 |
| Total/Weighted Average | 1 | 183,529 | 100.0% | $3,943,084 | 100.0% | $21.48 |
| (1) | Information obtained from the underwritten rent roll. |
The following table presents historical occupancy percentages at the Aurora Office Building Property:
Historical Occupancy
12/31/2012(1) | 12/31/2013(1) | 12/31/2014(1) | 12/31/2015(1) | 8/1/2016(2) | ||||
| 100.0% | 100.0% | 100.0% | 100.0% | 100.0% |
| (1) | Information based on the Northrop Grumman Systems lease. |
| (2) | Information obtained from the underwritten rent roll. |
Operating History and Underwritten Net Cash Flow. The following table presents certain information relating to the historical operating performance and the underwritten net cash flow at the Aurora Office Building Property:
Cash Flow Analysis
| 2013 | 2014 | 2015 | U/W | % of U/W Effective Gross Income | U/W $ per SF | |
| Base Rent | $3,579,358 | $3,618,413 | $3,688,818 | $3,943,084(1) | 105.7% | $21.48 |
| Grossed Up Vacant Space | 0 | 0 | 0 | 0 | 0.0 | 0.00 |
| Total Reimbursables | 0 | 31,207 | 27,187 | 0 | 0.0 | 0.00 |
| Other Income | 0 | 0 | 0 | 0 | 0.0 | 0.00 |
| Less Vacancy & Credit Loss | 0 | 0 | 0 | (212,926)(2) | (5.7) | (1.16) |
| Effective Gross Income | $3,579,358 | $3,649,620 | $3,716,004 | $3,730,158 | 100.0% | $20.32 |
| Total Operating Expenses | $33,452 | $38,498 | $41,296 | $55,952 | 1.5% | $0.30 |
|
|
|
|
|
| |
| Net Operating Income | $3,545,905 | $3,611,122 | $3,674,709 | $3,674,206 | 98.5% | $20.02 |
| TI/LC | 0 | 0 | 0 | 245,929 | 6.6 | 1.34 |
| Capital Expenditures | 0 | 0 | 0 | 36,706 | 1.0 | 0.20 |
| Net Cash Flow | $3,545,905 | $3,611,122 | $3,674,709 | $3,391,571 | 90.9% | $18.48 |
| NOI DSCR | 1.88x | 1.91x | 1.95x | 1.95x | ||
| NCF DSCR | 1.88x | 1.91x | 1.95x | 1.80x | ||
| NOI DY | 10.9% | 11.1% | 11.3% | 11.3% | ||
| NCF DY | 10.9% | 11.1% | 11.3% | 10.4% |
| (1) | U/W Base Rent includes contractual rent steps of $254,151, which are based on the net present value of rent steps during the loan term. |
| (2) | The underwritten economic vacancy is 5.7%. The Aurora Office Building Property was 100.0% physically occupied as of August 1, 2016. |
Appraisal.As of the appraisal valuation date of June 6, 2016, the Aurora Office Building Property had an “as-is” appraised value of $48,400,000.
Environmental Matters. According to a Phase I environmental site assessment dated June 14, 2016, there was no evidence of any recognized environmental conditions at the Aurora Office Building Property.
Market Overview and Competition.The Aurora Office Building Property is located in the Aurora office submarket of the broader Denver office market, approximately 10.0 miles to the east of the Denver central business district and 10.0 miles to the southwest of Denver International Airport. Access to the Aurora Office Building Property is provided via Interstate 225, Interstate 70 and Alameda
THE INFORMATION IN THIS STRUCTURAL AND COLLATERAL TERM SHEET IS NOT COMPLETE AND MAY BE AMENDED PRIOR TO THE TIME OF SALE. THIS TERM SHEET IS NOT AN OFFER TO SELL THESE SECURITIES AND IT IS NOT A SOLICITATION OF AN OFFER TO BUY THESE SECURITIES IN ANY JURISDICTION WHERE THE OFFER OR SALE IS NOT PERMITTED.
122
| AURORA OFFICE BUILDING |
Parkway. The Aurora Office Building Property is located immediately to the west of Buckley Air Force Base, which is a primary demand generator for office use in the Aurora office submarket. Buckley Air Force Base serves over 92,500 active duty, National Guard, Reserve and retired personnel, is the home of the 460th Space Wing under the direction of Air Force Space Command, and is home to the Colorado Air National Guard. Buckley Air Force Base has air operations, space-based missile defense, surveillance and communications operations, and general military support functions on site. The population within a one-, three- and five-mile radius of the Aurora Office Building Property was 18,426, 122,084 and 311,149, respectively, and the median household income within a one-, three- and five-mile radius of the Aurora Office Building Property was $55,919, $50,549 and $51,645, respectively, as of 2016.
According to the appraisal, the Denver office market exhibited vacancy of 10.3% with an asking rental rate of $24.96 per square foot on a gross basis as of the first quarter of 2016. The Aurora office submarket contained approximately 9.0 million square feet of space (including the Aurora Office Building Property), with no office space under construction, as of the first quarter of 2016. For the same time period, the Aurora office submarket exhibited vacancy of 8.9% with an asking rental rate of $17.83 per square foot on a gross basis.
The following table presents certain information relating to comparable office properties to the Aurora Office Building Property:
Comparable Leases(1)
| Property Name/Location | Year Built | Total GLA (SF) | Total Occupancy | Distance from Subject | Tenant Name | Lease Date/Term | Lease Area (SF) | Annual Base Rent PSF | Lease Type |
| Westmoor Center Westminster, CO | 1997 | 612,890 | 83.4% | 26.8 miles | Zimmer Biomet | July 2016 / 10.5 Yrs | 103,999 | $17.00 | NNN |
Circle Point Corporate Center Westminster, CO | 2001 | 272,873 | 86.4% | 25.5 miles | General Dynamics | February 2016 / 5.5 Yrs | 20,000 | $15.25 | NNN |
| Coal Creek Business Park Louisville, CO | 1999 | 203,243 | 100.0% | 32.4 miles | Medtronic | December 2015 / 3.0 Yrs | 76,233 | $15.00 | NNN |
| 4555 Airport Way Denver, CO | 2008 | 87,201 | 100.0% | 6.7 miles | Karcher North America, Inc. | April 2015 / 12.8 Yrs | 87,201 | $0.00(2) | FSG |
Raytheon-East Hughes Drive Aurora, CO | 2000-2001 | 175,921 | 100.0% | 1.3 miles | Raytheon | June 2014 / 5.4 Yrs | 175,921 | $12.00 | Absolute Net |
| (1) | Information obtained from the appraisal and underwritten rent roll. The appraiser concluded to a market rent of $17.00 per square foot. |
| (2) | The full building lease utilized a gross expense structure with a 2015 base year at $10.26 per square foot. |
The Borrower.The borrower, NRFC Denver Holdings LLC, is a Delaware limited liability company entity and single purpose entity with one independent director. Legal counsel to the borrower delivered a non-consolidation opinion in connection with the origination of the Aurora Office Building Mortgage Loan. NRFC NNN Holdings, LLC is the guarantor of certain nonrecourse carveouts under the Aurora Office Building Mortgage Loan.
The Sponsor.The loan sponsor is NRFC NNN Holdings, LLC, a subsidiary of NorthStar Realty Finance Corp. (“NorthStar”), which is a publicly-traded (NYSE: NRF), diversified commercial real estate company that is organized as a REIT. NorthStar invests in multiple asset classes across commercial real estate, including real estate assets, senior and subordinate loans, CDOs and interests in real estate private equity funds. During the period from 2009 to the present, the sponsor, NRFC NNN Holdings, LLC was the guarantor under three securitized mortgage loans which were the subject of a deed in lieu of foreclosure, and in one case, litigation, and is the guarantor under two securitized loans that matured in February 2016 and are currently the subject of modification discussions with the respective lender. See “Description of the Mortgage Pool — Loan Purpose; Default History, Bankruptcy Issues and Other Proceedings” in the Preliminary Prospectus.
On June 3, 2016, NorthStar, NorthStar Asset Management Group (“NSAM”) and Colony Capital, Inc. (“Colony”), announced that they have entered into a definitive merger agreement under which the companies will combine in an all-stock merger of equals transaction, subject to satisfaction of certain conditions. The combined company will be named “Colony NorthStar, Inc.” Upon completion of the transaction, NSAM shareholders will own approximately 32.9%, Colony shareholders will own approximately 33.3% and NorthStar shareholders will own approximately 33.9% of the combined company on a fully diluted basis. There can be no assurance as to whether, or when, such merger will occur.
Escrows.The loan documents provide for upfront reserves in the amount of $4,904,605 for outstanding tenant improvements and leasing commissions and landlord work obligations related to the Northrop Grumman Systems lease. The loan documents require monthly deposits of $3,059 for replacement reserves,provided that so long as the Northrop Grumman Systems lease is in effect, such monthly amount will be reduced to $1,529, and monthly deposits of $45,833 for tenant improvements and leasing commissions (capped at $3.0 million), however the monthly deposits for tenant improvements and leasing commissions (“TI/LC”) will be waived following the Northrop Grumman Lease Renewal Date.
The “Northrop Grumman Lease Renewal Date” means such date, if any, on which the term of the Northrop Grumman Systems lease is extended (beyond its current term) for at least ten years or 90.0% or more of the Aurora Office Building Property has been re-let to one or more replacement tenants under one or more replacement leases, as reasonably approved by lender.
The loan documents do not require monthly escrows for real estate taxes provided that Northrop Grumman Systems (or a replacement tenant) (i) is obligated under the terms of its lease to pay all taxes and (ii) has paid all taxes prior to the date upon which they are due. The loan documents do not require monthly escrows for insurance premiums provided that either (i) Northrop Grumman Systems (or a replacement tenant) (x) provides satisfactory evidence of the insurance coverages it is obligated to maintain under the terms of its lease and (y) provides evidence satisfactory to the lender that such insurance is being maintained by
THE INFORMATION IN THIS STRUCTURAL AND COLLATERAL TERM SHEET IS NOT COMPLETE AND MAY BE AMENDED PRIOR TO THE TIME OF SALE. THIS TERM SHEET IS NOT AN OFFER TO SELL THESE SECURITIES AND IT IS NOT A SOLICITATION OF AN OFFER TO BUY THESE SECURITIES IN ANY JURISDICTION WHERE THE OFFER OR SALE IS NOT PERMITTED.
123
| AURORA OFFICE BUILDING |
Northrop Grumman Systems (or a replacement tenant); or (ii) the Aurora Office Building Property is insured via an acceptable blanket insurance policy.
During the continuance of a Tenant Cash Sweep Event (as defined below),provided no event of default is continuing under the Aurora Office Building Mortgage Loan, all excess cash flow is required to be deposited into the TI/LC reserve, until such time as either (x) the balance of the TI/LC reserve (including any letter of credit posted for such purpose) equals $4.2 million or (y) the Northrop Grumman Lease Renewal Date occurs, and thereafter into an excess cash flow reserve subaccount. Upon the Northrop Grumman Lease Renewal Date, all funds in the TI/LC reserve are required to be disbursed to the borrower.
Lockbox and Cash Management.The Aurora Office Building Mortgage Loan requires that the borrower direct tenants to pay their rents directly into a lender-controlled lockbox account, which is already in place. The loan documents also require that all rents received by the borrower be deposited into the lockbox account within one business day of receipt. During a Cash Sweep Event Period (as defined below), at lender’s option, all cash flow is required to be swept to a lender-controlled cash management account and applied as provided in the loan documents. If no Cash Sweep Event Period exists, funds in the lockbox account are required to be transferred to a borrower-controlled operating account.
A “Cash Sweep Event Period” will commence upon the earlier of the occurrence and continuance of (i) an event of default; (ii) a DSCR Event (as defined below); or (iii) a Tenant Cash Sweep Event (as defined below). A Cash Sweep Event Period will end with respect to clause (i), upon the cure of such event of default; with respect to clause (ii), upon a DSCR Cure (as defined below); and with respect to clause (iii), upon a Tenant Cash Sweep Event Cure (as defined below).
A “DSCR Event” means the amortizing debt service coverage ratio being less than 1.20x for the immediately preceding six consecutive months.
“DSCR Cure” means either (a) an amortizing debt service coverage ratio equal to or greater than 1.25x for the immediately preceding six consecutive months;provided, that if the DSCR Event in question was the result of a bankruptcy, insolvency or similar event of Northrop Grumman Systems or of Northrop Grumman Systems going dark or terminating its lease or the occurrence of the date one year prior to its lease expiration, then such six month period is not applicable if there is otherwise a Cash Sweep Event Cure with respect to such event or (b) a voluntary prepayment (including during the lockout period) in the minimum amount sufficient to reduce the outstanding principal balance of the Aurora Office Building Mortgage Loan such that the amortizing debt service coverage ratio is equal to or greater than 1.25x (subject to a prepayment premium equal to the greater of a yield maintenance premium or 1.00% of the amount prepaid).
A “Tenant Cash Sweep Event” occurs when Northrop Grumman Systems terminates or cancels its lease in any bankruptcy or similar proceeding (including without limitation a rejection of such lease) or files for bankruptcy or becomes the subject of an insolvency proceeding, or the credit rating of Northrop Grumman Systems falls below BBB- by S&P Global Ratings (or its equivalent by any other nationally–recognized statistical rating agency) or the Northrop Grumman Systems lease terminates or fails to be in full force and effect, Northrop Grumman Systems goes dark, or gives a termination notice under its lease for all or a material portion of its premises, or one year prior to the expiration of the Northrop Grumman Systems lease unless it has been renewed or extended in accordance with its terms or on other terms reasonably acceptable to the lender.
“Tenant Cash Sweep Event Cure” means (a) if the Tenant Cash Sweep Event Period is caused by a bankruptcy, insolvency or similar proceeding of Northrop Grumman Systems, then either (1) the Northrop Grumman Systems lease has been affirmed in bankruptcy and the tenant is in occupancy, open for business and paying full contractual rent or (2) 90.0% or more of the Aurora Office Building Property has been re-let to one or more replacement tenants pursuant to replacement leases, as reasonably approved by the lender; (b) if the Cash Sweep Event Period is caused by Northrop Grumman Systems’ going dark or lease termination or the occurrence of the date one year prior to its lease expiration, then either (1) Northrop Grumman Systems is open for business either pursuant to its lease (which, if such Cash Sweep Event Period occurred due to the occurrence of the date one year prior to lease expiration, has been renewed or extended in accordance with its terms or on other terms reasonably acceptable to the lender) or a replacement lease approved by lender or (2) the Aurora Office Building Property has been re-let to one or more replacement tenants pursuant to replacement leases, as reasonably approved by lender, such that the amortizing debt service coverage ratio is at least 1.25x; or (c) if the Tenant Cash Sweep Event is caused by a downgrade in the rating of Northrop Grumman, then either (1) the credit rating issued by S&P Global Ratings (or its equivalent by any other rating agency) to Northrop Grumman is increased to BBB- or higher or (2) 90.0% or more of the Aurora Office Building Property has been re-let to one or more replacement tenants pursuant to replacement leases, as reasonably approved by the lender;provided, that in the case of (a), (b) or (c) above, a Tenant Cash Sweep Event Cure will also occur if the amount of funds in the TI/LC reserve is no less than $4.2 million (whether by deposit and/or borrower’s posting a letter of credit meeting the requirements of the loan documents).
Property Management. The Aurora Office Building Property is self-managed by the tenant.
Assumption.The borrower has the right to transfer the Aurora Office Building Propertyprovided that certain conditions are satisfied, including (i) no event of default has occurred and is continuing; (ii) the lender reasonably approves the transferee, taking into consideration the transferee’s experience, financial strength and general business standing; (iii) an affiliate of the transferee reasonably acceptable to the lender executes a non-recourse carveout guaranty and environmental indemnity in form and substance identical to the existing guaranty and environmental indemnity; and (iv) if required by the lender, the lender has received confirmation from Fitch, KBRA, Moody’s and S&P that the transfer will not result in a downgrade, withdrawal or qualification of the respective ratings assigned to the WFCM 2016-BNK1 Certificates.
Partial Release. Not permitted.
Real Estate Substitution.Not permitted.
THE INFORMATION IN THIS STRUCTURAL AND COLLATERAL TERM SHEET IS NOT COMPLETE AND MAY BE AMENDED PRIOR TO THE TIME OF SALE. THIS TERM SHEET IS NOT AN OFFER TO SELL THESE SECURITIES AND IT IS NOT A SOLICITATION OF AN OFFER TO BUY THESE SECURITIES IN ANY JURISDICTION WHERE THE OFFER OR SALE IS NOT PERMITTED.
124
| AURORA OFFICE BUILDING |
Subordinate and Mezzanine Indebtedness.Not permitted.
Ground Lease.None.
Terrorism Insurance. The loan documents require that the “all risk” and business interruption insurance policy required to be maintained by the borrower provide coverage for terrorism in an amount determined by the lender, but in no event more than an amount equal to the full replacement cost of the Aurora Office Building Property and twelve months of business interruption insurance (provided that the borrower is not required to pay terrorism insurance premiums in excess of two times the premium for all risk and business interruption coverage if the Terrorism Risk Insurance Program Reauthorization Act is no longer in effect).
THE INFORMATION IN THIS STRUCTURAL AND COLLATERAL TERM SHEET IS NOT COMPLETE AND MAY BE AMENDED PRIOR TO THE TIME OF SALE. THIS TERM SHEET IS NOT AN OFFER TO SELL THESE SECURITIES AND IT IS NOT A SOLICITATION OF AN OFFER TO BUY THESE SECURITIES IN ANY JURISDICTION WHERE THE OFFER OR SALE IS NOT PERMITTED.
125
| No. 11 – 633 Third Avenue - Retail Condo | |||||||||
| Loan Information | Property Information | ||||||||
| Mortgage Loan Seller: | Wells Fargo Bank, National Association | Single Asset/Portfolio: | Single Asset | ||||||
Credit Assessment (Fitch/KBRA/Moody’s/S&P): | NR/NR/NR/NR | Property Type: | Retail | ||||||
| Original Principal Balance: | $32,000,000 | Specific Property Type: | Anchored | ||||||
| Cut-off Date Balance: | $32,000,000 | Location: | New York, NY | ||||||
| % of Initial Pool Balance: | 3.7% | Size: | 40,468 SF | ||||||
| Loan Purpose: | Refinance | Cut-off Date Balance Per SF: | $790.75 | ||||||
| Borrower Name: | 633 Realty LLC | Year Built/Renovated: | 1962/NAP | ||||||
| Sponsor(1): | Joseph Nakash | Title Vesting: | Fee | ||||||
| Mortgage Rate: | 4.400% | Property Manager: | Self-managed | ||||||
| Note Date: | June 30, 2016 | 4th Most Recent Occupancy (As of): | 100.0% (12/31/2012) | ||||||
| Anticipated Repayment Date: | NAP | 3rd Most Recent Occupancy (As of): | 100.0% (12/31/2013) | ||||||
| Maturity Date: | July 11, 2026 | 2nd Most Recent Occupancy (As of): | 100.0% (12/31/2014) | ||||||
| IO Period: | 120 months | Most Recent Occupancy (As of): | 100.0% (12/31/2015) | ||||||
| Loan Term (Original): | 120 months | Current Occupancy (As of): | 100.0% (6/29/2016) | ||||||
| Seasoning: | 1 month | ||||||||
| Amortization Term (Original): | NAP | Underwriting and Financial Information: | |||||||
| Loan Amortization Type: | Interest-only, Balloon | ||||||||
| Interest Accrual Method: | Actual/360 | 4thMost Recent NOI (As of): | $2,067,683 (12/31/2013) | ||||||
| Call Protection: | L(36),GRTR 1% or YM(80),O(4) | 3rdMost Recent NOI (As of): | $2,403,775 (12/31/2014) | ||||||
| Lockbox Type: | Hard/Upfront Cash Management | 2ndMost Recent NOI (As of): | $2,272,290 (12/31/2015) | ||||||
| Additional Debt: | None | Most Recent NOI (As of): | $2,290,995 (TTM 4/30/2016) | ||||||
| Additional Debt Type: | NAP | ||||||||
| U/W Revenues: | $3,367,528 | ||||||||
| U/W Expenses: | $1,052,351 | ||||||||
| U/W NOI: | $2,315,177 | ||||||||
| U/W NCF: | $2,230,294 | ||||||||
| U/W NOI DSCR: | 1.62x | ||||||||
| Escrows and Reserves: | U/W NCF DSCR: | 1.56x | |||||||
| U/W NOI Debt Yield: | 7.2% | ||||||||
| Type: | Initial | Monthly | Cap (If Any) | U/W NCF Debt Yield: | 7.0% | ||||
| Taxes | $38,790 | $38,789 | NAP | As-Is Appraised Value: | $50,000,000 | ||||
| Insurance(2) | $0 | Springing | NAP | As-Is Appraisal Valuation Date: | May 23, 2016 | ||||
| Replacement Reserve | $675 | $675 | NAP | Cut-off Date LTV Ratio: | 64.0% | ||||
| TI/LC Reserve | $6,745 | $6,745 | NAP | LTV Ratio at Maturity or ARD: | 64.0% | ||||
| (1) | The sponsor filed for bankruptcy in 1994 which was dismissed in 1999. See “Description of the Mortgage Pool—Default History, Bankruptcy Issues and Other Proceedings” in the Preliminary Prospectus. |
| (2) | Ongoing reserves for insurance premiums are not required as long as (i) no event of default has occurred and is continuing; (ii) the 633 Third Avenue - Retail Condo Property (as defined below) is insured via an acceptable blanket insurance policy; and (iii) the borrower provides the lender with evidence of renewal of the insurance policies and timely proof of payment of insurance premiums. |
The 633 Third Avenue - Retail Condo mortgage loan is evidenced by a single promissory note that is secured by a first mortgage encumbering a 40,468 square foot retail condominium (the “633 Third Avenue - Retail Condo Property”) within 633 Third Avenue, a 41-story, Class A office condominium building located between East 40th and East 41st Street in New York, New York. Built in 1962, the 633 Third Avenue - Retail Condo Property’s tenancy includes JP Morgan Chase (“Chase Bank”) (representing 40.7% of the net rentable area and 74.4% of the underwritten base rent), New York Sports Club (representing 58.6% of the net rentable area and 24.0% of the underwritten base rent) and Gateway News Stand (representing 0.7% of the net rentable area and 1.6% of the underwritten base rent). Chase Bank, or its predecessor, has been in occupancy since 1962, while New York Sports Club and Gateway News Stand have been in occupancy since 1997. According to the appraisal the overall in-place contractual rents at the 633 Third Avenue – Retail Condo Property are approximately 22.4% below market rent. As of June 29, 2016, the 633 Third Avenue - Retail Condo Property was 100.0% occupied by 3 tenants.
The 633 Third Avenue - Retail Condo Property comprises the entire eastern blockfront of Third Avenue between East 40th and East 41st Streets within the Murray Hill neighborhood of Manhattan. According to a third party report, the estimated 2015 population within a one-, three- and five-mile radius of the 633 Third Avenue - Retail Condo Property was 153,967, 1,272,623 and 2,897,983, respectively, while the estimated 2015 average household income within the same radii was $144,348, $123,300 and $102,620, respectively. According to a third party market research report, the 633 Third Avenue - Retail Condo Property is located within the Grand Central submarket of the New York retail market. As of the second quarter of 2016, the Grand Central submarket reported total inventory of 365,422 square feet. During the same period, the Grand Central submarket exhibited a 2.6% vacancy rate and average asking rate $130.83 per square foot on a triple net basis.
THE INFORMATION IN THIS STRUCTURAL AND COLLATERAL TERM SHEET IS NOT COMPLETE AND MAY BE AMENDED PRIOR TO THE TIME OF SALE. THIS TERM SHEET IS NOT AN OFFER TO SELL THESE SECURITIES AND IT IS NOT A SOLICITATION OF AN OFFER TO BUY THESE SECURITIES IN ANY JURISDICTION WHERE THE OFFER OR SALE IS NOT PERMITTED.
126
| 633 THIRD AVENUE - RETAIL CONDO |
Sources and Uses
| Sources | Uses | |||||||
| Original loan amount | $32,000,000 | 100.0% | Loan payoff(1) | $24,185,557 | 75.6% | |||
| Closing costs | 804,457 | 2.5 | ||||||
| Reserves | 46,210 | 0.1 | ||||||
| Return of equity | 6,963,776 | 21.8 | ||||||
| Total Sources | $32,000,000 | 100.0% | Total Uses | $32,000,000 | 100.0% |
| (1) | The 633 Third Avenue - Retail Condo Property was previously securitized in the MSC 2006-HQ10 transaction. |
The following table presents certain information relating to the tenancies at the 633 Third Avenue - Retail Condo Property:
Major Tenants
| Tenant Name | Credit Rating (Fitch/Moody’s /S&P)(1) | Tenant NRSF | % of NRSF | Annual U/W Base Rent PSF | Annual U/W Base Rent | % of Total Annual U/W Base Rent | Sales PSF(2) | Occupancy Cost(2) | Lease Expiration Date |
| Tenants | |||||||||
| Chase Bank(3) | A+/A3/A- | 16,468 | 40.7% | $144.55(4) | $2,380,500(4) | 74.4% | NAV | NAV | 9/30/2023(5) |
| New York Sports Club | NR/Caa2/CCC+ | 23,700 | 58.6% | $32.38 | $767,306 | 24.0% | NAV | NAV | 5/31/2018 |
| Gateway News Stand | NR/NR/NR | 300 | 0.7% | $166.09 | $49,828 | 1.6% | NAV | NAV | 6/30/2017 |
| Occupied Collateral Total | 40,468 | 100.0% | $79.02 | $3,197,634 | 100.0% | ||||
| Vacant Space | 0 | 0.0% | |||||||
| Collateral Total | 40,468 | 100.0% | |||||||
| (1) | Certain ratings are those of the parent company, whether or not the parent guarantees the lease. |
| (2) | The tenants are not required to report sales. |
| (3) | Chase Bank subleases approximately 3,800 square feet (9.4% of the net rentable area) to Joseph Nakash (the “Sponsor”) on a sublease for $230,000 ($60.53 per square foot) expiring in September 2023. The Sponsor subleases this approximately 3,800 square foot space to HAS Group, LLC (Blue Olive Restaurant) for $264,000 ($69.47 per square foot) expiring in September 2023. The Chase Bank lease rent of $2,380,500 ($144.55 per square foot) was underwritten. |
| (4) | A contractual rent step on October 1, 2018 was underwritten for Chase Bank. Chase Bank currently pays an annual rent of $125.70 per square foot. |
| (5) | Chase Bank has one, 5-year lease renewal option. |
The following table presents certain information relating to the lease rollover schedule at the 633 Third Avenue - Retail Condo Property:
Lease Expiration Schedule(1)(2)
| Year Ending December 31, | No. of Leases Expiring | Expiring NRSF | % of Total NRSF | Cumulative Expiring NRSF | Cumulative % of Total NRSF | Annual U/W Base Rent | % of Total Annual U/W Base Rent | Annual U/W Base Rent PSF(3) |
| MTM | 0 | 0 | 0.0% | 0 | 0.0% | $0 | 0.0% | $0.00 |
| 2016 | 0 | 0 | 0.0% | 0 | 0.0% | $0 | 0.0% | $0.00 |
| 2017 | 1 | 300 | 0.7% | 300 | 0.7% | $49,828 | 1.6% | $166.09 |
| 2018 | 1 | 23,700 | 58.6% | 24,000 | 59.3% | $767,306 | 24.0% | $32.38 |
| 2019 | 0 | 0 | 0.0% | 24,000 | 59.3% | $0 | 0.0% | $0.00 |
| 2020 | 0 | 0 | 0.0% | 24,000 | 59.3% | $0 | 0.0% | $0.00 |
| 2021 | 0 | 0 | 0.0% | 24,000 | 59.3% | $0 | 0.0% | $0.00 |
| 2022 | 0 | 0 | 0.0% | 24,000 | 59.3% | $0 | 0.0% | $0.00 |
| 2023 | 1 | 16,468 | 40.7% | 40,468 | 100.0% | $2,380,500 | 74.4% | $144.55 |
| 2024 | 0 | 0 | 0.0% | 40,468 | 100.0% | $0 | 0.0% | $0.00 |
| 2025 | 0 | 0 | 0.0% | 40,468 | 100.0% | $0 | 0.0% | $0.00 |
| 2026 | 0 | 0 | 0.0% | 40,468 | 100.0% | $0 | 0.0% | $0.00 |
| Thereafter | 0 | 0 | 0.0% | 40,468 | 100.0% | $0 | 0.0% | $0.00 |
| Vacant | 0 | 0 | 0.0% | 40,468 | 100.0% | $0 | 0.0% | $0.00 |
| Total/Weighted Average | 3 | 40,468 | 100.0% | $3,197,634 | 100.0% | $79.02 |
| (1) | Information obtained from the underwritten rent roll. |
| (2) | Certain tenants may have lease termination options that are exercisable prior to the stated expiration date of the subject lease and that are not considered in the Lease Expiration Schedule. |
| (3) | Weighted Average Annual U/W Base Rent PSF excludes vacant space. |
THE INFORMATION IN THIS STRUCTURAL AND COLLATERAL TERM SHEET IS NOT COMPLETE AND MAY BE AMENDED PRIOR TO THE TIME OF SALE. THIS TERM SHEET IS NOT AN OFFER TO SELL THESE SECURITIES AND IT IS NOT A SOLICITATION OF AN OFFER TO BUY THESE SECURITIES IN ANY JURISDICTION WHERE THE OFFER OR SALE IS NOT PERMITTED.
127
| 633 THIRD AVENUE - RETAIL CONDO |
The following table presents historical occupancy percentages at the 633 Third Avenue - Retail Condo Property:
Historical Occupancy
12/31/2012(1) | 12/31/2013(1) | 12/31/2014(1) | 12/31/2015(1) | 6/29/2016(2) |
| 100.0% | 100.0% | 100.0% | 100.0% | 100.0% |
| (1) | Information obtained from the borrower. |
| (2) | Information obtained from the underwritten rent roll. |
Operating History and Underwritten Net Cash Flow. The following table presents certain information relating to the historical operating performance and underwritten net cash flow at the 633 Third Avenue - Retail Condo Property:
Cash Flow Analysis
| 2013 | 2014 | 2015 |
TTM | U/W | % of U/W | U/W $ | |||||||||
| Base Rent | $2,650,317 | $2,810,956 | $2,869,597 | $2,887,134 | $3,037,752(1) | 90.2% | $75.07 | ||||||||
| Grossed Up Vacant Space | 0 | 0 | 0 | 0 | 159,882 | 4.7 | 3.95 | ||||||||
| Percentage Rent | 0 | 0 | 0 | 0 | 0 | 0.0 | 0.00 | ||||||||
| Total Reimbursables | 21,819 | 261,876 | 363,303 | 364,335 | 329,776 | 9.8 | 8.15 | ||||||||
| Other Income | 0 | 0 | 0 | 0 | 0 | 0.0 | 0.00 | ||||||||
| Less Vacancy and Credit Loss | 0 | 0 | 0 | 0 | (159,882)(2) | (4.7) | (3.95) | ||||||||
| Effective Gross Income | $2,672,136 | $3,072,832 | $3,232,900 | $3,251,469 | $3,367,528 | 100.0% | $83.21 | ||||||||
| Total Operating Expenses | $604,453 | $669,057 | $960,609 | $960,475 | $1,052,351 | 31.2% | $26.00 | ||||||||
| Net Operating Income | $2,067,683 | $2,403,775 | $2,272,290 | $2,290,995 | $2,315,177 | 68.8% | $57.21 | ||||||||
| TI/LC | 0 | 0 | 0 | 0 | 76,790 | 2.3 | 1.90 | ||||||||
| Capital Expenditures | 0 | 0 | 0 | 0 | 8,094 | 0.2 | 0.20 | ||||||||
| Net Cash Flow | $2,067,683 | $2,403,775 | $2,272,290 | $2,290,995 | $2,230,294 | 66.2% | $55.11 | ||||||||
| NOI DSCR | 1.45x | 1.68x | 1.59x | 1.60x | 1.62x | ||||||||||
| NCF DSCR | 1.45x | 1.68x | 1.59x | 1.60x | 1.56x | ||||||||||
| NOI DY | 6.5% | 7.5% | 7.1% | 7.2% | 7.2% | ||||||||||
| NCF DY | 6.5% | 7.5% | 7.1% | 7.2% | 7.0% |
| (1) | A contractual rent step on October 1, 2018 was underwritten for Chase Bank, totaling $310,500 above the tenant’s current in-place contract rent. |
| (2) | The underwritten economic vacancy is 5.0%. The 633 Third Avenue - Retail Condo Property was 100.0% physically occupied as of June 29, 2016. |
The following table presents certain information relating to some comparable retail leases for the 633 Third Avenue - Retail Condo Property:
Comparable Leases(1)
| Property Name/ Location | Year Built/ Renovated | Anchor Tenants | Total GLA (SF) | Total Occupancy | Distance from Subject | Tenant Name | Lease Date / Term | Lease Area (SF) | Annual Base Rent PSF | Lease Type |
| 60 East 42nd Street New York, NY | 1930/NAP | NAV | 1,252,063 | 100% | 0.3 miles | Fed Ex | March 2016 | 2,690 | $200.24 | Gross |
100 Park Avenue New York, NY | 1950/2007 | NAV | 887,489 | 99% | 0.2 miles | Willner Chemist | December 2015 / 10 Yrs | 9,015 | $97.50 | Gross |
757 Third Avenue New York, NY | 1962/1987 | NAV | 504,953 | 90% | 0.3 miles | CVS | December 2014 / 10 Yrs | 9,800 | $200.00 | Gross |
125 Park Avenue New York, NY | 1923/2004 | NAV | 654,852 | 98% | 0.2 miles | Blonk Fitness | March 2015 / 15 Yrs | 18,200 | $65.93 | Gross |
| (1) | Information obtained from the appraisal and a third party report. |
THE INFORMATION IN THIS STRUCTURAL AND COLLATERAL TERM SHEET IS NOT COMPLETE AND MAY BE AMENDED PRIOR TO THE TIME OF SALE. THIS TERM SHEET IS NOT AN OFFER TO SELL THESE SECURITIES AND IT IS NOT A SOLICITATION OF AN OFFER TO BUY THESE SECURITIES IN ANY JURISDICTION WHERE THE OFFER OR SALE IS NOT PERMITTED.
128
(THIS PAGE INTENTIONALLY LEFT BLANK)
THE INFORMATION IN THIS STRUCTURAL AND COLLATERAL TERM SHEET IS NOT COMPLETE AND MAY BE AMENDED PRIOR TO THE TIME OF SALE. THIS TERM SHEET IS NOT AN OFFER TO SELL THESE SECURITIES AND IT IS NOT A SOLICITATION OF AN OFFER TO BUY THESE SECURITIES IN ANY JURISDICTION WHERE THE OFFER OR SALE IS NOT PERMITTED.
129
| No. 12 – Riverside University Village | |||||||
| Loan Information | Property Information | ||||||
| Mortgage Loan Seller: | Bank of America, National Association | Single Asset/Portfolio: | Single Asset | ||||
Credit Assessment (Fitch/KBRA/Moody’s/S&P): | NR/NR/NR/NR | Property Type: | Retail | ||||
| Original Principal Balance: | $29,250,000 | Specific Property Type: | Anchored | ||||
| Cut-off Date Balance: | $29,013,042 | Location: | Riverside, CA | ||||
| % of Initial Pool Balance: | 3.3% | Size: | 180,126 SF | ||||
| Loan Purpose: | Acquisition | Cut-off Date Balance Per SF: | $161.07 | ||||
| Borrower Name: | UR Village LLC | Year Built/Renovated: | 1998/NAP | ||||
| Sponsor: | Bochao Zhan | Title Vesting: | Fee | ||||
| Mortgage Rate: | 4.960% | Property Manager: | NewMark Merrill Companies, LLC | ||||
| Note Date: | February 23, 2016 | 4thMost Recent Occupancy: | NAV | ||||
| Anticipated Repayment Date: | NAP | 3rdMost Recent Occupancy (As of): | 83.5% (12/31/2013) | ||||
| Maturity Date: | March 1, 2026 | 2ndMost Recent Occupancy (As of): | 92.6% (12/31/2014) | ||||
| IO Period: | 0 months | Most Recent Occupancy (As of): | 94.1% (12/31/2015) | ||||
| Loan Term (Original): | 120 months | Current Occupancy (As of)(4): | 93.6% (7/1/2016) | ||||
| Seasoning: | 5 months | ||||||
| Amortization Term (Original): | 300 months | Underwriting and Financial Information: | |||||
| Loan Amortization Type: | Amortizing Balloon | ||||||
| Interest Accrual Method: | Actual/360 | 4thMost Recent NOI: | NAV | ||||
| Call Protection: | L(29),D(87),O(4) | 3rdMost Recent NOI (As of): | $2,263,515 (12/31/2013) | ||||
| Lockbox Type: | Springing | 2ndMost Recent NOI (As of): | $2,412,626 (12/31/2014) | ||||
| Additional Debt: | None | Most Recent NOI (As of): | $2,965,702 (12/31/2015) | ||||
| Additional Debt Type: | NAP | ||||||
| U/W Revenues: | $4,813,094 | ||||||
| U/W Expenses: | $1,864,575 | ||||||
| U/W NOI: | $2,948,519 | ||||||
| Escrows and Reserves: | U/W NCF: | $2,734,075 | |||||
| U/W NOI DSCR: | 1.44x | ||||||
| Type: | Initial | Monthly | Cap (If Any) | U/W NCF DSCR: | 1.34x | ||
| Taxes(1) | $0 | $26,625 | NAP | U/W NOI Debt Yield: | 10.2% | ||
| Insurance | $11,757 | $5,879 | NAP | U/W NCF Debt Yield: | 9.4% | ||
| Replacement Reserves(2) | $0 | $7,505 | NAP | As-Is Appraised Value: | $47,600,000 | ||
| Immediate Repair Reserve | $116,250 | $0 | NAP | As-Is Appraisal Valuation Date: | December 9, 2015 | ||
| TI/LC Reserve | $0 | $17,500 | $420,000 | Cut-off Date LTV Ratio: | 61.0% | ||
| Existing TI/LC Obligations(3) | $52,116 | $0 | NAP | LTV Ratio at Maturity or ARD: | 45.9% | ||
| (1) | The Riverside University Village Property is subject to a deed of trust in favor of the City of Riverside which is senior to the lender’s deed of trust. The deed of trust secured an HUD loan which was paid off at loan closing and a tax shortfall agreement. The tax shortfall agreement requires the borrower to pay a shortfall amount each year in an amount equal to the difference between actual property taxes incurred and a threshold amount established by the city. The tax shortfall agreement expires in 2023 and the shortfall amount based on historical payments is estimated to be approximately $30,000 per year. See “Description of the Mortgage Pool – Real Estate Taxes and Other Considerations” in the Preliminary Prospectus. |
| (2) | The Replacement Reserves deposit will decrease to $3,753 on each payment date starting on June 1, 2019. |
| (3) | Existing TI/LC Obligations relate to $20,000 for Sweet Daily, $17,892 for Regents – Design, $10,366 for Regents - Cap Resource and $3,858 for Lollicup Tea Zone. |
| (4) | See “Historical Occupancy” section. |
The Riverside University Village mortgage loan is evidenced by a single promissory note that is secured by a first mortgage encumbering a 180,126 square foot anchored retail center (the “Riverside University Village Property”) located in Riverside, California, approximately 60.0 miles east of downtown Los Angeles and 12.0 miles southwest of San Bernardino. Built between 1998 and 2007, the Riverside University Village Property consists of 180,126 square feet across four two-story buildings situated on a 12.0 acre parcel. The Riverside University Village Property is anchored by a 10-screen Regency Theatres and has a diverse mix of 54 tenants with no tenant representing more than 7.1% of net rentable area or 7.1% of base rent. There are 1,382 parking spaces at the Riverside University Village Property (472 surface spaces and 910 garage spaces) resulting in a parking ratio of 7.7 spaces per 1,000 square feet of net rentable area. As of July 1, 2016, the Riverside University Village Property was 93.6% leased to 54 tenants.
The Riverside University Village Property is located at the northeast corner of University and Iowa Avenues adjacent to the University of California Riverside (“UC Riverside”). UC Riverside is a research university with approximately 22,000 students and 900 instructional faculty. The Riverside University Village Property is part of the Moreno Valley/Riverside/Corona submarket of the San Bernardino/Riverside retail market. The Moreno Valley/Riverside/Corona submarket contains approximately 10.2 million square feet (20.1% of the region’s square feet) and, as of the third quarter of 2015, reported vacancy of 6.9% and average asking rents of
THE INFORMATION IN THIS STRUCTURAL AND COLLATERAL TERM SHEET IS NOT COMPLETE AND MAY BE AMENDED PRIOR TO THE TIME OF SALE. THIS TERM SHEET IS NOT AN OFFER TO SELL THESE SECURITIES AND IT IS NOT A SOLICITATION OF AN OFFER TO BUY THESE SECURITIES IN ANY JURISDICTION WHERE THE OFFER OR SALE IS NOT PERMITTED.
130
RIVERSIDE UNIVERSITY VILLAGE |
$21.67 per square foot, as compared to the broader San Bernardino/Riverside retail market’s vacancy of 9.3% and average asking rents of $21.48 per square foot. The primary trade area for the Riverside University Village Property is estimated to be a three-mile radius, which had an estimated 2015 population of 95,229, average household income of $67,169 and aggregate retail sales of approximately $1.6 billion ($52,203 sales/household). Population and average household income in the primary trade area have grown at a compound annual rate of 1.2% and 2.0%, respectively, since 2000. Estimated 2015 population and average household income within a five-mile radius were 212,789 and $74,641, respectively.
Sources and Uses
| Sources | Uses | |||||||
| Original loan amount | $29,250,000 | 65.6% | Purchase price | $43,890,000 | 98.4% | |||
| Sponsor’s new cash contribution | 15,331,179 | 34.4 | Reserves | 180,123 | 0.4 | |||
| Closing costs | 511,056 | 1.1 | ||||||
| Total Sources | $44,581,179 | 100.0% | Total Uses | $44,581,179 | 100.0% |
The following table presents certain information relating to the tenancy at the Riverside University Village Property:
Major Tenants
| Tenant Name | Credit Rating (Fitch/ Moody’s/ S&P)(1) | Tenant NRSF | % of NRSF | Annual U/W Base Rent PSF(2) | Annual U/W Base Rent(2) | % of Total Annual U/W Base Rent | Sales PSF(3) | Occupancy Cost(3) | Lease Expiration Date |
| Anchor Tenant | |||||||||
| Regency Theatres | NR/NR/NR | 41,915 | 23.3% | $9.42 | $395,000 | 10.5% | $309,232(4) | 12.8% | 12/31/2021 |
| Total Anchor Tenant | 41,915 | 23.3% | $9.42 | $395,000 | 10.5% | ||||
| Top 5 In-Line Retail Tenants | |||||||||
| US Army Corps of Engineers | AAA/Aaa/AA+ | 2,722 | 1.5% | $41.52 | $113,017 | 3.0% | NAV | NAV | 7/31/2019 |
| T-Mobile | NR/NR/BB | 2,940 | 1.6% | $37.95 | $111,573 | 3.0% | $873 | 5.5% | 7/31/2020 |
| 7-Eleven | NR/Baa1/AA- | 3,088 | 1.7% | $34.94 | $107,907 | 2.9% | NAV | NAV | 3/31/2019 |
| Sushi Ya | NR/NR/NR | 3,608 | 2.0% | $25.92 | $93,519 | 2.5% | $182 | 20.4% | 11/30/2016(5) |
| JP Morgan Chase | A+/A3/A- | 3,152 | 1.7% | $29.52 | $93,060 | 2.5% | NAV | NAV | 2/28/2019 |
| Total Top 5 In-Line Retail Tenants | 15,510 | 8.6% | $33.47 | $519,076 | 13.8% | ||||
| Non-Major In-Line Retail Tenants(6) | 58,979 | 32.7% | $31.92 | $1,797,315 | 47.6% | ||||
| Total In-Line Retail Tenants | 74,489 | 41.4% | $32.25 | $2,316,391 | 61.4% | ||||
| Top 5 Office Tenants | |||||||||
| Regents of UCR – UNEX | AA/Aa2/AA | 12,726 | 7.1% | $21.03 | $267,647 | 7.1% | N/A | N/A | Various(7) |
| Regents of UCR - Accounting | AA/Aa2/AA | 7,634 | 4.2% | $20.98 | $160,164 | 4.2% | N/A | N/A | 11/30/2018 |
| Regents of UCR – Design & Construction | AA/Aa2/AA | 8,946 | 5.0% | $17.82 | $159,446 | 4.2% | N/A | N/A | 10/17/2016 |
| Regents of UCR | AA/Aa2/AA | 8,579 | 4.8% | $14.84 | $127,308 | 3.4% | N/A | N/A | 7/31/2017 |
| Regents of UCR | AA/Aa2/AA | 4,652 | 2.6% | $20.98 | $97,601 | 2.6% | N/A | N/A | 11/30/2018 |
| Total Top 5 Office Tenants | 42,537 | 23.6% | $19.09 | $812,166 | 21.5% | ||||
| Non-Major Office Tenants(8) | 9,640 | 5.4% | $26.06(8) | $251,247 | 6.7% | ||||
| Total Office Tenants | 52,177 | 29.0% | $20.38 | $1,063,413 | 28.2% | ||||
| Occupied Collateral Total | 168,581 | 93.6% | $22.39 | $3,774,804 | 100.0% | ||||
| Vacant Space(9) | 11,545 | 6.4% | |||||||
| Collateral Total | 180,126 | 100.0% | |||||||
(1) | Certain ratings are those of the parent company whether or not the parent guarantees the lease. |
| (2) | Annual U/W Base Rent PSF and Annual U/W Base Rent include contractual rent steps through July 2017 totaling $29,317. |
| (3) | Sales PSF and Occupancy Cost are based on the on the trailing 12-month period ending May 31, 2016. |
| (4) | Regency Theatres has 10 screens at the property which results in $309,232 sales per screen. |
| (5) | Sushi Ya is currently in the process of negotiating a one-year lease renewal with the sponsor. |
| (6) | Non-Major In-Line Retail Tenants include a suite totaling 2,672 square feet (1.5% of the net rentable area) that is donated rent free for use by the University Police Department. |
| (7) | Regents of UCR – UNEX has a lease for 4,836 square feet (2.7% of the net rentable area) expiring September 11, 2016 and a lease for 7,890 square feet (4.4% of the net rentable area) expiring January 22, 2017. |
| (8) | Includes 138 square feet of storage space leased to Regents of UCR at $3.04 per square foot. Also includes antenna leases with T-Mobile and AT&T for $33,622 and $34,883 per year, respectively, which have no related square footage; Annual U/W Base Rent PSF excluding the rent related to these leases is $18.91. |
| (9) | The sponsor received an executed letter of intent with Noodle World for a 2,589 square foot suite at the Riverside University Village Property at $34.00 per square foot; an increase over the previous tenant’s rent of $28.00 per square foot. |
THE INFORMATION IN THIS STRUCTURAL AND COLLATERAL TERM SHEET IS NOT COMPLETE AND MAY BE AMENDED PRIOR TO THE TIME OF SALE. THIS TERM SHEET IS NOT AN OFFER TO SELL THESE SECURITIES AND IT IS NOT A SOLICITATION OF AN OFFER TO BUY THESE SECURITIES IN ANY JURISDICTION WHERE THE OFFER OR SALE IS NOT PERMITTED.
131
RIVERSIDE UNIVERSITY VILLAGE |
The following table presents certain information relating to the lease rollover schedule at the Riverside University Village Property:
Lease Expiration Schedule(1)(2)
| Year Ending December 31, | No. of Leases Expiring | Expiring NRSF | % of Total NRSF | Cumulative Expiring NRSF | Cumulative % of Total NRSF | Annual U/W Base Rent | % of Total Annual U/W Base Rent | Annual U/W Base Rent PSF(3) |
| MTM(4) | 2 | 2,810 | 1.6% | 2,810 | 1.6% | $420 | 0.0% | $0.15 |
| 2016 | 7 | 27,294 | 15.2% | 30,104 | 16.7% | $595,701 | 15.8% | $21.83 |
| 2017 | 9 | 27,259 | 15.1% | 57,363 | 31.8% | $632,767 | 16.8% | $23.21 |
| 2018 | 8 | 21,212 | 11.8% | 78,575 | 43.6% | $495,471 | 13.1% | $21.77 |
| 2019 | 12 | 23,613 | 13.1% | 102,188 | 56.7% | $761,228 | 20.2% | $32.24 |
| 2020 | 4 | 7,143 | 4.0% | 109,331 | 60.7% | $256,891 | 6.8% | $35.96 |
| 2021 | 9 | 51,303 | 28.5% | 160,634 | 89.2% | $776,283 | 20.6% | $14.45 |
| 2022 | 0 | 0 | 0.0% | 160,634 | 89.2% | $0 | 0.0% | $0.00 |
| 2023 | 0 | 0 | 0.0% | 160,634 | 89.2% | $0 | 0.0% | $0.00 |
| 2024 | 2 | 2,835 | 1.6% | 163,469 | 90.8% | $94,310 | 2.5% | $33.27 |
| 2025 | 1 | 2,095 | 1.2% | 165,564 | 91.9% | $80,272 | 2.1% | $38.32 |
| 2026 | 1 | 3,017 | 1.7% | 168,581 | 93.6% | $81,459 | 2.2% | $27.00 |
| Thereafter | 0 | 0 | 0.0% | 168,581 | 93.6% | $0 | 0.0% | $0.00 |
| Vacant | 0 | 11,545 | 6.4% | 180,126 | 100.0% | $0 | 0.0% | $0.00 |
| Total/Weighted Average | 55 | 180,126 | 100.0% | $3,774,804 | 100.0% | $22.34 |
| (1) | Information obtained from the underwritten rent roll. |
| (2) | Certain tenants may have lease termination options that are exercisable prior to the originally stated expiration date of the subject lease and that are not considered in the Lease Expiration Schedule. |
| (3) | Annual U/W Base Rent PSF excludes vacant space, one rent free suite and rent attributed to two antenna leases with T-Mobile and AT&T for $33,622 and $34,883 per year, respectively. |
| (4) | There are two MTM tenants at the Riverside University Village Property. A suite totaling 2,672 square feet is donated rent free for use by the University Police Department and 138 square feet of storage space is leased to Regents of UCR at $3.04 per square foot. |
The following table presents historical occupancy percentages at the Riverside University Village Property:
Historical Occupancy
12/31/2012 | 12/31/2013(1) | 12/31/2014(1) | 12/31/2015(1) | 7/1/2016(2) | ||||
| NAV | 83.5% | 92.6% | 94.1% | 93.6% |
| (1) | Information obtained from the borrower’s certified rent roll. |
| (2) | Information obtained from the underwritten rent roll. Current occupancy includes two tenants totaling 4,511 square feet (2.5% of net rentable area) with signed leases who are not yet in occupancy. Current occupancy excluding these tenants is 91.1%. |
THE INFORMATION IN THIS STRUCTURAL AND COLLATERAL TERM SHEET IS NOT COMPLETE AND MAY BE AMENDED PRIOR TO THE TIME OF SALE. THIS TERM SHEET IS NOT AN OFFER TO SELL THESE SECURITIES AND IT IS NOT A SOLICITATION OF AN OFFER TO BUY THESE SECURITIES IN ANY JURISDICTION WHERE THE OFFER OR SALE IS NOT PERMITTED.
132
RIVERSIDE UNIVERSITY VILLAGE |
Operating History and Underwritten Net Cash Flow.The following table presents certain information relating to the historical operating performance and underwritten net cash flow at the Riverside University Village Property:
Cash Flow Analysis
| 2013 | 2014 | 2015 | U/W | % of U/W Effective Gross Income | U/W $ per SF | |||||||
| Base Rent | $2,959,335 | 3,213,964 | $3,479,379 | $3,774,805(1) | 78.4% | $20.96 | ||||||
| Grossed Up Vacant Space | 0 | 0 | 0 | 271,888 | 5.6 | 1.51 | ||||||
| Percentage Rent | 0 | 0 | 0 | 0 | 0.0 | 0.00 | ||||||
| Total Reimbursables | 792,187 | 711,631 | 849,207 | 1,055,064 | 21.9 | 5.86 | ||||||
| Other Income | 29,758 | 21,117 | 25,873 | 12,280 | 0.3 | 0.07 | ||||||
| Less Vacancy & Credit Loss | 0 | 0 | 0 | (300,943)(1) | (6.3) | (1.67) | ||||||
| Effective Gross Income | $3,781,280 | $3,946,712 | $4,354,459 | $4,813,094 | 100.0% | $26.72 | ||||||
| Total Operating Expenses | $1,517,765 | $1,534,086 | $1,388,757 | $1,864,575 | 38.7% | $10.35 | ||||||
|
|
|
|
|
| |||||||
| Net Operating Income | $2,263,515 | $2,412,626 | $2,965,702 | $2,948,519 | 61.3% | $16.37 | ||||||
| TI/LC | 0 | 0 | 0 | 165,660 | 3.4 | 0.92 | ||||||
| Capital Expenditures | 0 | 0 | 0 | 48,784 | 1.0 | 0.27 | ||||||
| Net Cash Flow | $2,263,515 | $2,412,626 | $2,965,702 | $2,734,075 | 56.8% | $15.18 | ||||||
| NOI DSCR | 1.11x | 1.18x | 1.45x | 1.44x | ||||||||
| NCF DSCR | 1.11x | 1.18x | 1.45x | 1.34x | ||||||||
| NOI DY | 7.8% | 8.3% | 10.2% | 10.2% | ||||||||
| NCF DY | 7.8% | 8.3% | 10.2% | 9.4% |
| (1) | U/W Base Rent includes contractual rent steps through June 2017 totaling $29,317. |
| (2) | The underwritten economic vacancy is 5.9%. The Riverside University Village Property was 93.6% physically occupied as of July 1, 2016. |
The following table presents certain information relating to some competitive retail properties for the Riverside University Village Property:
Competitive Retail Properties(1)
| Property Name/ Location | Type | Year Built/Renovated | Occ. | Total GLA (SF) | Anchor GLA (SF) | Anchors | Inline Rent PSF | Distance to Subject |
Riverside University Village (Subject) | Community Center | 1998/NAP | 94% | 180,126 | 41,915 | Regency Theatres | $32.25 | N/A |
University Heights Center 3355 Iowa Ave Riverside, CA | Neighborhood Center | 1986/NAP | 93% | 33,185 | 0 | N/A | $18.00 | 0.9 miles |
University Plaza 755-783 Blaine St Riverside, CA | Neighborhood Center | 1963/2002 | 98% | 99,868 | 72,000 | Vons, Pier 1 Imports, Rite Aid | $36.00 | 1.1 miles |
Canyon Crest Towne Center 5225 Canyon Crest Dr Riverside, CA | Community Center | 1979/1999 | 98% | 253,300 | 50,727 | Ralph’s, Rite Aid | $26.11 | 1.3 miles |
Magnolia Towne Center 6033-6189 Magnolia Ave Riverside, CA | Neighborhood Center | 1993/NAP | 98% | 132,498 | 73,000 | Ralph’s, Rite Aid | $28.77 | 3.2 miles |
Riverside Plaza 3505-3659 Central Ave Riverside, CA | Regional Center | 1957/2014 | 92% | 517,757 | 211,661 | Regal Cinemas, Forever 21, Vons, Nordstrom Rack, Marshalls | $27.48 | 3.5 miles |
Mission Grove Plaza 301-375 E Alessandro Blvd Riverside, CA | Community Center | 1982/2000 | 94% | 315,833 | 129,000 | CinemaStar, Ralph’s | $29.52 | 4.2 miles |
Towngate Center 22950 Towngate Blvd Moreno Valley, CA | Power Center | 1988/1992 | 92% | 377,705 | 184,418 | Regency Theatres, Burlington Coat Factory, Ross Dress for Less, T.J. Maxx | $19.44 | 5.6 miles |
| (1) | Information obtained from the appraisal, property condition report and underwritten rent roll. |
THE INFORMATION IN THIS STRUCTURAL AND COLLATERAL TERM SHEET IS NOT COMPLETE AND MAY BE AMENDED PRIOR TO THE TIME OF SALE. THIS TERM SHEET IS NOT AN OFFER TO SELL THESE SECURITIES AND IT IS NOT A SOLICITATION OF AN OFFER TO BUY THESE SECURITIES IN ANY JURISDICTION WHERE THE OFFER OR SALE IS NOT PERMITTED.
133
| No. 13 & 14 – FedEx – Atlanta, GA & FedEx – West Palm Beach, FL(1) | ||||||||
| Loan Information | Property Information | |||||||
| Mortgage Loan Seller: | Bank of America, National Association | Single Asset/Portfolio: | Portfolio | |||||
Credit Assessment (Fitch/KBRA/Moody’s/S&P): | NR/NR/NR | Property Type: | Industrial | |||||
| Original Principal Balance(2): | $26,037,500 | Specific Property Type: | Warehouse Distribution | |||||
| Cut-off Date Balance(2): | $26,037,500 | Location: | Various | |||||
| % of Initial Pool Balance: | 3.0% | Size: | Various | |||||
| Loan Purpose: | Acquisition | Cut-off Date Balance Per SF(2): | $97.03 | |||||
| Borrower Names: | PA-SC Atlanta Project LLC; PA-SC West Palm Beach Project LLC | Year Built/Renovated: | 2016/NAP | |||||
| Sponsor: | MRP Group | Title Vesting: | Fee | |||||
| Mortgage Rate: | 4.246% | Property Manager: | Self-managed | |||||
| Note Date: | May 19, 2016 | 4thMost Recent Occupancy(7): | NAV | |||||
| Anticipated Repayment Date: | NAP | 3rdMost Recent Occupancy(7): | NAV | |||||
| Maturity Date: | June 1, 2026 | 2ndMost Recent Occupancy(7): | NAV | |||||
| IO Period: | 120 months | Most Recent Occupancy(7): | NAV | |||||
| Loan Term (Original): | 120 months | Current Occupancy (As of): | 100.0% (8/1/2016) | |||||
| Seasoning: | 2 months | |||||||
| Amortization Term (Original): | NAP | Underwriting and Financial Information: | ||||||
| Loan Amortization Type: | Interest-only, Balloon | |||||||
| Interest Accrual Method: | Actual/360 | 4thMost Recent NOI(8): | NAV | |||||
| Call Protection: | L(26),D(90),O(4) | 3rdMost Recent NOI(8): | NAV | |||||
| Lockbox Type: | Hard/Springing Cash Management | 2ndMost Recent NOI(8): | NAV | |||||
| Additional Debt(2): | Yes | Most Recent NOI(8): | NAV | |||||
| Additional Debt Type(2): | Pari Passu | |||||||
| U/W Revenues: | $6,626,359 | |||||||
| U/W Expenses: | $1,050,967 | |||||||
| U/W NOI: | $5,575,392 | |||||||
| U/W NCF: | $5,370,387 | |||||||
| Escrows and Reserves: | U/W NOI DSCR(2): | 2.49x | ||||||
| U/W NCF DSCR(2): | 2.40x | |||||||
| Type: | Initial | Monthly | Cap (If Any) | U/W NOI Debt Yield(2): | 10.7% | |||
| Taxes | $413,075 | $74,796 | NAP | U/W NCF Debt Yield(2): | 10.3% | |||
| Insurance(3) | $0 | Springing | NAP | As-Is Appraised Value: | $95,850,000 | |||
| Change Order Reserve(4) | $831,578 | $0 | NAP | As-Is Appraisal Valuation Date: | Various | |||
| General Contract Completion and Punchlist reserve(5) | $278,796 | $0 | NAP | Cut-off Date LTV Ratio(2): | 54.3% | |||
| Rent Credit Reserve(6) | $179,882 | $0 | NAP | LTV Ratio at Maturity or ARD(2): | 54.3% | |||
| (1) | The FedEx – Atlanta, GA mortgage loan and the FedEx – West Palm Beach, FL mortgage loan are cross-collateralized and cross-defaulted with one another. All information herein represents the FedEx – Atlanta, GA mortgage loan and the FedEx – West Palm Beach, FL mortgage loan presented as one mortgage loan, except as otherwise specified below. With respect to each of the FedEx – Atlanta, GA mortgage loan and the FedEx – West Palm Beach, FL mortgage loan, the applicable loan-to-value ratios, debt service coverage ratios and debt yields for each such mortgage loan are based upon the ratio or yield (as applicable) for the aggregate indebtedness evidenced by both mortgage loans (without regard to the limitation on the amount of indebtedness secured by the FedEx – West Palm Bach, FL Property). On an individual basis, without regard to the cross-collateralization feature, a related mortgage loan may have a higher loan-to-value ratio, lower debt service coverage ratio and/or lower debt yield than is presented herein. |
| (2) | The FedEx – Atlanta, GA Whole Loan (as defined below), totaling $28,400,000, is comprised of twopari passu notes (Notes A-1 and A-2). The controlling Note A-1 had an original principal balance of $14,200,000, has an outstanding principal balance of $14,200,000 as of the Cut-off Date and will be contributed to the WFCM 2016-BNK1 Trust. The non-controlling Note A-2 had an original principal balance of $14,200,000 and was contributed to the CGCMT 2016-P4 Trust. The FedEx – West Palm Beach, FL Whole Loan (as defined below), totaling $23,675,000, is comprised of twopari passu notes (Notes A-1 and A-2). The controlling Note A-1 had an original principal balance of $11,837,500, has an outstanding principal balance of $11,837,500 as of the Cut-off Date and will be contributed to the WFCM 2016-BNK1 Trust. The non-controlling Note A-2 had an original principal balance of $11,837,500 and was contributed to the CGCMT 2016-P4 Trust. All statistical financial information related to balances per square foot, loan-to-value ratios, debt service ratios and debt yields are based on the FedEx – Atlanta, GA Whole Loan and the FedEx – West Palm Beach, FL Whole Loan. |
| (3) | Ongoing reserves for insurance are not required as long as (i) no event of default has occurred and is continuing; (ii) none of the following events has occurred or is continuing: FedEx (defined below) (a) fails to occupy the space 12 months from the origination date of the loan, (b) goes dark, vacates or gives notice of intent to do so, (c) terminates or gives notice of its intention to terminate the lease, (d) fails to renew its lease for a period of at least five years, (e) fails to pay rent or any expenses due, or (f) files for bankruptcy or similar insolvency proceedings; and (iii) FedEx is directly paying the cost of insurance premiums which the borrower is required to make. |
| (4) | FedEx was provided a change order allowance for requested work at the FedEx – Atlanta, GA Property ($550,000) and FedEx – West Palm Beach, FL Property ($500,000). According to the leases, the funds will be disbursed for work requested by FedEx or refunded to FedEx if not used. There was $831,578 in allowance outstanding at loan origination which was escrowed upfront. |
| (5) | At loan origination there was a contract balance outstanding for general contractor work in the amount of $190,546 at the FedEx – Atlanta, GA Property and $30,000 at the FedEx – West Palm Beach, FL Property which was escrowed upfront. In addition, there were various punch list items to be completed by the sponsor including delivery of a storm water management system maintenance plan and landscaping, paving and grading obligations at the FedEx – Atlanta, GA Property and relocation of a record storage cage at the FedEx – West Palm Beach, FL Property totaling $58,250 which was escrowed upfront. |
| (6) | There is currently a $179,882 rent credit outstanding at the FedEx – Atlanta, GA Property due to the revision of the rent commencement date which was escrowed upfront. |
| (7) | See “Historical Occupancy” section. |
| (8) | See “Cash Flow Analysis” section. |
THE INFORMATION IN THIS STRUCTURAL AND COLLATERAL TERM SHEET IS NOT COMPLETE AND MAY BE AMENDED PRIOR TO THE TIME OF SALE. THIS TERM SHEET IS NOT AN OFFER TO SELL THESE SECURITIES AND IT IS NOT A SOLICITATION OF AN OFFER TO BUY THESE SECURITIES IN ANY JURISDICTION WHERE THE OFFER OR SALE IS NOT PERMITTED.
134
FEDEX – ATLANTA, GA & FEDEX – WEST PALM BEACH, FL
The FedEx – Atlanta, GA mortgage loan is part of a whole loan (the “FedEx – Atlanta, GA Whole Loan”) that is evidenced by twopari passu notes (Notes A-1 and A-2) secured by a first mortgage encumbering a 311,489 square foot industrial warehouse distribution center located in Austell, Georgia (the “FedEx – Atlanta, GA Property”). The FedEx – West Palm Beach, FL mortgage loan is part of a whole loan (the “FedEx – West Palm Beach, FL Whole Loan”) that is evidenced by twopari passu notes (Notes A-1 and A-2) secured by a first mortgage encumbering a 225,198 square foot industrial warehouse distribution center located in West Palm Beach, Florida (the “FedEx – West Palm Beach, FL Property”). The FedEx – Atlanta, GA Whole Loan and the FedEx – West Palm Beach, FL Whole Loan (collectively, the “FedEx – Atlanta, GA and FedEx – West Palm Beach, FL Crossed Mortgage Loans”) are cross-collateralized and cross-defaulted with one another;provided that the indebtedness secured by the FedEx – West Palm Beach, FL Property pursuant to the cross-collateralization agreement is limited to $29,593,750. The FedEx – Atlanta, GA Whole Loan and FedEx – West Palm Beach, FL Whole Loan were co-originated on May 19, 2016 by Bank of America, National Association and Citigroup Global Markets Realty Corp. Both the FedEx – Atlanta, GA Property and the FedEx – West Palm Beach, FL Property were built in 2016 as a build-to-suit for the sole tenant, FedEx Ground Package System, Inc. (“FedEx”). FedEx has a 15-year triple-net lease expiring January 2031 at the FedEx – Atlanta, GA Property and December 2030 at the FedEx – West Palm Beach, FL Property, both with two five-year renewal options.
The FedEx – Atlanta, GA Property is located 12.0 miles west of downtown Atlanta in Cobb County. Primary access to the FedEx – Atlanta, GA Property is provided by Interstate 20 and State Route 6. According to a third-party market research report, the FedEx – Atlanta, GA Property is located within the I-20 West Fulton submarket of the Atlanta Industrial market. As of the first quarter of 2016, the submarket reported an inventory of 1,750 buildings totaling approximately 102.0 million square feet with a 7.2% vacancy rate. The appraiser concluded to a market rent for the FedEx – Atlanta, GA Property of $10.23 per square foot, triple net. FedEx is expected to commence operations at the FedEx – Atlanta, GA Property in September 2016.
The FedEx – West Palm Beach, FL Property is located six miles west of the West Palm Beach central business district in Palm Beach County. Primary access to the FedEx – West Palm Beach, FL Property is provided by the Florida Turnpike and Interstate 95. According to a third-party market research report, the FedEx – West Palm Beach, FL Property is located within the West Palm Beach submarket of the Palm Beach County market. As of the first quarter of 2016, the submarket reported an inventory of 179 buildings totaling approximately 4.7 million square feet with a 4.0% vacancy rate. The appraiser concluded to a market rent for the FedEx – West Palm Beach, FL Property of $11.80 per square foot, triple net.
The following table presents certain information relating to the FedEx – Atlanta, GA Property and FedEx – West Palm Beach, FL Property:
| Property Name | Cut-off Date Balance | % of Crossed Cut-off Date Balance% | Occupancy | Net Rentable Area (SF) | Appraised Value | Allocated LTV(1) | Appraisal Valuation Date |
| FedEx – Atlanta, GA | $14,200,000 | 54.5% | 100.0% | 311,489 | $51,750,000 | 54.9% | April 25, 2016 |
| FedEx – West Palm Beach, FL | $11,837,500 | 45.5% | 100.0% | 225,198 | $44,100,000 | 53.7% | April 21, 2016 |
| Total/Weighted Average | $26,037,500 | 100.0% | 100.0% | 536,687 | $95,850,000 | 54.3% |
| (1) | Allocated LTV is based on the FedEx – Atlanta, GA Whole Loan balance and the FedEx – West Palm Beach, FL Whole Loan balance. |
Sources and Uses – FedEx – Atlanta, GA
| Sources | Uses | |||||||
| Original whole loan amount | $28,400,000 | 53.6% | Purchase price | $51,657,287 | 97.5% | |||
| Sponsor’s new cash contribution | 24,557,126 | 46.4 | Reserves | 977,573 | 1.8 | |||
| Closing costs | 322,266 | 0.6 | ||||||
| Total Sources | $52,957,126 | 100.0% | Total Uses | $52,957,126 | 100.0% |
Sources and Uses – FedEx – West Palm Beach, FL
| Sources | Uses | |||||||
| Original whole loan amount | $23,675,000 | 53.5% | Purchase price | $43,049,852 | 97.3% | |||
| Sponsor’s new cash contribution | 20,560,671 | 46.5 | Reserves | 725,758 | 1.6 | |||
| Closing costs | 460,061 | 1.0 | ||||||
| Total Sources | $44,235,671 | 100.0% | Total Uses | $44,235,671 | 100.0% |
THE INFORMATION IN THIS STRUCTURAL AND COLLATERAL TERM SHEET IS NOT COMPLETE AND MAY BE AMENDED PRIOR TO THE TIME OF SALE. THIS TERM SHEET IS NOT AN OFFER TO SELL THESE SECURITIES AND IT IS NOT A SOLICITATION OF AN OFFER TO BUY THESE SECURITIES IN ANY JURISDICTION WHERE THE OFFER OR SALE IS NOT PERMITTED.
135
FEDEX – ATLANTA, GA & FEDEX – WEST PALM BEACH, FL
The following table presents certain information relating to the tenancy at the FedEx - Atlanta, GA Property and FedEx – West Palm Beach, FL Property:
Major Tenants
| Tenant Name | Credit Rating (Fitch/Moody’s/S&P) | Tenant NRSF | % of NRSF | Annual U/W Base Rent PSF | Annual U/W Base Rent | % of Total Annual U/W Base Rent | Lease Expiration Date |
| FedEx – Atlanta, GA Major Tenant | |||||||
| FedEx | NR/Baa2/BBB | 311,489 | 100.0% | $10.23 | $3,186,489 | 100.0% | 1/31/2031(1) |
| Occupied Collateral Total | 311,489 | 100.0% | $10.23 | $3,186,489 | 100.0% | ||
| Vacant Space | 0 | 0.0% | |||||
| Total FedEx – Atlanta, GA Property | 311,489 | 100.0% | |||||
| FedEx – West Palm Beach, FL Major Tenant | |||||||
| FedEx | NR/Baa2/BBB | 225,198 | 100.0% | $11.80 | $2,656,662 | 100.0% | 12/31/2030(1) |
| Occupied Collateral Total | 225,198 | 100.0% | $11.80 | $2,656,662 | 100.0% | ||
| Vacant Space | 0 | 0.0% | |||||
| Total FedEx – West Palm Beach, FL Property | 225,198 | 100.0% | |||||
| Combined Occupied Total | 536,687 | 100.0% | $10.89 | $5,843,151 | 100.0% | ||
| Combined Vacant Total | 0 | 0.0% | |||||
| Combined Collateral Total | 536,687 | 100.0% | |||||
| (1) | FedEx has two, five-year lease renewal options. |
THE INFORMATION IN THIS STRUCTURAL AND COLLATERAL TERM SHEET IS NOT COMPLETE AND MAY BE AMENDED PRIOR TO THE TIME OF SALE. THIS TERM SHEET IS NOT AN OFFER TO SELL THESE SECURITIES AND IT IS NOT A SOLICITATION OF AN OFFER TO BUY THESE SECURITIES IN ANY JURISDICTION WHERE THE OFFER OR SALE IS NOT PERMITTED.
136
FEDEX – ATLANTA, GA & FEDEX – WEST PALM BEACH, FL
The following tables present certain information relating to the lease rollover schedule at the FedEx - Atlanta, GA Property and FedEx – West Palm Beach, FL Property:
Lease Expiration Schedule – FedEx – Atlanta, GA Property(1)
Year Ending December 31, | No. of Leases Expiring | Expiring NRSF | % of Total NRSF | Cumulative Expiring NRSF | Cumulative % of Total NRSF | Annual U/W Base Rent | % of Total Annual U/W Base Rent | Annual U/W Base Rent PSF |
| MTM | 0 | 0 | 0.0% | 0 | 0.0% | $0 | 0.0% | $0.00 |
| 2015 | 0 | 0 | 0.0% | 0 | 0.0% | $0 | 0.0% | $0.00 |
| 2016 | 0 | 0 | 0.0% | 0 | 0.0% | $0 | 0.0% | $0.00 |
| 2017 | 0 | 0 | 0.0% | 0 | 0.0% | $0 | 0.0% | $0.00 |
| 2018 | 0 | 0 | 0.0% | 0 | 0.0% | $0 | 0.0% | $0.00 |
| 2019 | 0 | 0 | 0.0% | 0 | 0.0% | $0 | 0.0% | $0.00 |
| 2020 | 0 | 0 | 0.0% | 0 | 0.0% | $0 | 0.0% | $0.00 |
| 2021 | 0 | 0 | 0.0% | 0 | 0.0% | $0 | 0.0% | $0.00 |
| 2022 | 0 | 0 | 0.0% | 0 | 0.0% | $0 | 0.0% | $0.00 |
| 2023 | 0 | 0 | 0.0% | 0 | 0.0% | $0 | 0.0% | $0.00 |
| 2024 | 0 | 0 | 0.0% | 0 | 0.0% | $0 | 0.0% | $0.00 |
| 2025 | 0 | 0 | 0.0% | 0 | 0.0% | $0 | 0.0% | $0.00 |
| Thereafter | 1 | 311,489 | 100.0% | 311,489 | 100.0% | $3,186,489 | 100.0% | $10.23 |
| Vacant | 0 | 0 | 0.0% | 311,489 | 100.0% | $0 | 0.0% | $0.00 |
| Total/Weighted Average | 1 | 311,489 | 100.0% | $3,186,489 | 100.0% | $10.23 |
| (1) | Information obtained from the underwritten rent roll. |
Lease Expiration Schedule – FedEx – West Palm Beach, FL Property(1)
Year Ending December 31, | No. of Leases Expiring | Expiring NRSF | % of Total NRSF | Cumulative Expiring NRSF | Cumulative % of Total NRSF | Annual U/W Base Rent | % of Total Annual U/W Base Rent | Annual U/W Base Rent PSF |
| MTM | 0 | 0 | 0.0% | 0 | 0.0% | $0 | 0.0% | $0.00 |
| 2015 | 0 | 0 | 0.0% | 0 | 0.0% | $0 | 0.0% | $0.00 |
| 2016 | 0 | 0 | 0.0% | 0 | 0.0% | $0 | 0.0% | $0.00 |
| 2017 | 0 | 0 | 0.0% | 0 | 0.0% | $0 | 0.0% | $0.00 |
| 2018 | 0 | 0 | 0.0% | 0 | 0.0% | $0 | 0.0% | $0.00 |
| 2019 | 0 | 0 | 0.0% | 0 | 0.0% | $0 | 0.0% | $0.00 |
| 2020 | 0 | 0 | 0.0% | 0 | 0.0% | $0 | 0.0% | $0.00 |
| 2021 | 0 | 0 | 0.0% | 0 | 0.0% | $0 | 0.0% | $0.00 |
| 2022 | 0 | 0 | 0.0% | 0 | 0.0% | $0 | 0.0% | $0.00 |
| 2023 | 0 | 0 | 0.0% | 0 | 0.0% | $0 | 0.0% | $0.00 |
| 2024 | 0 | 0 | 0.0% | 0 | 0.0% | $0 | 0.0% | $0.00 |
| 2025 | 0 | 0 | 0.0% | 0 | 0.0% | $0 | 0.0% | $0.00 |
| Thereafter | 1 | 225,198 | 100.0% | 225,198 | 100.0% | $2,656,662 | 100.0% | $11.80 |
| Vacant | 0 | 0 | 0.0% | 225,198 | 100.0% | $0 | 0.0% | $0.00 |
| Total/Weighted Average | 1 | 225,198 | 100.0% | $2,656,662 | 100.0% | $11.80 |
| (1) | Information obtained from the underwritten rent roll. |
The following table presents historical occupancy percentages at the FedEx- Atlanta, GA and FedEx – West Palm Beach, FL Properties:
Historical Occupancy(1)
| 12/31/2012 | 12/31/2013 | 12/31/2014 | 12/31/2015 | 8/1/2016(2) | |||||
| NAV | NAV | NAV | NAV | 100.0% |
| (1) | Both the FedEx – Atlanta, GA Property and the FedEx – West Palm Beach, FL Property were constructed in 2016. |
| (2) | Based on the underwritten rent roll. |
THE INFORMATION IN THIS STRUCTURAL AND COLLATERAL TERM SHEET IS NOT COMPLETE AND MAY BE AMENDED PRIOR TO THE TIME OF SALE. THIS TERM SHEET IS NOT AN OFFER TO SELL THESE SECURITIES AND IT IS NOT A SOLICITATION OF AN OFFER TO BUY THESE SECURITIES IN ANY JURISDICTION WHERE THE OFFER OR SALE IS NOT PERMITTED.
137
FEDEX – ATLANTA, GA & FEDEX – WEST PALM BEACH, FL
Operating History and Underwritten Net Cash Flow. The following table presents certain information relating to the underwritten net cash flow at the FedEx - Atlanta, GA Property and FedEx – West Palm Beach, FL Property:
Cash Flow Analysis – FedEx – Atlanta, GA Property(1)
| U/W | % of U/W Effective Gross Income | U/W $ per SF | |||||
| Base Rent | $3,186,489 | 93.8% | $10.23 | ||||
| Grossed Up Vacant Space | 0 | 0.0 | 0.00 | ||||
| Total Reimbursables | 279,648 | 8.2 | 0.90 | ||||
| Other Income | 0 | 0.0 | 0.00 | ||||
| Less Vacancy &Credit Loss | (69,323)(2) | (2.0) | (0.22) | ||||
| Effective Gross Income | $3,396,814 | 100% | $10.91 | ||||
| Total Operating Expenses | $347,584 | 10.2% | $1.12 | ||||
| Net Operating Income | $3,049,230 | 89.8% | $9.79 | ||||
| TI/LC | 85,069 | 2.5 | 0.27 | ||||
| Capital Expenditures | 31,149 | 0.9 | 0.10 | ||||
| Net Cash Flow | $2,933,012 | 86.3% | $9.42 | ||||
| NOI DSCR(3) | 2.49x | ||||||
| NCF DSCR(3) | 2.40x | ||||||
| NOI DY(3) | 10.7% | ||||||
| NCF DY(3) | 10.3% |
| (1) | The FedEx – Atlanta, GA Property was constructed in 2016; accordingly no historical operating information is available. |
| (2) | The underwritten economic vacancy is 2.0%. As of August 1, 2016, the FedEx – Atlanta, GA Property was 100.0% occupied. |
| (3) | The debt service coverage ratios and debt yields are based on the FedEx – Atlanta, GA Whole Loan and FedEx – West Palm Beach, FL Whole Loan in the aggregate. |
Cash Flow Analysis – FedEx – West Palm Beach, FL Property(1)
| U/W | % of U/W Effective Gross Income | U/W $ per SF | |||||
| Base Rent | $2,656,662 | 82.3% | $11.80 | ||||
| Grossed Up Vacant Space | 0 | 0.0 | 0.00 | ||||
| Total Reimbursables | 638,792 | 19.8 | 2.84 | ||||
| Other Income | 0 | 0.0 | 0.00 | ||||
| Less Vacancy &Credit Loss | (65,909)(2) | (2.0) | (0.29) | ||||
| Effective Gross Income | $3,229,545 | 100% | $14.34 | ||||
| Total Operating Expenses | $703,383 | 21.8% | $3.12 | ||||
| Net Operating Income | $2,526,162 | 78.2% | $11.22 | ||||
| TI/LC | 66,267 | 2.1 | 0.29 | ||||
| Capital Expenditures | 22,520 | 0.7 | 0.10 | ||||
| Net Cash Flow | $2,437,375 | 75.5% | $10.82 | ||||
| NOI DSCR(3) | 2.49x | ||||||
| NCF DSCR(3) | 2.40x | ||||||
| NOI DY(3) | 10.7% | ||||||
| NCF DY(3) | 10.3% |
| (1) | The FedEx – West Palm Beach, FL Property was constructed in 2016; accordingly no historical operating information is available. |
| (2) | The underwritten economic vacancy is 2.0%. As of August 1, 2016, the FedEx – West Palm Beach, FL Property was 100.0% occupied. |
| (3) | The debt service coverage ratios and debt yields are based on the FedEx – Atlanta, GA Whole Loan and FedEx – West Palm Beach, FL Whole Loan in the aggregate. |
THE INFORMATION IN THIS STRUCTURAL AND COLLATERAL TERM SHEET IS NOT COMPLETE AND MAY BE AMENDED PRIOR TO THE TIME OF SALE. THIS TERM SHEET IS NOT AN OFFER TO SELL THESE SECURITIES AND IT IS NOT A SOLICITATION OF AN OFFER TO BUY THESE SECURITIES IN ANY JURISDICTION WHERE THE OFFER OR SALE IS NOT PERMITTED.
138
FEDEX – ATLANTA, GA & FEDEX – WEST PALM BEACH, FL
The following table presents certain information relating to some comparable leases for the FedEx- Atlanta, GA Property and FedEx – West Palm Beach, FL Property:
Comparable Leases – FedEx – Atlanta, GA Property(1)
| Property Name/Location | Year Built | Tenant | Total SF | Occupancy | Clear Height (Ft.) | Lease Date | Lease Term | Rent PSF | Lease Type |
| FedEx Ground Louisville, KY | 2015 | FedEx Ground | 303,369 | 100% | 32 | Oct. 2015 | 15 yrs | $8.60 | Triple Net |
| FedEx Ground Mesquite Mesquite, TX | 2017 | FedEx Ground | 343,447 | 100% | 30 | Mar. 2017 | 15 yrs | $9.12 | Triple Net |
| FedEx Twinsburg Twinsburg, OH | 2015 | FedEx Ground | 312,146 | 100% | 32 | Dec. 2015 | 15 yrs | $10.70 | Absolute Net |
| FedEx Ground – Niles, IL Niles, IL | 2015 | FedEx Ground | 314,028 | 100% | 38 | Jun. 2015 | 15 yrs | $13.27 | Absolute Net |
| FedEx Ground Davenport, FL | 2016 | FedEx Ground | 311,684 | 100% | 31 | May 2016 | 15 yrs | $8.18 | Triple Net |
| (1) | Information obtained from the appraisal. |
Comparable Leases – FedEx – West Palm Beach, FL Property(1)
| Property Name/Location | Year Built | Tenant | Total SF | Occupancy | Clear Height (Ft.) | Lease Date | Lease Term | Rent PSF | Lease Type |
| DHL - Warehouse / Distribution Center Boston, MA | 1983 | Various | 90,234 | 100% | 21 | Various | Various | $15.00 | Triple Net |
| FedEx Ground Blauvelt, NY | 2012 | FedEx Ground | 142,139 | 100% | 29 | NAV | 15 yrs | $24.55 | Triple Net |
| FedEx Ground Redmond, WA | 2013 | FedEx Ground | 210,320 | 100% | 24 | Jul. 2013 | 15 yrs | $17.60 | Triple Net |
| FedEx Ground Saint Petersburg, FL | 2017 | FedEx Ground | 236,976 | 100% | 31 | Feb. 2017 | 15 yrs | $21.16 | Triple Net |
| FedEx Ground - BTS West Palm Beach, FL | 2007 | FedEx Ground | 119,165 | 100% | 24 | NAV | 10 yrs | $12.32 | Triple Net |
| Medley BTS LLC - Miami FedEx Distribution Center Medley, FL | 2009 | FedEx Ground | 306,803 | 100% | 31 | NAV | 15 yrs | $20.03 | Triple Net |
| (1) | Information obtained from the appraisal. |
THE INFORMATION IN THIS STRUCTURAL AND COLLATERAL TERM SHEET IS NOT COMPLETE AND MAY BE AMENDED PRIOR TO THE TIME OF SALE. THIS TERM SHEET IS NOT AN OFFER TO SELL THESE SECURITIES AND IT IS NOT A SOLICITATION OF AN OFFER TO BUY THESE SECURITIES IN ANY JURISDICTION WHERE THE OFFER OR SALE IS NOT PERMITTED.
139
| No. 15 – FedEx – Fife, WA | ||||||
| Loan Information | Property Information | |||||
| Mortgage Loan Seller: | Bank of America, National Association | Single Asset/Portfolio: | Single Asset | |||
| Credit Assessment (Fitch/KBRA/Moody’s/S&P): | NR/NR/NR/NR | Property Type: | Industrial | |||
| Original Principal Balance(1): | $20,125,000 | Specific Property Type: | Warehouse Distribution | |||
| Cut-off Date Balance(1): | $20,125,000 | Location: | Fife, WA | |||
| % of Initial Pool Balance: | 2.3% | Size: | 312,928 SF | |||
| Loan Purpose: | Acquisition | Cut-off Date Balance Per SF(1): | $128.62 | |||
| Borrower Names: | PA-SC Fife Project LLC | Year Built/Renovated: | 2015/NAP | |||
| Sponsor: | MRP Group | Title Vesting: | Fee | |||
| Mortgage Rate: | 4.236% | Property Manager: | Self-managed | |||
| Note Date: | May 4, 2016 | 4thMost Recent Occupancy(6): | NAV | |||
| Anticipated Repayment Date: | NAP | 3rdMost Recent Occupancy(6): | NAV | |||
| Maturity Date: | June 1, 2026 | 2ndMost Recent Occupancy(6): | NAV | |||
| IO Period: | 120 months | Most Recent Occupancy(6): | NAV | |||
| Loan Term (Original): | 120 months | Current Occupancy (As of): | 100.0% (8/1/2016) | |||
| Seasoning: | 2 months | |||||
| Amortization Term (Original): | NAP | Underwriting and Financial Information: | ||||
| Loan Amortization Type: | Interest-only, Balloon | |||||
| Interest Accrual Method: | Actual/360 | 4thMost Recent NOI(7): | NAV | |||
| Call Protection: | L(26),D(90),O(4) | 3rdMost Recent NOI(7): | NAV | |||
| Lockbox Type: | Hard/Springing Cash Management | 2ndMost Recent NOI(7): | NAV | |||
| Additional Debt(1): | Yes | Most Recent NOI(7): | NAV | |||
| Additional Debt Type(1): | Pari Passu | |||||
| U/W Revenues: | $4,945,466 | |||||
| U/W Expenses: | $607,463 | |||||
| U/W NOI: | $4,338,003 | |||||
| U/W NCF: | $4,203,204 | |||||
| Escrows and Reserves: | U/W NOI DSCR(1): | 2.51x | ||||
| U/W NCF DSCR(1): | 2.43x | |||||
| Type: | Initial | Monthly | Cap (If Any) | U/W NOI Debt Yield(1): | 10.8% | |
| Taxes | $22,237 | $43,006 | NAP | U/W NCF Debt Yield(1): | 10.4% | |
| Insurance(2) | $0 | Springing | NAP | As-Is Appraised Value: | $74,000,000 | |
| Environmental Reserve(3) | $50,010 | $0 | NAP | As-Is Appraisal Valuation Date: | November 20, 2015 | |
| Change Order Reserve(4) | $450,094 | $0 | NAP | Cut-off Date LTV Ratio(1): | 54.4% | |
| Fence Completion Reserve(5) | $20,004 | $0 | NAP | LTV Ratio at Maturity or ARD(1): | 54.4% | |
| (1) | The FedEx – Fife, WA Whole Loan (as defined below), which had an original principal balance of $40,250,000, is comprised of twopari passu notes (Notes A-1 and A-2). The controlling Note A-1 had an original principal balance of $20,125,000, has an outstanding principal balance of $20,125,000 as of the Cut-off Date and will be contributed to the WFCM 2016-BNK1 Trust. The non-controlling Note A-2 had an original principal balance of $20,125,000 and was contributed to the CGCMT 2016-P4 Trust. All statistical financial information related to balances per square foot, loan-to-value ratios, debt service ratios and debt yields are based on the FedEx – Fife, WA Whole Loan. |
| (2) | Ongoing reserves for insurance are not required as long as (i) no event of default has occurred and is continuing; (ii) none of the following events has occurred or is continuing: FedEx (defined below) (a) fails to occupy the space 12 months from the origination date of the loan, (b) goes dark, vacates or gives notice of intent to do so, (c) terminates or gives notice of its intention to terminate the lease, (d) fails to renew its lease for a period of at least five years, (e) fails to pay rent or any expenses due, or (f) files for bankruptcy or similar insolvency proceedings; and (iii) FedEx is directly paying the cost of insurance premiums which borrower is required to make. |
| (3) | Subsurface investigations conducted between 2006 and 2014 identified soil and groundwater with concentrations of one or more contaminants of concern in excess of their respective Model Toxics Control Act Method A Cleanup Level. Groundwater sampling conducted in August 2015 did not identify any petroleum compounds, solvents or metals at concentrations exceeding laboratory reporting limits or applicable Model Toxics Control Act Method A Cleanup Levels. The borrower has undertaken to complete the ongoing monitoring and obtain regulatory closure at an estimated cost of $30,000-$40,000, 125% of which higher amount has been escrowed. |
| (4) | FedEx was provided a change order allowance in the amount of $450,094 for requested work at the FedEx – Fife, WA Property that is currently outstanding. According to the lease, the funds will be disbursed for work requested by FedEx or refunded to FedEx if not used. The entire $450,094 of allowance was still outstanding at loan origination and was escrowed upfront. |
| (5) | At loan origination, the sponsor was still responsible for completing a fence on the perimeter of the property totaling $20,004 which was escrowed upfront. |
| (6) | See “Historical Occupancy” section. |
| (7) | See “Cash Flow Analysis” section. |
The FedEx – Fife, WA mortgage loan is part of a whole loan (the “FedEx – Fife, WA Whole Loan”) that is evidenced by twopari passu notes (Notes A-1 and A-2) secured by a first mortgage encumbering a 312,928 square foot industrial warehouse distribution center located in Fife, Washington (the “FedEx – Fife, WA Property”). The FedEx – Fife, WA Whole Loan was co-originated on May 4, 2016 by Bank of America, National Association and Citigroup Global Markets Realty Corp. The FedEx – Fife, WA Property was built in October 2015 as a build-to-suit for the sole tenant, FedEx Ground Package System, Inc. (“FedEx”). FedEx has a 15-year triple-net lease expiring October 2030 with two five-year lease renewal options. With over 288,500 square feet of warehouse space and approximately 12,905 square feet of office space, the FedEx – Fife, WA Property features a clear height of 30-feet throughout the
THE INFORMATION IN THIS STRUCTURAL AND COLLATERAL TERM SHEET IS NOT COMPLETE AND MAY BE AMENDED PRIOR TO THE TIME OF SALE. THIS TERM SHEET IS NOT AN OFFER TO SELL THESE SECURITIES AND IT IS NOT A SOLICITATION OF AN OFFER TO BUY THESE SECURITIES IN ANY JURISDICTION WHERE THE OFFER OR SALE IS NOT PERMITTED.
140
| FEDEX – FIFE, WA |
facility, 66 dock-high doors and 8 grade level doors. The FedEx – Fife, WA Property is situated on a 40.0-acre site with 400 surface parking spaces resulting in a parking ratio of 1.3 spaces per 1,000 square feet of net rentable area.
The FedEx – Fife, WA Property is located seven miles east of downtown Tacoma in Pierce County. Primary access to the FedEx – Fife, WA Property is provided by Interstate 5 and Highway 167. According to a third-party market research report, the FedEx – Fife, WA Property is located within the Puyallup/South Hill submarket of the Seattle light industrial market. As of the first quarter of 2016, the submarket reported an inventory of 291 buildings totaling approximately 4.9 million square feet with a 1.3% vacancy rate. The appraiser concluded to a market rent for the FedEx – Fife, WA Property of $14.50 per square foot, triple net.
Sources and Uses
| Sources | Uses | |||||||
| Original whole loan amount | $40,250,000 | 54.4% | Purchase price | $73,199,778 | 99.0% | |||
| Sponsor’s new cash contribution | 33,707,713 | 45.6 | Reserves | 542,346 | 0.7 | |||
| Closing costs | 215,589 | 0.3 | ||||||
| Total Sources | $73,957,713 | 100.0% | Total Uses | $73,957,713 | 100.0% |
The following table presents certain information relating to the tenant at the FedEx – Fife, WA Property:
Major Tenants
| Tenant Name | Credit Rating (Fitch/ Moody’s/ S&P) | Tenant NRSF | % of NRSF | Annual U/W Base Rent PSF | Annual U/W Base Rent | % of Total Annual U/W Base Rent | Lease Expiration Date |
| Major Tenant | |||||||
| FedEx | NR/Baa2/BBB | 312,926 | 100.0% | $14.50 | $4,537,840 | 100.0% | 10/31/2030(1) |
| Occupied Collateral Total | 312,926 | 100.0% | $14.50 | $4,537,840 | 100.0% | ||
| Vacant Space | 0 | 0.0% | |||||
| Collateral Total | 312,926 | 100.0% | |||||
| (1) | FedEx has two, five-year lease renewal options. |
The following table presents certain information relating to the lease rollover schedule at the FedEx – Fife, WA Property:
Lease Expiration Schedule(1)
| Year Ending December 31, | No. of Leases Expiring | Expiring NRSF | % of Total NRSF | Cumulative Expiring NRSF | Cumulative % of Total NRSF | Annual U/W Base Rent | % of Total Annual U/W Base Rent | Annual U/W Base Rent PSF |
| MTM | 0 | 0 | 0.0% | 0 | 0.0% | $0 | 0.0% | $0.00 |
| 2016 | 0 | 0 | 0.0% | 0 | 0.0% | $0 | 0.0% | $0.00 |
| 2017 | 0 | 0 | 0.0% | 0 | 0.0% | $0 | 0.0% | $0.00 |
| 2018 | 0 | 0 | 0.0% | 0 | 0.0% | $0 | 0.0% | $0.00 |
| 2019 | 0 | 0 | 0.0% | 0 | 0.0% | $0 | 0.0% | $0.00 |
| 2020 | 0 | 0 | 0.0% | 0 | 0.0% | $0 | 0.0% | $0.00 |
| 2021 | 0 | 0 | 0.0% | 0 | 0.0% | $0 | 0.0% | $0.00 |
| 2022 | 0 | 0 | 0.0% | 0 | 0.0% | $0 | 0.0% | $0.00 |
| 2023 | 0 | 0 | 0.0% | 0 | 0.0% | $0 | 0.0% | $0.00 |
| 2024 | 0 | 0 | 0.0% | 0 | 0.0% | $0 | 0.0% | $0.00 |
| 2025 | 0 | 0 | 0.0% | 0 | 0.0% | $0 | 0.0% | $0.00 |
| 2026 | 0 | 0 | 0.0% | 0 | 0.0% | $0 | 0.0% | $0.00 |
| Thereafter | 1 | 312,926 | 100.0% | 312,926 | 100.0% | $4,537,840 | 100.0% | $14.50 |
| Vacant | 0 | 0 | 0.0% | 312,926 | 100.0% | $0 | 0.0% | $0.00 |
| Total/Weighted Average | 1 | 312,926 | 100.0% | $4,537,840 | 100.0% | $14.50 |
| (1) | Information obtained from the underwritten rent roll. |
THE INFORMATION IN THIS STRUCTURAL AND COLLATERAL TERM SHEET IS NOT COMPLETE AND MAY BE AMENDED PRIOR TO THE TIME OF SALE. THIS TERM SHEET IS NOT AN OFFER TO SELL THESE SECURITIES AND IT IS NOT A SOLICITATION OF AN OFFER TO BUY THESE SECURITIES IN ANY JURISDICTION WHERE THE OFFER OR SALE IS NOT PERMITTED.
141
| FEDEX – FIFE, WA |
The following table presents historical occupancy percentages at the FedEx – Fife, WA Property:
Historical Occupancy
12/31/2012(1) | 12/31/2013(1) | 12/31/2014(1) | 12/31/2015(1) | 8/1/2016(2) | ||||
| NAV | NAV | NAV | NAV | 100.0% |
| (1) | The FedEx – Fife, WA Property was constructed in 2015. |
| (2) | Based on the underwritten rent roll. |
Operating History and Underwritten Net Cash Flow. The following table presents certain information relating to the underwritten net cash flow at the FedEx – Fife, WA Property:
Cash Flow Analysis(1)
| U/W | % of U/W Effective Gross Income | U/W $ per SF | ||||
| Base Rent | $4,537,840 | 91.8% | $14.50 | |||
| Grossed Up Vacant Space | 0 | 0.0 | 0.00 | |||
| Total Reimbursables | 508,554 | 10.3 | 1.63 | |||
| Other Income | 0 | 0.0 | 0.00 | |||
| Less Vacancy & Credit Loss | (100,928)(2) | (2.0) | (0.32) | |||
| Effective Gross Income | $4,945,466 | 100.0% | $15.80 | |||
| Total Operating Expenses | $607,463 | 12.3% | $1.94 | |||
| Net Operating Income | $4,338,003 | 87.7% | $13.86 | |||
| TI/LC | 103,506 | 2.1 | 0.33 | |||
| Capital Expenditures | 31,293 | 0.6 | 0.10 | |||
| Net Cash Flow | $4,203,204 | 85.0% | $13.43 | |||
| NOI DSCR(3) | 2.51x | |||||
| NCF DSCR(3) | 2.43x | |||||
| NOI DY(3) | 10.8% | |||||
| NCF DY(3) | 10.4% |
| (1) | The FedEx – Fife, WA Property was constructed in 2015; accordingly no historical operating information is available. |
| (2) | The underwritten economic vacancy is 2.0%. As of August 1, 2016, the FedEx – Fife, WA Property was 100.0% occupied. |
| (3) | The debt service coverage ratios and debt yields are based on the FedEx – Fife, WA Whole Loan. |
The following table presents certain information relating to some comparable leases for the FedEx – Fife, WA Property:
Comparable Leases(1)
| Property Name/Location | Year Built | Tenant | Total SF | Occupancy | Distance to Subject | Lease Date | Lease Term | Rent PSF | Lease Type |
FedEx Ground Eugene, OR | 2000 | FedEx | 54,118 | 100% | 222 miles | 1/1/2010 | 10 yrs | $13.30 | Triple Net |
FedEx Express Springfield, OR | 1999 | FedEx | 154,000 | 100% | 220 miles | 12/1/2007 | 10 yrs | $7.42 | Triple Net |
FedEx Ground Redmond, WA | 2013 | FedEx Ground | 210,320 | 100% | 32 miles | 10/1/2013 | 15 yrs | $17.62 | Triple Net |
FedEx Ground South San Francisco, CA | 2013 | FedEx Ground | 453,076 | 100% | 663 miles | 10/1/2013 | 20 yrs | $13.71 | Triple Net |
| (1) | Information obtained from the appraisal. |
THE INFORMATION IN THIS STRUCTURAL AND COLLATERAL TERM SHEET IS NOT COMPLETE AND MAY BE AMENDED PRIOR TO THE TIME OF SALE. THIS TERM SHEET IS NOT AN OFFER TO SELL THESE SECURITIES AND IT IS NOT A SOLICITATION OF AN OFFER TO BUY THESE SECURITIES IN ANY JURISDICTION WHERE THE OFFER OR SALE IS NOT PERMITTED.
142
(THIS PAGE INTENTIONALLY LEFT BLANK)
THE INFORMATION IN THIS STRUCTURAL AND COLLATERAL TERM SHEET IS NOT COMPLETE AND MAY BE AMENDED PRIOR TO THE TIME OF SALE. THIS TERM SHEET IS NOT AN OFFER TO SELL THESE SECURITIES AND IT IS NOT A SOLICITATION OF AN OFFER TO BUY THESE SECURITIES IN ANY JURISDICTION WHERE THE OFFER OR SALE IS NOT PERMITTED.
143
| No. 16 – 420 East Third Street | ||||||
| Loan Information | Property Information | |||||
| Mortgage Loan Seller: | Morgan Stanley Mortgage Capital Holdings LLC | Single Asset/Portfolio: | Single Asset | |||
| Credit Assessment (Fitch/KBRA/Moody’s/S&P): | NR/NR/NR/NR | Property Type: | Mixed Use | |||
| Original Principal Balance: | $19,000,000 | Specific Property Type: | Office/Retail | |||
| Cut-off Date Balance: | $19,000,000 | Location: | Los Angeles, CA | |||
| % of Initial Pool Balance: | 2.2% | Size: | 116,152 SF | |||
| Loan Purpose: | Refinance | Cut-off Date Balance Per SF: | $163.58 | |||
| Borrower Name: | Little Tokyo Associates, LLC | Year Built/Renovated: | 1989/2016 | |||
| Sponsors: | Naomi Nakagama Kurata; Fred Kurata | Title Vesting: | Fee | |||
| Mortgage Rate: | 4.110% | Property Manager: | Self-managed | |||
| Note Date: | July 8, 2016 | 4thMost Recent Occupancy: | NAV | |||
| Anticipated Repayment Date: | NAP | 3rdMost Recent Occupancy (As of): | 64.6% (12/31/2013) | |||
| Maturity Date: | August 1, 2026 | 2ndMost Recent Occupancy (As of): | 73.7% (12/31/2014) | |||
| IO Period: | None | Most Recent Occupancy (As of)(4): | 70.5% (12/31/2015) | |||
| Loan Term (Original): | 120 months | Current Occupancy (As of)(4): | 79.5% (6/1/2016) | |||
| Seasoning: | 0 months | |||||
| Amortization Term (Original): | 360 months | Underwriting and Financial Information: | ||||
| Loan Amortization Type: | Amortizing Balloon | |||||
| Interest Accrual Method: | Actual/360 | 4thMost Recent NOI (As of): | $1,488,892 (12/31/2013) | |||
| Call Protection: | L(24),D(89),O(7) | 3rdMost Recent NOI (As of): | $1,507,568 (12/31/2014) | |||
| Lockbox Type: | Springing | 2ndMost Recent NOI (As of): | $1,788,775 (12/31/2015) | |||
| Additional Debt: | None | Most Recent NOI (As of)(5): | $1,767,420 (TTM 4/30/2016) | |||
| Additional Debt Type: | NAP | |||||
| U/W Revenues: | $3,878,665 | |||||
| U/W Expenses: | $1,597,799 | |||||
| U/W NOI(5): | $2,280,865 | |||||
| Escrows and Reserves: | U/W NCF(5): | $2,160,065 | ||||
| U/W NOI DSCR: | 2.07x | |||||
| Type: | Initial | Monthly | Cap (If Any) | U/W NCF DSCR: | 1.96x | |
| Taxes | $121,085 | $24,217 | NAP | U/W NOI Debt Yield: | 12.0% | |
| Insurance | $7,812 | $3,906 | NAP | U/W NCF Debt Yield: | 11.4% | |
| Replacement Reserves | $0 | $1,950 | NAP | As-Is Appraised Value: | $35,000,000 | |
| TI/LC Reserve(1) | $1,500,000 | Springing | $750,000 | As-Is Appraisal Valuation Date: | May 25, 2016 | |
| Rent Reserve Escrow(2) | $69,875 | $0 | NAP | Cut-off Date LTV Ratio: | 54.3% | |
| Outstanding TI/LC Reserve(3) | $721,830 | $0 | NAP | LTV Ratio at Maturity or ARD: | 43.3% | |
| (1) | Ongoing monthly TI/LC reserves of $16,455 will be required if the balance on deposit in the TI/LC Reserve falls below the cap of $750,000 and will continue until the balance on deposit is at least $750,000. |
| (2) | The initial Rent Reserve Escrow represents approximately four months of free rent for Pfaffinger Foundation ($39,913) and approximately three months of free rent for Dr. Tod Wakamatsu ($29,962). |
| (3) | The Outstanding TI/LC Reserve represents existing TI/LC obligations for US Renal ($422,290), Takeshi Matsumoto / Urban Greens ($157,720), Pfaffinger Foundation ($116,820) and Common Grounds ($25,000) and does not count toward the $750,000 TI/LC reserve cap. |
| (4) | See “Historical Occupancy” section. |
| (5) | See “Cash Flow Analysis” section. |
The 420 East Third Street mortgage loan is evidenced by a single promissory note that is secured by a first mortgage encumbering a mixed use office and retail property comprising 116,152 square feet located in Los Angeles, California (the “420 East Third Street Property”), in the Little Tokyo neighborhood of downtown Los Angeles. Built in 1989, the 420 East Third Street Property is a ten-story office and retail building that is occupied by a diverse rent roll of office, medical office and retail tenants. The 420 East Third Street Property features large outdoor balconies with unobstructed views of the downtown Los Angeles skyline, and includes a four-story above-grade parking structure with 374 parking spaces located on floors 2-5, resulting in a parking ratio of 3.2 per 1,000 square feet of rentable area. The 420 East Third Street Property is located 1.4 miles southeast of the intersection of U.S. Highway 101 and State Route 110, and is served by the Metro Gold Line at the Little Tokyo/Arts District Station and the Metro Red Line and Metro Purple Line via either Civic Center Station or Union Station.
According to the appraisal, the 420 East Third Street Property is located within the Downtown Los Angeles submarket. As of the first quarter 2016, the submarket had a reported inventory of 62 office properties totaling approximately 31.8 million square feet with a 16.9% vacancy. The appraisal concluded to a market rent for the 420 East Third Street Property of $32.00 per square foot, full service gross, for general office space, $33.00 per square foot, full service gross, for medical office space, and $33.00 per square foot, triple net, for retail space. As of June 1, 2016, the 420 East Third Street Property was 79.5% occupied by 31 tenants.
THE INFORMATION IN THIS STRUCTURAL AND COLLATERAL TERM SHEET IS NOT COMPLETE AND MAY BE AMENDED PRIOR TO THE TIME OF SALE. THIS TERM SHEET IS NOT AN OFFER TO SELL THESE SECURITIES AND IT IS NOT A SOLICITATION OF AN OFFER TO BUY THESE SECURITIES IN ANY JURISDICTION WHERE THE OFFER OR SALE IS NOT PERMITTED.
144
| 420 EAST THIRD STREET |
Sources and Uses
| Sources | Uses | |||||||
| Original loan amount | $19,000,000 | 99.5% | Loan payoff(1) | $16,546,263 | 86.6% | |||
| Sponsor’s new cash contribution | 101,800 | 0.5 | Reserves | 2,420,602 | 12.7 | |||
| Closing costs | 134,936 | 0.7 | ||||||
| Total Sources | $19,101,800 | 100.0% | Total Uses | $19,101,800 | 100.0% |
| (1) | The 420 East Third Street Property was previously securitized in the PFP 2014-1 transaction. |
The following table presents certain information relating to the tenants at the 420 East Third Street Property:
Major Tenants
| Tenant Name | Credit Rating (Fitch/Moody’s/S&P) | Tenant NRSF | % of NRSF | Annual U/W Base Rent PSF(1) | Annual U/W Base Rent(1) | % of Total Annual U/W Base Rent | Lease Expiration Date |
| Major Tenants | |||||||
| Pacific Commerce Bank | NR/NR/NR | 7,948 | 6.8% | $41.26 | $327,972 | 10.7% | 8/31/2017 |
| Third Street Surgery Center LP(3) | NR/NR/NR | 7,996 | 6.9% | $35.53 | $284,099 | 9.3% | 12/31/2028 |
| Board of Supervisors/County of Los Angeles | NR/NR/NR | 8,526 | 7.3% | $31.57 | $269,186 | 8.8% | 5/31/2022(2) |
| US Renal | NR/NR/NR | 7,678 | 6.6% | $34.57 | $265,421 | 8.7% | 1/5/2026 |
| Premiere Practice Management, Inc. (3) | NR/NR/NR | 7,749 | 6.7% | $32.00 | $247,968 | 8.1% | 12/31/2028 |
| Total Major Tenants | 39,897 | 34.3% | $34.96 | $1,394,646 | 45.6% | ||
| Non-Major Tenants | 52,496 | 45.2% | $31.65 | $1,661,387 | 54.4% | ||
| Occupied Collateral Total | 92,393 | 79.5% | $33.08 | $3,056,033 | 100.0% | ||
| Vacant Space | 23,759 | 20.5% | |||||
| Collateral Total | 116,152 | 100.0% | |||||
| (1) | Annual U/W Base Rent PSF and Annual U/W Base Rent include contractual rent steps through June 1, 2017 totaling $91,664. |
| (2) | Board of Supervisors/County of Los Angeles has a termination option beginning June 1, 2019 with a minimum of 270 days prior written notice. |
| (3) | Third Street Surgery Center LP and Premiere Practice Management, Inc., along with the sixth largest tenant, East - West Eye Institute, which collectively represent approximately 19.7% of net rentable area and approximately 24.8% of Annual U/W Base Rent, are affiliates of the borrower. |
THE INFORMATION IN THIS STRUCTURAL AND COLLATERAL TERM SHEET IS NOT COMPLETE AND MAY BE AMENDED PRIOR TO THE TIME OF SALE. THIS TERM SHEET IS NOT AN OFFER TO SELL THESE SECURITIES AND IT IS NOT A SOLICITATION OF AN OFFER TO BUY THESE SECURITIES IN ANY JURISDICTION WHERE THE OFFER OR SALE IS NOT PERMITTED.
145
| 420 EAST THIRD STREET |
The following table presents certain information relating to the lease rollover schedule at the 420 East Third Street Property:
Lease Expiration Schedule(1)(2)
| Year Ending December 31, | No. of Leases Expiring | Expiring NRSF | % of Total NRSF | Cumulative Expiring NRSF | Cumulative % of Total NRSF | Annual U/W Base Rent | % of Total Annual U/W Base Rent | Annual U/W Base Rent PSF(3) |
| MTM | 3 | 3,357 | 2.9% | 3,357 | 2.9% | $110,180 | 3.6% | $32.82 |
| 2016 | 2 | 3,980 | 3.4% | 7,337 | 6.3% | $130,189 | 4.3% | $32.71 |
| 2017 | 5 | 15,830 | 13.6% | 23,167 | 19.9% | $557,787 | 18.3% | $35.24 |
| 2018 | 1 | 884 | 0.8% | 24,051 | 20.7% | $29,252 | 1.0% | $33.09 |
| 2019 | 3 | 6,758 | 5.8% | 30,809 | 26.5% | $205,997 | 6.7% | $30.48 |
| 2020 | 2 | 1,217 | 1.0% | 32,026 | 27.6% | $39,814 | 1.3% | $32.71 |
| 2021 | 6 | 11,580 | 10.0% | 43,606 | 37.5% | $382,300 | 12.5% | $33.01 |
| 2022 | 2 | 10,338 | 8.9% | 53,944 | 46.4% | $334,653 | 11.0% | $32.37 |
| 2023 | 1 | 3,894 | 3.4% | 57,838 | 49.8% | $114,484 | 3.7% | $29.40 |
| 2024 | 1 | 1,270 | 1.1% | 59,108 | 50.9% | $36,378 | 1.2% | $28.64 |
| 2025 | 0 | 0 | 0.0% | 59,108 | 50.9% | $0 | 0.0% | $0.00 |
| 2026 | 2 | 10,356 | 8.9% | 69,464 | 59.8% | $357,067 | 11.7% | $34.48 |
| Thereafter | 3 | 22,929 | 19.7% | 92,393 | 79.5% | $757,932 | 24.8% | $33.06 |
| Vacant | 0 | 23,759 | 20.5% | 116,152 | 100.0% | $0 | 0.0% | $0.00 |
| Total/Weighted Average | 31 | 116,152 | 100.0% | $3,056,033 | 100.0% | $33.08 |
| (1) | Information obtained from the underwritten rent roll. |
| (2) | Certain tenants may have lease termination options that are exercisable prior to the originally stated expiration date of the subject lease and that are not considered in the lease rollover schedule. |
| (3) | Weighted Average Annual U/W Base Rent PSF excludes vacant space. |
The following table presents historical occupancy percentages at the 420 East Third Street Property:
Historical Occupancy
12/31/2012(1) | 12/31/2013(1) | 12/31/2014(1) | 12/31/2015(1)(2) | 6/1/2016(2)(3) | ||||
| NAV | 64.6% | 73.7% | 70.5% | 79.5% |
| (1) | Information obtained from the borrower. |
| (2) | The increase in current occupancy over year end 2015 occupancy is due to recent leasing, including US Renal (7,678 square feet), which took occupancy in January 2016, Pfaffinger Foundation (3,894 square feet), which is expected to take occupancy in August 2016, and Takeshi Matsumoto / Urban Greens (3,246 square feet), which is expected to take occupancy in August 2016. |
| (3) | Information obtained from the underwritten rent roll. |
Operating History and Underwritten Net Cash Flow. The following table presents certain information relating to the historical operating performance and the underwritten net cash flow at the 420 East Third Street Property:
Cash Flow Analysis
| 2013 | 2014 | 2015 | TTM 4/30/2016 | U/W | % of U/W Effective Gross Income | U/W $ per SF | ||||||||||||||||
| Base Rent | $2,350,360 | $2,471,814 | $2,717,785 | $2,797,335 | $3,056,033 | (1) | 78.8 | % | $26.31 | |||||||||||||
| Grossed Up Vacant Space | 0 | 0 | 0 | 0 | 769,371 | 19.8 | 6.62 | |||||||||||||||
| Total Reimbursables | 44,474 | 37,040 | 32,080 | 21,711 | 36,877 | 1.0 | 0.32 | |||||||||||||||
| Other Income | 348,744 | 462,261 | 590,993 | 591,468 | 785,755 | (2) | 20.3 | 6.76 | ||||||||||||||
| Less Vacancy & Credit Loss | 0 | (17,833) | 0 | 0 | (769,371) | (3) | (19.8) | (6.62 | ) | |||||||||||||
| Effective Gross Income | $2,743,579 | $2,953,281 | $3,340,858 | $3,410,514 | $3,878,665 | 100.0 | % | $33.39 | ||||||||||||||
| Total Operating Expenses | $1,254,687 | $1,445,713 | $1,552,082 | $1,643,094 | $1,597,799 | 41.2 | % | $13.76 | ||||||||||||||
| Net Operating Income | $1,488,892 | $1,507,568 | $1,788,775 | $1,767,420 | $2,280,865 | 58.8 | % | $19.64 | ||||||||||||||
| TI/LC | 0 | 0 | 0 | 0 | 97,404 | 2.5 | 0.84 | |||||||||||||||
| Capital Expenditures | 0 | 0 | 0 | 0 | 23,396 | 0.6 | 0.20 | |||||||||||||||
| Net Cash Flow | $1,488,892 | $1,507,568 | $1,788,775 | $1,767,420 | $2,160,065 | 55.7 | % | $18.60 | ||||||||||||||
| NOI DSCR | 1.35x | 1.37x | 1.62x | 1.60x | 2.07x | |||||||||||||||||
| NCF DSCR | 1.35x | 1.37x | 1.62x | 1.60x | 1.96x | |||||||||||||||||
| NOI DY | 7.8% | 7.9% | 9.4% | 9.3% | 12.0% | |||||||||||||||||
| NCF DY | 7.8% | 7.9% | 9.4% | 9.3% | 11.4% |
| (1) | The increase in U/W Base Rent over TTM 4/30/2016 is primarily due to recent leasing, including US Renal ($265,421 of Annual U/W Base Rent), Pfaffinger Foundation ($114,484 of Annual U/W Base Rent) and Takeshi Matsumoto / Urban Greens ($125,994 of Annual U/W Base Rent), as well as $91,664 of underwritten rent steps through June 1, 2017. |
| (2) | Other Income includes $571,449 of parking income at the Mortgaged Property, of which approximately 70% of the parking income is from monthly parking for tenants at the property/nearby properties, approximately 20% of parking income is from transient parking demand and approximately 10% of parking income is from parking coupons. |
| (3) | The underwritten economic vacancy is 20.1%. The 420 East Third Street Property was 79.5% physically occupied as of June 1, 2016. |
THE INFORMATION IN THIS STRUCTURAL AND COLLATERAL TERM SHEET IS NOT COMPLETE AND MAY BE AMENDED PRIOR TO THE TIME OF SALE. THIS TERM SHEET IS NOT AN OFFER TO SELL THESE SECURITIES AND IT IS NOT A SOLICITATION OF AN OFFER TO BUY THESE SECURITIES IN ANY JURISDICTION WHERE THE OFFER OR SALE IS NOT PERMITTED.
146
| 420 EAST THIRD STREET |
The following table presents certain information relating to comparable office leases for the 420 East Third Street Property:
Comparable Office Leases(1)
| Property Name/Location | Year Built | Total SF | Occupancy | Tenant Name | Lease SF | Lease Date | Lease Term | Rent PSF | Lease Type |
| Creative Office 400-420 Boyd Street Los Angeles, CA | 1922 | 55,550 | 89% | Huff | 18,000 | Sept. 2015 | 5.0 Yrs | $25.00 | Modified Gross |
Little Tokyo Plaza 330-340 East 2ndStreet | 1984 | 44,351 | 98% | Quoted | NAV | NAV | NAV | $27.00 | Full Service Gross |
| 312 East 1st Street 312 East 1st Street Los Angeles, CA | 1992 | 34,320 | 74% | Undisclosed | 2,166 | Jan. 2015 | 3.0 Yrs | $25.20 | Modified Gross |
| Kajima Building 250 East 1st Street Los Angeles, CA | 1967 | 99,171 | 91% | Law Firm | 3,120 | Mar. 2015 | 5.0 Yrs | $27.60 | Full Service Gross |
| Office Property 321 West 2nd Street Los Angeles, CA | 1963 | 54,827 | 100% | Federal Public Defenders | 54,827 | Jan. 2017 | 10.0 Yrs | $30.60 | Full Service Gross |
| Broadway Media Center 205-207 S. Broadway Los Angeles, CA | 1926 | 212,283 | 80% | New Tenant | 2,400 | Jan. 2016 | 5.0 Yrs | $30.60 | Modified Gross |
| 801 Grand Tower 801 S. Grand Avenue Los Angeles, CA | 1985 | 202,245 | 91% | CSULA | 21,081 | Jan. 2016 | 10.0 Yrs | $33.50 | Full Service Gross |
| (1) | Information obtained from the appraisal. |
THE INFORMATION IN THIS STRUCTURAL AND COLLATERAL TERM SHEET IS NOT COMPLETE AND MAY BE AMENDED PRIOR TO THE TIME OF SALE. THIS TERM SHEET IS NOT AN OFFER TO SELL THESE SECURITIES AND IT IS NOT A SOLICITATION OF AN OFFER TO BUY THESE SECURITIES IN ANY JURISDICTION WHERE THE OFFER OR SALE IS NOT PERMITTED.
147
| Wells Fargo Commercial Mortgage Trust 2016-BNK1 | Transaction Contact Information |
VI. Transaction Contact Information
Questions regarding this Structural and Collateral Term Sheet may be directed to any of the following individuals:
| Wells Fargo Securities, LLC | |
| Brigid Mattingly | Tel. (312) 269-3062 |
| A.J. Sfarra | Tel. (212) 214-5613 |
| Alex Wong | Tel. (212) 214-5615 |
| BofA Merrill Lynch | |
| Leland Bunch | Tel. (646) 855-3953 |
| Danielle Caldwell | Tel. (646) 855-3421 |
| Anthony Candela | Tel. (646) 743-0727 |
| Morgan Stanley & Co. | |
| Zachary Fischer | Tel. (212) 761-3076 |
| Jane Lam | Tel. (212) 296-8567 |
| Brandon Atkins | Tel. (212) 761-4846 |
THE INFORMATION IN THIS STRUCTURAL AND COLLATERAL TERM SHEET IS NOT COMPLETE AND MAY BE AMENDED PRIOR TO THE TIME OF SALE. THIS TERM SHEET IS NOT AN OFFER TO SELL THESE SECURITIES AND IT IS NOT A SOLICITATION OF AN OFFER TO BUY THESE SECURITIES IN ANY JURISDICTION WHERE THE OFFER OR SALE IS NOT PERMITTED.
148