| FREE WRITING PROSPECTUS | ||
| FILED PURSUANT TO RULE 433 | ||
| REGISTRATION FILE NO.: 333-206677-08 | ||

Free Writing Prospectus
Structural and Collateral Term Sheet
$1,045,358,264
(Approximate Initial Pool Balance)
$918,608,000
(Approximate Aggregate Certificate Balance of Offered Certificates)
Wells Fargo Commercial Mortgage Trust 2016-LC24
as Issuing Entity
Wells Fargo Commercial Mortgage Securities, Inc.
as Depositor
Ladder Capital Finance LLC
Wells Fargo Bank, National Association
Rialto Mortgage Finance, LLC
National Cooperative Bank, N.A.
as Sponsors and Mortgage Loan Sellers
Commercial Mortgage Pass-Through Certificates
Series 2016-LC24
September 6, 2016
WELLS FARGO SECURITIES | ||
Lead Manager and Sole Bookrunner | ||
Academy Securities Co-Manager | Deutsche Bank Securities Co-Manager | |
STATEMENT REGARDING THIS FREE WRITING PROSPECTUS
The depositor has filed a registration statement (including a prospectus) with the Securities and Exchange Commission (‘‘SEC’’) (SEC File No. 333-206677) for the offering to which this communication relates. Before you invest, you should read the prospectus in the registration statement and other documents the depositor has filed with the SEC for more complete information about the depositor, the issuing entity and this offering. You may get these documents for free by visiting EDGAR on the SEC Web site at www.sec.gov. Alternatively, the depositor, any underwriter, or any dealer participating in the offering will arrange to send you the prospectus after filing if you request it by calling toll free 1-800-745-2063 (8 a.m. – 5 p.m. EST) or by emailing wfs.cmbs@wellsfargo.com.
Nothing in this document constitutes an offer of securities for sale in any jurisdiction where the offer or sale is not permitted. The information contained herein is preliminary as of the date hereof, supersedes any such information previously delivered to you and will be superseded by any such information subsequently delivered and ultimately by the final prospectus relating to the securities. These materials are subject to change, completion, supplement or amendment from time to time.
This free writing prospectus has been prepared by the underwriters for information purposes only and does not constitute, in whole or in part, a prospectus for the purposes of Directive 2003/71/EC (as amended) and/or Part VI of the Financial Services and Markets Act 2000, as amended, or other offering document.
STATEMENT REGARDING ASSUMPTIONS AS TO SECURITIES, PRICING ESTIMATES AND OTHER INFORMATION
The attached information contains certain tables and other statistical analyses (the “Computational Materials”) which have been prepared in reliance upon information furnished by the Mortgage Loan Sellers. Numerous assumptions were used in preparing the Computational Materials, which may or may not be reflected herein. As such, no assurance can be given as to the Computational Materials’ accuracy, appropriateness or completeness in any particular context; or as to whether the Computational Materials and/or the assumptions upon which they are based reflect present market conditions or future market performance. The Computational Materials should not be construed as either projections or predictions or as legal, tax, financial or accounting advice. You should consult your own counsel, accountant and other advisors as to the legal, tax, business, financial and related aspects of a purchase of these securities. Any weighted average lives, yields and principal payment periods shown in the Computational Materials are based on prepayment and/or loss assumptions, and changes in such prepayment and/or loss assumptions may dramatically affect such weighted average lives, yields and principal payment periods. In addition, it is possible that prepayments or losses on the underlying assets will occur at rates higher or lower than the rates shown in the attached Computational Materials. The specific characteristics of the securities may differ from those shown in the Computational Materials due to differences between the final underlying assets and the preliminary underlying assets used in preparing the Computational Materials. The principal amount and designation of any security described in the Computational Materials are subject to change prior to issuance. None of Wells Fargo Securities, LLC, Academy Securities, Inc., Deutsche Bank Securities Inc., or any of their respective affiliates, make any representation or warranty as to the actual rate or timing of payments or losses on any of the underlying assets or the payments or yield on the securities. The information in this presentation is based upon management forecasts and reflects prevailing conditions and management’s views as of this date, all of which are subject to change. In preparing this presentation, we have relied upon and assumed, without independent verification, the accuracy and completeness of all information available from public sources or which was provided to us by or on behalf of the Mortgage Loan Sellers or which was otherwise reviewed by us.
This free writing prospectus contains certain forward-looking statements. If and when included in this free writing prospectus, the words “expects”, “intends”, “anticipates”, “estimates” and analogous expressions and all statements that are not historical facts, including statements about our beliefs or expectations, are intended to identify forward-looking statements. Any forward-looking statements are made subject to risks and uncertainties which could cause actual results to differ materially from those stated. Those risks and uncertainties include, among other things, declines in general economic and business conditions, increased competition, changes in demographics, changes in political and social conditions, regulatory initiatives and changes in customer preferences, many of which are beyond our control and the control of any other person or entity related to this offering. The forward-looking statements made in this free writing prospectus are made as of the date stated on the cover. We have no obligation to update or revise any forward-looking statement.
Wells Fargo Securities is the trade name for the capital markets and investment banking services of Wells Fargo & Company and its subsidiaries, including but not limited to Wells Fargo Securities, LLC, a member of NYSE, FINRA, NFA and SIPC, Wells Fargo Prime Services, LLC, a member of FINRA, NFA and SIPC, and Wells Fargo Bank, N.A. Wells Fargo Securities, LLC and Wells Fargo Prime Services, LLC are distinct entities from affiliated banks and thrifts.
IMPORTANT NOTICE REGARDING THE OFFERED CERTIFICATES
The information herein is preliminary and may be supplemented or amended prior to the time of sale. In addition, the Offered Certificates referred to in these materials and the asset pool backing them are subject to modification or revision (including the possibility that one or more classes of certificates may be split, combined or eliminated at any time prior to issuance or availability of a final prospectus) and are offered on a “when, as and if issued” basis.
The underwriters described in these materials may from time to time perform investment banking services for, or solicit investment banking business from, any company named in these materials. The underwriters and/or their affiliates or respective employees may from time to time have a long or short position in any security or contract discussed in these materials.
The information contained herein supersedes any previous such information delivered to any prospective investor and will be superseded by information delivered to such prospective investor prior to the time of sale.
IMPORTANT NOTICE RELATING TO AUTOMATICALLY-GENERATED EMAIL DISCLAIMERS
Any legends, disclaimers or other notices that may appear at the bottom of any email communication to which this free writing prospectus is attached relating to (1) these materials not constituting an offer (or a solicitation of an offer), (2) any representation that these materials are accurate or complete and may not be updated or (3) these materials possibly being confidential, are not applicable to these materials and should be disregarded. Such legends, disclaimers or other notices have been automatically generated as a result of these materials having been sent via Bloomberg or another system.
THE INFORMATION IN THIS STRUCTURAL AND COLLATERAL TERM SHEET IS NOT COMPLETE AND MAY BE AMENDED PRIOR TO THE TIME OF SALE. THIS TERM SHEET IS NOT AN OFFER TO SELL THESE SECURITIES AND IT IS NOT A SOLICITATION OF AN OFFER TO BUY THESE SECURITIES IN ANY JURISDICTION WHERE THE OFFER OR SALE IS NOT PERMITTED.
2
| Wells Fargo Commercial Mortgage Trust 2016-LC24 | Certificate Structure |
I. Certificate Structure
| Class | Expected Ratings (Fitch/KBRA/Moody’s)(1) | Approximate Initial Certificate Balance or Notional Amount(2) |
Approx. Initial | Pass-Through Rate Description | Weighted Average Life (Years)(4) | Expected Principal Window(4) | Certificate Principal to Value Ratio(5) | Certificate Principal U/W NOI Debt Yield(6) | |||
| Offered Certificates | |||||||||||
| A-1 | AAAsf/AAA(sf)/Aaa(sf) | $41,394,000 | 30.000% | (7) | 2.22 | 10/16 – 10/20 | 43.7% | 16.8% | |||
| A-2 | AAAsf/AAA(sf)/Aaa(sf) | $55,655,000 | 30.000% | (7) | 4.50 | 10/20 – 07/21 | 43.7% | 16.8% | |||
| A-3 | AAAsf/AAA(sf)/Aaa(sf) | $275,000,000 | 30.000% | (7) | 9.65 | 12/25 – 07/26 | 43.7% | 16.8% | |||
| A-4 | AAAsf/AAA(sf)/Aaa(sf) | $290,568,000 | 30.000% | (7) | 9.84 | 07/26 – 08/26 | 43.7% | 16.8% | |||
| A-SB | AAAsf/AAA(sf)/Aaa(sf) | $69,133,000 | 30.000% | (7) | 7.08 | 07/21 – 12/25 | 43.7% | 16.8% | |||
| A-S | AAAsf/AAA(sf)/Aa2(sf) | $94,083,000 | 21.000% | (7) | 9.89 | 08/26 – 09/26 | 49.3% | 14.9% | |||
| X-A | AAAsf/AAA(sf)/Aaa(sf) | $731,750,000(8) | N/A | Variable(9) | N/A | N/A | N/A | N/A | |||
| X-B | A-sf/AAA(sf)/NR | $186,858,000(10) | N/A | Variable(11) | N/A | N/A | N/A | N/A | |||
| B | AA-sf/AA-(sf)/NR | $48,347,000 | 16.375% | (7) | 9.96 | 09/26 – 09/26 | 52.2% | 14.1% | |||
| C | A-sf/A-(sf)/NR | $44,428,000 | 12.125% | (7) | 9.96 | 09/26 – 09/26 | 54.8% | 13.4% | |||
| Non-Offered Certificates | |||||||||||
| X-D | BBB-sf/BBB-(sf)/NR | $49,655,000(12) | N/A | Variable(13) | N/A | N/A | N/A | N/A | |||
| X-EF | BB-sf/BB+(sf)/NR | $23,520,000(14) | N/A | Variable(15) | N/A | N/A | N/A | N/A | |||
| X-G | NR/BB-(sf)/NR | $10,454,000(16) | N/A | Variable(17) | N/A | N/A | N/A | N/A | |||
| X-H | NR/B-(sf)/NR | $10,453,000(18) | N/A | Variable(19) | N/A | N/A | N/A | N/A | |||
| X-I | NR/NR/NR | $32,668,263(20) | N/A | Variable(21) | N/A | N/A | N/A | N/A | |||
| D | BBB-sf/BBB-(sf)/NR | $49,655,000 | 7.375% | (7) | 9.96 | 09/26 – 09/26 | 57.8% | 12.7% | |||
| E | BB+sf/BBB-(sf)/NR | $13,067,000 | 6.125% | (7) | 9.96 | 09/26 – 09/26 | 58.6% | 12.6% | |||
| F | BB-sf/BB+(sf)/NR | $10,453,000 | 5.125% | (7) | 9.96 | 09/26 – 09/26 | 59.2% | 12.4% | |||
| G | NR/BB-(sf)/NR | $10,454,000 | 4.125% | (7) | 9.96 | 09/26 – 09/26 | 59.8% | 12.3% | |||
| H | NR/B-(sf)/NR | $10,453,000 | 3.125% | (7) | 9.96 | 09/26 – 09/26 | 60.4% | 12.2% | |||
| I | NR/NR/NR | $32,668,263 | 0.000% | (7) | 9.96 | 09/26 – 09/26 | 62.4% | 11.8% | |||
| Notes: | |||||||||||
| (1) | The expected ratings presented are those of Fitch Ratings, Inc. (“Fitch”), Kroll Bond Rating Agency, Inc. (“KBRA”) and Moody’s Investors Service, Inc. (“Moody’s”) which the depositor hired to rate the offered certificates. One or more other nationally recognized statistical rating organizations that were not hired by the depositor may use information they receive pursuant to Rule 17g-5 under the Securities Exchange Act of 1934, as amended (the “Exchange Act”) or otherwise, to rate or provide market reports and/or published commentary related to the offered certificates. We cannot assure you as to what ratings a non-hired nationally recognized statistical rating organization would assign or that its reports will not express differing, possibly negative, views of the mortgage loans and/or the offered certificates. The ratings of each class of offered certificates address the likelihood of the timely distribution of interest and, except in the case of the Class X-A and X-B Certificates, the ultimate distribution of principal due on those classes on or before the Rated Final Distribution Date. See “Risk Factors—Other Risks Relating to the Certificates—Nationally Recognized Statistical Rating Organizations May Assign Different Ratings to the Certificates; Ratings of the Certificates Reflect Only the Views of the Applicable Rating Agencies as of the Dates Such Ratings Were Issued; Ratings May Affect ERISA Eligibility; Ratings May Be Downgraded” and “Ratings” in the Preliminary Prospectus, expected to be dated September 6, 2016 (the “Preliminary Prospectus”). Fitch, KBRA and Moody’s have informed us that the “sf” designation in their ratings represents an identifier for structured finance product ratings. | ||||||||||
| (2) | The certificate balances and notional amounts set forth in the table are approximate. The actual initial certificate balances and notional amounts may be larger or smaller depending on the initial pool balance of the mortgage loans definitively included in the pool of mortgage loans, which aggregate cut-off date balance may be as much as 5% larger or smaller than the amount presented in the Preliminary Prospectus. | ||||||||||
| (3) | The approximate initial credit support with respect to the Class A-1, A-2, A-3, A-4 and A-SB Certificates represents the approximate credit enhancement for the Class A-1, A-2, A-3, A-4 and A-SB Certificates in the aggregate. | ||||||||||
| (4) | Weighted Average Lives and Expected Principal Windows are calculated based on an assumed prepayment rate of 0% CPR and the “Structuring Assumptions” described under “Yield and Maturity Considerations—Weighted Average Life” in the Preliminary Prospectus. | ||||||||||
| (5) | The Certificate Principal to Value Ratio for each Class of Certificates (other than the Class A-1, A-2, A-3, A-4 and A-SB Certificates) is calculated as the product of (a) the weighted average Cut-off Date LTV Ratio for the mortgage loans and (b) a fraction, the numerator of which is the total initial Certificate Balance of such Class of Certificates and all Classes of Principal Balance Certificates senior to such Class of Certificates and the denominator of which is the total initial Certificate Balance of all of the Principal Balance Certificates. The Certificate Principal to Value Ratio for each of the Class A-1, A-2, A-3, A-4 and A-SB Certificates is calculated in the aggregate for those Classes as if they were a single Class and is calculated as the product of (a) the weighted average Cut-off Date LTV Ratio for the mortgage loans and (b) a fraction, the numerator of which is the total initial aggregate Certificate Balances of such Classes of Certificates and the denominator of which is the total initial Certificate Balance of all of the Principal Balance Certificates. In any event, however, excess mortgaged property value associated with a mortgage loan will not be available to offset losses on any other mortgage loan. | ||||||||||
| (6) | The Certificate Principal U/W NOI Debt Yield for each Class of Certificates (other than the Class A-1, A-2, A-3, A-4 and A-SB Certificates) is calculated as the product of (a) the weighted average U/W NOI Debt Yield for the mortgage loans and (b) a fraction, the numerator of which is the total initial Certificate Balance of all of the Classes of Principal Balance Certificates and the denominator of which is the total initial Certificate Balance for such Class of Certificates and all Classes of Principal Balance Certificates senior to such Class of Certificates. The Certificate Principal U/W NOI Debt Yield for each of the Class A-1, A-2, A-3, A-4 and A-SB Certificates is calculated in the aggregate for those Classes as if they were a single Class and is calculated as the product of (a) the weighted average U/W NOI Debt Yield for the mortgage loans and (b) a fraction, the numerator of which is the total initial Certificate Balance of all of the Classes of Principal Balance Certificates and the denominator of which is the total aggregate initial Certificate Balances for the Class A-1, A-2, A-3, A-4 and A-SB Certificates. In any event, however, cash flow from each mortgaged property supports only the related mortgage loan and will not be available to support any other mortgage loan. | ||||||||||
THE INFORMATION IN THIS STRUCTURAL AND COLLATERAL TERM SHEET IS NOT COMPLETE AND MAY BE AMENDED PRIOR TO THE TIME OF SALE. THIS TERM SHEET IS NOT AN OFFER TO SELL THESE SECURITIES AND IT IS NOT A SOLICITATION OF AN OFFER TO BUY THESE SECURITIES IN ANY JURISDICTION WHERE THE OFFER OR SALE IS NOT PERMITTED.
3
| Wells Fargo Commercial Mortgage Trust 2016-LC24 | Certificate Structure |
| (7) | The pass-through rates for the Class A-1, A-2, A-3, A-4, A-SB, A-S, B, C, D, E, F, G, H and I Certificates in each case will be one of the following: (i) a fixed rateper annum, (ii) a variable rate per annum equal to the weighted average of the net mortgage interest rates on the mortgage loans for the related distribution date, (iii) a variable rateper annum equal to the lesser of (a) a fixed rate and (b) the weighted average of the net mortgage interest rates on the mortgage loans for the related distribution date or (iv) a variable rateper annum equal to the weighted average of the net mortgage interest rates on the mortgage loans for the related distribution date minus a specified percentage. For purposes of the calculation of the weighted average of the net mortgage interest rates on the mortgage loans for each distribution date, the mortgage interest rates will be adjusted as necessary to a 30/360 basis. |
| (8) | The Class X-A Certificates are notional amount certificates. The Notional Amount of the Class X-A Certificates will be equal to the aggregate Certificate Balance of the Class A-1, A-2, A-3, A-4 and A-SB Certificates outstanding from time to time. The Class X-A Certificates will not be entitled to distributions of principal. |
| (9) | The pass-through rate for the Class X-A Certificates for any distribution date will be aper annum rate equal to the excess, if any, of (a) the weighted average of the net mortgage interest rates on the mortgage loans for the related distribution date, over (b) the weighted average of the pass-through rates on the Class A-1, A-2, A-3, A-4 and A-SB Certificates for the related distribution date, weighted on the basis of their respective Certificate Balances outstanding immediately prior to that distribution date. For purposes of the calculation of the weighted average of the net mortgage interest rates on the mortgage loans for each distribution date, the mortgage interest rates will be adjusted as necessary to a 30/360 basis. |
| (10) | The Class X-B Certificates are notional amount certificates. The Notional Amount of the Class X-B Certificates will be equal to the aggregate Certificate Balance of the Class A-S, B and C Certificates outstanding from time to time. The Class X-B Certificates will not be entitled to distributions of principal. |
| (11) | The pass-through rate for the Class X-B Certificates for any distribution date will be aper annum rate equal to the excess, if any, of (a) the weighted average of the net mortgage interest rates on the mortgage loans for the related distribution date, over (b) the weighted average of the pass-through rates on the Class A-S, B and C Certificates for the related distribution date, weighted on the basis of their respective Certificate Balances outstanding immediately prior to that distribution date. For purposes of the calculation of the weighted average of the net mortgage interest rates on the mortgage loans for each distribution date, the mortgage interest rates will be adjusted as necessary to a 30/360 basis. |
| (12) | The Class X-D Certificates are notional amount certificates. The Notional Amount of the Class X-D Certificates will be equal to the Certificate Balance of the Class D Certificates outstanding from time to time. The Class X-D Certificates will not be entitled to distributions of principal. |
| (13) | The pass-through rate for the Class X-D Certificates for any distribution date will be a per annum rate equal to the excess, if any, of (a) the weighted average of the net mortgage interest rates on the mortgage loans for the related distribution date, over (b) the pass-through rate on the Class D Certificates for the related distribution date. For purposes of the calculation of the weighted average of the net mortgage interest rates on the mortgage loans for each distribution date, the mortgage interest rates will be adjusted as necessary to a 30/360 basis. |
| (14) | The Class X-EF Certificates are notional amount certificates. The Notional Amount of the Class X-EF Certificates will be equal to the aggregate Certificate Balance of the Class E and F Certificates outstanding from time to time. The Class X-EF Certificates will not be entitled to distributions of principal. |
| (15) | The pass-through rate for the Class X-EF Certificates for any distribution date will be aper annum rate equal to the excess, if any, of (a) the weighted average of the net mortgage interest rates on the mortgage loans for the related distribution date, over (b) the weighted average of the pass-through rates on the Class E and F Certificates for the related distribution date, weighted on the basis of their respective Certificate Balances outstanding immediately prior to that distribution date. For purposes of the calculation of the weighted average of the net mortgage interest rates on the mortgage loans for each distribution date, the mortgage interest rates will be adjusted as necessary to a 30/360 basis. |
| (16) | The Class X-G Certificates are notional amount certificates. The Notional Amount of the Class X-G Certificates will be equal to the Certificate Balance of the Class G Certificates outstanding from time to time. The Class X-G Certificates will not be entitled to distributions of principal. |
| (17) | The pass-through rate for the Class X-G Certificates for any distribution date will be aper annum rate equal to the excess, if any, of (a) the weighted average of the net mortgage interest rates on the mortgage loans for the related distribution date, over (b) the pass-through rate on the Class G Certificates for the related distribution date. For purposes of the calculation of the weighted average of the net mortgage interest rates on the mortgage loans for each distribution date, the mortgage interest rates will be adjusted as necessary to a 30/360 basis. |
| (18) | The Class X-H Certificates are notional amount certificates. The Notional Amount of the Class X-H Certificates will be equal to the Certificate Balance of the Class H Certificates outstanding from time to time. The Class X-H Certificates will not be entitled to distributions of principal. |
| (19) | The pass-through rate for the Class X-H Certificates for any distribution date will be aper annum rate equal to the excess, if any, of (a) the weighted average of the net mortgage interest rates on the mortgage loans for the related distribution date, over (b) the pass-through rate on the Class H Certificates for the related distribution date. For purposes of the calculation of the weighted average of the net mortgage interest rates on the mortgage loans for each distribution date, the mortgage interest rates will be adjusted as necessary to a 30/360 basis. |
| (20) | The Class X-I Certificates are notional amount certificates. The Notional Amount of the Class X-I Certificates will be equal to the Certificate Balance of the Class I Certificates outstanding from time to time. The Class X-I Certificates will not be entitled to distributions of principal. |
| (21) | The pass-through rate for the Class X-I Certificates for any distribution date will be aper annum rate equal to the excess, if any, of (a) the weighted average of the net mortgage interest rates on the mortgage loans for the related distribution date, over (b) the pass-through rate on the Class I Certificates for the related distribution date. For purposes of the calculation of the weighted average of the net mortgage interest rates on the mortgage loans for each distribution date, the mortgage interest rates will be adjusted as necessary to a 30/360 basis. |
THE INFORMATION IN THIS STRUCTURAL AND COLLATERAL TERM SHEET IS NOT COMPLETE AND MAY BE AMENDED PRIOR TO THE TIME OF SALE. THIS TERM SHEET IS NOT AN OFFER TO SELL THESE SECURITIES AND IT IS NOT A SOLICITATION OF AN OFFER TO BUY THESE SECURITIES IN ANY JURISDICTION WHERE THE OFFER OR SALE IS NOT PERMITTED.
4
| Wells Fargo Commercial Mortgage Trust 2016-LC24 | Transaction Highlights |
II. Transaction Highlights
Mortgage Loan Sellers:
| Mortgage Loan Seller | Number of Mortgage Loans | Number of Mortgaged Properties | Aggregate Cut-off Date Balance | % of Initial Pool Balance | ||||
| Ladder Capital Finance LLC(1) | 33 | 69 | $414,901,931 | 39.7% | ||||
| Wells Fargo Bank, National Association(2) | 22 | 23 | 361,466,899 | 34.6 | ||||
| Rialto Mortgage Finance, LLC | 21 | 21 | 200,236,091 | 19.2 | ||||
| National Cooperative Bank, N.A. | 15 | 15 | 68,753,344 | 6.6 | ||||
| Total | 91 | 128 | $1,045,358,264 | 100.0% |
| (1) | One mortgage loan secured by the portfolio of mortgaged properties identified on Annex A-1 to the Preliminary Prospectus as Equity Inns Portfolio, representing approximately 0.9% of the aggregate principal balance of the pool of mortgage loans as of the cut-off date, is part of a whole loan that was co-originated by Ladder Capital Finance LLC and German American Capital Corporation (“GACC”). In addition, one other mortgage loan as to which Ladder Capital Finance LLC is the mortgage loan seller was originated by Ladder Capital Finance I LLC and will be transferred to Ladder Capital Finance LLC on or before the closing date for this securitization transaction. |
| (2) | One mortgage loan identified on Annex A-1 to the Preliminary Prospectus as The Shops at Crystals, representing approximately 3.3% of the aggregate principal balance of the pool of mortgage loans as of the cut-off date, is part of a whole loan that was co-originated by Wells Fargo Bank, National Association, Bank of America, National Association (“BANA”) and JPMorgan Chase Bank, National Association (“JPMCB”). |
Loan Pool:
| Initial Pool Balance: | $1,045,358,264 |
| Number of Mortgage Loans: | 91 |
| Average Cut-off Date Balance per Mortgage Loan: | $11,487,453 |
| Number of Mortgaged Properties: | 128 |
| Average Cut-off Date Balance per Mortgaged Property(1): | $8,166,861 |
| Weighted Average Mortgage Interest Rate: | 4.486% |
| Ten Largest Mortgage Loans as % of Initial Pool Balance: | 38.0% |
| Weighted Average Original Term to Maturity or ARD (months): | 117 |
| Weighted Average Remaining Term to Maturity or ARD (months): | 116 |
| Weighted Average Original Amortization Term (months)(2): | 359 |
| Weighted Average Remaining Amortization Term (months)(2): | 358 |
| Weighted Average Seasoning (months): | 2 |
| (1) | Information regarding mortgage loans secured by multiple properties is based on an allocation according to relative appraised values or the allocated loan amounts or property-specific release prices set forth in the related loan documents or such other allocation as the related mortgage loan seller deemed appropriate. |
| (2) | Excludes any mortgage loan that does not amortize. |
Credit Statistics:
| Weighted Average U/W Net Cash Flow DSCR(1): | 2.00x |
| Weighted Average U/W Net Operating Income Debt Yield(1): | 11.8% |
| Weighted Average Cut-off Date Loan-to-Value Ratio(1): | 62.4% |
| Weighted Average Balloon or ARD Loan-to-Value Ratio(1): | 54.3% |
| % of Mortgage Loans with Additional Subordinate Debt(2): | 9.8% |
| % of Mortgage Loans with Single Tenants(3): | 6.6% |
| (1) | With respect to any mortgage loan that is part of a whole loan, loan-to-value ratio, debt service coverage ratio and debt yield calculations include the relatedpari passucompanion loan(s) but exclude any related subordinate companion loan(s) (unless otherwise stated). For mortgaged properties securing residential cooperative mortgage loans, the debt service coverage ratio or debt yield for each such mortgaged property is calculated using underwritten net cash flow for the related residential cooperative property which is the projected net cash flow reflected in the most recent appraisal obtained by or otherwise in the possession of the related mortgage loan seller as of the cut-off date, and the loan-to-value ratio is calculated based upon the appraised value of the residential cooperative property determined as if such residential cooperative property is operated as a residential cooperative. The debt service coverage ratio, debt yield and loan-to-value ratio information do not take into account any subordinate debt (whether or not secured by the related mortgaged property), that currently exists or is allowed under the terms of any mortgage loan. The information for each mortgaged property that relates to a mortgage loan that is cross-collateralized or cross-defaulted with one or more other mortgage loans is based upon the principal balance of that mortgage loan, except that the applicable loan-to-value ratio, debt service coverage ratio, and debt yield for each such mortgage loan is based upon the ratio or yield (as applicable) for the aggregate indebtedness evidenced by all loans in the group (without regard to any limitation on the amount of indebtedness secured by any mortgaged property in such cross-collateralized group). On an individual basis, without regard to the cross-collateralization feature, any mortgage loan that is part of a cross-collateralized group of mortgage loans may have a higher loan-to-value ratio, lower debt service coverage ratio and/or lower debt yield than is presented herein. See “Description of the Mortgage Pool—Mortgage Pool Characteristics” in the Preliminary Prospectus and Annex A-1 to the Preliminary Prospectus. |
| (2) | Eleven (11) of the mortgage loans, each of which is secured by a residential cooperative property, currently have in place subordinate secured lines of credit to the related mortgage borrowers that permit future advances (such loans, collectively, the “Subordinate Coop LOCs”). The percentage figure expressed as “% of Mortgage Loans with Additional Subordinate Debt” is determined as a percentage of the initial pool balance and does not take into account any future subordinate debt (whether or not secured by the mortgaged property), if any, that may be permitted under the terms of any mortgage loan or the pooling and servicing agreement. See “Description of the Mortgage Pool—Additional Indebtedness—Other Unsecured Indebtedness” and “Description of the Mortgage Pool—Additional Debt Financing for Mortgage Loans Secured by Residential Cooperatives” in the Preliminary Prospectus. |
| (3) | Excludes mortgage loans that are secured by multiple single tenant properties. |
THE INFORMATION IN THIS STRUCTURAL AND COLLATERAL TERM SHEET IS NOT COMPLETE AND MAY BE AMENDED PRIOR TO THE TIME OF SALE. THIS TERM SHEET IS NOT AN OFFER TO SELL THESE SECURITIES AND IT IS NOT A SOLICITATION OF AN OFFER TO BUY THESE SECURITIES IN ANY JURISDICTION WHERE THE OFFER OR SALE IS NOT PERMITTED.
5
| Wells Fargo Commercial Mortgage Trust 2016-LC24 | Transaction Highlights |
Loan Structural Features:
Amortization:Based on the Initial Pool Balance, 77.5% of the mortgage pool (75 mortgage loans) has scheduled amortization, as follows:
43.0% (49 mortgage loans) requires amortization during the entire loan term; and
34.5% (26 mortgage loans) provides for an interest-only period followed by an amortization period.
Interest-Only:Based on the Initial Pool Balance, 22.5% of the mortgage pool (16 mortgage loans) provides for interest-only payments during the entire loan term. The Weighted Average Cut-off Date Loan-to-Value Ratio and Weighted Average U/W Net Cash Flow DSCR for those mortgage loans are 56.2% and 2.26x, respectively.
Hard Lockboxes: Based on the Initial Pool Balance, 35.3% of the mortgage pool (25 mortgage loans) have hard lockboxes in place.
Reserves:The mortgage loans require amounts to be escrowed monthly as follows (excluding any mortgage loans with springing provisions):
| Real Estate Taxes: | 83.2% of the pool |
| Insurance: | 49.3% of the pool |
| Capital Replacements: | 69.0% of the pool |
| TI/LC: | 67.2% of the pool(1) |
| (1) | The percentage of Initial Pool Balance for mortgage loans with TI/LC reserves is based on the aggregate principal balance allocable to loans that include retail, office, mixed use and industrial properties. |
Call Protection/Defeasance: Based on the Initial Pool Balance, the mortgage pool has the following call protection and defeasance features:
66.6% of the mortgage pool (56 mortgage loans) features a lockout period, then defeasance only until an open period;
22.3% of the mortgage pool (13 mortgage loans) features a lockout period, then the greater of a prepayment premium or yield maintenance until an open period;
6.2% of the mortgage pool (14 mortgage loans) features no lockout period, but requires the greater of a prepayment premium or yield maintenance, then a prepayment premium until an open period;
2.8% of the mortgage pool (six mortgage loans) features no lockout period, but requires yield maintenance, then defeasance or yield maintenance until an open period;
1.2% of the mortgage pool (one mortgage loan) features a lockout period, then defeasance or the greater of a prepayment premium or yield maintenance until an open period; and
1.0% of the mortgage pool (one mortgage loan) features no lockout period, but requires the greater of a prepayment premium or yield maintenance until an open period.
Please refer to Annex A-1 and the footnotes related thereto to the Preliminary Prospectus for further information regarding individual loan call protection.
THE INFORMATION IN THIS STRUCTURAL AND COLLATERAL TERM SHEET IS NOT COMPLETE AND MAY BE AMENDED PRIOR TO THE TIME OF SALE. THIS TERM SHEET IS NOT AN OFFER TO SELL THESE SECURITIES AND IT IS NOT A SOLICITATION OF AN OFFER TO BUY THESE SECURITIES IN ANY JURISDICTION WHERE THE OFFER OR SALE IS NOT PERMITTED.
6
| Wells Fargo Commercial Mortgage Trust 2016-LC24 | Issue Characteristics |
| III. | Issue Characteristics |
| Securities Offered: | $918,608,000 approximate monthly pay, multi-class, commercial mortgage REMIC pass-through certificates consisting of ten classes (Classes A-1, A-2, A-3, A-4, A-SB, A-S, B, C, X-A and X-B), which are offered pursuant to a registration statement filed with the SEC (such classes of certificates, the “Offered Certificates”). |
| Mortgage Loan Sellers: | Ladder Capital Finance LLC (“LCF”), Wells Fargo Bank, National Association (“WFB”), Rialto Mortgage Finance, LLC (“RMF”) and National Cooperative Bank, N.A. (“NCB”). |
| Sole Lead Bookrunning Manager: | Wells Fargo Securities, LLC |
| Co-Managers: | Academy Securities, Inc. and Deutsche Bank Securities Inc. |
| Rating Agencies: | Fitch Ratings, Inc., Kroll Bond Rating Agency, Inc. and Moody’s Investors Service, Inc. |
| Master Servicers: | Wells Fargo Bank, National Association and National Cooperative Bank, N.A. |
| Special Servicers: | Midland Loan Services, a Division of PNC Bank, National Association and National Cooperative Bank, N.A. |
| Certificate Administrator: | Wells Fargo Bank, National Association |
| Trustee: | Wilmington Trust, National Association |
| Operating Advisor: | Trimont Real Estate Advisors, LLC |
| Asset Representations Reviewer: | Trimont Real Estate Advisors, LLC |
| Initial Majority Controlling Class Certificateholder: | Prime Finance CMBS B-Piece Holdco IV, L.P. |
| Cut-off Date: | The Cut-off Date with respect to each mortgage loan is the due date for the monthly debt service payment that is due in September 2016 (or, in the case of any mortgage loan that has its first due date in October 2016, the date that would have been its due date in September 2016 under the terms of that mortgage loan if a monthly debt service payment were scheduled to be due in that month). |
| Expected Closing Date: | On or about September 29, 2016. |
| Determination Dates: | The 11th day of each month (or if that day is not a business day, the next succeeding business day), commencing in October 2016. |
| Distribution Dates: | The fourth business day following the Determination Date in each month, commencing in October 2016. |
| Rated Final Distribution Date: | The Distribution Date in October 2049. |
| Interest Accrual Period: | With respect to any Distribution Date, the calendar month immediately preceding the month in which such Distribution Date occurs. |
| Day Count: | The Offered Certificates will accrue interest on a 30/360 basis. |
| Minimum Denominations: | $10,000 for each Class of Offered Certificates (other than the Class X-A and X-B Certificates) and $1,000,000 for the Class X-A and X-B Certificates. Investments may also be made in any whole dollar denomination in excess of the applicable minimum denomination. |
| Clean-up Call: | On each Distribution Date occurring after the aggregate unpaid principal balance of the pool of mortgage loans is less than (or, in the case of clause (ii) below, less than or equal to) the greater of (i) 1.0% of the principal balance of the mortgage loans as of the cut-off date, or (ii) if the FMC Corporation R&D HQ Mortgage Loan or the Walgreens Youngstown Mortgage Loan are assets of the trust fund, the sum of the outstanding principal balance of the FMC Corporation R&D HQ Mortgage Loan and/or the Walgreens Youngstown Mortgage Loan on any date of determination and 1.0% of the principal balance of the mortgage loans as of the cut-off date, however, this termination right will not be exercisable at the percentage threshold specified in clause (ii) above earlier than the distribution date in October 2026. |
| Delivery: | DTC, Euroclear and Clearstream Banking |
| ERISA/SMMEA Status: | Each Class of Offered Certificates is expected to be eligible for exemptive relief under ERISA. No Class of Offered Certificates will be SMMEA eligible. |
THE INFORMATION IN THIS STRUCTURAL AND COLLATERAL TERM SHEET IS NOT COMPLETE AND MAY BE AMENDED PRIOR TO THE TIME OF SALE. THIS TERM SHEET IS NOT AN OFFER TO SELL THESE SECURITIES AND IT IS NOT A SOLICITATION OF AN OFFER TO BUY THESE SECURITIES IN ANY JURISDICTION WHERE THE OFFER OR SALE IS NOT PERMITTED.
7
| Wells Fargo Commercial Mortgage Trust 2016-LC24 | Issue Characteristics |
| Risk Factors: | THE CERTIFICATES INVOLVE CERTAIN RISKS AND MAY NOT BE SUITABLE FOR ALL INVESTORS. SEE THE “RISK FACTORS” SECTION OF THE PRELIMINARY PROSPECTUS. |
| Bond Analytics Information: | The Certificate Administrator will be authorized to make distribution date statements, CREFC® reports and certain supplemental reports (other than confidential information) available to certain financial modeling and data provision services, including Bloomberg, L.P., Trepp, LLC, Intex Solutions, Inc., Markit Group Limited, Interactive Data Corp., BlackRock Financial Management, Inc., CMBS.com, Inc. and Thomson Reuters Corporation. |
THE INFORMATION IN THIS STRUCTURAL AND COLLATERAL TERM SHEET IS NOT COMPLETE AND MAY BE AMENDED PRIOR TO THE TIME OF SALE. THIS TERM SHEET IS NOT AN OFFER TO SELL THESE SECURITIES AND IT IS NOT A SOLICITATION OF AN OFFER TO BUY THESE SECURITIES IN ANY JURISDICTION WHERE THE OFFER OR SALE IS NOT PERMITTED.
8
| Wells Fargo Commercial Mortgage Trust 2016-LC24 | Characteristics of the Mortgage Pool |
IV. Characteristics of the Mortgage Pool(1)
A. Ten Largest Mortgage Loans
| Mortgage Loan Seller | Mortgage Loan Name | City | State | Number of Mortgage Loans / Mortgaged Properties | Mortgage Loan Cut-off Date Balance ($) | % of Initial Pool Balance (%) | Property Type | Number of SF / Pads / Rooms / Units | Cut-off Date Balance Per SF / Pad /Room/ Unit | Cut-off Date LTV Ratio (%) | Balloon or ARD LTV Ratio (%) | U/W NCF DSCR (x) | U/W NOI Debt Yield (%) |
| WFB | Central Park Retail | Fredericksburg | VA | 1 / 1 | $70,000,000 | 6.7% | Retail | 441,907 | $204 | 74.4% | 59.9% | 1.32x | 8.6% |
| LCF | Green Valley Portfolio | Various | Various | 1 / 7 | 58,750,000 | 5.6 | Manufactured Housing Community | 2,042 | 28,771 | 71.9 | 60.0 | 1.34 | 8.4 |
| WFB | Four Points by Sheraton Times Square – Leased Fee | New York | NY | 1 / 1 | 46,700,000 | 4.5 | Other | 4,938 | 9,457 | 75.3 | 75.3 | 1.25 | 5.6 |
| LCF | 1140 Avenue of the Americas | New York | NY | 1 / 1 | 45,000,000 | 4.3 | Office | 247,183 | 401 | 55.0 | 55.0 | 2.16 | 9.6 |
| LCF | One Meridian | Wyomissing | PA | 1 / 1 | 37,000,000 | 3.5 | Office | 366,728 | 101 | 67.6 | 62.1 | 1.61 | 11.6 |
| WFB | The Shops at Crystals | Las Vegas | NV | 1 / 1 | 35,000,000 | 3.3 | Retail | 262,327 | 1,459 | 34.8 | 34.8 | 3.28 | 12.9 |
| WFB | Pinnacle II | Burbank | CA | 1 / 1 | 27,000,000 | 2.6 | Office | 230,000 | 378 | 61.3 | 61.3 | 1.96 | 9.2 |
| WFB | Hyatt House Fairfax | Fairfax | VA | 1 / 1 | 26,935,947 | 2.6 | Hospitality | 148 | 182,000 | 66.5 | 54.0 | 1.72 | 11.6 |
| LCF | Skyline Village | Inver Grove Heights | MN | 1 / 1 | 25,725,000 | 2.5 | Manufactured Housing Community | 399 | 64,474 | 72.8 | 61.3 | 1.26 | 7.7 |
| RMF | Seasons at Horsetooth Apartments | Fort Collins | CO | 1 / 1 | 24,700,000 | 2.4 | Multifamily | 208 | 118,750 | 49.4 | 49.4 | 2.50 | 11.0 |
| Top Three Total/Weighted Average | 3 / 9 | $175,450,000 | 16.8% | 73.8% | 64.0% | 1.31x | 7.7% | ||||||
| Top Five Total/Weighted Average | 5 / 11 | $257,450,000 | 24.6% | 69.6% | 62.2% | 1.50x | 8.6% | ||||||
| Top Ten Total/Weighted Average | 10 / 16 | $396,810,947 | 38.0% | 64.7% | 58.3% | 1.75x | 9.3% | ||||||
| Non-Top Ten Total/Weighted Average | 81 / 112 | $648,547,317 | 62.0% | 61.0% | 51.9% | 2.15x | 13.3% | ||||||
| (1) | With respect to any mortgage loan that is part of a whole loan, Cut-off Date Balance Per SF/Pad/Room/Unit, loan-to-value ratio, debt service coverage ratio and debt yield calculations include the relatedpari passu companion loan(s) but exclude any related subordinate companion loan(s) (unless otherwise stated). With respect to each mortgage loan, debt service coverage ratio, debt yield and loan-to-value ratio information do not take into account of subordinate debt (whether or not secured by the related mortgaged property), if any, that currently exists or is allowed under the terms of such mortgage loan. The information for each mortgaged property that relates to a mortgage loan that is cross-collateralized or cross-defaulted with other mortgage loans is based upon the principal balance of that mortgage loan, except that the applicable loan-to-value ratio, debt service coverage ratio and debt yield for each such mortgage loan is based upon the ratio or yield (as applicable) for the aggregate indebtedness evidenced by all loans in the group (without regard to any limitation on the amount of indebtedness secured by any mortgaged property in such cross-collateralized group) ). On an individual basis, without regard to the cross-collateralization feature, any mortgage loan that is part of a cross-collateralized group of mortgage loans may have a higher loan-to-value ratio, lower debt service coverage ratio and/or lower debt yield than is presented herein. |
THE INFORMATION IN THIS STRUCTURAL AND COLLATERAL TERM SHEET IS NOT COMPLETE AND MAY BE AMENDED PRIOR TO THE TIME OF SALE. THIS TERM SHEET IS NOT AN OFFER TO SELL THESE SECURITIES AND IT IS NOT A SOLICITATION OF AN OFFER TO BUY THESE SECURITIES IN ANY JURISDICTION WHERE THE OFFER OR SALE IS NOT PERMITTED.
9
| Wells Fargo Commercial Mortgage Trust 2016-LC24 | Characteristics of the Mortgage Pool |
B. Summary of thePari PassuWhole Loans
| Property Name | Mortgage Loan Seller | Note(s) | Related Notes in Loan Group (Original Balance) | Holder of Note | Lead Servicer for Whole loan | Current Master Servicer Under Related Securitization Servicing Agreement | Current Special Servicer Under Related Securitization Servicing Agreement |
| Central Park Retail | WFB | A-1 | $70,000,000 | WFCM 2016-LC24 | Yes | Wells Fargo Bank, National Association | Midland Loan Services, a Division of PNC Bank, National Association |
| WFB | A-2 | $20,000,000 | (1) | No | TBD | TBD | |
| 1140 Avenue of the Americas | LCF | A-1 & A-2 | $54,000,000 | (2) | Yes(3) | TBD | TBD |
| LCF | A-3 & A-4 | $45,000,000 | WFCM 2016-LC24 | No(3) | Wells Fargo Bank, National Association | Midland Loan Services, a Division of PNC Bank, National Association | |
| The Shops at Crystals(4) | JPMCB/BANA/WFB | (5) | $132,700,000 | SHOPS 2016-CSTL | Yes | KeyBank National Association | Aegon USA Realty Advisors, LLC |
| WFB/BANA | (6) | $80,000,000 | WFCM 2016-BNK1 | No | Wells Fargo Bank, National Association | Rialto Capital Advisors, LLC | |
| JPMCB | A-1-B-1 & B-1-B-1 | $50,000,000 | JPMCC 2016-JP2 | No | Wells Fargo Bank, National Association | LNR Partners, LLC | |
| JPMCB | A-1-B-2 & B-1-B-2 | $50,000,000 | DBJPM 2016-C3 | No | Midland Loan Services, a Division of PNC Bank, National Association | Midland Loan Services, a Division of PNC Bank, National Association | |
| BANA | A-2-B-1 & B-2-B-1 | $35,000,000 | (7) | No | TBD | TBD | |
| WFB | A-3-B-1 & B-3-B-1 | $35,000,000 | WFCM 2016-LC24 | No | Wells Fargo Bank, National Association | Midland Loan Services, a Division of PNC Bank, National Association | |
| Pinnacle II | WFB | A-1 | $40,000,000 | WFCM 2016-BNK1 | Yes | Wells Fargo Bank, National Association | Rialto Capital Advisors, LLC |
| WFB | A-2 | $20,000,000 | WFCM 2016-C35 | No | Wells Fargo Bank, National Association | CWCapital Asset Management LLC | |
| WFB | A-3 | $27,000,000 | WFCM 2016-LC24 | No | Wells Fargo Bank, National Association | Midland Loan Services, a Division of PNC Bank, National Association | |
| One & Two Corporate Plaza | RMF | A-1 | $20,000,000 | WFCM 2016-LC24 | Yes | Wells Fargo Bank, National Association | Midland Loan Services, a Division of PNC Bank, National Association |
| RMF | A-2 | $7,000,000 | (8) | No | TBD | TBD | |
| Aspen at Norman Student Housing | LCF | A-1 | $22,000,000 | (9) | Yes(10) | TBD | TBD |
| LCF | A-2 | $16,600,000 | WFCM 2016-LC24 | No(10) | Wells Fargo Bank, National Association | Midland Loan Services, a Division of PNC Bank, National Association | |
| Equity Inns Portfolio | LCF/GACC | A-1-A & A-4-A | $80,000,000 | COMM 2015-LC23 | Yes | Wells Fargo Bank, National Association | LNR Partners, LLC |
| LCF/GACC | A-2-A1 & A-5A | $40,000,000 | COMM 2016-CCRE28 | No | Wells Fargo Bank, National Association | Midland Loan Services, a Division of PNC Bank, National Association | |
| GACC | A-4-B, A-5-B & A-6 | $44,800,000 | JPMDB 2016-C2 | No | Wells Fargo Bank, National Association | Midland Loan Services, a Division of PNC Bank, National Association | |
| LCF | A-2-B | $9,600,000 | WFCM 2016-LC24 | No | Wells Fargo Bank, National Association | Midland Loan Services, a Division of PNC Bank, National Association | |
| LCF | A-1-B, A-2-A2 & A-3 | $57,600,000 | (11) | No | TBD | TBD | |
| Hilton Garden Inn Athens Downtown | RMF | A-1 | $12,950,000 | CGCMT 2016-C2 | Yes | Midland Loan Services, a Division of PNC Bank, National Association | C-III Asset Management LLC |
| RMF | A-2 | $7,000,000 | WFCM 2016-LC24 | No | Wells Fargo Bank, National Association | Midland Loan Services, a Division of PNC Bank, National Association |
THE INFORMATION IN THIS STRUCTURAL AND COLLATERAL TERM SHEET IS NOT COMPLETE AND MAY BE AMENDED PRIOR TO THE TIME OF SALE. THIS TERM SHEET IS NOT AN OFFER TO SELL THESE SECURITIES AND IT IS NOT A SOLICITATION OF AN OFFER TO BUY THESE SECURITIES IN ANY JURISDICTION WHERE THE OFFER OR SALE IS NOT PERMITTED.
10
| Wells Fargo Commercial Mortgage Trust 2016-LC24 | Characteristics of the Mortgage Pool |
| (1) | The relatedpari passu Note A-2 is currently held by WFB and is expected to be contributed to a future securitization. No assurance can be provided that the Note A-2 will not be split further. |
| (2) | The relatedpari passu Notes A-1 and A-2 are currently held by LCF or an affiliate of LCF and are expected to be contributed to one or more future securitizations. No assurance can be provided that the Note A-1 or A-2 will not be split further. |
| (3) | The 1140 Avenue of the Americas whole loan is expected to initially be serviced under the WFCM 2016-LC24 pooling and servicing agreement until the securitization of the related controllingpari passu Note A-1 (the “1140 Avenue of the Americas Servicing Shift Securitization Date”), after which the 1140 Avenue of the Americas whole loan will be serviced under the pooling and servicing agreement related to the securitization of the related controllingpari passu Note A-1 (the “1140 Avenue of the Americas Servicing Shift PSA”). The master servicer and special servicer under the 1140 Avenue of the Americas Servicing Shift PSA will be identified in a notice, report or statement to holders of the WFCM 2016-LC24 certificates after the securitization of the related controllingpari passu Note A-1. |
| (4) | The Shops at Crystals whole loan includes nine junior companion loans with an aggregate original principal balance of $167,300,000. Such junior companion loans are not reflected in, and are subordinate to all of the notes listed in the “Related Notes in Loan Group (Original Balance)” column. |
| (5) | Consists of two tranches of three promissory notes each: threepari passupromissory notes and three subordinate promissory notes. The controlling pari passu Note A-1-A and non-controllingpari passuNotes A-2-A and A-3-A have an aggregate original balance of $112,000,000 and the non-controlling subordinate Notes B-1-A, B-2-A and B-3-A have an aggregate original balance of $20,700,000 and all six such notes were contributed to the SHOPS 2016-CSTL Trust. |
| (6) | Consists of fourpari passu promissory notes and four subordinate promissory notes. The non-controllingpari passuNotes A-2-B-2, A-2-B-3, A-3-B-2 and A-3-B-3 have an aggregate original balance of $67,488,000 and the non-controlling subordinate Notes B-2-B-2, B-2-B-3, B-3-B-2 and B-3-B-3 have an aggregate original balance of $12,512,000. |
| (7) | The non-controllingpari passuNote A-2-B-1 and the non-controlling subordinate Note B-2-B-1 are held by BANA and are expected to be contributed to one or more future securitizations. No assurance can be provided that the Note A-2-B-1 or Note B-2-B-1 will not be split further. |
| (8) | The relatedpari passu Note A-2 is currently held by RMF or an affiliate thereof and is expected to be contributed to a future securitization. No assurance can be provided that the Note A-2 will not be split further. |
| (9) | The relatedpari passu Note A-1 is currently held by LCF or an affiliate of LCF and is expected to be contributed to a future securitization. No assurance can be provided that the Note A-1 will not be split further. |
| (10) | The Aspen at Norman Student Housing whole loan is expected to initially be serviced under the WFCM 2016-LC24 pooling and servicing agreement until the securitization of the related controllingpari passu Note A-1 (the “Aspen Servicing Shift Securitization Date” and, together with the 1140 Avenue of the Americas Servicing Shift Securitization Date, the “Servicing Shift Securitization Dates”), after which the Aspen at Norman Student Housing whole loan will be serviced under the pooling and servicing agreement related to the securitization of the related controllingpari passu Note A-1 (the “Aspen Servicing Shift PSA” and, together with the 1140 Avenue of the Americas Servicing Shift PSA, the “Servicing Shift PSAs”). The master servicer and special servicer under the Aspen Servicing Shift PSA will be identified in a notice, report or statement to holders of the WFCM 2016-LC24 certificates after the securitization of the related controllingpari passu companion loan. |
| (11) | The relatedpari passu Notes A-1-B, A-2-A2 and A-3 are currently held by LCF or an affiliate of LCF and are expected to be contributed to future securitizations. No assurance can be provided that the Notes A-1-B, A-2-A2 and A-3 will not be split further. |
C. Mortgage Loans with Additional Secured and Mezzanine Financing(1)
| Loan No. | Mortgage Loan Seller | Mortgage Loan Name | Mortgage Loan Cut-off Date Balance ($) | % of Initial Pool Balance (%) | Subordinate Debt Cut-off Date Balance ($) | Mezzanine Debt Cut-off Date Balance ($) | Total Debt Interest Rate (%)(2) | Mortgage Loan U/W NCF DSCR (x)(3) | Total Debt (x) | Mortgage Loan Cut-off Date U/W NOI Debt Yield (%)(3) | Total Debt Cut-off Date U/W NOI Debt Yield (%) | Mortgage Loan Cut-off Date LTV Ratio (%)(3) | Total Debt Cut-off Date LTV Ratio (%) |
| 6 | WFB | The Shops at Crystals | $35,000,000 | 3.3% | $167,300,000 | NAP | 3.744% | 3.28x | 2.28x | 12.9% | 9.0% | 34.8% | 50.0% |
| 39 | LCF | RealOp SC Portfolio | 8,518,128 | 0.8 | NAP | $1,461,031 | 6.552 | 1.50 | 1.15 | 11.1 | 9.5 | 74.4 | 87.2 |
| Total/Weighted Average | $43,518,128 | 4.2% | $167,300,000 | $1,461,031 | 4.294% | 2.93x | 2.06x | 12.5% | 9.1% | 42.6% | 57.3% | ||
| (1) | In addition, eleven (11) of the mortgage loans, each of which is secured by a residential cooperative property, currently have in place Subordinate Coop LOCs, that permit future advances. See “Description of the Mortgage Pool—Additional Indebtedness—Other Unsecured Indebtedness” and “Description of the Mortgage Pool—Additional Debt Financing for Mortgage Loans Secured by Residential Cooperatives” in the Preliminary Prospectus. |
| (2) | Total Debt Interest Rate for any specified mortgage loan reflects the weighted average of the interest rates on the respective components of the total debt. |
| (3) | With respect to The Shops at Crystals mortgage loan, which is part of a whole loan, the loan-to-value ratio, debt service coverage ratio and debt yield calculations include the relatedpari passu companion loan(s). |
THE INFORMATION IN THIS STRUCTURAL AND COLLATERAL TERM SHEET IS NOT COMPLETE AND MAY BE AMENDED PRIOR TO THE TIME OF SALE. THIS TERM SHEET IS NOT AN OFFER TO SELL THESE SECURITIES AND IT IS NOT A SOLICITATION OF AN OFFER TO BUY THESE SECURITIES IN ANY JURISDICTION WHERE THE OFFER OR SALE IS NOT PERMITTED.
11
| Wells Fargo Commercial Mortgage Trust 2016-LC24 | Characteristics of the Mortgage Pool |
D. Previous Securitization History(1)
| Loan No. | Mortgage Loan Seller | Mortgage Loan or Mortgaged Property Name | City | State | Property Type | Mortgage Loan or Mortgaged Property Cut-off Date Balance ($) | % of (%) | Previous Securitization |
| 1 | WFB | Central Park Retail(2) | Fredericksburg | VA | Retail | $70,000,000 | 6.7% | MLCFC 2006-4 |
| 2 | LCF | Green Valley Portfolio | Various | Various | Manufactured Housing Community | 58,750,000 | 5.6 | LBUBS 2006-C4 |
| 3 | WFB | Four Points by Sheraton Times Square – Leased Fee | New York | NY | Other | 46,700,000 | 4.5 | DBUBS 2011-LC3A |
| 7 | WFB | Pinnacle II | Burbank | CA | Office | 27,000,000 | 2.6 | GSMS 2006-GG8 |
| 10 | RMF | Seasons at Horsetooth Apartments | Fort Collins | CO | Multifamily | 24,700,000 | 2.4 | MSC 2006-IQ12 |
| 12 | WFB | So Cal Self Storage – Hollywood | Los Angeles | CA | Self Storage | 23,000,000 | 2.2 | BACM 2007-1 |
| 15 | RMF | One & Two Corporate Plaza | Houston | TX | Office | 20,000,000 | 1.9 | CD 2006-CD3; CD 2007-CD4 |
| 21 | WFB | Century Springs Park | Atlanta | GA | Office | 15,500,000 | 1.5 | GSMS 2006-GG6 |
| 25 | WFB | New Garden Town Square Shopping Center | Kennett Square | PA | Retail | 13,000,000 | 1.2 | BSCMS 2006-PW14 |
| 26 | WFB | SPS - Walnut Creek | Walnut Creek | CA | Self Storage | 12,300,000 | 1.2 | JPMCC 2006-LDP7 |
| 27 | RMF | Hunting Creek Plaza | Conyers | GA | Retail | 12,300,000 | 1.2 | BSCMS 2007-PW16 |
| 28 | LCF | Lakeview Center | Montgomery | AL | Office | 11,971,019 | 1.1 | CD 2006-CD3 |
| 29 | RMF | Mesa South Shopping Center | Mesa | AZ | Retail | 11,250,000 | 1.1 | BSCMS 2006-T24 |
| 31 | WFB | Draper Retail Center | Draper | UT | Retail | 10,886,568 | 1.0 | CSMC 2007-C2 |
| 41 | WFB | Ridge Road Town Center | Rockwall | TX | Retail | 7,840,262 | 0.8 | MSC 2007-T25 |
| 48 | LCF | TIHT Commercial | New York | NY | Mixed Use | 6,990,791 | 0.7 | LBUBS 2006-C6 |
| 49 | NCB | 16 N. Broadway Owners, Inc. | White Plains | NY | Multifamily | 6,600,000 | 0.6 | MSC 2005-IQ10 |
| 52 | RMF | Greenrich Building | Houston | TX | Office | 6,375,000 | 0.6 | MLCFC 2006-3 |
| 57 | RMF | Westland Shopping Center | Columbus | OH | Retail | 5,294,099 | 0.5 | COMM 2006-C8 |
| 61 | WFB | College Square III | Stockton | CA | Retail | 4,794,279 | 0.5 | BSCMS 2006-T24 |
| 63 | WFB | Campbell Fair Shopping Center | Tucson | AZ | Retail | 4,591,790 | 0.4 | JPMCC 2006-LDP8 |
| 69 | WFB | A-Alpha Mini Storage | Smyrna | GA | Self Storage | 4,129,525 | 0.4 | MLCFC 2007-8 |
| 71 | WFB | Gratiot Retail Center | Roseville | MI | Retail | 3,930,257 | 0.4 | JPMCC 2006-CB17 |
| 72 | WFB | Shoppes at 521 | Fort Mill | SC | Retail | 3,840,407 | 0.4 | CSMC 2006-C5 |
| 75 | WFB | Walgreens - Jasper, IN | Jasper | IN | Retail | 2,675,000 | 0.3 | MLMT 2007-C1 |
| 80 | NCB | Woodlawn Veterans Mutual Housing Company, Inc. | Bronx | NY | Multifamily | 3,000,000 | 0.3 | MSC 2006-IQ11 |
| 82 | NCB | Beechwood Gardens Owners, Inc. | Flushing | NY | Multifamily | 2,800,000 | 0.3 | MSC 2007-IQ13 |
| 85 | NCB | 222 Bowery Owners Corp. | New York | NY | Multifamily | 1,500,000 | 0.1 | CSMC 2006-C4 |
| 89 | NCB | The Ponce De Leon Cooperative, Inc. | Washington | DC | Multifamily | 892,988 | 0.1 | MSC 2007-IQ13 |
| Total | $422,611,986 | 40.4% |
| (1) | The table above represents the most recent securitization with respect to the mortgaged property securing the related mortgage loan, based on information provided by the related borrower or obtained through searches of a third-party database. While loans secured by the above mortgaged properties may have been securitized multiple times in prior transactions, mortgage loans in this securitization are only listed in the above chart if the mortgage loan paid off a loan in another securitization. The information has not otherwise been confirmed by the mortgage loan sellers. |
| (2) | The Central Park Retail whole loan was used to pay off a portion of the previous $125,000,000 mortgage loan, which also included debt secured by a 229,611 square foot office complex, which was refinanced separately. Approximately $90,451,770 of the previous $125,000,000 loan is allocated to the Central Park Retail property. |
THE INFORMATION IN THIS STRUCTURAL AND COLLATERAL TERM SHEET IS NOT COMPLETE AND MAY BE AMENDED PRIOR TO THE TIME OF SALE. THIS TERM SHEET IS NOT AN OFFER TO SELL THESE SECURITIES AND IT IS NOT A SOLICITATION OF AN OFFER TO BUY THESE SECURITIES IN ANY JURISDICTION WHERE THE OFFER OR SALE IS NOT PERMITTED.
12
| Wells Fargo Commercial Mortgage Trust 2016-LC24 | Characteristics of the Mortgage Pool |
E. Mortgage Loans with Scheduled Balloon Payments and Related Classes
Class A-2(1)
| Loan No. | Mortgage Loan Seller | Mortgage Loan Name | State | Property Type | Mortgage Loan Cut-off Date Balance ($) | % of Initial Pool Balance (%) | Balloon Balance ($) | % of Class A-2 Certificate Balance (%)(2) | SF/ Rooms | Loan per SF/ Room ($)(3) | U/W NCF DSCR (x)(3) | U/W NOI Debt Yield (%)(3) | Cut-off Date LTV Ratio (%)(3) | Balloon or ARD LTV Ratio (%)(3) | Rem. IO Period (mos.) | Rem. Term to Maturity (mos.) |
| 18 | LCF | Aloft Nashville | TN | Hospitality | $17,489,723 | 1.7% | $16,356,381 | 29.4% | 143 | $122,306 | 1.63x | 12.8% | 70.2% | 65.7% | 0 | 58 |
| 33 | LCF | FedEx and Veolia Industrial Portfolio | Various | Industrial | 10,275,000 | 1.0 | 10,275,000 | 18.5 | 138,960 | 74 | 2.40 | 11.2 | 54.9 | 54.9 | 57 | 57 |
| 36 | LCF | Equity Inns Portfolio | Various | Hospitality | 9,600,000 | 0.9 | 9,600,000 | 17.2 | 2,690 | 86,245 | 2.30 | 13.1 | 64.4 | 64.4 | 49 | 49 |
| 39 | LCF | RealOp SC Portfolio | SC | Various | 8,518,128 | 0.8 | 7,992,337 | 14.4 | 100,423 | 85 | 1.50 | 11.1 | 74.4 | 69.8 | 0 | 52 |
| Total/Weighted Average | $45,882,851 | 4.4% | $44,223,718 | 79.5% | 1.92x | 12.2% | 66.3% | 63.8% | 23 | 55 | ||||||
| (1) | The table above presents the mortgage loan(s) whose balloon payments would be applied to pay down the principal balance of the Class A-2 Certificates, assuming a 0% CPR and applying the “Structuring Assumptions” described in the Preliminary Prospectus, including the assumptions that (i) none of the mortgage loans in the pool experience prepayments prior to maturity (or, in the case of an ARD loan, its anticipated repayment date), defaults or losses; (ii) there are no extensions of maturity dates of any mortgage loans in the pool; and (iii) each mortgage loan in the pool is paid in full on its stated maturity date (or, in the case of an ARD loan, its anticipated repayment date). Each Class of Certificates evidences undivided ownership interests in the entire pool of mortgage loans. Debt service coverage ratio, debt yield and loan-to-value ratio information do not take into account subordinate debt (whether or not secured by the related mortgaged property), if any, that currently exists or is allowed under the terms of any mortgage loan. See Annex A-1 to the Preliminary Prospectus. |
| (2) | Reflects the percentage equal to the Balloon Balance divided by the initial Class A-2 Certificate Balance. |
| (3) | With respect to the Equity Inns Portfolio mortgage loan, which is part of a whole loan, the Loan per SF/Room, loan-to-value ratio, debt service coverage ratio and debt yield calculations include the relatedpari passu companion loan(s). |
THE INFORMATION IN THIS STRUCTURAL AND COLLATERAL TERM SHEET IS NOT COMPLETE AND MAY BE AMENDED PRIOR TO THE TIME OF SALE. THIS TERM SHEET IS NOT AN OFFER TO SELL THESE SECURITIES AND IT IS NOT A SOLICITATION OF AN OFFER TO BUY THESE SECURITIES IN ANY JURISDICTION WHERE THE OFFER OR SALE IS NOT PERMITTED.
13
| Wells Fargo Commercial Mortgage Trust 2016-LC24 | Characteristics of the Mortgage Pool |
| F. | Property Type Distribution(1) |
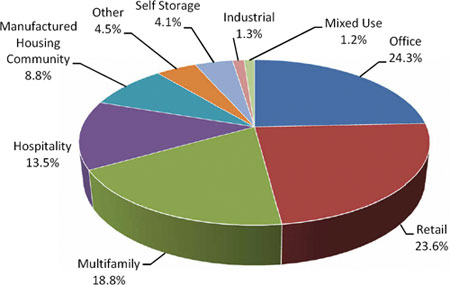
| Property Type | Number of Mortgaged Properties | Aggregate Cut-off Date Balance ($) | % of Initial Pool Balance (%) | Weighted Average Cut-off Date LTV Ratio (%) | Weighted Average Balloon or ARD LTV Ratio (%) | Weighted Average U/W NCF DSCR (x) | Weighted Average U/W NOI Debt Yield (%) | Weighted Average U/W NCF Debt Yield (%) | Weighted Average Mortgage Rate (%) | ||
| Office | 21 | $254,172,223 | 24.3% | 64.7% | 57.8% | 1.66x | 10.3% | 9.2% | 4.527% | ||
| Suburban | 15 | 157,363,328 | 15.1 | 67.8 | 58.4 | 1.50 | 10.5 | 9.3 | 4.634 | ||
| CBD | 3 | 85,952,707 | 8.2 | 58.9 | 57.0 | 1.98 | 9.7 | 8.9 | 4.306 | ||
| Medical | 3 | 10,856,188 | 1.0 | 66.6 | 57.2 | 1.56 | 11.5 | 9.8 | 4.736 | ||
| Retail | 29 | 246,889,679 | 23.6 | 65.5 | 55.0 | 1.71 | 9.9 | 9.2 | 4.373 | ||
| Anchored | 8 | 173,856,568 | 16.6 | 64.8 | 54.5 | 1.78 | 10.0 | 9.3 | 4.292 | ||
| Unanchored | 9 | 48,387,396 | 4.6 | 68.2 | 55.4 | 1.53 | 10.2 | 9.4 | 4.539 | ||
| Single Tenant | 12 | 24,645,715 | 2.4 | 65.4 | 58.0 | 1.54 | 8.6 | 8.6 | 4.612 | ||
| Multifamily | 26 | 196,991,724 | 18.8 | 50.1 | 44.1 | 3.29 | 18.1 | 17.7 | 4.244 | ||
| Garden | 11 | 115,838,380 | 11.1 | 65.5 | 57.8 | 1.76 | 10.3 | 9.9 | 4.570 | ||
| Cooperative | 14 | 64,553,344 | 6.2 | 16.2 | 13.0 | 6.55 | 34.8 | 34.1 | 3.502 | ||
| Student Housing | 1 | 16,600,000 | 1.6 | 75.0 | 69.0 | 1.30 | 8.4 | 8.2 | 4.858 | ||
| Hospitality | 32 | 140,611,270 | 13.5 | 63.8 | 53.0 | 1.95 | 13.8 | 12.4 | 4.915 | ||
| Limited Service | 24 | 101,918,081 | 9.7 | 63.0 | 52.2 | 2.00 | 14.4 | 13.0 | 5.024 | ||
| Extended Stay | 7 | 30,693,188 | 2.9 | 66.2 | 55.3 | 1.79 | 11.8 | 10.6 | 4.583 | ||
| Full Service | 1 | 8,000,000 | 0.8 | 65.0 | 53.1 | 1.94 | 14.0 | 12.2 | 4.800 | ||
| ManufacturedHousing Community | 10 | 91,469,200 | 8.8 | 71.9 | 60.1 | 1.33 | 8.3 | 8.2 | 4.572 | ||
| Manufactured Housing Community | 10 | 91,469,200 | 8.8 | 71.9 | 60.1 | 1.33 | 8.3 | 8.2 | 4.572 | ||
| Other | 1 | 46,700,000 | 4.5 | 75.3 | 75.3 | 1.25 | 5.6 | 5.6 | 4.450 | ||
| Leased Fee | 1 | 46,700,000 | 4.5 | 75.3 | 75.3 | 1.25 | 5.6 | 5.6 | 4.450 | ||
| Self Storage | 4 | 43,089,525 | 4.1 | 55.5 | 51.7 | 2.05 | 10.6 | 10.5 | 4.504 | ||
| Self Storage | 4 | 43,089,525 | 4.1 | 55.5 | 51.7 | 2.05 | 10.6 | 10.5 | 4.504 | ||
| Industrial | 3 | 13,250,765 | 1.3 | 59.3 | 58.2 | 2.20 | 11.2 | 10.7 | 4.716 | ||
| Flex | 2 | 7,085,765 | 0.7 | 63.1 | 61.2 | 2.02 | 11.2 | 10.6 | 4.943 | ||
| Warehouse Distribution | 1 | 6,165,000 | 0.6 | 54.9 | 54.9 | 2.40 | 11.2 | 10.8 | 4.455 | ||
| MixedUse | 2 | 12,183,877 | 1.2 | 39.4 | 31.4 | 1.87 | 11.3 | 10.7 | 4.029 | ||
| Retail/ Parking | 1 | 6,990,791 | 0.7 | 41.1 | 32.8 | 1.90 | 11.3 | 10.9 | 4.050 | ||
| Retail/Multifamily | 1 | 5,193,086 | 0.5 | 37.2 | 29.6 | 1.83 | 11.2 | 10.5 | 4.000 | ||
| Total/Weighted Average: | 128 | $1,045,358,264 | 100.0% | 62.4% | 54.3% | 2.00x | 11.8% | 11.1% | 4.486% | ||
| (1) | Because this table presents information relating to the mortgaged properties and not the mortgage loans, (a) the information for mortgage loans secured by more than one mortgaged property (other than through cross-collateralization with other mortgage loans) is based on allocated amounts (allocating the principal balance of the mortgage loan to each of those properties according to the relative appraised values of the mortgaged properties or the allocated loan amounts or property-specific release prices set forth in the related mortgage loan documents or such other allocation as the related mortgage loan seller deemed appropriate) and (b) the information for each mortgaged property that relates to a mortgage loan that is cross-collateralized or cross-defaulted with other mortgage loans is based upon the principal balance of that mortgage loan, except that the applicable loan-to-value ratio, debt service coverage ratio and debt yield for each such mortgage loan is based upon the ratio or yield (as applicable) for the aggregate indebtedness evidenced by all loans in the group (without regard to any limitation on the amount of indebtedness secured by any mortgaged property in such cross-collateralized group). On an individual basis, without regard to the cross-collateralization feature, any mortgage loan that is part of a cross-collateralized group of mortgage loans may have a higher loan-to-value ratio, lower debt service coverage ratio and/or lower debt yield than is presented herein. For mortgaged properties securing residential cooperative mortgage loans, the debt service coverage ratio or debt yield for each such mortgaged property is calculated using underwritten net cash flow for the related residential cooperative property which is the projected net cash flow reflected in the most recent appraisal obtained by or otherwise in the possession of the related mortgage loan seller as of the cut-off date and the loan-to-value ratio, is calculated based upon the appraised value of the residential cooperative property determined as if such residential cooperative property is operated as a residential cooperative. With respect to any mortgage loan that is part of a whole loan, the loan-to-value ratio, debt service coverage ratio and debt yield calculations include the relatedpari passucompanion loan(s) but exclude any related subordinate companion loan(s) (unless otherwise stated). With respect to each mortgage loan, debt service coverage ratio, debt yield and loan-to-value ratio information do not take into account of any subordinate debt (whether or not secured by the related mortgaged property) that currently exists or is allowed under the terms of such mortgage loan. See Annex A-1 to the Preliminary Prospectus. |
THE INFORMATION IN THIS STRUCTURAL AND COLLATERAL TERM SHEET IS NOT COMPLETE AND MAY BE AMENDED PRIOR TO THE TIME OF SALE. THIS TERM SHEET IS NOT AN OFFER TO SELL THESE SECURITIES AND IT IS NOT A SOLICITATION OF AN OFFER TO BUY THESE SECURITIES IN ANY JURISDICTION WHERE THE OFFER OR SALE IS NOT PERMITTED.
14
| Wells Fargo Commercial Mortgage Trust 2016-LC24 | Characteristics of the Mortgage Pool |
| G. | Geographic Distribution(1)(2) |
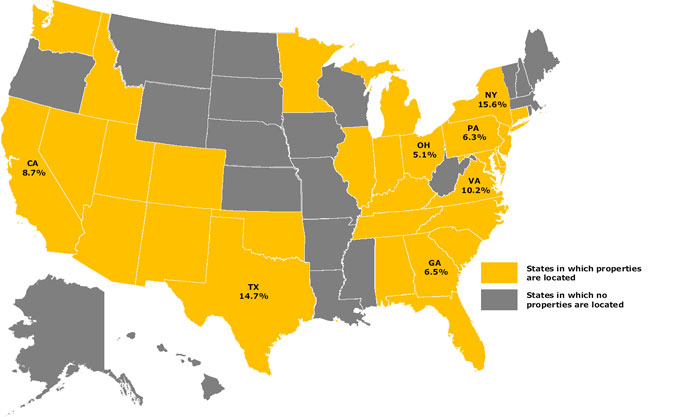
| Location | Number of Mortgaged Properties | Aggregate Cut-off Date Balance ($) | % of Initial Pool Balance (%) | Weighted Average Cut-off Date LTV Ratio (%) | Weighted Average Balloon or ARD LTV Ratio (%) | Weighted Average U/W NCF DSCR (x) | Weighted Average U/W NOI Debt Yield (%) | Weighted Average U/W NCF Debt Yield (%) | Weighted Average Mortgage Rate (%) | |
| New York | 17 | $163,422,147 | 15.6% | 45.3% | 43.7% | 3.56x | 17.6% | 17.2% | 3.973% | |
| Texas | 19 | 153,461,926 | 14.7 | 68.7 | 57.6 | 1.55 | 10.5 | 9.5 | 4.627 | |
| Virginia | 5 | 106,860,147 | 10.2 | 71.9 | 58.4 | 1.44 | 9.4 | 8.7 | 4.454 | |
| California | 9 | 90,532,957 | 8.7 | 56.7 | 52.8 | 1.89 | 10.0 | 9.6 | 4.440 | |
| Southern | 6 | 68,245,592 | 6.5 | 56.2 | 53.8 | 1.99 | 10.0 | 9.5 | 4.436 | |
| Northern | 3 | 22,287,365 | 2.1 | 58.5 | 49.6 | 1.61 | 10.1 | 9.7 | 4.450 | |
| Georgia | 11 | 68,287,532 | 6.5 | 66.7 | 54.9 | 1.65 | 11.0 | 10.0 | 4.503 | |
| Pennsylvania | 4 | 65,850,000 | 6.3 | 68.6 | 61.4 | 1.58 | 11.0 | 9.7 | 4.627 | |
| Ohio | 9 | 53,164,099 | 5.1 | 71.4 | 61.5 | 1.48 | 9.0 | 8.8 | 4.678 | |
| Other(3) | 54 | 343,779,456 | 32.9 | 62.8 | 54.6 | 1.88 | 11.5 | 10.8 | 4.628 | |
| Total/Weighted Average | 128 | $1,045,358,264 | 100.0% | 62.4% | 54.3% | 2.00x | 11.8% | 11.1% | 4.486% | |
| (1) | The mortgaged properties are located in 28 states and the District of Columbia. |
| (2) | Because this table presents information relating to the mortgaged properties and not the mortgage loans, (a) the information for mortgage loans secured by more than one mortgaged property (other than through cross-collateralization with other mortgage loans) is based on allocated amounts (allocating the principal balance of the mortgage loan to each of those properties according to the relative appraised values of the mortgaged properties or the allocated loan amounts or property-specific release prices set forth in the related mortgage loan documents or such other allocation as the related mortgage loan seller deemed appropriate), and (b) the information for each mortgaged property that relates to a mortgage loan that is cross-collateralized or cross-defaulted with other mortgage loans is based upon the principal balance of that mortgage loan, except that the applicable loan-to-value ratio, debt service coverage ratio and debt yield for each such mortgage loan is based upon the ratio or yield (as applicable) for the aggregate indebtedness evidenced by all loans in the group (without regard to any limitation on the amount of indebtedness secured by any mortgaged property in such cross-collateralized group). On an individual basis, without regard to the cross-collateralization feature, any mortgage loan that is part of a cross-collateralized group of mortgage loans may have a higher loan-to-value ratio, lower debt service coverage ratio and/or lower debt yield than is presented herein. For mortgaged properties securing residential cooperative mortgage loans, the debt service coverage ratio or debt yield for each such mortgaged property is calculated using underwritten net cash flow for the related residential cooperative property, which is the projected net cash flow reflected in the most recent appraisal obtained by or otherwise in the possession of the related mortgage loan seller as of the cut-off date, and the loan-to-value ratio, is calculated based upon the appraised value of the residential cooperative property determined as if such residential cooperative property is operated as a residential cooperative. With respect to any mortgage loan that is part of a whole loan, the loan-to-value ratio, debt service coverage ratio and debt yield calculations include the relatedpari passucompanion loan(s) but exclude any related subordinate companion loan(s) (unless otherwise stated). With respect to each mortgage loan, debt service coverage ratio, debt yield and loan-to-value ratio information do not take into account of any subordinate debt (whether or not secured by the related mortgaged property) that currently exists or is allowed under the terms of such mortgage loan. See Annex A-1 to the Preliminary Prospectus. |
| (3) | Includes 21 other states and the District of Columbia. |
THE INFORMATION IN THIS STRUCTURAL AND COLLATERAL TERM SHEET IS NOT COMPLETE AND MAY BE AMENDED PRIOR TO THE TIME OF SALE. THIS TERM SHEET IS NOT AN OFFER TO SELL THESE SECURITIES AND IT IS NOT A SOLICITATION OF AN OFFER TO BUY THESE SECURITIES IN ANY JURISDICTION WHERE THE OFFER OR SALE IS NOT PERMITTED.
15
| Wells Fargo Commercial Mortgage Trust 2016-LC24 | Characteristics of the Mortgage Pool |
H. Characteristics of the Mortgage Pool(1)
| CUT-OFF DATE BALANCE | ||||
| Range of Cut-off Date Balances ($) | Number of Mortgage Loans | Aggregate Cut- off Date Balance | % of Initial Pool Balance | |
| 620,750 - 1,000,000 | 3 | $2,339,238 | 0.2% | |
| 1,000,001 - 2,000,000 | 7 | 10,107,783 | 1.0 | |
| 2,000,001 - 4,000,000 | 12 | 41,328,100 | 4.0 | |
| 4,000,001 - 6,000,000 | 14 | 66,462,144 | 6.4 | |
| 6,000,001 - 8,000,000 | 16 | 111,336,132 | 10.7 | |
| 8,000,001 - 10,000,000 | 4 | 36,268,128 | 3.5 | |
| 10,000,001 - 15,000,000 | 14 | 165,874,445 | 15.9 | |
| 15,000,001 - 20,000,000 | 7 | 124,462,522 | 11.9 | |
| 20,000,001 - 30,000,000 | 8 | 194,729,770 | 18.6 | |
| 30,000,001 - 50,000,000 | 4 | 163,700,000 | 15.7 | |
| 50,000,001 - 70,000,000 | 2 | 128,750,000 | 12.3 | |
| Total: | 91 | $1,045,358,264 | 100.0% | |
| Average: | $11,487,453 | |||
| UNDERWRITTEN NOI DEBT SERVICE COVERAGE RATIO | ||||
| Range of U/W NOI DSCRs (x) | Number of Mortgage Loans | Aggregate Cut- off Date Balance | % of Initial Pool Balance | |
| 1.21 - 1.45 | 12 | $268,771,101 | 25.7% | |
| 1.46 - 1.70 | 26 | 236,291,647 | 22.6 | |
| 1.71 - 1.95 | 21 | 207,054,691 | 19.8 | |
| 1.96 - 2.00 | 1 | 17,472,800 | 1.7 | |
| 2.01 - 2.20 | 6 | 52,968,724 | 5.1 | |
| 2.21 - 2.50 | 6 | 97,396,732 | 9.3 | |
| 2.51 - 3.00 | 5 | 72,339,921 | 6.9 | |
| 3.01 - 3.50 | 1 | 35,000,000 | 3.3 | |
| 3.51 - 4.00 | 1 | 6,600,000 | 0.6 | |
| 4.01 - 17.19 | 12 | 51,462,649 | 4.9 | |
| Total: | 91 | $1,045,358,264 | 100.0% | |
| Weighted Average: | 2.12x | |||
UNDERWRITTEN NCF DEBT | ||||
| Range of U/W NCF DSCRs (x) | Number of Mortgage Loans | Aggregate Cut- off Date Balance | % of Initial Pool Balance | |
| 1.17 - 1.20 | 2 | $13,456,919 | 1.3% | |
| 1.21 - 1.45 | 20 | 357,123,714 | 34.2 | |
| 1.46 - 1.70 | 26 | 268,276,692 | 25.7 | |
| 1.71 - 1.95 | 17 | 124,080,886 | 11.9 | |
| 1.96 - 2.00 | 1 | 27,000,000 | 2.6 | |
| 2.01 - 2.20 | 3 | 49,750,275 | 4.8 | |
| 2.21 - 2.50 | 7 | 106,116,433 | 10.2 | |
| 2.51 - 3.00 | 1 | 6,490,695 | 0.6 | |
| 3.01 - 3.50 | 1 | 35,000,000 | 3.3 | |
| 3.51 - 4.00 | 2 | 10,600,000 | 1.0 | |
| 4.01 - 16.77 | 11 | 47,462,649 | 4.5 | |
| Total: | 91 | $1,045,358,264 | 100.0% | |
| Weighted Average: | 2.00x | |||
| LOAN PURPOSE | ||||
| Loan Purpose | Number of Mortgage Loans | Aggregate Cut- off Date Balance | % of Initial Pool Balance | |
| Refinance | 63 | $743,350,311 | 71.1% | |
| Acquisition | 26 | 258,489,824 | 24.7 | |
| Recapitalization | 1 | 35,000,000 | 3.3 | |
| Acquisition/Refinance | 1 | 8,518,128 | 0.8 | |
| Total: | 91 | $1,045,358,264 | 100.0% | |
| MORTGAGE RATE | ||||||
| Range of Mortgage Rates (%) | Number of Mortgage Loans | Aggregate Cut- off Date Balance | % of Initial Pool Balance | |||
| 3.300 - 3.500 | 7 | $39,875,074 | 3.8% | |||
| 3.501 - 4.000 | 9 | 64,871,355 | 6.2 | |||
| 4.001 - 4.500 | 30 | 490,695,641 | 46.9 | |||
| 4.501 - 5.000 | 30 | 350,790,173 | 33.6 | |||
| 5.001 - 5.500 | 11 | 64,320,195 | 6.2 | |||
| 5.501 - 5.850 | 4 | 34,805,825 | 3.3 | |||
| Total: | 91 | $1,045,358,264 | 100.0% | |||
| Weighted Average: | 4.486% | |||||
| UNDERWRITTEN NOI DEBT YIELD | ||||||
| Range of U/W NOI Debt Yields (%) | Number of Mortgage Loans | Aggregate Cut- off Date Balance | % of Initial Pool Balance | |||
| 5.6 - 8.0 | 4 | $85,881,919 | 8.2% | |||
| 8.1 - 9.0 | 11 | 193,830,439 | 18.5 | |||
| 9.1 - 10.0 | 19 | 211,654,268 | 20.2 | |||
| 10.1 - 11.0 | 17 | 187,908,005 | 18.0 | |||
| 11.1 - 12.0 | 10 | 133,008,971 | 12.7 | |||
| 12.1 - 13.0 | 5 | 63,535,717 | 6.1 | |||
| 13.1 - 14.0 | 6 | 57,646,194 | 5.5 | |||
| 14.1 - 15.0 | 1 | 6,490,695 | 0.6 | |||
| 15.1 - 16.0 | 5 | 47,339,406 | 4.5 | |||
| 20.1 - 159.7 | 13 | 58,062,649 | 5.6 | |||
| Total: | 91 | $1,045,358,264 | 100.0% | |||
| Weighted Average: | 11.8% | |||||
| UNDERWRITTEN NCF DEBT YIELD | ||||||
| Range of U/W NCF Debt Yields (%) | Number of Mortgage Loans | Aggregate Cut- off Date Balance | % of Initial Pool Balance | |||
| 5.6 - 8.0 | 5 | $155,881,919 | 14.9% | |||
| 8.1 - 9.0 | 22 | 300,187,007 | 28.7 | |||
| 9.1 - 10.0 | 21 | 170,955,705 | 16.4 | |||
| 10.1 - 11.0 | 14 | 178,483,651 | 17.1 | |||
| 11.1 - 12.0 | 6 | 63,354,906 | 6.1 | |||
| 12.1 - 13.0 | 4 | 64,602,325 | 6.2 | |||
| 13.1 - 14.0 | 2 | 10,772,313 | 1.0 | |||
| 14.1 - 15.0 | 4 | 43,057,789 | 4.1 | |||
| 20.1 - 156.5 | 13 | 58,062,649 | 5.6 | |||
| Total: | 91 | $1,045,358,264 | 100.0% | |||
| Weighted Average: | 11.1% | |||||
| ORIGINAL TERM TO MATURITY OR ARD | ||||||
| Original Terms to Maturity or ARD (months) | Number of Mortgage Loans | Aggregate Cut- off Date Balance | % of Initial Pool Balance | |||
| 60 | 4 | $45,882,851 | 4.4% | |||
| 120 | 86 | 997,941,413 | 95.5 | |||
| 125 | 1 | 1,534,000 | 0.1 | |||
| Total: | 91 | $1,045,358,264 | 100.0% | |||
| Weighted Average: | 117 months | |||||
| REMAINING TERM TO MATURITY OR ARD | ||||||
| Range of Remaining Terms to Maturity or ARD (months) | Number of Mortgage Loans | Aggregate Cut- off Date Balance | % of Initial Pool Balance | |||
| 49 – 60 | 4 | $45,882,851 | 4.4% | |||
| 85 – 120 | 87 | 999,475,413 | 95.6 | |||
| Total: | 91 | $1,045,358,264 | 100.0% | |||
| Weighted Average: | 116 months | |||||
| (1) | For mortgaged properties securing residential cooperative mortgage loans, the debt service coverage ratio or debt yield for each such mortgaged property is calculated using underwritten net cash flow for the related residential cooperative property, which is the projected net cash flow reflected in the most recent appraisal obtained by or otherwise in the possession of the related mortgage loan seller as of the cut-off date, and the loan-to-value ratio is calculated based upon the appraised value of the residential cooperative property determined as if such residential cooperative property is operated as a residential cooperative. Information regarding mortgage loans that are cross-collateralized or cross-defaulted with other mortgage loans is based upon the individual loan balances, except that the applicable loan-to-value ratio, debt service coverage ratio and debt yield for each such mortgage loan is based upon the ratio or yield (as applicable) for the aggregate indebtedness evidenced by all loans in the group (without regard to any limitation on the amount of indebtedness secured by any mortgaged property in such cross-collateralized group). On an individual basis, without regard to the cross-collateralization feature, any mortgage loan that is part of a cross-collateralized group of mortgage loans may have a higher loan-to-value ratio, lower debt service coverage ratio and/or lower debt yield than is presented herein. With respect to any mortgage loan that is part of a whole loan, the loan-to-value ratio, debt service coverage ratio and debt yield calculations include the relatedpari passu companion loan(s) but exclude any related subordinate companion loan(s) (unless otherwise stated). With respect to each mortgage loan, debt service coverage ratio, debt yield and loan-to-value ratio information do not take into account any subordinate debt (whether or not secured by the related mortgaged property), that currently exists or is allowed under the terms of such mortgage loan. See Annex A-1 to the Preliminary Prospectus. Prepayment provisions for each mortgage loan reflects the entire life of the loan (from origination to maturity or ARD). |
THE INFORMATION IN THIS STRUCTURAL AND COLLATERAL TERM SHEET IS NOT COMPLETE AND MAY BE AMENDED PRIOR TO THE TIME OF SALE. THIS TERM SHEET IS NOT AN OFFER TO SELL THESE SECURITIES AND IT IS NOT A SOLICITATION OF AN OFFER TO BUY THESE SECURITIES IN ANY JURISDICTION WHERE THE OFFER OR SALE IS NOT PERMITTED.
16
| Wells Fargo Commercial Mortgage Trust 2016-LC24 | Characteristics of the Mortgage Pool |
| ORIGINAL AMORTIZATION TERM(2) | ||||
| Original Amortization Terms (months) | Number of Mortgage Loans | Aggregate Cut- off Date Balance | % of Initial Pool Balance | |
| Non-Amortizing | 16 | $235,460,250 | 22.5% | |
| 120 | 1 | 892,988 | 0.1 | |
| 204 | 1 | 4,000,000 | 0.4 | |
| 300 | 6 | 42,905,957 | 4.1 | |
| 336 | 1 | 10,485,465 | 1.0 | |
| 360 | 60 | 730,722,629 | 69.9 | |
| 480 | 6 | 20,890,975 | 2.0 | |
| Total: | 91 | $1,045,358,264 | 100.0% | |
| Weighted Average(3): | 359 months | |||
(2) The original amortization term shown for any mortgage loan that is interest-only for part of its term does not include the number of months in its interest-only period and reflects only the number of months as of the commencement of amortization remaining from the end of such interest-only period. (3) Excludes the non-amortizing mortgage loans. | ||||
| REMAINING AMORTIZATION TERM(4) | ||||
| Range of Remaining Amortization Terms (months) | Number of Mortgage Loans | Aggregate Cut- off Date Balance | % of Initial Pool Balance | |
| Non-Amortizing | 16 | $235,460,250 | 22.5% | |
| 119 - 120 | 1 | 892,988 | 0.1 | |
| 181 - 240 | 1 | 4,000,000 | 0.4 | |
| 241 - 300 | 6 | 42,905,957 | 4.1 | |
| 301 - 360 | 61 | 741,208,094 | 70.9 | |
| 421 - 480 | 6 | 20,890,975 | 2.0 | |
| Total: | 91 | $1,045,358,264 | 100.0% | |
| Weighted Average(5): | 358 months | |||
(4) The remaining amortization term shown for any mortgage loan that is interest-only for part of its term does not include the number of months in its interest-only period and reflects only the number of months as of the commencement of amortization remaining from the end of such interest-only period. (5) Excludes the non-amortizing mortgage loans. | ||||
| LOCKBOXES | ||||
| Type of Lockbox | Number of Mortgage Loans | Aggregate Cut- off Date Balance | % of Initial Pool Balance | |
| Springing | 43 | $511,330,179 | 48.9% | |
| Hard | 25 | 368,684,808 | 35.3 | |
| None | 20 | 118,043,276 | 11.3 | |
| Soft | 3 | 47,300,000 | 4.5 | |
| Total: | 91 | $1,045,358,264 | 100.0% | |
| PREPAYMENT PROVISION SUMMARY | ||||
| Prepayment Provision(6) | Number of Mortgage Loans | Aggregate Cut- off Date Balance | % of Initial Pool Balance | |
| Lockout / Def / Open | 56 | $696,086,911 | 66.6% | |
| Lockout / GRTR 1% or YM / Open | 13 | 233,235,759 | 22.3 | |
| GRTR 1% or YM / 1% / Open | 14 | 64,553,344 | 6.2 | |
| YM / YM or Def / Open | 6 | 28,907,250 | 2.8 | |
| Lockout / GRTR 1% or YM or Def / Open | 1 | 12,300,000 | 1.2 | |
| GRTR 1% or YM / Open | 1 | 10,275,000 | 1.0 | |
| Total: | 91 | $1,045,358,264 | 100.0% | |
(6) Certain of the mortgage loans allow for prepayment following the lockout period without the payment of any yield maintenance or prepayment premium in order for the related borrower to maintain, or if the related borrower does not achieve, certain conditions set forth in the related mortgage loan documents. See “Description of the Mortgage Pool—Certain Terms of the Mortgage Loans—Prepayment Protections and Certain Involuntary Prepayments and Voluntary Prepayments” in the Preliminary Prospectus. | ||||
| CUT-OFF DATE LOAN-TO-VALUE RATIO | ||||
| Range of Cut-off Date LTV Ratios (%) | Number of Mortgage Loans | Aggregate Cut- off Date Balance | % of Initial Pool Balance | |
| 2.7 - 20.0 | 11 | $46,466,845 | 4.4% | |
| 20.1 - 30.0 | 3 | 18,086,499 | 1.7 | |
| 30.1 - 40.0 | 3 | 43,164,540 | 4.1 | |
| 40.1 - 50.0 | 5 | 46,745,316 | 4.5 | |
| 50.1 - 60.0 | 8 | 140,040,119 | 13.4 | |
| 60.1 - 70.0 | 39 | 355,800,532 | 34.0 | |
| 70.1 - 77.6 | 22 | 395,054,413 | 37.8 | |
| Total: | 91 | $1,045,358,264 | 100.0% | |
| Weighted Average: | 62.4% | |||
| BALLOON OR ARD LOAN-TO-VALUE RATIO | |||
| Range of Balloon or ARD LTV Ratios (%) | Number of Mortgage Loans | Aggregate Cut- off Date Balance | % of Initial Pool Balance |
| 0.0 - 20.0 | 11 | $46,466,845 | 4.4% |
| 20.1 - 30.0 | 5 | 26,251,038 | 2.5 |
| 30.1 - 40.0 | 4 | 50,712,106 | 4.9 |
| 40.1 - 50.0 | 9 | 103,103,342 | 9.9 |
| 50.1 - 60.0 | 37 | 504,716,074 | 48.3 |
| 60.1 - 70.0 | 24 | 267,408,858 | 25.6 |
| 70.1 - 75.3 | 1 | 46,700,000 | 4.5 |
| Total: | 91 | $1,045,358,264 | 100.0% |
| Weighted Average: | 54.3% | ||
| AMORTIZATION TYPE | |||||
| Type of Amortization | Number of Mortgage Loans | Aggregate Cut- off Date Balance | % of Initial Pool Balance | ||
| Amortizing Balloon | 48 | $448,264,526 | 42.9% | ||
| Interest-only, Amortizing Balloon | 25 | 339,250,500 | 32.5 | ||
| Interest-only, Balloon | 9 | 171,068,000 | 16.4 | ||
| Interest-only, ARD | 7 | 64,392,250 | 6.2 | ||
| Interest-only, Amortizing ARD | 1 | 21,490,000 | 2.1 | ||
| Fully Amortizing | 1 | 892,988 | 0.1 | ||
| Total: | 91 | $1,045,358,264 | 100.0% | ||
ORIGINAL TERM OF INTEREST-ONLY PERIOD FOR PARTIAL IO LOANS | |||||
| IO Terms (months) | Number of Mortgage Loans | Aggregate Cut- off Date Balance | % of Initial Pool Balance | ||
| 12 | 4 | $102,400,000 | 9.8% | ||
| 18 | 2 | 35,075,000 | 3.4 | ||
| 24 | 7 | 60,125,000 | 5.8 | ||
| 36 | 10 | 88,050,500 | 8.4 | ||
| 60 | 3 | 75,090,000 | 7.2 | ||
| Total: | 26 | $360,740,500 | 34.5% | ||
| Weighted Average: | 30 months | ||||
SEASONING | |||||
| Range of Seasoning (months) | Number of Mortgage Loans | Aggregate Cut- off Date Balance | % of Initial Pool Balance | ||
| 0 | 25 | $272,845,750 | 26.1% | ||
| 1 - 2 | 43 | 511,927,807 | 49.0 | ||
| 3 - 4 | 10 | 184,007,398 | 17.6 | ||
| 5 - 6 | 2 | 10,884,000 | 1.0 | ||
| 7 - 8 | 7 | 41,134,628 | 3.9 | ||
| 9 - 10 | 3 | 14,958,680 | 1.4 | ||
| 11 | 1 | 9,600,000 | 0.9 | ||
| Total: | 91 | $1,045,358,264 | 100.0% | ||
| Weighted Average: | 2 months | ||||
THE INFORMATION IN THIS STRUCTURAL AND COLLATERAL TERM SHEET IS NOT COMPLETE AND MAY BE AMENDED PRIOR TO THE TIME OF SALE. THIS TERM SHEET IS NOT AN OFFER TO SELL THESE SECURITIES AND IT IS NOT A SOLICITATION OF AN OFFER TO BUY THESE SECURITIES IN ANY JURISDICTION WHERE THE OFFER OR SALE IS NOT PERMITTED.
17
| Wells Fargo Commercial Mortgage Trust 2016-LC24 | Certain Terms and Conditions |
V. Certain Terms and Conditions
| Interest Entitlements: | The interest entitlement of each Class of Offered Certificates on each Distribution Date generally will be the interest accrued during the related Interest Accrual Period on the related Certificate Balance or Notional Amount at the related pass-through rate, net of any prepayment interest shortfalls allocated to that Class for such Distribution Date as described below. If prepayment interest shortfalls arise from voluntary prepayments (without applicable Master Servicer consent) on particular non-specially serviced loans during any collection period, the applicable Master Servicer is required to make a compensating interest payment to offset those shortfalls, generally up to an amount equal to the portion of its master servicing fees that accrue at 0.25 basis pointsper annum. The remaining amount of prepayment interest shortfalls will be allocated to reduce the interest entitlement on all Classes of Certificates,pro rata, based on their respective amounts of accrued interest for the related Distribution Date. If a Class receives less than the entirety of its interest entitlement on any Distribution Date, then the shortfall (excluding any shortfall due to prepayment interest shortfalls), together with interest thereon, will be added to its interest entitlement for the next succeeding Distribution Date. | |||
| Principal Distribution Amount: | The Principal Distribution Amount for each Distribution Date generally will be the aggregate amount of principal received or advanced in respect of the mortgage loans, net of any non-recoverable advances and interest thereon and workout-delayed reimbursement amounts that are reimbursed to the applicable Master Servicer, the applicable Special Servicer or the Trustee during the related collection period. Non-recoverable advances and interest thereon are reimbursable from principal collections and advances before reimbursement from other amounts. Workout-delayed reimbursement amounts are reimbursable from principal collections. | |||
| Distributions: | On each Distribution Date, funds available for distribution from the mortgage loans, net of specified trust fees, expenses and reimbursements will generally be distributed in the following amounts and order of priority (in each case to the extent of remaining available funds): | |||
| 1. | Class A-1, A-2, A-3, A-4, A-SB, X-A, X-B, X-D, X-EF, X-G, X-H and X-I Certificates: To interest on the Class A-1, A-2, A-3, A-4, A-SB, X-A, X-B, X-D, X-EF, X-G, X-H and X-I Certificates,pro rata, according to their respective interest entitlements. | |||
| 2. | Class A-1, A-2, A-3, A-4 and A-SB Certificates: To principal on the Class A-1, A-2, A-3, A-4 and A-SB Certificates in the following amounts and order of priority: (i) first, to principal on the Class A-SB Certificates, in an amount up to the Principal Distribution Amount for such Distribution Date until their Certificate Balance is reduced to the Class A-SB Planned Principal Balance for such Distribution Date; (ii) second, to principal on the Class A-1 Certificates until their Certificate Balance is reduced to zero, up to the remainder of the Principal Distribution Amount for such Distribution Date; (iii) third, to principal on the Class A-2 Certificates until their Certificate Balance is reduced to zero, up to the remainder of the Principal Distribution Amount for such Distribution Date; (iv) fourth, to principal on the Class A-3 Certificates, until their Certificate Balance is reduced to zero, up to the remainder of the Principal Distribution Amount for such Distribution Date; (v) fifth, to principal on the Class A-4 Certificates until their Certificate Balance is reduced to zero, up to the remainder of the Principal Distribution Amount for such Distribution Date; and (vi) sixth, to principal on the Class A-SB Certificates until their Certificate Balance is reduced to zero, up to the remainder of the Principal Distribution Amount for such Distribution Date. However, if the Certificate Balance of each and every Class of Principal Balance Certificates, other than the Class A-1, A-2, A-3, A-4 and A-SB Certificates, has been reduced to zero as a result of the allocation of Mortgage Loan losses and expenses and any of the Class A-1, A-2, A-3, A-4 and A-SB Certificates remains outstanding, then the Principal Distribution Amount will be distributed to the Class A-1, A-2, A-3, A-4 and A-SB Certificates,pro rata, based on their respective outstanding Certificate Balances, until their Certificate Balances have been reduced to zero. | |||
| 3. | Class A-1, A-2, A-3, A-4 and A-SB Certificates: To reimburse the holders of the Class A-1, A-2, A-3, A-4 and A-SB Certificates,pro rata, on the basis of previously allocated unreimbursed losses, for any previously unreimbursed losses (plus interest thereon) on the mortgage loans that were previously allocated in reduction of the Certificate Balances of such Classes. | |||
THE INFORMATION IN THIS STRUCTURAL AND COLLATERAL TERM SHEET IS NOT COMPLETE AND MAY BE AMENDED PRIOR TO THE TIME OF SALE. THIS TERM SHEET IS NOT AN OFFER TO SELL THESE SECURITIES AND IT IS NOT A SOLICITATION OF AN OFFER TO BUY THESE SECURITIES IN ANY JURISDICTION WHERE THE OFFER OR SALE IS NOT PERMITTED.
18
| Wells Fargo Commercial Mortgage Trust 2016-LC24 | Certain Terms and Conditions |
| 4. | Class A-S Certificates: To make distributions on the Class A-S Certificates as follows: (a) first, to interest on the Class A-S Certificates in the amount of the interest entitlement for that Class; (b) next, to the extent of the portion of the Principal Distribution Amount remaining after distributions in respect of principal to each Class with a higher distribution priority (in this case, the Class A-1, A-2, A-3, A-4 and A-SB Certificates), to principal on the Class A-S Certificates until their Certificate Balance is reduced to zero; and (c) next, to reimburse the holders of the Class A-S Certificates for any previously unreimbursed losses (plus interest thereon) on the mortgage loans that were previously allocated to that Class in reduction of their Certificate Balance. |
| 5. | Class B Certificates: To make distributions on the Class B Certificates as follows: (a) first, to interest on the Class B Certificates in the amount of the interest entitlement for that Class; (b) next, to the extent of the portion of the Principal Distribution Amount remaining after distributions in respect of principal to each Class with a higher distribution priority (in this case, the Class A-1, A-2, A-3, A-4, A-SB and A-S Certificates), to principal on the Class B Certificates until their Certificate Balance is reduced to zero; and (c) next, to reimburse the holders of the Class B Certificates for any previously unreimbursed losses (plus interest thereon) on the mortgage loans that were previously allocated to that Class in reduction of their Certificate Balance. | |||
| 6. | Class C Certificates: To make distributions on the Class C Certificates as follows: (a) first, to interest on the Class C Certificates in the amount of the interest entitlement for that Class; (b) next, to the extent of the portion of the Principal Distribution Amount remaining after distributions in respect of principal to each Class with a higher distribution priority (in this case, the Class A-1, A-2, A-3, A-4, A-SB, A-S and B Certificates), to principal on the Class C Certificates until their Certificate Balance is reduced to zero; and (c) next, to reimburse the holders of the Class C Certificates for any previously unreimbursed losses (plus interest thereon) on the mortgage loans that were previously allocated to that Class in reduction of their Certificate Balance. | |||
| 7. | After the Class A-1, A-2, A-3, A-4, A-SB, A-S, B and C Certificates are paid all amounts to which they are entitled, the remaining funds available for distribution will be used to pay interest, principal and loss reimbursement amounts on the Class D, E, F, G, H and I Certificates sequentially in that order in a manner analogous to the Class C Certificates. | |||
| Allocation of Yield Maintenance and Prepayment Premiums: | If any yield maintenance charge or prepayment premium is collected during any particular collection period with respect to any mortgage loan, then on the Distribution Date corresponding to that collection period, the certificate administrator will pay that yield maintenance charge or prepayment premium (net of liquidation fees payable therefrom) in the following manner: (1) to each of the Class A-1, A-2, A-3, A-4, A-SB, A-S, B, C and D Certificates, the product of (a) such yield maintenance charge or prepayment premium, (b) the related Base Interest Fraction (as defined in the Preliminary Prospectus) for such Class, and (c) a fraction, the numerator of which is equal to the amount of principal distributed to such Class for that Distribution Date, and the denominator of which is the total amount of principal distributed to all Principal Balance Certificatesfor that Distribution Date, and (2) to the Class X-A Certificates, the excess, if any, of (a) the product of (i) such yield maintenance charge or prepayment premium and (ii) a fraction, the numerator of which is equal to the amount of principal distributed to the Class A-1, A-2, A-3, A-4 and A-SB Certificates for that Distribution Date, and the denominator of which is the total amount of principal distributed to all Principal Balance Certificates for that Distribution Date, over (b) the amount of such yield maintenance charge or prepayment premium distributed to the Class A-1, A-2, A-3, A-4 and A-SB Certificates as described above, and (3) to the Class X-B Certificates, any remaining yield maintenance charge or prepayment premium not distributed as described above. No prepayment premiums or yield maintenance charges will be distributed to the holders of the Class X-D, X-EF, X-G, X-H, X-I, E, F, G, H, I, V or R Certificates. For a description of when prepayment premiums and yield maintenance charges are generally required on the mortgage loans, see Annex A-1 to the Preliminary Prospectus. See also “Risk Factors—Risks Relating to the Mortgage Loans—Risks Relating to Enforceability of Yield Maintenance Charges, Prepayment Premiums or Defeasance Provisions” and “Risk Factors—Other Risks Relating to the Certificates—Your Yield May Be Affected by Defaults, Prepayments and Other Factors” in the Preliminary Prospectus. Prepayment premiums and yield maintenance charges will be distributed on each Distribution Date only to the extent they are actually received on the mortgage loans as of the related Determination Date. | |||
| Realized Losses: | The Certificate Balances of the Class A-1, A-2, A-3, A-4, A-SB, A-S, B, C, D, E, F, G, H and I Certificates will be reduced without distribution on any Distribution Date as a write-off to the extent of any losses realized on the mortgage loans allocated to such Class on such Distribution Date. Such losses will be applied in the following order, in each case until the related Certificate Balance is reduced to zero: first, to the Class I Certificates; second, to the Class H Certificates; third, to the Class G Certificates; fourth, to the Class F Certificates; fifth, to the |
THE INFORMATION IN THIS STRUCTURAL AND COLLATERAL TERM SHEET IS NOT COMPLETE AND MAY BE AMENDED PRIOR TO THE TIME OF SALE. THIS TERM SHEET IS NOT AN OFFER TO SELL THESE SECURITIES AND IT IS NOT A SOLICITATION OF AN OFFER TO BUY THESE SECURITIES IN ANY JURISDICTION WHERE THE OFFER OR SALE IS NOT PERMITTED.
19
| Wells Fargo Commercial Mortgage Trust 2016-LC24 | Certain Terms and Conditions |
Class E Certificates; sixth, to the Class D Certificates; seventh, to the Class C Certificates; eighth, to the Class B Certificates; ninth, to the Class A-S Certificates; and, finally,pro rata, to the Class A-1, A-2, A-3, A-4 and A-SB Certificates based on their outstanding Certificate Balances.
The notional amount of the Class X-A Certificates will be reduced by the amount of all losses that are allocated to the Class A-1, A-2, A-3, A-4 or A-SB Certificates as write-offs in reduction of their Certificate Balances. The notional amount of the Class X-B Certificates will be reduced by the amount of all losses that are allocated to the Class A-S, B or C Certificates as write-offs in reduction of their Certificate Balances. The notional amount of the Class X-D Certificates will be reduced by the amount of all losses that are allocated to the Class D Certificates as write-offs in reduction of its Certificate Balance. The notional amount of the Class X-EF Certificates will be reduced by the amount of all losses that are allocated to the Class E or F Certificates as write-offs in reduction of their Certificate Balances. The notional amount of the Class X-G Certificates will be reduced by the amount of all losses that are allocated to the Class G Certificates as write-offs in reduction of its Certificate Balance. The notional amount of the Class X-H Certificates will be reduced by the amount of all losses that are allocated to the Class H Certificates as write-offs in reduction of its Certificate Balance. Class X-I Certificates will be reduced by the amount of all losses that are allocated to the Class I Certificates as write-offs in reduction of its Certificate Balance. | |||
| P&I Advances: | Each Master Servicer or, if such Master Servicer fails to do so, the Trustee, will be obligated to advance delinquent debt service payments with respect to the mortgage loans it services (other than balloon payments, excess interest and default interest) and assumed debt service payments on mortgage loans with delinquent balloon payments (excluding any related companion loan), except to the extent any such advance is deemed non-recoverable from collections on the related mortgage loan. In addition, if an Appraisal Reduction Amount exists for a given mortgage loan, the interest portion of any P&I advance for such mortgage loan will be reduced, which will have the effect of reducing the amount of interest available for distribution to the Certificates in reverse alphabetical order of their Class designations (except that interest payments on the Class A-1, A-2, A-3, A-4, A-SB, X-A, X-B, X-D, X-EF, X-G, X-H and X-I Certificates would be affected on apari passu basis). | ||
| Servicing Advances: | Each Master Servicer or, if such Master Servicer fails to do so, the Trustee, will be obligated to make servicing advances with respect to each mortgage loan it services, including the payment of delinquent property taxes, insurance premiums and ground rent, except to the extent that those advances are deemed non-recoverable from collections on the related mortgage loan. The applicable Master Servicer or the Trustee, as applicable, will have the primary obligation to make any required servicing advances with respect to the Central Park Retail whole loan and the One & Two Corporate Plaza whole loan. The servicer or trustee, as applicable, under the SHOPS 2016-CSTL securitization will have the primary obligation to make any required servicing advances with respect to The Shops at Crystals whole loan. The master servicer or trustee, as applicable, under the WFCM 2016-BNK1 securitization will have the primary obligation to make any required servicing advances with respect to the Pinnacle II whole loan. The master servicer or trustee, as applicable, under the COMM 2015-LC23 securitization will have the primary obligation to make any required servicing advances with respect to the Equity Inns Portfolio whole loan. The master servicer or trustee, as applicable, under the CGCMT 2016-C2 securitization will have the primary obligation to make any required servicing advances with respect to the Hilton Garden Inn Athens Downtown whole loan.Prior to the applicable Servicing Shift Securitization Date, the applicable Master Servicer under the WFCM 2016-LC24 securitization is expected to have the primary obligation to make any servicing advances with respect to each of the 1140 Avenue of the Americas whole loan and the Aspen at Norman Student Housing whole loan. With respect to each of the 1140 Avenue of the Americas whole loan and the Aspen at Norman Student Housing whole loan, after the applicable Servicing Shift Securitization Date, the respective master servicer under the applicable Servicing Shift PSA will have the primary obligation to make any servicing advances with respect to such whole loan. The Special Servicers will have no obligation to make servicing advances but may do so in an emergency situation. | ||
Appraisal Reduction Amounts and Collateral Deficiency Amounts:
| An Appraisal Reduction Amount generally will be created in the amount, if any, by which the principal balance of a required appraisal loan (which is a mortgage loan with respect to which certain defaults, modifications or insolvency events have occurred as further described in the Preliminary Prospectus) plus other amounts overdue or advanced in connection with such mortgage loan exceeds 90% of the appraised value of the related mortgaged property plus certain escrows and reserves (including letters of credit) held with respect to the mortgage loan. With respect to any whole loan, any Appraisal Reduction Amount will be allocated first to the related subordinate companion loan, if any, and then to the related mortgage loan and the relatedpari passu companion loan(s).
A mortgage loan will cease to be a required appraisal loan when the same has ceased to be a specially serviced loan (if applicable), has been brought current for at least three consecutive | ||
THE INFORMATION IN THIS STRUCTURAL AND COLLATERAL TERM SHEET IS NOT COMPLETE AND MAY BE AMENDED PRIOR TO THE TIME OF SALE. THIS TERM SHEET IS NOT AN OFFER TO SELL THESE SECURITIES AND IT IS NOT A SOLICITATION OF AN OFFER TO BUY THESE SECURITIES IN ANY JURISDICTION WHERE THE OFFER OR SALE IS NOT PERMITTED.
20
| Wells Fargo Commercial Mortgage Trust 2016-LC24 | Certain Terms and Conditions |
months and no other circumstances exist that would cause such mortgage loan to be a required appraisal loan.
A Collateral Deficiency Amount will exist with respect to any mortgage loan that is modified into an AB loan structure and remains a corrected mortgage loan and will generally equal the excess of (i) the stated principal balance of such AB modified loan (taking into account the related junior note(s) and anypari passu notes included therein), over (ii) the sum of (in the case of a whole loan, solely to the extent allocable to the subject mortgage loan) (x) the appraised value of the related mortgaged property plus (y) any capital or additional collateral contributed by the related borrower at the time the loan became an AB modified loan plus (z) certain escrows or reserves (including letters of credit) in addition to any amounts set forth in the immediately preceding clause (y)) held with respect to the mortgage loan.
A Cumulative Appraisal Reduction Amount with respect to any mortgage loan will be the sum of any Appraisal Reduction Amount and any Collateral Deficiency Amount.
Appraisal Reduction Amounts will affect the amount of debt service advances in respect of the related mortgage loan. Cumulative Appraisal Reduction Amounts will also be taken into account in the determination of the identity of the Class whose majority constitutes the “majority controlling class certificateholder” and is entitled to appoint the directing certificateholder. | |||
Clean-Up Call and Exchange Termination:
| On each Distribution Date occurring after the aggregate unpaid principal balance of the pool of mortgage loans is less than (or, in the case of clause (ii) below, less than or equal to) the greater of (i) 1.0% of the principal balance of the mortgage loans as of the cut-off date, or (ii) if the FMC Corporation R&D HQ Mortgage Loan or the Walgreens Youngstown Mortgage Loan are assets of the trust fund, the sum of the outstanding principal balance of the FMC Corporation R&D HQ Mortgage Loan and/or the Walgreens Youngstown Mortgage Loan on any date of determination and 1.0% of the principal balance of the mortgage loans as of the cut-off date, however, this termination right will not be exercisable at the percentage threshold specified in clause (ii) above earlier than the distribution date in October 2026.
If the aggregate Certificate Balances of each of the Class A-1, A-2, A-3, A-4, A-SB, A-S, B, C and D Certificates have been reduced to zero, the trust may also be terminated in connection with an exchange of all the then-outstanding certificates (other than the Class R and Class V Certificates) for the mortgage loans and REO properties then remaining in the issuing entity, but all of the holders of those Classes (other than the Class R and Class V Certificates) of outstanding certificates would have to voluntarily participate in the exchange. | ||
| Liquidation Loan Waterfall: | Following the liquidation of any loan or property, the net liquidation proceeds generally will be applied (after reimbursement of advances and certain trust fund expenses), first, as a recovery of accrued interest, other than delinquent interest that was not advanced as a result of Appraisal Reduction Amounts, second, as a recovery of principal until all principal has been recovered, and then as a recovery of delinquent interest that was not advanced as a result of Appraisal Reduction Amounts. Please see “Description of the Certificates—Distributions—Application Priority of Mortgage Loan Collections or Whole Loan Collections” in the Preliminary Prospectus. | ||
| Majority Controlling Class Certificateholder and Directing Certificateholder: | A directing certificateholder may be appointed by the “majority controlling class certificate-holder”, which will be the holder(s) of a majority of the “controlling class”, which means the most subordinate class among the Class E, F, G, H and I Certificates that has a Certificate Balance, as notionally reduced by any Cumulative Appraisal Reduction Amounts allocable to that class, that is at least equal to 25% of its total initial Certificate Balance; provided that if at any time the Certificate Balances of the Principal Balance Certificates (other than the Class E, F, G, H and I Certificates) have been reduced to zero as a result of principal payments on the mortgage loans, then the “controlling class” will be the most subordinate class of Class E, F, G, H and I Certificates that has a Certificate Balance greater than zero without regard to any Cumulative Appraisal Reduction Amounts. The majority controlling class certificateholder will have a continuing right to appoint, remove or replace the directing certificateholder in its sole discretion. This right may be exercised at any time and from time to time. See “Pooling and Servicing Agreement—The Directing Certificateholder” in the Preliminary Prospectus. | ||
| Control and Consultation: | The rights of various parties to replace each Special Servicer and approve or consult with respect to major actions of each Special Servicer will vary according to defined periods.
A “Control Termination Event” occurs if the Class E Certificates have a Certificate Balance, net of any Cumulative Appraisal Reduction Amounts allocable to that Class, that is less than 25% of the initial Certificate Balance of that Class or, while the Class E Certificates are the controlling class, the majority (by Certificate Balance) of the holders of the Class E Certificates irrevocably waived its right, in writing, to exercise any of the rights of the majority controlling class certificateholder and such rights have not been reinstated to a successor majority controlling class certificateholder.
A “Consultation Termination Event” occurs if the Class E Certificates have a Certificate Balance, without regard to any Cumulative Appraisal Reduction Amounts allocable to that Class, that is | ||
THE INFORMATION IN THIS STRUCTURAL AND COLLATERAL TERM SHEET IS NOT COMPLETE AND MAY BE AMENDED PRIOR TO THE TIME OF SALE. THIS TERM SHEET IS NOT AN OFFER TO SELL THESE SECURITIES AND IT IS NOT A SOLICITATION OF AN OFFER TO BUY THESE SECURITIES IN ANY JURISDICTION WHERE THE OFFER OR SALE IS NOT PERMITTED.
21
| Wells Fargo Commercial Mortgage Trust 2016-LC24 | Certain Terms and Conditions |
less than 25% of the initial Certificate Balance of that Class or, while the Class E Certificates are the controlling class, the majority (by Certificate Balance) of the holders of the Class E Certificates irrevocably waived its right, in writing, to exercise any of the rights of the majority controlling class certificateholder and such rights have not been reinstated to a successor majority controlling class certificateholder.
If no Control Termination Event has occurred and is continuing, except with respect to the Excluded Loans (as defined below) and Servicing Shift Whole Loans (as defined below), (i) the directing certificateholder will be entitled to grant or withhold approval of asset status reports prepared, and material servicing actions proposed, by each Special Servicer, and (ii) the directing certificateholder will be entitled to terminate and replace each Special Servicer with or without cause, and appoint itself or another person as the successor special servicer. It will be a condition to such appointment that Fitch, KBRA and Moody’s (and any Rating Agency rating any securities backed by any pari passu companion loan(s) serviced under this transaction) confirm that the appointment would not result in a qualification, downgrade or withdrawal of any of their then-current ratings of certificates (and any certificates backed by any pari passu companion loan(s) serviced under this transaction).
If a Control Termination Event has occurred and is continuing but no Consultation Termination Event has occurred and is continuing, each Special Servicer will be required to consult with the directing certificateholder (other than with respect to Excluded Loans) and the Operating Advisor in connection with asset status reports and material special servicing actions.
If a Consultation Termination Event has occurred and is continuing, each Special Servicer must seek to consult with the Operating Advisor in connection with asset status reports and material special servicing actions, and, in general, no directing certificateholder will be recognized or have any right to terminate the Special Servicers or approve, direct or consult with respect to servicing matters.
With respect to the Central Park Retail mortgage loan and the One & Two Corporate Plaza mortgage loan, the rights of the directing certificateholder described above will be subject to the consultation rights of the holder of the relatedpari passu companion loan(s) as described below. With respect to the 1140 Avenue of the Americas whole loan and the Aspen at Norman Student Housing whole loan (each a “Servicing Shift Whole Loan”), the rights of the directing certificateholder described above will be subject to the control rights of the related controllingpari passu companion loan as described below.
Notwithstanding any contrary description set forth above, with respect to the Central Park Retail mortgage loan and the One & Two Corporate Plaza mortgage loan, the holder of the relatedpari passu companion loan(s) in the related whole loan (or its representative, including any directing certificateholder under any securitization of suchpari passu companion loan(s)) will have consultation rights with respect to asset status reports and material special servicing actions involving the related whole loan, as provided for in the related intercreditor agreement and as described in the Preliminary Prospectus, and those rights will be in addition to the rights of the directing certificateholder in this transaction described above.
For purposes of the servicing of the Central Park Retail whole loan and the One & Two Corporate Plaza whole loan, the occurrence and continuance of a Control Termination Event or Consultation Termination Event under this securitization will not limit the consultation and other rights of the holder of the relatedpari passu companion loan(s).
Notwithstanding any contrary description set forth above, with respect to The Shops at Crystals mortgage loan, in general the related whole loan will be serviced under the SHOPS 2016-CSTL trust and servicing agreement, which grants the directing certificateholder under the SHOP 2016-CSTL securitization control rights that may include the right to approve or disapprove various material servicing actions involving the related whole loan. The directing certificateholder for this securitization (so long as no Consultation Termination Event has occurred and is occurring) will have the right to be consulted on a non-binding basis with respect to such actions, provided that such rights will only be exercisable upon and during the termination of a subordinate control period under the SHOPS 2016-CSTL trust and servicing agreement. For purposes of the servicing of The Shops at Crystals whole loan, the occurrence and continuance of a Control Termination Event or Consultation Termination Event under this securitization will not limit the control or other rights of the directing certificateholder (or equivalent) under the SHOPS 2016-CSTL securitization.
Also, notwithstanding any contrary description set forth above, with respect to the Pinnacle II mortgage loan, in general the related whole loan will be serviced under the WFCM 2016-BNK1 pooling and servicing agreement, which grants the directing certificateholder under the WFCM 2016-BNK1 securitization control rights that may include the right to approve or disapprove various material servicing actions involving the related whole loan. The directing certificateholder for this securitization (so long as no Consultation Termination Event has occurred and is occurring) will nonetheless have the right to be consulted on a non-binding basis with respect to such actions. For purposes of the servicing of the Pinnacle II whole loan,
|
THE INFORMATION IN THIS STRUCTURAL AND COLLATERAL TERM SHEET IS NOT COMPLETE AND MAY BE AMENDED PRIOR TO THE TIME OF SALE. THIS TERM SHEET IS NOT AN OFFER TO SELL THESE SECURITIES AND IT IS NOT A SOLICITATION OF AN OFFER TO BUY THESE SECURITIES IN ANY JURISDICTION WHERE THE OFFER OR SALE IS NOT PERMITTED.
22
| Wells Fargo Commercial Mortgage Trust 2016-LC24 | Certain Terms and Conditions |
the occurrence and continuance of a Control Termination Event or Consultation Termination Event under this securitization will not limit the control or other rights of the directing certificateholder (or equivalent) under the WFCM 2016-BNK1 securitization.
Also, notwithstanding any contrary description set forth above, with respect to the Equity Inns Portfolio mortgage loan, in general the related whole loan will be serviced under the COMM 2015-LC23 pooling and servicing agreement, which grants the directing certificateholder (or equivalent) under the COMM 2015-LC23 securitization control rights that may include the right to approve or disapprove various material servicing actions involving the related whole loan. The directing certificateholder for this securitization (so long as no Consultation Termination Event has occurred and is occurring) will nonetheless have the right to be consulted on a non-binding basis with respect to such actions. For purposes of the servicing of the Equity Inns Portfolio whole loan, the occurrence and continuance of a Control Termination Event or Consultation Termination Event under this securitization will not limit the control or other rights of the directing certificateholder (or equivalent) under the COMM 2015-LC23 securitization.
Also, notwithstanding any contrary description set forth above, with respect to the Hilton Garden Inn Athens Downtown mortgage loan, in general the related whole loan will be serviced under the CGCMT 2016-C2 pooling and servicing agreement, which grants the directing certificateholder under the CGCMT 2016-C2 securitization control rights that may include the right to approve or disapprove various material servicing actions involving the related whole loan. The directing certificateholder for this securitization (so long as no Consultation Termination Event has occurred and is occurring) will nonetheless have the right to be consulted on a non-binding basis with respect to such actions. For purposes of the servicing of the Hilton Garden Inn Athens Downtown whole loan, the occurrence and continuance of a Control Termination Event or Consultation Termination Event under this securitization will not limit the control or other rights of the directing certificateholder (or equivalent) under the CGCMT 2016-C2 securitization.
Also, notwithstanding any contrary description set forth above, with respect to the 1140 Avenue of the Americas mortgage loan and the Aspen at Norman Student Housing mortgage loan, in general, each such mortgage loan (as applicable) will be serviced (i) prior to the applicable Servicing Shift Securitization Date, under the WFCM 2016-LC24 pooling and servicing agreement, and (ii) after the applicable Servicing Shift Securitization Date, under the related Servicing Shift PSA, each of which grants, or is expected to grant, to the related controlling noteholder control rights that include the right to approve or disapprove various material servicing actions involving the 1140 Avenue of the Americas mortgage loan or the Aspen at Norman Student Housing mortgage loan, as applicable. The directing certificateholder for this securitization will nonetheless have the right to be consulted on a nonbinding basis with respect to such actions. For purposes of the servicing of each of the 1140 Avenue of the Americas whole loan and the Aspen at Norman Student Housing mortgage loan, the occurrence and continuance of a Control Termination Event or Consultation Termination Event under this securitization will not limit the control or other rights of the related controlling noteholder. The securitization of each related controllingpari passu companion loan will not limit the consultation rights of the directing certificateholder under this securitization.
Notwithstanding any contrary description set forth above, in the event that, with respect to any mortgage loan, the majority controlling class certificateholder or the directing certificateholder is (i) a borrower, a mortgagor or a manager of a mortgaged property, or the holder of a mezzanine loan that has accelerated the related mezzanine loan or commenced foreclosure or enforcement proceedings against the equity collateral pledged to secure the related mezzanine loan or any affiliate thereof, (ii) with respect to borrower, a mortgagor, a manager of a Mortgaged Property or a mezzanine lender that has accelerated the related mezzanine loan or commenced foreclosure or enforcement proceedings against the equity collateral pledged to secure the related mezzanine loan, (x) any other person controlling or controlled by or under common control with such borrower, mortgagor, manager or mezzanine lender, as applicable, or (y) any other person owning, directly or indirectly, 25% or more of the beneficial interests in such borrower, mortgagor, manager or mezzanine lender (each, a “borrower party”), the majority controlling class certificateholder and the directing certificateholder will have no right to receive asset status reports or such other information as may be specified in the pooling and servicing agreement, to grant or withhold approval of, or consult with respect to, asset status reports prepared, and material servicing actions proposed, by the applicable Special Servicer, with respect to such mortgage loan, and such mortgage loan will be referred to as an “Excluded Loan”.
In addition, notwithstanding any contrary description set forth above, in the event that, with respect to any mortgage loan, a controlling class certificateholder is a borrower party, such controlling class certificateholder will have no right to receive asset status reports or such other information as may be specified in the pooling and servicing agreement with respect to such mortgage loan, and such controlling class certificateholder will be referred to as an “excluded controlling class holder”. |
THE INFORMATION IN THIS STRUCTURAL AND COLLATERAL TERM SHEET IS NOT COMPLETE AND MAY BE AMENDED PRIOR TO THE TIME OF SALE. THIS TERM SHEET IS NOT AN OFFER TO SELL THESE SECURITIES AND IT IS NOT A SOLICITATION OF AN OFFER TO BUY THESE SECURITIES IN ANY JURISDICTION WHERE THE OFFER OR SALE IS NOT PERMITTED.
23
| Wells Fargo Commercial Mortgage Trust 2016-LC24 | Certain Terms and Conditions |
| Replacement of Special Servicer by General Vote of Certificateholders: | If a Control Termination Event has occurred and is continuing, the applicable Special Servicer (other than with respect to a Servicing Shift Whole Loan) may be removed and replaced without cause upon the affirmative direction of certificate owners holding not less than 66-2/3% of a certificateholder quorum, following a proposal from certificate owners holding not less than 25% of the appraisal-reduced voting rights of all Certificates. The certificateholders who initiate a vote on a termination and replacement of the applicable Special Servicer without cause must cause Fitch, KBRA and Moody’s to confirm the then-current ratings of the certificates (or decline to review the matter) and cause the payment of the fees and expenses incurred in the replacement. If no Control Termination Event has occurred and is continuing, either Special Servicer (other than with respect to a Servicing Shift Whole Loan) may be replaced by the directing certificateholder, subject to Fitch, KBRA and Moody’s (and any Rating Agency rating any securities backed by any pari passu companion loan(s) serviced under this transaction) confirming the then-current ratings of the Certificates (and any certificates backed by any pari passucompanion loans serviced under this transaction) or declining to review the matter. | |
| Excluded Special Servicer: | In the event that, with respect to any mortgage loan, a Special Servicer is a borrower party, such Special Servicer will be required to resign as special servicer of such mortgage loan (referred to as an “excluded special servicer loan”). If no Control Termination Event has occurred and is continuing, the directing certificateholder will be entitled to appoint (and may replace with or without cause) a separate special servicer that is not a borrower party (referred to as an “excluded special servicer”) with respect to such excluded special servicer loan unless such excluded special servicer loan is also an excluded loan. Otherwise, upon resignation of the applicable Special Servicer with respect to an excluded special servicer loan, such resigning Special Servicer will be required to appoint the excluded special servicer. | |
| Appraisal Remedy: | If the Class of Certificates comprising the controlling class loses its status as controlling class because of the application of an Appraisal Reduction Amount or Collateral Deficiency Amount, the holders of a majority of the Voting Rights of such Class may require the applicable Special Servicer to order a second appraisal for any mortgage loan in respect of which an Appraisal Reduction Amount or Collateral Deficiency Amount has been applied. Such Special Servicer must thereafter determine whether, based on its assessment of such second appraisal, any recalculation of the Appraisal Reduction Amount or Collateral Deficiency Amount is warranted. Such Class will not be able to exercise any direction, control, consent and/or similar rights of the controlling class unless and until reinstated as the controlling class through such determination; and pending such determination, the rights of the controlling class will be exercised by the control eligible certificates (which may only be any one of Class E, F, G, H and I), if any, that would be the controlling class taking into account the subject appraisal reduction amount. | |
| Sale of Defaulted Assets: | There will be no “fair value” purchase option. Instead, the pooling and servicing agreement will authorize each Special Servicer to sell defaulted mortgage loans serviced by such Special Servicer to the highest bidder in a manner generally similar to sales of REO properties.
The sale of a defaulted loan (other than with respect to 1140 Avenues of the Americas whole loan, The Shops at Crystals whole loan, the Pinnacle II whole loan, the Aspen at Norman Student Housing whole loan, the Equity Inns Portfolio whole loan and the Hilton Garden Inn Athens Downtown whole loan) for less than par plus accrued interest and certain other fees and expenses owed on the loan will be subject to consent or consultation rights of the directing certificateholder and/or Operating Advisor and, in the case of the Central Park Retail whole loan and the One & Two Corporate Plaza whole loan, consultation rights of the holders of the relatedpari passu companion loan(s), as described in the Preliminary Prospectus.
In the case of the Central Park Retail whole loan and the One & Two Corporate Plaza whole loan, pursuant to the related intercreditor agreements and the pooling and servicing agreement, if the applicable Special Servicer offers to sell to any person (or offers to purchase) for cash either such mortgage loan during such time as the related whole loan constitutes a defaulted mortgage loan, then in connection with any such sale, the applicable Special Servicer is required to sell both the mortgage loan and the relatedpari passu companion loan(s) as a single whole loan
In the case of The Shops at Crystals whole loan, pursuant to the SHOPS 2016-CSTL trust and servicing agreement and the related intercreditor agreement, the SHOPS 2016-CSTL special servicer may offer to sell to any person (or may offer to purchase) for cash the related whole loan during such time as the applicable companion loans constitute a defaulted mortgage loan under the SHOPS 2016-CSTL trust and servicing agreement, and, in connection with any such sale, the SHOPS 2016-CSTL special servicer is required to sell both the mortgage loan and the relatedpari passu companion loan(s) and subordinate companion loans as a whole loan. The directing certificateholder for this securitization will have consultation rights as the holder of an interest in the related mortgage loan, as described in the Preliminary Prospectus.
In the case of the Pinnacle II mortgage loan, the Equity Inns Portfolio mortgage loan and the Hilton Garden Inn Athens Downtown mortgage loan, pursuant to the WFCM 2016-BNK1 pooling |
THE INFORMATION IN THIS STRUCTURAL AND COLLATERAL TERM SHEET IS NOT COMPLETE AND MAY BE AMENDED PRIOR TO THE TIME OF SALE. THIS TERM SHEET IS NOT AN OFFER TO SELL THESE SECURITIES AND IT IS NOT A SOLICITATION OF AN OFFER TO BUY THESE SECURITIES IN ANY JURISDICTION WHERE THE OFFER OR SALE IS NOT PERMITTED.
24
| Wells Fargo Commercial Mortgage Trust 2016-LC24 | Certain Terms and Conditions |
and servicing agreement, the COMM 2015-LC23 pooling and servicing agreement or the CGCMT 2016-C2 pooling and servicing agreement, respectively, the related special servicer may offer to sell to any person (or may offer to purchase) for cash the related whole loan during such time as the applicable companion loan(s) constitute a defaulted mortgage loan under the related pooling and servicing agreement, and, in connection with any such sale, the related special servicer is required to sell both the mortgage loan and the relatedpari passu companion loan(s) as a whole loan. The directing certificateholder for this securitization will have consultation rights as the holder of an interest in the related mortgage loan, provided that such rights will only be exercisable prior to a consultation termination event under the related pooling and servicing agreement for this securitization, as described in the Preliminary Prospectus.
In the case of the 1140 Avenue of the Americas mortgage loan and the Aspen at Norman Student Housing mortgage loan, prior to the Servicing Shift Securitization Date, pursuant to the related intercreditor agreement and the WFCM 2016-LC24 pooling and servicing agreement, the applicable Special Servicer may, at the direction or upon the advice of the holder of the related controllingpari passu companion loan, offer to sell to any person (or may offer to purchase) for cash the related whole loan during such time as the related mortgage loan constitutes a defaulted mortgage loan under the WFCM 2016-LC24 pooling and servicing agreement, and, in connection with any such sale, the applicable Special Servicer is required to sell both the applicable mortgage loan and the relatedpari passu companion loans as a whole loan. After the Servicing Shift Securitization Date, pursuant to the related intercreditor agreement, the party acting as special servicer with respect to the related whole loan pursuant to the related Servicing Shift PSA, may offer to sell to any person (or may offer to purchase) for cash such loan, and, in connection with any such sale, such special servicer is required to sell both the related mortgage loan and the relatedpari passu companion loans as a whole loan. The directing certificateholder for this securitization will have consultation rights as the holder of an interest in the related mortgage loan, as described in the Preliminary Prospectus.
| ||
| “As-Is” Appraisals: | Appraisals must be conducted on an “as-is” basis, and must be no more than 9 months old, for purposes of determining Appraisal Reduction Amounts and market value in connection with REO sales. Required appraisals may consist of updates of prior appraisals. Internal valuations by the applicable Special Servicer are permitted if the principal balance of a mortgage loan is less than $2,000,000. | |
| Operating Advisor: | The Operating Advisor will perform certain review duties if a Control Termination Event has occurred and is continuing, which will generally include a limited annual review of, and the delivery of a report regarding, certain actions of each Special Servicer with respect to the resolution and/or liquidation of specially serviced loans to the Certificate Administrator. The review and report generally will be based on any asset status reports and additional information delivered to the Operating Advisor by each Special Servicer. In addition, if a Control Termination Event has occurred and is continuing, each Special Servicer must seek to consult with the Operating Advisor (in addition to the directing certificateholder if no Consultation Termination Event has occurred and is continuing) in connection with material special servicing actions with respect to specially serviced loans serviced by such Special Servicer. Furthermore, under certain circumstances, but only if a Consultation Termination Event has occurred and is continuing, the Operating Advisor may recommend the replacement of a Special Servicer, in which case the Certificate Administrator will deliver notice of such recommendation to the certificateholders, and certificateholders with specified percentages of the voting rights may direct the replacement of such Special Servicer at their expense. The Operating Advisor will not have any rights or powers with respect to a Servicing Shift Whole Loan.
If a Consultation Termination Event has occurred and is continuing, the Operating Advisor may be removed and replaced without cause upon the affirmative direction of certificate owners holding not less than 75% of the appraisal-reduced voting rights of all Principal Balance Certificates, following a proposal from certificate owners holding not less than 25% of the appraisal-reduced voting rights of all certificates. The certificateholders who initiate a vote on a termination and replacement of the Operating Advisor without cause must cause Fitch, KBRA and Moody’s to confirm the then-current ratings of the certificates (or decline to review the matter) and cause the payment of the fees and expenses incurred in the replacement. The Operating Advisor generally may be discharged from its duties if and when the Class A-1, A-2, A-3, A-4, A-SB, A-S, B, C and D Certificates are retired.
| |
| Asset Representations Reviewer: | The Asset Representations Reviewer will be required to review certain delinquent mortgage loans after a specified delinquency threshold has been exceeded (an “Asset Review Trigger”) and the required percentage of certificateholders vote to direct a review of such delinquent loans. An Asset Review Trigger will occur when either (1) mortgage loans with an aggregate outstanding principal balance of 25.0% or more of the aggregate outstanding principal balance of all of the mortgage loans (including any REO loans (or a portion of any REO loan in the case of a whole loan) held by the issuing entity as of the end of the applicable collection period are delinquent loans or (2) at least 15 mortgage loans are delinquent loans as of the end of the |
THE INFORMATION IN THIS STRUCTURAL AND COLLATERAL TERM SHEET IS NOT COMPLETE AND MAY BE AMENDED PRIOR TO THE TIME OF SALE. THIS TERM SHEET IS NOT AN OFFER TO SELL THESE SECURITIES AND IT IS NOT A SOLICITATION OF AN OFFER TO BUY THESE SECURITIES IN ANY JURISDICTION WHERE THE OFFER OR SALE IS NOT PERMITTED.
25
| Wells Fargo Commercial Mortgage Trust 2016-LC24 | Certain Terms and Conditions |
applicable collection period and the outstanding principal balance of such delinquent loans in the aggregate constitutes at least 20.0% of the aggregate outstanding principal balance of all of the mortgage loans (including any REO loans (or a portion of any REO loan in the case of a whole loan)) held by the issuing entity as of the end of the applicable collection period. See “Pooling and Servicing Agreement—The Asset Representations Reviewer—Asset Review” in the Preliminary Prospectus.
The Asset Representations Reviewer may be terminated and replaced without cause. Upon (i) the written direction of certificateholders evidencing not less than 25% of the voting rights (without regard to the application of any Appraisal Reduction Amounts) requesting a vote to terminate and replace the Asset Representations Reviewer with a proposed successor Asset Representations Reviewer that is an eligible asset reviewer, and (ii) payment by such holders to the certificate administrator of the reasonable fees and expenses to be incurred by the certificate administrator in connection with administering such vote, the certificate administrator will promptly provide notice to all certificateholders and the Asset Representations Reviewer of such request by posting such notice on its internet website, and by mailing such notice to all certificateholders and the Asset Representations Reviewer. Upon the written direction of certificateholders evidencing at least 75% of a certificateholder quorum (without regard to the application of any Appraisal Reduction Amounts), the Trustee will terminate all of the rights and obligations of the Asset Representations Reviewer under the pooling and servicing agreement by written notice to the Asset Representations Reviewer, and the proposed successor Asset Representations Reviewer will be appointed. See “Pooling and Servicing Agreement—The Asset Representations Reviewer” in the Preliminary Prospectus.
| ||
| Dispute Resolution Provisions: | The mortgage loan sellers will be subject to the dispute resolution provisions set forth in the pooling and servicing agreement to the extent those provisions are triggered with respect to any mortgage loan sold to the depositor by a mortgage loan seller and such mortgage loan seller will be obligated under the related mortgage loan purchase agreement to comply with all applicable provisions and to take part in any mediation or arbitration proceedings that may result.
Generally, in the event that a Repurchase Request (as defined in the Preliminary Prospectus) is not “Resolved” (as defined below) within 180 days after the related mortgage loan seller receives such Repurchase Request, then the enforcing servicer will be required to send a notice to the “Initial Requesting Certificateholder” (if any) and the Certificate Administrator indicating the enforcing servicer’s intended course of action with respect to the Repurchase Request. If (a) the enforcing servicer’s intended course of action with respect to the Repurchase Request does not involve pursuing further action to exercise rights against the related mortgage loan seller with respect to the Repurchase Request and the Initial Requesting Certificateholder, if any, or any other certificateholder or certificate owner wishes to exercise its right to refer the matter to mediation (including nonbinding arbitration) or arbitration, or (b) the enforcing servicer’s intended course of action is to pursue further action to exercise rights against the related mortgage loan seller with respect to the Repurchase Request but the Initial Requesting Certificateholder, if any, or any other certificateholder or certificate owner does not agree with the dispute resolution method selected by the enforcing servicer, then the Initial Requesting Certificateholder, if any, or such other certificateholder or certificate owner may deliver a written notice to the applicable Special Servicer indicating its intent to exercise its right to refer the matter to either mediation or arbitration.
| |
| “Resolved” means, with respect to a Repurchase Request, (i) that the related Material Defect has been cured, (ii) the related mortgage loan has been repurchased in accordance with the related mortgage loan purchase agreement, (iii) a mortgage loan has been substituted for the related mortgage loan in accordance with the related mortgage loan purchase agreement, (iv) the applicable mortgage loan seller makes a Loss of Value Payment (as defined in the Preliminary Prospectus), (v) a contractually binding agreement is entered into between the enforcing servicer, on behalf of the issuing entity, and the related mortgage loan seller that settles the related mortgage loan seller’s obligations under the related mortgage loan purchase agreement, or (vi) the related mortgage loan is no longer property of the issuing entity as a result of a sale or other disposition in accordance with the pooling and servicing agreement. See “Pooling and Servicing Agreement—Dispute Resolution Provisions” in the Preliminary Prospectus. | ||
| Investor Communications: | The certificate administrator is required to include on any Form 10–D any request received from a certificateholder to communicate with other certificateholders related to certificateholders exercising their rights under the terms of the pooling and servicing agreement. Any certificateholder wishing to communicate with other certificateholders regarding the exercise of its rights under the terms of the Pooling and Servicing Agreement will be able to deliver a written request signed by an authorized representative of the requesting investor to the certificate administrator. | |
| Certain Fee Offsets: | If a workout fee is earned by a Special Servicer following a loan default with respect to any mortgage loan that it services, then certain limitations will apply based on modification fees |
THE INFORMATION IN THIS STRUCTURAL AND COLLATERAL TERM SHEET IS NOT COMPLETE AND MAY BE AMENDED PRIOR TO THE TIME OF SALE. THIS TERM SHEET IS NOT AN OFFER TO SELL THESE SECURITIES AND IT IS NOT A SOLICITATION OF AN OFFER TO BUY THESE SECURITIES IN ANY JURISDICTION WHERE THE OFFER OR SALE IS NOT PERMITTED.
26
| Wells Fargo Commercial Mortgage Trust 2016-LC24 | Certain Terms and Conditions |
| paid by the borrower. The modification fee generally must not exceed 1% of the principal balance of the loan as modified in any 12-month period. In addition, if the loan re-defaults, any subsequent workout fee on that loan must be reduced by a portion of the modification fees paid by the borrower in the previous 12-months. Likewise, liquidation fees collected in connection with a liquidation or partial liquidation of a mortgage loan must be reduced by a portion of the modification fees paid by the borrower in the previous 12 months. | ||
| Deal Website: | The Certificate Administrator will be required to maintain a deal website which will include, among other items: (a) summaries of asset status reports prepared by each Special Servicer, (b) inspection reports, (c) appraisals, (d) various “special notices” described in the Preliminary Prospectus, (e) the “Investor Q&A Forum” and (f) a voluntary “Investor Registry”. Investors may access the deal website following execution of a certification and confidentiality agreement. | |
| Initial Majority Controlling Class Certificateholder: | It is expected that Prime Finance CMBS B-Piece Holdco IV, L.P. will be the initial majority controlling class certificateholder. | |
| Whole Loans: | The mortgaged properties identified on Annex A-1 to the Preliminary Prospectus as Central Park Retail, 1140 Avenue of the Americas, The Shops at Crystals, Pinnacle II, One & Two Corporate Plaza, Aspen at Norman Student Housing, Equity Inns Portfolio and Hilton Garden Inn Athens Downtown secure both a mortgage loan to be included in the trust fund and one or more other mortgage loans that will not be included in the trust fund, each of which will bepari passu or subordinate in right of payment with the mortgage loan included in the trust fund. We refer to each such group of mortgage loans as a “whole loan”. The Central Park Retail whole loan and the One & Two Corporate Plaza whole loan will each be principally serviced under the pooling and servicing agreement for this securitization. The Shops at Crystals whole loan will be principally serviced under the trust and servicing agreement for the SHOPS 2016-CSTL securitization. The Pinnacle II whole loan, Equity Inns Portfolio whole loan, and Hilton Garden Inn Athens Downtown whole loan will be principally serviced under the pooling and servicing agreement for the WFCM 2016-BNK1 securitization, COMM 2015-LC23 securitization and CGCMT 2016-C2 securitization, respectively. It is expected that prior to the applicable Servicing Shift Securitization Date, each of the Servicing Shift Whole Loans will be serviced under the pooling and servicing agreement for this securitization, and after the applicable Servicing Shift Securitization Date, each Servicing Shift Whole Loan will be serviced under the related Servicing Shift PSA.
As of the closing date, each companion loan in each whole loan will be held by the party identified above under “IV. Characteristics of the Mortgage Pool—B. Summary of thePari PassuWhole Loans”.
|
THE INFORMATION IN THIS STRUCTURAL AND COLLATERAL TERM SHEET IS NOT COMPLETE AND MAY BE AMENDED PRIOR TO THE TIME OF SALE. THIS TERM SHEET IS NOT AN OFFER TO SELL THESE SECURITIES AND IT IS NOT A SOLICITATION OF AN OFFER TO BUY THESE SECURITIES IN ANY JURISDICTION WHERE THE OFFER OR SALE IS NOT PERMITTED.
27
(THIS PAGE INTENTIONALLY LEFT BLANK)
THE INFORMATION IN THIS STRUCTURAL AND COLLATERAL TERM SHEET IS NOT COMPLETE AND MAY BE AMENDED PRIOR TO THE TIME OF SALE. THIS TERM SHEET IS NOT AN OFFER TO SELL THESE SECURITIES AND IT IS NOT A SOLICITATION OF AN OFFER TO BUY THESE SECURITIES IN ANY JURISDICTION WHERE THE OFFER OR SALE IS NOT PERMITTED.
28
CENTRAL PARK RETAIL
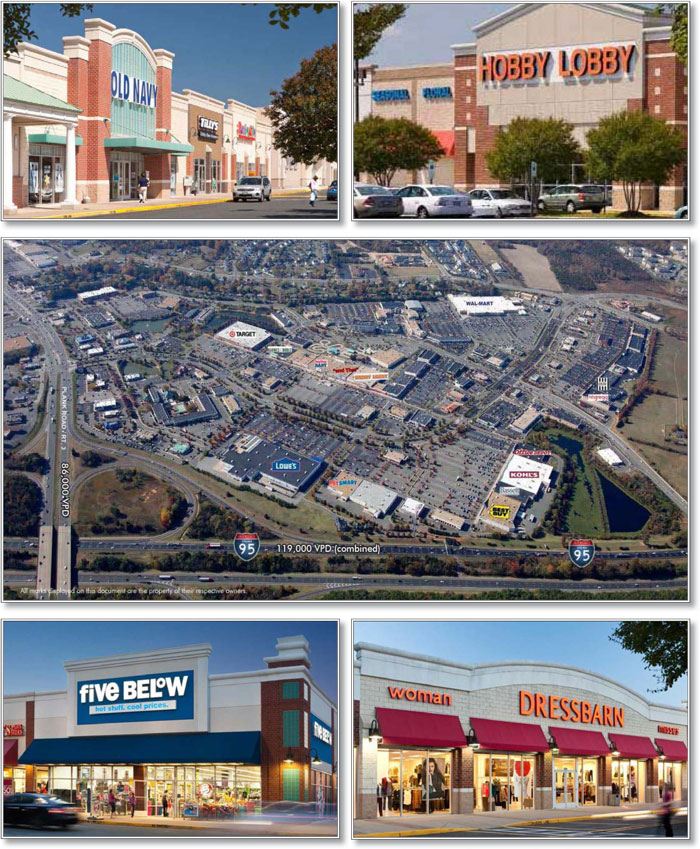
THE INFORMATION IN THIS STRUCTURAL AND COLLATERAL TERM SHEET IS NOT COMPLETE AND MAY BE AMENDED PRIOR TO THE TIME OF SALE. THIS TERM SHEET IS NOT AN OFFER TO SELL THESE SECURITIES AND IT IS NOT A SOLICITATION OF AN OFFER TO BUY THESE SECURITIES IN ANY JURISDICTION WHERE THE OFFER OR SALE IS NOT PERMITTED.
29
CENTRAL PARK RETAIL
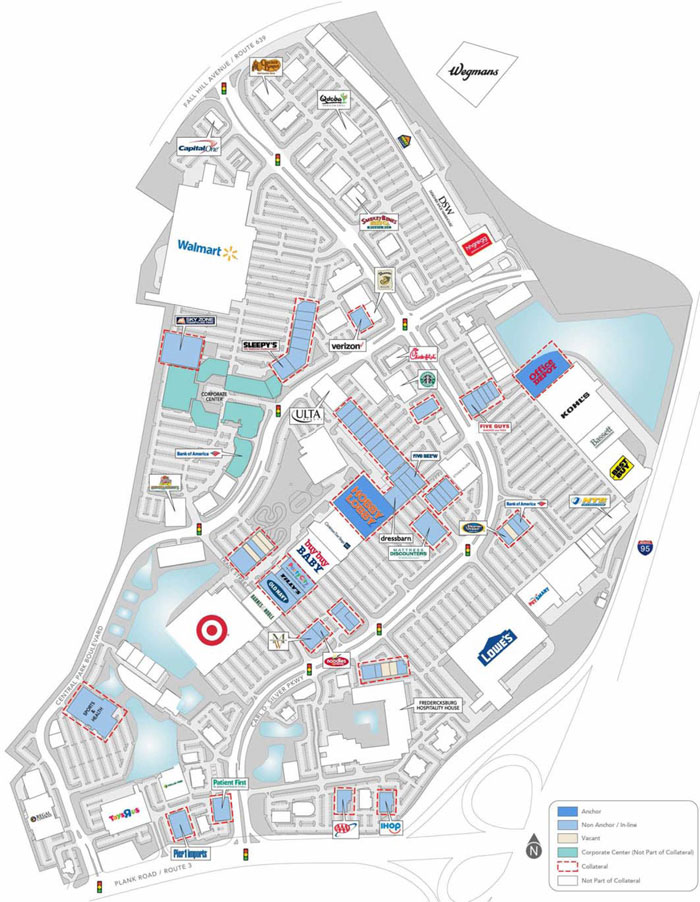
THE INFORMATION IN THIS STRUCTURAL AND COLLATERAL TERM SHEET IS NOT COMPLETE AND MAY BE AMENDED PRIOR TO THE TIME OF SALE. THIS TERM SHEET IS NOT AN OFFER TO SELL THESE SECURITIES AND IT IS NOT A SOLICITATION OF AN OFFER TO BUY THESE SECURITIES IN ANY JURISDICTION WHERE THE OFFER OR SALE IS NOT PERMITTED.
30
CENTRAL PARK RETAIL

THE INFORMATION IN THIS STRUCTURAL AND COLLATERAL TERM SHEET IS NOT COMPLETE AND MAY BE AMENDED PRIOR TO THE TIME OF SALE. THIS TERM SHEET IS NOT AN OFFER TO SELL THESE SECURITIES AND IT IS NOT A SOLICITATION OF AN OFFER TO BUY THESE SECURITIES IN ANY JURISDICTION WHERE THE OFFER OR SALE IS NOT PERMITTED.
31
| No. 1 - Central Park Retail |
| Loan Information | Property Information | |||||||
| Mortgage Loan Seller: | Wells Fargo Bank, National Association | Single Asset/Portfolio: | Single Asset | |||||
| Credit Assessment (Fitch/KBRA/Moody’s): | NR/NR/NR | Property Type: | Retail | |||||
| Original Principal Balance(1): | $70,000,000 | Specific Property Type: | Anchored | |||||
| Cut-off Date Balance(1): | $70,000,000 | Location: | Fredericksburg, VA | |||||
| % of Initial Pool Balance: | 6.7% | Size: | 441,907 SF | |||||
| Loan Purpose: | Refinance | Cut-off Date Balance Per SF(1): | $203.66 | |||||
| Borrower Name: | Central Park Retail, LLC | Year Built/Renovated: | 1966/2014 | |||||
| Sponsor: | Gary D. Rappaport | Title Vesting: | Fee | |||||
| Mortgage Rate: | 4.380% | Property Manager: | Self-managed | |||||
| Note Date: | August 5, 2016 | 4thMost Recent Occupancy (As of): | 95.2% (12/31/2012) | |||||
| Anticipated Repayment Date: | NAP | 3rdMost Recent Occupancy (As of): | 94.0% (12/31/2013) | |||||
| Maturity Date: | September 1, 2026 | 2ndMost Recent Occupancy (As of): | 92.8% (12/31/2014) | |||||
| IO Period: | 0 months | Most Recent Occupancy (As of): | 90.4% (12/31/2015) | |||||
| Loan Term (Original): | 120 months | Current Occupancy (As of)(3): | 95.7% (7/22/2016) | |||||
| Seasoning: | 0 months | |||||||
| Amortization Term (Original): | 360 months | Underwriting and Financial Information: | ||||||
| Loan Amortization Type: | Amortizing Balloon | |||||||
| Interest Accrual Method: | Actual/360 | 4thMost Recent NOI (As of): | $7,397,218 (12/31/2013) | |||||
| Call Protection: | L(24),D(92),O(4) | 3rdMost Recent NOI (As of): | $7,395,577 (12/31/2014) | |||||
| Lockbox Type: | Hard/Upfront Cash Management | 2ndMost Recent NOI (As of): | $7,303,906 (12/31/2015) | |||||
| Additional Debt(1): | Yes | Most Recent NOI (As of): | $7,307,782 (TTM 6/30/2016) | |||||
| Additional Debt Type(1): | Pari Passu | |||||||
| U/W Revenues: | $9,474,343 | |||||||
| U/W Expenses: | $1,715,283 | |||||||
| U/W NOI: | $7,759,060 | |||||||
| Escrows and Reserves(2): | U/W NCF: | $7,116,672 | ||||||
| U/W NOI DSCR(1): | 1.44x | |||||||
| Type: | Initial | Monthly | Cap (If Any) | U/W NCF DSCR(1): | 1.32x | |||
| Taxes | $278,383 | $55,677 | NAP | U/W NOI Debt Yield(1): | 8.6% | |||
| Insurance | $0 | Springing | NAP | U/W NCF Debt Yield(1): | 7.9% | |||
| Replacement Reserves | $0 | $11,807 | NAP | As-Is Appraised Value: | $121,000,000 | |||
| TI/LC Reserve | $0 | $36,898 | $1,328,340 | As-Is Appraisal Valuation Date: | June 1, 2016 | |||
| Rent Concession Reserve | $138,076 | $0 | NAP | Cut-off Date LTV Ratio(1): | 74.4% | |||
| Outstanding TI/LC Reserve | $526,940 | $0 | NAP | LTV Ratio at Maturity or ARD(1): | 59.9% | |||
| (1) | The Central Park Retail Whole Loan (as defined below), totaling $90,000,000, is comprised of twopari passu notes (Notes A-1 and A-2). Note A-1, which represents the controlling interest in the Central Park Retail Whole Loan, had an original principal balance of $70,000,000, has an outstanding principal balance of $70,000,000 as of the Cut-off Date and will be contributed to the WFCM 2016-LC24 Trust. The non-controlling Note A-2 had an original principal balance of $20,000,000 and is expected to be contributed to a future trust. All statistical financial information related to balances per square foot, loan-to-value ratios, debt service coverage ratios and debt yields are based on the Central Park Retail Whole Loan. The lender provides no assurances that any non-securitizedpari passunote will not be split further. |
| (2) | See “Escrows” section. |
| (3) | As of July 22, 2016, the Central Park Retail Property was 91.0% occupied and 95.7% leased by 62 tenants. |
The Mortgage Loan. The mortgage loan (the “Central Park Retail Mortgage Loan”) is part of a whole loan (the “Central Park Retail Whole Loan”) that is evidenced by twopari passu promissory notes (Note A-1 and Note A-2) secured by a first mortgage encumbering an anchored retail center located in Fredericksburg, Virginia (the “Central Park Retail Property”). The Central Park Retail Whole Loan was originated on August 5, 2016 by Wells Fargo Bank, National Association. The Central Park Retail Whole Loan had an original principal balance of $90,000,000, has an outstanding principal balance as of the Cut-off Date of $90,000,000 and accrues interest at an interest rate of 4.380%per annum. The Central Park Retail Whole Loan had an initial term of 120 months, has a remaining term of 120 months as of the Cut-off Date and requires payments of principal and interest based on a 30-year amortization schedule through the term of the Central Park Retail Mortgage Loan. The Central Park Retail Whole Loan matures on September 1, 2026.
Note A-1, which will be contributed to the WFCM 2016-LC24 Trust, had an original principal balance of $70,000,000, has an outstanding principal balance as of the Cut-off Date of $70,000,000 and represents the controlling interest in the Central Park Retail Whole Loan. The non-controlling Note A-2, which had an original principal balance of $20,000,000, referred to herein as the “Central Park Retail Companion Loan”, is expected to be contributed to a future securitization trust. The lender provides no assurances that any non-securitizedpari passu note will not be split further. See “Description of the Mortgage Pool—The Whole Loans—The Serviced Whole Loans—The Central Park Retail Whole Loan” in the Preliminary Prospectus.
THE INFORMATION IN THIS STRUCTURAL AND COLLATERAL TERM SHEET IS NOT COMPLETE AND MAY BE AMENDED PRIOR TO THE TIME OF SALE. THIS TERM SHEET IS NOT AN OFFER TO SELL THESE SECURITIES AND IT IS NOT A SOLICITATION OF AN OFFER TO BUY THESE SECURITIES IN ANY JURISDICTION WHERE THE OFFER OR SALE IS NOT PERMITTED.
32
CENTRAL PARK RETAIL
Note Summary
| Notes | Original Balance | Note Holder | Controlling Interest | |
| A-1 | $70,000,000 | WFCM 2016-LC24 | Yes | |
| A-2 | $20,000,000 | Wells Fargo Bank, National Association | No | |
| Total | $90,000,000 |
Following the lockout period, the borrower has the right to defease the Central Park Retail Mortgage Loan in whole, but not in part, on any date before June 1, 2026. In addition, the Central Park Retail Mortgage Loan is prepayable without penalty on or after June 1, 2026.
Sources and Uses
| Sources | Uses | |||||||
| Original whole loan amount | $90,000,000 | 97.5% | Loan payoff(1) | $90,451,700 | 98.0% | |||
| Sponsor’s new cash contribution | 2,340,661 | 2.5 | Reserves | 943,399 | 1.0 | |||
| Closing costs | 945,562 | 1.0 | ||||||
| Total Sources | $92,340,661 | 100.0% | Total Uses | $92,340,661 | 100.0% |
| (1) | The Central Park Retail Property was previously securitized in the MLCFC 2006-4 transaction. The Central Park Retail Whole Loan was used to pay off a portion of the previous $125,000,000 mortgage loan, which also included debt secured by a 229,611 square foot office complex, which was refinanced separately. Approximately $90,451,770 of the previous $125,000,000 loan is allocated to the Central Park Retail Property. |
The Property.The Central Park Shopping Center is a regional power center located in Fredericksburg, Virginia, approximately 53.7 miles southwest of Washington, D.C. that contains 2.5 million square feet of retail and office space, of which the 441,907 square feet of retail space (“Central Park Retail Property”, as defined above) serves as collateral for the Central Park Retail Whole Loan. The Central Park Retail Property is situated on a 48.4-acre parcel of land and is anchored by Office Depot and Hobby Lobby Stores. According to a third party geographic information provider, the Central Park Shopping Center is one of the largest power centers on the East Coast, and shadow anchors include Wal-Mart, Lowe’s, Target, Kohl’s, Regal Cinemas and Best Buy (all of which are not part of the collateral for the Central Park Retail Whole Loan). The Central Park Retail Property consists of a 29 single-story buildings and contains 2,837 parking spaces, resulting in a parking ratio of 6.4 spaces per 1,000 square feet of rentable area. The majority of the Central Park Retail Property is located along Carl D Silver Parkway, which serves as the backbone for the Central Park Shopping Center. This portion of the collateral is located in the heart of the Central Park Shopping Center and benefits from visibility and accessibility, being completely surrounded by roadways and shadow anchor tenancies on all four sides. Five buildings, representing 45,300 square feet (10.3% of net rentable area) are located in a retail area known as Waverly Village, which is located 0.3 miles southwest, across Plank Road (Route 3), from the Central Park Shopping Center and adjacent to the Spotsylvania Towne Center, an approximate 1.6 million square foot super-regional mall anchored by Macy’s, JCPenney, Sears, Dick’s Sporting Goods, Costco and Belk.
The Central Park Retail Property has benefited from positive leasing momentum, with a total of 117,247 square feet (26.5% of net rentable area) having either signed or renewed occupancy in 2015 and 2016. Tenants representing 51.1% of the underwritten base rent have been in occupancy at the Central Park Retail Property for over 10 years. Over the past eight years, the Central Park Retail Property has averaged 92.1% occupancy, with an average annual occupancy of at least 86.4%. As of July 22, 2016, the Central Park Retail Property was 91.0% occupied and 95.7% leased by 62 tenants subject to 63 leases. Skyzone has a fully executed lease for 20,930 square feet (4.7% of net rentable area) at the Central Park Retail Property but is still undergoing build-out of their space and is expected to take occupancy in November 2016.
As of April 2016, 15 tenants, representing approximately 77,728 square feet (17.6% of net rentable area) reported at least two full prior years of comparable sales (along with a trailing 12-month period ending in 2016). These tenants, along with the two anchor tenants, exhibited average trailing 12-month sales of $229 PSF with an average occupancy cost of 14.2%. Comparable year-over-year sales increased 1.8% from 2014 to 2015, and 1.4% from 2015 to the trailing 12-month period ending in 2016.
THE INFORMATION IN THIS STRUCTURAL AND COLLATERAL TERM SHEET IS NOT COMPLETE AND MAY BE AMENDED PRIOR TO THE TIME OF SALE. THIS TERM SHEET IS NOT AN OFFER TO SELL THESE SECURITIES AND IT IS NOT A SOLICITATION OF AN OFFER TO BUY THESE SECURITIES IN ANY JURISDICTION WHERE THE OFFER OR SALE IS NOT PERMITTED.
33
CENTRAL PARK RETAIL
The following table presents certain information relating to the tenancy at the Central Park Retail Property:
Major Tenants
| Tenant Name | Credit Rating (Fitch/Moody’s/ S&P)(1) | Tenant NRSF | % of NRSF | Annual U/W Base Rent PSF(2) | Annual U/W Base Rent(2) | % of Total Annual U/W Base Rent | Sales PSF | Occupancy Cost | Lease Expiration Date |
| Anchor Tenant – Not Part of Collateral | |||||||||
| Wal-Mart | AA/Aa2/AA | 230,000 | SHADOW ANCHOR – NOT PART OF THE COLLATERAL | ||||||
| Lowe’s | NR/A3/A- | 185,000 | SHADOW ANCHOR – NOT PART OF THE COLLATERAL | ||||||
| Target | A-/A2/A | 117,000 | SHADOW ANCHOR – NOT PART OF THE COLLATERAL | ||||||
| Kohl’s | BBB/Baa2/BBB | 86,000 | SHADOW ANCHOR – NOT PART OF THE COLLATERAL | ||||||
| Regal Cinemas | B+/B1/B+ | 51,000 | SHADOW ANCHOR – NOT PART OF THE COLLATERAL | ||||||
| Best Buy | BBB-/Baa1/BBB- | 46,000 | SHADOW ANCHOR – NOT PART OF THE COLLATERAL | ||||||
| Anchor Tenants | |||||||||
| Office Depot | NR/B1/B- | 29,887 | 6.8% | $16.40 | $490,200 | 5.9% | $143(3) | 12.4%(3) | 12/31/2017(4) |
| Hobby Lobby Stores | NR/NR/NR | 53,459 | 12.1% | $8.50 | $454,402 | 5.5% | $115(5) | 8.5%(5) | 10/31/2021(6) |
| Total Anchor Tenants | 83,346 | 18.9% | $11.33 | $944,602 | 11.4% | ||||
| Major Tenants | |||||||||
| Sports & Health | NR/NR/NR | 29,000 | 6.6% | $13.50 | $391,500 | 4.7% | NAV | NAV | 12/31/2020(7) |
| Mattress Discounters | NR/NR/NR | 15,700(8) | 3.6% | $23.00(8) | $361,040(8) | 4.4% | NAV | NAV | Various(8) |
| Party City | NR/NR/NR | 12,000 | 2.7% | $22.48 | $269,746 | 3.3% | NAV | NAV | 7/31/2019 |
| Old Navy | BB+/Baa2/BB+ | 15,002 | 3.4% | $17.60 | $264,035 | 3.2% | $322(9) | 6.3%(9) | 9/30/2018(10) |
| Pier 1 Imports | NR/NR/B+ | 9,013 | 2.0% | $29.01 | $261,464 | 3.2% | NAV | NAV | 2/28/2019 |
| Verizon Wireless | A-/Baa1/BBB+ | 11,000 | 2.5% | $22.00 | $242,004 | 2.9% | NAV | NAV | 3/31/2020(11)(12) |
| Patient First | NR/NR/NR | 7,502 | 1.7% | $32.26 | $242,000 | 2.9% | NAV | NAV | 3/31/2020(13) |
| Total Major Tenants | 99,217 | 22.5% | $20.48 | $2,031,789 | 24.5% | ||||
| Non-Major Tenants | 240,489 | 54.4% | $22.06 | $5,305,118 | 64.1% | ||||
| Occupied Collateral Total | 423,052 | 95.7%(14) | $19.58 | $8,281,509 | 100.0% | ||||
| Vacant Space | 18,855 | 4.3% | |||||||
| Collateral Total | 441,907 | 100.0% | |||||||
| (1) | Certain ratings are those of the parent company whether or not the parent guarantees the lease. |
| (2) | Annual U/W Base Rent PSF and Annual U/W Base Rent include contractual rent steps through December 2017 totaling $37,261. |
| (3) | Office Depot sales and occupancy costs are based on the trailing 12-month period ending December 31, 2015. |
| (4) | Office Depot has three, five-year lease extension options. |
| (5) | Hobby Lobby Stores sales and occupancy costs are based on the trailing 12-month period ending October 31, 2015. |
| (6) | Hobby Lobby Stores has two, five-year lease extension options. |
| (7) | Sports & Health has the right to terminate its lease at any time after January 1, 2019 with a minimum of 6 months’ notice. |
| (8) | Mattress Discounters leases multiple suites under multiple leases with 11,700 square feet (2.6% of the net rentable area) within the Central Park Shopping Center expiring January 31, 2018 and 4,000 square feet (0.9% of the net rentable area) within Waverly Village expiring on February 28, 2021. |
| (9) | Old Navy sales and occupancy costs are based on the trailing 12-month period ending April 30, 2016. |
| (10) | Old Navy has two, five-year lease extension options. |
| (11) | Verizon Wireless has a one time option to terminate its lease effective March 31, 2017 with notice required by October 1, 2016 along with the payment of a termination fee of approximately $121,002. |
| (12) | Verizon Wireless has two, five-year lease extension options. |
| (13) | Patient First has six, five-year lease extension options. |
| (14) | As of July 22, 2016, the Central Park Retail Property was 91.0% occupied and 95.7% leased. Skyzone has a fully executed lease for 20,930 square feet (4.7% of net rentable area) at the Central Park Retail Property but is still undergoing build-out of its space and is expected to take occupancy in November 2016. |
THE INFORMATION IN THIS STRUCTURAL AND COLLATERAL TERM SHEET IS NOT COMPLETE AND MAY BE AMENDED PRIOR TO THE TIME OF SALE. THIS TERM SHEET IS NOT AN OFFER TO SELL THESE SECURITIES AND IT IS NOT A SOLICITATION OF AN OFFER TO BUY THESE SECURITIES IN ANY JURISDICTION WHERE THE OFFER OR SALE IS NOT PERMITTED.
34
CENTRAL PARK RETAIL
The following table presents certain information relating to the historical sales and occupancy costs at the Central Park Retail Property:
Historical Sales (PSF) and Occupancy Costs(1)
| Tenant Name | 2014 | 2015 | TTM 4/30/2016 | Current Occupancy Cost |
| Office Depot | $139 | $143(2) | $143(2) | 12.4%(2) |
| Hobby Lobby Stores | $108 | $115(3) | $115(3) | 8.5%(3) |
| Old Navy | $335 | $328 | $322 | 6.3% |
| Ann Taylor Loft | $306 | $308 | $304 | 11.9% |
| Dress Barn Inc. | $160 | $156 | $159 | 15.5% |
| Noodles & Company | $427 | $452 | $467 | 11.4% |
| The Melting Pot | $216 | $228 | $228 | 10.0% |
| Lane Byrant | $252 | $257 | $258 | 10.9% |
| Kirkland’s | $237 | $249 | $250 | 9.7% |
| Shane’s Rib Shack | $389 | $362 | $347(4) | 8.0%(4) |
| Sleepys | $104 | $139 | $150 | 22.6% |
| Catherines Inc. | $146 | $146 | $150 | 16.0% |
| Total Comparable Sales(5) | $222 | $226 | $229 | |
| Occupancy Costs(5)(6) | 14.9% | 14.6% | 14.2% |
| (1) | Historical Sales (PSF) and Occupancy Costs were provided by the borrower. Current Occupancy Cost is based on the most recent available Historical Sales. |
| (2) | Office Depot sales and occupancy costs are based on the trailing 12-month period ending December 31, 2015. |
| (3) | Hobby Lobby Stores sales and occupancy costs are based on the trailing 12-month period ending October 31, 2015. |
| (4) | Shane’s Rib Shack sales are based on the trailing 12-month period ending February 28, 2016. |
| (5) | Represents the 15 tenants, comprising approximately 77,728 square feet (17.6% of net rentable area), that reported at least two full prior years of comparable sales and a trailing 12-month period ending in 2016, along with the two anchor tenants at the Central Park Retail Property. |
| (6) | Occupancy Costs are based on the Annual U/W Base Rent and reimbursements and historical sales. |
The following table presents certain information relating to the lease rollover schedule at the Central Park Retail Property:
Lease Expiration Schedule(1)(2)
| Year Ending December 31, | No. of Leases Expiring | Expiring NRSF | % of Total NRSF | Cumulative Expiring NRSF | Cumulative % of Total NRSF | Annual U/W Base Rent | % of Total Annual U/W Base Rent | Annual U/W Base Rent PSF(3) |
| MTM | 1 | 2,000 | 0.5% | 2,000 | 0.5% | $14,000 | 0.2% | $7.00 |
| 2016 | 0 | 0 | 0.0% | 2,000 | 0.5% | $0 | 0.0% | $0.00 |
| 2017 | 6 | 47,250 | 10.7% | 49,250 | 11.1% | $1,026,585 | 12.4% | $21.73 |
| 2018 | 7 | 53,488 | 12.1% | 102,738 | 23.2% | $1,105,948 | 13.4% | $20.68 |
| 2019 | 14 | 59,577 | 13.5% | 162,315 | 36.7% | $1,559,914 | 18.8% | $26.18 |
| 2020 | 9 | 71,486 | 16.2% | 233,801 | 52.9% | $1,476,613 | 17.8% | $20.66 |
| 2021 | 7 | 78,159 | 17.7% | 311,960 | 70.6% | $1,048,094 | 12.7% | $13.41 |
| 2022 | 4 | 18,483 | 4.2% | 330,443 | 74.8% | $469,011 | 5.7% | $25.38 |
| 2023 | 7 | 29,979 | 6.8% | 360,422 | 81.6% | $686,354 | 8.3% | $22.89 |
| 2024 | 3 | 10,800 | 2.4% | 371,222 | 84.0% | $254,110 | 3.1% | $23.53 |
| 2025 | 2 | 9,200 | 2.1% | 380,422 | 86.1% | $177,300 | 2.1% | $19.27 |
| 2026 | 3 | 42,630 | 9.6% | 423,052 | 95.7% | $463,579 | 5.6% | $10.87 |
| Thereafter | 0 | 0 | 0.0% | 423,052 | 95.7% | $0 | 0.0% | $0.00 |
| Vacant | 0 | 18,855 | 4.3% | 441,907 | 100.0% | $0 | 0.0% | $0.00 |
| Total/Weighted Average | 63(4) | 441,907 | 100.0% | $8,281,509 | 100.0% | $19.58 |
| (1) | Information obtained from the underwritten rent roll. |
| (2) | Certain tenants may have lease termination options that are exercisable prior to the originally stated expiration date of the subject lease and that are not considered in the Lease Expiration Schedule. |
| (3) | Weighted Average Annual U/W Base Rent PSF excludes vacant space. |
| (4) | There are 62 tenants subject to 63 leases at the Central Park Retail Property. |
THE INFORMATION IN THIS STRUCTURAL AND COLLATERAL TERM SHEET IS NOT COMPLETE AND MAY BE AMENDED PRIOR TO THE TIME OF SALE. THIS TERM SHEET IS NOT AN OFFER TO SELL THESE SECURITIES AND IT IS NOT A SOLICITATION OF AN OFFER TO BUY THESE SECURITIES IN ANY JURISDICTION WHERE THE OFFER OR SALE IS NOT PERMITTED.
35
CENTRAL PARK RETAIL
The following table presents historical occupancy percentages at the Central Park Retail Property:
Historical Occupancy
12/31/2010(1) | 12/31/2011(1) | 12/31/2012(1) | 12/31/2013(1) | 12/31/2014(1) | 12/31/2015(1) | 7/22/2016(2)(3) |
| 93.4% | 91.2% | 95.2% | 94.0% | 92.8% | 90.4% | 95.7% |
| (1) | Information obtained from the borrower. |
| (2) | Information obtained from the underwritten rent roll. |
| (3) | As of July 22, 2016, the Central Park Retail Property was 91.0% occupied and 95.7% leased by 62 tenants. |
Operating History and Underwritten Net Cash Flow. The following table presents certain information relating to the historical operating performance and the underwritten net cash flow at the Central Park Retail Property:
Cash Flow Analysis
| 2013 | 2014 | 2015 | TTM 6/30/2016 | U/W | %of U/W Effective Gross Income | U/W $ per SF | |||||||||
| Base Rent | $7,807,330 | $7,955,152 | $7,753,235 | $7,759,387 | $8,281,509(1) | 87.4% | $18.74 | ||||||||
| Grossed Up Vacant Space | 0 | 0 | 0 | 0 | 454,684 | 4.8 | 1.03 | ||||||||
| Percentage Rent | 70,970 | 13,821 | 0 | 0 | 0 | 0.0 | 0.00 | ||||||||
| Total Reimbursables | 932,000 | 930,523 | 1,101,723 | 1,119,845 | 1,164,834 | 12.3 | 2.64 | ||||||||
| Other Income | 24,240 | 22,877 | 38,443 | 21,969 | 28,000 | 0.3 | 0.06 | ||||||||
| Less Vacancy & Credit Loss | 0 | 0 | 0 | 0 | (454,684)(2) | (4.8) | (1.03) | ||||||||
| Effective Gross Income | $8,834,540 | $8,922,373 | $8,893,401 | $8,901,201 | $9,474,343 | 100.0% | $21.44 | ||||||||
| Total Operating Expenses | $1,437,322 | $1,526,796 | $1,589,495 | $1,593,420 | $1,715,283 | 18.1% | $3.88 | ||||||||
| Net Operating Income | $7,397,218 | $7,395,577 | $7,303,906 | $7,307,782 | $7,759,060 | 81.9% | $17.56 | ||||||||
| TI/LC | 0 | 0 | 0 | 0 | 501,167 | 5.3 | 1.13 | ||||||||
| Capital Expenditures | 0 | 0 | 0 | 0 | 141,221 | 1.5 | 0.32 | ||||||||
| Net Cash Flow | $7,397,218 | $7,395,577 | $7,303,906 | $7,307,782 | $7,116,672 | 75.1% | $16.10 | ||||||||
| NOI DSCR(3) | 1.37x | 1.37x | 1.35x | 1.35x | 1.44x | ||||||||||
| NCF DSCR(3) | 1.37x | 1.37x | 1.35x | 1.35x | 1.32x | ||||||||||
| NOI DY(3) | 8.2% | 8.2% | 8.1% | 8.1% | 8.6% | ||||||||||
| NCF DY(3) | 8.2% | 8.2% | 8.1% | 8.1% | 7.9% |
| (1) | Annual U/W Base Rent PSF and Annual U/W Base Rent include contractual rent steps through December 2017 totaling $37,261. |
| (2) | The underwritten economic vacancy is 5.2%. The Central Park Retail Property was 95.7% leased and 91.0% physically occupied as of July 22, 2016. |
| (3) | The debt service coverage ratios and debt yields are based on the Central Park Retail Whole Loan. |
Appraisal.As of the appraisal valuation date of June 1, 2016, the Central Park Retail Property had an “as-is” appraised value of $121,000,000.
Environmental Matters. According to a Phase I environmental site assessment dated June 8, 2016, there was no evidence of any recognized environmental conditions at the Central Park Retail Property.
Market Overview and Competition.The Central Park Retail Property is located in Fredericksburg, Virginia, approximately 53.7 miles southwest of Washington D.C and approximately 57.3 miles north of Richmond, Virginia. The Fredericksburg region, which includes the city of Fredericksburg and the counties of Caroline, King George, Spotsylvania, and Stafford, has been the fastest growing region in Virginia for the past 8 years. Additionally, with a population growth of over 16.2% between 2010 and 2014, Fredericksburg represents the sixth fastest growing area in the U.S. According to the appraisal, the employment character of Fredericksburg indicates a predominantly middle- to upper-income employment profile, with a 2016 average household income within a three- and five-mile radius of the Central Park Retail Property of $78,981 and $89,158, respectively, with the majority of the population holding government, business services and retail related jobs. According to the appraisal, the 2016 population within a three- and five-mile radius are 44,793 and 123,928, respectively. According to a third party market research report, the Central Park Retail Property is located within the Fredericksburg City retail submarket, which as of the second quarter of 2016 had a total inventory of approximately 5.1 million square feet with a vacancy rate of 5.2%, down from 8.3% as of the second quarter 2009. The Fredericksburg City retail submarket has averaged a vacancy rate of 4.5% over the past 10 years. Additionally, within a 1-mile radius of the Central Park Retail Property, the retail vacancy rate is 3.0% and has averaged 2.8% over the past 5 years. As of the second quarter of 2016, the average retail asking rent was $15.44 per square foot on a triple-net basis.
The Central Park Retail Property is located within a retail corridor in Northern Virginia and benefits from exposure along both Interstate-95, a six-lane highway just east of the Central Park Retail Property, and Plank Road (Route 3), a six-lane road just south of the Central Park Retail Property. Plank Road has a daily traffic count of 90,684 and I-95 has a daily traffic count of 144,375. The I-95 and Route 3 Interchange is currently undergoing a roadway improvement project that will increase accessibly to the Central Park Shopping Center by adding additional lanes and signalized intersections. The interchange improvement project has an estimated cost of $21.0 million with an anticipated completion in Fall 2018. Immediately north of the Central Park Retail Property is Celebrate Virginia, a 2,400-acre mixed use development featuring the 116,000 square foot Fredericksburg Expo & Conference Center, a multi-
THE INFORMATION IN THIS STRUCTURAL AND COLLATERAL TERM SHEET IS NOT COMPLETE AND MAY BE AMENDED PRIOR TO THE TIME OF SALE. THIS TERM SHEET IS NOT AN OFFER TO SELL THESE SECURITIES AND IT IS NOT A SOLICITATION OF AN OFFER TO BUY THESE SECURITIES IN ANY JURISDICTION WHERE THE OFFER OR SALE IS NOT PERMITTED.
36
CENTRAL PARK RETAIL
purpose facility which hosts over 250 events annually; three hotels (a 148-room Hilton Garden Inn, a 122-room Hampton Inn & Suites and a 124-room Homewood Suites by Hilton); 1,200 residences and the Cannon Ridge Golf Club. Bordering the Central Park Retail Property to the south is the Spotsylvania Towne Center, an approximately 1.6 million square foot super-regional mall anchored by Macy’s, JCPenney, Sears, Dick’s Sporting Goods, Costco and Belk. The Spotsylvania Towne Center is a prominent demand driver to the immediate area, drawing from a trade area population of 628,836 with an average income of $112,675.
The following table presents certain information relating to comparable properties to the Central Park Retail Property:
Comparable Leases(1)
| Property Name/Location | Year Built/ Renovated | Anchor Tenants | Total GLA (SF) | Total Occupancy | Distance from Subject | Tenant Name | Lease Date / Term | Lease Area (SF) | Annual Base Rent PSF | Lease Type |
Dulles Landing Chantilly, VA | 2015/NAP | TJ Maxx, Home Goods, Ross Dress for Less, Dick’s Sporting Goods, Michaels | 429,415 | 85% | 58.3 miles | Michaels | March 2016 / 10 Yrs | 21,080 | $16.00 | NNN |
Dulles Landing Chantilly, VA | 2015/ NAP | TJ Maxx, Home Goods, Ross Dress for Less, Dick’s Sporting Goods, Michaels | 429,415 | 85% | 58.3 miles | TJ Maxx | March 2016 / 10 Yrs | 25,000 | $13.25 | NNN |
Dulles Landing Chantilly, VA | 2015/ NAP | TJ Maxx, Home Goods, Ross Dress for Less, Dick’s Sporting Goods, Michaels | 429,415 | 85% | 58.3 miles | Dicks Sporting Goods | March 2016 / 10 Yrs | 45,000 | $11.50 | NNN |
The Shops at Waldorf Waldorf, MD | 1987/NAP | hhgregg, Michaels, LA Fitness | 496,071 | 90% | 56.3 miles | LA Fitness | June 2015 / 12 Yrs | 30,253 | $19.00 | NNN |
Plaza America Reston, VA | 1995/NAP | Whole, Michael’s CVS | 165,000 | 92% | 55.8 miles | Whole Foods | March 2014 / 15 Yrs | 25,000 | $29.00 | NNN |
| (1) | Information obtained from the appraisal, a third party market report and underwritten rent roll. |
| (2) | As of July 22, 2016, the Central Park Retail Property was 91.0% occupied and 95.7% leased. Skyzone has a fully executed lease for 20,930 square feet (4.7% of net rentable area) at the Central Park Retail Property but is still undergoing build-out of its space and is expected to take occupancy in November 2016. |
The Borrower.The borrower is Central Park Retail, LLC, a Delaware limited liability company and single purpose entity with two independent directors. Legal counsel to the borrower delivered a non-consolidation opinion in connection with the origination of the Central Park Retail Whole Loan. Gary D. Rappaport and The Gary D. Rappaport Revocable Trust are the guarantors of certain nonrecourse carveouts under the Central Park Retail Whole Loan.
The Sponsor.The sponsor is Gary D. Rappaport, CEO of Rappaport Companies, a retail real estate company he founded in 1984. Rappaport Companies provides leasing, tenant representation, management and development services for more than 14 million square feet. Rappaport Company’s portfolio includes more than 45 shopping centers and ground floor retail in approximately 100 mixed-use properties, both residential and office, located primarily throughout the mid-Atlantic region. Rappaport Companies and affiliates were subject to an indirect, minority-interest foreclosure proceeding in 2009. See “Description of the Mortgage Pool – Certain Terms of the Mortgage Loans—Non-Recourse Obligations” and“Description of the Mortgage Pool—Default History, Bankruptcy Issues and Other Proceedings” in the Preliminary Prospectus.
Escrows.The loan documents provide for upfront reserves in the amount of $278,383 for real estate taxes, $526,940 for outstanding TI/LC reserves for Skyzone ($284,962), Comcast ($178,980), The Cellular Connection ($38,998) and Ancient Kabob House ($24,000) and $138,076 for outstanding rent concessions for Skyzone ($62,720), Occasions by M&K ($29,878), Veterinary Emergency Center ($15,254), Comcast ($12,856), Potbelly ($6,602), iCare Optometry ($6,512) and Ancient Kabob House ($4,255).
The loan documents require monthly deposits of $55,677 for real estate taxes, $11,807 for replacement reserves and $36,898 for tenant improvements and leasing commissions (subject to a cap of $1,328,340 as long as no event of default has occurred and is continuing and the debt service coverage ratio is at least 1.20x). The loan documents do not require monthly escrows for insurance provided (i) no event of default has occurred and is continuing; (ii) the insurance required to be maintained by the borrower is maintained pursuant to one or more blanket insurance policies approved by the lender; (iii) the borrower provides the lender with timely proof of payment of insurance premiums; and (iv) the borrower provides evidence of renewal of insurance policies.
Lockbox and Cash Management.The Central Park Retail Whole Loan requires a lender-controlled lockbox account, which is already in place, and that the borrower direct the tenants to pay their rents directly into such lockbox account. The loan documents also require that all rents received by the borrower or property manager be deposited into the lockbox account within one business day of receipt. Prior to the occurrence of a Cash Trap Event Period (as defined below), all excess funds on deposit in the lockbox account are disbursed to the borrower. During a Cash Trap Event Period, all excess funds are required to be swept to a lender-controlled cash management account.
THE INFORMATION IN THIS STRUCTURAL AND COLLATERAL TERM SHEET IS NOT COMPLETE AND MAY BE AMENDED PRIOR TO THE TIME OF SALE. THIS TERM SHEET IS NOT AN OFFER TO SELL THESE SECURITIES AND IT IS NOT A SOLICITATION OF AN OFFER TO BUY THESE SECURITIES IN ANY JURISDICTION WHERE THE OFFER OR SALE IS NOT PERMITTED.
37
CENTRAL PARK RETAIL
A “Cash Trap Event Period” will commence upon the earlier of (i) the occurrence and continuance of an event of default and (ii) the debt service coverage ratio falling below 1.15x at the end of any calendar quarter. A Cash Trap Event Period will be cured, with regard to clause (i), upon the cure of such event of default; and with regard to clause (ii), upon the debt service coverage ratio being equal to or greater than 1.20x for two consecutive calendar quarters.
Property Management. The Central Park Retail Property is managed by an affiliate of the borrower.
Assumption.The borrower has a two-time right to transfer the Central Park Retail Property, provided that certain other conditions are satisfied, including, but not limited to: (i) no event of default has occurred and is continuing; (ii) the lender’s reasonable determination that the proposed transferee and guarantor satisfy the lender’s credit review and underwriting standards, taking into consideration transferee experience, financial strength and general business standing; and (iii) if requested by the lender, rating agency confirmation from Fitch, KBRA and Moody’s that the transfer will not result in a downgrade, withdrawal or qualification of the respective ratings assigned to the Series 2016-LC24 Certificates and similar confirmations from each rating agency rating any securities backed by the Central Park Retail Companion Loan with respect to the ratings of such securities.
Partial Release. Not permitted.
Real Estate Substitution.Not permitted.
Subordinate and Mezzanine Indebtedness.Not permitted.
Ground Lease. None.
Terrorism Insurance.The loan documents require that the “all risk” insurance policy required to be maintained by the borrower provide coverage for terrorism in an amount equal to the full replacement cost of the Central Park Retail Property, as well as business interruption insurance covering no less than the 18-month period following the occurrence of a casualty event, together with a six-month extended period of indemnity.
THE INFORMATION IN THIS STRUCTURAL AND COLLATERAL TERM SHEET IS NOT COMPLETE AND MAY BE AMENDED PRIOR TO THE TIME OF SALE. THIS TERM SHEET IS NOT AN OFFER TO SELL THESE SECURITIES AND IT IS NOT A SOLICITATION OF AN OFFER TO BUY THESE SECURITIES IN ANY JURISDICTION WHERE THE OFFER OR SALE IS NOT PERMITTED.
38
(THIS PAGE INTENTIONALLY LEFT BLANK)
THE INFORMATION IN THIS STRUCTURAL AND COLLATERAL TERM SHEET IS NOT COMPLETE AND MAY BE AMENDED PRIOR TO THE TIME OF SALE. THIS TERM SHEET IS NOT AN OFFER TO SELL THESE SECURITIES AND IT IS NOT A SOLICITATION OF AN OFFER TO BUY THESE SECURITIES IN ANY JURISDICTION WHERE THE OFFER OR SALE IS NOT PERMITTED.
39
| GREEN VALLEY PORTFOLIO |
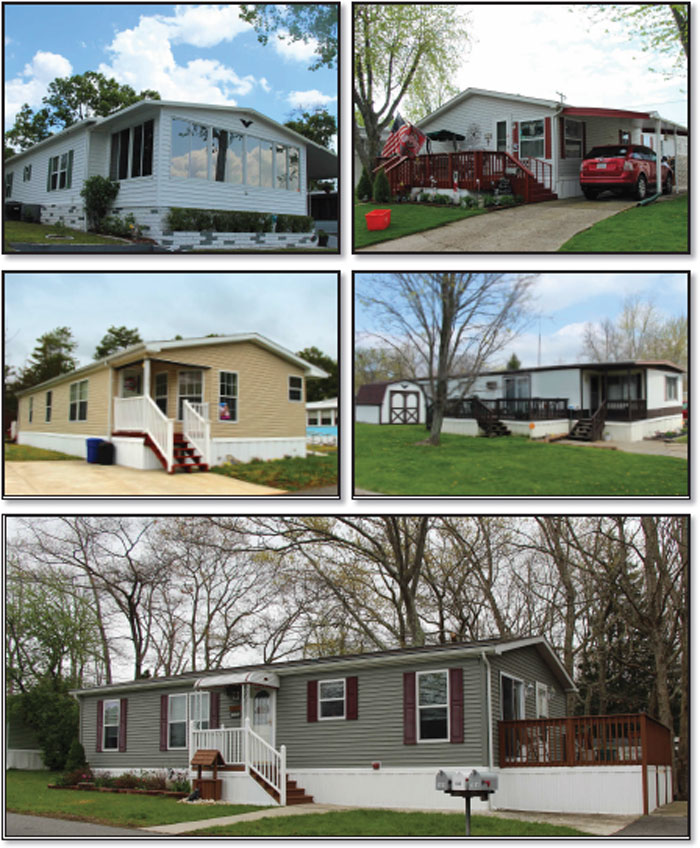
THE INFORMATION IN THIS STRUCTURAL AND COLLATERAL TERM SHEET IS NOT COMPLETE AND MAY BE AMENDED PRIOR TO THE TIME OF SALE. THIS TERM SHEET IS NOT AN OFFER TO SELL THESE SECURITIES AND IT IS NOT A SOLICITATION OF AN OFFER TO BUY THESE SECURITIES IN ANY JURISDICTION WHERE THE OFFER OR SALE IS NOT PERMITTED.
40
| GREEN VALLEY PORTFOLIO |
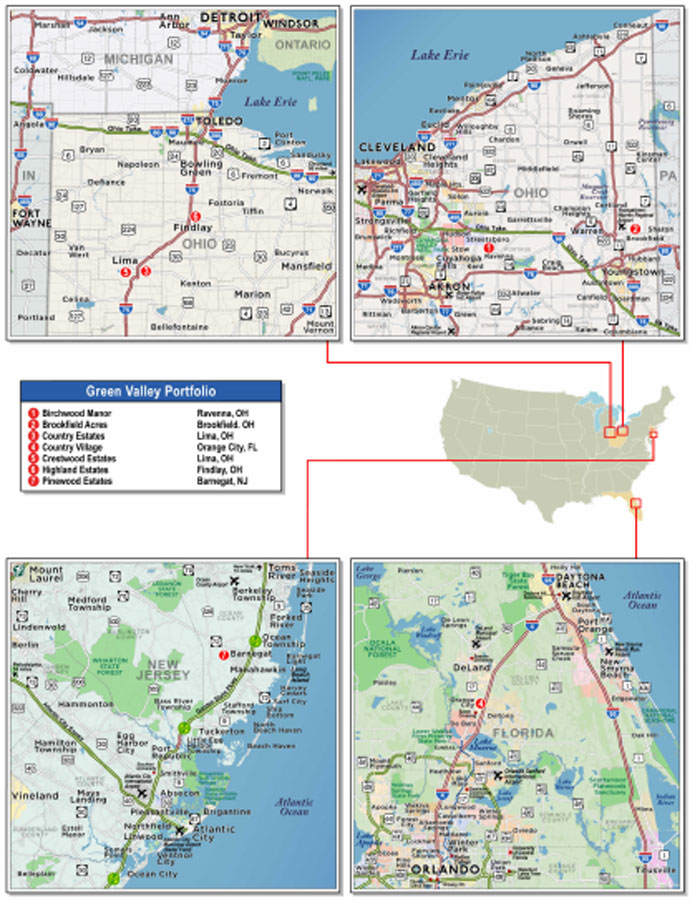
THE INFORMATION IN THIS STRUCTURAL AND COLLATERAL TERM SHEET IS NOT COMPLETE AND MAY BE AMENDED PRIOR TO THE TIME OF SALE. THIS TERM SHEET IS NOT AN OFFER TO SELL THESE SECURITIES AND IT IS NOT A SOLICITATION OF AN OFFER TO BUY THESE SECURITIES IN ANY JURISDICTION WHERE THE OFFER OR SALE IS NOT PERMITTED.
41
| No. 2 – Green Valley Portfolio | ||||||
| Loan Information | Property Information | |||||
| Mortgage Loan Seller: | Ladder Capital Finance LLC | Single Asset/Portfolio: | Portfolio | |||
| Credit Assessment (Fitch/KBRA/Moody’s): | NR/NR/NR | Property Type: | Manufactured Housing Community | |||
| Original Principal Balance: | $58,750,000 | Specific Property Type: | Manufactured Housing Community | |||
| Cut-off Date Balance: | $58,750,000 | Location: | Various – See Table | |||
| % of Initial Pool Balance: | 5.6% | Size: | 2,042 Pads | |||
| Loan Purpose: | Refinance | Cut-off Date Balance Per Pad: | $28,771 | |||
| Borrower Names(1): | Various | Year Built/Renovated: | Various – See Table | |||
| Sponsor: | Ross H. Partrich | Title Vesting: | Fee | |||
| Mortgage Rate: | 4.586% | Property Manager: | Self-managed | |||
| Note Date: | May 11, 2016 | 4thMost Recent Occupancy (As of): | 91.0% (12/31/2012) | |||
| Anticipated Repayment Date: | NAP | 3rdMost Recent Occupancy (As of): | 90.8% (12/31/2013) | |||
| Maturity Date: | June 6, 2026 | 2ndMost Recent Occupancy (As of): | 90.4%(12/31/2014) | |||
| IO Period: | 12 months | Most Recent Occupancy (As of): | 90.0% (12/31/2015) | |||
| Loan Term (Original): | 120 months | Current Occupancy (As of): | 89.1% (4/20/2016) | |||
| Seasoning: | 3 months | |||||
| Amortization Term (Original): | 360 months | Underwriting and Financial Information: | ||||
| Loan Amortization Type: | Interest-only, Amortizing Balloon | |||||
| Interest Accrual Method: | Actual/360 | 4thMost Recent NOI (As of): | $4,731,969 (12/31/2013) | |||
| Call Protection: | L(27),D(89),O(4) | 3rdMost Recent NOI (As of): | $4,772,817 (12/31/2014) | |||
| Lockbox Type: | Springing | 2ndMost Recent NOI (As of): | $4,754,223 (12/31/2015) | |||
| Additional Debt(2): | Yes | Most Recent NOI (As of): | $4,714,508 (TTM 3/31/2016) | |||
| Additional Debt Type(2): | Future Mezzanine | |||||
| U/W Revenues: | $7,876,585 | |||||
| U/W Expenses: | $2,921,435 | |||||
| U/W NOI: | $4,955,150 | |||||
| U/W NCF: | $4,853,050 | |||||
| U/W NOI DSCR: | 1.37x | |||||
| Escrows and Reserves(3): | U/W NCF DSCR: | 1.34x | ||||
| U/W NOI Debt Yield: | 8.4% | |||||
| Type: | Initial | Monthly | Cap (If Any) | U/W NCF Debt Yield: | 8.3% | |
| Taxes | $341,218 | $56,870 | NAP | As-Is Appraised Value: | $81,680,000 | |
| Insurance | $0 | Springing | NAP | As-Is Appraisal Valuation Dates: | Various | |
| Replacement Reserves | $0 | $8,508 | $408,400 | Cut-off Date LTV Ratio: | 71.9% | |
| Deferred Maintenance | $399,526 | $0 | NAP | LTV Ratio at Maturity or ARD: | 60.0% | |
| (1) | See “The Borrowers” section. |
| (2) | See “Subordinate and Mezzanine Indebtedness” section. |
| (3) | See “Escrows” section. |
The Mortgage Loan. The mortgage loan (the “Green Valley Portfolio Mortgage Loan”) is evidenced by a single promissory note that is secured by a first mortgage encumbering seven manufactured housing community properties totaling 2,042 pads located in Ohio, Florida, and New Jersey (the “Green Valley Portfolio Properties”). The Green Valley Portfolio Mortgage Loan was originated on May 11, 2016 by Ladder Capital Finance LLC. The Green Valley Portfolio Mortgage Loan had an original principal balance of $58,750,000, has an outstanding principal balance as of the Cut-off Date of $58,750,000 and accrues interest at an interest rate of 4.586%per annum. The Green Valley Portfolio Mortgage Loan had an initial term of 120 months, has a remaining term of 117 months as of the Cut-off Date and requires interest-only payments for the first 12 payments following origination and, thereafter, requires payments of principal and interest based on a 30-year amortization schedule. The Green Valley Portfolio Mortgage Loan matures on June 6, 2026.
Following the lockout period, the borrower has the right to defease the Green Valley Portfolio Mortgage Loan in whole or in part (see “Partial Release” section), on any due date before March 6, 2026. In addition, the Green Valley Portfolio Mortgage Loan is prepayable without penalty, on or after March 6, 2026.
THE INFORMATION IN THIS STRUCTURAL AND COLLATERAL TERM SHEET IS NOT COMPLETE AND MAY BE AMENDED PRIOR TO THE TIME OF SALE. THIS TERM SHEET IS NOT AN OFFER TO SELL THESE SECURITIES AND IT IS NOT A SOLICITATION OF AN OFFER TO BUY THESE SECURITIES IN ANY JURISDICTION WHERE THE OFFER OR SALE IS NOT PERMITTED.
42
| GREEN VALLEY PORTFOLIO |
Sources and Uses
| Sources | Uses | |||||||
| Original loan amount | $58,750,000 | 100.0% | Loan payoff(1) | $38,247,597 | 65.1% | |||
| Reserves | 740,744 | 1.3 | ||||||
| Closing costs | 1,430,093 | 2.4 | ||||||
| Return of equity | 18,331,566 | 31.2 | ||||||
| Total Sources | $58,750,000 | 100.0% | Total Uses | $58,750,000 | 100.0% |
| (1) | The Green Valley Portfolio Properties were previously securitized in the LBUBS 2006-C4 transaction. |
The Properties.The Green Valley Portfolio Properties consist of seven manufactured housing community properties containing 2,042 pads located in Ohio (five properties), Florida (one property) and New Jersey (one property). The Green Valley Portfolio Properties were built between 1965 and 1991. The Green Valley Portfolio Properties range in size from 199 pad sites to 457 pad sites, with monthly rents ranging from $282 to $471. As of April 20, 2016, the Green Valley Portfolio Properties were 89.1% occupied.
Country Village – Orange City, FL (38.9% of Cut-off Date Balance)
Country Village is a class-A, age-restricted (55+) manufactured housing community consisting of 457 pads on 77.5 acres (5.9 pads per acre), built in 1991 and located in Orange City, Florida, approximately 29.1 miles northeast of Orlando, Florida. As of April 20, 2016, the Country Village mortgaged property was 92.3% occupied. There are 961 total parking spaces including 914 pad spaces (2.1 spaces per pad) and 47 visitor spaces. The Country Village mortgaged property has amenities such as an outdoor pool/jacuzzi, shuffleboard and bocce courts, RV storage, and two clubhouses with on-site leasing, fitness center, library and a game room.
Birchwood Manor – Ravenna, OH (21.4% of Cut-off Date Balance)
Birchwood Manor is a class-B, manufactured housing community consisting of 392 pads on 109.1 acres (3.6 pads per acre), built in two phases (1968 and 1992) and located in Ravenna, Ohio, approximately 30.6 miles southeast of Cleveland, Ohio and approximately 14.7 miles northeast of Akron, Ohio. As of April 20, 2016, the Birchwood Manor mortgaged property was 95.2% occupied. The Birchwood Manor mortgaged property features 784 parking spaces (2.0 spaces per pad), an outdoor basketball court and playground as well as on-site leasing.
Pinewood Estates – Barnegat, NJ (12.0% of Cut-off Date Balance)
Pinewood Estates is a class-B, age-restricted (55+) manufactured housing community consisting of 321 pads on 67.5 acres (4.8 pads per acre), built in 1967 and located in Barnegat, New Jersey, approximately 46.4 miles southeast of Philadelphia, Pennsylvania and approximately 11.0 miles northwest of Long Beach Island, New Jersey. As of April 20, 2016, the Pinewood Estates mortgaged property was 99.7% occupied. There are 692 parking spaces (2.2 spaces per pad) and facility amenities include a clubhouse, playground, and a swimming pool. The Pinewood Estates mortgaged property is subject to rent control, which limits rent increases to once per year in an amount not to exceed the annual CPI for the region.
Country Estates – Lima, OH (8.1% of Cut-off Date Balance)
Country Estates is a class-B, manufactured housing community consisting of 226 pads on 36.3 acres (6.2 pads per acre), built in 1975 and located in Lima, Ohio. As of April 20, 2016, the Country Estates mortgaged property was 82.7% occupied. The County Estates mortgaged property features 452 parking spaces (2.0 spaces per pad), on-site leasing, outdoor storage, a club house and an outdoor pool.
Crestwood Estates – Lima, OH (7.5% of Cut-off Date Balance)
Crestwood Estates is a class-B, manufactured housing community consisting of 199 pads on 34.9 acres (5.7 pads per acre), built in 1965 and located in Lima, Ohio, approximately 4.5 miles northwest of the Country Estates Property. Access to the property is provided by one curb cut along North Cable Rd. As of April 20, 2016, the Crestwood Estates mortgaged property was 88.9% occupied. The Crestwood Estates mortgaged property features 398 parking spaces (2.0 spaces per pad) and outdoor storage.
Brookfield Acres – Brookfield, OH (7.0% of Cut-off Date Balance)
Brookfield Acres is a class-B, manufactured housing community consisting of 232 pads on 78.7 acres (2.9 pads per acre), built in 1972 and located in Brookfield, Ohio. As of April 20, 2016, the Brookfield Acres mortgaged property was 81.5% occupied. The Brookfield Acres mortgaged property features 464 parking spaces (2.0 spaces per pad), outdoor storage, a clubhouse, and a pool.
Highland Estates – Findlay, OH (5.3% of Cut-off Date Balance)
Highland Estates is a class-B, manufactured housing community consisting of 215 pads on 43.5 acres (4.9 pads per acre), built in 1967 and located in Findlay, Ohio. As of April 20, 2016, the Highland Estates mortgaged property was 70.7% occupied. The Highland Estates mortgaged property features 430 parking spaces (2.0 spaces per pad), on-site leasing, outdoor storage, a club house, a playground, and an outdoor pool.
THE INFORMATION IN THIS STRUCTURAL AND COLLATERAL TERM SHEET IS NOT COMPLETE AND MAY BE AMENDED PRIOR TO THE TIME OF SALE. THIS TERM SHEET IS NOT AN OFFER TO SELL THESE SECURITIES AND IT IS NOT A SOLICITATION OF AN OFFER TO BUY THESE SECURITIES IN ANY JURISDICTION WHERE THE OFFER OR SALE IS NOT PERMITTED.
43
| GREEN VALLEY PORTFOLIO |
The following table presents certain information relating to the Green Valley Portfolio Properties:
| Property Name | State | Allocated Cut-off Date Balance | % of Portfolio Cut-off Date Balance | Occupancy | Year Built/ Renovated | Pads | Appraised Value | Allocated LTV |
| Country Village | FL | $22,840,000 | 38.9% | 92.3% | 1991/NAP | 457 | $31,750,000 | 71.9% |
| Birchwood Manor | OH | $12,550,000 | 21.4% | 95.2% | 1968/ NAP | 392 | $17,440,000 | 72.0% |
| Pinewood Estates | NJ | $7,030,000 | 12.0% | 99.7% | 1967/NAP | 321 | $9,770,000 | 72.0% |
| Country Estates | OH | $4,740,000 | 8.1% | 82.7% | 1975/ NAP | 226 | $6,590,000 | 71.9% |
| Crestwood Estates | OH | $4,390,000 | 7.5% | 88.9% | 1965/ NAP | 199 | $6,110,000 | 71.8% |
| Brookfield Acres | OH | $4,090,000 | 7.0% | 81.5% | 1972/NAP | 232 | $5,690,000 | 71.9% |
| Highland Estates | OH | $3,110,000 | 5.3% | 70.7% | 1967/NAP | 215 | $4,330,000 | 71.8% |
| Total/Weighted | $58,750,000 | 100.0% | 89.1% | 2,042 | $81,680,000 | 71.9% |
The following table presents historical occupancy percentages at the Green Valley Portfolio Properties:
Historical Occupancy
12/31/2012(1) | 12/31/2013(1) | 12/31/2014(1) | 12/31/2015(1) | 4/20/2016(2) | ||||
| 91.0% | 90.8% | 90.4% | 90.0% | 89.1% | ||||
| (1) Information obtained from the borrower. | ||||||||
| (2) Information obtained from the underwritten rent roll. | ||||||||
Operating History and Underwritten Net Cash Flow.The following table presents certain information relating to the historical operating performance and underwritten net cash flow at the Green Valley Portfolio Properties:
Cash Flow Analysis
| 2013 | 2014 | 2015 | TTM 3/31/2016 | U/W | % of U/W Effective Gross Income | U/W $ per Pad | |||||||||
| Base Rent | $7,274,372 | $7,415,340 | $7,527,908 | $7,571,948 | $7,793,921 | 99.0% | $3,817 | ||||||||
| Grossed Up Vacant Space | 0 | 0 | 0 | 0 | 1,000,348 | 12.7 | 490 | ||||||||
| Other Income | 81,780 | 77,851 | 79,053 | 82,664 | 82,664 | 1.0 | 40 | ||||||||
| Less Vacancy & Credit Loss | 0 | 0 | 0 | 0 | (1,000,348)(1) | (12.7) | (490) | ||||||||
| Effective Gross Income | $7,356,152 | $7,493,191 | $7,606,961 | $7,654,612 | $7,876,585 | 100.0% | $3,857 | ||||||||
| Total Operating Expenses | $2,624,183 | $2,720,374 | $2,852,738 | $2,940,104 | $2,921,435 | 37.1% | $1,431 | ||||||||
| Net Operating Income | $4,731,969 | $4,772,817 | $4,754,223 | $4,714,508 | $4,955,150 | 62.9% | $2,427 | ||||||||
| Capital Expenditures | 0 | 0 | 0 | 0 | 102,100 | 1.3 | 50 | ||||||||
| Net Cash Flow | $4,731,969 | $4,772,817 | $4,754,223 | $4,714,508 | $4,853,050 | 61.6% | $2,377 | ||||||||
| NOI DSCR | 1.31x | 1.32x | 1.32x | 1.31x | 1.37x | ||||||||||
| NCF DSCR | 1.31x | 1.32x | 1.32x | 1.31x | 1.34x | ||||||||||
| NOI DY | 8.1% | 8.1% | 8.1% | 8.0% | 8.4% | ||||||||||
| NCF DY | 8.1% | 8.1% | 8.1% | 8.0% | 8.3% |
| (1) | The underwritten economic vacancy is 11.4%. The Green Valley Portfolio Properties were 89.1% occupied as of April 20, 2016. |
Appraisal.As of the appraisal valuation dates of April 19,2016 and April 20, 2016, the Green Valley Portfolio Properties had an aggregate “as-is” appraised value of $81,680,000.
Environmental Matters.According to Phase I environmental assessments dated April 28, 2016 and April 29, 2016, there was no evidence of any recognized environmental conditions at the Green Valley Portfolio Properties.
Market Overview.The Green Valley Portfolio Properties are located across Ohio (5 properties), Florida (1 property), and New Jersey (1 property).
Orange City, FL
The Country Village mortgaged property is located in Volusia County in Orange City, Florida, which is approximately 29.1 miles northeast of Orlando, Florida. According to the appraisal, the Country Village mortgaged property is part of the Deltona/Daytona Beach metropolitan statistical area, which had an estimated 2015 population of 618,018. The estimated 2015 population within a one-, three- and five- mile radius of the Country Village mortgaged property was 3,521, 43,098, and 112,588, respectively, and the estimated 2015 average annual household income within the same radii was $53,729, $55,600, and $57,628 respectively. Since 2009, the Volusia County manufactured housing submarket vacancy has never been above 5.0%. The submarket vacancy for Volusia County was 4.0% as of April 2016, while the Country Village mortgaged property was 7.7% vacant as of April 20, 2016.
THE INFORMATION IN THIS STRUCTURAL AND COLLATERAL TERM SHEET IS NOT COMPLETE AND MAY BE AMENDED PRIOR TO THE TIME OF SALE. THIS TERM SHEET IS NOT AN OFFER TO SELL THESE SECURITIES AND IT IS NOT A SOLICITATION OF AN OFFER TO BUY THESE SECURITIES IN ANY JURISDICTION WHERE THE OFFER OR SALE IS NOT PERMITTED.
44
| GREEN VALLEY PORTFOLIO |
Ravenna, OH
The Birchwood Manor mortgaged property is located in Ravenna, Ohio, which is approximately 30.6 miles southeast of Cleveland, Ohio and 14.7 miles northeast of Akron, Ohio. According to the appraisal, the Birchwood Manor mortgaged property is in the Akron, Ohio metropolitan statistical area, which had an estimated 2015 population of 704,168 people. The estimated 2015 population within a one-, three-, and five- mile radius of the Birchwood Manor property was 1,575, 18,346, and 56,037, respectively, and the estimated 2015 average annual household income within the same radii was $55,401, $52,810, and $55,798, respectively. The Birchwood Manor property is located in the Portage, Ohio manufactured housing submarket, which reported a 9.0% vacancy as of April 2016, while the Birchwood Manor mortgaged property was 4.8% vacant as of April 20, 2016.
Barnegat, NJ
The Pinewood Estates mortgaged property is located is Barnegat, New Jersey, which is approximately 46.4 miles southeast of Philadelphia, Pennsylvania, approximately 11.0 miles northwest of Long Beach Island, New Jersey and part of the New York-Newark-Jersey City, NY-NJ-PA metropolitan statistical area. According to the appraisal, the Pinewood Estates mortgaged property is located in Ocean County, which had an estimated 2015 population of 589,096. The estimated 2015 population within a one-, three-, and five-mile radius of the Pinewood Estates property was 704, 14,879, and 39,021, respectively, and the estimated 2015 average annual household income within the same radii was $69,944, $82,155, and $84,938, respectively. The Pinewood Estates mortgaged property is located in the Ocean County manufactured housing submarket, which reported a 2.1% vacancy as of April 2016, while the Pinewood Estates mortgaged property was 0.3% vacant as of April 20, 2016.
Lima, OH
The Country Estates and Crestwood Estates mortgaged properties are located in Lima, Ohio of Allen County, which is within the Lima, Ohio metropolitan statistical area. According to the appraisal, Allen County had an estimated 2015 population of 104,510 people. The estimated 2015 population within a one-, three-, and five-mile radius of the Country Estates mortgaged property was 3,655, 36,553, and 60,276, respectively, and the estimated 2015 average annual household income within the same radii was $43,897, $40,933, and $46,928, respectively. The estimated 2015 population within a one-, three-, and five-mile radius of the Crestwood Estates mortgaged property was 7,370, 46,137, and 68,862, respectively, and the estimated 2015 average annual household income within the same radii was $45,468, $47,711, and $52,583, respectively. The Country Estates and Crestwood Estates mortgaged properties are located in the Lima manufactured housing submarket, which reported an 11.4% vacancy as of April 2016, while the Country Estates and Crestwood Estates mortgaged properties were 17.3% and 11.1% vacant, respectively, as of April 20, 2016.
Brookfield, OH
The Brookfield Acres mortgaged property is located in Brookfield, Ohio, which is part of the Youngstown-Warren-Boardman, Ohio metropolitan statistical area. According to the appraisal, the property is located in Trumbull County which had an estimated 2015 population of 203,238 people. The estimated 2015 population within a one-, three-, and five-mile radius of the Brookfield Acres mortgaged property was 797, 5,616, and 19,765 respectively, and the estimated 2015 average annual household income within the same radii was $61,445, $62,952, and $59,761, respectively. The Brookfield Acres mortgaged property is located in the Trumbull manufactured housing submarket, which reported an 11.7% vacancy as of April 2016, while the Brookfield Acres mortgaged property was 18.5% vacant as of April 20, 2016.
Findlay, OH
The Highland Estates mortgaged property is located in Findlay, Ohio, part of Hancock County, which, according to the appraisal, had an estimated 2015 total population of 75,234 people. The estimated 2015 population within a one-, three-, and five-mile radius of the Highland Estates mortgaged property was 6,073, 40,027, and 52,407, respectively, and the estimated 2015 average annual household income within the same radii was $47,044, $62,917, and $65,246, respectively. The Highland Estates mortgaged property is located in the Findlay manufactured housing submarket, which reported a 14.0% vacancy as of April 2016, while the Highland Estates mortgaged property was 29.3% vacant as of April 20, 2016.
The Borrowers.The borrowers are: Birchwood Manor Mobile Home Park, L.L.C; Brookfield Associates MHC, LLC; Crestwood Associates, LLC; Country Estates Associates, LLC; Highland Estates of Ohio, L.L.C.; Country Village Orange City Associates, LLC; and Pinewood Estates Associates, LLC, each a Delaware limited liability company and single purpose entity with one independent director. Legal counsel to the borrower delivered a non-consolidation opinion in connection with the origination of the Green Valley Portfolio Mortgage Loan. Ross H. Partrich is the guarantor of certain nonrecourse carve-outs under the Green Valley Portfolio Mortgage Loan.
The Sponsor.The sponsor is Ross H. Partrich, who is the key principal of RHP Properties (“RHP”). Mr. Partrich owns and manages a total of 224 communities with over 56,349 housing units and sites spanning 23 states, with a combined value of approximately $3.4 billion. RHP employs more than 900 professionals at their Farmington Hills, Michigan corporate headquarters, regional offices, and on-site management properties across the country. RHP is the second largest private owner of manufactured home communities in the country. The sponsor is also a sponsor under the mortgage loan identified on Annex A-1 to the Preliminary Prospectus as Skyline Village (and further described on Annex A-3 to the Preliminary Prospectus). The sponsor had prior deeds in lieu of foreclosure. For additional information on the sponsor, see “Description of the Mortgage Loans—Loan Purpose; Default History, Bankruptcy Issues and Other Proceedings” in the Preliminary Prospectus.
Escrows.The loan documents provide for upfront reserves in the amount of $341,218 for real estate taxes and $399,526 for deferred maintenance. The loan documents also require monthly deposits in an amount equal to one-twelfth of the estimated annual real estate taxes, which currently equates to $56,870, and $8,508 for replacement reserves (capped at $408,400). The loan
THE INFORMATION IN THIS STRUCTURAL AND COLLATERAL TERM SHEET IS NOT COMPLETE AND MAY BE AMENDED PRIOR TO THE TIME OF SALE. THIS TERM SHEET IS NOT AN OFFER TO SELL THESE SECURITIES AND IT IS NOT A SOLICITATION OF AN OFFER TO BUY THESE SECURITIES IN ANY JURISDICTION WHERE THE OFFER OR SALE IS NOT PERMITTED.
45
| GREEN VALLEY PORTFOLIO |
documents do not require monthly escrows for insurance, provided that (i) the blanket policy is acceptable to the lender and (ii) the borrower provides the lender with evidence of payment five days prior to the due date.
Lockbox and Cash Management.Upon the occurrence and during the continuance of a Sweep Event Period (as defined below), the Green Valley Portfolio Mortgage Loan requires that the borrowers establish a lockbox account and the borrowers or property manager shall deposit all rents into such lockbox account and such funds will be swept to the cash management account. During a Sweep Event Period, all excess cash flow after payment of all sums due and payable under the loan documents and all operating expenses will be retained by the lender as additional collateral.
A “Sweep Event Period” will commence upon any of the following: (i) the occurrence and continuance of an event of default; (ii) the amortizing debt service coverage ratio falling below 1.05x for two consecutive calendar quarters; or (iii) the borrowers defaulting under the management agreement. A Sweep Event Period will be cured, with regard to clause (i), upon the cure of such event of default; with regard to clause (ii), upon the amortizing debt service coverage ratio being equal to or greater than 1.15x for two consecutive calendar quarters; and with regard to clause (iii), upon the date the borrowers have entered into a replacement management agreement with a qualified manager or the date on which the applicable default has been satisfied to the lender’s satisfaction.
Property Management.The Green Valley Portfolio Properties are managed by an affiliate of the sponsor.
Assumption.The borrowers have the right to transfer the Green Valley Portfolio Properties provided that certain conditions are satisfied, including: (i) no event of default has occurred and is continuing; (ii) the lender has reasonably determined that the proposed transferee and guarantor satisfy the lender’s credit review and underwriting standards, taking into consideration the transferee’s experience, financial strength, and general business standing; and (iii) if required by the lender, a rating agency confirmation is obtained from Fitch, KBRA and Moody’s to the effect that such assumption will not result in a downgrade, withdrawal or qualification of the respective ratings assigned to the Series 2016-LC24 Certificates.
Partial Release.Following the lockout period, the borrower is permitted to partially release any of the Green Valley Portfolio Properties in connection with a partial defeasance, subject to certain conditions including: (i) no event of default or Sweep Event Period has occurred and is continuing; (ii) partial defeasance of that portion of the Green Valley Portfolio Mortgage Loan equal to 110% of the allocated loan amount for the released property; (iii) the loan-to-value ratio with respect to the remaining Green Valley Portfolio Properties will be no greater than the lesser of the loan-to-value ratio at closing and the loan-to-value ratio immediately prior to the release; (iv) the amortizing debt service coverage ratio with respect to the remaining Green Valley Portfolio Properties will be no less than the greater of the debt service coverage ratio at closing and the debt service coverage ratio immediately prior to the release; and (v) the lender receives rating agency confirmation from each of Fitch, KBRA and Moody’s that the release will not result in a downgrade, withdrawal or qualification of the respective ratings assigned to the Series 2016-LC24 Certificates
Real Estate Substitution.Not permitted.
Subordinate and Mezzanine Indebtedness.The loan documents permit mezzanine financing subject to: (i) there being no event of default; (ii) a maximum combined loan-to-value ratio equal to the lesser of 75.0% and the loan-to-value ratio upon origination of the Green Valley Portfolio Mortgage Loan; (iii) a minimum combined amortizing debt service coverage ratio equal to the greater of 1.35x and the amortizing debt service coverage ratio upon origination of the Green Valley Portfolio Mortgage Loan; (iv) the lender’s review and approval of (a) the terms and conditions of the mezzanine loan and the mezzanine loan documents and (b) the structure of the mezzanine borrower; (v) if required under the pooling and servicing agreement, the receipt of a rating agency confirmation from each of Fitch, KBRA and Moody’s that the mezzanine financing will not result in a downgrade, withdrawal or qualification of the respective ratings assigned to the Series 2016-LC24 Certificates; and (vi) the execution of an intercreditor agreement acceptable to the lender.
Ground Lease.None.
Terrorism Insurance.The loan documents require that the “all risk” insurance policy required to be maintained by the borrowers provide coverage for terrorism in an amount equal to the full replacement cost of the Green Valley Portfolio Properties. The loan documents also require business interruption insurance covering no less than the 18-month period following the occurrence of a casualty event, together with an 18-month extended period of indemnity.
Windstorm Insurance.The loan documents require windstorm insurance covering the full replacement cost of the Green Valley Portfolio Properties. At origination of the Green Valley Portfolio Mortgage Loan, the Green Valley Portfolio Properties had insurance coverage for windstorm.
THE INFORMATION IN THIS STRUCTURAL AND COLLATERAL TERM SHEET IS NOT COMPLETE AND MAY BE AMENDED PRIOR TO THE TIME OF SALE. THIS TERM SHEET IS NOT AN OFFER TO SELL THESE SECURITIES AND IT IS NOT A SOLICITATION OF AN OFFER TO BUY THESE SECURITIES IN ANY JURISDICTION WHERE THE OFFER OR SALE IS NOT PERMITTED.
46
(THIS PAGE INTENTIONALLY LEFT BLANK)
THE INFORMATION IN THIS STRUCTURAL AND COLLATERAL TERM SHEET IS NOT COMPLETE AND MAY BE AMENDED PRIOR TO THE TIME OF SALE. THIS TERM SHEET IS NOT AN OFFER TO SELL THESE SECURITIES AND IT IS NOT A SOLICITATION OF AN OFFER TO BUY THESE SECURITIES IN ANY JURISDICTION WHERE THE OFFER OR SALE IS NOT PERMITTED.
47
| FOUR POINTS BY SHERATON TIMES SQUARE – LEASED FEE |

THE INFORMATION IN THIS STRUCTURAL AND COLLATERAL TERM SHEET IS NOT COMPLETE AND MAY BE AMENDED PRIOR TO THE TIME OF SALE. THIS TERM SHEET IS NOT AN OFFER TO SELL THESE SECURITIES AND IT IS NOT A SOLICITATION OF AN OFFER TO BUY THESE SECURITIES IN ANY JURISDICTION WHERE THE OFFER OR SALE IS NOT PERMITTED.
48
| FOUR POINTS BY SHERATON TIMES SQUARE – LEASED FEE |
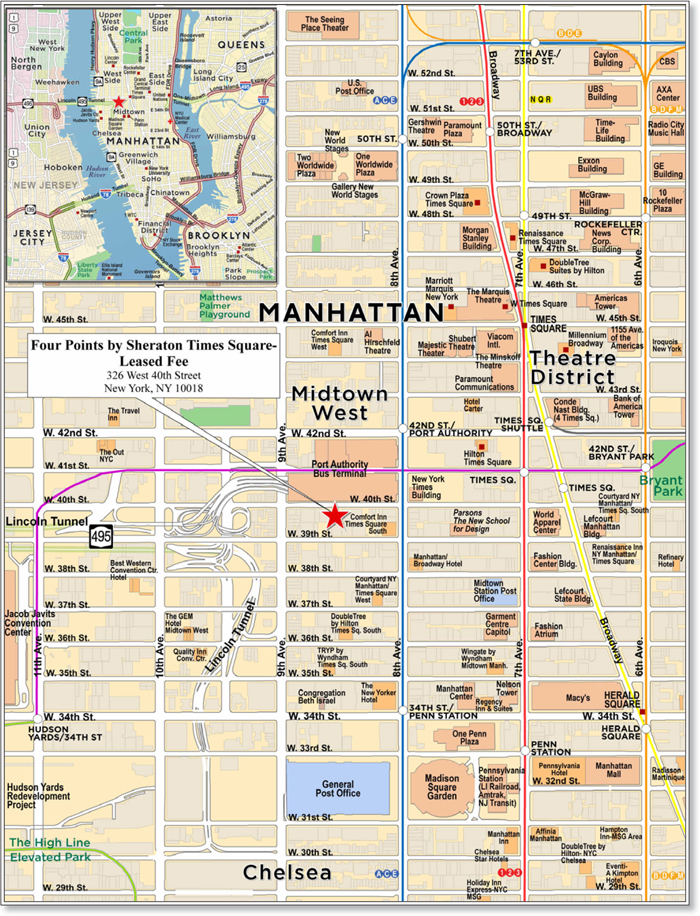
THE INFORMATION IN THIS STRUCTURAL AND COLLATERAL TERM SHEET IS NOT COMPLETE AND MAY BE AMENDED PRIOR TO THE TIME OF SALE. THIS TERM SHEET IS NOT AN OFFER TO SELL THESE SECURITIES AND IT IS NOT A SOLICITATION OF AN OFFER TO BUY THESE SECURITIES IN ANY JURISDICTION WHERE THE OFFER OR SALE IS NOT PERMITTED.
49
| No. 3 – Four Points by Sheraton Times Square - Leased Fee | |||||||||
| Loan Information | Property Information | ||||||||
| Mortgage Loan Seller: | Wells Fargo Bank, National Association | Single Asset/Portfolio: | Single Asset | ||||||
Credit Assessment (Fitch/KBRA/Moody’s): | NR/NR/NR | Property Type: | Other | ||||||
| Original Principal Balance: | $46,700,000 | Specific Property Type: | Leased Fee | ||||||
| Cut-off Date Balance: | $46,700,000 | Location: | New York, NY | ||||||
| % of Initial Pool Balance: | 4.5% | Size(2): | 4,938 SF | ||||||
| Loan Purpose: | Refinance | Cut-off Date Balance Per SF: | $9,457.27 | ||||||
| Borrower Name: | Times Square Hospitality Fee I LLC | Year Built/Renovated: | NAP/NAP | ||||||
| Sponsor: | The Gehr Group, Inc. | Title Vesting: | Fee | ||||||
| Mortgage Rate: | 4.450% | Property Manager: | NAP | ||||||
| Note Date: | July 6, 2016 | 4thMost Recent Occupancy: | NAP | ||||||
| Anticipated Repayment Date: | July 11, 2026 | 3rdMost Recent Occupancy: | NAP | ||||||
| Maturity Date: | July 11, 2036 | 2ndMost Recent Occupancy: | NAP | ||||||
| IO Period: | 120 months | Most Recent Occupancy: | NAP | ||||||
| Loan Term (Original): | 120 months | Current Occupancy (As of): | 100.0% (9/1/2016) | ||||||
| Seasoning: | 2 months | ||||||||
| Amortization Term (Original): | NAP | Underwriting and Financial Information: | |||||||
| Loan Amortization Type: | Interest-only, ARD | ||||||||
| Interest Accrual Method: | Actual/360 | 4thMost Recent NOI: | NAV | ||||||
| Call Protection: | L(36),GRTR 1% or YM(80),O(4) | 3rdMost Recent NOI: | NAV | ||||||
| Lockbox Type: | Springing | 2ndMost Recent NOI: | NAV | ||||||
| Additional Debt: | None | Most Recent NOI: | NAV | ||||||
| Additional Debt Type: | NAP | ||||||||
| U/W Revenues: | $2,627,933 | ||||||||
| U/W Expenses: | $0 | ||||||||
| U/W NOI: | $2,627,933 | ||||||||
| U/W NCF: | $2,627,933 | ||||||||
| U/W NOI DSCR: | 1.25x | ||||||||
| U/W NCF DSCR: | 1.25x | ||||||||
| Escrows and Reserves(1): | U/W NOI Debt Yield: | 5.6% | |||||||
| U/W NCF Debt Yield: | 5.6% | ||||||||
| Type: | Initial | Monthly | Cap (If Any) | As-Is Appraised Value(3): | $62,000,000 | ||||
| Taxes | $0 | Springing | NAP | As-Is Appraisal Valuation Date: | May 4, 2016 | ||||
| Insurance | $0 | Springing | NAP | Cut-off Date LTV Ratio: | 75.3% | ||||
| Replacement Reserves | $0 | $0 | NAP | LTV Ratio at Maturity or ARD: | 75.3% | ||||
| (1) | See “Escrows” section. |
| (2) | Size represents the land area beneath the Four Points by Sheraton Times Square – Hotel (as defined below). |
| (3) | The appraiser concluded to an “as-is” appraised value for the hypothetical fee simple interest in the Four Points by Sheraton Times Square – Hotel of $130,000,000 as of May 4, 2016. |
The Mortgage Loan. The mortgage loan (the “Four Points by Sheraton Times Square – Leased Fee Mortgage Loan”) is evidenced by a promissory note secured by a first mortgage encumbering the fee simple interest in the land which lies beneath the Four Points by Sheraton hotel (the “Four Points by Sheraton Times Square – Leased Fee Property”). The Four Points by Sheraton Times Square – Leased Fee Mortgage Loan was originated on July 6, 2016 by Wells Fargo Bank, National Association. The Four Points by Sheraton Times Square - Leased Fee Mortgage Loan had an original principal balance of $46,700,000, has an outstanding principal balance as of the Cut-off Date of $46,700,000 and accrues interest at an interest rate of 4.450%per annum. The Four Points by Sheraton Times Square - Leased Fee Mortgage Loan had an initial term of 120 months, has a remaining term of 118 months as of the Cut-off Date and requires interest-only payments through the anticipated repayment date (“ARD”). The ARD is July 11, 2026 and the final maturity date is July 11, 2036. In the event the Four Points by Sheraton Times Square – Leased Fee Mortgage Loan is not paid in full on or before the ARD, borrower will be required to make payments of principal and interest based on an interest rate equal to the initial mortgage rate plus 4.000%per annum. The ARD automatically triggers a Cash Trap Event Period (see “Lockbox and Cash Management” section) whereby all excess cash flow will be used to pay down the principal balance of the Four Points by Sheraton Times Square – Leased Fee Mortgage Loan. See “Description of the Mortgage Pool—ARD Loans” in the Preliminary Prospectus.
Following the lockout period, the borrower has the right to prepay the Four Points by Sheraton Times Square – Leased Fee Mortgage Loan in whole, but not in part, on any date before April 11, 2026, provided that the borrower pay the greater of a yield maintenance
THE INFORMATION IN THIS STRUCTURAL AND COLLATERAL TERM SHEET IS NOT COMPLETE AND MAY BE AMENDED PRIOR TO THE TIME OF SALE. THIS TERM SHEET IS NOT AN OFFER TO SELL THESE SECURITIES AND IT IS NOT A SOLICITATION OF AN OFFER TO BUY THESE SECURITIES IN ANY JURISDICTION WHERE THE OFFER OR SALE IS NOT PERMITTED.
50
| FOUR POINTS BY SHERATON TIMES SQUARE – LEASED FEE |
premium or a prepayment premium equal to 1.0% of the principal amount being prepaid. In addition, the Four Points by Sheraton Times Square – Leased Fee Mortgage Loan is prepayable without penalty on or after April 11, 2026.
Sources and Uses(1)
| Sources | Uses | |||||||
| Original loan amount | $46,700,000 | 84.9% | Loan payoff(2) | $54,397,823 | 98.9% | |||
| Sponsor’s new cash contribution | 8,284,955 | 15.1 | Closing costs | 587,132 | 1.1 | |||
| Total Sources | $54,984,955 | 100.0% | Total Uses | $54,984,955 | 100.0% |
| (1) | The Uses reflect only the loan payoff of the total outstanding debt allocated to the Four Points by Sheraton Times Square – Leased Fee Property and the Sources do not account for the additional financing secured by the Four Points by Sheraton Times Square – Hotel (as defined below). |
| (2) | The Four Points by Sheraton Times Square - Hotel was previously securitized in the DBUBS 2011-LC3A transaction. |
The Property. The Four Points by Sheraton Times Square – Leased Fee Property consists of a land parcel totaling 4,938 square feet, or 0.1 acres, located in New York, New York (the Four Points by Sheraton Times Square – Leased Fee Property) and the underlying the leasehold improvements, which are not collateral for the Four Points by Sheraton Times Square – Leased Fee Mortgage Loan (the “Four Points by Sheraton Times Square - Hotel”). The Four Points by Sheraton Times Square - Hotel is subject to a ground lease with the Four Points by Sheraton Times Square – Leased Fee Mortgage Loan borrower (the “Four Points by Sheraton Times Square Ground Lease”), which expires on June 6, 2115 and has an annual rental rate of $2.4 million with 2.0% annual increases for the first ten years and increases of the greater of (y) 2.5% and (z) the Consumer Price Index thereafter provided that the base rent does not increase more than 12.0% during any four year period.
Built in 2006, the Four Points by Sheraton Times Square - Hotel contains 33 stories and 244 guest rooms. Amenities at the Four Points by Sheraton Times Square - Hotel include a 24-hour fitness center, a 24-hour business center, the Gotham Bistro which serves breakfast, lunch and dinner, Best Brews bar and an approximately 5,000-square-foot bi-level rooftop bar and lounge, the Sky Room Bar, which offers a 360 degree view of Manhattan, Times Square and the Hudson River. The Sky Room Bar is owned by an affiliate of the borrower and occupies the top two floors of the Four Points by Sheraton Times Square - Hotel as well as the adjacent hotel building, the Fairfield Inn & Suites New York Manhattan Times Square, which is also owned by the borrower. As of the trailing 12-month period ending May 31, 2016, the Four Points by Sheraton Times Square - Hotel exhibited an occupancy rate of 95.9%, ADR of $229.27 and RevPAR of $219.93. Management is in the preliminary stages of a property improvement plan, which is scheduled to commence within the next 12 months with a preliminary budget of approximately $2.9 million ($11,680 per key). The franchise agreement between the Four Points by Sheraton Times Square - Hotel and The Sheraton LLC expires in June 2029.
Operating History and Underwritten Net Cash Flow. The following table presents certain information relating to the historical operating performance of the non-collateral Four Points by Sheraton Times Square - Hotel and the underwritten net cash flow at the Four Points by Sheraton Times Square – Leased Fee Property:
Cash Flow Analysis
| Non-Collateral Improvements | |||||||
| 2014(1) | 2015(1) | TTM 5/31/2016(1) | U/W “Look Through” to Non-Collateral Improvements(2) | U/W(3) | % of U/W Total Revenue | U/W $ per Room | |
| Occupancy | 96.3% | 94.7% | 95.9% | 85.0% | |||
| ADR | $247.00 | $233.00 | $229.27 | $229.27 | |||
| RevPAR | $237.95 | $220.55 | $219.93 | $194.88 | |||
| Room Revenue | $21,192,000 | $19,642,534 | $19,640,186 | $17,403,519 | $0 | 0.0% | $0 |
| F&B Revenue | 683,000 | 623,576 | 581,183 | 581,183 | 0 | 0.0 | 0 |
| Ground Lease Revenue | 0 | 0 | 0 | 0 | 2,627,933 | 100.0 | 10,770 |
| Other Revenue | 337,000 | 369,511 | 367,646 | 367,646 | 0 | 0.0 | 0 |
| Total Revenue | $22,212,000
| $20,635,621
| $20,589,015
| $18,352,348
| $2,627,933
| 100.0%
| $10,770
|
| Total Department Expenses | 4,571,000 | 4,307,653 | 4,480,442 | 4,042,049 | 0 | 0.0 | 0 |
| Gross Operating Profit | $17,641,000 | $16,327,968 | $16,108,573 | $14,310,299 | $2,627,933 | 100.0% | $10,770 |
| Total Undistributed Expenses | 4,933,000 | 4,750,558 | 4,740,546 | 4,620,934 | 0 | 0.0 | 0 |
| Profit Before Fixed Charges | $12,708,000 | $11,577,410 | $11,368,027 | $9,689,365 | $2,627,933 | 100.0% | $10,770 |
| Total Fixed Charges | 1,891,000 | 2,331,746 | 2,440,745 | 2,598,000 | 0 | 0.0 | 0 |
| Net Operating Income | $10,817,000 | $9,245,664 | $8,927,282 | $7,091,365 | $2,627,933 | 100.0% | $10,770 |
| FF&E | 0 | 0 | 0 | 734,094 | 0 | 0.0 | 0 |
| Net Cash Flow | $10,817,000 | $9,245,664 | $8,927,282 | $6,357,271 | $2,627,933 | 100.0% | $10,770 |
| NOI DSCR | 5.13x | 4.39x | 4.24x | 3.37x | 1.25x | ||
| NCF DSCR | 5.13x | 4.39x | 4.24x | 3.02x | 1.25x | ||
| NOI DY | 23.2% | 19.8% | 19.1% | 15.2% | 5.6% | ||
| NCF DY | 23.2% | 19.8% | 19.1% | 13.6% | 5.6% | ||
| (1) | Represents the fee simple historical operating performance of the non-collateral Four Points by Sheraton Times Square - Hotel, prior to the ground lease payment. |
| (2) | The U/W “Look Through” to Non-Collateral Improvement represents the lender’s estimates of the non-collateral Four Points by Sheraton Times Square - Hotel income and expenses, not including ground rent due under the Four Points by Sheraton Times Square Ground Lease. |
| (3) | U/W represents average the ground rent payable under the Four Points by Sheraton Times Square Ground Lease over the Four Points by Sheraton Times Square – Leased Fee Mortgage Loan term. |
THE INFORMATION IN THIS STRUCTURAL AND COLLATERAL TERM SHEET IS NOT COMPLETE AND MAY BE AMENDED PRIOR TO THE TIME OF SALE. THIS TERM SHEET IS NOT AN OFFER TO SELL THESE SECURITIES AND IT IS NOT A SOLICITATION OF AN OFFER TO BUY THESE SECURITIES IN ANY JURISDICTION WHERE THE OFFER OR SALE IS NOT PERMITTED.
51
| FOUR POINTS BY SHERATON TIMES SQUARE – LEASED FEE |
Appraisal. As of the appraisal valuation date of May 4, 2016, the Four Points by Sheraton Times Square – Leased Fee Property had an “as-is” appraised value of $62,000,000. The appraiser also concluded to an “as-is” appraised value for the hypothetical fee simple interest in the Four Points by Sheraton Times Square – Hotel of $130,000,000 as of May 4, 2016.
Environmental Matters. According to a Phase I environmental site assessment dated May 12, 2016, there was no evidence of any recognized environmental conditions at the Four Points by Sheraton Times Square – Leased Fee Property.
Market Overview and Competition.The Four Points by Sheraton Times Square – Leased Fee Property is located beneath the Four Points by Sheraton Times Square - Hotel (not part of the collateral) which is located mid-block on West 40th Street between Eighth and Ninth Avenues in Manhattan’s Midtown West neighborhood. The Midtown West neighborhood has good accessibility via major subway lines including A/C/E, N/Q/R, 7 and 1/2/3, and the Port Authority Bus Terminal, which is one of the largest transit hubs in the United States serving more than 65.0 million people annually. Major corporate tenants within walking distance of the Four Points by Sheraton Times Square – Leased Fee Property include the New York Times, Morgan Stanley, Proskauer Rose, Bain & Company, Viacom, Ernst & Young, Skadden Arps, Reuters and Bank of America. Furthermore, the Midtown West neighborhood benefits from its close proximity to the high end retail on Fifth Avenue as well as many of the New York City’s tourist attractions, including the Chrysler Building, St. Patrick’s Cathedral, Museum of Modern Art, Rockefeller Center, Empire State Building and the New York Public Library. The Four Points by Sheraton Times Square – Leased Fee Property is situated two blocks west of Bryant Park and is located at the edge of the Times Square area. Times Square hosts over 131.0 million visitors annually with approximately 360,000 pedestrians passing through the area daily. The high level of pedestrian traffic has resulted in approximately $4.8 billion in annual retail, entertainment and hotel sales. Approximately 22 cents out every dollar spent by visitors in New York City was spent in Times Square.
As the largest single hospitality concentration in New York, Times Square accounts for approximately 17,000 rooms, 21.0% of Manhattan’s total hotel supply and generates over $1.8 billion in hotel revenues. According to a third party market research firm, Times Square hotels generate over $190.0 million in sales and hotel occupancy tax revenue for the City and State of New York.
The following table presents certain information relating to the Four Points by Sheraton Times Square - Hotel’s competitive set:
Subject and Market Historical Occupancy, ADR and RevPAR(1)
Competitive Set | Four Points by Sheraton Times Square - Hotel | Penetration Factor | |||||||
Year | Occupancy | ADR | RevPAR | Occupancy | ADR | RevPAR | Occupancy | ADR | RevPAR |
| 3/31/2016 TTM | 94.9% | $230.00 | $218.24 | 95.9% | $236.09 | $226.30 | 101.0% | 102.6% | 103.7% |
| 3/31/2015 TTM | 96.1% | $235.28 | $226.16 | 95.0% | $244.08 | $231.91 | 98.8% | 103.7% | 102.5% |
| 3/31/2014 TTM | 95.1% | $236.87 | $225.21 | 95.2% | $253.40 | $241.13 | 100.1% | 107.0% | 107.1% |
| (1) | Information obtained from a third party hospitality research report dated April 21, 2016. According to such third party hospitality report, the competitive set includes the following hotels: Holiday Inn Express NYC Madison Square Garden, Fairfield Inn & Suites New York Manhattan Times Square, Hilton Garden Inn New York West 35th Street, Holiday Inn Express New York City Times Square, Hampton Inn Manhattan Times Square South and Doubletree New York Times Square South. |
The Borrower.The borrower is Times Square Hospitality Fee I LLC, a Delaware limited liability company and single purpose entity with one independent director. Legal counsel to the borrower delivered a non-consolidation opinion in connection with the origination of the Four Points by Sheraton Times Square – Leased Fee Mortgage Loan. The Gehr Group, Inc., the sponsor and indirect owner of the borrower, is the guarantor of certain nonrecourse carveouts under the Four Points by Sheraton Times Square – Leased Fee Mortgage Loan.
The Sponsor. The sponsor is The Gehr Group, Inc., a diversified multinational holding company with principal business units engaged in international trade, real estate, hospitality, manufacturing and wholesale and distribution. The real estate and hospitality arms of The Gehr Group, Inc. engage in the ownership and operation of hotels, commercial, shopping centers, industrial and multifamily residential real estate in California, New York and Florida. In the past 30 years, The Gehr Group, Inc. has owned and operated two hotels, over 1,000 multifamily residential units and over 1.0 million square feet of industrial, office and retail space. The Gehr Group, Inc. also owns the Four Points by Sheraton Times Square - Hotel.
Escrows.The loan documents do not require ongoing monthly escrows for real estate taxes as long as (i) no event of default has occurred and is continuing; (ii) Times Square Hospitality II, LLC (the “Ground Lessee”) occupies the Four Points by Sheraton Times Square – Leased Fee Property and is required by the Four Points by Sheraton Times Square Ground Lease to pay taxes directly; (iii) the Four Points by Sheraton Times Square Ground Lease is in full force and effect; and (iv) the borrower provides satisfactory evidence to lender of payment of real estate taxes. The loan documents also do not require ongoing monthly escrows for insurance premiums as long as (i) no event of default has occurred and is continuing; (ii) the Ground Lessee maintains the insurance policies approved by the lender; (iii) the Four Points by Sheraton Times Square Ground Lease is in full force and effect; and (iv) the borrower provides the lender with evidence of renewal of the policies and timely proof of payment of insurance premiums.
Lockbox and Cash Management.Upon the occurrence of a Cash Trap Event Period (as defined below), the borrower is required to establish a lender-controlled lockbox account and all rents shall be deposited directly into such lockbox account. The loan documents also require that all rents received by the borrower be deposited into the lockbox account within one business day of receipt. Prior to the occurrence of a Cash Trap Event Period, all excess cash flow is distributed to the borrower. During a Cash Trap Event Period, all excess cash flow is swept to a lender-controlled cash management subaccount.
THE INFORMATION IN THIS STRUCTURAL AND COLLATERAL TERM SHEET IS NOT COMPLETE AND MAY BE AMENDED PRIOR TO THE TIME OF SALE. THIS TERM SHEET IS NOT AN OFFER TO SELL THESE SECURITIES AND IT IS NOT A SOLICITATION OF AN OFFER TO BUY THESE SECURITIES IN ANY JURISDICTION WHERE THE OFFER OR SALE IS NOT PERMITTED.
52
| FOUR POINTS BY SHERATON TIMES SQUARE – LEASED FEE |
A “Cash Trap Event Period” will commence upon the earlier of (i) the occurrence and continuance of an event of default; (ii) the occurrence and continuance of an event of default by the ground lessee under the Four Points by Sheraton Times Square Ground Lease; or (iii) the ARD. A Cash Trap Event Period will be cured, with respect to the circumstances outlined in clauses (i) and (ii), upon the cure of such default. A Cash Trap Event Period triggered by the circumstances outlined in clause (iii) shall not expire.
Property Management. Not applicable.
Assumption.The borrower has the two time right to transfer the Four Points by Sheraton Times Square – Leased Fee Property, provided that certain other conditions are satisfied, including (i) no event of default has occurred and is continuing; (ii) the lender’s reasonable determination that the proposed transferee and guarantor satisfy the lender’s credit review and underwriting standards, taking into consideration transferee experience, financial strength and general business standing; (iii) execution of a recourse guaranty and an environmental indemnity by an affiliate of the transferee; and (iv) if requested by the lender, rating agency confirmation from Fitch, KBRA and Moody’s that the transfer will not result in a downgrade, withdrawal or qualification of the respective ratings assigned to the Series 2016-LC24 Certificates.
Right of First Offer. The borrower-affiliated Ground Lessee has a right of first offer (“ROFO”) to purchase the Four Points by Sheraton Times Square – Leased Fee Property if the borrower decides to market its leased fee interest for sale. The ROFO does not apply to foreclosure or deed in lieu thereof, or first transfer thereafter.
Real Estate Substitution.Not Permitted.
Subordinate and Mezzanine Indebtedness.Not Permitted.
Ground Lease. Not applicable.
Terrorism Insurance. The loan documents require that the “all risk” insurance policy required to be maintained by the borrower provides coverage for terrorism in an amount equal to the full replacement cost of the Four Points by Sheraton Times Square – Leased Fee Property (provided that the borrower is not required to pay terrorism premiums in excess of two times the premium for all risk and business interruption coverage if the Terrorism Risk Insurance Program Reauthorization Act is no longer in effect. The loan documents also require business interruption insurance covering no less than the 18-month period following the occurrence of a casualty event, together with a 12-month extended period of indemnity.
THE INFORMATION IN THIS STRUCTURAL AND COLLATERAL TERM SHEET IS NOT COMPLETE AND MAY BE AMENDED PRIOR TO THE TIME OF SALE. THIS TERM SHEET IS NOT AN OFFER TO SELL THESE SECURITIES AND IT IS NOT A SOLICITATION OF AN OFFER TO BUY THESE SECURITIES IN ANY JURISDICTION WHERE THE OFFER OR SALE IS NOT PERMITTED.
53
(THIS PAGE INTENTIONALLY LEFT BLANK)
THE INFORMATION IN THIS STRUCTURAL AND COLLATERAL TERM SHEET IS NOT COMPLETE AND MAY BE AMENDED PRIOR TO THE TIME OF SALE. THIS TERM SHEET IS NOT AN OFFER TO SELL THESE SECURITIES AND IT IS NOT A SOLICITATION OF AN OFFER TO BUY THESE SECURITIES IN ANY JURISDICTION WHERE THE OFFER OR SALE IS NOT PERMITTED.
54
| 1140 AVENUE OF THE AMERICAS |
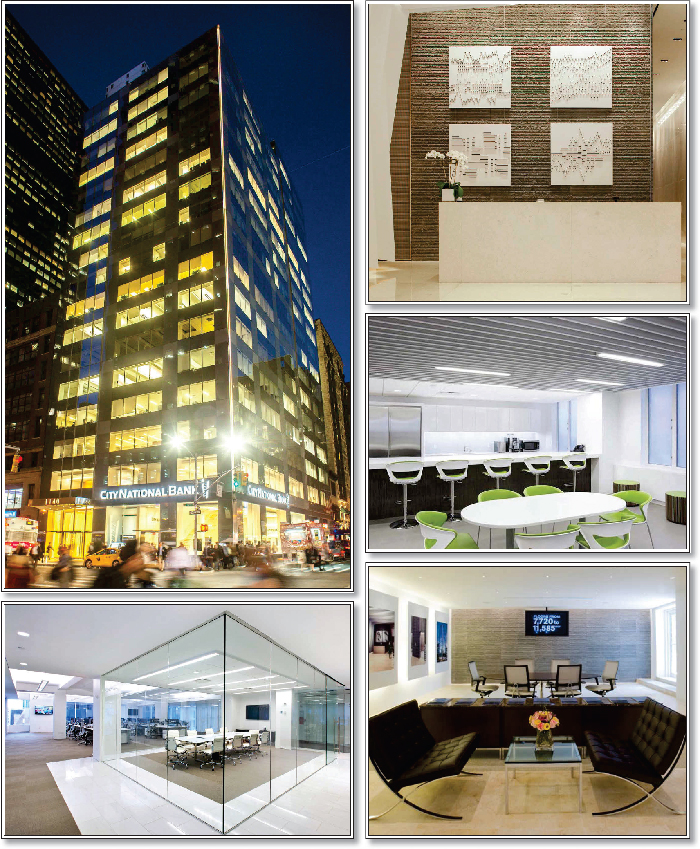
THE INFORMATION IN THIS STRUCTURAL AND COLLATERAL TERM SHEET IS NOT COMPLETE AND MAY BE AMENDED PRIOR TO THE TIME OF SALE. THIS TERM SHEET IS NOT AN OFFER TO SELL THESE SECURITIES AND IT IS NOT A SOLICITATION OF AN OFFER TO BUY THESE SECURITIES IN ANY JURISDICTION WHERE THE OFFER OR SALE IS NOT PERMITTED.
55
| 1140 AVENUE OF THE AMERICAS |
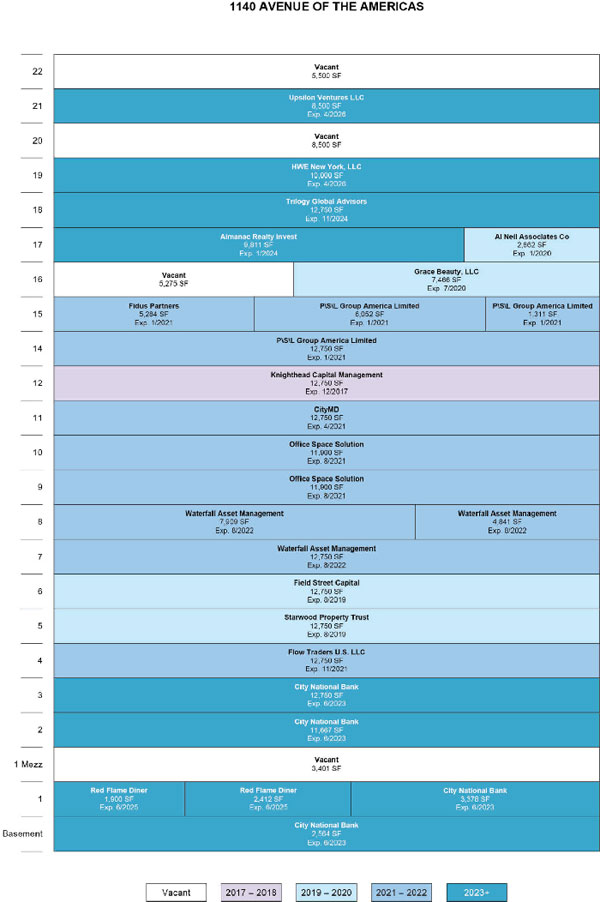
THE INFORMATION IN THIS STRUCTURAL AND COLLATERAL TERM SHEET IS NOT COMPLETE AND MAY BE AMENDED PRIOR TO THE TIME OF SALE. THIS TERM SHEET IS NOT AN OFFER TO SELL THESE SECURITIES AND IT IS NOT A SOLICITATION OF AN OFFER TO BUY THESE SECURITIES IN ANY JURISDICTION WHERE THE OFFER OR SALE IS NOT PERMITTED.
56
| 1140 AVENUE OF THE AMERICAS |
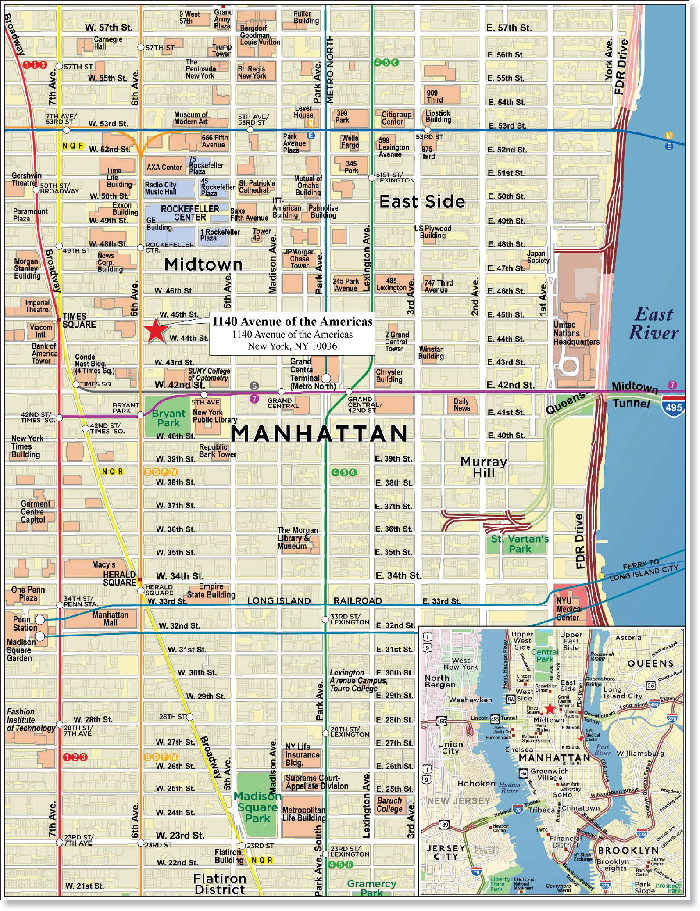
THE INFORMATION IN THIS STRUCTURAL AND COLLATERAL TERM SHEET IS NOT COMPLETE AND MAY BE AMENDED PRIOR TO THE TIME OF SALE. THIS TERM SHEET IS NOT AN OFFER TO SELL THESE SECURITIES AND IT IS NOT A SOLICITATION OF AN OFFER TO BUY THESE SECURITIES IN ANY JURISDICTION WHERE THE OFFER OR SALE IS NOT PERMITTED.
57
| No. 4 – 1140 Avenue of the Americas | |||||||
| Loan Information | Property Information | ||||||
| Mortgage Loan Seller: | Ladder Capital Finance LLC | Single Asset/Portfolio: | Single Asset | ||||
| Credit Assessment (Fitch/KBRA/Moody’s): | NR/NR/NR | Property Type: | Office | ||||
| Original Principal Balance(1): | $45,000,000 | Specific Property Type: | CBD | ||||
| Cut-off Date Balance(1): | $45,000,000 | Location: | New York, NY | ||||
| % of Initial Pool Balance: | 4.3% | Size: | 247,183 SF | ||||
| Loan Purpose: | Acquisition | Cut-off Date Balance Per SF(1): | $400.51 | ||||
| Borrower Name: | ARC NYC1140SIXTH, LLC | Year Built/Renovated: | 1926/2015 | ||||
| Sponsor: | American Realty Capital New York City REIT, Inc. | Title Vesting: | Leasehold | ||||
| Mortgage Rate: | 4.109% | Property Manager: | CBRE, Inc. | ||||
| Note Date: | June 15, 2016 | 4thMost Recent Occupancy (As of)(3): | 53.9% (12/31/2013) | ||||
| Anticipated Repayment Date: | NAP | 3rdMost Recent Occupancy (As of)(3): | 82.3% (12/31/2014) | ||||
| Maturity Date: | July 6, 2026 | 2ndMost Recent Occupancy (As of)(3): | 90.1% (12/31/2015) | ||||
| IO Period: | 120 months | Most Recent Occupancy (As of)(3): | 92.1% (3/31/2016) | ||||
| Loan Term (Original): | 120 months | Current Occupancy (As of)(3): | 90.8% (6/8/2016) | ||||
| Seasoning: | 2 months | ||||||
| Amortization Term (Original): | NAP | Underwriting and Financial Information: | |||||
| Loan Amortization Type: | Interest-only, Balloon | ||||||
| Interest Accrual Method: | Actual/360 | 4thMost Recent NOI (As of)(4): | $5,713,542 (12/31/2013) | ||||
| Call Protection: | L(24),GRTR1% or YM(92),O(4) | 3rdMost Recent NOI (As of)(4): | $10,868,784 (12/31/2014) | ||||
| Lockbox Type: | Hard/Upfront Cash Management | 2ndMost Recent NOI (As of)(4): | $13,011,926 (12/31/2015) | ||||
| Additional Debt(1): | Yes | Most Recent NOI (As of)(4): | $13,948,046 (TTM 3/31/2016) | ||||
| Additional Debt Type(1): | Pari Passu | ||||||
| U/W Revenues: | $20,833,881 | ||||||
| U/W Expenses: | $11,323,332 | ||||||
| U/W NOI(4): | $9,510,549 | ||||||
| Escrows and Reserves(2): | U/W NCF(4): | $8,893,069 | |||||
| U/W NOI DSCR(1): | 2.31x | ||||||
| Type: | Initial | Monthly | Cap (If Any) | U/W NCF DSCR(1): | 2.16x | ||
| Taxes | $342,123 | $171,061 | NAP | U/W NOI Debt Yield(1): | 9.6% | ||
| Insurance | $0 | Springing | NAP | U/W NCF Debt Yield(1): | 9.0% | ||
| Replacement Reserve | $0 | Springing | NAP | As-Is Appraised Value: | $180,000,000 | ||
| TI/LC Reserve | $961,116 | Springing | NAP | As-Is Appraisal Valuation Date: | May 1, 2016 | ||
| Ground Rent Reserve | $116,016 | $29,004 | NAP | Cut-off Date LTV Ratio(1): | 55.0% | ||
| Free Rent Reserve | $712,266 | $0 | NAP | LTV Ratio at Maturity or ARD(1): | 55.0% | ||
| (1) | The 1140 Avenue of the Americas Whole Loan (as defined below), totaling $99,000,000, is comprised of fourpari passu notes (Notes A-1, A-2, A-3 and A-4). The non-controlling Note A-3 and non-controlling Note A-4 have an aggregate original and outstanding principal balance of $45,000,000 as of the Cut-off Date and will be contributed to the WFCM 2016-LC24 Trust. The controlling Note A-1 and non-controlling Note A-2 have an aggregate original principal balance of $54,000,000 and will be contributed to one or more future trusts. All statistical information related to balances per square foot, loan-to-value ratios, debt service coverage ratios and debt yields are based on the 1140 Avenue of the Americas Whole Loan. |
| (2) | See “Escrows” section. |
| (3) | See “Historical Occupancy” section. |
| (4) | See “Cash Flow Analysis” section. |
The Mortgage Loan.The mortgage loan (the “1140 Avenue of the Americas Mortgage Loan”) is part of a whole loan (the “1140 Avenue of the Americas Whole Loan”) that is evidenced by fourpari passu promissory notes (Notes A-1, A-2, A-3, and A-4) and secured by a first mortgage encumbering the leasehold interest in an office building located in New York, New York (the “1140 Avenue of the Americas Property”). The 1140 Avenue of the Americas Whole Loan was originated on June 15, 2016 by Ladder Capital Finance LLC. The 1140 Avenue of the Americas Whole Loan had an original principal balance of $99,000,000, has an outstanding principal balance as of the Cut-off Date of $99,000,000 and accrues interest at an interest rate of 4.109%per annum. The 1140 Avenue of the Americas Whole Loan had an initial term of 120 months, has a remaining term of 118 months as of the Cut-off Date and requires interest-only payments through the term of the 1140 Avenue of the Americas Whole Loan. The 1140 Avenue of the Americas Whole Loan matures on July 6, 2026.
The non-controlling Note A-3 and non-controlling Note A-4, which will be contributed to the WFCM 2016-LC24 Trust and together evidence the 1140 Avenue of the Americas Mortgage Loan, had an aggregate original principal balance of $45,000,000 and an aggregate outstanding principal balance of $45,000,000 as of the Cut-off Date. The controlling Note A-1 and non-controlling Note A-2, with an aggregate original principal balance of $54,000,000, are each expected to be contributed to one or more future trusts. Each of the mortgage loans evidenced by Note A-1 and Note A-2 are referred to herein as the “1140 Avenue of the Americas
THE INFORMATION IN THIS STRUCTURAL AND COLLATERAL TERM SHEET IS NOT COMPLETE AND MAY BE AMENDED PRIOR TO THE TIME OF SALE. THIS TERM SHEET IS NOT AN OFFER TO SELL THESE SECURITIES AND IT IS NOT A SOLICITATION OF AN OFFER TO BUY THESE SECURITIES IN ANY JURISDICTION WHERE THE OFFER OR SALE IS NOT PERMITTED.
58
| 1140 AVENUE OF THE AMERICAS |
Companion Loans”. The lender provides no assurances that any non-securitized pari passu note will not be split further. See“Description of the Mortgage Pool—The Whole Loans—The Servicing Shift Whole Loans” in the Preliminary Prospectus.
Pari Passu Note Summary
| Notes | Original Balance | Note Holder | Controlling Piece | |
| Note A-1 | $30,000,000 | Ladder Capital Finance | Yes | |
| Note A-2 | $24,000,000 | Ladder Capital Finance | No | |
| Note A-3 | $25,000,000 | WFCM 2016-LC24 | No | |
| Note A-4 | $20,000,000 | WFCM 2016-LC24 | No | |
| Total | $99,000,000 |
Following the lockout period, the borrower has the right to prepay the 1140 Avenue of Americas Whole Loan in whole, but not in part, subject to payment of the greater of (i) a 1% prepayment premium or (ii) a yield maintenance premium, in each case based on the amount of principal balance being prepaid, on any date before April 6, 2026. In addition, the 1140 Avenue of the Americas Whole Loan is prepayable without penalty on or after April 6, 2026.
Sources and Uses
| Sources | Uses | |||||||
| Original whole loan amount | $99,000,000 | 52.5% | Purchase price | $180,000,000 | 95.4% | |||
| Sponsor’s new cash contribution | 87,989,527 | 46.6 | Reserves | 2,131,521 | 1.1 | |||
| Seller credits(1) | 1,673,382 | 0.9 | Closing costs | 6,531,388 | 3.5 | |||
| Total Sources | $188,662,909 | 100.0% | Total Uses | $188,662,909 | 100.0% |
| (1) | The seller provided credits of approximately $1.7 million for outstanding free rent and tenant improvements which were reserved at closing. |
The Property.The 1140 Avenue of the Americas Property is a 22-story class A, office building located in New York, New York. Constructed in 1926 and most recently renovated in 2015, the 1140 Avenue of the Americas Property is located at the northeastern corner of West 44th Street and Avenue of the Americas. The 1140 Avenue of the Americas Property totals 247,183 square feet and is comprised of 236,929 square feet of office space (95.9% of the net rentable area), 5,790 square feet of retail space (2.3% of the net rentable area) and 4,464 square feet of storage space (1.8% of the net rentable area). Office floor plates at the 1140 Avenue of the Americas Property average 11,242 square feet. The 1140 Avenue of the Americas Property has approximately 75 feet of frontage along Avenue of the Americas and 125 feet of frontage along West 44th Street. The 1140 Avenue of the Americas Mortgage Loan constitutes acquisition financing, and the seller thereof acquired the 1140 Avenue of the Americas Property after purchasing a note secured thereby following default on that note during the renovation of the 1140 Avenue of the Americas Property in 2011. For additional information, see“Description of the Mortgage Pool—Loan Purpose; Default History, Bankruptcy Issues and Other Proceedings” in the Preliminary Prospectus.
The 1140 Avenue of the Americas Property is leased to tenants in the financial and professional services industries and the largest tenants include City National Bank (12.3% of net rentable area; rated AA-, A3 and A+ by Fitch, Moody’s and S&P, respectively), Waterfall Asset Management (10.3% of net rentable area) and Office Space Solution (9.6% of net rentable area). Other office tenants at the 1140 Avenue of the Americas Property include Starwood Property Trust (5.2% of net rentable area), Knighthead Capital Management (5.2% of net rentable area), Flow Traders U.S. LLC (5.2% of net rentable area) and Field Street Capital (5.2% of net rentable area).
The 1140 Avenue of the Americas Property has undergone an extensive renovation, completed in 2015, including replacing the exterior of the building with an aluminum and glass curtain wall façade and providing floor-to-ceiling windows and enhanced sun exposure in tenant spaces. According to the seller of the 1140 Avenue of the Americas Property, $85.0 million ($343.87 per square foot) has been invested in renovations, tenant improvements and leasing costs at the 1140 Avenue of the Americas Property since 2007, with over $39.9 million ($161.42 per square foot) invested since 2011. As of June 8, 2016, the 1140 Avenue of the Americas Property was 90.8% occupied by 17 tenants.
THE INFORMATION IN THIS STRUCTURAL AND COLLATERAL TERM SHEET IS NOT COMPLETE AND MAY BE AMENDED PRIOR TO THE TIME OF SALE. THIS TERM SHEET IS NOT AN OFFER TO SELL THESE SECURITIES AND IT IS NOT A SOLICITATION OF AN OFFER TO BUY THESE SECURITIES IN ANY JURISDICTION WHERE THE OFFER OR SALE IS NOT PERMITTED.
59
| 1140 AVENUE OF THE AMERICAS |
The following table presents certain information relating to the tenancy at the 1140 Avenue of the Americas Property:
Major Tenants
| Tenant Name | Credit Rating (Fitch/Moody’s /S&P)(1) | Tenant NRSF | % of NRSF | Annual U/W Base Rent PSF(2) | Annual U/W Base Rent(2) | % of Total Annual U/W Base Rent | Lease Expiration Date |
| Major Tenants | |||||||
| City National Bank | AA-/A3/A+ | 30,359 | 12.3% | $122.54(3) | $3,720,105 | 19.0% | 6/30/2023(4) |
| Waterfall Asset Management(5) | NR/NR/NR | 25,500 | 10.3% | $79.65 | $2,031,135 | 10.4% | 8/31/2022(6) |
| P\S\L Group America Limited | NR/NR/NR | 20,113 | 8.1% | $82.94 | $1,668,155 | 8.5% | 1/31/2021(7) |
| Office Space Solution | NR/NR/NR | 23,800 | 9.6% | $57.38 | $1,365,644 | 7.0% | 8/31/2021(8) |
| Trilogy Global Advisors | NR/NR/NR | 12,750 | 5.2% | $84.00 | $1,071,000 | 5.5% | 11/30/2024(9) |
| Total Major Tenants | 112,522 | 45.5% | $87.59 | $9,856,039 | 50.5% | ||
| Non-Major Tenants | 111,985 | 45.3% | $86.38 | $9,672,718 | 49.5% | ||
| Occupied Collateral Total | 224,507 | 90.8% | $86.99 | $19,528,757 | 100.0% | ||
| Vacant Space | 22,676 | 9.2% | |||||
| Collateral Total | 247,183 | 100.0% | |||||
| (1) | Certain ratings are those of the parent company whether or not the parent guarantees the lease. |
| (2) | Annual U/W Base Rent PSF and Annual U/W Base Rent include contractual rent steps through May 1, 2017, totaling $758,916. |
| (3) | City National Bank occupies 24,417 square feet of office space, for which they pay $75.00 per square foot in Annual U/W Base Rent, 3,378 square feet of retail space, for which they pay $525.00 per square foot in Annual U/W Base Rent, and 2,564 square feet of storage space, for which they pay $45.00 per square foot in Annual U/W Base Rent. |
| (4) | City National Bank has two, five-year lease renewal options. |
| (5) | Waterfall Asset Management recently executed a lease for an additional 7,909 square feet that is currently occupied by TriOptima North America. TriOptima North America is to occupy this space until their lease expires on April 30, 2017 and Waterfall Asset Management is expected to take occupancy and commence rental payments on May 1, 2017. The additional space is included in Waterfall Asset Management’s underwritten NRSF. |
| (6) | Waterfall Asset Management has one, five-year lease renewal option. |
| (7) | P\S\L Group America Limited has one, five-year lease renewal option. |
| (8) | Office Space Solution has one, five-year lease renewal option. |
| (9) | Trilogy Global Advisors has one, five-year lease renewal option. |
The following table presents certain information relating to the lease rollover schedule at the 1140 Avenue of the Americas Property:
Lease Expiration Schedule(1)(2)
| Year Ending December 31, | No. of Leases Expiring | Expiring NRSF | % of Total NRSF | Cumulative Expiring NRSF | Cumulative % of Total NRSF | Annual U/W Base Rent | % of Annual U/W Base Rent | Annual U/W Base Rent PSF(3) |
| MTM | 0 | 0 | 0.0% | 0 | 0.0% | $0 | 0.0% | $0.00 |
| 2016 | 0 | 0 | 0.0% | 0 | 0.0% | $0 | 0.0% | $0.00 |
| 2017 | 1 | 12,750 | 5.2% | 12,750 | 5.2% | $1,211,250 | 6.2% | $95.00 |
| 2018 | 0 | 0 | 0.0% | 12,750 | 5.2% | $0 | 0.0% | $0.00 |
| 2019 | 2 | 25,500 | 10.3% | 38,250 | 15.5% | $1,969,875 | 10.1% | $77.25 |
| 2020 | 2 | 10,328 | 4.2% | 48,578 | 19.7% | $869,443 | 4.5% | $84.18 |
| 2021 | 5 | 74,697 | 30.2% | 123,275 | 49.9% | $5,401,447 | 27.7% | $72.31 |
| 2022 | 1 | 25,500 | 10.3% | 148,775 | 60.2% | $2,031,135 | 10.4% | $79.65 |
| 2023 | 1 | 30,359 | 12.3% | 179,134 | 72.5% | $3,720,105 | 19.0% | $122.54 |
| 2024 | 2 | 22,561 | 9.1% | 201,695 | 81.6% | $1,875,502 | 9.6% | $83.13 |
| 2025 | 1 | 4,312 | 1.7% | 206,007 | 83.3% | $510,000 | 2.6% | $118.27 |
| 2026 | 2 | 18,500 | 7.5% | 224,507 | 90.8% | $1,940,000 | 9.9% | $104.86 |
| Thereafter | 0 | 0 | 0.0% | 224,507 | 90.8% | $0 | 0.0% | $0.00 |
| Vacant | 0 | 22,676 | 9.2% | 247,183 | 100.0% | $0 | 0.0% | $0.00 |
| Total/Weighted Average | 17 | 247,183 | 100.0% | $19,528,757 | 100.0% | $86.99 |
| (1) | Information obtained from the underwritten rent roll. |
| (2) | Certain tenants may have lease termination or contraction options that are exercisable prior to the originally stated expiration date of the subject lease and that are not considered in the Lease Expiration Schedule. |
| (3) | Weighted Average Annual U/W Base Rent PSF excludes vacant space. |
THE INFORMATION IN THIS STRUCTURAL AND COLLATERAL TERM SHEET IS NOT COMPLETE AND MAY BE AMENDED PRIOR TO THE TIME OF SALE. THIS TERM SHEET IS NOT AN OFFER TO SELL THESE SECURITIES AND IT IS NOT A SOLICITATION OF AN OFFER TO BUY THESE SECURITIES IN ANY JURISDICTION WHERE THE OFFER OR SALE IS NOT PERMITTED.
60
| 1140 AVENUE OF THE AMERICAS |
The following table presents historical occupancy percentages at the 1140 Avenue of the Americas Property:
Historical Occupancy
12/31/2013(1)(2) | 12/31/2014(1)(2) | 12/31/2015(1)(2) | 3/31/2016(1) | 6/08/2016(3) |
| 53.9% | 82.3% | 90.1% | 92.1% | 90.8% |
| (1) | Information obtained from the borrower. |
| (2) | Occupancy increased from 2013 to 2015 due to tenants representing approximately 75.0% of the net rentable area executing leases since the repositioning of the 1140 Avenue of the Americas Property in 2012. |
| (3) | Information obtained from the underwritten rent roll. |
Operating History and Underwritten Net Cash Flow. The following table presents certain information relating to the historical operating performance and the underwritten net cash flow at the 1140 Avenue of the Americas Property:
Cash Flow Analysis
| 2013(1) | 2014(1) | 2015(1) | TTM 3/31/2016(2) | U/W(2) | % of U/W Effective Gross Income | U/W $ per SF | |||||||
| Base Rent | $10,572,440 | $16,494,082 | $18,732,841 | $19,210,125 | $19,528,757(3) | 93.7% | $79.01(3) | ||||||
| Grossed Up Vacant Space | 0 | 0 | 0 | 0 | 2,137,460 | 10.3 | 8.65 | ||||||
| Total Reimbursables | (48,910) | 52,675 | 354,068 | 435,992 | 754,179 | 3.6 | 3.05 | ||||||
| Other Income | 202,726 | 439,581 | 498,390 | 550,946 | 550,946 | 2.6 | 2.23 | ||||||
| Less Vacancy & Credit Loss | 0 | 0 | 0 | 0 | (2,137,460)(4) | (10.3) | (8.65) | ||||||
| Effective Gross Income | $10,726,256 | $16,986,338 | $19,585,299 | $20,197,064 | $20,833,881 | 100.0% | $84.29 | ||||||
| Total Operating Expenses | $5,012,714 | $6,117,554 | $6,573,373 | $6,249,017 | $11,323,332 | 54.4% | $45.81 | ||||||
| Net Operating Income | $5,713,542 | $10,868,784 | $13,011,926 | $13,948,046 | $9,510,549 | 45.6% | $38.48 | ||||||
| TI/LC | 0 | 0 | 0 | 0 | 555,684 | 2.7 | 2.25 | ||||||
| Capital Expenditures | 0 | 0 | 0 | 0 | 61,796 | 0.3 | 0.25 | ||||||
| Net Cash Flow | $5,713,542 | $10,868,784 | $13,011,926 | $13,948,046 | $8,893,069 | 42.7% | $35.98 | ||||||
| NOI DSCR(5) | 1.39x | 2.64x | 3.15x | 3.38x | 2.31x | ||||||||
| NCF DSCR(5) | 1.39x | 2.64x | 3.15x | 3.38x | 2.16x | ||||||||
| NOI DY(5) | 5.8% | 11.0% | 13.1% | 14.1% | 9.6% | ||||||||
| NCF DY(5) | 5.8% | 11.0% | 13.1% | 14.1% | 9.0% |
| (1) | Net Operating Income increased from 2013 to 2014 to 2015 due to tenants representing approximately 75.0% of the net rentable area executing leases since the repositioning of the 1140 Avenue of the Americas Property in 2012. |
| (2) | The decrease in Net Operating Income from TTM 3/31/2016 to U/W is primarily due to the U/W ground rent increasing. The current annual ground rent of $348,047 increases to $4,746,094 on January 1, 2017 which was underwritten. |
| (3) | U/W Base Rent includes contractual rent steps through May 1, 2017, totaling $758,916. |
| (4) | The underwritten economic vacancy is 9.5%. The 1140 Avenue of the Americas Property was 90.8% physically occupied as of June 8, 2016. |
| (5) | Debt service coverage ratios and debt yields are based on the 1140 Avenue of the Americas Whole Loan. |
Appraisal.As of the appraisal valuation date of May 1, 2016, the 1140 Avenue of the Americas Property had an “as-is” appraised value of $180,000,000.
Environmental Matters. According to a Phase I environmental site assessment dated March 25, 2016 there was no evidence of any recognized environmental conditions at the 1140 Avenue of the Americas Property.
Market Overview and Competition.The 1140 Avenue of the Americas Property is located in the Midtown Manhattan market within the Sixth Avenue/Rockefeller Center office submarket in New York City. The 1140 Avenue of the Americas Property is directly accessible by the A/C/E, B/D/F/M, N/Q/R, 1/2/3, 4/5/6, and 7 subway lines. New York City is the home to the headquarters of 48 companies on the 2015 Fortune 500 list and the two largest stock exchanges in the world. According to the appraisal, New York City has created more jobs over the past five years than during any five-year period in the last half century. As of the first quarter of 2016, Sixth Avenue/Rockefeller Center office inventory was comprised of approximately 40.3 million square feet, the largest submarket of primary office inventory in the country. As of the same quarter, Class A office inventory within the Sixth Avenue/Rockefeller Center office submarket was comprised of approximately 38.3 million square feet with a vacancy rate of 5.9%. As of first quarter 2016, the Class A Sixth Avenue/Rockefeller Center office submarket rental rates were $96.71 per square foot gross. The appraiser analyzed a set of five directly competitive properties within the immediate competitive area of the 1140 Avenue of the Americas Property and concluded an office market rental range of $64.00 to $120.00 per square foot gross. Underwritten weighted average office rents at the 1140 Avenue of the Americas Property is $86.99 per square foot gross, which is below the appraisal’s concluded office submarket rent for the 1140 Avenue of the Americas Property of $96.71 per square foot gross.
THE INFORMATION IN THIS STRUCTURAL AND COLLATERAL TERM SHEET IS NOT COMPLETE AND MAY BE AMENDED PRIOR TO THE TIME OF SALE. THIS TERM SHEET IS NOT AN OFFER TO SELL THESE SECURITIES AND IT IS NOT A SOLICITATION OF AN OFFER TO BUY THESE SECURITIES IN ANY JURISDICTION WHERE THE OFFER OR SALE IS NOT PERMITTED.
61
| 1140 AVENUE OF THE AMERICAS |
The following table presents certain information relating to comparable leases to the 1140 Avenue of the Americas Property:
Comparable Leases(1)
| Property Name/Location | Year Built/ Renovated | Stories | Total GLA (SF) | Total Occupancy | Distance from Subject | Tenant Name | Lease Date/Term | Lease Area (SF) | Annual Base Rent PSF | Lease Type |
1120 Avenue of the Americas New York, NY | 1951/2005 | 21 | 415,000 | 99.2% | 0.1 miles | Bank Hapoalim, B.M | January 2016 / 16 Yrs | 47,005 | $70.00 | Gross |
1065 Avenue of the Americas New York, NY | 1958/NAP | 34 | 536,524 | 86.5% | 0.3 miles | Schireson Associates | April 2016 / 7 Yrs | 7,558 | $87.00 | Gross |
1065 Avenue of the Americas New York, NY | 1958/NAP | 34 | 536,524 | 86.5% | 0.3 miles | XP Securities | March 2016 / 10 Yrs | 7,558 | $87.50 | Gross |
1350 Avenue of the Americas New York, NY | 1966/NAP | 35 | 424,000 | 93.7% | 0.5 miles | Entercom Communications | April 2016 / 5 Yrs | 3,391 | $80.00 | Gross |
1370 Avenue of the Americas New York, NY | 1971/2002 | 35 | 339,000 | 92.3% | 0.6 miles | Andor Capital Management | October 2015 / 10.43 Yrs | 10,269 | $96.00 | Gross |
| (1) | Information obtained from the appraisal and a third party market research report. |
The Borrower.The borrower is ARC NYC1140SIXTH, LLC, a Delaware limited liability company and single purpose entity with two independent directors. Legal counsel to the borrower delivered a non-consolidation opinion in connection with the origination of the 1140 Avenue of the Americas Whole Loan. American Realty Capital New York City REIT, Inc. (“ARCNYC REIT”) is the 99.993% owner and general partner of New York City Operating Partnership, L.P. which is the guarantor of certain nonrecourse carveouts under the 1140 Avenue of the Americas Whole Loan.
The Sponsor.The sponsor is ARCNYC REIT. As of June 30, 2016, ARCNYC REIT reported total assets of approximately $804.8 million, and a net worth of approximately $563.5 million. Exclusive of the 1140 Avenue of the Americas Property, the ARCNYC REIT owns five properties consisting of 841,857 square feet in New York City.
The external advisor and sponsor of ARCNYC REIT is an affiliate of AR Global Investments, LLC (“AR Global”). In addition, the 1140 Avenue of the Americas Property is subject to an operating management agreement with a wholly-owned subsidiary of AR Global (the “Operator”) pursuant to which the Operator is responsible for the management of the 1140 Avenue of the Americas Property. Certain principals and affiliates of AR Global as well as the previous external advisor and sponsor of ARCNYC REIT are subject to litigation and governmental proceedings. See“Description of the Mortgage Pool—Litigation and Other Considerations” in the Preliminary Prospectus.
Escrows.The loan documents provide for upfront reserves in the amount of $342,123 for real estate taxes; $961,116 for existing tenant improvements (“TI”) and leasing commissions (“LC”) related to HWE New York LLC ($150,000 for TI and $78,009 for LC), Waterfall Asset Management ($316,360 for TI), and Upsilon Ventures ($52,933 for LC); $116,016 for ground rent; and $712,266 for free rent related to Upsilon Ventures LLC ($148,750) and Waterfall Asset Management ($563,516). The loan documents require monthly reserve deposits of one-twelfth of the estimated annual real estate taxes (currently equates to $171,061) and one-twelfth of the estimated annual ground rent (currently equates to $29,004). The loan documents do not require monthly escrows for insurance, provided that: (i) the blanket policy is acceptable to the lender and (ii) the borrower provides the lender with evidence of payment. Monthly collections for replacement reserves and TI/LC are waived unless a Reserve Funds Trigger Period (as defined below) has occurred and is continuing.
A “Reserve Funds Trigger Period” will commence upon any of the following: (i) the occurrence and continuance of an event of default; (ii) the debt service coverage ratio falling below 1.50x at any time; or (iii) the borrower defaulting under the management agreement beyond notice and cure periods. A Reserve Funds Trigger Period will be cured, with regard to clause (i), upon the cure of such event of default; with regard to clause (ii), upon the debt service coverage ratio being equal to or greater than 1.52x for two consecutive calendar quarters; and with regard to clause (iii), upon the date the borrower has entered into a replacement management agreement with a qualified manager or the date on which the applicable default has been remedied to the lender’s satisfaction. Notwithstanding the foregoing, the borrower may avoid the existence of a Reserve Funds Trigger Period pursuant to clause (ii) above by (x) prior to the prepayment lockout period, posting a letter of credit with the lender in an amount (the “Reserve Funds Trigger Event DSCR Required Amount”) that when combined with the projected revenues of the 1140 Avenue of the Americas Mortgaged Property for the succeeding 12-month period achieves a debt service coverage ratio of at least 1.52x or (y) after the prepayment lockout date, prepaying the 1140 Avenue of the Americas Whole Loan in an amount equal to the Reserve Funds Trigger Event DSCR Required Amount in accordance with the related loan documents, which if prepaid prior to the prepayment open period, would include a payment equal to the greater of (A) 1% of the amount prepaid and (B) yield maintenance premium thereon.
Lockbox and Cash Management.The 1140 Avenue of the Americas Whole Loan requires a lender-controlled lockbox account, which is already in place, and that the borrower direct tenants to pay their rents directly into such lockbox account. The 1140 Avenue of the Americas Whole Loan also requires that all rents received by the borrower or the property manager be swept daily into
THE INFORMATION IN THIS STRUCTURAL AND COLLATERAL TERM SHEET IS NOT COMPLETE AND MAY BE AMENDED PRIOR TO THE TIME OF SALE. THIS TERM SHEET IS NOT AN OFFER TO SELL THESE SECURITIES AND IT IS NOT A SOLICITATION OF AN OFFER TO BUY THESE SECURITIES IN ANY JURISDICTION WHERE THE OFFER OR SALE IS NOT PERMITTED.
62
| 1140 AVENUE OF THE AMERICAS |
the lockbox account. Prior to a Sweep Event Period (as defined below), all excess cash flow will be disbursed to the borrower. Upon a Sweep Event Period, excess cash flow will be held by the lender.
A “Sweep Event Period” will commence upon any of the following: (i) the occurrence of an event of default; (ii) the debt service coverage ratio falling below 1.40x (a “DSCR Sweep Event Trigger”); or (iii) the borrower defaulting under the management agreement. A Sweep Event Period will be cured, with regard to clause (i), upon the cure of such event of default; with regard to clause (ii), upon the debt service coverage ratio being equal to or greater than 1.42x for two consecutive calendar quarters; and with regard to clause (iii), upon the date the borrower has entered into a replacement management agreement with a qualified manager or the date on which the applicable default has been remedied to the lender’s satisfaction. Notwithstanding the foregoing, the borrower may avoid the existence of a DSCR Sweep Event Trigger pursuant to clause (ii) above by (x) prior to the prepayment lockout period, posting a letter of credit with the lender in an amount (the “DSCR Sweep Event Trigger Required Amount”) that when combined with the projected revenues of the 1140 Avenue of the Americas Mortgaged Property for the succeeding 12-month period achieve a debt service coverage ratio of at least 1.42x or (y) after the prepayment lockout date, prepaying the 1140 Avenue of the Americas Whole Loan in an amount equal to the DSCR Sweep Event Trigger Required Amount in accordance with the loan documents, which if prepaid prior to the prepayment open period, would include a payment equal to the greater of (A) 1% of the amount prepaid and (B) yield maintenance thereon.
Property Management. The 1140 Avenue of the Americas Property is managed by CBRE, Inc. for a fee of $0.34 per square foot for the first year for the loan term and subject to annual increases of 3.0%.
Assumption.The borrower has the right to transfer the 1140 Avenue of the Americas Property provided that certain conditions are satisfied, including: (i) no event of default has occurred and is continuing; (ii) the proposed transferee is a qualified transferee as described in the 1140 Avenue of the Americas Whole Loan documents or is reasonably acceptable to the lender based upon, among other things, the lender reasonably determining that the proposed transferee and proposed guarantor satisfy the lender’s credit review and have an aggregate net worth of $175.0 million and liquidity of $7.5 million; (iii) unless the transferee is controlled and owned at least 51.0% by ARCNYC REIT or by a qualified equity holder as described in the 1140 Avenue of the Americas Whole Loan documents, the lender has received confirmation from each of Fitch, KBRA and Moody’s that such assumption will not result in a downgrade, withdrawal or qualification of the respective ratings assigned to the Series 2016-LC24 Certificates and similar confirmations from each rating agency rating any securities backed by any 1140 Avenue of the Americas Companion Loans with respect to the ratings of such securities; and (iv) unless the transferee is an affiliate of ARCNYC REIT, adequate transferee experience.
Partial Release. Not permitted.
Real Estate Substitution.Not permitted.
Subordinate and Mezzanine Indebtedness.Not permitted.
Ground Lease.The 1140 Avenue of the Americas Property is currently subject to a ground lease between 67 West 44th St. Inc., (“Ground Lessee”), a predecessor-in-interest to the borrower, and 1140 Sixth Avenue LLC (as successor-in-interest to Phoenix Mutual Life Insurance Company) (“Ground Lessor”). The 1140 Avenue of the Americas ground lease, dated October 1, 1951, expires December 31, 2066. The original term of the ground lease was fifty years and three months, and was scheduled to expire December 31, 2016; however, the Ground Lessee has exercised its final option to renew the ground lease for a term of fifty years commencing January 1, 2017 and expiring December 31, 2066. The current annual rent is $348,047 with an increase on January 1, 2017 to $4,746,094 and an increase on January 1, 2042 to $5,062,500. The 1140 Avenue of the Americas Property cash flows have been underwritten at the initial renewal rent step rent of $4,746,094 (see “Cash Flow Analysis” section).See “Description of the Mortgage Pool—Mortgage Pool Characteristics—Fee & Leasehold Estates; Ground Leases” in the Preliminary Prospectus.
Terrorism Insurance. The loan documents require that the “all risk” insurance policy required to be maintained by the borrower provides coverage for terrorism in an amount equal to the full replacement cost of the 1140 Avenue of the Americas Property (provided that the borrower is not required to pay terrorism insurance premiums in excess of two times the premiums for all risk and business interruption coverage (exclusive of terrorism coverage) if the Terrorism Risk Insurance Program Reauthorization Act is no longer in effect). The loan documents also require business interruption insurance covering no less than the 18-month period following the occurrence of a casualty event, together with a 12-month extended period of indemnity.
THE INFORMATION IN THIS STRUCTURAL AND COLLATERAL TERM SHEET IS NOT COMPLETE AND MAY BE AMENDED PRIOR TO THE TIME OF SALE. THIS TERM SHEET IS NOT AN OFFER TO SELL THESE SECURITIES AND IT IS NOT A SOLICITATION OF AN OFFER TO BUY THESE SECURITIES IN ANY JURISDICTION WHERE THE OFFER OR SALE IS NOT PERMITTED.
63
| ONE MERIDIAN |
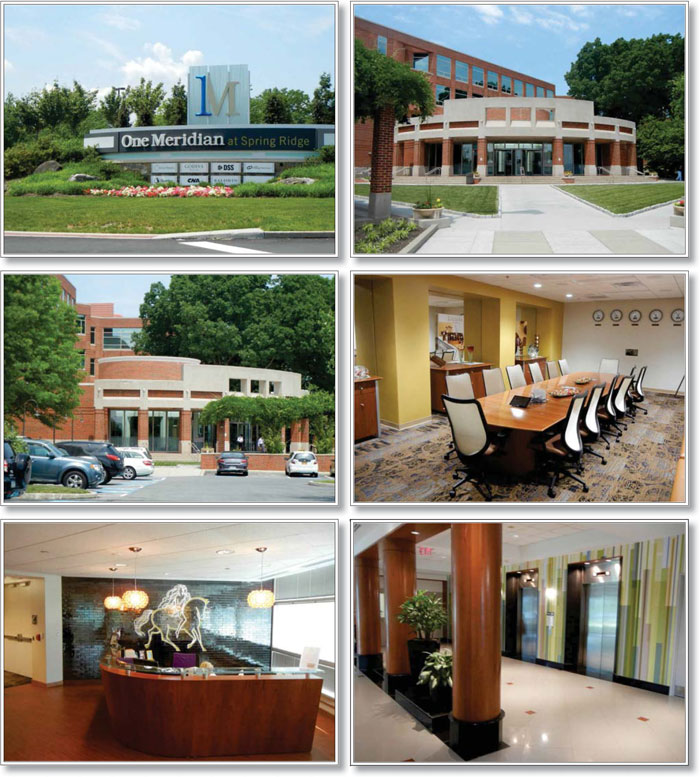
THE INFORMATION IN THIS STRUCTURAL AND COLLATERAL TERM SHEET IS NOT COMPLETE AND MAY BE AMENDED PRIOR TO THE TIME OF SALE. THIS TERM SHEET IS NOT AN OFFER TO SELL THESE SECURITIES AND IT IS NOT A SOLICITATION OF AN OFFER TO BUY THESE SECURITIES IN ANY JURISDICTION WHERE THE OFFER OR SALE IS NOT PERMITTED.
64
| ONE MERIDIAN |
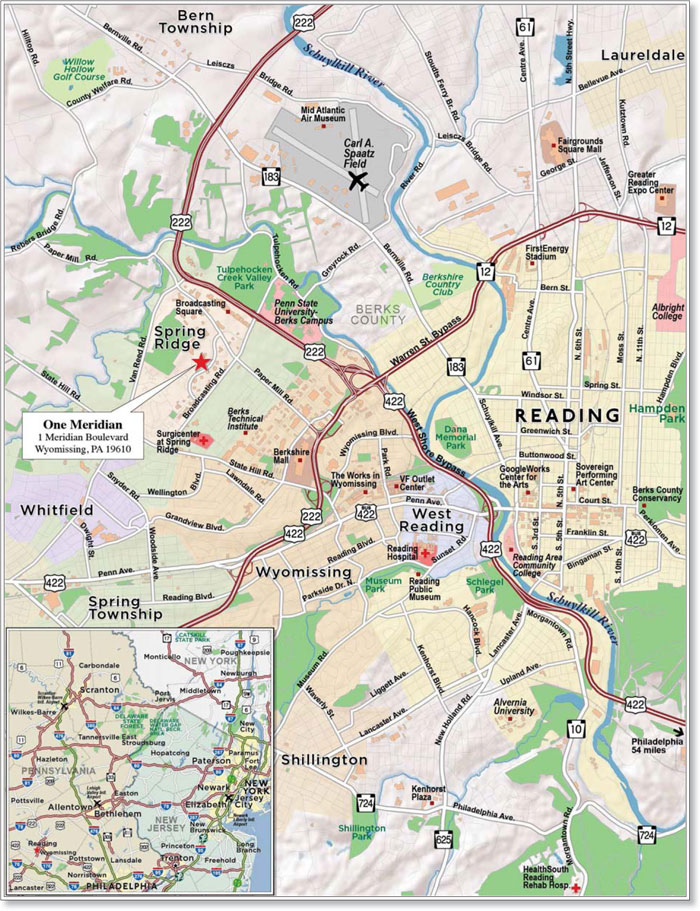
THE INFORMATION IN THIS STRUCTURAL AND COLLATERAL TERM SHEET IS NOT COMPLETE AND MAY BE AMENDED PRIOR TO THE TIME OF SALE. THIS TERM SHEET IS NOT AN OFFER TO SELL THESE SECURITIES AND IT IS NOT A SOLICITATION OF AN OFFER TO BUY THESE SECURITIES IN ANY JURISDICTION WHERE THE OFFER OR SALE IS NOT PERMITTED.
65
| No. 5 – One Meridian | |||||||||
| Loan Information | Property Information | ||||||||
| Mortgage Loan Seller: | Ladder Capital Finance LLC | Single Asset/Portfolio: | Single Asset | ||||||
| Credit Assessment (Fitch/KBRA/Moody’s): | NR/NR/NR | Property Type: | Office | ||||||
| Original Principal Balance: | $37,000,000 | Specific Property Type: | Suburban | ||||||
| Cut-off Date Balance: | $37,000,000 | Location: | Wyomissing, PA | ||||||
| % of Initial Pool Balance: | 3.5% | Size: | 366,728 SF | ||||||
| Loan Purpose: | Acquisition | Cut-off Date Balance Per SF: | $100.89 | ||||||
| Borrower Names: | Meridian Blvd Lofts Owner LLC; Agharta Meridian Realty LLC | Year Built/Renovated: | 1990/2014 | ||||||
| Sponsor: | Leibel Lederman | Title Vesting: | Fee | ||||||
| Mortgage Rate: | 4.750% | Property Manager: | BPG Management Company, L.P. | ||||||
| Note Date: | July 26, 2016 | 4thMost Recent Occupancy: | NAV | ||||||
| Anticipated Repayment Date: | NAP | 3rdMost Recent Occupancy (As of): | 78.8% (12/31/2013) | ||||||
| Maturity Date: | August 6, 2026 | 2ndMost Recent Occupancy (As of): | 83.8% (12/31/2014) | ||||||
| IO Period: | 60 months | Most Recent Occupancy (As of)(3): | 89.1% (12/31/2015) | ||||||
| Loan Term (Original): | 120 months | Current Occupancy (As of)(3): | 97.2% (6/24/2016) | ||||||
| Seasoning: | 1 month | ||||||||
| Amortization Term (Original): | 360 months | Underwriting and Financial Information: | |||||||
| Loan Amortization Type: | Interest-only, Amortizing Balloon | ||||||||
| Interest Accrual Method: | Actual/360 | 4thMost Recent NOI (As of)(4): | $3,793,692 (12/31/2013) | ||||||
| Call Protection: | L(25),D(92),O(3) | 3rdMost Recent NOI (As of)(4): | $2,589,387 (12/31/2014) | ||||||
| Lockbox Type: | Hard/Upfront Cash Management | 2ndMost Recent NOI (As of)(4): | $3,285,687 (12/31/2015) | ||||||
| Additional Debt(1): | None | Most Recent NOI (As of)(4): | $3,908,642 (TTM 3/31/2016) | ||||||
| Additional Debt Type(1): | NAP | ||||||||
| U/W Revenues(4): | $8,012,942 | ||||||||
| U/W Expenses(4): | $3,717,456 | ||||||||
| U/W NOI(4): | $4,295,487 | ||||||||
| U/W NCF(4): | $3,726,193 | ||||||||
| Escrows and Reserves(2): | U/W NOI DSCR : | 1.85x | |||||||
| U/W NCF DSCR: | 1.61x | ||||||||
| Type: | Initial | Monthly | Cap (If Any) | U/W NOI Debt Yield: | 11.6% | ||||
| Taxes | $122,848 | $61,424 | NAP | U/W NCF Debt Yield: | 10.1% | ||||
| Insurance | $16,664 | $5,555 | NAP | As-Is Appraised Value: | $54,750,000 | ||||
| Replacement Reserves | $0 | $6,112 | NAP | As-Is Appraisal Valuation Date: | May 3, 2016 | ||||
| TI/LC Reserve | $228,485 | $41,357 | NAP | Cut-off Date LTV Ratio: | 67.6% | ||||
| Free Rent Reserve | $51,100 | $0 | NAP | LTV Ratio at Maturity or ARD: | 62.1% | ||||
| (1) | See “Other Indebtedness” section. |
| (2) | See “Escrows” section. |
| (3) | See “Historical Occupancy” section. |
| (4) | See “Cash Flow Analysis” section. |
The Mortgage Loan.The mortgage loan (the “One Meridian Mortgage Loan”) is evidenced by a single promissory note that is secured by a first mortgage encumbering an office building located in Wyomissing, Pennsylvania (the “One Meridian Property”). The One Meridian Mortgage Loan was originated on July 26, 2016 by Ladder Capital Finance LLC. The One Meridian Mortgage Loan had an original principal balance of $37,000,000, has an outstanding principal balance as of the Cut-off Date of $37,000,000 and accrues interest at a rate of 4.750%per annum. The One Meridian Mortgage Loan had an initial term of 120 months, has a remaining term of 119 months as of the Cut-off Date and requires interest-only payments for the first 60 payments following origination and, thereafter, requires payments of principal and interest based on a 30-year amortization schedule. The One Meridian Mortgage Loan matures on August 6, 2026.
Following the lockout period, the borrowers have the right to defease the One Meridian Mortgage Loan in whole, but not in part, on any date before June 6, 2026. In addition, the One Meridian Mortgage Loan is prepayable without penalty on or after June 6, 2026.
THE INFORMATION IN THIS STRUCTURAL AND COLLATERAL TERM SHEET IS NOT COMPLETE AND MAY BE AMENDED PRIOR TO THE TIME OF SALE. THIS TERM SHEET IS NOT AN OFFER TO SELL THESE SECURITIES AND IT IS NOT A SOLICITATION OF AN OFFER TO BUY THESE SECURITIES IN ANY JURISDICTION WHERE THE OFFER OR SALE IS NOT PERMITTED.
66
| ONE MERIDIAN |
Sources and Uses
| Sources | Uses | |||||||
| Original loan amount | $37,000,000 | 70.1% | Purchase price | $51,500,000 | 97.6% | |||
| Sponsor’s new cash contribution | 13,274,412 | 25.2 | Reserves | 419,097 | 0.8 | |||
| Preferred equity | 2,500,000 | 4.7 | Closing costs | 855,315 | 1.6 | |||
| Total Sources | $52,774,412 | 100.0% | Total Uses | $52,774,412 | 100.0% |
The Property. The One Meridian Property is a four-story class A office building containing approximately 366,728 square feet located on a 5.4-acre parcel in Wyomissing, Pennsylvania, approximately 51.6 miles northwest of Philadelphia. The One Meridian Property was originally built to suit in 1990 as the former Meridian Bank headquarters and features an on-site fitness center, and an on-site cafeteria. The largest tenants at the One Meridian Property include Allstate Insurance Company (rated A-, A3 and A- by Fitch, Moody’s and S&P, respectively), Continental Casualty Company (rated BBB+, Baa2 and BBB by Fitch, Moody’s and S&P) and Godiva Chocolatier, Inc. The One Meridian Property features 1,600 surface parking spaces resulting in a parking ratio of 4.4 spaces per 1,000 square feet of rentable area. As of June 24, 2016, the One Meridian Property was 97.2% leased by 14 tenants.
The One Meridian Property is subject to a condominium regime. The One Meridian Property consists of unit one of a three -unit condominium association. The One Meridian Property currently comprises a total of 85% of the interests in the condominium with unit 2 comprising the remaining 15%. Unit 3 does not have any common interests. At origination, the condominium board consisted of 3 members. See“Description of the Mortgage Pool—Mortgage Pool Characteristics—Condominium Interests” in the Preliminary Prospectus.
The following table presents certain information relating to the tenancy at the One Meridian Property:
Major Tenants
| Tenant Name | Credit Rating (Fitch/Moody’s/ S&P)(1) | Tenant NRSF | % of NRSF | Annual U/W Base Rent PSF(2) | Annual U/W Base Rent(2) | % of Total Annual U/W Base Rent | Lease Expiration Date |
| Major Tenants | |||||||
| Allstate Insurance Company | A-/A3/A- | 62,383 | 17.0% | $24.14 | $1,505,926 | 20.7% | 3/31/2023(3) |
| Continental Casualty Company(4) | BBB+/Baa2/BBB | 62,354 | 17.0% | $21.45 | $1,337,691 | 18.4% | 7/31/2024(5) |
| Godiva Chocolatier, Inc. | NR/NR/NR | 50,274 | 13.7% | $21.75 | $1,093,460 | 15.0% | 3/31/2026 |
| UGI Energy Services Inc. | NR/NR/NR | 48,902 | 13.3% | $20.50 | $1,002,491 | 13.8% | 12/31/2020(6) |
| Distributed Systems Services, Inc. | NR/NR/NR | 41,533 | 11.3% | $19.70 | $818,200 | 11.3% | 9/30/2022 |
| Total Major Tenants | 265,446 | 72.4% | $21.69 | $5,757,767 | 79.2% | ||
| Non-Major Tenants(7) | 91,000 | 24.8% | $16.60(7) | $1,510,275 | 20.8% | ||
| Occupied Collateral Total(7) | 356,446 | 97.2% | $20.39(7) | $7,268,042 | 100.0% | ||
| Vacant Space | 10,282 | 2.8% | |||||
| Collateral Total | 366,728 | 100.0% | |||||
| (1) | Certain ratings are those of the parent company whether or not the parent guarantees the lease |
| (2) | Annual U/W Base Rent PSF and Annual U/W Base Rent include contractual rent steps through February 2017, totaling $135,714. |
| (3) | Allstate Insurance Company has one five-year lease extension option with at least 9 months’ prior notice. The tenant may terminate up to 14,521 square feet (approximately 4.0% of the net rentable area) of independently leasable space effective as of April 30, 2021 with at least 9 months’ prior notice. |
| (4) | Continental Casualty Company has 5,840 square feet of expansion space for which they are not yet in occupancy or paying rent. Continental Casualty Company is expected to take occupancy of the expansion space in October 2016 after completion of their build out and will receive free rent through December 2016; all remaining free rent following the origination date was reserved upfront. |
| (5) | Continental Casualty Company has one five-year lease extension option with at least 12 months’ prior notice. The tenant may terminate up to 31,081 square feet (approximately 8.5% of the net rentable area) effective as of October 31, 2019. |
| (6) | UGI Energy Services, Inc. may terminate its lease effective as of June 30, 2018 and continuing every 6 months thereafter with at least 6 months prior notice to the applicable termination date. |
| (7) | Non-Major Tenants includes the café, conference room, leasing office, and storage space totaling 13,114 square feet which has no associated rent; the Annual U/W Base Rent PSF for Non-Major Tenants and Occupied Collateral Total excluding that square footage is $19.39 and $21.17, respectively. |
THE INFORMATION IN THIS STRUCTURAL AND COLLATERAL TERM SHEET IS NOT COMPLETE AND MAY BE AMENDED PRIOR TO THE TIME OF SALE. THIS TERM SHEET IS NOT AN OFFER TO SELL THESE SECURITIES AND IT IS NOT A SOLICITATION OF AN OFFER TO BUY THESE SECURITIES IN ANY JURISDICTION WHERE THE OFFER OR SALE IS NOT PERMITTED.
67
| ONE MERIDIAN |
The following table presents certain information relating to the lease rollover schedule at the One Meridian Property:
Lease Expiration Schedule(1)(2)
Year Ending December 31, | No. of Leases Expiring | Expiring NRSF | % of Total NRSF | Cumulative Expiring NRSF | Cumulative % of Total NRSF | Annual U/W Base Rent | % of Total Annual U/W Base Rent | Annual U/W Base Rent PSF(3) |
| MTM | 0 | 0 | 0.0% | 0 | 0.0% | $0 | 0.0% | $0.00 |
| 2016 | 1 | 9,568 | 2.6% | 9,568 | 2.6% | $210,496 | 2.9% | $22.00 |
| 2017 | 1 | 6,729 | 1.8% | 16,297 | 4.4% | $25,503 | 0.4% | $3.79 |
| 2018 | 1 | 7,093 | 1.9% | 23,390 | 6.4% | $149,095 | 2.1% | $21.02 |
| 2019 | 1 | 2,120 | 0.6% | 25,510 | 7.0% | $44,520 | 0.6% | $21.00 |
| 2020 | 4 | 78,247 | 21.3% | 103,757 | 28.3% | $1,599,501 | 22.0% | $20.44 |
| 2021 | 1 | 14,186 | 3.9% | 117,943 | 32.2% | $297,906 | 4.1% | $21.00 |
| 2022 | 1 | 41,533 | 11.3% | 159,476 | 43.5% | $818,200 | 11.3% | $19.70 |
| 2023 | 1 | 62,383 | 17.0% | 221,859 | 60.5% | $1,505,926 | 20.7% | $24.14 |
| 2024 | 1 | 62,354 | 17.0% | 284,213 | 77.5% | $1,337,691 | 18.4% | $21.45 |
| 2025 | 1 | 8,845 | 2.4% | 293,058 | 79.9% | $185,745 | 2.6% | $21.00 |
| 2026 | 1 | 50,274 | 13.7% | 343,332 | 93.6% | $1,093,460 | 15.0% | $21.75 |
| Thereafter | 0 | 0 | 0.0% | 343,332 | 93.6% | $0 | 0.0% | $0.00 |
| Vacant | 0 | 10,282 | 2.8% | 353,614 | 96.4% | $0 | 0.0% | $0.00 |
Other(4) | 0 | 13,114 | 3.6% | 366,728 | 100.0% | $0 | 0.0% | $0.00 |
| Total/Weighted | 14 | 366,728 | 100.0% | $7,268,042 | 100.0% | $21.17 |
| (1) | Information obtained from the underwritten rent roll. |
| (2) | Certain tenants may have lease termination options that are exercisable prior to the originally stated expiration date of the subject lease and that are not considered in the Lease Expiration Schedule. |
| (3) | Weighted Average Annual U/W Base Rent PSF excludes vacant and Other space. |
| (4) | Includes the café, conference room, leasing office, and storage space which do not have leases or associated rent. |
The following table presents historical occupancy percentages at the One Meridian Property:
Historical Occupancy
12/31/2012 | 12/31/2013(1) | 12/31/2014(1) | 12/31/2015(1)(2) | 6/24/2016(2)(3)(4) |
| NAV | 78.8% | 83.8% | 89.1% | 97.2% |
| (1) | Information obtained from the borrower. |
| (2) | The increase in in occupancy from 2015 is due to recent leasing of 75,225 square feet since January 2015. |
| (3) | Information obtained from the underwritten rent roll. |
| (4) | As of June 24, 2016, the One Meridian Property was 97.2% leased; Continental Casualty Company is expected to take occupancy of its expansion space in October 2016 (1.6% of net rentable area). |
THE INFORMATION IN THIS STRUCTURAL AND COLLATERAL TERM SHEET IS NOT COMPLETE AND MAY BE AMENDED PRIOR TO THE TIME OF SALE. THIS TERM SHEET IS NOT AN OFFER TO SELL THESE SECURITIES AND IT IS NOT A SOLICITATION OF AN OFFER TO BUY THESE SECURITIES IN ANY JURISDICTION WHERE THE OFFER OR SALE IS NOT PERMITTED.
68
| ONE MERIDIAN |
Operating History and Underwritten Net Cash Flow. The following table presents certain information relating to the historical operating performance and the underwritten net cash flow at the One Meridian Property:
Cash Flow Analysis
| 2013(1) | 2014(1)(2) | 2015(2) | TTM 3/31/2016(2) | U/W(2) | % of U/W Effective Gross Income | U/W $ per SF | |
| Base Rent | $6,101,930 | $5,303,912 | $5,729,353 | $6,217,346 | $7,268,042 | 90.7% | $19.82 |
| Grossed Up Vacant Space | 0 | 0 | 0 | 0 | 208,942 | 2.6 | 0.57 |
| Total Reimbursables | 1,338,098 | 1,248,652 | 1,257,953 | 1,266,280 | 1,335,244 | 16.7 | 3.64 |
| Other Income | 22,260 | 51,925 | 27,865 | 81,937 | 81,937 | 1.0 | 0.22 |
| Less Vacancy & Credit Loss | 0 | 0 | 0 | 0 | (881,223)(3) | (11.0) | (2.40) |
| Effective Gross Income | $7,462,288 | $6,604,488 | $7,015,172 | $7,565,563 | $8,012,942 | 100.0% | $21.85 |
| Total Operating Expenses | $3,668,596 | $4,015,101 | $3,729,485 | $3,656,921 | $3,717,456 | 46.4% | $10.14 |
| Net Operating Income | $3,793,692 | $2,589,387 | $3,285,687 | $3,908,642 | $4,295,487 | 53.6% | $11.71 |
| TI/LC | 0 | 0 | 0 | 0 | 495,948 | 6.2 | 1.35 |
| Capital Expenditures | 0 | 0 | 0 | 0 | 73,346 | 0.9 | 0.20 |
| Net Cash Flow | $3,793,692 | $2,589,387 | $3,285,687 | $3,908,642 | $3,726,193 | 46.5% | $10.16 |
| NOI DSCR | 1.64x | 1.12x | 1.42x | 1.69x | 1.85x | ||
| NCF DSCR | 1.64x | 1.12x | 1.42x | 1.69x | 1.61x | ||
| NOI DY | 10.3% | 7.0% | 8.9% | 10.6% | 11.6% | ||
| NCF DY | 10.3% | 7.0% | 8.9% | 10.6% | 10.1% |
| (1) | The decrease in Net Operating Income from 2013 to 2014 was due to the termination of the lease of a major tenant in 2013. |
| (2) | The increase in Net Operating Income from 2014, 2015 and TTM 3/31/2016 to U/W is due to recent leasing which includes UGI Utilities ($297,906), Continental Casualty Company expansion ($116,613), UGI Energy Services Inc. expansion ($253,760), and free rent burn off from Engle-Hambright & Davies ($181,323). |
| (3) | The underwritten economic vacancy is 10.0%. The One Meridian Property was 97.2% physically occupied as of June 24, 2016. |
Appraisal. As of the appraisal valuation date of May 3, 2016, the One Meridian Property had an “as-is” appraised value of $54,750,000.
Environmental Matters. According to a Phase I environmental site assessment dated May 9, 2016, there was no evidence of any recognized environmental conditions at the One Meridian Property.
Market Overview and Competition.The One Meridian Property is located in the Spring Township section of Wyomissing, Pennsylvania, approximately 2.8 miles west of Reading, Pennsylvania. As of July 2015, Reading had a population of 87,879 making it the fifth largest city in Pennsylvania according to a government agency. The One Meridian Property is located off of Paper Mill Road and Broadcasting Station Road, which connect to US Route 222 in the north and State Hill Road in the south. The One Meridian Property also has access to US Route 422, which is a regional highway. The largest employers within Reading, Pennsylvania are Reading Hospital and Medical Center with approximately 6,920 employees, East Penn Manufacturing Co. Inc. with approximately 6,780 employees and Carpenter Technology Corp. with approximately 2,360 employees. The estimated 2015 population within a one-, three- and five-mile radius of the One Meridian Property was 20,037, 189,963, 478,159, respectively, while the estimated 2015 average household income within the same radii was $103,468, $109,630 and $103,333, respectively.
According to the appraisal, the One Meridian Property is located in the Wyomissing office submarket within Berks County, which reported a 11.4% vacancy rate as of the first quarter 2016. As of the same quarter, Berks County reported an occupancy of 91.4%. The appraiser identified a competitive peer group for the One Meridian Property which had a weighted average occupancy rate of 89.5%. The appraiser concluded to a blended market rent of $20.50 per square foot gross.
THE INFORMATION IN THIS STRUCTURAL AND COLLATERAL TERM SHEET IS NOT COMPLETE AND MAY BE AMENDED PRIOR TO THE TIME OF SALE. THIS TERM SHEET IS NOT AN OFFER TO SELL THESE SECURITIES AND IT IS NOT A SOLICITATION OF AN OFFER TO BUY THESE SECURITIES IN ANY JURISDICTION WHERE THE OFFER OR SALE IS NOT PERMITTED.
69
| ONE MERIDIAN |
The following table presents certain information relating to comparable leases to the One Meridian Property:
Comparable Leases(1)
| Property Name/Location | Year Built/ Renovated | Stories | Total GLA (SF) | Total Occupancy | Distance from Subject | Tenant Name | Lease Date/Term | Lease Area (SF) | Annual Base Rent PSF | Lease Type |
| 2 Meridian Blvd Wyomissing, PA | 1990/NAP | 3 | 70,000 | 97.5% | 0.4 miles | Waddell & Reed | July 2013 / 5 Yrs | 5,165 | $19.75 | MG |
| 30 Commerce Drive Wyomissing, PA | 1990/NAP | 1 | 8,315 | 100% | 0.6 miles | Goodlife Financial Group | August 2014 / 7.3 Yrs | 5,045 | $14.00 | MG |
| 1105 Berkshire Blvd Wyomissing, PA | 1986/2003 | 3 | 69,440 | 84.4% | 1.4 miles | Traveler’s Insurance – Ren. | March 2013 / 5 Yrs | 58,511 | $19.90 | MG |
| 1125 Berkshire Blvd Wyomissing, PA | 1989/NAP | 1 | 57,346 | 44.5% | 1.6 miles | JC Ehrlich | October 2015 / 10 Yrs | 17,796 | $11.31 | NNN |
| 1125 Berkshire Blvd Wyomissing, PA | 1989/NAP | 1 | 57,346 | 44.5% | 1.6 miles | Berks County Tax Bureau | November 2015 / 20 Yrs | 17,796 | $10.25 | NNN |
| (1) | Information obtained from the appraisal. |
The Borrowers.The borrowers are Meridian Blvd Lofts Owner LLC and Agharta Meridian Realty LLC as tenants-in-common with two independent directors. Meridian Blvd Lofts Owner LLC owns 81% of the tenancy in common interests and Agharta Meridian Realty LLC owns 19% of the tenancy in common interests in the One Meridian Property. Legal counsel to the borrower delivered a non-consolidation opinion in connection with the origination of the One Meridian Mortgage Loan. Leibel Lederman is the guarantor of certain nonrecourse carveouts under the One Meridian Mortgage Loan.
The Sponsor. The sponsor is Leibel Lederman, who is a partner at Galil Management (“Galil”), an investment firm specializing in multi-family properties throughout New York City. Galil developed, owned and managed a significant portfolio of commercial properties throughout the 1980’s and early 1990’s, and then shifted its focus into more multi-family holdings following the commercial real estate downturn in the early 1990’s. This shift into multi-family was accelerated in the 2000’s. Currently Galil’s portfolio consists of approximately 6,000 residential units across New York City. Mr. Lederman has been involved in commercial real estate for the last 35 years.
Escrows.The One Meridian Mortgage Loan documents provide for upfront escrows in the amount of $122,848 for real estate taxes, $16,664 for insurance premiums, $51,100 for a free rent reserve related to the Continental Casualty Company lease, and $228,485 for outstanding tenant improvement and leasing commissions related to the Continental Casualty Company expansion space ($145,663) and UGI Utilities ($82,822). The loan documents also provide for ongoing monthly reserve deposits in the amount of $61,424 for real estate taxes, $5,555 for insurance premiums, $6,112 for replacement reserves and $41,357 for tenant improvements and leasing commissions.
Lockbox and Cash Management.The One Meridian Mortgage Loan documents require a lender-controlled lockbox account, which is already in place, and require the borrowers to direct tenants to pay all rents directly into such lockbox account. The One Meridian Mortgage Loan documents also require that any rent received by a borrower or property manager will be deposited into such lockbox account within one business day of receipt. Prior to a Cash Sweep Event (as defined below), all excess cash flow will be held by the borrowers. Upon the occurrence and during the continuance of a Cash Sweep Event, any excess cash flow will be held as additional collateral for the One Meridian Mortgage Loan in the excess cash flow account.
A “Cash Sweep Event” will commence upon: (i) the occurrence of an event of default occurs under the loan documents or the property management agreement; (ii) the amortizing debt service coverage ratio falling below 1.20x at any time; (iii) any tenant accounting for more than 10.0% of the total rent or square footage (a “Significant Tenant”) ceasing to conduct, or giving notice of its intent to cease conducting, its normal business operations in substantially all of its leased premises; (iv) any Significant Tenant (or such tenant’s parent, if applicable) becoming insolvent or filing for bankruptcy; (v) twelve months prior to the expiration of a Significant Tenant’s lease; or (vi) the date upon which a Significant Tenant’s lease expires or terminates in whole or in part.
A Cash Sweep Event may be cured up to two times during the course of the One Meridian Mortgage Loan; with regard to clause (i), upon the cure of such event of default or upon the date the borrower has entered into a replacement management agreement with a qualified manager; with regard to clause (ii), upon the amortizing debt service coverage ratio being equal to or greater than 1.30xfor two consecutive calendar quarters; with regard to clause (iii), upon the applicable Significant Tenant resuming normal business operations at substantially all of its leased premises for two consecutive calendar quarters and, if applicable, revoking any such notice, or the retenanting of the applicable Significant Tenant’s space in accordance with the requirements of the One Meridian Mortgage Loan documents; with regard to clause (iv), upon the applicable Significant Tenant or such Significant Tenant’s parent company, as the case may be, becoming solvent to the lender’s satisfaction for two consecutive calendar quarters or emerging from bankruptcy and affirming its lease; and with regard to clauses (v) and (vi), upon the applicable Significant Tenant renewing its lease for a minimum of five years in accordance with (a) the renewal terms set forth in such lease or (b) in accordance with the requirements of the One Meridian Mortgage Loan documents or the retenanting of the applicable Significant Tenant’s space in accordance with the requirements of the One Meridian Mortgage Loan documents.
Property Management. The One Meridian Property is managed by BPG Management Company, L.P.
THE INFORMATION IN THIS STRUCTURAL AND COLLATERAL TERM SHEET IS NOT COMPLETE AND MAY BE AMENDED PRIOR TO THE TIME OF SALE. THIS TERM SHEET IS NOT AN OFFER TO SELL THESE SECURITIES AND IT IS NOT A SOLICITATION OF AN OFFER TO BUY THESE SECURITIES IN ANY JURISDICTION WHERE THE OFFER OR SALE IS NOT PERMITTED.
70
| ONE MERIDIAN |
Assumption. The borrowers have the one time right to transfer the One Meridian Property provided that certain conditions are satisfied, including: (i) no event of default has occurred and is continuing; (ii) the lender has reasonably determined that the proposed transferee and guarantor satisfy the lender’s credit review and underwriting standards, taking into consideration the transferee’s experience, financial strength, and general business standing; and (iii) if required by the lender, a rating agency confirmation is obtained from Fitch, KBRA and Moody’s to the effect that such assumption will not result in a downgrade, withdrawal or qualification of the respective ratings assigned to the Series 2016-LC24 Certificates.
Partial Release. Not permitted.
Real Estate Substitution.Not permitted.
Subordinate and Mezzanine Indebtedness.Not permitted.
Other Indebtedness. The One Meridian Mortgage Loan is acquisition financing, and the seller of the One Meridian Property contributed $2,500,000 towards the purchase price as preferred equity. The preferred equity is structured and based on an 8.0% return of future net cash flow. The seller is entitled to the return of its equity contribution and preferred returns as follows: an amount of not less than15% of any net profit available from the related One Meridian Property, which payment will first be used to pay down the equity contribution, and then to pay the preferred return. The seller’s equity contribution will not entitle the seller to any voting rights or management rights.No member has any obligations to make additional capital contributions. The managing member may make additional capital contributions and the preferred equity member may make contributions earmarked for distribution to the borrower to avoid foreclosure.
Ground Lease.None.
Terrorism Insurance. The loan documents require that the “all risk” insurance policy required to be maintained by the borrower provides coverage for terrorism in an amount equal to the full replacement cost of the One Meridian Property, as well as business interruption covering no less than the 12-month period following the occurrence of a casualty event, together with a 12-month extended period of indemnity.
THE INFORMATION IN THIS STRUCTURAL AND COLLATERAL TERM SHEET IS NOT COMPLETE AND MAY BE AMENDED PRIOR TO THE TIME OF SALE. THIS TERM SHEET IS NOT AN OFFER TO SELL THESE SECURITIES AND IT IS NOT A SOLICITATION OF AN OFFER TO BUY THESE SECURITIES IN ANY JURISDICTION WHERE THE OFFER OR SALE IS NOT PERMITTED.
71
THE SHOPS AT CRYSTALS |

THE INFORMATION IN THIS STRUCTURAL AND COLLATERAL TERM SHEET IS NOT COMPLETE AND MAY BE AMENDED PRIOR TO THE TIME OF SALE. THIS TERM SHEET IS NOT AN OFFER TO SELL THESE SECURITIES AND IT IS NOT A SOLICITATION OF AN OFFER TO BUY THESE SECURITIES IN ANY JURISDICTION WHERE THE OFFER OR SALE IS NOT PERMITTED.
72
THE SHOPS AT CRYSTALS |
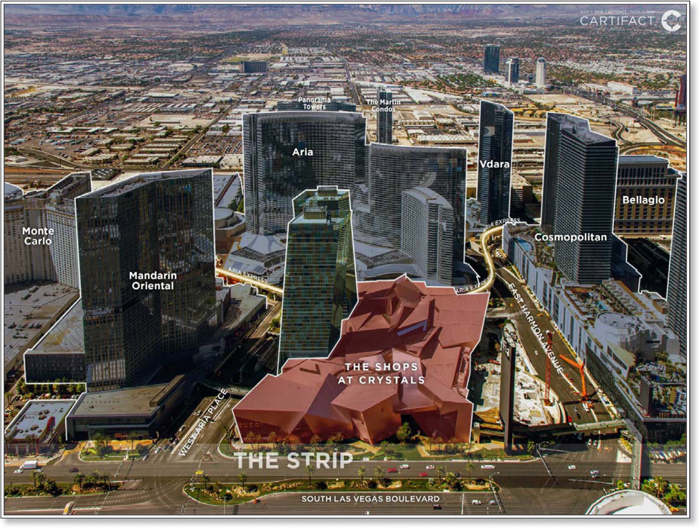
THE INFORMATION IN THIS STRUCTURAL AND COLLATERAL TERM SHEET IS NOT COMPLETE AND MAY BE AMENDED PRIOR TO THE TIME OF SALE. THIS TERM SHEET IS NOT AN OFFER TO SELL THESE SECURITIES AND IT IS NOT A SOLICITATION OF AN OFFER TO BUY THESE SECURITIES IN ANY JURISDICTION WHERE THE OFFER OR SALE IS NOT PERMITTED.
73
THE SHOPS AT CRYSTALS |
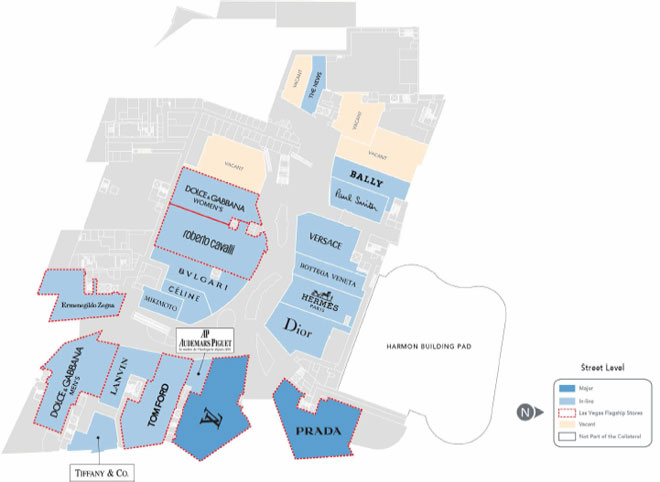
THE INFORMATION IN THIS STRUCTURAL AND COLLATERAL TERM SHEET IS NOT COMPLETE AND MAY BE AMENDED PRIOR TO THE TIME OF SALE. THIS TERM SHEET IS NOT AN OFFER TO SELL THESE SECURITIES AND IT IS NOT A SOLICITATION OF AN OFFER TO BUY THESE SECURITIES IN ANY JURISDICTION WHERE THE OFFER OR SALE IS NOT PERMITTED.
74
THE SHOPS AT CRYSTALS |
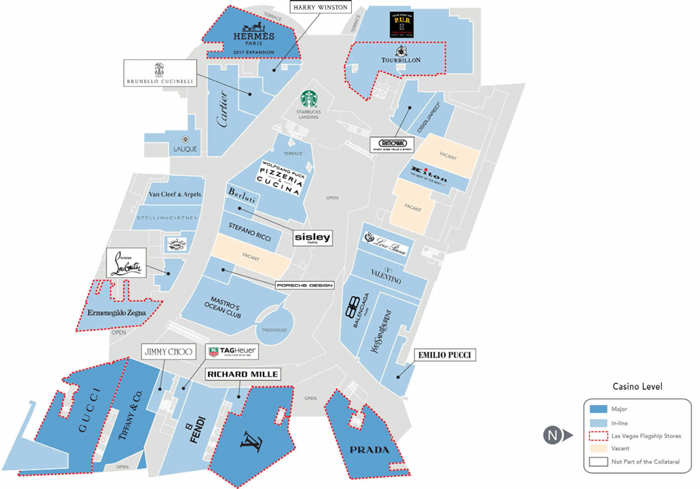
THE INFORMATION IN THIS STRUCTURAL AND COLLATERAL TERM SHEET IS NOT COMPLETE AND MAY BE AMENDED PRIOR TO THE TIME OF SALE. THIS TERM SHEET IS NOT AN OFFER TO SELL THESE SECURITIES AND IT IS NOT A SOLICITATION OF AN OFFER TO BUY THESE SECURITIES IN ANY JURISDICTION WHERE THE OFFER OR SALE IS NOT PERMITTED.
75
THE SHOPS AT CRYSTALS |
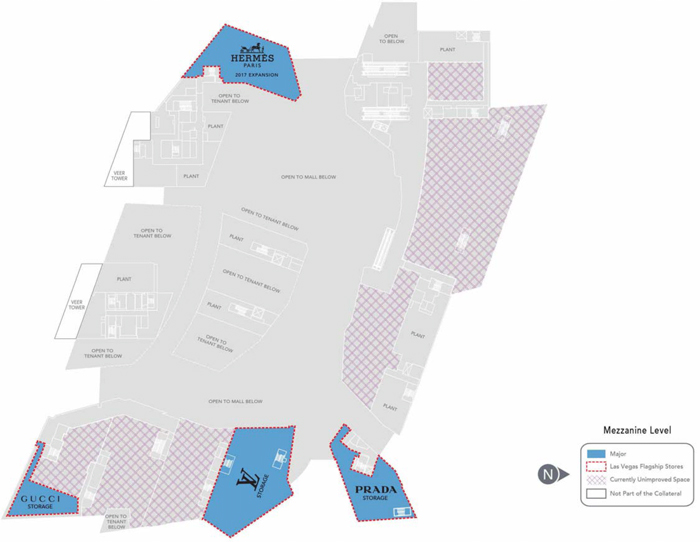
THE INFORMATION IN THIS STRUCTURAL AND COLLATERAL TERM SHEET IS NOT COMPLETE AND MAY BE AMENDED PRIOR TO THE TIME OF SALE. THIS TERM SHEET IS NOT AN OFFER TO SELL THESE SECURITIES AND IT IS NOT A SOLICITATION OF AN OFFER TO BUY THESE SECURITIES IN ANY JURISDICTION WHERE THE OFFER OR SALE IS NOT PERMITTED.
76
THE SHOPS AT CRYSTALS |
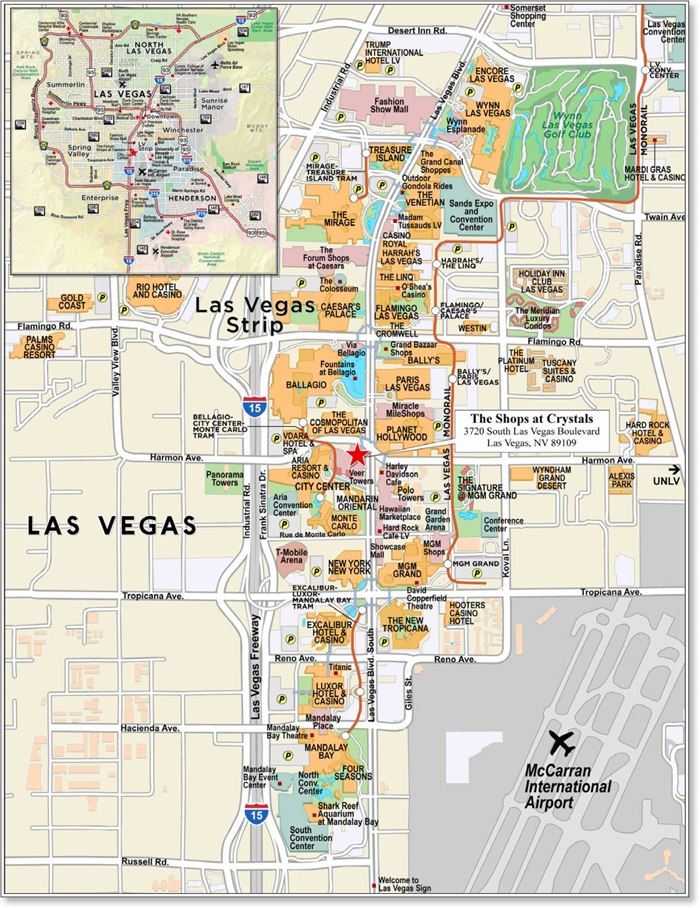
THE INFORMATION IN THIS STRUCTURAL AND COLLATERAL TERM SHEET IS NOT COMPLETE AND MAY BE AMENDED PRIOR TO THE TIME OF SALE. THIS TERM SHEET IS NOT AN OFFER TO SELL THESE SECURITIES AND IT IS NOT A SOLICITATION OF AN OFFER TO BUY THESE SECURITIES IN ANY JURISDICTION WHERE THE OFFER OR SALE IS NOT PERMITTED.
77
| No. 6 – The Shops at Crystals | |||||||
| Loan Information | Property Information | ||||||
| Mortgage Loan Seller: | Wells Fargo Bank, National Association | Single Asset/Portfolio: | Single Asset | ||||
Credit Assessment (Fitch/KBRA/Moody’s): | AAA/AA-/A2(sca.pd) | Property Type: | Retail | ||||
| Original Principal Balance(1): | $35,000,000 | Specific Property Type: | Anchored | ||||
| Cut-off Date Balance(1): | $35,000,000 | Location: | Las Vegas, NV | ||||
| % of Initial Pool Balance: | 3.3% | Size: | 262,327 SF | ||||
| Loan Purpose: | Recapitalization | Cut-off Date Balance Per SF(1): | $1,458.87 | ||||
| Borrower Name: | The Crystals Las Vegas, LLC | Year Built/Renovated: | 2009/NAP | ||||
| Sponsors(2): | Simon Property Group, L.P.; Invesco Advisers Inc. | Title Vesting: | Fee | ||||
| Mortgage Rate: | 3.744% | Property Manager: | Self-managed | ||||
| Note Date: | June 9, 2016 | 4thMost Recent Occupancy (As of): | 90.5% (12/31/2012) | ||||
| Anticipated Repayment Date: | NAP | 3rdMost Recent Occupancy (As of): | 95.7% (12/31/2013) | ||||
| Maturity Date: | July 1, 2026 | 2ndMost Recent Occupancy (As of): | 93.8% (12/31/2014) | ||||
| IO Period: | 120 months | Most Recent Occupancy (As of): | 91.0% (12/31/2015) | ||||
| Loan Term (Original): | 120 months | Current Occupancy (As of)(6): | 87.6% (4/21/2016) | ||||
| Seasoning: | 2 months | ||||||
| Amortization Term (Original): | None | Underwriting and Financial Information: | |||||
| Loan Amortization Type: | Interest-only, Balloon | ||||||
| Interest Accrual Method: | Actual/360 | 4thMost Recent NOI (As of): | $34,351,614 (12/31/2012) | ||||
| Call Protection(3): | L(26),D(87),O(7) | 3rdMost Recent NOI (As of): | $40,054,352 (12/31/2013) | ||||
| Lockbox Type: | Hard/Springing Cash Management | 2ndMost Recent NOI (As of): | $43,642,314 (12/31/2014) | ||||
| Additional Debt(1)(4): | Yes | Most Recent NOI (As of): | $46,376,811 (12/31/2015) | ||||
| Additional Debt Type(1)(4): | Pari Passu and Subordinate Debt | ||||||
| U/W Revenues: | $64,805,737 | ||||||
| U/W Expenses: | $15,337,868 | ||||||
| U/W NOI: | $49,467,869 | ||||||
| U/W NCF: | $47,610,240 | ||||||
| U/W NOI DSCR(1): | 3.41x | ||||||
| Escrows and Reserves(5): | U/W NCF DSCR(1): | 3.28x | |||||
| U/W NOI Debt Yield(1): | 12.9% | ||||||
| Type: | Initial | Monthly | Cap (If Any) | U/W NCF Debt Yield(1): | 12.4% | ||
| Taxes | $0 | Springing | NAP | As-Is Appraised Value: | $1,100,000,000 | ||
| Insurance | $0 | Springing | NAP | As-Is Appraisal Valuation Date: | April 26, 2016 | ||
| Replacement Reserves | $0 | Springing | $104,931 | Cut-off Date LTV Ratio(1): | 34.8% | ||
| TI/LC Reserve | $0 | Springing | $4,440,000 | LTV Ratio at Maturity or ARD(1): | 34.8% | ||
| (1) | The Shops at Crystals Whole Loan (as defined below), which had an original principal balance of $550,000,000, is comprised of The Shops at Crystals Senior Notes (as defined below) totaling $382,700,000 and The Shops at Crystals Subordinate Companion Loans (as defined below) totaling $167,300,000. The non-controlling The Shops at Crystals Mortgage Loan (as defined below) had an original principal balance of $35,000,000, has an outstanding principal balance of $35,000,000 as of the Cut-off Date and will be contributed to the WFCM 2016-LC24 Trust. All statistical financial information related to balances per square foot, loan-to-value ratios, debt service coverage ratios and debt yields are based on The Shops at Crystals Senior Notes. The Cut-off Date LTV Ratio, U/W NCF DSCR and U/W NCF DY based on The Shops at Crystals Whole Loan are 50.0%, 2.28x and 8.7%, respectively. |
| (2) | See “The Sponsors” section. |
| (3) | The defeasance lockout period will be at least 26 payment dates beginning with and including the first payment date of August 1, 2016. Defeasance of The Shops at Crystals Whole Loan is permitted after the date that is the earlier to occur of (i) two years after the closing date of the securitization that includes the last note to be securitized, and (ii) August 1, 2019. The assumed lockout period of 26 payments is based on the expected WFCM 2016-LC24 Trust closing date in September 2016. |
| (4) | See “Subordinate and Mezzanine Indebtedness” section. |
| (5) | See “Escrows” section. |
| (6) | See “Historical Occupancy” section. |
The Mortgage Loan. The mortgage loan (“The Shops at Crystals Mortgage Loan”) is part of a whole loan (“The Shops at Crystals Whole Loan”) evidenced by (i) two tranches of senior loans, each comprised of 11pari passu notes (“The Shops at Crystals Senior Notes”), and (ii) three subordinate loans, each comprised of threepari passu notes (“The Shops at Crystals Subordinate Companion Loans”), secured by the fee interest in a luxury shopping center located in Las Vegas, Nevada (“The Shops at Crystals Property”). The Shops at Crystals Whole Loan was co-originated on June 9, 2016 by Wells Fargo Bank, National Association, Bank of America, N.A. and JPMorgan Chase Bank, National Association. The Shops at Crystals Whole Loan had an original principal balance of $550,000,000, has an outstanding principal balance as of the Cut-off Date of $550,000,000 and accrues interest at an interest rate of 3.744%per annum. The Shops at Crystals Whole Loan had an initial term of 120 months, has a remaining term of 118 months as of the Cut-off Date and requires payments of interest only through the term of The Shops at Crystals Mortgage Loan. The Shops at Crystals Whole Loan matures on July 1, 2026.
THE INFORMATION IN THIS STRUCTURAL AND COLLATERAL TERM SHEET IS NOT COMPLETE AND MAY BE AMENDED PRIOR TO THE TIME OF SALE. THIS TERM SHEET IS NOT AN OFFER TO SELL THESE SECURITIES AND IT IS NOT A SOLICITATION OF AN OFFER TO BUY THESE SECURITIES IN ANY JURISDICTION WHERE THE OFFER OR SALE IS NOT PERMITTED.
78
THE SHOPS AT CRYSTALS |
The Shops at Crystals Mortgage Loan, evidenced by one note from each of the two tranches of The Shops at Crystals Senior Notes (Notes A-3-B-1 and B-3-B-1), which will be contributed to the WFCM 2016-LC24 Trust, had an aggregate original principal balance of $35,000,000, has an aggregate outstanding principal balance as of the Cut-off Date of $35,000,000 and represents a seniorpari passu non-controlling interest in The Shops at Crystals Whole Loan. Six of the seniorpari passu notes (three from each of the two tranches of The Shops at Crystals Senior Notes) and The Shops at Crystals Subordinate Companion Loans, which were contributed to the SHOPS 2016-CSTL Trust, had an original aggregate principal balance of $300,000,000 and include Note A-1-A, which represents the controlling interest in The Shops at Crystals Whole Loan. Eight notes of The Shops at Crystals Senior Notes (Notes A-2-B-2, A-2-B-3, A-3-B-2, A-3-B-3, B-2-B-2, B-2-B-3, B-3-B-2 and B-3-B-3), which had an aggregate original principal balance of $80,000,000, were contributed to the WFCM 2016-BNK1 Trust. Two notes from The Shops at Crystals Senior Notes (Notes A-1-B-1 and B-1-B-1), which had an aggregate original principal balance of $50,000,000, were contributed to the JPMCC 2016-JP2 Trust. Two notes from The Shops at Crystals Senior Notes (Notes A-1-B-2 and B-1-B-2), which had an aggregate original principal balance of $50,000,000, were contributed to the DBJPM 2016-C3 Trust. The remaining non-controlling notes from The Shops at Crystals Senior Notes, which had an aggregate original principal balance of $35,000,000, are currently held by Bank of America, N.A. and are expected to be contributed to future securitization trusts. The lender provides no assurances that any non-securitized notes will not be split further. See “Description of the Mortgage Pool—The Whole Loans—The Non-Serviced Whole Loans—The Shops at Crystals Whole Loan” in the Preliminary Prospectus.
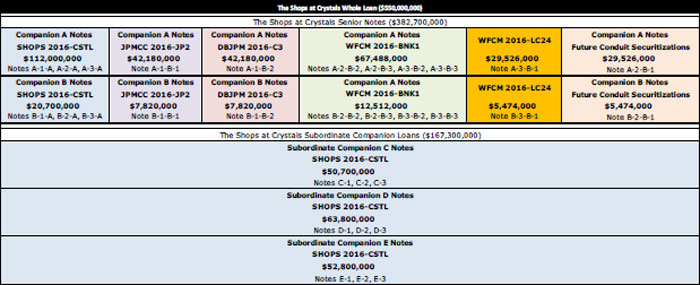
Following the lockout period, on any date before January 1, 2026, the borrower has the right to defease The Shops at Crystals Whole Loan in whole, but not in part. In addition, The Shops at Crystals Whole Loan is prepayable without penalty on or after January 1, 2026. The lockout period will expire on the earlier to occur of (i) two years after the closing date of the securitization that includes the last note to be securitized and (ii) August 1, 2019.
Sources and Uses
| Sources | Uses | |||||||
| Original whole loan amount | $550,000,000 | 100.0% | Closing costs | $1,952,902 | 0.4% | |||
| Return of equity | 548,047,098 | 99.6 | ||||||
| Total Sources | $550,000,000 | 100.0% | Total Uses | $550,000,000 | 100.0% | |||
The Property.The Shops at Crystals Property consists of the fee interest in an approximately 262,327 square foot, luxury shopping center located in the CityCenter development in the heart of the Las Vegas strip. Developed in 2009, The Shops at Crystals Property is highly visible and easily accessible with 374 feet of frontage along the Strip. The Shops at Crystals Property is attached to the Aria Resort & Casino, accessible via the ARIA Express Tram from the Bellagio Resort & Casino and the Monte Carlo, and adjacent to the Mandarin Oriental, The Cosmopolitan and the Vdara Hotel & Spa. The Shops at Crystals Property also forms the base of the twin, 37-story, 674-unit Veer Towers luxury condominium. CityCenter is an approximately 18 million square foot development and the largest retail district to receive LEED+ Gold Core & Shell certification from the United States Green Building Council. The development is situated on the west side of Las Vegas Boulevard and was developed by MGM Resorts International and Dubai World.
The Shops at Crystals Property features a collection of luxury brands. Tenants occupying 10,000 or more square feet include Louis Vuitton, Gucci, Prada and Tiffany & Co., which collectively comprise approximately 22.6% of the property’s net rentable area. The Shops at Crystals Property also serves, or will serve (in the case of the Hermès expansion), as the Las Vegas flagship location for nine of the tenants (Louis Vuitton, Gucci, Tom Ford, Prada, Roberto Cavalli, Ermenegildo Zegna, Dolce & Gabbana, Tourbillon and Hermès). Approximately 41.7% of 2015 sales and 33.6% of net rentable area comes from investment grade tenants including LVMH (parent company of Bulgari, Celine, Christian Dior, Emilio Pucci, Fendi, Loro Piana, Louis Vuitton and TAG Heuer), Kering (parent company of Yves Saint Laurent, Bottega Veneta, Balenciaga, Gucci and Stella McCartney), JAB Holdings (parent company of Bally and Jimmy Choo), Tiffany & Co. and Luxottica (parent company of Ilori).
THE INFORMATION IN THIS STRUCTURAL AND COLLATERAL TERM SHEET IS NOT COMPLETE AND MAY BE AMENDED PRIOR TO THE TIME OF SALE. THIS TERM SHEET IS NOT AN OFFER TO SELL THESE SECURITIES AND IT IS NOT A SOLICITATION OF AN OFFER TO BUY THESE SECURITIES IN ANY JURISDICTION WHERE THE OFFER OR SALE IS NOT PERMITTED.
79
THE SHOPS AT CRYSTALS |
As of April 21, 2016, The Shops at Crystals Property was approximately 87.6% leased by 50 tenants (excluding the Hermès expansion space). Hermès has executed a new lease to relocate from its 4,582 square foot space on the first floor to 13,507 square feet of space across two floors, effective December 1, 2017. Inclusive of the second floor expansion space, The Shops at Crystals Property was 88.2% leased as of April 21, 2016. The Shops at Crystals Property reported 2015 aggregate sales of approximately $317.8 million ($1,330 per square foot). Based on underwritten gross rent and 2015 total sales, the 2015 occupancy cost was 19.2%. Total sales per square foot have increased by approximately 9.4% from 2012 to 2015, and net operating income has increased by approximately 35.0% during the same period.
The following table presents certain information relating to the tenancy at The Shops at Crystals Property:
Major Tenants
| Tenant Name | Credit Rating (Fitch/Moody’s/ S&P)(1) | Tenant NRSF | % of NRSF | Annual U/W Base Rent PSF | Annual U/W Base Rent(2) | % of Total Annual U/W Base Rent | Sales PSF(3) | Occupancy Cost(3)(4) | Lease Expiration Date |
| Major Tenants | |||||||||
| Louis Vuitton | NR/NR/A+ | 22,745 | 8.7% | $192.57 | $4,380,010(5) | 9.5% | $2,140 | 9.0% | 12/31/2019 |
| Prada | NR/NR/NR | 15,525 | 5.9% | $243.45 | $3,779,524 | 8.2% | $729 | 33.4% | 12/31/2019 |
| Ermenegildo Zegna | NR/NR/NR | 9,926 | 3.8% | $277.46 | $2,754,064 | 6.0% | $685 | 40.5% | 12/31/2020 |
| Tiffany & Co. | BBB+/Baa2/BBB+ | 10,000 | 3.8% | $220.00 | $2,200,000 | 4.8% | $1,450 | 15.2% | 1/31/2024(6) |
| Tom Ford | NR/NR/NR | 7,693 | 2.9% | $275.55 | $2,119,775 | 4.6% | $1,654 | 16.7% | 12/31/2019 |
| Gucci | NR/NR/BBB | 10,952 | 4.2% | $166.45 | $1,822,983 | 4.0% | $1,380 | 12.1% | 12/31/2025 |
| Total Major Tenants | 76,841 | 29.3% | $221.97 | $17,056,356 | 37.0% | ||||
| Non-Major Tenants | 153,068 | 58.4% | $190.04 | $29,089,390 | 63.0% | ||||
| Occupied Collateral Total | 229,909 | 87.6% | $200.71 | $46,145,746 | 100.0% | ||||
| Vacant Space | 32,418 | 12.4% | |||||||
| Collateral Total | 262,327 | 100.0% | |||||||
| (1) | Certain ratings are those of the parent company whether or not the parent company guarantees the lease. |
| (2) | Annual U/W Base Rent includes contractual rent increases through May 2017 totaling $939,332. |
| (3) | Sales PSF and Occupancy Costs are for the trailing 12-month period ending December 31, 2015. |
| (4) | Occupancy Costs are calculated based on Annual U/W Base Rent divided by tenant sales. |
| (5) | Represents percentage rent in lieu of base rent, based on 2015 sales. |
| (6) | Tiffany & Co. has the right to terminate its lease if annual gross sales for 2016 are less than $30.0 million. Tiffany & Co. reported gross sales of approximately $14.5 million for the trailing 12-month period ending December 31, 2015. |
THE INFORMATION IN THIS STRUCTURAL AND COLLATERAL TERM SHEET IS NOT COMPLETE AND MAY BE AMENDED PRIOR TO THE TIME OF SALE. THIS TERM SHEET IS NOT AN OFFER TO SELL THESE SECURITIES AND IT IS NOT A SOLICITATION OF AN OFFER TO BUY THESE SECURITIES IN ANY JURISDICTION WHERE THE OFFER OR SALE IS NOT PERMITTED.
80
THE SHOPS AT CRYSTALS |
The following table presents certain information relating to the historical sales and occupancy costs at The Shops at Crystals Property:
Historical Tenant Sales (PSF) and Occupancy Costs(1)
| Historical Tenant Sales (PSF) | Current Occupancy Cost(2) | |||
| Tenant Name | 2013 | 2014 | 2015 | |
| Louis Vuitton | $2,084 | $2,151 | $2,140 | 9.0% |
| Prada | $1,102 | $943 | $729 | 33.4% |
| Ermenegildo Zegna | $769 | $787 | $685 | 40.5% |
| Tiffany & Co. | $1,593 | $1,863 | $1,450 | 15.2% |
| Tom Ford | $1,661 | $1,714 | $1,654 | 16.7% |
| Gucci | $1,704 | $1,580 | $1,380 | 12.1% |
| Tenants <10,000 Square Feet | ||||
| Comparable Sales PSF | $1,110 | $1,277 | $1,270 | |
| Occupancy Cost(2) | 20.1% | 20.3% | 19.9% | |
| Tenants >10,000 Square Feet | ||||
| Comparable Sales PSF | $1,673 | $1,680 | $1,513 | |
| Occupancy Cost(2) | 13.5% | 14.1% | 17.0% | |
| All Tenants | ||||
| Comparable Sales PSF | $1,246 | $1,378 | $1,279 | |
| Occupancy Cost(2) | 18.2% | 18.6% | 19.2% | |
| (1) | Historical Tenant Sales (PSF) and Occupancy Costs obtained from the underwritten rent roll. |
| (2) | Occupancy Costs are based on underwritten rent divided by tenant sales for the given year. |
The following table presents certain information relating to the lease rollover schedule at The Shops at Crystals Property:
Lease Expiration Schedule(1)(2)
| Year Ending December 31, | No. of Leases Expiring | Expiring NRSF | % of Total NRSF | Cumulative Expiring NRSF | Cumulative % of Total NRSF | Annual U/W Base Rent | % of Total Annual U/W Base Rent | Annual U/W Base Rent PSF(3) |
| MTM | 0 | 0 | 0.0% | 0 | 0.0% | $0 | 0.0% | $0.00 |
| 2016 | 1 | 1,949 | 0.7% | 1,949 | 0.7% | $104,775 | 0.2% | $53.76 |
| 2017 | 0 | 0 | 0.0% | 1,949 | 0.7% | $0 | 0.0% | $0.00 |
| 2018 | 5 | 12,359 | 4.7% | 14,308 | 5.5% | $2,899,100 | 6.3% | $234.57 |
| 2019 | 9 | 69,021 | 26.3% | 83,329 | 31.8% | $15,221,420 | 33.0% | $220.53 |
| 2020(4) | 11 | 45,909 | 17.5% | 129,238 | 49.3% | $10,280,922 | 22.3% | $223.94 |
| 2021 | 4 | 18,448 | 7.0% | 147,686 | 56.3% | $2,017,846 | 4.4% | $109.38 |
| 2022 | 3 | 6,560 | 2.5% | 154,246 | 58.8% | $1,709,609 | 3.7% | $260.61 |
| 2023 | 3 | 9,061 | 3.5% | 163,307 | 62.3% | $2,617,389 | 5.7% | $288.86 |
| 2024 | 10 | 47,908 | 18.3% | 211,215 | 80.5% | $7,488,292 | 16.2% | $156.31 |
| 2025 | 1 | 10,952 | 4.2% | 222,167 | 84.7% | $1,822,983 | 4.0% | $166.45 |
| 2026 | 2 | 3,160 | 1.2% | 225,327 | 85.9% | $800,000 | 1.7% | $253.16 |
| Thereafter | 1 | 4,582 | 1.7% | 229,909 | 87.6% | $1,183,409 | 2.6% | $258.27 |
| Vacant | 0 | 32,418 | 12.4% | 262,327 | 100.0% | $0 | 0.0% | $0.00 |
| Total/Weighted Average | 50 | 262,327 | 100.0% | $46,145,746 | 100.0% | $200.71 |
| (1) | Information obtained from the underwritten rent roll. |
| (2) | Certain tenants may have lease termination or contraction options that are exercisable prior to the originally stated expiration date of the subject lease and that are not considered in the Lease Expiration Schedule. |
| (3) | Weighted Average Annual U/W Base Rent PSF excludes vacant space. |
| (4) | Includes a concierge desk for Aria Resort & Casino (250 square feet), which has no Annual U/W Base Rent. |
THE INFORMATION IN THIS STRUCTURAL AND COLLATERAL TERM SHEET IS NOT COMPLETE AND MAY BE AMENDED PRIOR TO THE TIME OF SALE. THIS TERM SHEET IS NOT AN OFFER TO SELL THESE SECURITIES AND IT IS NOT A SOLICITATION OF AN OFFER TO BUY THESE SECURITIES IN ANY JURISDICTION WHERE THE OFFER OR SALE IS NOT PERMITTED.
81
THE SHOPS AT CRYSTALS |
The following table presents historical occupancy percentages at The Shops at Crystals Property:
Historical Occupancy(1)
12/31/2012 | 12/31/2013 | 12/31/2014 | 12/31/2015 | 4/21/2016(2)(3) |
| 90.5% | 95.7% | 93.8% | 91.0% | 87.6% |
| (1) | Information obtained from the underwrittenrent roll. |
| (2) | Current occupancy includes DSquared2 (2,200 square feet) and Berluti (960 square feet), which have executed leases but are not yet in occupancy. |
| (3) | Hermes has executed a new lease to relocate from its current 4,582 square foot space on the first floor to 13,507 square feet of space across two floors, effective December 1, 2017. Inclusive of the second floor expansion space, The Shops at Crystals Property was 88.2% leased as of April 21, 2016. |
Operating History and Underwritten Net Cash Flow. The following table presents certain information relating to the historical operating performance and underwritten net cash flow at The Shops at Crystals Property:
Cash Flow Analysis
| 2012 | 2013 | 2014 | 2015 | U/W | % of U/W Effective Gross Income | U/W $ per SF | |||||||||
| Base Rent | $34,796,623 | $40,421,000 | $44,060,423 | $46,579,251 | $46,145,746 | 71.2 | % | $175.91 | |||||||
| Grossed Up Vacant Space | 0 | 0 | 0 | 0 | 5,578,700 | 8.6 | 21.27 | ||||||||
| Total Reimbursables | 17,200,255 | 16,849,275 | 17,624,637 | 17,570,608 | 17,100,944 | 26.4 | 65.19 | ||||||||
| Other Income | 1,013,823 | 925,597 | 1,148,318 | 1,530,859 | 1,559,047 | 2.4 | 5.94 | ||||||||
| Less Vacancy & Credit Loss | 39,611 | (95,577) | (187,033) | (477,517) | (5,578,700)(2) | (8.6 | ) | (21.27) | |||||||
| Effective Gross Income | $53,050,312 | $58,100,295 | $62,646,345 | $65,203,201 | $64,805,737 | 100.0 | % | 247.04 | |||||||
| �� | |||||||||||||||
| Total Operating Expenses | $18,698,698 | $18,045,943 | $19,004,031 | $18,826,390 | $15,337,868 | 23.7 | % | $58.47 | |||||||
| Net Operating Income | $34,351,614(1) | $40,054,352(1) | $43,642,314 | $46,376,811 | $49,467,869 | 76.3 | % | $188.57 | |||||||
| TI/LC | 0 | 0 | 0 | 0 | 1,815,657 | 2.8 | 6.92 | ||||||||
| Capital Expenditures | 0 | 0 | 0 | 0 | 41,972 | 0.1 |
| 0.16 | |||||||
| Net Cash Flow | $34,351,614 | $40,054,352 | $43,642,314 | $46,376,811 | $47,610,240 | 73.5 | % | $181.49 | |||||||
| NOI DSCR(3) | 2.36x | 2.76x | 3.00x | 3.19x | 3.41x | ||||||||||
| NCF DSCR(3) | 2.36x | 2.76x | 3.00x | 3.19x | 3.28x | ||||||||||
| NOI DY(3) | 9.0% | 10.5% | 11.4% | 12.1% | 12.9% | ||||||||||
| NCF DY(3) | 9.0% | 10.5% | 11.4% | 12.1% | 12.4% | ||||||||||
| (1) | The increase in Net Operating Income from 2012 to 2013 was due to an increase in occupancy and contractual rent steps. |
| (2) | The underwritten economic vacancy is 10.8%. The Shops at Crystals Property was 87.6% physically occupied as of April 21, 2016. |
| (3) | Based on The Shops at Crystals Senior Notes totaling $382,700,000. |
Appraisal.As of the appraisal valuation date of April 26, 2016, The Shops at Crystals Property had an “as-is” appraised value of $1,100,000,000.
Environmental Matters.According to the Phase I environmental report dated February 5, 2016, there was no evidence of any recognized environmental conditions at The Shops at Crystals Property.
Market Overview and Competition.The Shops at Crystals Property is situated in the CityCenter development in the heart of the Las Vegas strip. According to the appraisal, the Las Vegas market has rebounded since the financial crisis and retail spending continues to increase as visitor spending becomes more diversified from its historical gaming focus. According to a third party research report, non-gaming revenues have increased from 42.1% of Las Vegas revenues in 1990 to 63.1% in 2015. According to the appraisal, retail spending also reached an all-time high of approximately $42.7 billion in 2015. Retail spending was the third largest non-gaming expenditure after accommodations and food and beverage, at an average of approximately $123 per person for the year. Additionally, Las Vegas experienced a record volume of approximately 42.3 million visitors in 2015, and total 2016 visitations through February 2016 increased from the record level during the same period in 2015 by approximately 3.8%.
THE INFORMATION IN THIS STRUCTURAL AND COLLATERAL TERM SHEET IS NOT COMPLETE AND MAY BE AMENDED PRIOR TO THE TIME OF SALE. THIS TERM SHEET IS NOT AN OFFER TO SELL THESE SECURITIES AND IT IS NOT A SOLICITATION OF AN OFFER TO BUY THESE SECURITIES IN ANY JURISDICTION WHERE THE OFFER OR SALE IS NOT PERMITTED.
82
THE SHOPS AT CRYSTALS |
The following table presents certain information relating to competitive properties for The Shops at Crystals Property:
Competitive Properties(1)
| Property | Year Built/ Renovated | Total GLA (SF) | Est. Sales PSF | Occupancy | Distance | Major/Anchor Tenants |
| The Shops at Crystals (Subject) | 2009/NAP | 262,327 | $1,279 | 88% | -- | Louis Vuitton, Prada, Ermenegildo Zegna, Tom Ford, Gucci |
| Fashion Show Mall | 1981/2003 | 1,890,000 | $900-$1,000 | 93% | 1.3 miles | Macy’s, Dillard’s, Saks Fifth Avenue, Neiman Marcus, Macy’s |
| Grand Canal Shoppes | 1999/2007 | 806,000 | $900-$1,100 | 95% | 1.1 miles | Barneys New York, Burberry, Canali, Dooney & Bourke, Armani |
| Forum Shops at Caesars | 1992/2004 | 650,000 | $1,500-$1,700 | 100% | 0.8 miles | Apple, Marc Jacobs, Christian Louboutin, Montblanc, Hugo Boss |
| Miracle Mile Shops | 2000/2016 | 500,000 | $825-$875 | 94% | Adjacent | H&M, Guess, bebe, BCBG MAXAZRIA, LOFT |
| Bellagio Shops | 1998/NAP | NAV | NAV | 100% | 0.3 miles | Bottega Veneta, Fendi, Gucci, Chanel, Valentino, Prada |
| (1) | Information obtained from the appraisal and underwritten rent roll. |
The Borrower.The borrower is The Crystals Las Vegas, LLC, a Delaware limited liability company and single purpose entity with two independent directors. Legal counsel to the borrower delivered a non-consolidation opinion in connection with the origination of The Shops at Crystals Whole Loan. The nonrecourse carveout guarantors are Simon Property Group, L.P. and ICRE REIT Holdings. The liability of the guarantors under the nonrecourse carve-out provisions in the loan documents is capped at $110.0 million plus reasonable collection costs. See “Description of the Mortgage Pool–Certain Terms of the Mortgage Loans—Non-Recourse Obligations” in the Preliminary Prospectus.
The Sponsors.The loan sponsors are Simon Property Group, L.P. and Invesco Advisors Inc. (“Invesco”). Simon Property Group, L.P. is an affiliate of Simon Property Group, Inc. (“SPG”). SPG was founded in 1960 and is headquartered in Indianapolis, Indiana. SPG (NYSE: SPG, rated A2/A by Moody’s and S&P) is an S&P 100 company and the largest public real estate company in the world. SPG currently owns or has an interest in 231 retail real estate properties in North America, Europe and Asia comprising 191 million square feet. Invesco, a Maryland real estate investment trust, is an affiliate of Invesco, Ltd., a publicly traded independent global investment management firm. Simon has sponsored other real estate projects over the last 10 years that have been the subject of mortgage loan defaults, foreclosure proceedings and deeds-in-lieu of foreclosure. See “Description of the Mortgage Pool—Default History, Bankruptcy Issues and Other Proceedings” in the Preliminary Prospectus.
Escrows.No upfront escrows were collected at origination.
Ongoing reserves for taxes are not required as long as (i) there is no event of default; (ii) no DSCR Reserve Trigger Event (as defined below) exists; and (iii) the borrower (a) pays all taxes prior to the assessment of any late payment penalty and the date that such taxes become delinquent or (b) upon request, provides the lender with satisfactory evidence of such payment of taxes.
Ongoing reserves for insurance are not required as long as (i) no event of default exists and (ii) the borrower provides satisfactory evidence that the property is insured under an acceptable blanket policy.
Ongoing replacement reserves are not required as long as no DSCR Reserve Trigger Event or event of default exists. Following the occurrence and during the continuance of a DSCR Reserve Trigger Event or an event of default, the borrower is required to deposit $4,372 per month ($0.20 per square foot annually) for replacement reserves. The reserve is subject to a cap of $104,931 ($0.40 per square foot).
Ongoing reserves for tenant improvements and leasing commissions(“TI/LC”) are waived in the event that the borrower delivers either (i) a guaranty from the guarantors for all monthly deposits to the TI/LC reserve required by the loan documents with the related liabilities of the guarantors capped at the TI/LC Reserve Cap (as defined below) plus all of the reasonable out-of-pocket costs and expenses in enforcing such guaranty; or (ii) the borrower delivers a letter of credit in the amount of the TI/LC Reserve Cap,provided that the borrower does not have the right to deliver such guaranty or letter of credit if an event of default is continuing. The guarantors delivered a guaranty of TI/LC reserves on the origination date. In the event that the borrower has not delivered such guaranty or letter of credit, the borrower is required to deposit $185,000 per month (approximately $8.46 per square foot annually) for TI/LC reserves. The TI/LC reserve is subject to a cap of $4,440,000 (“TI/LC Reserve Cap”) (approximately $16.93 per square foot).
A “DSCR Reserve Trigger Event” means the debt service coverage ratio for The Shops at Crystals Whole Loan based on the trailing four calendar quarter period immediately preceding the date of determination is less than 1.60x for two consecutive calendar
THE INFORMATION IN THIS STRUCTURAL AND COLLATERAL TERM SHEET IS NOT COMPLETE AND MAY BE AMENDED PRIOR TO THE TIME OF SALE. THIS TERM SHEET IS NOT AN OFFER TO SELL THESE SECURITIES AND IT IS NOT A SOLICITATION OF AN OFFER TO BUY THESE SECURITIES IN ANY JURISDICTION WHERE THE OFFER OR SALE IS NOT PERMITTED.
83
THE SHOPS AT CRYSTALS |
quarters. A DSCR Reserve Trigger Event will be cured upon the debt service coverage ratio for The Shops at Crystals Whole Loan being equal to or greater than 1.60x for two consecutive calendar quarters.
Lockbox and Cash Management.The Shops at Crystals Whole Loan requires a lender-controlled lockbox account, which is already in place, and that the borrower direct tenants to pay their rents directly into such lockbox account. The loan documents also require that all rents received by the borrower or the property manager be deposited into the lockbox account within two business days of receipt. Prior to the occurrence of a Cash Trap Event Period (as defined below), all cash flow is distributed to the borrower. During a Cash Trap Event Period, all cash flow is swept to a lender-controlled cash management account.
A “Cash Trap Event Period” means the occurrence of: (i) an event of default; (ii) any bankruptcy or insolvency action of the borrower; (iii) any bankruptcy or insolvency action of the property manager if the property manager is affiliated with the borrower (provided that the property manager is not replaced within 60 days with a qualified manager); or (iv) the date that the debt service coverage ratio for The Shops at Crystals Whole Loan based on the trailing four calendar quarter period immediately preceding the date of determination is less than 1.30x for two consecutive calendar quarters (a “DSCR Trigger Event”).
A Cash Trap Event Period may be cured (a) if the Cash Trap Event Period is caused solely by the occurrence of a DSCR Trigger Event, the achievement of a debt service coverage ratio of 1.30x or greater for two consecutive calendar quarters based upon the trailing four calendar quarter period immediately preceding the date of determination; (b) if the Cash Trap Event Period is caused solely by clause (i) above, by the acceptance of the lender of a cure of such event of default, provided that the lender has not accelerated the loan, moved for a receiver or commenced foreclosure proceedings; or (c) if the Cash Trap Event Period is caused solely by clause (iii) above, if the borrower replaces the property manager or such bankruptcy or insolvency action is discharged or dismissed without any adverse consequences to the property or the loan. The cures in this paragraph are also subject to the following conditions: (i) no event of default shall have occurred and be continuing; (ii) the borrower pays all of the lender’s reasonable out-of-pocket expenses incurred in connection with curing such Cash Trap Event Period including reasonable attorney’s fees and expenses; and (iii) the borrower may not cure a Cash Trap Event Period (x) more than a total of five times in the aggregate during the term of the loan or (y) triggered by a bankruptcy or insolvency action of the borrower.
Property Management.The Shops at Crystals Property is managed by an affiliate of the borrower.
Assumption.The borrower has the right to transfer The Shops at Crystals Propertyprovided that certain conditions are satisfied, including (i) no event of default has occurred and is continuing; (ii) in the event that in connection with such transfer, the manager will not thereafter continue to manage The Shops at Crystals Property, then a replacement management agreement with a qualified manager must be executed acceptable to lender; (iii) the transferee must not have been a party to any bankruptcy action within the previous seven years and there is no material litigation or regulatory action pending against the transferee unreasonable to lender; and (iv) the transferee is a qualified transferee meeting the requirements set forth in the loan documents or the lender receives rating agency confirmation that the sale and assumption will not result in a downgrade, withdrawal or qualification of the respective ratings assigned to the Series 2016-LC24 certificates and similar confirmations from each rating agency rating any securities backed by any of The Shops at Crystals Companion Loans with respect to the ratings of such securities.
Partial Release.Not permitted.
Real Estate Substitution.Not permitted.
Subordinate and Mezzanine Indebtedness.The Shops at Crystals Whole Loan includes three subordinate loans, each comprised of threepari passu notes, with an aggregate original principal balance of $167,300,000 that were contributed to the SHOPS 2016-CSTL transaction. See “Description of the Mortgage Pool – The Whole Loan – The Non-Serviced Whole Loan – The Shops at Crystals Whole Loan” in the Preliminary Prospectus.
Ground Lease. None.
Terrorism Insurance.The loan documents require that the “all risk” insurance policy required to be maintained by the borrower provide coverage for terrorism in an amount equal to the full replacement cost of The Shops at Crystals Property. The loan documents also require business interruption insurance covering no less than the 24-month period following the occurrence of a casualty event, together with a 365-day extended period of indemnity. Should the policy contain an exclusion for acts of terrorism, the loan documents require the borrower to obtain to the extent available a stand-alone policy providing the same coverage as previously in place prior to the exclusion, with a premium cap of two times the then current annual insurance premiums for the policy insuring The Shops at CrystalsProperty only (excluding the wind and flood components of the premiums) on a stand-alone basis, with a deductible no greater than $5,000,000.
THE INFORMATION IN THIS STRUCTURAL AND COLLATERAL TERM SHEET IS NOT COMPLETE AND MAY BE AMENDED PRIOR TO THE TIME OF SALE. THIS TERM SHEET IS NOT AN OFFER TO SELL THESE SECURITIES AND IT IS NOT A SOLICITATION OF AN OFFER TO BUY THESE SECURITIES IN ANY JURISDICTION WHERE THE OFFER OR SALE IS NOT PERMITTED.
84
(THIS PAGE INTENTIONALLY LEFT BLANK)
THE INFORMATION IN THIS STRUCTURAL AND COLLATERAL TERM SHEET IS NOT COMPLETE AND MAY BE AMENDED PRIOR TO THE TIME OF SALE. THIS TERM SHEET IS NOT AN OFFER TO SELL THESE SECURITIES AND IT IS NOT A SOLICITATION OF AN OFFER TO BUY THESE SECURITIES IN ANY JURISDICTION WHERE THE OFFER OR SALE IS NOT PERMITTED.
85
(THIS PAGE INTENTIONALLY LEFT BLANK)
THE INFORMATION IN THIS STRUCTURAL AND COLLATERAL TERM SHEET IS NOT COMPLETE AND MAY BE AMENDED PRIOR TO THE TIME OF SALE. THIS TERM SHEET IS NOT AN OFFER TO SELL THESE SECURITIES AND IT IS NOT A SOLICITATION OF AN OFFER TO BUY THESE SECURITIES IN ANY JURISDICTION WHERE THE OFFER OR SALE IS NOT PERMITTED.
86
| PINNACLE II |
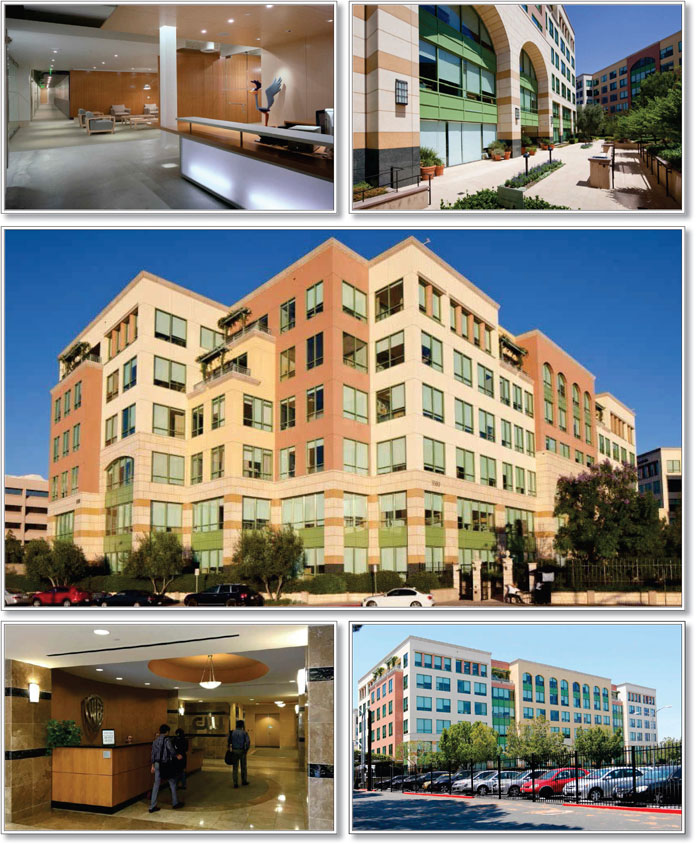
THE INFORMATION IN THIS STRUCTURAL AND COLLATERAL TERM SHEET IS NOT COMPLETE AND MAY BE AMENDED PRIOR TO THE TIME OF SALE. THIS TERM SHEET IS NOT AN OFFER TO SELL THESE SECURITIES AND IT IS NOT A SOLICITATION OF AN OFFER TO BUY THESE SECURITIES IN ANY JURISDICTION WHERE THE OFFER OR SALE IS NOT PERMITTED.
87
| PINNACLE II |
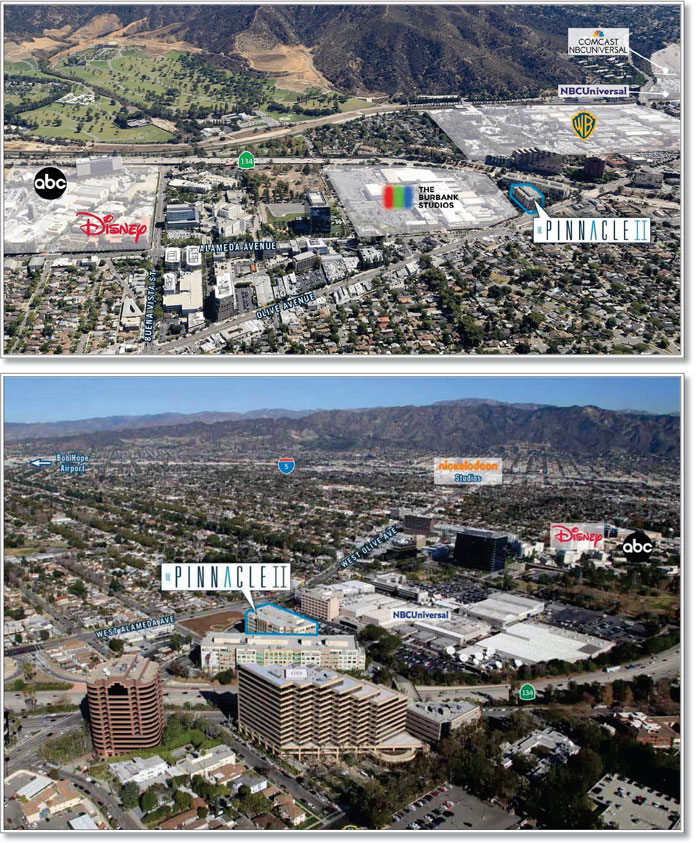
THE INFORMATION IN THIS STRUCTURAL AND COLLATERAL TERM SHEET IS NOT COMPLETE AND MAY BE AMENDED PRIOR TO THE TIME OF SALE. THIS TERM SHEET IS NOT AN OFFER TO SELL THESE SECURITIES AND IT IS NOT A SOLICITATION OF AN OFFER TO BUY THESE SECURITIES IN ANY JURISDICTION WHERE THE OFFER OR SALE IS NOT PERMITTED.
88
| PINNACLE II |
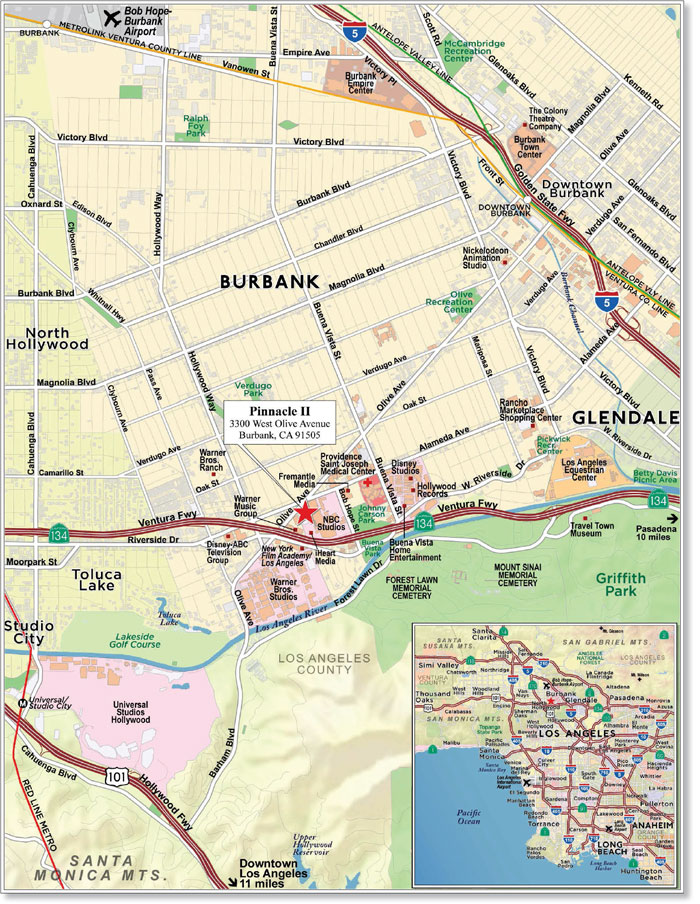
THE INFORMATION IN THIS STRUCTURAL AND COLLATERAL TERM SHEET IS NOT COMPLETE AND MAY BE AMENDED PRIOR TO THE TIME OF SALE. THIS TERM SHEET IS NOT AN OFFER TO SELL THESE SECURITIES AND IT IS NOT A SOLICITATION OF AN OFFER TO BUY THESE SECURITIES IN ANY JURISDICTION WHERE THE OFFER OR SALE IS NOT PERMITTED.
89
| No. 7 – Pinnacle II | |||||||
| Loan Information | Property Information | ||||||
| Mortgage Loan Seller: | Wells Fargo Bank, National Association | Single Asset/Portfolio: | Single Asset | ||||
| Credit Assessment (Fitch/KBRA/Moody’s): | NR/NR/NR | Property Type: | Office | ||||
| Original Principal Balance(1): | $27,000,000 | Specific Property Type: | CBD | ||||
| Cut-off Date Balance(1): | $27,000,000 | Location: | Burbank, CA | ||||
| % of Initial Pool Balance: | 2.6% | Size: | 230,000 SF | ||||
| Loan Purpose: | Refinance | Cut-off Date Balance Per SF(1): | $378.26 | ||||
| Borrower Name: | P2 Hudson MC Partners, LLC | Year Built/Renovated: | 2005/NAP | ||||
| Sponsors: | Hudson Pacific Properties, L.P.; M. David Paul Development, LLC | Title Vesting: | Fee | ||||
| Mortgage Rate: | 4.300% | Property Manager: | Self-managed | ||||
| Note Date: | June 7, 2016 | 4th Most Recent Occupancy (As of): | 100.0% (12/31/2012) | ||||
| Anticipated Repayment Date: | NAP | 3rd Most Recent Occupancy (As of): | 100.0% (12/31/2013) | ||||
| Maturity Date: | June 11, 2026 | 2nd Most Recent Occupancy (As of): | 100.0% (12/31/2014) | ||||
| IO Period: | 120 months | Most Recent Occupancy (As of): | 100.0% (12/31/2015) | ||||
| Loan Term (Original): | 120 months | Current Occupancy (As of): | 100.0% (9/1/2016) | ||||
| Seasoning: | 3 months | ||||||
| Amortization Term (Original): | NAP | Underwriting and Financial Information: | |||||
| Loan Amortization Type: | Interest-only, Balloon | ||||||
| Interest Accrual Method: | Actual/360 | 4th Most Recent NOI(3): | NAV | ||||
| Call Protection: | L(36),GRTR 1% or YM(80),O(4) | 3rd Most Recent NOI (As of): | $7,882,478 (12/31/2014) | ||||
| Lockbox Type: | Hard/Upfront Cash Management | 2nd Most Recent NOI (As of): | $7,794,991 (12/31/2015) | ||||
| Additional Debt(1): | Yes | Most Recent NOI (As of): | $7,572,595 (TTM 3/31/2016) | ||||
| Additional Debt Type(1): | Pari Passu | ||||||
| U/W Revenues: | $11,664,912 | ||||||
| U/W Expenses: | $3,645,672 | ||||||
| U/W NOI: | $8,019,240 | ||||||
| U/W NCF: | $7,423,010 | ||||||
| U/W NOI DSCR(1): | 2.11x | ||||||
| U/W NCF DSCR(1): | 1.96x | ||||||
| Escrows and Reserves(2): | U/W NOI Debt Yield(1): | 9.2% | |||||
| U/W NCF Debt Yield(1): | 8.5% | ||||||
| Type: | Initial | Monthly | Cap (If Any) | As-Is Appraised Value: | $142,000,000 | ||
| Taxes | $370,935 | $123,645 | NAP | As-Is Appraisal Valuation Date: | May 5, 2016 | ||
| Insurance | $0 | Springing | NAP | Cut-off Date LTV Ratio(1): | 61.3% | ||
| Replacement Reserves | $0 | Springing | (2) | LTV Ratio at Maturity or ARD(1): | 61.3% | ||
| (1) | The Pinnacle II Whole Loan (as defined below), which had an original principal balance of $87,000,000, is comprised of threepari passu notes (Notes A-1, A-2 and A-3). The non-controlling Note A-3 had an original principal balance of $27,000,000, has an outstanding principal balance of $27,000,000 as of the Cut-Off Date and will be contributed to the WFCM 2016-LC24 Trust. The controlling Note A-1 had an original principal balance of $40,000,000 and was contributed to the WFCM 2016-BNK1 Trust, and the non-controlling Note A-2 had an original principal balance of $20,000,000 and was contributed to the WFCM 2016-C35 Trust. All statistical financial information related to balances per square foot, loan-to-value ratios, debt service coverage ratios and debt yields are based on the Pinnacle II Whole Loan. |
| (2) | See “Escrows” section. |
| (3) | Historical financial information was not provided prior to 2014, as one of the sponsors purchased a majority interest in the Pinnacle II Property in 2013 and is now managing the Pinnacle II Property through an affiliated company. |
The Mortgage Loan.The mortgage loan (the “Pinnacle II Mortgage Loan”) is part of a whole loan (the “Pinnacle II Whole Loan”) that is evidenced by threepari passu promissory notes (Notes A-1, A-2 and A-3) secured by a first mortgage encumbering the fee interest in a class A office building located in Burbank, California (the “Pinnacle II Property”). The Pinnacle II Whole Loan was originated on June 7, 2016 by Wells Fargo Bank, National Association. The Pinnacle II Whole Loan had an original principal balance of $87,000,000, has an outstanding principal balance as of the Cut-off Date of $87,000,000 and accrues interest at an interest rate of 4.300%per annum. The Pinnacle II Whole Loan had an initial term of 120 months, has a remaining term of 117 months as of the Cut-off Date and requires payments of interest only through the term of the Pinnacle II Whole Loan. The Pinnacle II Whole Loan matures on June 11, 2026. See “Description of the Mortgage Pool—The Whole Loans – The Serviced Pari Passu Whole Loans – the Pinnacle II Whole Loan” and “Pooling and Servicing Agreement” in the Preliminary Prospectus.
The Pinnacle II Mortgage Loan, evidenced by the non-controlling Note A-3, which will be contributed to the WFCM 2016-LC24 Trust, had an original principal balance of $27,000,000 and has an outstanding principal balance as of the Cut-off Date of $27,000,000. The controlling Note A-1, which has an original principal balance of $40,000,000, was contributed to the WFCM 2016-BNK1 Trust. The non-controlling Note A-2, which had an original principal balance of $20,000,000, was contributed to the WFCM 2016-C35 Trust. Each of the mortgage loans evidenced by Notes A-1 and A-2 are referred to herein as the “Pinnacle II Companion Loans”.
THE INFORMATION IN THIS STRUCTURAL AND COLLATERAL TERM SHEET IS NOT COMPLETE AND MAY BE AMENDED PRIOR TO THE TIME OF SALE. THIS TERM SHEET IS NOT AN OFFER TO SELL THESE SECURITIES AND IT IS NOT A SOLICITATION OF AN OFFER TO BUY THESE SECURITIES IN ANY JURISDICTION WHERE THE OFFER OR SALE IS NOT PERMITTED.
90
| PINNACLE II |
Note Summary
| Notes | Original Balance | Note Holder | Controlling Interest | |
| A-1 | $40,000,000 | WFCM 2016-BNK1 | Yes | |
| A-2 | $20,000,000 | WFCM 2016-C35 | No | |
| A-3 | $27,000,000 | WFCM 2016-LC24 | No | |
| Total | $87,000,000 |
Following the lockout period, the borrower has the right to prepay the Pinnacle II Whole Loan in whole, but not in part, on any date before March 11, 2026, provided that the borrower pays the greater of (i) a prepayment premium equal to 1.0% of the principal amount being prepaid and (ii) the yield maintenance premium. In addition, the Pinnacle II Whole Loan is prepayable without penalty on or after March 11, 2026.
Sources and Uses
| Sources | Uses | |||||||
| Original whole loan | $87,000,000 | 99.6% | Loan payoff(1) | $86,203,966 | 98.6% | |||
| Sponsor’s new cash contribution | 390,399 | 0.4 | Reserves | 370,935 | 0.4 | |||
| Closing costs | 815,497 | 0.9 | ||||||
| Total Sources | $87,390,399 | 100.0% | Total Uses | $87,390,399 | 100.0% | |||
| (1) | The Pinnacle II Property was previously securitized in the GSMS 2006-GG8 transaction. The loan payoff amount also includes a $4.9 million B-note. |
The Property.The Pinnacle II Property is a 230,000 square foot, six-story, class A, single-tenant office building located in Burbank, California. Built by the sponsors in 2005, the Pinnacle II Property is situated on a 1.5-acre site and is part of a larger 4.3-acre entertainment and media campus. The Pinnacle II Property is situated adjacent to Pinnacle I (not part of the collateral), a 393,776 square foot multi-tenant office property that is approximately 95.0% leased to entertainment industry tenants, and was also built by the sponsors in 2002. The Pinnacle II Property has been 100.0% leased to Warner Brothers Entertainment Inc. (“Warner Brothers”) since construction and is located approximately two blocks from the 142-acre Warner Brothers Studios, the company’s headquarters since 1928. Combined with the 32-acre Warner Brothers Ranch located 0.9 miles from the Pinnacle II Property, Warner Brothers offers 35 soundstages (including one of the world’s tallest stages with an in-ground tank capable of holding more than two million gallons of water) and 15 back lot locations. Warner Brothers’ parent company, Time Warner Inc., reported 2015 total revenue of approximately $28.1 billion, of which Warner Brothers accounted for approximately $13.0 billion, or 46.2%. The Pinnacle II Property houses the Warner Brothers Technology Solutions staff. The Pinnacle II Property contains 683 underground parking spaces, resulting in a parking ratio of 3.0 spaces per 1,000 square feet of rentable area. As of September 1, 2016 the Pinnacle II Property was 100.0% occupied by Warner Brothers.
The following table presents certain information relating to the tenancy at the Pinnacle II Property:
Major Tenant
| Tenant Name | Credit Rating (Fitch/ Moody’s/ S&P)(1) | Tenant NRSF | % of NRSF | Annual U/W Base Rent PSF(2) | Annual U/W Base Rent(2) | % of Total Annual U/W Base Rent | Lease Expiration Date |
| Major Tenant | |||||||
| Warner Brothers(3) | BBB+/Baa2/BBB | 230,000 | 100.0% | $42.00 | $9,659,219 | 100.0% | 12/31/2021(4) |
| Total Major Tenant | 230,000 | 100.0% | $42.00 | $9,659,219 | 100.0% | ||
| Occupied Collateral Total | 230,000 | 100.0% | $42.00 | $9,659,219 | 100.0% | ||
| Vacant Space | 0 | 0.0% | |||||
| Collateral Total | 230,000 | 100.0% | |||||
| (1) | Ratings shown are those of the parent company Time Warner Inc. Time Warner Inc. does not guarantee the lease. |
| (2) | Annual U/W Base Rent PSF and Annual U/W Base Rent reflect the average rent over the lease term. The current base rent PSF is $39.56 ($9,099,396 annually). |
| (3) | Warner Brothers subleases 40,165 square feet (17.5% of net rentable area) to the CW Television Network, a 50/50 joint venture between Warner Brothers and CBS Corporation, for $2,094,794 annually ($52.15 per square foot, full-service gross). The sublease expiration is coterminous with the primary lease expiration date of December 31, 2021. Annual U/W Base Rent for this space was underwritten to Warner Brothers’ primary average lease rate of $42.00 per square foot, modified gross. |
| (4) | Warner Brothers has either one, 10-year or two, 5-year lease renewal options at 92.5% of market rent. |
THE INFORMATION IN THIS STRUCTURAL AND COLLATERAL TERM SHEET IS NOT COMPLETE AND MAY BE AMENDED PRIOR TO THE TIME OF SALE. THIS TERM SHEET IS NOT AN OFFER TO SELL THESE SECURITIES AND IT IS NOT A SOLICITATION OF AN OFFER TO BUY THESE SECURITIES IN ANY JURISDICTION WHERE THE OFFER OR SALE IS NOT PERMITTED.
91
| PINNACLE II |
The following table presents certain information relating to the lease rollover schedule at the Pinnacle II Property:
Lease Expiration Schedule(1)
| Year Ending December 31, | No. of Leases Expiring | Expiring NRSF | % of Total NRSF | Cumulative Expiring NRSF | Cumulative % of Total NRSF | Annual U/W Base Rent | % of Total Annual U/W Base Rent | Annual U/W Base Rent PSF |
| MTM | 0 | 0 | 0.0% | 0 | 0.0% | $0 | 0.0% | $0.00 |
| 2016 | 0 | 0 | 0.0% | 0 | 0.0% | $0 | 0.0% | $0.00 |
| 2017 | 0 | 0 | 0.0% | 0 | 0.0% | $0 | 0.0% | $0.00 |
| 2018 | 0 | 0 | 0.0% | 0 | 0.0% | $0 | 0.0% | $0.00 |
| 2019 | 0 | 0 | 0.0% | 0 | 0.0% | $0 | 0.0% | $0.00 |
| 2020 | 0 | 0 | 0.0% | 0 | 0.0% | $0 | 0.0% | $0.00 |
| 2021 | 1 | 230,000 | 100.0% | 230,000 | 100.0% | $9,659,219(2) | 100.0% | $42.00(2) |
| 2022 | 0 | 0 | 0.0% | 230,000 | 100.0% | $0 | 0.0% | $0.00 |
| 2023 | 0 | 0 | 0.0% | 230,000 | 100.0% | $0 | 0.0% | $0.00 |
| 2024 | 0 | 0 | 0.0% | 230,000 | 100.0% | $0 | 0.0% | $0.00 |
| 2025 | 0 | 0 | 0.0% | 230,000 | 100.0% | $0 | 0.0% | $0.00 |
| 2026 | 0 | 0 | 0.0% | 230,000 | 100.0% | $0 | 0.0% | $0.00 |
| Thereafter | 0 | 0 | 0.0% | 230,000 | 100.0% | $0 | 0.0% | $0.00 |
| Vacant | 0 | 0 | 0.0% | 230,000 | 100.0% | $0 | 0.0% | $0.00 |
| Total/Weighted Average | 1 | 230,000 | 100.0% | $9,659,219(2) | 100.0% | $42.00(2) |
| (1) | Information obtained from the underwritten rent roll. |
| (2) | Annual U/W Base Rent PSF and Annual U/W Base Rent reflect the average rent over the lease term. The current base rent PSF is $39.56 ($9,099,396 annually). |
The following table presents historical occupancy percentages at the Pinnacle II Property:
Historical Occupancy
12/31/2012(1) | 12/31/2013(1) | 12/31/2014(1) | 12/31/2015(1) | 9/1/2016(2) |
| 100.0% | 100.0% | 100.0% | 100.0% | 100.0% |
| (1) | Information obtained from the lease. |
| (2) | Information obtained from the underwrittenrent roll. |
Operating History and Underwritten Net Cash Flow. The following table presents certain information relating to the historical operating performance and underwritten net cash flow at the Pinnacle II Property:
Cash Flow Analysis(1)
| 2014 | 2015 | TTM 3/31/2016 | U/W | % of U/W Effective Gross Income | U/W $ per SF | |||||||
| Base Rent | $8,795,391 | $8,949,200 | $8,988,325 | $9,659,219(2) | 82.8% | $42.00 | ||||||
| Grossed Up Vacant Space | 0 | 0 | 0 | 0 | 0.0 | 0.00 | ||||||
| Total Reimbursables | 1,389,367 | 1,411,333 | 1,211,984 | 1,309,053 | 11.2 | 5.69 | ||||||
| Other Income | 1,329,897 | 1,076,098 | 1,035,764 | 1,295,511 | 11.1 | 5.63 | ||||||
| Less Vacancy & Credit Loss | 0 | 0 | 0 | (598,872)(3) | (5.1) | (2.60) | ||||||
| Effective Gross Income | $11,514,655 | $11,436,631 | $11,236,073 | $11,664,912 | 100.0% | $50.72 | ||||||
| Total Operating Expenses | $3,632,177 | $3,641,640 | $3,663,478 | $3,645,672 | 31.3% | $15.85 | ||||||
| Net Operating Income | $7,882,478 | $7,794,991 | $7,572,595 | $8,019,240 | 68.7% | $34.87 | ||||||
| TI/LC | 0 | 0 | 0 | 550,230 | 4.7 | 2.39 | ||||||
| Capital Expenditures | 0 | 0 | 0 | 46,000 | 0.4 | 0.20 | ||||||
| Net Cash Flow | $7,882,478 | $7,794,991 | $7,572,595 | $7,423,010 | 63.6% | 32.27 | ||||||
| NOI DSCR(4) | 2.08x | 2.06x | 2.00x | 2.11x | ||||||||
| NCF DSCR(4) | 2.08x | 2.06x | 2.00x | 1.96x | ||||||||
| NOI DY(4) | 9.1% | 9.0% | 8.7% | 9.2% | ||||||||
| NCF DY(4) | 9.1% | 9.0% | 8.7% | 8.5% |
| (1) | Historical financial information was not provided prior to 2014, as one of the sponsors purchased a majority interest in the Pinnacle II Property in 2013 and is now managing the Pinnacle II Property through an affiliated company. |
| (2) | U/W Base Rent reflects the average rent over the lease term. The current base rent is $9,099,396 annually ($39.56 per square foot). |
| (3) | The underwritten economic vacancy is 6.2%. The Pinnacle II Property was 100.0% physically occupied as of September 1, 2016. |
| (4) | The debt service coverage ratios and debt yields are based on the Pinnacle II Whole Loan. |
THE INFORMATION IN THIS STRUCTURAL AND COLLATERAL TERM SHEET IS NOT COMPLETE AND MAY BE AMENDED PRIOR TO THE TIME OF SALE. THIS TERM SHEET IS NOT AN OFFER TO SELL THESE SECURITIES AND IT IS NOT A SOLICITATION OF AN OFFER TO BUY THESE SECURITIES IN ANY JURISDICTION WHERE THE OFFER OR SALE IS NOT PERMITTED.
92
| PINNACLE II |
Appraisal. As of the appraisal valuation date of May 5, 2016, the Pinnacle II Property had an “as-is” appraised value of $142,000,000.
Environmental Matters. According to the Phase I environmental site assessment dated May 16, 2016, there was no evidence of any recognized environmental conditions at the Pinnacle II Property.
Market Overview and Competition.The Pinnacle II Property is located in the southwest portion of the city of Burbank, California, approximately 11.3 miles northwest of the Los Angeles central business district, in the area known as the “Media District”. In addition to its close proximity to the interstate network, Burbank is situated at the convergence of 14 local and express bus lines, making it the third most active Metropolitan Transit Authority bus transfer center in Los Angeles County. Burbank is referred to as the “media capital of the world” and is home to Warner Brothers, Walt Disney Company and NBC Studios. According to the appraisal, the 2015 estimated population within a one-, three- and five-mile radius of the Pinnacle II Property was 18,019, 191,728 and 645,328, respectively; while the 2015 estimated average household income within the same radii was $96,217, $88,976 and $84,324, respectively.
According to the appraisal, the Pinnacle II Property is located in the Media District micro-market of the Burbank office submarket. According to a third-party market research report, as of the first quarter of 2016, the Burbank class A office submarket contained a total inventory of 45 buildings totaling approximately 7.3 million square feet with a 12.4% vacancy rate. Excluding a 498,386 square foot building (“The Tower”) that is still in lease-up after the sole tenant vacated, the submarket vacancy rate is approximately 6.6%. Since 1996, the Burbank class A submarket has reported an average occupancy rate of 89.5%. According to the appraisal, for the same period, the Burbank Media District micro-market contained a total inventory of 3.2 million square feet with a 17.6% vacancy rate. Excluding The Tower, the micro-market vacancy rate is approximately 8.0%. The appraiser concluded to a market rent for the Pinnacle II Property of $42.00 per square foot with 3.0% annual escalations.
The following table presents certain information relating to comparable office leases for the Pinnacle II Property:
Comparable Leases(1)
| Property Name/Location | Year Built/ Renovated | Number of Stories | Total GLA (SF) | Total Occupancy | Distance from Subject | Tenant Name | Lease Date/Term | Lease Area (SF) | Annual Base Rent PSF | Lease Type |
| Burbank Studios Burbank, CA | 1956/NAV | 3 | 114,943 | 37.3% | <0.1 mile | NAV | 1st Qtr 2015 / 10.0 Yrs | 108,000 | $36.00 | NNN |
| The Tower Burbank, CA | 1969/NAV | 32 | 498,386 | 30.4% | 0.5 miles | NAV | 1st Qtr 2016 / 10.0 Yrs | 37,370 | $39.00 | FSG |
| Legacy Media Tower Burbank, CA | 1986/NAV | 10 | 150,755 | 96.3% | 0.5 miles | NAV | 2nd Qtr 2016 / 5.4 Yrs | 1,900 | $39.00 | FSG |
| The Pinnacle I Burbank, CA | 2002/NAV | 6 | 393,776 | 95.1% | <0.1 mile | NAV | 4th Qtr 2015 / 10.8 Yrs | 75,214 | $42.00 | FSG |
Central Park at Toluca Lake Burbank, CA | 1985/NAV | 15 | 249,000 | 81.8% | 0.2 miles | NAV | 1st Qtr 2016 / 5 Yrs | 3,898 | $42.60 | FSG |
| Business Arts Plaza Burbank, CA | 1985/NAV | 8 | 152,469 | 71.4% | 0.4 miles | NAV | 2nd Qtr 2016 / 5 Yrs | 60,000 | $38.40 | FSG |
| The Pointe – Phase I Burbank, CA | 2009/NAV | 14 | 480,645 | 93.2% | 0.4 miles | NAV | NAV | NAV | $46.20 | FSG |
| (1) | Information obtained from the appraisal and third-party market research reports. |
The Borrower.The borrower is P2 Hudson MC Partners, LLC, a Delaware limited liability company and single purpose entity with two independent directors. Legal counsel to the borrower delivered a non-consolidation opinion in connection with the origination of the Pinnacle II Whole Loan. Hudson MC Partners, LLC is the guarantor of certain nonrecourse carveouts under the Pinnacle II Whole Loan.
The Sponsors. The sponsors are Hudson Pacific Properties, L.P. (“Hudson Pacific”) and M. David Paul Development, LLC (“M. David Paul”). Founded in 2006, Hudson Pacific is a vertically integrated real estate company focused on acquiring, repositioning, developing and operating high quality office and state-of-the-art media and entertainment properties in select west coast markets. Hudson Pacific has assembled a commercial real estate portfolio totaling approximately 17.0 million square feet in submarkets throughout Northern and Southern California and the Pacific Northwest. Founded in 1967, M. David Paul has engaged in development and acquisition activities focused in the Los Angeles area. M. David Paul, along with its sister companies, Worthe Real Estate Group and Krismar Construction, own and operate a portfolio of 24 commercial real estate properties totaling approximately 5.3 million square feet, including six office buildings totaling 2.3 million square feet in the Burbank Media District submarket, accounting for approximately 60.9% of the total submarket inventory.
Escrows.The loan documents provide for an upfront escrow at closing in the amount of $370,935 for real estate taxes. The loan documents provide for ongoing monthly reserves of $123,645 for real estate taxes. Ongoing reserves for insurance premiums are not required as long as (i) no event of default has occurred and is continuing; (ii) the Pinnacle II Property is insured via an acceptable blanket insurance policy; and (iii) the borrower provides the lender with evidence of renewal of the insurance policies and timely proof of payment of insurance premiums. Upon the occurrence of a Cash Trap Event Period (as defined below), ongoing monthly replacement reserves of $3,833 will be required, subject to a cap of $138,000 provided no event of default has occurred and is continuing and the lender determines the Pinnacle II Property is being adequately maintained.
THE INFORMATION IN THIS STRUCTURAL AND COLLATERAL TERM SHEET IS NOT COMPLETE AND MAY BE AMENDED PRIOR TO THE TIME OF SALE. THIS TERM SHEET IS NOT AN OFFER TO SELL THESE SECURITIES AND IT IS NOT A SOLICITATION OF AN OFFER TO BUY THESE SECURITIES IN ANY JURISDICTION WHERE THE OFFER OR SALE IS NOT PERMITTED.
93
| PINNACLE II |
Lockbox and Cash Management. The Pinnacle II Whole Loan requires a lender-controlled lockbox account, which is already in place and that the borrower directs all tenants to pay their rents directly to such lockbox account. The loan documents also require that all rents received by the borrower or the property manager be deposited into the lockbox account. Prior to the occurrence of a Cash Trap Event Period (as defined below), all excess funds are distributed to the borrower. During a Cash Trap Event Period, all excess cash flow is required to be swept to a lender-controlled cash management account.
A “Cash Trap Event Period” will commence upon the earlier of (i) the occurrence and continuance of an event of default; (ii) the amortizing debt service coverage ratio falling below 1.30x at the end of any calendar month; (iii) Warner Brothers going dark in 35.0% or more of its space; (iv) Warner Brothers vacating or otherwise failing to occupy its premises; (v) Warner Brothers failing to exercise its lease extension option at least 18 months prior to lease expiration or (vi) Warner Brothers filing for bankruptcy or a similar insolvency proceeding. A Cash Trap Event Period will end, with respect to clause (i), upon the cure of such event of default; with respect to clause (ii), upon the amortizing debt service coverage ratio being equal to or greater than 1.35x for two consecutive calendar quarters; with respect to clause (iii), upon the earlier of (a) Warner Brothers re-occupying more than 65.0% of the net rentable area for 180 consecutive days or (b) the amount on deposit in the excess cash flow reserve equaling $9.2 million; with respect to clause (iv), upon the earliest of (x) the Warner Brothers lease being renewed or extended, (y) the borrower releasing the space to an acceptable replacement tenant and the replacement tenant commencing rent payments or (z) the amount on deposit in the excess cash flow reserve equaling $9.2 million; with respect to clause (v), upon the earlier of (a) the Warner Brothers lease being renewed or (b) the amount on deposit in the excess cash flow reserve equaling $9.2 million (provided that the borrower is required to deposit an amount equal to (1) $40 per square foot for all non-renewed space, minus (2) the aggregate amount on deposit at the end of the 18-month notice period); and with respect to clause (vi), upon the earlier of (x) the bankruptcy or insolvency proceedings being terminated or the Warner Brothers lease being affirmed or (y) the amount on deposit in the excess cash flow reserve equaling $9.2 million.
Property Management. The Pinnacle II Property is managed by an affiliate of the borrower.
Assumption. The borrower has a two-time right to transfer the Pinnacle II Property provided that certain conditions are satisfied, including (i) no event of default has occurred and is continuing; (ii) the lender has reasonably determined that the proposed transferee and guarantor satisfy the lender’s credit review and underwriting standards, taking into consideration transferee experience, financial strength and general business standing; and (iii) if requested by lender, rating agency confirmation from Fitch, KBRA and Moody’s that such assumption will not result in a downgrade, withdrawal or qualification of the respective ratings assigned to the Series 2016-LC24 certificates and similar confirmations from each rating agency rating any securities backed by any Pinnacle II Companion Loans with respect to the ratings of such securities.
Right of First Offer.Warner Brothers has a right of first offer (“ROFO”) to purchase the Pinnacle II Property if the borrower decides to market the building for sale. The ROFO is not extinguished by foreclosure; however, the ROFO does not apply to foreclosure or deed in lieu thereof.
Partial Release. Provided no event of default has occurred and is continuing, the borrower has the right to transfer and obtain a free release of excess development rights related to the Pinnacle II Property.
Real Estate Substitution.Not permitted.
Subordinate and Mezzanine Indebtedness.None.
Ground Lease. None.
Terrorism Insurance.The loan documents require that the “all risk” insurance policy required to be maintained by the borrower provide coverage for terrorism in an amount equal to the full replacement cost of the Pinnacle II Property, as well as business interruption insurance covering no less than the 24-month period following the occurrence of a casualty event, together with a six-month extended period of indemnity.
Earthquake Insurance. The loan documents do not require earthquake insurance. The seismic report indicated a probable maximum loss of 10%.
THE INFORMATION IN THIS STRUCTURAL AND COLLATERAL TERM SHEET IS NOT COMPLETE AND MAY BE AMENDED PRIOR TO THE TIME OF SALE. THIS TERM SHEET IS NOT AN OFFER TO SELL THESE SECURITIES AND IT IS NOT A SOLICITATION OF AN OFFER TO BUY THESE SECURITIES IN ANY JURISDICTION WHERE THE OFFER OR SALE IS NOT PERMITTED.
94
(THIS PAGE INTENTIONALLY LEFT BLANK)
THE INFORMATION IN THIS STRUCTURAL AND COLLATERAL TERM SHEET IS NOT COMPLETE AND MAY BE AMENDED PRIOR TO THE TIME OF SALE. THIS TERM SHEET IS NOT AN OFFER TO SELL THESE SECURITIES AND IT IS NOT A SOLICITATION OF AN OFFER TO BUY THESE SECURITIES IN ANY JURISDICTION WHERE THE OFFER OR SALE IS NOT PERMITTED.
95
HYATT HOUSE FAIRFAX

THE INFORMATION IN THIS STRUCTURAL AND COLLATERAL TERM SHEET IS NOT COMPLETE AND MAY BE AMENDED PRIOR TO THE TIME OF SALE. THIS TERM SHEET IS NOT AN OFFER TO SELL THESE SECURITIES AND IT IS NOT A SOLICITATION OF AN OFFER TO BUY THESE SECURITIES IN ANY JURISDICTION WHERE THE OFFER OR SALE IS NOT PERMITTED.
96
HYATT HOUSE FAIRFAX

THE INFORMATION IN THIS STRUCTURAL AND COLLATERAL TERM SHEET IS NOT COMPLETE AND MAY BE AMENDED PRIOR TO THE TIME OF SALE. THIS TERM SHEET IS NOT AN OFFER TO SELL THESE SECURITIES AND IT IS NOT A SOLICITATION OF AN OFFER TO BUY THESE SECURITIES IN ANY JURISDICTION WHERE THE OFFER OR SALE IS NOT PERMITTED.
97
| No. 8 – Hyatt House Fairfax | |||||||
| Loan Information | Property Information | ||||||
| Mortgage Loan Seller: | Wells Fargo Bank, National Association | Single Asset/Portfolio: | Single Asset | ||||
| Credit Assessment (Fitch/KBRA/Moody’s): | NR/NR/NR | Property Type: | Hospitality | ||||
| Original Principal Balance: | $27,000,000 | Specific Property Type: | Extended Stay | ||||
| Cut-off Date Balance: | $26,935,947 | Location: | Fairfax, VA | ||||
| % of Initial Pool Balance: | 2.6% | Size: | 148 Rooms | ||||
| Loan Purpose: | Refinance | Cut-off Date Balance Per Room: | $182,000 | ||||
| Borrower Name: | Merrifield Hotel Associates, L.P. | Year Built/Renovated: | 2012/NAP | ||||
| Sponsor: | Rolf E. Ruhfus | Title Vesting: | Fee | ||||
| Mortgage Rate: | 4.530% | Property Manager: | Self-managed | ||||
| Note Date: | June 15, 2016 | 4thMost Recent Occupancy: | NAV | ||||
| Anticipated Repayment Date: | NAP | 3rdMost Recent Occupancy (As of): | 70.4% (12/31/2013) | ||||
| Maturity Date: | July 11, 2026 | 2ndMost Recent Occupancy (As of): | 79.5% (12/31/2014) | ||||
| IO Period: | None | Most Recent Occupancy (As of): | 79.0% (12/31/2015) | ||||
| Loan Term (Original): | 120 months | Current Occupancy (As of): | 77.9% (6/30/2016) | ||||
| Seasoning: | 2 months | ||||||
| Amortization Term (Original): | 360 months | Underwriting and Financial Information: | |||||
| Loan Amortization Type: | Amortizing Balloon | ||||||
| Interest Accrual Method: | Actual/360 | 4thMost Recent NOI (As of)(3): | $2,080,239 (12/31/2013) | ||||
| Call Protection: | L(24),GRTR 1% or YM(92),O(4) | 3rdMost Recent NOI (As of)(3): | $2,838,061 (12/31/2014) | ||||
| Lockbox Type: | Hard/Springing Cash Management | 2ndMost Recent NOI (As of): | $3,228,376 (12/31/2015) | ||||
| Additional Debt(1): | Yes | Most Recent NOI (As of): | $3,140,011 (TTM 6/30/2016) | ||||
| Additional Debt Type(1): | Future Unsecured | ||||||
| U/W Revenues: | $7,348,836 | ||||||
| U/W Expenses: | $4,222,428 | ||||||
| U/W NOI: | $3,126,408 | ||||||
| U/W NCF: | $2,832,454 | ||||||
| Escrows and Reserves(2): | U/W NOI DSCR: | 1.90x | |||||
| U/W NCF DSCR: | 1.72x | ||||||
| Type: | Initial | Monthly | Cap (If Any) | U/W NOI Debt Yield: | 11.6% | ||
| Taxes | $55,419 | $18,473 | NAP | U/W NCF Debt Yield: | 10.5% | ||
| Insurance | $0 | Springing | NAP | As-Is Appraised Value: | $40,500,000 | ||
| FF&E Reserve | $0 | $24,556 | NAP | As-Is Appraisal Valuation Date: | May 10, 2016 | ||
| PIP Reserve | $0 | Springing | NAP | Cut-off Date LTV Ratio: | 66.5% | ||
| Seasonality Reserve | $0 | Springing | NAP | LTV Ratio at Maturity or ARD: | 54.0% | ||
| (1) | See “Subordinate and Mezzanine Indebtedness” section. |
| (2) | See “Escrows” section. |
| (3) | See “Cash Flow Analysis” section. |
The Mortgage Loan. The mortgage loan (the “Hyatt House Fairfax Mortgage Loan”) is evidenced by a single promissory note secured by a first mortgage encumbering the fee interest in one condominium unit that comprises a limited service hotel located in Fairfax, Virginia (the “Hyatt House Fairfax Property”). The Hyatt House Fairfax Mortgage Loan was originated on June 15, 2016 by Wells Fargo Bank, National Association. The Hyatt House Fairfax Mortgage Loan had an original principal balance of $27,000,000, has an outstanding principal balance as of the Cut-off Date of $26,935,947 and accrues interest at an interest rate of 4.530%per annum. The Hyatt House Fairfax Mortgage Loan had an initial term of 120 months, has a remaining term of 118 months as of the Cut-off Date and requires payments of principal and interest based on a 30-year amortization schedule through the term of the Hyatt House Fairfax Mortgage Loan. The Hyatt House Fairfax Mortgage Loan matures on July 11, 2026.
Following the lockout period, the borrower has the right to prepay the Hyatt House Fairfax Mortgage Loan in whole, but not in part, on any date before April 11, 2026, provided that the borrower pay the greater of a yield maintenance premium or a prepayment premium equal to 1.0% of the principal amount being prepaid. In addition, the Hyatt House Fairfax Mortgage Loan is prepayable without penalty on or after April 11, 2026.
THE INFORMATION IN THIS STRUCTURAL AND COLLATERAL TERM SHEET IS NOT COMPLETE AND MAY BE AMENDED PRIOR TO THE TIME OF SALE. THIS TERM SHEET IS NOT AN OFFER TO SELL THESE SECURITIES AND IT IS NOT A SOLICITATION OF AN OFFER TO BUY THESE SECURITIES IN ANY JURISDICTION WHERE THE OFFER OR SALE IS NOT PERMITTED.
98
HYATT HOUSE FAIRFAX
Sources and Uses
| Sources | Uses | |||||||
| Original loan amount | $27,000,000 | 100.0% | Loan payoff | $13,634,930 | 50.5% | |||
| Reserves | 55,419 | 0.2 | ||||||
| Closing costs | 234,292 | 0.9 | ||||||
| Return of equity | 13,075,359 | 48.4 | ||||||
| Total Sources | $27,000,000 | 100.0% | Total Uses | $27,000,000 | 100.0% |
The Property.The Hyatt House Fairfax Property consists of one unit in a four-unit mixed-use condominium and is comprised of a seven-story, LEED Silver Certified, limited-service hotel comprising 148 guestrooms located in Fairfax, Virginia, approximately 13.0 miles west of the Washington, D.C. central business district. The remaining units within the condominium, which are comprised of three retail spaces, do not serve as collateral for the Hyatt House Fairfax Mortgage Loan.
Situated on a 0.4-acre parcel, the Hyatt House Fairfax Property was originally constructed in 2012 as a Hyatt Summerfield Suites. In 2012, Hyatt Hotels rebranded all of their Hyatt Summerfield Suites into the newly-created Hyatt House extended stay concept. The Hyatt House Fairfax Property is part of the Mosaic District, a 31-acre mixed-use development that is home to approximately 2.0 million square feet of retail, restaurant, office and residential space. The Hyatt House Fairfax Property contains 18 king guestrooms, 24 standard double queen guestrooms, 82 studio suites, and 24 one bedroom suites. Each guestroom features a flat screen television with high definition channels, telephone, wireless internet access, small refrigerator, and a microwave oven. Additionally, approximately 71.6% of the rooms are extended stay suites that offer a full kitchen. Amenities at the Hyatt House Fairfax Property include a fitness center, business center, rooftop outdoor swimming pool, sundry shop, same day valet dry cleaning service, 1,800 square feet of meeting space and a complimentary breakfast buffet. The Hyatt House Fairfax Property contains a total of 160 parking spaces, accounting for a parking ratio of 1.1 spaces per room, provided via a parking garage subject to an easement agreement. According to the appraisal, the demand segmentation for the Hyatt House Fairfax Property is 20% corporate, 30% extended stay, 15% leisure and 35% government. The franchise agreement with Hyatt House Franchising, L.L.C. expires in January 2033.
Condominium.The Hyatt House Fairfax Property is comprised of one condominium unit within a four-unit mixed-use condominium property. The other components of the condominium are comprised of three ground floor retail units. The Hyatt House Fairfax Mortgage Loan borrower has a combined 81.1% voting interest in the master association.
Operating History and Underwritten Net Cash Flow. The following table presents certain information relating to the historical operating performance and the underwritten net cash flow at the Hyatt House Fairfax Property:
Cash Flow Analysis
| 2013 | 2014 | 2015 | TTM 6/30/2016 | U/W | % of U/W Total Revenue | U/W $ per Room | ||||||||
| Occupancy | 70.4% | 79.5% | 79.0% | 77.9% | 77.9% | |||||||||
| ADR | $131.26 | $149.79 | $163.81 | $162.84 | $162.84 | |||||||||
| RevPAR | $92.43 | $119.07 | $129.45 | $126.79 | $126.79 | |||||||||
| Room Revenue | $4,993,002 | $6,432,335 | $6,992,623 | $6,867,966 | $6,867,966 | 93.5% | $46,405 | |||||||
| F&B Revenue | 246,834 | 286,273 | 392,072 | 442,812 | 442,812 | 6.0 | 2,992 | |||||||
| Other Revenue | 51,871 | 56,298 | 44,941 | 38,058 | 38,058 | 0.5 | 257 | |||||||
| Total Revenue | $5,291,707 | $6,774,906 | $7,429,636 | $7,348,836 | $7,348,836 | 100.0% | $49,654 | |||||||
| Total Department Expenses | 1,284,375 | 1,536,750 | 1,515,676 | 1,586,351 | 1,586,351 | 21.6 | 10,719 | |||||||
| Gross Operating Profit | $4,007,332 | $5,238,156 | $5,913,960 | $5,762,485 | $5,762,485 | 78.4% | $38,936 | |||||||
| Total Undistributed Expenses | 1,566,236 | 2,030,210 | 2,265,880 | 2,193,747 | 2,193,747 | 29.9 | 14,823 | |||||||
| Profit Before Fixed Charges | $2,441,096 | $3,207,946 | $3,648,080 | $3,568,738 | $3,568,738 | 48.6% | $24,113 | |||||||
| Total Fixed Charges | 360,857 | 369,885 | 419,704 | 428,727 | 442,330 | 6.0 | 2,989 | |||||||
| Net Operating Income | $2,080,239(1) | $2,838,061(1) | $3,228,376 | $3,140,011 | $3,126,408 | 42.5% | $21,124 | |||||||
| FF&E | 0 | 0 | 0 | 0 | 293,953 | 4.0 | 1,986 | |||||||
| Net Cash Flow | $2,080,239 | $2,838,061 | $3,228,376 | $3,140,011 | $2,832,454 | 38.5% | $19,138 | |||||||
| NOI DSCR | 1.26x | 1.72x | 1.96x | 1.91x | 1.90x | |||||||||
| NCF DSCR | 1.26x | 1.72x | 1.96x | 1.91x | 1.72x | |||||||||
| NOI DY | 7.7% | 10.5% | 12.0% | 11.7% | 11.6% | |||||||||
| NCF DY | 7.7% | 10.5% | 12.0% | 11.7% | 10.5% | |||||||||
| (1) | The increase in Net Operating Income from 2013 to 2014 was due to an increase in occupancy and ADR. |
The Appraisal.As of the appraisal valuation date of May 10, 2016, the Hyatt House Fairfax Property had an “as-is” appraised value of $40,500,000.
THE INFORMATION IN THIS STRUCTURAL AND COLLATERAL TERM SHEET IS NOT COMPLETE AND MAY BE AMENDED PRIOR TO THE TIME OF SALE. THIS TERM SHEET IS NOT AN OFFER TO SELL THESE SECURITIES AND IT IS NOT A SOLICITATION OF AN OFFER TO BUY THESE SECURITIES IN ANY JURISDICTION WHERE THE OFFER OR SALE IS NOT PERMITTED.
99
HYATT HOUSE FAIRFAX
Environmental Matters. According to a Phase I environmental assessment dated May 13, 2016, there was no evidence of any recognized environmental conditions at the Hyatt House Fairfax Property.
Market Overview and Competition.The Hyatt House Fairfax Property is located in Fairfax, Virginia, approximately 13.0 miles west of the Washington D.C. central business district and 13.5 miles west of Ronald Reagan Washington National Airport. The Hyatt House Fairfax Property is situated on the south side of Route 29, just west of Capital Beltway (Interstate 495), which is a 64 mile interstate that surrounds Washington, D.C., and the city’s inner suburbs in Maryland and Virginia. Additionally, the Hyatt House Fairfax Property is located just south of Interstate 66, which is the primary east-west interstate in the area and provides access to Washington, D.C. The Hyatt House Fairfax Property is located within Mosaic District, a 31-acre mixed-use development that is home to approximately 2.0 million square feet of retail, restaurant, office and residential space. The Mosaic District is located less than one mile from the Dunn Loring Metro Station, which provides transit users access to the Washington, D.C. metropolitan statistical area via the Orange Line. Additionally, the Hyatt House Fairfax Property is located just south of Tyson’s Corner, which has approximately 46.0 million square feet of office and retail space and is home to numerous corporate headquarters including Capital One, Federal Home Loan Mortgage Corporation, and Hilton Worldwide. The Hyatt House Fairfax Property is also located 2.0 miles north of Inova Fairfax Hospital (“Inova”), which is the largest hospital in northern Virginia. Inova recently signed a 99-year lease on a 117-acre campus adjacent to its flagship hospital to develop a facility specializing in research, education, and complex treatments. According to the appraisal, the estimated 2015 population within a three- and five-mile radius of the Hyatt House Fairfax Property was 138,750 and 350,256, respectively; the estimated 2015 average household income within the same radii was $139,786 and $147,935, respectively.
The following table presents certain information relating to the Hyatt House Fairfax Property’s competitive set:
Subject and Market Historical Occupancy, ADR and RevPAR(1)
Competitive Set | Hyatt House Fairfax | Penetration Factor | ||||||||||||||||
Year | Occupancy | ADR | RevPAR | Occupancy | ADR | RevPAR | Occupancy | ADR | RevPAR | |||||||||
| 6/30/2016 TTM | 71.5% | $137.46 | $98.34 | 77.9% | $162.42 | $126.47 | 108.8% | 118.2% | 128.6% | |||||||||
| 6/30/2015 TTM | 74.3% | $139.31 | $103.47 | 80.0% | $159.78 | $127.78 | 107.7% | 114.7% | 123.5% | |||||||||
| 6/30/2014 TTM | 72.3% | $131.74 | $95.29 | 76.1% | $137.71 | $104.73 | 105.2% | 104.5% | 109.9% | |||||||||
| (1) | Information obtained from a third party hospitality research report dated July 18, 2016. The competitive set includes: Hampton Inn Fairfax City, Homewood Suites Fairfax I 495 @ Route 50, Residence Inn Fairfax Merrifield, Hilton Garden Inn Fairfax, and Courtyard Dunn Loring Fairfax. |
The Borrower.The borrower is Merrifield Hotel Associates, L.P., a Kansas limited partnership and single purpose entity. Legal counsel to the borrower delivered a non-consolidation opinion in connection with the origination of the Hyatt House Fairfax Mortgage Loan. LWP Hotel Interests, L.P., which is controlled by Rolf E. Ruhfus, is the guarantor of certain nonrecourse carveouts under the Hyatt House Fairfax Mortgage Loan.
The Sponsor.The sponsor is Rolf E. Ruhfus, the Chairman and CEO of LodgeWorks Partners, L.P. (“LodgeWorks”). LodgeWorks is a privately held hotel company that has created five brands and developed over 120 hotels for a cost of $2.2 billion. LodgeWorks has over 30 years’ of experience developing and managing hotels, and has established franchise partnerships with Hyatt Hotels Corporation, Hilton Hotels and Starwood. Mr. Ruhfus was involved in a loan modification as a result of loan default in 2010. See “Description of the Mortgage Pool – Loan Purpose; Default History, Bankruptcy Issues and Other Proceedings” in the Preliminary Prospectus.
Escrows.The loan documents provide for upfront escrows in the amount of $55,419 for real estate taxes. The loan documents also provide for ongoing monthly reserves in the amount of $18,473 for real estate taxes and $24,556 for FF&E reserves. The loan documents do not require ongoing monthly escrows for insurance premiums as long as (i) no event of default has occurred and is continuing; (ii) the Hyatt House Fairfax Property is insured via an acceptable blanket insurance policy; and (iii) the borrower provides the lender with evidence of renewal of the policies and timely proof of payment of insurance premiums.
If, at any time, the franchisor requires additional Property Improvement Plan (“PIP”) work under the franchise agreement and the funds collected in the FF&E reserve are insufficient to cover the required PIP, the borrower is required to deposit an amount equal to the difference between the FF&E reserve as of the PIP start date and the required PIP amount in either a lump sum or monthly installments. In addition, the loan documents require monthly deposits between April and September of each year for a seasonality reserve equal to one-sixth of the shortfall if, immediately following lender’s receipt of operating statements for the Hyatt House Fairfax Property, the cash flow shortfall for the most recent first and/or fourth calendar quarters is more than $100,000.
Lockbox and Cash Management.The Hyatt House Fairfax Mortgage Loan requires a lender-controlled lockbox account, which is already in place, and that the borrower direct tenants to pay all rents directly into such lockbox account. The loan documents also require that all rents received by the borrower or the property manager be deposited into the lockbox account within one business day of receipt. Prior to the occurrence of a Cash Trap Event Period (as defined below), all cash flow is distributed to the borrower. During a Cash Trap Event Period, all cash flow is swept to a lender-controlled cash management account.
A “Cash Trap Event Period” will commence upon the earlier of (i) the occurrence and continuance of an event of default; (ii) the debt service coverage ratio falling below 1.15x; or (iii) the termination, cancellation, or expiration of the franchise agreement. A Cash Trap Event Period will end, with regard to clause (i), upon the cure of such event of default; with regard to clause (ii), upon the debt
THE INFORMATION IN THIS STRUCTURAL AND COLLATERAL TERM SHEET IS NOT COMPLETE AND MAY BE AMENDED PRIOR TO THE TIME OF SALE. THIS TERM SHEET IS NOT AN OFFER TO SELL THESE SECURITIES AND IT IS NOT A SOLICITATION OF AN OFFER TO BUY THESE SECURITIES IN ANY JURISDICTION WHERE THE OFFER OR SALE IS NOT PERMITTED.
100
HYATT HOUSE FAIRFAX
service coverage ratio being at least 1.16x for two consecutive calendar quarters; and with respect to clause (iii), upon the borrower entering into a replacement franchise agreement satisfactory to lender.
Property Management.The Hyatt House Fairfax Property is managed by an affiliate of the borrower.
Assumption.The borrower has a two-time right to transfer the Hyatt House Fairfax Property provided that certain conditions are satisfied, including (i) no event of default has occurred and is continuing; (ii) the lender reasonably determines that the proposed transferee and guarantor satisfy the lender’s credit review and underwriting standards, taking into consideration the transferee’s experience, financial strength and general business standing; and (iii) the lender has received confirmation from Fitch, KBRA and Moody’s that such assumption will not result in a downgrade, withdrawal or qualification of the respective ratings assigned to the Series 2016-LC24 Certificates.
Right of First Refusal.The franchisor, Hyatt House Franchising, L.L.C., has right of first refusal (“ROFR”) if the borrower receives an unsolicited third-party offer to purchase the Hyatt House Fairfax property. The ROFR is not extinguished by foreclosure; however, the ROFR does not apply to foreclosure or deed in lieu thereof.
Partial Release.Not permitted.
Real Estate Substitution.Not permitted.
Subordinate and Mezzanine Indebtedness. The borrower is permitted to incur future unsecured debt in an aggregate amount up to $500,000 subject to the satisfaction of certain conditions, including but not limited to (i) no event of default has occurred or is continuing; (ii) the unsecured debt is subordinate to the Hyatt House Fairfax Mortgage Loan; (iii) the unsecured debt payments are only permitted to be paid out of excess cash flow; (iv) in a bankruptcy or similar proceeding, the unsecured debt lender must vote in favor of any reorganization plan proposed by the Hyatt House Fairfax Mortgage Loan lender; (v) the unsecured debt lender will not enforce its rights or remedies to collect any of the unsecured loan until one year and one day after the Hyatt House Fairfax Mortgage Loan has been satisfied in full; and (vi) each unsecured loan will be evidenced by a promissory note stating that the lender is a third party beneficiary.
Ground Lease.None.
Terrorism Insurance.The loan documents require that the “all risk” insurance policy required to be maintained by the borrower provide coverage for terrorism in an amount equal to the full replacement cost of the Hyatt House Fairfax Property. The loan documents also require business interruption insurance covering no less than the 12-month period following the occurrence of a casualty event, together with a six-month extended period of indemnity.
THE INFORMATION IN THIS STRUCTURAL AND COLLATERAL TERM SHEET IS NOT COMPLETE AND MAY BE AMENDED PRIOR TO THE TIME OF SALE. THIS TERM SHEET IS NOT AN OFFER TO SELL THESE SECURITIES AND IT IS NOT A SOLICITATION OF AN OFFER TO BUY THESE SECURITIES IN ANY JURISDICTION WHERE THE OFFER OR SALE IS NOT PERMITTED.
101
SKYLINE VILLAGE
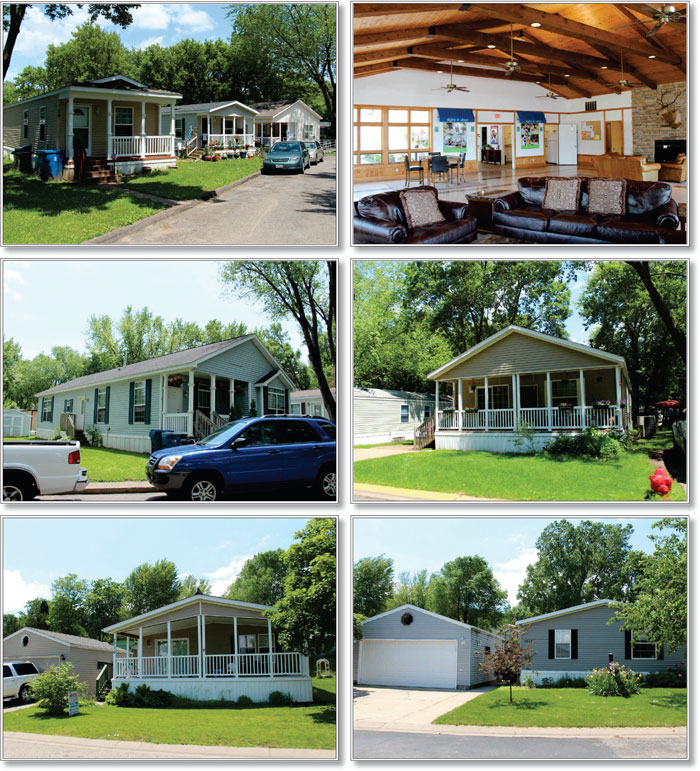
THE INFORMATION IN THIS STRUCTURAL AND COLLATERAL TERM SHEET IS NOT COMPLETE AND MAY BE AMENDED PRIOR TO THE TIME OF SALE. THIS TERM SHEET IS NOT AN OFFER TO SELL THESE SECURITIES AND IT IS NOT A SOLICITATION OF AN OFFER TO BUY THESE SECURITIES IN ANY JURISDICTION WHERE THE OFFER OR SALE IS NOT PERMITTED.
102
SKYLINE VILLAGE
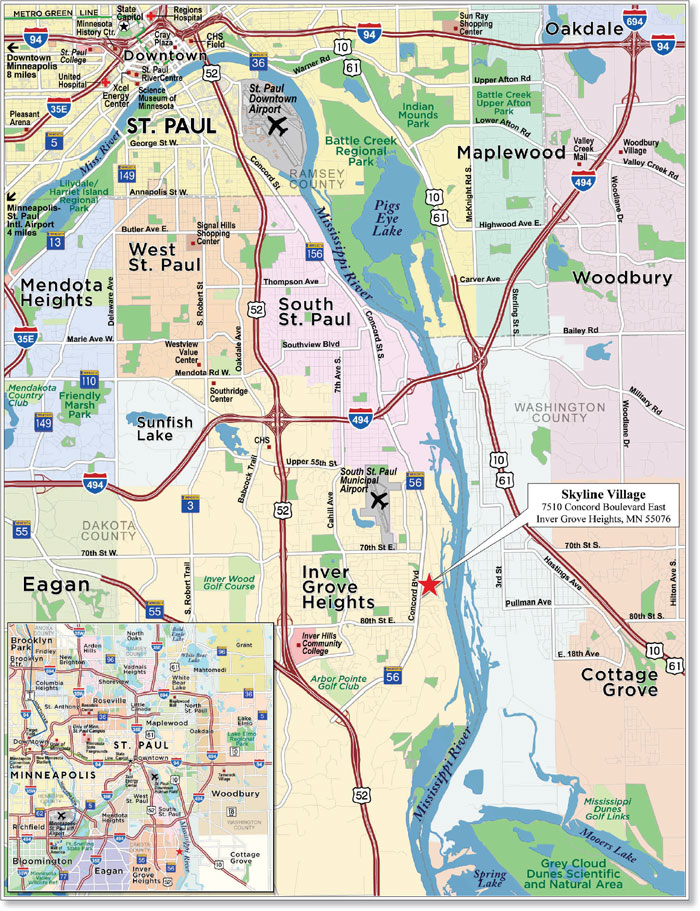
THE INFORMATION IN THIS STRUCTURAL AND COLLATERAL TERM SHEET IS NOT COMPLETE AND MAY BE AMENDED PRIOR TO THE TIME OF SALE. THIS TERM SHEET IS NOT AN OFFER TO SELL THESE SECURITIES AND IT IS NOT A SOLICITATION OF AN OFFER TO BUY THESE SECURITIES IN ANY JURISDICTION WHERE THE OFFER OR SALE IS NOT PERMITTED.
103
| No. 9 – Skyline Village | ||||||
| Loan Information | Property Information | |||||
| Mortgage Loan Seller: | Ladder Capital Finance LLC | Single Asset/Portfolio: | Single Asset | |||
| Credit Assessment (Fitch/KBRA/Moody’s/): | NR/NR/NR | Property Type: | Manufactured Housing Community | |||
| Original Principal Balance: | $25,725,000 | Specific Property Type: | Manufactured Housing Community | |||
| Cut-off Date Balance: | $25,725,000 | Location: | Inver Grove Heights, MN | |||
| % of Initial Pool Balance: | 2.5% | Size: | 399 Pads | |||
| Loan Purpose: | Acquisition | Cut-off Date Balance Per Pad: | $64,474 | |||
| Borrower Name: | CF MH Skyline Fee LLC | Year Built/Renovated: | 1976/NAP | |||
| Sponsor: | Ross H. Partrich | Title Vesting: | Fee | |||
| Mortgage Rate: | 4.488% | Property Manager: | Self-managed | |||
| Note Date: | June 24, 2016 | 4thMost Recent Occupancy(As of)(3): | 72.3% (12/31/2012) | |||
| Anticipated Repayment Date: | NAP | 3rdMost Recent Occupancy(As of)(3): | 79.1% (12/31/2013) | |||
| Maturity Date: | July 6, 2026 | 2ndMost Recent Occupancy(As of)(3): | 88.8%(12/31/2014) | |||
| IO Period: | 18 months | Most Recent Occupancy (As of)(3): | 93.6% (12/31/2015) | |||
| Loan Term (Original): | 120 months | Current Occupancy (As of)(3): | 94.9% (4/30/2016) | |||
| Seasoning: | 2 months | |||||
| Amortization Term (Original): | 360 months | Underwriting and Financial Information: | ||||
| Loan Amortization Type: | Interest-only, Amortizing Balloon | |||||
| Interest Accrual Method: | Actual/360 | 4thMost Recent NOI (As of)(4): | $1,228,739 (12/31/2013) | |||
| Call Protection: | L(26),D(90),O(4) | 3rdMost Recent NOI (As of)(4): | $1,461,207 (12/31/2014) | |||
| Lockbox Type: | Springing | 2ndMost Recent NOI (As of)(4): | $1,691,507 (12/31/2015) | |||
| Additional Debt(1): | Yes | Most Recent NOI (As of)(4): | $1,789,094 (TTM 4/30/2016) | |||
| Additional Debt Type(1): | Future Mezzanine | |||||
| U/W Revenues(4): | $2,861,673 | |||||
| U/W Expenses(4): | $878,719 | |||||
| U/W NOI(4): | $1,982,954 | |||||
| U/W NCF(4): | $1,963,004 | |||||
| U/W NOI DSCR: | 1.27x | |||||
| U/W NCF DSCR: | 1.26x | |||||
| Escrows and Reserves(2): | U/W NOI Debt Yield: | 7.7% | ||||
| U/W NCF Debt Yield: | 7.6% | |||||
| Type: | Initial | Monthly | Cap (If Any) | As-Is Appraised Value: | $35,360,000 | |
| Taxes | $98,207 | $16,368 | NAP | As-Is Appraisal Valuation Date: | June 9, 2016 | |
| Insurance | $0 | Springing | NAP | Cut-off Date LTV Ratio: | 72.8% | |
| Replacement Reserves | $0 | $1,663 | $79,800 | LTV Ratio at Maturity or ARD: | 61.3% | |
| (1) | See “Subordinate and Mezzanine Indebtedness” section. |
| (2) | See “Escrows” section. |
| (3) | See “Historical Occupancy” section. |
| (4) | See “Cash Flow Analysis” section. |
The Mortgage Loan. The mortgage loan (the “Skyline Village Mortgage Loan”) is evidenced by a single promissory note that is secured by a first mortgage encumbering a manufactured housing community property located in Inver Grove Heights, Minnesota (the “Skyline Village Property”). The Skyline Village Mortgage Loan was originated on June 24, 2016 by Ladder Capital Finance LLC. The Skyline Village Mortgage Loan had an original principal balance of $25,725,000, has an outstanding principal balance as of the Cut-off Date of $25,725,000 and accrues interest at an interest rate of 4.488%per annum. The Skyline Village Mortgage Loan had an initial term of 120 months, has a remaining term of 118 months as of the Cut-off Date and requires interest-only payments for the first 18 payments following origination and, thereafter, requires payments of principal and interest based on a 30-year amortization schedule. The Skyline Village Mortgage Loan matures on July 6, 2026.
Following the lockout period, the borrower has the right to defease the Skyline Village Mortgage Loan in whole, but not in part, on any due date before April 6, 2026. In addition, the Skyline Village Mortgage Loan is prepayable without penalty commencing on April 6, 2026.
THE INFORMATION IN THIS STRUCTURAL AND COLLATERAL TERM SHEET IS NOT COMPLETE AND MAY BE AMENDED PRIOR TO THE TIME OF SALE. THIS TERM SHEET IS NOT AN OFFER TO SELL THESE SECURITIES AND IT IS NOT A SOLICITATION OF AN OFFER TO BUY THESE SECURITIES IN ANY JURISDICTION WHERE THE OFFER OR SALE IS NOT PERMITTED.
104
SKYLINE VILLAGE
Sources and Uses
| Sources | Uses | |||||||
| Original loan amount | $25,725,000 | 75.1% | Purchase price | $33,800,000 | 98.7% | |||
| Sponsor’s new cash contribution | 8,536,972 | 24.9 | Reserves | 98,207 | 0.3 | |||
| Closing costs | 363,766 | 1.1 | ||||||
| Total Sources | $34,261,972 | 100.0% | Total Uses | $34,261,972 | 100.0% |
The Property. The Skyline Village Property is a 399 pad manufactured housing community located on a 72.1-acre parcel in Inver Grove Heights, Minnesota, which is approximately 8.8 miles south of St. Paul, Minnesota. The property is divided into four irregularly shaped parcels, containing nine common buildings, including a club house building, three maintenance buildings, and five concrete storm shelters. Out of the 399 pads, 226 (approximately 56.6% of total pads) are located in the north section while 173 pads (approximately 43.4% of total pads) are located in the south section. There are 121 mobile homes (occupying approximately 30.3% of the pads) owned by a borrower affiliate, with 119 of these homes rented to third party tenants. The borrower affiliate entered into an agreement with the lender restricting the number of homes it can own and restricting the circumstances under which it may remove homes from the property and the owner of the membership interest of such affiliate pledged to lender its equity in the affiliate. The Skyline Village Mortgage Loan is acquisition financing. A loan secured by the Skyline Village Property was transferred to special servicing in 2010 and the seller purchased the defaulted note in 2011 and took possession of the Skyline Village Property shortly thereafter. For additional information, see“Description of the Mortgage Pool—Loan Purpose; Default History, Bankruptcy Issues and Other Proceedings” in the Preliminary Prospectus.
There are 808 parking spaces at the Skyline Village Property with 346 concrete homesite parking spaces located on the south section of the Skyline Village Property, 452 asphalt street parking spaces in the north section of the Skyline Village Property, and 10 parking spaces at the clubhouse for a total parking ratio of 2.0 spaces per pad. Amenities include an on-site leasing office, a club room, a playground, and a recreational vehicle storage area. As of April 30, 2016, the Skyline Village property was 94.9% occupied.
The following table presents historical occupancy percentages at the Skyline Village Property:
Historical Occupancy
12/31/2012(1)(2) | 12/31/2013(1)(2) | 12/31/2014(1)(2) | 12/31/2015(1)(2) | 4/30/2016(2)(3) | ||||
| 72.3% | 79.1% | 88.8% | 93.6% | 94.9% |
| (1) | Information obtained from the borrower. |
| (2) | Occupancy at the Skyline Village Property increased as a result of a change in property management in 2011. Since the change, the Skyline Village Property has been leased up gradually to its occupancy of 94.9% as of April 30, 2016. |
| (3) | Information obtained from the underwritten rent roll. |
Operating History and Underwritten Net Cash Flow.The following table presents certain information relating to the historical operating performance and underwritten net cash flow at the Skyline Village Property:
Cash Flow Analysis
| 2013(1) | 2014(1) | 2015(1) | TTM 4/30/2016(1) | U/W(1) | % of U/W Effective Gross Income | U/W $ per Pad | ||||||||
| Base Rent | 1,952,867 | $2,225,065 | $2,474,846 | $2,572,171 | $2,887,944 | 100.9% | $7,238 | |||||||
| Grossed Up Vacant Space | 0 | 0 | 0 | 0 | 76,932 | 2.7 | 193 | |||||||
| Other Income | 92,046 | 105,639 | 109,963 | 117,209 | 117,209 | 4.1 | 294 | |||||||
| Less Vacancy & Credit Loss | 0 | 0 | 0 | 0 | (220,412)(2) | (7.7) | (552) | |||||||
| Effective Gross Income | $2,044,913 | $2,330,704 | $2,584,809 | $2,689,380 | $2,861,673 | 100.0% | $7,172 | |||||||
| Total Operating Expenses | $816,174 | $869,497 | $893,302 | $900,286 | $878,719 | 30.7% | $2,202 | |||||||
| Net Operating Income | $1,228,739 | $1,461,207 | $1,691,507 | $1,789,094 | $1,982,954 | 69.3% | $4,970 | |||||||
| Capital Expenditures | 0 | 0 | 0 | 0 | 19,950 | 0.7 | 50 | |||||||
| Net Cash Flow | $1,228,739 | $1,461,207 | $1,691,507 | $1,789,094 | $1,963,004 | 68.6% | $4,920 | |||||||
| NOI DSCR | 0.79x | 0.94x | 1.08x | 1.15x | 1.27x | |||||||||
| NCF DSCR | 0.79x | 0.94x | 1.08x | 1.15x | 1.26x | |||||||||
| NOI DY | 4.8% | 5.7% | 6.6% | 7.0% | 7.7% | |||||||||
| NCF DY | 4.8% | 5.7% | 6.6% | 7.0% | 7.6% |
| (1) | The increase in Net Operating Income from 2013 to U/W can be attributed to a gradual increase in occupancy at the Skyline Village Property after the stabilization from the 2010 default. |
| (2) | The underwritten economic vacancy is 7.4%. The Skyline Village property was 94.9% physically occupied as of April 30, 2016. |
Appraisal.As of the appraisal valuation date of June 9,2016, the Skyline Village Property had an aggregate “as-is” appraised value of $35,360,000.
Environmental Matters.According to a Phase I environmental assessment dated June 15, 2016 there was no evidence of any recognized environmental conditions at the Skyline Village Property.
THE INFORMATION IN THIS STRUCTURAL AND COLLATERAL TERM SHEET IS NOT COMPLETE AND MAY BE AMENDED PRIOR TO THE TIME OF SALE. THIS TERM SHEET IS NOT AN OFFER TO SELL THESE SECURITIES AND IT IS NOT A SOLICITATION OF AN OFFER TO BUY THESE SECURITIES IN ANY JURISDICTION WHERE THE OFFER OR SALE IS NOT PERMITTED.
105
SKYLINE VILLAGE
Market Overview.The Skyline Village Property is located in Inver Grove Heights, Minnesota, which is approximately 8.8 miles south of St. Paul, Minnesota. According to the appraisal, the Skyline Village Property is part of the Minneapolis-St. Paul-Bloomington, MN-WI metropolitan statistical area, which had an estimated 2015 population of 3,866,768, the 14th largest in the United States. Minneapolis–Saint Paul is a major metropolitan area built around the Mississippi, Minnesota and St. Croix rivers. The area is commonly known as the Twin Cities for its two largest cities, Minneapolis, the city with the largest population in Minnesota, and Saint Paul, the state capital. Together the two cities anchor the second largest economic center in the Midwest, behind Chicago. The estimated 2015 population within a one-, three- and five- mile radius of the Skyline Village Property was 8,056, 43,776, and 102,977, respectively, and the estimated 2015 average annual household income within the same radii was $81,602, $84,478, and $86,568, respectively. The appraiser concluded a market vacancy rate of 6.0%. The Skyline Village Property was 94.9% occupied as of April 30, 2016. The appraiser concluded a market rent of $619 per pad, which is in line with underwritten rent of $619 per pad.
The following table presents certain information relating to comparable manufactured housing properties for the Skyline Village Property:
Competitive Set(1)
| Skyline Village (Subject) | Emerald Hills Village | Rosemount Woods | Beaver Lake Estates | Rolling Hills of Maplewood | Rambush Estates | Arbor Vista | |
| Location | Inver Grove Heights, MN | Inver Grove Heights, MN | Rosemount, MN | Maplewood, MN | St. Paul, MN | Burnsville, MN | Burnsville, MN |
| Distance to Subject | -- | 4.3 miles | 8.2 miles | 9.4 miles | 9.8 miles | 16.2 miles | 16.6 miles |
| Year Built | 1976 | 1969 | 1980 | 1969 | 1985 | 1970 | 1968 |
| Number of Pads | 399 | 402 | 182 | 254 | 357 | 223 | 319 |
| Total Occupancy | 95% | 99% | 93% | 98% | 99% | 97% | 92% |
| Average Rent (per pad) | $619(2) | $578 | $590 | $533 | $581 | $579 | $596 |
| (1) | Information obtained from the appraisal. |
| (2) | Information obtained from the underwritten rent roll |
The Borrower.The borrower is CF MH Skyline Fee LLC, a Delaware limited liability company and single purpose entity with one independent director. Legal counsel to the borrower delivered a non-consolidation opinion in connection with the origination of the Skyline Village Mortgage Loan Ross H. Partrich is the guarantor of certain nonrecourse carve-outs under the Skyline Village Mortgage Loan.
The Sponsor.The sponsor is Ross H. Partrich, who is the key principal of RHP Properties (“RHP”). Mr. Partrich owns and manages a total of 224 manufactured housing communities with over 56,349 housing units and sites spanning 23 states, with a combined value of approximately $3.38 billion. RHP employs more than 900 professionals at their Farmington Hills, Michigan corporate headquarters, regional offices, and on-site management property across the country. RHP is the second largest private owner of manufactured home communities in the United States. The sponsor is also a sponsor under the mortgage loan identified in Annex A-1 to the Preliminary Prospectus as the Green Valley Portfolio (and further described in Annex A-3 to the Preliminary Prospectus). The sponsor had prior deeds in lieu of foreclosure. For additional information on the sponsor, see “Description of the Mortgage Loans—Loan Purpose; Default History, Bankruptcy Issues and Other Proceedings” in the Preliminary Prospectus.
Escrows.The loan documents provide for upfront reserves in the amount of $98,207 for real estate taxes. The loan documents also requires monthly deposits in an amount equal to one-twelfth of the estimated annual real estate taxes, which currently equates to $16,368, and $1,663 for replacement reserves. The replacement reserve is subject to a cap of $79,800. The loan documents do not require monthly escrows for insurance, provided that (i) the blanket policy is acceptable to the lender and (ii) the borrower provides the lender with evidence of payment five days prior to the due date.
Lockbox and Cash Management.Upon the occurrence and during the continuance of a Sweep Event Period (as defined below), the Skyline Village Mortgage Loan requires the borrower to establish a lockbox account and the borrower or property manager shall deposit all rents into such lockbox account and such funds will be swept to the cash management account. During a Sweep Event Period, all excess cash flow after payment of all sums due and payable under the loan documents and all operating expenses will be retained by the lender as additional collateral.
A “Sweep Event Period” will commence upon: (i) the occurrence and continuance of an event of default under the loan; (ii) the amortizing debt service coverage ratio falling below 1.05x for two consecutive quarters; or (iii) the borrower defaulting under the management agreement. A Sweep Event Period will be cured, with regard to clause (i), upon the cure of such event of default; with regard to clause (ii), upon the amortizing debt service coverage ratio being greater than 1.15x for two consecutive calendar quarters; with regard to clause (iii), upon the date borrower has entered into a replacement management agreement with a qualified manager or the date on which the applicable default has been remedied to the lender’s satisfaction.
Property Management.The Skyline Village Property is managed by an affiliate of the sponsor, Newbury Management Company.
Assumption.The borrower has the right to transfer the Skyline Village Property provided that certain conditions are satisfied, including: (i) no event of default has occurred and is continuing; (ii) the lender has reasonably determined that the proposed transferee and guarantor satisfy the lender’s credit review and underwriting standards, taking into consideration the transferee’s experience, financial strength, and general business standing; and (iii) a rating agency confirmation is obtained from Fitch, KBRA and Moody’s to the effect that such assumption will not result in a downgrade, withdrawal or qualification of the respective ratings assigned to the Series 2016-LC24 Certificates.
THE INFORMATION IN THIS STRUCTURAL AND COLLATERAL TERM SHEET IS NOT COMPLETE AND MAY BE AMENDED PRIOR TO THE TIME OF SALE. THIS TERM SHEET IS NOT AN OFFER TO SELL THESE SECURITIES AND IT IS NOT A SOLICITATION OF AN OFFER TO BUY THESE SECURITIES IN ANY JURISDICTION WHERE THE OFFER OR SALE IS NOT PERMITTED.
106
SKYLINE VILLAGE
Partial Release.Not Permitted.
Real Estate Substitution.Not permitted.
Subordinate and Mezzanine Indebtedness.The loan documents permit mezzanine financing subject to: (i) there being no event of default; (ii) a maximum combined loan-to-value ratio equal to the lesser of 75.0% and the loan-to-value ratio at the origination of the Skyline Village Mortgage Loan; (iii) a minimum combined amortizing debt service coverage ratio equal to the greater of 1.25x and the debt service coverage ratio at the origination of the Skyline Village Mortgage Loan; (iv) the lender’s review and approval of (a) the terms and conditions of the mezzanine loan and the mezzanine loan documents and (b) the structure of the mezzanine borrower; (v) if required under the servicing agreement, the receipt of a rating agency confirmation from each of Fitch, KBRA and Moody’s that the mezzanine financing will not result in a downgrade, withdrawal or qualification of the respective ratings assigned to the Series 2016-LC24 Certificates; and (vi) the execution of an intercreditor agreement acceptable to the lender.
Ground Lease.None.
Terrorism Insurance.The loan documents require that the “all risk” insurance policy required to be maintained by the borrowers provide coverage for terrorism in an amount equal to the full replacement cost of the Skyline Village Property. The loan documents also require business interruption insurance covering no less than the 12-month period following the occurrence of a casualty event, together with a 12-month extended period of indemnity.
THE INFORMATION IN THIS STRUCTURAL AND COLLATERAL TERM SHEET IS NOT COMPLETE AND MAY BE AMENDED PRIOR TO THE TIME OF SALE. THIS TERM SHEET IS NOT AN OFFER TO SELL THESE SECURITIES AND IT IS NOT A SOLICITATION OF AN OFFER TO BUY THESE SECURITIES IN ANY JURISDICTION WHERE THE OFFER OR SALE IS NOT PERMITTED.
107
| SEASONS AT HORSETOOTH APARTMENTS |
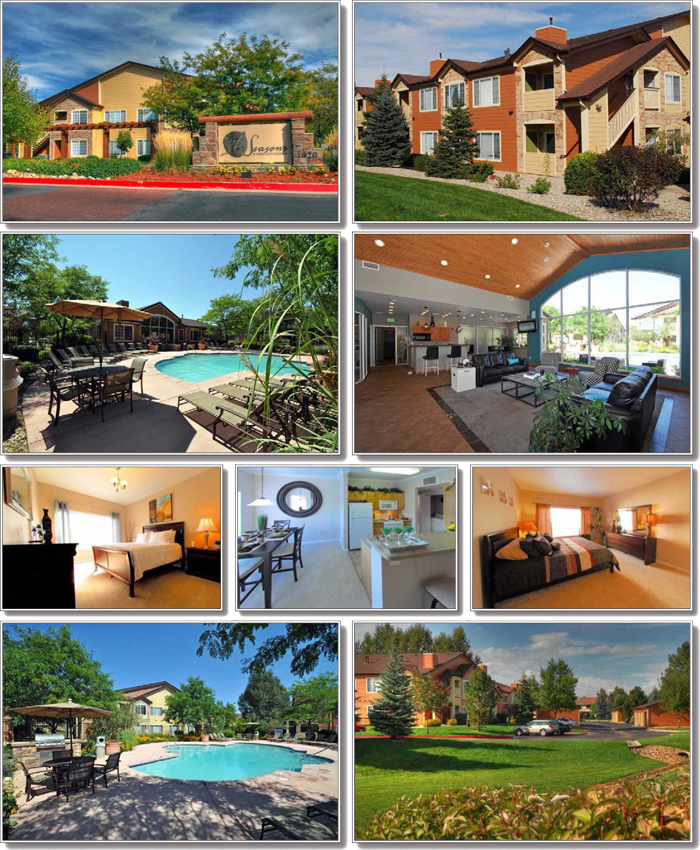
THE INFORMATION IN THIS STRUCTURAL AND COLLATERAL TERM SHEET IS NOT COMPLETE AND MAY BE AMENDED PRIOR TO THE TIME OF SALE. THIS TERM SHEET IS NOT AN OFFER TO SELL THESE SECURITIES AND IT IS NOT A SOLICITATION OF AN OFFER TO BUY THESE SECURITIES IN ANY JURISDICTION WHERE THE OFFER OR SALE IS NOT PERMITTED.
108
| SEASONS AT HORSETOOTH APARTMENTS |
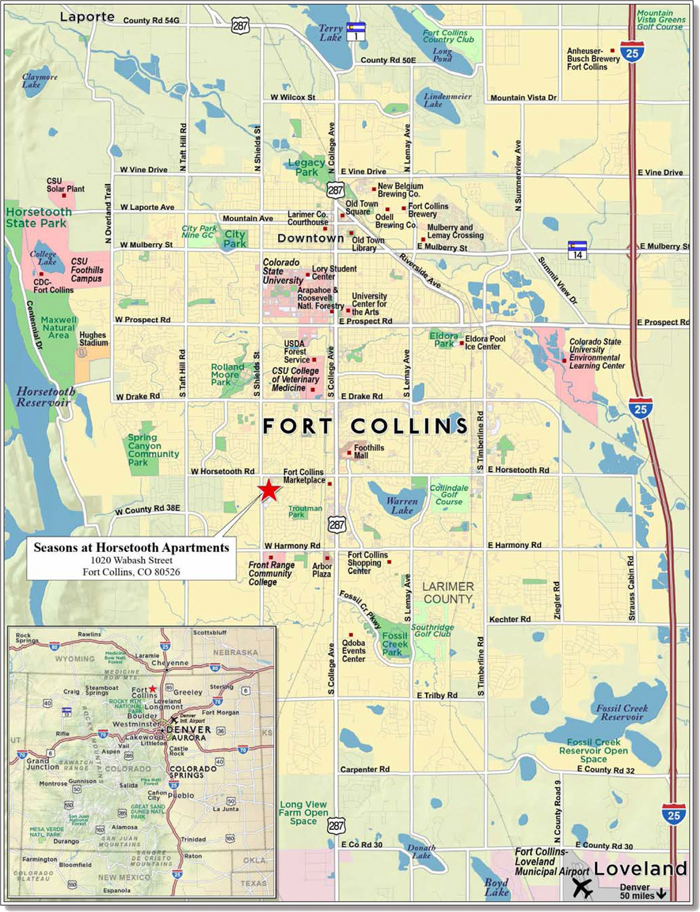
THE INFORMATION IN THIS STRUCTURAL AND COLLATERAL TERM SHEET IS NOT COMPLETE AND MAY BE AMENDED PRIOR TO THE TIME OF SALE. THIS TERM SHEET IS NOT AN OFFER TO SELL THESE SECURITIES AND IT IS NOT A SOLICITATION OF AN OFFER TO BUY THESE SECURITIES IN ANY JURISDICTION WHERE THE OFFER OR SALE IS NOT PERMITTED.
109
| No. 10 – Seasons at Horsetooth Apartments | ||||||||
| Loan Information | Property Information | |||||||
| Mortgage Loan Seller: | Rialto Mortgage Finance, LLC | Single Asset/Portfolio: | Single Asset | |||||
| Credit Assessment (Fitch/KBRA/Moody’s): | NR/NR/NR | Property Type: | Multifamily | |||||
| Original Principal Balance: | $24,700,000 | Specific Property Type: | Garden | |||||
| Cut-off Date Balance: | $24,700,000 | Location: | Fort Collins, CO | |||||
| % of Initial Pool Balance: | 2.4% | Size: | 208 Units | |||||
| Loan Purpose: | Refinance | Cut-off Date Balance Per Unit: | $118,750 | |||||
| Borrower Names(1): | Various | Year Built/Renovated: | 1998/2014 | |||||
| Sponsor: | J. Kenneth Dunn | Title Vesting: | Fee | |||||
| Mortgage Rate: | 4.240% | Property Managers: | Rainer Realty Management, LLC; Echelon Property Group LLC | |||||
| Note Date: | August 19, 2016 | 4thMost Recent Occupancy (As of): | 89.8% (12/31/2012) | |||||
| Anticipated Repayment Date: | NAP | 3rdMost Recent Occupancy (As of): | 90.7% (12/31/2013) | |||||
| Maturity Date: | September 6, 2026 | 2ndMost Recent Occupancy (As of): | 94.5% (12/31/2014) | |||||
| IO Period: | 120 months | Most Recent Occupancy (As of): | 93.5% (12/31/2015) | |||||
| Loan Term (Original): | 120 months | Current Occupancy (As of): | 95.7% (8/1/2016) | |||||
| Seasoning: | 0 months | |||||||
| Amortization Term (Original): | None | Underwriting and Financial Information: | ||||||
| Loan Amortization Type: | Interest-only, Balloon | |||||||
| Interest Accrual Method: | Actual/360 | 4th Most Recent NOI (As of): | $2,217,679 (12/31/2013) | |||||
| Call Protection: | L(24),D(92),O(4) | 3rd Most Recent NOI (As of): | $2,432,990 (12/31/2014) | |||||
| Lockbox Type: | Soft/Upfront Cash Management | 2nd Most Recent NOI (As of): | $2,626,241 (12/31/2015) | |||||
| Additional Debt: | None | Most Recent NOI (As of): | $2,742,287 (TTM 6/30/2016) | |||||
| Additional Debt Type: | NAP | |||||||
| U/W Revenues: | $3,844,826 | |||||||
| U/W Expenses: | $1,136,872 | |||||||
| U/W NOI: | $2,707,954 | |||||||
| U/W NCF: | $2,656,578 | |||||||
| U/W NOI DSCR: | 2.55x | |||||||
| Escrows and Reserves(2): | U/W NCF DSCR: | 2.50x | ||||||
| U/W NOI Debt Yield: | 11.0% | |||||||
| Type: | Initial | Monthly | Cap (If Any) | U/W NCF Debt Yield: | 10.8% | |||
| Taxes | $78,235 | $14,902 | NAP | As-Is Appraised Value: | $50,000,000 | |||
| Insurance | $36,997 | $3,524 | NAP | As-Is Appraisal Valuation Date: | June 28, 2016 | |||
| Replacement Reserves | $62,400 | $19,089 | NAP | Cut-off Date LTV Ratio: | 49.4% | |||
| Deferred Maintenance | $2,125 | $0 | NAP | LTV Ratio at Maturity or ARD: | 49.4% | |||
| (1) | See “The Borrowers” section. |
| (2) | See “Escrows” section. |
The Mortgage Loan. The mortgage loan (the “Seasons at Horsetooth Apartments Mortgage Loan”) is evidenced by a single promissory note that is secured by a first mortgage encumbering a garden-style multifamily property located in Fort Collins, Colorado (the “Seasons at Horsetooth Apartments Property”). The Seasons at Horsetooth Apartments Mortgage Loan was originated on August 19, 2016 by Rialto Mortgage Finance, LLC. The Seasons at Horsetooth Apartments Mortgage Loan had an original principal balance of $24,700,000, has an outstanding principal balance as of the Cut-off Date of $24,700,000 and accrues interest at an interest rate of 4.240%per annum. The Seasons at Horsetooth Apartments Mortgage Loan had an initial term of 120 months, has a remaining term of 120 months as of the Cut-off Date and requires interest-only payments through the term of the Seasons at Horsetooth Apartments Mortgage Loan. The Seasons at Horsetooth Apartments Mortgage Loan matures on September 6, 2026.
Following the lockout period, the borrower has the right to defease the Seasons at Horsetooth Apartments Mortgage Loan in whole, but not in part, on any date before June 6, 2026. In addition, the Seasons at Horsetooth Apartments Mortgage Loan is prepayable without any penalty on or after June 6, 2026.
THE INFORMATION IN THIS STRUCTURAL AND COLLATERAL TERM SHEET IS NOT COMPLETE AND MAY BE AMENDED PRIOR TO THE TIME OF SALE. THIS TERM SHEET IS NOT AN OFFER TO SELL THESE SECURITIES AND IT IS NOT A SOLICITATION OF AN OFFER TO BUY THESE SECURITIES IN ANY JURISDICTION WHERE THE OFFER OR SALE IS NOT PERMITTED.
110
| SEASONS AT HORSETOOTH APARTMENTS |
Sources and Uses
| Sources | Uses | |||||||
| Original loan amount | $24,700,000 | 100.0% | Loan payoff(1) | $14,607,376 | 59.1% | |||
| Reserves | 179,758 | 0.7 | ||||||
| Closing costs | 1,864,217 | 7.5 | ||||||
| Return of equity | 8,048,649 | 32.6 | ||||||
| Total Sources | $24,700,000 | 100.0% | Total Uses | $24,700,000 | 100.0% |
| (1) | The Seasons at Horsetooth Apartments Property was previously securitized in the MSC 2006-IQ12 transaction. |
The Property.The Seasons at Horsetooth Apartments Property is a 208 unit, garden-style multifamily property located in Fort Collins, Colorado. The improvements were constructed in 1998 and are situated on 13.6 acres. The Seasons at Horsetooth Apartments Property is comprised of 26 two-story residential buildings, a clubhouse and 16 enclosed garages. Common area amenities include a business center, 24-hour fitness center, a pool, jacuzzi, assigned parking, courtesy patrol and high speed internet with Wi-Fi in the pool/clubhouse area. Unit amenities feature 9 foot ceilings on the 1st floor, vaulted ceilings on the 2nd floor, wood floors (select units), fully equipped kitchen, washer & dryer and private patio or balcony. The Seasons at Horsetooth Apartments Property contains 299 parking spaces, reflecting a parking ratio of 1.4 spaces per unit. As of August 1, 2016, the Seasons at Horsetooth Apartments Property was 95.7% occupied.
The following table presents certain information relating to the unit mix of the Seasons at Horsetooth Apartments Property:
Apartment Unit Summary(1)
| Unit Type | No. of Units | % of Total Units | Average Unit Size (SF) | Average Monthly Rent per Unit |
| 1 Bedroom/1 Bath | 24 | 11.5% | 700 | $1,301 |
| 2 Bedroom/2 Bath - A | 96 | 46.2% | 1,008 | $1,379 |
| 2 Bedroom/2 Bath - B | 44 | 21.2% | 1,067 | $1,474 |
| 3 Bedroom/2 Bath | 44 | 21.2% | 1,260 | $1,678 |
| Total/Weighted Average | 208 | 100.0% | 1,038 | $1,456 |
| (1) | Information obtained from the underwritten rent roll. |
The following table presents historical occupancy percentages at the Seasons at Horsetooth Apartments Property:
Historical Occupancy
12/31/2012(1) | 12/31/2013(1) | 12/31/2014(1) | 12/31/2015(1) | 8/1/2016(2) |
| 89.8% | 90.7% | 94.5% | 93.5% | 95.7% |
| (1) | Information obtained from the borrower. |
| (2) | Information obtained from the underwritten rent roll. |
Operating History and Underwritten Net Cash Flow.The following table presents certain information relating to the historical operating performance and underwritten net cash flow at the Seasons at Horsetooth Apartments Property:
Cash Flow Analysis
| 2013 | 2014 | 2015 | TTM 6/30/2016 | U/W | % of U/W Effective Gross Income | U/W $ per Unit | |
| Base Rent | $3,188,444 | $3,363,847 | $3,567,796 | $3,604,883 | $3,476,304 | 90.4% | $16,713 |
| Grossed Up Vacant Space | 0 | 0 | 0 | 0 | 156,420 | 4.1 | 752 |
| Concessions | (88,152) | (54,835) | (37,705) | (17,668) | (17,668) | (0.5) | (85) |
| Other Income(1) | 348,302 | 344,545 | 409,307 | 411,697 | 411,697 | 10.7 | 1,979 |
| Less Vacancy & Credit Loss | (272,288) | (276,476) | (309,675) | (230,076) | (181,927)(2) | (4.7) | (875) |
| Effective Gross Income | $3,176,306 | $3,377,082 | $3,629,723 | $3,768,836 | $3,844,826 | 100.0% | $18,485 |
| Total Operating Expenses | $958,627 | $944,092 | $1,003,482 | $1,026,549 | $1,136,872 | 29.6% | $5,466 |
| Net Operating Income | $2,217,679 | $2,432,990 | $2,626,241 | $2,742,287 | $2,707,954 | 70.4% | $13,019 |
| Capital Expenditures | 0 | 0 | 0 | 0 | 51,376 | 1.3 | 247 |
| Net Cash Flow | $2,217,679 | $2,432,990 | $2,626,241 | $2,742,287 | $2,656,578 | 69.1% | $12,772 |
| NOI DSCR | 2.09x | 2.29x | 2.47x | 2.58x | 2.55x | ||
| NCF DSCR | 2.09x | 2.29x | 2.47x | 2.58x | 2.50x | ||
| NOI DY | 9.0% | 9.9% | 10.6% | 11.1% | 11.0% | ||
| NCF DY | 9.0% | 9.9% | 10.6% | 11.1% | 10.8% |
| (1) | Other Income includes application fees, late fees, pet fees and administrative fees. |
| (2) | The underwritten economic vacancy is 5.5%. The Seasons at Horsetooth Apartments Property was 95.7% physically occupied as of August 1, 2016. |
THE INFORMATION IN THIS STRUCTURAL AND COLLATERAL TERM SHEET IS NOT COMPLETE AND MAY BE AMENDED PRIOR TO THE TIME OF SALE. THIS TERM SHEET IS NOT AN OFFER TO SELL THESE SECURITIES AND IT IS NOT A SOLICITATION OF AN OFFER TO BUY THESE SECURITIES IN ANY JURISDICTION WHERE THE OFFER OR SALE IS NOT PERMITTED.
111
| SEASONS AT HORSETOOTH APARTMENTS |
Appraisal.As of the appraisal valuation date of June 28, 2016, the Seasons at Horsetooth Apartments Property had an “as-is” appraised value of $50,000,000.
Environmental Matters.According to a Phase I environmental assessment dated July 5, 2016, there was no evidence of any recognized environmental conditions at the Seasons at Horsetooth Apartments Property.
Market Overview and Competition.The Seasons at Horsetooth Apartments Property is located in Fort Collins, Colorado, approximately 4.1 miles south of the Fort Collins central business district and is within the Fort Collins-Loveland metropolitan statistical area. Fort Collins islocated 65 miles north of the state capitol of Denver and has an estimated 2016 population of 332,605. According to a government agency, the unemployment rate for the Fort Collins metropolitan statistical area was 3.1% as of March 2016. In comparison, the state’s unemployment rate was 3.5%, and the national unemployment rate was 5.0% for the same time period.
Regional access to the Seasons at Horsetooth Apartments Property is provided by Interstate Highway 25 which connects Fort Collins with Denver and extends north/south across the state, and State Route 14 which extends east/west. Immediately surrounding the Seasons at Horsetooth Apartments Property to the east and west are single family homes, to the immediate south is a church, and across Wabash Street directly north of the Seasons at Horsetooth Apartments Property is a neighborhood retail center which includes restaurants and a bank. Approximately 1.7 miles east of the Seasons at Horsetooth Apartments Property is the major retail corridor within the region with retailers such as Target, Wal-Mart, PetSmart, T.J Maxx, Best Buy, REI, Bed Bath & Beyond, Home Depot, Men’s Warehouse, and Albertson’s. Within the corridor is a newly constructed lifestyle mall called Renaissance on the Front Range with retailers such as H&M, Nordstrom Rack, Victoria’s Secret, Chico’s, and Ulta Beauty. According to the appraisal, the 2016 estimated population within a one-, three-, and five-mile radius was 16,183, 92,830 and 161,367, respectively, and the average household income within the same radii was $77,735, $74,934 and $78,028, respectively.
According to the appraisal, the Seasons at Horsetooth Apartments Property is located in the Northern Colorado multifamily market. As of the fourth quarter of 2015, the Northern Colorado multifamily market reported a vacancy rate of 4.6% and an average monthly rental rate of $1,149 per unit.
The following table presents certain information relating to some comparable multifamily properties for the Seasons at Horsetooth Apartments Property:
Competitive Set(1)
| Average Rent (per unit) | ||||||||||
| Location | Distance to Subject | Property Type | Number of Units | Studio | 1 BR | 2 BR | 3 BR | Overall Average PSF | Total Occupancy | |
| Seasons at Horsetooth Apartments (Subject) | Fort Collins, CO | -- | Garden | 208 | NAP | $1,301 | $1,379-$1,474 | $1,678 | $1.42 | 95.7% |
| Pinecone Apartments | Fort Collins, CO | 3.7 miles | Garden | 195 | NAP | $1,218 | $1,369-$1,666 | NAP | $1.54 | 95.0% |
| Miramont Apartments | Fort Collins, CO | 3.0 miles | Garden | 210 | NAP | $1,191 | $1,312-$1,390 | NAP | $1.28 | 95.0% |
| The Preserve at the Meadows | Fort Collins, CO | 0.9 miles | Garden | 220 | NAP | $1,235-$1,365 | $1,415-$1,545 | $1,730 | $1.51 | 97.0% |
| The Trails at Timberline | Fort Collins, CO | 4.3 miles | Garden | 314 | $1,034 | $1,279-$1,354 | $1,534-$2,459 | $1,834-$2,659 | $1.61 | 97.0% |
| Settler’s Creek | Fort Collins, CO | 2.2 miles | Garden | 229 | NAP | $1,130-$1,418 | $1,285-$1,363 | $1,675 | $1.38 | 97.0% |
| (1) | Information obtained from the appraisal and the underwritten rent roll. |
The Borrowers.There are 33 borrowers, jointly and severally who own the Seasons at Horsetooth Apartments Property as tenants-in-common. The tenants-in-common have waived their right to partition during the term of the Seasons at Horsetooth Apartments Mortgage Loan. Each of the tenants-in-common is a single purpose entity and a Delaware limited liability company with one independent director. Legal counsel to the borrowers delivered a non-consolidation opinion in connection with the origination of the Seasons at Horsetooth Apartments Mortgage Loan. J. Kenneth Dunn, is the guarantor of certain nonrecourse carveouts under Seasons at Horsetooth Apartments Mortgage Loan. See “Description of the Mortgage Pool – Mortgage Pool Characteristics – Tenancies-in-Common” in the Preliminary Prospectus.
The Sponsor.The sponsor, J. Kenneth Dunn, is co-founder of The Rainier Companies and has over two decades of experience in commercial real estate. Mr. Dunn is involved in all facets of the company and has primary responsibility for acquisitions, business development and negotiations. In 1994 Mr. Dunn co-founded Meridian Realty Advisors. As a principal, he directed the acquisition and management of more than $1.0 billion in transactions.
Escrows.The Seasons at Horsetooth Apartments Property Mortgage Loan documents provided for upfront escrows in the amount of $78,235 for real estate taxes, $36,997 for insurance premiums, $62,400 for replacement reserves and $2,125 for deferred maintenance.
THE INFORMATION IN THIS STRUCTURAL AND COLLATERAL TERM SHEET IS NOT COMPLETE AND MAY BE AMENDED PRIOR TO THE TIME OF SALE. THIS TERM SHEET IS NOT AN OFFER TO SELL THESE SECURITIES AND IT IS NOT A SOLICITATION OF AN OFFER TO BUY THESE SECURITIES IN ANY JURISDICTION WHERE THE OFFER OR SALE IS NOT PERMITTED.
112
| SEASONS AT HORSETOOTH APARTMENTS |
The Seasons at Horsetooth Apartments Mortgage Loan documents also require ongoing monthly reserve for real estate taxes in an amount equal to one-twelfth of the amount that the lender estimates will be necessary to pay taxes over the then succeeding 12-month period (currently estimated to be $14,902) and for insurance premiums in an amount equal to one-twelfth of the amount that the lender estimates will be necessary to pay insurance premiums over the then succeeding 12-month period (currently estimated to be $3,524). Ongoing monthly deposits are required for replacement reserves in an amount equal to $19,089 from the October 2016 payment date through the September 2019 payment date and $5,200 from the October 2019 payment date through the maturity date of the Seasons at Horsetooth Apartments Mortgage Loan.
Lockbox and Cash Management.The Seasons at Horsetooth Apartments Mortgage Loan requires a lender-controlled lockbox account, which is already in place. The borrower and the property managers are required to deposit all rents and any other income of the Seasons at Horsetooth Apartments Property into such lockbox account within two business days of receipt. Prior to the occurrence of a Cash Sweep Event (as defined below), all excess cash flow will be disbursed to the borrower. During a Cash Sweep Event, all excess cash flow with be swept to a lender-controlled subaccount.
A “Cash Sweep Event” will commence (i) if an event of default has occurred or is continuing; (ii) upon the occurrence of a bankruptcy action of the borrower, the guarantor or the property managers; (iii) upon any date the amortizing debt service coverage ratio, based on the trailing 12-month period immediately preceding the date of such determination, is less than 1.10x; or (iv) upon date the debt yield ratio as calculated by the lender is less than 8.0%. A Cash Sweep Event will end with respect to clause (i), upon the cure of such event of default; with respect to clause (ii), when such bankruptcy petition has been discharged, stayed, or dismissed within 30 days for a borrower or guarantor bankruptcy and within 120 days for a property manager bankruptcy, among other conditions; with respect to clause (iii), once the amortizing debt service coverage ratio based on the trailing 12-month period immediately preceding the date of determination is greater than 1.20x for two consecutive calendar quarters, among other conditions; and with respect to clause (iv), once the debt yield as calculated by the lender is greater than 9.5% for two consecutive calendar quarters.
Property Management.The Seasons at Horsetooth Apartments Property is managed by Rainer Realty Management, LLC and Echelon Property Group LLC.
Assumption.The borrower has the right to transfer the Seasons at Horsetooth Apartments Property provided that no event of default has occurred and is continuing and certain other conditions are satisfied, including (i) the lender’s reasonable determination that the proposed transferee and guarantor satisfy the lender’s credit review and underwriting standards, taking into consideration transferee experience, financial strength and general business standing; (ii) execution of a recourse guaranty and an environmental indemnity by an affiliate of the transferee; and (iii) if requested by the lender, rating agency confirmation from Fitch, KBRA and Moody’s that such assumption will not result in a downgrade, withdrawal or qualification of the respective ratings assigned to the Series 2016-LC24 Certificates.
Partial Release.Not permitted.
Real Estate Substitution.Not permitted.
Subordinate and Mezzanine Indebtedness.Not permitted.
Ground Lease.None.
Terrorism Insurance.The loan documents require that the “all risk” insurance policy required to be maintained by the borrower provides coverage for terrorism in an amount equal to the full replacement cost of the Seasons at Horsetooth Apartments Property, as well as business interruption insurance covering no less than the 12-month period following the occurrence of a casualty event, together with a 6-month extended period of indemnity.
THE INFORMATION IN THIS STRUCTURAL AND COLLATERAL TERM SHEET IS NOT COMPLETE AND MAY BE AMENDED PRIOR TO THE TIME OF SALE. THIS TERM SHEET IS NOT AN OFFER TO SELL THESE SECURITIES AND IT IS NOT A SOLICITATION OF AN OFFER TO BUY THESE SECURITIES IN ANY JURISDICTION WHERE THE OFFER OR SALE IS NOT PERMITTED.
113
| No. 11 – Hampton Inn & Suites - Boise | |||||||
| Loan Information | Property Information | ||||||
| Mortgage Loan Seller: | Wells Fargo Bank, National Association | Single Asset/Portfolio: | Single Asset | ||||
| Credit Assessment (Fitch/KBRA/Moody’s): | NR/NR/NR/NR | Property Type: | Hospitality | ||||
| Original Principal Balance: | $24,000,000 | Specific Property Type: | Limited Service | ||||
| Cut-off Date Balance: | $23,908,323 | Location: | Boise, ID | ||||
| % of Initial Pool Balance: | 2.3% | Size: | 186 rooms | ||||
| Loan Purpose: | Refinance | Cut-off Date Balance Per Room: | $128,539 | ||||
| Borrower Name: | Apple Nine SPE Boise, Inc. | Year Built/Renovated: | 2007/NAP | ||||
| Sponsor(1): | Apple Hospitality REIT, Inc. | Title Vesting: | Fee | ||||
| Mortgage Rate: | 4.366% | Property Manager: | Raymond Management Company, Inc. | ||||
| Note Date: | May 26, 2016 | 4thMost Recent Occupancy (As of): | 77.4% (12/31/2012) | ||||
| Anticipated Repayment Date: | NAP | 3rdMost Recent Occupancy (As of): | 79.9% (12/31/2013) | ||||
| Maturity Date: | June 11, 2026 | 2ndMost Recent Occupancy (As of): | 74.5% (12/31/2014) | ||||
| IO Period: | 0 months | Most Recent Occupancy (As of): | 79.2% (12/31/2015) | ||||
| Loan Term (Original): | 120 months | Current Occupancy (As of): | 79.8% (6/30/2016) | ||||
| Seasoning: | 3 months | ||||||
| Amortization Term (Original): | 360 months | Underwriting and Financial Information: | |||||
| Loan Amortization Type: | Amortizing Balloon | ||||||
| Interest Accrual Method: | Actual/360 | 4thMost Recent NOI (As of): | $3,147,167 (12/31/2013) | ||||
| Call Protection: | L(27),D(89),O(4) | 3rdMost Recent NOI (As of)(4): | $3,301,794 (12/31/2014) | ||||
| Lockbox Type: | Springing | 2ndMost Recent NOI (As of)(4): | $3,756,734 (12/31/2015) | ||||
| Additional Debt: | None | Most Recent NOI (As of): | $4,013,835 (TTM 6/30/2016) | ||||
| Additional Debt Type: | NAP | ||||||
| U/W Revenues: | $8,239,433 | ||||||
| U/W Expenses: | $4,518,349 | ||||||
| U/W NOI: | $3,721,084 | ||||||
| U/W NCF: | $3,391,507 | ||||||
| U/W NOI DSCR: | 2.59x | ||||||
| U/W NCF DSCR: | 2.36x | ||||||
| Escrows and Reserves: | U/W NOI Debt Yield: | 15.6% | |||||
| U/W NCF Debt Yield: | 14.2% | ||||||
| Type: | Initial | Monthly | Cap (If Any) | As-Is Appraised Value: | $40,000,000 | ||
| Taxes | $27,178 | $27,177 | NAP | As-Is Appraisal Valuation Date: | April 13, 2016 | ||
| Insurance | $0 | Springing(2) | NAP | Cut-off Date LTV Ratio: | 59.8% | ||
| FF&E Reserve | $0 | $26,758(3) | NAP | LTV Ratio at Maturity or ARD: | 48.3% | ||
| (1) | Apple Hospitality REIT, Inc. or its affiliates are involved in various lawsuits. See“Description of the Mortgage Pool—Litigation Considerations” in the Preliminary Prospectus. |
| (2) | Ongoing monthly reserves for insurance are not required so long as (i) no event of default has occurred and is continuing; (ii) Hampton Inn & Suites - Boise Property is insured via an acceptable blanket insurance policy; and (iii) the borrower provides the lender with evidence of renewal of the insurance policies and timely proof of payment of insurance premiums. |
| (3) | The borrower is required to deposit the greater of (i) the then existing FF&E Reserve Monthly Deposit or (ii) one-twelfth of 4.0% of gross revenues for the previous fiscal year through loan maturity. |
| (4) | See “Cash Flow Analysis” section. |
The Hampton Inn & Suites - Boise mortgage loan is evidenced by a single promissory note that is secured by a first mortgage encumbering the fee interest in a 186-room limited service hotel located in downtown Boise, Idaho (the “Hampton Inn & Suites - Boise Property”). The 11-story hotel was constructed in 2007, is situated on a 0.9-acre site and has 152 surface and garage parking spaces resulting in a parking ratio of 0.8 spaces per room. Since the sponsor acquired the Hampton Inn & Suites - Boise Property in 2010, there have been approximately $2.4 million ($12,903 per room) in capital improvements and renovations. The guestrooms are situated on floors five through eleven above a four-story parking garage and ground floor retail and are comprised of 67 King Guestrooms, 62 Queen/Queen Guestrooms, 38 King Suites, 6 Jacuzzi King Suites and 13 King Whirlpool Suites. Amenities at the Hampton Inn & Suites - Boise Property include an indoor saltwater swimming pool and whirlpool, a 24-hour fitness room, business center, free airport shuttle service, complimentary hot breakfast buffet and free Wi-Fi in the lobby areas and all guest rooms. The Hampton Inn & Suites - Boise Property has four separate meeting rooms, totaling 2,894 square feet, with the largest room accommodating up to 100 people. The Hampton Inn & Suites - Boise Property benefits from its downtown location within two blocks south of The Grove Plaza (one of Boise’s leading outdoor venues, hosting over 60 events each year) and the Boise Centre (Boise’s convention center that offers 86,000 square feet of flexible meeting and event space) and within six blocks of state government offices at the Idaho State Capitol Building. According to the appraisal, the estimated 2015 market mix of the Hampton Inn & Suites - Boise Property was 50% commercial, 30% leisure and 20% meeting and group. The franchise agreement with Hilton Worldwide expires in April 2030.
THE INFORMATION IN THIS STRUCTURAL AND COLLATERAL TERM SHEET IS NOT COMPLETE AND MAY BE AMENDED PRIOR TO THE TIME OF SALE. THIS TERM SHEET IS NOT AN OFFER TO SELL THESE SECURITIES AND IT IS NOT A SOLICITATION OF AN OFFER TO BUY THESE SECURITIES IN ANY JURISDICTION WHERE THE OFFER OR SALE IS NOT PERMITTED.
114
| HAMPTON INN & SUITES - BOISE |
The Hampton Inn & Suites - Boise Property is comprised of one hotel condominium unit within a four-unit condominium property. The Hampton Inn & Suites - Boise Mortgage Loan borrowers have a combined 62.5% voting interest in the master association.
Sources and Uses
| Sources | Uses | |||||||||
| Original loan amount | $24,000,000 | 100.0 | % | Loan payoff(1) | $0 | 0.0 | % | |||
| Reserves | 27,178 | 0.1 | ||||||||
| Closing costs | 337,322 | 1.4 | ||||||||
| Return of equity | 23,635,500 | 98.5 | ||||||||
| Total Sources | $24,000,000 | 100.0 | % | Total Uses | $24,000,000 | 100.0 | % |
| (1) | The Hampton Inn & Suites - Boise Property was previously unencumbered. |
Subject and Market Historical Occupancy, ADR and RevPAR(1)
| Competitive Set | Hampton Inn & Suites - Boise | Penetration Factor | |||||||||||||||||
| Year | Occupancy | ADR | RevPAR | Occupancy | ADR | RevPAR | Occupancy | ADR | RevPAR | ||||||||||
| TTM 7/31/2016 | 76.3% | $115.45 | $88.07 | 79.3% | $151.27 | $119.96 | 104.0% | 131.0% | 136.2% | ||||||||||
| TTM 7/31/2015 | 73.9% | $107.01 | $79.13 | 76.5% | $140.19 | $107.26 | 103.5% | 131.0% | 135.6% | ||||||||||
| TTM 7/31/2014 | 67.9% | $101.20 | $68.72 | 78.1% | $131.00 | $102.28 | 115.0% | 129.5% | 148.8% | ||||||||||
| (1) | Information obtained from a third party hospitality report dated August 18, 2016. The competitive set includes the following hotels: Holiday Inn Express Boise University Area, Springhill Suites Boise ParkCenter, Hampton Inn Boise Airport, Courtyard Boise Downtown, The Grove Hotel, Hilton Garden Inn Boise Spectrum and Holiday Inn Boise Airport. |
Operating History and Underwritten Net Cash Flow.The following table presents certain information relating to the historical operating performance and underwritten net cash flow at the Hampton Inn & Suites - Boise Property:
Cash Flow Analysis
| 2013 | 2014(1) | 2015(1) | TTM 6/30/2016 | U/W | % of U/W Total Revenue | U/W $ per Room | |||||||||
| Occupancy | 79.9% | 74.4% | 79.2% | 79.8% | 76.0% | ||||||||||
| ADR | $122.71 | $135.54 | $146.08 | $152.59 | $152.59 | ||||||||||
| RevPAR | $98.03 | $100.88 | $115.70 | $121.73 | $115.97 | ||||||||||
| Room Revenue | $6,655,340 | $6,849,015 | $7,854,809 | $8,286,993 | $7,894,665 | 95.8% | $42,444 | ||||||||
| F&B Revenue | 0 | 0 | 0 | 0 | 0 | 0.0 | 0 | ||||||||
| Parking Revenue | 0 | 0 | 0 | 0 | 0 | 0.0 | 0 | ||||||||
| Other Revenue | 297,439 | 320,494 | 351,327 | 344,768 | 344,768 | 4.2 | 1,854 | ||||||||
| Total Revenue | $6,952,779 | $7,169,509 | $8,206,136 | $8,631,761 | $8,239,433 | 100.0% | $44,298 | ||||||||
| Total Department Expenses | 1,361,568 | 1,410,459 | 1,581,591 | 1,640,936 | 1,610,175 | 19.5 | 8,657 | ||||||||
| Gross Operating Profit | $5,591,211 | $5,759,050 | $6,624,545 | $6,990,825 | $6,629,258 | 80.5% | $35,641 | ||||||||
| Total Undistributed Expenses | 2,145,535 | 2,150,414 | 2,513,014 | 2,605,553 | 2,536,737 | 30.8 | 13,638 | ||||||||
| Profit Before Fixed Charges | $3,445,676 | $3,608,636 | $4,111,531 | $4,385,272 | $4,092,521 | 49.7% | $22,003 | ||||||||
| Total Fixed Charges | 298,509 | 306,842 | 354,798 | 371,437 | 371,437 | 4.5 | 1,997 | ||||||||
| Net Operating Income | $3,147,167 | $3,301,794 | $3,756,734 | $4,013,835 | $3,721,084 | 45.2% | $20,006 | ||||||||
| FF&E | 0 | 0 | 0 | 0 | 329,577 | 4.0 | 1,772 | ||||||||
| Net Cash Flow | $3,147,167 | $3,301,794 | $3,756,734 | $4,013,835 | $3,391,507 | 41.2% | $18,234 | ||||||||
| NOI DSCR | 2.19x | 2.30x | 2.62x | 2.79x | 2.59x | ||||||||||
| NCF DSCR | 2.19x | 2.30x | 2.62x | 2.79x | 2.36x | ||||||||||
| NOI DY | 13.2% | 13.8% | 15.7% | 16.8% | 15.6% | ||||||||||
| NCF DY | 13.2% | 13.8% | 15.7% | 16.8% | 14.2% | ||||||||||
| (1) | The increase in Net Operating Income from 2014 to 2015 was due to an increase in both occupancy and ADR for the Hampton Inn & Suites - Boise Property, which resulted in a RevPAR increase from 2014 to 2015 of 14.7%. |
THE INFORMATION IN THIS STRUCTURAL AND COLLATERAL TERM SHEET IS NOT COMPLETE AND MAY BE AMENDED PRIOR TO THE TIME OF SALE. THIS TERM SHEET IS NOT AN OFFER TO SELL THESE SECURITIES AND IT IS NOT A SOLICITATION OF AN OFFER TO BUY THESE SECURITIES IN ANY JURISDICTION WHERE THE OFFER OR SALE IS NOT PERMITTED.
115
| No. 12 – So Cal Self Storage – Hollywood | ||||||
| Loan Information | Property Information | |||||
| Mortgage Loan Seller: | Wells Fargo Bank, National Association | Single Asset/Portfolio: | Single Asset | |||
| Credit Assessment (Fitch/KBRA/Moody’s): | NR/NR/NR | Property Type: | Self Storage | |||
| Original Principal Balance: | $23,000,000 | Specific Property Type: | Self Storage | |||
| Cut-off Date Balance: | $23,000,000 | Location: | Los Angeles, CA | |||
| % of Initial Pool Balance: | 2.2% | Size: | 84,282 SF | |||
| Loan Purpose: | Refinance | Cut-off Date Balance Per SF: | $272.89 | |||
| Borrower Name: | SoCal Self Storage – Hollywood & Bronson, LLC | Year Built/Renovated: | 2004/NAP | |||
| Sponsors(1): | Various | Title Vesting: | Fee | |||
| Mortgage Rate: | 4.514% | Property Manager: | Self-managed | |||
| Note Date: | May 31, 2016 | 4thMost Recent Occupancy (As of): | 89.6% (12/31/2012) | |||
| Anticipated Repayment Date: | NAP | 3rdMost Recent Occupancy (As of): | 91.3% (12/31/2013) | |||
| Maturity Date: | June 11, 2026 | 2ndMost Recent Occupancy (As of): | 93.9% (12/31/2014) | |||
| IO Period: | 120 months | Most Recent Occupancy (As of): | 90.6% (12/31/2015) | |||
| Loan Term (Original): | 120 months | Current Occupancy (As of): | 92.3% (8/2/2016) | |||
| Seasoning: | 3 months | |||||
| Amortization Term (Original): | NAP | Underwriting and Financial Information: | ||||
| Loan Amortization Type: | Interest-only, Balloon | |||||
| Interest Accrual Method: | Actual/360 | 4thMost Recent NOI (As of): | $2,020,452 (12/31/2013) | |||
| Call Protection: | L(36),GRTR 1% or YM(80),O(4) | 3rdMost Recent NOI (As of): | $2,172,266 (12/31/2014) | |||
| Lockbox Type: | None | 2ndMost Recent NOI (As of): | $2,437,427 (12/31/2015) | |||
| Additional Debt: | None | Most Recent NOI (As of): | $2,623,321 (TTM 6/30/2016) | |||
| Additional Debt Type: | NAP | |||||
| U/W Revenues: | $3,554,937 | |||||
| U/W Expenses: | $1,039,695 | |||||
| U/W NOI: | $2,515,243 | |||||
| U/W NCF: | $2,493,826 | |||||
| U/W NOI DSCR: | 2.39x | |||||
| U/W NCF DSCR: | 2.37x | |||||
| Escrows and Reserves: | U/W NOI Debt Yield: | 10.9% | ||||
| U/W NCF Debt Yield: | 10.8% | |||||
| Type: | Initial | Monthly | Cap (If Any) | As-Is Appraised Value: | $45,000,000 | |
| Taxes | $52,758 | $17,586 | NAP | As-Is Appraisal Valuation Date: | March 20, 2016 | |
| Insurance(2) | $0 | Springing | NAP | Cut-off Date LTV Ratio: | 51.1% | |
| Replacement Reserves(3) | $0 | Springing | NAP | LTV Ratio at Maturity or ARD: | 51.1% | |
| (1) | The Sponsors of the So Cal Self Storage – Hollywood mortgage loan are Dennis L. Geiler individually and as trustee of the Dennis L. Geiler Family Trust and William V. Bromiley individually and as trustee of the Edith Revocable Trust. |
| (2) | Ongoing monthly reserves for insurance are not required so long as (i) no event of default has occurred and is continuing; (ii) So Cal Self Storage – Hollywood Property is insured via an acceptable blanket insurance policy; and (iii) the borrower provides the lender with evidence of renewal of the insurance policies and timely proof of payment of insurance premiums. |
| (3) | Ongoing monthly reserves for replacements in the amount of $1,054 are not required so long as (i) no event of default has occurred and is continuing; and (ii) the lender determines the borrower is properly maintaining the So Cal Self Storage – Hollywood Property. |
The So Cal Self Storage - Hollywood mortgage loan is evidenced by a single promissory note secured by a first mortgage encumbering the borrower’s fee interest in a 84,282 square foot self-storage facility located in Los Angeles, California (the “So Cal Self Storage - Hollywood Property”), approximately 6.0 miles northwest of the Los Angeles central business district. Constructed in 2004, the So Cal Self Storage - Hollywood Property is situated on a 0.9-acre site and contains 1,007 units. The So Cal Self Storage Property consists of 97.9% climate controlled units and 2.1% non-climate controlled units ranging in size from 10 square feet to 400 square feet. Amenities at the So Cal Self Storage – Hollywood Property include individually alarmed units, surveillance cameras, electronic gate access, and an on-site leasing and manager’s office. According to the appraisal, the 2016 estimated population within a one-, three- and five-mile radius of the So Cal Self Storage - Hollywood Property was 65,875, 369,045 and 996,367, respectively; while the 2016 estimated average household income within the same radii was $55,028, $72,191 and $72,541, respectively. As of August 2, 2016 the So Cal Self Storage - Hollywood Property was 92.3% occupied.
THE INFORMATION IN THIS STRUCTURAL AND COLLATERAL TERM SHEET IS NOT COMPLETE AND MAY BE AMENDED PRIOR TO THE TIME OF SALE. THIS TERM SHEET IS NOT AN OFFER TO SELL THESE SECURITIES AND IT IS NOT A SOLICITATION OF AN OFFER TO BUY THESE SECURITIES IN ANY JURISDICTION WHERE THE OFFER OR SALE IS NOT PERMITTED.
116
| SO CAL SELF STORAGE - HOLLYWOOD |
Sources and Uses
| Sources | Uses | |||||||
| Original loan amount | $23,000,000 | 100.0 | % | Loan payoff(1) | $16,288,516 | 70.8 | % | |
| Reserves | 52,758 | 0.2 | ||||||
| Closing costs | 155,660 | 0.7 | ||||||
| Return of equity | 6,503,066 | 28.3 | ||||||
| Total Sources | $23,000,000 | 100.0 | % | Total Uses | $23,000,000 | 100.0 | % |
| (1) | The So Cal Self Storage - Hollywood Property was previously securitized in the BACM 2007-1 transaction. |
The following table presents historical occupancy percentages at the So Cal Self Storage – Hollywood Property:
Historical Occupancy
| 12/31/2012(1) | 12/31/2013(1) | 12/31/2014(1) | 12/31/2015(1) | 8/2/2016(2) | ||||
| 89.6% | 91.3% | 93.9% | 90.6% | 92.3% |
| (1) | Information obtained from the borrower. |
| (2) | Information obtained from the underwritten rent roll. |
Operating History and Underwritten Net Cash Flow. The following table presents certain information relating to the historical operating performance and the underwritten net cash flow at the So Cal Self Storage Property:
Cash Flow Analysis
| 2013 | 2014 | 2015 | TTM 6/30/2016 | U/W | % of U/W Effective Gross Income | U/W $ per SF | |||||||||
| Base Rent | 2,489,149 | $2,686,293 | $2,922,168 | $3,057,863 | $3,213,138 | 90.4% | $38.12 | ||||||||
| Grossed Up Vacant Space | 0 | 0 | 0 | 0 | 311,268 | 8.8 | 3.69 | ||||||||
| Other Income | 399,821 | 351,391 | 420,958 | 472,109 | 497,074 | 14.0 | 5.90 | ||||||||
| Less Vacancy & Credit Loss | 0 | 0 | 0 | 0 | (466,543)(1) | (13.1) | (5.54) | ||||||||
| Effective Gross Income | $2,888,970 | $3,037,684 | $3,343,126 | $3,529,972 | $3,554,937 | 100.0% | $42.18 | ||||||||
| Total Operating Expenses | $868,519 | $865,418 | $905,698 | $906,651 | $1,039,695 | 29.2% | $12.34 | ||||||||
| Net Operating Income | $2,020,452 | $2,172,266(2) | $2,437,427(2) | $2,623,321 | $2,515,243 | 70.8% | $29.84 | ||||||||
| Capital Expenditures | 0 | 0 | 0 | 0 | 21,417 | 0.6 | 0.25 | ||||||||
| Net Cash Flow | $2,020,452 | $2,172,266 | $2,437,427 | $2,623,321 | $2,493,826 | 70.2% | $29.59 | ||||||||
| NOI DSCR | 1.92x | 2.06x | 2.32x | 2.49x | 2.39x | ||||||||||
| NCF DSCR | 1.92x | 2.06x | 2.32x | 2.49x | 2.37x | ||||||||||
| NOI DY | 8.8% | 9.4% | 10.6% | 11.4% | 10.9% | ||||||||||
| NCF DY | 8.8% | 9.4% | 10.6% | 11.4% | 10.8% |
| (1) | The underwritten economic vacancy is 13.2%. As of August 2, 2016, the So Cal Self Storage – Hollywood Property was 92.3% physically occupied. |
| (2) | The increase in Net Operating Income from 2014 to 2015 was due to an increase in contract rents and the execution of a billboard lease that commenced in October 2015. |
The following table presents certain information relating to comparable self storage properties for So Cal Self Storage - Hollywood Property:
Competitive Set(1)
| Location | Distance to Subject | Total GLA (SF) | Number of Units | 5x5 Average Monthly Rent / Unit | 5x10 Average Monthly Rent / Unit | 10x10 Average Monthly Rent / Unit | Total Occupancy | |
| So Cal Self Storage – Hollywood (Subject) | Los Angeles | NAP | 84,282 | 1,007 | $143 | $208 | $298 | 92.3% |
| Extra Space Self Storage | Hollywood | 0.7 miles | 47,872 | 783 | $145 | $172 | $306 | 98.0% |
| Hollywood Bowl Self-Storage | Los Angeles | 0.6 miles | 27,389 | 452 | $85 | $125 | $220 | 99.0% |
| Storquest Self Storage | Los Angeles | 1.2 miles | 34,248 | 537 | $126 | $163 | $261 | 93.0% |
| Extra Space Storage | Los Angeles | 1.0 mile | 45,000 | 510 | $141 | $237 | $372 | 97.0% |
| Public Storage – Willoughby | Los Angeles | 1.7 miles | 56,250 | 434 | NAV | $205 | $275 | 98.0% |
| Public Storage | Los Angeles | 2.1 miles | 102,630 | 1,270 | $142 | $191 | NAV | 93.0% |
| (1) | Information obtained from the appraisal and the underwritten rent roll. |
THE INFORMATION IN THIS STRUCTURAL AND COLLATERAL TERM SHEET IS NOT COMPLETE AND MAY BE AMENDED PRIOR TO THE TIME OF SALE. THIS TERM SHEET IS NOT AN OFFER TO SELL THESE SECURITIES AND IT IS NOT A SOLICITATION OF AN OFFER TO BUY THESE SECURITIES IN ANY JURISDICTION WHERE THE OFFER OR SALE IS NOT PERMITTED.
117
| No. 13 – Fox Pointe Apartments | ||||||||
| Loan Information | Property Information | |||||||
| Mortgage Loan Seller: | Rialto Mortgage Finance, LLC | Single Asset/Portfolio: | Single Asset | |||||
| Credit Assessment (Fitch/KBRA/Moody’s): | NR/NR/NR | Property Type: | Multifamily | |||||
| Original Principal Balance: | $21,970,500 | Specific Property Type: | Garden | |||||
| Cut-off Date Balance: | $21,970,500 | Location: | Houston, TX | |||||
| % of Initial Pool Balance: | 2.1% | Size: | 488 Units | |||||
| Loan Purpose: | Refinance | Cut-off Date Balance Per Unit: | $45,022 | |||||
| Borrower Name: | Guardian FP, LLC | Year Built/Renovated: | 1984/NAP | |||||
| Sponsor(1): | Trey C. Stone | Title Vesting: | Fee | |||||
| Mortgage Rate: | 4.400% | Property Manager: | Self-managed | |||||
| Note Date: | July 20, 2016 | 4th Most Recent Occupancy (As of): | 92.0% (12/31/2012) | |||||
| Anticipated Repayment Date: | NAP | 3rd Most Recent Occupancy (As of): | 95.0% (12/31/2013) | |||||
| Maturity Date: | August 6, 2026 | 2nd Most Recent Occupancy (As of): | 97.0% (12/31/2014) | |||||
| IO Period: | 36 months | Most Recent Occupancy (As of): | 97.0% (12/31/2015) | |||||
| Loan Term (Original): | 120 months | Current Occupancy (As of): | 96.1% (7/19/2016) | |||||
| Seasoning: | 1 month | |||||||
| Amortization Term (Original): | 360 months | Underwriting and Financial Information: | ||||||
| Loan Amortization Type: | Interest-only, Amortizing Balloon | |||||||
| Interest Accrual Method: | Actual/360 | 4thMost Recent NOI (As of): | $1,600,998 (12/31/2013) | |||||
| Call Protection: | L(25),D(91),O(4) | 3rdMost Recent NOI (As of): | $1,924,495 (12/31/2014) | |||||
| Lockbox Type: | Springing | 2ndMost Recent NOI (As of): | $2,317,845 (12/31/2015) | |||||
| Additional Debt: | None | Most Recent NOI (As of): | $2,380,218 (TTM 6/30/2016) | |||||
| Additional Debt Type: | NAP | |||||||
| U/W Revenues: | $4,430,869 | |||||||
| U/W Expenses: | $2,158,449 | |||||||
| U/W NOI: | $2,272,419 | |||||||
| U/W NCF: | $2,150,419 | |||||||
| U/W NOI DSCR: | 1.72x | |||||||
| Escrows and Reserves: | U/W NCF DSCR: | 1.63x | ||||||
| U/W NOI Debt Yield: | 10.3% | |||||||
| Type: | Initial | Monthly | Cap (If Any) | U/W NCF Debt Yield: | 9.8% | |||
| Taxes | $413,544 | $49,231 | NAP | As-Is Appraised Value: | $29,670,000 | |||
| Insurance | $102,991 | $16,348 | NAP | As-Is Appraisal Valuation Date: | June 7, 2016 | |||
| Replacement Reserves | $0 | $10,167 | NAP | Cut-off Date LTV Ratio: | 74.0% | |||
| Deferred Maintenance | $53,138 | $0 | NAP | LTV Ratio at Maturity or ARD: | 64.7% | |||
| (1) | Trey C. Stone is also the guarantor of certain non-recourse carveouts under the mortgage loan identified on Annex A-1 to the Preliminary Prospectus as La Plaza Apartments. Mr. Stone was involved in a past bankruptcy filing. See “Description of the Mortgage Pool – Loan Purpose; Default History, Bankruptcy Issues and Other Proceedings”in the Preliminary Prospectus. |
The Fox Pointe Apartments mortgage loan is evidenced by a single promissory note that is secured by a first mortgage encumbering a 24 building, 488-unit garden-style multifamily property located in Houston, Texas (the “Fox Pointe Apartments Property”), approximately 19.5 miles southwest of the Houston central business district. The Fox Pointe Apartments Property was constructed in 1984 and is situated on 15.7 acres. The 24 buildings are comprised of 22 two and three-story apartment buildings,a single-story clubhouse/leasing office and a single-story fitness center. Community amenities include a clubhouse/leasing office, fitness center, two swimming pools, controlled access gates, two laundry facilities, a playground and limited covered parking. Unit amenities include fully equipped kitchens, ceiling fans, fireplace, washer/dryer connections, and patios/balconies. Since acquisition in 2007, the borrower has invested approximately $2.6 million ($5,392 per unit) in capital improvements including building improvements, HVAC replacement, apartment interior improvements, carpet replacement, exterior improvements, and common area improvements. The Fox Pointe Apartments Property features 693 parking spaces, resulting in a parking ratio of 1.4 spaces per unit.
The Fox Pointe Apartments Property is situated along Pavilion Point at the intersection of Route 6 (locally known as Addicks-Howell Road). Route 6 is a north/south surface street connecting to Westpark Tollway, Interstate 10, and Interstate 69. The neighborhood surrounding the Fox Pointe Apartments Property consists of commercial and residential development. Typical commercial developments within the area include neighborhood and community shopping centers, garden apartment projects, offices, restaurants, theatres and various freestanding retail properties. Retailers in the area include Dillard’s, Sears, Macy’s, Burlington Coat Factory, Floor & Décor, Goodwill, and The Home Depot. The Energy Corridor is located approximately five miles north of the Fox Pointe Apartments Property, and is home to more than 300 multi-national, national and local energy companies. According to a third party market research report, the 2016 estimated population within a one-, three- and five-mile radius of the Fox Pointe Apartments Property is 20,732, 185,214 and 387,464, respectively; the 2016 estimated average household income within the same radii is $67,779, $68,837 and $76,151, respectively.
THE INFORMATION IN THIS STRUCTURAL AND COLLATERAL TERM SHEET IS NOT COMPLETE AND MAY BE AMENDED PRIOR TO THE TIME OF SALE. THIS TERM SHEET IS NOT AN OFFER TO SELL THESE SECURITIES AND IT IS NOT A SOLICITATION OF AN OFFER TO BUY THESE SECURITIES IN ANY JURISDICTION WHERE THE OFFER OR SALE IS NOT PERMITTED.
118
FOX POINTE APARTMENTS
Sources and Uses
| Sources | Uses | |||||||
| Original loan amount | $21,970,500 | 100.0% | Loan payoff | $16,552,397 | 75.3% | |||
| Reserves | 569,672 | 2.6 | ||||||
| Closing costs | 391,900 | 1.8 | ||||||
| Return of equity | 4,456,531 | 20.3 | ||||||
| Total Sources | $21,970,500 | 100.0% | Total Uses | $21,970,500 | 100.0% |
The following table presents certain information relating to the unit mix of the Fox Pointe Apartments Property:
Apartment Unit Summary(1)
| Unit Type | No. of Units | % of Total Units | Average Unit Size (SF) | Average Monthly Rent per Unit |
| One Bedroom / One Bath - A | 144 | 29.5% | 718 | $638 |
| One Bedroom / One Bath - B | 96 | 19.7% | 827 | $673 |
| One Bedroom / One Bath - B3 | 48 | 9.8% | 827 | $666 |
| One Bedroom / One Bath - D1 | 32 | 6.6% | 876 | $778 |
| One Bedroom / One Bath - D3 | 16 | 3.3% | 876 | $765 |
| One Bedroom / One Bath - C | 24 | 4.9% | 1,072 | $800 |
| Two Bedroom / Two Bath - E3 | 32 | 6.6% | 1,040 | $878 |
| Two Bedroom / Two Bath - E | 64 | 13.1% | 1,041 | $890 |
| Two Bedroom / Two Bath - F | 32 | 6.6% | 1,042 | $899 |
| Total/Weighted Average | 488 | 100.0% | 868 | $735 |
| (1) | Information obtained from the underwritten rent roll. |
The following table presents historical occupancy percentages at the Fox Pointe Apartments Property:
Historical Occupancy
12/31/2012(1) | 12/31/2013(1) | 12/31/2014(1) | 12/31/2015(1) | 7/19/2016(2) |
| 92.0% | 95.0% | 97.0% | 97.0% | 96.1% |
| (1) | Information obtained from the borrower. |
| (2) | Information obtained from the underwritten rent roll. |
Operating History and Underwritten Net Cash Flow.The following table presents certain information relating to the historical operating performance and underwritten net cash flow at the Fox Pointe Apartments Property:
Cash Flow Analysis
| 2013 | 2014 | 2015 | TTM 6/30/2016 | U/W | % of U/W Effective Gross Income | U/W $ per Unit | ||||||||
| Base Rent | $3,700,397 | $3,892,883 | $4,077,964 | $4,174,355 | $4,132,188 | 93.3% | $8,468 | |||||||
| Grossed Up Vacant Space | 0 | 0 | 0 | 0 | 182,580 | 4.1 | 374 | |||||||
| Concessions | (81,526) | (69,485) | (18,104) | (6,120) | (11,475) | (0.3) | (24) | |||||||
| Other Income(1) | 314,958 | 323,410 | 346,753 | 364,070 | 364,070 | 8.2 | 746 | |||||||
| Less Vacancy & Credit Loss | (277,547) | (205,226) | (166,027) | (171,739) | (236,494)(2) | (5.3) | (485) | |||||||
| Effective Gross Income | $3,656,281 | $3,941,583 | $4,240,586 | $4,360,567 | $4,430,869 | 100.0% | $9,080 | |||||||
| Total Operating Expenses | $2,055,283 | $2,017,087 | $1,922,741 | $1,980,349 | $2,158,449 | 48.7% | $4,423 | |||||||
| Net Operating Income | $1,600,998 | $1,924,495 | $2,317,845 | $2,380,218 | $2,272,419 | 51.3% | $4,657 | |||||||
| Capital Expenditures | 0 | 0 | 0 | 0 | 122,000 | 2.8 | 250 | |||||||
| Net Cash Flow | $1,600,998 | $1,924,495 | $2,317,845 | $2,380,218 | $2,150,419 | 48.5% | $4,407 | |||||||
| NOI DSCR | 1.21x | 1.46x | 1.76x | 1.80x | 1.72x | |||||||||
| NCF DSCR | 1.21x | 1.46x | 1.76x | 1.80x | 1.63x | |||||||||
| NOI DY | 7.3% | 8.8% | 10.5% | 10.8% | 10.3% | |||||||||
| NCF DY | 7.3% | 8.8% | 10.5% | 10.8% | 9.8% |
| (1) | Other Income consists of application fees, late fees, pet fees, laundry and miscellaneous income. |
| (2) | The underwritten economic vacancy is 5.3%. The Fox Pointe Apartments Property was 96.1% physically occupied as of July 19, 2016. |
THE INFORMATION IN THIS STRUCTURAL AND COLLATERAL TERM SHEET IS NOT COMPLETE AND MAY BE AMENDED PRIOR TO THE TIME OF SALE. THIS TERM SHEET IS NOT AN OFFER TO SELL THESE SECURITIES AND IT IS NOT A SOLICITATION OF AN OFFER TO BUY THESE SECURITIES IN ANY JURISDICTION WHERE THE OFFER OR SALE IS NOT PERMITTED.
119
FOX POINTE APARTMENTS
The following table presents certain information relating to comparable multifamily properties for the Fox Pointe Apartments Property:
Competitive Set(1)
| Average Rent (per unit) | ||||||||||
| Location | Distance to Subject | Property Type | Number of Units |
Studio | 1 BR | 2 BR | 3 BR | Overall Average Rent PSF | Total Occupancy | |
| Fox Pointe Apartments (Subject) | Houston, TX | -- | Garden | 488 | NAP | $638-$800 | $878-$899 | NAP | $0.85 | 96.1% |
| Woodbridge Crossing | Houston, TX | 0.5 miles | Garden | 384 | NAP | $625-$720 | $840-$890 | $1,090-$1,160 | $0.89 | 94.0% |
| EL Sol Del Rio | Houston, TX | 1.3 miles | Garden | 424 | NAP | $604-$788 | $862-$1,107 | NAP | $1.02 | 94.0% |
| Falls of West Oaks | Houston, TX | 1.5 miles | Garden | 288 | NAP | $655-$735 | $845-$950 | NAP | $1.03 | 98.0% |
| Hartford Park | Houston, TX | 3.2 miles | Garden | 326 | NAP | $705-$775 | $845-$865 | NAP | $0.95 | 94.0% |
| Miramar Apartments | Houston, TX | 2.6 miles | Garden | 143 | NAP | $683-$800 | $958-$985 | NAP | $1.02 | 95.0% |
| (1) | Information obtained from the appraisal and the underwritten rent roll. |
THE INFORMATION IN THIS STRUCTURAL AND COLLATERAL TERM SHEET IS NOT COMPLETE AND MAY BE AMENDED PRIOR TO THE TIME OF SALE. THIS TERM SHEET IS NOT AN OFFER TO SELL THESE SECURITIES AND IT IS NOT A SOLICITATION OF AN OFFER TO BUY THESE SECURITIES IN ANY JURISDICTION WHERE THE OFFER OR SALE IS NOT PERMITTED.
120
(THIS PAGE INTENTIONALLY LEFT BLANK)
THE INFORMATION IN THIS STRUCTURAL AND COLLATERAL TERM SHEET IS NOT COMPLETE AND MAY BE AMENDED PRIOR TO THE TIME OF SALE. THIS TERM SHEET IS NOT AN OFFER TO SELL THESE SECURITIES AND IT IS NOT A SOLICITATION OF AN OFFER TO BUY THESE SECURITIES IN ANY JURISDICTION WHERE THE OFFER OR SALE IS NOT PERMITTED.
121
| No. 14 – FMC Corporation R&D HQ | ||||||
| Loan Information | Property Information | |||||
| Mortgage Loan Seller: | Ladder Capital Finance LLC | Single Asset/Portfolio: | Single Asset | |||
| Credit Assessment (Fitch/KBRA/Moody’s): | NR/NR/NR | Property Type: | Office | |||
| Original Principal Balance: | $21,490,000 | Specific Property Type: | Suburban | |||
| Cut-off Date Balance: | $21,490,000 | Location: | Ewing, NJ | |||
| % of Initial Pool Balance: | 2.1% | Size: | 110,765 SF | |||
| Loan Purpose: | Acquisition | Cut-off Date Balance Per SF: | $194.01 | |||
| Borrower: | LRF Ewing NJ LLC | Year Built/Renovated: | 2009/NAP | |||
| Sponsor(1): | Ladder Capital CRE Equity LLC | Title Vesting: | Fee | |||
| Mortgage Rate: | 4.330% | Property Manager: | G&E Real Estate Management Services, Inc. | |||
| Note Date: | August 4, 2016 | 4thMost Recent Occupancy (As of): | 100.0% (12/31/2012) | |||
| Anticipated Repayment Date: | August 6, 2026 | 3rdMost Recent Occupancy (As of): | 100.0% (12/31/2013) | |||
| Maturity Date: | August 6, 2030 | 2ndMost Recent Occupancy (As of): | 100.0% (12/31/2014) | |||
| IO Period: | 60 months | Most Recent Occupancy (As of): | 100.0% (12/31/2015) | |||
| Loan Term (Original): | 120 months | Current Occupancy (As of): | 100.0% (9/1/2016) | |||
| Seasoning: | 1 month | |||||
| Amortization Term (Original): | 360 months | Underwriting and Financial Information: | ||||
| Loan Amortization Type: | Interest-only, Amortizing ARD | |||||
| Interest Accrual Method: | Actual/360 | 4thMost Recent NOI(4): | NAV | |||
| Call Protection: | YM(25),YM or D(88),O(7) | 3rdMost Recent NOI (As of): | $2,113,967 (12/31/2013) | |||
| Lockbox Type: | Hard/Upfront Cash Management | 2ndMost Recent NOI (As of) | $2,202,101 (12/31/2014) | |||
| Additional Debt(2): | Yes | Most Recent NOI (As of): | $2,115,194 (12/31/2015) | |||
| Additional Debt Type(2): | Future Mezzanine | |||||
| U/W Revenues: | $3,348,801 | |||||
| U/W Expenses: | $1,453,305 | |||||
| U/W NOI: | $1,895,496 | |||||
| U/W NCF: | $1,873,343 | |||||
| U/W NOI DSCR: | 1.48x | |||||
| Escrows and Reserves: | U/W NCF DSCR: | 1.46x | ||||
| U/W NOI Debt Yield: | 8.8% | |||||
| Type: | Initial | Monthly | Cap (If Any) | U/W NCF Debt Yield: | 8.7% | |
| Taxes | $164,500 | (3) | NAP | As-Is Appraised Value: | $30,700,000 | |
| Insurance | $42,228 | $3,519 | NAP | As-Is Appraisal Valuation Date: | June 29, 2016 | |
| Replacement Reserve | $0 | $0 | NAP | Cut-off Date LTV Ratio: | 70.0% | |
| TI/LC | $250,000 | $0 | NAP | LTV Ratio at Maturity or ARD: | 63.9% | |
| (1) | The sponsor is an affiliate of the mortgage loan seller. Please see“Risk Factors-Risks Related to Conflicts of Interest-Interests and Incentives of the Originators, the Sponsors and Their Affiliates May Not Be Aligned With Your Interests” in the Preliminary Prospectus. |
| (2) | Future mezzanine debt is permitted subject to the following conditions: (i) no event of default has occurred and is continuing; (ii) execution of an intercreditor agreement in the form attached to the FMC Corporation R&D HQ mortgage loan agreement; (iii) the combined amortizing debt service coverage ratio will be equal to or greater than 1.20x; (iv) the combined loan-to-value ratio will be equal to or less than 85.0%; and (v) the mezzanine loan documents are reasonably acceptable to the lender. |
| (3) | The monthly tax escrow will be equal to one-twelfth of the estimated amount of tax payments. |
| (4) | See “Cash Flow Analysis” section. |
The FMC Corporation R&D HQ mortgage loan is evidenced by a single promissory note that is secured by a first mortgage encumbering a two-building 110,765 square foot property located in Ewing, New Jersey (the “FMC Corporation R&D HQ Property”). The FMC Corporation R&D HQ Property was built to suit for the single tenant, FMC Corporation (“FMC”), in 2009 and serves as their worldwide research and development headquarters. The FMC Corporation R&D HQ Property is 100.0% leased by FMC on a 15-year, triple-net lease, which was set to expire in August 2024. In 2015, FMC executed a lease amendment extending the lease for an additional 6 years through 2030. The new lease term commenced in August 2015 and is set to expire in July 2030. In total, approximately 55.0% of the FMC Corporation R&D HQ Property is comprised of laboratory space. FMC is a diversified chemical company, providing solutions, applications, and products for the agricultural, consumer, and industrial markets worldwide. The company operates through three segments: FMC Agricultural Solutions, FMC Health and Nutrition, and FMC Lithium. The FMC Corporation R&D HQ Property features an outdoor seating area, an onsite cafeteria, and 221 parking spaces, resulting in a parking ratio of 2.0 per 1,000 square feet of rentable area.
THE INFORMATION IN THIS STRUCTURAL AND COLLATERAL TERM SHEET IS NOT COMPLETE AND MAY BE AMENDED PRIOR TO THE TIME OF SALE. THIS TERM SHEET IS NOT AN OFFER TO SELL THESE SECURITIES AND IT IS NOT A SOLICITATION OF AN OFFER TO BUY THESE SECURITIES IN ANY JURISDICTION WHERE THE OFFER OR SALE IS NOT PERMITTED.
122
| FMC CORPORATION R&D HQ |
Sources and Uses
| Sources | Uses | |||||||||
| Original loan amount | $21,490,000 | 68.1 | % | Purchase price(1) | $30,640,000 | 97.2 | % | |||
| Sponsor contributed equity | 9,793,482 | 31.1 | Reserves | 456,728 | 1.4 | |||||
| Seller credit | 250,000 | 0.8 | Closing costs | 436,754 | 1.4 | |||||
| Total Sources | $31,533,482 | 100.0 | % | Total Uses | $31,533,482 | 100.0 | % |
| (1) | The seller of the FMC Corporation R&D HQ Property provided credits of approximately $250,000 for outstanding tenant improvements at mortgage loan closing. |
The following table presents certain information relating to the tenancy at the FMC Corporation R&D HQ Property:
Major Tenant
| Tenant Name | Credit Rating (Fitch/Moody’s/ S&P) | Tenant NRSF | % of NRSF | Annual U/W Base Rent PSF(1) | Annual U/W Base Rent(1) | % of Total Annual U/W Base Rent | Lease Expiration Date |
| Major Tenant | |||||||
| FMC | NR/Baa2/BBB | 110,765 | 100.0% | $19.01 | $2,105,753 | 100.0% | 7/31/2030 |
| Occupied Collateral Total | 110,765 | 100.0% | $19.01 | $2,105,753 | 100.0% | ||
| (1) | The Annual U/W Base Rent PSF and Annual U/W Base Rent for FMC represents the tenant’s average rent over the lease term. The tenant’s current in-place annual rent is $1,920,665 or $17.34 per square foot. |
The following table presents certain information relating to the lease rollover schedule at the FMC Corporation R&D HQ Property:
Lease Expiration Schedule(1)
Year Ending December 31, | No. of Leases Expiring | Expiring NRSF | % of Total NRSF | Cumulative Expiring NRSF | Cumulative % of Total NRSF | Annual U/W Base Rent(2) | % of Total Annual U/W Base Rent | Annual U/W Base Rent PSF(2) | |||||||||
| MTM | 0 | 0 | 0.0% | 0 | 0.0% | $0 | 0.0% | $0.00 | |||||||||
| 2016 | 0 | 0 | 0.0% | 0 | 0.0% | $0 | 0.0% | $0.00 | |||||||||
| 2017 | 0 | 0 | 0.0% | 0 | 0.0% | $0 | 0.0% | $0.00 | |||||||||
| 2018 | 0 | 0 | 0.0% | 0 | 0.0% | $0 | 0.0% | $0.00 | |||||||||
| 2019 | 0 | 0 | 0.0% | 0 | 0.0% | $0 | 0.0% | $0.00 | |||||||||
| 2020 | 0 | 0 | 0.0% | 0 | 0.0% | $0 | 0.0% | $0.00 | |||||||||
| 2021 | 0 | 0 | 0.0% | 0 | 0.0% | $0 | 0.0% | $0.00 | |||||||||
| 2022 | 0 | 0 | 0.0% | 0 | 0.0% | $0 | 0.0% | $0.00 | |||||||||
| 2023 | 0 | 0 | 0.0% | 0 | 0.0% | $0 | 0.0% | $0.00 | |||||||||
| 2024 | 0 | 0 | 0.0% | 0 | 0.0% | $0 | 0.0% | $0.00 | |||||||||
| 2025 | 0 | 0 | 0.0% | 0 | 0.0% | $0 | 0.0% | $0.00 | |||||||||
| 2026 | 0 | 0 | 0.0% | 0 | 0.0% | $0 | 0.0% | $0.00 | |||||||||
| Thereafter | 1 | 110,765 | 100.0% | 110,765 | 100.0% | $2,105,753 | 100.0% | $19.01 | |||||||||
| Vacant | 0 | 0 | 0.0% | 110,765 | 100.0% | $0 | 0.0% | $0.00 | |||||||||
| Total/Weighted | 1 | 110,765 | 100.0% | $2,105,753 | $19.01 |
| (1) | Information obtained from the underwritten rent roll. |
| (2) | The Annual U/W Base Rent PSF and Annual U/W Base Rent for FMC represents the tenant’s average rent over the lease term. The tenant’s current in-place annual rent is $1,920,665 or $17.34 per square foot. |
The following table presents historical occupancy percentages at the FMC Corporation R&D HQ Property:
Historical Occupancy
12/31/2012(1) | 12/31/2013(1) | 12/31/2014(1) | 12/31/2015(1) | 9/1/2016(2) | ||||
| 100.0% | 100.0% | 100.0% | 100.0% | 100.0% |
| (1) | Information obtained from the borrower. |
| (2) | Information obtained from the lease. |
THE INFORMATION IN THIS STRUCTURAL AND COLLATERAL TERM SHEET IS NOT COMPLETE AND MAY BE AMENDED PRIOR TO THE TIME OF SALE. THIS TERM SHEET IS NOT AN OFFER TO SELL THESE SECURITIES AND IT IS NOT A SOLICITATION OF AN OFFER TO BUY THESE SECURITIES IN ANY JURISDICTION WHERE THE OFFER OR SALE IS NOT PERMITTED.
123
| FMC CORPORATION R&D HQ |
Operating History and Underwritten Net Cash Flow. The following table presents certain information relating to the historical operating performance and the underwritten net cash flow at the FMC Corporation R&D HQ Property:
Cash Flow Analysis(1)
| 2013 | 2014 | 2015 | U/W | % of U/W Effective Gross Income | U/W $ per SF | |||||||
| Base Rent | $2,115,612 | $2,170,994 | $2,115,612 | $2,105,753(2) | 62.9% | $19.01 | ||||||
| Grossed Up Vacant Space | 0 | 0 | 0 | 0 | 0.0 | 0.00 | ||||||
| Total Reimbursables | 1,262,599 | 1,348,749 | 1,336,355 | 1,419,300 | 42.4 | 12.81 | ||||||
| Other Income | 0 | 0 | 0 | 0 | 0.0 | 0.00 | ||||||
| Less Vacancy & Credit Loss | 0 | 0 | 0 | (176,253)(3) | (5.3) | (1.59)(3) | ||||||
| Effective Gross Income | $3,378,210 | $3,519,743 | $3,451,967 | $3,348,801 | 100.0% | $30.23 | ||||||
| Total Operating Expenses | $1,264,243 | $1,317,642 | $1,336,773 | $1,453,305 | 43.4% | $13.12 | ||||||
| Net Operating Income | $2,113,967 | $2,202,101 | $2,115,194 | $1,895,496 | 56.6% | $17.11 | ||||||
| TI/LC | 0 | 0 | 0 | 0 | 0.0 | 0.00 | ||||||
| Capital Expenditures | 0 | 0 | 0 | 22,153 | 0.7 | 0.20 | ||||||
| Net Cash Flow | $2,113,967 | $2,202,101 | $2,115,194 | $1,873,343 | 55.9% | $16.91 | ||||||
| NOI DSCR | 1.65x | 1.72x | 1.65x | 1.48x | ||||||||
| NCF DSCR | 1.65x | 1.72x | 1.65x | 1.46x(2) | ||||||||
| NOI DY | 9.8% | 10.2% | 9.8% | 8.8% | ||||||||
| NCF DY | 9.8% | 10.2% | 9.8% | 8.7% |
| (1) | Historical financial statements prior to 2013 are not available as the borrower acquired the FMC Corporation R&D HQ Property in August 2016. |
| (2) | The U/W Base Rent includes straight line average rent increasesover the life of the FMC Corporation R&D HQ mortgage loan due to investment grade tenancy.The tenant’s current in-place annual rent is $1,920,665 or $17.34 per square foot which would yield a 1.33x amortizing debt service coverage ratio. |
| (3) | The underwritten economic vacancy is 5.0%. The FMC Corporation R&D HQ Property was 100.0% physically occupied as of September 1, 2016. |
The following table presents certain information relating to comparable office leases for the FMC Corporation R&D HQ Property:
Comparable Leases(1)
| Property Name/Location | Year Built/ Renovated | Stories | Total GLA (SF) | Total Occupancy | Distance from Subject | Tenant Name | Lease Date/Term | Lease Area (SF) | Annual Base Rent PSF | Lease Type |
Seven Graphics Drive Ewing, NJ | 1992/2001 | 2 | 72,307 | NAV | 1.6 miles | MicroDose Therapeutx | October 2015/ 10.5 Yrs | 22,011 | $15.14 | NNN |
1,7,9,11 Deerpark Drive South Brunswick, NJ | 1986/NAP | 1 | 201,029 | 91% | 14.5 miles | TyRx | May 2015/ 1.6 Yrs | 21,217 | $21.39 | NNN |
Cedarbrook Corporate Cranbury, NJ | 1991/NAP | 3 | 338,593 | 95% | 18.6 miles | PMV | June 2015/ 5 Yrs | 12,652 | $20.00 | NNN |
Cedarbrook Corporate Cranbury, NJ | 1991/NAP | 3 | 338,593 | 95% | 18.6 miles | Endo Pharm | March 2015/ 3 Yrs | 33,022 | $23.00 | NNN |
| (1) | Information obtained from the appraisal and a third party market research report. |
THE INFORMATION IN THIS STRUCTURAL AND COLLATERAL TERM SHEET IS NOT COMPLETE AND MAY BE AMENDED PRIOR TO THE TIME OF SALE. THIS TERM SHEET IS NOT AN OFFER TO SELL THESE SECURITIES AND IT IS NOT A SOLICITATION OF AN OFFER TO BUY THESE SECURITIES IN ANY JURISDICTION WHERE THE OFFER OR SALE IS NOT PERMITTED.
124
(THIS PAGE INTENTIONALLY LEFT BLANK)
THE INFORMATION IN THIS STRUCTURAL AND COLLATERAL TERM SHEET IS NOT COMPLETE AND MAY BE AMENDED PRIOR TO THE TIME OF SALE. THIS TERM SHEET IS NOT AN OFFER TO SELL THESE SECURITIES AND IT IS NOT A SOLICITATION OF AN OFFER TO BUY THESE SECURITIES IN ANY JURISDICTION WHERE THE OFFER OR SALE IS NOT PERMITTED.
125
| No. 15 - One & Two Corporate Plaza | |||||||
| Loan Information | Property Information | ||||||
| Mortgage Loan Seller: | Rialto Mortgage Finance, LLC | Single Asset/Portfolio: | Single Asset | ||||
| Credit Assessment (Fitch/KBRA/Moody’s): | NR/NR/NR | Property Type: | Office | ||||
| Original Principal Balance(1): | $20,000,000 | Specific Property Type: | Suburban | ||||
| Cut-off Date Balance(1): | $20,000,000 | Location: | Houston, TX | ||||
| % of Initial Pool Balance: | 1.9% | Size: | 276,025 SF | ||||
| Loan Purpose: | Refinance | Cut-off Date Balance Per Unit/SF(1): | $97.82 | ||||
| Borrower Names(2): | Various | Year Built/Renovated: | 1984/NAP | ||||
| Sponsors(3): | Nathaniel E. Williams; Rodney C. Freeman | Title Vesting: | Fee | ||||
| Mortgage Rate: | 5.060% | Property Manager: | Self-managed | ||||
| 4thMost Recent Occupancy (As of): | 80.9% (12/31/2012) | ||||||
| Note Date: | August 18, 2016 | 3rdMost Recent Occupancy (As of): | 88.5% (12/31/2013) | ||||
| Anticipated Repayment Date: | NAP | 2ndMost Recent Occupancy (As of): | 89.9% (12/31/2014) | ||||
| Maturity Date: | September 6, 2026 | Most Recent Occupancy (As of): | 89.3% (12/31/2015) | ||||
| IO Period: | 0 months | Current Occupancy (As of): | 83.0% (8/4/2016) | ||||
| Loan Term (Original): | 120 months | ||||||
| Seasoning: | 0 months | Underwriting and Financial Information: | |||||
| Amortization Term (Original): | 360 months | 4thMost Recent NOI (As of) | $2,490,333 (12/31/2013) | ||||
| Loan Amortization Type: | Amortizing Balloon | 3rdMost Recent NOI (As of): | $2,450,867 (12/31/2014) | ||||
| Interest Accrual Method: | Actual/360 | 2ndMost Recent NOI (As of): | $3,813,875 (12/31/2015) | ||||
| Call Protection(4): | L(24),D(92),O(4) | Most Recent NOI (As of): | $3,608,521 (TTM 6/30/2016) | ||||
| Lockbox Type: | Springing | ||||||
| Additional Debt: | Yes | ||||||
| Additional Debt Type: | Pari Passu | U/W Revenues: | $5,425,040 | ||||
| U/W Expenses: | $2,683,300 | ||||||
| Escrows and Reserves: | U/W NOI: | $2,741,740 | |||||
| U/W NCF: | $2,291,820 | ||||||
| Type: | Initial | Monthly | Cap (If Any) | U/W NOI DSCR(1): | 1.57x | ||
| Taxes | $789,921 | $83,590 | NAP | U/W NCF DSCR(1): | 1.31x | ||
| Insurance | $143,095 | $19,469 | NAP | U/W NOI Debt Yield(1): | 10.2% | ||
| Replacement Reserves | $0 | $4,600 | NAP | U/W NCF Debt Yield(1): | 8.5% | ||
| TI/LC Reserve | $1,500,047(5) | $32,904 | $1,579,392(6) | As-Is Appraised Value: | $43,000,000 | ||
| Deferred Maintenance | $12,813 | $0 | NAP | As-Is Appraisal Valuation Date: | July 13, 2016 | ||
| Performance Reserve(7) | $1,000,000 | $0 | NAP | Cut-off Date LTV Ratio(1): | 62.8% | ||
| Free Rent Reserve(8) | $54,816 | $0 | NAP | LTV Ratio at Maturity or ARD(1): | 51.7% | ||
| (1) | The One & Two Corporate Plaza whole loan, totaling $27,000,000, is comprised of two pari passu notes (Notes A-1 and A-2). The controlling Note A-1 had an original principal balance of $20,000,000, has an outstanding principal balance of $20,000,000 as of the Cut-off Date and will be contributed to the WFCM 2016-LC24 Trust. The non-controlling Note A-2 had an original principal balance of $7,000,000 and is held by an affiliate of Rialto Mortgage Finance, LLC. All statistical information related to balances per square foot, loan-to-value ratios, debt service coverage ratios and debt yields are based on the One & Two Corporate Plaza whole loan. See“Description of the Mortgage Pool—The Whole Loans—The Serviced Whole Loans—One & Two Corporate Plaza”in the Preliminary Prospectus. |
| (2) | The borrowers are Clear Lake Office Partners, LLC, Metro Clear Lake Office Partners, LLC, Clear Lake Office Partners II, LLC, and Metro Clear Lake Office Partners II, LLC, as tenants-in-common. |
| (3) | The sponsors disclosed involvement in a prior foreclosure. See“Description of the Mortgage Pool – Loan Purpose; Default History, Bankruptcy Issues and Other Proceedings”in the Preliminary Prospectus. |
| (4) | The lockout period will be at least 24 payments beginning with and including the first payment date of October 6, 2016. Defeasance of the One & Two Corporate Plaza whole loan is permitted after two years after the closing date of the securitization that includes the last note to be securitized. The assumed lockout period of 24 months is based on the expected WFCM 2016-LC24 Trust closing date in September 2016. |
| (5) | Initial TI/LC Reserve includes $500,047 in existing tenant improvement and leasing commission obligations with respect to the following tenants: Lockheed Martin ($199,422); Booz Allen Hamilton ($128,980); Kuraray ($122,321); North American Title ($28,000); Walker Parking ($20,000); and Aerospace ($1,324). |
| (6) | The TI/LC Reserve Cap of $1,579,392 is exclusive of the Initial TI/LC Reserve of $1,500,047. |
| (7) | The Initial Performance Reserve shall be disbursed to the borrower after the One & Two Corporate Plaza Mortgage Loan achieves a debt yield of 8.9%. |
| (8) | The Initial Free Rent Reserve of $54,816 represents four months of free rent related to Booz Allen Hamilton’s lease extension. |
The One & Two Corporate Plaza whole loan is evidenced by two promissory notes (Notes A-1 and A-2) secured by a first mortgage encumbering a suburban office property located in Houston, Texas (the “One & Two Corporate Plaza Property”). The One & Two Corporate Plaza Property consists of two adjacent office buildings containing approximately 276,025 square feet located in Houston, Texas situated on a 9.1 acre parcel. One Corporate Plaza was constructed in 1984 and consists of 114,676 net rentable area square feet. Two Corporate Plaza was constructed in 1989 and consists of 161,349 net rentable area square feet. Since acquiring the One & Two Corporate Plaza Property, the borrowers have indicated that they have invested approximately $1.2 million in capital improvements, which include exterior painting, HVAC repairs, roof replacement, renovations to the restrooms, and the installation of french drains. The One & Two Corporate Plaza Property is occupied by 38 tenants with the tenant base reflecting a diverse mix of
THE INFORMATION IN THIS STRUCTURAL AND COLLATERAL TERM SHEET IS NOT COMPLETE AND MAY BE AMENDED PRIOR TO THE TIME OF SALE. THIS TERM SHEET IS NOT AN OFFER TO SELL THESE SECURITIES AND IT IS NOT A SOLICITATION OF AN OFFER TO BUY THESE SECURITIES IN ANY JURISDICTION WHERE THE OFFER OR SALE IS NOT PERMITTED.
126
ONE & TWO CORPORATE PLAZA
industries including aerospace, financial services, legal, real estate, chemicals, construction, and energy/gas. Parking is provided via 1,036 surface parking spaces, resulting in a parking ratio of 3.8 spaces per 1,000 square feet of rentable area. As of August 4, 2016, the One & Two Corporate Plaza Property was 83.0% leased to 38 tenants.
Note Summary(1)
| Notes | Original Balance | Note Holder | Controlling Interest | |
| A-1 | $20,000,000 | WFCM 2016-LC24 | Yes | |
| A-2 | $7,000,000 | Rialto Mortgage Finance, LLC | No | |
| Total | $27,000,000 |
| (1) | The lender provides no assurances that any non-securitized pari passu note will not be split further. |
Sources and Uses
| Sources | Uses | |||||||
| Original whole loan amount | $27,000,000 | 98.8% | Loan payoff(1) | $23,253,937 | 85.1% | |||
| Sponsors’ new cash contribution | 315,971 | 1.2 | Reserves | 3,500,692 | 12.8 | |||
| Closing costs | 561,342 | 2.1 | ||||||
| Total Sources | $27,315,971 | 100.0% | Total Uses | $27,315,971 | 100.0% |
| (1) | The One & Two Corporate Plaza Property was previously securitized. One Corporate Plaza was previously securitized in the CD 2006-CD3 transaction and Two Corporate Plaza was previously securitized in the CD 2007-CD4 transaction. |
The following table presents certain information relating to the tenancies at the One & Two Corporate Plaza Property:
Major Tenants
| Tenant Name | Credit Rating (Fitch/Moody’s/ S&P)(1) | Tenant NRSF | % of NRSF | Annual U/W Base Rent PSF(2) | Annual U/W Base Rent(2) | % of Total Annual U/W Base Rent | Lease Expiration Date |
| Major Tenants | |||||||
| Lockheed Martin | BBB+/Baa1/BBB+ | 40,742 | 14.8% | $23.50 | $957,437 | 17.8% | Various(3) |
| Kuraray, Inc. | NR/NR/NR | 27,676 | 10.0% | $23.18 | $641,494 | 12.0% | Various(4) |
| Flow-Cal, Inc. | NR/NR/NR | 20,127 | 7.3% | $23.00 | $462,921 | 8.6% | 4/30/2021(5) |
| USA-Federal Aviation Admin. | NR/NR/NR | 17,958 | 6.5% | $22.50 | $404,055 | 7.5% | 12/31/2017(6) |
| Total Major Tenants | 106,503 | 38.6% | $23.15 | $2,465,907 | 46.0% | ||
| Non-Major Tenants | 122,645 | 44.4% | $23.63 | $2,898,376 | 54.0% | ||
| Occupied Collateral Total | 229,148 | 83.0% | $23.41 | $5,364,283 | 100.0% | ||
| Vacant Space | 46,877 | 17.0% | |||||
| Collateral Total | 276,025 | 100.0% | |||||
| (1) | Certain ratings are those of the parent company whether or not the parent guarantees the lease. |
| (2) | Annual U/W Base Rent PSF and Annual U/W Base Rent include contractual rent steps through August 2017 totaling $55,806. |
| (3) | Lockheed Martin occupies two suites within the One & Two Corporate Plaza Property. One suite (22,158 square feet) has an expiration date of April 30, 2020 with two, 2-year lease renewal options. The other suite (18,584 square feet) has an expiration date of December 31, 2017 with three, 1-year lease renewal options. According to the borrower, Lockheed Martin indicated that it will extend the term for the 18,584 square foot space through April 2020 upon the execution of a pending contract with NASA (anticipated to be signed in the summer of 2017). Lockheed Martin has the right to terminate its lease on the 22,158 square foot space at any time after May 2018 with at least 120 days’ notice and payment of a termination fee. |
| (4) | Kuraray, Inc. occupies two suites within the One & Two Corporate Plaza Property. One suite (25,792 square feet) has an expiration date of January 31, 2022 with no renewal options. The other suite (1,884 square feet) has an expiration date of December 31, 2017 with one, 5-year renewal option. |
| (5) | Flow-Cal, Inc. has one, 7-year renewal option remaining. Flow-Cal, Inc. has a termination right any time after April 2019 with a six month notice and termination fee. |
| (6) | USA-Federal Aviation Admin. has one, 5-year renewal option remaining. USA-Federal Aviation Administration is subject to federal government appropriations funding and may terminate its lease if there is a loss of federal funding or appropriations are insufficient to pay the lease, with at least 120 days’ prior notice and payment of a termination fee. |
THE INFORMATION IN THIS STRUCTURAL AND COLLATERAL TERM SHEET IS NOT COMPLETE AND MAY BE AMENDED PRIOR TO THE TIME OF SALE. THIS TERM SHEET IS NOT AN OFFER TO SELL THESE SECURITIES AND IT IS NOT A SOLICITATION OF AN OFFER TO BUY THESE SECURITIES IN ANY JURISDICTION WHERE THE OFFER OR SALE IS NOT PERMITTED.
127
ONE & TWO CORPORATE PLAZA
The following table presents certain information relating to the lease rollover schedule at the One & Two Corporate Plaza Property:
Lease Expiration Schedule(1)(2)
| Year Ending December 31, | No. of Leases Expiring(3) | Expiring NRSF | % of Total NRSF | Cumulative Expiring NRSF | Cumulative % of Total NRSF | Annual U/W Base Rent | % of Total Annual U/W Base Rent | Annual U/W Base Rent PSF(4) |
| MTM | 3 | 4,723 | 1.7% | 4,723 | 1.7% | $105,552 | 2.0% | $22.35 |
| 2016 | 0 | 0 | 0.0% | 4,723 | 1.7% | $0 | 0.0% | $0.00 |
| 2017 | 11 | 69,259 | 25.1% | 73,982 | 26.8% | $1,621,577 | 30.2% | $23.41 |
| 2018 | 8 | 16,061 | 5.8% | 90,043 | 32.6% | $388,570 | 7.2% | $24.19 |
| 2019 | 6 | 33,665 | 12.2% | 123,708 | 44.8% | $817,229 | 15.2% | $24.28 |
| 2020 | 5 | 37,329 | 13.5% | 161,037 | 58.3% | $873,048 | 16.3% | $23.39 |
| 2021 | 5 | 33,655 | 12.2% | 194,692 | 70.5% | $745,712 | 13.9% | $22.16 |
| 2022 | 1 | 25,792 | 9.3% | 220,484 | 79.9% | $597,220 | 11.1% | $23.16 |
| 2023 | 1 | 2,778 | 1.0% | 223,262 | 80.9% | $65,283 | 1.2% | $23.50 |
| 2024 | 0 | 0 | 0.0% | 223,262 | 80.9% | $0 | 0.0% | $0.00 |
| 2025 | 1 | 5,886 | 2.1% | 229,148 | 83.0% | $150,093 | 2.8% | $25.50 |
| 2026 | 0 | 0 | 0.0% | 229,148 | 83.0% | $0 | 0.0% | $0.00 |
| Thereafter | 0 | 0 | 0.0% | 229,148 | 83.0% | $0 | 0.0% | $0.00 |
| Vacant | 0 | 46,877 | 17.0% | 276,025 | 100.0% | $0 | 0.0% | $0.00 |
| Total/Weighted Average | 41 | 276,025 | 100.0% | $5,364,283 | $23.41 |
| (1) | Information obtained from the underwritten rent roll. |
| (2) | Certain tenants may have lease termination options that are exercisable prior to the stated expiration date of the subject lease and that are not considered in the Lease Expiration Schedule. |
| (3) | Lockheed Martin occupies two suites within the One & Two Corporate Plaza Property. One suite (22,158 square feet) has an expiration date of April 30, 2020 and the other suite (18,584 square feet) has an expiration date of December 31, 2017. Kuraray, Inc. occupies two suites within the One & Two Corporate Plaza Property. One suite (25,792 square feet) has an expiration date of January 31, 2022 and the other suite (1,884 square feet) has an expiration date of December 31, 2017. |
| (4) | Weighted Average Annual U/W Base Rent PSF excludes vacant space. |
The following table presents historical occupancy percentages at the One & Two Corporate Plaza Property:
Historical Occupancy
12/31/2012(1) | 12/31/2013(1) | 12/31/2014(1) | 12/31/2015(1) | 8/4/2016(2) |
| 80.9% | 88.5% | 89.9% | 89.3% | 83.0% |
| (1) | Information obtained from the borrower. |
| (2) | Information obtained from the underwritten rent roll. |
Operating History and Underwritten Net Cash Flow.The following table presents certain information relating to the historical operating performance and underwritten net cash flow at the One & Two Corporate Plaza Property:
Cash Flow Analysis
| 2013 | 2014 | 2015 | TTM 6/30/2016 | U/W | % of U/W Effective Gross Income | U/W $ per SF | |
| Base Rent | $4,938,071 | $5,076,166 | $5,564,155 | $5,672,300 | $5,308,477 | 97.9% | $19.23 |
| Rent Steps | 0 | 0 | 0 | 0 | 55,806 | 1.0 | $0.20 |
| Grossed Up Vacant Space | 0 | 0 | 0 | 0 | 1,178,415 | 21.7 | $4.27 |
| Total Reimbursables | 68,700 | 84,191 | 266,961 | 193,446 | 34,446 | 0.6 | $0.12 |
| Other Income(1) | 13,671 | 16,421 | 28,490 | 26,311 | 26,311 | 0.5 | $0.10 |
| Less Vacancy & Credit Loss | 0 | 0 | 0 | 0 | (1,178,415)(2) | (21.7) | ($4.27) |
| Effective Gross Income | $5,020,442 | $5,176,778 | $5,859,607 | $5,892,057 | $5,425,040 | 100.0% | $19.65 |
| Total Operating Expenses | $2,530,109 | $2,725,911 | $2,045,731 | $2,283,535 | $2,683,300 | 49.5% | $9.72 |
| Net Operating Income | $2,490,333 | $2,450,867 | $3,813,875 | $3,608,521 | $2,741,740 | 50.5% | $9.93 |
| TI/LC | 0 | 0 | 0 | 0 | 394,716 | 7.3 | $1.43 |
| Capital Expenditures | 0 | 0 | 0 | 0 | 55,205 | 1.0 | $0.20 |
| Net Cash Flow | $2,490,333 | $2,450,867 | $3,813,875 | $3,608,521 | $2,291,820 | 42.2% | $8.30 |
| NOI DSCR(3) | 1.42x | 1.40x | 2.18x | 2.06x | 1.57x | ||
| NCF DSCR(3) | 1.42x | 1.40x | 2.18x | 2.06x | 1.31x | ||
| NOI DY(3) | 9.2% | 9.1% | 14.1% | 13.4% | 10.2% | ||
| NCF DY(3) | 9.2% | 9.1% | 14.1% | 13.4% | 8.5% |
| (1) | Other Income includes parking income, late fee income and signage/keys income. |
| (2) | The underwritten economic vacancy is 17.9%. The One & Two Corporate Plaza Property was 83.0% physically occupied as of August 4, 2016. |
| (3) | The debt service coverage ratios and debt yields are based on the One & Two Corporate Plaza whole loan. |
THE INFORMATION IN THIS STRUCTURAL AND COLLATERAL TERM SHEET IS NOT COMPLETE AND MAY BE AMENDED PRIOR TO THE TIME OF SALE. THIS TERM SHEET IS NOT AN OFFER TO SELL THESE SECURITIES AND IT IS NOT A SOLICITATION OF AN OFFER TO BUY THESE SECURITIES IN ANY JURISDICTION WHERE THE OFFER OR SALE IS NOT PERMITTED.
128
ONE & TWO CORPORATE PLAZA
The following table presents certain information relating to comparable office leases for the One & Two Corporate Plaza Property:
Comparable Leases(1)
| Property Name/Location | Year Built/ Renovated | Stories | Total GLA (SF) | Total Occupancy | Distance from Subject | Tenant Name | Lease Date/Term | Lease Area (SF) | Annual Base Rent PSF | Lease Type |
16055 Space Center Houston, TX | 1985/NAP | 7 | 149,144 | 95% | 0.6 miles | NAV | NAV | NAV | $24.00- $25.00 | MG |
3700 Bay Area Houston, TX | 1984/NAP | 6 | 399,008 | 100% | 1.3 miles | NAV | NAV | NAV | $20.00 | FSG |
17225 El Camino Real Houston, TX | 1986/2000 | 4 | 64,435 | 86% | 2.1 miles | NAV | NAV | NAV | $25.00 | MG |
455 E. Medical Center Blvd. Webster, TX | 2008/NAP | 5 | 106,024 | 96% | 2.4 miles | AP Networks | December 2012/5 Yrs | 14,500 | $21.00 | MG |
455 E. Medical Center Blvd. Webster, TX | 2008/NAP | 5 | 106,024 | 96% | 2.4 miles | Bay IBI Architects | November 2012/10 Yrs | 18,000 | $21.75 | MG |
| (1) | Information obtained from the appraisal dated August 4, 2016. |
THE INFORMATION IN THIS STRUCTURAL AND COLLATERAL TERM SHEET IS NOT COMPLETE AND MAY BE AMENDED PRIOR TO THE TIME OF SALE. THIS TERM SHEET IS NOT AN OFFER TO SELL THESE SECURITIES AND IT IS NOT A SOLICITATION OF AN OFFER TO BUY THESE SECURITIES IN ANY JURISDICTION WHERE THE OFFER OR SALE IS NOT PERMITTED.
129
| Wells Fargo Commercial Mortgage Trust 2016-LC24 | Transaction Contact Information |
VI. Transaction Contact Information
Questions regarding this Structural and Collateral Term Sheet may be directed to any of the following individuals:
| Wells Fargo Securities, LLC | |
| Brigid Mattingly | Tel. (312) 269-3062 |
| A.J. Sfarra | Tel. (212) 214-5613 |
| Alex Wong | Tel. (212) 214-5615 |
THE INFORMATION IN THIS STRUCTURAL AND COLLATERAL TERM SHEET IS NOT COMPLETE AND MAY BE AMENDED PRIOR TO THE TIME OF SALE. THIS TERM SHEET IS NOT AN OFFER TO SELL THESE SECURITIES AND IT IS NOT A SOLICITATION OF AN OFFER TO BUY THESE SECURITIES IN ANY JURISDICTION WHERE THE OFFER OR SALE IS NOT PERMITTED.
130