| FREE WRITING PROSPECTUS | ||
| FILED PURSUANT TO RULE 433 | ||
| REGISTRATION FILE NO.: 333-206677-12 | ||
 |  |
Free Writing Prospectus
Structural and Collateral Term Sheet
$750,506,780
(Approximate Initial Pool Balance)
$656,693,000
(Approximate Aggregate Certificate Balance of Offered Certificates)
Wells Fargo Commercial Mortgage Trust 2016-C37
as Issuing Entity
Wells Fargo Commercial Mortgage Securities, Inc.
as Depositor
Barclays Bank PLC
Ladder Capital Finance LLC
Wells Fargo Bank, National Association
Silverpeak Real Estate Finance LLC
Rialto Mortgage Finance, LLC
C-III Commercial Mortgage LLC
as Sponsors and Mortgage Loan Sellers
Commercial Mortgage Pass-Through Certificates
Series 2016-C37
December 6, 2016
WELLS FARGO SECURITIES Co-Lead Manager and Joint Bookrunner | BARCLAYS Co-Lead Manager and Joint Bookrunner |
Academy Securities Co-Manager
| Deutsche Bank Securities Co-Manager
|
STATEMENT REGARDING THIS FREE WRITING PROSPECTUS
The depositor has filed a registration statement (including a prospectus) with the Securities and Exchange Commission (‘‘SEC’’) (SEC File No. 333-206677) for the offering to which this communication relates. Before you invest, you should read the prospectus in the registration statement and other documents the depositor has filed with the SEC for more complete information about the depositor, the issuing entity and this offering. You may get these documents for free by visiting EDGAR on the SEC Web site at www.sec.gov. Alternatively, the depositor, any underwriter, or any dealer participating in the offering will arrange to send you the prospectus after filing if you request it by calling toll free 1-800-745-2063 (8 a.m. – 5 p.m. EST) or by emailing wfs.cmbs@wellsfargo.com.
Nothing in this document constitutes an offer of securities for sale in any jurisdiction where the offer or sale is not permitted. The information contained herein is preliminary as of the date hereof, supersedes any such information previously delivered to you and will be superseded by any such information subsequently delivered and ultimately by the final prospectus relating to the securities. These materials are subject to change, completion, supplement or amendment from time to time.
This free writing prospectus has been prepared by the underwriters for information purposes only and does not constitute, in whole or in part, a prospectus for the purposes of Directive 2003/71/EC (as amended) and/or Part VI of the Financial Services and Markets Act 2000, as amended, or other offering document.
STATEMENT REGARDING ASSUMPTIONS AS TO SECURITIES, PRICING ESTIMATES AND OTHER INFORMATION
The attached information contains certain tables and other statistical analyses (the “Computational Materials”) which have been prepared in reliance upon information furnished by the Mortgage Loan Sellers. Numerous assumptions were used in preparing the Computational Materials, which may or may not be reflected herein. As such, no assurance can be given as to the Computational Materials’ accuracy, appropriateness or completeness in any particular context; or as to whether the Computational Materials and/or the assumptions upon which they are based reflect present market conditions or future market performance. The Computational Materials should not be construed as either projections or predictions or as legal, tax, financial or accounting advice. You should consult your own counsel, accountant and other advisors as to the legal, tax, business, financial and related aspects of a purchase of these securities. Any weighted average lives, yields and principal payment periods shown in the Computational Materials are based on prepayment and/or loss assumptions, and changes in such prepayment and/or loss assumptions may dramatically affect such weighted average lives, yields and principal payment periods. In addition, it is possible that prepayments or losses on the underlying assets will occur at rates higher or lower than the rates shown in the attached Computational Materials. The specific characteristics of the securities may differ from those shown in the Computational Materials due to differences between the final underlying assets and the preliminary underlying assets used in preparing the Computational Materials. The principal amount and designation of any security described in the Computational Materials are subject to change prior to issuance. None of Wells Fargo Securities, LLC, Barclays Capital Inc., Academy Securities, Inc., Deutsche Bank Securities Inc., or any of their respective affiliates, make any representation or warranty as to the actual rate or timing of payments or losses on any of the underlying assets or the payments or yield on the securities. The information in this presentation is based upon management forecasts and reflects prevailing conditions and management’s views as of this date, all of which are subject to change. In preparing this presentation, we have relied upon and assumed, without independent verification, the accuracy and completeness of all information available from public sources or which was provided to us by or on behalf of the Mortgage Loan Sellers or which was otherwise reviewed by us.
This free writing prospectus contains certain forward-looking statements. If and when included in this free writing prospectus, the words “expects”, “intends”, “anticipates”, “estimates” and analogous expressions and all statements that are not historical facts, including statements about our beliefs or expectations, are intended to identify forward-looking statements. Any forward-looking statements are made subject to risks and uncertainties which could cause actual results to differ materially from those stated. Those risks and uncertainties include, among other things, declines in general economic and business conditions, increased competition, changes in demographics, changes in political and social conditions, regulatory initiatives and changes in customer preferences, many of which are beyond our control and the control of any other person or entity related to this offering. The forward-looking statements made in this free writing prospectus are made as of the date stated on the cover. We have no obligation to update or revise any forward-looking statement.
Wells Fargo Securities is the trade name for the capital markets and investment banking services of Wells Fargo & Company and its subsidiaries, including but not limited to Wells Fargo Securities, LLC, a member of NYSE, FINRA, NFA and SIPC, Wells Fargo Prime Services, LLC, a member of FINRA, NFA and SIPC, and Wells Fargo Bank, N.A. Wells Fargo Securities, LLC and Wells Fargo Prime Services, LLC are distinct entities from affiliated banks and thrifts.
IMPORTANT NOTICE REGARDING THE OFFERED CERTIFICATES
The information herein is preliminary and may be supplemented or amended prior to the time of sale. In addition, the Offered Certificates referred to in these materials and the asset pool backing them are subject to modification or revision (including the possibility that one or more classes of certificates may be split, combined or eliminated at any time prior to issuance or availability of a final prospectus) and are offered on a “when, as and if issued” basis.
The underwriters described in these materials may from time to time perform investment banking services for, or solicit investment banking business from, any company named in these materials. The underwriters and/or their affiliates or respective employees may from time to time have a long or short position in any security or contract discussed in these materials.
The information contained herein supersedes any previous such information delivered to any prospective investor and will be superseded by information delivered to such prospective investor prior to the time of sale.
IMPORTANT NOTICE RELATING TO AUTOMATICALLY-GENERATED EMAIL DISCLAIMERS
Any legends, disclaimers or other notices that may appear at the bottom of any email communication to which this free writing prospectus is attached relating to (1) these materials not constituting an offer (or a solicitation of an offer), (2) any representation that these materials are accurate or complete and may not be updated or (3) these materials possibly being confidential, are not applicable to these materials and should be disregarded. Such legends, disclaimers or other notices have been automatically generated as a result of these materials having been sent via Bloomberg or another system.
THE INFORMATION IN THIS STRUCTURAL AND COLLATERAL TERM SHEET IS NOT COMPLETE AND MAY BE AMENDED PRIOR TO THE TIME OF SALE. THIS TERM SHEET IS NOT AN OFFER TO SELL THESE SECURITIES AND IT IS NOT A SOLICITATION OF AN OFFER TO BUY THESE SECURITIES IN ANY JURISDICTION WHERE THE OFFER OR SALE IS NOT PERMITTED.
2
Wells Fargo Commercial Mortgage Trust 2016-C37 | Certificate Structure |
| I. | Certificate Structure |
| Class | Expected Ratings (DBRS/Fitch/Moody’s)(1) | Approximate Initial Certificate Balance or Notional Amount(2) | Approx. Initial | Pass-Through Rate Description | Weighted Average Life (Years)(4) | Expected Principal Window(4) | Certificate Principal to Value Ratio(5) | Certificate Principal U/W NOI Debt Yield(6) | ||
| Offered Certificates | ||||||||||
| A-1 | AAA(sf)/AAAsf/Aaa(sf) | $35,482,000 | 30.000% | (7) | 2.62 | 01/17 – 09/21 | 43.6% | 16.7% | ||
| A-2 | AAA(sf)/AAAsf/Aaa(sf) | $105,724,000 | 30.000% | (7) | 4.81 | 09/21 – 12/21 | 43.6% | 16.7% | ||
| A-3 | AAA(sf)/AAAsf/Aaa(sf) | $28,449,000 | 30.000% | (7) | 6.90 | 11/23 – 11/23 | 43.6% | 16.7% | ||
| A-4 | AAA(sf)/AAAsf/Aaa(sf) | $120,000,000 | 30.000% | (7) | 9.69 | 06/26 – 11/26 | 43.6% | 16.7% | ||
| A-5 | AAA(sf)/AAAsf/Aaa(sf) | $188,138,000 | 30.000% | (7) | 9.90 | 11/26 – 11/26 | 43.6% | 16.7% | ||
| A-SB | AAA(sf)/AAAsf/Aaa(sf) | $47,561,000 | 30.000% | (7) | 7.28 | 12/21 – 06/26 | 43.6% | 16.7% | ||
| A-S | AAA(sf)/AAAsf/Aa1(sf) | $58,165,000 | 22.250% | (7) | 9.94 | 11/26 – 12/26 | 48.4% | 15.0% | ||
| X-A | AAA(sf)/AAAsf/Aaa(sf) | $525,354,000(8) | N/A | Variable(9) | N/A | N/A | N/A | N/A | ||
| X-B | AAA(sf)/AA-sf/NR | $96,628,000(10) | N/A | Variable(11) | N/A | N/A | N/A | N/A | ||
| B | AA(low)(sf)/AA-sf/NR | $38,463,000 | 17.125% | (7) | 9.98 | 12/26 – 12/26 | 51.6% | 14.1% | ||
| C | A(low)(sf)/A-sf/NR | $34,711,000 | 12.500% | (7) | 9.98 | 12/26 – 12/26 | 54.5% | 13.4% | ||
| Non-Offered Certificates | ||||||||||
| X-D | AAA(sf)/BBB-sf/NR | $37,525,000(12) | N/A | Variable(13) | N/A | N/A | N/A | N/A | ||
| X-EF | AAA(sf)/BB-sf/NR | $17,825,000(14) | N/A | Variable(15) | N/A | N/A | N/A | N/A | ||
| X-G | AAA(sf)/B-sf/NR | $8,443,000(16) | N/A | Variable(17) | N/A | N/A | N/A | N/A | ||
| X-H | AAA(sf)/NR/NR | $7,505,000(18) | N/A | Variable(19) | N/A | N/A | N/A | N/A | ||
| X-J | AAA(sf)/NR/NR | $22,515,779(20) | N/A | Variable(21) | N/A | N/A | N/A | N/A | ||
| D | BBB(high)(sf)/BBB-sf/NR | $37,525,000 | 7.500% | (7) | 9.98 | 12/26 – 12/26 | 57.6% | 12.6% | ||
| E | BBB(sf)/BB+sf/NR | $10,320,000 | 6.125% | (7) | 9.98 | 12/26 – 12/26 | 58.4% | 12.4% | ||
| F | BBB(low)(sf)/BB-sf/NR | $7,505,000 | 5.125% | (7) | 9.98 | 12/26 – 12/26 | 59.1% | 12.3% | ||
| G | BB(high)(sf)/B-sf/NR | $8,443,000 | 4.000% | (7) | 9.98 | 12/26 – 12/26 | 59.8% | 12.2% | ||
| H | B(high)(sf)/NR/NR | $7,505,000 | 3.000% | (7) | 9.98 | 12/26 – 12/26 | 60.4% | 12.0% | ||
| J | NR/NR/NR | $22,515,779 | 0.000% | (7) | 9.98 | 12/26 – 12/26 | 62.3% | 11.7% | ||
| Notes: | |
| (1) | The expected ratings presented are those of DBRS, Inc (“DBRS”), Fitch Ratings, Inc. (“Fitch”) and Moody’s Investors Service, Inc. (“Moody’s”) which the depositor hired to rate the offered certificates. One or more other nationally recognized statistical rating organizations that were not hired by the depositor may use information they receive pursuant to Rule 17g-5 under the Securities Exchange Act of 1934, as amended (the “Exchange Act”) or otherwise, to rate or provide market reports and/or published commentary related to the offered certificates. We cannot assure you as to what ratings a non-hired nationally recognized statistical rating organization would assign or that its reports will not express differing, possibly negative, views of the mortgage loans and/or the offered certificates. The ratings of each class of offered certificates address the likelihood of the timely distribution of interest and, except in the case of the Class X-A and X-B Certificates, the ultimate distribution of principal due on those classes on or before the Rated Final Distribution Date. See “Risk Factors—Other Risks Relating to the Certificates—Nationally Recognized Statistical Rating Organizations May Assign Different Ratings to the Certificates; Ratings of the Certificates Reflect Only the Views of the Applicable Rating Agencies as of the Dates Such Ratings Were Issued; Ratings May Affect ERISA Eligibility; Ratings May Be Downgraded” and “Ratings” in the Preliminary Prospectus, expected to be dated December 6, 2016 (the “Preliminary Prospectus”). DBRS, Fitch and Moody’s have informed us that the “sf” designation in their ratings represents an identifier for structured finance product ratings. |
| (2) | The certificate balances and notional amounts set forth in the table are approximate. The actual initial certificate balances and notional amounts may be larger or smaller depending on the initial pool balance of the mortgage loans definitively included in the pool of mortgage loans, which aggregate cut-off date balance may be as much as 5% larger or smaller than the amount presented in the Preliminary Prospectus. |
| (3) | The approximate initial credit support with respect to the Class A-1, A-2, A-3, A-4, A-5 and A-SB Certificates represents the approximate credit enhancement for the Class A-1, A-2, A-3, A-4, A-5 and A-SB Certificates in the aggregate. |
| (4) | Weighted Average Lives and Expected Principal Windows are calculated based on an assumed prepayment rate of 0% CPR and the “Structuring Assumptions” described under “Yield and Maturity Considerations—Weighted Average Life” in the Preliminary Prospectus. |
| (5) | The Certificate Principal to Value Ratio for each Class of Certificates (other than the Class A-1, A-2, A-3, A-4, A-5 and A-SB Certificates) is calculated as the product of (a) the weighted average Cut-off Date LTV Ratio for the mortgage loans and (b) a fraction, the numerator of which is the total initial Certificate Balance of such Class of Certificates and all Classes of Principal Balance Certificates senior to such Class of Certificates and the denominator of which is the total initial Certificate Balance of all of the Principal Balance Certificates. The Certificate Principal to Value Ratio for each of the Class A-1, A-2, A-3, A-4, A-5 and A-SB Certificates is calculated in the aggregate for those Classes as if they were a single Class and is calculated as the product of (a) the weighted average Cut-off Date LTV Ratio for the mortgage loans and (b) a fraction, the numerator of which is the total initial aggregate Certificate Balances of such Classes of Certificates and the denominator of which is the total initial Certificate Balance of all of the Principal Balance Certificates. In any event, however, excess mortgaged property value associated with a mortgage loan will not be available to offset losses on any other mortgage loan. |
THE INFORMATION IN THIS STRUCTURAL AND COLLATERAL TERM SHEET IS NOT COMPLETE AND MAY BE AMENDED PRIOR TO THE TIME OF SALE. THIS TERM SHEET IS NOT AN OFFER TO SELL THESE SECURITIES AND IT IS NOT A SOLICITATION OF AN OFFER TO BUY THESE SECURITIES IN ANY JURISDICTION WHERE THE OFFER OR SALE IS NOT PERMITTED.
3
Wells Fargo Commercial Mortgage Trust 2016-C37 | Certificate Structure |
| (6) | The Certificate Principal U/W NOI Debt Yield for each Class of Certificates (other than the Class A-1, A-2, A-3, A-4, A-5 and A-SB Certificates) is calculated as the product of (a) the weighted average U/W NOI Debt Yield for the mortgage loans and (b) a fraction, the numerator of which is the total initial Certificate Balance of all of the Classes of Principal Balance Certificates and the denominator of which is the total initial Certificate Balance for such Class of Certificates and all Classes of Principal Balance Certificates senior to such Class of Certificates. The Certificate Principal U/W NOI Debt Yield for each of the Class A-1, A-2, A-3, A-4, A-5 and A-SB Certificates is calculated in the aggregate for those Classes as if they were a single Class and is calculated as the product of (a) the weighted average U/W NOI Debt Yield for the mortgage loans and (b) a fraction, the numerator of which is the total initial Certificate Balance of all of the Classes of Principal Balance Certificates and the denominator of which is the total aggregate initial Certificate Balances for the Class A-1, A-2, A-3, A-4, A-5 and A-SB Certificates. In any event, however, cash flow from each mortgaged property supports only the related mortgage loan and will not be available to support any other mortgage loan. |
| (7) | The pass-through rates for the Class A-1, A-2, A-3, A-4, A-5, A-SB, A-S, B, C, D, E, F, G, H and J Certificates in each case will be one of the following: (i) a fixed rateper annum, (ii) a variable rate per annum equal to the weighted average of the net mortgage interest rates on the mortgage loans for the related distribution date, (iii) a variable rateper annumequal to the lesser of (a) a fixed rate and (b) the weighted average of the net mortgage interest rates on the mortgage loans for the related distribution date or (iv) a variable rateper annum equal to the weighted average of the net mortgage interest rates on the mortgage loans for the related distribution date minus a specified percentage. For purposes of the calculation of the weighted average of the net mortgage interest rates on the mortgage loans for each distribution date, the mortgage interest rates will be adjusted as necessary to a 30/360 basis. |
| (8) | The Class X-A Certificates are notional amount certificates. The Notional Amount of the Class X-A Certificates will be equal to the aggregate Certificate Balance of the Class A-1, A-2, A-3, A-4, A-5 and A-SB Certificates outstanding from time to time. The Class X-A Certificates will not be entitled to distributions of principal. |
| (9) | The pass-through rate for the Class X-A Certificates for any distribution date will be aper annum rate equal to the excess, if any, of (a) the weighted average of the net mortgage interest rates on the mortgage loans for the related distribution date, over (b) the weighted average of the pass-through rates on the Class A-1, A-2, A-3, A-4, A-5 and A-SB Certificates for the related distribution date, weighted on the basis of their respective Certificate Balances outstanding immediately prior to that distribution date. For purposes of the calculation of the weighted average of the net mortgage interest rates on the mortgage loans for each distribution date, the mortgage interest rates will be adjusted as necessary to a 30/360 basis. |
| (10) | The Class X-B Certificates are notional amount certificates. The Notional Amount of the Class X-B Certificates will be equal to the aggregate Certificate Balance of the Class A-S and B Certificates outstanding from time to time. The Class X-B Certificates will not be entitled to distributions of principal. |
| (11) | The pass-through rate for the Class X-B Certificates for any distribution date will be aper annum rate equal to the excess, if any, of (a) the weighted average of the net mortgage interest rates on the mortgage loans for the related distribution date, over (b) the weighted average of the pass-through rates on the Class A-S and B Certificates for the related distribution date, weighted on the basis of their respective Certificate Balances outstanding immediately prior to that distribution date. For purposes of the calculation of the weighted average of the net mortgage interest rates on the mortgage loans for each distribution date, the mortgage interest rates will be adjusted as necessary to a 30/360 basis. |
| (12) | The Class X-D Certificates are notional amount certificates. The Notional Amount of the Class X-D Certificates will be equal to the Certificate Balance of the Class D Certificates outstanding from time to time. The Class X-D Certificates will not be entitled to distributions of principal. |
| (13) | The pass-through rate for the Class X-D Certificates for any distribution date will be a per annum rate equal to the excess, if any, of (a) the weighted average of the net mortgage interest rates on the mortgage loans for the related distribution date, over (b) the pass-through rate on the Class D Certificates for the related distribution date. For purposes of the calculation of the weighted average of the net mortgage interest rates on the mortgage loans for each distribution date, the mortgage interest rates will be adjusted as necessary to a 30/360 basis. |
| (14) | The Class X-EF Certificates are notional amount certificates. The Notional Amount of the Class X-EF Certificates will be equal to the aggregate Certificate Balance of the Class E and F Certificates outstanding from time to time. The Class X-EF Certificates will not be entitled to distributions of principal. |
| (15) | The pass-through rate for the Class X-EF Certificates for any distribution date will be aper annum rate equal to the excess, if any, of (a) the weighted average of the net mortgage interest rates on the mortgage loans for the related distribution date, over (b) the weighted average of the pass-through rates on the Class E and F Certificates for the related distribution date, weighted on the basis of their respective Certificate Balances outstanding immediately prior to that distribution date. For purposes of the calculation of the weighted average of the net mortgage interest rates on the mortgage loans for each distribution date, the mortgage interest rates will be adjusted as necessary to a 30/360 basis. |
| (16) | The Class X-G Certificates are notional amount certificates. The Notional Amount of the Class X-G Certificates will be equal to the Certificate Balance of the Class G Certificates outstanding from time to time. The Class X-G Certificates will not be entitled to distributions of principal. |
| (17) | The pass-through rate for the Class X-G Certificates for any distribution date will be aper annum rate equal to the excess, if any, of (a) the weighted average of the net mortgage interest rates on the mortgage loans for the related distribution date, over (b) the pass-through rate on the Class G Certificates for the related distribution date. For purposes of the calculation of the weighted average of the net mortgage interest rates on the mortgage loans for each distribution date, the mortgage interest rates will be adjusted as necessary to a 30/360 basis. |
| (18) | The Class X-H Certificates are notional amount certificates. The Notional Amount of the Class X-H Certificates will be equal to the Certificate Balance of the Class H Certificates outstanding from time to time. The Class X-H Certificates will not be entitled to distributions of principal. |
| (19) | The pass-through rate for the Class X-H Certificates for any distribution date will be aper annum rate equal to the excess, if any, of (a) the weighted average of the net mortgage interest rates on the mortgage loans for the related distribution date, over (b) the pass-through rate on the Class H Certificates for the related distribution date. For purposes of the calculation of the weighted average of the net mortgage interest rates on the mortgage loans for each distribution date, the mortgage interest rates will be adjusted as necessary to a 30/360 basis. |
| (20) | The Class X-J Certificates are notional amount certificates. The Notional Amount of the Class X-J Certificates will be equal to the Certificate Balance of the Class J Certificates outstanding from time to time. The Class X-J Certificates will not be entitled to distributions of principal. |
| (21) | The pass-through rate for the Class X-J Certificates for any distribution date will be aper annum rate equal to the excess, if any, of (a) the weighted average of the net mortgage interest rates on the mortgage loans for the related distribution date, over (b) the pass-through rate on the Class J Certificates for the related distribution date. For purposes of the calculation of the weighted average of the net mortgage interest rates on the mortgage loans for each distribution date, the mortgage interest rates will be adjusted as necessary to a 30/360 basis. |
THE INFORMATION IN THIS STRUCTURAL AND COLLATERAL TERM SHEET IS NOT COMPLETE AND MAY BE AMENDED PRIOR TO THE TIME OF SALE. THIS TERM SHEET IS NOT AN OFFER TO SELL THESE SECURITIES AND IT IS NOT A SOLICITATION OF AN OFFER TO BUY THESE SECURITIES IN ANY JURISDICTION WHERE THE OFFER OR SALE IS NOT PERMITTED.
4
Wells Fargo Commercial Mortgage Trust 2016-C37 | Transaction Highlights |
| II. | Transaction Highlights |
Mortgage Loan Sellers:
Mortgage Loan Seller | Number of | Number of | Aggregate Cut-off Date Balance | % of Initial Pool | ||||
| Barclays Bank PLC(1) | 19 | 35 | $308,717,607 | 41.1% | ||||
| Ladder Capital Finance LLC(2) | 9 | 62 | 146,775,571 | 19.6 | ||||
| Wells Fargo Bank, National Association | 10 | 13 | 116,020,374 | 15.5 | ||||
| Silverpeak Real Estate Finance LLC | 9 | 14 | 93,942,500 | 12.5 | ||||
| Rialto Mortgage Finance, LLC | 8 | 9 | 51,987,107 | 6.9 | ||||
| C-III Commercial Mortgage LLC(3) | 8 | 8 | 33,063,621 | 4.4 | ||||
Total | 63 | 141 | $750,506,780 | 100.0% |
| (1) | The mortgage loan secured by the mortgaged property identified on Annex A-1 to the Preliminary Prospectus as Hilton Hawaiian Village, representing approximately 7.0% of the aggregate principal balance of the pool of mortgage loans as of the cut-off date, for which Barclays Bank PLC is the mortgage loan seller, was co-originated by Barclays Bank PLC, JPMorgan Chase Bank, National Association (“JPM”), Deutsche Bank, AG, New York Branch (“DBAG”), Goldman Sachs Mortgage Company (“GSMC”) and Morgan Stanley Bank, N.A (“MSB”). The mortgage loan secured by the mortgaged property identified on Annex A-1 to the Preliminary Prospectus as Potomac Mills, representing approximately 4.8% of the aggregate principal balance of the pool of mortgage loans as of the cut-off date, for which Barclays Bank PLC is the mortgage loan seller, was co-originated by Barclays Bank PLC, Societe Generale (“SG”), Cantor Commercial Real Estate Lending, L.P. (“CCRE”) and Bank of America, N.A. (“BANA”). Such Mortgage Loans were underwritten pursuant to Barclays Bank PLC’s underwriting guidelines. |
| (2) | The mortgage loan secured by the mortgaged property identified on Annex A-1 to the Preliminary Prospectus as 1140 Avenue of the Americas, representing approximately 4.0% of the aggregate principal balance of the pool of mortgage loans as of the cut-off date, for which Ladder Capital Finance LLC is the mortgage loan seller, was originated by Ladder Capital Finance I LLC. The mortgage loan secured by the mortgaged property identified on Annex A-1 to the Preliminary Prospectus as 80 Park Plaza, representing approximately 2.8% of the aggregate principal balance of the pool of mortgage loans as of the cut-off date, for which Ladder Capital Finance LLC is the mortgage loan seller, was co-originated by Ladder Capital Finance LLC and Citigroup Global Markets Realty Corp. (“CGMRC”). Such Mortgage Loans were underwritten pursuant to Ladder Capital Finance LLC’s underwriting guidelines. |
| (3) | The mortgage loan secured by the mortgaged property identified on Annex A-1 to the Preliminary Prospectus as Tice Mobile Home Court, representing approximately 0.3% of the aggregate principal balance of the pool of mortgage loans as of the cut-off date, for which C-III Commercial Mortgage LLC is the mortgage loan seller, was originated by Union Capital Investments, LLC. In connection with the acquisition thereof by C-III Commercial Mortgage LLC, such mortgage loan was re-underwritten pursuant to C-III Commercial Mortgage LLC’s underwriting guidelines. |
Loan Pool:
| Initial Pool Balance: | $750,506,780 |
| Number of Mortgage Loans: | 63 |
| Average Cut-off Date Balance per Mortgage Loan: | $11,912,806 |
| Number of Mortgaged Properties: | 141 |
| Average Cut-off Date Balance per Mortgaged Property(1): | $5,322,743 |
| Weighted Average Mortgage Interest Rate: | 4.514% |
| Ten Largest Mortgage Loans as % of Initial Pool Balance(2): | 45.7% |
| Weighted Average Original Term to Maturity or ARD (months): | 110 |
| Weighted Average Remaining Term to Maturity or ARD (months): | 109 |
| Weighted Average Original Amortization Term (months)(3): | 348 |
| Weighted Average Remaining Amortization Term (months)(3): | 348 |
| Weighted Average Seasoning (months): | 1 |
| (1) | Information regarding mortgage loans secured by multiple properties is based on an allocation according to relative appraised values or the allocated loan amounts or property-specific release prices set forth in the related loan documents or such other allocation as the related mortgage loan seller deemed appropriate. |
| (2) | Includes the ten largest mortgage loans or group of cross-collateralized underlying mortgage loans. |
| (3) | Excludes any mortgage loan that does not amortize. |
Credit Statistics:
| Weighted Average U/W Net Cash Flow DSCR(1): | 2.04x |
| Weighted Average U/W Net Operating Income Debt Yield(1): | 11.7% |
| Weighted Average Cut-off Date Loan-to-Value Ratio(1): | 62.3% |
| Weighted Average Balloon or ARD Loan-to-Value Ratio(1): | 54.2% |
| % of Mortgage Loans with Additional Subordinate Debt(2): | 18.6% |
| % of Mortgage Loans with Single Tenants(3): | 7.3% |
| (1) | With respect to any mortgage loan that is part of a whole loan, loan-to-value ratio, debt service coverage ratio and debt yield calculations include the relatedpari passucompanion loan(s) but exclude any related subordinate companion loan(s) (unless otherwise stated). The debt service coverage ratio, debt yield and loan-to-value ratio information do not take into account any subordinate debt (whether or not secured by the related mortgaged property), that currently exists or is allowed under the terms of any mortgage loan. The information for each mortgaged property that relates to a mortgage loan that is cross-collateralized or cross-defaulted with one or more other mortgage loans is based upon the principal balance of that mortgage loan, except that the applicable loan-to-value ratio, debt service coverage ratio, and debt yield for each such mortgage loan is based upon the ratio or yield (as applicable) for the aggregate indebtedness evidenced by all loans in the group (without regard to any limitation on the amount of indebtedness secured by any mortgaged property in such cross-collateralized group). On an individual basis, without regard to the cross-collateralization feature, any mortgage loan that is part of a cross-collateralized group of mortgage loans may have a higher loan-to-value ratio, lower debt service coverage ratio and/or lower debt yield than is presented herein. See “Description of the Mortgage Pool—Mortgage Pool Characteristics” in the Preliminary Prospectus and Annex A-1 to the Preliminary Prospectus. |
| (2) | The percentage figure expressed as “% of Mortgage Loans with Additional Subordinate Debt” is determined as a percentage of the initial pool balance and does not take into account any future subordinate debt (whether or not secured by the mortgaged property), if any, that may be permitted under the terms of any mortgage loan or the pooling and servicing agreement. See “Description of the Mortgage Pool—Additional Indebtedness—Other Unsecured Indebtedness” in the Preliminary Prospectus. |
| (3) | Excludes mortgage loans that are secured by multiple single tenant properties. |
THE INFORMATION IN THIS STRUCTURAL AND COLLATERAL TERM SHEET IS NOT COMPLETE AND MAY BE AMENDED PRIOR TO THE TIME OF SALE. THIS TERM SHEET IS NOT AN OFFER TO SELL THESE SECURITIES AND IT IS NOT A SOLICITATION OF AN OFFER TO BUY THESE SECURITIES IN ANY JURISDICTION WHERE THE OFFER OR SALE IS NOT PERMITTED.
5
Wells Fargo Commercial Mortgage Trust 2016-C37 | Transaction Highlights |
Loan Structural Features:
Amortization:Based on the Initial Pool Balance, 74.4% of the mortgage pool (57 mortgage loans) has scheduled amortization, as follows:
44.4% (39 mortgage loans) requires amortization during the entire loan term; and
30.0% (18 mortgage loans) provides for an interest-only period followed by an amortization period.
Interest-Only:Based on the Initial Pool Balance, 25.6% of the mortgage pool (6 mortgage loans) provides for interest-only payments during the entire loan term. The Weighted Average Cut-off Date Loan-to-Value Ratio and Weighted Average U/W Net Cash Flow DSCR for those mortgage loans are 48.5% and 3.50x, respectively.
Hard Lockboxes: Based on the Initial Pool Balance, 47.4% of the mortgage pool (17 mortgage loans) have hard lockboxes in place.
Reserves:The mortgage loans require amounts to be escrowed monthly as follows (excluding any mortgage loans with springing provisions):
| Real Estate Taxes: | 86.3% of the pool |
| Insurance: | 38.3% of the pool |
| Capital Replacements: | 75.5% of the pool |
| TI/LC: | 53.6% of the pool(1) |
| (1) | The percentage of Initial Pool Balance for mortgage loans with TI/LC reserves is based on the aggregate principal balance allocable to loans that include retail, office, mixed use and industrial properties. |
Call Protection/Defeasance: Based on the Initial Pool Balance, the mortgage pool has the following call protection and defeasance features:
75.8% of the mortgage pool (54 mortgage loans) features a lockout period, then defeasance only until an open period;
17.2% of the mortgage pool (8 mortgage loans) features a lockout period, then the greater of a prepayment premium or yield maintenance until an open period; and
7.0% of the mortgage pool (1 mortgage loan) features a lockout period, then defeasance or the greater of a prepayment premium or yield maintenance until an open period.
Please refer to Annex A-1 and the footnotes related thereto to the Preliminary Prospectus for further information regarding individual loan call protection.
THE INFORMATION IN THIS STRUCTURAL AND COLLATERAL TERM SHEET IS NOT COMPLETE AND MAY BE AMENDED PRIOR TO THE TIME OF SALE. THIS TERM SHEET IS NOT AN OFFER TO SELL THESE SECURITIES AND IT IS NOT A SOLICITATION OF AN OFFER TO BUY THESE SECURITIES IN ANY JURISDICTION WHERE THE OFFER OR SALE IS NOT PERMITTED.
6
| Wells Fargo Commercial Mortgage Trust 2016-C37 | Issue Characteristics |
| III. | Issue Characteristics |
| Securities Offered: | $656,693,000 approximate monthly pay, multi-class, commercial mortgage REMIC pass-through certificates consisting of eleven classes (Classes A-1, A-2, A-3, A-4, A-5, A-SB, A-S, B, C, X-A and X-B), which are offered pursuant to a registration statement filed with the SEC (such classes of certificates, the “Offered Certificates”). | |
| Mortgage Loan Sellers: | Barclays Bank PLC (“Barclays”), Ladder Capital Finance LLC (“LCF”), Wells Fargo Bank, National Association (“WFB”), Silverpeak Real Estate Finance LLC (“SPREF”), Rialto Mortgage Finance, LLC (“RMF”) and C-III Commercial Mortgage LLC (“C3CM”). | |
| Joint Bookrunners and Co-Lead Managers: | Wells Fargo Securities, LLC and Barclays Capital Inc. | |
| Co-Managers: | Academy Securities, Inc. and Deutsche Bank Securities Inc. | |
| Rating Agencies: | DBRS, Inc. Fitch Ratings, Inc. and Moody’s Investors Service, Inc. | |
| Master Servicer: | Wells Fargo Bank, National Association | |
| Special Servicer: | LNR Partners, LLC | |
| Certificate Administrator: | Wells Fargo Bank, National Association | |
| Trustee: | Wilmington Trust, National Association | |
| Operating Advisor: | Trimont Real Estate Advisors, LLC | |
| Asset Representations Reviewer: | Trimont Real Estate Advisors, LLC | |
| Initial Majority Controlling Class Certificateholder: | Prime Finance CMBS B-Piece Holdco VI, L.P. | |
| Cut-off Date: | The Cut-off Date with respect to each mortgage loan is the due date for the monthly debt service payment that is due in December 2016 (or, in the case of any mortgage loan that has its first due date in January 2017, the date that would have been its due date in December 2016 under the terms of that mortgage loan if a monthly debt service payment were scheduled to be due in that month). | |
| Expected Closing Date: | On or about December 22, 2016. | |
| Determination Dates: | The 11th day of each month (or if that day is not a business day, the next succeeding business day), commencing in January 2017. | |
| Distribution Dates: | The fourth business day following the Determination Date in each month, commencing in January 2017. | |
| Rated Final Distribution Date: | The Distribution Date in December 2049. | |
| Interest Accrual Period: | With respect to any Distribution Date, the calendar month immediately preceding the month in which such Distribution Date occurs. | |
| Day Count: | The Offered Certificates will accrue interest on a 30/360 basis. | |
| Minimum Denominations: | $10,000 for each Class of Offered Certificates (other than the Class X-A and X-B Certificates) and $1,000,000 for the Class X-A and X-B Certificates. Investments may also be made in any whole dollar denomination in excess of the applicable minimum denomination. | |
| Clean-up Call: | 1% | |
| Delivery: | DTC, Euroclear and Clearstream Banking | |
| ERISA/SMMEA Status: | Each Class of Offered Certificates is expected to be eligible for exemptive relief under ERISA. No Class of Offered Certificates will be SMMEA eligible. | |
| Risk Factors: | THE CERTIFICATES INVOLVE CERTAIN RISKS AND MAY NOT BE SUITABLE FOR ALL INVESTORS. SEE THE “RISK FACTORS” SECTION OF THE PRELIMINARY PROSPECTUS. | |
| Bond Analytics Information: | The Certificate Administrator will be authorized to make distribution date statements, CREFC® reports and certain supplemental reports (other than confidential information) available to certain financial modeling and data provision services, including Bloomberg, L.P., Trepp, LLC, Intex Solutions, Inc., Markit Group Limited, Interactive Data Corp., BlackRock Financial Management, Inc., CMBS.com, Inc., Moody’s Analytics and Thomson Reuters Corporation. |
THE INFORMATION IN THIS STRUCTURAL AND COLLATERAL TERM SHEET IS NOT COMPLETE AND MAY BE AMENDED PRIOR TO THE TIME OF SALE. THIS TERM SHEET IS NOT AN OFFER TO SELL THESE SECURITIES AND IT IS NOT A SOLICITATION OF AN OFFER TO BUY THESE SECURITIES IN ANY JURISDICTION WHERE THE OFFER OR SALE IS NOT PERMITTED.
7
| Wells Fargo Commercial Mortgage Trust 2016-C37 | Characteristics of the Mortgage Pool |
| IV. | Characteristics of the Mortgage Pool(1) |
| A. | Ten Largest Mortgage Loans or Groups of Cross-Collateralized Underlying Mortgage Loans |
| Mortgage Loan Seller | Mortgage Loan Name | City | State | Number of Mortgage Loans / Mortgaged Properties | Mortgage Loan Cut-off Date Balance ($) | % of Initial Pool Balance (%) | Property Type | Number of Rooms /SF / Units | Cut-off Date Balance Per Room / SF / Unit | Cut-off Date LTV Ratio (%) | Balloon or ARD LTV Ratio (%) | U/W NCF DSCR (x) | U/W NOI Debt Yield (%) |
| Barclays | Hilton Hawaiian Village | Honolulu | HI | 1 / 1 | $52,500,000 | 7.0% | Hospitality | 2,860 | $243,566 | 31.2% | 31.2% | 4.47x | 21.2% |
| Barclays | Quantum Park | Ashburn | VA | 1 / 1 | 52,000,000 | 6.9 | Office | 942,843 | 140 | 66.0 | 66.0 | 3.00 | 11.4 |
| LCF | Walmart Shadow Anchored Portfolio | Various | Various | 1 / 34 | 39,536,250 | 5.3 | Retail | 881,524 | 101 | 75.0 | 72.0 | 1.36 | 10.6 |
| Barclays | Potomac Mills | Woodbridge | VA | 1 / 1 | 36,375,000 | 4.8 | Retail | 1,459,997 | 199 | 38.0 | 38.0 | 4.39 | 13.9 |
| WFB | Franklin Square III | Gastonia | NC | 1 / 1 | 32,210,163 | 4.3 | Retail | 272,222 | 118 | 74.9 | 66.2 | 1.33 | 9.1 |
| LCF | 1140 Avenue of the Americas | New York | NY | 1 / 1 | 30,000,000 | 4.0 | Office | 247,183 | 401 | 55.0 | 55.0 | 2.16 | 9.6 |
| Barclays | The Hamptons(2) | Las Vegas | NV | 1 / 1 | 17,875,423 | 2.4 | Multifamily | 492 | 46,064 | 65.6 | 52.7 | 1.38 | 8.7 |
| Barclays | Park Pointe(2) | Los Angeles | CA | 1 / 1 | 8,887,780 | 1.2 | Multifamily | 89 | 46,064 | 65.6 | 52.7 | 1.38 | 8.7 |
| Barclays | Hampton Inn Tropicana | Las Vegas | NV | 1 / 1 | 25,443,445 | 3.4 | Hospitality | 322 | 79,017 | 66.4 | 54.4 | 1.73 | 12.6 |
| WFB | Fremaux Town Center | Slidell | LA | 1 / 1 | 24,700,712 | 3.3 | Retail | 397,493 | 181 | 62.7 | 45.2 | 1.32 | 9.0 |
| Barclays | Midwest Industrial Portfolio | Various | Various | 1 / 11 | 23,100,000 | 3.1 | Industrial | 1,255,014 | 31 | 71.3 | 65.5 | 1.39 | 9.8 |
| Top Three Total/Weighted Average | 3 / 36 | $144,036,250 | 19.2% | 55.8% | 55.0% | 3.09x | 14.8% | ||||||
| Top Five Total/Weighted Average | 5 / 38 | $212,621,413 | 28.3% | 55.6% | 53.8% | 3.04x | 13.8% | ||||||
| Top Ten Total/Weighted Average | 11 / 54 | $342,628,774 | 45.7% | 58.7% | 54.0% | 2.50x | 12.3% | ||||||
| Non-Top Ten Total/Weighted Average | 52 / 87 | $407,878,006 | 54.3% | 65.2% | 54.4% | 1.65x | 11.2% | ||||||
| (1) | With respect to any mortgage loan that is part of a whole loan, Cut-off Date Balance Per Room/SF/Unit, loan-to-value ratio, debt service coverage ratio and debt yield calculations include the relatedpari passu companion loan(s) but exclude any related subordinate companion loan(s) (unless otherwise stated). With respect to each mortgage loan, debt service coverage ratio, debt yield and loan-to-value ratio information do not take into account of subordinate debt (whether or not secured by the related mortgaged property), if any, that currently exists or is allowed under the terms of such mortgage loan. The information for each mortgaged property that relates to a mortgage loan that is cross-collateralized or cross-defaulted with other mortgage loans is based upon the principal balance of that mortgage loan, except that the applicable loan-to-value ratio, debt service coverage ratio and debt yield for each such mortgage loan is based upon the ratio or yield (as applicable) for the aggregate indebtedness evidenced by all loans in the group (without regard to any limitation on the amount of indebtedness secured by any mortgaged property in such cross-collateralized group). On an individual basis, without regard to the cross-collateralization feature, any mortgage loan that is part of a cross-collateralized group of mortgage loans may have a higher loan-to-value ratio, lower debt service coverage ratio and/or lower debt yield than is presented herein. |
| (2) | The Hamptons mortgage loan and the Park Pointe mortgage loan are cross-collateralized and cross-defaulted with each other. |
THE INFORMATION IN THIS STRUCTURAL AND COLLATERAL TERM SHEET IS NOT COMPLETE AND MAY BE AMENDED PRIOR TO THE TIME OF SALE. THIS TERM SHEET IS NOT AN OFFER TO SELL THESE SECURITIES AND IT IS NOT A SOLICITATION OF AN OFFER TO BUY THESE SECURITIES IN ANY JURISDICTION WHERE THE OFFER OR SALE IS NOT PERMITTED.
8
| Wells Fargo Commercial Mortgage Trust 2016-C37 | Characteristics of the Mortgage Pool |
| B. | Summary of thePari PassuWhole Loans |
| Property Name | Mortgage Loan Originator | Note(s) | Related Notes in Loan Group (Original Balance) | Holder of Note | Lead Servicer for Whole loan | Current Master Servicer Under Related Securitization Servicing Agreement | Current Special Servicer Under Related Securitization Servicing Agreement |
| Hilton Hawaiian Village(1) | JPM/DBAG/GSMC/Barclays/MSB | A-1-A, A-1-B, A-1-C, A-1-D, A-1-E | $171,600,000 | Hilton USA Trust 2016-HHV(1) | Yes | Wells Fargo Bank, National Association | AEGON USA Realty Advisors, LLC |
| JPM | A-2-A-1 | $94,000,000 | JPMCC 2016-JP4(2) | No | Wells Fargo Bank, National Association | LNR Partners, LLC | |
| MSB | A-2-D-1, A-2-D-2 | $63,000,000 | MSBAM 2016-C32(3) | No | Wells Fargo Bank, National Association | Midland Loan Services, a Division of PNC Bank, National Association | |
| Barclays | A-2-E-1, A-2-E-2 | $52,500,000 | WFCM 2016-C37 | No | Wells Fargo Bank, National Association | LNR Partners, LLC | |
| JPM/DBAG | A-2-A-2, A-2-A-3, A-2-A-4, A-2-B-1, A-2-B-2, A-2-B-3 | $315,500,000 | (4) | No | TBD | TDB | |
| Quantum Park | Barclays | A-1 | $30,000,000 | CGCMT 2016-C3 | No | Midland Loan Services, a Division of PNC Bank, National Association | Rialto Capital Advisors, LLC |
| Barclays | A-2 | $50,000,000 | CGCMT 2016-P6(5) | No | Midland Loan Services, a Division of PNC Bank, National Association | CWCapital Asset Management LLC | |
| Barclays | A-3 | $52,000,000 | WFCM 2016-C37 | Yes | Wells Fargo Bank, National Association | LNR Partners, LLC | |
| Walmart Shadow Anchored Portfolio | LCF | A-1 | $49,500,000 | WFCM 2016-LC25(6) | Yes | Wells Fargo Bank, National Association | CWCapital Asset Management LLC |
| LCF | A-2 | $39,536,250 | WFCM 2016-C37 | No | Wells Fargo Bank, National Association | LNR Partners, LLC | |
| Potomac Mills(7) | SG/CCRE | A-1 & A-6 | $70,000,000 | CFCRE 2016-C6 | Yes | Wells Fargo Bank, National Association | Rialto Capital Advisors, LLC |
| SG | A-2 & A-3 | $32,750,000 | (8) | No | TBD | TBD | |
| BANA | A-4 | $52,000,000 | MSBAM 2016-C32(3) | No | Wells Fargo Bank, National Association | Midland Loan Services, a Division of PNC Bank, National Association | |
| BANA | A-5 | $20,750,000 | (9) | No | TBD | TBD | |
| CCRE | A-7 | $35,000,000 | CGCMT 2016-C3 | No | Midland Loan Services, a Division of PNC Bank, National Association | Rialto Capital Advisors, LLC | |
| CCRE | A-8 | $7,750,000 | (10) | No | TBD | TBD | |
| Barclays | A-9 | $36,375,000 | CGCMT 2016-P6(5) | No | Midland Loan Services, a Division of PNC Bank, National Association | CWCapital Asset Management LLC | |
| Barclays | A-10 | $36,375,000 | WFCM 2016-C37 | No | Wells Fargo Bank, National Association | LNR Partners, LLC | |
| 1140 Avenue of the Americas | LCF | A-1 | $30,000,000 | WFCM 2016-C37 | Yes | Wells Fargo Bank, National Association | LNR Partners, LLC |
| LCF | A-2 | $24,000,000 | JPMCC 2016-JP4(2) | No | Wells Fargo Bank, National Association | LNR Partners, LLC | |
| LCF | A-3 & A-4 | $45,000,000 | WFCM 2016-LC24 | No | Wells Fargo Bank, National Association | Midland Loan Services, a Division of PNC Bank, National Association | |
| Fremaux Town Center | WFB | A-1 | $25,000,000 | WFCM 2016-C37 | Yes | Wells Fargo Bank, National Association | LNR Partners, LLC |
| WFB | A-2 | $30,000,000 | MSC 2016-BNK2 | No | Wells Fargo Bank, National Association | C-III Asset Management LLC | |
| WFB | A-3 | $18,000,000 | (11) | No | TBD | TBD | |
| Midwest Industrial Portfolio | Barclays | A-1 | $23,100,000 | WFCM 2016-C37 | Yes | Wells Fargo Bank, National Association | LNR Partners, LLC |
| Barclays | A-2 | $15,400,000 | (12) | No | TBD | TBD |
THE INFORMATION IN THIS STRUCTURAL AND COLLATERAL TERM SHEET IS NOT COMPLETE AND MAY BE AMENDED PRIOR TO THE TIME OF SALE. THIS TERM SHEET IS NOT AN OFFER TO SELL THESE SECURITIES AND IT IS NOT A SOLICITATION OF AN OFFER TO BUY THESE SECURITIES IN ANY JURISDICTION WHERE THE OFFER OR SALE IS NOT PERMITTED.
9
| Wells Fargo Commercial Mortgage Trust 2016-C37 | Characteristics of the Mortgage Pool |
| B. | Summary of thePari PassuWhole Loans (continued) |
| 80 Park Plaza | CGMRC | A-1 & A-2 | $50,000,000 | CGCMT 2016-C3 | Yes | Midland Loan Services, a Division of PNC Bank, National Association | Rialto Capital Advisors, LLC |
| CGMRC | A-3 | $41,500,000 | CD 2016-CD2(13) | No | Wells Fargo Bank, National Association | KeyBank National Association | |
| LCF | A-4A | $21,000,000 | WFCM 2016-C37 | No | Wells Fargo Bank, National Association | LNR Partners, LLC | |
| LCF | A-4B | $20,500,000 | JPMCC 2016-JP4(2) | No | Wells Fargo Bank, National Association | LNR Partners, LLC | |
| Redwood MHC Portfolio | LCF | A-1 | $20,600,000 | WFCM 2016-C37 | Yes | Wells Fargo Bank, National Association | LNR Partners, LLC |
| LCF | A-2 | $38,400,000 | WFCM 2016-LC25(6) | No | Wells Fargo Bank, National Association | CWCapital Asset Management LLC | |
| LCF | A-3 | $37,000,000 | JPMCC 2016-JP4(2) | No | Wells Fargo Bank, National Association | LNR Partners, LLC | |
| DoubleTree by Hilton Tempe | SPREF | A-1 | $11,000,000 | WFCM 2016-C37 | Yes | Wells Fargo Bank, National Association | LNR Partners, LLC |
| SPREF | A-2 | $9,600,000 | (14) | No | TBD | TBD |
| (1) | The Hilton Hawaiian Village whole loan also includes five subordinate companion loans with an aggregate outstanding principal balance as of the cut-off date of $578,400,000, which were contributed to the Hilton USA Trust 2016-HHV securitization. |
| (2) | The JPMCC 2016-JP4 securitization has not yet closed, however, based on a publicly available preliminary prospectus for such securitization, it is expected that (i) the non-controlling note A-2-A-1 of the Hilton Hawaiian Village whole loan will be included in that securitization by JPM, (ii) the non-controlling note A-2 of the 1140 Avenue of the Americas whole loan will be included in that securitization by LCF, (iii) the non-controlling note A-4B of the 80 Park Plaza whole loan will be included in that securitization by LCF, (iv) the non-controlling note A-3 of the Redwood MHC Portfolio whole loan will be included in that securitization by LCF and (v) that securitization will close on the same day as this transaction. |
| (3) | The MSBAM 2016-C32 securitization has not yet closed, however, based on a publicly available preliminary prospectus for such securitization, it is expected that (i) the non-controlling note A-2-D-1 and A-2-D-2 of the Hilton Hawaiian Village whole loan will be included in that securitization by MSB, (ii) the non-controlling note A-4 of the Potomac Mills whole loan will be included in that securitization by BANA and (iii) that securitization will close prior to this transaction. |
| (4) | The relatedpari passu Notes A-2-A-2, A-2-A-3, A-2-A-4, A-2-B-1, A-2-B-2 and A-2-B-3 are currently held by JPMorgan Chase Bank, National Association and Deutsche Bank, AG, New York Branch and are expected to be contributed to future securitizations. No assurance can be provided that such notes will not be split further. |
| (5) | The CGCMT 2016-P6 securitization has not yet closed, however, based on a publicly available preliminary prospectus for such securitization, it is expected that (i) the non-controlling note A-2 of the Quantum Park whole loan will be included in that securitization by Barclays, (ii) the non-controlling note A-9 of the Potomac Mills whole loan will be included in that securitization by Barclays and (iii) that securitization will close prior to this transaction. |
| (6) | The WFCM 2016-LC25 securitization has not yet closed, however, based on a publicly available preliminary prospectus for such securitization, it is expected that (i) the controlling note A-1 of the Walmart Shadow Anchored Portfolio whole loan will be included in that securitization by LCF, (ii) the non-controlling note A-2 of the Redwood MHC Portfolio whole loan will be included in that securitization by LCF and (iii) that securitization will close prior to this transaction. |
| (7) | The Potomac Mills whole loan also includes ten subordinate companion loans with an aggregate outstanding principal balance as of the cut-off date of $125,000,000, which are currently held by Teachers Insurance and Annuity Association of America. |
| (8) | The relatedpari passu Notes A-2 and A-3 are currently held by SG and are expected to be contributed to future securitizations. No assurance can be provided that the Note A-2 and A-3 will not be split further. |
| (9) | The relatedpari passu Note A-5 is currently held by BANA and is expected to be contributed to future securitizations. No assurance can be provided that the Note A-5 will not be split further. |
| (10) | The relatedpari passu Note A-8 is currently held by CCRE and is expected to be contributed to a future securitization. No assurance can be provided that the Note A-8 will not be split further. |
| (11) | The relatedpari passu Note A-3 is currently held by WFB and is expected to be contributed to a future securitization. No assurance can be provided that the Note A-3 will not be split further. |
| (12) | The relatedpari passu Note A-2 is currently held by Barclays and is expected to be contributed to a future securitization. No assurance can be provided that the Note A-2 will not be split further. |
| (13) | The CD 2016-CD2 securitization has not yet closed, however, based on a publicly available preliminary prospectus for such securitization, it is expected that (i) the non-controlling note A-3 of the 80 Park Plaza whole loan will be included in that securitization by CGMRC and (ii) that securitization will close prior to this transaction. |
| (14) | The relatedpari passu Note A-2 is currently held by SPREF and is expected to be contributed to a future securitization. No assurance can be provided that the Note A-2 will not be split further. |
THE INFORMATION IN THIS STRUCTURAL AND COLLATERAL TERM SHEET IS NOT COMPLETE AND MAY BE AMENDED PRIOR TO THE TIME OF SALE. THIS TERM SHEET IS NOT AN OFFER TO SELL THESE SECURITIES AND IT IS NOT A SOLICITATION OF AN OFFER TO BUY THESE SECURITIES IN ANY JURISDICTION WHERE THE OFFER OR SALE IS NOT PERMITTED.
10
| Wells Fargo Commercial Mortgage Trust 2016-C37 | Characteristics of the Mortgage Pool |
| C. | Mortgage Loans with Additional Secured and Mezzanine Financing |
| Loan No. | Mortgage Loan Seller | Mortgage Loan Name | Mortgage Loan Cut-off Date Balance ($) | % of Initial Pool Balance (%) | Sub Debt Cut- off Date Balance ($) | Mezzanine Debt Cut-off Date Balance ($) | Total Debt Interest Rate (%)(1) | Mortgage Loan U/W NCF DSCR (x)(2) | Total Debt U/W NCF DSCR (x) | Mortgage Loan Cut-off Date U/W NOI Debt Yield (%)(2) | Total Debt Cut-off Date U/W NOI Debt Yield (%) | Mortgage Loan Cut-off Date LTV Ratio (%)(2) | Total Debt Cut-off Date LTV Ratio (%) |
| 1 | Barclays | Hilton Hawaiian Village | $52,500,000 | 7.0% | $578,400,000 | NAP | 4.200% | 4.47x | 2.44x | 21.2% | 11.6% | 31.2% | 57.2% |
| 3 | LCF | Walmart Shadow Anchored Portfolio | 39,536,250 | 5.3 | NAP | 8,607,106 | 6.067 | 1.36 | 1.17 | 10.6 | 9.7 | 75.0 | 82.3 |
| 4 | Barclays | Potomac Mills | 36,375,000 | 4.8 | 125,000,000 | NAP | 3.457 | 4.39 | 2.65 | 13.9 | 9.7 | 38.0 | 54.4 |
| 25 | SPREF | DoubleTree by Hilton Tempe | 11,000,000 | 1.5 | NAP | 2,200,000 | 6.338 | 1.69 | 1.41 | 14.5 | 13.1 | 63.8 | 70.6 |
| Total/Weighted Average | $139,411,250 | 18.6% | $703,400,000 | $10,807,106 | 4.704% | 3.35x | 2.05x | 15.8% | 10.7% | 48.0% | 64.6% | ||
| (1) | Total Debt Interest Rate for any specified mortgage loan reflects the weighted average of the interest rates on the respective components of the total debt. |
| (2) | With respect to the Hilton Hawaiian Village mortgage loan, the Walmart Shadow Anchored Portfolio mortgage loan, the Potomac Mills mortgage loan and the DoubleTree by Hilton Tempe mortgage loan, each of which is part of a whole loan, the loan-to-value ratio, debt service coverage ratio and debt yield calculations include the relatedpari passu companion loan(s). |
THE INFORMATION IN THIS STRUCTURAL AND COLLATERAL TERM SHEET IS NOT COMPLETE AND MAY BE AMENDED PRIOR TO THE TIME OF SALE. THIS TERM SHEET IS NOT AN OFFER TO SELL THESE SECURITIES AND IT IS NOT A SOLICITATION OF AN OFFER TO BUY THESE SECURITIES IN ANY JURISDICTION WHERE THE OFFER OR SALE IS NOT PERMITTED.
11
| Wells Fargo Commercial Mortgage Trust 2016-C37 | Characteristics of the Mortgage Pool |
| D. | Previous Securitization History(1) |
| Loan No. | Mortgage Loan Seller | Mortgage Loan or Mortgaged Property Name | City | State | Property Type | Mortgage Loan or Mortgaged Property Cut-off Date Balance ($) | % of (%) | Previous Securitization |
| 1 | Barclays | Hilton Hawaiian Village | Honolulu | HI | Hospitality | $52,500,000 | 7.0% | HILT 2013-HLT |
| 3.01 | LCF | Alice Shopping Center | Alice | TX | Retail | 2,114,994 | 0.3 | CSMC 2007-C1 |
| 3.05 | LCF | Mustang Shopping Center | Mustang | OK | Retail | 1,619,438 | 0.2 | CSMC 2007-C1 |
| 3.07 | LCF | Yukon Shopping Center | Yukon | OK | Retail | 1,607,893 | 0.2 | CSMC 2007-C1 |
| 3.11 | LCF | Douglas Shopping Center | Douglas | AZ | Retail | 1,413,401 | 0.2 | CSMC 2007-C1 |
| 3.19 | LCF | Bad Axe Shopping Center | Bad Axe | MI | Retail | 1,057,719 | 0.1 | CSMC 2007-C1 |
| 3.26 | LCF | St. John’s Shopping Center | Saint Johns | MI | Retail | 905,855 | 0.1 | CSMC 2007-C1 |
| 3.33 | LCF | Liberty Shopping Center | Liberty | TX | Retail | 456,924 | 0.1 | CSMC 2007-C1 |
| 4 | Barclays | Potomac Mills | Woodbridge | VA | Retail | 36,375,000 | 4.8 | LBUBS 2007-C6 & WBCMT 2007-C33 |
| 5 | WFB | Franklin Square III | Gastonia | NC | Retail | 32,210,163 | 4.3 | WBCMT 2007-C32 |
| 7 | Barclays | The Hamptons | Las Vegas | NV | Multifamily | 17,875,423 | 2.4 | JPMCC 2007-LDPX |
| 8 | Barclays | Park Pointe | Los Angeles | CA | Multifamily | 8,887,780 | 1.2 | JPMCC 2006-LDP9 |
| 9 | Barclays | Hampton Inn Tropicana | Las Vegas | NV | Hospitality | 25,443,445 | 3.4 | WBCMT 2006-C25 |
| 12 | RMF | The Lodge & Waterfall Park Apartments Portfolio | Houston | TX | Multifamily | 22,900,000 | 3.1 | WFRBS 2013-C12 |
| 14 | LCF | Redwood MHC Portfolio | Various | Various | MHC | 20,600,000 | 2.7 | LBUBS 2006-C6 & LBUBS 2006-C7 |
| 19 | WFB | Parkway Plaza-NC | Durham | NC | Retail | 14,500,000 | 1.9 | CSFB 2005-C6 |
| 20 | WFB | Victor Valley Town Center I | Victorville | CA | Retail | 14,227,020 | 1.9 | WBCMT 2006-C28 |
| 23 | Barclays | Studio Village | North Hollywood | CA | Multifamily | 12,033,455 | 1.6 | JPMCC 2006-LDP9 |
| 26 | LCF | Holiday Inn Express- Hauppauge | Hauppauge | NY | Hospitality | 10,675,000 | 1.4 | CDGJ 2014-BXCH |
| 28 | C3CM | CubeSmart Self Storage of Lakeway | Lakeway | TX | Self Storage | 9,250,000 | 1.2 | JPMCC 2007-LD12 |
| 36 | LCF | Glendora-Whiteville Portfolio | Various | Various | Retail | 7,113,983 | 0.9 | LBUBS 2006-C6 |
| 39 | LCF | Holiday Inn Express & Suites Centerville | Centerville | OH | Hospitality | 6,641,811 | 0.9 | CSMC 2006-C5 |
| 40 | Barclays | Hollywood Pointe - Yucca | Los Angeles | CA | Multifamily | 5,792,037 | 0.8 | WBCMT 2006-C28 |
| 42 | Barclays | Rose Terrace - Whittier | Whittier | CA | Multifamily | 4,843,341 | 0.6 | WBCMT 2006-C28 |
| 43 | C3CM | The Elms MHC | Fond du Lac | WI | MHC | 4,439,610 | 0.6 | BSCMS 2007-T26 |
| 45 | Barclays | Suntree | Rialto | CA | Multifamily | 3,595,057 | 0.5 | WBCMT 2006-C28 |
| 48 | WFB | La Mirage Shopping Center | Southfield | MI | Retail | 3,408,300 | 0.5 | CSMC 2007-C1 |
| 52 | Barclays | Courtyard - Hawthorne | Hawthorne | CA | Multifamily | 3,195,606 | 0.4 | JPMCC 2006-LDP9 |
| 53 | LCF | Walgreens Brattleboro | Brattleboro | VT | Retail | 3,089,776 | 0.4 | LBUBS 2006-C6 |
| 54 | Barclays | Crosswinds | Las Vegas | NV | Multifamily | 3,045,812 | 0.4 | JPMCC 2007-LDPX |
| 55 | Barclays | Mountain Gate | San Bernardino | CA | Multifamily | 2,846,087 | 0.4 | JPMCC 2007-LDPX |
| 56 | RMF | Big Spring Marketplace | Big Spring | TX | Retail | 2,746,457 | 0.4 | MLCFC 2006-4 |
| 57 | RMF | Highland Park | Ocean Springs | MS | MHC | 2,500,000 | 0.3 | FNA 2015-M15 |
| 58 | WFB | Sterling Climatized Storage | Shreveport | LA | Self Storage | 2,415,000 | 0.3 | CSMC 2007-C2 |
| 60 | C3CM | Tice Mobile Home Court | Fort Myers | FL | MHC | 1,946,576 | 0.3 | MSC 2006-IQ12 |
| 61 | C3CM | Action’s Self Storage | Saint Paul | TX | Self Storage | 1,855,000 | 0.2 | LBUBS 2007-C1 |
| Total | $346,127,965 | 46.1% |
| (1) | The table above represents the most recent securitization with respect to the mortgaged property securing the related mortgage loan, based on information provided by the related borrower or obtained through searches of a third-party database. While loans secured by the above mortgaged properties may have been securitized multiple times in prior transactions, mortgage loans in this securitization are only listed in the above chart if the mortgage loan paid off a loan in another securitization. The information has not otherwise been confirmed by the mortgage loan sellers. |
THE INFORMATION IN THIS STRUCTURAL AND COLLATERAL TERM SHEET IS NOT COMPLETE AND MAY BE AMENDED PRIOR TO THE TIME OF SALE. THIS TERM SHEET IS NOT AN OFFER TO SELL THESE SECURITIES AND IT IS NOT A SOLICITATION OF AN OFFER TO BUY THESE SECURITIES IN ANY JURISDICTION WHERE THE OFFER OR SALE IS NOT PERMITTED.
12
| Wells Fargo Commercial Mortgage Trust 2016-C37 | Characteristics of the Mortgage Pool |
| E. | Mortgage Loans with Scheduled Balloon Payments and Related Classes |
| Class A-2(1) | ||||||||||||||||
| Loan No. | Mortgage Loan Seller | Mortgage Loan Name | State | Property Type | Mortgage Loan Cut-off Date Balance ($) | % of Initial Pool Balance (%) | Mortgage Loan Balance at Maturity ($) | % of Class A- 2 Certificate Principal Balance (%)(2) | SF | Loan per SF ($)(3) | U/W NCF DSCR (x)(3) | U/W NOI Debt Yield (%)(3) | Cut-off Date LTV Ratio (%)(3) | Balloon or ARD LTV Ratio (%)(3) | Rem. IO Period (mos.) | Rem. Term to Maturity (mos.) |
| 2 | Barclays | Quantum Park | VA | Office | $52,000,000 | 6.9% | $52,000,000 | 49.2% | 942,843 | $140 | 3.00x | 11.4% | 66.0% | 66.0% | 58 | 58 |
| 3 | LCF | Walmart Shadow Anchored Portfolio | Various | Retail | 39,536,250 | 5.3 | 37,976,898 | 35.9 | 881,524 | 101 | 1.36 | 10.6 | 75.0 | 72.0 | 21 | 57 |
| 21 | Barclays | One Conway Park | IL | Office | 12,600,000 | 1.7 | 12,600,000 | 11.9 | 105,000 | 120 | 2.60 | 12.8 | 64.0 | 64.0 | 60 | 60 |
| Total/Weighted Average | $104,136,250 | 13.9% | $102,576,898 | 97.0% | 2.33x | 11.3% | 69.2% | 68.0% | 44 | 58 | ||||||
| (1) | The table above presents the mortgage loan(s) whose balloon payments would be applied to pay down the principal balance of the Class A-2 Certificates, assuming a 0% CPR and applying the “Structuring Assumptions” described in the Preliminary Prospectus, including the assumptions that (i) none of the mortgage loans in the pool experience prepayments prior to maturity (or, in the case of an ARD loan, its anticipated repayment date), defaults or losses; (ii) there are no extensions of maturity dates of any mortgage loans in the pool; and (iii) each mortgage loan in the pool is paid in full on its stated maturity date (or, in the case of an ARD loan, its anticipated repayment date). Each Class of Certificates evidences undivided ownership interests in the entire pool of mortgage loans. Debt service coverage ratio, debt yield and loan-to-value ratio information do not take into account subordinate debt (whether or not secured by the related mortgaged property), if any, that currently exists or is allowed under the terms of any mortgage loan. See Annex A-1 to the Preliminary Prospectus. |
| (2) | Reflects the percentage equal to the Balloon Balance divided by the initial Class A-2 Certificate Balance. |
| (3) | With respect to the Quantum Park mortgage loan and the Walmart Shadow Anchored Portfolio mortgage loan, each of which is part of a whole loan, the Loan per SF, loan-to-value ratio, debt service coverage ratio and debt yield calculations include the relatedpari passucompanion loan(s). |
| Class A-3(1) | ||||||||||||||||
| Loan No. | Mortgage Loan Seller | Mortgage Loan Name | State | Property Type | Mortgage Loan Cut-off Date Balance ($) | % of Initial Pool Balance (%) | Mortgage Loan Balance at Maturity ($) | % of Class A-3 Certificate Principal Balance (%)(2) | SF | Loan per SF ($) | U/W NCF DSCR (x) | U/W NOI Debt Yield (%) | Cut-off Date LTV Ratio (%) | Balloon or ARD LTV Ratio (%) | Rem. IO Period (mos.) | Rem. Term to Maturity (mos.) |
| 5 | WFB | Franklin Square III | NC | Retail | $32,210,163 | 4.3% | $28,449,821 | 100.0% | 272,222 | $118 | 1.33x | 9.1% | 74.9% | 66.2% | 0 | 83 |
| Total/Weighted Average | $32,210,163 | 4.3% | $28,449,821 | 100.0% | 1.33x | 9.1% | 74.9% | 66.2% | 0 | 83 | ||||||
| (1) | The table above presents the mortgage loan(s) whose balloon payments would be applied to pay down the principal balance of the Class A-3 Certificates, assuming a 0% CPR and applying the “Structuring Assumptions” described in the Preliminary Prospectus, including the assumptions that (i) none of the mortgage loans in the pool experience prepayments prior to maturity (or, in the case of an ARD loan, its anticipated repayment date), defaults or losses; (ii) there are no extensions of maturity dates of any mortgage loans in the pool; and (iii) each mortgage loan in the pool is paid in full on its stated maturity date (or, in the case of an ARD loan, its anticipated repayment date). Each Class of Certificates evidences undivided ownership interests in the entire pool of mortgage loans. Debt service coverage ratio, debt yield and loan-to-value ratio information do not take into account subordinate debt (whether or not secured by the related mortgaged property), if any, that currently exists or is allowed under the terms of any mortgage loan. See Annex A-1 to the Preliminary Prospectus. |
| (2) | Reflects the percentage equal to the Balloon Balance divided by the initial Class A-3 Certificate Balance. |
THE INFORMATION IN THIS STRUCTURAL AND COLLATERAL TERM SHEET IS NOT COMPLETE AND MAY BE AMENDED PRIOR TO THE TIME OF SALE. THIS TERM SHEET IS NOT AN OFFER TO SELL THESE SECURITIES AND IT IS NOT A SOLICITATION OF AN OFFER TO BUY THESE SECURITIES IN ANY JURISDICTION WHERE THE OFFER OR SALE IS NOT PERMITTED.
13
| Wells Fargo Commercial Mortgage Trust 2016-C37 | Characteristics of the Mortgage Pool |
| F. | Property Type Distribution(1) |
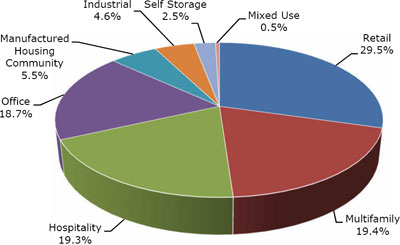
| Property Type | Number of Mortgaged Properties | Aggregate Cut-off Date Balance ($) | % of Initial Pool Balance (%) | Weighted Average Cut- off Date LTV Ratio (%) | Weighted Average Balloon or ARD LTV Ratio (%) | Weighted Average U/W NCF DSCR (x) | Weighted Average U/W NOI Debt Yield (%) | Weighted Average U/W NCF Debt Yield (%) | Weighted Average Mortgage Rate (%) | |||||||||||||||||||||||||||
| Retail | 52 | $221,080,218 | 29.5 | % | 62.0 | % | 54.4 | % | 1.96 | x | 11.0 | % | 10.1 | % | 4.552 | % | ||||||||||||||||||||
| Anchored | 7 | 112,546,196 | 15.0 | 64.0 | 54.1 | 1.54 | 10.4 | 9.5 | 4.588 | |||||||||||||||||||||||||||
| Shadow Anchored | 35 | 42,282,707 | 5.6 | 74.5 | 70.8 | 1.37 | 10.6 | 9.3 | 5.527 | |||||||||||||||||||||||||||
| Super Regional Mall | 1 | 36,375,000 | 4.8 | 38.0 | 38.0 | 4.39 | 13.9 | 13.3 | 2.988 | |||||||||||||||||||||||||||
| Unanchored | 6 | 19,672,556 | 2.6 | 71.4 | 56.9 | 1.41 | 10.3 | 9.5 | 4.989 | |||||||||||||||||||||||||||
| Single Tenant | 3 | 10,203,759 | 1.4 | 56.5 | 42.2 | 1.43 | 10.4 | 9.9 | 4.855 | |||||||||||||||||||||||||||
| Multifamily | 27 | 145,811,499 | 19.4 | 66.1 | 54.9 | 1.51 | 9.8 | 9.3 | 4.542 | |||||||||||||||||||||||||||
| Garden | 21 | 121,736,219 | 16.2 | 65.4 | 54.0 | 1.54 | 9.9 | 9.4 | 4.497 | |||||||||||||||||||||||||||
| Student Housing | 5 | 15,187,500 | 2.0 | 72.3 | 62.9 | 1.35 | 9.7 | 9.0 | 5.060 | |||||||||||||||||||||||||||
| Mid rise | 1 | 8,887,780 | 1.2 | 65.6 | 52.7 | 1.38 | 8.7 | 8.2 | 4.269 | |||||||||||||||||||||||||||
| Hospitality | 10 | 144,839,192 | 19.3 | 53.0 | 44.4 | 2.75 | 16.4 | 14.5 | 4.751 | |||||||||||||||||||||||||||
| Limited Service | 7 | 72,589,192 | 9.7 | 65.1 | 51.4 | 1.82 | 13.7 | 12.1 | 4.935 | |||||||||||||||||||||||||||
| Full Service | 2 | 63,500,000 | 8.5 | 36.8 | 35.1 | 3.99 | 20.0 | 17.7 | 4.447 | |||||||||||||||||||||||||||
| Extended Stay | 1 | 8,750,000 | 1.2 | 70.0 | 53.2 | 1.49 | 12.0 | 10.9 | 5.440 | |||||||||||||||||||||||||||
| Office | 6 | 140,255,000 | 18.7 | 65.4 | 62.0 | 2.29 | 10.6 | 10.1 | 4.116 | |||||||||||||||||||||||||||
| Suburban | 4 | 89,255,000 | 11.9 | 66.6 | 63.4 | 2.52 | 11.2 | 10.6 | 4.039 | |||||||||||||||||||||||||||
| CBD | 2 | 51,000,000 | 6.8 | 63.2 | 59.4 | 1.90 | 9.5 | 9.1 | 4.249 | |||||||||||||||||||||||||||
| Manufactured Housing Community | 25 | 41,541,308 | 5.5 | 67.7 | 56.0 | 1.53 | 9.7 | 9.5 | 4.412 | |||||||||||||||||||||||||||
| Manufactured Housing Community | 22 | 36,524,243 | 4.9 | 67.2 | 55.3 | 1.55 | 9.9 | 9.7 | 4.453 | |||||||||||||||||||||||||||
| Recreational Vehicle Community | 3 | 5,017,066 | 0.7 | 71.8 | 61.5 | 1.38 | 8.2 | 8.0 | 4.114 | |||||||||||||||||||||||||||
| Industrial | 15 | 34,584,562 | 4.6 | 66.3 | 58.8 | 1.80 | 12.7 | 11.1 | 4.640 | |||||||||||||||||||||||||||
| Warehouse | 15 | 34,584,562 | 4.6 | 66.3 | 58.8 | 1.80 | 12.7 | 11.1 | 4.640 | |||||||||||||||||||||||||||
| Self Storage | 5 | 18,895,000 | 2.5 | 65.0 | 54.4 | 1.37 | 9.0 | 8.8 | 5.003 | |||||||||||||||||||||||||||
| Self Storage | 5 | 18,895,000 | 2.5 | 65.0 | 54.4 | 1.37 | 9.0 | 8.8 | 5.003 | |||||||||||||||||||||||||||
| Mixed Use | 1 | 3,500,000 | 0.5 | 54.7 | 50.0 | 1.72 | 11.6 | 10.4 | 4.440 | |||||||||||||||||||||||||||
| Retail/Office | 1 | 3,500,000 | 0.5 | 54.7 | 50.0 | 1.72 | 11.6 | 10.4 | 4.440 | |||||||||||||||||||||||||||
| Total/Weighted Average: | 141 | $750,506,780 | 100.0 | % | 62.3 | % | 54.2 | % | 2.04 | x | 11.7 | % | 10.8 | % | 4.514 | % | ||||||||||||||||||||
| (1) | Because this table presents information relating to the mortgaged properties and not the mortgage loans, (a) the information for mortgage loans secured by more than one mortgaged property (other than through cross-collateralization with other mortgage loans) is based on allocated amounts (allocating the principal balance of the mortgage loan to each of those properties according to the relative appraised values of the mortgaged properties or the allocated loan amounts or property-specific release prices set forth in the related mortgage loan documents or such other allocation as the related mortgage loan seller deemed appropriate) and (b) the information for each mortgaged property that relates to a mortgage loan that is cross-collateralized or cross-defaulted with other mortgage loans is based upon the principal balance of that mortgage loan, except that the applicable loan-to-value ratio, debt service coverage ratio and debt yield for each such mortgage loan is based upon the ratio or yield (as applicable) for the aggregate indebtedness evidenced by all loans in the group (without regard to any limitation on the amount of indebtedness secured by any mortgaged property in such cross-collateralized group). On an individual basis, without regard to the cross-collateralization feature, any mortgage loan that is part of a cross-collateralized group of mortgage loans may have a higher loan-to-value ratio, lower debt service coverage ratio and/or lower debt yield than is presented herein. With respect to any mortgage loan that is part of a whole loan, the loan-to-value ratio, debt service coverage ratio and debt yield calculations include the relatedpari passucompanion loan(s) but exclude any related subordinate companion loan(s) (unless otherwise stated). With respect to each mortgage loan, debt service coverage ratio, debt yield and loan-to-value ratio information do not take into account of any subordinate debt (whether or not secured by the related mortgaged property) that currently exists or is allowed under the terms of such mortgage loan. See Annex A-1 to the Preliminary Prospectus. |
THE INFORMATION IN THIS STRUCTURAL AND COLLATERAL TERM SHEET IS NOT COMPLETE AND MAY BE AMENDED PRIOR TO THE TIME OF SALE. THIS TERM SHEET IS NOT AN OFFER TO SELL THESE SECURITIES AND IT IS NOT A SOLICITATION OF AN OFFER TO BUY THESE SECURITIES IN ANY JURISDICTION WHERE THE OFFER OR SALE IS NOT PERMITTED.
14
| Wells Fargo Commercial Mortgage Trust 2016-C37 | Characteristics of the Mortgage Pool |
| G. | Geographic Distribution(1)(2) |
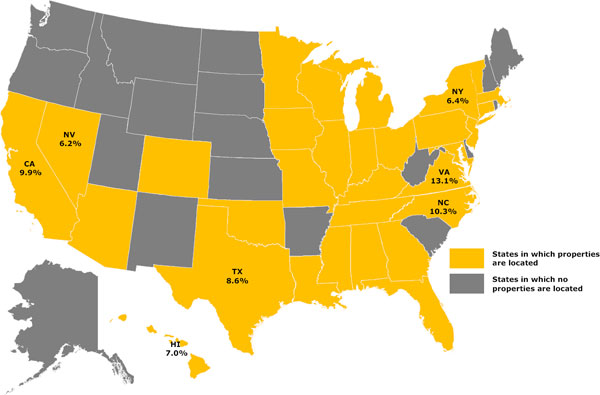
| Location | Number of Mortgaged Properties | Aggregate Cut-off Date Balance ($) | % of Initial Pool Balance (%) | Weighted Average Cut-off Date LTV Ratio (%) | Weighted Average Balloon or ARD LTV Ratio (%) | Weighted Average U/W NCF DSCR (x) | Weighted Average U/W NOI Debt Yield (%) | Weighted Average U/W NCF Debt Yield (%) | Weighted Average Mortgage Rate (%) | |||||||||||||||||||||||||||
| Virginia | 5 | $98,285,179 | 13.1 | % | 54.6 | % | 53.6 | % | 3.48 | x | 13. | % | 12.4 | % | 3.500 | % | ||||||||||||||||||||
| North Carolina | 8 | 77,067,759 | 10.3 | 67.2 | 56.8 | 1.54 | 11.1 | 10.1 | 4.877 | |||||||||||||||||||||||||||
| California | 11 | 74,045,384 | 9.9 | 61.0 | 49.6 | 1.68 | 10.6 | 10.0 | 4.550 | |||||||||||||||||||||||||||
| Southern | 10 | 70,670,384 | 9.4 | 60.6 | 49.1 | 1.70 | 10.7 | 10.1 | 4.521 | |||||||||||||||||||||||||||
| Northern | 1 | 3,375,000 | 0.4 | 70.2 | 59.5 | 1.31 | 8.7 | 8.6 | 5.140 | |||||||||||||||||||||||||||
| Texas | 17 | 64,839,605 | 8.6 | 64.9 | 56.1 | 1.51 | 10.4 | 9.7 | 5.006 | |||||||||||||||||||||||||||
| Hawaii | 1 | 52,500,000 | 7.0 | 31.2 | 31.2 | 4.47 | 21.2 | 19.0 | 4.200 | |||||||||||||||||||||||||||
| New York | 3 | 48,275,000 | 6.4 | 59.2 | 55.0 | 1.98 | 10.8 | 9.8 | 4.570 | |||||||||||||||||||||||||||
| Nevada | 3 | 46,364,681 | 6.2 | 66.4 | 53.9 | 1.59 | 10.9 | 9.8 | 4.580 | |||||||||||||||||||||||||||
| Other(3) | 93 | 289,129,172 | 38.5 | 68.7 | 58.6 | 1.54 | 10.5 | 9.6 | 4.680 | |||||||||||||||||||||||||||
| Total/Weighted Average | 141 | $750,506,780 | 100.0 | % | 62.3 | % | 54.2 | % | 2.04 | x | 11.7 | % | 10.8 | % | 4.514 | % | ||||||||||||||||||||
| (1) | The mortgaged properties are located in 31 states. |
| (2) | Because this table presents information relating to the mortgaged properties and not the mortgage loans, (a) the information for mortgage loans secured by more than one mortgaged property (other than through cross-collateralization with other mortgage loans) is based on allocated amounts (allocating the principal balance of the mortgage loan to each of those properties according to the relative appraised values of the mortgaged properties or the allocated loan amounts or property-specific release prices set forth in the related mortgage loan documents or such other allocation as the related mortgage loan seller deemed appropriate), and (b) the information for each mortgaged property that relates to a mortgage loan that is cross-collateralized or cross-defaulted with other mortgage loans is based upon the principal balance of that mortgage loan, except that the applicable loan-to-value ratio, debt service coverage ratio and debt yield for each such mortgage loan is based upon the ratio or yield (as applicable) for the aggregate indebtedness evidenced by all loans in the group (without regard to any limitation on the amount of indebtedness secured by any mortgaged property in such cross-collateralized group). On an individual basis, without regard to the cross-collateralization feature, any mortgage loan that is part of a cross-collateralized group of mortgage loans may have a higher loan-to-value ratio, lower debt service coverage ratio and/or lower debt yield than is presented herein. With respect to any mortgage loan that is part of a whole loan, the loan-to-value ratio, debt service coverage ratio and debt yield calculations include the relatedpari passucompanion loan(s) but exclude any related subordinate companion loan(s) (unless otherwise stated). With respect to each mortgage loan, debt service coverage ratio, debt yield and loan-to-value ratio information do not take into account of any subordinate debt (whether or not secured by the related mortgaged property) that currently exists or is allowed under the terms of such mortgage loan. See Annex A-1 to the Preliminary Prospectus. |
| (3) | Includes 24 other states. |
THE INFORMATION IN THIS STRUCTURAL AND COLLATERAL TERM SHEET IS NOT COMPLETE AND MAY BE AMENDED PRIOR TO THE TIME OF SALE. THIS TERM SHEET IS NOT AN OFFER TO SELL THESE SECURITIES AND IT IS NOT A SOLICITATION OF AN OFFER TO BUY THESE SECURITIES IN ANY JURISDICTION WHERE THE OFFER OR SALE IS NOT PERMITTED.
15
| Wells Fargo Commercial Mortgage Trust 2016-C37 | Characteristics of the Mortgage Pool |
| H. | Characteristics of the Mortgage Pool(1) |
| CUT-OFF DATE BALANCE | |||||||||
| Range of Cut-off Date Balances ($) | Number of Mortgage Loans | Aggregate Cut- off Date Balance | Percent by Aggregate Cut-off Date Pool Balance (%) | ||||||
| 1,450,000 - 2,000,000 | 5 | $8,970,076 | 1.2 | % | |||||
| 2,000,001 - 3,000,000 | 4 | 10,507,544 | 1.4 | ||||||
| 3,000,001 - 4,000,000 | 11 | 37,416,961 | 5.0 | ||||||
| 4,000,001 - 5,000,000 | 2 | 9,282,950 | 1.2 | ||||||
| 5,000,001 - 6,000,000 | 2 | 11,271,251 | 1.5 | ||||||
| 6,000,001 - 7,000,000 | 3 | 20,391,811 | 2.7 | ||||||
| 7,000,001 - 8,000,000 | 3 | 22,204,633 | 3.0 | ||||||
| 8,000,001 - 9,000,000 | 5 | 42,735,466 | 5.7 | ||||||
| 9,000,001 - 10,000,000 | 3 | 27,705,000 | 3.7 | ||||||
| 10,000,001 - 15,000,000 | 9 | 113,692,594 | 15.1 | ||||||
| 15,000,001 - 20,000,000 | 4 | 65,962,923 | 8.8 | ||||||
| 20,000,001 - 30,000,000 | 7 | 167,744,157 | 22.4 | ||||||
| 30,000,001 - 50,000,000 | 3 | 108,121,413 | 14.4 | ||||||
| 50,000,001 - 52,500,000 | 2 | 104,500,000 | 13.9 | ||||||
| Total: | 63 | $750,506,780 | 100.0 | % | |||||
| Average | $11,912,806 | ||||||||
| UNDERWRITTEN NOI DEBT SERVICE COVERAGE RATIO | |||||||||
| Range of U/W NOI DSCRs (x) | Number of Mortgage Loans | Aggregate Cut- off Date Balance | Aggregate Cut-off Pool Balance (%) | ||||||
| 1.33 - 1.40 | 5 | $18,290,076 | 2.4 | % | |||||
| 1.41 - 1.50 | 18 | 181,940,818 | 24.2 | ||||||
| 1.51 - 1.60 | 7 | 115,770,792 | 15.4 | ||||||
| 1.61 - 1.70 | 7 | 63,383,253 | 8.4 | ||||||
| 1.71 - 1.80 | 5 | 33,432,156 | 4.5 | ||||||
| 1.81 - 1.90 | 5 | 48,540,650 | 6.5 | ||||||
| 1.91 - 2.00 | 4 | 48,818,445 | 6.5 | ||||||
| 2.01 - 2.50 | 4 | 53,121,026 | 7.1 | ||||||
| 2.51 - 3.00 | 3 | 26,350,000 | 3.5 | ||||||
| 3.01 - 3.50 | 3 | 71,984,562 | 9.6 | ||||||
| 4.01 - 4.98 | 2 | 88,875,000 | 11.8 | ||||||
| Total: | 63 | $750,506,780 | 100.0 | % | |||||
| Weighted Average: | 2.21 x | ||||||||
| UNDERWRITTEN NCF DEBT SERVICE COVERAGE RATIO | |||||||||
| Range U/W NCF DSCRs (x) | Number of Mortgage Loans | Aggregate Cut- off Date Balance | Percent by Aggregate Cut-off Date Pool Balance (%) | ||||||
| 1.30 - 1.30 | 2 | $3,718,500 | 0.5 | % | |||||
| 1.31 - 1.40 | 22 | 251,029,895 | 33.4 | ||||||
| 1.41 - 1.50 | 6 | 56,403,292 | 7.5 | ||||||
| 1.51 - 1.60 | 8 | 88,622,413 | 11.8 | ||||||
| 1.61 - 1.70 | 6 | 45,810,589 | 6.1 | ||||||
| 1.71 - 1.80 | 7 | 66,391,503 | 8.8 | ||||||
| 1.81 - 1.90 | 1 | 9,200,000 | 1.2 | ||||||
| 1.91 - 2.00 | 1 | 6,641,811 | 0.9 | ||||||
| 2.01 - 2.50 | 4 | 49,229,215 | 6.6 | ||||||
| 2.51 - 3.00 | 4 | 84,584,562 | 11.3 | ||||||
| 4.01 - 4.47 | 2 | 88,875,000 | 11.8 | ||||||
| Total: | 63 | $750,506,780 | 100.0 | % | |||||
| Weighted Average: | 2.04 x | ||||||||
| LOAN PURPOSE | |||||||||
| Loan Purpose | Number of Mortgage Loans | Aggregate Cut- off Date Balance | Percent by Aggregate Cut- off Date Pool Balance (%) | ||||||
| Refinance | 49 | $525,381,177 | 70.0 | % | |||||
| Acquisition | 14 | 225,125,603 | 30.0 | ||||||
| Total: | 63 | $750,506,780 | 100.0 | % | |||||
| MORTGAGE RATE | |||||||||
| Range of Mortgage Rates (%) | Number of Number of Mortgage Loans | Aggregate Cut- off Date Balance | Percent by Aggregate Cut- off Date Pool Balance (%) | ||||||
| 2.988 - 3.500 | 1 | $36,375,000 | 4.8 | % | |||||
| 3.501 - 3.750 | 2 | 76,700,712 | 10.2 | ||||||
| 4.001 - 4.250 | 7 | 147,879,215 | 19.7 | ||||||
| 4.251 - 4.500 | 15 | 112,421,570 | 15.0 | ||||||
| 4.501 - 4.750 | 7 | 63,343,033 | 8.4 | ||||||
| 4.751 - 5.000 | 15 | 178,494,230 | 23.8 | ||||||
| 5.001 - 5.250 | 5 | 30,131,250 | 4.0 | ||||||
| 5.251 - 5.500 | 8 | 51,325,520 | 6.8 | ||||||
| 5.501 - 5.670 | 3 | 53,836,250 | 7.2 | ||||||
| Total: | 63 | $750,506,780 | 100.0 | % | |||||
| Weighted Average: | 4.514% | ||||||||
| UNDERWRITTEN NOI DEBT YIELD | |||||||||
| Range of U/W NOI Debt Yields (%) | Number of Mortgage Loans | Aggregate Cut- off Date Balance | Percent by Aggregate Cut- off Date Pool Balance (%) | ||||||
| 8.2 - 9.0 | 13 | $118,994,499 | 15.9 | % | |||||
| 9.1 - 10.0 | 17 | 188,030,938 | 25.1 | ||||||
| 10.1 - 11.0 | 9 | 115,245,927 | 15.4 | ||||||
| 11.1 - 12.0 | 8 | 112,757,447 | 15.0 | ||||||
| 12.1 - 13.0 | 5 | 57,768,445 | 7.7 | ||||||
| 13.1 - 14.0 | 2 | 44,853,936 | 6.0 | ||||||
| 14.1 - 15.0 | 5 | 35,121,026 | 4.7 | ||||||
| 16.1 - 17.0 | 1 | 6,750,000 | 0.9 | ||||||
| 17.1 - 18.0 | 1 | 7,000,000 | 0.9 | ||||||
| 18.1 - 19.0 | 1 | 11,484,562 | 1.5 | ||||||
| 20.1 - 21.2 | 1 | 52,500,000 | 7.0 | ||||||
| Total: | 63 | $750,506,780 | 100.0 | % | |||||
| Weighted Average: | 11.7% | ||||||||
| UNDERWRITTEN NCF DEBT YIELD | |||||||||
| Range of U/W NCF Debt Yields (%) | Number of Mortgage Loans | Aggregate Cut- off Date Balance | Percent by Aggregate Cut- off Date Pool Balance (%) | ||||||
| 8.0 | 1 | $20,600,000 | 2.7 | % | |||||
| 8.1 - 9.0 | 22 | 237,977,704 | 31.7 | ||||||
| 9.1 - 10.0 | 13 | 135,531,252 | 18.1 | ||||||
| 10.1 - 11.0 | 10 | 107,721,503 | 14.4 | ||||||
| 11.1 - 12.0 | 6 | 100,516,797 | 13.4 | ||||||
| 12.1 - 13.0 | 3 | 16,570,747 | 2.2 | ||||||
| 13.1 - 14.0 | 3 | 48,375,000 | 6.4 | ||||||
| 14.1 - 15.0 | 2 | 12,229,215 | 1.6 | ||||||
| 15.1 - 16.0 | 2 | 18,484,562 | 2.5 | ||||||
| 18.1 - 19.0 | 1 | 52,500,000 | 7.0 | ||||||
| Total: | 63 | $750,506,780 | 100.0 | % | |||||
| Weighted Average: | 10.8% | ||||||||
| ORIGINAL TERM TO MATURITY OR ARD | |||||||||
| Original Terms to Maturity or ARD (months) | Number of Mortgage Loans | Aggregate Cut- off Date Balance | Percent by Aggregate Cut- off Date Pool Balance (%) | ||||||
| 60 | 3 | $104,136,250 | 13.9 | % | |||||
| 84 | 1 | 32,210,163 | 4.3 | ||||||
| 120 | 59 | 614,160,367 | 81.8 | ||||||
| Total: | 63 | $750,506,780 | 100.0 | % | |||||
| Weighted Average: | 110 months | ||||||||
| (1) | Information regarding mortgage loans that are cross-collateralized or cross-defaulted with other mortgage loans is based upon the individual loan balances, except that the applicable loan-to-value ratio, debt service coverage ratio and debt yield for each such mortgage loan is based upon the ratio or yield (as applicable) for the aggregate indebtedness evidenced by all loans in the group (without regard to any limitation on the amount of indebtedness secured by any mortgaged property in such cross-collateralized group). On an individual basis, without regard to the cross-collateralization feature, any mortgage loan that is part of a cross-collateralized group of mortgage loans may have a higher loan-to-value ratio, lower debt service coverage ratio and/or lower debt yield than is presented herein. With respect to any mortgage loan that is part of a whole loan, the loan-to-value ratio, debt service coverage ratio and debt yield calculations include the relatedpari passu companion loan(s) but exclude any related subordinate companion loan(s) (unless otherwise stated). With respect to each mortgage loan, debt service coverage ratio, debt yield and loan-to-value ratio information do not take into account any subordinate debt (whether or not secured by the related mortgaged property), that currently exists or is allowed under the terms of such mortgage loan. See Annex A-1 to the Preliminary Prospectus. Prepayment provisions for each mortgage loan reflects the entire life of the loan (from origination to maturity or ARD). |
THE INFORMATION IN THIS STRUCTURAL AND COLLATERAL TERM SHEET IS NOT COMPLETE AND MAY BE AMENDED PRIOR TO THE TIME OF SALE. THIS TERM SHEET IS NOT AN OFFER TO SELL THESE SECURITIES AND IT IS NOT A SOLICITATION OF AN OFFER TO BUY THESE SECURITIES IN ANY JURISDICTION WHERE THE OFFER OR SALE IS NOT PERMITTED.
16
| Wells Fargo Commercial Mortgage Trust 2016-C37 | Characteristics of the Mortgage Pool |
REMAINING TERM TO MATURITY OR ARD
| Range of Remaining Terms to Maturity or ARD (months) | Number of Mortgage Loans | Aggregate Cut- off Date Balance | Percent by Aggregate Cut- off Date Pool Balance (%) | ||||||
| 57 - 60 | 3 | $104,136,250 | 13.9 | % | |||||
| 61 - 84 | 1 | 32,210,163 | 4.3 | ||||||
| 85 - 120 | 59 | 614,160,367 | 81.8 | ||||||
| Total: | 63 | $750,506,780 | 100.0 | % | |||||
| Weighted Average: | 109 months | ||||||||
ORIGINAL AMORTIZATION TERM(2)
| Range of Original Amortization Terms (months) | Number of Mortgage Loans | Aggregate Cut- off Date Balance | Percent by Aggregate Cut- off Date Pool Balance (%) | |||||||
| Non-Amortizing | 6 | $191,975,000 | 25.6 | % | ||||||
| 240 | 2 | 11,978,936 | 1.6 | |||||||
| 300 – 329 | 9 | 73,757,282 | 9.8 | |||||||
| 330 – 360 | 46 | 472,795,562 | 63.0 | |||||||
| Total: | 63 | $750,506,780 | 100.0 | % | ||||||
| Weighted Average(3): | 348 months | |||||||||
| (2) | The original amortization term shown for any mortgage loan that is interest-only for part of its term does not include the number of months in its interest-only period and reflects only the number of months as of the commencement of amortization remaining from the end of such interest-only period. |
| (3) | Excludes the non-amortizing mortgage loans. |
REMAINING AMORTIZATION TERM(4)
| Range of Remaining Amortization Terms (months) | Number of Mortgage Loans | Aggregate Cut- off Date Balance | Percent by Aggregate Cut- off Date Pool Balance (%) | ||||||
| Non-Amortizing | 6 | $191,975,000 | 25.6 | % | |||||
| 239 - 240 | 2 | 11,978,936 | 1.6 | ||||||
| 241 - 300 | 9 | 73,757,282 | 9.8 | ||||||
| 301 - 360 | 46 | 472,795,562 | 63.0 | ||||||
| Total: | 63 | $750,506,780 | 100.0 | % | |||||
| Weighted Average(5): | 348 months | ||||||||
| (4) | The remaining amortization term shown for any mortgage loan that is interest-only for part of its term does not include the number of months in its interest-only period and reflects only the number of months as of the commencement of amortization remaining from the end of such interest-only period. |
| (5) | Excludes the non-amortizing mortgage loans. |
LOCKBOXES
| Type of Lockbox | Number of Mortgage Loans | Aggregate Cut- off Date Balance | Percent by Aggregate Cut- off Date Pool Balance (%) | ||||||
| Springing | 38 | $293,894,245 | 39.2 | % | |||||
| Hard/Upfront Cash Management | 7 | 205,240,009 | 27.3 | ||||||
| Hard/Springing Cash Management | 10 | 150,433,007 | 20.0 | ||||||
| Soft/Springing Cash Management | 4 | 86,137,895 | 11.5 | ||||||
| None | 4 | 14,801,623 | 2.0 | ||||||
| Total: | 63 | $750,506,780 | 100.0 | % | |||||
PREPAYMENT PROVISION SUMMARY
| Prepayment Provision | Number of Mortgage Loans | Aggregate Cut- off Date Balance | Percent by Aggregate Cut- off Date Pool Balance (%) | ||||||
| Lockout / Def / Open | 54 | $568,931,853 | 75.8 | % | |||||
| Lockout / GRTR 1% or YM / Open | 8 | 129,074,927 | 17.2 | ||||||
| Lockout / Def or GRTR 1% or YM / Open | 1 | 52,500,000 | 7.0 | ||||||
| Total: | 63 | $750,506,780 | 100.0 | % | |||||
CUT-OFF DATE LOAN-TO-VALUE RATIO
| Range of Cut-off Date LTV Ratios (%) | Number of Mortgage Loans | Aggregate Cut- off Date Balance | Percent by Aggregate Cut- off Date Pool Balance (%) | ||||||
| 31.2 - 35.0 | 1 | $52,500,000 | 7.0 | % | |||||
| 35.1 - 40.0 | 1 | 36,375,000 | 4.8 | ||||||
| 45.1 - 50.0 | 3 | 17,068,991 | 2.3 | ||||||
| 50.1 - 55.0 | 4 | 44,135,378 | 5.9 | ||||||
| 55.1 - 60.0 | 6 | 50,266,583 | 6.7 | ||||||
| 60.1 - 65.0 | 13 | 150,298,631 | 20.0 | ||||||
| 65.1 - 70.0 | 16 | 169,890,643 | 22.6 | ||||||
| 70.1 - 75.0 | 19 | 229,971,555 | 30.6 | ||||||
| Total: | 63 | $750,506,780 | 100.0 | % | |||||
| Weighted Average: | 62.3% | ||||||||
BALLOON OR ARD LOAN-TO-VALUE RATIO
| Range of Balloon or ARD LTV Ratios (%) | Number of Mortgage Loans | Aggregate Cut- off Date Balance | Percent by Aggregate Cut- off Date Pool Balance (%) | ||||||
| 31.2 - 35.0 | 3 | $61,068,991 | 8.1 | % | |||||
| 35.1 - 40.0 | 2 | 44,853,936 | 6.0 | ||||||
| 40.1 - 45.0 | 5 | 29,812,398 | 4.0 | ||||||
| 45.1 - 50.0 | 8 | 70,904,258 | 9.4 | ||||||
| 50.1 - 55.0 | 16 | 197,145,332 | 26.3 | ||||||
| 55.1 - 60.0 | 14 | 81,148,738 | 10.8 | ||||||
| 60.1 - 65.0 | 10 | 97,726,716 | 13.0 | ||||||
| 65.1 - 70.0 | 4 | 128,310,163 | 17.1 | ||||||
| 70.1 - 72.0 | 1 | 39,536,250 | 5.3 | ||||||
| Total: | 63 | $750,506,780 | 100.0 | % | |||||
| Weighted Average: | 54.2% | ||||||||
AMORTIZATION TYPE
| Amortization Type | Number of Mortgage Loans | Aggregate Cut- off Date Balance | Percent by Aggregate Cut- off Date Pool Balance (%) | ||||||
| Amortizing Balloon | 39 | $333,044,280 | 44.4 | % | |||||
| Interest-only, Amortizing Balloon | 18 | 225,487,500 | 30.0 | ||||||
| Interest-only, Balloon | 4 | 127,375,000 | 17.0 | ||||||
| Interest-only, ARD | 2 | 64,600,000 | 8.6 | ||||||
| Total: | 63 | $750,506,780 | 100.0 | % | |||||
ORIGINAL TERM OF INTEREST-ONLY PERIOD FOR PARTIAL IO LOANS
| IO Terms (months) | Number of Mortgage Loans | Aggregate Cut- off Date Balance | Percent by Aggregate Cut- off Date Pool Balance (%) | |||||||
| 12 | 1 | $3,375,000 | 0.4 | % | ||||||
| 18 | 2 | 19,400,000 | 2.6 | |||||||
| 24 | 7 | 80,625,000 | 10.7 | |||||||
| 30 | 1 | 20,600,000 | 2.7 | |||||||
| 36 | 3 | 45,387,500 | 6.0 | |||||||
| 48 | 1 | 14,500,000 | 1.9 | |||||||
| 60 | 3 | 41,600,000 | 5.5 | |||||||
| Total: | 18 | $225,487,500 | 30.0 | % | ||||||
| Weighted Average: | 34 months | |||||||||
SEASONING
| Seasoning (months) | Number of Mortgage Loans | Aggregate Cut- off Date Balance | Percent by Aggregate Cut- off Date Pool Balance (%) | |||||||
| 0 | 27 | $246,784,750 | 32.9 | % | ||||||
| 1 | 27 | 300,202,094 | 40.0 | |||||||
| 2 | 4 | 81,568,991 | 10.9 | |||||||
| 3 | 3 | 67,250,233 | 9.0 | |||||||
| 5 | 1 | 30,000,000 | 4.0 | |||||||
| 6 | 1 | 24,700,712 | 3.3 | |||||||
| Total: | 63 | $750,506,780 | 100.0 | % | ||||||
| Weighted Average: | 1 month | |||||||||
THE INFORMATION IN THIS STRUCTURAL AND COLLATERAL TERM SHEET IS NOT COMPLETE AND MAY BE AMENDED PRIOR TO THE TIME OF SALE. THIS TERM SHEET IS NOT AN OFFER TO SELL THESE SECURITIES AND IT IS NOT A SOLICITATION OF AN OFFER TO BUY THESE SECURITIES IN ANY JURISDICTION WHERE THE OFFER OR SALE IS NOT PERMITTED.
17
| Wells Fargo Commercial Mortgage Trust 2016-C37 | Certain Terms and Conditions |
V. Certain Terms and Conditions
| Interest Entitlements: | The interest entitlement of each Class of Offered Certificates on each Distribution Date generally will be the interest accrued during the related Interest Accrual Period on the related Certificate Balance or Notional Amount at the related pass-through rate, net of any prepayment interest shortfalls allocated to that Class for such Distribution Date as described below. If prepayment interest shortfalls arise from voluntary prepayments (without Master Servicer consent) on particular non-specially serviced loans during any collection period, the Master Servicer is required to make a compensating interest payment to offset those shortfalls, generally up to an amount equal to the portion of its master servicing fees that accrue at 0.25 basis pointsper annum. The remaining amount of prepayment interest shortfalls will be allocated to reduce the interest entitlement on all Classes of Certificates,pro rata, based on their respective amounts of accrued interest for the related Distribution Date. If a Class receives less than the entirety of its interest entitlement on any Distribution Date, then the shortfall (excluding any shortfall due to prepayment interest shortfalls), together with interest thereon, will be added to its interest entitlement for the next succeeding Distribution Date. |
| Principal Distribution Amount: | The Principal Distribution Amount for each Distribution Date generally will be the aggregate amount of principal received or advanced in respect of the mortgage loans, net of any non-recoverable advances and interest thereon and workout-delayed reimbursement amounts that are reimbursed to the Master Servicer, the Special Servicer or the Trustee during the related collection period. Non-recoverable advances and interest thereon are reimbursable from principal collections and advances before reimbursement from other amounts. Workout-delayed reimbursement amounts are reimbursable from principal collections. |
| Distributions: | On each Distribution Date, funds available for distribution from the mortgage loans, net of specified trust fees, expenses and reimbursements will generally be distributed in the following amounts and order of priority (in each case to the extent of remaining available funds): |
| 1. Class A-1, A-2, A-3, A-4, A-5, A-SB, X-A, X-B, X-D, X-EF, X-G, X-H and X-J Certificates: To interest on the Class A-1, A-2, A-3, A-4, A-5, A-SB, X-A, X-B, X-D, X-EF, X-G, X-H and X-J Certificates,pro rata, according to their respective interest entitlements. | |
| 2. Class A-1, A-2, A-3, A-4, A-5 and A-SB Certificates: To principal on the Class A-1, A-2, A-3, A-4, A-5 and A-SB Certificates in the following amounts and order of priority: (i) first, to principal on the Class A-SB Certificates, in an amount up to the Principal Distribution Amount for such Distribution Date until their Certificate Balance is reduced to the Class A-SB Planned Principal Balance for such Distribution Date; (ii) second, to principal on the Class A-1 Certificates until their Certificate Balance is reduced to zero, up to the remainder of the Principal Distribution Amount for such Distribution Date; (iii) third, to principal on the Class A-2 Certificates until their Certificate Balance is reduced to zero, up to the remainder of the Principal Distribution Amount for such Distribution Date; (iv) fourth, to principal on the Class A-3 Certificates, until their Certificate Balance is reduced to zero, up to the remainder of the Principal Distribution Amount for such Distribution Date; (v) fifth, to principal on the Class A-4 Certificates until their Certificate Balance is reduced to zero, up to the remainder of the Principal Distribution Amount for such Distribution Date; (vi) sixth, to principal on the Class A-5 Certificates until their Certificate Balance is reduced to zero, up to the remainder of the Principal Distribution Amount for such Distribution Date; and (vii) seventh, to principal on the Class A-SB Certificates until their Certificate Balance is reduced to zero, up to the remainder of the Principal Distribution Amount for such Distribution Date. However, if the Certificate Balance of each and every Class of Principal Balance Certificates, other than the Class A-1, A-2, A-3, A-4, A-5 and A-SB Certificates, has been reduced to zero as a result of the allocation of Mortgage Loan losses and expenses and any of the Class A-1, A-2, A-3, A-4, A-5 and A-SB Certificates remains outstanding, then the Principal Distribution Amount will be distributed to the Class A-1, A-2, A-3, A-4, A-5 and A-SB Certificates,pro rata, based on their respective outstanding Certificate Balances, until their Certificate Balances have been reduced to zero. | |
| 3. Class A-1, A-2, A-3, A-4, A-5 and A-SB Certificates: To reimburse the holders of the Class A-1, A-2, A-3, A-4, A-5 and A-SB Certificates,pro rata, on the basis of previously allocated unreimbursed losses, for any previously unreimbursed losses (plus interest thereon) on the mortgage loans that were previously allocated in reduction of the Certificate Balances of such Classes. |
THE INFORMATION IN THIS STRUCTURAL AND COLLATERAL TERM SHEET IS NOT COMPLETE AND MAY BE AMENDED PRIOR TO THE TIME OF SALE. THIS TERM SHEET IS NOT AN OFFER TO SELL THESE SECURITIES AND IT IS NOT A SOLICITATION OF AN OFFER TO BUY THESE SECURITIES IN ANY JURISDICTION WHERE THE OFFER OR SALE IS NOT PERMITTED.
18
| Wells Fargo Commercial Mortgage Trust 2016-C37 | Certain Terms and Conditions |
4. Class A-S Certificates: To make distributions on the Class A-S Certificates as follows: (a) first, to interest on the Class A-S Certificates in the amount of the interest entitlement for that Class; (b) next, to the extent of the portion of the Principal Distribution Amount remaining after distributions in respect of principal to each Class with a higher distribution priority (in this case, the Class A-1, A-2, A-3, A-4, A-5 and A-SB Certificates), to principal on the Class A-S Certificates until their Certificate Balance is reduced to zero; and (c) next, to reimburse the holders of the Class A-S Certificates for any previously unreimbursed losses (plus interest thereon) on the mortgage loans that were previously allocated to that Class in reduction of their Certificate Balance.
5. Class B Certificates: To make distributions on the Class B Certificates as follows: (a) first, to interest on the Class B Certificates in the amount of the interest entitlement for that Class; (b) next, to the extent of the portion of the Principal Distribution Amount remaining after distributions in respect of principal to each Class with a higher distribution priority (in this case, the Class A-1, A-2, A-3, A-4, A-5, A-SB and A-S Certificates), to principal on the Class B Certificates until their Certificate Balance is reduced to zero; and (c) next, to reimburse the holders of the Class B Certificates for any previously unreimbursed losses (plus interest thereon) on the mortgage loans that were previously allocated to that Class in reduction of their Certificate Balance.
6. Class C Certificates: To make distributions on the Class C Certificates as follows: (a) first, to interest on the Class C Certificates in the amount of the interest entitlement for that Class; (b) next, to the extent of the portion of the Principal Distribution Amount remaining after distributions in respect of principal to each Class with a higher distribution priority (in this case, the Class A-1, A-2, A-3, A-4, A-5, A-SB, A-S and B Certificates), to principal on the Class C Certificates until their Certificate Balance is reduced to zero; and (c) next, to reimburse the holders of the Class C Certificates for any previously unreimbursed losses (plus interest thereon) on the mortgage loans that were previously allocated to that Class in reduction of their Certificate Balance.
7. After the Class A-1, A-2, A-3, A-4, A-5, A-SB, A-S, B and C Certificates are paid all amounts to which they are entitled, the remaining funds available for distribution will be used to pay interest, principal and loss reimbursement amounts on the Class D, E, F, G, H and J Certificates sequentially in that order in a manner analogous to the Class C Certificates.
| |
| Allocation of Yield Maintenance and Prepayment Premiums: | If any yield maintenance charge or prepayment premium is collected during any particular collection period with respect to any mortgage loan, then on the Distribution Date corresponding to that collection period, the certificate administrator will pay that yield maintenance charge or prepayment premium (net of liquidation fees payable therefrom) in the following manner: (1) to each of the Class A-1, A-2, A-3, A-4, A-5, A-SB, A-S, B, C and D Certificates, the product of (a) such yield maintenance charge or prepayment premium, (b) the related Base Interest Fraction (as defined in the Preliminary Prospectus) for such Class, and (c) a fraction, the numerator of which is equal to the amount of principal distributed to such Class for that Distribution Date, and the denominator of which is the total amount of principal distributed to all Principal Balance Certificates for that Distribution Date, and (2) to the Class X-A Certificates, the excess, if any, of (a) the product of (i) such yield maintenance charge or prepayment premium and (ii) a fraction, the numerator of which is equal to the amount of principal distributed to the Class A-1, A-2, A-3, A-4, A-5 and A-SB Certificates for that Distribution Date, and the denominator of which is the total amount of principal distributed to all Principal Balance Certificates for that Distribution Date, over (b) the amount of such yield maintenance charge or prepayment premium distributed to the Class A-1, A-2, A-3, A-4, A-5 and A-SB Certificates as described above, and (3) to the Class X-B Certificates, any remaining yield maintenance charge or prepayment premium not distributed as described above. No prepayment premiums or yield maintenance charges will be distributed to the holders of the Class X-D, X-EF, X-G, X-H, X-J, E, F, G, H, J, V or R Certificates. For a description of when prepayment premiums and yield maintenance charges are generally required on the mortgage loans, see Annex A-1 to the Preliminary Prospectus. See also “Risk Factors—Risks Relating to the Mortgage Loans—Risks Relating to Enforceability of Yield Maintenance Charges, Prepayment Premiums or Defeasance Provisions” and “Risk Factors—Other Risks Relating to the Certificates—Your Yield May Be Affected by Defaults, Prepayments and Other Factors” in the Preliminary Prospectus. Prepayment premiums and yield maintenance charges will be distributed on each Distribution Date only to the extent they are actually received on the mortgage loans as of the related Determination Date. |
| Realized Losses: | The Certificate Balances of the Class A-1, A-2, A-3, A-4, A-5, A-SB, A-S, B, C, D, E, F, G, H and J Certificates will be reduced without distribution on any Distribution Date as a write-off to the extent of any losses realized on the mortgage loans allocated to such Class on such Distribution |
THE INFORMATION IN THIS STRUCTURAL AND COLLATERAL TERM SHEET IS NOT COMPLETE AND MAY BE AMENDED PRIOR TO THE TIME OF SALE. THIS TERM SHEET IS NOT AN OFFER TO SELL THESE SECURITIES AND IT IS NOT A SOLICITATION OF AN OFFER TO BUY THESE SECURITIES IN ANY JURISDICTION WHERE THE OFFER OR SALE IS NOT PERMITTED.
19
| Wells Fargo Commercial Mortgage Trust 2016-C37 | Certain Terms and Conditions |
Date. Such losses will be applied in the following order, in each case until the related Certificate Balance is reduced to zero: first, to the Class J Certificates; second, to the Class H Certificates; third, to the Class G Certificates; fourth, to the Class F Certificates; fifth, to the Class E Certificates; sixth, to the Class D Certificates; seventh, to the Class C Certificates; eighth, to the Class B Certificates; ninth, to the Class A-S Certificates; and, finally,pro rata, to the Class A-1, A-2, A-3, A-4, A-5 and A-SB Certificates based on their outstanding Certificate Balances.
The notional amount of the Class X-A Certificates will be reduced by the amount of all losses that are allocated to the Class A-1, A-2, A-3, A-4, A-5 or A-SB Certificates as write-offs in reduction of their Certificate Balances. The notional amount of the Class X-B Certificates will be reduced by the amount of all losses that are allocated to the Class A-S or B Certificates as write-offs in reduction of their Certificate Balances. The notional amount of the Class X-D Certificates will be reduced by the amount of all losses that are allocated to the Class D Certificates as write-offs in reduction of its Certificate Balance. The notional amount of the Class X-EF Certificates will be reduced by the amount of all losses that are allocated to the Class E or F Certificates as write-offs in reduction of their Certificate Balances. The notional amount of the Class X-G Certificates will be reduced by the amount of all losses that are allocated to the Class G Certificates as write-offs in reduction of its Certificate Balance. The notional amount of the Class X-H Certificates will be reduced by the amount of all losses that are allocated to the Class H Certificates as write-offs in reduction of its Certificate Balance. The notional amount of the Class X-J Certificates will be reduced by the amount of all losses that are allocated to the Class J Certificates as write-offs in reduction of its Certificate Balance.
| |
| P&I Advances: | The Master Servicer or, if the Master Servicer fails to do so, the Trustee, will be obligated to advance delinquent debt service payments with respect to the mortgage loans it services (other than balloon payments, excess interest and default interest) and assumed debt service payments on mortgage loans with delinquent balloon payments (excluding any related companion loan), except to the extent any such advance is deemed non-recoverable from collections on the related mortgage loan. In addition, if an Appraisal Reduction Amount exists for a given mortgage loan, the interest portion of any P&I advance for such mortgage loan will be reduced, which will have the effect of reducing the amount of interest available for distribution to the Certificates in reverse alphabetical order of their Class designations (except that interest payments on the Class A-1, A-2, A-3, A-4, A-5, A-SB, X-A, X-B, X-D, X-EF, X-G, X-H and X-J Certificates would be affected on apari passu basis). |
| Servicing Advances: | The Master Servicer or, if the Master Servicer fails to do so, the Trustee, will be obligated to make servicing advances with respect to each mortgage loan it services, including the payment of delinquent property taxes, insurance premiums and ground rent, except to the extent that those advances are deemed non-recoverable from collections on the related mortgage loan. The Master Servicer or the Trustee, as applicable, will have the primary obligation to make any required servicing advances with respect to the Quantum Park whole loan, the 1140 Avenue of the Americas whole loan, the Fremaux Town Center whole loan, the Midwest Industrial Portfolio whole loan, the Redwood MHC Portfolio whole loan and the DoubleTree by Hilton Tempe whole loan. The servicer or trustee, as applicable, under the Hilton USA Trust 2016-HHV securitization will have the primary obligation to make any required servicing advances with respect to Hilton Hawaiian Village whole loan. The master servicer or trustee, as applicable, under the WFCM 2016-LC25 securitization will have the primary obligation to make any required servicing advances with respect to the Walmart Shadow Anchored Portfolio whole loan. The master servicer or trustee, as applicable, under the CFCRE 2016-C6 securitization will have the primary obligation to make any required servicing advances with respect to the Potomac Mills whole loan. The master servicer or trustee, as applicable, under the CGCMT 2016-C3 securitization will have the primary obligation to make any required servicing advances with respect to the 80 Park Plaza whole loan. The Special Servicer will have no obligation to make servicing advances but may do so in an emergency situation. |
Appraisal Reduction Amounts and Collateral | An Appraisal Reduction Amount generally will be created in the amount, if any, by which the principal balance of a required appraisal loan (which is a mortgage loan with respect to which certain defaults, modifications or insolvency events have occurred as further described in the Preliminary Prospectus) plus other amounts overdue or advanced in connection with such mortgage loan exceeds 90% of the appraised value of the related mortgaged property plus certain escrows and reserves (including letters of credit) held with respect to the mortgage loan. With respect to any whole loan, any Appraisal Reduction Amount will be allocated first to the related subordinate companion loan, if any, and then to the related mortgage loan and the relatedpari passu companion loan(s). |
THE INFORMATION IN THIS STRUCTURAL AND COLLATERAL TERM SHEET IS NOT COMPLETE AND MAY BE AMENDED PRIOR TO THE TIME OF SALE. THIS TERM SHEET IS NOT AN OFFER TO SELL THESE SECURITIES AND IT IS NOT A SOLICITATION OF AN OFFER TO BUY THESE SECURITIES IN ANY JURISDICTION WHERE THE OFFER OR SALE IS NOT PERMITTED.
20
| Wells Fargo Commercial Mortgage Trust 2016-C37 | Certain Terms and Conditions |
|
A mortgage loan will cease to be a required appraisal loan when the same has ceased to be a specially serviced loan (if applicable), has been brought current for at least three consecutive months and no other circumstances exist that would cause such mortgage loan to be a required appraisal loan.
A Collateral Deficiency Amount will exist with respect to any mortgage loan that is modified into an AB loan structure and remains a corrected mortgage loan and will generally equal the excess of (i) the stated principal balance of such AB modified loan (taking into account the related junior note(s) and anypari passu notes included therein), over (ii) the sum of (in the case of a whole loan, solely to the extent allocable to the subject mortgage loan) (x) the appraised value of the related mortgaged property plus (y) any capital or additional collateral contributed by the related borrower at the time the loan became an AB modified loan plus (z) certain escrows or reserves (including letters of credit) in addition to any amounts set forth in the immediately preceding clause (y)) held with respect to the mortgage loan.
A Cumulative Appraisal Reduction Amount with respect to any mortgage loan will be the sum of any Appraisal Reduction Amount and any Collateral Deficiency Amount.
Appraisal Reduction Amounts will affect the amount of debt service advances in respect of the related mortgage loan. Cumulative Appraisal Reduction Amounts will also be taken into account in the determination of the identity of the Class whose majority constitutes the “majority controlling class certificateholder” and is entitled to appoint the directing certificateholder.
|
Clean-Up Call and Exchange Termination:
| On each Distribution Date occurring after the aggregate unpaid principal balance of the pool of mortgage loans is less than 1.0% of the principal balance of the mortgage loans as of the cut-off date.
If the aggregate Certificate Balances of each of the Class A-1, A-2, A-3, A-4, A-5, A-SB, A-S, B, C and D Certificates have been reduced to zero, the trust may also be terminated in connection with an exchange of all the then-outstanding certificates (other than the Class V and Class R Certificates) for the mortgage loans and REO properties then remaining in the issuing entity, but all of the holders of those Classes (other than the Class V and Class R Certificates) of outstanding certificates would have to voluntarily participate in the exchange.
|
| Liquidation Loan Waterfall: | Following the liquidation of any loan or property, the net liquidation proceeds generally will be applied (after reimbursement of advances and certain trust fund expenses), first, as a recovery of accrued interest, other than delinquent interest that was not advanced as a result of Appraisal Reduction Amounts, second, as a recovery of principal until all principal has been recovered, and then as a recovery of delinquent interest that was not advanced as a result of Appraisal Reduction Amounts. Please see “Description of the Certificates—Distributions—Application Priority of Mortgage Loan Collections or Whole Loan Collections” in the Preliminary Prospectus. |
| Majority Controlling Class Certificateholder and Directing Certificateholder: | A directing certificateholder may be appointed by the “majority controlling class certificate-holder”, which will be the holder(s) of a majority of the “controlling class”, which means the most subordinate class among the Class E, F, G, H and J Certificates that has a Certificate Balance, as notionally reduced by any Cumulative Appraisal Reduction Amounts allocable to that class, that is at least equal to 25% of its total initial Certificate Balance; provided that if at any time the Certificate Balances of the Principal Balance Certificates (other than the Class E, F, G, H and J Certificates) have been reduced to zero as a result of principal payments on the mortgage loans, then the “controlling class” will be the most subordinate class of Class E, F, G, H and J Certificates that has a Certificate Balance greater than zero without regard to any Cumulative Appraisal Reduction Amounts. The majority controlling class certificateholder will have a continuing right to appoint, remove or replace the directing certificateholder in its sole discretion. This right may be exercised at any time and from time to time. See “Pooling and Servicing Agreement—The Directing Certificateholder” in the Preliminary Prospectus. |
| Control and Consultation: | The rights of various parties to replace the Special Servicer and approve or consult with respect to major actions of the Special Servicer will vary according to defined periods.
A “Control Termination Event” occurs if the Class E Certificates have a Certificate Balance, net of any Cumulative Appraisal Reduction Amounts allocable to that Class, that is less than 25% of the initial Certificate Balance of that Class or, while the Class E Certificates are the controlling class, the majority (by Certificate Balance) of the holders of the Class E Certificates irrevocably waived its right, in writing, to exercise any of the rights of the majority controlling class certificateholder and such rights have not been reinstated to a successor majority controlling class certificateholder.
A “Consultation Termination Event” occurs if the Class E Certificates have a Certificate Balance, without regard to any Cumulative Appraisal Reduction Amounts allocable to that Class, that is less than 25% of the initial Certificate Balance of that Class or, while the Class E Certificates are the controlling class, the majority (by Certificate Balance) of the holders of the Class E |
THE INFORMATION IN THIS STRUCTURAL AND COLLATERAL TERM SHEET IS NOT COMPLETE AND MAY BE AMENDED PRIOR TO THE TIME OF SALE. THIS TERM SHEET IS NOT AN OFFER TO SELL THESE SECURITIES AND IT IS NOT A SOLICITATION OF AN OFFER TO BUY THESE SECURITIES IN ANY JURISDICTION WHERE THE OFFER OR SALE IS NOT PERMITTED.
21
| Wells Fargo Commercial Mortgage Trust 2016-C37 | Certain Terms and Conditions |
Certificates irrevocably waived its right, in writing, to exercise any of the rights of the majority controlling class certificateholder and such rights have not been reinstated to a successor majority controlling class certificateholder.
If no Control Termination Event has occurred and is continuing, except with respect to the Excluded Loans (as defined below) and (i) the directing certificateholder will be entitled to grant or withhold approval of asset status reports prepared, and material servicing actions proposed, by the Special Servicer, and (ii) the directing certificateholder will be entitled to terminate and replace the Special Servicer with or without cause, and appoint itself or another person as the successor special servicer. It will be a condition to such appointment that DBRS, Fitch and Moody’s (and any Rating Agency rating any securities backed by any pari passu companion loan(s) serviced under this transaction) confirm that the appointment would not result in a qualification, downgrade or withdrawal of any of their then-current ratings of certificates (and any certificates backed by any pari passu companion loan(s) serviced under this transaction).
If a Control Termination Event has occurred and is continuing but no Consultation Termination Event has occurred and is continuing, the Special Servicer will be required to consult with the directing certificateholder (other than with respect to Excluded Loans) and the Operating Advisor in connection with asset status reports and material special servicing actions.
If a Consultation Termination Event has occurred and is continuing, the Special Servicer must seek to consult with the Operating Advisor in connection with asset status reports and material special servicing actions, and, in general, no directing certificateholder will be recognized or have any right to terminate the Special Servicer or approve, direct or consult with respect to servicing matters.
With respect to the Quantum Park mortgage loan, the 1140 Avenue of the Americas mortgage loan, the Fremaux Town Center mortgage loan, the Midwest Industrial Portfolio mortgage loan, the Redwood MHC Portfolio mortgage loan and the DoubleTree by Hilton Tempe mortgage loan, the rights of the directing certificateholder described above will be subject to the consultation rights of the holder of the relatedpari passu companion loan(s) as described below.
Notwithstanding any contrary description set forth above, with respect to the Quantum Park mortgage loan, the 1140 Avenue of the Americas mortgage loan, the Fremaux Town Center mortgage loan, the Midwest Industrial Portfolio mortgage loan, the Redwood MHC Portfolio mortgage loan and the DoubleTree by Hilton Tempe mortgage loan, the holder of the relatedpari passu companion loan(s) in the related whole loan (or its representative, including any directing certificateholder under any securitization of suchpari passu companion loan(s)) will have consultation rights with respect to asset status reports and material special servicing actions involving the related whole loan, as provided for in the related intercreditor agreement and as described in the Preliminary Prospectus, and those rights will be in addition to the rights of the directing certificateholder in this transaction described above.
For purposes of the servicing of the Quantum Park whole loan, the 1140 Avenue of the Americas mortgage loan, the Fremaux Town Center mortgage loan, the Midwest Industrial Portfolio mortgage loan, the Redwood MHC Portfolio mortgage loan and the DoubleTree by Hilton Tempe mortgage loan, the occurrence and continuance of a Control Termination Event or Consultation Termination Event under this securitization will not limit the consultation and other rights of the holder of the relatedpari passu companion loan(s).
Notwithstanding any contrary description set forth above, with respect to Hilton Hawaiian Village mortgage loan, in general the related whole loan will be serviced under the Hilton USA Trust 2016-HHV trust and servicing agreement, which grants the directing certificateholder (or equivalent) under the Hilton USA Trust 2016-HHV securitization control rights that may include the right to approve or disapprove various material servicing actions involving the related whole loan. The directing certificateholder for this securitization (so long as no Consultation Termination Event has occurred and is occurring) will have the right to be consulted on a non-binding basis with respect to such actions, provided that such rights will only be exercisable upon and during the termination of a subordinate control period under the Hilton USA Trust 2016-HHV trust and servicing agreement. For purposes of the servicing of Hilton Hawaiian Village whole loan, the occurrence and continuance of a Control Termination Event or Consultation Termination Event under this securitization will not limit the control or other rights of the directing certificateholder (or equivalent) under the Hilton USA Trust 2016-HHV securitization.
Also, notwithstanding any contrary description set forth above, with respect to the Walmart Shadow Anchored Portfolio mortgage loan, in general the related whole loan will be serviced under the WFCM 2016-LC25 pooling and servicing agreement, which is expected to grant the directing certificateholder under the WFCM 2016-LC25 securitization control rights that may include the right to approve or disapprove various material servicing actions involving the related whole loan. The directing certificateholder for this securitization (so long as no |
THE INFORMATION IN THIS STRUCTURAL AND COLLATERAL TERM SHEET IS NOT COMPLETE AND MAY BE AMENDED PRIOR TO THE TIME OF SALE. THIS TERM SHEET IS NOT AN OFFER TO SELL THESE SECURITIES AND IT IS NOT A SOLICITATION OF AN OFFER TO BUY THESE SECURITIES IN ANY JURISDICTION WHERE THE OFFER OR SALE IS NOT PERMITTED.
22
| Wells Fargo Commercial Mortgage Trust 2016-C37 | Certain Terms and Conditions |
| Consultation Termination Event has occurred and is occurring) will nonetheless have the right to be consulted on a non-binding basis with respect to such actions. For purposes of the servicing of the Walmart Shadow Anchored Portfolio whole loan, the occurrence and continuance of a Control Termination Event or Consultation Termination Event under this securitization will not limit the control or other rights of the directing certificateholder (or equivalent) under the WFCM 2016-LC25 securitization.
Also, notwithstanding any contrary description set forth above, with respect to the Potomac Mills mortgage loan, in general the related whole loan will be serviced under the CFCRE 2016-C6 pooling and servicing agreement, which grants the directing certificateholder (or equivalent) under the CFCRE 2016-C6 securitization control rights that may include the right to approve or disapprove various material servicing actions involving the related whole loan. The directing certificateholder for this securitization (so long as no Consultation Termination Event has occurred and is occurring) will nonetheless have the right to be consulted on a non-binding basis with respect to such actions. For purposes of the servicing of the Potomac Mills whole loan, the occurrence and continuance of a Control Termination Event or Consultation Termination Event under this securitization will not limit the control or other rights of the directing certificateholder (or equivalent) under the CFCRE 2016-C6 securitization.
Also, notwithstanding any contrary description set forth above, with respect to the 80 Park Plaza mortgage loan, in general the related whole loan will be serviced under the CGCMT 2016-C3 pooling and servicing agreement, which grants the directing certificateholder (or equivalent) under the CGCMT 2016-C3 securitization control rights that may include the right to approve or disapprove various material servicing actions involving the related whole loan. The directing certificateholder for this securitization (so long as no Consultation Termination Event has occurred and is occurring) will nonetheless have the right to be consulted on a non-binding basis with respect to such actions. For purposes of the servicing of the 80 Park Plaza whole loan, the occurrence and continuance of a Control Termination Event or Consultation Termination Event under this securitization will not limit the control or other rights of the directing certificateholder (or equivalent) under the CGCMT 2016-C3 securitization.
Notwithstanding any contrary description set forth above, in the event that, with respect to any mortgage loan, the majority controlling class certificateholder or the directing certificateholder is (i) a borrower, a mortgagor or a manager of a mortgaged property, or the holder of a mezzanine loan that has accelerated the related mezzanine loan or commenced foreclosure or enforcement proceedings against the equity collateral pledged to secure the related mezzanine loan or any affiliate thereof, (ii) with respect to borrower, a mortgagor, a manager of a Mortgaged Property or a mezzanine lender that has accelerated the related mezzanine loan or commenced foreclosure or enforcement proceedings against the equity collateral pledged to secure the related mezzanine loan, (x) any other person controlling or controlled by or under common control with such borrower, mortgagor, manager or mezzanine lender, as applicable, or (y) any other person owning, directly or indirectly, 25% or more of the beneficial interests in such borrower, mortgagor, manager or mezzanine lender (each, a “borrower party”), the majority controlling class certificateholder and the directing certificateholder will have no right to receive asset status reports or such other information as may be specified in the pooling and servicing agreement, to grant or withhold approval of, or consult with respect to, asset status reports prepared, and material servicing actions proposed, by the Special Servicer, with respect to such mortgage loan, and such mortgage loan will be referred to as an “Excluded Loan”.
In addition, notwithstanding any contrary description set forth above, in the event that, with respect to any mortgage loan, a controlling class certificateholder is a borrower party, such controlling class certificateholder will have no right to receive asset status reports or such other information as may be specified in the pooling and servicing agreement with respect to such mortgage loan, and such controlling class certificateholder will be referred to as an “excluded controlling class holder”.
| |
| Replacement of Special Servicer by General Vote of Certificateholders: | If a Control Termination Event has occurred and is continuing, the Special Servicer may be removed and replaced without cause upon the affirmative direction of certificate owners holding not less than 66-2/3% of a certificateholder quorum, following a proposal from certificate owners holding not less than 25% of the appraisal-reduced voting rights of all Certificates. The certificateholders who initiate a vote on a termination and replacement of the Special Servicer without cause must cause DBRS, Fitch and Moody’s to confirm the then-current ratings of the certificates (or decline to review the matter) and cause the payment of the fees and expenses incurred in the replacement. If no Control Termination Event has occurred and is continuing, the Special Servicer may be replaced by the directing certificateholder, subject to DBRS, Fitch and Moody’s (and any Rating Agency rating any securities backed by any pari passu companion loan(s) serviced under this transaction) confirming the then-current ratings of the Certificates (and any certificates backed by anypari passucompanion loans serviced under this transaction) or declining to review the matter. |
THE INFORMATION IN THIS STRUCTURAL AND COLLATERAL TERM SHEET IS NOT COMPLETE AND MAY BE AMENDED PRIOR TO THE TIME OF SALE. THIS TERM SHEET IS NOT AN OFFER TO SELL THESE SECURITIES AND IT IS NOT A SOLICITATION OF AN OFFER TO BUY THESE SECURITIES IN ANY JURISDICTION WHERE THE OFFER OR SALE IS NOT PERMITTED.
23
| Wells Fargo Commercial Mortgage Trust 2016-C37 | Certain Terms and Conditions |
| Excluded Special Servicer: | In the event that, with respect to any mortgage loan, the Special Servicer is a borrower party, the Special Servicer will be required to resign as special servicer of such mortgage loan (referred to as an “excluded special servicer loan”). If no Control Termination Event has occurred and is continuing, the directing certificateholder will be entitled to appoint (and may replace with or without cause) a separate special servicer that is not a borrower party (referred to as an “excluded special servicer”) with respect to such excluded special servicer loan unless such excluded special servicer loan is also an excluded loan. Otherwise, upon resignation of the Special Servicer with respect to an excluded special servicer loan, such resigning Special Servicer will be required to appoint the excluded special servicer. |
| Appraisal Remedy: | If the Class of Certificates comprising the controlling class loses its status as controlling class because of the application of an Appraisal Reduction Amount or Collateral Deficiency Amount, the holders of a majority of the Voting Rights of such Class may require the Special Servicer to order a second appraisal for any mortgage loan in respect of which an Appraisal Reduction Amount or Collateral Deficiency Amount has been applied. The Special Servicer must thereafter determine whether, based on its assessment of such second appraisal, any recalculation of the Appraisal Reduction Amount or Collateral Deficiency Amount is warranted. Such Class will not be able to exercise any direction, control, consent and/or similar rights of the controlling class unless and until reinstated as the controlling class through such determination; and pending such determination, the rights of the controlling class will be exercised by the control eligible certificates (which may only be any one of Class E, F, G, H and J), if any, that would be the controlling class taking into account the subject appraisal reduction amount. |
| Sale of Defaulted Assets: | There will be no “fair value” purchase option. Instead, the pooling and servicing agreement will authorize the Special Servicer to sell defaulted mortgage loans to the highest bidder in a manner generally similar to sales of REO properties.
The sale of a defaulted loan (other than with respect to the Hilton Hawaiian Village whole loan, the Walmart Shadow Anchored Portfolio whole loan, the Potomac Mills whole loan and the 80 Park Plaza whole loan) for less than par plus accrued interest and certain other fees and expenses owed on the loan will be subject to consent or consultation rights of the directing certificateholder and/or Operating Advisor and, in the case of the Quantum Park whole loan, the 1140 Avenue of the Americas whole loan, the Fremaux Town Center whole loan, the Midwest Industrial Portfolio whole loan, the Redwood MHC Portfolio whole loan and the DoubleTree by Hilton Tempe whole loan, consultation rights of the holders of the relatedpari passu companion loan(s), as described in the Preliminary Prospectus.
In the case of the Quantum Park whole loan, the 1140 Avenue of the Americas whole loan, the Fremaux Town Center whole loan, the Midwest Industrial Portfolio whole loan, the Redwood MHC Portfolio whole loan and the DoubleTree by Hilton Tempe whole loan, pursuant to the related intercreditor agreements and the pooling and servicing agreement, if the Special Servicer offers to sell to any person (or offers to purchase) for cash either such mortgage loan during such time as the related whole loan constitutes a defaulted mortgage loan, then in connection with any such sale, the Special Servicer is required to sell both the mortgage loan and the relatedpari passu companion loan(s) as a single whole loan
In the case of The Hilton Hawaiian Village whole loan, pursuant to the Hilton USA Trust 2016-HHV trust and servicing agreement and the related intercreditor agreement, the Hilton USA Trust 2016-HHV special servicer may offer to sell to any person (or may offer to purchase) for cash the related whole loan during such time as the applicable companion loans constitute a defaulted mortgage loan under the Hilton USA Trust 2016-HHV trust and servicing agreement, and, in connection with any such sale, the Hilton USA Trust 2016-HHV special servicer is required to sell both the mortgage loan and the relatedpari passu companion loan(s) and subordinate companion loans as a whole loan. The directing certificateholder for this securitization will have consultation rights as the holder of an interest in the related mortgage loan, as described in the Preliminary Prospectus.
In the case of the Walmart Shadow Anchored Portfolio mortgage loan, the Potomac Mills mortgage loan and the 80 Park Plaza mortgage loan, pursuant to the WFCM 2016-LC25 pooling and servicing agreement, the CFCRE 2016-C6 pooling and servicing agreement or the CGCMT 2016-C3 pooling and servicing agreement, respectively, the related special servicer may offer to sell to any person (or may offer to purchase) for cash the related whole loan during such time as the applicable companion loan(s) constitute a defaulted mortgage loan under the related pooling and servicing agreement, and, in connection with any such sale, the related special servicer is required to sell both the mortgage loan and the relatedpari passu companion loan(s) as a whole loan. The directing certificateholder for this securitization will have consultation rights as the holder of an interest in the related mortgage loan, as described in the Preliminary Prospectus.
|
THE INFORMATION IN THIS STRUCTURAL AND COLLATERAL TERM SHEET IS NOT COMPLETE AND MAY BE AMENDED PRIOR TO THE TIME OF SALE. THIS TERM SHEET IS NOT AN OFFER TO SELL THESE SECURITIES AND IT IS NOT A SOLICITATION OF AN OFFER TO BUY THESE SECURITIES IN ANY JURISDICTION WHERE THE OFFER OR SALE IS NOT PERMITTED.
24
| Wells Fargo Commercial Mortgage Trust 2016-C37 | Certain Terms and Conditions |
| “As-Is” Appraisals: | Appraisals must be conducted on an “as-is” basis, and must be no more than 12 months old, for purposes of determining Appraisal Reduction Amounts and market value in connection with REO sales. Required appraisals may consist of updates of prior appraisals. Internal valuations by the Special Servicer are permitted if the principal balance of a mortgage loan is less than $2,000,000. |
| Operating Advisor: | The Operating Advisor will perform certain review duties if a Control Termination Event has occurred and is continuing, which will generally include a limited annual review of, and the delivery of a report regarding, certain actions of the Special Servicer with respect to the resolution and/or liquidation of specially serviced loans to the Certificate Administrator. The review and report generally will be based on any asset status reports and additional information delivered to the Operating Advisor by the Special Servicer. In addition, if a Control Termination Event has occurred and is continuing, the Special Servicer must seek to consult with the Operating Advisor (in addition to the directing certificateholder if no Consultation Termination Event has occurred and is continuing) in connection with material special servicing actions with respect to specially serviced loans. Furthermore, under certain circumstances, but only if a Consultation Termination Event has occurred and is continuing, the Operating Advisor may recommend the replacement of the Special Servicer, in which case the Certificate Administrator will deliver notice of such recommendation to the certificateholders, and certificateholders with specified percentages of the voting rights may direct the replacement of the Special Servicer at their expense.
If a Consultation Termination Event has occurred and is continuing, the Operating Advisor may be removed and replaced without cause upon the affirmative direction of certificate owners holding not less than 75% of the appraisal-reduced voting rights of all Principal Balance Certificates, following a proposal from certificate owners holding not less than 25% of the appraisal-reduced voting rights of all certificates. The certificateholders who initiate a vote on a termination and replacement of the Operating Advisor without cause must cause DBRS, Fitch and Moody’s to confirm the then-current ratings of the certificates (or decline to review the matter) and cause the payment of the fees and expenses incurred in the replacement. The Operating Advisor generally may be discharged from its duties if and when the Class A-1, A-2, A-3, A-4, A-5, A-SB, A-S, B, C and D Certificates are retired.
|
| Asset Representations Reviewer: | The Asset Representations Reviewer will be required to review certain delinquent mortgage loans after a specified delinquency threshold has been exceeded (an “Asset Review Trigger”) and the required percentage of certificateholders vote to direct a review of such delinquent loans. An Asset Review Trigger will occur when either (1) mortgage loans with an aggregate outstanding principal balance of 25.0% or more of the aggregate outstanding principal balance of all of the mortgage loans (including any REO loans (or a portion of any REO loan in the case of a whole loan) held by the issuing entity as of the end of the applicable collection period are delinquent loans or (2) at least 15 mortgage loans are delinquent loans as of the end of the applicable collection period and the outstanding principal balance of such delinquent loans in the aggregate constitutes at least 20.0% of the aggregate outstanding principal balance of all of the mortgage loans (including any REO loans (or a portion of any REO loan in the case of a whole loan)) held by the issuing entity as of the end of the applicable collection period. See “Pooling and Servicing Agreement—The Asset Representations Reviewer—Asset Review” in the Preliminary Prospectus.
The Asset Representations Reviewer may be terminated and replaced without cause. Upon (i) the written direction of certificateholders evidencing not less than 25% of the voting rights (without regard to the application of any Appraisal Reduction Amounts) requesting a vote to terminate and replace the Asset Representations Reviewer with a proposed successor Asset Representations Reviewer that is an eligible asset reviewer, and (ii) payment by such holders to the certificate administrator of the reasonable fees and expenses to be incurred by the certificate administrator in connection with administering such vote, the certificate administrator will promptly provide notice to all certificateholders and the Asset Representations Reviewer of such request by posting such notice on its internet website, and by mailing such notice to all certificateholders and the Asset Representations Reviewer. Upon the written direction of certificateholders evidencing at least 75% of a certificateholder quorum (without regard to the application of any Appraisal Reduction Amounts), the Trustee will terminate all of the rights and obligations of the Asset Representations Reviewer under the pooling and servicing agreement by written notice to the Asset Representations Reviewer, and the proposed successor Asset Representations Reviewer will be appointed. See “Pooling and Servicing Agreement—The Asset Representations Reviewer” in the Preliminary Prospectus.
|
| Dispute Resolution Provisions: | The mortgage loan sellers will be subject to the dispute resolution provisions set forth in the pooling and servicing agreement to the extent those provisions are triggered with respect to any mortgage loan sold to the depositor by a mortgage loan seller and such mortgage loan seller will be obligated under the related mortgage loan purchase agreement to comply with all |
THE INFORMATION IN THIS STRUCTURAL AND COLLATERAL TERM SHEET IS NOT COMPLETE AND MAY BE AMENDED PRIOR TO THE TIME OF SALE. THIS TERM SHEET IS NOT AN OFFER TO SELL THESE SECURITIES AND IT IS NOT A SOLICITATION OF AN OFFER TO BUY THESE SECURITIES IN ANY JURISDICTION WHERE THE OFFER OR SALE IS NOT PERMITTED.
25
| Wells Fargo Commercial Mortgage Trust 2016-C37 | Certain Terms and Conditions |
applicable provisions and to take part in any mediation or arbitration proceedings that may result.
Generally, in the event that a Repurchase Request (as defined in the Preliminary Prospectus) is not “Resolved” (as defined below) within 180 days after the related mortgage loan seller receives such Repurchase Request, then the enforcing servicer will be required to send a notice to the “Initial Requesting Certificateholder” (if any) and the Certificate Administrator indicating the enforcing servicer’s intended course of action with respect to the Repurchase Request. If (a) the enforcing servicer’s intended course of action with respect to the Repurchase Request does not involve pursuing further action to exercise rights against the related mortgage loan seller with respect to the Repurchase Request and the Initial Requesting Certificateholder, if any, or any other certificateholder or certificate owner wishes to exercise its right to refer the matter to mediation (including nonbinding arbitration) or arbitration, or (b) the enforcing servicer’s intended course of action is to pursue further action to exercise rights against the related mortgage loan seller with respect to the Repurchase Request but the Initial Requesting Certificateholder, if any, or any other certificateholder or certificate owner does not agree with the dispute resolution method selected by the enforcing servicer, then the Initial Requesting Certificateholder, if any, or such other certificateholder or certificate owner may deliver a written notice to the Special Servicer indicating its intent to exercise its right to refer the matter to either mediation or arbitration.
| |
| “Resolved” means, with respect to a Repurchase Request, (i) that the related Material Defect has been cured, (ii) the related mortgage loan has been repurchased in accordance with the related mortgage loan purchase agreement, (iii) a mortgage loan has been substituted for the related mortgage loan in accordance with the related mortgage loan purchase agreement, (iv) the applicable mortgage loan seller makes a Loss of Value Payment (as defined in the Preliminary Prospectus), (v) a contractually binding agreement is entered into between the enforcing servicer, on behalf of the issuing entity, and the related mortgage loan seller that settles the related mortgage loan seller’s obligations under the related mortgage loan purchase agreement, or (vi) the related mortgage loan is no longer property of the issuing entity as a result of a sale or other disposition in accordance with the pooling and servicing agreement. See “Pooling and Servicing Agreement—Dispute Resolution Provisions” in the Preliminary Prospectus. | |
| Investor Communications: | The certificate administrator is required to include on any Form 10–D any request received from a certificateholder to communicate with other certificateholders related to certificateholders exercising their rights under the terms of the pooling and servicing agreement. Any certificateholder wishing to communicate with other certificateholders regarding the exercise of its rights under the terms of the Pooling and Servicing Agreement will be able to deliver a written request signed by an authorized representative of the requesting investor to the certificate administrator. |
| Certain Fee Offsets: | If a workout fee is earned by the Special Servicer following a loan default with respect to any mortgage loan that it services, then certain limitations will apply based on modification fees paid by the borrower. The modification fee generally must not exceed 1% of the principal balance of the loan as modified in any 12-month period. In addition, if the loan re-defaults, any subsequent workout fee on that loan must be reduced by a portion of the modification fees paid by the borrower in the previous 12-months. Likewise, liquidation fees collected in connection with a liquidation or partial liquidation of a mortgage loan must be reduced by a portion of the modification fees paid by the borrower in the previous 12 months. |
| Deal Website: | The Certificate Administrator will be required to maintain a deal website which will include, among other items: (a) summaries of asset status reports prepared by the Special Servicer, (b) inspection reports, (c) appraisals, (d) various “special notices” described in the Preliminary Prospectus, (e) the “Investor Q&A Forum” and (f) a voluntary “Investor Registry”. Investors may access the deal website following execution of a certification and confidentiality agreement. |
| Initial Majority Controlling Class Certificateholder: | It is expected that Prime Finance CMBS B-Piece Holdco VI, L.P. will be the initial majority controlling class certificateholder. |
| Whole Loans: | The mortgaged properties identified on Annex A-1 to the Preliminary Prospectus as Hilton Hawaiian Village, Quantum Park, Walmart Shadow Anchored Portfolio, Potomac Mills, 1140 Avenue of the Americas, Fremaux Town Center, Midwest Industrial Portfolio, 80 Park Plaza, Redwood MHC Portfolio and DoubleTree by Hilton Tempe, secure both a mortgage loan to be included in the trust fund and one or more other mortgage loans that will not be included in the trust fund, each of which will bepari passu or subordinate in right of payment with the mortgage loan included in the trust fund. We refer to each such group of mortgage loans as a “whole loan”. The Quantum Park whole loan, the 1140 Avenue of the Americas whole loan, the Fremaux Town Center whole loan, the Midwest Industrial Portfolio whole loan, the Redwood MHC Portfolio whole loan and the DoubleTree by Hilton Tempe whole loan will each be
|
THE INFORMATION IN THIS STRUCTURAL AND COLLATERAL TERM SHEET IS NOT COMPLETE AND MAY BE AMENDED PRIOR TO THE TIME OF SALE. THIS TERM SHEET IS NOT AN OFFER TO SELL THESE SECURITIES AND IT IS NOT A SOLICITATION OF AN OFFER TO BUY THESE SECURITIES IN ANY JURISDICTION WHERE THE OFFER OR SALE IS NOT PERMITTED.
26
| Wells Fargo Commercial Mortgage Trust 2016-C37 | Certain Terms and Conditions |
| principally serviced under the pooling and servicing agreement for this securitization. The Hilton Hawaiian Village whole loan will be principally serviced under the trust and servicing agreement for the Hilton USA Trust 2016-HHV securitization. The Walmart Shadow Anchored Portfolio whole loan, Potomac Mills whole loan and 80 Park Plaza whole loan will be principally serviced under the pooling and servicing agreement for the WFCM 2016-LC25 securitization, the CFCRE 2016-C6 securitization and the CGCMT 2016-C3 securitization, respectively.
As of the closing date, eachpari passucompanion loan in each whole loan will be held by the party identified above under “IV. Characteristics of the Mortgage Pool—B. Summary of thePari PassuWhole Loans”.
|
THE INFORMATION IN THIS STRUCTURAL AND COLLATERAL TERM SHEET IS NOT COMPLETE AND MAY BE AMENDED PRIOR TO THE TIME OF SALE. THIS TERM SHEET IS NOT AN OFFER TO SELL THESE SECURITIES AND IT IS NOT A SOLICITATION OF AN OFFER TO BUY THESE SECURITIES IN ANY JURISDICTION WHERE THE OFFER OR SALE IS NOT PERMITTED.
27
(THIS PAGE INTENTIONALLY LEFT BLANK)
THE INFORMATION IN THIS STRUCTURAL AND COLLATERAL TERM SHEET IS NOT COMPLETE AND MAY BE AMENDED PRIOR TO THE TIME OF SALE. THIS TERM SHEET IS NOT AN OFFER TO SELL THESE SECURITIES AND IT IS NOT A SOLICITATION OF AN OFFER TO BUY THESE SECURITIES IN ANY JURISDICTION WHERE THE OFFER OR SALE IS NOT PERMITTED.
28
| HILTON HAWAIIAN VILLAGE |

THE INFORMATION IN THIS STRUCTURAL AND COLLATERAL TERM SHEET IS NOT COMPLETE AND MAY BE AMENDED PRIOR TO THE TIME OF SALE. THIS TERM SHEET IS NOT AN OFFER TO SELL THESE SECURITIES AND IT IS NOT A SOLICITATION OF AN OFFER TO BUY THESE SECURITIES IN ANY JURISDICTION WHERE THE OFFER OR SALE IS NOT PERMITTED.
29
| HILTON HAWAIIAN VILLAGE |
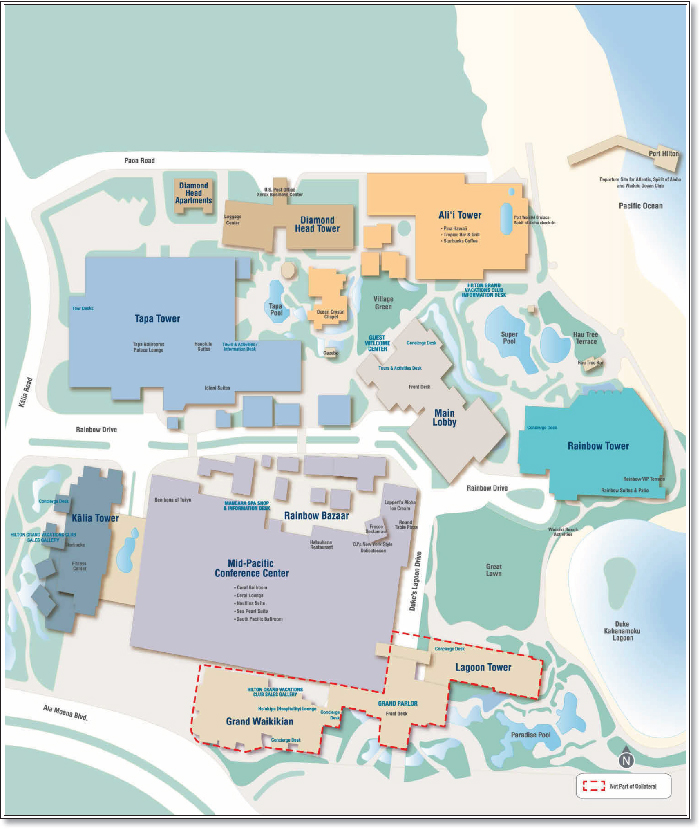
THE INFORMATION IN THIS STRUCTURAL AND COLLATERAL TERM SHEET IS NOT COMPLETE AND MAY BE AMENDED PRIOR TO THE TIME OF SALE. THIS TERM SHEET IS NOT AN OFFER TO SELL THESE SECURITIES AND IT IS NOT A SOLICITATION OF AN OFFER TO BUY THESE SECURITIES IN ANY JURISDICTION WHERE THE OFFER OR SALE IS NOT PERMITTED.
30
| HILTON HAWAIIAN VILLAGE |
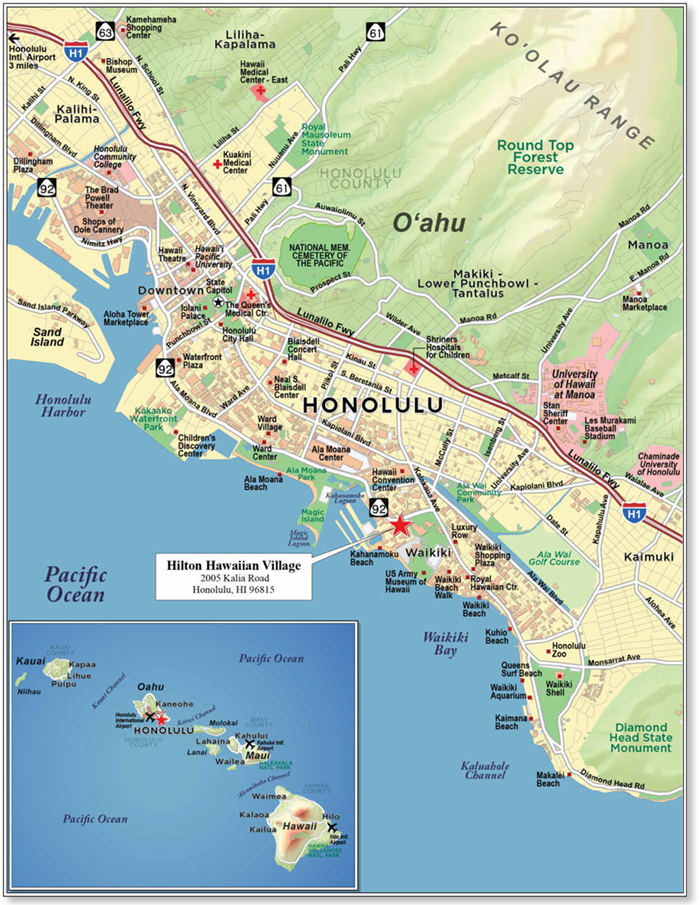
THE INFORMATION IN THIS STRUCTURAL AND COLLATERAL TERM SHEET IS NOT COMPLETE AND MAY BE AMENDED PRIOR TO THE TIME OF SALE. THIS TERM SHEET IS NOT AN OFFER TO SELL THESE SECURITIES AND IT IS NOT A SOLICITATION OF AN OFFER TO BUY THESE SECURITIES IN ANY JURISDICTION WHERE THE OFFER OR SALE IS NOT PERMITTED.
31
| No. 1 – Hilton Hawaiian Village | ||||||||
| Loan Information | Property Information | |||||||
| Mortgage Loan Seller: | Barclays Bank PLC | Single Asset/Portfolio: | Single Asset | |||||
| Credit Assessment (DBRS/Fitch/Moody’s): | BBB(high)/BBB-sf/Aa3 | Property Type: | Hospitality | |||||
| Original Principal Balance(1): | $52,500,000 | Specific Property Type: | Full Service | |||||
| Cut-off Date Balance(1): | $52,500,000 | Location: | Honolulu, HI | |||||
| % of Initial Pool Balance: | 7.0% | Size(4): | 2,860 Rooms | |||||
| Loan Purpose: | Refinance | Cut-off Date Balance Per Room(1): | $243,566 | |||||
| Borrower Name: | Hilton Hawaiian Village LLC | Year Built/Renovated: | 1961/2016 | |||||
| Sponsor: | Park Intermediate Holdings LLC | Title Vesting(5): | Fee/Leasehold | |||||
| Mortgage Rate: | 4.19950% | Property Manager: | Hilton Management LLC | |||||
| Note Date: | October 24, 2016 | 4thMost Recent Occupancy (As of): | 88.5% (12/31/2012) | |||||
| Anticipated Repayment Date: | NAP | 3rdMost Recent Occupancy (As of): | 89.9% (12/31/2013) | |||||
| Maturity Date: | November 1, 2026 | 2ndMost Recent Occupancy (As of): | 90.7% (12/31/2014) | |||||
| IO Period: | 120 months | Most Recent Occupancy (As of): | 94.4% (12/31/2015) | |||||
| Loan Term (Original): | 120 months | Current Occupancy (As of): | 94.6% (9/30/2016) | |||||
| Seasoning: | 1 month | |||||||
| Amortization Term (Original): | NAP | Underwriting and Financial Information: | ||||||
| Loan Amortization Type: | Interest-only, Balloon | |||||||
| Interest Accrual Method: | Actual/360 | 5thMost Recent NOI (As of): | $123,963,830 (12/31/2013) | |||||
| Call Protection: | L(25),GRTR 1% or YM or D(88),O(7) | 4thMost Recent NOI (As of): | $133,704,404 (12/31/2014) | |||||
| Lockbox Type: | Hard/Upfront Cash Management | 3rdMost Recent NOI (As of): | $143,409,371 (12/31/2015) | |||||
| Additional Debt(1)(2): | Yes | 2ndMost Recent NOI (As of): | $146,972,618 (TTM 9/30/2016) | |||||
| Additional Debt Type(1)(2): | Pari Passu and Subordinate Debt | Most Recent NOI (As of)(6): | $148,253,283 (2016 Reforecast) | |||||
| U/W Revenues: | $374,437,742 | |||||||
| U/W Expenses: | $226,873,258 | |||||||
| U/W NOI: | $147,564,484 | |||||||
| U/W NCF: | $132,586,975 | |||||||
| U/W NOI DSCR(1): | 4.98x | |||||||
| U/W NCF DSCR(1): | 4.47x | |||||||
| U/W NOI Debt Yield(1): | 21.2% | |||||||
| Escrows and Reserves(3): | U/W NCF Debt Yield(1): | 19.0% | ||||||
| Type: | Initial | Monthly | Cap (If Any) | Appraised Value: | $2,230,000,000 | |||
| Taxes | $0 | Springing | NAP | Appraisal Valuation Date: | August 30, 2016 | |||
| Insurance | $0 | Springing | NAP | Cut-Off Date LTV Ratio(1): | 31.2% | |||
| FF&E Reserves | $0 | Springing | NAP | LTV Ratio at Maturity or ARD(1): | 31.2% | |||
| (1) | See “The Mortgage Loan” section. All statistical information related to balance per room, loan-to-value ratios, debt service coverage ratios and debt yields are based on the seniorpari passu notes. The Cut-off Date LTV Ratio, U/W NCF DSCR and U/W NOI Debt Yield based on the Hilton Hawaiian Village Whole Loan are 57.2%, 2.44x and 11.6%, respectively. |
| (2) | See “Subordinate Indebtedness” section. |
| (3) | See “Escrows” section. |
| (4) | The Hilton Hawaiian Village Property also includes approximately 130,489 square feet of commercial/retail space leased to more than 100 tenants. |
| (5) | See “Ground Lease” section. |
| (6) | 2016 Reforecast represents actual year-to-date operating history through September 30, 2016 and the sponsor’s budget through year-end 2016. |
The Mortgage Loan. The mortgage loan (the “Hilton Hawaiian Village Mortgage Loan”) is part of a whole loan (“Hilton Hawaiian Village Whole Loan”) evidenced by 16pari passu and five subordinate promissory notes (Note A-1-A, Note A-1-B, Note A-1-C, Note A-1-D, Note A-1-E, Note A-2-A-1, Note A-2-A-2, Note A-2-A-3, Note A-2-A-4, Note A-2-B-1, Note A-2-B-2, Note A-2-B-3, Note A-2-D-1, Note A-2-D-2 , Note A-2-E-1, Note A-2-E-2, Note B-1, Note B-2, Note B-3, Note B-4 and Note B-5) that are secured by a first lien mortgage on the borrower’s fee and leasehold interest in a 2,860-room luxury beachfront resort located in Waikiki on the Island of Oahu, Hawaii (the “Hilton Hawaiian Village Property” or “Resort”). Additionally, the Hilton Hawaiian Village Whole Loan will be secured by the operating lessee’s leasehold interest in the Hilton Hawaiian Village Property from and after the date of the Restructuring (defined below). The Hilton Hawaiian Village Whole Loan was co-originated on October 24, 2016 by Barclays Bank PLC, JPMorgan Chase Bank, National Association, Deutsche Bank, AG, New York Branch, Goldman Sachs Mortgage Company and Morgan Stanley Bank, N.A. The Hilton Hawaiian Village Whole Loan had an original principal balance of $1,275,000,000, has an outstanding principal balance as of the Cut-off Date of $1,275,000,000 and accrues interest at an interest rate of 4.19950%per annum. The Hilton Hawaiian Village Whole Loan had an initial term of 120 months, has a remaining term of 119 months as of the Cut-off Date and requires interest-only payments through the term of the Hilton Hawaiian Village Whole Loan. The Hilton Hawaiian Village Whole Loan matures on November 1, 2026.
The Hilton Hawaiian Village Mortgage Loan, evidenced by the non-controlling Notes A-2-E-1 and A-2-E-2, has an aggregate original principal balance of $52,500,000, and has an outstanding aggregate principal balance as of the Cut-off Date of $52,500,000. Five
THE INFORMATION IN THIS STRUCTURAL AND COLLATERAL TERM SHEET IS NOT COMPLETE AND MAY BE AMENDED PRIOR TO THE TIME OF SALE. THIS TERM SHEET IS NOT AN OFFER TO SELL THESE SECURITIES AND IT IS NOT A SOLICITATION OF AN OFFER TO BUY THESE SECURITIES IN ANY JURISDICTION WHERE THE OFFER OR SALE IS NOT PERMITTED.
32
| HILTON HAWAIIAN VILLAGE |
pari passu notes (Note A-1-A, Note A-1-B, Note A-1-C, Note A-1-D and Note A-1-E) and five subordinate notes (Note B-1, Note B-2, Note B-3, Note B-4 and Note B-5) with an aggregate original principal balance of $750,000,000 were contributed to the Hilton USA Trust 2016-HHV. Note A-1-A represents the controlling interest in the Hilton Hawaiian Village Whole Loan. Each of the mortgage loans evidenced by Note B-1, Note B-2, Note B-3, Note B-4 and Note B-5 are collectively referred to as the “Hilton Hawaiian Village Subordinate Companion Loans”. The non-controlling Note A-2-A-1, which had an original principal balance of $94,000,000, is held by JPMorgan Chase Bank, National Association, and is expected to be contributed to the JPMCC 2016-JP4 trust. The non-controlling Notes A-2-D-1 and A-2-D-2, which had an aggregate original principal balance of $63,000,000, is held by Morgan Stanley Bank, N.A., and is expected to be contributed to the MSBAM 2016-C32 trust. The non-controlling Notes A-2-A-2, A-2-A-3, A-2-A-4, A-2-B-1, A-2-B-2 and A-2-B-3, which had an aggregate original principal balance of $315,500,000, are held by JPMorgan Chase Bank, National Association and Deutsche Bank, AG, New York Branch, and are expected to be contributed to future securitization trusts. The lender provides no assurances that any non-securitized notes will not be split further. Each of the mortgage notes evidenced by Note A-1-A, Note A-1-B, Note A-1-C, Note A-1-D, Note A-1-E, Note A-2-A-1, Note A-2-A-2, Note A-2-A-3, Note A-2-A-4, Note A-2-B-1, Note A-2-B-2, Note A-2-B-3, Note A-2-D-1 and Note A-2-D-2 are collectively referred to as the “Hilton Hawaiian Village Pari Passu Companion Loans”. See “Description of the Mortgage Pool—The Whole Loans—The Non-Serviced Whole Loans—The Hilton Hawaiian Village Whole Loan” and “Pooling and Servicing Agreement” in the Preliminary Prospectus.
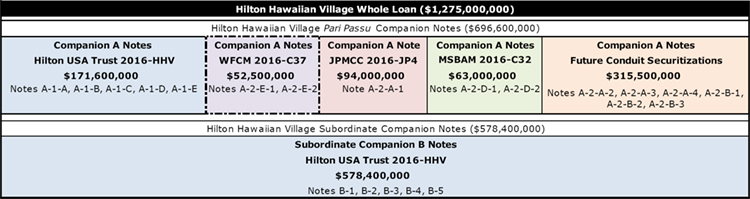
Following the lockout period, on any date before May 1, 2026, the borrower has the right to defease the Hilton Hawaiian Village Whole Loan in whole, but not in part. The lockout period will expire on the earlier to occur of (i) two years after the closing date of the securitization that includes the last note to be securitized and (ii) May 1, 2019. In addition, following the lockout period, on any date prior to May 1, 2026, the borrower has the right to prepay the Hilton Hawaiian Village Whole Loan in whole or in part, as long as such prepayment is accompanied with the payment of the greater of a yield maintenance premium or 1.0% of the amount being prepaid. Following the lockout period, the Hilton Hawaiian Village Whole Loan may be prepaid in part, with the payment of the greater of a yield maintenance premium or 1.0% of the amount being prepaid in connection with a partial release (see “Partial Release” section) or in order to achieve a net operating income debt yield of at least 7.0% in order to cure a Low Debt Yield Trigger. The Hilton Hawaiian Village Whole Loan is prepayable without penalty on or after May 1, 2026.
Sources and Uses
| Sources | Uses | |||||||||
| Original whole loan amount | $1,275,000,000 | 100.0% | Loan payoff(1) | $1,255,912,700 | 98.5% | |||||
| Closing costs | 8,465,540 | 0.7 | ||||||||
| Return of Equity | 10,621,760 | 0.8 | ||||||||
| Total Sources | $1,275,000,000 | 100.0% | Total Uses | $1,275,000,000 | 100.0% | |||||
| (1) | The Hilton Hawaiian Village Property was previously securitized in the Hilton USA Trust 2013-HLT transaction. |
The Property.The Hilton Hawaiian Village Property is a 2,860-room, luxury beachfront resort hotel located in Waikiki on the Island of Oahu, Hawaii. The Hilton Hawaiian Village Property is located on 22 beachfront acres and controls the longest expanse of Waikiki Beach, offering panoramic views of Diamond Head and the Pacific Ocean. The Hilton Hawaiian Village Property is spread across five towers and offers the largest guest room inventory in the state of Hawaii and the most meeting space within its competitive set. The hotel was built and has been owned by Hilton since 1961.
The Hilton Hawaiian Village Property offers a host of resort-style amenities and services, including 20 food and beverage outlets, over 150,000 square feet of flexible indoor and outdoor function space, three conference centers, five swimming pools, a saltwater lagoon, the Mandara Spa and Fitness Center, a chapel and the longest water slide in Waikiki. The indoor and outdoor function space is split between three primary locations: the second floor of the Tapa Tower, the base of the Kalia Tower and the stand alone Mid-Pacific Convention Center. The Mid-Pacific Convention Center is located in the center of the resort and features the Coral Ballroom, Nautilus Suites, South Pacific Ballroom, and Sea Pearl Suite. It is among the largest conference centers in the Hawaiian Islands and offers the largest capacity ballroom, accommodating up to 2,600 guests.
The Hilton Hawaiian Village Property features approximately 130,489 square feet of leased Class A retail and restaurant space, which was 78.5% occupied by over 100 tenants as of September 2016. For TTM September 30, 2016 period, the retail component of the Resort generated approximately $20.8 million in retail revenue which, net of related expenses, would account for approximately 13.1% of net cash flow, providing diversity to traditional hotel revenue streams. The retail component has demonstrated strong and consistent performance, as demonstrated by total sales for 2013, 2014, 2015 and TTM September 2016 of approximately $130.6
THE INFORMATION IN THIS STRUCTURAL AND COLLATERAL TERM SHEET IS NOT COMPLETE AND MAY BE AMENDED PRIOR TO THE TIME OF SALE. THIS TERM SHEET IS NOT AN OFFER TO SELL THESE SECURITIES AND IT IS NOT A SOLICITATION OF AN OFFER TO BUY THESE SECURITIES IN ANY JURISDICTION WHERE THE OFFER OR SALE IS NOT PERMITTED.
33
| HILTON HAWAIIAN VILLAGE |
million ($1,552 per square foot), $141.8 million ($1,651 per square foot), $137.3 million ($1,590 per square foot) and $136.1 million ($1,496 per square foot), respectively, for reporting tenants.
Top 10 Tenants
| Tenant Name | Credit Rating (Fitch/ Moody’s/ S&P)(1) | Tenant NRSF | % of NRSF | Annual U/W Base Rent PSF(2) | Annual U/W Base Rent(2) | % of Total Annual U/W Base Rent | Sales PSF(3) | Lease Expiration Date |
| Mandara Spa | NR/NR/NR | 12,583 | 9.6% | $53.61 | $674,544 | 3.9% | $231 | 8/31/2017 |
| Hatsuhana Hawaii | NR/NR/NR | 6,026 | 4.6% | $52.38 | $315,624 | 1.8% | $493 | 11/30/2018 |
| Fresco | NR/NR/NR | 5,983 | 4.6% | $58.38 | $349,317 | 2.0% | $557 | 12/31/2018 |
| Benihana of Tokyo | NR/NR/NR | 5,300 | 4.1% | $127.67 | $676,653 | 3.9% | $1,238 | 5/31/2021 |
| Best Bridal – Lagoon Chapel | NR/NR/NR | 4,755 | 3.6% | $57.45 | $273,180 | 1.6% | $109 | 10/31/2022 |
| Watabe Wedding(4) | NR/NR/NR | 4,158 | 3.2% | $63.93 | $265,825 | 1.5% | $40 | 1/14/2019 |
| ABC Stores – Tapa Tower | NR/NR/NR | 3,500 | 2.7% | $384.23 | $1,344,792 | 7.7% | $3,493 | 8/31/2022 |
| Louis Vitton | NR/NR/NR | 3,500 | 2.7% | $146.70 | $513,442 | 2.9% | $2,280 | 8/18/2023 |
| Lamonts & Whalers General Store | NR/NR/NR | 2,800 | 2.1% | $163.11 | $456,696 | 2.6% | $663 | MTM |
| ABC Discount Store | NR/NR/NR | 2,145 | 1.6% | $812.26 | $1,742,302 | 10.0% | $6,769 | 12/31/2018 |
| (1) | Certain ratings are those of the parent company whether or not the parent guarantees the lease. |
| (2) | Annual U/W Base Rent includes base rent and contractual rent steps through September 2017. |
| (3) | All Sales PSF information presented herein are based upon TTM September 2016 information provided by the borrower unless otherwise noted. |
Since 2008, approximately $232.2 million ($81,188 per room) has been invested in the Resort through September 2016. From 2014 through September 2016, the Hilton Hawaiian Village Property received $57.8 million ($20,215 per room) of capital investment including a $17.9 million renovation of the 380 room Diamond Head Tower in 2014. Going forward, the sponsor has budgeted for approximately $137.3 million in capital expenditures through 2021, to be spread across multiple categories with the intent of delivering a continually exceptional product offering.
Historical Capital Expenditures
| 2008 | 2009 | 2010 | 2011 | 2012 | 2013 | 2014 | 2015 | YTD 2016(1) | Total | |
| Capital Expenditures(2) | $22,216 | $16,509 | $8,834 | $56,117 | $42,568 | $28,138 | $32,965 | $15,559 | $9,293 | $232,198 |
| Per Room | $7,768 | $5,772 | $3,089 | $19,621 | $14,884 | $9,838 | $11,526 | $5,440 | $3,249 | $81,188 |
| (1) | YTD 2016 Capital Expenditures are as of September 2016. |
| (2) | Capital Expenditures are presented in (000)’s. |
The guestroom mix at the Hilton Hawaiian Village Property includes 1,078 king rooms, 175 queen suites and 1,607 double rooms. The Resort is divided among five primary guest room offerings: the Ali’i Tower (348 rooms), the Diamond Head Tower (380 rooms) and the three Village Towers, comprising of the Rainbow Tower (796 rooms), Kalia Tower (315 rooms) and the Tapa Tower (1,021 rooms). All guest rooms offer 37” flat-screen televisions with cable, in-room controlled air conditioning, and in-room refrigerators.
Condominium.The collateral includes the 14 hotel units of a condominium in the Kalia Tower (floors 5-11 and 19-25). The timeshare units of the condominium are not part of the collateral, but there are several agreements in place governing shared use of common facilities. See “Description of the Mortgage Pool—Mortgage Pool Characteristics— Condominium Interests” in the Preliminary Prospectus.
THE INFORMATION IN THIS STRUCTURAL AND COLLATERAL TERM SHEET IS NOT COMPLETE AND MAY BE AMENDED PRIOR TO THE TIME OF SALE. THIS TERM SHEET IS NOT AN OFFER TO SELL THESE SECURITIES AND IT IS NOT A SOLICITATION OF AN OFFER TO BUY THESE SECURITIES IN ANY JURISDICTION WHERE THE OFFER OR SALE IS NOT PERMITTED.
34
| HILTON HAWAIIAN VILLAGE |
Operating History and Underwritten Net Cash Flow. The following table presents certain information relating to the historical operating performance and the underwritten net cash flow at the Hilton Hawaiian Village Property:
Cash Flow Analysis
| 2013 | 2014 | 2015 | TTM 9/30/2016 | 2016 Actual / Reforecast(1) | U/W | % of U/W Total Revenue | U/W $ per Room | |
| Occupancy | 89.9% | 90.7% | 94.4% | 94.6% | 95.6% | 94.6% | ||
| ADR(2) | $247.48 | $259.85 | $240.62 | $250.09 | $248.79 | $250.09 | ||
| RevPAR | $222.57 | $235.77 | $227.20 | $236.65 | $237.76 | $236.65 | ||
| Room Revenue | $232,345,007 | $246,124,088 | $237,172,233 | $247,711,744 | $248,880,998 | $247,034,700 | 66.0% | $86,376 |
| F&B Revenue | 56,844,007 | 62,740,100 | 70,771,369 | 69,023,623 | 68,090,781 | 68,996,667 | 18.4 | 24,125 |
| Resort Fee Revenue(3) | 0 | 0 | 22,462,635 | 22,641,808 | 23,217,108 | 22,752,381 | 6.1 | 7,955 |
| Retail Store Rental Revenue | 19,071,361 | 20,048,658 | 20,582,018 | 20,786,062 | 20,860,438 | 19,162,812 | 5.1 | 6,700 |
| Other Revenue(4) | 16,714,514 | 17,176,781 | 15,802,967 | 16,824,201 | 16,916,244 | 16,491,183 | 4.4 | 5,766 |
| Total Revenue | $324,974,888 | $346,089,627 | $366,791,222 | $376,987,438 | $377,965,568 | $374,437,742 | 100.0% | $130,922 |
| Total Department Expenses | 108,450,526 | 115,746,148 | 126,658,376 | 127,698,731 | 126,082,294 | 126,780,054 | 33.9 | 44,329 |
| Gross Operating Profit | $216,524,362 | $230,343,479 | $240,132,846 | $249,288,707 | $251,883,274 | $247,657,688 | 66.1% | $86,594 |
| Total Undistributed Expenses | 61,997,168 | 64,229,329 | 62,250,540 | 64,897,454 | 65,820,931 | 62,099,714 | 16.6 | 21,713 |
| Profit Before Fixed Charges | $154,527,194 | $166,114,150 | $177,882,306 | $184,391,253 | $186,062,343 | $185,557,974 | 49.6% | $64,880 |
| Management Fee | 17,783,281 | 19,036,711 | 20,311,371 | 21,868,482 | 21,129,803 | 21,056,417 | 5.6 | 7,362 |
| Total Fixed Charges | 12,780,083 | 13,373,036 | 14,161,563 | 15,550,153 | 16,679,257 | 16,937,073 | 4.5 | 5,922 |
| Net Operating Income | $123,963,830 | $133,704,404 | $143,409,371 | $146,972,618 | $148,253,283 | $147,564,484 | 39.4% | $51,596 |
| FF&E | 12,998,996 | 13,843,585 | 14,671,649 | 15,079,498 | 15,118,623 | 14,977,510 | 4.0 | 5,237 |
| Net Cash Flow | $110,964,835 | $119,860,819 | $128,737,723 | $131,893,120 | $133,134,660 | $132,586,975 | 35.4% | $46,359 |
| NOI DSCR | 4.18 | 4.51 | 4.84 | 4.96 | 5.00 | 4.98 | ||
| NCF DSCR | 3.74 | 4.04 | 4.34 | 4.45 | 4.49 | 4.47 | ||
| NOI DY | 17.8% | 19.2% | 20.6% | 21.1% | 21.3% | 21.2% | ||
| NCF DY | 15.9% | 17.2% | 18.5% | 18.9% | 19.1% | 19.0% |
| (1) | 2016 Actual / Reforecast represents actual year-to-date operating history through September 30, 2016 and the sponsor’s budget through year-end 2016. |
| (2) | Due to an accounting change starting in 2015, ADR is calculated based on room revenue excluding resort fee revenue. Prior to 2015, ADR was calculated based on the combined room revenue and resort fee revenue. |
| (3) | Prior to 2015, resort fee revenue was included in room revenue and therefore also captured in ADR. |
| (4) | Other Revenue includes telephone revenue, parking revenue, recreation revenue, health club revenue, water sports, beach & pool revenue and miscellaneous other revenue. |
Appraisal.As of the appraisal valuation date of August 30, 2016, the Hilton Hawaiian Village Property had an “as-is” appraised value of $2,230,000,000. In addition, the appraiser concluded to an “as-stabilized” appraised value of $2,505,000,000 as of September 1, 2019.
Environmental Matters.According to the Phase I environmental assessment dated October 17, 2016, there was no evidence of any recognized environmental conditions at the Hilton Hawaiian Village Property. Historical recognized environmental conditions regarding the removal of underground storage tanks were identified in the Phase I environmental assessment. No further action or investigation was recommended. See “Description of the Mortgage Pool–Mortgage Pool Characteristics–Environmental Considerations” in the Preliminary Prospectus.
Market Overview and Competition.The Hilton Hawaiian Village Property is located in Waikiki on the Island of Oahu, Hawaii. Situated off of Kalakaua Avenue at the center of Waikiki, the resort is located only 7.9 miles from Honolulu International Airport. Additionally, the Resort is proximate to several attractions and demand generators including Ala Wai Harbor (0.4 miles), Ala Moana Mall (1.1 miles), the Hawaii Convention Center (0.7 miles), the Honolulu Zoo (1.5 miles), the University of Hawaii (2.0 miles) and Diamond Head Crater (3.8 miles).
The Hilton Hawaiian Village property is located in Honolulu, Hawaii in the greater Oahu lodging market and the Waikiki submarket. The island of Oahu serves as an economic center of the Hawaiian Islands. Oahu maintains its status as one of the world’s foremost destinations, with cultural venues, golf courses, restaurants, retail and recreational attractions. In 2015, approximately 5.3 million tourists, or 62.4% of Hawaii’s total air tourists, visited the island of Oahu, making it the most popular destination of the Hawaiian Islands. The total number of air visitors has increased by 435,867 from 2012 to 2015, which represents a 2.9% year-over-year increase. International travel to Oahu represented 46.3% of Oahu’s 5.3 million air visitors in 2015 and was marginally unchanged from 2014. Additionally, visitor expenditures in Oahu totaled $7.4 billion in 2015, which represents 49.3% of total expenditures by air visitors in 2015. Honolulu comprises the strongest lodging market in Oahu and all of the eight Hawaiian islands, a status attributable to a temperate year-round climate, popularity as one of the leading group and leisure destinations of Hawaii, superior visitor infrastructure and high barriers to new supply. Honolulu encompasses more than 24,000 guest rooms in 74 properties and consistently achieved occupancy rates in the mid 70% to 80% range, never dropping below 74%, between 2009 and 2015. During this same period, RevPAR in Honolulu increased at an average annual rate of 9.5%, ending 2015 at $190, while the average daily rate achieved a premium of $69 over 2009. The market’s RevPAR in 2009, which represented the trough during the downturn, reflects a 14.6% decline relative to 2007, less than other leading markets.
THE INFORMATION IN THIS STRUCTURAL AND COLLATERAL TERM SHEET IS NOT COMPLETE AND MAY BE AMENDED PRIOR TO THE TIME OF SALE. THIS TERM SHEET IS NOT AN OFFER TO SELL THESE SECURITIES AND IT IS NOT A SOLICITATION OF AN OFFER TO BUY THESE SECURITIES IN ANY JURISDICTION WHERE THE OFFER OR SALE IS NOT PERMITTED.
35
| HILTON HAWAIIAN VILLAGE |
The appraisal identified two hotels either recently opened or currently under construction in the Waikiki submarket that are expected to have some degree of competitive interaction with the Hilton Hawaiian Village property. The 623-room Hilton Garden Inn (Ohana Waikiki West Redevelopment) opened in June 2016, while the 230-room boutique Hyatt Centric (Waikiki Trade Center Redevelopment) is expected to open in March 2017. Though offered at a competitive price-point with national brand affiliations, the appraisal notes that both options are non-beachfront locations with select-service product offerings. Additionally, the appraisal notes significant barriers to entry, including nearly no developable ocean-front land and prohibitively high costs.
The following table presents certain information relating to the Hilton Hawaiian Village Property’s competitive set.
Subject and Market Historical Occupancy, ADR and RevPAR
Competitive Set(1) | Hilton Hawaiian | Penetration Factor | |||||||
Year | Occupancy | ADR | RevPAR | Occupancy | ADR | RevPAR | Occupancy | ADR | RevPAR |
| TTM 9/30/2016 | 89.9% | $259.08 | $232.92 | 94.6% | $250.09 | $236.65 | 105.3% | 96.5% | 101.6% |
| 2015 | 89.0% | $256.75 | $228.38 | 94.4% | $240.62 | $227.20 | 106.2% | 93.7% | 99.5% |
| 2014 | 87.8% | $250.07 | $219.50 | 90.7% | $238.34 | $216.26 | 103.4% | 95.3% | 98.5% |
| 2013 | 89.0% | $248.36 | $221.07 | 89.9% | $237.77 | $213.84 | 101.0% | 95.7% | 96.7% |
| (1) | Information obtained from third party hospitality reports dated January 19, 2016 and October 18, 2016. The competitive set includes the following hotels: Sheraton Hotel Waikiki, Marriott Waikiki Beach Resort & Spa, Hyatt Regency Waikiki Beach Resort & Spa, Westin Mona Surfrider, Sheraton Hotel Princess Kaiulani, Outrigger Reef Waikiki Beach Resort and Outrigger Waikiki Beach Resort. |
| (2) | Based on borrower provided operating statements, with the exception of 2013 and 2014 ADR and RevPAR which is based on a third party hospitality report that accounts for a change in accounting methodology in 2015. For 2013 through TTM September 2016, ADR is calculated exclusive of resort fees. |
The Borrower.The borrower is Hilton Hawaiian Village LLC, a Hawaii limited liability company and a single purpose entity with two independent directors. Legal counsel to the borrower delivered a non-consolidation opinion in connection with the origination of the Hilton Hawaiian Village Whole Loan. Park Intermediate Holdings LLC is the guarantor of certain nonrecourse carveouts under the Hilton Hawaiian Village Whole Loan.
The Sponsor.The sponsor is Park Intermediate Holdings LLC, a wholly owned subsidiary of Park Hotels & Resorts Inc. Park Hotels & Resorts is one of two Hilton Worldwide Holdings Inc. (“Hilton”) spin-offs. On February 26, 2016, Hilton announced plans to separate into three independent, publicly traded companies: Park Hotels & Resorts Inc. (NYSE: PK), Hilton Grand Vacations Inc. (NYSE: HGV) and Hilton (NYSE: HLT). Park Hotels & Resorts Inc. will own most of Hilton’s owned and leased real estate properties and, with over 35,000 rooms and 69 hotels, is expected to be the second-largest publicly traded real estate investment trust in the lodging industry (the “Restructuring”). Hilton Grand Vacations Inc. will own and operate Hilton’s timeshare business. Hilton will retain its core management and franchise business and continue to trade on the New York Stock Exchange. In connection with the proposed Restructuring, the borrower has signed an operating lease with an affiliate, which is also a signatory to the loan documents (other than the promissory notes) as a co-obligor. The operating lease will automatically be effective upon consummation of the Restructuring. The borrower is also required to deliver a substitute management agreement at that time. The aggregate liability of the guarantor with respect to all full recourse carveouts in the Hilton Hawaiian Village Whole Loan may not exceed an amount equal to 10.0% of the principal balance of the Hilton Hawaiian Village Whole Loan outstanding at the time of the occurrence of such event, plus any and all reasonable third-party collection costs actually incurred by the lender. In addition, the guarantor is not a party to the environmental indemnity, and in lieu of the guarantors signing the indemnity, the Hilton Hawaiian Village Whole Loan documents require the borrower to obtain environmental insurance.
Escrows.Pursuant to the Hilton Hawaiian Village Whole Loan documents, monthly escrows for real estate taxes, insurance premiums (unless insurance is maintained under a blanket policy) and other assessments, if any, are only required during a Trigger Period (defined below) unless such amounts are held in reserve by the property manager.
The loan documents also provide for monthly escrows in an amount equal to 4.0% of total revenues for the calendar month that is two months prior to the date when an applicable deposit to the FF&E reserve is to be made. However, such deposits will be waived if the property manager is making the deposits into a manager reserve account for the payment of replacements in accordance with the provisions of the management agreement and the amount being deposited in such account equals or exceeds 4.0% of total revenue and if the borrower and operating lessee maintain the Hilton Hawaiian Village Property in accordance with the management agreement.
A “Trigger Period” will commence upon, (i) an event of default or (ii) the net operating income debt yield falling below 7.0% for two consecutive quarters (a “Low Debt Yield Trigger”). A Trigger Period will end with respect to clause (i) above, upon the cure of an event of default or with respect to clause (ii) above, when the net operating income debt yield exceeds 7.0% for two consecutive quarters or if the borrower cures a Low Debt Yield Trigger by making a voluntary prepayment in such amounts necessary to achieve a net operating income debt yield of 7.0%.
Lockbox and Cash Management. The Hilton Hawaiian Village Mortgage Loan requires the borrower to establish a lender-controlled lockbox account, which is already in place, and to direct all tenants to pay their rents and all credit card companies under merchant agreements to pay receipts directly into such manager accounts and transferred to the cash management account. Prior to the occurrence and continuance of a Trigger Period, all excess funds should be transferred to the borrower and after the occurrence of a Trigger Period excess funds should be transferred to a lender controlled account.
Property Management.The Hilton Hawaiian Village Property is managed by Hilton Management LLC, a subsidiary of Hilton. The current management agreement is effective as of October 25, 2013 and expires as of December 31, 2073 (fully extended term); however, as part of the Restructuring, the current management agreement will be replaced with new management agreements with the same management companies. The terms of the new management agreement will provide for a fully extended term of 70 years
THE INFORMATION IN THIS STRUCTURAL AND COLLATERAL TERM SHEET IS NOT COMPLETE AND MAY BE AMENDED PRIOR TO THE TIME OF SALE. THIS TERM SHEET IS NOT AN OFFER TO SELL THESE SECURITIES AND IT IS NOT A SOLICITATION OF AN OFFER TO BUY THESE SECURITIES IN ANY JURISDICTION WHERE THE OFFER OR SALE IS NOT PERMITTED.
36
| HILTON HAWAIIAN VILLAGE |
from the effective date and (i) a base management fee equal to 3.0% of gross revenue (less revenue from the retail component of the property), (ii) an incentive management fee equal to 6.0% of adjusted gross profit (exclusive of the retail component of the Hilton Hawaiian Village Property), (iii) a management fee equal to 5.5% of net retail income with respect to the retail component of the Hilton Hawaiian Village Property and (iv) monthly FF&E deposits equal to 4.0% of gross revenue.
Assumption.The borrower has the right to transfer the Hilton Hawaiian Village Property, provided that certain conditions are satisfied, including (i) no event of default has occurred and is continuing; (ii) continued management by the property manager or another qualified manager; (iii) the proposed transferee is a qualified transferee as provided in the loan documents (including a minimum net worth of $500.0 million by the transferee or its controlling parent); and (iv) rating agency confirmation from DBRS, Fitch and Moody’s that the transfer will not result in a downgrade, withdrawal or qualification of the respective ratings assigned to the Series 2016-C37 Certificates and similar confirmations from each rating agency rating any securities backed by any Hilton Hawaiian Village Pari Passu Companion Loan or Hilton Hawaiian Village Subordinate Companion Loan with respect to the ratings of such securities.
Partial Release. Following the lockout period, the borrower is permitted to obtain releases (each, a “Partial Release”) of portions of the Resort (each, a “Release Parcel”) subject to, in addition to other requirements: (1) payment of a release price equal to the product of (x) 110% and (y) the product of (A) the Cut-Off Date LTV Ratio of the Hilton Hawaiian Village Whole Loan on the closing date (57.2%) and (B) the difference between the appraised value of the Hilton Hawaiian Village Property with and without the Release Parcel (the “Parcel Release Price”) (and such payment will be deemed to be a voluntary prepayment under the Hilton Hawaiian Village Whole Loan documents and the requirement of the Hilton Hawaiian Village Whole Loan documents relating to prepayments must be satisfied, including the payment of any applicable yield maintenance premium if made prior to May 1, 2026); (2) no event of default continuing, (3) delivery of evidence that would be reasonably acceptable to a prudent lender that the release of the Release Parcel will not materially and adversely affect the economic value of, or the revenue produced by (exclusive of the economic value or revenue lost attributable to the Release Parcel), the remaining improvements located on the Hilton Hawaiian Village Property, (4) delivery of any necessary easements together with evidence that the Hilton Hawaiian Village Property and the Release Parcel have been legally subdivided (or an application therefore shall have been filed and the transferee and transferor have entered into a property tax allocation agreement with the same economic effect of a tax lot subdivision) and continued zoning compliance, with any zoning, building, land use, parking or other similar legal requirements, (5) after giving effect to such release, the net operating income debt yield for the portion of the Hilton Hawaiian Village Property then remaining subject to the Hilton Hawaiian Village Whole Loan shall be equal to or greater than the Release Debt Yield (defined below), (6) if a Release Parcel encompasses more than 15% of the hotel rooms in the Hilton Hawaiian Village Property or the Parcel Release Price equals or exceeds the product of (i) 15% and (ii) the original principal balance of the Mortgage Loan, then the borrower may release such Release Parcel only if, following a securitization, the lenders have received rating agency confirmation and (7) if the Release Parcel is released to an affiliate, delivery of a non-consolidation opinion. No portion of the retail component of the Property may be released pursuant to the above provisions.
“Release Debt Yield” means the greater of (i) the lesser of (A) 15% or (B) the net operating income debt yield immediately prior to the release or (ii) 10.2%.
Following the lockout period, the retail component of the Hilton Hawaiian Village Property (or portions thereof) may be released (any such parcel, a “Retail Release Parcel”) subject to, in addition to other customary requirements: (1) no event of default continuing, (2) delivery of evidence that would be satisfactory to a prudent lender acting reasonably that (A) the Hilton Hawaiian Village Property and the Retail Release Parcel have been or will be concurrently with the release legally subdivided (or an application therefore shall have been filed and the transferee and transferor have entered into a property tax allocation agreement with the same economic effect of a tax lot subdivision) and (B) the Retail Release Parcel is not necessary for the Hilton Hawaiian Village Property to comply with any zoning, building, land use or parking or other similar legal requirements or that a reciprocal easement agreement, joint development agreement or other agreement (in each case superior to the Mortgage) has been executed and recorded that would allow the borrower to continue to use the Retail Release Parcel to the extent necessary for such purpose, (3) payment of a release price equal to product of (x) 110% and (y) the product of (A) the Cut-Off Date LTV Ratio of the Hilton Hawaiian Village Whole Loan on the closing date (57.2%) and (B) the greater of (i) the difference between the appraised value of the Hilton Hawaiian Village Property with and without the Retail Release Parcel and (ii) net sale proceeds (and such payment will be deemed to be a voluntary prepayment under the Mortgage Loan documents and the requirement of the Mortgage Loan documents relating to prepayments must be satisfied, including the payment of any applicable yield maintenance premium if made prior to May 1, 2026), (4) after giving effect to such release, the net operating income debt yield for the portion of the Hilton Hawaiian Village Property then remaining subject to the Hilton Hawaiian Village Whole Loan shall be equal to or greater than the Release Debt Yield, (5) receipt of rating agency confirmation and (6) the lender shall have received reasonable satisfactory evidence that any termination fees payable under the sub-management agreement have been paid in full.
Following the lockout period, a non-income producing ground-leased portion of the Hilton Hawaiian Village Property known as the “Taran Outparcel” may be released subject to, in addition to other customary requirements, payment of the $2,500,000 (and such payment will be deemed to be a voluntary prepayment under the Hilton Hawaiian Village Whole Loan documents which satisfies all requirements of the Hilton Hawaiian Village Whole Loan documents relating to prepayments, including the payment of any applicable yield maintenance premium if made prior to May 1, 2026). The Taran Outparcel is subject to a ground lease with Virginia L. Taran. The fully extended term of the ground lease expires on July 31, 2035 and governs an approximately 5,900 square foot piece of land historically used for employee housing.
Real Estate Substitution. Not permitted.
Subordinate and Mezzanine Indebtedness.The Hilton Hawaiian Village Whole Loan includes 16pari passu and five subordinate promissory notes (Note A-1-A, Note A-1-B, Note A-1-C, Note A-1-D, Note A-1-E, Note A-2-A-1, Note A-2-A-2, Note A-2-A-3, Note A-2-A-4, Note A-2-B-1, Note A-2-B-2, Note A-2-B-3, Note A-2-D-1, Note A-2-D-2 , Note A-2-E-1, Note A-2-E-2, Note B-1, Note B-2,
THE INFORMATION IN THIS STRUCTURAL AND COLLATERAL TERM SHEET IS NOT COMPLETE AND MAY BE AMENDED PRIOR TO THE TIME OF SALE. THIS TERM SHEET IS NOT AN OFFER TO SELL THESE SECURITIES AND IT IS NOT A SOLICITATION OF AN OFFER TO BUY THESE SECURITIES IN ANY JURISDICTION WHERE THE OFFER OR SALE IS NOT PERMITTED.
37
| HILTON HAWAIIAN VILLAGE |
Note B-3, Note B-4 and Note B-5) with an aggregate original principal balance of $1,275,000,000, and an outstanding aggregate principal balance as of the Cut-off Date of $1,275,000,000. The five subordinate notes (Note B-1, Note B-2, Note B-3, Note B-4 and Note B-5) have an aggregate original principal balance of $578,400,000 and an aggregate outstanding principal balance as of the Cut-off Date of $578,400,000.
Ground Lease.A portion of the Hilton Hawaiian Village Property consisting of 5,900 square feet of non-income producing space, the Taran Outparcel, is subject to a ground lease with Virginia L. Taran that expires July 31, 2035. See “Description of the Mortgage Pool—Mortgage Pool Characteristics—Ground Leases” in the Preliminary Prospectus.
Terrorism Insurance.The Hilton Hawaiian Village Whole Loan documents require that an “all risk” insurance policy (or if excluded from the “all risk” policy, coverage for the peril of terrorism and acts of terrorism shall be provided through a separate policy) be maintained by the borrower to provide coverage for terrorism equal to the lesser of (i) full replacement cost and (ii) $1,275,000,000 (provided that, in the event such limit is an annual aggregate and said limit is eroded by 5.0% or more due to claims, the borrower is required to reinstate the available limits within 90 days); provided that (a) TRIPRA or a similar statute is not in effect, (b) TRIPRA or a similar statute is modified which results in a significant increase in terrorism insurance premiums or (c) there is a disruption in the terrorism insurance marketplace as a result of a terrorism event which results in a material increase in terrorism insurance premiums for properties located in the United States, then provided terrorism insurance is commercially available, the borrower shall not be required to spend more than two times the amount of insurance premium that is payable at such time in respect of the property and/or business interruption insurance required under the loan documents (without giving effect to the cost of terrorism, earthquake and windstorm components). The loan documents also require business interruption insurance for the entire period of restoration or for a 24-months, plus an additional six-month extended period of indemnity.
THE INFORMATION IN THIS STRUCTURAL AND COLLATERAL TERM SHEET IS NOT COMPLETE AND MAY BE AMENDED PRIOR TO THE TIME OF SALE. THIS TERM SHEET IS NOT AN OFFER TO SELL THESE SECURITIES AND IT IS NOT A SOLICITATION OF AN OFFER TO BUY THESE SECURITIES IN ANY JURISDICTION WHERE THE OFFER OR SALE IS NOT PERMITTED.
38
(THIS PAGE INTENTIONALLY LEFT BLANK)
THE INFORMATION IN THIS STRUCTURAL AND COLLATERAL TERM SHEET IS NOT COMPLETE AND MAY BE AMENDED PRIOR TO THE TIME OF SALE. THIS TERM SHEET IS NOT AN OFFER TO SELL THESE SECURITIES AND IT IS NOT A SOLICITATION OF AN OFFER TO BUY THESE SECURITIES IN ANY JURISDICTION WHERE THE OFFER OR SALE IS NOT PERMITTED.
39
(THIS PAGE INTENTIONALLY LEFT BLANK)
THE INFORMATION IN THIS STRUCTURAL AND COLLATERAL TERM SHEET IS NOT COMPLETE AND MAY BE AMENDED PRIOR TO THE TIME OF SALE. THIS TERM SHEET IS NOT AN OFFER TO SELL THESE SECURITIES AND IT IS NOT A SOLICITATION OF AN OFFER TO BUY THESE SECURITIES IN ANY JURISDICTION WHERE THE OFFER OR SALE IS NOT PERMITTED.
40
| QUANTUM PARK |

THE INFORMATION IN THIS STRUCTURAL AND COLLATERAL TERM SHEET IS NOT COMPLETE AND MAY BE AMENDED PRIOR TO THE TIME OF SALE. THIS TERM SHEET IS NOT AN OFFER TO SELL THESE SECURITIES AND IT IS NOT A SOLICITATION OF AN OFFER TO BUY THESE SECURITIES IN ANY JURISDICTION WHERE THE OFFER OR SALE IS NOT PERMITTED.
41
| QUANTUM PARK |
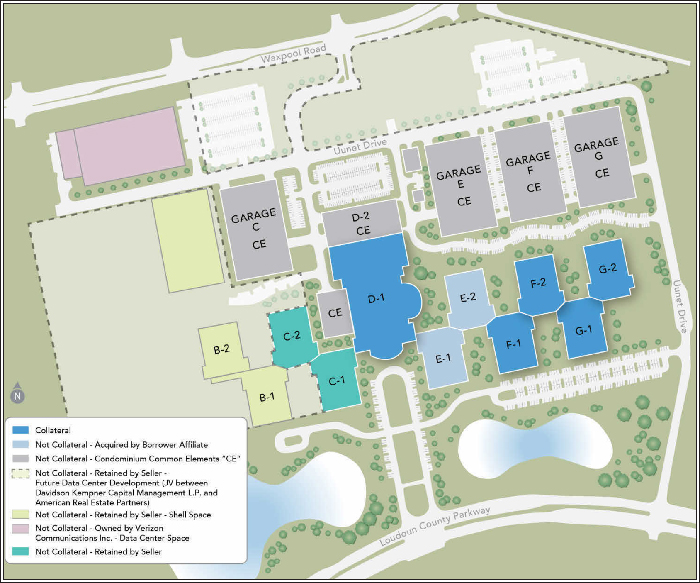
THE INFORMATION IN THIS STRUCTURAL AND COLLATERAL TERM SHEET IS NOT COMPLETE AND MAY BE AMENDED PRIOR TO THE TIME OF SALE. THIS TERM SHEET IS NOT AN OFFER TO SELL THESE SECURITIES AND IT IS NOT A SOLICITATION OF AN OFFER TO BUY THESE SECURITIES IN ANY JURISDICTION WHERE THE OFFER OR SALE IS NOT PERMITTED.
42
| QUANTUM PARK |
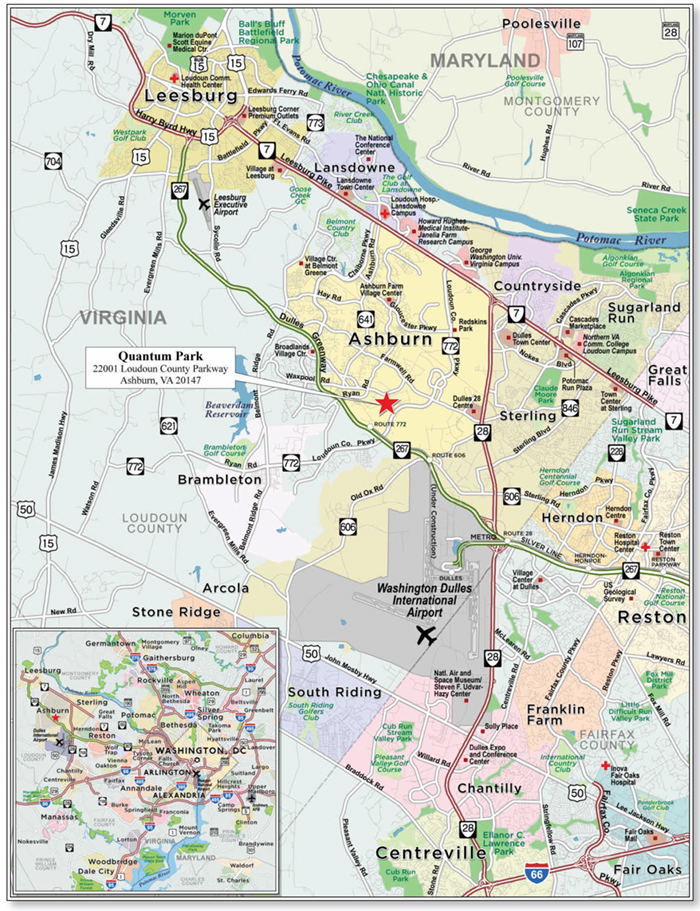
THE INFORMATION IN THIS STRUCTURAL AND COLLATERAL TERM SHEET IS NOT COMPLETE AND MAY BE AMENDED PRIOR TO THE TIME OF SALE. THIS TERM SHEET IS NOT AN OFFER TO SELL THESE SECURITIES AND IT IS NOT A SOLICITATION OF AN OFFER TO BUY THESE SECURITIES IN ANY JURISDICTION WHERE THE OFFER OR SALE IS NOT PERMITTED.
43
| No. 2 – Quantum Park | |||||||
| Loan Information | Property Information | ||||||
| Mortgage Loan Seller: | Barclays Bank PLC | Single Asset/Portfolio: | Single Asset | ||||
| Credit Assessment (DBRS/Fitch/Moody’s): | BBB(high)/NR/NR | Property Type: | Office | ||||
| Original Principal Balance(1): | $52,000,000 | Specific Property Type: | Suburban | ||||
| Cut-off Date Balance(1): | $52,000,000 | Location: | Ashburn, VA | ||||
| % of Initial Pool Balance: | 6.9% | Size: | 942,843 SF | ||||
| Loan Purpose: | Acquisition | Cut-off Date Balance Per SF(1): | $140.00 | ||||
| Borrower Name: | Solace Ashburn DFG LLC | Year Built/Renovated: | 1998, 2001/NAP | ||||
| Sponsor: | AGC Equity Partners Holding Ltd. | Title Vesting: | Fee | ||||
| Mortgage Rate(1): | 3.6885% | Property Manager: | American Real Estate Partners Management LLC | ||||
| Note Date: | September 28, 2016 | 4thMost Recent Occupancy(3): | NAV | ||||
| Anticipated Repayment Date: | October 6, 2021 | 3rdMost Recent Occupancy(3): | NAV | ||||
| Maturity Date: | October 6, 2026 | 2ndMost Recent Occupancy(3): | NAV | ||||
| IO Period: | 60 months | Most Recent Occupancy (As of)(3): | 100.0% (12/31/2015) | ||||
| Loan Term (Original): | 60 months | Current Occupancy (As of): | 100.0% (12/1/2016) | ||||
| Seasoning: | 2 months | ||||||
| Amortization Term (Original): | NAP | Underwriting and Financial Information: | |||||
| Loan Amortization Type(1): | Interest-only, ARD | ||||||
| Interest Accrual Method: | Actual/360 | 4thMost Recent NOI(4): | NAV | ||||
| Call Protection: | L(24),GRTR 1% or YM(31),O(5) | 3rdMost Recent NOI(4): | NAV | ||||
| Lockbox Type: | Hard/Upfront Cash Management | 2ndMost Recent NOI(4): | NAV | ||||
| Additional Debt(1): | Yes | Most Recent NOI(4): | NAV | ||||
| Additional Debt Type(1): | Pari Passu | ||||||
| U/W Revenues(4): | $27,065,253 | ||||||
| U/W Expenses(4): | $12,043,225 | ||||||
| U/W NOI(4): | $15,022,028 | ||||||
| U/W NCF(4): | $14,786,318 | ||||||
| Escrows and Reserves(2): | U/W NOI DSCR(1): | 3.04x | |||||
| U/W NCF DSCR(1): | 3.00x | ||||||
| Type: | Initial | Monthly | Cap (If Any) | U/W NOI Debt Yield(1): | 11.4% | ||
| Taxes | $0 | $191,400 | NAP | U/W NCF Debt Yield(1): | 11.2% | ||
| Insurance | $25,086 | Springing | NAP | As-Is Appraised Value: | $200,000,000 | ||
| Replacement Reserves | $0 | $11,786 | NAP | As-Is Appraisal Valuation Date: | September 12, 2016 | ||
| Rollover Reserve | $0 | Springing | $37,713,720 | Cut-off Date LTV Ratio(1): | 66.0% | ||
| Condominium Charge Reserve | $0 | $439,668 | NAP | LTV Ratio at Maturity or ARD(1): | 66.0% | ||
| (1) | See “The Mortgage Loan” section. All statistical information related to balance per square foot, loan-to-value ratios, debt service coverage ratios and debt yields are based on the funded outstanding principal balance of the Quantum Park Whole Loan (as defined below) as of the Cut-off Date. |
| (2) | See “Escrows” section. |
| (3) | See “Historical Occupancy” section. |
| (4) | See “Cash Flow Analysis” section. |
The Mortgage Loan.The mortgage loan (the “Quantum Park Mortgage Loan”) is part of a whole loan (the “Quantum Park Whole Loan”) that is evidenced by threepari passu promissory notes (Notes A-1, A-2 and A-3) secured by a first mortgage encumbering the fee interest in an office complex located in Ashburn, Virginia (the “Quantum Park Property”). The Quantum Park Whole Loan was originated on September 28, 2016 by Barclays Bank PLC. The Quantum Park Whole Loan had an original principal balance of $132,000,000, has an outstanding principal balance as of the Cut-off Date of $132,000,000 and accrues interest at an interest rate of 3.6885%per annum(the “Initial Interest Rate”). The Quantum Park Whole Loan had an initial term of 60 months, has a remaining term of 60 months as of the Cut-off Date and requires payments of interest-only through the anticipated repayment date (“ARD”). The ARD is October 6, 2021 and the final maturity date is October 6, 2026. In the event that the Quantum Park Whole Loan is not repaid in full on or prior to the ARD, the Quantum Park Whole Loan will accrue interest at aper annumrate equal to the Initial Interest Rate plus 3.0000% (the “Adjusted Interest Rate”); however, interest accrued at the excess of the Adjusted Interest Rate over the Initial Interest Rate (the “Accrued Interest”) will be deferred. In addition, from and after the ARD, all excess cash flow from the Quantum Park Property after the payment of reserves, interest calculated at the Initial Interest Rate and operating expenses will be applied (i)firstto repay the principal balance of the Quantum Park Whole Loan and (ii)second to the payment of Accrued Interest. See “Description of the Mortgage Pool—The Whole Loans—The Serviced Pari Passu Whole Loans—the Quantum Park Whole Loan” and “Pooling and Servicing Agreement” in the Preliminary Prospectus.
THE INFORMATION IN THIS STRUCTURAL AND COLLATERAL TERM SHEET IS NOT COMPLETE AND MAY BE AMENDED PRIOR TO THE TIME OF SALE. THIS TERM SHEET IS NOT AN OFFER TO SELL THESE SECURITIES AND IT IS NOT A SOLICITATION OF AN OFFER TO BUY THESE SECURITIES IN ANY JURISDICTION WHERE THE OFFER OR SALE IS NOT PERMITTED.
44
| QUANTUM PARK |
The Quantum Park Mortgage Loan, evidenced by the controlling Note A-3 will be contributed to the WFCM 2016-C37 Trust, had an original principal balance of $52,000,000 and has an outstanding principal balance as of the Cut-off Date of $52,000,000. The non-controlling Note A-1, which had an original principal balance of $30,000,000, was contributed to the CGCMT 2016-C3 Trust. The non-controlling Note A-2, which had an original principal balance of $50,000,000, is expected to be contributed to the CGCMT 2016-P6 Trust.
Note Summary
| Notes | Original Balance | Note Holder | Controlling Interest | |
| A-1 | $30,000,000 | CGCMT 2016-C3 | No | |
| A-2 | $50,000,000 | CGCMT 2016-P6 | No | |
| A-3 | $52,000,000 | WFCM 2016-C37 | Yes | |
| Total | $132,000,000 |
Following the lockout period, the borrower has the right to prepay the Quantum Park Whole Loan in whole, but not in part, on any date before June 6, 2021, provided that the borrower pays the greater of a yield maintenance premium or a prepayment premium equal to 1.0% of the principal amount being prepaid. In addition, the Quantum Park Whole Loan is prepayable without penalty on or after June 6, 2021.
Sources and Uses(1)
| Sources | Uses | |||||
| Original whole loan amount | $132,000,000 | 67.1% | Purchase price | $193,000,000 | 98.1% | |
| Sponsor’s new cash contribution | 61,070,342 | 31.0 | Reserves | 25,086 | 0.0 | |
| Other sources | 3,675,273 | 1.9 | Closing costs | 3,720,528 | 1.9 | |
| Total Sources | $196,745,614 | 100.0% | Total Uses | $196,745,614 | 100.0% |
| (1) | In conjunction with the acquisition of the Quantum Park Property, the sponsor also acquired two adjacent buildings which are not collateral for the Quantum Park Whole Loan. The Sources and Uses table reflect amounts allocated to the sponsor’s acquisition of the Quantum Park Property which serves as collateral for the Quantum Park Whole Loan. |
The Property.The Quantum Park Property consists of five Class A buildings totaling 942,843 square feet located in Ashburn, Virginia. The Quantum Park Property is part of a larger 128-acre campus totaling 1,518,366 square feet (the “Quantum Park Campus”) comprising a main campus building (collateral), 10 mid-rise office and data center buildings (four of which are collateral) and two other buildings (non-collateral) which house mechanical spaces. The 10 mid-rise office buildings are three to four stories in height and are inter-connected via a main corridor known as “Main Street” which also links to the main campus building. The main campus building includes approximately 56,000 square feet of secured data center space, a 38,000 square foot dining hall, collaborative meeting spaces, high-tech conference centers, and a 5,000 square foot fitness center. The Quantum Park Property includes approximately 842,843 square feet of office space and approximately 100,000 square feet of data center space. Parking at the Quantum Park Property is provided through perpetual reciprocal easement agreements and includes five parking structures and surface lots totaling 5,685 spaces, resulting in a parking ratio of 6.03 spaces per 1,000 square feet of net rentable area.
The Quantum Park Property was constructed between 1998 and 2001 as the original headquarters for MCI Communications, Corp. which subsequently became MCI Inc. MCI Inc. was acquired by Verizon Communications Inc. (“Verizon”) in January 2006 and changed its name to Verizon Business Network Services Inc. (“VZ Business”). In December 2015, VZ Business completed a sale-leaseback transaction with a joint venture between Davidson Kempner Capital Management L.P. and American Real Estate Partners for $212,500,000. In conjunction with the sale-leaseback transaction, VZ Business executed a lease through November 2027 with two, seven-year renewal options and no early termination rights. The lease is guaranteed by Verizon (NYSE: VZ) (Moody’s/Fitch/S&P: Baa1/A-/BBB+). As of December 31, 2015, Verizon had approximate consolidated revenues of $131.6 billion, net income of $17.9 billion, operating cash flows from continuing operations of $38.9 billion and total assets of $244.6 billion.
Following the sale-leaseback transaction, VZ Business began consolidating employees from the greater Quantum Park Campus into the buildings that comprise the Quantum Park Property. According to the sponsor, 2,917 VZ Business employees are currently on site. The consolidation into the Quantum Park Property coincided with Verizon’s 2015 reorganization of its wireless operations which consolidated 20 regional offices to six. VZ Business currently maintains mission-critical infrastructure and fiber optic connectivity at the Quantum Park Property including Verizon’s Network Operations Center (the “NOC”). Verizon uses the NOC to monitor and control the firms’ global internet protocol (“IP”) network, the FiOS network and the Digital Media Services Group. To support and develop this infrastructure, the Quantum Park Property features an executive briefing center, a FiOS testing lab, and Tier III data center space. Additionally, Verizon reported an $80.0 million investment into a public IP lab at the Quantum Park Property, which allows for full scale network server stress testing and internet traffic simulations.
The collateral for the Quantum Park Whole Loan includes five buildings comprised of buildings D-1, F-1, F-2, G- 1 and G-2, all of which are fully leased to VZ Business. The sponsor also acquired buildings E-1 and E-2, each of which is partially leased to VZ Business. The seller retained buildings B-1, B-2, C-1 and C-2. Buildings B-1 and B-2 are unimproved and have no assigned net rentable area and are not included in the total Quantum Park Campus square feet. Buildings C-1 and C-2 have short-term leases in place with VZ Business. The seller also retained several plots of future development land around the perimeter of the Quantum Park Property.
THE INFORMATION IN THIS STRUCTURAL AND COLLATERAL TERM SHEET IS NOT COMPLETE AND MAY BE AMENDED PRIOR TO THE TIME OF SALE. THIS TERM SHEET IS NOT AN OFFER TO SELL THESE SECURITIES AND IT IS NOT A SOLICITATION OF AN OFFER TO BUY THESE SECURITIES IN ANY JURISDICTION WHERE THE OFFER OR SALE IS NOT PERMITTED.
45
| QUANTUM PARK |
Condominium.In conjunction with the acquisition of the Quantum Park Property by the borrower, the Quantum Park Campus was structured as a building condominium over a land condominium. The dual condominium structure results in borrower ownership of both the land and the improvements that comprise the Quantum Park Property, which serves as collateral for the Quantum Park Whole Loan.
Under the building condominium (the “Building Condo”) and as of the Cut-off Date, (i) the borrower owns five Building Condo units, comprising 62.1% of the interest/voting rights in the Building Condo association, (ii) a sponsor affiliate owns two Building Condo units, comprising 18.9% of the interest/voting rights in the Building Condo association and (iii) the seller owns two Building Condo units, comprising 19.0% of the interest/voting rights in the Building Condo association. The Building Condo association owns and operates the parking garages, the central plant (electricity, heating and cooling) and the cafeteria, and is responsible for all common elements of maintenance, operations and security.
Under the land condominium (the “Land Condo”) and as of the Cut-off Date, (a) the borrower owns five Land Condo units, comprising 34.3% of the interest/voting rights in the Land Condo association, (b) a sponsor-affiliate owns two Land Condo units, comprising 9.5% of the interest/voting rights in the Land Condo association, (c) the seller owns two Land Condo units, comprising 9.5% of the interest/voting rights in the Land Condo association and (d) the Building Condo association owns five Land Condo units, comprising 46.8% of the interest/voting rights in the Land Condo association. The Land Condo association grants perpetual, non-exclusive reciprocal easements for ingress and egress and use of the parking garages.
As of the Cut-off Date, since the borrower controls the Building Condo association by virtue of holding 62.1% of the interest/voting rights in the Building Condo association and the Building Condo association holds 46.8% of the interest/voting rights in the Land Condo association, then the borrower indirectly controls the land condominium association with a combined interest/voting rights of 81.1% (inclusive of the borrower’s directly-held 34.3% of the interest/voting rights in the Land Condo association). Certain non-collateral parcels of land located around the perimeter of the Quantum Park Property were retained by the seller for future development and, as of the Cut-off Date, were not included in the Land Condo; however, pursuant to the Land Condo declaration, such parcels of land may be added to the Land Condo in the future which would have the effect of diluting the borrower’s interest/voting rights in the Land Condo association. See “Description of the Mortgage Pool–Mortgage Pool Characteristics–Condominium Interests”in the Preliminary Prospectus.
The following table presents certain information relating to the tenancy at the Quantum Park Property:
Major Tenants
| Tenant Name | Credit Rating (Fitch/Moody’s/S&P)(1) | Tenant NRSF | % of NRSF | Annual U/W Base Rent PSF(2) | Annual U/W Base Rent(2) | % of Total Annual U/W Base Rent | Lease Expiration Date | |
| Major Tenant | ||||||||
| Verizon Business Network Services Inc. | A- / Baa1/ BBB+ | 942,843 | 100.0% | $16.52 | $15,574,380 | 100.0% | 11/30/2027(3) | |
| Total Major Tenant | 942,843 | 100.0% | $16.52 | $15,574,380 | 100.0% | |||
| Vacant Space | 0 | 0.0% | ||||||
| Collateral Total | 942,843 | 100.0% | ||||||
| (1) | Certain ratings are those of the parent company whether or not the parent guarantees the lease. |
| (2) | Annual U/W Base Rent PSF and Annual U/W Base Rent include contractual rent steps through November 2017 totaling $273,424 and straight-lined rent from December 2017 through November 2027 totaling $1,629,733. |
| (3) | Verizon Business Network Services Inc. has two, seven-year lease extension option. |
THE INFORMATION IN THIS STRUCTURAL AND COLLATERAL TERM SHEET IS NOT COMPLETE AND MAY BE AMENDED PRIOR TO THE TIME OF SALE. THIS TERM SHEET IS NOT AN OFFER TO SELL THESE SECURITIES AND IT IS NOT A SOLICITATION OF AN OFFER TO BUY THESE SECURITIES IN ANY JURISDICTION WHERE THE OFFER OR SALE IS NOT PERMITTED.
46
| QUANTUM PARK |
The following table presents certain information relating to the lease rollover schedule at the Quantum Park Property:
Lease Expiration Schedule(1)
| Year Ending December 31, | No. of Leases Expiring | Expiring NRSF | % of Total NRSF | Cumulative Expiring NRSF | Cumulative % of Total NRSF | Annual U/W Base Rent | % of Total Annual U/W Base Rent | Annual U/W Base Rent PSF |
| MTM | 0 | 0 | 0.0% | 0 | 0.0% | $0 | 0.0% | $0.00 |
| 2016 | 0 | 0 | 0.0% | 0 | 0.0% | $0 | 0.0% | $0.00 |
| 2017 | 0 | 0 | 0.0% | 0 | 0.0% | $0 | 0.0% | $0.00 |
| 2018 | 0 | 0 | 0.0% | 0 | 0.0% | $0 | 0.0% | $0.00 |
| 2019 | 0 | 0 | 0.0% | 0 | 0.0% | $0 | 0.0% | $0.00 |
| 2020 | 0 | 0 | 0.0% | 0 | 0.0% | $0 | 0.0% | $0.00 |
| 2021 | 0 | 0 | 0.0% | 0 | 0.0% | $0 | 0.0% | $0.00 |
| 2022 | 0 | 0 | 0.0% | 0 | 0.0% | $0 | 0.0% | $0.00 |
| 2023 | 0 | 0 | 0.0% | 0 | 0.0% | $0 | 0.0% | $0.00 |
| 2024 | 0 | 0 | 0.0% | 0 | 0.0% | $0 | 0.0% | $0.00 |
| 2025 | 0 | 0 | 0.0% | 0 | 0.0% | $0 | 0.0% | $0.00 |
| 2026 | 0 | 0 | 0.0% | 0 | 0.0% | $0 | 0.0% | $0.00 |
| Thereafter | 1 | 942,843 | 100.0% | 942,843 | 100.0% | $15,574,380 | 100.0% | $16.52 |
| Vacant | 0 | 0 | 0.0% | 0 | 0.0% | $0 | 0.0% | $0.00 |
| Total/Weighted Average | 1 | 942,843 | 100.0% | $15,574,380 | 100.0% | $16.52 |
| (1) | Information obtained from the underwritten rent roll. |
The following table presents historical occupancy percentages at the Quantum Park Property:
Historical Occupancy
12/31/2012(1)(2) | 12/31/2013(1)(2) | 12/31/2014(1)(2) | 12/31/2015(1) | 12/1/2016 |
| NAV | NAV | NAV | 100.0% | 100.0% |
| (1) | Information obtained from the borrower. |
| (2) | Historical Occupancy is not available as the Quantum Park Property was acquired by the seller in December 2015. |
Operating History and Underwritten Net Cash Flow. The following table presents certain information relating to the underwritten net cash flow at the Quantum Park Property:
Cash Flow Analysis(1)
| U/W | % of U/W Effective Gross Income | U/W $ per SF | |
| Base Rent | $15,574,380(2) | 57.5% | $16.52 |
| Grossed Up Vacant Space | 0 | 0.0 | 0.00 |
| Total Reimbursables | 12,043,225 | 44.5 | 12.77 |
| Less Vacancy & Credit Loss | (552,352)(3) | (2.0) | (0.59) |
| Effective Gross Income | $27,065,253 | 100.0% | $28.71 |
| Total Operating Expenses | $12,043,225(4) | 44.5% | $12.77 |
|
|
| |
| Net Operating Income | $15,022,028 | 55.5% | $15.93 |
| TI/LC | 0 | 0.0 | 0.00 |
| Capital Expenditures | 235,711 | 0.9 | 0.25 |
| Net Cash Flow | $14,786,318 | 54.6% | $15.68 |
| NOI DSCR(5) | 3.04x | ||
| NCF DSCR(5) | 3.00x | ||
| NOI DY(5) | 11.4% | ||
| NCF DY(5) | 11.2% |
| (1) | Historical financial information is not available as the Quantum Park Property was acquired by the seller in December 2015 as part of a sale-leaseback transaction with VZ Business. |
| (2) | Annual U/W Base Rent PSF and Annual U/W Base Rent include contractual rent steps through November 2017 totaling $273,424 and straight-lined rent from December 2017 through November 2027 totaling $1,629,733. |
| (3) | The underwritten economic vacancy is 2.0%. Current occupancy at the Quantum Park Property was 100.0%, as of December 1, 2016. See “Historical Occupancy” section. |
| (4) | Operating Expenses were generally underwritten to the borrower’s 2016 budget and are fully reimbursable pursuant to the BZ Business lease. |
| (5) | The debt service coverage ratios and debt yields are based on the Quantum Park Whole Loan. |
THE INFORMATION IN THIS STRUCTURAL AND COLLATERAL TERM SHEET IS NOT COMPLETE AND MAY BE AMENDED PRIOR TO THE TIME OF SALE. THIS TERM SHEET IS NOT AN OFFER TO SELL THESE SECURITIES AND IT IS NOT A SOLICITATION OF AN OFFER TO BUY THESE SECURITIES IN ANY JURISDICTION WHERE THE OFFER OR SALE IS NOT PERMITTED.
47
| QUANTUM PARK |
Appraisal.As of the appraisal valuation date of September 12, 2016, the Quantum Park Property had an “as-is” appraised value of $200,000,000. In addition, the appraisal for the Quantum Park Property set forth a “hypothetical go-dark” appraised value of $95,600,000 as of September 12, 2016.
Environmental Matters. According to the Phase I environmental site assessment dated August 18, 2016, there are no recognized environmental conditions at the Quantum Park Property.
Market Overview and Competition.The Quantum Park Property is located in the Ashburn area of Loudoun County in Northern Virginia. Ashburn, Virginia is located in the Northern Virginia office market and is approximately 25 miles northwest of Washington D.C. The Quantum Park Property is located approximately one mile away from the Dulles Greenway which connects to Routes 7 and 28 as well as Interstate 66, each of which provides access to Washington D.C. In addition, the Quantum Park Property is located approximately four miles north of Dulles International Airport, which served 21.7 million passengers in 2015. According to the appraisal, the Quantum Park Property is situated in the Loudoun County submarket, which contains approximately 13.9 million square feet of office space in 214 buildings. As of the second quarter of 2016, the Loudoun County office submarket vacancy was 13.9%, decreasing steadily from 16.3% in 2013. The completion of the first phase of the Washington Metropolitan Transit Authority Silver Line rail project in July 2014 extended the reach of public transportation from Washington D.C. to Reston, Virginia (east of the Quantum Park Property). The completion of the second phase of the Silver Line rail project is scheduled for 2020 and will coincide with the opening of the new Ashburn Silver Line Metro Station, one mile from the Quantum Park Property. VZ Business’ base rent is approximately 27.5% below the appraiser-concluded median triple net office market base rental rate of $20.00 per square foot.
According to the appraisal, the Quantum Park Property is located in Northern Virginia’s Data Center Alley, the largest data center area globally in terms of demand with 56 data center facilities and 12.5 million square feet of space. The Metropolitan Area Exchange-East is a driver of the technological development and infrastructure in the area and is located approximately 15 miles east of the Quantum Park Property in Vienna, Virginia. According to the appraisal, the Data Center Alley submarket exhibited a data center vacancy rate of 3.8% with 109.9 megawatts of data center absorption in 2015. Data Center Alley is in close proximity to the Dulles Technology Corridor, home to over 30,000 research, technology and development-related companies including Accenture, Airbus, DynCorp, Microsoft, Nortel Networks and Oracle.
The following table presents certain information relating to comparable office leases for the Quantum Park Property:
Comparable Leases(1)
| Property Name/Location | Distance from Subject | Tenant Name | Lease Date/Term | Lease Area (SF) | Annual Base Rent PSF |
460 Herndon Parkway Herndon, Virginia | 7.7 miles | Boeing | Jun. 2016 / 7.3 Yrs | 168,154 | $15.00 |
8270 Willow Oaks Corporate Drive Fairfax, Virginia | 21.1 miles | Fairfax County School Board (FCPS) | Sep. 2015 / 13.0 Yrs | 122,000 | $14.00 |
13560 Dulles Technology Drive Herndon, Virginia | 7.2 miles | Lockheed Martin Corp. | Jun. 2015 / 5.5 Yrs | 189,764 | $13.00 |
12000 Sunrise Valley Drive Reston, Virginia | 9.4 miles | Fannie Mae | Feb. 2015 / 5.0 Yrs | 185,857 | $24.00 |
2070 Chain Bridge Road Vienna, Virginia | 17.0 miles | GSA – FINCEN | Feb. 2015 / 15.0 Yrs | 124,990 | $19.98 |
5107 Leesburg Pike Falls Church, Virginia | 26.4 miles | GSA – Execute Office of Immigration Review | Dec. 2014 / 15.0 Yrs | 169,131 | $20.00 |
5107 Leesburg Pike Falls Church, Virginia | 26.4 miles | GSA – DMV | Dec. 2014 / 1.3 Yrs | 166,685 | $20.00 |
2600 Park Tower Drive Vienna, Virginia | 19.7 miles | Boeing | Nov. 2014 / 3.0 Yrs | 121,000 | $26.25 |
2100 Washington Boulevard Arlington, Virginia | 26.7 miles | Arlington County Department of Human Services | Jul. 2014 / 7.0 Yrs | 144,740 | $31.78 |
| (1) | Information obtained from the appraisal. |
The Borrower.The borrower is Solace Ashburn DFG LLC, a single purpose Delaware limited liability company with two independent directors. Legal counsel to the borrower delivered a non-consolidation opinion in connection with the origination of the Quantum Park Whole Loan. Solace Ashburn Investments LLC is the guarantor of certain nonrecourse carveouts under the Quantum Park Whole Loan.
The Sponsor. The sponsor is AGC Equity Partners Holding Ltd. (“AGC”), a global alternative asset investment firm which manages equity capital in excess of $5.0 billion. Based out of London, AGC invests globally across a wide range of real estate, infrastructure and other opportunities focusing on European and North American markets. AGC invests directly in real estate assets and focuses on high quality tenants, long-term creditworthy leases and properties in primary markets. Other notable AGC investments include the Citigroup Tower in London, PwC headquarters in Dublin and the Vodafone Campus in Dusseldorf, Germany.
THE INFORMATION IN THIS STRUCTURAL AND COLLATERAL TERM SHEET IS NOT COMPLETE AND MAY BE AMENDED PRIOR TO THE TIME OF SALE. THIS TERM SHEET IS NOT AN OFFER TO SELL THESE SECURITIES AND IT IS NOT A SOLICITATION OF AN OFFER TO BUY THESE SECURITIES IN ANY JURISDICTION WHERE THE OFFER OR SALE IS NOT PERMITTED.
48
| QUANTUM PARK |
Escrows.The Quantum Park Whole Loan documents provide for an upfront escrow at closing in the amount of $25,086 for insurance expenses. The Quantum Park Whole Loan documents also provide for an escrow funded by two payments in the amount of $333,186 each for real estate taxes on October 6, 2016 and November 6, 2016.
The Quantum Park Whole Loan documents provide for ongoing monthly escrows of $191,400 for real estate taxes, $11,786 for replacement reserves and $439,668 for condominium charges. The Quantum Park Whole Loan documents do not require ongoing monthly escrows for insurance premiums so long as the borrower provides the lender with evidence that the Quantum Park Property is insured via an acceptable blanket insurance policy and such policy is in full force and effect. The Quantum Park Whole Loan documents do not require ongoing escrows for rollover reserves as long as no Verizon Trigger Period (as defined below) is in effect.
A “Verizon Trigger Period” means a period (A) commencing upon the first to occur of (i) a material monetary default under the VZ Business lease beyond all applicable notice and cure periods, (ii) any bankruptcy action or similar insolvency of VZ Business or Verizon, (iii) VZ Business giving notice that it is terminating the VZ Business lease for all or any portion of its space at the Quantum Park Property and (iv) the withdrawal or downgrade of the credit rating of Verizon to below an Investment Grade Rating (as defined below) by at least two of S&P, Moody’s or Fitch, and (B) ending upon the first to occur of (1) (a) with respect to clause (i) above, such event of default being cured; (b) with respect to clause (ii) above, VZ Business or Verizon no longer being insolvent or subject to any bankruptcy or insolvency proceedings and VZ Business affirming the VZ Business lease pursuant to a final, non-appealable order of a court of competent jurisdiction, (c) with respect to clause (iii) above, VZ Business revoking or rescinding all termination or cancellation notices with respect to the VZ Business lease and re-affirming the VZ Business lease as being in full force and effect and (d) with respect to clause (iv) above, (I) the credit rating of Verizon being reinstated by each of the rating agencies that withdrew such rating or increased to at least the Investment Grade Rating (as defined below) by each of the rating agencies that downgraded Verizon or (II) the credit rating of Verizon being at least “B1” or the equivalent thereof by each of S&P, Moody’s and Fitch and the amount on deposit in the rollover reserve account being equal to or exceeding $37,713,720, or (2) the borrower having leased the entire VZ Business space to one or more replacement tenants and (aa) each replacement tenant accepting the applicable premises demised under its lease and paying the full amount of the rent due thereunder (unless any such free rent is reserved with lender) and (bb) each such replacement tenant or guarantor of replacement tenant having an Investment Grade Rating by at least two of S&P, Moody’s or Fitch.
An “Investment Grade Rating” means a long-term unsecured debt or equity rating or corporate credit rating of “BBB-” or higher by S&P, an issuer default rating of “BBB-” or higher by Fitch or a long-term issuer rating of “Baa3” or higher by Moody’s.
Lockbox and Cash Management. The Quantum Park Whole Loan requires a lender-controlled lockbox account, which is already in place, and that the borrower direct the tenant to pay its rents directly to such lockbox account. The Quantum Park Whole Loan documents also require that all rents received by the borrower or the property manager be deposited into the lockbox account. All excess funds are required to be distributed to the borrower except during (i) the continuance of a Verizon Trigger Period (while the amount on deposit in the rollover reserve is equal to or exceeds $37,713,720) or (ii) the continuance of a Quantum Park Trigger Period (as defined below), other than a Verizon Trigger Period, when the remainder is held by the lender in an excess cash flow fund.
A “Quantum Park Trigger Period” means a period commencing upon (a) an event of default under the Quantum Park Whole Loan documents and ending once such event of default has been cured, (b) the occurrence of the ARD or (c) the continuance of a Verizon Trigger Period.
Property Management.The Quantum Park Property is managed by American Real Estate Partners Management LLC.
Assumption.The borrower has the right to transfer the Quantum Park Property provided that certain conditions are satisfied, including (i) no event of default has occurred and is continuing; (ii) the lender has reasonably determined that the proposed transferee and guarantor satisfy the lender’s credit review and underwriting standards, taking into consideration transferee experience, financial strength and general business standing; and (iii) the lender has received confirmation from Moody’s, Fitch, Kroll and DBRS that such assumption will not result in a downgrade, withdrawal or qualification of the respective ratings assigned to the Series 2016-C37 certificates, Series 2016-C3 certificates and Series 2016-P6 certificates.
Partial Release. None permitted.
Real Estate Substitution.Not permitted.
Subordinate and Mezzanine Indebtedness.Not permitted.
Ground Lease.None.
Terrorism Insurance.The Quantum Park Whole Loan documents require that the “all risk” insurance policy required to be maintained by the borrower provide coverage for terrorism in an amount equal to the full replacement cost of the Quantum Park Property, as well as loss of rents and/or business interruption insurance for a period no less than 18 months following the occurrence of a casualty event together with a six-month extended period of indemnity.
THE INFORMATION IN THIS STRUCTURAL AND COLLATERAL TERM SHEET IS NOT COMPLETE AND MAY BE AMENDED PRIOR TO THE TIME OF SALE. THIS TERM SHEET IS NOT AN OFFER TO SELL THESE SECURITIES AND IT IS NOT A SOLICITATION OF AN OFFER TO BUY THESE SECURITIES IN ANY JURISDICTION WHERE THE OFFER OR SALE IS NOT PERMITTED.
49
WALMART SHADOW ANCHORED PORTFOLIO |
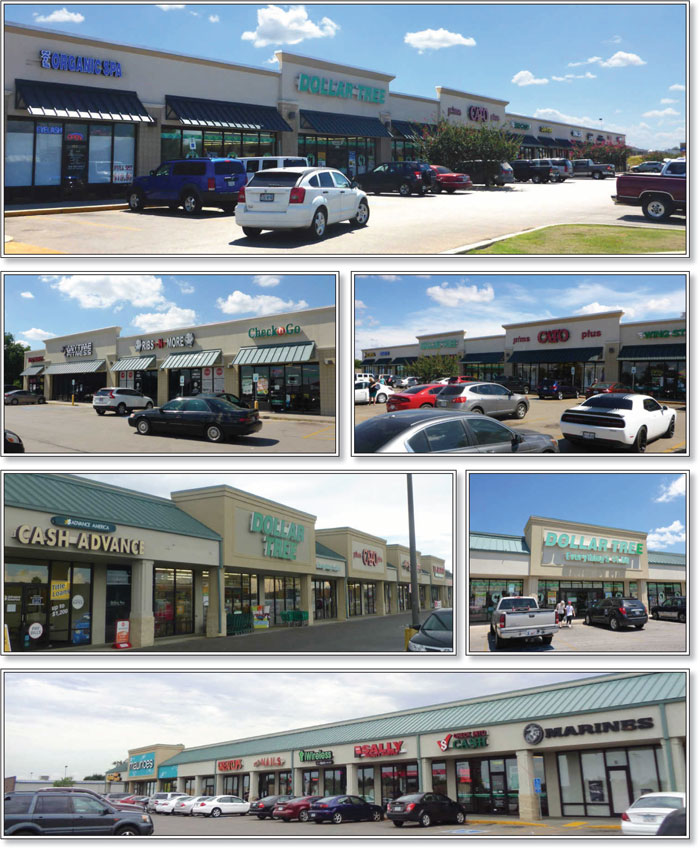
THE INFORMATION IN THIS STRUCTURAL AND COLLATERAL TERM SHEET IS NOT COMPLETE AND MAY BE AMENDED PRIOR TO THE TIME OF SALE. THIS TERM SHEET IS NOT AN OFFER TO SELL THESE SECURITIES AND IT IS NOT A SOLICITATION OF AN OFFER TO BUY THESE SECURITIES IN ANY JURISDICTION WHERE THE OFFER OR SALE IS NOT PERMITTED.
50
WALMART SHADOW ANCHORED PORTFOLIO |
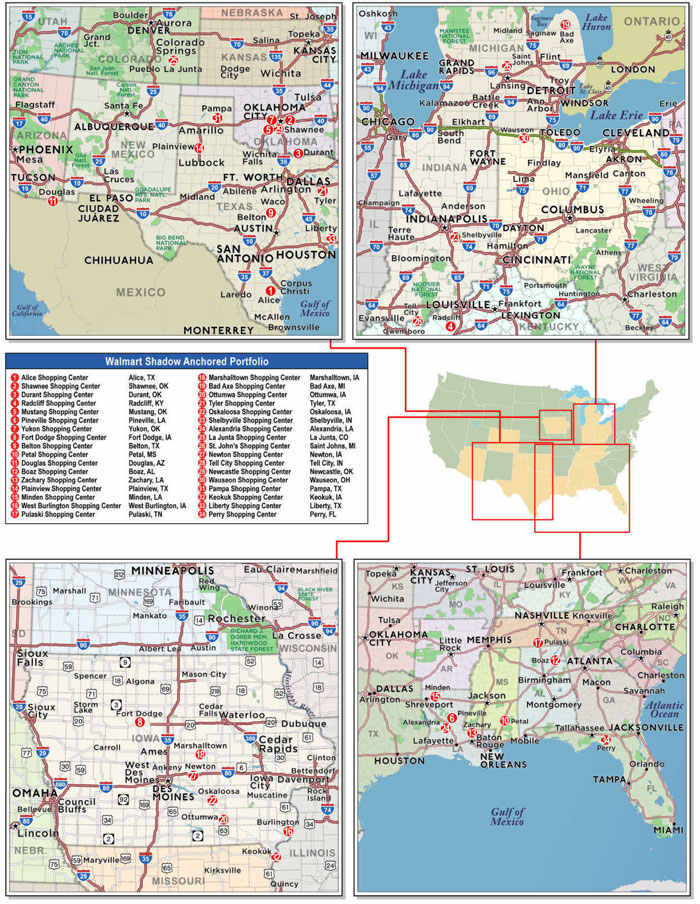
THE INFORMATION IN THIS STRUCTURAL AND COLLATERAL TERM SHEET IS NOT COMPLETE AND MAY BE AMENDED PRIOR TO THE TIME OF SALE. THIS TERM SHEET IS NOT AN OFFER TO SELL THESE SECURITIES AND IT IS NOT A SOLICITATION OF AN OFFER TO BUY THESE SECURITIES IN ANY JURISDICTION WHERE THE OFFER OR SALE IS NOT PERMITTED.
51
| No. 3 – Walmart Shadow Anchored Portfolio | |||||||
| Loan Information | Property Information | ||||||
| Mortgage Loan Seller: | Ladder Capital Finance | Single Asset/Portfolio: | Portfolio | ||||
| Credit Assessment (DBRS/Fitch/Moody’s): | NR/NR/NR | Property Type: | Retail | ||||
| Original Principal Balance(1): | $39,536,250 | Specific Property Type: | Shadow Anchored | ||||
| Cut-off Date Balance(1): | $39,536,250 | Location: | Various – See Table | ||||
| % of Initial Pool Balance: | 5.3% | Size: | 881,524 SF | ||||
| Loan Purpose: | Refinance | Cut-off Date Balance Per SF(1): | $101.00 | ||||
| Borrowers(2): | Various | Year Built/Renovated: | Various – See Table | ||||
| Sponsor: | David W. Schostak | Title Vesting(5): | Various | ||||
| Mortgage Rate: | 5.5898% | Property Manager: | Self-managed | ||||
| Note Date: | September 1, 2016 | 4thMost Recent Occupancy (As of): | 93.9% (12/31/2012) | ||||
| Anticipated Repayment Date: | NAP | 3rdMost Recent Occupancy (As of): | 92.1% (12/31/2013) | ||||
| Maturity Date: | September 6, 2021 | 2ndMost Recent Occupancy(As of): | 92.2% (12/31/2014) | ||||
| IO Period: | 24 months | Most Recent Occupancy (As of): | 93.4% (12/31/2015) | ||||
| Loan Term (Original): | 60 months | Current Occupancy (As of): | 93.1% (10/31/2016) | ||||
| Seasoning: | 3 months | ||||||
| Amortization Term (Original): | 360 months | Underwriting and Financial Information: | |||||
| Loan Amortization Type: | Interest-only, Amortizing Balloon | ||||||
| Interest Accrual Method: | Actual/360 | 4thMost Recent NOI (As of): | $8,667,457 (12/31/2013) | ||||
| Call Protection: | L(27),D(28),O(5) | 3rdMost Recent NOI (As of): | $9,035,547 (12/31/2014) | ||||
| Lockbox Type: | Hard/Upfront Cash Management | 2ndMost Recent NOI (As of): | $9,045,481 (12/31/2015) | ||||
| Additional Debt(1)(3): | Yes | Most Recent NOI (As of): | $9,050,388 (TTM 6/30/2016) | ||||
| Additional Debt Type(1)(3): | Pari Passu; Mezzanine | ||||||
| U/W Revenues: | $12,603,392 | ||||||
| U/W Expenses: | $3,145,985 | ||||||
| Escrows and Reserves(4): | U/W NOI: | $9,457,407 | |||||
| U/W NCF: | $8,311,424 | ||||||
| Type: | Initial | Monthly | Cap (If Any) | U/W NOI DSCR(1): | 1.54x | ||
| Taxes | $682,795 | $136,559 | NAP | U/W NCF DSCR(1): | 1.36x | ||
| Insurance | $150,051 | $12,504 | NAP | U/W NOI Debt Yield(1): | 10.6% | ||
| Replacement Reserves | $0 | $14,692 | $528,915 | U/W NCF Debt Yield(1): | 9.3% | ||
| TI/LC Reserve | $850,000 | $80,806 | $2,909,034 | As-Is Appraised Value: | $118,715,000 | ||
| Deferred Maintenance | $218,304 | $0 | NAP | As-Is Appraisal Valuation Date(6): | Various | ||
| Tell City Engineering Reserve | $129,000 | $0 | NAP | Cut-off Date LTV Ratio(1): | 75.0% | ||
| Ground Rent Reserve | $8,216 | Springing | $8,216 | LTV Ratio at Maturity or ARD(1): | 72.0% | ||
| (1) | See “The Mortgage Loan” section. All statistical information related to balances per square foot, loan-to-value ratios, debt service coverage ratios and debt yields are based on the Walmart Shadow Anchored Portfolio Whole Loan (as defined below). |
| (2) | See “Borrowers” section. |
| (3) | See “Subordinate and Mezzanine Indebtedness” section. The equity interest in the borrower has been pledged to secure mezzanine indebtedness with an original principal balance of $8,613,750. All statistical information related to the balances per square foot, loan-to-value ratios, debt service coverage ratios and debt yields are based solely on the Walmart Shadow Anchored Portfolio Whole Loan. As of the Cut-off Date, the Cut-off Date Balance per SF, U/W NCF DSCR, U/W NCF Debt Yield, Cut-off Date LTV Ratio and LTV Ratio at Maturity or ARD based on the Walmart Shadow Anchored Portfolio Whole Loan and the Walmart Shadow Anchored Portfolio Mezzanine Loan (as defined below) in the aggregate were $110.77, 1.17x, 8.5%, 82.3% and 79.2%, respectively. |
| (4) | See “Escrows” section. |
| (5) | The Walmart Shadow Anchored Portfolio Whole Loan is secured by the leasehold interests in two of the Walmart Shadow Anchored Portfolio Properties (as defined below) and by the fee interests in the remaining 32 Walmart Shadow Anchored Portfolio Properties. See “Ground Lease” section. |
| (6) | See “Appraisals” section. |
The Mortgage Loan.The mortgage loan (the “Walmart Shadow Anchored Portfolio Mortgage Loan”) is part of a whole loan (the “Walmart Shadow Anchored Portfolio Whole Loan”) that is evidenced by twopari passu promissory notes (Notes A-1 and A-2) and secured by a first mortgage encumbering the fee (or, as to two properties, the leasehold) interests in 34 retail properties, each shadow anchored by Walmart, across 14 states (the “Walmart Shadow Anchored Portfolio Properties”). The Walmart Shadow Anchored Portfolio Whole Loan was originated on September 1, 2016 by Ladder Capital Finance LLC. The Walmart Shadow Anchored Portfolio Whole Loan had an original principal balance of $89,036,250, has an outstanding principal balance as of the Cut-off Date of $89,036,250 and accrues interest at an interest rate of 5.5898%per annum. The Walmart Shadow Anchored Portfolio Whole Loan had an initial term of 60 months, has a remaining term of 57 months as of the Cut-off Date and requires interest-only payments for the first 24 payments following origination and, thereafter, requires payments of principal and interest based on a 30-year amortization schedule. The Walmart Shadow Anchored Portfolio Whole Loan matures on September 6, 2021.
The non-controlling Note A-2, which will be contributed to the WFCM 2016-C37 Trust, had an original principal balance of $39,536,250 and has an outstanding principal balance as of the Cut-off Date of $39,536,250. Note A-1, which is currently held by Ladder Capital Finance LLC or an affiliate and is expected to be contributed to the WFCM 2016-LC25 Trust, had an original principal balance of $49,500,000, has an outstanding principal balance as of the Cut-off Date of $49,500,000 and represents the controlling
THE INFORMATION IN THIS STRUCTURAL AND COLLATERAL TERM SHEET IS NOT COMPLETE AND MAY BE AMENDED PRIOR TO THE TIME OF SALE. THIS TERM SHEET IS NOT AN OFFER TO SELL THESE SECURITIES AND IT IS NOT A SOLICITATION OF AN OFFER TO BUY THESE SECURITIES IN ANY JURISDICTION WHERE THE OFFER OR SALE IS NOT PERMITTED.
52
WALMART SHADOW ANCHORED PORTFOLIO |
interest in the Walmart Shadow Anchored Portfolio Whole Loan. See“Description of the Mortgage Pool—The Whole Loans—Non-Serviced Whole Loans—The Walmart Shadow Anchored Portfolio Whole Loan” in the Preliminary Prospectus.
Pari Passu Note Summary
| Original Balance | Note Holder | Controlling Piece | ||
| Note A-1 | $49,500,000 | WFCM 2016-LC25 | Yes | |
| Note A-2 | $39,536,250 | WFCM 2016-C37 | No | |
| Total | $89,036,250 |
Following the lockout period, the borrower has the right to defease the Walmart Shadow Anchored Portfolio Whole Loan in whole but not in part, on any due date before May 6, 2021. In addition, the Walmart Shadow Anchored Portfolio Whole Loan is prepayable without penalty commencing on May 6, 2021. The lockout period will expire on the earlier to occur of (i) two years after the closing date of the securitization that includes the last note to be securitized and (ii) September 1, 2019. It is anticipated that the Walmart Shadow Anchored Portfolio Mortgage Loan will be the last note securitized from the Walmart Shadow Anchored Portfolio Whole Loan.
Sources and Uses
| Sources | Uses | |||||||
| Original Whole Loan amount | $89,036,250 | 91.2% | Loan payoff(1) | $89,698,349 | 91.9% | |||
| Mezzanine Loan | 8,613,750 | 8.8 | Reserves | 2,038,365 | 2.1 | |||
| Closing costs | 1,464,686 | 1.5 | ||||||
| Return of equity | 4,448,600 | 4.6 | ||||||
| Total Sources | $97,650,000 | 100.0% | Total Uses | $97,650,000 | 100.0% |
| (1) | Seven of the Walmart Shadow Anchored Portfolio Properties were previously securitized in the CSMC 2007-C1 transaction. The remainder of the properties were securitized in the CSMC 2006-C3 and CSMC 2006-C4 transactions but were not directly paid off by the Walmart Shadow Anchored Portfolio Whole Loan. |
The Properties. The Walmart Shadow Anchored Portfolio Properties consist of 34 retail properties, each shadow anchored by Walmart, comprised of approximately 881,524 rentable square feet that were built between 2002 and 2006 and are located in 14 states. The related borrowers hold leasehold interests in two of the Walmart Shadow Anchored Portfolio Properties (see “Ground Lease” section) and fee interests in the remaining 32 Walmart Shadow Anchored Portfolio Properties. No property accounts for more than 5.3% of allocated Cut-off Date Principal Balance. Since 2006, the Walmart Shadow Anchored Portfolio Properties have never been less than 91.0% occupied in the aggregate. The Walmart Shadow Anchored Portfolio Properties range in size from 10,160 square feet to 39,100 square feet and were 93.1% occupied as of October 31, 2016.
THE INFORMATION IN THIS STRUCTURAL AND COLLATERAL TERM SHEET IS NOT COMPLETE AND MAY BE AMENDED PRIOR TO THE TIME OF SALE. THIS TERM SHEET IS NOT AN OFFER TO SELL THESE SECURITIES AND IT IS NOT A SOLICITATION OF AN OFFER TO BUY THESE SECURITIES IN ANY JURISDICTION WHERE THE OFFER OR SALE IS NOT PERMITTED.
53
WALMART SHADOW ANCHORED PORTFOLIO |
The following table presents certain information relating to the Walmart Shadow Anchored Portfolio Properties:
Property Information(1)(2)
| Property Name | City, State | Allocated Cut-off Date Principal Balance | % of Portfolio Cut-off Date Principal Balance | Occupancy | Year Built/ Renovated | Net Rentable Area (SF) | Appraised Value | Allocated LTV | ||||
| Alice Shopping Center | Alice, TX | $4,763,000 | 5.3% | 91.8% | 2005/NAP | 39,100 | $6,100,000 | 78.1% | ||||
| Shawnee Shopping Center | Shawnee, OK | $4,186,000 | 4.7% | 100.0% | 2004/NAP | 35,640 | $5,360,000 | 78.1% | ||||
| Durant Shopping Center | Durant, OK | $3,834,000 | 4.3% | 100.0% | 2003/2012 | 32,200 | $4,910,000 | 78.1% | ||||
| Radcliff Shopping Center | Radcliff, KY | $3,819,000 | 4.3% | 84.8% | 2005/NAP | 36,900 | $4,890,000 | 78.1% | ||||
| Mustang Shopping Center | Mustang, OK | $3,647,000 | 4.1% | 100.0% | 2004/NAP | 35,849 | $4,670,000 | 78.1% | ||||
| Pineville Shopping Center | Pineville, LA | $3,639,000 | 4.1% | 100.0% | 2002/NAP | 32,300 | $4,660,000 | 78.1% | ||||
| Yukon Shopping Center | Yukon, OK | $3,621,000 | 4.1% | 100.0% | 2004/NAP | 31,500 | $4,560,000 | 79.4% | ||||
| Fort Dodge Shopping Center | Fort Dodge, IA | $3,491,000 | 3.9% | 95.3% | 2004/NAP | 33,700 | $4,470,000 | 78.1% | ||||
| Belton Shopping Center | Belton, TX | $3,389,000 | 3.8% | 100.0% | 2005/NAP | 28,052 | $4,340,000 | 78.1% | ||||
| Petal Shopping Center | Petal, MS | $3,183,000 | 3.6% | 84.8% | 2003/NAP | 30,180 | $4,100,000 | 77.6% | ||||
| Douglas Shopping Center | Douglas, AZ | $3,183,000 | 3.6% | 93.8% | 2004/NAP | 32,140 | $4,100,000 | 77.6% | ||||
| Boaz Shopping Center | Boaz, AL | $3,077,000 | 3.5% | 88.5% | 2004/NAP | 27,900 | $3,940,000 | 78.1% | ||||
| Zachary Shopping Center | Zachary, LA | $3,065,000 | 3.4% | 100.0% | 2002/NAP | 29,600 | $3,925,000 | 78.1% | ||||
| Plainview Shopping Center | Plainview, TX | $2,875,000 | 3.2% | 72.3% | 2005/NAP | 31,720 | $4,510,000 | 63.7% | ||||
| Minden Shopping Center | Minden, LA | $2,796,000 | 3.1% | 95.6% | 2003/NAP | 27,300 | $3,580,000 | 78.1% | ||||
| West Burlington Shopping Center | West Burlington, IA | $2,522,000 | 2.8% | 100.0% | 2004/NAP | 26,100 | $3,230,000 | 78.1% | ||||
| Pulaski Shopping Center | Pulaski, TN | $2,430,000 | 2.7% | 100.0% | 2004/NAP | 28,100 | $3,600,000 | 67.5% | ||||
| Marshalltown Shopping Center | Marshalltown, IA | $2,422,000 | 2.7% | 87.8% | 2004/NAP | 22,900 | $3,140,000 | 77.1% | ||||
| Bad Axe Shopping Center | Bad Axe, MI | $2,382,000 | 2.7% | 100.0% | 2005/NAP | 28,353 | $3,050,000 | 78.1% | ||||
| Ottumwa Shopping Center | Ottumwa, IA | $2,307,000 | 2.6% | 91.9% | 2004/NAP | 22,190 | $3,380,000 | 68.3% | ||||
| Tyler Shopping Center | Tyler, TX | $2,286,250 | 2.6% | 85.9% | 2004/NAP | 35,840 | $3,580,000 | 63.9% | ||||
| Oskaloosa Shopping Center | Oskaloosa, IA | $2,249,000 | 2.5% | 100.0% | 2004/NAP | 20,700 | $2,880,000 | 78.1% | ||||
| Shelbyville Shopping Center | Shelbyville, IN | $2,187,000 | 2.5% | 100.0% | 2005/NAP | 14,150 | $2,800,000 | 78.1% | ||||
| Alexandria Shopping Center | Alexandria, LA | $2,090,000 | 2.3% | 92.2% | 2003/NAP | 20,400 | $2,690,000 | 77.7% | ||||
| La Junta Shopping Center | La Junta, CO | $2,085,000 | 2.3% | 100.0% | 2004/NAP | 20,500 | $2,670,000 | 78.1% | ||||
| St. John’s Shopping Center | Saint Johns, MI | $2,040,000 | 2.3% | 74.0% | 2006/NAP | 29,930 | $3,400,000 | 60.0% | ||||
| Newton Shopping Center | Newton, IA | $2,008,000 | 2.3% | 88.2% | 2004/NAP | 20,300 | $2,610,000 | 76.9% | ||||
| Tell City Shopping Center | Tell City, IN | $1,952,000 | 2.2% | 82.2% | 2005/NAP | 27,000 | $2,740,000 | 71.2% | ||||
| Newcastle Shopping Center | Newcastle, OK | $1,577,000 | 1.8% | 100.0% | 2004/NAP | 11,600 | $2,020,000 | 78.1% | ||||
| Wauseon Shopping Center | Wauseon, OH | $1,406,000 | 1.6% | 100.0% | 2005/NAP | 13,100 | $1,800,000 | 78.1% | ||||
| Pampa Shopping Center | Pampa, TX | $1,374,000 | 1.5% | 100.0% | 2005/NAP | 16,160 | $1,760,000 | 78.1% | ||||
| Keokuk Shopping Center | Keokuk, IA | $1,203,000 | 1.4% | 100.0% | 2004/NAP | 10,160 | $1,540,000 | 78.1% | ||||
| Liberty Shopping Center | Liberty, TX | $1,029,000 | 1.2% | 67.9% | 2006/NAP | 14,960 | $1,960,000 | 52.5% | ||||
| Perry Shopping Center | Perry, FL | $919,000 | 1.0% | 100.0% | 2004/NAP | 15,000 | $1,750,000 | 52.5% | ||||
| Total/Weighted Average | $89,036,250 | 100.0% | 93.1% | 881,524 | $118,715,000 | 75.0% | ||||||
| (1) | Based on the Walmart Shadow Anchored Portfolio Whole Loan. |
| (2) | The 34 Walmart Shadow Anchored Portfolio Properties are cross collateralized with no partial release provisions in the loan documents. |
THE INFORMATION IN THIS STRUCTURAL AND COLLATERAL TERM SHEET IS NOT COMPLETE AND MAY BE AMENDED PRIOR TO THE TIME OF SALE. THIS TERM SHEET IS NOT AN OFFER TO SELL THESE SECURITIES AND IT IS NOT A SOLICITATION OF AN OFFER TO BUY THESE SECURITIES IN ANY JURISDICTION WHERE THE OFFER OR SALE IS NOT PERMITTED.
54
WALMART SHADOW ANCHORED PORTFOLIO |
The following table presents certain information relating to the tenancies at the Walmart Shadow Anchored Portfolio Properties (based on the portfolio in its entirety):
Major Tenants
| Tenant Name | Credit Rating (Fitch/Moody’s /S&P)(1) | Tenant NRSF | % of NRSF | Annual U/W Base Rent PSF | Annual U/W Base Rent | % of Total Annual U/W Base Rent | Lease Expiration Date | |
| Major Tenants | ||||||||
| Dollar Tree | NR/Ba2/BB+ | 245,426 | 27.8% | $8.22 | $2,017,160 | 20.8% | Various(2) | |
| Cato’s | NR/NR/NR | 79,910 | 9.1% | $11.34 | $906,555 | 9.3% | Various(2) | |
| Gamestop | NR/Ba1/BB+ | 45,503 | 5.2% | $16.90 | $769,216 | 7.9% | Various(2) | |
| Shoe Show | NR/NR/NR | 41,500 | 4.7% | $10.48 | $434,775 | 4.5% | Various(2) | |
| Sally Beauty | NR/NR/NR | 26,950 | 3.1% | $13.99 | $377,128 | 3.9% | Various(2) | |
| Total Major Tenants | 439,289 | 49.8% | $10.25 | $4,504,834 | 46.4% | |||
| Non-Major Tenants | 380,990 | 43.2% | $13.66 | $5,203,573 | 53.6% | |||
| Occupied Collateral Total | 820,279 | 93.1% | $11.84 | $9,708,407 | 100.0% | |||
| Vacant Space | 61,245 | 6.9% | ||||||
| Collateral Total | 881,524 | 100.0% | ||||||
| (1) | Certain ratings are those of the parent company whether or not the parent guarantees the lease. |
| (2) | See Annex A-1 to the Preliminary Prospectus for detailed information on lease expiration of individual properties. |
Historical Sales (PSF) and Occupancy Costs(1)
| Tenant Name | 2013 | 2014 | 2015 | Current Occupancy Cost(2) |
| Dollar Tree | $102 | $105 | $109 | 7.5% |
| Cato’s | $163 | $167 | $166 | 6.8% |
| Shoe Show | $115 | $118 | $97 | 10.1% |
| Sally Beauty | $228 | $236 | $245 | 3.9% |
| (1) | Historical Sales (PSF) and Occupancy Costs were provided by the borrower. Chart includes only tenants who have reported full sales for each respective year. |
| (2) | Current Occupancy Costs are based on the Annual U/W Base Rent, percentage rent and reimbursements and the most recent available historical sales. |
THE INFORMATION IN THIS STRUCTURAL AND COLLATERAL TERM SHEET IS NOT COMPLETE AND MAY BE AMENDED PRIOR TO THE TIME OF SALE. THIS TERM SHEET IS NOT AN OFFER TO SELL THESE SECURITIES AND IT IS NOT A SOLICITATION OF AN OFFER TO BUY THESE SECURITIES IN ANY JURISDICTION WHERE THE OFFER OR SALE IS NOT PERMITTED.
55
WALMART SHADOW ANCHORED PORTFOLIO |
The following table presents certain information relating to the lease rollover schedule at the Walmart Shadow Anchored Portfolio Properties:
Lease Expiration Schedule(1)(2)
Year Ending December 31, | No. of Leases Expiring | Expiring NRSF | % of Total NRSF | Cumulative Expiring NRSF | Cumulative % of Total NRSF | Annual U/W Base Rent | % of Total Annual U/W Base Rent | Annual U/W Base Rent PSF(3) |
| MTM | 7 | 12,500 | 1.4% | 12,500 | 1.4% | $155,500 | 1.6% | $12.44 |
| 2016 | 3 | 7,600 | 0.9% | 20,100 | 2.3% | $85,600 | 0.9% | $11.26 |
| 2017 | 52 | 119,310 | 13.5% | 139,410 | 15.8% | $1,602,251 | 16.5% | $13.43 |
| 2018 | 60 | 171,759 | 19.5% | 311,169 | 35.3% | $2,106,097 | 21.7% | $12.26 |
| 2019 | 55 | 188,860 | 21.4% | 500,029 | 56.7% | $2,093,540 | 21.6% | $11.09 |
| 2020 | 45 | 142,392 | 16.2% | 642,421 | 72.9% | $1,727,315 | 17.8% | $12.13 |
| 2021 | 33 | 111,170 | 12.6% | 753,591 | 85.5% | $1,254,114 | 12.9% | $11.28 |
| 2022 | 2 | 3,200 | 0.4% | 756,791 | 85.9% | $38,400 | 0.4% | $12.00 |
| 2023 | 6 | 26,888 | 3.1% | 783,679 | 88.9% | $314,380 | 3.2% | $11.69 |
| 2024 | 3 | 24,200 | 2.7% | 807,879 | 91.6% | $214,950 | 2.2% | $8.88 |
| 2025 | 0 | 0 | 0.0% | 807,879 | 91.6% | $0 | 0.0% | $0.00 |
| 2026 | 3 | 11,200 | 1.3% | 819,079 | 92.9% | $105,196 | 1.1% | $9.39 |
| Thereafter | 1 | 1,200 | 0.1% | 820,279 | 93.1% | $11,064 | 0.1% | $9.22 |
| Vacant | 0 | 61,245 | 6.9% | 881,524 | 100.0% | $0 | 0.0% | $0.00 |
| Total/Weighted Average | 270 | 881,524 | 100.0% | $9,708,407 | 100.0% | $11.84 |
| (1) | Information obtained from the underwritten rent roll. |
| (2) | Certain tenants may have lease termination options that are exercisable prior to the originally stated expiration date of the subject lease and that are not considered in the Lease Expiration Schedule. |
| (3) | Weighted Average Annual U/W Base Rent PSF excludes vacant space. |
The following table presents historical occupancy percentages at the Walmart Shadow Anchored Portfolio Properties:
Historical Occupancy
12/31/2012(1) | 12/31/2013(2) | 12/31/2014(2) | 12/31/2015(2) | 10/31/2016(3) |
| 93.9% | 92.1% | 92.2% | 93.4% | 93.1% |
| (1) | Information obtained from a third party source. |
| (2) | Information obtained from the borrower. |
| (3) | Information obtained from the underwritten rent roll. |
THE INFORMATION IN THIS STRUCTURAL AND COLLATERAL TERM SHEET IS NOT COMPLETE AND MAY BE AMENDED PRIOR TO THE TIME OF SALE. THIS TERM SHEET IS NOT AN OFFER TO SELL THESE SECURITIES AND IT IS NOT A SOLICITATION OF AN OFFER TO BUY THESE SECURITIES IN ANY JURISDICTION WHERE THE OFFER OR SALE IS NOT PERMITTED.
56
WALMART SHADOW ANCHORED PORTFOLIO |
Operating History and Underwritten Net Cash Flow. The following table presents certain information relating to the historical operating performance and underwritten net cash flow at the Walmart Shadow Anchored Portfolio Properties:
Cash Flow Analysis
| 2013 | 2014 | 2015 | TTM 6/30/2016 | U/W | % of U/W Effective Gross Income | U/W $ per SF | |
| Base Rent | $8,657,624 | $9,058,380 | $9,288,461 | $9,423,033 | $9,708,407 | 77.0% | $11.01 |
| Grossed Up Vacant Space | 0 | 0 | 0 | 0 | $903,439 | 7.2 | 1.02 |
| Total Reimbursables | 2,539,364 | 2,655,932 | 2,787,371 | 2,842,337 | 2,842,337 | 22.6 | 3.22 |
| Other Income | 691,995 | 504,250 | 199,885 | 52,648 | 52,648 | 0.4 | 0.06 |
| Less Vacancy & Credit Loss | 0 | 0 | 0 | 0 | (903,439)(1) | (7.2) | (1.02) |
| Effective Gross Income | $11,888,983 | $12,218,562 | $12,275,717 | $12,318,018 | $12,603,392 | 100.0% | $14.30 |
| Total Operating Expenses | $3,221,526 | $3,183,015 | $3,230,236 | $3,267,630 | $3,145,985 | 25.0% | $3.57 |
|
|
|
|
|
|
| |
| Net Operating Income | $8,667,457 | $9,035,547 | $9,045,481 | $9,050,388 | $9,457,407 | 75.0% | $10.73 |
| TI/LC | 0 | 0 | 0 | 0 | 969,678 | 7.7 | 1.10 |
| Capital Expenditures | 0 | 0 | 0 | 0 | 176,305 | 1.4 | 0.20 |
| Net Cash Flow | $8,667,457 | $9,035,547 | $9,045,481 | $9,050,388 | $8,311,424 | 65.9% | $9.43 |
| NOI DSCR(2) | 1.41x | 1.47x | 1.48x | 1.48x | 1.54x | ||
| NCF DSCR(2) | 1.41x | 1.47x | 1.48x | 1.48x | 1.36x | ||
| NOI DY(2) | 9.7% | 10.1% | 10.2% | 10.2% | 10.6% | ||
| NCF DY(2) | 9.7% | 10.1% | 10.2% | 10.2% | 9.3% |
| (1) | Underwritten economic vacancy is 6.9%. The Walmart Shadow Anchored Properties were 93.1% physically occupied as of October 31, 2016. |
| (2) | The debt service coverage ratios and debt yields are based on the Walmart Shadow Anchored Portfolio Whole Loan. |
Appraisals.As of the appraisal valuation dates ranging from July 12, 2016 to July 30, 2016, the Walmart Shadow Anchored Portfolio Properties had an aggregate “as-is” appraised value of $118,715,000.
The Borrowers. The borrowers are: SFP Pool One Shopping Centers L.P.; SFP Pool Two Shopping Centers L.P.; SFP Pool Three Shopping Centers L.P.; SFP Pool Four Shopping Centers L.P.; and SFP Pool Five Shopping Centers L.P. Each of the borrowers is a Delaware limited liability company and single purpose entity with two independent directors. Legal counsel to the borrowers delivered a non-consolidation opinion in connection with the origination of the Walmart Shadow Anchored Portfolio Whole Loan. David W. Schostak is the guarantor of certain nonrecourse carveouts under the Walmart Shadow Anchored Portfolio Whole Loan.
The Sponsor. The sponsor is David W. Schostak, who is the co-CEO of Schostak Brothers & Company with his brother Robert Schostak. The Schostaks are a fourth generation real estate family that has been involved in Michigan development, acquisitions, and leasing of retail, office, industrial, residential, and mixed use projects for over 100 years. Mr. Schostak’s current activities include joint ventures, build-to-suit projects, mixed-use developments and a variety of necessity-based retail and open air centers in 24 states. The Schostak family’s portfolio now includes over 100 restaurants including Applebee’s, Del Tacos, MOD Pizzas and Olga’s Kitchens.
The sponsor was involved in three defaults, one loan modification and one discounted payoff for loans as to which he was a sponsor. See“Description of the Mortgage Pool—Loan Purpose; Default History, Bankruptcy Issues and Other Proceedings”in the Preliminary Prospectus.
Escrows.The loan documents provide for upfront reserves in the amount of $682,795 for real estate taxes, $150,051 for insurance, $850,000 for upfront tenant improvements and leasing commissions, $218,304 for deferred maintenance, $129,000 for an engineering reserve, and $8,216 for future ground rent payments. The loan documents also require monthly deposits in an amount equal to one-twelfth of the estimated annual real estate taxes and insurance premiums, which currently equate to $136,559 and $12,504, respectively, $14,692 for replacement reserves (capped at $528,915), and $80,806 for tenant improvements and leasing commissions (capped at $2,909,034).
Lockbox and Cash Management.The Walmart Shadow Anchored Portfolio Whole Loan documents require a lender-controlled lockbox account, which is already in place, and that the borrowers direct tenants to pay their rents directly into such lockbox account. The loan documents also require that all rents received by the borrowers or the property manager will be deposited into the lockbox account within two business days of receipt. Prior to a Sweep Event Period (as defined below), all excess cash flow will be disbursed to the related borrower. Upon a Sweep Event Period, excess cash flow will be held by the lender.
A “Sweep Event Period” will commence upon the earlier of (i) an event of default occurs under the loan documents or the property management agreement, (ii) the aggregate amortizing debt service coverage ratio for the Walmart Shadow Anchored Portfolio Properties falls below 1.05x at any time and/or (iii) any tenant occupying (physical or economic) more than 10.0% of the entire Walmart Shadow Anchored Portfolio Properties files or bankruptcy, becomes insolvent, or goes dark in the majority of its locations. A Sweep Event Period will end with respect to clause (i) upon the cure of such event of default; with respect to clause (ii), upon the debt service coverage ratio being at least 1.10x for at least two consecutive quarters; or, with respect to clause (iii) if the tenant is no longer a debtor in any bankruptcy action and pays full rent for two consecutive quarters or reopens and pays full rent for two consecutive quarters. A Sweep Event Period with respect to clause (iii) may also be cured if the borrower releases the space and either the rents payable under the replacement leases are no less than 95.0% of the rent payable under the lease being replaced or if the debt service coverage ratio is at least 1.10x.
THE INFORMATION IN THIS STRUCTURAL AND COLLATERAL TERM SHEET IS NOT COMPLETE AND MAY BE AMENDED PRIOR TO THE TIME OF SALE. THIS TERM SHEET IS NOT AN OFFER TO SELL THESE SECURITIES AND IT IS NOT A SOLICITATION OF AN OFFER TO BUY THESE SECURITIES IN ANY JURISDICTION WHERE THE OFFER OR SALE IS NOT PERMITTED.
57
WALMART SHADOW ANCHORED PORTFOLIO |
Property Management.The Walmart Shadow Anchored Portfolio Properties are managed by an affiliate of the sponsor.
Assumption.The borrower has the right to transfer the Walmart Shadow Anchored Portfolio Properties, provided that no event of default has occurred and is continuing and certain other conditions are satisfied, including (i) the lender’s reasonable determination that the proposed transferee and guarantor satisfy the lender’s credit review and underwriting standards, taking into consideration transferee experience, financial strength and general business standing; (ii) execution of a recourse guaranty and an environmental indemnity by an affiliate of the transferee; and (iii) if requested by the lender, rating agency confirmation from DBRS, Fitch, Moody’s, and Morningstar that the transfer will not result in a downgrade, withdrawal or qualification of the respective ratings assigned to the Series 2016-C37 certificates and similar confirmations from each rating agency rating any securities backed by the Walmart Shadow Anchored Portfolio Companion Loan with respect to the ratings of such securities.
Partial Release.Not permitted.
Real Estate Substitution.Not permitted.
Subordinate and Mezzanine Indebtedness.Ladder Capital Finance LLC (the “Walmart Shadow Anchored Portfolio Mezzanine Lender”) funded an $8,613,750 mezzanine loan (the “Walmart Shadow Anchored Portfolio Mezzanine Loan”) to SFP LP Holdco L.P., a Delaware limited partnership owning the limited partnership interests of each borrower under the Walmart Shadow Anchored Portfolio Whole Loan, and SFP GP Holdco LLC, a Delaware limited liability company owning the general partnership interests of each borrower under the Walmart Shadow Anchored Portfolio Whole Loan (collectively, the “Walmart Shadow Anchored Portfolio Mezzanine Borrower”). The Walmart Shadow Anchored Portfolio Mezzanine Loan is secured by a pledge of the Walmart Shadow Anchored Portfolio Mezzanine Loan Borrowers’ interest in the borrowers under the Walmart Shadow Anchored Portfolio Whole Loan. The Walmart Shadow Anchored Portfolio Mezzanine Loan accrues interest at an interest rate of 11.000%per annum and requires payments of principal and interest based on a 30-year amortization schedule. The Walmart Shadow Anchored Portfolio Mezzanine Loan matures on September 6, 2021. The rights of The Walmart Shadow Anchored Portfolio Mezzanine Lender are further described under“Description of the Mortgage Pool–Additional Indebtedness—Mezzanine Indebtedness”in the Preliminary Prospectus.
Ground Lease. Two of the Walmart Shadow Anchored Portfolio Properties are subject to ground leases: (i) the Tyler Shopping Center property is subject to a ground lease with Jack and Peggy Waldie as ground lessor that expires on April 26, 2024 with 15 five-year ground lease extension options, each with $5,000 rent increases; and (ii) the Pulaski Shopping Center property is subject to a ground lease with Wakefield Realty, LLC as ground lessor that expires on October 31, 2023 with 15 five-year ground lease extension options, each with 5% rent increases. See “Description of the Mortgage Pool—Mortgage Pool Characteristics—Fee & Leasehold Estates; Ground Leases” in the Preliminary Prospectus.
Terrorism Insurance.The loan documents require that the “all risk” insurance policy required to be maintained by the borrower provide coverage for terrorism in an amount equal to the full replacement cost of the Walmart Shadow Anchored Portfolio Properties. The loan documents also require business interruption insurance that provides coverage for no less than the 24-month period following the occurrence of a casualty event, together with a six-month extended period of indemnity.
Windstorm Insurance.The loan documents require windstorm insurance covering the full replacement cost of the Walmart Shadow Anchored Portfolio Properties during the loan term. At the time of closing, the Walmart Shadow Anchored Portfolio Properties had windstorm insurance coverage.
THE INFORMATION IN THIS STRUCTURAL AND COLLATERAL TERM SHEET IS NOT COMPLETE AND MAY BE AMENDED PRIOR TO THE TIME OF SALE. THIS TERM SHEET IS NOT AN OFFER TO SELL THESE SECURITIES AND IT IS NOT A SOLICITATION OF AN OFFER TO BUY THESE SECURITIES IN ANY JURISDICTION WHERE THE OFFER OR SALE IS NOT PERMITTED.
58
(THIS PAGE INTENTIONALLY LEFT BLANK)
THE INFORMATION IN THIS STRUCTURAL AND COLLATERAL TERM SHEET IS NOT COMPLETE AND MAY BE AMENDED PRIOR TO THE TIME OF SALE. THIS TERM SHEET IS NOT AN OFFER TO SELL THESE SECURITIES AND IT IS NOT A SOLICITATION OF AN OFFER TO BUY THESE SECURITIES IN ANY JURISDICTION WHERE THE OFFER OR SALE IS NOT PERMITTED.
59
(THIS PAGE INTENTIONALLY LEFT BLANK)
THE INFORMATION IN THIS STRUCTURAL AND COLLATERAL TERM SHEET IS NOT COMPLETE AND MAY BE AMENDED PRIOR TO THE TIME OF SALE. THIS TERM SHEET IS NOT AN OFFER TO SELL THESE SECURITIES AND IT IS NOT A SOLICITATION OF AN OFFER TO BUY THESE SECURITIES IN ANY JURISDICTION WHERE THE OFFER OR SALE IS NOT PERMITTED.
60
| POTOMAC MILLS |
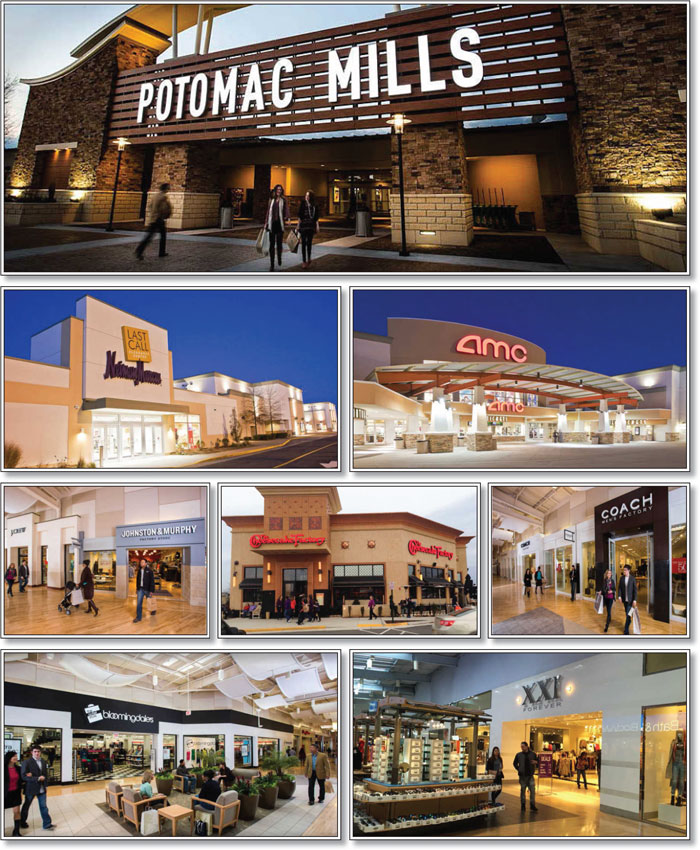
THE INFORMATION IN THIS STRUCTURAL AND COLLATERAL TERM SHEET IS NOT COMPLETE AND MAY BE AMENDED PRIOR TO THE TIME OF SALE. THIS TERM SHEET IS NOT AN OFFER TO SELL THESE SECURITIES AND IT IS NOT A SOLICITATION OF AN OFFER TO BUY THESE SECURITIES IN ANY JURISDICTION WHERE THE OFFER OR SALE IS NOT PERMITTED.
61
| POTOMAC MILLS |
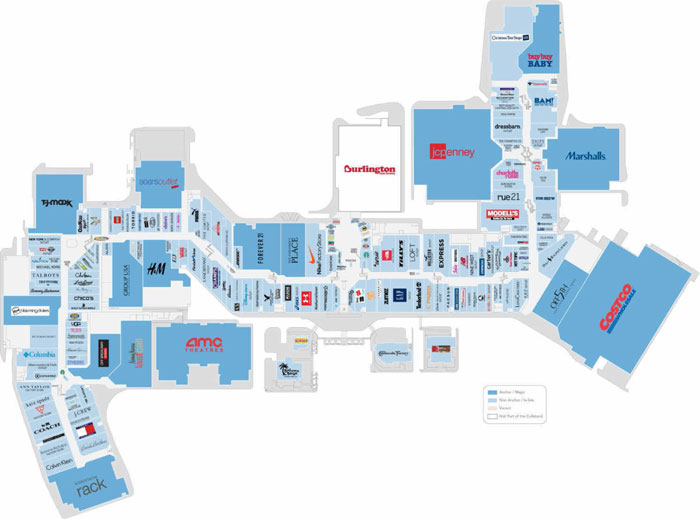
THE INFORMATION IN THIS STRUCTURAL AND COLLATERAL TERM SHEET IS NOT COMPLETE AND MAY BE AMENDED PRIOR TO THE TIME OF SALE. THIS TERM SHEET IS NOT AN OFFER TO SELL THESE SECURITIES AND IT IS NOT A SOLICITATION OF AN OFFER TO BUY THESE SECURITIES IN ANY JURISDICTION WHERE THE OFFER OR SALE IS NOT PERMITTED.
62
| POTOMAC MILLS |

THE INFORMATION IN THIS STRUCTURAL AND COLLATERAL TERM SHEET IS NOT COMPLETE AND MAY BE AMENDED PRIOR TO THE TIME OF SALE. THIS TERM SHEET IS NOT AN OFFER TO SELL THESE SECURITIES AND IT IS NOT A SOLICITATION OF AN OFFER TO BUY THESE SECURITIES IN ANY JURISDICTION WHERE THE OFFER OR SALE IS NOT PERMITTED.
63
| No. 4 – Potomac Mills | |||||||
| Loan Information | Property Information | ||||||
| Mortgage Loan Seller: | Barclays Bank PLC | Single Asset/Portfolio: | Single Asset | ||||
Credit Assessment (Fitch/Moody’s/DBRS): | BBBsf/Baa1/A(low) | Property Type: | Retail | ||||
| Original Principal Balance(1): | $36,375,000 | Specific Property Type: | Super Regional Mall | ||||
| Cut-off Date Balance(1): | $36,375,000 | Location: | Woodbridge, VA | ||||
| % of Initial Pool Balance: | 4.8% | Size(4): | 1,459,997 SF | ||||
| Loan Purpose: | Refinance | Cut-off Date Balance Per SF(1)(4): | $199.32 | ||||
| Borrower Name: | Mall at Potomac Mills, LLC | Year Built/Renovated: | 1985/2012 | ||||
| Sponsors: | Simon Property Group, L.P. | Title Vesting: | Fee | ||||
| Mortgage Rate: | 2.988213% | Property Manager: | Self-managed | ||||
| Note Date: | October 5, 2016 | 3rdMost Recent Occupancy (As of)(5): | 98.8% (12/31/2013) | ||||
| Anticipated Repayment Date: | NAP | 2ndMost Recent Occupancy (As of)(5): | 99.6% (12/31/2014) | ||||
| Maturity Date: | November 1, 2026 | Most Recent Occupancy (As of)(5): | 98.8% (12/31/2015) | ||||
| IO Period: | 120 months | Current Occupancy (As of)(5): | 97.7% (9/20/2016) | ||||
| Loan Term (Original): | 120 months | ||||||
| Seasoning: | 1 month | ||||||
| Amortization Term (Original): | NAP | Underwriting and Financial Information: | |||||
| Loan Amortization Type: | Interest-only, Balloon | ||||||
| Interest Accrual Method: | Actual/360 | 4thMost Recent NOI (As of)(6): | $34,999,313 (12/31/2013) | ||||
| Call Protection: | L(25), D(88), O(7) | 3rdMost Recent NOI (As of)(6): | $37,395,215 (12/31/2014) | ||||
| Lockbox Type: | Hard/Springing Cash Management | 2ndMost Recent NOI (As of)(6): | $38,949,641 (12/31/2015) | ||||
| Additional Debt(1)(2): | Yes | Most Recent NOI (As of)(6): | $40,298,052 (TTM 8/31/2016) | ||||
| Additional Debt Type(1)(2): | Pari Passu, Subordinate Debt | ||||||
| U/W Revenues(6): | $53,920,492 | ||||||
| U/W Expenses(6): | $13,594,604 | ||||||
| U/W NOI(6): | $40,325,888 | ||||||
| U/W NCF(6): | $38,713,977 | ||||||
| U/W NOI DSCR(1): | 4.57x | ||||||
| Escrows and Reserves(3): | U/W NCF DSCR(1): | 4.39x | |||||
| U/W NOI Debt Yield(1): | 13.9% | ||||||
| Type: | Initial | Monthly | Cap (If Any) | U/W NCF Debt Yield(1): | 13.3% | ||
| Taxes | $0 | Springing | NAP | As-Is Appraised Value: | $765,000,000 | ||
| Insurance | $0 | Springing | NAP | As-Is Appraisal Valuation Date: | September 12, 2016 | ||
| Replacement Reserves | $0 | Springing | $645,000 | Cut-off Date LTV Ratio(1): | 38.0% | ||
| TI/LC Reserve | $0 | Springing | $2,580,000 | LTV Ratio at Maturity or ARD(1): | 38.0% | ||
| (1) | See “The Mortgage Loan” section. All statistical information related to balance per square foot, loan-to-value ratios, debt service coverage ratios and debt yields are based on the seniorpari passu notes. The Cut-off Date LTV Ratio, U/W NCF DSCR and U/W NOI Debt Yield based on the Potomac Mills Whole Loan are 54.4%, 2.65x and 9.7%, respectively. |
| (2) | See “Subordinate and Mezzanine Indebtedness” section. |
| (3) | See “Escrows” section. |
| (4) | Size represents the square footage of collateral for the Potomac Mills Whole Loan. Total square footage of the Potomac Mills Property (as defined below) including non-collateral retail space is 1,839,997 square feet. See “The Property” and “Major Tenants” sections. |
| (5) | See “Historical Occupancy” section. |
| (6) | See “Cash Flow Analysis” section. |
The Mortgage Loan.The mortgage loan (the “Potomac Mills Mortgage Loan”) is part of a whole loan (the “Potomac Mills Whole Loan”) evidenced by tenpari passu and ten subordinate promissory notes (Note A-1, Note A-2, Note A-3, Note A-4, Note A-5, Note A-6, Note A-7, Note A-8, Note, A-9, Note A-10, Note B-1, Note B-2, Note B-3, Note B-4, Note B-5, Note B-6, Note B-7, Note B-8, Note B-9 and Note B-10) that are secured by a first lien deed of trust on the Borrower’s fee simple interest in a super regional mall located in Woodbridge, Virginia (“Potomac Mills Property”). The Potomac Mills Whole Loan was co-originated on October 5, 2016 by Barclays Bank PLC, Société Générale, Cantor Commercial Real Estate Lending, L.P. and Bank of America, N.A. The Potomac Mills Whole Loan had an original principal balance of $416,000,000 and has an outstanding principal balance as of the Cut-off Date of $416,000,000. The Potomac Mills Mortgage Loan and each Potomac Mills Pari Passu Companion Loan accrues interest at an interest rate of 2.988213%per annum and each Potomac Mills Subordinate Companion Loan accrues interest at an interest rate of 4.55000%per annum. The Potomac Mills Whole Loan had an initial term of 120 months, has a remaining term of 119 months as of the Cut-off Date and requires interest-only payments through the term of the Potomac Mills Whole Loan. The Potomac Mills Whole Loan matures on November 1, 2026.
The Potomac Mills Mortgage Loan, evidenced by the non-controlling Note A-10, had an original principal balance of $36,375,000, has an outstanding principal balance as of the Cut-off Date of $36,375,000 and represents a non-controlling interest in the Potomac Mills Whole Loan. Twopari passu notes (Note A-1 and Note A-6), with an aggregate original principal balance of $70,000,000 were contributed to the CFCRE 2016-C6 Trust. Note A-1 represents the controlling interest in the Potomac Mills Whole Loan during a
THE INFORMATION IN THIS STRUCTURAL AND COLLATERAL TERM SHEET IS NOT COMPLETE AND MAY BE AMENDED PRIOR TO THE TIME OF SALE. THIS TERM SHEET IS NOT AN OFFER TO SELL THESE SECURITIES AND IT IS NOT A SOLICITATION OF AN OFFER TO BUY THESE SECURITIES IN ANY JURISDICTION WHERE THE OFFER OR SALE IS NOT PERMITTED.
64
| POTOMAC MILLS |
control appraisal period, otherwise the controlling noteholder is the junior noteholder. The non-controlling Note A-7, which had an original principal balance of $35,000,000, was contributed to the CGCMT 2016-C3 Trust. The non-controlling Note A-9, which had an original principal balance of $36,375,000, is held by Barclays Bank, PLC and is expected to be contributed to the CGCMT 2016-P6 Trust. The non-controlling Note A-2 and Note A-3, which had an aggregate original principal balance of $32,750,000, are held by Société Générale, and are expected to be contributed to one or more future securitization trusts. The non-controlling Note A-4, which had an original principal balance of $52,000,000, is held by Bank of America, N.A. and is expected to be contributed to the MSBAM 2016-C32 Trust. The non-controlling Note A-5, which had an original principal balance of $20,750,000, is held by Bank of America, N.A., and is expected to be contributed to one or more future securitization trusts. The non-controlling Note A-8, which had an original principal balance of $7,750,000, is held by Cantor Commercial Real Estate Lending, L.P. and is expected to be contributed to one or more future securitization trusts. The Potomac Mills Subordinate Companion Loans are currently held by Teachers Insurance and Annuity Association of America. The lender provides no assurances that any non-securitized notes will not be split further. The mortgage loans evidenced by Note A-1, Note A-2, Note A-3, Note A-4, Note A-5, Note A-6, Note A-7, Note A-8 and Note A-9 are collectively referred to as the “Potomac Mills Pari Passu Companion Loans”. The mortgage loans evidenced by Note B-1, Note B-2, Note B-3, Note B-4, Note B-5, Note B-6, Note B-7, Note B-8. Note B-9 and Note B-10 are collectively referred to as the “Potomac Mills Subordinate Companion Loans”. See “Description of the Mortgage Pool—The Whole Loans—The Non-Serviced Whole Loans—The Potomac Mills Whole Loan” and “Pooling and Servicing Agreement” in the Preliminary Prospectus.
Note Summary
Notes | Original | Note Holder | Controlling | ||||
| A-1 | $40,000,000 | CFCRE 2016-C6 | Yes | ||||
| A-2 | $20,000,000 | Société Générale | No | ||||
| A-3 | $12,750,000 | Société Générale | No | ||||
| A-4 | $52,000,000 | MSBAM 2016-C32 | No | ||||
| A-5 | $20,750,000 | Bank of America, N.A. | No | ||||
| A-6 | $30,000,000 | CFCRE 2016-C6 | No | ||||
| A-7 | $35,000,000 | CGCMT 2016-C3 | No | ||||
| A-8 | $7,750,000 | Cantor Commercial Real Estate Lending, L.P. | No | ||||
| A-9 | $36,375,000 | CGCMT 2016-P6 | No | ||||
| A-10 | $36,375,000 | WFCM 2016-C37 | No | ||||
| Junior Notes | $125,000,000 | Teachers Insurance and Annuity Association of America | No | ||||
| Total | $416,000,000 | ||||||
Following the lockout period, on any date before May 1, 2026, the Borrower has the right to defease the Potomac Mills Whole Loan in whole, but not in part. The lockout period will expire on the earlier to occur of (i) two years after the closing date of the securitization that includes the last note to be securitized and (ii) October 5, 2019. The Potomac Mills Whole Loan is prepayable without penalty on or after May 1, 2026.
Sources and Uses
| Sources | Uses | |||||||
| Original whole loan amount | $416,000,000 | 100.0% | Loan payoff(1) | $411,992,396 | 99.0% | |||
| Closing costs | 2,011,635 | 0.5 | ||||||
| Return of equity | 1,995,969 | 0.5 | ||||||
| Total Sources | $416,000,000 | 100.0% | Total Uses | $416,000,000 | 100.0% |
| (1) | The Potomac Mills Property was previously securitized in LBUBS 2007-C6 and WBCMT 2007-C33. |
The Property.The Potomac Mills Property is a super regional mall located in Woodbridge, Virginia approximately 25.0 miles south of Washington, D.C. Built in 1985 by the sponsor, the Potomac Mills Property contains approximately 1,839,997 square feet of retail space, of which 1,459,997 square feet serves as collateral for the Potomac Mills Whole Loan (the “Potomac Mills Mortgaged Property”). The Potomac Mills Mortgaged Property features 7,292 parking spaces, resulting in a parking ratio of approximately 5.0 spaces per 1,000 feet of rentable area.
The Potomac Mills Property is anchored by IKEA, Burlington Coat Factory, Costco Warehouse, J.C. Penney, AMC Theatres, Buy Buy Baby/and That! and Marshalls; however, IKEA and Burlington Coat Factory are not part of the collateral for the Potomac Mills Whole Loan. Based on 2015 year-end sponsor-estimated sales, IKEA generated sales of $175.0 million. The IKEA located at the Potomac Mills Property is the only IKEA located in the state of Virginia. As of the trailing 12-month period ending June 2016 (“TTM June 2016”), Burlington Coat Factory generated approximately $22.3 million in sales. Per 2015 year-end sponsor-estimated sales, Costco Warehouse generated sales of $116.0 million ($783 sales per square foot). AMC Theatres achieved sales of approximately $14.5 million as of TTM June 2016, or approximately $804,794 per screen. AMC Theatres includes 18 screens at the Potomac Mills Property, which features an IMAX theater with stadium seating.
The Potomac Mills Property, features over 200 tenants, including retailers such as American Eagle Outfitters ($610 sales per square foot), Bloomingdales the Outlet ($138 sales per square foot), Coach ($757 sales per square foot), Fossil Company Store ($879 sales per square foot), GameStop ($1,162 sales per square foot), H&M ($309 sales per square foot), Michael Kors ($2,572 sales per square foot), Nike Factory Store ($577 sales per square foot), Polo Ralph Lauren Factory Store ($618 sales per square foot), Saks Fifth Avenue Off 5th ($185 sales per square foot) and Victoria’s Secret ($722 sales per square foot). Sales per square foot information is as of TTM June 2016.
Since 2012, the sponsor has invested approximately $30.0 million in the Potomac Mills Property adding four freestanding restaurants, renovating the exterior of the southern portion of the mall and main entrances, relocating Saks Fifth Avenue Off 5th and adding Buy Buy Baby/and That! in 2012.
THE INFORMATION IN THIS STRUCTURAL AND COLLATERAL TERM SHEET IS NOT COMPLETE AND MAY BE AMENDED PRIOR TO THE TIME OF SALE. THIS TERM SHEET IS NOT AN OFFER TO SELL THESE SECURITIES AND IT IS NOT A SOLICITATION OF AN OFFER TO BUY THESE SECURITIES IN ANY JURISDICTION WHERE THE OFFER OR SALE IS NOT PERMITTED.
65
| POTOMAC MILLS |
The following table presents certain information relating to the tenancy at the Potomac Mills Property:
Major Tenants
| Tenant Name | Credit Rating (Fitch/ Moody’s/ S&P)(1) | Tenant NRSF | % of NRSF(2) | Annual U/W Base Rent PSF(3) | Annual U/W Base Rent(3) | % of Total Annual U/W Base Rent | Sales PSF(4) | Occupancy Cost(4) | Lease Expiration Date |
| Anchor Tenants – Non-Collateral | |||||||||
| IKEA | NR/NR/NR | 300,000 | ANCHOR OWNED – NON-COLLATERAL | $583 | NAP | NAP | |||
| Burlington Coat Factory | NR/Ba3/NR | 80,000 | $279 | NAP | NAP | ||||
| Total Anchor Tenants – Non- Collateral | 380,000 | ||||||||
| Anchor Tenant - Collateral | |||||||||
| AMC Theatres | B+/NR/B+ | 75,273 | 5.2% | $23.00 | $1,731,279 | 5.4% | $804,794(5) | 12.7%(5) | 2/28/2019(6) |
| Buy Buy Baby/and That! | NR/Baa1/BBB+ | 73,432 | 5.0% | $10.61 | $779,114 | 2.4% | NAV | NAV | 1/31/2025(7) |
| J.C. Penney | B+/B1/B | 100,140 | 6.9% | $7.33 | $733,824 | 2.3% | $112 | 7.4% | 2/28/2022(8) |
| Costco Warehouse | A+/A1/A+ | 148,146 | 10.1% | $4.39 | $650,943 | 2.0% | $783 | 0.6% | 5/31/2032(9) |
| Marshalls | NR/A2/A+ | 61,763 | 4.2% | $9.75 | $602,189 | 1.9% | $291 | 3.8% | 1/31/2019(10) |
| Total Anchor Tenants – Collateral | 458,754 | 31.4% | $9.80 | $4,497,349 | 13.9% | ||||
| Major Tenants – Collateral | |||||||||
| XXI Forever | 30,428 | 2.1% | $24.00 | $730,337 | 2.3% | $197 | 12.0% | 1/31/2020 | |
| H&M | 22,686 | 1.6% | $28.98 | $657,499 | 2.0% | $309 | 9.4% | 1/31/2023 | |
| Saks Fifth Avenue Off 5th | 28,000 | 1.9% | $20.77 | $581,560 | 1.8% | $185 | 11.2% | 10/31/2023(11) | |
| Bloomingdales the Outlet | 25,038 | 1.7% | $21.13 | $529,053 | 1.6% | $138 | 14.7% | 1/31/2021 | |
| Last Call Neiman Marcus | 34,000 | 2.3% | $14.67 | $498,780 | 1.5% | $125 | 12.1% | 1/31/2020(12) | |
| Total Major Tenants – Collateral | 140,152 | 9.6% | $21.39 | $2,997,229 | 9.3% | ||||
| Non-Major Tenants – Collateral | 827,291 | 56.7% | $29.98 | $24,801,560 | 76.8% | ||||
| Occupied Collateral Total | 1,426,197 | 97.7% | $22.64 | $32,296,138 | 100.0% | ||||
| Vacant Space | 33,800 | 2.3% | |||||||
| Collateral Total | 1,459,997 | 100.0% | |||||||
| (1) | Certain ratings are those of the parent company whether or not the parent guarantees the lease. |
| (2) | % of NRSF is based on the Potomac Mills Mortgaged Property collateral square footage of 1,459,997, which excludes all non-collateral anchor tenants. |
| (3) | Annual U/W Base Rent includes base rent and contractual rent steps through May 2017 equal to $548,234. |
| (4) | All Sales PSF and Occupancy Cost information presented herein are based upon TTM June 2016 information provided by the Borrower unless otherwise noted. Sales PSF figures include 2015 year-end sponsors’ estimates for IKEA and Costco Warehouse. |
| (5) | AMC Theatres Sales PSF on a per screen basis, based on 18 screens. AMC Theatre’s TTM June 2016 Occupancy Cost is calculated on a PSF basis. |
| (6) | AMC Theatres has four, five-year extension options remaining. |
| (7) | Buy Buy Baby/and That! has two, five-year extension options remaining. |
| (8) | J.C. Penney has six, five-year extension options remaining. |
| (9) | Costco Warehouse has five, five-year extension options remaining. |
| (10) | Marshalls has two, five-year extension options remaining. |
| (11) | Saks Fifth Avenue Off 5th has two, five-year extension options remaining. |
| (12) | Last Call Neiman Marcus has two, five-year extension options remaining. |
THE INFORMATION IN THIS STRUCTURAL AND COLLATERAL TERM SHEET IS NOT COMPLETE AND MAY BE AMENDED PRIOR TO THE TIME OF SALE. THIS TERM SHEET IS NOT AN OFFER TO SELL THESE SECURITIES AND IT IS NOT A SOLICITATION OF AN OFFER TO BUY THESE SECURITIES IN ANY JURISDICTION WHERE THE OFFER OR SALE IS NOT PERMITTED.
66
| POTOMAC MILLS |
The following table presents certain information relating to the historical sales and occupancy costs at the Potomac Mills Property:
Historical Sales (PSF)(1)(2)
| 2014 | 2015(3) | TTM June 2016(3) | |
| Comparable Inline Sales PSF | $481 | $461 | $451 |
| Occupancy Costs | 13.0% | 14.1% | 14.4% |
| (1) | All Historical Sales PSF presented herein are based upon information provided by the Borrower. |
| (2) | Inline tenant sales include all tenants occupying less than 10,000 SF and who have reported sales for at least two full calendar years. |
| (3) | According to the sponsor, traffic into the center in 2015 was affected by construction on Interstate 95, which negatively impacted sales. The construction is now complete. |
The following table presents certain information relating to the lease rollover schedule at the Potomac Mills Mortgaged Property:
Lease Expiration Schedule(1)(2)
| Year Ending December 31, | No. of Leases Expiring | Expiring NRSF | % of Total NRSF | Cumulative Expiring NRSF | Cumulative % of Total NRSF | Annual U/W Base Rent | Annual U/W Base Rent PSF(3) |
| MTM | 7 | 11,168 | 0.8% | 11,168 | 0.8% | $840,364 | $75.25 |
| 2016 | 1 | 734 | 0.1% | 11,902 | 0.8% | $76,417 | $104.11 |
| 2017 | 23 | 74,317 | 5.1% | 86,219 | 5.9% | $2,927,149 | $39.39 |
| 2018 | 16 | 81,032 | 5.6% | 167,251 | 11.5% | $1,837,124 | $22.67 |
| 2019 | 18 | 278,554 | 19.1% | 445,805 | 30.5% | $5,003,818 | $17.96 |
| 2020 | 19 | 155,373 | 10.6% | 601,178 | 41.2% | $3,746,585 | $24.11 |
| 2021 | 19 | 111,242 | 7.6% | 712,420 | 48.8% | $3,103,543 | $27.90 |
| 2022 | 16 | 170,887 | 11.7% | 883,307 | 60.5% | $3,037,142 | $17.77 |
| 2023 | 25 | 137,241 | 9.4% | 1,020,548 | 69.9% | $4,286,413 | $31.23 |
| 2024 | 16 | 70,806 | 4.8% | 1,091,354 | 74.8% | $2,098,728 | $29.64 |
| 2025 | 17 | 132,240 | 9.1% | 1,223,594 | 83.8% | $2,786,460 | $21.07 |
| 2026 | 11 | 33,666 | 2.3% | 1,257,260 | 86.1% | $1,247,258 | $37.05 |
| Thereafter | 4 | 168,937 | 11.6% | 1,426,197 | 97.7% | $1,305,137 | $7.73 |
| Vacant | 0 | 33,800 | 2.3% | 1,459,997 | 100.0% | $0 | $0.00 |
| Total/Weighted Average | 192 | 1,459,997 | 100.0% | $32,296,138 | $22.64 |
| (1) | Information obtained from the underwritten rent roll. |
| (2) | Certain tenants may have lease termination options that are exercisable prior to the originally stated expiration date of the subject lease and that are not considered in the Lease Expiration Schedule. |
| (3) | Total/Weighted Average Annual U/W Base Rent PSF excludes vacant space. |
THE INFORMATION IN THIS STRUCTURAL AND COLLATERAL TERM SHEET IS NOT COMPLETE AND MAY BE AMENDED PRIOR TO THE TIME OF SALE. THIS TERM SHEET IS NOT AN OFFER TO SELL THESE SECURITIES AND IT IS NOT A SOLICITATION OF AN OFFER TO BUY THESE SECURITIES IN ANY JURISDICTION WHERE THE OFFER OR SALE IS NOT PERMITTED.
67
| POTOMAC MILLS |
The following table presents historical occupancy percentages at the Potomac Mills Mortgaged Property:
Historical Occupancy
12/31/2013(1) | 12/31/2014(1) | 12/31/2015(1) | 9/20/2016(2) |
| 98.8 | 99.6% | 98.8% | 97.7% |
| (1) | Information obtained from the Borrower. |
| (2) | Information obtained from the underwritten rent roll. |
Operating History and Underwritten Net Cash Flow.The following table presents certain information relating to the historical operating performance and underwritten net cash flow at the Potomac Mills Mortgaged Property:
Cash Flow Analysis
| 2014 | 2015 | TTM 8/31/2016 | U/W | % of U/W Effective Gross Income | U/W $ per SF | |
| Base Rent(1) | $30,841,532 | $31,686,259 | $32,123,521 | $32,296,138(2) | 59.9% | $22.12 |
| Grossed up Vacant Space | 0 | 0 | 0 | 2,034,462 | 3.8 | 1.39 |
| Percentage Rent(3) | 1,084,831 | 942,235 | 1,184,702 | 1,018,596 | 1.9 | 0.70 |
| Total Reimbursables | 17,019,559 | 16,706,267 | 17,076,158 | 17,154,584 | 31.8 | 11.75 |
| Other Income(4) | 4,050,543 | 4,001,498 | 4,254,633 | 4,254,633 | 7.9 | 2.91 |
| Less Vacancy & Credit Loss | 0 | 0 | 0 | (2,837,921) | (5.3) | (1.94) |
| Effective Gross Income | $52,996,465 | $53,336,259 | $54,639,014 | $53,920,492 | 100.0% | $36.93 |
| Total Operating Expenses | $15,601,250 | $14,386,618 | $14,340,962 | $13,594,604 | 25.2% | $9.31 |
|
|
|
|
|
| |
| Net Operating Income | $37,395,215 | $38,949,641 | $40,298,052 | $40,325,888 | 74.8% | $27.62 |
| TI/LC | 0 | 0 | 0 | 1,289,527 | 2.4 | 0.88 |
| Capital Expenditures | 0 | 0 | 0 | 322,385 | 0.6 | 0.22 |
| Net Cash Flow | $37,395,215 | $38,949,641 | $40,298,052 | $38,713,977 | 71.8% | $26.52 |
| NOI DSCR(5) | 4.24x | 4.42x | 4.57x | 4.57x | ||
| NCF DSCR(5) | 4.24x | 4.42x | 4.57x | 4.39x | ||
| NOI DY(5) | 12.9% | 13.4% | 13.8% | 13.9% | ||
| NCF DY(5) | 12.9% | 13.4% | 13.8% | 13.3% |
| (1) | Historical Base Rent is inclusive of collection loss. |
| (2) | U/W Base Rent includes rent steps through May 2017 totaling $548,234. |
| (3) | Percentage Rent was underwritten to in-place breakpoints as of June 30, 2016 and percentage rents based on TTM June 2016 sales. |
| (4) | Historical and TTM 8/31/2016 Other Income includes income from special leasing/temporary tenants, miscellaneous income, local media income, local and play area sponsorships, food court digital rent and other non-rental income |
| (5) | The debt service coverage ratios and debt yields are calculated based on the seniorpari passu notes. |
Appraisal.As of the appraisal valuation date of September 12, 2016, the Potomac Mills Mortgaged Property had an “as-is” appraised value of $765,000,000.
Environmental Matters.According to the Phase I environmental site assessment dated September 16, 2016, there was no evidence of any recognized environmental conditions at the Potomac Mills Mortgaged Property.
Market Overview and Competition.The Potomac Mills Property is located in Prince William County, along the north side of Smoketown Road and Opitz Boulevard, west of its intersection with Interstate 95 and approximately 25 miles south of Washington, DC. Potomac Mills Circle encircles the Potomac Mills Property and has multiple points of access along Smoketown Road, Gideon Drive, Telegraph Road and Worth Avenue, which extends north to Prince Williams Parkway. According to the appraisal, Smoketown Road and Prince Williams Parkway have average daily traffic counts of 33,749 and 44,512, respectively. Within a 25-mile drive of the Potomac Mills Property are Falls Church and Fairfax counties, which were two of the three wealthiest counties in the nation according to the 2014 Census Bureau Report.
The Potomac Mills Property is located within the Washington, D.C. Metropolitan Statistical Area, which is the seventh most populous Metropolitan Statistical Area in the nation. Fourteen Fortune 500 companies have headquarters located in the Washington, D.C. Metropolitan Statistical Area, including but not limited to Northrop Grumman, Lockheed Martin, General Dynamics, Fannie Mae and Freddie Mac. According to the appraisal, the Washington, D.C. Metropolitan Statistical Area Gross Metro Product (GMP) increased by 2.2% in 2015 and is expected to grow by an average of 2.6% annually from 2016 to 2020. The primary economic drivers of the Washington, D.C. Metropolitan Statistical Area are the federal government, defense and high technology. The Washington, D.C. Metropolitan Statistical Area is home to both the Ronald Reagan Washington National Airport and Washington Dulles International Airport, which are utilized by approximately 45.0 million passengers annually. The unemployment rate in the Washington, D.C. Metropolitan Statistical Area was 4.1% in the first quarter of 2016 which represents a decline of approximately 0.0060% versus the prior 12 month period. In 2015, the population and average household income within the Potomac Mills Property trade area were 1,076,175 and $124,574, respectively. The appraiser estimated market rent to be $33.21 per sq. ft. on a triple-net basis for in-line tenants.
THE INFORMATION IN THIS STRUCTURAL AND COLLATERAL TERM SHEET IS NOT COMPLETE AND MAY BE AMENDED PRIOR TO THE TIME OF SALE. THIS TERM SHEET IS NOT AN OFFER TO SELL THESE SECURITIES AND IT IS NOT A SOLICITATION OF AN OFFER TO BUY THESE SECURITIES IN ANY JURISDICTION WHERE THE OFFER OR SALE IS NOT PERMITTED.
68
| POTOMAC MILLS |
Competitive Set(1)
Potomac (Subject) | Manassas Mall | Fair Oaks Mall | Springfield Town Center | Stonebridge At Potomac Town Center | Tanger Outlet Center | St. Charles Town Center | Spotsylvania Towne Centre | |
| Location | Woodbridge, VA | Manassas, VA | Fairfax, VA | Springfield, VA | Woodbridge, VA | Fort Washington, MD | Waldorf, MD | Fredericksburg, VA |
| Distance from Subject | -- | 15.0 miles | 15.0 miles | 11.0 miles | 1.0 miles | 19.0 miles | 20.0 miles | 27.0 miles |
| Property Type | Super Regional Mall | Super Regional Mall | Super Regional Mall | Super Regional Mall | Lifestyle Center | Outlet Center | Super Regional Mall | Super Regional Mall |
| Year Built/Renovated | 1985/2012 | 1972/2015 | 1980/NAP | 1973/2014 | 2008/NAP | 2013/NAP | 1990/2015 | 1980/2008 |
| Anchors | IKEA, Costco Warehouse, J.C. Penney, Burlington Coat Factory | Macy’s, At Home, Sears, Walmart | J.C. Penney, Lord & Taylor, Macy’s, Macy’s Home, Sears | Macy’s, Target, J.C. Penney, Dick’s Sporting Goods, Regal Cinema, LA Fitness | Wegmans | NAP | Macy’s, Macy’s Home, J.C. Penney, Sears, Kohl’s, Dick’s Sporting Goods | Belk, Costco, Dick’s Sporting Goods, J.C. Penney, Macy’s, Sears |
| Total GLA (SF) | 1,839,997(2) | 906,463 | 1,550,434 | 1,300,000 | 485,611 | 221,765 | 960,618 | 1,600,000 |
| Inline Sales PSF | $452 | $345 | $620 | $500 | $460 | NAV | $365 | $365 |
| Total Occupancy | 97.7% | 94.0% | 93.0% | 87.0% | 87.0% | 100.0% | 97.0% | 95.0% |
| (1) | Information obtained from the appraisal and underwritten rent roll. |
| (2) | Total GLA includes non-collateral anchor tenants comprising 380,000 square feet. |
The Borrower.The borrowing entity, Mall at Potomac Mills, LLC, is a Delaware limited liability company and special purpose entity. Legal counsel to the borrower delivered a non-consolidation opinion in connection with origination. Simon Property Group, L.P. (“Simon”) is the guarantor of certain non-recourse carveouts under the Potomac Mills Whole Loan. Liabilities under the guaranty are capped at $83,200,000.
The Sponsor.The sponsor of the Potomac Mills Mortgage Loan is Simon.
Simon, the operating partnership of Simon Property Group, Inc., is a publicly traded (S&P 100; NYSE: SPG) real estate investment trust headquartered in Indianapolis, Indiana focused on retail real estate ownership, management and development. Simon owns or retains an interest in 227 retail real estate properties comprising 189.0 million square feet in North America, Europe and Asia. Simon’s portfolio was 96.3% occupied and generated tenant sales of $604 per square foot as of September 30, 2016. According to its consolidated balance sheet dated December 31, 2015, Simon reported cash and cash equivalents of approximately $701.1 million and total equity of approximately $70.3 billion. Simon has sponsored other real estate projects over the last 10 years that have been the subject of mortgage loan defaults, foreclosure proceedings and deed-in-lieu of foreclosure. See “Description of the Mortgage Pool—Non-Recourse Carveout Limitations” and “Description of the Mortgage Pool—Loan Purpose; Default History, Bankruptcy Issues and Other Proceedings” in the Preliminary Prospectus.
Escrows.Pursuant to the Potomac Mills Whole Loan documents, monthly escrows for real estate taxes are required (i) during a Debt Service Coverage Ratio Reserve Trigger Period (as defined below), (ii) during an event of default or (iii) if the borrower fails to provide satisfactory evidence to the lender that taxes have been paid prior to delinquency. Monthly escrows for insurance premiums are required (i) during an event of default or (ii) if the borrower fails to provide satisfactory evidence that the insurance policies are being maintained as part of a reasonably acceptable blanket insurance policy providing coverage required under the loan agreement. Monthly escrows for capital expenditures and tenant improvements and leasing commissions are required (i) during a Debt Service Coverage Ratio Reserve Trigger Period or (ii) during an event of default.
Following the occurrence and during the continuance of a Debt Service Coverage Ratio Reserve Trigger Period or an event of default under Potomac Mills Whole Loan documents, the borrower is required to escrow on each payment date: (i) one-twelfth of the taxes that the lender estimates will be payable during the next ensuing 12 months; (ii) $26,900 (approximately $0.22 per square foot annually) for capital expenditures and such reserve will be capped at approximately 24 monthly payments ($645,000); and (iii) $107,500 (approximately $0.88 per square foot annually) for tenant improvements and leasing commissions and such reserve will be capped at 24 monthly payments ($2,580,000). Following an event of default or if borrower fails to provide satisfactory evidence that the insurance policies are being maintained as part of a reasonably acceptable blanket policy providing coverage required under the loan agreement, one-twelfth of the insurance premiums that the lender estimates will be payable for the renewal of the coverage afforded by the policies up on the expiration thereof.
A “Debt Service Coverage Ratio Reserve Trigger Period” will be in effect if, as of the date of determination, the amortizing debt service coverage ratio based on the trailing four-calendar quarter period immediately preceding the date of such determination falls below 1.40x for two consecutive calendar quarters and will end if the debt service coverage ratio, as calculated under the loan documents, is at least equal to 1.40x for two consecutive calendar quarters based on the trailing four calendar quarter period immediately preceding the date of determination.
Lockbox and Cash Management.The Potomac Mills Whole Loan requires a lender-controlled lockbox account, which is already in place, and that the borrower direct tenants to pay all rents directly into such lockbox account. The loan documents also require that all rents received by the borrower or the property manager be deposited into the lockbox account within two business days of receipt. So long as no Lockbox Period (as defined below) has occurred and is continuing, the funds in the deposit account will be
THE INFORMATION IN THIS STRUCTURAL AND COLLATERAL TERM SHEET IS NOT COMPLETE AND MAY BE AMENDED PRIOR TO THE TIME OF SALE. THIS TERM SHEET IS NOT AN OFFER TO SELL THESE SECURITIES AND IT IS NOT A SOLICITATION OF AN OFFER TO BUY THESE SECURITIES IN ANY JURISDICTION WHERE THE OFFER OR SALE IS NOT PERMITTED.
69
| POTOMAC MILLS |
swept on a periodic basis to the borrower’s operating account. Upon the occurrence and during the continuance of a Lockbox Period, all cash flow is swept into a lender-controlled cash management account.
A “Lockbox Period” will commence upon, (i) an event of default under the Potomac Mills Whole Loan documents until such event of default is cured, (ii) the occurrence of any bankruptcy or insolvency proceeding of the property manager (if the property manager is an affiliate of the borrower) until the property manager is replaced with a qualified property manager pursuant to a replacement management agreement within 60 days or such bankruptcy action is dismissed within 90 days or (iii) the occurrence of, as of the date of determination, the debt service coverage ratio based on the trailing four-calendar quarter period immediately preceding the date of such determination falling below 1.35x for two consecutive calendar quarters until an amortizing debt service coverage ratio based on the trailing four-calendar quarters of at least 1.35x has been achieved for two consecutive calendar quarters. A Lockbox Period is only permitted to be cured up to five times in the aggregate during the term of the Potomac Mills Whole Loan provided that no event of default is continuing.
Property Management. The Potomac Mills Property is managed by an affiliate of the borrower.
Assumption.The borrower has, at anytime (other than the period 60 days prior to and 60 days after securitization of the Potomac Mills Whole Loan), the right to transfer the Potomac Mills Property or more than 50.0% of the aggregate interests in the borrower, provided that no event of default exists under the Potomac Mills Whole Loan documents and certain other conditions are satisfied, including, but not limited to: either (a) that the transfer is not a prohibited transfer under Potomac Mills Whole Loan documents or (b) that the proposed transferee will have been approved by the lender, which may be conditioned upon rating agency confirmation that the transfer will not result in a downgrade, withdrawal or qualification of the respective ratings assigned to the Series 2016-C37 Certificates or similar ratings confirmations from each rating agency rating any securities backed by any Potomac Mills Pari Passu Companion Loans with respect to the ratings of such securities.
Partial Release.Provided no event of default has occurred and is continuing under the Potomac Mills Whole Loan, the borrower has the right to obtain the release of immaterial or non-income producing portions of the Potomac Mills Property, at any time during the term of the Potomac Mills Whole Loan.
If the tenant under the IKEA lease exercises its purchase option, the borrower may also obtain the release of the IKEA parcel without the consent of any person if the borrower delivers reasonably satisfactory evidence to the lender that the IKEA parcel has been subdivided from the remainder of the Potomac Mills Property in accordance with applicable legal requirements and the remainder of the Potomac Mills Property constitutes a separate tax lot.
Real Estate Substitution.Not permitted.
Subordinate and Mezzanine Indebtedness.The Potomac Mills Whole Loan includes tenpari passuand ten subordinate promissory notes (Note A-1, Note A-2, Note A-3, Note A-4, Note A-5, Note A-6, Note A-7, Note A-8, Note A-9, Note A-10, Note B-1, Note B-2, Note B-3, Note B-4, Note B-5, Note B-6, Note B-7, Note B-8. Note B-9 and Note B-10) with an aggregate original principal balance of $416,000,000, and an outstanding aggregate principal balance as of the Cut-off Date of $416,000,000. The ten subordinate notes (Note B-1, Note B-2, Note B-3, Note B-4, Note B-5, Note B-6, Note B-7, Note B-8. Note B-9 and Note B-10) have an aggregate original principal balance of $125,000,000 and an aggregate outstanding principal balance as of the Cut-off Date of $125,000,000. The subordinate notes are currently held by Teachers Insurance and Annuity Association of America.
Ground Lease.None.
Terrorism Insurance.The Potomac Mills Whole Loan documents require that the “all risk” insurance policy required to be maintained by the borrower provide coverage for terrorism in an amount equal to the full replacement cost of Potomac Mills Property, or that if the Terrorism Risk Insurance Program Reauthorization Act is no longer in effect and such policies contain an exclusion for acts of terrorism, the borrower will obtain, to the extent available, a stand-alone policy that provides the same coverage as the policies would have if such exclusion did not exist; provided, however, that (A) in such event the borrower will not be required to pay annual premiums in excess of the Terrorism Cap (as defined below) in order to obtain the terrorism coverage, and (B) such stand-alone policy may have a deductible that is reasonable for such stand-alone policies with respect to properties similar to Potomac Mills Property and reasonable for the geographic region where Potomac Mills Property is located, so long as in no event may such deductible exceed $5,000,000.
“Terrorism Cap” means an amount equal to two times the then-current annual insurance premiums payable by the borrower for the policies insuring only Potomac Mills Property (excluding the wind and flood components of such insurance premiums) on a stand-alone basis.
THE INFORMATION IN THIS STRUCTURAL AND COLLATERAL TERM SHEET IS NOT COMPLETE AND MAY BE AMENDED PRIOR TO THE TIME OF SALE. THIS TERM SHEET IS NOT AN OFFER TO SELL THESE SECURITIES AND IT IS NOT A SOLICITATION OF AN OFFER TO BUY THESE SECURITIES IN ANY JURISDICTION WHERE THE OFFER OR SALE IS NOT PERMITTED.
70
(THIS PAGE INTENTIONALLY LEFT BLANK)
THE INFORMATION IN THIS STRUCTURAL AND COLLATERAL TERM SHEET IS NOT COMPLETE AND MAY BE AMENDED PRIOR TO THE TIME OF SALE. THIS TERM SHEET IS NOT AN OFFER TO SELL THESE SECURITIES AND IT IS NOT A SOLICITATION OF AN OFFER TO BUY THESE SECURITIES IN ANY JURISDICTION WHERE THE OFFER OR SALE IS NOT PERMITTED.
71
(THIS PAGE INTENTIONALLY LEFT BLANK)
THE INFORMATION IN THIS STRUCTURAL AND COLLATERAL TERM SHEET IS NOT COMPLETE AND MAY BE AMENDED PRIOR TO THE TIME OF SALE. THIS TERM SHEET IS NOT AN OFFER TO SELL THESE SECURITIES AND IT IS NOT A SOLICITATION OF AN OFFER TO BUY THESE SECURITIES IN ANY JURISDICTION WHERE THE OFFER OR SALE IS NOT PERMITTED.
72
FRANKLIN SQUARE III |
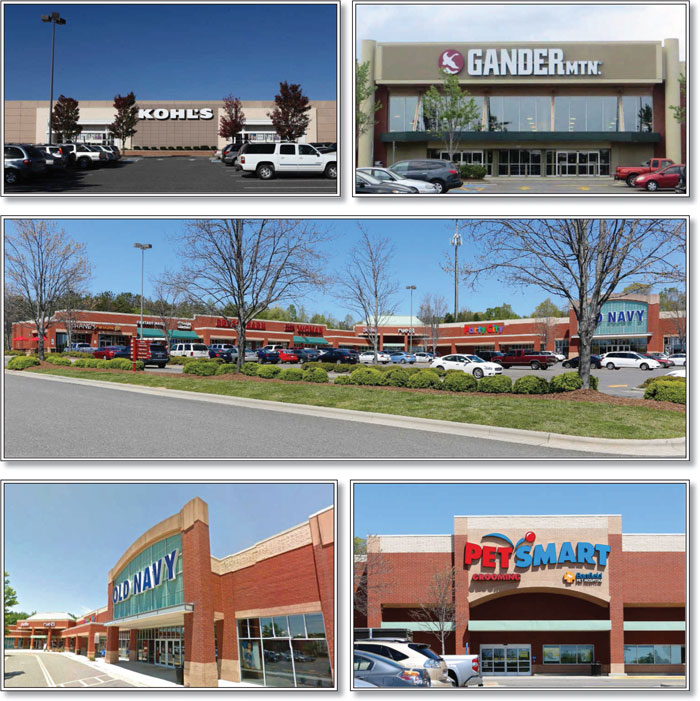
THE INFORMATION IN THIS STRUCTURAL AND COLLATERAL TERM SHEET IS NOT COMPLETE AND MAY BE AMENDED PRIOR TO THE TIME OF SALE. THIS TERM SHEET IS NOT AN OFFER TO SELL THESE SECURITIES AND IT IS NOT A SOLICITATION OF AN OFFER TO BUY THESE SECURITIES IN ANY JURISDICTION WHERE THE OFFER OR SALE IS NOT PERMITTED.
73
FRANKLIN SQUARE III |
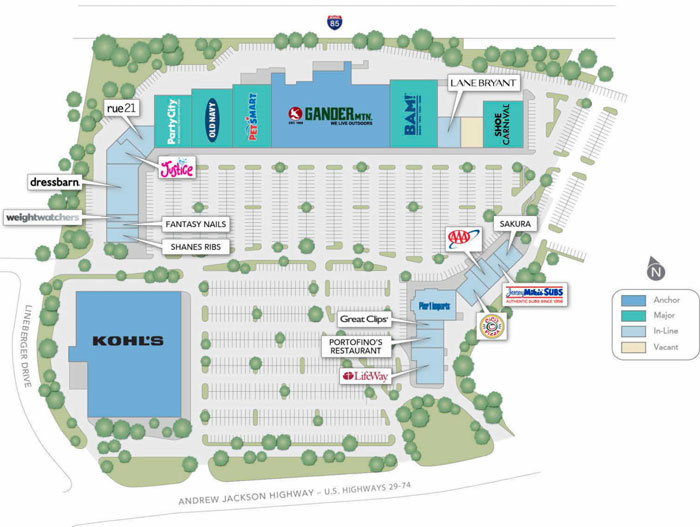
THE INFORMATION IN THIS STRUCTURAL AND COLLATERAL TERM SHEET IS NOT COMPLETE AND MAY BE AMENDED PRIOR TO THE TIME OF SALE. THIS TERM SHEET IS NOT AN OFFER TO SELL THESE SECURITIES AND IT IS NOT A SOLICITATION OF AN OFFER TO BUY THESE SECURITIES IN ANY JURISDICTION WHERE THE OFFER OR SALE IS NOT PERMITTED.
74
FRANKLIN SQUARE III |
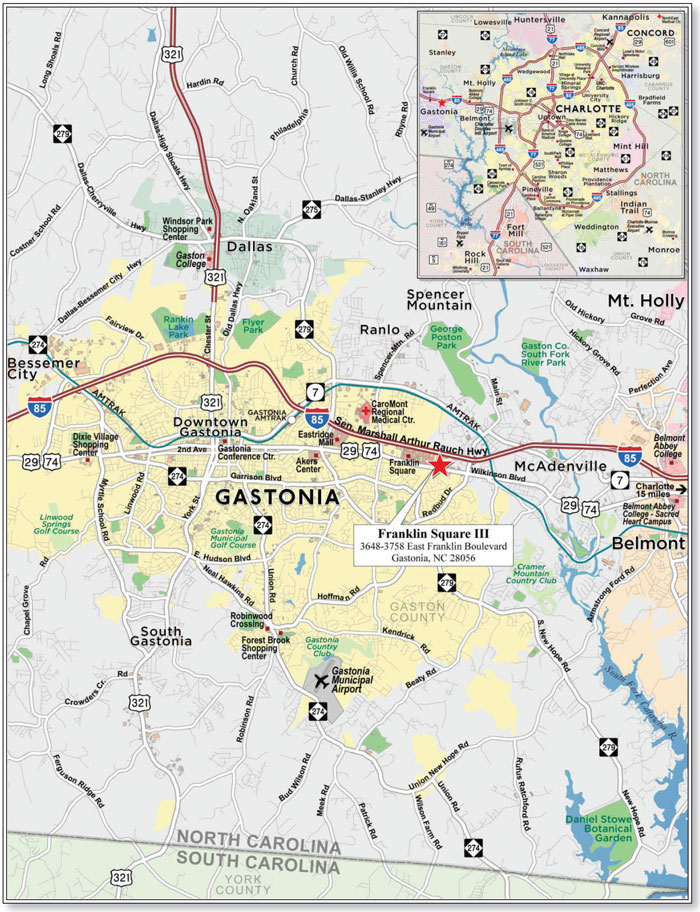
THE INFORMATION IN THIS STRUCTURAL AND COLLATERAL TERM SHEET IS NOT COMPLETE AND MAY BE AMENDED PRIOR TO THE TIME OF SALE. THIS TERM SHEET IS NOT AN OFFER TO SELL THESE SECURITIES AND IT IS NOT A SOLICITATION OF AN OFFER TO BUY THESE SECURITIES IN ANY JURISDICTION WHERE THE OFFER OR SALE IS NOT PERMITTED.
75
| No. 5 – Franklin Square III | |||||||
| Loan Information | Property Information | ||||||
| Mortgage Loan Seller: | Wells Fargo Bank, National Association | Single Asset/Portfolio: | Single Asset | ||||
| Credit Assessment (DBRS/Fitch/Moody’s): | NR/NR/NR | Property Type: | Retail | ||||
| Original Principal Balance: | $32,250,000 | Specific Property Type: | Anchored | ||||
| Cut-off Date Balance: | $32,210,163 | Location: | Gastonia, NC | ||||
| % of Initial Pool Balance: | 4.3% | Size: | 272,222 SF | ||||
| Loan Purpose: | Refinance | Cut-off Date Balance Per SF: | $118.32 | ||||
| Borrower Name: | Andrew Square85 LLC | Year Built/Renovated: | 1998/2004 | ||||
| Sponsors: | Amy Stevens; David Weinstein | Title Vesting: | Fee | ||||
| Mortgage Rate: | 4.850% | Property Manager: | Self-managed | ||||
| Note Date: | November 10, 2016 | 4thMost Recent Occupancy (As of): | 83.0% (12/31/2012) | ||||
| Anticipated Repayment Date: | NAP | 3rdMost Recent Occupancy (As of): | 98.0% (12/31/2013) | ||||
| Maturity Date: | November 11, 2023 | 2ndMost Recent Occupancy (As of): | 98.0% (12/31/2014) | ||||
| IO Period: | None | Most Recent Occupancy (As of): | 100.0% (12/31/2015) | ||||
| Loan Term (Original): | 84 months | Current Occupancy (As of): | 98.4% (11/8/2016) | ||||
| Seasoning: | 1 month | ||||||
| Amortization Term (Original): | 360 months | Underwriting and Financial Information: | |||||
| Loan Amortization Type: | Amortizing Balloon | ||||||
| Interest Accrual Method: | Actual/360 | 4thMost Recent NOI(2): | NAV | ||||
| Call Protection: | L(25),D(55),O(4) | 3rdMost Recent NOI (As of): | $2,924,801 (Annualized 6 12/31/2014) | ||||
| Lockbox Type: | Soft/Springing Cash Management | 2ndMost Recent NOI (As of): | $3,041,262 (12/31/2015) | ||||
| Additional Debt: | None | Most Recent NOI (As of): | $3,066,080 (TTM 8/31/2016) | ||||
| Additional Debt Type: | NAP | ||||||
| U/W Revenues: | $3,591,382 | ||||||
| U/W Expenses: | $659,315 | ||||||
| U/W NOI: | $2,932,067 | ||||||
| U/W NCF: | $2,717,471 | ||||||
| Escrows and Reserves(1): | U/W NOI DSCR: | 1.44x | |||||
| U/W NCF DSCR: | 1.33x | ||||||
| Type: | Initial | Monthly | Cap (If Any) | U/W NOI Debt Yield: | 9.1% | ||
| Taxes | $0 | $21,997 | NAP | U/W NCF Debt Yield: | 8.4% | ||
| Insurance | $0 | Springing | NAP | As-Is Appraised Value: | $43,000,000 | ||
| Replacement Reserves | $344,378 | Springing | $272,222 | As-Is Appraisal Valuation Date: | September 12, 2016 | ||
| TI/LC Reserve | $0 | $28,357 | $680,555 | Cut-off Date LTV Ratio: | 74.9% | ||
| Kohl’s TI/LC Reserve | $525,000 | $0 | NAP | LTV Ratio at Maturity or ARD: | 66.2% | ||
| (1) | See “Escrows” section. |
| (2) | See “Cash Flow Analysis” section. |
The Mortgage Loan. The mortgage loan (the “Franklin Square III Mortgage Loan”) is evidenced by a single promissory note that is secured by a first mortgage encumbering the fee interest in an anchored retail property located in Gastonia, North Carolina (the “Franklin Square III Property”). The Franklin Square III Mortgage Loan was originated on November 10, 2016 by Wells Fargo Bank, National Association. The Franklin Square III Mortgage Loan had an original principal balance of $32,250,000, has an outstanding principal balance as of the Cut-off Date of $32,210,163 and accrues interest at an interest rate of 4.850% per annum. The Franklin Square III Mortgage Loan had an initial term of 84 months, has a remaining term of 83 months as of the Cut-off Date and requires payments of principal and interest based on a 30-year amortization schedule through the term of the Franklin Square III Mortgage Loan. The Franklin Square III Mortgage Loan matures on November 11, 2023.
Following the lockout period, the borrower has the right to defease the Franklin Square III Mortgage Loan in whole, but not in part, on any date before August 11, 2023. In addition, the Franklin Square III Mortgage Loan is prepayable without penalty on or after August 11, 2023.
Sources and Uses
| Sources | Uses | |||||||
| Original loan amount | $32,250,000 | 100.0% | Loan payoff(1) | $29,547,085 | 91.6% | |||
| Reserves | 869,378 | 2.7 | ||||||
| Closing costs | 147,039 | 0.5 | ||||||
| Return of equity | 1,686,498 | 5.2 | ||||||
| Total Sources | $32,250,000 | 100.0% | Total Uses | $32,250,000 | 100.0% |
| (1) | The Franklin Square III Property was previously securitized in the WBCMT 2007-C32 transaction. |
THE INFORMATION IN THIS STRUCTURAL AND COLLATERAL TERM SHEET IS NOT COMPLETE AND MAY BE AMENDED PRIOR TO THE TIME OF SALE. THIS TERM SHEET IS NOT AN OFFER TO SELL THESE SECURITIES AND IT IS NOT A SOLICITATION OF AN OFFER TO BUY THESE SECURITIES IN ANY JURISDICTION WHERE THE OFFER OR SALE IS NOT PERMITTED.
76
FRANKLIN SQUARE III |
The Property.The Franklin Square III Property is a 272,222 square foot anchored retail power center situated on a 30.0-acre parcel of land and located on the north side of East Franklin Boulevard in Gastonia, North Carolina, approximately 16.4 miles west of the Charlotte central business district. Constructed in 1998 and renovated in 2004, the Franklin Square III Property is anchored by Kohl’s, Gander Mountain, PetSmart and Books-A-Million with additional major tenants including Dress Barn, Shoe Carnival, Old Navy, Party City, Lifeway Christian Stores, and Pier 1 Imports, among others. According to the appraisal, the Franklin Square III Property is located along East Franklin Boulevard in the heart of the region’s primary retail corridor. In addition to East Franklin Boulevard, the Franklin Square III Property abuts to Interstate 85 to the north. The Franklin Square III Property benefits from its proximity to these major roadways, which have a combined average daily vehicle count of approximately 142,000.
The Franklin Square III Property has maintained an average occupancy of 96.3% since 2007. In addition, 12 tenants at the Franklin Square III Property (including 9 of the 10 largest tenants) accounting for approximately 73.1% of the net rentable area, have been in occupancy since the center was originally constructed in 1998. As of November 8, 2016, the Franklin Square III Property was 98.4% occupied by 23 tenants.
The following table presents certain information relating to the tenancy at the Franklin Square III Property:
Major Tenants
| Tenant Name | Credit Rating (Fitch/Moody’s/ S&P)(1) | Tenant NRSF | % of NRSF | Annual U/W Base Rent PSF(2) | Annual U/W Base Rent(2) | % of Total Annual U/W Base Rent | Sales PSF(3) | Occupancy Cost(3) | Lease Expiration Date |
| Anchor Tenants | |||||||||
| Kohl’s | BBB/Baa2/BBB | 80,684 | 29.6% | $7.50 | $605,130 | 19.1% | $184 | 4.1% | 2/28/2029(4) |
| Gander Mountain | NR/NR/NR | 42,972 | 15.8% | $8.75 | $376,005 | 11.8% | NAP | NAP | 5/31/2028(5) |
| PetSmart | NR/B1/B+ | 26,040 | 9.6% | $10.50 | $273,420 | 8.6% | NAP | NAP | 1/31/2025(6) |
| Books-A-Million | NR/NR/NR | 20,000 | 7.3% | $11.00 | $220,000 | 6.9% | $132 | 9.8% | 1/31/2019(7) |
| Total Anchor Tenants | 169,696 | 62.3% | $8.69 | $1,474,555 | 46.4% | ||||
| Major Tenants | |||||||||
| Dress Barn | NR/Ba2/BB- | 9,000 | 3.3% | $20.54 | $184,860 | 5.8% | NAP | NAP | 1/31/2019(8) |
| Shoe Carnival | NR/NR/NR | 12,000 | 4.4% | $14.50 | $174,000 | 5.5% | $325 | 5.3% | 1/31/2019 |
| Old Navy | BB+/Baa2/BB+ | 15,000 | 5.5% | $11.25 | $168,750 | 5.3% | $311 | 4.5% | 7/31/2020 |
| Party City | NR/NR/NR | 11,970 | 4.4% | $12.50 | $149,625 | 4.7% | $248 | 6.5% | 8/15/2018 |
| Lifeway Christian Stores | NR/NR/NR | 7,300 | 2.7% | $19.00 | $138,700 | 4.4% | $220 | 10.3% | 11/30/2019 |
| Pier 1 Imports | NR/NR/B | 8,000 | 2.9% | $16.00 | $128,000 | 4.0% | NAP | NAP | 6/30/2018(9) |
| Total Major Tenants | 63,270 | 23.2% | $14.92 | $943,935 | 29.7% | ||||
| Non-Major Tenants | 34,776 | 12.8% | $21.76 | $756,594 | 23.8% | ||||
| Occupied Collateral Total | 267,742 | 98.4% | $11.86 | $3,175,084 | 100.0% | ||||
| Vacant Space | 4,480 | 1.6% | |||||||
| Collateral Total | 272,222 | 100.0% | |||||||
| (1) | Certain ratings are those of the parent company whether or not the parent guarantees the lease. |
| (2) | Annual U/W Base Rent PSF and Annual U/W Base Rent include contractual rent steps through August 2017 totaling $11,163. |
| (3) | Sales PSF and Occupancy Costs are for the period ending December 31, 2015. |
| (4) | Kohl’s has four, five-year lease extension options. |
| (5) | Gander Mountain has four, five-year lease extension options. |
| (6) | PetSmart has four, five-year lease extension options. |
| (7) | Books-A-Million has one, five-year lease extension option. |
| (8) | Dress Barn has one, five-year lease extension option. |
| (9) | Pier 1 Imports has one, five-year lease extension option. |
THE INFORMATION IN THIS STRUCTURAL AND COLLATERAL TERM SHEET IS NOT COMPLETE AND MAY BE AMENDED PRIOR TO THE TIME OF SALE. THIS TERM SHEET IS NOT AN OFFER TO SELL THESE SECURITIES AND IT IS NOT A SOLICITATION OF AN OFFER TO BUY THESE SECURITIES IN ANY JURISDICTION WHERE THE OFFER OR SALE IS NOT PERMITTED.
77
FRANKLIN SQUARE III |
The following table presents certain information relating to the historical sales and occupancy costs at the Franklin Square III Property:
Historical Sales (PSF) and Occupancy Costs(1)
| Tenant Name | 2013 | 2014 | 2015 | Current Occupancy Cost(2) |
| Kohl’s | $208 | $192 | $184 | 4.1% |
| Books-A-Million | $126 | $127 | $132 | 9.8% |
| Old Navy | NAV | $288 | $311 | 4.5% |
| Shoe Carnival | NAV | $327 | $325 | 5.3% |
| Party City | $209 | $228 | $248 | 6.5% |
| Lifeway Christian Stores | NAV | $222 | $220 | 10.3% |
| (1) | Historical Sales (PSF) and Occupancy Costs were provided by the borrower. Current Occupancy Cost is based on the most recent available Historical Sales. |
| (2) | Current Occupancy Costs are based on the Annual U/W Base Rent and reimbursements and historical sales. |
The following table presents certain information relating to the lease rollover schedule at the Franklin Square III Property:
Lease Expiration Schedule(1)(2)
| Year Ending December 31, | No. of Leases Expiring | Expiring NRSF | % of Total NRSF | Cumulative Expiring NRSF | Cumulative % of Total NRSF | Annual U/W Base Rent | % of Total Annual U/W Base Rent | Annual U/W Base Rent PSF(3) |
| MTM | 0 | 0 | 0.0% | 0 | 0.0% | $0 | 0.0% | $0.00 |
| 2016 | 0 | 0 | 0.0% | 0 | 0.0% | $0 | 0.0% | $0.00 |
| 2017 | 2 | 3,700 | 1.4% | 3,700 | 1.4% | $87,103 | 2.7% | $23.54 |
| 2018 | 6 | 31,250 | 11.5% | 34,950 | 12.8% | $525,383 | 16.5% | $16.81 |
| 2019 | 7 | 59,611 | 21.9% | 94,561 | 34.7% | $928,728 | 29.3% | $15.58 |
| 2020 | 3 | 18,000 | 6.6% | 112,561 | 41.3% | $262,932 | 8.3% | $14.61 |
| 2021 | 1 | 2,485 | 0.9% | 115,046 | 42.3% | $60,883 | 1.9% | $24.50 |
| 2022 | 1 | 3,000 | 1.1% | 118,046 | 43.4% | $55,500 | 1.7% | $18.50 |
| 2023 | 0 | 0 | 0.0% | 118,046 | 43.4% | $0 | 0.0% | $0.00 |
| Thereafter | 3 | 149,696 | 55.0% | 267,742 | 98.4% | $1,254,555 | 39.5% | $8.38 |
| Vacant | 0 | 4,480 | 1.6% | 272,222 | 100.0% | $0 | 0.0% | $0.00 |
| Total/Weighted Average | 23 | 272,222 | 100.0% | $3,175,084 | 100.0% | $11.86 |
| (1) | Information obtained from the underwritten rent roll. |
| (2) | Certain tenants may have lease termination options that are exercisable prior to the originally stated expiration date of the subject lease and that are not considered in the Lease Expiration Schedule. |
| (3) | Weighted Average Annual U/W Base Rent PSF excludes vacant space. |
The following table presents historical occupancy percentages at the Franklin Square III Property:
Historical Occupancy
12/31/2012(1) | 12/31/2013(1) | 12/31/2014(1) | 12/31/2015(1) | 11/8/2016(2) |
| 83.0% | 98.0% | 98.0% | 100.0% | 98.4% |
| (1) | Information obtained from the servicer of the previous loan securitized in WBCMT 2007-C32. |
| (2) | Information obtained from the underwritten rent roll. |
THE INFORMATION IN THIS STRUCTURAL AND COLLATERAL TERM SHEET IS NOT COMPLETE AND MAY BE AMENDED PRIOR TO THE TIME OF SALE. THIS TERM SHEET IS NOT AN OFFER TO SELL THESE SECURITIES AND IT IS NOT A SOLICITATION OF AN OFFER TO BUY THESE SECURITIES IN ANY JURISDICTION WHERE THE OFFER OR SALE IS NOT PERMITTED.
78
FRANKLIN SQUARE III |
Operating History and Underwritten Net Cash Flow. The following table presents certain information relating to the historical operating performance and the underwritten net cash flow at the Franklin Square III Property:
Cash Flow Analysis(1)
| Annualized 6 12/31/2014 | 2015 | TTM 8/31/2016 | U/W | % of U/W Effective Gross Income | U/W $ per SF | |
| Base Rent | $3,078,270 | $3,130,750 | $3,155,643 | $3,175,084(2) | 88.4% | $11.66(2) |
| Grossed Up Vacant Space | 0 | 0 | 0 | 85,120 | 2.4 | 0.31 |
| Total Reimbursables | 559,464 | 539,784 | 544,522 | 493,488 | 13.7 | 1.81 |
| Less Vacancy & Credit Loss | 0 | 0 | 0 | (162,311)(3) | (4.5) | (0.60) |
| Effective Gross Income | $3,637,734 | $3,670,534 | $3,700,165 | $3,591,382 | 100.0% | $13.19 |
| Total Operating Expenses | $712,933 | $629,272
| $634,085 | $659,315 | 18.4% | $2.42 |
| Net Operating Income | $2,924,801 | $3,041,262 | $3,066,080 | $2,932,067 | 81.6% | $10.77 |
| TI/LC | 0 | 0 | 0 | 160,151 | 4.5 | 0.59 |
| Capital Expenditures | 0 | 0 | 0 | 54,444 | 1.5 | 0.20 |
| Net Cash Flow | $2,924,801 | $3,041,262 | $3,066,080 | $2,717,471 | 75.7% | $9.98 |
| NOI DSCR | 1.43x | 1.49x | 1.50x | 1.44x | ||
| NCF DSCR | 1.43x | 1.49x | 1.50x | 1.33x | ||
| NOI DY | 9.1% | 9.4% | 9.5% | 9.1% | ||
| NCF DY | 9.1% | 9.4% | 9.5% | 8.4% |
| (1) | Historical operating statements prior to 2014 are not available because the sponsor purchased the Franklin Square III Property in June 2014 and such information was not provided by the seller. |
| (2) | Annual U/W Base Rent PSF and Annual U/W Base Rent include contractual rent steps through August 2017 totaling $11,163. |
| (3) | The underwritten economic vacancy is 5.0%. The Franklin Square III Property was 98.4% physically occupied as of November 8, 2016. |
Appraisal.As of the appraisal valuation date of September 12, 2016, the Franklin Square III Property had an “as-is” appraised value of $43,000,000.
Environmental Matters. According to a Phase I environmental site assessment dated September 22, 2016, there was no evidence of any recognized environmental conditions at the Franklin Square III Property.
Market Overview and Competition.The Franklin Square III Property is located in Gastonia, North Carolina, approximately 16.4 miles west of the Charlotte central business district. The Franklin Square III Property has excellent visibility and direct access from both East Franklin Boulevard and Interstate 85, the major east/west thoroughfares in the region with a traffic count of approximately 118,000 vehicles per day. The Franklin Square III Property is one in a series of anchored retail power centers located along East Franklin Boulevard, which include national retailers such as Regal Cinemas, Ashley Furniture, hhgregg, Sam’s Club, Lowe’s, Best Buy, Walmart Supercenter, Home Depot, Dick’s Sporting Goods, and Target.
According to the appraisal, the Franklin Square III Property has a trade area that encompasses a five-mile radius. The 2015 population within a three- and five-mile radius were reported at approximately 44,598 and 99,985, respectively, and the average household income within the same radii were reported at approximately $58,278 and $58,259, respectively. The population is expected to grow 0.8% and 0.7% within the same three- and five-mile radius from 2015 to 2020.
The appraiser estimated market rent for the Franklin Square III Property to be $11.96 per square foot on a triple net basis, compared to the Annual U/W Base Rent PSF of $11.86 per square foot. According to a third party market research report, the Franklin Square III Property is located in the Gaston County retail submarket, which as of the second quarter of 2016, had a total inventory of 12.5 million square feet and exhibits an average vacancy of 6.1%.
THE INFORMATION IN THIS STRUCTURAL AND COLLATERAL TERM SHEET IS NOT COMPLETE AND MAY BE AMENDED PRIOR TO THE TIME OF SALE. THIS TERM SHEET IS NOT AN OFFER TO SELL THESE SECURITIES AND IT IS NOT A SOLICITATION OF AN OFFER TO BUY THESE SECURITIES IN ANY JURISDICTION WHERE THE OFFER OR SALE IS NOT PERMITTED.
79
FRANKLIN SQUARE III |
The following table presents certain information relating to properties that are comparable to the Franklin Square III Property:
Competitive Set(1)
Franklin Square III (Subject) | The Shops at Franklin Square | Franklin Square II | Gaston Mall | Akers Center | |
| Location | Gastonia, NC | Gastonia, NC | Gastonia, NC | Gastonia, NC | Gastonia, NC |
| Distance from Subject | -- | 0.0 miles | 0.1 miles | 1.1 miles | 2.2 miles |
| Property Type | Anchored | Community Center | Power Center | Power Center | Power Center |
| Year Built/Renovated | 1998/2004 | 2006 | 1989 | 1970/2008 | 1954/2015 |
| Anchors | Kohl’s, Gander Mountain, PetSmart, Books-A-Million | Ashley Furniture, hhgregg | Best Buy, Ross Dress For Less, Dollar Tree, Pep Boys, Michaels, Walmart | Target, Dick’s Sporting Goods, TJ Maxx, Mary Jo’s Cloth Store, Ulta, Bed, Bath & Beyond | Gabe’s, Conn’s HomePlus, Ollie’s Bargain Outlet |
| Total GLA | 272,222 SF | 134,299 SF | 317,705 SF | 346,603 SF | 336,974 SF |
| Total Occupancy | 98.4% | 100.0% | 85.0% | 100.0% | 60.0% |
| (1) | Information obtained from the appraisal and underwritten rent roll. |
The Borrower.The borrower is Andrew Square85 LLC, a Delaware limited liability company and single purpose entity with one independent director. Andrew Square85 LLC is 20% owned by DNA Franklin LLC, which is 100% owned by DNA Helix LLC. DNA Helix LLC is 50% owned by Amy Stevens and 50% owned by David Weinstein. Legal counsel to the borrower delivered a non-consolidation opinion in connection with the origination of the Franklin Square III Mortgage Loan. Amy Stevens and David Weinstein are the guarantors of certain nonrecourse carveouts under the Franklin Square III Mortgage Loan.
The Sponsor.The sponsors are Amy Stevens and David Weinstein, who founded DNA Partners in 2002 to acquire and manage commercial real estate in select markets with strong demographics and economic drivers. Ms. Stevens has over 25 years of experience in commercial real estate as an owner, asset manager, lender, and mortgage broker, and currently oversees the leasing of all properties within DNA Partners’ portfolio. Mr. Weinstein has over 10 years of experience in commercial real estate and oversees the financial and property management of all properties within DNA Partners’ portfolio. Ms. Stevens and Mr. Weinstein are actively involved in all aspects of acquisition, disposition, and property management of the DNA Partners’ portfolio.
Escrows.The loan documents provide for an upfront escrow at closing in the amount of $344,378 for replacement reserves and $525,000 for future tenant improvements related to Kohl’s.
The loan documents provide for ongoing monthly escrows of $21,997 for taxes, $28,357 for tenant improvements and leasing commissions (capped at $680,555), and $4,537 for replacement reserves (capped at $272,222). However, the loan documents do not require ongoing monthly escrows for replacement reserves as long as (i) the replacement reserves on deposit are greater than the cap of $272,222, (ii) no event of default has occurred and is continuing, and (iii) the Franklin Square III Property is being adequately maintained as determined by the lender based on annual site inspections. The loan documents do not require ongoing monthly escrows for insurance premiums as long as (i) no event of default has occurred and is continuing and (ii) borrower provides the lender with evidence that the Franklin Square III Property is insured via an acceptable blanket insurance policy and such policy is in full force and effect.
Lockbox and Cash Management.The Franklin Square III Mortgage Loan requires a lender-controlled lockbox account, which is already in place, and that the borrower deposits all rents directly into such lockbox account within three business days of receipt. Prior to the occurrence of a Cash Trap Event Period (as defined below), all cash flow is distributed to the borrower. During a Cash Trap Event Period, all cash flow is swept to a lender-controlled cash management account.
A “Cash Trap Event Period” means the occurrence of (i) an event of default; (ii) the debt service coverage ratio falling below 1.15x at the end of any calendar month; or (iii) Kohl’s or Gander Mountain defaulting on its respective lease, going dark, vacating, or entering into bankruptcy or similar insolvency proceedings. A Cash Trap Event Period will end, with respect to clause (i), upon the cure of such event of default; with respect to clause (ii), upon the debt service coverage ratio being equal to or greater than 1.25x for two consecutive calendar quarters; and with respect to clause (iii), upon the cure of such default and no other default under Kohl’s or Gander Mountain’s respective lease occuring for two consecutive calendar quarters, any bankruptcy proceedings related to Kohl’s or Gander Mountain being terminated, or the respective spaces being re-tenanted and leased to one or more replacement tenants reasonably acceptable to the lender who are in occupancy and paying full unabated rent.
Property Management. The Franklin Square III Property is managed by an affiliate of the borrower.
Assumption.The borrower has the right to transfer the Franklin Square III Property provided that certain conditions are satisfied, including (i) no event of default has occurred and is continuing; (ii) the lender reasonably determines that the proposed transferee and guarantor satisfy the lender’s credit review and underwriting standards, taking into consideration the transferee’s experience, financial strength and general business standing; and (iii) if required by the lender, the lender has received confirmation from DBRS, Fitch and Moody’s that such assumption will not result in a downgrade, withdrawal or qualification of the respective ratings assigned to the Series 2016-C37 certificates.
Partial Release. Not permitted.
Real Estate Substitution.Not permitted.
THE INFORMATION IN THIS STRUCTURAL AND COLLATERAL TERM SHEET IS NOT COMPLETE AND MAY BE AMENDED PRIOR TO THE TIME OF SALE. THIS TERM SHEET IS NOT AN OFFER TO SELL THESE SECURITIES AND IT IS NOT A SOLICITATION OF AN OFFER TO BUY THESE SECURITIES IN ANY JURISDICTION WHERE THE OFFER OR SALE IS NOT PERMITTED.
80
FRANKLIN SQUARE III |
Subordinate and Mezzanine Indebtedness.Not permitted.
Ground Lease. None.
Terrorism Insurance.The loan documents require that the “all risk” insurance policy required to be maintained by the borrower provide coverage for terrorism in an amount equal to the full replacement cost of the Franklin Square III Property, as well as business interruption insurance covering no less than an amount equal to 100% of the projected gross income from the Franklin Square III Property on an actual loss sustained basis for a period beginning on the date of business interruption and continuing until the restoration of the Franklin Square III Property is completed, or the 18-month period following the occurrence of a casualty event, together with a six-month extended period of indemnity.
THE INFORMATION IN THIS STRUCTURAL AND COLLATERAL TERM SHEET IS NOT COMPLETE AND MAY BE AMENDED PRIOR TO THE TIME OF SALE. THIS TERM SHEET IS NOT AN OFFER TO SELL THESE SECURITIES AND IT IS NOT A SOLICITATION OF AN OFFER TO BUY THESE SECURITIES IN ANY JURISDICTION WHERE THE OFFER OR SALE IS NOT PERMITTED.
81
(THIS PAGE INTENTIONALLY LEFT BLANK)
THE INFORMATION IN THIS STRUCTURAL AND COLLATERAL TERM SHEET IS NOT COMPLETE AND MAY BE AMENDED PRIOR TO THE TIME OF SALE. THIS TERM SHEET IS NOT AN OFFER TO SELL THESE SECURITIES AND IT IS NOT A SOLICITATION OF AN OFFER TO BUY THESE SECURITIES IN ANY JURISDICTION WHERE THE OFFER OR SALE IS NOT PERMITTED.
82
1140 AVENUE OF THE AMERICAS

THE INFORMATION IN THIS STRUCTURAL AND COLLATERAL TERM SHEET IS NOT COMPLETE AND MAY BE AMENDED PRIOR TO THE TIME OF SALE. THIS TERM SHEET IS NOT AN OFFER TO SELL THESE SECURITIES AND IT IS NOT A SOLICITATION OF AN OFFER TO BUY THESE SECURITIES IN ANY JURISDICTION WHERE THE OFFER OR SALE IS NOT PERMITTED.
83
1140 AVENUE OF THE AMERICAS
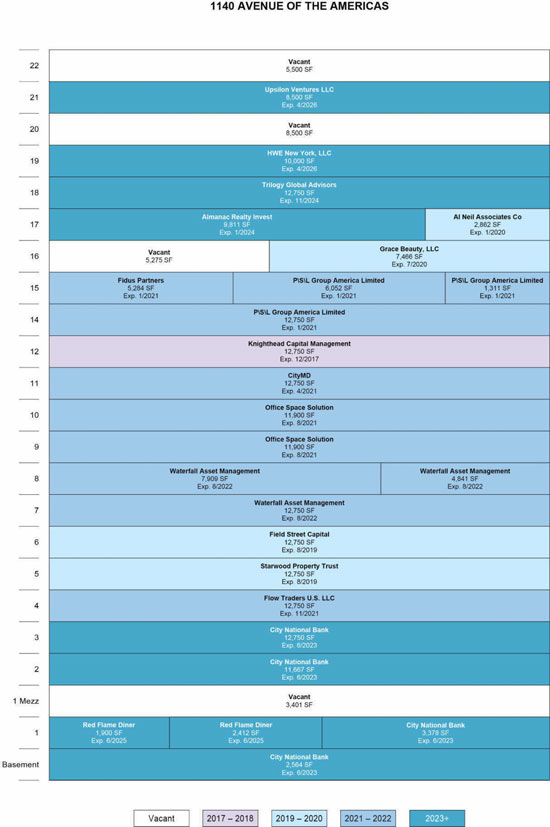
THE INFORMATION IN THIS STRUCTURAL AND COLLATERAL TERM SHEET IS NOT COMPLETE AND MAY BE AMENDED PRIOR TO THE TIME OF SALE. THIS TERM SHEET IS NOT AN OFFER TO SELL THESE SECURITIES AND IT IS NOT A SOLICITATION OF AN OFFER TO BUY THESE SECURITIES IN ANY JURISDICTION WHERE THE OFFER OR SALE IS NOT PERMITTED.
84
1140 AVENUE OF THE AMERICAS
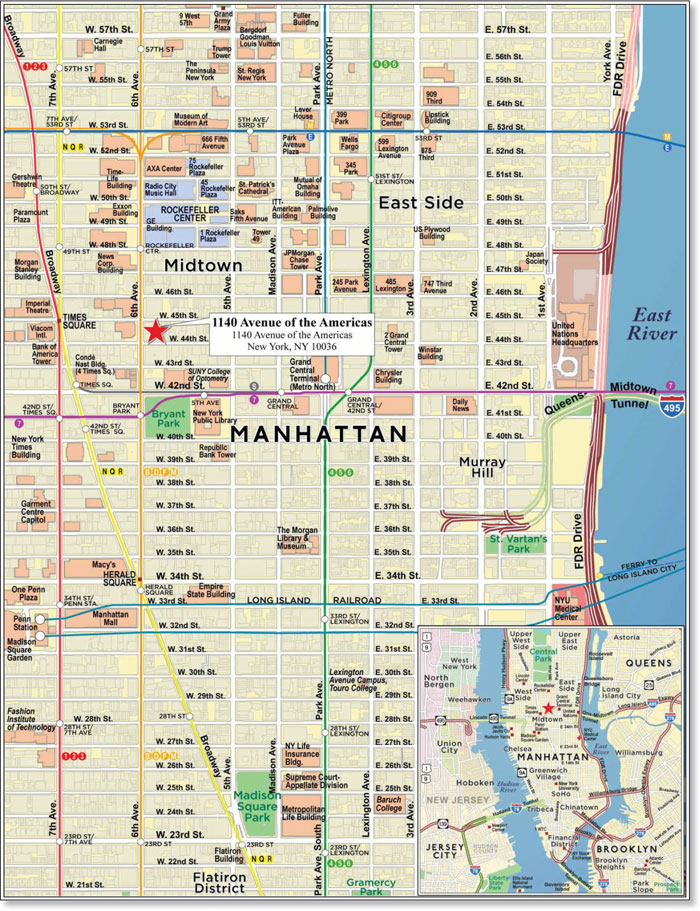
THE INFORMATION IN THIS STRUCTURAL AND COLLATERAL TERM SHEET IS NOT COMPLETE AND MAY BE AMENDED PRIOR TO THE TIME OF SALE. THIS TERM SHEET IS NOT AN OFFER TO SELL THESE SECURITIES AND IT IS NOT A SOLICITATION OF AN OFFER TO BUY THESE SECURITIES IN ANY JURISDICTION WHERE THE OFFER OR SALE IS NOT PERMITTED.
85
| No. 6 – 1140 Avenue of the Americas | |||||||
| Loan Information | Property Information | ||||||
| Mortgage Loan Seller: | Ladder Capital Finance LLC | Single Asset/Portfolio: | Single Asset | ||||
| Credit Assessment (DBRS/Fitch/Moody’s): | NR/NR/NR | Property Type: | Office | ||||
| Original Principal Balance(1): | $30,000,000 | Specific Property Type: | CBD | ||||
| Cut-off Date Balance(1): | $30,000,000 | Location: | New York, NY | ||||
| % of Initial Pool Balance: | 4.0% | Size: | 247,183 SF | ||||
| Loan Purpose: | Acquisition | Cut-off Date Balance Per SF(1): | $400.51 | ||||
| Borrower Name: | ARC NYC1140SIXTH, LLC | Year Built/Renovated: | 1926/2015 | ||||
| Sponsor: | American Realty Capital New York City REIT, Inc. | Title Vesting: | Leasehold | ||||
| Mortgage Rate: | 4.109% | Property Manager: | CBRE, Inc. | ||||
| Note Date: | June 15, 2016 | 4thMost Recent Occupancy (As of)(3): | 53.9% (12/31/2013) | ||||
| Anticipated Repayment Date: | NAP | 3rdMost Recent Occupancy (As of)(3): | 82.3% (12/31/2014) | ||||
| Maturity Date: | July 6, 2026 | 2ndMost Recent Occupancy (As of)(3): | 90.1% (12/31/2015) | ||||
| IO Period: | 120 months | Most Recent Occupancy (As of)(3): | 92.1% (3/31/2016) | ||||
| Loan Term (Original): | 120 months | Current Occupancy (As of)(3): | 90.8% (6/8/2016) | ||||
| Seasoning: | 5 months | ||||||
| Amortization Term (Original): | NAP | Underwriting and Financial Information: | |||||
| Loan Amortization Type: | Interest-only, Balloon | ||||||
| Interest Accrual Method: | Actual/360 | 4thMost Recent NOI (As of)(4): | $5,713,542 (12/31/2013) | ||||
| Call Protection: | L(24),GRTR1% or YM(92),O(4) | 3rdMost Recent NOI (As of)(4): | $10,868,784 (12/31/2014) | ||||
| Lockbox Type: | Hard/Upfront Cash Management | 2ndMost Recent NOI (As of)(4): | $13,011,926 (12/31/2015) | ||||
| Additional Debt(1): | Yes | Most Recent NOI (As of)(4): | $13,948,046 (TTM 3/31/2016) | ||||
| Additional Debt Type(1): | Pari Passu | ||||||
| U/W Revenues: | $20,833,881 | ||||||
| U/W Expenses: | $11,323,332 | ||||||
| U/W NOI(4): | $9,510,549 | ||||||
| Escrows and Reserves(2): | U/W NCF(4): | $8,893,069 | |||||
| U/W NOI DSCR(1): | 2.31x | ||||||
| Type: | Initial | Monthly | Cap (If Any) | U/W NCF DSCR(1): | 2.16x | ||
| Taxes | $342,123 | $171,061 | NAP | U/W NOI Debt Yield(1): | 9.6% | ||
| Insurance | $0 | Springing | NAP | U/W NCF Debt Yield(1): | 9.0% | ||
| Replacement Reserve | $0 | Springing | NAP | As-Is Appraised Value: | $180,000,000 | ||
| TI/LC Reserve | $961,116 | Springing | NAP | As-Is Appraisal Valuation Date: | May 1, 2016 | ||
| Ground Rent Reserve | $116,016 | $29,004 | NAP | Cut-off Date LTV Ratio(1): | 55.0% | ||
| Free Rent Reserve | $712,266 | $0 | NAP | LTV Ratio at Maturity or ARD(1): | 55.0% | ||
| (1) | See “The Mortgage Loan” section. All statistical information related to balances per square foot, loan-to-value ratios, debt service coverage ratios and debt yields are based on the 1140 Avenue of the Americas Whole Loan. |
| (2) | See “Escrows” section. |
| (3) | See “Historical Occupancy” section. |
| (4) | See “Cash Flow Analysis” section. |
The Mortgage Loan.The mortgage loan (the “1140 Avenue of the Americas Mortgage Loan”) is part of a whole loan (the “1140 Avenue of the Americas Whole Loan”) that is evidenced by fourpari passu promissory notes (Notes A-1, A-2, A-3, and A-4) and secured by a first mortgage encumbering the leasehold interest in an office building located in New York, New York (the “1140 Avenue of the Americas Property”). The 1140 Avenue of the Americas Whole Loan was originated on June 15, 2016 by Ladder Capital Finance I LLC and Series TRS of Ladder Capital Finance I LLC. The 1140 Avenue of the Americas Whole Loan had an original principal balance of $99,000,000, has an outstanding principal balance as of the Cut-off Date of $99,000,000 and accrues interest at an interest rate of 4.109%per annum. The 1140 Avenue of the Americas Whole Loan had an initial term of 120 months, has a remaining term of 115 months as of the Cut-off Date and requires interest-only payments through the term of the 1140 Avenue of the Americas Whole Loan. The 1140 Avenue of the Americas Whole Loan matures on July 6, 2026.
The 1140 Avenue of the Americas Mortgage Loan, evidenced by the controlling Note A-1, which will be contributed to the WFCM 2016-C37 Trust, had an original principal balance of $30,000,000 and has an outstanding principal balance as of the Cut-off Date of $30,000,000. The non-controlling Note A-3 and non-controlling Note A-4, were contributed to the WFCM 2016-LC24 Trust and had an aggregate original principal balance of $45,000,000. The non-controlling Note A-2, which is expected to be contributed to the JPMCC 2016-JP4 Trust, had an original principal balance of $24,000,000. See“Description of the Mortgage Pool—The Whole Loans—The Serviced Whole Loans—The 1140 Avenue of the Americas Whole Loan” in the Preliminary Prospectus.
THE INFORMATION IN THIS STRUCTURAL AND COLLATERAL TERM SHEET IS NOT COMPLETE AND MAY BE AMENDED PRIOR TO THE TIME OF SALE. THIS TERM SHEET IS NOT AN OFFER TO SELL THESE SECURITIES AND IT IS NOT A SOLICITATION OF AN OFFER TO BUY THESE SECURITIES IN ANY JURISDICTION WHERE THE OFFER OR SALE IS NOT PERMITTED.
86
1140 AVENUE OF THE AMERICAS
Pari Passu Note Summary
| Notes | Original Balance | Note Holder | Controlling Piece | |
| Note A-1 | $30,000,000 | WFCM 2016-C37 | Yes | |
| Note A-2 | $24,000,000 | JPMCC 2016-JP4 | No | |
| Note A-3 | $25,000,000 | WFCM 2016-LC24 | No | |
| Note A-4 | $20,000,000 | WFCM 2016-LC24 | No | |
| Total | $99,000,000 |
Following the lockout period, the borrower has the right to prepay the 1140 Avenue of Americas Whole Loan in whole, but not in part, subject to payment of the greater of (i) a 1% prepayment premium or (ii) a yield maintenance premium, in each case based on the amount of principal balance being prepaid, on any date before April 6, 2026. In addition, the 1140 Avenue of the Americas Whole Loan is prepayable without penalty on or after April 6, 2026.
Sources and Uses
| Sources | Uses | |||||||
| Original whole loan amount | $99,000,000 | 52.5% | Purchase price | $180,000,000 | 95.4% | |||
| Sponsor’s new cash contribution | 88,177,366 | 46.7 | Reserves | 2,131,521 | 1.1 | |||
| Seller credits(1) | 1,485,544 | 0.8 | Closing costs | 6,531,388 | 3.5 | |||
| Total Sources | $188,662,909 | 100.0% | Total Uses | $188,662,909 | 100.0% |
| (1) | The seller provided credits of approximately $1.5 million for outstanding free rent and tenant improvements which were reserved at closing. |
The Property.The 1140 Avenue of the Americas Property is a 22-story class A, office building located in New York, New York. Constructed in 1926 and most recently renovated in 2015, the 1140 Avenue of the Americas Property is located at the northeastern corner of West 44th Street and Avenue of the Americas. The 1140 Avenue of the Americas Property totals 247,183 square feet and is comprised of 236,929 square feet of office space (95.9% of the net rentable area), 5,790 square feet of retail space (2.3% of the net rentable area) and 4,464 square feet of storage space (1.8% of the net rentable area). Office floor plates at the 1140 Avenue of the Americas Property average 11,242 square feet. The 1140 Avenue of the Americas Property has approximately 75 feet of frontage along Avenue of the Americas and 125 feet of frontage along West 44th Street. The 1140 Avenue of the Americas Mortgage Loan constitutes acquisition financing, and the seller thereof acquired the 1140 Avenue of the Americas Property after purchasing a note secured thereby following default on that note during the renovation of the 1140 Avenue of the Americas Property in 2011. For additional information, see“Description of the Mortgage Pool—Loan Purpose; Default History, Bankruptcy Issues and Other Proceedings” in the Preliminary Prospectus.
The 1140 Avenue of the Americas Property is leased to tenants in the financial and professional services industries and the largest tenants include City National Bank (12.3% of net rentable area; rated AA-, A3 and A+ by Fitch, Moody’s and S&P, respectively), Waterfall Asset Management (10.3% of net rentable area) and Office Space Solution (9.6% of net rentable area). Other office tenants at the 1140 Avenue of the Americas Property include Starwood Property Trust (5.2% of net rentable area), Knighthead Capital Management (5.2% of net rentable area), Flow Traders U.S. LLC (5.2% of net rentable area) and Field Street Capital (5.2% of net rentable area).
The 1140 Avenue of the Americas Property has undergone an extensive renovation, completed in 2015, including replacing the exterior of the building with an aluminum and glass curtain wall façade and providing floor-to-ceiling windows and enhanced sun exposure in tenant spaces. According to the seller of the 1140 Avenue of the Americas Property, $85.0 million ($343.87 per square foot) has been invested in renovations, tenant improvements and leasing costs at the 1140 Avenue of the Americas Property since 2007, with over $39.9 million ($161.42 per square foot) invested since 2011. As of June 8, 2016, the 1140 Avenue of the Americas Property was 90.8% occupied by 17 tenants.
THE INFORMATION IN THIS STRUCTURAL AND COLLATERAL TERM SHEET IS NOT COMPLETE AND MAY BE AMENDED PRIOR TO THE TIME OF SALE. THIS TERM SHEET IS NOT AN OFFER TO SELL THESE SECURITIES AND IT IS NOT A SOLICITATION OF AN OFFER TO BUY THESE SECURITIES IN ANY JURISDICTION WHERE THE OFFER OR SALE IS NOT PERMITTED.
87
1140 AVENUE OF THE AMERICAS
The following table presents certain information relating to the tenancy at the 1140 Avenue of the Americas Property:
Major Tenants
| Tenant Name | Credit Rating (Fitch/Moody’s /S&P)(1) | Tenant NRSF | % of NRSF | Annual U/W Base Rent PSF(2) | Annual U/W Base Rent(2) | % of Total Annual U/W Base Rent | Lease Expiration Date |
| Major Tenants | |||||||
| City National Bank | AA-/A3/A+ | 30,359 | 12.3% | $122.54(3) | $3,720,105 | 19.0% | 6/30/2023(4) |
| Waterfall Asset Management(5) | NR/NR/NR | 25,500 | 10.3% | $79.65 | $2,031,135 | 10.4% | 8/31/2022(6) |
| P\S\L Group America Limited | NR/NR/NR | 20,113 | 8.1% | $82.94 | $1,668,155 | 8.5% | 1/31/2021(7) |
| Office Space Solution | NR/NR/NR | 23,800 | 9.6% | $57.38 | $1,365,644 | 7.0% | 8/31/2021(8) |
| Trilogy Global Advisors | NR/NR/NR | 12,750 | 5.2% | $84.00 | $1,071,000 | 5.5% | 11/30/2024(9) |
| Total Major Tenants | 112,522 | 45.5% | $87.59 | $9,856,039 | 50.5% | ||
| Non-Major Tenants | 111,985 | 45.3% | $86.38 | $9,672,718 | 49.5% | ||
| Occupied Collateral Total | 224,507 | 90.8% | $86.99 | $19,528,757 | 100.0% | ||
| Vacant Space | 22,676 | 9.2% | |||||
| Collateral Total | 247,183 | 100.0% | |||||
| (1) | Certain ratings are those of the parent company whether or not the parent guarantees the lease. |
| (2) | Annual U/W Base Rent PSF and Annual U/W Base Rent include contractual rent steps through May 1, 2017, totaling $758,916. |
| (3) | City National Bank occupies 24,417 square feet of office space, for which they pay $75.00 per square foot in Annual U/W Base Rent, 3,378 square feet of retail space, for which they pay $525.00 per square foot in Annual U/W Base Rent, and 2,564 square feet of storage space, for which they pay $45.00 per square foot in Annual U/W Base Rent. |
| (4) | City National Bank has two, five-year lease renewal options. |
| (5) | Waterfall Asset Management recently executed a lease for an additional 7,909 square feet that is currently occupied by TriOptima North America. TriOptima North America is to occupy this space until their lease expires on April 30, 2017 and Waterfall Asset Management is expected to take occupancy and commence rental payments on May 1, 2017. The additional space is included in Waterfall Asset Management’s underwritten NRSF. |
| (6) | Waterfall Asset Management has one, five-year lease renewal option. |
| (7) | P\S\L Group America Limited has one, five-year lease renewal option. |
| (8) | Office Space Solution has one, five-year lease renewal option. |
| (9) | Trilogy Global Advisors has one, five-year lease renewal option. |
The following table presents certain information relating to the lease rollover schedule at the 1140 Avenue of the Americas Property:
Lease Expiration Schedule(1)(2)
| Year Ending December 31, | No. of Leases Expiring | Expiring NRSF | % of Total NRSF | Cumulative Expiring NRSF | Cumulative % of Total NRSF | Annual U/W Base Rent | % of Annual U/W Base Rent | Annual U/W Base Rent PSF(3) |
| MTM | 0 | 0 | 0.0% | 0 | 0.0% | $0 | 0.0% | $0.00 |
| 2016 | 0 | 0 | 0.0% | 0 | 0.0% | $0 | 0.0% | $0.00 |
| 2017 | 1 | 12,750 | 5.2% | 12,750 | 5.2% | $1,211,250 | 6.2% | $95.00 |
| 2018 | 0 | 0 | 0.0% | 12,750 | 5.2% | $0 | 0.0% | $0.00 |
| 2019 | 2 | 25,500 | 10.3% | 38,250 | 15.5% | $1,969,875 | 10.1% | $77.25 |
| 2020 | 2 | 10,328 | 4.2% | 48,578 | 19.7% | $869,443 | 4.5% | $84.18 |
| 2021 | 5 | 74,697 | 30.2% | 123,275 | 49.9% | $5,401,447 | 27.7% | $72.31 |
| 2022 | 1 | 25,500 | 10.3% | 148,775 | 60.2% | $2,031,135 | 10.4% | $79.65 |
| 2023 | 1 | 30,359 | 12.3% | 179,134 | 72.5% | $3,720,105 | 19.0% | $122.54 |
| 2024 | 2 | 22,561 | 9.1% | 201,695 | 81.6% | $1,875,502 | 9.6% | $83.13 |
| 2025 | 1 | 4,312 | 1.7% | 206,007 | 83.3% | $510,000 | 2.6% | $118.27 |
| 2026 | 2 | 18,500 | 7.5% | 224,507 | 90.8% | $1,940,000 | 9.9% | $104.86 |
| Thereafter | 0 | 0 | 0.0% | 224,507 | 90.8% | $0 | 0.0% | $0.00 |
| Vacant | 0 | 22,676 | 9.2% | 247,183 | 100.0% | $0 | 0.0% | $0.00 |
| Total/Weighted Average | 17 | 247,183 | 100.0% | $19,528,757 | 100.0% | $86.99 |
| (1) | Information obtained from the underwritten rent roll. |
| (2) | Certain tenants may have lease termination or contraction options that are exercisable prior to the originally stated expiration date of the subject lease and that are not considered in the Lease Expiration Schedule. |
| (3) | Weighted Average Annual U/W Base Rent PSF excludes vacant space. |
THE INFORMATION IN THIS STRUCTURAL AND COLLATERAL TERM SHEET IS NOT COMPLETE AND MAY BE AMENDED PRIOR TO THE TIME OF SALE. THIS TERM SHEET IS NOT AN OFFER TO SELL THESE SECURITIES AND IT IS NOT A SOLICITATION OF AN OFFER TO BUY THESE SECURITIES IN ANY JURISDICTION WHERE THE OFFER OR SALE IS NOT PERMITTED.
88
1140 AVENUE OF THE AMERICAS
The following table presents historical occupancy percentages at the 1140 Avenue of the Americas Property:
Historical Occupancy
12/31/2013(1)(2) | 12/31/2014(1)(2) | 12/31/2015(1)(2) | 3/31/2016(1) | 6/08/2016(3) |
| 53.9% | 82.3% | 90.1% | 92.1% | 90.8% |
| (1) | Information obtained from the borrower. |
| (2) | Occupancy increased from 2013 to 2015 due to tenants representing approximately 75.0% of the net rentable area executing leases since the repositioning of the 1140 Avenue of the Americas Property in 2012. |
| (3) | Information obtained from the underwritten rent roll. |
Operating History and Underwritten Net Cash Flow. The following table presents certain information relating to the historical operating performance and the underwritten net cash flow at the 1140 Avenue of the Americas Property:
Cash Flow Analysis
| 2013(1) | 2014(1) | 2015(1) | TTM 3/31/2016(2) | U/W(2) | % of U/W Effective Gross Income | U/W $ per SF | |||||||
| Base Rent | $10,572,440 | $16,494,082 | $18,732,841 | $19,210,125 | $19,528,757(3) | 93.7% | $79.01(3) | ||||||
| Grossed Up Vacant Space | 0 | 0 | 0 | 0 | 2,137,460 | 10.3 | 8.65 | ||||||
| Total Reimbursables | (48,910) | 52,675 | 354,068 | 435,992 | 754,179 | 3.6 | 3.05 | ||||||
| Other Income | 202,726 | 439,581 | 498,390 | 550,946 | 550,946 | 2.6 | 2.23 | ||||||
| Less Vacancy & Credit Loss | 0 | 0 | 0 | 0 | (2,137,460)(4) | (10.3) | (8.65) | ||||||
| Effective Gross Income | $10,726,256 | $16,986,338 | $19,585,299 | $20,197,064 | $20,833,881 | 100.0% | $84.29 | ||||||
| Total Operating Expenses | $5,012,714 | $6,117,554 | $6,573,373 | $6,249,017 | $11,323,332 | 54.4% | $45.81 | ||||||
| Net Operating Income | $5,713,542 | $10,868,784 | $13,011,926 | $13,948,046 | $9,510,549 | 45.6% | $38.48 | ||||||
| TI/LC | 0 | 0 | 0 | 0 | 555,684 | 2.7 | 2.25 | ||||||
| Capital Expenditures | 0 | 0 | 0 | 0 | 61,796 | 0.3 | 0.25 | ||||||
| Net Cash Flow | $5,713,542 | $10,868,784 | $13,011,926 | $13,948,046 | $8,893,069 | 42.7% | $35.98 | ||||||
| NOI DSCR(5) | 1.39x | 2.64x | 3.15x | 3.38x | 2.31x | ||||||||
| NCF DSCR(5) | 1.39x | 2.64x | 3.15x | 3.38x | 2.16x | ||||||||
| NOI DY(5) | 5.8% | 11.0% | 13.1% | 14.1% | 9.6% | ||||||||
| NCF DY(5) | 5.8% | 11.0% | 13.1% | 14.1% | 9.0% |
| (1) | Net Operating Income increased from 2013 to 2014 to 2015 due to tenants representing approximately 75.0% of the net rentable area executing leases since the repositioning of the 1140 Avenue of the Americas Property in 2012. |
| (2) | The decrease in Net Operating Income from TTM 3/31/2016 to U/W is primarily due to the U/W ground rent increasing. The current annual ground rent of $348,047 increases to $4,746,094 on January 1, 2017 which was underwritten. |
| (3) | U/W Base Rent includes contractual rent steps through May 1, 2017, totaling $758,916. |
| (4) | The underwritten economic vacancy is 9.5%. The 1140 Avenue of the Americas Property was 90.8% physically occupied as of June 8, 2016. |
| (5) | Debt service coverage ratios and debt yields are based on the 1140 Avenue of the Americas Whole Loan. |
Appraisal.As of the appraisal valuation date of May 1, 2016, the 1140 Avenue of the Americas Property had an “as-is” appraised value of $180,000,000.
Environmental Matters. According to a Phase I environmental site assessment dated March 25, 2016 there was no evidence of any recognized environmental conditions at the 1140 Avenue of the Americas Property.
Market Overview and Competition.The 1140 Avenue of the Americas Property is located in the Midtown Manhattan market within the Sixth Avenue/Rockefeller Center office submarket in New York City. The 1140 Avenue of the Americas Property is directly accessible by the A/C/E, B/D/F/M, N/Q/R, 1/2/3, 4/5/6, and 7 subway lines. New York City is the home to the headquarters of 48 companies on the 2015 Fortune 500 list and the two largest stock exchanges in the world. According to the appraisal, New York City has created more jobs over the past five years than during any five-year period in the last half century. According to the appraisal, as of the first quarter of 2016, Sixth Avenue/Rockefeller Center office inventory was comprised of approximately 40.3 million square feet, the largest submarket of primary office inventory in the country. As of the same quarter, Class A office inventory within the Sixth Avenue/Rockefeller Center office submarket was comprised of approximately 38.3 million square feet with a vacancy rate of 5.9%. As of first quarter 2016, the Class A Sixth Avenue/Rockefeller Center office submarket rental rates were $96.71 per square foot gross. The appraiser analyzed a set of five directly competitive properties within the immediate competitive area of the 1140 Avenue of the Americas Property and concluded an office market rental range of $64.00 to $120.00 per square foot gross. Underwritten weighted average office rents at the 1140 Avenue of the Americas Property is $86.99 per square foot gross, which is below the appraisal’s concluded office submarket rent for the 1140 Avenue of the Americas Property of $96.71 per square foot gross.
THE INFORMATION IN THIS STRUCTURAL AND COLLATERAL TERM SHEET IS NOT COMPLETE AND MAY BE AMENDED PRIOR TO THE TIME OF SALE. THIS TERM SHEET IS NOT AN OFFER TO SELL THESE SECURITIES AND IT IS NOT A SOLICITATION OF AN OFFER TO BUY THESE SECURITIES IN ANY JURISDICTION WHERE THE OFFER OR SALE IS NOT PERMITTED.
89
1140 AVENUE OF THE AMERICAS
The following table presents certain information relating to comparable leases to the 1140 Avenue of the Americas Property:
Comparable Leases(1)
| Property Name/Location | Year Built/ Renovated | Stories | Total GLA (SF) | Total Occupancy | Distance from Subject | Tenant Name | Lease Date/ Term | Lease Area (SF) | Annual Base Rent PSF | Lease Type |
1120 Avenue of the Americas New York, NY | 1951/2005 | 21 | 415,000 | 99.2% | 0.1 miles | Bank Hapoalim, B.M | January 2016 / 16 Yrs | 47,005 | $70.00 | Gross |
1065 Avenue of the Americas New York, NY | 1958/NAP | 34 | 536,524 | 86.5% | 0.3 miles | Schireson Associates | April 2016 / 7 Yrs | 7,558 | $87.00 | Gross |
1065 Avenue of the Americas New York, NY | 1958/NAP | 34 | 536,524 | 86.5% | 0.3 miles | XP Securities | March 2016 / 10 Yrs | 7,558 | $87.50 | Gross |
1350 Avenue of the Americas New York, NY | 1966/NAP | 35 | 424,000 | 93.7% | 0.5 miles | Entercom Communications | April 2016 / 5 Yrs | 3,391 | $80.00 | Gross |
1370 Avenue of the Americas New York, NY | 1971/2002 | 35 | 339,000 | 92.3% | 0.6 miles | Andor Capital Management | October 2015 / 10.43 Yrs | 10,269 | $96.00 | Gross |
| (1) | Information obtained from the appraisal and a third party market research report. |
The Borrower.The borrower is ARC NYC1140SIXTH, LLC, a Delaware limited liability company and single purpose entity with two independent directors. Legal counsel to the borrower delivered a non-consolidation opinion in connection with the origination of the 1140 Avenue of the Americas Whole Loan. American Realty Capital New York City REIT, Inc. (“ARCNYC REIT”) is the 99.993% owner and general partner of New York City Operating Partnership, L.P. which is the guarantor of certain nonrecourse carveouts under the 1140 Avenue of the Americas Whole Loan.
The Sponsor.The sponsor is ARCNYC REIT. As of June 30, 2016, ARCNYC REIT reported total assets of approximately $804.8 million, and a net worth of approximately $563.5 million. Exclusive of the 1140 Avenue of the Americas Property, the ARCNYC REIT owns five properties consisting of 841,857 square feet in New York City.
The external advisor and sponsor of ARCNYC REIT is an affiliate of AR Global Investments, LLC (“AR Global”). In addition, the 1140 Avenue of the Americas Property is subject to an operating management agreement with a wholly-owned subsidiary of AR Global (the “Operator”) pursuant to which the Operator is responsible for the management of the 1140 Avenue of the Americas Property. Certain principals and affiliates of AR Global as well as the previous external advisor and sponsor of ARCNYC REIT are subject to litigation and governmental proceedings. See“Description of the Mortgage Pool—Litigation and Other Considerations”in the Preliminary Prospectus.
Escrows.The loan documents provide for upfront reserves in the amount of $342,123 for real estate taxes; $961,116 for existing tenant improvements (“TI”) and leasing commissions (“LC”) related to HWE New York LLC ($150,000 for TI and $78,009 for LC), Waterfall Asset Management ($316,360 for TI), and Upsilon Ventures ($52,933 for LC); $116,016 for ground rent; and $712,266 for free rent related to Upsilon Ventures LLC ($148,750) and Waterfall Asset Management ($563,516). The loan documents require monthly reserve deposits of one-twelfth of the estimated annual real estate taxes (currently equates to $171,061) and one-twelfth of the estimated annual ground rent (currently equates to $29,004). The loan documents do not require monthly escrows for insurance, provided that: (i) the blanket policy is acceptable to the lender and (ii) the borrower provides the lender with evidence of payment. Monthly collections for replacement reserves and TI/LC are waived unless a Reserve Funds Trigger Period (as defined below) has occurred and is continuing.
A “Reserve Funds Trigger Period” will commence upon any of the following: (i) the occurrence and continuance of an event of default; (ii) the debt service coverage ratio falling below 1.50x at any time; or (iii) the borrower defaulting under the management agreement beyond notice and cure periods. A Reserve Funds Trigger Period will be cured, with regard to clause (i), upon the cure of such event of default; with regard to clause (ii), upon the debt service coverage ratio being equal to or greater than 1.52x for two consecutive calendar quarters; and with regard to clause (iii), upon the date the borrower has entered into a replacement management agreement with a qualified manager or the date on which the applicable default has been remedied to the lender’s satisfaction. Notwithstanding the foregoing, the borrower may avoid the existence of a Reserve Funds Trigger Period pursuant to clause (ii) above by (x) prior to the prepayment lockout period, posting a letter of credit with the lender in an amount (the “Reserve Funds Trigger Event DSCR Required Amount”) that when combined with the projected revenues of the 1140 Avenue of the Americas Mortgaged Property for the succeeding 12-month period achieves a debt service coverage ratio of at least 1.52x or (y) after the prepayment lockout date, prepaying the 1140 Avenue of the Americas Whole Loan in an amount equal to the Reserve Funds Trigger Event DSCR Required Amount in accordance with the related loan documents, which if prepaid prior to the prepayment open period, would include a payment equal to the greater of (A) 1% of the amount prepaid and (B) yield maintenance premium thereon.
Lockbox and Cash Management.The 1140 Avenue of the Americas Whole Loan requires a lender-controlled lockbox account, which is already in place, and that the borrower direct tenants to pay their rents directly into such lockbox account. The 1140 Avenue of the Americas Whole Loan also requires that all rents received by the borrower or the property manager be swept daily into the lockbox account. Prior to a Sweep Event Period (as defined below), all excess cash flow will be disbursed to the borrower. Upon a Sweep Event Period, excess cash flow will be held by the lender.
THE INFORMATION IN THIS STRUCTURAL AND COLLATERAL TERM SHEET IS NOT COMPLETE AND MAY BE AMENDED PRIOR TO THE TIME OF SALE. THIS TERM SHEET IS NOT AN OFFER TO SELL THESE SECURITIES AND IT IS NOT A SOLICITATION OF AN OFFER TO BUY THESE SECURITIES IN ANY JURISDICTION WHERE THE OFFER OR SALE IS NOT PERMITTED.
90
1140 AVENUE OF THE AMERICAS
A “Sweep Event Period” will commence upon any of the following: (i) the occurrence of an event of default; (ii) the debt service coverage ratio falling below 1.40x (a “DSCR Sweep Event Trigger”); or (iii) the borrower defaulting under the management agreement. A Sweep Event Period will be cured, with regard to clause (i), upon the cure of such event of default; with regard to clause (ii), upon the debt service coverage ratio being equal to or greater than 1.42x for two consecutive calendar quarters; and with regard to clause (iii), upon the date the borrower has entered into a replacement management agreement with a qualified manager or the date on which the applicable default has been remedied to the lender’s satisfaction. Notwithstanding the foregoing, the borrower may avoid the existence of a DSCR Sweep Event Trigger pursuant to clause (ii) above by (x) prior to the prepayment lockout period, posting a letter of credit with the lender in an amount (the “DSCR Sweep Event Trigger Required Amount”) that when combined with the projected revenues of the 1140 Avenue of the Americas Mortgaged Property for the succeeding 12-month period achieve a debt service coverage ratio of at least 1.42x or (y) after the prepayment lockout date, prepaying the 1140 Avenue of the Americas Whole Loan in an amount equal to the DSCR Sweep Event Trigger Required Amount in accordance with the loan documents, which if prepaid prior to the prepayment open period, would include a payment equal to the greater of (A) 1% of the amount prepaid and (B) yield maintenance thereon.
Property Management. The 1140 Avenue of the Americas Property is managed by CBRE, Inc. for a fee of $0.34 per square foot for the first year for the loan term and subject to annual increases of 3.0%.
Assumption.The borrower has the right to transfer the 1140 Avenue of the Americas Property provided that certain conditions are satisfied, including: (i) no event of default has occurred and is continuing; (ii) the proposed transferee is a qualified transferee as described in the 1140 Avenue of the Americas Whole Loan documents or is reasonably acceptable to the lender based upon, among other things, the lender reasonably determining that the proposed transferee and proposed guarantor satisfy the lender’s credit review and have an aggregate net worth of $175.0 million and liquidity of $7.5 million; (iii) unless the transferee is controlled and owned at least 51.0% by ARCNYC REIT or by a qualified equity holder as described in the 1140 Avenue of the Americas Whole Loan documents, the lender has received confirmation from each of DBRS, Fitch and Moody’s that such assumption will not result in a downgrade, withdrawal or qualification of the respective ratings assigned to the Series 2016-C37 Certificates and similar confirmations from each rating agency rating any securities backed by any 1140 Avenue of the Americas Companion Loans with respect to the ratings of such securities; and (iv) unless the transferee is an affiliate of ARCNYC REIT, adequate transferee experience.
Partial Release. Not permitted.
Real Estate Substitution.Not permitted.
Subordinate and Mezzanine Indebtedness.Not permitted.
Ground Lease.The 1140 Avenue of the Americas Property is currently subject to a ground lease between 67 West 44th St. Inc., (“Ground Lessee”), a predecessor-in-interest to the borrower, and 1140 Sixth Avenue LLC (as successor-in-interest to Phoenix Mutual Life Insurance Company) (“Ground Lessor”). The 1140 Avenue of the Americas ground lease, dated October 1, 1951, expires December 31, 2066. The original term of the ground lease was fifty years and three months, and was scheduled to expire December 31, 2016; however, the Ground Lessee has exercised its final option to renew the ground lease for a term of fifty years commencing January 1, 2017 and expiring December 31, 2066. The current annual rent is $348,047 with an increase on January 1, 2017 to $4,746,094 and an increase on January 1, 2042 to $5,062,500. The 1140 Avenue of the Americas Property cash flows have been underwritten at the initial renewal rent step rent of $4,746,094 (see “Cash Flow Analysis” section).See “Description of the Mortgage Pool—Mortgage Pool Characteristics—Fee & Leasehold Estates; Ground Leases” in the Preliminary Prospectus.
Terrorism Insurance. The loan documents require that the “all risk” insurance policy required to be maintained by the borrower provides coverage for terrorism in an amount equal to the full replacement cost of the 1140 Avenue of the Americas Property (provided that the borrower is not required to pay terrorism insurance premiums in excess of two times the premiums for all risk and business interruption coverage (exclusive of terrorism coverage) if the Terrorism Risk Insurance Program Reauthorization Act is no longer in effect). The loan documents also require business interruption insurance covering no less than the 18-month period following the occurrence of a casualty event, together with a 12-month extended period of indemnity.
THE INFORMATION IN THIS STRUCTURAL AND COLLATERAL TERM SHEET IS NOT COMPLETE AND MAY BE AMENDED PRIOR TO THE TIME OF SALE. THIS TERM SHEET IS NOT AN OFFER TO SELL THESE SECURITIES AND IT IS NOT A SOLICITATION OF AN OFFER TO BUY THESE SECURITIES IN ANY JURISDICTION WHERE THE OFFER OR SALE IS NOT PERMITTED.
91
| The Hamptons AND Park Pointe |
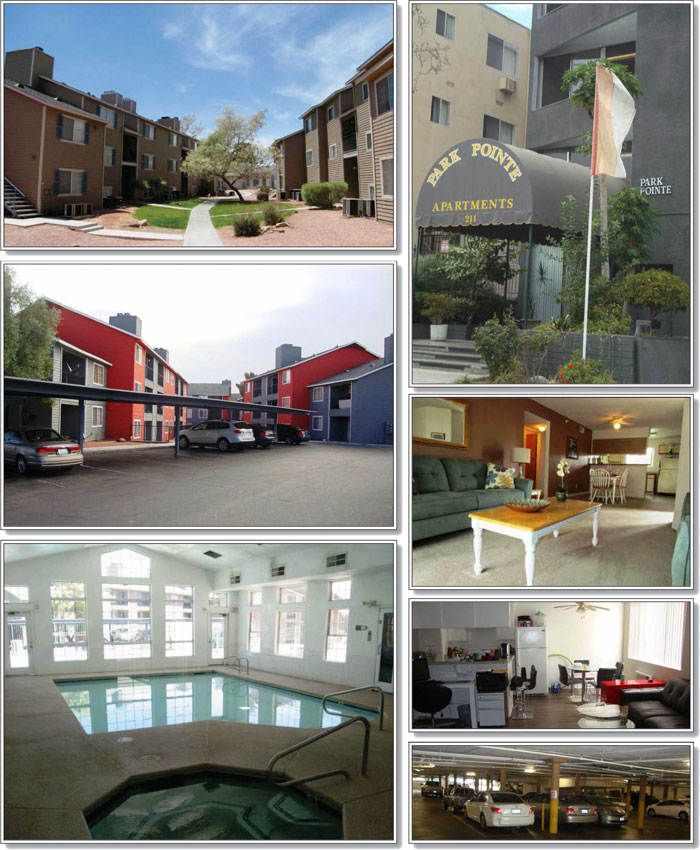
THE INFORMATION IN THIS STRUCTURAL AND COLLATERAL TERM SHEET IS NOT COMPLETE AND MAY BE AMENDED PRIOR TO THE TIME OF SALE. THIS TERM SHEET IS NOT AN OFFER TO SELL THESE SECURITIES AND IT IS NOT A SOLICITATION OF AN OFFER TO BUY THESE SECURITIES IN ANY JURISDICTION WHERE THE OFFER OR SALE IS NOT PERMITTED.
92
| The Hamptons AND Park Pointe |
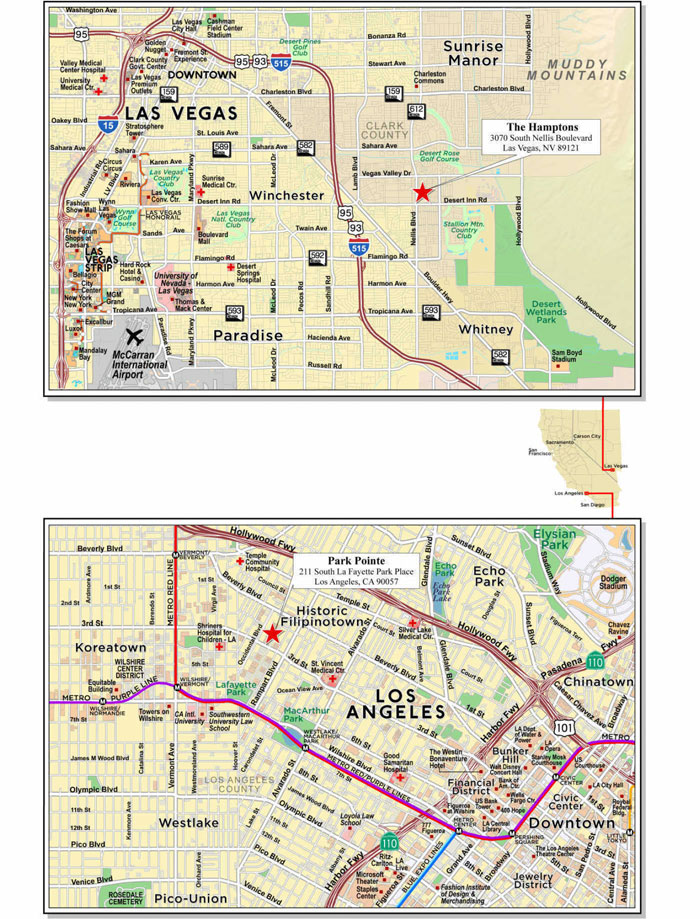
THE INFORMATION IN THIS STRUCTURAL AND COLLATERAL TERM SHEET IS NOT COMPLETE AND MAY BE AMENDED PRIOR TO THE TIME OF SALE. THIS TERM SHEET IS NOT AN OFFER TO SELL THESE SECURITIES AND IT IS NOT A SOLICITATION OF AN OFFER TO BUY THESE SECURITIES IN ANY JURISDICTION WHERE THE OFFER OR SALE IS NOT PERMITTED.
93
| No. 7 & 8 – The Hamptons and Park Pointe(1) | ||||||
| Loan Information | Property Information | |||||
| Mortgage Loan Seller: | Barclays Bank PLC | Single Asset/Portfolio: | Portfolio | |||
Credit Assessment (DBRS/Fitch/Moody’s): | NR/NR/NR | Property Type: | Multifamily | |||
| Original Principal Balance: | $26,800,000 | Specific Property Type: | Various | |||
| Cut-off Date Balance: | $26,763,204 | Location: | Various | |||
| % of Initial Pool Balance: | 3.6% | Size: | Various | |||
| Loan Purpose: | Refinance | Cut-off Date Balance Per Unit: | $46,064 | |||
| Borrower Names(2): | Various | Year Built/Renovated: | Various/NAP | |||
| Sponsor(3): | J.K. Properties, Inc. | Title Vesting: | Fee | |||
| Mortgage Rate: | 4.2691% | Property Manager(5): | Various | |||
| Note Date: | October 11, 2016 | 4th Most Recent Occupancy(6): | 79.8% (12/31/2012) | |||
| Anticipated Repayment Date: | NAP | 3rd Most Recent Occupancy(6): | 76.4% (12/31/2013) | |||
| Maturity Date: | November 6, 2026 | 2nd Most Recent Occupancy(6): | 77.9% (12/31/2014) | |||
| IO Period: | None | Most Recent Occupancy(6): | 83.4% (12/31/2015) | |||
| Loan Term (Original): | 120 months | Current Occupancy (As of)(6): | 93.8% (Various) | |||
| Seasoning: | 1 month | |||||
| Amortization Term (Original): | 360 months | Underwriting and Financial Information: | ||||
| Loan Amortization Type: | Amortizing Balloon | |||||
| Interest Accrual Method: | Actual/360 | 4th Most Recent NOI(7): | $1,887,960 (12/31/2013) | |||
| Call Protection: | L(25),D(90),O(5) | 3rd Most Recent NOI(7): | $1,949,597 (12/31/2014) | |||
| Lockbox Type: | Springing | 2nd Most Recent NOI(7): | $2,069,547 (12/31/2015) | |||
| Additional Debt: | None | Most Recent NOI(7): | $2,371,844 (TTM 8/31/2016) | |||
| Additional Debt Type: | NAP | |||||
| U/W Revenues: | $4,398,502 | |||||
| U/W Expenses: | $2,063,115 | |||||
| U/W NOI(7): | $2,335,387 | |||||
| U/W NCF(7): | $2,181,281 | |||||
| U/W NOI DSCR(7): | 1.47x | |||||
| Escrows and Reserves(4): | U/W NCF DSCR(7): | 1.38x | ||||
| U/W NOI Debt Yield(7): | 8.7% | |||||
| Type: | Initial | Monthly | Cap (If Any) | U/W NCF Debt Yield(7): | 8.2% | |
| Taxes | $78,791 | $23,385 | NAP | As-Is Appraised Value(8): | $40,800,000 | |
| Insurance | $0 | Springing | NAP | As-Is Appraisal Valuation Date(8): | Various | |
| Replacement Reserves | $0 | $12,842 | NAP | Cut-off Date LTV Ratio: | 65.6% | |
| Deferred Maintenance | $187,369 | $0 | NAP | LTV Ratio at Maturity or ARD: | 52.7% | |
| (1) | The Hamptons mortgage loan and the Park Pointe mortgage loan (collectively, “The Hamptons and Park Pointe Crossed Mortgage Loans”) are cross-collateralized and cross-defaulted with one another. All information herein represents The Hamptons mortgage loan and the Park Pointe mortgage loan presented as one mortgage loan, except as otherwise specified below. With respect to each of the Hamptons mortgage loan and the Park Pointe mortgage loan, the applicable loan-to-value ratios, debt service coverage ratios and debt yields for each such mortgage loan are based upon the ratio or yield (as applicable) for the aggregate indebtedness evidenced by both mortgage loans. On an individual basis, without regard to the cross-collateralization feature, a related mortgage loan may have a higher loan-to-value ratio, lower debt service coverage ratio and/or lower debt yield than is presented herein. |
| (2) | See “The Borrowers” section. |
| (3) | J.K. Properties, Inc., the sponsor, is affiliated with the sponsor of the Studio Village Mortgage Loan, the Hollywood Pointe – Yucca Mortgage Loan, the Rose Terrace – Whittier Mortgage Loan, the Suntree Mortgage Loan, the Courtyard - Hawthorne Mortgage Loan, the Crosswinds Mortgage Loan and the Mountain Gate Mortgage Loan being contributed to WFCM 2016-C37. |
| (4) | See “Escrows” section. |
| (5) | See “Property Management” section. |
| (6) | See “Historical Occupancy” section. |
| (7) | The underwriting and financial information shown represents the Hamptons and Park Pointe Crossed Mortgage Loans in aggregate. See “Cash Flow Analysis – The Hamptons Property” and “Cash Flow Analysis – Park Pointe Property” sections. |
| (8) | See “Appraisal” section. |
The Mortgage Loan. The Hamptons mortgage loan and the Park Pointe mortgage loan (collectively, “The Hamptons and Park Pointe Crossed Mortgage Loans”) are cross-collateralized and cross-defaulted with one another and are each evidenced by a single promissory note. The Hamptons mortgage loan is secured by a first mortgage encumbering a 492 unit multifamily garden property in Las Vegas, Nevada (the “Hamptons Property”), and the Park Pointe mortgage loan is secured by a first mortgage encumbering an 89 unit multifamily mid rise property in Los Angeles, California (the “Park Pointe Property”). The Hamptons and Park Pointe Crossed Mortgage Loans were originated on October 11, 2016 by Barclays Bank PLC. The Hamptons and Park Pointe Crossed Mortgage Loans had an aggregate original principal balance of $26,800,000, have an aggregate outstanding principal balance as of the Cut-off Date of $26,763,204 and accrue interest at a rate of 4.2691%per annum. The Hamptons and Park Pointe Crossed Mortgage Loans had an initial term of 120 months, have a remaining term of 119 months as of the Cut-off Date and require payments of principal and interest based on a 30-year amortization schedule through the term of the Hamptons and Park Pointe Crossed Mortgage Loans. The Hamptons and Park Pointe Crossed Mortgage Loans mature on November 6, 2026.
THE INFORMATION IN THIS STRUCTURAL AND COLLATERAL TERM SHEET IS NOT COMPLETE AND MAY BE AMENDED PRIOR TO THE TIME OF SALE. THIS TERM SHEET IS NOT AN OFFER TO SELL THESE SECURITIES AND IT IS NOT A SOLICITATION OF AN OFFER TO BUY THESE SECURITIES IN ANY JURISDICTION WHERE THE OFFER OR SALE IS NOT PERMITTED.
94
| The Hamptons AND Park Pointe |
The following table presents certain information relating to The Hamptons Property and the Park Pointe Property:
| Property Name | Location | Cut-off Date Balance | % of Crossed Cut- off Date Balance% | Occupancy | Net Rentable Area (Units) | Year Built | As-Is Appraised | Allocated LTV |
| The Hamptons | Las Vegas, NV | $17,875,423 | 66.8% | 92.9% | 492 | 1989 | $24,600,000 | 72.7% |
| Park Pointe | Los Angeles, CA | $8,887,780 | 33.2% | 98.9% | 89 | 1971 | $16,200,000 | 54.9% |
| Total/Weighted Average | $26,763,204 | 100.0% | 93.8% | 581 | $40,800,000 | 65.6% |
Following the lockout period, the borrowers have the right to defease The Hamptons and Park Pointe Crossed Mortgage Loans in whole, but not in part (except as otherwise stated in the “Partial Release” section), on any date before July 6, 2026. In addition, The Hamptons and Park Pointe Crossed Mortgage Loans are prepayable without penalty on or after July 6, 2026.
Sources and Uses – The Hamptons
| Sources | Uses | |||||||
| Original whole loan amount | $17,900,000 | 88.9% | Loan payoff(1) | $19,878,040 | 98.7% | |||
| Sponsor’s new cash contribution | 2,238,330 | 11.1 | Reserves | 188,228 | 0.9 | |||
| Closing costs | 72,062 | 0.4 | ||||||
| Total Sources | $20,138,330 | 100.0% | Total Uses | $20,138,330 | 100.0% |
| (1) | The Hamptons Property was previously securitized in the JPMCC 2007-LDPX transaction. |
Sources and Uses – Park Pointe
| Sources | Uses | |||||||
| Original whole loan amount | $8,900,000 | 100.0% | Loan payoff(1) | $6,911,052 | 77.7% | |||
| Reserves | 77,933 | 0.9 | ||||||
| Closing costs | 140,138 | 1.6 | ||||||
| Return of equity | 1,770,878 | 19.9 | ||||||
| Total Sources | $8,900,000 | 100.0% | Total Uses | $8,900,000 | 100.0% |
| (1) | The Park Pointe Property was previously securitized in the JPMCC 2006-LDP9 transaction. |
The Property. The Hamptons Property was constructed in 1989 and consists of 492 units in 39 two and three-story walk-up garden style apartment buildings situated on a 24.1-acre site located in Las Vegas, Nevada. The Hamptons Property features a recreation center, outdoor and indoor pools, a spa, tennis court, a clubhouse with a business center and a leasing office. The sponsor has reported approximately $300,000 of investment into The Hamptons Property since 2012, which includes new exterior painting, plumbing and electrical work, landscaping and pavement repairs. Parking is provided via 372 open parking spaces and 492 covered parking spaces throughout The Hamptons Property, resulting in a parking ratio of approximately 1.8 spaces per unit. Since 2013, net operating income has increased from $1.2 million to $1.6 million as of August 31, 2016 driven by the recent renovations and general improvement in the overall market. The sponsor has owned The Hamptons Property since 2001. As of August 20, 2016, The Hamptons Property was 92.9% occupied.
The Park Pointe Property was constructed in 1971 and consists of an 89-unit three-story mid-rise style apartment building situated on a 0.8-acre site located in Los Angeles, California. The Park Pointe Property features a recreation center, outdoor pool, laundry room, private balconies and on-site management. The sponsor has reported approximately $321,000 of investments into the Park Pointe Property since 2012, which includes carpeting, counter tops, appliances, fixtures and other building and land improvements. Parking is provided via 94 parking spaces in a semi-subterranean parking garage, resulting in a parking ratio of approximately 1.1 spaces per unit. The sponsor has owned the Park Pointe Property since 2002. As of August 31, 2016, the Park Pointe Property was 98.9% occupied. Since 2012, occupancy has ranged between 93.5% and 98.9% averaging 95.7%. Additionally, net operating income has increased from $715,084 in 2013 to $782,100 as of August 31, 2016, consistent with the increase in occupancy.
The Park Pointe Property is subject to the rent stabilization ordinance of the Los Angeles municipal code, which limits the annual allowable rent increase at the Park Pointe Property. The annual allowable rent increase is based on the consumer price index average for the Los-Angeles-Long Beach-Anaheim metropolitan statistical area for a 12-month period ending September 30th of each year and must be between 3.0% and 8.0%.
The following tables present certain information relating to the unit mix at The Hamptons Property and the Park Pointe Property:
Apartment Unit Summary – The Hamptons Property(1)
| Unit Type | No. of Units | % of Total Units | Average Unit Size (SF) | Average Monthly Rent per Unit |
| One Bedroom / One Bath | 140 | 28.5% | 674 | $550 |
| Two Bedroom / Two Bath | 282 | 57.3% | 970 | $640 |
| Three Bedroom / Three Bath | 70 | 14.2% | 1,098 | $769 |
| Total/Weighted Average | 492 | 100.0% | 904 | $631(2) |
| (1) | Information obtained from the underwritten rent roll. |
| (2) | Total/Weighted Average for Average Monthly Rent per Unit is weighted by occupied units. |
THE INFORMATION IN THIS STRUCTURAL AND COLLATERAL TERM SHEET IS NOT COMPLETE AND MAY BE AMENDED PRIOR TO THE TIME OF SALE. THIS TERM SHEET IS NOT AN OFFER TO SELL THESE SECURITIES AND IT IS NOT A SOLICITATION OF AN OFFER TO BUY THESE SECURITIES IN ANY JURISDICTION WHERE THE OFFER OR SALE IS NOT PERMITTED.
95
| The Hamptons AND Park Pointe |
Apartment Unit Summary – Park Pointe Property(1)
| Unit Type | No. of Units | % of Total Units | Average Unit Size (SF) | Average Monthly Rent per Unit |
| Studio - Small | 5 | 5.6% | 600 | $848 |
| Studio | 16 | 18.0% | 650 | $1,050 |
| Studio - Large | 3 | 3.4% | 750 | $1,186 |
| One Bedroom / One Bath | 65 | 73.0% | 850 | $1,174 |
| Total/Weighted Average | 89 | 100.0% | 797 | $1,135(2) |
| (1) | Information obtained from the underwritten rent roll. |
| (2) | Total/Weighted Average for Average Monthly Rent per Unit is weighted by occupied unit. |
The following table presents historical occupancy percentages at The Hamptons Property and the Park Pointe Property:
Historical Occupancy – The Hamptons Property
12/31/2012(1)(2) | 12/31/2013(1)(2) | 12/31/2014(1)(2) | 12/31/2015(1)(2) | 8/20/2016(2)(3) |
| 77.3% | 73.4% | 74.5% | 81.0% | 92.9% |
| (1) | Information obtained from the borrower. |
| (2) | According to the sponsor, Historical Occupancy has increased from 2012 to August 20, 2016 due to the sponsor investing approximately $300,000 in The Hamptons Property and overall submarket vacancy decreasing from 6.1% to 3.3%. |
| (3) | Information obtained from the underwritten rent roll. |
Historical Occupancy – Park Pointe Property
12/31/2012(1) | 12/31/2013(1) | 12/31/2014(1) | 12/31/2015(1) | 8/31/2016(2) |
| 93.5% | 93.1% | 96.6% | 96.5% | 98.9% |
| (1) | Information obtained from the borrower. |
| (2) | Information obtained from the underwritten rent roll. |
Operating History and Underwritten Net Cash Flow. The following table presents certain information relating to the historical operating performance and underwritten net cash flow at The Hamptons Property and the Park Pointe Property:
Cash Flow Analysis – The Hamptons Property
| 2013 | 2014 | 2015 | TTM 8/31/2016 | U/W | % of U/W Effective Gross Income | U/W $ per Unit | |
| Base Rent(1) | $2,453,038 | $2,535,167 | $2,803,530 | $3,007,611 | $3,458,952 | 107.3% | $7,030 |
| Grossed Up Vacant Space | 0 | 0 | 0 | 0 | 283,740 | 8.8 | 577 |
| Other Income(2) | 158,965 | 163,074 | 175,319 | 215,415 | 219,551 | 6.8 | 446 |
| Less Vacancy & Credit Loss | 0 | 0 | 0 | 0 | (739,218)(3) | (22.9) | (1,502) |
| Effective Gross Income | $2,612,002 | $2,698,241 | $2,978,849 | $3,223,025 | $3,223,025 | 100.0% | $6,551 |
| Total Operating Expenses | $1,439,126 | $1,457,251 | $1,658,468 | $1,633,281 | $1,629,562 | 50.6% | $3,312 |
| Net Operating Income(4) | $1,172,876 | $1,240,990 | $1,320,381 | $1,589,744 | $1,593,463 | 49.4% | $3,239 |
| Capital Expenditures | 0 | 0 | 0 | 0 | 131,856 | 4.1 | 268 |
| Net Cash Flow | $1,172,876 | $1,240,990 | $1,320,381 | $1,589,744 | $1,461,607 | 45.3% | $2,971 |
| NOI DSCR | 1.11x | 1.17x | 1.25x | 1.50x | 1.50x | ||
| NCF DSCR | 1.11x | 1.17x | 1.25x | 1.50x | 1.38x | ||
| NOI DY | 6.6% | 6.9% | 7.4% | 8.9% | 8.9% | ||
| NCF DY | 6.6% | 6.9% | 7.4% | 8.9% | 8.2% |
| (1) | Historical Base Rent is net of vacancy and credit loss. |
| (2) | Other Income consists of laundry, parking revenue, storage, phone, cable and other miscellaneous income. |
| (3) | The underwritten economic vacancy is 18.7%. The Hamptons Property was 92.9% physically occupied as of August 20, 2016. |
| (4) | According to the sponsor, Net Operating Income has increased from 2013 to TTM August 31, 2016 due to the sponsor investing approximately $300,000 in The Hamptons Property and overall submarket vacancy decreasing from 6.1% to 3.3%. |
THE INFORMATION IN THIS STRUCTURAL AND COLLATERAL TERM SHEET IS NOT COMPLETE AND MAY BE AMENDED PRIOR TO THE TIME OF SALE. THIS TERM SHEET IS NOT AN OFFER TO SELL THESE SECURITIES AND IT IS NOT A SOLICITATION OF AN OFFER TO BUY THESE SECURITIES IN ANY JURISDICTION WHERE THE OFFER OR SALE IS NOT PERMITTED.
96
| The Hamptons AND Park Pointe |
Cash Flow Analysis – Park Pointe Property
| 2013 | 2014 | 2015 | TTM 8/31/2016 | U/W | % of U/W Effective Gross Income | U/W $ per Unit | |
| Base Rent(1) | $1,016,949 | $1,068,655 | $1,090,260 | $1,138,370 | $1,198,687 | 102.0% | $13,468 |
| Grossed Up Vacant Space | 0 | 0 | 0 | 0 | 13,200 | 1.1 | 148 |
| Other Income(2) | 47,687 | 32,994 | 29,972 | 23,412 | 25,458 | 2.2 | 286 |
| Less Vacancy & Credit Loss | 0 | 0 | 0 | 0 | (61,867)(3) | (5.3) | (695) |
| Effective Gross Income | $1,064,636 | $1,101,649 | $1,120,232 | $1,161,783 | $1,175,477 | 100.0% | $13,208 |
| Total Operating Expenses | $349,552 | $393,042 | $371,066 | $379,683 | $433,553 | 36.9% | $4,871 |
| Net Operating Income | $715,084 | $708,607 | $749,166 | $782,100 | $741,924 | 63.1% | $8,336 |
| Capital Expenditures | 0 | 0 | 0 | 0 | 22,250 | 1.9 | 250 |
| Net Cash Flow | $715,084 | $708,607 | $749,166 | $782,100 | $719,674 | 61.2% | $8,086 |
| NOI DSCR | 1.36x | 1.35x | 1.42x | 1.49x | 1.41x | ||
| NCF DSCR | 1.36x | 1.35x | 1.42x | 1.49x | 1.37x | ||
| NOI DY | 8.0% | 8.0% | 8.4% | 8.8% | 8.3% | ||
| NCF DY | 8.0% | 8.0% | 8.4% | 8.8% | 8.1% |
| (1) | Historical Base Rent is net of vacancy and credit loss. |
| (2) | Other Income consists of laundry, parking revenue, storage, phone, cable and other miscellaneous income. |
| (3) | The underwritten economic vacancy is 5.0%. The Park Pointe Property was 98.9% physically occupied as of August 31, 2016. |
Appraisal.As of the appraisal valuation date of April 19, 2016, The Hamptons Property had an “as-is” appraised value of $24,600,000. As of the appraisal valuation date of May 2, 2016, the Park Pointe Property had an “as-is” appraised value of $16,200,000.
Environmental Matters.According to a Phase I environmental assessment dated May 4, 2016, there was no evidence of any recognized environmental conditions at The Hamptons Property. According to a Phase I environmental assessment dated May 16, 2016, there was no evidence of any recognized environmental conditions at the Park Pointe Property.
Market Overview and Competition.The Hamptons Property is located approximately 10.0 miles southeast of the Las Vegas central business district. Primary access to The Hamptons Property is provided by U.S. Route 95 and Interstate 515. According to a third party research report, The Hamptons Property is located within the East submarket of Las Vegas metropolitan area which had a 2016 third quarter submarket vacancy of 2.6%. The 2016 estimated population within a one-, three- and five-mile radius of The Hamptons Property is 29,230, 194,905 and 450,558, respectively; the 2016 estimated average household income within the same radii is $41,856, $51,536 and $49,113, respectively.
The Park Pointe Property is located in the neighborhood of Westlake, Los Angeles between Koreatown to the west and downtown Los Angeles to the east. Primary access to the Park Pointe Property is provided by State Highway 101. According to a third party research report, the Park Pointe Property is located within the Wilshire/Westlake submarket of Los Angeles metropolitan area which had a 2016 third quarter submarket vacancy of 4.1%. The 2016 estimated population within a one-, three- and five-mile radius of the Park Pointe Property is 112,238, 604,847 and 1,214,969, respectively; the 2016 estimated average household income within the same radii is $45,381, $53,250 and $59,053, respectively.
The following table presents certain information relating to comparable multifamily properties for The Hamptons Property and the Park Pointe Property:
Competitive Set – The Hamptons Property(1)
| Average Rent (per unit) | ||||||||||
| Location | Distance to Subject | Property Type | Number of Units | Studio | 1 BR | 2 BR | 3 BR | Overall Average Rent PSF | Total Occupancy | |
| The Hamptons (Subject) | Las Vegas, NV | -- | Garden | 492 | NAP | $550 | $640 | $769 | $0.70 | 92.9% |
| Villa Del Rio | Las Vegas, NV | 0.9 miles | Garden | 168 | NAP | $665 | $760-825 | $939 | $0.85 | 96.0% |
| Sunrise Springs | Las Vegas, NV | 1.0 miles | Garden | 192 | NAP | $712 | $956 | $999 | $1.03 | 96.0% |
| Silverwood | Las Vegas, NV | 0.1 miles | Garden | 296 | NAP | $657 | $824 | $902 | $0.90 | 95.0% |
| Stonegate | Las Vegas, NV | 0.5 miles | Garden | 440 | NAP | $684-$694 | $779-$814 | NAP | $0.86 | 97.0% |
| Eastgate | Las Vegas, NV | 0.1 miles | Garden | 320 | NAP | $704 | $843-879 | NAP | $0.75 | 98.0% |
| Oasis Meadows | Las Vegas, NV | 0.1 miles | Garden | 383 | NAP | $745 | $905 | $1,080 | $0.85 | 91.0% |
| Sanoma Hills | Las Vegas, NV | 2.0 miles | Garden | 340 | NAP | $550 | $640-$665 | $775 | $0.75 | 97.0% |
| Weighted Average | $652 | $787 | $894 | $0.82 | 95.1% | |||||
| (1) | Information obtained from the appraisal and the underwritten rent roll. |
THE INFORMATION IN THIS STRUCTURAL AND COLLATERAL TERM SHEET IS NOT COMPLETE AND MAY BE AMENDED PRIOR TO THE TIME OF SALE. THIS TERM SHEET IS NOT AN OFFER TO SELL THESE SECURITIES AND IT IS NOT A SOLICITATION OF AN OFFER TO BUY THESE SECURITIES IN ANY JURISDICTION WHERE THE OFFER OR SALE IS NOT PERMITTED.
97
| The Hamptons AND Park Pointe |
Competitive Set – Park Pointe Property(1)
| Average Rent (per unit) | |||||||||
| Location | Distance to Subject | Property Type | Number of Units | Studio | 1 BR | 2 BR | Overall Average Rent PSF | Total Occupancy | |
| Park Pointe (Subject) | Los Angeles, CA | -- | Mid Rise | 89 | $848-$1,186 | $1,174 | NAP | $1.42 | 98.9% |
| 349 South La Fayette | Los Angeles, CA | 0.2 miles | Garden | 120 | $998 | $1,181 | NAP | $1.85 | 96.0% |
| Century House | Sherman Oaks, CA | 14.9 miles | Walk-up | 72 | NAV | NAV | NAV | NAV | 100.0% |
| Emerald Terrace | Los Angeles, CA | 0.7 miles | Mid/High Rise | 302 | $1,190-$1,543 | $1,488-$1,543 | $2,032-$2,042 | $2.31 | 95.0% |
| Villa Del Rey | Alhambra, CA | 8.5 miles | Walk-up | 109 | NAV | NAV | NAV | NAV | 96.0% |
| 220 S Commonwealth | Los Angeles, CA | 0.5 miles | Walk-up | 24 | NAV | NAV | NAV | NAV | 100.0% |
| The Esquire | Los Angeles, CA | 0.1 miles | Mid/High Rise | 117 | NAV | NAV | NAV | NAV | 97.0% |
| Weighted Average | $1,219 | $1,377 | $2,037 | $2.05 | 96.5% | ||||
| (1) | Information obtained from the appraisal and the underwritten rent roll. |
The Borrowers. The borrower for The Hamptons mortgage loan is Hampton Apts., Inc., a Nevada corporation. The borrower for the Park Pointe mortgage loan is 211 S. La Fayette Park Place, Inc., a California corporation. J.K. Properties, Inc. is the guarantor of certain nonrecourse carveouts under The Hamptons and Park Pointe Crossed Mortgage Loans.
The Sponsor. The sponsor of The Hamptons and Park Pointe Crossed Mortgage Loans is J.K. Properties, Inc., which is wholly owned by Haresh Jogani. Through J.K. Properties, Inc. and other entities, Haresh Jogani began acquiring multi-family residential properties in 1995 aiming to acquire income-producing real estate opportunities offering significant profit potential. Haresh Jogani has maintained a portfolio of over 17,000 units over the past 18 years in Southern California, Nevada, Arizona and Texas comprising 170 apartment communities. See“Description of the Mortgage Pool—Loan Purpose; Default History, Bankruptcy Issues and Other Proceedings”in the Preliminary Prospectus.
Escrows.The mortgage loan documents provide for upfront escrows in the amount of $78,791 for real estate taxes and $187,369 for deferred maintenance. The loan documents also provide for ongoing monthly reserves in the amount of $23,385 for real estate taxes and $12,842 for replacement reserves. The loan documents do not require ongoing monthly reserves for insurance so long as The Hamptons Property and the Park Pointe Property are insured via an acceptable blanket or umbrella insurance policy that meets the requirements set forth in the mortgage loan documents.
Lockbox and Cash Management. Upon the occurrence and during the continuance of a Triggering Event Period (as defined below), The Hamptons and Park Pointe Crossed Mortgage Loans require that the borrowers establish lockbox accounts, that the borrowers or property managers deposit all rents into such lockbox accounts and that such funds be swept to the lender-controlled cash management accounts. During a Triggering Event Period (as defined below), all excess cash flow after payment of all sums due and payable under the mortgage loan documents and all operating expenses will be retained by the lender as additional collateral.
A “Triggering Event Period” will commence upon the earliest of any of the following: (i) the occurrence and continuance of an event of default or (ii) the trailing 12-month debt service coverage ratio falling below 1.10x for any two consecutive calendar quarters. A Triggering Event Period will be cured, with regard to clause (i), upon the cure of such event of default; and with regard to clause (ii), upon the debt service coverage ratio being equal to or greater than 1.10x for two consecutive calendar quarters.
Property Management. The Hamptons Property is managed by Anza Management Company and the Park Point Property is managed by J.K. Residential Services, Inc., an affiliate of the borrower.
Assumption.The borrowers have a one-time right to transfer The Hamptons Property and the Park Pointe Property provided that certain conditions are satisfied, including (i) no event of default has occurred and is continuing; (ii) the lender reasonably determines that the proposed transferee and guarantor satisfy the lender’s credit review and underwriting standards, taking into consideration the transferee’s experience, financial strength and general business standing; (iii) in the event that in connection with such transfer, the manager will not thereafter continue to manage The Hamptons Property or the Park Pointe Property, then a replacement manager must be acceptable to the lender and (iv) if required by the lender, the lender has received confirmation from Fitch, Moody’s and DBRS that such assumption will not result in a downgrade, withdrawal or qualification of the respective ratings assigned to the Series 2016-C37 Certificates.
Partial Release. The borrowers may obtain the release of either The Hamptons Property or the Park Pointe Property after the lockout period with the payment of a defeasance deposit equal to 115% of the remaining principal amount of the applicable note plus the sum of the applicable expenses required under the loan documents provided (i) the debt service coverage ratio for the remaining property is greater than the greater of (a) the debt service coverage ratio for the 12 calendar months at loan origination and (b) the debt service ratio including the property to be released for the 12 calendar months prior to the release; (ii) the loan to value ratio for the remaining property is no greater than the lesser of (x) the loan to value ratio at loan closing and (y) the loan to value ratio including the property to be released immediately prior to the release and (iii) the debt yield for the remaining property is greater than the greater of (a) the debt yield ratio at the origination date of The Hamptons and Park Pointe Crossed Mortgage Loans and (b) the debt yield including the property to be released immediately prior to the release.
Real Estate Substitution. Not permitted.
Subordinate and Mezzanine Indebtedness. Not permitted.
Ground Lease. None.
THE INFORMATION IN THIS STRUCTURAL AND COLLATERAL TERM SHEET IS NOT COMPLETE AND MAY BE AMENDED PRIOR TO THE TIME OF SALE. THIS TERM SHEET IS NOT AN OFFER TO SELL THESE SECURITIES AND IT IS NOT A SOLICITATION OF AN OFFER TO BUY THESE SECURITIES IN ANY JURISDICTION WHERE THE OFFER OR SALE IS NOT PERMITTED.
98
| The Hamptons AND Park Pointe |
Terrorism Insurance. The mortgage loan documents require an “all risk” insurance policy to be maintained by the borrowers to provide coverage for terrorism in an amount equal to the full replacement cost of The Hamptons Property and the Park Pointe Property, as well as business income insurance covering no less than the 12-month period following the occurrence of a casualty event, together with a 6-month extended period of indemnity.
THE INFORMATION IN THIS STRUCTURAL AND COLLATERAL TERM SHEET IS NOT COMPLETE AND MAY BE AMENDED PRIOR TO THE TIME OF SALE. THIS TERM SHEET IS NOT AN OFFER TO SELL THESE SECURITIES AND IT IS NOT A SOLICITATION OF AN OFFER TO BUY THESE SECURITIES IN ANY JURISDICTION WHERE THE OFFER OR SALE IS NOT PERMITTED.
99
| Hampton Inn Tropicana |
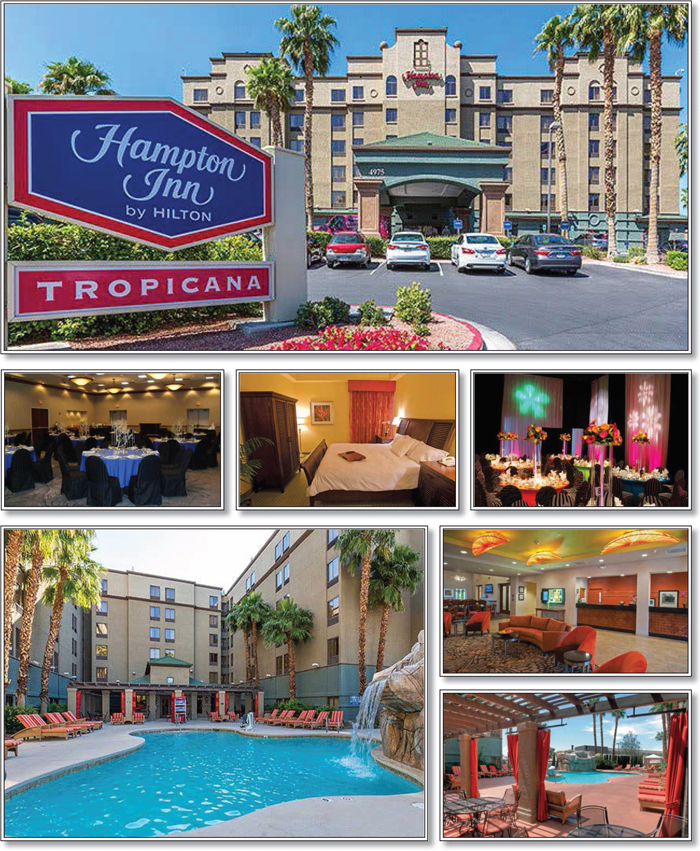
THE INFORMATION IN THIS STRUCTURAL AND COLLATERAL TERM SHEET IS NOT COMPLETE AND MAY BE AMENDED PRIOR TO THE TIME OF SALE. THIS TERM SHEET IS NOT AN OFFER TO SELL THESE SECURITIES AND IT IS NOT A SOLICITATION OF AN OFFER TO BUY THESE SECURITIES IN ANY JURISDICTION WHERE THE OFFER OR SALE IS NOT PERMITTED.
100
| Hampton Inn Tropicana |
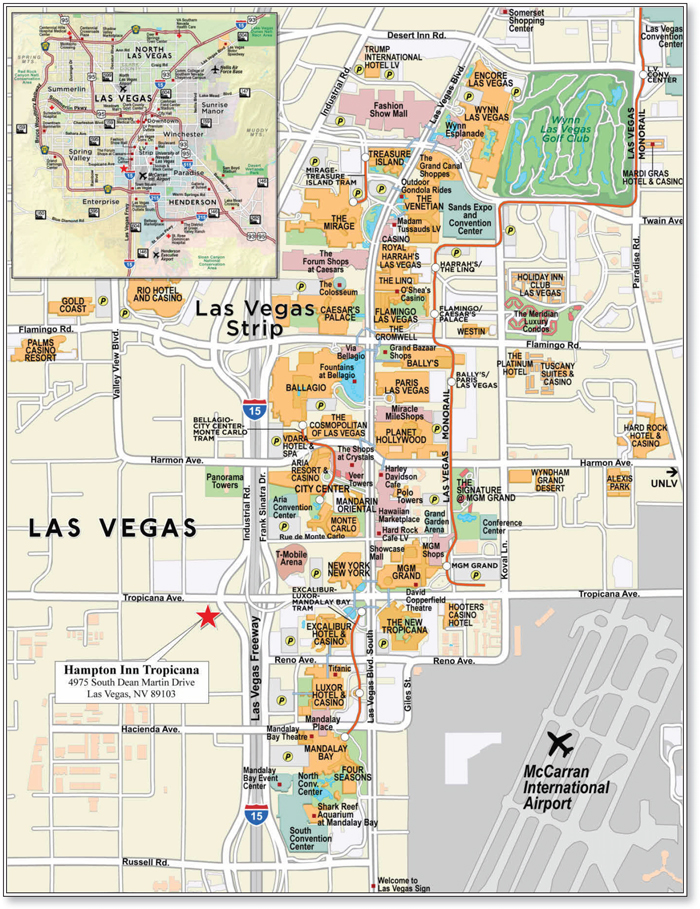
THE INFORMATION IN THIS STRUCTURAL AND COLLATERAL TERM SHEET IS NOT COMPLETE AND MAY BE AMENDED PRIOR TO THE TIME OF SALE. THIS TERM SHEET IS NOT AN OFFER TO SELL THESE SECURITIES AND IT IS NOT A SOLICITATION OF AN OFFER TO BUY THESE SECURITIES IN ANY JURISDICTION WHERE THE OFFER OR SALE IS NOT PERMITTED.
101
| No. 9 – Hampton Inn Tropicana | |||||||||
| Loan Information | Property Information | ||||||||
| Mortgage Loan Seller: | Barclays Bank PLC | Single Asset/Portfolio: | Single Asset | ||||||
| Credit Assessment (DBRS/Fitch/Moody’s): | NR/NR/NR | Property Type: | Hospitality | ||||||
| Original Principal Balance: | $25,475,000 | Specific Property Type: | Limited Service | ||||||
| Cut-off Date Balance: | $25,443,445 | Location: | Las Vegas, NV | ||||||
| % of Initial Pool Balance: | 3.4% | Size: | 322 Rooms | ||||||
| Loan Purpose: | Acquisition | Cut-off Date Balance Per Room: | $79,017 | ||||||
| Borrower Name: | LV Trop Partners LLC | Year Built/Renovated: | 1998/2015 | ||||||
| Sponsor: | Newcastle Properties, LLC; Driftwood Hospitality Management | Title Vesting: | Fee | ||||||
| Mortgage Rate: | 4.835% | Property Manager: | Self-managed | ||||||
| Note Date: | October 21, 2016 | 4thMost Recent Occupancy (As of): | 60.8% (12/31/2012) | ||||||
| Anticipated Repayment Date: | NAP | 3rdMost Recent Occupancy (As of): | 67.7% (12/31/2013) | ||||||
| Maturity Date: | November 6, 2026 | 2ndMost Recent Occupancy (As of): | 71.1% (12/31/2014) | ||||||
| IO Period: | None | Most Recent Occupancy (As of): | 77.8% (12/31/2015) | ||||||
| Loan Term (Original): | 120 months | Current Occupancy (As of): | 81.7% (9/30/2016) | ||||||
| Seasoning: | 1 month | ||||||||
| Amortization Term (Original): | 360 months | Underwriting and Financial Information: | |||||||
| Loan Amortization Type: | Amortizing Balloon | ||||||||
| Interest Accrual Method: | Actual/360 | 4thMost Recent NOI (As of): | $1,722,485 (12/31/2013) | ||||||
| Call Protection: | L(25),D(90),O(5) | 3rdMost Recent NOI (As of): | $2,136,571 (12/31/2014) | ||||||
| Lockbox Type: | Hard/Springing Cash Management | 2ndMost Recent NOI (As of): | $3,014,537 (12/31/2015) | ||||||
| Additional Debt: | None | Most Recent NOI (As of): | $3,487,339 (TTM 9/30/2016) | ||||||
| Additional Debt Type: | NAP | ||||||||
| U/W Revenues: | $10,557,900 | ||||||||
| U/W Expenses: | $7,348,017 | ||||||||
| U/W NOI: | $3,209,884 | ||||||||
| U/W NCF: | $2,787,568 | ||||||||
| Escrows and Reserves(1): | U/W NOI DSCR: | 1.99x | |||||||
| U/W NCF DSCR: | 1.73x | ||||||||
| Type: | Initial | Monthly | Cap (If Any) | U/W NOI Debt Yield: | 12.6% | ||||
| Taxes | $24,351 | $12,175 | NAP | U/W NCF Debt Yield: | 11.0% | ||||
| Insurance | $0 | Springing | NAP | Appraised Value(2): | $38,300,000 | ||||
| FF&E Reserve | $0 | $35,193 | NAP | Appraisal Valuation Date(2): | September 29, 2016 | ||||
| Deferred Maintenance | $13,125 | $0 | NAP | Cut-Off Date LTV Ratio(2): | 66.4% | ||||
| PIP Reserve | $7,935,000 | $0 | NAP | LTV Ratio at Maturity or ARD(2): | 54.4% | ||||
| (1) | See “Escrows” section. |
| (2) | The Cut-off Date LTV Ratio and LTV Ratio at Maturity or ARD are calculated based on the “as-is” appraised value which assumes the upcoming PIP expenditure was reserved at closing. The appraiser concluded to an “as-complete” value of $41,000,000 as of October 1, 2018, which assumes the completion of a property improvement plan for which $7,935,000 was reserved. The Cut-off Date LTV Ratio and LTV Ratio at Maturity or ARD based on the “as-complete” appraised value are 62.1% and 50.8%, respectively. |
The Mortgage Loan. The mortgage loan (the “Hampton Inn Tropicana Mortgage Loan”) is evidenced by a single promissory note that is secured by a first mortgage encumbering the borrower’s fee interest in a limited service hotel located in Las Vegas, Nevada (the “Hampton Inn Tropicana Property”). The Hampton Inn Tropicana Mortgage Loan was originated on October 21, 2016 by Barclays Bank PLC. The Hampton Inn Tropicana Mortgage Loan had an original principal balance of $25,475,000, has an outstanding principal balance as of the Cut-off Date of $25,443,445 and accrues interest at an interest rate of 4.835%per annum. The Hampton Inn Tropicana Mortgage Loan had an initial term of 120 months, has a remaining term of 119 months as of the Cut-off Date and requires payments of principal and interest based on a 30-year amortization schedule. The Hampton Inn Tropicana Mortgage Loan matures on November 6, 2026.
Following the lockout period, the borrower has the right to defease the Hampton Inn Tropicana Mortgage Loan in whole, but not in part, on any date before July 6, 2026. In addition, the Hampton Inn Tropicana Mortgage Loan is prepayable in whole, but not in part, without penalty on or after July 6, 2026.
THE INFORMATION IN THIS STRUCTURAL AND COLLATERAL TERM SHEET IS NOT COMPLETE AND MAY BE AMENDED PRIOR TO THE TIME OF SALE. THIS TERM SHEET IS NOT AN OFFER TO SELL THESE SECURITIES AND IT IS NOT A SOLICITATION OF AN OFFER TO BUY THESE SECURITIES IN ANY JURISDICTION WHERE THE OFFER OR SALE IS NOT PERMITTED.
102
| Hampton Inn Tropicana |
Sources and Uses
| Sources | Uses | |||||
| Original loan amount | 25,475,000 | 63.8% | Purchase price(1) | 28,900,000 | 72.4% | |
| Sponsor’s new cash equity | 14,460,162 | 36.2 | Reserves | 7,972,476 | 20.0 | |
| Closing costs | 3,062,686 | 7.7 | ||||
| Total Sources | $ 39,935,162 | 100.0% | Total Uses | $ 39,935,162 | 100.0% |
| (1) | The Hampton Inn Tropicana Property was previously securitized in the WBCMT 2006-C25 transaction. |
The Property.The Hampton Inn Tropicana Property consists of a six-story, limited-service hotel comprising 322 guestrooms located in Las Vegas, Nevada. Situated on a 4.57-acre parcel, the Hampton Inn Tropicana Property was originally constructed in 1998 with a separate meeting facility known as the Hampton Inn Event Center constructed in 2002 and most recently renovated in 2015 included in the collateral. Occupancy, ADR, RevPAR and NOI have steadily increased as a result of over $2.9 million in capital expenditures since 2011, including lobby renovations and guestroom upgrades according to the appraisal. Coinciding with a new franchise agreement with Hilton Franchise Holding LLC (“Hilton”), the sponsor has renovations planned through a property improvement plan (“PIP”) totaling approximately $7.9 million ($24,643 per room) which has been reserved. These renovations include upgrades to the interior and exterior of the Hampton Inn Tropicana Property to conform to Hilton Worldwide brand standards. The franchise agreement with Hilton expires approximately five years beyond the loan term in October 2031.
The Hampton Inn Tropicana Property contains 181 king guestrooms, 134 double guestrooms, 6 one-bedroom suites and one conference suite. All of the guestrooms are equipped with a telephone with voicemail, a clock radio, a flat-screen television, a safe, an iron, a coffeemaker and a hairdryer. The Hampton Inn Tropicana Property offers 8,440 square feet of meeting space which can be divided into eight separate spaces, the largest of which can accommodate 500 guests. The Hampton Inn Tropicana Property offers more meeting space than any of the primary competitors identified by the appraisal, which have spaces that range from 200 square feet to 2,600 square feet. Other amenities at the Hampton Inn Tropicana Property include an outdoor swimming pool and whirlpool, a fitness center, a business center, a sundry shop, a guest laundry room and vending areas. The Hampton Inn Tropicana Property also includes a breakfast dining area with 72 seats offering complimentary breakfast service and a full service bar. The Hampton Inn Tropicana Property offers complimentary parking and contains a total of 341 dedicated parking spaces in an adjacent three-story parking garage, accounting for a parking ratio of approximately 1.1 space per room. See“Description of the Mortgage Pool—Loan Purpose; Default History, Bankruptcy Issues and Other Proceedings”in the Preliminary Prospectus.
Operating History and Underwritten Net Cash Flow. The following table presents certain information relating to the historical operating performance and the underwritten net cash flow at the Hampton Inn Tropicana Property:
Cash Flow Analysis
| 2013 | 2014 | 2015 | TTM 9/30/2016 | U/W | % of U/W Total Revenue | U/W $ per Room | |
| Occupancy | 67.7% | 71.1% | 77.8% | 81.7% | 80.0% | ||
| ADR | $82.42 | $88.30 | $95.84 | $99.11 | $99.11 | ||
| RevPAR | $50.94 | $62.74 | $74.58 | $80.96 | $79.29 | ||
| Room Revenue | $6,555,178 | $7,373,616 | $8,764,795 | $9,541,521 | $9,344,249 | 88.5% | $29,019 |
| F&B Revenue | 725,044 | 845,756 | 1,009,233 | 1,085,897 | 1,063,446 | 10.1 | 3,303 |
| Other Revenue(1) | 127,357 | 210,946 | 215,951 | 153,376 | 150,205 | 1.4 | 466 |
| Total Revenue | $7,407,579 | $8,430,318 | $9,989,979 | $10,780,794 | $10,557,900 | 100.0% | $32,789 |
| Total Department Expenses | 2,621,882 | 3,007,537 | 3,174,129 | 3,376,280 | 3,299,475 | 31.3 | 10,247 |
| Gross Operating Profit | $4,785,697 | $5,422,781 | $6,815,850 | $7,404,514 | $7,258,425 | 68.7% | $22,542 |
| Total Undistributed Expenses | 2,793,043 | 3,024,276 | 3,547,184 | 3,666,318 | 3,812,985 | 36.1 | 11,842 |
| Profit Before Fixed Charges | $1,992,654 | $2,398,505 | $3,268,666 | $3,738,196 | $3,445,440 | 32.6% | $10,700 |
| Total Fixed Charges | 270,169 | 261,934 | 254,129 | 250,857 | 235,556 | 2.2 | 732 |
| Net Operating Income(2) | $1,722,485 | $2,136,571 | $3,014,537 | $3,487,339 | $3,209,884 | 30.4% | $9,969 |
| FF&E | 0 | 0 | 0 | 0 | 422,316 | 4.0 | 1,312 |
| Net Cash Flow | $1,722,485 | $2,136,571 | $3,014,537 | $3,487,339 | $2,787,568 | 26.4% | $8,657 |
| NOI DSCR | 1.07x | 1.33x | 1.87x | 2.17x | 1.99x | ||
| NCF DSCR | 1.07x | 1.33x | 1.87x | 2.17x | 1.73x | ||
| NOI DY | 6.8% | 8.4% | 11.8% | 13.7% | 12.6% | ||
| NCF DY | 6.8% | 8.4% | 11.8% | 13.7% | 11.0% |
| (1) | Other Revenue includes sundry shop revenue, cancellation fees, telephone charges, guest laundry, and other minor collections. |
| (2) | Net Operating Income has increased from 2013 to TTM 9/30/2016 as a result of over $2.9 million in capital expenditures invested in the Hampton Inn Tropicana Property according to the appraisal. |
THE INFORMATION IN THIS STRUCTURAL AND COLLATERAL TERM SHEET IS NOT COMPLETE AND MAY BE AMENDED PRIOR TO THE TIME OF SALE. THIS TERM SHEET IS NOT AN OFFER TO SELL THESE SECURITIES AND IT IS NOT A SOLICITATION OF AN OFFER TO BUY THESE SECURITIES IN ANY JURISDICTION WHERE THE OFFER OR SALE IS NOT PERMITTED.
103
| Hampton Inn Tropicana |
The Appraisal.As of the appraisal valuation date of September 29, 2016, the Hampton Inn Tropicana Property had an “as is” appraised value of $38,300,000 which assumes the upcoming PIP expenditure was reserved at closing . The appraiser concluded to an “as-complete” value of $41,000,000 as of October 1, 2018, which assumes the completion of a property improvement plan for which $7,935,000 was reserved.
Environmental Matters.According to the Phase I environmental assessment dated October 3, 2016, there was no evidence of any recognized environmental conditions at the Hampton Inn Tropicana Property.
Market Overview and Competition.The Hampton Inn Tropicana Property is located in Las Vegas, Nevada, approximately one half mile west of the Las Vegas Strip. The Hampton Inn Tropicana Property is located immediately off Interstate 15 which runs from San Diego, California to the US/Canada border. The neighborhood is characterized by restaurants, casinos, hotels, and retail outlets along the primary thoroughfares, with residential areas located along the secondary roadways. Additionally, the T-Mobile Arena (“TMA”), a $375 million, multi-use event center owned and operated by MGM Resorts, opened in April 2016 located along Tropicana Avenue, between the Hampton Inn Tropicana Property and the Las Vegas Strip. The TMA can seat up to 20,000 people and hosts a variety of events including concerts, sporting events and other special events. In June 2016, the NHL awarded Las Vegas an expansion franchise which is expected to compete beginning in the 2017/18 NHL season and play its home games in the TMA. Additionally, McCarran International Airport is located approximately two miles from the Hampton Inn Tropicana Property which serves over 40 million passengers annually and is accessible through a free shuttle running from the Hampton Inn Tropicana Property.
The Hampton Inn Tropicana Property is located in the Las Vegas/Clark County market. The market’s demand mix comprises 54.7% commercial, 29.8% leisure and 15.5% meeting and group comparable with The Hampton Inn Tropicana Property’s demand of 50.0% commercial, 30.0% leisure and 20.0% meeting and group. According to the appraisal, the market benefits from high tourism levels year-round with over 42.3 million visitors and approximately 47.9 million total room nights occupied in 2015. In addition, the market has seen annual employment and population growth each year since 2011 with major employers including MGM Resorts International, Caesars Entertainment Corporation, Nellis and Creech Air Force Bases and Wynn Resorts.
Subject and Market Historical Occupancy, ADR and RevPAR(1)
Competitive Set | Hampton Inn Tropicana | Penetration Factor | |||||||
Year | Occupancy | ADR | RevPAR | Occupancy | ADR | RevPAR | Occupancy | ADR | RevPAR |
| 08/31/2016 TTM | 84.4% | $101.49 | $85.61 | 82.8% | $99.52 | $82.41 | 98.2% | 98.1% | 96.3% |
| 12/31/2015 TTM | 76.7% | $96.98 | $74.40 | 78.1% | $95.49 | $74.57 | 101.8% | 98.5% | 100.2% |
| 12/31/2014 TTM | 74.2% | $ 89.22 | $66.17 | 71.2% | $87.86 | $62.57 | 96.0% | 98.5% | 94.6% |
| (1) | Information obtained from third party hospitality report dated September 26, 2016. The competitive set includes the following hotels: Courtyard Las Vegas South, DoubleTree Las Vegas Airport, Hampton Inn Suites Las Vegas Airport, Holiday Inn Express Las Vegas South, Fairfield Inn & Suites Las Vegas South, Four Points by Sheraton Las Vegas Flamingo, La Quinta Inns & Suites Las Vegas Airport South, Hilton Garden Inn Las Vegas Strip South, Fairfield Inn Las Vegas Airport and Hyatt Place Las Vegas. |
The Borrower.The borrower is LV Trop Partners LLC, a Nevada limited liability company and single purpose entity with an independent director. John E. Gross is the guarantor of certain nonrecourse carve-outs under the Hampton Inn Tropicana Mortgage Loan.
The Sponsor.The Sponsors are Newcastle Properties, LLC (“Newcastle”) and Driftwood Hospitality Management (“Driftwood”). Newcastle is a real estate investment, management, leasing and advisory company and sponsor of numerous real estate ventures. John E. Gross is the Chief Executive Officer and Principal of Newcastle. Since 1980, John E. Gross has been involved in the acquisition, ownership, development, management, leasing and financing of diverse properties across the United States. This includes a geographically diverse portfolio comprised of 110 properties in excess of 6.2 million square feet. Driftwood operates and develops hotels throughout the United States and Latin America. Driftwood’s portfolio includes over 40 hotels and more than 8,000 rooms in markets around the United States and Costa Rica.
Escrows.The Hampton Inn Tropicana Mortgage Loan documents require upfront escrows in the amount of $24,351 for real estate taxes, $13,125 for required repairs and $7,935,000 for a PIP Reserve. The Hampton Inn Tropicana Mortgage Loan documents also require monthly escrows in the amount of $12,175 for taxes and $35,193 for FF&E during the first year of the loan term. After the first year of the loan term, the monthly FF&E reserve will be an amount equal to one-twelfth of (i) 2.0% of the projected annual gross income during year two of the loan term, (ii) 3.0% of the projected annual gross income during year three of the loan term, and (iii) 4.0% of the projected annual gross income or an amount reasonably determined by the lender and permitted under the Hampton Inn Tropicana Mortgage Loan documents during year four of the term and thereafter. The Hampton Inn Tropicana Mortgage Loan documents do not require monthly escrows for insurance premiums as long as the Hampton Inn Tropicana Property is insured via an acceptable blanket insurance policy.
Lockbox and Cash Management.The Hampton Inn Tropicana Mortgage Loan requires a lender-controlled hard lockbox account, which is already in place, and that the borrower and property manager deposit all credit card payments directly into the lockbox account. The loan documents also require that the borrower or property manager deposit into the lockbox account no later than one business day after receipt all gross income from operations and all other revenue of any kind from the Hampton Inn Tropicana Property. Prior to the occurrence of a Trigger Period (as defined below), all funds on deposit in the lockbox account are to be disbursed to the borrower. During a Trigger Period, all cash flow is to be swept to a lender-controlled cash management account. Upon the occurrence and continuance of (i) a Low DSCR Period (as defined below) or (ii) an event of default, all excess funds in the cash management account are to be swept to a lender controlled sub-account.
THE INFORMATION IN THIS STRUCTURAL AND COLLATERAL TERM SHEET IS NOT COMPLETE AND MAY BE AMENDED PRIOR TO THE TIME OF SALE. THIS TERM SHEET IS NOT AN OFFER TO SELL THESE SECURITIES AND IT IS NOT A SOLICITATION OF AN OFFER TO BUY THESE SECURITIES IN ANY JURISDICTION WHERE THE OFFER OR SALE IS NOT PERMITTED.
104
| Hampton Inn Tropicana |
A “Trigger Period” will commence upon the earlier of (i) the occurrence of an event of default; or (ii) the debt service coverage ratio being less than 1.20x at the end of any trailing 12-month period. A Trigger Period will expire, with regard to clause (i), upon the cure of such event of default; and with regard to clause (ii), upon the debt service coverage ratio being equal to or greater than 1.20x at the end of any trailing 12-month period.
A “Low DSCR Period” will commence on the last day of the second consecutive calendar quarter for which the debt service coverage ratio is less than 1.20x and ends on the last day of any two consecutive calendar quarters thereafter for each of which the debt service coverage ratio is greater than or equal to 1.25x.
Property Management.The Hampton Inn Tropicana Property is managed by an affiliate of the borrower.
Assumption.The borrower has the right to transfer the Hampton Inn Tropicana Property provided that certain conditions are satisfied, including (i) no event of default has occurred and is continuing; (ii) the lender reasonably determines that the proposed transferee and guarantor satisfy the lender’s credit review and underwriting standards, taking into consideration the transferee’s experience, financial strength and general business standing; and (iii) the lender has received confirmation from DBRS, Fitch and Moody’s that such assumption will not result in a downgrade, withdrawal or qualification of the respective ratings assigned to the Series 2016-C37 Certificates.
Partial Release.Not permitted.
Real Estate Substitution.Not permitted.
Subordinate and Mezzanine Indebtedness. None Permitted.
Ground Lease.None.
Terrorism Insurance.The Hampton Inn Tropicana Mortgage Loan documents require that an “all risk” insurance policy be maintained by the borrower that provides coverage for terrorism in an amount equal to the full replacement cost of the Hampton Inn Tropicana Property, as well as business interruption coverage covering no less than the 18-month period following the occurrence of a casualty event, together with a six-month extended period of indemnity.
THE INFORMATION IN THIS STRUCTURAL AND COLLATERAL TERM SHEET IS NOT COMPLETE AND MAY BE AMENDED PRIOR TO THE TIME OF SALE. THIS TERM SHEET IS NOT AN OFFER TO SELL THESE SECURITIES AND IT IS NOT A SOLICITATION OF AN OFFER TO BUY THESE SECURITIES IN ANY JURISDICTION WHERE THE OFFER OR SALE IS NOT PERMITTED.
105
(THIS PAGE INTENTIONALLY LEFT BLANK)
THE INFORMATION IN THIS STRUCTURAL AND COLLATERAL TERM SHEET IS NOT COMPLETE AND MAY BE AMENDED PRIOR TO THE TIME OF SALE. THIS TERM SHEET IS NOT AN OFFER TO SELL THESE SECURITIES AND IT IS NOT A SOLICITATION OF AN OFFER TO BUY THESE SECURITIES IN ANY JURISDICTION WHERE THE OFFER OR SALE IS NOT PERMITTED.
106
| FREMAUX TOWN CENTER |
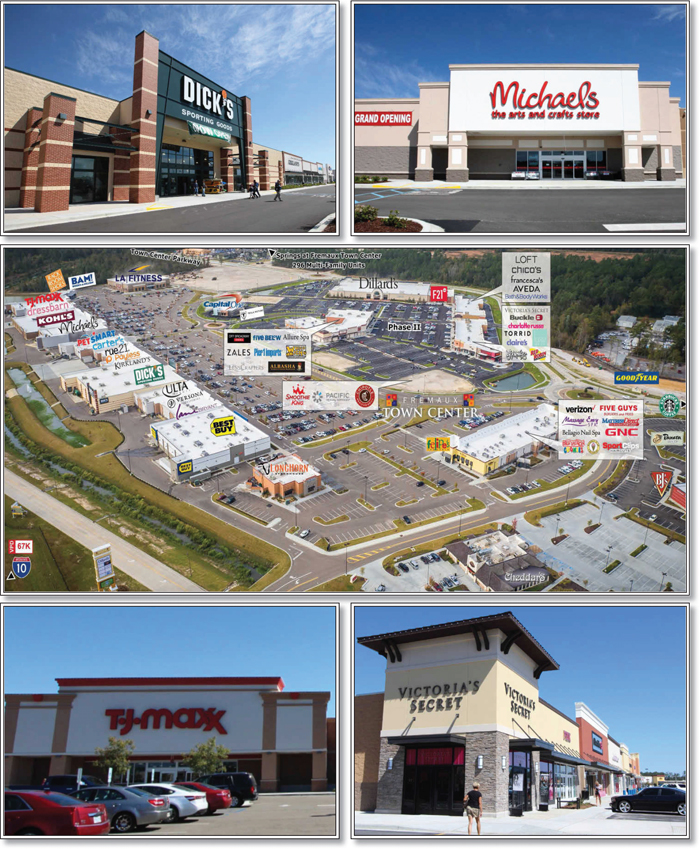
THE INFORMATION IN THIS STRUCTURAL AND COLLATERAL TERM SHEET IS NOT COMPLETE AND MAY BE AMENDED PRIOR TO THE TIME OF SALE. THIS TERM SHEET IS NOT AN OFFER TO SELL THESE SECURITIES AND IT IS NOT A SOLICITATION OF AN OFFER TO BUY THESE SECURITIES IN ANY JURISDICTION WHERE THE OFFER OR SALE IS NOT PERMITTED.
107
| FREMAUX TOWN CENTER |

THE INFORMATION IN THIS STRUCTURAL AND COLLATERAL TERM SHEET IS NOT COMPLETE AND MAY BE AMENDED PRIOR TO THE TIME OF SALE. THIS TERM SHEET IS NOT AN OFFER TO SELL THESE SECURITIES AND IT IS NOT A SOLICITATION OF AN OFFER TO BUY THESE SECURITIES IN ANY JURISDICTION WHERE THE OFFER OR SALE IS NOT PERMITTED.
108
| FREMAUX TOWN CENTER |
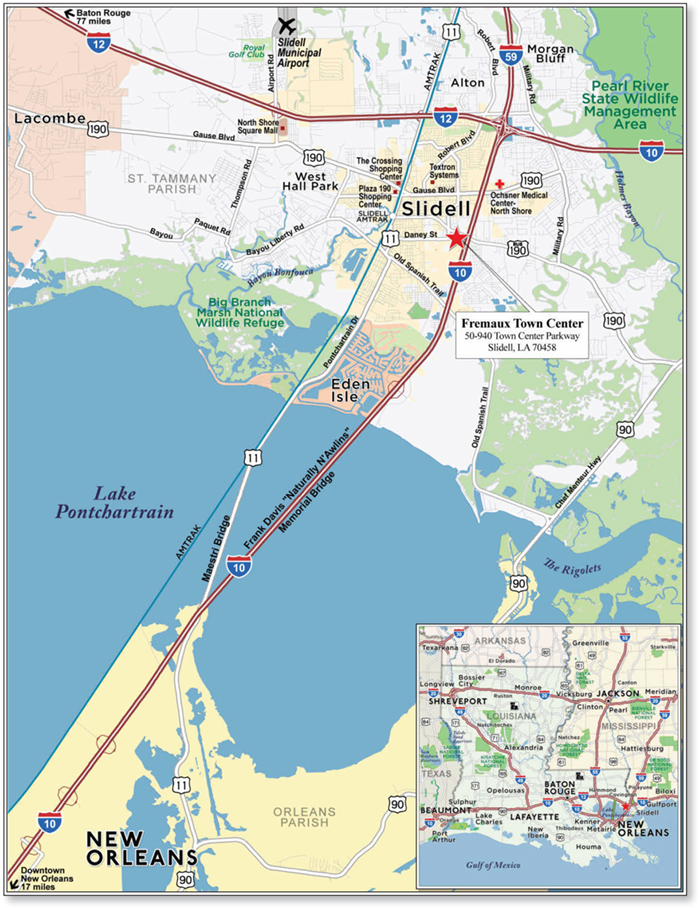
THE INFORMATION IN THIS STRUCTURAL AND COLLATERAL TERM SHEET IS NOT COMPLETE AND MAY BE AMENDED PRIOR TO THE TIME OF SALE. THIS TERM SHEET IS NOT AN OFFER TO SELL THESE SECURITIES AND IT IS NOT A SOLICITATION OF AN OFFER TO BUY THESE SECURITIES IN ANY JURISDICTION WHERE THE OFFER OR SALE IS NOT PERMITTED.
109
| No. 10 - Fremaux Town Center | |||||||
| Loan Information | Property Information | ||||||
| Mortgage Loan Seller: | Wells Fargo Bank, National Association | Single Asset/Portfolio: | Single Asset | ||||
| Credit Assessment (DBRS/Fitch/Moody’s): | NR/NR/NR | Property Type: | Retail | ||||
| Original Principal Balance(1): | $25,000,000 | Specific Property Type: | Anchored | ||||
| Cut-off Date Balance(1): | $24,700,712 | Location: | Slidell, LA | ||||
| % of Initial Pool Balance: | 3.3% | Size: | 397,493 SF | ||||
| Loan Purpose: | Refinance | Cut-off Date Balance Per SF(1): | $181.45 | ||||
| Borrower Name: | Fremaux Town Center SPE, LLC | Year Built/Renovated: | 2014/NAP | ||||
| Sponsors(2): | Various | Title Vesting: | Fee | ||||
| Mortgage Rate: | 3.699% | Property Manager: | Self-managed | ||||
| Note Date: | June 9, 2016 | 4thMost Recent Occupancy(4): | NAV | ||||
| Anticipated Repayment Date: | NAP | 3rdMost Recent Occupancy(4): | NAV | ||||
| Maturity Date: | June 11, 2026 | 2ndMost Recent Occupancy(4): | NAV | ||||
| IO Period: | None | Most Recent Occupancy (As of)(4): | 91.3% (12/31/2015) | ||||
| Loan Term (Original): | 120 months | Current Occupancy (As of): | 93.4% (5/24/2016) | ||||
| Seasoning: | 6 months | ||||||
| Amortization Term (Original): | 300 months | Underwriting and Financial Information: | |||||
| Loan Amortization Type: | Amortizing Balloon | ||||||
| Interest Accrual Method: | Actual/360 | 4thMost Recent NOI(5): | NAV | ||||
| Call Protection: | L(35),GRTR 1% or YM(81),O(4) | 3rdMost Recent NOI(5): | NAV | ||||
| Lockbox Type: | Soft/Springing Cash Management | 2ndMost Recent NOI(5): | NAV | ||||
| Additional Debt(1): | Yes | Most Recent NOI (As of): | $5,582,822 (TTM 8/31/2016) | ||||
| Additional Debt Type(1): | Pari Passu | ||||||
| U/W Revenues: | $9,050,800 | ||||||
| U/W Expenses: | $2,578,047 | ||||||
| U/W NOI: | $6,472,753 | ||||||
| Escrows and Reserves(3): | U/W NCF: | $5,932,001 | |||||
| U/W NOI DSCR(1): | 1.44x | ||||||
| Type: | Initial | Monthly | Cap (If Any) | U/W NCF DSCR(1): | 1.32x | ||
| Taxes | $507,691 | $63,462 | NAP | U/W NOI Debt Yield(1): | 9.0% | ||
| Insurance | $0 | Springing | NAP | U/W NCF Debt Yield(1): | 8.2% | ||
| Replacement Reserves | $0 | $4,970 | NAP | As-Is Appraised Value: | $115,000,000 | ||
| TI/LC Reserve | $0 | Springing | NAP | As-Is Appraisal Valuation Date: | April 28, 2016 | ||
| Free Rent | $44,448 | $0 | NAP | Cut-off Date LTV Ratio(1): | 62.7% | ||
| Existing TI/LC | $475,335 | $0 | NAP | LTV Ratio at Maturity or ARD(1): | 45.2% | ||
| (1) | See “The Mortgage Loan” section. All statistical financial information related to balance per square foot, loan-to-value ratios, debt service coverage ratios and debt yields are based on the funded outstanding principal balance of the Fremaux Town Center Whole Loan (as defined below) as of the Cut-off Date. |
| (2) | See “Sponsors” section. |
| (3) | See “Escrows” section. |
| (4) | See “Historical Occupancy” section. |
| (5) | See “Cash Flow Analysis” section. |
The Mortgage Loan. The mortgage loan (the “Fremaux Town Center Mortgage Loan”) is part of a whole loan (the “Fremaux Town Center Whole Loan”) that is evidenced by threepari passu promissory notes (Notes A-1, A-2 and A-3) secured by a first mortgage encumbering an anchored retail property located in Slidell, Louisiana (the “Fremaux Town Center Property”). The Fremaux Town Center Whole Loan was originated on June 9, 2016 by Wells Fargo Bank, National Association. The Fremaux Town Center Whole Loan had an original principal balance of $73,000,000, has an outstanding principal balance as of the Cut-off Date of $72,126,079 and accrues interest at an interest rate of 3.699%per annum. The Fremaux Town Center Whole Loan had an initial term of 120 months, has a remaining term of 114 months as of the Cut-off Date and requires payments of principal and interest based on a 25-year amortization schedule through the term of the Fremaux Town Center Whole Loan. The Fremaux Town Center Whole Loan matures on June 11, 2026.
Note A-1, which will be contributed to the WFCM 2016-C37 Trust, had an original principal balance of $25,000,000, has an outstanding principal balance as of the Cut-off Date of $24,700,712 and represents the controlling interest in the Fremaux Town Center Whole Loan. The non-controlling Note A-2, which had an original principal balance of $30,000,000, was contributed to the MSC 2016-BNK2 securitization trust. The non-controlling Note A-3, which had an original principal balance of $18,000,000, is expected to be contributed to a future securitization trust. The lender provides no assurances that any non-securitizedpari passu note will not be split further. See “Description of the Mortgage Pool—The Whole Loans—The Non-Serviced Whole Loans—The Fremaux Town Center Whole Loan” in the Preliminary Prospectus.
THE INFORMATION IN THIS STRUCTURAL AND COLLATERAL TERM SHEET IS NOT COMPLETE AND MAY BE AMENDED PRIOR TO THE TIME OF SALE. THIS TERM SHEET IS NOT AN OFFER TO SELL THESE SECURITIES AND IT IS NOT A SOLICITATION OF AN OFFER TO BUY THESE SECURITIES IN ANY JURISDICTION WHERE THE OFFER OR SALE IS NOT PERMITTED.
110
| FREMAUX TOWN CENTER |
Note Summary(1)
| Notes | Original Balance | Note Holder | Controlling Interest | |
| A-1 | $25,000,000 | WFCM 2016-C37 | Yes | |
| A-2 | $30,000,000 | MSC 2016-BNK2 | No | |
| A-3 | $18,000,000 | Wells Fargo Bank, National Association | No | |
| Total | $73,000,000 |
| (1) | The lender provides no assurances that any non-securitized pari passu note will not be split further. |
Following the lockout period, the borrower has the right to prepay the Fremaux Town Center Whole Loan in whole, but not in part, on any date before March 11, 2026, provided that the borrower pay the greater of a yield maintenance premium or a prepayment premium equal to 1.0% of the principal amount being prepaid. The lockout period will expire on or after June 11, 2019.
Sources and Uses
| Sources | Uses | |||||||
| Original whole loan amount | $73,000,000 | 99.3% | Loan payoff | $71,163,492 | 96.8% | |||
| Sponsor’s new cash contribution | 498,618 | 0.7 | Reserves | 1,027,474 | 1.4 | |||
| Closing costs | 1,307,652 | 1.8 | ||||||
| Total Sources | $73,498,618 | 100.0% | Total Uses | $73,498,618 | 100.0% |
The Property.The Fremaux Town Center Property comprises 397,493 square feet of a larger 631,643 square foot retail power center built in two phases in 2014 and 2015 and located in Slidell, Louisiana, approximately 33 miles northeast of the New Orleans, Louisiana central business district. The Fremaux Town Center Property is anchored by Dillard’s (not part of the collateral), Kohl’s, Dick’s Sporting Goods, LA Fitness, Best Buy, TJ Maxx and Michaels with other major tenants including ULTA, PetSmart, Off Broadway and Forever 21. The Fremaux Town Center Property is also tenanted by a mix of lifestyle and restaurant tenants including Ann Taylor Loft, Chico’s, Francesca’s, Victoria’s Secret, Charlotte Russe, Torrid, Journey’s, BJ’s Restaurant & Brewhouse, Cheddar’s, Longhorn Steakhouse and Red Robin. The Fremaux Town Center Property is situated on a 58.3-acre parcel and contains 3,418 surface parking spaces, resulting in a parking ratio of 8.6 spaces per 1,000 square feet of rentable area. As of May 24, 2016, the Fremaux Town Center Property was 93.4% occupied by 51 tenants.
THE INFORMATION IN THIS STRUCTURAL AND COLLATERAL TERM SHEET IS NOT COMPLETE AND MAY BE AMENDED PRIOR TO THE TIME OF SALE. THIS TERM SHEET IS NOT AN OFFER TO SELL THESE SECURITIES AND IT IS NOT A SOLICITATION OF AN OFFER TO BUY THESE SECURITIES IN ANY JURISDICTION WHERE THE OFFER OR SALE IS NOT PERMITTED.
111
| FREMAUX TOWN CENTER |
The following table presents certain information relating to the tenancy at the Fremaux Town Center Property:
Major Tenants
| Tenant Name | Credit Rating (Fitch/Moody’s/ S&P)(1) | Tenant NRSF | % of NRSF | Annual U/W Base Rent PSF | Annual U/W Base Rent | % of Total Annual U/W Base Rent | Sales PSF(2) | Occupancy Cost(2) | Lease Expiration Date |
| Anchor Tenant – Not Part of Collateral | |||||||||
| Dillard’s | NR/NR/NR | 128,000 | ANCHOR OWNED – NOT PART OF THE COLLATERAL | ||||||
| Anchor Tenants | |||||||||
| LA Fitness | NR/NR/NR | 41,000 | 10.3% | $14.50 | $594,500 | 8.3% | NAV | NAV | 8/31/2029 |
| Dick’s | NR/NR/NR | 45,000 | 11.3% | $10.50 | $472,500 | 6.6% | NAV | NAV | 1/31/2025 |
| Best Buy | BBB-/Baa1/BBB- | 30,000 | 7.5% | $12.35 | $370,500 | 5.2% | NAV | NAV | 1/31/2025 |
| TJ Maxx | NR/A2/A+ | 26,000 | 6.5% | $9.50 | $247,000 | 3.4% | $310 | 4.4% | 3/31/2024 |
| Michaels | NR/Ba2/B+ | 21,513 | 5.4% | $11.25 | $242,021 | 3.4% | $106 | 14.6% | 4/30/2024 |
| Kohl’s | BBB/Baa2/BBB | (3) | (3) | (3) | $140,000 | 2.0% | NAV | NAV | 1/31/2035 |
| Total Anchor Tenants(3) | 163,513 | 41.1% | $11.78 | $2,066,521 | 28.8% | ||||
| Major Tenants | |||||||||
| Forever 21 | NR/NR/NR | 16,900 | 4.3% | $19.23 | $325,000 | 4.5% | $149 | 12.9% | 1/31/2026 |
| Off Broadway | NR/NR/NR | 17,024 | 4.3% | $19.00 | $323,456 | 4.5% | $85 | 28.8% | 1/31/2026 |
| PetSmart | NR/B1/B+ | 14,463 | 3.6% | $15.90 | $229,962 | 3.2% | NAV | NAV | 3/31/2024 |
| ULTA | NR/NR/NR | 10,000 | 2.5% | $19.22 | $192,153 | 2.7% | NAV | NAV | 4/30/2024 |
| Pier One | NR/NR/NR | 9,002 | 2.3% | $20.00 | $180,040 | 2.5% | NAV | NAV | 2/28/2026 |
| Five Below | NR/NR/NR | 8,024 | 2.0% | $21.88 | $175,604 | 2.5% | NAV | NAV | 1/31/2026 |
| Total Major Tenants | 75,413 | 19.0% | $18.91 | $1,426,215 | 19.9% | ||||
| Non-Major Tenants(4) | 132,246 | 33.3% | $24.83 | $3,671,060 | 51.2% | ||||
| Occupied Collateral Total(3)(4) | 371,172 | 93.4% | $17.87 | $7,163,796 | 100.0% | ||||
| Vacant Space | 26,321 | 6.6% | |||||||
| Collateral Total | 397,493 | 100.0% | |||||||
| (1) | Certain ratings are those of the parent company whether or not the parent guarantees the lease. |
| (2) | Sales for TJ Maxx are for the trailing 12-month period ending January 31, 2016; sales for Michaels are for the trailing 12-month period ending December 31, 2015; and sales for Off Broadway and Forever 21 are based on the trailing 11-month period, annualized, ending August 31, 2016. |
| (3) | Kohl’s is a leased fee tenant, owns its improvements and has no associated square footage. The aggregate Annual U/W Base Rent associated with Kohl’s was excluded from the Annual U/W Base Rent PSF calculations. |
| (4) | Non-Major Tenants and Occupied Collateral Total includes (i) three leased fee tenants (in addition to Kohl’s) that own their improvements and have no associated square footage and (ii) management office space that has no associated lease or Annual U/W Base Rent. The aggregate Annual U/W Base Rent associated with the three leased fee tenants ($425,000) and the square footage associated with the management office (483 SF) were excluded from the Annual U/W Base Rent PSF calculations. |
THE INFORMATION IN THIS STRUCTURAL AND COLLATERAL TERM SHEET IS NOT COMPLETE AND MAY BE AMENDED PRIOR TO THE TIME OF SALE. THIS TERM SHEET IS NOT AN OFFER TO SELL THESE SECURITIES AND IT IS NOT A SOLICITATION OF AN OFFER TO BUY THESE SECURITIES IN ANY JURISDICTION WHERE THE OFFER OR SALE IS NOT PERMITTED.
112
| FREMAUX TOWN CENTER |
The following table presents certain information relating to the lease rollover schedule at the Fremaux Town Center Property:
Lease Expiration Schedule(1)(2)
| Year Ending December 31, | No. of Leases Expiring | Expiring NRSF | % of Total NRSF | Cumulative Expiring NRSF | Cumulative % of Total NRSF | Annual U/W Base Rent | % of Total Annual U/W Base Rent | Annual U/W Base Rent PSF(3) |
| MTM | 0 | 0 | 0.0% | 0 | 0.0% | $0 | 0.0% | $0.00 |
| 2016 | 0 | 0 | 0.0% | 0 | 0.0% | $0 | 0.0% | $0.00 |
| 2017 | 0 | 0 | 0.0% | 0 | 0.0% | $0 | 0.0% | $0.00 |
| 2018 | 0 | 0 | 0.0% | 0 | 0.0% | $0 | 0.0% | $0.00 |
| 2019 | 6 | 21,799 | 5.5% | 21,799 | 5.5% | $574,218 | 8.0% | $26.34 |
| 2020 | 4 | 10,860 | 2.7% | 32,659 | 8.2% | $275,375 | 3.8% | $25.36 |
| 2021 | 1 | 3,745 | 0.9% | 36,404 | 9.2% | $93,625 | 1.3% | $25.00 |
| 2022 | 1 | 7,500 | 1.9% | 43,904 | 11.0% | $110,000 | 1.5% | $14.67 |
| 2023 | 0 | 0 | 0.0% | 43,904 | 11.0% | $0 | 0.0% | $0.00 |
| 2024(4) | 10 | 86,526 | 21.8% | 130,430 | 32.8% | $1,440,326 | 20.1% | $15.32 |
| 2025 | 11 | 106,651 | 26.8% | 237,081 | 59.6% | $1,652,691 | 23.1% | $15.50 |
| 2026 | 13 | 88,108 | 22.2% | 325,189 | 81.8% | $1,865,085 | 26.0% | $21.17 |
| Thereafter(4)(5)(6) | 6 | 45,983 | 11.6% | 371,172 | 93.4% | $1,152,475 | 16.1% | $15.99 |
| Vacant | 0 | 26,321 | 6.6% | 397,493 | 100.0% | $0 | 0.0% | $0.00 |
| Total/Weighted Average(4)(5)(6) | 52 | 397,493 | 100.0% | $7,163,796 | 100.0% | $17.87 |
| (1) | Information obtained from the underwritten rent roll. |
| (2) | Certain tenants may have lease termination options that are exercisable prior to the originally stated expiration date of the subject lease and that are not considered in the Lease Expiration Schedule. |
| (3) | Weighted Average Annual U/W Base Rent PSF excludes vacant space. |
| (4) | Includes Longhorn Steakhouse, which is a leased fee tenant, owns its improvements and has no attributed square footage. Longhorn Steakhouse’s U/W Rent of $115,000 was excluded from the Weighted Average Annual U/W Base Rent PSF calculation. |
| (5) | Includes Capital One, Cheddar’s and Kohl’s, which are leased fee tenants, own their improvements and have no attributed square footage. The aggregate U/W Rent associated with these three tenants of $425,000 was excluded from the Weighted Average Annual U/W base rent PSF calculation. |
| (6) | Includes management space totaling 483 square feet, which has no associated lease or U/W Base Rent. The square footage associated with the management space was excluded from the Weighted Average Annual U/W Base Rent PSF calculation. |
The following table presents historical occupancy percentages at the Fremaux Town Center Property:
Historical Occupancy
12/31/2012(1) | 12/31/2013(1) | 12/31/2014(1) | 12/31/2015(2) | 5/24/2016(3) |
| NAV | NAV | NAV | 91.3% | 93.4% |
| (1) | Historical occupancy prior to 2015 is not available, as the Fremaux Town Center Property was built in two phases in 2014 and 2015. |
| (2) | Information obtained from the borrower. |
| (3) | Information obtained from the underwritten rent roll. |
THE INFORMATION IN THIS STRUCTURAL AND COLLATERAL TERM SHEET IS NOT COMPLETE AND MAY BE AMENDED PRIOR TO THE TIME OF SALE. THIS TERM SHEET IS NOT AN OFFER TO SELL THESE SECURITIES AND IT IS NOT A SOLICITATION OF AN OFFER TO BUY THESE SECURITIES IN ANY JURISDICTION WHERE THE OFFER OR SALE IS NOT PERMITTED.
113
| FREMAUX TOWN CENTER |
Operating History and Underwritten Net Cash Flow. The following table presents certain information relating to the historical operating performance and the underwritten net cash flow at the Fremaux Town Center Property:
Cash Flow Analysis(1)
| TTM 8/31/2016 | U/W | % of U/W Effective Gross Income | U/W $ per SF | ||
| Base Rent | $6,608,553(2) | $7,163,796(2) | 79.2% | $18.02 | |
| Grossed Up Vacant Space | 0 | 1,032,858 | 11.4 | 2.60 | |
| Total Reimbursables | 1,429,202 | 1,887,004 | 20.8 | 4.75 | |
| Other Income | 0 | 0 | 0.0 | 0.00 | |
| Less Vacancy & Credit Loss | 0 | (1,032,858)(3) | (11.4) | (2.60) | |
| Effective Gross Income | $8,037,755 | $9,050,800 | 100.0% | $22.77 | |
| Total Operating Expenses | $2,454,934 | $2,578,047 | 28.5% | $6.49 | |
| Net Operating Income | $5,582,822(2) | $6,472,753(2) | 71.5% | $16.28 | |
| TI/LC | 0 | 481,128 | 5.3 | 1.21 | |
| Capital Expenditures | 0 | 59,624 | 0.7 | 0.15 | |
| Net Cash Flow | $5,582,822 | $5,932,001 | 65.5% | $14.92 | |
| NOI DSCR(4) | 1.25x | 1.44x | |||
| NCF DSCR(4) | 1.25x | 1.32x | |||
| NOI DY(4) | 7.7% | 9.0% | |||
| NCF DY(4) | 7.7% | 8.2% |
| (1) | Historical financials prior to TTM 8/31/2016 are not available, as the Fremaux Town Center Property was built in two phases in 2014 and 2015. |
| (2) | U/W Base Rent and U/W Net Operating Income are higher than TTM 8/31/2016 as the Fremaux Town Center Property was built in two phases in 2014 and 2015. Twenty-seven tenants accounting for 42.4% of U/W Base Rent have signed new leases and taken occupancy since October 2015. |
| (3) | The underwritten economic vacancy is 12.6%. The Fremaux Town Center Property was 93.4% physically occupied as of September 22, 2016. |
| (4) | The debt service coverage ratios and debt yields are based on the Fremaux Town Center Whole Loan. |
Appraisal.As of the appraisal valuation date of April 28, 2016, the Fremaux Town Center Property had an “as-is” appraised value of $115,000,000. The appraiser also concluded to an “as-stabilized” value of $120,000,000 as of March 1, 2017, which equates to an “as-stabilized” Cut-off Date LTV Ratio of 60.1%.
Environmental Matters. According to a Phase I environmental site assessment dated May 2, 2016, there was no evidence of any recognized environmental conditions at the Fremaux Town Center Property.
Market Overview and Competition.The Fremaux Town Center Property is situated at the southwest corner of Interstate 10 and Fremaux Avenue in the city of Slidell, Louisiana, approximately 33 miles northeast of the New Orleans, Louisiana central business district. The city of Slidell is located within St. Tammany Parish and according to the appraisal, is the largest city on the northeastern shore of Lake Pontchartrain, serving as one of the primary economic hubs of the broader parish. Health care represents Slidell’s largest employment sector, accounting for approximately 25% of total employment in the city. Among the top employers in the surrounding area are Slidell Memorial Hospital, Ochsner Medical Center Northshore and Louisiana Medical Center. The Fremaux Town Center Property is situated along Interstate 10, which according to a third-party market research provider, has a daily traffic count of approximately 78,360.
The neighborhood surrounding the Fremaux Town Center Property is centered around Interstate 10 and comprises commercial, residential and small clusters of light industrial uses. A number of retail and office developments are situated along Interstate 10, the largest of which is the Fremaux Town Center Property. Interstate 10 connects with Gause Boulevard, one of Slidell’s primary commercial corridors, which includes a wide variety of local and national retailers. According to the appraisal, as of 2015, the estimated population and household income within a five-mile radius of the Fremaux Town Center Property was 79,623 and $79,149, respectively.
According to a third-party market research report, the Fremaux Town Center Property is located within the St. Tammany Parish submarket, which accounts for approximately 18.2% of the overall New Orleans retail market. As of the second quarter of 2016, the submarket reported total inventory of 944 retail properties totaling approximately 13.9 million square feet with a 6.2% vacancy rate. The appraisal concluded to the following market rents for the Fremaux Town Center Property, all on a triple-net basis: $10.50 per square foot for anchor spaces; $14.50 per square foot for the LA Fitness space; $11.00 per square foot for junior anchor spaces over 20,000 square foot; $18.00 per square foot for junior anchor spaces less than 20,000 square foot; and $20.00 to $25.00 per square foot for inline spaces.
THE INFORMATION IN THIS STRUCTURAL AND COLLATERAL TERM SHEET IS NOT COMPLETE AND MAY BE AMENDED PRIOR TO THE TIME OF SALE. THIS TERM SHEET IS NOT AN OFFER TO SELL THESE SECURITIES AND IT IS NOT A SOLICITATION OF AN OFFER TO BUY THESE SECURITIES IN ANY JURISDICTION WHERE THE OFFER OR SALE IS NOT PERMITTED.
114
| FREMAUX TOWN CENTER |
The following table presents certain information relating to comparable properties to the Fremaux Town Center Property:
Competitive Set(1)
Fremaux Town Center (Subject) | River Chase | Stirling Slidell Center | The Village at Northshore | Midtown Square | |
| Location | Slidell, LA | Covington, LA | Slidell, LA | Slidell, LA | Slidell, LA |
| Distance from Subject | -- | 30.2 miles | 9.6 miles | 5.7 miles | 1.8 miles |
| Property Type | Anchored Retail Center | Anchored Retail Center | Anchored Retail Center | Anchored Retail Center | Anchored Retail Center |
| Year Built/Renovated | 2014/NAP | 2004/NAP | 2003/NAP | 1988/1993 | 1976/1999 |
| Anchors | Dillard’s (non-collateral), Kohl’s, Dick’s, LA Fitness, Best Buy, TJ Maxx, Michaels | Belk, JCPenney, Marshalls, Michaels, Cost Plus, Ulta, Ross Dress for Less, Best Buy, Hollywood Theaters | Target, Ross Dress for Less, Shoe Carnival, Party City, Academy Sports, PetSmart | Toys R Us, Marshalls, Bed Bath & Beyond, Jo-Ann, Dollar Tree | Hobby Lobby, Harbor Freight Tools, Office Depot, Stage |
| Total GLA | 397,493 SF | 488,000 SF | 350,194 SF | 114,638 SF | 153,000 SF |
| Total Occupancy | 93.4% | 100.0% | 91.4% | 96.7% | 100.0% |
| (1) | Information obtained from the appraisal and underwritten rent roll. |
The Borrower.The borrower is Fremaux Town Center SPE, LLC, a Delaware limited liability company and single purpose entity with one independent director. Legal counsel to the borrower delivered a non-consolidation opinion in connection with the origination of the Fremaux Town Center Whole Loan. The guarantors of certain nonrecourse carveouts under the Fremaux Town Center Whole Loan are CBL & Associates Limited Partnership (“CBL”) and seven executives of Stirling Properties: Martin A. Mayer; Lewis W. Stirling, III; Grady K. Brame; George T. Underhill, IV; Jeffrey L. Marshall; Paul M. Mastio; and Donna F. Taylor.
The Sponsor.The sponsors are CBL and seven executives of Stirling Properties: Martin A. Mayer; Lewis W. Stirling, III; Grady K. Brame; George T. Underhill, IV; Jeffrey L. Marshall; Paul M. Mastio; and Donna F. Taylor. CBL is a real estate investment trust listed on the New York Stock Exchange and is one of the largest mall REITs in the United States with ownership or management interests in more than 140 properties including enclosed malls and open-air centers. Based in Covington, Louisiana, Stirling Properties is a regionally-focused full-service commercial real estate firm. Stirling Properties was founded in 1975 and currently owns and manages a portfolio of 89 retail properties totaling approximately 11.4 million square feet, with approximately 72.7% of the portfolio in the state of Louisiana. CBL’s parent company is subject to ongoing litigation. See“Description of the Mortgage Pool—Litigation and Other Considerations” in the Preliminary Prospectus.
Escrows.The loan documents provide for an upfront escrow at closing in the amount of $507,691 for real estate taxes, $44,448 for future rent credits or abatements reserves and $475,335 for existing tenant improvement and leasing commission (“TI/LC”) obligations ($205,975 for Albasha and $269,360 for Chico’s).
The loan documents provide for ongoing monthly escrows of $63,462 for taxes, $4,970 for replacement reserves and commencing in June 2023, $135,000 for TI/LCs. The loan documents do not require ongoing monthly escrows for insurance premiums as long as (i) no event of default has occurred and is continuing, (ii) the borrower provides the lender with evidence that the Fremaux Town Center Property is insured via an acceptable blanket insurance policy and such policy is in full force and effect and (iii) the borrower provides the lender with evidence of renewal of the insurance policies and timely proof of payment of insurance premiums.
Lockbox and Cash Management.The Fremaux Town Center Whole Loan requires a lender-controlled lockbox account, which is already in place, and that the borrower will deposit all rents directly into such lockbox account. The loan documents also require that all rents received by the borrower or the property manager be deposited into the lockbox account within two business days of receipt. Prior to the occurrence of a Cash Trap Event Period (as defined below), all cash flow is distributed to the borrower. During a Cash Trap Event Period, all cash flow is swept to a lender-controlled cash management account.
A “Cash Trap Event Period” means the occurrence of (i) an event of default or (ii) the debt service coverage ratio falling below 1.20x (based on 25-year amortization). A Cash Trap Event Period will end, with respect to clause (i), upon the cure of such event of default and with respect to clause (ii), upon the debt service coverage ratio being equal to or greater than 1.25x (based on 25-year amortization) for two consecutive calendar quarters.
Property Management. The Fremaux Town Center Property is managed by an affiliate of the borrower.
Assumption. The borrower has the right to transfer the Fremaux Town Center Whole Property provided that certain conditions are satisfied, including (i) no event of default has occurred and is continuing; (ii) in the event that in connection with such transfer, the manager will not thereafter continue to manage the Fremaux Town Center Property, then a replacement management agreement with a qualified manager must be executed acceptable to lender; (iii) the transferee must not have been a party to any bankruptcy action within the previous seven years and there is no material litigation or regulatory action pending against the transferee unreasonable to lender; and (iv) the transferee is a qualified transferee meeting the requirements set forth in the loan documents or the lender receives rating agency confirmation from DBRS, Fitch and Moody’s that the sale and assumption will not result in a downgrade, withdrawal or qualification of the respective ratings assigned to the Series 2016-C37 certificates and similar confirmations from each rating agency rating any securities backed by any of the Fremaux Town Center Companion Loans with respect to the ratings of such securities.
THE INFORMATION IN THIS STRUCTURAL AND COLLATERAL TERM SHEET IS NOT COMPLETE AND MAY BE AMENDED PRIOR TO THE TIME OF SALE. THIS TERM SHEET IS NOT AN OFFER TO SELL THESE SECURITIES AND IT IS NOT A SOLICITATION OF AN OFFER TO BUY THESE SECURITIES IN ANY JURISDICTION WHERE THE OFFER OR SALE IS NOT PERMITTED.
115
| FREMAUX TOWN CENTER |
Partial Release. Not permitted.
Additional Indebtedness. None.
Real Estate Substitution.Not permitted.
Subordinate and Mezzanine Indebtedness.Not permitted.
Ground Lease. None.
Terrorism Insurance.The loan documents require that the “all risk” insurance policy required to be maintained by the borrower provide coverage for terrorism in an amount equal to the full replacement cost of the Fremaux Town Center Property, as well as business interruption insurance covering no less than an amount equal to 100% of the projected gross income from the Fremaux Town Center Property on an actual loss sustained basis for a period beginning on the date of business interruption and continuing until the restoration of the Fremaux Town Center Property is completed, or the 18-month period following the occurrence of a casualty event, together with a six-month extended period of indemnity.
Windstorm and Flood Insurance. The loan documents require windstorm and flood insurance covering the full replacement cost of the Fremaux Town Center Property during the loan term. At the time of loan closing, the Fremaux Town Center Property had windstorm insurance coverage and flood insurance in the maximum limit available under the National Flood Insurance Program together with excess coverage.
THE INFORMATION IN THIS STRUCTURAL AND COLLATERAL TERM SHEET IS NOT COMPLETE AND MAY BE AMENDED PRIOR TO THE TIME OF SALE. THIS TERM SHEET IS NOT AN OFFER TO SELL THESE SECURITIES AND IT IS NOT A SOLICITATION OF AN OFFER TO BUY THESE SECURITIES IN ANY JURISDICTION WHERE THE OFFER OR SALE IS NOT PERMITTED.
116
(THIS PAGE INTENTIONALLY LEFT BLANK)
THE INFORMATION IN THIS STRUCTURAL AND COLLATERAL TERM SHEET IS NOT COMPLETE AND MAY BE AMENDED PRIOR TO THE TIME OF SALE. THIS TERM SHEET IS NOT AN OFFER TO SELL THESE SECURITIES AND IT IS NOT A SOLICITATION OF AN OFFER TO BUY THESE SECURITIES IN ANY JURISDICTION WHERE THE OFFER OR SALE IS NOT PERMITTED.
117
| MIDWEST INDUSTRIAL PORTFOLIO |

THE INFORMATION IN THIS STRUCTURAL AND COLLATERAL TERM SHEET IS NOT COMPLETE AND MAY BE AMENDED PRIOR TO THE TIME OF SALE. THIS TERM SHEET IS NOT AN OFFER TO SELL THESE SECURITIES AND IT IS NOT A SOLICITATION OF AN OFFER TO BUY THESE SECURITIES IN ANY JURISDICTION WHERE THE OFFER OR SALE IS NOT PERMITTED.
118
| MIDWEST INDUSTRIAL PORTFOLIO |
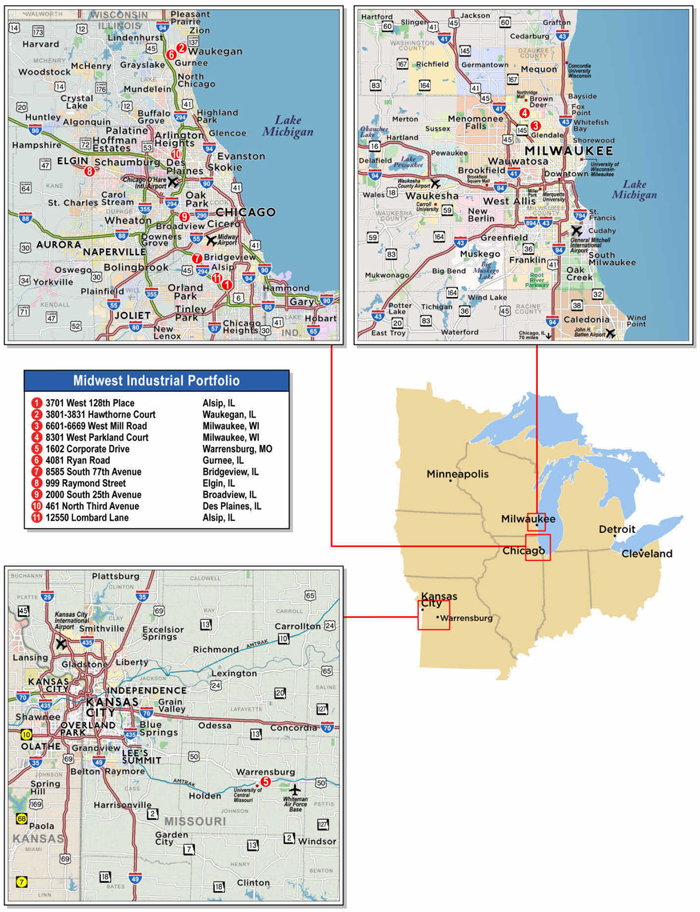
THE INFORMATION IN THIS STRUCTURAL AND COLLATERAL TERM SHEET IS NOT COMPLETE AND MAY BE AMENDED PRIOR TO THE TIME OF SALE. THIS TERM SHEET IS NOT AN OFFER TO SELL THESE SECURITIES AND IT IS NOT A SOLICITATION OF AN OFFER TO BUY THESE SECURITIES IN ANY JURISDICTION WHERE THE OFFER OR SALE IS NOT PERMITTED.
119
| No. 11 – Midwest Industrial Portfolio | |||||||
| Loan Information | Property Information | ||||||
| Mortgage Loan Seller: | Barclays Bank PLC | Single Asset/Portfolio: | Portfolio | ||||
| Credit Assessment (DBRS/Fitch/Moody’s): | NR/NR/NR | Property Type: | Industrial | ||||
| Original Principal Balance(1): | $23,100,000 | Specific Property Type: | Warehouse | ||||
| Cut-off Date Principal Balance(1): | $23,100,000 | Location: | Various – See Table | ||||
| % of Initial Pool Balance: | 3.1% | Size: | 1,255,014 SF | ||||
| Loan Purpose(2): | Acquisition | Cut-off Date Balance Per SF(1): | $30.68 | ||||
| Borrower Name(3): | GFG CI-1 LLC | Year Built/Renovated: | Various – See Table | ||||
| Sponsors: | GFH Capital, Limited; Brennan Investment Group | Title Vesting: | Fee | ||||
| Mortgage Rate: | 4.763% | Property Manager: | Self-managed | ||||
| Note Date: | November 21, 2016 | 4thMost Recent Occupancy (As of)(5): | 81.8% (12/31/2012) | ||||
| Anticipated Repayment Date: | NAP | 3rdMost Recent Occupancy (As of)(5): | 94.9% (12/31/2013) | ||||
| Maturity Date: | December 6, 2026 | 2ndMost Recent Occupancy(As of)(5): | 94.9% (12/31/2014) | ||||
| IO Period: | 60 months | Most Recent Occupancy(As of)(5): | 93.4% (12/31/2015) | ||||
| Loan Term (Original): | 120 months | Current Occupancy (As of)(5): | 90.7% (11/15/2016) | ||||
| Seasoning: | 0 months | ||||||
| Amortization Term (Original): | 360 months | Underwriting and Financial Information: | |||||
| Loan Amortization Type: | Interest-only, Amortizing Balloon | ||||||
| Interest Accrual Method: | Actual/360 | 4thMost Recent NOI (As of)(6): | $3,077,831 (12/31/2013) | ||||
| Call Protection: | L(24),D(92),O(4) | 3rdMost Recent NOI (As of)(6): | $3,067,389 (12/31/2014) | ||||
| Lockbox Type: | Hard/Springing Cash Management | 2ndMost Recent NOI (As of)(6): | $3,509,323 (12/31/2015) | ||||
| Additional Debt(1): | Yes | Most Recent NOI (As of)(6): | $3,916,045 (TTM 6/30/2016) | ||||
| Additional Debt Type(1): | Pari Passu | ||||||
| U/W Revenues: | $5,992,154 | ||||||
| U/W Expenses: | $2,208,494 | ||||||
| U/W NOI: | $3,783,660 | ||||||
| Escrows and Reserves(4): | U/W NCF: | $3,364,371 | |||||
| U/W NOI DSCR(1): | 1.57x | ||||||
| Type: | Initial | Monthly | Cap (If Any) | U/W NCF DSCR(1): | 1.39x | ||
| Taxes | $374,833 | $116,397 | NAP | U/W NOI Debt Yield(1): | 9.8% | ||
| Insurance | $0 | Springing | NAP | U/W NCF Debt Yield(1): | 8.7% | ||
| Replacement Reserves | $0 | Springing | $617,940 | As-Is Appraised Value: | $53,990,000 | ||
| TI/LC Reserves | $0 | $19,130 | $753,008 | As-Is Appraisal Valuation Date: | Various | ||
| Deferred Maintenance | $2,599,530 | $0 | NAP | Cut-off Date LTV Ratio(1): | 71.3% | ||
| Broadview Property Repairs | $250,000 | $0 | NAP | LTV Ratio at Maturity or ARD(1): | 65.5% | ||
| (1) | See “The Mortgage Loan” section. All statistical financial information related to balance per square foot, loan-to-value ratios, debt based on the funded outstanding principal balance of the Midwest Industrial Portfolio Whole Loan (as defined below) as of the Cut-off Date. |
| (2) | See “Sources and Uses” section. |
| (3) | See “The Borrowers” section. |
| (4) | See “Escrows” section. |
| (5) | See “Historical Occupancy” section. |
| (6) | See “Cash Flow Analysis” section. |
The Mortgage Loan. The mortgage loan (the “Midwest Industrial Portfolio Mortgage Loan”) is part of a whole loan (the “Midwest Industrial Portfolio Whole Loan”) that is evidenced by twopari passu promissory notes (Notes A-1 and A-2) that are secured by a first mortgage encumbering 11 industrial properties located in Illinois, Missouri and Wisconsin (the “Midwest Industrial Portfolio Properties”). The Midwest Industrial Portfolio Whole Loan was originated on November 21, 2016 by Barclays Bank PLC. The Midwest Industrial Portfolio Whole Loan had an original principal balance of $38,500,000, has an outstanding principal balance as of the Cut-off Date of $38,500,000 and accrues interest at an interest rate of 4.763%per annum. The Midwest Industrial Portfolio Whole Loan had an initial term of 120 months, has a remaining term of 120 months as of the Cut-off Date and requires interest-only payments for the first 60 payments of the Midwest Industrial Portfolio Whole Loan. The Midwest Industrial Portfolio Whole Loan matures on December 6, 2026.
The Midwest Industrial Portfolio Mortgage Loan, evidenced by the controlling Note A-1, which will be contributed to the WFCM 2016-C37 Trust, had an original principal balance of $23,100,000 and has an outstanding principal balance as of the Cut-off Date of $23,100,000. The non-controlling Note A-2, with an original principal balance of $15,400,000, is currently held by Barclays Bank PLC and is expected to be contributed to a future trust or trusts. The lender provides no assurances that the non-securitized pari passu note will not be split further.
THE INFORMATION IN THIS STRUCTURAL AND COLLATERAL TERM SHEET IS NOT COMPLETE AND MAY BE AMENDED PRIOR TO THE TIME OF SALE. THIS TERM SHEET IS NOT AN OFFER TO SELL THESE SECURITIES AND IT IS NOT A SOLICITATION OF AN OFFER TO BUY THESE SECURITIES IN ANY JURISDICTION WHERE THE OFFER OR SALE IS NOT PERMITTED.
120
| MIDWEST INDUSTRIAL PORTFOLIO |
Note Summary
| Notes | Original Balance | Note Holder | Controlling Interest | |
| A-1 | $23,100,000 | WFCM 2016-C37 | Yes | |
| A-2 | $15,400,000 | Barclays Bank PLC | No | |
| Total | $38,500,000 |
Following the lockout period, the borrowers have the right to defease the Midwest Industrial Portfolio Whole Loan in whole, or in part (see “Partial Release” section), on any date before September 6, 2026. In addition, the Midwest Industrial Portfolio Whole Loan is prepayable without penalty on or after September 6, 2026. The lockout period will expire on the earlier to occur of (i) two years after the closing date of the securitization that includes the last note to be securitized and (ii) November 21, 2019.
Sources and Uses
| Sources | Uses | |||||||
| Original loan amount | $38,500,000 | 65.1% | Purchase price(1) | $53,266,000 | 90.0% | |||
| Sponsor’s new cash contribution | 17,829,324 | 30.1 | Reserves | 3,224,363 | 5.4 | |||
| Other Sources | 2,853,446 | 4.8 | Closing costs | 2,692,407 | 4.5 | |||
| Total Sources | $59,182,770 | 100.0% | Total Uses | $59,182,770 | 100.0% |
| (1) | Two of the Midwest Industrial Portfolio Properties were acquired by Brennan (as defined below) in April 2015 and January 2016 and will be contributed to the JV partnership with GFH (as defined below) as part of the acquisition financing. |
The Properties. The Midwest Industrial Portfolio Properties comprise 11 industrial properties totaling 1,255,014 square feet. Eight of the Midwest Industrial Portfolio Properties are located throughout the Chicago, Illinois metropolitan statistical area; one of the Midwest Industrial Portfolio Properties is located in the Kansas City, Missouri metropolitan statistical area; and two of the Midwest Industrial Portfolio Properties are located in the Milwaukee, Wisconsin metropolitan statistical area. The Midwest Industrial Portfolio Properties are geographically diverse as the properties are located in eight different submarkets. Built between 1956 and 1998, the Midwest Industrial Portfolio Properties range in size from 54,308 square feet to 217,500 square feet and feature clear heights ranging from 10 feet to 25 feet.
Four of the Midwest Industrial Portfolio Properties (25.8% of net rentable area) are 100% occupied by single tenants including the 1602 Corporate Drive Property, the 8585 South 77th Avenue Property, the 12550 Lombard Lane Property and the 999 Raymond Street Property; while the seven remaining Midwest Industrial Portfolio Properties (74.2% of net rentable area) are multi-tenanted and feature two to 21 tenant spaces. The Midwest Industrial Portfolio Properties feature an average remaining lease term of 5.9 years. The two largest tenants by net rentable area, Labriola, Inc. and Swisher Acquisition, Inc., have lease terms extending through March 2026 and March 2035; respectively and Labriola, Inc.’s leased space serves as its headquarters and its main production facility. Other than Labriola, Inc., no tenant accounts for more than 7.5% of underwritten base rent or 8.5% of net rentable area. The Midwest Industrial Portfolio Properties contain tenants from a variety of businesses and services including food production, consumer goods and industrial equipment and supplies. As of November 15, 2016, the Midwest Industrial Portfolio Properties were 90.7% occupied by 42 tenants.
THE INFORMATION IN THIS STRUCTURAL AND COLLATERAL TERM SHEET IS NOT COMPLETE AND MAY BE AMENDED PRIOR TO THE TIME OF SALE. THIS TERM SHEET IS NOT AN OFFER TO SELL THESE SECURITIES AND IT IS NOT A SOLICITATION OF AN OFFER TO BUY THESE SECURITIES IN ANY JURISDICTION WHERE THE OFFER OR SALE IS NOT PERMITTED.
121
| MIDWEST INDUSTRIAL PORTFOLIO |
The following table presents certain information relating to the Midwest Industrial Portfolio Properties:
Property Name – Location | Specific Property Type | Allocated Cut-off Date Principal Balance | % of Portfolio Cut-off Date Principal Balance | Occupancy | Year Built/ Renovated | Net Rentable Area (SF) | Appraised Value | Allocated LTV |
| 3701 West 128th Place – Alsip, IL | Warehouse | $6,950,000 | 18.1% | 100.0% | 1975/1995 | 217,500 | $8,900,000 | 78.1% |
| 3801-3831 Hawthorne Court - Waukegan, IL | Warehouse | $6,050,000 | 15.7% | 78.6% | 1974/NAP | 194,708 | $8,700,000 | 69.5% |
| 6601-6669 West Mill Road - Milwaukee, WI | Warehouse | $5,200,000 | 13.5% | 75.2% | 1987/NAP | 126,335 | $6,870,000 | 75.7% |
| 8301 West Parkland Court – Milwaukee, WI | Warehouse | $4,500,000 | 11.7% | 100.0% | 1981/NAP | 119,000 | $6,020,000 | 74.8% |
| 1602 Corporate Drive - Warrensburg, MO | Warehouse | $3,550,000 | 9.2% | 100.0% | 1998/NAP | 107,228 | $4,700,000 | 75.5% |
| 8585 South 77th Avenue – Bridgeview, IL | Warehouse | $2,550,000 | 6.6% | 100.0% | 1959/NAP | 75,000 | $3,500,000 | 72.9% |
| 999 Raymond Street – Elgin, IL | Warehouse | $2,450,000 | 6.4% | 100.0% | 1972/NAP | 87,075 | $3,170,000 | 77.3% |
| 4081 Ryan Road – Gurnee, IL | Warehouse | $2,300,000 | 6.0% | 70.2% | 1995/NAP | 75,000 | $4,100,000 | 56.1% |
| 461 North Third Avenue – Des Plaines, IL | Warehouse | $1,900,000 | 4.9% | 100.0% | 1967/NAP | 79,322 | $2,730,000 | 69.6% |
| 12550 Lombard Lane – Alsip, IL | Warehouse | $1,800,000 | 4.7% | 100.0% | 1963/NAP | 54,308 | $2,400,000 | 75.0% |
| 2000 South 25th Avenue – Broadview, IL | Warehouse | $1,250,000 | 3.2% | 82.2% | 1956/NAP | 119,538 | $2,900,000 | 43.1% |
| Total/Weighted Average | $38,500,000 | 100.0% | 90.7% | 1,255,014 | $53,990,000 | 71.3% |
THE INFORMATION IN THIS STRUCTURAL AND COLLATERAL TERM SHEET IS NOT COMPLETE AND MAY BE AMENDED PRIOR TO THE TIME OF SALE. THIS TERM SHEET IS NOT AN OFFER TO SELL THESE SECURITIES AND IT IS NOT A SOLICITATION OF AN OFFER TO BUY THESE SECURITIES IN ANY JURISDICTION WHERE THE OFFER OR SALE IS NOT PERMITTED.
122
| MIDWEST INDUSTRIAL PORTFOLIO |
The following table presents certain information relating to the tenancy at the Midwest Industrial Portfolio Properties:
Major Tenants
| Tenant Name | Property Name – Location | Credit Rating (Fitch/ Moody’s/ S&P) | Tenant NRSF | % of NRSF | Annual U/W Base Rent PSF(1) | Annual U/W Base Rent(1) | % of Total Annual U/W Base Rent | Lease Expiration Date |
| Major Tenants | ||||||||
| Labriola, Inc. | 3701 West 128th Place – Alsip, IL | NR/NR/NR | 177,500 | 14.1% | $4.36 | $773,176 | 15.0% | 3/31/2026(2) |
| State of Wisconsin, DOC | 6601-6669 West Mill Road - Milwaukee, WI | NR/NR/NR | 24,500 | 2.0% | $15.73 | $385,385 | 7.5% | 2/28/2023(3) |
| Micron Metal Finishing LLC | 8585 South 77th Avenue - Bridgeview, IL | NR/NR/NR | 75,000 | 6.0% | $4.78 | $358,216 | 7.0% | 12/31/2020(4) |
| Swisher Acquisition, Inc. | 1602 Corporate Drive - Warrensburg, MO | NR/NR/NR | 107,228 | 8.5% | $3.20 | $343,332 | 6.7% | 3/31/2035 |
| Ludlow Manufacturing, Inc. | 3801-3831 Hawthorne Court - Waukegan, IL | NR/NR/NR | 72,150 | 5.7% | $4.24 | $306,176 | 6.0% | 8/31/2018(5) |
| Tri Dim Filter | 999 Raymond Street - Elgin, IL | NR/NR/NR | 87,075 | 6.9% | $3.15 | $274,286 | 5.3% | 12/31/2019(6) |
| Vector Technologies LTD | 8301 West Parkland Court – Milwaukee, WI | NR/NR/NR | 42,000 | 3.3% | $5.36 | $225,120 | 4.4% | 12/31/2026(7) |
| Complete Warehouse and Distribution, LLC | 8301 West Parkland Court – Milwaukee, WI | NR/NR/NR | 57,000 | 4.5% | $3.84 | $219,094 | 4.3% | 2/29/2024 |
| Oakley Signs & Graphics LLC | 461 North Third Avenue – Des Plaines, IL | NR/NR/NR | 42,997 | 3.4% | $4.99 | $214,724 | 4.2% | 12/31/2019(8) |
| Spectrum Metals/Rolled Metal | 12550 Lombard Lane – Alsip, IL | NR/NR/NR | 54,308 | 4.3% | $3.75 | $203,574 | 4.0% | 9/30/2025 |
| Total Major Tenants | 739,758 | 58.9% | $4.47 | $3,303,082 | 64.2% | |||
| Non-Major Tenants | 398,583 | 31.8% | $4.62 | $1,841,615 | 35.8% | |||
| Occupied Collateral Total | 1,138,341 | 90.7% | $4.52 | $5,144,697 | 100.0% | |||
| Vacant Space | 116,673 | 9.3% | ||||||
| Collateral Total | 1,255,014 | 100.0% | ||||||
| (1) | Annual U/W Base Rent PSF and Annual U/W Base Rent include contractual rent steps through October 2017 totaling $30,130. |
| (2) | Labriola, Inc. has three, 5-year lease renewal options and holds a right of first refusal under its lease to purchase the 3701 West 128th Place Property in the event the borrower elects to sell the 3701 West 128th Place Property at any time during the term of the lease. |
| (3) | State of Wisconsin, DOC (Department of Corrections) has two, 5-year lease renewal options. |
| (4) | Micron Metal Finishing, LLC has one, 7-year lease renewal option and holds a right of first refusal under its lease to purchase the 8585 South 77th Avenue Property in the event the borrower elects to sell the 8585 South 77th Avenue Property at any time during the term of the lease. |
| (5) | Ludlow Manufacturing, Inc. has two, 3-year lease renewal options. |
| (6) | Tri Dim Filter has one, 5-year lease renewal option. |
| (7) | Vector Technologies LTD has two, 5-year lease renewal options and a one-time right to terminate its lease on December 31, 2020 with notice on or before July 4, 2020 and a termination fee of $456,729. |
| (8) | Oakley Signs & Graphics has one, 5-year lease renewal option and holds a right of first refusal under its lease to purchase the 461 North Third Avenue Property in the event the borrower elects to sell the 461 North Third Avenue Property at any time during the term of the lease. |
THE INFORMATION IN THIS STRUCTURAL AND COLLATERAL TERM SHEET IS NOT COMPLETE AND MAY BE AMENDED PRIOR TO THE TIME OF SALE. THIS TERM SHEET IS NOT AN OFFER TO SELL THESE SECURITIES AND IT IS NOT A SOLICITATION OF AN OFFER TO BUY THESE SECURITIES IN ANY JURISDICTION WHERE THE OFFER OR SALE IS NOT PERMITTED.
123
| MIDWEST INDUSTRIAL PORTFOLIO |
The following table presents certain information relating to the lease rollover schedule at the Midwest Industrial Portfolio Properties:
Lease Expiration Schedule(1)(2)
| Year Ending December 31, | No. of Leases Expiring | Expiring NRSF | % of Total NRSF | Cumulative Expiring NRSF | Cumulative % of Total NRSF | Annual U/W Base Rent | % of Total Annual U/W Base Rent | Annual U/W Base Rent PSF(3) |
| MTM | 0 | 0 | 0.0% | 0 | 0.0% | $0 | 0.0% | $0.00 |
| 2016 | 1 | 3,600 | 0.3% | 3,600 | 0.3% | $22,490 | 0.4% | $6.25 |
| 2017 | 10 | 121,414 | 9.7% | 125,014 | 10.0% | $546,747 | 10.6% | $4.50 |
| 2018 | 8 | 223,348 | 17.8% | 348,362 | 27.8% | $1,052,446 | 20.5% | $4.71 |
| 2019 | 10 | 212,704 | 16.9% | 561,066 | 44.7% | $791,633 | 15.4% | $3.72 |
| 2020 | 5 | 93,923 | 7.5% | 654,989 | 52.2% | $476,172 | 9.3% | $5.07 |
| 2021 | 2 | 20,816 | 1.7% | 675,805 | 53.8% | $105,530 | 2.1% | $5.07 |
| 2022 | 0 | 0 | 0.0% | 675,805 | 53.8% | $0 | 0.0% | $0.00 |
| 2023 | 1 | 24,500 | 2.0% | 700,305 | 55.8% | $385,385 | 7.5% | $15.73 |
| 2024 | 1 | 57,000 | 4.5% | 757,305 | 60.3% | $219,094 | 4.3% | $3.84 |
| 2025 | 1 | 54,308 | 4.3% | 811,613 | 64.7% | $203,574 | 4.0% | $3.75 |
| 2026 | 2 | 219,500 | 17.5% | 1,031,113 | 82.2% | $998,296 | 19.4% | $4.55 |
| Thereafter | 1 | 107,228 | 8.5% | 1,138,341 | 90.7% | $343,332 | 6.7% | $3.20 |
| Vacant | 0 | 116,673 | 9.3% | 1,255,014 | 100.0% | $0 | 0.0% | $0.00 |
| Total/Weighted Average | 42 | 1,255,014 | 100.0% | $5,144,697 | 100.0% | $4.52 |
| (1) | Information obtained from the underwritten rent roll. |
| (2) | Certain tenants may have lease termination options that are exercisable prior to the originally stated expiration date of the subject lease and that are not considered in the Lease Expiration Schedule. |
| (3) | Weighted Average Annual U/W Base Rent PSF excludes vacant space. |
The following table presents historical occupancy percentages at the Midwest Industrial Portfolio Properties:
Historical Occupancy
12/31/2012(1)(2)(3) | 12/31/2013(1)(2)(3) | 12/31/2014(1)(2) | 12/31/2015(1)(2)(4) | 11/15/2016(4)(5) |
| 81.8% | 94.9% | 94.9% | 93.4% | 90.7% |
| (1) | Information obtained from the borrower. |
| (2) | Occupancy does not include 1602 Corporate Drive and 8301 West Parkland Court which were purchased by the seller in April 2015 and January 2016. |
| (3) | Occupancy increased from 12/31/2012 to 12/31/2013 primarily due to Ludlow Manufacturing, Inc., which began its lease in February 2013 for 72,150 square feet (5.7% of net rentable area). |
| (4) | Occupancy decreased from 12/31/2015 to 11/15/2016 primarily due to three tenants vacating 41,254 square feet (3.3% of net rentable area) of space at the end of their lease terms in August 2016 and September 2016. |
| (5) | Information obtained from the underwritten rent roll. |
THE INFORMATION IN THIS STRUCTURAL AND COLLATERAL TERM SHEET IS NOT COMPLETE AND MAY BE AMENDED PRIOR TO THE TIME OF SALE. THIS TERM SHEET IS NOT AN OFFER TO SELL THESE SECURITIES AND IT IS NOT A SOLICITATION OF AN OFFER TO BUY THESE SECURITIES IN ANY JURISDICTION WHERE THE OFFER OR SALE IS NOT PERMITTED.
124
| MIDWEST INDUSTRIAL PORTFOLIO |
Operating History and Underwritten Net Cash Flow. The following table presents certain information relating to the historical operating performance and the underwritten net cash flow at the Midwest Industrial Portfolio Properties:
Cash Flow Analysis(1)
| 2013(2) | 2014(2) | 2015(2) | TTM 6/30/2016(2) | U/W | % of U/W Effective Gross Income | U/W $ per SF | |
| Base Rent | $4,708,710 | $4,927,921 | $5,264,683 | $5,289,576 | $5,144,697(1) | 85.9% | $4.10 |
| Grossed Up Vacant Space | 0 | 0 | 0 | 0 | 531,356 | 8.9 | 0.42 |
| Total Reimbursables(3) | 613,019 | 558,412 | 572,177 | 879,101 | 1,043,593 | 17.4 | 0.83 |
| Other Income | 51,788 | 57,862 | 34,376 | 36,572 | 24,311 | 0.4 | 0.02 |
| Less Vacancy & Free Rent | 0 | 0 | 0 | 0 | (751,803)(4) | (12.5) | (0.60) |
| Effective Gross Income | $5,373,517 | $5,544,194 | $5,871,236 | $6,205,249 | $5,992,154 | 100.0% | $4.77 |
| Total Operating Expenses | $2,295,686 | $2,476,805 | $2,361,913 | $2,289,205 | $2,208,494 | 36.9% | $1.76 |
| Net Operating Income | $3,077,831 | $3,067,389 | $3,509,323 | $3,916,044 | $3,783,660 | 63.1% | $3.01 |
| TI/LC | 0 | 0 | 0 | 0 | 213,294 | 3.6 | 0.17 |
| Capital Expenditures | 0 | 0 | 0 | 0 | 205,995 | 3.4 | 0.16 |
| Net Cash Flow | $3,077,831 | $3,067,389 | $3,509,323 | $3,916,044 | $3,364,371 | 56.1% | $2.68 |
| NOI DSCR(5) | 1.28x | 1.27x | 1.45x | 1.62x | 1.57x | ||
| NCF DSCR(5) | 1.28x | 1.27x | 1.45x | 1.62x | 1.39x | ||
| NOI DY(5) | 8.0% | 8.0% | 9.1% | 10.2% | 9.8% | ||
| NCF DY(5) | 8.0% | 8.0% | 9.1% | 10.2% | 8.7% |
| (1) | U/W Base Rent includes contractual rent steps through October 2017 totalling $30,130. |
| (2) | Certain assumptions were made for 1602 Corporate Drive and 8301 West Parkland Court, which were purchased by the seller in April 2015 and January2016. |
| (3) | The increase in Total Reimbursables from 2015 to TTM 6/30/2016 is primarily due to Complete Warehouse and Distribution, LLC and Vector Technologies LTD starting triple-net leases January 2016 and December 2016, respectively. |
| (4) | The underwritten economic vacancy is 11.1%. The Midwest Industrial Portfolio Properties are 90.7% occupied as of November 15, 2016. |
| (5) | The debt service coverage ratios and debt yields are based on the Midwest Industrial Portfolio Whole Loan. |
Appraisal. As of the appraisal valuation dates ranging from September 12, 2016 to September 20, 2016, the Midwest Industrial Portfolio Properties had an “as-is” appraised value of $53,990,000.
Environmental Matters. According to Phase I environmental site assessments dated from September 14, 2016 to September 21, 2016, there was evidence of recognized environmental conditions (“RECs”) at three of the Midwest Industrial Portfolio Properties including 999 Raymond Street, 461 North Third Avenue and 2000 South 25th Avenue. Based on the results of subsurface investigations for 999 Raymond Street and 461 North Third Avenue, summarized in a Phase II environmental site assessments dated October 28, 2016, no further investigation was recommended.
The majority of historical industrial operations at the 2000 South 25th Avenue Property were conducted prior to the onset of modern environmental regulations and waste management practices. Based on the duration of operations by Boyar Schultz Division from at least 1969 to 1986 and the likely use of hazardous substances and petroleum products, a REC was recognized. Based on the results of a subsurface investigation summarized in a Phase II environmental site assessment dated November 16, 2016, there is evidence of impacts to the subsurface as a potential consequence of the historical industrial operations at the 2000 South 25th Avenue Property and recommended further investigation. The 2000 South 25th Avenue Property loan documents require that the borrower will enroll the 2000 South 25th Avenue Property into the Illinois Environmental Protection Agency (“IEPA”) Site Remediation Program within 60 days after loan closing and will complete all environmental remedial work necessary to obtain a no further remediation (“NFR”) determination from the IEPA. The borrower has entered into an escrow agreement with the seller whereby the seller has agreed to place $220,000 in escrow to be released to the seller once it delivers the NFR or, if that is not achieved by December 2017, released to the borrower to fund the completion of the work. If the seller has exercised its right to complete the remediation work and for any reason the total cost to complete the remediation work exceeds the amount placed in escrow, the seller is responsible, at its sole cost and expense, to pay any outstanding costs.
Market Overview and Competition. Eight of the Midwest Industrial Portfolio Properties are located within the Chicago Industrial market, which has experienced a steady decline in vacancy from 11.5% in 2011 to 6.9% in 2016. Additionally, according to the appraisal, the Chicago Industrial market has experienced positive absorption over the same time period. The Chicago Industrial market is divided into 26 submarkets, and the Midwest Industrial Portfolio Properties are located within six of these submarkets. According to the appraisal, the submarket vacancy rates ranged from 7.3% to 12.0% and market rents ranging from $4.53 per square foot to $5.71 per square foot.
Two of the Midwest Industrial Portfolio Properties are located in the Milwaukee/Madison Industrial market which has experienced a steady decline in vacancy from 7.8% in 2012 to 5.2% in 2015. Additionally, according to the appraisal, the Milwaukee/Madison Industrial market has experienced positive absorption over the same time period and asking rents have increased from $3.91 per square foot to $4.02 per square foot. One of the Midwest Industrial Portfolio Properties is located in the Kansas City Industrial market, which has experienced a steady decline in vacancy from 7.1% in 2012 to 5.8% in 2015. Additionally, according to the appraisal, the Kansas City Industrial market has experienced positive absorption over the same time period and asking rents have increased from $3.71 per square foot to $3.88 per square foot.
THE INFORMATION IN THIS STRUCTURAL AND COLLATERAL TERM SHEET IS NOT COMPLETE AND MAY BE AMENDED PRIOR TO THE TIME OF SALE. THIS TERM SHEET IS NOT AN OFFER TO SELL THESE SECURITIES AND IT IS NOT A SOLICITATION OF AN OFFER TO BUY THESE SECURITIES IN ANY JURISDICTION WHERE THE OFFER OR SALE IS NOT PERMITTED.
125
| MIDWEST INDUSTRIAL PORTFOLIO |
The Borrower.The borrower is GFG CI-1 LLC, a Delaware limited liability company with two independent directors. GFG CI-1 LLC has master leased the Midwest Industrial Portfolio Properties to a Shari’ah compliant master lessee affiliated with the sponsor. The master lessee is structured as a special purpose entity. The master lessee’s interest in the master lease and all rents are assigned to the lender. The sponsors have a 100% ownership interest in the master lessee. The master lease is subordinate to the Midwest Industrial Portfolio Whole Loan. Michael Brennan and Scott McKibben, both individual principals of Brennan Investment Group, are the guarantors of certain nonrecourse carveouts under the Midwest Industrial Portfolio Whole Loan. See “Description of the Mortgage Pool – Shari’ah Compliant Loan” in the Preliminary Prospectus.
The Sponsors.The sponsors are Brennan Investment Group (“Brennan”) and GFH Capital, Limited (“GFH”). Brennan is a Chicago-based private real estate investment firm which acquires, develops and operates industrial properties throughout the United States. Since 2010, Brennan has acquired a portfolio of over 24 million square feet spanning 22 states with the majority located in the Midwest. Brennan owns 145 properties in the Midwest inclusive of over 16 million square feet. Michael Brennan, the Chairman and Managing Principal of Brennan has managed over $10 billion in industrial real estate transactions over his career. Scott McKibben, the Chief Investment Officer and Managing Principal of Brennan, is responsible for industrial property transactions in the Midwestern United States with a focus on Chicago. Scott McKibben has completed the acquisition and development of approximately $3 billion in office and industrial properties throughout his career. Mr. McKibben has three properties over which he had controlling interest that went through foreclosure processes and two with debt forgiveness. See “Description of the Mortgage Pool – Non-Recourse Carveout Limitations” and “Description of the Mortgage Pool – Loan Purpose: Default History, Bankruptcy Issues and Other Proceedings” in the Preliminary Prospectus.
GFH, formerly known as Injazat Capital, is a Middle Eastern financial group established by the Islamic Corporation for the Development of the Private Sector. GFH, based out of Bahrain, focuses on wealth management, commercial banking, asset management and real estate development. GFH is listed on a number of international stock exchanges, including the Bahrain Stock Exchange, Kuwait Stock Exchange and the Dubai Financial Market. GFH has undertaken and structured investments of more than $8.0 billion in over 40 companies across 25 countries.
Escrows. The loan documents provide for upfront reserves in the amount of $374,833 for real estate taxes, $2,599,530 for deferred maintenance and $250,000 for repairs at 2000 South 25th Avenue – Broadview, IL property required by the Village of Broadview, Illinois. The loan documents provide for ongoing monthly escrows of $116,397 for real estate taxes, $19,130 for TI/LC reserves (capped at $753,008) and beginning on the payment date in January 2018, $17,165 for replacement reserves (capped at $617,940). The loan documents do not require ongoing monthly escrows for insurance premiums as long as (i) no event of default has occurred and is continuing and (ii) borrower provides the lender with evidence that the Midwest Industrial Portfolio Properties are insured via an acceptable blanket insurance policy and such policy is in full force and effect.
Lockbox and Cash Management. The Midwest Industrial Portfolio Whole Loan requires a lender-controlled lockbox account, which is already in place, and that the borrower and property manager direct all tenants to pay rent payments directly into such lockbox account. The loan documents also require that all rents received by the borrower or property manager be deposited into the lockbox account within two business day of receipt. Prior to the occurrence of a Cash Management Period (as defined below), all excess funds on deposit in the lockbox account are disbursed to the borrower. During a Cash Management Period, all excess funds are swept to a lender-controlled cash management account.
A “Cash Management Period” will commence upon the earlier of (i) the occurrence and continuance of an event of default; (ii) on payment dates before January 6, 2022, the amortizing debt service coverage ratio for the trailing 12-month period being less than 1.25x at the end of any calendar quarter; or (iii) on payment dates on or after January 6, 2022, the amortizing debt service coverage ratio for the trailing 12-month period being less than 1.15x at the end of any calendar quarter. A Cash Management Period will expire, with regard to clause (i), upon the cure of such event of default; with regard to clause (ii), upon the amortizing debt service coverage ratio being equal to or greater than 1.25x for one calendar quarter or the borrower posts cash or a letter of credit acceptable to the lender in an amount which would result in the amortizing debt service coverage ratio being equal to or greater than 1.25x; and with regard to clause (iii), upon the amortizing debt service coverage ratio being equal to or greater than 1.20x for two consecutive calendar quarters or the borrower posts cash or a letter of credit acceptable to the lender in an amount which would result in the amortizing debt service coverage ratio being equal to or greater than 1.20x.
Property Management. The Midwest Industrial Portfolio Properties are managed by Brennan Management LLC, an affiliate of the borrower.
Assumption. The borrower has a right to transfer the Midwest Industrial Portfolio Properties, provided that certain conditions are satisfied, including (i) no event of default has occurred and is continuing; (ii) the lender has reasonably determined that the proposed transferee and guarantor satisfy the lender’s credit review and underwriting standards, taking into consideration transferee experience, financial strength and general business standing; (iii) execution of a recourse guaranty and an environmental indemnity by an affiliate of the transferee; and (iv) the lender has received confirmation from Moody’s, Fitch and DBRS that such assumption will not result in a downgrade, withdrawal or qualification of the respective ratings assigned to the Series 2016-C37 Certificates and similar confirmations from each rating agency rating any securities backed by any Midwest Industrial Portfolio Pari Passu Companion Loan with respect to the ratings of such securities.
Partial Release.Following the lockout period, the borrower is permitted to partially release any of the Midwest Industrial Portfolio Properties, subject to certain conditions including (i) no event of default has occurred and is continuing; (ii) the defeasance of an amount of principal equal to 115% of the released property’s allocated loan amount; (iii) the principal balance is reduced by an amount that would result in the underwritten debt service coverage ratio of the remaining Midwest Industrial Portfolio Properties following the release being no less than the greater of (a) 1.39x and (b) the underwritten debt service coverage ratio of the Midwest Industrial Portfolio Properties immediately prior to the release if less than 1.64x; (iv) the principal balance is reduced by an amount that would result in a loan-to-value ratio of the remaining Midwest Industrial Portfolio Properties following the release being no more
THE INFORMATION IN THIS STRUCTURAL AND COLLATERAL TERM SHEET IS NOT COMPLETE AND MAY BE AMENDED PRIOR TO THE TIME OF SALE. THIS TERM SHEET IS NOT AN OFFER TO SELL THESE SECURITIES AND IT IS NOT A SOLICITATION OF AN OFFER TO BUY THESE SECURITIES IN ANY JURISDICTION WHERE THE OFFER OR SALE IS NOT PERMITTED.
126
| MIDWEST INDUSTRIAL PORTFOLIO |
than the greater of (a) 75.0% and (b) the loan-to-value ratio of the Midwest Industrial Portfolio Properties immediately prior to the release; (v) rating agency confirmation from Moody’s, Fitch and DBRS that the transfer will not result in a downgrade, withdrawal or qualification of the respective ratings assigned to the Series 2016-C37 Certificates and similar confirmations from each rating agency rating any securities backed by any Midwest Industrial Portfolio Pari Passu Companion Loan with respect to the ratings of such securities; and (vi) the lender receives a legal opinion that the release satisfies REMIC requirements.
Free Release.The borrower is permitted to obtain the release of a vacant parcel at the 1602 Corporate Drive property (the “1602 Corporate Release Parcel”), subject to the satisfaction of certain conditions contained in the loan agreement, including but not limited to (i) no event of default has occurred and is continuing; (ii) release will not adversely affect the use, operations, or access to the remaining property; (iii) release conforms to REMIC requirements; (iv) evidence that the remaining 1602 Corporate Drive property will be in compliance with all applicable legal and zoning requirements; and (v) the loan to value ratio for the remaining 1602 Corporate Drive property is in compliance with all REMIC requirements. As of the appraisal valuation date of September 14, 2016, the excess land parcel had an appraised value of $340,000; however, this was excluded from the “as-is” appraised values of the 1602 Corporate Drive property and the Midwest Industrial Portfolio Properties.
Real Estate Substitution.Not permitted.
Subordinate and Mezzanine Indebtedness.None.
Ground Lease. None.
Terrorism Insurance.The loan documents require that the “all risk” insurance policy required to be maintained by the borrower provide coverage for terrorism in an amount equal to the full replacement cost of the Midwest Industrial Portfolio Properties. The loan documents also require business interruption insurance covering no less than the 18-month period following the occurrence of a casualty event, together with a 12-month period of indemnity.
THE INFORMATION IN THIS STRUCTURAL AND COLLATERAL TERM SHEET IS NOT COMPLETE AND MAY BE AMENDED PRIOR TO THE TIME OF SALE. THIS TERM SHEET IS NOT AN OFFER TO SELL THESE SECURITIES AND IT IS NOT A SOLICITATION OF AN OFFER TO BUY THESE SECURITIES IN ANY JURISDICTION WHERE THE OFFER OR SALE IS NOT PERMITTED.
127
| No. 12 – The Lodge & Waterfall Park Apartments Portfolio | ||||||||
| Loan Information | Property Information | |||||||
| Mortgage Loan Seller: | Rialto Mortgage Finance, LLC | Single Asset/Portfolio: | Portfolio | |||||
| Credit Assessment (DBRS/Fitch/Moody’s): | NR/NR/NR | Property Type: | Multifamily | |||||
| Original Principal Balance: | $22,900,000 | Specific Property Type: | Garden | |||||
| Cut-off Date Balance: | $22,900,000 | Location: | Houston, TX | |||||
| % of Initial Pool Balance: | 3.1% | Size: | 634 Units | |||||
| Loan Purpose: | Refinance | Cut-off Date Balance Per Unit: | $36,120 | |||||
| Borrower Names: | JAW The Lodge Holding LLC; JAW Waterfall Park Holding LLC | Year Built/Renovated: | 1979/2016 | |||||
| Sponsor(1): | Emery Jakab | Title Vesting: | Fee | |||||
| Mortgage Rate: | 4.980% | Property Manager: | Self-managed | |||||
| 4thMost Recent Occupancy: | NAV | |||||||
| Note Date: | November 15, 2016 | 3rdMost Recent Occupancy (As of): | 95.5% (12/31/2013) | |||||
| Anticipated Repayment Date: | NAP | 2ndMost Recent Occupancy (As of): | 94.8% (12/31/2014) | |||||
| Maturity Date: | December 6, 2026 | Most Recent Occupancy (As of): | 89.8% (12/31/2015) | |||||
| IO Period: | 24 months | Current Occupancy (As of): | 92.4% (9/30/2016) | |||||
| Loan Term (Original): | 120 months | |||||||
| Seasoning: | 0 months | Underwriting and Financial Information: | ||||||
| Amortization Term (Original): | 360 months | 4thMost Recent NOI (As of): | $1,702,947 (12/31/2013) | |||||
| Loan Amortization Type: | Interest-only, Amortizing Balloon | 3rdMost Recent NOI (As of): | $1,974,319 (12/31/2014) | |||||
| Interest Accrual Method: | Actual/360 | 2ndMost Recent NOI (As of): | $2,294,415 (12/31/2015) | |||||
| Call Protection: | L(24),D(92),O(4) | Most Recent NOI (As of): | $2,497,386 (TTM 9/30/2016) | |||||
| Lockbox Type: | Springing | |||||||
| Additional Debt: | None | U/W Revenues: | $5,638,897 | |||||
| Additional Debt Type: | NAP | U/W Expenses: | $3,169,761 | |||||
| U/W NOI: | $2,469,136 | |||||||
| U/W NCF: | $2,310,636 | |||||||
| U/W NOI DSCR: | 1.68x | |||||||
| Escrows and Reserves: | U/W NCF DSCR: | 1.57x | ||||||
| U/W NOI Debt Yield: | 10.8% | |||||||
| Type: | Initial | Monthly | Cap (If Any) | |||||
| Taxes | $510,666 | $42,555 | NAP | U/W NCF Debt Yield: | 10.1% | |||
| Insurance | $300,212 | $28,592 | NAP | As-Is Appraised Value: | $37,210,000 | |||
| Replacement Reserves | $0 | $13,208 | NAP | As-Is Appraisal Valuation Date: | September 27, 2016 | |||
| Deferred Maintenance | $45,875 | $0 | NAP | Cut-off Date LTV Ratio: | 61.5% | |||
| Other(2) | $3,170,000 | $0 | NAP | LTV Ratio at Maturity or ARD: | 53.2% | |||
| (1) | See“Description of the Mortgage Pool—Loan Purpose; Default History, Bankruptcy Issues and Other Proceedings” in the Preliminary Prospectus. |
| (2) | Other escrows include $3,170,000 for planned interior and exterior renovations at The Lodge & Waterfall Park Portfolio Properties (as defined below). |
The mortgage loan is evidenced by a single promissory note that is secured by a first mortgage encumbering two Class B, garden-style multifamily properties located in Houston, Texas (the “The Lodge & Waterfall Park Apartments Portfolio Properties”). The Lodge & Waterfall Park Apartments Portfolio mortgage loan was originated on November 15, 2016 by Rialto Mortgage Finance, LLC. The Lodge & Waterfall Park Apartments Portfolio mortgage loan had an original principal balance of $22,900,000, has an outstanding principal balance as of the Cut-off Date of $22,900,000 and accrues interest at an interest rate of 4.980%per annum. The Lodge & Waterfall Park Apartments Portfolio mortgage loan had an initial term of 120 months, has a remaining term of 120 months as of the Cut-off Date and requires interest-only payments for the first 24 months following origination and, thereafter, requires payments of principal and interest based on a 30-year amortization schedule. The Lodge & Waterfall Park Apartments Portfolio mortgage loan matures on December 6, 2026.
Following the lockout period, the borrower has the right to defease The Lodge & Waterfall Park Apartments Portfolio mortgage loan in whole, but not in part, on any date before September 6, 2026. In addition, The Lodge & Waterfall Park Apartments Portfolio mortgage loan is prepayable without any penalty on or after September 6, 2026.
THE INFORMATION IN THIS STRUCTURAL AND COLLATERAL TERM SHEET IS NOT COMPLETE AND MAY BE AMENDED PRIOR TO THE TIME OF SALE. THIS TERM SHEET IS NOT AN OFFER TO SELL THESE SECURITIES AND IT IS NOT A SOLICITATION OF AN OFFER TO BUY THESE SECURITIES IN ANY JURISDICTION WHERE THE OFFER OR SALE IS NOT PERMITTED.
128
| THE LODGE & WATERFALL PARK APARTMENTS PORTFOLIO |
Sources and Uses
| Sources | Uses | |||||||
| Original loan amount | $22,900,000 | 100.0% | Loan payoff(1) | $16,422,191 | 71.7% | |||
| Reserves | 4,026,752 | 17.6 | ||||||
| Closing costs | 475,206 | 2.1 | ||||||
| Return of equity | 1,975,850 | 8.6 | ||||||
| Total Sources | $22,900,000 | 100.0% | Total Uses | $22,900,000 | 100.0% |
| (1) | The Lodge & Waterfall Park Apartments Portfolio mortgage loan was previously securitized in WFRBS 2013-C12. |
The Lodge & Waterfall Park Apartments Portfolio Properties are comprised of two Class B, garden-style multifamily properties totaling 634 units located within one-half mile of each other in Houston, Texas approximately 12 miles southwest from the Houston central business district.
The Lodge property is a 340-unit, Class B garden-style multifamily property consisting of 37, two-story residential buildings totaling 278,986 square feet of net rentable area. The improvements were constructed in phases with Phase I (north phase) being completed in 1979 and Phase II (south phase) completed in 1983. The improvements are situated on an 11.9-acre site and include 544 surface parking spaces (1.6 spaces per unit). The unit mix consists of 218 one-bedroom/one-bathroom units and 122 two-bedroom/two-bathroom units. According to the rent roll dated September 30, 2016, The Lodge property was 90.6% occupied. Community amenities include gated access, a clubhouse, fitness center, business center, a playground, and two pools. Unit amenities include fully equipped kitchens, ceiling fans, washers and dryer connections in all units, and fireplaces in some units.
The Waterfall Park property is a 294-unit, Class B garden-style multifamily property consisting of 24, two-story residential buildings totaling 266,578 square feet of net rentable area. Situated on a 10.6-acre site, the improvements were constructed in 1979 and include 470 surface parking spaces (1.6 spaces per unit). The unit mix consists of 40 one-bedroom/one-bathroom units, 48 two-bedroom/one-bathroom units, 160 two-bedroom/two-bathroom units, and 46 three-bedroom/two-bathroom units. According to the rent roll dated September 30, 2016, the Waterfall Park property was 94.6% occupied. Community amenities include gated access, a clubhouse, fitness center, a playground, and pool. Unit amenities include fully equipped kitchens, ceiling fans, washers and dryer connections in all units, and fireplaces in some units.
Since acquisition of The Lodge & Waterfall Park Apartments Portfolio Properties, the borrower has invested an additional $4.5 million ($7,103 per unit) to improve common areas, the exteriors and interiors of The Lodge & Waterfall Park Apartments Portfolio Properties. Common area improvements were made to landscaping and the leasing offices/fitness center while exterior improvements included upgrades to the swimming pools, roofs, siding, signage, boiler rooms and HVAC systems. Interior renovations consisted of new appliances, carpet, tile, blinds and window coverings. The borrower plans to invest an additional $3.2 million ($4,979 per unit) to The Lodge & Waterfall Park Apartments Portfolio Properties for interior and exterior improvements. The entire renovation budget was reserved at closing.
The following table presents certain information relating to the unit mix of The Lodge & Waterfall Park Apartments Portfolio Properties:
| Property Name – Location | Allocated Cut-off Date Balance | Year Built/Renovated | # of Units | Occupancy % | Appraised Value | Allocated LTV |
| The Lodge – Houston, TX | $11,480,000 | 1979/2016 | 340 | 90.6% | $18,660,000 | 61.5% |
| Waterfall Park – Houston, TX | $11,420,000 | 1979/2016 | 294 | 94.6% | $18,550,000 | 61.6% |
| Total/Weighted Average | $22,900,000 | 634 | 92.4% | $37,210,000 | 61.5% |
Apartment Unit Summary(1)
| Unit Type | No. of Units | % of Total Units | Average Unit Size (SF) | Average Monthly Rent per Unit |
| 1 Bedroom / 1 Bathroom - The Lodge | 218 | 34.4% | 735 | $626 |
| 2 Bedroom / 2 Bathroom - The Lodge | 122 | 19.2% | 973 | $736 |
| 1 Bedroom / 1 Bathroom - Waterfall Park | 40 | 6.3% | 643 | $584 |
| 2 Bedroom / 1 Bathroom - Waterfall Park | 48 | 7.6% | 732 | $675 |
| 2 Bedroom / 2 Bathroom - Waterfall Park | 128 | 20.2% | 933 | $719 |
| 2 Bedroom / 2 Bathroom - NEW - Waterfall Park | 32 | 5.0% | 933 | $810 |
| 3 Bedroom / 2 Bathroom - Waterfall Park | 46 | 7.3% | 1,227 | $940 |
| Total/Weighted Average | 634 | 100.0% | 861 | $699 |
| (1) | Information obtained from the underwritten rent roll. |
THE INFORMATION IN THIS STRUCTURAL AND COLLATERAL TERM SHEET IS NOT COMPLETE AND MAY BE AMENDED PRIOR TO THE TIME OF SALE. THIS TERM SHEET IS NOT AN OFFER TO SELL THESE SECURITIES AND IT IS NOT A SOLICITATION OF AN OFFER TO BUY THESE SECURITIES IN ANY JURISDICTION WHERE THE OFFER OR SALE IS NOT PERMITTED.
129
| THE LODGE & WATERFALL PARK APARTMENTS PORTFOLIO |
The following table presents historical occupancy percentages at The Lodge & Waterfall Park Apartments Portfolio Properties:
Historical Occupancy
12/31/2012(1) | 12/31/2013(1) | 12/31/2014(1) | 12/31/2015(1) | 9/30/2016(2) |
| NAV | 95.5% | 94.8% | 89.8% | 92.4% |
| (1) | Information obtained from the borrower. |
| (2) | Information obtained from the underwritten rent roll. |
Operating History and Underwritten Net Cash Flow.The following table presents certain information relating to the historical operating performance and underwritten net cash flow at The Lodge & Waterfall Park Apartments Portfolio Properties:
Cash Flow Analysis
| 2013 | 2014 | 2015 | TTM 9/30/2016 | U/W | % of U/W Effective Gross Income | U/W $ per Unit | |
| Base Rent | $3,751,140 | $4,002,970 | $4,370,925 | $5,211,351 | $4,901,400 | 86.9% | $7,731 |
| Grossed Up Vacant Space | 0 | 0 | 0 | 0 | 459,060 | 8.1 | 724 |
| Concessions | (195) | 0 | (900) | (61,000) | (65,600) | (1.2) | (103) |
| Other Income(1) | 668,360 | 820,109 | 919,844 | 877,580 | 877,580 | 15.6 | 1,384 |
| Less Vacancy & Credit Loss | (13,998) | (23,068) | (18,270) | (514,834) | (533,543)(2) | (9.5) | (842) |
| Effective Gross Income | $4,405,307 | $4,800,011 | $5,271,599 | $5,513,097 | $5,638,897 | 100.0% | $8,894 |
| Total Operating Expenses | $2,702,360 | $2,825,692 | $2,977,184 | $3,015,711 | $3,169,761 | 56.2% | $5,000 |
|
|
|
|
|
|
| |
| Net Operating Income | $1,702,947 | $1,974,319 | $2,294,415 | $2,497,386 | $2,469,136 | 43.8% | $3,895 |
| Capital Expenditures | 0 | 0 | 0 | 0 | 158,500 | 2.8 | 250 |
| Net Cash Flow | $1,702,947 | $1,974,319 | $2,294,415 | $2,497,386 | $2,310,636 | 41.0% | $3,645 |
| NOI DSCR | 1.16x | 1.34x | 1.56x | 1.70x | 1.68x | ||
| NCF DSCR | 1.16x | 1.34x | 1.56x | 1.70x | 1.57x | ||
| NOI DY | 7.4% | 8.6% | 10.0% | 10.9% | 10.8% | ||
| NCF DY | 7.4% | 8.6% | 10.0% | 10.9% | 10.1% |
| (1) | Other Income consists of administration fees, application fees, late fees, forfeited deposits, month-to-month premiums, lease breakage fees and washer & dryer income. |
| (2) | The underwritten economic vacancy is 11.2%. The Lodge & Waterfall Park Apartments Portfolio Properties were 92.4% occupied as of September 30, 2016. |
The following table presents certain information relating to some comparable multifamily properties for The Lodge & Waterfall Park Apartments Portfolio Properties:
Competitive Set(1)
| Average Rent (per unit) | ||||||||||
| Location | Distance to Subject | Property Type | Number of Units | Studio | 1 BR | 2 BR | 3 BR | Overall Average PSF | Total Occupancy | |
| The Lodge & Waterfall Park (Subject) | Houston, TX | -- | Garden | 634 | NAP | $670-$755(2) | $710-$830(2) | $1,050(2) | $0.91-$0.92 | 92.4% |
| The Sebring | Houston, TX | 0.4 miles | Garden | 204 | $535-$600 | $599-$645 | $735-$790 | $950-$990 | $0.91 | 98.0% |
| EL Paraiso | Houston, TX | 0.3 miles | Garden | 372 | NAP | $550 | $650-$750 | $875 | $0.81 | 92.0% |
| Emerald Isle | Houston, TX | 1.1 miles | Garden | 157 | NAP | $520-$580 | $640-$890 | $890 | $0.77 | 94.0% |
| Summerfield | Houston, TX | 1.4 miles | Garden | 110 | NAP | $525 | $625-$675 | $800 | $0.70 | 99.0% |
| Summer Creek | Houston, TX | 1.4 miles | Garden | 264 | NAP | $689 | $819-$1,029 | $1,079 | $0.83 | 98.0% |
| (1) | Information obtained from the October 14, 2016 appraisals. |
| (2) | The concluded rents reflect the planned renovations at The Lodge & Waterfall Park Apartments Portfolio Properties. |
THE INFORMATION IN THIS STRUCTURAL AND COLLATERAL TERM SHEET IS NOT COMPLETE AND MAY BE AMENDED PRIOR TO THE TIME OF SALE. THIS TERM SHEET IS NOT AN OFFER TO SELL THESE SECURITIES AND IT IS NOT A SOLICITATION OF AN OFFER TO BUY THESE SECURITIES IN ANY JURISDICTION WHERE THE OFFER OR SALE IS NOT PERMITTED.
130
(THIS PAGE INTENTIONALLY LEFT BLANK)
THE INFORMATION IN THIS STRUCTURAL AND COLLATERAL TERM SHEET IS NOT COMPLETE AND MAY BE AMENDED PRIOR TO THE TIME OF SALE. THIS TERM SHEET IS NOT AN OFFER TO SELL THESE SECURITIES AND IT IS NOT A SOLICITATION OF AN OFFER TO BUY THESE SECURITIES IN ANY JURISDICTION WHERE THE OFFER OR SALE IS NOT PERMITTED.
131
| No. 13 – 80 Park Plaza | ||||||||||
| Loan Information | Property Information | |||||||||
| Mortgage Loan Seller: | Ladder Capital Finance LLC | Single Asset/Portfolio: | Single Asset | |||||||
| Credit Assessment (DBRS/Fitch/Moody’s): | NR/NR/NR | Property Type: | Office | |||||||
| Original Principal Balance(1): | $21,000,000 | Specific Property Type: | CBD | |||||||
| Cut-off Date Balance(1): | $21,000,000 | Location: | Newark, NJ | |||||||
| % of Initial Pool Balance: | 2.8% | Size: | 960,689 SF | |||||||
| Loan Purpose: | Acquisition | Cut-off Date Balance Per SF(1): | $138.44 | |||||||
| Borrowers(2): | Various | Year Built/Renovated: | 1979/2015 | |||||||
| Sponsors(3): | Elchonon Schwartz; Simon Glick | Title Vesting: | Fee | |||||||
| Mortgage Rate: | 4.450% | Property Manager: | Nightingale Realty, LLC | |||||||
| Note Date: | September 30, 2016 | 4thMost Recent Occupancy (As of): | 100.0% (12/31/2012) | |||||||
| Anticipated Repayment Date: | NAP | 3rdMost Recent Occupancy (As of): | 100.0% (12/31/2013) | |||||||
| Maturity Date: | October 6, 2026 | 2ndMost Recent Occupancy (As of)(8): | 100.0% (12/31/2014) | |||||||
| IO Period: | 36 months | Most Recent Occupancy (As of)(8): | 85.8% (12/31/2015) | |||||||
| Loan Term (Original): | 120 months | Current Occupancy (As of): | 85.8% (7/19/2016) | |||||||
| Seasoning: | 2 months | |||||||||
| Amortization Term (Original): | 360 months | Underwriting and Financial Information: | ||||||||
| Loan Amortization Type: | Interest-only, Amortizing Balloon | |||||||||
| Interest Accrual Method: | Actual/360 | 4thMost Recent NOI: | $8,866,667 (12/31/2013) | |||||||
| Call Protection: | L(26),D(90),O(4) | 3rdMost Recent NOI (As of): | $8,956,493 (12/31/2014) | |||||||
| Lockbox Type: | Hard/Upfront Cash Management | 2ndMost Recent NOI (As of): | $9,413,563 (12/31/2015) | |||||||
| Additional Debt(1)(4): | Yes | Most Recent NOI (As of): | $9,647,342 (TTM 5/31/2016) | |||||||
| Additional Debt Type(1)(4): | Pari Passu; Future Mezzanine | |||||||||
| U/W Revenues: | $24,135,155 | |||||||||
| U/W Expenses: | $11,627,672 | |||||||||
| U/W NOI(9): | $12,507,483 | |||||||||
| U/W NCF: | $12,199,014 | |||||||||
| Escrows and Reserves: | U/W NOI DSCR(1): | 1.56x | ||||||||
| U/W NCF DSCR(1): | 1.52x | |||||||||
| Type: | Initial | Monthly | Cap (If Any) | U/W NOI Debt Yield(1): | 9.4% | |||||
| Taxes | $906,128 | $302,043 | NAP | U/W NCF Debt Yield(1): | 9.2% | |||||
| Insurance | $35,304 | $17,652 | NAP | As-Is Appraised Value: | $177,400,000 | |||||
| Replacement Reserve(5) | $4,500,000 | Springing | $1,000,000 | As-Is Appraisal Valuation Date: | August 1, 2016 | |||||
| TI/LC(6) | $1,500,000 | Springing | $1,000,000 | Cut-off Date LTV Ratio(1): | 75.0% | |||||
| Unfunded TI/LC Funds(7) | $1,422,745 | $0 | NAP | LTV Ratio at Maturity or ARD(1): | 65.6% | |||||
| (1) | All statistical information related to balances per square foot, loan-to-value ratios, debt service coverage ratios and debt yields are based on the 80 Park Plaza Whole Loan (as defined below). |
| (2) | Borrowers are 80 Park Plaza SPE LLC; Quentin 80 Park Plaza LLC; Jo-Ash 80 Park Plaza LLC as tenants in common. |
| (3) | The sponsor was a key principal with respect to four loan defaults from 2009 to 2014. See“Description of the Mortgage Pool—Litigation and Other Considerations” and“Loan Purpose; Default History, Bankruptcy Issues and Other Proceedings” in the Preliminary Prospectus. |
| (4) | Future mezzanine debt is permitted subject to the following conditions: (i) no event of default has occurred and is continuing; (ii) execution of an intercreditor agreement reasonably satisfactory to the lender; (iii) the combined amortizing debt service coverage ratio will be equal to or greater than 1.50x; (iv) the combined loan-to-value ratio will be equal to or less than 75.0%; (v) the net cash flow debt yield will be equal to or greater than 10.0% and (vi) the mezzanine loan documents are reasonably acceptable to the lender. |
| (5) | If the replacement reserve balance falls below $250,000 the borrowers are required to deposit $16,012 monthly until the funds on deposit in the replacement reserve account are equal to or greater than $1,000,000. |
| (6) | If the TI/LC reserve falls below $1,000,000 the borrowers are required to deposit $40,029 monthly until the funds on deposit in the TI/LC account are equal to or greater than $1,000,000 (the “Leasing Reserve Cap”). At any time PSEG Services Corporation (including any subsequent occupant of the PSEG space, “PSEG”) is not controlled and 51% owned by an entity that has a senior unsecured credit rating of at least “BBB-” by S&P (and its equivalent or higher by each other rating agency), the borrowers are required to deposit $80,057 each month into the TI/LC account (such amount is not subject to the Leasing Reserve Cap and is in addition to the $40,029 monthly deposit, if applicable). At any time PSEG is not controlled and 51% owned by an entity that has a senior unsecured credit rating of at least “BB” by S&P (and its equivalent or higher by each other rating agency), the borrowers are required to deposit $160,115 each month into the TI/LC account (such amount is not subject to the Leasing Reserve Cap and as applicable, is in addition to the $40,029 monthly deposit and the $80,057 deposit described in the prior sentence). |
| (7) | The Unfunded TI/LC Funds are unfunded obligations to PSEG Services Corporation for their lease renewal. |
| (8) | See “Historical Occupancy” table. |
| (9) | See “Cash Flow Analysis” table. |
The 80 Park Plaza mortgage loan is part of a whole loan (the “80 Park Plaza Whole Loan”) that is evidenced by fivepari passu promissory notes (Notes A-1, A-2, A-3, A-4A, and A-4B) and secured by a first mortgage encumbering the fee interest in a 960,689 square foot, Class A office building (“The 80 Park Plaza Property”) located in the Newark, New Jersey central business district. The 80 Park Plaza Whole Loan was originated on September 30, 2016 by Ladder Capital Finance LLC and Citigroup Global Markets Realty Corp. The 80 Park Plaza Whole Loan had an original principal balance of $133,000,000, has an outstanding principal balance as of the Cut-off Date of $133,000,000 and accrues interest at an interest rate of 4.450%per annum. The 80 Park Plaza Whole Loan had an initial term of 120 months, has a remaining term of 118 months as of the Cut-off Date and requires interest-only payments for
THE INFORMATION IN THIS STRUCTURAL AND COLLATERAL TERM SHEET IS NOT COMPLETE AND MAY BE AMENDED PRIOR TO THE TIME OF SALE. THIS TERM SHEET IS NOT AN OFFER TO SELL THESE SECURITIES AND IT IS NOT A SOLICITATION OF AN OFFER TO BUY THESE SECURITIES IN ANY JURISDICTION WHERE THE OFFER OR SALE IS NOT PERMITTED.
132
| 80 PARK PLAZA |
the first 36 payments following origination and, thereafter, requires payments of principal and interest based on a 30-year amortization schedule. The 80 Park Plaza Whole Loan matures on October 6, 2026.
The 80 Park Plaza Mortgage Loan, evidenced by Note A-4A, which will be contributed to the WFCM 2016-C37 Trust, had an original principal balance of $21,000,000, has an outstanding principal balance as of the Cut-off Date of $21,000,000, representing a non-controlling note. The controlling Note A-1 and non-controlling Note A-2 were contributed to the CGCMT 2016-C3 Trust and had an aggregate original principal balance of $50,000,000. The non-controlling Note A-3, with an original principal balance of $41,500,000, is currently held by Citigroup Global Markets Realty Corp. and is expected to be contributed to the CD 2016-CD2 Trust. The non-controlling Note A-4B, with an original principal balance of $20,500,000, is currently held by Ladder Capital Finance VI TRS LLC and is expected to be contributed to the JPMCC 2016-JP4 Trust. See“Description of the Mortgage Pool—The Whole Loans—The Non-Serviced Whole Loans—The 80 Park Plaza Whole Loan” in the Preliminary Prospectus.
The 80 Park Plaza Property was developed as a build-to-suit in 1979 to serve as the headquarters for Public Service Enterprise Group (“PSEG”). The 80 Park Plaza Property includes both a 26-story office tower and a three-story plaza building which is used as PSEG’s walk-in customer service center. Building amenities include a full service cafeteria with executive dining, a fitness center, a conference room and a 70,000 sq. ft. data center. The two buildings are connected via a two-story, enclosed pedestrian bridge. The 80 Park Plaza Property currently serves as the headquarters of PSEG which has been in Newark since the company’s inception in 1903.
Pari Passu Note Summary
| Original Balance | Note Holder | Controlling Piece | ||
| Note A-1 | $25,000,000 | CGCMT 2016-C3 | Yes | |
| Note A-2 | $25,000,000 | CGCMT 2016-C3 | No | |
| Note A-3 | $41,500,000 | CD 2016-CD2 | No | |
| Note A-4A | $21,000,000 | WFCM 2016-C37 | No | |
| Note A-4B | $20,500,000 | JPMCC 2016-JP4 | No | |
| Total | $133,000,000 |
Sources and Uses
| Sources | Uses | |||||||
| Whole loan amount | $133,000,000 | 71.6% | Purchase price | $174,500,000 | 93.9% | |||
| Sponsor contributed equity | 50,500,000 | 27.2 | Reserves | 8,364,176 | 4.5 | |||
| Other Sources(1) | 2,355,765 | 1.3 | Closing costs | 2,991,588 | 1.6 | |||
| Total Sources | $185,855,765 | 100.0% | Total Uses | $185,855,765 | 100.0% |
| (1) | Other sources are comprised of seller credits and deposits. |
The following table presents certain information relating to the tenancy at the 80 Park Plaza Property:
Major Tenants
| Tenant Name | Credit Rating (Fitch/Moody’s /S&P)(1) | Tenant NRSF | % of NRSF | Annual U/W Base Rent PSF(2) | Annual U/W Base Rent | % of Total Annual U/W Base Rent | Lease Expiration Date |
| Major Tenant | |||||||
| PSEG Services Corporation | BBB+/NR/BBB+ | 824,124 | 85.8% | $17.52 | $14,438,859 | 100.0% | 9/30/2030(2) |
| Total Major Tenants | 824,124 | 85.8% | $17.52 | $14,438,859 | 100.0% | ||
| Occupied Collateral Total | 824,124 | 85.8% | $17.52 | $14,438,859 | 100.0% | ||
| Vacant Space | 136,565 | 14.2% | |||||
| Collateral Total | 960,689 | 100.0% | |||||
| (1) | Certain ratings are those of the parent company whether or not the parent guarantees the lease. |
| (2) | PSEG Services Corporation has two, five-year lease renewal options. |
THE INFORMATION IN THIS STRUCTURAL AND COLLATERAL TERM SHEET IS NOT COMPLETE AND MAY BE AMENDED PRIOR TO THE TIME OF SALE. THIS TERM SHEET IS NOT AN OFFER TO SELL THESE SECURITIES AND IT IS NOT A SOLICITATION OF AN OFFER TO BUY THESE SECURITIES IN ANY JURISDICTION WHERE THE OFFER OR SALE IS NOT PERMITTED.
133
| 80 PARK PLAZA |
The following table presents certain information relating to the lease rollover schedule at the 80 Park Plaza Property:
Lease Expiration Schedule(1)
Year Ending December 31, | No. of Leases Expiring | Expiring NRSF | % of Total NRSF | Cumulative Expiring NRSF | Cumulative % of Total NRSF | Annual U/W Base Rent | % of Total Annual U/W Base Rent | Annual U/W Base Rent PSF(3) |
| MTM | 0 | 0 | 0.0% | 0 | 0.0% | $0 | 0.0% | $0.00 |
| 2016 | 0 | 0 | 0.0% | 0 | 0.0% | $0 | 0.0% | $0.00 |
| 2017 | 0 | 0 | 0.0% | 0 | 0.0% | $0 | 0.0% | $0.00 |
| 2018 | 0 | 0 | 0.0% | 0 | 0.0% | $0 | 0.0% | $0.00 |
| 2019 | 0 | 0 | 0.0% | 0 | 0.0% | $0 | 0.0% | $0.00 |
| 2020 | 0 | 0 | 0.0% | 0 | 0.0% | $0 | 0.0% | $0.00 |
| 2021 | 0 | 0 | 0.0% | 0 | 0.0% | $0 | 0.0% | $0.00 |
| 2022 | 0 | 0 | 0.0% | 0 | 0.0% | $0 | 0.0% | $0.00 |
| 2023 | 0 | 0 | 0.0% | 0 | 0.0% | $0 | 0.0% | $0.00 |
| 2024 | 0 | 0 | 0.0% | 0 | 0.0% | $0 | 0.0% | $0.00 |
| 2025 | 0 | 0 | 0.0% | 0 | 0.0% | $0 | 0.0% | $0.00 |
| 2026 | 0 | 0 | 0.0% | 0 | 0.0% | $0 | 0.0% | $0.00 |
| Thereafter(2) | 1 | 824,124 | 85.8% | 824,124 | 85.8% | $14,438,859(4) | 100.0% | $17.52 |
| Vacant | 0 | 136,565 | 14.2% | 960,689 | 100.0% | $0 | 0.0% | $0.00 |
| Total/Weighted Average | 1 | 960,689 | 100.0% | $14,438,859 | 100.0% | $17.52 |
| (1) | Information obtained from the underwritten rent roll. |
| (2) | PSEG Services Corporation’s lease expiration of September 30, 2030 extends beyond the maturity date of the 80 Park Plaza Whole Loan of October 6, 2026. |
| (3) | Weighted Average Annual U/W Base Rent excludes vacant space. |
| (4) | Annual U/W Base Rent includes straight line rent through the term of the loan. |
The following table presents historical occupancy percentages at the 80 Park Plaza Property:
Historical Occupancy
12/31/2012(1) | 12/31/2013(1) | 12/31/2014(1) | 12/31/2015(2) | 7/19/2016(2)(3) |
| 100.0% | 100.0% | 100.0% | 85.8% | 85.8% |
| (1) | Information obtained from the borrower. |
| (2) | The 80 Park Plaza Property was 100% occupied until October 2015, when PSEG Services Corporation vacated the top 5 floors in conjunction with a 15-year lease extension bringing the occupancy down to 85.8%. |
| (3) | Information obtained from the lease. |
THE INFORMATION IN THIS STRUCTURAL AND COLLATERAL TERM SHEET IS NOT COMPLETE AND MAY BE AMENDED PRIOR TO THE TIME OF SALE. THIS TERM SHEET IS NOT AN OFFER TO SELL THESE SECURITIES AND IT IS NOT A SOLICITATION OF AN OFFER TO BUY THESE SECURITIES IN ANY JURISDICTION WHERE THE OFFER OR SALE IS NOT PERMITTED.
134
| 80 PARK PLAZA |
Operating History and Underwritten Net Cash Flow. The following table presents certain information relating to the historical operating performance and the underwritten net cash flow at the 80 Park Plaza Property:
Cash Flow Analysis
| 2013 | 2014 | 2015 | TTM 5/31/2016 | U/W | % of U/W Effective Gross Income | U/W $ per SF | |||||||
| Base Rent | $8,928,829 | $8,974,084 | $9,821,028 | $11,232,600 | 14,438,859(1) | 59.8% | $15.03(1) | ||||||
| Grossed Up Vacant Space | 0 | 0 | 0 | 0 | 4,096,950 | 17.0 | 4.26 | ||||||
| Total Reimbursables | 10,479,296 | 10,714,894 | 10,364,439 | 9,923,181 | 9,696,296 | 40.2 | 10.09 | ||||||
| Other Income | 0 | 0 | 0 | 0 | 0 | 0.0 | 0.00 | ||||||
| Less Vacancy & Credit Loss | 0 | 0 | 0 | 0 | (4,096,950)(2) | (17.0) | (4.26) | ||||||
| Effective Gross Income | $19,408,125 | $19,688,978 | $20,185,467 | $21,155,781 | $24,135,155 | 100.0% | $25.12 | ||||||
| Total Operating Expenses | $10,541,458 | $10,732,485 | $10,771,904 | $11,508,439 | $11,627,672 | 48.2% | $12.10 | ||||||
| Net Operating Income | $8,866,667 | $8,956,493 | $9,413,563 | $9,647,342 | $12,507,483(3) | 51.8% | $13.02 | ||||||
| TI/LC | 0 | 0 | 0 | 0 | 308,469 | 1.3 | 0.32 | ||||||
| Capital Expenditures | 0 | 0 | 0 | 0 | 0 | 0.0 | 0.00 | ||||||
| Net Cash Flow | $8,866,667 | $8,956,493 | $9,413,563 | $9,647,342 | $12,199,014 | 50.5% | $12.70 | ||||||
| NOI DSCR(4) | 1.10x | 1.11x | 1.17x | 1.20x | 1.56x | ||||||||
| NCF DSCR(4) | 1.10x | 1.11x | 1.17x | 1.20x | 1.52x | ||||||||
| NOI DY(4) | 6.7% | 6.7% | 7.1% | 7.3% | 9.4% | ||||||||
| NCF DY(4) | 6.7% | 6.7% | 7.1% | 7.3% | 9.2% |
| (1) | U/W Base Rent includes straight line rent through the term of the loan. |
| (2) | The underwritten economic vacancy is 14.5%. Occupancy at the 80 Park Plaza Property was 85.8%, as of July 19, 2016. See “Historical Occupancy” section. |
| (3) | The increase in Net Operating Income from TTM 5/31/2016 to U/W is primarily due to PSEG Services Corporation’s rent increasing from $10.89 per square foot to $15.00 per square foot in October 2015 and then to $15.30 per square foot in October 2016 and straight line rent of $1,829,762. |
| (4) | Debt service coverage ratios and debt yields are based on the 80 Park Plaza Whole Loan. |
The following table presents certain information relating to comparable office leases for the 80 Park Plaza Property:
Comparable Leases(1)
| Property Name/Location | Year Built/ Renovated | Stories | Total GLA (SF) | Total Occupancy | Distance from Subject | Tenant Name | Lease Date/Term | Lease Area (SF) | Annual Base Rent PSF | Lease Type |
Gateway Center 1 Newark, NJ | 1971/NAP | 26 | 466,919 | 85.0% | 0.3 miles | Salber | March 2015/ 5.3 years | 4,400 | $31.00 | Gross |
One Newark Center Newark, NJ | 1992/NAP | 22 | 418,027 | 93.6% | 0.1 miles | Connell Foley | January 15/ 10.8 years | 12,600 | $31.00 | Gross |
National Newark Building Newark, NJ | 1930/NAP | 33 | 591,931 | 53.4% | 0.2 miles | PAETEC Communications | September 14/ 5 years | 15,436 | $25.00 | Gross |
Riverfront Plaza Newark, NJ | 1989/NAP | 19 | 446,625 | 78.0% | 0.2 miles | Lewis Brisbois Bisgaard | February 14/ 7.3 years | 7,856 | $29.00 | Gross |
| (1) | Information obtained from the appraisal and third party research report. |
THE INFORMATION IN THIS STRUCTURAL AND COLLATERAL TERM SHEET IS NOT COMPLETE AND MAY BE AMENDED PRIOR TO THE TIME OF SALE. THIS TERM SHEET IS NOT AN OFFER TO SELL THESE SECURITIES AND IT IS NOT A SOLICITATION OF AN OFFER TO BUY THESE SECURITIES IN ANY JURISDICTION WHERE THE OFFER OR SALE IS NOT PERMITTED.
135
| No. 14 – Redwood MHC Portfolio | |||||||
| Loan Information | Property Information | ||||||
| Mortgage Loan Seller: | Ladder Capital Finance LLC | Single Asset/Portfolio: | Portfolio | ||||
| Credit Assessment (DBRS/Fitch/Moody’s): | NR/NR/NR | Property Type: | Manufactured Housing Community | ||||
| Original Principal Balance(1): | $20,600,000 | Specific Property Type(6): | Various | ||||
| Cut-off Date Balance(1): | $20,600,000 | Location(6): | Various – See Table | ||||
| % of Initial Pool Balance: | 2.7% | Size: | 4,007 Pads | ||||
| Loan Purpose: | Refinance | Cut-off Date Balance Per Pad(1): | $23,958 | ||||
| Borrower Names(2): | Various | Year Built/Renovated: | Various – See Table | ||||
| Sponsor(3): | Ross H. Partrich | Title Vesting: | Fee | ||||
| Mortgage Rate: | 4.114% | Property Manager: | Self-managed | ||||
| Note Date: | September 6, 2016 | 4thMost Recent Occupancy (As of)(7): | NAV (12/31/2012) | ||||
| Anticipated Repayment Date: | NAP | 3rdMost Recent Occupancy (As of): | 73.3% (12/31/2013) | ||||
| Maturity Date: | September 6, 2026 | 2ndMost Recent Occupancy (As of): | 74.6% (12/31/2014) | ||||
| IO Period: | 30 months | Most Recent Occupancy (As of): | 73.6% (12/31/2015) | ||||
| Loan Term (Original): | 120 months | Current Occupancy (As of): | 70.9% (7/18/2016) | ||||
| Seasoning: | 3 months | ||||||
| Amortization Term (Original): | 360 months | Underwriting and Financial Information: | |||||
| Loan Amortization Type: | Interest-only, Amortizing Balloon | ||||||
| Interest Accrual Method: | Actual/360 | 4thMost Recent NOI (As of): | $7,767,948 (12/31/2013) | ||||
| Call Protection: | L(27),D(89),O(4) | 3rdMost Recent NOI (As of): | $7,597,616 (12/31/2014) | ||||
| Lockbox Type: | Springing | 2ndMost Recent NOI (As of): | $7,841,666 (12/31/2015) | ||||
| Additional Debt(1)(4): | Yes | Most Recent NOI (As of): | $7,860,403 (TTM 6/30/2016) | ||||
| Additional Debt Type(1)(4): | Pari Passu; Future Mezzanine | ||||||
| U/W Revenues: | $14,797,750 | ||||||
| U/W Expenses: | $6,919,649 | ||||||
| Escrows and Reserves(5): | U/W NOI: | $7,878,101 | |||||
| U/W NCF: | $7,677,751 | ||||||
| Type: | Initial | Monthly | Cap (If Any) | U/W NOI DSCR(1): | 1.41x | ||
| Taxes | $303,973 | $101,324 | NAP | U/W NCF DSCR(1): | 1.38x | ||
| Insurance | $0 | (5) | NAP | U/W NOI Debt Yield(1): | 8.2% | ||
| Replacement Reserves | $0 | $16,757 | $804,340 | U/W NCF Debt Yield(1): | 8.0% | ||
| Deferred Maintenance | $1,000,000 | $0 | NAP | As-Is Appraised Value(8): | $133,710,000 | ||
| Environmental Reserve | $42,000 | $0 | NAP | As-Is Appraisal Valuation Dates(8): | Various | ||
| Michigan CapEx Reserve | $900,000 | $0 | NAP | Cut-off Date LTV Ratio(1): | 71.8% | ||
| Manufactured Homes Reserve | $1,000,000 | $0 | NAP | LTV Ratio at Maturity or ARD(1): | 61.5% | ||
| (1) | All statistical information related to balances per pad, loan-to-value ratios, debt service coverage ratios and debt yields are based on the Redwood MHC Portfolio Whole Loan (as defined below). |
| (2) | The borrowers are: El Frontier Associates, LLC; Town & Country Associates, LLC; Weststar Associates, LLC; Cedar Grove Associates, LLC; Evergreen Associates, LLC; Green Acres Associates, LLC; Highland Associates, LLC; Avalon Associates, LLC; Camp Inn Associates, LLC; Winter Paradise Associates, LLC; Lexington MHC, LLC; St. Clement’s Crossing Associates, LLC; Suburban Associates, LLC; Algoma Associates, LLC; Colonial Acres Associates, LLC; Colonial Manor Associates, LLC; Twenty-Nine Pines Associates, LLC; and Hunter’s Chase MHC, LLC. Each of the borrowers is a Delaware limited liability company and single purpose entity with one independent director. Legal counsel to the borrower delivered a non-consolidation opinion in connection with the origination of the Redwood MHC Portfolio Whole Loan. Ross H. Partrich is the guarantor of certain nonrecourse carve-outs under the Redwood MHC Portfolio Whole Loan. |
| (3) | The sponsor reported commercial mortgage loans that resulted in the delivery of deeds in lieu of foreclosure. See“Description of Mortgage Pool—Loan Purpose; Default History, Bankruptcy Issues and Other Proceedings” in the Preliminary Prospectus. |
| (4) | The loan documents permit mezzanine financing from an institutional lender subject to: (i) no event of default under the related loan documents has occurred and is continuing; (ii) a maximum combined loan-to-value ratio equal to the lesser of 75.0% and the loan-to-value ratio upon origination of the Redwood MHC Portfolio Whole Loan; (iii) a minimum combined amortizing debt service coverage ratio equal to the greater of 1.25x and the amortizing debt service coverage ratio upon origination of the Redwood MHC Portfolio Whole Loan; (iv) the lender’s review and approval of (a) the terms and conditions of the mezzanine loan and the mezzanine loan documents and (b) the structure of the mezzanine borrower; (v) if required under the pooling and servicing agreement, the receipt of a rating agency confirmation from each of the applicable rating agencies that the mezzanine financing will not result in a downgrade, withdrawal or qualification of the respective ratings assigned to the Series 2016-C37 certificates or any other securities evidencing an interest in a Redwood MHC Portfolio Companion Loan; and (vi) the execution of an intercreditor agreement acceptable to the lender. |
| (5) | The loan documents do not require monthly escrows for insurance, provided that (i) a blanket insurance policy acceptable to the lender is in place and (ii) the borrower provides the lender with evidence of payment five days prior to the due date. |
| (6) | See “Property Information” table. |
| (7) | See “Historical Occupancy” table. |
| (8) | As of the appraisal valuation dates between August 1, 2016 and August 5, 2016, the Redwood MHC Portfolio Properties had an aggregate “as-is” appraised value of $133,710,000. |
THE INFORMATION IN THIS STRUCTURAL AND COLLATERAL TERM SHEET IS NOT COMPLETE AND MAY BE AMENDED PRIOR TO THE TIME OF SALE. THIS TERM SHEET IS NOT AN OFFER TO SELL THESE SECURITIES AND IT IS NOT A SOLICITATION OF AN OFFER TO BUY THESE SECURITIES IN ANY JURISDICTION WHERE THE OFFER OR SALE IS NOT PERMITTED.
136
| Redwood MHC Portfolio |
The Redwood MHC Portfolio mortgage loan is part of a whole loan (the “Redwood MHC Portfolio Whole Loan”) that is evidenced by threepari passu promissory notes (Notes A-1, A-2, and A-3) and secured by a first mortgage encumbering the fee interests in 18 manufactured housing community and recreational vehicle community properties located across seven states (the “Redwood MHC Portfolio Properties”). The Redwood MHC Portfolio Whole Loan was originated on September 6, 2016 by Ladder Capital Finance LLC. The Redwood MHC Portfolio Whole Loan had an original principal balance of $96,000,000, has an outstanding principal balance as of the Cut-off Date of $96,000,000 and accrues interest at an interest rate of 4.114%per annum. The Redwood MHC Portfolio Whole Loan had an initial term of 120 months, has a remaining term of 117 months as of the Cut-off Date and requires interest-only payments for the first 30 payments following origination and, thereafter, requires payments of principal and interest based on a 30-year amortization schedule. The Redwood MHC Portfolio Whole Loan matures on September 6, 2026.
The Redwood MHC Portfolio mortgage loan, evidenced by Note A-1, which will be contributed to the WFCM 2016-C37 Trust, had an original principal balance of $20,600,000, has an outstanding principal balance as of the Cut-off Date of $20,600,000, and represents a controlling note. The non-controlling Note A-2, with an original principal balance of $38,400,000, is held by Ladder Capital Finance LLC or an affiliate and is expected to be contributed to the WFCM 2016-LC25 Trust. The non-controlling Note A-3, with an original principal balance of $37,000,000, is expected to be contributed to the JPMCC 2016-JP4 Trust. See“Description of the Mortgage Pool—The Whole Loans—The Serviced Whole Loans—The Redwood MHC Portfolio Whole Loan” in the Preliminary Prospectus.
The Redwood MHC Portfolio Properties consist of 18 manufactured housing and recreational vehicle community properties containing 4,007 pads located in Connecticut (four properties), Michigan (three properties), Arizona (three properties), Maryland (three properties), Florida (three properties), Minnesota (one property) and Ohio (one property). The Redwood MHC Portfolio Properties were built between 1935 and 1994. The Redwood MHC Portfolio Properties range in size from 49 pad sites to 797 pad sites, with monthly rents ranging from $259 to $621. As of July 18, 2016, the Redwood MHC Portfolio Properties were 70.9% occupied.
Pari Passu Note Summary
| Original Balance | Note Holder | Controlling Piece | ||
| Note A-1 | $20,600,000 | WFCM 2016-C37 | Yes | |
| Note A-2 | $38,400,000 | WFCM 2016-LC25 | No | |
| Note A-3 | $37,000,000 | JPMCC 2016-JP4 | No | |
| Total | $96,000,000 |
Following the lockout period, the borrower has the right to defease the Redwood MHC Portfolio Whole Loan in whole or, in connection with the release of an individual property, in part (see “Partial Release” section), on any due date before June 6, 2026. In addition, the Redwood MHC Portfolio Whole Loan is prepayable without penalty commencing on June 6, 2026. The lockout period will expire on the earlier to occur of (i) two years after the closing date of the securitization that includes the last note to be securitized and (ii) September 6, 2019. It is anticipated that the Redwood MHC Portfolio mortgage loan will be the last note securitized of the Redwood MHC Portfolio Whole Loan.
Sources and Uses
| Sources | Uses | |||||||
| Original Whole Loan amount | $96,000,000 | 100.0% | Loan payoff(1) | $73,052,958 | 76.1% | |||
| Reserves | 3,245,973 | 3.4 | ||||||
| Closing costs | 2,090,447 | 2.2 | ||||||
| Return of equity | 17,610,622 | 18.3 | ||||||
| Total Sources | $96,000,000 | 100.0% | Total Uses | $96,000,000 | 100.0% |
| (1) | The Redwood MHC Portfolio Properties were previously un-crossed and securitized in the LBUBS 2006-C6 and LBUBS 2006-C7 transactions. |
THE INFORMATION IN THIS STRUCTURAL AND COLLATERAL TERM SHEET IS NOT COMPLETE AND MAY BE AMENDED PRIOR TO THE TIME OF SALE. THIS TERM SHEET IS NOT AN OFFER TO SELL THESE SECURITIES AND IT IS NOT A SOLICITATION OF AN OFFER TO BUY THESE SECURITIES IN ANY JURISDICTION WHERE THE OFFER OR SALE IS NOT PERMITTED.
137
| Redwood MHC Portfolio |
The following table presents certain information relating to the Redwood MHC Portfolio Properties:
Property Information(1)
| Property Name | City, State | Allocated Cut-off Date Balance | % of Portfolio Cut-off Date Balance | Occupancy | Year Built/ Renovated | Pads | Appraised Value | Allocated LTV | |
| Camp Inn(2) | Frostproof, FL | $15,288,000 | 15.9% | 77.3% | 1972/NAP | 797 | $20,800,000 | 73.5% | |
| Town & Country Estates | Tucson, AZ | $8,946,000 | 9.3% | 79.4% | 1971/NAP | 320 | $13,130,000 | 68.1% | |
| St. Clements Crossing | Lexington Park, MD | $7,947,000 | 8.3% | 95.7% | 1968/2002 | 186 | $11,600,000 | 68.5% | |
| Algoma | Rockford, MI | $7,688,000 | 8.0% | 74.2% | 1980/NAP | 322 | $10,000,000 | 76.9% | |
| Suburban Estates | Lexington Park, MD | $7,561,000 | 7.9% | 97.7% | 1970/NAP | 132 | $10,240,000 | 73.8% | |
| Colonial Acres | Portage, MI | $7,169,500 | 7.5% | 45.3% | 1965/NAP | 612 | $11,070,000 | 64.8% | |
| Twenty Nine Pines | Oakdale, MN | $6,637,000 | 6.9% | 90.3% | 1975/NAP | 144 | $8,310,000 | 79.9% | |
| Evergreen Springs | Clinton, CT | $6,155,000 | 6.4% | 96.1% | 1935/NAP | 102 | $8,070,000 | 76.3% | |
| Avalon(2) | Clearwater, FL | $5,805,000 | 6.0% | 64.5% | 1984/NAP | 256 | $7,740,000 | 75.0% | |
| Lexington | Lexington Park, MD | $3,359,000 | 3.5% | 89.5% | 1980/NAP | 76 | $4,760,000 | 70.6% | |
| Colonial Manor | Kalamazoo, MI | $3,152,500 | 3.3% | 69.2% | 1965/NAP | 195 | $5,240,000 | 60.2% | |
| Green Acres | Westbrook, CT | $3,066,000 | 3.2% | 96.9% | 1955/NAP | 64 | $4,070,000 | 75.3% | |
| Cedar Grove | Clinton, CT | $2,455,000 | 2.6% | 98.3% | 1950/NAP | 60 | $3,070,000 | 80.0% | |
| Hunters Chase | Lima, OH | $2,424,000 | 2.5% | 69.4% | 1994/NAP | 134 | $3,270,000 | 74.1% | |
| Highland Bluff | Branford, CT | $2,293,000 | 2.4% | 89.8% | 1950/NAP | 49 | $3,200,000 | 71.7% | |
| Winter Paradise(2) | Hudson, FL | $2,287,500 | 2.4% | 48.6% | 1972/NAP | 290 | $3,090,000 | 74.0% | |
| Weststar | Tucson, AZ | $1,982,500 | 2.1% | 76.7% | 1984/NAP | 90 | $3,290,000 | 60.3% | |
| El Frontier | Tucson, AZ | $1,784,000 | 1.9% | 46.6% | 1964/NAP | 178 | $2,760,000 | 64.6% | |
| Total/Weighted Average | $96,000,000 | 100.0% | 70.9% | 4,007 | $133,710,000 | 71.8% | |||
| (1) | Based on the Redwood MHC Portfolio Whole Loan. |
| (2) | The Camp Inn, Avalon and Winter Paradise properties are recreational vehicle communities. The remainder of the Redwood MHC Portfolio Properties are manufactured housing communities. |
The following table presents historical occupancy percentages at the Redwood MHC Portfolio Properties:
Historical Occupancy
12/31/2012(1) | 12/31/2013(2) | 12/31/2014(2) | 12/31/2015(2) | 7/18/2016(3) |
| NAV | 73.3% | 74.6% | 73.6% | 70.9% |
| (1) | Complete occupancy information was not provided for 2012. |
| (2) | Information obtained from the borrower. |
| (3) | Information obtained from the underwritten rent roll. |
Operating History and Underwritten Net Cash Flow.The following table presents certain information relating to the historical operating performance and underwritten net cash flow at the Redwood MHC Portfolio Properties:
Cash Flow Analysis
| 2013 | 2014 | 2015 | TTM 6/30/2016 | U/W | % of U/W Effective Gross Income | U/W $ per Pad | |
| Base Rent | $12,575,785 | $12,829,506 | $13,290,442 | $13,390,552 | $13,390,552 | 90.5% | $3,342 |
| Grossed Up Vacant Space | 0 | 0 | 0 | 0 | 5,917,724 | 40.0 | 1,477 |
| Other Income | 1,375,218 | 1,497,460 | 1,442,255 | 1,407,198 | 1,407,198 | 9.5 | 351 |
| Less Vacancy & Credit Loss | 0 | 0 | 0 | 0 | (5,917,724)(1) | (40.0) | (1,477) |
| Effective Gross Income | $13,951,003 | $14,326,966 | $14,732,697 | $14,797,750 | $14,797,750 | 100.0% | $3,693 |
| Total Operating Expenses | $6,183,055 | $6,729,350 | $6,891,031 | $6,937,347 | $6,919,649 | 46.8% | $1,727 |
| Net Operating Income | $7,767,948 | $7,597,616 | $7,841,666 | $7,860,403 | $7,878,101 | 53.2% | $1,966 |
| Capital Expenditures | 0 | 0 | 0 | 0 | 200,350 | 1.4 | 50 |
| Net Cash Flow | $7,767,948 | $7,597,616 | $7,841,666 | $7,860,403 | $7,677,751 | 51.9% | $1,916 |
| NOI DSCR(2) | 1.39x | 1.36x | 1.41x | 1.41x | 1.41x | ||
| NCF DSCR(2) | 1.39x | 1.36x | 1.41x | 1.41x | 1.38x | ||
| NOI DY(2) | 8.1% | 7.9% | 8.2% | 8.2% | 8.2% | ||
| NCF DY(2) | 8.1% | 7.9% | 8.2% | 8.2% | 8.0% |
| (1) | The underwritten economic vacancy is 30.6%. The Redwood MHC Portfolio Properties were 70.9% physically occupied as of July 18, 2016. |
| (2) | The debt service coverage ratios and debt yields are based on the Redwood MHC Portfolio Whole Loan. |
THE INFORMATION IN THIS STRUCTURAL AND COLLATERAL TERM SHEET IS NOT COMPLETE AND MAY BE AMENDED PRIOR TO THE TIME OF SALE. THIS TERM SHEET IS NOT AN OFFER TO SELL THESE SECURITIES AND IT IS NOT A SOLICITATION OF AN OFFER TO BUY THESE SECURITIES IN ANY JURISDICTION WHERE THE OFFER OR SALE IS NOT PERMITTED.
138
(THIS PAGE INTENTIONALLY LEFT BLANK)
THE INFORMATION IN THIS STRUCTURAL AND COLLATERAL TERM SHEET IS NOT COMPLETE AND MAY BE AMENDED PRIOR TO THE TIME OF SALE. THIS TERM SHEET IS NOT AN OFFER TO SELL THESE SECURITIES AND IT IS NOT A SOLICITATION OF AN OFFER TO BUY THESE SECURITIES IN ANY JURISDICTION WHERE THE OFFER OR SALE IS NOT PERMITTED.
139
| No. 15 – Ventron Georgia Portfolio | |||||||
| Loan Information | Property Information | ||||||
| Mortgage Loan Seller: | Silverpeak Real Estate Finance | Single Asset/Portfolio: | Portfolio | ||||
| Credit Assessment (DBRS/Fitch/Moody’s): | NR/NR/NR | Property Type: | Multifamily | ||||
| Original Principal Balance: | $17,500,000 | Specific Property Type: | Garden | ||||
| Cut-off Date Balance: | $17,500,000 | Location: | Various – See Property Information Table | ||||
| % of Initial Pool Balance: | 2.3% | Size: | 402 Units | ||||
| Loan Purpose: | Refinance | Cut-off Date Balance Per Unit: | $43,532 | ||||
| Borrower Names: | Hampton Downs Atlanta Apartments LP; Harvard Place Atlanta Apartments LP | Year Built/Renovated: | Various – See Property Information Table | ||||
| Sponsors: | Daniel Assouline; Michael Dadoun; Ronald Eisenberg | Title Vesting: | Fee | ||||
| Mortgage Rate: | 4.182% | Property Manager: | Self-managed | ||||
| Note Date: | November 18, 2016 | 4thMost Recent Occupancy(2): | NAV | ||||
| Anticipated Repayment Date: | NAP | 3rdMost Recent Occupancy(2): | NAV | ||||
| Maturity Date: | December 6, 2026 | 2ndMost Recent Occupancy (As of)(2): | 85.5% (11/30/2014) | ||||
| IO Period: | None | Most Recent Occupancy (As of): | 91.1% (12/31/2015) | ||||
| Loan Term (Original): | 120 months | Current Occupancy (As of): | 94.3% (9/30/2016) | ||||
| Seasoning: | 0 months | ||||||
| Amortization Term (Original): | 360 months | Underwriting and Financial Information: | |||||
| Loan Amortization Type: | Amortizing Balloon | ||||||
| Interest Accrual Method: | Actual/360 | 4thMost Recent NOI(2): | NAV | ||||
| Call Protection(1): | L(24),D(92),O(4) | 3rdMost Recent NOI (As of)(2): | $1,042,588 (TTM 11/30/2014) | ||||
| Lockbox Type: | Springing | 2ndMost Recent NOI (As of): | $1,411,046 (12/31/2015) | ||||
| Additional Debt: | Yes | Most Recent NOI (As of): | $1,613,061 (TTM 9/30/2016) | ||||
| Additional Debt Type: | Future Unsecured | ||||||
| U/W Revenues: | $3,710,049 | ||||||
| U/W Expenses: | $1,829,786 | ||||||
| U/W NOI(3): | $1,880,263 | ||||||
| U/W NCF: | $1,749,613 | ||||||
| Escrows and Reserves: | U/W NOI DSCR: | 1.83x | |||||
| U/W NCF DSCR: | 1.71x | ||||||
| Type: | Initial | Monthly | Cap (If Any) | U/W NOI Debt Yield: | 10.7% | ||
| Taxes | $40,706 | $20,353 | NAP | U/W NCF Debt Yield: | 10.0% | ||
| Insurance | $99,102 | $9,910 | NAP | As-Is Appraised Value: | $27,550,000 | ||
| Replacement Reserves | $400,000 | $10,888 | NAP | As-Is Appraisal Valuation Date: | October 10, 2016 | ||
| Environmental | $60,000 | $0 | NAP | Cut-off Date LTV Ratio: | 63.5% | ||
| Deferred Maintenance | $10,000 | $0 | NAP | LTV Ratio at Maturity or ARD: | 50.8% | ||
| (1) | Following the lockout period, the borrowers are permitted, upon a third-party sale, to obtain the release of any of the Ventron Georgia Portfolio Properties from the lien of the related mortgage in connection with a partial defeasance, subject to certain conditions including: (i) partial defeasance of the Ventron Georgia Portfolio mortgage loan equal to 130% of the allocated loan amount for the released property; (ii) the loan-to-value ratio with respect to the remaining Ventron Georgia Portfolio Properties will be no greater than 70.0%; (iii) the amortizing debt service coverage ratio with respect to the remaining Ventron Georgia Portfolio Properties will be no less than the greater of (a) the debt service coverage ratio immediately prior to the release and (b) 1.25x; and (iv) the lender receives rating agency confirmation from DBRS, Fitch and Moody’s that the release will not result in a downgrade, withdrawal or qualification of the respective ratings assigned to the Series 2016-C37 certificates. |
| (2) | The sponsors purchased the Ventron Georgia Portfolio Properties in separate transactions in November 2014. |
| (3) | See “Cash Flow Analysis” table. |
The Ventron Georgia Portfolio mortgage loan is evidenced by a single promissory note that is secured by a first mortgage encumbering two garden-style multifamily properties, Harvard Place Apartments and Hampton Downs Apartments, totaling 402 units located in Morrow, Georgia and Lithonia, Georgia (the “Ventron Georgia Portfolio Properties”), respectively.
Built in 1989 and renovated in 2015, Hampton Downs Apartments is comprised of 202 units across 13 garden-style buildings and is situated on a 19.5-acre site. Community amenities include a swimming pool, free standing clubhouse/management office facility, business center, fitness center, playground and tennis court. Each unit features a range/oven with vent hood, a dishwasher, a refrigerator, washer/dryer connections and a private patio or balcony. Hampton Downs Apartments features 409 surface parking spaces, resulting in a parking ratio of 2.0 spaces per unit.
Hampton Downs Apartments is situated approximately one mile northeast of Interstate 75, and approximately 1.5 miles west of Interstate 675. National retailers located within a three-mile radius of the Hampton Downs property include Publix, Costco Wholesale, Home Depot, PetSmart, Ashley Furniture, Dollar General, and LA Fitness. According to a third party market research report, the 2016 estimated population within a three- and five-mile radius of the Hampton Downs property is 60,226 and 151,287, respectively and the 2016 estimated average household income within the same radii is $56,176 and $54,574, respectively.
THE INFORMATION IN THIS STRUCTURAL AND COLLATERAL TERM SHEET IS NOT COMPLETE AND MAY BE AMENDED PRIOR TO THE TIME OF SALE. THIS TERM SHEET IS NOT AN OFFER TO SELL THESE SECURITIES AND IT IS NOT A SOLICITATION OF AN OFFER TO BUY THESE SECURITIES IN ANY JURISDICTION WHERE THE OFFER OR SALE IS NOT PERMITTED.
140
| VENTRON GEORGIA PORTFOLIO |
Built in 1985 and renovated in 2015, Harvard Place Apartments is comprised of 200 units across 14 two-story garden-style buildings and is situated on an 18.0-acre site. Community amenities include a swimming pool, a dog park, two playgrounds, and an outdoor sport court. Each unit features a range/oven with vent hood, a dishwasher, a garbage disposal, a refrigerator, a washer/dryer connection and a private patio of balcony. Harvard Place Apartments features 400 surface parking spaces, resulting in a parking ratio of 2.0 spaces per unit.
Harvard Place Apartments is located 15 miles east of the Atlanta central business district and is approximately 1.3 miles from Interstate 20. Harvard Place Apartments is located approximately 3.3 miles west of Turner Hill Marketplace, a 409,094 square foot shopping center that includes major tenants such as Walmart Supercenter, Sam’s Club, and Bed Bath & Beyond. Additional major retailers located within a four mile radius of Harvard Place property include Marshalls, Dollar Tree, Kroger, ALDI, and Walgreen’s. According to a third party market research report, the 2016 estimated population within a three- and five-mile radius is 58,057 and 142,054, respectively, and the 2016 estimated average household income within the same radii is $51,090 and $59,484, respectively.
Sources and Uses
| Sources | Uses | |||||||
| Original loan amount | $17,500,000 | 100.0% | Loan payoff | $15,988,821 | 91.4% | |||
| Reserves | 609,808 | 3.5 | ||||||
| Closing costs | 553,536 | 3.2 | ||||||
| Return of equity | 347,834 | 2.0 | ||||||
| Total Sources | $17,500,000 | 100.0% | Total Uses | $17,500,000 | 100.0% |
Property Information
| Property Name | City, State | Allocated Cut-off Date Balance | % of Portfolio Cut-off Date Balance | Occupancy | Year Built / Renovated | Units | Appraised Value | Allocated LTV |
| Hampton Downs Apartments | Morrow, GA | 8,850,000 | 50.6% | 93.6% | 1989 / 2015 | 202 | 13,400,000 | 66.0% |
Harvard Place Apartments | Lithonia, GA | 8,650,000 | 49.4% | 95.0% | 1985 / 2015 | 200 | 14,150,000 | 61.1% |
| Total / Weighted Average | 17,500,000 | 100.0% | 94.3% | 402 | 27,550,000 | 63.5% | ||
The following table presents certain information relating to the unit mix of the Ventron Georgia Portfolio Properties:
Unit Mix Summary(1)
| Unit Type | No. of Units | % of Total Units | Average Unit Size (SF) | Average Monthly Market Rent per Unit |
Hampton Downs Apartments 1 Bedroom / 1 Bath 2 Bedroom / 2 Bath | 83 119 | 20.6% 29.6% | 720 1,009 | $692 $773 |
| Harvard Place Apartments | ||||
1 Bedroom / 1 Bath 2 Bedroom / 2 Bath | 48 119 | 11.9% 29.6% | 740 1,005 | $709 $817 |
| 3 Bedroom / 2 Bath | 33 | 8.2% | 1,240 | $952 |
| Total/Weighted Average | 402 | 100.0% | 935 | $776 |
| (1) | Information obtained from the underwritten rent roll as of September 30, 2016 and the appraisal. |
THE INFORMATION IN THIS STRUCTURAL AND COLLATERAL TERM SHEET IS NOT COMPLETE AND MAY BE AMENDED PRIOR TO THE TIME OF SALE. THIS TERM SHEET IS NOT AN OFFER TO SELL THESE SECURITIES AND IT IS NOT A SOLICITATION OF AN OFFER TO BUY THESE SECURITIES IN ANY JURISDICTION WHERE THE OFFER OR SALE IS NOT PERMITTED.
141
| VENTRON GEORGIA PORTFOLIO |
The following table presents historical occupancy percentages at the Ventron Georgia Portolio:
Historical Occupancy
12/31/2012(1) | 12/31/2013(1) | 11/30/2014(1)(2) | 12/31/2015(2) | 9/30/2016(3) (4) |
| NAV | NAV | 85.5% | 91.1% | 94.3% |
| (1) | The Sponsor purchased the Ventron Georgia Portfolio Properties in November 2014. |
| (2) | Information obtained from the borrower |
| (3) | Information obtained from the underwritten rent roll. |
| (4) | Occupancy excludes model units. |
Operating History and Underwritten Net Cash Flow.The following table presents certain information relating to the historical operating performance and underwritten net cash flow at the Ventron Georgia Portfolio Properties:
Cash Flow Analysis
| TTM 11/30/2014(1) | 2015 | TTM 9/30/2016 | U/W | % of U/W Effective Gross Income | U/W $ per Unit | |
| Base Rent | $2,718,242 | $3,214,997 | $3,489,511 | $3,765,345 | 101.5% | $9,367 |
| Other Income(2) | 21,996 | 412,501 | 499,285 | 538,511 | 14.5 | 1,340 |
| Less Vacancy & Credit Loss | 0 | (444,493) | (473,295) | (593,807)(3) | (16.0) | (1,477) |
| Effective Gross Income | $2,740,238 | $3,183,005 | $3,515,500 | $3,710,049 | 100.0% | $9,229 |
| Total Operating Expenses | $1,697,650 | $1,771,959 | $1,902,440 | $1,829,786 | 49.3% | $4,552 |
| Net Operating Income | $1,042,588 | $1,411,046 | $1,613,061 | $1,880,263(4) | 50.7% | $4,677 |
| Capital Expenditures | 0 | 0 | 0 | 130,650 | 3.5 | 325 |
| Net Cash Flow | $1,042,588 | $1,411,046 | $1,613,061 | $1,749,613 | 47.2% | $4,352 |
| NOI DSCR | 1.02x | 1.38x | 1.57x | 1.83x | ||
| NCF DSCR | 1.02x | 1.38x | 1.57x | 1.71x | ||
| NOI DY | 6.0% | 8.1% | 9.2% | 10.7% | ||
| NCF DY | 6.0% | 8.1% | 9.2% | 10.0% |
| (1) | The sponsors purchased the Ventron Georgia Portfolio Properties in November 2014. |
| (2) | Other Income consists of collection fees, late fees, early termination fees, utility reimbursements, risk fee, and miscellaneous income. |
| (3) | The underwritten economic vacancy is 9.5%. The Ventron Georgia Portfolio Properties were 94.3% occupied as of September 30, 2016. |
| (4) | The increase in Net Operating Income from TTM 9/30/2016 to U/W is primarily due to an increase in rents and utility reimbursements from the TTM 9/30/2016 period to the annualized trailing three month period ending September 30, 2016. |
Competitive Set (Hampton Downs)(1)
| Location | Distance to Subject | Number of Units | Average Rent per Unit | Total Occupancy | |
| Hampton Downs Apartments (Subject) | Morrow, GA | -- | 202 | $732(2) | 93.6%(3) |
| Pines at South Lake | Morrow, GA | 4.5 miles | 93 | $696 | 96.0% |
| Bridgewater at Mt. Zion | Stockbridge, GA | 3.3 miles | 200 | $957 | 92.0% |
| Hidden Creek | Morrow, GA | 0.6 miles | 116 | $788 | 98.0% |
| Regal Pointe | Morrow, GA | 0.5 miles | 121 | $661 | 95.0% |
| Windsor Landing | Morrow, GA | 3.5 miles | 200 | $725 | 100.0% |
| Magnolia Woods | Morrow, GA | 1.5 miles | 240 | $728 | 78.0% |
| (1) | Information obtained from the appraisal. |
| (2) | Information based upon actual rents and occupied units according to the September 30, 2016 rent roll. |
| (3) | Occupancy excludes model units. |
THE INFORMATION IN THIS STRUCTURAL AND COLLATERAL TERM SHEET IS NOT COMPLETE AND MAY BE AMENDED PRIOR TO THE TIME OF SALE. THIS TERM SHEET IS NOT AN OFFER TO SELL THESE SECURITIES AND IT IS NOT A SOLICITATION OF AN OFFER TO BUY THESE SECURITIES IN ANY JURISDICTION WHERE THE OFFER OR SALE IS NOT PERMITTED.
142
| VENTRON GEORGIA PORTFOLIO |
Competitive Set (Harvard Place)(1)
| Location | Distance to Subject | Number of Units | Average Rent per Unit | Total Occupancy | |
Harvard Place Apartments (Subject)
| Lithonia, GA | -- | 200 | $820(2) | 95.0%(3) |
| Windward Forest | Lithonia, GA | 0.2 miles | 216 | $705 | 94.0% |
| The Reserve | Lithonia, GA | 1.4 miles | 252 | $744 | 94.0% |
| Oaks at Stonecrest | Lithonia, GA | 1.8 miles | 280 | $675 | 67.0% |
| Woodcrest Village | Lithonia, GA | 2.3 miles | 344 | $735 | 93.0% |
| The Park at Edinburgh | Lithonia, GA | 2.6 miles | 415 | $834 | 92.0% |
| Arbor Crossing | Lithonia, GA | 0.5 miles | 240 | $866 | 95.0% |
| (1) | Information obtained from the appraisal. |
| (2) | Information based upon actual rents and occupied units according to the September 30, 2016 rent roll. |
| (3) | Occupancy excludes model units. |
THE INFORMATION IN THIS STRUCTURAL AND COLLATERAL TERM SHEET IS NOT COMPLETE AND MAY BE AMENDED PRIOR TO THE TIME OF SALE. THIS TERM SHEET IS NOT AN OFFER TO SELL THESE SECURITIES AND IT IS NOT A SOLICITATION OF AN OFFER TO BUY THESE SECURITIES IN ANY JURISDICTION WHERE THE OFFER OR SALE IS NOT PERMITTED.
143
| No. 16 – Cranberry Crossroads | ||||||||
| Loan Information | Property Information | |||||||
| Mortgage Loan Seller: | Barclays Bank PLC | Single Asset/Portfolio: | Single Asset | |||||
| Credit Assessment (DBRS/Fitch/Moody’s): | NR/NR/NR | Property Type: | Office | |||||
| Original Principal Balance: | $15,400,000 | Specific Property Type: | Suburban | |||||
| Cut-off Date Balance: | $15,400,000 | Location: | Cranberry Township, PA | |||||
| % of Initial Pool Balance: | 2.1% | Size: | 86,511 SF | |||||
| Loan Purpose: | Refinance | Cut-off Date Balance Per SF: | $178.01 | |||||
| Borrower: | Cranberry Crossroads LP | Year Built/Renovated: | 2013/NAP | |||||
| Sponsor: | Elmhurst Corporation | Title Vesting: | Fee | |||||
| Mortgage Rate: | 4.611% | Property Manager: | Self-managed | |||||
| Note Date: | November 18, 2016 | 4thMost Recent Occupancy (As of): | NAV | |||||
| Anticipated Repayment Date: | NAP | 3rdMost Recent Occupancy (As of)(1): | 4.5% (12/31/2013) | |||||
| Maturity Date: | December 6, 2026 | 2ndMost Recent Occupancy (As of)(1): | 44.6% (12/31/2014) | |||||
| IO Period: | 18 months | Most Recent Occupancy (As of)(1): | 74.4% (12/31/2015) | |||||
| Loan Term (Original): | 120 months | Current Occupancy (As of)(1): | 98.1% (10/20/2016) | |||||
| Seasoning: | 0 months | |||||||
| Amortization Term (Original): | 360 months | Underwriting and Financial Information: | ||||||
| Loan Amortization Type: | Interest-only, Amortizing Balloon | |||||||
| Interest Accrual Method: | Actual/360 | 4thMost Recent NOI (As of)(2): | ($160,387) (12/31/2013) | |||||
| Call Protection: | L(24),D(92),O(4) | 3rdMost Recent NOI (As of)(2): | ($113,310) (12/31/2014) | |||||
| Lockbox Type: | Springing | 2ndMost Recent NOI (As of)(2): | $626,887 (12/31/2015) | |||||
| Additional Debt: | None | Most Recent NOI (As of)(2): | $1,024,559 (TTM 8/31/2016) | |||||
| Additional Debt Type: | NAP | |||||||
| U/W Revenues: | $2,064,118 | |||||||
| U/W Expenses: | $562,187 | |||||||
| U/W NOI(2): | $1,501,930 | |||||||
| U/W NCF: | $1,372,679 | |||||||
| Escrows and Reserves: | U/W NOI DSCR : | 1.58x | ||||||
| U/W NCF DSCR: | 1.45x | |||||||
| Type: | Initial | Monthly | Cap (If Any) | U/W NOI Debt Yield: | 9.8% | |||
| Taxes | $36,934 | $10,044 | NAP | U/W NCF Debt Yield: | 8.9% | |||
| Insurance(3) | $0 | Springing | NAP | As-Is Appraised Value: | $21,100,000 | |||
| Replacement Reserve(4) | $0 | Springing | NAP | As-Is Appraisal Valuation Date: | October 13, 2016 | |||
| TI/LC | $0 | $9,012 | $432,555 | Cut-off Date LTV Ratio: | 73.0% | |||
| Rent Abatement Reserve | $119,585 | $0 | NAP | LTV Ratio at Maturity or ARD: | 61.7% | |||
| (1) | The Cranberry Crossroads Property (as defined below) was constructed in 2013 and has steadily increased occupancy from 4.5% as of December 31, 2013 to 98.1% occupied as of October 20, 2016. |
| (2) | See “Cash Flow Analysis” section. |
| (3) | Ongoing reserves for insurance premiums are not required as long as (i) no event of default has occurred and is continuing and (ii) the Cranberry Crossroads Property is insured via an acceptable blanket insurance policy. |
| (4) | Beginning on January 6, 2019, the borrower will deposit $1,442 on each scheduled payment date. |
The Cranberry Crossroads mortgage loan is evidenced by a single promissory note that is secured by a first mortgage encumbering an 86,511 square foot Class-A office building (“the Cranberry Crossroads Property”) located at 2009 Mackenzie Way in Cranberry Township, PA (Pittsburgh metropolitan statistical area). The Cranberry Crossroads Property was built in 2013 and is situated on a 5.0-acre site with 343 surface parking spaces, resulting in a parking ratio of 4.0 spaces per 1,000 square feet of net rentable area. As of October 20, 2016, the Cranberry Crossroads Property was 98.1% leased by 11 tenants in diverse fields including, automotive, finance, insurance, engineering, manufacturing, and technology. The top three tenants, Regus Corporation, Farmers Insurance Exchange, and SR Snodgrass PC, occupy 43.6% of NRA and 45.0% of U/W base rent. These tenants all have at least one remaining renewal option to extend their term five years.
The Cranberry Crossroads Property is located in Butler County, PA, approximately 20 miles from the Pittsburgh central business district. It is served by Pittsburgh International Airport, which is approximately 25 miles southwest of the Cranberry Crossroads Property. The Cranberry Crossroads Property is located within close proximity of major retailers and amenities, including Dick’s Sporting Goods, Target, T. J. Maxx, Lowe’s, Staples and GetGo Gas Station, as well as two hotels, Pittsburgh Marriot North and Home2 Suites by Hilton. In addition, two major retail centers, Cranberry Commons and Cranberry Square, are located in the area and feature major tenants like Lowe’s, Kohl’s, Target, and Walmart. According to the appraisal, the 2015 population within a three- and five-mile radius of the Cranberry Crossroads was 33,514 and 68,487, respectively, while the average household income within the same radii was $126,758 and $128,551, respectively. As of the third quarter of 2016, the Cranberry Crossroads office submarket reported a total inventory of 6,405,937 square feet and vacancy of 4.4%.
THE INFORMATION IN THIS STRUCTURAL AND COLLATERAL TERM SHEET IS NOT COMPLETE AND MAY BE AMENDED PRIOR TO THE TIME OF SALE. THIS TERM SHEET IS NOT AN OFFER TO SELL THESE SECURITIES AND IT IS NOT A SOLICITATION OF AN OFFER TO BUY THESE SECURITIES IN ANY JURISDICTION WHERE THE OFFER OR SALE IS NOT PERMITTED.
144
| CRANBERRY CROSSROADS |
Sources and Uses
| Sources | Uses | |||||||
| Original loan amount | $15,400,000 | 100.0% | Loan Payoff | $14,948,774 | 97.1% | |||
| Reserves | 156,519 | 1.0 | ||||||
| Closing costs | 258,095 | 1.7 | ||||||
| Return of Equity | 36,612 | 0.2 | ||||||
| Total Sources | $15,400,000 | 100.0% | Total Uses | $15,400,000 | 100.0% |
The following table presents certain information relating to the tenancy at the Cranberry Crossroads Property:
Major Tenants
| Tenant Name | Credit Rating (Fitch/Moody’s/ S&P)(1) | Tenant NRSF | % of NRSF | Annual U/W Base Rent PSF | Annual U/W Base Rent | % of Total Annual U/W Base Rent | Lease Expiration Date | |
| Major Tenant | ||||||||
| Regus Corporation(2) | NR/NR/NR | 15,074 | 17.4% | $26.50 | $399,461 | 18.9% | 12/31/2024(3) | |
| Farmers Insurance Exchange | NR/A2/A+ | 11,943 | 13.8% | $24.00 | $286,632 | 13.6% | 6/30/2020(4) | |
| SR Snodgrass PC | NR/NR/NR | 10,725 | 12.4% | $24.50 | $262,763 | 12.5% | 8/31/2026(5) | |
| Vert Markets(6) | NR/NR/NR | 10,060 | 11.6% | $24.50 | $246,470 | 11.7% | 2/28/2022 | |
| Whitman, Requardt & Associates LLP | NR/NR/NR | 8,646 | 10.0% | $24.75 | $213,989 | 10.2% | 5/31/2021 | |
| Total Major Tenants | 56,448 | 65.2% | $24.97 | $1,409,314 | 66.9% | |||
| Non-Major Tenants | 28,431 | 32.9% | $24.58 | $698,747 | 33.1% | |||
| Occupied Collateral Total | 84,879 | 98.1% | $24.84 | $2,108,061 | 100.0% | |||
| Vacant Space | 1,632 | 1.9% | ||||||
| Collateral Total | 86,511 | 100.0% | ||||||
| (1) | Certain ratings are those of the parent company whether or not the parent guarantees the lease. |
| (2) | The Cranberry Crossroad loan is structured with a cash flow sweep 12 months in advance of either Regus Corporation’s termination option or lease expiration. Any funds collected with respect to the cash flow sweep will be returned to the borrower upon satisfactory renewal or replacement of the Regus Corporation lease. |
| (3) | Regus Corporation has the option to extend the term of the lease for one additional term of five years. In addition, the tenant shall have the right to terminate the lease effective on December 31, 2020 and pay a termination fee of approximately $494,812 ($32.83 PSF). |
| (4) | Farmers Insurance Exchange has the option to extend the term of the lease for two additional terms of five years. In addition, the tenant has a one-time right to terminate the lease effective on June 30, 2018 and pay a termination fee of approximately $374,055 ($31.32 PSF). |
| (5) | SR Snodgrass PC has the option to extend the term of the lease for one additional term of five years. In addition, the tenant has the one-time right to terminate the lease effective on August 31, 2023 and pay a termination fee of approximately (i) three months of base rent and (ii) unamortized costs totaling $267,334 ($24.93 PSF). |
| (6) | Vert Markets is entitled to $104,792 in abated rent and will commence paying full, unabated rent effective November 2021. At origination, a reserve in the amount of $104,792 was established to cover such abated rent. |
THE INFORMATION IN THIS STRUCTURAL AND COLLATERAL TERM SHEET IS NOT COMPLETE AND MAY BE AMENDED PRIOR TO THE TIME OF SALE. THIS TERM SHEET IS NOT AN OFFER TO SELL THESE SECURITIES AND IT IS NOT A SOLICITATION OF AN OFFER TO BUY THESE SECURITIES IN ANY JURISDICTION WHERE THE OFFER OR SALE IS NOT PERMITTED.
145
| CRANBERRY CROSSROADS |
The following table presents certain information relating to the lease rollover schedule at the Cranberry Crossroads Property:
Lease Expiration Schedule(1)
Year Ending December 31, | No. of Leases Expiring | Expiring NRSF | % of Total NRSF | Cumulative Expiring NRSF | Cumulative % of Total NRSF | Annual U/W Base Rent(2) | % of Total Annual U/W Base Rent | Annual U/W Base Rent PSF(2) |
| MTM | 0 | 0 | 0.0% | 0 | 0.0% | $0 | 0.0% | $0.00 |
| 2016 | 0 | 0 | 0.0% | 0 | 0.0% | $0 | 0.0% | $0.00 |
| 2017 | 0 | 0 | 0.0% | 0 | 0.0% | $0 | 0.0% | $0.00 |
| 2018 | 0 | 0 | 0.0% | 0 | 0.0% | $0 | 0.0% | $0.00 |
| 2019 | 1 | 6,156 | 7.1% | 6,156 | 7.1% | $150,268 | 7.1% | $24.41 |
| 2020 | 4 | 29,727 | 34.4% | 35,883 | 41.5% | $725,081 | 34.4% | $24.39 |
| 2021 | 2 | 12,052 | 13.9% | 47,935 | 55.4% | $297,436 | 14.1% | $24.68 |
| 2022 | 1 | 10,060 | 11.6% | 57,995 | 67.0% | $246,470 | 11.7% | $24.50 |
| 2023 | 1 | 1,085 | 1.3% | 59,080 | 68.3% | $26,583 | 1.3% | $24.50 |
| 2024 | 1 | 15,074 | 17.4% | 74,154 | 85.7% | $399,461 | 18.9% | $26.50 |
| 2025 | 0 | 0 | 0.0% | 74,154 | 85.7% | $0 | 0.0% | $0.00 |
| 2026 | 1 | 10,725 | 12.4% | 84,879 | 98.1% | $262,763 | 12.5% | $24.50 |
| Thereafter | 0 | 0 | 0.0% | 84,879 | 98.1% | $0 | 0.0% | $0.00 |
| Vacant | 0 | 1,632 | 1.9% | 86,511 | 100.0% | $0 | 0.0% | $0.00 |
| Total/Weighted Average | 11 | 86,511 | 100.0% | $2,108,061 | $24.84 |
| (1) | Information obtained from the underwritten rent roll. |
| (2) | The Annual U/W Base Rent PSF and Annual U/W Base Rent for Cranberry Crossroads represent the tenant’s average rent over the lease term. The tenant’s current in-place annual rent is $2,048,540 or $24.13 per square foot. |
The following table presents historical occupancy percentages at the Cranberry Crossroads Property:
Historical Occupancy
12/31/2013(1)(3) | 12/31/2014(1)(3) | 12/31/2015(1)(3) | 10/20/2016(2)(3) |
| 4.5% | 44.6% | 74.4% | 98.1% |
| (1) | Information obtained from the borrower. |
| (2) | Information obtained from the underwritten rent roll. |
| (3) | The Cranberry Crossroads Property was constructed in 2013 and has steadily increased occupancy from 4.5% as of December 31, 2013 to 98.1% occupied as of October 20, 2016. |
Operating History and Underwritten Net Cash Flow. The following table presents certain information relating to the historical operating performance and the underwritten net cash flow at the Cranberry Crossroads Property:
Cash Flow Analysis
| 2014 | 2015 | TTM 8/31/2016 | U/W | % of U/W Effective Gross Income | U/W $ per SF | ||||||||
| Base Rent | $235,974 | $1,131,944 | $1,537,260 | $2,108,061(1) | 102.1% | $24.37 | |||||||
| Grossed Up Vacant Space | 0 | 0 | 0 | 39,984 | 1.9 | 0.46 | |||||||
| Total Reimbursables | 0 | 4,154 | 16,456 | 24,711 | 1.2 | 0.29 | |||||||
| Other Income | 0 | 0 | 0 | 0 | 0.0 | 0.00 | |||||||
| Less Vacancy & Credit Loss | 0 | 0 | 0 | (108,638)(2) | (5.3) | (1.26) | |||||||
| Effective Gross Income | $235,974 | $1,136,098 | $1,553,716 | $2,064,118 | 100.0% | $23.86 | |||||||
| Total Operating Expenses | $349,284 | $509,211 | $529,157 | $562,187 | 27.2% | $6.50 | |||||||
| Net Operating Income(3) | ($113,310) | $626,887 | $1,024,559 | $1,501,930 | 72.8% | $17.36 | |||||||
| TI/LC | 0 | 0 | 0 | 111,949 | 5.4 | 1.29 | |||||||
| Capital Expenditures | 0 | 0 | 0 | 17,302 | 0.8 | 0.20 | |||||||
| Net Cash Flow | ($113,310) | $626,887 | $1,024,559 | $1,372,679 | 66.5% | $15.87 | |||||||
| NOI DSCR | (0.12x) | 0.66x | 1.08x | 1.58x | |||||||||
| NCF DSCR | (0.12x) | 0.66x | 1.08x | 1.45x | |||||||||
| NOI DY | (0.7%) | 4.1% | 6.7% | 9.8% | |||||||||
| NCF DY | (0.7%) | 4.1% | 6.7% | 8.9% |
| (1) | U/W Base Rent includes $59,521 of contractual rent steps through January 1, 2018. |
| (2) | The underwritten economic vacancy is 5.0%. The Cranberry Crossroads Property was 98.1% physically occupied as of October 20, 2016. |
| (3) | NOI has increased from 2013 to TTM 8/31/2016 as a result of the increase in occupancy following the Cranberry Crossroads Property construction in 2013. NOI has increased from TTM 8/31/2016 to U/W NOI as a result of three tenants that started their leases in 2016 representing 20,456 square feet (23.6% of net rentable area) and $493,106 of Base Rent. |
THE INFORMATION IN THIS STRUCTURAL AND COLLATERAL TERM SHEET IS NOT COMPLETE AND MAY BE AMENDED PRIOR TO THE TIME OF SALE. THIS TERM SHEET IS NOT AN OFFER TO SELL THESE SECURITIES AND IT IS NOT A SOLICITATION OF AN OFFER TO BUY THESE SECURITIES IN ANY JURISDICTION WHERE THE OFFER OR SALE IS NOT PERMITTED.
146
| CRANBERRY CROSSROADS |
Comparable Leases(1)
| Property Name/Location | Year Built/ Renovated | Stories | Total GLA (SF) | Total Occupancy | Distance from Subject | Tenant Name | Lease Term | Lease Area (SF) | Annual Base Rent PSF | Lease Type |
500 Cranberry Woods Drive, PA | 2003/NAP | 4 | 119,444 | 89% | 0.7 miles | Aesynt, Inc. | 6 Yrs. | 102,000 | $25.25 | Gross |
| Cloverleaf Commons of Cranberry, PA | 2014/NAP | 3 | 63,000 | 65% | 0.7 miles | Available | 5 Yrs. | 4,806 | $25.00 | Gross |
| Brush Creek Commons II, PA | 2008/NAP | 3 | 35,463 | 73% | 1.1 miles | Available | 5 Yrs. | 9,546 | $24.75 | Gross |
| 600 Cranberry Woods Drive, PA | 2007/NAP | 4 | 106,435 | 100% | 0.8 miles | Confidential | 5 Yrs. | 3,817 | $24.50 | Gross |
| 800 Cranberry Woods Drive, PA | 1999/NAP | 4 | 120,000 | 93% | 0.8 miles | ERM Group Inc. | 3 Yrs. | 4,581 | $23.50 | Gross |
| 8050 Row an Road, PA | 2004/NAP | 6 | 52,800 | 76% | 1.2 miles | Federated Mutual Insurance Co. | 5 Yrs. | 1,777 | $23.00 | Gross |
| (1) | Information obtained from the appraisal and a third party market research report. |
THE INFORMATION IN THIS STRUCTURAL AND COLLATERAL TERM SHEET IS NOT COMPLETE AND MAY BE AMENDED PRIOR TO THE TIME OF SALE. THIS TERM SHEET IS NOT AN OFFER TO SELL THESE SECURITIES AND IT IS NOT A SOLICITATION OF AN OFFER TO BUY THESE SECURITIES IN ANY JURISDICTION WHERE THE OFFER OR SALE IS NOT PERMITTED.
147
Wells Fargo Commercial Mortgage Trust 2016-C37 | Transaction Contact Information |
| VI. | Transaction Contact Information |
Questions regarding this Structural and Collateral Term Sheet may be directed to any of the following individuals:
| Wells Fargo Securities, LLC | |
| Brigid Mattingly | Tel. (312) 269-3062 |
| A.J. Sfarra | Tel. (212) 214-5613 |
| Alex Wong | Tel. (212) 214-5615 |
| Barclays Capital Inc. | |
| Daniel Vinson | Tel. (212) 528-8224 |
| Brian Wiele | Tel. (212) 412-5780 |
| Brian La Belle | Tel. (212) 526-1809 |
THE INFORMATION IN THIS STRUCTURAL AND COLLATERAL TERM SHEET IS NOT COMPLETE AND MAY BE AMENDED PRIOR TO THE TIME OF SALE. THIS TERM SHEET IS NOT AN OFFER TO SELL THESE SECURITIES AND IT IS NOT A SOLICITATION OF AN OFFER TO BUY THESE SECURITIES IN ANY JURISDICTION WHERE THE OFFER OR SALE IS NOT PERMITTED.
148