Wells Fargo Commercial Mortgage Securities
Filed: 15 Mar 17, 12:00am
| FREE WRITING PROSPECTUS | ||
| FILED PURSUANT TO RULE 433 | ||
| REGISTRATION FILE NO.: 333-206677-14 | ||

Free Writing Prospectus
Structural and Collateral Term Sheet
$637,555,685
(Approximate Initial Pool Balance)
$531,482,000
(Approximate Aggregate Certificate Balance of Offered Certificates)
Wells Fargo Commercial Mortgage Trust 2017-RB1
as Issuing Entity
Wells Fargo Commercial Mortgage Securities, Inc.
as Depositor
Barclays Bank PLC
Wells Fargo Bank, National Association
UBS AG
Société Générale
as Sponsors and Mortgage Loan Sellers
Commercial Mortgage Pass-Through Certificates
Series 2017-RB1
March 14, 2017
WELLS FARGO SECURITIES Co-Lead Manager and Joint Bookrunner
| BARCLAYS Co-Lead Manager and Joint Bookrunner | ||
SOCIETE GENERALE Co-Lead Manager and Joint Bookrunner | UBS SECURITIES LLC Co-Lead Manager and Joint Bookrunner | ||
Academy Securities Co-Manager | |||
STATEMENT REGARDING THIS FREE WRITING PROSPECTUS
The depositor has filed a registration statement (including a prospectus) with the Securities and Exchange Commission (‘‘SEC’’) (SEC File No. 333-206677) for the offering to which this communication relates. Before you invest, you should read the prospectus in the registration statement and other documents the depositor has filed with the SEC for more complete information about the depositor, the issuing entity and this offering. You may get these documents for free by visiting EDGAR on the SEC Web site at www.sec.gov. Alternatively, the depositor, any underwriter, or any dealer participating in the offering will arrange to send you the prospectus after filing if you request it by calling toll free 1-800-745-2063 (8 a.m. – 5 p.m. EST) or by emailing wfs.cmbs@wellsfargo.com.
Nothing in this document constitutes an offer of securities for sale in any jurisdiction where the offer or sale is not permitted. The information contained herein is preliminary as of the date hereof, supersedes any such information previously delivered to you and will be superseded by any such information subsequently delivered and ultimately by the final prospectus relating to the securities. These materials are subject to change, completion, supplement or amendment from time to time.
This free writing prospectus has been prepared by the underwriters for information purposes only and does not constitute, in whole or in part, a prospectus for the purposes of Directive 2003/71/EC (as amended) and/or Part VI of the Financial Services and Markets Act 2000, as amended, or other offering document.
STATEMENT REGARDING ASSUMPTIONS AS TO SECURITIES, PRICING ESTIMATES AND OTHER INFORMATION
The attached information contains certain tables and other statistical analyses (the “Computational Materials”) which have been prepared in reliance upon information furnished by the Mortgage Loan Sellers. Numerous assumptions were used in preparing the Computational Materials, which may or may not be reflected herein. As such, no assurance can be given as to the Computational Materials’ accuracy, appropriateness or completeness in any particular context; or as to whether the Computational Materials and/or the assumptions upon which they are based reflect present market conditions or future market performance. The Computational Materials should not be construed as either projections or predictions or as legal, tax, financial or accounting advice. You should consult your own counsel, accountant and other advisors as to the legal, tax, business, financial and related aspects of a purchase of these securities. Any weighted average lives, yields and principal payment periods shown in the Computational Materials are based on prepayment and/or loss assumptions, and changes in such prepayment and/or loss assumptions may dramatically affect such weighted average lives, yields and principal payment periods. In addition, it is possible that prepayments or losses on the underlying assets will occur at rates higher or lower than the rates shown in the attached Computational Materials. The specific characteristics of the securities may differ from those shown in the Computational Materials due to differences between the final underlying assets and the preliminary underlying assets used in preparing the Computational Materials. The principal amount and designation of any security described in the Computational Materials are subject to change prior to issuance. None of Wells Fargo Securities, LLC, Barclays Capital Inc., SG Americas Securities, LLC, UBS Securities LLC, Academy Securities, Inc., or any of their respective affiliates, make any representation or warranty as to the actual rate or timing of payments or losses on any of the underlying assets or the payments or yield on the securities. The information in this presentation is based upon management forecasts and reflects prevailing conditions and management’s views as of this date, all of which are subject to change. In preparing this presentation, we have relied upon and assumed, without independent verification, the accuracy and completeness of all information available from public sources or which was provided to us by or on behalf of the Mortgage Loan Sellers or which was otherwise reviewed by us.
This free writing prospectus contains certain forward-looking statements. If and when included in this free writing prospectus, the words “expects”, “intends”, “anticipates”, “estimates” and analogous expressions and all statements that are not historical facts, including statements about our beliefs or expectations, are intended to identify forward-looking statements. Any forward-looking statements are made subject to risks and uncertainties which could cause actual results to differ materially from those stated. Those risks and uncertainties include, among other things, declines in general economic and business conditions, increased competition, changes in demographics, changes in political and social conditions, regulatory initiatives and changes in customer preferences, many of which are beyond our control and the control of any other person or entity related to this offering. The forward-looking statements made in this free writing prospectus are made as of the date stated on the cover. We have no obligation to update or revise any forward-looking statement.
Wells Fargo Securities is the trade name for the capital markets and investment banking services of Wells Fargo & Company and its subsidiaries, including but not limited to Wells Fargo Securities, LLC, a member of NYSE, FINRA, NFA and SIPC, Wells Fargo Prime Services, LLC, a member of FINRA, NFA and SIPC, and Wells Fargo Bank, N.A. Wells Fargo Securities, LLC and Wells Fargo Prime Services, LLC are distinct entities from affiliated banks and thrifts.
IMPORTANT NOTICE REGARDING THE OFFERED CERTIFICATES
The information herein is preliminary and may be supplemented or amended prior to the time of sale. In addition, the Offered Certificates referred to in these materials and the asset pool backing them are subject to modification or revision (including the possibility that one or more classes of certificates may be split, combined or eliminated at any time prior to issuance or availability of a final prospectus) and are offered on a “when, as and if issued” basis.
The underwriters described in these materials may from time to time perform investment banking services for, or solicit investment banking business from, any company named in these materials. The underwriters and/or their affiliates or respective employees may from time to time have a long or short position in any security or contract discussed in these materials.
The information contained herein supersedes any previous such information delivered to any prospective investor and will be superseded by information delivered to such prospective investor prior to the time of sale.
IMPORTANT NOTICE RELATING TO AUTOMATICALLY-GENERATED EMAIL DISCLAIMERS
Any legends, disclaimers or other notices that may appear at the bottom of any email communication to which this free writing prospectus is attached relating to (1) these materials not constituting an offer (or a solicitation of an offer), (2) any representation that these materials are accurate or complete and may not be updated or (3) these materials possibly being confidential, are not applicable to these materials and should be disregarded. Such legends, disclaimers or other notices have been automatically generated as a result of these materials having been sent via Bloomberg or another system.
THE INFORMATION IN THIS STRUCTURAL AND COLLATERAL TERM SHEET IS NOT COMPLETE AND MAY BE AMENDED PRIOR TO THE TIME OF SALE. THIS TERM SHEET IS NOT AN OFFER TO SELL THESE SECURITIES AND IT IS NOT A SOLICITATION OF AN OFFER TO BUY THESE SECURITIES IN ANY JURISDICTION WHERE THE OFFER OR SALE IS NOT PERMITTED.
| 2 |
| Wells Fargo Commercial Mortgage Trust 2017-RB1 | Certificate Structure |
| I. | Certificate Structure |
| Class | Expected Ratings (DBRS/Fitch/Moody’s)(1) | Approximate Initial Certificate Balance or Notional Amount(2) | Approx. | Pass-Through Rate Description | Weighted Average Life (Years)(4) | Expected Principal Window(4) | Certificate Principal to Value Ratio(5) | Certificate Principal U/W NOI Debt Yield(6) |
| Offered Certificates | ||||||||
| A-1 | AAA(sf)/AAAsf/Aaa(sf) | $10,516,000 | 30.000% | (7) | 2.81 | 04/17 – 02/22 | 39.5% | 15.3% |
| A-2 | AAA(sf)/AAAsf/Aaa(sf) | $19,868,000 | 30.000% | (7) | 4.88 | 02/22 – 02/22 | 39.5% | 15.3% |
| A-3 | AAA(sf)/AAAsf/Aaa(sf) | $5,556,000 | 30.000% | (7) | 6.87 | 02/24 – 02/24 | 39.5% | 15.3% |
| A-4 | AAA(sf)/AAAsf/Aaa(sf) | $160,000,000 | 30.000% | (7) | 9.80 | 12/26 – 02/27 | 39.5% | 15.3% |
| A-5 | AAA(sf)/AAAsf/Aaa(sf) | $203,194,000 | 30.000% | (7) | 9.89 | 02/27 – 03/27 | 39.5% | 15.3% |
| A-SB | AAA(sf)/AAAsf/Aaa(sf) | $24,840,000 | 30.000% | (7) | 7.38 | 02/22 – 12/26 | 39.5% | 15.3% |
| A-S | AAA(sf)/AAAsf/Aa3(sf) | $37,855,000 | 23.750% | (7) | 9.96 | 03/27 – 03/27 | 43.1% | 14.0% |
| X-A | AAA(sf)/AAAsf/Aaa(sf) | $423,974,000(8) | N/A | Variable(9) | N/A | N/A | N/A | N/A |
| X-B | A(sf)/A-sf/NR | $107,508,000(10) | N/A | Variable(11) | N/A | N/A | N/A | N/A |
| B | AA(low)(sf)/AA-sf/NR | $42,397,000 | 16.750% | (7) | 9.96 | 03/27 ��� 03/27 | 47.0% | 12.9% |
| C | A(low)(sf)/A-sf/NR | $27,256,000 | 12.250% | (7) | 9.96 | 03/27 – 03/27 | 49.6% | 12.2% |
| Non-Offered Certificates | ||||||||
| X-D | BBB(sf)/BBB-sf/NR | $31,798,000(12) | N/A | Variable(13) | N/A | N/A | N/A | N/A |
| D | BBB(low)(sf)/BBB-sf/NR | $31,798,000 | 7.000% | (7) | 9.96 | 03/27 – 03/27 | 52.5% | 11.5% |
| E-1(14) | BB(sf)/BB+sf/NR | $7,192,500 | 5.813% | (7) | 9.97 | 03/27 – 04/27 | 53.2% | 11.4% |
| E-2(14) | BB(low)(sf)/BB-sf/NR | $7,192,500 | 4.625% | (7) | 10.04 | 04/27 – 04/27 | 53.9% | 11.2% |
| F-1(14) | B(high)(sf)/NR/NR | $3,407,000 | 4.063% | (7) | 10.04 | 04/27 – 04/27 | 54.2% | 11.2% |
| F-2(14) | B(sf)/NR/NR | $3,407,000 | 3.500% | (7) | 10.04 | 04/27 – 04/27 | 54.5% | 11.1% |
| G-1(14) | B(low)(sf)/NR/NR | $2,649,500 | 3.063% | (7) | 10.04 | 04/27 – 04/27 | 54.7% | 11.0% |
| G-2(14) | B(low)(sf)/NR/NR | $2,649,500 | 2.625% | (7) | 10.04 | 04/27 – 04/27 | 55.0% | 11.0% |
| H-1(14) | NR/NR/NR | $7,949,950 | 1.313% | (7) | 10.04 | 04/27 – 04/27 | 55.7% | 10.9% |
| H-2(14) | NR/NR/NR | $7,949,950 | 0.000% | (7) | 10.04 | 04/27 – 04/27 | 56.5% | 10.7% |
| Non-Offered Eligible Vertical Interest | ||||||||
| RR Interest | NR/NR/NR | $31,877,784.26 | N/A | WAC(15) | 9.47 | 04/17 – 04/27 | N/A | N/A |
Notes:
| (1) | The expected ratings presented are those of DBRS, Inc. (“DBRS”), Fitch Ratings, Inc. (“Fitch”) and Moody’s Investors Service, Inc. (“Moody’s”), which the depositor hired to rate the Offered Certificates. One or more other nationally recognized statistical rating organizations that were not hired by the depositor may use information they receive pursuant to Rule 17g-5 under the Securities Exchange Act of 1934, as amended (the “Exchange Act”) or otherwise, to rate or provide market reports and/or published commentary related to the Offered Certificates. We cannot assure you as to what ratings a non-hired nationally recognized statistical rating organization would assign or that its reports will not express differing, possibly negative, views of the mortgage loans and/or the Offered Certificates. The ratings of each class of Offered Certificates address the likelihood of the timely distribution of interest and, except in the case of the Class X-A and X-B Certificates, the ultimate distribution of principal due on those classes on or before the Rated Final Distribution Date. See “Risk Factors—Other Risks Relating to the Certificates—Nationally Recognized Statistical Rating Organizations May Assign Different Ratings to the Certificates; Ratings of the Certificates Reflect Only the Views of the Applicable Rating Agencies as of the Dates Such Ratings Were Issued; Ratings May Affect ERISA Eligibility; Ratings May Be Downgraded” and “Ratings” in the Preliminary Prospectus, expected to be dated March 15, 2017 (the “Preliminary Prospectus”). DBRS, Fitch and Moody’s have informed us that the “sf” designation in their ratings represents an identifier for structured finance product ratings. |
| (2) | The certificate balances and notional amounts set forth in the table are approximate. The actual initial certificate balances and notional amounts may be larger or smaller depending on the initial pool balance of the mortgage loans definitively included in the pool of mortgage loans, which aggregate cut-off date balance may be as much as 5% larger or smaller than the amount presented in the Preliminary Prospectus. |
| (3) | The approximate initial credit support with respect to the Class A-1, A-2, A-3, A-4, A-5 and A-SB Certificates represents the approximate credit enhancement for the Class A-1, A-2, A-3, A-4, A-5 and A-SB Certificates in the aggregate. The RR Interest only provides credit support to the limited extent that losses incurred on the underlying mortgage loans are allocated to it, on the one hand, and to the Offered Certificates and the Non-Offered Certificates, on the other hand,pro rata, in accordance with their respective Percentage Allocation Entitlements. |
| (4) | Weighted Average Lives and Expected Principal Windows are calculated based on an assumed prepayment rate of 0% CPR and the “Structuring Assumptions” described under “Yield and Maturity Considerations—Weighted Average Life” in the Preliminary Prospectus. |
| (5) | The Certificate Principal to Value Ratio for each Class of Certificates (other than the Class A-1, A-2, A-3, A-4, A-5 and A-SB Certificates) is calculated as the product of (a) the weighted average Cut-off Date LTV Ratio for the mortgage loans and (b) a fraction, the numerator of which is the total initial Certificate Balance of such Class of Certificates and all Classes of Principal Balance Certificates senior to such Class of Certificates and the denominator of which is the total initial Certificate Balance of all of the Principal Balance Certificates (other than the RR Interest). The Certificate Principal to Value Ratio for each of the Class A-1, A-2, A-3, A-4, A-5 and A-SB Certificates is calculated in the aggregate for those Classes as if they were a single Class and is calculated as the product of (a) the weighted average Cut-off Date LTV Ratio for the mortgage loans and (b) a fraction, the numerator of which is the total initial aggregate Certificate Balances of such Classes of Certificates and the denominator of which is the total initial Certificate Balance of all of the Principal Balance Certificates (other than the RR Interest). In any event, however, excess mortgaged property value associated with a mortgage loan will not be available to offset losses on any other mortgage loan. |
THE INFORMATION IN THIS STRUCTURAL AND COLLATERAL TERM SHEET IS NOT COMPLETE AND MAY BE AMENDED PRIOR TO THE TIME OF SALE. THIS TERM SHEET IS NOT AN OFFER TO SELL THESE SECURITIES AND IT IS NOT A SOLICITATION OF AN OFFER TO BUY THESE SECURITIES IN ANY JURISDICTION WHERE THE OFFER OR SALE IS NOT PERMITTED.
| 3 |
| Wells Fargo Commercial Mortgage Trust 2017-RB1 | Certificate Structure |
| (6) | The Certificate Principal U/W NOI Debt Yield for each Class of Certificates (other than the Class A-1, A-2, A-3, A-4, A-5 and A-SB Certificates) is calculated as the product of (a) the weighted average U/W NOI Debt Yield for the mortgage loans and (b) a fraction, the numerator of which is the total initial Certificate Balance of all of the Classes of Principal Balance Certificates (other than the RR Interest) and the denominator of which is the total initial Certificate Balance for such Class of Certificates and all Classes of Principal Balance Certificates senior to such Class of Certificates. The Certificate Principal U/W NOI Debt Yield for each of the Class A-1, A-2, A-3, A-4, A-5 and A-SB Certificates is calculated in the aggregate for those Classes as if they were a single Class and is calculated as the product of (a) the weighted average U/W NOI Debt Yield for the mortgage loans and (b) a fraction, the numerator of which is the total initial Certificate Balance of all of the Classes of Principal Balance Certificates (other than the RR Interest) and the denominator of which is the total aggregate initial Certificate Balances for the Class A-1, A-2, A-3, A-4, A-5 and A-SB Certificates. In any event, however, cash flow from each mortgaged property supports only the related mortgage loan and will not be available to support any other mortgage loan. |
| (7) | The pass-through rates for the Class A-1, A-2, A-3, A-4, A-5, A-SB, A-S, B, C, D, E-1, E-2, F-1, F-2, G-1, G-2, H-1 and H-2 Certificates in each case will be one of the following: (i) a fixed rateper annum, (ii) a variable rate per annum equal to the weighted average of the net mortgage interest rates on the mortgage loans for the related distribution date, (iii) a variable rateper annum equal to the lesser of (a) a fixed rate and (b) the weighted average of the net mortgage interest rates on the mortgage loans for the related distribution date or (iv) a variable rateper annum equal to the weighted average of the net mortgage interest rates on the mortgage loans for the related distribution date minus a specified percentage. For purposes of the calculation of the weighted average of the net mortgage interest rates on the mortgage loans for each distribution date, the mortgage interest rates will be adjusted as necessary to a 30/360 basis. |
| (8) | The Class X-A Certificates are notional amount certificates. The Notional Amount of the Class X-A Certificates will be equal to the aggregate Certificate Balance of the Class A-1, A-2, A-3, A-4, A-5 and A-SB Certificates outstanding from time to time. The Class X-A Certificates will not be entitled to distributions of principal. |
| (9) | The pass-through rate for the Class X-A Certificates for any distribution date will be aper annum rate equal to the excess, if any, of (a) the weighted average of the net mortgage interest rates on the mortgage loans for the related distribution date, over (b) the weighted average of the pass-through rates on the Class A-1, A-2, A-3, A-4, A-5 and A-SB Certificates for the related distribution date, weighted on the basis of their respective Certificate Balances outstanding immediately prior to that distribution date. For purposes of the calculation of the weighted average of the net mortgage interest rates on the mortgage loans for each distribution date, the mortgage interest rates will be adjusted as necessary to a 30/360 basis. |
| (10) | The Class X-B Certificates are notional amount certificates. The Notional Amount of the Class X-B Certificates will be equal to the aggregate Certificate Balance of the Class A-S, B and C Certificates outstanding from time to time. The Class X-B Certificates will not be entitled to distributions of principal. |
| (11) | The pass-through rate for the Class X-B Certificates for any distribution date will be aper annum rate equal to the excess, if any, of (a) the weighted average of the net mortgage interest rates on the mortgage loans for the related distribution date, over (b) the weighted average of the pass-through rates on the Class A-S, B and C Certificates for the related distribution date, weighted on the basis of their respective Certificate Balances outstanding immediately prior to that distribution date. For purposes of the calculation of the weighted average of the net mortgage interest rates on the mortgage loans for each distribution date, the mortgage interest rates will be adjusted as necessary to a 30/360 basis. |
| (12) | The Class X-D Certificates are notional amount certificates. The Notional Amount of the Class X-D Certificates will be equal to the Certificate Balance of the Class D Certificates outstanding from time to time. The Class X-D Certificates will not be entitled to distributions of principal. |
| (13) | The pass-through rate for the Class X-D Certificates for any distribution date will be aper annum rate equal to the excess, if any, of (a) the weighted average of the net mortgage interest rates on the mortgage loans for the related distribution date, over (b) the pass-through rate on the Class D Certificates for the related distribution date. For purposes of the calculation of the weighted average of the net mortgage interest rates on the mortgage loans for each distribution date, the mortgage interest rates will be adjusted as necessary to a 30/360 basis. |
| (14) | On and after the Closing Date, a holder of a uniform percentage interest of such class of certificates may exchange such percentage interest for a corresponding class of exchangeable certificates pursuant to the terms of the pooling and servicing agreement. |
| (15) | The effective interest rate for the RR Interest will be the weighted average of the net mortgage interest rates on the mortgage loans for the related distribution date. |
THE INFORMATION IN THIS STRUCTURAL AND COLLATERAL TERM SHEET IS NOT COMPLETE AND MAY BE AMENDED PRIOR TO THE TIME OF SALE. THIS TERM SHEET IS NOT AN OFFER TO SELL THESE SECURITIES AND IT IS NOT A SOLICITATION OF AN OFFER TO BUY THESE SECURITIES IN ANY JURISDICTION WHERE THE OFFER OR SALE IS NOT PERMITTED.
| 4 |
| Wells Fargo Commercial Mortgage Trust 2017-RB1 | Transaction Highlights |
| II. | Transaction Highlights |
Mortgage Loan Sellers:
Mortgage Loan Seller | Number of | Number of | Aggregate Cut-off | % of Initial | |||||
| Barclays Bank PLC(1) | 8 | 21 | $202,110,000 | 31.7 | % | ||||
| Wells Fargo Bank, National Association | 13 | 16 | 173,727,264 | 27.2 | |||||
| UBS AG, by and through its branch office at 1285 Avenue of the Americas, New York, New York(2) | 8 | 12 | 170,554,269 | 26.8 | |||||
| Société Générale | 8 | 23 | 91,164,152 | 14.3 | |||||
Total | 37 | 72 | $637,555,685 | 100.0 | % | ||||
| (1) | One mortgage loan secured by the mortgaged property identified on Annex A-1 to the Preliminary Prospectus as The Summit Birmingham, representing approximately 3.6% of the aggregate principal balance of the pool of mortgage loans as of the cut-off date, is part of a whole loan that was co-originated by Bank of America, N.A. (“BANA”) and Barclays. One mortgage loan secured by the mortgaged property identified on Annex A-1 to the Preliminary Prospectus as Merrill Lynch Drive, representing approximately 3.2% of the aggregate principal balance of the pool of mortgage loans as of the cut-off date, is part of a whole loan that was co-originated by Morgan Stanley Bank, N.A. (“MSBNA”) and Barclays. |
| (2) | One mortgage loan secured by the mortgaged property identified on Annex A-1 to the Preliminary Prospectus as KOMO Plaza, representing approximately 5.1% of the aggregate principal balance of the pool of mortgage loans as of the cut-off date, is part of a whole loan that was co-originated by UBSAG and MSBNA. The $69,500,000 Note A-5 of the KOMO Plaza whole loan, which was originated by MSBNA, was subsequently sold by Morgan Stanley Mortgage Capital Holdings LLC (“MSMCH”) into the BACM 2017-BNK3 securitization. One mortgage loan secured by the mortgaged property identified on Annex A-1 to the Preliminary Prospectus as 340 Bryant, representing approximately 2.3% of the aggregate principal balance of the pool of mortgage loans as of the cut-off date, is part of a whole loan that was originated by Cantor Commercial Real Estate Lending, L.P. (“CCRE”) and the related Note A-2 of the 340 Bryant whole loan was later purchased by UBSAG. |
| Loan Pool: | |
| Initial Pool Balance: | $637,555,685 |
| Number of Mortgage Loans: | 37 |
| Average Cut-off Date Balance per Mortgage Loan: | $17,231,235 |
| Number of Mortgaged Properties: | 72 |
| Average Cut-off Date Balance per Mortgaged Property(1): | $8,854,940 |
| Weighted Average Mortgage Interest Rate: | 4.748% |
| Ten Largest Mortgage Loans as % of Initial Pool Balance: | 57.0% |
| Weighted Average Original Term to Maturity or ARD (months): | 118 |
| Weighted Average Remaining Term to Maturity or ARD (months): | 117 |
| Weighted Average Original Amortization Term (months)(2): | 354 |
| Weighted Average Remaining Amortization Term (months)(2): | 354 |
| Weighted Average Seasoning (months): | 1 |
| (1) | Information regarding mortgage loans secured by multiple properties is based on an allocation according to relative appraised values or the allocated loan amounts or property-specific release prices set forth in the related loan documents or such other allocation as the related mortgage loan seller deemed appropriate. |
| (2) | Excludes any mortgage loan that does not amortize. |
| Credit Statistics: | |
| Weighted Average U/W Net Cash Flow DSCR(1): | 1.82x |
| Weighted Average U/W Net Operating Income Debt Yield(1): | 10.7% |
| Weighted Average Cut-off Date Loan-to-Value Ratio(1): | 56.5% |
| Weighted Average Balloon or ARD Loan-to-Value Ratio(1): | 52.6% |
| % of Mortgage Loans with Additional Subordinate Debt(2): | 4.5% |
| % of Mortgage Loans with Single Tenants(3): | 8.1% |
| (1) | With respect to any mortgage loan that is part of a whole loan, loan-to-value ratio, debt service coverage ratio and debt yield calculations include the relatedpari passucompanion loan(s) but exclude any related subordinate companion loan(s) (unless otherwise stated). The debt service coverage ratio, debt yield and loan-to-value ratio information do not take into account any subordinate debt (whether or not secured by the related mortgaged property), that currently exists or is allowed under the terms of any mortgage loan. See “Description of the Mortgage Pool—Mortgage Pool Characteristics” in the Preliminary Prospectus and Annex A-1 to the Preliminary Prospectus. |
| (2) | The percentage figure expressed as “% of Mortgage Loans with Additional Subordinate Debt” is determined as a percentage of the initial pool balance and does not take into account any future subordinate debt (whether or not secured by the mortgaged property), if any, that may be permitted under the terms of any mortgage loan or the pooling and servicing agreement. See “Description of the Mortgage Pool—Additional Indebtedness—Other Unsecured Indebtedness” in the Preliminary Prospectus. |
| (3) | Excludes mortgage loans that are secured by multiple single tenant properties. |
THE INFORMATION IN THIS STRUCTURAL AND COLLATERAL TERM SHEET IS NOT COMPLETE AND MAY BE AMENDED PRIOR TO THE TIME OF SALE. THIS TERM SHEET IS NOT AN OFFER TO SELL THESE SECURITIES AND IT IS NOT A SOLICITATION OF AN OFFER TO BUY THESE SECURITIES IN ANY JURISDICTION WHERE THE OFFER OR SALE IS NOT PERMITTED.
| 5 |
| Wells Fargo Commercial Mortgage Trust 2017-RB1 | Transaction Highlights |
Loan Structural Features:
Amortization:Based on the Initial Pool Balance, 47.7% of the mortgage pool (24 mortgage loans) has scheduled amortization, as follows:
33.1% (12 mortgage loans) provides for an interest-only period followed by an amortization period; and
14.6% (12 mortgage loans) requires amortization during the entire loan term.
Interest-Only:Based on the Initial Pool Balance, 52.3% of the mortgage pool (13 mortgage loans) provides for interest-only payments during the entire loan term. The Weighted Average Cut-off Date Loan-to-Value Ratio and Weighted Average U/W Net Cash Flow DSCR for those mortgage loans are 50.2% and 2.00x, respectively.
Hard Lockboxes: Based on the Initial Pool Balance, 55.0% of the mortgage pool (17 mortgage loans) have hard lockboxes in place.
Reserves:The mortgage loans require amounts to be escrowed monthly as follows (excluding any mortgage loans with springing provisions):
| Real Estate Taxes: | 53.1% of the pool | ||
| Insurance: | 38.7% of the pool | ||
| Capital Replacements: | 39.2% of the pool | ||
| TI/LC: | 30.7% of the pool(1) |
| (1) | The percentage of Initial Pool Balance for mortgage loans with TI/LC reserves is based on the aggregate principal balance allocable to loans that include retail, office, mixed use and industrial properties. |
Call Protection/Defeasance: Based on the Initial Pool Balance, the mortgage pool has the following call protection and defeasance features:
67.3% of the mortgage pool (27 mortgage loans) features a lockout period, then defeasance only until an open period;
17.9% of the mortgage pool (six mortgage loans) features a lockout period, then the greater of a prepayment premium or yield maintenance until an open period;
9.8% of the mortgage pool (one mortgage loan) features no lockout period but requires the greater of a prepayment premium or yield maintenance, then the greater of a prepayment premium or yield maintenance or defeasance until an open period;
3.2% of the mortgage pool (one mortgage loan) features no lockout period but requires the greater of a prepayment premium or yield maintenance until an open period; and
1.8% of the mortgage pool (two mortgage loans) features a lockout period, then the greater of a prepayment premium or yield maintenance or defeasance until an open period
Prepayment restrictions for each mortgage loan reflect the entire life of the mortgage loan. Please refer to Annex A-1 to the Preliminary Prospectus and the footnotes related thereto for further information regarding individual loan call protection.
THE INFORMATION IN THIS STRUCTURAL AND COLLATERAL TERM SHEET IS NOT COMPLETE AND MAY BE AMENDED PRIOR TO THE TIME OF SALE. THIS TERM SHEET IS NOT AN OFFER TO SELL THESE SECURITIES AND IT IS NOT A SOLICITATION OF AN OFFER TO BUY THESE SECURITIES IN ANY JURISDICTION WHERE THE OFFER OR SALE IS NOT PERMITTED.
| 6 |
| Wells Fargo Commercial Mortgage Trust 2017-RB1 | Issue Characteristics |
| III. | Issue Characteristics |
| Securities Offered: | $531,482,000 approximate monthly pay, multi-class, commercial mortgage REMIC pass-through certificates consisting of eleven classes (Classes A-1, A-2, A-3, A-4, A-5, A-SB, A-S, B, C, X-A and X-B), which are offered pursuant to a registration statement filed with the SEC (such classes of certificates, the “Offered Certificates”). | |
| Mortgage Loan Sellers: | Barclays Bank PLC (“Barclays”), Wells Fargo Bank, National Association (“WFB”), UBS AG, by and through its branch office at 1285 Avenue of the Americas, New York, New York (“UBSAG”) and Société Générale (“SG”). | |
| Joint Bookrunners and Co-Lead Managers: | Wells Fargo Securities, LLC, Barclays Capital Inc., SG Americas Securities, LLC and UBS Securities LLC | |
| Co-Managers: | Academy Securities, Inc. | |
| Rating Agencies: | DBRS, Inc., Fitch Ratings, Inc. and Moody’s Investors Service, Inc. | |
| Master Servicer: | Wells Fargo Bank, National Association | |
| Special Servicer: | C-III Asset Management LLC | |
| Certificate Administrator: | Wells Fargo Bank, National Association | |
| Trustee: | Wilmington Trust, National Association | |
| Operating Advisor: | Trimont Real Estate Advisors, LLC | |
| Asset Representations Reviewer: | Trimont Real Estate Advisors, LLC | |
| Initial Majority Controlling Class Certificateholder: | C-III Investment Management LLC or an affiliate | |
| U.S. Credit Risk Retention: | For a discussion on the manner in which the U.S. credit risk retention requirements will be satisfied by Wells Fargo Bank, National Association, as the retaining sponsor, see “Credit Risk Retention” in the Preliminary Prospectus. | |
| EU Credit Risk Retention | None of the sponsors, the depositor or the issuing entity intends to retain a material net economic interest in the securitization constituted by the issue of the Offered Certificates in accordance with the EU risk retention and due diligence requirements or to take any other action which may be required by EEA-regulated investors for the purposes of their compliance with the EU risk retention and due diligence requirements or similar requirements. | |
| Risk Retention Consultation Party: | Wells Fargo Bank, National Association | |
| Cut-off Date: | The Cut-off Date with respect to each mortgage loan is the due date for the monthly debt service payment that is due in March 2017 (or, in the case of any mortgage loan that has its first due date in April or May 2017, the date that would have been its due date in March 2017 under the terms of that mortgage loan if a monthly debt service payment were scheduled to be due in that month). | |
| Expected Closing Date: | On or about March 30, 2017. | |
| Determination Dates: | The 11th day of each month (or if that day is not a business day, the next succeeding business day), commencing in April 2017. | |
| Distribution Dates: | The fourth business day following the Determination Date in each month, commencing in April 2017. | |
| Rated Final Distribution Date: | The Distribution Date in March 2050. | |
| Interest Accrual Period: | With respect to any Distribution Date, the calendar month immediately preceding the month in which such Distribution Date occurs. | |
| Day Count: | The Offered Certificates will accrue interest on a 30/360 basis. | |
| Minimum Denominations: | $10,000 for each Class of Offered Certificates (other than the Class X-A and X-B Certificates) and $1,000,000 for the Class X-A and X-B Certificates. Investments may also be made in any whole dollar denomination in excess of the applicable minimum denomination. | |
| Clean-up Call: | 1.0% |
THE INFORMATION IN THIS STRUCTURAL AND COLLATERAL TERM SHEET IS NOT COMPLETE AND MAY BE AMENDED PRIOR TO THE TIME OF SALE. THIS TERM SHEET IS NOT AN OFFER TO SELL THESE SECURITIES AND IT IS NOT A SOLICITATION OF AN OFFER TO BUY THESE SECURITIES IN ANY JURISDICTION WHERE THE OFFER OR SALE IS NOT PERMITTED.
| 7 |
| Wells Fargo Commercial Mortgage Trust 2017-RB1 | Issue Characteristics |
| Delivery: | DTC, Euroclear and Clearstream Banking | |
| ERISA/SMMEA Status: | Each Class of Offered Certificates is expected to be eligible for exemptive relief under ERISA. No Class of Offered Certificates will be SMMEA eligible. | |
| Risk Factors: | THE CERTIFICATES INVOLVE CERTAIN RISKS AND MAY NOT BE SUITABLE FOR ALL INVESTORS. SEE THE “RISK FACTORS” SECTION OF THE PRELIMINARY PROSPECTUS. | |
| Bond Analytics Information: | The Certificate Administrator will be authorized to make distribution date statements, CREFC® reports and certain supplemental reports (other than confidential information) available to certain financial modeling and data provision services, including Bloomberg, L.P., Trepp, LLC, Intex Solutions, Inc., Markit Group Limited, Interactive Data Corp., BlackRock Financial Management, Inc., CMBS.com, Inc., Moody’s Analytics and Thomson Reuters Corporation. |
THE INFORMATION IN THIS STRUCTURAL AND COLLATERAL TERM SHEET IS NOT COMPLETE AND MAY BE AMENDED PRIOR TO THE TIME OF SALE. THIS TERM SHEET IS NOT AN OFFER TO SELL THESE SECURITIES AND IT IS NOT A SOLICITATION OF AN OFFER TO BUY THESE SECURITIES IN ANY JURISDICTION WHERE THE OFFER OR SALE IS NOT PERMITTED.
| 8 |
| Wells Fargo Commercial Mortgage Trust 2017-RB1 | Characteristics of the Mortgage Pool |
| IV. | Characteristics of the Mortgage Pool(1) |
| A. | Ten Largest Mortgage Loans |
| Mortgage Loan Seller | Mortgage Loan Name | City | State | Number of Mortgage Loans / Mortgaged Properties | Mortgage Loan Cut-off Date Balance ($) | % of Initial Pool Balance (%) | Property Type | Number of Rooms / SF | Cut-off Date Balance Per Room / SF | Cut-off Date LTV Ratio (%) | Balloon or ARD LTV Ratio (%) | U/W NCF DSCR (x) | U/W NOI Debt Yield (%) |
| Barclays | 123 William Street | New York | NY | 1 / 1 | $62,500,000 | 9.8% | Office | 545,216 | $257 | 48.3% | 48.3% | 1.56x | ��8.4% |
| WFB | The Davenport | Cambridge | MA | 1 / 1 | 55,000,000 | 8.6 | Office | 230,864 | 455 | 49.1 | 49.1 | 1.86 | 8.6 |
| UBSAG | Center West | Los Angeles | CA | 1 / 1 | 40,000,000 | 6.3 | Office | 349,298 | 229 | 38.3 | 38.3 | 1.94 | 9.7 |
| UBSAG | KOMO Plaza | Seattle | WA | 1 / 1 | 32,500,000 | 5.1 | Mixed Use | 291,151 | 477 | 50.0 | 50.0 | 2.47 | 11.3 |
| WFB | Santa Rosa Office Portfolio | Santa Rosa | CA | 1 / 4 | 31,900,000 | 5.0 | Office | 337,082 | 95 | 69.0 | 60.6 | 1.44 | 10.4 |
| Barclays | IPCC Texas Self Storage Portfolio | Various | TX | 1 / 9 | 31,500,000 | 4.9 | Self Storage | 685,835 | 46 | 57.8 | 53.3 | 1.62 | 10.6 |
| SG | ExchangeRight Net Leased Portfolio 15 | Various | Various | 1 / 16 | 31,200,000 | 4.9 | Various | 218,276 | 143 | 60.0 | 60.0 | 2.09 | 9.6 |
| Barclays | 1166 Avenue of the Americas | New York | NY | 1 / 1 | 28,750,000 | 4.5 | Office | 195,375 | 435 | 37.8 | 37.8 | 1.79 | 10.2 |
| WFB | Hotel Wilshire | Los Angeles | CA | 1 / 1 | 25,800,000 | 4.0 | Hospitality | 74 | 348,649 | 64.5 | 59.4 | 1.71 | 11.9 |
| UBSAG | Anaheim Marriott Suites | Garden Grove | CA | 1 / 1 | 24,000,000 | 3.8 | Hospitality | 371 | 145,553 | 65.1 | 60.3 | 1.62 | 12.8 |
| Top Three Total/Weighted Average | 3 / 3 | $157,500,000 | 24.7% | 46.0% | 46.0% | 1.76x | 8.8% | ||||||
| Top Five Total/Weighted Average | 5 / 8 | $221,900,000 | 34.8% | 49.9% | 48.7% | 1.82x | 9.4% | ||||||
| Top Ten Total/Weighted Average | 10 / 36 | $363,150,000 | 57.0% | 52.5% | 50.7% | 1.80x | 10.0% | ||||||
| Non-Top Ten Total/Weighted Average | 27 / 36 | $274,405,685 | 43.0% | 61.7% | 55.1% | 1.85x | 11.7% | ||||||
| (1) | With respect to any mortgage loan that is part of a whole loan, Cut-off Date Balance Per Room/SF, loan-to-value ratio, debt service coverage ratio and debt yield calculations include the relatedpari passu companion loan(s) but exclude any related subordinate companion loan(s) (unless otherwise stated). With respect to each mortgage loan, debt service coverage ratio, debt yield and loan-to-value ratio information do not take into account subordinate debt (whether or not secured by the related mortgaged property), if any, that currently exists or is allowed under the terms of such mortgage loan. |
THE INFORMATION IN THIS STRUCTURAL AND COLLATERAL TERM SHEET IS NOT COMPLETE AND MAY BE AMENDED PRIOR TO THE TIME OF SALE. THIS TERM SHEET IS NOT AN OFFER TO SELL THESE SECURITIES AND IT IS NOT A SOLICITATION OF AN OFFER TO BUY THESE SECURITIES IN ANY JURISDICTION WHERE THE OFFER OR SALE IS NOT PERMITTED.
| 9 |
| Wells Fargo Commercial Mortgage Trust 2017-RB1 | Characteristics of the Mortgage Pool |
| B. | Summary of the Whole Loans |
| Property Name | Mortgage Loan Seller | Note(s) | Related Notes in Loan Group (Original Balance) | Holder of Note | Lead Servicer for Whole loan | Current Master Servicer Under Related Securitization Servicing Agreement | Current Special Servicer Under Related Securitization Servicing Agreement |
| 123 William Street | Barclays | A-1 | $62,500,000 | WFCM 2017-RB1 | Yes | Wells Fargo Bank, National Association | C-III Asset Management LLC |
| Barclays | A-2 & A-3 | $77,500,000 | (1) | No | TBD | TBD | |
| The Davenport | WFB | A-1 | $55,000,000 | WFCM 2017-RB1 | Yes | Wells Fargo Bank, National Association | C-III Asset Management LLC |
| WFB | A-2 | $50,000,000 | (2) | No | TBD | TBD | |
| Center West | UBSAG | A-1 | $30,000,000 | BBCMS 2017-C1 | No | Wells Fargo Bank, National Association | Rialto Capital Advisors, LLC |
| UBSAG | A-2 & A-3 | $40,000,000 | WFCM 2017-RB1 | Yes | Wells Fargo Bank, National Association | C-III Asset Management LLC | |
| UBSAG | A-4 | $10,000,000 | (3) | No | TBD | TBD | |
| KOMO Plaza | UBSAG | A-1 & A-4 | $32,500,000 | WFCM 2017-RB1 | No | Wells Fargo Bank, National Association | C-III Asset Management LLC |
| UBSAG | A-2 & A-3 | $37,000,000 | BBCMS 2017-C1 | Yes | Wells Fargo Bank, National Association | Rialto Capital Advisors, LLC | |
| MSMCH | A-5 | $69,500,000 | BACM 2017-BNK3 | No | Wells Fargo Bank, National Association | Midland Loan Services, a Division of PNC Bank, National Association | |
| 1166 Avenue of the Americas(4) | Barclays | A-1 | $56,250,000 | BBCMS 2017-C1 | Yes(5) | Wells Fargo Bank, National Association | Rialto Capital Advisors, LLC |
| Barclays | A-2 | $28,750,000 | WFCM 2017-RB1 | No | Wells Fargo Bank, National Association | C-III Asset Management LLC | |
| Anaheim Marriott Suites | UBSAG | A-1 & A-3 | $30,000,000 | BBCMS 2017-C1 | Yes | Wells Fargo Bank, National Association | Rialto Capital Advisors, LLC |
| UBSAG | A-2 & A-4 | $24,000,000 | WFCM 2017-RB1 | No | Wells Fargo Bank, National Association | C-III Asset Management LLC | |
| The Summit Birmingham | BANA | A-1 | $61,875,000 | (6) | No | TBD | TBD |
| BANA | A-2 | $73,325,000 | BACM 2017-BNK3 | Yes | Wells Fargo Bank, National Association | Midland Loan Services, a Division of PNC Bank, National Association | |
| Barclays | A-3 | $50,000,000 | BBCMS 2017-C1 | No | Wells Fargo Bank, National Association | Rialto Capital Advisors, LLC | |
| Barclays | A-4 | $22,800,000 | WFCM 2017-RB1 | No | Wells Fargo Bank, National Association | C-III Asset Management LLC | |
| Connecticut Financial Center | UBSAG | A-1 | $22,750,000 | BBCMS 2017-C1 | No | Wells Fargo Bank, National Association | Rialto Capital Advisors, LLC |
| UBSAG | A-2 & A-3 | $22,750,000 | WFCM 2017-RB1 | Yes | Wells Fargo Bank, National Association | C-III Asset Management LLC | |
| Merrill Lynch Drive | Barclays | A-1 | $41,500,000 | BBCMS 2017-C1 | Yes | Wells Fargo Bank, National Association | Rialto Capital Advisors, LLC |
| Barclays | A-2 | $20,660,000 | WFCM 2017-RB1 | No | Wells Fargo Bank, National Association | C-III Asset Management LLC | |
| MSBNA | A-3 | $41,440,000 | (7) | No | TBD | TBD | |
| Art Van Portfolio | UBSAG | A-1, A-2 & A-3 | $50,000,000 | (8) | Yes(9) | TBD | TBD |
| UBSAG | A-4 & A-5 | $18,750,000 | WFCM 2017-RB1 | No(9) | Wells Fargo Bank, National Association | C-III Asset Management LLC | |
| 340 Bryant | CCRE | A-1 | $16,000,000 | (10) | Yes(11) | TBD | TBD |
| UBSAG | A-2 | $14,700,000 | WFCM 2017-RB1 | No(11) | Wells Fargo Bank, National Association | C-III Asset Management LLC |
THE INFORMATION IN THIS STRUCTURAL AND COLLATERAL TERM SHEET IS NOT COMPLETE AND MAY BE AMENDED PRIOR TO THE TIME OF SALE. THIS TERM SHEET IS NOT AN OFFER TO SELL THESE SECURITIES AND IT IS NOT A SOLICITATION OF AN OFFER TO BUY THESE SECURITIES IN ANY JURISDICTION WHERE THE OFFER OR SALE IS NOT PERMITTED.
| 10 |
| Wells Fargo Commercial Mortgage Trust 2017-RB1 | Characteristics of the Mortgage Pool |
| (1) | The relatedpari passu Note A-2 and Note A-3 are currently held by Barclays and are expected to be contributed to one or more future securitization(s). No assurance can be provided that Note A-2 or Note A-3 will not be split further. |
| (2) | The relatedpari passu Note A-2 is currently held by WFB and is expected to be contributed to a future securitization. No assurance can be provided that Note A-2 will not be split further. |
| (3) | The relatedpari passu Note A-4 is currently held by UBSAG and is expected to be contributed to a future securitization. No assurance can be provided that Note A-4 will not be split further. |
| (4) | The 1166 Avenue of the Americas whole loan includes a subordinate companion loan with an original principal balance of $25,000,000. Such subordinate companion loan is not reflected in, and is subordinate to all of the notes listed in the “Related Notes in Loan Group (Original Balance)” column. |
| (5) | The 1166 Avenue of the Americas whole loan will be serviced pursuant to the BBCMS 2017-C1 pooling and servicing agreement. However, so long as no control appraisal period has occurred and is continuing, the holder of the 1166 Avenue of the Americas subordinate companion loan will be the controlling noteholder and will have the right to approve certain modifications and consent to certain actions to be taken with respect to the 1166 Avenue of the Americas whole loan. If a control appraisal period has occurred and is continuing, the holder of Note A-1 will be the controlling note holder. |
| (6) | The relatedpari passu Note A-1 is currently held by BANA and is expected to be contributed to a future securitization. No assurance can be provided that Note A-1 will not be split further. |
| (7) | The relatedpari passu Note A-3 is currently held by MSBNA and is expected to be contributed to a future securitization. No assurance can be provided that Note A-3 will not be split further. |
| (8) | The relatedpari passu Note A-1, Note A-2 and Note A-3 are currently held by UBSAG and are expected to be contributed to one or more future securitization(s). No assurance can be provided that Note A-1, Note A-2 or Note A-3 will not be split further. |
| (9) | The Art Van Portfolio whole loan is expected to initially be serviced under the WFCM 2017-RB1 pooling and servicing agreement until the securitization of the related controllingpari passu Note A-1 (the “Art Van Portfolio Servicing Shift Securitization Date”), after which the Art Van Portfolio whole loan will be serviced under the pooling and servicing agreement related to the securitization of the related controllingpari passu Note A-1 (the “Art Van Portfolio Servicing Shift PSA”). The master servicer and special servicer under the Art Van Portfolio Servicing Shift PSA will be identified in a notice, report or statement to holders of the WFCM 2017-RB1 certificates after the securitization of the related controllingpari passu Note A-1. |
| (10) | The relatedpari passu Note A-1 is currently held by CCRE and is expected to be contributed to a future securitization. No assurance can be provided that Note A-1 will not be split further. |
| (11) | The 340 Bryant whole loan is expected to initially be serviced under the WFCM 2017-RB1 pooling and servicing agreement until the securitization of the related controllingpari passuNote A-1 (the “340 Bryant Servicing Shift Securitization Date”), after which the 340 Bryant whole loan will be serviced under the pooling and servicing agreement related to the securitization of the related controllingpari passu Note A-1 (the “340 Bryant Servicing Shift PSA”). The master servicer and special servicer under the 340 Bryant Servicing Shift PSA will be identified in a notice, report or statement to holders of the WFCM 2017-RB1 certificates after the securitization of the related controllingpari passu Note A-1. |
| C. | Mortgage Loans with Additional Secured and Mezzanine Financing |
| Loan No. | Mortgage Loan Seller | Mortgage Loan Name | Mortgage Loan Cut-off Date Balance ($) | % of Initial Pool Balance (%) | Sub Debt Cut-off Date Balance ($) | Mezzanine Debt Cut-off Date Balance ($) | Total Debt Interest Rate (%)(1) | Mortgage Loan U/W NCF DSCR (x)(2) | Total Debt U/W NCF DSCR (x) | Mortgage Loan Cut-off Date U/W NOI Debt Yield (%)(2) | Total Debt Cut-off Date U/W NOI Debt Yield (%) | Mortgage Loan Cut-off Date LTV Ratio (%)(2) | Total Debt Cut-off Date LTV Ratio (%) |
| 8 | Barclays | 1166 Avenue of the Americas | $28,750,000 | 4.5% | $25,000,000 | $20,000,000 | 5.3761% | 1.79x | 1.15x | 10.2% | 6.6% | 37.8% | 57.8% |
| Total/Weighted Average | $28,750,000 | 4.5% | $25,000,000 | $20,000,000 | 5.3761% | 1.79x | 1.15x | 10.2% | 6.6% | 37.8% | 57.8% | ||
| (1) | Total Debt Interest Rate for any specified mortgage loan reflects the weighted average of the interest rates on the respective components of the total debt. |
| (2) | With respect to the 1166 Avenue of the Americas mortgage loan, which is part of a whole loan, the loan-to-value ratio, debt service coverage ratio and debt yield calculations include the relatedpari passu companion loan(s). |
THE INFORMATION IN THIS STRUCTURAL AND COLLATERAL TERM SHEET IS NOT COMPLETE AND MAY BE AMENDED PRIOR TO THE TIME OF SALE. THIS TERM SHEET IS NOT AN OFFER TO SELL THESE SECURITIES AND IT IS NOT A SOLICITATION OF AN OFFER TO BUY THESE SECURITIES IN ANY JURISDICTION WHERE THE OFFER OR SALE IS NOT PERMITTED.
| 11 |
| Wells Fargo Commercial Mortgage Trust 2017-RB1 | Characteristics of the Mortgage Pool |
| D. | Previous Securitization History(1) |
| Loan No. | Mortgage Loan Seller | Mortgage Loan or Mortgaged Property Name | City | State | Property Type | Mortgage Loan or Mortgaged Property Cut-off Date Balance ($) | % of (%) | Previous Securitization |
| 1 | Barclays | 123 William Street | New York | NY | Office | 62,500,000 | 9.8% | GECMC 2005-C3 |
| 3 | UBSAG | Center West | Los Angeles | CA | Office | 40,000,000 | 6.3 | JPMCC 2007-LDPX |
| 5.01 | WFB | 100-120 Stony Point Road | Santa Rosa | CA | Office | 19,000,000 | 3.0 | BSCMS 2007-T26 |
| 5.02 | WFB | 131 Stony Circle | Santa Rosa | CA | Office | 5,995,000 | 0.9 | BSCMS 2007-T26 |
| 6.08 | Barclays | Bell Street | Amarillo | TX | Self Storage | 2,650,000 | 0.4 | BSCMS 2007-PW16 |
| 8 | Barclays | 1166 Avenue of the Americas | New York | NY | Office | 28,750,000 | 4.5 | LBUBS 2007-C1 |
| 9 | WFB | Hotel Wilshire | Los Angeles | CA | Hospitality | 25,800,000 | 4.0 | JPMCC 2013-C10 |
| 10 | UBSAG | Anaheim Marriott Suites | Garden Grove | CA | Hospitality | 24,000,000 | 3.8 | LBUBS 2007-C2 |
| 12 | UBSAG | Connecticut Financial Center | New Haven | CT | Office | 22,715,562 | 3.6 | BACM 2007-2 |
| 15.01 | Barclays | Towne Centre Village Retail Center | McDonough | GA | Retail | 4,650,000 | 0.7 | BSCMS 2006-T24 |
| 15.02 | Barclays | Hillcrest Shopping Center | Millbrook | AL | Retail | 3,125,000 | 0.5 | LBUBS 2007-C7 |
| 15.03 | Barclays | Shippensburg Shopping Center | Shippensburg | PA | Retail | 2,600,000 | 0.4 | MLCFC 2006-3 |
| 18 | UBSAG | Quail Lakes Shopping Center | Stockton | CA | Retail | 13,100,000 | 2.1 | CSMC 2007-C2 |
| 22 | Barclays | Center Ithaca | Ithaca | NY | Mixed Use | 10,000,000 | 1.6 | LBUBS 2007-C7 |
| 25 | Barclays | Hampton Inn Munster | Munster | IN | Hospitality | 9,300,000 | 1.5 | JPMCC 2007-LDPX |
| 28 | WFB | Fairfield Inn & Suites - Bend, OR | Bend | OR | Hospitality | 6,590,302 | 1.0 | MSC 2007-IQ14 |
| 30 | WFB | The Promenade Shopping Centre | Smyrna | GA | Retail | 5,900,000 | 0.9 | COMM 2007-C9 |
| 31 | UBSAG | StoreSmart Conway | Conway | AR | Self Storage | 4,788,707 | 0.8 | BACM 2007-1 |
| 33 | WFB | CT Storage Outlet Pomona | Pomona | CA | Self Storage | 4,477,003 | 0.7 | LBUBS 2007-C7 |
| 34 | SG | Shops at The Artisan | Decatur | GA | Mixed Use | 3,000,000 | 0.5 | CWCI 2007-C2 |
| 35 | SG | The Milliken Building | Saint George | UT | Industrial | 2,800,000 | 0.4 | MLCFC 2007-6 |
| 37 | WFB | Snellville Place | Snellville | GA | Retail | 2,075,000 | 0.3 | RCMT 2014-1A |
| Total | $303,816,574 | 47.7% |
| (1) | The table above represents the most recent securitization with respect to the mortgaged property securing the related mortgage loan, based on information provided by the related borrower or obtained through searches of a third-party database. While loans secured by the above mortgaged properties may have been securitized multiple times in prior transactions, mortgage loans in this securitization are only listed in the above chart if the mortgage loan paid off a loan in another securitization. The information has not otherwise been confirmed by the mortgage loan sellers. |
THE INFORMATION IN THIS STRUCTURAL AND COLLATERAL TERM SHEET IS NOT COMPLETE AND MAY BE AMENDED PRIOR TO THE TIME OF SALE. THIS TERM SHEET IS NOT AN OFFER TO SELL THESE SECURITIES AND IT IS NOT A SOLICITATION OF AN OFFER TO BUY THESE SECURITIES IN ANY JURISDICTION WHERE THE OFFER OR SALE IS NOT PERMITTED.
| 12 |
| Wells Fargo Commercial Mortgage Trust 2017-RB1 | Characteristics of the Mortgage Pool |
| E. | Mortgage Loans with Scheduled Balloon Payments and Related Classes |
| Class A-2(1) | ||||||||||||||||
| Loan No. | Mortgage Loan Seller | Mortgage Loan Name | State | Property Type | Mortgage Loan Cut-off Date Balance ($) | % of Initial Pool Balance (%) | Mortgage Loan Balance at ARD ($) | % of Class A-2 Certificate Principal Balance (%)(2) | SF | Loan per | U/W NCF DSCR (x) | U/W NOI Debt Yield (%) | Cut-off Date LTV Ratio (%) | Balloon Or ARD LTV Ratio (%) | Rem. IO Period (mos.) | Rem. Term to ARD (mos.) |
| 13 | Barclays | Merrill Lynch Drive | NJ | Office | $20,660,000 | 3.2% | $20,660,000 | 104.0% | 553,841 | $187 | 2.95x | 11.8% | 67.7% | 67.7% | 59 | 59 |
| Total/Weighted Average | $20,660,000 | 3.2% | $20,660,000 | 104.0% | 2.95x | 11.8% | 67.7% | 67.7% | 59 | 59 | ||||||
| (1) | The table above presents the mortgage loan(s) whose balloon payments would be applied to pay down the principal balance of the Class A-2 Certificates, assuming a 0% CPR and applying the “Structuring Assumptions” described in the Preliminary Prospectus, including the assumptions that (i) none of the mortgage loans in the pool experience prepayments prior to maturity (or, in the case of an ARD loan, its anticipated repayment date), defaults or losses; (ii) there are no extensions of maturity dates of any mortgage loans in the pool; and (iii) each mortgage loan in the pool is paid in full on its stated maturity date (or, in the case of an ARD loan, its anticipated repayment date). Each Class of Certificates evidences undivided ownership interests in the entire pool of mortgage loans. Debt service coverage ratio, debt yield and loan-to-value ratio information do not take into account subordinate debt (whether or not secured by the related mortgaged property), if any, that currently exists or is allowed under the terms of any mortgage loan. See Annex A-1 to the Preliminary Prospectus. |
| (2) | Reflects the percentage equal to the Balloon Balance divided by the initial Class A-2 Certificate Balance. |
| Class A-3(1) | ||||||||||||||||
| Loan No. | Mortgage Loan Seller | Mortgage Loan Name | State | Property Type | Mortgage Loan Cut-off Date Balance ($) | % of Initial Pool Balance (%) | Mortgage Loan Balance at Maturity ($) | % of Class A-3 Certificate Principal Balance (%)(2) | Rooms | Loan per | U/W NCF DSCR (x) | U/W NOI Debt Yield (%) | Cut-off Date LTV Ratio (%) | Balloon LTV Ratio (%) | Rem. IO Period (mos.) | Rem. Term to Maturity (mos.) |
| 28 | WFB | Fairfield Inn & Suites - Bend, OR | OR | Hospitality | $6,590,302 | 1.0% | $5,848,756 | 105.3% | 80 | $82,379 | 2.64x | 19.2% | 48.5% | 43.0% | 0 | 83 |
| Total/Weighted Average | $6,590,302 | 1.0% | $5,848,756 | 105.3% | 2.64x | 19.2% | 48.5% | 43.0% | 0 | 83 | ||||||
| (1) | The table above presents the mortgage loan(s) whose balloon payments would be applied to pay down the principal balance of the Class A-3 Certificates, assuming a 0% CPR and applying the “Structuring Assumptions” described in the Preliminary Prospectus, including the assumptions that (i) none of the mortgage loans in the pool experience prepayments prior to maturity (or, in the case of an ARD loan, its anticipated repayment date), defaults or losses; (ii) there are no extensions of maturity dates of any mortgage loans in the pool; and (iii) each mortgage loan in the pool is paid in full on its stated maturity date (or, in the case of an ARD loan, its anticipated repayment date). Each Class of Certificates evidences undivided ownership interests in the entire pool of mortgage loans. Debt service coverage ratio, debt yield and loan-to-value ratio information do not take into account subordinate debt (whether or not secured by the related mortgaged property), if any, that currently exists or is allowed under the terms of any mortgage loan. See Annex A-1 to the Preliminary Prospectus. |
| (2) | Reflects the percentage equal to the Balloon Balance divided by the initial Class A-3 Certificate Balance. |
THE INFORMATION IN THIS STRUCTURAL AND COLLATERAL TERM SHEET IS NOT COMPLETE AND MAY BE AMENDED PRIOR TO THE TIME OF SALE. THIS TERM SHEET IS NOT AN OFFER TO SELL THESE SECURITIES AND IT IS NOT A SOLICITATION OF AN OFFER TO BUY THESE SECURITIES IN ANY JURISDICTION WHERE THE OFFER OR SALE IS NOT PERMITTED.
| 13 |
| Wells Fargo Commercial Mortgage Trust 2017-RB1 | Characteristics of the Mortgage Pool |
| F. | Property Type Distribution(1) |
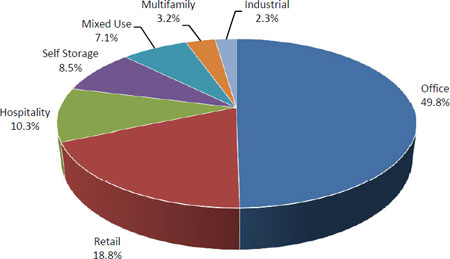
| Property Type | Number of Mortgaged Properties | Aggregate Cut-off Date Balance ($) | % of Initial Pool Balance (%) | Weighted Average Cut-off Date LTV Ratio (%) | Weighted Average Balloon or ARD LTV Ratio (%) | Weighted Average U/W NCF DSCR (x) | Weighted Average U/W NOI Debt Yield (%) | Weighted Average U/W NCF Debt Yield (%) | Weighted Average Mortgage Rate (%) |
| Office | 16 | $317,306,355 | 49.8% | 53.6% | 50.9% | 1.77x | 10.0% | 9.0% | 4.644% |
| CBD | 6 | 223,665,562 | 35.1 | 47.7 | 46.3 | 1.76 | 9.7 | 8.7 | 4.673 |
| Suburban | 8 | 88,672,000 | 13.9 | 68.1 | 62.0 | 1.78 | 10.6 | 9.5 | 4.584 |
| Medical | 2 | 4,968,793 | 0.8 | 60.0 | 60.0 | 2.09 | 9.6 | 9.3 | 4.379 |
| Retail | 30 | 120,165,347 | 18.8 | 61.3 | 56.1 | 1.79 | 10.8 | 10.0 | 4.798 |
| Single Tenant | 18 | 42,670,347 | 6.7 | 60.1 | 55.6 | 1.99 | 11.0 | 10.6 | 4.634 |
| Shadow Anchored | 7 | 27,850,000 | 4.4 | 66.3 | 60.2 | 1.72 | 11.6 | 10.4 | 5.026 |
| Lifestyle Center | 1 | 22,800,000 | 3.6 | 54.3 | 54.3 | 1.68 | 8.7 | 8.1 | 4.762 |
| Anchored | 2 | 20,120,000 | 3.2 | 63.2 | 52.5 | 1.59 | 11.2 | 10.2 | 4.862 |
| Unanchored | 2 | 6,725,000 | 1.1 | 67.3 | 59.8 | 1.72 | 11.9 | 10.8 | 4.828 |
| Hospitality | 4 | 65,690,302 | 10.3 | 63.2 | 57.4 | 1.75 | 13.0 | 11.5 | 5.161 |
| Full Service | 2 | 49,800,000 | 7.8 | 64.8 | 59.8 | 1.67 | 12.3 | 10.8 | 5.113 |
| Limited Service | 2 | 15,890,302 | 2.5 | 58.2 | 49.6 | 2.03 | 15.2 | 13.5 | 5.314 |
| Self Storage | 14 | 54,080,669 | 8.5 | 54.5 | 48.6 | 1.86 | 11.6 | 11.3 | 4.910 |
| Self Storage | 14 | 54,080,669 | 8.5 | 54.5 | 48.6 | 1.86 | 11.6 | 11.3 | 4.910 |
| Mixed Use | 3 | 45,500,000 | 7.1 | 53.5 | 51.1 | 2.20 | 10.9 | 10.4 | 4.562 |
| Office/Data Center/Retail | 1 | 32,500,000 | 5.1 | 50.0 | 50.0 | 2.47 | 11.3 | 10.8 | 4.299 |
| Multifamily/Office/Retail/Self Storage | 1 | 10,000,000 | 1.6 | 63.1 | 52.4 | 1.36 | 9.6 | 9.1 | 5.302 |
| Office/Retail | 1 | 3,000,000 | 0.5 | 58.8 | 58.8 | 2.02 | 10.7 | 10.1 | 4.940 |
| Multifamily | 2 | 20,235,000 | 3.2 | 58.1 | 58.1 | 2.24 | 10.9 | 10.4 | 4.582 |
| Garden | 2 | 20,235,000 | 3.2 | 58.1 | 58.1 | 2.24 | 10.9 | 10.4 | 4.582 |
| Industrial | 3 | 14,578,012 | 2.3 | 62.7 | 52.4 | 1.58 | 11.5 | 10.7 | 4.973 |
| Distribution | 2 | 11,778,012 | 1.8 | 68.2 | 58.9 | 1.47 | 10.1 | 9.4 | 4.962 |
| Manufacturing | 1 | 2,800,000 | 0.4 | 39.4 | 24.9 | 2.06 | 17.6 | 16.4 | 5.020 |
| Total/Weighted Average: | 72 | $637,555,685 | 100.0% | 56.5% | 52.6% | 1.82x | 10.7% | 9.8% | 4.748% |
| (1) | Because this table presents information relating to the mortgaged properties and not the mortgage loans, the information for mortgage loans secured by more than one mortgaged property is based on allocated amounts (allocating the principal balance of the mortgage loan to each of those properties according to the relative appraised values of the mortgaged properties or the allocated loan amounts or property-specific release prices set forth in the related mortgage loan documents or such other allocation as the related mortgage loan seller deemed appropriate). With respect to any mortgage loan that is part of a whole loan, the loan-to-value ratio, debt service coverage ratio and debt yield calculations include the relatedpari passu companion loan(s) but exclude any related subordinate companion loan(s) (unless otherwise stated). With respect to each mortgage loan, debt service coverage ratio, debt yield and loan-to-value ratio information do not take into account any subordinate debt (whether or not secured by the related mortgaged property) that currently exists or is allowed under the terms of such mortgage loan. See Annex A-1 to the Preliminary Prospectus. |
THE INFORMATION IN THIS STRUCTURAL AND COLLATERAL TERM SHEET IS NOT COMPLETE AND MAY BE AMENDED PRIOR TO THE TIME OF SALE. THIS TERM SHEET IS NOT AN OFFER TO SELL THESE SECURITIES AND IT IS NOT A SOLICITATION OF AN OFFER TO BUY THESE SECURITIES IN ANY JURISDICTION WHERE THE OFFER OR SALE IS NOT PERMITTED.
| 14 |
| Wells Fargo Commercial Mortgage Trust 2017-RB1 | Characteristics of the Mortgage Pool |
| G. | Geographic Distribution(1)(2) |
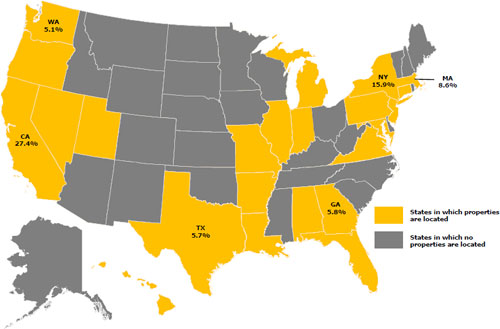
| Location | Number of Mortgaged Properties | Aggregate Cut-off Date Balance ($) | % of Initial Pool Balance (%) | Weighted Average Cut- off Date LTV Ratio (%) | Weighted Average Balloon or ARD LTV Ratio (%) | Weighted Average U/W NCF DSCR (x) | Weighted Average U/W NOI Debt Yield (%) | Weighted Average U/W NCF Debt Yield (%) | Weighted Average Mortgage Rate (%) |
| California | 12 | $174,427,003 | 27.4% | 58.4% | 52.8% | 1.63x | 10.8% | 9.7% | 4.855% |
| Southern | 6 | 114,727,003 | 18.0 | 55.2 | 50.7 | 1.71 | 11.0 | 9.8 | 4.842 |
| Northern | 6 | 59,700,000 | 9.4 | 64.7 | 56.7 | 1.47 | 10.5 | 9.4 | 4.879 |
| New York | 3 | 101,250,000 | 15.9 | 46.8 | 45.7 | 1.61 | 9.0 | 8.2 | 4.903 |
| Massachusetts | 1 | 55,000,000 | 8.6 | 49.1 | 49.1 | 1.86 | 8.6 | 8.0 | 4.220 |
| Georgia | 7 | 36,733,426 | 5.8 | 66.8 | 60.3 | 1.64 | 10.9 | 9.8 | 4.868 |
| Texas | 11 | 36,191,497 | 5.7 | 58.1 | 53.6 | 1.66 | 10.6 | 10.3 | 4.915 |
| Washington | 1 | 32,500,000 | 5.1 | 50.0 | 50.0 | 2.47 | 11.3 | 10.8 | 4.299 |
| Other(3) | 37 | 201,453,759 | 31.6 | 60.6 | 55.8 | 2.04 | 11.9 | 11.0 | 4.744 |
| Total/Weighted Average | 72 | $637,555,685 | 100.0% | 56.5% | 52.6% | 1.82x | 10.7% | 9.8% | 4.748% |
| (1) | The mortgaged properties are located in 23 states. |
| (2) | Because this table presents information relating to the mortgaged properties and not the mortgage loans, the information for mortgage loans secured by more than one mortgaged property is based on allocated amounts (allocating the principal balance of the mortgage loan to each of those properties according to the relative appraised values of the mortgaged properties or the allocated loan amounts or property-specific release prices set forth in the related mortgage loan documents or such other allocation as the related mortgage loan seller deemed appropriate). With respect to any mortgage loan that is part of a whole loan, the loan-to-value ratio, debt service coverage ratio and debt yield calculations include the relatedpari passu companion loan(s) but exclude any related subordinate companion loan(s) (unless otherwise stated). With respect to each mortgage loan, debt service coverage ratio, debt yield and loan-to-value ratio information do not take into account any subordinate debt (whether or not secured by the related mortgaged property) that currently exists or is allowed under the terms of such mortgage loan. See Annex A-1 to the Preliminary Prospectus. |
| (3) | Includes 17 other states. |
THE INFORMATION IN THIS STRUCTURAL AND COLLATERAL TERM SHEET IS NOT COMPLETE AND MAY BE AMENDED PRIOR TO THE TIME OF SALE. THIS TERM SHEET IS NOT AN OFFER TO SELL THESE SECURITIES AND IT IS NOT A SOLICITATION OF AN OFFER TO BUY THESE SECURITIES IN ANY JURISDICTION WHERE THE OFFER OR SALE IS NOT PERMITTED.
| 15 |
| Wells Fargo Commercial Mortgage Trust 2017-RB1 | Characteristics of the Mortgage Pool |
| H. | Characteristics of the Mortgage Pool(1) |
| CUT-OFF DATE BALANCE | |||
| Range of Cut-off Date Balances ($) | Number of Mortgage Loans | Aggregate Cut- off Date Balance | Percent by Aggregate Cut-off Date Pool Balance (%) |
| 2,075,000 - 3,000,000 | 4 | $9,969,959 | 1.6% |
| 3,000,001 - 5,000,000 | 3 | 13,985,710 | 2.2 |
| 5,000,001 - 6,000,000 | 1 | 5,900,000 | 0.9 |
| 6,000,001 - 7,000,000 | 2 | 13,090,302 | 2.1 |
| 7,000,001 - 8,000,000 | 2 | 14,720,000 | 2.3 |
| 8,000,001 - 10,000,000 | 4 | 38,767,152 | 6.1 |
| 10,000,001 - 15,000,000 | 5 | 60,785,000 | 9.5 |
| 15,000,001 - 20,000,000 | 3 | 51,012,000 | 8.0 |
| 20,000,001 - 30,000,000 | 6 | 144,725,562 | 22.7 |
| 30,000,001 - 50,000,000 | 5 | 167,100,000 | 26.2 |
| 50,000,001 - 62,500,000 | 2 | 117,500,000 | 18.4 |
| Total: | 37 | $637,555,685 | 100.0% |
| Average | $17,231,235 | ||
| UNDERWRITTEN NOI DEBT SERVICE COVERAGE RATIO | |||
| Range of U/W NOI DSCRs (x) | Number of Mortgage Loans | Aggregate Cut- off Date Balance | Percent by Aggregate Cut-off Date Pool Balance (%) |
| 1.36 - 1.40 | 1 | $4,788,707 | 0.8% |
| 1.41 - 1.50 | 3 | 35,000,000 | 5.5 |
| 1.51 - 1.60 | 3 | 30,975,000 | 4.9 |
| 1.61 - 1.70 | 5 | 89,682,000 | 14.1 |
| 1.71 - 1.80 | 5 | 107,514,959 | 16.9 |
| 1.81 - 1.90 | 6 | 102,327,003 | 16.0 |
| 1.91 - 2.50 | 10 | 201,017,714 | 31.5 |
| 2.51 - 3.00 | 3 | 59,750,302 | 9.4 |
| 3.01 - 3.76 | 1 | 6,500,000 | 1.0 |
| Total: | 37 | $637,555,685 | 100.0% |
| Weighted Average: | 1.98x | ||
| UNDERWRITTEN NCF DEBT SERVICE COVERAGE RATIO | |||
Range of U/W NCF DSCRs (x) | Number of Mortgage Loans | Aggregate Cut- off Date Balance | Percent by Aggregate Cut-off Date Pool Balance (%) |
| 1.31 - 1.40 | 3 | $25,088,707 | 3.9% |
| 1.41 - 1.50 | 7 | 99,137,000 | 15.5 |
| 1.51 - 1.60 | 4 | 91,920,000 | 14.4 |
| 1.61 - 1.70 | 6 | 95,114,959 | 14.9 |
| 1.71 - 1.80 | 3 | 59,027,003 | 9.3 |
| 1.81 - 1.90 | 2 | 71,600,000 | 11.2 |
| 1.91 - 2.00 | 2 | 62,715,562 | 9.8 |
| 2.01 - 2.50 | 7 | 99,202,152 | 15.6 |
| 2.51 - 3.00 | 2 | 27,250,302 | 4.3 |
| 3.01 - 3.70 | 1 | 6,500,000 | 1.0 |
| Total: | 37 | $637,555,685 | 100.0% |
| Weighted Average: | 1.82x | ||
| LOAN PURPOSE | |||
| Loan Purpose | Number of Mortgage Loans | Aggregate Cut- off Date Balance | Percent by Aggregate Cut-off Date Pool Balance (%) |
| Acquisition | 19 | $354,072,000 | 55.5% |
| Refinance | 17 | 273,483,685 | 42.9 |
| Recapitalization | 1 | 10,000,000 | 1.6 |
| Total: | 37 | $637,555,685 | 100.0% |
| MORTGAGE RATE | |||
| Range of Mortgage Rates (%) | Number of Number of Mortgage Loans | Aggregate Cut- off Date Balance | Percent by Aggregate Cut-off Date Pool Balance (%) |
| 3.930 - 4.000 | 1 | $20,660,000 | 3.2% |
| 4.001 - 4.250 | 1 | 55,000,000 | 8.6 |
| 4.251 - 4.500 | 5 | 122,735,000 | 19.3 |
| 4.501 - 4.750 | 5 | 128,820,000 | 20.2 |
| 4.751 - 5.000 | 10 | 165,154,565 | 25.9 |
| 5.001 - 5.250 | 6 | 39,477,454 | 6.2 |
| 5.251 - 5.500 | 8 | 91,008,666 | 14.3 |
| 5.501 - 5.675 | 1 | 14,700,000 | 2.3 |
| Total: | 37 | $637,555,685 | 100.0% |
| WeightedAverage: | 4.748% | ||
| UNDERWRITTEN NOI DEBT YIELD | |||
| Range of U/W NOI Debt Yields (%) | Number of Mortgage Loans | Aggregate Cut- off Date Balance | Percent by Aggregate Cut-off Date Pool Balance (%) |
| 8.4 - 9.0 | 3 | $140,300,000 | 22.0% |
| 9.1 - 10.0 | 7 | 116,438,707 | 18.3 |
| 10.1 - 11.0 | 11 | 176,692,000 | 27.7 |
| 11.1 - 12.0 | 7 | 101,674,959 | 15.9 |
| 12.1 - 13.0 | 3 | 49,900,000 | 7.8 |
| 13.1 - 15.0 | 1 | 4,477,003 | 0.7 |
| 15.1 - 16.0 | 2 | 32,182,714 | 5.0 |
| 16.1 - 18.0 | 2 | 9,300,000 | 1.5 |
| 18.1 - 19.2 | 1 | 6,590,302 | 1.0 |
| Total: | 37 | $637,555,685 | 100.0% |
| WeightedAverage: | 10.7% | ||
| UNDERWRITTEN NCF DEBT YIELD | |||
| Range of U/W NCF Debt Yields (%) | Number of Mortgage Loans | Aggregate Cut- off Date Balance | Percent by Aggregate Cut-off Date Pool Balance (%) |
| 7.4 – 8.0 | 2 | $117,500,000 | 18.4% |
| 8.1 - 9.0 | 4 | 105,000,000 | 16.5 |
| 9.1 - 10.0 | 12 | 171,710,707 | 26.9 |
| 10.1 - 11.0 | 9 | 143,740,000 | 22.5 |
| 11.1 - 12.0 | 4 | 47,054,959 | 7.4 |
| 12.1 - 13.0 | 1 | 22,715,562 | 3.6 |
| 13.1 - 14.0 | 1 | 4,477,003 | 0.7 |
| 14.1 - 16.0 | 1 | 9,467,152 | 1.5 |
| 16.1 - 17.0 | 2 | 9,300,000 | 1.5 |
| 17.1 - 17.2 | 1 | 6,590,302 | 1.0 |
| Total: | 37 | $637,555,685 | 100.0% |
| WeightedAverage: | 9.8% | ||
| ORIGINAL TERM TO MATURITY OR ARD | |||
| Original Terms to Maturity or ARD (months) | Number of Mortgage Loans | Aggregate Cut- off Date Balance | Percent by Aggregate Cut-off Date Pool Balance (%) |
| 60 | 1 | $20,660,000 | 3.2% |
| 84 | 1 | 6,590,302 | 1.0 |
| 120 | 33 | 572,605,383 | 89.8 |
| 121 | 2 | 37,700,000 | 5.9 |
| Total: | 37 | $637,555,685 | 100.0% |
| WeightedAverage: | 118 months | ||
| (1) | With respect to any mortgage loan that is part of a whole loan, the loan-to-value ratio, debt service coverage ratio and debt yield calculations include the relatedpari passucompanion loan(s) but exclude any related subordinate companion loan(s) (unless otherwise stated). With respect to each mortgage loan, debt service coverage ratio, debt yield and loan-to-value ratio information do not take into account any subordinate debt (whether or not secured by the related mortgaged property) that currently exists or is allowed under the terms of such mortgage loan. See Annex A-1 to the Preliminary Prospectus. Prepayment provisions for each mortgage loan reflects the entire life of the loan (from origination to maturity or ARD). |
THE INFORMATION IN THIS STRUCTURAL AND COLLATERAL TERM SHEET IS NOT COMPLETE AND MAY BE AMENDED PRIOR TO THE TIME OF SALE. THIS TERM SHEET IS NOT AN OFFER TO SELL THESE SECURITIES AND IT IS NOT A SOLICITATION OF AN OFFER TO BUY THESE SECURITIES IN ANY JURISDICTION WHERE THE OFFER OR SALE IS NOT PERMITTED.
| 16 |
| Wells Fargo Commercial Mortgage Trust 2017-RB1 | Characteristics of the Mortgage Pool |
| REMAINING TERM TO MATURITY OR ARD | |||
| Range of Remaining Terms to Maturity or ARD (months) | Number of Mortgage Loans | Aggregate Cut- off Date Balance | Percent by Aggregate Cut-off Date Pool Balance (%) |
| 59 | 1 | $20,660,000 | 3.2% |
| 83 | 1 | 6,590,302 | 1.0 |
| 84 - 120 | 33 | 572,605,383 | 89.8 |
| 121 | 2 | 37,700,000 | 5.9 |
| Total: | 37 | $637,555,685 | 100.0% |
| WeightedAverage: | 117 months | ||
| ORIGINAL AMORTIZATION TERM(2) | |||
| Original Amortization Terms (months) | Number of Mortgage Loans | Aggregate Cut- off Date Balance | Percent by Aggregate Cut-off Date Pool Balance (%) |
| Non-Amortizing | 13 | $333,145,000 | 52.3% |
| 240 | 2 | 7,277,003 | 1.1 |
| 300 | 2 | 15,367,152 | 2.4 |
| 348 | 1 | 7,020,000 | 1.1 |
| 360 | 19 | 274,746,530 | 43.1 |
| Total: | 37 | $637,555,685 | 100.0% |
| Weighted Average(3): | 354 months | ||
(2) The original amortization term shown for any mortgage loan that is interest-only for part of its term does not include the number of months in its interest-only period and reflects only the number of months as of the commencement of amortization remaining from the end of such interest-only period. (3) Excludes the non-amortizing mortgage loans. | |||
| REMAINING AMORTIZATION TERM(4) | |||
| Range of Remaining Amortization Terms (months) | Number of Mortgage Loans | Aggregate Cut- off Date Balance | Percent by Aggregate Cut-off Date Pool Balance (%) |
| Non-Amortizing | 13 | $333,145,000 | 52.3% |
| 238 - 240 | 2 | 7,277,003 | 1.1 |
| 241 - 300 | 2 | 15,367,152 | 2.4 |
| 301 - 360 | 20 | 281,766,530 | 44.2 |
| Total: | 37 | $637,555,685 | 100.0% |
| Weighted Average(5): | 354 months | ||
(4) The remaining amortization term shown for any mortgage loan that is interest-only for part of its term does not include the number of months in its interest-only period and reflects only the number of months as of the commencement of amortization remaining from the end of such interest-only period. (5) Excludes the non-amortizing mortgage loans. | |||
| LOCKBOXES | |||
| Type of Lockbox | Number of Mortgage Loans | Aggregate Cut- off Date Balance | Percent by Aggregate Cut-off Date Pool Balance (%) |
| Springing | 15 | $263,884,305 | 41.4% |
| Hard/Springing Cash Management | 13 | 238,521,421 | 37.4 |
| Hard/Upfront Cash Management | 4 | 112,060,000 | 17.6 |
| None | 5 | 23,089,959 | 3.6 |
| Total: | 37 | $637,555,685 | 100.0% |
| PREPAYMENT PROVISION SUMMARY | |||
| Prepayment Provision | Number of Mortgage Loans | Aggregate Cut- off Date Balance | Percent by Aggregate Cut-off Date Pool Balance (%) |
| Lockout/Def/Open | 27 | $428,973,383 | 67.3% |
| Lockout/GRTR 1% or YM/Open | 5 | 74,112,000 | 11.6 |
| GRTR 1.0% or YM/GRTR 1% or YM or Def/Open | 1 | 62,500,000 | 9.8 |
| Lockout/GRTR 2% or YM/Open | 1 | 40,000,000 | 6.3 |
| GRTR 0.5% or YM/Open | 1 | 20,660,000 | 3.2 |
| Lockout/GRTR 1% or YM or Def/Open | 2 | 11,310,302 | 1.8 |
| Total: | 37 | $637,555,685 | 100.0% |
CUT-OFF DATE LOAN-TO-VALUE RATIO | |||
| Range of Cut-off Date LTV Ratios (%) | Number of Mortgage Loans | Aggregate Cut- off Date Balance | Percent by Aggregate Cut-off Date Pool Balance (%) |
| 37.8 - 45.0 | 4 | $78,050,000 | 12.2% |
| 45.1 - 50.0 | 4 | 156,590,302 | 24.6 |
| 50.1 - 55.0 | 5 | 49,164,155 | 7.7 |
| 55.1 - 60.0 | 6 | 87,283,666 | 13.7 |
| 60.1 - 65.0 | 7 | 103,450,562 | 16.2 |
| 65.1 - 69.6 | 11 | 163,017,000 | 25.6 |
| Total: | 37 | $637,555,685 | 100.0% |
| WeightedAverage: | 56.5% | ||
BALLOON OR ARD LOAN-TO-VALUE RATIO | |||
| Range of Balloon or ARD LTV Ratios (%) | Number of Mortgage Loans | Aggregate Cut- off Date Balance | Percent by Aggregate Cut-off Date Pool Balance (%) |
| 24.9 - 30.0 | 1 | $2,800,000 | 0.4% |
| 30.1 - 35.0 | 1 | 4,477,003 | 0.7 |
| 35.1 - 40.0 | 3 | 75,250,000 | 11.8 |
| 40.1 - 45.0 | 2 | 16,057,454 | 2.5 |
| 45.1 - 50.0 | 7 | 174,703,666 | 27.4 |
| 50.1 - 55.0 | 8 | 124,615,562 | 19.5 |
| 55.1 - 60.0 | 8 | 108,295,000 | 17.0 |
| 60.1 - 65.0 | 6 | 110,697,000 | 17.4 |
| 65.1 - 67.7 | 1 | 20,660,000 | 3.2 |
| Total: | 37 | $637,555,685 | 100.0% |
| WeightedAverage: | 52.6% | ||
AMORTIZATION TYPE | |||
| Amortization Type | Number of Mortgage Loans | Aggregate Cut- off Date Balance | Percent by Aggregate Cut-off Date Pool Balance (%) |
| Interest-only, Balloon | 12 | $312,485,000 | 49.0% |
| Interest-only, Amortizing Balloon | 12 | 211,102,000 | 33.1 |
| Amortizing Balloon | 11 | 83,841,533 | 13.2 |
| Interest-only, ARD | 1 | 20,660,000 | 3.2 |
| Amortizing ARD | 1 | 9,467,152 | 1.5 |
| Total: | 37 | $637,555,685 | 100.0% |
ORIGINAL TERM OF INTEREST-ONLY PERIOD FOR PARTIAL IO LOANS | |||
| IO Terms (months) | Number of Mortgage Loans | Aggregate Cut- off Date Balance | Percent by Aggregate Cut-off Date Pool Balance (%) |
| 24 | 4 | $46,220,000 | 7.2% |
| 36 | 2 | 36,620,000 | 5.7 |
| 60 | 6 | 128,262,000 | 20.1 |
| Total: | 12 | $211,102,000 | 33.1% |
| WeightedAverage: | 48 months | ||
SEASONING | |||
| Seasoning (months) | Number of Mortgage Loans | Aggregate Cut- off Date Balance | Percent by Aggregate Cut-off Date Pool Balance (%) |
| 0 | 15 | $241,845,000 | 37.9% |
| 1 | 15 | 279,582,864 | 43.9 |
| 2 | 6 | 76,127,821 | 11.9 |
| 3 | 1 | 40,000,000 | 6.3 |
| Total: | 37 | $637,555,685 | 100.0% |
| WeightedAverage: | 1 month | ||
THE INFORMATION IN THIS STRUCTURAL AND COLLATERAL TERM SHEET IS NOT COMPLETE AND MAY BE AMENDED PRIOR TO THE TIME OF SALE. THIS TERM SHEET IS NOT AN OFFER TO SELL THESE SECURITIES AND IT IS NOT A SOLICITATION OF AN OFFER TO BUY THESE SECURITIES IN ANY JURISDICTION WHERE THE OFFER OR SALE IS NOT PERMITTED.
| 17 |
| Wells Fargo Commercial Mortgage Trust 2017-RB1 | Certain Terms and Conditions |
| V. | Certain Terms and Conditions |
| Allocation Between the RR Interest and the Non-Retained Certificates: | Amounts available for distributions to the holders of the Certificates (including the RR Interest) will be allocated between amounts available for distribution to the holders of the RR Interest, on the one hand, and to all other Certificates, referred to herein as the “Non-Retained Certificates”, on the other hand. The portion of such amount allocable to (a) the RR Interest will at all times be the product of such amount multiplied by 5% and (b) the Non-Retained Certificates will at all times be the product of such amount multiplied by 95% (each, the respective “Percentage Allocation Entitlement”). |
| Interest Entitlements: | The interest entitlement of each Class of Non-Retained Certificates on each Distribution Date generally will be the interest accrued during the related Interest Accrual Period on the related Certificate Balance or Notional Amount at the related pass-through rate, net of any prepayment interest shortfalls allocated to that Class for such Distribution Date as described below. If prepayment interest shortfalls arise from voluntary prepayments (without Master Servicer consent) on particular non-specially serviced loans during any collection period, the Master Servicer is required to make a compensating interest payment to offset those shortfalls, generally up to an amount equal to the portion of its master servicing fees that accrue at 0.25 basis pointsper annum. The remaining amount of prepayment interest shortfalls will be allocated between the RR Interest, on the one hand, and the Non-Retained Certificates, on the other hand, in accordance with their respective Percentage Allocation Entitlements. The prepayment interest shortfalls allocated to the Non-Retained Certificates (other than the Class V and Class R Certificates) will be allocated among such Classes of Certificates entitled to interest, on apro ratabasis, based on their respective amounts of accrued interest for the related Distribution Date, to reduce the interest entitlement on each such class of Certificates. If a Class receives less than the entirety of its interest entitlement on any Distribution Date, then the shortfall (excluding any shortfall due to prepayment interest shortfalls), together with interest thereon, will be added to its interest entitlement for the next succeeding Distribution Date. |
| Aggregate Principal Distribution Amount: | The Aggregate Principal Distribution Amount for each Distribution Date generally will be the aggregate amount of principal received or advanced in respect of the mortgage loans, net of any non-recoverable advances and interest thereon and workout-delayed reimbursement amounts that are reimbursed to the Master Servicer, the Special Servicer or the Trustee during the related collection period. Non-recoverable advances and interest thereon are reimbursable from principal collections and advances before reimbursement from other amounts. Workout-delayed reimbursement amounts are reimbursable from principal collections. The Non-Retained Certificates will be entitled to the portion of the Aggregate Principal Distribution Amount equal to their Percentage Allocation Entitlement, which is referred to herein as the “Principal Distribution Amount”. |
| Subordination, Allocation of Losses and Certain Expenses | The chart below describes the manner in which the payment rights of certain Classes of Non-Retained Certificates will be senior or subordinate, as the case may be, to the payment rights of other Classes of Non-Retained Certificates. The chart also shows the allocation between the RR Interest and the Non-Retained Certificates and the corresponding entitlement to receive principal and/or interest of certain Classes of Non-Retained Certificates (other than excess interest that accrues on each mortgage loan that has an anticipated repayment date) on any distribution date in descending order. It also shows the manner in which losses are allocated between the RR Interest and the Non-Retained Certificates and the manner in which the Non-Retained Certificate allocations are further allocated to certain Classes of those Certificates in ascending order (beginning with the Non-Offered Certificates, other than the Class V and Class R certificates and the RR Interest) to reduce the balance of each such class to zero;provided that no principal payments or mortgage loan losses will be allocated to the Class X-A, X-B, X-D, V or R Certificates, although principal payments and losses may reduce the notional amounts of the Class X-A, X-B and X-D certificates and, therefore, the amount of interest they accrue. |
THE INFORMATION IN THIS STRUCTURAL AND COLLATERAL TERM SHEET IS NOT COMPLETE AND MAY BE AMENDED PRIOR TO THE TIME OF SALE. THIS TERM SHEET IS NOT AN OFFER TO SELL THESE SECURITIES AND IT IS NOT A SOLICITATION OF AN OFFER TO BUY THESE SECURITIES IN ANY JURISDICTION WHERE THE OFFER OR SALE IS NOT PERMITTED.
| 18 |
| Wells Fargo Commercial Mortgage Trust 2017-RB1 | Certain Terms and Conditions |
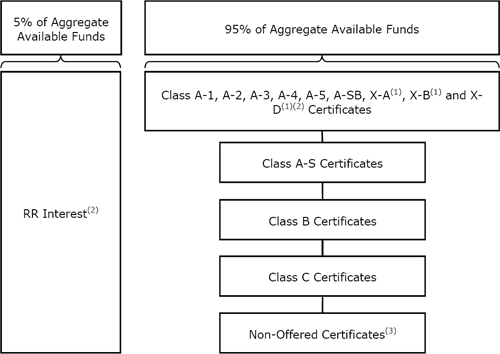 |
| (1) | The Class X-A, X-B and X-D Certificates are interest-only certificates. |
| (2) | The Class X-D Certificates and the RR Interest are Non-Offered Certificates. |
| (3) | Other than the Class X-D, V and R Certificates and the RR Interest. |
| Distributions: | On each Distribution Date, funds available for distribution from the mortgage loans, net of specified trust fees, expenses and reimbursements that are allocable to the Non-Retained Certificates will generally be distributed in the following amounts and order of priority (in each case to the extent of remaining available funds): |
| 1. Class A-1, A-2, A-3, A-4, A-5, A-SB, X-A, X-B and X-D Certificates: To interest on the Class A-1, A-2, A-3, A-4, A-5, A-SB, X-A, X-B and X-D Certificates,pro rata, according to their respective interest entitlements. | |
| 2. Class A-1, A-2, A-3, A-4, A-5 and A-SB Certificates: To principal on the Class A-1, A-2, A-3, A-4, A-5 and A-SB Certificates in the following amounts and order of priority: (i) first, to principal on the Class A-SB Certificates, in an amount up to the Principal Distribution Amount for such Distribution Date until their Certificate Balance is reduced to the Class A-SB Planned Principal Balance for such Distribution Date; (ii) second, to principal on the Class A-1 Certificates until their Certificate Balance is reduced to zero, up to the remainder of the Principal Distribution Amount for such Distribution Date; (iii) third, to principal on the Class A-2 Certificates until their Certificate Balance is reduced to zero, up to the remainder of the Principal Distribution Amount for such Distribution Date; (iv) fourth, to principal on the Class A-3 Certificates, until their Certificate Balance is reduced to zero, up to the remainder of the Principal Distribution Amount for such Distribution Date; (v) fifth, to principal on the Class A-4 Certificates until their Certificate Balance is reduced to zero, up to the remainder of the Principal Distribution Amount for such Distribution Date; (vi) sixth, to principal on the Class A-5 Certificates until their Certificate Balance is reduced to zero, up to the remainder of the Principal Distribution Amount for such Distribution Date; and (vii) seventh, to principal on the Class A-SB Certificates until their Certificate Balance is reduced to zero, up to the remainder of the Principal Distribution Amount for such Distribution Date. However, if the Certificate Balance of each and every Class of Principal Balance Certificates, other than the Class A-1, A-2, A-3, A-4, A-5 and A-SB Certificates and the RR Interest, has been reduced to zero as a result of the allocation of Mortgage Loan losses and expenses and any of the Class A-1, A-2, A-3, A-4, A-5 and A-SB Certificates remains outstanding, then the Principal Distribution Amount will be distributed to the Class A-1, A-2, A-3, A-4, A-5 and A-SB Certificates,pro rata, based on their respective outstanding Certificate Balances, until their Certificate Balances have been reduced to zero. |
THE INFORMATION IN THIS STRUCTURAL AND COLLATERAL TERM SHEET IS NOT COMPLETE AND MAY BE AMENDED PRIOR TO THE TIME OF SALE. THIS TERM SHEET IS NOT AN OFFER TO SELL THESE SECURITIES AND IT IS NOT A SOLICITATION OF AN OFFER TO BUY THESE SECURITIES IN ANY JURISDICTION WHERE THE OFFER OR SALE IS NOT PERMITTED.
| 19 |
| Wells Fargo Commercial Mortgage Trust 2017-RB1 | Certain Terms and Conditions |
| 3. Class A-1, A-2, A-3, A-4, A-5 and A-SB Certificates: To reimburse the holders of the Class A-1, A-2, A-3, A-4, A-5 and A-SB Certificates,pro rata, on the basis of previously allocated unreimbursed losses, for any previously unreimbursed losses (plus interest thereon) on the mortgage loans that were previously allocated in reduction of the Certificate Balances of such Classes. | |
4. Class A-S Certificates: To make distributions on the Class A-S Certificates as follows: (a) first, to interest on the Class A-S Certificates in the amount of the interest entitlement for that Class; (b) next, to the extent of the portion of the Principal Distribution Amount remaining after distributions in respect of principal to each Class with a higher distribution priority (in this case, the Class A-1, A-2, A-3, A-4, A-5 and A-SB Certificates), to principal on the Class A-S Certificates until their Certificate Balance is reduced to zero; and (c) next, to reimburse the holders of the Class A-S Certificates for any previously unreimbursed losses (plus interest thereon) on the mortgage loans that were previously allocated to that Class in reduction of their Certificate Balance.
5. Class B Certificates: To make distributions on the Class B Certificates as follows: (a) first, to interest on the Class B Certificates in the amount of the interest entitlement for that Class; (b) next, to the extent of the portion of the Principal Distribution Amount remaining after distributions in respect of principal to each Class with a higher distribution priority (in this case, the Class A-1, A-2, A-3, A-4, A-5, A-SB and A-S Certificates), to principal on the Class B Certificates until their Certificate Balance is reduced to zero; and (c) next, to reimburse the holders of the Class B Certificates for any previously unreimbursed losses (plus interest thereon) on the mortgage loans that were previously allocated to that Class in reduction of their Certificate Balance.
6. Class C Certificates: To make distributions on the Class C Certificates as follows: (a) first, to interest on the Class C Certificates in the amount of the interest entitlement for that Class; (b) next, to the extent of the portion of the Principal Distribution Amount remaining after distributions in respect of principal to each Class with a higher distribution priority (in this case, the Class A-1, A-2, A-3, A-4, A-5, A-SB, A-S and B Certificates), to principal on the Class C Certificates until their Certificate Balance is reduced to zero; and (c) next, to reimburse the holders of the Class C Certificates for any previously unreimbursed losses (plus interest thereon) on the mortgage loans that were previously allocated to that Class in reduction of their Certificate Balance.
7. After the Class A-1, A-2, A-3, A-4, A-5, A-SB, A-S, B and C Certificates are paid all amounts to which they are entitled, the remaining funds available for distribution will be used to pay interest, principal and loss reimbursement amounts on the Class D, E-1, E-2, F-1, F-2, G-1, G-2, H-1 and H-2 Certificates sequentially in that order in a manner analogous to the Class C Certificates.
| |
| Exchangeable Certificates: | The Class E-1, E-2, F-1, F-2, G-1, G-2, H-1 and H-2 Certificates are collectively referred to herein as the “Initial Issuance Exchangeable Certificates”. The Initial Issuance Exchangeable Certificates may be exchanged for Class E, F, EF, G, EFG and H Certificates (the “Exchangeable Combined Certificates.”), andvice versa, as and to the extent set forth in the pooling and servicing agreement. |
| Allocation of Yield Maintenance and Prepayment Premiums: | If any yield maintenance charge or prepayment premium is collected during any particular collection period with respect to any mortgage loan, then on the Distribution Date corresponding to that collection period, the certificate administrator will pay that yield maintenance charge or prepayment premium (net of liquidation fees payable therefrom) in the following manner: (x)(1) to each of the Class A-1, A-2, A-3, A-4, A-5, A-SB, A-S, B, C and D Certificates, the product of (a) the Non-Retained Certificates’ Percentage Allocation Entitlement of the yield maintenance charge or prepayment premium, (b) the related Base Interest Fraction (as defined in the Preliminary Prospectus) for such Class, and (c) a fraction, the numerator of which is equal to the amount of principal distributed to such Class for that Distribution Date, and the denominator of which is the total amount of principal distributed to all Principal Balance Certificates (other than the RR Interest) for that Distribution Date, (2) to the Class X-A Certificates, the excess, if any, of (a) the product of (i) the Non-Retained Certificates’ Percentage Allocation Entitlement of such yield maintenance charge or prepayment premium and (ii) a fraction, the numerator of which is equal to the amount of principal distributed to the Class A-1, A-2, A-3, A-4, A-5 and A-SB Certificates for that Distribution Date, and the denominator of which is the total amount of principal distributed to all Principal Balance Certificates (other than the RR Interest) for that Distribution Date, over (b) the amount of such yield maintenance charge or prepayment premium distributed to the Class A-1, A-2, A-3, A-4, A-5 and A-SB Certificates as described above, and (3) to the Class X-B Certificates, any remaining portion of the Non-Retained Percentage of such yield maintenance charge or prepayment premium not distributed as described above and (y) to the RR Interest, its Percentage Allocation Entitlement of the yield maintenance charges or prepayment premiums. |
THE INFORMATION IN THIS STRUCTURAL AND COLLATERAL TERM SHEET IS NOT COMPLETE AND MAY BE AMENDED PRIOR TO THE TIME OF SALE. THIS TERM SHEET IS NOT AN OFFER TO SELL THESE SECURITIES AND IT IS NOT A SOLICITATION OF AN OFFER TO BUY THESE SECURITIES IN ANY JURISDICTION WHERE THE OFFER OR SALE IS NOT PERMITTED.
| 20 |
| Wells Fargo Commercial Mortgage Trust 2017-RB1 | Certain Terms and Conditions |
| No prepayment premiums or yield maintenance charges will be distributed to the holders of the Class X-D, Class E-1, Class E-2, Class F-1, Class F-2, Class G-1, Class G-2, Class H-1 or Class H-2 certificates. For a description of when prepayment premiums and yield maintenance charges are generally required on the mortgage loans, see Annex A-1 to the Preliminary Prospectus. See also “Risk Factors—Risks Relating to the Mortgage Loans—Risks Relating to Enforceability of Yield Maintenance Charges, Prepayment Premiums or Defeasance Provisions” and “Risk Factors—Other Risks Relating to the Certificates—Your Yield May Be Affected by Defaults, Prepayments and Other Factors” in the Preliminary Prospectus. Prepayment premiums and yield maintenance charges will be distributed on each Distribution Date only to the extent they are actually received on the mortgage loans as of the related Determination Date. | |
| Realized Losses: | The Certificate Balances of the Class A-1, A-2, A-3, A-4, A-5, A-SB, A-S, B, C, D, E-1, E-2, F-1, F-2, G-1, G-2, H-1 and H-2 Certificates will be reduced without distribution on any Distribution Date as a write-off to the extent of any losses realized on the mortgage loans allocated to such Class on such Distribution Date. Such losses will be applied in the following order, in each case until the related Certificate Balance is reduced to zero: first, to the Class H-2 Certificates; second, to the Class H-1 Certificates; third, to the Class G-2 Certificates; fourth, to the Class G-1 Certificates; fifth, to the Class F-2 Certificates; sixth, to the Class F-1 Certificates; seventh, to the Class E-2 Certificates; eighth, to the Class E-1 Certificates; ninth, to the Class D Certificates; tenth, to the Class C Certificates; eleventh, to the Class B Certificates; twelfth, to the Class A-S Certificates; and, finally,pro rata, to the Class A-1, A-2, A-3, A-4, A-5 and A-SB Certificates based on their outstanding Certificate Balances.
The notional amount of the Class X-A Certificates will be reduced by the amount of all losses that are allocated to the Class A-1, A-2, A-3, A-4, A-5 or A-SB Certificates as write-offs in reduction of their Certificate Balances. The notional amount of the Class X-B Certificates will be reduced by the amount of all losses that are allocated to the Class A-S, B or C Certificates as write-offs in reduction of their Certificate Balances. The notional amount of the Class X-D Certificates will be reduced by the amount of all losses that are allocated to the Class D Certificates as write-offs in reduction of its Certificate Balance.
|
| P&I Advances: | The Master Servicer or, if the Master Servicer fails to do so, the Trustee, will be obligated to advance delinquent debt service payments (other than balloon payments, excess interest and default interest) and assumed debt service payments on mortgage loans with delinquent balloon payments (excluding any related companion loan), except to the extent any such advance is deemed non-recoverable from collections on the related mortgage loan. In addition, if an Appraisal Reduction Amount exists for a given mortgage loan, the interest portion of any P&I advance for such mortgage loan will be reduced, which will have the effect of reducing the amount of interest available for distribution to the Certificates, which with respect to the Non-Retained Certificates will be applied in reverse alphabetical order of their Class designations (except that interest payments on the Class A-1, A-2, A-3, A-4, A-5, A-SB, X-A, X-B and X-D Certificates would be affected on apari passu basis). |
| Servicing Advances: | The Master Servicer or, if the Master Servicer fails to do so, the Trustee, will be obligated to make servicing advances, including the payment of delinquent property taxes, insurance premiums and ground rent, except to the extent that those advances are deemed non-recoverable from collections on the related mortgage loan. The Master Servicer or the Trustee, as applicable, will have the primary obligation to make any required servicing advances with respect to the 123 William Street whole loan, The Davenport whole loan, the Center West whole loan and the Connecticut Financial Center whole loan. The master servicer or trustee, as applicable, under the BBCMS 2017-C1 securitization will have the primary obligation to make any required servicing advances with respect to the KOMO Plaza whole loan, the 1166 Avenue of the Americas whole loan, the Anaheim Marriott Suites whole loan and the Merrill Lynch Drive whole loan. The master servicer or trustee, as applicable, under the BACM 2017-BNK3 securitization will have the primary obligation to make any required servicing advances with respect to The Summit Birmingham whole loan. Prior to the applicable Servicing Shift Securitization Date, the Master Servicer under this securitization is expected to have the primary obligation to make any servicing advances with respect to each of the Art Van Portfolio whole loan and the 340 Bryant whole loan. With respect to each of the Art Van Portfolio whole loan and the 340 Bryant whole loan, after the applicable Servicing Shift Securitization Date, the respective master servicer under the applicable Servicing Shift PSA will have the primary obligation to make any servicing advances with respect to such whole loan. |
Appraisal Reduction Amounts and Collateral Deficiency Amounts: | An Appraisal Reduction Amount generally will be created in the amount, if any, by which the principal balance of a required appraisal loan (which is a mortgage loan with respect to which certain defaults, modifications or insolvency events have occurred as further described in the |
THE INFORMATION IN THIS STRUCTURAL AND COLLATERAL TERM SHEET IS NOT COMPLETE AND MAY BE AMENDED PRIOR TO THE TIME OF SALE. THIS TERM SHEET IS NOT AN OFFER TO SELL THESE SECURITIES AND IT IS NOT A SOLICITATION OF AN OFFER TO BUY THESE SECURITIES IN ANY JURISDICTION WHERE THE OFFER OR SALE IS NOT PERMITTED.
| 21 |
| Wells Fargo Commercial Mortgage Trust 2017-RB1 | Certain Terms and Conditions |
| Preliminary Prospectus) plus other amounts overdue or advanced in connection with such mortgage loan exceeds 90% of the appraised value of the related mortgaged property plus certain escrows and reserves (including letters of credit) held with respect to the mortgage loan. With respect to any whole loan, any Appraisal Reduction Amount will be allocated first to the related subordinate companion loan, if any, and then to the related mortgage loan and the relatedpari passu companion loan(s).
A mortgage loan will cease to be a required appraisal loan when the same has ceased to be a specially serviced loan (if applicable), has been brought current for at least three consecutive months and no other circumstances exist that would cause such mortgage loan to be a required appraisal loan.
A Collateral Deficiency Amount will exist with respect to any mortgage loan that is modified into an AB loan structure and remains a corrected mortgage loan and will generally equal the excess of (i) the stated principal balance of such AB modified loan (taking into account the related junior note(s) and anypari passu notes included therein), over (ii) the sum of (in the case of a whole loan, solely to the extent allocable to the subject mortgage loan) (x) the most recent appraised value of the related mortgaged property plus (y) solely to the extent not reflected or taken into account in such appraised value and to the extent on deposit with, or otherwise under the control of, the lender as of the date of such determination, any capital or additional collateral contributed by the related borrower at the time the mortgage loan (and as part of the modification thereto) became an AB modified loan plus (z) any other escrows or reserves (in addition to any amounts set forth in the immediately preceding clause (y)) held with respect to the mortgage loan as of the date of such determination.
A Cumulative Appraisal Reduction Amount with respect to any mortgage loan will be the sum of any Appraisal Reduction Amount and any Collateral Deficiency Amount.
Appraisal Reduction Amounts will affect the amount of debt service advances in respect of the related mortgage loan. Additionally, Cumulative Appraisal Reduction Amounts will be taken into account in the determination of the identity of the Class whose majority constitutes the “majority controlling class certificateholder” and is entitled to appoint the directing certificateholder.
|
Clean-Up Call and Exchange Termination:
| On each Distribution Date occurring after the aggregate unpaid principal balance of the pool of mortgage loans is less than 1.0% of the principal balance of the mortgage loans as of the cut-off date.
If the aggregate Certificate Balances of each of the Class A-1, A-2, A-3, A-4, A-5, A-SB, A-S, B, C and D Certificates have been reduced to zero, the trust may also be terminated in connection with an exchange of all the then-outstanding certificates (other than the Class R Certificates and the RR Interest) for the mortgage loans and REO properties then remaining in the issuing entity, subject to payment of a price specified in the Preliminary Prospectus, but all of the holders of those outstanding Classes (other than the Class V, Class R Certificates and RR Interest) of certificates would have to voluntarily participate in the exchange.
|
| Liquidation Loan Waterfall: | Following the liquidation of any loan or property, the net liquidation proceeds generally will be applied (after reimbursement of advances and certain trust fund expenses), first, as a recovery of accrued interest, other than delinquent interest that was not advanced as a result of Appraisal Reduction Amounts, second, as a recovery of principal until all principal has been recovered, and then as a recovery of delinquent interest that was not advanced as a result of Appraisal Reduction Amounts. Please see “Description of the Certificates—Distributions—Application Priority of Mortgage Loan Collections or Whole Loan Collections” in the Preliminary Prospectus. |
| Control Eligible Certificates: | The Class E-1, E-2, F-1, F-2, G-1, G-2, H-1 and H-2 Certificates. Each of the Control Eligible Certificates may be exchanged for classes of exchangeable certificates, which are certificates that entitle its respective holders to the same principal and interest entitlements and are subject to the same loss allocation as the exchanged certificates as set forth in the Pooling and Servicing Agreement.
In the event that any of the Control Eligible Certificates are exchanged for a related class of exchangeable certificates, holders of those classes of exchangeable certificates will exercise the voting rights of those certificates in its respective exchange proportion as set forth in the Pooling and Servicing Agreement.
|
THE INFORMATION IN THIS STRUCTURAL AND COLLATERAL TERM SHEET IS NOT COMPLETE AND MAY BE AMENDED PRIOR TO THE TIME OF SALE. THIS TERM SHEET IS NOT AN OFFER TO SELL THESE SECURITIES AND IT IS NOT A SOLICITATION OF AN OFFER TO BUY THESE SECURITIES IN ANY JURISDICTION WHERE THE OFFER OR SALE IS NOT PERMITTED.
| 22 |
| Wells Fargo Commercial Mortgage Trust 2017-RB1 | Certain Terms and Conditions |
| Directing Certificateholder/ Controlling Class: | A directing certificateholder may be appointed by the “majority controlling class certificateholder”, which will be the holder(s) of a majority of the “controlling class”, which means the most subordinate pair of Certificates among the Control Eligible Certificates having the same alphabetical designation.
The “Controlling Class” will be, as of any time of determination, the most subordinate pair of certificates among the Control Eligible Certificates having the same alphabetical designation with an aggregate Certificate Balance (as notionally reduced by any Cumulative Appraisal Reduction Amounts allocable to such class(es)) at least equal to 25% of the initial Certificate Balance of such pair of certificates;provided,however, that if at any time the Certificate Balances of the certificates other than the Control Eligible Certificates and the RR Interest have been reduced to zero as a result of principal payments on the Mortgage Loans, then the Controlling Class will be the most subordinate pair of Control Eligible Certificates having the same alphabetical designation that have a Certificate Balance greater than zero without regard to any Cumulative Appraisal Reduction Amounts. The Controlling Class as of the Closing Date will be, collectively, the Class H-1 Certificates and the Class H-2 Certificates.
|
| Control and Consultation: | The rights of various parties to replace the Special Servicer and approve or consult with respect to major actions of the Special Servicer will vary according to defined periods.
A “Control Termination Event” will occur when (i) the Class E-1 Certificates and Class E-2 Certificates have an aggregate Certificate Balance (taking into account the application of any Cumulative Appraisal Reduction Amounts to notionally reduce the Certificate Balance of such classes) of less than 25% of the initial aggregate Certificate Balance of such classes or (ii) the holder of a majority of the aggregate Certificate Balance of the Class E-1 and Class E-2 Certificates has irrevocably waived its right, in writing, to exercise any of the rights of the Controlling Class Certificateholder and such rights have not been reinstated to a successor controlling class certificateholder as described below;provided,however, that a Control Termination Event will not be deemed continuing in the event that the Certificate Balances of the certificates other than the Control Eligible Certificates and the RR Interest have been reduced to zero as a result of principal payments on the Mortgage Loans.
A “Consultation Termination Event” will occur when (i) there is no pair of Control Eligible Certificates having the same alphabetical designation that have a then-outstanding Certificate Balance at least equal to 25% of the initial aggregate Certificate Balance of those classes, in each case, without regard to the application of any Cumulative Appraisal Reduction Amounts; or (ii) the holder of a majority of the aggregate Certificate Balance of the Class E-1 and Class E-2 Certificates has irrevocably waived its right, in writing, to exercise any of the rights of the Controlling Class Certificateholder and such rights have not been reinstated to a successor controlling class certificateholder pursuant to the terms of the Pooling and Servicing Agreement;provided that no Consultation Termination Event resulting solely from the operation of clause (ii) will be deemed to have existed or be in continuance with respect to a successor holder of any such class of certificates that has not irrevocably waived its right to exercise any of the rights of the Controlling Class Certificateholder;provided,however, that a Consultation Termination Event will not be deemed continuing in the event that the Certificate Balances of the certificates other than the Control Eligible Certificates and the RR Interest have been reduced to zero as a result of principal payments on the Mortgage Loans.
If no Control Termination Event has occurred and is continuing, except with respect to the Excluded Loans (as defined below) with respect to the directing certificateholder and except with respect to Servicing Shift Whole Loans (as defined below) (i) the directing certificateholder will be entitled to grant or withhold approval of asset status reports prepared, and material servicing actions proposed, by the Special Servicer, and (ii) the directing certificateholder will be entitled to terminate and replace the Special Servicer with or without cause, and appoint itself or another person as the successor special servicer. It will be a condition to such appointment that DBRS, Fitch and Moody’s (and any Rating Agency rating any securities backed by anypari passu companion loan(s) serviced under this transaction) confirm that the appointment would not result in a qualification, downgrade or withdrawal of any of their then-current ratings of certificates (and any certificates backed by anypari passu companion loan(s) serviced under this transaction).
If a Control Termination Event has occurred and is continuing but no Consultation Termination Event has occurred and is continuing, the Special Servicer will be required to consult with the directing certificateholder (other than with respect to Excluded Loans as to such party) and the Operating Advisor in connection with asset status reports and material special servicing actions.
If a Consultation Termination Event has occurred and is continuing, the Special Servicer must seek to consult with the Operating Advisor in connection with asset status reports and material special servicing actions, and, in general, no directing certificateholder will be recognized or have any right to terminate the Special Servicer or approve, direct or consult with respect to servicing matters.
|
THE INFORMATION IN THIS STRUCTURAL AND COLLATERAL TERM SHEET IS NOT COMPLETE AND MAY BE AMENDED PRIOR TO THE TIME OF SALE. THIS TERM SHEET IS NOT AN OFFER TO SELL THESE SECURITIES AND IT IS NOT A SOLICITATION OF AN OFFER TO BUY THESE SECURITIES IN ANY JURISDICTION WHERE THE OFFER OR SALE IS NOT PERMITTED.
| 23 |
| Wells Fargo Commercial Mortgage Trust 2017-RB1 | Certain Terms and Conditions |
With respect to the 123 William Street mortgage loan, The Davenport mortgage loan, the Center West mortgage loan and the Connecticut Financial Center mortgage loan, the rights of the directing certificateholder described above will be subject to the consultation rights of the holders of the relatedpari passu companion loans as described below. With respect to each of the Art Van Portfolio mortgage loan and the 340 Bryant mortgage loan (each, a “Servicing Shift Whole Loan”), prior to the applicable Servicing Shift Securitization Date, the rights of the directing certificateholder described above will be, in each such case, subject to the control rights of the related controllingpari passu companion loan(s) as described below.
Notwithstanding any contrary description set forth above, with respect to the 123 William Street mortgage loan, The Davenport mortgage loan, the Center West mortgage loan and the Connecticut Financial Center mortgage loan, the holder of the relatedpari passu companion loan(s) in the related whole loan (or its representative, including any directing certificateholder under any securitization of suchpari passu companion loan(s)) will have consultation rights with respect to asset status reports and material special servicing actions involving the related whole loan, as provided for in the related intercreditor agreement and as described in the Preliminary Prospectus, and those rights will be in addition to the rights of the directing certificateholder in this transaction described above.
Notwithstanding any contrary description set forth above, with respect to each of the KOMO Plaza mortgage loan, the 1166 Avenue of the Americas mortgage loan, the Anaheim Marriott Suites mortgage loan and the Merrill Lynch Drive mortgage loan, in general the related whole loan will be serviced under the BBCMS 2017-C1 pooling and servicing agreement, which grants the directing certificateholder under the BBCMS 2017-C1 securitization control rights that may include the right to approve or disapprove various material servicing actions involving the related whole loan. The directing certificateholder for this securitization (so long as no Consultation Termination Event has occurred and is occurring) will nonetheless have the right to be consulted on a non-binding basis with respect to such actions. For purposes of the servicing of each of the KOMO Plaza whole loan, the 1166 Avenue of the Americas whole loan, the Anaheim Marriott Suites whole loan and the Merrill Lynch Drive whole loan, the occurrence and continuance of a Control Termination Event or Consultation Termination Event under this securitization will not limit the control or other rights of the directing certificateholder (or equivalent) under the BBCMS 2017-C1 securitization.
Also, notwithstanding any contrary description set forth above, with respect to each of the Art Van Portfolio mortgage loan and the 340 Bryant mortgage loan, in general, the related whole loan will be serviced (i) prior to the applicable Servicing Shift Securitization Date, under the pooling and servicing agreement for this securitization and (ii) after the applicable Servicing Shift Securitization Date, under the related Servicing Shift PSA, each of which grants, or is expected to grant, to the related controlling noteholder control rights that include the right to approve or disapprove various material servicing actions involving the related whole loan. The directing certificateholder for this securitization will nonetheless have the right to be consulted on a non-binding basis with respect to such actions. For purposes of the servicing each Servicing Shift Whole Loan, the occurrence and continuance of a Control Termination Event or Consultation Termination Event under this securitization will not limit the control or other rights of the related controlling noteholder, and the securitization of each related controllingpari passu companion loan will not limit the consultation rights of the directing certificateholder under this securitization.
Notwithstanding any contrary description set forth above, with respect to The Summit Birmingham mortgage loan, in general the related whole loan will be serviced under the BACM 2017-BNK3 pooling and servicing agreement, which grants the directing certificateholder under the BACM 2017-BNK3 securitization control rights that may include the right to approve or disapprove various material servicing actions involving the related whole loan. The directing certificateholder for this securitization (so long as no Consultation Termination Event has occurred and is occurring) will nonetheless have the right to be consulted on a non-binding basis with respect to such actions. For purposes of the servicing of The Summit Birmingham whole loan, the occurrence and continuance of a Control Termination Event or Consultation Termination Event under this securitization will not limit the control or other rights of the directing certificateholder (or equivalent) under the BACM 2017-BNK3 securitization.
Notwithstanding any contrary description set forth above, in the event that, with respect to any mortgage loan, (a) with respect to the directing certificateholder, the majority controlling class certificateholder or the directing certificateholder or (b) with respect to the risk retention consultation party, the risk retention consultation party or the holder of the majority of the RR Interest, in either case, is a Borrower Party, the majority controlling class certificateholder and the directing certificateholder will have no right to receive asset status reports or such other
|
THE INFORMATION IN THIS STRUCTURAL AND COLLATERAL TERM SHEET IS NOT COMPLETE AND MAY BE AMENDED PRIOR TO THE TIME OF SALE. THIS TERM SHEET IS NOT AN OFFER TO SELL THESE SECURITIES AND IT IS NOT A SOLICITATION OF AN OFFER TO BUY THESE SECURITIES IN ANY JURISDICTION WHERE THE OFFER OR SALE IS NOT PERMITTED.
| 24 |
| Wells Fargo Commercial Mortgage Trust 2017-RB1 | Certain Terms and Conditions |
information as may be specified in the pooling and servicing agreement, to grant or withhold approval of, or consult with respect to, asset status reports prepared, and material servicing actions proposed, by the Special Servicer, with respect to such mortgage loan, and such mortgage loan will be referred to as an “Excluded Loan” as to such party.
In addition, notwithstanding any contrary description set forth above, in the event that, with respect to any mortgage loan, a controlling class certificateholder is a Borrower Party, such controlling class certificateholder will have no right to receive asset status reports or such other information as may be specified in the pooling and servicing agreement with respect to such mortgage loan, and such controlling class certificateholder will be referred to as an “excluded controlling class holder”.
“Borrower Party” means a borrower, a mortgagor or a manager of a mortgaged property, an Accelerated Mezzanine Loan Lender, or any Borrower Party Affiliate. “Accelerated Mezzanine Loan Lender” means a mezzanine lender under a mezzanine loan that has been accelerated or as to which foreclosure or enforcement proceedings have been commenced against the equity collateral pledged to secure such mezzanine loan. “Borrower Party Affiliate” means, with respect to a borrower, a mortgagor, a manager of a Mortgaged Property or an Accelerated Mezzanine Loan Lender, (x) any other person controlling or controlled by or under common control with such borrower, mortgagor, manager or Accelerated Mezzanine Loan Lender, as applicable, or (y) any other person owning, directly or indirectly, 25% or more of the beneficial interests in such borrower, mortgagor, manager or Accelerated Mezzanine Loan Lender.
| |
| Risk Retention Consultation Party: | A risk retention consultation party may be appointed by the holder or holders of more than 50% of the RR Interest, by Certificate Balance. The majority RR Interest holder will have a continuing right to appoint, remove or replace the risk retention consultation party in its sole discretion. This right may be exercised at any time and from time to time.
Except with respect to an Excluded Loan as to such party, the risk retention consultation party will be entitled to consult with the Special Servicer, upon request of the risk retention consultation party, with respect to certain material servicing actions proposed by the Special Servicer.
|
| Replacement of Special Servicer by General Vote of Certificateholders: | If a Control Termination Event has occurred and is continuing, the Special Servicer (other than with respect to a Servicing Shift Whole Loan) may be removed and replaced without cause upon the affirmative direction of certificate owners holding not less than 66-2/3% of a certificateholder quorum, following a proposal from certificate owners holding not less than 25% of the appraisal-reduced voting rights of all Certificates. The certificateholders who initiate a vote on a termination and replacement of the Special Servicer without cause must cause DBRS, Fitch and Moody’s to confirm the then-current ratings of the certificates (or decline to review the matter) and cause the payment of the fees and expenses incurred in the replacement. If no Control Termination Event has occurred and is continuing, the Special Servicer (other than with respect to a Servicing Shift Whole Loan) may be replaced by the directing certificateholder, subject to DBRS, Fitch and Moody’s (and any Rating Agency rating any securities backed by anypari passu companion loan(s) serviced under this transaction) confirming the then-current ratings of the Certificates (and any certificates backed by anypari passucompanion loans serviced under this transaction) or declining to review the matter. |
| Excluded Special Servicer: | In the event that, with respect to any mortgage loan, the Special Servicer is a Borrower Party, the Special Servicer will be required to resign as special servicer of such mortgage loan (referred to as an “excluded special servicer loan”). If no Control Termination Event has occurred and is continuing, the directing certificateholder will be entitled to appoint (and may replace with or without cause) a separate special servicer that is not a Borrower Party (referred to as an “excluded special servicer”) with respect to such excluded special servicer loan unless such excluded special servicer loan is also an excluded loan. Otherwise, upon resignation of the Special Servicer with respect to an excluded special servicer loan, the resigning Special Servicer will be required to appoint the excluded special servicer. |
| Appraisal Remedy: | If the Class of Certificates comprising the controlling class loses its status as controlling class because of the application of an Appraisal Reduction Amount or Collateral Deficiency Amount, the holders of a majority of the voting rights of such Class may require the Special Servicer to order a second appraisal for any mortgage loan in respect of which an Appraisal Reduction Amount or Collateral Deficiency Amount has been applied. The Special Servicer must thereafter determine whether, based on its assessment of such second appraisal, any recalculation of the Appraisal Reduction Amount or Collateral Deficiency Amount is warranted. Such Class will not be able to exercise any direction, control, consent and/or similar rights of the controlling class unless and until reinstated as the controlling class through such determination; and pending such determination, the rights of the controlling class will be exercised by the Control Eligible Certificates, if any, that would be the controlling class taking into account the subject appraisal reduction amount. |
THE INFORMATION IN THIS STRUCTURAL AND COLLATERAL TERM SHEET IS NOT COMPLETE AND MAY BE AMENDED PRIOR TO THE TIME OF SALE. THIS TERM SHEET IS NOT AN OFFER TO SELL THESE SECURITIES AND IT IS NOT A SOLICITATION OF AN OFFER TO BUY THESE SECURITIES IN ANY JURISDICTION WHERE THE OFFER OR SALE IS NOT PERMITTED.
| 25 |
| Wells Fargo Commercial Mortgage Trust 2017-RB1 | Certain Terms and Conditions |
| Sale of Defaulted Assets: | There will be no “fair value” purchase option. Instead, the pooling and servicing agreement will authorize the Special Servicer to sell defaulted mortgage loans serviced by such Special Servicer to the highest bidder in a manner generally similar to sales of REO properties.
The sale of a defaulted loan (other than with respect to the KOMO Plaza whole loan, the 1166 Avenue of the Americas whole loan, the Anaheim Marriott Suites whole loan, The Summit Birmingham whole loan, the Merrill Lynch Drive whole loan, the Art Van whole loan and the 340 Bryant whole loan) for less than par plus accrued interest and certain other fees and expenses owed on the loan will be subject to consent or consultation rights of the directing certificateholder and/or Operating Advisor, as described in the Preliminary Prospectus.
In the case of the KOMO Plaza mortgage loan, the 1166 Avenue of the Americas mortgage loan, the Anaheim Marriott Suites mortgage loan and the Merrill Lynch Drive mortgage loan, pursuant to the BBCMS 2017-C1 pooling and servicing agreement, the related special servicer may offer to sell to any person (or may offer to purchase) for cash the related whole loan during such time as the applicable companion loan(s) constitute a defaulted mortgage loan under the related pooling and servicing agreement, and, in connection with any such sale, the related special servicer is required to sell both the mortgage loan and the relatedpari passu companion loan(s) as a whole loan. The directing certificateholder for this securitization will have consultation rights as the holder of an interest in the related mortgage loan, as described in the Preliminary Prospectus.
In the case of each of the Art Van Portfolio mortgage loan and the 340 Bryant mortgage loan, prior to the related Servicing Shift Securitization Date, pursuant to the related intercreditor agreement and the pooling and servicing agreement for this securitization, the Special Servicer may, at the direction or upon the advice of the holder of the related controllingpari passu companion loan, offer to sell to any person (or may offer to purchase) for cash the related whole loan during such time as the Art Van Portfolio mortgage loan or the 340 Bryant mortgage loan, as applicable, constitutes a defaulted mortgage loan under the pooling and servicing agreement for this securitization, and, in connection with any such sale, the Special Servicer is required to sell both the applicable mortgage loan and the relatedpari passu companion loan(s) as a whole loan. After the related Servicing Shift Securitization Date, pursuant to the related intercreditor agreement, the party acting as special servicer with respect to the Art Van Portfolio whole loan or the 340 Bryant whole loan, as applicable, pursuant to the related Servicing Shift PSA, may offer to sell to any person (or may offer to purchase) for cash such loan, and, in connection with any such sale, the special servicer is required to sell both the Art Van Portfolio mortgage loan or the 340 Bryant mortgage loan, as applicable, and the relatedpari passu companion loans as a whole loan. The directing certificateholder for this securitization will have consultation rights as the holder of an interest in the Art Van Portfolio mortgage loan and the 340 Bryant mortgage loan, as described in the Preliminary Prospectus.
In the case of The Summit Birmingham mortgage loan, pursuant to the BACM 2017-BNK3 pooling and servicing agreement or the CFCRE 2016-C6 pooling and servicing agreement, respectively, the related special servicer may offer to sell to any person (or may offer to purchase) for cash the related whole loan during such time as the applicable companion loan(s) constitute a defaulted mortgage loan under the related pooling and servicing agreement, and, in connection with any such sale, the related special servicer is required to sell both the mortgage loan and the relatedpari passu companion loan(s) as a whole loan. The directing certificateholder for this securitization will have consultation rights as the holder of an interest in the related mortgage loan, as described in the Preliminary Prospectus.
|
| “As-Is” Appraisals: | Appraisals must be conducted on an “as-is” basis, and must be no more than 12 months old, for purposes of determining Appraisal Reduction Amounts and market value in connection with REO sales. Required appraisals may consist of updates of prior appraisals. Internal valuations by the Special Servicer are permitted if the principal balance of a mortgage loan is less than $2,000,000. |
| Operating Advisor: | The Operating Advisor will perform certain review duties if a Control Termination Event has occurred and is continuing, which will generally include a limited annual review of, and the delivery of a report regarding, certain actions of the Special Servicer with respect to the resolution and/or liquidation of specially serviced loans to the Certificate Administrator. The review and report generally will be based on any asset status reports and additional information delivered to the Operating Advisor by the Special Servicer. In addition, if a Control Termination Event has occurred and is continuing, the Special Servicer must seek to consult with the Operating Advisor (in addition to the directing certificateholder if no Consultation Termination Event has occurred and is continuing) in connection with material special servicing actions with respect to specially serviced loans serviced by the Special Servicer. Furthermore, under certain |
THE INFORMATION IN THIS STRUCTURAL AND COLLATERAL TERM SHEET IS NOT COMPLETE AND MAY BE AMENDED PRIOR TO THE TIME OF SALE. THIS TERM SHEET IS NOT AN OFFER TO SELL THESE SECURITIES AND IT IS NOT A SOLICITATION OF AN OFFER TO BUY THESE SECURITIES IN ANY JURISDICTION WHERE THE OFFER OR SALE IS NOT PERMITTED.
| 26 |
| Wells Fargo Commercial Mortgage Trust 2017-RB1 | Certain Terms and Conditions |
circumstances, but only if a Consultation Termination Event has occurred and is continuing, the Operating Advisor may recommend the replacement of the Special Servicer, in which case the Certificate Administrator will deliver notice of such recommendation to the certificateholders, and certificateholders with specified percentages of the voting rights may direct the replacement of the Special Servicer at their expense. The Operating Advisor will not have any rights or powers with respect to a Servicing Shift Mortgage Loan.
If a Consultation Termination Event has occurred and is continuing, the Operating Advisor may be removed and replaced without cause upon the affirmative direction of certificate owners holding not less than 75% of the appraisal-reduced voting rights of all Principal Balance Certificates (other than the RR Interest), following a proposal from certificate owners holding not less than 25% of the appraisal-reduced voting rights of all certificates. The certificateholders who initiate a vote on a termination and replacement of the Operating Advisor without cause must cause DBRS, Fitch and Moody’s to confirm the then-current ratings of the certificates (or decline to review the matter) and cause the payment of the fees and expenses incurred in the replacement. The Operating Advisor generally may be discharged from its duties if and when the Class A-1, A-2, A-3, A-4, A-5, A-SB, A-S, B, C and D Certificates are retired.
| |
| Asset Representations Reviewer: | The Asset Representations Reviewer will be required to review certain delinquent mortgage loans after a specified delinquency threshold has been exceeded (an “Asset Review Trigger”) and the required percentage of certificateholders vote to direct a review of such delinquent loans. An Asset Review Trigger will occur when either (1) mortgage loans with an aggregate outstanding principal balance of 25.0% or more of the aggregate outstanding principal balance of all of the mortgage loans (including any REO loans (or a portion of any REO loan in the case of a whole loan) held by the issuing entity as of the end of the applicable collection period are delinquent loans or (2) at least 15 mortgage loans are delinquent loans as of the end of the applicable collection period and the outstanding principal balance of such delinquent loans in the aggregate constitutes at least 20.0% of the aggregate outstanding principal balance of all of the mortgage loans (including any REO loans (or a portion of any REO loan in the case of a whole loan)) held by the issuing entity as of the end of the applicable collection period. See “Pooling and Servicing Agreement—The Asset Representations Reviewer—Asset Review” in the Preliminary Prospectus.
The Asset Representations Reviewer may be terminated and replaced without cause. Upon (i) the written direction of certificateholders evidencing not less than 25% of the voting rights (without regard to the application of any Appraisal Reduction Amounts) requesting a vote to terminate and replace the Asset Representations Reviewer with a proposed successor Asset Representations Reviewer that is an eligible asset reviewer, and (ii) payment by such holders to the certificate administrator of the reasonable fees and expenses to be incurred by the certificate administrator in connection with administering such vote, the certificate administrator will promptly provide notice to all certificateholders and the Asset Representations Reviewer of such request by posting such notice on its internet website, and by mailing such notice to all certificateholders and the Asset Representations Reviewer. Upon the written direction of certificateholders evidencing at least 75% of a certificateholder quorum (without regard to the application of any Appraisal Reduction Amounts), the Trustee will terminate all of the rights and obligations of the Asset Representations Reviewer under the pooling and servicing agreement by written notice to the Asset Representations Reviewer, and the proposed successor Asset Representations Reviewer will be appointed. See “Pooling and Servicing Agreement—The Asset Representations Reviewer” in the Preliminary Prospectus.
|
| Dispute Resolution Provisions: | The mortgage loan sellers will be subject to the dispute resolution provisions set forth in the pooling and servicing agreement to the extent those provisions are triggered with respect to any mortgage loan sold to the depositor by a mortgage loan seller and such mortgage loan seller will be obligated under the related mortgage loan purchase agreement to comply with all applicable provisions and to take part in any mediation or arbitration proceedings that may result.
Generally, in the event that a Repurchase Request (as defined in the Preliminary Prospectus) is not “Resolved” (as defined below) within 180 days after the related mortgage loan seller receives such Repurchase Request, then the enforcing servicer will be required to send a notice to the “Initial Requesting Certificateholder” (if any) and the Certificate Administrator indicating the enforcing servicer’s intended course of action with respect to the Repurchase Request. If (a) the enforcing servicer’s intended course of action with respect to the Repurchase Request does not involve pursuing further action to exercise rights against the related mortgage loan seller with respect to the Repurchase Request and the Initial Requesting Certificateholder, if any, or any other certificateholder or certificate owner wishes to exercise its right to refer the matter to mediation (including non-binding arbitration) or arbitration, or (b) the enforcing servicer’s intended course of action is to pursue further action to exercise rights against the |
THE INFORMATION IN THIS STRUCTURAL AND COLLATERAL TERM SHEET IS NOT COMPLETE AND MAY BE AMENDED PRIOR TO THE TIME OF SALE. THIS TERM SHEET IS NOT AN OFFER TO SELL THESE SECURITIES AND IT IS NOT A SOLICITATION OF AN OFFER TO BUY THESE SECURITIES IN ANY JURISDICTION WHERE THE OFFER OR SALE IS NOT PERMITTED.
| 27 |
| Wells Fargo Commercial Mortgage Trust 2017-RB1 | Certain Terms and Conditions |
related mortgage loan seller with respect to the Repurchase Request but the Initial Requesting Certificateholder, if any, or any other certificateholder or certificate owner does not agree with the dispute resolution method selected by the enforcing servicer, then the Initial Requesting Certificateholder, if any, or such other certificateholder or certificate owner may deliver a written notice to the Special Servicer indicating its intent to exercise its right to refer the matter to either mediation or arbitration.
“Resolved” means, with respect to a Repurchase Request, (i) that the related Material Defect has been cured, (ii) the related mortgage loan has been repurchased in accordance with the related mortgage loan purchase agreement, (iii) a mortgage loan has been substituted for the related mortgage loan in accordance with the related mortgage loan purchase agreement, (iv) the applicable mortgage loan seller has made a Loss of Value Payment (as defined in the Preliminary Prospectus), (v) a contractually binding agreement is entered into between the enforcing servicer, on behalf of the issuing entity, and the related mortgage loan seller that settles the related mortgage loan seller’s obligations under the related mortgage loan purchase agreement or (vi) the related mortgage loan is no longer property of the issuing entity as a result of a sale or other disposition in accordance with the pooling and servicing agreement. See “Pooling and Servicing Agreement—Dispute Resolution Provisions” in the Preliminary Prospectus.
| |
| Investor Communications: | The certificate administrator is required to include on any Form 10–D any request received from a certificateholder to communicate with other certificateholders related to certificateholders exercising their rights under the terms of the pooling and servicing agreement. Any certificateholder wishing to communicate with other certificateholders regarding the exercise of its rights under the terms of the Pooling and Servicing Agreement will be able to deliver a written request signed by an authorized representative of the requesting investor to the certificate administrator. |
| Certain Fee Offsets: | If a workout fee is earned by the Special Servicer following a loan default with respect to any mortgage loan that it services, then certain limitations will apply based on modification fees paid by the borrower. The modification fee generally must not exceed 1% of the principal balance of the loan as modified in any 12-month period. In addition, if the loan re-defaults, any subsequent workout fee on that loan must be reduced by a portion of the modification fees paid by the borrower in the previous 12-months. Likewise, liquidation fees collected in connection with a liquidation or partial liquidation of a mortgage loan must be reduced by a portion of the modification fees paid by the borrower in the previous 12 months. |
| Deal Website: | The Certificate Administrator will be required to maintain a deal website, which will include, among other items: (a) summaries of asset status reports prepared by the Special Servicer, (b) inspection reports, (c) appraisals, (d) various “special notices” described in the Preliminary Prospectus, (e) the “Investor Q&A Forum”, (f) a voluntary “Investor Registry” and (g) the “Risk Retention” tab. Investors may access the deal website following execution of a certification and confidentiality agreement. |
| Initial Majority Controlling Class Certificateholder: | It is expected that C-III Investment Management LLC or an affiliate will be the initial majority controlling class certificateholder. |
| Whole Loans: | The mortgaged properties identified on Annex A-1 to the Preliminary Prospectus as 123 William Street, The Davenport, Center West, KOMO Plaza, 1166 Avenue of the Americas, Anaheim Marriott Suites, The Summit Birmingham, Connecticut Financial Center, Merrill Lynch Drive, Art Van Portfolio and 340 Bryant, secure both a mortgage loan to be included in the trust fund and one or more other mortgage loans that will not be included in the trust fund, each of which will bepari passu or subordinate in right of payment with the mortgage loan included in the trust fund. We refer to each such group of mortgage loans as a “whole loan”. The KOMO Plaza whole loan, the 1166 Avenue of the Americas whole loan, the Anaheim Marriott Suites whole loan and the Merrill Lynch Drive whole loan will be principally serviced under the pooling and servicing agreement for the BBCMS 2017-C1 securitization. Prior to the applicable Servicing Shift Securitization Date, each of the Art Van Portfolio whole loan and the 340 Bryant whole loan will be serviced under the pooling and servicing agreement for this securitization, and after the applicable Servicing Shift Securitization Date, each such whole loan will be serviced under the related Servicing Shift PSA. The Summit Birmingham whole loan will be principally serviced under the pooling and servicing agreement for the BACM 2017-BNK3 securitization.
As of the closing date, thepari passucompanion loans in the whole loans are expected to be held by the party identified above under “IV. Characteristics of the Mortgage Pool—B. Summary of the Whole Loans”. |
THE INFORMATION IN THIS STRUCTURAL AND COLLATERAL TERM SHEET IS NOT COMPLETE AND MAY BE AMENDED PRIOR TO THE TIME OF SALE. THIS TERM SHEET IS NOT AN OFFER TO SELL THESE SECURITIES AND IT IS NOT A SOLICITATION OF AN OFFER TO BUY THESE SECURITIES IN ANY JURISDICTION WHERE THE OFFER OR SALE IS NOT PERMITTED.
| 28 |
(THIS PAGE INTENTIONALLY LEFT BLANK)
THE INFORMATION IN THIS STRUCTURAL AND COLLATERAL TERM SHEET IS NOT COMPLETE AND MAY BE AMENDED PRIOR TO THE TIME OF SALE. THIS TERM SHEET IS NOT AN OFFER TO SELL THESE SECURITIES AND IT IS NOT A SOLICITATION OF AN OFFER TO BUY THESE SECURITIES IN ANY JURISDICTION WHERE THE OFFER OR SALE IS NOT PERMITTED.
| 29 |
| 123 WILLIAM STREET |
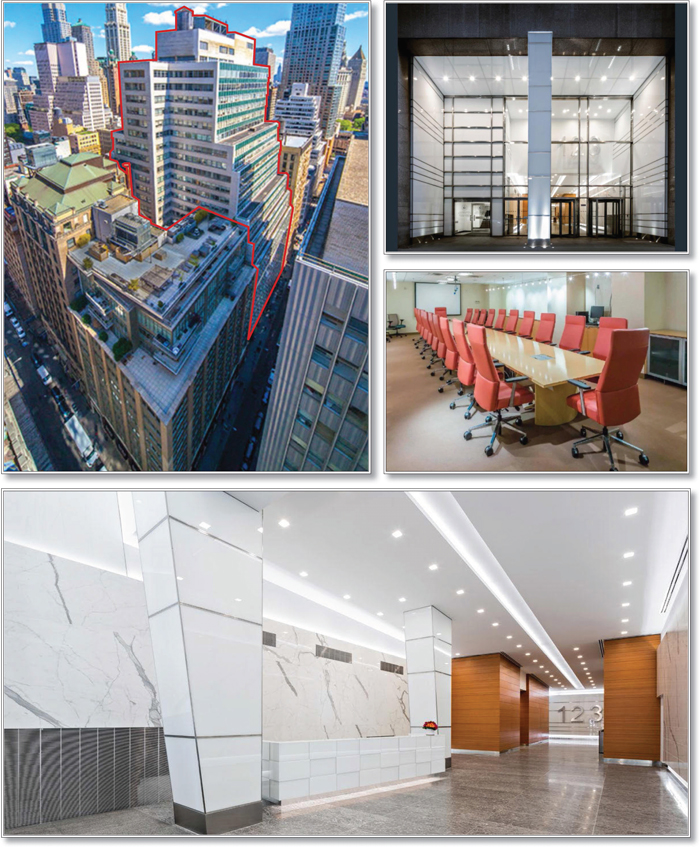
THE INFORMATION IN THIS STRUCTURAL AND COLLATERAL TERM SHEET IS NOT COMPLETE AND MAY BE AMENDED PRIOR TO THE TIME OF SALE. THIS TERM SHEET IS NOT AN OFFER TO SELL THESE SECURITIES AND IT IS NOT A SOLICITATION OF AN OFFER TO BUY THESE SECURITIES IN ANY JURISDICTION WHERE THE OFFER OR SALE IS NOT PERMITTED.
| 30 |
| 123 WILLIAM STREET |
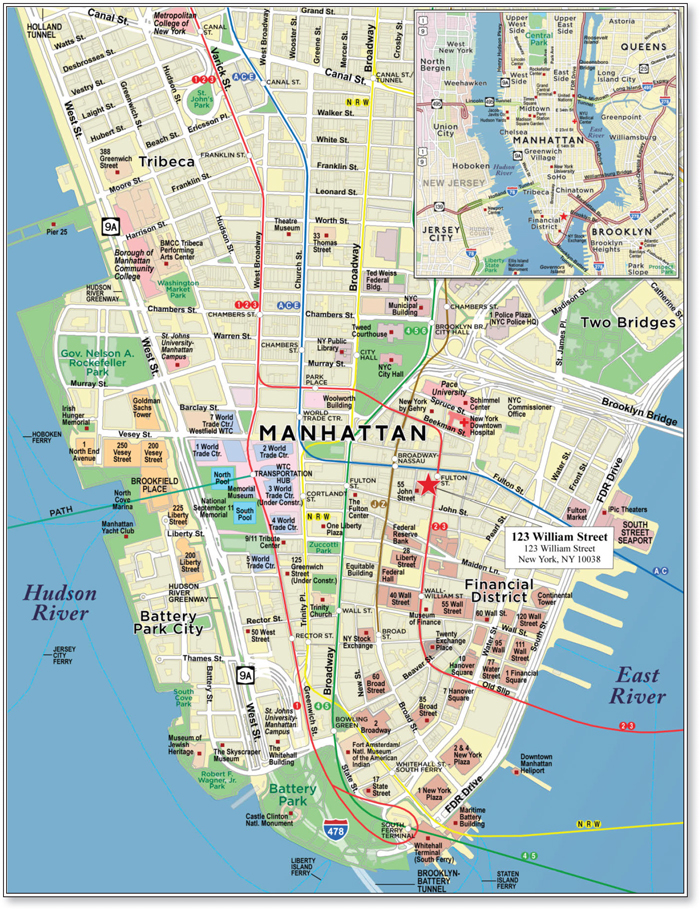
THE INFORMATION IN THIS STRUCTURAL AND COLLATERAL TERM SHEET IS NOT COMPLETE AND MAY BE AMENDED PRIOR TO THE TIME OF SALE. THIS TERM SHEET IS NOT AN OFFER TO SELL THESE SECURITIES AND IT IS NOT A SOLICITATION OF AN OFFER TO BUY THESE SECURITIES IN ANY JURISDICTION WHERE THE OFFER OR SALE IS NOT PERMITTED.
| 31 |
| No. 1 – 123 William Street | ||||||
| Loan Information | Property Information | |||||
| Mortgage Loan Seller: | Barclays Bank PLC | Single Asset/Portfolio: | Single Asset | |||
| Credit Assessment (DBRS/Fitch/Moody’s): | NR/NR/NR | Property Type: | Office | |||
| Original Principal Balance(1): | $62,500,000 | Specific Property Type: | CBD | |||
| Cut-off Date Balance(1): | $62,500,000 | Location: | New York, NY | |||
| % of Initial Pool Balance: | 9.8% | Size: | 545,216 SF | |||
| Loan Purpose: | Refinance | Cut-off Date Balance Per SF(1): | $256.78 | |||
| Borrower Name: | ARC NYC123WILLIAM, LLC | Year Built/Renovated: | 1912/2016 | |||
| Borrower Sponsor: | American Realty Capital New York City REIT | Title Vesting: | Fee | |||
| Mortgage Rate: | 4.666% | Property Manager: | Talpiot Management, LLC, d/b/a East End Realty | |||
| Note Date: | March 6, 2017 | 4thMost Recent Occupancy (As of)(3): | 53.0% (12/31/2013) | |||
| Anticipated Repayment Date: | NAP | 3rdMost Recent Occupancy (As of)(3): | 71.1% (12/31/2014) | |||
| Maturity Date: | March 6, 2027 | 2ndMost Recent Occupancy (As of)(3): | 94.7% (12/31/2015) | |||
| IO Period: | 120 months | Most Recent Occupancy (As of)(3): | 98.3% (12/31/2016) | |||
| Loan Term (Original): | 120 months | Current Occupancy (As of)(3): | 91.7% (1/31/2017) | |||
| Seasoning: | 0 months | |||||
| Amortization Term (Original): | NAP | Underwriting and Financial Information: | ||||
| Loan Amortization Type: | Interest-only, Balloon | |||||
| Interest Accrual Method: | Actual/360 | 4thMost Recent NOI(4): | NAV | |||
| Call Protection: | GRTR 1% or YM(24),GRTR 1% or YM or D(92),O(4) | 3rdMost Recent NOI (As of)(4): | $3,447,351 (12/31/2014) | |||
| Lockbox Type: | Hard/Upfront Cash Management | 2ndMost Recent NOI (As of)(4): | $4,944,963 (12/31/2015) | |||
| Additional Debt(1): | Yes | Most Recent NOI (As of)(4): | $9,478,769 (12/31/2016) | |||
| Additional Debt Type(1): | Pari Passu | |||||
| U/W Revenues: | $22,111,086 | |||||
| U/W Expenses: | $10,391,444 | |||||
| U/W NOI: | $11,719,642 | |||||
| Escrows and Reserves(2): | U/W NCF: | $10,340,702 | ||||
| U/W NOI DSCR(1): | 1.77x | |||||
| Type: | Initial | Monthly | Cap (If Any) | U/W NCF DSCR(1): | 1.56x | |
| Taxes | $0 | Springing | NAP | U/W NOI Debt Yield(1): | 8.4% | |
| Insurance | $0 | Springing | NAP | U/W NCF Debt Yield(1): | 7.4% | |
| Replacement Reserves | $0 | Springing | NAP | As-Is Appraised Value: | $290,000,000 | |
| TI/LC Reserve | $0 | Springing | NAP | As-Is Appraisal Valuation Date: | February 1, 2017 | |
| Outstanding TI/LC and Free Rent Reserves | $4,819,755 | $0 | NAP | Cut-off Date LTV Ratio(1): | 48.3% | |
| DYCD Reserve | $20,000,000 | $0 | NAP | LTV Ratio at Maturity(1): | 48.3% | |
| (1) | See “The Mortgage Loan” section. All statistical financial information related to balances per square foot, loan-to-value ratios, debt service coverage ratios and debt yields are based on the 123 William Street Whole Loan (as defined below). |
| (2) | See “Escrows” section. |
| (3) | See “Historical Occupancy” section. In 2011, the largest and second largest tenants at the 123 William Street Property (as defined below) vacated when their lease expired. In 2013, a new owner acquired the 123 William Street Property and proceeded to lease up the 123 William Street Property through the borrower sponsor’s acquisition in March 2015. Over $11.9 million in capital expenditures were invested in the property from 2014-2016, including a redesigned lobby and building main entrance, elevator cab modernization, new windows throughout the entire building, a retail space renovation and a facade restoration. Since the borrower’s acquisition, eight new or renewal leases have been executed for 146,006 SF (26.8% of net rentable area). |
| (4) | See “Cash Flow Analysis” section. Historical cash flow information prior to 2014 was not available for the 123 William Street Property due to acquisition financing. The increase from 3rd Most Recent NOI to Most Recent NOI is primarily attributable to the increase in Occupancy from 12/31/2013 to 1/31/2017 and increases in base rent due to the recent capital expenditures invested in the 123 William Street Property. The increase from Most Recent NOI to U/W NOI is primarily attributable to U/W Base Rent including contractual rent steps through March 31, 2018 totaling $486,228, approximately $53,916 of straight-line rent attributable to NYS Licensing, an investment grade-rated tenant and $765,873 of signed but not occupied rent, related to NYC Rent Stabilization Association which entered into a new lease relocating to a portion of the 12th Floor which will commence in June 2017. |
THE INFORMATION IN THIS STRUCTURAL AND COLLATERAL TERM SHEET IS NOT COMPLETE AND MAY BE AMENDED PRIOR TO THE TIME OF SALE. THIS TERM SHEET IS NOT AN OFFER TO SELL THESE SECURITIES AND IT IS NOT A SOLICITATION OF AN OFFER TO BUY THESE SECURITIES IN ANY JURISDICTION WHERE THE OFFER OR SALE IS NOT PERMITTED.
| 32 |
| 123 WILLIAM STREET |
The Mortgage Loan.The mortgage loan (the “123 William Street Mortgage Loan”) is part of a whole loan (the “123 William Street Whole Loan”) that is evidenced by threepari passu promissory notes (Note A-1, Note A-2 and Note A-3) secured by a first mortgage encumbering the fee interest in a class A office building located in New York, New York (the “123 William Street Property”). The 123 William Street Whole Loan was originated on March 6, 2017 by Barclays Bank PLC. The 123 William Street Whole Loan had an original principal balance of $140,000,000, has an outstanding principal balance as of the Cut-off Date of $140,000,000 and accrues interest at an interest rate of 4.666%per annum. The 123 William Street Whole Loan had an initial term of 120 months, has a remaining term of 120 months as of the Cut-off Date and requires payments of interest only through the term of the 123 William Street Whole Loan. The 123 William Street Whole Loan matures on March 6, 2027.
Note A-1, which will be contributed to the WFCM 2017-RB1 Trust, had an original principal balance of $62,500,000, has an outstanding principal balance as of the Cut-off Date of $62,500,000 and represents the controlling interest in the 123 William Street Whole Loan. The non-controlling Notes A-2 and A-3, which have an aggregate original principal balance of $77,500,000, referred to herein as the “123 William Street Companion Loans”, are expected to be contributed to a future securitization trust or trusts. The lender provides no assurances that any non-securitizedpari passu notes will not be split further. See “Description of the Mortgage Pool—The Whole Loans—The Serviced Whole Loans—123 William Street Whole Loan” in the Preliminary Prospectus.
Note Summary(1)
| Notes | Original Balance | Note Holder | Controlling Interest | |
| A-1 | $62,500,000 | WFCM 2017-RB1 | Yes | |
| A-2 | $50,000,000 | Barclays Bank PLC | No | |
| A-3 | $27,500,000 | Barclays Bank PLC | No | |
| Total | $140,000,000 |
| (1) | The lender provides no assurances that any non-securitizedpari passu note will not be split further. |
Following the lockout period, on any date before December 6, 2026, the borrower has the right to defease the 123 William Street Whole Loan in whole, but not in part. The lockout period will expire on the earlier to occur of (i) two years after the closing date of the securitization that includes the last note to be securitized and (ii) March 6, 2020. In addition, at any time prior to December 6, 2026, the borrower has the right to prepay the 123 William Street Whole Loan in whole, as long as such prepayment is accompanied with the payment of the greater of a yield maintenance premium or 1.0% of the amount being prepaid. The 123 William Street Whole Loan may be partially prepaid with the payment of the greater of a yield maintenance premium or 1.0% of the amount being prepaid in order to achieve a debt service coverage ratio of at least 1.12x if a Trigger Period (as defined below) is in effect. The 123 William Street Whole Loan is prepayable without penalty on or after December 6, 2026.
Sources and Uses(1)
| Sources | Uses | |||||
| Original whole loan amount | $140,000,000 | 100% | Loan payoff | $96,056,570 | 68.6% | |
| Reserves | 24,819,755 | 17.7 | ||||
| Return of equity | 16,168,024 | 11.5 | ||||
| Closing costs | 2,955,651 | 2.1 | ||||
| Total Sources | $140,000,000 | 100.0% | Total Uses | $140,000,000 | 100.0% |
| (1) | The borrower purchased the 123 William Street Property in March 2015 for approximately $253.0 million and reported a total cost basis of $279.3 million as of December 31, 2016. Assuming the DYCD holdback is returned to the borrower, the borrower as of the loan closing date had approximately $147.0 million of equity remaining in the 123 William Street Property. |
The Property. The 123 William Street Property is a 27-story office tower located in New York, New York within Downtown Manhattan. Constructed in 1912 and most recently renovated in 2016, the 123 William Street Property totals 545,216 square feet and is comprised of 525,753 square feet of office space (96.4% of the net rentable area) and 19,463 square feet of ground floor retail space (3.6% of the net rentable area). Office floor plates at the 123 William Street Property range in size from approximately 12,658 to 26,566 square feet and offer both office intensive and open floor plan layouts. The higher floors at the 123 William Street Property feature views of the World Trade Center, the Brooklyn Bridge, City Hall and the Empire State Building. The 123 William Street Property is located between John Street and Fulton Street directly across from the Fulton Street subway station. The Fulton Street subway station provides immediate access to 11 subway lines and connects to the PATH train, which connects New York and New Jersey. The Fulton Street subway station connects to the larger Fulton Center complex, a $1.4 billion retail and transportation hub which opened in 2014. According to a third party report, the surrounding area of Manhattan’s financial district has been spurred by over $30.0 billion in public and private investment over the last 10 years. Since 2014, approximately $11.9 million ($21.83 per square foot) has been invested in capital upgrades at the 123 William Street Property including a redesigned lobby and building main entrance, elevator cab modernization, new windows throughout the entire building, a retail space renovation and a facade restoration.
The 123 William Street Property is leased to 29 tenants in a variety of industries including governmental, non-profit, private and retail. The largest tenants include Planned Parenthood (13.3% of U/W base rent), U.S. Social Security Administration (9.4% of U/W base rent) and NYC Department of Youth & Community Development (“DYCD”) (8.3% of U/W base rent). Five tenants leasing 167,679 SF (31.7% of U/W base rent) are investment-grade rated tenants.
THE INFORMATION IN THIS STRUCTURAL AND COLLATERAL TERM SHEET IS NOT COMPLETE AND MAY BE AMENDED PRIOR TO THE TIME OF SALE. THIS TERM SHEET IS NOT AN OFFER TO SELL THESE SECURITIES AND IT IS NOT A SOLICITATION OF AN OFFER TO BUY THESE SECURITIES IN ANY JURISDICTION WHERE THE OFFER OR SALE IS NOT PERMITTED.
| 33 |
| 123 WILLIAM STREET |
Planned Parenthood recently executed a 15-year lease that commenced February 2016 and expires July 2031 with no termination options and a five year extension option. Planned Parenthood moved its headquarters to the 123 William Street Property from its previous location on West 33rd Street in Manhattan and utilizes its space exclusively as an office. Planned Parenthood provides healthcare, educational programs and outreach to over 2.5 million people through approximately 650 health centers across thecountry. The U.S. Social Security Administration leases 48,221 SF at the property through June 2022 with no termination options. The U.S. Social Security Administration is an independent agency of the United States federal government that administers the Social Security program.
DYCD currently leases 40,610 square feet on the 17th and 18th floors under a license agreement on a month-to-month basis. DYCD and the borrower sponsor are in the process of finalizing a new 20-year lease to DYCD at a proposed annual base rent of $2,071,111 or $51.00 PSF. According to the borrower sponsor, the City of New York is meeting in March to review the proposal. At closing, $20.0 million of the loan amount was reserved and is releasable pursuant to the loan documents back to the borrower upon the execution of the DYCD lease or replacement tenants, both with an initial term of not less than ten years and a net effective rent, as reasonably determined by Lender, at least equal to the net effective rent under the current lease/license agreement. See “Escrows” section below. DYCD, established in 1996, provides programs for New York City youth and their families by funding a wide range of community development programs administrating city, state and federal funds. Other than Planned Parenthood, U.S. Social Security Administration and NYS Licensing, no other tenant accounts for more than 7.5% of net rentable area of the 123 William Street Property. As of January 31, 2017, the 123 William Street Property was 91.7% occupied by 29 tenants.
The following table presents certain information relating to the tenancy at the 123 William Street Property:
Major Tenants
| Tenant Name | Credit Rating (Fitch/Moody’s/ S&P)(1) | Tenant NRSF | % of NRSF | Annual U/W Base Rent PSF(2) | Annual U/W Base Rent(2) | % of Total Annual U/W Base Rent | Lease Expiration Date |
| Major Tenants | |||||||
| Planned Parenthood (Corporate) | NR/NR/NR | 65,242(3) | 12.0% | $41.82 | $2,728,420 | 13.3% | 7/31/2031(4) |
| U.S. Social Security Administration | AAA/Aaa/AA+ | 48,221 | 8.8% | $39.94 | $1,926,086 | 9.4% | 6/28/2022 |
| NYC Department of Youth & Community Development (“DYCD”) | AA/Aa2/AA | 40,610 | 7.4% | $42.00 | $1,705,620 | 8.3% | MTM(5) |
| NYS Licensing | AA+/Aa1/AA+ | 45,313 | 8.3% | $34.56 | $1,565,964(6) | 7.6% | 7/31/2022(7) |
| Securities Training Corporation | NR/NR/NR | 32,356 | 5.9% | $34.00 | $1,100,104 | 5.4% | 6/30/2025 |
| McAloon Friedman | NR/NR/NR | 25,316 | 4.6% | $42.73 | $1,081,710 | 5.3% | 10/31/2019 |
| Urban Justice Center | NR/NR/NR | 20,305 | 3.7% | $46.00 | $934,030 | 4.6% | 12/31/2027(8) |
| Institute for Career Development | NR/NR/NR | 26,459 | 4.9% | $30.23 | $799,856 | 3.9% | 8/31/2024(9) |
| NYC Rent Stabilization Association(10) | NR/NR/NR | 17,811 | 3.3% | $43.00 | $765,873 | 3.7% | 1/31/2028(11) |
| NYC Administration Services (DCAS) | AA/Aa2/AA | 20,877 | 3.8% | $32.00 | $668,064 | 3.3% | 4/30/2030(12) |
| Total Major Tenants | 342,510 | 62.8% | $38.76 | $13,275,727 | 64.8% | ||
| Non-Major Tenants | 157,370 | 28.9% | $45.91 | $7,225,186 | 35.2% | ||
| Occupied Collateral Total | 499,880 | 91.7% | $41.01 | $20,500,913 | 100.0% | ||
| Vacant Space | 45,336 | 8.3% | |||||
| Collateral Total | 545,216 | 100.0% | |||||
| (1) | Certain ratings are those of the parent company whether or not the parent guarantees the lease. |
| (2) | Annual U/W Base Rent PSF and Annual U/W Base Rent include contractual rent steps through March 31, 2018 totaling $486,228. |
| (3) | Planned Parenthood’s net rentable area does not include 5,212 square feet of space on the 9th floor which Planned Parenthood subleases from Single Stop USA Inc. through December 2025. |
| (4) | Planned Parenthood has one, five-year renewal option. |
| (5) | DYCD currently leases 40,610 square feet on the 17th and 18th floors under a license agreement on a MTM basis. DYCD and the borrower sponsor are in the process of finalizing a new 20-year lease to DYCD at a proposed annual base rent of $2,071,111 or $51.00 per square foot. According to the borrower sponsor, the City of New York is meeting in March to review the proposal. At closing, $20.0 million of the loan amount was held back, which will be releasable back to the borrower upon the execution of the DYCD lease or replacement tenants, both with an initial term of not less than ten years and a net effective rent, as reasonably determined by Lender, at least equal to the net effective rent under the current lease/license agreement. |
| (6) | NYS Licensing has one, five-year renewal option. |
| (7) | Rent for NYS Licensing has been straight lined through lease expiration as these suites are leased to the State of New York, an investment grade tenant. |
| (8) | Urban Justice Center has one, five-year renewal option. |
| (9) | Institute for Career Development has one, five-year renewal option. |
| (10) | NYC Rent Stabilization Association entered into a new lease relocating to a portion of the 12th Floor which will commence in June 2017. NYC Rent Stabilization Association is currently in occupancy of 20,745 square feet on the 14th Floor. Information presented reflects the terms of the new lease. |
| (11) | NYC Rent Stabilization Association has one, five-year renewal option. |
| (12) | NYC Administration Services (DCAS) has the right to terminate its lease on or after May 2020 with 270 days written notice and one, five-year renewal option. |
THE INFORMATION IN THIS STRUCTURAL AND COLLATERAL TERM SHEET IS NOT COMPLETE AND MAY BE AMENDED PRIOR TO THE TIME OF SALE. THIS TERM SHEET IS NOT AN OFFER TO SELL THESE SECURITIES AND IT IS NOT A SOLICITATION OF AN OFFER TO BUY THESE SECURITIES IN ANY JURISDICTION WHERE THE OFFER OR SALE IS NOT PERMITTED.
| 34 |
| 123 WILLIAM STREET |
The following table presents certain information relating to the lease rollover schedule at the 123 William Street Property:
Lease Expiration Schedule(1)(2)
| Year Ending December 31, | No. of Leases Expiring | Expiring NRSF | % of Total NRSF | Cumulative Expiring NRSF | Cumulative % of Total NRSF | Annual U/W Base Rent | % of Total Annual U/W Base Rent | Annual U/W Base Rent PSF(3) |
| MTM(4) | 1 | 40,610 | 7.4% | 40,610 | 7.4% | $1,705,620 | 8.3% | $42.00 |
| 2017(5) | 1 | 0 | 0.0% | 40,610 | 7.4% | $6,615 | 0.0% | $0.00 |
| 2018 | 1 | 12,658 | 2.3% | 53,268 | 9.8% | $577,838 | 2.8% | $45.65 |
| 2019 | 4 | 32,198 | 5.9% | 85,466 | 15.7% | $1,458,636 | 7.1% | $45.30 |
| 2020 | 1 | 4,548 | 0.8% | 90,014 | 16.5% | $195,908 | 1.0% | $43.08 |
| 2021 | 1 | 7,746 | 1.4% | 97,760 | 17.9% | $406,897 | 2.0% | $52.53 |
| 2022 | 3 | 98,445 | 18.1% | 196,205 | 36.0% | $3,679,798 | 17.9% | $37.38 |
| 2023 | 0 | 0 | 0.0% | 196,205 | 36.0% | $0 | 0.0% | $0.00 |
| 2024 | 2 | 37,980 | 7.0% | 234,185 | 43.0% | $1,221,639 | 6.0% | $32.17 |
| 2025 | 8 | 112,749 | 20.7% | 346,934 | 63.6% | $4,819,374 | 23.5% | $42.74 |
| 2026 | 2 | 19,000 | 3.5% | 365,934 | 67.1% | $932,202 | 4.5% | $49.06 |
| 2027 | 1 | 20,305 | 3.7% | 386,239 | 70.8% | $934,030 | 4.6% | $46.00 |
| Thereafter | 4 | 113,641 | 20.8% | 499,880 | 91.7% | $4,562,357 | 22.3% | $40.15 |
| Vacant | 0 | 45,336 | 8.3% | 545,216 | 100.0% | $0 | 0.0% | $0.00 |
| Total/Weighted Average | 29 | 545,216 | 100.0% | $20,500,913 | 100.0% | $41.01 |
| (1) | Information obtained from the underwritten rent roll. |
| (2) | Certain tenants may have lease termination options that are exercisable prior to the originally stated expiration date of the subject lease and that are not considered in the Lease Expiration Schedule. |
| (3) | Weighted Average Annual U/W Base Rent PSF excludes vacant space. |
| (4) | DYCD is currently MTM. DYCD and the borrower sponsor are in the process of finalizing a new 20-year lease to DYCD at a proposed annual base rent of $2,071,111 or $51.00 PSF. According to the borrower sponsor, the City of New York is meeting in March to review the proposal. At closing, $20.0 million of the loan amount was held back, which will be releasable back to the borrower upon the execution of the DYCD lease or a replacement tenant, both with an initial term of not less than ten years and a net effective rent, as reasonably determined by Lender, at least equal to the net effective rent under the current license agreement. |
| (5) | 2017 includes Light Tower Fiber Networks which has no attributable net rentable area. |
The following table presents historical occupancy percentages at the 123 William Street Property:
Historical Occupancy
12/31/2013(1)(2)(3) | 12/31/2014(1)(3)(4) | 12/31/2015(1)(4) | 12/31/2016(1)(5) | 1/31/2017(5)(6) |
| 53.0% | 71.1% | 94.7% | 98.3% | 91.7% |
| (1) | Information obtained from the borrower. |
| (2) | 12/31/2013 Occupancy is lower due to the largest and second largest tenants vacating the 123 William Street Property in 2011, totaling approximately 49.0% of the net rentable area. |
| (3) | The increase from 12/31/2013 Occupancy to 12/31/2014 Occupancy is primarily due to six tenants signing new leases totaling 88,549 square feet. |
| (4) | The increase from 12/31/2014 Occupancy to 12/31/2015 Occupancy is due to nine tenants signing new leases totaling 129,109 square feet. |
| (5) | The decrease from 12/31/2016 Occupancy to 1/31/2017 Occupancy is due to the expiration of NYS Office of Court Administration’s lease for 24,901 square feet on 12/31/2016. |
| (6) | Information obtained from the underwritten rent roll. Reflects NYC Rent Stabilization Association’s new lease of 17,811 square feet on the 12th Floor, which will commence in June 2017. NYC Rent Stabilization Association is currently in occupancy of 20,745 square feet on the 14th Floor. Based on NYC Rent Stabilization Association’s currently occupied space, current Occupancy is 92.2%. |
THE INFORMATION IN THIS STRUCTURAL AND COLLATERAL TERM SHEET IS NOT COMPLETE AND MAY BE AMENDED PRIOR TO THE TIME OF SALE. THIS TERM SHEET IS NOT AN OFFER TO SELL THESE SECURITIES AND IT IS NOT A SOLICITATION OF AN OFFER TO BUY THESE SECURITIES IN ANY JURISDICTION WHERE THE OFFER OR SALE IS NOT PERMITTED.
| 35 |
| 123 WILLIAM STREET |
Operating History and Underwritten Net Cash Flow. The following table presents certain information relating to the historical operating performance and underwritten net cash flow at the 123 William Street Property:
Cash Flow Analysis
| 2014(1) | 2015(1) | 2016(1) | U/W | % of U/W Effective Gross Income | U/W $ per SF | |||||||||||||
| Base Rent | $10,255,831 | $12,645,631 | $18,150,854 | $20,500,913(2) | 92.7% | $37.60 | ||||||||||||
| Grossed Up Vacant Space | 0 | 0 | 0 | 2,225,261 | 10.1 | 4.08 | ||||||||||||
| Total Reimbursables | 847,404 | 1,155,488 | 1,521,125 | 1,540,393 | 7.0 | 2.83 | ||||||||||||
| Other Income | 197,074 | 40,307 | 72,393 | 69,780 | 0.3 | 0.13 | ||||||||||||
| Less Vacancy & Credit Loss | 0 | 0 | 0 | (2,225,261)(3) | (10.1) | (4.08) | ||||||||||||
| Effective Gross Income | $11,300,309 | $13,841,425 | $19,744,372 | $22,111,086 | 100.0% | $40.55 | ||||||||||||
| Total Operating Expenses | $7,852,958 | $8,896,462 | $10,265,603 | $10,391,444 | 47.0% | $19.06 | ||||||||||||
| Net Operating Income | $3,447,351 | $4,944,963 | $9,478,769 | $11,719,642 | 53.0% | $21.50 | ||||||||||||
| TI/LC | 0 | 0 | 0 | 1,269,897 | 5.7 | 2.33 | ||||||||||||
| Capital Expenditures | 0 | 0 | 0 | 109,043 | 0.5 | 0.20 | ||||||||||||
| Net Cash Flow | $3,447,351 | $4,944,963 | $9,478,769 | $10,340,702 | 46.8% | $18.97 | ||||||||||||
| NOI DSCR(4) | 0.52x | 0.75x | 1.43x | 1.77x | ||||||||||||||
| NCF DSCR(4) | 0.52X | 0.75x | 1.43x | 1.56x | ||||||||||||||
| NOI DY(4) | 2.5% | 3.5% | 6.8% | 8.4% | ||||||||||||||
| NCF DY(4) | 2.5% | 3.5% | 6.8% | 7.4% |
| (1) | Net Operating Income increased from 2014 to 2016 due to increases in base rent due and occupancy corresponding with approximately $11.9 million in recent capital expenditures invested in the 123 William Street Property. |
| (2) | U/W Base Rent includes contractual rent steps through March 31, 2018 totaling $486,228, approximately $53,916 of straight-line rent attributable to NYS Licensing, an investment grade-rated tenant and $765,873 of signed but not occupied rent, related to NYC Rent Stabilization Association which entered into a new lease relocating to a portion of the 12th Floor which will commence in June 2017. |
| (3) | The underwritten economic vacancy is 9.2%. The 123 William Street Property is currently 92.2% physically occupied and 91.7% leased as of January 31, 2017 based on the NYC Rent Stabilization’s new lease. |
| (4) | The debt service coverage ratios and debt yields are based on the 123 William Street Whole Loan. |
Appraisal.As of the appraisal valuation date of February 1, 2017, the 123 William Street Property had an “as-is” appraised value of $290,000,000.
Environmental Matters. According to the Phase I environmental site assessment dated January 31, 2017, there are no recognized environmental conditions at the 123 William Street Property.
Market Overview and Competition.The 123 William Street Property is located in Downtown Manhattan market within the Insurance office submarket in New York City. The Downtown Manhattan market consists of approximately 88.0 million square feet of office inventory, 13.3 million square feet of which attributable to the Insurance office submarket. The Insurance office submarket is located on the eastern side of the Downtown market, south of City Hall and north of the Financial East submarket. The Insurance office submarket has an 8.7% overall vacancy rate as of the third quarter of 2016, with overall asking rents of approximately $55.86 per square foot gross, below the average asking rent for Midtown Manhattan of $79.91 per square foot gross. According to the Downtown Alliance, 624 firms have moved to Downtown Manhattan since 2005, 361 of which are in TAMI (technology, advertising, media and information). The 123 William Street Property is directly across from the Fulton Street subway station which provides access to the 2, 3, 4, 5, A, C and Z subway lines. The Fulton Street subway station connects to the larger Fulton Center complex, a $1.4 billion retail and transportation hub which opened in 2014. In addition, the 123 William Street Property is in proximity to the World Trade Center site, which upon completion will have a total of six office towers, a memorial, a 370,000 square foot retail concourse, a transportation hub and a performing arts center.
The appraisal identified six office buildings totaling approximately 4.0 million square feet that are considered to be directly competitive with the 123 William Street Property. The competitive set properties are located range in size from 355,364 square feet to 970,627 square feet with a weighted average occupancy rate of 96.3%.
THE INFORMATION IN THIS STRUCTURAL AND COLLATERAL TERM SHEET IS NOT COMPLETE AND MAY BE AMENDED PRIOR TO THE TIME OF SALE. THIS TERM SHEET IS NOT AN OFFER TO SELL THESE SECURITIES AND IT IS NOT A SOLICITATION OF AN OFFER TO BUY THESE SECURITIES IN ANY JURISDICTION WHERE THE OFFER OR SALE IS NOT PERMITTED.
| 36 |
| 123 WILLIAM STREET |
The following table presents certain information relating to comparable office leases for the 123 William Street Property:
Comparable Leases(1)
| Property Name/Location | Year Built/ Renovated | Number of Stories | Total GLA (SF) | Distance from Subject | Tenant Name | Lease Date/Term | Lease Area (SF) | Annual Base Rent PSF | Lease Type |
| 140 Broadway New York, NY | 1967/NAV | 51 | 1,141,266 | 0.3 miles | Sirius Insurance | Jan 2017 / 7.0 Yrs | 8,371 | $57.43 | Gross |
| 1 Liberty Plaza New York, NY | 1972/NAV | 54 | 2,126,437 | 0.3 miles | The Solomon R. Guggenheim Foundation | Sep 2016 / 15.0 Yrs | 45,558 | $53.25 | Gross |
| 55 Broadway New York, NY | 1983/NAV | 32 | 295,000 | 0.6 miles | Cohen Seglias Pallas Greenhall & Furman PC | Aug 2016 / 7.0 Yrs | 5,386 | $52.30 | Gross |
55 Broadway New York, NY | 1983/NAV | 32 | 295,000 | 0.6 miles | ZaZoom Media Group | May 2016 / 10.0 Yrs | 10,557 | $48.18 | Gross |
88 Pine Street New York, NY | 1971/NAV | 32 | 624,000 | 0.4 miles | AmWins Group | May 2016 / 10.0 Yrs | 21,760 | $44.61 | Gross |
| 180 Maiden Lane New York, NY | 1983/NAV | 41 | 982,089 | 0.3 miles | MidVentures | Jul 2016 / 10.0 Yrs | 20,768 | $46.13 | Gross |
100 Wall Street New York, NY | 1968/NAV | 29 | 457,622 | 0.4 miles | Siebert Brandford & Shank | May 2016 / 10.0 Yrs | 7,150 | $51.91 | Gross |
100 Wall Street New York, NY | 1968/NAV | 29 | 457,622 | 0.4 miles | Aflac | Apr 2016 / 10.0 Yrs | 12,352 | $50.11 | Gross |
| (1) | Information obtained from the appraisal. |
The Borrower.The borrower is ARC NYC123WILLIAM, LLC, a Delaware limited liability company and single purpose entity with two independent directors. Legal counsel to the borrower delivered a non-consolidation opinion in connection with the origination of the 123 William Street Whole Loan. New York City Operating Partnership, L.P. is the guarantor of certain nonrecourse carveouts under the 123 William Street Whole Loan.
The Borrower Sponsor. The borrower sponsor is American Realty Capital New York City REIT (“NYC REIT”). NYC REIT is a real estate investment trust formed in 2013 with a primary strategy of purchasing income producing commercial real estate in New York City. NYC REIT maintains a portfolio of six properties in Manhattan including 1140 Avenue of the Americas, 9 Times Square, 200 Riverside Boulevard, 400 E. 67th Street and 421 W. 54th Street. As of September 30, 2016 the portfolio maintains approximately 1.1 million square feet of net rentable area and a weighted average occupancy of 89.8%. NYC REIT is an affiliate of AR Global Investments, LLC (“AR Global”), the successor business to AR Capital, LLC, parent of American Realty Capital Properties, Inc. Certain principals and affiliates of AR Global as well as the previous external advisor and sponsor of NYC REIT are subject to litigation and governmental proceedings. See“Description of the Mortgage Pool—Litigation and Other Considerations”in the Preliminary Prospectus.
Escrows.The loan documents provide for an upfront escrow at closing in the amount of $4,819,755 for outstanding tenant TI/LCs and free rent consisting of (i) $1,510,269 for outstanding TI/LCs associated with two tenants, (ii) $1,309,486 for outstanding free rent related to four tenants and (iii) $2,000,000 allocable to the TI/LCs and free rent for DYCD or an approved replacement tenant or tenants. Additionally, the loan documents provide for an upfront escrow at closing in the amount of $20,000,000 for a reserve related to DYCD which will be released to the borrower (less the amount equal to the aggregate cost of TI/LCs and free rent under the DYCD lease in excess of $2,000,000) upon the execution of a lease with DYCD for the existing DYCD premises for an initial term of at least ten years with a net effective rent at least equal to the net effective rent under DYCD’s current license agreement. Additionally, the reserve related to DYCD will be released to the borrower proportional to the percentage of leased space (less the sum of (a) the amount equal to the aggregate cost of TI/LCs and free rent under the replacement tenant or tenant’s lease in excess of $2,000,000 and (b) the amount equal to the amount that the loan would have to be prepaid in order for the debt yield as calculated in accordance with the loan documents to be equal to or greater than 8.2%) upon the execution and occupancy of one or more approved replacement leases of not less than 10,000 square feet. The loan documents do not require ongoing monthly escrows for real estate taxes, TI/LCs or replacement reserves as long as no Trigger Period (as defined below) is in effect. The loan documents do not require ongoing monthly escrows for insurance premiums as long as (i) no Trigger Period is in effect and (ii) borrower provides the lender with evidence that the 123 William Street Property is insured via an acceptable blanket insurance policy and such policy is in full force and effect.
A “Trigger Period” will commence upon the earlier of (i) the occurrence and continuance of an event of default; and (ii) the debt service coverage ratio for the trailing 12-month period falling below 1.10x at the end of any calendar quarter. A Trigger Period will expire, with regard to clause (i), upon the cure of such event of default; and with regard to clause (ii), upon the debt service coverage ratio being equal to or greater than 1.12x for two consecutive calendar quarters.
THE INFORMATION IN THIS STRUCTURAL AND COLLATERAL TERM SHEET IS NOT COMPLETE AND MAY BE AMENDED PRIOR TO THE TIME OF SALE. THIS TERM SHEET IS NOT AN OFFER TO SELL THESE SECURITIES AND IT IS NOT A SOLICITATION OF AN OFFER TO BUY THESE SECURITIES IN ANY JURISDICTION WHERE THE OFFER OR SALE IS NOT PERMITTED.
| 37 |
| 123 WILLIAM STREET |
Lockbox and Cash Management. The 123 William Street Whole Loan requires a lender-controlled lockbox account, which is already in place, and that the borrower directs all tenants to pay their rents directly to such lockbox account. The loan documents also require that all rents received by the borrower or the property manager be deposited into the lockbox account. Prior to the occurrence of a Trigger Period, all excess funds are distributed to the borrower. During a Trigger Period, all excess cash flow is required to be swept to an excess cash flow fund.
Property Management. The 123 William Street Property is managed by Talpiot Management, LLC, d/b/a East End Realty.
Assumption.The borrower has the right to transfer the 123 William Street Property provided that certain conditions are satisfied, including (i) no event of default has occurred and is continuing; (ii) the lender has reasonably determined that the proposed transferee and guarantor satisfy the lender’s credit review and underwriting standards, taking into consideration transferee experience, financial strength and general business standing; and (iii) the lender has received confirmation from DBRS, Fitch and Moody’s that such assumption will not result in a downgrade, withdrawal or qualification of the respective ratings assigned to the Series 2017-RB1 certificates.
Partial Release. None permitted.
Real Estate Substitution.Not permitted.
Subordinate and Mezzanine Indebtedness.None.
Ground Lease.None.
Windstorm Insurance.The loan documents require windstorm insurance covering the full replacement cost of the 123 William Street Property during the loan term. At origination, the 123 William Street Property had windstorm insurance coverage.
Terrorism Insurance.The loan documents require that the “all risk” insurance policy required to be maintained by the borrower provide coverage for terrorism in an amount equal to the full replacement cost of the 123 William Street Property, as well as loss of rents and/or business interruption insurance for a period beginning on the date of casualty and continuing until the restoration of the 123 William Street Property is completed or the expiration of 18 months, whichever first occurs as well as an extended period of indemnity covering the 12 months following restoration. If TRIPRA or a similar statute is no longer in effect, borrower shall only be obligated to carry terrorism insurance if commercially available and, in such event, subject to a cap equal to two times the premium for the property and business/rental interruption coverage.
THE INFORMATION IN THIS STRUCTURAL AND COLLATERAL TERM SHEET IS NOT COMPLETE AND MAY BE AMENDED PRIOR TO THE TIME OF SALE. THIS TERM SHEET IS NOT AN OFFER TO SELL THESE SECURITIES AND IT IS NOT A SOLICITATION OF AN OFFER TO BUY THESE SECURITIES IN ANY JURISDICTION WHERE THE OFFER OR SALE IS NOT PERMITTED.
| 38 |
(this page intentionally left blank)
THE INFORMATION IN THIS STRUCTURAL AND COLLATERAL TERM SHEET IS NOT COMPLETE AND MAY BE AMENDED PRIOR TO THE TIME OF SALE. THIS TERM SHEET IS NOT AN OFFER TO SELL THESE SECURITIES AND IT IS NOT A SOLICITATION OF AN OFFER TO BUY THESE SECURITIES IN ANY JURISDICTION WHERE THE OFFER OR SALE IS NOT PERMITTED.
| 39 |
| THE DAVENPORT |

THE INFORMATION IN THIS STRUCTURAL AND COLLATERAL TERM SHEET IS NOT COMPLETE AND MAY BE AMENDED PRIOR TO THE TIME OF SALE. THIS TERM SHEET IS NOT AN OFFER TO SELL THESE SECURITIES AND IT IS NOT A SOLICITATION OF AN OFFER TO BUY THESE SECURITIES IN ANY JURISDICTION WHERE THE OFFER OR SALE IS NOT PERMITTED.
| 40 |
| THE DAVENPORT |

THE INFORMATION IN THIS STRUCTURAL AND COLLATERAL TERM SHEET IS NOT COMPLETE AND MAY BE AMENDED PRIOR TO THE TIME OF SALE. THIS TERM SHEET IS NOT AN OFFER TO SELL THESE SECURITIES AND IT IS NOT A SOLICITATION OF AN OFFER TO BUY THESE SECURITIES IN ANY JURISDICTION WHERE THE OFFER OR SALE IS NOT PERMITTED.
| 41 |
| No. 2 - The Davenport | ||||||
| Loan Information | Property Information | |||||
| Mortgage Loan Seller: | Wells Fargo Bank, National Association | Single Asset/Portfolio: | Single Asset | |||
Credit Assessment (DBRS/Fitch/ Moody’s):
| NR/NR/NR | Property Type: | Office | |||
| Original Principal Balance(1): | $55,000,000 | Specific Property Type: | CBD | |||
| Cut-off Date Balance(1): | $55,000,000 | Location: | Cambridge, MA | |||
| % of Initial Pool Balance: | 8.6% | Size: | 230,864 SF | |||
| Loan Purpose: | Acquisition | Cut-off Date Balance Per SF(1): | $454.81 | |||
| Borrower Name: | Davenport Owner (DE) LLC | Year Built/Renovated: | 1888/2015 | |||
| Borrower Sponsors(2): | Various | Title Vesting: | Fee | |||
| Mortgage Rate: | 4.220% | Property Manager: | Self-managed | |||
| Note Date: | February 6, 2017 | 4thMost Recent Occupancy: | 100.0% (12/31/2013) | |||
| Anticipated Repayment Date: | NAP | 3rdMost Recent Occupancy: | 100.0% (12/31/2014) | |||
| Maturity Date: | February 11, 2027 | 2ndMost Recent Occupancy(4): | 71.5% (12/31/2015) | |||
| IO Period: | 120 months | Most Recent Occupancy (As of): | 100.0% (12/31/2016) | |||
| Loan Term (Original): | 120 months | Current Occupancy (As of)(4): | 93.2% (1/31/2017) | |||
| Seasoning: | 1 month | |||||
| Amortization Term (Original): | NAP | Underwriting and Financial Information: | ||||
| Loan Amortization Type: | Interest-only, Balloon | |||||
| Interest Accrual Method: | Actual/360 | 4thMost Recent NOI(5): | NAV | |||
| Call Protection: | L(25),D(90),O(5) | 3rdMost Recent NOI(5): | NAV | |||
| Lockbox Type: | Hard/Springing Cash Management | 2ndMost Recent NOI(5): | $6,085,945 (12/31/2015) | |||
| Additional Debt(1): | Yes | Most Recent NOI (As of)(5): | $5,850,147 (Annualized 11 11/30/2016) | |||
| Additional Debt Type(1): | Pari Passu; Future Mezzanine | |||||
| U/W Revenues: | $13,321,827 | |||||
| Escrows and Reserves(3): | U/W Expenses: | $4,276,442 | ||||
| U/W NOI(5): | $9,045,386 | |||||
| Type: | Initial | Monthly | Cap (If Any) | U/W NCF: | $8,368,772 | |
| Taxes | $0 | Springing | NAP | U/W NOI DSCR(1): | 2.01x | |
| Insurance | $0 | Springing | NAP | U/W NCF DSCR(1): | 1.86x | |
| Replacement Reserves | $0 | Springing | NAP | U/W NOI Debt Yield(1): | 8.6% | |
| Deferred Maintenance | $5,225 | $0 | NAP | U/W NCF Debt Yield(1): | 8.0% | |
| TI/LC Reserve | $0 | Springing | (3) | As-Stabilized Appraised Value(6): | $214,000,000 | |
| Rent Abatement Reserve | $2,030,190 | $78,177 | $938,123 | As-Stabilized Appraisal Valuation Date(6): | November 1, 2018 | |
| HubSpot TI/LC Reserve | $7,938,810 | $181,108 | $2,173,299 | Cut-off Date LTV Ratio(1): | 49.1% | |
| HubSpot Basement Reserve | $94,633 | $94,633 | $1,135,600 | LTV Ratio at Maturity(1): | 49.1% | |
| (1) | See “The Mortgage Loan” section. All statistical financial information related to balance per square foot, loan-to-value ratios, debt service coverage ratios and debt yields are based on the funded outstanding principal balance of The Davenport Whole Loan (as defined below) as of the Cut-off Date. |
| (2) | See “Borrower Sponsors” section. |
| (3) | See “Escrows” section. |
| (4) | See “Historical Occupancy” section. |
| (5) | See “Cash Flow Analysis” section. |
| (6) | See “Appraisal” section. The Davenport Property (as defined below) has an “As-is” Appraised Value of $204,000,000, resulting in an As-is Cut-off Date LTV Ratio and LTV Ratio at Maturity of 51.5%. |
The Mortgage Loan. The mortgage loan (“The Davenport Mortgage Loan”) is part of a whole loan (the “The Davenport Whole Loan”) that is evidenced by twopari passu promissory notes (Note A-1 and Note A-2) secured by a first mortgage encumbering a class A office property located in Cambridge, Massachusetts (“The Davenport Property”). The Davenport Whole Loan was originated on February 6, 2017 by Wells Fargo Bank, National Association. The Davenport Whole Loan had an original principal balance of $105,000,000, has an outstanding principal balance as of the Cut-off Date of $105,000,000 and accrues interest at an interest rate of 4.220%per annum. The Davenport Whole Loan had an initial term of 120 months, has a remaining term of 119 months as of the Cut-off Date and requires interest-only payments. The Davenport Whole Loan matures on February 11, 2027.
Note A-1, which will be contributed to the WFCM 2017-RB1 Trust, had an original principal balance of $55,000,000, has an outstanding principal balance as of the Cut-off Date of $55,000,000 and represents the controlling interest in The Davenport Whole Loan. The non-controlling Note A-2, which had an original principal balance of $50,000,000, is expected to be contributed to a future securitization trust or trusts. The lender provides no assurances that any non-securitizedpari passu note will not be split further. See “Description of the Mortgage Pool—The Whole Loans—The Serviced Whole Loans—The Davenport Whole Loan” in the Preliminary Prospectus.
THE INFORMATION IN THIS STRUCTURAL AND COLLATERAL TERM SHEET IS NOT COMPLETE AND MAY BE AMENDED PRIOR TO THE TIME OF SALE. THIS TERM SHEET IS NOT AN OFFER TO SELL THESE SECURITIES AND IT IS NOT A SOLICITATION OF AN OFFER TO BUY THESE SECURITIES IN ANY JURISDICTION WHERE THE OFFER OR SALE IS NOT PERMITTED.
| 42 |
| THE DAVENPORT |
Note Summary(1)
| Notes | Original Balance | Note Holder | Controlling Interest | |
| A-1 | $55,000,000 | WFCM 2017-RB1 | Yes | |
| A-2 | $50,000,000 | Wells Fargo Bank, National Association | No | |
| Total | $105,000,000 |
| (1) | The lender provides no assurances that any non-securitizedpari passu note will not be split further. |
Following the lockout period, the borrower has the right to defease The Davenport Whole Loan in whole, but not in part, on any date before October 11, 2026. In addition, The Davenport Whole Loan is prepayable without penalty on or after October 11, 2026. The lockout period will expire on the earlier to occur of (i) two years after the closing date of the securitization that includes the last note to be securitized and (ii) March 11, 2019.
Sources and Uses
| Sources | Uses | |||||||||
| Original whole loan amount | $105,000,000 | 49.0 | % | Purchase price | $202,500,000 | 94.5 | % | |||
| Borrower Sponsor’s new cash contribution | 109,393,255 | 51.0 | Reserves | 10,068,858 | 4.7 | |||||
| Closing costs | 1,824,397 | 0.9 | ||||||||
| Total Sources | $214,393,255 | 100.0 | % | Total Uses | $214,393,255 | 100.0 | % |
The Property.The Davenport Property is a four story, class A office building totaling 230,864 square feet and located in Cambridge, Massachusetts, approximately 1.4 miles northwest of the Boston central business district. Built in 1888 and renovated in 2015, The Davenport Property is situated on a full 1.6-acre city block. The previous owners invested approximately $26.7 million into The Davenport Property including $11.0 million of capital expenditures, $7.8 million in prior tenant improvement and leasing commissions (“TI/LC”), and $7.9 million in current TI/LCs, which have been reserved upfront. The capital expenditures include a completely redesigned and upgraded lobby, elevator modernization and cab upgrade, roof replacement and repairs, façade improvements, and building system upgrades to the HVAC and fire alarm. The Davenport Property also has Wired Certified Gold internet infrastructure and connectivity and features many amenities for the younger, tech-oriented workforce including nap rooms, common areas for collaborative work and an employee cafeteria and conference center.
The Davenport Property serves as the global headquarters of HubSpot, a provider of cloud-based marketing and sales software for small and mid-size businesses. HubSpot uses integrated applications, such as social media, search engine optimization, blogging, website content management, marketing automation, email, and analytics and reporting, which enable businesses to attract visitors to their websites, convert visitors into leads, and close leads into customers. HubSpot’s products allow its customers to easily execute, manage and analyze sophisticated email marketing campaigns. According to a third party industry research report, HubSpot is a leader in the marketing automation industry and controls approximately 50% of global market share and approximately 29% of U.S. market share. HubSpot has over 23,000 customers in more than 90 countries and strong customer relationships as evidenced by its monthly subscription retention rate of over 90%. HubSpot is a publicly traded company on the New York Stock Exchange (HUBS) and had a market capitalization of $2.2 billion as of March 1, 2017.
HubSpot has been in occupancy since 2010 and has gradually expanded within The Davenport Property. In 2015, in order to facilitate its rapid growth, HubSpot executed a long-term lease renewal through October 2027 for its 118,561 square feet of space and added 66,887 square feet of expansion space. HubSpot currently occupies 185,448 square feet (80.3% of net rentable area). Further, HubSpot’s lease has contractual phased-in expansions to lease 100% of the net rentable area at The Davenport Property by May 2018. The first expansion will commence on January 1, 2018 and encompass 18,674 square feet (8.1% of net rentable area), and the second expansion will occur on May 1, 2018 where HubSpot will take over 11,064 square feet (4.8% of net rentable area). After the second expansion, HubSpot is contractually obligated to lease the 15,678 square feet (6.8% of net rentable area) of basement space. These three spaces are collectively referred to as the “Put Premises” (see “Major Tenants” section). On December 1, 2020, HubSpot’s below market rent on its original 118,561 square feet of space will be re-set to $57.00 per square foot, triple net, bringing its rent in-line with the expansion spaces. The Davenport Property will benefit from the December 2020 rent re-set, which will equate to an increase in effective gross income of approximately $4.7 million by year-end 2021.
The Davenport Property does not offer on-site parking but has a long-term 99-year parking agreement with the City of Cambridge, which was executed on November 18, 1985, to lease up to 250 parking spaces at the adjacent parking garage, resulting in a parking ratio of 1.1 spaces per 1,000 square feet of rentable area. HubSpot is contractually obligated to lease a minimum of 202 parking spaces. As of January 31, 2017, The Davenport Property was 93.2% occupied by three tenants (see ���Major Tenants” section).
THE INFORMATION IN THIS STRUCTURAL AND COLLATERAL TERM SHEET IS NOT COMPLETE AND MAY BE AMENDED PRIOR TO THE TIME OF SALE. THIS TERM SHEET IS NOT AN OFFER TO SELL THESE SECURITIES AND IT IS NOT A SOLICITATION OF AN OFFER TO BUY THESE SECURITIES IN ANY JURISDICTION WHERE THE OFFER OR SALE IS NOT PERMITTED.
| 43 |
| THE DAVENPORT |
The following table presents certain information relating to the tenancy at The Davenport Property:
Major Tenants
| Tenant Name | Credit Rating (Fitch/Moody’s/ S&P) | Tenant NRSF | % of NRSF | Annual U/W Base Rent PSF(1) | Annual U/W Base Rent(1) | % of Total Annual U/W Base Rent | Lease Expiration Date | |
| Major Tenants | ||||||||
| HubSpot(2)(3) | NR/NR/NR | 185,448 | 80.3% | $42.54 | $7,889,432 | 84.2% | 10/31/2027(7) | |
| Atlas Venture(4) | NR/NR/NR | 18,674 | 8.1% | $54.00 | $1,008,396 | 10.8% | 10/31/2017 | |
| Nature Publishing Group(5) | NR/NR/NR | 11,064 | 4.8% | $43.00 | $475,752 | 5.1% | 4/30/2018 | |
| Total Major Tenants | 215,186 | 93.2% | $43.56 | $9,373,580 | 100.0% | |||
| Non-Major Tenants | 0 | 0.0% | $0.00 | $0 | 0.0% | |||
| Occupied Collateral Total | 215,186 | 93.2% | $43.56 | $9,373,580 | 100.0% | |||
| Vacant Space(6) | 15,678 | 6.8% | ||||||
| Collateral Total | 230,864 | 100.0% | ||||||
| (1) | Annual U/W Base Rent PSF and Annual U/W Base Rent include contractual rent steps through March 2018 totaling $448,637. |
| (2) | HubSpot occupies eight office spaces totaling 185,448 square feet. The office spaces have Annual U/W Base Rent PSFs of $36.15 (four spaces totaling 112,930 square feet), $34.65 (one space totaling 5,631 square feet), and $54.00 (three spaces totaling 66,887 square feet). |
| (3) | HubSpot is receiving six months free rent through June 2017 on 15,910 square feet (6.9% of net rentable area) and eight months free rent through August 2017 on 42,834 square feet (18.6% of net rentable area). This free rent amount has been reserved upfront at closing. |
| (4) | “Put Premise A” and “Put Premise B” are currently occupied by Atlas Venture through October 31, 2017. HubSpot is contractually obligated to take possession of these spaces by January 1, 2018. Annual U/W Base Rent PSF of $54.00 is based on HubSpot’s contractual rent beginning on January 1, 2018. Atlas Venture currently leases Put Premise A for $35.78 per square foot and Put Premise B for $49.00 per square foot. |
| (5) | “Put Premise C” is currently occupied by Nature Publishing Group through April 30, 2018. HubSpot is contractually obligated to take possession of Put Premise C by May 1, 2018 at a rental rate of $55.00 per square foot. Annual U/W Base Rent PSF of $43.00 is based on Nature Publishing Group’s May 2017 contractual rent step. |
| (6) | Vacant Space is comprised of 5,678 square feet of basement office space and 10,000 square feet of basement storage space. Upon the commencement of Put Premise C, HubSpot is contractually obligated to lease the basement office space for $48.00 per square foot and the basement storage space for $15.00 per square foot. Both spaces were underwritten as vacant, but HubSpot will likely use this space for a tenant amenity. |
| (7) | HubSpot has two, 5-year lease renewal options. |
The following table presents certain information relating to the lease rollover schedule at The Davenport Property:
Lease Expiration Schedule(1)
| Year Ending December 31, | No. of Leases Expiring | Expiring NRSF | % of Total NRSF | Cumulative Expiring NRSF | Cumulative % of Total NRSF | Annual U/W Base Rent | % of Total Annual U/W Base Rent | Annual U/W Base Rent PSF(2) |
| MTM | 0 | 0 | 0.0% | 0 | 0.0% | $0 | 0.0% | $0.00 |
| 2017 | 2(3) | 18,674 | 8.1% | 18,674 | 8.1% | $1,008,396 | 10.8% | $54.00 |
| 2018 | 1(4) | 11,064 | 4.8% | 29,738 | 12.9% | $475,752 | 5.1% | $43.00 |
| 2019 | 0 | 0 | 0.0% | 29,738 | 12.9% | $0 | 0.0% | $0.00 |
| 2020 | 0 | 0 | 0.0% | 29,738 | 12.9% | $0 | 0.0% | $0.00 |
| 2021 | 0 | 0 | 0.0% | 29,738 | 12.9% | $0 | 0.0% | $0.00 |
| 2022 | 0 | 0 | 0.0% | 29,738 | 12.9% | $0 | 0.0% | $0.00 |
| 2023 | 0 | 0 | 0.0% | 29,738 | 12.9% | $0 | 0.0% | $0.00 |
| 2024 | 0 | 0 | 0.0% | 29,738 | 12.9% | $0 | 0.0% | $0.00 |
| 2025 | 0 | 0 | 0.0% | 29,738 | 12.9% | $0 | 0.0% | $0.00 |
| 2026 | 0 | 0 | 0.0% | 29,738 | 12.9% | $0 | 0.0% | $0.00 |
| 2027 | 8 | 185,448 | 80.3% | 215,186 | 93.2% | $7,889,432 | 84.2% | $42.54 |
| Thereafter | 0 | 0 | 0.0% | 215,186 | 93.2% | $0 | 0.0% | $0.00 |
| Vacant(5) | 0 | 15,678 | 6.8% | 230,864 | 100.0% | $0 | 0.0% | $0.00 |
| Total/Weighted Average | 11(6) | 230,864 | 100.0% | $9,373,580 | 100.0% | $43.56 |
| (1) | Information obtained from the underwritten rent roll. |
| (2) | Weighted Average Annual U/W Base Rent PSF excludes vacant space. |
| (3) | Put Premise A and Put Premise B are currently occupied by Atlas Venture through October 31, 2017. HubSpot is contractually obligated to take possession of these spaces by January 1, 2018. Annual U/W Base Rent PSF of $54.00 is based on HubSpot’s contractual rent beginning on January 1, 2018. Atlas Venture currently leases Put Premise A for $35.78 per square foot and Put Premise B for $49.00 per square foot. |
| (4) | Put Premise C is currently occupied by Nature Publishing Group through April 30, 2018. HubSpot is contractually obligated to take possession of Put Premise C by May 1, 2018 at a rental rate of $55.00 per square foot. |
| (5) | Vacant Space is comprised of 5,678 square feet of basement office space and 10,000 square feet of basement storage space. Upon the commencement of Put Premise C, HubSpot is contractually obligated to lease the basement office space for $48.00 per square foot and the basement storage space for $15.00 per square foot. |
| (6) | The Davenport Property is occupied by three tenants subject to 11 leases. |
THE INFORMATION IN THIS STRUCTURAL AND COLLATERAL TERM SHEET IS NOT COMPLETE AND MAY BE AMENDED PRIOR TO THE TIME OF SALE. THIS TERM SHEET IS NOT AN OFFER TO SELL THESE SECURITIES AND IT IS NOT A SOLICITATION OF AN OFFER TO BUY THESE SECURITIES IN ANY JURISDICTION WHERE THE OFFER OR SALE IS NOT PERMITTED.
| 44 |
| THE DAVENPORT |
The following table presents historical occupancy percentages at The Davenport Property:
Historical Occupancy
12/31/2013(1) | 12/31/2014(1) | 12/31/2015(1)(2) | 12/31/2016(1)(2) | 1/31/2017(3) | ||||
| 100.0% | 100.0% | 71.5% | 100.0% | 93.2% |
| (1) | Information obtained from the borrower. |
| (2) | HubSpot expanded into the space formerly occupied by Sonos and Zipcar, which vacated in 2015. |
| (3) | Information obtained from the underwritten rent roll. |
Operating History and Underwritten Net Cash Flow. The following table presents certain information relating to the historical operating performance and the underwritten net cash flow at The Davenport Property:
Cash Flow Analysis(1)
| 2015 | Annualized 11 11/30/2016 | U/W | % of U/W Effective Gross Income | U/W $ per SF | Year 4 12/31/2021(2) | |||||||
| Base Rent | $8,832,174 | $6,853,343 | $9,373,580(3) | 70.4% | $40.60 | $13,152,367 | ||||||
| Grossed Up Vacant Space | 0 | 0 | 422,544 | 3.2 | 1.83 | 0 | ||||||
| Total Reimbursables | 785,719 | 2,535,443 | 3,524,376 | 26.5 | 15.27 | 4,300,986 | ||||||
| Other Income | 778,407 | 476,360 | 491,134 | 3.7 | 2.13 | 557,924 | ||||||
| Less Vacancy & Credit Loss | 0 | 0 | (489,806) | (3.7) | (2.12) | 0 | ||||||
| Effective Gross Income | $10,396,300 | $9,865,147 | $13,321,827 | 100.0% | $57.70 | $18,011,277 | ||||||
| Total Operating Expenses | $4,310,355 | $4,014,999 | $4,276,442 | 32.1% | $18.52 | $4,975,245 | ||||||
| Net Operating Income | $6,085,945(4) | $5,850,147(4) | $9,045,386(4) | 67.9% | $39.18 | $13,036,032 | ||||||
| TI/LC | 0 | 0 | 630,441 | 4.7 | 2.73 | 0 | ||||||
| Capital Expenditures | 0 | 0 | 46,173 | 0.3 | 0.20 | 66,862 | ||||||
| Net Cash Flow | $6,085,945 | $5,850,147 | $8,368,772 | 62.8% | $36.25 | $12,969,170 | ||||||
| NOI DSCR(5) | 1.35x | 1.30x | 2.01x | 2.90x | ||||||||
| NCF DSCR(5) | 1.35x | 1.30x | 1.86x | 2.89x | ||||||||
| NOI DY(5) | 5.8% | 5.6% | 8.6% | 12.4% | ||||||||
| NCF DY(5) | 5.8% | 5.6% | 8.0% | 12.4% |
| (1) | Historical financials prior to 2015 are not available as The Davenport Property was acquired in February 2017 and the seller did not provide historical cash flows. |
| (2) | Year 4 12/31/2021 is based on the appraiser’s as-stabilized discounted cash flow analysis when HubSpot will be leasing 100.0% of The Davenport Property at $58.00 per square foot for the office space (see “Appraisal” section). |
| (3) | In addition to the HubSpot expansion spaces, Base Rent includes contractual rent steps through March 2018 totaling $448,637 (see “Major Tenants” section). |
| (4) | U/W Net Operating Income is greater than 2015 and Annualized 11 11/30/2016 due to HubSpot leasing the three expansion spaces, Put Premise A and Put Premise B. HubSpot had not yet commenced paying rent on those spaces. |
| (5) | The debt service coverage ratios and debt yields are based on The Davenport Whole Loan. |
Appraisal.As of the appraisal valuation date of January 19, 2017, The Davenport Property had an “as-is” appraised value of $204,000,000, which equates to an “as-is” Cut-off Date LTV Ratio of 51.5%. The appraiser also concluded to an “as-stabilized” value of $214,000,000 as of November 1, 2018, which equates to an “as-stabilized” Cut-off Date LTV Ratio of 49.1%. The appraiser also concluded to a dark value of $162,000,000, which equates to a loan to dark value of 64.8%.
Environmental Matters. According to a Phase I environmental site assessment dated January 18, 2017, there was no evidence of any recognized environmental conditions at The Davenport Property.
Market Overview and Competition.The Davenport Property is located in Cambridge, Massachusetts, approximately 1.4 miles northwest of the central business district of Boston one block from the MBTA Lechmere Green Line station and 3.4 miles west of Boston Logan International Airport. The Davenport Property is located within the East Cambridge neighborhood of the Kendall Square area of Boston, which is known for its concentration of life science, pharmaceutical, technology firms and its proximity to the Massachusetts Institute of Technology (“MIT”), which is located approximately 1.0 mile southwest of The Davenport Property. Additional businesses in the Kendall Square area include Google, Biogen Idec, Camp, Dresser, McKee, Whitehead Institute for Biomedical Research, Genzyme, Novartis, Vertex, and the John A. Volpe National Transportation Systems Center.
According to a third-party report, the Boston area is home to 35 colleges and universities, including Harvard and MIT and serves as a hub for life sciences research and technology companies. Cambridge is home to 14 innovative incubators and co-working spaces, including the Cambridge Innovation Center (“CIC”), which was founded in 1999 and has been home to over 3,500 companies. Companies originally founded at CIC have created over $3.9 billion in publicly disclosed exit value since 2001 and have raised approximately $2.7 billion in venture capital and strategic investment since 2001. Additionally, Cambridge-based companies raised approximately $1.0 billion in 21 venture capital placements in 2016. According to a third party market research report, the 2016 estimated population within a one-, three- and five- mile radius of The Davenport Property was 45,036, 455,360 and 977,515. The 2016 estimated average household income within the same radii was $117,803, $98,958 and $92,307.
THE INFORMATION IN THIS STRUCTURAL AND COLLATERAL TERM SHEET IS NOT COMPLETE AND MAY BE AMENDED PRIOR TO THE TIME OF SALE. THIS TERM SHEET IS NOT AN OFFER TO SELL THESE SECURITIES AND IT IS NOT A SOLICITATION OF AN OFFER TO BUY THESE SECURITIES IN ANY JURISDICTION WHERE THE OFFER OR SALE IS NOT PERMITTED.
| 45 |
| THE DAVENPORT |
According to a third party market research report, the most significant impact on commercial real estate, particularly in Boston, comes from shifting demographic preferences like access to collaborative space, live/work/play environments and proximity to urban amenities, which drive corporate site selection. Cambridge has benefited from this as rents continue to grow and availability remains limited. In addition, The Davenport Property is located within the East Cambridge/Kendall Square submarket of the Boston office market. As of the fourth quarter of 2016, the class A office submarket reported an inventory of 58 buildings totaling approximately 13.0 million square feet with a 2.9% vacancy rate, an asking rental rate of $78.01 per square foot, gross, and positive absorption of 120,373 square feet.
The appraiser concluded to market rents for The Davenport Property of $71.00 per square foot, gross, for office space on floors 1-4; $48.00 per square foot, gross, for basement office space; and $15.00 per square foot, gross, for storage space. Overall, the appraiser concluded that the in-place rents at The Davenport Property are below market levels, but are expected to increase to market levels by December 2020 due to HubSpot’s contractual rent increases of $1.00 per square foot per year.
The following table presents certain information relating to comparable office leases for The Davenport Property:
Comparable Leases(1)
| Property Name/Location | Year Built/ Renovated | Stories | Total GLA (SF) | Total Occupancy | Distance from Subject | Tenant Name | Lease Date/ Term | Lease Area (SF) | Annual Base Rent PSF | Lease Type |
55 Cambridge Pky Cambridge, MA | 1985/NAP | 9 | 275,968 | 100% | 0.4 miles | Flagship Ventures | October 2016 / 12.0 Years | 20,623 | $73.00 | Gross |
| One Broadway Cambridge, MA | 1969/2000 | 16 | 312,000 | 100% | 0.7 miles | Facebook, Inc. | September 2016 / 5.0 Years | 18,768 | $79.00 | Modified Gross |
55 Cambridge Pky Cambridge, MA | 1985/NAP | 9 | 275,968 | 100% | 0.4 miles | CarGurus | September 2016 / 6.3 Years | 30,534 | $73.00 | Gross |
One Kendall Square Cambridge, MA | 1887/1985 | 3 | 19,821 | 100% | 0.9 miles | Toyota | July 2016 / 7.0 Years | 13,000 | $74.00 | Gross |
Canal Park Cambridge, MA | 1983/2015 | 4 | 101,457 | 100% | 180 feet | HubSpot | April 2016 / 6.8 Years | 8,562 | $69.00 | Modified Gross |
One Memorial Cambridge, MA | 1985/2007 | 17 | 352,905 | 100% | 0.8 miles | Microsoft | February 2016 / 10.5 Years | 156,000 | $67.50 | Net |
Riverfront Office Park Cambridge, MA | 1986/NAP | 14 | 305,589 | 98.2% | 0.6 miles | MIT | June 2015 / 6.0 Years | 45,868 | $69.00 | Gross |
450 Kendall St Cambridge, MA | 2014/NAP | 5 | 64,000 | 100% | 0.6 miles | MPM Capital | January 2015 / 7.0 Years | 14,700 | $59.00 | Net |
| (1) | Information obtained from the appraisal and underwritten rent roll. |
The Borrower.The borrower is Davenport Owner (DE) LLC, a Delaware limited liability company and single purpose entity with one independent director. Legal counsel to the borrower delivered a non-consolidation opinion in connection with the origination of The Davenport Whole Loan.
The Borrower Sponsors.The borrower sponsors are OPG Investment Holdings US Inc. (“OPG”) and Alony-Hetz Properties & Investments Ltd. (“Alony Hetz”). Alony-Hetz was established in 1989 and is one of Israel’s largest real estate investment holding companies, with assets in Israeli and overseas. Alony-Hetz primarily focuses on real estate with long-term leases and quality tenant rosters. OPG, also known as Oxford Properties Group, is the real estate arm of the Ontario Municipal Employees Retirement System (“OMERS”). OMERS is one of Canada’s largest pension funds with net assets of $85.2 billion as of year-end 2016, representing an $8.1 billion increase over 2015. OPG is a global platform for real estate investment, development and management with over 2,000 employees and over $40 billion of real assets under management, including seven office properties in Boston totaling more than 4.0 million square feet.
Escrows.The loan documents provide for an upfront escrow at closing in the amount of $5,225 for deferred maintenance, $2,030,190 for rent abatements (excluding the Put Premises), $7,938,810 for TI/LC obligations related to HubSpot, and $94,633 for HubSpot’s basement reserve.
The loan documents provide for ongoing monthly escrows of $78,177 for rent abatements related to the Put Premises (subject to a cap of $938,123), $181,108 for HubSpot TI/LCs (subject to a cap of $2,173,299), and $94,633 for HubSpot’s basement reserve (subject to a cap of $1,135,600). The loan documents do not require ongoing monthly escrows for taxes, replacements reserves, and TI/LCs as long as no Cash Trap Event Period (as defined below) has occurred and is continuing, or with regard to insurance premiums, as long as (i) no Cash Trap Event Period (as defined below) has occurred and is continuing, (ii) borrower provides the lender with evidence that The Davenport Property is insured via an acceptable blanket insurance policy and such policy is in full force and effect and (iii) borrower provides the lender with evidence of renewal of the insurance policies and timely proof of payment of insurance premiums. During a Cash Trap Event Period, TI/LC reserves will be capped at $25.00 multiplied by the net rentable area of The Davenport Property.
THE INFORMATION IN THIS STRUCTURAL AND COLLATERAL TERM SHEET IS NOT COMPLETE AND MAY BE AMENDED PRIOR TO THE TIME OF SALE. THIS TERM SHEET IS NOT AN OFFER TO SELL THESE SECURITIES AND IT IS NOT A SOLICITATION OF AN OFFER TO BUY THESE SECURITIES IN ANY JURISDICTION WHERE THE OFFER OR SALE IS NOT PERMITTED.
| 46 |
| THE DAVENPORT |
Lockbox and Cash Management.The Davenport Whole Loan requires a lender-controlled lockbox account, which is already in place, and that the borrower direct tenants to pay all rents directly into such lockbox account. The loan documents also require that all rents received by the borrower or the property manager be deposited into the lockbox account within one business day of receipt. Prior to the occurrence of a Cash Trap Event Period (as defined below), all excess cash flow is required to be distributed to the borrower. During a Cash Trap Event Period, all rents are required to be swept to a lender-controlled cash management account and excess cash flow is held by lender as additional collateral unless the Cash Trap Event Period is triggered by clause (iii) in the paragraph below, in which event all excess funds will be swept to a subaccount for the payment of potential re-leasing expenses related to the HubSpot space (the “HubSpot Reserve Subaccount”).
A “Cash Trap Event Period” will commence upon the earlier of (i) the occurrence and continuance of an event of default; (ii) the debt service coverage ratio falling below 1.25x for two consecutive quarters; or (iii) the occurrence of a HubSpot Trigger Event (as defined below).
A Cash Trap Event Period will end, with respect to clause (i), upon the cure of such event of default; with respect to clause (ii), upon the debt service coverage ratio being equal to or greater than 1.25x for two consecutive calendar quarters; and with respect to clause (iii), upon the earlier of (a) the date on which the aggregate amount of funds deposited in the HubSpot Reserve Subaccount equals or exceeds the applicable HubSpot Reserve Cap (as defined below); (b) HubSpot’s space is at least 90% occupied by HubSpot and/or one or more satisfactory replacement tenants paying full unabated rent in an amount not less than HubSpot’s weighted average contractual rental rate, and all TI/LCs provided have been paid and accepted; (c) the borrower executes new leases with one or more tenants resulting in The Davenport Property achieving a net cash flow debt yield of 7.2% or more, and all TI/LCs provided have been paid and accepted; or (d) HubSpot is no longer insolvent or subject to any bankruptcy or insolvency proceedings and has affirmed its lease pursuant to final, non-appealable order of a court of competent jurisdiction.
A “HubSpot Trigger Event” will occur upon the earlier of HubSpot (1) failing to renew its lease on or prior to March 1, 2026; (2) failing to occupy at least 67% of its space; or (3) entering into or being subject to bankruptcy or similar insolvency proceedings.
The “HubSpot Reserve Cap” is an amount equal to the product of (a) the net rentable square footage of the HubSpot space and (b) $50.00. With regard to a HubSpot Trigger Event triggered by clause (2) above, the HubSpot Reserve Cap will be reduced proportionately if (I) any of the HubSpot space is re-leased; (II) all tenant obligations have been paid with respect to such re-leased space; and (III) the replacement tenant has unconditionally accepted possession of such re-leased space (“Proportionate HubSpot Reduction”). A Proportionate HubSpot Reduction does not apply to a HubSpot Trigger Event triggered by clauses (1) or (3) above.
Property Management. The Davenport Property is managed by an affiliate of the borrower.
Assumption.The borrower has the two-time right to transfer The Davenport Property provided that certain conditions are satisfied, including (i) no event of default has occurred and is continuing; (ii) the lender reasonably determines that the proposed transferee and guarantor satisfy the lender’s credit review and underwriting standards, taking into consideration the transferee’s experience, financial strength and general business standing; and (iii) if requested by lender, rating agency confirmation that the sale and assumption will not result in a downgrade, withdrawal or qualification of the respective ratings assigned to the Series 2017-RB1 certificates and similar confirmations from each rating agency rating any securities backed by The Davenport Companion Loan with respect to the ratings of such securities.
Partial Release. Not permitted.
Real Estate Substitution.Not permitted.
Subordinate and Mezzanine Indebtedness.Provided no event of default has occurred and is continuing and upon written notice provided to the lender, the borrower is permitted to incur future mezzanine indebtedness, provided that (a) the mezzanine lender enters into an intercreditor agreement acceptable to the rating agencies and reasonably acceptable to the lender; (b) the mezzanine loan will have a term that is at least co-terminus with The Davenport Whole Loan; (c) the combined loan-to-value ratio will not be greater than 51.5%; (d) the debt service coverage ratio of The Davenport Whole Loan and the mezzanine loan will not be less than 1.82x; (e) a rating agency confirmation from DBRS, Fitch, and Moody’s that the future mezzanine indebtedness will not result in a downgrade, withdrawal or qualification of the respective ratings assigned to the Series 2017-RB1 Certificates or similar ratings confirmations from each rating agency rating any securities backed by The Davenport Companion Loan with respect to the ratings of such securities; and (f) any other requirements as stated under the loan documents are met.
Ground Lease. None.
Terrorism Insurance.The loan documents require that the “all risk” insurance policy required to be maintained by the borrower provide coverage for terrorism in an amount equal to the full replacement cost of The Davenport Property (provided the borrower is not required to pay terrorism insurance premiums in excess of two times the premium for all risk and business interruption insurance coverage on a stand-alone basis if the Terrorism Risk Insurance Program Authorization Act is no longer in effect), as well as business interruption insurance covering no less than an amount equal to 100% of the projected gross income from The Davenport Property on an actual loss sustained basis for a period beginning on the date of business interruption and continuing until the restoration of The Davenport Property is completed, or the 18-month period following the occurrence of a casualty event, together with a six-month extended period of indemnity.
Windstorm and Flood Insurance. The loan documents require windstorm and flood insurance covering the full replacement cost of The Davenport Property during the loan term. At the time of loan closing, The Davenport Property had windstorm insurance coverage and flood insurance in the maximum limit available under the National Flood Insurance Program together with excess coverage.
THE INFORMATION IN THIS STRUCTURAL AND COLLATERAL TERM SHEET IS NOT COMPLETE AND MAY BE AMENDED PRIOR TO THE TIME OF SALE. THIS TERM SHEET IS NOT AN OFFER TO SELL THESE SECURITIES AND IT IS NOT A SOLICITATION OF AN OFFER TO BUY THESE SECURITIES IN ANY JURISDICTION WHERE THE OFFER OR SALE IS NOT PERMITTED.
| 47 |
| CENTER WEST |
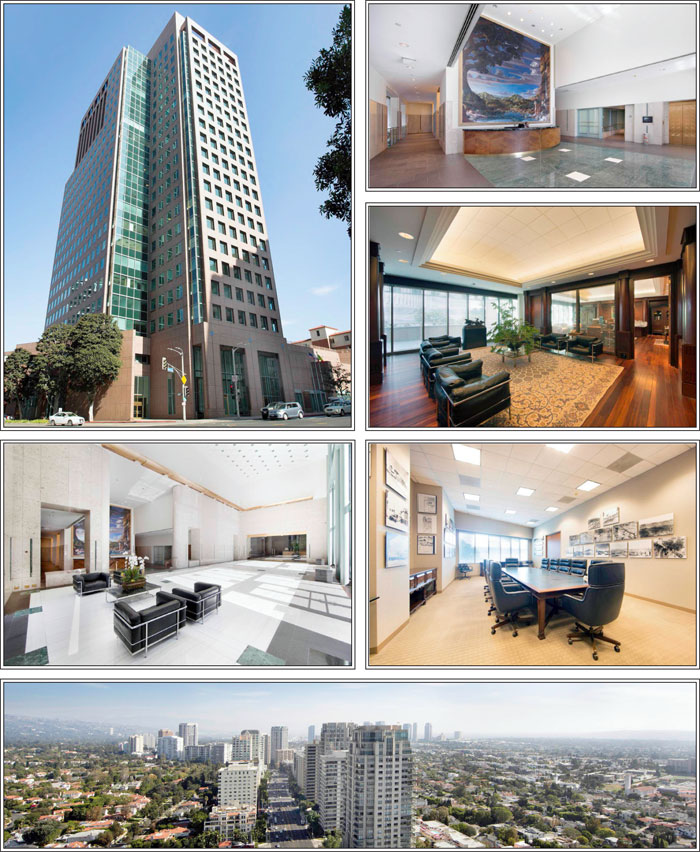
THE INFORMATION IN THIS STRUCTURAL AND COLLATERAL TERM SHEET IS NOT COMPLETE AND MAY BE AMENDED PRIOR TO THE TIME OF SALE. THIS TERM SHEET IS NOT AN OFFER TO SELL THESE SECURITIES AND IT IS NOT A SOLICITATION OF AN OFFER TO BUY THESE SECURITIES IN ANY JURISDICTION WHERE THE OFFER OR SALE IS NOT PERMITTED.
| 48 |
| CENTER WEST |
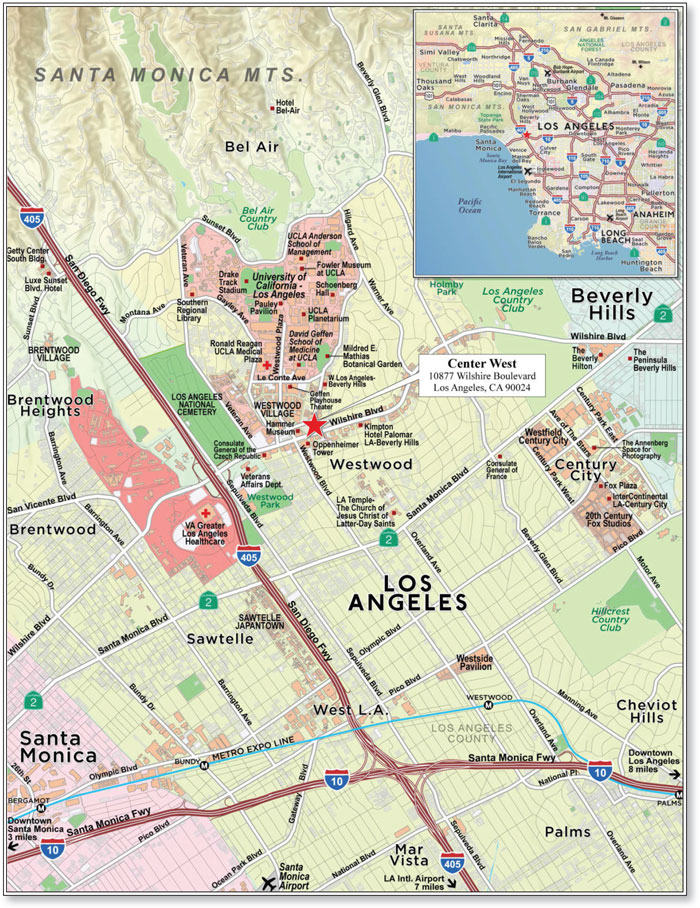
THE INFORMATION IN THIS STRUCTURAL AND COLLATERAL TERM SHEET IS NOT COMPLETE AND MAY BE AMENDED PRIOR TO THE TIME OF SALE. THIS TERM SHEET IS NOT AN OFFER TO SELL THESE SECURITIES AND IT IS NOT A SOLICITATION OF AN OFFER TO BUY THESE SECURITIES IN ANY JURISDICTION WHERE THE OFFER OR SALE IS NOT PERMITTED.
| 49 |
| No. 3 – Center West | |||||||
| Loan Information | Property Information | ||||||
| Mortgage Loan Seller: | UBS AG | Single Asset/Portfolio: | Single Asset | ||||
| Credit Assessment (DBRS/Fitch/Moody’s): | NR/NR/NR | Property Type: | Office | ||||
| Original Principal Balance(1): | $40,000,000 | Specific Property Type: | CBD | ||||
| Cut-off Date Balance(1): | $40,000,000 | Location: | Los Angeles, CA | ||||
| % of Initial Pool Balance: | 6.3% | Size: | 349,298 SF | ||||
| Loan Purpose: | Refinance | Cut-off Date Balance Per SF(1): | $229.03 | ||||
| Borrower Name: | Center West | Year Built/Renovated: | 1985/NAP | ||||
| Borrower Sponsor: | Kambiz Hekmat | Title Vesting: | Leasehold | ||||
| Mortgage Rate: | 4.4350% | Property Manager: | Self-managed | ||||
| Note Date: | December 6, 2016 | 4thMost Recent Occupancy(4): | NAV | ||||
| Anticipated Repayment Date: | NAP | 3rdMost Recent Occupancy (As of)(4): | 66.2% (12/31/2013) | ||||
| Maturity Date: | December 6, 2026 | 2ndMost Recent Occupancy (As of)(4): | 55.4% (12/31/2014) | ||||
| IO Period: | 120 months | Most Recent Occupancy (As of)(4): | 53.8% (12/31/2015) | ||||
| Loan Term (Original): | 120 months | Current Occupancy (As of)(4): | 57.1% (11/2/2016) | ||||
| Seasoning: | 3 months | ||||||
| Amortization Term (Original): | NAP | Underwriting and Financial Information: | |||||
| Loan Amortization Type: | Interest-only, Balloon | ||||||
| Interest Accrual Method: | Actual/360 | 4thMost Recent NOI (As of): | $7,071,123 (12/31/2013) | ||||
| Call Protection(2): | L(24),GRTR 2%orYM(92),O(4) | 3rdMost Recent NOI (As of): | $7,429,652 (12/31/2014) | ||||
| Lockbox Type: | Springing | 2ndMost Recent NOI (As of): | $6,675,068 (12/31/2015) | ||||
| Additional Debt(1): | Yes | Most Recent NOI (As of): | $7,164,676 (TTM 8/31/2016) | ||||
| Additional Debt Type(1): | Pari Passu | ||||||
| U/W Revenues: | $13,841,932 | ||||||
| U/W Expenses: | $6,099,920 | ||||||
| U/W NOI(5): | $7,742,012 | ||||||
| Escrows and Reserves(3): | U/W NCF(5): | $6,990,633 | |||||
| U/W NOI DSCR(1)(5): | 2.15x | ||||||
| Type: | Initial | Monthly | Cap (If Any) | U/W NCF DSCR(1)(5): | 1.94x | ||
| Taxes | $0 | Springing | NAP | U/W NOI Debt Yield(1)(5): | 9.7% | ||
| Insurance | $0 | Springing | NAP | U/W NCF Debt Yield(1)(5): | 8.7% | ||
| Replacement Reserves | $0 | Springing | NAP | As-Is Appraised Value(1)(6): | $209,000,000 | ||
| TI/LC Reserve | $0 | Springing | NAP | As-Is Appraisal Valuation Date: | October 20, 2016 | ||
| Unfunded Obligations | $2,352,223 | $0 | NAP | Cut-off Date LTV Ratio(1)(6): | 38.3% | ||
| Ground Rent | $0 | Springing | NAP | LTV Ratio at Maturity(1)(6): | 38.3% | ||
| (1) | See “The Mortgage Loan” section. All statistical financial information related to balance per square foot, loan-to-value ratios, debt service coverage ratios and debt yields are based on the Center West Whole Loan. |
| (2) | See “Partial Prepayment” section. |
| (3) | See “Escrows” section. |
| (4) | See “Historical Occupancy” section. |
| (5) | Stabilized U/W NOI and Stabilized U/W NCF, assuming the underwritten rent roll is leased up to the third quarter 2016 Westwood Class A office submarket occupancy of 90.7% and vacant spaces are grossed up at the appraisal’s concluded market rents, would be $14.8 million and $13.6 million, respectively. Based on the Stabilized NOI and Stabilized U/W NCF, the U/W NOI Debt Yield and U/W NCF DSCR are 18.4% and 3.78x, respectively. |
| (6) | See “Appraisal” section. The appraisal concluded an “as-is” and “as stabilized” appraised value. The Cut-off Date LTV Ratio and LTV Ratio at Maturity is calculated based on the “as-is” value of $209.0 million as of October 20, 2016. The Cut-off Date LTV Ratio and LTV Ratio at Maturity, calculated based on the “as stabilized” appraised value of $256.0 million as of April 1, 2019, assuming a stabilized occupancy of 95.0%, is 31.3%. |
The Mortgage Loan.The mortgage loan (the “Center West Mortgage Loan”) is part of a whole loan (the “Center West Whole Loan”) that is evidenced by fourpari passu promissory notes (Note A-1, Note A-2, Note A-3 and Note A-4) secured by a first mortgage encumbering the borrower’s leasehold interest in a 23-story, 349,298 square feet Class A office building located in Los Angeles, California (the “Center West Property”). The Center West Whole Loan was originated on December 6, 2016 by UBS AG, by and through its branch office at 1285 Avenue of the Americas, New York, New York (“UBS AG, New York Branch”). The Center West Whole Loan had an original principal balance of $80,000,000, has an outstanding principal balance as of the Cut-off Date of $80,000,000 and accrues interest at an interest rate of 4.4350%per annum. The Center West Whole Loan had an initial term of 120 months, has a remaining term of 117 months as of the Cut-off Date and requires interest-only payments through the term of the Center West Whole Loan. The Center West Whole Loan matures on December 6, 2026.
The Center West Mortgage Loan, evidenced by the controlling Note A-2 and non-controlling Note A-3, had an aggregate original principal balance of $40,000,000, has an aggregate outstanding principal balance of $40,000,000 as of the Cut-Off Date and will be contributed to the WFCM 2017-RB1 Trust. The non-controlling Note A-1, with an original principal balance of $30,000,000, is currently held in the BBCMS 2017-C1 Trust. The non-controlling Note A-4, with an original principal balance of $10,000,000, is currently held by UBS AG, New York Branch and is expected to be contributed to one or more future trusts. Each of the mortgage loans evidenced by Note A-1 and Note A-4 are referred to herein as the “Center West Companion Loans”. The lender provides no
THE INFORMATION IN THIS STRUCTURAL AND COLLATERAL TERM SHEET IS NOT COMPLETE AND MAY BE AMENDED PRIOR TO THE TIME OF SALE. THIS TERM SHEET IS NOT AN OFFER TO SELL THESE SECURITIES AND IT IS NOT A SOLICITATION OF AN OFFER TO BUY THESE SECURITIES IN ANY JURISDICTION WHERE THE OFFER OR SALE IS NOT PERMITTED.
| 50 |
| CENTER WEST |
assurances that any non-securitizedpari-passu note will not be split further. See “Description of the Mortgage Pool—The Whole Loans—The Serviced Whole Loans—Center West Whole Loan” in the Preliminary Prospectus.
Note Summary
| Notes | Original Balance | Note Holder | Controlling Interest |
| A-1 | $30,000,000 | BBCMS 2017-C1 | No |
| A-2 | $25,000,000 | WFCM 2017-RB1 | Yes |
| A-3 | $15,000,000 | WFCM 2017-RB1 | No |
| A-4 | $10,000,000 | UBS AG, New York Branch | No |
| Total | $80,000,000 |
The borrower has the right to prepay the Center West Whole Loan in whole on any date after December 6, 2019, provided that the borrower pays the greater of a yield maintenance premium or prepayment premium equal to 2.0% of the principal amount being prepaid; provided however, the Center West Whole Loan is prepayable without penalty on or after September 6, 2026. Under certain circumstances, the borrower will be required to prepay the Center West Whole Loan in part. See “Partial Prepayment” section.
Sources and Uses
| Sources | Uses | |||||||
| Original whole loan amount | $80,000,000 | 85.8% | Loan payoff(1) | $90,419,400 | 97.0% | |||
| Borrower sponsor’s new cash contribution | 13,211,537 | 14.2 | Reserves | 2,352,223 | 2.5 | |||
| Closing costs | 439,914 | 0.5 | ||||||
| Total Sources | $93,211,537 | 100.0% | Total Uses | $93,211,537 | 100.0% |
| (1) | The Center West Property was previously securitized in the JPMCC 2007-LDPX transaction. |
The Property.The Center West Property is a 23-story, 349,298 square foot, Class A office building located situated in the central business district of Los Angeles, California. Constructed in 1985, the Center West Property is situated on a 1.3-acre site containing 773 parking spaces (2.2 spaces per 1,000 square feet) in a four-level subterranean parking garage as well as two above grade partial parking levels. Amenities at the Center West Property include ground floor retail and service tenants, a three-story main lobby with coffered ceilings, an atrium lobby with 40-foot ceilings with a café and landscaped dining area, single corridor configuration, with bay depths varying from 33 to 39 feet, on-site management office, 24-hour security, valet/self-parking service and on-site car wash service.
The Center West Property is located in the area of Los Angeles known as Westwood. Westwood provides for ease of access and availability of nearby amenities in one of Los Angeles’ major business centers, according to the appraisal. Westwood is bounded by Beverly Hills and Century City to the east, by Bel Air to the north, by Rancho Park to the south and by Brentwood to the west. Westwood is home to the University of California, Los Angeles (“UCLA”) and the Ronald Reagan UCLA Medical Center.
The borrower sponsor developed the Center West Property between 1985 and 1990 at an original cost basis of approximately $31.8 million. Since its development, the borrower sponsor has invested approximately $10.2 million ($29.32 per square foot) in capital improvements related to building improvements, tenant improvements, furniture, fixtures and equipment, and approximately $4.6 million ($13.05 per square foot) in soft costs for a total cost basis of approximately $46.6 million.
As of November 2, 2016, the Center West Property was 57.1% occupied by 31 local, regional and national tenants. The largest tenants include Merrill Lynch Pierce Fenner & Smith (“Merrill Lynch”) (6.6% of net rentable area; rated A/Baa1/BBB+ by Fitch/Moody’s/S&P), Aurora Capital Group (6.6% of net rentable area), Radar Pictures (4.8% of net rentable area) and Wells Fargo Advisors (4.8% of net rentable area; rated AA-/A2/A by Fitch/Moody’s/S&P).
THE INFORMATION IN THIS STRUCTURAL AND COLLATERAL TERM SHEET IS NOT COMPLETE AND MAY BE AMENDED PRIOR TO THE TIME OF SALE. THIS TERM SHEET IS NOT AN OFFER TO SELL THESE SECURITIES AND IT IS NOT A SOLICITATION OF AN OFFER TO BUY THESE SECURITIES IN ANY JURISDICTION WHERE THE OFFER OR SALE IS NOT PERMITTED.
| 51 |
| CENTER WEST |
The following table presents certain information relating to the tenancy at the Center West Property:
Major Tenant
| Tenant Name | Credit Rating (Fitch/Moody’s/ S&P)(1) | Tenant NRSF | % of NRSF | Annual U/W Base Rent PSF | Annual U/W Base Rent | % of Total Annual U/W Base Rent | Lease Expiration Date |
| Major Tenant | |||||||
| Aurora Capital Group | NR/NR/NR | 22,911 | 6.6% | $60.51 | $1,386,394 | 12.1% | 3/31/2021 |
| Merrill Lynch(2) | A/Baa1/BBB+ | 23,121 | 6.6% | $58.20 | $1,345,642 | 11.8% | 4/30/2022 |
| Radar Pictures | NR/NR/NR | 16,894 | 4.8% | $63.02 | $1,064,617 | 9.3% | 9/20/2020 |
| Rentech | NR/NR/NR | 16,567 | 4.7% | $57.29 | $949,101 | 8.3% | 6/14/2020 |
| Wells Fargo Advisors(3) | AA-/A2/A | 16,894 | 4.8% | $54.00 | $912,276 | 8.0% | 7/31/2024 |
| Total Major Tenant | 96,387 | 27.6% | $58.70 | $5,658,030 | 49.5% | ||
| Non-Major Tenants | 103,176 | 29.5% | $56.03 | $5,780,566 | 50.5% | ||
| Occupied Collateral Total | 199,563 | 57.1% | $57.32 | $11,438,597 | 100.0% | ||
| Vacant Space | 149,735 | 42.9% | |||||
| Collateral Total | 349,298 | 100.0% | |||||
| (1) | Certain ratings are those of the parent company whether or not the parent company guarantees the lease. |
| (2) | Merrill Lynch currently subleases 4,550 square feet to General Electric (NYSE: GE) with a lease expiration of April 29, 2017. General Electric has been in occupancy since February 2008 and has a current rental rate of $64.60 per square foot. Merrill Lynch recently executed a lease amendment extending its lease term for 60 months through April 2022. Merrill Lynch has the right to terminate its lease effective April 30, 2020 with a nine-month written notice and payment of a termination fee, estimated at $1,352,662, which is equal to the sum of unamortized tenant improvement allowance, excused rent, brokerage commissions paid by the landlord and six months of monthly basic rent for months 37 through 42, discounted at 8.0%. The underwritten cash flow is based on Merrill Lynch’s direct rent of $58.20 per square foot. |
| (3) | Wells Fargo Advisors has the one-time right to terminate its lease effective as of October 31, 2021 with 12 months’ written notice and payment of a termination fee, estimated at approximately $1,049,608, which is equal to the unamortized tenant improvement allowance, eight-month rent abatement, and the tenant’s broker commission and five months of the then applicable base rent, discounted at 8.0%. |
The following table presents certain information relating to the lease rollover schedule at the Center West Property:
Lease Expiration Schedule(1)(2)
| Year Ending December 31, | No. of Leases Expiring | Expiring NRSF | % of Total NRSF | Cumulative Expiring NRSF | Cumulative % of Total NRSF | Annual U/W Base Rent | Total % of Annual U/W Base Rent | Annual U/W Base Rent PSF(3) |
| MTM | 2 | 1,782 | 0.5% | 1,782 | 0.5% | $66,132 | 0.6% | $37.11 |
| 2017 | 5 | 34,247 | 9.8% | 36,029 | 10.3% | $2,058,104 | 18.0% | $60.10 |
| 2018 | 1 | 12,261 | 3.5% | 48,290 | 13.8% | $616,521 | 5.4% | $50.28 |
| 2019 | 1 | 1,185 | 0.3% | 49,475 | 14.2% | $62,154 | 0.5% | $52.45 |
| 2020 | 11 | 63,071 | 18.1% | 112,546 | 32.2% | $3,628,538 | 31.7% | $57.53 |
| 2021 | 6 | 38,196 | 10.9% | 150,742 | 43.2% | $2,253,621 | 19.7% | $59.00 |
| 2022 | 2 | 26,660 | 7.6% | 177,402 | 50.8% | $1,543,431 | 13.5% | $57.89 |
| 2023 | 0 | 0 | 0.0% | 177,402 | 50.8% | $0 | 0.0% | $0.00 |
| 2024 | 3 | 22,161 | 6.3% | 199,563 | 57.1% | $1,210,096 | 10.6% | $54.60 |
| 2025 | 0 | 0 | 0.0% | 199,563 | 57.1% | $0 | 0.0% | $0.00 |
| 2026 | 0 | 0 | 0.0% | 199,563 | 57.1% | $0 | 0.0% | $0.00 |
| 2027 | 0 | 0 | 0.0% | 199,563 | 57.1% | $0 | 0.0% | $0.00 |
| Thereafter | 0 | 0 | 0.0% | 199,563 | 57.1% | $0 | 0.0% | $0.00 |
| Vacant | 0 | 149,735 | 42.9% | 349,298 | 100.0% | $0 | 0.0% | $0.00 |
| Total/Weighted Average | 31 | 349,298 | 100.0% | $11,438,597 | 100.0% | $57.32 |
| (1) | Certain tenants may have lease termination options that are exercisable prior to the originally stated expiration date of the subject lease and that are not considered in the Lease Expiration Schedule. |
| (2) | Information obtained from the underwritten rent roll. |
| (3) | Weighted Average Annual U/W Base Rent PSF excludes vacant space. |
THE INFORMATION IN THIS STRUCTURAL AND COLLATERAL TERM SHEET IS NOT COMPLETE AND MAY BE AMENDED PRIOR TO THE TIME OF SALE. THIS TERM SHEET IS NOT AN OFFER TO SELL THESE SECURITIES AND IT IS NOT A SOLICITATION OF AN OFFER TO BUY THESE SECURITIES IN ANY JURISDICTION WHERE THE OFFER OR SALE IS NOT PERMITTED.
| 52 |
| CENTER WEST |
The following table presents historical occupancy percentages at the Center West Property:
Historical Occupancy(1)
12/31/2013(2) | 12/31/2014(2) | 12/31/2015(2) | 11/2/2016(3) |
| 66.2% | 55.4% | 53.8% | 57.1% |
| (1) | The Center West Property is 57.1% leased as of November 2, 2016 and occupancy has fluctuated between 53.8% and 78.6% since 2008. The low occupancy is due in part to the borrower sponsor’s selectivity and preference for leasing to only the highest quality tenants. |
| (2) | Information obtained from the borrower. |
| (3) | Information obtained from the underwritten rent roll. |
Operating History and Underwritten Net Cash Flow. The following table presents certain information relating to the underwritten net cash flow at the Center West Property:
Cash Flow Analysis
| 2013 | 2014 | 2015 | TTM 8/31/2016 | Stabilized U/W(1) | U/W | % of U/W Effective Gross Income(2) | U/W $ per SF(2) | |||||||||
| Base Rent(3)(4) | $12,359,287 | $10,303,944 | $9,849,792 | $10,906,561 | $20,455,112 | $11,438,597 | 82.6% | $32.75 | ||||||||
| Grossed Up Vacant Space | 0 | 0 | 0 | 0 | 0 | 9,016,515 | 65.1 | 25.81 | ||||||||
| Total Reimbursables | 95,639 | 250,150 | 328,174 | 284,371 | 421,559 | 265,543 | 1.9 | 0.76 | ||||||||
| Other Income(5) | 2,720,583 | 2,436,874 | 2,147,856 | 2,137,792 | 3,080,551 | 2,137,792 | 15.4 | 6.12 | ||||||||
| Less Vacancy & Credit Loss(6) | (1,360,874) | (25,044) | (172,396) | (251,792) | (1,941,530) | (9,016,515) | (65.1) | (25.81) | ||||||||
| Effective Gross Income | $13,814,635 | $12,965,924 | $12,153,426 | $13,076,932 | $22,015,691 | $13,841,932 | 100.0% | $39.63 | ||||||||
| Total Operating Expenses(7) | $6,743,512 | $5,536,272 | $5,478,358 | $5,912,256 | $7,259,275 | $6,099,920 | 44.1% | $17.46 | ||||||||
| Net Operating Income | $7,071,123 | $7,429,652 | $6,675,068 | $7,164,676 | $14,756,416 | $7,742,012 | 55.9% | $22.16 | ||||||||
| TI/LC | 0 | 0 | 0 | 0 | 1,094,332 | 681,519 | 4.9 | 1.95 | ||||||||
| Capital Expenditures | 0 | 0 | 0 | 0 | 69,860 | 69,860 | 0.5 | 0.20 | ||||||||
| Net Cash Flow | $7,071,123 | $7,429,652 | $6,675,068 | $7,164,676 | $13,592,224 | $6,990,633 | 50.5% | $20.01 | ||||||||
| NOI DSCR(8) | 1.97x | 2.07x | 1.86x | 1.99x | 4.10x | 2.15x | ||||||||||
| NCF DSCR(8) | 1.97x | 2.07x | 1.86x | 1.99x | 3.78x | 1.94x | ||||||||||
| NOI DY(8) | 8.8% | 9.3% | 8.3% | 9.0% | 18.4% | 9.7% | ||||||||||
| NCF DY(8) | 8.8% | 9.3% | 8.3% | 9.0% | 17.0% | 8.7% |
| (1) | Stabilized Underwritten assumes that the underwritten rent roll is leased up to the third quarter 2016 Westwood Class A office submarket occupancy of 90.7% and vacant spaces are grossed up at the appraisal’s concluded market rents. |
| (2) | % of U/W Effective Gross Income and U/W $ per SF columns are reflective of the U/W column. |
| (3) | The decrease in Base Rent from 2013 to 2015 is primarily attributed to Northern Trust Bank vacating suites 100 and 1000 (27,140 square feet, 7.8% of net rentable area, 8.7% of gross potential rent) on May 31, 2013 and Gores Technology vacating suites 1600, 1700 and 1800 (38,747 square feet, 11.1% of net rentable area, 11.1% of gross potential rent) on April 30, 2014. Suites 1800 and 1700 were re-tenanted in September 2015 and November 2016, respectively. Rentech relocated to suite 1000 per its third lease amendment. |
| (4) | Underwritten Base Rent is based on the underwritten rent roll dated November 2, 2016 and include contractual rent steps through October 31, 2017 of $182,237. |
| (5) | Other Income includes parking income and tenant service income. |
| (6) | Historical Vacancy/Credit Loss represents rent credits. Underwritten Vacancy/Credit Loss is based on the actual vacancy based on the underwritten rent roll dated November 2, 2016 at the appraisal’s concluded market rents. |
| (7) | The Center West Property is subject to a ground lease that expires on December 23, 2085. The ground lessor is an affiliate of the borrower. The underwritten ground lease rent is based on the current payable ground lease rent during the term of the loan of $1,589,160. See “Ground Lease” section. |
| (8) | Debt service coverage ratios and debt yields are based on the Center West Whole Loan. |
Appraisal.The appraisal concluded an “as-is” and “as stabilized” appraisal value assuming a sale of the Center West Property to a third party, whereby pursuant to the Center West loan documents and ground lease, the ground rent would be equal to the total actual annual fixed rent of $3,938,240 as of January 1, 2017, subject to 5.0% per annum increases, and a reset every 10 years to 12.0% of the fair market value of the ground leased land, provided, however, that the annual fixed rent upon reset will not be less than the then applicable current annual fixed rent. As of the appraisal valuation date of October 20, 2016, the Center West Property had an “as-is” appraised value of $209.0 million. As of the appraisal valuation date of April 1, 2019, the Center West Property has an “as stabilized” appraised value of $256.0 million, assuming a stabilized occupancy of 95.0%, equating to a Cut-off Date LTV Ratio and LTV Ratio at Maturity Date of 31.3%. The appraisal concluded a “lender as-is” and “lender as stabilized” appraised value of $277.3 million as of 2017 and $330.4 million as of 2020, respectively. The “lender as-is” and “lender as stabilized” appraised values were derived utilizing a discounted cash flow analysis assuming ground rent payments of the Current Payable Annual Ground Rent for the remainder of the ground lease term, an 8.0% discount rate and 5.50% reversion cap rate for the “lender as-is” analysis and a 7.5% discount rate and 5.50% reversion cap rate for the “lender as stabilized” analysis, equating to a Cut-off Date LTV Ratio and LTV Ratio at Maturity Date of 28.9% for the “lender as-is” and 24.2% for the “lender as stabilized”.
THE INFORMATION IN THIS STRUCTURAL AND COLLATERAL TERM SHEET IS NOT COMPLETE AND MAY BE AMENDED PRIOR TO THE TIME OF SALE. THIS TERM SHEET IS NOT AN OFFER TO SELL THESE SECURITIES AND IT IS NOT A SOLICITATION OF AN OFFER TO BUY THESE SECURITIES IN ANY JURISDICTION WHERE THE OFFER OR SALE IS NOT PERMITTED.
| 53 |
| CENTER WEST |
Environmental Matters. According to a Phase I environmental site assessment dated October 28, 2016, there was no evidence of any recognized environmental condition at the Center West Property.
Market Overview and Competition.The Center West Property is located in the central business district area of downtown Los Angeles on the northeast corner of Wilshire Boulevard and Glendon Avenue in the heart of Westwood. The property is located approximately 0.5 miles east of Interstate 405, a major north/south thoroughfare that provides the Westwood neighborhood with access to Los Angeles International Airport (“LAX”) and downtown Los Angeles and connects with Interstate 5, a major north/south thoroughfare providing access to San Diego, downtown Los Angeles, Sacramento and Seattle. Westwood is located approximately 10 miles north of the Los Angeles Civic Center, six miles east of the Pacific Ocean and nine miles north of LAX.
According to the appraisal, Westwood is best known in the region for its Westwood Village development. Built in the 1920s, Westwood Village became a center for movie theater openings between 1920 and 1950. Westwood Village attracts tourists and visitors, with amenities such as the W Hotel, the Armand Hammer Museum of Art, the Geffen Playhouse, UCLA Performing Arts Center at Royce Hall, boutiques, galleries, cafés and restaurants. The Center West Property is located at the western edge of The Golden Mile, a two-mile stretch of luxury high-rise condominiums that runs from Westwood Village to the City of Beverly Hills. Westwood Marketplace, a retail center anchored by Whole Foods Market, is located approximately 0.4 miles northwest of the Center West Property. Nearby employers include UCLA, Oppenheimer, Jefferies & Co., Merrill Lynch, Kaufman & Broad, Tishman and Saban.
The Center West Property is located in the Westwood Class A office submarket within the Los Angeles Class A office market. According to a third party market research report, the Westwood Class A office submarket contains 28 buildings accounting for 6.0 million square feet of Class A office space. As of the third quarter of 2016, the Westwood Class A office submarket reported a 9.3% vacancy rate and an average asking rent of $53.28 per square foot compared to the overall Los Angeles Class A office market, which has a 13.6% vacancy rate and an average asking rent of $35.91 per square foot.
According to a third party market research report, the estimated 2016 population within a one-, three- and five-mile radius of the Center West Property is 47,485, 228,957 and 592,391, respectively. The annual projected growth rate over the next five years within the same radii is 0.98%, 0.85% and 0.79%, respectively. The estimated 2016 average household income within the same radii is $98,559, $121,864 and $114,835, respectively. Comparatively, the estimated 2016 average household income for Los Angeles County, the metropolitan statistical area and the state of California are $83,656, $89,083 and $90,633, respectively.
THE INFORMATION IN THIS STRUCTURAL AND COLLATERAL TERM SHEET IS NOT COMPLETE AND MAY BE AMENDED PRIOR TO THE TIME OF SALE. THIS TERM SHEET IS NOT AN OFFER TO SELL THESE SECURITIES AND IT IS NOT A SOLICITATION OF AN OFFER TO BUY THESE SECURITIES IN ANY JURISDICTION WHERE THE OFFER OR SALE IS NOT PERMITTED.
| 54 |
| CENTER WEST |
The following table presents certain information relating to comparable properties to the Center West Property:
Comparable Properties(1)
| Year Built | Total GLA (SF) | Direct Occupancy | Overall Occupancy | Asking Rent PSF | |
| Center West | 1985 | 349,298(2) | 57.1%(2) | 57.1%(2) | $57.32(2) |
| Brentwood Submarket | |||||
| Wilshire Landmark II | 1989 | 412,944 | 95.4% | 91.1% | $32.40 - $38.40 |
| Wilshire Landmark I | 1986 | 328,331 | 97.4% | 96.1% | $59.40 - $61.80 |
| 12100 Wilshire | 1985 | 365,000 | 76.8% | 74.4% | $44.40 |
| Wilshire Bundy Plaza | 1984 | 310,000 | 88.0% | 78.7% | $35.40 - $42.00 |
| Gateway LA | 1986 | 147,815 | 95.6% | 90.6% | $36.00 |
| Wilshire Brentwood Plaza | 1985 | 235,808 | 94.9% | 94.9% | $33.00 - $36.00 |
| Wells Fargo Center | 1983 | 500,475 | 85.5% | 83.6% | $51.00 - $54.00 |
| Brentwood Submarket Total/Wtd. Avg. | 2,300,373 | 89.5% | 86.2% | $32.40 - $61.80 | |
| Westwood Tier 1 Submarket | |||||
| One Westwood | 1987 | 201,923 | 86.3% | 86.1% | $36.00 |
| The Tower | 1988 | 221,396 | 85.7% | 82.8% | $51.60 - $54.00 |
| Westwood Place | 1987 | 194,844 | 88.5% | 86.7% | $33.60 |
| Center West | 1985 | 349,298(2) | 57.1%(2) | 57.1%(2) | $57.32(2) |
| 10900 Wilshire(3) | 1981 | 237,147 | 44.3% | 42.5% | $55.20 |
| Westwood Tier 1 Submarket Total/Wtd. Avg.(4) | 855,310 | 75.0% | 73.3% | $33.60 - $55.20 | |
| Westwood Tier 2 Submarket | |||||
| UCLA Wilshire Building | 1981 | 295,625 | 100.0% | 100.0% | NAV |
| AVCO Center | 1972 | 142,000 | 96.1% | 95.5% | $48.00 |
| Oppenheimer Tower | 1970 | 581,384 | 83.7% | 79.8% | $54.00 - $57.00 |
| 10960 Wilshire | 1971 | 590,558 | 85.1% | 84.3% | $57.00 |
| Westwood Tier 2 Submarket Total/Wtd. Avg. | 1,609,567 | 88.3% | 86.5% | $48.00 - $57.00 | |
| Westwood Village Submarket | |||||
| UCLA Westwood Center | 1971 | 143,377 | 100.0% | 100.0% | NAV |
| Westwood Center | 1965 | 332,163 | 92.3% | 87.6% | $42.00 - $54.00 |
| Westwood Village Submarket Total/Wtd. Avg. | 475,540 | 94.6% | 91.3% | $42.00 - $54.00 | |
| Southwest Westwood Submarket | |||||
| Westwood Gateway Phase I | 1983 | 332,082 | 99.2% | 98.2% | $51.00 |
| Westwood Gateway II (East) | 1986 | 332,800 | 100.0% | 100.0% | NAV |
| Westwood Gateway II (North) | 1988 | 264,997 | 96.6% | 96.6% | $48.00 - $54.00 |
| Southwest Westwood Submarket Total/Wtd. Avg. | 929,879 | 98.7% | 98.4% | $48.00 - $54.00 | |
| Market Total/Wtd. Avg.(4) | 6,170,669 | 89.0% | 86.7% | $32.40 - $61.80 |
| (1) | Information obtained from the appraisal. |
| (2) | Information obtained from the underwritten rent roll dated November 2, 2016. |
| (3) | According to the appraisal, the 10900 Wilshire (Murdock Plaza) property and Center West property are better quality assets relative to the market. The 10900 Wilshire property, which is located three blocks west of the Center West property on Wilshire Boulevard, was previously owned and operated by the Center West borrower sponsor, Kambiz Hekmat, prior to its sale in 2014. Similar to the Center West property, its low occupancy is due in part to the borrower sponsor’s selectivity and preference for leasing to only the highest quality tenants. In addition, the 10900 Wilshire property is currently planning for an extensive renovation. Excluding the 10900 Wilshire property and Center West property, the Westwood Tier 1 Submarket and Market Wtd. Avg. Direct Occupancy are 86.8% and 90.8%, respectively. In 2014, the leasehold interest of the 10900 Wilshire property was sold to Tishman Speyer for $124.7 million with an implied cap rate of 2.9% on 2013 NOI, NCF, and occupancy of approximately $3.6 million, $2.7 million, and 54.0%, respectively. The purchase price of the 10900 Wilshire property of $124.7 million equates to a cost basis of approximately $526 per square foot compared to the Center West property’s loan basis of $229 per square foot. |
| (4) | Submarket and Market Total/Wtd. Avg. excludes the Center West property. |
The Borrower.The borrower is Center West, a California limited partnership and special purpose entity with two independent directors. Legal counsel to the borrower delivered a non-consolidation opinion in connection with the origination of the Center West Whole Loan. Kambiz Hekmat is the guarantor of certain nonrecourse carveouts under the Center West Whole Loan.
The Borrower Sponsor. The borrower sponsor is Kambiz Hekmat, the CEO of Indivest, Inc. (“Indivest”), a boutique real estate development, investment and management company based in Westwood Village in Los Angeles. Founded in 1972, Indivest has become a premier developer of Westwood Village real estate. Current developments in Indivest’s portfolio include a 29-story luxury hotel or condominium tower and a six-story luxury residential hotel and retail building in Westwood Village.
Escrows.At origination, the borrower deposited into escrow $2,352,223 for outstanding tenant improvements and leasing commissions and free rent allowances related to four tenants. The requirement for the borrower to make monthly deposits to the tax and insurance escrows is waived so long as (i) no Cash Management Period (defined below) exists and (ii) (a) taxes for the Center West Property are paid in accordance with the loan documents and (b) the Center West Property is insured in accordance with the loan documents.
THE INFORMATION IN THIS STRUCTURAL AND COLLATERAL TERM SHEET IS NOT COMPLETE AND MAY BE AMENDED PRIOR TO THE TIME OF SALE. THIS TERM SHEET IS NOT AN OFFER TO SELL THESE SECURITIES AND IT IS NOT A SOLICITATION OF AN OFFER TO BUY THESE SECURITIES IN ANY JURISDICTION WHERE THE OFFER OR SALE IS NOT PERMITTED.
| 55 |
| CENTER WEST |
The requirement for the borrower to make deposits to the capital expenditures escrow is waived, provided that the lender may require the borrower to escrow funds monthly if a Cash Management Period exists or the Center West Property is not being maintained in accordance with the loan documents and such failure is not corrected within 30 days of the lender’s notice. The borrower is required to escrow on a monthly basis $29,108 (which is equal to $1.00 per square foot annually) for tenant improvement and leasing commission obligations, provided, however, that the borrower will not be required to make such deposits to the TI/LC escrow until a Cash Management Period exists.
The borrower is required to escrow (i) on a monthly basis, 1/12 of the annual ground rent payments required under the ground lease agreement and (ii) within 10 business days following the commencement of a Cash Management Period, the borrower is required to escrow an amount equal to the annual ground rent payments estimated to be paid during the ensuing two months; provided however, the borrower will not be required to make such deposits for ground rent until (i) the lender receives notice that the borrower has failed to timely pay ground rent or (ii) a Cash Management Period exists.
During the continuance of a Material Tenant Trigger Event (defined below), on a monthly basis, the borrower is required to escrow all excess cash flow for tenant improvements and leasing commissions incurred in connection with a re-letting, extension or renewal of at least 75% of such material tenant space in accordance with such material tenant lease and the loan documents, and, in the case of a replacement lease, with a term of at least three years.
A “Cash Management Period” occurs upon (i) the occurrence of a material event of default until its cure (provided that the lender has not commenced a foreclosure proceeding); (ii) the debt service coverage ratio (“DSCR”) for the trailing six-month period falling below 1.20x until the DSCR for the trailing six-month period is at least 1.20x; (iii) the bankruptcy or insolvency of the borrower, guarantor or property manager; (iv) the occurrence of a Material Tenant Trigger Event until its cure; or (v) an indictment of fraud or misappropriation of funds by the borrower, guarantor or property manager or any director or officer of the borrower, guarantor or property manager until, if the indictment relates to the property manager, the borrower replaces the manager with a qualified manager that is not an affiliate of the borrower. There is no cure for a Cash Management Period caused by clause (iii) above and clause (v) above in relation to an indictment of fraud or misappropriation of funds by the borrower or guarantor, and no more than two Cash Management Periods may be cured through the term of the loan.
A “Material Tenant Trigger Event” occurs upon (i) a Material Tenant (defined below) giving notice of its intention to terminate, cancel, not extend or not renew its material tenant lease until such Material Tenant rescinds such notices or at least 75% of such material tenant space is re-let or extended or renewed in accordance with such material tenant lease and the loan documents, and in the case of a replacement lease, with a term of at least three years; (ii) a Material Tenant failing to re-let or extend or renew such material tenant lease on or prior to the date that is 12 months prior to the then applicable expiration date under such material tenant lease until at least 75% of such material tenant space is extended or renewed in accordance with such material tenant lease and the loan documents, and in the case of a replacement lease, with a term of at least three years; (iii) a Material Tenant failing to extend or renew such material tenant lease on or prior to the date that is required under such material tenant lease until at least 75% of such material tenant space is re-let or extended or renewed in accordance with such material tenant lease and the loan documents, and in the case of a replacement lease, with a term of at least three years; (iv) the occurrence of an event of default until its cure under the applicable lease; (v) a Material Tenant becoming insolvent or a debtor in a bankruptcy action until the affirmation of such material tenant lease in the applicable bankruptcy proceeding and the Material Tenant is actually paying all rents and other amounts due under its material tenant lease; (vi) the termination of a material tenant lease until at least 75% of such material tenant space is re-let or extended or renewed in accordance with such material tenant lease and the loan documents, and in the case of a replacement lease, with a term of at least three years; or (vii) a Material Tenant going dark, vacating, ceasing to occupy or conduct business at 25% or more of such material tenant space until such Material Tenant resumes continuous operations at such material tenant space for three consecutive calendar months or at least 75% of such material tenant space is re-let in accordance with the loan documents, in each case with a term of at least three years.
A “Material Tenant” is a tenant, together with its affiliates, that leases more than 20% of the net rentable area or pays base rent of more than 20% of the total in-place base rent at the Center West Property.
Lockbox and Cash Management.The Center West Whole Loan is structured with a springing lockbox and springing cash management. Upon the occurrence of a Cash Management Period, the borrower is required to establish a lockbox account and instruct all tenants to deposit all rents and payments directly into the lockbox account controlled by the lender. All funds in the lockbox account are (i) during a Cash Management Period, disbursed to a cash management account controlled by the lender, and (ii) in the absence of a Cash Management Period, swept daily to an account controlled by the borrower. During a Cash Management Period, all funds remaining in the cash management account after payment of debt service, required reserves and approved expenses are required to be (i) deposited into the Material Tenant Rollover account during the continuance of a Material Tenant Trigger Event, (ii) deposited into a lender-controlled cash sweep account during a Cash Sweep Period (defined below), or (iii) in the absence of a Cash Sweep Period, swept to an account controlled by the borrower. Provided no event of default has occurred and is then continuing after a Cash Sweep Period ends, funds in the cash sweep account are released to the borrower within 10 business days.
A “Cash Sweep Period” occurs upon (i) the occurrence of a material event of default until its cure (provided that the lender has not commenced a foreclosure proceeding); (ii) the DSCR for the trailing six-month period falling below 1.15x until the DSCR for the trailing six-month period is at least 1.15x; or (iii) the bankruptcy or insolvency of the borrower, guarantor or property manager. There is no cure for a Cash Sweep Period caused by clause (iii) above and no more than two Cash Sweep Periods may be cured through the term of the Center West Whole Loan.
Property Management. The Center West Property is managed by Indivest, Inc., an affiliate of the borrower.
THE INFORMATION IN THIS STRUCTURAL AND COLLATERAL TERM SHEET IS NOT COMPLETE AND MAY BE AMENDED PRIOR TO THE TIME OF SALE. THIS TERM SHEET IS NOT AN OFFER TO SELL THESE SECURITIES AND IT IS NOT A SOLICITATION OF AN OFFER TO BUY THESE SECURITIES IN ANY JURISDICTION WHERE THE OFFER OR SALE IS NOT PERMITTED.
| 56 |
| CENTER WEST |
Assumption.The borrower has the right to transfer the Center West Property, provided that certain conditions are satisfied, including: (i) no event of default has occurred and is continuing; (ii) the lender has reasonably determined that the proposed transferee and guarantor satisfy the lender’s credit review and underwriting standards, taking into consideration transferee experience, financial strength and general business standing; (iii) execution of a recourse guaranty and an environmental indemnity by an affiliate of the transferee; and (iv) the lender has received confirmation from DBRS, Fitch and Moody’s that such transfer will not result in a downgrade, withdrawal or qualification of the respective ratings assigned to the WFCM Series 2017-RB1 Certificates and similar ratings confirmations from each rating agency rating any securities backed by any Center West Companion Loans with respect to the ratings of such securities. Notwithstanding anything herein to the contrary, the lender will not unreasonably withhold its consent to a transfer of the Center West Property so long as (i) the ground lessor continues to be controlled by Kambiz Hekmat, (ii) the transferee is an affiliate of the ground lessor, and (iii) the Center West Property continues to be managed by a qualified manager.
Partial Prepayment. During the term of the loan, if the ground lessor and borrower are not controlled, directly or indirectly, by the same Hekmat Control Person (defined below) and the legal, beneficial and economic interest of the ground lessor and borrower are not majority owned, directly or indirectly, by the same Hekmat Control Person (an “Ownership Severance Event”), the borrower is required to prepay $20.0 million of the Center West Whole Loan amount within 10 business days of such Ownership Severance Event, together with (i) the applicable yield maintenance premium if such prepayment occurs prior to September 6, 2026 and (ii) interest on the amount prepaid for the full interest period during which the prepayment occurs if such prepayment is not on a monthly payment date.
A “Hekmat Control Person” means, individually or collectively, Kambiz Hekmat, Mahnaz Hekmat, their children or grandchildren or trusts for their benefit or the benefit of their children or grandchildren.
Real Estate Substitution.Not permitted.
Subordinate and Mezzanine Indebtedness. Not permitted.
Ground Lease.The Center West Property is subject to a ground lease with an affiliate of the borrower, effective through December 23, 2085. On January 1 of each year during the term of the ground lease, the annual ground lease rent is adjusted to 105% of the prior year’s rent. In addition, every 10 years, the annual ground lease rent will be adjusted upwards to equal 12% of the fair market value of the ground leased land, as if unencumbered and unimproved, provided however, the annual ground lease rent will not be less than the then applicable current annual ground lease rent. The next such adjustment is on January 1, 2023. The current annual ground lease rent under the ground lease is $3,938,240, however, only an annual amount of $1,589,160 (the “Current Payable Annual Ground Rent”) will be due on a monthly basis during the term of the loan and therefore, the Current Payable Annual Ground Rent was underwritten by the lender. All annual ground rent in excess of the Current Payable Annual Ground Rent will be deferred and accrue interest and all previously deferred annual ground lease rent of approximately $6.4 million will continue to be deferred and accrue interest. Such deferrals of annual ground lease rent and accrued interest thereon are subordinate to the Center West Whole Loan and are only payable to the extent excess cash flow is available. Upon a foreclosure (or deed-in-lieu of foreclosure) or a monetary event of default (subject to cure rights) with respect to the borrower’s leasehold estate, any and all deferred rents and accrued interest thereon will be deemed eliminated, and total annual rent due under the ground lease will be $1,589,160 (i.e., no further annual increases of 5.0% or any future readjustment to 12% of fair market value every ten years). In addition, upon the occurrence of an Ownership Severance Event, any and all obligations to pay rents deferred and accrued prior to the Ownership Severance Event will be extinguished, and the rent readjustment occurring every 10 years will be revised to 9% of the fair market value of the ground leased land, as if unencumbered and unimproved.
Terrorism Insurance. The loan documents provide that the required “all risk” insurance policy must include coverage for terrorism in an amount equal to the full replacement cost of the Center West Property. The loan documents also require business interruption insurance covering no less than the 18-month period following the occurrence of a casualty event, together with a twelve-month extended period of indemnity.
Earthquake Insurance. The loan documents do not require earthquake insurance. The seismic report indicated a probable maximum loss of 11.0%.
THE INFORMATION IN THIS STRUCTURAL AND COLLATERAL TERM SHEET IS NOT COMPLETE AND MAY BE AMENDED PRIOR TO THE TIME OF SALE. THIS TERM SHEET IS NOT AN OFFER TO SELL THESE SECURITIES AND IT IS NOT A SOLICITATION OF AN OFFER TO BUY THESE SECURITIES IN ANY JURISDICTION WHERE THE OFFER OR SALE IS NOT PERMITTED.
| 57 |
(THIS PAGE INTENTIONALLY LEFT BLANK)
THE INFORMATION IN THIS STRUCTURAL AND COLLATERAL TERM SHEET IS NOT COMPLETE AND MAY BE AMENDED PRIOR TO THE TIME OF SALE. THIS TERM SHEET IS NOT AN OFFER TO SELL THESE SECURITIES AND IT IS NOT A SOLICITATION OF AN OFFER TO BUY THESE SECURITIES IN ANY JURISDICTION WHERE THE OFFER OR SALE IS NOT PERMITTED.
| 58 |
KOMO PLAZA
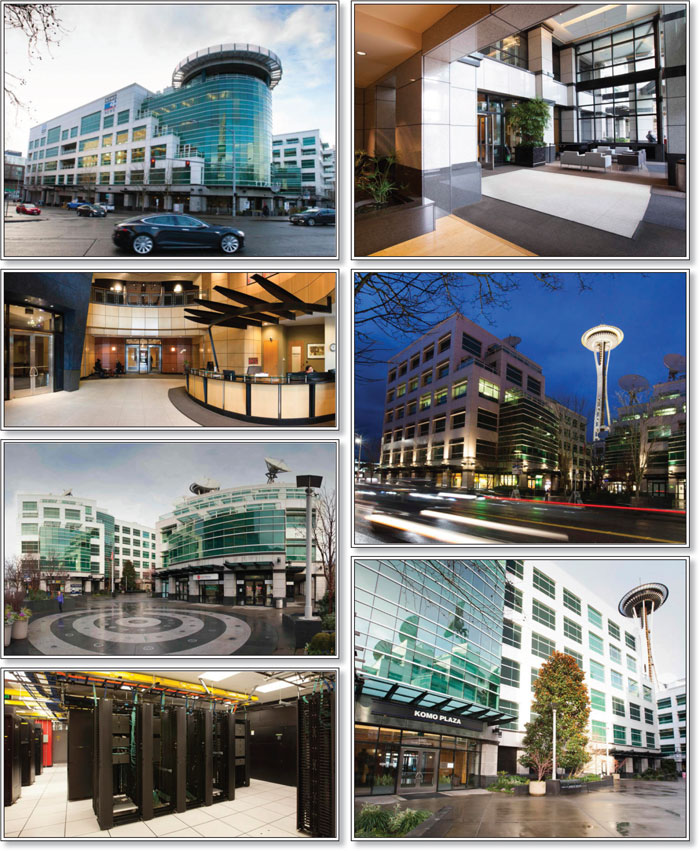
THE INFORMATION IN THIS STRUCTURAL AND COLLATERAL TERM SHEET IS NOT COMPLETE AND MAY BE AMENDED PRIOR TO THE TIME OF SALE. THIS TERM SHEET IS NOT AN OFFER TO SELL THESE SECURITIES AND IT IS NOT A SOLICITATION OF AN OFFER TO BUY THESE SECURITIES IN ANY JURISDICTION WHERE THE OFFER OR SALE IS NOT PERMITTED.
| 59 |
KOMO PLAZA
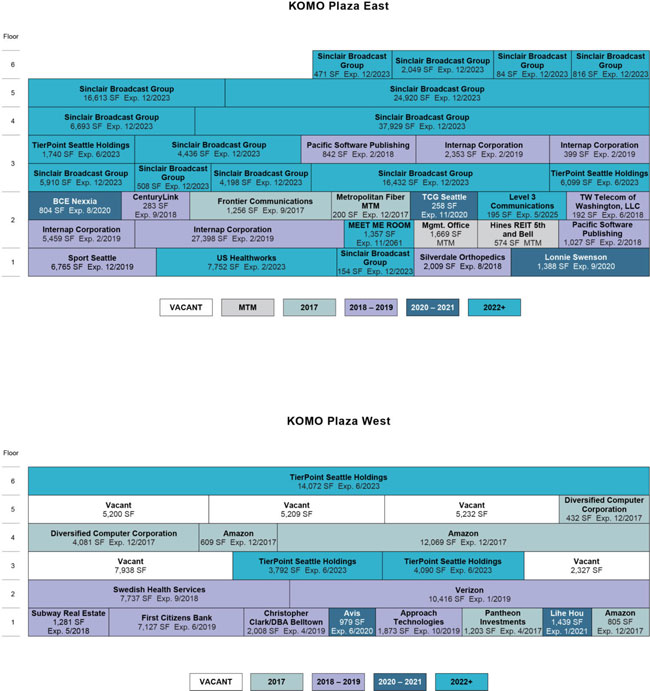
THE INFORMATION IN THIS STRUCTURAL AND COLLATERAL TERM SHEET IS NOT COMPLETE AND MAY BE AMENDED PRIOR TO THE TIME OF SALE. THIS TERM SHEET IS NOT AN OFFER TO SELL THESE SECURITIES AND IT IS NOT A SOLICITATION OF AN OFFER TO BUY THESE SECURITIES IN ANY JURISDICTION WHERE THE OFFER OR SALE IS NOT PERMITTED.
| 60 |
KOMO PLAZA
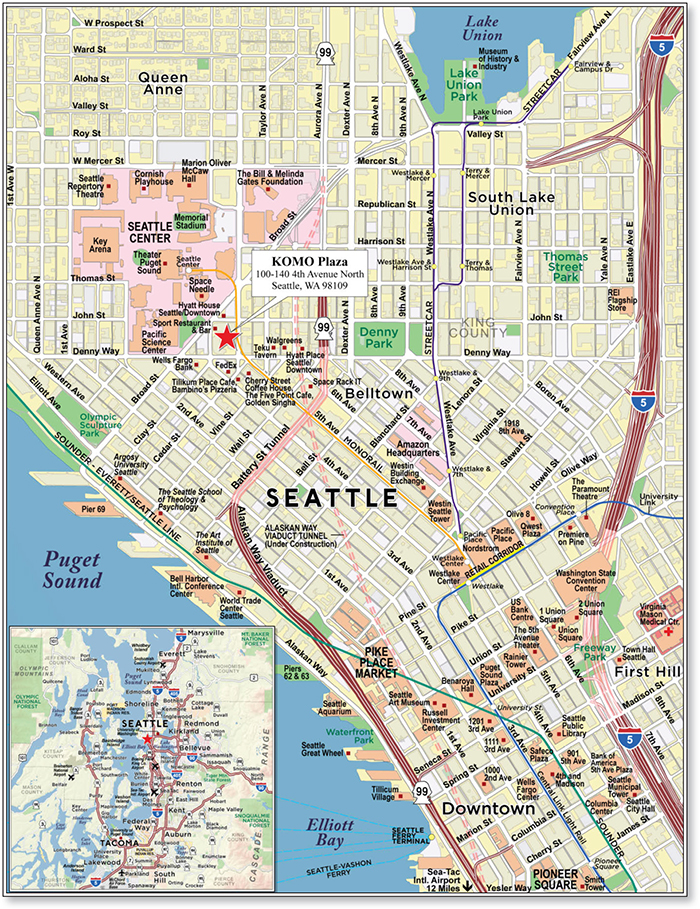
THE INFORMATION IN THIS STRUCTURAL AND COLLATERAL TERM SHEET IS NOT COMPLETE AND MAY BE AMENDED PRIOR TO THE TIME OF SALE. THIS TERM SHEET IS NOT AN OFFER TO SELL THESE SECURITIES AND IT IS NOT A SOLICITATION OF AN OFFER TO BUY THESE SECURITIES IN ANY JURISDICTION WHERE THE OFFER OR SALE IS NOT PERMITTED.
| 61 |
| No. 4 – KOMO Plaza | ||||||||
| Loan Information | Property Information | |||||||
| Mortgage Loan Seller: | UBS AG | Single Asset/Portfolio: | Single Asset | |||||
Credit Assessment (DBRS/Fitch/Moody’s): | NR/NR/NR | Property Type: | Mixed Use | |||||
| Original Principal Balance(1): | $32,500,000 | Specific Property Type: | Office/Data Center/Retail | |||||
| Cut-off Date Balance(1): | $32,500,000 | Location: | Seattle, WA | |||||
| % of Initial Pool Balance: | 5.1% | Size: | 291,151 SF | |||||
| Loan Purpose: | Acquisition | Cut-off Date Balance Per SF(1): | $477.42 | |||||
| Borrower Name: | GI TC Seattle LLC | Year Built/Renovated: | 2000/2007 | |||||
| Borrower Sponsor: | TechCore, LLC | Title Vesting: | Fee | |||||
| Mortgage Rate: | 4.2993% | Property Manager: | Hines Interests Limited Partnership | |||||
| Note Date: | December 20, 2016 | 4thMost Recent Occupancy (As of): | 92.0% (12/31/2012) | |||||
| Anticipated Repayment Date: | NAP | 3rdMost Recent Occupancy (As of): | 96.0% (12/31/2013) | |||||
| Maturity Date: | January 6, 2027 | 2ndMost Recent Occupancy (As of): | 92.0% (12/31/2014) | |||||
| IO Period: | 120 months | Most Recent Occupancy (As of): | 91.0% (12/31/2015) | |||||
| Loan Term (Original): | 120 months | Current Occupancy (As of): | 91.1% (9/30/2016) | |||||
| Seasoning: | 2 months | |||||||
| Amortization Term (Original): | NAP | Underwriting and Financial Information: | ||||||
| Loan Amortization Type: | Interest-only, Balloon | |||||||
| Interest Accrual Method: | Actual/360 | 4thMost Recent NOI (As of)(3): | $14,079,614 (12/31/2013) | |||||
| Call Protection: | L(26),D(90),O(4) | 3rdMost Recent NOI (As of)(3): | $15,534,334 (12/31/2014) | |||||
| Lockbox Type: | Springing | 2ndMost Recent NOI (As of)(3): | $14,450,665 (12/31/2015) | |||||
| Additional Debt(1): | Yes | Most Recent NOI (As of): | $14,886,268 (TTM 10/31/2016) | |||||
| Additional Debt Type(1): | Pari Passu | |||||||
| U/W Revenues: | $22,049,734 | |||||||
| U/W Expenses: | $6,350,267 | |||||||
| U/W NOI: | $15,699,467 | |||||||
| U/W NCF: | $14,983,440 | |||||||
| Escrows and Reserves(2): | U/W NOI DSCR(1): | 2.59x | ||||||
| U/W NCF DSCR(1): | 2.47x | |||||||
| Type: | Initial | Monthly | Cap (If Any) | U/W NOI Debt Yield(1): | 11.3% | |||
| Taxes | $0 | Springing | NAP | U/W NCF Debt Yield(1): | 10.8% | |||
| Insurance | $0 | Springing | NAP | As-Is Appraised Value: | $278,000,000 | |||
| Replacement Reserves | $0 | Springing | $117,491 | As-Is Appraisal Valuation Date: | October 26, 2016 | |||
| TI/LC | $0 | Springing | $1,982,657 | Cut-off Date LTV Ratio(1): | 50.0% | |||
| Verizon Reserve | $2,500,000 | $0 | NAP | LTV Ratio at Maturity(1): | 50.0% | |||
| (1) | See “The Mortgage Loan” section. All statistical financial information related to balances per square foot, loan-to-value ratios, debt service coverage ratios and debt yields are based on the KOMO Plaza Whole Loan. |
| (2) | See “Escrows” section. |
| (3) | See “Cash Flow Analysis” section. |
The Mortgage Loan.The mortgage loan (the “KOMO Plaza Mortgage Loan”) is part of a whole loan (the “KOMO Plaza Whole Loan”) that is evidenced by fivepari passu promissory notes (Note A-1, Note A-2, Note A-3, Note A-4 and Note A-5) secured by a first mortgage encumbering a mixed-use property located in Seattle, Washington (the “KOMO Plaza Property”). The KOMO Plaza Whole Loan was co-originated on December 20, 2016 by UBS AG, by and through its branch office at 1285 Avenue of the Americas, New York, New York (“UBS AG, New York Branch”) and Morgan Stanley Bank, N.A. The KOMO Plaza Whole Loan had an original principal balance of $139,000,000, has an outstanding principal balance as of the Cut-off Date of $139,000,000 and accrues interest at an interest rate of 4.2993%per annum. The KOMO Plaza Whole Loan had an initial term of 120 months, has a remaining term of 118 months as of the Cut-off Date, and requires interest-only payments through the term of the KOMO Plaza Whole Loan. The KOMO Plaza Whole Loan matures on January 6, 2027.
The KOMO Plaza Mortgage Loan is evidenced by the non-controlling Note A-1 and Note A-4, which had an aggregate original principal balance of $32,500,000, have an aggregate outstanding principal balance as of the Cut-off Date of $32,500,000 and will be contributed to the WFCM 2017-RB1 Trust. The controlling Note A-2 and the non-controlling Note A-3, with an aggregate original principal balance of $37,000,000, were contributed to the BBCMS 2017-C1 Trust; and the non-controlling Note A-5, with an original principal balance of $69,500,000, was contributed to the BACM 2017-BNK3 Trust. Each of the mortgage loans evidenced by Note A-2, Note A-3 and Note A-5 are referred to herein as the “KOMO Plaza Companion Loans”. See “Description of the Mortgage Pool—The Whole Loans—The Non-Serviced Whole Loans—KOMO Plaza Whole Loan” in the Preliminary Prospectus.
THE INFORMATION IN THIS STRUCTURAL AND COLLATERAL TERM SHEET IS NOT COMPLETE AND MAY BE AMENDED PRIOR TO THE TIME OF SALE. THIS TERM SHEET IS NOT AN OFFER TO SELL THESE SECURITIES AND IT IS NOT A SOLICITATION OF AN OFFER TO BUY THESE SECURITIES IN ANY JURISDICTION WHERE THE OFFER OR SALE IS NOT PERMITTED.
| 62 |
KOMO PLAZA
Note Summary
| Notes | Original Balance | Note Holder | Controlling Interest | |
| A-1 | $30,000,000 | WFCM 2017-RB1 | No | |
| A-2 | $20,000,000 | BBCMS 2017-C1 | Yes | |
| A-3 | $17,000,000 | BBCMS 2017-C1 | No | |
| A-4 | $2,500,000 | WFCM 2017-RB1 | No | |
| A-5 | $69,500,000 | BACM 2017-BNK3 | No | |
| Total | $139,000,000 |
Following the lockout period, the borrower has the right to defease the KOMO Plaza Whole Loan in whole on any date before October 6, 2026. In addition, the KOMO Plaza Whole Loan is prepayable without penalty on or after October 6, 2026.
Sources and Uses
| Sources | Uses | |||||||
| Original whole loan amount | $139,000,000 | 49.7% | Purchase price | $276,000,000 | 98.8% | |||
| Borrower sponsor’s new cash contribution | 140,408,566 | 50.3 | Reserves | 2,500,000 | 0.9 | |||
| Closing costs | 908,566 | 0.3 | ||||||
| Total Sources | $279,408,566 | 100.0% | Total Uses | $279,408,566 | 100.0% |
The Property.The KOMO Plaza Property is a 291,151 square foot mixed use facility containing Class A office and retail, data center and co-location and communications space located in the central business district of Seattle, Washington. The KOMO Plaza Property is located in the heart of Seattle adjacent to the Space Needle, Seattle Center and the Bill and Melinda Gates Foundation headquarters. The KOMO Plaza Property was built in 2000, renovated in 2007, and consists of two six-story buildings: the east building (191,232 square feet), which is 100.0% leased and the west building (99,919 square feet), which is approximately 74.1% leased. The KOMO Plaza Property consists of 120,925 square feet (41.5% of net rentable area) of office space, 93,115 square feet (32.0% of net rentable area) of data center and co-location space, 34,629 square feet (11.9% of net rentable area) of retail space, 30,692 square feet (10.5% of net rentable area) of communications space and 11,790 square feet (4.0% of net rentable area) of other space, including storage. Improvements include 525 parking spaces (1.80 spaces per 1,000 square feet) in a four-story subterranean parking garage. As of September 30, 2016, the KOMO Plaza Property was 91.1% leased by 38 tenants.
The KOMO Plaza Property offers diverse connectivity through the “Meet Me Room” with approximately 15 telecommunications and internet service providers, rooftop satellite and antenna facilities, as well as interconnection to other networks, including the Pacific Northwest Gigapop, and via one of four core switches for the Seattle Internet Exchange, a neutral and independent peering point and the fourth most active internet exchange in the United States. The KOMO Plaza Property has 14 megawatts of utility power, with nine generators providing 16.5 megawatts of backup power. It can support power densities of more than 150 watts per square foot. The KOMO Plaza Property also has close proximity to transpacific subsea cables for low latency service to Asia.
THE INFORMATION IN THIS STRUCTURAL AND COLLATERAL TERM SHEET IS NOT COMPLETE AND MAY BE AMENDED PRIOR TO THE TIME OF SALE. THIS TERM SHEET IS NOT AN OFFER TO SELL THESE SECURITIES AND IT IS NOT A SOLICITATION OF AN OFFER TO BUY THESE SECURITIES IN ANY JURISDICTION WHERE THE OFFER OR SALE IS NOT PERMITTED.
| 63 |
KOMO PLAZA
The following table presents certain information relating to the tenancy at the KOMO Plaza Property:
Major Tenants
| Tenant Name | Credit Rating (Fitch/Moody’s/ S&P)(1) | Tenant NRSF | % of NRSF | Annual U/W Base Rent PSF(2) | Annual U/W Base Rent(2) | % of Total Annual U/W Base Rent(2) | Lease Expiration Date |
| Major Tenants | |||||||
| Internap Corporation | NR/B3/B | 35,609 | 12.2% | $111.91 | $3,985,098 | 24.8% | 2/28/2019(3) |
| Sinclair Broadcast Group | NR/Ba3/BB- | 121,213 | 41.6% | $32.67 | $3,959,904 | 24.6% | 12/31/2023(4) |
| TierPoint Seattle Holdings | NR/B3/NR | 29,793 | 10.2% | $90.01 | $2,681,656 | 16.7% | 6/30/2023(5) |
| Amazon | NR/Baa1/AA- | 13,483 | 4.6% | $90.68 | $1,222,676 | 7.6% | 12/31/2017 |
| Verizon | A-/Baa1/BBB+ | 10,416 | 3.6% | $61.64 | $642,069 | 4.0% | 1/31/2019(6) |
| Total Major Tenants | 210,514 | 72.3% | $59.34 | $12,491,403 | 77.6% | ||
| Non-Major Tenants(7) | 54,731 | 18.8% | $65.83 | $3,602,722 | 22.4% | ||
| Occupied Collateral Total | 265,245 | 91.1% | $60.68 | $16,094,125 | 100.0% | ||
| Vacant Space | 25,906 | 8.9% | |||||
| Collateral Total | 291,151 | 100.0% | |||||
| (1) | Certain ratings are those of the parent company whether or not the parent company guarantees the lease. |
| (2) | The Annual U/W Base Rent includes contractual rent steps through January 31, 2018, totaling $631,911 of which $155,567 is associated with the Verizon lease. For a full description of the reserve associated with the Verizon lease, see “Escrows” section. |
| (3) | Internap Corporation (“Internap”) has the right to terminate 2,353 square feet of its co-location space at any time upon six months’ prior written notice. Internap has one five-year renewal option remaining. |
| (4) | Sinclair Broadcast Group (“Sinclair”) has a one-time right to terminate up to 20% of its contiguous areas, excluding the studio space on the fifth floor, on or before January 1, 2021, with at least 12 months’ notice and the payment of a termination fee approximately equal to the sum of (i) an amount equal to six months of the applicable base rent and (ii) the tenant’spro rata share of operating expenses, water charges, room fees and all other charges and amounts due and owed under its lease. Sinclair also has the right to terminate up to $73,588 of Base Rent associated with Sinclair’s storage space at any time with at least 30 days’ notice. If the portion terminated is not separately demised, Sinclair is required to pay costs of demising, so that the landlord has separate rentable areas of storage space following Sinclair’s termination. Sinclair has three five-year renewal options. |
| (5) | TierPoint Seattle Holdings has two five-year renewal options remaining. |
| (6) | Verizon has one, five-year renewal option remaining. |
| (7) | Includes Meet-Me-Room, which occupies 1,357 square feet of space at the KOMO Plaza Property, but does not have any Annual U/W Base Rent associated with its lease. |
The following table presents certain information relating to the lease rollover schedule at the KOMO Plaza Property:
Lease Expiration Schedule(1)(2)
| Year Ending December 31, | No. of Leases Expiring | Expiring NRSF | % of Total NRSF | Cumulative Expiring NRSF | Cumulative % of Total NRSF | Annual U/W Base Rent(3) | % of Total Annual U/W Base Rent(3) | Annual U/W Base Rent PSF(3)(4) |
| MTM | 4 | 2,243 | 0.8% | 2,243 | 0.8% | $68,263 | 0.4% | $30.43 |
| 2017 | 22 | 20,655 | 7.1% | 22,898 | 7.9% | $2,090,358 | 13.0% | $101.20 |
| 2018 | 12 | 13,371 | 4.6% | 36,269 | 12.5% | $1,305,056 | 8.1% | $97.60 |
| 2019 | 16 | 63,798 | 21.9% | 100,067 | 34.4% | $5,134,504 | 31.9% | $80.48 |
| 2020 | 5 | 3,429 | 1.2% | 103,496 | 35.5% | $428,676 | 2.7% | $125.01 |
| 2021 | 8 | 1,439 | 0.5% | 104,935 | 36.0% | $151,759 | 0.9% | $105.46 |
| 2022 | 0 | 0 | 0.0% | 104,935 | 36.0% | $0 | 0.0% | $0.00 |
| 2023 | 28 | 158,758 | 54.5% | 263,693 | 90.6% | $6,837,066 | 42.5% | $43.07 |
| 2024 | 0 | 0 | 0.0% | 263,693 | 90.6% | $0 | 0.0% | $0.00 |
| 2025 | 1 | 195 | 0.1% | 263,888 | 90.6% | $78,444 | 0.5% | $402.28 |
| 2026 | 0 | 0 | 0.0% | 263,888 | 90.6% | $0 | 0.0% | $0.00 |
| 2027 | 0 | 0 | 0.0% | 263,888 | 90.6% | $0 | 0.0% | $0.00 |
| Thereafter(5) | 1 | 1,357 | 0.5% | 265,245 | 91.1% | $0 | 0.0% | $0.00 |
| Vacant | 0 | 25,906 | 8.9% | 291,151 | 100.0% | $0 | 0.0% | $0.00 |
| Total/Weighted Average | 97 | 291,151 | 100.0% | $16,094,125 | 100.0% | $60.68 |
| (1) | Information obtained from the underwritten rent roll. |
| (2) | Certain tenants may have lease termination options that are exercisable prior to the originally stated expiration date of the subject lease and that are not considered in the Lease Expiration Schedule. |
| (3) | The Annual U/W Base Rent includes contractual rent steps through January 31, 2018, totaling $631,911 of which $155,567 is associated with the Verizon lease. For a full description of the reserve associated with the Verizon lease, see “Escrows” section. |
| (4) | Weighted Average Annual U/W Base Rent PSF excludes vacant space. |
| (5) | Includes Meet-Me-Room, which occupies 1,357 square feet of space at the KOMO Plaza Property, but does not have any Annual U/W Base Rent associated with its lease. |
THE INFORMATION IN THIS STRUCTURAL AND COLLATERAL TERM SHEET IS NOT COMPLETE AND MAY BE AMENDED PRIOR TO THE TIME OF SALE. THIS TERM SHEET IS NOT AN OFFER TO SELL THESE SECURITIES AND IT IS NOT A SOLICITATION OF AN OFFER TO BUY THESE SECURITIES IN ANY JURISDICTION WHERE THE OFFER OR SALE IS NOT PERMITTED.
| 64 |
KOMO PLAZA
The following table presents historical occupancy percentages at the KOMO Plaza Property:
Historical Occupancy
12/31/2012(1) | 12/31/2013(1) | 12/31/2014(1) | 12/31/2015(1) | 9/30/2016(2) |
| 92.0% | 96.0% | 92.0% | 91.0% | 91.1% |
| (1) | Information obtained from the borrower. |
| (2) | Information obtained from the underwritten rent roll. |
Operating History and Underwritten Net Cash Flow. The following table presents certain information relating to the historical operating performance and the underwritten net cash flow at the KOMO Plaza Property:
Cash Flow Analysis
| 2013 | 2014 | 2015 | TTM 10/31/2016 | U/W | % of U/W Effective Gross Income | U/W $ per SF | |||||||||||||||||||||||
| Base Rent | $14,978,034 | $16,143,463(1) | $15,119,777 | $15,372,527 | $16,094,125 | (2) | 73.0 | % | $55.28 | ||||||||||||||||||||
| Grossed Up Vacant Space | 0 | 0 | 0 | 0 | 1,495,730 | 6.8 | 5.14 | ||||||||||||||||||||||
| Total Reimbursables | 4,730,189 | 4,939,604 | 4,597,346 | 4,609,579 | 5,200,102 | 23.6 | 17.86 | ||||||||||||||||||||||
| Other Income | 925,681 | 1,139,839 | 1,271,030 | 1,291,699 | 1,287,692 | 5.8 | 4.42 | ||||||||||||||||||||||
| Less Vacancy & Credit Loss | 0 | 0 | 0 | 0 | (2,027,916) | (3) | (9.2 | ) | (6.97) | ||||||||||||||||||||
| Effective Gross Income | $20,633,904 | $22,222,906 | $20,988,153 | $21,273,805 | $22,049,734 | 100.0 | % | $75.73 | |||||||||||||||||||||
| Total Operating Expenses | $6,554,290 | $6,688,572 | $6,537,488 | $6,387,537 | $6,350,267 | 28.8 | % | $21.81 | |||||||||||||||||||||
| Net Operating Income | $14,079,614 | $15,534,334 | $14,450,665 | $14,886,268 | $15,699,467 | 71.2 | % | $53.92 | |||||||||||||||||||||
| TI/LC | 0 | 0 | 0 | 0 | 657,796 | 3.0 | 2.26 | ||||||||||||||||||||||
| Capital Expenditures | 0 | 0 | 0 | 0 | 58,230 | 0.3 | 0.20 | ||||||||||||||||||||||
| Net Cash Flow | $14,079,614 | $15,534,334 | $14,450,665 | $14,886,268 | $14,983,440 | 68.0 | % | $51.46 | |||||||||||||||||||||
| NOI DSCR(4) | 2.32 | x | 2.56x | 2.38x | 2.46x | 2.59 | x | ||||||||||||||||||||||
| NCF DSCR(4) | 2.32 | x | 2.56x | 2.38x | 2.46x | 2.47 | x | ||||||||||||||||||||||
| NOI DY(4) | 10.1 | % | 11.2% | 10.4% | 10.7% | 11.3 | % | ||||||||||||||||||||||
| NCF DY(4) | 10.1 | % | 11.2% | 10.4% | 10.7% | 10.8 | % | ||||||||||||||||||||||
| (1) | The 2014 Base Rent is higher than other historical periods primarily due to an approximate $1.2 million increase in Telecomm/Riser income caused by an increase in power consumption by the data center tenants. |
| (2) | U/W Base Rent includes contractual rent steps through January 31, 2018, totaling $631,911 of which $155,567 is associated with the Verizon lease. For a full description of the reserve associated with the Verizon lease, see “Escrows” section. |
| (3) | The underwritten economic vacancy is 8.9%. The KOMO Plaza Property was 91.1% physically occupied as of September 30, 2016. |
| (4) | The debt service coverage ratios and debt yields are based on the KOMO Plaza Whole Loan. |
Appraisal.As of the appraisal valuation date of October 26, 2016, the KOMO Plaza Property had an “as-is” appraised value of $278,000,000.
Environmental Matters. According to a Phase I environmental assessment dated December 8, 2016, there was no evidence of any recognized environmental conditions at the KOMO Plaza Property.
Market Overview and Competition.The KOMO Plaza Property is located in Seattle, King County, Washington, within the Seattle central business district. Situated on Elliott Bay, the eastern shoreline of Puget Sound, the Seattle central business district is the commercial and financial center of western Washington. The KOMO Plaza Property is located across from the Space Needle, at the cross section of South Lake Union, Belltown and Lower Queen Anne submarkets. The South Lake Union, Belltown and Lower Queen Anne submarkets are also the highest growth, lowest vacancy commercial submarkets in the Seattle central business district. Eight Fortune 500 companies are headquartered in Seattle including Costco, Amazon, Microsoft, Starbucks, Paccar, Nordstrom, Weyerhaeuser and Expeditors Int. In addition, several large technology companies own and occupy offices near the KOMO Plaza Property, including Amazon’s headquarters, Google and Facebook.
The Seattle Center, originally built for the 1962 World’s Fair, is a 74-acre park and arts and entertainment center. Its landmark feature is the Space Needle. Other attractions at the Seattle Center include Key Arena, home of the Seattle University Redhawks men’s basketball team and the Seattle Storm of the WNBA, the International Fountain, the Seattle Center Armory, the Center House Theater, home to Seattle Shakespeare Company and Book-It Repertory Theatre, the Children’s Museum, the EMP Museum, the Mural Amphitheater, the Pacific Science Center, the Boeing IMAX Theater, PACCAR IMAX Theater and the Seattle Laser Dome.
According to the appraisal, the KOMO Plaza Property is located in the Northwest data center market. Major cities and areas within the Northwest data center market include Seattle, Washington, Central Washington and Hillsboro, Oregon. According to a third party market research report, the Northwest data center market has a total inventory of approximately 3.7 million square feet (343 megawatts) with total commission vacancy of 485,500 square feet (53.15 megawatts), which represents a vacancy rate of approximately 13.0% as of 2016. Current rental rates for the Northwest data center market are $250 to $350 per kW (all in) for less than 250 kW of usage and $130 to $140 per kW (+E) for more than 250 kW of usage. The appraisal identified 11 directly competitive data center properties built between 1959 and 2012 ranging in size from approximately 18,000 to 1,000,000 square feet. Initial rents for the comparable data centers range from $18.00 to $32.00 per square foot.
THE INFORMATION IN THIS STRUCTURAL AND COLLATERAL TERM SHEET IS NOT COMPLETE AND MAY BE AMENDED PRIOR TO THE TIME OF SALE. THIS TERM SHEET IS NOT AN OFFER TO SELL THESE SECURITIES AND IT IS NOT A SOLICITATION OF AN OFFER TO BUY THESE SECURITIES IN ANY JURISDICTION WHERE THE OFFER OR SALE IS NOT PERMITTED.
| 65 |
KOMO PLAZA
According to a third party market research report, the KOMO Plaza Property is located in the Queen Anne/Magnolia office and retail submarket of Downtown Seattle. As of the third quarter of 2016, the office submarket comprised approximately 1.8 million square feet of Class A office space with an overall vacancy rate of 1.5% and average asking Class A office rents of $32.60 per square foot gross. As of the third quarter of 2016, the retail submarket comprised approximately 2.2 million square feet of retail space with an overall vacancy rate of 1.7% and average asking retail rents of $25.94 per square foot.
According to a third party market research report, the estimated 2016 population within a one-, three- and five-mile radius of the KOMO Plaza Property is 45,438, 214,147 and 424,774, respectively and the estimated 2016 average household income within the same radii of the KOMO Plaza Property is $95,029, $99,997 and $104,723, respectively. Comparatively, the average household income for King County, the metropolitan statistical area, and the state of Washington are $105,450, $95,290 and $82,519, respectively.
The following table presents certain information relating to comparable office properties for the KOMO Plaza Property:
Comparable Office Leases(1)
| Property Name/Location | Year Built | Class | Total GLA (SF) | Distance from Subject | Tenant Name | Lease Date/Term | Lease Area (SF) | Annual Base Rent PSF | Lease Type |
2211 Elliott Avenue Seattle, WA | 1999 | A | 186,112 | 0.7 miles | Haworth, Inc. | 1Q 2016 / 61 mos. | 3,366 | $21.50 | NNN |
2025 1st Avenue Seattle, WA | 1988 | A | 194,687 | 0.7 miles | Dernbach and Harris, PLLC | 1Q 2016 / 66 mos. | 1,172 | $38.00 | Modified |
3131 Elliott Avenue Seattle, WA | 1986 | A | 189,220 | 0.5 miles | Twinstrand Biosciences, Inc. Fox Commerce, Inc. | Sep 2016 / 60 mos. Jun 2016 / 60 mos. | 5,374 3,042 | $32.00 $26.00 | Modified Modified |
3101 Western Avenue Seattle, WA | 1984 | A | 187,074 | 0.4 miles | Merrick, Hofstedt & Lindsey, P.S. | Jul 2016 / 84 mos. | 8,309 | $29.00 | Modified |
2400 Third Avenue Seattle, WA | 2016 | A | 75,120 | 0.3 miles | Antioch University | 4Q 2015 / 180 mos. | 50,825 | $26.25 | NNN |
2401 Elliott Avenue Seattle, WA | 2016 | A | 75,120 | 0.5 miles | Sound Community Bank | 3Q 2015 / 144 mos. | 17,322 | $27.75 | NNN |
501 Fairview Avenue North Seattle, WA | 2016 | A | 291,000 | 1.0 miles | Amazon.com | 1Q 2016 / 192 mos. | 286,000 | $35.17 | NNN |
400 Fairview Avenue North Seattle, WA | 2015 | A | 345,452 | 0.9 miles | Delta Dental | 3Q 2016 / 144 mos. | 62,000 | $37.75 | NNN |
| (1) | Information obtained from the appraisal. |
The following table presents certain information relating to comparable retail properties for the KOMO Plaza Property:
Comparable Retail Leases(1)
| Property Name/Location | Year Built | Class | Distance from Subject | Tenant Name | Lease Date/Term | Lease Area (SF) | Annual Base Rent PSF | Lease Type |
229 Queen Anne Avenue North Seattle, WA | 2004 | A | 0.5 miles | Confidential | 3Q 2016 / 120 mos. | NAV | $25.00 | NNN |
315 1st Avenue North Seattle, WA | 2015 | A | 0.5 miles | Listings | NAV / NAV | 11,229 | NAV | NNN |
2720 4th Avenue Seattle, WA | 2015 | A | <0.1 miles | Breath Yoga | 4Q 2015 / 60 mos. | 2,377 | $32.00 | NNN |
810 Dexter Avenue North Seattle, WA | 2015 | A | 0.8 miles | Taco Shukis | 2Q 2016 / 120 mos. | 1,661 | $25.00 | NNN |
325 9th Avenue North Seattle, WA | 2015 | A | 0.6 miles | Hurry Curry of Tokyo | 4Q 2015 / 120 mos. | 3,282 | $34.00 | NNN |
515 Westlake Avenue North Seattle, WA | 2015 | A | 0.8 miles | HWC Merlake | 2Q 2015 / 120 mos. | 5,753 | $33.80 | NNN |
| (1) | Information obtained from the appraisal. |
The Borrower.The borrower is GI TC Seattle LLC, a Delaware limited liability company and single purpose entity, with two independent directors. Legal counsel to the borrower delivered a non-consolidation opinion in connection with the origination of the KOMO Plaza Whole Loan. TechCore, LLC, a California limited liability company, is the nonrecourse carve-out guarantor of the KOMO Plaza Whole Loan.
The Borrower Sponsor.The borrower sponsor is TechCore, LLC. TechCore, LLC is a core real estate fund capitalized by California Public Employees’ Retirement System (“CalPERS”) and GI Partners. CalPERS is the largest public pension fund in the United States. Its pension fund serves more than 1.8 million members in the CalPERS retirement system and administers benefits for more than 1.4 million members and their families in its health program. CalPERS’ total fund market value as of December 31, 2015 is approximately $288.9 billion. GI Partners is a leading alternative asset manager focused on real estate and private equity strategies. GI Partners currently manages over $12 billion in capital commitments across four discretionary real estate accounts and three private equity funds on behalf of recognized institutional investors across the globe. To date, GI Partners has acquired over $1 billion in technology advantaged real estate totaling over 3.5 million square feet.
THE INFORMATION IN THIS STRUCTURAL AND COLLATERAL TERM SHEET IS NOT COMPLETE AND MAY BE AMENDED PRIOR TO THE TIME OF SALE. THIS TERM SHEET IS NOT AN OFFER TO SELL THESE SECURITIES AND IT IS NOT A SOLICITATION OF AN OFFER TO BUY THESE SECURITIES IN ANY JURISDICTION WHERE THE OFFER OR SALE IS NOT PERMITTED.
| 66 |
KOMO PLAZA
Escrows.The loan documents provide for upfront reserves in the amount of $2,500,000 (the “Verizon Funds”) with the title insurance company pursuant to an escrow agreement, which has been assigned to the lender, in connection with the potential extension of the existing lease with Verizon. Any of the Verizon Funds that are to be paid to the borrower pursuant to such escrow agreement will be deposited with the lender. If Verizon renews its lease within six months after the origination of the KOMO Plaza Whole Loan then the Verizon Funds will be disbursed as follows: (a) to the extent the borrower is required to pay Verizon or any other vendor any amount for tenant improvement allowances, leasing commissions or similar concessions that are due and payable at the time the lender receives the Verizon Funds, the amount of Verizon Funds necessary to pay such costs will be disbursed to Verizon or the applicable vendor to pay such costs, (b) to the extent borrower is obligated to expend the Verizon Funds to pay for tenant improvement allowances, leasing commissions or similar concessions, after such funds have been received by the lender, that portion of the Verizon Funds will be held by the lender and disbursed to the borrower to pay such costs as they are incurred and (c) any amount of the Verizon Funds that represent the difference between the rent under the Verizon lease that existed as of the date of origination of the KOMO Plaza Whole Loan and the rent that would be due pursuant to any executed Verizon extension calculated from the KOMO Plaza Whole Loan origination date through, but not including the date on which such extension is executed, so long as no Cash Sweep Period (as defined below) then exists, funds remaining in such reserve will be disbursed to the borrower, and if a Cash Sweep Period is continuing, deposited with the lender into the cash management account.
However, if Verizon does not renew its lease within six months after the KOMO Plaza Whole Loan origination date, (a) $77,784 of the Verizon Funds will be disbursed either, if no Cash Sweep Period is continuing, to the borrower, or if a Cash Sweep Period is continuing, into the cash management account, (b) $723,000 of the Verizon Funds will be disbursed into an account to be held by the lender to be used to pay for tenant improvement and leasing commissions applicable to the re-leasing of the space previously occupied by Verizon, (c) $246,315 of the Verizon Funds will be held by the lender and disbursed on a monthly basis in equal amounts of $12,964 either, if no Cash Sweep Period is continuing, to the borrower, or if a Cash Sweep Period is continuing, into the cash management account and (d) the balance of the Verizon Funds will be held by the lender and available to the borrower to pay for tenant improvement and leasing commissions at the KOMO Plaza Property but only to the extent that there are no other reserve funds being held by the lender that are available to pay such costs.
The loan documents do not require monthly escrows for taxes so long as (i) if CalPERS is the borrower sponsor, no Triggering Event Period (as defined below) or Cash Sweep Period (as defined below) has occurred and is continuing or (ii) if CalPERS is not the borrower sponsor (a) no Triggering Event Period or Cash Sweep Period has occurred and is continuing and (b) the borrower provides proof of payment of such taxes to the lender within five business days of such request from the lender.
The loan documents do not require monthly escrows for insurance so long as (i) if CalPERS is the borrower sponsor, the KOMO Plaza Property is insured under one or more blanket insurance policies in accordance with the loan documents as part of the master policy of CalPERS or (ii) if CalPERS is not the borrower sponsor (a) either (x) no Triggering Event Period or Cash Sweep Period has occurred and is continuing or (y) the KOMO Plaza Property is insured under one or more blanket insurance policies in accordance with the loan documents and (b) the borrower provides the lender with evidence that all insurance premiums have been paid within five business days of such request from the lender.
The loan documents do not require monthly escrows for replacement reserves or tenant improvements and leasing commissions so long as no Triggering Event Period or Cash Sweep Period exists. Following the occurrence and during the continuance of a Triggering Event Period or Cash Sweep Period, the borrower is required to deposit $4,895 per month (approximately $0.20 per square foot annually) for replacement reserves. The reserve is subject to a cap of $117,491 (approximately $0.40 per square foot). Following the occurrence and during the continuance of a Triggering Event Period or Cash Sweep Period, the borrower is required to deposit $55,074 per month (approximately $2.27 per square foot annually) for tenant improvements and leasing commissions. The reserve is subject to a cap of $1,982,657 (approximately $6.81 per square foot).
The requirement for the borrower to deposit all excess cash flow into the specified tenant sweep reserve is waived so long as no Cash Sweep Period exists solely due to the continuance of a Specified Tenant Sweep Event (as defined below). Following the occurrence and during the continuance of a Cash Sweep Period that exists solely due to the continuance of a Specified Tenant Sweep Event, the borrower is required to deposit all excess cash flow into the specified tenant sweep reserve. The reserve is subject to a cap of $40.00 per square foot multiplied by the total square footage demised to the applicable Specified Tenant (as defined below) that caused the Specified Tenant Sweep Event.
The borrower is required to deposit any termination fees to the extent they are in excess of $750,000 (if CalPERS is the borrower sponsor) or $500,000 (if CalPERS is not the borrower sponsor) and any termination fees received during the continuance of a Cash Sweep Period or an event of default that are in any case in excess of $40 per square foot of terminated space into the cash flow shortfall reserve. Funds in the cash flow shortfall reserve are available for tenant improvements and leasing commissions and in some circumstances as set forth in the loan documents, to pay for operating cash shortfalls (including, monthly debt service payments, deposits into reserves, operating expenses, and other expenses approved by the lender).
The requirement for the borrower to deposit excess cash flow generated by the KOMO Plaza Property for the immediately preceding interest period into the flexible excess cash flow reserve is waived so long as no Cash Sweep Period exists due solely to the debt yield as calculated in the loan documents based on the most recent three-month period annualized is less than 6.75% (a “Low Debt Yield Sweep Period”) solely because of the exclusion of rents from the debt yield calculation from tenants that are not open for business or are not in actual physical occupancy of their demised space. Following the occurrence and during the continuance of a Cash Sweep Period that exists solely due to the reason in the immediately preceding sentence, the borrower is required to deposit excess cash flow generated by the KOMO Plaza Property for the immediately preceding interest period into the flexible excess cash flow reserve. Funds in the flexible excess cash flow reserve are available for tenant improvements and leasing commissions and in
THE INFORMATION IN THIS STRUCTURAL AND COLLATERAL TERM SHEET IS NOT COMPLETE AND MAY BE AMENDED PRIOR TO THE TIME OF SALE. THIS TERM SHEET IS NOT AN OFFER TO SELL THESE SECURITIES AND IT IS NOT A SOLICITATION OF AN OFFER TO BUY THESE SECURITIES IN ANY JURISDICTION WHERE THE OFFER OR SALE IS NOT PERMITTED.
| 67 |
KOMO PLAZA
some circumstances as set forth in the loan documents, to pay for operating cash shortfalls (including, monthly debt service payments, deposits into reserves, operating expenses, and other expenses approved by the lender).
A “Cash Sweep Period” means the occurrence of (i) an event of default; (ii) any bankruptcy or insolvency proceeding of the borrower or the related guarantor; (iii) a Low Debt Yield Sweep Period; or (iv) a Specified Tenant Sweep Event. A Cash Sweep Period will end, with respect to clause (i), upon the cure of such event of default; with respect to clause (ii), upon the bankruptcy or insolvency proceeding being discharged, stayed or dismissed; with respect to clause (iii), when the debt yield based on the most recent three-month period annualized is at least 7.00% for two consecutive quarters; or with respect to clause (iv), upon the cure of such Specified Tenant Sweep Event.
A “Specified Tenant Sweep Event” means the occurrence of (i) the Specified Tenant’s lease terminating or no longer being in full force or effect; (ii) any bankruptcy or insolvency proceeding of the Specified Tenant; or (iii) the Specified Tenant failing to give notice of its intent to renew or extend its lease. In the case of each of the foregoing clauses (i) through (iii), the borrower can prevent the occurrence of a Specified Tenant Sweep Event by depositing with the lender, $40.00 per square foot of space demised to the Specified Tenant that caused the Specified Tenant Sweep Event, within the time period set forth in the loan documents. A Specified Tenant Sweep Event will end, with respect to clause (i), when the Specified Tenant rescinds in writing any notification of termination, cancellation or surrender of its lease; with respect to clause (ii), when the Specified Tenant is no longer insolvent or subject to any bankruptcy or insolvency proceedings; or with respect to clause (iii), the lender receives evidence that (a) the Specified Tenant has extended or renewed its lease and (b) such renewal or extension was exercised by such Specified Tenant without imposing on the borrower any additional landlord obligations, including leasing commissions and tenant improvements.
A “Specified Tenant” means (i) any non-data center lease (other than Sinclair) together with its affiliates, which leases space comprising 25.0% or more of the total in-place base rent at the KOMO Plaza Property; (ii) any data center lease (other than Sinclair) together with its affiliates, which leases space comprising 35.0% or more of the total in-place base rent at the KOMO Plaza Property; and (iii) any lease with Sinclair together with its affiliates, which leases space comprising 27.5% or more of the total in-place base rent at the KOMO Plaza Property.
Lockbox and Cash Management.Upon the occurrence of a Triggering Event Period (as defined below) or a Cash Sweep Period the borrower is required to (i) establish a lockbox account and (ii) send tenant direction letters to each tenant then occupying space at the KOMO Plaza property, instructing them to deposit all rents and payments into the lockbox account controlled by the lender. During the continuance of a Triggering Event Period that is not a Cash Sweep Period, all funds in the lockbox account will be transferred to or at the direction of the borrower unless a Cash Sweep Period exists, in which case all funds in the lockbox account are swept on each business day to a segregated cash management account under the control of the lender where it will be applied through the waterfall set forth in the loan documents, with all excess cash being retained by the lender and held as additional collateral for the KOMO Plaza Whole Loan (until all Cash Sweep Periods are cured pursuant to the loan documents, at which time such excess cash is returned to the borrower).
A “Triggering Event Period” means the occurrence of the NOI debt yield, as calculated in the loan documents based on the most recent three-month period annualized, being less than 7.5%. A Triggering Event Period will end when the debt yield based on the most recent three-month period annualized is at least 7.5% for two consecutive quarters.
Property Management. The KOMO Plaza Property is managed by Hines Interests Limited Partnership, a Delaware limited partnership.
Assumption.The borrower is permitted to transfer the KOMO Plaza Property, provided that certain conditions are satisfied, including (i) no event of default has occurred and is continuing; (ii) the lender has reasonably determined that the proposed transferee (other than a proposed transferee that is qualified equityholder (as defined in the KOMO Plaza Whole Loan documents) or CalPERS (or 20% owned and controlled by either of the foregoing)) and guarantor satisfy the lender’s credit review and underwriting standards, taking into consideration transferee experience, financial strength and general business standing; (iii) execution of a recourse guaranty and an environmental indemnity by an affiliate of the transferee; and (iv) the lender has received confirmation from DBRS, Fitch and Moody’s that such transfer will not result in a downgrade, withdrawal or qualification of the respective ratings assigned to the WFCM Series 2017-RB1 Certificates and similar ratings confirmations from each rating agency rating any securities backed by any KOMO Plaza Companion Loans with respect to the ratings of such securities.
Right of First Refusal. Sinclair’s lease provides that it has a right of first refusal (“ROFR”) to purchase the KOMO Plaza Property if a bona fide offer is received that the borrower is otherwise willing to accept, which such ROFR may have been extinguished by its terms in connection with the sale to the borrower. But, to the extent the ROFR has not been extinguished, it would not be extinguished by foreclosure; however, pursuant to a Subordination, Non-Disturbance and Attornment Agreement among the lender, the borrower and the tenant, the ROFR does not apply to foreclosure or deed in lieu thereof.
Partial Release.Not Permitted.
Real Estate Substitution.Not permitted.
Subordinate and Mezzanine Indebtedness.Not permitted.
Ground Lease. None.
THE INFORMATION IN THIS STRUCTURAL AND COLLATERAL TERM SHEET IS NOT COMPLETE AND MAY BE AMENDED PRIOR TO THE TIME OF SALE. THIS TERM SHEET IS NOT AN OFFER TO SELL THESE SECURITIES AND IT IS NOT A SOLICITATION OF AN OFFER TO BUY THESE SECURITIES IN ANY JURISDICTION WHERE THE OFFER OR SALE IS NOT PERMITTED.
| 68 |
KOMO PLAZA
Terrorism Insurance.The KOMO Plaza Whole Loan documents require that the “all risk” insurance policy required to be maintained by the borrower provide coverage for terrorism in an amount equal to the full replacement cost of the KOMO Plaza Property, or if the terrorism risk insurance program reauthorization act is no longer in effect and such policies contain an exclusion for acts of terrorism, the borrower will be required to obtain, to the extent available, a stand-alone policy that provides the same coverage as the policies would have if such exclusion did not exist; provided, however, in such event the borrower will not be required to pay annual premiums in excess of the Terrorism Cap (as defined below) in order to obtain the terrorism coverage.
“Terrorism Cap” means an amount equal to two times the then-current annual insurance premiums payable by the borrower for the policies insuring only the KOMO Plaza Property on a stand-alone basis.
Earthquake Insurance. The loan documents do not require earthquake insurance. The seismic report indicated a probable maximum loss of 6.0%.
THE INFORMATION IN THIS STRUCTURAL AND COLLATERAL TERM SHEET IS NOT COMPLETE AND MAY BE AMENDED PRIOR TO THE TIME OF SALE. THIS TERM SHEET IS NOT AN OFFER TO SELL THESE SECURITIES AND IT IS NOT A SOLICITATION OF AN OFFER TO BUY THESE SECURITIES IN ANY JURISDICTION WHERE THE OFFER OR SALE IS NOT PERMITTED.
| 69 |
| Santa Rosa Office Portfolio |

THE INFORMATION IN THIS STRUCTURAL AND COLLATERAL TERM SHEET IS NOT COMPLETE AND MAY BE AMENDED PRIOR TO THE TIME OF SALE. THIS TERM SHEET IS NOT AN OFFER TO SELL THESE SECURITIES AND IT IS NOT A SOLICITATION OF AN OFFER TO BUY THESE SECURITIES IN ANY JURISDICTION WHERE THE OFFER OR SALE IS NOT PERMITTED.
| 70 |
| Santa Rosa Office Portfolio |
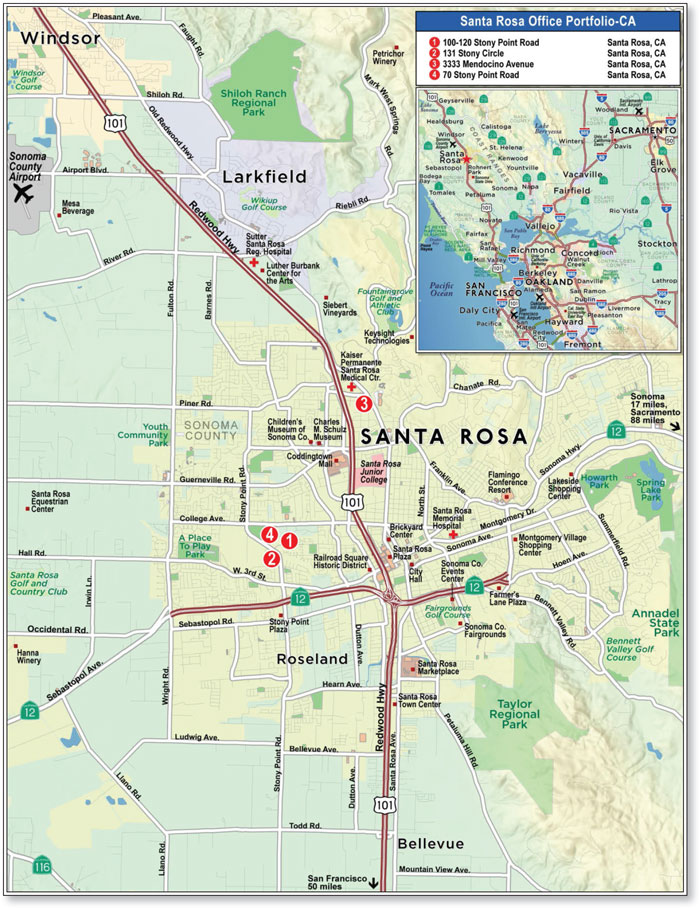
THE INFORMATION IN THIS STRUCTURAL AND COLLATERAL TERM SHEET IS NOT COMPLETE AND MAY BE AMENDED PRIOR TO THE TIME OF SALE. THIS TERM SHEET IS NOT AN OFFER TO SELL THESE SECURITIES AND IT IS NOT A SOLICITATION OF AN OFFER TO BUY THESE SECURITIES IN ANY JURISDICTION WHERE THE OFFER OR SALE IS NOT PERMITTED.
| 71 |
| No. 5 – Santa Rosa Office Portfolio | ||||||
| Loan Information | Property Information | |||||
| Mortgage Loan Seller: | Wells Fargo Bank, National Association | Single Asset/Portfolio: | Portfolio | |||
| Credit Assessment (DBRS/Fitch/Moody’s): | NR/NR/NR | Property Type: | Office | |||
| Original Principal Balance: | $31,900,000 | Specific Property Type: | Suburban | |||
| Cut-off Date Balance: | $31,900,000 | Location: | Santa Rosa, CA | |||
| % of Initial Pool Balance: | 5.0% | Size: | 337,082 SF | |||
| Loan Purpose: | Acquisition | Cut-off Date Balance Per SF: | $94.64 | |||
| Borrower Name: | SR Stony Point De LLC | Year Built/Renovated: | Various – See Table | |||
| Borrower Sponsor: | Matthew T. White | Title Vesting: | Fee | |||
| Mortgage Rate: | 4.590% | Property Manager: | Self-managed | |||
| Note Date: | January 31, 2017 | 4thMost Recent Occupancy (As of): | 76.5% (12/31/2012) | |||
| Anticipated Repayment Date: | NAP | 3rdMost Recent Occupancy (As of): | 82.1% (12/31/2013) | |||
| Maturity Date: | February 11, 2027 | 2ndMost Recent Occupancy (As of): | 82.1% (12/31/2014) | |||
| IO Period: | 36 months | Most Recent Occupancy (As of): | 86.9% (12/31/2015) | |||
| Loan Term (Original): | 120 months | Current Occupancy (As of): | 86.4% (1/1/2017) | |||
| Seasoning: | 1 month | |||||
| Amortization Term (Original): | 360 months | Underwriting and Financial Information: | ||||
| Loan Amortization Type: | Interest-only, Amortizing Balloon | |||||
| Interest Accrual Method: | Actual/360 | 4thMost Recent NOI (As of): | $2,967,124 (12/31/2013) | |||
| Call Protection: | L(25),D(90),O(5) | 3rdMost Recent NOI (As of): | $2,942,443 (12/31/2014) | |||
| Lockbox Type: | Springing | 2ndMost Recent NOI (As of): | $3,097,343 (12/31/2015) | |||
| Additional Debt: | None | Most Recent NOI (As of)(2): | $2,827,936 (12/31/2016) | |||
| Additional Debt Type: | NAP | |||||
| U/W Revenues: | $6,343,231 | |||||
| U/W Expenses: | $3,033,656 | |||||
| U/W NOI(2): | $3,309,575 | |||||
| U/W NCF: | $2,819,710 | |||||
| Escrows and Reserves(1): | U/W NOI DSCR: | 1.69x | ||||
| U/W NCF DSCR: | 1.44x | |||||
| Type: | Initial | Monthly | Cap (If Any) | U/W NOI Debt Yield: | 10.4% | |
| Taxes | $42,316 | $42,316 | NAP | U/W NCF Debt Yield: | 8.8% | |
| Insurance | $0 | Springing | NAP | As-Is Appraised Value: | $46,200,000 | |
| Replacement Reserve | $1,000,000 | Springing | NAP | As-Is Appraisal Valuation Date: | January 3, 2017 | |
| TI/LC Reserve | $1,100,000 | $42,697 | $1,000,000 | Cut-off Date LTV Ratio: | 69.0% | |
| Kaiser and Pacific Union Lease Reserve | $600,000 | $0 | NAP | LTV Ratio at Maturity: | 60.6% | |
| (1) | See “Escrows” section. |
| (2) | See “Cash Flow Analysis” section. |
The Mortgage Loan.The mortgage loan (the “Santa Rosa Office Portfolio Mortgage Loan”) is evidenced by a promissory note secured by a first mortgage encumbering the fee interest in four suburban office properties located in Santa Rosa, California (the “Santa Rosa Office Portfolio Properties”). The Santa Rosa Office Portfolio Mortgage Loan was originated on January 31, 2017 by Wells Fargo Bank, National Association. The Santa Rosa Office Portfolio Mortgage Loan had an original principal balance of $31,900,000, has an outstanding principal balance as of the Cut-off Date of $31,900,000 and accrues interest at an interest rate of 4.590%per annum. The Santa Rosa Office Portfolio Mortgage Loan had an initial term of 120 months, has a remaining term of 119 months as of the Cut-off Date and requires payments of interest-only for the first 36 payments following origination and thereafter requires payments of principal and interest based on a 30-year amortization schedule. The Santa Rosa Office Portfolio Mortgage Loan matures on February 11, 2027.
Following the lockout period, the borrower has the right to defease the Santa Rosa Office Portfolio Mortgage Loan in whole or in part (see “Partial Release” section), on any payment date before October 11, 2026. In addition, the Santa Rosa Office Portfolio Mortgage Loan is prepayable without penalty on or after October 11, 2026.
THE INFORMATION IN THIS STRUCTURAL AND COLLATERAL TERM SHEET IS NOT COMPLETE AND MAY BE AMENDED PRIOR TO THE TIME OF SALE. THIS TERM SHEET IS NOT AN OFFER TO SELL THESE SECURITIES AND IT IS NOT A SOLICITATION OF AN OFFER TO BUY THESE SECURITIES IN ANY JURISDICTION WHERE THE OFFER OR SALE IS NOT PERMITTED.
| 72 |
| Santa Rosa Office Portfolio |
Sources and Uses
| Sources | Uses | |||||||
| Original loan amount | $31,900,000 | 67.5% | Purchase price | $43,900,000 | 92.9% | |||
| Borrower Sponsor’s new cash contribution | 15,350,000 | 32.5 | Reserves | 2,742,316 | 5.8 | |||
| Closing costs | 607,684 | 1.3 | ||||||
| Total Sources | $47,250,000 | 100.0% | Total Uses | 47,250,000 | 100.0% |
The Properties.The Santa Rosa Office Portfolio Properties consist of four office properties comprised of 7 separate buildings located in Santa Rosa, California, approximately 54.6 miles north of San Francisco. Constructed from 1981 to 2000, the Santa Rosa Office Portfolio Properties total 337,082 square feet and are leased to 55 tenants across a diverse spectrum of industries, including legal, insurance, financial services, healthcare, real estate services, and media, with no one tenant representing more than 5.6% of net rentable area or 6.9% of annual in-place underwritten base rent. Tenants comprising approximately 32.7% of net rentable area have been in occupancy for over 10 years, and tenants comprising approximately 53.8% of net rentable area have been in occupancy for over 5 years. Additionally, The Santa Rosa Office Portfolio Properties have benefited from significant leasing momentum with approximately 206,668 square feet (61.3% of net rentable area) having signed a new or renewal lease since 2015. Effective gross income for the Santa Rosa Office Portfolio Properties has increased year-over-year from $2,725,988 in 2013 to $3,122,281 in 2016, representing a compound annual growth rate of 3.5%.
The Santa Rosa Office Portfolio Properties range in size from 19,328 square feet to 198,931 square feet and are comprised 7 separate one and two-story buildings. The Santa Rosa Office Portfolio Properties contain 1,071 surface parking spaces, accounting for a parking ratio of 3.2 spaces per 1,000 square feet of rentable area and are located within 3.7 miles of one another on the east and north sides of downtown Santa Rosa. The 100-120 Stony Point Road property and 70 Stony Point Road property are located adjacent to one another, providing for a class A campus-like environment with walkable retail services and restaurants surrounding a lake and park area. The 131 Stony Circle property is located directly across Stony Point Road and comprises two separate adjacent buildings. The 100-120 Stony Point Road property and 131 Stony Circle property were subject to prior loan modifications due to payment defaults, which did not occur under the ownership of the current sponsor. See “Description of the Mortgage Pool—Loan Purpose; Default History, Bankruptcy Issues and Other Proceedings” in the Preliminary Prospectus. The 3333 Mendocino Avenue property is further north, located along Mendocino Avenue and Bicentennial Way, sharing the intersection with the Kaiser Permanente Santa Rosa Medical Center (a 173-bed acute care hospital serving approximately 160,000 members) and a retail center anchored by an approximately 95,092 square foot Home Depot.
The largest tenants include Sutter Care at Home (5.5% of net rentable area and 6.9% of underwritten base rent; rated AA-/Aa3/AA-by Fitch/Moody’s/S&P), one of the region’s largest not-for-profit, community-based home care providers serving 24 counties throughout Northern California and Burr Pilger Mayer (5.2% of net rentable area and 6.3% of underwritten base rent), one of the largest California-based accounting and consulting firms, ranking in the top 50 in the country. As of January 1, 2017, the Santa Rosa Office Portfolio Properties were 86.4% occupied by 55 tenants.
The following table presents certain information relating to the Santa Rosa Office Portfolio Properties:
| Property Name – Location | Allocated Cut-off Date Balance | % of Portfolio Cut-off Date Balance | Occupancy | Year Built/ Renovated | Net Rentable Area (SF) | As-Is Appraised Value | Allocated Cut-off Date LTV |
| 100-120 Stony Point Road | $19,000,000 | 59.6% | 85.5% | 1990/NAP | 198,931 | $27,750,000 | 68.5% |
| 131 Stony Circle | $5,995,000 | 18.8% | 87.5% | 1986/NAP | 80,812 | $9,000,000 | 66.6% |
| 3333 Mendocino Avenue | $4,610,000 | 14.5% | 88.7% | 1981/NAP | 38,011 | $6,150,000 | 75.0% |
| 70 Stony Point Road | $2,295,000 | 7.2% | 86.4% | 2000/NAP | 19,328 | $3,300,000 | 69.5% |
| Total/Weighted Average | $31,900,000 | 100.0% | 86.4% | 337,082 | $46,200,000 | 69.0% |
THE INFORMATION IN THIS STRUCTURAL AND COLLATERAL TERM SHEET IS NOT COMPLETE AND MAY BE AMENDED PRIOR TO THE TIME OF SALE. THIS TERM SHEET IS NOT AN OFFER TO SELL THESE SECURITIES AND IT IS NOT A SOLICITATION OF AN OFFER TO BUY THESE SECURITIES IN ANY JURISDICTION WHERE THE OFFER OR SALE IS NOT PERMITTED.
| 73 |
| Santa Rosa Office Portfolio |
The following table presents certain information relating to the tenancies at the Santa Rosa Office Portfolio Properties:
Major Tenants
| Tenant Name | Credit Rating (Fitch/ Moody’s/ S&P)(1) | Tenant NRSF | % of NRSF | Annual U/W Base Rent PSF(2) | Annual U/W Base Rent(2) | % of Total Annual U/W Base Rent | Lease Expiration Date |
| Major Tenants | |||||||
| Sutter Care at Home | AA-/Aa3/AA- | 18,532 | 5.5% | $23.44 | $434,482 | 6.9% | 3/31/2020 |
| Burr Pilger Mayer | NR/NR/NR | 17,676 | 5.2% | $22.20 | $392,407 | 6.3% | 1/31/2020(3) |
| Sutter West Bay | AA-/Aa3/AA- | 18,754 | 5.6% | $20.68 | $387,763 | 6.2% | 9/30/2024 |
| National Instruments | NR/NR/NR | 16,147 | 4.8% | $20.54 | $331,676 | 5.3% | 2/28/2021 |
| Flowmaster | NR/NR/NR | 14,984(4) | 4.4% | $20.68(4) | $309,871(4) | 5.0% | 1/31/2018 |
| Total Major Tenants | 86,093 | 25.5% | $21.56 | $1,856,200 | 29.7% | ||
| Non-Major Tenants | 205,261 | 60.9% | $21.45 | $4,403,520 | 70.3% | ||
| Occupied Collateral Total | 291,354 | 86.4% | $21.48 | $6,259,720 | 100.0% | ||
| Vacant Space | 45,728 | 13.6% | |||||
| Collateral Total | 337,082 | 100.0% | |||||
| (1) | Certain ratings are those of the parent company whether or not the parent guarantees the lease. |
| (2) | Annual U/W Base Rent PSF and Annual U/W Base Rent include contractual rent steps through January 2018 totaling $169,675. |
| (3) | Burr Pilger Mayer has two one-time rights to terminate its lease effective January 31, 2018 and January 31, 2019, each with 180 days’ notice and payment of a termination fee equal to the sum of (i) either $98,102 (3 months’ rent) if terminating on January 31, 2018 or $33,584 (1 months’ rent) if terminating on January 31, 2019 plus the (ii) landlord’s unamortized TI/LC costs. |
| (4) | Flowmaster leases 12,133 square feet with an Annual U/W Base Rent of $20.80 per square foot and 2,851 square feet with an Annual U/W Base Rent of $20.16 per square foot. |
The following table presents certain information relating to the lease rollover schedule at the Santa Rosa Office Portfolio Properties:
Lease Expiration Schedule(1)(2)
| Year Ending December 31, | No. of Leases Expiring | Expiring NRSF | % of Total NRSF | Cumulative Expiring NRSF | Cumulative % of Total NRSF | Annual U/W Base Rent | % of Total Annual U/W Base Rent | Annual U/W Base Rent PSF(3) |
| MTM | 0 | 0 | 0.0% | 0 | 0.0% | $0 | 0.0% | $0.00 |
| 2017 | 12 | 34,035 | 10.1% | 34,035 | 10.1% | $742,456 | 11.9% | $21.81 |
| 2018 | 16 | 55,068 | 16.3% | 89,103 | 26.4% | $1,113,896 | 17.8% | $20.23 |
| 2019 | 5 | 13,896 | 4.1% | 102,999 | 30.6% | $324,148 | 5.2% | $23.33 |
| 2020 | 14 | 104,224 | 30.9% | 207,223 | 61.5% | $2,233,846 | 35.7% | $21.43 |
| 2021 | 8 | 42,682 | 12.7% | 249,905 | 74.1% | $957,392 | 15.3% | $22.43 |
| 2022 | 5 | 22,695 | 6.7% | 272,600 | 80.9% | $500,218 | 8.0% | $22.04 |
| 2023 | 0 | 0 | 0.0% | 272,600 | 80.9% | $0 | 0.0% | $0.00 |
| 2024 | 1 | 18,754 | 5.6% | 291,354 | 86.4% | $387,763 | 6.2% | $20.68 |
| 2025 | 0 | 0 | 0.0% | 291,354 | 86.4% | $0 | 0.0% | $0.00 |
| 2026 | 0 | 0 | 0.0% | 291,354 | 86.4% | $0 | 0.0% | $0.00 |
| 2027 | 0 | 0 | 0.0% | 291,354 | 86.4% | $0 | 0.0% | $0.00 |
| Thereafter | 0 | 0 | 0.0% | 291,354 | 86.4% | $0 | 0.0% | $0.00 |
| Vacant | 0 | 45,728 | 13.6% | 337,082 | 100.0% | $0 | 0.0% | $0.00 |
| Total/Weighted Average | 61(4) | 337,082 | 100.0% | $6,259,720 | 100.0% | $21.48 |
| (1) | Information obtained from the underwritten rent roll. |
| (2) | Certain tenants may have lease termination options that are exercisable prior to the originally stated expiration date of the subject lease and that are not considered in the Lease Expiration Table. |
| (3) | Weighted Average Annual U/W Base Rent PSF excludes vacant space. |
| (4) | The Santa Rosa Office Portfolio Properties are occupied by 55 tenants subject to 61 leases. |
THE INFORMATION IN THIS STRUCTURAL AND COLLATERAL TERM SHEET IS NOT COMPLETE AND MAY BE AMENDED PRIOR TO THE TIME OF SALE. THIS TERM SHEET IS NOT AN OFFER TO SELL THESE SECURITIES AND IT IS NOT A SOLICITATION OF AN OFFER TO BUY THESE SECURITIES IN ANY JURISDICTION WHERE THE OFFER OR SALE IS NOT PERMITTED.
| 74 |
| Santa Rosa Office Portfolio |
The following table presents historical occupancy percentages at the Santa Rosa Office Portfolio Properties:
Historical Occupancy
12/31/2012(1) | 12/31/2013(1) | 12/31/2014(1) | 12/31/2015(1) | 1/1/2017(2) |
| 76.5% | 82.1% | 82.1% | 86.9% | 86.4% |
| (1) | Information obtained from the borrower. |
| (2) | Information obtained from the underwritten rent roll. |
Operating History and Underwritten Net Cash Flow. The following table presents certain information relating to the historical operating performance and the underwritten net cash flow at the Santa Rosa Office Portfolio Properties:
Cash Flow Analysis
| 2013 | 2014 | 2015 | 2016(1) | U/W(1) | % of U/W Effective Gross Income | U/W $ per SF | |||||||||
| Base Rent | $5,621,007 | $5,594,031 | $5,760,743 | $5,769,598 | $6,259,720(2) | 98.7% | $18.57 | ||||||||
| Grossed Up Vacant Space | 0 | 0 | 0 | 0 | 998,878 | 15.7 | 2.96 | ||||||||
| Total Reimbursables | 52,799 | 148,490 | 174,610 | 161,915 | 64,806 | 1.0 | 0.19 | ||||||||
| Other Income | 19,307 | 21,641 | 21,663 | 18,704 | 18,704 | 0.3 | 0.06 | ||||||||
| Less Vacancy & Credit Loss | 0 | 0 | 0 | 0 | (998,878)(3) | (15.7) | (2.96) | ||||||||
| Effective Gross Income | $5,693,112 | $5,764,161 | $5,957,017 | $5,950,217 | $6,343,231 | 100.0% | $18.82 | ||||||||
| Total Operating Expenses | $2,725,988 | $2,821,718 | $2,859,674 | $3,122,281 | $3,033,656 | 47.8% | $9.00 | ||||||||
| Net Operating Income | $2,967,124 | $2,942,443 | $3,097,343 | $2,827,936 | $3,309,575 | 52.2% | $9.82 | ||||||||
| TI/LC | 0 | 0 | 0 | 0 | 314,694 | 5.0 | 0.93 | ||||||||
| Capital Expenditures | 0 | 0 | 0 | 0 | 175,171 | 2.8 | 0.52 | ||||||||
| Net Cash Flow | $2,967,124 | $2,942,443 | $3,097,343 | $2,827,936 | $2,819,710 | 44.5% | $8.37 | ||||||||
| NOI DSCR | 1.51x | 1.50x | 1.58x | 1.44x | 1.69x | ||||||||||
| NCF DSCR | 1.51x | 1.50x | 1.58x | 1.44x | 1.44x | ||||||||||
| NOI DY | 9.3% | 9.2% | 9.7% | 8.9% | 10.4% | ||||||||||
| NCF DY | 9.3% | 9.2% | 9.7% | 8.9% | 8.8% |
| (1) | The increase in Base Rent, Effective Gross Income and Net Operating Income from 2016 to U/W was a result of approximately 206,668 square feet (61.3% of net rentable area) having signed a new or renewal lease since 2015. |
| (2) | U/W Base Rent includes contractual rent steps through January 2018 totaling $169,675. |
| (3) | The underwritten economic vacancy is 13.8%. The Santa Rosa Office Portfolio Properties were 86.4% physically occupied as of January 1, 2017. |
Appraisal.As of the appraisal valuation date of January 3, 2017, the Santa Rosa Office Portfolio Properties had an aggregate “as-is” appraised value of $46,200,000.
Environmental Matters. According to the Phase I environmental site assessments dated August 23, 2016 through August 25, 2016, there was no evidence of any recognized environmental conditions at the Santa Rosa Office Portfolio Properties.
Market Overview and Competition.Santa Rosa is located along Highway 101 in the heart of Sonoma County, approximately 54.6 miles north of San Francisco, California. Historically, Santa Rosa has been a center for agriculture, industry, and shipping. Today, the city is a hub for local industries, including winemaking, healthcare, engineering, biotechnology, financial services, education and tourism. In recent years, it has been a center for innovation of tech start-ups and medical firms. According to the appraisal, the city acts as the main medical service area for all cities in Sonoma County and has the only Level II Trauma Center (Santa Rosa Memorial Hospital) that serves the Coastal Valley region that includes Sonoma, Napa, Mendocino and Lake Counties. The Sonoma-Marin Area Rail Transit (“SMART”), an approximately $690.0 million light passenger rail development, will add to the draw and accessibility of Santa Rosa. SMART, which is currently under construction and expected to be completed in late spring of 2017, will span approximately 70.0 miles from Cloverdale, California in the north, through Santa Rosa to Larkspur, California. Currently, more than 75.0% of commuters in the North Bay area travel either within or between Sonoma and Marin counties to get to work. A third-party business publication ranked Santa Rosa as one of the top cities in the United States in 2016 for “Best Places for Business and Careers”, rated 10th in Job Growth and 71st in Education. As of 2016, the estimated population and average household income for Santa Rosa was 502,400 and $70,688, respectively. The unemployment rate in the North Bay region declined 50 basis points to 3.5% during the fourth quarter of 2016, and positioned the North Bay job market as one of the healthiest in the greater Bay Area.
The Santa Rosa office market provides tenants a lower-cost competitive alternative to other submarkets of the North Bay area, while offering ease of access and proximity to San Francisco. According to a third party market research report, the Santa Rosa Office Portfolio Properties are located within the Santa Rosa submarket. As of the fourth quarter of 2016, the submarket reported a total inventory of 902 office buildings totaling approximately 9.2 million square feet with a 5.3% vacancy rate and average asking rents of $19.40 per square foot, full service gross. Over the same period, net absorptions totaled 282,000 square feet while the average asking rents in the Santa Rosa submarket were approximately 38.1% below Marin County office asking rates and approximately 65.8% below San Francisco office asking rates.
THE INFORMATION IN THIS STRUCTURAL AND COLLATERAL TERM SHEET IS NOT COMPLETE AND MAY BE AMENDED PRIOR TO THE TIME OF SALE. THIS TERM SHEET IS NOT AN OFFER TO SELL THESE SECURITIES AND IT IS NOT A SOLICITATION OF AN OFFER TO BUY THESE SECURITIES IN ANY JURISDICTION WHERE THE OFFER OR SALE IS NOT PERMITTED.
| 75 |
| Santa Rosa Office Portfolio |
The following table presents certain information relating to comparable office leases for the Santa Rosa Office Portfolio Properties:
Comparable Leases(1)
Property Name/ Location | Year Built/ Renovated | Stories | Total GLA (SF) | Total Occupancy | Distance from Subject(2) | Tenant Name | Lease Date/Term | Lease Area (SF) | Annual Base Rent PSF | Lease Type |
141 Stony Point Circle Santa Rosa, CA | 1988/NAP | 2 | 65,783 | 79% | 3.6 miles | Univision | December 2016 / 2.1 Yrs | 1,221 | $22.32 | FSG |
141 Stony Point Circle Santa Rosa, CA | 1988/NAP | 2 | 65,783 | 79% | 3.6 miles | First Bank | September 2016 / 1.5 Yrs | 2,193 | $19.80 | FSG |
420 Aviation Blvd Santa Rosa, CA | 1995/NAP | 1 | 29,500 | 100% | 7.1 miles | William M. Andrew | June 2016 / 3.0 Yrs | 3,000 | $21.00 | FSG |
3562 Round Barn Circle Santa Rosa, CA | 2008/NAP | 3 | 63,292 | 95% | 4.4 miles | Santa Rosa Capitol Holdings | February 2016 / 5.0 Yrs | 11,956 | $26.40 | FSG |
2455 Bennett Valley Road Santa Rosa, CA | 1981/NAP | 3 | 91,929 | 80% | 3.7 miles | Simon & Boitano CPA | August 2015 / 4.1 Yrs | 2,046 | $19.80 | FSG |
2455 Bennett Valley Road Santa Rosa, CA | 1981/NAP | 3 | 91,929 | 80% | 3.7 miles | Andrews & Larson | March 2015 / 3.2 Yrs | 722 | $21.00 | FSG |
| (1) | Information obtained from the appraisal. |
| (2) | Represents the greater of the distances of each comparable property from the Santa Rosa Office Portfolio Properties. |
The Borrower.The borrower is SR Stony Point De LLC, a Delaware limited liability company and single purpose entity with one independent director. Legal counsel to the borrower delivered a non-consolidation opinion in connection with the origination of the Santa Rosa Office Portfolio Mortgage Loan. Matthew T. White and the Matthew White Family Trust (the “Santa Rosa Office Portfolio Guarantor”) are collectively guarantor of certain nonrecourse carveouts under the Santa Rosa Office Portfolio Mortgage Loan.
The Borrower Sponsor. The borrower sponsor is Matthew T. White. Matthew T. White is the CEO of Basin Street Properties, one of northern California’s and northern Nevada’s prominent developers, investors and managers of commercial properties founded over 40 years ago. Basin Street Properties has a portfolio of more than 4.0 million square foot of office, light-industrial, retail, multifamily and hospitality properties in the North Bay, Sacramento area and Reno, Nevada, and more than 2.0 million square feet in the North Bay area alone. The sponsor was involved in two prior mortgage defaults. See “Description of the Mortgage Pool – Loan Purpose; Default History, Bankruptcy Issues and Other Proceedings” in the Preliminary Prospectus.
Escrows.The loan documents provide for upfront escrows at closing in the amount of $42,316 for real estate taxes, $1,000,000 for replacement reserves, $1,100,000 for general tenant improvements and leasing commissions (“TI/LCs”) and $600,000 for potential TI/LCs associated for the Kaiser and Pacific Union leased spaces.
The loan documents provide for ongoing monthly escrows of $42,316 for taxes, $14,045 for replacement reserves (should reserve funds fall below $300,000, not subject to a cap) and $42,697 for TI/LCs (should reserve funds fall below $600,000, subject to a cap of $1,000,000). The loan documents do not require ongoing monthly escrows for insurance premiums as long as (i) no event of default has occurred and is continuing, (ii) the borrower provides the lender with evidence that the Santa Rosa Office Portfolio Properties is insured via an acceptable blanket insurance policy and such policy is in full force and effect and (iii) the borrower provides the lender with evidence of renewal of the insurance policies and timely proof of payment of insurance premiums.
Lockbox and Cash Management. Upon the occurrence and during the continuance of a Cash Trap Event Period (as defined below), the Santa Rosa Office Portfolio Mortgage Loan requires that the borrower establish a lockbox account and the borrowers or property manager is required to deposit all rents into such lockbox account and such funds will be swept to the cash management account. During a Cash Trap Event Period, all excess cash flow after payment of all sums due and payable under the loan documents and all operating expenses will be retained by the lender as additional collateral.
A “Cash Trap Event Period” will commence upon any of the following: (i) the occurrence and continuance of an event of default or (ii) the amortizing debt service coverage ratio falling below 1.15x (tested quarterly). A Cash Trap Event Period will be cured, with regard to clause (i), upon the cure of such event of default; and with regard to clause (ii), upon the amortizing debt service coverage ratio being greater than 1.15x for two consecutive calendar quarters.
Property Management. The Santa Rosa Office Portfolio Properties are managed by an affiliate of the borrower.
Assumption.The borrower has the two-time right to transfer the Santa Rosa Office Portfolio Properties provided that certain conditions are satisfied, including (i) no event of default has occurred and is continuing; (ii) the lender reasonably determines that the proposed transferee and Santa Rosa Office Portfolio Guarantor satisfy the lender’s credit review and underwriting standards, taking into consideration transferee experience, financial strength and general business standing; and (iii) the lender has received confirmation from DBRS, Fitch and Moody’s that such assumption will not result in a downgrade, withdrawal or qualification of the respective ratings assigned to the Series 2017-RB1 Certificates.
THE INFORMATION IN THIS STRUCTURAL AND COLLATERAL TERM SHEET IS NOT COMPLETE AND MAY BE AMENDED PRIOR TO THE TIME OF SALE. THIS TERM SHEET IS NOT AN OFFER TO SELL THESE SECURITIES AND IT IS NOT A SOLICITATION OF AN OFFER TO BUY THESE SECURITIES IN ANY JURISDICTION WHERE THE OFFER OR SALE IS NOT PERMITTED.
| 76 |
| Santa Rosa Office Portfolio |
Partial Release. Following the lockout period, the borrower is permitted to partially release any of the Santa Rosa Office Portfolio Properties, subject to certain conditions including (a) no event of default has occurred and is continuing and (b) partial defeasance of the greater of (i) 120% of the released property’s allocated loan balance; (ii) an amount which would result in the loan-to-value ratio with respect to the remaining properties being no greater than the lesser of a 70.0% loan-to-value ratio and the loan-to-value ratio immediately prior to the release; (iii) an amount which would result in the amortizing debt service coverage ratio with respect to the remaining properties being no less than the greater of 1.40x and the debt service coverage ratio immediately prior to the release; and (iv) an amount which would result in the net cash flow debt yield with respect to the remaining properties being no less than the greater of 8.7% and the debt yield immediately prior to the release.
Real Estate Substitution.Not permitted.
Subordinate and Mezzanine Indebtedness.Not permitted.
Ground Lease.None.
Terrorism Insurance. The loan documents require that the “all risk” insurance policy required to be maintained by the borrower provides coverage for terrorism in an amount equal to the full replacement cost of the Santa Rosa Office Portfolio Properties. The loan documents also require business interruption insurance covering no less than the 18-month period following the occurrence of a casualty event, together with a six-month extended period of indemnity.
Earthquake Insurance. The loan documents do not require earthquake insurance. The seismic reports indicated a probable maximum loss of 11% to 12% for each of the Santa Rosa Office Portfolio Properties.
THE INFORMATION IN THIS STRUCTURAL AND COLLATERAL TERM SHEET IS NOT COMPLETE AND MAY BE AMENDED PRIOR TO THE TIME OF SALE. THIS TERM SHEET IS NOT AN OFFER TO SELL THESE SECURITIES AND IT IS NOT A SOLICITATION OF AN OFFER TO BUY THESE SECURITIES IN ANY JURISDICTION WHERE THE OFFER OR SALE IS NOT PERMITTED.
| 77 |
| IPCC TEXAS SELF STORAGE PORTFOLIO |
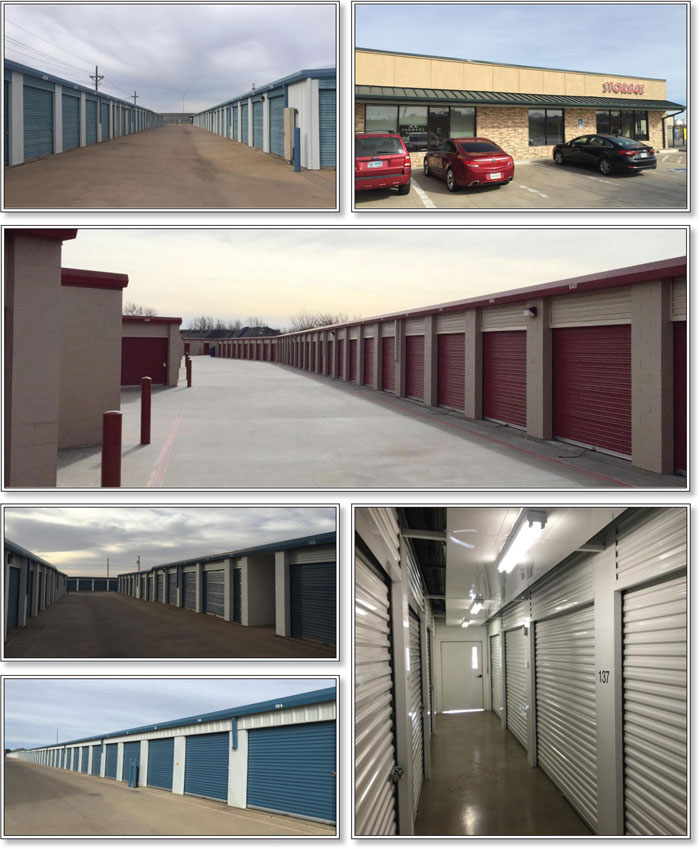
THE INFORMATION IN THIS STRUCTURAL AND COLLATERAL TERM SHEET IS NOT COMPLETE AND MAY BE AMENDED PRIOR TO THE TIME OF SALE. THIS TERM SHEET IS NOT AN OFFER TO SELL THESE SECURITIES AND IT IS NOT A SOLICITATION OF AN OFFER TO BUY THESE SECURITIES IN ANY JURISDICTION WHERE THE OFFER OR SALE IS NOT PERMITTED.
| 78 |
| IPCC TEXAS SELF STORAGE PORTFOLIO |
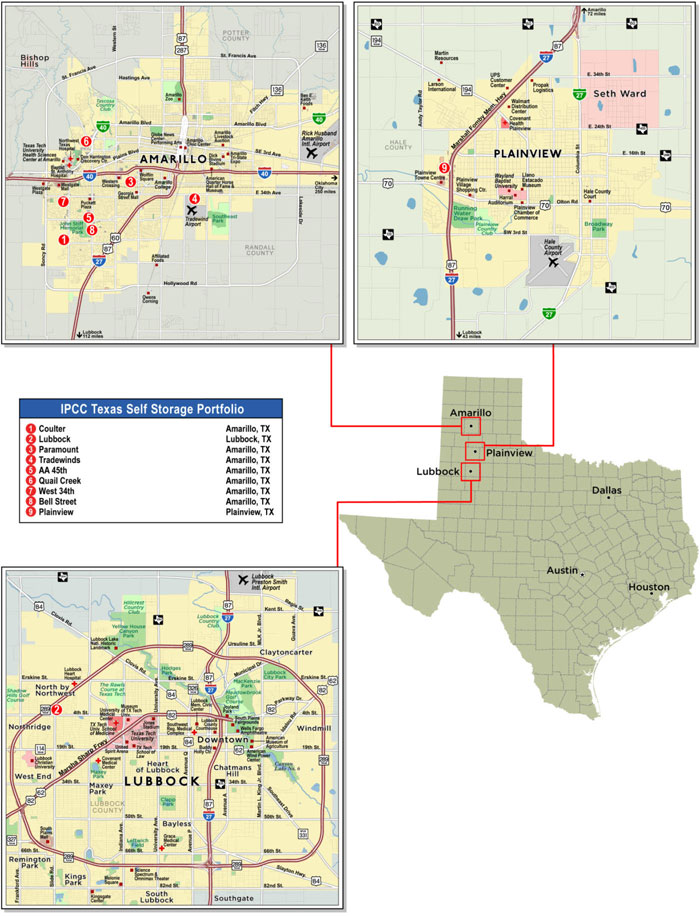
THE INFORMATION IN THIS STRUCTURAL AND COLLATERAL TERM SHEET IS NOT COMPLETE AND MAY BE AMENDED PRIOR TO THE TIME OF SALE. THIS TERM SHEET IS NOT AN OFFER TO SELL THESE SECURITIES AND IT IS NOT A SOLICITATION OF AN OFFER TO BUY THESE SECURITIES IN ANY JURISDICTION WHERE THE OFFER OR SALE IS NOT PERMITTED.
| 79 |
| No. 6 – IPCC Texas Self Storage Portfolio | |||||||
| Loan Information | Property Information | ||||||
| Mortgage Loan Seller: | Barclays Bank PLC | Single Asset/Portfolio: | Portfolio | ||||
Credit Assessment (DBRS/Fitch/ Moody’s): | NR/NR/NR | Property Type: | Self Storage | ||||
| Original Principal Balance: | $31,500,000 | Specific Property Type: | Self Storage | ||||
| Cut-off Date Balance: | $31,500,000 | Location: | Various – See Table | ||||
| % of Initial Pool Balance: | 4.9% | Size: | 685,835 SF | ||||
| Loan Purpose: | Acquisition | Cut-off Date Balance Per SF: | $45.93 | ||||
| Borrower Name: | Self-Storage Portfolio IV DST | Year Built/Renovated: | Various – See Table | ||||
| Borrower Sponsor: | Inland Private Capital Corporation | Title Vesting: | Fee | ||||
| Mortgage Rate: | 4.930% | Property Manager(3): | Metro Storage LLC | ||||
| Note Date: | March 1, 2017 | 4thMost Recent Occupancy(4): | NAV | ||||
| Anticipated Repayment Date: | NAP | 3rdMost Recent Occupancy (As of): | 79.0% (12/31/2014) | ||||
| Maturity Date: | March 6, 2027 | 2ndMost Recent Occupancy (As of): | 84.4% (12/31/2015) | ||||
| IO Period: | 60 months | Most Recent Occupancy (As of): | 80.6% (12/31/2016) | ||||
| Loan Term (Original): | 120 months | Current Occupancy (As of): | 79.4% (1/31/2017) | ||||
| Seasoning: | None | ||||||
| Amortization Term (Original): | 360 months | Underwriting and Financial Information: | |||||
| Loan Amortization Type: | Interest-only, Amortizing Balloon | ||||||
| Interest Accrual Method: | Actual/360 | 4thMost Recent NOI: | NAV | ||||
| Call Protection: | L(24),GRTR 1% or YM(92),O(4) | 3rdMost Recent NOI (As of): | $2,525,417 (12/31/2014) | ||||
| Lockbox Type: | Springing | 2ndMost Recent NOI (As of)(5): | $2,883,768 (12/31/2015) | ||||
| Additional Debt(1): | Yes | Most Recent NOI (As of)(5): | $3,228,987 (12/31/2016) | ||||
| Additional Debt Type(1): | Future Unsecured | ||||||
| U/W Revenues: | $5,166,920 | ||||||
| U/W Expenses: | $1,840,770 | ||||||
| U/W NOI: | $3,326,150 | ||||||
| U/W NCF: | $3,251,280 | ||||||
| U/W NOI DSCR: | 1.65x | ||||||
| Escrows and Reserves(2): | U/W NCF DSCR: | 1.62x | |||||
| U/W NOI Debt Yield: | 10.6% | ||||||
| Type: | Initial | Monthly | Cap (If Any) | U/W NCF Debt Yield: | 10.3% | ||
| Taxes | $0 | Springing | NAP | As-Is Appraised Value: | $54,500,000 | ||
| Insurance | $0 | Springing | NAP | As-Is Appraisal Valuation Date: | 10/28/2016 | ||
| Replacement Reserves | $70,000 | Springing | $350,000 | Cut-off Date LTV Ratio: | 57.8% | ||
| Deferred Maintenance | $2,500 | $0 | NAP | LTV Ratio at Maturity: | 53.3% | ||
| (1) | See “Additional Unsecured Subordinate Indebtedness” Section. |
| (2) | See “Escrows” section. |
| (3) | See “Property Management” section. |
| (4) | See “Historical Occupancy” section and “Cash Flow Analysis” section. Historical occupancy and cash flow information prior to 2014 was not available for the IPCC Texas Self Storage Portfolio Properties due to acquisition financing. |
| (5) | See “Cash Flow Analysis” section. The increase from 2nd Most Recent NOI to Most Recent NOI is primarily attributable to a 440 unit expansion of the Tradewinds, Paramount and Lubbock properties over 2015 and 2016. |
The Mortgage Loan. The mortgage loan (the “IPCC Texas Self Storage Portfolio Mortgage Loan”) is evidenced by a single promissory note that is secured by first mortgages encumbering a portfolio of nine self storage properties located in Texas (the “IPCC Texas Self Storage Portfolio Properties”). The IPCC Texas Self Storage Portfolio Mortgage Loan was originated on March 1, 2017 by Barclays Bank PLC. The IPCC Texas Self Storage Portfolio Mortgage Loan had an original principal balance of $31,500,000, has an outstanding principal balance as of the Cut-off Date of $31,500,000 and accrues interest at an interest rate of 4.930%per annum. The IPCC Texas Self Storage Portfolio Mortgage Loan had an initial term of 120 months, has a remaining term of 120 months as of the Cut-off Date and requires interest-only payments during the first 60 payment periods, followed by payments of principal and interest based on a 30-year amortization schedule. The IPCC Texas Self Storage Portfolio Mortgage Loan matures on March 6, 2027.
Following the lockout period, the borrower has the right to voluntarily prepay the IPCC Texas Self Storage Portfolio Mortgage Loan in whole or in part (see “Partial Release” section), on any day before December 6, 2026 provided that the borrower pays the greater of a yield maintenance premium or a prepayment premium equal to 1.0% of the then outstanding principal balance. In addition, the IPCC Texas Self Storage Portfolio Mortgage Loan is prepayable without penalty on or after December 6, 2026.
THE INFORMATION IN THIS STRUCTURAL AND COLLATERAL TERM SHEET IS NOT COMPLETE AND MAY BE AMENDED PRIOR TO THE TIME OF SALE. THIS TERM SHEET IS NOT AN OFFER TO SELL THESE SECURITIES AND IT IS NOT A SOLICITATION OF AN OFFER TO BUY THESE SECURITIES IN ANY JURISDICTION WHERE THE OFFER OR SALE IS NOT PERMITTED.
| 80 |
| IPCC TEXAS SELF STORAGE PORTFOLIO |
Sources and Uses
| Sources | Uses | |||||||
| Original loan amount | $31,500,000 | 59.7% | Purchase price | $52,350,000 | 99.2% | |||
| Borrower sponsor’s new cash | 21,253,662 | 40.3 | Closing costs | 331,162 | 0.6 | |||
| contribution(1) | Reserves | 72,500 | 0.1 | |||||
| Total Sources | $52,753,662 | 100.0% | Total Uses | $52,753,662 | 100.0% |
| (1) | Borrower equity was funded in part by a $10,380,000 unsecured corporate loan made by Barclays Bank PLC to Inland Private Capital Corporation, the borrower sponsor, which is guaranteed by its parent company, Inland Real Estate Investment Corporation, and matures September 6, 2017. The corporate unsecured loan is not to the borrower and is neither secured by nor dependent upon income from the IPCC Self Storage Portfolio Properties. |
The Properties.The IPCC Texas Self Storage Portfolio Mortgage Loan is secured by the fee interest in a portfolio of nine self-storage properties totaling 685,835 rentable square feet or 4,979 units (including 40 parking/RV spaces and 18 office spaces) located in three cities in Texas: Amarillo (7 properties), Plainview (1 property) and Lubbock (1 property). Approximately 1,263 units are climate controlled (approximately 25.4% of total units) and 3,658 units (approximately 73.5% of total units) are non-climate controlled. Three of the properties recently expanded between March 2015 and September 2016, adding 440 new units to the portfolio. The IPCC Texas Self Storage Portfolio Properties feature gated entrances, 24-hour video surveillance, steel roll-up doors, paved drives and on-site management offices. Approximately 2.0% of the underwritten gross rent is derived from 18 office spaces, 15 of which are located at the AA 45th – Amarillo, TX property. The IPCC Texas Self Storage Portfolio Properties range in size from 53,625 square feet to 103,240 square feet. As of January 31, 2017, the IPCC Texas Self Storage Portfolio Properties were 79.4% occupied.
The following table presents certain information relating to the IPCC Texas Self Storage Portfolio Properties:
| Property Name – Location | Allocated Cut-off Date Balance | % of Portfolio Cut-off Date Balance | Physical Occupancy | Year Built/ Renovated | Units | Net Rentable Area (SF) | Appraised Value | Allocated Cut-off Date LTV |
| Coulter – Amarillo, TX | $5,350,000 | 17.0% | 83.0% | 2007/NAP | 692 | 102,382 | $8,230,000 | 65.0% |
| Lubbock – Lubbock, TX | $4,350,000 | 13.8% | 71.0% | 1997/2015 | 684 | 77,311 | $7,850,000 | 55.4% |
| Paramount – Amarillo, TX | $3,700,000 | 11.7% | 86.5% | 1997/NAP | 524 | 65,039 | $6,190,000 | 59.8% |
| Tradewinds – Amarillo, TX | $3,600,000 | 11.4% | 72.0% | 2005/2016 | 668 | 103,240 | $6,080,000 | 59.2% |
| AA 45th – Amarillo, TX | $3,350,000 | 10.6% | 75.2% | 1986/NAP | 514 | 93,625 | $6,590,000 | 50.8% |
| Quail Creek – Amarillo, TX | $3,100,000 | 9.8% | 82.4% | 2008/NAP | 455 | 62,300 | $5,720,000 | 54.2% |
| West 34th – Amarillo, TX | $3,000,000 | 9.5% | 83.2% | 1993/NAP | 523 | 60,778 | $5,110,000 | 58.7% |
| Bell Street – Amarillo, TX | $2,650,000 | 8.4% | 85.2% | 2003/NAP | 440 | 53,625 | $4,710,000 | 56.3% |
| Plainview – Plainview, TX | $2,400,000 | 7.6% | 82.9% | 1996/NAP | 479 | 67,535 | $4,020,000 | 59.7% |
| Total/Weighted Average | $31,500,000 | 100.0% | 79.4% | 4,979 | 685,835 | $54,500,000 | 57.8% |
The following table presents historical occupancy percentages at the IPCC Texas Self Storage Portfolio Properties:
Historical Occupancy
12/31/2013(1) | 12/31/2014(2) | 12/31/2015(2)(3) | 12/31/2016(2)(3) | 1/31/2017(2) |
| NAV | 79.0% | 84.4% | 80.6% | 79.4% |
| (1) | Historical occupancy and cash flow information prior to 2014 was not available for the IPCC Texas Self Storage Portfolio Properties due to acquisition financing. |
| (2) | Information obtained from the borrower and represents average occupancy for each respective period. |
| (3) | The decrease in occupancy from 2015 to 2016 is mainly due to the Tradewinds – Amarillo, TX property expanding from 457 units as of May 2016 to 668 units in June through September 2016. The influx of newly added units caused in-place occupancy at the property to drop to approximately 65.1% at the Tradewinds – Amarillo, TX property. Average occupancy at the Tradewinds – Amarillo, TX property was approximately 85.8% for January 2014 through May 2016 prior to the expansion. Excluding the newly added units, the Tradewinds – Amarillo, TX 2016 occupancy would have been 91.6%. |
THE INFORMATION IN THIS STRUCTURAL AND COLLATERAL TERM SHEET IS NOT COMPLETE AND MAY BE AMENDED PRIOR TO THE TIME OF SALE. THIS TERM SHEET IS NOT AN OFFER TO SELL THESE SECURITIES AND IT IS NOT A SOLICITATION OF AN OFFER TO BUY THESE SECURITIES IN ANY JURISDICTION WHERE THE OFFER OR SALE IS NOT PERMITTED.
| 81 |
| IPCC TEXAS SELF STORAGE PORTFOLIO |
Operating History and Underwritten Net Cash Flow. The following table presents certain information relating to the historical operating performance and the underwritten net cash flow at the IPCC Texas Self Storage Portfolio Properties:
Cash Flow Analysis
2014 | 2015 | 2016 | U/W | % of U/W Effective Gross Income | U/W $ per SF | ||||||||
| Base Rent | $4,159,584 | $4,544,968 | $4,860,820 | $5,074,984(1) | 98.2% | $7.40 | |||||||
| Grossed Up Vacant Space | 0 | 0 | 0 | 1,483,164 | 28.7 | 2.16 | |||||||
| Other Income | 257,503 | 291,571 | 306,100 | 306,100 | 5.9 | 0.45 | |||||||
| Less Vacancy & Credit Loss | 0 | 0 | 0 | (1,697,328)(2) | (32.8) | (2.47) | |||||||
| Effective Gross Income | $4,417,087 | $4,836,539 | $5,166,920 | $5,166,920 | 100.0% | $7.53 | |||||||
| Total Operating Expenses | $1,891,670 | $1,952,771 | $1,937,933 | $1,840,770 | 35.6% | $2.68 | |||||||
| Net Operating Income | $2,525,417 | $2,883,768(3) | $3,228,987(3) | $3,326,150 | 64.4% | $4.85 | |||||||
| Capital Expenditures | 0 | 0 | 0 | 74,870 | 1.4 | 0.11 | |||||||
| Net Cash Flow | $2,525,417 | $2,883,768 | $3,228,987 | $3,251,280 | 62.9% | $4.74 | |||||||
| NOI DSCR | 1.25x | 1.43x | 1.60x | 1.65x | |||||||||
| NCF DSCR | 1.25x | 1.43x | 1.60x | 1.62x | |||||||||
| NOI DY | 8.0% | 9.2% | 10.3% | 10.6% | |||||||||
| NCF DY | 8.0% | 9.2% | 10.3% | 10.3% |
| (1) | Approximately $101,373 of U/W Base Rent is attributable to 18 commercial tenants. |
| (2) | The underwritten economic vacancy is 24.7%. As of January 31, 2017, the IPCC Texas Self Storage Portfolio Properties were 79.4% physically occupied. |
| (3) | The increase from 2015 to 2016 in net operating income is primarily attributable to a 440 unit expansion of Tradewinds, Paramount and Lubbock properties over 2015 and 2016. |
Appraisal.As of the appraisal valuation date October 28, 2016, the IPCC Texas Self Storage Portfolio Properties had an aggregate “as-is” appraised value of $54,500,000.
Environmental Matters. According to Phase I environmental assessments dated September 12, 2016 through September 28, 2016, there was no evidence of any recognized environmental conditions at the IPCC Texas Self Storage Portfolio Properties.
Market Overview and Competition. Seven of the IPCC Texas Self Storage Portfolio Properties (the “Amarillo Properties”), representing approximately 78.6% of the Allocated Cut-off Date Balance, are located in Amarillo, Texas. According to the appraisal, the largest employers in Amarillo include Tysons Foods Inc., CNS Pantex and Baptist St. Anthony’s Health Systems. The unemployment rate of Amarillo is the lowest in the state of Texas at 2.9% coinciding with current year-over-year growth rate of hourly pay being three times the nation’s average. The comparable Southwest Region market vacancy rate for self-storage properties as of Q3 2016 is approximately 89.9%. The Lubbock – Lubbock, TX property, representing approximately 13.8% of the Allocated Cut-off Date Balance, is located in the Lubbock, Texas market. Lubbock, Texas is home to Texas Tech University and is categorized by below-average living and business costs. The Plainview - Plainview, TX property, representing approximately 7.6% of the Allocated Cut-off Date Balance, is located in the Plainview, Texas market. Plainview, Texas is situated between Amarillo and Lubbock along Interstate 27.
The Borrower. The borrower is Self-Storage Portfolio IV DST (“the IPCC Self Storage Portfolio Borrower”), a Delaware Statutory Trust (“DST”) that is a single-purpose bankruptcy-remote entity. Upon the occurrence of a Springing LLC Event (as defined below), the IPCC Self Storage Portfolio Borrower must convert from a DST to a Delaware Limited Liability Company (“LLC”). The IPCC Self Storage Portfolio Borrower has master leased the IPCC Self Storage Portfolio Properties to a master lessee affiliated with the borrower sponsor. The master lessee is structured as a special purpose entity. The master lessee’s interest in the master lease and all rents are assigned to the lender. The borrower sponsor has a 100% ownership interest in the master lessee. The master lease is subordinate to the IPCC Self Storage Portfolio Mortgage Loan. There is no income underwritten from the master lease as the IPCC Self Storage Portfolio was underwritten to the underlying property income. There is one independent director for the borrowing entity and one independent director for the master lessee. Legal counsel to the borrower delivered a non-consolidation opinion in connection with the origination of the IPCC Self Storage Portfolio Mortgage Loan. See“Description of the Mortgage Pool—Delaware Statutory Trusts” in the Preliminary Prospectus.
A “Springing LLC Event” will commence upon the earlier of (i) any event of default with respect to which the IPCC Self Storage Portfolio Borrower does not deliver within 10 business days a reasoned opinion of tax counsel acceptable to lender that (a) the IPCC Self Storage Portfolio Borrower is able to remedy such event of default without effectuating a conversion or (b) effectuating a conversion would not reasonably be expected to improve the ability of the IPCC Self Storage Portfolio Borrower to remedy the event of default, (ii) 30 days prior to maturity if lender does not have reasonable evidence that the loan will be repaid or (iii) the IPCC Self Storage Portfolio Borrower deems it prudent to effectuate such conversion.
The Borrower Sponsor. The borrower sponsor and nonrecourse carve-out guarantor is Inland Private Capital Corporation (“IPCC”). IPCC is part of Inland Real Estate Group of Companies, Inc., a fully-integrated group of legally and financially independent real estate companies engaged in property management, leasing, marketing, acquisition, disposition, development, redevelopment, renovation, construction, finance and other related services for over 40 years. As of December 31, 2015, IPCC sponsored 182 private placement programs comprising 451 properties, totaling over 26.0 million square feet and more than 6,800 residential units with an aggregate offering price in excess of $5.3 million. IPCC is involved in ongoing litigation related to other real estate
THE INFORMATION IN THIS STRUCTURAL AND COLLATERAL TERM SHEET IS NOT COMPLETE AND MAY BE AMENDED PRIOR TO THE TIME OF SALE. THIS TERM SHEET IS NOT AN OFFER TO SELL THESE SECURITIES AND IT IS NOT A SOLICITATION OF AN OFFER TO BUY THESE SECURITIES IN ANY JURISDICTION WHERE THE OFFER OR SALE IS NOT PERMITTED.
| 82 |
| IPCC TEXAS SELF STORAGE PORTFOLIO |
investment programs. See“Description of the Mortgage Pools—Loan Purpose; Default History, Bankruptcy Issues and Other Proceedings”in the Preliminary Prospectus.
Escrows.The loan documents provide for upfront reserves in the amount of $2,500 for deferred maintenance. The loan documents do not require monthly escrows for real estate taxes provided the following conditions are met: (i) no event of default has occurred and is continuing and (ii) the amortizing debt service coverage ratio for the trailing 12-month period is greater than or equal to 1.15x at the end of any calendar month. The loan documents do not require monthly escrows for insurance provided the following conditions are met: (i) no event of default has occurred and is continuing; (ii) the amortizing debt service coverage ratio for the trailing 12-month period is greater than or equal to 1.15x at the end of any calendar month, (iii) the IPCC Texas Self Storage Portfolio Properties are insured via an acceptable blanket insurance policy; and (iv) the borrower provides the lender with evidence of renewal of the policies and timely proof of payment of the insurance premiums. The loan documents do not require monthly reserves for replacement reserves provided the following conditions are met: (i) no event of default has occurred and is continuing, (ii) borrower has deposited into the replacement reserve account cash or posted a letter of credit in an amount equal to $70,000 and (iii) borrower has provided lender with satisfactory evidence of payment of replacements in an amount equal to or greater than $0.10 per square footper annum.
The master lease agreement provide for upfront reserves to be held in a trust reserve, not collateral for the loan, in the amount of $1,338,639 for replacement reserves to be used for capital expenditures for the IPCC Texas Self Storage Portfolio Properties over the loan term.
Lockbox and Cash Management.Within five business days following the occurrence of a Triggering Event (as defined below), the borrower will be required to establish a lender-controlled lockbox account and direct all tenants to deposit all rents directly into such lockbox account. Additionally, all revenues and other monies received by the borrower, master tenant or property manager relating to the IPCC Texas Self Storage Portfolio Properties will be deposited into the lockbox account no later than three business days after receipt. Upon the occurrence and during the continuance of a Triggering Event, all excess funds on deposit in the lockbox account are swept to a lender-controlled subaccount on each business day.
A “Triggering Event” will commence upon the earlier of (i) the occurrence and continuance of an event of default; and (ii) the amortizing debt service coverage ratio for the trailing 12-month period falling below 1.20x at the end of any calendar quarter. A Triggering Event will expire, with regard to clause (i), upon the cure of such event of default; and with regard to clause (ii), upon the amortizing debt service coverage ratio being equal to or greater than 1.25x for two consecutive calendar quarters.
Property Management.The IPCC Texas Self Storage Portfolio Properties are managed by Metro Storage LLC, a privately-owned, fully-integrated, international self-storage operating company specializing in the development, construction, acquisition and management of self-storage facilities in the United States and Brazil. Metro Storage LLC has over $1.0 billion of assets under management and is the fourth largest private self-storage company in the United States and the tenth largest among private and public self-storage companies. Additionally, Metro Storage LLC has a 2.0% beneficial ownership interest in the IPCC Self Storage Portfolio Borrower.
Assumption.The borrower has the right to transfer the IPCC Texas Self Storage Portfolio Properties in whole, provided that no event of default has occurred and is continuing and certain other conditions are satisfied, including (i) the lender’s reasonable determination that the proposed transferee and guarantor satisfy the lender’s credit review and underwriting standards, taking into consideration transferee experience, financial strength and general business standing; (ii) execution of a recourse guaranty and an environmental indemnity by an affiliate of the transferee; and (iii) if requested by the lender, rating agency confirmation from DBRS, Fitch and Moody’s that the transfer will not result in a downgrade, withdrawal or qualification of the respective ratings assigned to the Series 2017-RB1 Certificates.
Partial Release.Following the lockout period, the borrower is permitted to partially release any constituent properties in connection with a partial defeasance, subject to certain conditions including (i) no event of default has occurred and is continuing; (ii) release price of 120% of the released property’s allocated cut-off date balance; (iii) the loan-to-value with respect to the remaining properties will be no greater than 57.8%; (iv) the amortizing debt service coverage ratio with respect to the remaining properties will be no less than the greater of 1.55x and the debt service coverage ratio immediately prior to the release; (v) the NOI debt yield with respect to the remaining properties will be no less than 10.1% and (v) the lender receives rating agency confirmation from DBRS, Fitch and Moody’s that the release will not result in a downgrade, withdrawal or qualification of the respective ratings assigned to the Series 2017-RB1 Certificates.
Real Estate Substitution.Not Permitted.
Subordinate and Mezzanine Indebtedness.Not Permitted.
Additional Unsecured Subordinate Indebtedness.Provided no event of default has occurred and is continuing, the borrower may obtain unsecured loans from the guarantor provided that the proceeds of such loans are required to be used solely to pay the monthly debt service payment amount, capital expenditures (as approved by the lender), extraordinary expenses, maintenance expenses, re-tenanting of the property and actual operating expenses as a result of insufficient reserves held by the borrower or as a result of insufficient rents being paid. The subordinate debt must at all times be, (i) unsecured, (ii) subordinate in all respects to the IPCC Texas Self Storage Portfolio Mortgage Loan pursuant to a subordination and standstill agreement, which is required to be executed and delivered by the guarantor prior to providing the subordinate debt, (iii) without a maturity date and (iv) evidenced by a
THE INFORMATION IN THIS STRUCTURAL AND COLLATERAL TERM SHEET IS NOT COMPLETE AND MAY BE AMENDED PRIOR TO THE TIME OF SALE. THIS TERM SHEET IS NOT AN OFFER TO SELL THESE SECURITIES AND IT IS NOT A SOLICITATION OF AN OFFER TO BUY THESE SECURITIES IN ANY JURISDICTION WHERE THE OFFER OR SALE IS NOT PERMITTED.
| 83 |
| IPCC TEXAS SELF STORAGE PORTFOLIO |
promissory note with terms and conditions otherwise acceptable to the lender. Under no circumstances may the subordinate debt be used to make distributions to any beneficial owners of the borrower.
Ground Lease. None.
Condominium.One of the IPCC Texas Self Storage Portfolio Properties is subject to a condominium regime. The Paramount – Amarillo, TX Property consists of a two-unit condominium; one unit is owned by the borrower as collateral for the IPCC Texas Self Storage Portfolio Whole Loan. The remaining unit is not owned by the borrower, utilized as office space and is not collateral for the IPCC Texas Self Storage Portfolio Whole Loan. The IPCC Texas Self-Storage Portfolio Properties comprise approximately a 50.0% interest in the condominium regime. See “Description of the Mortgage Pool—Mortgage Pool Characteristics—Condominium Interest” in the Preliminary Prospectus.
Terrorism Insurance. The loan documents require that the “all risk” insurance policy required to be maintained by the borrower provide coverage for terrorism in an amount equal to the full replacement cost of the IPCC Texas Self Storage Portfolio Properties, as well as business interruption insurance covering no less than the 18-month period following the occurrence of a casualty event, together with a six-month extended period of indemnity.
THE INFORMATION IN THIS STRUCTURAL AND COLLATERAL TERM SHEET IS NOT COMPLETE AND MAY BE AMENDED PRIOR TO THE TIME OF SALE. THIS TERM SHEET IS NOT AN OFFER TO SELL THESE SECURITIES AND IT IS NOT A SOLICITATION OF AN OFFER TO BUY THESE SECURITIES IN ANY JURISDICTION WHERE THE OFFER OR SALE IS NOT PERMITTED.
| 84 |
(THIS PAGE INTENTIONALLY LEFT BLANK)
THE INFORMATION IN THIS STRUCTURAL AND COLLATERAL TERM SHEET IS NOT COMPLETE AND MAY BE AMENDED PRIOR TO THE TIME OF SALE. THIS TERM SHEET IS NOT AN OFFER TO SELL THESE SECURITIES AND IT IS NOT A SOLICITATION OF AN OFFER TO BUY THESE SECURITIES IN ANY JURISDICTION WHERE THE OFFER OR SALE IS NOT PERMITTED.
| 85 |
| EXCHANGERIGHT NET LEASED PORTFOLIO 15 |
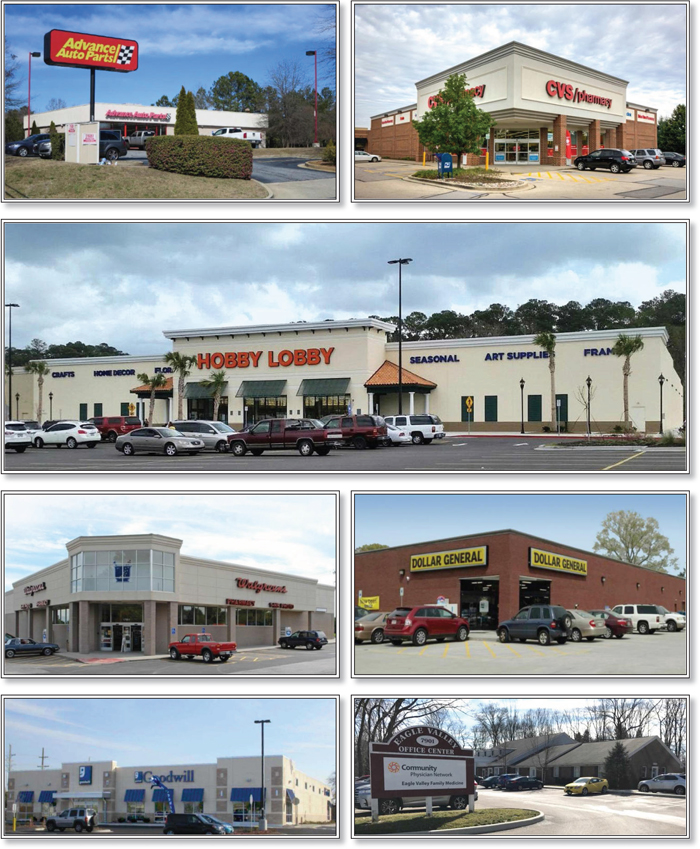
THE INFORMATION IN THIS STRUCTURAL AND COLLATERAL TERM SHEET IS NOT COMPLETE AND MAY BE AMENDED PRIOR TO THE TIME OF SALE. THIS TERM SHEET IS NOT AN OFFER TO SELL THESE SECURITIES AND IT IS NOT A SOLICITATION OF AN OFFER TO BUY THESE SECURITIES IN ANY JURISDICTION WHERE THE OFFER OR SALE IS NOT PERMITTED.
| 86 |
| EXCHANGERIGHT NET LEASED PORTFOLIO 15 |
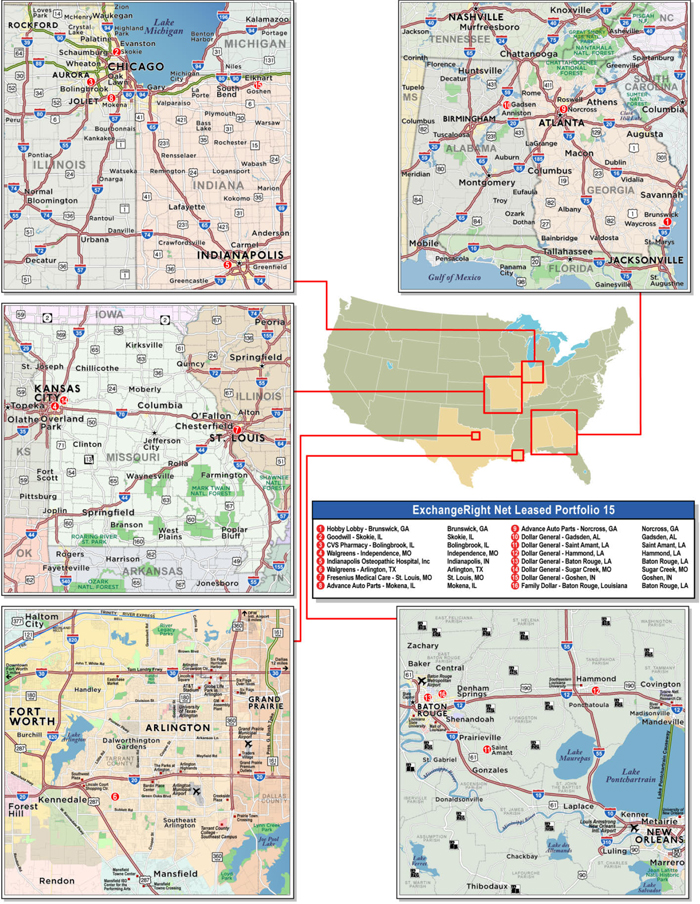
THE INFORMATION IN THIS STRUCTURAL AND COLLATERAL TERM SHEET IS NOT COMPLETE AND MAY BE AMENDED PRIOR TO THE TIME OF SALE. THIS TERM SHEET IS NOT AN OFFER TO SELL THESE SECURITIES AND IT IS NOT A SOLICITATION OF AN OFFER TO BUY THESE SECURITIES IN ANY JURISDICTION WHERE THE OFFER OR SALE IS NOT PERMITTED.
| 87 |
| No. 7 – ExchangeRight Net Leased Portfolio 15 | ||||||
| Loan Information | Property Information | |||||
| Mortgage Loan Seller: | Société Générale | Single Asset/Portfolio: | Portfolio | |||
| Credit Assessment (DBRS/Fitch/Moody’s): | NR/NR/NR | Property Type(3): | Various | |||
| Original Principal Balance: | $31,200,000 | Specific Property Type(3): | Various | |||
| Cut-off Date Balance: | $31,200,000 | Location(3): | Various | |||
| % of Initial Pool Balance: | 4.9% | Size: | 218,276 SF | |||
| Loan Purpose: | Acquisition | Cut-off Date Balance Per Unit: | $142.94 | |||
| Borrower Name(1): | ExchangeRight Net Leased Portfolio 15 DST | Year Built/Renovated(3): | Various | |||
| Borrower Sponsors: | David Fisher; Joshua Ungerecht; Warren Thomas; ExchangeRight Real Estate, LLC | Title Vesting: | Fee | |||
| Mortgage Rate: | 4.379% | Property Manager: | Self-managed | |||
| Note Date: | March 2, 2017 | 4thMost Recent Occupancy(4): | NAV | |||
| Anticipated Repayment Date: | NAP | 3rdMost Recent Occupancy(4): | NAV | |||
| Maturity Date: | April 1, 2027 | 2ndMost Recent Occupancy(4): | NAV | |||
| IO Period: | 121 months | Most Recent Occupancy(4): | NAV | |||
| Loan Term (Original): | 121 months | Current Occupancy (As of)(4): | 100.0% (3/1/2017) | |||
| Seasoning: | 0 months | |||||
| Amortization Term (Original): | NAP | Underwriting and Financial Information: | ||||
| Loan Amortization Type: | Interest-only, Balloon | |||||
| Interest Accrual Method: | Actual/360 | 4thMost Recent NOI(5): | NAV | |||
| Call Protection: | L(24),D(93),O(4) | 3rdMost Recent NOI(5): | NAV | |||
| Lockbox Type: | Hard/Springing Cash Management | 2ndMost Recent NOI(5): | NAV | |||
| Additional Debt: | None | Most Recent NOI(5): | NAV | |||
| Additional Debt Type: | NAP | |||||
| U/W Revenues: | $3,440,805 | |||||
| U/W Expenses: | $458,133 | |||||
| U/W NOI: | $2,982,672 | |||||
| U/W NCF: | $2,890,150 | |||||
| Escrows and Reserves(2): | U/W NOI DSCR: | 2.15x | ||||
| U/W NCF DSCR: | 2.09x | |||||
| Type: | Initial | Monthly | Cap (If Any) | U/W NOI Debt Yield: | 9.6% | |
| Taxes | $93,589 | $51,358 | NAP | U/W NCF Debt Yield: | 9.3% | |
| Insurance | $10,347 | $2,587 | NAP | As-Is Appraised Value(6): | $52,025,000 | |
| Replacement Reserves | $344,598 | $2,040 | NAP | As-Is Appraisal Valuation Date(6): | Various | |
| TI/LC Reserve | $500,000 | Springing | NAP | Cut-off Date LTV Ratio: | 60.0% | |
| Osteopathic Hospital Rollover Reserve | $0 | Springing | NAP | LTV Ratio at Maturity: | 60.0% | |
| (1) | See “The Borrower” section. |
| (2) | See “Escrows” section. |
| (3) | See “The Properties” section. |
| (4) | See “Historical Occupancy” section. |
| (5) | See “Cash Flow Analysis” section. The ExchangeRight Net Leased Portfolio Properties were acquired by the borrower sponsors between August 2016 and March 2017. The sellers of the ExchangeRight Net Leased Portfolio Properties did not provide historical operating statements to the borrower. |
| (6) | See “Appraisal” section. Each of the ExchangeRight Net Leased Portfolio Properties was valued individually. The appraisals are dated from November 2, 2016 to February 15, 2017. |
The Mortgage Loan.The mortgage loan (the “ExchangeRight Mortgage Loan”) is evidenced by a single promissory note secured by a first mortgage encumbering 16 cross-collateralized, single-tenant properties (14 retail and two medical offices) located in Alabama, Georgia, Illinois, Indiana, Louisiana, Missouri, and Texas (the “ExchangeRight Net Leased Portfolio Properties”). The ExchangeRight Mortgage Loan was originated on March 2, 2017 by Société Générale. The ExchangeRight Mortgage Loan had an original principal balance of $31,200,000, has an outstanding principal balance as of the Cut-off Date of $31,200,000 and accrues interest at an interest rate of 4.379%per annum. The ExchangeRight Mortgage Loan had an initial term of 121 months, has a remaining term of 121 months as of the Cut-off Date and requires payments of interest only through the loan term. The ExchangeRight Mortgage Loan matures on April 1, 2027.
Following the lockout period, the borrower has the right to defease the ExchangeRight Mortgage Loan in whole, but not in part, on any date before January 1, 2027. In addition, the ExchangeRight Mortgage Loan is prepayable without penalty on or after January 1, 2027.
THE INFORMATION IN THIS STRUCTURAL AND COLLATERAL TERM SHEET IS NOT COMPLETE AND MAY BE AMENDED PRIOR TO THE TIME OF SALE. THIS TERM SHEET IS NOT AN OFFER TO SELL THESE SECURITIES AND IT IS NOT A SOLICITATION OF AN OFFER TO BUY THESE SECURITIES IN ANY JURISDICTION WHERE THE OFFER OR SALE IS NOT PERMITTED.
| 88 |
| EXCHANGERIGHT NET LEASED PORTFOLIO 15 |
Sources and Uses
| Sources | Uses | |||||||
| Original loan amount | $31,200,000 | 58.5% | Purchase Price | $51,542,845 | 96.7% | |||
| Borrower sponsor’s new cash contribution | 22,113,583 | 41.5 | Reserves | 948,534 | 1.8 | |||
| Closing costs | 822,204 | 1.5 | ||||||
| Total Sources | $53,313,583 | 100.0% | Total Uses | $53,313,583 | 100.0% |
The Properties. The ExchangeRight Net Leased Portfolio Properties comprise 16 cross-collateralized, single-tenant properties (14 retail and two medical offices) totaling 218,276 square feet located in Alabama (one property), Georgia (two properties), Illinois (three properties), Indiana (two properties), Louisiana (four properties), Missouri (three properties) and Texas (one property). Built between 1941 and 2016, the ExchangeRight Net Leased Portfolio Properties range in size from 6,831 square feet to 55,000 square feet. The borrower sponsors (as defined below) acquired the ExchangeRight Net Leased Portfolio Properties between August 2016 and March 2017 for a combined purchase price of approximately $51.5 million. As of March 1, 2017, the ExchangeRight Net Leased Portfolio Properties were 100.0% occupied.
The ExchangeRight Net Leased Portfolio Properties include nationally recognized credit-tenants, such as Walgreens (rated BBB/Baa2/BBB by Fitch/Moody’s/S&P), CVS Pharmacy (rated Baa1/BBB+ by Moody’s/S&P), Dollar General (rated Baa2/BBB by Moody’s/S&P), Advance Auto Parts (rated Baa2/BBB- by Moody’s/S&P), Family Dollar (rated Ba2/BB+ by Moody’s/S&P), and Fresenius Medical Care (rated BBB-/Ba1/BBB- by Fitch/Moody’s/S&P). Credit rated tenants occupy 13 of the 16 properties, representing 65.5% of underwritten base rent (leases are directly with rated entities or are guaranteed by such entities), while investment grade-rated tenants occupy 11 of the 16 properties representing 55.9% of the underwritten base rent. Leases representing approximately 89.3% of the net rentable area and 85.8% of the underwritten base rent expire after the ExchangeRight Mortgage Loan maturity date. No individual property within the ExchangeRight Net Leased Portfolio Properties accounts for more than 13.1% of the underwritten base rent. The largest property, Hobby Lobby – Brunswick, GA, comprises approximately 55,000 square feet (25.2% of the total net rentable area) and $418,000 of the underwritten base rent (12.8% of underwritten base rent). Other than Hobby Lobby – Brunswick, GA, no individual property accounts for more than 9.6% of the net rentable area.
The following table presents certain information relating to the ExchangeRight Net Leased Portfolio Properties:
Property Information(1)
| Property Name | City, State | Allocated Cut-off Date Balance | % of Portfolio Cut-off Date Balance | Occupancy | Year Built / Renovated | Net Rentable Area (SF) | Allocated Cut-off Date LTV | Appraised Value |
| Hobby Lobby | Brunswick, GA | $4,184,321 | 13.4% | 100.0% | 2016/NAP | 55,000 | 60.2% | $6,950,000 |
| Goodwill | Skokie, IL | $3,982,472 | 12.8% | 100.0% | 2016/NAP | 20,850 | 60.3% | $6,600,000 |
| CVS Pharmacy | Bolingbrook, IL | $3,517,142 | 11.3% | 100.0% | 2005/NAP | 13,013 | 59.6% | $5,900,000 |
| Walgreens | Independence, MO | $2,951,507 | 9.5% | 100.0% | 2001/NAP | 15,120 | 60.2% | $4,900,000 |
| Indianapolis Osteopathic Hospital, Inc | Indianapolis, IN | $2,725,314 | 8.7% | 100.0% | 1986/2013 | 15,109 | 58.6% | $4,650,000 |
| Walgreens | Arlington, TX | $2,596,538 | 8.3% | 100.0% | 1997/2016 | 13,905 | 60.4% | $4,300,000 |
| Fresenius Medical Care | St. Louis, MO | $2,243,479 | 7.2% | 100.0% | 1941/2006 | 7,500 | 60.6% | $3,700,000 |
| Advance Auto Parts | Mokena, IL | $1,361,043 | 4.4% | 100.0% | 2012/NAP | 6,831 | 59.2% | $2,300,000 |
| Advance Auto Parts | Norcross, GA | $1,262,105 | 4.0% | 100.0% | 2005/NAP | 7,000 | 60.1% | $2,100,000 |
| Dollar General | Gadsden, AL | $1,099,828 | 3.5% | 100.0% | 2016/NAP | 10,542 | 61.1% | $1,800,000 |
| Dollar General | Saint Amant, LA | $1,006,821 | 3.2% | 100.0% | 2015/NAP | 9,026 | 59.2% | $1,700,000 |
| Dollar General | Hammond, LA | $983,880 | 3.2% | 100.0% | 2013/NAP | 9,026 | 59.6% | $1,650,000 |
| Dollar General | Baton Rouge, LA | $907,534 | 2.9% | 100.0% | 2014/NAP | 9,026 | 60.5% | $1,500,000 |
| Dollar General | Sugar Creek, MO | $832,735 | 2.7% | 100.0% | 1950/2016 | 8,908 | 60.6% | $1,375,000 |
| Dollar General | Goshen, IN | $828,032 | 2.7% | 100.0% | 2016/NAP | 9,100 | 59.1% | $1,400,000 |
| Family Dollar | Baton Rouge, LA | $717,249 | 2.3% | 100.0% | 2016/NAP | 8,320 | 59.8% | $1,200,000 |
| Total/Weighted Average | $31,200,000 | 100.0% | 100.0% | 218,276 | 60.0% | $52,025,000 |
| (1) | The ExchangeRight Net Leased Portfolio Properties comprise 16 single-tenant properties (14 retail and two medical offices). |
THE INFORMATION IN THIS STRUCTURAL AND COLLATERAL TERM SHEET IS NOT COMPLETE AND MAY BE AMENDED PRIOR TO THE TIME OF SALE. THIS TERM SHEET IS NOT AN OFFER TO SELL THESE SECURITIES AND IT IS NOT A SOLICITATION OF AN OFFER TO BUY THESE SECURITIES IN ANY JURISDICTION WHERE THE OFFER OR SALE IS NOT PERMITTED.
| 89 |
| EXCHANGERIGHT NET LEASED PORTFOLIO 15 |
The following table presents certain information relating to the tenancy at the ExchangeRight Net Leased Portfolio Properties:
Major Tenants(1)
| Tenant Name | Credit Rating (Fitch/Moody’s/ S&P)(2) | Tenant NRSF | % of NRSF | Annual U/W Base Rent PSF | Annual U/W Base | % of Total Annual U/W Base Rent | Lease |
| Major Tenants | |||||||
| Dollar General | NR/Baa2/BBB | 55,628 | 25.5% | $11.22 | $624,240 | 19.1% | Various(3) |
| Walgreens | BBB/Baa2/BBB | 29,025 | 13.3% | $19.82 | $575,195 | 17.6% | Various(4) |
| Goodwill | NR/NR/NR | 20,850 | 9.6% | $20.50 | $427,425 | 13.1% | 10/27/2031(5) |
| Hobby Lobby | NR/NR/NR | 55,000 | 25.2% | $7.60 | $418,000 | 12.8% | 8/31/2031(6) |
| CVS Pharmacy | NR/Baa1/BBB+ | 13,013 | 6.0% | $27.00 | $351,351 | 10.7% | 1/31/2030(7) |
| Indianapolis Osteopathic Hospital, Inc | NR/NR/NR | 15,109 | 6.9% | $18.85 | $284,805 | 8.7% | 7/15/2029(8) |
| Advance Auto Parts | NR/Baa2/BBB- | 13,831 | 6.3% | $20.27 | $280,324 | 8.6% | Various(9) |
| Fresenius Medical Care | BBB-/Ba1/BBB- | 7,500 | 3.4% | $30.87 | $231,525 | 7.1% | 5/25/2026(10) |
| Family Dollar | NR/Ba2/BB+ | 8,320 | 3.8% | $9.61 | $79,941 | 2.4% | 6/30/2031(11) |
| Occupied Collateral Total | 218,276 | 100.0% | $14.99 | $3,272,806 | 100.0% | ||
| Vacant Space | 0 | 0.0% | |||||
| Collateral Total | 218,276 | 100.0% | |||||
| (1) | Tenants are not required to report sales information. |
| (2) | Certain ratings are those of the parent company whether or not the parent company guarantees the lease. |
| (3) | Dollar General is a tenant at six of the ExchangeRight Net Leased Portfolio Properties and leases (i) 10,542 square feet at the Dollar General – Gadsden, AL property under a lease that expires on March 31, 2031 and has four, 5-year lease renewal options; (ii) 9,100 square feet at the Dollar General – Goshen, IN property under a lease that expires on December 31, 2031 and has five, 5-year lease renewal options; (iii) 9,026 square feet at the Dollar General – Hammond, LA property under a lease that expires on June 30, 2028 and has three, 5-year lease renewal options; (iv) 9,026 square feet at the Dollar General – Saint Amant, LA property under a lease that expires on April 30, 2030 and has three, 5-year lease renewal options; (v) 9,026 square feet at the Dollar General – Baton Rouge, LA property under a lease that expires on February 28, 2029 and has three, 5-year lease renewal options and (vi) 8,908 square feet at the Dollar General – Sugar Creek, MO property under a lease that expires on March 31, 2026 and has four, 5-year lease renewal options. |
| (4) | Walgreens is a tenant at two of the ExchangeRight Net Leased Portfolio Properties and leases (i) 15,120 square feet at the Walgreens – Independence, MO property under a lease that expires on July 31, 2028 and has eight, 5-year lease renewal options.; and (ii) 13,905 square feet at the Walgreens – Arlington, TX property under a lease that expires on August 31, 2027 and has eight, 5-year lease renewal options. |
| (5) | Goodwill has three, 5-year lease renewal options. |
| (6) | Hobby Lobby has four, 5-year lease renewal options. |
| (7) | CVS Pharmacy has six, 5-year lease renewal options. |
| (8) | Indianapolis Osteopathic Hospital, Inc has two, 5-year lease renewal options. |
| (9) | Advance Auto Parts is a tenant at two of the ExchangeRight Net Leased Portfolio Properties and leases (i) 7,000 square feet at the Advance Auto Parts – Norcross, GA property under a lease that expires on December 31, 2026 and has four, 5-year lease renewal options; and (ii) 6,831 square feet at the Advance Auto Parts – Mokena, IL property under a lease that expires on September 20, 2027 and has three, 5-year lease renewal options. |
| (10) | Fresenius Medical Care has two, 5-year lease renewal options. |
| (11) | Family Dollar has six, 5-year lease renewal options. |
THE INFORMATION IN THIS STRUCTURAL AND COLLATERAL TERM SHEET IS NOT COMPLETE AND MAY BE AMENDED PRIOR TO THE TIME OF SALE. THIS TERM SHEET IS NOT AN OFFER TO SELL THESE SECURITIES AND IT IS NOT A SOLICITATION OF AN OFFER TO BUY THESE SECURITIES IN ANY JURISDICTION WHERE THE OFFER OR SALE IS NOT PERMITTED.
| 90 |
| EXCHANGERIGHT NET LEASED PORTFOLIO 15 |
The following table presents certain information relating to the lease rollover schedule at the ExchangeRight Net Leased Portfolio Properties:
Lease Expiration Schedule(1)
| Year Ending December 31, | No. of Leases Expiring | Expiring NRSF | % of Total NRSF | Cumulative Expiring NRSF | Cumulative % of Total NRSF | Annual U/W Base Rent | % of Total Annual U/W Base Rent | Annual Rent PSF |
| MTM | 0 | 0 | 0.0% | 0 | 0.0% | $0 | 0.0% | $0.00 |
| 2017 | 0 | 0 | 0.0% | 0 | 0.0% | $0 | 0.0% | $0.00 |
| 2018 | 0 | 0 | 0.0% | 0 | 0.0% | $0 | 0.0% | $0.00 |
| 2019 | 0 | 0 | 0.0% | 0 | 0.0% | $0 | 0.0% | $0.00 |
| 2020 | 0 | 0 | 0.0% | 0 | 0.0% | $0 | 0.0% | $0.00 |
| 2021 | 0 | 0 | 0.0% | 0 | 0.0% | $0 | 0.0% | $0.00 |
| 2022 | 0 | 0 | 0.0% | 0 | 0.0% | $0 | 0.0% | $0.00 |
| 2023 | 0 | 0 | 0.0% | 0 | 0.0% | $0 | 0.0% | $0.00 |
| 2024 | 0 | 0 | 0.0% | 0 | 0.0% | $0 | 0.0% | $0.00 |
| 2025 | 0 | 0 | 0.0% | 0 | 0.0% | $0 | 0.0% | $0.00 |
| 2026 | 3 | 23,408 | 10.7% | 23,408 | 10.7% | $464,605 | 14.2% | $19.85 |
| 2027 | 2 | 20,736 | 9.5% | 44,144 | 20.2% | $401,066 | 12.3% | $19.34 |
| Thereafter | 11 | 174,132 | 79.8% | 218,276 | 100.0% | $2,407,135 | 73.5% | $13.82 |
| Vacant | 0 | 0 | 0.0% | 218,276 | 100.0% | $0 | 0.0% | $0.00 |
| Total/Weighted | 16 | 218,276 | 100.0% | $3,272,806 | 100.0% | $14.99 |
| (1) | Information obtained from the underwritten rent roll. |
The following table presents historical occupancy percentages at the ExchangeRight Net Leased Portfolio Properties:
Historical Occupancy
| 12/31/2013(1) | 12/31/2014(1) | 12/31/2015(1) | 12/31/2016(1) | 3/1/2017(2) | ||||
| NAV | NAV | NAV | NAV | 100.0% | ||||
| (1) | The ExchangeRight Net Leased Portfolio Properties were acquired by the borrower sponsors between August 2016 and March 2017. The sellers of the ExchangeRight Net Leased Portfolio Properties did not provide historical occupancy information to the borrower. |
| (2) | Information obtained from the underwritten rent roll. |
THE INFORMATION IN THIS STRUCTURAL AND COLLATERAL TERM SHEET IS NOT COMPLETE AND MAY BE AMENDED PRIOR TO THE TIME OF SALE. THIS TERM SHEET IS NOT AN OFFER TO SELL THESE SECURITIES AND IT IS NOT A SOLICITATION OF AN OFFER TO BUY THESE SECURITIES IN ANY JURISDICTION WHERE THE OFFER OR SALE IS NOT PERMITTED.
| 91 |
| EXCHANGERIGHT NET LEASED PORTFOLIO 15 |
Operating History and Underwritten Net Cash Flow.The following table presents certain information relating to the historical operating performance and underwritten net cash flow at the ExchangeRight Net Leased Portfolio Properties:
Cash Flow Analysis(1)
| U/W | % of U/W Effective Gross Income | U/W $ per SF | |||||
| Base Rent(2) | $3,272,806 | 95.1% | $14.99 | ||||
| Total Reimbursables(3) | 346,619 | 10.1 | 1.59 | ||||
| Less Vacancy & Credit Loss | (178,620) | (5.2) | (0.82) | ||||
| Effective Gross Income | $3,440,805 | 100.0% | $15.76 | ||||
| Total Operating Expenses | $458,133 | 13.3% | $2.10 | ||||
| Net Operating Income | $2,982,672 | 86.7% | $13.66 | ||||
| TI/LC | 67,549 | 2.0 | 0.31 | ||||
| Capital Expenditures | 24,973 | 0.7 | 0.11 | ||||
| Net Cash Flow | $2,890,150 | 84.0% | $13.24 | ||||
| NOI DSCR | 2.15x | ||||||
| NCF DSCR | 2.09x | ||||||
| NOI DY | 9.6% | ||||||
| NCF DY | 9.3% |
| (1) | Historical cash flows are unavailable as the ExchangeRight Net Leased Portfolio Properties were acquired by the borrower sponsors between August 2016 and March 2017. The sellers of the ExchangeRight Net Leased Portfolio Properties did not provide historical operating statements to the borrower. |
| (2) | UW Base Rent is based on in-place rent per lease. |
| (3) | Total Reimbursables are underwritten based on tenant leases and discussions with the borrower. There are no reimbursements at six of the properties as the tenants pay for the respective property expenses directly. All of the tenants pay either property taxes, insurance or operating expenses or some combination of the three. |
Appraisal.The ExchangeRight Net Leased Portfolio Properties were individually appraised, with the individual values reflecting a cumulative “as-is” appraised value of $52,025,000. The appraisals are dated between November 2, 2016 and February 15, 2017. Additionally, each appraisal provided a corresponding “go dark” value which equates to a cumulative “go dark” appraised value of $32,600,000 for the ExchangeRight Net Leased Portfolio Properties.
Environmental Matters.According to Phase I environmental assessments dated between November 1, 2016 and February 15, 2017, there was no evidence of any recognized environmental conditions at the ExchangeRight Net Leased Portfolio Properties.
The Borrower. The borrower is ExchangeRight Net Leased Portfolio 15 DST, a Delaware Statutory Trust. At origination of the ExchangeRight Mortgage Loan, the ExchangeRight Net Leased Portfolio Properties were conveyed and assumed from ExchangeRight Net Leased Portfolio 15, LLC to and by the borrower. The borrower has master leased the ExchangeRight Net Leased Portfolio Properties to ExchangeRight NLP 15 Master Lessee, LLC, a Delaware limited liability company (the “Master Lessee”), which is affiliated with the borrower sponsors. The Master Lessee is structured as a special purpose entity in which the borrower sponsors have a 100% ownership interest. The Master Lessee’s interest in the master lease and all tenant rents are assigned to the lender. The master lease is subordinate to the ExchangeRight Mortgage Loan. There is one independent director for the borrower and one independent director for the Master Lessee. Legal counsel to the borrower delivered a non-consolidation opinion in connection with the origination of the ExchangeRight Mortgage Loan. ExchangeRight Real Estate, LLC (“ExchangeRight”), David Fisher, Joshua Ungerecht and Warren Thomas are the guarantors of certain nonrecourse carveouts under the ExchangeRight Mortgage Loan. See“Risk Factors—Delaware Statutory Trusts” in the Preliminary Prospectus.
The Borrower Sponsors. The borrower sponsors are David Fisher, Joshua Ungerecht, Warren Thomas and ExchangeRight (the “Borrower Sponsors”), all of whom are managing members of ExchangeRight. ExchangeRight has more than $600.0 million in assets and more than 3.2 million square feet under management. ExchangeRight has more than 195 investment-grade retail, medical offices and class B/B+ multifamily properties located across 27 states with a focus in providing long-term stable income and asset preservation through long-term net-leased portfolios backed by investment grade corporations.
Escrows.The loan documents provide for an upfront escrow at closing in the amount of $93,589 for real estate taxes, $10,347 for insurance premiums, $344,598 for outstanding replacement reserves, and $500,000 for tenant improvement and leasing commissions. The loan documents provide for ongoing monthly escrows of $51,358 for real estate taxes, $2,587 for insurance premiums and other assessments, and $2,040 for replacement reserves.
THE INFORMATION IN THIS STRUCTURAL AND COLLATERAL TERM SHEET IS NOT COMPLETE AND MAY BE AMENDED PRIOR TO THE TIME OF SALE. THIS TERM SHEET IS NOT AN OFFER TO SELL THESE SECURITIES AND IT IS NOT A SOLICITATION OF AN OFFER TO BUY THESE SECURITIES IN ANY JURISDICTION WHERE THE OFFER OR SALE IS NOT PERMITTED.
| 92 |
| EXCHANGERIGHT NET LEASED PORTFOLIO 15 |
Notwithstanding the foregoing, the borrower will not be required to provide monthly real estate taxes and insurance premiums which are solely the obligation of a tenant and paid directly to the relevant taxing authority or insurance company by such tenant in accordance with such tenant’s lease, for so long as (i) no event of default has occurred and is continuing, (ii) the borrower provides proof of payment by the tenant (or the borrower) directly to the taxing authority or the applicable insurance company on or before 15 days prior to the delinquency date of such taxes, (iii) the lease(s) with the applicable tenant(s) will be and continue to be in full force and effect and will not be subject to any default beyond any applicable grace or notice and cure period by either the borrower or the tenant, and (iv) no material adverse change has, in the lender’s reasonable determination, occurred with respect to the applicable tenant such that the ability to timely pay the taxes or insurance premiums that the applicable tenant is required to pay pursuant to its lease has, been materially jeopardized. In addition, the borrower is not required to make deposits into a capital reserve subaccount with respect to the aggregate number of rentable square feet at the ExchangeRight Net Leased Portfolio Properties for which the tenants are obligated under their applicable leases to pay capital expenses for their respective premises, for so long as (i) no event of default has occurred and be continuing, (ii) the borrower provides proof of payment by all applicable tenants of the payment of all such capital expenses promptly following request by the lender, (iii) the leases with the applicable tenants are and continue to be in full force and effect and are not be subject to any default beyond any applicable grace or notice and cure period, and (iv) no material adverse change has, in the lender’s reasonable determination, occurred with respect to the applicable tenant such that the ability to timely pay the capital expenses for its respective premises pursuant to its lease has been materially jeopardized. If an event of default has occurred and is continuing, the borrower is required to deposit $12,733 on a monthly basis into the TI/LC reserve and any sum or termination fee payable to the borrower. In the event the Indianapolis Osteopathic Hospital, Inc tenant (the “Osteopathic Hospital Tenant”) exercises its early termination option under its lease, the borrower is required to deposit $766,723 plus any other amounts then due and payable from the Osteopathic Hospital Tenant into the Osteopathic Hospital Rollover Reserve.
Lockbox and Cash Management.The ExchangeRight Mortgage Loan requires a lender-controlled lockbox account, which is already in place, and requires the borrower, Master Lessee, or manager to cause all rents to be paid directly into an eligible account maintained by the borrower at a local bank selected by the borrower, which is required at all times to be an eligible institution. Without in any way limiting the foregoing, if the borrower, Master Lessee or manager receive any rents, then (i) such amounts will be deemed to be collateral for the ExchangeRight Mortgage Loan and will be held in trust by the borrower, Master Lessee or the manager, as applicable, for the benefit, and as the property, of the lender, (ii) such amounts may not be commingled with any other funds or property of the borrower, Master Lessee, or manager, and (iii) the borrower, Master Lessee, or manager, as applicable, is required to deposit such amounts into a clearing account within two business days of receipt. Funds deposited into the clearing account will be swept by the clearing bank on a daily basis into the Master Lessee’s operating account at the clearing bank, unless a Cash Management Period (as defined below) is continuing, in which event such funds will be swept on a daily basis into an eligible account at a deposit bank controlled by the lender. To the extent any Cash Management Period expires or terminates, any funds deposited into the clearing account will be swept by clearing bank on a daily basis into Master Lessee’s operating account by the lender’s delivery of a notice to the clearing bank, with the lender being entitled to send a subsequent notice to the clearing bank upon the occurrence of a subsequent Cash Management Period to redirect all amounts from the clearing account to the deposit account.
A “Cash Management Period” will commence upon the lender giving notice to the clearing bank of the occurrence of any of the following: (i) the maturity date, (ii) a default or an event of default, (iii) if, as of the last day of each calendar quarter during the term, the debt service coverage ratio is less than 1.40x or (iv) on May 1, 2024, to the extent a qualified transfer (i.e., the transfer of all outstanding ownership interest in the borrower to an approved transferee and the replacement of a guarantor with an acceptable replacement guarantor) has not occurred as of such date; and will end upon the lender giving notice to the clearing bank that the sweeping of funds into the deposit account may cease, which notice the lender will only be required to give if (1) the ExchangeRight Mortgage Loan and all other obligations under the loan documents have been repaid in full or (2) the maturity date has not occurred and (A) with respect to the matters described in clause (ii) above, such event of default has been cured and no other event of default has occurred and is continuing, (B) with respect to the matter described in clause (iii) above, the lender has determined that the ExchangeRight Net Leased Portfolio Properties have achieved a debt service coverage ratio of at least 1.45x for two (2) calendar quarters, or (C) with respect to the matter described in clause (iv) above, a qualified transfer has occurred.
Property Management.The ExchangeRight Net Leased Portfolio Properties are managed by an affiliate of the borrower.
Assumption.The borrower has the right to transfer the ExchangeRight Net Leased Portfolio Properties in whole, but not in part, provided that certain conditions are satisfied, including (i) no event of default has occurred and is continuing; (ii) the borrower has provided the lender with not less than 60 days’ prior written notice, which notice is required to contain sufficient detail to enable the lender to determine that the transferee borrower complies with the requirements set forth in the loan agreement; (iii) the lender has reasonably determined that the proposed transferee and guarantor satisfy the lender’s credit review and underwriting standards, taking into consideration transferee experience, financial strength and general business standing; (iv) the delivery of a REMIC opinion, an insolvency opinion and other opinions required by the lender; and (v) the lender has received confirmation from Fitch, DBRS and Moody’s that such assumption will not result in a downgrade, withdrawal or qualification of the respective ratings assigned to the WFCM Series 2017-RB1 Certificates. If such transfer is a permitted transfer as set forth in the loan documents, the borrower is not required to receive lender consent and fulfill the aforementioned provisions.
Right of First Refusal. Each sole tenant at the Walgreens – Independence, MO property, the Walgreens – Arlington, TX property, and the Family Dollar – Baton Rouge, LA property has a right of first refusal to purchase the related mortgaged property in the event of a proposed sale of such mortgaged property to an unaffiliated third party. Each right of first refusal has been subordinated to the ExchangeRight Mortgage Loan documents and does not apply to a transfer in connection with a foreclosure, deed-in-lieu of foreclosure or other enforcement action under the ExchangeRight Mortgage Loan documents.
THE INFORMATION IN THIS STRUCTURAL AND COLLATERAL TERM SHEET IS NOT COMPLETE AND MAY BE AMENDED PRIOR TO THE TIME OF SALE. THIS TERM SHEET IS NOT AN OFFER TO SELL THESE SECURITIES AND IT IS NOT A SOLICITATION OF AN OFFER TO BUY THESE SECURITIES IN ANY JURISDICTION WHERE THE OFFER OR SALE IS NOT PERMITTED.
| 93 |
| EXCHANGERIGHT NET LEASED PORTFOLIO 15 |
Partial Release.Not permitted.
Real Estate Substitution.Not permitted.
Subordinate and Mezzanine Indebtedness.Not permitted.
Ground Lease.None.
Terrorism Insurance.The loan documents require that an “all risk” insurance policy be maintained by the borrower and such policy must provide coverage for terrorism in an amount equal to the full replacement cost of the ExchangeRight Net Leased Portfolio Properties. The loan documents also require business interruption insurance covering no less than the 12-month period following the occurrence of a casualty event, together with a 90 day extended period of indemnity.
THE INFORMATION IN THIS STRUCTURAL AND COLLATERAL TERM SHEET IS NOT COMPLETE AND MAY BE AMENDED PRIOR TO THE TIME OF SALE. THIS TERM SHEET IS NOT AN OFFER TO SELL THESE SECURITIES AND IT IS NOT A SOLICITATION OF AN OFFER TO BUY THESE SECURITIES IN ANY JURISDICTION WHERE THE OFFER OR SALE IS NOT PERMITTED.
| 94 |
(THIS PAGE INTENTIONALLY LEFT BLANK)
THE INFORMATION IN THIS STRUCTURAL AND COLLATERAL TERM SHEET IS NOT COMPLETE AND MAY BE AMENDED PRIOR TO THE TIME OF SALE. THIS TERM SHEET IS NOT AN OFFER TO SELL THESE SECURITIES AND IT IS NOT A SOLICITATION OF AN OFFER TO BUY THESE SECURITIES IN ANY JURISDICTION WHERE THE OFFER OR SALE IS NOT PERMITTED.
| 95 |
(THIS PAGE INTENTIONALLY LEFT BLANK)
THE INFORMATION IN THIS STRUCTURAL AND COLLATERAL TERM SHEET IS NOT COMPLETE AND MAY BE AMENDED PRIOR TO THE TIME OF SALE. THIS TERM SHEET IS NOT AN OFFER TO SELL THESE SECURITIES AND IT IS NOT A SOLICITATION OF AN OFFER TO BUY THESE SECURITIES IN ANY JURISDICTION WHERE THE OFFER OR SALE IS NOT PERMITTED.
| 96 |
| 1166 AVENUE OF THE AMERICAS |
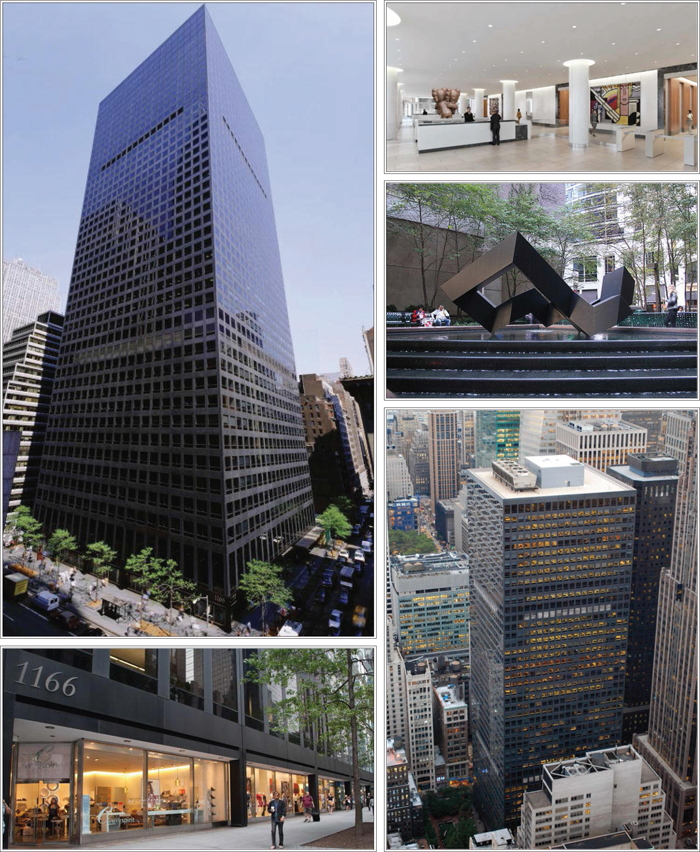
THE INFORMATION IN THIS STRUCTURAL AND COLLATERAL TERM SHEET IS NOT COMPLETE AND MAY BE AMENDED PRIOR TO THE TIME OF SALE. THIS TERM SHEET IS NOT AN OFFER TO SELL THESE SECURITIES AND IT IS NOT A SOLICITATION OF AN OFFER TO BUY THESE SECURITIES IN ANY JURISDICTION WHERE THE OFFER OR SALE IS NOT PERMITTED.
| 97 |
| 1166 AVENUE OF THE AMERICAS |
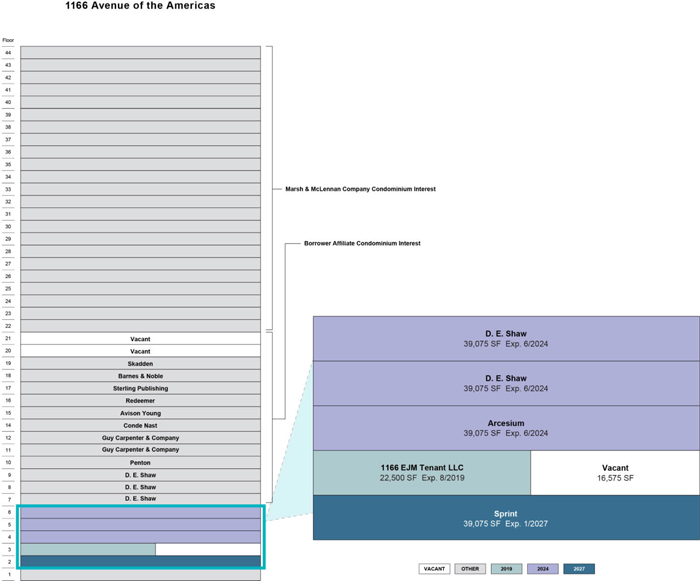
THE INFORMATION IN THIS STRUCTURAL AND COLLATERAL TERM SHEET IS NOT COMPLETE AND MAY BE AMENDED PRIOR TO THE TIME OF SALE. THIS TERM SHEET IS NOT AN OFFER TO SELL THESE SECURITIES AND IT IS NOT A SOLICITATION OF AN OFFER TO BUY THESE SECURITIES IN ANY JURISDICTION WHERE THE OFFER OR SALE IS NOT PERMITTED.
| 98 |
| 1166 AVENUE OF THE AMERICAS |
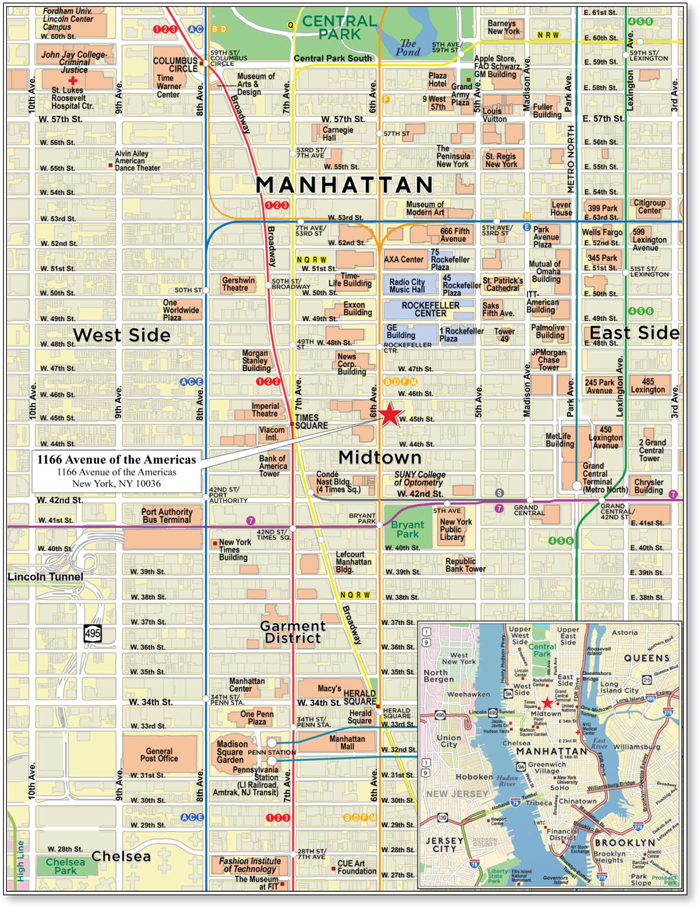
THE INFORMATION IN THIS STRUCTURAL AND COLLATERAL TERM SHEET IS NOT COMPLETE AND MAY BE AMENDED PRIOR TO THE TIME OF SALE. THIS TERM SHEET IS NOT AN OFFER TO SELL THESE SECURITIES AND IT IS NOT A SOLICITATION OF AN OFFER TO BUY THESE SECURITIES IN ANY JURISDICTION WHERE THE OFFER OR SALE IS NOT PERMITTED.
| 99 |
| No. 8 – 1166 Avenue of the Americas | ||||||
| Loan Information | Property Information | |||||
| Mortgage Loan Seller: | Barclays Bank PLC | Single Asset/Portfolio: | Single Asset | |||
| Credit Assessment (DBRS/Fitch/Moody’s): | NR/NR/NR | Property Type: | Office | |||
| Original Principal Balance(1): | $28,750,000 | Specific Property Type: | CBD | |||
| Cut-off Date Balance(1): | $28,750,000 | Location: | New York, NY | |||
| % of Initial Pool Balance: | 4.5% | Size: | 195,375 SF | |||
| Loan Purpose: | Refinance | Cut-off Date Balance Per SF(1): | $435.06 | |||
| Borrower: | 1166 EJM LLC | Year Built/Renovated: | 1974/NAP | |||
| Borrower Sponsor: | Edward J. Minskoff Equities, Inc. | Title Vesting: | Fee | |||
| Mortgage Rate: | 5.2788% | Property Manager: | Edward J. Minskoff Equities, Inc. | |||
| Note Date: | January 11, 2017 | 4thMost Recent Occupancy (As of)(4): | 100.0% (12/31/2013) | |||
| Anticipated Repayment Date: | NAP | 3rdMost Recent Occupancy (As of)(4): | 100.0% (12/31/2014) | |||
| Maturity Date: | February 6, 2027 | 2ndMost Recent Occupancy (As of)(4): | 90.0% (12/31/2015) | |||
| IO Period: | 120 months | Current Occupancy (As of)(4): | 91.5% (1/24/2017) | |||
| Loan Term (Original): | 120 months | |||||
| Seasoning: | 1 month | |||||
| Amortization Term (Original): | NAP | Underwriting and Financial Information: | ||||
| Loan Amortization Type(1): | Interest-only, Balloon | |||||
| Interest Accrual Method: | Actual/360 | 4thMost Recent NOI (As of)(5): | $8,680,406 (12/31/2013) | |||
| Call Protection: | L(25),D(88),O(7) | 3rdMost Recent NOI (As of)(5): | $9,152,554 (12/31/2014) | |||
| Lockbox Type: | Hard/Springing Cash Management | 2ndMost Recent NOI (As of)(5): | $8,250,030 (12/31/2015) | |||
| Additional Debt(1): | Yes | Most Recent NOI (As of)(5): | $6,347,326 (TTM 10/31/2016) | |||
| Additional Debt Type(1)(2): | Pari Passu; B-Note; Mezzanine Loan | |||||
| Escrows and Reserves(3): | U/W Revenues: | $14,201,718 | ||||
| U/W Expenses: | $5,559,507 | |||||
| Type: | Initial | Monthly | Cap (If Any) | U/W NOI: | $8,642,211 | |
| Taxes | $0 | Springing | NAP | U/W NCF: | $8,151,944 | |
| Insurance | $0 | Springing | NAP | U/W NOI DSCR(1): | 1.90x | |
| Replacement Reserves | $0 | Springing | NAP | U/W NCF DSCR(1): | 1.79x | |
| TI/LC Reserves: | $0 | Springing | NAP | U/W NOI Debt Yield(1): | 10.2% | |
| Unfunded Obligations Reserve | $7,539,492 | $0 | NAP | U/W NCF Debt Yield(1): | 9.6% | |
| Unfunded Free Rent Reserve | $5,742,179 | $0 | NAP | As-Is Appraised Value(6): | $225,000,000 | |
| Third Floor Reserve | $4,058,916 | $0 | NAP | As-Is Appraisal Valuation Date(6): | January 1, 2017 | |
| Lobby Renovation Reserve | $488,422 | $0 | NAP | Cut-off Date LTV Ratio(1)(6): | 37.8% | |
| Condominium Assessment Reserve | $0 | Springing | NAP | LTV Ratio at Maturity(1)(6): | 37.8% | |
| (1) | See “The Mortgage Loan” section. All statistical information related to balance per square foot, loan-to-value ratios, debt service coverage ratios and debt yields are based on the two seniorpari passu notes. The Cut-off Date LTV Ratio, U/W NCF DSCR and U/W NOI Debt Yield based on the 1166 Avenue of the Americas Whole Loan are 48.9%, 1.37x and 7.9%, respectively. The Cut-off Date LTV Ratio, U/W NCF DSCR and U/W NOI Debt Yield based on the 1166 Avenue of the Americas total debt, inclusive of the mezzanine loan are 57.8%, 1.15x and 6.6%, respectively. |
| (2) | See “Subordinate and Mezzanine Indebtedness” section. |
| (3) | See “Escrows” section. |
| (4) | See “Historical Occupancy” section. |
| (5) | See “Cash Flow Analysis” section. |
| (6) | See “Appraisal” section. |
The Mortgage Loan.The mortgage loan (the “1166 Avenue of the Americas Mortgage Loan”) is part of a whole loan (the “1166 Avenue of the Americas Whole Loan”), that is evidenced by two seniorpari passu notes (Note A-1 and Note A-2) and a subordinate companion loan (Note B) secured by a first mortgage encumbering the fee interest of a five-unit condominium portion of the 1166 Avenue of the Americas property (the “1166 Avenue of the Americas Property”). The 1166 Avenue of the Americas Whole Loan was originated on January 11, 2017 by Barclays Bank PLC. The 1166 Avenue of the Americas Whole Loan had an original principal balance of $110,000,000, has an outstanding principal balance as of the Cut-off Date of $110,000,000 and accrues at a blended interest rate of 5.3427%per annum. The 1166 Avenue of the Americas Whole Loan had an initial term of 120 months, has a remaining term of 119 months as of the Cut-off Date and requires interest-only payments. The 1166 Avenue of the Americas Whole Loan matures on February 6, 2027.
THE INFORMATION IN THIS STRUCTURAL AND COLLATERAL TERM SHEET IS NOT COMPLETE AND MAY BE AMENDED PRIOR TO THE TIME OF SALE. THIS TERM SHEET IS NOT AN OFFER TO SELL THESE SECURITIES AND IT IS NOT A SOLICITATION OF AN OFFER TO BUY THESE SECURITIES IN ANY JURISDICTION WHERE THE OFFER OR SALE IS NOT PERMITTED.
| 100 |
| 1166 AVENUE OF THE AMERICAS |
Note A-2, which will be contributed to the WFCM 2017-RB1 Trust, had an original principal balance of $28,750,000 and has an outstanding principal balance as of the Cut-off Date of $28,750,000 and represents the non-controlling interest in the 1166 Avenue of the Americas Whole Loan. Note A-1, which had an original principal balance of $56,250,000 and has an outstanding principal balance as of the Cut-off Date of $56,250,000, was contributed to the BBCMS 2017-C1 Trust. Note A-1 represents the controlling interest in the 1166 Avenue of the Americas Whole Loan during a control appraisal period under the related intercreditor agreement; otherwise the controlling noteholder is the junior noteholder. The 1166 Avenue of the Americas subordinate companion loan, which had an original principal balance of $25,000,000 and has an outstanding principal balance as of the Cut-off Date of $25,000,000, is currently held by an affiliate of Square Mile Capital Management LLC. See “Description of the Mortgage Pool—The Whole Loans—The Non-Serviced Whole Loans—1166 Avenue of the Americas Whole Loan” and “Pooling and Servicing Agreement” in the Preliminary Prospectus.
Note Summary
| Notes | Cut-off Date Balance | Note Holder | Controlling Interest | |
| A-1 | $56,250,000 | BBCMS 2017-C1 | No(1) | |
| A-2 | $28,750,000 | WFCM 2017-RB1 | No | |
| B | $25,000,000 | An affiliate of Square Mile Capital Management LLC | Yes(1) | |
| Total | $110,000,000 |
| (1) | The 1166 Avenue of the Americas Whole Loan will be serviced pursuant to the BBCMS 2017-C1 pooling and servicing agreement. However, so long as no control appraisal period has occurred and is continuing, the holder of the 1166 Avenue of the Americas subordinate companion loan (Note B) will be the controlling noteholder and will have the right to approve certain modifications and consent to certain actions to be taken with respect to the 1166 Avenue of the Americas Whole Loan. If a control appraisal period has occurred and is continuing, the holder of Note A-1 will be the controlling note holder. |
Following the lockout period, the borrower has the right to defease the 1166 Avenue of the Americas Whole Loan in whole, but not in part on any date before August 6, 2026. The 1166 Avenue of the Americas Whole Loan is prepayable without penalty on or after August 6, 2026.
Sources and Uses
| Sources | Uses | |||||
| Original whole loan amount | $110,000,000 | 84.6% | Loan payoff(1) | $110,534,218 | 85.0% | |
| Mezzanine Loan | 20,000,000 | 15.4 | Reserves | 17,829,009 | 13.7 | |
| Closing costs | 1,447,482 | 1.1 | ||||
| Return of equity | 189,291 | 0.1 | ||||
| Total Sources | $130,000,000 | 100.0% | Total Uses | $130,000,000 | 100.0% |
| (1) | The 1166 Avenue of the Americas Property was previously securitized in LBUBS 2007-C1. |
The Property.The 1166 Avenue of the Americas Property is comprised of a 46-unit condominium, of which five units, (floors 2-6) serve as collateral for the 1166 Avenue of the Americas Whole Loan and comprise class A office space totaling 195,375 square feet of net rentable area.
The 1166 Avenue of the Americas Property is a 44-story, 1,204,839 square foot, class A office building located on Avenue of the Americas between West 45th Street and West 46th Street in midtown Manhattan. The 1166 Avenue of the Americas Property was built in 1974 and is currently undergoing lobby renovations, which are expected to be substantially completed by March 31, 2017. As a part of the ongoing renovation, the property’s lobby was redesigned showcasing modern art. The scope of the lobby renovation work includes the installation of new lobby desks, new glass security panels, new security turnstiles, new sheetrock ceilings, new light fixtures throughout the space and the refinishing of all interior lobby columns. Originally built as the world headquarters for International Paper Company, the 1166 Avenue of the Americas Property currently serves as the world headquarters to Marsh & McLennan Companies, which occupy floors 22 to 44 (not collateral). The 1166 Avenue of the Americas Property’s floor heights are generally 11.5 feet; however, Sprint’s second floor space has a floor height of 20 feet. The 1166 Avenue of the Americas Property also benefits from its high-tech infrastructure, providing tenants with access to multiple high-quality internet service providers and fiber optic connections.
The largest tenant, D.E. Shaw, leases 78,150 square feet (40.0% of the net rentable area), comprising the entirety of the fifth and sixth floors, through June 2024. D.E. Shaw has been a tenant at the 1166 Avenue of the Americas Property since September 2006. Founded in 1998, D.E. Shaw is a global investment and technology development firm with more than $40 billion in investment capital as of October 1, 2016. D.E. Shaw invests globally in both public and private markets and is recognized as a pioneer in quantitative investing, particularly in equities, futures and options. The 1166 Avenue of the Americas Property serves as the headquarters of D.E. Shaw. The second largest tenant, Sprint, leases 39,075 square feet (20.0% of the net rentable area), comprising the entirety of the second floor, through January 2027 and has been a tenant at the 1166 Avenue of the Americas Property since June 2006. Sprint is a communications company that offers a wide range of wireless and wireline communications products and services to various types of consumers. Sprint utilizes its office space at the 1166 Avenue of the Americas Property for its executive offices, sales and marketing division and as showrooms. The third largest tenant, Arcesium, leases 39,075 square feet (20.0% of the net rentable area), comprising the entirety of the fourth floor, through June 2024. Affiliated with and launched by D.E. Shaw in 2015, but now its own independent company, Arcesium is a post-trade technology and professional services firm offering technology platforms to hedge fund professionals to solve their post-trade challenges. Arcesium has received additional equity backing from Blackstone Alternative Asset Management and has since grown to support more than $60 billion in assets with a staff of over 550 professionals. However, Arcesium’s lease is guaranteed by D.E. Shaw. The third floor was previously occupied by CT
THE INFORMATION IN THIS STRUCTURAL AND COLLATERAL TERM SHEET IS NOT COMPLETE AND MAY BE AMENDED PRIOR TO THE TIME OF SALE. THIS TERM SHEET IS NOT AN OFFER TO SELL THESE SECURITIES AND IT IS NOT A SOLICITATION OF AN OFFER TO BUY THESE SECURITIES IN ANY JURISDICTION WHERE THE OFFER OR SALE IS NOT PERMITTED.
| 101 |
| 1166 AVENUE OF THE AMERICAS |
Partners until June 2015 when it vacated its space with little notice due to corporate issues including bankruptcy. 1166 EJM Tenant LLC, a borrower sponsor-affiliated entity, has a master lease of 22,500 square feet, representing approximately 57.6% of the third floor for a term of 30 months. Edward J. Minskoff, the principal of the borrower sponsor, has executed a personal guaranty for such space. According to the borrower sponsor, it has identified a third party tenant with whom it has agreed to a term sheet and with whom it is currently negotiating a lease that encompasses most of the third floor for a 10-year term and a base rental rate higher than that of the master lease base rental rate. An upfront reserve of approximately $4.1 million was reserved for third floor leasing costs.
From 2013 through 2016, the 1166 Avenue of the Americas Property has averaged 93.0% occupancy. As of January 24, 2017, the 1166 Avenue of the Americas Property was 91.5% occupied, inclusive of the borrower sponsor’s master lease. The 1166 Avenue of the Americas Property is 80.0% occupied excluding the borrower sponsor’s master lease.
The following table presents certain information relating to the tenancy at the 1166 Avenue of the Americas Property:
Major Tenant
| Tenant Name | Credit Rating (Fitch/Moody’s/S&P)(1) | Tenant NRSF | % of NRSF | Annual U/W Base Rent PSF | Annual U/W Base Rent | % of Total Annual U/W Base Rent | Lease Expiration Date | |
| Major Tenant | ||||||||
| D.E. Shaw | NR/NR/NR | 78,150 | 40.0% | $76.24 | $5,958,156 | 44.3% | 6/30/2024(2) | |
| Sprint | NA/Ba1/BB+ | 39,075 | 20.0% | $81.00 | $3,165,075 | 23.6% | 1/31/2027(3)(4) | |
| Arcesium | NR/NR/NR | 39,075 | 20.0% | $73.00 | $2,852,475 | 21.2% | 6/30/2024(5)(6) | |
| 1166 EJM Tenant LLC(7) | NR/NR/NR | 22,500 | 11.5% | $65.00 | $1,462,500 | 10.9% | 8/1/2019(8) | |
| Total Major Tenant | 178,800 | 91.5% | $75.16 | $13,438,206 | 100.0% | |||
| Vacant Space | 16,575 | 8.5% | ||||||
| Collateral Total | 195,375 | 100.0% | ||||||
| (1) | Certain ratings are those of the parent whether or not the parent guarantees the lease. |
| (2) | D.E. Shaw has one, five-year lease extension option. |
| (3) | Sprint has one, five-year lease extension option. |
| (4) | Sprint has the right to terminate its lease on January 31, 2022 with 15 months’ notice and the payment of a termination fee equal to nine months of fixed rent and unamortized leasing costs. |
| (5) | Arcesium has one, five-year lease extension option. |
| (6) | Arcesium has the right to terminate its lease on the fourth anniversary of the rent commencement date with 12 months’ notice and the payment of a termination fee equal to two months of rent and the unamortized leasing costs. |
| (7) | 1166 EJM Tenant LLC, an affiliate of the borrower sponsor, is master leasing 22,500 square feet of the third floor and Edward J. Minskoff, the principal of the borrower sponsor, has provided a personal guaranty for such master leased space. According to the borrower sponsor, it has identified a third party tenant with whom it has agreed to a term sheet for, and is currently negotiating a lease that encompasses most of the third floor, for a 10-year term and a base rental rate higher than that of the master lease base rental rate. |
| (8) | The tenant’s master lease expires upon the earlier of (i) the date on which all or any portion of the third floor have been relet pursuant to one or more leases that are, (a) at least 60 months in term, with no termination option during that time, (b) having a base rent of not less than $65.00 per square foot after the first year, (c) other lease terms that are in line with market with a tenant that is suitable for occupancy in a class A office building and (d) such tenant takes the space as-is or, (ii) August 1, 2019. In addition, the rent payable under the master lease is reduced proportionately as rent is paid under qualifying leases of the space. |
THE INFORMATION IN THIS STRUCTURAL AND COLLATERAL TERM SHEET IS NOT COMPLETE AND MAY BE AMENDED PRIOR TO THE TIME OF SALE. THIS TERM SHEET IS NOT AN OFFER TO SELL THESE SECURITIES AND IT IS NOT A SOLICITATION OF AN OFFER TO BUY THESE SECURITIES IN ANY JURISDICTION WHERE THE OFFER OR SALE IS NOT PERMITTED.
| 102 |
| 1166 AVENUE OF THE AMERICAS |
The following table presents certain information relating to the lease rollover schedule at the 1166 Avenue of the Americas Property:
Lease Expiration Schedule(1)(2)
| Year Ending December 31, | No. of Leases Expiring | Expiring NRSF | % of Total NRSF | Cumulative Expiring NRSF | Cumulative % of Total NRSF | Annual U/W Base Rent | % of Total Annual U/W Base Rent | Annual U/W Base Rent PSF(3) |
| MTM | 0 | 0 | 0.0% | 0 | 0.0% | $0 | 0.0% | $0.00 |
| 2017 | 0 | 0 | 0.0% | 0 | 0.0% | $0 | 0.0% | $0.00 |
| 2018 | 0 | 0 | 0.0% | 0 | 0.0% | $0 | 0.0% | $0.00 |
| 2019(2) | 1 | 22,500 | 11.5% | 22,500 | 11.5% | $1,462,500 | 10.9% | $65.00 |
| 2020 | 0 | 0 | 0.0% | 22,500 | 11.5% | $0 | 0.0% | $0.00 |
| 2021 | 0 | 0 | 0.0% | 22,500 | 11.5% | $0 | 0.0% | $0.00 |
| 2022 | 0 | 0 | 0.0% | 22,500 | 11.5% | $0 | 0.0% | $0.00 |
| 2023 | 0 | 0 | 0.0% | 22,500 | 11.5% | $0 | 0.0% | $0.00 |
| 2024 | 2 | 117,225 | 60.0% | 139,725 | 71.5% | $8,810,631 | 65.6% | $75.16 |
| 2025 | 0 | 0 | 0.0% | 139,725 | 71.5% | $0 | 0.0% | $0.00 |
| 2026 | 0 | 0 | 0.0% | 139,725 | 71.5% | $0 | 0.0% | $0.00 |
| 2027 | 1 | 39,075 | 20.0% | 178,800 | 91.5% | $3,165,075 | 23.6% | $81.00 |
| Thereafter | 0 | 0 | 0.0% | 178,800 | 91.5% | $0 | 0.0% | $0.00 |
| Vacant | 0 | 16,575 | 8.5% | 195,375 | 100.0% | $0 | 0.0% | $0.00 |
| Total/Weighted Average | 4 | 195,375 | 100.0% | $13,438,206 | 100.0% | $75.16 |
| (1) | Information obtained from the underwritten rent roll. |
| (2) | Certain tenants may have lease termination options that are exercisable prior to the originally stated expiration date of the subject lease that are not considered in the lease expiration schedule. |
| (3) | Weighted Average Annual U/W Base Rent PSF excludes vacant space. |
| (4) | Includes the borrower sponsor’s master lease space commencing on February 1, 2017. The borrower sponsor’s master lease expires upon the earlier of (i) the date on which all or any portion of the third floor have been relet pursuant to one or more leases that are, (a) at least 60 months in term, with no termination option during that time, (b) having a base rent of not less than $65.00 per square foot after the first year, (c) other lease terms are in line with market with a tenant that is suitable for occupancy in a Class A office building and (d) such tenant takes the space as-is or, (ii) August 1, 2019. In addition, the rent payable under the master lease is reduced proportionately as rent is paid under qualifying leases of the space. |
The following table presents historical occupancy percentages at the 1166 Avenue of the Americas Property:
Historical Occupancy
12/31/2013(1) | 12/31/2014(1) | 12/31/2015(1)(2) | 1/24/2017(3) |
| 100.0% | 100.0% | 90.0% | 91.5% |
| (1) | Historical Occupancies are the averages of each respective year. |
| (2) | The decrease in 2015 occupancy is due to CTPartners vacating its space for corporate issues including bankruptcy |
| (3) | Occupancy as of January 24, 2017 includes the borrower sponsor’s master lease space representing 22,500 square feet or 11.5% of the net rentable area. Excluding the borrower sponsor’s master lease space, the 1166 Avenue of the Americas Property is 80.0% occupied. |
THE INFORMATION IN THIS STRUCTURAL AND COLLATERAL TERM SHEET IS NOT COMPLETE AND MAY BE AMENDED PRIOR TO THE TIME OF SALE. THIS TERM SHEET IS NOT AN OFFER TO SELL THESE SECURITIES AND IT IS NOT A SOLICITATION OF AN OFFER TO BUY THESE SECURITIES IN ANY JURISDICTION WHERE THE OFFER OR SALE IS NOT PERMITTED.
| 103 |
| 1166 AVENUE OF THE AMERICAS |
Operating History and Underwritten Net Cash Flow. The following table presents certain information relating to the underwritten net cash flow at the 1166 Avenue of the Americas Property:
Cash Flow Analysis
| 2013 | 2014 | 2015 | TTM 10/31/2016 | U/W | % of U/W Effective Gross Income | U/W $ per SF | ||||||||
| Base Rent(1)(2) | $11,990,407 | $12,199,324 | $11,572,572 | $9,692,318 | $13,438,206 | 94.6% | $68.78 | |||||||
| Grossed Up Vacant Space | 0 | 0 | 0 | 0 | 1,326,000 | 9.3 | 6.79 | |||||||
| Total Reimbursables(3) | 1,933,371 | 2,285,366 | 2,421,481 | 2,085,321 | 717,098(4) | 5.0 | 3.67 | |||||||
| Other Income(5) | 48,882 | 48,987 | 55,929 | 46,414 | 46,414 | 0.3 | 0.24 | |||||||
| Less Vacancy & Credit Loss | 0 | 0 | 0 | 0 | (1,326,000)(6) | (9.3) | (6.79) | |||||||
| Effective Gross Income | $13,972,660 | $14,533,677 | $14,049,983 | $11,824,052 | $14,201,718 | 100.0% | $72.69 | |||||||
| Total Operating Expenses | $5,292,254 | $5,381,123 | $5,799,952 | $5,476,727 | $5,559,507 | 39.1% | $28.46 | |||||||
| Net Operating Income | $8,680,406 | $9,152,554 | $8,250,030 | $6,347,326 | $8,642,211(7) | 60.9% | $44.23 | |||||||
| TI/LC | 0 | 0 | 0 | 0 | 470,730 | 3.3 | 2.41 | |||||||
| Capital Expenditures | 0 | 0 | 0 | 0 | 19,538 | 0.1 | 0.10 | |||||||
| Net Cash Flow | $8,680,406 | $9,152,554 | $8,250,030 | $6,347,326 | $8,151,944(7) | 57.4% | $41.72 | |||||||
| NOI DSCR(8) | 1.91x | 2.01x | 1.81x | 1.40x | 1.90x | |||||||||
| NCF DSCR(8) | 1.91x | 2.01x | 1.81x | 1.40x | 1.79x | |||||||||
| NOI DY(8) | 10.2% | 10.8% | 9.7% | 7.5% | 10.2% | |||||||||
| NCF DY(8) | 10.2% | 10.8% | 9.7% | 7.5% | 9.6% |
| (1) | The decrease of Base Rent from 2015 to TTM 10/31/2016 is primarily due to CTPartners vacating its space for corporate issues including bankruptcy. |
| (2) | The increase in Base Rent from TTM 10/31/2016 to U/W is primarily due to (i) the borrower sponsor executing a master lease for 22,500 square feet of space on the third floor (former CTPartners space) and (ii) underwriting the renewal base rent for D.E. Shaw, Sprint and Arcesium. See “Major Tenants” section. |
| (3) | Total Reimbursables are inclusive of CAM recoveries, tax recoveries and tenant services. |
| (4) | Underwritten Total Reimbursables do not include CAM recoveries and tax recoveries due to 2017 base year resets for all tenants. |
| (5) | Other Income is comprised of storage income and other miscellaneous income. |
| (6) | The underwritten economic vacancy is 8.5%. The 1166 Avenue of the Americas Property was 91.5% occupied as of January 24, 2017, inclusive of the master lease space, and 80% exclusive of the master lease. |
| (7) | Underwritten Net Operating Income and Underwritten Net Cash Flow excluding the master lease rental income are $7,179,711 and $6,689,444, respectively. The U/W NCF DSCR and U/W NCF DY excluding the master lease rental income are 1.47x and 7.9%, respectively |
| (8) | The debt service coverage ratios and debt yields are based on the 1166 Avenue of the Americas seniorpari passu notes. |
Appraisal.As of the appraisal valuation date of January 1, 2017, the 1166 Avenue of the Americas Property had an “as-is” appraised value of $205,000,000. The appraiser also concluded to an as-is “assuming holdbacks” value of $225,000,000 as of January 1, 2017. The Cut-off Date LTV Ratio based on the senior pari passu notes for the “as-is” appraised value is 41.5%.
Environmental Matters. According to the Phase I environmental site assessment dated December 9, 2016, there are no recognized environmental conditions at the 1166 Avenue of the Americas Property.
Market Overview and Competition.The 1166 Avenue of the Americas Property is located in midtown Manhattan and is situated between West 45th Street and West 46th Street facing Sixth Avenue. The 1166 Avenue of the Americas Property is in close proximity to Manhattan’s transportation hubs, Grand Central Terminal, Penn Station, Port Authority and all the major subway lines, A, B, C, D, E, F, N, Q, R, S, W, 1, 2, 3 and 7. Midtown Manhattan’s attractions include Times Square, Rockefeller Center, Bryant Park and the Museum of Modern Art, amongst others. Some of the 1166 Avenue of the Americas Property’s neighbors include, Bank of America, MetLife, Barclays, UBS and JP Morgan Chase.
According to the appraisal, the property is located in the Sixth Avenue/Rockefeller Center submarket of Manhattan, which is part of the larger Plaza District Office submarket. As of the third quarter of 2016, the Sixth Avenue/Rockefeller Center submarket comprised approximately 38.8 million square feet of class A office space with a direct vacancy rate of 7.2% and average Class A office rents of $91.33 per square foot. This compares to 9.0% and $86.79 per square foot respectively, as of the third quarter of 2015. The appraisal identified eight directly competitive properties built between 1959 and 1992 and ranging in size from approximately 960,050 to 2,200,000 square feet. The comparable properties reported occupancies ranging from 86.3% to 99.3% with a weighted average of 91.0%. Asking rents for the comparable properties range from $69.00 to $110.00 per square foot. The weighted average in-place office rental rate at 1166 Avenue of the Americas Property is $75.16 per square foot, which is below the appraisal concluded market rent of $80.00 per square foot.
The Borrower.The borrower is 1166 EJM LLC, a Delaware limited liability company, with at least two independent directors. Legal counsel to the borrower delivered a non-consolidation opinion in connection with the origination of the 1166 Avenue of the Americas Whole Loan. The borrowing entity is currently in litigation with JPMorgan Chase Bank, N.A., who provided a letter of credit to CT Partners, a former tenant at the 1166 Avenue of the Americas Property, in regards to such letter of credit. See “Description of the Mortgage Pool—Litigation and Other Considerations” in the Preliminary Prospectus. Edward J. Minskoff Equities, Inc. is the guarantor of certain nonrecourse carveouts under the 1166 Avenue of the Americas Whole Loan.
The Borrower Sponsor. The borrower sponsor is Edward J. Minskoff Equities, Inc. (“EJME”). Founded in 1987, EJME is a real estate acquisition and development company founded by Edward J. Minskoff. Currently, EJME owns an interest in, leases and/or manages approximately four million square feet of commercial space. EJME’s current New York City portfolio includes the 1166
THE INFORMATION IN THIS STRUCTURAL AND COLLATERAL TERM SHEET IS NOT COMPLETE AND MAY BE AMENDED PRIOR TO THE TIME OF SALE. THIS TERM SHEET IS NOT AN OFFER TO SELL THESE SECURITIES AND IT IS NOT A SOLICITATION OF AN OFFER TO BUY THESE SECURITIES IN ANY JURISDICTION WHERE THE OFFER OR SALE IS NOT PERMITTED.
| 104 |
| 1166 AVENUE OF THE AMERICAS |
Avenue of the Americas Property, 500-512 Seventh Avenue, 590 Madison Avenue, 101 Avenue of the Americas, the FAA Office Building, 270 Greenwich Street, 101 Warren Street, 89 Murray Street and 825 Seventh Avenue. EJME, as one of three owners with a minority non-controlling interest, was subject to a loan modification as a result of a maturity default on an unrelated mortgage loan. See “Description of the Mortgage Pool—Loan Purpose; Default History, Bankruptcy Issues and Other Proceedings” in the Preliminary Prospectus.
Escrows.The loan documents provide for an upfront escrow at closing in the amount of $7,539,492 for unfunded obligations, $5,742,179 for unfunded free rent and gap rent, $4,058,916 for third floor leasing costs and $488,422 for the borrower’s share of the lobby renovation.
The loan documents do not require ongoing monthly escrows for real estate taxes, so long as no Reserve Trigger Period (as defined below) has occurred and is continuing. Upon the expiration of a Reserve Trigger Period, any remaining funds in the tax escrow account will be disbursed back to the borrower, except during the Arcesium/D.E. Shaw Rollover Reserve Sweep Period (as defined below) if the Arcesium/D.E. Shaw Rollover Reserve Deposit Cap (as defined below) has not been satisfied, such funds will be transferred to the Arcesium/D.E. Shaw Rollover Reserve account up to the Arcesium/D.E. Shaw Rollover Reserve Deposit Cap and then any excess funds to the borrower.
The loan documents do not require ongoing monthly escrows for insurance premiums so long as (i) no Reserve Trigger Period has occurred and is continuing and (ii) the 1166 Avenue of the Americas Property is insured via an acceptable blanket insurance policy. Upon the expiration of a Reserve Trigger Period, any remaining funds in the insurance escrow account will be disbursed back to the borrower, except during the Arcesium/D.E. Shaw Rollover Reserve Sweep Period if the Arcesium/D.E. Shaw Rollover Reserve Deposit Cap has not been satisfied, such funds will be transferred to the Arcesium/D.E. Shaw Rollover Reserve account up to the Arcesium/D.E. Shaw Rollover Reserve Deposit Cap and then any excess funds to the borrower.
The loan documents do not require ongoing monthly escrows for replacement reserves so long as no Reserve Trigger Period has occurred and is continuing. Following the occurrence and during the continuance of a Reserve Trigger Period, the borrower is required to deposit $1,628 per month (approximately $0.10 per square foot annually) for replacement reserves.
The loan documents do not require ongoing monthly escrows for TI/LC reserves so long as no Reserve Trigger Period has occurred and is continuing. Following the occurrence and during the continuance of a Reserve Trigger Period, the borrower is required to deposit approximately $20,352 per month (approximately $1.25 per square foot annually) for TI/LC reserves. The borrower is also required to deposit any lease termination payments into the TI/LC reserve, unless such termination payments are in connection with the Arcesium lease or the D.E. Shaw lease, in which case, the payments will be deposited into the Arcesium/D.E. Shaw Rollover Reserve account. Upon the expiration of any Reserve Trigger Period and provided no other Reserve Trigger Period exists, any leasing reserve funds remaining in the reserve account will be disbursed to the borrower, except, during the Arcesium/D.E. Shaw Rollover Reserve Sweep Period if the Arcesium/D.E. Shaw Rollover Reserve Deposit Cap has not been satisfied, such funds that are not lease termination payments will be transferred to the Arcesium/D.E. Shaw Rollover Reserve account up to the Arcesium/D.E. Shaw Rollover Reserve Deposit Cap, and then any excess funds to the borrower.
The loan documents do not require ongoing monthly escrows for condominium assessment reserves so long as no Reserve Trigger Period has occurred and is continuing. Following the occurrence and during the continuance of a Reserve Trigger Period, the borrower is required to deposit an amount in order to pay assessment fees as determined in accordance with the loan documents into the condominium assessment reserve. Upon the expiration of any Reserve Trigger Period and provided no other Reserve Trigger Period exists, any condominium assessment reserve funds remaining in the reserve account will be disbursed to the borrower, except during the Arcesium/D.E. Shaw Rollover Reserve Sweep Period if the Arcesium/D.E. Shaw Rollover Reserve Deposit Cap has not been satisfied, such funds will be transferred to the Arcesium/D.E. Shaw Rollover Reserve account up to the Arcesium/D.E. Shaw Rollover Reserve Deposit Cap and then any excess funds to the borrower.
Following the occurrence and the continuation of an Arcesium/D.E. Shaw Rollover Reserve Sweep Period, the borrower will be required to make monthly deposits to the Arcesium/D.E. Shaw Rollover Reserve in the amount remaining after having paid certain items in the cash management waterfall. The borrower will be required to deposit funds into the reserve until the aggregate amount of funds on deposit in the Arcesium/D.E. Shaw reserve account equals or exceeds the sum of the product of (i) $75.00 and (ii) the aggregate square footage leased by Arcesium and D.E. Shaw scheduled to expire on June 30, 2024 (“Arcesium/D.E. Shaw Rollover Reserve Deposit Cap”). However, if any of the Arcesium or D.E. Shaw space is leased pursuant to a new lease or any of the aforementioned tenants renew their lease in accordance with the loan documents, the Arcesium/D.E. Shaw Rollover Reserve Deposit Cap will be reduced by the sum of the product of (i) the positive difference between $75.00 and the amount per square foot of approved leasing expenses constituting TI/LCs under the new lease or lease renewal and (ii) the square footage of the space subject to the new lease or lease renewal.
A “Reserve Trigger Period” will commence upon (i) an event of default, (ii) the total loan debt service coverage ratio falling below 1.10x or (iii) a mezzanine loan event of default. A Reserve Trigger Period will expire upon, with regard to clause (i), a cure of the event of default; with regard to clause (ii), the total loan debt service coverage ratio being equal to or greater than 1.10x for two consecutive calendar quarters; with regard to clause (iii), the cure of the mezzanine loan event of default. In the event a tenant exercises a termination option, the tenant’s rental income and termination payments will be excluded from the underwritten cash flow utilized to calculate the total loan debt service coverage ratio; however, the termination payments will be included in such calculation if the amounts deposited in the TI/LC reserve with respect to such space equal or exceed the product of (i) $75.00 and (ii) the square footage of the Property subject to termination.
Lockbox and Cash Management. The 1166 Avenue of the Americas Whole Loan requires a lender-controlled lockbox account, which is already in place, and that the borrower direct the tenants to pay all rents directly into such lockbox account. In the absence of a Trigger Period (as defined below), the funds in the clearing account will be subject to the direction of the borrower. During a
THE INFORMATION IN THIS STRUCTURAL AND COLLATERAL TERM SHEET IS NOT COMPLETE AND MAY BE AMENDED PRIOR TO THE TIME OF SALE. THIS TERM SHEET IS NOT AN OFFER TO SELL THESE SECURITIES AND IT IS NOT A SOLICITATION OF AN OFFER TO BUY THESE SECURITIES IN ANY JURISDICTION WHERE THE OFFER OR SALE IS NOT PERMITTED.
| 105 |
| 1166 AVENUE OF THE AMERICAS |
Trigger Period, any transfers to the borrower’s operating account are required to cease and sums on deposit in the clearing account will be transferred on a daily basis to a deposit account controlled by the lender and applied to payment of all monthly amounts due under the loan documents. To the extent there is a Reserve Trigger Period continuing, all excess cash flow after payment of the mortgage loan debt service, required reserves, operating expenses and mezzanine debt service will be swept into an excess cash flow reserve to be held in a lender controlled account. Upon the expiration of a Reserve Trigger Period, any remaining excess cash flow funds will be disbursed to the borrower except during an Arcesium/D.E. Shaw Rollover Reserve Sweep Period, during which time, all excess cash flow will be swept into the Arcesium/D.E. Shaw Rollover Reserve up to the Arcesium/D.E. Shaw Rollover Reserve Deposit Cap, and then any excess to the borrower.
A “Trigger Period” means the occurrence of (i) an event of default, (ii) the total loan debt service coverage ratio falling below 1.10x, (iii) a mezzanine loan event of default or (iv) the occurrence of an Arcesium/D.E. Shaw Rollover Reserve Sweep Period and expiring upon, with regard to clause (i), a cure of the event of default, with regard to clause (ii), the total loan debt service coverage ratio being equal to or greater than 1.10x for two consecutive calendar quarters, with regard to clause (iii), the cure of the mezzanine loan event of default and with regard to clause (iv), the first date on which the aggregate amounts deposited in the Arcesium/D.E. Shaw Rollover Reserve account equal or exceed the Arcesium/D.E. Shaw Rollover Reserve Deposit Cap.
An “Arcesium/D.E. Shaw Rollover Reserve Sweep Period” means the period commencing on the monthly payment date in December 2022.
Property Management. The 1166 Avenue of the Americas Property is managed by Edward J. Minskoff Equities, Inc., an affiliate of the borrower.
Assumption. The borrower has the right to transfer the 1166 Avenue of the Americas Property provided that certain conditions are satisfied, including (i) no event of default has occurred and is continuing; (ii) the lender will not unreasonably withhold consent provided certain requirements are met under the loan documents; and (iii) the lender has received confirmation from DBRS, Fitch and Moody’s that such assumption will not result in a downgrade, withdrawal or qualification of the respective ratings assigned to the Series 2017-RB1 certificates and similar confirmation from each rating agency rating any securities backed by the 1166 Avenue of the Americas Companion Loans with respect to the ratings of such securities.
Partial Release. Not permitted.
Real Estate Substitution.Not permitted.
Subordinate and Mezzanine Indebtedness.The 1166 Avenue of the Americas Whole Loan includes a 1166 Avenue of the Americas subordinate companion loan with an aggregate original principal balance of $25,000,000 that was sold to an affiliate of Square Mile Capital Management LLC. The 1166 Avenue of the Americas subordinate companion loan accrues interest at a fixedper annum rate equal to 5.560%. Additionally, a $20,000,000 mezzanine loan was funded concurrently with the origination of the 1166 Avenue of the Americas Whole Loan and was sold to the same third party as the holder of the 1166 Avenue of the Americas subordinate companion loan. The mezzanine loan is coterminous with the 1166 Avenue of the Americas Whole Loan and accrues interest at a fixedper annum rate equal to 5.560%. The UW NCF DSCR and UW NOI Debt Yield on the 1166 Avenue of the Americas total debt is 1.15x and 6.6%, respectively. An intercreditor agreement is in place with respect to the 1166 Avenue of the Americas Whole Loan and the related mezzanine loan.
Ground Lease.None.
Condominium. The 1166 Avenue of the Americas Property is subject to a condominium regime. The 1166 Avenue of the Americas Property consists of a 46-unit condominium; five units are owned by the borrower as collateral for the 1166 Avenue of the Americas Whole Loan. The remaining 41 units are not owned by the 1166 Avenue of the Americas borrower and are not collateral for the 1166 Avenue of the Americas Whole Loan. The 1166 Avenue of the Americas Property comprises approximately an 11.1% interest in the common elements of the condominium. An affiliate of the borrower sponsor owns an additional 15 units in the condominium (which are not collateral for the 1166 Avenue of the Americas Whole Loan), bringing the borrower sponsor’s total current interest in the condominium to approximately 41.8%. See “Description of the Mortgage Pool — Mortgage Pool Characteristics — Condominium Interest” in the Preliminary Prospectus.
Windstorm Insurance.The loan documents require windstorm insurance covering the full replacement cost of the 1166 Avenue of the Americas Property during the loan term. At origination, the 1166 Avenue of the Americas Property had windstorm insurance coverage.
Terrorism Insurance.The 1166 Avenue of the Americas Whole Loan documents require that the “all risk” insurance policy required to be maintained by the borrower provide coverage for terrorism in an amount equal to the full replacement cost of the 1166 Avenue of the Americas Property, subject to a premium cap of two times the insurance premium payable for “all risk” insurance on a stand-alone basis the time any terrorism coverage is excluded from the policy, as well as loss of rents and/or business interruption insurance for a period no less than 24 months following the occurrence of a casualty event.
THE INFORMATION IN THIS STRUCTURAL AND COLLATERAL TERM SHEET IS NOT COMPLETE AND MAY BE AMENDED PRIOR TO THE TIME OF SALE. THIS TERM SHEET IS NOT AN OFFER TO SELL THESE SECURITIES AND IT IS NOT A SOLICITATION OF AN OFFER TO BUY THESE SECURITIES IN ANY JURISDICTION WHERE THE OFFER OR SALE IS NOT PERMITTED.
| 106 |
(THIS PAGE INTENTIONALLY LEFT BLANK)
THE INFORMATION IN THIS STRUCTURAL AND COLLATERAL TERM SHEET IS NOT COMPLETE AND MAY BE AMENDED PRIOR TO THE TIME OF SALE. THIS TERM SHEET IS NOT AN OFFER TO SELL THESE SECURITIES AND IT IS NOT A SOLICITATION OF AN OFFER TO BUY THESE SECURITIES IN ANY JURISDICTION WHERE THE OFFER OR SALE IS NOT PERMITTED.
| 107 |
| HOTEL WILSHIRE |

THE INFORMATION IN THIS STRUCTURAL AND COLLATERAL TERM SHEET IS NOT COMPLETE AND MAY BE AMENDED PRIOR TO THE TIME OF SALE. THIS TERM SHEET IS NOT AN OFFER TO SELL THESE SECURITIES AND IT IS NOT A SOLICITATION OF AN OFFER TO BUY THESE SECURITIES IN ANY JURISDICTION WHERE THE OFFER OR SALE IS NOT PERMITTED.
| 108 |
| HOTEL WILSHIRE |
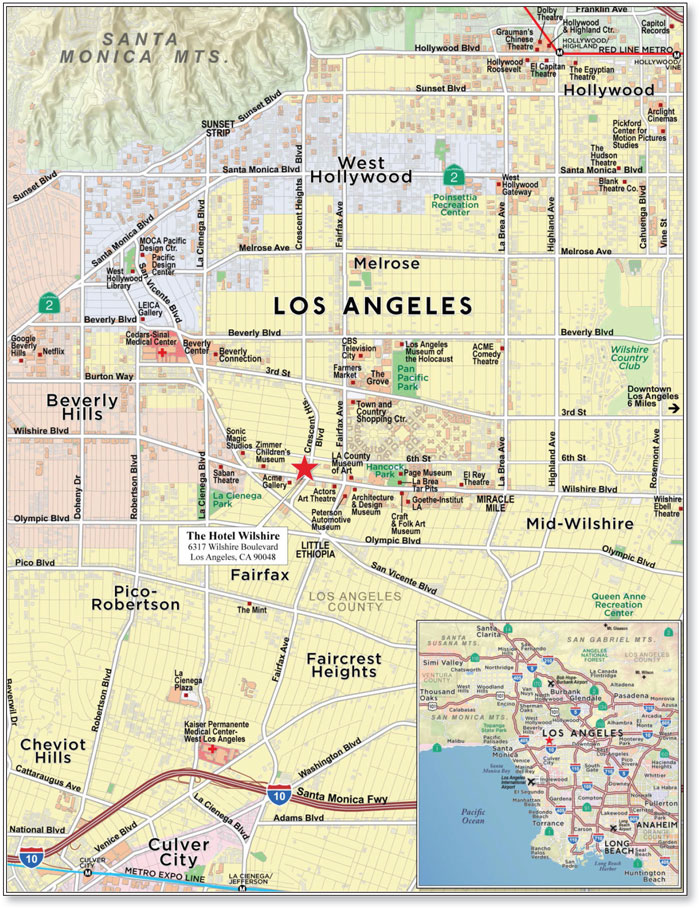
THE INFORMATION IN THIS STRUCTURAL AND COLLATERAL TERM SHEET IS NOT COMPLETE AND MAY BE AMENDED PRIOR TO THE TIME OF SALE. THIS TERM SHEET IS NOT AN OFFER TO SELL THESE SECURITIES AND IT IS NOT A SOLICITATION OF AN OFFER TO BUY THESE SECURITIES IN ANY JURISDICTION WHERE THE OFFER OR SALE IS NOT PERMITTED.
| 109 |
| No. 9 – Hotel Wilshire | ||||||
| Loan Information | Property Information | |||||
| Mortgage Loan Seller: | Wells Fargo Bank, National Association | Single Asset/Portfolio: | Single Asset | |||
| Credit Assessment (DBRS/Fitch/Moody’s): | NR/NR/NR | Property Type: | Hospitality | |||
| Original Principal Balance: | $25,800,000 | Specific Property Type: | Full Service | |||
| Cut-off Date Balance: | $25,800,000 | Location: | Los Angeles, CA | |||
| % of Initial Pool Balance: | 4.0% | Size: | 74 Rooms | |||
| Loan Purpose: | Acquisition | Cut-off Date Balance Per Room: | $348,649 | |||
| Borrower Name: | LA OSM Wilshire LLC | Year Built/Renovated: | 1950/2011 | |||
| Borrower Sponsor: | Michael Orwitz | Title Vesting: | Fee | |||
| Mortgage Rate: | 4.850% | Property Manager: | Kimpton Hotel & Restaurant Group, LLC | |||
| Note Date: | February 16, 2017 | 4thMost Recent Occupancy: | 80.8% (12/31/2012) | |||
| Anticipated Repayment Date: | NAP | 3rdMost Recent Occupancy (As of): | 87.3% (12/31/2013) | |||
| Maturity Date: | March 11, 2027 | 2ndMost Recent Occupancy (As of): | 90.0% (12/31/2014) | |||
| IO Period: | 60 months | Most Recent Occupancy (As of): | 84.6% (12/31/2015) | |||
| Loan Term (Original): | 120 months | Current Occupancy (As of): | 89.2% (12/31/2016) | |||
| Seasoning: | 0 months | |||||
| Amortization Term (Original): | 360 months | Underwriting and Financial Information: | ||||
| Loan Amortization Type: | Interest-only, Amortizing Balloon | |||||
| Interest Accrual Method: | Actual/360 | 4thMost Recent NOI (As of): | $2,219,550 (12/31/2013) | |||
| Call Protection: | L(24),D(92),O(4) | 3rdMost Recent NOI (As of): | $2,680,499 (12/31/2014) | |||
| Lockbox Type: | Springing | 2ndMost Recent NOI (As of): | $2,679,457 (12/31/2015) | |||
| Additional Debt: | None | Most Recent NOI (As of): | $3,188,350 (12/31/2016) | |||
| Additional Debt Type: | NAP | |||||
| U/W Revenues: | $7,198,705 | |||||
| U/W Expenses: | $4,119,740 | |||||
| U/W NOI: | $3,078,965 | |||||
| U/W NCF: | $2,791,017 | |||||
| Escrows and Reserves(1): | U/W NOI DSCR: | 1.88x | ||||
| U/W NCF DSCR: | 1.71x | |||||
| Type: | Initial | Monthly | Cap (If Any) | U/W NOI Debt Yield: | 11.9% | |
| Taxes | $32,633 | $32,633 | NAP | U/W NCF Debt Yield: | 10.8% | |
| Insurance | $14,346 | $4,782 | NAP | As-Is Appraised Value: | $40,000,000 | |
| FF&E Reserve | $0 | Springing | NAP | As-Is Appraisal Valuation Date: | December 22, 2016 | |
| PIP Reserve | $0 | Springing | NAP | Cut-off Date LTV Ratio: | 64.5% | |
| Seasonality Reserve | $0 | Springing | NAP | LTV Ratio at Maturity: | 59.4% | |
| (1) | See “Escrows” section. |
The Mortgage Loan. The mortgage loan (the “Hotel Wilshire Mortgage Loan”) is evidenced by a single promissory note secured by a first mortgage encumbering the fee interest in a full service hotel located in Los Angeles, California (the “Hotel Wilshire Property”). the Hotel Wilshire Mortgage Loan was originated on February 16, 2017 by Wells Fargo Bank, National Association. The Hotel Wilshire Mortgage Loan had an original principal balance of $25,800,000, has an outstanding principal balance as of the Cut-off Date of $25,800,000 and accrues interest at an interest rate of 4.850%per annum. The Hotel Wilshire Mortgage Loan had an initial term of 120 months, has a remaining term of 120 months as of the Cut-off Date and requires payments of interest-only for the first 60 payments following origination and thereafter requires payments of principal and interest based on a 30-year amortization schedule. the Hotel Wilshire Mortgage Loan matures on March 11, 2027.
Following the lockout period, the borrower has the right to prepay the Hotel Wilshire Mortgage Loan in whole, but not in part, on any payment date before December 11, 2026. In addition, the Hotel Wilshire Mortgage Loan is prepayable without penalty on or after December 11, 2026.
THE INFORMATION IN THIS STRUCTURAL AND COLLATERAL TERM SHEET IS NOT COMPLETE AND MAY BE AMENDED PRIOR TO THE TIME OF SALE. THIS TERM SHEET IS NOT AN OFFER TO SELL THESE SECURITIES AND IT IS NOT A SOLICITATION OF AN OFFER TO BUY THESE SECURITIES IN ANY JURISDICTION WHERE THE OFFER OR SALE IS NOT PERMITTED.
| 110 |
| HOTEL WILSHIRE |
Sources and Uses
| Sources | Uses | |||||||
| Original loan amount | $25,800,000 | 64.7% | Purchase price(1) | $36,000,000 | 90.3% | |||
| Borrower sponsor equity contribution | 14,073,140 | 35.3 | Loan payoff(1) | 2,852,219 | 7.2 | |||
| Reserves | 46,979 | 0.1 | ||||||
| Closing costs | 973,941 | 2.4 | ||||||
| Total Sources | $39,873,140 | 100.0% | Total Uses | $39,873,140 | 100.0% |
| (1) | The Hotel Wilshire Mortgage Loan was used to finance the borrower’s acquisition of the existing 90.0% equity partner’s interest in the Hotel Wilshire Property for $36,000,000 (reflecting an implied total purchase price of $40,000,000), as well as retire the borrower sponsor’s 10.0% share of existing debt previously securitized in the JPMCC 2013-C10 transaction, including a $1,338,395 prepayment premium. |
The Property.The Hotel Wilshire Property consists of a seven-story, LEED Silver Certified, full service hotel comprising 74 guestrooms located along Wilshire Boulevard adjacent to the Miracle Mile district in Los Angeles, California. The Hotel Wilshire Property is situated on a 0.2-acre parcel located approximately 7.7 miles west of the Los Angeles central business district. The Hotel Wilshire Property was originally constructed in 1950 as a medical office building. In 2011 the borrower sponsor acquired and redeveloped the building into a boutique hotel for a total cost of $30.5 million ($412,196 per key). In addition to the redevelopment costs, the borrower sponsor indicated that it has invested $458,387 of capital improvements since purchasing the Hotel Wilshire Property, and has plans to invest an additional $850,000 through 2017. The ground floor of the Hotel Wilshire Property houses parking, a registration desk, a small lobby area, and back-of-house space. The 2nd floor includes the 300 square foot boardroom, the continental breakfast/wine area, a small prep kitchen, and guestrooms, while floors 3 to 7 are exclusively guestrooms. The Hotel Wilshire Property contains 50 standard king guestrooms, 5 standard double queen guestrooms, 18 suites, and one penthouse suite with a 570 square foot patio. Each of the guestrooms features a remote control flat screen television with premium channel selection, telephone, desk with chair, dresser, nightstands, lamps and lounge chairs. Additionally, the Hotel Wilshire Property has a combined rooftop restaurant and lounge area known as The Roof on Wilshire, which is leased to an operator that recently executed its first of two, 5-year renewal options through August 2021. The rooftop offers views of the Hollywood Hills and Los Angeles skyline. The Hotel Wilshire Property contains a total of 50 parking spaces within a subterranean garage, accounting for a parking ratio of 0.7 spaces per room. According to the appraisal, the demand segmentation for the Hotel Wilshire Property is 40% commercial, 40% leisure, 15% group and 5% extended-stay. The hotel operating agreement with Kimpton Hotel & Restaurant Group, LLC (“Hotel Operator”) expires on December 31, 2022 with two, 5-year extension options.
Operating History and Underwritten Net Cash Flow. The following table presents certain information relating to the historical operating performance and the underwritten net cash flow at the Hotel Wilshire Property:
Cash Flow Analysis
| 2013 | 2014 | 2015 | 2016 | U/W | % of U/W Total Revenue | U/W $ per Room | |
| Occupancy | 87.3% | 90.0% | 84.6% | 89.2% | 89.2% | ||
| ADR | $220.93 | $241.26 | $258.44 | $275.83 | 275.83 | ||
| RevPAR | $192.98 | $217.10 | $ 218.54 | $246.02 | 246.02 | ||
| Room Revenue | $5,212,370 | $5,863,970 | $5,902,667 | $6,663,118 | $6,644,913 | 92.3% | $89,796 |
| F&B Revenue | 89,677 | 113,401 | 116,676 | 121,054 | 121,054 | 1.7 | 1,636 |
| Other Revenue | 376,541 | 405,798 | 396,291 | 432,738 | 432,738 | 6.0 | 5,848 |
| Total Revenue | $5,678,588 | $6,383,169 | $6,415,634 | $7,216,910 | $7,198,705 | 100.0% | $97,280 |
| Total Department Expenses | 1,324,926 | 1,420,423 | 1,332,156 | 1,480,342 | 1,476,486 | 20.5 | 19,953 |
| Gross Operating Profit | $4,353,662 | $4,962,746 | $5,083,478 | $5,736,568 | $5,722,219 | 79.5% | $77,327 |
| Total Undistributed Expenses | 1,624,226 | 1,784,069 | 1,921,678 | 2,094,837 | 2,086,033 | 29.0 | 28,190 |
| Profit Before Fixed Charges | $2,729,436 | $3,178,677 | $3,161,800 | $3,641,731 | $3,636,186 | 50.5% | $49,138 |
| Total Fixed Charges | 509,886 | 498,178 | 482,343 | 453,381 | 557,222 | 7.7% | 7,530 |
| Net Operating Income | $2,219,550 | $2,680,499 | $2,679,457 | $3,188,350 | $3,078,965 | 42.8% | $41,608 |
| FF&E | 0 | 0 | 0 | 0 | 287,948 | 4.0 | 3,891 |
| Net Cash Flow | $2,219,550 | $2,680,499 | $2,679,457 | $3,188,350 | $2,791,017 | 38.8% | $37,716 |
| NOI DSCR | 1.36x | 1.64x | 1.64x | 1.95x | 1.88x | ||
| NCF DSCR | 1.36x | 1.64x | 1.64x | 1.95x | 1.71x | ||
| NOI DY | 8.6% | 10.4% | 10.4% | 12.4% | 11.9% | ||
| NCF DY | 8.6% | 10.4% | 10.4% | 12.4% | 10.8% | ||
Appraisal.As of the appraisal valuation date of December 22, 2016, the Hotel Wilshire Property had an “as-is” appraised value of $40,000,000.
Environmental Matters. According to a Phase I environmental assessment dated January 16, 2017, there was no evidence of any recognized environmental conditions at the Hotel Wilshire Property.
THE INFORMATION IN THIS STRUCTURAL AND COLLATERAL TERM SHEET IS NOT COMPLETE AND MAY BE AMENDED PRIOR TO THE TIME OF SALE. THIS TERM SHEET IS NOT AN OFFER TO SELL THESE SECURITIES AND IT IS NOT A SOLICITATION OF AN OFFER TO BUY THESE SECURITIES IN ANY JURISDICTION WHERE THE OFFER OR SALE IS NOT PERMITTED.
| 111 |
| HOTEL WILSHIRE |
Market Overview and Competition.The Hotel Wilshire Property is located in Los Angeles, California, along the Wilshire Center District’s Miracle Mile, experiencing an average daily traffic count of 43,056 vehicles per day. The Hotel Wilshire Property is at the center of a deep concentration of corporate employers in the entertainment, fashion, media, technology, and financial services sectors. The immediate area also contains a wide variety of upscale dining, retail and entertainment options while having a scarcity of high-quality hotel product. According to a third party market report, within a one-mile radius of the Hotel Wilshire Property, there are approximately 3,654,680 square feet of retail space and 9,002,058 square feet of office space. Furthermore, the retail and office vacancies within the same radius are 2.0% and 11.0%, respectively. Surrounded by Hollywood, Beverly Hills, Culver City, Century City and Koreatown, the Hotel Wilshire Property benefits from an extensive base of demand drivers including its location within Museum Row, an area including the Los Angeles County Museum of Art (LACMA), the Petersen Automotive Museum, the A+D Museum, the Craft and Folk Art Museum, the George C. Page Museum, the La Brea Tar Pits And Museum and the currently expanding Academy Museum of Motion Pictures (approximately 0.3 miles east of the Hotel Wilshire Property). Other leisure destinations within close proximity include The Grove shopping promenade, CBS Television City, El Rey Theatre, Beverly Center shopping mall, Rodeo Drive, and Melrose Avenue, each located within two miles of the Hotel Wilshire Property, as well as the nightlife of the Sunset Strip. According to a third party market report, the estimated 2016 population within a one- and three-mile radius of the Hotel Wilshire Property was 48,495 and 353,330, respectively; the estimated 2016 average household income within the same radii was $101,436 and $93,174, respectively. A third party hospitality research report identified 5 other hotels within the Hotel Wilshire Property’s competitive set. Average daily rate for the competitive set has improved from $238.20 for the trailing twelve month period ending December 2014 to $270.98 for the trailing twelve month period ending December 2016, while occupancy has remained relatively stable, increasing from 86.0% to 86.4% over the same period. As a result, revenue per available room (“RevPAR”) for the competitive set has improved from $204.86 to $234.06 over the same period.
The following table presents certain information relating to the Hotel Wilshire Property’s competitive set:
Subject and Market Historical Occupancy, ADR and RevPAR(1)
Competitive Set | The Hotel Wilshire | Penetration Factor | |||||||
Year | Occupancy | ADR | RevPAR | Occupancy | ADR | RevPAR | Occupancy | ADR | RevPAR |
| TTM 12/31/2016 | 86.4% | $270.98 | $234.06 | 89.2% | $274.87 | $245.16 | 103.3% | 101.4% | 104.7% |
| TTM 12/31/2015 | 82.9% | $251.38 | $208.45 | 84.6% | $258.27 | $218.54 | 102.0% | 102.7% | 104.8% |
| TTM 12/31/2014 | 86.0% | $238.20 | $204.86 | 90.0% | $241.26 | $217.10 | 104.6% | 101.3% | 106.0% |
| (1) | Information obtained from a third party hospitality research report dated January 18, 2017. The competitive set includes: Sixty Beverly Hills, Mosaic Hotel, The Chamberlain West Hollywood, Hilton Checkers Los Angeles, and Avalon Hotel. |
The Borrower.The borrower is LA OSM Wilshire LLC, a California limited liability company and single purpose entity. Michael Orwitz and the Michael Orwitz Living Trust are collectively the guarantor of certain nonrecourse carveouts under the Hotel Wilshire Mortgage Loan.
The Borrower Sponsor.The borrower sponsor is Michael Orwitz, the President and Founder of OSM Investment Company (“OSM”). OSM, founded in 1997, is a Los Angeles based real estate developer, investor and owner with a portfolio including two boutique hotels, 35 apartment complexes, four self-storage facilities, and seven other commercial properties. OSM has been investing in hotels since 2004, including five boutique properties in California. Mr. Orwitz is involved in direct oversight of the development, acquisition, financing and management of OSM’s real estate portfolio.
Escrows.The loan documents provide for upfront escrows in the amount of $32,633 for real estate taxes and $14,346 for insurance. The loan documents also provide for ongoing monthly reserves in the amount of $32,633 for real estate taxes and $4,782 for insurance. The loan documents do not require ongoing monthly deposits for FF&E reserves as long as (i) the borrower is required to deposit with the Hotel Operator an amount equal to or greater than $23,996 (adjustable by lender) on each month and (ii) the borrower provides the lender with evidence that the borrower is depositing such amounts with the Hotel Operator.
If, at any time, the Hotel Operator requires a Property Improvement Plan (“PIP”) under the hotel operating agreement, the borrower is required to deposit an amount equal to the 125% of the estimated costs to complete such additional PIP work. In addition, the loan documents require monthly deposits of $5,109 from origination through October 2017 for a seasonality reserve. Moreover, for each year during the loan term, should the net cash flow for the month of December produce a debt service shortfall, the borrower is required to make deposits on each monthly payment date commencing in March up to and including October, in an amount equal to the equal to one-eighth of (a) the difference of net cash flow for the month of December, less (b) the amount of any funds in the seasonality reserve account.
Lockbox and Cash Management. Upon the occurrence and during the continuance of a Cash Trap Event Period (as defined below), the Hotel Wilshire Mortgage Loan requires that the borrower establish a lockbox account and the borrowers or property manager is required to deposit all rents into such lockbox account and such funds will be swept to the cash management account. During a Cash Trap Event Period, all excess cash flow after payment of all sums due and payable under the loan documents and all operating expenses will be retained by the lender as additional collateral.
A “Cash Trap Event Period” will commence upon the earlier of (i) the occurrence and continuance of an event of default; (ii) the net cash flow debt yield falling below 8.25% (tested quarterly); (iii) the expiration or termination of the hotel operating agreement; (iv) the occurrence of an event of default by the borrower under the hotel operating agreement, or (v) the occurrence of a material event of default by the Hotel Operator under the hotel operating agreement. A Cash Trap Event Period will end, with regard to clause (i),
THE INFORMATION IN THIS STRUCTURAL AND COLLATERAL TERM SHEET IS NOT COMPLETE AND MAY BE AMENDED PRIOR TO THE TIME OF SALE. THIS TERM SHEET IS NOT AN OFFER TO SELL THESE SECURITIES AND IT IS NOT A SOLICITATION OF AN OFFER TO BUY THESE SECURITIES IN ANY JURISDICTION WHERE THE OFFER OR SALE IS NOT PERMITTED.
| 112 |
| HOTEL WILSHIRE |
upon the cure of such event of default; with regard to clause (ii), upon the net cash flow debt yield being at least 8.5% for one calendar quarter; with regard to clause (iii), upon receipt of satisfactory evidence that the borrower has entered into a replacement hotel operating agreement; with regard to clause (iv), upon receipt of satisfactory evidence that (a) the related default has been cured, that such cure has been accepted by the Hotel Operator, and that the borrower has regained good standing status with the Hotel Operator or (b) the borrower has entered into a replacement hotel operating agreement; and regard to clause (v) upon receipt of satisfactory evidence that (a) the related default has been cured or (b) the borrower has entered into a replacement hotel operating agreement.
Property Management.The Hotel Wilshire Property is managed by Kimpton Hotel & Restaurant Group, LLC.
Assumption.The borrower has a two-time right to transfer the Hotel Wilshire Property provided that certain conditions are satisfied, including (i) no event of default has occurred and is continuing; (ii) the lender reasonably determines that the proposed transferee and guarantor satisfy the lender’s credit review and underwriting standards, taking into consideration the transferee’s experience, financial strength and general business standing; and (iii) the lender has received confirmation from DBRS, Fitch and Moody’s that such assumption will not result in a downgrade, withdrawal or qualification of the respective ratings assigned to the Series 2017-RB1 Certificates.
Partial Release.Not permitted.
Real Estate Substitution.Not permitted.
Subordinate and Mezzanine Indebtedness. Not permitted.
Ground Lease.None.
Terrorism Insurance.The loan documents require that the “all risk” insurance policy required to be maintained by the borrower provide coverage for terrorism in an amount equal to the full replacement cost of the Hotel Wilshire Property. The loan documents also require business interruption insurance covering no less than the 12-month period following the occurrence of a casualty event, together with a six-month extended period of indemnity.
Windstorm Insurance. The loan documents require windstorm insurance covering the full replacement cost of the Hotel Wilshire Property during the loan term. At origination, the Hotel Wilshire Property had windstorm insurance coverage.
Earthquake Insurance. The loan documents do not require earthquake insurance. The seismic report indicated a probable maximum loss of 9.0%.
THE INFORMATION IN THIS STRUCTURAL AND COLLATERAL TERM SHEET IS NOT COMPLETE AND MAY BE AMENDED PRIOR TO THE TIME OF SALE. THIS TERM SHEET IS NOT AN OFFER TO SELL THESE SECURITIES AND IT IS NOT A SOLICITATION OF AN OFFER TO BUY THESE SECURITIES IN ANY JURISDICTION WHERE THE OFFER OR SALE IS NOT PERMITTED.
| 113 |
| ANAHEIM MARRIOTT SUITES |

THE INFORMATION IN THIS STRUCTURAL AND COLLATERAL TERM SHEET IS NOT COMPLETE AND MAY BE AMENDED PRIOR TO THE TIME OF SALE. THIS TERM SHEET IS NOT AN OFFER TO SELL THESE SECURITIES AND IT IS NOT A SOLICITATION OF AN OFFER TO BUY THESE SECURITIES IN ANY JURISDICTION WHERE THE OFFER OR SALE IS NOT PERMITTED.
| 114 |
| ANAHEIM MARRIOTT SUITES |
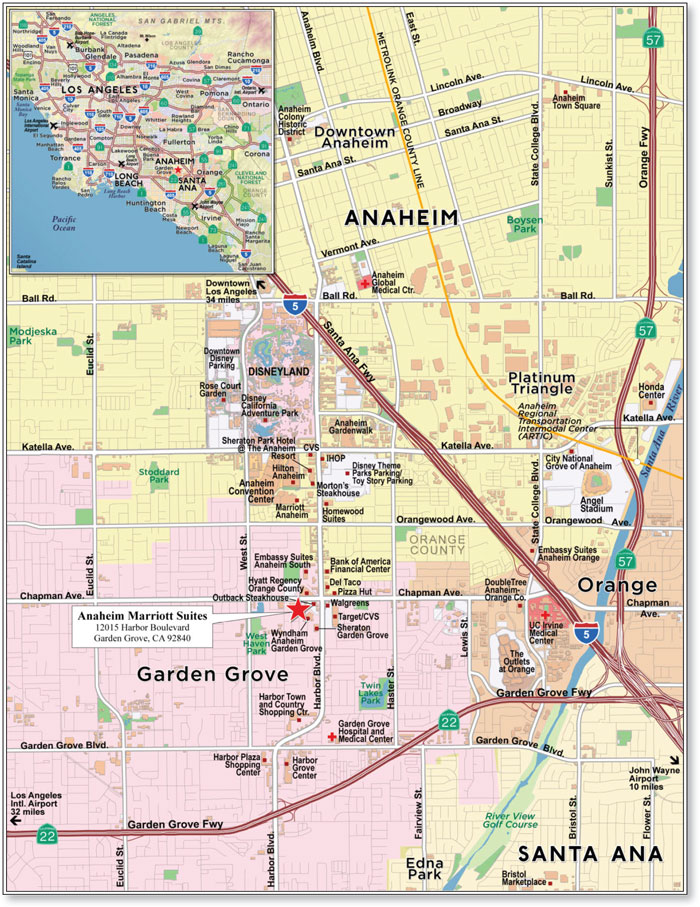
THE INFORMATION IN THIS STRUCTURAL AND COLLATERAL TERM SHEET IS NOT COMPLETE AND MAY BE AMENDED PRIOR TO THE TIME OF SALE. THIS TERM SHEET IS NOT AN OFFER TO SELL THESE SECURITIES AND IT IS NOT A SOLICITATION OF AN OFFER TO BUY THESE SECURITIES IN ANY JURISDICTION WHERE THE OFFER OR SALE IS NOT PERMITTED.
| 115 |
| No. 10 – Anaheim Marriott Suites | ||||||
| Loan Information | Property Information | |||||
| Mortgage Loan Seller: | UBS AG | Single Asset/Portfolio: | Single Asset | |||
Credit Assessment (DBRS/Fitch/Moody’s):
| NR/NR/NR | Property Type: | Hospitality | |||
| Original Principal Balance(1): | $24,000,000 | Specific Property Type: | Full Service | |||
| Cut-off Date Balance(1): | $24,000,000 | Location: | Garden Grove, CA | |||
| % of Initial Pool Balance: | 3.8% | Size: | 371 Rooms | |||
| Loan Purpose: | Refinance | Cut-off Date Balance Per Room(1): | $145,553 | |||
| Borrower Name: | Landmark Marriott Suites, LLC | Year Built/Renovated: | 2002/2016 | |||
| Borrower Sponsors: | Richard H. Packard; Lauren Packard; Mark B. David | Title Vesting: | Fee | |||
| Mortgage Rate: | 5.3952% | Property Manager: | Dow Anaheim LLC | |||
| Note Date: | January 27, 2017 | 4thMost Recent Occupancy (As of)(3): | 83.6% (12/31/2012) | |||
| Anticipated Repayment Date: | NAP | 3rdMost Recent Occupancy (As of): | 83.1% (12/31/2013) | |||
| Maturity Date: | February 6, 2027 | 2ndMost Recent Occupancy (As of): | 85.2% (12/31/2014) | |||
| IO Period: | 60 months | Most Recent Occupancy (As of): | 86.9% (12/31/2015) | |||
| Loan Term: | 120 months | Current Occupancy (As of): | 88.2% (12/31/2016) | |||
| Seasoning: | 1 month | |||||
| Amortization Term: | 360 months | Underwriting and Financial Information: | ||||
| Loan Amortization Type: | Interest-only, Amortizing Balloon | |||||
| Interest Accrual Method: | Actual/360 | 4thMost Recent NOI (As of): | $5,016,010 (12/31/2013) | |||
| Call Protection: | L(25),D(91),O(4) | 3rdMost Recent NOI (As of): | $5,780,543 (12/31/2014) | |||
| Lockbox Type: | Hard/Springing Cash Management | 2ndMost Recent NOI (As of): | $6,724,642 (12/31/2015) | |||
| Additional Debt(1): | Yes | Most Recent NOI (As of): | $6,895,618 (12/31/2016) | |||
| Additional Debt Type(1): | Pari Passu | |||||
| U/W Revenues: | $20,320,665 | |||||
| U/W Expenses: | $13,418,469 | |||||
| U/W NOI: | $6,902,196 | |||||
| Escrows and Reserves(2): | U/W NCF: | $5,886,707 | ||||
| U/W NOI DSCR(1): | 1.90x | |||||
| Type: | Initial | Monthly | Cap (If Any) | U/W NCF DSCR(1): | 1.62x | |
| Taxes | $171,890 | $66,111 | NAP | U/W NOI Debt Yield(1): | 12.8% | |
| Insurance | $54,892 | $15,248 | NAP | U/W NCF Debt Yield(1): | 10.9% | |
| FF&E Reserve | $0 | $8,462 | NAP | As-Is Appraised Value: | $83,000,000 | |
| Seasonality Reserve | $0 | Springing | NAP | As-Is Appraisal Valuation Date: | December 5, 2016 | |
| Renovation Project Funds | $1,300,000 | $84,624 | NAP | Cut-off Date LTV Ratio(1): | 65.1% | |
| PIP Reserve | $0 | Springing | NAP | LTV Ratio at Maturity(1): | 60.3% | |
| (1) | See “The Mortgage Loan” section. All statistical financial information related to balances per room, loan-to-value ratios, debt service coverage ratios and debt yields are based on the Anaheim Marriott Suites Whole Loan. |
| (2) | See “Escrows” section. |
| (3) | Information obtained from the borrower. |
The Mortgage Loan. The mortgage loan (the “Anaheim Marriott Suites Mortgage Loan”) is part of a whole loan (the “Anaheim Marriott Suites Whole Loan”) that is evidenced by fourpari passu promissory notes (Note A-1, Note A-2, Note A-3 and Note A-4) and is secured by a first mortgage encumbering a 371-room full service hotel located in Garden Grove, California (the “Anaheim Marriott Suites Property”). The Anaheim Marriott Suites Whole Loan was originated on January 27, 2017 by UBS AG, by and through its branch office at 1285 Avenue of the Americas, New York, New York (“UBS AG, New York Branch”). The Anaheim Marriott Suites Whole Loan had an original principal balance of $54,000,000, has an outstanding principal balance of $54,000,000 as of the Cut-off Date and accrues interest at an interest rate of 5.3952%per annum. The Anaheim Marriott Suites Whole Loan had an initial term of 120 months, has a remaining term of 119 months as of the Cut-off Date and requires interest-only payments for the first 60 payments following origination and, thereafter, requires payments of principal and interest based on a 30-year amortization schedule. The Anaheim Marriott Suites Whole Loan matures on February 6, 2027.
The Anaheim Marriott Suites Mortgage Loan is evidenced by the non-controlling Note A-2 and the non-controlling Note A-4, which had an aggregate original principal balance of $24,000,000, have an aggregate outstanding principal balance of $24,000,000 as of the Cut-off Date and will be contributed to the WFCM 2017-RB1 Trust. The controlling Note A-1 and the non-controlling Note A-3, which had an aggregate original principal balance $30,000,000, were contributed to the BBCMS 2017-C1 securitization trust (collectively, the “Anaheim Marriott Suites Companion Loans”). See “Description of the Mortgage Pool—The Whole Loans—The Non-Serviced Whole Loans—Anaheim Marriott Suites Whole Loan” in the Preliminary Prospectus.
THE INFORMATION IN THIS STRUCTURAL AND COLLATERAL TERM SHEET IS NOT COMPLETE AND MAY BE AMENDED PRIOR TO THE TIME OF SALE. THIS TERM SHEET IS NOT AN OFFER TO SELL THESE SECURITIES AND IT IS NOT A SOLICITATION OF AN OFFER TO BUY THESE SECURITIES IN ANY JURISDICTION WHERE THE OFFER OR SALE IS NOT PERMITTED.
| 116 |
| ANAHEIM MARRIOTT SUITES |
Note Summary
| Notes | Cut-off Date Balance | Note Holder | Controlling Interest | |
| A-1 | $20,000,000 | BBCMS 2017-C1 | Yes | |
| A-2 | $15,000,000 | WFCM 2017-RB1 | No | |
| A-3 | $10,000,000 | BBCMS 2017-C1 | No | |
| A-4 | $9,000,000 | WFCM 2017-RB1 | No | |
| Total | $54,000,000 |
Following the lockout period, the borrower has the right to defease the Anaheim Marriott Suites Whole Loan in whole, but not in part, on any date before November 6, 2026. In addition, the Anaheim Marriott Suites Whole Loan is prepayable without penalty on or after November 6, 2026.
Sources and Uses
| Sources | Uses | |||||||||
| Original whole loan amount | $54,000,000 | 98.2 | % | Loan payoff(1) | $52,799,614 | 96.0 | % | |||
| Borrower sponsors’ new cash contribution | 971,719 | 1.8 | Reserves | 1,526,782 | 2.8 | |||||
| Closing costs | 645,323 | 1.2 | ||||||||
| Total Sources | $54,971,719 | 100.0 | % | Total Uses | $54,971,719 | 100.0 | % |
| (1) | The Anaheim Marriott Suites Property was previously securitized in the LBUBS 2007-C2 transaction. The loan was transferred to special servicing on March 24, 2011 and received a minor modification to the escrow structure. |
The Property. The Anaheim Marriott Suites Property is a 14-story, 371-room full service hotel located in Garden Grove, Orange County, California. The Anaheim Marriott Suites Property is located along Harbor Boulevard near the Disneyland Resort and the Anaheim Convention Center. The Anaheim Marriott Suites Property has 371 two-room suites, including 199 king rooms and 172 double/double rooms. Guest room amenities include living room with a sofa sleeper and separate bedroom area, two remote-controlled televisions, desk and chair, nightstand, sofa, chair, iron and ironing board, mini-refrigerator, coffee and tea maker, and wireless and high speed internet access. Deluxe suites offer a larger living space and additional amenities such as a wet-bar area with microwave and small refrigerator. Amenities at the Anaheim Marriott Suites Property include 9,727 square feet of meeting space, which includes a 7,102 square foot ballroom and six meeting rooms, a restaurant and lounge, Starbucks coffee shop, an outdoor swimming pool and whirlpool, a fitness center, a business center, a gift shop, room service, vending areas, dry cleaning services, laundry facility and valet and self-parking. The Anaheim Marriott Suites Property offers 435 surface parking spaces, resulting in a parking ratio of approximately 1.2 spaces per room. The Anaheim Marriott Suites Property features an onsite Disney Desk that provides guests with information and the ability to buy tickets for admission into the Disneyland Resort. The Anaheim Marriott Suites Property also provides a shuttle service to the Disneyland Resort that runs every 20 minutes until 11:30pm.
According to the borrower sponsors, from 2003 to 2016, approximately $9.1 million ($24,595 per room) was spent on capital expenditures. Improvements included approximately $1.8 million in soft good replacements in 2011, approximately $1.5 million in guest room soft good upgrades, corridor upgrades and Starbucks renovations in 2013, $723,607 in restaurant upgrades in 2015 and approximately $1.2 million in lobby renovations, bed replacements, fitness equipment and other various upgrades in 2016. Since 2013, the Anaheim Marriott Suites Property has outperformed its competitive set in occupancy, posting an average annual occupancy penetration rate of 108.7%.
According to the appraisal, the Anaheim Marriott Suites Property generates approximately 86% of its room revenue from transient demand, which includes both commercial and leisure transient business and 14% from meeting and group demand.
The Anaheim Marriott Suites Property has a franchise agreement with Marriott International, Inc., a Delaware corporation. The current franchise agreement is effective as of November 13, 2004 for a term of 30 years, with an expiration date of November 13, 2034. Among other fees, the franchise agreement provides for a royalty fee based on 6.0% of gross room revenues, a 3.0% fee based on gross food and beverage sales, and a marketing fee based on 1.0% of gross room revenues.
THE INFORMATION IN THIS STRUCTURAL AND COLLATERAL TERM SHEET IS NOT COMPLETE AND MAY BE AMENDED PRIOR TO THE TIME OF SALE. THIS TERM SHEET IS NOT AN OFFER TO SELL THESE SECURITIES AND IT IS NOT A SOLICITATION OF AN OFFER TO BUY THESE SECURITIES IN ANY JURISDICTION WHERE THE OFFER OR SALE IS NOT PERMITTED.
| 117 |
| ANAHEIM MARRIOTT SUITES |
Operating History and Underwritten Net Cash Flow.The following table presents certain information relating to the historical operating performance and Underwritten Net Cash Flow at the Anaheim Marriott Suites Property:
Cash Flow Analysis
| 2013 | 2014 | 2015 | 2016 | U/W | % of U/W Total Revenue | U/W $ per Room | |||||||
| Occupancy | 83.1% | 85.2% | 86.9% | 88.2% | 88.0% | ||||||||
| ADR | $113.62 | $121.65 | $130.02 | $130.60 | $130.60 | ||||||||
| RevPAR | $94.39 | $103.60 | $113.03 | $115.23 | $114.93 | ||||||||
| Room Revenue | $12,782,417 | $14,028,984 | $15,305,459 | $15,646,723 | $15,562,878 | 76.6% | $41,948 | ||||||
| F&B Revenue | 3,206,094 | 3,205,034 | 3,579,039 | 3,628,529 | 3,609,085 | 17.8 | 9,728 | ||||||
| Other Revenue | 748,621 | 879,317 | 1,047,845 | 1,154,890 | 1,148,701 | 5.7 | 3096 | ||||||
| Total Revenue | $16,737,132 | $18,113,335 | $19,932,343 | $20,430,142 | $20,320,665 | 100.0% | $54,773 | ||||||
| Total Department Expenses | 5,693,986 | 5,890,620 | 6,302,839 | 6,478,464 | 6,443,748 | 31.7 | 17,369 | ||||||
| Gross Operating Profit | $11,043,146 | $12,222,715 | $13,629,504 | $13,951,678 | $13,876,916 | 68.3% | $37,404 | ||||||
| Total Undistributed Expenses | 4,885,831 | 5,329,429 | 5,857,290 | 5,949,975 | 5,960,516 | 29.3 | 16,066 | ||||||
| Profit Before Fixed Charges | $6,157,315 | $6,893,286 | $7,772,214 | $8,001,703 | $7,916,401 | 39.0% | $21,338 | ||||||
| Total Fixed Charges | 1,141,305 | 1,112,743 | 1,047,572 | 1,106,085 | 1,014,205 | 5.0 | 2,734 | ||||||
| Net Operating Income | $5,016,010 | $5,780,543 | $6,724,642 | $6,895,618 | $6,902,196 | 34.0% | $18,604 | ||||||
| FF&E | 836,733 | 906,544 | 995,888 | 1,020,960 | 1,015,489 | 5.0 | 2,737 | ||||||
| Net Cash Flow | $4,179,277 | $4,873,999 | $5,728,754 | $5,874,658 | $5,886,707 | 29.0% | $15,867 | ||||||
| NOI DSCR(1) | 1.38x | 1.59x | 1.85x | 1.90x | 1.90x | ||||||||
| NCF DSCR(1) | 1.15x | 1.34x | 1.58x | 1.62x | 1.62x | ||||||||
| NOI DY(1) | 9.3% | 10.7% | 12.5% | 12.8% | 12.8% | ||||||||
| NCF DY(1) | 7.7% | 9.0% | 10.6% | 10.9% | 10.9% |
| (1) | The debt service coverage ratios and debt yields are based on the Anaheim Marriott Suites Whole Loan. |
Appraisal.As of the appraisal valuation date of December 5, 2016, the Anaheim Marriott Suites Property had an “as-is” appraised value of $83,000,000.
Environmental Matters.According to the Phase I environmental site assessment dated December 16, 2016, there was no evidence of any recognized environmental conditions at the Anaheim Marriott Suites Property.
Market Overview and Competition.The Anaheim Marriott Suites Property is located in Garden Grove, Orange County, California, adjacent to the City of Anaheim. Anaheim is the second largest city in Orange County and the 10th most populous city in California with more than 350,000 estimated residents in 2015. Los Angeles International Airport is located approximately 25 miles northwest of the Anaheim Marriott Suites Property. The Anaheim Marriott Suites Property is located near Interstate 5, a major north/south highway providing access to San Diego, downtown Los Angeles, Sacramento and Seattle, Washington. Within a five-mile radius, the 2016 estimated population and average household income is 857,654 and $71,933, respectively. The neighborhood surrounding the property consists of the Anaheim Convention Center, amusement parks, restaurants, hotels, and retail shopping centers.
Walt Disney Corporation is the largest employer in Orange County and is one of the largest demand generators for the Anaheim Marriott Suites Property. Disneyland Resort, approximately 2.9 miles north of the Anaheim Marriott Suites Property, features two theme parks, three hotels, and a shopping and entertainment area. Disneyland Park, the only theme park designed and built under the direct supervision of Walt Disney, has attracted over 650 million visitors since it opened in 1955, the largest cumulative attendance of any other theme park in the world, featuring over 60 major attractions. The Disneyland property underwent a significant expansion in 2001 with the addition of Disney’s California Adventure. Disneyland Resort is currently constructing Star Wars Land, a 14-acre theme park that is slated for completion in December 2018. According to a third party report from 2016, Disneyland Park attracted approximately 18.3 million visitors in 2015, while Disney California Adventure attracted approximately 9.4 million visitors. The Anaheim market is also driven by the Anaheim Convention Center, located approximately 1.4 miles north of the Anaheim Marriott Suites Property. The Anaheim Convention Center is the largest convention center on the West Coast and is currently undergoing a 200,000 square-foot expansion project as well as the addition of a 1,350-space underground parking structure, expected to be completed in September 2017. The expansion will provide the convention center with over 1.0 million square feet of exhibit space. Other developments and attractions in the area include Universal Studios, Anaheim’s Garden Walk, Knott’s Berry Farm, the Discovery Science Center, Anaheim’s Angel Stadium and the Anaheim Regional Transportation Intermodal Center.
There is currently a 352-room, select service Cambria Suites hotel under construction located approximately 1.7 miles northeast of the Anaheim Marriott Suites Property, with an estimated delivery date in January 2019, and a 466-room, full service JW Marriott hotel under construction located approximately 1.4 miles northeast of the Anaheim Marriott Suites Property, with an estimated delivery date in January 2020. The appraisal considers these hotels as secondary competition given the expected lower select service level of the Cambria Suites along with its location off of Harbor Boulevard and the luxury, full service level of the JW Marriott. The appraisal does not identify any additional properties that are currently under construction that are expected to be competitive with the Anaheim Marriott Suites Property.
THE INFORMATION IN THIS STRUCTURAL AND COLLATERAL TERM SHEET IS NOT COMPLETE AND MAY BE AMENDED PRIOR TO THE TIME OF SALE. THIS TERM SHEET IS NOT AN OFFER TO SELL THESE SECURITIES AND IT IS NOT A SOLICITATION OF AN OFFER TO BUY THESE SECURITIES IN ANY JURISDICTION WHERE THE OFFER OR SALE IS NOT PERMITTED.
| 118 |
| ANAHEIM MARRIOTT SUITES |
The following table presents certain information relating to the Anaheim Marriott Suites Property’s competitive set:
Subject and Market Historical Occupancy, ADR and RevPAR(1)
Competitive Set | Anaheim Marriott Suites | Penetration Factor | ||||||||||||||
Year | Occupancy | ADR | RevPAR | Occupancy | ADR | RevPAR | Occupancy | ADR | RevPAR | |||||||
| 11/30/2016 TTM | 81.3% | $145.35 | $118.12 | 87.9% | $132.04 | $116.04 | 108.1% | 90.8% | 98.2% | |||||||
| 11/30/2015 TTM | 79.8% | $142.09 | $113.38 | 86.8% | $131.48 | $114.18 | 108.8% | 92.5% | 100.7% | |||||||
| 11/30/2014 TTM | 76.8% | $131.68 | $101.16 | 84.6% | $121.20 | $102.51 | 110.1% | 92.0% | 101.3% | |||||||
| (1) | Information obtained from a third party hospitality report dated December 19, 2016. The competitive set includes the following hotels: Doubletree Anaheim Orange County, Sheraton Park Hotel at The Anaheim Resort, Hyatt Regency Orange County, Embassy Suites Anaheim Orange, Wyndham Anaheim Garden Grove and Embassy Suites Anaheim South. |
The Borrower.The borrower, Landmark Marriott Suites, LLC, is aspecial-purpose entity and Delaware limited liability company, with two independent directors. Legal counsel to the borrower delivered a non-consolidation opinion in connection with the origination of the Anaheim Marriott Suites Whole Loan. Mark B. David, Richard H. Packard and Lauren Packard are the guarantors of certain nonrecourse carveouts under the Anaheim Marriott Suites Whole Loan. They are also the guarantors under the completion guaranty that was delivered in connection with the Anaheim Marriott Suites Whole Loan.
The Borrower Sponsors.The borrower sponsors are Mark B. David, Richard H. Packard and Lauren Packard. Mark B. David is the Chairman and CEO of Landmark Companies, LLC (“Landmark”), a diversified real estate development company founded in 1982. Landmark develops thousands of single family homes, condominiums, apartment units, hotel rooms, seniors’ master planned golf course communities and various other senior housing. Landmark is currently a franchisee of Marriott International, Hilton Hotels Corporation and Starbucks. Richard H. Packard is currently the President and Chief Operating Officer of Landmark and is responsible for the day to day management of the company.
Escrows.The loan documents provide for upfront reserves in the amount of $171,890 for real estate taxes, $54,892 for insurance premiums and $1,300,000 for the construction, development, replacement, renovation, and/or rehabilitation of improvements at the property in order to comply with the borrower’s responsibilities under the franchise agreement (the “Renovation Project Work”). Additionally, the loan documents require monthly deposits of $66,111 for real estate taxes, $15,248 for insurance premiums and a FF&E reserve equal to the applicable FF&E Reserve Monthly Deposit (as defined below). Beginning in the calendar year 2017, monthly seasonality reserve payments in the amount of $14,167 will be collected in the months of March, April, May, June, July and August. Beginning in the calendar year 2018 and thereafter, the seasonality reserve will be recalculated annually based on the most recent trailing 12-month financials, and replenished (if necessary) to the recalculated amount through as many monthly deposits as are required in March through August of the following year.
In the event the borrower is required to complete a property improvement plan, the borrower is required to deposit 110.0% of any amounts reasonably estimated by the lender to complete the plan. On each monthly payment date during a PIP Triggering Event (as defined below), any amount deposited in the PIP reserve will be held by the lender as additional collateral for the Anaheim Marriott Suites Whole Loan.
On a monthly basis, the borrower is required to deposit renovation project funds for the construction, development, replacement, renovation and/or rehabilitation of the improvements at the Anaheim Marriott Suites Property in connection with the satisfaction, maintenance, conformity and compliance by the borrower of its responsibilities under the franchise agreement relating to Marriott’s standards (a) prior to the Renovation Project Completion Date (as defined below), 1/12 of 5.0% of gross revenues from operations at the property for the immediately preceding calendar year as determined by the lender and (b) on the monthly payment date of the month that is 24 months prior to the completion date as set forth in the renovation plans and on each monthly payment date thereafter until (i) the amount in the renovation project account equals or exceeds 110% of the remaining renovation project costs (provided that the borrower shall be given credit for the 12 months of scheduled monthly deposits to such account that follow such excess cash sweep commencement date) or (ii) the borrower posts with the lender, a letter of credit in an amount equal to the renovation project shortfall (prior to the occurrence of (i) or (ii), collectively, a “Renovation Project Excess Cash Flow Triggering Event” and the occurrence of (i) or (ii), collectively, a “Renovation Project Excess Cash Flow Triggering Event Cure Date”), an additional amount equal to the renovation project excess cash flow, of which sums shall be held by the lender as additional collateral for the Anaheim Marriott Suites Whole Loan. In addition, the guarantors have provided a completion guaranty in connection with the renovation project, and have agreed to maintain a combined minimum net worth and liquidity of $30.0 million and $5.0 million, respectively.
The “FF&E Reserve Monthly Deposit” means an amount equal to the greater of (a) 1/12 of (i) 0.5% of gross revenues from operations at the property for the immediately preceding calendar year as determined by the lender, prior to the Renovation Project Completion Date and (ii) 5.0% of gross revenues from operations at the property for the immediately preceding calendar year as determined by the lender, on or after the Renovation Project Completion Date and (b) the aggregate amount, if any, required to be reserved under the management agreement and/or franchise agreement for annual capital expenditures set forth in the approved annual budget or as approved by the lender.
A “PIP Triggering Event” will commence upon any of the following: (i) the franchisor giving notice of its intent to terminate the franchise agreement; (ii) an event of default under the franchise agreement; (iii) a bankruptcy or insolvency of the franchisor; (iv) the date that is 18 months prior to the then applicable expiration date under the franchise agreement; or (v) the requirement of any PIP work. A PIP Trigger Event will end with respect to clauses (i) and (iv) above, when the borrower replaces the franchisor with a
THE INFORMATION IN THIS STRUCTURAL AND COLLATERAL TERM SHEET IS NOT COMPLETE AND MAY BE AMENDED PRIOR TO THE TIME OF SALE. THIS TERM SHEET IS NOT AN OFFER TO SELL THESE SECURITIES AND IT IS NOT A SOLICITATION OF AN OFFER TO BUY THESE SECURITIES IN ANY JURISDICTION WHERE THE OFFER OR SALE IS NOT PERMITTED.
| 119 |
| ANAHEIM MARRIOTT SUITES |
qualified franchisor pursuant to the replacement franchise agreement and the borrower completes any PIP work required under the replacement franchise agreement, with respect to clause (ii) above, when such event of default has been cured, with respect to clause (iii) above, when such bankruptcy or insolvency petition has been discharged, stayed or dismissed within 120 days of such filing among other conditions, and with respect to clause (v) above, the deposit of 110% of the estimated cost to perform such PIP work.
The “Renovation Project Completion Date” means (i) the completion of the Renovation Project Work in accordance with the loan documents; (ii) the receipt by the lender of evidence satisfactory to the lender that confirms the franchisor has approved and accepted the completion of the Renovation Project Work; and (iii) the borrower pays in full, all costs and expenses related to the performance and/or completion of the Renovation Project Work.
Lockbox and Cash Management.The Anaheim Marriott Suites Whole Loan is structured with a lender-controlled hard lockbox and springing cash management. At origination, the borrower and property manager were required to deliver written instructions to both tenants and credit card companies to deposit all revenues into the lockbox account controlled by the lender. In the absence of a Triggering Event (as defined below), the funds in the lockbox account will be swept daily into an account controlled by the borrower. Upon the occurrence of a Triggering Event, all funds on deposit in the lockbox account are swept on a daily basis into a cash management account controlled by the lender and disbursed during each interest period of the term of the Anaheim Marriott Suites Whole Loan in accordance with the Anaheim Marriott Suites Whole Loan documents.
A “Triggering Event” will commence upon any of the following: (i) an event of default; (ii) any bankruptcy action by the borrower, guarantors or property manager; (iii) the debt service coverage ratio based on the trailing 12-month period immediately preceding the date of determination falling below 1.20x; (iv) a PIP Triggering Event; or (v) a Renovation Project Excess Cash Flow Triggering Event. A Triggering Event will end with respect to clause (i) above, when such event of default has been cured, with respect to clause (ii) above, when such bankruptcy petition has been discharged, stayed or dismissed within 120 days of such filing among other conditions for the borrower or guarantor and within 120 days for the property manager, with respect to clause (iii) above, upon the debt service coverage ratio being greater than 1.25x for two consecutive quarters, with respect to clause (iv) above, when such PIP Triggering Event has been cured, and with respect to clause (v) above, the occurrence of the Renovation Project Excess Cash Flow Trigger Event Cure Date.
Property Management.The Anaheim Marriott Suites Property is managed by Dow Anaheim LLC, a subsidiary of Dow Hotel Company, LLC, each a Washington limited liability company.
Assumption.The borrower has the right to transfer the Anaheim Marriott Suites Property provided that certain conditions are satisfied, including: (i) no event of default has occurred and is continuing; (ii) the lender has reasonably determined that the proposed transferee satisfies the lender’s credit review and underwriting standards, taking into consideration such transferee’s experience, financial strength and general business standing; and (iii) if required by the lender, a rating agency confirmation from DBRS, Fitch and Moody’s stating that such assumption will not result in a downgrade, withdrawal or qualification of the respective ratings to the Series 2017-RB1 Certificates and similar confirmations from each rating agency rating securities backed by any of the Anaheim Marriott Suites Companion Loans.
Partial Release.Not permitted.
Real Estate Substitution.Not permitted.
Additional Secured Indebtedness.Not permitted.
Subordinate and Mezzanine Indebtedness.Not permitted.
Ground Lease.None.
Terrorism Insurance.The Anaheim Marriott Suites Whole Loan documents require that the “all risk” insurance policy required to be maintained by the borrower provide coverage for terrorism in an amount equal to the full replacement cost of the Anaheim Marriott Suites Property, or if the Terrorism Risk Insurance Program Reauthorization Act is no longer in effect and such policies contain an exclusion for acts of terrorism, the borrower will be required to obtain, to the extent available, a stand-alone policy that provides the same coverage as the policies would have if such exclusion did not exist; provided, however, in such event the borrower will not be required to pay annual premiums in excess of the Terrorism Cap (as defined below) in order to obtain the terrorism coverage.
“Terrorism Cap” means an amount equal to 200% of the then-current annual insurance premiums payable by the borrower for the policies insuring only the Anaheim Marriott Suites Property on a stand-alone basis.
Earthquake Insurance. The loan documents do not require earthquake insurance. The seismic report indicated a probable maximum loss of 11.0%.
THE INFORMATION IN THIS STRUCTURAL AND COLLATERAL TERM SHEET IS NOT COMPLETE AND MAY BE AMENDED PRIOR TO THE TIME OF SALE. THIS TERM SHEET IS NOT AN OFFER TO SELL THESE SECURITIES AND IT IS NOT A SOLICITATION OF AN OFFER TO BUY THESE SECURITIES IN ANY JURISDICTION WHERE THE OFFER OR SALE IS NOT PERMITTED.
| 120 |
(THIS PAGE INTENTIONALLY LEFT BLANK)
THE INFORMATION IN THIS STRUCTURAL AND COLLATERAL TERM SHEET IS NOT COMPLETE AND MAY BE AMENDED PRIOR TO THE TIME OF SALE. THIS TERM SHEET IS NOT AN OFFER TO SELL THESE SECURITIES AND IT IS NOT A SOLICITATION OF AN OFFER TO BUY THESE SECURITIES IN ANY JURISDICTION WHERE THE OFFER OR SALE IS NOT PERMITTED.
| 121 |
| No. 11 – The Summit Birmingham |
| Loan Information | Property Information | |||||
| Mortgage Loan Seller: | Barclays Bank PLC | Single Asset/Portfolio: | Single Asset | |||
| Credit Assessment (DBRS/Fitch/Moody’s): | NR/NR/NR | Property Type: | Retail | |||
| Original Principal Balance(1): | $22,800,000 | Specific Property Type: | Lifestyle Center | |||
| Cut-off Date Balance(1): | $22,800,000 | Location: | Birmingham, AL | |||
| % of Initial Pool Balance: | 3.6% | Size: | 681,245 SF | |||
| Loan Purpose: | Refinance | Cut-off Date Balance Per SF(1): | $305.32 | |||
| Borrower: | BRC Holding Company, L.L.C. | Year Built/Renovated(9): | 1997/2009 | |||
| Borrower Sponsors: | Bayer Properties, LLC; Institutional Mall Investors LLC | Title Vesting: | Fee | |||
| Mortgage Rate: | 4.762% | Property Manager: | Self-managed | |||
| Note Date: | December 20, 2016 | 4thMost Recent Occupancy (As of)(10): | 97.4% (12/31/2012) | |||
| Anticipated Repayment Date: | NAP | 3rdMost Recent Occupancy (As of)(10): | 98.9% (12/31/2013) | |||
| Maturity Date: | January 1, 2027 | 2ndMost Recent Occupancy (As of)(10): | 96.4% (12/31/2014) | |||
| IO Period: | 120 months | Most Recent Occupancy (As of)(10): | 97.8% (12/31/2015) | |||
| Loan Term (Original): | 120 months | Current Occupancy (As of)(11): | 98.5% (12/14/2016) | |||
| Seasoning: | 2 months | |||||
| Amortization Term (Original): | NAP | Underwriting and Financial Information: | ||||
| Loan Amortization Type: | Interest-only, Balloon | |||||
| Interest Accrual Method: | Actual/360 | 4thMost Recent NOI (As of)(12): | $19,160,180 (12/31/2013) | |||
| Call Protection: | L(26),D(87),O(7) | 3rdMost Recent NOI (As of)(12): | $19,415,128 (12/31/2014) | |||
| Lockbox Type: | Hard/Springing Cash Management | 2ndMost Recent NOI (As of)(12): | $19,589,779 (12/31/2015) | |||
| Additional Debt(1): | Yes | Most Recent NOI (As of)(12): | $17,296,891 (12/31/2016) | |||
| Additional Debt Type(1): | Pari Passu | |||||
| U/W Revenues(12): | $24,205,097 | |||||
| U/W Expenses(12): | $6,134,767 | |||||
| Escrows and Reserves: | U/W NOI(12): | $18,070,330 | ||||
| U/W NCF(12): | $16,883,902 | |||||
| Type: | Initial | Monthly | Cap (If Any) | U/W NOI DSCR(1)(12): | 1.80x | |
| Taxes(2) | $0 | Springing | NAP | U/W NCF DSCR(1)(12): | 1.68x | |
| Insurance(3) | $0 | Springing | NAP | U/W NOI Debt Yield(1)(12): | 8.7% | |
| Replacement Reserve(4) | $0 | Springing | $225,984 | U/W NCF Debt Yield(1)(12): | 8.1% | |
| TI/LC Reserves(5) | $0 | Springing | $2,146,872 | As-Is Appraised Value: | $383,000,000 | |
| Outstanding TI/LC Reserves(6) | $1,989,285 | $0 | NAP | As-Is Appraisal Valuation Date: | November 7, 2016 | |
| Gap Rent Reserves(7) | $346,727 | $0 | NAP | Cut-off Date LTV Ratio(1): | 54.3% | |
| Other Reserves(8) | $506,123 | $0 | NAP | LTV Ratio at Maturity(1): | 54.3% | |
| (1) | All statistical information related to balances per SF, loan-to-value ratios, debt service coverage ratios and debt yields are based on The Summit Birmingham Whole Loan (as defined below). |
| (2) | Ongoing monthly reserves for taxes are not required as long as (i) no event of default has occurred and is continuing and (ii)no Collection Reserve Trigger Period has occurred and is continuing. A “Collection Reserve Trigger Period” will commence if the debt service coverage ratio (as calculated in the loan documents) is less than 1.50x for two consecutive calendar quarters and will end if the debt service coverage ratio (as calculated in the loan documents) is greater than 1.50x for two consecutive calendar quarters. |
| (3) | Ongoing monthly reserves for insurance are not required as long as (i) The Summit Birmingham Property (as defined below) is insured under an acceptable blanket insurance policy in accordance with the loan documents, (ii) no event of default has occurred and is continuing, and (iii)no Collection Reserve Trigger Period has occurred and is continuing. |
| (4) | Upon an event of default or if a Collection Reserve Trigger Period exists, the borrower is required to escrow $9,416 (approximately $0.17 per square foot annually) on a monthly basis for replacement reserves. |
| (5) | Upon an event of default or if a Collection Reserve Trigger Period exists, the borrower is required to escrow $89,453 (approximately $1.58 per square foot annually) on a monthly basis for tenant improvement and leasing commission (“TI/LC”) reserves. |
| (6) | Outstanding TI/LC Reserves are related to nine individual tenants. |
| (7) | Gap Rent Reserves are related to three individual tenants. See footnote (11) below. |
| (8) | Other Reserves are related to a tenant (“Gap”) dispute concerning the overpayment of rent. |
| (9) | The Summit Birmingham Property was built in phases between 1997 and 2009. |
| (10) | Historical occupancy figures include tenants at Phase IB (not collateral for The Summit Birmingham Whole Loan) of The Summit (as defined below). |
| (11) | Current Occupancy includes Altar’d State Christian Stores, The Cowfish and Hanna Anderson LLC, each of which has an executed lease but is not yet in occupancy as of the Cut-off Date. The lender has reserved 100.0% of the rent associated with each tenant from the note date through each lease’s scheduled commencement date. The Current Occupancy excluding these tenants is 96.4%. |
| (12) | See “Cash Flow Analysis” section. |
THE INFORMATION IN THIS STRUCTURAL AND COLLATERAL TERM SHEET IS NOT COMPLETE AND MAY BE AMENDED PRIOR TO THE TIME OF SALE. THIS TERM SHEET IS NOT AN OFFER TO SELL THESE SECURITIES AND IT IS NOT A SOLICITATION OF AN OFFER TO BUY THESE SECURITIES IN ANY JURISDICTION WHERE THE OFFER OR SALE IS NOT PERMITTED.
| 122 |
THE SUMMIT BIRMINGHAM
The mortgage loan (“The Summit Birmingham Mortgage Loan”) is part of a whole loan (“The Summit Birmingham Whole Loan”) that is evidenced by fourpari passu promissory notes (Note A-1, Note A-2, Note A-3, and Note A-4) and secured by a first mortgage encumbering the fee interest in a 681,245 square foot portion (“The Summit Birmingham Property”) of an upscale mixed-use development located in Birmingham, Alabama (“The Summit”). The Summit Birmingham Whole Loan was originated on December 20, 2016 by Barclays Bank PLC and Bank of America, N.A. The Summit Birmingham Whole Loan had an original principal balance of $208,000,000, has an outstanding principal balance as of the Cut-off Date of $208,000,000 and accrues interest at an interest rate of 4.762%per annum. The Summit Birmingham Whole Loan had an initial term of 120 months, has a remaining term of 118 months as of the Cut-off Date and requires interest-only payments through the term of The Summit Birmingham Whole Loan. The Summit Birmingham Whole Loan matures on January 1, 2027.
Note A-4, which will be contributed to the WFCM 2017-RB1 Trust, had an original principal balance of $22,800,000, has an outstanding principal balance as of the Cut-off Date of $22,800,000, and represents a non-controlling interest in The Summit Birmingham Whole Loan. Note A-1 had an original principal balance of $61,875,000, and is expected to be contributed to a future securitization trust. The controlling Note A-2, which had an original principal balance of $73,325,000, was contributed to the BACM 2017-BNK3 trust. Note A-3 had an original principal balance of $50,000,000, was contributed to the BBCMS 2017-C1 trust. See “Description of the Mortgage Pool—The Whole Loans—The Non-Serviced Whole Loans—The Summit Birmingham.”
Note Summary
| Notes | Cut-off Date Balance | Note Holder | Controlling Interest | |
| A-1 | $61,875,000 | Bank of America, N.A. | No | |
| A-2 | $73,325,000 | BACM 2017-BNK3 | Yes | |
| A-3 | $50,000,000 | BBCMS 2017-C1 | No | |
| A-4 | $22,800,000 | WFCM 2017-RB1 | No | |
| Total | $208,000,000 |
Following the lockout period, the borrower has the right to defease The Summit Birmingham Whole Loan in whole but not in part, on any due date before July 1, 2026. In addition, The Summit Birmingham Whole Loan is prepayable without penalty commencing on July 1, 2026. The lockout period will expire on the earlier to occur of (i) two years after the closing date of the securitization that includes the last note to be securitized and (ii) February 1, 2020.
Sources and Uses
| Sources | Uses | |||||||
| Original whole loan amount | $208,000,000 | 100.0% | Loan Payoff | $155,905,651 | 75.0% | |||
| Return of Equity | 46,991,895 | 22.6 | ||||||
| Reserves | 2,842,135 | 1.4 | ||||||
| Closing Costs | 2,260,319 | 1.1 | ||||||
| Total Sources | $208,000,000 | 100.0% | Total Uses | $208,000,000 | 100.0% |
The Summit Birmingham Property consists of a 681,245 square foot portion of The Summit. The Summit is an upscale mixed-use development comprised of a total of 1,036,240 square feet of retail and office space. The borrower sponsors acquired a large portion of the property as vacant land in 1996 and developed that land in phases between 1997 and 2009. Phases IA (collateral for The Summit Birmingham Whole Loan) and IB (not collateral for The Summit Birmingham Whole Loan) were opened in 1997 with over 400,000 square feet featuring tenants including Barnes & Noble, Banana Republic, Williams-Sonoma, Ann Taylor, Victoria’s Secret, P.F. Chang’s and Macaroni Grill. Phase II (collateral for The Summit Birmingham Whole Loan) was opened in 2000 and brought new-to-the-market retailers including California Pizza Kitchen, Everything But Water, Pottery Barn and Pottery Barn Kids and also allowed Gap to relocate and add Gap Kids and Gap Body to its offerings. Phase III (collateral for The Summit Birmingham Whole Loan except for Saks Fifth Avenue) opened in 2001, bringing Saks Fifth Avenue to open its first and only store in the state of Alabama, adding J. Crew, Fleming’s Prime Steakhouse and Panera Bread, and allowing Chico’s and Talbots to expand their stores. Phase IV (collateral for The Summit Birmingham Whole Loan) opened in 2005 bringing The Cheesecake Factory, Anthropologie, Vera Bradley and Swoozie’s as first-time retailers in the state of Alabama. Phase VI (collateral for The Summit Birmingham Whole Loan) opened in 2009 with 50,000 square feet of office and 50,000 square feet of retail space including tenants Banana Republic, Charming Charlie and Michael Kors. Phase V (not collateral for The Summit Birmingham Whole Loan) is an unimproved 2.1 acre parcel together with Phase IB (not collateral for the Summit Birmingham Whole Loan) may be developed or redeveloped in the future by the borrower sponsors.
The Summit Birmingham Property contains 19 buildings situated on approximately 71.9 acres and is comprised of 630,395 square feet of retail space (inclusive of retail tenant storage space) and 50,850 square feet of office space. The Summit Birmingham Property contains 3,474 parking spaces with an overall parking ratio of approximately 5.1 spaces per 1,000 square feet of net rentable area.
As of December 14, 2016, The Summit Birmingham Property was 98.5% occupied by 100 retail tenants and two office tenants. Anchor tenants at The Summit Birmingham Property include Saks Fifth Avenue (not collateral for The Summit Birmingham Whole Loan) and Belk. The property benefits both from institutional quality anchor tenants, as well as a diverse tenant roster, with no individual tenant accounting for greater than 5.3% of net rentable area or 6.2% of underwritten base rent outside of Belk. Belk leases 163,480 square feet (24.0% of the net rentable area) through January 2018 and has occupied its space since the property was developed in 1997. For the trailing 12-month period ending August 31, 2016, Belk reported approximately $40.0 million in total
THE INFORMATION IN THIS STRUCTURAL AND COLLATERAL TERM SHEET IS NOT COMPLETE AND MAY BE AMENDED PRIOR TO THE TIME OF SALE. THIS TERM SHEET IS NOT AN OFFER TO SELL THESE SECURITIES AND IT IS NOT A SOLICITATION OF AN OFFER TO BUY THESE SECURITIES IN ANY JURISDICTION WHERE THE OFFER OR SALE IS NOT PERMITTED.
| 123 |
THE SUMMIT BIRMINGHAM
sales (approximately $245 per square foot) resulting in an occupancy cost of 3.2%. Belk’s sales at the property are more than 3.0 times greater than Belk’s national average sales per store of approximately $13.3 million. Belk expanded its space by approximately 53,480 square feet in 2007 and has six five-year extension options remaining. Excess cash flow will be collected and held as additional collateral for The Summit Birmingham Whole Loan in the event Belk (i) vacates or gives notice of its intent to vacate or terminate its lease, (ii) does not exercise its option to extend the term of its lease, (iii) defaults in payment of rent under its lease or (iv) files or is the subject of bankruptcy proceedings or has its assets made subject to the jurisdiction of a bankruptcy court. Other national tenants located at The Summit Birmingham Property include Allen Edmonds Shoes, Barnes & Noble, Brooks Brothers, The Cheesecake Factory, J. Crew, Panera Bread, Urban Outfitters, Victoria’s Secret, Vineyard Vines and West Elm. Approximately 50 of the retailers are exclusive to The Summit in Alabama or Birmingham including Saks Fifth Avenue, Trader Joe’s, Art of Shaving, Apple, Pottery Barn, Restoration Hardware and lululemon athletica.
The Summit Birmingham Property has generated approximately $213.8 million in overall gross sales for the trailing 12 month period ending August 31, 2016, with comparable in-line sales of approximately $603 per square foot and occupancy costs of 8.0%. For the same time period and excluding Apple, the property has generated approximately $178.4 million in overall gross sales, with comparable in-line sales of approximately $513 per square foot and occupancy costs of 9.4%. The Summit has demonstrated consistent performance with overall occupancy having averaged 97.6% for the period between 2012 and 2015.
The following table presents certain information relating to the tenancy at The Summit Birmingham Property:
Major Tenants
| Tenant Name | Credit Rating (Fitch/ Moody’s/ S&P)(1) | Tenant NRSF(2) | % of NRSF(3) | Annual U/W Base Rent PSF | Annual U/W Base Rent | % of Total Annual U/W Base Rent | Sales PSF(4) | Occupancy Cost(4) | Lease Expiration Date |
| Anchor Tenant – Not Collateral | |||||||||
| Saks Fifth Avenue | NR/B1/B+ | 99,459 | ANCHOR OWNED – NOT PART OF THE COLLATERAL | ||||||
| Total Anchor Tenants – Not Collateral | 99,459 | ||||||||
| Anchor Tenant - Collateral | |||||||||
| Belk | NR/B2/B | 163,480 | 24.0% | $6.41 | $1,047,986 | 5.3% | $245 | 3.2% | 1/31/2018(5) |
| Total Anchor Tenants - Collateral | 163,480 | 24.0% | $6.41 | $1,047,986 | 5.3% | ||||
| Major Tenants - Collateral | |||||||||
| RSM US LLP | NR/NR/NR | 35,724 | 5.2% | $33.84 | $1,208,900 | 6.2% | NAP | NAP | 10/31/2021(6) |
| Barnes & Noble | NR/NR/NR | 25,397 | 3.7% | $20.97 | $532,575 | 2.7% | NAV | NAV | 2/1/2018(7) |
| Gap | BB+/Baa2/BB+ | 17,522 | 2.6% | $40.09 | $702,507 | 3.6% | $267 | 17.5% | 3/31/2020 |
| Gus Mayer(8) | NR/NR/NR | 16,410 | 2.4% | $23.39 | $383,760 | 2.0% | $711 | 5.2% | 1/31/2019(9) |
| Brownell Travel | NR/NR/NR | 15,126 | 2.2% | $26.00 | $393,276 | 2.0% | NAP | NAP | 3/31/2018 |
| Trader Joe’s | NR/NR/NR | 12,922 | 1.9% | $36.00 | $465,192 | 2.4% | NAV | NAV | 9/30/2025(10) |
| Urban Outfitters | NR/NR/NR | 12,503 | 1.8% | $26.00 | $325,078 | 1.7% | $292 | 11.3% | 1/31/2027 |
| Pottery Barn | NR/NR/NR | 10,810 | 1.6% | $33.79 | $365,270 | 1.9% | $441 | 9.5% | 1/31/2023(11) |
| The Cheesecake Factory | NR/NR/NR | 10,057 | 1.5% | $36.00 | $362,052 | 1.8% | $1,260 | 5.6% | 1/31/2024(12) |
| Total Major Tenants - Collateral | 156,471 | 23.0% | $30.28 | $4,738,610 | 24.1% | ||||
| Non-Major Tenants - Collateral | 350,866 | 51.5% | $39.53 | $13,868,210 | 70.6% | ||||
| Occupied Collateral Total | 670,817 | 98.5% | $29.30 | $19,654,807 | 100.0% | ||||
| Vacant Space | 10,428 | 1.5% | |||||||
| Collateral Total | 681,245 | 100.0% | |||||||
| (1) | Certain ratings are those of the parent company whether or not the parent guarantees the lease. |
| (2) | Tenant NRSF includes storage space. |
| (3) | % of NRSF is based on The Summit Birmingham Property collateral square footage of 681,245, which excludes the non-collateral anchor tenant. |
| (4) | Sales PSF and Occupancy Costs are for the trailing 12-month period ending August 31, 2016. Sales PSF excludes storage space. Belk has six, five-year lease renewal options. |
| (5) | RSM US LLP has three, five-year lease renewal options. |
| (6) | Barnes & Noble has two, five-year lease renewal options |
| (7) | Gus Mayer’s NRSF includes 1,650 square feet of storage space which was excluded from the Sales PSF and Occupancy Cost calculations. |
| (8) | Gus Mayer has one, four-year lease renewal option. |
| (9) | Trader Joe’s has four, five-year lease renewal options. |
| (10) | Pottery Barn has one, five-year renewal lease renewal option. |
| (11) | The Cheesecake Factory has two, five-year renewal lease renewal options. |
THE INFORMATION IN THIS STRUCTURAL AND COLLATERAL TERM SHEET IS NOT COMPLETE AND MAY BE AMENDED PRIOR TO THE TIME OF SALE. THIS TERM SHEET IS NOT AN OFFER TO SELL THESE SECURITIES AND IT IS NOT A SOLICITATION OF AN OFFER TO BUY THESE SECURITIES IN ANY JURISDICTION WHERE THE OFFER OR SALE IS NOT PERMITTED.
| 124 |
THE SUMMIT BIRMINGHAM
The following table presents certain information relating to the lease rollover schedule at The Summit Birmingham Property:
Lease Expiration Schedule(1)(2)
Year Ending December 31, | No. of Leases Expiring | Expiring NRSF | % of Total NRSF | Cumulative Expiring NRSF | Cumulative % of Total NRSF | Annual U/W Base Rent | % of Total Annual U/W Base Rent | Annual U/W Base Rent PSF(3) |
| MTM | 8 | 17,983 | 2.6% | 17,983 | 2.6% | $620,584 | 3.2% | $34.51 |
| 2017 | 8 | 32,744 | 4.8% | 50,727 | 7.4% | $1,040,803 | 5.3% | $31.79 |
| 2018 | 12 | 235,982 | 34.6% | 286,709 | 42.1% | $3,159,659 | 16.1% | $13.39 |
| 2019 | 12 | 65,570 | 9.6% | 352,279 | 51.7% | $2,301,694 | 11.7% | $35.10 |
| 2020 | 6 | 40,535 | 6.0% | 392,814 | 57.7% | $1,612,627 | 8.2% | $39.78 |
| 2021 | 9 | 78,078 | 11.5% | 470,892 | 69.1% | $2,825,302 | 14.4% | $36.19 |
| 2022 | 7 | 25,290 | 3.7% | 496,182 | 72.8% | $1,067,334 | 5.4% | $42.20 |
| 2023 | 11 | 55,727 | 8.2% | 551,909 | 81.0% | $2,060,614 | 10.5% | $36.98 |
| 2024 | 10 | 39,789 | 5.8% | 591,698 | 86.9% | $1,651,661 | 8.4% | $41.51 |
| 2025 | 8 | 37,072 | 5.4% | 628,770 | 92.3% | $1,586,300 | 8.1% | $42.79 |
| 2026 | 4 | 7,295 | 1.1% | 636,065 | 93.4% | $392,140 | 2.0% | $53.75 |
| 2027 | 6 | 32,752 | 4.8% | 668,817 | 98.2% | $1,242,087 | 6.3% | $37.92 |
| Thereafter | 1 | 2,000 | 0.3% | 670,817 | 98.5% | $94,000 | 0.5% | $47.00 |
| Vacant | 0 | 10,428 | 1.5% | 681,245 | 100.0% | $0 | 0.0% | $0.00 |
| Total/Weighted Average Average | 102 | 681,245 | 100.0% | $19,654,807 | 100.0% | $29.30 |
| (1) | Information obtained from the underwritten rent roll. |
| (2) | Certain tenants may have lease termination options that are exercisable prior to the originally stated expiration date of the subject lease and that are not considered in the Lease Expiration Schedule. |
| (3) | Weighted Average Annual U/W Base Rent PSF excludes vacant space. |
The following table presents historical occupancy percentages at The Summit Birmingham Property:
Historical Occupancy
12/31/2012(1)(2) | 12/31/2013(1)(2) | 12/31/2014(1)(2) | 12/31/2015(1)(2) | 12/14/2016(3)(4) |
| 97.4% | 98.9% | 96.4% | 97.8% | 98.5% |
| (1) | Information obtained from the borrower. |
| (2) | Occupancy figures include tenants at Phase IB (not collateral for The Summit Birmingham Whole Loan) of The Summit. |
| (3) | Information obtained from the rent roll. |
| (4) | Occupancy includes Altar’d State Christian Stores, The Cowfish and Hanna Anderson LLC, each of which has an executed lease but is not yet in occupancy as of the Cut-off Date. The lender has reserved 100.0% of the rent associated with each tenant from the note date through each lease’s scheduled commencement date. Occupancy excluding these tenants is 96.4%. |
THE INFORMATION IN THIS STRUCTURAL AND COLLATERAL TERM SHEET IS NOT COMPLETE AND MAY BE AMENDED PRIOR TO THE TIME OF SALE. THIS TERM SHEET IS NOT AN OFFER TO SELL THESE SECURITIES AND IT IS NOT A SOLICITATION OF AN OFFER TO BUY THESE SECURITIES IN ANY JURISDICTION WHERE THE OFFER OR SALE IS NOT PERMITTED.
| 125 |
THE SUMMIT BIRMINGHAM
Operating History and Underwritten Net Cash Flow. The following table presents certain information relating to the historical operating performance and the underwritten net cash flow at The Summit Birmingham Property:
Cash Flow Analysis
| 2013(1) | 2014(1) | 2015(1) | 2016 | U/W | % of U/W Effective Gross Income | U/W $ per SF | |||||||
| Base Rent | $20,183,299 | $20,629,285 | $21,131,879 | $18,703,522 | $19,654,807(2) | 81.2% | $28.85 | ||||||
| Grossed Up Vacant Space | 0 | 0 | 0 | 0 | 557,813 | 2.3 | 0.82 | ||||||
| Total Reimbursables | 4,613,871 | 4,492,764 | 4,656,167 | 3,878,724 | 4,075,464 | 16.8 | 5.98 | ||||||
| Percentage Rent | 632,464 | 663,574 | 754,191 | 666,761 | 678,386 | 2.8 | 1.00 | ||||||
| Other Income(4) | 623,952 | 580,232 | 583,742 | 526,344 | 486,950 | 2.0 | 0.71 | ||||||
| Less Vacancy & Credit Loss | (79,446) | 15,402 | (191,313) | (479,711) | (1,248,324)(3) | (5.2) | (1.83) | ||||||
| Effective Gross Income | $25,974,140 | $26,381,257 | $26,934,666 | $23,295,640 | $24,205,097 | 100.0% | $35.53 | ||||||
| Total Operating Expenses | $6,813,961 | $6,966,130 | $7,344,888 | $5,998,750 | $6,134,767 | 25.3% | $9.01 | ||||||
| Net Operating Income | $19,160,180 | $19,415,128 | $19,589,779 | $17,296,891 | $18,070,330 | 74.7% | $26.53 | ||||||
| TI/LC | 0 | 0 | 0 | 0 | 1,073,437 | 4.4 | 1.58 | ||||||
| Capital Expenditures | 0 | 0 | 0 | 0 | 112,991 | 0.5 | 0.17 | ||||||
| Net Cash Flow | $19,160,180 | $19,415,128 | $19,589,779 | $17,296,891 | $16,883,902 | 69.8% | $24.78 | ||||||
| NOI DSCR(5) | 1.91x | 1.93x | 1.95x | 1.72x | 1.80x | ||||||||
| NCF DSCR(5) | 1.91x | 1.93x | 1.95x | 1.72x | 1.68x | ||||||||
| NOI DY(5) | 9.2% | 9.3% | 9.4% | 8.3% | 8.7% | ||||||||
| NCF DY(5) | 9.2% | 9.3% | 9.4% | 8.3% | 8.1% |
| (1) | 2013, 2014 and 2015 financial statements include the Phase IB portion of The Summit, which is not collateral for The Summit Birmingham Whole Loan. |
| (2) | U/W Base Rent consist of in-place rents as of December 14, 2016, including (i) three tenants that have executed leases but not yet taken occupancy, representing 13,818 square feet and approximately $566,720 of underwritten base rent, and (ii) underwritten contractual rent increases of $393,165 through January 2018. |
| (3) | The underwritten economic vacancy is 5.0%. Current physical occupancy at The Summit Birmingham Property was 98.5% as of December 14, 2016. See “Historical Occupancy” section. |
| (4) | Other Income consists of specialty leasing income related to temporary tenants, storage and ATM tenants, media, event and sponsorship income and other miscellaneous income. |
| (5) | The debt service coverage ratios and debt yields are based on The Summit Birmingham Whole Loan. |
Comparable Leases(1)
| Location | Tenant Category | Number of Leases | Lease Term Range | Lease Area (SF) Range | Annual Base Rent PSF Range | Average Occupancy Cost | Lease Type |
| Various | Anchor | 5 | 7 – 20 Years | 76,000 – 184,913 | $1.12 - $8.75 | 3.4% | NNN |
| Various | > 10,000 SF | 8 | 5 - 10 Years | 12,000 – 25,194 | $9.50 - $23.87 | 10.9% | NNN |
| Various | 5,000 – 10,000 SF | 13 | 1 – 10 Years | 5,043 – 9,160 | $5.39 - $53.00 | 11.0% | NNN |
| Various | 3,000 – 4,999 SF | 17 | 1 – 10 Years | 3,000 – 4,549 | $6.50 - $46.03 | 13.2% | NNN |
| Various | 1,500 – 2,999 SF | 14 | 1 – 10 Years | 1,668 – 2,991 | $8.18 - $40.80 | 25.9% | NNN |
| Various | < 1,500 SF | 20 | 1 – 10 Years | 400 – 1,272 | $16.42 - $83.50 | 21.4% | NNN |
| Various | Restaurant | 11 | 3 – 10 Years | 789 – 7,500 | $40.08 - $118.53 | 19.3% | NNN |
| Various | Jewelry | 4 | 2 – 10 Years | 681 – 2,392 | $18.63 - $104.90 | 13.4% | NNN |
| Birmingham | Outparcel | 2 | 10 Years | 4,703 – 6,436 | $23.31 - $28.50 | N/A | NNN |
| (1) | Information obtained from the appraisal and reflects lease data from competitive properties within the primary and secondary trade areas. |
THE INFORMATION IN THIS STRUCTURAL AND COLLATERAL TERM SHEET IS NOT COMPLETE AND MAY BE AMENDED PRIOR TO THE TIME OF SALE. THIS TERM SHEET IS NOT AN OFFER TO SELL THESE SECURITIES AND IT IS NOT A SOLICITATION OF AN OFFER TO BUY THESE SECURITIES IN ANY JURISDICTION WHERE THE OFFER OR SALE IS NOT PERMITTED.
| 126 |
(THIS PAGE INTENTIONALLY LEFT BLANK)
THE INFORMATION IN THIS STRUCTURAL AND COLLATERAL TERM SHEET IS NOT COMPLETE AND MAY BE AMENDED PRIOR TO THE TIME OF SALE. THIS TERM SHEET IS NOT AN OFFER TO SELL THESE SECURITIES AND IT IS NOT A SOLICITATION OF AN OFFER TO BUY THESE SECURITIES IN ANY JURISDICTION WHERE THE OFFER OR SALE IS NOT PERMITTED.
| 127 |
| No. 12 – Connecticut Financial Center | ||||||
| Loan Information | Property Information | |||||
| Mortgage Loan Seller: | UBS AG | Single Asset/Portfolio: | Single Asset | |||
| Credit Assessment (DBRS/Fitch/Moody’s): | NR/NR/NR | Property Type: | Office | |||
| Original Principal Balance(1): | $22,750,000 | Specific Property Type: | CBD | |||
| Cut-off Date Balance(1): | $22,715,562 | Location: | New Haven, CT | |||
| % of Initial Pool Balance: | 3.6% | Size: | 470,251 SF | |||
| Loan Purpose: | Refinance | Cut-off Date Balance Per SF(1): | $96.61 | |||
| Borrower Name: | 157 Church, LLC | Year Built/Renovated: | 1990/NAP | |||
| Borrower Sponsor: | Chase Financial Resources LLC | Title Vesting(4): | Leasehold | |||
| Mortgage Rate: | 4.7975% | Property Manager: | Self-managed | |||
| Note Date: | January 31, 2017 | 4thMost Recent Occupancy (As of): | 72.0% (12/31/2012) | |||
| Anticipated Repayment Date: | NAP | 3rdMost Recent Occupancy (As of): | 71.0% (12/31/2013) | |||
| Maturity Date: | February 6, 2027 | 2ndMost Recent Occupancy (As of): | 73.0% (12/31/2014) | |||
| IO Period: | None | Most Recent Occupancy (As of): | 79.0% (12/31/2015) | |||
| Loan Term (Original): | 120 months | Current Occupancy (As of)(5): | 84.1% (1/1/2017) | |||
| Seasoning: | 1 month | |||||
| Amortization Term (Original): | 360 months | Underwriting and Financial Information: | ||||
| Loan Amortization Type: | Amortizing Balloon | |||||
| Interest Accrual Method: | Actual/360 | 4thMost Recent NOI (As of)(6): | $6,234,408 (12/31/2013) | |||
| Call Protection: | L(25),D(90),O(5) | 3rdMost Recent NOI (As of): | $5,832,909 (12/31/2014) | |||
| Lockbox Type: | Hard/Springing Cash Management | 2ndMost Recent NOI (As of): | $5,853,492 (12/31/2015) | |||
| Additional Debt(1): | Yes | Most Recent NOI (As of): | $6,293,876 (12/31/2016) | |||
| Additional Debt Type(1): | Pari Passu | |||||
| U/W Revenues(6): | $14,291,406 | |||||
| U/W Expenses: | $7,284,556 | |||||
| U/W NOI: | $7,006,849 | |||||
| Escrows and Reserves: | U/W NCF: | $5,596,368 | ||||
| U/W NOI DSCR(1): | 2.45x | |||||
| Type: | Initial | Monthly | Cap (If Any) | U/W NCF DSCR(1): | 1.95x | |
| Taxes | $411,453 | $114,293 | NAP | U/W NOI Debt Yield(1): | 15.4% | |
| Insurance | $145,683 | $15,175 | NAP | U/W NCF Debt Yield(1): | 12.3% | |
| Replacement Reserves | $0 | $5,878 | NAP | As-Is Appraised Value: | $70,000,000 | |
| TI/LC Reserve | $0 | $54,863 | $2,000,000 | As-Is Appraisal Valuation Date: | December 27, 2016 | |
| Unfunded Obligations Reserve(2) | $1,615,176 | $0 | NAP | Cut-off Date LTV Ratio(1): | 64.9% | |
| Specified Tenant TI/LC Reserve(3) | $0 | Springing | NAP | LTV Ratio at Maturity(1): | 53.1% | |
| (1) | The Connecticut Financial Center Whole Loan (as defined below), which had an original principal balance of $45,500,000, is comprised of threepari passu notes (Note A-1, Note A-2 and Note A-3). The controlling Note A-2 and non-controlling Note A-3 had an aggregate original principal balance of $22,750,000, have an aggregate outstanding principal balance of $22,715,562 as of the Cut-Off Date and will be contributed to the WFCM 2017-RB1 Trust. The non-controlling Note A-1 had an original principal balance of $22,750,000 and was contributed to the BBCMS 2017-C1 transaction. All statistical financial information related to balances per square foot, loan-to-value ratios, debt service coverage ratios and debt yields are based on the Connecticut Financial Center Whole Loan. |
| (2) | At origination, the borrower was required to escrow $1,615,176 in the unfunded obligations reserve comprised of: $1,171,643 in outstanding tenant improvements and leasing commissions (“TI/LC”) relating to G.S.A. Hearings & Appeals, outstanding tenant improvements relating to Yale University, and $443,533 in free rent obligations relating to Webster Bank, RGN-New Haven II, LLC, G.S.A. Hearings & Appeals and Yale University. G.S.A. Hearings & Appeals is expected to take occupancy of its space in September 2017, with respect to 13,272 square feet, and Yale University is expected to take occupancy of its space in June 2017 and September 2017, with respect to 9,028 square feet and 5,834 square feet, respectively. |
| (3) | Upon the occurrence and during the continuation of a Specified Tenant Trigger Event (as defined below), on each monthly payment date, the borrower is required to deposit with the lender all excess cash flow for TI/LCs related to re-tenanting or extending the applicable Specified Tenant (as defined below) space at the Connecticut Financial Center Property (as defined below), as particularly set forth in the loan documents. A “Specified Tenant Trigger Event” will commence upon the earliest of (i) a Specified Tenant giving notice to terminate, cancel or not extend or renew its lease, failing to extend its lease at least six months prior to its expiration date, or failing to notify the landlord of its intent to extend or renew its lease by the notice date required in its lease (ii) an event of default as defined under a Specified Tenant lease occurs; (iii) the bankruptcy or insolvency of a Specified Tenant (or, if applicable, any lease guarantor) occurs; or (iv) a Specified Tenant terminates its lease, “goes dark”, vacates, ceases to occupy or discontinues its operations at the Connecticut Financial Center Property (unless the Specified Tenant is an investment grade tenant, which continues to perform the monetary obligations under its lease). In addition, with respect to any Specified Tenant that is (or whose lease guarantor is) a governmental authority or an agency or a division of any governmental unit, a Specified Tenant Trigger Event will commence upon the earliest of the applicable Specified Tenant (or, if applicable, any lease guarantor) (i) failing to pay rent or (ii) stating or giving notice that it does not have sufficient funds to pay rent. If a Specified Tenant is a tenant under more than one lease at the Connecticut Financial Center Property, a Specified Tenant Trigger Event will be deemed to occur if such event occurs under one or more of the lease(s) of such Specified Tenant, which individually or in the aggregate comprise 20% or more of either the total in-place base rent or the total rentable square footage at the Connecticut Financial Center Property. If the Connecticut Financial Center Whole Loan has a debt service coverage ratio of at least 1.20x, the Specified Tenant cash sweep is capped at $30 per square foot of applicable space. A “Specified Tenant” is any tenant or replacement tenant under one or more leases, together with its affiliates, (a) leasing 20% or more of the total rentable square footage at the Connecticut Financial Center Property or (b) pays 20% of more of the total in-place base rent at the Connecticut Financial Center Property. All G.S.A. and Yale University affiliates are not aggregated to qualify as Specified Tenants. |
| (4) | The Connecticut Financial Center Property is subject to a ground lease with The City of New Haven. The lease commenced on October 30, 1986 and expires on October 31, 2111. The ground rent began on September 5, 1990 based on the following schedule: Years 1-10: $50,000 per year, Years 11-20: $200,000 per year, Year 21: $125 per year and Years 22-125: $0 per year. The ground lease has no ground rent for the remainder of the ground lease, other than the payment of real estate taxes. |
| (5) | See “Historical Occupancy” section. |
| (6) | See “Cash Flow Analysis” section. |
THE INFORMATION IN THIS STRUCTURAL AND COLLATERAL TERM SHEET IS NOT COMPLETE AND MAY BE AMENDED PRIOR TO THE TIME OF SALE. THIS TERM SHEET IS NOT AN OFFER TO SELL THESE SECURITIES AND IT IS NOT A SOLICITATION OF AN OFFER TO BUY THESE SECURITIES IN ANY JURISDICTION WHERE THE OFFER OR SALE IS NOT PERMITTED.
| 128 |
CONNECTICUT FINANCIAL CENTER
The Connecticut Financial Center mortgage loan is part of a whole loan (the “Connecticut Financial Center Whole Loan”) that is evidenced by three promissory notes (Note A-1, Note A-2 and Note A-3) secured by a first mortgage encumbering the leasehold interest in a 27-story, 470,251 square foot, Class A office building located in the central business district (“CBD”) of New Haven, Connecticut (the “Connecticut Financial Center Property”). The Connecticut Financial Center Property was built in 1990 and comprises 449,306 square feet of office space (95.5% of the net rentable area), 9,645 square feet of ground-level retail space (2.1% of the net rentable area), 8,361 square feet of storage space (1.8% of the net rentable area) and 2,939 square feet of mezzanine-level other space (0.6% of the net rentable area), including a 1,044 square foot fitness center, all set on a 48,264 square foot parcel of land. The Connecticut Financial Center Property also contains a nine-level parking garage providing 666 parking spaces with a gross area of 288,513 square feet, as well as an off-site parking lot that provides 101 parking spaces with a gross area of 33,787 square feet, for a total of 767 parking spaces resulting in a parking ratio of approximately 1.6 spaces per 1,000 square feet. The floor plates vary in size from 18,243 to 20,450 square feet and are functional for single or multi-tenancy.
As of January 1, 2017, the Connecticut Financial Center Property was 84.1% occupied by 18 tenants. The largest tenant at the Connecticut Financial Center Property, Yale University, leases 18.0% of the net rentable area, including two spaces accounting for 3.2% of the net rentable area, which Yale University has executed leases on, but has not yet taken occupancy. Yale University leases multiple spaces at the Connecticut Financial Center Property with 3,611 square feet expiring in July 2019, 9,028 square feet expiring in May 2022 and 71,803 square feet expiring in May 2027. Yale University accounts for 16.9% of the underwritten base rent and has one 10-year renewal option on its 65,969 space on the eighth, ninth, tenth and eleventh floors and one two-year renewal option remaining on its 3,611 square foot space on the seventeenth floor. The second largest tenant, G.S.A. US Attorney’s Office, leases 12.5% of the net rentable area through April 2022 and has been a tenant at the Connecticut Financial Center Property since May 1992. G.S.A. US Attorney’s Office currently pays an amortization component representing the repayment of tenant improvement funds previously disbursed as part of its total rental payment, equal to $305,897 per year. As such, this amount has been excluded from the underwritten base rent. G.S.A. US Attorney’s Office accounts for 19.5% of the underwritten base rent. The third largest tenant, The United Illuminating Company, leases 10.9% of the net rentable area through June 2022 and has occupied its space since June 1992. The United Illuminating Company occupies 49,307 square feet of office space and 2,000 square feet of storage space and has two five-year renewal options remaining.
The Connecticut Financial Center Property is located along Church Street in the CBD of New Haven, Connecticut adjacent to New Haven City Hall, Federal Plaza and the New Haven Green, which borders Yale University. The Connecticut Financial Center Property is located approximately 75 miles northeast of New York City, 137 miles southwest of Boston and 39 miles south of Hartford, the state capital. New Haven is home to Yale University, the city’s largest employer and the third-oldest institution of higher education in the United States, with over 12,000 students and over 9,000 employees. The Connecticut Financial Center Property is part of Federal Plaza, a pedestrian concourse connecting the Connecticut Financial Center Property to City Hall, the federal district courthouse, the Robert N. Giaimo Federal Building, and the New Haven Hall of Records. The Connecticut Financial Center Property is located two blocks from the New Haven State Street Station, the secondary railroad station in the city, with travel time to New Haven Union Station of approximately two minutes. New Haven Union Station provides transportation services for Amtrak, Metro-North, Shore Line East as well as buses and shuttles. According to a third party market research report, the Connecticut Financial Center Property is located in the New Haven office submarket. As of the third quarter of 2016, the submarket comprised approximately 11.4 million square feet of office space with an overall vacancy rate of 8.2% and average Class A office rents of $27.44 per square foot. This compares to 10.1% and $21.65 per square foot respectively, as of the third quarter of 2015.
Note Summary
| Notes | Original Balance | Note Holder | Controlling Interest | |
| A-1 | $22,750,000 | BBCMS 2017-C1 | No | |
| A-2 | $11,375,000 | WFCM 2017-RB1 | Yes | |
| A-3 | $11,375,000 | WFCM 2017-RB1 | No | |
| Total | $45,500,000 |
Sources and Uses
| Sources | Uses | |||||||
| Original whole loan amount | $45,500,000 | 62.0% | Loan payoff(1) | $70,378,275 | 96.0% | |||
| Borrower sponsor’s new cash contribution | 27,829,207 | 38.0 | Reserves | 2,172,312 | 3.0 | |||
| Closing costs | 778,620 | 1.1 | ||||||
| Total Sources | $73,329,207 | 100.0% | Total Uses | $73,329,207 | 100.0% |
| (1) | The Connecticut Financial Center Property was previously securitized in the BACM 2007-2 transaction and was subject to a discounted pay off. See “Description of the Mortgage Pool–Loan Purpose; Default History, Bankruptcy Issues and Other Proceedings” in the Preliminary Prospectus. |
THE INFORMATION IN THIS STRUCTURAL AND COLLATERAL TERM SHEET IS NOT COMPLETE AND MAY BE AMENDED PRIOR TO THE TIME OF SALE. THIS TERM SHEET IS NOT AN OFFER TO SELL THESE SECURITIES AND IT IS NOT A SOLICITATION OF AN OFFER TO BUY THESE SECURITIES IN ANY JURISDICTION WHERE THE OFFER OR SALE IS NOT PERMITTED.
| 129 |
CONNECTICUT FINANCIAL CENTER
The following table presents certain information relating to the tenancy at the Connecticut Financial Center Property:
Major Tenants
| Tenant Name | Credit Rating (Fitch/Moody’s/ S&P)(1) | Tenant NRSF | % of NRSF | Annual U/W Base Rent PSF(2) | Annual U/W Base Rent(2) | % of Total Annual U/W Base Rent | Lease Expiration Date |
| Major Tenants | |||||||
| G.S.A. US Attorney’s Office | AAA/Aaa/NR | 58,601 | 12.5% | $36.44 | $2,135,420 | 19.5% | 4/18/2022 |
| Yale University | NR/NR/NR | 84,442 | 18.0% | $22.02 | $1,859,530 | 16.9% | Various(3) |
| Bank of America | A/Baa1/BBB+ | 39,835 | 8.5% | $28.84 | $1,148,753 | 10.5% | 3/31/2021(4) |
| G.S.A. US Bankruptcy Court | AAA/Aaa/NR | 29,907 | 6.4% | $35.70 | $1,067,700 | 9.7% | 4/30/2025 |
| Withers Bergman LLP | NR/NR/NR | 34,303 | 7.3% | $28.31 | $971,268 | 8.9% | 3/31/2025(5) |
| The United Illuminating Company | A-/NR/A- | 51,307 | 10.9% | $16.04 | $822,880 | 7.5% | 6/14/2022(6) |
| Merrill Lynch & Co Inc. | NR/NR/NR | 20,309 | 4.3% | $36.00 | $731,124 | 6.7% | 9/30/2018(7) |
| RGN-New Haven II, LLC | NR/NR/NR | 20,450 | 4.3% | $25.00 | $511,250 | 4.7% | 11/30/2027(8) |
| G.S.A. Hearings & Appeals | AAA/Aaa/NR | 13,272 | 2.8% | $30.57 | $405,732 | 3.7% | 9/30/2026(9) |
| Woodcreek Capital | NR/NR/NR | 10,100 | 2.1% | $31.00 | $313,100 | 2.9% | 7/31/2026(10) |
| Total Major Tenants | 362,526 | 77.1% | $27.49 | $9,966,757 | 90.8% | ||
| Non-Major Tenants | 32,811 | 7.0% | $30.61 | $1,004,407 | 9.2% | ||
| Occupied Collateral Total | 395,337 | 84.1% | $27.75 | $10,971,163 | 100.0% | ||
| Vacant Space(11) | 74,914 | 15.9% | |||||
| Collateral Total | 470,251 | 100.0% | |||||
| (1) | Certain ratings are those of the parent company or government entity of the entity listed whether or not the parent company or government entity guarantees the lease. |
| (2) | Annual U/W Base Rent PSF and Annual U/W Base Rent include underwritten contractual rent increases of $394,824 through August 2017 for non-investment grade tenants and through February 2018 for investment grade tenants. |
| (3) | Yale University leases multiple spaces with 3,611 square feet expiring in July 2019, 9,028 square feet expiring in May 2022 and 71,803 square feet expiring in May 2027. Yale University has one, 10-year renewal option with respect to 65,969 square feet of space and one, two-year renewal option with respect to 3,611 square feet of space. Yale University’s total net rentable square footage includes two spaces (3.2% of the net rentable area), which Yale University has executed leases for, but has not yet taken occupancy. Excluding the two spaces, Yale University occupies 14.8% of the net rentable area at the Connecticut Financial Center Property. |
| (4) | Bank of America has three, five-year renewal options. |
| (5) | Withers Bergman LLP has a one-time right to terminate its lease on March 31, 2021, with no more than 15 months’ notice and no less than 12 months’ notice and the payment of a termination fee approximately equal to the sum of all unamortized expenses for tenant improvements. |
| (6) | The United Illuminating Company has a termination option on 8,925 square feet of its leased premises on the 4th floor on or after June 15, 2017, with nine months’ notice and no termination fee. The United Illuminating Company has two, five-year renewal options. |
| (7) | Merrill Lynch & Co Inc. has one, five-year renewal option. |
| (8) | RGN-New Haven II, LLC has two, five-year renewal options. |
| (9) | G.S.A. Hearings & Appeals has recently signed a new 10-year lease totaling 13,272 square feet, moving from the 17th and 22nd floors where it currently occupies 12,963 square feet to the seventh floor where it will occupy 13,272 square feet. G.S.A. Hearings & Appeals is expected to take occupancy of its space in September 2017. G.S.A. Hearings & Appeals has the right to terminate its lease on or after October 1, 2021, with 90 days’ notice and no termination fee. G.S.A. Hearings & Appeals has one, five-year renewal option. |
| (10) | Woodcreek Capital has a one-time right to terminate its lease as of July 31, 2021, with notice between August 1, 2020 and September 30, 2020 and the payment of a termination fee approximately equal to the sum of (i) six months of base rent and (ii) any unamortized costs incurred by the landlord as of July 31, 2021. The unamortized costs are capped at $60.00 per square feet and would total $606,000. Woodcreek Capital has one, five-year renewal option. |
| (11) | Vacant Space includes G.S.A. Hearings & Appeals current space on the 17th and 22nd floors of 12,963 square feet. G.S.A. Hearings & Appeals is expected to take occupancy of its space on the seventh floor (13,272 square feet) in September 2017. |
THE INFORMATION IN THIS STRUCTURAL AND COLLATERAL TERM SHEET IS NOT COMPLETE AND MAY BE AMENDED PRIOR TO THE TIME OF SALE. THIS TERM SHEET IS NOT AN OFFER TO SELL THESE SECURITIES AND IT IS NOT A SOLICITATION OF AN OFFER TO BUY THESE SECURITIES IN ANY JURISDICTION WHERE THE OFFER OR SALE IS NOT PERMITTED.
| 130 |
CONNECTICUT FINANCIAL CENTER
The following table presents certain information relating to the lease rollover schedule at the Connecticut Financial Center Property:
Lease Expiration Schedule(1)(2)
| Year Ending December 31, | No. of Leases Expiring | Expiring NRSF | % of Total NRSF | Cumulative Expiring NRSF | Cumulative % of Total NRSF | Annual U/W Base Rent | % of Total Annual U/W Base Rent | Annual U/W Base Rent PSF(3) |
| MTM(4) | 1 | 1,044 | 0.2% | 1,044 | 0.2% | $0 | 0.0% | $0.00 |
| 2017 | 0 | 0 | 0.0% | 1,044 | 0.2% | $0 | 0.0% | $0.00 |
| 2018 | 3 | 29,646 | 6.3% | 30,690 | 6.5% | $1,043,811 | 9.5% | $35.21 |
| 2019 | 1 | 3,611 | 0.8% | 34,301 | 7.3% | $81,248 | 0.7% | $22.50 |
| 2020 | 2 | 3,500 | 0.7% | 37,801 | 8.0% | $191,127 | 1.7% | $54.61 |
| 2021 | 5 | 48,759 | 10.4% | 86,560 | 18.4% | $1,408,326 | 12.8% | $28.88 |
| 2022(5) | 7 | 118,936 | 25.3% | 205,496 | 43.7% | $3,156,916 | 28.8% | $26.54 |
| 2023 | 0 | 0 | 0.0% | 205,496 | 43.7% | $0 | 0.0% | $0.00 |
| 2024 | 0 | 0 | 0.0% | 205,496 | 43.7% | $0 | 0.0% | $0.00 |
| 2025 | 4 | 64,210 | 13.7% | 269,706 | 57.4% | $2,038,968 | 18.6% | $31.75 |
| 2026(6) | 3 | 33,378 | 7.1% | 303,084 | 64.5% | $959,852 | 8.7% | $28.76 |
| 2027(7) | 3 | 92,253 | 19.6% | 395,337 | 84.1% | $2,090,916 | 19.1% | $22.67 |
| Thereafter | 0 | 0 | 0.0% | 395,337 | 84.1% | $0 | 0.0% | $0.00 |
| Vacant(8) | 0 | 74,914 | 15.9% | 470,251 | 100.0% | $0 | 0.0% | $0.00 |
| Total/Weighted Average | 29 | 470,251 | 100.0% | $10,971,163 | 100.0% | $27.75 |
| (1) | Information obtained from the underwritten rent roll. |
| (2) | Certain tenants may have lease termination options that are exercisable prior to the stated expiration date of the subject lease and that are not considered in the Lease Expiration Schedule. |
| (3) | Weighted Average Annual U/W Base Rent PSF excludes vacant space. |
| (4) | MTM includes a 1,044 square foot fitness center. |
| (5) | Includes Yale University, which has an executed lease, but has not yet taken occupancy, representing 9,028 square feet and approximately $198,616 of underwritten rent. |
| (6) | Includes G.S.A. Hearings & Appeals, which has an executed lease, but has not yet taken occupancy of its current space on the seventh floor, representing 13,272 square feet and approximately $405,732 of underwritten rent. |
| (7) | Includes Yale University, which has an executed lease, but has not yet taken occupancy, representing 5,834 square feet and approximately $128,348 of underwritten rent. |
| (8) | Vacant includes G.S.A. Hearings & Appeals current space on the 17th and 22nd floors of 12,963 square feet. G.S.A. Hearings & Appeals is expected to take occupancy of its space on the seventh floor (13,272 square feet) in September 2017. |
The following table presents historical occupancy percentages at the Connecticut Financial Center Property:
Historical Occupancy
12/31/2012(1) | 12/31/2013(1) | 12/31/2014(1) | 12/31/2015(1) | 1/1/2017(2) |
| 72.0% | 71.0% | 73.0% | 79.0% | 84.1% |
| (1) | Information obtained from the borrower. |
| (2) | Information obtained from the underwritten rent roll. Includes two tenants that have executed leases, but have not yet taken occupancy, representing 28,134 square feet and approximately $732,696 of underwritten rent, and excludes one tenant, representing 1,335 square feet and approximately $18,000 of in-place base rent, which has a near term lease expiration and was underwritten as vacant. The Connecticut Financial Center Property is 80.9% physically occupied. |
THE INFORMATION IN THIS STRUCTURAL AND COLLATERAL TERM SHEET IS NOT COMPLETE AND MAY BE AMENDED PRIOR TO THE TIME OF SALE. THIS TERM SHEET IS NOT AN OFFER TO SELL THESE SECURITIES AND IT IS NOT A SOLICITATION OF AN OFFER TO BUY THESE SECURITIES IN ANY JURISDICTION WHERE THE OFFER OR SALE IS NOT PERMITTED.
| 131 |
CONNECTICUT FINANCIAL CENTER
Operating History and Underwritten Net Cash Flow. The following table presents certain information relating to the historical operating performance and underwritten net cash flow at the Connecticut Financial Center Property:
Cash Flow Analysis
| 2013 | 2014 | 2015 | 2016 | U/W | % of U/W Effective Gross Income | U/W $ per SF | |||||||
| Base Rent(1) | $9,572,276 | $9,384,067 | $9,958,273 | $10,311,135 | $10,971,163 | 76.8% | $23.33 | ||||||
| Grossed Up Vacant Space | 0 | 0 | 0 | 0 | 1,622,864 | 11.4 | 3.45 | ||||||
| Total Reimbursements(2) | 2,711,644 | 2,339,568 | 1,172,924 | 1,237,050 | 1,427,891 | 10.0 | 3.04 | ||||||
| Other Income(3) | 1,549,273 | 1,576,859 | 1,738,091 | 1,952,117 | 1,952,117 | 13.7 | 4.15 | ||||||
| Less Vacancy & Credit Loss | (13,619) | (25,735) | 84,376 | 285,242 | (1,682,630)(4) | (11.8) | (3.58) | ||||||
| Effective Gross Income | $13,819,575 | $13,274,759 | $12,953,665 | $13,785,546 | $14,291,406 | 100.0% | $30.39 | ||||||
| Total Operating Expenses | $7,585,166 | $7,441,849 | $7,100,172 | $7,491,670 | $7,284,556 | 51.0% | $15.49 | ||||||
| Net Operating Income | $6,234,408 | $5,832,909 | $5,853,492 | $6,293,876 | $7,006,849 | 49.0% | $14.90 | ||||||
| TI/LC | 0 | 0 | 0 | 0 | 1,339,944 | 9.4 | 2.85 | ||||||
| Capital Expenditures | 0 | 0 | 0 | 0 | 70,538 | 0.5 | 0.15 | ||||||
| Net Cash Flow | $6,234,408 | $5,832,909 | $5,853,492 | $6,293,876 | $5,596,368 | 39.2% | $11.90 | ||||||
| NOI DSCR(5) | 2.18x | 2.04x | 2.04x | 2.20x | 2.45x | ||||||||
| NCF DSCR(5) | 2.18x | 2.04x | 2.04x | 2.20x | 1.95x | ||||||||
| NOI DY(5) | 13.7% | 12.8% | 12.9% | 13.9% | 15.4% | ||||||||
| NCF DY(5) | 13.7% | 12.8% | 12.9% | 13.9% | 12.3% |
| (1) | U/W Base Rent consists of in-place rents as of January 1, 2017, including (i) two tenants that have executed leases, but have not yet taken occupancy, representing 28,134 square feet and approximately $732,696 of underwritten rent, and (ii) underwritten contractual rent increases of $394,824 through August 2017 for non-investment grade tenants and through February 2018 for investment grade tenants, and excluding one tenant, representing 1,335 square feet and $18,000 of in-place base rent, which has a near term lease expiration and was underwritten as vacant. |
| (2) | 2013 Total Reimbursements and 2014 Total Reimbursements are higher than other historical periods primarily due to Yale University converting its sublease with The United Illuminating Company to a direct lease with a 2014 base year. The United Illuminating Company paid a pro rata recovery with no base year. |
| (3) | Other Income is comprised of parking and tenant service income. |
| (4) | The underwritten economic vacancy is 12.0%. As of January 1, 2017, the Connecticut Financial Center Property was 80.9% physically occupied and 84.1% leased. |
| (5) | The debt service coverage ratios and debt yields are based on the Connecticut Financial Center Whole Loan. |
The following table presents certain information relating to comparable office leases for the Connecticut Financial Center Property:
Competitive Leases(1)
| Property Name/Location | Year Built/ Renovated | Stories | Total GLA (SF) | Total Occupancy | Distance from Subject | Tenant Name | Lease Date/Term | Lease Area (SF) | Annual Base Rent PSF | Lease Type |
Connecticut Financial New Haven, CT | 1990/NAP | 27 | 470,251 | 84.1% | -- | Webster Bank | Nov-16 / 120 mos. | 10,006 | $24.09 | Gross |
545 Long Wharf Drive New Haven, CT | 1988/NAV | NAV | 360,000 | 68.2% | 1.4 miles | Morgan Stanley | Jan-16 / 60 mos. | 15,768 | $24.00 | NAV |
555 Long Wharf Drive New Haven, CT | 1985/NAV | NAV | 418,595 | 78.3% | 1.4 miles | Northwestern Mutual Chubb
| May-15 / 89 mos. Jan-16 / 60 mos. | 5,211 21,222
| $25.25 $24.50
| NAV |
265 Church Street New Haven, CT
| 1990/NAV | NAV | 282,256 | 94.0% | 0.2 miles | Halloran & Sage Snowden Lane Ptns. Littler Mendelson Acuity Lighting | Jul-15 / 96 mos. Jul-15 / 108 mos. Sep-15 / 60 mos. Dec-16 / 132 mos. | 9,130 3,479 9,976 32,686
| $22.31 $24.75 $23.75 $22.50
| NAV |
| (1) | Information obtained from the appraisal and underwritten rent roll. |
THE INFORMATION IN THIS STRUCTURAL AND COLLATERAL TERM SHEET IS NOT COMPLETE AND MAY BE AMENDED PRIOR TO THE TIME OF SALE. THIS TERM SHEET IS NOT AN OFFER TO SELL THESE SECURITIES AND IT IS NOT A SOLICITATION OF AN OFFER TO BUY THESE SECURITIES IN ANY JURISDICTION WHERE THE OFFER OR SALE IS NOT PERMITTED.
| 132 |
(THIS PAGE INTENTIONALLY LEFT BLANK)
THE INFORMATION IN THIS STRUCTURAL AND COLLATERAL TERM SHEET IS NOT COMPLETE AND MAY BE AMENDED PRIOR TO THE TIME OF SALE. THIS TERM SHEET IS NOT AN OFFER TO SELL THESE SECURITIES AND IT IS NOT A SOLICITATION OF AN OFFER TO BUY THESE SECURITIES IN ANY JURISDICTION WHERE THE OFFER OR SALE IS NOT PERMITTED.
| 133 |
| No. 13 – Merrill Lynch Drive | |||||||
| Loan Information | Property Information | ||||||
| Mortgage Loan Seller: | Barclays Bank PLC | Single Asset/Portfolio: | Single Asset | ||||
| Credit Assessment (DBRS/Fitch/Moody’s): | A/NR/NR | Property Type: | Office | ||||
| Original Principal Balance(1): | $20,660,000 | Specific Property Type: | Suburban | ||||
| Cut-off Date Balance(1): | $20,660,000 | Location: | Hopewell, NJ | ||||
| % of Initial Pool Balance: | 3.2% | Size: | 553,841 SF | ||||
| Loan Purpose: | Acquisition | Cut-off Date Balance Per SF(1): | $187.06 | ||||
| Borrower: | CCI-Hopewell VI LLC | Year Built/Renovated: | 2001/NAP | ||||
| Borrower Sponsors: | Capital Commercial Investments, Inc.; Atalaya Capital Management LP | Title Vesting: | Fee | ||||
| Mortgage Rate: | 3.930% | Property Manager: | NREM Hopewell Manager, LLC | ||||
| Note Date: | January 31, 2017 | 4thMost Recent Occupancy (As of): | 100.0% (12/31/2013) | ||||
| Anticipated Repayment Date: | February 6, 2022 | 3rdMost Recent Occupancy (As of): | 100.0% (12/31/2014) | ||||
| Maturity Date: | February 6, 2025 | 2ndMost Recent Occupancy (As of): | 100.0% (12/31/2015) | ||||
| IO Period: | 60 months | Most Recent Occupancy (As of): | 100.0% (12/31/2016) | ||||
| Loan Term (Original): | 60 months | Current Occupancy (As of): | 100.0% (3/1/2017) | ||||
| Seasoning: | 1 month | ||||||
| Amortization Term (Original): | NAP | Underwriting and Financial Information: | |||||
| Loan Amortization Type: | Interest-only, ARD | ||||||
| Interest Accrual Method: | Actual/360 | 4thMost Recent NOI(As of)(2): | NAV | ||||
| Call Protection: | GRTR 0.5% or YM(56),O(4) | 3rdMost Recent NOI (As of)(2): | NAV | ||||
| Lockbox Type: | Hard/Upfront Cash Management | 2ndMost Recent NOI (As of)(2): | NAV | ||||
| Additional Debt(1): | Yes | Most Recent NOI (As of)(2): | NAV | ||||
| Additional Debt Type(1): | Pari Passu | ||||||
| U/W Revenues: | $12,496,038 | ||||||
| U/W Expenses: | $249,921 | ||||||
| U/W NOI: | $12,246,117 | ||||||
| U/W NCF: | $12,163,041 | ||||||
| U/W NOI DSCR(1): | 2.97x | ||||||
| Escrows and Reserves: | U/W NCF DSCR(1): | 2.95x | |||||
| Type: | Initial | Monthly | Cap (If Any) | U/W NOI Debt Yield(1): | 11.8% | ||
| Taxes | $737,682 | $122,947 | NAP | U/W NCF Debt Yield(1): | 11.7% | ||
| Insurance | $124,482 | $10,374 | NAP | As-Is Appraised Value(3): | $153,000,000 | ||
| Replacement Reserve | $0 | $6,923 | NAP | As-Is Appraisal Valuation Date(3): | January 3, 2017 | ||
| TI/LC | $0 | $0 | NAP | Cut-off Date LTV Ratio(1): | 67.7% | ||
| Deferred Maintenance | $18,113 | $0 | NAP | LTV Ratio at Maturity or ARD(1): | 67.7% | ||
| (1) | See below. All statistical information related to balance per square foot, loan-to-value ratios, debt service coverage ratios and debt yields are based on the funded outstanding principal balance of the Merrill Lynch Drive Whole Loan (as defined below) as of the Cut-off Date. |
| (2) | See “Cash Flow Analysis” section. |
| (3) | The appraisal also concluded a “hypothetical-go-dark” value of $93.2 million as of January 3, 2017, which equates to a 111.2% loan to dark value ratio. |
The mortgage loan (the “Merrill Lynch Drive Mortgage Loan”) is part of a whole loan (the “Merrill Lynch Drive Whole Loan”) that is evidenced by threepari passu promissory notes (Notes A-1, A-2 and A-3) secured by a first mortgage encumbering the fee interest in three office buildings located in Hopewell, New Jersey (the “Merrill Lynch Drive Property”). The Merrill Lynch Drive Whole Loan was co-originated on January 31, 2017 by Barclays Bank PLC and Morgan Stanley Bank, N.A. The Merrill Lynch Drive Whole Loan had an original principal balance of $103,600,000, has an outstanding principal balance as of the Cut-off Date of $103,600,000 and accrues interest at an interest rate of 3.930%per annum(the “Initial Interest Rate”). The Merrill Lynch Drive Whole Loan had an initial term of 60 months, has a remaining term of 59 months as of the Cut-off Date and requires interest-only payments through the anticipated repayment date (“ARD”). The ARD is February 6, 2022 and the final maturity date is February 6, 2025. In the event that the Merrill Lynch Drive Whole Loan is not repaid in full on or prior to the ARD, the Merrill Lynch Drive Whole Loan will accrue interest at aper annumrate equal to the greater of (i) the Initial Interest Rate plus 3.000% and (ii) the treasury rate as of the ARD plus 3.000% (the “Adjusted Interest Rate”);however, interest accrued at the excess of the Adjusted Interest Rate over the Initial Interest Rate (the “Accrued Interest”) will be deferred. In addition, from and after the ARD, all excess cash flow from the Merrill Lynch Drive Property after the payment of reserves, interest calculated at the Initial Interest Rate and operating expenses will be applied (a)firstto repay the principal balance of the Merrill Lynch Drive Whole Loan and (b)second to the payment of Accrued Interest. See “Description of the Mortgage Pool—The Whole Loans—The Non-Serviced Whole Loans—Merrill Lynch Drive Whole Loan” and “Pooling and Servicing Agreement” in the Preliminary Prospectus.
THE INFORMATION IN THIS STRUCTURAL AND COLLATERAL TERM SHEET IS NOT COMPLETE AND MAY BE AMENDED PRIOR TO THE TIME OF SALE. THIS TERM SHEET IS NOT AN OFFER TO SELL THESE SECURITIES AND IT IS NOT A SOLICITATION OF AN OFFER TO BUY THESE SECURITIES IN ANY JURISDICTION WHERE THE OFFER OR SALE IS NOT PERMITTED.
| 134 |
MERRILL LYNCH DRIVE |
The Merrill Lynch Drive Mortgage Loan, evidenced by the non-controlling Note A-2, will be contributed to the WFCM 2017-RB1 Trust, had an original principal balance of $20,660,000 and has an outstanding principal balance as of the Cut-off Date of $20,660,000. The controlling Note A-1, which had an original principal balance of $41,500,000, was contributed to the BBCMS 2017-C1 Trust. The non-controlling Note A-3, which had an original principal balance of $41,440,000, is currently held by Morgan Stanley Bank, N.A. and is expected to be contributed to one or more future securitization trusts.
Note Summary
| Notes | Original Balance | Note Holder | Controlling Interest |
| A-1 | $41,500,000 | BBCMS 2017-C1 | Yes |
| A-2 | 20,660,000 | WFCM 2017-RB1 | No |
| A-3 | 41,440,000 | Morgan Stanley Bank, N.A. | No |
| Total | $103,600,000 |
The borrower has the right to prepay the Merrill Lynch Drive Whole Loan in whole, but not in part, on any date before November 6, 2021, provided that the borrower pays the greater of a yield maintenance premium or a prepayment premium equal to 0.5% of the principal amount being prepaid. In addition, the Merrill Lynch Drive Whole Loan is prepayable without penalty on or after November 6, 2021.
Sources and Uses
| Sources | Uses | |||||||
| Original loan amount | $103,600,000 | 67.3% | Purchase price | $148,000,000 | 96.1% | |||
| Borrower sponsor’s new cash contribution | 48,309,153 | 31.4 | Closing costs | 5,152,327 | 3.3 | |||
| Other sources(1) | 2,123,450 | 1.4 | Reserves | 880,276 | 0.6 | |||
| Total Sources | $154,032,603 | 100.0% | Total Uses | $154,032,603 | 100.0% |
| (1) | Other Sources reflects credits to the purchaser for pre-paid rents and pre-paid expense reimbursements collected by the seller from the tenant prior to the origination date of the Merrill Lynch Drive Whole Loan in respect of rents and expenses reimbursements due after the origination date of the Merrill Lynch Drive Whole Loan. |
The Merrill Lynch Drive Property consists of three Class A office buildings totaling 553,841 square feet within a larger 12-building, approximately 1.8 million square foot office campus (the “Hopewell Campus”) located in Hopewell, New Jersey, approximately 30 miles northeast of Philadelphia and 50 miles southwest of New York City. The Hopewell Campus was constructed in 2001 on a built-to-suit basis for Merrill Lynch Pierce Fenner & Smith Incorporated (“Merrill Lynch”) (S&P: A+; Fitch: A+). The Hopewell Campus is home to Merrill Lynch’s Global Wealth Management division including the executive team as well as technology support, credit card processing and the 24/7 Merrill Edge call center, one of the only two in the United States. The 12 LEED®-certified buildings comprising the Hopewell Campus were designed to function and operate as four separate, three-building “pods” each of which includes a dedicated parking garage and surface lot. Common amenities at the Hopewell Campus include a 30,500 square foot day care center, an indoor basketball court, a drop-off dry cleaning service and a hair salon. Pedestrian walkways provide access throughout the Hopewell Campus, connecting to a central plaza which features a landscaped garden with ponds and a waterfall, artwork and outdoor dining areas. Access to the common amenities, pedestrian walkways and public spaces is provided for under perpetual non-exclusive easement agreements. In December 2012, Merrill Lynch completed a sale-leaseback transaction for the Hopewell Campus and simultaneously executed separate leases for each of the four pods. The four pods were each subsequently sold in separate transactions. As of the Cut-off Date, Merrill Lynch was the sole tenant in nine buildings at the Hopewell Campus, representing three of the four pods (one of which is collateral for the Merrill Lynch Drive Whole Loan); Merrill Lynch vacated one of the pods in December 2014 and ownership subsequently leased the buildings to four unique tenants. According to the borrower sponsor, approximately 6,200 Merrill Lynch employees currently work on site at the Hopewell Campus.
As of the Cut-off Date, the Merrill Lynch Drive Property was 100.0% leased to Merrill Lynch on a triple-net basis through November 30, 2024 with three five-year renewal options remaining and no termination rights. The Merrill Lynch Drive Property consists of three buildings, 1300 Merrill Lynch Drive (the “1300 Building”), 1350 Merrill Lynch Drive (the “1350 Building”) and 1400 Merrill Lynch Drive (the “1400 Building”). According to the borrower sponsor, the three-story 1300 Building consisting of 167,715 square feet of office space is utilized to provide technical and operational support to Merrill Lynch’s Global Wealth Management division and the four-story 1400 Building consisting of 327,278 square feet is utilized by financial advisors in the Merrill Edge and Global Wealth Management divisions and also includes the 24/7 Merrill Edge call center. The two-story, 58,848-square foot 1350 Building features a cafeteria and meeting/conference room space, and connects to a dedicated 2,469-space parking area with 953 garage spaces and 1,516 surface spaces (parking ratio of approximately 4.46 spaces per 1,000 square feet of net rentable area).
Merrill Lynch is the wealth management, brokerage, and investment banking subsidiary of the Bank of America Corporation (“BofA”) (NYSE: BAC; Moody’s: Baa1; S&P: BBB+; Fitch: A). BofA operates through five business segments: Consumer & Business Banking, Consumer Real Estate Services, Global Wealth & Investment Management, Global Banking, Global Markets and Legal Assets & Servicing segments. Merrill Lynch is part of BofA’s Global Wealth & Investment Management segment, where it operates as Merrill Lynch Global Wealth Management. Merrill Lynch Global Wealth Management’s network of financial advisors focus on serving clients with over $250,000 in investable assets by offering a full set of investment management, brokerage, banking and retirement products. As of December 31, 2015, client balances held by Merrill Lynch Global Wealth Management totaled approximately $2.0 trillion.
THE INFORMATION IN THIS STRUCTURAL AND COLLATERAL TERM SHEET IS NOT COMPLETE AND MAY BE AMENDED PRIOR TO THE TIME OF SALE. THIS TERM SHEET IS NOT AN OFFER TO SELL THESE SECURITIES AND IT IS NOT A SOLICITATION OF AN OFFER TO BUY THESE SECURITIES IN ANY JURISDICTION WHERE THE OFFER OR SALE IS NOT PERMITTED.
| 135 |
MERRILL LYNCH DRIVE |
The Merrill Lynch Drive Property is approximately 8 miles southwest of Princeton University and approximately one mile north of the Trenton Mercer Airport. The Merrill Lynch Drive Property has access to Interstate 95 (south of the Merrill Lynch Drive Property) and Route 1 (east of the Merrill Lynch Drive Property) which provide access to the New Jersey Turnpike and the Garden State Parkway. According to the appraisal, the estimated 2015 population within a three-, five- and ten-mile radius of the Merrill Lynch Drive Property was 31,406, 96,829, and 444,396, respectively. According to the appraisal, the estimated 2015 average household income within a three-, five- and ten-mile radius of the Merrill Lynch Drive Property was $140,207, $114,230 and $105,514, respectively.
According to the appraisal, the Merrill Lynch Drive Property is located within the Princeton submarket of the Central New Jersey office market. As of the third quarter of 2016, the Central New Jersey office market vacancy rate and average asking gross lease rate were 17.7% and $24.85 per square foot, respectively. The Princeton office submarket vacancy rate and average asking gross lease rate were 16.0% and $27.48 per square foot, respectively, for the same time period. The appraisal identified 11 leases within nine competitive office buildings built between 1980 and 2001 and ranging in size from approximately 28,269 to 563,289 square feet. The average rental rate for the 11 leases ranged from $17.50 to $28.00 per square foot on net lease equivalent basis. The appraisal concluded a market rent of $21.00 per square foot for the Merrill Lynch Drive Property.
The following table presents certain information relating to the tenancy at the Merrill Lynch Drive Property:
Major Tenants
| Tenant Name | Credit Rating (Fitch/Moody’s /S&P) | Tenant NRSF | % of NRSF | Annual U/W Base Rent PSF | Annual U/W Base Rent(1) | % of Total Annual U/W Base Rent | Lease Expiration Date |
| Major Tenant | |||||||
| Merrill Lynch Pierce Fenner & Smith Incorporated(2) | A+/NR/A+ | 553,841 | 100.0% | $23.75 | $13,153,724 | 100.0% | 11/30/2024(3) |
| Total Major Tenant | 553,841 | 100.0% | $23.75 | $13,153,724 | 100.0% | ||
| Vacant Space | 0 | 0.0% | |||||
| Collateral Total | 553,841 | 100.0% | |||||
| (1) | Annual U/W Base Rent PSF and Annual U/W Base Rent include straight-lined rent through the term of the Merrill Lynch lease totaling $969,222. The tenant’s current in-place annual base rent is $12,184,502 or $22.00 per square foot. |
| (2) | The Merrill Lynch Drive Whole Loan is structured with an excess cash flow sweep commencing upon the earlier of (i) the occurrence and continuance of a material monetary default under the Merrill Lynch lease beyond all applicable notice and cure periods, (ii) any bankruptcy or similar insolvency of Merrill Lynch, (iii) Merrill Lynch giving notice that it is terminating its lease for or otherwise abandoning all or any substantial portion of its space at the Merrill Lynch Drive Property (or applicable portion thereof), and (iv) the occurrence of (a) the withdrawal of the credit rating of Merrill Lynch, (b) the downgrade of the credit rating of Merrill Lynch below “BBB-” by S&P and Fitch or (c) the downgrade of the credit rating of Merrill Lynch below “BB” by either S&P or Fitch; |
| (3) | Merrill Lynch has three, five-year lease renewal options. |
The following table presents certain information relating to the lease rollover schedule at the Merrill Lynch Drive Property:
Lease Expiration Schedule(1)
Year Ending | No. of Leases Expiring | Expiring NRSF | % of Total NRSF | Cumulative Expiring NRSF | Cumulative % of Total NRSF | Annual U/W Base Rent(2) | % of Total Annual U/W Base Rent | Annual U/W Base Rent PSF(2) |
| MTM | 0 | 0 | 0.0% | 0 | 0.0% | $0 | 0.0% | $0.00 |
| 2017 | 0 | 0 | 0.0% | 0 | 0.0% | $0 | 0.0% | $0.00 |
| 2018 | 0 | 0 | 0.0% | 0 | 0.0% | $0 | 0.0% | $0.00 |
| 2019 | 0 | 0 | 0.0% | 0 | 0.0% | $0 | 0.0% | $0.00 |
| 2020 | 0 | 0 | 0.0% | 0 | 0.0% | $0 | 0.0% | $0.00 |
| 2021 | 0 | 0 | 0.0% | 0 | 0.0% | $0 | 0.0% | $0.00 |
| 2022 | 0 | 0 | 0.0% | 0 | 0.0% | $0 | 0.0% | $0.00 |
| 2023 | 0 | 0 | 0.0% | 0 | 0.0% | $0 | 0.0% | $0.00 |
| 2024 | 1 | 553,841 | 100.0% | 553,841 | 100.0% | $13,153,724 | 100.0% | $23.75 |
| 2025 | 0 | 0 | 0.0% | 553,841 | 100.0% | $0 | 0.0% | $0.00 |
| 2026 | 0 | 0 | 0.0% | 553,841 | 100.0% | $0 | 0.0% | $0.00 |
| 2027 | 0 | 0 | 0.0% | 553,841 | 100.0% | $0 | 0.0% | $0.00 |
| Thereafter | 0 | 0 | 0.0% | 553,841 | 100.0% | $0 | 0.0% | $0.00 |
| Vacant | 0 | 0 | 0.0% | 553,841 | 100.0% | $0 | 0.0% | $0.00 |
| Total/Weighted Average | 1 | 553,841 | 100.0% | $13,153,724 | $23.75 |
| (1) | Information obtained from the underwritten rent roll. |
| (2) | Annual U/W Base Rent and Annual U/W Base Rent PSF include straight-lined rent through the term of the Merrill Lynch lease totaling $969,222. The tenant’s current in-place annual base rent is $12,184,502 or $22.00 per square foot. |
THE INFORMATION IN THIS STRUCTURAL AND COLLATERAL TERM SHEET IS NOT COMPLETE AND MAY BE AMENDED PRIOR TO THE TIME OF SALE. THIS TERM SHEET IS NOT AN OFFER TO SELL THESE SECURITIES AND IT IS NOT A SOLICITATION OF AN OFFER TO BUY THESE SECURITIES IN ANY JURISDICTION WHERE THE OFFER OR SALE IS NOT PERMITTED.
| 136 |
MERRILL LYNCH DRIVE |
The following table presents historical occupancy percentages at the Merrill Lynch Drive Property:
Historical Occupancy(1)
12/31/2013 | 12/31/2014 | 12/31/2015 | 12/31/2016 | 3/1/2017 |
| 100.0% | 100.0% | 100.0% | 100.0% | 100.0% |
| (1) | Information obtained from the borrower. |
Operating History and Underwritten Net Cash Flow. The following table presents certain information relating to the historical operating performance and the underwritten net cash flow at the Merrill Lynch Drive Property:
Cash Flow Analysis(1)
| U/W | % of U/W Effective Gross Income | U/W $ per SF | ||||
| Base Rent | $13,153,724(2) | 105.3% | $23.75 | |||
| Grossed Up Vacant Space | 0 | 0.0 | 0.00 | |||
| Total Reimbursables | 0 | 0.0 | 0.00 | |||
| Other Income | 0 | 0.0 | 0.00 | |||
| Less Vacancy & Credit Loss | (657,686)(3) | (5.3) | (1.19) | |||
| Effective Gross Income | $12,496,038 | 100.0% | $22.56 | |||
| Total Operating Expenses(4) | $249,921 | 2.0% | $0.45 | |||
| Net Operating Income | $12,246,117 | 98.0% | $22.11 | |||
| TI/LC | 0 | 0.0 | 0.00 | |||
| Capital Expenditures | 83,076 | 0.7 | 0.15 | |||
| Net Cash Flow | $12,163,041 | 97.3% | $21.96 | |||
| NOI DSCR(5) | 2.97x | |||||
| NCF DSCR(5) | 2.95x | |||||
| NOI DY(5) | 11.8% | |||||
| NCF DY(5) | 11.7% |
| (1) | The Merrill Lynch Drive Property is leased to Merrill Lynch pursuant to a triple-net lease; the single tenant, Merrill Lynch is responsible for the payment of property expenses and as such, historical financial information is not presented. The Merrill Lynch Drive Property was acquired by the borrower in January 2017. |
| (2) | U/W Base Rent and U/W Base Rent per SF include straight-lined rent through the term of the Merrill Lynch lease totaling $969,222. The tenant’s current in-place annual base rent is $12,184,502 or $22.00 per square foot. |
| (3) | The underwritten economic vacancy is 5.0% of U/W Base Rent. The Merrill Lynch Drive Property was 100.0% physically occupied as of March 1, 2017. |
| (4) | The Merrill Lynch Drive Property is leased to Merrill Lynch pursuant to a triple-net lease; the single tenant, Merrill Lynch is responsible for the payment of property expenses and as such U/W Total Operating Expenses is comprised solely of a 2.0% management fee. |
| (5) | All statistical information related to debt service coverage ratios and debt yields is based on the funded outstanding principal balance of the Merrill Lynch Drive Whole Loan as of the Cut-off Date. |
THE INFORMATION IN THIS STRUCTURAL AND COLLATERAL TERM SHEET IS NOT COMPLETE AND MAY BE AMENDED PRIOR TO THE TIME OF SALE. THIS TERM SHEET IS NOT AN OFFER TO SELL THESE SECURITIES AND IT IS NOT A SOLICITATION OF AN OFFER TO BUY THESE SECURITIES IN ANY JURISDICTION WHERE THE OFFER OR SALE IS NOT PERMITTED.
| 137 |
| No. 14 – Art Van Portfolio | ||||||
| Loan Information | Property Information | |||||
| Mortgage Loan Seller: | UBS AG | Single Asset/Portfolio: | Portfolio | |||
| Credit Assessment (DBRS/Fitch/Moody’s): | NR/NR/NR | Property Type: | Various – See Table | |||
| Original Principal Balance(1): | $18,750,000 | Specific Property Type: | Various – See Table | |||
| Cut-off Date Balance(1): | $18,750,000 | Location: | Various – See Table | |||
| % of Initial Pool Balance: | 2.9% | Size: | 1,407,911 SF | |||
| Loan Purpose: | Acquisition | Cut-off Date Balance Per SF(1): | $48.83 | |||
| Borrower Name: | LCN AVF Warren (MI) LLC | Year Built/Renovated: | Various – See Table | |||
| Borrower Sponsor: | LCN Capital Partners, L.P. | Title Vesting: | Fee | |||
| Mortgage Rate: | 4.962% | Property Manager: | Self-managed | |||
| Note Date: | March 2, 2017 | 4thMost Recent Occupancy (As of): | 100.0% (12/31/2013) | |||
| Anticipated Repayment Date: | NAP | 3rdMost Recent Occupancy (As of): | 100.0% (12/31/2014) | |||
| Maturity Date: | March 6, 2027 | 2ndMost Recent Occupancy (As of): | 100.0% (12/31/2015) | |||
| IO Period: | 24 months | Most Recent Occupancy (As of): | 100.0% (12/31/2016) | |||
| Loan Term (Original): | 120 months | Current Occupancy (As of): | 100.0% (3/1/2017) | |||
| Seasoning: | 0 months | |||||
| Amortization Term (Original): | 360 months | Underwriting and Financial Information: | ||||
| Loan Amortization Type: | Interest-only, Amortizing Balloon | |||||
| Interest Accrual Method: | Actual/360 | 4thMost Recent NOI (As of)(7): | NAV | |||
| Call Protection(2): | L(24),D(89),O(7) | 3rdMost Recent NOI (As of)(7): | NAV | |||
| Lockbox Type: | Hard/Upfront Cash Management | 2ndMost Recent NOI (As of)(7): | NAV | |||
| Additional Debt(1): | Yes | Most Recent NOI (As of)(7): | NAV | |||
| Additional Debt Type(1): | Pari Passu | |||||
| U/W Revenues: | $7,134,388 | |||||
| U/W Expenses: | $214,032 | |||||
| Escrows and Reserves: | U/W NOI: | $6,920,356 | ||||
| U/W NCF: | $6,491,378 | |||||
| Type: | Initial | Monthly | Cap (If Any) | U/W NOI DSCR(1): | 1.57x | |
| Taxes(3) | $0 | Springing | NAP | U/W NCF DSCR(1): | 1.47x | |
| Insurance(3) | $0 | Springing | NAP | U/W NOI Debt Yield(1): | 10.1% | |
| Replacement Reserve(3) | $0 | Springing | NAP | U/W NCF Debt Yield(1): | 9.4% | |
| TI/LC Reserve(4) | $0 | Springing | NAP | As-Is Appraised Value(8): | $100,850,000 | |
| Environmental Reserve | $82,500 | $0 | NAP | As-Is Appraisal Valuation Date(8): | Various | |
| Condominium Common Charge Reserve(5) | $0 | Springing | NAP | Cut-off Date LTV Ratio(1)(8): | 68.2% | |
| Art Van Prepaid Rent Reserve(6) | $0 | Springing | NAP | LTV Ratio at Maturity(1): | 58.9% | |
| (1) | All statistical financial information related to balances per square foot, loan-to-value ratios, debt service coverage ratios and debt yields are based on the Art Van Portfolio Whole Loan (as defined below). |
| (2) | Following the lockout period, the borrower is permitted to partially release any of the Art Van Portfolio Properties (as defined below) (other than the Warren Distribution Center property), subject to certain conditions, including (i) no event of default has occurred and is continuing; (ii) partial defeasance of 115% of the released property’s allocated loan balance; (iii) the loan-to-value ratio with respect to the remaining property(ies) will be no greater than the lesser of (a) 68.2% and (b) the loan-to-value ratio immediately prior to the release; (iv) the debt service coverage ratio with respect to the remaining property(ies) will be no less than the greater of (a) 1.47x and (b) the debt service coverage ratio immediately prior to the release; and (v) the debt yield with respect to the remaining property(ies) will be no less than the greater of (a) 9.4% and (b) the debt yield immediately prior to the release. |
| (3) | Ongoing monthly reserves for taxes, insurance and replacement reserves are not required as long as (i) no event of default has occurred and is continuing; (ii) all of the Art Van Portfolio Properties are demised pursuant to the Art Van Furniture, Inc. (“Art Van”) lease (subject to the borrower’s right to release the individual properties as detailed in footnote (2) above); (iii) the Art Van lease is in full force and effect; (iv) no Material Tenant Trigger Event (as defined below) exists; and (v) Art Van (a) pays all taxes directly to the applicable government authorities; (b) performs its obligations to maintain insurance; and (c) performs its maintenance obligations, pursuant to the Art Van lease and the borrower provides evidence to the lender of such performance by Art Van, provided, however, with respect to replacement reserves, the borrower is only required to deliver such evidence to the extent Art Van is obligated to deliver such evidence to the borrower pursuant to the terms of its lease. A “Material Tenant Trigger Event” will commence upon the earlier of (i) the Material Tenant (as defined below) providing written notice to the borrower of its intention to terminate, not extend, or not renew its lease; (ii) the Material Tenant failing to provide written notice to the borrower of its election to extend or renew the Material Tenant lease on or before the earlier of (a) the date required under the Material Tenant lease for such notice and (b) the date that is 12 months prior to the then applicable expiration date under the Material Tenant lease; (iii) an event of default under any Material Tenant lease continuing beyond any applicable notice or cure period; (iv) the Material Tenant “going dark,” vacating, ceasing to occupy or discontinuing its operations at its space; (v) the termination or cancellation of the Material Tenant lease; or (vi) any bankruptcy action of the Material Tenant. A “Material Tenant” means (i) Art Van or (ii) any tenant at any of the Art Van Portfolio Properties that now or hereafter, together with its affiliates, whose lease or leases account for 20% or more of either (a) the total net rentable square footage at any individual property or (b) the total in place base rent at any individual property. |
| (4) | Ongoing monthly reserves for tenant improvements and leasing commissions (“TI/LC”) are not required as long as (i) no default has occurred and is continuing under the Art Van lease and (ii) the Art Van lease is in full force and effect. |
| (5) | Ongoing monthly reserves for condominium common charges reserves are not required as long as (i) no event of default has occurred and is continuing; (ii) all of the Art Van Portfolio Properties are demised pursuant to the Art Van lease; (iii) the Art Van lease is in full force and effect; (iv) no Material Tenant Trigger Event exists; and (v) Art Van performs its obligations to pay all condominium common charges directly to the condominium association pursuant to the Art Van lease and the borrower provides evidence to the lender of such performance by Art Van. |
| (6) | On each date that the quarterly Art Van rent is due under the terms of the Art Van lease or the date that the quarterly Art Van rent is actually paid (the “Art Van Rent Payment Date”), the borrower will deposit with the lender, the Art Van rent due by Art Van on such Art Van Rent Payment Date into the Art Van prepaid rent reserve (the “Art Van Prepaid Rent Reserve”). Provided no event of default has occurred and is continuing, on each monthly payment date in January, April, July and October during the |
THE INFORMATION IN THIS STRUCTURAL AND COLLATERAL TERM SHEET IS NOT COMPLETE AND MAY BE AMENDED PRIOR TO THE TIME OF SALE. THIS TERM SHEET IS NOT AN OFFER TO SELL THESE SECURITIES AND IT IS NOT A SOLICITATION OF AN OFFER TO BUY THESE SECURITIES IN ANY JURISDICTION WHERE THE OFFER OR SALE IS NOT PERMITTED.
| 138 |
| ART VAN PORTFOLIO |
term of the loan, the borrower instructs the lender to disburse from the Art Van Prepaid Rent Reserve the Quarterly Prepaid Rent Amount into the cash management account. A “Quarterly Prepaid Rent Amount” means an amount equal to the lesser of (i) the quarterly Art Van rent related to the three consecutive month period commencing with the month the disbursement is being made and (ii) the balance then on deposit in the Art Van Prepaid Rent Reserve. The Quarterly Prepaid Rent Amount will under no circumstances exceed one-quarter of the annual Art Van rent due under the Art Van lease for the related three-month period.
| (7) | See “Cash Flow Analysis” section. |
| (8) | As of the appraisal valuation dates between January 27, 2017 and January 31, 2017, the aggregate dark value is $87,840,00, resulting in a dark value Cut-off Date LTV Ratio of 78.3%. |
The Art Van Portfolio mortgage loan is part of a whole loan (the “Art Van Portfolio Whole Loan”) evidenced by fivepari passu promissory notes (Note A-1, Note A-2, Note A-3, Note A-4 and Note A-5) secured by a first mortgage encumbering the fee interest in two warehouse distribution properties and three retail properties located in Michigan (collectively, the “Art Van Portfolio Properties”). The Art Van Portfolio Whole Loan was originated on March 2, 2017 by UBS AG, by and through its branch office at 1285 Avenue of the Americas, New York, New York (“UBS AG, New York Branch”). The Art Van Portfolio Whole Loan had an original principal balance of $68,750,000, has an outstanding principal balance as of the Cut-off Date of $68,750,000 and accrues interest at an interest rate of 4.962%per annum. The Art Van Portfolio Whole Loan had an initial term of 120 months, has a remaining term of 120 months as of the Cut-off Date and requires interest-only payments for the first 24 payments following origination and, thereafter, requires payments of principal and interest based on a 30-year amortization schedule. The Art Van Portfolio Whole Loan matures on March 6, 2027.
The Art Van Portfolio Mortgage Loan is evidenced by the non-controlling Note A-4 and Note A-5, which had an aggregate original principal balance of $18,750,000, have an aggregate outstanding principal balance as of the Cut-off Date of $18,750,000 and will be contributed to the WFCM 2017-RB1 Trust. The controlling Note A-1 and the non-controlling Note A-2 and Note A-3, with an aggregate original principal balance of $50,000,000, are currently held by UBS AG, New York Branch and are expected to be contributed to a future trust or trusts. The mortgage loans evidenced by Note A-1, Note A-2 and Note A-3 are referred to herein as the “Art Van Portfolio Companion Loans”. The lender provides no assurances that any of the Art Van Portfolio Companion Loans will not be split further. See “Description of the Mortgage Pool—The Whole Loans—The Servicing Shift Whole Loans—Art Van Portfolio Whole Loan” and “Pooling and Servicing Agreement” in the Preliminary Prospectus.
Note Summary
| Notes | Original Balance | Note Holder | Controlling Interest | |
| A-1 | $25,000,000 | UBS AG, New York Branch | Yes | |
| A-2 | $15,000,000 | UBS AG, New York Branch | No | |
| A-3 | $10,000,000 | UBS AG, New York Branch | No | |
| A-4 | $5,000,000 | WFCM 2017-RB1 | No | |
| A-5 | $13,750,000 | WFCM 2017-RB1 | No | |
| Total | $68,750,000 |
Sources and Uses
| Sources | Uses | |||||||
| Original whole loan amount | $68,750,000 | 69.2% | Purchase price | $98,257,240 | 98.9% | |||
| Borrower sponsor’s new cash contribution | 30,647,305 | 30.8 | Closing costs | 1,057,565 | 1.1 | |||
| Reserves | 82,500 | 0.1 | ||||||
| Total Sources | $99,397,305 | 100.0% | Total Uses | $99,397,305 | 100.0% |
The Art Van Portfolio Properties consist of two warehouse distribution centers and three retail properties located in Michigan. The Art Van Portfolio Properties are 100.0% occupied by Art Van Furniture, Inc. (“Art Van”) under a 20-year triple net master lease that commenced in March 2017 and will expire in February 2037 with two, 10-year renewal options. The Warren Distribution Center property located in Warren, Michigan, consists of 1,056,890 square feet and comprises Art Van’s headquarters with 39,200 square feet, its top performing retail store with 175,875 square feet, and its sole furniture distribution center with 841,815 square feet. The Warren Distribution Center property makes up 75.1% of the portfolio net rentable area and 55.8% of the underwritten base rent. The retail portion of the Warren Distribution Center property realized approximately $46.5 million of sales in 2016 ($534 sales PSF). The Mattress Distribution Center property located in Roseville, Michigan, consists of 129,021 square feet and is the sole distribution center for all PureSleep Mattress Stores and a manufacturing and training facility for Art Van’s mattress operations. Art Van’s PureSleep division reported net sales of approximately $43.4 million in fiscal year (“FY”) 2016. The remaining three Art Van Portfolio Properties, Comstock Park Retail (6.8% of net rentable area), Grand Rapids Retail (5.6% of net rentable area), and Bloomfield Hills Retail (3.3% of net rentable area), are large format retail stores operated as Art Van furniture stores, apart from Bloomfield Hills Retail, which was acquired by Art Van in March 2016 and continues to operate as Hillside Furniture. Weighted average sales PSF on selling space across the retail space in the portfolio was approximately $416 PSF in 2016, up from $407 PSF in 2015.
Founded in 1959, Art Van is a major furniture and mattress retailer in the Midwest. Art Van operates more than 100 stores across Michigan, Ohio, Indiana, Illinois and Iowa, including freestanding Art Van PureSleep mattress stores, Art Van Flooring stores, and Art Van Furniture franchise locations, as well as a full service e-commerce website. Art Van’s five brands include Art Van Showroom, Clearance Center, Puresleep Mattress Store, Art Van Flooring and Scott Shuptrine Interiors. Art Van is the 15th largest furniture retailer in the country. As of the fiscal year ending September 2016, Art Van reported net revenue of approximately $796.3 million, compared to net revenue of approximately $725.2 million as of the fiscal year ending September 2015, an increase of 9.8%.
THE INFORMATION IN THIS STRUCTURAL AND COLLATERAL TERM SHEET IS NOT COMPLETE AND MAY BE AMENDED PRIOR TO THE TIME OF SALE. THIS TERM SHEET IS NOT AN OFFER TO SELL THESE SECURITIES AND IT IS NOT A SOLICITATION OF AN OFFER TO BUY THESE SECURITIES IN ANY JURISDICTION WHERE THE OFFER OR SALE IS NOT PERMITTED.
| 139 |
| ART VAN PORTFOLIO |
Art Van Operating Performance
| 2013(1) | 2014(1) | 2015(2) | 2016(2) | |
| Net Revenue (millions) | $570.1 | $639.1 | $725.2 | $796.3 |
| EBITDA (millions) | $48.7 | $52.4 | $52.5 | $60.9 |
| Total Assets (millions) | NAV | NAV | $323.3 | $332.6 |
| Total Stores | 81 | 85 | 92 | 110 |
| (1) | 2013 and 2014 Art Van Operating Performance are based on unaudited historical statements provided by Art Van. |
| (2) | 2015 and 2016 Art Van Operating Performance are based on audited historical statements provided by Art Van. |
Art Van was acquired by Thomas H. Lee Partners, L.P. (“THL”) for $636.4 million at the origination of the Art Van Portfolio Whole Loan. THL is utilizing the sale of the real estate assets through several sale-leaseback transactions totaling $436.4 million, of which includes approximately $98.3 million used to acquire the Art Van Portfolio Properties, to finance the acquisition in addition to $100.0 million of cash equity from THL along with a $100.0 million GSO Capital Partners term loan.
The Art Van Portfolio Properties are comprised of two warehouse distribution centers and three retail properties located in Michigan within the Detroit-Warren-Dearborn metropolitan statistical area (Warren Distribution Center, Bloomfield Hills Retail and Mattress Distribution Center) and the Grand Rapids-Wyoming metropolitan statistical area (Comstock Park Retail and Grand Rapids Retail).
The following table presents certain information relating to the Art Van Portfolio Properties:
| Property Name – Location | Allocated Cut-off Date Principal Balance(1) | Estimated 2017 Population (5-mile Radius)(2) | Estimated 2017 Average Household Income (5-mile Radius)(2) | Average Submarket Vacancy(2) |
| Warren Distribution Center - Warren, MI | $38,857,214 | 287,984 | $68,899 | 0.8%/3.9%(3) |
| Comstock Park Retail - Comstock Park, MI | $11,111,800 | 119,928 | $62,556 | 3.6% |
| Grand Rapids Retail - Kentwood, MI | $9,134,854 | 144,496 | $88,887 | 5.5% |
| Bloomfield Hills Retail - Bloomfield Hills, MI | $5,317,302 | 157,907 | $107,681 | 4.6% |
| Mattress Distribution Center - Roseville, MI | $4,328,830 | 264,645 | $62,421 | 1.7% |
| (1) | Based on the Art Van Portfolio Whole Loan. |
| (2) | Information obtained from third party market research reports. |
| (3) | The Warren Distribution Center property is located in the West of Van Dyke/Macomb industrial submarket with an average submarket vacancy of 0.8% and the West Macomb retail submarket with an average submarket vacancy of 3.9%. |
The following table presents certain information relating to the Art Van Portfolio Properties:
| Property Name – Location | Property Type | Allocated Cut-off Date Principal Balance(1) | % of Portfolio Cut-off Date Principal Balance | Occupancy | Year Built/ Renovated | Net Rentable Area (SF) | As-Is Appraised Value(2) | Allocated Cut-off Date LTV |
| Warren Distribution Center - Warren, MI | Industrial | $38,857,214 | 56.5% | 100.0% | 1969/2015 | 1,056,890 | $57,000,000 | 68.2% |
| Comstock Park Retail - Comstock Park, MI | Retail | $11,111,800 | 16.2% | 100.0% | 1999/NAP | 96,400 | $16,300,000 | 68.2% |
| Grand Rapids Retail - Kentwood, MI | Retail | $9,134,854 | 13.3% | 100.0% | 1986/2001 | 79,212 | $13,400,000 | 68.2% |
| Bloomfield Hills Retail - Bloomfield Hills, MI | Retail | $5,317,302 | 7.7% | 100.0% | 2004/2016 | 46,388 | $7,800,000 | 68.2% |
| Mattress Distribution Center - Roseville, MI | Industrial | $4,328,830 | 6.3% | 100.0% | 1968/2012 | 129,021 | $6,350,000 | 68.2% |
| Total/Weighted Average | $68,750,000 | 100.0% | 100.0% | 1,407,911 | $100,850,000 | 68.2% |
| (1) | Based on the Art Van Portfolio Whole Loan. |
| (2) | As of the appraisal valuation dates ranging from January 27, 2017 to January 31, 2017. |
THE INFORMATION IN THIS STRUCTURAL AND COLLATERAL TERM SHEET IS NOT COMPLETE AND MAY BE AMENDED PRIOR TO THE TIME OF SALE. THIS TERM SHEET IS NOT AN OFFER TO SELL THESE SECURITIES AND IT IS NOT A SOLICITATION OF AN OFFER TO BUY THESE SECURITIES IN ANY JURISDICTION WHERE THE OFFER OR SALE IS NOT PERMITTED.
| 140 |
| ART VAN PORTFOLIO |
The following table presents certain information relating to the Art Van tenancy at the Art Van Portfolio Properties:
Major Tenant
| Property Name | Credit Rating (Fitch/Moody’s/ S&P) | Property NRSF | % of NRSF | Annual U/W Base Rent PSF | Annual U/W Base Rent | % of Total Annual U/W Base Rent | Lease Expiration Date |
| Distribution Centers | |||||||
| Warren Distribution Center | NR/NR/NR | 1,056,890 | 75.1% | $3.85 | $4,069,027 | 55.8% | 2/28/2037(1) |
| Mattress Distribution Center | NR/NR/NR | 129,021 | 9.2% | $3.50 | $451,574 | 6.2% | 2/28/2037(1) |
| Total Distribution Centers | 1,185,911 | 84.2% | $3.81 | $4,520,601 | 62.0% | ||
| Retail Centers | |||||||
| Comstock Park Retail | NR/NR/NR | 96,400 | 6.8% | $12.50 | $1,205,000 | 16.5% | 2/28/2037(1) |
| Grand Rapids Retail | NR/NR/NR | 79,212 | 5.6% | $12.50 | $990,150 | 13.6% | 2/28/2037(1) |
| Bloomfield Hills Retail | NR/NR/NR | 46,388 | 3.3% | $12.50 | $579,850 | 7.9% | 2/28/2037(1) |
| Total Retail Centers | 222,000 | 15.8% | $12.50 | $2,775,000 | 38.0% | ||
| Occupied Collateral Total | 1,407,911 | 100.0% | $5.18 | $7,295,601 | 100.0% | ||
| Vacant Space | 0 | 0.0% | |||||
| Collateral Total | 1,407,911 | 100.0% | �� | ||||
| (1) | Art Van has two, 10-year renewal options. |
The following table presents certain information relating to the historical retail sales at the Art Van Portfolio Properties:
Historical Sales (PSF)(1)
| Property Name | Selling NRSF | % of Total NRSF | FY 2014(2) | FY 2015(2) | FY 2016 |
| Warren Distribution Center | 86,996 | 6.2% | $529 | $559 | $534 |
| Comstock Park Retail | 63,700 | 4.5% | $183 | $211 | $227 |
| Grand Rapids Retail | 69,174 | 4.9% | $364 | $396 | $424 |
| Bloomfield Hills Retail | 26,440 | 1.9% | NAV | NAV | $462 |
| Total/Weighted Average(3) | 246,310 | 17.5% | $377 | $407 | $416 |
| (1) | Historical Sales (PSF) are based on historical statements provided by the borrower. Historical Sales (PSF) for the Mattress Distribution Center property are not available as it is the sole distribution center for all PureSleep Mattress Stores and a manufacturing and training facility for Art Van’s mattress operations. Art Van’s PureSleep division recognized net sales of approximately $43.4 million in FY 2016. |
| (2) | FY 2014 and FY 2015 are not available for the Bloomfield Hills Retail property as the Bloomfield Hills Retail property was purchased by Art Van in March 2016. |
| (3) | FY 2014 and FY 2015 Weighted Average exclude the Bloomfield Hills Retail property Selling NRSF. |
THE INFORMATION IN THIS STRUCTURAL AND COLLATERAL TERM SHEET IS NOT COMPLETE AND MAY BE AMENDED PRIOR TO THE TIME OF SALE. THIS TERM SHEET IS NOT AN OFFER TO SELL THESE SECURITIES AND IT IS NOT A SOLICITATION OF AN OFFER TO BUY THESE SECURITIES IN ANY JURISDICTION WHERE THE OFFER OR SALE IS NOT PERMITTED.
| 141 |
| ART VAN PORTFOLIO |
The following table presents certain information relating to the lease rollover schedule at the Art Van Portfolio Properties:
Lease Expiration Schedule(1)
| Year Ending December 31, | No. of Leases Expiring | Expiring NRSF | % of Total NRSF | Cumulative Expiring NRSF | Cumulative % of Total NRSF | Annual U/W Base Rent | Total % of Annual U/W Base Rent | Annual U/W Base Rent PSF |
| MTM | 0 | 0 | 0.0% | 0 | 0.0% | $0 | 0.0% | $0.00 |
| 2017 | 0 | 0 | 0.0% | 0 | 0.0% | $0 | 0.0% | $0.00 |
| 2018 | 0 | 0 | 0.0% | 0 | 0.0% | $0 | 0.0% | $0.00 |
| 2019 | 0 | 0 | 0.0% | 0 | 0.0% | $0 | 0.0% | $0.00 |
| 2020 | 0 | 0 | 0.0% | 0 | 0.0% | $0 | 0.0% | $0.00 |
| 2021 | 0 | 0 | 0.0% | 0 | 0.0% | $0 | 0.0% | $0.00 |
| 2022 | 0 | 0 | 0.0% | 0 | 0.0% | $0 | 0.0% | $0.00 |
| 2023 | 0 | 0 | 0.0% | 0 | 0.0% | $0 | 0.0% | $0.00 |
| 2024 | 0 | 0 | 0.0% | 0 | 0.0% | $0 | 0.0% | $0.00 |
| 2025 | 0 | 0 | 0.0% | 0 | 0.0% | $0 | 0.0% | $0.00 |
| 2026 | 0 | 0 | 0.0% | 0 | 0.0% | $0 | 0.0% | $0.00 |
| 2027 | 0 | 0 | 0.0% | 0 | 0.0% | $0 | 0.0% | $0.00 |
| Thereafter | 1 | 1,407,911 | 100.0% | 1,407,911 | 100.0% | $7,295,601 | 100.0% | $5.18 |
| Vacant | 0 | 0 | 0.0% | 1,407,911 | 100.0% | $0 | 0.0% | $0.00 |
| Total/Weighted Average | 1 | 1,407,911 | 100.0% | $7,295,601 | 100.0% | $5.18 |
| (1) | Information obtained from the underwritten rent roll. |
The following table presents historical occupancy percentages at the Art Van Portfolio Properties:
Historical Occupancy
12/31/2013(1) | 12/31/2014(1) | 12/31/2015(1) | 12/31/2016(1) | 3/1/2017(2) |
| 100.0% | 100.0% | 100.0% | 100.0% | 100.0% |
| (1) | Information obtained from the borrower. |
| (2) | Information obtained from the underwritten rent roll. |
Operating History and Underwritten Net Cash Flow. The following table presents certain information relating to the underwritten net cash flow at the Art Van Portfolio Properties:
Cash Flow Analysis(1)
| U/W | % of U/W Effective Gross Income | U/W $ per SF | ||||||||
| Base Rent | $7,295,601 | 102.3 | % | $5.18 | ||||||
| Grossed Up Vacant Space | 0 | 0.0 | 0.00 | |||||||
| Total Reimbursables | 214,281 | 3.0 | 0.15 | |||||||
| Other Income | 0 | 0.0 | 0.00 | |||||||
| Less Vacancy & Credit Loss | (375,494 | )(2) | (5.3 | ) | (0.27 | ) | ||||
| Effective Gross Income | $7,134,388 | 100.0 | % | $5.07 | ||||||
| Total Operating Expenses | $214,032 | 3.0 | % | $0.15 | ||||||
| Net Operating Income | $6,920,356 | 97.0 | % | $4.92 | ||||||
| TI/LC | 243,737 | 3.4 | 0.17 | |||||||
| Capital Expenditures | 185,242 | 2.6 | 0.13 | |||||||
| Net Cash Flow | $6,491,378 | 91.0 | % | $4.61 | ||||||
| NOI DSCR | 1.57x | �� | ||||||||
| NCF DSCR | 1.47x | |||||||||
| NOI DY | 10.1% | |||||||||
| NCF DY | 9.4% | |||||||||
| (1) | Historical financials are not available as the Art Van Portfolio Properties were acquired in a sale-leaseback transaction. The Art Van Portfolio Properties were previously owner occupied. The lease is structured as a true triple net lease where all of the operating management expenses are paid for directly by Art Van, including capital expenditures. |
| (2) | The underwriting economic vacancy is 5.0%. The Art Van Portfolio Properties were 100.0% physically occupied as of March 1, 2017. |
THE INFORMATION IN THIS STRUCTURAL AND COLLATERAL TERM SHEET IS NOT COMPLETE AND MAY BE AMENDED PRIOR TO THE TIME OF SALE. THIS TERM SHEET IS NOT AN OFFER TO SELL THESE SECURITIES AND IT IS NOT A SOLICITATION OF AN OFFER TO BUY THESE SECURITIES IN ANY JURISDICTION WHERE THE OFFER OR SALE IS NOT PERMITTED.
| 142 |
(THIS PAGE INTENTIONALLY LEFT BLANK)
THE INFORMATION IN THIS STRUCTURAL AND COLLATERAL TERM SHEET IS NOT COMPLETE AND MAY BE AMENDED PRIOR TO THE TIME OF SALE. THIS TERM SHEET IS NOT AN OFFER TO SELL THESE SECURITIES AND IT IS NOT A SOLICITATION OF AN OFFER TO BUY THESE SECURITIES IN ANY JURISDICTION WHERE THE OFFER OR SALE IS NOT PERMITTED.
| 143 |
| No. 15 Rivercrest Realty Portfolio 2017 | |||||||
| Loan Information | Property Information | ||||||
| Mortgage Loan Seller: | Barclays Bank PLC | Single Asset/Portfolio: | Portfolio | ||||
| Credit Assessment (DBRS/Fitch/Moody’s): | NR/NR/NR | Property Type: | Retail | ||||
| Original Principal Balance: | $16,600,000 | Specific Property Type: | Various | ||||
| Cut-off Date Principal Balance: | $16,600,000 | Location: | Various, Various – See Table | ||||
| % of Initial Pool Balance: | 2.6% | Size: | 180,033 SF | ||||
| Loan Purpose: | Acquisition | Cut-off Date Principal Balance Per SF: | $92.21 | ||||
| Borrower Names(1): | Various | Year Built/Renovated: | Various – See Table | ||||
| Borrower Sponsors: | Jonathan Gaines; Stanley Werb | Title Vesting: | Fee | ||||
| Mortgage Rate: | 4.617% | Property Manager: | Self-managed | ||||
| Note Date: | January 25, 2017 | 4thMost Recent Occupancy (As of)(6): | NAV | ||||
| Anticipated Repayment Date: | NAP | 3rdMost Recent Occupancy (As of)(6): | NAV | ||||
| Maturity Date: | February 6, 2027 | 2ndMost Recent Occupancy (As of)(6): | NAV | ||||
| IO Period: | 60 months | Most Recent Occupancy (As of)(6): | NAV | ||||
| Loan Term (Original): | 120 months | Current Occupancy (As of): | 92.9% (2/1/2017) | ||||
| Seasoning: | 1 month | ||||||
| Amortization Term (Original): | 360 months | Underwriting and Financial Information: | |||||
| Loan Amortization Type: | Interest-only, Amortizing Balloon | ||||||
| Interest Accrual Method: | Actual/360 | 4thMost Recent NOI (As of)(7): | $1,425,525 (Various) | ||||
| Call Protection: | L(25),D(90),O(5) | 3rdMost Recent NOI (As of)(7): | $1,487,481 (Various) | ||||
| Lockbox Type: | Springing | 2ndMost Recent NOI (As of)(7): | $1,774,750 (12/31/2015) | ||||
| Additional Debt: | None | Most Recent NOI (As of)(7): | $1,870,630 (Various) | ||||
| Additional Debt Type: | NAP | ||||||
| U/W Revenues: | $2,820,074 | ||||||
| U/W Expenses: | $704,207 | ||||||
| U/W NOI(7): | $2,115,867 | ||||||
| Escrows and Reserves: | U/W NCF: | $1,898,875 | |||||
| U/W NOI DSCR | 2.07x | ||||||
| Type: | Initial | Monthly | Cap (If Any) | U/W NCF DSCR: | 1.86x | ||
| Taxes | $82,869 | $15,733 | NAP | U/W NOI Debt Yield: | 12.7% | ||
| Insurance(2) | $0 | Springing | NAP | U/W NCF Debt Yield: | 11.4% | ||
| Replacement Reserve | $0 | $2,250 | NAP | As-Is Appraised Value: | $24,900,000 | ||
| TI/LC Reserve(3) | $325,000 | Springing | $325,000 | As-Is Appraisal Valuation Date(8): | Various | ||
| Unfunded Obligations(4) | $20,000 | $0 | NAP | Cut-off Date LTV Ratio: | 66.7% | ||
| Free Rent Reserve(5) | $11,543 | $0 | NAP | LTV Ratio at Maturity: | 61.1% | ||
| (1) | The borrowers are Altavista (Altavista Commons) SRX, LLC; Millbrook (Hillcrest) SRX, LLC; McDonough (Towne Centre) SRX, LLC; Callaway (Callaway) SRX, LLC; Shippensburg (Shippen) SRX, LLC and South Boston (Tri-Rivers) SRX, LLC. |
| (2) | Ongoing monthly reserves for insurance are not required as long as: (i) no event of default has occurred or is continuing, (ii) the debt service coverage ratio is greater than 1.15x and (iii) the Rivercrest Realty Portfolio 2017 Properties (as defined below) are insured by an acceptable blanket insurance policy. |
| (3) | The loan documents require the borrower to escrow an amount of $325,000 for the TI/LC Reserve at the closing of the mortgage loan. Ongoing monthly reserves of $15,003 for tenant improvements and leasing commissions (“TI/LC”) are not required as long as (i) no event of default has occurred or is continuing, (ii) the debt service coverage ratio is greater than 1.15x and (iii) the amounts on deposit are $325,000. The TI/LC Reserve is subject to a cap of $325,000. |
| (4) | The Initial Unfunded Obligations reserve amount represents outstanding funds for TI/LCs at the closing of the mortgage loan. |
| (5) | The Initial Free Rent reserve represents two months of free rent (November 2017 and November 2018) associated with the FixxTech lease (representing 0.7% of the portfolio net rentable area) and four months free rent (March 2017, April 2017, May 2017 and June 2017) associated with the Virginia A.B.C. lease (representing 1.8% of the portfolio net rentable area). |
| (6) | See “Historical Occupancy” section. |
| (7) | See “Cash Flow Analysis” section. |
| (8) | The appraisal reports are dated from December 19, 2016 to December 26, 2016. |
The Rivercrest Realty Portfolio 2017 mortgage loan is evidenced by a single promissory note secured by a first mortgage encumbering the fee interests in five Wal-Mart shadow anchored retail properties and one unanchored retail property totaling 180,033 square feet located across five states, Georgia, Alabama, Pennsylvania, Florida and Virginia (the “Rivercrest Realty Portfolio 2017 Properties”). The Rivercrest Realty Portfolio 2017 Properties include the Towne Centre Village Retail Center property (located in McDonough, Georgia), the Hillcrest Shopping Center property (located in Millbrook, Alabama), the Shippensburg Shopping Center property (located in Shippensburg, Pennsylvania), the Callaway Commons property (located in Callaway, Florida), the Tri-Rivers Plaza property (located in South Boston, Virginia) and The Alta Vista Commons property (located in Altavista, Virginia). As of February 1, 2017, the Rivercrest Realty Portfolio 2017 Properties were 92.9% occupied by 70 tenants.
THE INFORMATION IN THIS STRUCTURAL AND COLLATERAL TERM SHEET IS NOT COMPLETE AND MAY BE AMENDED PRIOR TO THE TIME OF SALE. THIS TERM SHEET IS NOT AN OFFER TO SELL THESE SECURITIES AND IT IS NOT A SOLICITATION OF AN OFFER TO BUY THESE SECURITIES IN ANY JURISDICTION WHERE THE OFFER OR SALE IS NOT PERMITTED.
| 144 |
| RIVERCREST REALTY PORTFOLIO 2017 |
Sources and Uses(1)
| Sources | Uses | |||||||
| Original loan amount | $16,600,000 | 71.7% | Purchase price | $22,365,814 | 96.6% | |||
| Borrower sponsor’s new cash contribution | $6,559,928 | 28.3 | Reserves | 439,412 | 1.9 | |||
| Closing costs | 354,702 | 1.5 | ||||||
| Total Sources | $23,159,928 | 100.0% | Total Uses | $23,159,928 | 100.0% |
| (1) | The borrower sponsors acquired The Alta Vista Commons property, the Hillcrest Shopping Center property, the Shippensburg Shopping Center property and the Towne Centre Village Retail Center property between August 2016 and January 2017 for cash in four separate transactions, each of which properties is included in the Purchase price. Loan proceeds were used to acquire the Callaway Commons and the Tri-Rivers Plaza properties. Information presented reflects the acquisition prices of all of the Rivercrest Realty Portfolio 2017 Properties. |
The following table presents certain information relating to the Rivercrest Realty Portfolio 2017 Properties:
| Property Name – Location | Allocated Cut-off Date Principal Balance | % of Portfolio Cut-off Date Principal Balance | Occupancy(1) | Year Built/ Renovated | Net Rentable Area (SF) | Allocated Cut-off Date LTV | Appraised Value | |
| Towne Centre Village Retail Center | $4,650,000 | 28.0% | 100.0% | 2004/NAP | 33,600 | 66.0% | $7,050,000 | |
| Hillcrest Shopping Center | $3,125,000 | 18.8% | 85.6% | 2007/2016 | 32,542 | 70.2% | $4,450,000(2) | |
| Shippensburg Shopping Center | $2,600,000 | 15.7% | 87.8% | 2004/NAP | 31,889 | 68.4% | $3,800,000 | |
| Callaway Commons | $2,575,000 | 15.5% | 100.0% | 2003/NAP | 29,650 | 66.0% | $3,900,000 | |
| Tri-Rivers Plaza | $2,350,000 | 14.2% | 100.0% | 1997/2004 | 24,400 | 71.2% | $3,300,000 | |
| The Alta Vista Commons | $1,300,000 | 7.8% | 85.1% | 2007/NAP | 27,952 | 54.2% | $2,400,000 | |
| Total/Weighted Average | $16,600,000 | 100.0% | 92.9% | 180,033 | 66.7% | $24,900,000 | ||
| (1) | Information obtained from the underwritten rent roll. |
| (2) | The prospective market value upon stabilization of the Hillcrest Shopping Center property is $4,600,000 as of January 1, 2018. |
The following table presents certain information relating to the tenancies at the Rivercrest Realty Portfolio 2017 Properties:
Major Tenants
| Tenant Name | Credit S&P)(1) | Tenant NRSF | % of NRSF | Annual U/W Base Rent PSF | Annual U/W Base | % of Total Annual U/W Base Rent | Sales PSF | Occupancy Cost | Lease Expiration Date |
| Major Tenants | |||||||||
| Dollar Tree | NR/Ba2/BB+ | 28,015 | 15.6% | $9.84 | $275,627 | 11.7% | NAV | NAV | Various(2) |
| Cato | NR/NR/NR | 12,300 | 6.8% | $9.81 | $120,675 | 5.1% | NAV | NAV | Various(3) |
| Wine & Spirits | NR/NR/NR | 4,800 | 2.7% | $13.42 | $64,414 | 2.7% | NAV | NAV | 10/31/2018(4) |
| Dumas Karate | NR/NR/NR | 4,800 | 2.7% | $12.51 | $60,025 | 2.5% | NAV | NAV | MTM |
| Hibbett Sports | NR/NR/NR | 4,200 | 2.3% | $13.75 | $57,750 | 2.4% | NAV | NAV | 06/30/2022 |
| Total Major Tenant | 54,115 | 30.1% | $10.69 | $578,491 | 24.5% | ||||
| Non-Major Tenants(5) | 113,152 | 62.9% | $15.77 | $1,784,218 | 75.5% | ||||
| Occupied Collateral Total | 167,267 | 92.9% | $14.13 | $2,362,709 | 100.0% | ||||
| Vacant Space | 12,766 | 7.1% | |||||||
| Collateral Total | 180,033 | 100.0% | |||||||
| (1) | Certain ratings are those of the parent company whether or not the parent guarantees the lease. |
| (2) | Dollar Tree is a tenant at three of the Rivercrest Realty Portfolio 2017 Properties and leases (i) 10,000 square feet at the Hillcrest Shopping Center property under a lease that expires on June 30, 2022 and has one, 5-year lease renewal option; (ii) 10,000 square feet at the Callaway Commons property under a lease that expires on June 30, 2018 and has one, 5-year lease renewal option and (iii) 8,015 square feet at The Alta Vista Commons property under a lease that expires on January 31, 2019 and has two, 5-year lease renewal options. |
| (3) | Cato is a tenant at three of the Rivercrest Realty Portfolio 2017 Properties and leases (i) 4,800 square feet at the Tri-Rivers Plaza property under a lease that expires on January 31, 2018 and has one, automatic 2-year lease renewal option, (ii) 3,900 square feet at the Callaway Commons property under a lease that expires on January 31, 2018 and has one, automatic 5-year lease renewal option and (iii) 3,600 square feet at the Shippensburg Shopping Center property under a lease that expires on January 31, 2020 and has one, automatic 3-year lease renewal option. |
| (4) | Wine & Spirits has one, 5-year lease renewal option. |
| (5) | Alltell – Verizon Tower at the Tri-Rivers Plaza property, has no square footage but contributes $7,200 to the Annual U/W Base Rent; Annual U/W Base Rent PSF for Non-Major Tenants excluding the rent related to Alltell – Verizon Tower is $15.70. |
THE INFORMATION IN THIS STRUCTURAL AND COLLATERAL TERM SHEET IS NOT COMPLETE AND MAY BE AMENDED PRIOR TO THE TIME OF SALE. THIS TERM SHEET IS NOT AN OFFER TO SELL THESE SECURITIES AND IT IS NOT A SOLICITATION OF AN OFFER TO BUY THESE SECURITIES IN ANY JURISDICTION WHERE THE OFFER OR SALE IS NOT PERMITTED.
| 145 |
| RIVERCREST REALTY PORTFOLIO 2017 |
The following table presents certain information relating to the lease rollover schedule at the Rivercrest Realty Portfolio 2017 Properties:
Lease Expiration Schedule(1)(2)
Year Ending December 31 | No. of Leases Expiring | Expiring NRSF | % of Total NRSF | Cumulative | Cumulative % of Total NRSF | Annual U/W Base Rent | % of Total Annual U/W Base Rent | Annual |
| MTM | 1 | 4,800 | 2.7% | 4,800 | 2.7% | $60,025 | 2.5% | $12.51 |
| 2017 | 9 | 17,667 | 9.8% | 22,467 | 12.5% | $242,117 | 10.2% | $13.70 |
| 2018 | 16 | 43,767 | 24.3% | 66,234 | 36.8% | $631,233 | 26.7% | $14.42 |
| 2019 | 17 | 35,321 | 19.6% | 101,555 | 56.4% | $455,072 | 19.3% | $12.88 |
| 2020 | 10 | 18,800 | 10.4% | 120,355 | 66.9% | $316,232 | 13.4% | $16.82 |
| 2021 | 11 | 19,267(4) | 10.7% | 139,622 | 77.6% | $324,699 | 13.7% | $16.85 |
| 2022 | 3 | 17,400 | 9.7% | 157,022 | 87.2% | $210,292 | 8.9% | $12.09 |
| 2023 | 1 | 4,805 | 2.7% | 161,827 | 89.9% | $57,660 | 2.4% | $12.00 |
| 2024 | 1 | 1,200 | 0.7% | 163,027 | 90.6% | $26,455 | 1.1% | $22.05 |
| 2025 | 1 | 4,240 | 2.4% | 167,267 | 92.9% | $38,923 | 1.6% | $9.18 |
| 2026 | 0 | 0 | 0.0% | 167,267 | 92.9% | $0 | 0.0% | $0.00 |
| 2027 | 0 | 0 | 0.0% | 167,267 | 92.9% | $0 | 0.0% | $0.00 |
| Thereafter | 0 | 0 | 0.0% | 167,267 | 92.9% | $0 | 0.0% | $0.00 |
| Vacant | 0 | 12,766 | 7.1% | 180,033 | 100.0% | $0 | 0.0% | $0.00 |
| Total/Weighted Average | 70 | 180,033 | 100.0% | $2,362,709 | 100.0% | $14.13 |
| (1) | Information obtained from the underwritten rent roll. |
| (2) | Certain tenants may have lease termination options that are exercisable prior to the originally stated expiration date of the subject lease and that are not considered in the Lease Expiration Schedule. |
| (3) | Weighted Average Annual U/W Base Rent PSF excludes vacant space. |
| (4) | The Alltell – Verizon Tower at the Tri-Rivers Plaza property has no square footage but is included in the annual U/W Base Rent. The Annual U/W Base Rent PSF excluding the rent related to the Alltell – Verizon Tower at the Tri-Rivers Plaza property is $14.08. |
The following table presents historical occupancy percentages at the Rivercrest Realty Portfolio 2017 Properties:
Historical Occupancy
12/31/2013(1) | 12/31/2014(1) | 12/31/2015(1) | 12/31/2016(1) | 2/1/2017(2) |
| NAV | NAV | NAV | NAV | 92.9% |
| (1) | The sellers of the Rivercrest Realty Portfolio 2017 Properties did not provide historical occupancy information to the borrowers. |
| (2) | Information obtained from the underwritten rent roll. |
THE INFORMATION IN THIS STRUCTURAL AND COLLATERAL TERM SHEET IS NOT COMPLETE AND MAY BE AMENDED PRIOR TO THE TIME OF SALE. THIS TERM SHEET IS NOT AN OFFER TO SELL THESE SECURITIES AND IT IS NOT A SOLICITATION OF AN OFFER TO BUY THESE SECURITIES IN ANY JURISDICTION WHERE THE OFFER OR SALE IS NOT PERMITTED.
| 146 |
| RIVERCREST REALTY PORTFOLIO 2017 |
Operating History and Underwritten Net Cash Flow. The following table presents certain information relating to the historical operating performance and underwritten net cash flow at the Rivercrest Realty Portfolio 2017 Properties:
Cash Flow Analysis
| 2013(1) | 2014(2) | 2015 | 2016(3) | U/W | % of U/W Effective Gross Income | U/W $ per SF | |
| Base Rent | $1,706,094 | $1,858,928 | $2,156,758 | $2,193,187 | $2,362,709 | 83.8% | $13.12 |
| Grossed Up Vacant Space | 0 | 0 | 0 | 0 | 148,634 | 5.3 | 0.83 |
| Total Reimbursables(4) | 165,541 | 228,801 | 317,550 | 353,594 | 586,232 | 20.8 | 3.26 |
| Other Income | 160 | 3,707 | 6,466 | 11,796 | 2,736 | 0.1 | 0.02 |
| Less Vacancy & Credit Loss | 0 | 0 | 0 | 0 | (280,237)(5) | (9.9) | (1.56) |
| Effective Gross Income | $1,871,795 | $2,091,436 | $2,480,774 | $2,558,577 | $2,820,074 | 100.0% | $15.66 |
| Total Operating Expenses | $446,270 | $603,955 | $706,024 | $687,946 | $704,207 | 25.0% | $3.91 |
| Net Operating Income | $1,425,525 | $1,487,481 | $1,774,750 | $1,870,630 | $2,115,867 | 75.0% | $11.75 |
| TI/LC | 0 | 520 | 53,096 | 7,855 | 179,813 | 6.4 | 1.00 |
| Capital Expenditures | 0 | 0 | 0 | 0 | 37,178 | 1.3 | 0.21 |
| Non-Recurring Item | 1,200 | 19,593 | 20,556 | 27,572 | 0 | 0.0 | 0.00 |
| Net Cash Flow | $1,424,325 | $1,467,368 | $1,701,098 | $1,835,203 | $1,898,875 | 67.3% | $10.55 |
| NOI DSCR | 1.39x | 1.45x | 1.73x | 1.83x | 2.07x | ||
| NCF DSCR | 1.39x | 1.43x | 1.66x | 1.79x | 1.86x | ||
| NOI DY | 8.6% | 9.0% | 10.7% | 11.3% | 12.7% | ||
| NCF DY | 8.6% | 8.8% | 10.2% | 11.1% | 11.4% |
| (1) | 2013 cash flows do not include the Shippensburg Shopping Center property, as the respective seller of the Shippensburg Shopping Center property did not provide 2013 cash flow information to the borrowers. |
| (2) | 2014 cash flows represent a partial year (4 months) for the Shippensburg Shopping Center property and 6-months annualized as of June 2014 for the Tri-Rivers Plaza property, as the sellers of the respective Rivercrest Realty Portfolio 2017 properties did not provide complete 2014 cash flow information to the borrowers. |
| (3) | For the Towne Centre Village Retail Center property, the 2016 financial information represents annualized operations from January 2016 through July 2016 and October 2016 through November 2016. For the Hillcrest Shopping Center property, the 2016 financial information represents annualized operations from January 2016 through September 2016. For the Callaway Commons property, the 2016 financial information represents annualized operations from January 2016 through July 2016. For the Tri-Rivers Plaza property, the 2016 financial information represents annualized operations from January 2016 through September 2016. For the Alta Vista Commons property, the 2016 financial information represents annualized operations from January 2016 through March 2016. |
| (4) | Total Reimbursables are comprised of real estate taxes reimbursements, insurance reimbursements, CAM reimbursements, parking reimbursements and expense recoveries. |
| (5) | The underwritten economic vacancy is 9.0%. The Rivercrest Realty Portfolio 2017 Properties were 92.9% physically occupied as of February 1, 2017. |
THE INFORMATION IN THIS STRUCTURAL AND COLLATERAL TERM SHEET IS NOT COMPLETE AND MAY BE AMENDED PRIOR TO THE TIME OF SALE. THIS TERM SHEET IS NOT AN OFFER TO SELL THESE SECURITIES AND IT IS NOT A SOLICITATION OF AN OFFER TO BUY THESE SECURITIES IN ANY JURISDICTION WHERE THE OFFER OR SALE IS NOT PERMITTED.
| 147 |
| Wells Fargo Commercial Mortgage Trust 2017-RB1 | Transaction Contact Information |
VI. Transaction Contact Information
Questions regarding this Structural and Collateral Term Sheet may be directed to any of the following individuals:
| Wells Fargo Securities, LLC | |
| Brigid Mattingly | Tel. (312) 269-3062 |
| A.J. Sfarra | Tel. (212) 214-5613 |
| Alex Wong | Tel. (212) 214-5615 |
| Barclays Capital Inc. | |
| Daniel Vinson | Tel. (212) 528-8224 |
| Brian Wiele | Tel. (212) 412-5780 |
| Brian La Belle | Tel. (212) 526-1809 |
| SG Americas Securities, LLC | |
| Adam Ansaldi | Tel. (212) 278-6126 |
| Jim Barnard | Tel. (212) 278-6263 |
| Warren Geiger | Tel. (212) 278-5692 |
| UBS Securities LLC | |
| David Schell | Tel. (212) 713-3375 |
| Nicholas Galeone | Tel. (212) 713-8832 |
| Siho Ham | Tel. (212) 713-1278 |
THE INFORMATION IN THIS STRUCTURAL AND COLLATERAL TERM SHEET IS NOT COMPLETE AND MAY BE AMENDED PRIOR TO THE TIME OF SALE. THIS TERM SHEET IS NOT AN OFFER TO SELL THESE SECURITIES AND IT IS NOT A SOLICITATION OF AN OFFER TO BUY THESE SECURITIES IN ANY JURISDICTION WHERE THE OFFER OR SALE IS NOT PERMITTED.
| 148 |