| FREE WRITING PROSPECTUS | ||
| FILED PURSUANT TO RULE 433 | ||
| REGISTRATION FILE NO.: 333-206677-17 | ||
 |  |
Free Writing Prospectus
Structural and Collateral Term Sheet
$1,132,834,836
(Approximate Initial Pool Balance)
$996,894,000
(Approximate Aggregate Certificate Balance of Offered Certificates)
Wells Fargo Commercial Mortgage Trust 2017-C39
as Issuing Entity
Wells Fargo Commercial Mortgage Securities, Inc.
as Depositor
Wells Fargo Bank, National Association
Barclays Bank PLC
Argentic Real Estate Finance LLC
Natixis Real Estate Capital LLC
Basis Real Estate Capital II, LLC
as Sponsors and Mortgage Loan Sellers
Commercial Mortgage Pass-Through Certificates
Series 2017-C39
August 3, 2017
WELLS FARGO SECURITIES
Co-Lead Manager and Joint Bookrunner | BARCLAYS
Joint Bookrunner | |
Citigroup Co-Manager | Natixis Securities Americas LLC Co-Manager |
STATEMENT REGARDING THIS FREE WRITING PROSPECTUS
The depositor has filed a registration statement (including a prospectus) with the Securities and Exchange Commission (‘‘SEC’’) (SEC File No. 333-206677) for the offering to which this communication relates. Before you invest, you should read the prospectus in the registration statement and other documents the depositor has filed with the SEC for more complete information about the depositor, the issuing entity and this offering. You may get these documents for free by visiting EDGAR on the SEC Web site at www.sec.gov. Alternatively, the depositor, any underwriter, or any dealer participating in the offering will arrange to send you the prospectus after filing if you request it by calling toll free 1-800-745-2063 (8 a.m. – 5 p.m. EST) or by emailing wfs.cmbs@wellsfargo.com.
Nothing in this document constitutes an offer of securities for sale in any jurisdiction where the offer or sale is not permitted. The information contained herein is preliminary as of the date hereof, supersedes any such information previously delivered to you and will be superseded by any such information subsequently delivered and ultimately by the final prospectus relating to the securities. These materials are subject to change, completion, supplement or amendment from time to time.
This free writing prospectus has been prepared by the underwriters for information purposes only and does not constitute, in whole or in part, a prospectus for the purposes of Directive 2003/71/EC (as amended) and/or Part VI of the Financial Services and Markets Act 2000, as amended, or other offering document.
STATEMENT REGARDING ASSUMPTIONS AS TO SECURITIES, PRICING ESTIMATES AND OTHER INFORMATION
The attached information contains certain tables and other statistical analyses (the “Computational Materials”) which have been prepared in reliance upon information furnished by the Mortgage Loan Sellers. Numerous assumptions were used in preparing the Computational Materials, which may or may not be reflected herein. As such, no assurance can be given as to the Computational Materials’ accuracy, appropriateness or completeness in any particular context; or as to whether the Computational Materials and/or the assumptions upon which they are based reflect present market conditions or future market performance. The Computational Materials should not be construed as either projections or predictions or as legal, tax, financial or accounting advice. You should consult your own counsel, accountant and other advisors as to the legal, tax, business, financial and related aspects of a purchase of these securities. Any weighted average lives, yields and principal payment periods shown in the Computational Materials are based on prepayment and/or loss assumptions, and changes in such prepayment and/or loss assumptions may dramatically affect such weighted average lives, yields and principal payment periods. In addition, it is possible that prepayments or losses on the underlying assets will occur at rates higher or lower than the rates shown in the attached Computational Materials. The specific characteristics of the securities may differ from those shown in the Computational Materials due to differences between the final underlying assets and the preliminary underlying assets used in preparing the Computational Materials. The principal amount and designation of any security described in the Computational Materials are subject to change prior to issuance. None of Wells Fargo Securities, LLC, Barclays Capital Inc., Citigroup Global Markets Inc., Natixis Securities Americas LLC, or any of their respective affiliates, make any representation or warranty as to the actual rate or timing of payments or losses on any of the underlying assets or the payments or yield on the securities. The information in this presentation is based upon management forecasts and reflects prevailing conditions and management’s views as of this date, all of which are subject to change. In preparing this presentation, we have relied upon and assumed, without independent verification, the accuracy and completeness of all information available from public sources or which was provided to us by or on behalf of the Mortgage Loan Sellers or which was otherwise reviewed by us.
This free writing prospectus contains certain forward-looking statements. If and when included in this free writing prospectus, the words “expects”, “intends”, “anticipates”, “estimates” and analogous expressions and all statements that are not historical facts, including statements about our beliefs or expectations, are intended to identify forward-looking statements. Any forward-looking statements are made subject to risks and uncertainties which could cause actual results to differ materially from those stated. Those risks and uncertainties include, among other things, declines in general economic and business conditions, increased competition, changes in demographics, changes in political and social conditions, regulatory initiatives and changes in customer preferences, many of which are beyond our control and the control of any other person or entity related to this offering. The forward-looking statements made in this free writing prospectus are made as of the date stated on the cover. We have no obligation to update or revise any forward-looking statement.
Wells Fargo Securities is the trade name for the capital markets and investment banking services of Wells Fargo & Company and its subsidiaries, including but not limited to Wells Fargo Securities, LLC, a member of NYSE, FINRA, NFA and SIPC, Wells Fargo Prime Services, LLC, a member of FINRA, NFA and SIPC, and Wells Fargo Bank, N.A. Wells Fargo Securities, LLC and Wells Fargo Prime Services, LLC are distinct entities from affiliated banks and thrifts.
IMPORTANT NOTICE REGARDING THE OFFERED CERTIFICATES
The information herein is preliminary and may be supplemented or amended prior to the time of sale. In addition, the Offered Certificates referred to in these materials and the asset pool backing them are subject to modification or revision (including the possibility that one or more classes of certificates may be split, combined or eliminated at any time prior to issuance or availability of a final prospectus) and are offered on a “when, as and if issued” basis.
The underwriters described in these materials may from time to time perform investment banking services for, or solicit investment banking business from, any company named in these materials. The underwriters and/or their affiliates or respective employees may from time to time have a long or short position in any security or contract discussed in these materials.
The information contained herein supersedes any previous such information delivered to any prospective investor and will be superseded by information delivered to such prospective investor prior to the time of sale.
IMPORTANT NOTICE RELATING TO AUTOMATICALLY-GENERATED EMAIL DISCLAIMERS
Any legends, disclaimers or other notices that may appear at the bottom of any email communication to which this free writing prospectus is attached relating to (1) these materials not constituting an offer (or a solicitation of an offer), (2) any representation that these materials are accurate or complete and may not be updated or (3) these materials possibly being confidential, are not applicable to these materials and should be disregarded. Such legends, disclaimers or other notices have been automatically generated as a result of these materials having been sent via Bloomberg or another system.
THE INFORMATION IN THIS STRUCTURAL AND COLLATERAL TERM SHEET IS NOT COMPLETE AND MAY BE AMENDED PRIOR TO THE TIME OF SALE. THIS TERM SHEET IS NOT AN OFFER TO SELL THESE SECURITIES AND IT IS NOT A SOLICITATION OF AN OFFER TO BUY THESE SECURITIES IN ANY JURISDICTION WHERE THE OFFER OR SALE IS NOT PERMITTED.
2
| Wells Fargo Commercial Mortgage Trust 2017-C39 | Certificate Structure |
| I. | Certificate Structure |
| Class | Expected Ratings (Fitch/KBRA/Moody’s)(1) | Approximate Initial Certificate Balance or Notional Amount(2) | Approx. | Pass-Through Rate Description | Weighted Average Life (Years)(4) | Expected Principal Window(4) | Certificate Principal to Value Ratio(5) | Certificate Principal U/W NOI Debt Yield(6) | |
| Offered Certificates | |||||||||
| A-1 | AAAsf/AAA(sf)/Aaa(sf) | $27,816,000 | 30.000% | (7) | 2.90 | 09/17 – 07/22 | 41.2% | 16.0% | |
| A-2 | AAAsf/AAA(sf)/Aaa(sf) | $80,706,000 | 30.000% | (7) | 4.90 | 07/22 – 07/22 | 41.2% | 16.0% | |
| A-3 | AAAsf/AAA(sf)/Aaa(sf) | $4,389,000 | 30.000% | (7) | 6.90 | 07/24 – 07/24 | 41.2% | 16.0% | |
| A-SB | AAAsf/AAA(sf)/Aaa(sf) | $44,790,000 | 30.000% | (7) | 7.18 | 07/22 – 12/26 | 41.2% | 16.0% | |
| A-4 | AAAsf/AAA(sf)/Aaa(sf) | $305,000,000 | 30.000% | (7) | 9.72 | 12/26 – 06/27 | 41.2% | 16.0% | |
| A-5 | AAAsf/AAA(sf)/Aaa(sf) | $330,283,000 | 30.000% | (7) | 9.84 | 06/27 – 07/27 | 41.2% | 16.0% | |
| A-S | AAAsf/AAA(sf)/Aa2(sf) | $106,203,000 | 20.625% | (7) | 9.90 | 07/27 – 07/27 | 46.7% | 14.1% | |
| X-A | AAAsf/AAA(sf)/Aaa(sf) | $792,984,000(8) | N/A | Variable(9) | N/A | N/A | N/A | N/A | |
| X-B(10) | NR/AAA(sf)/NR | $222,942,000(11) | N/A | Variable(12) | N/A | N/A | N/A | N/A | |
| B | AA-sf/AA(sf)/NR | 50,978,000 | 16.125% | (7) | 9.93 | 07/27 – 08/27 | 49.3% | 13.3% | |
| C | A-sf/A(sf)/NR | 46,729,000 | 12.000% | (7) | 9.98 | 08/27 – 08/27 | 51.7% | 12.7% | |
| Non-Offered Certificates | |||||||||
| D(10) | BBB+sf/A-(sf)/NR | 19,032,000 | 10.320% | (7) | 9.98 | 08/27 – 08/27 | 52.7% | 12.5% | |
| Risk Retention Certificates | |||||||||
| E-RR(10) | BBB-sf/BBB-(sf)/NR | 37,610,000 | 7.000% | (7) | 9.98 | 08/27 – 08/27 | 54.7% | 12.0% | |
| F-RR(10) | BB-sf/BB-(sf)/NR | 25,489,000 | 4.750% | (7) | 9.98 | 08/27 – 08/27 | 56.0% | 11.7% | |
| G-RR(10) | B-sf/B(sf)/NR | 11,328,000 | 3.750% | (7) | 9.98 | 08/27 – 08/27 | 56.6% | 11.6% | |
| H-RR(10) | NR/NR/NR | 42,481,836 | 0.000% | (7) | 9.98 | 08/27 – 08/27 | 58.8% | 11.2% | |
| Notes: | |
| (1) | The expected ratings presented are those of Fitch Ratings, Inc. (“Fitch”), Kroll Bond Rating Agency, Inc. (“KBRA”) and Moody’s Investors Service, Inc. (“Moody’s”), which the depositor hired to rate the Offered Certificates. One or more other nationally recognized statistical rating organizations that were not hired by the depositor may use information they receive pursuant to Rule 17g-5 under the Securities Exchange Act of 1934, as amended (the “Exchange Act”) or otherwise, to rate or provide market reports and/or published commentary related to the Offered Certificates. We cannot assure you as to what ratings a non-hired nationally recognized statistical rating organization would assign or that its reports will not express differing, possibly negative, views of the mortgage loans and/or the Offered Certificates. The ratings of each class of Offered Certificates address the likelihood of the timely distribution of interest and, except in the case of the Class X-A and X-B Certificates, the ultimate distribution of principal due on those classes on or before the Rated Final Distribution Date. See “Risk Factors—Other Risks Relating to the Certificates—Nationally Recognized Statistical Rating Organizations May Assign Different Ratings to the Certificates; Ratings of the Certificates Reflect Only the Views of the Applicable Rating Agencies as of the Dates Such Ratings Were Issued; Ratings May Affect ERISA Eligibility; Ratings May Be Downgraded” and “Ratings” in the Preliminary Prospectus, expected to be dated August 3, 2017 (the “Preliminary Prospectus”). KBRA, Fitch and Moody’s have informed us that the “sf” designation in their ratings represents an identifier for structured finance product ratings. |
| (2) | The certificate balances and notional amounts set forth in the table are approximate. The actual initial certificate balances and notional amounts may be larger or smaller depending on the initial pool balance of the mortgage loans definitively included in the pool of mortgage loans, which aggregate cut-off date balance may be as much as 5% larger or smaller than the amount presented in the Preliminary Prospectus. In addition, the notional amounts of the Class X-A and Class X-B certificates may vary depending upon the final pricing of the classes of principal balance certificates whose certificate balances comprise such notional amounts, and, if as a result of such pricing the pass-through rate of the Class X-A or Class X-B certificates, as applicable, would be equal to zero at all times, such class of certificates may not be issued on the closing date of this securitization. |
| (3) | The approximate initial credit support with respect to the Class A-1, A-2, A-3, A-SB, A-4 and A-5 Certificates represents the approximate credit enhancement for the Class A-1, A-2, A-3, A-SB, A-4 and A-5 Certificates in the aggregate. |
| (4) | Weighted Average Lives and Expected Principal Windows are calculated based on an assumed prepayment rate of 0% CPR and the “Structuring Assumptions” described under “Yield and Maturity Considerations—Weighted Average Life” in the Preliminary Prospectus. |
| (5) | The Certificate Principal to Value Ratio for each Class of Certificates (other than the Class A-1, A-2, A-3, A-SB, A-4 and A-5 Certificates) is calculated as the product of (a) the weighted average Cut-off Date LTV Ratio for the mortgage loans and (b) a fraction, the numerator of which is the total initial Certificate Balance of such Class of Certificates and all Classes of Principal Balance Certificates senior to such Class of Certificates and the denominator of which is the total initial Certificate Balance of all of the Principal Balance Certificates. The Certificate Principal to Value Ratio for each of the Class A-1, A-2, A-3, A-SB, A-4 and A-5 Certificates is calculated in the aggregate for those Classes as if they were a single Class and is calculated as the product of (a) the weighted average Cut-off Date LTV Ratio for the mortgage loans and (b) a fraction, the numerator of which is the total initial aggregate Certificate Balances of such Classes of Certificates and the denominator of which is the total initial Certificate Balance of all of the Principal Balance Certificates. In any event, however, excess mortgaged property value associated with a mortgage loan will not be available to offset losses on any other mortgage loan. |
| (6) | The Certificate Principal U/W NOI Debt Yield for each Class of Certificates (other than the Class A-1, A-2, A-3, A-SB, A-4 and A-5 Certificates) is calculated as the product of (a) the weighted average U/W NOI Debt Yield for the mortgage loans and (b) a fraction, the numerator of which is the total initial Certificate Balance of all of the Classes of Principal Balance Certificates and the denominator of which is the total initial Certificate Balance for such Class of Certificates and all Classes of Principal Balance Certificates senior to such Class of Certificates. The Certificate Principal U/W NOI Debt Yield for each of the Class A-1, A-2, A-3, A-SB, A-4 and A-5 Certificates is calculated in the aggregate for those Classes as if they were a single Class and is calculated as the product of (a) the weighted average U/W NOI Debt Yield for the mortgage loans and (b) a fraction, the numerator of which is the total initial Certificate Balance of all of the Classes of Principal Balance Certificates and the denominator of which is the total aggregate initial Certificate Balances for the Class A-1, A-2, A-3, A-SB, A-4 and A-5 Certificates. In any event, however, cash flow from each mortgaged property supports only the related mortgage loan and will not be available to support any other mortgage loan. |
THE INFORMATION IN THIS STRUCTURAL AND COLLATERAL TERM SHEET IS NOT COMPLETE AND MAY BE AMENDED PRIOR TO THE TIME OF SALE. THIS TERM SHEET IS NOT AN OFFER TO SELL THESE SECURITIES AND IT IS NOT A SOLICITATION OF AN OFFER TO BUY THESE SECURITIES IN ANY JURISDICTION WHERE THE OFFER OR SALE IS NOT PERMITTED.
3
| Wells Fargo Commercial Mortgage Trust 2017-C39 | Certificate Structure |
| (7) | The pass-through rates for the Class A-1, A-2, A-3, A-SB, A-4, A-5, A-S, B, C, D, E-RR, F-RR, G-RR and H-RR Certificates in each case will be one of the following: (i) a fixed rateper annum, (ii) a variable rate per annum equal to the weighted average of the net mortgage interest rates on the mortgage loans for the related distribution date, (iii) a variable rateper annum equal to the lesser of (a) a fixed rate and (b) the weighted average of the net mortgage interest rates on the mortgage loans for the related distribution date or (iv) a variable rateper annum equal to the weighted average of the net mortgage interest rates on the mortgage loans for the related distribution date minus a specified percentage. For purposes of the calculation of the weighted average of the net mortgage interest rates on the mortgage loans for each distribution date, the mortgage interest rates will be adjusted as necessary to a 30/360 basis. |
| (8) | The Class X-A Certificates are notional amount certificates. The Notional Amount of the Class X-A Certificates will be equal to the aggregate Certificate Balance of the Class A-1, A-2, A-3, A-SB, A-4 and A-5 Certificates outstanding from time to time. The Class X-A Certificates will not be entitled to distributions of principal. |
| (9) | The pass-through rate for the Class X-A Certificates for any distribution date will be aper annum rate equal to the excess, if any, of (a) the weighted average of the net mortgage interest rates on the mortgage loans for the related distribution date, over (b) the weighted average of the pass-through rates on the Class A-1, A-2, A-3, A-SB, A-4 and A-5 Certificates for the related distribution date, weighted on the basis of their respective Certificate Balances outstanding immediately prior to that distribution date. For purposes of the calculation of the weighted average of the net mortgage interest rates on the mortgage loans for each distribution date, the mortgage interest rates will be adjusted as necessary to a 30/360 basis. |
| (10) | The initial notional amount of the Class X-B certificates and the initial certificate balance of each of the Class D, E-RR, F-RR, G-RR and H-RR certificates are subject to change based on final pricing of all certificates and the final determination of the Class E-RR, Class F-RR, Class G-RR and Class H-RR certificates (collectively, the “horizontal risk retention certificates”) that will be retained by the retaining sponsor as part of the U.S. risk retention requirements. For more information regarding the methodology and key inputs and assumptions used to determine the sizing of the horizontal risk retention certificates, see “Credit Risk Retention” in the Preliminary Prospectus. |
| (11) | The Class X-B Certificates are notional amount certificates. The Notional Amount of the Class X-B Certificates will be equal to the aggregate Certificate Balance of the Class A-S, B, C and D Certificates outstanding from time to time. The Class X-B Certificates will not be entitled to distributions of principal. |
| (12) | The pass-through rate for the Class X-B Certificates for any distribution date will be aper annum rate equal to the excess, if any, of (a) the weighted average of the net mortgage interest rates on the mortgage loans for the related distribution date, over (b) the weighted average of the pass-through rates on the Class A-S, B, C and D Certificates for the related distribution date, weighted on the basis of their respective Certificate Balances outstanding immediately prior to that distribution date. For purposes of the calculation of the weighted average of the net mortgage interest rates on the mortgage loans for each distribution date, the mortgage interest rates will be adjusted as necessary to a 30/360 basis. |
THE INFORMATION IN THIS STRUCTURAL AND COLLATERAL TERM SHEET IS NOT COMPLETE AND MAY BE AMENDED PRIOR TO THE TIME OF SALE. THIS TERM SHEET IS NOT AN OFFER TO SELL THESE SECURITIES AND IT IS NOT A SOLICITATION OF AN OFFER TO BUY THESE SECURITIES IN ANY JURISDICTION WHERE THE OFFER OR SALE IS NOT PERMITTED.
4
| Wells Fargo Commercial Mortgage Trust 2017-C39 | Transaction Highlights |
| II. | Transaction Highlights |
Mortgage Loan Sellers:
| Mortgage Loan Seller | Number of | Number of | Aggregate Cut-off | % of Initial | |||||
| Wells Fargo Bank, National Association | 17 | 17 | $333,036,782 | 29.4 | % | ||||
| Barclays Bank PLC | 11 | 87 | 301,354,734 | 26.6 | |||||
| Argentic Real Estate Finance LLC | 19 | 27 | 269,737,998 | 23.8 | |||||
| Natixis Real Estate Capital LLC | 8 | 9 | 154,458,553 | 13.6 | |||||
| Basis Real Estate Capital II, LLC | 9 | 9 | 74,246,771 | 6.6 | |||||
Total | 64 | 149 | $1,132,834,836 | 100.0 | % | ||||
Loan Pool:
| Initial Pool Balance: | $1,132,834,836 |
| Number of Mortgage Loans: | 64 |
| Average Cut-off Date Balance per Mortgage Loan: | $17,700,544 |
| Number of Mortgaged Properties: | 149 |
| Average Cut-off Date Balance per Mortgaged Property(1): | $7,602,918 |
| Weighted Average Mortgage Interest Rate: | 4.372% |
| Ten Largest Mortgage Loans as % of Initial Pool Balance: | 45.2% |
| Weighted Average Original Term to Maturity or ARD (months): | 115 |
| Weighted Average Remaining Term to Maturity or ARD (months): | 114 |
| Weighted Average Original Amortization Term (months)(2): | 354 |
| Weighted Average Remaining Amortization Term (months)(2): | 353 |
| Weighted Average Seasoning (months): | 2 |
(1) Information regarding mortgage loans secured by multiple properties is based on an allocation according to relative appraised values or the allocated loan amounts or property-specific release prices set forth in the related loan documents or such other allocation as the related mortgage loan seller deemed appropriate. (2) Excludes any mortgage loan that does not amortize. | |
Credit Statistics:
| Weighted Average U/W Net Cash Flow DSCR(1): | 2.15x |
| Weighted Average U/W Net Operating Income Debt Yield(1): | 11.2% |
| Weighted Average Cut-off Date Loan-to-Value Ratio(1): | 58.8% |
| Weighted Average Balloon or ARD Loan-to-Value Ratio(1): | 54.2% |
| % of Mortgage Loans with Additional Subordinate Debt(2): | 29.5% |
| % of Mortgage Loans with Single Tenants(3): | 10.6% |
(1) With respect to any mortgage loan that is part of a whole loan, loan-to-value ratio, debt service coverage ratio and debt yield calculations include the relatedpari passucompanion loan(s) but exclude any related subordinate companion loan(s) (unless otherwise stated). The debt service coverage ratio, debt yield and loan-to-value ratio information do not take into account any subordinate debt (whether or not secured by the related mortgaged property), that currently exists or is allowed under the terms of any mortgage loan. See “Description of the Mortgage Pool—Mortgage Pool Characteristics” in the Preliminary Prospectus and Annex A-1 to the Preliminary Prospectus. (2) The percentage figure expressed as “% of Mortgage Loans with Additional Subordinate Debt” is determined as a percentage of the initial pool balance and does not take into account any future subordinate debt (whether or not secured by the mortgaged property), if any, that may be permitted under the terms of any mortgage loan or the WFCM 2017-C39 pooling and servicing agreement. See “Description of the Mortgage Pool—Additional Indebtedness—Other Unsecured Indebtedness” in the Preliminary Prospectus. (3) Excludes mortgage loans that are secured by multiple single tenant properties. | |
THE INFORMATION IN THIS STRUCTURAL AND COLLATERAL TERM SHEET IS NOT COMPLETE AND MAY BE AMENDED PRIOR TO THE TIME OF SALE. THIS TERM SHEET IS NOT AN OFFER TO SELL THESE SECURITIES AND IT IS NOT A SOLICITATION OF AN OFFER TO BUY THESE SECURITIES IN ANY JURISDICTION WHERE THE OFFER OR SALE IS NOT PERMITTED.
5
| Wells Fargo Commercial Mortgage Trust 2017-C39 | Transaction Highlights |
Loan Structural Features:
Amortization:Based on the Initial Pool Balance, 50.6% of the mortgage pool (50 mortgage loans) has scheduled amortization, as follows:
33.4% (26 mortgage loans) provides for an interest-only period followed by an amortization period; and
17.2% (24 mortgage loans) requires amortization during the entire loan term.
Interest-Only:Based on the Initial Pool Balance, 49.4% of the mortgage pool (14 mortgage loans) provides for interest-only payments during the entire loan term. The Weighted Average Cut-off Date Loan-to-Value Ratio and Weighted Average U/W Net Cash Flow DSCR for those mortgage loans are 52.6% and 2.72x, respectively.
Hard Lockboxes: Based on the Initial Pool Balance, 70.3% of the mortgage pool (31 mortgage loans) have hard lockboxes in place.
Reserves: The mortgage loans require amounts to be escrowed monthly as follows (excluding any mortgage loans with springing provisions):
| Real Estate Taxes: | 64.8% of the pool |
| Insurance: | 42.5% of the pool |
| Capital Replacements: | 77.4% of the pool |
| TI/LC: | 48.2% of the pool(1) |
| (1) The percentage of Initial Pool Balance for mortgage loans with TI/LC reserves is based on the aggregate principal balance allocable to loans that include retail, office, mixed use and industrial properties. | |
Call Protection/Defeasance: Based on the Initial Pool Balance, the mortgage pool has the following call protection and defeasance features:
87.9% of the mortgage pool (55 mortgage loans) features a lockout period, then defeasance only until an open period;
8.9% of the mortgage pool (six mortgage loans) features a lockout period, then the greater of a prepayment premium or yield maintenance until an open period; and
3.1% of the mortgage pool (three mortgage loan) features a lockout period, then the greater of a prepayment premium or yield maintenance or defeasance until an open period.
Prepayment restrictions for each mortgage loan reflect the entire life of the mortgage loan. Please refer to Annex A-1 to the Preliminary Prospectus and the footnotes related thereto for further information regarding individual loan call protection.
THE INFORMATION IN THIS STRUCTURAL AND COLLATERAL TERM SHEET IS NOT COMPLETE AND MAY BE AMENDED PRIOR TO THE TIME OF SALE. THIS TERM SHEET IS NOT AN OFFER TO SELL THESE SECURITIES AND IT IS NOT A SOLICITATION OF AN OFFER TO BUY THESE SECURITIES IN ANY JURISDICTION WHERE THE OFFER OR SALE IS NOT PERMITTED.
6
| Wells Fargo Commercial Mortgage Trust 2017-C39 | Issue Characteristics |
| III. | Issue Characteristics |
| Securities Offered: | $996,894,000 approximate monthly pay, multi-class, commercial mortgage REMIC pass-through certificates consisting of eleven classes (Classes A-1, A-2, A-3, A-SB, A-4, A-5, A-S, B, C, X-A and X-B), which are offered pursuant to a registration statement filed with the SEC (such classes of certificates, the “Offered Certificates”). | |
| Mortgage Loan Sellers: | Wells Fargo Bank, National Association (“WFB”), Barclays Bank PLC (“Barclays”), Argentic Real Estate Finance LLC (“AREF”), Natixis Real Estate Capital LLC (“NXS”) and Basis Real Estate Capital II, LLC (“Basis”) | |
| Joint Bookrunners and Co-Lead Managers: | Wells Fargo Securities, LLC and Barclays Capital Inc. | |
| Co-Managers: | Citigroup Global Markets Inc. and Natixis Securities Americas LLC | |
| Rating Agencies: | Fitch Ratings, Inc., Kroll Bond Rating Agency, Inc. and Moody’s Investors Service, Inc. | |
| Master Servicer: | Wells Fargo Bank, National Association | |
| Special Servicer: | LNR Partners, LLC | |
| Certificate Administrator: | Wells Fargo Bank, National Association | |
| Trustee: | Wilmington Trust, National Association | |
| Operating Advisor: | Trimont Real Estate Advisors, LLC | |
| Asset Representations Reviewer: | Trimont Real Estate Advisors, LLC | |
| Initial Majority Controlling Class Certificateholder: | B-Piece Holdings Cayman Limited or an affiliate. B-Piece Holdings Cayman Limited or such affiliate will be a “majority-owned affiliate” (as defined in the U.S. credit risk retention rules) of Argentic Real Estate Finance LLC. | |
| U.S. Credit Risk Retention: | For a discussion on the manner in which the U.S. credit risk retention requirements will be satisfied by AREF, as the retaining sponsor, see “Credit Risk Retention” in the Preliminary Prospectus. | |
| EU Credit Risk Retention | None of the sponsors, the depositor or the issuing entity intends to retain a material net economic interest in the securitization constituted by the issue of the Offered Certificates in accordance with the EU risk retention and due diligence requirements or to take any other action which may be required by EEA-regulated investors for the purposes of their compliance with the EU risk retention and due diligence requirements or similar requirements. | |
| Cut-off Date: | The Cut-off Date with respect to each mortgage loan is the due date for the monthly debt service payment that is due in August 2017 (or, in the case of any mortgage loan that has its first due date in September 2017, the date that would have been its due date in August 2017 under the terms of that mortgage loan if a monthly debt service payment were scheduled to be due in that month). | |
| Expected Closing Date: | On or about August 22, 2017. | |
| Determination Dates: | The 11th day of each month (or if that day is not a business day, the next succeeding business day), commencing in September 2017. | |
| Distribution Dates: | The fourth business day following the Determination Date in each month, commencing in September 2017. | |
| Rated Final Distribution Date: | The Distribution Date in September 2050. | |
| Interest Accrual Period: | With respect to any Distribution Date, the calendar month immediately preceding the month in which such Distribution Date occurs. | |
| Day Count: | The Offered Certificates will accrue interest on a 30/360 basis. | |
| Minimum Denominations: | $10,000 for each Class of Offered Certificates (other than the Class X-A and X-B Certificates) and $1,000,000 for the Class X-A and X-B Certificates. Investments may also be made in any whole dollar denomination in excess of the applicable minimum denomination. |
THE INFORMATION IN THIS STRUCTURAL AND COLLATERAL TERM SHEET IS NOT COMPLETE AND MAY BE AMENDED PRIOR TO THE TIME OF SALE. THIS TERM SHEET IS NOT AN OFFER TO SELL THESE SECURITIES AND IT IS NOT A SOLICITATION OF AN OFFER TO BUY THESE SECURITIES IN ANY JURISDICTION WHERE THE OFFER OR SALE IS NOT PERMITTED.
7
| Wells Fargo Commercial Mortgage Trust 2017-C39 | Issue Characteristics |
| Clean-up Call: | 1.0% | |
| Delivery: | DTC, Euroclear and Clearstream Banking | |
| ERISA/SMMEA Status: | Each Class of Offered Certificates is expected to be eligible for exemptive relief under ERISA. No Class of Offered Certificates will be SMMEA eligible. | |
| Risk Factors: | THE CERTIFICATES INVOLVE CERTAIN RISKS AND MAY NOT BE SUITABLE FOR ALL INVESTORS. SEE THE “RISK FACTORS” SECTION OF THE PRELIMINARY PROSPECTUS. | |
| Bond Analytics Information: | The Certificate Administrator will be authorized to make distribution date statements, CREFC® reports and certain supplemental reports (other than confidential information) available to certain financial modeling and data provision services, including Bloomberg, L.P., Trepp, LLC, Intex Solutions, Inc., Markit Group Limited, Interactive Data Corp., BlackRock Financial Management, Inc., CMBS.com, Inc., Moody’s Analytics and Thomson Reuters Corporation. |
THE INFORMATION IN THIS STRUCTURAL AND COLLATERAL TERM SHEET IS NOT COMPLETE AND MAY BE AMENDED PRIOR TO THE TIME OF SALE. THIS TERM SHEET IS NOT AN OFFER TO SELL THESE SECURITIES AND IT IS NOT A SOLICITATION OF AN OFFER TO BUY THESE SECURITIES IN ANY JURISDICTION WHERE THE OFFER OR SALE IS NOT PERMITTED.
8
| Wells Fargo Commercial Mortgage Trust 2017-C39 | Characteristics of the Mortgage Pool |
| IV. | Characteristics of the Mortgage Pool(1) |
| A. | Ten Largest Mortgage Loans |
| Mortgage Loan Seller | Mortgage Loan Name | City | State | Number of Mortgage Loans / Mortgaged Properties | Mortgage Loan Cut-off Date Balance ($) | % of Initial Pool Balance (%) | Property Type | Number of Rooms / SF | Cut-off Date Balance Per Room / SF | Cut-off Date LTV Ratio (%) | Balloon or ARD LTV Ratio (%) | U/W NCF DSCR (x) | U/W NOI Debt Yield (%) | ||||||||||||||||||
| Barclays | 225 & 233 Park Avenue South | New York | NY | 1 / 1 | $70,000,000 | 6.2 | % | Office | 675,756 | $348 | 31.3 | % | 31.3 | % | 3.27 | x | 12.6 | % | |||||||||||||
| WFB | 211 Mount Airy Road | Basking Ridge | NJ | 1 / 1 | 65,000,000 | 5.7 | Office | 306,194 | 212 | 67.2 | 67.2 | 2.20 | 9.2 | ||||||||||||||||||
| WFB | Lakeside Shopping Center | Metairie | LA | 1 / 1 | 58,000,000 | 5.1 | Retail | 1,211,349 | 144 | 47.9 | 47.9 | 2.74 | 11.3 | ||||||||||||||||||
| Barclays | Long Island Prime Portfolio - Uniondale | Uniondale | NY | 1 / 2 | 50,000,000 | 4.4 | Office | 1,750,761 | 113 | 61.9 | 61.9 | 2.49 | 12.6 | ||||||||||||||||||
| AREF | Columbia Park Shopping Center | North Bergen | NJ | 1 / 1 | 50,000,000 | 4.4 | Retail | 345,703 | 181 | 60.3 | 60.3 | 1.63 | 8.4 | ||||||||||||||||||
| Natixis | 245 Park Avenue | New York | NY | 1 / 1 | 45,000,000 | 4.0 | Office | 1,723,993 | 626 | 48.9 | 48.9 | 2.73 | 10.7 | ||||||||||||||||||
| Natixis | Two Independence Square | Washington | DC | 1 / 1 | 45,000,000 | 4.0 | Office | 605,897 | 271 | 43.7 | 43.7 | 3.80 | 12.5 | ||||||||||||||||||
| AREF | Yeshiva University Portfolio | New York | NY | 1 / 5 | 45,000,000 | 4.0 | Office | 696,371 | 201 | 40.5 | 36.1 | 1.97 | 12.9 | ||||||||||||||||||
| WFB | Lincolnshire Commons | Lincolnshire | IL | 1 / 1 | 43,500,000 | 3.8 | Mixed Use | 133,024 | 327 | 74.6 | 68.2 | 1.37 | 8.7 | ||||||||||||||||||
| Barclays | Starwood Capital Group Hotel Portfolio | Various | Various | 1 / 65 | 40,000,000 | 3.5 | Hospitality | 6,366 | 90,680 | 60.4 | 60.4 | 2.72 | 13.9 | ||||||||||||||||||
| Top Three Total/Weighted Average | 3 / 3 | $193,000,000 | 17.0 | % | 48.4 | % | 48.4 | % | 2.75 | x | 11.1 | % | |||||||||||||||||||
| Top Five Total/Weighted Average | 5 / 6 | $293,000,000 | 25.9 | % | 52.7 | % | 52.7 | % | 2.51 | x | 10.9 | % | |||||||||||||||||||
| Top Ten Total/Weighted Average | 10 / 79 | $511,500,000 | 45.2 | % | 53.0 | % | 52.0 | % | 2.52 | x | 11.2 | % | |||||||||||||||||||
| Non-Top Ten Total/Weighted Average | 54 / 70 | $621,334,836 | 54.8 | % | 63.6 | % | 56.0 | % | 1.85 | x | 11.2 | % | |||||||||||||||||||
| (1) | With respect to any mortgage loan that is part of a whole loan, Cut-off Date Balance Per Room/SF, loan-to-value ratio, debt service coverage ratio and debt yield calculations include the relatedpari passu companion loan(s) but exclude any related subordinate companion loan(s) (unless otherwise stated). With respect to each mortgage loan, debt service coverage ratio, debt yield and loan-to-value ratio information do not take into account subordinate debt (whether or not secured by the related mortgaged property), if any, that currently exists or is allowed under the terms of such mortgage loan. |
THE INFORMATION IN THIS STRUCTURAL AND COLLATERAL TERM SHEET IS NOT COMPLETE AND MAY BE AMENDED PRIOR TO THE TIME OF SALE. THIS TERM SHEET IS NOT AN OFFER TO SELL THESE SECURITIES AND IT IS NOT A SOLICITATION OF AN OFFER TO BUY THESE SECURITIES IN ANY JURISDICTION WHERE THE OFFER OR SALE IS NOT PERMITTED.
��
9
| Wells Fargo Commercial Mortgage Trust 2017-C39 | Characteristics of the Mortgage Pool |
| B. | Summary of the Whole Loans |
| Property Name | Mortgage Loan Seller | Note(s) | Original Balance | Holder of Note(1) | Lead Servicer for Whole Loan | Master Servicer Under Lead Securitization Servicing Agreement | Special Servicer Under Lead Securitization Servicing Agreement | ||
| 225 & 233 Park Avenue South | Barclays | A-1 | $70,000,000 | WFCM 2017-C39 | Yes | Wells Fargo Bank, National Association | LNR Partners, LLC | ||
| A-2, A-3 | $120,000,000 | Barclays | No | ||||||
| A-4 | $45,000,000 | WFCM 2017-C38 | No | ||||||
| Lakeside Shopping Center | WFB | A-1 | $59,000,000 | Morgan Stanley Bank, N.A. | Yes(2) | Wells Fargo Bank, National Association(2) | LNR Partners, LLC(2) | ||
| A-2 | $58,000,000 | WFCM 2017-C39 | No | ||||||
| A-3 | $58,000,000 | Barclays | No | ||||||
| Long Island Prime Portfolio – Uniondale | Barclays | A-1-1 | $85,000,000 | GSMS 2017-GS7(3) | Yes | Wells Fargo Bank, National Association(3) | LNR Partners, LLC(3) | ||
| A-1-2 | $33,770,000 | Goldman Sachs Mortgage Company | No | ||||||
| A-2-1 | $50,000,000 | WFCM 2017-C39 | No | ||||||
| A-2-2 | $29,180,000 | Barclays | No | ||||||
| Columbia Park Shopping Center | AREF | A-1 | $50,000,000 | WFCM 2017-C39 | Yes | Wells Fargo Bank, National Association | LNR Partners, LLC | ||
| A-2 | $12,700,000 | AREF | No | ||||||
| 245 Park Avenue | NXS | A-1-A, A-1-B, A-1-C, A-1-D, A-1-E | $380,000,000 | (4) | 245 Park Avenue Trust 2017-245P | Yes | Wells Fargo Bank, National Association | AEGON USA Realty Advisors, LLC | |
| A-2-A-1 | $98,000,000 | JPMCC 2017-JP6 | No | ||||||
| A-2-A-2, A-2-C-1-A | $93,750,000 | DBJPM 2017-C6 | No | ||||||
| A-2-A-3 | $75,000,000 | JPMCC 2017-JP7 | No | ||||||
| A-2-A-4 | $32,000,000 | JPMorgan Chase Bank, N.A. | No | ||||||
| A-2-B-1 | $80,000,000 | CSAIL 2017-C8 | No | ||||||
| A-2-B-2, A-2-B-3-B | $85,000,000 | NXS | No | ||||||
| A-2-B-3-A | $45,000,000 | WFCM 2017-C39 | No | ||||||
| A-2-C-1-B, A-2-C-2 | $51,250,000 | Deutsche Bank AG, New York Branch | No | ||||||
| A-2-D-1, A-2-D-2, A-2-D-3 | $70,000,000 | Société Générale | No | ||||||
| A-2-E-1 | $55,000,000 | WFCM 2017-C38 | No | ||||||
| A-2-E-2 | $15,000,000 | Barclays | No | ||||||
| Two Independence Square | NXS | A-1 | $64,000,000 | (4) | CSMC 2017-MOON | Yes | KeyBank National Association | AEGON USA Realty Advisors, LLC | |
| A-2 | $30,000,000 | Column Financial, Inc. | No | ||||||
| A-3-A | $45,000,000 | WFCM 2017-C39 | No | ||||||
| A-3-B | $25,000,000 | NXS | No | ||||||
THE INFORMATION IN THIS STRUCTURAL AND COLLATERAL TERM SHEET IS NOT COMPLETE AND MAY BE AMENDED PRIOR TO THE TIME OF SALE. THIS TERM SHEET IS NOT AN OFFER TO SELL THESE SECURITIES AND IT IS NOT A SOLICITATION OF AN OFFER TO BUY THESE SECURITIES IN ANY JURISDICTION WHERE THE OFFER OR SALE IS NOT PERMITTED.
10
| Wells Fargo Commercial Mortgage Trust 2017-C39 | Characteristics of the Mortgage Pool |
| Property Name | Mortgage Loan Seller | Note(s) | Original Balance | Holder of Note(1) | Lead Servicer for Whole Loan | Master Servicer Under Lead Securitization Servicing Agreement | Special Servicer Under Lead Securitization Servicing Agreement | ||
| Yeshiva University Portfolio | AREF | A-1, A-3 | $60,000,000 | MSC 2017-H1 | Yes | Midland Loan Services, a Division of PNC Bank, National Association | LNR Partners, LLC | ||
| A-2 | $45,000,000 | WFCM 2017-C39 | No | ||||||
| A-4 | $35,000,000 | CFCRE 2017-C8 | No | ||||||
| Starwood Capital Group Hotel Portfolio | Barclays | A-1, A-7 | $80,000,000 | DBJPM 2017-C6 | Yes | Midland Loan Services, a Division of PNC Bank, National Association | Midland Loan Services, a Division of PNC Bank, National Association | ||
| A-2-1, A-16-1 | $60,000,000 | JPMCC 2017-JP7 | No | ||||||
| A-2-2, A-9, A-14 | $46,817,500 | JPMorgan Chase Bank, N.A. | No | ||||||
| A-3 | $72,500,000 | BANK 2017-BNK5 | No | ||||||
| A-4 | $59,317,500 | BANK 2017-BNK6 | No | ||||||
| A-5 | $50,000,000 | WFCM 2017-C38 | No | ||||||
| A-6-1 | $40,000,000 | WFCM 2017-C39 | No | ||||||
| A-6-2, A-17 | $41,817,500 | Barclays | No | ||||||
| A-8, A-10 | $40,000,000 | CD 2017-CD5(5) | No | ||||||
| A-11, A-12, A-13-2 | $37,500,000 | UBS 2017-C2(6) | No | ||||||
| A-13-1 | $14,317,500 | Deutsche Bank AG, New York Branch | No | ||||||
| A-15, A-16-2 | $35,000,000 | Starwood Mortgage Funding II LLC | No | ||||||
| University Center Chicago | WFB | A-1 | $85,600,000 | WFB | Yes(2) | Wells Fargo Bank, National Association(3) | LNR Partners, LLC(3) | ||
| A-2 | $35,000,000 | WFCM 2017-C39 | No | ||||||
| Del Amo Fashion Center | Barclays | A-1-1, A-2-1, A-3-1, A-4-1, B-1-1, B-2-1, B-3-1, B-4-1 | $59,300,000 | (4) | DAFC 2017-AMO | Yes | KeyBank National Association | Cohen Financial, a Division of SunTrust Bank | |
| A-1-2, A-4-2, B-1-2, B-4-2 | $90,000,000 | BANK 2017-BNK5 | No | ||||||
| A-1-3, A-4-4, B-1-3, B-1-4, B-4-4 | $59,543,000 | BANK 2017-BNK6 | No | ||||||
| A-1-4 | $20,457,000 | Bank of America, N.A. | No | ||||||
| A-2-2-A, B-2-2-A | $30,000,000 | WFCM 2017-C39 | No | ||||||
| A-2-2-B, A-2-4, B-2-2-B, B-2-4 | $40,000,000 | Barclays | No | ||||||
| A-2-3, A-4-3, B-2-3, B-4-3 | $60,000,000 | WFCM 2017-C38 | No | ||||||
| A-3-2, A-3-4, B-3-2, B-3-4 | $55,000,000 | Société Générale | No | ||||||
| A-3-3, B-3-3 | $45,000,000 | UBS 2017-C2(6) | No | ||||||
| Cleveland East Office Portfolio | AREF | A-1 | $30,000,000 | WFCM 2017-C39 | Yes | Wells Fargo Bank, National Association | LNR Partners, LLC | ||
| A-2 | $12,000,000 | AREF | No | ||||||
THE INFORMATION IN THIS STRUCTURAL AND COLLATERAL TERM SHEET IS NOT COMPLETE AND MAY BE AMENDED PRIOR TO THE TIME OF SALE. THIS TERM SHEET IS NOT AN OFFER TO SELL THESE SECURITIES AND IT IS NOT A SOLICITATION OF AN OFFER TO BUY THESE SECURITIES IN ANY JURISDICTION WHERE THE OFFER OR SALE IS NOT PERMITTED.
11
| Wells Fargo Commercial Mortgage Trust 2017-C39 | Characteristics of the Mortgage Pool |
| Property Name | Mortgage Loan Seller | Note(s) | Original Balance | Holder of Note(1) | Lead Servicer for Whole Loan | Master Servicer Under Lead Securitization Servicing Agreement | Special Servicer Under Lead Securitization Servicing Agreement | ||
| First Stamford Place | WFB | A-1-A | $60,000,000 | JPMCC 2017-JP7 | Yes | Wells Fargo Bank, National Association | CWCapital Asset Management LLC | ||
| A-1-B, A-1-C | $54,800,000 | JPMorgan Chase Bank, N.A. | No | ||||||
| A-2-A | $25,000,000 | WFB | No | ||||||
| A-2-B | $24,200,000 | WFCM 2017-C39 | No | ||||||
| iStar Leased Fee Portfolio | Barclays | A-1-1 | $55,000,000 | MSC 2017-H1 | Yes | Midland Loan Services, a Division of PNC Bank, National Association | LNR Partners, LLC | ||
| A-1-2 | $40,600,000 | WFCM 2017-C38 | No | ||||||
| A-1-3-1 | $20,600,000 | WFCM 2017-C39 | No | ||||||
| A-1-3-2 | $20,000,000 | Barclays | No | ||||||
| A-2 | $45,400,000 | DBJPM 2017-C6 | No | ||||||
| A-3 | $45,400,000 | BANK 2017-BNK5 | No | ||||||
| Crowne Plaza JFK | AREF | A-1 | $20,250,000 | MSC 2017-H1 | No | Wells Fargo Bank, National Association | LNR Partners, LLC | ||
| A-2 | $20,250,000 | WFCM 2017-C39 | Yes | ||||||
| Hilton Garden Inn Chicago/North Loop | WFB | A-1 | $20,000,000 | WFB | Yes(2) | Wells Fargo Bank, National Association(3) | LNR Partners, LLC(3) | ||
| A-2 | $14,000,000 | WFCM 2017-C39 | No | ||||||
| Marble Hall Gardens | NXS | A-1 | $11,500,000 | CSAIL 2017-C8 | Yes | Wells Fargo Bank, National Association | Midland Loan Services, a Division of PNC Bank, National Association | ||
| A-2 | $10,000,000 | WFCM 2017-C39 | No | ||||||
| (1) | Unless otherwise indicated, each note not currently held by a securitization trust is expected to be contributed to a future securitization. No assurance can be provided that any such note will not be split further. |
| (2) | The related whole loan is expected to initially be serviced under the WFCM 2017-C39 pooling and servicing agreement until the securitization of the related “lead”pari passu note (namely, the relatedpari passu note marked “Yes” in the column entitled “Lead Servicer for Whole Loan”), after which the related whole loan will be serviced under the pooling and servicing agreement governing such securitization of the related “lead”pari passu note. The master servicer and special servicer for such securitization will be identified in a notice, report or statement to holders of the WFCM 2017-C39 certificates after the closing of such securitization. |
| (3) | The GSMS 2017-GS7 transaction is expected to close on August 24, 2017. |
| (4) | The related whole loan also includes certain related junior notes, which have been contributed to the related standalone securitization listed under the “Holder of Note” column. Such related junior notes are not reflected in the “Note(s)” column. |
| (5) | The CD 2017-CD5 transaction is expected to close on August 15, 2017. |
| (6) | The UBS 2017-C2 transaction is expected to close on August 17, 2017. |
THE INFORMATION IN THIS STRUCTURAL AND COLLATERAL TERM SHEET IS NOT COMPLETE AND MAY BE AMENDED PRIOR TO THE TIME OF SALE. THIS TERM SHEET IS NOT AN OFFER TO SELL THESE SECURITIES AND IT IS NOT A SOLICITATION OF AN OFFER TO BUY THESE SECURITIES IN ANY JURISDICTION WHERE THE OFFER OR SALE IS NOT PERMITTED.
12
| Wells Fargo Commercial Mortgage Trust 2017-C39 | Characteristics of the Mortgage Pool |
| C. | Mortgage Loans with Additional Secured and Mezzanine Financing |
| Loan No. | Mortgage Loan Seller | Mortgage Loan Name | Mortgage Loan Cut-off Date Balance ($) | % of Initial Pool Balance (%) | Sub Debt Cut-off Date Balance ($) | Mezzanine Debt Cut-off Date Balance ($) | Total Debt Interest Rate (%)(1) | Mortgage Loan U/W NCF DSCR (x)(2) | Total Debt U/W NCF DSCR (x) | Mortgage Loan Cut-off Date U/W NOI Debt Yield (%)(2) | Total Debt Cut-off Date U/W NOI Debt Yield (%) | Mortgage Loan Cut-off Date LTV Ratio (%)(2) | Total Debt Cut-off Date LTV Ratio (%) | |||||||||||||||||||||
| 1 | Barclays | 225 & 233 Park Avenue South | $70,000,000 | 6.2 | % | NAP | $195,000,000 | 4.1133% | 3.27 | x | 1.59 | x | 12.6 | % | 6.9 | % | 31.3 | % | 57.3 | % | ||||||||||||||
| 4 | Barclays | Long Island Prime Portfolio - Uniondale | $50,000,000 | 4.4 | NAP | $45,970,000 | 5.4159 | 2.49 | 1.66 | 12.6 | 10.2 | 61.9 | 76.2 | |||||||||||||||||||||
| 5 | AREF | Columbia Park Shopping Center | $50,000,000 | 4.4 | NAP | $7,958,333 | 5.3875 | 1.63 | 1.21 | 8.4 | 7.5 | 60.3 | 68.0 | |||||||||||||||||||||
| 6 | Natixis | 245 Park Avenue | $45,000,000 | 4.0 | $120,000,000 | $568,000,000 | 4.3000 | 2.73 | 1.42 | 10.7 | 6.5 | 48.9 | 80.0 | |||||||||||||||||||||
| 7 | Natixis | Two Independence Square | $45,000,000 | 4.0 | $61,700,000 | NAP | 3.2300 | 3.80 | 2.76 | 12.5 | 9.1 | 43.7 | 60.2 | |||||||||||||||||||||
| 13 | Barclays | Del Amo Fashion Center | $30,000,000 | 2.6 | $125,700,000 | NAP | 3.6575 | 3.34 | 2.63 | 12.9 | 10.1 | 39.8 | 50.6 | |||||||||||||||||||||
| 16 | WFB | First Stamford Place | $24,200,000 | 2.1 | NAP | $16,000,000 | 4.2800 | 2.71 | 1.73 | 12.7 | 11.5 | 57.5 | 63.2 | |||||||||||||||||||||
| 19 | AREF | Crowne Plaza JFK | $20,250,000 | 1.8 | NAP | $4,300,000 | 6.2407 | 1.63 | 1.35 | 13.4 | 12.1 | 65.3 | 72.3 | |||||||||||||||||||||
| Total/Weighted Average | $334,450,000 | 29.5 | % | $307,400,000 | $837,228,333 | 4.5048% | 2.77 | x | 1.77 | x | 11.8 | % | 8.7 | % | 49.0 | % | 65.9 | % | ||||||||||||||||
| (1) | Total Debt Interest Rate for any specified mortgage loan reflects the weighted average of the interest rates on the respective components of the total debt. |
| (2) | With respect to any mortgage loan that is part of a whole loan, the loan-to-value ratio, debt service coverage ratio and debt yield calculations include the relatedpari passucompanion loan(s). |
THE INFORMATION IN THIS STRUCTURAL AND COLLATERAL TERM SHEET IS NOT COMPLETE AND MAY BE AMENDED PRIOR TO THE TIME OF SALE. THIS TERM SHEET IS NOT AN OFFER TO SELL THESE SECURITIES AND IT IS NOT A SOLICITATION OF AN OFFER TO BUY THESE SECURITIES IN ANY JURISDICTION WHERE THE OFFER OR SALE IS NOT PERMITTED.
13
| Wells Fargo Commercial Mortgage Trust 2017-C39 | Characteristics of the Mortgage Pool |
| D. | Previous Securitization History(1) |
| Loan No. | Mortgage Loan Seller | Mortgage Loan or Mortgaged Property Name | City | State | Property Type | Mortgage Loan or Mortgaged Property Cut-off Date Balance ($) | % of (%) | Previous Securitization |
| 3 | WFB | Lakeside Shopping Center | Metairie | LA | Retail | 58,000,000 | 5.1% | BACM 2007-4 |
| 4.01 | Barclays | RXR Plaza | Uniondale | NY | Office | 29,767,618 | 2.6 | GSMS 2007-GG10 |
| 4.02 | Barclays | Omni | Uniondale | NY | Office | 20,232,382 | 1.8 | GCCFC 2007-GG9 |
| 5 | AREF | Columbia Park Shopping Center | North Bergen | NJ | Retail | 50,000,000 | 4.4 | CGCMT 2007-C6 |
| 10.01 | Barclays | Larkspur Landing Sunnyvale | Sunnyvale | CA | Hospitality | 2,360,633 | 0.2 | COMM 2013-CR7 |
| 10.02 | Barclays | Larkspur Landing Milpitas | Milpitas | CA | Hospitality | 1,989,094 | 0.2 | COMM 2013-CR7 |
| 10.03 | Barclays | Larkspur Landing Campbell | Campbell | CA | Hospitality | 1,748,953 | 0.2 | COMM 2013-CR7 |
| 10.04 | Barclays | Larkspur Landing San Francisco | South San Francisco | CA | Hospitality | 1,440,847 | 0.1 | COMM 2013-CR7 |
| 10.05 | Barclays | Larkspur Landing Pleasanton | Pleasanton | CA | Hospitality | 1,409,130 | 0.1 | COMM 2013-CR7 |
| 10.06 | Barclays | Larkspur Landing Bellevue | Bellevue | WA | Hospitality | 1,255,077 | 0.1 | COMM 2013-CR7 |
| 10.07 | Barclays | Larkspur Landing Sacramento | Sacramento | CA | Hospitality | 937,910 | 0.1 | COMM 2013-CR7 |
| 10.09 | Barclays | Larkspur Landing Hillsboro | Hillsboro | OR | Hospitality | 915,255 | 0.1 | COMM 2013-CR7 |
| 10.10 | Barclays | Larkspur Landing Renton | Renton | WA | Hospitality | 906,193 | 0.1 | COMM 2013-CR7 |
| 10.11 | Barclays | Holiday Inn Arlington Northeast Rangers Ballpark | Arlington | TX | Hospitality | 869,945 | 0.1 | WFCM 2012-LC5 |
| 10.13 | Barclays | Residence Inn Williamsburg | Williamsburg | VA | Hospitality | 824,636 | 0.1 | WFRBS 2013-C11 |
| 10.14 | Barclays | Hampton Inn Suites Waco South | Waco | TX | Hospitality | 761,202 | 0.1 | WFCM 2012-LC5 |
| 10.15 | Barclays | Holiday Inn Louisville Airport Fair Expo | Louisville | KY | Hospitality | 747,609 | 0.1 | WFRBS 2012-C10 |
| 10.16 | Barclays | Courtyard Tyler | Tyler | TX | Hospitality | 734,016 | 0.1 | WFCM 2012-LC5 |
| 10.17 | Barclays | Hilton Garden Inn Edison Raritan Center | Edison | NJ | Hospitality | 734,016 | 0.1 | WFRBS 2013-C11 |
| 10.20 | Barclays | Peoria, AZ Residence Inn | Peoria | AZ | Hospitality | 711,362 | 0.1 | GSMS 2012-GCJ9 |
| 10.25 | Barclays | Courtyard Wichita Falls | Wichita Falls | TX | Hospitality | 638,866 | 0.1 | WFCM 2012-LC5 |
| 10.26 | Barclays | Hampton Inn Morehead | Morehead City | NC | Hospitality | 620,742 | 0.1 | CSMC 2008-C1 |
| 10.28 | Barclays | Courtyard Lufkin | Lufkin | TX | Hospitality | 575,433 | 0.1 | WFCM 2012-LC5 |
| 10.29 | Barclays | Hampton Inn Carlisle | Carlisle | PA | Hospitality | 570,902 | 0.1 | WFRBS 2013-C11 |
| 10.30 | Barclays | Springhill Suites Williamsburg | Williamsburg | VA | Hospitality | 570,902 | 0.1 | WFRBS 2013-C11 |
| 10.32 | Barclays | Waco Residence Inn | Waco | TX | Hospitality | 552,778 | 0.0 | GSMS 2012-GCJ9 |
| 10.33 | Barclays | Holiday Inn Express Fishers | Fishers | IN | Hospitality | 516,530 | 0.0 | WFRBS 2012-C10 |
| 10.34 | Barclays | Larkspur Landing Folsom | Folsom | CA | Hospitality | 502,937 | 0.0 | COMM 2013-CR7 |
| 10.36 | Barclays | Holiday Inn Express & Suites Paris | Paris | TX | Hospitality | 471,220 | 0.0 | WFCM 2012-LC5 |
| 10.37 | Barclays | Toledo Homewood Suites | Maumee | OH | Hospitality | 471,220 | 0.0 | GSMS 2012-GCJ9 |
| 10.38 | Barclays | Grand Rapids Homewood Suites | Grand Rapids | MI | Hospitality | 457,627 | 0.0 | GSMS 2012-GCJ9 |
| 10.39 | Barclays | Fairfield Inn Laurel | Laurel | MD | Hospitality | 425,911 | 0.0 | WFRBS 2013-C11 |
| 10.40 | Barclays | Cheyenne Fairfield Inn and Suites | Cheyenne | WY | Hospitality | 425,911 | 0.0 | GSMS 2012-GCJ9 |
| 10.41 | Barclays | Courtyard Akron Stow | Stow | OH | Hospitality | 416,849 | 0.0 | WFRBS 2012-C10 |
| 10.43 | Barclays | Larkspur Landing Roseville | Roseville | CA | Hospitality | 394,194 | 0.0 | COMM 2013-CR7 |
| 10.44 | Barclays | Hampton Inn Danville | Danville | PA | Hospitality | 389,663 | 0.0 | WFRBS 2013-C11 |
| 10.45 | Barclays | Holiday Inn Norwich | Norwich | CT | Hospitality | 385,132 | 0.0 | WFRBS 2013-C11 |
| 10.46 | Barclays | Hampton Inn Suites Longview North | Longview | TX | Hospitality | 380,601 | 0.0 | WFCM 2012-LC5 |
THE INFORMATION IN THIS STRUCTURAL AND COLLATERAL TERM SHEET IS NOT COMPLETE AND MAY BE AMENDED PRIOR TO THE TIME OF SALE. THIS TERM SHEET IS NOT AN OFFER TO SELL THESE SECURITIES AND IT IS NOT A SOLICITATION OF AN OFFER TO BUY THESE SECURITIES IN ANY JURISDICTION WHERE THE OFFER OR SALE IS NOT PERMITTED.
14
| Wells Fargo Commercial Mortgage Trust 2017-C39 | Characteristics of the Mortgage Pool |
| Loan No. | Mortgage Loan Seller | Mortgage Loan or Mortgaged Property Name | City | State | Property Type | Mortgage Loan or Mortgaged Property Cut-off Date Balance ($) | % of (%) | Previous Securitization |
| 10.48 | Barclays | Hampton Inn Suites Buda | Buda | TX | Hospitality | 376,070 | 0.0 | WFCM 2012-LC5 |
| 10.49 | Barclays | Shawnee Hampton Inn | Shawnee | OK | Hospitality | 376,070 | 0.0 | GSMS 2012-GCJ9 |
| 10.50 | Barclays | Racine Fairfield Inn | Racine | WI | Hospitality | 367,008 | 0.0 | GSMS 2012-GCJ9 |
| 10.51 | Barclays | Hampton Inn Selinsgrove Shamokin Dam | Shamokin Dam | PA | Hospitality | 357,946 | 0.0 | WFRBS 2013-C11 |
| 10.52 | Barclays | Holiday Inn Express & Suites Terrell | Terrell | TX | Hospitality | 339,822 | 0.0 | WFCM 2012-LC5 |
| 10.53 | Barclays | Westchase Homewood Suites | Houston | TX | Hospitality | 328,912 | 0.0 | GSMS 2012-GCJ9 |
| 10.54 | Barclays | Holiday Inn Express & Suites Tyler South | Tyler | TX | Hospitality | 326,229 | 0.0 | WFCM 2012-LC5 |
| 10.55 | Barclays | Holiday Inn Express & Suites Huntsville | Huntsville | TX | Hospitality | 312,637 | 0.0 | WFCM 2012-LC5 |
| 10.56 | Barclays | Hampton Inn Sweetwater | Sweetwater | TX | Hospitality | 285,451 | 0.0 | WFCM 2012-LC5 |
| 10.57 | Barclays | Comfort Suites Buda Austin South | Buda | TX | Hospitality | 240,141 | 0.0 | WFCM 2012-LC5 |
| 10.58 | Barclays | Fairfield Inn & Suites Weatherford | Weatherford | TX | Hospitality | 226,548 | 0.0 | WFCM 2012-LC5 |
| 10.59 | Barclays | Holiday Inn Express & Suites Altus | Altus | OK | Hospitality | 183,578 | 0.0 | WFCM 2012-LC5 |
| 10.60 | Barclays | Comfort Inn & Suites Paris | Paris | TX | Hospitality | 163,115 | 0.0 | WFCM 2012-LC5 |
| 10.61 | Barclays | Hampton Inn Suites Decatur | Decatur | TX | Hospitality | 156,090 | 0.0 | WFCM 2012-LC5 |
| 10.62 | Barclays | Holiday Inn Express & Suites Texarkana East | Texarkana | AR | Hospitality | 144,545 | 0.0 | WFCM 2012-LC5 |
| 10.63 | Barclays | Mankato Fairfield Inn | Mankato | MN | Hospitality | 129,531 | 0.0 | GSMS 2012-GCJ9 |
| 10.64 | Barclays | Candlewood Suites Texarkana | Texarkana | TX | Hospitality | 100,147 | 0.0 | WFCM 2012-LC5 |
| 10.65 | Barclays | Country Inn & Suites Houston Intercontinental Airport East | Humble | TX | Hospitality | 95,109 | 0.0 | WFCM 2012-LC5 |
| 15 | WFB | Crowne Plaza Dallas | Dallas | TX | Hospitality | 27,000,000 | 2.4 | CSMC 2007-C4 |
| 16 | WFB | First Stamford Place | Stamford | CT | Office | 24,200,000 | 2.1 | MSC 2007-IQ15; JPMCC 2017-JP7 |
| 17 | Natixis | 181 Second Avenue | San Mateo | CA | Office | 22,600,000 | 2.0 | WBCMT 2007-C32 |
| 22 | Basis | River City Plaza | Muskogee | OK | Retail | 14,965,102 | 1.3 | JPMCC 2007-CB19 |
| 23 | AREF | Super 8 Resort Portfolio | Various | Various | Hospitality | 14,431,851 | 1.3 | MLCFC 2007-7 |
| 24 | Basis | Village Shopping Center | Davenport | IA | Retail | 14,372,326 | 1.3 | RAITF 2014-FL3 |
| 25 | AREF | Melville Plaza | Melville | NY | Retail | 14,000,000 | 1.2 | JPMCC 2007-LD12 |
| 28 | Basis | White Flint - ExtraSpace Self Storage | Kensington | MD | Self Storage | 11,650,000 | 1.0 | BSCMS 2007-PW16 |
| 29 | Natixis | SoNo Square | Norwalk | CT | Mixed Use | 11,500,000 | 1.0 | JPMCC 2007-LD12 |
| 30 | Barclays | Village at Peachtree Corners | Norcross | GA | Retail | 10,585,384 | 0.9 | MLCFC 2007-8 |
| 35 | WFB | Lotte Plaza | Ellicott City | MD | Retail | 9,972,515 | 0.9 | BSCMS 2007-T28 |
| 37 | Basis | Millersville - ExtraSpace Self Storage | Millersville | MD | Self Storage | 9,100,000 | 0.8 | BSCMS 2007-PW16 |
| 38 | AREF | Bennett Street Design District | Atlanta | GA | Retail | 8,977,376 | 0.8 | GSMS 2013-GC12 |
| 44 | AREF | Hampton Inn & Suites - Albuquerque | Albuquerque | NM | Hospitality | 7,536,121 | 0.7 | JPMCC 2007-CB20 |
| 48 | AREF | Sam Houston Technology Center | Houston | TX | Office | 6,492,296 | 0.6 | WBCMT 2007-C33 |
| 49 | WFB | Camp Creek Pointe | East Point | GA | Retail | 6,467,973 | 0.6 | MLCFC 2007-9 |
| 50 | WFB | Sandpointe Apartments | Redding | CA | Multifamily | 6,150,000 | 0.5 | BSCMS 2007-PW17 |
| 57 | Basis | Landover - ExtraSpace Self Storage | Landover | MD | Self Storage | 3,400,000 | 0.3 | BSCMS 2007-PW16 |
| 59.01 | AREF | 6556 Siegen Lane | Baton Rouge | LA | Retail | 2,369,669 | 0.2 | CSMSC 2007-C3 |
| 59.02 | AREF | 9827 Bluebonnet Boulevard | Baton Rouge | LA | Retail | 939,696 | 0.1 | BSCMS 2007-PW18 |
| Total | $416,332,554 | 36.8% |
THE INFORMATION IN THIS STRUCTURAL AND COLLATERAL TERM SHEET IS NOT COMPLETE AND MAY BE AMENDED PRIOR TO THE TIME OF SALE. THIS TERM SHEET IS NOT AN OFFER TO SELL THESE SECURITIES AND IT IS NOT A SOLICITATION OF AN OFFER TO BUY THESE SECURITIES IN ANY JURISDICTION WHERE THE OFFER OR SALE IS NOT PERMITTED.
15
| Wells Fargo Commercial Mortgage Trust 2017-C39 | Characteristics of the Mortgage Pool |
| (1) | The table above represents the most recent securitization with respect to the mortgaged property securing the related mortgage loan, based on information provided by the related borrower or obtained through searches of a third-party database. While loans secured by the above mortgaged properties may have been securitized multiple times in prior transactions, mortgage loans in this securitization are only listed in the above chart if the mortgage loan paid off a loan in another securitization. The information has not otherwise been confirmed by the mortgage loan sellers. |
THE INFORMATION IN THIS STRUCTURAL AND COLLATERAL TERM SHEET IS NOT COMPLETE AND MAY BE AMENDED PRIOR TO THE TIME OF SALE. THIS TERM SHEET IS NOT AN OFFER TO SELL THESE SECURITIES AND IT IS NOT A SOLICITATION OF AN OFFER TO BUY THESE SECURITIES IN ANY JURISDICTION WHERE THE OFFER OR SALE IS NOT PERMITTED.
16
| Wells Fargo Commercial Mortgage Trust 2017-C39 | Characteristics of the Mortgage Pool |
| E. | Mortgage Loans with Scheduled Balloon Payments and Related Classes |
| Class A-2(1) | ||||||||||||||||||||||||||||||||||||||
| Loan No. | Mortgage Loan Seller | Mortgage Loan Name | State | Property Type | Mortgage Loan Cut-off Date Balance ($) | % of Initial Pool Balance (%) | Mortgage Loan Balance at ARD ($) | % of Class A-2 Certificate Principal Balance (%)(2) | SF / Rooms | Loan per | U/W NCF DSCR (x) | U/W NOI Debt Yield (%) | Cut-off Date LTV Ratio (%) | Balloon Or ARD LTV Ratio (%) | Rem. IO Period (mos.) | Rem. Term to ARD (mos.) | ||||||||||||||||||||||
| 7 | Natixis | Two Independence Square | DC | Office | $45,000,000 | 4.0 | % | $45,000,000 | 55.8 | % | 605,897 | $271 | 3.80 | x | 12.5 | % | 43.7 | % | 43.7 | % | 59 | 59 | ||||||||||||||||
| 14 | AREF | Cleveland East Office Portfolio | OH | Office | 30,000,000 | 2.6 | 28,255,991 | 35.0 | 499,454 | 84 | 1.55 | 11.6 | 70.0 | 65.9 | 11 | 59 | ||||||||||||||||||||||
| 45 | WFB | Holiday Inn Express – Huntsville | AL | Hospitality | 7,291,551 | 0.6 | 6,694,131 | 8.3 | 109 | 66,895 | 2.01 | 13.9 | 60.3 | 55.3 | 0 | 59 | ||||||||||||||||||||||
| Total/Weighted Average | $82,291,551 | 7.3 | % | $79,950,122 | 99.1 | % | 2.82 | x | 12.3 | % | 54.8 | % | 52.8 | % | 36 | 59 | ||||||||||||||||||||||
(1) The table above presents the mortgage loan(s) whose balloon payments would be applied to pay down the principal balance of the Class A-2 Certificates, assuming a 0% CPR and applying the “Structuring Assumptions” described in the Preliminary Prospectus, including the assumptions that (i) none of the mortgage loans in the pool experience prepayments prior to maturity (or, in the case of an ARD loan, its anticipated repayment date), defaults or losses; (ii) there are no extensions of maturity dates of any mortgage loans in the pool; and (iii) each mortgage loan in the pool is paid in full on its stated maturity date (or, in the case of an ARD loan, its anticipated repayment date). Each Class of Certificates evidences undivided ownership interests in the entire pool of mortgage loans. Debt service coverage ratio, debt yield and loan-to-value ratio information do not take into account subordinate debt (whether or not secured by the related mortgaged property), if any, that currently exists or is allowed under the terms of any mortgage loan. See Annex A-1 to the Preliminary Prospectus. (2) Reflects the percentage equal to the Balloon Balance divided by the initial Class A-2 Certificate Balance. | ||||||||||||||||||||||||||||||||||||||
| Class A-3(1) | ||||||||||||||||||||||||||||||||||||||
| Loan No. | Mortgage Loan Seller | Mortgage Loan Name | State | Property Type | Mortgage Loan Cut-off Date Balance ($) | % of Initial Pool Balance (%) | Mortgage Loan Balance at Maturity ($) | % of Class A-3 Certificate Principal Balance (%)(2) | Units | Loan per | U/W NCF DSCR (x) | U/W NOI Debt Yield (%) | Cut-off Date LTV Ratio (%) | Balloon LTV Ratio (%) | Rem. IO Period (mos.) | Rem. Term to Maturity (mos.) | ||||||||||||||||||||||
| 51 | AREF | The Preserve at Tumbling Creek | GA | Multifamily | $5,073,538 | 0.4 | % | $4,389,817 | 100.0 | % | 243 | $20,879 | 1.69 | x | 11.9 | % | 64.2 | % | 55.6 | % | 0 | 83 | ||||||||||||||||
| Total/Weighted Average | $5,073,538 | 0.4 | % | $4,389,817 | 100.0 | % | 1.69 | x | 11.9 | % | 64.2 | % | 55.6 | % | 0 | 83 | ||||||||||||||||||||||
(1) The table above presents the mortgage loan(s) whose balloon payments would be applied to pay down the principal balance of the Class A-3 Certificates, assuming a 0% CPR and applying the “Structuring Assumptions” described in the Preliminary Prospectus, including the assumptions that (i) none of the mortgage loans in the pool experience prepayments prior to maturity (or, in the case of an ARD loan, its anticipated repayment date), defaults or losses; (ii) there are no extensions of maturity dates of any mortgage loans in the pool; and (iii) each mortgage loan in the pool is paid in full on its stated maturity date (or, in the case of an ARD loan, its anticipated repayment date). Each Class of Certificates evidences undivided ownership interests in the entire pool of mortgage loans. Debt service coverage ratio, debt yield and loan-to-value ratio information do not take into account subordinate debt (whether or not secured by the related mortgaged property), if any, that currently exists or is allowed under the terms of any mortgage loan. See Annex A-1 to the Preliminary Prospectus. (2) Reflects the percentage equal to the Balloon Balance divided by the initial Class A-3 Certificate Balance. | ||||||||||||||||||||||||||||||||||||||
THE INFORMATION IN THIS STRUCTURAL AND COLLATERAL TERM SHEET IS NOT COMPLETE AND MAY BE AMENDED PRIOR TO THE TIME OF SALE. THIS TERM SHEET IS NOT AN OFFER TO SELL THESE SECURITIES AND IT IS NOT A SOLICITATION OF AN OFFER TO BUY THESE SECURITIES IN ANY JURISDICTION WHERE THE OFFER OR SALE IS NOT PERMITTED.
17
| Wells Fargo Commercial Mortgage Trust 2017-C39 | Characteristics of the Mortgage Pool |
| F. | Property Type Distribution(1) |
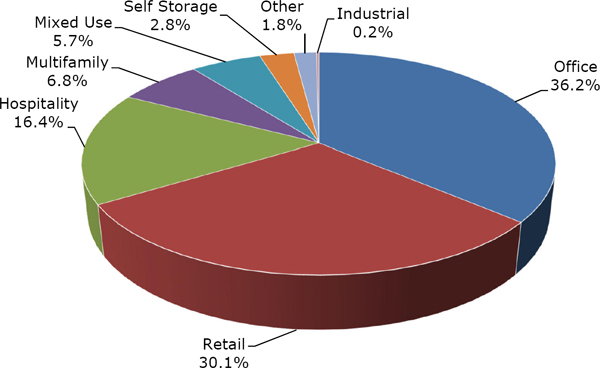
| Property Type | Number of Mortgaged Properties | Aggregate Balance ($) | % of Initial Pool Balance (%) | Weighted Average Cut-off Date LTV Ratio (%) | Weighted Average Balloon or ARD LTV Ratio (%) | Weighted Average U/W NCF DSCR (x) | Weighted Average U/W NOI Debt Yield (%) | Weighted Average U/W NCF Debt Yield (%) | Weighted Average Mortgage Rate (%) | ||||||||||||||||
| Office | 17 | $410,521,645 | 36.2 | % | 51.9 | % | 50.7 | % | 2.63 | x | 11.7 | % | 11.0 | % | 4.015 | % | |||||||||
| CBD | 10 | 251,800,000 | 22.2 | 42.8 | 42.0 | 2.96 | 12.2 | 11.6 | 3.737 | ||||||||||||||||
| Suburban | 7 | 158,721,645 | 14.0 | 66.4 | 64.5 | 2.11 | 10.9 | 10.0 | 4.456 | ||||||||||||||||
| Retail | 23 | 340,690,724 | 30.1 | 60.4 | 54.7 | 1.90 | 10.2 | 9.6 | 4.432 | ||||||||||||||||
| Anchored | 10 | 183,655,327 | 16.2 | 65.6 | 58.5 | 1.54 | 9.5 | 8.9 | 4.656 | ||||||||||||||||
| Super Regional Mall | 2 | 88,000,000 | 7.8 | 45.1 | 45.1 | 2.94 | 11.8 | 11.1 | 3.732 | ||||||||||||||||
| Unanchored | 5 | 45,895,348 | 4.1 | 68.0 | 57.8 | 1.51 | 10.1 | 9.5 | 4.804 | ||||||||||||||||
| Shadow Anchored | 3 | 13,980,352 | 1.2 | 66.1 | 56.7 | 1.44 | 9.7 | 9.3 | 4.688 | ||||||||||||||||
| Single Tenant | 3 | 9,159,696 | 0.8 | 55.1 | 50.3 | 1.76 | 9.4 | 9.4 | 4.421 | ||||||||||||||||
| Hospitality | 81 | 185,259,868 | 16.4 | 62.5 | 54.0 | 1.98 | 13.5 | 11.9 | 4.936 | ||||||||||||||||
| Limited Service | 53 | 102,159,801 | 9.0 | 63.8 | 53.6 | 1.94 | 13.5 | 12.0 | 5.008 | ||||||||||||||||
| Full Service | 5 | 49,252,687 | 4.3 | 62.1 | 54.3 | 1.89 | 14.0 | 12.1 | 5.008 | ||||||||||||||||
| Extended Stay | 22 | 19,880,493 | 1.8 | 60.4 | 60.4 | 2.72 | 13.9 | 12.4 | 4.486 | ||||||||||||||||
| Select Service | 1 | 13,966,888 | 1.2 | 57.2 | 46.8 | 1.59 | 11.2 | 10.0 | 4.800 | ||||||||||||||||
| Multifamily | 6 | 76,725,986 | 6.8 | 63.6 | 58.0 | 2.12 | 10.9 | 10.4 | 4.325 | ||||||||||||||||
| Student Housing | 2 | 40,073,538 | 3.5 | 59.9 | 58.8 | 2.56 | 11.0 | 10.8 | 4.059 | ||||||||||||||||
| Garden | 4 | 36,652,447 | 3.2 | 67.7 | 57.0 | 1.63 | 10.7 | 10.0 | 4.617 | ||||||||||||||||
| Mixed Use | 3 | 64,953,660 | 5.7 | 73.3 | 65.6 | 1.36 | 8.9 | 8.4 | 4.592 | ||||||||||||||||
| Office/Retail | 1 | 43,500,000 | 3.8 | 74.6 | 68.2 | 1.37 | 8.7 | 8.3 | 4.460 | ||||||||||||||||
| Retail/Office | 1 | 11,500,000 | 1.0 | 72.3 | 63.8 | 1.42 | 10.0 | 9.0 | 4.810 | ||||||||||||||||
| Multifamily/Retail | 1 | 9,953,660 | 0.9 | 68.6 | 56.6 | 1.26 | 8.2 | 8.1 | 4.920 | ||||||||||||||||
| Self Storage | 6 | 31,697,855 | 2.8 | 63.2 | 56.1 | 1.39 | 9.1 | 8.9 | 4.979 | ||||||||||||||||
| Self Storage | 6 | 31,697,855 | 2.8 | 63.2 | 56.1 | 1.39 | 9.1 | 8.9 | 4.979 | ||||||||||||||||
| Other | 12 | 20,600,000 | 1.8 | 65.6 | 65.6 | 2.12 | 8.2 | 8.2 | 3.795 | ||||||||||||||||
| Leased Fee | 12 | 20,600,000 | 1.8 | 65.6 | 65.6 | 2.12 | 8.2 | 8.2 | 3.795 | ||||||||||||||||
| Industrial | 1 | 2,385,098 | 0.2 | 61.6 | 52.2 | 1.25 | 9.6 | 8.8 | 5.730 | ||||||||||||||||
| Flex | 1 | 2,385,098 | 0.2 | 61.6 | 52.2 | 1.25 | 9.6 | 8.8 | 5.730 | ||||||||||||||||
| Total/Weighted Average: | 149 | $1,132,834,836 | 100.0 | % | 58.8 | % | 54.2 | % | 2.15 | x | 11.2 | % | 10.4 | % | 4.372 | % | |||||||||
| (1) | Because this table presents information relating to the mortgaged properties and not the mortgage loans, the information for mortgage loans secured by more than one mortgaged property is based on allocated amounts (allocating the principal balance of the mortgage loan to each of those properties according to the relative appraised values of the mortgaged properties or the allocated loan amounts or property-specific release prices set forth in the related mortgage loan documents or such other allocation as the related mortgage loan seller deemed appropriate). With respect to any mortgage loan that is part of a whole loan, the loan-to-value ratio, debt service coverage ratio and debt yield calculations include the relatedpari passu companion loan(s) but exclude any related subordinate companion loan(s) (unless otherwise stated). With respect to each mortgage loan, debt service coverage ratio, debt yield and loan-to-value ratio information do not take into account any subordinate debt (whether or not secured by the related mortgaged property) that currently exists or is allowed under the terms of such mortgage loan. See Annex A-1 to the Preliminary Prospectus. |
THE INFORMATION IN THIS STRUCTURAL AND COLLATERAL TERM SHEET IS NOT COMPLETE AND MAY BE AMENDED PRIOR TO THE TIME OF SALE. THIS TERM SHEET IS NOT AN OFFER TO SELL THESE SECURITIES AND IT IS NOT A SOLICITATION OF AN OFFER TO BUY THESE SECURITIES IN ANY JURISDICTION WHERE THE OFFER OR SALE IS NOT PERMITTED.
18
| Wells Fargo Commercial Mortgage Trust 2017-C39 | Characteristics of the Mortgage Pool |
| G. | Geographic Distribution(1)(2) |
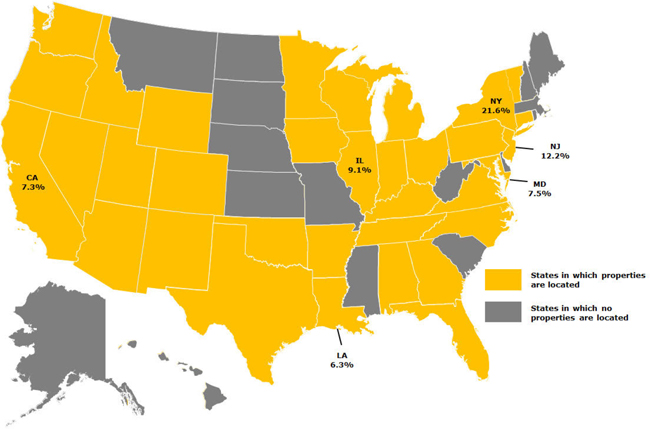
| Location | Number of Mortgaged Properties | Aggregate Cut-off Date Balance ($) | % of Initial Pool Balance (%) | Weighted Average Cut-off Date LTV Ratio (%) | Weighted Average Balloon or ARD LTV Ratio (%) | Weighted Average U/W NCF DSCR (x) | Weighted Average U/W NOI Debt Yield (%) | Weighted Average U/W NCF Debt Yield (%) | Weighted Average Mortgage Rate (%) | ||||||||||||||||
| New York | 11 | $244,250,000 | 21.6 | % | 47.4 | % | 45.2 | % | 2.53 | x | 12.2 | % | 11.2 | % | 4.150 | % | |||||||||
| New Jersey | 5 | 138,315,121 | 12.2 | 65.5 | 63.7 | 1.86 | 9.0 | 8.7 | 4.476 | ||||||||||||||||
| Illinois | 7 | 102,767,477 | 9.1 | 66.0 | 60.5 | 1.89 | 10.2 | 9.7 | 4.400 | ||||||||||||||||
| Maryland | 8 | 84,596,860 | 7.5 | 67.3 | 58.4 | 1.59 | 10.0 | 9.6 | 4.544 | ||||||||||||||||
| California | 16 | 83,037,088 | 7.3 | 51.2 | 50.0 | 2.85 | 12.2 | 11.6 | 3.921 | ||||||||||||||||
| Northern | 13 | 42,581,007 | 3.8 | 55.4 | 54.4 | 2.80 | 12.3 | 11.6 | 3.891 | ||||||||||||||||
| Southern | 3 | 40,456,081 | 3.6 | 46.9 | 45.4 | 2.90 | 12.0 | 11.5 | 3.953 | ||||||||||||||||
| Louisiana | 4 | 71,263,025 | 6.3 | 51.2 | 48.5 | 2.47 | 10.9 | 10.2 | 3.991 | ||||||||||||||||
| Other(3) | 98 | 408,605,265 | 36.1 | 62.7 | 55.8 | 2.00 | 11.7 | 10.6 | 4.584 | ||||||||||||||||
| Total/Weighted Average | 149 | $1,132,834,836 | 100.0 | % | 58.8 | % | 54.2 | % | 2.15 | x | 11.2 | % | 10.4 | % | 4.372 | % | |||||||||
| (1) | The mortgaged properties are located in 34 states and Washington D.C. |
| (2) | Because this table presents information relating to the mortgaged properties and not the mortgage loans, the information for mortgage loans secured by more than one mortgaged property is based on allocated amounts (allocating the principal balance of the mortgage loan to each of those properties according to the relative appraised values of the mortgaged properties or the allocated loan amounts or property-specific release prices set forth in the related mortgage loan documents or such other allocation as the related mortgage loan seller deemed appropriate). With respect to any mortgage loan that is part of a whole loan, the loan-to-value ratio, debt service coverage ratio and debt yield calculations include the relatedpari passu companion loan(s) but exclude any related subordinate companion loan(s) (unless otherwise stated). With respect to each mortgage loan, debt service coverage ratio, debt yield and loan-to-value ratio information do not take into account any subordinate debt (whether or not secured by the related mortgaged property) that currently exists or is allowed under the terms of such mortgage loan. See Annex A-1 to the Preliminary Prospectus. |
| (3) | Includes 28 other states and Washington D.C. |
THE INFORMATION IN THIS STRUCTURAL AND COLLATERAL TERM SHEET IS NOT COMPLETE AND MAY BE AMENDED PRIOR TO THE TIME OF SALE. THIS TERM SHEET IS NOT AN OFFER TO SELL THESE SECURITIES AND IT IS NOT A SOLICITATION OF AN OFFER TO BUY THESE SECURITIES IN ANY JURISDICTION WHERE THE OFFER OR SALE IS NOT PERMITTED.
19
| Wells Fargo Commercial Mortgage Trust 2017-C39 | Characteristics of the Mortgage Pool |
| H. | Characteristics of the Mortgage Pool(1) |
| CUT-OFF DATE BALANCE | ||||||||||||
| Range of Cut-off Date Balances ($) | Number of Mortgage Loans | Aggregate Cut- off Date Balance | Percent by Aggregate Cut- off Date Pool Balance (%) | |||||||||
| 1,897,855 - 2,000,000 | 1 | $1,897,855 | 16.8 | % | ||||||||
| 2,000,001 - 3,000,000 | 4 | 10,301,886 | 0.9 | |||||||||
| 3,000,001 - 4,000,000 | 6 | 21,629,312 | 1.9 | |||||||||
| 4,000,001 - 5,000,000 | 2 | 9,105,000 | 0.8 | |||||||||
| 5,000,001 - 6,000,000 | 1 | 5,073,538 | 0.4 | |||||||||
| 6,000,001 - 7,000,000 | 4 | 26,110,269 | 2.3 | |||||||||
| 7,000,001 - 8,000,000 | 4 | 29,687,021 | 2.6 | |||||||||
| 8,000,001 - 9,000,000 | 5 | 43,539,782 | 3.8 | |||||||||
| 9,000,001 - 10,000,000 | 5 | 49,003,622 | 4.3 | |||||||||
| 10,000,001 - 15,000,000 | 11 | 138,886,551 | 12.3 | |||||||||
| 15,000,001 - 20,000,000 | 2 | 36,850,000 | 3.3 | |||||||||
| 20,000,001 - 30,000,000 | 7 | 174,650,000 | 15.4 | |||||||||
| 30,000,001 - 50,000,000 | 9 | 393,100,000 | 34.7 | |||||||||
| 50,000,001 - 70,000,000 | 3 | 193,000,000 | 17.0 | |||||||||
| Total: | 64 | $1,132,834,836 | 100.0 | % | ||||||||
| Average | $17,700,544 | |||||||||||
| UNDERWRITTEN NOI DEBT SERVICE COVERAGE RATIO | ||||||||||||
| Range of U/W NOI DSCRs (x) | Number of Mortgage Loans | Aggregate Cut- off Date Balance | Percent by Aggregate Cut- off Date Pool Balance (%) | |||||||||
| 1.28 - 1.30 | 1 | $9,953,660 | 0.9 | % | ||||||||
| 1.31 - 1.40 | 7 | 50,788,753 | 4.5 | |||||||||
| 1.41 - 1.50 | 10 | 153,916,794 | 13.6 | |||||||||
| 1.51 - 1.60 | 7 | 52,458,240 | 4.6 | |||||||||
| 1.61 - 1.70 | 3 | 21,677,296 | 1.9 | |||||||||
| 1.71 - 1.80 | 8 | 136,383,900 | 12.0 | |||||||||
| 1.81 - 1.90 | 3 | 37,456,797 | 3.3 | |||||||||
| 1.91 - 2.00 | 2 | 11,556,105 | 1.0 | |||||||||
| 2.01 - 2.50 | 12 | 228,870,777 | 20.2 | |||||||||
| 2.51 - 3.00 | 5 | 197,972,515 | 17.5 | |||||||||
| 3.01 - 3.50 | 5 | 186,800,000 | 16.5 | |||||||||
| 3.51 - 3.83 | 1 | 45,000,000 | 4.0 | |||||||||
| Total: | 64 | $1,132,834,836 | 100.0 | % | ||||||||
| Weighted Average: | 2.30x | |||||||||||
| UNDERWRITTEN NCF DEBT SERVICE COVERAGE RATIO | ||||||||||||
Range of U/W NCF DSCRs (x) | Number of Mortgage Loans | Aggregate Cut- off Date Balance | Percent by Aggregate Cut- off Date Pool Balance (%) | |||||||||
| 1.25 - 1.30 | 7 | $56,996,767 | 5.0 | % | ||||||||
| 1.31 - 1.40 | 9 | 146,342,441 | 12.9 | |||||||||
| 1.41 - 1.50 | 9 | 73,435,152 | 6.5 | |||||||||
| 1.51 - 1.60 | 9 | 93,330,746 | 8.2 | |||||||||
| 1.61 - 1.70 | 4 | 82,552,887 | 7.3 | |||||||||
| 1.71 - 1.80 | 4 | 35,965,403 | 3.2 | |||||||||
| 1.81 - 1.90 | 3 | 30,520,000 | 2.7 | |||||||||
| 1.91 - 2.00 | 1 | 45,000,000 | 4.0 | |||||||||
| 2.01 - 2.50 | 8 | 188,918,926 | 16.7 | |||||||||
| 2.51 - 3.00 | 6 | 212,172,515 | 18.7 | |||||||||
| 3.01 - 3.50 | 3 | 122,600,000 | 10.8 | |||||||||
| 3.51 - 3.80 | 1 | 45,000,000 | 4.0 | |||||||||
| Total: | 64 | $1,132,834,836 | 100.0 | % | ||||||||
| Weighted Average: | 2.15x | |||||||||||
| LOAN PURPOSE | ||||||||||||
| Loan Purpose | Number of Mortgage Loans | Aggregate Cut- off Date Balance | Percent by Aggregate Cut- off Date Pool Balance (%) | |||||||||
| Refinance | 41 | $694,976,984 | 61.3 | % | ||||||||
| Acquisition | 21 | 408,982,852 | 36.1 | |||||||||
| Recapitalization | 1 | 20,600,000 | 1.8 | |||||||||
| Acquisition/Refinance | 1 | 8,275,000 | 0.7 | |||||||||
| Total: | 64 | $1,132,834,836 | 100.0 | % | ||||||||
| MORTGAGE RATE | ||||||||||||
| Range of Mortgage Rates (%) | Number of Mortgage Loans | Aggregate Cut- off Date Balance | Percent by Aggregate Cut- off Date Pool Balance (%) | |||||||||
| 3.230 - 3.500 | 1 | $45,000,000 | 4.0 | % | ||||||||
| 3.501 - 3.750 | 4 | 167,600,000 | 14.8 | |||||||||
| 3.751 - 4.000 | 4 | 119,750,000 | 10.6 | |||||||||
| 4.001 - 4.250 | 3 | 99,172,515 | 8.8 | |||||||||
| 4.251 - 4.500 | 9 | 244,122,376 | 21.5 | |||||||||
| 4.501 - 4.750 | 14 | 141,396,051 | 12.5 | |||||||||
| 4.751 - 5.000 | 12 | 168,709,008 | 14.9 | |||||||||
| 5.001 - 5.250 | 7 | 73,728,323 | 6.5 | |||||||||
| 5.251 - 5.500 | 3 | 30,109,732 | 2.7 | |||||||||
| 5.501 - 5.750 | 4 | 34,145,781 | 3.0 | |||||||||
| 5.751 - 6.000 | 2 | 6,269,947 | 0.6 | |||||||||
| 6.001 - 6.130 | 1 | 2,831,105 | 0.2 | |||||||||
| Total: | 64 | $1,132,834,836 | 100.0 | % | ||||||||
| Weighted Average: | 4.372% | |||||||||||
| UNDERWRITTEN NOI DEBT YIELD | ||||||||||||
| Range of U/W NOI Debt Yields (%) | Number of Mortgage Loans | Aggregate Cut- off Date Balance | Percent by Aggregate Cut- off Date Pool Balance (%) | |||||||||
| 8.2 - 9.0 | 12 | $233,341,633 | 20.6 | % | ||||||||
| 9.1 - 10.0 | 14 | 157,081,064 | 13.9 | |||||||||
| 10.1 - 11.0 | 8 | 131,662,681 | 11.6 | |||||||||
| 11.1 - 12.0 | 8 | 150,156,588 | 13.3 | |||||||||
| 12.1 - 13.0 | 11 | 302,073,474 | 26.7 | |||||||||
| 13.1 - 14.0 | 6 | 95,306,551 | 8.4 | |||||||||
| 14.1 - 15.0 | 3 | 50,409,226 | 4.4 | |||||||||
| 15.1 - 16.0 | 1 | 2,831,105 | 0.2 | |||||||||
| 16.1 – 16.6 | 1 | 9,972,515 | 0.9 | |||||||||
| Total: | 64 | $1,132,834,836 | 100.0 | % | ||||||||
| Weighted Average: | 11.2% | |||||||||||
| UNDERWRITTEN NCF DEBT YIELD | ||||||||||||
| Range of U/W NCF Debt Yields (%) | Number of Mortgage Loans | Aggregate Cut- off Date Balance | Percent by Aggregate Cut- off Date Pool Balance (%) | |||||||||
| 7.8 - 8.0 | 3 | $68,400,000 | 6.0 | % | ||||||||
| 8.1 - 9.0 | 18 | 231,864,993 | 20.5 | |||||||||
| 9.1 - 10.0 | 11 | 153,487,273 | 13.5 | |||||||||
| 10.1 - 11.0 | 6 | 177,529,349 | 15.7 | |||||||||
| 11.1 - 12.0 | 14 | 231,173,825 | 20.4 | |||||||||
| 12.1 - 13.0 | 10 | 257,575,777 | 22.7 | |||||||||
| 13.1 - 15.0 | 1 | 2,831,105 | 0.2 | |||||||||
| 15.1 - 16.0 | 1 | 9,972,515 | 0.9 | |||||||||
| Total: | 64 | $1,132,834,836 | 100.0 | % | ||||||||
| Weighted Average: | 10.4% | |||||||||||
| ORIGINAL TERM TO MATURITY OR ARD | ||||||||||||
| Original Term to Maturity or ARD (months) | Number of Mortgage Loans | Aggregate Cut- off Date Balance | Percent by Aggregate Cut- off Date Pool Balance (%) | |||||||||
| 60 | 3 | $82,291,551 | 7.3 | % | ||||||||
| 84 | 1 | 5,073,538 | 0.4 | |||||||||
| 120 | 60 | 1,045,469,748 | 92.3 | |||||||||
| Total: | 64 | $1,132,834,836 | 100.0 | % | ||||||||
| Weighted Average: | 115 months | |||||||||||
| (1) | With respect to any mortgage loan that is part of a whole loan, the loan-to-value ratio, debt service coverage ratio and debt yield calculations include the relatedpari passucompanion loan(s) but exclude any related subordinate companion loan(s) (unless otherwise stated). With respect to each mortgage loan, debt service coverage ratio, debt yield and loan-to-value ratio information do not take into account any subordinate debt (whether or not secured by the related mortgaged property) that currently exists or is allowed under the terms of such mortgage loan. See Annex A-1 to the Preliminary Prospectus. Prepayment provisions for each mortgage loan reflects the entire life of the loan (from origination to maturity or ARD). |
THE INFORMATION IN THIS STRUCTURAL AND COLLATERAL TERM SHEET IS NOT COMPLETE AND MAY BE AMENDED PRIOR TO THE TIME OF SALE. THIS TERM SHEET IS NOT AN OFFER TO SELL THESE SECURITIES AND IT IS NOT A SOLICITATION OF AN OFFER TO BUY THESE SECURITIES IN ANY JURISDICTION WHERE THE OFFER OR SALE IS NOT PERMITTED.
20
| Wells Fargo Commercial Mortgage Trust 2017-C39 | Characteristics of the Mortgage Pool |
| REMAINING TERM TO MATURITY OR ARD | ||||||||||||
| Range of Remaining Terms to Maturity or ARD (months) | Number of Mortgage Loans | Aggregate Cut- off Date Balance | Percent by Aggregate Cut- off Date Pool Balance (%) | |||||||||
| 59 - 60 | 3 | $82,291,551 | 7.3 | % | ||||||||
| 61 - 84 | 1 | 5,073,538 | 0.4 | |||||||||
| 85 - 120 | 60 | 1,045,469,748 | 92.3 | |||||||||
| Total: | 64 | $1,132,834,836 | 100.0 | % | ||||||||
| Weighted Average: | 114 months | |||||||||||
| ORIGINAL AMORTIZATION TERM(2) | ||||||||||||
| Range of Original Amortization Terms (months) | Number of Mortgage Loans | Aggregate Cut- off Date Balance | Percent by Aggregate Cut- off Date Pool Balance (%) | |||||||||
| Non-Amortizing | 14 | $559,300,000 | 49.4 | % | ||||||||
| 240 | 1 | 3,309,365 | 0.3 | |||||||||
| 241 - 300 | 4 | 33,536,483 | 3.0 | |||||||||
| 301 - 360 | 45 | 536,688,988 | 47.4 | |||||||||
| Total: | 64 | $1,132,834,836 | 100.0 | % | ||||||||
| Weighted Average(3): | 354 months | |||||||||||
| (2) The original amortization term shown for any mortgage loan that is interest-only for part of its term does not include the number of months in its interest-only period and reflects only the number of months as of the commencement of amortization remaining from the end of such interest-only period. | ||||||||||||
| (3) Excludes the non-amortizing mortgage loans. | ||||||||||||
| REMAINING AMORTIZATION TERM(4) | ||||||||||||
| Range of Remaining Amortization Terms (months) | Number of Mortgage Loans | Aggregate Cut- off Date Balance | Percent by Aggregate Cut- off Date Pool Balance (%) | |||||||||
| Non-Amortizing | 14 | $559,300,000 | 49.4 | % | ||||||||
| 238 - 240 | 1 | 3,309,365 | 0.3 | |||||||||
| 241 - 300 | 4 | 33,536,483 | 3.0 | |||||||||
| 301 - 360 | 45 | 536,688,988 | 47.4 | |||||||||
| Total: | 64 | $1,132,834,836 | 100.0 | % | ||||||||
| Weighted Average(5): | 353 months | |||||||||||
| (4) The remaining amortization term shown for any mortgage loan that is interest-only for part of its term does not include the number of months in its interest-only period and reflects only the number of months as of the commencement of amortization remaining from the end of such interest-only period. | ||||||||||||
| (5) Excludes the non-amortizing mortgage loans. | ||||||||||||
| LOCKBOXES | ||||||||||||
| Type of Lockbox | Number of Mortgage Loans | Aggregate Cut- off Date Balance | Percent by Aggregate Cut- off Date Pool Balance (%) | |||||||||
| Hard/Springing Cash Management | 25 | $541,499,248 | 47.8 | % | ||||||||
| Hard/Upfront Cash Management | 6 | 254,965,102 | 22.5 | |||||||||
| Springing | 24 | 237,754,696 | 21.0 | |||||||||
| Soft/Springing Cash Management | 2 | 49,977,447 | 4.4 | |||||||||
| None | 7 | 48,638,343 | 4.3 | |||||||||
| Total: | 64 | $1,132,834,836 | 100.0 | % | ||||||||
| PREPAYMENT PROVISION SUMMARY(6) | ||||||||||||
| Prepayment Provision | Number of Mortgage Loans | Aggregate Cut- off Date Balance | Percent by Aggregate Cut- off Date Pool Balance (%) | |||||||||
| Lockout / Defeasance / Open | 55 | $995,959,890 | 87.9 | % | ||||||||
| Lockout / GRTR 1% or YM / Open | 6 | 101,299,947 | 8.9 | |||||||||
| Lockout / GRTR 1% or YM or D / Open | 3 | 35,575,000 | 3.1 | |||||||||
| Total: | 64 | $1,132,834,836 | 100.0 | % | ||||||||
| (6) As a result of property releases or the application of funds in a performance reserve, partial principal prepayments could occur during a period that voluntary principal prepayments are otherwise prohibited. | ||||||||||||
| CUT-OFF DATE LOAN-TO-VALUE RATIO | ||||||||||||
| Range of Cut-off Date LTV Ratios (%) | Number of Mortgage Loans | Aggregate Cut- off Date Balance | Percent by Aggregate Cut- off Date Pool Balance (%) | |||||||||
| 31.3 - 35.0 | 1 | $70,000,000 | 6.2 | % | ||||||||
| 35.1 - 40.0 | 1 | 30,000,000 | 2.6 | |||||||||
| 40.1 - 45.0 | 2 | 90,000,000 | 7.9 | |||||||||
| 45.1 - 50.0 | 6 | 131,999,890 | 11.7 | |||||||||
| 50.1 - 55.0 | 2 | 25,431,105 | 2.2 | |||||||||
| 55.1 - 60.0 | 7 | 117,461,638 | 10.4 | |||||||||
| 60.1 - 65.0 | 15 | 229,852,298 | 20.3 | |||||||||
| 65.1 - 70.0 | 19 | 268,066,797 | 23.7 | |||||||||
| 70.1 - 75.0 | 11 | 170,023,107 | 15.0 | |||||||||
| Total: | 64 | $1,132,834,836 | 100.0 | % | ||||||||
| Weighted Average: | 58.8% | |||||||||||
| BALLOON OR ARD LOAN-TO-VALUE RATIO | ||||||||||||
| Range of Balloon or ARD LTV Ratios (%) | Number of Mortgage Loans | Aggregate Cut- off Date Balance | Percent by Aggregate Cut- off Date Pool Balance (%) | |||||||||
| 31.3 - 35.0 | 1 | $70,000,000 | 6.2 | % | ||||||||
| 35.1 - 40.0 | 5 | 97,259,256 | 8.6 | |||||||||
| 40.1 - 45.0 | 4 | 64,566,489 | 5.7 | |||||||||
| 45.1 - 50.0 | 6 | 144,036,145 | 12.7 | |||||||||
| 50.1 - 55.0 | 10 | 93,754,021 | 8.3 | |||||||||
| 55.1 - 60.0 | 21 | 227,493,140 | 20.1 | |||||||||
| 60.1 - 65.0 | 12 | 237,025,785 | 20.9 | |||||||||
| 65.1 - 68.2 | 5 | 198,700,000 | 17.5 | |||||||||
| Total: | 64 | $1,132,834,836 | 100.0 | % | ||||||||
| Weighted Average: | 54.2% | |||||||||||
| AMORTIZATION TYPE | ||||||||||||
| Amortization Type | Number of Mortgage Loans | Aggregate Cut- off Date Balance | Percent by Aggregate Cut- off Date Pool Balance (%) | |||||||||
| Interest-only, Balloon | 12 | $473,700,000 | 41.8 | % | ||||||||
| Interest-only, Amortizing Balloon | 25 | 333,710,000 | 29.5 | |||||||||
| Amortizing Balloon | 24 | 194,824,836 | 17.2 | |||||||||
| Interest-only, ARD | 2 | 85,600,000 | 7.6 | |||||||||
| Interest-only, Amortizing ARD | 1 | 45,000,000 | 4.0 | |||||||||
| Total: | 64 | $1,132,834,836 | 100.0 | % | ||||||||
| ORIGINAL TERM OF INTEREST-ONLY PERIOD FOR PARTIAL IO LOANS | ||||||||||||
| IO Terms (months) | Number of Mortgage Loans | Aggregate Cut- off Date Balance | Percent by Aggregate Cut- off Date Pool Balance (%) | |||||||||
| 12 | 5 | $61,380,000 | 5.4 | % | ||||||||
| 18 | 1 | 14,000,000 | 1.2 | |||||||||
| 24 | 6 | 71,010,000 | 6.3 | |||||||||
| 36 | 6 | 90,250,000 | 8.0 | |||||||||
| 48 | 1 | 45,000,000 | 4.0 | |||||||||
| 60 | 7 | 97,070,000 | 8.6 | |||||||||
| Total: | 26 | $378,710,000 | 33.4 | % | ||||||||
| Weighted Average: | 37 months | |||||||||||
| SEASONING | ||||||||||||
| Range of Seasoning (months) | Number of Mortgage Loans | Aggregate Cut- off Date Balance | Percent by Aggregate Cut- off Date Pool Balance (%) | |||||||||
| 0 | 10 | $213,240,000 | 18.8 | % | ||||||||
| 1 - 3 | 42 | 829,247,018 | 73.2 | |||||||||
| 4 - 6 | 9 | 70,889,809 | 6.3 | |||||||||
| 7 - 8 | 3 | 19,458,009 | 1.7 | |||||||||
| Total: | 64 | $1,132,834,836 | 100.0 | % | ||||||||
| Weighted Average: | 2 months | |||||||||||
THE INFORMATION IN THIS STRUCTURAL AND COLLATERAL TERM SHEET IS NOT COMPLETE AND MAY BE AMENDED PRIOR TO THE TIME OF SALE. THIS TERM SHEET IS NOT AN OFFER TO SELL THESE SECURITIES AND IT IS NOT A SOLICITATION OF AN OFFER TO BUY THESE SECURITIES IN ANY JURISDICTION WHERE THE OFFER OR SALE IS NOT PERMITTED.
21
| Wells Fargo Commercial Mortgage Trust 2017-C39 | Certain Terms and Conditions |
| V. | Certain Terms and Conditions |
| Interest Entitlements: | The interest entitlement of each Class of Certificates on each Distribution Date generally will be the interest accrued during the related Interest Accrual Period on the related Certificate Balance or Notional Amount at the related pass-through rate, net of any prepayment interest shortfalls allocated to that Class for such Distribution Date as described below. If prepayment interest shortfalls arise from voluntary prepayments (without Master Servicer consent) on particular non-specially serviced loans during any collection period, the Master Servicer is required to make a compensating interest payment to offset those shortfalls, generally up to an amount equal to the portion of its master servicing fees that accrue at 0.25 basis pointsper annum. The remaining amount of prepayment interest shortfalls will be allocated to reduce the interest entitlement on all Classes of Certificates entitled to interest, on apro ratabasis, based on their respective amounts of accrued interest for the related Distribution Date. If a Class receives less than the entirety of its interest entitlement on any Distribution Date, then the shortfall (excluding any shortfall due to prepayment interest shortfalls), together with interest thereon, will be added to its interest entitlement for the next succeeding Distribution Date. | |
| Principal Distribution Amount: | The Principal Distribution Amount for each Distribution Date generally will be the aggregate amount of principal received or advanced in respect of the mortgage loans, net of any non-recoverable advances and interest thereon and workout-delayed reimbursement amounts that are reimbursed to the Master Servicer, the Special Servicer or the Trustee during the related collection period. Non-recoverable advances and interest thereon are reimbursable from principal collections and advances before reimbursement from other amounts. Workout-delayed reimbursement amounts are reimbursable from principal collections. | |
| Subordination, Allocation of Losses and Certain Expenses | The chart below describes the manner in which the payment rights of certain Classes of Certificates will be senior or subordinate, as the case may be, to the payment rights of other Classes of Certificates. The chart also shows the corresponding entitlement to receive principal and/or interest of certain Classes of Certificates (other than excess interest that accrues on each mortgage loan that has an anticipated repayment date) on any distribution date in descending order. It also shows the manner in which losses are allocated to certain Classes of Certificates in ascending order (beginning with the Non-Offered Certificates, other than the Class V and R certificates) to reduce the balance of each such class to zero;provided that no principal payments or mortgage loan losses will be allocated to the Class X-A, X-B, V or R Certificates, although principal payments and losses may reduce the notional amounts of the Class X-A and X-B certificates and, therefore, the amount of interest they accrue. |
THE INFORMATION IN THIS STRUCTURAL AND COLLATERAL TERM SHEET IS NOT COMPLETE AND MAY BE AMENDED PRIOR TO THE TIME OF SALE. THIS TERM SHEET IS NOT AN OFFER TO SELL THESE SECURITIES AND IT IS NOT A SOLICITATION OF AN OFFER TO BUY THESE SECURITIES IN ANY JURISDICTION WHERE THE OFFER OR SALE IS NOT PERMITTED.
22
| Wells Fargo Commercial Mortgage Trust 2017-C39 | Certain Terms and Conditions |
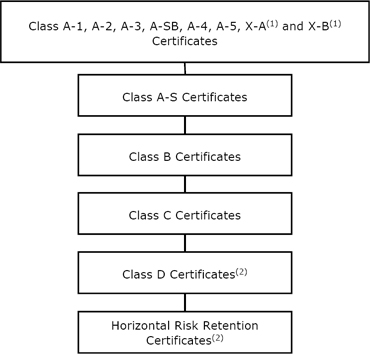 | ||
(1) The Class X-A and X-B Certificates are interest-only certificates. (2) Non-Offered Certificates. | ||
| Distributions: | On each Distribution Date, funds available for distribution from the mortgage loans, net of specified trust fees, expenses and reimbursements will generally be distributed in the following amounts and order of priority (in each case to the extent of remaining available funds): | |
| 1. Class A-1, A-2, A-3, A-SB, A-4, A-5, X-A and X-B Certificates: To interest on the Class A-1, A-2, A-3, A-SB, A-4, A-5, X-A and X-B Certificates,pro rata, according to their respective interest entitlements. | ||
| 2. Class A-1, A-2, A-3, A-SB, A-4 and A-5 Certificates: To principal on the Class A-1, A-2, A-3, A-SB, A-4 and A-5 Certificates in the following amounts and order of priority: (i) first, to principal on the Class A-SB Certificates, in an amount up to the Principal Distribution Amount for such Distribution Date until their Certificate Balance is reduced to the Class A-SB Planned Principal Balance for such Distribution Date; (ii) second, to principal on the Class A-1 Certificates until their Certificate Balance is reduced to zero, up to the remainder of the Principal Distribution Amount for such Distribution Date; (iii) third, to principal on the Class A-2 Certificates until their Certificate Balance is reduced to zero, up to the remainder of the Principal Distribution Amount for such Distribution Date; (iv) fourth, to principal on the Class A-3 Certificates, until their Certificate Balance is reduced to zero, up to the remainder of the Principal Distribution Amount for such Distribution Date; (v) fifth, to principal on the Class A-4 Certificates until their Certificate Balance is reduced to zero, up to the remainder of the Principal Distribution Amount for such Distribution Date; (vi) sixth, to principal on the Class A-5 Certificates until their Certificate Balance is reduced to zero, up to the remainder of the Principal Distribution Amount for such Distribution Date; and (vii) seventh, to principal on the Class A-SB Certificates until their Certificate Balance is reduced to zero, up to the remainder of the Principal Distribution Amount for such Distribution Date. However, if the Certificate Balance of each and every Class of Principal Balance Certificates, other than the Class A-1, A-2, A-3, A-SB, A-4 and A-5 Certificates, has been reduced to zero as a result of the allocation of Mortgage Loan losses and expenses and any of the Class A-1, A-2, A-3, A-SB, A-4 and A-5 Certificates remains outstanding, then the Principal Distribution Amount will be distributed to the Class A-1, A-2, A-3, A-SB, A-4 and A-5 Certificates,pro rata, based on their respective outstanding Certificate Balances, until their Certificate Balances have been reduced to zero. | ||
| 3. Class A-1, A-2, A-3, A-SB, A-4 and A-5 Certificates: To reimburse the holders of the Class A-1, A-2, A-3, A-SB, A-4 and A-5 Certificates,pro rata, on the basis of previously allocated unreimbursed losses, for any previously unreimbursed losses (plus interest thereon) on the mortgage loans that were previously allocated in reduction of the Certificate Balances of such Classes. |
THE INFORMATION IN THIS STRUCTURAL AND COLLATERAL TERM SHEET IS NOT COMPLETE AND MAY BE AMENDED PRIOR TO THE TIME OF SALE. THIS TERM SHEET IS NOT AN OFFER TO SELL THESE SECURITIES AND IT IS NOT A SOLICITATION OF AN OFFER TO BUY THESE SECURITIES IN ANY JURISDICTION WHERE THE OFFER OR SALE IS NOT PERMITTED.
23
| Wells Fargo Commercial Mortgage Trust 2017-C39 | Certain Terms and Conditions |
4. Class A-S Certificates: To make distributions on the Class A-S Certificates as follows: (a) first, to interest on the Class A-S Certificates in the amount of the interest entitlement for that Class; (b) next, to the extent of the portion of the Principal Distribution Amount remaining after distributions in respect of principal to each Class with a higher distribution priority (in this case, the Class A-1, A-2, A-3, A-SB, A-4 and A-5 Certificates), to principal on the Class A-S Certificates until their Certificate Balance is reduced to zero; and (c) next, to reimburse the holders of the Class A-S Certificates for any previously unreimbursed losses (plus interest thereon) on the mortgage loans that were previously allocated to that Class in reduction of their Certificate Balance. 5. Class B Certificates: To make distributions on the Class B Certificates as follows: (a) first, to interest on the Class B Certificates in the amount of the interest entitlement for that Class; (b) next, to the extent of the portion of the Principal Distribution Amount remaining after distributions in respect of principal to each Class with a higher distribution priority (in this case, the Class A-1, A-2, A-3, A-SB, A-4, A-5 and A-S Certificates), to principal on the Class B Certificates until their Certificate Balance is reduced to zero; and (c) next, to reimburse the holders of the Class B Certificates for any previously unreimbursed losses (plus interest thereon) on the mortgage loans that were previously allocated to that Class in reduction of their Certificate Balance. 6. Class C Certificates: To make distributions on the Class C Certificates as follows: (a) first, to interest on the Class C Certificates in the amount of the interest entitlement for that Class; (b) next, to the extent of the portion of the Principal Distribution Amount remaining after distributions in respect of principal to each Class with a higher distribution priority (in this case, the Class A-1, A-2, A-3, A-SB, A-4, A-5, A-S and B Certificates), to principal on the Class C Certificates until their Certificate Balance is reduced to zero; and (c) next, to reimburse the holders of the Class C Certificates for any previously unreimbursed losses (plus interest thereon) on the mortgage loans that were previously allocated to that Class in reduction of their Certificate Balance. 7. After the Class A-1, A-2, A-3, A-SB, A-4, A-5, A-S, B and C Certificates are paid all amounts to which they are entitled, the remaining funds available for distribution will be used to pay interest, principal and loss reimbursement amounts on the Class D, E-RR, F-RR, G-RR and H-RR Certificates sequentially in that order in a manner analogous to the Class C Certificates. | ||
| Allocation of Yield Maintenance and Prepayment Premiums: | If any yield maintenance charge or prepayment premium is collected during any particular collection period with respect to any mortgage loan, then on the Distribution Date corresponding to that collection period, the certificate administrator will pay that yield maintenance charge or prepayment premium (net of liquidation fees payable therefrom) in the following manner: (1) to each of the Class A-1, A-2, A-3, A-SB, A-4, A-5, A-S, B, C and D Certificates, the product of (a) the yield maintenance charge or prepayment premium, (b) the related Base Interest Fraction (as defined in the Preliminary Prospectus) for such Class, and (c) a fraction, the numerator of which is equal to the amount of principal distributed to such Class for that Distribution Date, and the denominator of which is the total amount of principal distributed to all Principal Balance Certificates for that Distribution Date, (2) to the Class X-A Certificates, the excess, if any, of (a) the product of (i) such yield maintenance charge or prepayment premium and (ii) a fraction, the numerator of which is equal to the amount of principal distributed to the Class A-1, A-2, A-3, A-SB, A-4 and A-5 Certificates for that Distribution Date, and the denominator of which is the total amount of principal distributed to all Principal Balance Certificates for that Distribution Date, over (b) the amount of such yield maintenance charge or prepayment premium distributed to the Class A-1, A-2, A-3, A-SB, A-4 and A-5 Certificates as described above, and (3) to the Class X-B Certificates, any remaining portion of such yield maintenance charge or prepayment premium not distributed as described above.
No prepayment premiums or yield maintenance charges will be distributed to the holders of the Class E-RR, F-RR, G-RR or H-RR certificates. For a description of when prepayment premiums and yield maintenance charges are generally required on the mortgage loans, see Annex A-1 to the Preliminary Prospectus. See also “Risk Factors—Risks Relating to the Mortgage Loans—Risks Relating to Enforceability of Yield Maintenance Charges, Prepayment Premiums or Defeasance Provisions” and “Risk Factors—Other Risks Relating to the Certificates—Your Yield May Be Affected by Defaults, Prepayments and Other Factors” in the Preliminary Prospectus. Prepayment premiums and yield maintenance charges will be distributed on each Distribution Date only to the extent they are actually received on the mortgage loans as of the related Determination Date. |
THE INFORMATION IN THIS STRUCTURAL AND COLLATERAL TERM SHEET IS NOT COMPLETE AND MAY BE AMENDED PRIOR TO THE TIME OF SALE. THIS TERM SHEET IS NOT AN OFFER TO SELL THESE SECURITIES AND IT IS NOT A SOLICITATION OF AN OFFER TO BUY THESE SECURITIES IN ANY JURISDICTION WHERE THE OFFER OR SALE IS NOT PERMITTED.
24
| Wells Fargo Commercial Mortgage Trust 2017-C39 | Certain Terms and Conditions |
| Realized Losses: | The Certificate Balances of the Class A-1, A-2, A-3, A-SB, A-4, A-5, A-S, B, C, D, E-RR, F-RR, G-RR and H-RR Certificates will be reduced without distribution on any Distribution Date as a write-off to the extent of any losses realized on the mortgage loans allocated to such Class on such Distribution Date. Such losses will be applied in the following order, in each case until the related Certificate Balance is reduced to zero: first, to the Class H-RR Certificates; second, to the Class G-RR Certificates; third, to the Class F-RR Certificates; fourth, to the Class E-RR Certificates; fifth, to the Class D Certificates; sixth, to the Class C Certificates; seventh, to the Class B Certificates; eighth, to the Class A-S Certificates; and, finally,pro rata, to the Class A-1, A-2, A-3, A-SB, A-4 and A-5 Certificates based on their outstanding Certificate Balances.
The notional amount of the Class X-A Certificates will be reduced by the amount of all losses that are allocated to the Class A-1, A-2, A-3, A-SB, A-4 or A-5 Certificates as write-offs in reduction of their Certificate Balances. The notional amount of the Class X-B Certificates will be reduced by the amount of all losses that are allocated to the Class A-S, B, C or D Certificates as write-offs in reduction of their Certificate Balances. | |
| P&I Advances: | The Master Servicer or, if the Master Servicer fails to do so, the Trustee, will be obligated to advance delinquent debt service payments (other than balloon payments, excess interest and default interest) and assumed debt service payments on mortgage loans with delinquent balloon payments (excluding any related companion loan), except to the extent any such advance is deemed non-recoverable from collections on the related mortgage loan. In addition, if an Appraisal Reduction Amount exists for a given mortgage loan, the interest portion of any P&I advance for such mortgage loan will be reduced, which will have the effect of reducing the amount of interest available for distribution to the Certificates in reverse alphabetical order of their Class designations (except that interest payments on the Class A-1, A-2, A-3, A-SB, A-4, A-5, X-A and X-B Certificates would be affected on apari passu basis). | |
| Servicing Advances: | The Master Servicer or, if the Master Servicer fails to do so, the Trustee, will be obligated to make servicing advances, including the payment of delinquent property taxes, insurance premiums and ground rent, except to the extent that those advances are deemed non-recoverable from collections on the related mortgage loan. The Master Servicer or the Trustee, as applicable, will have the primary obligation to make any required servicing advances with respect to any serviced whole loan. With respect to any non-serviced whole loan, the master servicer or trustee, as applicable, under the related lead securitization servicing agreement will have the primary obligation to make any required servicing advances with respect to such non-serviced whole loan. | |
Appraisal Reduction Amounts and Collateral Deficiency Amounts:
| An Appraisal Reduction Amount generally will be created in the amount, if any, by which the principal balance of a required appraisal loan (which is a mortgage loan with respect to which certain defaults, modifications or insolvency events have occurred as further described in the Preliminary Prospectus) plus other amounts overdue or advanced in connection with such mortgage loan exceeds 90% of the appraised value of the related mortgaged property plus certain escrows and reserves (including letters of credit) held with respect to the mortgage loan. With respect to any whole loan, any Appraisal Reduction Amount will be allocated first to the related subordinate companion loan, if any, and then to the related mortgage loan and the relatedpari passu companion loan(s).
A mortgage loan will cease to be a required appraisal loan when the same has ceased to be a specially serviced loan (if applicable), has been brought current for at least three consecutive months and no other circumstances exist that would cause such mortgage loan to be a required appraisal loan.
A Collateral Deficiency Amount will exist with respect to any mortgage loan that is modified into an AB loan structure and remains a corrected mortgage loan and will generally equal the excess of (i) the stated principal balance of such AB modified loan (taking into account the related junior note(s) and anypari passu notes included therein), over (ii) the sum of (in the case of a whole loan, solely to the extent allocable to the subject mortgage loan) (x) the most recent appraised value of the related mortgaged property plus (y) solely to the extent not reflected or taken into account in such appraised value and to the extent on deposit with, or otherwise under the control of, the lender as of the date of such determination, any capital or additional collateral contributed by the related borrower at the time the mortgage loan (and as part of the modification thereto) became an AB modified loan plus (z) any other escrows or reserves (in addition to any amounts set forth in the immediately preceding clause (y)) held with respect to the mortgage loan as of the date of such determination.
A Cumulative Appraisal Reduction Amount with respect to any mortgage loan will be the sum of any Appraisal Reduction Amount and any Collateral Deficiency Amount. |
THE INFORMATION IN THIS STRUCTURAL AND COLLATERAL TERM SHEET IS NOT COMPLETE AND MAY BE AMENDED PRIOR TO THE TIME OF SALE. THIS TERM SHEET IS NOT AN OFFER TO SELL THESE SECURITIES AND IT IS NOT A SOLICITATION OF AN OFFER TO BUY THESE SECURITIES IN ANY JURISDICTION WHERE THE OFFER OR SALE IS NOT PERMITTED.
25
| Wells Fargo Commercial Mortgage Trust 2017-C39 | Certain Terms and Conditions |
Appraisal Reduction Amounts will affect the amount of debt service advances in respect of the related mortgage loan. Additionally, Cumulative Appraisal Reduction Amounts will be taken into account in the determination of the identity of the Class whose majority constitutes the “majority controlling class certificateholder” and is entitled to appoint the directing certificateholder. | ||
Clean-Up Call and Exchange Termination:
| On each Distribution Date occurring after the aggregate unpaid principal balance of the pool of mortgage loans is less than 1.0% of the principal balance of the mortgage loans as of the cut-off date.
If the aggregate Certificate Balances of each of the Class A-1, A-2, A-3, A-SB, A-4, A-5, A-S, B, C and D Certificates have been reduced to zero, the trust may also be terminated in connection with an exchange of all the then-outstanding certificates (other than the Class R Certificates) for the mortgage loans and REO properties then remaining in the issuing entity, subject to payment of a price specified in the Preliminary Prospectus, but all of the holders of those outstanding Classes (other than the Class V and R Certificates) of certificates would have to voluntarily participate in the exchange. | |
| Liquidation Loan Waterfall: | Following the liquidation of any loan or property, the net liquidation proceeds generally will be applied (after reimbursement of advances and certain trust fund expenses), first, as a recovery of accrued interest, other than delinquent interest that was not advanced as a result of Appraisal Reduction Amounts, second, as a recovery of principal until all principal has been recovered, and then as a recovery of delinquent interest that was not advanced as a result of Appraisal Reduction Amounts. Please see “Description of the Certificates—Distributions—Application Priority of Mortgage Loan Collections or Whole Loan Collections” in the Preliminary Prospectus. | |
| Control Eligible Certificates: | The Class E-RR, F-RR, G-RR and H-RR Certificates. | |
| Directing Certificateholder/ Controlling Class: | A directing certificateholder may be appointed by the “majority controlling class certificateholder”, which will be the holder(s) of a majority of the “controlling class”, which means the most subordinate class of Certificates among the Control Eligible Certificates.
The “Controlling Class” will be, as of any time of determination, the most subordinate class of Control Eligible Certificates then outstanding that has an aggregate Certificate Balance (as notionally reduced by any Cumulative Appraisal Reduction Amounts allocable to such class(es)) at least equal to 25% of the initial Certificate Balance of that class;provided,however, that if at any time the Certificate Balances of the certificates other than the Control Eligible Certificates have been reduced to zero as a result of principal payments on the Mortgage Loans, then the Controlling Class will be the most subordinate class of Control Eligible Certificates that has a Certificate Balance greater than zero without regard to any Cumulative Appraisal Reduction Amounts. The Controlling Class as of the Closing Date will be the Class H-RR Certificates.
| |
| Control and Consultation/ Replacement of Special Servicer by Directing Certificateholder: | The rights of various parties to replace the Special Servicer and approve or consult with respect to major actions of the Special Servicer will vary according to defined periods.
A “Control Termination Event” will occur when (i) the Class E-RR Certificates have a Certificate Balance (taking into account the application of any Cumulative Appraisal Reduction Amounts to notionally reduce the Certificate Balance of such class) of less than 25% of the initial Certificate Balance of that class or (ii) a holder of the Class E-RR Certificates is the majority Controlling Class Certificateholder and has irrevocably waived its right, in writing, to exercise any of the rights of the Controlling Class Certificateholder and such rights have not been reinstated to a successor controlling class certificateholder as described below;provided,however, that a Control Termination Event will not be deemed continuing in the event that the Certificate Balances of the certificates other than the Control Eligible Certificates have been reduced to zero as a result of principal payments on the Mortgage Loans.
A “Consultation Termination Event” will occur when (i) there is no class of Control Eligible Certificates that has a then-outstanding Certificate Balance at least equal to 25% of the initial Certificate Balance of that class, in each case, without regard to the application of any Cumulative Appraisal Reduction Amounts; or (ii) a holder of a majority of the Class E-RR Certificates is the majority Controlling Class Certificateholder and has irrevocably waived its right, in writing, to exercise any of the rights of the Controlling Class Certificateholder and such rights have not been reinstated to a successor controlling class certificateholder pursuant to the terms of the WFCM 2017-C39 pooling and servicing agreement;provided that no Consultation Termination Event resulting solely from the operation of clause (ii) will be deemed to have existed or be in continuance with respect to a successor holder of the Class E-RR Certificates that has not irrevocably waived its right to exercise any of the rights of the Controlling Class |
THE INFORMATION IN THIS STRUCTURAL AND COLLATERAL TERM SHEET IS NOT COMPLETE AND MAY BE AMENDED PRIOR TO THE TIME OF SALE. THIS TERM SHEET IS NOT AN OFFER TO SELL THESE SECURITIES AND IT IS NOT A SOLICITATION OF AN OFFER TO BUY THESE SECURITIES IN ANY JURISDICTION WHERE THE OFFER OR SALE IS NOT PERMITTED.
26
| Wells Fargo Commercial Mortgage Trust 2017-C39 | Certain Terms and Conditions |
Certificateholder;provided,however, that a Consultation Termination Event will not be deemed continuing in the event that the Certificate Balances of the certificates other than the Control Eligible Certificates have been reduced to zero as a result of principal payments on the Mortgage Loans.
If no Control Termination Event has occurred and is continuing, except with respect to the Excluded Loans (as defined below) with respect to the directing certificateholder and except with respect to Servicing Shift Whole Loans (as defined below) (i) the directing certificateholder will be entitled to grant or withhold approval of asset status reports prepared, and material servicing actions proposed, by the Special Servicer, and (ii) the directing certificateholder will be entitled to terminate and replace the Special Servicer with or without cause, and appoint itself or another person as the successor special servicer. It will be a condition to such appointment that KBRA, Fitch and Moody’s (and any Rating Agency rating any securities backed by anypari passu companion loan(s) serviced under this transaction) confirm that the appointment would not result in a qualification, downgrade or withdrawal of any of their then-current ratings of certificates (and any certificates backed by anypari passu companion loan(s) serviced under this transaction).
If a Control Termination Event has occurred and is continuing but no Consultation Termination Event has occurred and is continuing, the Special Servicer will be required to consult with the directing certificateholder (other than with respect to Excluded Loans as to such party and except with respect to Servicing Shift Whole Loans (as defined below)) and the Operating Advisor in connection with asset status reports and material special servicing actions.
If a Consultation Termination Event has occurred and is continuing, the Special Servicer must seek to consult with the Operating Advisor in connection with asset status reports and material special servicing actions, and, in general, no directing certificateholder will be recognized or have any right to terminate the Special Servicer or approve, direct or consult with respect to servicing matters.
With respect to each serviced whole loan that is not a Servicing Shift Whole Loan, the rights of the directing certificateholder described above will be subject to the consultation rights of the holders of the relatedpari passu companion loans. Those consultation rights will generally extend to asset status reports and material special servicing actions involving the related whole loan, will be as set forth in the related intercreditor agreement, and will be in addition to the rights of the directing certificateholder in this transaction described above.
With respect to each whole loan marked with footnote (3) under “IV. Characteristics of the Mortgage Pool—B. Summary of the Whole Loans” (each, a “Servicing Shift Whole Loan”), prior to the applicable Servicing Shift Securitization Date, the holder of the related controllingpari passu companion loan will have certain control rights regarding the servicing of the related whole loan under the WFCM 2017-C39 pooling and servicing agreement, including the right to approve or disapprove various material servicing actions involving the related whole loan.
With respect to (x) each non-serviced whole loan and (y) each Servicing Shift Whole Loan after its related Servicing Shift Securitization Date, the applicable servicing agreement for the related controllingpari passu companion loan(s) generally grants (or will grant) the directing certificateholder under the related securitization control rights that may include the right to approve or disapprove various material servicing actions involving the related whole loan. The directing certificateholder for this securitization (so long as no Consultation Termination Event has occurred and is occurring) generally will nonetheless have the right to be consulted on a non-binding basis with respect to such actions. For purposes of the servicing of any such whole loan contemplated by this paragraph, the occurrence and continuance of a Control Termination Event or Consultation Termination Event under this securitization will not limit the control or other rights of the directing certificateholder (or equivalent) under the securitization of the related controllingpari passu companion loan(s).
The control rights and consent and consultation rights described in the three preceding paragraphs are subject to various limitations, conditions and exceptions as described in the Preliminary Prospectus.
Notwithstanding any contrary description set forth above, in the event that, with respect to any mortgage loan, if the majority controlling class certificateholder or the directing certificateholder is a Borrower Party, the majority controlling class certificateholder and the directing certificateholder will have no right to receive asset status reports or such other information as may be specified in the WFCM 2017-C39 pooling and servicing agreement, to grant or withhold approval of, or consult with respect to, asset status reports prepared, and material servicing actions proposed, by the Special Servicer, with respect to such mortgage loan, and such mortgage loan will be referred to as an “Excluded Loan” as to such party. |
THE INFORMATION IN THIS STRUCTURAL AND COLLATERAL TERM SHEET IS NOT COMPLETE AND MAY BE AMENDED PRIOR TO THE TIME OF SALE. THIS TERM SHEET IS NOT AN OFFER TO SELL THESE SECURITIES AND IT IS NOT A SOLICITATION OF AN OFFER TO BUY THESE SECURITIES IN ANY JURISDICTION WHERE THE OFFER OR SALE IS NOT PERMITTED.
27
| Wells Fargo Commercial Mortgage Trust 2017-C39 | Certain Terms and Conditions |
In addition, notwithstanding any contrary description set forth above, in the event that, with respect to any mortgage loan, a controlling class certificateholder is a Borrower Party, such controlling class certificateholder will have no right to receive asset status reports or such other information as may be specified in the WFCM 2017-C39 pooling and servicing agreement with respect to such mortgage loan, and such controlling class certificateholder will be referred to as an “excluded controlling class holder”.
“Borrower Party” means a borrower, a mortgagor or a manager of a mortgaged property, an Accelerated Mezzanine Loan Lender, or any Borrower Party Affiliate. “Accelerated Mezzanine Loan Lender” means a mezzanine lender under a mezzanine loan that has been accelerated or as to which foreclosure or enforcement proceedings have been commenced against the equity collateral pledged to secure such mezzanine loan. “Borrower Party Affiliate” means, with respect to a borrower, a mortgagor, a manager of a Mortgaged Property or an Accelerated Mezzanine Loan Lender, (x) any other person controlling or controlled by or under common control with such borrower, mortgagor, manager or Accelerated Mezzanine Loan Lender, as applicable, or (y) any other person owning, directly or indirectly, 25% or more of the beneficial interests in such borrower, mortgagor, manager or Accelerated Mezzanine Loan Lender. | ||
| Replacement of Special Servicer by General Vote of Certificateholders: | If a Control Termination Event has occurred and is continuing, the Special Servicer (other than with respect to a Servicing Shift Whole Loan) may be removed and replaced without cause upon the affirmative direction of certificate owners holding not less than 66-2/3% of a certificateholder quorum, following a proposal from certificate owners holding not less than 25% of the appraisal-reduced voting rights of all Certificates. The certificateholders who initiate a vote on a termination and replacement of the Special Servicer without cause must cause KBRA, Fitch and Moody’s to confirm the then-current ratings of the certificates (or decline to review the matter) and cause the payment of the fees and expenses incurred in the replacement. If no Control Termination Event has occurred and is continuing, the Special Servicer (other than with respect to a Servicing Shift Whole Loan) may be replaced by the directing certificateholder, subject to KBRA, Fitch and Moody’s (and any Rating Agency rating any securities backed by anypari passu companion loan(s) serviced under this transaction) confirming the then-current ratings of the Certificates (and any certificates backed by anypari passucompanion loans serviced under this transaction) or declining to review the matter. | |
| Excluded Special Servicer: | In the event that, with respect to any mortgage loan, the Special Servicer is a Borrower Party, the Special Servicer will be required to resign as special servicer of such mortgage loan (referred to as an “excluded special servicer loan”). If no Control Termination Event has occurred and is continuing, the directing certificateholder will be entitled to appoint (and may replace with or without cause) a separate special servicer that is not a Borrower Party (referred to as an “excluded special servicer”) with respect to such excluded special servicer loan unless such excluded special servicer loan is also an excluded loan. Otherwise, upon resignation of the Special Servicer with respect to an excluded special servicer loan, the resigning Special Servicer will be required to appoint the excluded special servicer. | |
| Appraisal Remedy: | If the Class of Certificates comprising the controlling class loses its status as controlling class because of the application of an Appraisal Reduction Amount or Collateral Deficiency Amount, the holders of a majority of the voting rights of such Class may require the Special Servicer to order a second appraisal for any mortgage loan in respect of which an Appraisal Reduction Amount or Collateral Deficiency Amount has been applied. The Special Servicer must thereafter determine whether, based on its assessment of such second appraisal, any recalculation of the Appraisal Reduction Amount or Collateral Deficiency Amount is warranted. Such Class will not be able to exercise any direction, control, consent and/or similar rights of the controlling class unless and until reinstated as the controlling class through such determination; and pending such determination, the rights of the controlling class will be exercised by the Control Eligible Certificates, if any, that would be the controlling class taking into account the subject appraisal reduction amount. | |
| Sale of Defaulted Assets: | There will be no “fair value” purchase option. Instead, the WFCM 2017-C39 pooling and servicing agreement will authorize the Special Servicer to sell defaulted mortgage loans serviced by such Special Servicer to the highest bidder in a manner generally similar to sales of REO properties.
The sale of a defaulted loan (other than a non-serviced whole loan) for less than par plus accrued interest and certain other fees and expenses owed on the loan will be subject to consent or consultation rights of the directing certificateholder and/or Operating Advisor, as described in the Preliminary Prospectus. Generally speaking, the directing certificateholder for any securitization holding apari passu companion loan will have consent and/or consultation rights as the holder of an interest in the related mortgage loan, as described in the Preliminary Prospectus. |
THE INFORMATION IN THIS STRUCTURAL AND COLLATERAL TERM SHEET IS NOT COMPLETE AND MAY BE AMENDED PRIOR TO THE TIME OF SALE. THIS TERM SHEET IS NOT AN OFFER TO SELL THESE SECURITIES AND IT IS NOT A SOLICITATION OF AN OFFER TO BUY THESE SECURITIES IN ANY JURISDICTION WHERE THE OFFER OR SALE IS NOT PERMITTED.
28
| Wells Fargo Commercial Mortgage Trust 2017-C39 | Certain Terms and Conditions |
With respect to (x) any serviced whole loan and (y) any Servicing Shift Whole Loan prior to its Servicing Shift Securitization Date, if such whole loan becomes a defaulted loan under the WFCM 2017-C39 pooling and servicing agreement, the Special Servicer will generally be required to sell both the mortgage loan and the relatedpari passu companion loan(s) as a single whole loan. If the subject whole loan includes one or more subordinate companion loans, those subordinate companion loans may be included in such sale as well.
With respect to (x) each non-serviced whole loan and (y) each Servicing Shift Whole Loan after its related Servicing Shift Securitization Date, the applicable servicing agreement governing the servicing of such whole loan generally will provide that, if the relatedpari passu companion loan(s) serviced under such agreement become a defaulted loan under such servicing agreement, then the related special servicer may offer to sell to any person (or may offer to purchase) for cash such whole loan during such time as such applicablepari passu companion loan(s) constitute a defaulted loan under such servicing agreement. Generally speaking, in connection with any such sale, the related special servicer is required to sell both the mortgage loan and the relatedpari passu companion loan(s) as a whole loan. The directing certificateholder for this securitization generally will have consent and/or consultation rights as the holder of an interest in the related mortgage loan, as described in the Preliminary Prospectus. If the subject whole loan includes one or more subordinate companion loans, those subordinate companion loans may be included in such sale as well.
The procedures for the sale of any whole loan that becomes a defaulted whole loan, and any associated consultation rights, are subject to various limitations, conditions and exceptions as described in the Preliminary Prospectus. | ||
| “As-Is” Appraisals: | Appraisals must be conducted on an “as-is” basis, and must be no more than 12 months old, for purposes of determining Appraisal Reduction Amounts and market value in connection with REO sales. Required appraisals may consist of updates of prior appraisals. Internal valuations by the Special Servicer are permitted if the principal balance of a mortgage loan is less than $2,000,000. | |
| Operating Advisor: | The Operating Advisor will perform certain review duties if a Control Termination Event has occurred and is continuing, which will generally include a limited annual review of, and the delivery of a report regarding, certain actions of the Special Servicer with respect to the resolution and/or liquidation of specially serviced loans to the Certificate Administrator. The review and report generally will be based on any asset status reports and additional information delivered to the Operating Advisor by the Special Servicer. In addition, if a Control Termination Event has occurred and is continuing, the Special Servicer must seek to consult with the Operating Advisor (in addition to the directing certificateholder if no Consultation Termination Event has occurred and is continuing) in connection with material special servicing actions with respect to specially serviced loans. Furthermore, under certain circumstances, but only if a Consultation Termination Event has occurred and is continuing, the Operating Advisor may recommend the replacement of the Special Servicer, in which case the Certificate Administrator will deliver notice of such recommendation to the certificateholders, and certificateholders with specified percentages of the voting rights may direct the replacement of the Special Servicer at their expense.
If a Consultation Termination Event has occurred and is continuing, the Operating Advisor may be removed and replaced without cause upon the affirmative direction of certificate owners holding at least 75% of the appraisal-reduced voting rights of all Principal Balance Certificates, following a proposal from certificate owners holding not less than 25% of the appraisal-reduced voting rights of all certificates. The certificateholders who initiate a vote on a termination and replacement of the Operating Advisor without cause must cause Fitch, KBRA and Moody’s to confirm the then-current ratings of the certificates (or decline to review the matter) and cause the payment of the fees and expenses incurred in the replacement. The Operating Advisor generally may be discharged from its duties if and when the Class A-1, A-2, A-3, A-SB, A-4, A-5, A-S, B, C and D Certificates are retired. | |
| Asset Representations Reviewer: | The Asset Representations Reviewer will be required to review certain delinquent mortgage loans after a specified delinquency threshold has been exceeded (an “Asset Review Trigger”) and the required percentage of certificateholders vote to direct a review of such delinquent loans. An Asset Review Trigger will occur when either (1) mortgage loans with an aggregate outstanding principal balance of 25.0% or more of the aggregate outstanding principal balance of all of the mortgage loans (including any REO loans (or a portion of any REO loan in the case of a whole loan)) held by the issuing entity as of the end of the applicable collection period are delinquent loans or (2) at least 15 mortgage loans are delinquent loans as of the end of the |
THE INFORMATION IN THIS STRUCTURAL AND COLLATERAL TERM SHEET IS NOT COMPLETE AND MAY BE AMENDED PRIOR TO THE TIME OF SALE. THIS TERM SHEET IS NOT AN OFFER TO SELL THESE SECURITIES AND IT IS NOT A SOLICITATION OF AN OFFER TO BUY THESE SECURITIES IN ANY JURISDICTION WHERE THE OFFER OR SALE IS NOT PERMITTED.
29
| Wells Fargo Commercial Mortgage Trust 2017-C39 | Certain Terms and Conditions |
applicable collection period and the outstanding principal balance of such delinquent loans in the aggregate constitutes at least 20.0% of the aggregate outstanding principal balance of all of the mortgage loans (including any REO loans (or a portion of any REO loan in the case of a whole loan)) held by the issuing entity as of the end of the applicable collection period. See “Pooling and Servicing Agreement—The Asset Representations Reviewer—Asset Review” in the Preliminary Prospectus.
The Asset Representations Reviewer may be terminated and replaced without cause. Upon (i) the written direction of certificateholders evidencing not less than 25% of the voting rights (without regard to the application of any Appraisal Reduction Amounts) requesting a vote to terminate and replace the Asset Representations Reviewer with a proposed successor Asset Representations Reviewer that is an eligible asset reviewer, and (ii) payment by such holders to the certificate administrator of the reasonable fees and expenses to be incurred by the certificate administrator in connection with administering such vote, the certificate administrator will promptly provide notice to all certificateholders and the Asset Representations Reviewer of such request by posting such notice on its internet website, and by mailing such notice to all certificateholders and the Asset Representations Reviewer. Upon the written direction of certificateholders evidencing at least 75% of a certificateholder quorum (without regard to the application of any Appraisal Reduction Amounts), the Trustee will terminate all of the rights and obligations of the Asset Representations Reviewer under the WFCM 2017-C39 pooling and servicing agreement by written notice to the Asset Representations Reviewer, and the proposed successor Asset Representations Reviewer will be appointed. See “Pooling and Servicing Agreement—The Asset Representations Reviewer” in the Preliminary Prospectus. | ||
| Dispute Resolution Provisions: | The mortgage loan sellers will be subject to the dispute resolution provisions set forth in the WFCM 2017-C39 pooling and servicing agreement to the extent those provisions are triggered with respect to any mortgage loan sold to the depositor by a mortgage loan seller and such mortgage loan seller will be obligated under the related mortgage loan purchase agreement to comply with all applicable provisions and to take part in any mediation or arbitration proceedings that may result.
Generally, in the event that a Repurchase Request (as defined in the Preliminary Prospectus) is not “Resolved” (as defined below) within 180 days after the related mortgage loan seller receives such Repurchase Request, then the enforcing servicer will be required to send a notice to the “Initial Requesting Certificateholder” (if any) and the Certificate Administrator indicating the enforcing servicer’s intended course of action with respect to the Repurchase Request. If (a) the enforcing servicer’s intended course of action with respect to the Repurchase Request does not involve pursuing further action to exercise rights against the related mortgage loan seller with respect to the Repurchase Request and the Initial Requesting Certificateholder, if any, or any other certificateholder or certificate owner wishes to exercise its right to refer the matter to mediation (including non-binding arbitration) or arbitration, or (b) the enforcing servicer’s intended course of action is to pursue further action to exercise rights against the related mortgage loan seller with respect to the Repurchase Request but the Initial Requesting Certificateholder, if any, or any other certificateholder or certificate owner does not agree with the dispute resolution method selected by the enforcing servicer, then the Initial Requesting Certificateholder, if any, or such other certificateholder or certificate owner may deliver a written notice to the Special Servicer indicating its intent to exercise its right to refer the matter to either mediation or arbitration.
“Resolved” means, with respect to a Repurchase Request, (i) that the related Material Defect has been cured, (ii) the related mortgage loan has been repurchased in accordance with the related mortgage loan purchase agreement, (iii) a mortgage loan has been substituted for the related mortgage loan in accordance with the related mortgage loan purchase agreement, (iv) the applicable mortgage loan seller has made a Loss of Value Payment (as defined in the Preliminary Prospectus), (v) a contractually binding agreement is entered into between the enforcing servicer, on behalf of the issuing entity, and the related mortgage loan seller that settles the related mortgage loan seller’s obligations under the related mortgage loan purchase agreement or (vi) the related mortgage loan is no longer property of the issuing entity as a result of a sale or other disposition in accordance with the WFCM 2017-C39 pooling and servicing agreement. See “Pooling and Servicing Agreement—Dispute Resolution Provisions” in the Preliminary Prospectus. | |
| Investor Communications: | The certificate administrator is required to include on any Form 10–D any request received from a certificateholder to communicate with other certificateholders related to certificateholders exercising their rights under the terms of the WFCM 2017-C39 pooling and servicing agreement. Any certificateholder wishing to communicate with other certificateholders regarding the exercise of its rights under the terms of the WFCM 2017-C39 pooling and |
THE INFORMATION IN THIS STRUCTURAL AND COLLATERAL TERM SHEET IS NOT COMPLETE AND MAY BE AMENDED PRIOR TO THE TIME OF SALE. THIS TERM SHEET IS NOT AN OFFER TO SELL THESE SECURITIES AND IT IS NOT A SOLICITATION OF AN OFFER TO BUY THESE SECURITIES IN ANY JURISDICTION WHERE THE OFFER OR SALE IS NOT PERMITTED.
30
| Wells Fargo Commercial Mortgage Trust 2017-C39 | Certain Terms and Conditions |
servicing agreement will be able to deliver a written request signed by an authorized representative of the requesting investor to the certificate administrator. | ||
| Certain Fee Offsets: | If a workout fee is earned by the Special Servicer following a loan default with respect to any mortgage loan that it services, then certain limitations will apply based on modification fees paid by the borrower. The modification fee generally must not exceed 1% of the principal balance of the loan as modified in any 12-month period. In addition, if the loan re-defaults, any subsequent workout fee on that loan must be reduced by a portion of the modification fees paid by the borrower in the previous 12-months. Likewise, liquidation fees collected in connection with a liquidation or partial liquidation of a mortgage loan must be reduced by a portion of the modification fees paid by the borrower in the previous 12 months. | |
| Deal Website: | The Certificate Administrator will be required to maintain a deal website, which will include, among other items: (a) summaries of asset status reports prepared by the Special Servicer, (b) inspection reports, (c) appraisals, (d) various “special notices” described in the Preliminary Prospectus, (e) the “Investor Q&A Forum”, (f) a voluntary “Investor Registry” and (g) the “Risk Retention” tab. Investors may access the deal website following execution of a certification and confidentiality agreement. | |
| Initial Majority Controlling Class Certificateholder: | It is expected that B-Piece Holdings Cayman Limited or an affiliate will be the initial majority controlling class certificateholder. B-Piece Holdings Cayman Limited or such affiliate will be a “majority-owned affiliate” (as defined in the U.S. credit risk retention rules) of Argentic Real Estate Finance LLC. | |
| Whole Loans: | Each of the mortgaged properties identified above under “IV. Characteristics of the Mortgage Pool—B. Summary of the Whole Loans” secures both a mortgage loan to be included in the trust fund and one or more other mortgage loans that will not be included in the trust fund, each of which will bepari passu or subordinate in right of payment with the mortgage loan included in the trust fund. We refer to each such group of mortgage loans as a “whole loan”. Such “—Summary of the Whole Loans” section includes further information regarding the various notes in each whole loan, the holders of such notes, the lead servicing agreement for each such whole loan, and the master servicer and special servicer under such lead servicing agreement. |
THE INFORMATION IN THIS STRUCTURAL AND COLLATERAL TERM SHEET IS NOT COMPLETE AND MAY BE AMENDED PRIOR TO THE TIME OF SALE. THIS TERM SHEET IS NOT AN OFFER TO SELL THESE SECURITIES AND IT IS NOT A SOLICITATION OF AN OFFER TO BUY THESE SECURITIES IN ANY JURISDICTION WHERE THE OFFER OR SALE IS NOT PERMITTED.
31
(THIS PAGE INTENTIONALLY LEFT BLANK)
THE INFORMATION IN THIS STRUCTURAL AND COLLATERAL TERM SHEET IS NOT COMPLETE AND MAY BE AMENDED PRIOR TO THE TIME OF SALE. THIS TERM SHEET IS NOT AN OFFER TO SELL THESE SECURITIES AND IT IS NOT A SOLICITATION OF AN OFFER TO BUY THESE SECURITIES IN ANY JURISDICTION WHERE THE OFFER OR SALE IS NOT PERMITTED.
32
| 225 & 233 PARK AVENUE SOUTH |
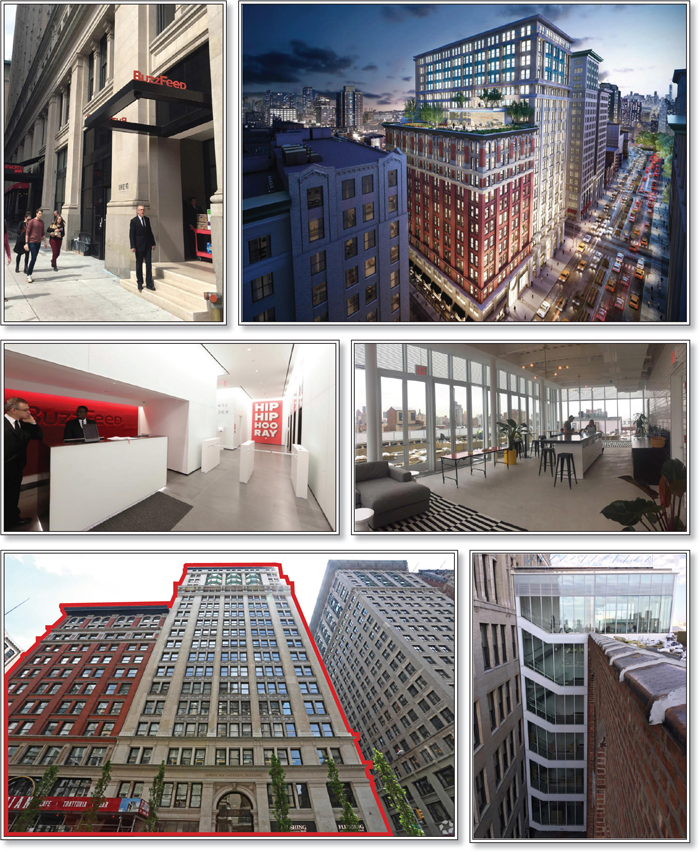
THE INFORMATION IN THIS STRUCTURAL AND COLLATERAL TERM SHEET IS NOT COMPLETE AND MAY BE AMENDED PRIOR TO THE TIME OF SALE. THIS TERM SHEET IS NOT AN OFFER TO SELL THESE SECURITIES AND IT IS NOT A SOLICITATION OF AN OFFER TO BUY THESE SECURITIES IN ANY JURISDICTION WHERE THE OFFER OR SALE IS NOT PERMITTED.
33
| 225 & 233 PARK AVENUE SOUTH |
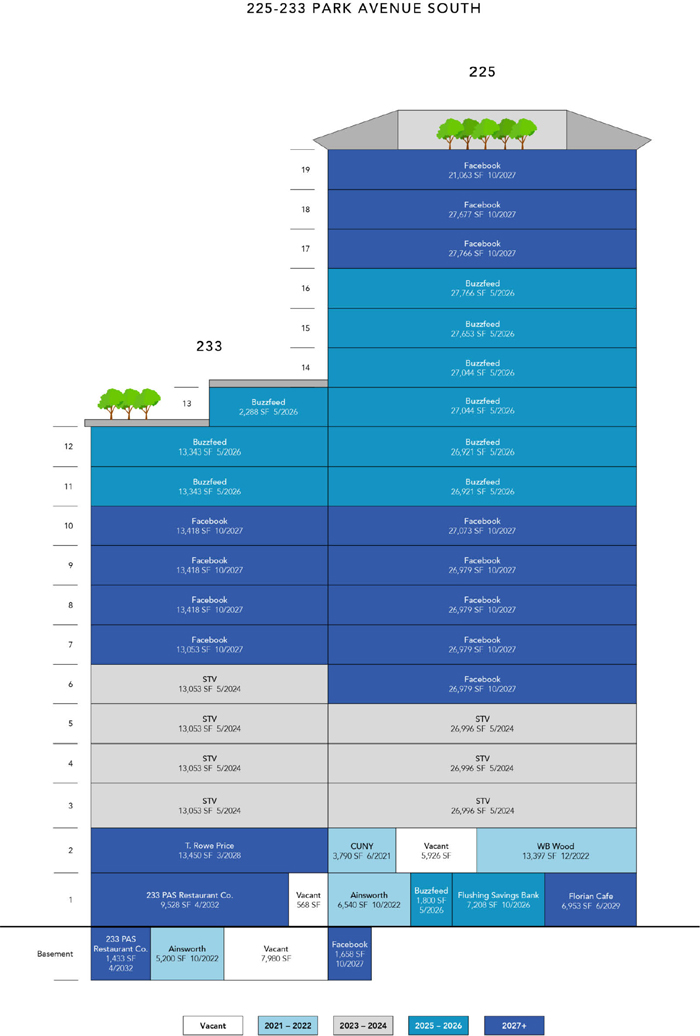
THE INFORMATION IN THIS STRUCTURAL AND COLLATERAL TERM SHEET IS NOT COMPLETE AND MAY BE AMENDED PRIOR TO THE TIME OF SALE. THIS TERM SHEET IS NOT AN OFFER TO SELL THESE SECURITIES AND IT IS NOT A SOLICITATION OF AN OFFER TO BUY THESE SECURITIES IN ANY JURISDICTION WHERE THE OFFER OR SALE IS NOT PERMITTED.
34
| 225 & 233 PARK AVENUE SOUTH |
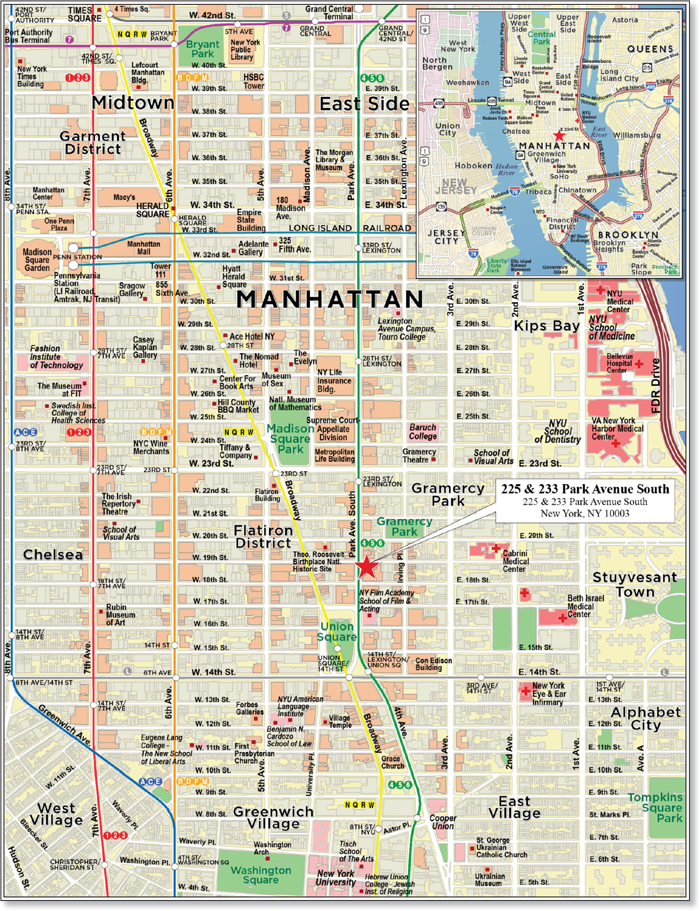
THE INFORMATION IN THIS STRUCTURAL AND COLLATERAL TERM SHEET IS NOT COMPLETE AND MAY BE AMENDED PRIOR TO THE TIME OF SALE. THIS TERM SHEET IS NOT AN OFFER TO SELL THESE SECURITIES AND IT IS NOT A SOLICITATION OF AN OFFER TO BUY THESE SECURITIES IN ANY JURISDICTION WHERE THE OFFER OR SALE IS NOT PERMITTED.
35
| No. 1 – 225 & 233 Park Avenue South | ||||||||
| Loan Information | Property Information | |||||||
| Mortgage Loan Seller: | Barclays Bank PLC | Single Asset/Portfolio: | Single Asset | |||||
| Credit Assessment (Fitch/KBRA/Moody’s): | BBB+/A/NR | Property Type: | Office | |||||
| Original Principal Balance(1): | $70,000,000 | Specific Property Type: | CBD | |||||
| Cut-off Date Balance(1): | $70,000,000 | Location: | New York, NY | |||||
| % of Initial Pool Balance: | 6.2% | Size: | 675,756 SF | |||||
| Loan Purpose: | Refinance | Cut-off Date Balance Per SF: | $347.76 | |||||
| Borrower Name: | 225 Fourth LLC | Year Built/Renovated: | 1909/2017 | |||||
| Borrower Sponsor: | Orda Management Corporation | Title Vesting: | Fee | |||||
| Mortgage Rate: | 3.6514% | Property Manager: | Self-Managed | |||||
| Note Date: | May 31, 2017 | 4thMost Recent Occupancy (As of)(5): | 100.0% (12/31/2013) | |||||
| Anticipated Repayment Date: | NAP | 3rdMost Recent Occupancy (As of)(5): | 95.8% (12/31/2014) | |||||
| Maturity Date: | June 6, 2027 | 2ndMost Recent Occupancy (As of)(5): | 49.2% (12/31/2015) | |||||
| IO Period: | 120 months | Most Recent Occupancy (As of)(5): | 96.6% (12/31/2016) | |||||
| Loan Term (Original): | 120 months | Current Occupancy (As of)(5)(6): | 97.9% (5/24/2017) | |||||
| Seasoning: | 2 months | |||||||
| Amortization Term (Original): | NAP | Underwriting and Financial Information: | ||||||
| Loan Amortization Type: | Interest-only, Balloon | 4thMost Recent NOI (As of)(7): | $21,053,461 (12/31/2014) | |||||
| Interest Accrual Method: | Actual/360 | 3rdMost Recent NOI (As of)(7): | $22,749,971 (12/31/2015) | |||||
| Call Protection(2): | L(26),D(89),O(5) | 2ndMost Recent NOI (As of)(7): | $16,244,360 (12/31/2016) | |||||
| Lockbox Type: | Hard/Springing Cash Management | Most Recent NOI (As of)(7): | $15,248,156 (TTM 3/31/2017) | |||||
| Additional Debt(1): | Yes | |||||||
| Additional Debt Type(1)(3): | Pari Passu; Mezzanine; Future Mezzanine | |||||||
| U/W Revenues: | $48,106,942 | |||||||
| U/W Expenses: | $18,601,103 | |||||||
| U/W NOI(7): | $29,505,839 | |||||||
| Escrows and Reserves(4): | U/W NCF: | $28,439,583 | ||||||
| U/W NOI DSCR(1): | 3.39x | |||||||
| Type: | Initial | Monthly | Cap (If Any) | U/W NCF DSCR(1): | 3.27x | |||
| Taxes | $0 | Springing | NAP | U/W NOI Debt Yield(1): | 12.6% | |||
| Insurance | $0 | Springing | NAP | U/W NCF Debt Yield(1): | 12.1% | |||
| Replacement Reserves | $0 | Springing | NAP | As-Is Appraised Value(8): | $750,000,000 | |||
| TI/LC Reserve | $8,106,455 | Springing | NAP | As-Is Appraisal Valuation Date: | April 1, 2017 | |||
| Remaining Capital Expenditures | $11,529,288 | $0 | NAP | Cut-off Date LTV Ratio(1)(8): | 31.3% | |||
| Free Rent Reserve | $14,864,252 | $0 | NAP | LTV Ratio at Maturity or ARD(1)(8): | 31.3% | |||
| Buzzfeed Rollover Reserve | $0 | Springing | $13,000,000 | |||||
| (1) | See “The Mortgage Loan” section. All statistical information related to balances per square foot, loan-to-value ratios, debt service coverage ratios and debt yields are based on the 225 & 233 Park Avenue South Whole Loan (as defined below). The Cut-off Date LTV Ratio, U/W NCF DSCR and U/W NOI Debt Yield based on the 225 & 233 Park Avenue South Total Debt (as defined below), including the 225 & 233 Park Avenue South Mezzanine Loan (as defined below), are 57.3%, 1.59x and 6.9%, respectively. |
| (2) | The lockout period will be at least 26 payments, beginning with and including the first payment date of July 6, 2017. Defeasance of the 225 & 233 Park Avenue South Mortgage Loan is permitted at any time after the earlier to occur of (i) May 31, 2020 or (ii) two years after the closing date of the securitization that includes the last note to be securitized. |
| (3) | See “Subordinate and Mezzanine Indebtedness” section. |
| (4) | See “Escrows” section. |
| (5) | See “Historical Occupancy” section. |
| (6) | Current Occupancy includes the Facebook Expansion Space (as defined below) and Facebook’s 8th floor space (40,397 square feet), which have lease commencement dates of July 1, 2018 and June 1, 2017, respectively. The tenant is currently building out both spaces. The tenant expects to take occupancy of the 8th floor space in November 2017. All free rent amounts attributable to both spaces were deposited into escrow by the borrower on the origination date. |
| (7) | See “Cash Flow Analysis” section. |
| (8) | See “Appraisal” section. The As-Is Appraised Value reflects the “As-is assuming holdbacks” value for the 225 & 233 Park Avenue South Property (as defined below) which assumes that all outstanding amounts for TI/LCs, free rent and capital expenditures are deposited into escrow on the origination date. The borrower deposited all such amounts into escrow on the origination date. The “As-is” appraised value is $720,000,000, which results in a Cut-off Date LTV Ratio and an LTV at Maturity or ARD for the 225 & 233 Park Avenue South Whole Loan and 225 & 233 Park Avenue South Total Debt of 32.6% and 59.7%, respectively. |
The Mortgage Loan.The mortgage loan (the “225 & 233 Park Avenue South Mortgage Loan”) is part of a whole loan (the “225 & 233 Park Avenue South Whole Loan”) evidenced by fourpari passu notes secured by a first mortgage encumbering the fee interest in two, contiguous office buildings located on Park Avenue South between East 18th and East 19th streets in Manhattan, New York (the “225 & 233 Park Avenue South Property”). The 225 & 233 Park Avenue South Whole Loan was originated on May 31, 2017 by Barclays Bank PLC. The 225 & 233 Park Avenue South Whole Loan had an original principal balance of $235,000,000, has an outstanding principal balance as of the Cut-off Date of $235,000,000 and accrues interest at an interest rate of 3.6514%per annum. The 225 & 233 Park Avenue South Whole Loan had an initial term of 120 months, has a remaining term of 118 months as of the Cut-
THE INFORMATION IN THIS STRUCTURAL AND COLLATERAL TERM SHEET IS NOT COMPLETE AND MAY BE AMENDED PRIOR TO THE TIME OF SALE. THIS TERM SHEET IS NOT AN OFFER TO SELL THESE SECURITIES AND IT IS NOT A SOLICITATION OF AN OFFER TO BUY THESE SECURITIES IN ANY JURISDICTION WHERE THE OFFER OR SALE IS NOT PERMITTED.
36
225 & 233 PARK AVENUE SOUTH
off Date and requires payments of interest-only through the term of the 225 & 233 Park Avenue South Whole Loan. The 225 & 233 Park Avenue South Whole Loan matures on June 6, 2027.
Note A-1, which will be contributed to the WFCM 2017-C39 Trust, had an original principal balance of $70,000,000, has an outstanding principal balance as of the Cut-off Date of $70,000,000 and represents the controlling interest in the 225 & 233 Park Avenue South Whole Loan. The non-controlling Note A-4, which had an original principal balance of $45,000,000, was contributed to the WFCM 2017-C38 Trust. The non-controlling Notes A-2 and A-3, which have an aggregate original principal balance of $120,000,000, are currently held by Barclays Bank PLC and are expected to be contributed to a future securitization trust or trusts. Each of the mortgage loans evidenced by Note A-2, A-3 and A-4 are referred to herein as the “225 & 233 Park Avenue South Companion Loans”. The lender provides no assurances that any non-securitizedpari passu notes will not be split further. See“Description of the Mortgage Pool—The Whole Loans—The Serviced Whole Loans” and“Pooling and Servicing Agreement” in the Preliminary Prospectus.
Note Summary(1)
| Notes | Original Balance | Note Holder | Controlling Interest | |
| A-1 | $70,000,000 | WFCM 2017-C39 | Yes | |
| A-2 | $60,000,000 | Barclays Bank PLC | No | |
| A-3 | $60,000,000 | Barclays Bank PLC | No | |
| A-4 | $45,000,000 | WFCM 2017-C38 | No | |
| Total | $235,000,000 |
| (1) | The lender provides no assurances that any non-securitizedpari passu note will not be split further. |
Following the lockout period, on any date before February 6, 2027, the borrower has the right to defease the 225 & 233 Park Avenue South Whole Loan in whole, but not in part. The lockout period will expire on the earlier to occur of (i) two years after the closing date of the securitization that includes the last note to be securitized or (ii) May 31, 2020. The 225 & 233 Park Avenue South Whole Loan is prepayable without penalty on or after February 6, 2027.
Sources and Uses
| Sources | Uses | |||||||
| Original whole loan amount | $235,000,000 | 54.7% | Loan Payoff | $226,370,056 | 52.6% | |||
| Mezzanine Loan | 195,000,000 | 45.3 | Return of equity | 159,383,488 | 37.1 | |||
| Reserves | 34,499,995 | 8.0 | ||||||
| Closing costs | 9,746,461 | 2.3 | ||||||
| Total Sources | $430,000,000 | 100.0% | Total Uses | $430,000,000 | 100.0% |
The Property.The 225 & 233 Park Avenue South Property comprises two contiguous Class A office buildings, totaling 675,756 square feet, located on Park Avenue South, between East 18th and East 19th Streets in Manhattan, New York. 225 Park Avenue South is a 19-story Class A office building with 503,104 square feet built in 1910. 233 Park Avenue South is a 13-story Class A office building built in 1909 with 172,652 square feet. The two buildings operate as a single property, as they are interconnected on each floor. The 225 & 233 Park Avenue South Property provides various amenities, including, but not limited to, exclusive outdoor spaces on the roof of each building, bike storage and separate entrances, one on Park Avenue South and one on East 18th Street. The 225 & 233 Park Avenue South Property is located one block north of Union Square and one block south of Gramercy Park. According to the appraisal, the 225 & 233 Park Avenue South Property is considered to be located in a trendy, upscale neighborhood with access to restaurants, nightclubs, galleries, theaters and universities. As of May 24, 2017, the 225 & 233 Park Avenue South Property was 97.9% leased to 10 tenants.
Prior to 2014, the 225 & 233 Park Avenue South Property was 100.0% occupied by the Port Authority of New York and New Jersey (the “Port Authority”) and STV. Once the Port Authority elected to leave the building in 2015, the borrower sponsor commenced an approximately $133 million capital improvement plan for the 225 & 233 Park Avenue South Property. Of the $133 million, approximately $113.6 million had been spent as of the origination date on various hard and soft improvements and tenant improvements and leasing costs for Facebook, Buzzfeed, T. Rowe Price and the new ground floor restaurant. The remaining $19.6 million was deposited into escrow by the borrower on the origination date. The outstanding hard and soft improvements include upgrading the elevators, building out the 19th floor garden courtyard/rooftop and finishing the build-out of the ground floor retail.
The 225 & 233 Park Avenue South Property’s largest tenant is Facebook, a technology company whose platforms allow users to communicate with family, friends and coworkers. Facebook utilizes the 225 & 233 Park Avenue South Property as its marketing headquarters and leases 39.4% of net rentable area through October 2027. Facebook has been a tenant at the 225 & 233 Park Avenue South Property since October 2016 and has invested approximately $60 million in excess of its initial tenant improvement allowance into its respective space. The build-out includes a sit-down restaurant and garden courtyard/rooftop on the 19thfloor, a contiguous staircase between the 8th, 9th and 10th floors and interior design by Frank Gehry. On May 26, 2017, Facebook exercised an expansion option to lease a portion of the 6th floor and the entire 7th floor, an increase of 67,011 square feet. The tenant is currently engaged in the build-out of the expansion space and is expected to take occupancy in July 2018. As of December 31, 2016, Facebook had approximately 1.23 billion daily active users.
The second largest tenant, Buzzfeed, leases 28.7% of net rentable area through May 2026 (see “Escrows” below). Buzzfeed is an independent digital media company delivering news and entertainment to millions of users globally. Buzzfeed, who has its
THE INFORMATION IN THIS STRUCTURAL AND COLLATERAL TERM SHEET IS NOT COMPLETE AND MAY BE AMENDED PRIOR TO THE TIME OF SALE. THIS TERM SHEET IS NOT AN OFFER TO SELL THESE SECURITIES AND IT IS NOT A SOLICITATION OF AN OFFER TO BUY THESE SECURITIES IN ANY JURISDICTION WHERE THE OFFER OR SALE IS NOT PERMITTED.
37
225 & 233 PARK AVENUE SOUTH
headquarters at 225 & 233 Park Avenue South, has been a tenant at the 225 & 233 Park Avenue South Property since June 2015 and has spent approximately $23.9 million in excess of its initial tenant improvement allowance into its space. Buzzfeed has its own separate building entrance on East 18th street and has a garden courtyard/rooftop on the 13th floor (the top floor of the 233 Park Avenue South Property). As of November 2016, Buzzfeed raised approximately $200 million from NBCUniversal, increasing the company’s investment in Buzzfeed to approximately $400 million. Based on the terms of the NBCUniversal investment, Buzzfeed would be valued at approximately $1.7 billion.
The third largest tenant is STV, a firm offering engineering, architectural, planning, environmental and construction management services. STV leases 19.7% of net rentable area through May 2024, has been a tenant at the 225 & 233 Park Avenue South Property since 1983 and recently expanded into a portion of the fourth floor totaling 13,053 square feet.
The following table presents certain information relating to the tenancy at the 225 & 233 Park Avenue South Property:
Major Tenants
| Tenant Name | Credit Rating (Fitch/Moody’s /S&P)(1) | Tenant NRSF | % of NRSF | Annual U/W Base Rent PSF | Annual U/W Base Rent | % of Total Annual U/W Base Rent | Lease Expiration Date |
| Major Tenants | |||||||
| Facebook(2)(3) | NR/NR/NR | 266,460 | 39.4% | $79.36 | $21,146,899 | 45.1% | 10/31/2027(4)(5) |
| Buzzfeed(6)(7) | NR/NR/NR | 194,123 | 28.7% | $76.28 | $14,808,325 | 31.6% | 5/31/2026 |
| STV | NR/NR/NR | 133,200 | 19.7% | $45.33 | $6,037,948 | 12.9% | 5/31/2024(8) |
| 233 PAS Restaurant Co.(9) | NR/NR/NR | 10,961 | 1.6% | $100.36 | $1,100,000 | 2.3% | 4/30/2032(10) |
| T. Rowe Price(11) | NR/NR/NR | 13,450 | 2.0% | $78.00 | $1,049,100 | 2.2% | 3/31/2028(12) |
| Total Major Tenants | 618,194 | 91.5% | $71.41 | $44,142,272 | 94.2% | ||
| Non-Major Tenants | 43,088 | 6.4% | $63.64 | $2,742,314 | 5.8% | ||
| Occupied Collateral Total | 661,282 | 97.9% | $70.90 | $46,884,586 | 100.0% | ||
| Vacant Space | 14,474 | 2.1% | |||||
| Collateral Total | 675,756 | 100.0% | |||||
| (1) | Certain ratings are those of the parent company whether or not the parent guarantees the lease. |
| (2) | Facebook recently exercised its expansion option at the 225 & 233 Park Avenue South Property for a portion of the 6th floor and the entire 7th floor totaling 67,011 square feet (the “Facebook Expansion Space”). |
| (3) | Facebook is entitled to 19 months of free rent through December 2018 for the Facebook Expansion Space (9.9% of net rentable area), 12 months of free rent through May 2018 for the 8thfloor, totaling 40,397 square feet (6.0% of net rentable area) and five months of free rent through October 2017 for the 18th and 19th floors, totaling 48,740 square feet (7.2% of net rentable area). Such free rent amount was deposited into escrow by the borrower on the origination date. |
| (4) | Facebook has one five-year lease renewal option on the (i) 8th, 9th, 10th, 17th, 18th and 19th floors, (ii) 9th and 10th floors, (iii) 17th, 18th and 19th floors or (iv) 9th, 10th, 17th, 18th and 19thfloors. |
| (5) | Facebook has a one-time right to terminate its lease effective March 31, 2024 by providing 18 months’ written notice and delivering a termination payment of $32,991,937. However, the termination payment will be increased by seven months of fixed rent with respect to the Facebook Expansion Space and the unamortized value of the transaction costs with respect to the Facebook Expansion Space amortized at a 6% interest rate over the term of the Facebook Expansion Space. |
| (6) | Buzzfeed currently subleases the entire 11th floor of the 225 building (26,921 square feet) to Teacher Synergy, LLC, through June 30, 2019. The sublease will automatically renew on a month-to-month basis after the expiration date until either Buzzfeed or Teacher Synergy, LLC give six months’ termination notice to one another. |
| (7) | Buzzfeed is entitled to 16 months of free rent through September 2018 on 2,288 square feet (0.3% of the net rentable area). Such free rent amount was deposited into escrow by the borrower on the origination date. |
| (8) | STV has one, ten-year lease renewal option. The renewal may apply to all or a part of the STV premises, provided that the renewal may not consist of less than two full contiguous floors within the 225 & 233 Park Avenue South Property. |
| (9) | 233 PAS Restaurant Co. is entitled to 10 months of free rent through March 2018 on 9,488 square feet (1.4% of net rentable area). Such free rent amount was deposited into escrow by the borrower on the origination date. |
| (10) | 233 PAS Restaurant Co. has one, five-year lease renewal option. |
| (11) | T. Rowe Price is entitled to nine months of free rent through February 2018 on 13,450 square feet (2.0% of net rentable area). Such free rent amount was deposited into escrow by the borrower on the origination date. |
| (12) | T. Rowe Price has one, five-year lease renewal option. |
THE INFORMATION IN THIS STRUCTURAL AND COLLATERAL TERM SHEET IS NOT COMPLETE AND MAY BE AMENDED PRIOR TO THE TIME OF SALE. THIS TERM SHEET IS NOT AN OFFER TO SELL THESE SECURITIES AND IT IS NOT A SOLICITATION OF AN OFFER TO BUY THESE SECURITIES IN ANY JURISDICTION WHERE THE OFFER OR SALE IS NOT PERMITTED.
38
| 225 & 233 PARK AVENUE SOUTH |
The following table presents certain information relating to the lease rollover schedule at the 225 & 233 Park Avenue South Property:
Lease Expiration Schedule(1)(2)
| Year Ending December 31, | No. of Leases Expiring | Expiring NRSF | % of Total NRSF | Cumulative Expiring NRSF | Cumulative % of Total NRSF | Annual U/W Base Rent | % of Annual U/W Base Rent | Annual U/W Base Rent PSF |
| MTM | 0 | 0 | 0.0% | 0 | 0.0% | $0 | 0.0% | $0.00 |
| 2017 | 0 | 0 | 0.0% | 0 | 0.0% | $0 | 0.0% | $0.00 |
| 2018 | 0 | 0 | 0.0% | 0 | 0.0% | $0 | 0.0% | $0.00 |
| 2019 | 0 | 0 | 0.0% | 0 | 0.0% | $0 | 0.0% | $0.00 |
| 2020 | 0 | 0 | 0.0% | 0 | 0.0% | $0 | 0.0% | $0.00 |
| 2021 | 1 | 3,790 | 0.6% | 3,790 | 0.6% | $287,547 | 0.6% | $75.87 |
| 2022 | 2 | 25,137 | 3.7% | 28,927 | 4.3% | $1,353,139 | 2.9% | $53.83 |
| 2023 | 0 | 0 | 0.0% | 28,927 | 4.3% | $0 | 0.0% | $0.00 |
| 2024 | 1 | 133,200 | 19.7% | 162,127 | 24.0% | $6,037,948 | 12.9% | $45.33 |
| 2025 | 0 | 0 | 0.0% | 162,127 | 24.0% | $0 | 0.0% | $0.00 |
| 2026 | 2 | 201,331 | 29.8% | 363,458 | 53.8% | $15,309,953 | 32.7% | $76.04 |
| 2027 | 1 | 266,460 | 39.4% | 629,918 | 93.2% | $21,146,899 | 45.1% | $79.36 |
| Thereafter | 3 | 31,364 | 4.6% | 661,282 | 97.9% | $2,749,100 | 5.9% | $87.65 |
| Vacant | 0 | 14,474 | 2.1% | 675,756 | 100.0% | $0 | 0.0% | $0.00 |
| Total/Weighted Average | 10 | 675,756 | 100.0% | $46,884,586 | 100.0% | $70.90 |
| (1) | Information obtained from the underwritten rent roll and includes rent steps through April 2018. |
| (2) | Certain tenants may have lease termination or contraction options that are exercisable prior to the originally stated expiration date of the subject lease and that are not considered in the Lease Expiration Schedule. |
The following table presents historical occupancy percentages at the 225 & 233 Park Avenue South Property:
Historical Occupancy
12/31/2013(1) | 12/31/2014(1)(2) | 12/31/2015(1)(2) | 12/31/2016(1) | 5/24/2017(3)(4) |
| 100.0% | 95.8% | 49.2% | 96.6% | 97.9% |
| (1) | Information obtained from the borrower. |
| (2) | The decrease in occupancy from year-end 2014 to year-end 2015 is a result of Port Authority vacating its premises at the 225 & 233 Park Avenue South Property, except for Floors 4 and 8 in the 233 Park Avenue South building. The borrower sponsor commenced gut renovating the space made available after Port Authority vacated. |
| (3) | Information obtained from the underwritten rent roll. |
| (4) | Current Occupancy includes the Facebook Expansion Space and Facebook’s 8th floor space (40,397 square feet), which have a lease commencement date of July 1, 2018 and June 1, 2017, respectively. The tenant is currently building out both spaces. The tenant expects to take occupancy of the 8th floor space in November 2017. All free rent amounts attributable to both spaces were deposited into escrow by the borrower on the origination date. |
THE INFORMATION IN THIS STRUCTURAL AND COLLATERAL TERM SHEET IS NOT COMPLETE AND MAY BE AMENDED PRIOR TO THE TIME OF SALE. THIS TERM SHEET IS NOT AN OFFER TO SELL THESE SECURITIES AND IT IS NOT A SOLICITATION OF AN OFFER TO BUY THESE SECURITIES IN ANY JURISDICTION WHERE THE OFFER OR SALE IS NOT PERMITTED.
39
| 225 & 233 PARK AVENUE SOUTH |
Operating History and Underwritten Net Cash Flow. The following table presents certain information relating to the historical operating performance and the underwritten net cash flow at the 225 & 233 Park Avenue South Property:
Cash Flow Analysis
| 2014 | 2015(1) | 2016(1)(2) | TTM 3/31/2017(2) | U/W(3) | % of U/W Effective Gross Income | U/W $ per SF | |
| Base Rent(4) | $34,757,905 | $36,390,135 | $30,962,652 | $31,901,632 | $45,723,854 | 95.0% | $67.66 |
| Grossed Up Vacant Space | 0 | 0 | 0 | 0 | 977,863 | 2.0 | 1.45 |
| Rent Steps | 0 | 0 | 0 | 0 | 445,767 | 0.9 | 0.66 |
| Total Reimbursables | 5,329,836 | 5,220,534 | 4,283,556 | 2,896,654 | 2,082,476 | 4.3 | 3.08 |
| Other Income(5) | 311,227 | 271,394 | 248,411 | 245,387 | 245,387 | 0.5 | 0.36 |
| Less Vacancy & Credit Loss | 0 | 0 | 0 | 0 | (1,368,405) | (2.8) | (2.02) |
| Effective Gross Income | $40,398,967 | $41,882,063 | $35,494,619 | $35,043,673 | 48,106,942 | 100.0% | $71.19 |
| Total Operating Expenses | $19,345,506 | $19,132,092 | $19,250,259 | $19,795,518 | $18,601,103 | 38.7% | $27.53 |
| Net Operating Income | $21,053,461 | $22,749,971 | $16,244,360 | $15,248,156 | $29,505,839 | 61.3% | $43.66 |
| TI/LC | 0 | 0 | 0 | 0 | 991,923 | 2.1 | 1.47 |
| Capital Expenditures | 0 | 0 | 0 | 0 | 74,333 | 0.2 | 0.11 |
| Net Cash Flow | $21,053,461 | $22,749,971 | $16,244,360 | $15,248,156 | $28,439,583 | 59.1% | $42.09 |
| NOI DSCR(6) | 2.42x | 2.61x | 1.87x | 1.75x | 3.39x | ||
| NCF DSCR(6) | 2.42x | 2.61x | 1.87x | 1.75x | 3.27x | ||
| NOI DY(6) | 9.0% | 9.7% | 6.9% | 6.5% | 12.6% | ||
| NCF DY(6) | 9.0% | 9.7% | 6.9% | 6.5% | 12.1% |
| (1) | The decrease in Net Operating Income from 2015 to 2016 is primarily due to the Port Authority of New York and New Jersey vacating its premises in March 2015, with the exception of Floors 4 and 8. The Port Authority of New York and New Jersey previously occupied 305,426 square feet and at rental rates between $56 and $62 per square foot on a modified gross basis. |
| (2) | The decrease in Net Operating Income from 2016 to TTM 3/31/2017 is a result of the borrower sponsor’s gut renovation of the space previously occupied by the Port Authority of New York and New Jersey. Additionally, two tenants, Buzzfeed and Facebook, totaling 186,368 square feet (27.6% of the net rentable area) were in free rent periods. |
| (3) | The increase in Effective Gross Income from TTM 3/31/2017 to U/W is primarily due to (i) Facebook’s signed-not-occupied rent of $8,163,008 for the Facebook Expansion Space and its space on the 8th floor, (ii) three tenants (Buzzfeed, Facebook and STV) totaling 198,791 square feet (29.4% of net rentable area) concluding their rent abatement period and (iii) rent steps taken through April 2018. |
| (4) | Underwritten Base Rent is inclusive of a rent credit of $714,965 for Facebook who is reimbursed $2.70 per square foot for cleaning costs. |
| (5) | Other Income consists of cleaning income and other miscellaneous items. |
| (6) | Debt service coverage ratios and debt yields are based on the 225 & 233 Park Avenue South Whole Loan. |
Appraisal.As of the appraisal valuation date of April 1, 2017 the 225 & 233 Park Avenue South Property had an “as-is” appraised value of $720,000,000, which equates to an “as-is” Cut-off Date LTV of 32.6% and 59.7% for the 225 & 233 Park Avenue South Whole Loan and the 225 & 233 Park Avenue South Total Debt, respectively. The appraiser also concluded to an “as-is assuming holdbacks” value of $750,000,000 as of April 1, 2017, which equates to an “as-is assuming holdbacks” Cut-off Date LTV Ratio of 31.3% and 57.3% for the 225 & 233 Park Avenue South Whole Loan and the 225 & 233 Park Avenue South Total Debt, respectively. The “as-is assuming holdbacks” value presumes that all outstanding amounts related to the TI/LCs, free rent and capital expenditures are deposited into escrow on the origination date. The borrower deposited all such amounts into escrow on the origination date.
Environmental Matters. According to a Phase I environmental site assessment dated April 13, 2017, there was no evidence of any recognized environmental conditions at the 225 & 233 Park Avenue South Property.
Market Overview and Competition.The 225 & 233 Park Avenue South Property is located in the Madison/Union Square office submarket of the Midtown South Manhattan market, a block north of Union Square and a few blocks south of Madison Square Park. The 225 & 233 Park Avenue South Property is located within “Silicon Alley”, the stretch of Broadway from the Flatiron District to SoHo, and is also considered a hub for startups and tech companies. A few of the corporate neighbors to the 225 & 233 Park Avenue South Property are Tumblr, Sony, MasterCard and Digitas. The 225 & 233 Park Avenue South Property also benefits from its vicinity to numerous retailers and various fine and casual dining options. Proximity to Union Square provides access to multiple subway lines, including the 4, 5, 6, N, Q, R, W and L, all of which connect to various parts of New York City.
As of the first quarter of 2017, the Madison/Union Square office submarket had approximately 32.0 million square feet of office inventory, direct weighted average Class A asking rents of $84.23 per square foot and a vacancy rate of 3.9%. According to the appraisal, average Class A office rents in the Madison/Union Square submarket are $81.83 per square foot, with multiple spaces in the market exceeding $90.00 per square foot.
THE INFORMATION IN THIS STRUCTURAL AND COLLATERAL TERM SHEET IS NOT COMPLETE AND MAY BE AMENDED PRIOR TO THE TIME OF SALE. THIS TERM SHEET IS NOT AN OFFER TO SELL THESE SECURITIES AND IT IS NOT A SOLICITATION OF AN OFFER TO BUY THESE SECURITIES IN ANY JURISDICTION WHERE THE OFFER OR SALE IS NOT PERMITTED.
40
| 225 & 233 PARK AVENUE SOUTH |
The following table presents certain information relating to comparable leases to the 225 & 233 Park Avenue South Property:
Comparable Leases(1)
| Property Name/Location | Year Built | Stories | Floor | Total GLA (SF) | Distance from Subject | Tenant Name | Lease Date/Term | Lease Area (SF) | Annual Base Rent PSF | Lease Type |
412 West 13th Street New York, NY | 1900/2001 | 8 | 3 – 6 | 80,330 | 1.5 miles | Bumble & Bumble | Feb 2017 / 15 Yrs | 41,210 | $93.00 | Gross |
853 Broadway New York, NY | 1929 | 21 | 21 | 126,000 | 0.3 miles | 21stCentury Fox / True XMedia | Jan 2017 / 10 Yrs | 5,864 | $110.00 | Gross |
413 West 14th Street New York, NY | 2017 | 5 | 3, 4, PH | 110,358 | 1.4 miles | Argo Group | Feb 2017 / 15 Yrs | 45,495 | $92.00 | Gross |
430 West 15th Street New York, NY | 1950/2016 | 7 | 2 – 7 | 98,087 | 1.4 miles | Live Nation Entertainment, Inc. | Jan 2017 / 15 Yrs | 76,915 | $98.66 | Gross |
315 Park Avenue South New York, NY | 1928/2007 | 20 | 11 – 12 | 276,000 | 0.3 miles | BDG Media | Nov 2016 / 10 Yrs | 34,100 | $85.00 | Gross |
330 Hudson Street New York, NY | 2013 | 13 | Pt. 9 - 10 | 394,315 | 2.0 miles | Deloitte Digital | Nov 2016 / 12 Yrs | 37,356 | $80.00 | Gross |
250 Hudson Street New York, NY | 1928 | 14 | 8 | 30,000 | 2.3 miles | Lieff Cabraser Heimann & Bernstein | Sept 2016 / 10 Yrs | 27,778 | $78.00 | Gross |
315 Park Avenue South New York, NY | 1928/2007 | 20 | 19 – 20 | 276,000 | 0.3 miles | Winton Capital | July 2016 / 10 Yrs | 34,844 | $100.00 | Gross |
200 Park Avenue South New York, NY | 1908 | 17 | 6 – 7 | 225,000 | 0.05 miles | Elizabeth Arden | Mar 2016 / 10 Yrs | 35,698 | $64.00 | Gross |
770 Broadway New York, NY | 1905 | 15 | 14 | 911,213 | 0.5 miles | Feb. 2016 / 12 Yrs | 79,998 | $105.00 | Gross |
| (1) | Information obtained from the appraisal. |
The Borrower.The borrower for the 225 & 233 Park Avenue South Whole Loan is 225 Fourth LLC, a Delaware limited liability company and a special purpose entity with two independent directors. Legal counsel to the borrower delivered a non-consolidation opinion in connection with the origination of the 225 & 233 Park Avenue South Whole Loan. Morton F. Silver and Orda Management Corporation are the guarantors of certain nonrecourse carveouts under the 225 & 233 Park Avenue South Whole Loan. Morton F. Silver’s carveouts under the 225 & 233 Park Avenue South Whole Loan are limited to (i) transfers by the borrower of ownership of all or any material portion of the real property comprising part of the 225 & 233 Park Avenue South Property, (ii) a sale, assignment, pledge or other encumbrance by the borrower of the rents and (iii) bankruptcy related carveouts.
The Borrower Sponsor.The borrower sponsor is Orda Management Corporation (“ORDA”). ORDA is a New York-based family-owned business organized in New York in 1952 as a company and incorporated in 1956. ORDA predominantly develops, manages and owns residential and commercial real estate in the New York metropolitan area. ORDA has also gained a reputation for developing and renovating historic buildings. ORDA, in conjunction with the Related Companies, has developed the Armory, The Sierra, the Tate and the Westport.
Escrows.The loan documents provide for upfront reserves in the amount of $14,864,252 for free rent, $11,529,288 for remaining base building costs and fees and $8,106,455 for outstanding tenant improvements and leasing commissions.
The loan documents do not require monthly reserve deposits for real estate taxes, replacement reserves and TI/LCs so long as no Trigger Period (as defined below) has occurred and is continuing. The loan documents do not require ongoing monthly escrows for insurance premiums as long as (i) noTrigger Period is in effect and (ii) the borrower provides the lender with evidence that the 225 & 233 Park Avenue South Property is insured via an acceptable blanket insurance policy and such policy is in full force and effect. Following the occurrence and during the continuance of a Trigger Period, the borrower is required to make monthly deposits of one-twelfth of the real estate taxes due, one-twelfth of the estimated insurance premiums, $11,176 (approximately $0.20 per square foot annually) for replacement reserves and $55,878 (approximately $1.00 per square foot annually) for TI/LCs.
The borrower is required, no later than one business day after receipt of the Facebook lease termination payment, to deposit such lease termination payment into the TI/LC reserve (“Facebook Rollover Reserve Fund”). The Facebook Rollover Reserve Fund will be used for tenant improvements and leasing commissions incurred in connection with the re-leasing of the Facebook space.
On the payment date occurring in June 2018 and each payment date thereafter prior to the occurrence of a Buzzfeed Trigger Period (as defined below), the borrower will be required to deposit $112,623 into a reserve (the “Buzzfeed Rollover Reserve”) and on each payment date during the continuation of a Buzzfeed Trigger Period, the borrower will be required to sweep all excess cash flow from
THE INFORMATION IN THIS STRUCTURAL AND COLLATERAL TERM SHEET IS NOT COMPLETE AND MAY BE AMENDED PRIOR TO THE TIME OF SALE. THIS TERM SHEET IS NOT AN OFFER TO SELL THESE SECURITIES AND IT IS NOT A SOLICITATION OF AN OFFER TO BUY THESE SECURITIES IN ANY JURISDICTION WHERE THE OFFER OR SALE IS NOT PERMITTED.
41
| 225 & 233 PARK AVENUE SOUTH |
the 225 & 233 Park Avenue South Property into the Buzzfeed Rollover Reserve until the amounts on deposit equal or exceed $13,000,000 (the “Buzzfeed Rollover Cap”).
A “Trigger Period” means the occurrence of a (i) Default Trigger Period, (ii) Buzzfeed Trigger Period, (iii) Mezzanine Trigger Period or (iv) DSCR Trigger Period.
A “Default Trigger Period” will commence upon the occurrence and continuance of an event of default under the 225 & 233 Park Avenue South Whole Loan documents and expire upon the cure of such event of default.
A “Buzzfeed Trigger Period” will commence on April 1, 2025, the date that is 14 months prior to the scheduled expiration of the Buzzfeed lease, and terminate upon (i) Buzzfeed renewing or extending its lease in accordance with the 225 & 233 Park Avenue South Whole Loan documents and (a) Buzzfeed paying full, unabated rent under such renewed or extended lease or (b) Buzzfeed being obligated to begin paying full unabated rent under such renewed or extended lease if the borrower reserves with the lender the amount equal to the aggregate amount of the rent that would accrue during such free rent period, (ii) (1) the borrower leasing the entire Buzzfeed space to one or more tenants pursuant to replacement lease(s) acceptable to the lender, (2) such tenants being in physical occupancy of their space, (3) such tenants being open for business and the landlord’s leasing obligations for such replacement lease(s) having been paid and (4) the applicable replacement tenant(s) paying full, unabated rent equaling or exceeding the rent payable under the Buzzfeed lease or (iii) the amount reserved in the Buzzfeed Rollover Reserve equaling or exceeding the Buzzfeed Rollover Cap. However, if clauses (i) and (ii) above occur prior to April 1, 2025, a Buzzfeed Trigger Period will not commence.
A “Mezzanine Trigger Period” will commence upon the date that the lender has received written notice from the mezzanine lender that an event of default under the 225 & 233 Park Avenue South Mezzanine Loan exists and expire upon the date that the lender has received written notice from the mezzanine lender that such event of default no longer exists.
A “DSCR Trigger Period” will commence upon the debt service coverage ratio (on the 225 & 233 Park Avenue South Total Debt), as calculated in the loan documents, being less than 1.20x and expire upon the date that the debt service coverage ratio (on the 225 & 233 Park Avenue South Total Debt) is equal to or greater than 1.25x for two consecutive quarters.
Lockbox and Cash Management.The 225 & 233 Park Avenue South Whole Loan is structured with a hard lockbox and springing cash management. The borrower was required at origination to deliver letters to all tenants at the 225 & 233 Park Avenue South Property directing them to pay all rents directly into a lender-controlled lockbox account. All funds received by the borrower or manager are required to be deposited in the lockbox account within two business days following receipt, unless a Trigger Period has occurred, in which event such funds are required to be swept each business day into the cash management account controlled by the lender and disbursed on each payment date in accordance with the loan documents.
Property Management. The 225 & 233 Park Avenue South Property is managed by an affiliate of the borrower.
Assumption.The borrower has, at any time (other than the period 90 days prior to a securitization of a note or the period 90 days after a securitization of a note) the right to transfer the 225 & 233 Park Avenue South Property, provided that certain conditions are satisfied, including: (i) no event of default has occurred and is continuing, (ii) the borrower has provided the lender with 30 days’ prior written notice, (iii) the proposed transferee qualifies as a qualified transferee under the loan documents, (iv) the payment of an assumption fee of $136,628 for the first such assumption of the 225 & 233 Park Avenue South Whole Loan and $273,256 for each subsequent assumption of the 225 & 233 Park Avenue South Whole Loan, and (v) the lender has received confirmation from KBRA, Fitch and Moody’s that such assumption will not result in a downgrade of the respective ratings assigned to the Series 2017-C39 certificates and similar confirmations from each rating agency rating any securities backed by any of the 225 & 233 Park Avenue South Companion Loans.
Partial Release. Not permitted.
Real Estate Substitution.Not permitted.
Subordinate and Mezzanine Indebtedness.Barclays Bank PLC funded a $195,000,000 mezzanine loan (the “225 & 233 Park Avenue South Mezzanine Loan” and together with the 225 & 233 Park Avenue South Whole Loan, the “225 & 233 Park Avenue South Total Debt”) with the origination of the 225 & 233 Park Avenue South Whole Loan. The 225 & 233 Park Avenue South Mezzanine Loan is coterminous with the 225 & 233 Park Avenue South Whole Loan and accrues interest at a fixedper annumrate equal to 4.6700%. The Cut-off Date LTV, UW NCF DSCR and UW NOI Debt Yield on the 225 & 233 Park Avenue South Total Debt is 57.3%, 1.59x and 6.9%, respectively. An intercreditor agreement is in place with respect to the 225 & 233 Park Avenue South Whole Loan and the 225 & 233 Park Avenue South Mezzanine Loan. The 225 & 233 Park Avenue South Mezzanine Loan may be split into a senior mezzanine loan and one or more junior mezzanine loans. Barclays Bank PLC currently holds the 225 & 233 Park Avenue South Mezzanine Loan and expects to sell the 225 & 233 Park Avenue South Mezzanine Loan to one or more third-party investors.
Provided no event of default has occurred and is continuing, the borrower is permitted to incur future mezzanine indebtedness, provided (a) prior written notice of not less than 45 days, but not more than 90 days, is provided to the lender specifying the origination date of the permitted mezzanine loan, (b) the mezzanine lender enters into an intercreditor agreement acceptable to the rating agencies and reasonably acceptable to the lender, (c) the mezzanine loan will have a term that is at least coterminous with the 225 & 233 Park Avenue South Whole Loan, (d) the mezzanine loan will be current pay and will not be a payment in kind structure, (e) the combined loan-to-value ratio for the 225 & 233 Park Avenue South Total Debt and permitted mezzanine loan will not be greater than 54.46%, (f) the debt service coverage ratio of the 225 & 233 Park Avenue South Total Debt and the permitted mezzanine loan is equal to or greater than 1.67x, (g) if the mezzanine loan is floating rate, the borrower is required to acquire and maintain an interest rate cap or swap agreement from a counterparty reasonably acceptable to the lender, (h) a rating agency confirmation from each of KBRA, Fitch and Moody’s that the future mezzanine indebtedness will not result in a downgrade,
THE INFORMATION IN THIS STRUCTURAL AND COLLATERAL TERM SHEET IS NOT COMPLETE AND MAY BE AMENDED PRIOR TO THE TIME OF SALE. THIS TERM SHEET IS NOT AN OFFER TO SELL THESE SECURITIES AND IT IS NOT A SOLICITATION OF AN OFFER TO BUY THESE SECURITIES IN ANY JURISDICTION WHERE THE OFFER OR SALE IS NOT PERMITTED.
42
| 225 & 233 PARK AVENUE SOUTH |
withdrawal or qualification of the respective ratings assigned to the Series 2017-C39 Certificates and similar ratings confirmations from each rating agency rating any securities backed by the 225 & 233 Park Avenue South Companion Loans with respect to the ratings of such securities, and (i) any other requirements as stated under the 225 & 233 Park Avenue South Whole Loan documents are met.
Ground Lease.None.
Terrorism Insurance. The 225 & 233 Park Avenue South Whole Loan documents require that the “all risk” insurance policy required to be maintained by the borrower provide coverage for terrorism in an amount equal to the full replacement cost of the 225 & 233 Park Avenue South Property, or that if the Terrorism Risk Insurance Program Reauthorization Act is no longer in effect and such policies contain an exclusion for acts of terrorism, the borrower will obtain, to the extent available, a stand-alone policy that provides the same coverage as the policies would have if such exclusion did not exist.
THE INFORMATION IN THIS STRUCTURAL AND COLLATERAL TERM SHEET IS NOT COMPLETE AND MAY BE AMENDED PRIOR TO THE TIME OF SALE. THIS TERM SHEET IS NOT AN OFFER TO SELL THESE SECURITIES AND IT IS NOT A SOLICITATION OF AN OFFER TO BUY THESE SECURITIES IN ANY JURISDICTION WHERE THE OFFER OR SALE IS NOT PERMITTED.
43
211 MOUNT AIRY ROAD |

THE INFORMATION IN THIS STRUCTURAL AND COLLATERAL TERM SHEET IS NOT COMPLETE AND MAY BE AMENDED PRIOR TO THE TIME OF SALE. THIS TERM SHEET IS NOT AN OFFER TO SELL THESE SECURITIES AND IT IS NOT A SOLICITATION OF AN OFFER TO BUY THESE SECURITIES IN ANY JURISDICTION WHERE THE OFFER OR SALE IS NOT PERMITTED.
44
211 MOUNT AIRY ROAD |

THE INFORMATION IN THIS STRUCTURAL AND COLLATERAL TERM SHEET IS NOT COMPLETE AND MAY BE AMENDED PRIOR TO THE TIME OF SALE. THIS TERM SHEET IS NOT AN OFFER TO SELL THESE SECURITIES AND IT IS NOT A SOLICITATION OF AN OFFER TO BUY THESE SECURITIES IN ANY JURISDICTION WHERE THE OFFER OR SALE IS NOT PERMITTED.
45
| No. 2 – 211 Mount Airy Road | ||||||
| Loan Information | Property Information | |||||
| Mortgage Loan Seller: | Wells Fargo Bank, National Association | Single Asset/Portfolio: | Single Asset | |||
| Credit Assessment (Fitch/KBRA/Moody’s): | NR/NR/NR | Property Type: | Office | |||
| Original Principal Balance: | $65,000,000 | Specific Property Type: | Suburban | |||
| Cut-off Date Balance: | $65,000,000 | Location: | Basking Ridge, NJ | |||
| % of Initial Pool Balance: | 5.7% | Size: | 306,194 SF | |||
| Loan Purpose: | Acquisition | Cut-off Date Balance Per SF: | $212.28 | |||
| Borrower: | RW 211 Mount Airy, LLC; 211 Mount Airy Associates, LLC | Year Built/Renovated: | 1975/2017 | |||
| Borrower Sponsors(1): | Various | Title Vesting: | Fee | |||
| Mortgage Rate(2): | 4.070% | Property Manager: | Self-managed | |||
| Note Date: | June 30, 2017 | 4thMost Recent Occupancy(4): | NAV | |||
| Anticipated Repayment Date(2): | July 11, 2027 | 3rdMost Recent Occupancy(4): | NAV | |||
| Maturity Date(2): | January 11, 2033 | 2ndMost Recent Occupancy(4): | NAV | |||
| IO Period: | 120 months | Most Recent Occupancy (As of): | 100.0% (12/31/2016) | |||
| Loan Term (Original): | 120 months | Current Occupancy (As of): | 100.0% (8/1/2017) | |||
| Seasoning: | 1 month | |||||
| Amortization Term (Original): | NAP | Underwriting and Financial Information: | ||||
| Loan Amortization Type: | Interest-only, ARD | |||||
| Interest Accrual Method: | Actual/360 | 4thMost Recent NOI(4): | NAV | |||
| Call Protection: | L(25),D(91),O(4) | 3rdMost Recent NOI(4): | NAV | |||
| Lockbox Type: | Hard/Upfront Cash Management | 2ndMost Recent NOI(4): | NAV | |||
| Additional Debt: | None | Most Recent NOI(4): | NAV | |||
| Additional Debt Type: | NAP | |||||
| U/W Revenues: | $8,290,203 | |||||
| U/W Expenses: | $2,326,564 | |||||
| U/W NOI: | $5,963,638 | |||||
| U/W NCF: | $5,902,400 | |||||
| Escrows and Reserves(3): | U/W NOI DSCR: | 2.22x | ||||
| U/W NCF DSCR: | 2.20x | |||||
| Type: | Initial | Monthly | Cap (If Any) | U/W NOI Debt Yield: | 9.2% | |
| Taxes | $15,264 | $75,374 | NAP | U/W NCF Debt Yield: | 9.1% | |
| Insurance | $0 | Springing | NAP | As-Is Appraised Value: | $96,700,000 | |
| Replacement Reserves | $0 | $5,103 | NAP | As-Is Appraisal Valuation Date: | July 1, 2017 | |
| Tenant Specific TI/LC Reserve | $2,243,437 | $0 | NAP | Cut-off Date LTV Ratio: | 67.2% | |
| Rent Concession Reserve | $8,514,457 | $0 | NAP | LTV Ratio at Maturity or ARD: | 67.2% | |
| (1) | See “The Borrower Sponsor” section. |
| (2) | See “The Mortgage Loan” section. |
| (3) | See “Escrows” section. |
| (4) | See “Historical Occupancy” and “Cash Flow Analysis” sections. |
The Mortgage Loan.The mortgage loan (the “211 Mount Airy Road Mortgage Loan”) is evidenced by a single promissory note secured by the fee interest in a suburban office building located in Basking Ridge, New Jersey (the “211 Mount Airy Road Property”). The 211 Mount Airy Road Mortgage Loan was originated on June 30, 2017 by Wells Fargo Bank, National Association. The 211 Mount Airy Road Mortgage Loan had an original principal balance of $65,000,000, has an outstanding principal balance of $65,000,000 as of the Cut-off Date and accrues interest at an interest rate of 4.070%per annum. The 211 Mount Airy Road Mortgage Loan had an initial term of 120 months, has a remaining term of 119 months as of the Cut-off Date and requires interest-only payments through the Anticipated Repayment Date (“ARD”). The ARD is July 11, 2027 and the final maturity date is January 11, 2033. In the event the 211 Mount Airy Road Mortgage Loan is not paid off in full on or before the ARD, the borrower will be required to make payments of principal and interest based on an interest rate equal to the greater of (i) the Mortgage Rate plus 5.000%per annum, and (ii) the sum of (A) the most recent issue 10-year offer side swap rate or Treasury Rate, whichever is greater and (B) 6.800%per annum. The ARD automatically triggers a Cash Trap Event Period (see “Lockbox and Cash Management” section) whereby all excess cash flow will be used to pay down the principal balance of the 211 Mount Airy Road Mortgage Loan. See “Description of the Mortgage Pool—ARD Loans” in the Preliminary Prospectus.
Following the lockout period, the borrower has the right to defease the 211 Mount Airy Road Mortgage Loan in whole, but not in part, on any date before April 11, 2027. In addition, the 211 Mount Airy Road Mortgage Loan is prepayable without penalty on or after April 11, 2027.
THE INFORMATION IN THIS STRUCTURAL AND COLLATERAL TERM SHEET IS NOT COMPLETE AND MAY BE AMENDED PRIOR TO THE TIME OF SALE. THIS TERM SHEET IS NOT AN OFFER TO SELL THESE SECURITIES AND IT IS NOT A SOLICITATION OF AN OFFER TO BUY THESE SECURITIES IN ANY JURISDICTION WHERE THE OFFER OR SALE IS NOT PERMITTED.
46
211 MOUNT AIRY ROAD |
Sources and Uses
| Sources | Uses | |||||
| Original loan amount | $65,000,000 | 64.5% | Purchase price | $98,500,000 | 97.7% | |
| Sponsor’s new cash contribution | 35,806,546 | 35.5 | Reserves | 10,773,158 | 10.7 | |
| Closing costs | 2,401,997 | 2.4 | ||||
| Acquisition credits(1) | (10,868,609) | (10.8) | ||||
| Total Sources | $100,806,546 | 100.0% | Total Uses | $100,806,546 | 100.0% |
| (1) | The seller provided the borrower sponsor acquisition credits for outstanding free rent ($8,514,457), outstanding tenant improvement allowance ($2,243,437) andpro rata expense credits ($110,715). |
The Property.The 211 Mount Airy Road Property consists of the fee interest in a three-story, class A office building totaling approximately 306,194 square feet and located in Basking Ridge, New Jersey. The 211 Mount Airy Road Property was constructed in 1975 and fully renovated from 2013 to 2017 for a total cost of $11.5 million ($38 per square foot). The 211 Mount Airy Road Property consists of one building segregated into three separate pods on a 52.0-acres site. The 211 Mount Airy Road Property features a modern glass façade that provides natural light and panoramic views, along with amenities such as high-tech conference and training facilities; a 127-seat auditorium; a 100-seat, full-service café with patio seating; and a state-of-the-art fitness center with locker rooms. The 211 Mount Airy Road Property contains 1,288 surface parking spaces, equating to a parking ratio of 4.2 spaces per 1,000 square feet of rentable area. As of August 1, 2017, the 211 Mount Airy Road Property was 100.0% occupied.
The 211 Mount Airy Road Property is 100.0% leased by Daiichi Sankyo, Inc. (“DSI”), the United States subsidiary of Daiichi Sankyo Company, Limited (“DSCL”). The 211Mount Airy Road Property serves as DSI’s North American headquarters location and represents the consolidation of two prior DSI office locations in Parsippany and Edison, New Jersey. DSI signed a 16-year lease at the 211 Mount Airy Road Property in April 2016 with a lease expiration date of January 31, 2033, with one, 10-year extension option. In conjunction with the DSI lease, the tenant invested approximately $23.0 million ($75 per square foot) into improvement of their space. In addition, DSI’s lease is backed by a $25.0 million letter of credit issued by Bank of America, N.A., which will remain in-place throughout the lease term.
DSCL is rated A1 by Moody’s and is listed on the Tokyo Stock Exchange (4568) and has American Depositary Receipt shares listed on the Nasdaq Stock Exchange (DSNKY).DSCL is a Japan-based researcher, developer, manufacturer, producer and seller of pharmaceuticals. DSCL employs approximately 15,000 people in more than 20 countries. DSCL is the second-largest pharmaceutical company in Japan and had fiscal year 2016 total revenues of approximately ¥955.1 billion (or $8.6 billion, as of June 1, 2017), resulting in a net profit of ¥47.5 billion (or $427.0 million, as of June 1, 2017).
The following table presents certain information relating to the tenancy at the 211 Mount Airy Road Property:
Major Tenant
| Tenant Name | Credit Rating (Fitch/Moody’s/S&P) | Tenant NRSF | % of NRSF | Annual U/W Base Rent PSF(1) | Annual U/W Base Rent(1) | % of Total Annual U/W Base Rent | Lease Expiration Date | |
| Major Tenant | ||||||||
| DSI | NR/A1/NR(2) | 306,194 | 100.0% | $28.50 | $8,726,529 | 100.0% | 1/31/2033(3)(4) | |
| Total Major Tenant | 306,194 | 100.0% | $28.50 | $8,726,529 | 100.0% | |||
| Vacant Space | 0 | 0.0% | ||||||
| Collateral Total | 306,194 | 100.0% | ||||||
| (1) | Annual U/W Base Rent and Annual U/W Base Rent PSF represent DSI’s average rent over the term of the 211 Mount Airy Road Mortgage Loan. DSI is currently in a rent abatement period through February 2021. All future rent credits or abatements under the DSI lease were reserved at the origination of the 211 Mount Airy Road Mortgage Loan (see “Escrows” section below). |
| (2) | The Credit Rating shown represents DSI’s parent company, DSCL, which does not guarantee the lease, however, DSI’s lease is backed by a $25,000,000 letter of credit, issued by Bank of America, N.A., which will remain in place through DSI’s lease term. |
| (3) | DSI has one, ten-year lease extension options. |
| (4) | DSI has a one-time option on January 31, 2029 to terminate its lease with 12 months’ written notice and payment of a termination fee in an amount equal to $34,178,013. |
THE INFORMATION IN THIS STRUCTURAL AND COLLATERAL TERM SHEET IS NOT COMPLETE AND MAY BE AMENDED PRIOR TO THE TIME OF SALE. THIS TERM SHEET IS NOT AN OFFER TO SELL THESE SECURITIES AND IT IS NOT A SOLICITATION OF AN OFFER TO BUY THESE SECURITIES IN ANY JURISDICTION WHERE THE OFFER OR SALE IS NOT PERMITTED.
47
211 MOUNT AIRY ROAD |
The following table presents certain information relating to the lease rollover schedule at the 211 Mount Airy Road Property:
Lease Expiration Schedule(1)
| Year Ending December 31, | No. of Leases Expiring | Expiring NRSF | % of Total NRSF | Cumulative Expiring NRSF | Cumulative % of Total NRSF | Annual U/W Base Rent | % of Total Annual U/W Base Rent | Annual U/W Base Rent PSF |
| MTM | 0 | 0 | 0.0% | 0 | 0.0% | $0 | 0.0% | $0.00 |
| 2017 | 0 | 0 | 0.0% | 0 | 0.0% | $0 | 0.0% | $0.00 |
| 2018 | 0 | 0 | 0.0% | 0 | 0.0% | $0 | 0.0% | $0.00 |
| 2019 | 0 | 0 | 0.0% | 0 | 0.0% | $0 | 0.0% | $0.00 |
| 2020 | 0 | 0 | 0.0% | 0 | 0.0% | $0 | 0.0% | $0.00 |
| 2021 | 0 | 0 | 0.0% | 0 | 0.0% | $0 | 0.0% | $0.00 |
| 2022 | 0 | 0 | 0.0% | 0 | 0.0% | $0 | 0.0% | $0.00 |
| 2023 | 0 | 0 | 0.0% | 0 | 0.0% | $0 | 0.0% | $0.00 |
| 2024 | 0 | 0 | 0.0% | 0 | 0.0% | $0 | 0.0% | $0.00 |
| 2025 | 0 | 0 | 0.0% | 0 | 0.0% | $0 | 0.0% | $0.00 |
| 2026 | 0 | 0 | 0.0% | 0 | 0.0% | $0 | 0.0% | $0.00 |
| 2027 | 0 | 0 | 0.0% | 0 | 0.0% | $0 | 0.0% | $0.00 |
| Thereafter | 1 | 306,194 | 100.0% | 306,194 | 100.0% | $8,726,529 | 100.0% | $28.50 |
| Vacant | 0 | 0 | 0.0% | 306,194 | 100.0% | $0 | 0.0% | $0.00 |
| Total/Weighted Average | 1 | 306,194 | 100.0% | $8,726,529 | 100.0% | $28.50 |
| (1) | Information obtained from the underwritten rent roll. |
The following table presents historical occupancy percentages at the 211 Mount Airy Road Property:
Historical Occupancy
12/31/2013(1) | 12/31/2014(1) | 12/31/2015(1) | 12/31/2016(2) | 8/1/2017(2) | ||||
| NAV | NAV | NAV | 100.0% | 100.0% |
| (1) | The 211 Mount Airy Road Mortgage Loan represents acquisition financing. As such, historical information prior to the signing of the DSI lease in April 2016 is not available |
| (2) | Information obtained from the underwritten rent roll. |
Operating History and Underwritten Net Cash Flow. The following table presents certain information relating to the underwritten net cash flow at the 211 Mount Airy Road Property:
Cash Flow Analysis(1)
| U/W | % of U/W Effective Gross Income | U/W $ per SF | |
| Base Rent(2) | $8,726,529 | 105.3% | $28.50 |
| Grossed Up Vacant | 0 | 0.0 | 0.00 |
| Total Reimbursables | 0 | 0.0 | 0.00 |
| Less Vacancy & Credit | (436,326)(3) | (5.3) | (1.43) |
| Effective Gross Income | $8,290,203 | 100.0% | $27.08 |
| Total Operating Expenses | $2,326,564 | 28.1% | $7.60 |
| Net Operating Income | $5,963,638 | 71.9% | $19.48 |
| TI/LC | 0 | 0.0 | 0.00 |
| Capital Expenditures | 61,239 | 0.7 | 0.20 |
| Net Cash Flow | $5,902,400 | 71.2% | $19.28 |
| NOI DSCR | 2.22x | ||
| NCF DSCR | 2.20x | ||
| NOI DY | 9.2% | ||
| NCF DY | 9.1% |
| (1) | The 211 Mount Airy Road Mortgage Loan represents acquisition financing. As such, historical information prior to the signing of the DSI lease in April 2016 is not available. |
| (2) | U/W Base Rent and U/W Base Rent per SF represent DSI’s average rent over the term of the 211 Mount Airy Road Mortgage Loan. DSI is currently in a rent abatement period through February 2021. All future rent credits or abatements under the DSI lease were reserved at the origination of the 211 Mount Airy Road Mortgage Loan (see “Escrows” section below). |
| (3) | The underwritten economic vacancy is 5.0%. The 211 Mount Airy Road Property was 100.0% physically occupied as of August 1, 2017. |
THE INFORMATION IN THIS STRUCTURAL AND COLLATERAL TERM SHEET IS NOT COMPLETE AND MAY BE AMENDED PRIOR TO THE TIME OF SALE. THIS TERM SHEET IS NOT AN OFFER TO SELL THESE SECURITIES AND IT IS NOT A SOLICITATION OF AN OFFER TO BUY THESE SECURITIES IN ANY JURISDICTION WHERE THE OFFER OR SALE IS NOT PERMITTED.
48
211 MOUNT AIRY ROAD |
Appraisal.As of the appraisal valuation date of July 1, 2017, the 211 Mount Airy Road Property had an “as-is” appraised value of $96,700,000. The appraiser also concluded to a dark value of $69,400,000, as of June 5, 2017.
Environmental Matters. According to the Phase I environmental site assessment dated May 30, 2017, there are no recognized environmental conditions at the 211 Mount Airy Road Property.
Market Overview and Competition.The 211 Mount Airy Road Property is located in Basking Ridge, New Jersey, approximately 7.2 miles from the Interstate 78/Interstate 287 interchange and 39.0 miles west of Manhattan. In close proximity to the 211 Mount Airy Road Property are several large corporate offices along the Interstate 78 corridor including Johnson & Johnson, Sanofi-Aventis, GlaxoSmithKline, Pfizer, Actavis, Celegen and Valeant Pharmaceuticals. The most notable office lease and location in the area is Verizon, who executed a 20-year sale-leaseback at its Basking Ridge headquarters location for approximately 1.4 million square feet. The June 2015 transaction totaled approximately $650.3 million ($464 per square foot). The 211 Mount Airy Road Property benefits from its affluent location in Somerset County. According to a third party report, the estimated 2017 population within a five- and ten-mile radius of the 211 Mount Airy Road Property was 59,121, and 363,102, respectively. The estimated 2017 average household income within the same radii was $156,944 and $136,926, respectively.
According to a third party market research report, the 211 Mount Airy Road Property is located in the Route 78 East office submarket of Northern New Jersey. As of the second quarter of 2017, the Route 78 East office submarket comprised 378 buildings totaling 18.8 million square feet with a reported vacancy rate of 9.1%. For the same period, the Route 78 East class A office submarket comprised 62 buildings totaling 11.7 million square feet with a reported vacancy rate of 9.7%. The appraiser concluded to a market rent of $26.00 per square foot, modified gross, with $0.50 per square foot annual rent increase, which is in-line with DSI’s current rental rate (as of August 1, 2017) of $26.00 per square foot, modified gross.
The following table presents certain information relating to comparable office leases for the 211 Mount Airy Road Property:
Comparable Leases(1)
| Property Name/Location | Year Built/ Renovated | Stories | Total GLA (SF) | Class | Distance from Subject | Tenant Name | Lease Date/Term | Lease Area (SF) | Annual Base Rent PSF | Lease Type |
Park Place 200 Park Avenue Florham Park, NJ | 1976/2001 | 3 | 165,000 | A | 12.6 miles | Confidential | November 2016 / 11.0 Yrs | 52,787 | $29.50 | MG |
Somerset Corporate Center I 100 Somerset Corporate Boulevard Bridgewater, NJ | 1997/NAP | 8 | 240,000 | A | 10.0 miles | Confidential | September 2016 / 10.0 Yrs | 115,158 | $28.50 | MG |
Arbor Circle North 7 Sylvan Way Parsippany, NJ | 1986/NAP | 4 | 145,983 | A | 16.3 miles | Confidential | April 2016 / 12.0 Yrs | 50,000 | $30.00 | MG |
Somerset Corporate Center II 200 Somerset Corporate Boulevard Bridgewater, NJ | 1998/NAP | 8 | 250,000 | A | 10.1 miles | Confidential | February 2016 / 12.0 Yrs | 115,634 | $28.50 | MG |
The Crossings at Jefferson Park 115 South Jefferson Road - Building 200 Whippany, NJ | 2001/NAP | 4 | 150,558 | A | 12.8 miles | Confidential | July 2016 / 10.0 Yrs | 59,651 | $24.65 | MG |
The Offices at Fox Hill 169 Lackawanna Avenue Parsippany, NJ | 2001/NAP | 3 | 256,000 | A | 19.7 miles | Confidential | May 2016 / 11.0 Yrs | 59,848 | $25.00 | MG |
(1) | Information obtained from the appraisal. |
The Borrower.The borrower comprises two tenants-in-common (RW 211 Mount Airy, LLC and 211 Mount Airy Associates, LLC), both of which are Delaware limited liability companies structured to be bankruptcy-remote with at least two independent directors. Legal counsel to the borrower delivered a non-consolidation opinion in connection with the origination of the 211 Mount Airy Road Mortgage Loan. HGGP Capital VIII, LLC; HGGP Capital IX, LLC; HGGP Capital X, LLC; and HGGP Capital XI, LLC are the guarantors of certain nonrecourse carveouts under the 211 Mount Airy Road Mortgage Loan.
The Borrower Sponsor. The sponsors are HGGP Capital VIII, LLC; HGGP Capital IX, LLC; HGGP Capital X, LLC; and HGGP Capital XI, LLC, entities ultimately controlled by Harbor Group International, LLC (“HGI”). Founded in 1990, HGI is a privately-held global real estate management and investment services firm. HGI currently owns in excess of 5.1 million square feet of commercial properties and in excess of 25,000 apartment units, with a portfolio valued at approximately $4.7 billion. HGI, or an affiliate, has sponsored other real estate projects that have been the subject of mortgage loan defaults, foreclosure proceedings or deeds-in-lieu of foreclosure. See “Description of the Mortgage Pool—Default History, Bankruptcy Issues and Other Proceedings” in the Preliminary Prospectus.
THE INFORMATION IN THIS STRUCTURAL AND COLLATERAL TERM SHEET IS NOT COMPLETE AND MAY BE AMENDED PRIOR TO THE TIME OF SALE. THIS TERM SHEET IS NOT AN OFFER TO SELL THESE SECURITIES AND IT IS NOT A SOLICITATION OF AN OFFER TO BUY THESE SECURITIES IN ANY JURISDICTION WHERE THE OFFER OR SALE IS NOT PERMITTED.
49
211 MOUNT AIRY ROAD |
Escrows.The 211 Mount Airy Road Mortgage Loan documents provide for an upfront escrow at closing in the amount of $15,264 for real estate taxes, $2,243,437 for all existing tenant improvements and leasing commissions (“TI/LCs”) obligations and $8,514,457 for all future rent credits or abatements under the DSI lease. Until February 2018, DSI has fully abated rent; for February 2018, DSI will pay an effective annual base rent of $0.36 per square foot; from March 2018 to July 2018, DSI will pay an effective annual base rent of $21.16 per square foot; for August 2018, DSI will pay an effective annual base rent of $22.66 per square foot; from September 2018 to January 2019, DSI will pay an effective annual base rent of $23.37 per square foot; from February 2019 to January 2020, DSI will pay an effective annual base rent of $23.81 per square foot; from February 2020 to January 2021, DSI will pay an effective annual base rent of $24.25 per square foot; and for February 2021, DSI will pay an effective annual base rent of $26.82 per square foot. Beginning March 2021, DSI will pay fully unabated rent.
The 211 Mount Airy Road Mortgage Loan documents require monthly escrows of $75,374 for real estate taxes and $5,103 for replacement reserves. The 211 Mount Airy Road Mortgage Loan documents do not require ongoing monthly escrows for insurance premiums so long as (i) no event of default; (ii) insurance requirements are being satisfied by a blanket policy acceptable to the lender; and (iii) the borrower provides the lender with evidence of renewal of the policies and timely proof of payment of the insurance premiums.
Lockbox and Cash Management. The 211 Mount Airy Road Mortgage Loan requires a lender-controlled lockbox account, which is already in place, and that the borrower direct the tenant to pay its rents directly into such lockbox account. The loan documents also require that all rents received by the borrower or the property manager be deposited into the lockbox account within one business day of receipt. Prior to the occurrence of a Cash Trap Event Period (as defined below), all excess cash flow is required to be distributed to the borrower. During a Cash Trap Event Period, all excess funds are required to be swept to a lender-controlled cash management account.
A “Cash Trap Event Period” will commence upon the earlier of (i) the occurrence and continuance of an event of default; (ii) the date that the DSI lease (or any material portion thereof) is surrendered, cancelled or terminated prior to its then current expiration date or DSI gives notice of its intent to commence any of the foregoing, (iii) the date that DSI discontinues its business (i.e. “goes dark”) at 20% or more of the 211 Mount Airy Road Property or DSI gives notice of its intent to commence the foregoing; (iv) a monetary or material non-monetary default under the DSI lease that continues beyond any applicable notice and cure period; (v) DSI or DSCL becoming involved, as a debtor, in a bankruptcy proceeding or other insolvency proceeding; (vi) a decline in the credit rating of DSCL to “Baa3” or lower by Moody’s or the equivalent by any rating agency; or (vii) the 211 Mount Airy Road Mortgage Loan not being paid off in full on or before the ARD.
A Cash Trap Event Period will end, with respect to clause (i), upon the cure of such event of default; with respect to clauses (ii) and (iii), upon the entirety of the DSI’s space (or applicable portion thereof) being leased pursuant to one or more lender qualified leases and sufficient funds having been accumulated to cover all anticipated qualified leasing expenses, free rent periods, and/or rent abatement periods; with respect to clause (iv), upon the date on which the subject default has been cured, and no other monetary or material non-monetary default under the DSI lease having occurred for a period of three consecutive months following such cure; with respect to clause (v), upon the date which the applicable DSI bankruptcy proceeding or other insolvency proceeding has terminated and the DSI lease has been affirmed, assumed or assigned in a manner reasonably satisfactory to the lender; and with respect to clause (vi), upon the date the credit rating of DSCL has been restored to above “Baa3” by Moody’s or the equivalent by the relevant rating agencies. No cure of a Cash Trap Event Period with regard to clause (vii) is permitted.
Property Management. The 211 Mount Airy Road Property is managed by an affiliate of the borrower.
Assumption.The borrower has a three-time right to transfer the 211 Mount Airy Road Property provided that certain conditions are satisfied, including (i) no event of default has occurred and is continuing; (ii) the lender has reasonably determined that the proposed transferee and guarantor satisfy the lender’s credit review and underwriting standards, taking into consideration transferee experience, financial strength and general business standing; and (iii) the lender has received confirmation from Fitch, KBRA and Moody’s that such assumption will not result in a downgrade, withdrawal or qualification of the respective ratings assigned to the Series 2017-C39 certificates.
Partial Release. Not permitted.
Real Estate Substitution.Not permitted.
Subordinate and Mezzanine Indebtedness.Not permitted.
Ground Lease.None.
Terrorism Insurance.The 211 Mount Airy Road Mortgage Loan documents require that the “all risk” insurance policy required to be maintained by the borrower provide coverage for terrorism in an amount equal to the full replacement cost of the 211 Mount Airy Road Property, as well as loss of rents and/or business interruption insurance for a period no less than 18 months following the occurrence of a casualty event together with a six-month extended period of indemnity.
THE INFORMATION IN THIS STRUCTURAL AND COLLATERAL TERM SHEET IS NOT COMPLETE AND MAY BE AMENDED PRIOR TO THE TIME OF SALE. THIS TERM SHEET IS NOT AN OFFER TO SELL THESE SECURITIES AND IT IS NOT A SOLICITATION OF AN OFFER TO BUY THESE SECURITIES IN ANY JURISDICTION WHERE THE OFFER OR SALE IS NOT PERMITTED.
50
(THIS PAGE INTENTIONALLY LEFT BLANK)
THE INFORMATION IN THIS STRUCTURAL AND COLLATERAL TERM SHEET IS NOT COMPLETE AND MAY BE AMENDED PRIOR TO THE TIME OF SALE. THIS TERM SHEET IS NOT AN OFFER TO SELL THESE SECURITIES AND IT IS NOT A SOLICITATION OF AN OFFER TO BUY THESE SECURITIES IN ANY JURISDICTION WHERE THE OFFER OR SALE IS NOT PERMITTED.
51
(THIS PAGE INTENTIONALLY LEFT BLANK)
THE INFORMATION IN THIS STRUCTURAL AND COLLATERAL TERM SHEET IS NOT COMPLETE AND MAY BE AMENDED PRIOR TO THE TIME OF SALE. THIS TERM SHEET IS NOT AN OFFER TO SELL THESE SECURITIES AND IT IS NOT A SOLICITATION OF AN OFFER TO BUY THESE SECURITIES IN ANY JURISDICTION WHERE THE OFFER OR SALE IS NOT PERMITTED.
52
| LAKESIDE SHOPPING CENTER |
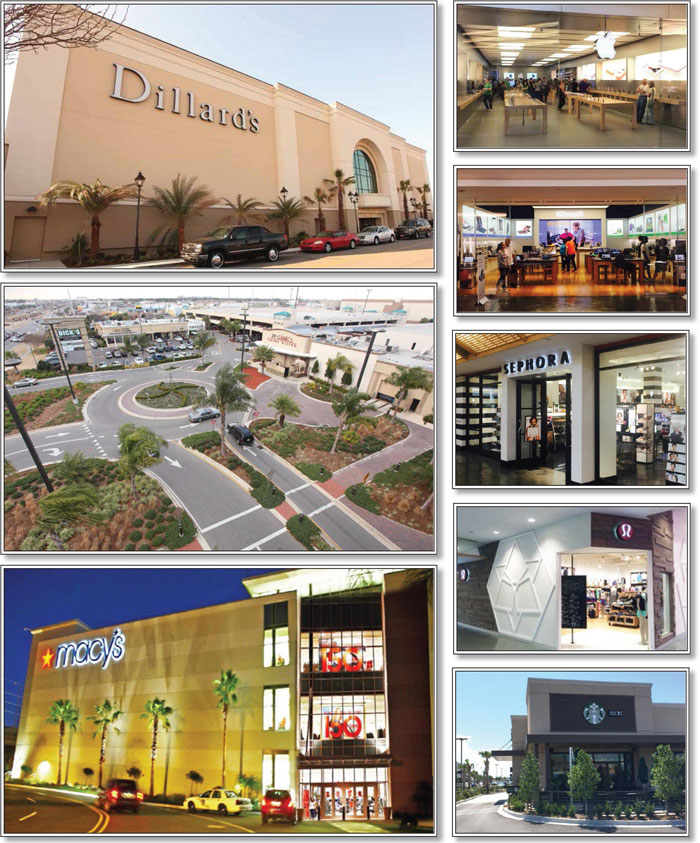
THE INFORMATION IN THIS STRUCTURAL AND COLLATERAL TERM SHEET IS NOT COMPLETE AND MAY BE AMENDED PRIOR TO THE TIME OF SALE. THIS TERM SHEET IS NOT AN OFFER TO SELL THESE SECURITIES AND IT IS NOT A SOLICITATION OF AN OFFER TO BUY THESE SECURITIES IN ANY JURISDICTION WHERE THE OFFER OR SALE IS NOT PERMITTED.
53
| LAKESIDE SHOPPING CENTER |
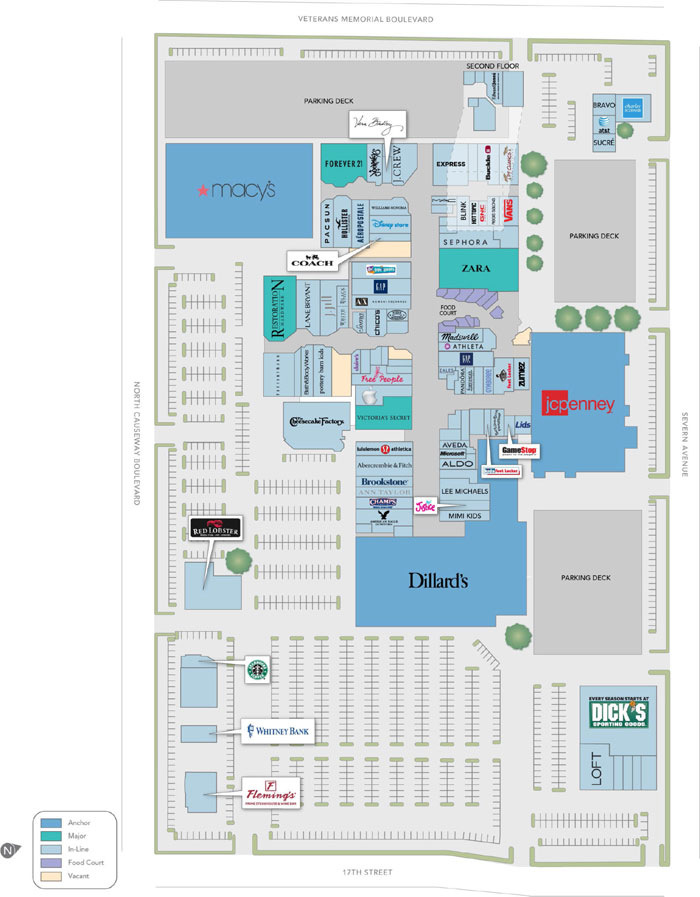
THE INFORMATION IN THIS STRUCTURAL AND COLLATERAL TERM SHEET IS NOT COMPLETE AND MAY BE AMENDED PRIOR TO THE TIME OF SALE. THIS TERM SHEET IS NOT AN OFFER TO SELL THESE SECURITIES AND IT IS NOT A SOLICITATION OF AN OFFER TO BUY THESE SECURITIES IN ANY JURISDICTION WHERE THE OFFER OR SALE IS NOT PERMITTED.
54
| LAKESIDE SHOPPING CENTER |
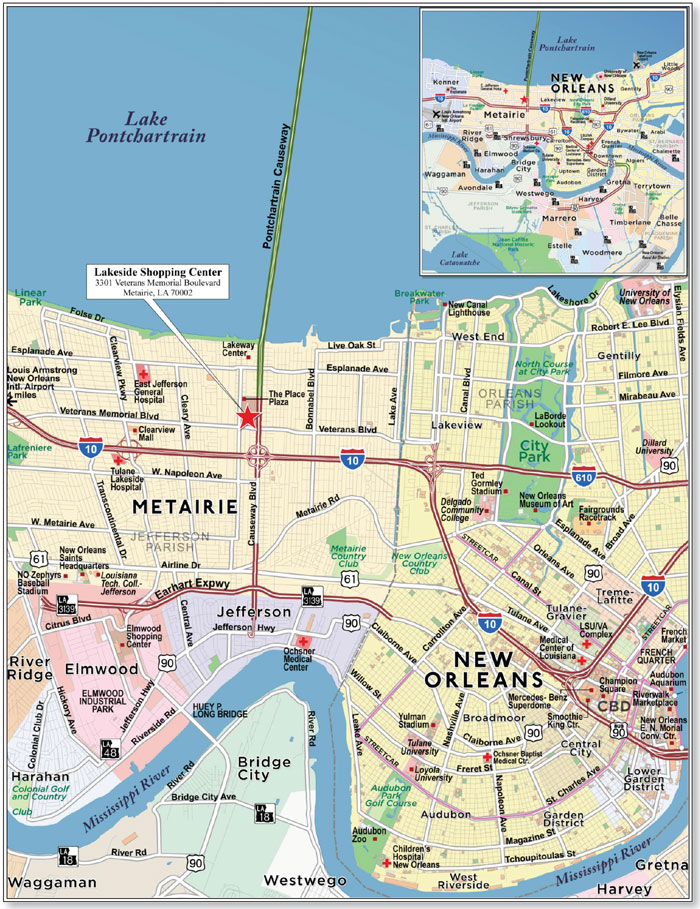
THE INFORMATION IN THIS STRUCTURAL AND COLLATERAL TERM SHEET IS NOT COMPLETE AND MAY BE AMENDED PRIOR TO THE TIME OF SALE. THIS TERM SHEET IS NOT AN OFFER TO SELL THESE SECURITIES AND IT IS NOT A SOLICITATION OF AN OFFER TO BUY THESE SECURITIES IN ANY JURISDICTION WHERE THE OFFER OR SALE IS NOT PERMITTED.
55
| No. 3 – Lakeside Shopping Center | ||||||
| Loan Information | Property Information | |||||
| Mortgage Loan Seller: | Wells Fargo Bank, National Association | Single Asset/Portfolio: | Single Asset | |||
| Credit Assessment (Fitch/KBRA/Moody’s): | NR/NR/NR | Property Type: | Retail | |||
| Original Principal Balance(1): | $58,000,000 | Specific Property Type: | Super Regional Mall | |||
| Cut-off Date Balance(1): | $58,000,000 | Location: | Metairie, LA | |||
| % of Initial Pool Balance: | 5.1% | Size: | 1,211,349 SF | |||
| Loan Purpose: | Refinance | Cut-off Date Balance Per SF(1): | $144.47 | |||
| Borrower Name: | Causeway LLC | Year Built/Renovated: | 1960/2008 | |||
| Borrower Sponsor: | Jeffrey J. Feil | Title Vesting: | Fee/Leasehold | |||
| Mortgage Rate: | 3.770% | Property Manager: | Self-managed | |||
| Note Date: | July 28, 2017 | 4thMost Recent Occupancy (As of): | 98.3% (12/31/2013) | |||
| Anticipated Repayment Date: | NAP | 3rdMost Recent Occupancy (As of): | 97.1% (12/31/2014) | |||
| Maturity Date: | August 1, 2027 | 2ndMost Recent Occupancy (As of): | 98.2% (12/31/2015) | |||
| IO Period: | 120 months | Most Recent Occupancy (As of): | 98.9% (12/31/2016) | |||
| Loan Term (Original): | 120 months | Current Occupancy (As of)(4): | 97.5% (6/1/2017) | |||
| Seasoning: | 0 month | |||||
| Amortization Term (Original): | NAP | Underwriting and Financial Information: | ||||
| Loan Amortization Type: | Interest-only, Balloon | |||||
| Interest Accrual Method: | Actual/360 | 4thMost Recent NOI (As of): | $19,748,210 (12/31/2014) | |||
| Call Protection(2): | L(24),D(91),O(5) | 3rdMost Recent NOI (As of): | $19,177,687 (12/31/2015) | |||
| Lockbox Type: | Hard/Springing Cash Management | 2ndMost Recent NOI (As of): | $19,025,476 (12/31/2016) | |||
| Additional Debt(1): | Yes | Most Recent NOI (As of): | $18,822,381 (TTM 3/31/2017) | |||
| Additional Debt Type(1): | Pari Passu | |||||
| U/W Revenues: | $32,713,717 | |||||
| U/W Expenses: | $12,933,343 | |||||
| U/W NOI: | $19,780,375 | |||||
| Escrows and Reserves(3): | U/W NCF: | $18,307,305 | ||||
| U/W NOI DSCR(1): | 2.96x | |||||
| Type: | Initial | Monthly | Cap (If Any) | U/W NCF DSCR(1): | 2.74x | |
| Taxes | $0 | Springing | NAP | U/W NOI Debt Yield(1): | 11.3% | |
| Insurance | $0 | Springing | NAP | U/W NCF Debt Yield(1): | 10.5% | |
| Replacement Reserves | $0 | Springing | $1,00,000 | As-Is Appraised Value: | $365,000,000 | |
| TI/LC Reserve | $0 | Springing | NAP | As-Is Appraisal Valuation Date: | June 7, 2017 | |
| Rent Concession Reserve | $1,214,427 | $0 | NAP | Cut-off Date LTV Ratio(1): | 47.9% | |
| Tenant Specific TI/LC Reserve | $7,606,095 | $0 | NAP | LTV Ratio at Maturity or ARD(1): | 47.9% | |
| Ground Rent Reserve | $0 | Springing | NAP | |||
| Lease Termination Reserve | $0 | Springing | NAP | |||
| (1) | See “The Mortgage Loan” section. All statistical financial information related to balance per square foot, loan-to-value ratios, debt service coverage ratios and debt yields are based on the funded outstanding principal balance of the Lakeside Shopping Center Whole Loan (as defined below). |
| (2) | The lockout period will be at least 24 payments, beginning with and including the first payment date of September 1, 2017. Defeasance of the Lakeside Shopping Center Whole Loan is permitted at any time after the earlier to occur of (i) July 28, 2020 or (ii) two years after the closing date of the securitization that includes the last note to be securitized |
| (3) | See “Escrows” section. |
| (4) | As of June 1, 2017, the Lakeside Shopping Center Property was 97.5% leased and 92.7% occupied by 129 tenants. |
The Mortgage Loan. The mortgage loan (the “Lakeside Shopping Center Mortgage Loan”) is part of a whole loan (the “Lakeside Shopping Center Whole Loan”) that is evidenced by 3pari passu promissory notes in the aggregate original principal amount of $175,000,000, which are secured by a first priority fee and leasehold mortgage encumbering a 1,211,349 square foot regional mall in Metairie, Louisiana (the “Lakeside Shopping Center Property”). Promissory Note A-2 (contributed by Wells Fargo Bank, National Association), in the aggregate principal amount of $58,000,000, represents the Lakeside Shopping Center Mortgage Loan and will be included in the WFCM 2017-C39 securitization trust.
The Lakeside Shopping Center Whole Loan was co-originated on July 28, 2017 by Morgan Stanley Bank, National Association, Wells Fargo Bank, National Association and Barclays Bank PLC. The Lakeside Shopping Center Whole Loan had an original principal balance of $175,000,000, has an outstanding principal balance as of the Cut-off Date of $175,000,000 and accrues interest at an interest rate of 3.770%per annum. The Lakeside Shopping Center Whole Loan had an initial term of 120 months, has a remaining term of 120 months as of the Cut-off Date and requires payments of interest only through the term of the Lakeside Shopping Center Whole Loan. The Lakeside Shopping Center Whole Loan matures on August 1, 2027.
THE INFORMATION IN THIS STRUCTURAL AND COLLATERAL TERM SHEET IS NOT COMPLETE AND MAY BE AMENDED PRIOR TO THE TIME OF SALE. THIS TERM SHEET IS NOT AN OFFER TO SELL THESE SECURITIES AND IT IS NOT A SOLICITATION OF AN OFFER TO BUY THESE SECURITIES IN ANY JURISDICTION WHERE THE OFFER OR SALE IS NOT PERMITTED.
56
| LAKESIDE SHOPPING CENTER |
The remaining Notes A-1 and A-3 from the Lakeside Shopping Center Whole Loan, which had an aggregate original principal balance of $117,000,000, are expected to be contributed to future securitization trusts. The following table presents a summary of the promissory notes comprising the Lakeside Shopping Center Whole Loan. The lender provides no assurances that any non-securitized notes will not be split further. See “Description of the Mortgage Pool—The Whole Loans—The Serviced Whole Loans” and “—The Non-Serviced Pari Passu Whole Loans” in the Preliminary Prospectus.
Note Summary(1)
| Notes | Original Balance | Note Holder | Controlling Interest | |
| A-1 | $59,000,000 | Morgan Stanley Bank, N.A | Yes | |
| A-2 | $58,000,000 | WCM 2017-C39 | No | |
| A-3 | $58,000,000 | Barclays Bank PLC | No | |
| Total | $175,000,000 |
Following the lockout period, the borrower has the right to defease the Lakeside Shopping Center Whole Loan in whole, but not in part, on any date before April 1, 2027. In addition, the Lakeside Shopping Center Whole Loan is prepayable without penalty on or after April 1, 2027. The lockout period will expire on the earlier to occur of (i) two years after the closing date of the securitization that includes the last note to be securitized and (ii) July 28, 2020.
Sources and Uses
| Sources | Uses | |||||||
| Original whole loan amount | $175,000,000 | 100.0% | Loan Payoff(1): | $95,495,796 | 54.6% | |||
| Closing Costs: | 635,826 | 0.4 | ||||||
| Upfront reserves: | 8,820,522 | 5.0 | ||||||
| Return of Equity: | 70,047,856 | 40.0 | ||||||
| Total Sources | $175,000,000 | 100.0% | Total Uses | $175,000,000 | 100.0% |
| (1) | The Lakeside Shopping Center Property was previously securitized in the BACM 2007-4 transaction. |
The Property.The Lakeside Shopping Center Property consists of a one- to three-story, 1,211,349 square foot regional mall located at the northwestern corner of the intersection of Veterans Boulevard and Causeway Boulevard in Metairie, Louisiana, approximately 7.8 miles northwest of the New Orleans central business district. The Lakeside Shopping Center Property is anchored by J.C. Penney, Macy’s and Dillard’s, which collectively account for 10.9% of the underwritten base rent. Aside from the anchor tenants, the Lakeside Shopping Center Property includes a diverse rent roll of national tenants, including Zara, Victoria’s Secret, Forever 21, Dick’s Sporting Goods, Champs, Apple and Express and restaurants such as Cheesecake Factory, Red Lobster, Flemings Prime Steakhouse and P.F. Chang’s China Bistro. The Lakeside Shopping Center Property provides a variety of first-to-market tenants, including 42 tenants that are the respective company’s exclusive location in New Orleans and 16 tenants that are the respective company’s exclusive location in Louisiana. The Lakeside Shopping Center Property contains 2,029 surface parking spaces and 3 multi-level parking decks providing an additional 3,203 parking spaces, for a total of 5,232 parking spaces (approximately 4.4 spaces per 1,000 square feet).
Since 2005, the borrower sponsor has invested approximately $86.7 million ($72 per square foot) in repairs and capital improvements to the Lakeside Shopping Center Property. In addition, the borrower sponsor is currently undertaking an approximately $10.0 million capital improvement program which is scheduled for completion in 2018 and is anticipated to renovate all common areas and corridors, as well as complete the construction and build-out of the Zara space (scheduled lease commencement of May 2018).
For the trailing 12-month period ending April 30, 2017, the Lakeside Shopping Center Property reported in-line sales of $187.0 million, which equates to $795 PSF and an occupancy cost of 9.9%, including Apple. Excluding Apple, the comparable in-line sales for the same trailing 12-month period equated to $651 per square foot with an occupancy cost of 12.0%. Since 2012, comparable in-line sales per square foot have increased from $706 per square foot to $795 per square foot, representing a 12.6% increase. In-line sales per square foot includes food court tenants. As of June 1, 2017, the Lakeside Shopping Center Property was 97.5% leased and 92.7% occupied by 129 tenants. The leased percentage includes the Zara and four other tenants, which account for a combined 4.8% of net rentable area and are all anticipated to take occupancy by June 2018. Since 2007, the Lakeside Shopping Center Property has averaged 97.7% occupancy, never dropping below 95.2%.
THE INFORMATION IN THIS STRUCTURAL AND COLLATERAL TERM SHEET IS NOT COMPLETE AND MAY BE AMENDED PRIOR TO THE TIME OF SALE. THIS TERM SHEET IS NOT AN OFFER TO SELL THESE SECURITIES AND IT IS NOT A SOLICITATION OF AN OFFER TO BUY THESE SECURITIES IN ANY JURISDICTION WHERE THE OFFER OR SALE IS NOT PERMITTED.
57
| LAKESIDE SHOPPING CENTER |
The following table presents certain information relating to the tenancy at the Lakeside Shopping Center Property:
Major Tenants
| Tenant Name | Credit Rating (Fitch/Moody’s/ S&P)(1) | Tenant NRSF | % of NRSF | Annual U/W Base Rent PSF(2) | Annual U/W Base Rent(2) | % of Total Annual U/W Base Rent | Sales PSF(3) | Occupancy Cost(3) | Lease Expiration Date |
| Anchor Tenants | |||||||||
| J.C. Penney | B+/B1/B+ | 203,410 | 16.8% | $6.49 | $1,320,131 | 5.6% | $116 | 8.5% | 11/30/2022(4) |
| Macy’s(5) | BBB/Baa3/BBB- | 229,520 | 18.9% | $2.83 | $649,542 | 2.8% | $168 | 2.1% | 1/31/2029(6) |
| Dillard’s | BBB-/Baa3/BBB- | 291,700 | 24.1% | $1.71 | $499,974 | 2.1% | $199 | 2.4% | 12/31/2019(7) |
| Dillard’s Mens | BBB-/Baa3/BBB- | 18,958 | 1.6% | $5.00 | $94,790 | 0.4% | N/A | N/A | 12/31/2019(8) |
| Total Anchor Tenants | 743,588 | 61.4% | $3.45 | $2,564,436 | 10.9% | ||||
| Major Tenants | |||||||||
| Zara(9) | NR/NR/NR | 34,722 | 2.9% | $29.08 | $1,009,716 | 4.3% | N/A | N/A | 4/30/2028(10) |
| Victoria’s Secret | BB+/Ba1/BB+ | 13,459 | 1.1% | $55.00 | $740,245 | 3.2% | $742 | 10.3% | 11/30/2025 |
| Forever 21 | NR/NR/NR | 15,094 | 1.2% | $48.00 | $724,512 | 3.1% | $417 | 16.6% | 1/31/2018 |
| Dick’s Sporting Goods | NR/NR/NR | 36,667 | 3.0% | $14.50 | $531,672 | 2.3% | $252 | 8.6% | 1/31/2021(11) |
| Champs | NR/Ba1/BB+ | 4,500 | 0.4% | $110.00 | $495,000 | 2.1% | $1,191 | 11.2% | 1/31/2024 |
| Apple | NR/Aa1/AA+ | 5,260 | 0.4% | $88.72 | $466,667 | 2.0% | $7,096 | 1.3% | 1/31/2019 |
| Express | NR/NR/NR | 8,464 | 0.7% | $55.00 | $465,520 | 2.0% | $596 | 9.2% | 7/31/2027 |
| Total Major Tenants | 118,166 | 9.8% | $37.52 | $4,433,331 | 18.9% | ||||
| Non-Major Tenants(12) | 319,596 | 26.4% | $51.40 | $16,427,195 | 70.1% | ||||
| Occupied Collateral Total | 1,181,350 | 97.5% | $19.83 | $23,424,962 | 100.0% | ||||
| Vacant Space | 29,999 | 2.5% | |||||||
| Collateral Total | 1,211,349 | 100.0% | |||||||
| (1) | Certain ratings are those of the parent company whether or not the parent guarantees the lease. |
| (2) | Annual U/W Base Rent PSF and Annual U/W Base Rent include contractual rent steps through July 30, 2018. |
| (3) | Sales PSF and Occupancy Costs are for the trailing 12-month period ending April 30, 2017, except for J.C. Penney, which represents 2016 data. |
| (4) | J.C. Penny has three, five-year lease extension options. |
| (5) | Macy’s is subject to a ground lease and owns its improvements. |
| (6) | Macy’s has five, five-year lease extension options. |
| (7) | Dillard’s has one, 10-year lease extension options. |
| (8) | Dillard’s Mens has one, 10-year lease extension options. |
| (9) | Zara is currently constructing and building out approximately 15,000 square feet of second floor space, which is in addition to its approximately 19,722 square feet of ground level space. Zara has an executed a 10-year lease with an expected May 2018 commencement date for its entire 34,722 square foot space. |
| (10) | Zara has one, five-year lease extension option. |
| (11) | Dick’s Sporting Goods has four, five-year lease extension option. |
| (12) | Non-Major Tenants includes Flemings Prime Steakhouse (0.6% of NRA and 0.8% of underwritten rent) with a signed lease but a future rent commencement date (November 2017). |
The following table presents a summary of historical comparable in-line sales per square foot and occupancy cost at the Lakeside Shopping Center Property:
Comparable In-Line Sales (PSF)(1)(2)
| 2014 | 2015 | 2016 | 4/31/2017 TTM | |
| In-Line Sales PSF | $740 | $784 | $799 | $795 |
| In-Line Sales PSF (excluding Apple) | $608 | $648 | $657 | $651 |
| Occupancy Cost | 10.6% | 10.0% | 9.8% | 9.9% |
| Occupancy Cost (excluding Apple) | 12.8% | 12.0% | 11.9% | 12.0% |
| (1) | Information as provided by the borrower sponsor. |
| (2) | Comparable In-Line Sales (PSF) includes food court tenants. |
THE INFORMATION IN THIS STRUCTURAL AND COLLATERAL TERM SHEET IS NOT COMPLETE AND MAY BE AMENDED PRIOR TO THE TIME OF SALE. THIS TERM SHEET IS NOT AN OFFER TO SELL THESE SECURITIES AND IT IS NOT A SOLICITATION OF AN OFFER TO BUY THESE SECURITIES IN ANY JURISDICTION WHERE THE OFFER OR SALE IS NOT PERMITTED.
58
| LAKESIDE SHOPPING CENTER |
The following table presents certain information relating to the historical anchor sales at the Lakeside Shopping Center Property:
Anchor Sales Summary(1)
| Tenant Name | 2014 | 2015 | 2016 | 4/31/2017 TTM | Sales PSF |
| J.C. Penney | $20,123,607 | $24,937,466 | $23,676,934 | NAV | $116(2) |
| Macy’s | $46,918,633 | $43,337,465 | $39,222,133 | $38,523,848 | $168 |
| Dillard’s | $64,544,357 | $62,962,609 | $57,212,818 | $57,919,534 | $199 |
| (1) | Information as provided by the borrower sponsor. |
| (2) | J.C. Penney’s Sales PSF represents 2016 data. |
The following table presents certain information relating to the lease rollover schedule at the Lakeside Shopping Center Property:
Lease Expiration Schedule(1)(2)
| Year Ending December 31, | No. of Leases Expiring | Expiring NRSF | % of Total NRSF | Cumulative Expiring NRSF | Cumulative % of Total NRSF | Annual U/W Base Rent | % of Total Annual U/W Base Rent | Annual U/W Base Rent PSF(3) |
| MTM | 6 | 10,905 | 0.9% | 10,905 | 0.9% | $24,002 | 0.1% | $2.20 |
| 2017 | 2 | 2,322 | 0.2% | 13,227 | 1.1% | $549,668 | 2.3% | $236.72 |
| 2018 | 26 | 52,024 | 4.3% | 65,251 | 5.4% | $2,442,261 | 10.4% | $46.94 |
| 2019 | 15 | 358,007 | 29.6% | 423,258 | 34.9% | $3,195,857 | 13.6% | $8.93 |
| 2020 | 14 | 30,050 | 2.5% | 453,308 | 37.4% | $1,729,215 | 7.4% | $57.54 |
| 2021 | 11 | 63,990 | 5.3% | 517,298 | 42.7% | $2,088,586 | 8.9% | $32.64 |
| 2022 | 12 | 235,698 | 19.5% | 752,996 | 62.2% | $3,021,892 | 12.9% | $12.82 |
| 2023 | 11 | 24,888 | 2.1% | 777,884 | 64.2% | $1,747,188 | 7.5% | $70.20 |
| 2024 | 7 | 30,568 | 2.5% | 808,452 | 66.7% | $1,613,418 | 6.9% | $52.78 |
| 2025 | 13 | 53,657 | 4.4% | 862,109 | 71.2% | $2,613,729 | 11.2% | $48.71 |
| 2026 | 4 | 7,183 | 0.6% | 869,292 | 71.8% | $603,132 | 2.6% | $83.97 |
| 2027 | 5 | 25,274 | 2.1% | 894,566 | 73.8% | $1,267,383 | 5.4% | $50.15 |
| Thereafter | 6 | 286,784 | 23.7% | 1,181,350 | 97.5% | $2,528,633 | 10.8% | $8.82 |
| Vacant | 0 | 29,999 | 2.5% | 1,211,349 | 100.0% | $0 | 0.0% | $0.00 |
| Total/Weighted Average | 132(4) | 1,211,349 | 100.0% | $23,424,962 | 100.0% | $19.83 |
| (1) | Information obtained from the underwritten rent roll. |
| (2) | Certain tenants may have lease termination options that are exercisable prior to the originally stated expiration date of the subject lease and that are not considered in the Lease Expiration Schedule. |
| (3) | Weighted Average Annual U/W Base Rent PSF excludes vacant space. |
| (4) | MiMi’s Kids Boutique, Starbucks and Maggie G operate under two leases each. |
The following table presents historical occupancy percentages at the Lakeside Shopping Center Property:
Historical Occupancy
12/31/2013(1) | 12/31/2014(1) | 12/31/2015(1) | 12/31/2016(1) | 6/1/2017(2)(3) | ||||
| 98.3% | 97.1% | 98.2% | 98.9% | 97.5% |
| (1) | Information obtained from the borrower. |
| (2) | Information obtained from the underwritten rent roll. |
| (3) | As of June 1, 2017, the Lakeside Shopping Center Property was 97.5% leased and 92.7% occupied by 129 tenants. |
THE INFORMATION IN THIS STRUCTURAL AND COLLATERAL TERM SHEET IS NOT COMPLETE AND MAY BE AMENDED PRIOR TO THE TIME OF SALE. THIS TERM SHEET IS NOT AN OFFER TO SELL THESE SECURITIES AND IT IS NOT A SOLICITATION OF AN OFFER TO BUY THESE SECURITIES IN ANY JURISDICTION WHERE THE OFFER OR SALE IS NOT PERMITTED.
59
| LAKESIDE SHOPPING CENTER |
Operating History and Underwritten Net Cash Flow. The following table presents certain information relating to the historical operating performance and the underwritten net cash flow at the Lakeside Shopping Center Property:
Cash Flow Analysis
| 2014 | 2015 | 2016 | TTM 3/31/2017 | U/W | % of U/W Effective Gross Income | U/W $ per SF | |||||||||
| Base Rent | $22,511,952 | $22,224,455 | $22,643,543 | $22,644,279 | $23,424,962(1)(2) | 71.6% | $19.34 | ||||||||
| Total Reimbursables | 7,819,042 | 7,732,795 | 7,909,595 | 7,853,546 | 7,415,542 | 22.7 | 6.12 | ||||||||
| Percentage Rent Income(3) | 1,904,324 | 1,892,475 | 1,601,600 | 1,558,077 | 1,462,657 | 4.5 | 1.21 | ||||||||
| Other Income(4) | 413,733 | 556,196 | 460,051 | 447,054 | 410,556 | 1.3 | 0.34 | ||||||||
| Less Vacancy & Credit Loss | 0 | 0 | 0 | 0 | 0(2) | 0.0 | 0.00 | ||||||||
| Effective Gross Income | $32,649,051 | $32,405,920 | $32,614,789 | $32,502,956 | $32,713,717 | 100.0% | $27.01 | ||||||||
| Total Operating Expenses | $12,900,841 | $13,228,233 | $13,589,313 | $13,680,575 | $12,933,343 | 39.5% | $10.68 | ||||||||
| Net Operating Income | $19,748,210 | $19,177,687 | $19,025,476 | $18,822,381 | $19,780,375 | 60.5% | $16.33 | ||||||||
| Capital Expenditures | 0 | 0 | 0 | 0 | 242,270 | 0.7 | 0.20 | ||||||||
| TI/LC | 0 | 0 | 0 | 0 | 1,230,800 | 3.8 | 1.02 | ||||||||
| Net Cash Flow | $19,748,210 | $19,177,687 | $19,025,476 | $18,822,381 | $18,307,305 | 56.0% | $15.11 | ||||||||
| NOI DSCR(5) | 2.95x | 2.87x | 2.84x | 2.81x | 2.96x | ||||||||||
| NCF DSCR(5) | 2.95x | 2.87x | 2.84x | 2.81x | 2.74x | ||||||||||
| NOI DY(5) | 11.3% | 11.0% | 10.9% | 10.8% | 11.3% | ||||||||||
| NCF DY(5) | 11.3% | 11.0% | 10.9% | 10.8% | 10.5% |
| (1) | U/W Base Rent includes contractual rent steps through July 30, 2018. |
| (2) | The Lakeside Shopping Center Property was 97.5% leased and 92.7% occupied by 129 tenants as of June 1, 2017. All outstanding rent concessions and gap rent have been reserved at origination of the Lakeside Shopping Center Whole Loan. The underwritten economic vacancy is included in the U/W Base Rent. |
| (3) | Percentage Rent Income represents overage rent in addition to base rent for gross tenant sales above a threshold. U/W Percentage Rent Income is based on the trailing 12-month period ending April 30, 2017. |
| (4) | Other income includes income from rubbish removal, advertising, storage and other miscellaneous income. |
| (5) | Debt service coverage ratios and debt yields are based on the Lakeside Shopping Center Whole Loan. |
Appraisal.As of the appraisal valuation date of June 7, 2017, the Lakeside Shopping Center Property had an “as-is” appraised value of $365,000,000.
Environmental Matters. Based on the Phase I environmental site assessment and other information, certain elevated environmental matters related to prior automotive service uses at the Lakeside Shopping Center Property were identified. The borrower has an existing Premises Pollution Liability-type environmental insurance policy covering multiple locations with an aggregate $20,000,000 limits of liability and $5,000,000 per claim (with a $2,000,000 sublimit being set-aside for the Lakeside Shopping Center Property) with a term expiring June 18, 2022 and a $25,000 deductible. In addition, the loan documents include the borrower’s covenant to renew the environmental insurance policy for an additional 5-year term in 2022, and for an additional 3 year term in 2027. The lender and its successors will be an additional named insured to the environmental insurance policy. The loan documents further provide that the borrower and guarantor are personally liable for losses related to such environmental matters. See “Description of the Mortgage Pool–Environmental Considerations” in the prospectus.
Market Overview and Competition.The Lakeside Shopping Center Property is located in Metairie, Jefferson Parish, Louisiana, along North Causeway Boulevard, between Interstate 10 (0.4 miles south) and the Lake Pontchartrain Causeway (0.7 miles north). The Lake Pontchartrain Causeway is a 23.8-mile-long bridge spanning the entirety of Lake Pontchartrain – connecting northeast Louisiana to Metairie and New Orleans. According to a third party report, the estimated 2016 population within a three-, five- and seven-mile radius of the Lakeside Shopping Center Property was 120,280, 269,800 and 484,994, respectively, and average household income within the same radii was $83,024, $78,656 and $74,785, respectively. The area surrounding the Lakeside Shopping Center Property is mainly comprised of commercial uses with larger residential concentrations further from North Causeway Boulevard, West Esplanade Avenue and Veterans Memorial Boulevard. The Lakeside Shopping Center Property benefits from its large draw as a super-regional mall located in close proximity to the heavily-trafficked Interstate 10 and Lake Pontchartrain Causeway and 7.8 miles northwest of New Orleans, as well as a high daytime population in the immediate area. Within a one-mile radius of the Lakeside Shopping Center Property there are 223 office properties, comprising approximately 5.4 million square feet, with a total occupancy of 92.1% and a five-year average total occupancy of 93.1%.
The Lakeside Shopping Center Property is located in the Causeway Corridor submarket of the New Orleans/Metairie/Kenner retail market, which as of the second quarter of 2017 contained 146 buildings comprising approximately 2.4 million square feet with a vacancy rate of 2.4%. As of the same period, the Mall subsector of the New Orleans/Metairie/Kenner retail market contained 10 centers comprising approximately 5.8 million square feet with a vacancy rate of 4.7%. Since 2009, the Mall subsector of the New Orleans/Metairie/Kenner retail market has maintained and average year-end occupancy of 94.5%, never falling below 91.7%.
THE INFORMATION IN THIS STRUCTURAL AND COLLATERAL TERM SHEET IS NOT COMPLETE AND MAY BE AMENDED PRIOR TO THE TIME OF SALE. THIS TERM SHEET IS NOT AN OFFER TO SELL THESE SECURITIES AND IT IS NOT A SOLICITATION OF AN OFFER TO BUY THESE SECURITIES IN ANY JURISDICTION WHERE THE OFFER OR SALE IS NOT PERMITTED.
60
| LAKESIDE SHOPPING CENTER |
The following table presents certain information relating to comparable properties to the Lakeside Shopping Center Property:
Competitive Set(1)
Lakeside Shopping Center (Subject) | Clearview Mall | The Esplanade | The Shops at Canal Place | Oakwood Center | |
| Location | Metairie, LA | Metairie, LA | Kenner, LA | New Orleans, LA | Gretna, LA |
| Distance from Subject | -- | 1.6 miles | 5.5 miles | 6.7 miles | 9.2 miles |
| Property Type | Super-Regional Mall | Super-Regional Mall | Super-Regional Mall | Specialty Center | Super-Regional Mall |
| Year Built/Renovated | 1960/2002 | 1966/2002 | 1984/2011 | 1982/2006 | 1966/2007 |
| Anchors | Dillard’s, Macy’s, JC Penney, Dick’s Sporting Goods | Target, Sears, AMC Theatres, Bed Bath & Beyond | Dillard’s, Target, The Grand Theatre Image | Saks Fifth Avenue | Dillard’s, JC Penney, Dick’s Sporting Goods, Shoe Depot/Encore |
| Total GLA | 1,211,349 SF | 700,000 SF | 965,858 SF | 269,376 SF | 907,145 SF |
| Sales PSF | $795 | $285 | $235 | $625 | $400 |
| Total Occupancy | 97.5% | 90.0% | 89.0% | 98.0% | 98.0% |
| (1) | Information obtained from the appraisal and the underwritten rent roll. |
The Borrower.The borrower is Causeway LLC, a Delaware limited liability company and single-purpose entity with two independent directors. Legal counsel to the borrowers delivered a non-consolidation opinion in connection with the origination of the Lakeside Shopping Center Whole Loan. Jeffrey J. Feil is the guarantor of certain nonrecourse carveouts under the Lakeside Shopping Center Whole Loan.
The Borrower Sponsor.The borrower sponsor is Jeffrey J. Feil, CEO of The Feil Organization, a real estate investment, development and management firm based New York City. Founded over 60 years ago, The Feil Organization developed and manages over 26.0 million square feet of retail, commercial and industrial properties, over 5,000 residential rental units, as well as hundreds of net leased properties and thousands of acres of undeveloped land across the United States. The Feil organization’s New Orleans market real estate holdings include approximately 1.7 million square feet of retail, 2.9 million square feet of space, 700,000 square feet of industrial space and 942 multifamily units. Mr. Feil is involved in two ongoing litigations: (i) a civil rights case that is currently open in the State of New York Supreme Court, and (ii) as borrower sponsor, an uncontested foreclosure. See “Description of the Mortgage Pool – Litigation and Other Considerations” in the Preliminary Prospectus.
Escrows.The loan documents provide for upfront escrows at closing in the amount of $7,606,095 for all outstanding tenant improvement and leasing commission (“TI/LC”) costs relating to Zara ($3,000,000), Charles Schwab ($2,000,000), Whitney Bank ($1,035,325), Free People ($475,000), Express ($423,200), Flemings Prime Steakhouse ($390,320), J. Jill ($247,250) and Regis Corporation ($35,000); and $1,214,427 for all outstanding rent credits, concessions and abatements relating to Zara ($841,430), Charles Schwab ($325,000), and Flemings Prime Steakhouse ($47,997).
During a Trigger Period (as defined below), the borrower is required to deposit monthly escrows for real estate taxes and insurance premiums (unless the Lakeside Shopping Center Property is insured under an acceptable blanket insurance policy), monthly escrows of $20,193 for replacement reserves (capped at $1,000,000), a monthly amount equal to $0.10 per square foot for leases at the Lakeside Shopping Center Property covering less than 20,000 square feet for tenant improvement and leasing commissions, monthly escrows totaling $5,643 for ground rent (see “Ground Lease” section below), and any lease termination fee incurred by the termination of a tenant’s lease, which will be used for tenant improvements and leasing commissions.
Lockbox and Cash Management.The Lakeside Shopping Center Whole Loan requires a lender-controlled lockbox account, which is already in place, and that the borrower direct all tenants to pay their rents directly into such lockbox account. The Lakeside Shopping Center Whole Loan documents also require that all rents received by the borrower or the property manager be deposited into the lockbox account within one business day of receipt. Prior to the occurrence of Trigger Period (as defined below), all funds are required to be distributed to the borrower. During a Trigger Period, all rents are required to be swept to a lender-controlled cash management account and excess cash flow shall be held by the lender.
A “Trigger Period” will commence upon the earlier of (i) the occurrence and continuance of an event of default or (ii) the debt yield being less than 8.0% for two consecutive calendar quarters. A Trigger Period will end, with respect to clause (i), upon the cure of such event of default; or, with respect to clause (ii), upon the debt yield being at least 8.0% for two consecutive calendar quarters. However, with respect to clause (ii), the failure to maintain a debt yield of at least 8.0% for two consecutive calendar quarters shall not result in the occurrence of a Trigger Period hereunder if within 10 business days after the borrowers sponsor’s receipt of written notice of the failure to satisfy the debt yield requirement, the borrower sponsor delivers a letter of credit in an amount which, if applied as a partial prepayment of the Lakeside Shopping Center Whole Loan, would cause the debt yield to be greater than or equal to 8.0%.
Property Management. The Lakeside Shopping Center Property is managed by an affiliate of the borrower.
THE INFORMATION IN THIS STRUCTURAL AND COLLATERAL TERM SHEET IS NOT COMPLETE AND MAY BE AMENDED PRIOR TO THE TIME OF SALE. THIS TERM SHEET IS NOT AN OFFER TO SELL THESE SECURITIES AND IT IS NOT A SOLICITATION OF AN OFFER TO BUY THESE SECURITIES IN ANY JURISDICTION WHERE THE OFFER OR SALE IS NOT PERMITTED.
61
| LAKESIDE SHOPPING CENTER |
Assumption.The borrower has the right to transfer the Lakeside Shopping Center Property, provided that certain other conditions are satisfied, including, but not limited to: (i) no event of default has occurred and is continuing; (ii) the lender’s reasonable determination that the proposed transferee and guarantor satisfy the lender’s credit review and underwriting standards, taking into consideration transferee experience, financial strength and general business standing; and (iii) if requested by the lender, rating agency confirmation from Fitch, KBRS and Moody’s that the transfer will not result in a downgrade, withdrawal or qualification of the respective ratings assigned to the Series 2017-C39 Certificates and similar confirmations from each rating agency rating any securities backed by the Lakeside Shopping Center Whole Loan with respect to the ratings of such securities.
Partial Release. Not permitted.
Real Estate Substitution.Not permitted.
Subordinate and Mezzanine Indebtedness.Not permitted.
Ground Lease. The Lakeside Shopping Center Property is subject to two separate long-term ground leases encompassing a total of 24,560 square feet with a current aggregate annual ground rent payment of $67,710, subject to re-adjustments every 10 years based on the appraised value of the two ground lease premises. Both ground leases have expirations in 2056. One of the ground leases totaling 5,760 square feet is subject to re-appraisal after August 31, 2017, which may result in rent escalation.
Terrorism Insurance.The Lakeside Shopping Center Whole Loan documents require that the “all risk” insurance policy required to be maintained by the borrower to provide coverage for terrorism in an amount equal to the full replacement cost of the Lakeside Shopping Center Property, subject to a cap equal to one and a half times the premium for the casualty and business interruption insurance coverage on a stand-alone basis, as well as business interruption insurance covering no less than the 18-month period following the occurrence of a casualty event, together with a 12-month extended period of indemnity.
Windstorm and Flood Insurance. The loan documents require windstorm and flood insurance covering the full replacement cost of the Lakeside Shopping Center Property during the loan term. At the time of loan closing, the Lakeside Shopping Center Property had windstorm insurance coverage and flood insurance in the maximum limit available under the National Flood Insurance Program together with excess coverage.
THE INFORMATION IN THIS STRUCTURAL AND COLLATERAL TERM SHEET IS NOT COMPLETE AND MAY BE AMENDED PRIOR TO THE TIME OF SALE. THIS TERM SHEET IS NOT AN OFFER TO SELL THESE SECURITIES AND IT IS NOT A SOLICITATION OF AN OFFER TO BUY THESE SECURITIES IN ANY JURISDICTION WHERE THE OFFER OR SALE IS NOT PERMITTED.
62
(THIS PAGE INTENTIONALLY LEFT BLANK)
THE INFORMATION IN THIS STRUCTURAL AND COLLATERAL TERM SHEET IS NOT COMPLETE AND MAY BE AMENDED PRIOR TO THE TIME OF SALE. THIS TERM SHEET IS NOT AN OFFER TO SELL THESE SECURITIES AND IT IS NOT A SOLICITATION OF AN OFFER TO BUY THESE SECURITIES IN ANY JURISDICTION WHERE THE OFFER OR SALE IS NOT PERMITTED.
63
| LONG ISLAND PRIME PORTFOLIO - UNIONDALE |

THE INFORMATION IN THIS STRUCTURAL AND COLLATERAL TERM SHEET IS NOT COMPLETE AND MAY BE AMENDED PRIOR TO THE TIME OF SALE. THIS TERM SHEET IS NOT AN OFFER TO SELL THESE SECURITIES AND IT IS NOT A SOLICITATION OF AN OFFER TO BUY THESE SECURITIES IN ANY JURISDICTION WHERE THE OFFER OR SALE IS NOT PERMITTED.
64
| LONG ISLAND PRIME PORTFOLIO - UNIONDALE |
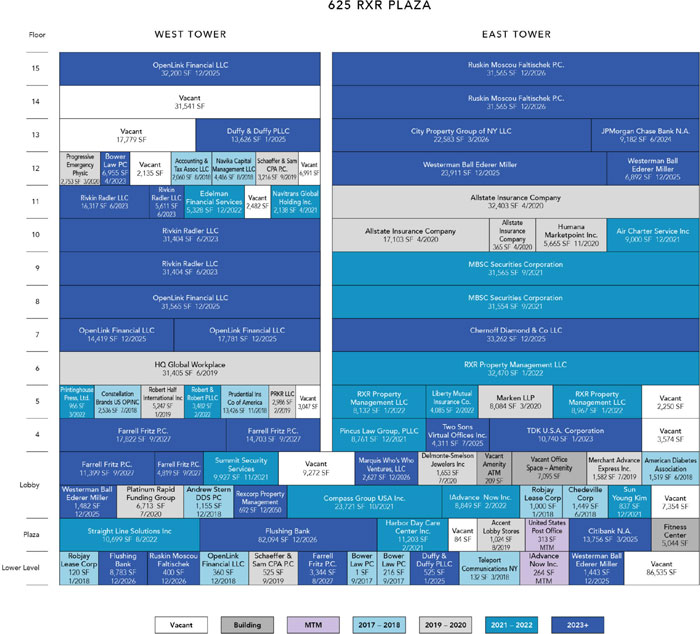
THE INFORMATION IN THIS STRUCTURAL AND COLLATERAL TERM SHEET IS NOT COMPLETE AND MAY BE AMENDED PRIOR TO THE TIME OF SALE. THIS TERM SHEET IS NOT AN OFFER TO SELL THESE SECURITIES AND IT IS NOT A SOLICITATION OF AN OFFER TO BUY THESE SECURITIES IN ANY JURISDICTION WHERE THE OFFER OR SALE IS NOT PERMITTED.
65
| LONG ISLAND PRIME PORTFOLIO - UNIONDALE |
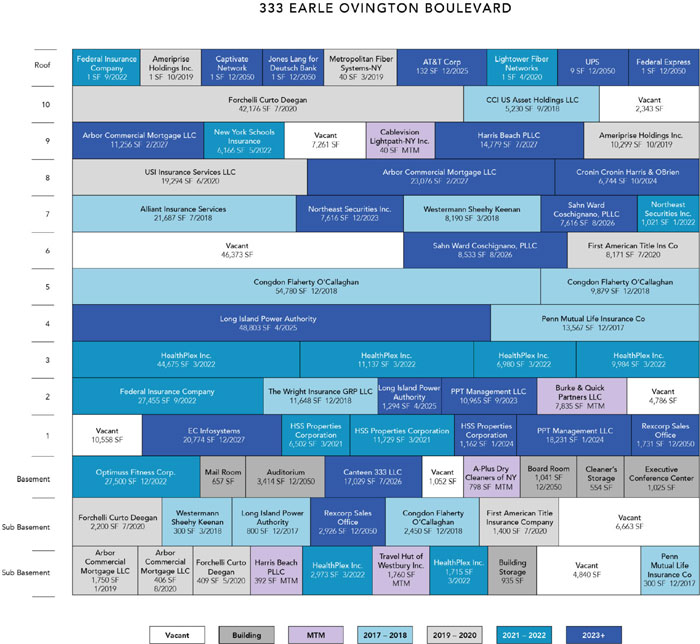
THE INFORMATION IN THIS STRUCTURAL AND COLLATERAL TERM SHEET IS NOT COMPLETE AND MAY BE AMENDED PRIOR TO THE TIME OF SALE. THIS TERM SHEET IS NOT AN OFFER TO SELL THESE SECURITIES AND IT IS NOT A SOLICITATION OF AN OFFER TO BUY THESE SECURITIES IN ANY JURISDICTION WHERE THE OFFER OR SALE IS NOT PERMITTED.
66
| LONG ISLAND PRIME PORTFOLIO - UNIONDALE |
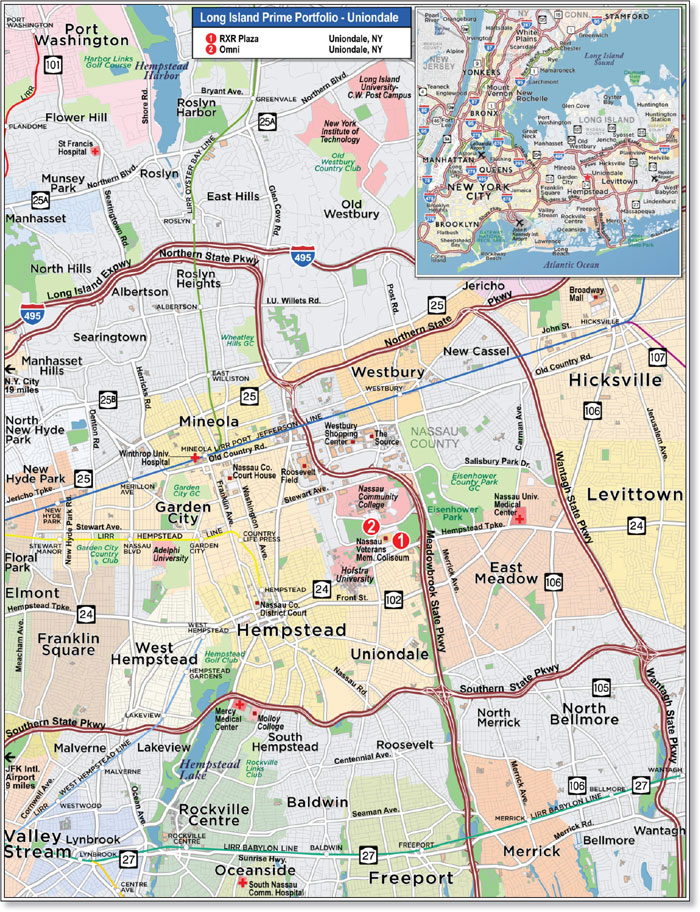
THE INFORMATION IN THIS STRUCTURAL AND COLLATERAL TERM SHEET IS NOT COMPLETE AND MAY BE AMENDED PRIOR TO THE TIME OF SALE. THIS TERM SHEET IS NOT AN OFFER TO SELL THESE SECURITIES AND IT IS NOT A SOLICITATION OF AN OFFER TO BUY THESE SECURITIES IN ANY JURISDICTION WHERE THE OFFER OR SALE IS NOT PERMITTED.
67
| No. 4 – Long Island Prime Portfolio - Uniondale | ||||||
| Loan Information | Property Information | |||||
| Mortgage Loan Seller: | Barclays Bank PLC | Single Asset/Portfolio: | Portfolio | |||
| Credit Assessment | NR/NR/NR | Property Type: | Office | |||
| (Fitch/KBRA/Moody’s): | Specific Property Type: | Suburban | ||||
| Original Principal Balance(1): | $50,000,000 | Location: | Uniondale, NY | |||
| Cut-off Date Balance(1): | $50,000,000 | Size: | 1,750,761 SF | |||
| % of Initial Pool Balance: | 4.4% | Cut-off Date Balance Per SF(1): | $113.07 | |||
| Loan Purpose: | Refinance | Year Built/Renovated: | Various – See Table | |||
| Borrower Names: | 333 Earle Ovington Boulevard SPE LLC; | Title Vesting: | Leasehold | |||
| Rexcorp Plaza SPE LLC | Property Manager: | Self-managed | ||||
| Borrower Sponsor: | RXR Realty LLC | 4thMost Recent Occupancy (As of)(4): | 83.7% (12/31/2013) | |||
| Mortgage Rate: | 4.450% | 3rdMost Recent Occupancy (As of)(4): | 86.9% (12/31/2014) | |||
| Note Date: | June 6, 2017 | 2ndMost Recent Occupancy (As of)(4): | 89.1% (12/31/2015) | |||
| Anticipated Repayment Date: | NAP | Most Recent Occupancy (As of)(4): | 86.9% (12/31/2016) | |||
| Maturity Date: | June 6, 2027 | Current Occupancy (As of): | 85.5% (4/20/2017) | |||
| IO Period: | 120 months | |||||
| Loan Term (Original): | 120 months | |||||
| Seasoning: | 2 months | |||||
| Amortization Term (Original): | NAP | Underwriting and Financial Information: | ||||
| Loan Amortization Type: | Interest-only, Balloon | |||||
| Interest Accrual Method: | Actual/360 | 4thMost Recent NOI (As of): | $19,225,204 (12/31/2014) | |||
| Call Protection(2): | L(26),D(87),O(7) | 3rdMost Recent NOI (As of): | $21,599,852 (12/31/2015) | |||
| Lockbox Type: | Hard/Springing Cash Management | 2ndMost Recent NOI (As of): | $19,274,181 (12/31/2016) | |||
| Additional Debt(1): | Yes | Most Recent NOI (As of)(5): | $18,177,231 (TTM 3/31/2017) | |||
| Additional Debt Type(1): | Pari Passu, Mezzanine | |||||
| U/W Revenues: | $53,504,787 | |||||
| U/W Expenses: | $28,574,757 | |||||
| Escrows and Reserves(3): | U/W NOI(5): | $24,930,030 | ||||
| U/W NCF(5): | $22,222,017 | |||||
| Type: | Initial | Monthly | Cap (If Any) | U/W NOI DSCR(1): | 2.79x | |
| Taxes | $2,049,623 | $906,920 | NAP | U/W NCF DSCR(1): | 2.49x | |
| Insurance | $0 | Springing | NAP | U/W NOI Debt Yield(1): | 12.6% | |
| Replacement Reserves | $0 | $33,207 | NAP | U/W NCF Debt Yield(1): | 11.2% | |
| Deferred Maintenance | $0 | $55,603 | $1,334,472 | As-Is Appraised Value: | $320,000,000 | |
| TI/LC Reserve | $3,350,000 | $199,244 | NAP | As-Is Appraisal Valuation Date: | March 24, 2017 | |
| Unfunded Obligations Reserve | $11,598,911 | $0 | NAP | Cut-off Date LTV Ratio(1): | 61.9% | |
| Ground Rent Reserve | $110,240 | $0 | NAP | LTV Ratio at Maturity or ARD(1): | 61.9% | |
| (1) | See “The Mortgage Loan” section. All statistical information related to balances per square foot, loan-to-value ratios, debt service coverage ratios and debt yields are based on the Long Island Prime Portfolio - Uniondale Whole Loan (as defined below). See “Subordinate and Mezzanine Indebtedness” section. The equity interest in the borrower has been pledged to secure mezzanine indebtedness with an original principal balance of $45,970,000. As of the Cut-off Date, the Cut-off Date Balance per SF, U/W NCF DSCR, U/W NOI Debt Yield, Cut-off Date LTV Ratio and LTV Ratio at Maturity or ARD based on the Long Island Prime Portfolio - Uniondale Whole Loan and the Long Island Prime Portfolio - Uniondale Mezzanine Loan (as defined below) were $139.32, 1.66x, 10.2%, 76.2% and 76.2%, respectively. |
| (2) | The lockout period will be at least 26 payments beginning with and including the first payment date of July 6, 2017. Defeasance of the Long Island Prime Portfolio - Uniondale Whole Loan is permitted at any time after the earlier to occur of (i) June 6, 2020 or (ii) two years after the closing date of the securitization that includes the last note to be securitized. |
| (3) | See “Escrows” section. |
| (4) | See “Historical Occupancy” section. |
| (5) | See “Cash Flow Analysis” section. |
The Mortgage Loan.The mortgage loan (the “Long Island Prime Portfolio - Uniondale Mortgage Loan”) is part of a whole loan (the “Long Island Prime Portfolio - Uniondale Whole Loan”) that is evidenced by fourpari passunotes (Note A-1-1, Note A-1-2, Note A-2-1 and Note A-2-2) secured by a first mortgage encumbering the leasehold interest in two Class A office buildings located in Uniondale, New York on Long Island (the “Long Island Prime Portfolio - Uniondale Properties”). The Long Island Prime Portfolio - Uniondale Whole Loan was originated on June 6, 2017 by Barclays Bank PLC and Goldman Sachs Mortgage Company. The Long Island Prime Portfolio - Uniondale Whole Loan had an original principal balance of $197,950,000, has an outstanding principal balance as of the Cut-off Date of $197,950,000 and accrues interest at an interest rate of 4.450%per annum. The Long Island Prime Portfolio - Uniondale Whole Loan had an initial term of 120 months, has a remaining term of 118 months as of the Cut-off Date and requires payments of interest only through the term of the Long Island Prime Portfolio - Uniondale Whole Loan. The Long Island Prime Portfolio - Uniondale Whole Loan matures on June 6, 2027.
THE INFORMATION IN THIS STRUCTURAL AND COLLATERAL TERM SHEET IS NOT COMPLETE AND MAY BE AMENDED PRIOR TO THE TIME OF SALE. THIS TERM SHEET IS NOT AN OFFER TO SELL THESE SECURITIES AND IT IS NOT A SOLICITATION OF AN OFFER TO BUY THESE SECURITIES IN ANY JURISDICTION WHERE THE OFFER OR SALE IS NOT PERMITTED.
68
| LONG ISLAND PRIME PORTFOLIO - UNIONDALE |
The Long Island Prime Portfolio - Uniondale Mortgage Loan is evidenced by the non-controlling Note A-2-1, which had an original principal balance of $50,000,000, has an outstanding principal balance as of the Cut-off Date of $50,000,000 and will be contributed to the WFCM 2017-C39 Trust. The controlling Note A-1-1, had an aggregate original principal balance of $85,000,000, has an outstanding principal balance as of the Cut-off Date of $85,000,000, is currently held by Goldman Sachs Mortgage Company and is expected to be contributed to the GSMS 2017-GS7 securitization trust. The non-controlling Note A-1-2, had an aggregate original principal balance of $33,770,000, has an outstanding principal balance as of the Cut-off Date of $33,770,000, is currently held by Goldman Sachs Mortgage Company and is expected to be contributed to a future securitization trust or trusts. The non-controlling Note A-2-2, had an aggregate original principal balance of $29,180,000, has an outstanding principal balance as of the Cut-off Date of $29,180,000, is currently held by Barclays Bank PLC and is expected to be contributed to a future securitization trust or trusts (Note A-1-1, Note A-1-2 and Note A-2-2 collectively, the “Long Island Prime Portfolio - UniondalePari PassuCompanion Loan”). The lender provides no assurances that any non-securitizedpari passu notes will not be split further. See “Description of the Mortgage Pool—The Whole Loans—The Serviced Whole Loans” and “—The Non-Serviced Pari Passu Whole Loans” in the Preliminary Prospectus.
Note Summary(1)
| Notes | Original Balance | Note Holder | Controlling Interest | |
| A-1-1 | $85,000,000 | GSMS 2017-GS7 (expected) | Yes | |
| A-1-2 | $33,770,000 | Goldman Sachs Mortgage Company | No | |
| A-2-1 | $50,000,000 | WFCM 2017-C39 | No | |
| A-2-2 | $29,180,000 | Barclays Bank PLC | No | |
| Total | $197,950,000 |
| (1) | The lender provides no assurances that any non-securitizedpari passu note will not be split further. |
Following the lockout period, the borrower has the right to defease the Long Island Prime Portfolio - Uniondale Whole Loan in whole or in part (see “Partial Release” section). The lockout period will expire on the earlier to occur of (i) two years after the closing date of the securitization that includes the last note to be securitized or (ii) June 6, 2020. In addition, the Long Island Prime Portfolio - Uniondale Whole Loan is prepayable without penalty on or after December 6, 2026.
Sources and Uses
| Sources | Uses | |||||||
| Original whole loan amount | $197,950,000 | 63.9% | Loan payoff(2) | $279,997,156 | 90.3% | |||
| Mezzanine Loan(1) | 45,970,000 | 14.8 | Reserves | 17,108,774 | 5.5 | |||
| Preferred Equity(1) | 40,525,135 | 13.1 | Closing costs | 12,868,362 | 4.2 | |||
| Borrower Sponsor’s new cash contribution(2) | 25,529,157 | 8.2 | ||||||
| Total Sources | $309,974,292 | 100.0% | Total Uses | $309,974,292 | 100.0% |
| (1) | See “Subordinate and Mezzanine Indebtedness” and “Preferred Equity” sections. |
| (2) | Loan payoff represents (i) a loan collateralized by the RXR Plaza property previously securitized in the GSMS 2007-GG10 trust and (ii) a loan collateralized by the Omni property previously securitized in the GCCFC 2007-GG9 trust. Prior to loan origination, the previous financing for the RXR Plaza property resulted in a loss to the related trust in connection with a previous loan modification and a maturity default and the previous financing for the Omni property resulted in a loss to the trust due to a maturity default. See “Description of the Mortgage Pool – Loan Purpose; Default History, Bankruptcy Issues and Other Proceedings” in the Preliminary Prospectus. |
The Properties.The Long Island Prime Portfolio - Uniondale Properties consist of two Class A office properties (the RXR Plaza and the Omni) located in Uniondale, New York, on Long Island, approximately 20.0 miles east of Manhattan. Constructed in 1985 and 1990, the Long Island Prime Portfolio - Uniondale Properties total 1,750,761 square feet. The RXR Plaza property features amenities including 24-hour/7-day access, a winter garden public space within a 60-foot atrium, a four-story parking facility connected via a protected pedestrian walkway, a cafe, retail amenities (including a U.S. postal office, sundry shop, dry cleaner, jewelry store and day care center), an outdoor ice skating facility and a full service fitness center. The Omni property features amenities including 24-hour/7-day access, retail amenities (including a travel agency and dry cleaners), a lobby which features a fully accredited art gallery, an executive dining room, a 150 seat teleconferencing theatre, a private VIP boardroom and a full service fitness center with an indoor pool.
The Long Island Prime Portfolio - Uniondale Properties are located adjacent to the Meadowbrook State Parkway and Route 24 in Uniondale, New York which is in Nassau County, Long Island. The Meadowbrook Parkway offers access to Interstate 495 (also known as the Long Island Expressway), which connects Manhattan to Nassau and Suffolk counties in Long Island. The Long Island Prime Portfolio - Uniondale Properties are accessible by the Long Island Rail Road from the Garden City station, using the Hempstead branch, which directly connects to Penn Station in Manhattan. Notable attractions in the immediate vicinity of the Long Island Prime Portfolio - Uniondale Properties include the Nassau Coliseum, Hofstra University, Nassau County Community, the Long Island Children’s Museum, the Cradle of Aviation Museum and the Firefighter’s Museum.
The Long Island Prime Portfolio - Uniondale Properties are leased to 77 unique tenants across a diverse spectrum of industries, including the legal, insurance, financial services, telecommunications and healthcare industries. No single tenant represents more than 5.5% of net rentable area or 7.7% of annual in-place underwritten base rent of the Long Island Prime Portfolio - Uniondale Properties. The largest tenants at the Long Island Prime Portfolio - Uniondale Properties include OpenLink Financial LLC at the RXR Plaza property (6.8% of U/W base rent), Flushing Bank at the RXR Plaza property (4.4% of U/W base rent) and Rivkin Radler LLP at the RXR Plaza property (7.7% of U/W base rent). As of April 20, 2017, the Long Island Prime Portfolio - Uniondale Properties were 85.5% occupied by 77 tenants.
THE INFORMATION IN THIS STRUCTURAL AND COLLATERAL TERM SHEET IS NOT COMPLETE AND MAY BE AMENDED PRIOR TO THE TIME OF SALE. THIS TERM SHEET IS NOT AN OFFER TO SELL THESE SECURITIES AND IT IS NOT A SOLICITATION OF AN OFFER TO BUY THESE SECURITIES IN ANY JURISDICTION WHERE THE OFFER OR SALE IS NOT PERMITTED.
69
| LONG ISLAND PRIME PORTFOLIO - UNIONDALE |
The following table presents certain information relating to the Long Island Prime Portfolio - Uniondale Properties:
| Property Name | Allocated Whole Loan Cut-off Date Balance | % of Portfolio Cut-off Date Balance | Occupancy | Year Built/ Renovated | Net Rentable Area (SF) | As-Is Appraised Value | Allocated Cut-off Date LTV |
| RXR Plaza | $117,850,000 | 59.5% | 84.9% | 1985/NAP | 1,085,298 | $189,000,000 | 62.4% |
| Omni | $80,100,000 | 40.5% | 86.5% | 1990/NAP | 665,463 | $131,000,000 | 61.1% |
| Total/Weighted Average | $197,950,000 | 100.0% | 85.5% | 1,750,761 | $320,000,000 | 61.9% |
The following table presents certain information relating to the tenancies at the Long Island Prime Portfolio - Uniondale Properties:
Major Tenants
| Tenant Name - Property | Credit Rating (Fitch/ Moody’s/ S&P)(1) | Tenant NRSF | % of NRSF | Annual U/W Base Rent PSF(2) | Annual U/W Base Rent(2) | % of Total Annual U/W Base Rent | Lease Expiration Date |
| Major Tenants | |||||||
OpenLink Financial LLC(3) RXR Plaza | NR/NR/NR | 96,325 | 5.5% | $33.85 | $3,261,014 | 6.8% | 12/31/2025(4) |
Flushing Bank(5) RXR Plaza | NR/NR/NR | 90,877 | 5.2% | $23.52 | $2,137,313 | 4.4% | 12/31/2026(6) |
Rivkin Radler LLP(7) RXR Plaza | NR/NR/NR | 84,736 | 4.8% | $43.72 | $3,704,882 | 7.7% | 6/30/2023 |
Healthplex Inc. Omni | NR/NR/NR | 77,464 | 4.4% | $33.51 | $2,595,654 | 5.4% | 3/31/2022(8) |
Congdon Flaherty O’Callaghan(9) Omni | NR/NR/NR | 67,109 | 3.8% | $36.93 | $2,478,380 | 5.1% | 12/31/2018(10) |
| Total Major Tenants | 416,511 | 23.8% | $34.04 | $14,177,242 | 29.4% | ||
| Non-Major Tenants | 1,080,501 | 61.7% | $31.51 | $34,041,895 | 70.6% | ||
| Occupied Collateral Total | 1,497,012 | 85.5% | $32.21 | $48,219,138 | 100.0% | ||
| Vacant Space | 253,749 | 14.5% | |||||
| Collateral Total | 1,750,761 | 100.0% | |||||
| (1) | Certain ratings are those of the parent company whether or not the parent guarantees the lease. |
| (2) | Annual U/W Base Rent includes rent steps through July 2018 totaling, $1,734,163. |
| (3) | OpenLink Financial LLC has a rent abatement period from January 2021 to March 2021 and January 2025 to February 2025. Such free rent amount was deposited into escrow by the borrower on the origination date. See “Escrows” section below. |
| (4) | OpenLink Financial LLC has 360 square feet of storage space that expires December 31, 2018. OpenLink Financial has two, five-year renewal options. |
| (5) | Flushing Bank has an approximately 50% rent abatement period through December 2018. Such free rent amount was deposited into escrow by the borrower on the origination date. See “Escrows” section below. |
| (6) | Flushing Bank has one, five year renewal option. |
| (7) | Rivkin Radler LLP has an approximately $6,000/month rent abatement period from March 2021 through June 2023. Such free rent amount was deposited into escrow by the borrower on the origination date. |
| (8) | Healthplex Inc. has one, five year renewal option. |
| (9) | Congdon Flaherty O’Callachan has a rent abatement period for the month of December 2018. Such free rent amount was deposited into escrow by the borrower on the origination date. |
| (10) | Congdon Flaherty O’Callaghan has one, five year renewal option. Congdon Flaherty O’Callaghan has the right to terminate 2,540 of storage space with 60-days’ notice. |
THE INFORMATION IN THIS STRUCTURAL AND COLLATERAL TERM SHEET IS NOT COMPLETE AND MAY BE AMENDED PRIOR TO THE TIME OF SALE. THIS TERM SHEET IS NOT AN OFFER TO SELL THESE SECURITIES AND IT IS NOT A SOLICITATION OF AN OFFER TO BUY THESE SECURITIES IN ANY JURISDICTION WHERE THE OFFER OR SALE IS NOT PERMITTED.
70
| LONG ISLAND PRIME PORTFOLIO - UNIONDALE |
The following table presents certain information relating to the lease rollover schedule at the Long Island Prime Portfolio - Uniondale Properties:
Lease Expiration Schedule(1)(2)
| Year Ending December 31, | No. of Leases Expiring(3) | Expiring NRSF | % of Total NRSF | Cumulative Expiring NRSF | Cumulative % of Total NRSF | Annual U/W Base Rent | % of Total Annual U/W Base Rent | Annual U/W Base Rent PSF(4) |
| MTM | 4 | 17,451 | 1.0% | 17,451 | 1.0% | $277,961 | 0.6% | $15.93 |
| 2017 | 1 | 14,926 | 0.9% | 32,377 | 1.8% | 500,571 | 1.0% | $33.54 |
| 2018 | 13 | 145,447 | 8.3% | 177,824 | 10.2% | 5,140,709 | 10.7% | $35.34 |
| 2019 | 7 | 58,075 | 3.3% | 235,899 | 13.5% | 2,044,981 | 4.2% | $35.21 |
| 2020 | 9 | 148,798 | 8.5% | 384,697 | 22.0% | 5,220,301 | 10.8% | $35.08 |
| 2021 | 9 | 144,856 | 8.3% | 529,553 | 30.2% | 4,394,539 | 9.1% | $30.34 |
| 2022 | 11 | 222,585 | 12.7% | 752,138 | 43.0% | 6,482,810 | 13.4% | $29.13 |
| 2023 | 5 | 121,012 | 6.9% | 873,150 | 49.9% | 4,891,942 | 10.1% | $40.43 |
| 2024 | 3 | 35,319 | 2.0% | 908,469 | 51.9% | 1,333,549 | 2.8% | $37.76 |
| 2025 | 7 | 243,788 | 13.9% | 1,152,257 | 65.8% | 8,398,031 | 17.4% | $34.45 |
| 2026 | 4 | 203,361 | 11.6% | 1,355,618 | 77.4% | 5,424,878 | 11.3% | $26.68 |
| 2027 | 4 | 121972 | 7.0% | 1,477,590 | 84.4% | 4,108,865 | 8.5% | $33.69 |
| Thereafter | 0 | 19,422 | 1.1% | 1,497,012 | 85.5% | 0 | 0.0% | $0.00 |
| Vacant | 0 | 253,749 | 14.5% | 1,750,761 | 100.0% | 0 | 0.0% | $0.00 |
| Total/Weighted Average | 77 | 1,750,761 | 100.0% | $48,219,138 | 100.0% | $32.21 |
| (1) | Information obtained from the underwritten rent roll. |
| (2) | Certain tenants may have lease termination options that are exercisable prior to the originally stated expiration date of the subject lease and that are not considered in the Lease Expiration Table. |
| (3) | No. of Leases Expiring does not include miscellaneous administrative space (auditorium, tenant storage spaces, cafeteria, fitness and conference space) and tenants which have no attributable base rent. |
| (4) | Weighted Average Annual U/W Base Rent PSF excludes vacant space. |
The following table presents historical occupancy percentages at the Long Island Prime Portfolio - Uniondale Properties:
Historical Occupancy(1)
2013(2) | 2014(2) | 2015(2) | 2016(2) | 4/20/2017(3) |
| 83.7% | 86.9% | 89.1% | 86.9% | 85.5% |
| (1) | Approximately 87,587 square feet (5.0% of net rentable area) is below grade office space with no windows, which was formerly occupied by Citibank and has been vacant since 2010. Excluding this space, the Long Island Prime Portfolio – Uniondale properties are 90.5% occupied as of April 20, 2017. |
| (2) | Information obtained from the borrower and represents the average occupancy for the year stated. |
| (3) | Information obtained from the underwritten rent roll. |
THE INFORMATION IN THIS STRUCTURAL AND COLLATERAL TERM SHEET IS NOT COMPLETE AND MAY BE AMENDED PRIOR TO THE TIME OF SALE. THIS TERM SHEET IS NOT AN OFFER TO SELL THESE SECURITIES AND IT IS NOT A SOLICITATION OF AN OFFER TO BUY THESE SECURITIES IN ANY JURISDICTION WHERE THE OFFER OR SALE IS NOT PERMITTED.
71
| LONG ISLAND PRIME PORTFOLIO - UNIONDALE |
Operating History and Underwritten Net Cash Flow. The following table presents certain information relating to the historical operating performance and the underwritten net cash flow at the Long Island Prime Portfolio - Uniondale Properties:
Cash Flow Analysis
| 2014 | 2015 | 2016 | TTM 3/31/2017(1) | U/W(1)(2) | %of U/W Effective Gross Income | U/W $ per SF | |||||||||
| Base Rent | $43,715,452 | $44,823,950 | $41,924,024 | $40,623,924 | $48,234,239 | 90.1% | $27.55 | ||||||||
| Grossed Up Vacant Space | 0 | 0 | 0 | 0 | 8,352,081 | 15.6 | 4.77 | ||||||||
| Total Reimbursables | 5,690,588 | 5,552,157 | 4,611,207 | 4,635,643 | 4,643,884 | 8.7 | 2.65 | ||||||||
| Other Income | 788,748 | 655,823 | 683,299 | 702,082 | 626,664 | 1.2 | 0.36 | ||||||||
| Less Vacancy & Credit Loss | (100,821) | (224,646) | (54,708) | 165,667 | (8,352,081)(3) | (15.6) | (4.77) | ||||||||
| Effective Gross Income | $50,093,967 | $50,807,283 | $47,163,821 | $46,127,315 | $53,504,787 | 100.0% | $30.56 | ||||||||
| Total Operating Expenses | $30,868,763 | $29,207,431 | $27,889,640 | $27,950,084 | $28,574,757 | 53.4% | $16.32 | ||||||||
| Net Operating Income | $19,225,204 | $21,599,852 | $19,274,181 | $18,177,231 | $24,930,030 | 46.6% | $14.24 | ||||||||
| TI/LC | 0 | 0 | 0 | 0 | 2,270,323 | 4.2 | 1.30 | ||||||||
| Capital Expenditures | 0 | 0 | 0 | 0 | 437,690 | 0.8 | 0.25 | ||||||||
| Net Cash Flow | $19,225,204 | $21,599,852 | $19,274,181 | $18,177,231 | $22,222,017 | 41.5% | $12.69 | ||||||||
| NOI DSCR(4) | 2.15x | 2.42x | 2.16x | 2.04x | 2.79x | ||||||||||
| NCF DSCR(4) | 2.15x | 2.42x | 2.16x | 2.04x | 2.49x | ||||||||||
| NOI DY(4) | 9.7% | 10.9% | 9.7% | 9.2% | 12.6% | ||||||||||
| NCF DY(4) | 9.7% | 10.9% | 9.7% | 9.2% | 11.2% |
| (1) | The increase in Base Rent, Effective Gross Income and Net Operating Income from TTM 3/31/2017 to U/W was a result of (i) approximately 230,059 square feet (13.1% of net rentable area) having signed a new or renewal lease since 3/31/2016 at an average base rent of $32.48 per square foot, (ii) rent steps through July 2018 totaling $1,734,163, (iii) approximately $2,462,416 of free rent which was not included in the TTM 3/31/2017 period and was included in U/W (all outstanding free rent has been reserved) and (iv) the present value of investment grade tenant rent steps discounted at 7.0% totaling $15,101. |
| (2) | A third party sub-leases a portion of the land (approximately 22.5% of the acreage) from the borrower. Both the $183,886 ground lease expense and the $183,886 third party sub-lease rent were excluded from the underwriting. See “Ground Lease” section. |
| (3) | The underwritten economic vacancy is 13.5%. The Long Island Prime Portfolio - Uniondale Properties were 85.5% physically occupied as of April 20, 2017. |
| (4) | The debt service coverage ratios and debt yields are based on the Long Island Prime Portfolio – Uniondale Whole Loan. |
Appraisal.As of the appraisal valuation date of March 24, 2017, the Long Island Prime Portfolio - Uniondale Properties had an aggregate “as-is” appraised value of $320,000,000.
Environmental Matters. According to the Phase I environmental site assessment for the RXR Plaza property dated April 7, 2017, the currently existing and previously removed underground storage tanks (“USTs”) was considered a recognized environmental condition. According to the Phase II environmental site assessment for the RXR Plaza property dated May 15, 2017, the RXR Plaza property has not been significantly impacted by the USTs and no further action or investigation was recommended. According to the Phase I environmental site assessments dated April 10, 2017, there are no recognized environmental conditions at the Omni property. The borrower has provided the lender with an environmental insurance policy in lieu of an environmental recourse carveout. See “Description of the Mortgage Pool – Non-Recourse Carveout Limitations” in the Preliminary Prospectus.
Market Overview and Competition.The Long Island Prime Portfolio - Uniondale Properties are located in Uniondale, New York which is in Nassau County, Long Island. According to the appraisal, leasing activity in the Nassau-Suffolk region for the fourth quarter of 2016 totaled 625,000 square feet, up 17.0% from its five-year quarterly average. As of the fourth quarter of 2016, the Long Island Class A office market reported a total inventory of 104 office buildings, totaling approximately 19.0 million square feet, with a 8.2% vacancy rate and average asking rents of $30.62 per square foot. The Long Island Prime Portfolio - Uniondale Properties are situated in the Central Nassau submarket, which reported a total inventory of 26 office buildings, totaling approximately 5.4 million square feet, with a 8.7% vacancy rate and average asking rents of $32.02 per square foot. As of 2016, the estimated population within a one-, three- and five- mile radius of the RXR Plaza property was 18,384, 213,749 and 535,317, respectively. The 2016 estimated average household income within the same radii of the RXR Plaza property was $96,873, $105,523 and $119,402, respectively. As of 2016, the estimated population within a one-, three- and five- mile radius of the Omni property was 11,689, 203,784 and 528,108, respectively. The 2016 estimated average household income within the same radii of the Omni property was $98,822, $104,164 and $121,415, respectively. The unemployment rate in Nassau County has steadily declined over the past five years to 3.6% as of December 2016.
THE INFORMATION IN THIS STRUCTURAL AND COLLATERAL TERM SHEET IS NOT COMPLETE AND MAY BE AMENDED PRIOR TO THE TIME OF SALE. THIS TERM SHEET IS NOT AN OFFER TO SELL THESE SECURITIES AND IT IS NOT A SOLICITATION OF AN OFFER TO BUY THESE SECURITIES IN ANY JURISDICTION WHERE THE OFFER OR SALE IS NOT PERMITTED.
72
| LONG ISLAND PRIME PORTFOLIO - UNIONDALE |
The following table presents certain information relating to comparable office leases for the Long Island Prime Portfolio - Uniondale Properties:
Comparable Leases(1)
Property Name/ Location | Year Built/ Renovated | Total GLA (SF) | Distance from Subject | Tenant Name | Lease Term | Lease Area (SF) | Annual Base Rent PSF | Lease Type |
900 Stewart Avenue Garden City, NY | 1986/NAP | 235,431 | <3.0 miles | Quickfund | 8.5 Yrs | 5,330 | $33.70 | Modified Gross |
| Signature Bank | 11.0 Yrs | 8,600 | $34.93 | Modified Gross | ||||
400 Garden City Plaza Garden City, NY | 1989/2001 | 176,073 | <4.0 miles | Scully, Scott Murpy & Presser | 7.3 Yrs | 21,840 | $30.53 | Modified Gross |
| Morritt Hock & Hamroff | 8.8 Yrs | 31,471 | $30.86 | Modified Gross | ||||
100 Quentin-Roosevelt Boulevard Garden City, NY | 1990/NAP | 200,000 | <3.0 miles | Beacon Health Partners | 10.9 Yrs | 17,188 | $31.19 | Modified Gross |
| Vincent Russo | 9.8 Yrs | 9,213 | $30.19 | Modified Gross | ||||
330 Old Country Road Mineola, NY | 1989/NAP | 107,071 | <5.0 miles | Liberty Mutual | 5.5 Yrs | 13,846 | $31.69 | Modified Gross |
825 East Gate Boulevard Garden City, NY | 1985/NAP | 81,396 | <4.0 miles | Richard Allen Marketing | 7.3 Yrs | 1,643 | $28.38 | Modified Gross |
| Auerbach Grayson Global Express | 7.0 Yrs | 1,881 | $30.65 | Modified Gross | ||||
1225 Franklin Avenue Garden City, NY | 1980/NAP | 198,066 | <5.0 miles | Israeloff, Trattner & Co. | 12.0 Yrs | 15,000 | $33.11 | Modified Gross |
90 Merrick Avenue East Meadow, NY | 1985/NAP | 249,659 | <1.5 miles | HIBU | 5.0 Yrs | 7,130 | $30.19 | Modified Gross |
1055 Franklin Avenue Garden City, NY | 1970/2004 | 60,000 | <5.0 miles | UBS Financial | 10.0 Yrs | 10,982 | $37.26 | Modified Gross |
50 Charles Lindbergh Boulevard Uniondale, NY | 1984/NAP | 232,443 | <2.0 miles | Gewurz & Zaccaria | 5.4 Yrs | 2,398 | $28.01 | Modified Gross |
| Struass Law Firm | 5.4 Yrs | 1,391 | $28.01 | Modified Gross |
| (1) | Information obtained from the appraisal. |
The Borrowers.The borrowers are 333 Earle Ovington Boulevard SPE LLC and Rexcorp Plaza SPE LLC, each a Delaware limited liability company and single purpose entity with two independent directors. Legal counsel to the borrower delivered a non-consolidation opinion in connection with the origination of the Long Island Prime Portfolio - Uniondale Whole Loan. RXR Properties Holdings LLC is the guarantor of certain nonrecourse carveouts under the Long Island Prime Portfolio - Uniondale Whole Loan.
The Borrower Sponsor. The borrower sponsor is RXR Realty LLC (“RXR”), a New York-based, vertically integrated real estate owner/operator and investment management firm. RXR manages 81 commercial real estate properties and investments with an aggregate gross asset value of approximately $15.4 billion as of March 31, 2017, comprised of approximately 23.0 million square feet of commercial operating properties and approximately 3,200 multi-family and for sale units under active development in the New York Metropolitan area. Affiliates of RXR have previously negotiated three discounted loan payoffs, including RXR Plaza. See “Description of the Mortgage Pool – Loan Purpose; Default History, Bankruptcy Issues and Other Proceedings” in the Preliminary Prospectus.
Escrows.The Long Island Prime Portfolio - Uniondale Whole Loan documents provide for upfront escrows at origination in the amount of $2,049,623 for real estate taxes, $3,350,000 for general tenant improvements and leasing commissions (“TI/LCs”), $110,240 for ground rent and $11,598,911 for unfunded obligations reserves comprised of (i) $8,396,722 for free rent related to 21 tenants at the Long Island Prime Portfolio – Uniondale Properties, (ii) $676,988 for TI/LCs related to 13 tenants at the Long Island Prime Portfolio – Uniondale Properties and (iii) $2,525,200 for a Ruskin Incentive Payment, in which free rent periods can be converted, at the landlord’s option, into obligations by Ruskin to pay fixed monthly rents in exchange for certain payments to Ruskin set forth in their lease.
The Long Island Prime Portfolio - Uniondale Whole Loan documents provide for ongoing monthly escrows for taxes ($906,920 as of the origination date), $33,207 for replacement reserves (to be reduced by approximately $0.02 per square foot for each property released pursuant to the “Partial Release” section below) and $199,244 for TI/LCs (to be reduced by $0.125 per square foot for each property released pursuant to the “Partial Release” section below). Additionally, the Long Island Prime Portfolio - Uniondale Whole Loan documents provide for ongoing monthly escrows for deferred maintenance through and including June 6, 2019 in an amount equal to $55,603 (subject to a cap of $1,334,472 less (a) the amount disbursed from the escrow account pursuant to the Long Island Prime Portfolio – Uniondale Whole Loan documents and (b) the aggregate amount with respect to each item set forth in the Long Island Prime Portfolio - Uniondale Whole Loan documents that the lender has received reasonably satisfactory evidence that the work related to such item has been completed and no amounts have been disbursed with respect to such item). The Long Island Prime Portfolio - Uniondale Whole Loan documents do not require ongoing monthly escrows for insurance premiums as long as (i) no event of default has occurred and is continuing and (ii) the borrower provides the lender with evidence that the Long Island Prime Portfolio - Uniondale Properties is insured via an acceptable blanket insurance policy and such policy is in full force and effect.
Lockbox and Cash Management. The Long Island Prime Portfolio - Uniondale Whole Loan requires a lender-controlled lockbox account, which is already in place, and that the borrower direct tenants to pay all rents directly into such lockbox account. In the
THE INFORMATION IN THIS STRUCTURAL AND COLLATERAL TERM SHEET IS NOT COMPLETE AND MAY BE AMENDED PRIOR TO THE TIME OF SALE. THIS TERM SHEET IS NOT AN OFFER TO SELL THESE SECURITIES AND IT IS NOT A SOLICITATION OF AN OFFER TO BUY THESE SECURITIES IN ANY JURISDICTION WHERE THE OFFER OR SALE IS NOT PERMITTED.
73
| LONG ISLAND PRIME PORTFOLIO - UNIONDALE |
absence of a Trigger Period (as defined below) or event of default, the funds in the lockbox account will be remitted to the borrower’s operating account. During a Trigger Period or event of default, any transfers to the borrower’s operating account are required to cease and sums on deposit in the lockbox account will be transferred on a daily basis to a lender-controlled cash management account. To the extent there is a Trigger Period continuing, all excess cash flow after payment of the Long Island Prime Portfolio – Uniondale Whole Loan debt service, required reserves, operating expenses and mezzanine debt service will be swept into an excess cash flow reserve to be held in a lender controlled account. Upon the expiration of a Trigger Period, any remaining excess cash flow funds will be disbursed to the borrower’s operating account.
A “Trigger Period” will commence upon any of the following: (i) the net operating income of the Long Island Prime Portfolio - Uniondale Properties falling below $21,178,075 (as calculated in the Long Island Prime Portfolio - Uniondale Whole Loan documents and tested quarterly), (ii) the failure of the borrower to deliver required financial reports to the lender or (iii) the occurrence and continuance of an event of default under the Long Island Prime Portfolio – Uniondale Mezzanine Loan (as defined below). A Trigger Period will be cured, with regard to clause (i), upon the conclusion of the second of two consecutive quarters thereafter during each of which the net operating income of the Long Island Prime Portfolio - Uniondale Properties is equal to or greater than $21,178,075; with regard to clause (ii), upon the borrower delivering such financial reports to the lender indicating that, in fact, no Trigger Period is ongoing; and with regard to clause (iii), upon the waiver by mezzanine lender of such event of default under the Long Island Prime Portfolio – Uniondale Mezzanine Loan (as defined below).
Property Management. The Long Island Prime Portfolio - Uniondale Properties are managed by an affiliate of the borrower.
Assumption.The borrower has the right to transfer the Long Island Prime Portfolio - Uniondale Properties from and after June 6, 2018 provided that certain conditions are satisfied, including (i) no event of default has occurred and is continuing; (ii) the proposed transferee is controlled be a qualified transferee as provided in the Long Island Prime Portfolio - Uniondale Whole Loan documents (including total assets in excess of $650.0 million, shareholder’s equity in excess of $250.0 million); and (iii) the lender has received confirmation that the transfer will not result in a downgrade, withdrawal or qualification of the respective ratings assigned to the Series 2017-C39 Certificates or similar ratings confirmations from each rating agency rating any securities backed by the Long Island Prime Portfolio - UniondalePari Passu Companion Loan with respect to the ratings of such securities.
Partial Release. Following the lockout period, the borrower is permitted to release either of the Long Island Prime Portfolio - Uniondale Properties with partial defeasance of 115% of the released property’s allocated loan balance, subject to certain conditions including (i) no event of default has occurred and is continuing; (ii) after giving effect to such defeasance, the debt yield (with respect to the Long Island Prime Portfolio - Uniondale Whole Loan and the Long Island Prime Portfolio - Uniondale Mezzanine Loan) with respect to the remaining Long Island Prime Portfolio - Uniondale Properties being no less than the greater of (a) 10.21% and (b) the debt yield immediately prior to the release; (iii) the lender has received confirmation that the defeasance will not result in a downgrade, withdrawal or qualification of the respective ratings assigned to the Series 2017-C39 Certificates or similar ratings confirmations from each rating agency rating any securities backed by the Long Island Prime Portfolio - UniondalePari Passu Companion Loan with respect to the ratings of such securities; (iv) the lender receives a legal opinion that the release satisfies REMIC requirements.
Real Estate Substitution.Not permitted.
Subordinate and Mezzanine Indebtedness.CBRE Venture Debt REIT, LLC, a related entity of CBRE Global Investors (the “Long Island Prime Portfolio - Uniondale Mezzanine Lender”) funded a $45,970,000 mezzanine loan (the “Long Island Prime Portfolio - Uniondale Mezzanine Loan”) to RXR Uniondale Mezz LLC, a Delaware limited liability company owning 100.0% of each borrower under the Long Island Prime Portfolio - Uniondale Whole Loan (collectively, the “Long Island Prime Portfolio - Uniondale Mezzanine Borrower”). The Long Island Prime Portfolio - Uniondale Mezzanine Loan is secured by a pledge of the Long Island Prime Portfolio - Uniondale Mezzanine Borrower’s interest in the borrowers under the Long Island Prime Portfolio - Uniondale Whole Loan. The Long Island Prime Portfolio - Uniondale Mezzanine Loan accrues interest at a rate of 9.575% perannumand requires interest-only payments through the maturity date of June 6, 2027. The rights of the Long Island Prime Portfolio - Uniondale Mezzanine Lender are further described under “Description of the Mortgage Pool–Additional Indebtedness-Mezzanine Indebtedness” in the Preliminary Prospectus.
Preferred Equity.CNI RXR Prime Investor, LLC, a related entity of Colony NorthStar, Inc., had made a preferred equity investment in RXR LI Prime Property Venture LP in an amount equal to $85,000,000, of which $40,525,135 is attributable to the 100.0% preferred interest in the Long Island Prime Portfolio - Uniondale Mezzanine Borrower. Pursuant to the limited partnership agreement of RXR LI Prime Property Venture LP, the preferred equity interest is payable only from excess cash after the payment of amounts due under the Long Island Prime Portfolio - Uniondale Whole Loan and the Long Island Prime Portfolio - Uniondale Mezzanine Loan. See “Description of the Mortgage Pool–Additional Indebtedness–Preferred Equity” in the Preliminary Prospectus.
Permitted Future Industrial Development Agency (“IDA”) Lease. The borrower is permitted to convey its current leasehold interest in either of the Long Island Prime Portfolio – Uniondale Properties (but not its reversionary interest) to the Industrial Development Agency (“IDA”), subject to certain conditions including (i) no event of default has occurred and is continuing; (ii) the future IDA lease is satisfactory to lender; (iii) the leasehold interest in the applicable property is subject to the Long Island Prime Portfolio - Uniondale Whole Loan; (iv) no material adverse effect as determined under the Long Island Prime Portfolio - Uniondale Whole Loan documents; and (v) the lender has received confirmation that the conveyance will not result in a downgrade, withdrawal or qualification of the respective ratings assigned to the Series 2017-C39 Certificates or similar ratings confirmations from each rating agency rating any securities backed by the Long Island Prime Portfolio - UniondalePari Passu Companion Loan with respect to the ratings of such securities. The conveyance is to be by virtue of an assignment of the leasehold interest in the applicable ground lease to the IDA and the sublease of such ground lease from the IDA to the applicable borrower for the purpose of facilitating the granting of economic benefits to the borrower.
THE INFORMATION IN THIS STRUCTURAL AND COLLATERAL TERM SHEET IS NOT COMPLETE AND MAY BE AMENDED PRIOR TO THE TIME OF SALE. THIS TERM SHEET IS NOT AN OFFER TO SELL THESE SECURITIES AND IT IS NOT A SOLICITATION OF AN OFFER TO BUY THESE SECURITIES IN ANY JURISDICTION WHERE THE OFFER OR SALE IS NOT PERMITTED.
74
| LONG ISLAND PRIME PORTFOLIO - UNIONDALE |
Ground Lease. The Long Island Prime Portfolio – Uniondale Properties are subject to ground leases with the County of Nassau. The ground lease at the RXR Plaza property expires in April 2083 and the borrower is currently obligated to pay ground rent at the rate of $68,271 per month, of which $15,324 is reimbursed by a third party who is sub-leasing a portion of the land (approximately 22.5% of the acreage). The ground lease at the Omni property expires in January 2088 and the borrower is currently obligated to pay ground rent at the rate of $57,293 per month. See“Description of the Mortgage Pool – Mortgage Pool Characteristics – Fee & Leasehold Estates; Ground Leases” in the Preliminary Prospectus.
Terrorism Insurance. The Long Island Prime Portfolio - Uniondale Whole Loan documents require that the “all risk” insurance policy required to be maintained by the borrower provide coverage for terrorism in an amount equal to the full replacement cost of the Long Island Prime Portfolio - Uniondale Properties. The Long Island Prime Portfolio - Uniondale Whole Loan documents also require business interruption insurance covering no less than the 18-month period following the occurrence of a casualty event, together with a 12-month extended period of indemnity. If TRIPRA or a similar statute is no longer in effect, borrower will only be obligated to carry terrorism insurance if commercially available and, in such event, subject to a cap equal to two times the premium for the property and business/rental interruption coverage.
Windstorm Insurance. The Long Island Prime Portfolio - Uniondale Whole Loan documents require windstorm insurance covering the full replacement cost of the Long Island Prime Portfolio - Uniondale Properties during the loan term. At origination, the Long Island Prime Portfolio - Uniondale Properties had windstorm insurance coverage.
THE INFORMATION IN THIS STRUCTURAL AND COLLATERAL TERM SHEET IS NOT COMPLETE AND MAY BE AMENDED PRIOR TO THE TIME OF SALE. THIS TERM SHEET IS NOT AN OFFER TO SELL THESE SECURITIES AND IT IS NOT A SOLICITATION OF AN OFFER TO BUY THESE SECURITIES IN ANY JURISDICTION WHERE THE OFFER OR SALE IS NOT PERMITTED.
75
(THIS PAGE INTENTIONALLY LEFT BLANK)
THE INFORMATION IN THIS STRUCTURAL AND COLLATERAL TERM SHEET IS NOT COMPLETE AND MAY BE AMENDED PRIOR TO THE TIME OF SALE. THIS TERM SHEET IS NOT AN OFFER TO SELL THESE SECURITIES AND IT IS NOT A SOLICITATION OF AN OFFER TO BUY THESE SECURITIES IN ANY JURISDICTION WHERE THE OFFER OR SALE IS NOT PERMITTED.
76
| COLUMBIA PARK SHOPPING CENTER |
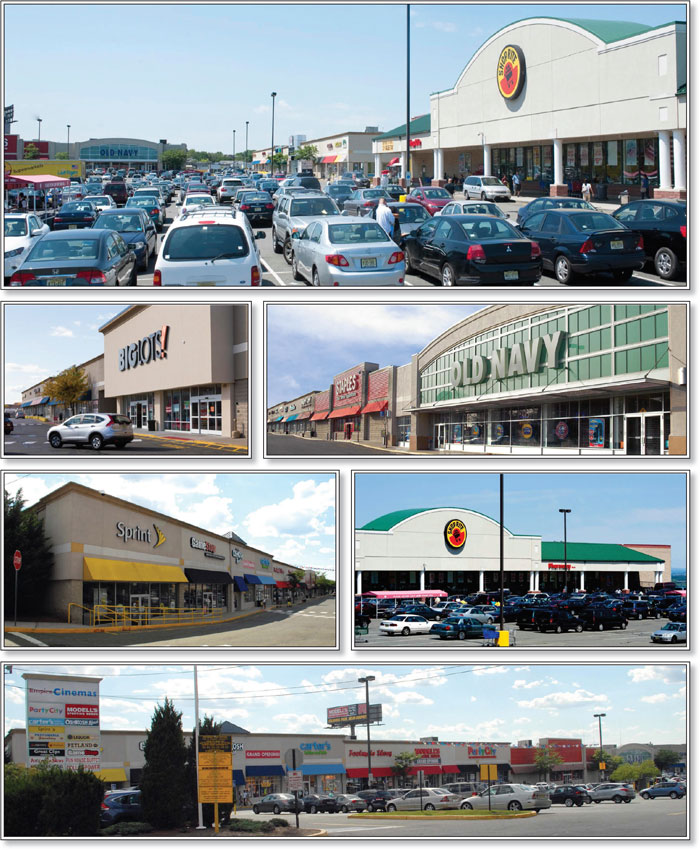
THE INFORMATION IN THIS STRUCTURAL AND COLLATERAL TERM SHEET IS NOT COMPLETE AND MAY BE AMENDED PRIOR TO THE TIME OF SALE. THIS TERM SHEET IS NOT AN OFFER TO SELL THESE SECURITIES AND IT IS NOT A SOLICITATION OF AN OFFER TO BUY THESE SECURITIES IN ANY JURISDICTION WHERE THE OFFER OR SALE IS NOT PERMITTED.
77
| COLUMBIA PARK SHOPPING CENTER |
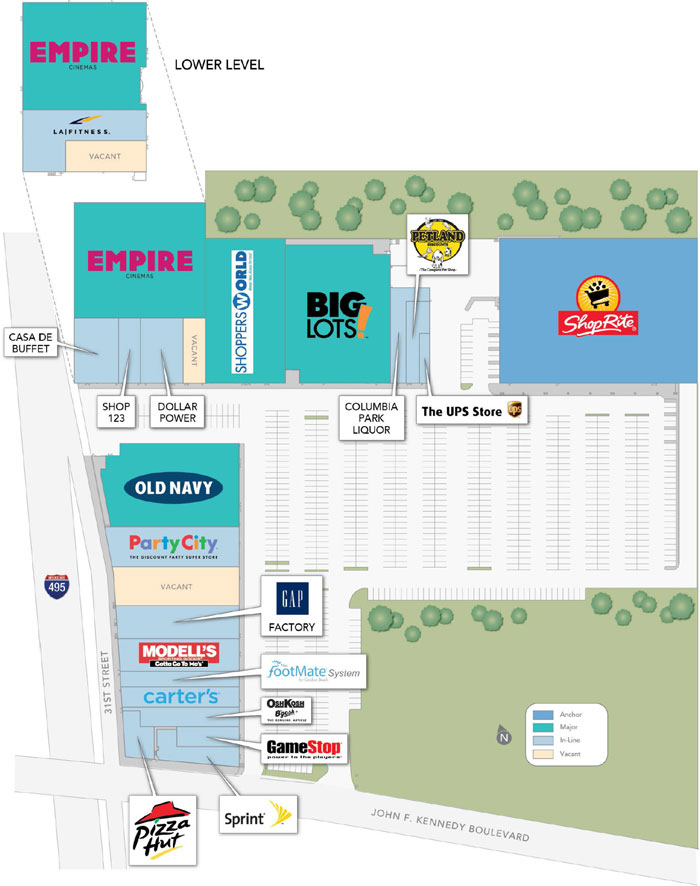
THE INFORMATION IN THIS STRUCTURAL AND COLLATERAL TERM SHEET IS NOT COMPLETE AND MAY BE AMENDED PRIOR TO THE TIME OF SALE. THIS TERM SHEET IS NOT AN OFFER TO SELL THESE SECURITIES AND IT IS NOT A SOLICITATION OF AN OFFER TO BUY THESE SECURITIES IN ANY JURISDICTION WHERE THE OFFER OR SALE IS NOT PERMITTED.
78
| COLUMBIA PARK SHOPPING CENTER |
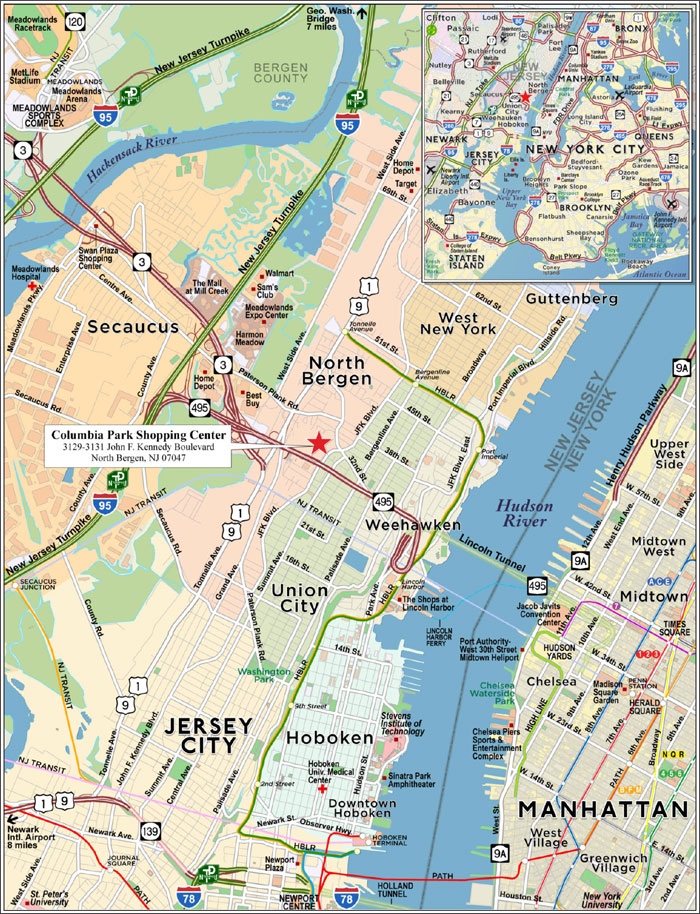
THE INFORMATION IN THIS STRUCTURAL AND COLLATERAL TERM SHEET IS NOT COMPLETE AND MAY BE AMENDED PRIOR TO THE TIME OF SALE. THIS TERM SHEET IS NOT AN OFFER TO SELL THESE SECURITIES AND IT IS NOT A SOLICITATION OF AN OFFER TO BUY THESE SECURITIES IN ANY JURISDICTION WHERE THE OFFER OR SALE IS NOT PERMITTED.
79
| No. 5 – Columbia Park Shopping Center | |||||||||
| Loan Information | Property Information | ||||||||
| Mortgage Loan Seller: | Argentic Real Estate Finance LLC | Single Asset/Portfolio: | Single Asset | ||||||
Credit Assessment (Fitch/KBRA/Moody’s): | NR/NR/NR | Property Type: | Retail | ||||||
| Original Principal Balance(1): | $50,000,000 | Specific Property Type: | Anchored | ||||||
| Cut-off Date Balance(1): | $50,000,000 | Location: | North Bergen, NJ | ||||||
| % of Initial Pool Balance: | 4.4% | Size: | 345,703 SF | ||||||
| Loan Purpose: | Refinance | Cut-off Date Balance Per SF(1): | $181.37 | ||||||
| Borrower: | Columbia Park Retail Owner, LLC; Columbia Park Development Owner, LLC | Year Built/Renovated: | 1999/NAP | ||||||
| Borrower Sponsor: | Forest City Realty Trust, Inc. | Title Vesting: | Fee | ||||||
| Mortgage Rate: | 4.802% | Property Manager: | Self-managed | ||||||
| 4thMost Recent Occupancy (As of): | 85.0% (12/31/2013) | ||||||||
| Note Date: | May 10, 2017 | 3rdMost Recent Occupancy (As of): | 85.5% (12/31/2014) | ||||||
| Anticipated Repayment Date: | NAP | 2ndMost Recent Occupancy (As of): | 88.9% (12/31/2015) | ||||||
| Maturity Date: | June 6, 2027 | Most Recent Occupancy (As of): | 91.7% (12/31/2016) | ||||||
| IO Period: | 120 months | Current Occupancy (As of): | 94.8% (7/1/2017) | ||||||
| Loan Term (Original): | 120 months | ||||||||
| Seasoning: | 2 months | Underwriting and Financial Information: | |||||||
| Amortization Term (Original): | NAP | 4thMost Recent NOI (As of): | $4,270,727 (12/31/2014) | ||||||
| Loan Amortization Type: | Interest-only, Balloon | 3rdMost Recent NOI (As of): | $4,518,482 (12/31/2015) | ||||||
| Interest Accrual Method: | Actual/360 | 2ndMost Recent NOI (As of): | $4,878,816 (12/31/2016) | ||||||
| Call Protection(2): | L(26),D(91),O(3) | Most Recent NOI (As of): | $5,021,875 (TTM 3/31/2017) | ||||||
| Lockbox Type: | Hard/Upfront Cash Management | ||||||||
| Additional Debt(1): | Yes | U/W Revenues: | $8,241,386 | ||||||
| Additional Debt Type(1): | Pari Passu; Mezzanine | U/W Expenses: | $2,949,849 | ||||||
| U/W NOI: | $5,291,537 | ||||||||
| Escrows and Reserves(3): | U/W NCF: | $4,963,119 | |||||||
| U/W NOI DSCR(1): | 1.73x | ||||||||
| Type: | Initial | Monthly | Cap (If Any) | U/W NCF DSCR(1): | 1.63x | ||||
| Taxes | $434,093 | $144,698 | NAP | U/W NOI Debt Yield(1): | 8.4% | ||||
| Insurance | $62,164 | $8,881 | NAP | U/W NCF Debt Yield(1): | 7.9% | ||||
| Deferred Maintenance | $39,086 | $0 | NAP | As-Is Appraised Value: | $103,900,000 | ||||
| Replacement Reserves | $0 | $5,762 | $350,000 | As-Is Appraisal Valuation Date: | April 3, 2017 | ||||
| TI/LC Reserve | $0 | $21,606 | $1,200,000 | Cut-off Date LTV Ratio(1): | 60.3% | ||||
| Environmental Reserve | $175,000 | $0 | NAP | LTV Ratio at Maturity or ARD(1): | 60.3% | ||||
| (1) | See “The Mortgage Loan” section. All statistical information related to the balance per square foot, loan-to-value ratios, debt service coverage ratios and debt yields are based on the Columbia Park Shopping Center Whole Loan (as defined below). See “Subordinate and Mezzanine Indebtedness” sections. As of the Cut-off Date, the Cut-off Balance per SF, UW NCF DSCR, UW NCF Debt Yield, Cut-Off Date LTV Ratio and LTV Ratio at Maturity or ARD based on the Columbia Park Shopping Center Whole Loan and the mezzanine indebtedness were $204.39, 1.21x, 7.0%, 68.0%, and 65.6%, respectively. |
| (2) | The lockout period will be at least 26 payments, beginning with and including the first payment date of July 6, 2017. Defeasance of the Columbia Park Shopping Center Whole Loan is permitted at any time after the earlier to occur of (i) March 6, 2020 or (ii) two years after the closing date of the securitization that includes the last note to be securitized |
| (3) | See “Escrows” section. |
The Mortgage Loan. The mortgage loan (the “Columbia Park Shopping Center Mortgage Loan”) is part of a whole loan (the “Columbia Park Shopping Center Whole Loan”) that is evidenced by twopari passupromissory notes (A-1 and A-2) secured by a first mortgage encumbering the fee interest in a grocery anchored retail property located in North Bergen, New Jersey (the “Columbia Park Shopping Center Property”). The Columbia Park Shopping Center Whole Loan was originated on May 10, 2017 by Argentic Real Estate Finance LLC. The Columbia Park Shopping Center Whole Loan had an original principal balance of $62,700,000, has an outstanding principal balance as of the Cut-off Date of $62,700,000 and accrues interest at an interest rate of 4.802%per annum. The Columbia Park Shopping Center Whole Loan had an initial term of 120 months, has a remaining term of 118 months as of the Cut-off Date and requires interest-only payments through the term of the Columbia Park Shopping Center Whole Loan. The Columbia Park Shopping Center Whole Loan matures on June 6, 2027.
Note A-1, which will be contributed to the WFCM 2017-C39 Trust, had an original principal balance of $50,000,000, has an outstanding principal balance as of the Cut-off Date of $50,000,000 and represents the controlling interest in the Columbia Park Shopping Center Whole Loan. The non-controlling Note A-2, which had an original principal balance of $12,700,000, is expected to be contributed to a future securitization trust or trusts. The lender provides no assurances that any non-securitizedpari passu notes will not be split further. See “Description of the Mortgage Pool-The Whole Loans-The Serviced Whole Loans” In the Preliminary Prospectus.
THE INFORMATION IN THIS STRUCTURAL AND COLLATERAL TERM SHEET IS NOT COMPLETE AND MAY BE AMENDED PRIOR TO THE TIME OF SALE. THIS TERM SHEET IS NOT AN OFFER TO SELL THESE SECURITIES AND IT IS NOT A SOLICITATION OF AN OFFER TO BUY THESE SECURITIES IN ANY JURISDICTION WHERE THE OFFER OR SALE IS NOT PERMITTED.
80
| COLUMBIA PARK SHOPPING CENTER |
Note Summary(1)
| Notes | Original Balance | Note Holder | Controlling Interest |
| A-1 | $50,000,000 | WFCM 2017-C39 | Yes |
| A-2 | 12,700,000 | Argentic Real Estate Finance LLC | No |
| Total Sources | $62,700,000 |
| (1) | The lender provides no assurances that any non-securitized pari passu note will not be split further. |
Following the lockout period, the borrower has the right to defease the Columbia Park Shopping Center Whole Loan in whole or in part (see “Partial Release” section), on any payment date before April 6, 2027. In addition, the Columbia Park Shopping Center Whole Loan is prepayable without penalty on or after April 6, 2027. The lockout period will expire on the earlier to occur of (i) two years after the closing date of the securitization that includes the last note to be securitized and (ii) March 6, 2020.
Sources and Uses
| Sources | Uses | |||||||
| Original whole loan amount | $62,700,000 | 85.3% | Loan payoff(1) | $71,519,983 | 97.3% | |||
| Mezzanine loan | 8,000,000 | 10.9 | Closing costs | 1,241,772 | 1.7 | |||
| Sponsor’s new cash contribution | 2,772,099 | 3.8 | Reserves | 710,343 | 1.0 | |||
| Total Sources | $73,472,099 | 100.0% | Total Uses | $73,472,099 | 100.0% |
| (1) | The Columbia Park Shopping Center Property was previously securitized in the CGCMT 2007-C6 transaction. |
The Property.The Columbia Park Shopping Center Property is a 345,703 square foot grocery anchored retail center located in North Bergen, New Jersey. The Columbia Park Shopping Center Property is located approximately one mile from Interstate 95 and the Lincoln Tunnel, which provides access to Midtown Manhattan, and seven miles north of Jersey City and the Holland Tunnel, which provides access to Downtown Manhattan. The Columbia Park Shopping Center Property is located along John F. Kennedy Boulevard and 31st Street, which functions as a State Route 495 on-ramp. These two major roadways have a combined average daily vehicle count of approximately 216,679. The Columbia Park Shopping Center Property contains 1,371 surface and garage parking spaces, resulting in a parking ratio of 4.0 spaces per 1,000 square feet of rentable area.
Developed in 1999 by the borrower sponsor, the Columbia Park Shopping Center Property consists of four one- and two-story buildings situated on a 16.1-acre site. The Columbia Park Shopping Center Property is anchored by a freestanding 66,000 square foot (19.1% of the net rentable area) ShopRite, on an initial lease term of 25 years that commenced in 1999 with two ten-year lease renewal options remaining. As of March 30, 2017, ShopRite reported sales at the Columbia Park Shopping Center Property of $796 per square feet and an occupancy cost of 3.7%. Wakefern Food Corp., the merchandising and distribution arm for ShopRite, is the largest retailer-owned cooperative in the United States and the largest employer in New Jersey. The cooperative is comprised of 50 members who individually own and operate supermarkets under the ShopRite banner. There are over 270 ShopRite locations in New Jersey, New York, Pennsylvania, Connecticut, Delaware and Maryland. The Columbia Park Shopping Center Property also features two inline retail buildings with Old Navy and Big Lots as the junior anchors as well as a 12-screen, 70,000 square feet movie theater (Empire 12 Cineplex). Approximately 11 new and renewal leases totaling 107,533 square feet (31.1% of the net rentable area) have been executed since 2015. As of July 1, 2017, the Columbia Park Shopping Center Property was 94.8% occupied by 21 tenants.
THE INFORMATION IN THIS STRUCTURAL AND COLLATERAL TERM SHEET IS NOT COMPLETE AND MAY BE AMENDED PRIOR TO THE TIME OF SALE. THIS TERM SHEET IS NOT AN OFFER TO SELL THESE SECURITIES AND IT IS NOT A SOLICITATION OF AN OFFER TO BUY THESE SECURITIES IN ANY JURISDICTION WHERE THE OFFER OR SALE IS NOT PERMITTED.
81
| COLUMBIA PARK SHOPPING CENTER |
The following table presents certain information relating to the tenancies at the Columbia Park Shopping Center Property:
Major Tenants
| Tenant Name | Credit Rating (Fitch / Moody’s / S&P)(1) | Tenant NRSF | % of NRSF | Annual U/W Base Rent PSF(2) | Annual U/W Base Rent(2) | % of Total Annual U/W Base Rent | Sales PSF(3) | Occupancy Cost(3) | Lease Expiration Date | |||
| Anchor Tenant | ||||||||||||
| ShopRite | NR/NR/NR | 66,000 | 19.1% | $22.96 | $1,515,360 | 23.4% | $796 | 3.7% | 9/30/2024(4) | |||
| Total Anchor Tenant | 66,000 | 19.1% | $22.96 | $1,515,360 | 23.4% | |||||||
| Major Tenants | ||||||||||||
| Old Navy | NR/NR/NR | 25,301 | 7.3% | $28.00 | $708,428 | 10.9% | $271 | 13.7% | 1/31/2020(5) | |||
| Empire 12 Cineplex | NR/NR/NR | 70,000 | 20.2% | $8.57 | $600,000 | 9.3% | $153,673(6) | 32.5% | 4/30/2029 | |||
| Shoppers World | NR/NR/NR | 26,260 | 7.6% | $20.00 | $525,200 | 8.1% | $150 | 13.4% | 11/30/2019 | |||
| Big Lots | NR/NR/BBB | 32,569 | 9.4% | $15.76(7) | $513,445(7) | 7.9% | NAV | NAV | 1/31/2025(8)(9) | |||
| Total Major Tenants | 154,130 | 44.6% | $15.23 | $2,347,073 | 36.2% | |||||||
| Non-Major Tenants | 107,596 | 31.1% | $24.38 | 2,623,385 | 40.4% | |||||||
| Occupied Total | 327,726 | 94.8% | $19.79 | $6,485,818 | 100.0% | |||||||
| Vacant Space | 17,977 | 5.2% | ||||||||||
| Collateral Total | 345,703 | 100.0% | ||||||||||
| (1) | Certain ratings are those of the parent company whether or not the parent guarantees the lease. |
| (2) | Annual U/W Base Rent PSF and Annual U/W Base Rent include contractual rent steps through December 2017 totaling $16,103. |
| (3) | Sales PSF and Occupancy Cost are for the trailing 12-month period ending in March 30, 2017 for ShopRite and December 31, 2016 for Old Navy, Empire 12 Cineplex and Shoppers World. |
| (4) | ShopRite has two, 10-year renewal options remaining. |
| (5) | Old Navy has two, 5-year renewal options remaining. |
| (6) | Empire 12 Cineplex has 12 screens at the Columbia Park Shopping Center Property. The number shown represents sales per screen. |
| (7) | Annual U/W Base Rent PSF and Annual U/W Base Rent represent the tenant’s average rent over the remaining lease term. The tenant’s current in-place annual base rent is $482,347 or $14.81 per square foot. |
| (8) | Big Lots has three, 5-year renewal options remaining. |
| (9) | Big Lots has the right to terminate its lease in the event that a closeout store is operated at the Columbia Park Shopping Center Property and the borrower fails to cure within 60 days upon Big Lots providing written notice. Big Lots has executed a waiver that allows The GAP (Factory Store) (2.6% of the net rentable area) to operate at the Columbia Park Shopping Center Property. |
THE INFORMATION IN THIS STRUCTURAL AND COLLATERAL TERM SHEET IS NOT COMPLETE AND MAY BE AMENDED PRIOR TO THE TIME OF SALE. THIS TERM SHEET IS NOT AN OFFER TO SELL THESE SECURITIES AND IT IS NOT A SOLICITATION OF AN OFFER TO BUY THESE SECURITIES IN ANY JURISDICTION WHERE THE OFFER OR SALE IS NOT PERMITTED.
82
| COLUMBIA PARK SHOPPING CENTER |
The following table presents certain information relating to the lease rollover schedule at the Columbia Park Shopping Center Property:
Lease Expiration Schedule(1)(2)
| Year Ending December 31, | No. of Leases Expiring | Expiring NRSF | % of Total NRSF | Cumulative Expiring NRSF | Cumulative% of Total NRSF | Annual U/W Base Rent | % of Total Annual U/W Base Rent | Annual U/W Base Rent PSF(3) |
| MTM | 0 | 0 | 0.0% | 0 | 0.0% | $0 | 0.0% | $0.00 |
| 2017 | 0 | 0 | 0.0% | 0 | 0.0% | $0 | 0.0% | $0.00 |
| 2018 | 0 | 0 | 0.0% | 0 | 0.0% | $0 | 0.0% | $0.00 |
| 2019 | 5 | 41,424 | 12.0% | 41,424 | 12.0% | $1,018,370 | 15.7% | $24.58 |
| 2020 | 2 | 28,501 | 8.2% | 69,925 | 20.2% | $770,304 | 11.9% | $27.03 |
| 2021 | 2 | 26,050 | 7.5% | 95,975 | 27.8% | $465,401 | 7.2% | $17.87 |
| 2022 | 4 | 21,523 | 6.2% | 117,498 | 34.0% | $661,861 | 10.2% | $30.75 |
| 2023 | 0 | 0 | 0.0% | 117,498 | 34.0% | $0 | 0.0% | $0.00 |
| 2024 | 1 | 66,000 | 19.1% | 183,498 | 53.1% | $1,515,360 | 23.4% | $22.96 |
| 2025 | 4 | 48,358 | 14.0% | 231,856 | 67.1% | $854,344 | 13.2% | $17.67 |
| 2026 | 2 | 25,870 | 7.5% | 257,726 | 74.6% | $600,179 | 9.3% | $23.20 |
| 2027 | 0 | 0 | 0.0% | 257,726 | 74.6% | $0 | 0.0% | $0.00 |
| Thereafter | 1 | 70,000 | 20.2% | 327,726 | 94.8% | $600,000 | 9.3% | $8.57 |
| Vacant | 0 | 17,977 | 5.2% | 345,703 | 100.0% | $0 | 0.0% | $0.00 |
| Total/Weighted Average | 21 | 345,703 | 100.0% | $6,485,818 | 100.0% | $19.79 |
| (1) | Information obtained from the underwritten rent roll. |
| (2) | Certain tenants may have lease termination options that are exercisable prior to the originally stated expiration date of the subject lease and that are not considered in the Lease Expiration Schedule. |
| (3) | Weighted Average Annual U/W Base Rent PSF excludes vacant space. |
The following table presents historical occupancy percentages at the Columbia Park Shopping Center Property:
Historical Occupancy
12/31/2013(1) | 12/31/2014(1) | 12/31/2015(1) | 12/31/2016(1) | 7/1/2017(1) |
| 85.0% | 85.5% | 88.9% | 91.7% | 94.8% |
| (1) | Information obtained from the borrower. |
Operating History and Underwritten Net Cash Flow. The following table presents certain information relating to the historical operating performance and underwritten net cash flow at the Columbia Park Shopping Center Property:
Cash Flow Analysis
| 2014 | 2015 | 2016 | TTM 3/31/2017 | U/W | % of U/W Effective Gross Income | U/W $ per SF | |
| Base Rent | $6,067,012 | $5,796,954 | $6,201,987 | $6,321,235 | $6,485,818(1) | 78.7% | $18.76 |
| Grossed Up Vacant Space | 0 | 0 | 0 | 0 | 589,041 | 7.1 | 1.70 |
| Percentage Rent | 0 | 12,295 | 54,646 | 54,646 | 28,816 | 0.3 | 0.08 |
| Total Reimbursables | 1,523,717 | 1,593,516 | 1,600,684 | 1,591,512 | 1,726,753 | 21.0 | 4.99 |
| Rent Abatements | (356,066) | (17,208) | (154,049) | (191,686) | 0 | 0.0 | 0.00 |
| Other Income | 6,750 | 78,788 | 0 | 0 | 0 | 0.0 | 0.00 |
| Less Vacancy & Credit Loss | 0 | (4,545) | 0 | 0 | (589,041)(2) | (7.1) | (1.70) |
| Effective Gross Income | $7,241,414 | $7,459,800 | $7,703,268 | $7,775,707 | $8,241,386 | 100.0% | $23.84 |
| Total Operating Expenses | $2,970,687 | $2,941,317 | $2,824,452 | $2,753,833 | $2,949,849 | 35.8% | $8.53 |
| Net Operating Income | $4,270,727 | $4,518,482 | $4,878,816 | $5,021,875 | $5,291,537 | 64.2% | $15.31 |
| TI/LC | 0 | 0 | 0 | 0 | 259,277 | 3.1 | 0.75 |
| Capital Expenditures | 0 | 0 | 0 | 0 | 69,141 | 0.8 | 0.20 |
| Net Cash Flow | $4,270,727 | $4,518,482 | $4,878,816 | $5,021,875 | $4,963,119 | 60.2% | $14.36 |
| NOI DSCR(3) | 1.40x | 1.48x | 1.60x | 1.65x | 1.73x | ||
| NCF DSCR(3) | 1.40x | 1.48x | 1.60x | 1.65x | 1.63x | ||
| NOI DY(3) | 6.8% | 7.2% | 7.8% | 8.0% | 8.4% | ||
| NCF DY(3) | 6.8% | 7.2% | 7.8% | 8.0% | 7.9% |
| (1) | U/W Base Rent includes contractual rent steps through December 2017 totalling $16,103 and the straight-line rent though the lease term of the Big Lots, an investment-grade tenant. |
| (2) | The underwritten economic vacancy is 6.7%. The Columbia Park Shopping Center Property was 94.8% physically occupied as of July 1, 2017. |
| (3) | The debt service coverage ratios and debt yields are based on the Columbia Park Shopping Center Whole Loan. |
THE INFORMATION IN THIS STRUCTURAL AND COLLATERAL TERM SHEET IS NOT COMPLETE AND MAY BE AMENDED PRIOR TO THE TIME OF SALE. THIS TERM SHEET IS NOT AN OFFER TO SELL THESE SECURITIES AND IT IS NOT A SOLICITATION OF AN OFFER TO BUY THESE SECURITIES IN ANY JURISDICTION WHERE THE OFFER OR SALE IS NOT PERMITTED.
83
| COLUMBIA PARK SHOPPING CENTER |
Appraisal.As of the appraisal valuation date of April 3, 2017, the Columbia Park Shopping Center Property had an “as-is” appraised value of $103,900,000.
Environmental Matters.According to a Phase I environmental assessment dated April 25, 2017, there was no evidence of any recognized environmental conditions at the Columbia Park Shopping Center Property; however, the report indicated that the borrower is obligated to comply with certain requirements related to use of institutional and engineering controls mandated by the New Jersey Department of Environmental Protection. The borrower has been out of compliance with such filing requirements since 1999. A reserve in the amount of $175,000 was collected at origination of the Columbia Park Shopping Center Whole Loan to pay for and monitor such filings and the compliance process. There is a recourse carve-out for losses incurred or suffered by the lender arising out of or in connection with the borrower’s failure to satisfy the requirements and such failure will constitute an event of default under the loan agreement. Additionally, the borrower purchased a $3.0 million environmental insurance policy with a 10-year term and 3-year tail and the lender is named as an additional insured on the borrower’s existing $5,000,000 environmental insurance policy. See “Description of the Mortgage Pool—Environmental Considerations” in the Preliminary Prospectus.
Market Overview and Competition. The Columbia Park Shopping Center Property is located in North Bergen, New Jersey, within the New York-Northern New Jersey-Long Island metropolitan statistical area. The Columbia Park Shopping Center Property is situated within a mile east of U.S. Route 9, within a mile east of State Route 3 and within two miles east of Interstate 95. The Columbia Park Shopping Center Property is located within an Urban Enterprise Zone, which provides incentives for businesses including consumer sales tax discounts and exemptions, corporate tax credits and various other corporate subsidies.
According to the appraisal, the 2016 population within a three- and five-mile radius of the Columbia Park Shopping Center Property was 556,717 and 1,823,800, respectively, and the average household income within the same radii was $116,138 and $123,972, respectively. According to the appraisal, the Columbia Park Shopping Center Property is located within the Hudson Waterfront retail submarket of the Northern New Jersey market. As of the first quarter of 2017, the retail submarket contained inventory totaling approximately 31.9 million square feet with an overall vacancy rate of 2.2% and an average rental rate of $30.65 per square foot.
The following table presents certain information relating to comparable retail properties for the Columbia Park Shopping Center Property:
Competitive Set(1)
| Property | Year Built / Renovated | Total NRA (SF) | Occupancy | Distance to Subject | Property Type |
| Harmon Meadow | 1940/NAV | 465,596 | 99.0% | 1.4 miles | Power Center |
| Kennedy Commons | 1994/NAV | 62,121 | 93.4% | 1.5 miles | Community Center |
| Tonnelle Plaza | 1990/NAV | 347,752 | 97.0% | 2.6 miles | Community Center |
| Tonelle Commons | 2009/NAV | 410,015 | 100.0% | 3.0 miles | Power Center |
| Edgewater Commons | 1996/NAV | 434,795 | 100.0% | 4.8 miles | Power Center |
| Hudson Commons | 1985/NAV | 236,024 | 100.0% | 7.3 miles | Power Center |
(1) Information obtained from the appraisal.
The Borrower. The borrowers are Columbia Park Retail Owner, LLC and Columbia Park Development Owner, LLC, each a single-purpose Delaware limited liability company with two independent directors. Legal counsel to the borrowers delivered a non-consolidation opinion in connection with the origination of the Columbia Park Shopping Center Whole Loan. The borrowers are owned by Columbia Park Retail Mezzanine, LLC and Columbia Park Development Mezzanine, LLC, each a wholly-owned subsidiary of FC/TREECO Columbia Park, LLC and FC/TREECO Columbia Park Development, LLC. Forest City Realty Trust, Inc. is the guarantor of certain nonrecourse carveouts under the Columbia Park Shopping Center Whole Loan.
The Borrower Sponsor.The borrower sponsor, Forest City Realty Trust, Inc. (“Forest City”) (NYSE: FCE.A) is an operator, developer and manager of office, apartment and retail real estate and land throughout the United States. As of March 31, 2017, Forest City had approximately $8.2 billion of consolidated assets in 20 states and the District of Columbia. As of December 31, 2016, Forest City had ownership interest in 115 apartment complexes with over 31,000 units, 32 retail properties with gross leasable area of approximately 11.1 million square feet and 36 office buildings with 9.8 million square feet.
In August 2016, Forest City announced the disposition of the majority of its retail portfolio through the sale of 11 regional malls and 12 New York area shopping center assets, including the Columbia Park Shopping Center Property, to their existing partners, QIC and Madison International Realty. Madison NYC Core Retail Partners, LP, a subsidiary of Madison International Realty, currently owns a 36.9% non-controlling interest in the Columbia Park Shopping Center Property.
After the sale of the Columbia Park Shopping Center Property is completed, the lender will grant a free transfer of the remaining equity interest in the Columbia Park Shopping Center Property to a Madison International Realty-controlled entity, provided that certain conditions are satisfied including (i) no event of default has occurred or is continuing and (ii) such entity is a qualified transferee (i.e. an entity that has passed certain checks regarding Patriot Act offenses, felony convictions, bankruptcy and material judgements and litigations) and the lender has verified that such entity complies with the lender’s then applicable KYC procedures) and (iii) the replacement guarantors and indemnitors are satisfactory to the lender.
THE INFORMATION IN THIS STRUCTURAL AND COLLATERAL TERM SHEET IS NOT COMPLETE AND MAY BE AMENDED PRIOR TO THE TIME OF SALE. THIS TERM SHEET IS NOT AN OFFER TO SELL THESE SECURITIES AND IT IS NOT A SOLICITATION OF AN OFFER TO BUY THESE SECURITIES IN ANY JURISDICTION WHERE THE OFFER OR SALE IS NOT PERMITTED.
84
| COLUMBIA PARK SHOPPING CENTER |
Since 2002, Madison International Realty has raised over $4.4 billion in capital commitments from more than 150 institutional investors around the world and has invested in more than 185 million square feet of commercial real estate.
The borrower sponsor was involved in one foreclosure and seven discounted payoffs. See “Description of the Mortgaged Pool-Loan Purpose; Default History, Bankruptcy Issues and Other Proceedings” in the Preliminary Prospectus.
Escrows.The loan documents provide for upfront reserves in the amount of $434,093 for real estate taxes; $62,164 for insurance premiums; $39,086 for deferred maintenance and $175,000 for an environmental reserve described in the “Environmental Matters” section above. The loan documents also provide for ongoing monthly deposits of $144,698 for real estate taxes; $8,881 for insurance; $5,762 for replacement reserves (capped at $350,000) and $21,606 for tenant improvements and leasing commission (capped at $1,200,000).
Lockbox and Cash Management. The Columbia Park Shopping Center Whole Loan requires a lender-controlled lockbox account, which is already in place, and requires that the borrower and property manager direct all tenants to pay rent directly into such lockbox account. The Columbia Park Shopping Center Whole Loan documents also require that all rents received by the borrower or property manager be deposited into the lockbox account within two business days of receipt. All funds in the lockbox account will be swept to a lender controlled cash management account. Prior to the occurrence of a Cash Trap Period and/or a Lease Sweep Period (each as defined below), all excess funds are required to be distributed to the borrowers. During the continuance of a Lease Sweep Period, all excess funds are swept into a lender-controlled account for tenant improvement and leasing commission expense. During a Cash Trap Period, all excess funds are required to be swept to a lender-controlled cash management account.
A “Cash Trap Period” will commence upon the occurrence of any of the following: (i) an event of default; or (ii) the combined debt service coverage ratio being less than 1.05x at the end of any calendar quarter. A Cash Trap Period will end, with respect to clause (i), upon the cure of such event of default and no other event of default having occurred or continuing; and, with respect to clause (ii), upon the combined debt service coverage ratio being equal to or greater than 1.10x for two consecutive quarters.
A “Lease Sweep Period” will commence upon the occurrence of any of the following: (i) the date that is 12 months prior to the end of the term of any lease (inclusive of renewal terms) at the Columbia Park Shopping Center Property that represents at least 50,000 square feet or by Shoppers World Stores Inc. (each, a “Major Lease”); (ii) the date under a Major Lease by which the applicable tenant is required to give notice of its exercise of a renewal option thereunder (if such renewal has not been so exercised); (iii) the date any Major Lease is surrendered, cancelled or terminated prior to its then current expiration date; (iv) the date any tenant under a Major Lease goes dark, discontinues its business or gives notice of its intent to discontinue its business; (v) the occurrence and continuance (beyond any applicable notice and cure periods) of a monetary default under any Major Lease by the applicable tenant; or (vi) an insolvency proceeding with respect to a tenant under a Major Lease.
A Lease Sweep Period will end, (a) upon collecting $50 per square foot for the applicable space demised by the Major Lease, or (b) with respect to clauses (i), (ii), (iii) or (iv) above, on the date that (x) a tenant under a Major Lease exercises its renewal or extension option on a lease acceptable to the lender with respect to all of its space and the lender determines that funds accumulated in the special rollover reserve subaccount are sufficient to cover leasing expenses and rent abatement periods in connection with such extension or (y) the Major Lease space is fully leased to one or more replacement tenants acceptable to the lender and the lender determining that funds accumulated in the special rollover reserve subaccount are sufficient to cover leasing expenses and rent abatement periods under such acceptable lease; with respect to clause (v) above, the applicable default has been cured, and no default by any other tenant under a Major Lease has occurred for a period of six consecutive months following such cure; or with respect to clause (vi) above, the applicable insolvency proceeding has terminated and the applicable Major Lease has been affirmed, assumed or assigned in a manner satisfactory to the lender.
Property Management.The Columbia Park Shopping Center Property is managed by an affiliate of the borrower sponsor.
Assumption.The borrower has the right to transfer the Columbia Park Shopping Center Property provided that certain conditions are satisfied, including (i) no event of default has occurred or is continuing; (ii) the identity, experience, financial condition and creditworthiness of the transferee and the replacement guarantors and indemnitors are satisfactory to the lender; (iii) the proposed property manager and proposed management agreement are satisfactory to the lender and (iv) the lender has received confirmation from Fitch, KBRA and Moody’s that the transfer will not result in a downgrade, withdrawal or qualification of the respective ratings assigned to the Series WFCM 2017-C39 Certificates.
Partial Release.Following the lockout period, the borrower may obtain the release of the Empire 12 Cineplex parcel (the “Empire Release Parcel”) in connection with either a bona fide third-party sale of the Empire Release Parcel or a conveyance of the Empire Release Parcel to an affiliate of the borrower for purposes of redevelopment as a multi-family property, provided certain conditions are satisfied, including: (i) no event of default has occurred and is continuing; (ii) partial defeasance of a portion of the principal in an amount equal to the greater of (x) $8,864,100 and (y) 88.7% of the net sales proceeds; (iii) the combined net cash flow debt yield of the remaining Columbia Park Shopping Center Property following the release is no less than the greater of (x) 7.02% and (y) the combined net cash flow debt yield of the Columbia Park Shopping Center Property immediately prior to the release; (iv) the combined loan-to-value ratio of the remaining Columbia Park Shopping Center Property following the release is no more than the lesser of (x) 68.0% and (y) the loan-to-value ratio of the Columbia Park Shopping Center Property immediately prior to the release; (v) the combined debt service coverage ratio of the remaining Columbia Park Shopping Center Property following the release is no less than the greater of (x) 1.21x and (y) the combined debt service coverage ratio of the Columbia Park Shopping Center Property immediately prior to the release; (vi) receipt of a confirmation from Fitch, KBRA and Moody’s that the transfer will not result in a downgrade, withdrawal or qualification of the respective ratings assigned to the Series 2017-C39 Certificates; and (vii) the lender receives a legal opinion that the release satisfies REMIC requirements.
THE INFORMATION IN THIS STRUCTURAL AND COLLATERAL TERM SHEET IS NOT COMPLETE AND MAY BE AMENDED PRIOR TO THE TIME OF SALE. THIS TERM SHEET IS NOT AN OFFER TO SELL THESE SECURITIES AND IT IS NOT A SOLICITATION OF AN OFFER TO BUY THESE SECURITIES IN ANY JURISDICTION WHERE THE OFFER OR SALE IS NOT PERMITTED.
85
| COLUMBIA PARK SHOPPING CENTER |
Real Estate Substitution.Not permitted.
Subordinate and Mezzanine Indebtedness.Argentic Real Estate Investment LLC, a Delaware limited liability company (the “Argentic Mezzanine lender”) originated a $8,000,000 mezzanine loan (the “Columbia Park Shopping Center Mezzanine Loan”) to Columbia Park Retail Mezzanine, LLC and Columbia Park Development Mezzanine, LLC, each a Delaware limited liability company (collectively, the “Columbia Park Mezzanine Borrower”). The Columbia Park Shopping Center Mezzanine Borrower is owned by FC/TREECO Columbia Park, LLC and FC/TREECO Columbia Park Development, LLC, which are managed by Forest City Commercial Holdings, LLC. The Columbia Park Mezzanine Loan had an initial term of 120 months and has a remaining term as of the cut-off date of 118 months. The Columbia Park Shopping Center Mezzanine Loan accrues interest at a rate of 10.000% per annum and amortizes based on a scheduled payment equal to $20,833.34 per month.
Ground Lease.None.
Terrorism Insurance.The Columbia Park Shopping Center Whole Loan documents require that the “all risk” insurance policy required to be maintained by the borrowers provide coverage for terrorism in an amount equal to the full replacement cost of the Columbia Park Shopping Center Property, as well as business interruption insurance covering no less than the 18-month period following the occurrence of a casualty event, together with a 6-month extended period of indemnity.
THE INFORMATION IN THIS STRUCTURAL AND COLLATERAL TERM SHEET IS NOT COMPLETE AND MAY BE AMENDED PRIOR TO THE TIME OF SALE. THIS TERM SHEET IS NOT AN OFFER TO SELL THESE SECURITIES AND IT IS NOT A SOLICITATION OF AN OFFER TO BUY THESE SECURITIES IN ANY JURISDICTION WHERE THE OFFER OR SALE IS NOT PERMITTED.
86
(THIS PAGE INTENTIONALLY LEFT BLANK)
THE INFORMATION IN THIS STRUCTURAL AND COLLATERAL TERM SHEET IS NOT COMPLETE AND MAY BE AMENDED PRIOR TO THE TIME OF SALE. THIS TERM SHEET IS NOT AN OFFER TO SELL THESE SECURITIES AND IT IS NOT A SOLICITATION OF AN OFFER TO BUY THESE SECURITIES IN ANY JURISDICTION WHERE THE OFFER OR SALE IS NOT PERMITTED.
87
(THIS PAGE INTENTIONALLY LEFT BLANK)
THE INFORMATION IN THIS STRUCTURAL AND COLLATERAL TERM SHEET IS NOT COMPLETE AND MAY BE AMENDED PRIOR TO THE TIME OF SALE. THIS TERM SHEET IS NOT AN OFFER TO SELL THESE SECURITIES AND IT IS NOT A SOLICITATION OF AN OFFER TO BUY THESE SECURITIES IN ANY JURISDICTION WHERE THE OFFER OR SALE IS NOT PERMITTED.
88
245 PARK AVENUE
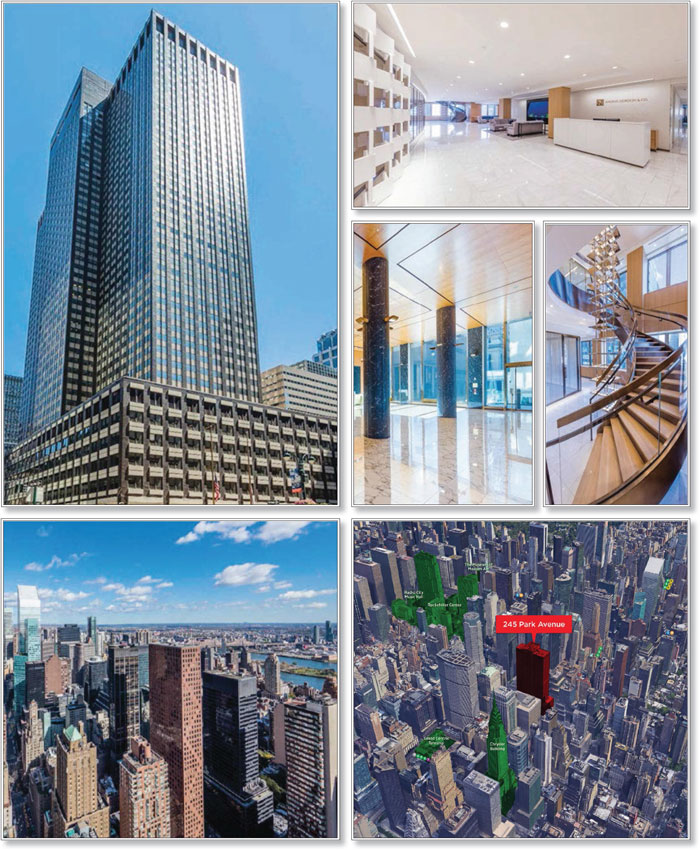
THE INFORMATION IN THIS STRUCTURAL AND COLLATERAL TERM SHEET IS NOT COMPLETE AND MAY BE AMENDED PRIOR TO THE TIME OF SALE. THIS TERM SHEET IS NOT AN OFFER TO SELL THESE SECURITIES AND IT IS NOT A SOLICITATION OF AN OFFER TO BUY THESE SECURITIES IN ANY JURISDICTION WHERE THE OFFER OR SALE IS NOT PERMITTED.
89
245 PARK AVENUE
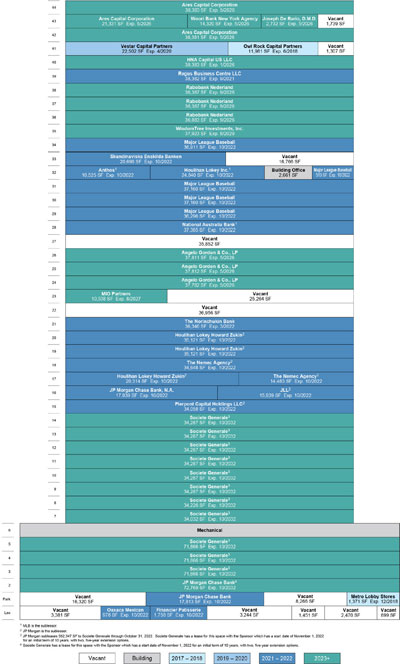
THE INFORMATION IN THIS STRUCTURAL AND COLLATERAL TERM SHEET IS NOT COMPLETE AND MAY BE AMENDED PRIOR TO THE TIME OF SALE. THIS TERM SHEET IS NOT AN OFFER TO SELL THESE SECURITIES AND IT IS NOT A SOLICITATION OF AN OFFER TO BUY THESE SECURITIES IN ANY JURISDICTION WHERE THE OFFER OR SALE IS NOT PERMITTED.
90
245 PARK AVENUE
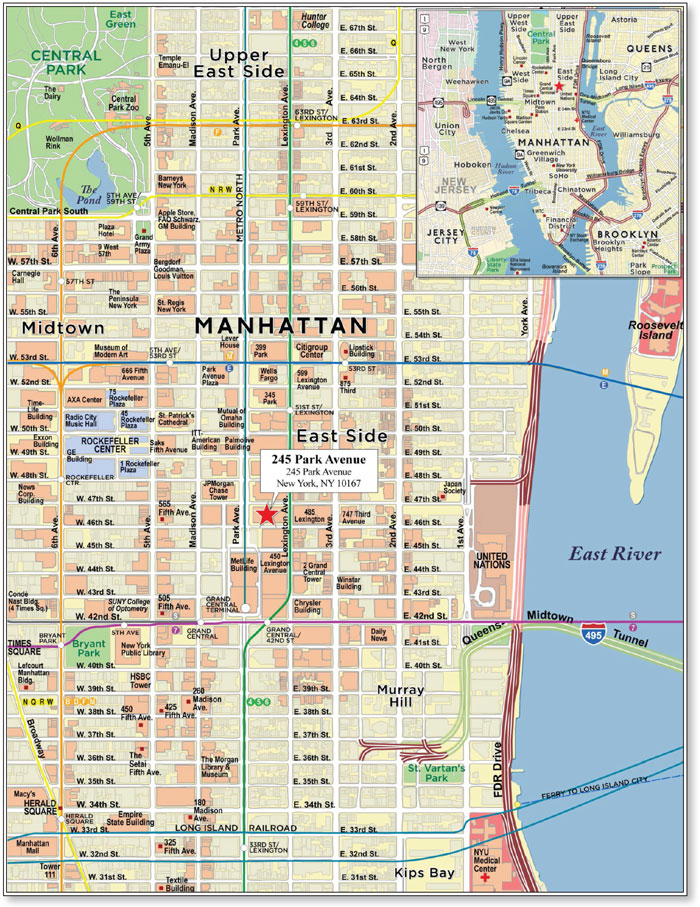
THE INFORMATION IN THIS STRUCTURAL AND COLLATERAL TERM SHEET IS NOT COMPLETE AND MAY BE AMENDED PRIOR TO THE TIME OF SALE. THIS TERM SHEET IS NOT AN OFFER TO SELL THESE SECURITIES AND IT IS NOT A SOLICITATION OF AN OFFER TO BUY THESE SECURITIES IN ANY JURISDICTION WHERE THE OFFER OR SALE IS NOT PERMITTED.
91
| No. 6 – 245 Park Avenue | ||||||||
| Loan Information | Property Information | |||||||
| Mortgage Loan Seller: | Natixis | Single Asset/Portfolio: | Single Asset | |||||
| Credit Assessment (Fitch/KBRA/Moody’s): | BBB-/BBB/NR | Property Type: | Office | |||||
| Original Principal Balance(1): | $45,000,000 | Specific Property Type: | CBD | |||||
| Cut-off Date Balance(1): | $45,000,000 | Location: | New York, NY | |||||
| % of Initial Pool Balance: | 4.0% | Size(5): | 1,779,515 SF | |||||
| Loan Purpose: | Acquisition | Cut-off Date Balance Per SF(1)(5): | $606.91 | |||||
| Borrower Names: | 245 Park Avenue Property LLC | Year Built/Renovated: | 1965/2006 | |||||
| Borrower Sponsor: | HNA Group | Title Vesting: | Fee | |||||
| Mortgage Rate: | 3.6694% | Property Manager: | Brookfield Properties Management LLC | |||||
| Note Date: | May 5, 2017 | 4thMost Recent Occupancy (As of)(6): | 93.6% (12/31/2013) | |||||
| Anticipated Repayment Date: | NAP | 3rdMost Recent Occupancy (As of)(6): | 93.6% (12/31/2014) | |||||
| Maturity Date: | June 1, 2027 | 2ndMost Recent Occupancy (As of)(6): | 93.6% (12/31/2015) | |||||
| IO Period: | 120 months | Most Recent Occupancy (As of)(6): | 95.0% (12/31/2016) | |||||
| Loan Term (Original): | 120 months | Current Occupancy (As of)(6)(7): | 91.2% (2/28/2017) | |||||
| Seasoning: | 2 months | |||||||
| Amortization Term (Original): | NAP | Underwriting and Financial Information: | ||||||
| Loan Amortization Type: | Interest-only, Balloon | 4thMost Recent NOI (As of)(8): | $98,558,306 (12/31/2014) | |||||
| Interest Accrual Method: | Actual/360 | 3rdMost Recent NOI (As of)(8): | $102,667,705 (12/31/2015) | |||||
| Call Protection(2): | L(26),D(90),O(4) | 2ndMost Recent NOI (As of)(8): | $106,715,962 (12/31/2016) | |||||
| Lockbox Type: | Hard/Springing Cash Management | Most Recent NOI (As of)(8): | $107,676,675 (TTM 3/31/2017) | |||||
| Additional Debt(1): | Yes | |||||||
| Additional Debt Type(1)(3): | Pari Passu; Subordinate Secured; Mezzanine | |||||||
| U/W Revenues: | $177,756,680 | |||||||
| U/W Expenses: | $62,448,738 | |||||||
| U/W NOI(8): | $115,307,942 | |||||||
| Escrows and Reserves(4): | U/W NCF: | $109,564,903 | ||||||
| U/W NOI DSCR(1): | 2.87x | |||||||
| Type: | Initial | Monthly | Cap (If Any) | U/W NCF DSCR(1): | 2.73x | |||
| Taxes | $0 | $3,878,518 | NAP | U/W NOI Debt Yield(1): | 10.7% | |||
| Insurance | $227,000 | $113,500 | NAP | U/W NCF Debt Yield(1): | 10.1% | |||
| Replacement Reserves | $47,738 | $47,738 | NAP | As-Is Appraised Value: | $2,210,000,000 | |||
| TI/LC Reserve | $0 | Springing | NAP | As-Is Appraisal Valuation Date: | April 1, 2017 | |||
| Outstanding TI/LC Reserve | $10,298,441 | $0 | NAP | Cut-off Date LTV Ratio(1): | 48.9% | |||
| MIO Partners Free Rent Reserve | $1,133,167 | $0 | NAP | LTV Ratio at Maturity or ARD(1): | 48.9% | |||
| (1) | See “The Mortgage Loan” section. All statistical information related to balances per square foot, loan-to-value ratios, debt service coverage ratios and debt yields are based on the 245 Park Avenue Senior Notes only. The Cut-off Date LTV Ratio, U/W NCF DSCR and U/W NOI Debt Yield based on the 245 Park Avenue Whole Loan, including the 245 Park Avenue Subordinate Companion Notes, are 54.3%, 2.45x and 9.6%, respectively. |
| (2) | The lockout period will be at least 26 payments beginning with and including the first payment date of July 1, 2017. Defeasance of the full $1.2 billion 245 Park Avenue Whole Loan is permitted at any time after the earlier to occur of (i) July 1, 2020 or (ii) two years after the closing date of the securitization that includes the last note to be securitized. |
| (3) | See “Subordinate and Mezzanine Indebtedness” section. |
| (4) | See “Escrows” section. |
| (5) | Size and Cut-off Date Balance Per SF represent the remeasured net rentable area of 1,779,515 in accordance with current Real Estate Board of New York (“REBNY”) standards, which is the basis for the square footage in future leasing. The 245 Park Avenue Property’s contractual square footage is 1,723,993 square feet as leased. |
| (6) | See “Historical Occupancy” section. |
| (7) | Occupancy is calculated based on the remeasured net rentable area of 1,779,515 square feet. |
| (8) | See “Cash Flow Analysis” section. |
The Mortgage Loan. The mortgage loan (the “245 Park Avenue Mortgage Loan”) is part of a whole loan (the “245 Park Avenue Whole Loan”) evidenced by 21 senior pari passu notes (the “245 Park Avenue Senior Notes”) and five subordinate notes (the “245 Park Avenue Subordinate Companion Notes”), secured by the fee interest in a 44-story office building located on Park Avenue between 46th and 47th streets in Manhattan, New York (the “245 Park Avenue Property”). On May 5, 2017, the 245 Park Avenue Whole Loan was co-originated by Barclays Bank PLC, JPMorgan Chase Bank, National Association, Natixis Real Estate Capital LLC, Deutsche Bank AG, New York Branch and Société Générale. The 245 Park Avenue Whole Loan had an original principal balance of $1,200,000,000, has an outstanding principal balance as of the Cut-off Date of $1,200,000,000 and accrues interest at an interest rate of 3.6694% per annum. The 245 Park Avenue Whole Loan had an initial term of 120 months, has a remaining term of 118 months as of the Cut-off Date and requires interest-only payments through the term of the 245 Park Avenue Whole Loan. The 245 Park Avenue Whole Loan matures on June 1, 2027.
THE INFORMATION IN THIS STRUCTURAL AND COLLATERAL TERM SHEET IS NOT COMPLETE AND MAY BE AMENDED PRIOR TO THE TIME OF SALE. THIS TERM SHEET IS NOT AN OFFER TO SELL THESE SECURITIES AND IT IS NOT A SOLICITATION OF AN OFFER TO BUY THESE SECURITIES IN ANY JURISDICTION WHERE THE OFFER OR SALE IS NOT PERMITTED.
92
245 PARK AVENUE
Note A-2-B-3-A, which will be contributed to the WFCM 2017-C39 Trust, had an original principal balance of $45,000,000, has an outstanding principal balance as of the Cut-off Date of $45,000,000 and represents a non-controlling interest in the 245 Park Avenue Whole Loan. Fivepari passunotes (Note A-1-A, Note A-1-B, Note A-1-C, Note A-1-D and Note A-1-E) and five subordinate notes (Note B-1, Note B-2, Note B-3, Note B-4 and Note B-5) with an aggregate original principal balance of $500,000,000 were contributed to the 245 Park Avenue 2017-245P Trust. Note A-1-A represents the controlling interest in the 245 Park Avenue Whole Loan. The non-controlling Note A-2-A-1, which had an original principal balance of $98,000,000, was contributed to the JPMCC 2017-JP6 Trust. The non-controlling Notes A-2-A-2 and A-2-C-1-A, which had an aggregate original principal balance of $93,750,000, were expected to be contributed to the DBJPM 2017-C6 Trust. The non-controlling Note A-2-A-3, which had an original principal balance of $75,000,000, was contributed to the JPMCC 2017-JP7 Trust. The non-controlling Note A-2-B-1, which had an original principal balance of $80,000,000, was contributed to the CSAIL 2017-C8 Trust. The non-controlling Note A-2-E-1, which had an original principal balance of $55,000,000 was contributed to the WFCM 2017-C38 Trust. The remaining non-controlling notes, which had an aggregate original principal balance of $253,250,000, are expected to be contributed to future securitization trusts. Notes A-1-A, A-1-B, A-1-C, A-1-D, A-1-E, A-2-A-1, A-2-A-2, A-2-A-3, A-2-A-4, A-2-B-1, A-2-B-2, A-2-B-3-B, A-2-C-1-A, A-2-C-1-B, A-2-C-2, A-2-D-1, A-2-D-2, A-2-D-3, A-2-E-1, A-2-E-2, B-1, B-2, B-3, B-4 and B-5 collectively constitute the “245 Park Avenue Companion Loans”). The lender provides no assurances that any non-securitizedpari passunotes will not be split further. See “Description of the Mortgage Pool—The Whole Loans—Non-Serviced AB Whole Loans—245 Park Avenue Whole Loan” and “Pooling and Servicing Agreement” in the Preliminary Prospectus.
| 245 Park Avenue Whole Loan ($1,200,000,000) | |||||||
| 245 Park AvenuePari Passu Companion Notes ($1,080,000,000) | |||||||
| Companion A Notes | Companion A Note | Companion A Note | Companion A Notes | Companion A Note | Companion A Note | Companion A Note | Companion A Notes |
| 245 Park Avenue 2017-245P | WFCM 2017-C39 | JPMCC 2017-JP6 | DBJPM 2017-C6 | CSAIL 2017-C8 | JPMCC 2017-JP7 | WFCM 2017-C38 | Future Conduit Securitizations |
| $380,000,000 | $45,000,000 | $98,000,000 | $93,750,000 | $80,000,000 | $75,000,000 | $55,000,000 | $253,250,000 |
| Notes A-1-A, A-1-B, A-1-C, A-1-D, A-1-E | Note A-2-B-3-A | Note A-2-A-1 | Notes A-2-A-2, A-2-C-1-A | Note A-2-B-1 | Note A-2-A-3 | Note A-2-E-1 | Notes A-2-A-4, A-2-B-2, A-2-B-3-B, A-2-C-1-B, A-2-C-2, A-2-D-1, A-2-D-2, A-2-D-3, A-2-E-2 |
| 245 Park Avenue Subordinate Companion Notes ($120,000,000) | |||||||
Subordinate Companion B Notes
| |||||||
245 Park Avenue 2017-245P
| |||||||
$120,000,000
| |||||||
Notes B-1, B-2, B-3, B-4, B-5
| |||||||
Following the lockout period, on any date before March 1, 2027, the borrower has the right to defease the 245 Park Avenue Whole Loan in whole, but not in part. The lockout period will expire on the earlier to occur of (i) two years after the closing date of the securitization that includes the last 245 Park Avenue Whole Loan note to be securitized or (ii) July 1, 2020. The 245 Park Avenue Whole Loan is prepayable without penalty on or after March 1, 2027.
Sources and Uses
| Sources | Uses | ||||||||
| Original whole loan amount | $1,200,000,000 | 52.4% | Purchase price | $2,210,000,000 | 96.4% | ||||
| Mezzanine Loan A | 236,500,000 | 10.3 | Closing costs | 70,356,233 | 3.1 | ||||
| Mezzanine Loan B | 221,000,000 | 9.6 | Reserves | 11,706,346 | 0.5 | ||||
| Mezzanine Loan C | 110,500,000 | 4.8 | |||||||
| Sponsor cash equity | 524,062,579 | 22.9 | |||||||
| Total Sources | $2,292,062,579 | 100.0% | Total Uses | $2,292,062,579 | 100.0% | ||||
The Property. The 245 Park Avenue Property is a 44-story, 1,779,515 square foot, Class A office building located on Park Avenue in Manhattan, New York, between 46th and 47th Streets. The 44 stories comprise 42 office floors, 57,799 remeasured square feet of retail space and 1,580 remeasured square feet of lobby retail space. The 245 Park Avenue Property is one of 12 buildings that feature direct underground access to Grand Central Terminal, Metro North Transit and the 4, 5, 6, 7 and S subway lines. The 245 Park Avenue Property is located in the Park Avenue office submarket, adjacent to Grand Central Terminal and within half a mile of 5th Avenue, Rockefeller Center, Radio City Music Hall, St. Patrick’s Cathedral and the Museum of Modern Art. According to the appraisal, Park Avenue is considered to be one of the premier office corridors in the United States due to its central location, prestigious tenancy, proximity to Grand Central Terminal and other amenities. As of February 28, 2017, the 245 Park Avenue Property was 91.2% leased to 19 tenants based on remeasured net rentable area. From 2007 to 2016, the 245 Park Avenue Property has demonstrated an average occupancy of 95.0%.
THE INFORMATION IN THIS STRUCTURAL AND COLLATERAL TERM SHEET IS NOT COMPLETE AND MAY BE AMENDED PRIOR TO THE TIME OF SALE. THIS TERM SHEET IS NOT AN OFFER TO SELL THESE SECURITIES AND IT IS NOT A SOLICITATION OF AN OFFER TO BUY THESE SECURITIES IN ANY JURISDICTION WHERE THE OFFER OR SALE IS NOT PERMITTED.
93
245 PARK AVENUE
As of February 28, 2017, 65.1% of the 245 Park Avenue Property’s annual in-place base rent was attributed to investment grade tenants. The 245 Park Avenue Property serves as the U.S. headquarters for Société Générale (33.3% of remeasured net rentable area, rated A2 and A by Moody’s and S&P, respectively). The 245 Park Avenue Property also features other investment grade and institutional tenants including JPMorgan Chase Bank, National Association (“JPMorgan Chase”) (13.4% of remeasured net rentable area, rated Aa3, A+ and AA- by Moody’s, S&P and Fitch, respectively), Major League Baseball (“MLB”) (12.6% of remeasured net rentable area), Angelo Gordon (6.4% of remeasured net rentable area) and Rabobank (6.3% of remeasured net rentable area, rated Aa2, A+, AA- by Moody’s, S&P and Fitch, respectively).
The 245 Park Avenue Property’s largest tenant is Société Générale, a French multinational banking and financial services company, which utilizes the 245 Park Avenue Property as its U.S. headquarters and leases 33.3% of the remeasured net rentable area through October 2032 across 12 floors. In 2010, Société Générale executed a sublease from JPMorgan Chase for 562,347 contractual square feet through October 31, 2022. Furthermore, in 2010, Société Générale executed a 10-year direct lease with the prior owner of the 245 Park Avenue Property for 593,344 remeasured square feet, which has a start date of November 1, 2022 at (i) approximately $88.00 per square foot for the first five years of the term and (ii) a base rent for the second five-year period of the term equal to the higher of the rent payable for the first five years and a fair market rental value (not to exceed $110 per square foot). Société Générale’s direct lease has a base year of 2013. As of December 31, 2016, Société Générale had offices in 66 countries, employed approximately 145,700 people and served approximately 31 million customers. The second largest tenant, JPMorgan Chase, leases 13.4% of the remeasured net rentable area through October 2022. The JPMorgan Chase space does not include the space subleased to Société Générale because Société Générale has executed a direct lease for such space, which commences November 1, 2022. Of the 225,438 contractual square feet of JPMorgan Chase space, 189,686 contractual square feet is subleased through October 30, 2022. This includes 90,556 contractual square feet to Houlihan Lokey Inc., 49,133 contractual square feet to The Nemec Agency, 34,058 contractual square feet to Pierpont Capital Holdings LLC and 15,939 contractual square feet to JLL. The third largest tenant is MLB, who is headquartered at the 245 Park Avenue Property and leases 12.6% of the remeasured net rentable area through October 2022. MLB subleases 37,385 contractual square feet to the National Bank of Australia, 24,840 contractual square feet to Houlihan Lokey Inc. and 10,525 contractual square feet to Anthos USA Inc. through October 30, 2022.
The following table presents certain information relating to the tenancy at the 245 Park Avenue Property:
Major Tenants
| Tenant Name | Credit Rating (Fitch/Moody’s /S&P)(1) | Tenant NRSF(2) | % of NRSF(2) | Annual U/W Base Rent PSF(3) | Annual U/W Base Rent(3) | % of Total Annual U/W Base Rent | Lease Expiration Date |
| Major Tenants | |||||||
| Société Générale(4) | NR/A2/A | 593,344 | 33.3% | $61.50 | $34,584,340 | 27.4% | 10/31/2032(5) |
| JPMorgan Chase(4)(6) | AA-/Aa3/A+ | 237,781 | 13.4% | $52.42 | $11,817,255 | 9.4% | 10/31/2022 |
| MLB(7) | NR/NR/NR | 224,477 | 12.6% | $124.75 | $27,515,096 | 21.8% | 10/31/2022 |
| Angelo Gordon | NR/NR/NR | 113,408 | 6.4% | $81.00 | $9,185,805 | 7.3% | 5/31/2026 |
| Rabobank | AA-/Aa2/A+ | 112,662 | 6.3% | $138.00 | $15,132,666 | 12.0% | 9/30/2026 |
| Total Major Tenants | 1,281,672 | 72.0% | $79.77 | $98,235,162 | 77.9% | ||
| Non-Major Tenants | 341,270 | 19.2% | $82.51 | $27,942,337 | 22.1% | ||
| Occupied Collateral Total | 1,622,942 | 91.2% | $80.36 | $126,177,500 | 100.0% | ||
| Vacant Space | 156,573 | 8.8% | |||||
| Collateral Total | 1,779,515 | 100.0% | |||||
| (1) | Certain ratings are those of the parent company whether or not the parent guarantees the lease. |
| (2) | Based on remeasured net rentable square feet of 1,779,515. |
| (3) | Based on 1,723,993 contractual square feet. |
| (4) | JPMorgan Chase subleases 562,347 contractual square feet to Société Générale through October 31, 2022. In 2010, Société Générale executed a 10-year direct lease with the prior owner for 593,344 remeasured square feet, which has a start date of November 1, 2022 at (i) approximately $88.00 per square foot for the first five years of the term and (ii) a base rent for the second five-year period of the term equal to the higher of the rent payable for the first five years and a fair market rental value (not to exceed $110 per square foot). Société Générale’s direct lease has a base year of 2013 and two five-year renewal options and in addition, Société Générale subleases 36,425 contractual square feet to Brunswick Group and 36,425 square feet to MIO Partners. The terms shown for Société Générale in the table above are based on JPMorgan Chase’s direct lease. |
| (5) | Société Générale has the right to terminate either the highest floor or the highest two full floors that it leases (if such floors are contiguous) under either the related sublease described above or under its direct lease with the borrower, with notice by May 1, 2021. Société Générale may not exercise the option if all or any portion of the termination space is covered by a non-disturbance agreement granted by the borrower. |
| (6) | The JPMorgan Chase space does not include the space subleased to Société Générale due to the fact that Société Générale has executed a direct lease, which begins November 1, 2022. Of the 225,438 contractual square feet of the JPMorgan Chase space, 189,686 contractual square feet is subleased through October 30, 2022 to the following tenants: Houlihan Lokey Inc. (90,556 contractual square feet), The Nemec Agency (49,133 contractual square feet), Pierpont Capital Holdings LLC (34,058 contractual square feet) and JLL (15,939 contractual square feet). The JPMorgan Chase space includes 17,813 contractual square feet of retail space that it leases at the 245 Park Avenue Property. The terms shown for JPMorgan Chase in the table above are based on its direct lease. JPMorgan Chase may not extend any portion of its lease currently subleased to Société Générale pursuant to its sublease agreement with Société Générale. |
| (7) | MLB subleases 37,385 contractual square feet to the National Bank of Australia, 24,840 contractual square feet to Houlihan Lokey Inc. and 10,525 contractual square feet to Anthos USA Inc. through October 30, 2022. The terms shown for MLB in the table above are based on its direct lease. |
THE INFORMATION IN THIS STRUCTURAL AND COLLATERAL TERM SHEET IS NOT COMPLETE AND MAY BE AMENDED PRIOR TO THE TIME OF SALE. THIS TERM SHEET IS NOT AN OFFER TO SELL THESE SECURITIES AND IT IS NOT A SOLICITATION OF AN OFFER TO BUY THESE SECURITIES IN ANY JURISDICTION WHERE THE OFFER OR SALE IS NOT PERMITTED.
94
245 PARK AVENUE
The following table presents certain information relating to the lease rollover schedule at the 245 Park Avenue Property:
Lease Expiration Schedule(1)(2)
| Year Ending December 31, | No. of Leases Expiring | Expiring NRSF(3) | % of Total NRSF(3) | Cumulative Expiring NRSF(3) | Cumulative % of Total NRSF(3) | Annual U/W Base Rent(3) | % of Annual U/W Base Rent | Annual U/W Base Rent PSF(3) |
| MTM | 0 | 0 | 0.0% | 0 | 0.0% | $0 | 0.0% | $0.00 |
| 2017 | 0 | 0 | 0.0% | 0 | 0.0% | $0 | 0.0% | $0.00 |
| 2018 | 2 | 13,352 | 0.8% | 13,352 | 0.8% | $1,282,100 | 1.0% | $96.02 |
| 2019 | 0 | 0 | 0.0% | 13,352 | 0.8% | $0 | 0.0% | $0.00 |
| 2020 | 1 | 22,502 | 1.3% | 35,854 | 2.1% | $1,597,404 | 1.3% | $70.99 |
| 2021 | 1 | 38,382 | 2.2% | 74,236 | 4.3% | $3,224,088 | 2.6% | $84.00 |
| 2022(4) | 6 | 505,781 | 29.3% | 580,017 | 33.6% | $45,017,995 | 35.7% | $89.01 |
| 2023 | 0 | 0 | 0.0% | 580,017 | 33.6% | $0 | 0.0% | $0.00 |
| 2024 | 0 | 0 | 0.0% | 580,017 | 33.6% | $0 | 0.0% | $0.00 |
| 2025 | 0 | 0 | 0.0% | 580,017 | 33.6% | $0 | 0.0% | $0.00 |
| 2026 | 6 | 376,592 | 21.8% | 956,609 | 55.5% | $36,765,311 | 29.1% | $97.63 |
| 2027 | 1 | 10,538 | 0.6% | 967,147 | 56.1% | $937,882 | 0.7% | $89.00 |
| Thereafter(5) | 2 | 602,931 | 35.0% | 1,570,078 | 91.1% | $37,352,719 | 29.6% | $61.95 |
| Vacant | 0 | 153,915 | 8.9% | 1,723,993 | 100.0% | $0 | 0.0% | $0.00 |
| Total/Weighted Average | 19 | 1,723,993 | 100.0% | $126,177,500 | 100.0% | $80.36(6) |
| (1) | Information obtained from the underwritten rent roll and includes rent steps through April 2018. |
| (2) | Certain tenants may have lease termination or contraction options that are exercisable prior to the originally stated expiration date of the subject lease and that are not considered in the Lease Expiration Schedule. |
| (3) | Based on 1,723,993 contractual square feet. |
| (4) | JPMorgan Chase subleases 562,347 square feet to Société Générale through October 31, 2022. In 2010, Société Générale executed a direct lease with the prior owner that has a start date of November 1, 2022, for an initial term of 10 years, with two five-year extension options. The lease maturity of this space is reflected as 2032 in the table above. |
| (5) | Thereafter includes 2,661 square feet of building office space. |
| (6) | Weighted Average Annual U/W Base Rent PSF excludes vacant space. |
The following table presents historical occupancy percentages at the 245 Park Avenue Property:
Historical Occupancy
12/31/2013(1) | 12/31/2014(1) | 12/31/2015(1) | 12/31/2016(1)(2) | 2/28/2017(2)(3)(4) | ||||
| 93.6% | 93.6% | 93.6% | 95.0% | 91.2% |
| (1) | Information obtained from the borrower. |
| (2) | The decrease in occupancy from year-end 2016 to February 28, 2017 is a result of the 245 Park Avenue Property being remeasured in accordance with current REBNY standards. |
| (3) | Information obtained from the underwritten rent roll. |
| (4) | Occupancy as of February 28, 2017 includes HNA Capital USA LLC (an affiliate of the borrower sponsor) and MIO Partners, which have executed leases but have not yet taken occupancy. |
THE INFORMATION IN THIS STRUCTURAL AND COLLATERAL TERM SHEET IS NOT COMPLETE AND MAY BE AMENDED PRIOR TO THE TIME OF SALE. THIS TERM SHEET IS NOT AN OFFER TO SELL THESE SECURITIES AND IT IS NOT A SOLICITATION OF AN OFFER TO BUY THESE SECURITIES IN ANY JURISDICTION WHERE THE OFFER OR SALE IS NOT PERMITTED.
95
245 PARK AVENUE
Operating History and Underwritten Net Cash Flow. The following table presents certain information relating to the historical operating performance and the underwritten net cash flow at the 245 Park Avenue Property:
Cash Flow Analysis
| 2014(1) | 2015(1)(2) | 2016(2) | TTM 3/31/2017(3) | U/W(3) | % of U/W Effective Gross Income | U/W $ per SF(4) | ||||||||
| Base Rent | $118,736,577 | $125,320,974 | $128,705,034 | $129,095,683 | $126,177,500 | 71.0% | $73.19 | |||||||
| Grossed Up Vacant Space | 0 | 0 | 0 | 0 | 16,425,575 | 9.2 | 9.53 | |||||||
| Rent Steps | 0 | 0 | 0 | 0 | 10,341,838 | 5.8 | 6.00 | |||||||
| Total Reimbursables(5) | 31,667,499 | 34,635,748 | 37,032,022 | 37,903,249 | 40,918,609 | 23.0 | 23.73 | |||||||
| Other Income(6) | 488,183 | 704,333 | 1,901,893 | 1,888,513 | 318,732 | 0.2 | 0.18 | |||||||
| Less Vacancy & Credit Loss | 0 | 0 | 0 | 0 | (16,425,575) | (9.2) | (9.53) | |||||||
| Effective Gross Income | $150,892,259 | $160,661,056 | $167,638,950 | $168,887,445 | $177,756,680 | 100.0% | $103.11 | |||||||
| Total Operating Expenses | $52,333,953 | $57,993,351 | $60,922,988 | $61,210,770 | $62,448,738 | 35.1% | $36.22 | |||||||
| Net Operating Income | $98,558,306 | $102,667,705 | $106,715,962 | $107,676,675 | $115,307,942 | 64.9% | $66.88 | |||||||
| TI/LC | 0 | 0 | 0 | 0 | 5,191,362 | 2.9 | 3.01 | |||||||
| Capital Expenditures | 0 | 0 | 0 | 0 | 551,678 | 0.3 | 0.32 | |||||||
| Net Cash Flow | $98,558,306 | $102,667,705 | $106,715,962 | $107,676,675 | $109,564,903 | 61.6% | $63.55 | |||||||
| NOI DSCR(7) | 2.45x | 2.56x | 2.66x | 2.68x | 2.87x | |||||||||
| NCF DSCR(7) | 2.45x | 2.56x | 2.66x | 2.68x | 2.73x | |||||||||
| NOI DY(7) | 9.1% | 9.5% | 9.9% | 10.0% | 10.7% | |||||||||
| NCF DY(7) | 9.1% | 9.5% | 9.9% | 10.0% | 10.1% |
| (1) | The increase in Net Operating Income from 2014 to 2015 is primarily due to contractual rent increases resulting in an increase in the weighted average base rent per square foot from approximately $68.87 to approximately $72.69 per square foot. |
| (2) | The increase in Net Operating Income from 2015 to 2016 is primarily due to an increase in occupancy from 93.6% to 95.0% and an increase in the weighted average base rent per square foot from approximately $72.69 to approximately $74.66 per square foot. |
| (3) | The increase in Effective Gross Income from TTM 3/31/2017 to Underwritten is primarily due to the inclusion of rent steps, which are underwritten to (i) for non-investment-grade tenants, rent steps through April 2018 and (ii) for investment-grade tenants, the average rent over the lesser of the 245 Park Avenue Whole Loan term and the applicable lease term. With respect to the Société Générale subleased space, rent steps are underwritten based on the average of the JPMorgan Case base rent of $61.50 per square foot through October 2022 and base rent pursuant to Société Générale’s direct lease of $88.00 per square foot through the remainder of the loan term. |
| (4) | U/W $ per SF is based on the 1,723,993 contractual square feet. |
| (5) | Total Reimbursables are calculated on a tenant-by-tenant basis according to each tenant’s reimbursement methodology. Reimbursements for the JPMorgan Chase space subleased to Société Générale are underwritten pursuant to the triple-net JPMorgan Chase lease. Upon the commencement of the Société Générale’s direct modified gross lease in October 2022, the tenant will reimburse expenses over a base year of 2013. |
| (6) | Other Income consists of licensing fees, utility fees, generator fees and other miscellaneous items. |
| (7) | Debt service coverage ratios and debt yields are based on the 245 Park Avenue Senior Notes. |
Appraisal.As of the appraisal valuation date of April 1, 2017, the 245 Park Avenue Property had an “as-is” appraised value of $2,210,000,000.
Environmental Matters. According to a Phase I environmental site assessment dated April 19, 2017 there was no evidence of any recognized environmental conditions at the 245 Park Avenue Property.
Market Overview and Competition. The 245 Park Avenue Property is located in the Park Avenue submarket of the Plaza District in Midtown Manhattan and adjacent to Grand Central Terminal. Midtown Manhattan is home to numerous national and multinational corporations, such as Bloomberg L.P., BlackRock, the Blackstone Group, Colgate-Palmolive, JPMorgan Chase and NBC. The surrounding area has a number of luxury hotels, including The Waldorf Astoria, The Four Seasons and the New York Palace as well as Michelin starred restaurants such as Aquavit, The Modern and Le Bernardin.
As of the fourth quarter of 2016, the Park Avenue office submarket had approximately 21.8 million square feet of office inventory, direct weighted average Class A asking rents of $102.15 per square foot and a vacancy rate of 10.5%. The appraisal identified seven comparable Class A office buildings including 200 Park Avenue, 277 Park Avenue, 299 Park Avenue, 300 Park Avenue, 320 Park Avenue, 345 Park Avenue and 350 Park Avenue with current asking rents ranging from $85.00 per square foot to $125.00 per square foot, which is in-line with the 245 Park Avenue Property. The comparable buildings had a weighted average occupancy of 97.0%. The 245 Park Avenue Property’s weighted average in-place office rent of $80.72 per square foot is approximately $14.58 per square foot lower than the appraiser’s concluded weighted average in-place market rent of $95.30 per square foot.
THE INFORMATION IN THIS STRUCTURAL AND COLLATERAL TERM SHEET IS NOT COMPLETE AND MAY BE AMENDED PRIOR TO THE TIME OF SALE. THIS TERM SHEET IS NOT AN OFFER TO SELL THESE SECURITIES AND IT IS NOT A SOLICITATION OF AN OFFER TO BUY THESE SECURITIES IN ANY JURISDICTION WHERE THE OFFER OR SALE IS NOT PERMITTED.
96
245 PARK AVENUE
The following table presents certain information relating to comparable leases to the 245 Park Avenue Property:
Comparable Leases(1)
| Property Name/Location | Year Built | Stories | Floor | Total GLA (SF) | Distance from Subject | Tenant Name | Lease Date/Term | Lease Area (SF) | Annual Base Rent PSF | Lease Type |
277 Park Avenue New York, NY | 1964/2001 | 50 | 50th | 1,529,945 | 0.1 miles | Visa | April 2016 / 10 Yrs | 24,618 | $116.00 | Gross |
280 Park Avenue New York, NY | 1962/1968 | 35/43 | 40th | 1,283,145 | 0.1 miles | Orix USA Corporation | March 2017 / 10 Yrs | 20,123 | $110.00 | Gross |
520 Madison Avenue New York, NY | 1982 | 43 | 36 - 37 | 849,600 | 0.5 miles | CIC Union Europeene International et Cie | January 2017 / 15 Yrs | 46,822 | $127.00 | Gross |
1177 Avenue of the Americas New York, NY | 1992 | 50 | 22 - 30 | 960,050 | 0.5 miles | Kramer Levin Naftalis & Frankel LLP | March 2017 / 15 Yrs | 219,000 | $80.00 | Gross |
280 Park Avenue New York, NY | 1962/1968 | 35/43 | 27th | 1,283,145 | 0.1 miles | Wells Fargo | February 2017 / 10 Yrs | 49,316 | $110.00 | Gross |
237 Park Avenue New York, NY | 1981 | 21 | 19 – 20 | 1,142,196 | 0.1 miles | Permanent Mission of Canada to the UN | September 2016 / 15 Yrs | 77,873 | $79.00 | Gross |
599 Lexington Avenue New York, NY | 1986 | 47 | 17 – 18 | 955,274 | 0.3 miles | Vroom | February 2017 / 11 Yrs | 31,337 | $85.00 | Gross |
90 Park Avenue New York, NY | 1964 | 41 | 12 – 15 | 785,000 | 0.5 miles | Alston & Bird | May 2016 / 10 Yrs | 122,000 | $80.00 | Gross |
75 Rockefeller Plaza New York, NY | 1947/2016 | 32 | GL, 2-5 | 635,917 | 0.5 miles | Merrill Lynch Wealth Management | June 2016 / 15 Yrs | 124,063 | $82.50 | Gross |
399 Park Avenue New York, NY | 1961 | 39 | 12, 23-24 | 1,250,000 | 0.4 miles | Morgan Stanley | July 2016 / 15 Yrs | 110,025 | $108.50 | Gross |
1285 Avenue of the Americas New York, NY | 1960 | 42 | GL, 2-5, 8, 19, 37-39 | 1,473,950 | 0.7 miles | UBS | May 2016 / 15 Yrs | 891,000 | $79.00 | Gross |
| (1) | Information obtained from the appraisal. |
The Borrower. The borrowing entity for the 245 Park Avenue Whole Loan is 245 Park Avenue Property LLC, a Delaware limited liability company and special purpose entity. Legal counsel to the borrower delivered a non-consolidation opinion in connection with the origination of the 245 Park Avenue Whole Loan.
The Borrower Sponsor. The nonrecourse carve-out guarantor is 181 West Madison Holding LLC, an affiliate of the borrower sponsor, HNA Group (“HNA”). HNA is a China based global Fortune 500 conglomerate with core divisions of aviation, hospitality, tourism, real estate, retail, finance, logistics, shipbuilding and eco-tech. HNA has a real estate group that focuses on the development and management of central business district and urban real estate assets and, as of December 31, 2016, had 34 real estate investments in over 40 cities. In 2016, HNA purchased a 25% stake in Hilton Worldwide Holdings Inc. from Blackstone Group LP for $6.5 billion.
Escrows. The loan documents provide for upfront reserves in the amount of $10,298,441 for outstanding tenant improvements and leasing commissions, $1,133,167 for free rent, $227,000 for insurance reserves and $47,738 for replacement reserves. The loan documents require monthly reserve deposits of one-twelfth of the estimated annual real estate taxes (which currently equates to $3,878,518 per month), one-twelfth of the estimated annual insurance premiums (which currently equates to $113,500 per month) and $47,738 for replacement reserves.
Commencing on May 1, 2025 and continuing on a monthly basis, the borrower is required to deposit $446,775 ($3.00 per remeasured square foot annually) with the lender for costs related to tenant improvements and leasing commissions. The borrower is also required to deposit with the lender any lease modification fees, settlement of claims against third parties related to any lease, any rejection, termination, cancellation or surrender fee and any holdover rents or use and occupancy fees from any current or former tenants.
In lieu of depositing reserve amounts required under the loan documents in cash, the borrower may deliver to the lender one or more letters of credit for all or any portion of the deposit requirements. The amount of any such letter(s) of credit may not exceed 10% of the 245 Park Avenue Whole Loan, unless such excess is permitted under a new non-consolidation opinion delivered to the lender.
THE INFORMATION IN THIS STRUCTURAL AND COLLATERAL TERM SHEET IS NOT COMPLETE AND MAY BE AMENDED PRIOR TO THE TIME OF SALE. THIS TERM SHEET IS NOT AN OFFER TO SELL THESE SECURITIES AND IT IS NOT A SOLICITATION OF AN OFFER TO BUY THESE SECURITIES IN ANY JURISDICTION WHERE THE OFFER OR SALE IS NOT PERMITTED.
97
245 PARK AVENUE
Lockbox and Cash Management. The 245 Park Avenue Whole Loan is structured with a hard lockbox and springing cash management. The borrower and property manager were required at origination to deliver letters to all tenants at the 245 Park Avenue Property directing them to pay rents into a lockbox account. All funds in the lockbox account are required to be swept within one business day into the borrower’s operating account, unless a Cash Sweep Event (as defined below) is continuing, in which event such funds are required to be swept each business day into the cash management account controlled by the lender and disbursed on each payment date in accordance with the loan documents.
A “Cash Sweep Event” means the occurrence of (i) an event of default under the 245 Park Avenue Whole Loan or an event of default under the mezzanine loans, (ii) the bankruptcy or insolvency of the borrower or property manager (in the case of the property manager, to the extent such action results in the cash or bank accounts associated with the 245 Park Avenue Property being subsumed in the action or that has a material adverse effect on the 245 Park Avenue Property or the value or security of the lender’s interests), (iii) the debt service coverage ratio (as calculated in the loan documents) for the 245 Park Avenue Whole Loan and mezzanine loans based on underwritten net cash flow falling below 1.15x at the end of any quarter, based on the trailing three-month period or (iv) MLB not renewing all or substantially all of its premises at least 12 months before its lease expiration date or MLB vacating or abandoning all or substantially all of its premises (provided that any sweep in the case of (iv), the cash swept will be capped at $85.00 per square foot with respect to the space leased by MLB) (a “Tenant Trigger Event”).
A Cash Sweep Event will end, with respect to clause (i), upon the acceptance of a cure by the applicable lender of the related event of default; with respect to clause (ii), if the borrower replaces such manager within 60 days of such action in accordance with the loan documents; with respect to (iii), upon either (I) the achievement of a debt service coverage ratio for the 245 Park Avenue Whole Loan and mezzanine loans of at least 1.15x for six consecutive months based on the trailing three-month period or (II) the borrower effecting a “DSCR Cure” (as defined below); and with respect to clause (iv), upon the occurrence of a Tenant Trigger Cure (as defined below). Each Cash Sweep Event cure is also subject to the following: (x) no other event of default has occurred and is continuing, (y) a cure may not occur more than five times in the aggregate during the term of the loan (except that there are no limits on the number of times a DSCR Cure may occur and a DSCR Cure is excluded from the foregoing limit) and (z) the borrower may not cure a Cash Sweep Event caused by the bankruptcy or insolvency of the borrower.
A “DSCR Cure” means the satisfaction of the following conditions: (i) the borrower delivers a letter of credit with a notional amount which, if applied to the 245 Park Avenue Whole Loan and each mezzanine loan, would result in a debt service coverage ratio of at least 1.15x based upon the trailing three-month period immediately preceding the date of determination; and (ii) no Cash Sweep Event resulting from a separate event has occurred which has not been cured; provided that (x) the amount of the letter of credit (together with the amount of any other letters of credit that have been delivered by the borrower under the loan documents) may not exceed 10% of the 245 Park Avenue Whole Loan, unless such excess is permitted under a new non-consolidation opinion and (y) the borrower has no reimbursement obligations with respect to such letter of credit.
A “Tenant Trigger Cure” means either (i) the replacement of MLB with one or more tenants approved by the lender if required under the loan documents leasing not less than 90% of the leaseable area of the MLB space (including any portion of the space retained by MLB), which tenant(s) are in occupancy and paying full contractual rent, without right of offset or free rent credit, as evidenced by an estoppels certificate or (ii) during the period of any Cash Sweep Event from and after a Tenant Trigger Event, excess cash flow is required to be deposited in the cash management account in an amount equal to or exceeding $85.00 per rentable square foot with respect to the space demised under the MLB lease.
Property Management. The 245 Park Avenue Property is managed by Brookfield Properties Management LLC (“Brookfield”) on an interim basis subject to a property management agreement in place until October 31, 2017. The borrower has indicated that it expects to replace Brookfield and select a long term property manager on or before the expiration of the current management agreement. Under the loan documents, the sponsor may replace the property manager with a qualified manager, which will include certain preapproved parties or, among other criteria, a nationally recognized property management company having at least 7.5 million rentable square feet under management (excluding the 245 Park Avenue Property), including at least 5.0 million rentable square feet under management in office properties in New York City.
Assumption.The borrower has, at any time (other than the period 60 days prior to and 60 days after the securitization of the 245 Park Avenue Whole Loan, provided that the aforementioned is not applicable from and after July 1, 2020) the right to transfer the 245 Park Avenue Property or more than 49.0% of the aggregate interests in the borrower, provided that certain conditions are satisfied, including: (i) no event of default has occurred and is continuing; (ii) the borrower has provided the lender with 30 days’ prior written notice; (iii) the proposed transferee qualifies as a qualified transferee under the loan documents; (iv) the payment of a 0.50% assumption fee of the outstanding principal balance of the 245 Park Avenue Whole Loan at the time of such transfer; and (v) the lender has received confirmation from KBRA, Fitch and Moody’s that such assumption will not result in a downgrade of the respective ratings assigned to the Series 2017-C39 certificates and similar confirmations from each rating agency rating any securities backed by any of the 245 Park Avenue Companion Loans.
Partial Release. Not permitted.
Real Estate Substitution. Not permitted.
Subordinate and Mezzanine Indebtedness.The 245 Park Avenue Subordinate Companion Notes had an aggregate original balance of $120,000,000, have a cut-off date balance of $120,000,000 and are coterminous with the 245 Park Avenue Senior Notes. The 245 Park Avenue Subordinate Companion Notes require interest-only payments through maturity. The 245 Park Avenue Subordinate Companion Notes were contributed to the 245 Park Avenue 2017-245P Trust, pursuant to which the 245 Park Avenue Whole Loan is serviced and administered.
THE INFORMATION IN THIS STRUCTURAL AND COLLATERAL TERM SHEET IS NOT COMPLETE AND MAY BE AMENDED PRIOR TO THE TIME OF SALE. THIS TERM SHEET IS NOT AN OFFER TO SELL THESE SECURITIES AND IT IS NOT A SOLICITATION OF AN OFFER TO BUY THESE SECURITIES IN ANY JURISDICTION WHERE THE OFFER OR SALE IS NOT PERMITTED.
98
245 PARK AVENUE
The $568,000,000 mezzanine debt consists of a $236,500,000 mezzanine loan A, a $221,000,000 mezzanine loan B and a $110,500,000 mezzanine loan C. The mezzanine loan A has a 5.0000% coupon, the mezzanine loan B has a 5.7000% coupon and the mezzanine Loan C has a 6.8500% coupon. The mezzanine loans are interest-only for the full term of the loans and are coterminous with the 245 Park Avenue Whole Loan. Including the 245 Park Avenue Senior Notes, 245 Park Avenue Subordinate Companion Notes and the mezzanine loans, the cumulative cut-off date LTV, cumulative UW NCF DSCR and cumulative UW NOI Debt Yield are 80.0%, 1.42x and 6.5%, respectively. The mortgage and mezzanine lenders have entered into an intercreditor agreement. The mezzanine loans have been or are expected to be sold to institutional investors.
Ground Lease. None.
Terrorism Insurance. The 245 Park Avenue Whole Loan documents require that the “all risk” insurance policy required to be maintained by the borrowers provide coverage for terrorism in an amount equal to the full replacement cost of the 245 Park Avenue Property, or that if the Terrorism Risk Insurance Program Reauthorization Act is no longer in effect and such policies contain an exclusion for acts of terrorism, the borrower will obtain, to the extent available, a stand-alone policy that provides the same coverage as the policies would have if such exclusion did not exist; provided, however, that the borrower will not be required to pay annual premiums in excess of the Terrorism Cap (as defined below) in order to obtain the terrorism coverage.
“Terrorism Cap” means an amount equal to two times the then-current annual insurance premiums payable by the borrower for the casualty and business interruption policies insuring the 245 Park Avenue Property.
THE INFORMATION IN THIS STRUCTURAL AND COLLATERAL TERM SHEET IS NOT COMPLETE AND MAY BE AMENDED PRIOR TO THE TIME OF SALE. THIS TERM SHEET IS NOT AN OFFER TO SELL THESE SECURITIES AND IT IS NOT A SOLICITATION OF AN OFFER TO BUY THESE SECURITIES IN ANY JURISDICTION WHERE THE OFFER OR SALE IS NOT PERMITTED.
99
TWO INDEPENDENCE SQUARE |

THE INFORMATION IN THIS STRUCTURAL AND COLLATERAL TERM SHEET IS NOT COMPLETE AND MAY BE AMENDED PRIOR TO THE TIME OF SALE. THIS TERM SHEET IS NOT AN OFFER TO SELL THESE SECURITIES AND IT IS NOT A SOLICITATION OF AN OFFER TO BUY THESE SECURITIES IN ANY JURISDICTION WHERE THE OFFER OR SALE IS NOT PERMITTED.
100
TWO INDEPENDENCE SQUARE |
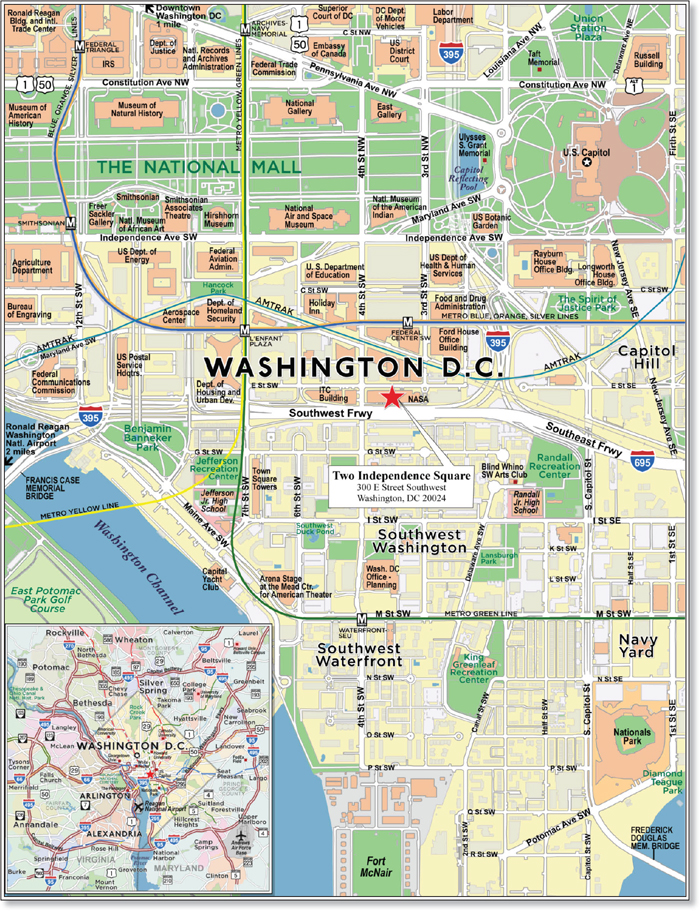
THE INFORMATION IN THIS STRUCTURAL AND COLLATERAL TERM SHEET IS NOT COMPLETE AND MAY BE AMENDED PRIOR TO THE TIME OF SALE. THIS TERM SHEET IS NOT AN OFFER TO SELL THESE SECURITIES AND IT IS NOT A SOLICITATION OF AN OFFER TO BUY THESE SECURITIES IN ANY JURISDICTION WHERE THE OFFER OR SALE IS NOT PERMITTED.
101
| No. 7 – Two Independence Square | ||||||||
| Loan Information | Property Information | |||||||
| Mortgage Loan Seller: | Natixis | Single Asset/Portfolio: | Single Asset | |||||
| Credit Assessment (Fitch/KBRA/Moody’s): | A-/BBB-/Ba3 | Property Type: | Office | |||||
| Original Principal Balance(1): | $45,000,000 | Specific Property Type: | CBD | |||||
| Cut-off Date Balance(1): | $45,000,000 | Location: | Washington, DC | |||||
| % of Initial Pool Balance: | 4.0% | Size: | 605,897 SF | |||||
| Loan Purpose: | Acquisition | Cut-off Date Balance Per SF(1): | $270.67 | |||||
| Borrower Name: | Two Independence Hana OW, LLC | Year Built/Renovated: | 1992/2014 | |||||
| Borrower Sponsor(2): | NAP | Title Vesting: | Fee | |||||
| Mortgage Rate: | 3.230% | Property Manager: | OW Management Services, Inc. | |||||
| Note Date: | July 5, 2017 | 4thMost Recent Occupancy (As of): | 100.0% (12/31/2013) | |||||
| Anticipated Repayment Date: | NAP | 3rdMost Recent Occupancy (As of): | 100.0% (12/31/2014) | |||||
| Maturity Date: | July 6, 2022 | 2ndMost Recent Occupancy (As of): | 100.0% (12/31/2015) | |||||
| IO Period: | 60 months | Most Recent Occupancy (As of): | 100.0% (12/31/2016) | |||||
| Loan Term (Original): | 60 months | Current Occupancy (As of): | 100.0% (7/31/2017) | |||||
| Seasoning: | 1 month | |||||||
| Amortization Term (Original): | NAP | Underwriting and Financial Information: | ||||||
| Loan Amortization Type: | Interest-only, Balloon | |||||||
| Interest Accrual Method: | Actual/360 | 4thMost Recent NOI (As of): | $20,670,983 (12/31/2014) | |||||
| Call Protection(3): | L(25),D(31),O(4) | 3rdMost Recent NOI (As of): | $20,576,410 (12/31/2015) | |||||
| Lockbox Type: | Hard/Upfront Cash Management | 2ndMost Recent NOI (As of): | $20,939,551 (12/31/2016) | |||||
| Additional Debt(1): | Yes | Most Recent NOI (As of): | $21,189,590 (TTM 3/31/2017) | |||||
| Additional Debt Type(1)(4): | Pari Passu; Subordinate Secured | |||||||
| U/W Revenues: | $31,593,604 | |||||||
| U/W Expenses: | $11,035,326 | |||||||
| U/W NOI: | $20,558,277 | |||||||
| U/W NCF: | $20,418,701 | |||||||
| U/W NOI DSCR(1): | 3.83x | |||||||
| Escrows and Reserves(5): | U/W NCF DSCR(1): | 3.80x | ||||||
| U/W NOI Debt Yield(1): | 12.5% | |||||||
| Type: | Initial | Monthly | Cap (If Any) | U/W NCF Debt Yield(1): | 12.5% | |||
| Taxes | $0 | Springing | NAP | As-Is Appraised Value: | $375,000,000 | |||
| Insurance | $0 | Springing | NAP | As-Is Appraisal Valuation Date: | January 5, 2017 | |||
| GSA Replacements Reserves | $2,500,000 | $250,000 | $4,000,000 | Cut-off Date LTV Ratio(1): | 43.7% | |||
| Replacement Reserve | $0 | Springing | NAP | LTV Ratio at Maturity or ARD(1): | 43.7% | |||
| TI/LC Reserve | $0 | Springing | NAP | |||||
| Garage Replacements Reserve | $871,097 | $0 | NAP | |||||
| (1) | See “The Mortgage Loan” section. All statistical information related to balances per square foot, loan-to-value ratios, debt service coverage ratios and debt yields are based on the Two Independence Square Senior Loans (as defined below) only. The Cut-off Date LTV Ratio, U/W NCF DSCR and U/W NOI Debt Yield based on the Two Independence Square Whole Loan, including the Two Independence Square Subordinate Companion Loan (as defined below), are 60.2%, 2.76x and 9.1%, respectively. |
| (2) | See “The Sponsor” section. |
| (3) | The lockout period will be at least 25 payments beginning with and including the first payment date of August 6, 2017. Defeasance of the Two Independence Square Whole Loan is permitted at any time after two years after the closing date of the securitization that includes the last note to be securitized. |
| (4) | See “Subordinate and Mezzanine Indebtedness” section. |
| (5) | See “Escrows” section. |
The Mortgage Loan.The mortgage loan (the “Two Independence Square Mortgage Loan”) is a part of a whole loan (the “Two Independence Square Whole Loan”) that is evidenced by fourpari passu promissory notes (Notes A-1, A-2, A-3-A and A-3-B, collectively the “Two Independence Square Senior Loans”) and one subordinate note (Note B or the “Two Independence Square Subordinate Companion Loan”), secured by a first mortgage encumbering the nine-story, Class A office building totaling 605,897 square feet located in Washington, District of Columbia (DC), just south of the National Mall and the Capitol Building (the “Two Independence Square Property”). The Two Independence Square Whole Loan was originated on July 5, 2017 by Column Financial, Inc. Note A-3-A and Note A-3-B were purchased by Natixis Real Estate Capital LLC on July 14, 2017. The Two Independence Square Whole Loan had an original principal balance of $225,700,000, has an outstanding principal balance as of the Cut-off Date of $225,700,000 and accrues interest at an interest rate of 3.230% per annum. The Two Independence Square Whole Loan had an initial term of 60 months, has a remaining term of 59 months as of the Cut-off Date and requires payments of interest-only through the term of the Two Independence Square Whole Loan.
THE INFORMATION IN THIS STRUCTURAL AND COLLATERAL TERM SHEET IS NOT COMPLETE AND MAY BE AMENDED PRIOR TO THE TIME OF SALE. THIS TERM SHEET IS NOT AN OFFER TO SELL THESE SECURITIES AND IT IS NOT A SOLICITATION OF AN OFFER TO BUY THESE SECURITIES IN ANY JURISDICTION WHERE THE OFFER OR SALE IS NOT PERMITTED.
102
TWO INDEPENDENCE SQUARE |
The Two Independence Square Mortgage Loan is evidenced by the non-controlling Note A-3-A, which will be contributed to the WFCM 2017-C39 Trust, had an original principal balance of $45,000,000 and has an outstanding principal balance of $45,000,000 as of the Cut-off Date. The controlling Note A-1 and the Two Independence Square Subordinate Companion Loan, which had an aggregate original principal balance of $125,700,000, were contributed to the CSMC 2017-MOON Trust. The remaining non-controlling Notes A-2 and A-3-B, which had an aggregate original principal balance of $55,000,000, are expected to be contributed to one or more future securitization trusts. See “Description of the Mortgage Pool—The Whole Loans—The Non-Serviced AB Whole Loans—The Two Independence Square Whole Loan” in the Preliminary Prospectus.
| Two Independence Square Whole Loan ($225,700,000) | |||||||
| Two Independence Square Senior Loans ($164,000,000) | |||||||
| Senior A Note | Senior A Note | Senior A Notes | |||||
| CSMC 2017-MOON | WFCM 2017-C39 | Future Conduit Securitizations | |||||
| $64,000,000 | $45,000,000 | $55,000,000 | |||||
| Note A-1 | Note A-3-A | Notes A-2, A-3-B | |||||
| Two Independence Square Subordinate Companion Loan ($61,700,000) | |||||||
| Subordinate Companion B Note | |||||||
| CSMC 2017-MOON | |||||||
| $61,700,000 | |||||||
| Note B | |||||||
Following the defeasance lockout period, on any date before April 6, 2022, the borrower has the right to defease the Two Independence Square Whole Loan in whole, but not in part. The defeasance lockout period will expire two years after the closing date of the securitization that includes the last Two Independence Square Senior Loans note to be securitized. The Two Independence Square Whole Loan is prepayable without penalty on or after April 6, 2022.
Sources and Uses
| Sources | Uses | ||||||||
| Original Whole Loan Amount | $225,700,000 | 60.3% | Purchase Price | $354,701,303 | 94.8 | % | |||
Sponsor equity
| 148,576,402 | 39.7 | Closing Costs | 16,204,002 | 4.3 | ||||
| Reserves | 3,371,097 | 0.9 | |||||||
| Total Sources | $374,276,402 | 100.0% | Total Uses | $374,276,402 | 100.0 | % | |||
The Property.The Two Independence Square Property is a 605,897-square foot, nine-story, Class A office building located on a 2.3-acre site on the southeast corner of E Street SW and 4th Street SW in Washington, DC. The Two Independence Square Property is the headquarters for the National Aeronautics and Space Administration (“NASA”). The Two Independence Square Property is LEED Gold Certified and Level IV secured and contains an underground parking garage permitted for 796 spaces (1.3 spaces per 1,000 square feet of net rentable area), which is leased to NASA and operated by a third party garage operator. Major required security features include among others: vehicle barriers and gates at parking entrances, bollards/posts and rails on perimeter with decorative walls and fencing; screening equipment, visitor processing with ID badges, access control systems, reinforced door and window glass to resist explosive blasts; magnetometers and X-ray machines at building entrances, armed security guards, with ballistic protective barriers around central or other security stations.
Amenities in the NASA space include an auditorium for 200+ people with 14 levels of stadium seating and a 20 foot ceiling, which is located on the first floor adjacent to the main lobby, a daycare center for approximately 100 children with related outdoor space, a fitness facility of 4,500 square feet with separate male/female locker rooms, showers, saunas, and towel service, and two ninth floor rooftop terraces with seating, planters and views of the Washington Monument and U.S. Capitol.
As of July 31, 2017, the Two Independence Square Property is 100.0% occupied. NASA has been a tenant at the Independence Square Property since it was built in 1992. In 2013, the United States Government Services Administration (“GSA”) (Fitch/Moody’s/S&P: AAA/Aaa/AA+), on behalf of NASA, renewed its lease for 15 years through August 2028. As part of the renewal, the seller has invested approximately $86.3 million ($142 per square foot) to date to renovate the building, including $45.4 million ($76 per square foot) expended on tenant improvements in the NASA space. NASA occupies 597,253 square feet or 98.6% of the net rentable area, and the balance of 8,644 square feet is leased to three ground floor retail tenants, including the Grand Deli & Café (7,292 square feet), Independence Lobby Shop (718 square feet), and Cleaner of Cleaners (634 square feet).
THE INFORMATION IN THIS STRUCTURAL AND COLLATERAL TERM SHEET IS NOT COMPLETE AND MAY BE AMENDED PRIOR TO THE TIME OF SALE. THIS TERM SHEET IS NOT AN OFFER TO SELL THESE SECURITIES AND IT IS NOT A SOLICITATION OF AN OFFER TO BUY THESE SECURITIES IN ANY JURISDICTION WHERE THE OFFER OR SALE IS NOT PERMITTED.
103
TWO INDEPENDENCE SQUARE |
The following table presents certain information relating to the tenancy at the Two Independence Square Property:
Major Tenants
| Tenant Name | Credit Rating (Fitch/Moody’s /S&P)(1) | Tenant NRSF | % of NRSF | Annual U/W Base Rent PSF | Annual U/W Base Rent | % of Total Annual U/W Base Rent | Lease Expiration Date |
| Major Tenants | |||||||
| NASA(2) | AAA/Aaa/AA+ | 597,253 | 98.6% | $44.87 | $26,797,263 | 99.1% | 8/3/2028(2) |
| Grand Deli & Café | NR/NR/NR | 7,292 | 1.2% | $26.75 | $195,068 | 0.7% | 7/31/2027 |
| Independence Lobby Shop | NR/NR/NR | 718 | 0.1% | $44.35 | $31,843 | 0.1% | 5/31/2023 |
| Cleaner of Cleaners | NR/NR/NR | 634 | 0.1% | $35.11 | $22,260 | 0.1% | 3/31/2026 |
| Occupied Collateral Total | 605,897 | 100.0% | $44.64 | $27,046,434 | 100.0% | ||
| Vacant Space | 0 | 0.0% | |||||
| Collateral Total | 605,897 | 100.0% | |||||
| (1) | Certain ratings are those of the parent company whether or not the parent guarantees the lease. |
| (2) | NASA can go dark in a portion or all of its space without terminating its lease. Upon NASA going dark, the GSA receives annual rent reductions of: $1.00 per square foot for less than one full floor, with a minimum of one-half floor; $2.00 per square foot for a full floor or more; and $3.00 per square foot for the entire premises, with proper notice. There is no adjustment for vacating less than one-half floor. |
Lease Expiration Schedule(1)
| Year Ending December 31, | No. of Leases Expiring | Expiring NRSF | % of Total NRSF | Cumulative Expiring NRSF | Cumulative % of Total NRSF | Annual U/W Base Rent | % of Total Annual U/W Base Rent | Annual U/W Base Rent PSF |
| MTM | 0 | 0 | 0.0% | 0 | 0.0% | $0 | 0.0% | $0.00 |
| 2017 | 0 | 0 | 0.0% | 0 | 0.0% | $0 | 0.0% | 0.00 |
| 2018 | 0 | 0 | 0.0% | 0 | 0.0% | $0 | 0.0% | 0.00 |
| 2019 | 0 | 0 | 0.0% | 0 | 0.0% | $0 | 0.0% | 0.00 |
| 2020 | 0 | 0 | 0.0% | 0 | 0.0% | $0 | 0.0% | 0.00 |
| 2021 | 0 | 0 | 0.0% | 0 | 0.0% | $0 | 0.0% | 0.00 |
| 2022 | 0 | 0 | 0.0% | 0 | 0.0% | $0 | 0.0% | 0.00 |
| 2023 | 1 | 718 | 0.1% | 718 | 0.1% | $31,843 | 0.1% | $44.35 |
| 2024 | 0 | 0 | 0.0% | 718 | 0.1% | $0 | 0.0% | 0.00 |
| 2025 | 0 | 0 | 0.0% | 718 | 0.1% | $0 | 0.0% | 0.00 |
| 2026 | 1 | 634 | 0.1% | 1,352 | 0.2% | $22,260 | 0.1% | $35.11 |
| 2027 | 1 | 7,292 | 1.2% | 8,644 | 1.4% | $195,068 | 0.7% | $26.75 |
| Thereafter | 1 | 597,253 | 98.6% | 605,897 | 100.0% | $26,797,263 | 99.1% | $44.87 |
| Vacant | 0 | 0 | 0.0% | 605,897 | 100.0% | $0 | 0.0% | 0.00 |
| Total/Weighted Average | 4 | 605,897 | 100.0% | $ 27,046,434 | 100.0% | $44.64 |
| (1) | Information obtained from the underwritten rent roll. |
The following table presents historical occupancy percentages at the Two Independence Square Property:
Historical Occupancy
12/31/2013(1) | 12/31/2014(1) | 12/31/2015(1) | 12/31/2016(1) | 7/31/2017(2) |
| 100.0% | 100.0% | 100.0% | 100.0% | 100.0% |
| (1) | Information obtained from the borrower. |
| (2) | Information obtained from the underwritten rent roll. |
THE INFORMATION IN THIS STRUCTURAL AND COLLATERAL TERM SHEET IS NOT COMPLETE AND MAY BE AMENDED PRIOR TO THE TIME OF SALE. THIS TERM SHEET IS NOT AN OFFER TO SELL THESE SECURITIES AND IT IS NOT A SOLICITATION OF AN OFFER TO BUY THESE SECURITIES IN ANY JURISDICTION WHERE THE OFFER OR SALE IS NOT PERMITTED.
104
TWO INDEPENDENCE SQUARE |
Underwritten Net Cash Flow. The following table presents certain information relating to the underwritten net cash flow at the Two Independence Square Property:
Cash Flow Analysis
| 2014 | 2015 | 2016 | TTM 3/31/2017 | U/W | % of U/W Effective Gross Income | U/W $ per SF | |
| Base Rent | $26,646,134 | $27,002,748 | $26,990,943 | $27,001,926 | $27,046,434 | 85.6% | $44.64 |
| Grossed Up Vacant Space | 0 | 0 | 0 | 0 | 0 | 0.0 | 0.00 |
| Rent Steps | 0 | 0 | 0 | 0 | 0 | 0.0 | 0.00 |
| Total Reimbursables(1) | 1,143,975 | 605,679 | 561,455 | 675,196 | 1,592,642 | 5.0 | 2.63 |
| Other Income(2) | 2,527,602 | 2,664,809 | 2,849,061 | 2,926,794 | 2,954,528 | 9.4 | 4.88 |
| Less Vacancy & Credit Loss | 0 | 0 | 0 | 0 | 0 | 0.0 | 0.00 |
| Effective Gross Income | $30,317,711 | $30,273,236 | $30,401,458 | $30,603,916 | $31,593,604 | 100.0% | $52.14 |
| Total Operating Expenses | $9,646,728 | $9,696,826 | $9,461,907 | $9,414,326 | $11,035,326 | 34.9% | $18.21 |
| Net Operating Income | $20,670,983 | $20,576,410 | $20,939,551 | $21,189,590 | $20,558,277 | 65.1% | $33.93 |
| Capital Expenditures | 0 | 0 | 0 | 0 | 121,179 | 0.4 | 0.20 |
| TI/LC | 0 | 0 | 0 | 0 | 18,397 | 0.1 | 0.03 |
| Net Cash Flow | $20,670,983 | $20,576,410 | $20,939,551 | $21,189,590 | $20,418,701 | 64.6% | $33.70 |
| NOI DSCR(3) | 3.85x | 3.83x | 3.90x | 3.95x | 3.83x | ||
| NCF DSCR(3) | 3.85x | 3.83x | 3.90x | 3.95x | 3.80x | ||
| NOI DY(3) | 12.6% | 12.5% | 12.8% | 12.9% | 12.5% | ||
| NCF DY(3) | 12.6% | 12.5% | 12.8% | 12.9% | 12.5% |
| (1) | Total Reimbursables are based on contractual lease recoveries. 2016 and TTM ending 3/31/2017 included a prior year reimbursement of $628,781. |
| (2) | Other Income consists of parking income and other miscellaneous items. |
| (3) | Debt service coverage ratios and debt yields are based on the Two Independence Square Senior Loans. |
Appraisal.As of the appraisal valuation date of January 5, 2017, the Two Independence Square Property had an “as-is” appraised value of $375,000,000.
Environmental Matters. According to a Phase I environmental site assessment dated January 5, 2017, there was no evidence of any recognized environmental conditions at the Two Independence Square Property.
Market Overview and Competition.The Two Independence Square Property is located in the Southwest submarket of downtown Washington, DC, a business district predominantly occupied by branches of the federal government and many of the Smithsonian Museums. In addition to leasing the majority of the office space in this submarket, the federal government owns over 5.0 million square feet of property in this submarket. The Two Independence Square Property is within a few blocks of the United States Capitol, the District’s most recognizable landmark. The Two Independence Square Property is situated just east of the heavily trafficked entrance to Interstates 395 and 695, has excellent visibility and access, and is one block southwest of the Federal Center SW MetroRail station.
According to the appraiser, the Southwest submarket is undergoing significant new mixed-use development and gentrification. Major projects include The Wharf, a $2.3 billion landmark waterfront development to contain 3.2 million square feet and located one-mile south, the $300 million, 20,000 seat, DC United pro soccer team Stadium at Buzzard Point expected to open in 2018, and the $400.0 million Museum of the Bible re-development to open in 2017. The L’Enfant Plaza complex is located 0.6 miles west and contains four office towers above the “La Promenade” shopping mall, the 370-key Loews L’Enfant Plaza Hotel and L’Enfant MetroRail station, all totaling 1.2 million SF. The retail promenade is undergoing a $60.0 million renovation, and the International Spy Museum with 600,000 annual visitors are expected to move to the Plaza in 2018, at an estimated cost of $100.0 million.
Per the appraisal, as of year-end 2016, the Southwest office submarket contained 11,853,498 square feet of inventory, with an 11.1% vacancy rate, unchanged from year-end 2015, and had an average asking rent of $47.81 per square foot. The year-end 2016 Class A vacancy was 11.0%, a 10bps decline from year-end 2015, with an average asking rent of $50.87 per square foot, a 5.1% increase over $48.38 per square foot for yearend 2015. The appraisal concluded a market rent of $48.00 per square foot for office space at the Two Independence Square Property, which is 7.0% higher than the underwritten rent for NASA.
THE INFORMATION IN THIS STRUCTURAL AND COLLATERAL TERM SHEET IS NOT COMPLETE AND MAY BE AMENDED PRIOR TO THE TIME OF SALE. THIS TERM SHEET IS NOT AN OFFER TO SELL THESE SECURITIES AND IT IS NOT A SOLICITATION OF AN OFFER TO BUY THESE SECURITIES IN ANY JURISDICTION WHERE THE OFFER OR SALE IS NOT PERMITTED.
105
TWO INDEPENDENCE SQUARE |
The following table presents certain information relating to comparable office leases to the Two Independence Square Property:
Comparable Leases(1)
| Property Name/Location | Year Built | Total GLA (SF) | Tenant Name | Lease Area (SF) | Lease Date/Term | Base Rent PSF | Lease Structure | TI’s PSF | Annual Escal. |
Patriots Plaza II 375 E Street SW,
| 2009 | 321,499 | GSA – FBI GSA – DOL
| 45,034 58,143
| Jul-16/5.0 Yrs Feb-15/5.0 Yrs
| $48.25 $47.50
| Base Year Stop Base Year Stop
| $25.00 $10.00
| CPI CPI
|
One Patriots Plaza 395 E Street SW,
| 2005 | 280,001 | GSA – FBI
| 49,804 | Mar-16/8.0 Yrs
| $46.50
| Full Service | $28.38
| $2.00 PSF in Yr 6
|
Capitol View 425 3rd Street SW,
| 2007 | 249,334 | GSA – HUD
| 76,200 | Sep-14/10.0 Yrs | $44.05 | Full Service | $30.00 | Flat |
Aerospace Center 370 L’Enfant
| 1987 | 400,215 | GSA Bureau of Prisons | 114,000 | Feb-16/15.0 Yrs | $45.00 | Full Service | $71.09 | Flat |
Three & Four 175 N Street NE, | 2014 | 839,000 | GSA – DOJ
| 839,000 | Oct-15/15.0 Yrs | $49.00 | Full Service | $150.97 | Flat GSA |
| (1) | Information obtained from the appraisal. |
The Borrower.The borrower is Two Independence Hana OW, LLC, a single purpose Delaware limited liability company with two independent directors. Legal counsel to the borrower delivered a non-consolidation opinion in connection with the origination of the Two Independence Square Whole Loan.
The Sponsor. The borrower, Two Independence Hana OW, LLC, is the sole party liable for any breach or violation of the non-recourse provisions in the loan documents. There is no separate nonrecourse carve-out guarantor. Two Independence Hana OW, LLC is newly formed, indirectly owned by Two Independence Hana, LLC (the “REIT”), a public U.S. REIT and a Delaware LLC, and indirectly owned by two Korean Investment Trusts (one public and one private), which are both managed by Hana Asset Management Co., Ltd., a wholly owned subsidiary of Hana Financial Group Inc. (“Hana”) (KRX:086790), with year-end 2016 revenues of $7.7 billion, total assets of $288.2 billion, total equity of $19.4 billion, and a market cap of $12.7 billion as of July 20, 2017. Hana Asset Management Co., Ltd. will be the REIT’s asset manager in Korea, and Ocean West Capital Partners will serve as the REIT’s U.S. asset and property manager. Ocean West Capital Partners is an experienced real estate investment and management firm with a history of operating Class A assets. Since inception in 2009, Ocean West Capital Partners has acquired and operated investments valued at over $550.0 million, and its principals have completed over $50.0 billion of real estate transactions.
Escrows.The loan documents provide for upfront reserves in the amount of $2,500,000 for painting, floor covering replacements, mechanical repairs and replacements required to be made to the Two Independence Square Property pursuant to the GSA lease (the “GSA Replacements Reserve”) and $871,097 for repairs and improvements to the parking garage at Two Independence Square Property (the “Garage Replacements Reserve”). Ongoing monthly escrows for real estate taxes, insurance premiums, tenant improvements and leasing commissions and replacement are not required prior to a Cash Sweep Period (as defined below). Following the occurrence and during the continuance of a Cash Sweep Period, the borrower is required to escrow on each payment date: (i) one-twelfth of the taxes that lender estimates will be payable during the next twelve months; (ii) one-twelfth of the insurance premiums that lender estimates will be payable during the next twelve months; (iii) $75,737 (approximately $1.50 per square foot annually) for tenant improvements and leasing commissions; and (iv) one-twelfth of $151,474 for the replacement reserve. The loan documents also provide for ongoing monthly deposits of $250,000 for the GSA Replacements Reserve until a cap of $4,000,000 is met.
Lockbox and Cash Management.The Two Independence Square Whole Loan is structured with a hard lockbox and in-place cash management. Tenants have been directed to remit all payments due under their leases directly into such lockbox account. The borrower will, and will cause the manager to, deposit all amounts received constituting rents into the lockbox account within one business day after receipt. All funds in the lockbox account will be swept to a lender-controlled cash management account. Upon the occurrence of a Cash Sweep Period, all excess cash flow will be swept to the lender-controlled account.
A “Cash Sweep Period” will commence upon: (i) the occurrence of an event of default under the Two Independence Square Whole Loan documents; (ii) the occurrence of any bankruptcy action of the borrower or the manager; (iii) the debt yield being less than 7.5% on any date of determination for the calendar quarter immediately preceding the date of such determination, based upon the trailing 12-month period immediately preceding such date of determination, as determined by the lender; or (iv) the occurrence of a GSA Trigger Event (as defined below). A Cash Sweep Period will end, with respect to clause (i), upon the acceptance by the lender of a cure of such event of default; with respect to clause (ii), if the borrower replaces the manager with a qualified manager under a replacement management agreement following such bankruptcy action; with respect to clause (iii), if (a) no event of default is continuing and (b) the debt yield is at least 7.5% for the two consecutive calendar quarters immediately preceding the date of
THE INFORMATION IN THIS STRUCTURAL AND COLLATERAL TERM SHEET IS NOT COMPLETE AND MAY BE AMENDED PRIOR TO THE TIME OF SALE. THIS TERM SHEET IS NOT AN OFFER TO SELL THESE SECURITIES AND IT IS NOT A SOLICITATION OF AN OFFER TO BUY THESE SECURITIES IN ANY JURISDICTION WHERE THE OFFER OR SALE IS NOT PERMITTED.
106
TWO INDEPENDENCE SQUARE |
determination based upon the trailing 12-month period immediately preceding such date of determination; and with respect to clause (iv), upon the occurrence of a GSA Cure (as defined below).
A “GSA Trigger Event” will commence if (a) GSA ceases operation and/or “goes dark” with respect to more than 50.0% of its space or (b) GSA vacates, abandons or ceases to occupy more than 50.0% of its space.
A “GSA Cure” will occur if (a) GSA has recommenced operations within 45 days of going dark or (b) the borrower replaces GSA with a new tenant or tenants acceptable to the lender pursuant to a new lease acceptable to the lender such that GSA and the replacement tenant(s) collectively occupy more than 50.0% of the GSA space.
Property Management. The Two Independence Square Property is managed by OW Management Services, Inc.
Assumption. The borrower has a one-time right to transfer the Two Independence Square Property provided that certain conditions are satisfied, including (i) no event of default has occurred and is continuing; (ii) the lender reasonably determines that the proposed transferee and guarantor satisfy the lender’s standards, taking into consideration the transferee’s identity, experience, financial condition and creditworthiness; and (iii) the lender has received confirmation from each rating agency rating the WFCM 2017-C39 Certificates and each rating agency rating any securities backed by any of the Two Independence Square Whole Loan that such assumption will not result in a downgrade, withdrawal or qualification of the respective ratings assigned to the Certificates and any such other securities.
Partial Release. Not permitted.
Real Estate Substitution.Not permitted.
Subordinate and Mezzanine Indebtedness.The Two Independence Square Subordinate Companion Loan had an aggregate original principal balance of $61,700,000, has an outstanding balance as of the cut-off date of $61,700,000 and is coterminous with the Two Independence Square Senior Loans. The Two Independence Square Subordinate Companion Loan requires interest-only payments through maturity. The Two Independence Square Subordinate Companion Loan was contributed to the CSMC 2017-MOON Trust, pursuant to which the Two Independence Square Whole Loan is serviced and administered. See “Description of the Mortgage Pool—The Whole Loans—The Non-Serviced AB Whole Loans—The Two Independence Square Whole Loan” in the Preliminary Prospectus.
Ground Lease.None.
Terrorism Insurance. The loan documents require that the “all risk” insurance policy, business interruption, commercial general liability and umbrella, and excess liability policy required to be maintained by the borrower provide coverage for terrorism in an amount equal to the full replacement cost of the Two Independence Square Property and 18 months of business interruption insurance together with a 12-month extended period of indemnity; provided that if the Terrorism Risk Insurance Program Reauthorization Act of 2015 or subsequent statute, extension or reauthorization thereof (“TRIPRA”) is in effect and continues to cover both foreign and domestic acts of terrorism, the lender is required to accept terrorism insurance with coverage against “covered acts” within the meaning of TRIPRA.
THE INFORMATION IN THIS STRUCTURAL AND COLLATERAL TERM SHEET IS NOT COMPLETE AND MAY BE AMENDED PRIOR TO THE TIME OF SALE. THIS TERM SHEET IS NOT AN OFFER TO SELL THESE SECURITIES AND IT IS NOT A SOLICITATION OF AN OFFER TO BUY THESE SECURITIES IN ANY JURISDICTION WHERE THE OFFER OR SALE IS NOT PERMITTED.
107
| YESHIVA UNIVERSITY PORTFOLIO |
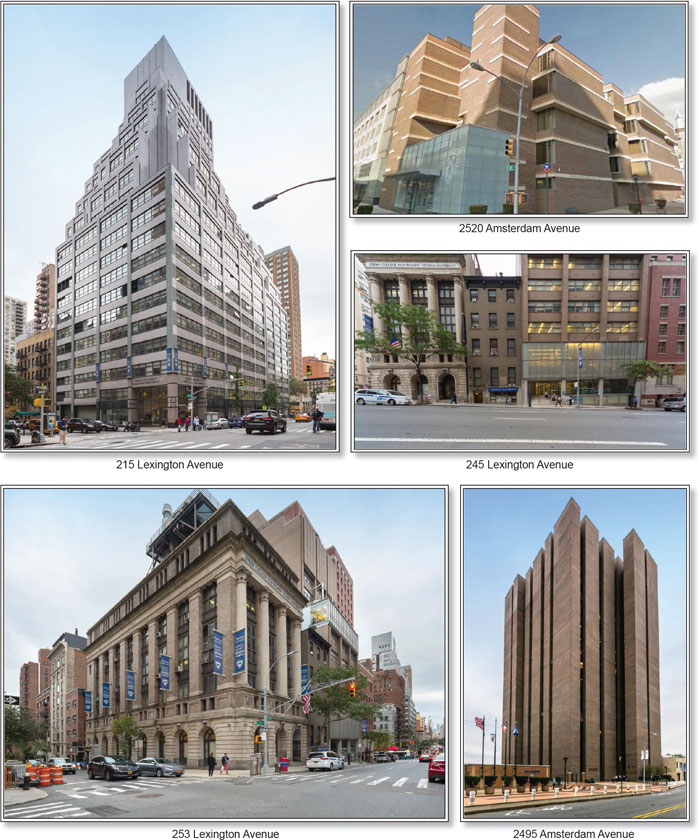
THE INFORMATION IN THIS STRUCTURAL AND COLLATERAL TERM SHEET IS NOT COMPLETE AND MAY BE AMENDED PRIOR TO THE TIME OF SALE. THIS TERM SHEET IS NOT AN OFFER TO SELL THESE SECURITIES AND IT IS NOT A SOLICITATION OF AN OFFER TO BUY THESE SECURITIES IN ANY JURISDICTION WHERE THE OFFER OR SALE IS NOT PERMITTED.
108
| YESHIVA UNIVERSITY PORTFOLIO |
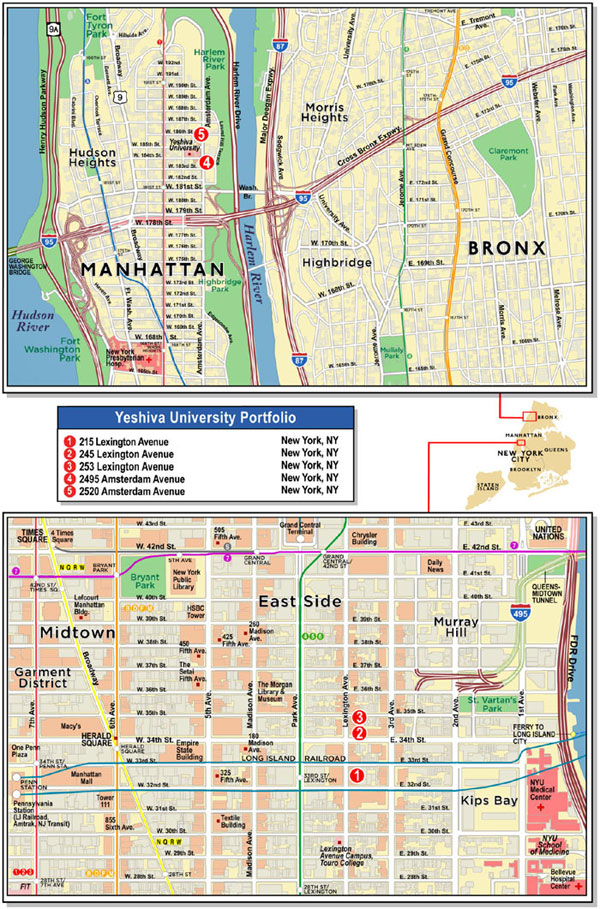
THE INFORMATION IN THIS STRUCTURAL AND COLLATERAL TERM SHEET IS NOT COMPLETE AND MAY BE AMENDED PRIOR TO THE TIME OF SALE. THIS TERM SHEET IS NOT AN OFFER TO SELL THESE SECURITIES AND IT IS NOT A SOLICITATION OF AN OFFER TO BUY THESE SECURITIES IN ANY JURISDICTION WHERE THE OFFER OR SALE IS NOT PERMITTED.
109
| No. 8 Yeshiva University Portfolio | |||||||
| Loan Information | Property Information | ||||||
| Mortgage Loan Seller: | Argentic Real Estate Finance LLC | Single Asset/Portfolio: | Portfolio | ||||
Credit Assessment (Fitch/KBRA/Moody’s): | NR/NR/NR | Property Type: | Office | ||||
| Original Principal Balance(1): | $45,000,000 | Specific Property Type: | CBD | ||||
| Cut-off Date Balance(1): | $45,000,000 | Location: | New York, NY | ||||
| % of Initial Pool Balance: | 4.0% | Size: | 696,371 SF | ||||
| Loan Purpose: | Refinance | Cut-off Date Balance Per SF(1): | $201.04 | ||||
| Borrower Name: | Y Properties Holdings, LLC | Year Built/Renovated: | Various/Various | ||||
| Borrower Sponsor: | Yeshiva University | Title Vesting: | Fee | ||||
| Mortgage Rate: | 4.324% | Property Manager: | Self-managed | ||||
| Note Date: | April 21, 2017 | 4thMost Recent Occupancy (As of): | 100.0% (12/31/2013) | ||||
| Anticipated Repayment Date: | May 6, 2027 | 3rdMost Recent Occupancy (As of): | 100.0% (12/31/2014) | ||||
| Maturity Date: | May 6, 2032 | 2ndMost Recent Occupancy (As of): | 100.0% (12/31/2015) | ||||
| IO Period: | 48 months | Most Recent Occupancy (As of): | 100.0% (12/31/2016) | ||||
| Loan Term (Original): | 120 months | Current Occupancy (As of): | 100.0% (8/1/2017) | ||||
| Seasoning: | 3 months | ||||||
| Amortization Term (Original): | 360 months | Underwriting and Financial Information: | |||||
| Loan Amortization Type: | Interest-only, Amortizing ARD | ||||||
| Interest Accrual Method: | Actual/360 | 4thMost Recent NOI (As of)(3): | NAV | ||||
| Call Protection: | L(27),D(92),O(1) | 3rdMost Recent NOI (As of)(3): | NAV | ||||
| Lockbox Type: | Hard/Upfront Cash Management | 2ndMost Recent NOI (As of)(3): | NAV | ||||
| Additional Debt(1): | Yes | Most Recent NOI (As of)(3): | NAV | ||||
| Additional Debt Type(1): | Pari Passu | ||||||
| U/W Revenues: | $18,026,336 | ||||||
| U/W Expenses: | $0 | ||||||
| U/W NOI: | $18,026,336 | ||||||
| U/W NCF: | $16,400,766 | ||||||
| U/W NOI DSCR(1): | 2.16x | ||||||
| Escrows and Reserves(2): | U/W NCF DSCR(1): | 1.97x | |||||
| U/W NOI Debt Yield(1): | 12.9% | ||||||
| Type: | Initial | Monthly | Cap (If Any) | U/W NCF Debt Yield(1): | 11.7% | ||
| Taxes | $0 | Springing | NAP | As-Is Appraised Value(4): | $346,000,000 | ||
| Insurance | $0 | Springing | NAP | As-Is Appraisal Valuation Date: | February 6, 2017 | ||
| Replacement Reserves | $0 | $19,402 | NAP | Cut-off Date LTV Ratio(1): | 40.5% | ||
| Deferred Maintenance | $275,625 | $0 | NAP | LTV Ratio at Maturity or ARD(1): | 36.1% | ||
| (1) | See “The Mortgage Loan” section. All statistical financial information related to balance per square foot, loan-to-value ratios, debt service coverage ratios and debt yields are based on the Yeshiva University Portfolio Whole Loan (as defined below). |
| (2) | See “Escrows” section. |
| (3) | See “Cash Flow Analysis” section. |
| (4) | The appraisal also concluded a hypothetical “go-dark” value of $189,100,000 as of February 6, 2017, which equates to a 74.0% loan-to-dark-value ratio. With respect to the Yeshiva University Portfolio Property located at 253 Lexington Avenue, the “as is” Appraised Value included in the Appraised Value above represents the land value less demolition costs. |
The Mortgage Loan.The mortgage loan (the “Yeshiva University Portfolio Mortgage Loan”) is part of a whole loan (the “Yeshiva University Portfolio Whole Loan”) that is evidenced by fourpari passu promissory notes (Notes A-1, A-2, A-3 and A-4) secured by a first mortgage encumbering the fee interest in five central business district office buildings totaling 696,371 square feet, located in New York, New York (collectively, the “Yeshiva University Portfolio Properties” and each individually, a “Yeshiva University Portfolio Property”). The Yeshiva University Portfolio Whole Loan was originated on April 21, 2017 by Argentic Real Estate Finance LLC and Citi Real Estate Funding Inc. The Yeshiva University Portfolio Whole Loan had an original principal balance of $140,000,000, has an outstanding principal balance as of the Cut-off Date of $140,000,000 and accrues interest at a rate of 4.324%per annum(the “Initial Interest Rate”). The Yeshiva University Portfolio Whole Loan had an initial term of 120 months, has a remaining term of 117 months as of the Cut-off Date and requires interest-only payments for the first 48 payments following origination and, thereafter, requires payments of principal and interest based on a 30-year amortization schedule. The anticipated repayment date (“ARD”) is May 6, 2027 and the final maturity date is May 6, 2032. In the event that the Yeshiva University Portfolio Whole Loan is not repaid in full on or prior to the ARD, the Yeshiva University Portfolio Whole Loan will accrue interest at aper annum rate equal to the greater of (i) 4.0% above the interpolated U.S. treasury rate and (ii) 8.324% (the “Adjusted Interest Rate”); however, interest accrued at the excess of the Adjusted Interest Rate over the Initial Interest Rate (the “Accrued Interest”) will be deferred. In addition, from and after the ARD, all excess cash flow from the Yeshiva University Portfolio Properties after the payment of reserves
THE INFORMATION IN THIS STRUCTURAL AND COLLATERAL TERM SHEET IS NOT COMPLETE AND MAY BE AMENDED PRIOR TO THE TIME OF SALE. THIS TERM SHEET IS NOT AN OFFER TO SELL THESE SECURITIES AND IT IS NOT A SOLICITATION OF AN OFFER TO BUY THESE SECURITIES IN ANY JURISDICTION WHERE THE OFFER OR SALE IS NOT PERMITTED.
110
| YESHIVA UNIVERSITY PORTFOLIO |
and interest calculated at the Initial Interest Rate will be applied (i)first to repay the principal balance of the Yeshiva University Portfolio Whole Loan until paid in full and (ii)second to the payment of accrued interest.
The Yeshiva University Portfolio Mortgage Loan, evidenced by the non-controlling Note A-2, which will be contributed to the WFCM 2017-C39 Trust, had an original principal balance of $45,000,000 and has an outstanding principal balance as of the Cut-Off Date of $45,000,000. The controlling Note A-1, which had an original principal balance of $45,000,000, and the non-controlling Note A-3, which had an original principal balance of $15,000,000, were contributed to the MSC 2017-H1 Trust. The non-controlling Note A-4, which was purchased by Cantor Commercial Real Estate Lending, L.P. after origination, had an original principal balance of $35,000,000 and was contributed to the CFCRE 2017-C8 Trust. See“Description of the Mortgage Pool–The Whole Loans–The Non-Serviced Whole Loans-Yeshiva University Portfolio Whole Loan” in the Preliminary Prospectus.
| Notes | Original Balance | Note Holder |
Controlling |
| A-1 | $45,000,000 | MSC 2017-H1 | Yes |
| A-2 | $45,000,000 | WFCM 2017-C39 | No |
| A-3 | $15,000,000 | MSC 2017-H1 | No |
| A-4 | $35,000,000 | CFCRE 2017-C8 | No |
| Total | $140,000,000 |
Following the lockout period, the borrower has the right to defease the Yeshiva University Portfolio Whole Loan in whole or in part (see “Partial Release” section) on any date before May 6, 2027. In addition, the Yeshiva University Portfolio Mortgage Loan is prepayable without penalty on or after May 6, 2027.
Sources and Uses
| Sources | Uses | |||||||
| Original whole loan amount | $140,000,000 | 100.0% | Loan payoff | $136,146,875 | 97.2% | |||
| Closing costs | 2,623,001 | 1.9 | ||||||
| Return of equity | 954,499 | 0.7 | ||||||
| Reserves | 275,625 | 0.2 | ||||||
| Total Sources | $140,000,000 | 100.0% | Total Uses | $140,000,000 | 100.0% |
The Properties.The Yeshiva University Portfolio Properties consist of five central business district office buildings totaling 696,371 square feet, all of which are located in New York, New York. The Yeshiva University Portfolio Properties are 100.0% occupied as of August 1, 2017 by Yeshiva University and are used for classroom, laboratory, library, administrative, faculty office, gymnasium and cafeteria space.
At origination of the Yeshiva University Portfolio Whole Loan, Yeshiva University transferred the Yeshiva University Portfolio Properties to the borrower and executed a twenty-year, triple-net unitary lease (the “Yeshiva University Lease”) that expires in April 2037, covering all of the Yeshiva University Portfolio Properties. Prior to origination of the Yeshiva University Portfolio Whole Loan, the Yeshiva University Portfolio Properties were owned and occupied by Yeshiva University. Per the terms of the Yeshiva University Lease, base rent is $27.42 per square foot, increases by 5.0% effective May 1, 2027 and increases by an additional 5.0% every five years thereafter.
THE INFORMATION IN THIS STRUCTURAL AND COLLATERAL TERM SHEET IS NOT COMPLETE AND MAY BE AMENDED PRIOR TO THE TIME OF SALE. THIS TERM SHEET IS NOT AN OFFER TO SELL THESE SECURITIES AND IT IS NOT A SOLICITATION OF AN OFFER TO BUY THESE SECURITIES IN ANY JURISDICTION WHERE THE OFFER OR SALE IS NOT PERMITTED.
111
| YESHIVA UNIVERSITY PORTFOLIO |
The following table presents certain information relating to the Yeshiva University Portfolio Properties:
| Property Name | Allocated Whole Loan Cut-off Date Balance | % of Portfolio Cut-off Date Balance | Occupancy | Year Built/ Renovated | Net Rentable Area (SF) | As-Is Appraised Value(1) | Allocated Cut-off Date LTV(1) |
| 2495 Amsterdam Avenue(2) | $53,233,892 | 38.0% | 100.0% | 1969/NAP | 295,694 | $108,000,000 | 49.3% |
| 215 Lexington Avenue(2) | $29,409,130 | 21.0% | 100.0% | 1962/2006 | 111,270 | $78,700,000 | 37.4% |
| 2520 Amsterdam Avenue(2)(3) | $28,290,790 | 20.2% | 100.0% | 1967/2016 | 163,321 | $60,000,000 | 47.2% |
| 245 Lexington Avenue | $21,528,737 | 15.4% | 100.0% | 1969/NAP | 87,927 | $56,300,000 | 38.2% |
| 253 Lexington Avenue(2) | $7,537,451 | 5.4% | 100.0% | 1911/NAP | 38,159 | $43,000,000(4) | 17.5% |
| Total/Weighted Average | $140,000,000 | 100.0% | 100.0% | 696,371 | $346,000,000 | 40.5% |
| (1) | The appraiser assigned a hypothetical “go-dark” value of $189,100,000. The Cut-off Date LTV Ratio based on the hypothetical “go-dark” value is approximately 74.0%. |
| (2) | Each of the 2495 Amsterdam Avenue property, the 2520 Amsterdam Avenue property and the 253 Lexington property is currently operating without a valid or permanent certificate of occupancy. In addition, it is unclear whether the use of the 215 Lexington Avenue Property as a classroom is in compliance with the related certificate of occupancy on file. Pursuant to the loan documents, within 180 days of origination of the Yeshiva University Portfolio Whole Loan (the “C/O Cure Period”), the borrower is required to (i) cause a valid temporary or permanent certificate of occupancy to be issued for each of the 253 Lexington, 2495 Amsterdam and 2520 Amsterdam properties and, to the extent any floors at the 215 Lexington property are used for classrooms, obtain an updated valid temporary or permanent certificate of occupancy permitting such classroom use on such floors and deliver copies of such new temporary or permanent certificates of occupancy to the lender, (ii) cause a “Letter of No Objection” to be issued by the New York City Department of Buildings with respect to occupancy or (iii) deliver to the lender a memorandum with respect to the applicable property from a code consultant or land use counsel (in either case as reasonably acceptable to the lender), setting forth such person’s determination that such property complies with all applicable legal requirements without the need to obtain any new or different certificate of occupancy. If, notwithstanding the borrower’s good faith and commercially reasonable diligent compliance with the obligations detailed above, the borrower is not able to complete such obligations within the C/O Cure Period, the C/O Cure Period will be extended for such time as is necessary for the borrower, with the exercise of commercially reasonable diligence, to complete such obligations. |
| (3) | The borrower is party to a certain revocable consent agreement with the New York City Department of Transportation and the Department of Information, Technology and Telecommunications (collectively, the “NYC Departments”) dated April 21, 2009 (the “Revocable Consent Agreement”), which provides the 2520 Amsterdam Avenue property with access to certain utility services. The Revocable Consent Agreement is revocable at any time by the NYC Departments. The loan documents require the borrower, prior to the expiration of the Revocable Consent Agreement, to (i) petition for a renewal of such Revocable Consent Agreement or (ii) take such steps in the ordinary course of business to provide the necessary utilities for the operation of the 2520 Amsterdam Avenue property and ensure that such utility services are not interrupted due to the expiration of the Revocable Consent Agreement. The related title policy provides affirmative coverage over the Revocable Consent Agreement. |
| (4) | The appraiser concluded an “as-is” Appraised Value, which represents the land value less demolition costs. |
2495 Amsterdam Avenue Property (42.5% of portfolio NRA)
Built in 1969, the 2495 Amsterdam Avenue Property is a 295,694 square foot, 18-story office building located on Amsterdam Avenue at West 184th Street in the Washington Heights area of northern Manhattan. Also known as Belfer Hall, the 2495 Amsterdam Avenue Property is a building located in the Wilf Campus, which is home to the men’s campus of Yeshiva University, Yeshiva College and the Sy Syms School of Business (men’s division). The building includes classrooms, labs, common areas, the office of the Yeshiva University president, and administrative and faculty offices.
215 Lexington Avenue Property (16.0% of portfolio NRA)
Built in 1962 and renovated in 2006, the 215 Lexington Avenue Property is an 111,270 square foot, 8-story commercial condominium unit situated within a 21-story office building that contains one additional condominium unit that is not collateral for the Yeshiva University Portfolio Whole Loan. The condominium association board is controlled by the sponsor with a 63.3% interest in the condominium association. The 215 Lexington Avenue Property is located on the southeast corner of East 33rd Street and Lexington Avenue in midtown Manhattan. The 215 Lexington Avenue Property is located in the Israel Henry Beren Campus of Yeshiva University, which is home to the Stern College for Women and Sy Syms School of Business (women’s division). The building includes classrooms, offices, common areas and a cafeteria.
2520 Amsterdam Avenue Property (23.5% of portfolio NRA)
Built in 1967 and most recently renovated in 2016, the 2520 Amsterdam Avenue Property is a 163,321 square foot, 6-story office building located on Amsterdam Avenue between West 185th and 186th Streets in the Washington Heights area of northern Manhattan. The building is utilized as the Mendel Gottesman Library on floors 1-5.
245 Lexington Avenue Property (12.6% of portfolio NRA)
Built in 1969, the 245 Lexington Avenue Property is an 87,927 square foot, 12-story school building located on Lexington Avenue between East 34th and 35th Streets in midtown Manhattan. The building is utilized as classroom and office space, and also contains a cafeteria, library and gymnasium. The 245 Lexington Avenue Property is interconnected with the 253 Lexington Avenue Property by way of walkways located on the second, third and fifth floors as well as the basement.
253 Lexington Avenue Property (5.5% of portfolio NRA)
Built in 1911, the 253 Lexington Avenue Property is a 38,159 square foot, 5-story school building located on the southeast corner of East 35th Street and Lexington Avenue in midtown Manhattan. The building has classroom and lab space, as well as an auditorium and office space. The 253 Lexington Avenue Property is interconnected with the 245 Lexington Avenue Property by way of walkways located on the second, third and fourth floors as well as the basement.
THE INFORMATION IN THIS STRUCTURAL AND COLLATERAL TERM SHEET IS NOT COMPLETE AND MAY BE AMENDED PRIOR TO THE TIME OF SALE. THIS TERM SHEET IS NOT AN OFFER TO SELL THESE SECURITIES AND IT IS NOT A SOLICITATION OF AN OFFER TO BUY THESE SECURITIES IN ANY JURISDICTION WHERE THE OFFER OR SALE IS NOT PERMITTED.
112
| YESHIVA UNIVERSITY PORTFOLIO |
The following table presents certain information relating to the tenancies at the Yeshiva University Portfolio Properties:
Major Tenants
| Tenant Name | Credit Rating | Tenant | % of NRSF | Annual | Annual | % of Total Annual U/W Base Rent | Lease Expiration Date |
| Major Tenant | |||||||
| Yeshiva University | NR/B3/NR | 696,371 | 100.0% | $27.42 | $19,094,070 | 100.0% | 4/30/2037 |
| Total Major Tenant | 696,371 | 100.0% | $27.42 | $19,094,070 | 100.0% | ||
| Vacant Space | 0 | 0.0% | |||||
| Collateral Total | 696,371 | 100.0% | |||||
| (1) | Certain ratings are those of the parent company whether or not the parent guarantees the lease. |
The following table presents certain information relating to the lease rollover schedule at the Yeshiva University Portfolio Properties:
Lease Expiration Schedule(1)
Year Ending | No. of | Expiring NRSF | % of | Cumulative | Cumulative % of Total NRSF | Annual | % of Total Annual U/W Base Rent | Annual |
| MTM | 0 | 0 | 0.0% | 0 | 0.0% | $0 | 0.0% | $0.0 |
| 2017 | 0 | 0 | 0.0% | 0 | 0.0% | $0 | 0.0% | $0.0 |
| 2018 | 0 | 0 | 0.0% | 0 | 0.0% | $0 | 0.0% | $0.0 |
| 2019 | 0 | 0 | 0.0% | 0 | 0.0% | $0 | 0.0% | $0.0 |
| 2020 | 0 | 0 | 0.0% | 0 | 0.0% | $0 | 0.0% | $0.0 |
| 2021 | 0 | 0 | 0.0% | 0 | 0.0% | $0 | 0.0% | $0.0 |
| 2022 | 0 | 0 | 0.0% | 0 | 0.0% | $0 | 0.0% | $0.0 |
| 2023 | 0 | 0 | 0.0% | 0 | 0.0% | $0 | 0.0% | $0.0 |
| 2024 | 0 | 0 | 0.0% | 0 | 0.0% | $0 | 0.0% | $0.0 |
| 2025 | 0 | 0 | 0.0% | 0 | 0.0% | $0 | 0.0% | $0.0 |
| 2026 | 0 | 0 | 0.0% | 0 | 0.0% | $0 | 0.0% | $0.0 |
| 2027 | 0 | 0 | 0.0% | 0 | 0.0% | $0 | 0.0% | $0.0 |
| Thereafter | 1 | 696,371 | 100.0% | 696,371 | 100.0% | $19,094,070 | 100.0% | $27.42 |
| Vacant | 0 | 0 | 0.% | 696,371 | 100.0% | $0 | 0.0% | $0.00 |
| Total/Weighted Average | 1 | 696,371 | 100.0% | $19,094,070 | 100.0% | $27.42 |
| (1) | Information obtained from the underwritten rent roll. |
The following table presents historical occupancy percentages at the Yeshiva University Portfolio Properties:
Historical Occupancy
12/31/2013(1) | 12/31/2014(1) | 12/31/2015(1) | 12/31/2016(1) | 8/1/2017(2) |
| 100% | 100.0% | 100.0% | 100.0% | 100.0% |
| (1) | Information obtained from the borrower. |
| (2) | Information obtained from the underwritten rent roll. |
THE INFORMATION IN THIS STRUCTURAL AND COLLATERAL TERM SHEET IS NOT COMPLETE AND MAY BE AMENDED PRIOR TO THE TIME OF SALE. THIS TERM SHEET IS NOT AN OFFER TO SELL THESE SECURITIES AND IT IS NOT A SOLICITATION OF AN OFFER TO BUY THESE SECURITIES IN ANY JURISDICTION WHERE THE OFFER OR SALE IS NOT PERMITTED.
113
| YESHIVA UNIVERSITY PORTFOLIO |
Operating History and Underwritten Net Cash Flow. The following table presents certain information relating to the underwritten net cash flow at the Yeshiva University Portfolio Properties:
Cash Flow Analysis(1)
| U/W | % of U/W Effective Gross Income | U/W $ per SF | |
| Base Rent | $19,094,070 | 105.9% | $27.42 |
| Grossed Up Vacant Space | 0.00 | 0.0 | 0.00 |
| Total Reimbursables | 0.00 | 0.0 | 0.00 |
| Less Vacancy & Credit Loss | (1,067,734)(2) | (5.9) | (1.53) |
| Effective Gross Income | $18,026,336 | 100.0% | $25.89 |
|
|
| |
| Total Operating Expenses(3)(4) | $0.00 | 0.0% | $0.00 |
| Net Operating Income | $18,026,336 | 100.0% | $25.89 |
| TI/LC | 1,392,742 | 7.7 | 2.00 |
| Capital Expenditures | 232,828 | 1.3 | 0.33 |
| Net Cash Flow | $16,400,766 | 91.0% | $23.55 |
| NOI DSCR(5) | 2.16x | ||
| NCF DSCR(5) | 1.97x | ||
| NOI DY(5) | 12.9% | ||
| NCF DY(5) | 11.7% |
| (1) | Historical financial information is not available as the Yeshiva University Lease was executed at origination of the Yeshiva University Portfolio Whole Loan. Prior to the Yeshiva University Lease, the Yeshiva University Portfolio Properties were owned and occupied by Yeshiva University. The Yeshiva University lease is a twenty-year, triple-net unitary lease that expires in April 2037, covering all of the Yeshiva University Portfolio Properties. Per the terms of the Yeshiva University Lease, base rent is $27.42 per square foot, increases by 5.0% effective May 1, 2027 and increases by an additional 5.0% every five years thereafter. The Yeshiva University Lease is structured with no renewal options and no termination options (other than in connection with certain casualty and condemnation events). |
| (2) | The underwritten economic vacancy is 5.6%, which represents a 6.0% vacancy on the Amsterdam Avenue Properties and a 5.0% vacancy on the Lexington Avenue Properties. The Yeshiva University Portfolio Properties were 100.0% physically occupied as of August 1, 2017 by Yeshiva University. |
| (3) | The Yeshiva University Portfolio Properties are leased to Yeshiva University pursuant to a triple-net lease; the single tenant, Yeshiva University, is responsible for the payment of property expenses. |
| (4) | Prior to the conveyance of the Yeshiva University Portfolio Properties to the borrower, the Yeshiva University Portfolio Properties were afforded a tax exemption pursuant to Section 420-a of the NYS Real Property Law. The borrower has filed the necessary paperwork to maintain the tax exemption. However, there is no assurance that a tax exemption will be granted. In the event that all real estate taxes are no longer abated, the cumulative amount of real estate taxes for the Yeshiva University Portfolio Properties would be approximately $3,872,443. |
| (5) | The debt service coverage ratios and debt yields are based on the Yeshiva University Portfolio Whole Loan. |
Appraisal.As of the appraisal valuation date of February 6, 2017, the Yeshiva University Portfolio Properties had an aggregate “as-is” appraised value of $346,000,000. In addition, the appraisal for Yeshiva University Portfolio Properties concluded a hypothetical “go-dark” appraised value of $189,100,000 as of February 6, 2017.
Environmental Matters.According to the Phase I environmental assessments datedFebruary 7, 2017, there was no evidence of any recognized environmental conditions at the Yeshiva University Portfolio Properties.
Market Overview and Competition. The Yeshiva University Portfolio Properties are comprised of five office properties located in New York, New York.
The Amsterdam Avenue Properties
The Amsterdam Avenue properties consist of the 2495 Amsterdam Avenue property and the 2520 Amsterdam Avenue property (together, the “Amsterdam Avenue Properties”). The Amsterdam Avenue Properties are located in the Washington Heights neighborhood of northern Manhattan. Washington Heights is bounded to the south by 155th Street and to the north by Fairview Avenue and extends from the Harlem River on the east to the Hudson River on the west. The Amsterdam Avenue Properties are located within the main campus of Yeshiva University, which is comprised of the area between Audubon Avenue and Laurel Hill Terrace between 181st and 187th Streets. In addition to school buildings, there are various apartment buildings owned by Yeshiva University in the immediate area. This has brought additional residents into the area, many of whom are affiliated with Yeshiva University. Primary access is provided by all major avenues, including Broadway, Henry Hudson Parkway and the Harlem River Drive as well as public transportation via the 1/A subway lines and M101/M3 bus service.
According to the appraisal, the Amsterdam Avenue Properties are located in the Northern Manhattan/Harlem office submarket of the Manhattan office market. Within the Northern Manhattan/Harlem office submarket, there is approximately 6.7 million square feet of inventory, with a reported vacancy of 5.2% and an average asking rent of $35.04 per square foot. According to the appraisal, the
THE INFORMATION IN THIS STRUCTURAL AND COLLATERAL TERM SHEET IS NOT COMPLETE AND MAY BE AMENDED PRIOR TO THE TIME OF SALE. THIS TERM SHEET IS NOT AN OFFER TO SELL THESE SECURITIES AND IT IS NOT A SOLICITATION OF AN OFFER TO BUY THESE SECURITIES IN ANY JURISDICTION WHERE THE OFFER OR SALE IS NOT PERMITTED.
114
| YESHIVA UNIVERSITY PORTFOLIO |
2016 population and median household income within the 10033 zip code were 57,011 and $36,820, respectively. The appraiser concluded gross market rents for the 2520 Amsterdam Avenue property and 2495 Amsterdam property of $38.00 per square foot and $40.00 per square foot, respectively.
The following table presents recent leasing data at competitive office buildings with respect to the Amsterdam Avenue Properties:
Competitive Set(1)
| Property Name/Location | Year Built / Renovated | Total GLA (SF) | Total Occupancy | Distance from Subject | Tenant Name | Lease Date/Term | Lease Area (SF) | Annual Base Rent PSF | Lease Type |
313 West 125th Street New York, NY | 1910/2011 | 27,105 | 100.0% | 3.1 miles | College of New Rochelle | April 2016 | 21,684 | $45.00 | Modified Gross |
2090 Adam Clayton New York, NY | 1913/NAP | 163,440 | NAV | 3.3 miles | Legal Aid Society; Center for Alternative Sentencing & Employment | July 2016
June 2014
| 20,881
13,871
| $38.50
$29.33
| Modified Gross |
145 East 125th Street New York, NY | 1900/2006 | 35,970 | 100.0% | 3.9 miles | Salvation Army | February 2015 | 30,000 | $31.00 | Modified Gross |
4 West 125th Street New York, NY | 1910/2004 | 44,495 | 100.0% | 3.7 miles | Children’s Aid Society | December 2014 | 25,300 | $39.00 | Modified Gross |
88 Pine Street New York, NY | 1973/NAP | 624,000 | 97.0% | 11.3 miles | Cornell University (Expansion) | May 2016 | 21,750 | $50.00 | Modified Gross |
17 Battery Place South New York, NY | 1903/1998 | 446,501 | 79.7% | 11.3 miles | John V. Lindsay Wildcat Academy | June2016 | 23,050 | $50.00 | Modified Gross |
| (1) | Information obtained from the appraisal. |
The Lexington Avenue Properties
The Lexington Avenue properties consist of the 215 Lexington Avenue property, the 245 Lexington Avenue property and the 253 Lexington Avenue property (together, the “Lexington Avenue Properties”). According to the appraisal, the Lexington Avenue Properties are located in the northern area of the Park Avenue South submarket of Manhattan and the immediate area surrounding the Lexington Avenue Properties is primarily a mixture of commercial and residential development. The Lexington Avenue Properties have direct access to the 6/B/D/F/M/N/Q/R subway lines. Additionally, Penn Station and Grand Central Terminal are located nearby, providing access to commuters from New Jersey, Long Island, Westchester and Putnam Counties and Western Connecticut. As of the fourth quarter of 2016, the Park Avenue South/Madison Square office submarket had a reported vacancy of 6.2% and an average asking rent of $66.33 PSF. According to the appraisal, the 2016 population and median household income within the 10016 zip code were 57,766 and $99,589, respectively. The appraiser concluded gross market rents for the 215 Lexington Property, 245 Lexington Property and 253 Lexington Property of $55.00 PSF, $50.00 PSF and $46.00 PSF, respectively.
The following table presents recent leasing data at competitive office buildings with respect to the Lexington Avenue Properties:
Competitive Set(1)
| Property Name/Location | Year Built / Renovated | Total GLA (SF) | Total Occupancy | Distance from Subject | Tenant Name | Lease Date/Term | Lease Area (SF) | Annual Base Rent PSF | Lease Type |
180 Madison Avenue New York, NY | 1927/NAP | 280,863 | 88.7% | 0.2 miles | New York University | December 2016 | 99,132 | $60.00 | Modified Gross |
31-35 West 27th Street New York, NY | 1910/NAP | 137,358 | 100.0% | 0.7 miles | Stella Adler Conservator | June 2016 | 23,156 | $58.30 | Modified Gross |
900 Broadway New York, NY | 1887/2008 | 98,146 | 96.7% | 0.9 miles | Tutor Associates, Inc. | November 2015 | 4,500 | $53.00 | Modified Gross |
1250 Broadway New York, NY | 1968/NAP | 770,000 | 96.0% | 0.5 miles | Prometric Technology Center | June 2015 | 11,628 | $64.77 | Modified Gross |
22 West 21st Street New York, NY | 1907/NAP | 125,100 | 86.4% | 1.0 miles | Journee | April 2015 | 5,170 | $50.00 | Modified Gross |
180 Maiden Lane New York, NY | 1984/NAP | 1,192,893 | 45.2% | 3.2 miles | MicroTek Business Education | September 2016 | 20,396 | $58.32 | Modified Gross |
88 Pine Street New York, NY | 1973/NAP | 624,000 | 97.0% | 3.2 miles | Cornell University (Expansion) | May 2016 | 21,750 | $50.00 | Modified Gross |
17 Battery Place New York, NY | 1903/1998 | 446,501 | 79.7% | 3.5 miles | John V. Lindsay Wildcat Academy | June 2016 | 23,050 | $50.00 | Modified Gross |
| (1) | Information obtained from the appraisal. |
THE INFORMATION IN THIS STRUCTURAL AND COLLATERAL TERM SHEET IS NOT COMPLETE AND MAY BE AMENDED PRIOR TO THE TIME OF SALE. THIS TERM SHEET IS NOT AN OFFER TO SELL THESE SECURITIES AND IT IS NOT A SOLICITATION OF AN OFFER TO BUY THESE SECURITIES IN ANY JURISDICTION WHERE THE OFFER OR SALE IS NOT PERMITTED.
115
| YESHIVA UNIVERSITY PORTFOLIO |
The Borrower.The borrower is Y Properties Holdings, LLC, a single-purpose Delaware limited liability company with two independent directors. Legal counsel to the borrower delivered a non-consolidation opinion in connection with the origination of the Yeshiva University Portfolio Whole Loan. Yeshiva University, the sole tenant at the Yeshiva University Portfolio Properties, is the guarantor of certain nonrecourse carveouts under the Yeshiva University Portfolio Whole Loan. Yeshiva University is the sole member of the borrower.
The Borrower Sponsor.Yeshiva University is a private Jewish university founded in 1886 with approximately 3,000 undergraduate and 3,500 graduate students across four campuses. Yeshiva University is divided into three undergraduate colleges: Yeshiva College, the Stern College for Women and the SY Syms School of Business. In addition to its undergraduate programs, the school includes the Albert Einstein College of Medicine (a joint entity between Montefiore Medical Center and Yeshiva University), the Benjamin N. Cardozo School of Law and the Wurzweiler School of Social Work. Yeshiva University has experienced recent operating deficits and student enrollment declined 7.5% between 2012 and 2017. In 2017, Yeshiva University reported long-term investments with a market value of greater than $550 million.
Escrows.The Yeshiva University Portfolio Whole Loan documents provide for upfront escrows in the amount of $275,625 for immediate repairs. The Yeshiva University Portfolio Whole Loan documents do not require ongoing monthly escrows for real estate taxes provided a tax exemption is in effect for the Yeshiva University Portfolio Properties. The Yeshiva University Portfolio Whole Loan documents do not require monthly ongoing escrows for insurance premiums as long (x) (i) Yeshiva University pays the insurance premiums directly, (ii) the borrower furnishes evidence of the renewal of any expiring policy, (iii) the Yeshiva University Lease is in full force and effect, (iv) no default under the Yeshiva University Lease has occurred or is continuing, and (iv) no Cash Trap Period (as defined below) has occurred or is continuing and (y) the balance of the insurance account is equal to one-half of the annual insurance premiums. Pursuant to the Yeshiva University Lease, Yeshiva University, as tenant thereunder, is required to deposit $19,402 ($0.33 per square foot annually) into a replacement reserve account that is held by the lender but is subject to the tenant’s rights under the Yeshiva University Lease.
Lockbox and Cash Management.The Yeshiva University Portfolio Whole Loan requires a lender-controlled hard lockbox, which is already in place, and requires that the borrower directs the tenant to pay rent directly into such lockbox account. The Yeshiva University Portfolio Whole Loan documents also require that all rents received by the borrower or property manager be deposited into the lockbox account within one business day of receipt. All funds in the lockbox account will be swept to a lender-controlled cash management account. Prior to the occurrence of a Cash Trap Period (as defined below), all excess cash flow is required to be distributed to the borrower. During a Cash Trap Period, all excess funds are required to be swept to a lender-controlled cash management account.
A “Cash Trap Period” will commence upon the occurrence of any of the following: (i) an event of default; (ii) an event of default by Yeshiva University under the Yeshiva University Lease; (iii) an insolvency proceeding with respect to Yeshiva University; (iv) a default by Yeshiva University under the Yeshiva University Lease of any obligation thereunder to a third party that is for an amount equal to or greater than $15,000,000; (v) Yeshiva University going dark in more than 25% of the space demised under the Yeshiva University Lease; or (vi) the ARD.
A Cash Trap Period will end, with respect to clause (i), (ii) and (iv), upon the cure of such event of default; with respect to clause (iii), if the applicable insolvency proceeding has terminated and the Yeshiva University Lease has been affirmed, assumed or assigned in a manner satisfactory to the lender; and with respect to clause (v), on the date that Yeshiva University resumes its normal business operations in at least 75% of the demised space.
In the event that a Cash Trap Period is triggered by clauses (iv) and/or (v) above, the cash flow sweep is subject to a monthly cap of $600,000 and an aggregate cap of $18,000,000.
Property Management.The Yeshiva University Properties are self-managed.
Assumption.Not permitted.
Right of First Refusal.Each of the two condominium unit owners (one of which is the borrower) of the 215 Lexington Avenue Property has a right of first offer to purchase the other condominium unit, provided that, among other conditions, the unit owner that intends to sell (the “selling unit”) provides the other condominium unit owner (the “purchasing unit”) with written notice of the selling unit’s intent to sell, along with a copy of the proposed contract of sale. The purchasing unit then has 10 business days to notify the selling unit if it intends to accept such offer. The right of first refusal does not apply in connection with (i) a sale to an affiliate of the unit owner, (ii) a foreclosure or deed-in-lieu of foreclosure or (iii) the transfer of the unit to a permitted mortgagee or its designee as further described under the related condominium association documents.
Partial Release.On any payment date following the lockout period, the borrower is permitted to partially release any of the Amsterdam Avenue Properties in connection with a refinancing or a bona fide third-party sale, with partial defeasance of 125% of the released property’s allocated loan amount, subject to certain conditions including (i) no event of default has occurred or is continuing; (ii) after giving effect to such defeasance, the net operating income debt yield with respect to the remaining Yeshiva University Portfolio Properties being no less than the greater of (a) 10.96% and (b) the net operating income debt yield immediately preceding such release; and (iii) the REMIC loan-to-value ratio of the remaining Yeshiva University Portfolio Properties is no greater than 125%.
Upon release of the 2495 Amsterdam Avenue Property, the rent due to the borrower, as landlord under the Yeshiva University Lease, will be reduced by an amount that is not greater than $7,375,149 ($24.94 per square foot) per year.
Upon release of the 2520 Amsterdam Avenue Property, the rent due to borrower, as landlord under the Yeshiva University Lease, will be reduced by an amount that is not greater than $3,927,891($24.05 per square foot) per year.
THE INFORMATION IN THIS STRUCTURAL AND COLLATERAL TERM SHEET IS NOT COMPLETE AND MAY BE AMENDED PRIOR TO THE TIME OF SALE. THIS TERM SHEET IS NOT AN OFFER TO SELL THESE SECURITIES AND IT IS NOT A SOLICITATION OF AN OFFER TO BUY THESE SECURITIES IN ANY JURISDICTION WHERE THE OFFER OR SALE IS NOT PERMITTED.
116
| YESHIVA UNIVERSITY PORTFOLIO |
Real Estate Substitution.Not permitted.
Subordinate and Mezzanine Indebtedness.Not permitted.
Ground Lease.None.
Terrorism Insurance.The Yeshiva University Portfolio Whole Loan documents require that the “all risk” insurance policy required to be maintained by the borrower provide coverage for terrorism in an amount equal to the full replacement cost of the Yeshiva University Portfolio Properties, as well as business interruption insurance covering no less than the 18-month period following the occurrence of a casualty event, together with a six-month extended period of indemnity.
THE INFORMATION IN THIS STRUCTURAL AND COLLATERAL TERM SHEET IS NOT COMPLETE AND MAY BE AMENDED PRIOR TO THE TIME OF SALE. THIS TERM SHEET IS NOT AN OFFER TO SELL THESE SECURITIES AND IT IS NOT A SOLICITATION OF AN OFFER TO BUY THESE SECURITIES IN ANY JURISDICTION WHERE THE OFFER OR SALE IS NOT PERMITTED.
117
(THIS PAGE INTENTIONALLY LEFT BLANK)
THE INFORMATION IN THIS STRUCTURAL AND COLLATERAL TERM SHEET IS NOT COMPLETE AND MAY BE AMENDED PRIOR TO THE TIME OF SALE. THIS TERM SHEET IS NOT AN OFFER TO SELL THESE SECURITIES AND IT IS NOT A SOLICITATION OF AN OFFER TO BUY THESE SECURITIES IN ANY JURISDICTION WHERE THE OFFER OR SALE IS NOT PERMITTED.
118
| LINCOLNSHIRE COMMONS |
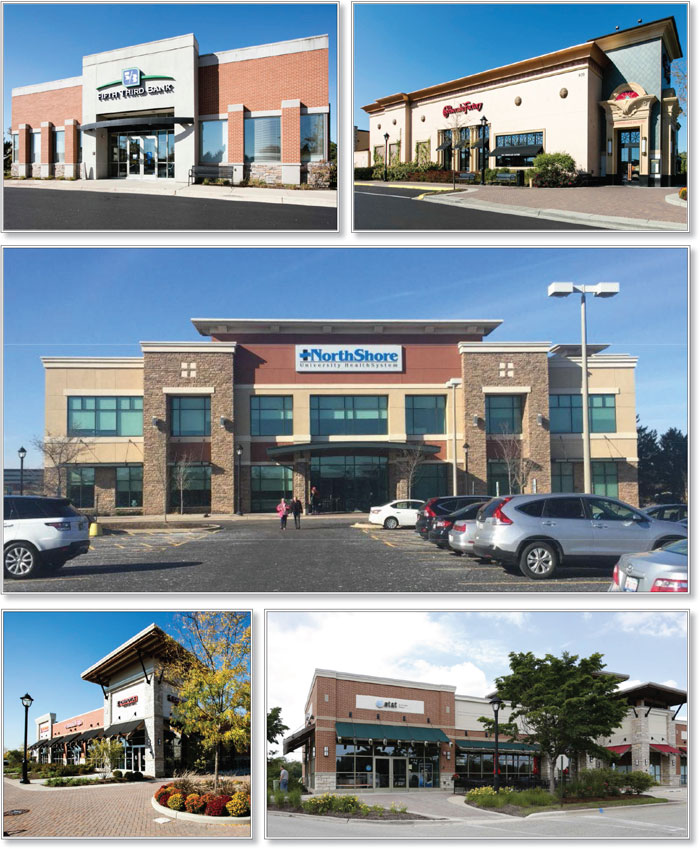
THE INFORMATION IN THIS STRUCTURAL AND COLLATERAL TERM SHEET IS NOT COMPLETE AND MAY BE AMENDED PRIOR TO THE TIME OF SALE. THIS TERM SHEET IS NOT AN OFFER TO SELL THESE SECURITIES AND IT IS NOT A SOLICITATION OF AN OFFER TO BUY THESE SECURITIES IN ANY JURISDICTION WHERE THE OFFER OR SALE IS NOT PERMITTED.
119
| LINCOLNSHIRE COMMONS |
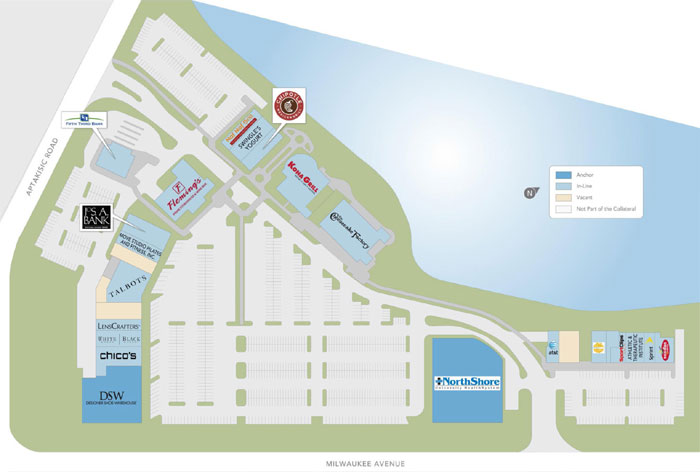
THE INFORMATION IN THIS STRUCTURAL AND COLLATERAL TERM SHEET IS NOT COMPLETE AND MAY BE AMENDED PRIOR TO THE TIME OF SALE. THIS TERM SHEET IS NOT AN OFFER TO SELL THESE SECURITIES AND IT IS NOT A SOLICITATION OF AN OFFER TO BUY THESE SECURITIES IN ANY JURISDICTION WHERE THE OFFER OR SALE IS NOT PERMITTED.
120
| LINCOLNSHIRE COMMONS |
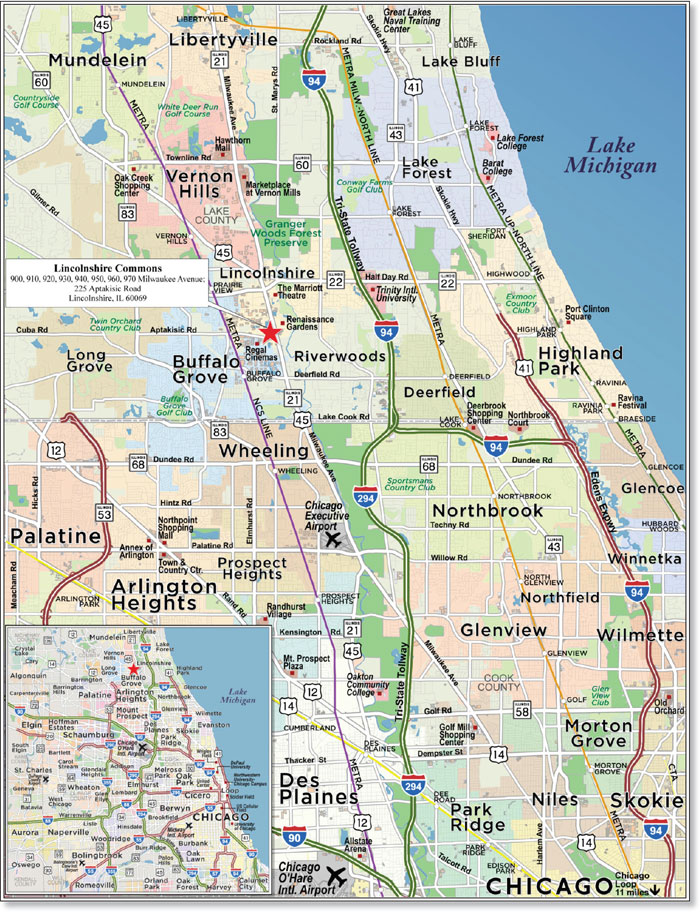
THE INFORMATION IN THIS STRUCTURAL AND COLLATERAL TERM SHEET IS NOT COMPLETE AND MAY BE AMENDED PRIOR TO THE TIME OF SALE. THIS TERM SHEET IS NOT AN OFFER TO SELL THESE SECURITIES AND IT IS NOT A SOLICITATION OF AN OFFER TO BUY THESE SECURITIES IN ANY JURISDICTION WHERE THE OFFER OR SALE IS NOT PERMITTED.
121
| No. 9 – Lincolnshire Commons | ||||||
| Loan Information | Property Information | |||||
| Mortgage Loan Seller: | Wells Fargo Bank, National Association | Single Asset/Portfolio: | Single Asset | |||
Credit Assessment (Fitch/ KBRA/Moody’s) | NR/NR/NR | Property Type: | Mixed Use | |||
| Original Principal Balance: | $43,500,000 | Specific Property Type: | Office/Retail | |||
| Cut-off Date Balance: | $43,500,000 | Location: | Lincolnshire, IL | |||
| % of Initial Pool Balance: | 3.8% | Size: | 133,024 SF | |||
| Loan Purpose: | Acquisition | Cut-off Date Balance Per SF: | $327.01 | |||
| Borrower: | Lincolnshire Propco, LLC | Year Built/Renovated: | 2005/2016 | |||
| Borrower Sponsors: | Andrew Hochberg; Marc Blum | Title Vesting: | Fee | |||
| Mortgage Rate: | 4.460% | Property Manager: | Self-managed | |||
| Note Date: | July 18, 2017 | 4thMost Recent Occupancy(2): | NAV | |||
| Maturity Date: | August 11, 2027 | 3rdMost Recent Occupancy (As of): | 93.8% (1/1/2015) | |||
| IO Period: | 60 months | 2ndMost Recent Occupancy (As of): | 92.2% (1/1/2016) | |||
| Loan Term (Original): | 120 months | Most Recent Occupancy (As of): | 90.5% (1/1/2017) | |||
| Seasoning: | 0 months | Current Occupancy (As of): | 91.1% (7/12/2017) | |||
| Amortization Term (Original): | 360 months | |||||
| Loan Amortization Type: | Interest-only, Amortizing Balloon | Underwriting and Financial Information: | ||||
| Interest Accrual Method: | Actual/360 | |||||
| Call Protection: | L(24),D(92),O(4) | 4thMost Recent NOI (As of): | $3,442,170 (Annualized 4 – 12/31/2014) | |||
| Lockbox Type: | Springing | 3rdMost Recent NOI (As of): | $3,300,503 (12/31/2015) | |||
| Additional Debt: | None | 2ndMost Recent NOI (As of)(2): | $2,162,750 (12/31/2016) | |||
| Additional Debt Type: | NAP | Most Recent NOI (As of)(2): | $2,749,839 (TTM 4/30/2017) | |||
| U/W Revenues: | $4,715,610 | |||||
| U/W Expenses: | $921,885 | |||||
| U/W NOI: | $3,793,726 | |||||
| Escrows and Reserves(1): | U/W NCF: | $3,598,532 | ||||
| U/W NOI DSCR: | 1.44x | |||||
| Type: | Initial | Monthly | Cap (If Any) | U/W NCF DSCR: | 1.37x | |
| Taxes | $152,381 | $41,025 | NAP | U/W NOI Debt Yield: | 8.7% | |
| Insurance | $0 | Springing | NAP | U/W NCF Debt Yield: | 8.3% | |
| Replacement Reserves | $0 | $2,332 | $100,000 | As-Is Appraised Value: | $58,300,000 | |
| TI/LC Reserve | $0 | $13,857 | $500,000 | As-Is Appraisal Valuation Date: | June 2, 2017 | |
| Rent Concession Reserve | $330,677 | $0 | NAP | Cut-off Date LTV Ratio: | 74.6% | |
| Tenant Specific TI/LC Reserve | $1,412,951 | $0 | NAP | LTV Ratio at Maturity: | 68.2% | |
| (1) | See “Escrows” section. |
| (2) | See “Historical Occupancy” and “Cash Flow Analysis” sections. |
The Mortgage Loan.The mortgage loan (the “Lincolnshire Commons Mortgage Loan”) is evidenced by a single promissory note that is secured by a first mortgage encumbering a mixed use center located in Lincolnshire, Illinois (the “Lincolnshire Commons Property”). The Lincolnshire Commons Mortgage Loan was originated on July 18, 2017 by Wells Fargo Bank, National Association. The Lincolnshire Commons Mortgage Loan had an original principal balance of $43,500,000, has an outstanding principal balance as of the Cut-off Date of $43,500,000 and accrues interest at an interest rate of 4.460%per annum. The Lincolnshire Commons Mortgage Loan had an initial term of 120 months, has a remaining term of 120 months as of the Cut-off Date and requires interest-only payments during the first 60 payment periods, followed by payments of principal and interest based on a 30-year amortization schedule. The Lincolnshire Commons Mortgage Loan matures on August 11, 2027.
Following the lockout period, the borrower has the right to defease the Lincolnshire Commons Mortgage Loan in whole, but not in part, on any date before May 11, 2027. In addition, the Lincolnshire Commons Mortgage Loan is prepayable without penalty on or after May 11, 2027.
THE INFORMATION IN THIS STRUCTURAL AND COLLATERAL TERM SHEET IS NOT COMPLETE AND MAY BE AMENDED PRIOR TO THE TIME OF SALE. THIS TERM SHEET IS NOT AN OFFER TO SELL THESE SECURITIES AND IT IS NOT A SOLICITATION OF AN OFFER TO BUY THESE SECURITIES IN ANY JURISDICTION WHERE THE OFFER OR SALE IS NOT PERMITTED.
122
| LINCOLNSHIRE COMMONS |
Sources and Uses
| Sources | Uses | |||||||
| Original Loan Amount | $43,500,000 | 73.5% | Purchase Price | $57,800,000 | 97.7% | |||
| Sponsor Equity Contribution | 15,657,269 | 26.5 | Upfront Tax Reserve(1) | 152,381 | 0.3 | |||
| Closing Costs | 1,204,888 | 2.0 | ||||||
| Total Sources | $59,157,269 | 100.0% | Total Uses | $59,157,269 | 100.0% |
| (1) | Upfront reserves collected at the origination of the Lincolnshire Commons Mortgage Loan totalled $1,896,009; however, the seller provided the borrower sponsor credits in the amount of $1,412,951 for outstanding tenant improvement and leasing commission (“TI/LC”) and $330,677 for outstanding rent concessions. |
The Property.The Lincolnshire Commons Property is a nine-building, mixed-use open air center totaling 133,024 square feet located in Lincolnshire, Illinois, approximately 32.2 miles north of Chicago. Constructed in 2005 and most recently renovated in 2016, the Lincolnshire Commons Property is situated on a 17.1-acre parcel and contains a 2-story office building totaling 34,848 square feet (26.2% of net rentable area) and eight, one-story retail buildings totaling 98,176 square feet (73.8% of net rentable area). The Lincolnshire Commons Property contains 829 parking spaces, resulting in a parking ratio of 6.2 spaces per 1,000 square feet of rentable area. As of July 12, 2017 the Lincolnshire Commons Property was 91.1% leased to 20 tenants.
The largest tenant at the Lincolnshire Commons Property is NorthShore University HealthSystem, IL (“NSUH”) (rated Aa2 by Moody’s), which represents approximately 26.2% of the net rentable area and 25.4% of the underwritten base rent and is the only office tenant in the center. Headquartered in Evanston, Illinois, NSUH is a healthcare delivery system serving the Chicago region. The NSUH system includes four hospitals, operating as the principal teaching affiliate for the University of Chicago Pritzker School of Medicine, has annual revenues of $1.9 billion, employs approximately 10,000 people and has approximately 2,100 affiliated physicians. NSUH’s office space at the Lincolnshire Commons Property is utilized for various services including orthopedics, hand therapy, immediate care, neurological, and rehab services. NSUH invested approximately $7.0 million ($201 per square foot) into their space.
The second largest tenant at the Lincolnshire Commons Property is DSW, which represents approximately 10.8% of the net rentable area and is currently paying 4.0% of gross sales as a result of a previous anchor (Barnes and Noble) going dark in January 2016. No base rent was underwritten for the DSW space. The third largest tenant at the Lincolnshire Commons Property is Cheesecake Factory, which represents approximately 7.7% of the net rentable area and 11.1% of the underwritten base rent and is an original tenant since 2005. Aside from the aforementioned tenants, no tenant at Lincolnshire Commons Property comprises more than 6.0% of the net rentable area or 8.8% of the underwritten base rent. Approximately 45.1% of the net rentable area at the Lincolnshire Commons Property has been in occupancy for over 10 years, and nine tenants accounting for 49.9% of the net rentable area have signed new or renewal leases since July 2016.
THE INFORMATION IN THIS STRUCTURAL AND COLLATERAL TERM SHEET IS NOT COMPLETE AND MAY BE AMENDED PRIOR TO THE TIME OF SALE. THIS TERM SHEET IS NOT AN OFFER TO SELL THESE SECURITIES AND IT IS NOT A SOLICITATION OF AN OFFER TO BUY THESE SECURITIES IN ANY JURISDICTION WHERE THE OFFER OR SALE IS NOT PERMITTED.
123
| LINCOLNSHIRE COMMONS |
The following table presents certain information relating to the tenancy at the Lincolnshire Commons Property:
Major Tenants(1)
| Tenant Name | Credit Rating Moody’s/ S&P)(2) | Tenant NRSF | % of NRSF | Annual U/W Base Rent PSF | Annual U/W Base Rent | % of Total Annual U/W Base Rent | Sales PSF(3) | Occupancy Cost(3) | Lease Expiration Date |
| Major Tenants | |||||||||
| NSUH(4) | NR/Aa2/NR | 34,848 | 26.2% | $26.89 | $936,997 | 25.4% | NAV | NAV | 9/30/2031(5) |
| Cheesecake Factory | NR/NR/NR | 10,231 | 7.7% | $40.00 | $409,240 | 11.1% | $753 | 6.2% | 1/31/2026 |
| Fifth Third Bank | A/Baa1/BBB+ | 4,130 | 3.1% | $78.97 | $326,144 | 8.8% | NAV | NAV | 1/31/2021 |
| Kona Sushi, Inc. | NR/NR/NR | 6,850 | 5.1% | $45.00 | $308,250 | 8.4% | $500 | 10.3% | 1/31/2022 |
| Talbots Inc. | NR/B2/B- | 6,228 | 4.7% | $34.00 | $211,752 | 5.7% | $164 | 24.6% | 1/31/2019 |
| Chico’s | NR/NR/NR | 4,480 | 3.4% | $43.00 | $192,640 | 5.2% | $373 | 11.5% | 12/31/2021 |
| OSI/Fleming’s LLC | NR/Ba2/BB | 8,005 | 6.0% | $23.30 | $186,506 | 5.1% | $412 | 7.2% | 12/31/2020 |
| White House|Black Market | NR/NR/NR | 3,426 | 2.6% | $43.00 | $147,318 | 4.0% | $434 | 9.9% | 12/31/2021 |
| Marigold Maison Indian Cuisine | NR/NR/NR | 3,472 | 2.6% | $42.00 | $145,824 | 4.0% | NAV | NAV | 3/31/2027 |
| Noodles & Company | NR/NR/NR | 2,453 | 1.8% | $45.00 | $110,385 | 3.0% | $387 | 13.3% | 6/30/2021 |
| Total Major Tenants | 84,123 | 63.2% | $35.37 | $2,975,056 | 80.7% | ||||
| Total Other Tenants | 37,006 | 27.8% | $19.24(6) | $711,895 | 19.3% | ||||
| Occupied Collateral Total | 121,129 | 91.1% | $30.44(6) | $3,686,951 | 100.0% | ||||
| Vacant Space | 11,895 | 8.9% | |||||||
| Collateral Total | 133,024 | 100.0% | |||||||
| (1) | Information based on the underwritten rent roll. |
| (2) | Certain ratings are those of the parent company whether or not the parent guarantees the lease. |
| (3) | Sales PSF and Occupancy Cost are for the trailing 12-month period ending December 31, 2016. |
| (4) | NSUH’s Annual U/W Base Rent and Annual U/W Base Rent PSF represent the tenant’s average rent over the term of the Lincolnshire Commons Mortgage Loan. As of July 12, 2017, NSUH’s current rental rate is $24.00 per square foot. |
| (5) | NSUH has three, five-year lease extension options. |
| (6) | Includes 14,404 square footage attributed to DSW, which has no attributed underwritten base rent as the tenant is currently paying percentage rent in lieu of base rent (see “Cash Flow Analysis” section). The Other Tenants Annual U/W Base Rent PSF and Occupied Collateral Total Annual U/W Base Rent PSF excluding this square footage are $31.50 per square foot and $34.55 per square foot, respectively. |
The following table presents certain information relating to the lease rollover schedule at the Lincolnshire Commons Property:
Lease Expiration Schedule(1)
| Year Ending December 31, | No. of Leases Expiring | Expiring NRSF | % of Total NRSF | Cumulative Expiring NRSF | Cumulative % of Total NRSF | Annual U/W Base Rent | % of Total Annual U/W Base Rent | Annual U/W Base Rent PSF(2) |
| 2017 | 1 | 2,340 | 1.8% | 2,340 | 1.8% | $93,600 | 2.5% | $40.00 |
| 2018 | 0 | 0 | 0.0% | 2,340 | 1.8% | $0 | 0.0% | $0.00 |
| 2019 | 2 | 10,551 | 7.9% | 12,891 | 9.7% | $319,827 | 8.7% | $30.31 |
| 2020 | 2 | 11,215 | 8.4% | 24,106 | 18.1% | $227,434 | 6.2% | $20.28 |
| 2021 | 5 | 16,221 | 12.2% | 40,327 | 30.3% | $857,025 | 23.2% | $52.83 |
| 2022 | 1 | 6,850 | 5.1% | 47,177 | 35.5% | $308,250 | 8.4% | $45.00 |
| 2023(3) | 1 | 14,404 | 10.8% | 61,581 | 46.3% | $0 | 0.0% | $0.00 |
| 2024 | 2 | 5,183 | 3.9% | 66,764 | 50.2% | $205,448 | 5.6% | $39.64 |
| 2025 | 2 | 4,335 | 3.3% | 71,099 | 53.4% | $135,431 | 3.7% | $31.24 |
| 2026 | 2 | 11,710 | 8.8% | 82,809 | 62.3% | $457,115 | 12.4% | $39.04 |
| 2027 | 1 | 3,472 | 2.6% | 86,281 | 64.9% | $145,824 | 4.0% | $42.00 |
| Thereafter | 1 | 34,848 | 26.2% | 121,129 | 91.1% | $936,997 | 25.4% | $26.89 |
| Vacant | 0 | 11,895 | 8.9% | 133,024 | 100.0% | $0 | 0.0% | $0.00 |
| Total/Weighted Average(3) | 20 | 133,024 | 100.0% | $3,686,951 | 100.0% | $30.44 |
| (1) | Information obtained from the underwritten rent roll. |
| (2) | Weighted Average Annual U/W Base Rent PSF excludes vacant space. |
| (3) | Includes 14,404 square footage attributed to DSW Shoe Warehouse (“DSW”), which has no attributed underwritten base rent as the tenant is currently paying percentage rent in lieu of base rent (see “Cash Flow Analysis” section). |
THE INFORMATION IN THIS STRUCTURAL AND COLLATERAL TERM SHEET IS NOT COMPLETE AND MAY BE AMENDED PRIOR TO THE TIME OF SALE. THIS TERM SHEET IS NOT AN OFFER TO SELL THESE SECURITIES AND IT IS NOT A SOLICITATION OF AN OFFER TO BUY THESE SECURITIES IN ANY JURISDICTION WHERE THE OFFER OR SALE IS NOT PERMITTED.
124
| LINCOLNSHIRE COMMONS |
The following table presents historical occupancy percentages at the Lincolnshire Commons Property:
Historical Occupancy
1/1/2015(1)(2) | 1/1/2016(2) | 1/1/2017(2) | 7/12/2017(3) |
| 93.8% | 92.2% | 90.5% | 91.1% |
| (1) | The Lincolnshire Commons Mortgage Loan represents acquisition financing. As such, historical occupancy prior to January 1, 2015 is not available. |
| (2) | Information obtained the borrower sponsor. |
| (3) | Information obtained from the underwritten rent roll. |
Operating History and Underwritten Net Cash Flow. The following table presents certain information relating to the historical operating performance and the underwritten net cash flow at the Lincolnshire Commons Property:
Cash Flow Analysis
| Annualized 4 – December 2014(1) | 2015 | 2016(2) | TTM 4/30/2017(2) | U/W(2) | % of U/W Effective Gross Income | U/W $ per SF | |
| Base Rent | $3,598,473 | $3,350,632 | $2,088,385 | $2,637,523 | $3,686,951 | 78.2% | $27.72 |
| Grossed Up Vacant Space | 0 | 0 | 0 | 0 | 267,398 | 5.7 | 2.01 |
| Percentage Rent(3) | 0 | 0 | 270,886 | 229,552 | 110,000 | 2.3 | 0.83 |
| Total Reimbursables | 787,695 | 848,240 | 678,184 | 767,078 | 883,942 | 18.7 | 6.64 |
| Other Income | 15,366 | 15,491 | 12,927 | 34,717 | 34,717 | 0.7 | 0.26 |
| Less Vacancy & Credit Loss | 0 | 0 | 0 | 0 | (267,398)(4) | (5.7) | (2.01) |
| Effective Gross Income | $4,401,534 | $4,214,363 | $3,050,382 | $3,668,870 | $4,715,610 | 100% | $35.45 |
| Total Operating Expenses | $959,364 | $913,860 | $887,632 | $919,031 | $ 921,885 | 19.5% | $6.93 |
| Net Operating Income | $ 3,442,170 | $3,300,503 | $2,162,750 | $2,749,839 | $3,793,726 | 80.5% | $28.52 |
| TI/LC | 0 | 0 | 0 | 0 | 167,209 | 3.5 | 1.26 |
| Capital Expenditures | 0 | 0 | 0 | 0 | 27,985 | 0.6 | 0.21 |
| Net Cash Flow | $ 3,442,170 | $3,300,503 | $2,162,750 | $2,749,839 | $3,598,532 | 76.3% | $27.05 |
| NOI DSCR | 1.31x | 1.25x | 0.82x | 1.04x | 1.44x | ||
| NCF DSCR | 1.31x | 1.25x | 0.82x | 1.04x | 1.37x | ||
| NOI DY | 7.9% | 7.6% | 5.0% | 6.3% | 8.7% | ||
| NCF DY | 7.9% | 7.6% | 5.0% | 6.3% | 8.3% |
| (1) | The Lincolnshire Commons Mortgage Loan represents acquisition financing. As such, a full calendar year’s operating statement for 2014 is not available. |
| (2) | The decrease in Net Operating Income in 2016 and subsequent increase to U/W is a result of the previous retail anchor (Barnes and Noble) which went dark in January 2016 and triggered several co-tenancy clauses causing some tenants at the Lincolnshire Commons Property to pay percentage rent in lieu of base rent. The sponsor leased the former Barnes and Noble space to NSUH and all co-tenancy clauses have been resolved and the tenants are currently paying full base rent, except for DSW. NSUH’s lease commenced September 2016. |
| (3) | U/W Percentage Rent represents percentage rent in lieu of base rent for DSW, which has a lease expiration of January 31, 2023 and is currently paying 4.0% of gross sales as a result of a previous anchor (Barnes and Noble) going dark in January 2016. U/W Percentage Rent for DSW is estimated based on the 2016 gross sales and no Base Rent was underwritten for the DSW space. |
| (4) | The underwritten economic vacancy is 6.8%. As of July 12, 2017, the Lincolnshire Commons Property was 91.1% physically occupied by 20 tenants. |
Appraisal.As of the appraisal valuation date of June 2, 2017, the Lincolnshire Commons Property had an “as-is” appraised value of $58,300,000.
Environmental Matters. According to the Phase I environmental site assessment dated June 7, 2017, there are no recognized environmental conditions at the Lincolnshire Commons Property.
Market Overview and Competition.The Lincolnshire Commons Property is located at the intersection of Milwaukee Avenue and Aptakisic Road in Lincolnshire, Illinois. The Lincolnshire Commons Property benefits from its location with 178,403 daytime employees within a 5-mile radius exposure to over 65,000 vehicles per day passing the intersection of Milwaukee Avenue and Aptakisic Road. Complementary demand drivers, such as the Regal 14 Cinema and IMAX adjacent to the Lincolnshire Commons Property and the presence of 14 Fortune 500 companies within a 10-mile radius provides the Lincolnshire Commons Property help fuel consumer traffic in the immediate area. Additionally, directly across Milwaukee Avenue is a retirement community, which houses over 600 residents and over 350 daytime employees. According to the appraisal, the estimated 2016 population within a three- and five-mile radius of the Lincolnshire Commons Property was 58,396 and 174,702, respectively, and average household income within the same radii was $144,653 and $132,754, respectively.
According to a third party market research report, the Lincolnshire Commons Property is located within the Central North submarket of the Chicago retail market. As of the second quarter of 2017, the submarket reported a total inventory of 1,209 properties totaling approximately 23.4 million square feet with a 7.5% vacancy rate and year to date net absorption of 18,500 square feet. The appraiser concluded to market rents for the Lincolnshire Commons Property of $20.00 per square foot for the junior anchor space and $30.00 to $40.00 per square foot for inline space depending on the location within the center, all on a triple net basis. The Lincolnshire Commons Property is located within the Central North submarket of the Chicago office market. As of the second quarter of 2017, the class B submarket reported a total inventory of 421 properties totaling approximately 16.9 million square feet with a 8.0% vacancy rate. The appraiser concluded to market rents for the Lincolnshire Commons Property of $24.00 per square foot triple net for the office space.
THE INFORMATION IN THIS STRUCTURAL AND COLLATERAL TERM SHEET IS NOT COMPLETE AND MAY BE AMENDED PRIOR TO THE TIME OF SALE. THIS TERM SHEET IS NOT AN OFFER TO SELL THESE SECURITIES AND IT IS NOT A SOLICITATION OF AN OFFER TO BUY THESE SECURITIES IN ANY JURISDICTION WHERE THE OFFER OR SALE IS NOT PERMITTED.
125
| LINCOLNSHIRE COMMONS |
The following table presents certain information relating to comparable properties to the Lincolnshire Commons Property:
Comparable Retail Leases(1)
| Property Name/Location | Year Built/ Renovated | Total GLA (SF) | Distance from Subject | Tenant Name | Lease Date / Term | Lease Area (SF) | Annual Base Rent PSF | Lease Type |
Lincolnshire Commons Lincolnshire, IL
| 2005/2016 | 133,024 | -- | Cheesecake Factory | November 2005 / 20.2 Years
| 10,231 | $40.00 | NNN |
100 W. Rand Road Mount Prospect, IL
| 2016/NAP | 4,908 | 7.1 Miles | Potbelly | October 2016 / 10.0 Years
| 2,308 | $40.00 | NNN |
Westlake Plaza, Wilmette, IL
| 1963/NAP | 42,216 | 11.4 Miles | Sleepy’s | October 2016 / 10.0 Years
| 3,518 | $37.50 | NNN |
Panera Bread Skokie, IL
| 2016/NAP | 4,300 | 14.5 Miles | Panera Bread | October 2016 / 15.0 Years
| 4,300 | $40.00 | Absolute Net |
SWC Skokie Blvd and Gross Point Road Skokie, IL
| 2016/NAP | 5,200 | 13.2 Miles | Sleepy’s | April 2016 / 10.0 Years
| 4,000 | $45.00 | NNN |
955 Rockland Road Lake Bluff, IL
| 2015/NAP | 11,193 | 7.1 Miles | Sport Clips | November 2015 / 10.0 Years
| 1,324 | $34.00 | NNN |
Marketplace South Vernon Hills, IL
| 2010/NAP | 8,364 | 3.4 Miles | Sweet Lorraine Fabulous Mac & Cheese | October 2015 / 5.0 Years
| 1,864 | $39.00 | NNN |
| (1) | Information obtained from the appraisal and underwritten rent roll. |
The following table presents certain information relating to comparable properties to the Lincolnshire Commons Property:
Comparable Office Leases(1)
| Property Name/Location | Year Built/ Renovated | Total GLA (SF) | Distance from Subject | Tenant Name | Lease Date / Term | Lease Area (SF) | Annual Base Rent PSF | Lease Type |
Lincolnshire Commons Lincolnshire, IL
| 2005/2016 | 133,024 | -- | NSUH | September 2016 / 15.0 Years
| 34,848 | $24.00(2) | NNN |
Prairie Glen Medical Glenview, IL
| 2002/NAP | 74,200 | 8.1 Miles | Pathways Pediatric Therapy Clinic | November 2017 / 5.0 Years
| 15,321 | $26.00 | NNN |
555 Wilson Lane, Des Plaines, IL
| 1953/2016 | 85,000 | 10.1 Miles | Chicago Behavioral | July 2016 / 20.0 Years
| 85,000 | $22.35 | NNN |
| Corporate 520 Center Deerfield, IL | 1986/NAP | 186,857 | 4.8 Miles | Surgical Care Affiliates | June 2016 / 10.8 Years
| 28,410 | $20.50 | NNN |
| 1630 Gateway Drive Sycamore, IL | 2015/NAP | 36,100 | 42.9 Miles | Hauser-Ross Eye Institute | May 2015
/ 20.0 Years
| 36,100 | $26.59 | NNN |
| (1) | Information obtained from the appraisal and underwritten rent roll. |
| (2) | NSUH’s Annual U/W Base Rent of $26.89 PSF represents the tenant’s average rent over the term of the Lincolnshire Commons Mortgage Loan. As of July 12, 2017, NSUH’s current rental rate is $24.00 per square foot. |
The Borrower.The borrower is Lincolnshire Propco, LLC, a Delaware limited liability company and single purpose entity with one independent director. Legal counsel to the borrower delivered a non-consolidation opinion in connection with the origination of the Lincolnshire Commons Mortgage Loan. Andrew S. Hochberg and Marc J. Blum are the guarantors of certain nonrecourse carveouts under the Lincolnshire Commons Mortgage Loan.
The Borrower Sponsors.The borrower sponsors are Andrew S. Hochberg and Marc J. Blum. Mr. Hochberg is the founder and Chief Executive Officer of Next Realty, LLC (“Next”), and Mr. Blum is the president and Chief Operating Officer of Next. Headquartered in Skokie, Illinois, approximately 16.9 miles from the Lincolnshire Commons Property, Next is a privately held, commercial real estate investment firm focused on retail and parking investment opportunities. Next has made over 60 investments nationwide, representing approximately $500.0 million in total asset value and has a current portfolio consisting of approximately 1.0 million square feet of retail space and more than 1,800 parking spaces nationwide.
THE INFORMATION IN THIS STRUCTURAL AND COLLATERAL TERM SHEET IS NOT COMPLETE AND MAY BE AMENDED PRIOR TO THE TIME OF SALE. THIS TERM SHEET IS NOT AN OFFER TO SELL THESE SECURITIES AND IT IS NOT A SOLICITATION OF AN OFFER TO BUY THESE SECURITIES IN ANY JURISDICTION WHERE THE OFFER OR SALE IS NOT PERMITTED.
126
| LINCOLNSHIRE COMMONS |
Escrows. The loan documents provide for upfront reserves in the amount of $152,381 for real estate taxes, $330,677 for rent concession reserves related to DSW Shoe Warehouse and $1,412,951 for outstanding TI/LC obligations, of which $1,276,477 is related to NSUH and $136,474 is related to Marigold Madison Indian Cuisine. The loan documents provide for ongoing monthly escrows of $41,025 for real estate taxes, $2,332 for replacement reserves (subject to a $100,000 cap) and $13,857 for general TI/LCs (subject to a $500,000 cap).
The Lincolnshire Commons Mortgage Loan does not require ongoing monthly escrows for insurance premiums so long as (i) no event of default; (ii) insurance requirements are being satisfied by a blanket policy acceptable to the lender; and (iii) the borrower provides the lender with evidence of renewal of the policies and timely proof of payment of the insurance premiums. Additional ongoing real estate tax escrows related to the NSUH space are not required so long as (i) no event of default has occurred and is continuing; (ii) the NSUH space is a separate tax parcel; (iii) NSUH is obligated to pay and is paying real estate taxes directly; (iv) the NSUH lease is in full force and effect with no defaults thereunder; (v) NSUH is not rated below investment grade by either S&P, Moody’s, Fitch, DBRS, Kroll and Morningstar; and (vi) the borrower provides the lender with timely proof of payments of such NSUH real estate taxes prior to delinquency. Additional ongoing replacement reserve escrows beyond the $100,000 cap are not required as long as (i) no event of default has occurred and is continuing and (ii) the lender determines that the borrower is properly maintaining the Lincolnshire Commons Property.
Lockbox and Cash Management.Upon the occurrence and during the continuance of a Cash Trap Event Period (as defined below), the Lincolnshire Commons Mortgage Loan documents requires that the borrower establish a lockbox account and the borrowers or property manager is required to deposit all rents into such lockbox account and such funds will be swept to the cash management account. During a Cash Trap Event Period, all excess cash flow after payment of all sums due and payable under the Lincolnshire Commons Mortgage Loan documents and all operating expenses will be retained by the lender as additional collateral.
A “Cash Trap Event Period” will commence upon the earlier of (i) the occurrence and continuance of an event of default; (ii) the debt service coverage ratio being less than 1.10x at the end of any calendar quarter; (iii) the date upon which NSUH files, as a debtor, a bankruptcy or similar insolvency proceeding, or otherwise becomes involved, as a debtor, in a bankruptcy or any similar insolvency proceeding (unless, within 15 business days of receipt of notice of the occurrence of any of the aforementioned events described in this subsection (iii), the borrower making the NSUH Trigger Avoidance Deposit (as defined below), in which case, no Cash Trap Event Period shall be deemed to have occurred in connection with such event). A Cash Trap Event Period will end, with respect to clause (i), upon the cure of such event of default; with respect to clause (ii), upon the debt service coverage ratio being equal to or greater than 1.25x for a calendar quarter; or with respect to clause (iii), upon (A) the occurrence of a NSUH Re-Tenanting Event (as defined below) or (B) the bankruptcy or insolvency proceeding having terminated and NSUH having emerged therefrom in good standing and the NSUH lease having been affirmed on the same terms as the terms of such NSUH lease prior to the occurrence of such bankruptcy or insolvency proceeding.
An “NSUH Trigger Avoidance Deposit” shall mean that the borrower has deposited with the lender an amount equal to 12 months of projected excess cash flow (as determined by the lender in its sole discretion) in the form of cash or an acceptable letter of credit.
An “NSUH Re-Tenanting Event” shall mean that the lender has received satisfactory evidence that the NSUH space (either in its entirety or, if the debt service coverage ratio is then equal to or greater than 1.25x, in part) has been leased to one or more satisfactory replacement tenants that have taken occupancy of the applicable space, are conducting normal business operations in such space and are then paying full, unabated rent pursuant to the terms of a lease reasonably satisfactory to the lender under which all tenant improvement costs and leasing commissions have been paid or are adequately reserved for by the lender, such evidence to include, without limitation, a satisfactory estoppel from each such replacement tenant(s) affirming the foregoing.
Property Management.The Lincolnshire Commons Property is managed by an affiliate of the borrower.
Assumption.The borrower has a two-time right to transfer the Lincolnshire Commons Property, provided that no event of default has occurred and is continuing and certain other conditions are satisfied, including, but not limited to: (i) the lender’s reasonable determination that the proposed transferee and guarantor satisfy the lender’s credit review and underwriting standards, taking into consideration transferee experience, financial strength and general business standing; (ii) execution of a recourse guaranty and an environmental indemnity by an affiliate of the transferee; and (iii) if requested by the lender, rating agency confirmation from Fitch, Moody’s and KBRA that such assumption will not result in a downgrade, withdrawal or qualification of the respective ratings assigned to the Series 2017-C39 Certificates.
Partial Release.Not permitted.
Real Estate Substitution.Not permitted.
Subordinate and Mezzanine Indebtedness.Not permitted.
Ground Lease.None.
Terrorism insurance.The Lincolnshire Commons Mortgage Loan documents require that the “all risk” insurance policy required to be maintained by the borrower provide coverage for terrorism in an amount equal to the full replacement cost of the Lincolnshire Commons Property, as well as loss of rents and/or business interruption insurance for a period no less than 18 months following the occurrence of a casualty event together with a six-month extended period of indemnity.
THE INFORMATION IN THIS STRUCTURAL AND COLLATERAL TERM SHEET IS NOT COMPLETE AND MAY BE AMENDED PRIOR TO THE TIME OF SALE. THIS TERM SHEET IS NOT AN OFFER TO SELL THESE SECURITIES AND IT IS NOT A SOLICITATION OF AN OFFER TO BUY THESE SECURITIES IN ANY JURISDICTION WHERE THE OFFER OR SALE IS NOT PERMITTED.
127
| STARWOOD CAPITAL GROUP HOTEL PORTFOLIO |
THE INFORMATION IN THIS STRUCTURAL AND COLLATERAL TERM SHEET IS NOT COMPLETE AND MAY BE AMENDED PRIOR TO THE TIME OF SALE. THIS TERM SHEET IS NOT AN OFFER TO SELL THESE SECURITIES AND IT IS NOT A SOLICITATION OF AN OFFER TO BUY THESE SECURITIES IN ANY JURISDICTION WHERE THE OFFER OR SALE IS NOT PERMITTED.
128
| STARWOOD CAPITAL GROUP HOTEL PORTFOLIO |

THE INFORMATION IN THIS STRUCTURAL AND COLLATERAL TERM SHEET IS NOT COMPLETE AND MAY BE AMENDED PRIOR TO THE TIME OF SALE. THIS TERM SHEET IS NOT AN OFFER TO SELL THESE SECURITIES AND IT IS NOT A SOLICITATION OF AN OFFER TO BUY THESE SECURITIES IN ANY JURISDICTION WHERE THE OFFER OR SALE IS NOT PERMITTED.
129
| No. 10 – Starwood Capital Group Hotel Portfolio | ||||||
| Loan Information | Property Information | |||||
| Mortgage Loan Seller: | Barclays Bank PLC | Single Asset/Portfolio: | Portfolio | |||
| Credit Assessment | Property Type: | Hospitality | ||||
| (Fitch/KBRA/Moody’s): | NR/NR/NR | Specific Property Type: | Various – See Table | |||
| Original Principal Balance(1): | $40,000,000 | Location: | Various – See Table | |||
| Cut-off Date Balance(1): | $40,000,000 | Size: | 6,366 Rooms | |||
| % of Initial Pool Balance: | 3.5% | Cut-off Date Balance Per Room(1): | $90,680 | |||
| Loan Purpose: | Refinance | Year Built/Renovated: | Various – See Table | |||
| Borrowers(2): | Various | Title Vesting: | Fee / Leasehold | |||
| Borrower Sponsor: | Starwood Capital Group, L.P. | Property Manager(4): | Various | |||
| Mortgage Rate: | 4.4860% | 4thMost Recent Occupancy (As of): | 72.8% (12/31/2013) | |||
| Note Date: | May 24, 2017 | 3rdMost Recent Occupancy (As of): | 73.7% (12/31/2014) | |||
| Anticipated Repayment Date: | NAP | 2ndMost Recent Occupancy (As of): | 74.8% (12/31/2015) | |||
| Maturity Date: | June 1, 2027 | Most Recent Occupancy (As of): | 74.7% (12/31/2016) | |||
| IO Period: | 120 months | Current Occupancy (As of): | 74.6% (3/31/2017) | |||
| Loan Term (Original): | 120 months | |||||
| Seasoning: | 2 months | Underwriting and Financial Information: | ||||
| Amortization Term (Original): | NAP | 4thMost Recent NOI (As of): | $76,532,121 (12/31/2014) | |||
| Loan Amortization Type: | Interest-only, Balloon | 3rdMost Recent NOI (As of): | $82,590,153 (12/31/2015) | |||
| Interest Accrual Method: | Actual/360 | 2ndMost Recent NOI (As of): | $83,225,892 (12/31/2016) | |||
| Call Protection: | L(12),GRTR 1% or YM(105),O(3) | Most Recent NOI (As of): | $81,268,623 (TTM 3/31/2017) | |||
| Lockbox Type: | Soft/Springing Cash Management | |||||
| Additional Debt(1): | Yes | U/W Revenues: | $213,600,210 | |||
| Additional Debt Type(1): | Pari Passu; Future Mezzanine | U/W Expenses: | $133,537,987 | |||
| U/W NOI: | $80,062,224 | |||||
| Escrows and Reserves(3): | U/W NCF: | $71,329,392 | ||||
| U/W NOI DSCR(1): | 3.05x | |||||
| Type: | Initial | Monthly | Cap (If Any) | U/W NCF DSCR(1): | 2.72x | |
| Taxes | $0 | Springing | NAP | U/W NOI Debt Yield(1): | 13.9% | |
| Insurance | $0 | Springing | NAP | U/W NCF Debt Yield(1): | 12.4% | |
| FF&E | $0 | 4.0% of Rev. | NAP | As-Is Appraised Value(5): | $956,000,000 | |
| Larkspur Landing Capital Work: | $6,385,000 | NAP | NAP | As-Is Appraisal Valuation Date(5): | April 23, 2017 | |
| Capital Work: | $5,883,991 | Springing | NAP | Cut-off Date LTV Ratio(1)(5): | 60.4% | |
| Ground Rent: | $0 | Springing | NAP | LTV Ratio at Maturity(1)(5): | 60.4% | |
| (1) | See “The Mortgage Loan” section. All statistical financial information related to balances per room, loan-to-value ratios, debt service coverage ratios and debt yields are based on the SCG Hotel Portfolio Whole Loan (as defined below). |
| (2) | See “The Borrowers” section. |
| (3) | See “Escrows” section. |
| (4) | See “Property Management” section. |
| (5) | See “Appraisals” section. The As-Is Appraised Value reflects the “As Portfolio” value of $956,000,000 for the SCG Hotel Portfolio (as defined below) as a whole which includes an 8.1% premium to the aggregate “As-is” value of the individual SCG Hotel Portfolio Properties (as defined below). The sum of the “As-is” and “As-Renovated” values, as applicable, for each of the SCG Hotel Portfolio Properties on an individual basis is $889,200,000, which represents a Cut-off Date LTV Ratio and LTV Ratio at Maturity of 64.9%. Additionally, the aggregate “As-is” value for each of the SCG Hotel Portfolio Properties on an individual basis is $884,700,000 as of April 23, 2017, which results in a Cut-off Date LTV Ratio and LTV Ratio at Maturity of 65.3%. |
The Mortgage Loan.The mortgage loan (the “SCG Hotel Portfolio Mortgage Loan”) is part of a whole loan (the “SCG Hotel Portfolio Whole Loan”) that is evidenced by 21pari passu promissory notes secured by first mortgages encumbering the fee and leasehold interests in a hospitality portfolio which is comprised of 65 properties and 6,366 rooms located across 21 states throughout the continental United States (the “SCG Hotel Portfolio” or “SCG Hotel Portfolio Properties”). The SCG Hotel Portfolio Whole Loan was originated on May 24, 2017 by Barclays Bank PLC, Bank of America, N.A., Deutsche Bank AG, New York Branch and JPMorgan Chase Bank, National Association. The SCG Hotel Portfolio Whole Loan had an original principal balance of $577,270,000, has an outstanding principal balance as of the Cut-off Date of $577,270,000 and accrues interest at an interest rate of 4.4860%per annum. The SCG Hotel Portfolio Whole Loan had an initial term of 120 months, has a remaining term of 118 months as of the Cut-off Date and requires payments of interest only through the term of the SCG Hotel Portfolio Whole Loan. The SCG Hotel Portfolio Whole Loan matures on June 1, 2027.
Note A-6-1, which will be contributed to the WFCM 2017-C39 Trust, had an original principal balance of $40,000,000, has an outstanding principal balance as of the Cut-off Date of $40,000,000 and represents a non-controlling interest in the SCG Hotel Portfolio Whole Loan. The controlling Note A-1 and the non-controlling Note A-7, which had an aggregate original principal balance of $80,000,000, were contributed to the DBJPM 2017-C6 Trust. The non-controlling Note A-2-1 and Note A-16-1, which had an aggregate original principal balance of $60,000,000, were contributed to the JPMCC 2017-JP7 Trust. The non-controlling Note A-3, which had an original principal balance of $72,500,000, was contributed to the BANK 2017-BNK5 Trust. The non-controlling Note A-4, which had an original principal balance of $59,317,500, was contributed to the BANK 2017-BNK6 Trust. The non-controlling Note A-5, which had an original principal balance of $50,000,000, was contributed to the WFCM 2017-C38 Trust. The non-controlling Note
THE INFORMATION IN THIS STRUCTURAL AND COLLATERAL TERM SHEET IS NOT COMPLETE AND MAY BE AMENDED PRIOR TO THE TIME OF SALE. THIS TERM SHEET IS NOT AN OFFER TO SELL THESE SECURITIES AND IT IS NOT A SOLICITATION OF AN OFFER TO BUY THESE SECURITIES IN ANY JURISDICTION WHERE THE OFFER OR SALE IS NOT PERMITTED.
130
STARWOOD CAPITAL GROUP HOTEL PORTFOLIO |
A-8 and Note A-10, which had an aggregate original principal balance of $40,000,000, are expected to be contributed to the CD 2017-CD5 Trust. The non-controlling Note A-11, Note A-12 and Note A-13-2, which had an aggregate original principal balance of $37,500,000, are expected to be contributed to the UBS 2017-C2 Trust. The remaining non-controlling notes, which had an aggregate original principal balance of $137,952,500, are expected to be contributed to future securitization trusts (referred to herein collectively as the “SCG Hotel Portfolio Companion Loans”). The lender provides no assurances that any non-securitizedpari passu notes will not be split further. See “Description of the Mortgage Pool—The Whole Loans—The Non-Serviced Pari Passu Whole Loans” in the Preliminary Prospectus.
Note Summary(1)
| Notes | Original | Note Holder | Controlling Interest | |
| A-1; A-7 | $80,000,000 | DBJPM 2017-C6 | Yes(2) | |
| A-2-1; A-16-1 | $60,000,000 | JPMCC 2017-JP7 | No | |
| A-2-2; A-9; A-14 | $46,817,500 | JPMorgan Chase Bank, National Association | No | |
| A-3 | $72,500,000 | BANK 2017-BNK5 | No | |
| A-4 | $59,317,500 | BANK 2017-BNK6 | No | |
| A-5 | $50,000,000 | WFCM 2017-C38 | No | |
| A-6-1 | $40,000,000 | WFCM 2017-C39 | No | |
| A-6-2; A-17 | $41,817,500 | Barclays Bank PLC | No | |
| A-8; A-10 | $40,000,000 | CD 2017-CD5 (expected) | No | |
| A-11; A-12; A-13-2 | $37,500,000 | UBS 2017-C2 (expected) | No | |
| A-13-1 | $14,317,500 | Deutsche Bank AG, New York Branch | No | |
| A-15; A-16-2 | $35,000,000 | Starwood Mortgage Funding II LLC(3) | No | |
| Total | $577,270,000 |
| (1) | The lender provides no assurances that any non-securitizedpari passu note will not be split further. |
| (2) | Only the Note A-1, which had an original principal balance of $40,000,000, represents the controlling interest in the SCG Hotel Portfolio Whole Loan. |
| (3) | An affiliate of the borrower sponsor. |
Following the lockout period, the borrower has the right to prepay the SCG Hotel Portfolio Whole Loan in whole or in part (see “Partial Release” section), on any date before April 1, 2027, provided that the borrowers pay the greater of a yield maintenance premium or a prepayment premium equal to 1.0% of the principal amount being prepaid. In addition, the SCG Hotel Portfolio Whole Loan is prepayable without penalty on or after April 1, 2027.
Sources and Uses
| Sources | Uses | |||||||
| Original whole loan amount | $577,270,000 | 100.0% | Loan payoff | $425,033,863 | 73.6% | |||
| Reserves | 12,268,991 | 2.1 | ||||||
| Closing costs | 8,975,399 | 1.6 | ||||||
| Return of equity | 130,991,748 | 22.7 | ||||||
| Total Sources | $577,270,000 | 100.0% | Total Uses | $577,270,000 | 100.0% |
The Properties.The SCG Hotel Portfolio Whole Loan is secured by the fee simple and leasehold interests in the SCG Hotel Portfolio, which is comprised of 65 hospitality properties located across 21 states, totaling 6,366 rooms. The SCG Hotel Portfolio Properties offer a range of amenities, spanning the limited service, full service and extended stay hospitality sectors. The hotels range in size from 56 to 147 rooms with an average of 98 rooms. The SCG Hotel Portfolio benefits from geographic diversity, in addition to an overall granular property mix. None of the SCG Hotel Portfolio Properties account for more than 2.3% of total rooms or 5.8% of underwritten net cash flow on an individual basis. Further, the ten largest SCG Hotel Portfolio Properties based on allocated loan amount account for 19.4% of total rooms and 35.1% of underwritten net cash flow. All 65 SCG Hotel Portfolio Properties are operated pursuant to management agreements with one of Hersha (39 hotels), First Hospitality (nine hotels), TMI (nine hotels), Schulte (six hotels) or Pillar (two hotels) (each as defined below). The SCG Hotel Portfolio Properties range in age from seven to 42 years old with an average age of approximately 16 years, while 59.0% of the SCG Hotel Portfolio based on underwritten net cash flow has been renovated since 2012.
Approximately $84.8 million ($13,319 per room) of capital expenditures have been made since 2012 in order to update the SCG Hotel Portfolio Properties and maintain competitiveness within each property’s market. Going forward, the borrowers have budgeted for approximately $28.8 million ($4,519 per room) in capital expenditures through 2019, of which approximately $5.9 million ($924 per room) is related to brand mandated property improvement plans. On the origination date, the borrowers deposited approximately $5.9 million into escrow for capital expenditures related to brand mandated property improvement plans. Additionally, on the origination date, the borrowers deposited approximately $6.4 million ($5,000 per Larkspur Landing branded room) into escrow for any future capital work or FF&E associated with the 11 Larkspur Landing properties. The Larkspur Landing properties operate pursuant to licensing agreements with an affiliate of the borrower sponsor, which may be terminated upon 60 days’ notice, as further described below.
Historically, the SCG Hotel Portfolio as a whole has outperformed its competitive set with occupancy, ADR and RevPAR penetration rates each in excess of 100.0% for 2014 through the trailing 12-month period ending March 31, 2017. Additionally, on a granular level, the majority of the SCG Hotel Portfolio Properties have outperformed their respective competitive sets on an individual basis, with 80.1% of the SCG Hotel Portfolio Properties based on room count achieving a RevPAR penetration in excess of 100.0% for the
THE INFORMATION IN THIS STRUCTURAL AND COLLATERAL TERM SHEET IS NOT COMPLETE AND MAY BE AMENDED PRIOR TO THE TIME OF SALE. THIS TERM SHEET IS NOT AN OFFER TO SELL THESE SECURITIES AND IT IS NOT A SOLICITATION OF AN OFFER TO BUY THESE SECURITIES IN ANY JURISDICTION WHERE THE OFFER OR SALE IS NOT PERMITTED.
131
| STARWOOD CAPITAL GROUP HOTEL PORTFOLIO |
trailing 12-month period ending March 31, 2017. Further, dividing the SCG Hotel Portfolio Properties by property sub-type, the SCG Hotel Portfolio has outperformed across the limited service, extended stay and full service hospitality sectors.
The following table presents certain summary information relating to the SCG Hotel Portfolio Properties:
Portfolio Summary
| Property | City / State | Rooms | Year Built/ Renovated | Allocated Loan Amount | % of Total ALA | Appraised Value(1) | UW NCF | % of Total UW NCF | TTM Occ. | TTM RevPAR Penet.(2) |
| Larkspur Landing Sunnyvale(3) | Sunnyvale, CA | 126 | 2000 / NAP | $34,068,063 | 5.9% | $52,100,000 | $4,171,961 | 5.8% | 83.8% | 105.3% |
| Larkspur Landing Milpitas(3) | Milpitas, CA | 124 | 1998 / NAP | $28,706,103 | 5.0% | $43,900,000 | $3,562,157 | 5.0% | 85.7% | 111.6% |
| Larkspur Landing Campbell(3) | Campbell, CA | 117 | 2000 / NAP | $25,240,446 | 4.4% | $38,600,000 | $3,199,426 | 4.5% | 84.3% | 93.3% |
| Larkspur Landing San Francisco(3) | S. San Francisco, CA | 111 | 1999 / NAP | $20,793,943 | 3.6% | $31,800,000 | $2,426,585 | 3.4% | 84.9% | 83.6% |
| Larkspur Landing Pleasanton(3) | Pleasanton, CA | 124 | 1997 / NAP | $20,336,214 | 3.5% | $31,100,000 | $2,438,362 | 3.4% | 82.9% | 87.8% |
| Larkspur Landing Bellevue(3) | Bellevue, WA | 126 | 1998 / NAP | $18,112,963 | 3.1% | $27,700,000 | $2,173,526 | 3.0% | 78.8% | 108.6% |
| Larkspur Landing Sacramento(3) | Sacramento, CA | 124 | 1998 / NAP | $13,535,680 | 2.3% | $20,700,000 | $1,816,912 | 2.5% | 83.0% | 110.0% |
| Hampton Inn Ann Arbor North | Ann Arbor, MI | 129 | 1988 / 2015 | $13,208,731 | 2.3% | $20,200,000 | $1,836,126 | 2.6% | 73.9% | 123.7% |
| Larkspur Landing Hillsboro(3) | Hillsboro, OR | 124 | 1997 / NAP | $13,208,731 | 2.3% | $20,200,000 | $1,708,763 | 2.4% | 74.1% | 77.6% |
| Larkspur Landing Renton(3) | Renton, WA | 127 | 1998 / NAP | $13,077,951 | 2.3% | $20,000,000 | $1,694,132 | 2.4% | 80.3% | 103.3% |
| Holiday Inn Arlington NE Rangers Ballpark | Arlington, TX | 147 | 2008 / 2013 | $12,554,833 | 2.2% | $19,200,000 | $1,537,247 | 2.2% | 78.3% | 100.5% |
| Residence Inn Toledo Maumee | Maumee, OH | 108 | 2008 / 2016 | $12,424,054 | 2.2% | $19,000,000 | $1,468,871 | 2.1% | 81.7% | 142.7% |
| Residence Inn Williamsburg | Williamsburg, VA | 108 | 1999 / 2012 | $11,900,936 | 2.1% | $18,200,000 | $1,358,744 | 1.9% | 73.0% | 158.8% |
| Hampton Inn Suites Waco South | Waco, TX | 123 | 2008 / 2013 | $10,985,479 | 1.9% | $16,800,000 | $1,414,791 | 2.0% | 77.7% | 116.2% |
| Holiday Inn Louisville Airport Fair Expo | Louisville, KY | 106 | 2008 / NAP | $10,789,310 | 1.9% | $16,500,000 | $1,388,767 | 1.9% | 72.9% | 102.1% |
| Courtyard Tyler | Tyler, TX | 121 | 2010 / 2016 | $10,593,141 | 1.8% | $16,200,000 | $1,253,360 | 1.8% | 58.8% | 125.6% |
| Hilton Garden Inn Edison Raritan Center(4) | Edison, NJ | 132 | 2002 / 2014 | $10,593,141 | 1.8% | $16,200,000 | $1,317,397 | 1.8% | 78.1% | 135.7% |
| Hilton Garden Inn St. Paul Oakdale | Oakdale, MN | 116 | 2005 / 2013 | $10,462,361 | 1.8% | $16,000,000 | $1,689,847 | 2.4% | 80.0% | 141.9% |
| Residence Inn Grand Rapids West | Grandville, MI | 90 | 2000 / 2017 | $10,331,582 | 1.8% | $15,800,000 | $1,106,127 | 1.6% | 72.6% | 115.2% |
| Peoria, AZ Residence Inn | Peoria, AZ | 90 | 1998 / 2013 | $10,266,192 | 1.8% | $15,700,000 | $1,158,027 | 1.6% | 80.8% | 145.9% |
| Hampton Inn Suites Bloomington Normal | Normal, IL | 128 | 2007 / 2015 | $10,200,802 | 1.8% | $15,600,000 | $1,396,943 | 2.0% | 70.8% | 123.5% |
| Courtyard Chico | Chico, CA | 90 | 2005 / 2015 | $10,004,633 | 1.7% | $15,300,000 | $1,439,185 | 2.0% | 84.6% | 157.5% |
| Hampton Inn Suites Kokomo | Kokomo, IN | 105 | 1997 / 2013 | $9,677,684 | 1.7% | $14,800,000 | $1,255,566 | 1.8% | 77.9% | 158.5% |
| Hampton Inn Suites South Bend | South Bend, IN | 117 | 1997 / 2014 | $9,677,684 | 1.7% | $14,800,000 | $1,232,210 | 1.7% | 69.9% | 113.2% |
| Courtyard Wichita Falls | Wichita Falls, TX | 93 | 2009 / 2017 | $9,219,956 | 1.6% | $14,100,000 | $1,095,610 | 1.5% | 77.4% | 106.0% |
| Hampton Inn Morehead | Morehead City, NC | 118 | 1991 / 2017 | $8,958,397 | 1.6% | $13,700,000 | $1,094,065 | 1.5% | 66.6% | 139.7% |
| Residence Inn Chico | Chico, CA | 78 | 2005 / 2014 | $8,696,838 | 1.5% | $13,300,000 | $1,208,180 | 1.7% | 88.0% | 166.0% |
| Courtyard Lufkin | Lufkin, TX | 101 | 2009 / 2017 | $8,304,499 | 1.4% | $12,700,000 | $738,285 | 1.0% | 64.9% | 105.9% |
| Hampton Inn Carlisle | Carlisle, PA | 97 | 1997 / 2014 | $8,239,109 | 1.4% | $12,600,000 | $1,116,905 | 1.6% | 76.1% | 175.6% |
| Springhill Suites Williamsburg | Williamsburg, VA | 120 | 2002 / 2012 | $8,239,109 | 1.4% | $12,600,000 | $876,108 | 1.2% | 71.7% | 106.8% |
| Fairfield Inn Bloomington | Bloomington, IN | 105 | 1995 / 2015 | $8,173,720 | 1.4% | $12,500,000 | $1,271,230 | 1.8% | 87.1% | 106.3% |
| Waco Residence Inn | Waco, TX | 78 | 1997 / 2012 | $7,977,550 | 1.4% | $12,200,000 | $912,234 | 1.3% | 82.0% | 112.5% |
| Holiday Inn Express Fishers | Fishers, IN | 115 | 2000 / 2012 | $7,454,432 | 1.3% | $11,400,000 | $951,428 | 1.3% | 67.1% | 90.5% |
| Larkspur Landing Folsom(3) | Folsom, CA | 84 | 2000 / NAP | $7,258,263 | 1.3% | $11,100,000 | $858,864 | 1.2% | 86.4% | 98.1% |
| Springhill Suites Chi. Naperville Warrenville | Warrenville, IL | 128 | 1997 / 2013 | $6,865,924 | 1.2% | $10,500,000 | $667,822 | 0.9% | 67.1% | 96.1% |
| Holiday Inn Express & Suites Paris | Paris, TX | 84 | 2009 / NAP | $6,800,535 | 1.2% | $10,400,000 | $798,480 | 1.1% | 72.6% | 126.5% |
| Toledo Homewood Suites | Maumee, OH | 78 | 1997 / 2014 | $6,800,535 | 1.2% | $10,400,000 | $944,205 | 1.3% | 82.2% | 123.0% |
| Grand Rapids Homewood Suites | Grand Rapids, MI | 78 | 1997 / 2013 | $6,604,365 | 1.1% | $10,100,000 | $739,572 | 1.0% | 84.1% | 113.7% |
| Cheyenne Fairfield Inn & Suites | Cheyenne, WY | 60 | 1994 / 2013 | $6,146,637 | 1.1% | $9,400,000 | $753,591 | 1.1% | 74.6% | 117.6% |
| Fairfield Inn Laurel | Laurel, MD | 109 | 1988 / 2013 | $6,146,637 | 1.1% | $9,400,000 | $657,471 | 0.9% | 79.9% | 139.2% |
| Courtyard Akron Stow | Stow, OH | 101 | 2005 / 2014 | $6,015,858 | 1.0% | $9,200,000 | $886,115 | 1.2% | 65.9% | 98.4% |
| Larkspur Landing Roseville(3) | Roseville, CA | 90 | 1999 / NAP | $5,688,909 | 1.0% | $8,700,000 | $786,149 | 1.1% | 79.5% | 96.9% |
| Towneplace Suites Bloomington | Bloomington, IN | 83 | 2000 / 2013 | $5,688,909 | 1.0% | $8,700,000 | $850,105 | 1.2% | 89.1% | 101.3% |
| Hampton Inn Danville | Danville, PA | 71 | 1998 / 2013 | $5,623,519 | 1.0% | $8,600,000 | $728,609 | 1.0% | 80.0% | 222.0% |
| Holiday Inn Norwich | Norwich, CT | 135 | 1975 / 2013 | $5,558,129 | 1.0% | $8,500,000 | $752,132 | 1.1% | 56.7% | 116.3% |
| Hampton Inn Suites Longview North | Longview, TX | 91 | 2008 / 2013 | $5,492,740 | 1.0% | $8,400,000 | $650,443 | 0.9% | 63.8% | 129.8% |
| Springhill Suites Peoria Westlake | Peoria, IL | 124 | 2000 / 2013 | $5,492,740 | 1.0% | $8,400,000 | $470,046 | 0.7% | 63.3% | 89.1% |
| Hampton Inn Suites Buda | Buda, TX | 74 | 2008 / NAP | $5,427,350 | 0.9% | $8,300,000 | $853,603 | 1.2% | 74.5% | 139.5% |
| Shawnee Hampton Inn | Shawnee, OK | 63 | 1996 / 2013 | $5,427,350 | 0.9% | $8,300,000 | $618,775 | 0.9% | 77.6% | 146.0% |
| Racine Fairfield Inn | Racine, WI | 62 | 1991 / 2016 | $5,296,570 | 0.9% | $8,100,000 | $603,823 | 0.8% | 68.6% | 154.1% |
| HI Selinsgrove Shamokin Dam | Shamokin Dam, PA | 75 | 1996 / 2013 | $5,165,791 | 0.9% | $7,900,000 | $687,279 | 1.0% | 75.6% | 184.0% |
| Holiday Inn Express & Suites Terrell | Terrell, TX | 68 | 2007 / 2013 | $4,904,232 | 0.8% | $7,500,000 | $605,485 | 0.8% | 84.0% | 183.4% |
| Westchase Homewood Suites | Houston, TX | 96 | 1998 / 2016 | $4,746,774 | 0.8% | $9,800,000 | $379,742 | 0.5% | 63.4% | 142.9% |
| HIE & Suites Tyler South | Tyler, TX | 88 | 2000 / 2015 | $4,708,062 | 0.8% | $7,200,000 | $599,880 | 0.8% | 65.9% | 132.5% |
| HIE & Suites Huntsville | Huntsville, TX | 87 | 2008 / 2013 | $4,511,893 | 0.8% | $6,900,000 | $689,387 | 1.0% | 65.5% | 243.3% |
| Hampton Inn Sweetwater | Sweetwater, TX | 72 | 2009 / NAP | $4,119,555 | 0.7% | $6,300,000 | $400,369 | 0.6% | 62.9% | 132.2% |
| Comfort Suites Buda Austin South | Buda, TX | 72 | 2009 / NAP | $3,465,657 | 0.6% | $5,300,000 | $541,569 | 0.8% | 76.8% | 109.7% |
| Fairfield Inn & Suites Weatherford | Weatherford, TX | 86 | 2009 / 2016 | $3,269,488 | 0.6% | $5,000,000 | $311,718 | 0.4% | 63.4% | 91.1% |
| Holiday Inn Express & Suites Altus | Altus, OK | 68 | 2008 / 2013 | $2,649,352 | 0.5% | $4,600,000 | $211,948 | 0.3% | 67.4% | 151.2% |
| Comfort Inn & Suites Paris | Paris, TX | 56 | 2009 / NAP | $2,354,031 | 0.4% | $3,600,000 | $251,060 | 0.4% | 67.4% | 146.2% |
| Hampton Inn Suites Decatur | Decatur, TX | 74 | 2008 / 2013 | $2,252,646 | 0.4% | $3,600,000 | $180,212 | 0.3% | 64.6% | 228.4% |
| Holiday Inn Express & Suites Texarkana E. | Texarkana, AR | 88 | 2009 / NAP | $2,086,036 | 0.4% | $4,100,000 | $166,883 | 0.2% | 66.5% | 100.5% |
| Mankato Fairfield Inn | Mankato, MN | 61 | 1997 / 2016 | $1,869,354 | 0.3% | $3,600,000 | $149,548 | 0.2% | 58.0% | 100.2% |
| Candlewood Suites Texarkana | Texarkana, TX | 80 | 2009 / 2014 | $1,445,301 | 0.3% | $2,600,000 | $115,624 | 0.2% | 75.0% | 110.1% |
| Country Inn & Suites Houston IC Airport | Humble, TX | 62 | 2001 / 2017 | $1,372,592 | 0.2% | $3,200,000 | $109,807 | 0.2% | 54.1% | 86.8% |
| Total/Weighted Average | 6,366 | $577,270,000 | 100.0% | $889,200,000 | $71,329,392 | 100.0% | 74.6 | 123.3% |
| (1) | Appraised Value reflects the “As-is” and “As-Renovated” values, as applicable, for each of the SCG Hotel Portfolio Properties, as of April 23, 2017. The aggregate “As-is” value for each of the SCG Hotel Portfolio Properties on an individual basis is $884,700,000, as of April 23, 2017. The appraisal also concluded an “As Portfolio” value of $956,000,000 for the SCG Hotel Portfolio as a whole which includes an 8.1% premium to the aggregate “As-is” value of the individual SCG Hotel Portfolio Properties. |
| (2) | TTM RevPAR Penetration is calculated based on operating statements provided by the borrowers as of March 31, 2017 and competitive set data provided by third party hospitality research reports. Weighted average figures are based on total room count. |
| (3) | The Larkspur Landing properties operate pursuant to a licensing agreement with an affiliate of the borrower sponsor. |
| (4) | The Hilton Garden Inn Edison Raritan Center property is subject to a ground lease, which commenced in September 2001 for a term of 75 years with current annual ground rent of $275,517. |
| (5) | The Country Inn & Suites Houston Intercontinental Airport East property was out of service from May 2016 through January 2017 due to flood damage. The related borrower utilized insurance proceeds of approximately $1.1 million to renovate the property and repair the flood damage, and the property has since re-opened. |
THE INFORMATION IN THIS STRUCTURAL AND COLLATERAL TERM SHEET IS NOT COMPLETE AND MAY BE AMENDED PRIOR TO THE TIME OF SALE. THIS TERM SHEET IS NOT AN OFFER TO SELL THESE SECURITIES AND IT IS NOT A SOLICITATION OF AN OFFER TO BUY THESE SECURITIES IN ANY JURISDICTION WHERE THE OFFER OR SALE IS NOT PERMITTED.
132
| STARWOOD CAPITAL GROUP HOTEL PORTFOLIO |
The following table presents a summary of the SCG Hotel Portfolio Properties by property subtype:
Portfolio Sub-Types
| Property Sub-Type | Properties | Rooms | % Total Rooms | UW NCF | % Total UW NCF | Appraised Value(1) | Appraised Value Per Room(1) | TTM RevPAR Penetration(2) |
| Extended Stay | 22 | 2,244 | 35.2% | $35,078,267 | 49.2% | $441,700,000 | $196,836 | 112.5% |
| Limited Service | 40 | 3,734 | 58.7% | $32,572,979 | 45.7% | $403,300,000 | $108,007 | 131.5% |
| Full Service | 3 | 388 | 6.1% | $3,678,146 | 5.2% | $44,200,000 | $113,918 | 106.4% |
| Total/Weighted | 65 | 6,366 | 100.0% | $71,329,392 | 100.0% | $956,000,000 | $150,173 | 123.3% |
| (1) | The Total Appraised Value reflects the “As Portfolio” value of $956,000,000 for the SCG Hotel Portfolio as a whole which includes an 8.1% premium to the aggregate “As-is” value of the individual SCG Hotel Portfolio Properties. The sum of the “As-is” and “As-Renovated” values, as applicable, for each of the SCG Hotel Portfolio Properties on an individual basis is $889,200,000, which represents an Appraised Value Per Room of $139,680. Additionally, the aggregate “As-is” value for each of the SCG Hotel Portfolio Properties on an individual basis is $884,700,000 as of April 23, 2017, which results in an Appraised Value Per Room of $138,973. |
| (2) | TTM RevPAR Penetration is calculated based on operating statements provided by the borrowers as of March 31, 2017 and competitive set data provided by third party hospitality research reports. Weighted average figures are based on total room count. |
The following table presents a summary of both historical and budgeted capital expenditures at the SCG Hotel Portfolio Properties:
Portfolio Historical and Budgeted Capital Expenditures(1)
| 2012 | 2013 | 2014 | 2015 | 2016 | 2017B | 2018B | 2019B | Total | |
| Total | $15,974,481 | $28,295,183 | $14,870,099 | $10,258,955 | $15,388,521 | $11,852,877 | $5,093,750 | $11,818,750 | $113,552,617 |
| Per Room | $2,509 | $4,445 | $2,336 | $1,612 | $2,417 | $1,862 | $800 | $1,857 | $17,837 |
| (1) | Information obtained from the borrowers. |
The following table presents a summary of the franchise agreement expiration dates of the SCG Hotel Portfolio Properties:
Franchise Expiration Schedule(1)
| Year Ending December 31, | No. of Franchise Agreements Expiring | Rooms | % of Total Rooms | Cumulative Rooms Expiring | Cumulative % of Total Rooms Expiring | UW NCF | % of Total UW NCF |
| 2017 | 0 | 0 | 0.0% | 0 | 0.0% | $0 | 0.0% |
| 2018 | 1 | 90 | 1.8% | 90 | 1.8% | $1,158,027 | 2.5% |
| 2019 | 3 | 337 | 6.6% | 427 | 8.4% | $2,892,322 | 6.2% |
| 2020 | 0 | 0 | 0.0% | 427 | 8.4% | $0 | 0.0% |
| 2021 | 1 | 62 | 1.2% | 489 | 9.6% | $603,823 | 1.3% |
| 2022 | 21 | 2,025 | 39.8% | 2,514 | 49.4% | $18,055,211 | 38.8% |
| 2023 | 0 | 0 | 0.0% | 2,514 | 49.4% | $0 | 0.0% |
| 2024 | 0 | 0 | 0.0% | 2,514 | 49.4% | $0 | 0.0% |
| 2025 | 4 | 378 | 7.4% | 2,892 | 56.8% | $4,634,247 | 10.0% |
| 2026 | 1 | 128 | 2.5% | 3,020 | 59.3% | $1,396,943 | 3.0% |
| 2027 | 2 | 140 | 2.8% | 3,160 | 62.1% | $1,022,042 | 2.2% |
| Thereafter | 21 | 1,929 | 37.9% | 5,089 | 100.0% | $16,729,941 | 36.0% |
| Total | 54 | 5,089 | 100.0% | $46,492,556 | 100.0% |
| (1) | The above Franchise Expiration Schedule is exclusive of the Larkspur Landing properties, which operate pursuant to a licensing agreement with an affiliate of the borrower sponsor. The Larkspur Landing brand/flag is owned by an affiliate of Starwood Capital Group, L.P. On the origination date, the borrowers deposited approximately $6.4 million into escrow for any future capital work or FF&E expenditures associated with the Larkspur Landing properties. |
The SCG Hotel Portfolio Properties benefit from strong brand and flag affiliations, as well as related customer loyalty programs. Approximately 60.2% based on room count and 53.0% based on underwritten net cash flow of the SCG Hotel Portfolio Properties are associated with Marriott or Hilton affiliated flags, providing the SCG Hotel Portfolio with institutional quality brand affiliations across the majority of the SCG Hotel Portfolio Properties. Approximately 20.1% based on room count and 34.8% by underwritten net cash flow of the SCG Hotel Portfolio Properties are associated with the Larkspur Landing brand, all of which are located in California, Washington and Oregon. Larkspur Landing is an upscale select service and extended stay brand, which has developed guest loyalty since the brand’s inception in 1997. The Larkspur Landing properties operate pursuant to a licensing agreement between the related operating companies (as licensee) and an affiliate of Starwood Capital Group, L.P. (as licensor), which effectively owns the licensing rights to the Larkspur Landing brand/flag. The Larkspur Landing licensing agreement for each individual Larkspur Landing property, as applicable, calls for an annual license fee in the amount of $10 and may be terminated upon 60 days’ notice by either the licensor or the licensee. Pursuant to the terms of the SCG Hotel Portfolio Whole Loan documents, the Larkspur Landing licensing agreements may not be terminated by the licensor during the term of the SCG Hotel Portfolio Whole Loan unless the related borrowers replace the Larkspur Landing flag with a qualified franchisor (as defined therein).
THE INFORMATION IN THIS STRUCTURAL AND COLLATERAL TERM SHEET IS NOT COMPLETE AND MAY BE AMENDED PRIOR TO THE TIME OF SALE. THIS TERM SHEET IS NOT AN OFFER TO SELL THESE SECURITIES AND IT IS NOT A SOLICITATION OF AN OFFER TO BUY THESE SECURITIES IN ANY JURISDICTION WHERE THE OFFER OR SALE IS NOT PERMITTED.
133
| STARWOOD CAPITAL GROUP HOTEL PORTFOLIO |
In the event of any franchise or license agreement expiration, termination or cancellation in violation of the loan documents, a full excess cash flow sweep will be triggered, as further described in “Lockbox and Cash Management” below. Additionally, there is a recourse carve-out for losses incurred or suffered by the lender arising out of or in connection with any material amendment, modification, expiration, cancellation or termination of any franchise or Larkspur Landing license agreement in violation of the SCG Hotel Portfolio Whole Loan documents without the prior written consent of the lender.
The SCG Hotel Portfolio Properties are operated under six brands and 14 flags, a summary of which is provided in the table below:
Portfolio Flags
| Brand | Properties | Rooms | % of Total Rooms | Allocated Loan Amount | Allocated Loan Amount Per Room | Appraised Value(1) | Cut-off Date LTV(1) | UW NCF | % of Total UW NCF |
| Larkspur Landing | |||||||||
| Larkspur Landing | 11 | 1,277 | 20.1% | $200,027,266 | $156,638 | $305,900,000 | 65.4% | $24,836,836 | 34.8% |
| Total Larkspur Landing | 11 | 1,277 | 20.1% | $200,027,266 | $156,638 | $305,900,000 | 65.4% | $24,836,836 | 34.8% |
| Marriott | |||||||||
| Residence Inn | 6 | 552 | 8.7% | $61,597,152 | $111,589 | $94,200,000 | 65.4% | $7,212,183 | 10.1% |
| Courtyard | 5 | 506 | 7.9% | $44,138,087 | $87,229 | $67,500,000 | 65.4% | $5,412,556 | 7.6% |
| Fairfield Inn & Suites | 6 | 483 | 7.6% | $30,902,406 | $63,980 | $48,000,000 | 64.4% | $3,747,382 | 5.3% |
| SpringHill Suites | 3 | 372 | 5.8% | $20,597,773 | $55,370 | $31,500,000 | 65.4% | $2,013,975 | 2.8% |
| TownePlace Suites | 1 | 83 | 1.3% | $5,688,909 | $68,541 | $8,700,000 | 65.4% | $850,105 | 1.2% |
| Total Marriot | 21 | 1,996 | 31.4% | $162,924,327 | $81,625 | $249,900,000 | 65.2% | $19,236,201 | 27.0% |
| Hilton | |||||||||
| Hampton Inn & Suites | 14 | 1,337 | 21.0% | $104,456,837 | $78,128 | $159,900,000 | 65.3% | $13,465,895 | 18.9% |
| Hilton Garden Inn | 2 | 248 | 3.9% | $21,055,502 | $84,901 | $32,200,000 | 65.4% | $3,007,244 | 4.2% |
| Homewood Suites | 3 | 252 | 4.0% | $18,151,674 | $72,030 | $30,300,000 | 59.9% | $2,063,519 | 2.9% |
| Total Hilton | 19 | 1,837 | 28.9% | $143,664,013 | $78,206 | $222,400,000 | 64.6% | $18,536,658 | 26.0% |
| IHG | |||||||||
| Holiday Inn Express | 7 | 598 | 9.4% | $33,114,542 | $55,375 | $52,100,000 | 63.6% | $4,023,491 | 5.6% |
| Holiday Inn | 3 | 388 | 6.1% | $28,902,272 | $74,490 | $44,200,000 | 65.4% | $3,678,146 | 5.2% |
| Candlewood Suites | 1 | 80 | 1.3% | $1,445,301 | $18,066 | $2,600,000 | 55.6% | $115,624 | 0.2% |
| Total IHG | 11 | 1,066 | 16.7% | $63,462,115 | $59,533 | $98,900,000 | 64.2% | $7,817,261 | 11.0% |
| Choice | |||||||||
| Comfort Inn | 2 | 128 | 2.0% | $5,819,688 | $45,466 | $8,900,000 | 65.4% | $792,628 | 1.1% |
| Total Choice | 2 | 128 | 2.0% | $5,819,688 | $45,466 | $8,900,000 | 65.4% | $792,628 | 1.1% |
| Carlson | |||||||||
| Country Inn & Suites | 1 | 62 | 1.0% | $1,372,592 | $22,139 | $3,200,000 | 42.9% | $109,807 | 0.2% |
| Total Carlson | 1 | 62 | 1.0% | $1,372,592 | $22,139 | $3,200,000 | 42.9% | $109,807 | 0.2% |
| Total/Weighted Average | 65 | 6,366 | 100.0% | $577,270,000 | $90,680 | $956,000,000 | 60.4% | $71,329,392 | 100.0% |
| (1) | The Total Appraised Value reflects the “As Portfolio” value of $956,000,000 for the SCG Hotel Portfolio as a whole which includes an 8.1% premium to the aggregate “As-is” value of the individual SCG Hotel Portfolio Properties. The sum of the “As-is” and “As-Renovated” values, as applicable, for each of the SCG Hotel Portfolio Properties on an individual basis is $889,200,000, which represents a Cut-off Date LTV of 64.9%. Additionally, the aggregate “As-is” value for each of the SCG Hotel Portfolio Properties on an individual basis is $884,700,000 as of April 23, 2017, which results in a Cut-off Date LTV of 65.3%. |
THE INFORMATION IN THIS STRUCTURAL AND COLLATERAL TERM SHEET IS NOT COMPLETE AND MAY BE AMENDED PRIOR TO THE TIME OF SALE. THIS TERM SHEET IS NOT AN OFFER TO SELL THESE SECURITIES AND IT IS NOT A SOLICITATION OF AN OFFER TO BUY THESE SECURITIES IN ANY JURISDICTION WHERE THE OFFER OR SALE IS NOT PERMITTED.
134
| STARWOOD CAPITAL GROUP HOTEL PORTFOLIO |
Operating History and Underwritten Net Cash Flow.The following table presents certain information relating to the historical operating performance and underwritten net cash flow of the SCG Hotel Portfolio:
Cash Flow Analysis
| 2014 | 2015 | 2016 | TTM 3/31/2017(1) | U/W | % of U/W Total Revenue | U/W $ per Room | |
| Occupancy | 73.7% | 74.8% | 74.7% | 74.6% | 74.6% | ||
| ADR | $112.28 | $116.76 | $119.48 | $119.07 | $118.83 | ||
| RevPAR | $82.80 | $87.29 | $89.23 | $88.81 | $88.68 | ||
| Room Revenue | $192,509,535 | $202,927,905 | $206,707,091 | $205,120,564 | $206,046,538 | 96.5% | $32,367 |
| F&B Revenue | 4,481,265 | 5,413,425 | 5,367,185 | 5,436,865 | 5,449,118 | 2.6 | 856 |
| Other Revenue | 2,518,145 | 1,839,946 | 2,161,754 | 2,093,187 | 2,104,554 | 1.0 | 331 |
| Total Revenue | $199,508,945
| $210,181,276
| $214,236,030
| $212,650,616
| $213,600,210
| 100.0%
| $33,553
|
| Total Departmental Expenses | 49,228,191 | 49,537,243 | 51,301,086 | 51,520,462 | 52,386,303 | 24.5 | 8,229 |
| Gross Operating Profit | $150,280,754
| $160,644,033
| $162,934,944
| $161,130,154
| $161,213,908
| 75.5%
| $25,324
|
| Total Undistributed Expenses | 56,768,412 | 60,404,169 | 61,876,151 | 62,127,172 | 62,263,971 | 29.1 | 9,781 |
| Profit Before Fixed Charges | $93,512,342
| $100,239,865
| $101,058,793
| $99,002,982
| $98,949,936
| 46.3%
| $15,544
|
| Total Fixed Charges | 16,980,221 | 17,649,712 | 17,832,901 | 17,734,359 | 18,887,712 | 8.8 | 2,967 |
|
|
|
|
|
|
| |
| Net Operating Income | $76,532,121 | $82,590,153 | $83,225,892 | $81,268,623 | $80,062,224 | 37.5% | $12,577 |
| FF&E | 7,980,358 | 8,583,513 | 8,756,495 | 8,693,699 | 8,732,831 | 4.1 | 1,372 |
| Net Cash Flow | $68,551,763
| $74,006,639
| $74,469,397
| $72,574,924
| $71,329,392
| 33.4%
| $11,205
|
| NOI DSCR(2) | 2.91x | 3.15x | 3.17x | 3.10x | 3.05x | ||
| NCF DSCR(2) | 2.61x | 2.82x | 2.84x | 2.76x | 2.72x | ||
| NOI DY(2) | 13.3% | 14.3% | 14.4% | 14.1% | 13.9% | ||
| NCF DY(2) | 11.9% | 12.8% | 12.9% | 12.6% | 12.4% | ||
| (1) | The Country Inn & Suites Houston Intercontinental Airport East property was out of service from May 2016 through January 2017 due to flood damage. The related borrower utilized insurance proceeds of approximately $1.1 million to renovate the property and repair the flood damage, and the property has since re-opened. |
| (2) | All statistical financial information related to debt service coverage ratios and debt yields is based on the SCG Hotel Portfolio Whole Loan. |
Appraisals.As of the appraisal valuation date of April 23, 2017, the SCG Hotel Portfolio Properties had an aggregate “As-is” appraised value of $884,700,000. The appraisal concluded “As-Renovated” values for nine of the SCG Hotel Portfolio Properties which assumes that all amounts required for outstanding capital improvements at such properties is deposited into escrow on the origination date of the SCG Hotel Portfolio Whole Loan. On the origination date, the related borrowers deposited $5,883,991 into escrow for, among other things, the outstanding capital improvements to the aforementioned nine SCG Hotel Portfolio Properties. The sum of the “As-is” and “As-Renovated” values, as applicable, for each of the SCG Hotel Portfolio Properties on an individual basis is $889,200,000. Additionally, the appraisal concluded an “As Portfolio” value of $956,000,000 which reflects an 8.1% premium attributable to the aggregate “As-is” value of the individual SCG Hotel Portfolio Properties.
Environmental Matters.According to Phase I environmental assessments with dates ranging from March 29, 2017 to April 28, 2017 (each an “ESA”), there was no evidence of any recognized environmental conditions at the SCG Hotel Portfolio Properties with the exception of the Hampton Inn Morehead and Hampton Inn Carlisle properties. With respect to the Hampton Inn Morehead property, the ESA recommended that certain surveys and limited subsurface investigation be conducted. With respect to the Hampton Inn Carlisle property, the ESA recommended that a regulatory file review be conducted. The related borrowers obtained an environmental insurance policy in lieu of any post-origination remediation work for the Hampton Inn Morehead and Hampton Inn Carlisle properties. The policy was issued by Great American E&S Insurance Company with individual and aggregate claim limits of $1,000,000 with a $25,000 deductible and an expiration date of May 24, 2030. The policy includes the lender as a named insured and was paid in full on the origination date. The SCG Hotel Portfolio Whole Loan documents require that any future environmental insurance policy include the same coverages, terms, conditions and endorsements as the lender environmental policy approved on the origination date (and may not be amended in without the prior written consent of the lender).
Market Overview and Competition.The SCG Hotel Portfolio Properties have broad exposure to the hospitality industry across the United States with properties located across 21 states and 55 cities, covering a broad geographical area with no individual state accounting for more than 16.8% of the SCG Hotel Portfolio’s total rooms or 30.7% of underwritten net cash flow. California represents the largest exposure to a single state, with 10 properties totaling 30.7% of underwritten net cash flow. No other state accounts for more than 18.8% of total underwritten net cash flow, which is represented by 20 properties located in Texas.
THE INFORMATION IN THIS STRUCTURAL AND COLLATERAL TERM SHEET IS NOT COMPLETE AND MAY BE AMENDED PRIOR TO THE TIME OF SALE. THIS TERM SHEET IS NOT AN OFFER TO SELL THESE SECURITIES AND IT IS NOT A SOLICITATION OF AN OFFER TO BUY THESE SECURITIES IN ANY JURISDICTION WHERE THE OFFER OR SALE IS NOT PERMITTED.
135
STARWOOD CAPITAL GROUP HOTEL PORTFOLIO |
The following table presents the geographic concentration of the SCG Hotel Portfolio Properties:
Portfolio Geographic Concentration
| State | Properties | Rooms | % of Total Rooms | TTM Occupancy(1) | TTM ADR(1) | TTM RevPAR(1) | TTM RevPAR Penetration(1) | UW NCF | % of Total UW NCF |
| California | 10 | 1,068 | 16.8% | 84.2% | $145.73 | $122.71 | 108.5% | $21,907,781 | 30.7% |
| Texas | 20 | 1,753 | 27.5% | 70.2% | $105.64 | $74.18 | 131.2% | $13,438,906 | 18.8% |
| Indiana | 5 | 525 | 8.2% | 77.4% | $107.72 | $83.34 | 114.0% | $5,560,538 | 7.8% |
| Washington | 2 | 253 | 4.0% | 79.6% | $122.62 | $97.56 | 105.9% | $3,867,658 | 5.4% |
| Michigan | 3 | 297 | 4.7% | 76.2% | $130.98 | $99.85 | 118.5% | $3,681,825 | 5.2% |
| Ohio | 3 | 287 | 4.5% | 76.3% | $121.84 | $92.95 | 121.8% | $3,299,191 | 4.6% |
| Illinois | 3 | 380 | 6.0% | 67.1% | $105.14 | $70.56 | 103.1% | $2,534,810 | 3.6% |
| Pennsylvania | 3 | 243 | 3.8% | 77.1% | $123.04 | $94.83 | 191.7% | $2,532,793 | 3.6% |
| Virginia | 2 | 228 | 3.6% | 72.3% | $119.08 | $86.15 | 131.4% | $2,234,852 | 3.1% |
| Minnesota | 2 | 177 | 2.8% | 72.4% | $122.88 | $88.92 | 127.6% | $1,839,395 | 2.6% |
| Oregon | 1 | 124 | 1.9% | 74.1% | $115.72 | $85.79 | 77.6% | $1,708,763 | 2.4% |
| Kentucky | 1 | 106 | 1.7% | 72.9% | $135.94 | $99.11 | 102.1% | $1,388,767 | 1.9% |
| New Jersey | 1 | 132 | 2.1% | 78.1% | $126.40 | $98.76 | 135.7% | $1,317,397 | 1.8% |
| Arizona | 1 | 90 | 1.4% | 80.8% | $120.72 | $97.54 | 145.9% | $1,158,027 | 1.6% |
| North Carolina | 1 | 118 | 1.9% | 66.6% | $108.23 | $72.10 | 139.7% | $1,094,065 | 1.5% |
| Oklahoma | 2 | 131 | 2.1% | 72.3% | $95.08 | $68.74 | 148.7% | $830,723 | 1.2% |
| Wyoming | 1 | 60 | 0.9% | 74.6% | $118.88 | $88.74 | 117.6% | $753,591 | 1.1% |
| Connecticut | 1 | 135 | 2.1% | 56.7% | $131.41 | $74.49 | 116.3% | $752,132 | 1.1% |
| Maryland | 1 | 109 | 1.7% | 79.9% | $97.48 | $77.87 | 139.2% | $657,471 | 0.9% |
| Wisconsin | 1 | 62 | 1.0% | 68.6% | $115.68 | $79.34 | 154.1% | $603,823 | 0.8% |
| Arkansas | 1 | 88 | 1.4% | 66.5% | $75.50 | $50.18 | 100.5% | $166,883 | 0.2% |
| Total/Weighted Average | 65 | 6,366 | 100.0% | 74.6% | $119.07 | $88.81 | 123.3% | $71,329,392 | 100.0% |
| (1) | TTM Occupancy, TTM ADR and TTM RevPAR are based on borrower-provided operating statements dated as of March 31, 2017 and weighted based on available rooms and occupied rooms, as applicable. TTM RevPAR Penetration is calculated based on operating statements provided by the borrowers and competitive set data provided by third party hospitality research reports, and is weighted based on total rooms. The minor variances between the underwriting, the hospitality research reports and the above table with respect to Occupancy, ADR and RevPAR at the SCG Hotel Portfolio Properties are attributable to variances in reporting methodologies and/or timing differences. |
The following table presents certain information relating to the SCG Hotel Portfolio’s competitive set:
Subject and Market Historical Occupancy, ADR and RevPAR(1)
Year | Competitive Set | SCG Hotel Portfolio | Penetration Factor | ||||||
Occupancy(2) | ADR(2) | RevPAR(2) | Occupancy(3) | ADR(3) | RevPAR(3) | Occupancy(4) | ADR(4) | RevPAR(4) | |
| 12/31/2014 | 66.0% | $103.25 | $67.56 | 73.7% | $112.28 | $82.80 | 111.7% | 108.7% | 122.6% |
| 12/31/2015 | 66.6% | $108.28 | $71.42 | 74.8% | $116.76 | $87.29 | 112.2% | 107.8% | 122.2% |
| 12/31/2016 | 65.9% | $110.28 | $71.95 | 74.7% | $119.48 | $89.23 | 113.4% | 108.3% | 124.0% |
| 3/31/2017 TTM | 65.9% | $110.31 | $72.05 | 74.6% | $119.07 | $88.81 | 113.1% | 107.9% | 123.3% |
| (1) | The variances between the underwriting, the hospitality research reports and the above table with respect to Occupancy, ADR and RevPAR for the SCG Hotel Portfolio are attributable to variances in reporting methodologies and/or timing differences. |
| (2) | Information obtained from third party hospitality research reports and weighted on available rooms and occupied rooms, as applicable. |
| (3) | Information obtained from the borrowers. |
| (4) | Penetration Factor figures are calculated based on operating statements provided by the borrowers and competitive set data provided by third party hospitality research reports. Portfolio level figures are weighted based on total room count. |
The Borrowers.The borrowers consist of 92 single purpose Delaware limited liability companies and 36 single purpose Delaware limited partnerships, each structured to be bankruptcy remote with two independent directors in its organizational structure. Legal counsel to the borrowers delivered a non-consolidation opinion in connection with the origination of the SCG Hotel Portfolio Whole Loan. SCG Hotel Investors Holdings, L.P. is the guarantor of certain nonrecourse carveouts under the SCG Hotel Portfolio Whole Loan. The liability of the guarantor under the non-recourse carveout provisions for breaches or violations related to bankruptcy or insolvency actions under the SCG Hotel Portfolio Whole Loan documents is capped at 20.0% of the outstanding principal balance of the SCG Hotel Portfolio Whole Loan at the time of the occurrence of such action plus reasonable third party costs and expenses actually incurred by the lender in connection with the enforcement of any rights under the guaranty or the SCG Hotel Portfolio Whole Loan documents. See “Description of the Mortgage Pool—Certain Terms of the Mortgage Loans—Non-Recourse Obligations” in the Preliminary Prospectus.
The Borrower Sponsor.The borrower sponsor of the SCG Hotel Portfolio Whole Loan is Starwood Capital Group, L.P. (“SCG”). SCG is a private alternative investment firm with a primary focus on global real estate. Since its inception in 1991, SCG has raised over $40 billion of equity capital and currently manages over $51 billion in assets. Over the past 26 years, SCG has acquired over $86.5 billion of assets across major real estate asset classes. SCG directly employs over 2,200 professionals and approximately 16,000 additional employees through various portfolio operating companies across offices in Atlanta, Chicago, Greenwich, Hong Kong, London, Los Angeles, Luxembourg, Miami, San Francisco and Washington D.C.
THE INFORMATION IN THIS STRUCTURAL AND COLLATERAL TERM SHEET IS NOT COMPLETE AND MAY BE AMENDED PRIOR TO THE TIME OF SALE. THIS TERM SHEET IS NOT AN OFFER TO SELL THESE SECURITIES AND IT IS NOT A SOLICITATION OF AN OFFER TO BUY THESE SECURITIES IN ANY JURISDICTION WHERE THE OFFER OR SALE IS NOT PERMITTED.
136
STARWOOD CAPITAL GROUP HOTEL PORTFOLIO |
Escrows.The SCG Hotel Portfolio Whole Loan documents provide for upfront escrows in the amount of $6,385,000 into a Larkspur Landing capital work reserve account to be used towards capital work and FF&E expenditures only at the Larkspur Landing properties and $5,883,991 into a general capital work reserve account to be used towards existing capital improvement and property improvement plan work as described in the SCG Hotel Portfolio Whole Loan documents.
The SCG Hotel Portfolio Whole Loan documents also provide for monthly escrows whereby upon the occurrence and during the continuance of a Trigger Period (as defined below), on a monthly basis, the borrowers are required to make deposits of (i) 1/12 of the required annual taxes, (ii) 1/12 of the annual insurance premiums if, among other things, (a) an acceptable blanket policy is no longer in place or (b) an event of default has occurred and is continuing and (iii) 1/12 of the ground rent that the lender reasonably estimates will be payable under the ground lease encumbering the Hilton Garden Inn Edison Raritan Center property.
Additionally, the SCG Hotel Portfolio Whole Loan documents provide that, on a monthly basis, regardless of whether a Trigger Period has occurred and is continuing, the borrowers are required to make deposits into an FF&E reserve equal to the greater of (a) 4.0% of gross revenue for the calendar month that is two months prior to the applicable payment date and (b) the amount required under the franchise agreement for FF&E work. For any future capital work required under any franchise agreement after the origination date of the SCG Hotel Portfolio Whole Loan, the borrowers are required to deposit into a future capital work reserve account an amount equal to (x) 100.0% of any future capital work required pursuant to a replacement franchise agreement mandated property improvement plan less (y) any amounts then on deposit in the FF&E reserve (provided that a capital work guaranty or a letter of credit may be provided by the guarantor in lieu of such deposit).
Lockbox and Cash Management.The SCG Hotel Portfolio Whole Loan requires a soft lockbox and springing cash management. At origination the borrowers were required to establish seven lender-controlled lockbox accounts. Prior to the occurrence of a Cash Management Trigger Period (as defined below), all sums payable to the borrowers under the related property management agreements, after the property managers have paid all amounts required to be paid under such agreements, are required to be deposited directly into the applicable lender-controlled lockbox account within two business days of receipt. Upon the occurrence and during the continuance of a Cash Management Trigger Period, the borrowers or managers are required to (i) deposit all revenues received by the borrowers and property managers directly into such lockbox accounts within two business days of receipt and (ii) cause all credit card companies or clearing banks to deliver all receipts directly into the applicable lender-controlled lockbox account. All funds in the lockbox accounts are required to be swept each business day into the applicable lender-controlled cash management account and then to the applicable borrower’s operating account, unless a Trigger Period (as defined below) has occurred and is continuing, in which case such funds are required to be swept each business day into the applicable lender-controlled cash management account and disbursed on each payment date in accordance with the loan documents. Upon the occurrence and during the continuance of a Trigger Period, all excess cash flow is required to be swept into the applicable cash management account and held by the lender as additional collateral for the SCG Hotel Portfolio Whole Loan.
A “Cash Management Trigger Period” will commence upon the debt service coverage ratio for the SCG Hotel Portfolio Whole Loan falling below 2.00x as of the last day of any calendar quarter. A Cash Management Trigger Period will cease to exist upon the debt service coverage ratio being at least 2.00x for two consecutive calendar quarters.
A “Trigger Period” will commence upon (i) an event of default under the SCG Hotel Portfolio Whole Loan documents, (ii) any bankruptcy or insolvency action of any property manager, (iii) any termination, expiration or cancellation of a franchise agreement or Larkspur Landing license agreement in violation of the SCG Hotel Portfolio Whole Loan documents, (iv) the debt service coverage ratio for the SCG Hotel Portfolio Whole Loan falling below 1.75x as of the last day of any calendar quarter or (v) any borrower being subject to an involuntary bankruptcy or insolvency action. A Trigger Period will cease to exist upon (a) with respect to clause (i) above, a cure of the event of default being accepted by the lender in its sole and absolute discretion, (b) with respect to clause (ii) above, the borrowers entering into a replacement management agreement with a qualified manager within 60 days of the initial bankruptcy or insolvency action (provided that such 60-day period may be extended an additional 30 days upon borrowers’ written request at lender’s reasonable discretion), (c) with respect to clause (iii) above, the borrowers entering into a replacement franchise agreement with a qualified franchisor within 60 days of the existing franchise agreement expiration, cancellation or termination (provided that such 60-day period may be extended an additional 30 days upon borrowers’ written request at lender’s reasonable discretion), (d) with respect to clause (iv) above, the debt service coverage ratio being at least 1.75x for two consecutive calendar quarters, which may be achieved at any time (x) the underwritten net cash flow has increased to achieve such debt service coverage ratio threshold or (y) by a prepayment of principal or deposit of cash in an amount determined by the lender such that the debt service coverage ratio is at least 1.75x for two consecutive calendar quarters (provided such prepayment is to be accompanied by the applicable yield maintenance premium) and (e) with respect to clause (v) above, the date such involuntary bankruptcy or insolvency proceeding is discharged, stayed or dismissed.
Property Management.The SCG Hotel Portfolio Properties are subject to operating agreements (“Operating Agreements”) with affiliates of SCG Hotel Investors Holdings, L.P. (the “Operators”) pursuant to which the Operators are responsible for the management of the SCG Hotel Portfolio Properties. The Operators subcontract such management responsibilities under management agreements with the following five managers: Hersha Hospitality Management L.P. (“Hersha”), First Hospitality Group, Inc. (“First Hospitality”), Schulte Hospitality Group, Inc. (“Schulte”), TMI Property Management, L.L.C. (“TMI”) and Pillar Hotels and Resorts, LLC (“Pillar”).
THE INFORMATION IN THIS STRUCTURAL AND COLLATERAL TERM SHEET IS NOT COMPLETE AND MAY BE AMENDED PRIOR TO THE TIME OF SALE. THIS TERM SHEET IS NOT AN OFFER TO SELL THESE SECURITIES AND IT IS NOT A SOLICITATION OF AN OFFER TO BUY THESE SECURITIES IN ANY JURISDICTION WHERE THE OFFER OR SALE IS NOT PERMITTED.
137
STARWOOD CAPITAL GROUP HOTEL PORTFOLIO |
The following table presents certain information relating to the management companies of the SCG Hotel Portfolio Properties:
Portfolio Management Companies
| Management Company | Properties | Rooms | % of Total Rooms | UW NCF | % of Total UW NCF | Appraised Value(1) | Appraised Value Per Room |
| Hersha | 39 | 3,859 | 60.6% | $44,857,243 | 62.9% | $565,900,000 | $146,644 |
| First Hospitality | 9 | 981 | 15.4% | $12,107,023 | 17.0% | $137,400,000 | $140,061 |
| TMI | 9 | 666 | 10.5% | $6,259,518 | 8.8% | $87,600,000 | $131,532 |
| Schulte | 6 | 692 | 10.9% | $5,458,243 | 7.7% | $69,700,000 | $100,723 |
| Pillar | 2 | 168 | 2.6% | $2,647,365 | 3.7% | $28,600,000 | $170,238 |
| Total | 65 | 6,366 | 100.0% | $71,329,392 | 100.0% | $956,000,000 | $150,173 |
| (1) | The Total Appraised Value reflects the “As Portfolio” value of $956,000,000 for the SCG Hotel Portfolio as a whole which includes an 8.1% premium to the aggregate “As-is” value of the individual SCG Hotel Portfolio Properties as a whole. The sum of the “As-is” and “As-Renovated” values, as applicable, for each of the SCG Hotel Portfolio Properties on an individual basis is $889,200,000, which represents an Appraised Value Per Room of $139,680. Additionally, the aggregate “As-is” value for each of the SCG Hotel Portfolio Properties on an individual basis is $884,700,000 as of April 23, 2017, which results in an Appraised Value Per Room of $138,973. |
Assumption.The borrower has a right to transfer the SCG Hotel Portfolio Properties, provided that no event of default has occurred and is continuing and certain other conditions are satisfied, including (i) the lender’s reasonable determination that the proposed transferee and guarantor satisfy the lender’s credit review and underwriting standards, taking into consideration transferee experience, financial strength and general business standing; (ii) execution of a recourse guaranty and an environmental indemnity by an affiliate of the transferee; and (iii) if requested by the lender, rating agency confirmation from Fitch, KBRA and Moody’s that the transfer will not result in a downgrade, withdrawal or qualification of the respective ratings assigned to the Series 2017-C39 Certificates or similar ratings confirmations from each rating agency rating any securities backed by the SCG Hotel Portfolio Companion Loans with respect to the ratings of such securities.
Partial Release.After June 1, 2018, the borrowers may obtain the release of one or more individual SCG Hotel Portfolio Properties from the lien of the SCG Hotel Portfolio Whole Loan subject to, among other terms and conditions: (i) no monetary event of default has occurred and is continuing, (ii) the remaining collateral has a debt service coverage ratio no less than the greater of (a) 2.65x and (b) the debt service coverage ratio in place immediately prior to the release and (iii) payment of a Release Price (as defined below), together with the related yield maintenance premium associated with the Release Price, provided that the debt service coverage ratio test may be satisfied with an additional prepayment of principal (with the related yield maintenance premium, as applicable) or a cash deposit with the lender in an amount reasonably determined by the lender to meet such test.
The “Release Price” is an amount equal to, (a) if less than $57,727,000 has been prepaid to date, 105% of the allocated loan amount of each such individual property, (b) if less than $86,590,500 has been prepaid to date, 110% of the allocated loan amount of each such individual property, (c) if less than $115,454,000 has been prepaid to date, 115% of the allocated loan amount of each such individual property and (d) (x) for all amounts prepaid in excess of $115,454,000 or (y) if any release property is to be conveyed to an affiliate of the borrowers, principals, operating companies or guarantors, 120% of the allocated loan amount of each such individual property.
In addition, with respect to the Holiday Inn Express & Suites Terrell property, pursuant to a recorded declaration, Tanger Properties Limited Partnership, together with its successors and assigns, have the right to purchase the Holiday Inn Express & Suites Terrell property upon the occurrence of certain events set forth in the recorded declaration, including, among other things, (i) the Holiday Inn Express & Suites Terrell property is abandoned or permanently closes or (ii) the use of the Holiday Inn Express & Suites Terrell property does not constitute a “permitted use” pursuant to the recorded declaration, for a continuous period of 60 days. In the event that such purchase option is exercised, the applicable borrower is required to promptly cause the release of the Holiday Inn Express & Suites Terrell property in compliance with the release provisions described above (except that the applicable borrower may release the Holiday Inn Express & Suites Terrell property during the lockout period with payment of the applicable yield maintenance premium). The SCG Hotel Portfolio Whole Loan documents require that any release of the Holiday Inn Express & Suites Terrell property in connection with the exercise of the purchase option be in compliance with the release provisions described above (except that the release may occur on or prior to June 1, 2018 with payment of the applicable yield maintenance premium). The SCG Hotel Portfolio Whole Loan is recourse to the guarantor for any losses suffered by the lender if and when the purchase option is exercised.
Real Estate Substitution.Not permitted.
Subordinate and Mezzanine Indebtedness.From and after the date that is the earlier of (i) May 24, 2018 and (ii) the date that all notes comprising of the SCG Hotel Portfolio Whole Loan have been securitized, certain direct and indirect owners of the borrowers are permitted to obtain mezzanine financing secured by the direct or indirect ownership interests in the borrowers upon satisfaction of certain terms and conditions including, among others, (i) no event of default has occurred and is continuing under the SCG Hotel Portfolio Whole Loan, (ii) the combined loan-to-value ratio does not exceed 64.9%, (iii) the combined debt service coverage ratio is not less than 2.65x, (iv) in the event that the mezzanine loan bears a floating rate of interest, the mezzanine borrowers have obtained an interest rate cap agreement from a provider reasonably acceptable to the mortgage lender containing a strike rate that provides for a debt service coverage ratio of not greater than 1.75x, (v) the mezzanine lenders have entered into an intercreditor agreement reasonably acceptable to the mortgage lender and (vi) delivery of a rating agency confirmation.
THE INFORMATION IN THIS STRUCTURAL AND COLLATERAL TERM SHEET IS NOT COMPLETE AND MAY BE AMENDED PRIOR TO THE TIME OF SALE. THIS TERM SHEET IS NOT AN OFFER TO SELL THESE SECURITIES AND IT IS NOT A SOLICITATION OF AN OFFER TO BUY THESE SECURITIES IN ANY JURISDICTION WHERE THE OFFER OR SALE IS NOT PERMITTED.
138
STARWOOD CAPITAL GROUP HOTEL PORTFOLIO |
Ground Lease.The Hilton Garden Inn Edison Raritan Center property is subject to a ground lease, which expires on September 30, 2076 with no extension options. The ground lease requires a current annual rent of $275,517 and is subject to scheduled rent increases every five years during the term of the ground lease. The SCG Portfolio Whole Loan provides for monthly escrows of ground rent equal to 1/12 of the ground rent that the lender reasonably estimates will be payable on such ground lease upon the occurrence and during the continuance of a Trigger Period. Please see the representation and warranty regarding ground leases and the exceptions thereto in the Preliminary Prospectus for additional information regarding the risks associated with this ground lease.
Terrorism Insurance.The SCG Hotel Portfolio Whole Loan documents require that the “all risk” insurance policy required to be maintained by the borrowers provide coverage for terrorism in an amount equal to the full replacement cost of the SCG Hotel Portfolio Properties, as well as business interruption insurance covering no less than the 24-month period following the occurrence of a casualty event, together with a six-month extended period of indemnity.
Windstorm Insurance. The SCG Hotel Portfolio Whole Loan documents require windstorm insurance covering the full replacement cost of the SCG Hotel Portfolio Properties during the loan term. At origination, the SCG Hotel Portfolio Properties had windstorm insurance coverage.
THE INFORMATION IN THIS STRUCTURAL AND COLLATERAL TERM SHEET IS NOT COMPLETE AND MAY BE AMENDED PRIOR TO THE TIME OF SALE. THIS TERM SHEET IS NOT AN OFFER TO SELL THESE SECURITIES AND IT IS NOT A SOLICITATION OF AN OFFER TO BUY THESE SECURITIES IN ANY JURISDICTION WHERE THE OFFER OR SALE IS NOT PERMITTED.
139
| No. 11 – Hilltop Plaza | ||||||
| Loan Information | Property Information | |||||
| Mortgage Loan Seller: | Barclays Bank PLC | Single Asset/Portfolio: | Single Asset | |||
Credit Assessment (Fitch/KBRA/Moody’s) | NR/NR/NR | Property Type: | Retail | |||
| Original Principal Balance(1): | $39,600,000 | Specific Property Type: | Anchored | |||
| Cut-off Date Balance(1): | $39,600,000 | Location: | Bowie, MD | |||
| % of Initial Pool Balance: | 3.5% | Size(6): | 181,529 SF | |||
| Loan Purpose: | Acquisition | Cut-off Date Balance Per SF: | $218.15 | |||
| Borrower: | Hilltop Borrower, LLC | Year Built/Renovated: | 1970/2011 | |||
| Borrower Sponsor: | Gary D. Rappaport | Title Vesting: | Fee | |||
| Mortgage Rate: | 4.295% | Property Manager: | Self-Managed | |||
| Note Date: | July 5, 2017 | 4thMost Recent Occupancy (As of): | 97.1% (12/31/2013) | |||
| Anticipated Repayment Date: | NAP | 3rdMost Recent Occupancy (As of): | 95.2% (12/31/2014) | |||
| Maturity Date: | July 6, 2027 | 2ndMost Recent Occupancy (As of): | 100.0% (12/31/2015) | |||
| IO Period: | 36 months | Most Recent Occupancy (As of): | 97.4% (12/31/2016) | |||
| Loan Term (Original): | 120 months | Current Occupancy (As of)(7): | 94.8% (6/19/2017) | |||
| Seasoning: | 1 month | |||||
| Amortization Term (Original): | 360 months | Underwriting and Financial Information: | ||||
| Loan Amortization Type: | Interest-only, Amortizing Balloon | |||||
| Interest Accrual Method: | Actual/360 | 4thMost Recent NOI (As of): | $3,303,042 (12/31/2014) | |||
| Call Protection: | L(25),D(91),O(4) | 3rdMost Recent NOI (As of): | $3,530,359 (12/31/2015) | |||
| Lockbox Type: | Hard/Springing Cash Management | 2ndMost Recent NOI (As of): | $3,560,415 (12/31/2016) | |||
| Additional Debt: | None | Most Recent NOI (As of)(8): | $3,702,388 (TTM 5/31/2017) | |||
| Additional Debt Type: | NAP | |||||
| U/W Revenues: | $4,522,110 | |||||
| U/W Expenses: | $1,132,553 | |||||
| Escrows and Reserves: | U/W NOI(8): | $3,389,556 | ||||
| U/W NCF: | $3,263,908 | |||||
| Type: | Initial | Monthly | Cap (If Any) | U/W NOI DSCR: | 1.44x | |
| Taxes | $0 | $51,665 | NAP | U/W NCF DSCR: | 1.39x | |
| Insurance(1) | $0 | Springing | NAP | U/W NOI Debt Yield: | 8.6% | |
| Replacement Reserves(2) | $537,000 | Springing | $100,000 | U/W NCF Debt Yield: | 8.2% | |
| TI/LC Reserve(3) | $1,173,154 | Springing | $550,887 | As-Is Appraised Value: | $52,800,000 | |
| Free Rent Reserve(4) | $10,718 | $0 | NAP | As-Is Appraisal Valuation Date: | May 1, 2017 | |
| Dunkin Donuts Reserve(5) | $650,000 | $0 | NAP | Cut-off Date LTV Ratio: | 75.0% | |
| LTV Ratio at Maturity: | 65.3% | |||||
| (1) | Ongoing monthly reserves for insurance are not required so long as (i) no event of default has occurred and is continuing; (ii) the Hilltop Plaza Property (as defined below) is insured via an acceptable blanket insurance policy and (iii) the borrower provides the lender with evidence of renewal of the insurance policies and timely proof of payment of insurance premiums. |
| (2) | Ongoing monthly replacement reserves are not required so long as no event of default has occurred and is continuing and to the extent that the balance of the replacement reserves is at least $100,000. However, if the balance of the replacement reserve is less than $100,000, then the borrower is required to make monthly payments of $2,295. |
| (3) | Ongoing monthly TI/LC reserves are not required so long as no event of default has occurred and is continuing and to the extent that the balance of the TI/LC reserves is at least $550,887. However, if the balance of the TI/LC reserve is less than $550,887, then the borrower is required to make monthly payments of $15,302. In conjunction with the acquisition, the seller of the Hilltop Plaza Property deposited $300,000 into escrow with the title company, for tenant improvements and leasing commission costs associated with the suite currently occupied by Jump! Zone, which is currently delinquent on rental payments. |
| (4) | The Initial Free Rent Reserve represents three months of contractual free rent for the CoreLife tenant, pursuant to its lease. |
| (5) | The Upfront Dunkin Donuts Reserve will be used in connection with the construction of the Dunkin Donuts/Basking Robbins building located on the Hilltop Plaza Property. Any deposits remaining in the Dunkin Donuts Reserve will be disbursed to the borrower (less any amounts owed to the prior owner of the Hilltop Plaza Property) provided the Dunkin Donuts tenant has moved into its space and has commenced paying rent. |
| (6) | The Total Size of 181,529 SF excludes the Dunkin Donuts/Basking Robbins space of 2,100 SF. As of the origination date, Dunkin Donuts/Baskin Robbins executed a 10-year lease at the Hilltop Plaza Property for 2,100 SF, and is awaiting approval from Prince George’s County in order to commence construction. On the origination date, $650,000 was held back by the lender in connection with the construction of the Dunkin Donuts/Baskin Robbins building. |
| (7) | Current Occupancy excludes the space occupied by Jump! Zone (5,817 SF). Jump! Zone is currently in occupancy at the Hilltop Plaza Property, but is delinquent on rent payments and has thus been underwritten as vacant. Jazzercise and CoreLife were underwritten as occupied, but will not begin paying rent until August 2017 and November 2017, respectively. All free rent amounts for CoreLife were deposited into escrow on the origination date. |
| (8) | See “Cash Flow Analysis” section. |
The mortgage loan is evidenced by a single promissory note that is secured by a first mortgage encumbering the fee interest in a 181,529 square foot anchored retail center located in Bowie, Maryland (the “Hilltop Plaza Property”), approximately 18.0 miles northeast of Washington D.C.’s central business district. The Hilltop Plaza Property was built in 1970, renovated in 2011 and is situated on a 16.7-acre site. Major tenants at the Hilltop Plaza Property include Aldi, Walgreens, Planet Fitness, Dollar Tree and Advance Auto Parts. The Hilltop Plaza Property contains 785 surface parking spaces, resulting in a parking ratio of 4.3 spaces per 1,000 square feet of rentable area. As of June 19, 2017, the Hilltop Plaza Property was 94.8% occupied by 37 tenants.
THE INFORMATION IN THIS STRUCTURAL AND COLLATERAL TERM SHEET IS NOT COMPLETE AND MAY BE AMENDED PRIOR TO THE TIME OF SALE. THIS TERM SHEET IS NOT AN OFFER TO SELL THESE SECURITIES AND IT IS NOT A SOLICITATION OF AN OFFER TO BUY THESE SECURITIES IN ANY JURISDICTION WHERE THE OFFER OR SALE IS NOT PERMITTED.
140
| HILLTOP PLAZA |
The Hilltop Plaza Property is located within Prince George’s County, east of Washington D.C. and south of Baltimore. According to the appraisal, the 2016 population within a three- and five-mile radius of the Hilltop Plaza Property was 47,684 and 113,646, respectively; and the average household income within the same radii was $126,202 and $132,716, respectively. The Hilltop Plaza Property benefits from its proximity to several transportation arteries, including U.S. Highway 50, Interstate-95/495 (the Capital Beltway), and Route 301. Additionally, the average daily traffic count along the Hilltop Plaza Property is approximately 47,000 vehicles. According to a third party market research report, the Hilltop Plaza Property is located within the Bowie submarket of the Washington, D.C. retail market. As of the first quarter of 2017, the submarket reported a total inventory of approximately 6.2 million square feet with a 5.5% vacancy rate and an average asking rent of $33.59 per square foot. The appraiser concluded to market rents for the Hilltop Plaza Property of $14.00 per square foot for the big box space, $15.00 per square foot for large inline space, $35.00 per square foot for the highly visible retail space, $19.00 per square foot for the less visible retail space, $65.00 per square foot for the bank pad space and $29.00 per square foot for the drug store space, all on a triple net basis.
Sources and Uses
| Sources | Uses | |||||||
| Original loan amount | $39,600,000 | 74.6% | Purchase price(1) | $48,938,105 | 92.1% | |||
| Borrower sponsor’s new cash | 13,515,199 | 25.4 | Reserves | 2,370,872 | 4.5 | |||
| contribution | Closing Costs | 1,806,222 | 3.4 | |||||
| Total Sources | $53,115,199 | 100.0% | Total Uses | $53,115,199 | 100.0% |
| (1) | The Purchase price is net of purchaser and seller credits. |
The following table presents certain information relating to the tenancy at the Hilltop Plaza Property:
Major Tenants
| Tenant Name | Credit Rating (Fitch/ Moody’s/ S&P)(1) | Tenant NRSF | % of NRSF | Annual U/W Base Rent PSF(2) | Annual U/W Base Rent(2) | % of Total Annual U/W Base Rent | Sales PSF(3) | Occupancy Cost(3) | Lease Expiration Date |
| Major Tenants | |||||||||
| Walgreens(4) | BBB/Baa2/BBB | 11,440 | 6.3% | $30.75 | $351,774 | 9.1% | NAV | NAV | 4/30/2031(5) |
| Bank of America(4) | A/Baa1/BBB+ | 6,277 | 3.5% | $50.76 | $318,626 | 8.3% | NAV | NAV | 7/31/2028(6) |
| SunTrust Bank(4) | A-/Baa1/BBB+ | 4,734 | 2.6% | $58.09 | $275,000 | 7.1% | NAV | NAV | 8/31/2020(7) |
| Planet Fitness | NR/NR/NR | 19,895 | 11.0% | $13.80 | $274,551 | 7.1% | NAV | NAV | 12/31/2018(8) |
| Outback Steakhouse | NR/NR/NR | 6,398 | 3.5% | $35.00 | $223,930 | 5.8% | NAV | NAV | 10/31/2018(9) |
| Aldi | NR/NR/NR | 17,051 | 9.4% | $12.10 | $206,317 | 5.4% | NAV | NAV | 12/31/2019(10) |
| Total Major Tenants | 65,795 | 36.2% | $25.08(11) | $1,650,199 | 42.8% | ||||
| Non-Major Tenants | 106,329 | 58.6% | $20.74 | $2,205,610 | 57.2% | ||||
| Occupied Collateral Total | 172,124 | 94.8% | $22.40 | $3,855,808 | 100.0% | ||||
| Vacant Space(12) | 9,405 | 5.2% | |||||||
| Collateral Total | 181,529 | 100.0% | |||||||
| (1) | Certain ratings are those of the parent company whether or not the parent guarantees the lease. |
| (2) | Annual U/W Base Rent PSF and Annual U/W Base Rent include contractual rent steps through July 2018 totaling $149,513 and straight-lined rent for Walgreens and Bank of America. |
| (3) | Sales PSF and Occupancy Costs are not available as none of tenants at the Hilltop Plaza Property are required to report sales. |
| (4) | Walgreens, Bank of America and SunTrust Bank ground lease their pad sites from the borrower sponsor and own their own improvements. |
| (5) | Walgreens has five, five-year lease renewal options. |
| (6) | Bank of America has four, five-year lease renewal options. |
| (7) | SunTrust Bank has four, five-year lease renewal options. |
| (8) | Planet Fitness has two, five-year lease renewal options. |
| (9) | Outback Steakhouse, which is in occupancy and paying rent, has given notice to the borrower sponsor that they will be vacating their suite at the expiration of their lease in October 2018. |
| (10) | Aldi has four, five-year lease renewal options. |
| (11) | When excluding Walgreens, Bank of America and SunTrust Bank, who ground lease their pad sites from the borrower sponsor, the Total Major Tenants Annual U/W Base Rent PSF is $16.26. |
| (12) | Vacant Space includes the space occupied by Jump! Zone (5,817 SF). Jump! Zone is currently in occupancy at the Hilltop Plaza Property, but is delinquent on rent payments and has thus been underwritten as vacant. |
THE INFORMATION IN THIS STRUCTURAL AND COLLATERAL TERM SHEET IS NOT COMPLETE AND MAY BE AMENDED PRIOR TO THE TIME OF SALE. THIS TERM SHEET IS NOT AN OFFER TO SELL THESE SECURITIES AND IT IS NOT A SOLICITATION OF AN OFFER TO BUY THESE SECURITIES IN ANY JURISDICTION WHERE THE OFFER OR SALE IS NOT PERMITTED.
141
| HILLTOP PLAZA |
The following table presents certain information relating to the lease rollover schedule at the Hilltop Plaza Property:
Lease Expiration Schedule(1)(2)
| Year Ending December 31, | No. of Leases Expiring | Expiring NRSF | % of Total NRSF | Cumulative Expiring NRSF | Cumulative % of Total NRSF | Annual U/W Base Rent | % of Total Annual U/W Base Rent | Annual U/W Base Rent PSF(3) |
| MTM | 0 | 0 | 0.0% | 0 | 0.0% | $0 | 0.0% | $0.00 |
| 2017 | 0 | 0 | 0.0% | 0 | 0.0% | $0 | 0.0% | $0.00 |
| 2018 | 4 | 28,451 | 15.7% | 28,451 | 15.7% | $544,344 | 14.1% | $19.13 |
| 2019 | 8 | 41,373 | 22.8% | 69,824 | 38.5% | $779,414 | 20.2% | $18.84 |
| 2020 | 6 | 29,823 | 16.4% | 99,647 | 54.9% | $662,569 | 17.2% | $22.22 |
| 2021 | 3 | 5,593 | 3.1% | 105,240 | 58.0% | $181,770 | 4.7% | $32.50 |
| 2022 | 6 | 14,228 | 7.8% | 119,468 | 65.8% | $353,711 | 9.2% | $24.86 |
| 2023 | 1 | 2,799 | 1.5% | 122,267 | 67.4% | $54,760 | 1.4% | $19.56 |
| 2024 | 1 | 2,684 | 1.5% | 124,951 | 68.8% | $64,416 | 1.7% | $24.00 |
| 2025 | 1 | 7,812 | 4.3% | 132,763 | 73.1% | $108,626 | 2.8% | $13.91 |
| 2026 | 3 | 12,331 | 6.8% | 145,094 | 79.9% | $263,266 | 6.8% | $21.35 |
| 2027 | 1 | 2,684 | 1.5% | 147,778 | 81.4% | $58,182 | 1.5% | $21.68 |
| Thereafter | 3 | 24,346 | 13.4% | 172,124 | 94.8% | $784,751 | 20.4% | $32.23 |
| Vacant(4) | 0 | 9,405 | 5.2% | 181,529 | 100.0% | $0 | 0.0% | $0.00 |
| Total/Weighted Average | 37 | 181,529 | 100.0% | $3,855,808 | 100.0% | $22.40 |
| (1) | Information obtained from the underwritten rent roll. |
| (2) | Certain tenants may have lease termination options that are exercisable prior to the originally stated expiration date of the subject lease and that are not considered in the Lease Expiration Schedule. |
| (3) | Weighted Average Annual U/W Base Rent PSF excludes vacant space. |
| (4) | Vacant Space includes the space occupied by Jump! Zone (5,817 SF). Jump! Zone is currently in occupancy at the Hilltop Plaza Property, but is delinquent on rent payments and has thus been underwritten as vacant. |
The following table presents historical occupancy percentages at the Hilltop Plaza Property:
Historical Occupancy
12/31/2013(1) | 12/31/2014(1) | 12/31/2015(1) | 12/31/2016(1) | 6/19/2017(2)(3) | ||||
| 97.1% | 95.2% | 100.0% | 97.4% | 94.8% |
| (1) | Information obtained a third party market research report. |
| (2) | Information obtained from the underwritten rent roll. |
| (3) | Current Occupancy excludes the space occupied by Jump! Zone (5,817 SF). Jump! Zone is currently in occupancy at the Hilltop Plaza Property, but is delinquent on rent payments and has thus been underwritten as vacant. Jazzercise and CoreLife were underwritten as occupied, but will not begin paying rent until August 2017 and November 2017, respectively. All free rent amounts for CoreLife were deposited into escrow on the origination date. |
THE INFORMATION IN THIS STRUCTURAL AND COLLATERAL TERM SHEET IS NOT COMPLETE AND MAY BE AMENDED PRIOR TO THE TIME OF SALE. THIS TERM SHEET IS NOT AN OFFER TO SELL THESE SECURITIES AND IT IS NOT A SOLICITATION OF AN OFFER TO BUY THESE SECURITIES IN ANY JURISDICTION WHERE THE OFFER OR SALE IS NOT PERMITTED.
142
| HILLTOP PLAZA |
Operating History and Underwritten Net Cash Flow. The following table presents certain information relating to the historical operating performance and the underwritten net cash flow at the Hilltop Plaza Property:
Cash Flow Analysis
| 2014 | 2015 | 2016 | TTM 5/31/2017 | U/W | % of U/W Effective Gross Income | U/W $ per SF | |
| Base Rent(1) | $3,490,497 | $3,633,565 | $3,585,967 | $3,599,390 | $3,855,808(2) | 85.3% | $21.24 |
| Grossed Up Vacant Space | 0 | 0 | 0 | 0 | 252,195 | 5.6 | 1.39 |
| Total Reimbursables | 780,384 | 953,783 | 1,083,194 | 1,119,742 | 999,445 | 22.1 | 5.51 |
| Other Income | 7,470 | 5,688 | 21,874 | 24,447 | 7,492(3) | 0.2 | 0.04 |
| Less Vacancy & Credit Loss | 0 | 0 | 0 | 0 | (592,831)(4)(5) | (13.1) | (3.27) |
| Effective Gross Income | $4,278,351 | $4,593,036 | $4,691,035 | $4,743,579 | $4,522,110 | 100.0% | $24.91 |
| Total Operating Expenses | $975,309 | $1,062,677 | $1,130,620 | $1,041,191 | $1,132,553 | 25.0% | $6.24 |
| Net Operating Income | $3,303,042 | $3,530,359 | $3,560,415 | $3,702,388 | $3,389,556 | 75.0% | $18.67 |
| TI/LC | 0 | 0 | 0 | 0 | 238,104 | 5.3 | 1.31 |
| Capital Expenditures | 0 | 0 | 0 | 0 | 27,544 | 0.6 | 0.15 |
| Upfront TI/LC Reserve Credit | 0 | 0 | 0 | 0 | (140,000)(6) | (3.1) | (0.77) |
| Net Cash Flow | $3,303,042 | $3,530,359 | $3,560,415 | $3,702,388 | $3,263,908 | 72.2% | $17.98 |
| NOI DSCR | 1.41x | 1.50x | 1.51x | 1.58x | 1.44x | ||
| NCF DSCR | 1.41x | 1.50x | 1.51x | 1.58x | 1.39x | ||
| NOI DY | 8.3% | 8.9% | 9.0% | 9.3% | 8.6% | ||
| NCF DY | 8.3% | 8.9% | 9.0% | 9.3% | 8.2% |
| (1) | Historical Base Rent is net of vacancy loss. |
| (2) | U/W Base Rent includes contractual rent steps through July 2018 totaling $149,513 and straight-lined rent for Walgreens and Bank of America. |
| (3) | Other Income includes percentage rent from Chesapeake Grille ($1,841), late fees and other miscellaneous income. |
| (4) | The underwritten economic vacancy is 13.1%. The Hilltop Plaza Property was 94.8% physically occupied as of June 19, 2017. |
| (5) | Outback Steakhouse (6,398 SF, 3.5% of net rentable area), which is in occupancy and paying rent, has given notice to the borrower sponsor that they will be vacating their suite at the expiration of their lease in October 2018. |
| (6) | Represents one-tenth of the upfront TI/LC reserve and the Jump! Zone escrow totaling $140,000. |
The following table presents certain information relating to comparable properties to the Hilltop Plaza Property:
Comparable Properties(1)
| Hilltop Plaza (Subject) | Towne Centre at Laurel | Magothy Gateway | Village South at Waugh Chapel | Bowie Marketplace | Bowie Plaza | |
| Location | Bowie, MD | Laurel, MD | Severna Park, MD | Crofton, MD | Bowie, MD | Bowie, MD |
| Distance from Subject | -- | 11.9 miles | 13.8 miles | 5.2 miles | 0.5 miles | 2.5 miles |
| Year Built/Renovated | 1970/2011 | 2014/NAP | 2016/NAP | 2012/NAP | 2016/NAP | 1969/NAP |
| Anchors | Aldi, Planet Fitness | Harris Teeter, Regal Cinemas, Burlington Coat Factory, Sports Authority, Old Navy, Party City | Harris Teeter | -- | Harris Teeter, Petco | Fitness 4 Less, CVS |
| Total GLA | 181,529 SF | 387,041 SF | 115,102 SF | 501,797 SF | 133,575 SF | 102,903 SF |
| Total Occupancy | 94.8% | 92.0% | 91.0% | 100.0% | 92.0% | 96.0% |
| (1) | Information obtained from the appraisal and the underwritten rent roll. |
THE INFORMATION IN THIS STRUCTURAL AND COLLATERAL TERM SHEET IS NOT COMPLETE AND MAY BE AMENDED PRIOR TO THE TIME OF SALE. THIS TERM SHEET IS NOT AN OFFER TO SELL THESE SECURITIES AND IT IS NOT A SOLICITATION OF AN OFFER TO BUY THESE SECURITIES IN ANY JURISDICTION WHERE THE OFFER OR SALE IS NOT PERMITTED.
143
| No. 12 – University Center Chicago | ||||||||
| Loan Information | Property Information | |||||||
| Mortgage Loan Seller: | Well Fargo Bank, National Association | Single Asset/Portfolio: | Single Asset | |||||
| Credit Assessment (Fitch/KBRA/Moody’s): | NR/NR/NR | Property Type: | Multifamily | |||||
| Original Principal Balance(1): | $35,000,000 | Specific Property Type: | Student Housing | |||||
| Cut-off Date Balance(1): | $35,000,000 | Location: | Chicago, IL | |||||
| % of Initial Pool Balance: | 3.1% | Size: | 1,732 Beds | |||||
| Loan Purpose: | Acquisition | Cut-off Date Balance Per Bed(1): | $69,630 | |||||
| Borrower Name: | University Center Property LLC | Year Built/Renovated: | 2004/NAP | |||||
| Sponsors: | UCC Chicago Acquisition Partner LLC; Blue Vista Capital Management, LLC | Title Vesting: | Fee | |||||
| Mortgage Rate: | 3.920% | Property Manager: | Self-managed | |||||
| Note Date: | July 20, 2017 | 4thMost Recent Occupancy(As of)(4): | 94.4% (12/31/2013) | |||||
| Anticipated Repayment Date: | NAP | 3rdMost Recent Occupancy (As of)(4): | 92.8% (12/31/2014) | |||||
| Maturity Date: | August 11, 2027 | 2ndMost Recent Occupancy (As of)(4): | 91.7% (12/31/2015) | |||||
| IO Period: | 120 months | Most Recent Occupancy (As of)(4): | 88.7% (12/31/2016) | |||||
| Loan Term (Original): | 120 months | Current Occupancy (As of): | 89.8% (7/17/2017) | |||||
| Seasoning: | 0 months | |||||||
| Amortization Term (Original): | NAP | Underwriting and Financial Information: | ||||||
| Loan Amortization Type: | Interest-only, Balloon | 4thMost Recent NOI (As of): | $15,800,231 (12/31/2014) | |||||
| Interest Accrual Method: | Actual/360 | 3rdMost Recent NOI (As of): | $14,762,415 (12/31/2015) | |||||
| Call Protection: | L(24),D(89),O(7) | 2ndMost Recent NOI (As of): | $14,452,181 (12/31/2016) | |||||
| Lockbox Type: | Hard/Upfront Cash Management | Most Recent NOI (As of): | $14,263,985 (TTM 3/31/2017) | |||||
| Additional Debt(1): | Yes | |||||||
| Additional Debt Type(1): | Pari Passu | U/W Revenues: | $23,284,431 | |||||
| U/W Expenses: | $10,155,231 | |||||||
| U/W NOI: | $13,129,200 | |||||||
| U/W NCF: | $12,890,034 | |||||||
| Escrows and Reserves: | U/W NOI DSCR(1): | 2.74x | ||||||
| U/W NCF DSCR(1): | 2.69x | |||||||
| Type: | Initial | Monthly | Cap (If Any) | U/W NOI Debt Yield(1): | 10.9% | |||
| Taxes | $0 | $118,585 | NAP | U/W NCF Debt Yield(1): | 10.7% | |||
| Insurance | $96,969 | $16,162 | NAP | As-Is Appraised Value: | $203,400,000 | |||
| Replacement Reserves | $1,385,081 | $14,700 | NAP | As-Is Appraisal Valuation Date: | June 1, 2017 | |||
| Tenant Specific TI/LC Reserves(2) | $485,951 | $0 | NAP | Cut-off Date LTV Ratio(1): | 59.3% | |||
| Seasonality Reserve(3) | $0 | $430,018 | NAP | LTV Ratio at Maturity or ARD(1): | 59.3% | |||
| (1) | The University Center Chicago Whole Loan (as defined below), which had an original principal balance of $120,600,000, is comprised of two pari passu notes (Notes A-1 and A-2). The non-controlling Note A-2 had an original principal balance of $35,000,000, has an outstanding principal balance of $35,000,000 as of the Cut-Off Date and will be contributed to the WFCM 2017-C39 Trust. The controlling Note A-1 had an original principal balance of $85,600,000 and will be contributed to a future trust or trusts. All statistical financial information related to balances per square foot, loan-to-value ratios, debt service coverage ratios and debt yields are based on the University Center Chicago Whole Loan. The lender provides no assurances that any non-securitizedpari passu note will not be split further. |
| (2) | Includes existing tenant improvement and leasing commission obligations relating to Blaze Pizza ($185,951) and WiFi installation costs for Columbia College, DePaul University and Roosevelt University ($300,000). |
| (3) | Required monthly deposits for seasonality are adjustable based on the annual rent of the DePaul University, Columbia College, Roosevelt University and Robert Morris University master leases for the applicable academic year. |
| (4) | Historical occupancy is based on per bed occupancy for residential units only. |
The University Center Chicago mortgage loan is part of a whole loan (the “University Center Chicago Whole Loan”) that is evidenced by two promissory notes (Notes A-1 and A-2) secured by a first mortgage encumbering the fee interest of a student housing property located in downtown Chicago, Illinois (the “University Center Chicago Property”). See “Description of the Mortgage Pool—The Whole Loans—The University Center Chicago Whole Loan” and “Pooling and Servicing Agreement” in the Preliminary Prospectus.
The University Center Chicago Property is located in the South Loop neighborhood of Chicago, along State Street just south of Congress Parkway, and is a class A student housing complex that contains 504 units and 1,732 beds (comprising 95.3% of the underwritten base rent) and 28,085 square feet of retail space that is 87.6% occupied (4.7% of underwritten base rent). Constructed in 2004, the University Center Chicago Property includes amenities such as a 30,000 square feet dining facility, 15,000 square feet of meeting space, on-site fitness center, game room, study room on every floor, laundry facilities, 24-hour security with key card access, student lounge with kitchen on every floor, meeting rooms, bicycle storage, computer center (providing access to printing and IT help) and a 20,000 square feet terrace garden on the 3rd floor. Over the past five years, the seller invested approximately $4.5 million ($2,598 per bed) into the University Center Chicago Property including residential unit renovations, corridor improvements and updates to the meeting rooms and lounges. The borrower sponsor plans to complete an approximately $6.7
THE INFORMATION IN THIS STRUCTURAL AND COLLATERAL TERM SHEET IS NOT COMPLETE AND MAY BE AMENDED PRIOR TO THE TIME OF SALE. THIS TERM SHEET IS NOT AN OFFER TO SELL THESE SECURITIES AND IT IS NOT A SOLICITATION OF AN OFFER TO BUY THESE SECURITIES IN ANY JURISDICTION WHERE THE OFFER OR SALE IS NOT PERMITTED.
144
| University Center Chicago |
million ($3,868 per bed) capital improvement plan over the next several years which will include updates to the residential units, lobby and leasing office renovations, LED retrofitting and IT upgrades. The University Center Chicago Property is located within three blocks of the Harold Washington Library, DePaul University, Robert Morris University, Roosevelt University, Columbia College, American Academy of Arts, Grant Park and three Chicago Transit Authority (“CTA”) train stations. According to the appraisal, the 2016 estimated population within a one-, three- and five-mile radius of the University Center Chicago Property was 52,638, 311,966 and 743,479, respectively; and the 2016 estimated average household income within the same radii was $124,720, $108,624 and $95,730, respectively. The University Center Chicago Property is located in the Loop submarket of the Chicago apartment market, which as of first quarter 2017, contained a total inventory of 18,803 units and vacancy rate of approximately 7.3%.
The University Center Chicago Property is subject to five separate master leases (see “Master Lease Summary” below) with different universities, colleges and academies in the immediate area comprising a total of 1,538 beds. The campuses of all five master tenants are located within three blocks of the University Center Chicago Property. Master leases comprising approximately 83.2% of the master leased beds (or 73.9% of the total beds at the University Center Chicago Property) have lease expirations in 2027.
Note Summary
| Notes | Original Balance | Note Holder | Controlling Interest | |
| A-1 | $85,600,000 | Wells Fargo Bank, National Association | Yes | |
| A-2 | $35,000,000 | WFCM 2017-C39 | No | |
| Total | $120,600,000 |
Sources and Uses
| Sources | Uses | |||||||
| Original loan amount | $120,600,000 | 59.6% | Purchase price(1) | $198,608,753 | 98.1% | |||
| Sponsor’s new cash contribution | 81,851,234 | 40.4 | Reserves | 1,968,001 | 1.0 | |||
| Closing costs | 1,874,480 | 0.9 | ||||||
| Total Sources | $202,451,234 | 100.0% | Total Uses | $202,451,234 | 100.0% |
| (1) | The total Purchase Price of the University Center Chicago Property was $201,000,000 subject to seller prorations totaling $2,391,247. |
The following table presents certain information relating to the unit mix of the University Center Chicago Property:
Unit Mix Summary(1)
| Unit Type | No. of Beds | No. of Units | % of Total Beds | Average Unit Size (SF) |
| Studio / 1 Bathroom | 32 | 32 | 1.8% | 500 |
| 1 Bedroom / 1 Bathroom | 32 | 32 | 1.8% | 365 |
| 2 Bedroom / 1 Bathroom | 92 | 46 | 5.3% | 365 |
| 4 Bedroom / 1 Bathroom | 936 | 234 | 54.0% | 730 |
| 2 Bedroom / 2 Bathroom | 68 | 17 | 3.9% | 1100 |
| 4 Bedroom / 2 Bathroom | 572 | 143 | 33.0% | 1300 |
| Total/Weighted Average | 1,732 | 504 | 100.0% | 833 |
| (1) | Information obtained from the appraisal and underwritten rent roll. |
Master Lease Summary
| Tenant Name | Contract Rent(2) | No. of Beds | Average Annual Rent per Bed | Average Monthly Rent per Bed | Lease Expiration |
| Columbia College | $6,695,556 | 636 | $10,528 | $877 | 5/14/2027(1) |
| DePaul University | $4,872,792 | 427 | $11,412 | $951 | 6/11/2027(1) |
| Roosevelt University | $2,531,016 | 217 | $11,664 | $972 | 5/12/2027(1) |
| American Academy of Arts | $64,152 | 8 | $8,019 | $668 | 4/22/2018 |
| Robert Morris University | $2,302,120 | 250 | $9,208 | $767 | 7/13/2019 |
| Total | $16,465,636 | 1,538 | $10,706 | $892 |
| (1) | Tenant has one, 10-year renewal option. |
| (2) | Contract Rents for master leases are for Academic Year 2017/2018. |
THE INFORMATION IN THIS STRUCTURAL AND COLLATERAL TERM SHEET IS NOT COMPLETE AND MAY BE AMENDED PRIOR TO THE TIME OF SALE. THIS TERM SHEET IS NOT AN OFFER TO SELL THESE SECURITIES AND IT IS NOT A SOLICITATION OF AN OFFER TO BUY THESE SECURITIES IN ANY JURISDICTION WHERE THE OFFER OR SALE IS NOT PERMITTED.
145
| University Center Chicago |
The following table presents historical occupancy percentages at the University Center Chicago Property:
Historical Occupancy
12/31/2014(1)(2) | 12/31/2015(1)(2) | 12/31/2016(1)(2) | 7/17/2017(3) | |||
| 92.8% | 91.7% | 88.7% | 89.8% |
| (1) | Information obtained from the borrower. |
| (2) | Occupancy is based on per bed occupancy for residential units only. |
| (3) | Information obtained from the underwritten rent roll. |
Operating History and Underwritten Net Cash Flow.The following table presents certain information relating to the historical operating performance and underwritten net cash flow at the University Center Chicago Property:
Cash Flow Analysis
| 2014 | 2015 | 2016 | TTM 3/31/2017 | U/W | % of U/W Effective Gross Income | U/W $ per Bed | ||||||||
| Base Rent | $19,378,465 | $18,416,594 | $18,253,530 | $18,140,770 | $18,841,061(1) | 80.9% | $10,878 | |||||||
| Grossed Up Vacant Space | 0 | 0 | 0 | 0 | $2,242,666(2) | 9.6 | 1,295 | |||||||
| Total Reimbursement | 294,736 | 287,601 | 277,796 | 237,426 | 292,698 | 1.3 | 169 | |||||||
| Other Income(3) | 4,245,340 | 4,492,586 | 4,398,444 | 4,439,554 | 4,150,671 | 17.8 | 2,396 | |||||||
| Less Vacancy & Credit Loss | 0 | 0 | 0 | 0 | (2,242,666)(2) | (9.6) | (1,295) | |||||||
| Effective Gross Income | $23,918,541 | $23,196,781 | $22,929,770 | $22,817,750 | $23,284,431 | 100.0% | $13,444 | |||||||
| Total Operating Expenses | $8,118,310 | $8,434,366 | $8,477,589 | $8,553,765 | $10,155,231 | 43.6% | $5,863 | |||||||
| Net Operating Income | $15,800,231 | $14,762,415 | $14,452,181 | $14,263,985 | $13,129,200 | 56.4% | $7,580 | |||||||
| Capital Expenditures | 0 | 0 | 0 | 239,166 | 1.0 | 138 | ||||||||
| Net Cash Flow | $15,800,231 | $14,762,415 | $14,452,181 | $14,263,985 | $12,890,034 | 55.4% | $7,442 | |||||||
| NOI DSCR(4) | 3.30x | 3.08x | 3.02x | 2.98x | 2.74x | |||||||||
| NCF DSCR(4) | 3.30x | 3.08x | 3.02x | 2.98x | 2.69x | |||||||||
| NOI DY(4) | 13.1% | 12.2% | 12.0% | 11.8% | 10.9% | |||||||||
| NCF DY(4) | 13.1% | 12.2% | 12.0% | 11.8% | 10.7% |
| (1) | U/W Base Rent is comprised of $17,954,176 of residential income (95.3% of U/W Base Rent) and $886,886 of retail income (4.7% of U/W Base Rent). |
| (2) | The underwritten economic vacancy is 10.6%. The University Center Chicago Property was 89.8% physically occupied as of July 17, 2017. |
| (3) | Other income includes food services, conference income and other revenues. |
| (4) | The debt service coverage ratios and debt yields are based on the University Center Chicago Whole Loan. |
The following table presents certain information relating to some comparable student housing multifamily properties for the University Center Chicago Property:
Competitive Set(1)
| University Center Chicago (Subject) | 777 South State Student Apartments | Buckingham Student Apartments | Dwight Lofts Student Apartments | Tailor Lofts | Automatic Lofts Student Apartments | Infinite Student Apartments | ARC at Old Colony | |
| Location | Chicago, IL | Chicago, IL | Chicago, IL | Chicago, IL | Chicago, IL | Chicago, IL | Chicago, IL | Chicago, IL |
| Distance to Subject | -- | 0.2 miles | 0.2 miles | 0.3 miles | 1.4 miles | 1.4 miles | 0.3 miles | 0.2 miles |
| Property Type | Student Housing | Student Housing | Student Housing | Student Housing | Student Housing | Student Housing | Student Housing | Student Housing |
| Year Built/Renovated | 2004/NAP | 1985/NAP | 1927/NAP | 1911/2008 | 1920/NAP | 1906/NAP | 1912/2015 | 1911/2014 |
| Number of Beds | 1732 | 882 | 441 | 771 | 441 | 489 | 404 | 373 |
| Average Rent (per bed) | $1,139 | $1,616 | $1,351 | $1,025 | $1,104 | $1,049 | $1,215 | $1,271 |
| Occupancy | 89.8% | 94.0% | 81.0% | 100.0% | 98.0% | 87.0% | 82.0% | 85.0% |
| (1) | Information obtained from the appraisal and underwritten rent roll. |
THE INFORMATION IN THIS STRUCTURAL AND COLLATERAL TERM SHEET IS NOT COMPLETE AND MAY BE AMENDED PRIOR TO THE TIME OF SALE. THIS TERM SHEET IS NOT AN OFFER TO SELL THESE SECURITIES AND IT IS NOT A SOLICITATION OF AN OFFER TO BUY THESE SECURITIES IN ANY JURISDICTION WHERE THE OFFER OR SALE IS NOT PERMITTED.
146
(THIS PAGE INTENTIONALLY LEFT BLANK)
THE INFORMATION IN THIS STRUCTURAL AND COLLATERAL TERM SHEET IS NOT COMPLETE AND MAY BE AMENDED PRIOR TO THE TIME OF SALE. THIS TERM SHEET IS NOT AN OFFER TO SELL THESE SECURITIES AND IT IS NOT A SOLICITATION OF AN OFFER TO BUY THESE SECURITIES IN ANY JURISDICTION WHERE THE OFFER OR SALE IS NOT PERMITTED.
147
| No. 13 – Del Amo Fashion Center | |||||||
| Loan Information | Property Information | ||||||
| Mortgage Loan Seller: | Barclays Bank PLC | Single Asset/Portfolio: | Single Asset | ||||
| Credit Assessment (Fitch/KBRA/Moody’s): | AA-/BBB-/Baa1 | Property Type: | Retail | ||||
| Original Principal Balance(1): | $30,000,000 | Specific Property Type: | Super Regional Mall | ||||
| Cut-off Date Balance(1): | $30,000,000 | Location: | Torrance, CA | ||||
| % of Initial Pool Balance: | 2.6% | Size: | 1,769,525 SF | ||||
| Loan Purpose: | Refinance | Cut-off Date Balance Per SF(1): | $259.56 | ||||
| Borrower Names: | Del Amo Fashion Center Operating Company, L.L.C. | Year Built/Renovated: | 1961/2017 | ||||
| Borrower Sponsor: | Simon Property Group, L.P.; Commingled Pension Trust Fund (Strategic Property) of JPMorgan Chase Bank, N.A. | Title Vesting: | Fee | ||||
| Mortgage Rate: | 3.6575% | Property Manager: | Self-managed | ||||
| Note Date: | May 12, 2017 | 4thMost Recent Occupancy (As of)(4): | 93.5% (12/31/2014) | ||||
| Anticipated Repayment Date: | NAP | 3rdMost Recent Occupancy (As of)(4): | 86.1% (12/31/2015) | ||||
| Maturity Date: | June 1, 2027 | 2ndMost Recent Occupancy (As of)(4): | 91.5% (12/31/2016) | ||||
| IO Period: | 120 months | Most Recent Occupancy (As of)(4): | 85.2% (5/15/2017) | ||||
| Loan Term (Original): | 120 months | Current Occupancy (As of)(4): | 85.2% (5/15/2017) | ||||
| Seasoning: | 2 months | ||||||
| Amortization Term (Original): | NAP | Underwriting and Financial Information: | |||||
| Loan Amortization Type: | Interest-only, Balloon | ||||||
| Interest Accrual Method: | Actual/360 | 4thMost Recent NOI (As of): | $28,984,156 (12/31/2014) | ||||
| Call Protection: | L(26),D(87),O(7) | 3rdMost Recent NOI (As of): | $35,039,436 (12/31/2015) | ||||
| Lockbox Type: | Hard/Springing Cash Management | 2ndMost Recent NOI (As of): | $51,101,092 (12/31/2016) | ||||
| Additional Debt(1): | Yes | Most Recent NOI (As of): | $53,218,707 (TTM 3/31/2017) | ||||
| Additional Debt Type(1): | Pari Passu;Subordinate Secured Debt | ||||||
| U/W Revenues: | $81,259,520 | ||||||
| U/W Expenses: | $21,915,628 | ||||||
| U/W NOI(5): | $59,343,892 | ||||||
| U/W NCF(5): | $56,965,434 | ||||||
| Escrows and Reserves: | U/W NOI DSCR(1): | 3.48x | |||||
| U/W NCF DSCR(1): | 3.34x | ||||||
| Type: | Initial | Monthly | Cap (If Any) | U/W NOI Debt Yield(1): | 12.9% | ||
| Taxes(2) | $0 | Springing | NAP | U/W NCF Debt Yield(1): | 12.4% | ||
| Insurance(2) | $0 | Springing | NAP | As-Is Appraised Value(6): | $1,155,000,000 | ||
| Replacement Reserves(2) | $0 | Springing | $446,400 | As-Is Appraisal Valuation Date(6): | April 23, 2017 | ||
| TI/LC Reserve(2) | $0 | Springing | $6,465,600 | Cut-off Date LTV Ratio(1)(6): | 39.8% | ||
| Other(3) | $8,071,240 | $0 | NAP | LTV Ratio at Maturity or ARD(1)(6): | 39.8% | ||
| (1) | See “The Mortgage Loan” section. All statistical financial information related to balance per square foot, loan-to-value ratios, debt service coverage ratios and debt yields are based on the funded outstanding principal balance of the Del Amo Fashion Center Senior Loan (as defined below). |
| (2) | During either an event of default or a DSCR Reserve Trigger Period (as defined below), the Del Amo Fashion Center Borrowers are required to deposit monthly escrows for real estate taxes, insurance premiums (unless the Del Amo Fashion Center Property is insured under an acceptable blanket insurance policy), $18,600 for replacement reserves, capped at $446,400, and $179,600 for tenant improvement and leasing commissions, capped at $6,465,600. The Del Amo Fashion Center Borrowers will additionally be required to deposit monthly escrows for real estate taxes if the Del Amo Fashion Center Borrowers fail to provide evidence that the real estate taxes have been paid prior to the assessment of any penalty for late charges. A “DSCR Reserve Trigger Period” will commence upon the debt service coverage ratio for the Del Amo Fashion Center Whole Loan being less than 1.50x for two consecutive quarters based on the trailing four quarters and will end (provided no event of default has occurred and is continuing) upon the debt service coverage ratio for the Del Amo Fashion Center Whole Loan being equal to or greater than 1.50x for two consecutive quarters based on the trailing four quarters. |
| (3) | No upfront escrows were collected at origination. At loan origination, the Del Amo Fashion Center Whole Loan guarantor provided guarantees in the amount of $7,242,346 for outstanding landlord obligations relating to fourteen tenants and $828,894 for abated rent periods relating to eleven tenants which continue through as late as February 1, 2018. |
| (4) | See “Historical Occupancy” section. |
| (5) | See “Cash Flow Analysis” section. |
| (6) | As of the appraisal valuation date of April 23, 2017, the Del Amo Fashion Center Property had an “as-is” appraised value of $1,155,000,000. The appraiser also concluded to an “as-stabilized” value of $1,255,000,000 as of May 1, 2019, which equates to an “as-stabilized” loan-to-value-ratio of 36.6% and an “as-stabilized” loan-to-value ratio at maturity of 36.6%. |
The Mortgage Loan. The mortgage loan (the “Del Amo Fashion Center Mortgage Loan”) is part of a whole loan (the “Del Amo Fashion Center Whole Loan”) that is evidenced by 17pari passu promissory A-notes in the aggregate original principal amount of $375,800,000, which arepari passu with each other, 17 promissory B-Notes in the aggregate original amount of $83,500,000, which are subordinate to the A-Notes andpari passu with each other (such A-Notes and B-Notes, collectively, the “Del Amo Fashion Center Senior Loan”) and twelve subordinate promissory notes in the aggregate original principal amount of $125,700,000, which are evidenced by four notes from each of three tranches (C-Notes, D-Notes and E-Notes, each of which is subordinate to the Del Amo
THE INFORMATION IN THIS STRUCTURAL AND COLLATERAL TERM SHEET IS NOT COMPLETE AND MAY BE AMENDED PRIOR TO THE TIME OF SALE. THIS TERM SHEET IS NOT AN OFFER TO SELL THESE SECURITIES AND IT IS NOT A SOLICITATION OF AN OFFER TO BUY THESE SECURITIES IN ANY JURISDICTION WHERE THE OFFER OR SALE IS NOT PERMITTED.
148
| DEL AMO FASHION CENTER |
Fashion Center Senior Loan and to each other such tranche with a prior alphabetical designation (collectively, the “Del Amo Fashion Center Subordinate Loan”), which are secured by a first priority fee mortgage encumbering 1,769,525 square feet of a super regional mall in Torrance, California (the “Del Amo Fashion Center Property”). Promissory Notes A-2-2-A and B-2-2-A, in the aggregate principal amount of $30,000,000, are from each of the A and B tranches ofpari passu components that comprise the Del Amo Fashion Center Senior Loan and represent the Del Amo Fashion Center Mortgage Loan and will be included in the WFCM 2017-C39 securitization trust.
The Del Amo Fashion Center Whole Loan was co-originated on May 12, 2017 by Wells Fargo Bank, National Association, Bank of America, N.A., Barclays Bank PLC, and Société Générale. The Del Amo Fashion Center Whole Loan had an original principal balance of $585,000,000, has an outstanding principal balance as of the Cut-off Date of $585,000,000 and accrues interest at an interest rate of 3.6575%per annum. The Del Amo Fashion Center Whole Loan had an initial term of 120 months, has a remaining term of 118 months as of the Cut-off Date and requires payments of interest only through the term of the Del Amo Fashion Center Whole Loan. The Del Amo Fashion Center Whole Loan matures on June 1, 2027.
Notes A-2-2-A and B-2-2-A, which will be contributed to the WFCM 2017-C39 Trust, had an aggregate original principal balance of $30,000,000, have an aggregate outstanding principal balance as of the Cut-off Date of $30,000,000 and represent a non-controlling interest in the Del Amo Fashion Center Whole Loan. The following table presents a summary of the promissory notes comprising the Del Amo Fashion Center Whole Loan. The Del Amo Fashion Center Whole Loan is expected to be serviced pursuant to the trust and servicing agreement for the DAFC 2017-AMO transaction. See “Description of the Mortgage Pool—The Whole Loans—The Non-Serviced AB Whole Loans—The Del Amo Fashion Center Whole Loan” in the Preliminary Prospectus.
Note Summary(1)(2)
| Notes | Original Balance | Note Holder | Controlling Interest | |
| A-1-1 | $12,125,000 | DAFC 2017-AMO | Yes | |
| A-1-2 | $36,821,000 | BANK 2017-BNK5 | No | |
| A-1-3 | $24,547,000 | BANK 2017-BNK6 | No | |
| A-1-4 | $20,457,000 | Bank of America, NA | No | |
| A-2-1 | $12,125,000 | DAFC 2017-AMO | No | |
| A-2-2-A | $24,547,333 | WFCM 2017-C39 | No | |
| A-2-2-B | $12,273,667 | Barclays Bank PLC | No | |
| A-2-3 | $24,547,000 | WFCM 2017-C38 | No | |
| A-2-4 | $20,457,000 | Barclays Bank PLC | No | |
| A-3-1 | $12,125,000 | DAFC 2017-AMO | No | |
| A-3-2 | $32,730,000 | Société Générale | No | |
| A-3-3(3) | $36,821,250 | UBS 2017-C2 | No | |
| A-3-4 | $12,273,750 | Société Générale | No | |
| A-4-1 | $12,125,000 | DAFC 2017-AMO | No | |
| A-4-2 | $36,821,000 | BANK 2017-BNK5 | No | |
| A-4-3 | $24,547,000 | WFCM 2017-C38 | No | |
| A-4-4 | $20,457,000 | BANK 2017-BNK6 | No | |
| B-1-1 | $2,700,000 | DAFC 2017-AMO | No | |
| B-1-2 | $8,179,000 | BANK 2017-BNK5 | No | |
| B-1-3 | $5,453,000 | BANK 2017-BNK6 | No | |
| B-1-4 | $4,543,000 | BANK 2017-BNK6 | No | |
| B-2-1 | $2,700,000 | DAFC 2017-AMO | No | |
| B-2-2-A | $5,452,667 | WFCM 2017-C39 | No | |
| B-2-2-B | $2,726,333 | Barclays Bank PLC | No | |
| B-2-3 | $5,453,000 | WFCM 2017-C38 | No | |
| B-2-4 | $4,543,000 | Barclays Bank PLC | No | |
| B-3-1 | $2,700,000 | DAFC 2017-AMO | No | |
| B-3-2 | $7,270,000 | Société Générale | No | |
| B-3-3(3) | $8,178,750 | UBS 2017-C2 | No | |
| B-3-4 | $2,726,250 | Société Générale | No | |
| B-4-1 | $2,700,000 | DAFC 2017-AMO | No | |
| B-4-2 | $8,179,000 | BANK 2017-BNK5 | No | |
| B-4-3 | $5,453,000 | WFCM 2017-C38 | No | |
| B-4-4 | $4,543,000 | BANK 2017-BNK6 | No | |
| Subordinate Loan | $125,700,000 | DAFC 2017-AMO | No | |
| Total | $585,000,000 |
| (1) | The promissory notes currently held by Wells Fargo Bank, National Association, Bank of America, N.A., Barclays Bank PLC, and Société Générale and are expected to be contributed to future securitization transactions or may be otherwise transferred at any time. The lender provides no assurances that any non-securitizedpari passunote will not be split further. |
| (2) | The B-Notes are subordinate to the A-Notes. |
| (3) | Notes A-3-3 and B-3-3 are expected to be contributed to the UBS 2017-C2 transaction. |
Following the lockout period, the borrower has the right to defease the Del Amo Fashion Center Whole Loan in whole, but not in part, on any date before December 1, 2026. In addition, the Del Amo Fashion Center Whole Loan is prepayable without penalty on or after December 1, 2026. The lockout period will expire on the earlier to occur of (i) two years after the closing date of the securitization that includes the last note to be securitized and (ii) May 2, 2020.
THE INFORMATION IN THIS STRUCTURAL AND COLLATERAL TERM SHEET IS NOT COMPLETE AND MAY BE AMENDED PRIOR TO THE TIME OF SALE. THIS TERM SHEET IS NOT AN OFFER TO SELL THESE SECURITIES AND IT IS NOT A SOLICITATION OF AN OFFER TO BUY THESE SECURITIES IN ANY JURISDICTION WHERE THE OFFER OR SALE IS NOT PERMITTED.
149
| DEL AMO FASHION CENTER |
Sources and Uses
| Sources | Uses | |||||||
| Original whole loan amount(1) | $585,000,000 | 100.0% | Loan Payoff: | $511,127,344 | 87.4% | |||
| Closing Costs: | 3,288,487 | 0.6 | ||||||
| Return of Equity: | 70,584,168 | 12.1 | ||||||
| Total Sources | $585,000,000 | 100.0% | Total Uses | $585,000,000 | 100.0% |
| (1) | The Del Amo Fashion Center Mortgage Loan is part of the Del Amo Fashion Center Whole Loan, which is comprised of seventeen promissory A-Notes (which arepari passu with each other) with an aggregate principal balance of $375,800,000, seventeen promissory B-Notes (which are subordinate to the A-Notes andpari passu with each other) with an aggregate principal balance of $83,500,000, and twelve subordinate mortgage notes with an aggregate principal balance of $125,700,000. |
The Property.The Del Amo Fashion Center Property consists of 1,769,525 square feet of traditional mall, open air lifestyle and entertainment space which together with the non-collateral Macy’s and Sears anchors comprise the 2.51 million square feet Del Amo Fashion Center mall, the largest shopping center in the western United States. The Del Amo Fashion Center Property is located in the suburban community of Torrance, California, at the intersection of Hawthorne and Sepulveda Boulevards. Hawthorne Boulevard is a ten-lane arterial providing access to the Pacific Coast Highway to the south and I-105 to the north. Sepulveda Boulevard is an eight-lane thoroughfare that provides access between Redondo Beach and I-110.
The Del Amo Fashion Center Property is a two-level super regional mall with a diverse tenancy including large chain stores such as Dick’s Sporting Goods, H&M, XXI Forever and Crate & Barrel, restaurants including P.F. Chang’s China Bistro, Lazy Dog Cafe, Great Maple and Din Tai Fung (a Michelin-starred restaurant), entertainment options including the 18-screen AMC Theatres and Dave & Buster’s (not yet open), as well as over 100 in-line retailers and brands including 25 first-to-market brands including Arhaus Furniture, Kate Spade New York, Hugo Boss, J. Crew, Lululemon and Michael Kors. Collateral anchors include J.C. Penney and Nordstrom. The Del Amo Fashion Center Property was 85.2% leased as of May 15, 2017 to 208 retail and restaurant tenants. Included in the collateral are 11,892 parking spaces (approximately 6.7 spaces per 1,000 square feet).
The Del Amo Fashion Center Property is currently undergoing a $423 million redevelopment that started in 2013. The multi-phased project includes (i) the renovation of the north mall area and creation of the new Patio Café Dining Pavilion which opened in 2014 and includes ten eateries, seating for 700, floor to ceiling living plant walls, skylights and lounge areas with complimentary Wi-Fi, (ii) the addition of approximately 350,000 square feet of in-line shops, the Nordstrom anchor and a multi-level parking deck, delivered in 2015, (iii) the renovation of the south mall area, completed in November 2016, (iv) the construction of the Dick’s Sporting Goods store, which opened in June 2017, and additional adjacent in-line stores and renovation of neighboring in-line stores, which construction and renovation was expected to have been completed in May 2017, (v) the build-out of two restaurant pads, BRIO Tuscan Grille and EMC Seafood & Raw Bar (which is expected to be completed in 2017), and (vi) the construction of the Marshalls and Dave & Buster’s which is expected to be completed in May 2018. The remaining cost of the redevelopment has not been reserved for under the Del Amo Fashion Center Whole Loan documents and such redevelopment is not required to be completed by the Del Amo Fashion Center Borrowers.
THE INFORMATION IN THIS STRUCTURAL AND COLLATERAL TERM SHEET IS NOT COMPLETE AND MAY BE AMENDED PRIOR TO THE TIME OF SALE. THIS TERM SHEET IS NOT AN OFFER TO SELL THESE SECURITIES AND IT IS NOT A SOLICITATION OF AN OFFER TO BUY THESE SECURITIES IN ANY JURISDICTION WHERE THE OFFER OR SALE IS NOT PERMITTED.
150
| DEL AMO FASHION CENTER |
The following table presents certain information relating to the tenancy at the Del Amo Fashion Center Property:
Major Tenants
| Tenant Name | Credit Rating (Fitch/Moody’s/ S&P)(1) | Tenant NRSF | % of NRSF | Annual U/W Base Rent PSF(2) | Annual U/W Base Rent(2) | % of Total Annual U/W Base Rent | Sales PSF(3) | Occupancy Cost(3) | Lease Expiration Date |
| Anchor Tenants – Not Part of Collateral | |||||||||
| Macy’s | BBB/Baa3/BBB- | 423,307 | ANCHOR OWNED – NOT PART OF THE COLLATERAL | ||||||
| Sears | CC/Caa2/CCC+ | 313,495 | |||||||
| Anchor Tenants | |||||||||
| J.C. Penney | B+/B1/B+ | 163,346 | 9.2% | $2.80 | $457,325 | 0.9% | $129 | N/A | 12/31/2018 |
| Nordstrom | BBB+/Baa1/BBB+ | 138,000 | 7.8% | $0(4) | $0(4) | 0.0%(4) | $373 | N/A | 2/28/2031 |
| AMC Theaters | NR/B1/NR | 76,800 | 4.3% | $39.93 | $3,066,624 | 6.1% | $961,500(6) | 17.7% | 9/30/2021 |
| Total Anchor Tenants | 378,146 | 21.4% | $14.67(5) | $3,523,949 | 7.0% | ||||
| Major Tenants | |||||||||
| LA Fitness | NR/NR/NR | 47,137 | 2.7% | $38.02 | $1,792,237 | 3.6% | N/A | N/A | 1/31/2022 |
| Dave & Buster’s(7) | NR/NR/NR | 42,336 | 2.4% | $34.00 | $1,439,424 | 2.9% | N/A | N/A | 4/30/2033 |
| Dick’s Sporting Goods | NR/NR/NR | 83,210 | 4.7% | $16.25 | $1,352,163 | 2.7% | N/A | N/A | 4/30/2027 |
| H&M | NR/NR/NR | 25,086 | 1.4% | $42.90 | $1,076,189 | 2.1% | N/A | N/A | 1/31/2026 |
| Zara | NR/NR/NR | 26,802 | 1.5% | $39.20 | $1,050,625 | 2.1% | $328 | 12.0% | 10/31/2027 |
| Burlington Coat Factory | NR/NR/NR | 60,000 | 3.4% | $14.00 | $840,000 | 1.7% | N/A | N/A | 1/31/2025(8) |
| Marshalls(7) | NR/A2/A+ | 30,716 | 1.7% | $24.50 | $752,542 | 1.5% | N/A | N/A | 2/29/2028 |
| Express | NR/NR/NR | 11,208 | 0.6% | $66.19 | $741,858 | 1.5% | N/A | N/A | 1/31/2026 |
| Old Navy | BB+/Baa2/BB+ | 17,990 | 1.0% | $39.62 | $712,799 | 1.4% | $433 | 9.7% | 1/31/2024 |
| XXI Forever | NR/NR/NR | 20,217 | 1.1% | $35.00 | $707,595 | 1.4% | $377 | 13.4% | 1/31/2018 |
| Total Major Tenants | 364,702 | 20.6% | $28.70 | 10,465,431 | 20.8% | ||||
| Non-Major Tenants(9) | 764,810 | 43.2% | $47.61 | $36,415,851 | 72.2% | ||||
| Occupied Collateral Total | 1,507,658 | 85.2% | $33.43 | $50,405,231 | 100.0% | ||||
| Vacant Space | 261,867 | 14.8% | |||||||
| Collateral Total | 1,769,525 | 100.0% | |||||||
| (1) | Certain ratings are those of the parent company whether or not the parent guarantees the lease. |
| (2) | Annual U/W Base Rent PSF and Annual U/W Base Rent include contractual rent steps through July 1, 2018. |
| (3) | Sales PSF and Occupancy Costs are for the trailing 12-month period ending March 31, 2017 for Old Navy and XXI Forever, and 2016 for all other tenants. |
| (4) | Nordstrom opened in October 2015 and does not pay base rent but pays percentage rent equivalent to 2% of sales over a $60.0 million breakpoint. |
| (5) | The Total Anchor Tenants Annual U/W Base Rent PSF excludes Nordstrom square footage. Including Nordstrom, the Annual U/W Base Rent PSF is $9.32. |
| (6) | Sales PSF represents Sales per screen, based on 18 screens. |
| (7) | Dave & Buster’s and Marshalls have executed leases with expected May 2018 commencement dates. The Del Amo Fashion Center Whole Loan guarantor has signed a ten-year master lease which provides for the annual rent obligations for these tenants. |
| (8) | Burlington Coat Factory has the option to terminate its lease at any time upon at least 270 days’ prior written notice. |
| (9) | Non-Major Tenants include eleven tenants (2.1% of NRA and 3.4% of underwritten rent) with signed leases with future commencement dates (June 13, 2017 to January 1, 2018). |
As of the trailing-twelve-month period that ended on March 31, 2017, the Del Amo Fashion Center Property had total comparable in-line sales of $124.3 million, with average in-line sales of $611 PSF and an occupancy cost of 13.7%. While the renovations and redevelopment have been ongoing at the Del Amo Fashion Center Property since 2013, in-line sales per square foot have grown from $441 per square foot to $611 per square foot, representing a 39% increase from 2013 to the trailing twelve month period that ended on March 31, 2017.
THE INFORMATION IN THIS STRUCTURAL AND COLLATERAL TERM SHEET IS NOT COMPLETE AND MAY BE AMENDED PRIOR TO THE TIME OF SALE. THIS TERM SHEET IS NOT AN OFFER TO SELL THESE SECURITIES AND IT IS NOT A SOLICITATION OF AN OFFER TO BUY THESE SECURITIES IN ANY JURISDICTION WHERE THE OFFER OR SALE IS NOT PERMITTED.
151
| DEL AMO FASHION CENTER |
The following table presents a summary of historical comparable in-line sales at the Del Amo Fashion Center Property:
Comparable In-Line Sales Summary(1)
| 2013 | 2014 | 2015 | 2016 | 3/31/2017 TTM | |
| In-Line Sales PSF | $441 | $449 | $499 | $560 | $611 |
| Occupancy Cost | 14.3% | 14.7% | 15.9% | 14.4% | 13.7% |
| (1) | Information as provided by the borrower sponsor and only include tenants reporting comparable sales. |
The following table presents certain information relating to the historical anchor sales at the Del Amo Fashion Center Property:
Anchor Sales Summary
| Tenant Name | 2014 | 2015 | 2016 | Sales PSF(1) |
| Macy’s (non-collateral)(2)(3) | $75,100,000 | $62,000,000 | $73,895,000 | $175 |
| Sears (non-collateral)(2)(4) | $32,500,000 | $30,200,000 | NAV(5) | $96 |
| Nordstrom(6) | NAV | NAV | $51,480,000 | $373 |
| J.C. Penney | $23,689,000 | $24,372,000 | $21,061,000 | $129 |
| AMC Theaters(7) | $17,979,000 | $18,114,000 | $17,307,000 | $961,500 |
| (1) | Sales (PSF) reflects most recent year-end sales figures available. |
| (2) | Sales figures reflect estimates for non-collateral anchors. |
| (3) | Macy’s currently operates two stores at the Del Amo Fashion Center Property, totaling 423,307 square feet. Sales figures are representative of both stores. The 2014 sales figures represents three Macy’s stores. |
| (4) | Sears occupies 313,495 square feet, with approximately two levels being used for merchandizing and one level being used for office space. When excluding the office space, the adjusted estimated Sales figure is approximately $144 per square feet. |
| (5) | 2016 sales data not yet available. |
| (6) | Nordstrom opened in October 2015. |
| (7) | AMC Theaters Sales PSF reflects sales per screen, based on 18 screens. |
The following table presents certain information relating to the lease rollover schedule at the Del Amo Fashion Center Property:
Lease Expiration Schedule(1)(2)
| Year Ending December 31, | No. of Leases Expiring | Expiring NRSF | % of Total NRSF | Cumulative Expiring NRSF | Cumulative % of Total NRSF | Annual U/W Base Rent | % of Total Annual U/W Base Rent | Annual U/W Base Rent PSF(3) |
| MTM/2017 | 8 | 26,342 | 1.5% | 26,342 | 1.5% | $1,040,552 | 2.1% | $39.50 |
| 2018 | 11 | 204,233 | 11.5% | 230,575 | 13.0% | $2,054,097 | 4.1% | $10.06 |
| 2019 | 16 | 45,696 | 2.6% | 276,271 | 15.6% | $2,051,118 | 4.1% | $44.89 |
| 2020 | 12 | 88,993 | 5.0% | 365,264 | 20.6% | $2,174,566 | 4.3% | $24.44 |
| 2021 | 10 | 115,598 | 6.5% | 480,862 | 27.2% | $4,593,303 | 9.1% | $39.74 |
| 2022 | 11 | 67,982 | 3.8% | 548,844 | 31.0% | $3,243,680 | 6.4% | $47.71 |
| 2023 | 4 | 75,763 | 4.3% | 624,607 | 35.3% | $1,365,309 | 2.7% | $18.02 |
| 2024 | 17 | 51,974 | 2.9% | 676,581 | 38.2% | $3,595,680 | 7.1% | $69.18 |
| 2025 | 44 | 176,862 | 10.0% | 853,443 | 48.2% | $8,913,244 | 17.7% | $50.40 |
| 2026 | 56 | 222,472 | 12.6% | 1,075,915 | 60.8% | $11,548,229 | 22.9% | $51.91 |
| 2027 | 22 | 202,821 | 11.5% | 1,278,736 | 72.3% | $6,772,847 | 13.4% | $33.39 |
| Thereafter | 6 | 228,922 | 12.9% | 1,507,658 | 85.2% | $3,052,606 | 6.1% | $13.33 |
| Vacant | 0 | 261,867 | 14.8% | 1,769,525 | 100.0% | $0 | 0.0% | $0.00 |
| Total/Weighted Average | 217 | 1,769,525 | 100.0% | $50,405,231 | 100.0% | $33.43 |
| (1) | Information was obtained from the underwritten rent roll and includes ten tenants (1.7% of NRA and 2.5% of underwritten rent) with signed leases with future commencement dates (June 13, 2017 to January 1, 2018) and three tenants (4.5% of NRA and 5.3% of underwritten rent) with signed leases that are not yet in occupancy (Dave & Buster’s (expected lease commencement date of May 2018), Marshalls (expected lease commencement date of May 2018) and EMC Seafood & Raw Bar (expected lease commencement date of January 2018)), for which a ten-year master lease was signed by the Del Amo Fashion Center Whole Loan guarantor which provides for annual rent equivalent to the tenants’ combined annual rent. |
| (2) | Certain tenants may have lease termination options that are exercisable prior to the originally stated expiration date of the subject lease and that are not considered in the Lease Expiration Schedule. |
| (3) | Weighted Average Annual U/W Base Rent PSF excludes vacant space. |
The following table presents historical occupancy percentages at the Del Amo Fashion Center Property:
Historical Occupancy
12/31/2014(1) | 12/31/2015(1) | 12/31/2016(1) | 5/15/2017(2)(3) |
| 93.5% | 86.1% | 91.5% | 85.2% |
| (1) | Information obtained from the borrower. |
| (2) | Information obtained from the underwritten rent roll. |
| (3) | The May 15, 2017 underwritten rent roll includes ten tenants (1.7% of NRA and 2.5% of underwritten rent) with signed leases with future commencement dates (June 13, 2017 to January 1, 2018). It also includes three tenants (4.5% of NRA and 5.3% of underwritten rent) with signed leases not yet in occupancy: Dave & Buster’s (expected lease commencement date of May 2018), Marshalls (expected lease commencement date of May 2018) and EMC Seafood & Raw Bar (expected lease commencement date of January 2018), for which a ten-year master lease was signed by the Del Amo Fashion Center Whole Loan guarantor which provides for annual rent equivalent to the tenants’ combined annual rent. |
THE INFORMATION IN THIS STRUCTURAL AND COLLATERAL TERM SHEET IS NOT COMPLETE AND MAY BE AMENDED PRIOR TO THE TIME OF SALE. THIS TERM SHEET IS NOT AN OFFER TO SELL THESE SECURITIES AND IT IS NOT A SOLICITATION OF AN OFFER TO BUY THESE SECURITIES IN ANY JURISDICTION WHERE THE OFFER OR SALE IS NOT PERMITTED.
152
| DEL AMO FASHION CENTER |
Operating History and Underwritten Net Cash Flow. The following table presents certain information relating to the historical operating performance and the underwritten net cash flow at the Del Amo Fashion Center Property:
Cash Flow Analysis
| 2014 | 2015 | 2016 | TTM 3/31/2017 | U/W | % of U/W Effective Gross Income | U/W $ per SF | |
| Base Rent(1)(2) | $29,467,993 | $33,241,859 | $45,831,077 | $46,804,573 | $51,545,895 | 63.4% | $29.13 |
| Grossed Up Vacant Space(3) | 0 | 0 | 0 | 0 | 11,430,694 | 14.1 | 6.46 |
| Total Reimbursables | 12,142,979 | 15,224,540 | 25,514,526 | 26,374,801 | 25,211,150 | 31.0 | 14.25 |
| Specialty Leasing Income(4) | 1,960,645 | 2,348,117 | 3,373,175 | 3,266,342 | 3,366,899 | 4.1 | 1.90 |
| Other Income(5) | 584,173 | 964,983 | 1,396,597 | 1,359,783 | 1,135,576 | 1.4 | 0.64 |
| Less Vacancy & Credit Loss | (316,274) | (134,368) | (441,700) | (630,344) | (11,430,694) | (-14.1) | (6.46) |
| Effective Gross Income | $43,839,516 | $51,645,131 | $75,673,675 | $77,175,155 | $81,259,520 | 100.0% | $45.92 |
| Total Operating Expenses | $14,855,360 | $16,605,695 | $24,572,583 | $23,956,448 | $21,915,628 | 27.0% | $12.39 |
| Net Operating Income | $28,984,156 | $35,039,436 | $51,101,092 | $53,218,707 | $59,343,892 | 73.0% | $33.54 |
| Capital Expenditures | 0 | 0 | 0 | 0 | 223,460 | 0.3 | 0.13 |
| TI/LC | 0 | 0 | 0 | 0 | 2,154,999 | 2.7 | 1.22 |
| Net Cash Flow | $28,984,156 | $35,039,436 | $51,101,092 | $53,218,707 | $56,965,434 | 70.1% | $32.19 |
| NOI DSCR(6) | 1.70x | 2.06x | 3.00x | 3.12x | 3.48x | ||
| NCF DSCR(6) | 1.70x | 2.06x | 3.00x | 3.12x | 3.34x | ||
| NOI DY(6) | 6.3% | 7.6% | 11.1% | 11.6% | 12.9% | ||
| NCF DY(6) | 6.3% | 7.6% | 11.1% | 11.6% | 12.4% |
| (1) | U/W Base Rent includes contractual rent steps through July 1, 2018. |
| (2) | The increase in U/W Base Rent from TTM 3/31/2017 Base Rent is partially due to the inclusion of ten tenants (1.7% of NRA and 2.5% of underwritten rent) with signed leases with future commencement dates (June 13, 2017 to January 1, 2018) and three tenants (4.5% of NRA and 5.3% of underwritten rent) with signed leases not yet in occupancy: Dave & Buster’s (expected lease commencement date of May 2018), Marshalls (expected lease commencement date of May 2018) and EMC Seafood & Raw Bar (expected lease commencement date of January 2018), for which a ten-year master lease was signed by the Del Amo Fashion Center Whole Loan guarantor which provides for annual rent equivalent to the tenants’ combined annual rent. |
| (3) | Grossed up vacant space includes gross-up rent and recoveries. |
| (4) | Specialty leasing income includes income from temporary rental of available in-line space, kiosks, and carts as well as miscellaneous sources such as special events. |
| (5) | Other income includes income from storage, stroller rentals, ATMs and other miscellaneous rental income. |
| (6) | Debt service coverage ratios and debt yields are based on the Del Amo Fashion Center Senior Loan and exclude the Del Amo Fashion Center Subordinate Loan. |
The following table presents certain information relating to comparable properties to the Del Amo Fashion Center Property:
Competitive Set(1)
Del Amo Fashion Center (Subject) | South Bay Galleria | Promenade on the Peninsula | Manhattan Village | South Bay Pavilion | |
| Location | Torrance, CA | Redondo Beach, CA | Rancho Palos Verdes, CA | Manhattan Beach, CA | Carson, CA |
| Distance from Subject | -- | 3.5 miles | 5.4 miles | 7.5 miles | 8.5 miles |
| Property Type | Super Regional Mall | Super Regional Mall | Regional Center | Super Regional Mall | Super Regional Mall |
| Year Built/Renovated | 1961/2017 | 1984/2014 | 1981/NAP | 1981/NAP | 1973/NAP |
| Anchors | Macy’s (non-collateral), Sears (non-collateral), Nordstrom, J.C. Penney | Macy’s, Kohl’s, Cinemas | Equinox Fitness, Cinemas | Macy’s, Fry’s Electronics, Ralph’s/CVS | J.C. Penney, Target, IKEA, 24-Hour Fitness, Cinemas |
| Total GLA | 1,769,525 SF | 960,200 SF | 374,186 SF | 620,008 SF | 1,016,554 SF |
| Total Occupancy | 85.2%(2) | 84.9% | 80.6% | 99.4% | 82.2% |
| (1) | Information obtained from the appraisal. |
| (2) | As of May 15, 2017 which includes (i) ten tenants (1.7% of NRA and 2.5% of underwritten rent) with signed leases with future commencement dates (June 13, 2017 to January 1, 2018) and (ii) three tenants (4.5% of NRA and 5.3% of underwritten rent) with signed leases not yet in occupancy: Dave & Buster’s (expected lease commencement date of May 2018), Marshalls (expected lease commencement date of May 2018) and EMC Seafood & Raw Bar (expected lease commencement date of January 2018), for which a ten-year master lease was signed by the Del Amo Fashion Center Whole Loan guarantor which provides for annual rent equivalent to the tenants’ combined annual rent. See “Cash Flow Analysis” section.
|
THE INFORMATION IN THIS STRUCTURAL AND COLLATERAL TERM SHEET IS NOT COMPLETE AND MAY BE AMENDED PRIOR TO THE TIME OF SALE. THIS TERM SHEET IS NOT AN OFFER TO SELL THESE SECURITIES AND IT IS NOT A SOLICITATION OF AN OFFER TO BUY THESE SECURITIES IN ANY JURISDICTION WHERE THE OFFER OR SALE IS NOT PERMITTED.
153
| No. 14 – Cleveland East Office Portfolio | |||||||
| Loan Information | Property Information | ||||||
| Mortgage Loan Seller: | Argentic Real Estate Finance LLC | Single Asset/Portfolio: | Portfolio | ||||
Credit Assessment (Fitch/KBRA/Moody’s): | NR/NR/NR | Property Type: | Office | ||||
| Original Principal Balance(1): | $30,000,000 | Specific Property Type: | Suburban | ||||
| Cut-off Date Balance(1): | $30,000,000 | Location: | Various – See Table | ||||
| % of Initial Pool Balance: | 2.6% | Size: | 499,454 SF | ||||
| Loan Purpose: | Acquisition | Cut-off Date Balance Per SF(1): | $84.09 | ||||
| Borrower Name: | Shelbourne Cleveland East, LLC | Year Built/Renovated: | Various – See Table | ||||
| Sponsors: | Shelbourne Global Solutions, LLC | Title Vesting: | Fee | ||||
| Mortgage Rate: | 5.217% | Property Manager: | Self-managed | ||||
| Note Date: | June 27, 2017 | 4thMost Recent Occupancy (As of): | 77.4% (12/31/2014) | ||||
| Anticipated Repayment Date: | NAP | 3rdMost Recent Occupancy (As of): | 86.5% (12/31/2015) | ||||
| Maturity Date: | July 6, 2022 | 2ndMost Recent Occupancy (As of): | 90.8% (12/31/2016) | ||||
| IO Period: | 12 months | Most Recent Occupancy (As of): | 91.6% (4/30/2017) | ||||
| Loan Term (Original): | 60 months | Current Occupancy (As of): | 90.0% (5/22/2017) | ||||
| Seasoning: | 1 month | ||||||
| Amortization Term (Original): | 360 months | Underwriting and Financial Information: | |||||
| Loan Amortization Type: | Interest-only, Amortizing Balloon | ||||||
| Interest Accrual Method: | Actual/360 | 4thMost Recent NOI(4) (As of): | $3,019,578 (12/31/2014) | ||||
| Call Protection(2): | L(25),D(31),O(4) | 3rdMost Recent NOI(4) (As of): | $2,876,786 (12/31/2015) | ||||
| Lockbox Type: | Hard/Springing Cash Management | 2ndMost Recent NOI(4) (As of): | $4,256,701 (12/31/2016) | ||||
| Additional Debt(1): | Yes | Most Recent NOI(4) (As of): | $4,161,486 (TTM 4/30/2017) | ||||
| Additional Debt Type(1): | Pari Passu | ||||||
| U/W Revenues: | $9,717,961 | ||||||
| U/W Expenses: | $4,851,848 | ||||||
| U/W NOI(4): | $4,866,113 | ||||||
| U/W NCF: | $4,291,741 | ||||||
| Escrows and Reserves: | U/W NOI DSCR(1): | 1.75x | |||||
| Type: | Initial | Monthly | Cap (If Any) | U/W NCF DSCR(1): | 1.55x | ||
| Taxes | $124,065 | $124,065 | NAP | U/W NOI Debt Yield(1)(3): | 11.6% | ||
| Insurance | $69,859 | $5,822 | NAP | U/W NCF Debt Yield(1)(3): | 10.2% | ||
| Replacement Reserves | $0 | $6,243 | NAP | As-Is Appraised Value: | $60,000,000 | ||
| General TI/LC Reserve | $882,525 | $41,621 | $2,500,000 | As-Is Appraisal Valuation Dates: | February 21, 2017 | ||
| Landerbrook I Reserve(3) | $2,890,500 | $0 | $0 | Cut-off Date LTV Ratio(1)(3): | 70.0% | ||
| Deferred Maintenance | $196,507 | $0 | NAP | LTV Ratio at Maturity or ARD(1)(3): | 65.9% | ||
| (1) | All statistical information related to balance per square foot, loan-to-value ratios, debt service coverage ratios and debt yields are based on the funded outstanding principal balance of the Cleveland East Office Portfolio Whole Loan (as defined below). |
| (2) | Following the lockout period, the borrower is permitted to partially release either the three Landerbrook Corporate Center buildings (collectively, the “Landerbrook Corporate Center Property”) or the Metropolitan Plaza Property in connection with a bona fide third party sale, subject to certain conditions, including (i) no event of default has occurred or is continuing; (ii) partial defeasance of the Cleveland East Office Portfolio Whole Loan in the amount equal to the greater of 120% of the released property’s allocated loan balance and 95% of the net sales proceeds; (iii) the debt service coverage ratio with respect to the remaining property will be no less than the greater of 1.55x and the debt service coverage ratio immediately prior to the release; (iv) the loan-to-value ratio with respect to the remaining property will be no greater than the lesser of 70.0% and the loan-to-value ratio immediately prior to the release; and (v) the debt yield with respect to the remaining property will be no less than the greater of 10.22% and the debt yield immediately prior to the release. |
| (3) | The loan documents provide for an upfront escrow at closing in the amount of $2,890,500 for a reserve related to suite 100 (18,050 square feet) and suite 150 (4,484 square feet) at the Landerbrook Corporate Center I property, which will be released to the borrower upon (i) the debt yield of the Cleveland East Office Portfolio Properties (as defined below) being no less than 11.0%; and (ii) the following leasing conditions being met: (a) the execution of a new lease for the entirety of the suite 100 space or suite 150 space for an initial term of at least five years with a minimum base rent of $23.50 per square foot (exclusive of any adjustments for free rent, if any), (b) all leasing expenses have been paid in full, and (c) the tenant under such lease has commenced paying full unabated rent. In the event that the borrower has only satisfied conditions (a) through (c) above with respect to one of the two spaces, the amount released will be based on the pro rata portion attributable to such space. Any funds not released to the borrower prior to April 6, 2022 maybe used by the lender to partially prepay the loan. Assuming the full balance of $2,890,500 is applied to the Cleveland East Portfolio Whole Loan, the U/W NOI Debt Yield, U/W NCF Debt Yield, Cut-Off Date LTV Ratio and LTV Ratio at Maturity or ARD are 12.4%, 11.0%, 65.2% and 61.1%, respectively. |
| (4) | See “Cash Flow Analysis” section. |
The Cleveland East Office Portfolio Mortgage loan is part of a whole loan (the “Cleveland East Office Portfolio Whole Loan”) that is evidenced by two promissory notes (Notes A-1 and A-2) secured by a first mortgage encumbering the fee interest in one class A and one class B suburban office properties located in Mayfield Heights and Highland Hills, Ohio (the “Cleveland East Office Portfolio Properties”). The Cleveland East Office Portfolio Whole Loan was originated on June 27, 2017 by Argentic Real Estate Finance LLC. The Cleveland East Office Portfolio Whole Loan had an original principal balance of $42,000,000, has an outstanding principal balance as of the Cut-off Date of $42,000,000 and accrues interest at an interest rate of 5.217%per annum. The Cleveland East Office Portfolio Whole Loan had an initial term of 60 months, has a remaining term of 59 months as of the Cut-off Date and requires
THE INFORMATION IN THIS STRUCTURAL AND COLLATERAL TERM SHEET IS NOT COMPLETE AND MAY BE AMENDED PRIOR TO THE TIME OF SALE. THIS TERM SHEET IS NOT AN OFFER TO SELL THESE SECURITIES AND IT IS NOT A SOLICITATION OF AN OFFER TO BUY THESE SECURITIES IN ANY JURISDICTION WHERE THE OFFER OR SALE IS NOT PERMITTED.
154
| CLEVELAND EAST OFFICE PORTFOLIO |
interest-only payments for the first 12 payments following origination and, thereafter, requires payments of principal and interest based on a 30-year amortization schedule. The Cleveland East Office Portfolio Whole Loan matures on July 6, 2022.
The controlling Note A-1 had an original principal balance of $30,000,000, has an outstanding principal balance of $30,000,000 as of the Cut-Off Date and will be contributed to the WFCM 2017-C39 Trust. The non-controlling Note A-2 had an original principal balance of $12,000,000 and will be contributed to a future trust. The lender provides no assurances that any non-securitizedpari passu notes will not be split further. See “Description of the Mortgage Pool-The Whole Loans-The Serviced Whole Loans” in the Preliminary Prospectus.
Note Summary(1)
| Notes | Original Balance | Note Holder | Controlling Interest |
| A-1 | $30,000,000 | WFCM 2017-C39 | Yes |
| A-2 | 12,000,000 | Argentic Real Estate Finance LLC | No |
| Total Sources | $42,000,000 |
| (1) | The lender provides no assurances that any non-securitizedpari passu notes will not be split further. |
Sources and Uses
| Sources | Uses | |||||||
| Original whole loan amount | $42,000,000 | 69.4% | Purchase Price | $59,505,000 | 98.3% | |||
| Sponsor’s new cash contribution | 18,527,011 | 30.6 | Seller credit(1) | (3,773,025 | ) | (6.2) | ||
| Reserves | 4,163,456 | 6.9 | ||||||
| Closing costs | 631,580 | 1.0 | ||||||
| Total Sources | $60,527,011 | 100.0% | Total Uses | $60,527,011 | 100.0% |
| (1) | A $3,773,025 credit was provided by the seller that was used to fund the Landerbrook I Reserve ($2,890,500) and a general TI/LC escrow ($882,525). As part of the sale, the seller master leased suite 100 (18,050 square feet) and suite 105 (4,484 square feet) at the Landerbrook Corporate Center I Property for a term of five years and cash collateralized the master lease with $2,890,500. No underwriting credit was given to such master lease. |
The Cleveland East Office Portfolio Properties consist of two suburban office properties comprised of four separate buildings totaling 499,454 square feet. As of May 22, 2017, the Cleveland East Office Portfolio Properties were 90.0% leased to 27 tenants across a diverse spectrum of industries, including insurance, technology, financial services, real estate and healthcare.
The following table presents certain information relating to the Cleveland East Office Portfolio Properties:
Property Information
| Property Name - Location | Allocated Cut-off Date | % of Portfolio Cut- off Date Principal Balance | Occupancy | Year Renovated | Net Rentable Area (SF) | Appraised Value | Allocated Cut- off Date LTV |
Landerbrook Corporate Center – Mayfield Heights, OH | $29,400,000 | 70.0% | 85.3% | 1997/NAP | 336,349 | $42,000,000 | 70.0% |
Metropolitan Plaza – Highland Hills, OH | $12,600,000 | 30.0% | 99.8% | 2000/NAP | 163,105 | $18,000,000 | 70.0% |
| Total/Weighted Average | $42,000,000 | 100.0% | 90.0% | 499,454 | $60,000,000 | 70.0% |
| (1) | Allocated Cut-Off Date Principal Balance based on Cleveland East Office Portfolio Whole Loan. |
Landerbrook Corporate Center
Situated on a 20.0-acre site, the Landerbrook Corporate Center Property consists of three separate, three-story buildings (Landerbrook Corporate Center I, II and III) totaling 336,349 square feet (67.3% of net rentable area) located in Mayfield Heights, Ohio, approximately 12.2 miles east of Cleveland. Since 2014, approximately 175,511 square feet (52.2% of property net rentable area) of new or renewal leases have been executed at the Landerbrook Corporate Center Property. As of May 22, 2017, the Landerbrook Corporate Center Property was 85.3% leased to 15 tenants.
The 2016 estimated population within a three- and five-mile radius was 63,753, and 156,202, respectively, while the 2016 estimated average household income within the same radii was $92,895 and $93,129, respectively. According to a third party research report, the Landerbrook Corporate Center Property is located in the Lyndhurst/Landerhaven office submarket of the Cleveland office market, which, as of the third quarter of 2017, contained a total inventory of 2.5 million square feet, reported a vacancy rate of 5.6% and reported an average asking rental rate of $20.12 per square foot.
Metropolitan Plaza
Built in 2000 and situated on a 15.6-acre site, the Metropolitan Plaza Property consists of one, six-story building totaling 163,105 square feet (32.7% of net rentable area) located in Highland Hills, Ohio, approximately 10.7 miles southeast of Cleveland. Since 2014, approximately 42,808 square feet (26.2% of property net rentable area) of new or renewal leases have been executed at the Metropolitan Plaza Property. As of May 22, 2017, the Metropolitan Plaza Property was 99.8% leased to 12 tenants.
THE INFORMATION IN THIS STRUCTURAL AND COLLATERAL TERM SHEET IS NOT COMPLETE AND MAY BE AMENDED PRIOR TO THE TIME OF SALE. THIS TERM SHEET IS NOT AN OFFER TO SELL THESE SECURITIES AND IT IS NOT A SOLICITATION OF AN OFFER TO BUY THESE SECURITIES IN ANY JURISDICTION WHERE THE OFFER OR SALE IS NOT PERMITTED.
155
| CLEVELAND EAST OFFICE PORTFOLIO |
The 2016 estimated population within a three- and five-mile radius was 80,755, and 243,108, respectively, while the 2016 estimated average household income within the same radii was $79,117 and $71,661, respectively. According to a third party research report, the Metropolitan Plaza property is located in the Chagrin Corridor office submarket of the Cleveland office market, which, as of the third quarter of 2017, contained a total inventory of 6.1 million square feet, reported a vacancy rate of 5.9% and reported an average asking rental rate of $20.12 per square foot.
The following table presents certain information relating to the tenancy at the Cleveland East Office Portfolio Properties:
Major Tenants
| Tenant Name | Credit Rating (Fitch/ Moody’s/ S&P)(1) | Tenant NRSF | % of NRSF | Annual U/W Base Rent PSF(2) | Annual U/W Base Rent(2) | % of Total Annual U/W Base Rent | Lease Expiration Date | ||
| Major Tenants | |||||||||
| Progressive Insurance | A/A2/A | 114,448 | 22.9% | $11.80(3) | $1,350,316(3) | 15.7% | 1/31/2023(4)(5) | ||
| Victoria Fire & Casualty Co. | NR/A1/NR | 86,183(6) | 17.3% | $20.83 | $1,795,515 | 20.9% | 9/30/2020(7)(8) | ||
| Park Place Technologies, LLC | NR/NR/NR | 51,356 | 10.3% | $21.91 | $1,125,060 | 13.1% | Various(9)(10) | ||
| ONX USA LLC | NR/NR/NR | 23,464 | 4.7% | $22.50 | $527,940 | 6.2% | 3/31/2019(11) | ||
| COVERMYMEDS LLC | NR/NR/NR | 20,896 | 4.2% | $21.50 | $449,264 | 5.2% | 1/31/2026(12) | ||
| Total Major Tenants | 296,347 | 59.3% | $17.71 | $5,248,095 | 61.2% | ||||
| Non-Major Tenants | 153,374 | 30.7% | $21.74 | $3,333,757 | 38.8% | ||||
| Occupied Collateral Total | 449,721 | 90.0% | $19.08 | $8,581,852 | 100.0% | ||||
| Vacant Space | 49,733(13) | 10.0% | |||||||
| Collateral Total | 499,454 | 100.0% | |||||||
| (1) | Certain ratings are those of the parent company whether or not the parent guarantees the lease. |
| (2) | Annual U/W Base Rent PSF and Annual U/W Base Rent include contractual rent steps through February 2018 totaling $78,522. |
| (3) | Annual U/W Base Rent PSF and Annual U/W Base Rent represents the tenant’s average rent over the remaining lease term. The tenant’s current in-place annual base rent is $1,287,540 or $11.25 per square foot. |
| (4) | Progressive Insurance has two, three-year lease renewal options. |
| (5) | Progressive Insurance may terminate its lease on 38,486 square feet of its space on January 31, 2021 or January 31, 2022 with nine months’ written notice and payment of a termination fee equal to three months’ base rent and unamortized tenant improvements and leasing commissions (prorated for the 38,486 square feet only). |
| (6) | Victoria Fire & Casualty Co. is not utilizing approximately 10,200 square feet of its space. |
| (7) | Victoria Fire & Casualty Co. has one, five-year lease renewal option. |
| (8) | Victoria Fire & Casualty Co. may terminate its lease on 1,791 square feet of its space at any time upon providing 30 days’ written notice. |
| (9) | Park Place Technologies, LLC may terminate its lease with written notice, provided the tenant leases a minimum of 52,000 square feet within the Landerbrook Corporate Center Property. The tenant may also reduce its space by 6,155 square feet prior to November 31, 2019 with written notice, provided the tenant leases a minimum of 6,155 square feet within the Landerbrook Corporate Center Property. |
| (10) | Park Place Technologies, LLC has multiple leases that expire as follows: 4,156 square feet expiring December 31, 2017 and 47,200 square feet expiring November 30, 2022. Park Place Technologies, LLC lease has one, five-year lease renewal option for the 47,200 square feet expiring November 30, 2022. |
| (11) | ONX USA LLChas two, five-year lease renewal options. |
| (12) | COVERMYMEDS LLC has one, five-year lease renewal option. |
| (13) | Vacant spaceincludes 7,750 square feet (1.6% of net rentable area) associated with one tenant that is dark but currently still paying rent. This tenant was underwritten as vacant. |
THE INFORMATION IN THIS STRUCTURAL AND COLLATERAL TERM SHEET IS NOT COMPLETE AND MAY BE AMENDED PRIOR TO THE TIME OF SALE. THIS TERM SHEET IS NOT AN OFFER TO SELL THESE SECURITIES AND IT IS NOT A SOLICITATION OF AN OFFER TO BUY THESE SECURITIES IN ANY JURISDICTION WHERE THE OFFER OR SALE IS NOT PERMITTED.
156
| CLEVELAND EAST OFFICE PORTFOLIO |
The following table presents certain information relating to the lease rollover schedule at the Cleveland East Office Portfolio Properties:
Lease Expiration Schedule(1)(2)
| Year Ending December 31, | No. of Leases Expiring | Expiring NRSF | % of Total NRSF | Cumulative Expiring NRSF | Cumulative % of Total NRSF | Annual U/W Base Rent | % of Total Annual U/W Base Rent | Annual U/W Base Rent PSF(3) |
| MTM | 0 | 0 | 0.0% | 0 | 0.0% | $0 | 0.0% | $0.00 |
| 2017 | 5 | 20,830 | 4.2% | 20,830 | 4.2% | $466,773 | 5.4% | $22.41 |
| 2018 | 6 | 25,443 | 5.1% | 46,273 | 9.3% | $521,222 | 6.1% | $20.49 |
| 2019 | 5 | 40,360 | 8.1% | 86,633 | 17.3% | $919,909 | 10.7% | $22.79 |
| 2020 | 4 | 96,894 | 19.4% | 183,527 | 36.7% | $2,047,526 | 23.9% | $21.13 |
| 2021 | 4 | 37,473 | 7.5% | 221,000 | 44.2% | $803,477 | 9.4% | $21.44 |
| 2022 | 4 | 55,601 | 11.1% | 276,601 | 55.4% | $1,217,058 | 14.2% | $21.89 |
| 2023 | 4 | 141,272 | 28.3% | 417,873 | 83.7% | $1,938,568 | 22.6% | $13.72 |
| 2024 | 1 | 10,952 | 2.2% | 428,825 | 85.9% | $218,054 | 2.5% | $19.91 |
| 2025 | 0 | 0 | 0.0% | 428,825 | 85.9% | $0 | 0.0% | $0.00 |
| 2026 | 2 | 20,896 | 4.2% | 449,721 | 90.0% | $449,264 | 5.2% | $21.50 |
| 2027 | 0 | 0 | 0.0% | 449,721 | 90.0% | $0 | 0.0% | $0.00 |
| Thereafter | 0 | 0 | 0.0% | 449,721 | 90.0% | $0 | 0.0% | $0.00 |
| Vacant(4) | 0 | 49,733 | 10.0% | 499,454 | 100.0% | $0 | 0.0% | $0.00 |
| Total/Weighted Average(5) | 35 | 499,454 | 100.0% | $8,581,852 | 100.0% | $19.08 |
| (1) | Information obtained from the underwritten rent roll. |
| (2) | Certain tenants may have lease termination options that are exercisable prior to the originally stated expiration of date of the subject lease and that are not considered in the Lease Expiration Schedule. |
| (3) | Weighted Average Annual U/W Base Rent PSF excludes vacant space. |
| (4) | Vacant spaceincludes 7,750 square feet (1.6% of net rentable area) associated with one tenant that is dark but currently still paying rent. This tenant was underwritten as vacant. |
| (5) | The Cleveland East Office Portfolio Properties are occupied by 27 tenants subject to 35 leases. |
The following table presents historical occupancy percentages at the Cleveland East Office Portfolio Properties:
Historical Occupancy
12/31/2014(1) | 12/31/2015(1) | 12/31/2016(1) | 4/30/2017(1) | 5/22/2017(2)(3) |
| 77.4% | 86.5% | 90.8% | 91.6% | 90.0% |
| (1) | Information obtained from the borrower. |
| (2) | Information obtained from the underwritten rent roll. |
| (3) | Occupancy does not include 7,750 square feet (1.6% of net rentable area) associated with one tenant that is dark but currently still paying rent and is required to pay rent through the term of their lease (February 29, 2020). This tenant was underwritten as vacant. Occupancy including this tenant is 91.6%. |
THE INFORMATION IN THIS STRUCTURAL AND COLLATERAL TERM SHEET IS NOT COMPLETE AND MAY BE AMENDED PRIOR TO THE TIME OF SALE. THIS TERM SHEET IS NOT AN OFFER TO SELL THESE SECURITIES AND IT IS NOT A SOLICITATION OF AN OFFER TO BUY THESE SECURITIES IN ANY JURISDICTION WHERE THE OFFER OR SALE IS NOT PERMITTED.
157
| CLEVELAND EAST OFFICE PORTFOLIO |
Operating History and Underwritten Net Cash Flow.The following table presents certain information relating to the historical operating performance and Underwritten Net Cash Flow at the Cleveland East Office Portfolio Properties:
Cash Flow Analysis
| 2014 | 2015 | 2016 | TTM 4/30/2017 | U/W | % of U/W Effective Gross Income | U/W $ per SF | |
| Base Rent | $6,762,142 | $7,605,396 | $8,408,624 | $8,551,513 | $8,581,852(1) | 88.3% | $17.18 |
| Grossed Up Vacant Space | 0 | 0 | 0 | 0 | 1,118,342 | 11.5 | 2.24 |
| Total Reimbursables | 1,167,559 | 942,628 | 1,417,220 | 1,211,969 | 1,162,567 | 12.0 | 2.33 |
| Other Income | 116,002 | 156,210 | 147,843 | 149,229 | 149,229 | 1.5 | 0.30 |
| Rent Abatement | (428,762) | (1,371,734) | (1,149,542) | (967,891) | 0 | 0.0 | 0.00 |
| Less Vacancy & Credit Loss | 0 | 0 | (2,690) | (2,690) | (1,294,029)(2) | (13.3) | (2.59) |
| Effective Gross Income | $7,616,941 | $7,332,501 | $8,821,455 | $8,942,130 | $9,717,961 | 100.0% | $19.46 |
| Total Operating Expenses | $4,597,362 | $4,455,714 | $4,564,755 | $4,780,644 | $4,851,848 | 49.9 | $9.71 |
| Net Operating Income | $3,019,578 | $2,876,786(3) | $4,256,701(3) | $4,161,486(4) | $4,866,113(4) | 50.1% | $9.74 |
| TI/LC | 0 | 0 | 0 | 0 | 499,454 | 5.1 | 1.00 |
| Capital Expenditures | 0 | 0 | 0 | 0 | 74,918 | 0.8 | 0.15 |
| Net Cash Flow | $3,019,578 | $2,876,786 | $4,256,701 | $4,161,486 | $4,291,741 | 44.2% | $8.59 |
| NOI DSCR(5) | 1.09x | 1.04x | 1.54x | 1.50x | 1.75x | ||
| NCF DSCR(5) | 1.09x | 1.04x | 1.54x | 1.50x | 1.55x | ||
| NOI DY(5) | 7.2% | 6.8% | 10.1% | 9.9% | 11.6% | ||
| NCF DY(5) | 7.2% | 6.8% | 10.1% | 9.9% | 10.2% |
| (1) | Annual U/W Base Rent PSF and Annual U/W Base Rent include contractual rent steps through February 2018 totaling $78,522 and straight-line rent through the lease term of Progressive Insurance, an investment-grade tenant. |
| (2) | The underwritten economic vacancy is 11.9%. The Cleveland East Office Portfolio Properties were 90.0% physically occupied as of May 22, 2017. |
| (3) | The increase in Net Operating Income from 2015 to 2016 is primarily due to new and renewal leases totaling 74,143 square feet (14.8% of net rentable area) commencing between October 2015 and June 2016 as well as expiring abated rent periods from new and renewal leases signed in 2014 and 2015. |
| (4) | The increase in Net Operating Income from TTM 4/30/2017 to U/W is primarily due to abated rent periods associated with 141,819 square feet (28.4% of the net rentable area) of new and renewal leases that have expired. |
| (5) | The debt service coverage ratios and debt yields are based on the Cleveland East Office Portfolio Whole Loan. |
The following table presents certain information relating to comparable retail properties to the Landerbrook Corporate Center Property:
Comparable Retail Leases(1)
| Property Name/Location | Year Built/ Renovated | Total GLA (SF) | Total Occupancy | Distance from Subject | Tenant Name | Lease Date/Term | Lease Area (SF) | Annual Base Rent PSF | Lease Type |
Paragon Center I Mayfield Heights, OH | 1988/NAV | 53,676 | 100.0% | 0.7 miles | Confidential | Dec 2016/ 5 Yrs | 3,945 | $19.95 | NNN |
Monarch Centre Mayfield Heights, OH | 1988/NAV | 88,000 | 80.0% | 0.1 miles | Confidential | Sept 2016/ 5 Yrs | 5,709 | $22.50 | MG |
Landerbrook Office Park I Mayfield Heights, OH | 1991/NAV | 90,659 | 96.0% | 0.2 miles | Confidential | Oct 2016/ 5 Yrs | 2,448 | $21.50 | MG |
Landerbrook Place Mayfield Heights, OH | 1988/NAV | 77,580 | 100.0% | 0.1 miles | Confidential | Oct 2016/ 3 Yrs | 1,718 | $22.95 | FSG |
Landerbrook Place Mayfield Heights, OH | 1988/NAV | 77,580 | 100.0% | 0.1 miles | Allied Dermatology | Aug 2016/ 11 Yrs | 972 | $24.41 | MG |
| (1) | Information obtained from the appraisal. |
THE INFORMATION IN THIS STRUCTURAL AND COLLATERAL TERM SHEET IS NOT COMPLETE AND MAY BE AMENDED PRIOR TO THE TIME OF SALE. THIS TERM SHEET IS NOT AN OFFER TO SELL THESE SECURITIES AND IT IS NOT A SOLICITATION OF AN OFFER TO BUY THESE SECURITIES IN ANY JURISDICTION WHERE THE OFFER OR SALE IS NOT PERMITTED.
158
| CLEVELAND EAST OFFICE PORTFOLIO |
The following table presents certain information relating to comparable retail properties to the Metropolitan Plaza Property
Comparable Retail Leases(1)
| Property Name/Location | Year Built/ Renovated | Total GLA (SF) | Total Occupancy | Distance from Subject | Tenant Name | Lease Date/Term | Lease Area (SF) | Annual Base Rent PSF | Lease Type |
| Brulant Center Beachwood, OH | 1978 | 96,006 | 92.2% | 1.4 miles | Confidential | Oct 2016/ 5 Yrs | 5,600 | $20.00 | FSG |
| Signature Square II Beachwood, OH | 1989 | 82,000 | 90.8% | 1.3 miles | Shimadzu | Aug 2016/ 3 Yrs | 2,298 | $22.50 | MG |
| Executive Commons I Pepper Pike, OH | 1971 | 36,880 | 89.8% | 2.6 miles | Supreme Lending | May 2015/ 5 Yrs | 508 | $20.50 | MG |
| Enterprise Place Beachwood, OH | 1985 | 132,000 | 95.7% | 1.7 miles | Aligned Health Center | Jan 2017/ 7 Yrs | 2,175 | $22.50 | MG |
| Pepper Pike Place, Pepper Pike, OH | 1980 | 72,000 | 97.7% | 2.9 miles | Harvey Kotler Inc | Nov 2016/ 3 Yrs | 829 | $23.00 | FSG |
| (1) | Information obtained from the appraisal. |
THE INFORMATION IN THIS STRUCTURAL AND COLLATERAL TERM SHEET IS NOT COMPLETE AND MAY BE AMENDED PRIOR TO THE TIME OF SALE. THIS TERM SHEET IS NOT AN OFFER TO SELL THESE SECURITIES AND IT IS NOT A SOLICITATION OF AN OFFER TO BUY THESE SECURITIES IN ANY JURISDICTION WHERE THE OFFER OR SALE IS NOT PERMITTED.
159
| No. 15 – Crowne Plaza Dallas | |||||||
| Loan Information | Property Information | ||||||
| Mortgage Loan Seller: | Wells Fargo Bank, National Association | Single Asset/Portfolio: | Single Asset | ||||
| Credit Assessment (Fitch/KBRA/Moody’s): | NR/NR/NR | Property Type: | Hospitality | ||||
| Original Principal Balance: | $27,000,000 | Specific Property Type: | Full Service | ||||
| Cut-off Date Balance: | $27,000,000 | Location: | Dallas, TX | ||||
| % of Initial Pool Balance: | 2.4% | Size: | 292 Rooms | ||||
| Loan Purpose: | Refinance | Cut-off Date Balance Per Room: | $92,466 | ||||
| Borrower Name: | TOG Hotels Downtown Dallas LLC | Year Built/Renovated: | 1969/2016 | ||||
| Sponsor: | Terry D. Tognazzini | Title Vesting: | Fee | ||||
| Mortgage Rate: | 4.660% | Property Manager: | Self-managed | ||||
| Note Date: | June 19, 2017 | 4thMost Recent Occupancy (As of): | 64.3% (12/31/2013) | ||||
| Anticipated Repayment Date: | NAP | 3rdMost Recent Occupancy (As of): | 71.9% (12/31/2014) | ||||
| Maturity Date: | July 4, 2027 | 2ndMost Recent Occupancy (As of): | 79.6% (12/31/2015) | ||||
| IO Period: | 36 months | Most Recent Occupancy (As of): | 78.9% (12/31/2016) | ||||
| Loan Term (Original): | 120 months | Current Occupancy (As of): | 78.8% (4/30/2017) | ||||
| Seasoning: | 1 month | ||||||
| Amortization Term (Original): | 360 months | ||||||
| Loan Amortization Type: | Interest-only, Amortizing Balloon | Underwriting and Financial Information: | |||||
| Interest Accrual Method: | Actual/360 | 4thMost Recent NOI (As of): | $2,937,402 (12/31/2014) | ||||
| Call Protection: | L(25),D(91),O(4) | 3rdMost Recent NOI (As of): | $3,522,337 (12/31/2015) | ||||
| Lockbox Type: | Hard/Springing Cash Management | 2ndMost Recent NOI (As of): | $3,607,960 (12/31/2016) | ||||
| Additional Debt: | None | Most Recent NOI (As of): | $3,966,748 (TTM 4/30/2017) | ||||
| Additional Debt Type: | NAP | U/W Revenues: | $13,158,749 | ||||
| U/W Expenses: | $9,242,238 | ||||||
| U/W NOI: | $3,916,511 | ||||||
| U/W NCF: | $3,390,161 | ||||||
| Escrows and Reserves: | U/W NOI DSCR: | 2.34x | |||||
| Type: | Initial | Monthly | Cap (If Any) | U/W NCF DSCR: | 2.03x | ||
| Taxes | $355,894 | $50,842 | NAP | U/W NOI Debt Yield: | 14.5% | ||
| Insurance | $80,232 | $26,744 | NAP | U/W NCF Debt Yield: | 12.6% | ||
| Replacement Reserves | $0 | $43,863 | NAP | As-If Complete Appraised Value(3): | $45,100,000 | ||
| Deferred Maintenance | $122,000 | $0 | NAP | As-If Complete Appraisal Valuation Date(3): | March 21, 2017 | ||
| PIP Reserve(1) | $4,765,255 | Springing | NAP | Cut-off Date LTV Ratio(3): | 59.9% | ||
| Seasonality Reserve(2) | $184,597 | Springing | $184,597 | LTV Ratio at Maturity or ARD(3): | 52.6% | ||
| (1) | An upfront PIP Reserve of $4,765,255 for the Crowne Plaza Dallas Property was collected at closing for the proposed capital improvements required by the franchisor (“PIP Work”). In addition to this initial deposit, should any additional PIP Work be required by the franchisor, the borrower must deposit (within 30 days of receipt of notice from the franchisor) an amount equal to 115% of the estimated costs to complete such additional PIP Work, as reasonably determined by lender. |
| (2) | The Seasonality Reserve funds may be used for any monthly debt service payments occurring in June, July and August of each year if and only to the extent there is insufficient cash flow from the Crowne Plaza Dallas Property to make the monthly payments required; however, each disbursement can be no greater than $23,075. Any funds drawn down from the Seasonality Reserve will be replenished during the high season of February to June and October to December at a monthly amount equal to the lesser of $23,075 and the amount required for the Seasonality Reserve to be equal to the $184,597 cap. The cap may be adjusted annually by the lender based on the training 12-month operations to an amount that would result in a debt service coverage ratio of 1.25x for any shortfall months. If the monthly Seasonality Reserve is not sufficient to cover debt service shortfalls in any given month, the borrower will be required to deposit the difference. |
| (3) | The As-If Complete Appraised Value represents the value expected following the completion of renovations at the Crowne Plaza Dallas Property. The Cut-off Date LTV Ratio and LTV Ratio at Maturity or ARD based on the “as-is” appraised value of $38,900,000 are 69.4% and 61.0%, respectively. |
The Crowne Plaza Dallas mortgage loan is evidenced by a first mortgage encumbering the fee interest in a 292-room full service hotel located in downtown Dallas, Texas (the “Crowne Plaza Dallas Property”). The Crowne Plaza Dallas Property was constructed in 1969, renovated in 2016 and is situated on a 0.7-acre site. The Crowne Plaza Dallas Property consists of 159 standard double full-size guestrooms, 83 standard king guestrooms, 30 two-bedroom suites, 16 double queen guestrooms and 4 king suites. Guestroom amenities include high definition television and complimentary high-speed WiFi. Amenities at the Crowne Plaza Dallas Property include a fitness center, business center, laundry service, valet parking, rooftop swimming pool, and 30,000 square feet of meeting space across 22 rooms, including the Dallas Grand Ballroom at 8,735 square feet accommodating up to 900 people. The Crowne Plaza Dallas Property also features Thrive Restaurant and Bar (“Thrive”) and Illume Nightclub. Thrive, which was recently renovated in September 2016 at approximately $500,000, offers a for-purchase breakfast and lunch buffet daily, as well as dinner offerings and room service. In total, approximately $1.9 million has been spent in capital expenditure upgrades at the Crowne Plaza Dallas Property over the past five years, which included renovations to the fitness center, Ilume Nightclub and Thrive as well as elevator maintenance and modernization of common areas.
The Crowne Plaza Dallas Property comprises a 480-space parking garage, resulting in a parking ratio of 1.6 spaces per guestroom. According to the appraisal, the market segmentation at the Crowne Plaza Dallas Property is 40% commercial, 35% meeting & group
THE INFORMATION IN THIS STRUCTURAL AND COLLATERAL TERM SHEET IS NOT COMPLETE AND MAY BE AMENDED PRIOR TO THE TIME OF SALE. THIS TERM SHEET IS NOT AN OFFER TO SELL THESE SECURITIES AND IT IS NOT A SOLICITATION OF AN OFFER TO BUY THESE SECURITIES IN ANY JURISDICTION WHERE THE OFFER OR SALE IS NOT PERMITTED.
160
| CROWNE PLAZA DALLAS |
and 25% leisure. The franchise agreement with Holiday Hospitality Franchising, LLC was recently extended and expires in October 2039. As part of the franchise extension, a property improvement plan (“PIP”) was required. A PIP reserve of approximately $4.8 million was escrowed at closing and is expected to be completed within approximately two years of loan closing.
Sources and Uses
| Sources | Uses | |||||||
| Original loan amount | $27,000,000 | 100.0% | Loan payoff | $18,482,643 | 68.5% | |||
| Reserves | 5,507,978 | 20.4 | ||||||
| Closing costs | 739,801 | 2.7 | ||||||
| Return of equity | 2,269,578 | 8.4 | ||||||
| Total Sources | $27,000,000 | 100.0% | Total Uses | $27,000,000 | 100.0% |
Subject and Market Historical Occupancy, ADR and RevPAR(1)
Competitive Set | Crowne Plaza Dallas | Penetration Factor | |||||||
Year | Occupancy | ADR | RevPAR | Occupancy | ADR | RevPAR | Occupancy | ADR | RevPAR |
| TTM 4/30/2017 | 63.5% | $138.65 | $88.09 | 79.1% | $114.42 | $90.47 | 124.5% | 82.5% | 102.7% |
| TTM 4/30/2016 | 63.9% | $135.07 | $86.36 | 77.5% | $115.68 | $89.60 | 121.1% | 85.6% | 103.7% |
| TTM 4/30/2015 | 66.4% | $124.53 | $82.69 | 76.4% | $107.45 | $82.10 | 115.1% | 86.3% | 99.3% |
| (1) | Information obtained from a third party hospitality report dated May 17, 2017. The competitive set includes the following hotels: Crowne Plaza Dallas Market Center, Doubletree Dallas Market Center, Autograph Collection the Adolphus, Hotel Indigo Dallas Downtown, Magnolia Dallas Downtown, Aloft Hotel Dallas Downtown. |
Operating History and Underwritten Net Cash Flow.The following table presents certain information relating to the historical operating performance and underwritten net cash flow at the Crowne Plaza Dallas Property:
Cash Flow Analysis
| 2014 | 2015 | 2016 | TTM 4/30/2017 | U/W | % of U/W Total Revenue | U/W $ perRoom | |
| Occupancy | 71.9% | 79.6% | 78.9% | 78.8% | 78.8% | ||
| ADR | $108.72 | $112.30 | $113.98 | $113.86 | $113.86 | ||
| RevPAR | $78.20 | $89.38 | $89.88 | $89.68 | $89.68 | ||
| Room Revenue | $8,378,637 | $9,450,913 | $9,619,518 | $9,602,063 | $9,602,063 | 73.0% | $32,884 |
| F&B Revenue | 2,757,951 | 2,428,661 | 2,083,751 | 2,373,393 | 2,373,393 | 18.0 | 8,128 |
| Other Revenue | 1,498,513 | 1,507,041 | 1,227,228 | 1,183,293 | 1,183,293 | 9.0 | 4,052 |
| Total Revenue | $12,635,101 | $13,386,614 | $12,930,498 | $13,158,749 | $13,158,749 | 100.0% | $45,064 |
| Total Department Expenses | 4,461,737 | 4,524,988 | 4,123,717 | 4,025,953 | 4,025,953 | 30.6 | 13,788 |
| Gross Operating Profit | $8,173,364 | $8,861,626 | $8,806,780 | $9,132,796 | $9,132,796 | 69.4% | $31,277 |
| Total Undistributed Expenses | 4,423,497 | 4,432,246 | 4,295,372 | 4,286,794 | 4,286,794 | 32.6 | 14,681 |
| Profit Before Fixed Charges | $3,749,867 | $4,429,380 | $4,511,408 | $4,846,002 | $4,846,002 | 36.8% | $16,596 |
| Total Fixed Charges | 812,465 | 907,043 | 903,449 | 879,254 | 929,491 | 7.1 | 3,183 |
| Net Operating Income | $2,937,402 | $3,522,337 | $3,607,960 | $3,966,748 | $3,916,511 | 29.8% | $13,413 |
| FF&E | 0 | 0 | 0 | 0 | 526,350 | 4.0 | 1,803 |
| Net Cash Flow | $2,937,402 | $3,522,337 | $3,607,960 | $3,966,748 | 3,390,161 | 25.8% | 11,610 |
| NOI DSCR | 1.76x | 2.11x | 2.16x | 2.37x | 2.34x | ||
| NCF DSCR | 1.76x | 2.11x | 2.16x | 2.37x | 2.03x | ||
| NOI DY | 10.9% | 13.0% | 13.4% | 14.7% | 14.5% | ||
| NCF DY | 10.9% | 13.0% | 13.4% | 14.7% | 12.6% | ||
THE INFORMATION IN THIS STRUCTURAL AND COLLATERAL TERM SHEET IS NOT COMPLETE AND MAY BE AMENDED PRIOR TO THE TIME OF SALE. THIS TERM SHEET IS NOT AN OFFER TO SELL THESE SECURITIES AND IT IS NOT A SOLICITATION OF AN OFFER TO BUY THESE SECURITIES IN ANY JURISDICTION WHERE THE OFFER OR SALE IS NOT PERMITTED.
161
| Wells Fargo Commercial Mortgage Trust 2017-C39 | Transaction Contact Information |
VI. Transaction Contact Information
Questions regarding this Structural and Collateral Term Sheet may be directed to any of the following individuals:
| Wells Fargo Securities, LLC | |
| Brigid Mattingly | Tel. (312) 269-3062 |
| A.J. Sfarra | Tel. (212) 214-5613 |
| Alex Wong | Tel. (212) 214-5615 |
| Barclays Capital Inc. | |
| Daniel Vinson | Tel. (212) 528-8224 |
| Brian Wiele | Tel. (212) 412-5780 |
| Brian La Belle | Tel. (212) 526-1809 |
THE INFORMATION IN THIS STRUCTURAL AND COLLATERAL TERM SHEET IS NOT COMPLETE AND MAY BE AMENDED PRIOR TO THE TIME OF SALE. THIS TERM SHEET IS NOT AN OFFER TO SELL THESE SECURITIES AND IT IS NOT A SOLICITATION OF AN OFFER TO BUY THESE SECURITIES IN ANY JURISDICTION WHERE THE OFFER OR SALE IS NOT PERMITTED.
162