| FREE WRITING PROSPECTUS | ||
| FILED PURSUANT TO RULE 433 | ||
| REGISTRATION FILE NO.: 333-206677-18 | ||
 |  |  |
Free Writing Prospectus
Collateral Term Sheet
$1,213,814,926
(Approximate Aggregate Cut-off Date Balance of Mortgage Pool)
BANK 2017-BNK7
as Issuing Entity
Wells Fargo Commercial Mortgage Securities, Inc.
as Depositor
Wells Fargo Bank, National Association
Morgan Stanley Mortgage Capital Holdings LLC
Bank of America, National Association
National Cooperative Bank, N.A.
as Sponsors and Mortgage Loan Sellers
Commercial Mortgage Pass-Through Certificates
Series 2017-BNK7
September 8, 2017
WELLS FARGO
Co-Lead Manager and Joint Bookrunner | BofA MERRILL
Co-Lead Manager and Joint Bookrunner | MORGAN
Co-Lead Manager and Joint Bookrunner |
Academy Securities Co-Manager |
STATEMENT REGARDING THIS FREE WRITING PROSPECTUS
The depositor has filed a registration statement (including a prospectus) with the Securities and Exchange Commission (’’SEC’’) (SEC File No. 333-206677) for the offering to which this communication relates. Before you invest, you should read the prospectus in the registration statement and other documents the depositor has filed with the SEC for more complete information about the depositor, the issuing entity and this offering. You may get these documents for free by visiting EDGAR on the SEC Web site at www.sec.gov. Alternatively, the depositor, any underwriter, or any dealer participating in the offering will arrange to send you the prospectus after filing if you request it by calling toll free 1-800-745-2063 (8 a.m. – 5 p.m. EST) or by emailing wfs.cmbs@wellsfargo.com.
Nothing in this document constitutes an offer of securities for sale in any jurisdiction where the offer or sale is not permitted. The information contained herein is preliminary as of the date hereof, supersedes any such information previously delivered to you and will be superseded by any such information subsequently delivered and ultimately by the final prospectus relating to the securities. These materials are subject to change, completion, supplement or amendment from time to time.
This free writing prospectus has been prepared by the underwriters for information purposes only and does not constitute, in whole or in part, a prospectus for the purposes of Directive 2003/71/EC (as amended) and/or Part VI of the Financial Services and Markets Act 2000, as amended, or other offering document.
STATEMENT REGARDING ASSUMPTIONS AS TO SECURITIES, PRICING ESTIMATES AND OTHER INFORMATION
The attached information contains certain tables and other statistical analyses (the “Computational Materials”) which have been prepared in reliance upon information furnished by the Mortgage Loan Sellers. Numerous assumptions were used in preparing the Computational Materials, which may or may not be reflected herein. As such, no assurance can be given as to the Computational Materials’ accuracy, appropriateness or completeness in any particular context; or as to whether the Computational Materials and/or the assumptions upon which they are based reflect present market conditions or future market performance. The Computational Materials should not be construed as either projections or predictions or as legal, tax, financial or accounting advice. You should consult your own counsel, accountant and other advisors as to the legal, tax, business, financial and related aspects of a purchase of these securities. Any weighted average lives, yields and principal payment periods shown in the Computational Materials are based on prepayment and/or loss assumptions, and changes in such prepayment and/or loss assumptions may dramatically affect such weighted average lives, yields and principal payment periods. In addition, it is possible that prepayments or losses on the underlying assets will occur at rates higher or lower than the rates shown in the attached Computational Materials. The specific characteristics of the securities may differ from those shown in the Computational Materials due to differences between the final underlying assets and the preliminary underlying assets used in preparing the Computational Materials. The principal amount and designation of any security described in the Computational Materials are subject to change prior to issuance. None of Wells Fargo Securities, LLC, Merrill Lynch, Pierce, Fenner & Smith Incorporated, Morgan Stanley & Co. LLC, Academy Securities, Inc., or any of their respective affiliates, make any representation or warranty as to the actual rate or timing of payments or losses on any of the underlying assets or the payments or yield on the securities. The information in this presentation is based upon management forecasts and reflects prevailing conditions and management’s views as of this date, all of which are subject to change. In preparing this presentation, we have relied upon and assumed, without independent verification, the accuracy and completeness of all information available from public sources or which was provided to us by or on behalf of the Mortgage Loan Sellers or which was otherwise reviewed by us.
This free writing prospectus contains certain forward-looking statements. If and when included in this free writing prospectus, the words “expects”, “intends”, “anticipates”, “estimates” and analogous expressions and all statements that are not historical facts, including statements about our beliefs or expectations, are intended to identify forward-looking statements. Any forward-looking statements are made subject to risks and uncertainties which could cause actual results to differ materially from those stated. Those risks and uncertainties include, among other things, declines in general economic and business conditions, increased competition, changes in demographics, changes in political and social conditions, regulatory initiatives and changes in customer preferences, many of which are beyond our control and the control of any other person or entity related to this offering. The forward-looking statements made in this free writing prospectus are made as of the date stated on the cover. We have no obligation to update or revise any forward-looking statement.
Wells Fargo Securities is the trade name for the capital markets and investment banking services of Wells Fargo & Company and its subsidiaries, including but not limited to Wells Fargo Securities, LLC, a member of NYSE, FINRA, NFA and SIPC, Wells Fargo Prime Services, LLC, a member of FINRA, NFA and SIPC, and Wells Fargo Bank, N.A. Wells Fargo Securities, LLC and Wells Fargo Prime Services, LLC are distinct entities from affiliated banks and thrifts.
IMPORTANT NOTICE REGARDING THE OFFERED CERTIFICATES
The information herein is preliminary and may be supplemented or amended prior to the time of sale. In addition, the Offered Certificates referred to in these materials and the asset pool backing them are subject to modification or revision (including the possibility that one or more classes of certificates may be split, combined or eliminated at any time prior to issuance or availability of a final prospectus) and are offered on a “when, as and if issued” basis.
The underwriters described in these materials may from time to time perform investment banking services for, or solicit investment banking business from, any company named in these materials. The underwriters and/or their affiliates or respective employees may from time to time have a long or short position in any security or contract discussed in these materials.
The information contained herein supersedes any previous such information delivered to any prospective investor and will be superseded by information delivered to such prospective investor prior to the time of sale.
IMPORTANT NOTICE RELATING TO AUTOMATICALLY-GENERATED EMAIL DISCLAIMERS
Any legends, disclaimers or other notices that may appear at the bottom of any email communication to which this free writing prospectus is attached relating to (1) these materials not constituting an offer (or a solicitation of an offer), (2) any representation that these materials are accurate or complete and may not be updated or (3) these materials possibly being confidential, are not applicable to these materials and should be disregarded. Such legends, disclaimers or other notices have been automatically generated as a result of these materials having been sent via Bloomberg or another system.
THE INFORMATION IN THIS STRUCTURAL AND COLLATERAL TERM SHEET IS NOT COMPLETE AND MAY BE AMENDED PRIOR TO THE TIME OF SALE. THIS TERM SHEET IS NOT AN OFFER TO SELL THESE SECURITIES AND IT IS NOT A SOLICITATION OF AN OFFER TO BUY THESE SECURITIES IN ANY JURISDICTION WHERE THE OFFER OR SALE IS NOT PERMITTED.
2
GENERAL MOTORS BUILDING
THE INFORMATION IN THIS STRUCTURAL AND COLLATERAL TERM SHEET IS NOT COMPLETE AND MAY BE AMENDED PRIOR TO THE TIME OF SALE. THIS TERM SHEET IS NOT AN OFFER TO SELL THESE SECURITIES AND IT IS NOT A SOLICITATION OF AN OFFER TO BUY THESE SECURITIES IN ANY JURISDICTION WHERE THE OFFER OR SALE IS NOT PERMITTED.
3
GENERAL MOTORS BUILDING
THE INFORMATION IN THIS STRUCTURAL AND COLLATERAL TERM SHEET IS NOT COMPLETE AND MAY BE AMENDED PRIOR TO THE TIME OF SALE. THIS TERM SHEET IS NOT AN OFFER TO SELL THESE SECURITIES AND IT IS NOT A SOLICITATION OF AN OFFER TO BUY THESE SECURITIES IN ANY JURISDICTION WHERE THE OFFER OR SALE IS NOT PERMITTED.
4
GENERAL MOTORS BUILDING
THE INFORMATION IN THIS STRUCTURAL AND COLLATERAL TERM SHEET IS NOT COMPLETE AND MAY BE AMENDED PRIOR TO THE TIME OF SALE. THIS TERM SHEET IS NOT AN OFFER TO SELL THESE SECURITIES AND IT IS NOT A SOLICITATION OF AN OFFER TO BUY THESE SECURITIES IN ANY JURISDICTION WHERE THE OFFER OR SALE IS NOT PERMITTED.
5
| No. 1 – General Motors Building | |||||||
| Loan Information | Property Information | ||||||
| Mortgage Loan Seller: | Morgan Stanley Mortgage Capital Holdings LLC | Single Asset/Portfolio: | Single Asset | ||||
Credit Assessment (DBRS/Fitch/Moody’s): | AAA/AAAsf /Aaa(sf) | Property Type: | Mixed Use | ||||
| Original Principal Balance(1): | $111,900,000 | Specific Property Type: | Office/Retail | ||||
| Cut-off Date Balance(1): | $111,900,000 | Location: | New York, NY | ||||
| % of Initial Pool Balance: | 9.2% | Size: | 1,989,983 SF | ||||
| Loan Purpose: | Refinance | Cut-off Date Balance Per SF(1): | $738.70 | ||||
| Borrower Name: | 767 Fifth Partners LLC | Year Built/Renovated: | 1968/2017 | ||||
| Borrower Sponsors: | Boston Properties Limited Partnership; 767 LLC; Sungate Fifth Avenue LLC | Title Vesting: | Fee | ||||
| Mortgage Rate: | 3.430% | Property Manager: | Self-managed | ||||
| Note Date: | June 7, 2017 | 4th Most Recent Occupancy (As of): | 96.9% (12/31/2013) | ||||
| Anticipated Repayment Date: | NAP | 3rd Most Recent Occupancy (As of): | 98.5% (12/31/2014) | ||||
| Maturity Date: | June 9, 2027 | 2nd Most Recent Occupancy (As of): | 96.7% (12/31/2015) | ||||
| IO Period: | 120 months | Most Recent Occupancy (As of): | 96.3% (12/31/2016) | ||||
| Loan Term (Original): | 120 months | Current Occupancy (As of)(4): | 95.0% (6/1/2017) | ||||
| Seasoning: | 3 months | ||||||
| Amortization Term (Original): | NAP | Underwriting and Financial Information: | |||||
| Loan Amortization Type: | Interest-only, Balloon | ||||||
| Interest Accrual Method: | Actual/360 | 4th Most Recent NOI (As of)(5): | $168,011,596 (12/31/2013) | ||||
| Call Protection: | L(27),D(86),O(7) | 3rd Most Recent NOI (As of)(5): | $165,315,617 (12/31/2014) | ||||
| Lockbox Type: | Hard/Springing Cash Management | 2nd Most Recent NOI (As of)(5): | $150,511,664 (12/31/2015) | ||||
| Additional Debt(1): | Yes | Most Recent NOI (As of)(5): | $151,425,346 (12/31/2016) | ||||
| Additional Debt Type(1): | Pari Passu; Subordinate Secured Debt | ||||||
| U/W Revenues: | $334,764,418 | ||||||
| U/W Expenses: | $107,458,009 | ||||||
| U/W NOI: | $227,306,409 | ||||||
| Escrows and Reserves(2): | U/W NCF: | $221,544,794 | |||||
| U/W NOI DSCR(1): | 4.45x | ||||||
| Type: | Initial | Monthly | Cap (If Any) | U/W NCF DSCR(1): | 4.33x | ||
| Taxes | $0 | Springing | NAP | U/W NOI Debt Yield(1): | 15.5% | ||
| Insurance | $0 | Springing | NAP | U/W NCF Debt Yield(1): | 15.1% | ||
| TI/LC Reserve | $0 | $0 | NAP | As-Is Appraised Value: | $4,800,000,000 | ||
| Replacement Reserve | $0 | $0 | NAP | As-Is Appraisal Valuation Date: | May 8, 2017 | ||
| Tenant Specific TI/LC Reserve(3) | $0 | $0 | NAP | Cut-off Date LTV Ratio(1): | 30.6% | ||
| Free Rent Reserve(3) | $0 | $0 | NAP | LTV Ratio at Maturity(1): | 30.6% | ||
| (1) | The General Motors Building Whole Loan (as defined below), totaling $2,300,000,000, is comprised of the General Motors Building Senior Whole Loan (as defined below) totaling $1,470,000,000 and the General Motors Building Junior Notes (as defined below) totaling $830,000,000. The non-controlling General Motors Building Mortgage Loan (as defined below) had an original principal balance of $111,900,000, has an outstanding principal balance of $111,900,000 as of the Cut-off Date and will be contributed to the BANK 2017-BNK7 Trust. All statistical financial information related to balances PSF, loan-to-value ratios, debt service coverage ratios and debt yields are based on the General Motors Building Senior Whole Loan. The Cut-off Date LTV Ratio, U/W NCF DSCR, U/W NCF DY and Cut-off Date Balance Per SF based on the General Motors Building Whole Loan are 47.9%, 2.77x, 9.6% and $1,156, respectively. |
| (2) | See “Escrows” section. |
| (3) | At closing, Boston Properties Limited Partnership (“BPLP”) provided a guaranty in lieu of depositing (i) $107,946,183 for existing tenant improvement and leasing commission costs and (ii) $161,161,013 in existing gap rent and free rent obligations. |
| (4) | Current Occupancy includes Under Armour, which has an executed lease but is not expected to be in occupancy at the General Motors Building Property (as defined below) until on or after January 1, 2019. |
| (5) | See “Cash Flow Analysis” section. |
The Mortgage Loan. The mortgage loan (the “General Motors Building Mortgage Loan”) is part of a whole loan (the “General Motors Building Whole Loan”) evidenced by (i) a senior loan tranche (the “General Motors Building Senior Whole Loan”), and (ii) a subordinate loan tranche (the “General Motors Building Junior Notes”), secured by the fee interest in a mixed use office building located in New York, New York (the “General Motors Building Property”). The General Motors Building Whole Loan was co-originated on June 7, 2017 by Morgan Stanley Bank, N.A., Citigroup Global Markets Realty Corp., Deutsche Bank AG, New York Branch and Wells Fargo Bank, National Association (the “General Motors Building Whole Loan Origination Syndicate”). The General Motors Building Whole Loan had an original principal balance of $2,300,000,000, has an outstanding principal balance as of the Cut-off Date of $2,300,000,000 and accrues interest at an interest rate of 3.430%per annum. The General Motors Building Whole Loan had an initial term of 120 months, has a remaining term of 117 months as of the Cut-off Date and requires payments of interest only through the term of the General Motors Building Whole Loan. The General Motors Building Whole Loan matures on June 9, 2027.
THE INFORMATION IN THIS STRUCTURAL AND COLLATERAL TERM SHEET IS NOT COMPLETE AND MAY BE AMENDED PRIOR TO THE TIME OF SALE. THIS TERM SHEET IS NOT AN OFFER TO SELL THESE SECURITIES AND IT IS NOT A SOLICITATION OF AN OFFER TO BUY THESE SECURITIES IN ANY JURISDICTION WHERE THE OFFER OR SALE IS NOT PERMITTED.
6
GENERAL MOTORS BUILDING
The General Motors Building Mortgage Loan, evidenced by certain notes of the General Motors Building Senior Whole Loan, which will be contributed to the BANK 2017-BNK7 Trust, had an original aggregate principal balance of $111,900,000, has an outstanding aggregate principal balance as of the Cut-off Date of $111,900,000 and represents a seniorpari passu non-controlling interest in the General Motors Building Whole Loan. Certain notes of the General Motors Building Senior Whole Loan (totaling $725,000,000) and the General Motors Building Junior Notes (totaling $830,000,000) were contributed to the BXP Trust 2017-GM Trust and represent the controlling interest in the General Motors Building Whole Loan. The remaining notes from the General Motors Building Senior Whole Loan, which had an aggregate original principal balance of $633,100,000 (the “General Motors Building Non-Serviced Pari Passu Companion Loans”), have either been contributed to securitization trusts or are expected to be contributed to future securitization trusts. After origination of the General Motors Building Whole Loan, the General Motors Building Whole Loan Origination Syndicate sold $85,000,000 of the General Motors Building Non-Serviced Pari Passu Companion Loans to Cantor Commercial Real Estate Lending, L.P. (“CCRE”). The lender provides no assurances that any non-securitized notes will not be split further or otherwise sold outside of the General Motors Building Whole Loan Origination Syndicate. See “Description of the Mortgage Pool—The Whole Loans—The Non-Serviced AB Whole Loans—General Motors Building Whole Loan” in the Preliminary Prospectus.
| General Motors Building Senior Whole Loan | ||
$725,000,000 BXP Trust 2017-GM | $111,900,000 BANK 2017-BNK7 | $633,100,000 General Motors Building Non- |
| General Motors Building Junior Notes | ||
$830,000,000 BXP Trust 2017-GM(2)
| ||
| (1) | After origination of the General Motors Building Whole Loan, the General Motors Building Whole Loan Origination Syndicate sold $85,000,000 of the General Motors Building Non-ServicedPari Passu Companion Loans to CCRE. |
| (2) | The holder of the controlling class of the BXP Trust 2017-GM is the controlling noteholder. |
Following the lockout period, on any date before December 9, 2026, the borrower has the right to defease the General Motors Building Whole Loan in whole, but not in part. In addition, the General Motors Building Whole Loan is prepayable without penalty on or after the due date in December 2026. The lockout period will expire on the earlier to occur of (i) two years after the closing date of the securitization that includes the last note to be securitized and (ii) June 7, 2020.
Sources and Uses
| Sources | Uses | |||||||
| Original whole loan amount | $2,300,000,000 | 100.0% | Loan payoff | $1,606,000,000 | 69.8% | |||
| Closing costs | 41,107,676 | 1.8 | ||||||
| Return of equity | 652,892,324 | 28.4 | ||||||
| Total Sources | $2,300,000,000 | 100.0% | Total Uses | $2,300,000,000 | 100.0% | |||
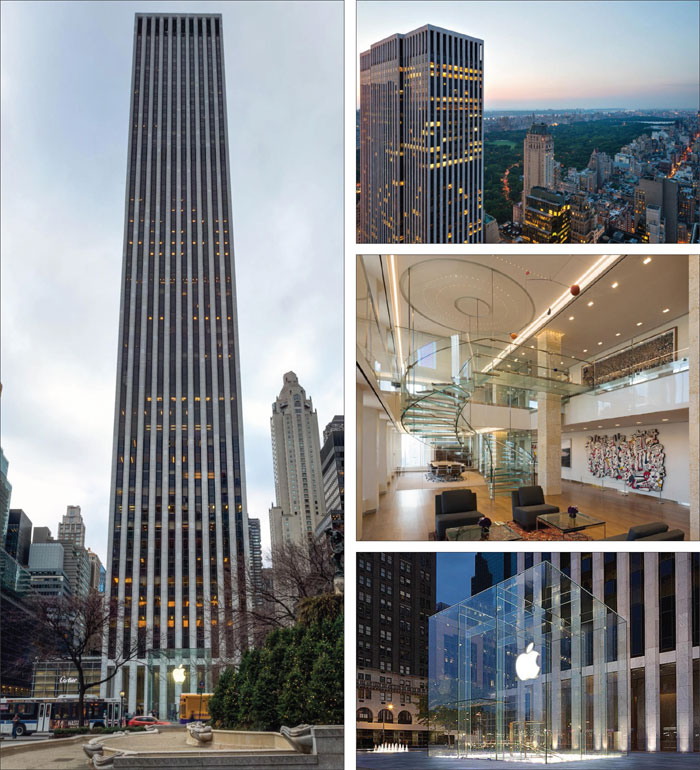
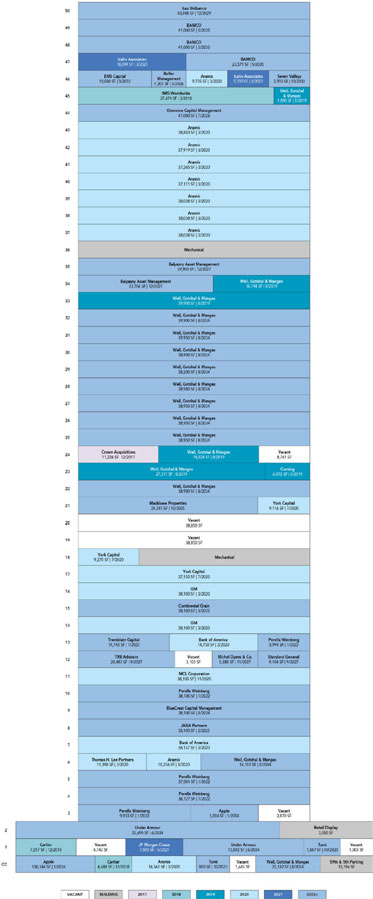
The Property. The General Motors Building Property is a 50-story mixed use office building comprised of approximately 1,989,983 total square feet, including approximately 187,954 square feet of retail space in the two-story retail base that wraps around the building and the below grade concourse. Originally developed in 1968 for the General Motors Corporation to serve as its headquarters, the General Motors Building Property occupies the entire city block bound by 58th Street, 59th Street, Madison Avenue and Fifth Avenue on the southeast corner of Central Park. The Fifth Avenue frontage of the General Motors Building Property features an open plaza with seating and is topped by the glass Apple cube, which serves as the entrance to Apple’s store in the below grade concourse (the “Apple Cube Space”). Because of its location, the General Motors Building Property features unobstructed views of Central Park from every office floor.
The General Motors Building Property is 95.0% leased as of June 1, 2017 by a diverse roster of office and retail tenants. Approximately 54.0% of the General Motors Building Property net rentable area (“NRA”) is leased by investment grade or large law firm tenants, which contribute approximately 49.0% of the General Motors Building Property’s underwritten gross rent. The General Motors Building Property serves as the global headquarters for Weil, Gotshal & Manges LLP (24.6% of NRA, 19.3% of underwritten base rent), which has been in occupancy since the building was constructed in 1968, headquarters for Aramis, an Estée Lauder company and another original tenant at the General Motors Building, (15.1% of NRA, 10.3% of underwritten base rent), is expected to serve as a flagship retail location for Under Armour (2.5% of NRA, 11.3% of underwritten base rent), and serves as headquarters for BAMCO (5.3% of NRA, 8.0% of underwritten base rent) and Apple’s flagship retail store (5.3% of NRA, 6.8% of underwritten base rent). The top five tenants by underwritten base rent at the General Motors Building Property lease 52.8% of NRA and comprise 55.6% of the underwritten base rent. The weighted average remaining lease term for the top five tenants is approximately 11.7 years, and the weighted average remaining lease term for the entire General Motors Building Property is approximately 9.4 years. The General Motors Building Property has a nine year average historical occupancy of 97.4% dating back to 2008.
According to the borrower sponsor, since acquiring the General Motors Building Property in 2008 and through 2016, the borrower has invested approximately $98.0 million in capital expenditures for tenant improvements and other capital projects at the General Motors Building Property.The Apple Cube Space is under renovation to expand such space by approximately 34,000 square feet, increasing ceiling heights by lowering the floor approximately five feet and adding storage space and back of house capacity by expanding into formerly dark space located below grade. Under Armour’s space is currently occupied by Apple while the Apple Cube Space and expansion is under construction. Under Armour is not currently in occupancy or paying rent. Apple is obligated to vacate
THE INFORMATION IN THIS STRUCTURAL AND COLLATERAL TERM SHEET IS NOT COMPLETE AND MAY BE AMENDED PRIOR TO THE TIME OF SALE. THIS TERM SHEET IS NOT AN OFFER TO SELL THESE SECURITIES AND IT IS NOT A SOLICITATION OF AN OFFER TO BUY THESE SECURITIES IN ANY JURISDICTION WHERE THE OFFER OR SALE IS NOT PERMITTED.
7
GENERAL MOTORS BUILDING
its temporary space by December 31, 2018 and has the right to terminate its entire lease if its expanded Apple Cube Space is not delivered by February 3, 2020, subject to force majeure. Under Armour has the right to terminate its lease if its space is not delivered by July 1, 2019 and if such failure to deliver the space is not due to tenant-caused delays or force majeure.
The majority of the General Motors Building Property’s annual underwritten base rent comes from office tenants (73.2%), with the remaining underwritten rent coming from retail tenants (26.3%) and storage space (0.4%).
The following table presents certain information relating to the tenancies at the General Motors Building Property:
Major Tenants
| Tenant Name | Credit Rating (Fitch/Moody’s/ S&P)(1) | Tenant NRSF | % of NRSF | Annual U/W Base Rent PSF(2) | Annual Rent(2) | % of Total Annual U/W Base Rent | Lease Expiration Date |
| Major Tenants | |||||||
| Weil, Gotshal & Manges LLP(3) | NR/NR/NR | 489,867 | 24.6% | $104.68 | $51,278,352 | 19.3% | Various |
| Under Armour(4) | NR/Baa2/BB+ | 49,582 | 2.5% | $605.06 | $29,999,945 | 11.3% | 6/30/2034 |
| Aramis(5) | NR/A2/A+ | 299,895 | 15.1% | $91.80 | $27,530,236 | 10.3% | 3/31/2020 |
| BAMCO(6) | NR/NR/NR | 105,579 | 5.3% | $201.65 | $21,290,010 | 8.0% | 5/31/2035 |
| Apple(7) | NR/Aa1/AA+ | 105,748 | 5.3% | $170.76 | $18,057,615 | 6.8% | Various |
| Perella Weinberg | NR/NR/NR | 130,155 | 6.5% | $95.21 | $12,392,687 | 4.7% | 1/31/2022 |
| JP Morgan Chase | A+/A3/A- | 7,500 | 0.4% | $1,464.10 | $10,980,750 | 4.1% | 5/31/2021 |
| Cartier | NR/NR/NR | 11,745 | 0.6% | $757.05 | $8,891,545 | 3.3% | 12/31/2018 |
| Balyasny Asset Management(8) | NR/NR/NR | 63,606 | 3.2% | $128.14 | $8,150,250 | 3.1% | 12/31/2027 |
| GM(9) | BBB/Baa3/BBB | 76,200 | 3.8% | $92.00 | $7,010,400 | 2.6% | 3/31/2020 |
| Total Major Tenants | 1,339,877 | 67.3% | $145.97 | $195,581,790 | 73.4% | ||
| Non-Major Tenants | 550,242 | 27.7% | $128.55 | $70,735,275 | 26.6% | ||
| Occupied Collateral Total | 1,890,119 | 95.0% | $140.90 | $266,317,065 | 100.0% | ||
| Vacant Space | 99,864 | 5.0% | |||||
| Collateral Total | 1,989,983 | 100.0% | |||||
| (1) | Certain ratings provided are for the parent company of the tenant whether or not the parent company guarantees the lease. |
| (2) | Annual U/W Base Rent PSF and Annual U/W Base Rent excludes $11,269,632 ($5.66 PSF) of total underwritten straight line rents through the tenants’ respective lease terms associated with Weil, Gotshal & Manges LLP ($6,010,916) and Apple ($4,107,800), as well as other tenants, which straight line rents are included in the “Cash Flow Analysis” table below. |
| (3) | Weil, Gotshal & Manges LLP leases 100,024 square feet of space through August 31, 2019 and 389,843 square feet through August 31, 2034. Weil, Gotshal & Manges LLP has the right to terminate (a) its 20,791 square feet of below grade storage space, at any time, and (b) either (i) its 38,900 square feet of space on the 22nd floor or (ii) its 39,900 square feet space on the 32nd floor, on or after August 31, 2022. Weil, Gotshal & Manges LLP most recently extended its lease for 389,843 square feet of its space through August 2034 at an initial base rent of $114.00 PSF, above its current in place weighted average gross rent of $92.37 PSF. BPLP, one of the borrower sponsors, provided a payment guaranty for the gap rent between Weil, Gotshal & Manges LLP current rent and Weil, Gotshal & Manges LLP underwritten rent which commences in September 2019. |
| (4) | Under Armour’s lease commences on the substantial completion of landlord’s work, which is projected to be January 1, 2019. Under Armour has the right to terminate its lease if its space is not delivered by July 1, 2019 and the failure to deliver the space is not due to tenant-caused delays or force majeure. Under Armour’s space is currently occupied by Apple while the Apple Cube Space and expansion is under construction. Under Armour is not currently in occupancy or paying rent. BPLP provided a payment guaranty with respect to Under Armour’s gap rent (for the difference between the rent being paid by Apple for the space anticipated to be occupied by Under Armour and the rent that will be due upon commencement of Under Armour’s lease), as well as for Under Armour’s free rent. Under Armour has 12 months of free rent, equal to $30,000,000, beginning after its lease commencement date. |
| (5) | Aramis subleases 9,725 square feet of its space on the 46th floor to GF Capital Management & Advisors, LLC at $107.00 PSF. |
| (6) | BAMCO has executed a renewal to extend its lease to May 2035, commencing in January 2024 for a weighted average base rent of approximately $201.65 PSF. BAMCO’s in place weighted average base rent is approximately $147.77 PSF. BPLP provided a payment guaranty with respect to BAMCO’s gap rent between closing and the renewal rent commencing in January 2024. After the expiration of the guaranty by BPLP, the lower of market or in place rent has been underwritten. |
| (7) | Apple is temporarily occupying the space expected to be occupied by Under Armour once its lease commences while the Apple Cube Space and expansion is under construction. Apple is obligated to vacate its temporary space by December 31, 2018 and has the right to terminate its entire lease if its space is not delivered by February 3, 2020, subject to force majeure. Apple leases 2,754 square feet through December 31, 2018 and 102,994 square feet through January 31, 2034. Apple has 17 months of free rent, equal to $9,562,500, on its 21,907 square feet of expansion space commencing in August 2017. BPLP provided a guaranty with respect to Apple’s free rent. Annual U/W Base Rent for Apple has been underwritten to Apple’s base rent as of January 2019 in conjunction with the Under Armour lease commencement date. |
| (8) | Balyasny Asset Management may terminate its lease effective December 31, 2022 with a minimum of one year’s notice and payment of a termination fee. Balyasny Asset Management has six months of free rent on its 34th floor space, totaling $1,481,625. |
| (9) | GM subleases 38,100 square feet on the 14th floor to Grosvenor Capital Management Holdings, LLLP at $80.00 PSF and 38,100 square feet on the 16th floor to Reservoir Operations, L.P. at $85.00 PSF. |
THE INFORMATION IN THIS STRUCTURAL AND COLLATERAL TERM SHEET IS NOT COMPLETE AND MAY BE AMENDED PRIOR TO THE TIME OF SALE. THIS TERM SHEET IS NOT AN OFFER TO SELL THESE SECURITIES AND IT IS NOT A SOLICITATION OF AN OFFER TO BUY THESE SECURITIES IN ANY JURISDICTION WHERE THE OFFER OR SALE IS NOT PERMITTED.
8
GENERAL MOTORS BUILDING
The following table presents certain information relating to the lease rollover schedule at the General Motors Building Property:
Lease Expiration Schedule(1)(2)
| Year Ending December 31, | No. of Leases Expiring | Expiring NRSF | % of Total NRSF | Cumulative Expiring NRSF | Cumulative % of Total NRSF | Annual U/W Base Rent(3) | % of Total Annual U/W Base Rent | Annual U/W Base Rent PSF(4) |
| MTM | 0 | 0 | 0.0% | 0 | 0.0% | $0 | 0.0% | $0.00 |
| 2017 | 1 | 11,226 | 0.6% | 11,226 | 0.6% | $993,600 | 0.4% | $88.51 |
| 2018 | 6 | 52,373 | 2.6% | 63,599 | 3.2% | $15,456,871 | 5.8% | $295.13 |
| 2019 | 9 | 106,096 | 5.3% | 169,695 | 8.5% | $9,123,113 | 3.4% | $85.99 |
| 2020 | 22 | 532,016 | 26.7% | 701,711 | 35.3% | $50,741,831 | 19.1% | $95.38 |
| 2021 | 4 | 35,486 | 1.8% | 737,197 | 37.0% | $16,570,250 | 6.2% | $466.95 |
| 2022 | 8 | 144,898 | 7.3% | 882,095 | 44.3% | $14,412,478 | 5.4% | $99.47 |
| 2023 | 2 | 2,747 | 0.1% | 884,842 | 44.5% | $1,870,937 | 0.7% | $681.08 |
| 2024 | 1 | 38,100 | 1.9% | 922,942 | 46.4% | $3,429,000 | 1.3% | $90.00 |
| 2025 | 3 | 66,347 | 3.3% | 989,289 | 49.7% | $6,783,128 | 2.5% | $102.24 |
| 2026 | 6 | 48,201 | 2.4% | 1,037,490 | 52.1% | $9,096,994 | 3.4% | $188.73 |
| 2027 | 6 | 99,324 | 5.0% | 1,136,814 | 57.1% | $12,273,236 | 4.6% | $123.57 |
| Thereafter | 38 | 753,305 | 37.9% | 1,890,119 | 95.0% | $125,565,627 | 47.1% | $166.69 |
| Vacant | 0 | 99,864 | 5.0% | 1,989,983 | 100.0% | $0 | 0.0% | $0.00 |
| Total/Weighted Average | 106 | 1,989,983 | 100.0% | $266,317,065 | 100.0% | $140.90 |
| (1) | Information obtained from the underwritten rent roll. |
| (2) | Certain tenants may have lease termination options that are exercisable prior to the stated expiration date of the subject lease and that are not considered in the Lease Expiration Schedule. |
| (3) | Annual U/W Base Rent excludes $11,269,632 ($5.66 PSF) of total underwritten straight line rents through the tenants’ respective lease terms associated with Weil, Gotshal & Manges LLP ($6,010,916) and Apple ($4,107,800), as well as other tenants. |
| (4) | Weighted Average Annual U/W Base Rent PSF excludes vacant space. |
The following table presents historical occupancy percentages at the General Motors Building Property:
Historical Occupancy
2010(1) | 2011(1) | 2012(1) | 2013(1) | 2014(1) | 2015(1) | 2016(1) | 6/1/2017(2) | |||||||
| 98.5% | 98.2% | 95.5% | 96.9% | 98.5% | 96.7% | 96.3% | 95.0% |
| (1) | Information obtained from the borrower and represents average occupancy for the indicated year unless otherwise specified. |
| (2) | Information obtained from the underwritten rent roll. Underwritten occupancy includes Under Armour, which has an executed lease but is not expected to be in occupancy at the General Motors Building Property until on or after January 1, 2019. |
THE INFORMATION IN THIS STRUCTURAL AND COLLATERAL TERM SHEET IS NOT COMPLETE AND MAY BE AMENDED PRIOR TO THE TIME OF SALE. THIS TERM SHEET IS NOT AN OFFER TO SELL THESE SECURITIES AND IT IS NOT A SOLICITATION OF AN OFFER TO BUY THESE SECURITIES IN ANY JURISDICTION WHERE THE OFFER OR SALE IS NOT PERMITTED.
9
GENERAL MOTORS BUILDING
Operating History and Underwritten Net Cash Flow.The following table presents certain information relating to the historical operating performance and the underwritten net cash flow at the General Motors Building Property:
Cash Flow Analysis
2013 | 2014 | 2015 | 2016 | U/W | % of U/W Effective Gross Income | U/W $ per SF | |||||||
| Base Rent | $188,477,818 | $197,172,437 | $193,759,747 | $206,851,492 | $266,317,065(1) | 79.6% | $133.83 | ||||||
| Straight Line Rent | 0 | 0 | 0 | 0 | 11,269,632(2) | 3.4 | 5.66 | ||||||
| Grossed Up Vacant Space | 0 | 0 | 0 | 0 | 16,547,756(3) | 4.9 | 8.32 | ||||||
| Percentage Rent | 13,435,678 | 11,075,213 | 9,266,920 | 5,301,583 | 4,921,916(4) | 1.5 | 2.47 | ||||||
| Mark to Market(5) | 0 | 0 | 0 | 0 | 17,100,676 | 5.1 | 8.59 | ||||||
| Total Reimbursables | 29,544,790 | 35,800,858 | 38,501,366 | 39,027,298 | 27,629,542 | 8.3 | 13.88 | ||||||
| Other Income(6) | 20,814,262 | 13,270,276 | 8,240,130 | 5,169,082 | 7,525,587 | 2.2 | 3.78 | ||||||
| Less Vacancy & Credit Loss | 0 | 0 | 0 | 0 | (16,547,756)(3) | (4.9) | (8.32) | ||||||
| Effective Gross Income | $252,272,548 | $257,318,784 | $249,768,162 | $256,349,455 | $334,764,418 | 100.0% | $168.22 | ||||||
| Total Operating Expenses | $84,260,952 | $92,003,166 | $99,256,499 | $104,924,109 | $107,458,009(7) | 32.1% | $54.00 | ||||||
| Net Operating Income(8) | $168,011,596 | $165,315,617 | $150,511,664 | $151,425,346 | $227,306,409 | 67.9% | $114.23 | ||||||
| TI/LC | 0 | 0 | 0 | 0 | 5,363,618 | 1.6 | 2.70 | ||||||
| Capital Expenditures | 0 | 0 | 0 | 0 | 397,997 | 0.1 | 0.20 | ||||||
| Net Cash Flow | $168,011,596 | $165,315,617 | $150,511,664 | $151,425,346 | $221,544,794 | 66.2% | $111.33 | ||||||
| NOI DSCR(9) | 3.29x | 3.23x | 2.94x | 2.96x | 4.45x | ||||||||
| NCF DSCR(9) | 3.29x | 3.23x | 2.94x | 2.96x | 4.33x | ||||||||
| NOI DY(9) | 11.4% | 11.2% | 10.2% | 10.3% | 15.5% | ||||||||
| NCF DY(9) | 11.4% | 11.2% | 10.2% | 10.3% | 15.1% |
| (1) | U/W Base Rent is based on the rent roll as of June 1, 2017, and includes rent steps through June 2018. Lenders have made various adjustments to the in place rents which are detailed below. |
| i. | Apple is currently undergoing a major renovation to their Apple Cube Space. During the renovations, Apple is occupying the former FAO Schwarz space as temporary space until the earlier of the completion of their renovations or the outside kick out date of December 31, 2018. Base rent for Apple has been underwritten to Apple’s base rent as of January 2019 in conjunction with the Under Armour lease commencement date. Apple is currently paying annual contractual rent of $12,500,004 on the temporary space, which steps up to $24,000,000 annually in August 2018 in addition to their existing lease for the Apple Cube Space. Lenders are underwriting $18,057,615 in base rent and $19,429,881 in gross rent (base rent plus recoveries) for Apple. |
| ii. | Under Armour has executed a lease commencing in January 2019 for the space that is currently occupied by Apple as temporary space. Contractual rent has been underwritten for Under Armour based on the rent due as of January 2019 when the lease commences. BPLP provided a payment guaranty for the gap rent between the rent Apple is currently paying to occupy its temporary space and the rent that will be due under Under Armour’s lease once such lease commences. |
| iii. | Weil, Gotshal & Manges LLP has executed a renewal for 389,843 square feet of its space through August 2034, commencing in September 2019. For these spaces Underwritten base rent for Weil, Gotshal & Manges LLP uses rents effective as of September 2019. For the space not extended, contractual in-place rent inclusive of 12 months’ rent steps and existing recoveries has been underwritten. BPLP provided a payment guaranty for the gap rent between Weil, Gotshal & Manges LLP’ current rent and their underwritten rent which commences in September 2019. |
| iv. | BAMCO has executed a renewal to extend its lease to May 2035, commencing in January 2024 for a weighted average base rent of approximately $201.65 PSF. BAMCO’s in place weighted average base rent is approximately $147.77 PSF. The gap rent between closing and the renewal rent commencing in January 2024 is guaranteed by BPLP. After the expiration of the BPLP guaranty, the lower of market or in place rent has been underwritten. |
| v. | Continental Grain is currently subleasing from GM and has executed a direct lease commencing in April 2020 on the expiration of their existing sublease. GM is currently paying $92.00 PSF in base rent. Continental Grain’s direct rent in 2020 of $110.00 PSF has been underwritten. BPLP provided a guaranty for the gap rent until 2020. |
| (2) | U/W Straight Line Rent is based on net present value of future contractual rent steps after June 1, 2018 for investment grade and law firm tenants included in a listing of the largest 100 Untied States law firms through the tenants’ lease expirations (which in the case of certain tenants, expire beyond the loan term). Tenants with U/W straight line rents include $11,269,632 ($5.66 PSF) of total underwritten straight line rents through the tenants’ respective lease terms associated with Weil, Gotshal & Manges LLP ($6,010,916) and Apple ($4,107,800), as well as other tenants. |
| (3) | Vacancy is underwritten to current physical vacancy of 5.0%. |
| (4) | Apple has an abatement period for its percentage rent component that commences in October 2017. Once Apple has moved back into its expanded and redeveloped space, it will be required to pay 2.25% in percentage rent above $200,000,000 a year in sales. BPLP provided a guaranty for the estimated gap percentage rent. U/W Percentage Rent is equal to the average Apple sales from 2013 through 2016 over the new $200,000,000 breakpoint and the 2.25% percentage rent. |
| (5) | Rents have been marked up or down, as applicable, based on the appraiser’s conclusion of market rents. |
| (6) | Other income consists of primarily antenna income, direct utilities income and service income. |
| (7) | Contractual management fee is equal to 2.0% of Effective Gross Income. Underwritten management fee included in U/W Total Operating Expenses is capped at $1,000,000. |
| (8) | The Net Operating Income for the period beginning on January 1, 2017 and ending on March 31, 2017 was $49,643,832. |
| (9) | The debt service coverage ratios and debt yields are based on the outstanding principal balance of the General Motors Building Senior Whole Loan and exclude the outstanding principal balance of the General Motors Building Junior Notes. |
Appraisal.As of the appraisal valuation date of May 8, 2017, the General Motors Building Property had an “as-is” appraised value of $4,800,000,000.
Environmental Matters. According to the Phase I environmental site assessment dated May 9, 2017, there are no recognized environmental conditions at the General Motors Building Property. However, the General Motors Building Property is covered against certain environmental matters by a pollution legal liability-type environmental insurance policy issued by Chartis Specialty Insurance Company (a member company of American International Group Inc.) with limits of $20 million per incident and $40 million in the aggregate, subject to a $50,000 deductible. American International Group Inc. has an S&P rating of “BBB+”. The policy period ends September 15, 2018. Upon expiration of the existing policy, the General Motors Building Whole Loan documents require the borrower to provide a replacement policy, issued by an insurer having a minimum A.M. Best’s rating of “A-/VIII” that is maintained and renewed annually with a combined single limit of $5 million and a deductible no greater that $100,000.
THE INFORMATION IN THIS STRUCTURAL AND COLLATERAL TERM SHEET IS NOT COMPLETE AND MAY BE AMENDED PRIOR TO THE TIME OF SALE. THIS TERM SHEET IS NOT AN OFFER TO SELL THESE SECURITIES AND IT IS NOT A SOLICITATION OF AN OFFER TO BUY THESE SECURITIES IN ANY JURISDICTION WHERE THE OFFER OR SALE IS NOT PERMITTED.
10
GENERAL MOTORS BUILDING
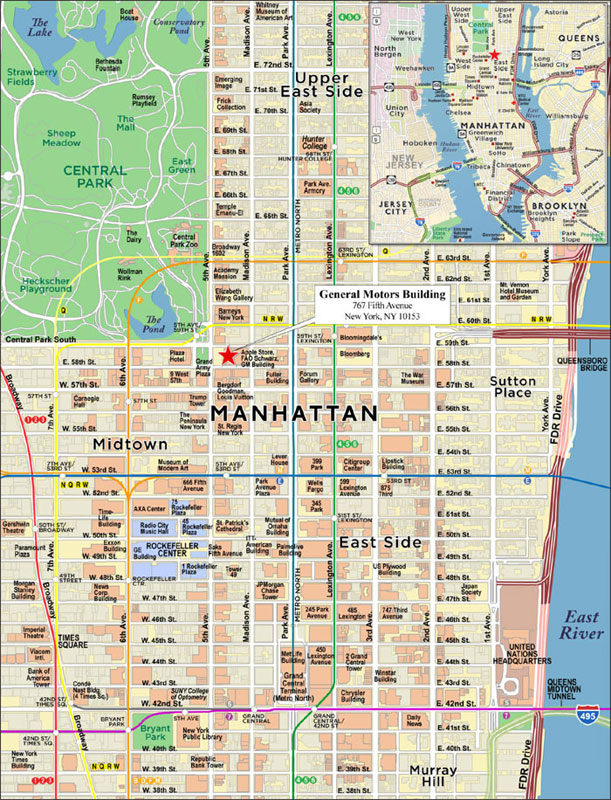
Market Overview and Competition. The General Motors Building Property is located on the entire city block bounded by Fifth Avenue and Madison Avenue between East 58th Street and East 59th Street. This area of Midtown Manhattan is known as the Madison/Fifth Avenue subdistrict, according to the appraisal. The Property is surrounded by many of New York’s landmarks, restaurants, hotels, shops and tourist attractions, made accessible by the presence of several major transportation hubs. The General Motors Building Property is located within the boundaries of the Plaza District, which is generally bound by 47th Street to the south and 65th Street to the north, and from Avenue of the Americas to the East River.
As of the first quarter 2017, the three office statistical areas that comprise the Plaza District contain 81.1 million square feet of Class A office space, 6.4 million square feet of Class B office space and 481,485 square feet of Class C office space. Historically, the Plaza District has evidenced the highest rents in Midtown Manhattan due to the demand generated by its location and quality space, according to the appraisal. As of the first quarter of 2017, the Class A office space in the Plaza District had a direct vacancy rate of 9.4% and average asking rents of $99.69 PSF, above the direct primary Midtown Manhattan average of $88.93 PSF. According to the appraisal, as of first quarter 2017, the Madison/Fifth Avenue subdistrict consisted of approximately 19.8 million square feet of Class A office space and had a direct vacancy rate of 11.0% and overall direct weighted average asking rents of $110.15 PSF.
The appraisal identified 29 comparable office properties totaling approximately 20.0 million square feet that exhibited a gross rental range of $75.00 PSF to $200.00 PSF and a weighted average occupancy rate of approximately 90.5% for direct space. Of the 29 buildings surveyed, seven are considered directly competitive with the General Motors Building Property in terms of building classification, asking rents, rentable office area and current occupancy. The directly competitive properties exhibited a gross rental range of $85.00 PSF to $200.00 PSF and a weighted average direct occupancy of approximately 86.0%, and excluding 9 West 57th Street, the average direct occupancy rate for these buildings is 94.0%, compared to 90.5% for all the competitive buildings compared with the General Motors Building Property, and 91.3% for Class A space within Midtown as a whole.
The following tables present certain information relating to comparable leases for the General Motors Building Property:
Comparable Office Leases(1)
| Property Location | Year Built | Stories | Total Office GLA (SF) | Tenant Name | Lease Date/Term | Lease Area (SF) | Annual Base Rent PSF | Lease Type |
590 Madison Avenue New York, New York | 1982 | 43 | 1,016,413 | Cemex | February 2017 / 15.0 Yrs. | 5,903 | $145.00 | Gross |
520 Madison Avenue New York, New York | 1982 | 43 | 849,600 | CIC Union | January 2017 / 10.0 Yrs. | 46,822 | $127.00 | Gross |
375 Park Avenue New York, New York | 1958 | 38 | 830,009 | Servcorp NYC | January 2017 / 10.0 Yrs. | 9,572 | $173.00 | Gross |
9 West 57th Street New York, New York | 1971 | 50 | 1,500,000 | Qatar Investment Authority | January 2017 / 10.0 Yrs | 14,000 | $180.00 | Gross |
650 Madison Avenue New York, New York | 1987 | 27 | 521,544 | Carson Family Trust | January 2017 / 10.0 Yrs | 4,002 | $120.00 | Gross |
450 Park Avenue New York, New York | 1972/2003 | 33 | 247,242 | Banco Bradesco | December 2016 / 13.0 Yrs | 21,822 | $149.00 | Gross |
399 Park Avenue New York, New York | 1961 | 39 | 1,250,000 | Morgan Stanley | July 2016 / 15.0 Yrs | 110,025 | $108.50 | Gross |
9 West 57th Street New York, New York | 1971 | 50 | 1,500,000 | Zimmer Partners | July 2016 / 10.0 Yrs | 20,100 | $155.00 | Gross |
375 Park Avenue New York, New York | 1958 | 38 | 830,009 | Fried Frank | June 2016 / 6.0 Yrs | 11,703 | $167.00 | Gross |
375 Park Avenue New York, New York | 1958 | 38 | 830,009 | Strategic Asset Services | May 2016 / 7.0 Yrs | 16,000 | $165.00 | Gross |
| (1) | Information obtained from the appraisal. |
THE INFORMATION IN THIS STRUCTURAL AND COLLATERAL TERM SHEET IS NOT COMPLETE AND MAY BE AMENDED PRIOR TO THE TIME OF SALE. THIS TERM SHEET IS NOT AN OFFER TO SELL THESE SECURITIES AND IT IS NOT A SOLICITATION OF AN OFFER TO BUY THESE SECURITIES IN ANY JURISDICTION WHERE THE OFFER OR SALE IS NOT PERMITTED.
11
GENERAL MOTORS BUILDING
Comparable Retail Leases(1)
| Property Location | Tenant Name | Lease Date/Term | Lease Area (SF) | Level | Annual Base Rent PSF | Lease Type |
723 Madison Avenue New York, New York | Paule Ka | December 2016 / 10.0 Yrs | 1,661 | Lower, Ground, Second | (2) | Gross |
650 Fifth Avenue New York, New York | Nike | December 2016 / 15.5 Yrs | 69,214 | Lower – Sixth | (3) | Gross |
680 Madison Avenue New York, New York | Tom Ford | August 2016 / 10.0 Yrs | 8,470 | Ground, Second | (4) | Gross |
683 Fifth Avenue New York, New York | Stuart Weitzman | June 2016 / 10.0 Yrs | 1,281 | Ground | $3,903.20 | Gross |
685 Fifth Avenue New York, New York | Coach | February 2016 / 10.0 Yrs | 24,149 | Lower, Ground, Mezz, Second, Third | (5) | Gross |
683 Madison Avenue New York, New York | Bally’s | January 2016 / 10.0 Yrs | 3,013 | Ground | $1,660.00 | Gross |
730 Fifth Avenue New York, New York | Zegna | February 2016 / 15.0 Yrs | 11,580 | Lower, Ground, Mezz, Second | (6) | Gross |
650 Madison Avenue New York, New York | Moncler | September 2015 / 10.0 Yrs | 3,000 | Ground | $1,500.00 | Gross |
| (1) | Information obtained from the appraisal and a third party market report. |
| (2) | Paule Ka has a blended Annual Base Rent PSF of $874.31, which represents $50.00 PSF on its lower level space (415 square feet), $1,600 PSF on its ground floor space (867 square feet) and $125.00 PSF on its second floor space (379 square feet). |
| (3) | Nike has a blended Annual Base Rent PSF of $479.53, which represents $50.00 PSF on its lower level space (4,706 square feet), $3,500.00 PSF on its ground floor space (7,008 square feet), $350.00 PSF on its second floor space (9,500 square feet), $200.00 PSF on its third floor space (12,000 square feet), $75.00 PSF on its fourth floor space (12,000 square feet), $75.00 PSF on its fifth floor space (12,000 square feet), and $75.00 PSF on its sixth floor space (12,000 square feet). |
| (4) | Tom Ford has a blended Annual Base Rent PSF of $743.80, which represents $1,650.00 PSF on its ground floor space (3,470 square feet), $115.00 PSF on its second floor space (5,000 square feet). |
| (5) | Coach has a blended Annual Base Rent PSF of $869.60, which represents $150.00 PSF on its lower level space (5,247 square feet), $3,550.00 PSF on its ground floor space (4,627 square feet), $200.00 PSF on its mezzanine level space (1,601 square feet), $400.00 PSF on its second floor space (6,337 square feet) and $150.00 PSF on its third floor space (6,337 square feet). |
| (6) | Zegna has a blended Annual Base Rent PSF of $621.76, which represents $150.00 PSF on its lower level space (850 square feet), $3,515 PSF on its ground floor space (1,600 square feet), $200.00 PSF on its mezzanine level space (1,600 square feet) and $150.00 PSF on its second floor space (7,530 square feet). |
The Borrower.The borrower is 767 Fifth Partners LLC, a Delaware limited liability company and single purpose entity with two independent directors. Legal counsel to the borrower delivered a non-consolidation opinion in connection with the origination of the General Motors Building Whole Loan. Other than the borrower, no person or entity guarantees the nonrecourse carveouts or provides environmental indemnities with respect to the General Motors Building Whole Loan.
The Borrower Sponsor.The borrower sponsors are Boston Properties Limited Partnership, 767 LLC and Sungate Fifth Avenue LLC. BPLP is one of the largest owners, managers and developers of Class A office properties in the United States, with significant presence in five markets: Boston, Los Angeles, New York, San Francisco and Washington, D.C. As of May 31, 2017, BPLP owned or had interests in 175 commercial real estate properties, aggregating approximately 48.2 million net rentable square feet. New York is BPLP’s largest market by net operating income, generating annualized net operating income of approximately $452 million as of the first quarter 2017. For the same time period, its New York CBD portfolio was 94.3% leased at an average rental rate of $102.50 PSF.
Escrows.The General Motors Building Whole Loan documents provide for upfront escrows at origination in the amount of $107,946,183 for existing tenant improvement and leasing commissions costs (TI/LCs) and $161,161,013 for in existing gap rent and free rent obligations. At origination, BPLP provided a BPLP Guaranty (as defined below) in lieu of depositing $107,946,183 for existing TI/LCs and $161,161,013 in existing gap rent and free rent obligations. The loan documents do not require ongoing monthly reserve deposits for TI/LCs and replacement reserves. The General Motors Building Whole Loan documents do not require ongoing monthly deposits for real estate taxes and insurance premiums so long as there is no Cash Management Sweep Period (as defined below). During a Cash Management Sweep Period, monthly reserves are required to be collected in an amount equal to 1/12 of the real estate taxes that the lender reasonably estimates will be payable during the ensuing 12 months and 1/12 of the insurance premiums that the lender reasonably estimates will be payable for renewal of the coverage afforded by the insurance policies upon their expiration (unless the General Motors Building Property is insured as part of a “blanket” policy reasonably acceptable to the lenders) equal to one-twelfth of the amount.
The borrower has the right to deliver to the lender a guaranty (a “BPLP Guaranty”) from BPLP (in the context of the BPLP Guaranty, the “BPLP Guarantor”), in lieu of making the payments to any of the reserve accounts, so long as BPLP’s senior unsecured credit rating is BBB or higher by S&P and Baa3 or higher by Moody’s. The aggregate amount guaranteed under any such BPLP Guaranty (together with any cash delivered by the borrower to the lender in lieu of making the deposits to any reserve accounts and/or any letter of credit delivered by the borrower to the lender) related to any such purpose, must at all times be at least equal to the aggregate amount which the borrower is required to have on deposit for such purpose. The aggregate amount guaranteed under any such BPLP Guaranty will be reduced as the borrower expends funds for the purposes which such funds would have otherwise been deposited in the reserve account. The aggregate amount of any BPLP Guaranty may not at any time exceed 11.8% of the outstanding principal balance of the General Motors Building Whole Loan.
THE INFORMATION IN THIS STRUCTURAL AND COLLATERAL TERM SHEET IS NOT COMPLETE AND MAY BE AMENDED PRIOR TO THE TIME OF SALE. THIS TERM SHEET IS NOT AN OFFER TO SELL THESE SECURITIES AND IT IS NOT A SOLICITATION OF AN OFFER TO BUY THESE SECURITIES IN ANY JURISDICTION WHERE THE OFFER OR SALE IS NOT PERMITTED.
12
GENERAL MOTORS BUILDING
Lockbox and Cash Management.The General Motors Building Whole Loan requires a lender-controlled lockbox account, which is already in place, and that the borrower direct all tenants to pay their rents directly into such lockbox account. The loan documents also require that all rents received by the borrower or the property manager be deposited into the lockbox account within five business days after receipt thereof. Prior to the occurrence of Cash Management Sweep Period, all funds in the lockbox account are required to be distributed to the borrower. During a Cash Management Sweep Period, all rents are required to be swept to a lender-controlled cash management account and applied to payment of debt service and funding of required reserves, with the remainder (i) to the extent a Cash Management Sweep Period is continuing, first applied to pay monthly operating expenses and then deposited into an excess cash flow reserve and held by the lender as additional collateral for the General Motors Building Whole Loan; provided, however, if no event of default is continuing, such funds are required to be disbursed to the borrower within ten days after the lender’s receipt of a written request from the borrower (at its election) (a) to pay shortfalls on debt service on the General Motors Building Whole Loan, (b) to disburse monthly operating expenses (including payments to any affiliate of the borrower if set forth in the approved annual budget or otherwise approved by the lender) as set forth in the approved annual budget and extraordinary expenses reasonably approved by the lender, (c) to pay capital expenditures (other than payments to any affiliate of the borrower unless set forth in the approved annual budget or otherwise approved by the lender) subject to the satisfaction of certain capital expenditure release conditions and (d) to pay tenant improvement costs, tenant improvement allowances or leasing expenses as set forth in the approved annual budget or incurred on commercially reasonable terms in connection with leases which do not require the lender’s approval, subject to satisfaction of certain tenant improvement release conditions or leasing commission/allowance release conditions, and (ii) to the extent no Cash Management Sweep Period is continuing, to be distributed to the borrower.
A “Cash Management Sweep Period” will commence upon the occurrence of (i) an event of default under the General Motors Building Whole Loan documents or (ii) debt service coverage ratio (“DSCR”) being less than 1.20x at the end of any calendar quarter. A Cash Management Sweep Period will end, with respect to clause (i) upon the cure of such event of default; or, with respect to clause (ii), upon (a) the DSCR being 1.20x or greater for one calendar quarter or (b) the borrower’s delivery of (x) cash to be held as an additional reserve fund, (y) a letter of credit satisfying the requirements of the General Motors Building Whole Loan documents or (z) so long as BPLP’s senior unsecured credit rating is “BBB” or higher by S&P and “Baa3” or higher by Moody’s, a guaranty by BPLP, in each case in an amount that would be required to be prepaid in order for the DSCR to equal at least 1.20x for one calendar quarter.
Property Management.The General Motors Building Property is managed by BPLP, an affiliate of the borrower.
Assumption.The borrower has the right to transfer the General Motors Building Property, provided that certain other conditions are satisfied, including, but not limited to: (i) no event of default has occurred and is continuing; (ii) the transferee is a “permitted transferee” as defined in the General Motors Building Whole Loan documents; and (iii) if requested by the lender, rating agency confirmation from each rating agency rating the Series 2017-BNK7 Certificates that the transfer will not result in a downgrade, withdrawal or qualification of the respective ratings assigned to the Series 2017-BNK7 Certificates and similar confirmations from each rating agency rating any securities backed by any portion of the General Motors Building Whole Loan with respect to the ratings of such securities. A “permitted transferee” includes (a) various types of institutional investors that own or control a specified dollar amount of real estate assets, (b) entities at least 20% owned by one or more of the types of entities in clause (a) and controlled by such entities or by a nationally recognized manager of investment funds investing in debt or equity relating to commercial real estate, and (c) entities at least 20% directly or indirectly owned by BPLP or Boston Properties, Inc.
Partial Release.Not permitted.
Real Estate Substitution.Not permitted.
Subordinate and Mezzanine Indebtedness.The General Motors Building Whole Loan includes the General Motors Building Junior Notes with an aggregate original principal balance of $830,000,000 that have been contributed to the BXP Trust 2017-GM transaction. See “Description of the Mortgage Pool—The Whole Loans—The Non-Serviced AB Whole Loans—General Motors Building Whole Loan” in the Preliminary Prospectus.
Ground Lease.None.
Terrorism Insurance.The General Motors Building Whole Loan documents require that the “all risk” insurance policy required to be maintained by the borrower provide coverage for terrorism in an amount equal to the full replacement cost of the General Motors Building Property, as well as 18 months of business interruption insurance and subject to a cap equal to two times the premium for the casualty (excluding any terrorism, earthquake or flood component thereof) and business interruption coverage on a stand-alone basis.
Windstorm Insurance.The General Motors Building Whole Loan documents require windstorm insurance covering the full replacement cost of the General Motors Building Property (subject to a deductible per loss that may not exceed 5% of the total insurable value of the General Motors Building Property) during the General Motors Building Whole Loan term.
THE INFORMATION IN THIS STRUCTURAL AND COLLATERAL TERM SHEET IS NOT COMPLETE AND MAY BE AMENDED PRIOR TO THE TIME OF SALE. THIS TERM SHEET IS NOT AN OFFER TO SELL THESE SECURITIES AND IT IS NOT A SOLICITATION OF AN OFFER TO BUY THESE SECURITIES IN ANY JURISDICTION WHERE THE OFFER OR SALE IS NOT PERMITTED.
13
222 SECOND STREET

THE INFORMATION IN THIS STRUCTURAL AND COLLATERAL TERM SHEET IS NOT COMPLETE AND MAY BE AMENDED PRIOR TO THE TIME OF SALE. THIS TERM SHEET IS NOT AN OFFER TO SELL THESE SECURITIES AND IT IS NOT A SOLICITATION OF AN OFFER TO BUY THESE SECURITIES IN ANY JURISDICTION WHERE THE OFFER OR SALE IS NOT PERMITTED.
14
222 SECOND STREET
THE INFORMATION IN THIS STRUCTURAL AND COLLATERAL TERM SHEET IS NOT COMPLETE AND MAY BE AMENDED PRIOR TO THE TIME OF SALE. THIS TERM SHEET IS NOT AN OFFER TO SELL THESE SECURITIES AND IT IS NOT A SOLICITATION OF AN OFFER TO BUY THESE SECURITIES IN ANY JURISDICTION WHERE THE OFFER OR SALE IS NOT PERMITTED.
15
| No. 2– 222 Second Street | |||||||
| Loan Information | Property Information | ||||||
| Mortgage Loan Seller: | Bank of America, N.A. | Single Asset/Portfolio: | Single Asset | ||||
Credit Assessment (Fitch/DBRS/Moody’s): | NR/NR/NR | Property Type: | Office | ||||
| Original Principal Balance(1): | $110,000,000 | Specific Property Type: | CBD | ||||
| Cut-off Date Balance(1): | $110,000,000 | Location: | San Francisco, CA | ||||
| % of Initial Pool Balance: | 9.1% | Size: | 452,418 SF | ||||
| Loan Purpose: | Refinance | Cut-off Date Balance Per SF(1): | $644.32 | ||||
| Borrower Name: | 222 Second Street Owner, L.P. | Year Built/Renovated: | 2015/NAP | ||||
| Sponsor: | TSCE Real Estate, L.P. | Title Vesting: | Fee | ||||
| Mortgage Rate: | 3.926% | Property Manager: | Tishman Speyer Properties, L.P. | ||||
| Note Date: | August 30, 2017 | 4thMost Recent Occupancy (As of)(4): | NAV | ||||
| Anticipated Repayment Date: | September 10, 2027 | 3rdMost Recent Occupancy (As of)(4): | NAV | ||||
| Maturity Date: | September 10, 2029 | 2ndMost Recent Occupancy (As of)(4): | NAV | ||||
| IO Period: | 120 months | Most Recent Occupancy (As of)(4): | 100.0% (12/31/2016) | ||||
| Loan Term (Original): | 120 months | Current Occupancy (As of)(4): | 100.0% (9/1/2017) | ||||
| Seasoning: | 0 months | ||||||
| Amortization Term (Original): | NAP | Underwriting and Financial Information: | |||||
| Loan Amortization Type: | Interest-only, ARD | ||||||
| Interest Accrual Method: | Actual/360 | 4thMost Recent NOI (As of)(4): | NAV | ||||
| Call Protection(2): | L(24),D(89),O(7) | 3rdMost Recent NOI (As of)(4): | NAV | ||||
| Lockbox Type: | Hard/Springing Cash Management | 2ndMost Recent NOI (As of)(4): | NAV | ||||
| Additional Debt(1): | Yes | Most Recent NOI (As of)(4): | NAV | ||||
| Additional Debt Type(1): | Pari Passu | ||||||
| U/W Revenues: | $35,316,832 | ||||||
| U/W Expenses: | $12,580,939 | ||||||
| U/W NOI: | $22,735,893 | ||||||
| U/W NCF: | $21,310,776 | ||||||
| U/W NOI DSCR(1): | 1.96x | ||||||
| Escrows and Reserves(3): | U/W NCF DSCR(1): | 1.84x | |||||
| Type: | Initial | Monthly | Cap (If Any) | U/W NOI Debt Yield(1): | 7.8% | ||
| Taxes | $0 | Springing | NAP | U/W NCF Debt Yield(1): | 7.3% | ||
| Insurance | $0 | Springing | NAP | As-Is Appraised Value(5): | $516,000,000 | ||
| Replacement Reserves | $0 | Springing | $180,967 | As-Is Appraisal Valuation Date: | July 26, 2017 | ||
| TI/LC Reserve | $0 | Springing | $22,620,900 | Cut-off Date LTV Ratio(1)(5): | 56.5% | ||
| Other Reserve | $11,158,354 | $0 | NAP | LTV Ratio at Maturity or ARD(1)(5): | 56.5% | ||
| (1) | The 222 Second Street Whole Loan (as defined below) is comprised of threepari passu promissory notes with an aggregate original principal balance of $291,500,000. The controlling 222 Second Street Mortgage Loan (as defined below) had an original principal balance of $110,000,000, has an outstanding principal balance of $110,000,000 as of the Cut-off Date and will be contributed to the BANK 2017-BNK7 securitization trust. All statistical financial information related to balances per square foot, loan-to-value ratios, debt service coverage ratios and debt yields are based on the 222 Second Street Whole Loan balance of $291,500,000. |
| (2) | The defeasance lockout period will be at least 24 payment dates beginning with and including the first payment date of October 10, 2017. Defeasance of the 222 Second Street Whole Loan is permitted after the date that is the earlier to occur of (i) two years after the closing date of the securitization that includes the last note to be securitized, and (ii) October 10, 2020. The assumed lockout period of 24 payments is based on the expected BANK 2017-BNK7 securitization trust closing date in September 2017. |
| (3) | See “Escrows” section. |
| (4) | The 222 Second Street Property is entirely leased to LinkedIn. The lease provides for four phases of occupancy: Phase I (34.6% of NRA) began on January 1, 2016, Phase II (32.9% of NRA) began on January 1, 2017, Phase III (15.7% of NRA) began on July 1, 2017 and Phase IV (16.8% of NRA) will begin on January 1, 2018. Historical occupancy and NOI information is not available. |
| (5) | The appraiser provided a hypothetical dark value for the 222 Second Street Property of $445.0 million, which would result in a Cut-off Date LTV Ratio and a LTV Ratio at Maturity of 65.5% and 65.5%, respectively. |
The Mortgage Loan. The mortgage loan (“222 Second Street Mortgage Loan”) is part of a whole loan (“222 Second Street Whole Loan”) evidenced by threepari passu promissory notes, secured by the fee interest in a 452,418 square foot Class A office tower in San Francisco, California (the “222 Second Street Property”). The 222 Second Street Whole Loan was originated on August 30, 2017 by Bank of America, N.A. The 222 Second Street Whole Loan had an original principal balance of $291,500,000, has an outstanding principal balance as of the Cut-off Date of $291,500,000 and accrues interest at an interest rate of 3.926%per annum (the “Initial Interest Rate”) through the anticipated repayment date of September 10, 2027. The 222 Second Street Whole Loan had an initial term to the anticipated repayment date of 120 months, has a remaining term to the anticipated repayment date of 120 months as of the Cut-off Date and requires payments of interest-only through the anticipated repayment date. After the anticipated repayment date, if the 222 Second Street Whole Loan remains outstanding, (a) all excess cash flow with respect to the 222 Second Street Property is required to be applied to prepay the 222 Second Street Whole Loan and (b) the 222 Second Street Whole loan will accrue interest an at interest rate equal to the sum of (x) the Initial Interest Rate plus (y) 3.000% through the final maturity date of
THE INFORMATION IN THIS STRUCTURAL AND COLLATERAL TERM SHEET IS NOT COMPLETE AND MAY BE AMENDED PRIOR TO THE TIME OF SALE. THIS TERM SHEET IS NOT AN OFFER TO SELL THESE SECURITIES AND IT IS NOT A SOLICITATION OF AN OFFER TO BUY THESE SECURITIES IN ANY JURISDICTION WHERE THE OFFER OR SALE IS NOT PERMITTED.
16
222 SECOND STREET |
September 10, 2029, with all interest accrued over the Initial Interest Rate deferred and due and payable with the repayment of the 222 Second Street Whole Loan in full at the maturity date.
The 222 Second Street Whole Loan was funded on August 30, 2017 in the amount of $280,341,646 and the 222 Second Street Whole Loan documents require that either (i) so long as no event of default has occurred and is continuing, before September 14, 2017, the 222 Second Street Borrower may request the lender to fund an amount up to $11,158,354 (resulting in the total whole loan amount of $291,500,000) to fund the required LinkedIn Reserve, Downtime Rent Reserve and Proposition 13 Reserve (collectively the “Tenant Reserves” as described below under “Escrows”), or (ii) by September 21, 2017 the 222 Second Street Borrower may deposit with lender up to $11,158,354 to fund the Tenant Reserves. In the event the 222 Second Street Borrower fails to make such funding request or deposit by September 21, 2017, the lender in its discretion may fund up to $11,158,354 to fund the Tenant Reserves. In any event, such funding will be completed prior to the Closing Date. The related Mortgage Loan seller expects, and all calculations and other information presented with respect to the 222 Second Street Mortgage Loan and the 222 Second Street Whole Loan (including the principal balances of the 222 Second Street companion loans) assume, that the Tenant Reserves will be funded by the lender.
The 222 Second Street Mortgage Loan, evidenced by Note A-1 will be contributed to the BANK 2017-BNK7 securitization trust, had an original principal balance of $110,000,000, has an outstanding principal balance as of the Cut-off Date of $110,000,000 and represents apari passu controlling interest in the 222 Second Street Whole Loan. The non-controlling notes and noteholders are shown in the note summary table below. The lender provides no assurances that any non-securitized notes will not be split further. See “Description of the Mortgage Pool—The Whole Loans” in the Preliminary Prospectus.
Note Summary
| Notes | Original Balance | Note Holder | Controlling Interest |
| A-1 | $110,000,000 | BANK 2017-BNK7 | Yes |
| A-2 | $100,000,000 | Bank of America, N.A. | No |
| A-3 | $81,500,000 | Bank of America, N.A. | No |
| Total | $291,500,000 |
Following the lockout period, the borrower has the right to defease the 222 Second Street Whole Loan in whole, but not in part. In addition, the 222 Second Street Whole Loan is prepayable without penalty on or after March 10, 2027. The lockout period will expire on the earlier to occur of (i) two years after the closing date of the securitization that includes the last note to be securitized and (ii) October 10, 2020.
Sources and Uses
| Sources | Uses(1) | |||||||
| Original whole loan amount | $291,500,000 | 100.0% | Loan Payoff | $213,720,346 | 73.3% | |||
| Closing costs | 2,080,863 | 0.7 | ||||||
| Reserves(2) | 11,158,354 | 3.8 | ||||||
| Return of equity(3) | 64,540,437 | 22.1 | ||||||
| Total Sources | $291,500,000 | 100.0% | Total Uses | $291,500,000 | 100.0% | |||
| (1) | The 222 Second Street Property was developed by the 222 Second Street Whole Loan sponsor in a joint venture partnership for a construction cost of approximately $304.5 million. |
| (2) | See “The Mortgage Loan” and “Escrows”. |
| (3) | Return of equity was used to pay off the previous joint venture partner. |
The Property. The 222 Second Street Property is a 452,418 square foot, 26-story high-rise, LEED-Gold certified, Class A office building that was constructed in 2015 and is entirely leased to LinkedIn. Approximately $103 million ($228 per square foot) in tenant improvements was invested to build out LinkedIn’s space, inclusive of approximately $60 million reportedly invested by LinkedIn directly, as it consolidated its San Francisco workforce previously housed in various buildings in San Francisco’s Financial District and SOMA district to the 222 Second Street Property. The LinkedIn lease provides for phased-in occupancy that began January 2016, with the last phase (16.8% of NRA, floors 21-26) expected to commence on January 1, 2018. On the ground floor of the building there is the LinkedIn lobby with a coffee kiosk, 2,209 square feet of retail space and a landscaped public open space. The 222 Second Street Property also features a fitness center offering fitness classes and a massage room and a café with a full-service kitchen on the 2nd floor, outdoor terraces on floors 5 and 17, and a two level sub-grade parking garage with 90 valet spots. The column-free floorplans provide for flexible layouts with floor-to-ceiling windows that allow for 360-degree bay and city views. LinkedIn has customized its space with art installations, creative interactive wall spaces, conference rooms, quiet areas, business centers and kitchenettes on every floor, a band room, pool hall, lending library, music library, and secure bicycle parking.
The Tenant.The 222 Second Street Property is entirely leased to LinkedIn Corporation (“LinkedIn”) under a lease dated April 21, 2014 with four phases of occupancy (Phase I (34.6% of NRA) began on January 1, 2016, Phase II (32.9% of NRA) began on January 1, 2017, Phase III (15.7% of NRA) began on July 1, 2017 and Phase IV (16.8% of NRA) is expected to begin on January 2018) and with staggered expirations in 2025, 2026 and 2027. The LinkedIn lease provides for an initial weighted average rent per square foot of $69.70 with annual rent increases of $1.50 per square foot on the office space and 3.0% on the retail space. The LinkedIn lease does not have any contraction or termination options. The LinkedIn lease contains two five-year renewal options for all or a portion of its space at 95% of fair market rent with 15 months’ notice, which if exercised consecutively and on the entire space, allows for a third five-year renewal option at 95% of fair market rent with 15 months’ notice. If the 222 Second Street Property is ever marketed for sale, LinkedIn has a one-time right of first offer to purchase the 222 Second Street Property provided that it continues to directly lease more than 400,000 square feet and there is no default under the lease.
THE INFORMATION IN THIS STRUCTURAL AND COLLATERAL TERM SHEET IS NOT COMPLETE AND MAY BE AMENDED PRIOR TO THE TIME OF SALE. THIS TERM SHEET IS NOT AN OFFER TO SELL THESE SECURITIES AND IT IS NOT A SOLICITATION OF AN OFFER TO BUY THESE SECURITIES IN ANY JURISDICTION WHERE THE OFFER OR SALE IS NOT PERMITTED.
17
222 SECOND STREET |
LinkedIn is the world’s largest professional social network company with over 400 million members globally and more than 10,000 full time employees. LinkedIn has users in over 200 countries and provides services in 23 languages and earns revenue through three main sources: talent solutions, marketing solutions and premium subscriptions. LinkedIn launched in 2003, went public in 2011 and was acquired by Microsoft Corporation (NasdaqGS: MSFT) in December 2016 for $26.2 billion, the largest acquisition in Microsoft history. Microsoft Corporation fully guarantees the lease.
The following table presents certain information relating to the lease phases at the 222 Second Street Property:
Lease Phase Summary
| Tenant Name | Credit Rating (Fitch/Moody’s/ S&P)(1) | Tenant NRSF | % of NRSF | Annual U/W Base Rent PSF(2) | Annual U/W Base Rent(2) | % of Total Annual U/W Base Rent | Lease Expiration Date | |||
| LinkedIn Phase I | Floors 2-8 | AA+/Aaa/AAA | 154,450 | 34.1% | $70.98 | $10,962,862 | 32.2% | 12/1/2025 | ||
| LinkedIn Phase II | Floors 9-15 | AA+/Aaa/AAA | 148,664 | 32.9% | $74.23 | $11,035,648 | 32.4% | 12/1/2026 | ||
| LinkedIn Phase III | Floors 16-20 | AA+/Aaa/AAA | 70,883 | 15.7% | $78.86 | $5,590,148 | 16.4% | 6/1/2027 | ||
| LinkedIn Phase IV | Floors 21-26 | AA+/Aaa/AAA | 76,212 | 16.8% | $82.52 | $6,288,804 | 18.5% | 12/1/2027 | ||
| LinkedIn Retail Space | Lobby | AA+/Aaa/AAA | 2,209 | 0.5% | $76.26 | $168,463 | 0.5% | 12/1/2025 | ||
| Total | 452,418 | 100.0% | $75.25 | $34,045,925 | 100.0% | |||||
| Vacant Space | 0 | 0.0% | ||||||||
| Collateral Total | 452,418 | 100.0% | ||||||||
| (1) | The LinkedIn lease is guaranteed by Microsoft Corporation, whose ratings are shown. |
| (2) | Annual U/W Base Rent includes contractual rent increases through August 2018 and straightlined rent through the lease term. |
The following table presents certain information relating to the lease rollover schedule at the 222 Second Street Property:
Lease Phase Expiration Schedule(1)
| Year Ending December 31, | Expiring NRSF | % of Total NRSF | Cumulative Expiring NRSF | Cumulative % of Total NRSF | Annual U/W Base Rent(2) | % of Total Annual U/W Base Rent(2) | Annual U/W Base Rent PSF(2) |
| 2017 | 0 | 0.0% | 0 | 0.0% | $0 | 0.0% | $0.00 |
| 2018 | 0 | 0.0% | 0 | 0.0% | 0 | 0.0% | $0.00 |
| 2019 | 0 | 0.0% | 0 | 0.0% | 0 | 0.0% | $0.00 |
| 2020 | 0 | 0.0% | 0 | 0.0% | 0 | 0.0% | $0.00 |
| 2021 | 0 | 0.0% | 0 | 0.0% | 0 | 0.0% | $0.00 |
| 2022 | 0 | 0.0% | 0 | 0.0% | 0 | 0.0% | $0.00 |
| 2023 | 0 | 0.0% | 0 | 0.0% | 0 | 0.0% | $0.00 |
| 2024 | 0 | 0.0% | 0 | 0.0% | 0 | 0.0% | $0.00 |
| 2025 | 156,659 | 34.6% | 156,659 | 34.6% | 11,131,325 | 32.7% | $71.05 |
| 2026 | 148,664 | 32.9% | 305,323 | 67.5% | 11,035,648 | 32.4% | $74.23 |
| 2027 | 147,095 | 32.5% | 452,418 | 100.0% | 11,878,952 | 34.9% | $80.76 |
| Thereafter | 0 | 0.0% | 452,418 | 100.0% | 0 | 0.0% | $0.00 |
| Vacant | 0 | 0.0% | 452,418 | 100.0% | 0 | 0.0% | $0.00 |
| Total/Wtd. Avg. | 452,418 | 100.0% | $34,045,925 | 100.0% | $75.25 |
| (1) | Information obtained from the underwritten rent roll. |
| (2) | Annual U/W Base Rent includes contractual rent increases through August 2018 and straightlined rent through the lease term. |
THE INFORMATION IN THIS STRUCTURAL AND COLLATERAL TERM SHEET IS NOT COMPLETE AND MAY BE AMENDED PRIOR TO THE TIME OF SALE. THIS TERM SHEET IS NOT AN OFFER TO SELL THESE SECURITIES AND IT IS NOT A SOLICITATION OF AN OFFER TO BUY THESE SECURITIES IN ANY JURISDICTION WHERE THE OFFER OR SALE IS NOT PERMITTED.
18
222 SECOND STREET |
Underwritten Net Cash Flow. The following table presents certain information relating to the underwritten net cash flow at the 222 Second Street Property:
Cash Flow Analysis(1)
| U/W | % of U/W Effective Gross Income | U/W $ per SF | |||
| Base Rent(2) | $ 34,045,925 | 96.4% | $75.25 | ||
| Expense Reimbursements | 2,035,199 | 5.8 | 4.50 | ||
| Other Income & Parking Income(3) | 1,039,764 | 2.9 | 2.30 | ||
| Less Vacancy & Credit Loss | (1,804,056) | (5.1) | (3.99) | ||
| Effective Gross Income | $ 35,316,832 | 100.0% | $78.06 | ||
| Total Operating Expenses | 12,580,939 | 35.6 | 27.81 | ||
| Net Operating Income | $22,735,893 | 64.4% | $50.25 | ||
| TI/LC | 1,357,254 | 3.8 | 3.00 | ||
| Capital Expenditures | 67,863 | 0.2 | 0.15 | ||
| Net Cash Flow | $21,310,776 | 60.3% | $47.10 | ||
| NOI DSCR(4) | 1.96x | ||||
| NCF DSCR(4) | 1.84x | ||||
| NOI DY(4) | 7.8% | ||||
| NCF DY(4) | 7.3% |
| (1) | The 222 Second Street Property is entirely leased to LinkedIn. The lease provides for four phases of occupancy: Phase I (34.6% of NRA) began on January 1, 2016, Phase II (32.9% of NRA) began on January 1, 2017, Phase III (15.7% of NRA) began on July 1, 2017 and Phase IV (16.8% of NRA) is expected to begin on January 1, 2018. Historical information is not available. |
| (2) | U/W Base Rent includes contractual rent increases through August 2018 and straightlined rent through the lease term. |
| (3) | Other Income includes work order income, overtime HVAC, sub-metered electric and cleaning income. Parking Income includes the contractual rent step effective April 16, 2018. |
| (4) | Based on the 222 Second Street Whole Loan balance of $291,500,000. |
Appraisal.As of the appraisal valuation date of July 26, 2017, the 222 Second Street Property had an “as-is” appraised value of $516,000,000.
Environmental Matters.According to the Phase I environmental report dated July 31, 2017, there was no evidence of any recognized environmental conditions at the 222 Second Street Property.
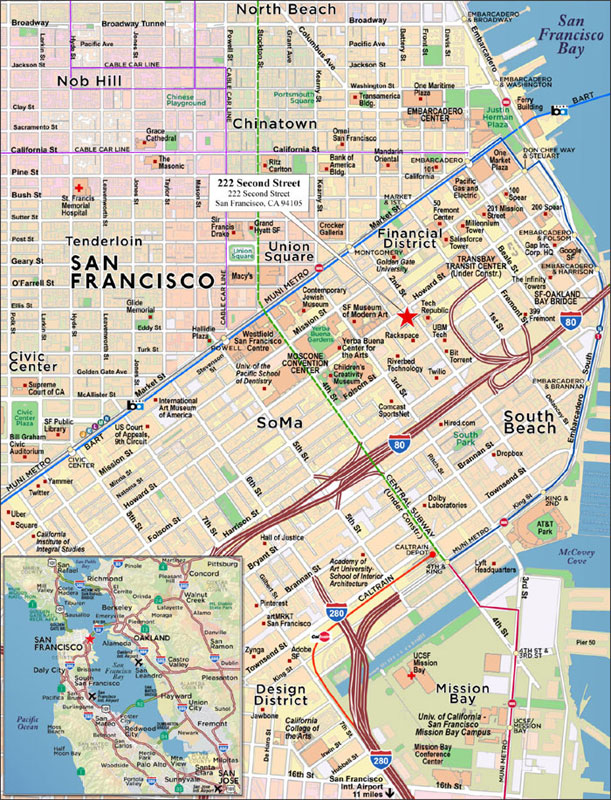
Market Overview and Competition. The 222 Second Street Property is located in the South Financial District of downtown San Francisco, California, on the southwest corner of Howard and Second Streets with additional frontage on Tehama Street. To the north, the North Financial District contains most of the older development and prestigious buildings of San Francisco. To the south is the Rincon Hill/South Beach/SOMA District, which has seen a resurgence in leasing activity particularly with respect to the technology sector. To the west is the Yerba Buena District, which is home to several major redevelopment projects that have enhanced the economic utility of the area, including the Yerba Buena complex, the Moscone convention center, and Westfield Shopping Center.
Land area surrounding the 222 Second Street Property is approximately 95% developed, predominantly with commercial uses. Each October, the City of San Francisco releases office development allowances of 950,000 square feet (875,000 square feet available for office buildings of 50,000 square feet or more). Notable recent developments in the South Financial District and SOMA, in addition to the 222 Second Street Property, include 350 Mission Street, a 30-story Class A office tower fully leased to Salesforce, 333 & 345 Brannan, a 6-story creative office building fully leased to Dropbox, 270 Brannan, a 5-story office building occupied by Splunk, and 85 Bluxome a 5-story creative office building fully leased to Collective Health. Large buildings under construction in the (North and South) Financial District include 101 1st Street (1,370,577 square feet, 52% leased to Salesforce, expected to deliver in December 2017), 50 First Street (1,057,549 square feet, mixed use development expected to deliver in late 2021), 181 Fremont Street (361,038 square feet, mixed use tower expected to deliver in December 2017), and 250 Howard (766,745 square feet expected to deliver in October 2018), with no other large buildings currently entitled.
The 222 Second Street Property is located two blocks from Interstate 80 leading across the Bay Bridge to the east and south to Highway 101, and within two blocks from the major mass transit arteries of Mission Street and Market Street. Public transportation access to the 222 Second Street Property is provided via a CalTrain station seven blocks south, a MUNI/BART station two blocks north, and a temporary Transbay Terminal (serving all bus routes in and out of San Francisco) located roughly three blocks northeast while the existing terminal just north of the 222 Second Street Property is undergoing an estimated $6 billion transformation into a modern transit hub connecting eight Bay Area counties through eleven transit systems and creating a new neighborhood of homes, offices, parks and shops.
According to the appraisal, the 222 Second Street Property is located within the South Financial District office market. The South Financial District office market had second quarter 2017 inventory of approximately 25,627,040 square feet with a 7.7% vacancy rate, average asking rents of $71.76 per square foot, as compared to the overall San Francisco office market which had an 8.4% vacancy rate and average asking rents of $70.16 per square foot for the same period.
The estimated 2017 population within a 0.5, 1.0 and 3.0-mile radius around the 222 Second Street Property was 19,599, 99,419, and 400,571, respectively, reflective of a population compound growth rate from 2010-2017 of 4.2%, 2.3% and 1.6%. The estimated 2017 median household income within the same radii was $129,833, $51,078 and $86,193, respectively.
THE INFORMATION IN THIS STRUCTURAL AND COLLATERAL TERM SHEET IS NOT COMPLETE AND MAY BE AMENDED PRIOR TO THE TIME OF SALE. THIS TERM SHEET IS NOT AN OFFER TO SELL THESE SECURITIES AND IT IS NOT A SOLICITATION OF AN OFFER TO BUY THESE SECURITIES IN ANY JURISDICTION WHERE THE OFFER OR SALE IS NOT PERMITTED.
19
222 SECOND STREET |
The following table presents certain information relating to competitive leases for the 222 Second Street Property:
Competitive Leases(1)
| Property | Year Built | Size (SF / Stories) | Tenant | SF | Lease Start | Term (mos) | Rent PSF | Free Rent/TI | ||||||
| 222 Second Street | 2015 | 452,418 / 26 | 452,418 | Jan-16 | 120 NNN | $69.70 | 4 mos/$75 | |||||||
| 350 Bush St. | 2017 | 447,000 / 21 | Twitch | 236,942 | Apr-17 | 120 NNN | $62 | 4 mos/$65 | ||||||
| China Basin Landing | 1920 | 918,179 / 6 | Lyft | 97,274 | Aug-16 | 108 MG | $80 | 4-5mos/$41 | ||||||
101 California St. | 1982 | 1,262,538 / 48 | Paul Hastings | 40,422 | Jan-17 | 127 NNN | $71 | 5 mos/$75 | ||||||
211 Main | 1973 | 373,657 / 17 | Charles Schwab | 360,000 | May-18 | 120 NNN | $40 | 0 mos/$34 | ||||||
| (1) | Information obtained from the appraisal and tenant lease. |
The Borrower.The borrower is 222 Second Street Owner, L.P. (the “222 Second Street Borrower”), a single-purpose Delaware limited partnership, with two independent directors. Legal counsel to the borrower delivered a non-consolidation opinion in connection with the origination of the 222 Second Street Whole Loan.
The Sponsor.The loan sponsor is TSCE Real Estate, L.P. which is 93.8% owned by Tishman Speyer Crown Equities LLC, an affiliate of Tishman Speyer. Tishman Speyer is one of the leading owners, developers, operators and fund managers of real estate worldwide. Tishman Speyer operates in 30 markets in 7 countries and since inception in 1978 has acquired, developed and operated 402 assets totaling over 165 million square feet, with a current portfolio value in excess of $82.6 billion.
Escrows.During a Cash Trap Event Period (as defined below), the 222 Second Street Borrower is required to deposit monthly or provide a letter of credit for (i) 1/12th of the estimated annual real estate taxes and 1/12th of the estimated annual insurance premiums (unless the 222 Second Street Property is covered by a blanket insurance policy), (ii) $7,540 to a replacement reserve subject to a cap of $180,967, and (iii) $113,105 to leasing reserve subject to a cap of $22,620,900.
The 222 Second Street Borrower is required to deposit (i) to the LinkedIn Reserve the amount of $7,709,282 for leasing expenses payable pursuant to the LinkedIn lease, (ii) to the Downtime Rent Reserve the amount of $1,930,704 for September through December 2017 rents for LinkedIn, and (iii) to the Proposition 13 Reserve the amount of $1,518,368 for lost tax reimbursements due to LinkedIn’s Proposition 13 reassessment (collectively the “Tenant Reserves”) by either (a) requesting the lender to fund an amount up to $11,158,354 before September 14, 2017, so long as no default has occurred and is continuing, or (b) making a deposit of up to $11,158,354 before September 21, 2017. In the event the 222 Second Street Borrower fails to make such funding request or deposit by September 21, 2017, the lender in its discretion may fund up to $11,158,354 to fund the Tenant Reserves. In any event, such funding will be completed prior to the Closing Date. The related Mortgage Loan seller expects, and all calculations and other information presented with respect to the 222 Second Street Mortgage Loan and the 222 Second Street Whole Loan (including the principal balances of the 222 Second Street companion loans) assume, that the Tenant Reserves will be funded by the lender.
A “Cash Trap Event Period” will commence upon the first to occur of (i) an event of default, (ii) the debt service coverage ratio being less than 1.30x for two consecutive quarters, (iii) the occurrence of a LinkedIn Non-Renewal Trigger (as defined below), (iv) the occurrence of a LinkedIn Dark Trigger (as defined below), or (v) borrower’s failure to repay or defease the 222 Second Street Whole Loan in full by September 10, 2027 (the anticipated repayment date).
A Cash Trap Event Period will end upon (i) if triggered by clause (i) above, a cure of such event of default, (ii) if triggered by clause (ii) above, either (x) the debt service coverage ratio being equal to or greater than 1.30x for two consecutive quarters or (y) borrower’s deposit of Cash Trap Event Cure Collateral (as defined below), (iii) if triggered by clause (iii) above, the date either (1) LinkedIn renews its lease, or (2) (x) a replacement lease is entered into for the LinkedIn leased space and (y) the debt service coverage ratio for two consecutive calendar quarters is equal to or greater than 1.30x, or (iv) if triggered by clause (iv) above, a LinkedIn Dark Trigger Cure (as defined below). If triggered by clause (v) above, a Cash Trap Event Period will not end and will continue until the 222 Second Street Whole Loan is paid in full. Additionally, a Cash Trap Event Period will not end if a separate trigger remains uncured.
A “LinkedIn Non-Renewal Trigger” means the date which is seventeen months prior to the expiration of a phase of the LinkedIn lease if LinkedIn has not renewed its lease for that leased space.
A “LinkedIn Dark Trigger” means after September 10, 2021, if and for so long as none of LinkedIn (or the current tenant under the LinkedIn lease if the lease has been assigned), the parent company of LinkedIn (or the current tenant under the LinkedIn Lease if the lease has been assigned) or the guarantor under the LinkedIn lease is rated at least “BBB-” (or the equivalent) by each of S&P and Moody’s, LinkedIn fails to occupy at least 50% of its space for a period of more than six months.
A “LinkedIn Dark Trigger Cure” means (1) (x) a replacement lease is entered into for at least 50% of the LinkedIn leased space, (y) 50% of the LinkedIn leased space which is not occupied by LinkedIn is subleased to one or more subtenants, or (z) LinkedIn reoccupies at least 50% of its leased space for a period of at least six months, and (2) the debt service coverage ratio is equal to or greater than 1.30x for two consecutive quarters.
THE INFORMATION IN THIS STRUCTURAL AND COLLATERAL TERM SHEET IS NOT COMPLETE AND MAY BE AMENDED PRIOR TO THE TIME OF SALE. THIS TERM SHEET IS NOT AN OFFER TO SELL THESE SECURITIES AND IT IS NOT A SOLICITATION OF AN OFFER TO BUY THESE SECURITIES IN ANY JURISDICTION WHERE THE OFFER OR SALE IS NOT PERMITTED.
20
222 SECOND STREET |
“Cash Trap Event Cure Collateral” means cash or a letter of credit in an amount that if applied to the reduction of the outstanding principal of the 222 Second Street Whole loan would result in a debt service coverage ratio of not less than 1.30x for the previous two quarters.
Lockbox and Cash Management.A hard lockbox is in place with respect to the 222 Second Street Whole Loan. Funds deposited to the lockbox will be swept daily to the borrower’s operating account unless a Cash Trap Event Period exists. During a Cash Trap Event Period, funds in the lockbox are required to be automatically transferred to a cash management account under the sole control of the lender for the payment of, among other things, operating expenses, debt service and monthly escrows, with all excess cash being deposited to an excess cash reserve to be held as additional collateral for the 222 Second Street Whole Loan (or if the Cash Trap Event Period is triggered by a LinkedIn Dark Trigger solely, then 50% of the excess cash with respect to the 222 Second Street Property will be held as additional collateral for the 222 Second Street Whole Loan and 50% will be swept to the 222 Second Street Borrower’s operating account).
Property Management.The 222 Second Street Property is managed by Tishman Speyer Properties, L.P., an affiliate of the borrower.
Assumption.The borrower has the right to transfer the 222 Second Street Propertyprovided that certain conditions are satisfied, including (i) no event of default exists; (ii) the transferee is either (a) a TS Control Party, (b) a qualified equity holder or controlled by a qualified equity holder, or (c) approved by lender based on underwriting and credit requirements and consideration of the track record, financial strength and good standing of the transferee, with rating agency confirmation if required; (iii) the 222 Second Street Property will be managed by a qualifying manager; (iv) a replacement guarantor has assumed the obligations of the 222 Second Street Whole Loan guarantor; and (v) lender has received a non-consolidation opinion.
A “TS Control Party” means any of (a) Jerry I. Speyer and/or Robert J. Speyer, their spouses, descendants, heirs, legatees, devisees or trusts or family limited partnerships created for the benefit of any of the foregoing and any descendants, heirs, legatees, devisees of Robert V. Tishman and trusts or family limited partnerships created for the benefit of any descendants, heirs, legatees, devisees of Robert V. Tishman, (b) the managing directors of Tishman Speyer Properties, L.P. or any of its affiliates currently serving or who have served as full time employees for at least five years, and/or (c) an entity controlled by any of the foregoing.
Partial Release.Not permitted.
Real Estate Substitution.Not permitted.
Subordinate and Mezzanine Indebtedness. Not permitted.
Ground Lease. None.
Terrorism Insurance.The 222 Second Street Borrower is required to obtain and maintain property insurance, public liability insurance and rental loss and/or business interruption insurance that covers perils of terrorism and acts of terrorism,provided that if the Terrorism Risk Insurance Program Reauthorization Act of 2015 or any extension thereof or substantially similar program is in effect, the 222 Second Street Whole Loan documents provide for an annual terrorism premium cap of two times the cost of the annual premiums for property and business interruption insurance required under the related 222 Second Street Whole Loan documents (excluding the cost of the terrorism and earthquake components of such property insurance).
THE INFORMATION IN THIS STRUCTURAL AND COLLATERAL TERM SHEET IS NOT COMPLETE AND MAY BE AMENDED PRIOR TO THE TIME OF SALE. THIS TERM SHEET IS NOT AN OFFER TO SELL THESE SECURITIES AND IT IS NOT A SOLICITATION OF AN OFFER TO BUY THESE SECURITIES IN ANY JURISDICTION WHERE THE OFFER OR SALE IS NOT PERMITTED.
21
UNIVERSITY CENTER CHICAGO |
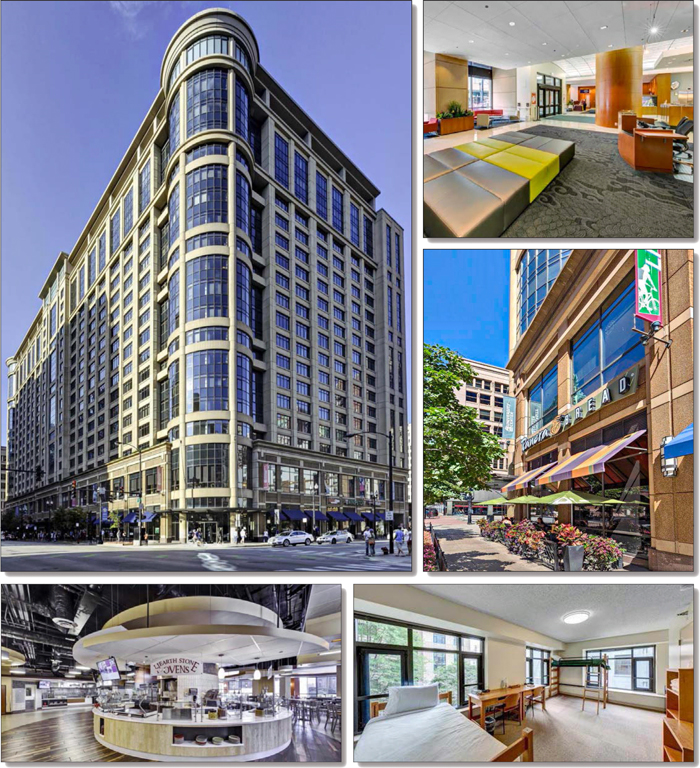
THE INFORMATION IN THIS STRUCTURAL AND COLLATERAL TERM SHEET IS NOT COMPLETE AND MAY BE AMENDED PRIOR TO THE TIME OF SALE. THIS TERM SHEET IS NOT AN OFFER TO SELL THESE SECURITIES AND IT IS NOT A SOLICITATION OF AN OFFER TO BUY THESE SECURITIES IN ANY JURISDICTION WHERE THE OFFER OR SALE IS NOT PERMITTED.
22
UNIVERSITY CENTER CHICAGO |
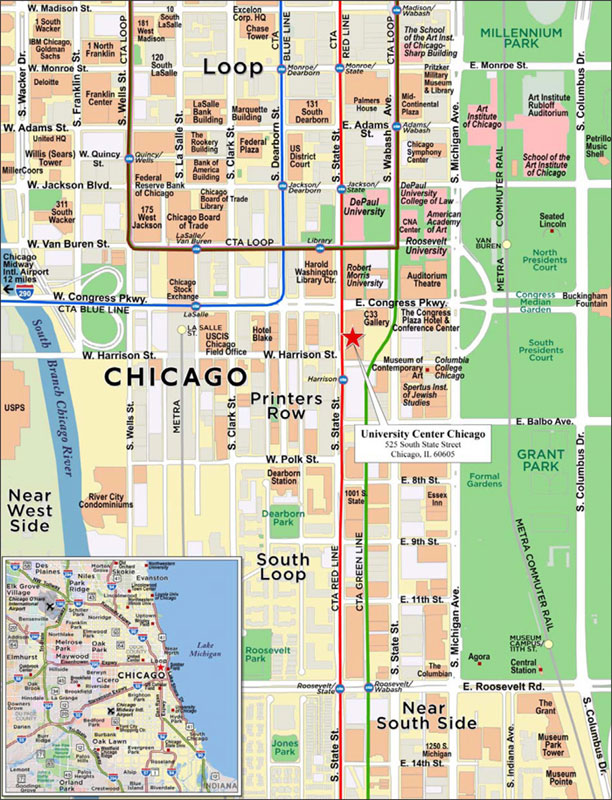
THE INFORMATION IN THIS STRUCTURAL AND COLLATERAL TERM SHEET IS NOT COMPLETE AND MAY BE AMENDED PRIOR TO THE TIME OF SALE. THIS TERM SHEET IS NOT AN OFFER TO SELL THESE SECURITIES AND IT IS NOT A SOLICITATION OF AN OFFER TO BUY THESE SECURITIES IN ANY JURISDICTION WHERE THE OFFER OR SALE IS NOT PERMITTED.
23
| No. 3 – University Center Chicago | ||||||
| Loan Information | Property Information | |||||
| Mortgage Loan Seller: | Well Fargo Bank, National Association | Single Asset/Portfolio: | Single Asset | |||
| Credit Assessment (DBRS/Fitch/Moody’s): | NR/NR/NR | Property Type: | Multifamily | |||
| Original Principal Balance(1): | $85,600,000 | Specific Property Type: | Student Housing | |||
| Cut-off Date Balance(1): | $85,600,000 | Location: | Chicago, IL | |||
| % of Initial Pool Balance: | 7.1% | Size: | 1,732 Beds | |||
| Loan Purpose: | Acquisition | Cut-off Date Balance Per Bed(1): | $69,630 | |||
| Borrower Name: | University Center Property LLC | Year Built/Renovated: | 2004/NAP | |||
| Borrower Sponsors: | UCC Chicago Acquisition Partner LLC; Blue Vista Capital Management, LLC | Title Vesting: | Fee | |||
| Mortgage Rate: | 3.920% | Property Manager: | Self-managed | |||
| Note Date: | July 20, 2017 | 4thMost Recent Occupancy (As of)(3): | 94.4% (12/31/2013) | |||
| Anticipated Repayment Date: | NAP | 3rdMost Recent Occupancy (As of)(3): | 92.8% (12/31/2014) | |||
| Maturity Date: | August 11, 2027 | 2ndMost Recent Occupancy (As of)(3): | 91.7% (12/31/2015) | |||
| IO Period: | 120 months | Most Recent Occupancy (As of)(3): | 88.7% (12/31/2016) | |||
| Loan Term (Original): | 120 months | Current Occupancy (As of)(3): | 89.8% (7/17/2017) | |||
| Seasoning: | 1 month | |||||
| Amortization Term (Original): | NAP | Underwriting and Financial Information: | ||||
| Loan Amortization Type: | Interest-only, Balloon | 4thMost Recent NOI: | $15,800,231 (12/31/2014) | |||
| Interest Accrual Method: | Actual/360 | 3rdMost Recent NOI (As of): | $14,762,415 (12/31/2015) | |||
| Call Protection: | L(25),D(88),O(7) | 2ndMost Recent NOI (As of): | $14,452,181 (12/31/2016) | |||
| Lockbox Type: | Hard/Upfront Cash Management | Most Recent NOI (As of): | $14,263,985 (TTM 3/31/2017) | |||
| Additional Debt(1): | Yes | |||||
| Additional Debt Type(1): | Pari Passu | U/W Revenues: | $23,284,431 | |||
| U/W Expenses: | $10,155,231 | |||||
| U/W NOI: | $13,129,200 | |||||
| U/W NCF: | $12,890,034 | |||||
| Escrows and Reserves(2): | U/W NOI DSCR(1): | 2.74x | ||||
| U/W NCF DSCR(1): | 2.69x | |||||
| Type: | Initial | Monthly | Cap (If Any) | U/W NOI Debt Yield(1): | 10.9% | |
| Taxes | $0 | $118,585 | NAP | U/W NCF Debt Yield(1): | 10.7% | |
| Insurance | $96,969 | $16,162 | NAP | As-Is Appraised Value: | $203,400,000 | |
| Replacement Reserves | $1,385,081 | $14,700 | NAP | As-Is Appraisal Valuation Date: | June 1, 2017 | |
| Tenant Specific TI/LC Reserves | $485,951 | $0 | NAP | Cut-off Date LTV Ratio(1): | 59.3% | |
| Seasonality Reserve | $0 | $430,018 | NAP | LTV Ratio at Maturity or ARD(1): | 59.3% | |
| (1) | See “The Mortgage Loan” section. All statistical financial information related to balance per bed, loan-to-value ratios, debt service coverage ratios and debt yields are based on the funded outstanding principal balance of University Center Chicago Whole Loan (as defined below). |
| (2) | See “Escrows” section. |
| (3) | Occupancy shown is based on per-bed occupancy for residential units only. The University Center Chicago Property contains 13 retail spaces totaling 28,085 square feet that were 87.6% physically occupied as of July 17, 2017. |
The Mortgage Loan. The mortgage loan (the “University Center Chicago Mortgage Loan”) is part of a whole loan (the “University Center Chicago Whole Loan”) that is evidenced by two promissory notes (Notes A-1 and A-2) secured by a first mortgage encumbering the fee interest of a student housing property located in downtown Chicago, Illinois (the “University Center Chicago Property”). The University Center Chicago Whole Loan had an original principal balance of $120,600,000, has an outstanding principal balance as of the Cut-off Date of $120,600,000 and accrues interest at an interest rate of 3.920% per annum. The University Center Chicago Whole Loan had an initial term of 120 months, has a remaining term of 119 months as of the Cut-off Date and requires payments of interest-only through the term of the University Center Chicago Whole Loan. The University Center Chicago Whole Loan matures on August 11, 2027.
The University Center Chicago Mortgage Loan, evidenced by the controlling Note A-1, which will be contributed to the BANK 2017-BNK7 Trust, had an original aggregate principal balance of $85,600,000 and has an aggregate outstanding principal balance as of the Cut-off Date of $85,600,000. The non-controlling Note A-2, with an original principal balance of $35,000,000, was contributed to the WFCM 2017-C39 Trust. See “Description of the Mortgage Pool—The Whole Loans— University Center Chicago Whole Loan” and “Pooling and Servicing Agreement” in the Preliminary Prospectus.
THE INFORMATION IN THIS STRUCTURAL AND COLLATERAL TERM SHEET IS NOT COMPLETE AND MAY BE AMENDED PRIOR TO THE TIME OF SALE. THIS TERM SHEET IS NOT AN OFFER TO SELL THESE SECURITIES AND IT IS NOT A SOLICITATION OF AN OFFER TO BUY THESE SECURITIES IN ANY JURISDICTION WHERE THE OFFER OR SALE IS NOT PERMITTED.
24
| UNIVERSITY CENTER CHICAGO |
Note Summary
| Notes | Original Balance | Note Holder | Controlling Interest | |
| A-1 | $85,600,000 | BANK 2017-BNK7 | Yes | |
| A-2 | $35,000,000 | WFCM 2017-C39 | No | |
| Total | $120,600,000 |
Sources and Uses
| Sources | Uses | |||||||
| Original loan amount | $120,600,000 | 59.6% | Purchase price | $201,000,000 | 99.3% | |||
| Sponsor’s new cash contribution | 81,851,234 | 40.4 | Seller prorations | (2,391,247) | (1.2) | |||
| Reserves | 1,968,001 | 1.0 | ||||||
| Closing costs | 1,874,480 | 0.9 | ||||||
| Total Sources | $202,451,234 | 100.0% | Total Uses | $202,451,234 | 100.0% |
The Property.The University Center Chicago Property is located in the South Loop neighborhood of Chicago, along South State Street just south of Congress Parkway. The University Center Chicago Property is an 18-story class A student housing complex that contains 504 residential units totaling 1,732 beds (comprising 93.7% of the total net rentable area and 95.3% of the underwritten base rent) and 28,085 square feet of retail space that was 87.6% physically occupied by 12 tenants as of July 17, 2017. Constructed in 2004, the University Center Chicago Property includes amenities such as a 30,000-square-foot dining facility, 15,000 square feet of meeting space, an on-site fitness center, game room, study room on every floor, laundry facilities, 24-hour security with key card access, student lounge with kitchen on every floor, meeting rooms, bicycle storage, computer center (providing access to printing and IT help) and a 20,000-square-foot terrace garden on the third floor. The unit mix at the University Center Chicago Property consists of a mixture of studio, one-, two-, and four-bedroom units. Over the past five years, the seller has invested approximately $4.5 million ($2,598 per bed) into the University Center Chicago Property. The borrower sponsor plans to complete an approximately $6.7 million ($3,868 per bed) capital improvement project including $2.1 million in common area renovations, and $3.9 million in-unit renovations over the next 24 months.
The University Center Chicago Property is subject to five separate master leases (see “Master Lease Summary” below) with different universities, colleges and academies in the immediate area comprising a total of 1,538 beds (88.8% of total beds). The campuses of all five master tenants are located within three blocks of the University Center Chicago Property. Master leases for Columbia College, DePaul University, and Roosevelt University account for approximately 83.2% of the master leased beds (or 73.9% of the total beds at the University Center Chicago Property) and have lease expirations in 2027. As of July 17, 2017, the University Center Chicago Property was 89.8% occupied.
The following table presents certain information relating to the unit mix of the University Center Chicago Property:
Unit Mix Summary(1)
| Unit Type | No. of Beds | No. of Units | % of Total Beds | Average Unit Size (SF) |
| Studio / 1 Bathroom | 32 | 32 | 1.8% | 500 |
| 1 Bedroom / 1 Bathroom | 32 | 32 | 1.8% | 365 |
| 2 Bedroom / 1 Bathroom | 92 | 46 | 5.3% | 365 |
| 4 Bedroom / 1 Bathroom | 936 | 234 | 54.0% | 730 |
| 2 Bedroom / 2 Bathroom | 68 | 17 | 3.9% | 1100 |
| 4 Bedroom / 2 Bathroom | 572 | 143 | 33.0% | 1300 |
| Total/Weighted Average | 1,732 | 504 | 100.0% | 833 |
| (1) | Information obtained from the appraisal and underwritten rent roll. |
Master Lease Summary
| Tenant Name | Contract Rent(1) | No. of Beds | Average Annual Rent per Bed | Average Monthly Rent per Bed | Lease Expiration |
| Columbia College | $6,695,556 | 636 | $10,528 | $877 | 5/14/2027(2) |
| DePaul University | $4,872,792 | 427 | $11,412 | $951 | 6/11/2027(2) |
| Roosevelt University | $2,531,016 | 217 | $11,664 | $972 | 5/12/2027(2) |
| American Academy of Arts | $64,152 | 8 | $8,019 | $668 | 4/22/2018 |
| Robert Morris University | $2,302,120 | 250 | $9,208 | $767 | 7/13/2019 |
| Total | $16,465,636 | 1,538 | $10,706 | $892 |
| (1) | Contract Rents for master leases are for Academic Year 2017/2018. |
| (2) | Tenant has one, 10-year renewal option. |
THE INFORMATION IN THIS STRUCTURAL AND COLLATERAL TERM SHEET IS NOT COMPLETE AND MAY BE AMENDED PRIOR TO THE TIME OF SALE. THIS TERM SHEET IS NOT AN OFFER TO SELL THESE SECURITIES AND IT IS NOT A SOLICITATION OF AN OFFER TO BUY THESE SECURITIES IN ANY JURISDICTION WHERE THE OFFER OR SALE IS NOT PERMITTED.
25
| UNIVERSITY CENTER CHICAGO |
The following table presents historical occupancy percentages at the University Center Chicago Property:
Historical Occupancy
12/31/2014(1)(2) | 12/31/2015(1)(2) | 12/31/2016(1)(2) | 7/17/2017(2)(3) | |||
| 92.8% | 91.7% | 88.7% | 89.8% |
| (1) | Information obtained from the borrower. |
| (2) | Occupancy shown is based on per-bed occupancy for residential units only. The University Center Chicago Property contains 13 retail spaces totaling 28,085 square feet that were 87.6% physically occupied as of July 17, 2017. |
| (3) | Information obtained from the underwritten rent roll. |
Operating History and Underwritten Net Cash Flow.The following table presents certain information relating to the historical operating performance and underwritten net cash flow at the University Center Chicago Property:
Cash Flow Analysis
| 2014 | 2015 | 2016 | TTM 3/31/2017 | U/W | % of U/W Effective Gross Income | U/W $ per Bed | |||||||||
| Base Rent | $19,378,465 | $18,416,594 | $18,253,530 | $18,140,770 | $18,841,061(1) | 80.9% | $10,878 | ||||||||
| Grossed Up Vacant Space | 0 | 0 | 0 | 0 | $2,242,666 | 9.6 | 1,295 | ||||||||
| Total Reimbursement | 294,736 | 287,601 | 277,796 | 237,426 | 292,698 | 1.3 | 169 | ||||||||
| Other Income(2) | 4,245,340 | 4,492,586 | 4,398,444 | 4,439,554 | 4,150,671 | 17.8 | 2,396 | ||||||||
| Less Vacancy & Credit Loss | 0 | 0 | 0 | 0 | (2,242,666)(3) | (9.6) | (1,295) | ||||||||
| Effective Gross Income | $23,918,541 | $23,196,781 | $22,929,770 | $22,817,750 | $23,284,431 | 100.0% | $13,444 | ||||||||
| Total Operating Expenses | $8,118,310 | $8,434,366 | $8,477,589 | $8,553,765 | $10,155,231(4) | 43.6% | $5,863 | ||||||||
| Net Operating Income | $15,800,231 | $14,762,415 | $14,452,181 | $14,263,985 | $13,129,200 | 56.4% | $7,580 | ||||||||
| Capital Expenditures | 0 | 0 | 0 | 239,166 | 1.0 | 138 | |||||||||
| Net Cash Flow | $15,800,231 | $14,762,415 | $14,452,181 | $14,263,985 | $12,890,034 | 55.4% | $7,442 | ||||||||
| NOI DSCR(5) | 3.30x | 3.08x | 3.02x | 2.98x | 2.74x | ||||||||||
| NCF DSCR(5) | 3.30x | 3.08x | 3.02x | 2.98x | 2.69x | ||||||||||
| NOI DY(5) | 13.1% | 12.2% | 12.0% | 11.8% | 10.9% | ||||||||||
| NCF DY(5) | 13.1% | 12.2% | 12.0% | 11.8% | 10.7% | ||||||||||
| (1) | U/W Base Rent is comprised of $17,954,176 of residential income (95.3% of U/W Base Rent) and $886,886 of retail income (4.7% of U/W Base Rent). |
| (2) | Other income includes food services, conference income and other revenues. |
| (3) | The underwritten economic vacancy is 10.6%. The University Center Chicago Property was 89.8% physically occupied as of July 17, 2017. |
| (4) | The increase in U/W Total Operating Expenses is primarily due to the projected property tax re-assessment due to the change in ownership. The current tax assessment is lower due to the non-profit status of the previous ownership. |
| (5) | The debt service coverage ratios and debt yields are based on the University Center Chicago Whole Loan. |
Appraisal.As of the appraisal valuation date of June 1, 2017 the University Center Chicago Property had an “as-is” appraised value of $203,400,000.
Environmental Matters.According to a Phase I environmental assessment dated May 2, 2017 there was no evidence of any recognized environmental conditions at the University Center Chicago Property.
Market Overview and Competition.The University Center Chicago Property is located along South State Street just south of Congress Parkway in the South Loop neighborhood of Chicago, Illinois. The University Center Chicago Property is located within three blocks of the Harold Washington Library, DePaul University, Robert Morris University, Roosevelt University, Columbia College, American Academy of Art, Grant Park and three Chicago Transit Authority (“CTA”) train stations. According to the appraisal, the 2016 estimated population within a one-, three- and five-mile radius of the University Center Chicago Property was 52,638, 311,966 and 743,479, respectively; while the 2016 estimated average household income within the same radii was $124,720, $108,624 and $95,730, respectively. From 2010 to 2016, the estimated population and average household income within a one-mile radius of the University Center Chicago Property have exhibited annual growth rates of 2.2% and 2.3%, respectively. The University Center Chicago Property is located in the Loop submarket of the Chicago apartment market, which as of first quarter of 2017, contained a total inventory of 18,803 units and vacancy rate of approximately 7.3%. According to the appraisal, the annual average occupancy for Loop apartment submarket has averaged 6.9% since 1999.
THE INFORMATION IN THIS STRUCTURAL AND COLLATERAL TERM SHEET IS NOT COMPLETE AND MAY BE AMENDED PRIOR TO THE TIME OF SALE. THIS TERM SHEET IS NOT AN OFFER TO SELL THESE SECURITIES AND IT IS NOT A SOLICITATION OF AN OFFER TO BUY THESE SECURITIES IN ANY JURISDICTION WHERE THE OFFER OR SALE IS NOT PERMITTED.
26
| UNIVERSITY CENTER CHICAGO |
The following table presents certain information relating to some comparable student housing properties for the University Center Chicago Property:
Competitive Set(1)
| University Center Chicago (Subject) | 777 South State Student Apartments | Buckingham Student Apartments | Dwight Lofts Student Apartments | Tailor Lofts | Automatic Lofts Student Apartments | Infinite Student Apartments | ARC at Old Colony | |
| Location | Chicago, IL | Chicago, IL | Chicago, IL | Chicago, IL | Chicago, IL | Chicago, IL | Chicago, IL | Chicago, IL |
| Distance to Subject | -- | 0.2 miles | 0.2 miles | 0.3 miles | 1.3 miles | 1.4 miles | 0.3 miles | 0.2 miles |
| Property Type | Student Housing | Student Housing | Student Housing | Student Housing | Student Housing | Student Housing | Student Housing | Student Housing |
| Year Built/Renovated | 2004/NAP | 1985/NAP | 1927/NAP | 1911/2008 | 1920/NAP | 1906/NAP | 1912/2015 | 1911/2014 |
| Number of Beds | 1,732 | 882 | 441 | 771 | 441 | 489 | 404 | 373 |
| Average Rent (per bed) | $1,139 | $1,616 | $1,351 | $1,025 | $1,104 | $1,049 | $1,215 | $1,271 |
| Occupancy | 89.8% | 94.0% | 81.0% | 100.0% | 98.0% | 87.0% | 82.0% | 85.0% |
| (1) | Information obtained from the appraisal and underwritten rent roll. |
The Borrower.The borrower is University Center Property LLC, a Delaware limited liability company and single purpose entity with two independent directors. Legal counsel to the borrower provided a non-consolidation opinion in connection with the origination of the University Center Chicago Mortgage Loan.
The Borrower Sponsors.The sponsors are UCC Chicago Acquisition Partner LLC and Blue Vista Capital Management, LLC (“Blue Vista”). Founded in 2002 in Chicago, Blue Vista has participated in transactions totaling over $7.2 billion total capitalization, and completed over $25.0 billion in real estate transactions. Since 2003, Blue Vista has acquired and/or developed over $2.1 billion in student housing properties, representing 36,000 beds at 68 properties on 50 college campuses throughout the U.S.
Escrows.The loan documents provide for upfront reserves of $96,969 for insurance reserve, $1,385,081 for replacement reserve, and $485,951 for tenant specific TI/LC reserve. The tenant specific TI/LC reserve includes existing tenant improvement and leasing commission obligations of $185,951 for Blaze Pizza and $300,000 for Wifi installation expense for Columbia College, DePaul University and Roosevelt University. The loan documents also provide for ongoing monthly reserves of $118,585 for taxes, $16,162 for insurance reserve, $14,700 for replacement reserve, and $430,018 for seasonality reserve. The seasonality reserve is adjustable based on the annual rent of the DePaul University, Columbia College, Roosevelt University and Robert Morris University master leases for the applicable academic year.
Lockbox and Cash Management.The University Center Chicago Property Mortgage Loan requires a lender-controlled lockbox account, which is already in place, and that the borrower direct the tenants to pay their rents directly into such lockbox account. The loan documents also require that all rents received by the borrower or the property manager be deposited into the lockbox account within one business day of receipt. Prior to the occurrence of a Cash Trap Event Period (as defined below), all excess cash flow is required to be distributed to the borrower. During a Cash Trap Event Period, all excess funds are required to be swept to a lender-controlled cash management account.
A “Cash Trap Event Period” will commence upon the earlier of (i) the occurrence and continuance of an event of default; and (ii) the amortizing debt service coverage ratio falling below 1.25x (based on a hypothetical 30-year amortization period) at the end of any calendar month. A Cash Trap Event Period will end, with respect to clause (i), upon the cure of such event of default; with respect to clause (ii), upon the date that the amortizing debt service coverage ratio is equal to or greater than 1.25x for two consecutive calendar quarters.
Property Management.The University Center Chicago Property is managed by an affiliate of the borrower.
Assumption.The borrower has the right to transfer the University Center Chicago Property, provided that no event of default has occurred and is continuing and certain other conditions are satisfied, including (i) the lender’s reasonable determination that the proposed transferee and guarantor satisfy the lender’s credit review and underwriting standards, taking into consideration transferee experience, financial strength and general business standing; (ii) the execution of a recourse guaranty and an environmental indemnity by an affiliate of the transferee; and (iii) if requested by the lender, a rating agency confirmation from DBRS, Fitch and Moody’s that the transfer will not result in a downgrade, withdrawal or qualification of the respective ratings assigned to the Series 2017-BNK7 Certificates and similar confirmations from each rating agency rating any securities backed by the University Center Chicago Whole Loan with respect to the ratings of such securities.
Partial Release.Not permitted.
Real Estate Substitution.Not permitted.
Subordinate and Mezzanine Indebtedness.None
Ground Lease.None
THE INFORMATION IN THIS STRUCTURAL AND COLLATERAL TERM SHEET IS NOT COMPLETE AND MAY BE AMENDED PRIOR TO THE TIME OF SALE. THIS TERM SHEET IS NOT AN OFFER TO SELL THESE SECURITIES AND IT IS NOT A SOLICITATION OF AN OFFER TO BUY THESE SECURITIES IN ANY JURISDICTION WHERE THE OFFER OR SALE IS NOT PERMITTED.
27
| UNIVERSITY CENTER CHICAGO |
Terrorism Insurance. The loan documents require that the “all risk” insurance policy required to be maintained by the borrower provides coverage for terrorism in an amount equal to the full replacement cost of the University Center Chicago Property, and not in excess of the two times the premium of the property and business interruption coverage on a stand-alone basis, as well as business interruption insurance covering no less than the 18-month period following the occurrence of a casualty event, together with a six-month extended period of indemnity.
THE INFORMATION IN THIS STRUCTURAL AND COLLATERAL TERM SHEET IS NOT COMPLETE AND MAY BE AMENDED PRIOR TO THE TIME OF SALE. THIS TERM SHEET IS NOT AN OFFER TO SELL THESE SECURITIES AND IT IS NOT A SOLICITATION OF AN OFFER TO BUY THESE SECURITIES IN ANY JURISDICTION WHERE THE OFFER OR SALE IS NOT PERMITTED.
28
| CORPORATE WOODS PORTFOLIO |
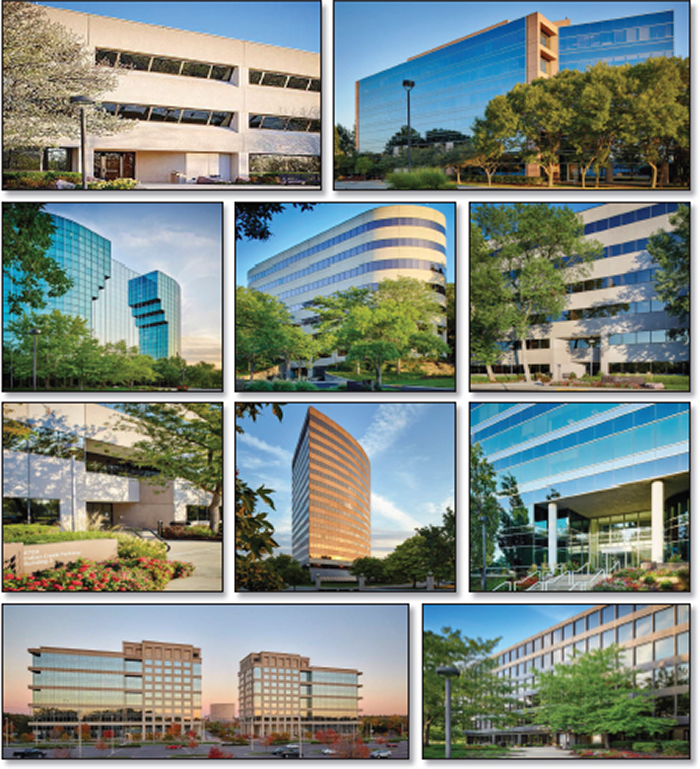
THE INFORMATION IN THIS STRUCTURAL AND COLLATERAL TERM SHEET IS NOT COMPLETE AND MAY BE AMENDED PRIOR TO THE TIME OF SALE. THIS TERM SHEET IS NOT AN OFFER TO SELL THESE SECURITIES AND IT IS NOT A SOLICITATION OF AN OFFER TO BUY THESE SECURITIES IN ANY JURISDICTION WHERE THE OFFER OR SALE IS NOT PERMITTED.
29
| CORPORATE WOODS PORTFOLIO |
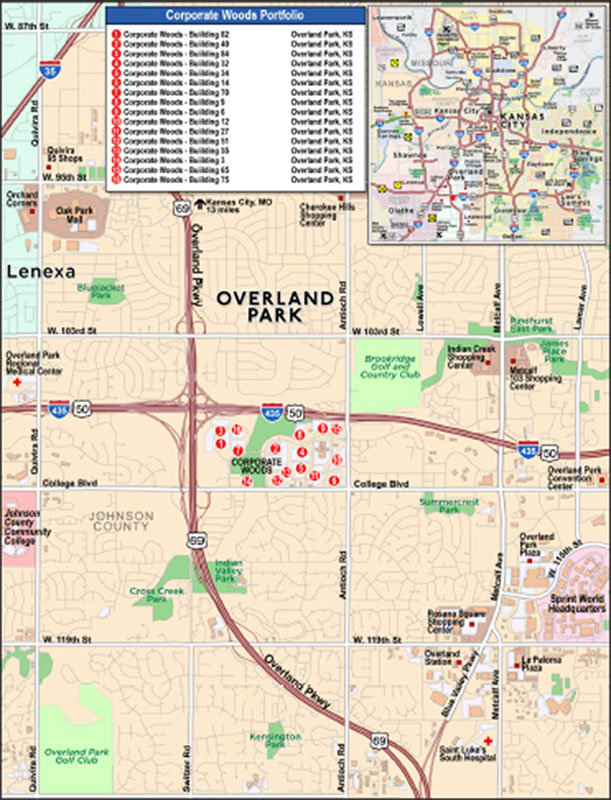
THE INFORMATION IN THIS STRUCTURAL AND COLLATERAL TERM SHEET IS NOT COMPLETE AND MAY BE AMENDED PRIOR TO THE TIME OF SALE. THIS TERM SHEET IS NOT AN OFFER TO SELL THESE SECURITIES AND IT IS NOT A SOLICITATION OF AN OFFER TO BUY THESE SECURITIES IN ANY JURISDICTION WHERE THE OFFER OR SALE IS NOT PERMITTED.
30
| No. 4 – Corporate Woods Portfolio | ||||||
| Loan Information | Property Information | |||||
| Mortgage Loan Seller: | Morgan Stanley Mortgage Capital Holdings LLC | Single Asset/Portfolio: | Portfolio | |||
Credit Assessment (DBRS/Fitch/Moody’s): | NR/NR/NR | Property Type(3): | Various | |||
| Original Principal Balance(1): | $70,625,000 | Specific Property Type(3): | Various | |||
| Cut-off Date Balance(1): | $70,625,000 | Location: | Overland Park, KS | |||
| % of Initial Pool Balance: | 5.8% | Size: | 2,033,179 SF | |||
| Loan Purpose: | Acquisition | Cut-off Date Balance Per SF(1): | $108.82 | |||
| Borrower Name: | Corporate Woods Kansas Realty LP | Year Built/Renovated(3): | Various | |||
| Borrower Sponsors: | Raymond Massa | Title Vesting: | Fee | |||
| Mortgage Rate: | 4.450% | Property Manager: | Block Real Estate Services, LLC | |||
| Note Date: | August 9, 2017 | 4thMost Recent Occupancy (As of): | 92.7% (12/31/2013) | |||
| Anticipated Repayment Date: | NAP | 3rdMost Recent Occupancy (As of): | 93.5% (12/31/2014) | |||
| Maturity Date: | September 6, 2027 | 2ndMost Recent Occupancy (As of): | 88.9% (12/31/2015) | |||
| IO Period: | None | Most Recent Occupancy (As of): | 91.9% (12/31/2016) | |||
| Loan Term (Original): | 120 months | Current Occupancy (As of): | 92.7% (7/1/2017) | |||
| Seasoning: | 0 months | |||||
| Amortization Term (Original): | 360 months | Underwriting and Financial Information: | ||||
| Loan Amortization Type: | Amortizing Balloon | |||||
| Interest Accrual Method: | Actual/360 | 4thMost Recent NOI (As of): | $21,179,271 (12/31/2014) | |||
| Call Protection: | L(24),D(90),O(6) | 3rdMost Recent NOI (As of): | $21,181,276 (12/31/2015) | |||
| Lockbox Type: | Hard/Springing Cash Management | 2ndMost Recent NOI (As of): | $19,879,471 (12/31/2016) | |||
| Additional Debt(1): | Yes | Most Recent NOI (As of): | $20,692,963 (Various) | |||
| Additional Debt Type(1): | Pari Passu | |||||
| U/W Revenues: | $45,713,777 | |||||
| U/W Expenses: | $23,101,714 | |||||
| U/W NOI(4): | $22,612,063 | |||||
| Escrows and Reserves(2): | U/W NCF: | $19,853,093 | ||||
| U/W NOI DSCR(1): | 1.69x | |||||
| Type: | Initial | Monthly | Cap (If Any) | U/W NCF DSCR(1): | 1.48x | |
| Taxes | $6,258,114 | $625,811 | NAP | U/W NOI Debt Yield(1): | 10.2% | |
| Insurance | $0 | Springing | NAP | U/W NCF Debt Yield(1): | 9.0% | |
| Replacement Reserves | $0 | $38,258 | NAP | As-Is Appraised Value(5): | $299,100,000 | |
| TI/LC Reserve | $7,500,000 | $0 | $7,500,000 | As-Is Appraisal Valuation Date: | June 15, 2017 | |
| Deferred Maintenance | $620,488 | $0 | NAP | Cut-off Date LTV Ratio(1): | 74.0% | |
| Unfunded Landlord Obligations | $1,481,165 | $0 | NAP | LTV Ratio at Maturity(1): | 59.7% | |
| (1) | See “The Mortgage Loan” section. All statistical financial information related to balances per square foot, loan-to-value ratios, debt service coverage ratios and debt yields are based on the Corporate Woods Portfolio Whole Loan (as defined below). |
| (2) | See “Escrows” section. |
| (3) | The Corporate Woods Portfolio Properties are made up of 15 suburban office buildings and one unanchored retail building. See table below titled “Corporate Woods Portfolio Properties.” |
| (4) | UW NOI includes UW Gross Potential Rent which has been underwritten based on the July 1, 2017 rent roll and includes rent escalations through August 1, 2018, for non-investment grade tenants ($577,892) and the present value of all rent steps through the earlier of their respective lease terms or earliest effective termination date for investment grade tenants ($376,234). |
| (5) | The “As-Is” Appraised Value represents the “As Portfolio” bulk appraised value of the Corporate Woods Portfolio Properties (as defined below) as June 15, 2017, which is inclusive of a $3,600,000 portfolio premium. The Cut-off Date LTV Ratio and LTV Ratio at Maturity are calculated based upon the portfolio “As-Is” Appraised Value of $299,100,000. The Cut-off Date LTV Ratio and LTV Ratio at Maturity based on the sum of the individual “as-is” appraised values of $295,500,000, which excludes the portfolio premium, are 74.9% and 60.4%, respectively. |
The Mortgage Loan. The mortgage loan (the “Corporate Woods Portfolio Mortgage Loan”) is part of a whole loan (the “Corporate Woods Portfolio Whole Loan”) that is evidenced by fivepari passu promissory notes (Notes A-1, A-2, A-3, A-4 and A-5) secured by a first mortgage encumbering 15 office buildings and one retail building located in Overland Park, Kansas (the “Corporate Woods Portfolio Properties”). The Corporate Woods Portfolio Whole Loan was co-originated on August 9, 2017 by Morgan Stanley Bank, N.A. and Citi Real Estate Funding Inc. The Corporate Woods Portfolio Whole Loan had an original principal balance of $221,250,000, has an outstanding principal balance as of the Cut-off Date of $221,250,000 and accrues interest at an interest rate of 4.450%per annum. The Corporate Woods Portfolio Whole Loan had an initial term of 120 months, has a remaining term of 120 months as of the Cut-off Date and requires payments of principal and interest based on a 30-year amortization schedule. The Corporate Woods Portfolio Whole Loan matures on September 6, 2027.
THE INFORMATION IN THIS STRUCTURAL AND COLLATERAL TERM SHEET IS NOT COMPLETE AND MAY BE AMENDED PRIOR TO THE TIME OF SALE. THIS TERM SHEET IS NOT AN OFFER TO SELL THESE SECURITIES AND IT IS NOT A SOLICITATION OF AN OFFER TO BUY THESE SECURITIES IN ANY JURISDICTION WHERE THE OFFER OR SALE IS NOT PERMITTED.
31
| CORPORATE WOODS PORTFOLIO |
The Corporate Woods Portfolio Mortgage Loan, evidenced by the non-controlling Note A-4, which will be contributed to the BANK 2017-BNK7 trust, had an original principal balance of $70,625,000 and has an outstanding principal balance as of the Cut-off Date of $70,625,000. The controlling Note A-1, with an original principal balance of $55,000,000, is currently held by Citigroup Global Markets Realty Corp. and is expected to be contributed to the CGCMT 2017-P8 trust. The non-controlling Notes A-2 and A-3, with an aggregate original principal balance of $56,625,000, are currently held by Citigroup Global Markets Realty Corp. and is expected to be contributed to a future trust or trusts. The non-controlling Note A-5, with an original principal balance of $40,000,000, is currently held by Morgan Stanley Bank, N.A. and is expected to be contributed to a future trust or trusts. The lender provides no assurances that any non-securitizedpari passu note will not be split further. See “Description of the Mortgage Pool—The Whole Loans—The Serviced Whole Loans” and “Pooling and Servicing Agreement” in the Preliminary Prospectus.
Note Summary
| Notes | Original Balance | Note Holder | Controlling Interest | |
| A-1-A | $30,000,000 | CGCMT 2017-P8 | Yes | |
| A-1-B | $25,000,000 | Citigroup Global Markets Realty Corp. | No | |
| A-2 | $35,625,000 | Citigroup Global Markets Realty Corp. | No | |
| A-3 | $20,000,000 | CGCMT 2017-P8 | No | |
| A-4 | $70,625,000 | BANK 2017-BNK7 | No | |
| A-5 | $40,000,000 | Morgan Stanley Bank, N.A. | No | |
| Total | $221,250,000 |
Following the lockout period, the borrower has the right to defease the Corporate Woods Portfolio Whole Loan in whole, or in part as described below under “Partial Release,” on any date before April 6, 2027. In addition, the Corporate Woods Portfolio Whole Loan is prepayable without penalty on or after April 6, 2027, in whole, or in part as described below under “Partial Release”. The lockout period will expire on the earlier to occur of (i) two years after the closing date of the securitization that includes the last note to be securitized and (ii) August 9, 2020.
Sources and Uses
| Sources | Uses | |||||||
| Original whole loan amount | $221,250,000 | 76.1% | Purchase price(1) | $271,091,733 | 93.3% | |||
| Sponsor’s new cash contribution | 69,445,915 | 23.9 | Reserves | 15,859,767 | 5.5 | |||
| Closing costs | 3,193,771 | 1.1 | ||||||
| Other uses(2) | 550,644 | 0.2 | ||||||
| Total Sources | $290,695,915 | 100.0% | Total Uses | $290,695,915 | 100.0% |
| (1) | The borrower acquired 21 buildings and 8.3 acres of excess developable land, all within the Corporate Woods Office Park (as defined below), for a contract purchase price of $295,000,000. The collateral for the Corporate Woods Portfolio Whole Loan excludes 138,627 SF of class C office space and 8.3 acres of excess developable land, which was given a cumulative allocated purchase price of $15,000,000. The Corporate Woods Portfolio Properties had an allocated purchase price of $280,000,000. The $280,000,000 less a seller credit of $8,908,267, which represents real estate tax prorations ($4,255,153), prepaid rent ($2,791,756), security deposits ($1,711,995) and various other credits ($149,363) (which were paid at closing) results in a net purchase price of $271,091,733. |
| (2) | Other uses represent $550,644 of tenant improvements and leasing commissions that were paid at closing. |
The Properties. The Corporate Woods Portfolio Properties are comprised of 16 buildings located within a 29-building master-planned, suburban office park in Overland Park, Kansas (“Corporate Woods Office Park”), located approximately 13 miles southwest of the Kansas City central business district. Of the 16 buildings serving as collateral for the Corporate Woods Portfolio Loan (“the Buildings”), five are Class A office buildings (1,096,082 SF), ten are Class B office buildings (908,485 SF) and one is a retail building (28,612 SF). The Corporate Woods Portfolio Properties were constructed in stages between 1977 and 2001 and range from three to sixteen stories. The Corporate Woods Portfolio Properties are positioned at the southeast corner of Interstate 435 and U.S. Highway 169, and provide for 7,704 parking spaces, which equates to a ratio of 3.8 spaces per 1,000 SF. The Corporate Woods Office Park features a Doubletree Hotel and a 50 acre wooded park, with bike/walk trails that run along Indian Creek, both of which are not collateral for the Corporate Woods Portfolio Loan. As of July 1, 2017, the Corporate Woods Portfolio Properties were 92.7% leased to approximately 280 tenants.
Of the 29 buildings that are part of the Corporate Woods Office Park, but are not included in the Corporate Woods Portfolio Properties, an affiliate of the borrower acquired four Class C office buildings, as well as adjacent developable land (which may be developed as office properties). The four Class C office buildings are 86.5% occupied, with approximately 98% of leases expiring by 2020. The remaining buildings at the Corporate Woods Office Park consist of the Doubletree hotel and office buildings, which are owned by a third party.
THE INFORMATION IN THIS STRUCTURAL AND COLLATERAL TERM SHEET IS NOT COMPLETE AND MAY BE AMENDED PRIOR TO THE TIME OF SALE. THIS TERM SHEET IS NOT AN OFFER TO SELL THESE SECURITIES AND IT IS NOT A SOLICITATION OF AN OFFER TO BUY THESE SECURITIES IN ANY JURISDICTION WHERE THE OFFER OR SALE IS NOT PERMITTED.
32
| CORPORATE WOODS PORTFOLIO |
The following table presents certain information relating to the Corporate Woods Portfolio Properties:
Corporate Woods Portfolio Properties
| Building | Property Type | Allocated Cut-off Date Balance(1) | % of Portfolio Cut-off Date Balance | Occupancy(2) | Year Built | Net Rentable Area (SF) | Appraised | Replacement Cost | U/W NCF | Appraisal Market Rent $ per SF(4) | UW Base Rent $ per SF(5) |
| 82 | Office | $34,441,624 | 15.6% | 98.2% | 2001 | 245,413 | $46,000,000 | $53,145,129 | $3,618,028 | $27.00 | $28.38 |
| 40 | Office | $32,420,051 | 14.7% | 96.8% | 1981 | 300,043 | $43,300,000 | $47,059,741 | $3,015,444 | $24.00 | $23.11 |
| 84 | Office | $31,596,447 | 14.3% | 83.1% | 1998 | 241,573 | $42,200,000 | $53,145,129 | $2,332,658 | $27.00 | $25.80 |
| 32 | Office | $23,809,645 | 10.8% | 98.5% | 1985 | 208,244 | $31,800,000 | $32,034,249 | $1,992,435 | $24.00 | $22.28 |
| 34 | Office | $11,530,457 | 5.2% | 100.0% | 1978 | 97,023 | $15,400,000 | $14,568,965 | $973,541 | $23.00 | $23.24 |
| 14 | Office | $10,781,726 | 4.9% | 96.7% | 1981 | 120,385 | $14,400,000 | $18,974,570 | $987,468 | $21.50 | $20.21 |
| 70 | Office | $10,257,614 | 4.6% | 94.6% | 1987 | 100,809 | $13,700,000 | $15,137,471 | $1,163,715 | $23.00 | $25.10 |
| 9 | Office | $9,583,756 | 4.3% | 92.7% | 1984 | 99,400 | $12,800,000 | $15,722,193 | $963,037 | $22.00 | $21.95 |
| 6 | Office | $9,508,883 | 4.3% | 83.8% | 1979 | 108,395 | $12,700,000 | $16,821,364 | $752,156 | $21.00 | $20.67 |
| 12 | Office | $9,359,137 | 4.2% | 80.6% | 1986 | 98,648 | $12,500,000 | $17,470,510 | $642,797 | $23.00 | $22.77 |
| 27 | Office | $9,134,518 | 4.1% | 95.2% | 1978 | 96,518 | $12,200,000 | $14,975,598 | $882,814 | $22.00 | $22.26 |
| 51 | Office | $7,861,675 | 3.6% | 94.2% | 1977 | 89,789 | $10,500,000 | $13,482,708 | $769,152 | $21.25 | $20.94 |
| 55 | Office | $7,711,929 | 3.5% | 88.4% | 1977 | 89,221 | $10,300,000 | $13,397,418 | $674,971 | $22.25 | $21.50 |
| 65 | Retail | $4,941,624 | 2.2% | 100.0% | 1982 | 28,612 | $6,600,000 | $2,464,918 | $436,257 | $20.00 | $19.22 |
| 3 | Office | $4,941,624 | 2.2% | 81.2% | 1979 | 60,951 | $6,600,000 | $9,336,100 | $334,075 | $21.00 | $21.02 |
| 75 | Office | $3,369,289 | 1.5% | 88.9% | 1980 | 48,156 | $4,500,000 | $7,664,564 | $314,544 | $20.00 | $19.67 |
| Total/Weighted Average | $221,250,000 | 100.0% | 92.7% | 2,033,180 | $295,500,000 | $345,400,627 | $19,853,093 | $23.63 | $23.32 | ||
| (1) | Allocated Cut-off Date Balance is based on the Corporate Woods Portfolio Whole Loan Cut-off Date balance. |
| (2) | Information obtained from the underwritten rent roll dated July 1, 2017.The Total Appraised Value of $295,500,000 represents the sum of the individual appraised values of the Corporate Woods Portfolio Properties, as compared to the portfolio “As-Is” Appraised Value of $299,100,000. |
| (3) | As of the appraisaldated June 15, 2017. |
| (4) | Appraisal Market Rent is quoted on a modified gross basis for all buildings except Building 65, which is quoted on a triple net basis. |
| (5) | Annual U/W Base Rent PSF includes rent escalations through August 1, 2018, for non-investment grade tenants ($577,892) and the present value of all rent steps through the earlier of their respective lease terms or earliest effective termination date for investment grade tenants ($376,234). |
THE INFORMATION IN THIS STRUCTURAL AND COLLATERAL TERM SHEET IS NOT COMPLETE AND MAY BE AMENDED PRIOR TO THE TIME OF SALE. THIS TERM SHEET IS NOT AN OFFER TO SELL THESE SECURITIES AND IT IS NOT A SOLICITATION OF AN OFFER TO BUY THESE SECURITIES IN ANY JURISDICTION WHERE THE OFFER OR SALE IS NOT PERMITTED.
33
| CORPORATE WOODS PORTFOLIO |
The following tables present certain information relating to the tenancies at the Corporate Woods properties:
Major Tenants
| Tenant Name | Credit Rating (Fitch/Moody’s/ S&P)(1) | Tenant NRSF | % of NRSF | Annual U/W Base Rent PSF(2) | Annual U/W Base Rent(2) | % of Total Annual U/W Base Rent | Lease Expiration Date |
| Major Tenants | |||||||
| PNC Bank National Association | A+/A3/A- | 159,270 | 7.8% | $29.29 | $4,665,105 | 10.6% | 10/31/2019(3) |
| Coventry Health Care of Kansas, Inc. | A-/Baa2/NR | 69,640 | 3.4% | $22.00 | $1,532,080 | 3.5% | 12/31/2023 |
| Compass Minerals International, Inc. | NR/B1/BB | 55,576 | 2.7% | $27.08 | $1,504,728 | 3.4% | 2/29/2020 |
| Lathrop & Gage, LLP. | NR/NR/NR | 39,993 | 2.0% | $27.03 | $1,081,091 | 2.5% | Various(4) |
| Lansing Trade Group, LLC | NR/NR/NR | 44,496 | 2.2% | $22.05 | $981,171 | 2.2% | 1/31/2018 |
| Scoular Company | NR/NR/NR | 37,432 | 1.8% | $25.40 | $950,773 | 2.2% | 8/31/2020 |
| QC Holdings, Inc. | NR/NR/NR | 39,022 | 1.9% | $21.50 | $838,973 | 1.9% | 10/31/2017 |
| Amerigroup Corp. & Amerigroup Kansas, Inc. | NR/Baa2/NR | 39,056 | 1.9% | $21.25 | $829,940 | 1.9% | 12/31/2020 |
| TMFS Holdings, LLC | NR/NR/NR | 33,100 | 1.6% | $21.75 | $719,925 | 1.6% | 3/1/2027 |
| Vendor Credentialing Service LLC dba symplr | NR/NR/NR | 30,823 | 1.5% | $23.00 | $708,929 | 1.6% | 8/31/2024 |
| Total Major Tenants | 553,531 | 27.2% | $24.95 | 13,812,714 | 31.4% | ||
| Non-Major Tenants | 1,331,180 | 65.5% | $22.64 | $30,142,376 | 68.6% | ||
| Occupied Collateral Total(7) | 1,884,711 | 92.7% | $23.32 | $43,955,091 | 100.0% | ||
| Vacant Space | 148,468 | 7.3% | |||||
| Collateral Total | 2,033,179 | 100.0% | |||||
| (1) | Certain ratings are those of the parent company whether or not the parent guarantees the lease. |
| (2) | Annual U/W Base Rent PSF and Annual U/W Base Rent include rent escalations through August 1, 2018, for non-investment grade tenants ($577,892) and the present value of all rent steps through the earlier of their respective lease terms or earliest effective termination date for investment grade tenants ($376,234). |
| (3) | PNC Bank National Association has exercised an option to reduce its space by 12,870 SF on the 8th floor effective November 30, 2017. PNC Bank National Association has executed a letter of intent to extend their lease to October 31, 2029 pursuant to the following terms: 146,450 SF leased at $15.00/SF NNN with $0.50 per SF annual rent increases. The letter of intent provides PNC Bank National Association with an option to reduce its space by 13,672 SF effective October 31, 2019 and an option to terminate its lease effective October 31, 2026 with 12 months’ prior notice. We cannot assure you that PNC Bank National Association will execute an extension of their lease pursuant to the aforementioned terms or at all. |
| (4) | Lathrop & Gage, LLP has 13,497 SF that expires on January 31, 2018 and 26,496 SF that expires on January 31, 2023. |
Corporate Woods Largest Tenants by Building
| Building | Building NRSF | Building Occupancy as-of 5/31/2017 | Building Largest Tenant | Largest Tenant NRSF | Largest Tenant % Building NRSF | Largest Tenant Lease Expiration Date | ||
| 82 | 245,413 | 98.20% | PNC Bank National Association(1) | 159,270 | 64.90% | 10/31/2019 | ||
| 40 | 300,043 | 96.80% | Coventry Health Care of Kansas, Inc. | 69,640 | 23.20% | 12/31/2023 | ||
| 84 | 241,573 | 83.10% | Scoular Company | 37,432 | 15.50% | 8/31/2020 | ||
| 32 | 208,244 | 98.50% | Amerigroup Corp. & Amerigroup Kansas, Inc. | 39,056 | 18.80% | 12/31/2020 | ||
| 34 | 97,023 | 100.00% | TMFS Holdings, LLC | 33,100 | 34.10% | 3/1/2027 | ||
| 14 | 120,385 | 96.70% | Propharma Group, Inc. | 16,218 | 13.50% | 2/28/2021 | ||
| 70 | 100,809 | 94.60% | Compass Minerals International, Inc. | 60,699 | 60.20% | 2/29/2020 | ||
| 9 | 99,400 | 92.70% | University of Kansas Hospital Authority | 16,785 | 16.90% | 8/31/2018 | ||
| 6 | 108,395 | 83.80% | National Crop Insurance Services, Inc. | 18,522 | 17.10% | 9/30/2019 | ||
| 12 | 98,648 | 80.60% | Lansing Trade Group, LLC | 44,496 | 45.10% | 1/31/2018 | ||
| 27 | 96,518 | 95.20% | CSC Covansys Corporation | 16,550 | 17.10% | 3/31/2022 | ||
| 51 | 89,789 | 94.20% | RGN-Overland Park I, LLC | 15,796 | 17.60% | 5/31/2020 | ||
| 55 | 89,221 | 88.40% | Emerson Electric Co. | 10,073 | 11.30% | 3/31/2020 | ||
| 65 | 28,612 | 100.00% | Garozzo’s III, Inc. | 5,575 | 19.50% | 9/30/2021 | ||
| 3 | 60,950 | 81.20% | DeMars Pension Consulting Services, Inc. | 10,247 | 16.80% | 9/30/2021 | ||
| 75 | 48,156 | 88.90% | Multi Service Technology Solutions, Inc. | 12,182 | 25.30% | 11/30/2017 | ||
| Total / Wtd. Avg. | 2,033,179 | 92.7% | 565,641 | 27.8% |
|
| (1) | PNC Bank National Association has exercised an option to reduce its space by 12,870 SF on the 8th floor effective November 30, 2017. PNC Bank National Association has executed a letter of intent to extend their lease to October 31, 2029 pursuant to the following terms: 146,450 SF leased at $15.00/SF NNN with $0.50 per SF annual rent increases. The letter of intent provides PNC Bank National Association with an option to reduce its space by 13,672 SF effective October 31, 2019 and an option to terminate its lease effective October 31, 2026 with 12 months’ prior notice. We cannot assure you that PNC Bank National Association will execute a lease pursuant to the aforementioned terms. |
THE INFORMATION IN THIS STRUCTURAL AND COLLATERAL TERM SHEET IS NOT COMPLETE AND MAY BE AMENDED PRIOR TO THE TIME OF SALE. THIS TERM SHEET IS NOT AN OFFER TO SELL THESE SECURITIES AND IT IS NOT A SOLICITATION OF AN OFFER TO BUY THESE SECURITIES IN ANY JURISDICTION WHERE THE OFFER OR SALE IS NOT PERMITTED.
34
| CORPORATE WOODS PORTFOLIO |
The following table presents certain information relating to the lease rollover schedule at the Corporate Woods Portfolio Properties:
Lease Expiration Schedule(1)(2)
| Year Ending December 31, | No. of Leases Expiring | Expiring NRSF | % of Total NRSF | Cumulative Expiring NRSF | Cumulative % of Total NRSF | Annual U/W Base Rent(3) | % of Total Annual U/W Base Rent | Annual U/W Base Rent PSF(4) |
| MTM | 4 | 1,885 | 0.1% | 1,885 | 0.1% | $103,177 | 0.2% | $23.79(5) |
| 2017 | 11 | 67,965 | 3.3% | 69,850 | 3.4% | $1,430,918 | 3.3% | $21.05 |
| 2018 | 49 | 316,500 | 15.6% | 386,350 | 19.0% | $7,063,187 | 16.1% | $22.32 |
| 2019 | 69 | 465,746 | 22.9% | 852,096 | 41.9% | $11,634,141 | 26.5% | $24.98 |
| 2020 | 60 | 405,813 | 20.0% | 1,257,909 | 61.9% | $9,205,093 | 20.9% | $22.68 |
| 2021 | 35 | 171,096 | 8.4% | 1,429,005 | 70.3% | $3,926,071 | 8.9% | $22.95 |
| 2022 | 33 | 183,823 | 9.0% | 1,612,828 | 79.3% | $4,145,160 | 9.4% | $22.55 |
| 2023 | 7 | 144,131 | 7.1% | 1,756,959 | 86.4% | $3,386,284 | 7.7% | $23.49 |
| 2024 | 6 | 61,082 | 3.0% | 1,818,041 | 89.4% | $1,457,728 | 3.3% | $23.87 |
| 2025 | 3 | 27,547 | 1.4% | 1,845,588 | 90.8% | $750,901 | 1.7% | $27.26 |
| 2026 | 0 | 0 | 0.0% | 1,845,588 | 90.8% | $0 | 0.0% | $0.00 |
| 2027 | 2 | 39,123 | 1.9% | 1,884,711 | 92.7% | $852,431 | 1.9% | $21.79 |
| Thereafter | 0 | 0 | 0.0% | 1,884,711 | 92.7% | $0 | 0.0% | $0.00 |
| Vacant | 0 | 148,468 | 7.3% | 2,033,179 | 100.0% | $0 | 0.0% | $0.00 |
| Total/Weighted Average | 279 | 2,033,179 | 100.0% | $43,955,091 | 100.0% | $23.32 |
| (1) | Information obtained from the underwritten rent roll. |
| (2) | Certain tenants have lease termination options that are exercisable prior to the originally stated expiration date of the subject lease and which are not reflected in the Lease Expiration Schedule. |
| (3) | Annual U/W Base Rent PSF and Annual U/W Base Rent include rent escalations through August 1, 2018, for non-investment grade tenants ($577,892) and the present value of all rent steps through the earlier of their respective lease terms or earliest effective termination date for investment grade tenants ($376,234). |
| (4) | Weighted Average Annual U/W Base Rent PSF excludes vacant space. |
| (5) | Annual U/W Base Rent $ per SF for MTM tenants is calculated based on the $44,843 of UW Base Rent associated with 1,885 SF of conference room space. The remaining UW Base Rent of $58,334 is associated with antenna space, mail boxes and other miscellaneous tenants which have 0 SF attributed to them. |
The following table presents historical occupancy percentages at the Corporate Woods Portfolio Properties:
Historical Occupancy
12/31/2013(1) | 12/31/2014(1) | 12/31/2015(1) | 12/31/2016(1) | 7/1/2017(2) | ||||
| 92.7% | 93.5% | 88.9% | 91.9% | 92.7% |
| (1) | Information obtained from the borrower. |
| (2) | Information obtained from the underwritten rent roll. |
THE INFORMATION IN THIS STRUCTURAL AND COLLATERAL TERM SHEET IS NOT COMPLETE AND MAY BE AMENDED PRIOR TO THE TIME OF SALE. THIS TERM SHEET IS NOT AN OFFER TO SELL THESE SECURITIES AND IT IS NOT A SOLICITATION OF AN OFFER TO BUY THESE SECURITIES IN ANY JURISDICTION WHERE THE OFFER OR SALE IS NOT PERMITTED.
35
| CORPORATE WOODS PORTFOLIO |
Operating History and Underwritten Net Cash Flow.The following table presents certain information relating to the historical operating performance and the underwritten net cash flow at the Corporate Woods Portfolio Properties:
Cash Flow Analysis
| 2014 | 2015 | 2016(2) | TTM 3/31/2017 | U/W(1) | % of U/W Effective Gross Income | U/W $ per SF | ||||||||
| Base Rent | $40,743,337 | $40,641,844 | $40,285,194 | $41,587,085 | $43,000,965 | 94.1% | $21.15 | |||||||
| Contractual Rent Steps(2) | 0 | 0 | 0 | 0 | 954,126 | 2.1 | 0.47 | |||||||
| Grossed Up Vacant Space | 0 | 0 | 0 | 0 | 3,494,670 | 7.6 | 1.72 | |||||||
| Total Reimbursables | 952,901 | 1,912,725 | 2,243,749 | 2,653,606 | 3,080,143 | 6.7 | 1.51 | |||||||
| Other Income | 184,342 | 317,945 | 206,088 | 236,942 | 236,942 | 0.5 | 0.12 | |||||||
| Less Vacancy & Credit Loss | (685,338) | (638,017) | (953,455) | (1,237,930) | (5,053,068)(3) | (11.1) | (2.49) | |||||||
| Effective Gross Income | $41,195,243 | $42,234,497 | $41,781,575 | $43,239,702 | $45,713,777 | 100.0% | $22.48 | |||||||
| Total Operating Expenses | 20,015,972 | 21,053,221 | 21,902,104 | 22,546,739 | 23,101,714 | 50.5 | 11.36 | |||||||
| Net Operating Income | $21,179,271 | $21,181,276 | $19,879,471 | $20,692,963 | $22,612,063 | 49.5% | $11.12 | |||||||
| TI/LC | 0 | 0 | 0 | 0 | 2,299,877 | 5.0 | 1.13 | |||||||
| Capital Expenditures | 0 | 0 | 0 | 0 | 459,093 | 1.0 | 0.23 | |||||||
| Net Cash Flow | $21,179,271 | $21,181,276 | $19,879,471 | $20,692,963 | $19,853,093 | 43.4% | $9.76 | |||||||
| NOI DSCR(4) | 1.58x | 1.58x | 1.49x | 1.55x | 1.69x | |||||||||
| NCF DSCR(4) | 1.58x | 1.58x | 1.49x | 1.55x | 1.48x | |||||||||
| NOI DY(4) | 9.6% | 9.6% | 9.0% | 9.4% | 10.2% | |||||||||
| NCF DY(4) | 9.6% | 9.6% | 9.0% | 9.4% | 9.0% |
| (1) | U/W cash flow based on contractual rents as of July 1, 2017. |
| (2) | Contractual Rent Steps include rent escalations through August 1, 2018, for non-investment grade tenants ($577,892) and the present value of all rent steps through the earlier of their respective lease terms or earliest effective termination date for investment grade tenants ($376,234). |
| (3) | The underwritten economic vacancy is 7.5%. As of July 1, 2017, the Corporate Woods Portfolio Properties were 92.7% physically occupied. |
| (4) | The debt service coverage ratios and debt yields are based on the Corporate Woods Portfolio Whole Loan. |
Appraisal.As of the appraisal valuation date of June 15, 2017, the Corporate Woods Portfolio Properties had an “as-portfolio” bulk appraised value of $299,100,000, which includes a portfolio premium of $3,600,000. The sum of the individual “as-is” appraised values of the Corporate Woods Portfolio Properties is $295,500,000.
Environmental Matters. According to the Phase I environmental site assessments dated August 9, 2017, there are no recognized environmental conditions at the Corporate Woods Portfolio Properties.
Market Overview and Competition. The Corporate Woods Portfolio Properties are located in Overland Park, Kansas which is situated in Johnson County, about 15 miles southwest of the Kansas City central business district. Major employers within the area include: HCA Midwest Health System, Sprint Corporation, Saint Luke’s Health System, Cerner Corporation, Children’s Mercy Hospitals & Clinics, DST Systems, Inc., Truman Medical Center, and Black & Veatch Corporation, among others.
The Corporate Woods Portfolio Properties are in the City of Overland Park, which is the second-most populous city in Kansas and the largest suburb in the Kansas City metropolitan area. According to the appraisal, the 2016 population within a one-, three- and five-mile radius of the Corporate Wood Property was 9,145, 97,171 and 248,477, respectively. The 2016 estimated average household income within a one-, three- and five-mile radius of the Corporate Woods Portfolio Properties was $87,815, $93,240 and $104,793, respectively.
The Corporate Woods Portfolio Properties are part of the Kansas City metropolitan statistical area (“MSA”) office market and the South Johnson County/College Boulevard office submarket. According to a market report, as of March 2017, the Kansas City MSA office market consisted of 136.8 million SF with an average occupancy rate of 92.1% and an average rent of $18.26 per SF. As of March 2017, the College Boulevard office submarket consisted of 20.5 million SF with an average occupancy rate of 91.5% and an average rent of $21.65 per SF. The appraisal identified a subset of six comparable properties, located within the College Boulevard submarket and within three miles of the Corporate Woods Portfolio Properties. The table below is based on the information available to the appraiser in connection with such comparable properties, which had gross rents ranging from $20.75 per SF to $26.00 per SF.
THE INFORMATION IN THIS STRUCTURAL AND COLLATERAL TERM SHEET IS NOT COMPLETE AND MAY BE AMENDED PRIOR TO THE TIME OF SALE. THIS TERM SHEET IS NOT AN OFFER TO SELL THESE SECURITIES AND IT IS NOT A SOLICITATION OF AN OFFER TO BUY THESE SECURITIES IN ANY JURISDICTION WHERE THE OFFER OR SALE IS NOT PERMITTED.
36
| CORPORATE WOODS PORTFOLIO |
The following table presents certain information relating to comparable office sales for the Corporate Woods Portfolio Properties:
Comparable Sales(1)
| Property Name/Location | Sale Date | Year Built | Total GLA (SF) | Total Occupancy | Sale Price(2) | Sales Price PSF(2) | OAR |
Corporate Woods Portfolio Properties (Subject) | Aug-2017 | 1977-2001 | 2,033,179 | 92.7% | $280,000,000 | $137.72 | N/A |
Colony Office Portfolio Overland Park, KS | Sept-2016 | 1986 | 802,262 | 90.0% | $94,000,000 | $117.17 | 8.02% |
Creve Coeur Center Portfolio Creve Coeur, MO | Mar-2016 | 1985 | 590,446 | 96.0% | $78,000,000 | $132.10 | 7.12% |
Airport North Office Portfolio Nashville, TN | Jul-2016 | 1984 | 482,151 | 92.4% | $58,500,000 | $121.33 | 7.63% |
| Parkwood Crossing Indianapolis, IN | Aug-2016 | 1990 | 1,207,076 | 90.0% | $162,900,000 | $134.91 | 8.31% |
| (1) | Information obtained from the appraisal. |
| (2) | The Sale Price for the Corporate Woods Portfolio Properties was net of a seller credit of $8,908,267, which represents rent, tax and other tenant credits (which were paid at closing). After giving effect to such seller credit, the net Sale Price of the Corporate Woods Portfolio Properties is $271,091,733 and the effective Sales Price PSF is $133.33. |
The following tables present certain information relating to competitive office properties to the Corporate Woods Portfolio Properties:
Competitive Office Properties(1)
| Property Name/Location | Year Built | Total GLA (SF) | Occupancy | Distance from Subject | Annual Base Rent PSF | Lease Type |
Lighton Plaza I & II/Tower Overland Park, KS | 1989 | 476,278 | 92.8% | 1.5 miles | $22.00 to $26.00 | Full Service |
7107 Tower Overland Park, KS | 1986 | 228,040 | 93.9% | 1.5 miles | $23.50 to $23.50 | Full Service |
| Commerce Plaza I & II Overland Park, KS | 1986 | 285,465 | 97.4% | 1.5 miles | $23.50 to $23.50 | Full Service |
South Creek Office Park Overland Park, KS | 1995 | 898,488 | 89.5% | 3.0 miles | $20.75 to $22.25 | Full Service |
Financial Plaza II & III Overland Park, KS | 1985 | 254,336 | 87.7% | 1.5 miles | $21.50 to $23.00 | Full Service |
Renaisance/Del Sarto Overland Park, KS | 1986 | 545,218 | 90.3% | 1.75 miles | $21.50 to $23.00 | Full Service |
| (1) | Information obtained from the appraisal. |
The following tables present certain information relating to comparable office leases for the Corporate Woods Portfolio Properties:
Comparable Office Leases(1)
| Property Name/Location | Year Built | Total GLA (SF) | Distance from Subject | Tenant Name | Lease Date/Term | Lease Area (SF) | Annual Base Rent PSF | Lease Type |
7101 College Overland Park, KS | 1986 | 228,040 | 1.4 miles | Insight Financial | March 2017 / 5.0 Yrs | 2,330 | $22.33 | Full Service |
Five Pine Ridge Lenexa, KS | 2000 | 123,101 | 3.3 miles | University of Phoenix | October 2015 / 3.0 Yrs | 8,216 | $21.46 | Full Service |
4400 Corporate Overland Park, KS | 1987 | 105,980 | 3.2 miles | Edison Spaces | December 2016 / 7.0 Yrs | 37,384 | $19.00 | Full Service |
College Oaks Overland Park, KS | 1985 | 31,000 | 0.5 miles | Sunflower | November 2017 / 5.0 Yrs | 2,518 | $19.70 | Full Service |
Indian Creek I Overland Park, KS | 1999 | 112,172 | 2.3 miles | Banking Industry | October 2016 / 5.0 Yrs | 1,907 | $22.11 | Full Service |
| (1) | Information obtained from the appraisal. |
The Borrower.The borrower is Corporate Woods Kansas Realty LP, a Delaware limited partnership and single purpose entity with two independent directors. Legal counsel to the borrower delivered a non-consolidation opinion in connection with the origination of the Corporate Woods Portfolio Whole Loan. Raymond Massa is the guarantor of certain nonrecourse carveouts under the Corporate Woods Portfolio Whole Loan.
The borrower is 0.50% owned by its general partner, Corporate Woods Kansas Realty Management LLC and 99.5% owned by Corporate Woods Kansas LP. Corporate Woods Realty Management LLC and Corporate Woods Kansas Management LLC are controlled by Group RMC Management Inc. Group RMC is a real estate management company headquartered in New York City targeting investments in office assets throughout the United States. Group RMC is currently invested in 19 office properties totaling approximately 6.49 million square feet across more than 80 buildings throughout the United States and Canada.
THE INFORMATION IN THIS STRUCTURAL AND COLLATERAL TERM SHEET IS NOT COMPLETE AND MAY BE AMENDED PRIOR TO THE TIME OF SALE. THIS TERM SHEET IS NOT AN OFFER TO SELL THESE SECURITIES AND IT IS NOT A SOLICITATION OF AN OFFER TO BUY THESE SECURITIES IN ANY JURISDICTION WHERE THE OFFER OR SALE IS NOT PERMITTED.
37
| CORPORATE WOODS PORTFOLIO |
The Borrower Sponsor.The borrower sponsor is Raymond Massa. Raymond Massa controls Group RMC and has a 4.77% beneficial interest in the borrower.
Escrows.The loan documents provide for upfront escrows at closing in the amount of $7,500,000 for future tenant improvement and leasing commission obligations (the “TILC Reserve”), $6,258,114 for real estate taxes, $1,481,165 for existing unfunded landlord obligations, and $620,488 for deferred maintenance. The loan documents require ongoing monthly reserve deposits in the amount of 1/12 of the estimated taxes due in the ensuing twelve months (currently $625,811) for real estate taxes, and $38,258 for replacement reserves. In addition, at any time the amount in the TILC Reserve falls below $5,000,000, the borrower is required to make monthly deposits of $169,428 until the amount in the TILC Reserve reaches $7,500,000. The loan documents do not require ongoing monthly deposits for insurance premiums as long as the Corporate Woods Portfolio Properties are insured under an acceptable blanket insurance policy.
Lockbox and Cash Management.The Corporate Woods Portfolio Whole Loan requires a lender-controlled lockbox account, which is already in place, and requires that the borrower direct all tenants to pay their rents directly into such lockbox account. The loan documents also require that all rents received by the borrower or the property manager be deposited into the lockbox account within two business days of receipt. Prior to the occurrence of a Trigger Period (as defined below), all funds in the lockbox account are required to be distributed to the borrower. Upon the first occurrence of a Trigger Period, the lender has the right to establish a lender-controlled cash management account. During the continuance of a Trigger Period, all funds in the lockbox account are required to be swept into such lender-controlled cash management account and applied to pay reserves as described above under “Escrows,” to pay debt service under the Corporate Woods Portfolio Whole Loan, to pay operating expenses set forth in the approved annual budget and lender-approved extraordinary expenses, and to apply any remainder, (i) if a Specified Tenant Trigger Period (as defined below) exists, to be deposited into an account (the “Specified Tenant Excess Cash Flow Account”) to be used for tenant improvements and leasing commissions to relet the applicable tenant’s space until the funds in the Specified Tenant Excess Cash Flow Account equal $20 per square foot of the applicable tenant’s space, (ii) if no Specified Tenant Trigger Period exists, but another Trigger Period exists, to be held in an account (the “Excess Cash Flow Account”) as additional security for the Corporate Woods Portfolio Whole Loan, and (iii) if a Trigger Period no longer exists, to be released to the borrower.
A “Trigger Period” will commence upon the earliest of (i) the occurrence and continuance of an event of default, (ii) the debt service coverage ratio being less than 1.20x at the end of any calendar quarter and (iii) a Specified Tenant Trigger Period. A Trigger Period will end, with respect to clause (i), upon the cure of such event of default; with respect to clause (ii), upon the debt service coverage ratio being at least 1.25x for two consecutive calendar quarters; and with respect to clause (iii), upon such Specified Tenant Trigger Period (as defined below) ceasing to exist in accordance with the definition of such term.
“Specified Tenant Trigger Period” means a period (A) commencing upon (i) a Specified Tenant being in default under its lease beyond any applicable notice and/or cure periods, (ii) a Specified Tenant failing to be in actual, physical possession of at least 80% of its leased space, (iii) a Specified Tenant giving notice that it is terminating its lease for 15% or more of its leased space, (iv) any termination or cancellation of any Specified Tenant’s lease (including, without limitation, rejection in any bankruptcy or similar insolvency proceeding) and/or any Specified Tenant’s lease failing to otherwise be in full force and effect, (v) any bankruptcy or similar insolvency of a Specified Tenant or its guarantor or (vi) a Specified Tenant failing to extend or renew its lease on or prior to the earlier of (a) the renewal period required in such lease and (b) 12 months prior to expiration in accordance with such lease and the Corporate Woods Portfolio Whole Loan documents for a term of at least five years; and (B) expiring upon the first to occur of the lender’s receipt of reasonably acceptable evidence (including, without limitation, a tenant estoppel acceptable to the lender) of (1) the satisfaction of the Specified Tenant Cure Conditions (as defined below) or (2) the borrower leasing the entirety of the Specified Tenant’s space (or applicable portion thereof) for a term of at least five years in accordance with the Corporate Woods Portfolio Whole Loan documents, and the applicable tenant being in actual, physical occupancy of its space and paying full rent.
“Specified Tenant Cure Conditions” means each of the following, as applicable: (i) the applicable Specified Tenant has cured all applicable lease defaults, (ii) the applicable Specified Tenant is in actual, physical possession of the vacant space referenced in clause (ii) of the definition of “Specified Tenant Trigger Period”, and paying full rent, (iii) the applicable Specified Tenant has revoked or rescinded all termination or cancellation notices and re-affirmed its lease as being in full force and effect, (iv) if the Specified Tenant Trigger Period arose under clause (vi) of the definition of “Specified Tenant Trigger Period”, (a) the applicable Specified Tenant has renewed or extended its lease in accordance with Corporate Woods Portfolio Whole Loan documents and such lease for a term of at least five years, or (b) a Specified Tenant Re-Tenanting Event (as defined below) has occurred, (v) with respect to any bankruptcy or insolvency proceedings involving the applicable Specified Tenant or its guarantor or lease, the applicable Specified Tenant or guarantor is no longer insolvent or subject to any bankruptcy or insolvency proceedings and has affirmed the applicable Specified Tenant lease pursuant to final, non-appealable order of a court of competent jurisdiction, (vi) the applicable Specified Tenant is paying full rent, or (vii) amounts in the Specified Tenant Excess Cash Flow Account equal or exceed $20 per square foot of the applicable Specified Tenant’s space.
“Specified Tenant Re-Tenanting Event” means each of the following: (i) the borrower leasing 80% or more of the applicable Specified Tenant’s space for at least five years in accordance with the Corporate Woods Portfolio Whole Loan documents, the applicable tenant being in actual, physical occupancy of its space and paying full rent (or if the tenant is not in occupancy or not paying full rent, the applicable lease may not contain any “outs”, and the borrower has deposited into the leasing reserve all unpaid tenant improvements, leasing commissions, and/or “free rent”); provided, that if less than 100% of the applicable Specified Tenant space has been leased, then (a) the rent for the applicable space that has been leased must be in an annual amount of at least the rent payable under the original applicable Specified Tenant lease prior to the related Specified Tenant Trigger Period (or, if 95% or more of such space has been leased, such rent must be prorated by the lender in applying such calculation), and (b) the borrower has deposited with the lender any unpaid tenant improvements and leasing commissions under such lease; (ii) either (a) the applicable new tenant(s) is(are) paying full rent, or (b) the borrower has deposited any applicable “free rent” granted under the new lease (provided, that to the extent no other Trigger Period then exists, the lender may apply any excess cash flow then on deposit in the
THE INFORMATION IN THIS STRUCTURAL AND COLLATERAL TERM SHEET IS NOT COMPLETE AND MAY BE AMENDED PRIOR TO THE TIME OF SALE. THIS TERM SHEET IS NOT AN OFFER TO SELL THESE SECURITIES AND IT IS NOT A SOLICITATION OF AN OFFER TO BUY THESE SECURITIES IN ANY JURISDICTION WHERE THE OFFER OR SALE IS NOT PERMITTED.
38
| CORPORATE WOODS PORTFOLIO |
Excess Cash Flow Account towards such “free rent” deposit); and (iii) such lease(s) may not contain any “outs”, except following the fifth anniversary of their commencement, or, in the case of a casualty or condemnation.
A “Specified Tenant” means any tenant that, together with any affiliates, leases space at the Corporate Woods Portfolio Properties that comprises more than 20% of either (1) the Corporate Woods Portfolio Properties’ aggregate gross leasable area, or (2) the total rental income (in the aggregate) for the Corporate Woods Portfolio Properties.
Property Management.The Corporate Woods Portfolio Properties are currently managed by Block Real Estate Services, LLC.
Assumption.The borrower has the right to transfer the Corporate Woods Portfolio Properties in their entirety, provided that certain other conditions are satisfied, including, but not limited to: (i) no event of default has occurred and is continuing; (ii) the lender’s reasonable determination that the proposed transferee and guarantor satisfy the lender’s credit review and underwriting standards, taking into consideration transferee experience, financial strength and general business standing; and (iii) if requested by the lender, rating agency confirmation from Fitch, DBRS and Moody’s that the transfer will not result in a downgrade, withdrawal or qualification of the respective ratings assigned to the Series 2017-BNK7 Certificates and similar confirmations from each rating agency rating any securities backed by the Corporate Woods Portfolio companion loans with respect to the ratings of such securities.
Partial Release.Following the lockout date and prior to the open period, each of the Corporate Woods Portfolio Properties may be separately released upon defeasance of a release price equal to the greater of (x) 120% of the allocated loan amount of such individual property and (y) 95% of the net sale proceeds of such individual property, and satisfaction of the following conditions, among others: (i) the loan-to-value ratio of the remaining Corporate Woods Portfolio Properties following such release does not exceed the lesser of (x) 74.0% or (y) the loan-to-value ratio immediately prior to the release, (ii) the debt service coverage ratio of the remaining Corporate Woods Portfolio Properties following such release equals or exceeds the greater of (x) 1.40x and (y) the debt service coverage ratio immediately prior to the release, (iii) the debt yield of the remaining Corporate Woods Portfolio Properties following such release equals or exceeds the greater of (x) 9.0% and (y) the debt yield immediately prior to the release, (iv) delivery of a reciprocal easement agreement reasonably acceptable to the lender, providing access, parking, utility and other customary easements, (v) compliance with applicable legal and zoning requirements, leases and covenants, (vi) the released individual property must constitute a separate tax parcel and (vii) the release must be permitted under REMIC requirements and the lender must receive a legal opinion to such effect. During the open period, each of the Corporate Woods Portfolio Properties may be separately released upon satisfaction of the above conditions, except that prepayment, rather than defeasance, of the release price is required.
Real Estate Substitution.Not permitted.
Subordinate and Mezzanine Indebtedness.Not permitted.
Ground Lease.None.
Terrorism Insurance.The loan documents require that the “all risk” insurance policy required to be maintained by the borrower provide coverage for terrorism in an amount equal to the full replacement cost of the Corporate Woods properties, as well as business interruption insurance covering no less than the 18-month period following the occurrence of a casualty event, together with an up to six-month extended period of indemnity, with a deductible not to exceed $100,000.
THE INFORMATION IN THIS STRUCTURAL AND COLLATERAL TERM SHEET IS NOT COMPLETE AND MAY BE AMENDED PRIOR TO THE TIME OF SALE. THIS TERM SHEET IS NOT AN OFFER TO SELL THESE SECURITIES AND IT IS NOT A SOLICITATION OF AN OFFER TO BUY THESE SECURITIES IN ANY JURISDICTION WHERE THE OFFER OR SALE IS NOT PERMITTED.
39
| WESTIN BUILDING EXCHANGE |
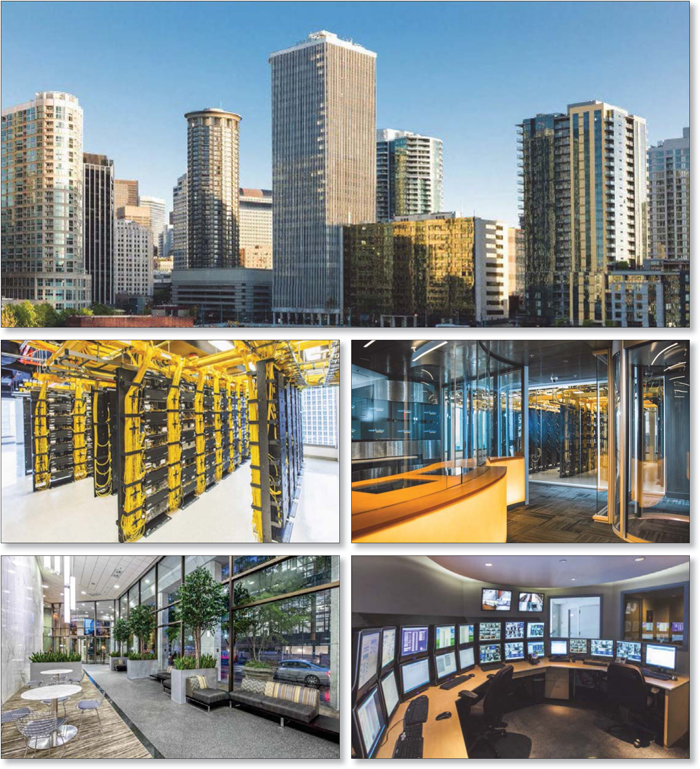
THE INFORMATION IN THIS STRUCTURAL AND COLLATERAL TERM SHEET IS NOT COMPLETE AND MAY BE AMENDED PRIOR TO THE TIME OF SALE. THIS TERM SHEET IS NOT AN OFFER TO SELL THESE SECURITIES AND IT IS NOT A SOLICITATION OF AN OFFER TO BUY THESE SECURITIES IN ANY JURISDICTION WHERE THE OFFER OR SALE IS NOT PERMITTED.
40
| WESTIN BUILDING EXCHANGE |
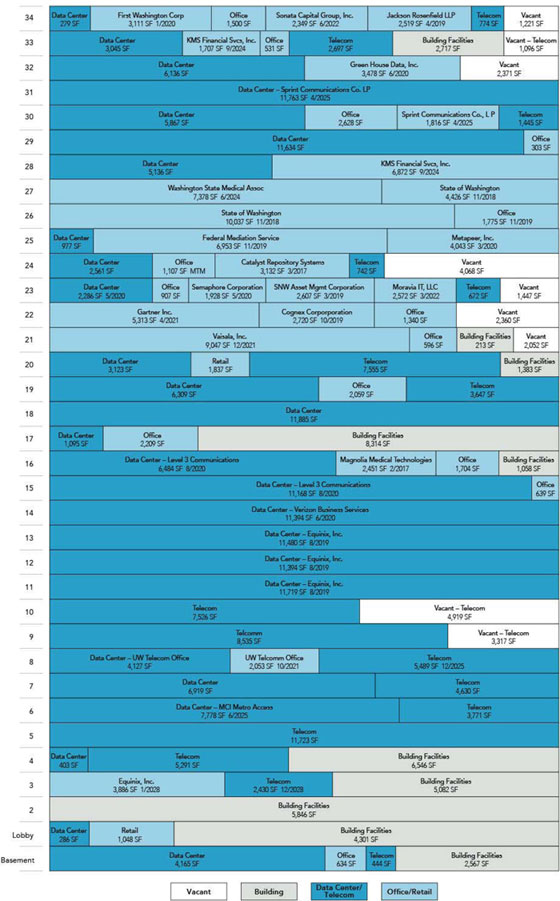
THE INFORMATION IN THIS STRUCTURAL AND COLLATERAL TERM SHEET IS NOT COMPLETE AND MAY BE AMENDED PRIOR TO THE TIME OF SALE. THIS TERM SHEET IS NOT AN OFFER TO SELL THESE SECURITIES AND IT IS NOT A SOLICITATION OF AN OFFER TO BUY THESE SECURITIES IN ANY JURISDICTION WHERE THE OFFER OR SALE IS NOT PERMITTED.
41
| WESTIN BUILDING EXCHANGE |
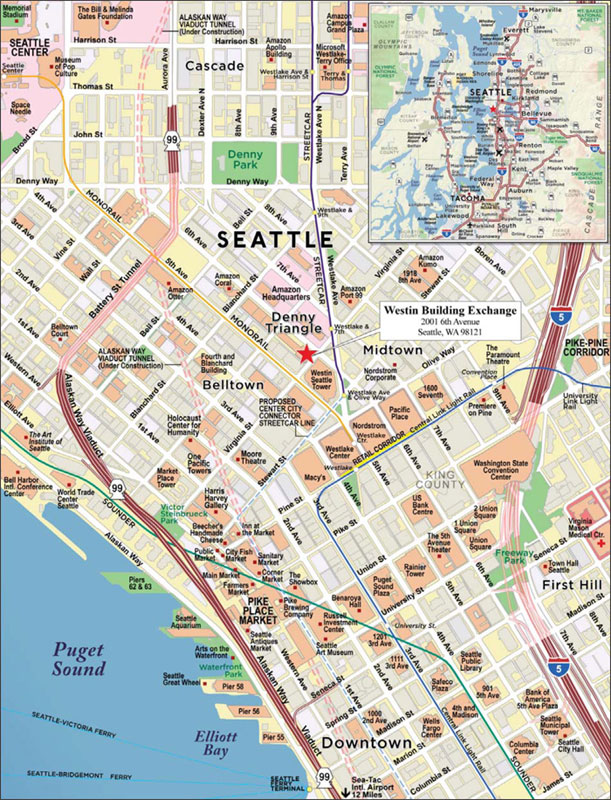
THE INFORMATION IN THIS STRUCTURAL AND COLLATERAL TERM SHEET IS NOT COMPLETE AND MAY BE AMENDED PRIOR TO THE TIME OF SALE. THIS TERM SHEET IS NOT AN OFFER TO SELL THESE SECURITIES AND IT IS NOT A SOLICITATION OF AN OFFER TO BUY THESE SECURITIES IN ANY JURISDICTION WHERE THE OFFER OR SALE IS NOT PERMITTED.
42
| No. 5 – Westin Building Exchange | |||||||
| Loan Information | Property Information | ||||||
| Mortgage Loan Seller: | Wells Fargo Bank, National Association | Single Asset/Portfolio: | Single Asset | ||||
Credit Assessment (DBRS/Fitch/Moody’s): | NR/NR/NR | Property Type: | Other | ||||
| Original Principal Balance(1): | $67,500,000 | Specific Property Type: | Data Center | ||||
| Cut-off Date Balance(1): | $67,500,000 | Location: | Seattle, WA | ||||
| % of Initial Pool Balance: | 5.6% | Size: | 401,544 SF | ||||
| Loan Purpose: | Refinance | Cut-off Date Balance Per SF(1): | $336.20 | ||||
| Borrower Name: | 2001 Sixth LLC | Year Built/Renovated: | 1981/2007 | ||||
| Sponsor: | Clise Properties, Inc.; Digital Realty Trust, L.P. | Title Vesting: | Fee | ||||
| Mortgage Rate: | 3.290% | Property Manager: | Self-managed | ||||
| Note Date: | June 29, 2017 | 4thMost Recent Occupancy (As of): | 91.5% (12/31/2014) | ||||
| Anticipated Repayment Date: | NAP | 3rdMost Recent Occupancy (As of): | 91.5% (12/31/2015) | ||||
| Maturity Date: | July 11, 2027 | 2ndMost Recent Occupancy (As of): | 93.9% (12/31/2016) | ||||
| IO Period: | 120 months | Most Recent Occupancy (As of): | 94.6% (3/31/2017) | ||||
| Loan Term (Original): | 120 months | Current Occupancy (As of)(3): | 93.5% (6/26/2017) | ||||
| Seasoning: | 2 months | ||||||
| Amortization Term (Original): | NAP | Underwriting and Financial Information: | |||||
| Loan Amortization Type: | Interest-only, Balloon | ||||||
| Interest Accrual Method: | Actual/360 | 4thMost Recent NOI (As of): | $26,342,988 (12/31/2014) | ||||
| Call Protection: | L(26),D(87),O(7) | 3rdMost Recent NOI (As of): | $28,765,913 (12/31/2015) | ||||
| Lockbox Type: | Soft/Springing Cash Management | 2ndMost Recent NOI (As of): | $30,064,403 (12/31/2016) | ||||
| Additional Debt(1): | Yes | Most Recent NOI (As of): | $30,830,493 (TTM 4/30/2017) | ||||
| Additional Debt Type(1): | Pari Passu | ||||||
| U/W Revenues: | $49,623,834 | ||||||
| U/W Expenses: | $16,327,188 | ||||||
| U/W NOI: | $33,296,646 | ||||||
| U/W NCF: | $32,413,249 | ||||||
| U/W NOI DSCR(1): | 7.39x | ||||||
| Escrows and Reserves(2): | U/W NCF DSCR(1): | 7.20x | |||||
| U/W NOI Debt Yield(1): | 24.7% | ||||||
| Type: | Initial | Monthly | Cap (If Any) | U/W NCF Debt Yield(1): | 24.0% | ||
| Taxes | $0 | Springing | NAP | As-Is Appraised Value: | $507,000,000 | ||
| Insurance | $0 | Springing | NAP | As-Is Appraisal Valuation Date: | May 23, 2017 | ||
| Replacement Reserves | $0 | Springing | NAP | Cut-off Date LTV Ratio(1): | 26.6% | ||
| TI/LC | $0 | Springing | NAP | LTV Ratio at Maturity or ARD(1): | 26.6% | ||
| (1) | See “Mortgage Loan” section. All statistical financial information related to balances per square foot, loan-to-value ratios, debt service coverage ratios and debt yields are based on the Westin Building Exchange Whole Loan (as defined below). The lender provides no assurances that any non-securitizedpari passu note will not be split further. |
| (2) | See “Escrows” section. |
| (3) | The Westin Building Exchange Building was 94.1% occupied as of June 26, 2017. Wells Fargo underwrote occupancy to 93.5% as one tenant comprising 0.6% of net rentable area is vacating its space. |
The Mortgage Loan. The mortgage loan (the “Westin Building Exchange Mortgage Loan”) is part of a whole loan (the “Westin Building Exchange Whole Loan”) that is evidenced by twopari passu promissory notes (Note A-1 and Note A-2) secured by a first mortgage encumbering an office building located in Seattle, Washington (the “Westin Building Exchange Property”). The Westin Building Exchange Whole Loan was co-originated on June 29, 2017 by Wells Fargo Bank, National Association and Column Financial Inc., a subsidiary of Credit Suisse Securities (USA) LLC. The Westin Building Exchange Whole Loan had an original principal balance of $135,000,000, has an outstanding principal balance as of the Cut-off Date of $135,000,000 and accrues interest at an interest rate of 3.290%per annum. The Westin Building Exchange Whole Loan had an initial term of 120 months, has a remaining term of 118 months as of the Cut-off Date and requires interest-only payments through the loan term. The Westin Building Exchange Whole Loan matures on July 11, 2027.
Note A-1, which will be contributed to the BANK 2017-BNK7 Trust, had an original principal balance of $67,500,000, has an outstanding principal balance as of the Cut-off Date of $67,500,000 and represents the controlling interest in the Westin Building Exchange Whole Loan. The non-controlling Note A-2, which had an original principal balance of $67,500,000, referred to herein as the “Westin Building Exchange Companion Loan”, is expected to be contributed to a future securitization trust. The lender provides no assurances that any non-securitizedpari passu note will not be split further. See “Description of the Mortgage Pool—The Whole Loans—The Serviced Pari Passu Whole Loans—The Westin Building Exchange Whole Loan” in the Preliminary Prospectus.
THE INFORMATION IN THIS STRUCTURAL AND COLLATERAL TERM SHEET IS NOT COMPLETE AND MAY BE AMENDED PRIOR TO THE TIME OF SALE. THIS TERM SHEET IS NOT AN OFFER TO SELL THESE SECURITIES AND IT IS NOT A SOLICITATION OF AN OFFER TO BUY THESE SECURITIES IN ANY JURISDICTION WHERE THE OFFER OR SALE IS NOT PERMITTED.
43
| WESTIN BUILDING EXCHANGE |
Following the lockout period, the borrower has the right to prepay the Westin Building Exchange Mortgage Loan in whole, but not in part, on any date before January 11, 2027. The lockout period will expire on or after September 11, 2019.
Note Summary
| Notes | Original Balance | Note Holder | Controlling Interest | |
| A-1 | $67,500,000 | BANK 2017-BNK7 | Yes | |
| A-2 | $67,500,000 | Column Financial Inc., a subsidiary of Credit Suisse Securities (USA) LLC | No | |
| Total | $135,000,000 |
Sources and Uses
| Sources | Uses | |||||||
| Original whole loan amount | $135,000,000 | 100.0% | Loan payoff(1) | $101,080,612 | 74.9% | |||
| Return of equity | $32,940,179 | 24.4 | ||||||
| Closing costs | $979,209 | 0.7 | ||||||
| Total Sources | $135,000,000 | 100.0% | Total Uses | $135,000,000 | 100.0% | |||
| (1) | The Westin Building Exchange Property was previously securitized in the BSCMS 2007-PW17 transaction. |
The Properties.The Westin Building Exchange Property is a 34-story class A building totaling approximately 401,544 square feet, located in downtown Seattle, Washington. The Westin Building Exchange Property comprises 159,413 square feet of data center space (39.7% of net rentable area; 46.9% of underwritten base rent), followed by 121,849 square feet of office space (30.3% of net rentable area; 12.9% of underwritten base rent), 76,703 square feet of colocation/telecommunication space (19.1% of net rentable area; 39.9% of underwritten base rent) and 43,579 square feet attributed to building facilities, retail and storage space (10.9% of net rentable area; 0.3% of underwritten base rent). Additionally, the Westin Building Exchange Property includes a 7-story, above-grade parking garage totaling 426 spaces, resulting in 1.1 spaces per 1,000 square feet (or 3.5 spaces per 1,000 square feet of office space).
Built in 1981 and renovated in 2007, the Westin Building Exchange Property is situated on a 0.7-acre site and is one of the leading data center and colocation facilities in the United States. As one of the largest carrier hotel data centers in the United States, the Westin Building Exchange Property serves as the primary hub for interconnection, hosting, and business deployment in the Pacific Northwest with more than 40,000 interconnections as the Westin Building Exchange Property is physically located between submarine and terrestrial cable routes. Through the Westin Building Exchange Property’s extensive fiber and copper “Meet-Me” rooms, the Westin Building Exchange Property provides neutral connectivity points to Asian, Canadian, European and American network service providers, carriers, and internet service providers. The Westin Building Exchange Property also provides access to numerous other networks via the Seattle Internet Exchange (“SIX”) and the Pacific Northwest Gigapop (“PN-WGP”), both of which have access points located at the Westin Building Exchange Property. In total, the Westin Building Exchange Property provides access to over 250 carriers and service/content providers. The Westin Building Exchange Property has a total utility power of 19.5 megawatts, a critical IT load of 10.0 megawatts and can facilitate an electrical build-out up to 150 watts per square foot for the data center space. The Westin Building Exchange Property has 17 emergency backup generators, with capacity ranging from 500 kilowatts to 2.5 megawatts, and approximately 20,000 gallons of fuel storage on site. The Westin Building Exchange Property has multiple layers of security, including 24/7/365 security guards on site, 24/7/365 secure and monitored access, CCTV monitoring, proximity card readers and secure key card access.
The Westin Building Exchange Property has a diversified rent roll with over 170 tenants, including internet and cloud service providers, as well as telecommunication, social media, gaming and streaming companies. The Westin Building Exchange Building was 94.1% occupied as of June 26, 2017, and Wells Fargo underwrote occupancy to 93.5% as one tenant comprising 0.6% of net rentable area is vacating its space. The largest tenant by underwritten base rent is Equinix, Inc. (“Equinix”), which has been in occupancy at the Westin Building Exchange Property since 1999. Equinix’s annual underwritten base rent at the Westin Building Exchange Property is approximately $5.3 million, of which 57.1% is attributed to colocation/telecommunication space, 40.6% attributed to data center space, 2.1% attributed to office space and 0.2% attributed to storage space. Equinix connects more than 9,500 businesses to their customers, employees and partners inside carrier-neutral data centers and internet exchanges. Equinix serves approximately 42.0% of Fortune 500 companies and 30.0% of Global 2000 companies and operates over 175 data center locations in 44 global markets, representing approximately 17.0 million square feet globally, with more than 1,500 networks and approximately 230,000 connections.
THE INFORMATION IN THIS STRUCTURAL AND COLLATERAL TERM SHEET IS NOT COMPLETE AND MAY BE AMENDED PRIOR TO THE TIME OF SALE. THIS TERM SHEET IS NOT AN OFFER TO SELL THESE SECURITIES AND IT IS NOT A SOLICITATION OF AN OFFER TO BUY THESE SECURITIES IN ANY JURISDICTION WHERE THE OFFER OR SALE IS NOT PERMITTED.
44
| WESTIN BUILDING EXCHANGE |
The following table presents certain information relating to the tenancies at the Westin Building Exchange Property:
Major Tenants
| Tenant Name | Credit Rating (Fitch/Moody’s/ DBRS)(1) | Tenant NRSF | % of NRSF | Annual U/W Base Rent PSF(2) | Annual U/W Base Rent(2) | % of Total Annual U/W Base Rent | Lease Expiration Date |
| Major Tenants | |||||||
| Equinix, Inc.(3) | BB/Ba3/NR | 38,650 | 9.6% | $136.22 | $5,264,913 | 18.6% | Various(3) |
| Level 3 Communications(4) | BB/Ba3/NR | 19,718 | 4.9% | $94.51 | $1,863,480 | 6.6% | 8/1/2020 |
| Sprint Communications Co., L.P.(5) | B2/B+/NR | 17,031 | 4.2% | $89.62 | $1,526,391 | 5.4% | 4/1/2025 |
| Verizon Business Svcs.(6) | A-/Baa1/NR | 12,362 | 3.1% | $88.92 | $1,099,224 | 3.9% | Various(6) |
| BCE Nexxia Corporation(7) | NR/NR/NR | 4,641 | 1.2% | $195.70 | $908,221 | 3.2% | 5/1/2022 |
| Green House Data, Inc.(8) | NR/NR/NR | 13,359 | 3.3% | $67.50 | $901,716 | 3.2% | Various(8) |
| The Mead Group/Colocenters Inc | NR/NR/NR | 8,805 | 2.2% | $78.67 | $692,712 | 2.4% | 3/1/2022 |
| Total Major Tenants | 114,566 | 28.5% | $106.98 | $12,256,657 | 43.2% | ||
| Non-Major Tenants | 260,756 | 64.9% | $61.80 | $16,115,940 | 56.8% | ||
| Occupied Collateral Total(9) | 375,322 | 93.5% | $75.60 | $28,372,597 | 100.0% | ||
| Vacant Space | 26,222 | 6.5% | |||||
| Collateral Total | 401,544 | 100.0% | |||||
| (1) | Certain ratings are those of the parent company whether or not the parent guarantees the lease. |
| (2) | Annual U/W Base Rent PSF and Annual U/W Base Rent include contractual rent steps through July 2018 totaling $1,050,165. |
| (3) | Equinix leases 34,593 square feet of data center space with an annual underwritten rent of $61.76 per square foot expiring August 1, 2019; 3,886 square feet of office space with an annual underwritten rent of $28.63 per square foot expiring January 1, 2028; and 171 square feet of storage space with an annual underwritten rent of $49.82 per square foot on a month-to-month basis. Additionally, Equinix leases colocation/telecommunication space with no attributed square footage for Annual U/W Base Rent of $3,008,665 expiring September 1, 2023. |
| (4) | Level 3 Communications leases 19,079 square feet of data center space with an annual underwritten rent of $96.37 per square foot expiring August 1, 2020; and 639 square feet of office space with an annual underwritten rent of $38.72 per square foot expiring August 1, 2020. |
| (5) | Sprint Communications Co., L.P. leases 15,215 square feet of data center space with an annual underwritten rent of $85.04 per square foot expiring April 1, 2025; and 1,816 square feet of office space with an Annual U/W Base Rent of $88.40 per square foot expiring April 1, 2025. |
| (6) | Verizon Business Svcs leases 12,083 square feet of data center space with an annual underwritten rent of $81.60 per square foot expiring June 1, 2020; and 279 square feet of data space with an annual underwritten rent of $256.90 per square foot expiring December 1, 2022. |
| (7) | BCE Nexxia Corporation leases 4,641 square feet of data center space with an annual underwritten rent of $116.54 per square foot expiring May 1, 2022. Additionally, BCE Nexxia Corporation leases colocation/telecommunication space with no attributed square footage for annual underwritten rent of $367,345 expiring May 1, 2022. |
| (8) | Green House Data, Inc. leases 8,548 square feet of data center space a with an annual underwritten rent of $84.45 per square foot expiring April 1, 2023 and 4,811 square feet of office space with an Annual U/W Base Rent of $37.38 per square foot expiring June 1, 2020. |
| (9) | Included in the Total Annual U/W Base Rent is approximately $11,323,923 which represents Annual U/W Base Rent related to infrastructure such as colocation/telecommunication cages and cabinets leased for their connection ability, which has no attributed square footage. Additionally, the Westin Building Exchange Property includes approximately 106,790 square feet with no attributed annual U/W base rent that is used as information technology rooms, customer care and maintenance rooms, conference rooms and electrical vaults which are primarily provided to the Westin Building Exchange Property tenants as amenity space. Excluding the annual U/W base rent with no attributed square footage and excluding the square footage with no Annual U/W Base Rent, the Weighted Average Annual U/W Base Rent is $63.49 per square foot. |
THE INFORMATION IN THIS STRUCTURAL AND COLLATERAL TERM SHEET IS NOT COMPLETE AND MAY BE AMENDED PRIOR TO THE TIME OF SALE. THIS TERM SHEET IS NOT AN OFFER TO SELL THESE SECURITIES AND IT IS NOT A SOLICITATION OF AN OFFER TO BUY THESE SECURITIES IN ANY JURISDICTION WHERE THE OFFER OR SALE IS NOT PERMITTED.
45
| WESTIN BUILDING EXCHANGE |
The following table presents historical occupancy percentages at the Westin Building Exchange Property:
Historical Occupancy
12/31/2014(1) | 12/31/2015(1) | 12/31/2016(1) | 3/31/2017(1) | 6/26/2017(2)(3) | ||||
| 91.5% | 91.5% | 93.9% | 94.6% | 93.5% |
| (1) | Information obtained from the borrower. |
| (2) | Information obtained from the underwritten rent roll. |
| (3) | The Westin Building Exchange Building was 94.1% occupied as of June 26, 2017. Wells Fargo underwrote occupancy to 93.5% as one tenant comprising 0.6% of net rentable area is vacating its space. |
Operating History and Underwritten Net Cash Flow.The following table presents certain information relating to the historical operating performance and the underwritten net cash flow at the Westin Building Exchange Property:
Cash Flow Analysis
| 2014 | 2015 | 2016 | TTM 4/30/2017 | U/W | % of U/W Effective Gross Income | U/W $ per SF | |||||||||
| Base Rent | $23,992,078 | $25,887,855 | $26,538,150 | $27,005,422 | $28,332,402(1) | 57.1% | $70.56 | ||||||||
| Grossed Up Vacant Space | 0 | 0 | 0 | 0 | 2,376,919 | 4.8 | 5.92 | ||||||||
| Free Rent Adjustment | 0 | 0 | 0 | 0 | 0 | 0.0 | 0.00 | ||||||||
| Infrastructure Fee(2) | 2,951,414 | 2,927,375 | 2,770,041 | 2,747,610 | 2,747,610 | 5.5 | 6.84 | ||||||||
| Total Reimbursables | 9,882,290 | 11,501,798 | 12,963,371 | 13,837,929 | 15,379,313 | 31.0 | 38.30 | ||||||||
| Other Income(3) | 1,377,452 | 1,426,789 | 1,475,383 | 1,405,615 | 1,405,615 | 2.8 | 3.50 | ||||||||
| Parking Income | 1,603,101 | 1,649,847 | 1,758,795 | 1,758,895 | 1,758,895 | 3.5 | 4.38 | ||||||||
| Less Vacancy & Credit Loss | 0 | 0 | 0 | 0 | (2,376,919)(4) | (4.8) | (5.92) | ||||||||
| Effective Gross Income | $39,806,335 | $43,393,664 | $45,505,740 | $46,755,471 | $49,623,834 | 100.0% | $123.58 | ||||||||
| Total Operating Expenses | $13,463,347 | $14,627,751 | $15,441,337 | $15,924,978 | $16,327,188 | 32.9% | $40.66 | ||||||||
| Net Operating Income | $26,342,988 | $28,765,913 | $30,064,403 | $30,830,493 | $33,296,646 | 67.1% | $82.92 | ||||||||
| TI/LC | 0 | 0 | 0 | 0 | 803,088 | 1.6 | 2.00 | ||||||||
| Capital Expenditures | 0 | 0 | 0 | 0 | 80,309 | 0.2 | 0.20 | ||||||||
| Net Cash Flow | $26,342,988 | $28,765,913 | $30,064,403 | $30,830,493 | $32,413,249 | 65.3% | $80.72 | ||||||||
| NOI DSCR(5) | 5.85x | 6.39x | 6.68x | 6.85x | 7.39x | ||||||||||
| NCF DSCR(5) | 5.85x | 6.39x | 6.68x | 6.85x | 7.20x | ||||||||||
| NOI DY(5) | 19.5% | 21.3% | 22.3% | 22.8% | 24.7% | ||||||||||
| NCF DY(5) | 19.5% | 21.3% | 22.3% | 22.8% | 24.0% |
| (1) | U/W Base Rent includes contractual rent steps through July 2018 totaling $1,050,165. |
| (2) | Infrastructure Fee includes infrastructure connection fees and cooling tower, HVAC, and generator charges which are recurring items according to tenant leases. |
| (3) | Other income includes tenant services income, roof and antenna rent and other miscellaneous income. |
| (4) | The underwritten economic vacancy is 7.7%. The Westin Building Exchange Property was 94.1% physically occupied as of June 26, 2017, but Wells Fargo underwrote occupancy to 93.5% as one tenant comprising 0.6% of net rentable area is vacating its space. |
| (5) | The debt service coverage ratios and debt yields are based on the Westin Building Exchange Whole Loan. |
Appraisal.As of the appraisal valuation date of May 23, 2017, the Westin Building Exchange Property had an “as-is” appraised value of $507,000,000.
Environmental Matters.According to the Phase I environmental site assessment dated May 31, 2017, there was no evidence of any recognized environmental conditions at the Westin Building Exchange Property.
Market Overview and Competition. The Westin Exchange Building Property is located in downtown Seattle, Washington, on Virginia Street between 5th and 6th Avenues in an area known as the Denny Triangle. Located adjacent to the southeast of the Westin Exchange Building Property (and connected via sky-bridge) is the 891-room Westin Seattle. Located adjacent to the northeast of the Westin Exchange Building Property is the 36-story Doppler building, which is the southern-most portion of Amazon.com’s approximately 3.3 million square foot headquarters campus, which is expected to be completed in 2021 and will encompass three blocks. Amazon.com purchased the three block site for approximately $207.5 million from Clise Properties, Inc., one of the borrower sponsors of the Westin Building Exchange Whole Loan.
The 2017 estimated population within a three- and five-mile radius of the Westin Building Exchange Property is 219,468 and 443,849, respectively. The 2017 estimated average household income within the same three- and five-mile radii was $109,857 and $111,943, respectively. Within a 0.5-mile radius of the Westin Exchange Building Property there are 171 retail properties, comprising approximately 4.4 million square feet, with a total occupancy rate of 96.4% and a five-year average total occupancy of 97.0%. Located two blocks to the southeast of the Westin Exchange Building Property is Seattle’s retail core district which contains Seattle’s only Macy’s, Nordstrom’s Seattle flagship store, Nike’s downtown Seattle location, as well as Pacific Place (a 339,000 square foot five-level indoor retail center) and Westlake Center (a 102,706 square foot indoor retail center home to Zara’s flagship location). Additionally, Pike Place Market is located 5 blocks southwest of the Westin Building Exchange Property.
THE INFORMATION IN THIS STRUCTURAL AND COLLATERAL TERM SHEET IS NOT COMPLETE AND MAY BE AMENDED PRIOR TO THE TIME OF SALE. THIS TERM SHEET IS NOT AN OFFER TO SELL THESE SECURITIES AND IT IS NOT A SOLICITATION OF AN OFFER TO BUY THESE SECURITIES IN ANY JURISDICTION WHERE THE OFFER OR SALE IS NOT PERMITTED.
46
| WESTIN BUILDING EXCHANGE |
According to the appraisal, Seattle is the 10th-largest U.S. data center market with 58 existing facilities containing a total 981,800 square feet of operational space, and the Westin Building Exchange Property currently accounts for approximately 21.0% of all operational data center square footage in Seattle.
According to a third party market report, the Westin Building Exchange Property is located in the Belltown/Denny Regrade submarket of the Downtown Seattle office market. As of the second quarter of 2017, the Belltown/Denny Regrade submarket consisted of approximately 7.6 million square feet of office space with an overall vacancy rate of 5.5%. For the same period, the class A office segment of the Belltown/Denny Regrade submarket consisted of approximately 3.8 million square feet of inventory with an overall vacancy rate of 2.9%. The Westin Building Exchange appraisal determined office market rents of $36.00 per square foot for space on floors 1 through 17 and $39.00 per square foot for space on floors 18 through 34, both on a modified gross basis. The appraiser determined data center market rents of $95.00 per square foot on a modified gross basis.
The following table presents certain information relating to comparable data center leases for the Westin Building Exchange Property:
Comparable Data Center Leases(1)
| U.S. Market | Date | Premises (SF) | Term (months) | Annual Rent PSF | Lease Type(2) |
| West Coast | 2Q 2017 | 7,750 | 60 | $70.00 | MG |
| Northwest | 1Q 2017 | 8,000 | 120 | $212.00 | MG |
| Northwest | 1Q 2017 | 5,000 | 120 | $102.00 | MG |
| West Coast | 3Q 2016 | 2,500 | 180 | $118.00 | MG |
| Northeast | 2Q 2016 | 10,000 | 240 | $59.00 | MG |
| Northeast | 2Q 2016 | 50,000 | 240 | $74.50 | MG |
| Northeast | 2Q 2016 | 38,000 | 120 | $77.50 | MG |
| Northeast | 4Q 2015 | 7,500 | 120 | $57.00 | MG |
| Northeast | 4Q 2015 | 50,000 | 120 | $67.00 | MG |
| Northeast | 4Q 2015 | 1,000 | 240 | $72.00 | MG |
| Northwest | 4Q 2015 | 7,700 | 36 | $97.00 | MG |
| Northeast | 3Q 2015 | 2,150 | 120 | $110.00 | MG |
| West Coast | 3Q 2015 | 2,500 | 120 | $127.00 | MG |
| Northeast | 2Q 2015 | 14,500 | 60 | $107.00 | MG |
| Northeast | 4Q 2014 | 64,000 | 60 | $97.00 | MG |
| Northwest | 1Q 2014 | 840 | 168 | $139.00 | MG |
| Northwest | 3Q 2013 | 14,000 | 118 | $106.00 | MG |
| Northeast | 3Q 2013 | 45,000 | 240 | $72.00 | MG |
| Northeast | 3Q 2013 | 27,500 | 240 | $217.00 | MG |
| Northeast | 3Q 2012 | 12,000 | 240 | $77.00 | MG |
| (1) | Information obtained from the appraisal. |
| (2) | Modified Gross leases are net of utilities. |
The following table presents certain information relating to comparable office leases for the Westin Building Exchange Property:
Comparable Office Leases(1)
| Property Name/Location | Year Built/ Renovated | Total GLA (SF) | Distance from Subject | Tenant Name | Lease Date/Term | Lease Area (SF) | Annual Base Rent PSF | Lease Type |
428 Westlake Avenue North Seattle, WA | 2004/NAP | 88,546 | 0.9 miles | Amazon.com | 2Q17/ 10.0 Yrs | 80,978 | $44.00 | Gross |
800 Fifth Avenue Seattle, WA | 1981/NAP | 933,808 | 0.9 miles | Greystar | 1Q17/ 8.25 Yrs | 34,484 | $40.50 | Gross |
800 Fifth Avenue Seattle, WA | 1981/NAP | 933,808 | 0.9 miles | Entercom Seattle, LLC | 1Q17/ 10.0 Yrs | 21,485 | $38.00 | Gross |
US Bank Centre Seattle, WA | 1989/NAP | 943,575 | 0.4 miles | Badgely, Phelps & Bell | 4Q16/ 5.0 Yrs | 16,579 | $44.85 | Gross |
First & Stew Art Seattle, WA | 1986/NAP | 94,333 | 0.4 miles | Hewitt Architexts | 3Q16/ 7.0 Yrs | 10,829 | $36.00 | Gross |
Market Place Tower Seattle, WA | 1988/NAP | 194,687 | 0.5 miles | Snapchat | 4Q16/ 5.0 Yrs | 47,000 | $42.00 | Gross |
Market Place II Seattle, WA | 1988/NAP | 46,752 | 0.5 miles | Davis Law | 4Q16/ 4.0 Yrs | 1,648 | $39.00 | Gross |
Fourth & Blanchard Seattle, WA | 1979/NAP | 409,874 | 0.3 miles | Aritex USA, Inc | 4Q16/ 2.0 Yrs | 1,009 | $31.00 | Gross |
| (1) | Information obtained from the appraisal |
THE INFORMATION IN THIS STRUCTURAL AND COLLATERAL TERM SHEET IS NOT COMPLETE AND MAY BE AMENDED PRIOR TO THE TIME OF SALE. THIS TERM SHEET IS NOT AN OFFER TO SELL THESE SECURITIES AND IT IS NOT A SOLICITATION OF AN OFFER TO BUY THESE SECURITIES IN ANY JURISDICTION WHERE THE OFFER OR SALE IS NOT PERMITTED.
47
| WESTIN BUILDING EXCHANGE |
The Borrower.The borrower is 2001 Sixth LLC, a 50/50 joint venture between Clise Properties, Inc., and Digital Realty Trust, L.P., and single purpose entity with two independent directors. Legal counsel to the borrower delivered a non-consolidation opinion in connection with the origination of the Westin Building Exchange Whole Loan. Clise Properties, Inc., and Digital Realty Trust, L.P., are the guarantors of certain nonrecourse carveouts under the Westin Building Exchange Whole Loan.
The Sponsors.The sponsors are Clise Properties, Inc, a major Seattle-based commercial real estate firm, and Digital Realty Trust, L.P., one of the world’s largest publicly-traded data center REITs. Digital Realty Trust, Inc. (NYSE: DLR), an S&P 500 company, focuses on providing data center, colocation, and interconnection solutions for domestic and international customers across a variety of industrial verticals. As of December 31, 2016, the company had 145 properties located throughout North America, Europe, Asia, and Australia. Founded by J.W. Clise in 1889, Clise Properties owns and manages over three million square feet of properties in the Seattle area including the Securities Building, Westin Building Exchange, Denny Building, 2020 Fifth Avenue, Six & Lenora, 1700 Seventh Avenue.
Escrows.The loan documents do not require monthly escrows for real estate taxes, insurance, replacement reserve, and TI/LC reserve as long as (i) no event of default has occurred or is continuing; and (ii) the debt yield is greater than or equal to 13.0%. Additionally, the loan documents do not require ongoing monthly escrows for insurance premiums as long as (i) no event of default has occurred and is continuing and (ii) the borrower provides the lender with evidence that the Westin Building Exchange Property’s insurance coverage is included in a blanket policy and such policy is in full force and effect and (iii) borrower pays all applicable insurance premiums and provides the lender with evidence of renewals.
Lockbox and Cash Management.The Westin Building Exchange Whole Loan requires a lender-controlled lockbox account, which is already in place, and that the borrower deposits all rents directly into such lockbox account within two business days of receipt. Prior to the occurrence of a Cash Trap Event Period (as defined below), all funds are required to be distributed to the borrower. During a Cash Trap Event Period, all cash flow is required to be swept to a lender-controlled cash management account.
A “Cash Trap Event Period” will commence upon the earlier of (i) the occurrence and continuance of an event of default or (ii) the debt yield being less than 13.0%. A Cash Trap Event Period will end, with respect to clause (i), upon the cure of such event of default; or, with respect to clause (ii), upon the debt yield being at least 13.0% for two consecutive calendar quarters.
Property Management.The Westin Building Exchange Property is managed by an affiliate of the borrower.
Assumption.The borrower has a two-time right to transfer the Westin Building Exchange Property, provided that certain other conditions are satisfied, including, but not limited to: (i) no event of default has occurred and is continuing; (ii) the lender’s reasonable determination that the proposed transferee and guarantor satisfy the lender’s credit review and underwriting standards, taking into consideration transferee experience, financial strength and general business standing; and (iii) if requested by the lender, rating agency confirmation from DBRS, Fitch and Moody’s that the transfer will not result in a downgrade, withdrawal or qualification of the respective ratings assigned to the Series 2017-BNK7 Certificates and similar confirmations from each rating agency rating any securities backed by the Westin Building Exchange Companion Loan with respect to the ratings of such securities.
Partial Release.Not permitted.
Real Estate Substitution.Not permitted.
Subordinate and Mezzanine Indebtedness.Not permitted.
Ground Lease.None.
Terrorism Insurance.The loan documents require that the “all risk” insurance policy required to be maintained by the borrower provide coverage for terrorism in an amount equal to the full replacement cost of the Westin Building Exchange Property, as well as business interruption insurance covering no less than the 18-month period following the occurrence of a casualty event, together with a six-month extended period of indemnity.
THE INFORMATION IN THIS STRUCTURAL AND COLLATERAL TERM SHEET IS NOT COMPLETE AND MAY BE AMENDED PRIOR TO THE TIME OF SALE. THIS TERM SHEET IS NOT AN OFFER TO SELL THESE SECURITIES AND IT IS NOT A SOLICITATION OF AN OFFER TO BUY THESE SECURITIES IN ANY JURISDICTION WHERE THE OFFER OR SALE IS NOT PERMITTED.
48
MALL OF LOUISIANA
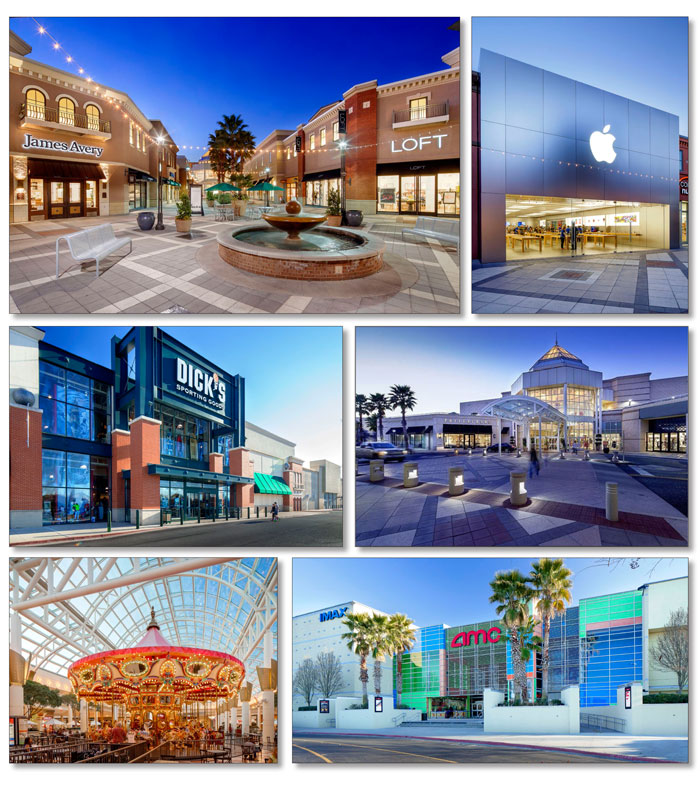
THE INFORMATION IN THIS STRUCTURAL AND COLLATERAL TERM SHEET IS NOT COMPLETE AND MAY BE AMENDED PRIOR TO THE TIME OF SALE. THIS TERM SHEET IS NOT AN OFFER TO SELL THESE SECURITIES AND IT IS NOT A SOLICITATION OF AN OFFER TO BUY THESE SECURITIES IN ANY JURISDICTION WHERE THE OFFER OR SALE IS NOT PERMITTED.
49
MALL OF LOUISIANA
THE INFORMATION IN THIS STRUCTURAL AND COLLATERAL TERM SHEET IS NOT COMPLETE AND MAY BE AMENDED PRIOR TO THE TIME OF SALE. THIS TERM SHEET IS NOT AN OFFER TO SELL THESE SECURITIES AND IT IS NOT A SOLICITATION OF AN OFFER TO BUY THESE SECURITIES IN ANY JURISDICTION WHERE THE OFFER OR SALE IS NOT PERMITTED.
50
MALL OF LOUISIANA
(THIS PAGE INTENTIONALLY LEFT BLANK)
THE INFORMATION IN THIS STRUCTURAL AND COLLATERAL TERM SHEET IS NOT COMPLETE AND MAY BE AMENDED PRIOR TO THE TIME OF SALE. THIS TERM SHEET IS NOT AN OFFER TO SELL THESE SECURITIES AND IT IS NOT A SOLICITATION OF AN OFFER TO BUY THESE SECURITIES IN ANY JURISDICTION WHERE THE OFFER OR SALE IS NOT PERMITTED.
51
MALL OF LOUISIANA
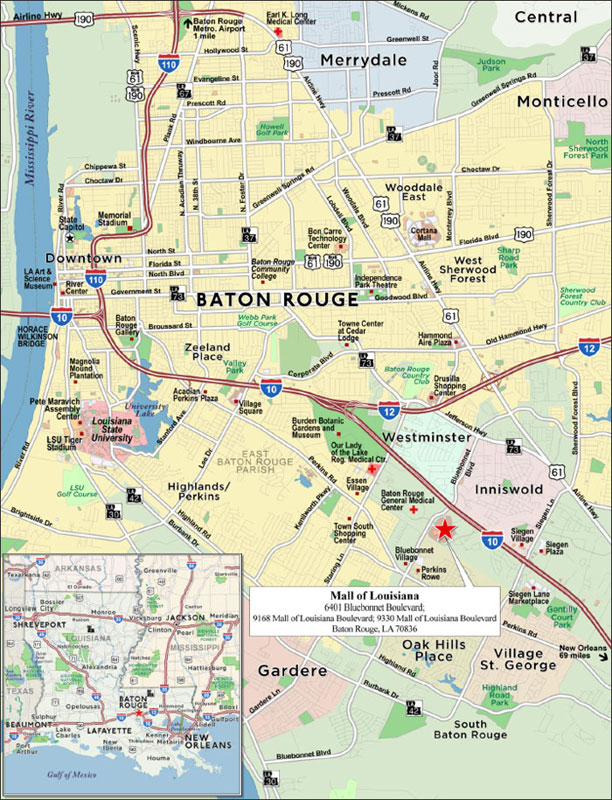
THE INFORMATION IN THIS STRUCTURAL AND COLLATERAL TERM SHEET IS NOT COMPLETE AND MAY BE AMENDED PRIOR TO THE TIME OF SALE. THIS TERM SHEET IS NOT AN OFFER TO SELL THESE SECURITIES AND IT IS NOT A SOLICITATION OF AN OFFER TO BUY THESE SECURITIES IN ANY JURISDICTION WHERE THE OFFER OR SALE IS NOT PERMITTED.
52
| No. 6– Mall of Louisiana | |||||||
| Loan Information | Property Information | ||||||
| Mortgage Loan Seller: | Bank of America, N.A. | Single Asset/Portfolio: | Single Asset | ||||
Credit Assessment (Fitch/DBRS/Moody’s): | NR/NR/NR | Property Type: | Retail | ||||
| Original Principal Balance(1): | $65,000,000 | Specific Property Type: | Super-Regional Mall | ||||
| Cut-off Date Balance(1): | $65,000,000 | Location: | Baton Rouge, LA | ||||
| % of Initial Pool Balance: | 5.4% | Size: | 776,789 SF | ||||
| Loan Purpose: | Recapitalization | Cut-off Date Balance Per SF(1): | $418.39 | ||||
| Borrower Name: | Mall of Louisiana, LLC; Mall of Louisiana Land, LLC | Year Built/Renovated: | 1997/2008 | ||||
| Sponsor: | GGP Real Estate Holding I, Inc. | Title Vesting: | Fee | ||||
| Mortgage Rate: | 3.984% | Property Manager(4): | General Growth Management, Inc. | ||||
| Note Date: | July 26, 2017 | 4thMost Recent Occupancy (As of)(4): | 94.0% (12/31/2013) | ||||
| Anticipated Repayment Date: | NAP | 3rdMost Recent Occupancy (As of)(4): | 96.6% (12/31/2014) | ||||
| Maturity Date: | August 1, 2027 | 2ndMost Recent Occupancy (As of(4): | 96.6% (12/31/2015) | ||||
| IO Period: | 36 months | Most Recent Occupancy (As of)(4): | 94.5% (12/31/2016) | ||||
| Loan Term (Original): | 120 months | Current Occupancy (As of)(4): | 95.8% (6/30/2017) | ||||
| Seasoning: | 1 month | ||||||
| Amortization Term (Original): | 360 months | Underwriting and Financial Information: | |||||
| Loan Amortization Type: | Interest-only, Amortizing Balloon | ||||||
| Interest Accrual Method: | Actual/360 | 4thMost Recent NOI (As of): | $33,541,166 (12/31/2014) | ||||
| Call Protection(2): | L(25),D(91),O(4) | 3rdMost Recent NOI (As of): | $34,580,536 (12/31/2015) | ||||
| Lockbox Type: | Hard/Springing Cash Management | 2ndMost Recent NOI (As of): | $35,038,477 (12/31/2016) | ||||
| Additional Debt(1): | Yes | Most Recent NOI (As of): | $34,995,624 (TTM 4/31/2017) | ||||
| Additional Debt Type(1): | Pari Passu | ||||||
| U/W Revenues: | $43,215,234 | ||||||
| U/W Expenses: | $7,152,311 | ||||||
| U/W NOI: | $36,062,923 | ||||||
| U/W NCF: | $34,433,637 | ||||||
| U/W NOI DSCR(1): | 1.94x | ||||||
| U/W NCF DSCR(1): | 1.85x | ||||||
| Escrows and Reserves(3): | U/W NOI Debt Yield(1): | 11.1% | |||||
| Type: | Initial | Monthly | Cap (If Any) | U/W NCF Debt Yield(1): | 10.6% | ||
| Taxes | $0 | Springing | NAP | As-Is Appraised Value: | $570,000,000 | ||
| Insurance | $0 | Springing | NAP | As-Is Appraisal Valuation Date: | June 23, 2017 | ||
| Replacement Reserves | $0 | Springing | $155,169 | Cut-off Date LTV Ratio(1): | 57.0% | ||
| TI/LC Reserve | $0 | Springing | $1,551,690 | LTV Ratio at Maturity or ARD(1): | 49.3% | ||
| (1) | The Mall of Louisiana Whole Loan (as defined below) is comprised of sevenpari passu promissory notes with an aggregate original principal balance of $325,000,000. The controlling Mall of Louisiana Mortgage Loan (as defined below) had an original principal balance of $65,000,000, has an outstanding principal balance of $65,000,000 as of the Cut-off Date and will be contributed to the BANK 2017-BNK7 securitization trust. All statistical financial information related to balances per square foot, loan-to-value ratios, debt service coverage ratios and debt yields are based on the Mall of Louisiana Whole Loan. |
| (2) | The defeasance lockout period will be at least 25 payment dates beginning with and including the first payment date of September 1, 2017. Defeasance of the Mall of Louisiana Whole Loan is permitted after the date that is the earlier to occur of (i) two years after the closing date of the securitization that includes the last note to be securitized, and (ii) August 1, 2020. The assumed lockout period of 25 payments is based on the expected BANK 2017-BNK7 securitization trust closing date in September 2017. |
| (3) | See “Escrows” section. |
| (4) | Occupancy figures include temporary tenants. Current Occupancy excluding temporary tenants is 91.8%. Current Occupancy includes Main Event (6.0% of NRA) which has a signed leases but is not expected to take occupancy until August 2018. The Mall of Louisiana Whole Loan guarantor has provided a guaranty for all outstanding landlord obligations and fifteen months of gap rent specific to Main Event. |
The Mortgage Loan. The mortgage loan (the “Mall of Louisiana Mortgage Loan”) is part of a whole loan (the “Mall of Louisiana Whole Loan”) evidenced by sevenpari passu promissory notes, secured by the fee interest in a 776,789 square foot portion of a super-regional mall and adjacent power center in Baton Rouge, Louisiana (the “Mall of Louisiana Property”). The Mall of Louisiana Whole Loan was co-originated on July 26, 2017 by Bank of America, N.A., Citi Real Estate Funding Inc. and Barclays Bank PLC. The Mall of Louisiana Whole Loan had an original principal balance of $325,000,000, has an outstanding principal balance as of the Cut-off Date of $325,000,000 and accrues interest at an interest rate of 3.984%per annum. The Mall of Louisiana Whole Loan had an initial term of 120 months, has a remaining term of 119 months as of the Cut-off Date and requires payments of interest-only until August 1, 2020, after which payments of interest and principal are required through its term. The Mall of Louisiana Whole Loan matures on August 1, 2027.
The Mall of Louisiana Mortgage Loan, evidenced by Note A-1 will be contributed to the BANK 2017-BNK7 securitization trust, had an original principal balance of $65,000,000, has an outstanding principal balance as of the Cut-off Date of $65,000,000 and represents
THE INFORMATION IN THIS STRUCTURAL AND COLLATERAL TERM SHEET IS NOT COMPLETE AND MAY BE AMENDED PRIOR TO THE TIME OF SALE. THIS TERM SHEET IS NOT AN OFFER TO SELL THESE SECURITIES AND IT IS NOT A SOLICITATION OF AN OFFER TO BUY THESE SECURITIES IN ANY JURISDICTION WHERE THE OFFER OR SALE IS NOT PERMITTED.
53
MALL OF LOUISIANA
apari passu controlling interest in the Mall of Louisiana Whole Loan. The non-controlling notes and noteholders are shown in the note summary table below. The lender provides no assurances that any non-securitized notes will not be split further. See “Description of the Mortgage Pool—The Whole Loans” in the Preliminary Prospectus.
Note Summary
| Notes | Original Balance | Note Holder | Controlling Interest |
| A-1 | $65,000,000 | BANK 2017-BNK7 | Yes |
| A-2 | $44,000,000 | Bank of America, N.A. | No |
| A-3 | $58,000,000 | Citi Real Estate Funding Inc. | No |
| A-4 | $50,000,000 | Citi Real Estate Funding Inc. | No |
| A-5 | $58,000,000 | Barclays Bank PLC | No |
| A-6 | $25,000,000 | Barclays Bank PLC | No |
| A-7 | $25,000,000 | Barclays Bank PLC | No |
| Total | $325,000,000 |
Following the lockout period, the Mall of Louisiana Borrower has the right to defease the Mall of Louisiana Whole Loan in whole, but not in part. In addition, the Mall of Louisiana Whole Loan is prepayable without penalty on or after May 1, 2027. The lockout period will expire on the earlier to occur of (i) two years after the closing date of the securitization that includes the last note to be securitized and (ii) August 1, 2020.
Sources and Uses
| Sources | Uses | ||||||||
| Original whole loan amount | $325,000,000 | 100.0% | Closing costs | $1,411,459 | 0.4 | % | |||
| Return of equity(1) | 323,588,541 | 99.6 | |||||||
| Total Sources | $325,000,000 | 100.0% | Total Uses | $325,000,000 | 100.0 | % |
| (1) | The Mall of Louisiana Property was previously unencumbered. The Mall of Louisiana Whole Loan sponsor acquired the Mall of Louisiana Property for approximately $265 million in 2004 and including the $100 million spent on the 2008 property expansion, maintains a cost basis of approximately $413 million. |
The Property. The Mall of Louisiana Property consists of a two-story enclosed super-regional mall known as Mall of Louisiana, which contains a total of 1,593,545 square feet and is anchored by non-collateral anchors Dillard’s, Dillard’s Men’s & Home, JC Penney, Macy’s and Sears. The 776,789 square foot portion of the Mall of Louisiana that serves as collateral for the Mall of Louisiana Whole Loan was 95.8% leased as of June 30, 2017 by 135 retail and restaurant tenants (and 91.8% leased by permanent tenants). The largest tenants by size are AMC Theaters (9.6% of NRA, 5.9% of base rent, expiring July 2026), Dick’s Sporting Goods (9.5% of NRA, 3.3% of base rent, expiring January 2019), Nordstrom Rack (3.9% of NRA, 2.0% of base rent, expiring September 2025) and Forever 21 (3.5% of NRA, 5.1% of base rent, expiring January 2019). Main Event (6.0% of NRA, 4.0% of base rent, expiring June 2028) has a signed lease but is not expected to take occupancy until June 2018. The Mall of Louisiana Whole Loan guarantor has provided a guaranty for all outstanding landlord obligations and fifteen months of gap rent specific to Main Event.
No other tenant represents more than 1.9% of NRA or 2.6% of underwritten rent. Other notable tenants at the Mall of Louisiana Property include: Apple, DSW, Lush Handmade Cosmetics, Michael Kors, Pandora, Pottery Barn and Williams Sonoma. The Mall of Louisiana Property features an 11-bay food court and nine full service restaurants. Inline sales at the Mall of Louisiana Property as of May 31, 2017 were approximately $183 million with an average of $585 PSF ($496 PSF excluding Apple), resulting in an occupancy cost of 13.6% (16.1% excluding Apple).
The Mall of Louisiana Property was built in 1997 and renovated in 2008 with a $100 million expansion project which added over 330,000 square feet, comprised of a 125,000 square foot lifestyle component, a 140,000 square foot power center and 15-screen stadium seating cinema with IMAX – 3D. The Mall of Louisiana features the only Sears within 40 miles and the only Macy’s, Dick’s Sporting Goods and Nordstrom Rack within 60 miles. The Mall of Louisiana Property includes 8,404 surface parking spaces (approximately 5.27 per 1,000 square feet).
THE INFORMATION IN THIS STRUCTURAL AND COLLATERAL TERM SHEET IS NOT COMPLETE AND MAY BE AMENDED PRIOR TO THE TIME OF SALE. THIS TERM SHEET IS NOT AN OFFER TO SELL THESE SECURITIES AND IT IS NOT A SOLICITATION OF AN OFFER TO BUY THESE SECURITIES IN ANY JURISDICTION WHERE THE OFFER OR SALE IS NOT PERMITTED.
54
MALL OF LOUISIANA
Thefollowing table presents certain information relating to the tenancy at the Mall of Louisiana Property:
Major Tenants
| Tenant Name | Credit Rating (Fitch/Moody’s/ S&P)(1) | Tenant NRSF(2) | % of NRSF | Annual U/W | Annual U/W Base Rent(4) | % of Total Annual U/W Base Rent | 5/30/2017 TTM Sales PSF(2) | 5/30/2017 TTM Occupancy Cost | Lease Expiration Date | |||||||||
| Major Tenants | ||||||||||||||||||
| AMC Theatres | B/B1/B+ | 74,400 | 9.6% | $23.38 | $1,739,472 | 5.9% | $560,583(5) | 22.6% | 7/21/2026 | |||||||||
| Forever 21 | NR/NR/NR | 26,885 | 3.5% | $55.20 | $1,483,980 | 5.1% | $183 | 28.6% | 1/31/2019 | |||||||||
| Main Event(6) | NR/NR/NR | 46,900 | 6.0% | $25.00 | $1,172,500 | 4.0% | N/A | N/A | 6/30/2028 | |||||||||
| Dick’s Sporting Goods | NR/NR/NR | 74,061 | 9.5% | $13.00 | $962,793 | 3.3% | $131 | 11.9% | 1/31/2019 | |||||||||
| Nordstrom Rack | BBB+/Baa1/BBB+ | 30,002 | 3.9% | $19.25 | $577,500 | 2.0% | N/A | N/A | 9/30/2025 | |||||||||
| Total Major Tenants | 252,248 | 32.5% | $23.53 | $5,936,245 | 20.2% | |||||||||||||
| Other Tenants | 460,886 | 59.3% | $50.73 | $23,378,585 | 79.8% | |||||||||||||
| Occupied Total | 713,134 | 91.8% | $41.11 | $29,314,830 | 100.0% | |||||||||||||
| Vacant Retail Space | 63,655 | 8.2% | ||||||||||||||||
| Collateral Total | 776,789 | 100.0% | ||||||||||||||||
| Non-Collateral Anchor Tenants | ||||||||||||||||||
| Dillard’s / Dillard’s Men’s and Home(7) | BBB-/Baa3/BBB- | 370,655 | $148 | N/A | N/A | |||||||||||||
| Macy’s | BBB/Baa3/BBB- | 204,890 | $166 | N/A | N/A | |||||||||||||
| JC Penney | B+/B1/B+ | 116,568 | $309 | N/A | N/A | |||||||||||||
| Sears / Sears Auto Center(8) | CC/Caa2/CCC+ | 113,517 | $123 | N/A | N/A | |||||||||||||
| (1) | Certain ratings are those of the parent company whether or not the parent company guarantees the lease. |
| (2) | Tenant NRSF and Sales PSF for the Non-Collateral Anchor Tenants are as of 2016 as reported in the appraisal. |
| (3) | Occupied Total Annual U/W Base Rent PSF excludes vacant space. |
| (4) | Annual U/W Base Rent includes contractual rent increases through August 2018. |
| (5) | Sales PSF is shown as Sales per screen (15 screens). |
| (6) | Main Event has an executed lease but is not expected to take occupancy until August 2018. The Mall of Louisiana Whole Loan guarantor has provided a guaranty for all outstanding landlord obligations and fifteen months of gap rent specific to Main Event. |
| (7) | Dillard’s and Dillard’s Men’s and Home stores have been combined for this table. |
The following table presents certain information relating to the historical sales and occupancy costs at the Mall of Louisiana Property:
Historical Tenant Sales (PSF) and Occupancy Costs
Historical Tenant Sales (PSF)
| |||||
| 2014 | 2015 | 2016 | 5/31/2017 TTM | 5/31/2017 TTM Occupancy Cost | |
| Total In-Line | |||||
| Comparable Sales PSF w/Apple | $557 | $568 | $571 | $585 | 13.6% |
| Comparable Sales PSF w/o Apple | $481 | $493 | $488 | $496 | 16.1% |
THE INFORMATION IN THIS STRUCTURAL AND COLLATERAL TERM SHEET IS NOT COMPLETE AND MAY BE AMENDED PRIOR TO THE TIME OF SALE. THIS TERM SHEET IS NOT AN OFFER TO SELL THESE SECURITIES AND IT IS NOT A SOLICITATION OF AN OFFER TO BUY THESE SECURITIES IN ANY JURISDICTION WHERE THE OFFER OR SALE IS NOT PERMITTED.
55
MALL OF LOUISIANA
The following table presents certain information relating to the lease rollover schedule at the Mall of Louisiana Property:
Lease Expiration Schedule(1)(2)
| Year Ending December 31, | No. of Leases Expiring | Expiring NRSF | % of Total NRSF | Cumulative Expiring NRSF | Cumulative % of Total NRSF | Annual U/W Base Rent | % of Total Annual U/W Base Rent | Annual U/W Base Rent PSF(3) | |||||||||||||||
| 2017 | 11 | 27,967 | 3.6 | % | 27,967 | 3.6 | % | 2,330,756 | 8.0 | % | $83.34 | ||||||||||||
| 2018 | 23 | 82,248 | 10.6 | % | 110,215 | 14.2 | % | 3,354,434 | 11.4 | % | $40.78 | ||||||||||||
| 2019 | 17 | 165,390 | 21.3 | % | 275,605 | 35.5 | % | 4,979,391 | 17.0 | % | $30.11 | ||||||||||||
| 2020 | 14 | 43,189 | 5.6 | % | 318,794 | 41.0 | % | 2,581,653 | 8.8 | % | $59.78 | ||||||||||||
| 2021 | 16 | 60,190 | 7.7 | % | 378,984 | 48.8 | % | 2,840,401 | 9.7 | % | $47.19 | ||||||||||||
| 2022 | 10 | 32,000 | 4.1 | % | 410,984 | 52.9 | % | 1,317,420 | 4.5 | % | $41.17 | ||||||||||||
| 2023 | 11 | 39,863 | 5.1 | % | 450,847 | 58.0 | % | 2,544,415 | 8.7 | % | $63.83 | ||||||||||||
| 2024 | 7 | 32,366 | 4.2 | % | 483,213 | 62.2 | % | 1,357,288 | 4.6 | % | $41.94 | ||||||||||||
| 2025 | 9 | 58,878 | 7.6 | % | 542,091 | 69.8 | % | 1,792,374 | 6.1 | % | $30.44 | ||||||||||||
| 2026 | 6 | 88,514 | 11.4 | % | 630,605 | 81.2 | % | 2,885,732 | 9.8 | % | $32.60 | ||||||||||||
| 2027 | 6 | 11,360 | 1.5 | % | 641,965 | 82.6 | % | 1,081,295 | 3.7 | % | $95.18 | ||||||||||||
| Thereafter | 5 | 71,169 | 9.2 | % | 713,134 | 91.8 | % | 2,249,670 | 7.7 | % | $31.61 | ||||||||||||
| Vacant | 0 | 63,655 | 8.2 | % | 776,789 | 100.0 | % | $0 | 0.0 | % | $0.00 | ||||||||||||
| Total/Wtd. Avg. | 135 | 776,789 | 100.00 | % | $29,314,830 | 100.0 | % | $41.11 | |||||||||||||||
| (1) | Information obtained from the underwritten rent roll. |
| (2) | Certain tenants may have lease termination or contraction options that are exercisable prior to the originally stated expiration date of the subject lease and that are not considered in the Lease Expiration Schedule. |
| (3) | Weighted Average Annual U/W Base Rent PSF excludes vacant space. |
The following table presents historical occupancy percentages at the Mall of Louisiana Property:
Historical Occupancy
12/31/2014(1) | 12/31/2015(1) | 12/31/2016(1) | 6/30/2017(2) | |||
| 96.6% | 96.6% | 94.5% | 95.8% |
| (1) | Information obtained from the Mall of Louisiana Borrower and includes temporary tenants. |
| (2) | Information obtained from the underwritten rent roll and includes temporary tenants and Main Event (6.0% of NRA) which has a signed leases but is not expected to take occupancy until August 2018. Current Occupancy excluding temporary tenants is 91.8%. |
Operating History and Underwritten Net Cash Flow. The followingtable presents certain information relating to the historical operating performance and underwritten net cash flow at the Mall of Louisiana Property:
Cash Flow Analysis
| 2014 | 2015 | 2016 | TTM 4/30/2017 | U/W | % of U/W Effective Gross Income | U/W $ per SF | ||||||||||||||||
| Base Rent(1) | $27,008,300 | $27,841,212 | $28,448,668 | $28,641,673 | $30,002,849(2) | 69.4 | % | $38.62 | ||||||||||||||
| Grossed Up Vacant Space | 0 | 0 | 0 | 0 | 3,395,375 | 7.9 | 4.37 | |||||||||||||||
| Total Reimbursables | 10,554,704 | 10,707,373 | 10,410,615 | 10,242,969 | 10,408,010 | 24.1 | 13.40 | |||||||||||||||
| Specialty Leasing | 3,089,790 | 3,046,453 | 3,044,110 | 2,921,431 | 2,956,431 | 6.8 | 3.81 | |||||||||||||||
| Other Income(3) | 402,762 | 384,936 | 331,822 | 399,049 | 384,049 | 0.9 | 0.49 | |||||||||||||||
| Less Vacancy & Credit Loss | 0 | 0 | 0 | 0 | -3,931,479 | -9.1 | 5.12 | |||||||||||||||
| Effective Gross Income | $41,055,555 | $41,979,974 | $42,235,214 | $42,205,123 | $43,215,234 | 100.0 | % | $55.63 | ||||||||||||||
| 0.00 | ||||||||||||||||||||||
| Total Operating Expenses | 7,514,389 | 7,399,438 | 7,196,737 | 7,209,498 | 7,152,311 | 16.6 | 9.21 | |||||||||||||||
| Net Operating Income | $33,541,166 | $34,580,536 | $35,038,477 | $34,995,624 | $36,062,923 | 83.4 | % | $46.43 | ||||||||||||||
| TI/LC | 0 | 0 | 0 | 0 | 1,473,928 | 3.4 | 1.90 | |||||||||||||||
| Capital Expenditures | 0 | 0 | 0 | 0 | 155,358 | 0.4 | 0.20 | |||||||||||||||
| Net Cash Flow | $33,541,166 | $34,580,536 | $35,038,477 | $34,995,624 | $34,433,637 | 79.7 | % | $44.33 | ||||||||||||||
| NOI DSCR(4) | 1.80x | 1.86x | 1.89x | 1.88x | 1.94x | |||||||||||||||||
| NCF DSCR(4) | 1.80x | 1.86x | 1.89x | 1.88x | 1.85x | |||||||||||||||||
| NOI DY(4) | 10.3% | 10.6% | 10.8% | 10.8% | 11.1% | |||||||||||||||||
| NCF DY(4) | 10.3% | 10.6% | 10.8% | 10.8% | 10.6% | |||||||||||||||||
| (1) | Base Rent includes percentage rent. |
| (2) | U/W Base Rent includes all tenants with signed leases and contractual rent steps through August 2018. |
| (3) | Other Income includes carousel revenue, rebates, and miscellaneous non-rental income. |
| (4) | Based on the Mall of Louisiana Whole Loan amount of $325,000,000. |
THE INFORMATION IN THIS STRUCTURAL AND COLLATERAL TERM SHEET IS NOT COMPLETE AND MAY BE AMENDED PRIOR TO THE TIME OF SALE. THIS TERM SHEET IS NOT AN OFFER TO SELL THESE SECURITIES AND IT IS NOT A SOLICITATION OF AN OFFER TO BUY THESE SECURITIES IN ANY JURISDICTION WHERE THE OFFER OR SALE IS NOT PERMITTED.
56
MALL OF LOUISIANA
Appraisal.As of the appraisal valuation date of June 23, 2017, the Mall of Louisiana Property had an “as-is” appraised value of $570,000,000.
Environmental Matters.According to the Phase I environmental report dated July 24, 2017, there was no evidence of any recognized environmental conditions at the Mall of Louisiana Property.
Market Overview and Competition.The Mall of Louisiana Property is located in East Baton Rouge Parish within the greater Baton Rouge metropolitan statistical area (“MSA”) of Louisiana. The Mall of Louisiana Property is located approximately 6.0 miles southeast of the Baton Rouge central business district, immediately south of Interstate 10, which connects to Interstate 12 approximately 2 miles north and connects to the New Orleans metropolitan area to the southeast. East Baton Rouge Parish includes the City of Baton Rouge and other established neighborhoods including Mid-City, the Garden District and Spanish Town and is home of the capital of Louisiana and Louisiana State University, Southern University and Baton Rouge Community College. There are two hospitals located within two miles of the Mall of Louisiana Property: Baton Rouge General Medical Center and Our Lady of the Lake Regional Medical Center. East Baton Rouge Parish’ top employers include Turner Industries Group LLC (9,875 employees), LSU System (6,250 employees), Performance Contractors (5,500 employees), Our Lady of the Lake Regional Medical Center (4,500 employees) and ExxonMobil (4,214 employees). IBM recently developed a $55 million office and residential building in downtown Baton Rouge and has committed to maintain 800 new jobs through 2023 in downtown Baton Rouge. The Baton Rouge MSA had a 2016 unemployment rate of 5.2% continuing year over year declines since 2011.
According to the appraisal, the primary trade area for the Mall of Louisiana Property encompasses an approximately fifteen-mile radius. The estimated 2016 population within a five-, ten- and fifteen-mile radius around the Mall of Louisiana Property was 169,831, 406,664 and 603,052, respectively. The estimated 2016 average household income within the same radii was $90,572, $76,294 and $74,587, respectively. The 2016 fifteen-mile radius population and average household income reflects a compound annual growth rate from 2000-2016 of 1.0% and 2.41%, respectively. Estimated 2016 average retail sales per household within a fifteen-mile radius of the Mall of Louisiana Property were $48,449.
The Mall of Louisiana Property is located in the Baton Rouge retail market which had 2017 first quarter-end average asking rents of $11.32 per square foot and a vacancy rate of 4.5%, a 1.3% decrease from the first quarter end 2016, with only 11,581 SF vacant in the market. There are currently six lifestyle centers and regional malls in the Baton Rouge retail market with 2017 first quarter-end average asking rents of $19.61 per square foot and a vacancy rate of 8.6%, a 1.7% decrease from the first quarter end 2016, with 74,739 square feet of positive absorption. There is no proposed new competitive supply noted by the appraisal.
The following table presents certain information relating to competitive properties for the Mall of Louisiana Property:
Competitive Properties(1)
| Property | Property | Year Built/ Renovated | Total GLA (SF) | Est. Sales PSF | Occupancy | Distance | Major/Anchor Tenants |
| Mall of Louisiana | Super-regional mall | 1997/2008 | 776,789 | $585(2) | 95.8%(3) | -- | Dillard’s (non-collateral), Dillard’s Men’s (non-collateral), JC Penney (non-collateral), Macy’s (non-collateral), Sears (non-collateral), AMC Theaters
|
Perkins Rowe Baton Rouge, LA
| Lifestyle Center | 2006/N/A | 749,300 | $420 | 85% | 1.5 miles | Cinemark, LA Fitness, Barnes
|
Town Center at Cedar Lodge Baton Rouge, LA
| Lifestyle Center | 2007/N/A | 410,000 | $400 | 98% | 5.0 miles | Whole Foods, Books A Million, LOFT, Gap |
Siegen Lane Marketplace Baton Rouge, LA
| Power Center | 1994/2002 | 462,150 | N/A | 100% | 3.0 miles | Walmart, Lowes, Bed Bath Beyond, TJMaxx |
Cortana Mall(4) Baton Rouge, LA
| Super-regional mall | 1976/2010 | 1,360,000 | $250 | 30% | 6.5 miles | Dillard’s, JC Penney |
| (1) | Information obtained from the appraisal and underwritten rent roll for the subject collateral. Total GLA, Est. Sales and Occupancy are shown for the collateral portion of the Mall of Louisiana. |
| (2) | Comparable inline sales shown as of May 2017. Comparable inline sales excluding Apple for that period were $496 per square foot. |
| (3) | Occupancy as of June 30, 2017 and includes Main Event (6.0% of NRA) which has a signed leases but is not expected to take occupancy until August 2018. The Mall of Louisiana Whole Loan guarantor has provided a guaranty for all outstanding landlord obligations and fifteen months of gap rent specific to Main Event. |
| (4) | Cortana Mall is the only other enclosed shopping mall in Baton Rouge. Only two of the six anchor units at Cortana Mall are currently occupied and approximately 45 of 110 inline stores are occupied. |
THE INFORMATION IN THIS STRUCTURAL AND COLLATERAL TERM SHEET IS NOT COMPLETE AND MAY BE AMENDED PRIOR TO THE TIME OF SALE. THIS TERM SHEET IS NOT AN OFFER TO SELL THESE SECURITIES AND IT IS NOT A SOLICITATION OF AN OFFER TO BUY THESE SECURITIES IN ANY JURISDICTION WHERE THE OFFER OR SALE IS NOT PERMITTED.
57
MALL OF LOUISIANA
The Borrower.The borrowers are Mall of Louisiana, LLC and Mall of Louisiana Land, LLC (individually and collectively, the “Mall of Louisiana Borrower”), each a single-purpose Delaware limited liability company, with at least two independent directors. Legal counsel to the Mall of Louisiana Borrower delivered a non-consolidation opinion in connection with the origination of the Mall of Louisiana Whole Loan.
The Sponsor.The loan sponsor and nonrecourse carveout guarantor is GGP Real Estate Holding I, Inc., wholly owned by GGP Inc. GGP Inc. (NYSE: GGP) is an S&P 500 company focused exclusively on owning, managing, leasing and redeveloping retail properties throughout the U.S. GGP Inc.’s portfolio as of June 2017 included 127 properties (121 million square feet) in 40 states with an enterprise value of approximately $39 billion.
GGP Real Estate Holding I, Inc. has provided a guaranty for payment of $1,726,914 in unfunded tenant allowances for ten various tenants and a guaranty related to the tenant Main Event for payment of $8,519,922 of unfunded tenant allowances ($3,986,500), landlord work ($3,067,797) and gap rent ($1,465,625).
Escrows.During a Trigger Period (as defined below), unless there are sufficient funds in the lockbox account to make the deposits, the Mall of Louisiana Borrower is required to deposit monthly (i) 1/12th of the estimated annual real estate taxes and 1/12th of the estimated annual insurance premiums (unless the Mall of Louisiana Property is covered by a blanket insurance policy and the premiums for the blanket policy are prepaid for at least one year in advance), (ii) $12,930.75 to a replacement reserve subject to a cap of $155,169, (iii) $129,307.50 to a tenant improvement and leasing commissions reserve subject to a cap of $1,551,690.
A “Trigger Period” will commence upon (i) an event of default or (ii) the debt service coverage ratio being less than 1.15x. A Trigger Period will cease upon (i) the cure or waiver of the event of default and (ii) the debt service coverage ratio being equal to or greater than 1.15x.
Lockbox and Cash Management.A hard lockbox is in place with respect to the Mall of Louisiana Whole Loan. Funds deposited to the lockbox will be swept daily to the Mall of Louisiana Borrower’s operating account unless a Trigger Period exists. During a Trigger Period, funds in the lockbox are required to be transferred daily to a cash management account under the sole control of the lender for the payment of, among other things, debt service, monthly escrows and operating expenses with all excess cash being deposited to an excess cash reserve to be held as additional collateral for the Mall of Louisiana Whole Loan.
Property Management.The Mall of Louisiana Property is managed by General Growth Management, Inc, an affiliate of the Mall of Louisiana Borrower.
Assumption.The Mall of Louisiana Borrower has the right to transfer the Mall of Louisiana Propertyprovided that certain conditions are satisfied, including (i) no event of default has occurred and is continuing; (ii) the Mall of Louisiana Property will be managed by a qualifying manager; (iii) a replacement guarantor has assumed the obligations of the Mall of Louisiana Whole Loan guarantor; (iv) the lender has received a non-consolidation opinion; and (v) the transferee is a qualified transferee.
Partial Release.The Mall of Louisiana Borrower may obtain the release of any vacant, non-income producing, unimproved parcel or outlot (including “air rights” parcels), any expansion parcel or the Picardy Street Extension Parcel (as defined below) in connection with a transfer to a person other than a person owned or controlled by the Mall of Louisiana Borrower, provided among other conditions that the following are satisfied: (i) no event of default has occurred and is continuing, and (ii)(A) as it relates to any parcel release other than an expansion parcel release: (a) the lender receives evidence that the parcel is not necessary for the operation of the Mall of Louisiana Property and that it may be readily separated from the Mall of Louisiana Property without material diminution of the value of the Mall of Louisiana Property, (b) lender receives rating agency confirmation (except with respect to a release of the Picardy Street Expansion Parcel so long as it remains vacant, non-income producing and unimproved), (c) the loan to value ratio for the remaining property is less than or equal to 125% provided that the Mall of Louisiana Borrower may prepay the Mall of Louisiana Whole Loan and pay the associated yield maintenance premium in order to meet the required loan to value ratio, or (B) as it relates to the release of an expansion parcel: (x) lender receives evidence that (I) during the time that the expansion parcel was a part of the Mall of Louisiana Property, any tenants that were relocated to the expansion parcel from other areas of the Mall of Louisiana Property have been replaced with tenants of comparable credit quality and paying equal or better rent than the relocated tenants or (II) to the extent existing tenants proposed to be relocated to the expansion parcel after its release, the Mall of Louisiana Borrower has entered into fully executed replacement leases with replacement tenants of comparable credit quality and on rental terms equal or better than the existing tenant, and (y) the release of the expansion parcel does not have a material adverse effect on the use or value of the Mall of Louisiana Property, priority of the lien of the mortgage, the enforcement of the Mall of Louisiana Whole Loan documents, or the Mall of Louisiana Borrower’s ability to repay the Mall of Louisiana Whole Loan.
The “Picardy Street Extension Parcel” is the portion of land subject to the extension and/or widening of Picardy Street by the City of Baton Rouge.
Real Estate Substitution.The Mall of Louisiana Borrower may obtain the release of a vacant, non-income producing, unimproved parcel for transfer to a person other than the Mall of Louisiana Borrower, provided among other conditions that the following are satisfied: (i) no event of default has occurred or is continuing, (ii) simultaneous with the substitution, the Mall of Louisiana Borrower acquires an exchange parcel at or adjacent to the Mall of Louisiana Property of reasonably equivalent value to the release parcel, (iii) rating agency confirmation is obtained, and (iv) the loan to value ratio immediately after the substitution is less than or equal to 125%, provided that the Mall of Louisiana Borrower may prepay the Mall of Louisiana Whole Loan and pay the associated yield maintenance premium in order to meet the required loan to value ratio.
Real Estate Expansion.The Mall of Louisiana Borrower may acquire one or more expansion parcels, provided among other conditions that the following are satisfied: (i) no event of default has occurred or is continuing, and (ii) the Mall of Louisiana
THE INFORMATION IN THIS STRUCTURAL AND COLLATERAL TERM SHEET IS NOT COMPLETE AND MAY BE AMENDED PRIOR TO THE TIME OF SALE. THIS TERM SHEET IS NOT AN OFFER TO SELL THESE SECURITIES AND IT IS NOT A SOLICITATION OF AN OFFER TO BUY THESE SECURITIES IN ANY JURISDICTION WHERE THE OFFER OR SALE IS NOT PERMITTED.
58
MALL OF LOUISIANA
Borrower acquires fee simple or leasehold interest in the expansion parcel. Any expansion parcel may be released (see “Partial Release” above.)
Subordinate and Mezzanine Indebtedness.Not permitted.
Ground Lease. None.
Terrorism Insurance.The Mall of Louisiana Borrower is required to obtain and maintain property insurance, commercial general liability insurance and business interruption insurance that covers acts of terrorism in an amount determined by the lender in its sole discretion (but not to exceed the full replacement cost of the Mall of Louisiana Property and 18-months of business interruption insurance),provided that if the Terrorism Risk Insurance Program Reauthorization Act of 2015 or any extension thereof or substantially similar program (“TRIPRA”) is in effect, the Mall of Louisiana Whole Loan documents provide for an annual terrorism premium cap of two times the cost of the annual premiums for property and business interruption insurance required under the related Mall of Louisiana Whole Loan documents.
THE INFORMATION IN THIS STRUCTURAL AND COLLATERAL TERM SHEET IS NOT COMPLETE AND MAY BE AMENDED PRIOR TO THE TIME OF SALE. THIS TERM SHEET IS NOT AN OFFER TO SELL THESE SECURITIES AND IT IS NOT A SOLICITATION OF AN OFFER TO BUY THESE SECURITIES IN ANY JURISDICTION WHERE THE OFFER OR SALE IS NOT PERMITTED.
59
REDONDO BEACH HOTEL PORTFOLIO
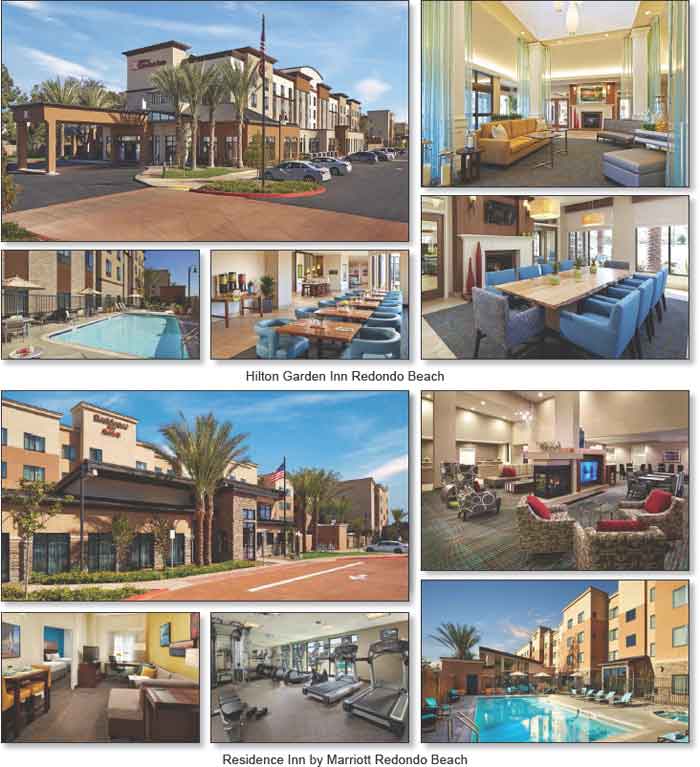
THE INFORMATION IN THIS STRUCTURAL AND COLLATERAL TERM SHEET IS NOT COMPLETE AND MAY BE AMENDED PRIOR TO THE TIME OF SALE. THIS TERM SHEET IS NOT AN OFFER TO SELL THESE SECURITIES AND IT IS NOT A SOLICITATION OF AN OFFER TO BUY THESE SECURITIES IN ANY JURISDICTION WHERE THE OFFER OR SALE IS NOT PERMITTED.
60
REDONDO BEACH HOTEL PORTFOLIO
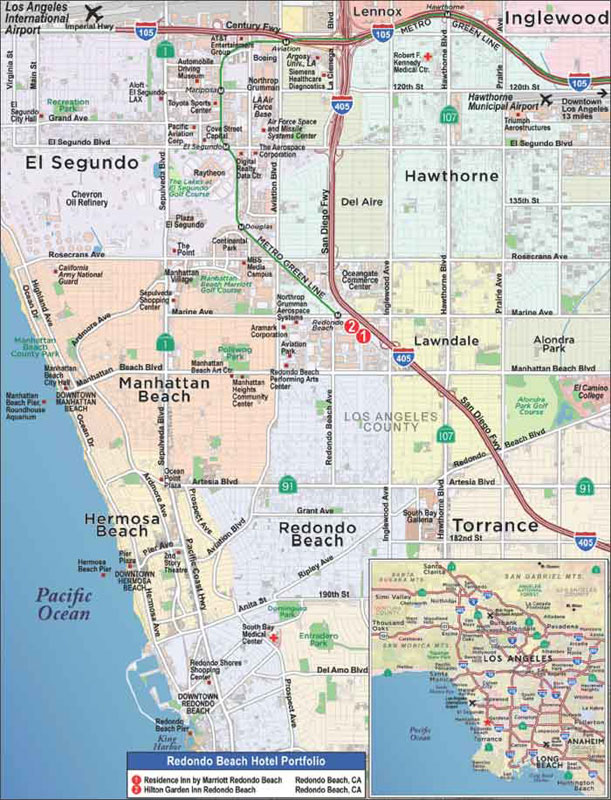
THE INFORMATION IN THIS STRUCTURAL AND COLLATERAL TERM SHEET IS NOT COMPLETE AND MAY BE AMENDED PRIOR TO THE TIME OF SALE. THIS TERM SHEET IS NOT AN OFFER TO SELL THESE SECURITIES AND IT IS NOT A SOLICITATION OF AN OFFER TO BUY THESE SECURITIES IN ANY JURISDICTION WHERE THE OFFER OR SALE IS NOT PERMITTED.
61
| No. 7 – Redondo Beach Hotel Portfolio | |||||||
| Loan Information | Property Information | ||||||
| Mortgage Loan Seller: | Bank of America, N.A. | Single Asset/Portfolio: | Portfolio | ||||
| Credit Assessment (Fitch/DBRS/Moody’s): | NR/NR/NR | Property Type: | Hospitality | ||||
| Original Principal Balance: | $64,000,000 | Specific Property Type: | Various | ||||
| Cut-off Date Balance: | $64,000,000 | Location: | Redondo Beach, CA | ||||
| % of Initial Pool Balance: | 5.3% | Size: | 319 Rooms | ||||
| Loan Purpose: | Refinance | Cut-off Date Balance Per Room: | $200,626.96 | ||||
| Borrower Name: | TRCF Redondo, LLC | Year Built/Renovated: | 2014 / NAP | ||||
| Sponsor: | James Bradley Wagstaff | Title Vesting: | Leasehold | ||||
| Mortgage Rate: | 5.117% | Property Manager: | Evolution Hospitality, LLC | ||||
| Note Date: | August 7, 2017 | 4thMost Recent Occupancy (As of): | NAP | ||||
| Anticipated Repayment Date: | NAP | 3rdMost Recent Occupancy (As of): | NAP | ||||
| Maturity Date: | September 1, 2027 | 2ndMost Recent Occupancy (As of): | 87.9% (12/31/2015) | ||||
| IO Period: | NAP | Most Recent Occupancy (As of): | 90.5% (12/31/2016) | ||||
| Loan Term (Original): | 120 months | Current Occupancy (As of): | 91.2% (6/30/2017) | ||||
| Seasoning: | 0 months | ||||||
| Amortization Term (Original): | 360 months | Underwriting and Financial Information: | |||||
| Loan Amortization Type: | Amortizing Balloon | ||||||
| Interest Accrual Method: | Actual/360 | 4thMost Recent NOI (As of): | NAV | ||||
| Call Protection: | L(24),D(92),O(4) | 3rdMost Recent NOI (As of): | $7,684,072 (12/31/2015) | ||||
| Lockbox Type: | Soft/Springing Cash Management | 2ndMost Recent NOI (As of): | $8,585,492 (12/31/2016) | ||||
| Additional Debt: | No | Most Recent NOI (As of): | $8,371,358 (TTM 6/30/2017) | ||||
| Additional Debt Type: | N/A | ||||||
| U/W Revenues: | $19,280,938 | ||||||
| U/W Expenses: | $11,259,706 | ||||||
| U/W NOI: | $8,021,232 | ||||||
| U/W NCF: | $6,620,265 | ||||||
| U/W NOI DSCR: | 1.92x | ||||||
| Escrows and Reserves(1): | U/W NCF DSCR: | 1.58x | |||||
| Type: | Initial | Monthly | Cap (If Any) | U/W NOI Debt Yield: | 12.5% | ||
| Taxes | $368,514 | $92,129 | NAP | U/W NCF Debt Yield: | 10.3% | ||
| Insurance | $0 | Springing | NAP | As-Is Appraised Value: | $99,500,000 | ||
| FF&E Reserve | $0 | $63,456 | NAP | As-Is Appraisal Valuation Date: | June 29, 2017 | ||
| Other Reserve | $336,000 | $0 | NAP | Cut-off Date LTV Ratio: | 64.3% | ||
| Ground Rent Reserve | $0 | $48,750 | NAP | LTV Ratio at Maturity or ARD: | 53.1% | ||
| (1) | See “Escrows” section. |
The Mortgage Loan. The mortgage loan (the “Redondo Beach Hotel Portfolio Mortgage Loan”) is evidenced by a single promissory note secured by a first mortgage encumbering the leasehold interests in one limited service hotel (the “Hilton Garden Inn Redondo Beach Property”) and one extended stay hotel (the “Residence Inn by Marriott Redondo Beach Property”), both located in Redondo Beach, California (together, the “Redondo Beach Hotel Portfolio Property”). The Redondo Beach Hotel Portfolio Mortgage Loan was originated on August 7, 2017 by Bank of America, N.A. The Redondo Beach Hotel Portfolio Mortgage Loan had an original principal balance of $64,000,000, has an outstanding principal balance as of the Cut-off Date of $64,000,000 and accrues interest at an interest rate of 5.117%per annum. The Redondo Beach Hotel Portfolio Mortgage Loan had an initial term of 120 months, has a remaining term of 120 months as of the Cut-off Date and requires payments of principal and interest based on a 30-year amortization schedule. The Redondo Beach Hotel Portfolio Mortgage Loan matures on September 1, 2027.
Following the lockout period, the Redondo Beach Hotel Portfolio Borrower has the right to defease the Redondo Beach Hotel Portfolio Mortgage Loan in whole, but not in part, on any date before June 1, 2027. The Redondo Beach Hotel Portfolio Mortgage Loan is prepayable without penalty on or after June 1, 2027.
THE INFORMATION IN THIS STRUCTURAL AND COLLATERAL TERM SHEET IS NOT COMPLETE AND MAY BE AMENDED PRIOR TO THE TIME OF SALE. THIS TERM SHEET IS NOT AN OFFER TO SELL THESE SECURITIES AND IT IS NOT A SOLICITATION OF AN OFFER TO BUY THESE SECURITIES IN ANY JURISDICTION WHERE THE OFFER OR SALE IS NOT PERMITTED.
62
REDONDO BEACH HOTEL PORTFOLIO
Sources and Uses
| Sources | Uses | |||||||
| Original loan amount | $64,000,000 | 100.0% | Loan Payoff | $56,774,108 | 88.7% | |||
| Return of equity(1) | $5,789,559 | 9.0 | ||||||
| Reserves | 704,514 | 1.1 | ||||||
| Closing costs | 731,819 | 1.1 | ||||||
| Total Sources | $64,000,000 | 100.0% | Total Uses | $64,000,000 | 100.0% |
| (1) | The Redondo Beach Hotel Portfolio Property was developed by the sponsor. |
The Property.The Redondo Beach Hotel Portfolio Property is comprised of two adjacent sister properties: Residence Inn by Marriott Redondo Beach Property and the Hilton Garden Inn Redondo Beach Property.
The following table presents certain information relating to the Redondo Beach Hotel Portfolio Property:
Property Schedule
| Property Name/Location | Allocated Cut-Off Date Balance | % of Portfolio | Occupancy | Year Built/ Renovated | Rooms | Appraised Value | Allocated LTV |
Residence Inn By Marriott 2420 Marine Drive Redondo Beach, CA 90278 | $37,628,141 | 58.8% | 90.5% | 2014 / N/A | 172 | $58,500,000 | 64.3% |
Hilton Garden Inn Redondo Beach, CA 90278 | $26,371,859 | 41.2% | 92.0% | 2014 / N/A | 147 | $41,000,000 | 64.3% |
| Total/Weighted Average | $64,000,000 | 100.00% | 91.2% | 319 | $99,500,000(3) |
The Residence Inn by Marriott Redondo Beach Property is a four-story, extended-stay, all-suite hotel opened in May 2014 that contains 172 guestrooms, a breakfast room, business center, 24-hour market, guest laundry, outdoor swimming pool with hot tub, fitness center, Bar-B-Q area, and 2,157 square feet of flexible meeting space. The guestroom configuration at the Residence Inn by Marriott Redondo Beach Property includes 74 king guestrooms, 37 queen/queen guestrooms, 33 king studios, 24 executive suites and 4 two-bedroom king suites. All rooms feature a kitchenette with stove, full sized refrigerator and microwave and pull-out sofabed. In-room amenities include flat panel TV’s, work desks, complimentary high-speed internet and coffee makers. There are 172 surface parking spaces in a shared lot with the Hilton Garden Inn Redondo Beach Property.
The demand segmentation for the Redondo Beach Hotel Portfolio Property is 50% extended stay, 40% transient and 10% group. Top corporate accounts for 2016 included Northrop Grumman (3,018 room nights) and Space X (1,456 room nights).
The Residence Inn by Marriott Redondo Beach Property is managed by Marriott International, Inc. pursuant to a franchise agreement expiring May 9, 2034 with one ten-year extension option.
The Hilton Garden Inn Redondo Beach Property is a four-story, select-service hotel opened in May 2014 that contains 147 guestrooms, the Garden Grille & Bar restaurant and bar, evening room service, 24-hour business center, 24-hour market, guest laundry, outdoor swimming pool with hot tub, fitness center and 2,500 square feet of flexible meeting space. The guestroom configuration at the Hilton Garden Inn Redondo Beach Property includes 67 king guestrooms, 66 queen/queen guestrooms and 14 executive suites. In-room amenities include flat panel TV’s, work desks, complimentary high-speed internet and coffee makers. There are 146 surface parking spaces in a shared lot with the Residence Inn by Marriott Redondo Beach Property.
The demand segmentation for the Hilton Garden Inn Redondo Beach Property is 65% corporate, 30% leisure and 5% group. The top corporate account for 2016 was Northrop Grumman (1,526 room nights).
The Hilton Garden Inn Redondo Beach Property is managed by Hilton Garden Inns Franchise LLC pursuant to a franchise agreement expiring February 28, 2034 with no extension options.
THE INFORMATION IN THIS STRUCTURAL AND COLLATERAL TERM SHEET IS NOT COMPLETE AND MAY BE AMENDED PRIOR TO THE TIME OF SALE. THIS TERM SHEET IS NOT AN OFFER TO SELL THESE SECURITIES AND IT IS NOT A SOLICITATION OF AN OFFER TO BUY THESE SECURITIES IN ANY JURISDICTION WHERE THE OFFER OR SALE IS NOT PERMITTED.
63
REDONDO BEACH HOTEL PORTFOLIO
The following table presents certain information relating to the historical operating performance and the underwritten net cash flow at the Redondo Beach Hotel Portfolio Property:
Cash Flow Analysis
| 2015 | 2016 | 6/30/2017 TTM | U/W | % of U/W Total Rev. | U/W $ per Room | ||||||||
| Occupancy | 87.9% | 90.5% | 91.2% | 91.2% | |||||||||
| ADR | $152.22 | $164.59 | $165.56 | $165.56 | |||||||||
| RevPAR | $133.80 | $148.93 | $150.93 | $150.93 | |||||||||
| Room Revenue | $15,578,610 | $17,387,787 | $17,573,033 | $17,573,033 | 91.1% | $55,088 | |||||||
| F&B Revenue | 633,860 | 756,050 | 767,774 | 767,774 | 4.0 | 2,407 | |||||||
| Other Income(1) | 844,105 | 874,841 | 940,131 | 940,131 | 4.9 | 2,947 | |||||||
| Total Revenue | $17,056,575 | $19,018,678 | $19,280,938 | $19,280,938 | 100.0% | $60,442 | |||||||
| Total Dept Expenses | 3,909,441 | 4,405,075 | 4,477,859 | 4,477,859 | 23.2 | 14,037 | |||||||
| Gross Op Profit | $13,147,134 | $14,613,603 | $14,803,079 | $14,803,079 | 76.8% | $46,405 | |||||||
| Total Undistrib Exp | 4,681,393 | 5,262,550 | 5,480,939 | 5,585,828 | 29.0 | 17,510 | |||||||
| Profit Before Fixed Charges | $8,465,741 | $9,351,053 | $9,322,140 | $9,217,251 | 47.8% | $28,894 | |||||||
| Total Fixed Charges | 781,669 | 765,561 | 950,782 | 1,196,019 | 6.2 | 3,749 | |||||||
| Net Op Income | $7,684,072 | $8,585,492 | $8,371,358 | $8,021,232 | 41.6% | $25,145 | |||||||
| FF&E | 0 | 0 | 0 | 771,238 | 4.0 | 2,418 | |||||||
| Ground Rent(2) | $542,565 | $584,960 | $506,946 | $629,729 | 3.3 | 1,974 | |||||||
| Net Cash Flow | $7,141,507 | $8,000,532 | $7,864,412 | $6,620,265 | 34.3% | $20,753 | |||||||
| NOI DSCR | 1.84x | 2.05x | 2.00x | 1.92x | |||||||||
| NCF DSCR | 1.71x | 1.91x | 1.88x | 1.58x | |||||||||
| NOI DY | 12.0% | 13.4% | 13.1% | 12.5% | |||||||||
| NCF DY | 11.2% | 12.5% | 12.3% | 10.3% |
| (1) | Other Income includes parking revenue, guest laundry, vending commissions, gift shop revenue and other miscellaneous income. |
| (2) | U/W Ground Rent is based on 15-year average payments. |
Appraisal.As of the appraisal valuation date of June 29, 2017, the Redondo Beach Hotel Portfolio Property had an aggregate “as-is” appraised value of $99,500,000.
Environmental Matters. According to a Phase I environmental assessments dated July 5, 2017, there was no evidence of any recognized environmental conditions at the Redondo Hotel Portfolio Property.
Ground Lease.The Residence Inn by Marriott Redondo Beach Property and the Hilton Garden Inn Redondo Beach Property improvements are subject to separate ground leases with Redondo Industrial Park LLC as ground lessor. The ground leases are each dated February 28, 2013 and expire on August 31, 2109. The ground leases require a current annual payment of $220,000 and $176,012, respectively, for the Residence Inn by Marriott Redondo Beach Property and the Hilton Garden Inn Redondo Beach Property. Both ground leases require a 10% increase every five years, with the next increases to occur on September 1, 2020, and rent resets to fair market value on September 1, 2045 and September 1, 2080.
The Redondo Beach Hotel Portfolio Property’s 2.09-acre land area which includes the parking areas for the Residence Inn by Marriott Redondo Beach Property and the Hilton Garden Inn Redondo Beach Property is subject to a ground lease with the City of Redondo Beach as ground lessor. The ground lease is dated November 30, 2012 and expires on August 31, 2109. The ground lease requires a current annual payment of $70,000, with a 10% increase every five years (the next increase to occur on November 30, 2017) and a rent reset to fair market value on November 30, 2047, November 30, 2057, November 30, 2072 and November 30, 2102. The ground lease also requires payment of 1% of the gross receipts from the Residence Inn by Marriott Redondo Beach Property and the Hilton Garden Inn Redondo Beach Property in excess of the monthly ground rent, to be renegotiated on every tenth anniversary of the ground lease.
Market Overview and Competition.The Redondo Beach Hotel Portfolio Property is located in Redondo Beach, California, directly off Interstate 405 (whereby 271,000 cars pass daily), 3.5 miles south of its interchange with Interstate 105. Major corporations within the market include Northrop Grumman, Raytheon, AT&T, Chevron, Exxon, Sketchers and Mattel. The unemployment rate in the city of Redondo Beach was 2.5% as of April 2017.
The Redondo Beach Hotel Portfolio Property is proximate to several major corporate campuses including the Northrop Grumman Corporation campus (0.7 miles west) serving as the headquarters for the Aerospace Systems division, and the Raytheon Space and Airborne Systems campus (3.6 miles northwest). Also within a five-mile radius are several retail and entertainment facilities including Redondo Beach Pier and King Harbor, Hermosa Beach Pier, Manhattan Beach Pier and the Galleria at South Bay. Los Angeles International Airport (“LAX”), the fourth busiest passenger airport and 14th largest air cargo processor in the world is 5.9 miles north of the Redondo Beach Hotel Portfolio Property and Hawthorne Municipal Airport (also known as Jack Northrop Field), a reliever airport for LAX that also houses Northrop Grumman Aviation, Inc., is 3.7 miles northeast of the Redondo Beach Hotel
THE INFORMATION IN THIS STRUCTURAL AND COLLATERAL TERM SHEET IS NOT COMPLETE AND MAY BE AMENDED PRIOR TO THE TIME OF SALE. THIS TERM SHEET IS NOT AN OFFER TO SELL THESE SECURITIES AND IT IS NOT A SOLICITATION OF AN OFFER TO BUY THESE SECURITIES IN ANY JURISDICTION WHERE THE OFFER OR SALE IS NOT PERMITTED.
64
REDONDO BEACH HOTEL PORTFOLIO
Portfolio Property. Los Angeles Air Force Base is 3.4 miles north of the Redondo Beach Hotel Portfolio Property. Downtown Los Angeles is 19.0 miles north of the Redondo Beach Hotel Portfolio Property.
As of 2017, the estimated population within a three- and five-mile radius of the Redondo Beach Hotel Portfolio Property was 286,900 and 586,751, respectively, and the average household income within the same radii was $109,493 and $96,302, respectively.
The only recent or anticipated competitive supply noted by the appraiser is a 184-room Homewood Suites which opened in May 2017 (also developed by Redondo Beach Hotel Portfolio sponsor) that is competitive to the Residence Inn by Marriott Redondo Beach Property, and a 152-room Cambria Suites which opened in May 2017 that is competitive to the Hilton Garden Inn Redondo Beach Property.
The following table presents certain information relating to the Redondo Beach Hotel Portfolio Property’s competitive sets:
Subject and Market Historical Occupancy, ADR and RevPAR(1)
Competitive Set | Residence Inn by Marriott Redondo | Penetration Factor | |||||||
Year | Occupancy | ADR | RevPAR | Occupancy | ADR | RevPAR | Occupancy | ADR | RevPAR |
| 6/30/2017 TTM | 90.70% | $166.72 | $151.15 | 90.80% | $172.70 | $156.89 | 100.20% | 103.60% | 103.80% |
| 12/31/2016 | 89.60% | $166.87 | $149.49 | 90.30% | $170.91 | $154.31 | 100.80% | 102.40% | 103.20% |
| 12/31/2015 | 87.10% | $158.58 | $138.10 | 88.60% | $158.47 | $140.41 | 101.70% | 99.90% | 101.70% |
Competitive Set | Hilton Garden Inn Redondo | Penetration Factor | |||||||
Year | Occupancy | ADR | RevPAR | Occupancy | ADR | RevPAR | Occupancy | ADR | RevPAR |
| 6/30/2017 TTM | 89.50% | $163.41 | $146.29 | 92.00% | $156.12 | $143.64 | 102.80% | 95.50% | 98.20% |
| 12/31/2016 | 89.80% | $164.82 | $148.03 | 91.30% | $156.02 | $142.52 | 101.70% | 94.70% | 96.30% |
| 12/31/2015 | 86.50% | $156.61 | $135.51 | 87.80% | $143.58 | $126.01 | 101.40% | 91.70% | 93.00% |
| (1) | Information obtained from a third party hospitality research report. |
The Borrower.The borrower is TRCF Redondo, LLC (the “Redondo Beach Hotel Portfolio Borrower”), a Delaware limited liability company with at least two independent directors. Legal counsel to the Redondo Beach Hotel Portfolio Borrower delivered a non-consolidation opinion in connection with the origination of the Redondo Beach Hotel Portfolio Mortgage Loan. James Bradley Wagstaff is a 47.9% owner of TRCF Redondo, LLC (with 52.9% voting rights) and is the guarantor of certain nonrecourse carveouts under the Redondo Beach Hotel Portfolio Mortgage Loan.
The Sponsor.The sponsor is James Bradley Wagstaff. Mr. Wagstaff has over 15 years of experience in real estate development, finance and investment and acquisitions and is the owner and managing partner of Mogul Capital. Mogul Capital was formed in 2005 as a specialty real estate development fund. Since inception, Mogul Capital has acquired, developed and invested in over $125 million in real estate projects and approximately $245 million in equity, debt and sale-leaseback financings.
The sponsor is required by the Redondo Beach Hotel Portfolio Mortgage Loan documents to maintain a minimum net worth of $32,000,000 and a minimum liquidity of $1,500,000.
Escrows.The Redondo Beach Hotel Portfolio Borrower deposited at loan origination $368,514 for real estate taxes and is required to deposit monthly 1/12th the estimated annual real estate taxes (currently $92,129). The Redondo Beach Hotel Portfolio Borrower is additionally required to deposit monthly (i) 1/12th the estimated annual insurance premiums (unless the Redondo Beach Hotel Portfolio Property is covered by a blanket policy); (ii) an FF&E reserve deposit adjusted annually to be the greater of (x) the amount required by the franchisor under the franchise agreement and (y) 1/12th of 4% of the operating income for the preceding year (currently $63,456); and (iii) 1/12th the ground rent payments due (currently $48,750).
The Redondo Beach Hotel Portfolio Borrower deposited at loan origination $336,000 in connection with a breach of contract dispute with US Hotel Advisors, a mortgage brokerage firm, which amount will be released upon settlement of the related dispute, dismissal of the related dispute or entry of non-appealable judgement regarding the related dispute.
Lockbox and Cash Management.The Redondo Beach Hotel Portfolio Borrower has established a lockbox account into which all rents are required to be deposited. Upon a Cash Sweep Period (as defined below) all funds in the lockbox account are required to be swept on each business day to a lender-controlled cash management account for payment of among other things, debt service, monthly escrows and operating expenses with all excess cash to be deposited to an excess cash reserve to be held as additional security for the Redondo Beach Hotel Portfolio Mortgage Loan for so long as a Cash Sweep Period exists.
A “Cash Sweep Period” will commence upon the debt service coverage ratio falling below 1.20x for two consecutive calendar quarters and will end upon the debt service coverage ratio equaling or exceeding 1.20x for two consecutive calendar quarters.
Property Management.The Residence Inn by Marriott Redondo Beach Property and the Hilton Garden Inn Redondo Beach Property are managed under separate management agreements by Evolution Hospitality, LLC expiring May 2019 (60 months from opening), each with one two-year extension option and one three-year extension option. Evolution Hospitality, LLC is a San Clemente, California based company with 34 hotels under management in Southern California.
Assumption.Following six months from the loan origination date of the Redondo Beach Hotel Portfolio Mortgage Loan, the Redondo Beach Hotel Portfolio Borrower has a right to transfer the Redondo Beach Hotel Portfolio Propertyprovided that certain conditions are
THE INFORMATION IN THIS STRUCTURAL AND COLLATERAL TERM SHEET IS NOT COMPLETE AND MAY BE AMENDED PRIOR TO THE TIME OF SALE. THIS TERM SHEET IS NOT AN OFFER TO SELL THESE SECURITIES AND IT IS NOT A SOLICITATION OF AN OFFER TO BUY THESE SECURITIES IN ANY JURISDICTION WHERE THE OFFER OR SALE IS NOT PERMITTED.
65
REDONDO BEACH HOTEL PORTFOLIO
satisfied, including (i) no event of default has occurred and is continuing; (ii) the lender reasonably determines that the proposed transferee satisfies the lender’s credit review and underwriting standards, taking into consideration transferee experience, financial strength and general business standing; (iii) a replacement guarantor assumes the obligations of the Redondo Beach Hotel Portfolio guarantor; and (iv) if required by the lender, the lender has received confirmation from Fitch, DBRS and Moody’s that such assumption will not result in a downgrade, withdrawal or qualification of the respective ratings assigned to the Series 2017-BNK7 certificates.
Partial Release.Not permitted.
Real Estate Substitution.Not permitted.
Subordinate and Mezzanine Indebtedness.Not permitted.
Terrorism Insurance.The loan documents require that the “all risk” insurance policy required to be maintained by the Redondo Beach Hotel Portfolio Borrower provide coverage for acts of terrorism in an amount equal to the full replacement cost of the Redondo Beach Hotel Portfolio Property, provided that if the Terrorism Risk Insurance Program Reauthorization Act of 2007 or any extension thereof or substantially similar program (TRIPRA) is in effect, the Redondo Beach Hotel Portfolio Mortgage Loan documents provide for an annual terrorism premium cap of two times the cost of the annual premiums for property and business interruption insurance required under the related Redondo Beach Hotel Portfolio Mortgage Loan documents.
THE INFORMATION IN THIS STRUCTURAL AND COLLATERAL TERM SHEET IS NOT COMPLETE AND MAY BE AMENDED PRIOR TO THE TIME OF SALE. THIS TERM SHEET IS NOT AN OFFER TO SELL THESE SECURITIES AND IT IS NOT A SOLICITATION OF AN OFFER TO BUY THESE SECURITIES IN ANY JURISDICTION WHERE THE OFFER OR SALE IS NOT PERMITTED.
66
THE CHURCHILL
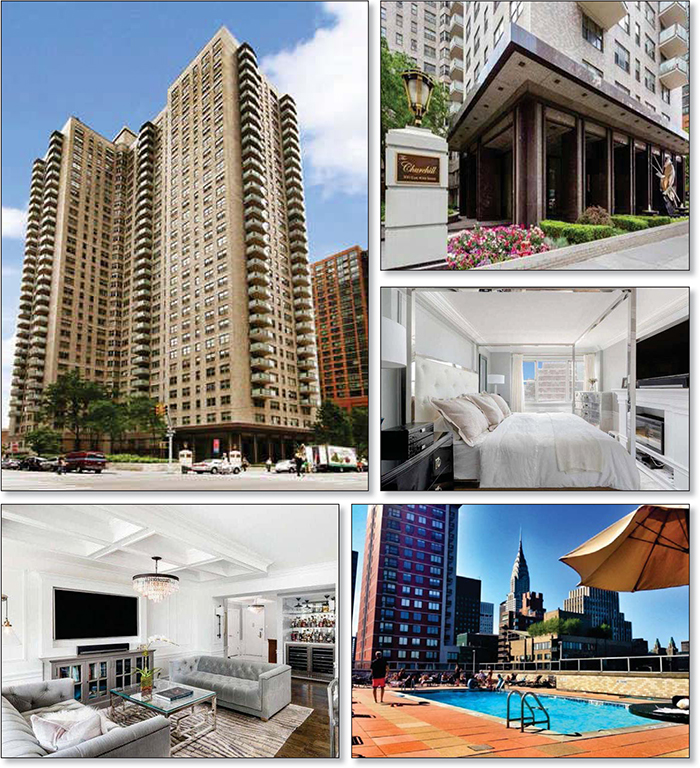
THE INFORMATION IN THIS STRUCTURAL AND COLLATERAL TERM SHEET IS NOT COMPLETE AND MAY BE AMENDED PRIOR TO THE TIME OF SALE. THIS TERM SHEET IS NOT AN OFFER TO SELL THESE SECURITIES AND IT IS NOT A SOLICITATION OF AN OFFER TO BUY THESE SECURITIES IN ANY JURISDICTION WHERE THE OFFER OR SALE IS NOT PERMITTED.
67
THE CHURCHILL
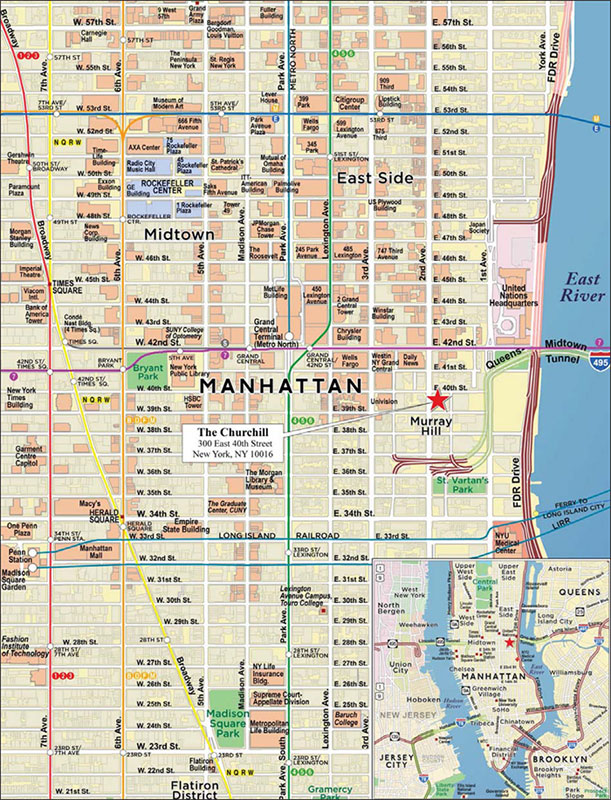
THE INFORMATION IN THIS STRUCTURAL AND COLLATERAL TERM SHEET IS NOT COMPLETE AND MAY BE AMENDED PRIOR TO THE TIME OF SALE. THIS TERM SHEET IS NOT AN OFFER TO SELL THESE SECURITIES AND IT IS NOT A SOLICITATION OF AN OFFER TO BUY THESE SECURITIES IN ANY JURISDICTION WHERE THE OFFER OR SALE IS NOT PERMITTED.
68
| No. 8 – The Churchill | ||||||
| Loan Information | Property Information | |||||
| Mortgage Loan Seller: | Morgan Stanley Mortgage Capital Holdings LLC | Single Asset/Portfolio: | Single Asset | |||
Credit Assessment (DBRS/Fitch/Moody’s): | NR/NR/NR | Property Type: | Multifamily | |||
| Original Principal Balance: | $49,000,000 | Specific Property Type: | Cooperative | |||
| Cut-off Date Balance: | $49,000,000 | Location: | New York, NY | |||
| % of Initial Pool Balance: | 4.0% | Size: | 587 Units | |||
| Loan Purpose: | Refinance | Cut-off Date Balance Per Unit:
| $83,475 | |||
| Borrower Name: | Churchill Owners Corp. | Year Built/Renovated: | 1967/2016 | |||
| Sponsor(1): | None | Title Vesting: | Fee | |||
| Mortgage Rate: | 3.288% | Property Manager: | Rose-Terra Management LLC | |||
| Note Date: | August 4, 2017 | 4thMost Recent Occupancy(4): | NAP | |||
| Anticipated Repayment Date: | NAP | 3rdMost Recent Occupancy(4): | NAP | |||
| Maturity Date: | September 1, 2027 | 2ndMost Recent Occupancy(4): | NAP | |||
| IO Period: | 120 months | Most Recent Occupancy(4): | NAP | |||
| Loan Term (Original): | 120 months | Current Occupancy (As of)(4): | 95.0% (6/29/2017) | |||
| Seasoning: | 0 months | |||||
| Amortization Term (Original): | NAP | Underwriting and Financial Information: | ||||
| Loan Amortization Type: | Interest-only, Balloon | 4thMost Recent NOI(5): | NAV | |||
| Interest Accrual Method: | Actual/360 | 3rdMost Recent NOI(5): | NAV | |||
| Call Protection: | L(23),GRTR 1% or YM(93),O(4) | 2ndMost Recent NOI(5): | NAV | |||
| Lockbox Type: | None | Most Recent NOI(5): | NAV | |||
| Additional Debt(2): | Yes | |||||
| Additional Debt Type(2): | Future Subordinate Debt | U/W Revenues(5): | $22,400,194 | |||
| U/W Expenses(5): | $12,120,905 | |||||
| U/W NOI(5): | $10,279,289 | |||||
| U/W NCF(5): | $10,073,839 | |||||
| U/W NOI DSCR(5): | 6.29x | |||||
| U/W NCF DSCR(5): | 6.17x | |||||
| U/W NOI Debt Yield(5): | 21.0% | |||||
| Escrows and Reserves(3): | U/W NCF Debt Yield(5): | 20.6% | ||||
| As-Is Appraised Value(6): | $516,000,000 | |||||
| Type: | Initial | Monthly | Cap (If Any) | As-Is Appraisal Valuation Date: | June 29, 2017 | |
| Taxes | $1,567,769 | $522,590 | NAP | Cut-off Date LTV Ratio(6): | 9.5% | |
| Insurance | $0 | Springing | NAP | LTV Ratio at Maturity or ARD(6): | 9.5% | |
| Replacement Reserves | $0 | $0 | NAP | Coop-Rental Value(7): | $275,000,000 | |
| Capital Improvements | $0 | $0 | NAP | Coop-LTV as Rental(7): | 17.8% | |
| (1) | See “The Sponsor” section. |
| (2) | See “Subordinate and Mezzanine Indebtedness” section. |
| (3) | See “Escrows” section. |
| (4) | See “Historical Occupancy” section. |
| (5) | See “Cash Flow Analysis” section. |
| (6) | The As-Is Appraised Value represents the estimated gross sellout value of all cooperative units (as cooperative units) at The Churchill Property cooperative, assuming the units other than the coop sponsor-owned units were sold individually, and the sponsor units were sold in bulk, plus the existing debt (prior to the mortgage loan) of $33,000,000. Such estimate does not represent a market value. The Cut-off Date LTV Ratio and LTV Ratio at Maturity or ARD are based on such As-Is Appraised Value. See “Description of the Mortgage Pool-Certain Characteristics of Mortgage Loans Secured by Residential Cooperatives” in the Preliminary Prospectus. |
| (7) | The Coop-Rental Value and the Coop-LTV as Rental assumes The Churchill Property (as defined below) is operated as a multifamily rental property. |
The Mortgage Loan. The mortgage loan (“The Churchill Mortgage Loan”) is evidenced by a single promissory note that is secured by a first mortgage encumbering a multifamily residential cooperative building located in New York, New York (“The Churchill Property”). The Churchill Mortgage Loan was originated on August 4, 2017 by Morgan Stanley Bank, N.A. The Churchill Mortgage Loan had an original principal balance of $49,000,000, has an outstanding principal balance as of the Cut-off Date of $49,000,000, and accrues interest at a rate of 3.288%per annum. The Churchill Mortgage Loan had an initial term of 120 months, has a remaining term of 120 months as of the Cut-off Date and requires interest-only payments through the term of The Churchill Mortgage Loan. The Churchill Mortgage Loan matures on September 1, 2027.
Following the lockout period, the borrower has the right to prepay The Churchill Mortgage Loan in whole, but not in part, on any date before June 1, 2027 provided the borrower pays the greater of a yield maintenance premium or a prepayment premium equal to 1.0% of the principal amount being prepaid. In addition, The Churchill Mortgage Loan is prepayable without penalty on and after the monthly payment date in June 2027.
THE INFORMATION IN THIS STRUCTURAL AND COLLATERAL TERM SHEET IS NOT COMPLETE AND MAY BE AMENDED PRIOR TO THE TIME OF SALE. THIS TERM SHEET IS NOT AN OFFER TO SELL THESE SECURITIES AND IT IS NOT A SOLICITATION OF AN OFFER TO BUY THESE SECURITIES IN ANY JURISDICTION WHERE THE OFFER OR SALE IS NOT PERMITTED.
69
THE CHURCHILL
Sources and Uses
| Sources | Uses | ||||
| Original loan amount | $49,000,000 | 100.0% | Loan payoff | $36,293,258 | 74.1% |
| Reserves | 1,567,769 | 3.2 | |||
| Closing costs | 955,837 | 2.0 | |||
| Proceeds to borrower | 10,183,136 | 20.8 | |||
| Total Sources | $49,000,000 | 100.0% | Total Uses | $49,000,000 | 100.0% |
The Property. The Churchill Property consists of 587 units in a 32-story residential cooperative apartment building located in New York, New York. The Churchill Property is situated in Midtown Manhattan, with frontage at both the northeast corner of Second Avenue and 39th Street and the southeast corner of Second Avenue and 40th Street. The Churchill Property was built in 1967, converted by the coop sponsor, Churchill Capital to cooperative ownership in 1991 and renovated between 2012 and 2016. Renovations at The Churchill Property between 2012 and 2016 totaled approximately $6.8 million and included upgrades to all hallways and roof level common areas (including the gym), freight elevator modernization, boiler replacement, back-up generator installation, and conversion to dual fuel. As of July 21, 2017, The Churchill Property is 89.1% (523 units) shareholder-owned and 10.9% (64 units) coop sponsor owned. The units owned by the coop sponsor are leased pursuant to rent stabilized leases. As of July 2017, the aggregate rent for coop sponsor-owned units is $1,254,500 and the aggregate maintenance on such units is $1,357,500, reflecting a net annual shortfall of approximately $103,000. As of May 3, 2017, approximately 144 tenant-owned units are subleased by the owners of such units.
The Churchill Property features a roof top deck with panoramic New York City skyline views, a heated swimming pool, a kiddie pool and a lounge area. Other amenities at The Churchill Property includes a fitness center, tenant lounge, units with private terraces, storage rooms, laundry rooms on each floor, concierge service, valet service, a laundry take-out service and a 24-hour doorman. In addition, there is a two-level, 235 space underground parking garage beneath the building (the “Parking Garage Unit”), which charges at an hourly rate and is not part of the collateral.
The Churchill Property comprises one of three condominium units within its building; the other two condominium units comprise (i) the Parking Garage Unit and (ii) a portion of the second floor occupied by two office tenants (a dentist and a construction management company) (the “Commercial Unit”), both of which are not included in the collateral. The Churchill Property condominium unit represents 96.92% of common interest in the condominium, and accordingly controls the condominium.
The following table presents certain information relating to the residential unit mix of The Churchill Property:
Unit Mix Summary(1)
Unit Type | No. of Units | % of Total Units | Unit Size (SF)(2) | Total Net SF |
| Studio | 208 | 35.4 | 541 | 112,541 |
| 1 Bedroom | 320 | 54.5 | 841 | 269,262 |
| 2 Bedroom | 59 | 10.1 | 1,259 | 74,281 |
| Total/Weighted Average | 587 | 100.0 | 777 | 456,084 |
| (1) | Information obtained from the appraisal. |
| (2) | Unit sizes are reflective of average sizes for each of the respective unit types. |
The following table presents historical occupancy percentages at The Churchill Property:
Historical Occupancy
| 12/31/2013(1) | 12/31/2014(1) | 12/31/2015(1) | 12/31/2016(1) | 6/29/2017(2) | ||||
| NAP | NAP | NAP | NAP | 95.0% |
| (1) | Historical occupancy is not reported as all units are owned by either shareholders or the coop sponsor. |
| (2) | Occupancy reported as of July 5, 2017 reflects the vacancy assumption in the related appraisal for purposes of determining the appraised value of The Churchill Property as a multifamily rental property (i.e., the Coop - Rental Value) as of the appraisal valuation date. |
THE INFORMATION IN THIS STRUCTURAL AND COLLATERAL TERM SHEET IS NOT COMPLETE AND MAY BE AMENDED PRIOR TO THE TIME OF SALE. THIS TERM SHEET IS NOT AN OFFER TO SELL THESE SECURITIES AND IT IS NOT A SOLICITATION OF AN OFFER TO BUY THESE SECURITIES IN ANY JURISDICTION WHERE THE OFFER OR SALE IS NOT PERMITTED.
70
THE CHURCHILL
Operating History and Underwritten Net Cash Flow. The following table presents certain information relating to underwritten net cash flow at The Churchill Property:
Cash Flow Analysis(1)
| U/W | % of U/W Effective Gross Income | U/W $ per Unit | ||||
| Gross Rental Income | $23,158,099 | 103.4% | $39,452 | |||
| Other Income(2) | 400,000 | 1.8 | 681 | |||
| Less Vacancy & Credit Loss(3) | (1,157,905) | (5.2) | (1,973) | |||
| Effective Gross Income | $22,400,194 | 100.0% | $38,160 | |||
| Total Operating Expenses | $12,120,905 | 54.1% | $20,649 | |||
| Net Operating Income | $10,279,289 | 45.9% | $17,512 | |||
| Reserves | 205,450 | 0.9 | 350 | |||
| Net Cash Flow | $10,073,839 | 45.0% | $17,162 | |||
| NOI DSCR | 6.29x | |||||
| NCF DSCR | 6.17x | |||||
| NOI DY | 21.0% | |||||
| NCF DY | 20.6% |
| (1) | Residential cooperatives are generally organized and operated as not-for-profit entities that set maintenance fees to cover current expenses and plan for future capital needs. The U/W Net Operating Income and the U/W Net Cash Flow for The Churchill Property are the projected net operating income and the projected net cash flow, respectively, reflected in the appraisal. The projected net operating income, in general, equals projected effective gross income at the property assuming such property is operated as a rental property with rents and other income set at the prevailing market rates, reduced by underwritten property operating expenses and a market-rate vacancy assumption – in each case as determined by the appraiser. The projected net cash flow equals the projected net operating income reduced by the projected replacement reserves – as determined by the appraiser. The projected rental income used in such determinations differs materially from the scheduled monthly maintenance payments from the tenant-shareholders at such property. |
| (2) | Other Income is comprised of laundry, storage, moving fees, and roof level rental revenues. |
| (3) | The vacancy reported reflects the vacancy assumption in the related appraisal for purposes of determining the appraised value of The Churchill Property as a multifamily rental property. |
Appraisal.As of the appraisal valuation date of June 29, 2017, The Churchill Property had an “as-is” appraised value of $516,000,000. The “as-is” appraised value represents the estimated gross sellout value of all cooperative units (as cooperative units) at The Churchill Property cooperative, assuming the units other than the coop sponsor-owned units were sold individually, and the sponsor units were sold in bulk, plus the existing debt (prior to the mortgage loan) of $33,000,000. Such estimate does not represent a market value. See“Description of the Mortgage Pool-Certain Characteristics of Mortgage Loans Secured by Residential Cooperatives” in the Preliminary Prospectus.
As of the appraisal valuation date of June 29, 2017, The Churchill Property had a “coop-rental value” appraised value of $275,000,000. The coop-rental value assumes The Churchill Property is operated as a multifamily rental property.
Environmental Matters. According to a Phase I environmental assessment dated July 6, 2017, there are no recognized environmental conditions at The Churchill Property.
Market Overview and Competition. The Churchill Property is located in Midtown Manhattan, with frontage at both the northeast corner of Second Avenue and 39th Street and the southeast corner of Second Avenue and 40th Street.
The Churchill Property is situated within walking distance of Grand Central Terminal, Bryant Park, the New York Public Library and the United Nations Headquarters. Grand Central Terminal provides convenient access to transportation including subway service along the 4, 5, 6, 7 and S lines. Penn Station and Port Authority are also accessible via the subway, connecting The Churchill Property to the major rail lines in the New York tristate area, namely Metro-North Railroad, Long Island Rail Road, Amtrak and New Jersey Transit. The Churchill Property is also adjacent to the entrance street to the Queens Midtown Tunnel, providing vehicular access to various Long Island thoroughfares, and is two blocks south of the entrance to the FDR Drive.
According to a third-party market research report, as of the first quarter of 2017 the vacancy rate for multifamily properties in New York City was approximately 3.6%. According to the appraisal, The Churchill Property is located in the Stuyvesant/Turtle Bay multifamily submarket of Manhattan. According to a third-party market research report, the Stuyvesant/Turtle Bay multifamily submarket reported a multifamily inventory of 23,048 units and vacancy rate of 2.6% as of the first quarter of 2017.
THE INFORMATION IN THIS STRUCTURAL AND COLLATERAL TERM SHEET IS NOT COMPLETE AND MAY BE AMENDED PRIOR TO THE TIME OF SALE. THIS TERM SHEET IS NOT AN OFFER TO SELL THESE SECURITIES AND IT IS NOT A SOLICITATION OF AN OFFER TO BUY THESE SECURITIES IN ANY JURISDICTION WHERE THE OFFER OR SALE IS NOT PERMITTED.
71
THE CHURCHILL
The following table presents certain information relating to comparable multifamily rental properties to The Churchill Property:
Competitive Set(1)
| Average Rent (per unit) | ||||||
| Location | Property Type | Number of Units | Studio | 1 BR | 2 BR | |
| The Churchill (Subject)(2) | New York, NY | High Rise | 587 | $2,794 | $3,523 | $4,983 |
| 5 Tudor City Place | New York, NY | High Rise | 788 | $1,994 | $2,800 | NAP |
| 250 East 40th Street | New York, NY | High Rise | 232 | $2,699 | $3,427 | $5,199 |
| 235 East 40th Street | New York, NY | High Rise | 362 | $2,550 | $3,583 | $4,669 |
| 330 East 38th Street | New York, NY | High Rise | 817 | $2,805 | $4,018 | $5,322 |
| 279 East 44th Street | New York, NY | High Rise | 244 | $2,460 | $3,497 | $3,864 |
| 415 East 37th Street | New York, NY | High Rise | 443 | $2,900 | $3,621 | $8,875 |
| (1) | Information obtained from the appraisal and a third party market research report. |
| (2) | Average Rent (per unit) for The Churchill Property is based on current subleases (and does not include leases of the rent stabilized units owned by the coop sponsor). There are 64 rent stabilized units owned by the coop sponsor at The Churchill Property which have average rents of $1,090 for studio units, $1,798 for one bedroom units and $2,249 for two bedroom units. |
The Borrower. The borrower is Churchill Owners Corp., a cooperative housing corporation organized under the laws of the State of New York.
The Sponsor. The Churchill Mortgage Loan is secured by a first priority fee mortgage encumbering The Churchill Property. No individual or entity (other than the borrower) has recourse obligations with respect to The Churchill Mortgage Loan, including pursuant to any guaranty or environmental indemnity.
Escrows.An upfront escrow in the amount of $1,567,769 was collected for real estate taxes. The loan documents also provide for ongoing monthly reserves for real estate taxes. The loan documents do not require initial or ongoing monthly reserves for insurance so long as there is no event of default and the liability and casualty policies maintained by the borrower covering The Churchill Property are part of a blanket or umbrella policy approved by the lender in its reasonable discretion.
Lockbox and Cash Management.None.
Property Management. The Churchill Property is managed by Rose-Terra Management LLC, which is an affiliate of the coop sponsor.
Assumption.Not permitted. Tenant shareholders at The Churchill Property are generally permitted to sell or pledge their shares without limitation.
Partial Release. Not permitted.
Real Estate Substitution. Not permitted.
Subordinate and Mezzanine Indebtedness. The Churchill Property does not, as of the Cut-off Date, have any additional secured indebtedness. However, the borrower is permitted to incur additional subordinate indebtedness secured by The Churchill Property, subject to the lender’s prior written consent (which may not be unreasonably withheld, conditioned or delayed), provided that certain conditions are satisfied, including but not limited to: (i) the aggregate loan-to-value ratio with respect to The Churchill Mortgage Loan and such additional financing may not exceed 40% (determined, if prior to the third anniversary of the loan origination date, based on the appraisal delivered in connection with loan origination, and thereafter, based on an updated appraisal); (ii) the subordinate lender enters into a subordination and standstill agreement in form and substance reasonably acceptable to the lender, which provides that the subordinate debt is subordinate to The Churchill Mortgage Loan, that payments under such additional indebtedness may be made by the borrower only to the extent of “excess cash flow” available after payment of all amounts payable under The Churchill Mortgage Loan documents and all of The Churchill Property-level operating expenses, and that the subordinate lender may not exercise any remedies in connection with a default under the additional indebtedness so long as any portion of The Churchill Mortgage Loan remains outstanding; and (iii) such additional indebtedness shall have a maturity date that is either co-terminous with or extends beyond the term of The Churchill Mortgage Loan.
Ground Lease. None.
Terrorism Insurance. The loan documents require an “all risk” insurance policy to be maintained by the borrower to provide coverage for terrorism in an amount equal to the full replacement cost of The Churchill Property, as well as business income insurance covering no less than the 12-month period following the occurrence of a casualty event; provided that, if the Terrorism Risk Insurance Program Reauthorization Act of 2015 or extension thereof or similar federal governmental program (“TRIPRA”) is in effect and continues to cover both foreign and domestic acts of terrorism, the lender is required to accept terrorism insurance with coverage against “covered acts” within the meaning of TRIPRA.
Windstorm Insurance. The loan documents require an “all risk” insurance policy to be maintained by the borrower which provides coverage for windstorm damage in an amount equal to the full replacement cost of The Churchill Property and with a deductible not in excess of 5.0% of total insurable value per loss.
THE INFORMATION IN THIS STRUCTURAL AND COLLATERAL TERM SHEET IS NOT COMPLETE AND MAY BE AMENDED PRIOR TO THE TIME OF SALE. THIS TERM SHEET IS NOT AN OFFER TO SELL THESE SECURITIES AND IT IS NOT A SOLICITATION OF AN OFFER TO BUY THESE SECURITIES IN ANY JURISDICTION WHERE THE OFFER OR SALE IS NOT PERMITTED.
72
OVERLOOK AT KING OF PRUSSIA |
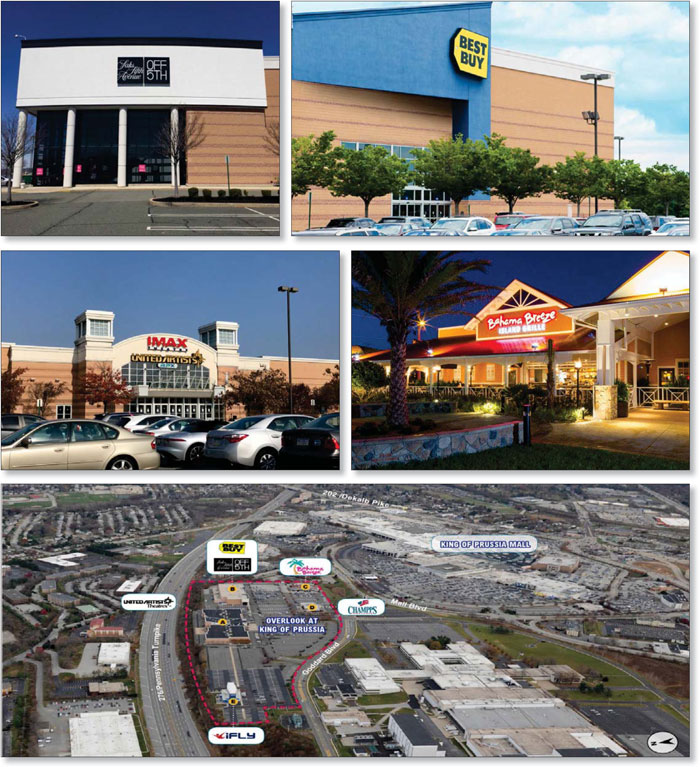
THE INFORMATION IN THIS STRUCTURAL AND COLLATERAL TERM SHEET IS NOT COMPLETE AND MAY BE AMENDED PRIOR TO THE TIME OF SALE. THIS TERM SHEET IS NOT AN OFFER TO SELL THESE SECURITIES AND IT IS NOT A SOLICITATION OF AN OFFER TO BUY THESE SECURITIES IN ANY JURISDICTION WHERE THE OFFER OR SALE IS NOT PERMITTED.
73
OVERLOOK AT KING OF PRUSSIA |
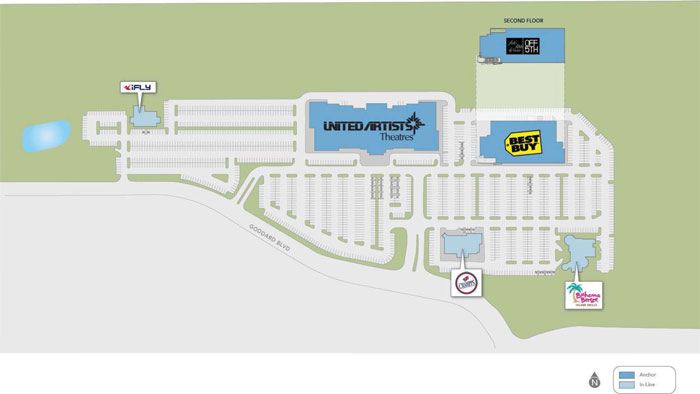
THE INFORMATION IN THIS STRUCTURAL AND COLLATERAL TERM SHEET IS NOT COMPLETE AND MAY BE AMENDED PRIOR TO THE TIME OF SALE. THIS TERM SHEET IS NOT AN OFFER TO SELL THESE SECURITIES AND IT IS NOT A SOLICITATION OF AN OFFER TO BUY THESE SECURITIES IN ANY JURISDICTION WHERE THE OFFER OR SALE IS NOT PERMITTED.
74
OVERLOOK AT KING OF PRUSSIA |

THE INFORMATION IN THIS STRUCTURAL AND COLLATERAL TERM SHEET IS NOT COMPLETE AND MAY BE AMENDED PRIOR TO THE TIME OF SALE. THIS TERM SHEET IS NOT AN OFFER TO SELL THESE SECURITIES AND IT IS NOT A SOLICITATION OF AN OFFER TO BUY THESE SECURITIES IN ANY JURISDICTION WHERE THE OFFER OR SALE IS NOT PERMITTED.
75
| No. 9 – Overlook at King of Prussia | ||||||
| Loan Information | Property Information | |||||
| Mortgage Loan Seller: | Wells Fargo Bank, National Association | Single Asset/Portfolio: | Single Asset | |||
Credit Assessment (DBRS/Fitch/Moody’s) | NR/NR/NR | Property Type: | Retail | |||
| Original Principal Balance: | $40,800,000 | Specific Property Type: | Anchored | |||
| Cut-off Date Balance: | $40,800,000 | Location: | King of Prussia, PA | |||
| % of Initial Pool Balance: | 9.0% | Size: | 194,736 SF | |||
| Loan Purpose: | Refinance | Cut-off Date Balance Per SF: | $209.51 | |||
| Borrower: | DDRTC Overlook at King of Prussia LLC | Year Built/Renovated: | 2000/2015 | |||
| Borrower Sponsor: | DDRTC Core Retail Fund, LLC | Title Vesting: | Fee | |||
| Mortgage Rate: | 3.820% | Property Manager: | Self-managed | |||
| Note Date: | August 14, 2017 | 4thMost Recent Occupancy (As of): | 100.0% (12/31/2013) | |||
| Anticipated Repayment Date: | NAP | 3rdMost Recent Occupancy (As of): | 100.0% (12/31/2014) | |||
| Maturity Date: | September 11, 2027 | 2ndMost Recent Occupancy (As of): | 100.0% (12/31/2015) | |||
| IO Period: | 120 months | Most Recent Occupancy (As of): | 100.0% (9/30/2016) | |||
| Loan Term (Original): | 120 months | Current Occupancy (As of): | 100.0% (7/6/2017) | |||
| Seasoning: | 0 months | |||||
| Amortization Term (Original): | NAP | Underwriting and Financial Information: | ||||
| Loan Amortization Type: | Interest-only, Balloon | |||||
| Interest Accrual Method: | Actual/360 | 4thMost Recent NOI (As of): | $4,714,233 (12/31/2014) | |||
| Call Protection: | L(36),GRTR 1% or YM(77),O(7) | 3rdMost Recent NOI (As of): | $4,707,089 (12/31/2015) | |||
| Lockbox Type: | Springing | 2ndMost Recent NOI (As of): | $4,924,775 (12/31/2016) | |||
| Additional Debt: | None | Most Recent NOI (As of): | $4,911,836 (TTM 6/30/2017) | |||
| Additional Debt Type: | NAP | U/W Revenues: | $6,700,754 | |||
| U/W Expenses: | $1,715,868 | |||||
| U/W NOI: | $4,984,886 | |||||
| U/W NCF: | $4,731,750 | |||||
| U/W NOI DSCR: | 3.15x | |||||
| Escrows and Reserves(1): | U/W NCF DSCR: | 2.99x | ||||
| U/W NOI Debt Yield: | 12.2% | |||||
| Type: | Initial | Monthly | Cap (If Any) | U/W NCF Debt Yield: | 11.6% | |
| Taxes | $0 | Springing | NAP | As-Is Appraised Value: | $77,300,000 | |
| Insurance | $0 | Springing | NAP | As-Is Appraisal Valuation Date: | July 12, 2017 | |
| Replacement Reserve | $0 | Springing | NAP | Cut-off Date LTV Ratio: | 52.8% | |
| TI/LC Reserve | $442,104 | $0 | NAP | LTV Ratio at Maturity: | 52.8% | |
| (1) | See “Escrows” section. |
The Mortgage Loan. The mortgage loan (the “Overlook at King of Prussia Mortgage Loan”) is evidenced by a single promissory note that is secured by a first mortgage encumbering the fee interest in an anchored retail center located in King of Prussia, Pennsylvania (the “Overlook at King of Prussia Property”). The Overlook at King of Prussia Mortgage Loan was originated on August 14, 2017 by Wells Fargo Bank, National Association. The Overlook at King of Prussia Mortgage Loan had an original principal balance of $40,800,000, has an outstanding principal balance as of the Cut-off Date of $40,800,000 and accrues interest at an interest rate of 3.820% per annum. The Overlook at King of Prussia Mortgage Loan had an initial term of 120 months, has a remaining term of 120 months as of the Cut-off Date and requires interest-only payments through the term of the Overlook at King of Prussia Mortgage Loan. The Overlook at King of Prussia Mortgage Loan matures on September 11, 2027.
Following the lockout period, the borrower has the right to prepay the Overlook at King of Prussia Mortgage Loan in whole, but not in part, on any date before March 11, 2027, provided that the borrower pays the greater of a yield maintenance premium or a prepayment premium equal to 1.0% of the principal amount being prepaid. The lockout period will expire on October 11, 2020. In addition, the Overlook at King of Prussia Mortgage Loan is prepayable without penalty on or after March 11, 2027.
THE INFORMATION IN THIS STRUCTURAL AND COLLATERAL TERM SHEET IS NOT COMPLETE AND MAY BE AMENDED PRIOR TO THE TIME OF SALE. THIS TERM SHEET IS NOT AN OFFER TO SELL THESE SECURITIES AND IT IS NOT A SOLICITATION OF AN OFFER TO BUY THESE SECURITIES IN ANY JURISDICTION WHERE THE OFFER OR SALE IS NOT PERMITTED.
76
OVERLOOK AT KING OF PRUSSIA |
Sources and Uses
| Sources | Uses | |||||||
| Original loan amount | $40,800,000 | 85.2% | Loan payoff(1) | $47,065,383 | 98.3% | |||
| Borrower sponsors’ new cash contribution | 7,069,998 | 14.8 | Reserves | 442,104 | 0.9 | |||
| Closing costs | 362,511 | 0.8 | ||||||
| Total Sources | $47,869,998 | 100.0% | Total Uses | $47,869,998 | 100.0% |
| (1) | The Overlook at King of Prussia Property was previously securitized in BACM 2007-3. |
The Property. The Overlook at King of Prussia Property is a 194,736 square foot anchored retail center situated on a 32.4-acre site and located in King of Prussia, Pennsylvania, adjacent to the Simon-owned King of Prussia Mall. Constructed in 2000 and 2003 and renovated in 2015, the Overlook at King of Prussia Property consists of five buildings and is currently 100.0% occupied by six tenants. The Overlook at King of Prussia Property is anchored by the United Artists Theaters (“UAT”; 44.2% of underwritten base rent), a subsidiary of Regal Cinemas, which operates a 16-screen, 81,365 square foot freestanding movie theater subject to a 25-year ground lease through December 2025. In addition to UAT, three tenants totaling 14.8% of underwritten base rent are subject to ground leases and own their improvements (Champps Restaurant, Bahama Breeze and iFly Indoor Skydiving). The Overlook at King of Prussia Property has 1,765 surface parking spaces, resulting in a parking ratio of 9.1 per 1,000 square feet. The Overlook at King of Prussia Property has averaged 99.0% occupancy over the past 10 years, and is 100.0% occupied as of July 6, 2017.
The following table presents certain information relating to the tenancy at the Overlook at King of Prussia Property:
Major Tenants(1)
| Tenant Name | Credit Rating Moody’s/ S&P)(2) | Tenant NRSF | % of NRSF | Annual U/W Base Rent PSF | Annual U/W Base Rent | % of Total Annual U/W Base Rent | Sales PSF(3) | Occupancy Cost(3) | Lease Expiration Date |
| Anchor Tenants | |||||||||
| United Artists Theatre(4) | B+/B1/BB- | 81,365 | 41.8% | $30.36 | $2,470,454 | 44.2% | $606,685(5) | 8.0% | 12/31/2025(6) |
| Best Buy | BBB-/Baa1/BBB- | 43,405 | 22.3% | $31.50 | $1,367,258 | 24.5% | NAV | NAV | 1/31/2022(7) |
| Saks Off Fifth | NR/B2/B | 41,589 | 21.4% | $22.27 | $926,049 | 16.6% | NAV | NAV | 4/30/2027(8) |
| Total Anchor Tenants | 166,359 | 85.4% | $28.64 | $4,763,761 | 85.2% | ||||
| Major Tenants | |||||||||
| Champps Restaurant(4) | NR/NR/NR | 10,538 | 5.4% | $38.24 | $403,000 | 7.2% | NAV | NAV | 2/28/2027(9) |
| Bahama Breeze(4) | NR/NR/NR | 11,409 | 5.9% | $25.32 | $288,827 | 5.2% | NAV | NAV | 6/30/2022(10) |
| iFly Indoor Skydiving(4) | NR/NR/NR | 6,430 | 3.3% | $21.00 | $135,000 | 2.4% | NAV | NAV | 1/31/2031(11) |
| Total Major Tenants | 28,377 | 14.6% | $29.14 | $826,827 | 14.8% | ||||
| Occupied Collateral Total | 194,736 | 100.0% | $28.71 | $5,590,588 | 100.0% | ||||
| Vacant Space | 0 | 0.0% | |||||||
| Collateral Total | 194,736 | 100% | |||||||
| (1) | Information obtained from the underwritten rent roll. |
| (2) | Certain ratings are those of the parent company whether or not the parent company guarantees the lease. |
| (3) | Sales PSF and Occupancy Costs are for the 2016 full year period. |
| (4) | Tenant is subject to a ground lease and owns its improvements. |
| (5) | Sales shown are on a per-screen basis. UAT operates 16 screens at the Overlook at King of Prussia Property. |
| (6) | UAT has one, four-year extension option. |
| (7) | Best Buy has one, five-year extension option and one, four and a half-year extension option. |
| (8) | Saks Off Fifth has three, five-year extension options. |
| (9) | Champps Restaurant has one, five-year extension option. |
| (10) | Bahama Breeze has two, five-year extension options and one, four-year extension option. |
| (11) | iFly Indoor Skydiving has four, five-year extension options. |
THE INFORMATION IN THIS STRUCTURAL AND COLLATERAL TERM SHEET IS NOT COMPLETE AND MAY BE AMENDED PRIOR TO THE TIME OF SALE. THIS TERM SHEET IS NOT AN OFFER TO SELL THESE SECURITIES AND IT IS NOT A SOLICITATION OF AN OFFER TO BUY THESE SECURITIES IN ANY JURISDICTION WHERE THE OFFER OR SALE IS NOT PERMITTED.
77
OVERLOOK AT KING OF PRUSSIA |
The following table presents certain information relating to the lease rollover schedule at the Overlook at King of Prussia Property:
Lease Expiration Schedule(1)
| Year Ending December 31, | No. of Leases Expiring | Expiring NRSF | % of Total NRSF | Cumulative Expiring NRSF | Cumulative % of Total NRSF | Annual U/W Base Rent | % of Total Annual U/W Base Rent | Annual U/W Base Rent PSF |
| MTM | 0 | 0 | 0.0% | 0 | 0.0% | $0 | 0.0% | $0.00 |
| 2017 | 0 | 0 | 0.0% | 0 | 0.0% | $0 | 0.0% | $0.00 |
| 2018 | 0 | 0 | 0.0% | 0 | 0.0% | $0 | 0.0% | $0.00 |
| 2019 | 0 | 0 | 0.0% | 0 | 0.0% | $0 | 0.0% | $0.00 |
| 2020 | 0 | 0 | 0.0% | 0 | 0.0% | $0 | 0.0% | $0.00 |
| 2021 | 0 | 0 | 0.0% | 0 | 0.0% | $0 | 0.0% | $0.00 |
| 2022 | 2 | 54,814 | 28.1% | 54,814 | 28.1% | $1,656,085 | 29.6% | $30.21 |
| 2023 | 0 | 0 | 0.0% | 54,814 | 28.1% | $0 | 0.0% | $0.00 |
| 2024 | 0 | 0 | 0.0% | 54,814 | 28.1% | $0 | 0.0% | $0.00 |
| 2025 | 1 | 81,365 | 41.8% | 136,179 | 69.9% | $2,470,454 | 44.2% | $30.36 |
| 2026 | 0 | 0 | 0.0% | 136,179 | 69.9% | $0 | 0.0% | $0.00 |
| 2027 | 2 | 52,127 | 26.8% | 188,306 | 96.7% | $1,329,049 | 23.8% | $25.50 |
| Thereafter | 1 | 6,430 | 3.3% | 194,736 | 100.0% | $135,000 | 2.4% | $21.00 |
| Vacant | 0 | 0 | 0.0% | 194,736 | 100.0% | $0 | 0.0% | $0.00 |
| Total/Weighted Average | 6 | 194,736 | 100% | $5,590,588 | 100.0% | $28.71 |
| (1) | Information obtained from the underwritten rent roll. |
The following table presents historical occupancy percentages at the Overlook at King of Prussia Property:
Historical Occupancy
12/31/2013(1) | 12/31/2014(1) | 12/31/2015(1) | 9/30/2016(1) | 7/6/2017(2) | ||||
| 100.0% | 100.0% | 100.0% | 100.0% | 100.0% |
| (1) | Information obtained a historical occupancy report |
| (2) | Information obtained from the underwritten rent roll. |
Operating History and Underwritten Net Cash Flow. The following table presents certain information relating to the historical operating performance and the underwritten net cash flow at the Overlook at King of Prussia Property:
Cash Flow Analysis
| 2014 | 2015 | 2016 | TTM 6/30/2017 | U/W | % of U/W Effective Gross Income | U/W $ per SF | |
| Base Rent | $4,911,300 | $4,914,366 | $5,179,737 | $5,235,476 | $5,590,588 | 83.4% | $28.71 |
| Total Reimbursables | 1,197,051 | 1,220,702 | 1,367,115 | 1,374,870 | 1,375,445 | 20.5 | 7.06 |
| Other Income | 22,125 | 25,017 | 13,250 | 14,750 | 14,250 | 0.2 | 0.07 |
| Less Vacancy & Credit Loss | 0 | 0 | 0 | 0 | (279,529)(1) | (4.2) | (1.44) |
| Effective Gross Income | $6,130,476 | $6,160,085 | $6,560,102 | $6,625,096 | $6,700,754 | 100.0% | $34.41 |
| Total Operating Expenses | $1,416,243 | $1,452,996 | $1,635,327 | $1,713,259 | $1,715,868 | 25.6% | $8.81 |
| Net Operating Income | $4,714,233 | $4,707,089 | $4,924,775 | $4,911,836 | $4,984,886 | 74.4% | $25.60 |
| Replacement Reserves | 0 | 0 | 0 | 0 | 29,210 | 0.4 | 0.15 |
| TI/LC | 0 | 0 | 0 | 0 | 223,926 | 3.3 | 1.15 |
| Net Cash Flow | $4,714,233 | $4,707,089 | $4,924,775 | $4,911,836 | $4,731,750 | 70.6% | $24.30 |
| NOI DSCR | 2.98x | 2.98x | 3.12x | 3.11x | 3.15x | ||
| NCF DSCR | 2.98x | 2.98x | 3.12x | 3.11x | 2.99x | ||
| NOI DY | 11.6% | 11.5% | 12.1% | 12.0% | 12.2% | ||
| NCF DY | 11.6% | 11.5% | 12.1% | 12.0% | 11.6% |
| (1) | The underwritten economic vacancy is 5.0%. The Overlook at King of Prussia Property was 100.0% physically occupied as of July 6, 2017. |
Appraisal.As of the appraisal valuation date of July 12, 2017, the Overlook at King of Prussia Property had an “as-is” appraised value of $77,300,000.
Environmental Matters. According to the Phase I environmental site assessment dated November 8, 2016, the Overlook at King of Prussia Property has been impacted by an off-site release of tetrachloroethene (“PCE”) from a former water tank on a parcel owned by Lockheed Martin located south of the Overlook at King of Prussia Property, which the Phase I consultant considered a recognized environmental condition (“REC”). Lockheed Martin is monitoring the groundwater and actively working towards attaining Pennsylvania Department of Environmental Protection Act 2 Compliance. Based on information provided by Lockheed Martin, shallow groundwater in the surrounding area is located between 115 feet and 180 feet below the ground surface. Although the impacted groundwater beneath the Overlook at King of Prussia Property is considered an REC, given the depth of the groundwater, the relatively low concentrations, and since the Overlook at King of Prussia Property has not been named as a responsibly party, an
THE INFORMATION IN THIS STRUCTURAL AND COLLATERAL TERM SHEET IS NOT COMPLETE AND MAY BE AMENDED PRIOR TO THE TIME OF SALE. THIS TERM SHEET IS NOT AN OFFER TO SELL THESE SECURITIES AND IT IS NOT A SOLICITATION OF AN OFFER TO BUY THESE SECURITIES IN ANY JURISDICTION WHERE THE OFFER OR SALE IS NOT PERMITTED.
78
OVERLOOK AT KING OF PRUSSIA |
agent or contributor to the contamination, no further investigation was recommended by the Phase I consultant and this identified contamination is not considered a threat to the occupants of the Overlook at King of Prussia Property.
Market Overview and Comparable Properties.The Overlook at King of Prussia Property is located in Upper Merion Township, Pennsylvania, approximately 19.5 miles northwest of the Philadelphia central business district. The Overlook at King of Prussia Property is located on the northeast corner of Goddard Boulevard and Mall Boulevard, adjacent to the Simon-owned King of Prussia Mall, which is rated A++ by Green Street Advisors. King of Prussia Mall is a 2.8 million square foot luxury mall with numerous upscale retailers and is the largest shopping mall in the United States of America in terms of leasable retail space. The Overlook at King of Prussia Property benefits from its location directly south of the Pennsylvania Turnpike and directly north of Interstate 76 (Schuylkill Expressway). The surrounding area is improved with complementary retail and commercial uses, including the Hyatt House and Crowne Plaza hotels, The Capital Grille, Toys R Us, and Costco Wholesale. According to the appraisal, the 2016 estimated population within a three- and five-mile radius of the Overlook at King of Prussia Property was 54,503 and 173,196, respectively; while the 2016 estimated average household income within a three- and five-mile radius was $115,828 and $113,881, respectively.
According to a third party market report, the Overlook at King of Prussia Property is located within the King of Prussia/Wayne submarket which contains approximately 7.9 million square feet of retail space with a 2.5% vacancy rate and an average asking rental rate of $37.71 per square foot, gross. Further, the appraiser identified a competitive set of seven retail properties totaling approximately 4.0 million square feet within 2.2 miles of the Overlook at King of Prussia Property, which reported a weighted average occupancy rate of approximately 95.5%.
The following table presents certain information relating to comparable properties to the Overlook at King of Prussia Property:
Competitive Properties(1)
| Overlook at King of Prussia (Subject) | King of Prussia Mall | Courtside Square | Valley Forge Center | King of Prussia Town Center | King of Prussia Center | Henderson Square | Dekalb Plaza | |
| Location | King of Prussia, PA | King of Prussia, PA | King of Prussia, PA | King of Prussia, PA | King of Prussia, PA | King of Prussia, PA | King of Prussia, PA | King of Prussia, PA |
| Distance from Subject | -- | Adjacent | 1.0 mile | 1.4 miles | 1.5 miles | 1.7 miles | 1.8 miles | 2.2 miles |
Year Built/Renovated | 2000/2015 | 1995/2016 | 1970/NAP | 1956/1997 | 2012/NAP | 1995/NAP | 2000/NAP | 1993/NAP |
| Anchors | United Artist Theatres, Saks Off Fifth, Best Buy | Bloomingdale’s, Neiman Marcus, Macy’s, Nordstrom | E*Trade, Willner Properties, The Melting Pot | Target, Bed Bath and Beyond, Michaels, K&G Men’s Store | Wegmans, LA Fitness, Nordstrom Rack, REI | Men’s Warehouse, Sam Ash Music, Walgreen’s | Giant Food, CVS Pharmacy, Avalon Flooring | Acme Markets, Bob’s Discount Furniture, Lakeshore |
| Total GLA | 193,4736 SF | 2,832,000 SF | 119,108 SF | 354,483 SF | 407,728 SF | 70,000 SF | 107,344 SF | 102,002 SF |
| Total Occupancy | 100.0% | 96.0% | 92.0% | 98.0% | 91.0% | 100.0% | 91.0% | 97.0% |
| (1) | Information obtained from the appraisal and underwritten rent roll. |
The Borrower. The borrower is DDRTC Overlook at King of Prussia LLC, a Delaware limited liability company and single purpose entity with one independent director. DDRTC Overlook at King of Prussia LLC is 100.0% indirectly owned by DDRTC Core Retail Fund, LLC, a joint venture between TREA Retail Property Portfolio 2006 LLC (“TREA”), a wholly-owned subsidiary of Teachers Insurance and Annuity Association of America (“TIAA”) (85.0% membership interest), and DDR TC LLC, a wholly-owned subsidiary of DDR Corp. (“DDR”) (15.0% membership interest). Legal counsel to the borrower delivered a non-consolidation opinion in connection with the origination of the Overlook at King of Prussia Mortgage Loan. DDRTC Core Retail Fund, LLC is the guarantor of certain nonrecourse carveouts under the Overlook at King of Prussia Mortgage Loan.
The Borrower Sponsor.The borrower sponsor is DDRTC Core Retail Fund, LLC. DDR is a self-administered and self-managed real estate investment trust in the business of acquiring, owning, developing, redeveloping, expanding, leasing and managing shopping centers. Headquartered in Beachwood, Ohio, DDR’s shopping center portfolio features open-air, value-oriented neighborhood and community centers, mixed-use centers and lifestyle centers located in prime markets with stable populations and high-growth potential. As of February 10, 2017, DDR’s portfolio consisted of 317 shopping centers (including 152 centers owned through joint ventures) and more than 650 acres of undeveloped land (of which approximately 100 acres are owned through unconsolidated joint ventures) throughout 35 states as well as Puerto Rico (14 assets). TIAA serves approximately 5.0 million active and retired employees participating at more than 15,000 institutions and had over $938.0 billion in combined assets under management as of the first quarter of 2017. As of June 30, 2017, TIAA’s Real Estate Account had $24.8 billion in net assets.
Escrows.The loan documents provide for an upfront reserve at closing in the amount of $442,104 for tenant improvements and leasing commissions related to Saks Off Fifth. The loan documents do not require ongoing monthly escrows for replacement reserves as long as (i) no event of default has occurred and is continuing and (ii) the Overlook at King of Prussia Property is being adequately maintained as determined by the lender based on annual site inspections. The loan documents do not require ongoing monthly escrows for taxes as long as (i) no event of default has occurred and is continuing and (ii) borrower provides the lender with evidence that the Overlook at King of Prussia Property taxes have been paid. The loan documents do not require ongoing monthly escrows for insurance premiums as long as (i) no event of default has occurred and is continuing and (ii) borrower provides the lender with evidence that the Overlook at King of Prussia Property is insured via an acceptable blanket insurance policy and such policy is in full force and effect.
THE INFORMATION IN THIS STRUCTURAL AND COLLATERAL TERM SHEET IS NOT COMPLETE AND MAY BE AMENDED PRIOR TO THE TIME OF SALE. THIS TERM SHEET IS NOT AN OFFER TO SELL THESE SECURITIES AND IT IS NOT A SOLICITATION OF AN OFFER TO BUY THESE SECURITIES IN ANY JURISDICTION WHERE THE OFFER OR SALE IS NOT PERMITTED.
79
OVERLOOK AT KING OF PRUSSIA |
Additionally, the borrower and the sponsor have springing recourse liability for a $1,550,000 tenant improvements allowance in connection with a potential renovation to the UAT space. According to the terms of the third amendment of the UAT lease, the remodeling construction allowance will be paid in two installments, with the first $775,000 installment payable within 15 business days after UAT’s remodeling work commences. The second $775,000 installment will be payable within 15 business days after UAT’s remodeling work is substantially complete, which is required on or before December 31, 2017.
Lockbox and Cash Management. Upon the occurrence and during the continuance of a Cash Trap Event Period (as defined below), the Overlook at King of Prussia Mortgage Loan documents require the borrower establish a lockbox account and the borrower or property manager is required to deposit all rents into such lockbox account within one business day of receipt. Prior to the occurrence of a Cash Trap Event Period, all cash flow is distributed to the borrower. During a Cash Trap Event Period, all cash flow is swept to a lender-controlled cash management account.
A “Cash Trap Event Period” means the occurrence of (i) an event of default or (ii) the trailing 12-month net operating income (“NOI”) debt yield falling below 7.75% for two consecutive calendar quarters. A Cash Trap Event Period will end, with respect to clause (i), upon the cure of such event of default, and with respect to clause (ii), upon the trailing 12-month NOI debt yield being greater than or equal to 8.25% for two consecutive calendar quarters.
In lieu of a cash flow sweep, the borrower may provide a letter of credit, or a guaranty from DDRTC Core Retail Fund, LLC, or post cash, equal to an amount as estimated by the lender that would have otherwise been swept in a cash flow sweep event for the following 12-month period, but not less than the amount estimated by the lender that would be swept for the following 12-month period assuming an NOI that yields a 7.75% NOI debt yield, refreshed annually on the anniversary of the trigger event.
Property Management.The Overlook at King of Prussia Property is managed by an affiliate of the borrower.
Assumption.The borrower has the two-time right to transfer the Overlook at King of Prussia Property provided that certain conditions are satisfied, including (i) no event of default under the Overlook at King of Prussia Mortgage Loan documents has occurred and is continuing; (ii) in the event that in connection with such transfer, the manager will not thereafter continue to manage the Overlook at King of Prussia Property, then a replacement management agreement with a qualified manager must be executed acceptable to lender; (iii) the lender reasonably determines that the proposed transferee and guarantor satisfy the lender’s credit review and underwriting standards, taking into consideration the transferee’s experience, financial strength and general business standing; and (iv) if requested by lender, rating agency confirmation from DBRS, Fitch and Moody’s that such assumption will not result in a downgrade, withdrawal or qualification of the respective ratings assigned to the BANK 2017-BNK7 certificates.
Partial Release.Following the lockout period, the borrower is permitted to partially release any of the unimproved outparcels at the Overlook at King of Prussia Property in connection with the sale of an outparcel, subject to certain conditions including (i) no event of default has occurred and is continuing, (ii) the borrower shall deposit into the excess cash flow reserve the difference between the net sale proceeds and 110% of the allocated loan amount for such released outparcel, (iii) the NOI debt yield for the remaining Overlook at King of Prussia Property will be no less than the greater of 11.1% and the NOI debt yield immediately prior to the release; and (iv) the loan-to-value ratio for the remaining Overlook at King of Prussia Property is no greater than the lesser of 52.8% and the loan-to-value ratio immediately prior to the release (as determined by an appraisal at the time of release). If the aforementioned tests are not met, the Overlook at King of Prussia Mortgage Loan must be paid down (together with the applicable prepayment premium) in an amount sufficient to cure the tests above. To effect the release, the borrower also must satisfy certain standard applicable compliance requirements per the related loan documents.
Real Estate Substitution.None
Subordinate and Mezzanine Indebtedness.None
Ground Lease.None.
Terrorism Insurance.The loan documents require that the “all risk” insurance policy required to be maintained by the borrower provide coverage for terrorism in an amount equal to the full replacement cost of the Overlook at King of Prussia Property, as well as business interruption insurance covering no less than an amount equal to 100% of the projected gross income from the Overlook at King of Prussia Property on an actual loss sustained basis for a period beginning on the date of business interruption and continuing until the restoration of the Overlook at King of Prussia Property is completed, or the 18-month period following the occurrence of a casualty event, together with a 12-month extended period of indemnity.
THE INFORMATION IN THIS STRUCTURAL AND COLLATERAL TERM SHEET IS NOT COMPLETE AND MAY BE AMENDED PRIOR TO THE TIME OF SALE. THIS TERM SHEET IS NOT AN OFFER TO SELL THESE SECURITIES AND IT IS NOT A SOLICITATION OF AN OFFER TO BUY THESE SECURITIES IN ANY JURISDICTION WHERE THE OFFER OR SALE IS NOT PERMITTED.
80
RALEIGH MARRIOTT CITY CENTER

THE INFORMATION IN THIS STRUCTURAL AND COLLATERAL TERM SHEET IS NOT COMPLETE AND MAY BE AMENDED PRIOR TO THE TIME OF SALE. THIS TERM SHEET IS NOT AN OFFER TO SELL THESE SECURITIES AND IT IS NOT A SOLICITATION OF AN OFFER TO BUY THESE SECURITIES IN ANY JURISDICTION WHERE THE OFFER OR SALE IS NOT PERMITTED.
81
RALEIGH MARRIOTT CITY CENTER
THE INFORMATION IN THIS STRUCTURAL AND COLLATERAL TERM SHEET IS NOT COMPLETE AND MAY BE AMENDED PRIOR TO THE TIME OF SALE. THIS TERM SHEET IS NOT AN OFFER TO SELL THESE SECURITIES AND IT IS NOT A SOLICITATION OF AN OFFER TO BUY THESE SECURITIES IN ANY JURISDICTION WHERE THE OFFER OR SALE IS NOT PERMITTED.
82
| No. 10 – Raleigh Marriott City Center | |||||||
| Loan Information | Property Information | ||||||
| Mortgage Loan Seller: | Wells Fargo Bank, National Association | Single Asset/Portfolio: | Single Asset | ||||
Credit Assessment (DBRS/Fitch/Moody’s): | NR/NR/NR | Property Type: | Hospitality | ||||
| Original Principal Balance(1): | $38,000,000 | Specific Property Type: | Full Service | ||||
| Cut-off Date Balance(1): | $38,000,000 | Location: | Raleigh, NC | ||||
| % of Initial Pool Balance: | 3.1% | Size: | 400 Rooms | ||||
| Loan Purpose: | Refinance | Cut-off Date Balance Per Room(1): | $170,000 | ||||
| Borrower Name: | CWI Raleigh Hotel, LLC | Year Built/Renovated: | 2008/2017 | ||||
| Borrower Sponsors: | Carey Watermark Investors Incorporated | Title Vesting: | Fee/Leasehold | ||||
| Mortgage Rate: | 4.940% | Property Manager: | Noble-Interstate Management Group, LLC | ||||
| Note Date: | May 25, 2017 | 4thMost Recent Occupancy (As of): | 71.8% (12/31/2013) | ||||
| Anticipated Repayment Date: | NAP | 3rdMost Recent Occupancy (As of): | 73.4% (12/31/2014) | ||||
| Maturity Date: | June 1, 2022 | 2ndMost Recent Occupancy (As of): | 74.8% (12/31/2015) | ||||
| IO Period: | 24 months | Most Recent Occupancy (As of): | 75.3% (12/31/2016) | ||||
| Loan Term (Original): | 60 months | Current Occupancy (As of): | 76.4% (7/31/2017) | ||||
| Seasoning: | 3 months | ||||||
| Amortization Term (Original): | 360 months | Underwriting and Financial Information: | |||||
| Loan Amortization Type: | Interest-only, Amortizing Balloon | ||||||
| Interest Accrual Method: | Actual/360 | 4thMost Recent NOI (As of): | $7,694,779 (12/31/2014) | ||||
| Call Protection: | L(27),D(29),O(4) | 3rdMost Recent NOI (As of): | $8,895,001 (12/31/2015) | ||||
| Lockbox Type: | Hard/Springing Cash Management | 2ndMost Recent NOI (As of): | $9,501,406 (12/31/2016) | ||||
| Additional Debt(1): | Yes | Most Recent NOI (As of): | $9,411,667 (TTM 7/31/2017) | ||||
| Additional Debt Type(1): | Pari Passu | ||||||
| U/W Revenues: | $26,805,604 | ||||||
| U/W Expenses: | $17,409,526 | ||||||
| U/W NOI: | $9,396,078 | ||||||
| U/W NCF: | $8,323,854 | ||||||
| U/W NOI DSCR(1): | 2.16x | ||||||
| Escrows and Reserves: | U/W NCF DSCR(1): | 1.91x | |||||
| U/W NOI Debt Yield(1): | 13.8% | ||||||
| Type: | Initial | Monthly | Cap (If Any) | U/W NCF Debt Yield(1): | 12.2% | ||
| Taxes | $372,351 | $62,059 | NAP | As-Is Appraised Value: | $108,000,000 | ||
| Insurance | $0 | Springing | NAP | As-Is Appraisal Valuation Date: | March 30, 2017 | ||
| Replacement Reserves | $0 | $89,235 | NAP | Cut-off Date LTV Ratio(1): | 63.0% | ||
| PIP Reserve | $12,000,000 | $0 | NAP | LTV Ratio at Maturity(1): | 60.1% | ||
| (1) | See “The Mortgage Loan” section. All statistical financial information related to balances per room, loan-to-value ratios, debt service coverage ratios and debt yields are based on the Raleigh Marriott City Center Whole Loan (as defined below). |
The Mortgage Loan. The mortgage loan (the “Raleigh Marriott City Center Mortgage Loan”) is part of a whole loan (the “Raleigh Marriott City Center Whole Loan”) evidenced by two promissory notes (Note A-1 and Note A-2) secured by a first mortgage encumbering the fee and leasehold interests in a 400-room full service hotel and conference center located in Raleigh, North Carolina (the “Raleigh Marriott City Center Property”). The Raleigh Marriott City Center Whole Loan was originated on May 25, 2017 by Wells Fargo Bank, National Association. The Raleigh Marriott City Center Whole Loan had an original loan principal balance of $68,000,000, has an outstanding balance as of the Cut-Off Date of $68,000,000 and accrues interest at an interest rate of 4.940%per annum. The Raleigh Marriott City Center Whole Loan had an initial term of 60 months, has a remaining term of 57 months as of the Cut-off Date and requires payments of interest-only for the first 24 months following origination and, thereafter, requires payments of principal and interest based on a 30-year amortization schedule. The Raleigh Marriott City Center Whole Loan matures on June 1, 2022.
Note A-1, which will be contributed to the BANK 2017-BNK7 trust, had an original principal balance of $38,000,000, has an outstanding principal balance of $38,000,000 as of the Cut-Off Date and represents the controlling interest in the Raleigh Marriott City Center Whole. The non-controlling Note A-2, which had an original principal of $30,000,000, was contributed to the WFCM 2017-C38 Trust.
THE INFORMATION IN THIS STRUCTURAL AND COLLATERAL TERM SHEET IS NOT COMPLETE AND MAY BE AMENDED PRIOR TO THE TIME OF SALE. THIS TERM SHEET IS NOT AN OFFER TO SELL THESE SECURITIES AND IT IS NOT A SOLICITATION OF AN OFFER TO BUY THESE SECURITIES IN ANY JURISDICTION WHERE THE OFFER OR SALE IS NOT PERMITTED.
83
RALEIGH MARRIOTT CITY CENTER
Note Summary
| Notes | Original Balance | Note Holder | Controlling Interest | |
| A-1 | $38,000,000 | BANK 2017-BNK7 | Yes | |
| A-2 | $30,000,000 | WFCM 2017-C38 | No | |
| Total | $68,000,000 |
The Property.The Raleigh Marriott City Center Property was built in 2008 and is situated on a 2.9-acre site. The Raleigh Marriott City Center Property comprises 195 standard double queen guestrooms, 189 standard king guestrooms, 8 ADA king guestrooms, 5 ADA double queen guestrooms and 3 suites. All guestrooms include a flat-screen television with premium channels, desk with chair, dresser and lounge chair. Amenities at the Raleigh Marriott City Center Property include a restaurant and lounge, a Starbucks retail store, 15,119 square feet of meeting space, indoor pool and fitness center. The borrower has plans to complete a $12.0 million ($30,000 per room) property improvement plan (“PIP”) that will further improve the guestroom product at the Raleigh Marriott City Center Property (see “Escrows” section).
The Raleigh Marriott City Center Property is located in downtown Raleigh and is connected to the Raleigh Convention Center (“RCC”) via an underground walkway. The RCC is a 500,000 square foot facility, containing a 150,000 square foot exhibit hall, 20 meeting rooms and a 32,000 square foot ballroom. According to the appraisal, the market segmentation at the Raleigh Marriott City Center Property is 55% transient and 45% meeting & group. The franchise agreement with Marriott International, Inc. expires in July 2038.
The Raleigh Marriott City Center Property is attached to a 900-space parking garage, which is operated by the city of Raleigh. The Raleigh Marriott City Center Property has exclusive use of 176 spaces within the parking garage with the right to 24 additional spaces. The Raleigh Marriott City Center Property is subject to a 99-year ground lease with the City of Raleigh through 2107, and the borrower has the right to purchase the parcel at fair market value upon expiration of the ground lease.
Sources and Uses
| Sources | Uses | |||||||
| Original loan amount | $68,000,000 | 100.0% | Loan payoff | $48,539,938 | 71.4% | |||
| Reserves | 12,372,351 | 18.2 | ||||||
| Closing costs | 616,458 | 0.9 | ||||||
| Return of equity | 6,471,253 | 9.5 | ||||||
| Total Sources | $68,000,000 | 100.0% | Total Uses | $68,000,000 | 100.0% |
Operating History and Underwritten Net Cash Flow.The following table presents certain information relating to the historical operating performance and underwritten net cash flow at the Raleigh Marriott City Center Property:
Cash Flow Analysis
| 2014 | 2015 | 2016 | TTM 7/31/2017 | U/W | % of U/W Total Revenue | U/W $ per Room | ||||||||
| Occupancy | 73.4% | 74.8% | 75.3% | 76.4% | 76.4% | |||||||||
| ADR | $148.60 | $153.69 | $160.34 | $160.78 | $160.78 | |||||||||
| RevPAR | $109.06 | $114.95 | $120.79 | $122.88 | $122.88 | |||||||||
| Room Revenue | $15,923,064 | $16,782,212 | $17,684,112 | $17,941,046 | $17,941,046 | 66.9% | $44,853 | |||||||
| F&B Revenue | 6,562,963 | 8,247,560 | 8,407,749 | 8,092,775 | 8,092,775 | 30.2 | 20,232 | |||||||
| Other Revenue | 911,714 | 860,493 | 682,131 | 771,783 | 771,783 | 2.9 | 1,929 | |||||||
| Total Revenue | $23,397,741 | $25,890,265 | $26,773,992 | $26,805,604 | $26,805,604 | 100.0% | $67,014 | |||||||
| Total Department Expenses | 8,530,005 | 9,031,623 | 8,908,275 | 8,954,689 | 8,954,689 | 33.4 | 22,387 | |||||||
| Gross Operating Profit | $14,867,736 | $16,858,642 | $17,865,717 | $17,850,915 | $17,850,915 | 66.6% | $44,627 | |||||||
| Total Undistributed Expenses | 6,346,321 | 7,151,823 | 7,444,595 | 7,456,700 | 7,465,737 | 27.9 | 18,664 | |||||||
| Profit Before Fixed Charges | $8,521,415 | $9,706,819 | $10,421,122 | $10,394,215 | $10,385,178 | 38.7% | $25,963 | |||||||
| Total Fixed Charges | 826,636 | 811,818 | 919,716 | 982,548 | 989,100 | 3.7 | 2,473 | |||||||
| Net Operating Income | $7,694,779 | $8,895,001 | $9,501,406 | $9,411,667 | $9,396,078 | 35.1% | $23,490 | |||||||
| FF&E | 0 | 0 | 0 | 0 | 1,072,224 | 4.0 | 2,681 | |||||||
| Net Cash Flow | $7,694,779 | $8,895,001 | $9,501,406 | $9,411,667 | $8,323,854 | 31.1% | $20,810 | |||||||
| NOI DSCR(1) | 1.77x | 2.04x | 2.18x | 2.16x | 2.16x | |||||||||
| NCF DSCR(1) | 1.77x | 2.04x | 2.18x | 2.16x | 1.91x | |||||||||
| NOI DY(1) | 11.3% | 13.1% | 14.0% | 13.8% | 13.8% | |||||||||
| NCF DY(1) | 11.3% | 13.1% | 14.0% | 13.8% | 12.2% | |||||||||
| (1) | The debt service coverage ratios and debt yields are based on Raleigh Marriott City Center Whole Loan. |
THE INFORMATION IN THIS STRUCTURAL AND COLLATERAL TERM SHEET IS NOT COMPLETE AND MAY BE AMENDED PRIOR TO THE TIME OF SALE. THIS TERM SHEET IS NOT AN OFFER TO SELL THESE SECURITIES AND IT IS NOT A SOLICITATION OF AN OFFER TO BUY THESE SECURITIES IN ANY JURISDICTION WHERE THE OFFER OR SALE IS NOT PERMITTED.
84
RALEIGH MARRIOTT CITY CENTER
Appraisal.As of the appraisal valuation date of March 30, 2017, the Raleigh Marriott City Center Property had an “as-is” appraised value of $108,000,000. The appraiser also concluded to an “as-stabilized” value of $115,000,000 as of March 30, 2019, which equates to an “as-stabilized” Cut-off Date LTV Ratio of 59.1%.
Environmental Matters. According to the Phase I environmental site assessment dated March 23, 2017, there was no evidence of any recognized environmental conditions at The Raleigh Marriott City Center Property.
Market Overview and Competition.The Raleigh Marriott City Center Property is located in Raleigh, North Carolina, within the Raleigh-Durham-Cary Combined Statistical Area (“CSA”). The Raleigh Marriott City Center Property is located at the crossroads of Interstate 85 and Interstate 40. Interstate 85 extends southwest to Raleigh and Durham, North Carolina and Atlanta, Georgia, and northeast to Richmond, Virginia. Interstate 40 extends west to Southern California, and east to Wilmington, North Carolina.
The Raleigh Marriott City Center Property is situated in downtown Raleigh which is experiencing considerable growth. According to a third party market report, downtown Raleigh is in the midst of a $1.1 billion construction boom. This includes adding 2,850 new residential units, which is anticipated to attract 4,500 new residents. There is also an additional 1.1 million square feet of office space under construction or planned. Downtown Raleigh is also becoming a hub of transit and alternative modes of transportation with a new $79.8 million multimodal center under construction and a newly approved bike share system set to add 30 stations and 300 bicycles to the city. The CSA, with a current population of 2.2 million people as of 2016, grew at an average annual rate of 2.3% between 2006 and 2016 and is expected to increase to 2.5 million people by 2021 at an average rate of 2.9% between 2017 and 2021. The Raleigh Marriott City Center Property has continued to benefit from this continued population growth and developments in the downtown.
According to a third party market report, the 2016-estimated population within a one-, three- and five-mile radius of the Raleigh Marriott City Center Property was 15,258, 101,438, and 198,703, respectively; while the 2016 estimated average household income within the same radii was $48,730, $61,989, and $66,716, respectively.
The following table presents certain information relating to comparable office leases for The Raleigh Marriott City Center Property:
Subject and Market Historical Occupancy, ADR and RevPAR(1)
Competitive Set | Raleigh Marriott City Center | Penetration Factor | |||||||
Year | Occupancy | ADR | RevPAR | Occupancy | ADR | RevPAR | Occupancy | ADR | RevPAR |
| TTM 7/31/2017 | 66.2% | $147.48 | $97.58 | 76.4% | $160.78 | $122.88 | 115.5% | 109.0% | 125.9% |
| TTM 7/31/2016 | 62.1% | $144.71 | $89.81 | 74.8% | $158.45 | $118.58 | 120.6% | 109.5% | 132.0% |
| TTM 7/31/2015 | 66.3% | $138.78 | $91.96 | 73.7% | $149.88 | $110.47 | 111.2% | 108.0% | 120.1% |
| (1) | Information obtained from a third party hospitality report dated August 17, 2017. The competitive set includes the following hotels: Holiday Inn Raleigh Downtown, Marriott Raleigh Crabtree Valley, Sheraton Hotel Raleigh, Doubletree Raleigh Brownstone University, Embassy Suites Raleigh Durham Research Triangle and Renaissance Raleigh North Hills Hotel. |
The Borrower.The borrower is CWI Raleigh Hotel, LLC, a limited liability company and single purpose entity with two independent directors. The borrower is 100.0% owned by CWI OP, LP (“Operating Partnership”). Carey Watermark Investors Incorporated (“CWI”) is a general partner and a limited partner of the Operating Partnership and owns a 99.985% capital interest in the Operating Partnership. CWI is the sponsor’s public, non-traded real estate investment trust (“REIT”). Carey Watermark Holdings, LLC, which is owned indirectly by W.P. Carey Inc., and Watermark Capital Partners, LLC holds a special general partner interest of 0.015% in the Operating Partnership. In order to qualify as a REIT, CWI cannot operate the hotel directly; therefore, CWI leases the hotel to Raleigh Hotel Operator, Inc., a wholly-owned taxable REIT subsidiary (“TRS”), as the TRS lessee. Legal counsel to the borrower delivered a non-consolidation opinion in connection with the origination of the Raleigh Marriott City Center Whole Loan. CWI is the guarantor of certain nonrecourse carveouts under the Raleigh Marriott City Center Whole Loan.
The Borrower Sponsor.The borrower sponsor is CWI, a publicly owned, non-listed hospitality REIT formed in 2008 for the purpose of acquiring, owning, managing, and enhancing the value of interests in lodging properties primarily in the United States. CWI is managed by W.P. Carey Inc. and Watermark Capital Partners, LLC, both with significant hotel and real estate experience. As of December 31, 2016, CWI owned interests in 35 hotels comprising 8,823 guest rooms, and had a net worth and liquidity of $863.3 million and $61.8 million, respectively.
Escrows.The loan documents provide for an upfront escrow at closing in the amount of $372,351 for real estate taxes and $12,000,000 for the PIP. The loan documents also provide for ongoing monthly escrows of $62,059 for real estate taxes and $89,235 for replacement reserves.
The loan documents do not require ongoing monthly escrows for insurance premiums as long as (i) no event of default has occurred and is continuing and (ii) the borrower provides the lender with evidence that the Raleigh Marriott City Center Property’s insurance coverage is included in a blanket policy and such policy is in full force and effect and (iii) borrower pays all applicable insurance premiums and provides the lender with evidence of renewals.
Lockbox and Cash Management.The Raleigh Marriot City Center Loan requires a lender-controlled lockbox account, which is already in place, and the borrower directs all tenants to pay their rents directly into such lockbox account. The loan documents also require that all rents received by the borrower or the property manager be deposited into the lockbox account without one business day of receipt. Prior to the occurrence of the Cash Trap Event Period (as defined below), all cash flow is distributed to the borrower. During a Cash Trap Event Period, all rents are required to be swept to a lender-controlled cash management account.
THE INFORMATION IN THIS STRUCTURAL AND COLLATERAL TERM SHEET IS NOT COMPLETE AND MAY BE AMENDED PRIOR TO THE TIME OF SALE. THIS TERM SHEET IS NOT AN OFFER TO SELL THESE SECURITIES AND IT IS NOT A SOLICITATION OF AN OFFER TO BUY THESE SECURITIES IN ANY JURISDICTION WHERE THE OFFER OR SALE IS NOT PERMITTED.
85
RALEIGH MARRIOTT CITY CENTER
A “Cash Trap Event Period” will commence upon the earlier of (i) an event of default under the Raleigh Marriott City Center Whole Loan documents or (ii) the debt yield falling below (a) 8.0% during a PIP construction period or (b) 9.0% if no PIP construction period has occurred and is continuing. A Cash Trap Event Period will end with respect to clause (i), upon the cure of such event of default; or with respect to clause (ii), upon the Raleigh Marriot City Center Property achieving a debt yield of at least (a) if a PIP construction period has occurred and is continuing, 9.0% for two consecutive calendar quarters; (b) if no PIP construction period has occurred and is continuing, 9.5% for two consecutive calendar quarters; or (c) 10.0% for one calendar quarter. The borrower shall have the option to post a letter of credit or cash to raise the DSCR to cure clause (ii). The required amount shall be equal to the amount such that when credited to the outstanding Raleigh Marriott City Center Mortgage Loan balance, the resulting debt yield is equal to or greater than 10.0%.
Property Management. The Raleigh Marriott City Center Property is managed by Noble-Interstate Management Group, LLC, which has managed the Raleigh Marriott City Center Property since it opened in 2008. Interstate Hotels & Resorts (“Interstate”) is a leading global hotel management company with nearly 430 hotels, resorts and conference centers with over 76,000 rooms located throughout the United States and around the globe. Interstate was founded in 1960 and grew through multiple acquisitions and mergers, including its acquisition of Noble Management Group (“Noble”) in 2011. Noble developed the Raleigh Marriott City Center Property in 2008 and sold it to CWI in August 2013. In 2016, Interstate was acquired by New York-based private equity firm, Kohlberg & Company.
Partial Release. Not permitted.
Real Estate Substitution.Not permitted.
Additional Subordinate and Mezzanine Indebtedness.None
Ground Lease.The Hotel Sub-Condo Unit (see “Condominium Structure” below) is subject to a 99-year ground lease with the City of Raleigh through 2107 with an annual rental rate of $75,000 (the “Ground Lease”). The Ground Lease does not have any renewal options; however, the borrower has the right to purchase the Hotel Sub-Condo Unit land parcel for fair market value upon expiration of the Ground Lease.
Condominium Structure. The Raleigh Marriott City Center Property is part of a two-unit condominium regime (one unit comprised of the hotel and conference center (which collectively comprise the Raleigh Marriott City Center Property) and one unit comprised of the adjacent parking garage (not part of the collateral)). The hotel and conference center condo unit was further converted to a separate sub-condominium regime consisting of two units (one sub-unit comprised of the hotel (the “Hotel Sub-Condo Unit”) and one sub-unit comprised of the conference center (the “Conference Center Sub-Condo Unit”)). The Conference Center Sub-Condo Unit, which is currently owned by the City of Raleigh, has been leased to the borrower through January 2039 for an annual rental rate of $100; and the borrower has the option to purchase the Conference Center Sub-Condo Unit upon lease expiration for $100. The Hotel Sub-Condo Unit is subject to the Ground Lease (see “Ground Lease” section above).
Terrorism Insurance.The loan documents require that the “all risk” insurance policy required to be maintained by the borrower provide coverage for terrorism in an amount equal to the full replacement cost of the Raleigh Marriott City Center Property, as well as business interruption insurance covering no less than an amount equal to 150% of the net cash flow from the Raleigh Marriott City Center Property on an actual loss sustained basis for a period beginning on the date of business interruption and continuing until the restoration of the Raleigh Marriott City Center Property is completed, or the 18-month period following the occurrence of a casualty event, together with a six-month extended period of indemnity.
THE INFORMATION IN THIS STRUCTURAL AND COLLATERAL TERM SHEET IS NOT COMPLETE AND MAY BE AMENDED PRIOR TO THE TIME OF SALE. THIS TERM SHEET IS NOT AN OFFER TO SELL THESE SECURITIES AND IT IS NOT A SOLICITATION OF AN OFFER TO BUY THESE SECURITIES IN ANY JURISDICTION WHERE THE OFFER OR SALE IS NOT PERMITTED.
86
| BANK 2017-BNK7 | Transaction Contact Information |
I. Transaction Contact Information
Questions regarding this Structural and Collateral Term Sheet may be directed to any of the following individuals:
| Wells Fargo Securities, LLC | |
| Brigid Mattingly | Tel. (312) 269-3062 |
| A.J. Sfarra | Tel. (212) 214-5613 |
| Alex Wong | Tel. (212) 214-5615 |
| Morgan Stanley & Co. | |
| Zachary Fischer | Tel. (212) 761-3076 |
| Jane Lam | Tel. (212) 296-8567 |
| Brandon Atkins | Tel. (212) 761-4846 |
| BofA Merrill Lynch | |
| Leland Bunch | Tel. (646) 855-3953 |
| Danielle Caldwell | Tel. (646) 855-3421 |
THE INFORMATION IN THIS STRUCTURAL AND COLLATERAL TERM SHEET IS NOT COMPLETE AND MAY BE AMENDED PRIOR TO THE TIME OF SALE. THIS TERM SHEET IS NOT AN OFFER TO SELL THESE SECURITIES AND IT IS NOT A SOLICITATION OF AN OFFER TO BUY THESE SECURITIES IN ANY JURISDICTION WHERE THE OFFER OR SALE IS NOT PERMITTED.
87