Wells Fargo Commercial Mortgage Securities
Filed: 28 Sep 17, 12:00am
| FREE WRITING PROSPECTUS | ||
| FILED PURSUANT TO RULE 433 | ||
| REGISTRATION FILE NO.: 333-206677-19 | ||
 |  |
Free Writing Prospectus
Structural and Collateral Term Sheet
$705,379,517
(Approximate Initial Pool Balance)
Wells Fargo Commercial Mortgage Trust 2017-C40
as Issuing Entity
Wells Fargo Commercial Mortgage Securities, Inc.
as Depositor
Barclays Bank PLC
Wells Fargo Bank, National Association
Rialto Mortgage Finance, LLC
C-III Commercial Mortgage LLC
as Sponsors and Mortgage Loan Sellers
Commercial Mortgage Pass-Through Certificates
Series 2017-C40
September 27, 2017
WELLS FARGO SECURITIES
Co-Lead Manager and Joint Bookrunner | BARCLAYS
Co-Lead Manager and Joint Bookrunner | |
Academy Securities Co-Manager |
STATEMENT REGARDING THIS FREE WRITING PROSPECTUS
The depositor has filed a registration statement (including a prospectus) with the Securities and Exchange Commission (‘‘SEC’’) (SEC File No. 333-206677) for the offering to which this communication relates. Before you invest, you should read the prospectus in the registration statement and other documents the depositor has filed with the SEC for more complete information about the depositor, the issuing entity and this offering. You may get these documents for free by visiting EDGAR on the SEC Web site at www.sec.gov. Alternatively, the depositor, any underwriter, or any dealer participating in the offering will arrange to send you the prospectus after filing if you request it by calling toll free 1-800-745-2063 (8 a.m. – 5 p.m. EST) or by emailing wfs.cmbs@wellsfargo.com.
Nothing in this document constitutes an offer of securities for sale in any jurisdiction where the offer or sale is not permitted. The information contained herein is preliminary as of the date hereof, supersedes any such information previously delivered to you and will be superseded by any such information subsequently delivered and ultimately by the final prospectus relating to the securities. These materials are subject to change, completion, supplement or amendment from time to time.
This free writing prospectus has been prepared by the underwriters for information purposes only and does not constitute, in whole or in part, a prospectus for the purposes of Directive 2003/71/EC (as amended) and/or Part VI of the Financial Services and Markets Act 2000, as amended, or other offering document.
STATEMENT REGARDING ASSUMPTIONS AS TO SECURITIES, PRICING ESTIMATES AND OTHER INFORMATION
The attached information contains certain tables and other statistical analyses (the “Computational Materials”) which have been prepared in reliance upon information furnished by the Mortgage Loan Sellers. Numerous assumptions were used in preparing the Computational Materials, which may or may not be reflected herein. As such, no assurance can be given as to the Computational Materials’ accuracy, appropriateness or completeness in any particular context; or as to whether the Computational Materials and/or the assumptions upon which they are based reflect present market conditions or future market performance. The Computational Materials should not be construed as either projections or predictions or as legal, tax, financial or accounting advice. You should consult your own counsel, accountant and other advisors as to the legal, tax, business, financial and related aspects of a purchase of these securities. Any weighted average lives, yields and principal payment periods shown in the Computational Materials are based on prepayment and/or loss assumptions, and changes in such prepayment and/or loss assumptions may dramatically affect such weighted average lives, yields and principal payment periods. In addition, it is possible that prepayments or losses on the underlying assets will occur at rates higher or lower than the rates shown in the attached Computational Materials. The specific characteristics of the securities may differ from those shown in the Computational Materials due to differences between the final underlying assets and the preliminary underlying assets used in preparing the Computational Materials. The principal amount and designation of any security described in the Computational Materials are subject to change prior to issuance. None of Wells Fargo Securities, LLC, Barclays Capital Inc., Academy Securities, Inc., or any of their respective affiliates, make any representation or warranty as to the actual rate or timing of payments or losses on any of the underlying assets or the payments or yield on the securities. The information in this presentation is based upon management forecasts and reflects prevailing conditions and management’s views as of this date, all of which are subject to change. In preparing this presentation, we have relied upon and assumed, without independent verification, the accuracy and completeness of all information available from public sources or which was provided to us by or on behalf of the Mortgage Loan Sellers or which was otherwise reviewed by us.
This free writing prospectus contains certain forward-looking statements. If and when included in this free writing prospectus, the words “expects”, “intends”, “anticipates”, “estimates” and analogous expressions and all statements that are not historical facts, including statements about our beliefs or expectations, are intended to identify forward-looking statements. Any forward-looking statements are made subject to risks and uncertainties which could cause actual results to differ materially from those stated. Those risks and uncertainties include, among other things, declines in general economic and business conditions, increased competition, changes in demographics, changes in political and social conditions, regulatory initiatives and changes in customer preferences, many of which are beyond our control and the control of any other person or entity related to this offering. The forward-looking statements made in this free writing prospectus are made as of the date stated on the cover. We have no obligation to update or revise any forward-looking statement.
Wells Fargo Securities is the trade name for the capital markets and investment banking services of Wells Fargo & Company and its subsidiaries, including but not limited to Wells Fargo Securities, LLC, a member of NYSE, FINRA, NFA and SIPC, Wells Fargo Prime Services, LLC, a member of FINRA, NFA and SIPC, and Wells Fargo Bank, N.A. Wells Fargo Securities, LLC and Wells Fargo Prime Services, LLC are distinct entities from affiliated banks and thrifts.
IMPORTANT NOTICE REGARDING THE OFFERED CERTIFICATES
The information herein is preliminary and may be supplemented or amended prior to the time of sale. In addition, the Offered Certificates referred to in these materials and the asset pool backing them are subject to modification or revision (including the possibility that one or more classes of certificates may be split, combined or eliminated at any time prior to issuance or availability of a final prospectus) and are offered on a “when, as and if issued” basis.
The underwriters described in these materials may from time to time perform investment banking services for, or solicit investment banking business from, any company named in these materials. The underwriters and/or their affiliates or respective employees may from time to time have a long or short position in any security or contract discussed in these materials.
The information contained herein supersedes any previous such information delivered to any prospective investor and will be superseded by information delivered to such prospective investor prior to the time of sale.
IMPORTANT NOTICE RELATING TO AUTOMATICALLY-GENERATED EMAIL DISCLAIMERS
Any legends, disclaimers or other notices that may appear at the bottom of any email communication to which this free writing prospectus is attached relating to (1) these materials not constituting an offer (or a solicitation of an offer), (2) any representation that these materials are accurate or complete and may not be updated or (3) these materials possibly being confidential, are not applicable to these materials and should be disregarded. Such legends, disclaimers or other notices have been automatically generated as a result of these materials having been sent via Bloomberg or another system.
THE INFORMATION IN THIS STRUCTURAL AND COLLATERAL TERM SHEET IS NOT COMPLETE AND MAY BE AMENDED PRIOR TO THE TIME OF SALE. THIS TERM SHEET IS NOT AN OFFER TO SELL THESE SECURITIES AND IT IS NOT A SOLICITATION OF AN OFFER TO BUY THESE SECURITIES IN ANY JURISDICTION WHERE THE OFFER OR SALE IS NOT PERMITTED.
2
| Wells Fargo Commercial Mortgage Trust 2017-C40 | Transaction Highlights |
| I. | Transaction Highlights |
Mortgage Loan Sellers:
Mortgage Loan Seller | Number of | Number of | Aggregate Cut-off Date Balance | % of Initial Pool | |||||
| Barclays Bank PLC | 17 | 93 | $263,526,846 | 37.4 | % | ||||
| Wells Fargo Bank, National Association | 17 | 22 | 261,105,441 | 37.0 | |||||
| Rialto Mortgage Finance, LLC | 12 | 16 | 109,139,205 | 15.5 | |||||
| C-III Commercial Mortgage LLC | 19 | 19 | 71,608,026 | 10.2 | |||||
Total | 65 | 150 | $705,379,517 | 100.0 | % | ||||
Loan Pool:
| Initial Pool Balance: | $705,379,517 |
| Number of Mortgage Loans: | 65 |
| Average Cut-off Date Balance per Mortgage Loan: | $10,851,993 |
| Number of Mortgaged Properties: | 150 |
| Average Cut-off Date Balance per Mortgaged Property(1): | $4,702,530 |
| Weighted Average Mortgage Interest Rate: | 4.357% |
| Ten Largest Mortgage Loans as % of Initial Pool Balance: | 49.2% |
| Weighted Average Original Term to Maturity or ARD (months): | 118 |
| Weighted Average Remaining Term to Maturity or ARD (months): | 116 |
| Weighted Average Original Amortization Term (months)(2): | 353 |
| Weighted Average Remaining Amortization Term (months)(2): | 352 |
| Weighted Average Seasoning (months): | 3 |
| (1) | Information regarding mortgage loans secured by multiple properties is based on an allocation according to relative appraised values or the allocated loan amounts or property-specific release prices set forth in the related loan documents or such other allocation as the related mortgage loan seller deemed appropriate. |
| (2) | Excludes any mortgage loan that does not amortize. |
Credit Statistics:
| Weighted Average U/W Net Cash Flow DSCR(1): | 2.10x |
| Weighted Average U/W Net Operating Income Debt Yield(1): | 11.4% |
| Weighted Average Cut-off Date Loan-to-Value Ratio(1): | 56.6% |
| Weighted Average Balloon or ARD Loan-to-Value Ratio(1): | 50.7% |
| % of Mortgage Loans with Additional Subordinate Debt(2): | 12.8% |
| % of Mortgage Loans with Single Tenants(3): | 4.7% |
| (1) | With respect to any mortgage loan that is part of a whole loan, loan-to-value ratio, debt service coverage ratio and debt yield calculations include the relatedpari passucompanion loan(s) but exclude any related subordinate companion loan(s) (unless otherwise stated). The debt service coverage ratio, debt yield and loan-to-value ratio information do not take into account any subordinate debt (whether or not secured by the related mortgaged property), that currently exists or is allowed under the terms of any mortgage loan. The information for each mortgaged property that relates to a mortgage loan that is cross-collateralized or cross-defaulted with one or more other mortgage loans is based upon the principal balance of that mortgage loan, except that the applicable loan-to-value ratio, debt service coverage ratio, and debt yield for each such mortgage loan is based upon the ratio or yield (as applicable) for the aggregate indebtedness evidenced by all loans in the group (without regard to any limitation on the amount of indebtedness secured by any mortgaged property in such cross-collateralized group). See “Description of the Mortgage Pool—Mortgage Pool Characteristics” in the Preliminary Prospectus and Annex A-1 to the Preliminary Prospectus. |
| (2) | The percentage figure expressed as “% of Mortgage Loans with Additional Subordinate Debt” is determined as a percentage of the initial pool balance and does not take into account any future subordinate debt (whether or not secured by the mortgaged property), if any, that may be permitted under the terms of any mortgage loan or the pooling and servicing agreement. See “Description of the Mortgage Pool—Additional Indebtedness—Other Unsecured Indebtedness” in the Preliminary Prospectus. |
| (3) | Excludes mortgage loans that are secured by multiple single tenant properties. |
THE INFORMATION IN THIS STRUCTURAL AND COLLATERAL TERM SHEET IS NOT COMPLETE AND MAY BE AMENDED PRIOR TO THE TIME OF SALE. THIS TERM SHEET IS NOT AN OFFER TO SELL THESE SECURITIES AND IT IS NOT A SOLICITATION OF AN OFFER TO BUY THESE SECURITIES IN ANY JURISDICTION WHERE THE OFFER OR SALE IS NOT PERMITTED.
3
| Wells Fargo Commercial Mortgage Trust 2017-C40 | Transaction Highlights |
Loan Structural Features:
Amortization:Based on the Initial Pool Balance, 57.6% of the mortgage pool (52 mortgage loans) has scheduled amortization, as follows:
32.6% (35 mortgage loans) requires amortization during the entire loan term; and
25.0% (17 mortgage loans) provides for an interest-only period followed by an amortization period.
Interest-Only:Based on the Initial Pool Balance, 42.4% of the mortgage pool (13 mortgage loans) provides for interest-only payments during the entire loan term. The Weighted Average Cut-off Date Loan-to-Value Ratio and Weighted Average U/W Net Cash Flow DSCR for those mortgage loans are 48.7% and 2.74x, respectively.
Hard Lockboxes: Based on the Initial Pool Balance, 47.2% of the mortgage pool (15 mortgage loans) have hard lockboxes in place.
Reserves:The mortgage loans require amounts to be escrowed monthly as follows (excluding any mortgage loans with springing provisions):
| Real Estate Taxes: | 58.0% of the pool |
| Insurance: | 24.2% of the pool |
| Capital Replacements: | 59.0% of the pool |
| TI/LC: | 48.3% of the pool(1) |
| (1) | The percentage of Initial Pool Balance for mortgage loans with TI/LC reserves is based on the aggregate principal balance allocable to loans that include retail, office, mixed use and industrial properties. |
Call Protection/Defeasance: Based on the Initial Pool Balance, the mortgage pool has the following call protection and defeasance features:
88.6% of the mortgage pool (53 mortgage loans) features a lockout period, then defeasance only until an open period;
7.8% of the mortgage pool (eight mortgage loans) features a lockout period, then the greater of a prepayment premium or yield maintenance until an open period;
3.4% of the mortgage pool (three mortgage loans) features a lockout period, then the greater of a prepayment premium or yield maintenance or defeasance until an open period; and
0.2% of the mortgage pool (one mortgage loan) features a lockout period, then defeasance period then requires the greater of a prepayment premium or yield maintenance until an open period.
Prepayment restrictions for each mortgage loan reflect the entire life of the mortgage loan. Based on the seasoning of a mortgage loan, it may no longer be prohibited from prepayment. Please refer to Annex A-1 to the Preliminary Prospectus and the footnotes related thereto for further information regarding individual loan call protection.
THE INFORMATION IN THIS STRUCTURAL AND COLLATERAL TERM SHEET IS NOT COMPLETE AND MAY BE AMENDED PRIOR TO THE TIME OF SALE. THIS TERM SHEET IS NOT AN OFFER TO SELL THESE SECURITIES AND IT IS NOT A SOLICITATION OF AN OFFER TO BUY THESE SECURITIES IN ANY JURISDICTION WHERE THE OFFER OR SALE IS NOT PERMITTED.
4
| Wells Fargo Commercial Mortgage Trust 2017-C40 | Characteristics of the Mortgage Pool |
| II. | Characteristics of the Mortgage Pool(1) |
| A. | Ten Largest Mortgage Loans |
| Mortgage Loan Seller | Mortgage Loan Name | City | State | Number of Mortgage Loans / Mortgaged Properties | Mortgage Loan Cut-off Date Balance ($) | % of Initial Pool Balance (%) | Property Type | Number of Rooms / SF | Cut-off Date Balance Per Room / SF | Cut-off Date LTV Ratio (%) | Balloon or ARD LTV Ratio (%) | U/W NCF DSCR (x) | U/W NOI Debt Yield (%) | ||||||||||||||||||||
| Barclays | 225 & 233 Park Avenue South | New York | NY | 1 / 1 | $60,000,000 | 8.5 | % | Office | 675,756 | $348 | 31.3 | % | 31.3 | % | 3.27 | x | 12.6 | % | |||||||||||||||
| Barclays | Mall of Louisiana | Baton Rouge | LA | 1 / 1 | 50,000,000 | 7.1 | Retail | 776,789 | 418 | 57.0 | 49.3 | 1.85 | 11.1 | ||||||||||||||||||||
| WFB | Marketplace at Millcreek | Buford | GA | 1 / 1 | 39,600,000 | 5.6 | Retail | 401,947 | 99 | 52.2 | 52.2 | 2.77 | 11.9 | ||||||||||||||||||||
| RMF | SAVA Holdings IHG Portfolio | Various | TX | 1 / 3 | 37,000,000 | 5.2 | Hospitality | 429 | 86,247 | 57.0 | 49.3 | 1.94 | 14.0 | ||||||||||||||||||||
| WFB | Wilshire Pacific Plaza | Los Angeles | CA | 1 / 1 | 32,850,000 | 4.7 | Office | 107,737 | 305 | 55.7 | 55.7 | 2.42 | 10.4 | ||||||||||||||||||||
| WFB | Pinnacle Medical Plaza | San Diego | CA | 1 / 1 | 29,000,000 | 4.1 | Office | 80,402 | 361 | 58.1 | 58.1 | 2.08 | 9.7 | ||||||||||||||||||||
| WFB | Winslow Bay Commons | Mooresville | NC | 1 / 1 | 25,800,000 | 3.7 | Retail | 255,598 | 101 | 45.8 | 45.8 | 3.26 | 13.8 | ||||||||||||||||||||
| Barclays | Del Amo Fashion Center | Torrance | CA | 1 / 1 | 25,000,000 | 3.5 | Retail | 1,769,525 | 260 | 39.8 | 39.8 | 3.34 | 12.9 | ||||||||||||||||||||
| WFB | Pleasant Prairie Premium Outlets | Pleasant Prairie | WI | 1 / 1 | 25,000,000 | 3.5 | Retail | 402,615 | 360 | 50.0 | 50.0 | 2.66 | 11.2 | ||||||||||||||||||||
| WFB | Gehl Foods Portfolio | Germantown | WI | 1 / 3 | 22,500,000 | 3.2 | Industrial | 628,657 | 36 | 65.2 | 59.4 | 1.59 | 10.2 | ||||||||||||||||||||
| Top Three Total/Weighted Average | 3 / 3 | $149,600,000 | 21.2 | % | 45.4 | % | 42.8 | % | 2.66 | x | 11.9 | % | |||||||||||||||||||||
| Top Five Total/Weighted Average | 5 / 7 | $219,450,000 | 31.1 | % | 48.9 | % | 45.9 | % | 2.50 | x | 12.0 | % | |||||||||||||||||||||
| Top Ten Total/Weighted Average | 10 / 14 | $346,750,000 | 49.2 | % | 49.9 | % | 47.6 | % | 2.54 | x | 11.9 | % | |||||||||||||||||||||
| Non-Top Ten Total/Weighted Average | 55 / 136 | $358,629,517 | 50.8 | % | 63.1 | % | 53.8 | % | 1.68 | x | 10.9 | % | |||||||||||||||||||||
| (1) | With respect to any mortgage loan that is part of a whole loan, Cut-off Date Balance Per Room/SF, loan-to-value ratio, debt service coverage ratio and debt yield calculations include the relatedpari passu companion loan(s) but exclude any related subordinate companion loan(s) (unless otherwise stated). With respect to each mortgage loan, debt service coverage ratio, debt yield and loan-to-value ratio information do not take into account subordinate debt (whether or not secured by the related mortgaged property), if any, that currently exists or is allowed under the terms of such mortgage loan. |
THE INFORMATION IN THIS STRUCTURAL AND COLLATERAL TERM SHEET IS NOT COMPLETE AND MAY BE AMENDED PRIOR TO THE TIME OF SALE. THIS TERM SHEET IS NOT AN OFFER TO SELL THESE SECURITIES AND IT IS NOT A SOLICITATION OF AN OFFER TO BUY THESE SECURITIES IN ANY JURISDICTION WHERE THE OFFER OR SALE IS NOT PERMITTED.
5
| Wells Fargo Commercial Mortgage Trust 2017-C40 | Characteristics of the Mortgage Pool |
| B. | Summary of the Whole Loans |
| Property Name | Mortgage Loan Seller in WFCM 2017-C40 | Note(s) | Original Balance | Holder of Note(1) | Lead Servicer for Whole Loan | Master Servicer Under Lead Securitization Servicing Agreement | Special Servicer Under Lead Securitization Servicing Agreement |
| 225 & 233 Park Avenue South | Barclays | A-1 | $70,000,000 | WFCM 2017-C39 | Yes | Wells Fargo Bank, National Association | LNR Partners, LLC |
| A-2 | $60,000,000 | CGCMT 2017-P8(2) | No | ||||
| A-3 | $60,000,000 | WFCM 2017-C40 | No | ||||
| A-4 | $45,000,000 | WFCM 2017-C38 | No | ||||
| Mall of Louisiana | Barclays | A-1 | $65,000,000 | BANK 2017-BNK7(3) | Yes | Wells Fargo Bank, National Association | Rialto Capital Advisors, LLC |
| A-2 | $44,000,000 | Bank of America, N.A. | No | ||||
| A-3-1, A-5-2 | $47,000,000 | CGCMT 2017-P8(2) | No | ||||
| A-3-2 | $28,000,000 | Citi Real Estate Funding Inc. | No | ||||
| A-4 | $50,000,000 | COMM 2017-COR2(4) | No | ||||
| A-5-1 | $41,000,000 | Barclays | No | ||||
| A-6, A-7 | $50,000,000 | WFCM 2017-C40 | No | ||||
| Del Amo Fashion Center | Barclays | A-1-1, A-2-1, A-3-1, A-4-1, B-1-1, B-2-1, B-3-1, B-4-1 | $59,300,000(5) | DAFC 2017-AMO | Yes | KeyBank National Association | Cohen Financial, a Division of SunTrust Bank |
| A-1-2, A-4-2, B-1-2, B-4-2 | $90,000,000 | BANK 2017-BNK5 | No | ||||
| A-1-3, A-4-4, B-1-3, B-1-4, B-4-4 | $59,543,000 | BANK 2017-BNK6 | No | ||||
| A-1-4 | $20,457,000 | CGCMT 2017-B1 | No | ||||
| A-2-2-A, B-2-2-A | $30,000,000 | WFCM 2017-C39 | No | ||||
| A-2-2-B, B-2-2-B | $15,000,000 | Barclays | No | ||||
| A-2-4, B-2-4 | $25,000,000 | WFCM 2017-C40 | No | ||||
| A-2-3, A-4-3, B-2-3, B-4-3 | $60,000,000 | WFCM 2017-C38 | No | ||||
| A-3-2, B-3-2 | $50,000,000 | UBS 2017-C3 | No | ||||
| A-3-3, B-3-3 | $45,000,000 | UBS 2017-C2 | No | ||||
| A-3-4, B-3-4 | $5,000,000 | UBS 2017-C4(6) | No | ||||
| Pleasant Prairie Premium Outlets | WFB | A-1 | $34,000,000 | CGCMT 2017-P8(2) | Yes | Wells Fargo Bank, National Association(2) | KeyBank National Association(2) |
| A-2 | $41,000,000 | Citi Real Estate Funding Inc. | No | ||||
| A-3 | $45,000,000 | WFB | No | ||||
| A-4 | $25,000,000 | WFCM 2017-C40 | No |
THE INFORMATION IN THIS STRUCTURAL AND COLLATERAL TERM SHEET IS NOT COMPLETE AND MAY BE AMENDED PRIOR TO THE TIME OF SALE. THIS TERM SHEET IS NOT AN OFFER TO SELL THESE SECURITIES AND IT IS NOT A SOLICITATION OF AN OFFER TO BUY THESE SECURITIES IN ANY JURISDICTION WHERE THE OFFER OR SALE IS NOT PERMITTED.
6
| Wells Fargo Commercial Mortgage Trust 2017-C40 | Characteristics of the Mortgage Pool |
| iStar Leased Fee Portfolio | Barclays | A-1-1 | $55,000,000 | MSC 2017-H1 | Yes | Midland Loan Services, a Division of PNC Bank, National Association | LNR Partners, LLC |
| A-1-2 | $40,600,000 | WFCM 2017-C38 | No | ||||
| A-1-3-1 | $20,600,000 | WFCM 2017-C39 | No | ||||
| A-1-3-2 | $20,000,000 | WFCM 2017-C40 | No | ||||
| A-2 | $45,400,000 | DBJPM 2017-C6 | No | ||||
| A-3 | $45,400,000 | BANK 2017-BNK5 | No | ||||
| Hilton Garden Inn Chicago/North Loop | WFB | A-1 | $20,000,000 | WFCM 2017-C40 | Yes | Wells Fargo Bank, National Association | C-III Asset Management LLC |
| A-2 | $14,000,000 | WFCM 2017-C39 | No | ||||
| Magnolia Hotel Denver | RMF | A-1, A-2 | $40,000,000 | MSC 2017-H1 | Yes | Midland Loan Services, a Division of PNC Bank, National Association | LNR Partners, LLC |
| A-3 | $14,000,000 | WFCM 2017-C40 | No | ||||
| Starwood Capital Group Hotel Portfolio | Barclays | A-1, A-7 | $80,000,000 | DBJPM 2017-C6 | Yes | Midland Loan Services, a Division of PNC Bank, National Association | Midland Loan Services, a Division of PNC Bank, National Association |
| A-2-1, A-16-1 | $60,000,000 | JPMCC 2017-JP7 | No | ||||
| A-2-2, A-9, A-14 | $46,817,500 | JPMorgan Chase Bank, N.A. | No | ||||
| A-3 | $72,500,000 | BANK 2017-BNK5 | No | ||||
| A-4 | $59,317,500 | BANK 2017-BNK6 | No | ||||
| A-5 | $50,000,000 | WFCM 2017-C38 | No | ||||
| A-6-1 | $40,000,000 | WFCM 2017-C39 | No | ||||
| A-6-2 | $10,000,000 | WFCM 2017-C40 | No | ||||
| A-8, A-10 | $40,000,000 | CD 2017-CD5 | No | ||||
| A-11, A-12, A-13-2 | $37,500,000 | UBS 2017-C2 | No | ||||
| A-13-1 | $14,317,500 | Deutsche Bank AG, New York Branch | No | ||||
| A-15 | $25,000,000 | Starwood Mortgage Funding II LLC | No | ||||
| A-16-2, A-17 | $41,817,500 | CGCMT 2017-P8(2) | No | ||||
| Atrisco Plaza Shopping Center | RMF | A-1 | $14,750,000 | RMF | Yes(7) | Wells Fargo Bank, National Association(7) | C-III Asset Management LLC(7) |
| A-2 | $5,000,000 | WFCM 2017-C40 | No |
| (1) | Unless otherwise indicated, each note not currently held by a securitization trust is expected to be contributed to a future securitization. No assurance can be provided that any such note will not be split further. |
| (2) | The CGCMT 2017-P8 transaction is expected to close on September 29, 2017. |
| (3) | The BANK 2017-BNK7 transaction is expected to close on September 28, 2017. |
| (4) | The COMM 2017-COR2 transaction is expected to close on September 28, 2017. |
| (5) | The related whole loan also includes certain related junior notes, which have been contributed to the related standalone securitization listed under the “Holder of Note” column. Such related junior notes are not reflected in the “Note(s)” column. |
| (6) | The UBS 2017-C4 transaction is expected to close on October 18, 2017. |
| (7) | The related whole loan is expected to initially be serviced under the WFCM 2017-C40 pooling and servicing agreement until the securitization of the related “lead” pari passu note (namely, the related pari passu note marked “Yes” in the column entitled “Lead Servicer for Whole Loan”), after which the related whole loan will be serviced under the pooling and servicing agreement governing such securitization of the related “lead” pari passu note. The master servicer and special servicer for such securitization will be identified in a notice, report or statement to holders of the WFCM 2017-C40 certificates after the closing of such securitization. |
THE INFORMATION IN THIS STRUCTURAL AND COLLATERAL TERM SHEET IS NOT COMPLETE AND MAY BE AMENDED PRIOR TO THE TIME OF SALE. THIS TERM SHEET IS NOT AN OFFER TO SELL THESE SECURITIES AND IT IS NOT A SOLICITATION OF AN OFFER TO BUY THESE SECURITIES IN ANY JURISDICTION WHERE THE OFFER OR SALE IS NOT PERMITTED.
7
| Wells Fargo Commercial Mortgage Trust 2017-C40 | Characteristics of the Mortgage Pool |
| C. | Mortgage Loans with Additional Secured and Mezzanine Financing |
| Loan No. | Mortgage Loan Seller | Mortgage Loan Name | Mortgage Loan Cut-off Date Balance ($) | % of Initial Pool Balance (%) | Sub Debt Cut-off Date Balance ($) | Mezzanine Debt Cut-off Date Balance ($) | Total Debt Interest Rate (%)(1) | Mortgage Loan U/W NCF DSCR (x)(2) | Total Debt U/W NCF DSCR (x) | Mortgage Loan Cut-off Date U/W NOI Debt Yield (%)(2) | Total Debt Cut-off Date U/W NOI Debt Yield (%) | Mortgage Loan Cut-off Date LTV Ratio (%)(2) | Total Debt Cut-off Date LTV Ratio (%) | ||||||||||||||||||||||
| 1 | Barclays | 225 & 233 Park Avenue South | $60,000,000 | 8.5 | % | NAP | $195,000,000 | 4.1133 | % | 3.27 | x | 1.59 | x | 12.6 | % | 6.9 | % | 31.3 | % | 57.3 | % | ||||||||||||||
| 8 | Barclays | Del Amo Fashion Center | 25,000,000 | 3.5 | 125,700,000 | NAP | 3.6575 | 3.34 | 2.63 | 12.9 | 10.1 | 39.8 | 50.6 | ||||||||||||||||||||||
| 40 | Barclays | Sterling Oaks | 4,993,253 | 0.7 | 802,163 | NAP | 5.0065 | 1.75 | 1.26 | 11.4 | 9.8 | 66.6 | 77.3 | ||||||||||||||||||||||
| Total/Weighted Average | $89,993,253 | 12.8 | % | $126,502,163 | $195,000,000 | 4.0362 | % | 3.21 | x | 1.86 | x | 12.6 | % | 7.9 | % | 35.6 | % | 56.5 | % | ||||||||||||||||
| (1) | Total Debt Interest Rate for any specified mortgage loan reflects the weighted average of the interest rates on the respective components of the total debt. |
| (2) | With respect to any mortgage loan that is part of a whole loan, the loan-to-value ratio, debt service coverage ratio and debt yield calculations include the relatedpari passucompanion loan(s). |
THE INFORMATION IN THIS STRUCTURAL AND COLLATERAL TERM SHEET IS NOT COMPLETE AND MAY BE AMENDED PRIOR TO THE TIME OF SALE. THIS TERM SHEET IS NOT AN OFFER TO SELL THESE SECURITIES AND IT IS NOT A SOLICITATION OF AN OFFER TO BUY THESE SECURITIES IN ANY JURISDICTION WHERE THE OFFER OR SALE IS NOT PERMITTED.
8
| Wells Fargo Commercial Mortgage Trust 2017-C40 | Characteristics of the Mortgage Pool |
| D. | Previous Securitization History(1) |
| Loan No. | Mortgage Loan Seller | Mortgage Loan or Mortgaged Property Name | City | State | Property Type | Mortgage Loan or Mortgaged Property Cut-off Date Balance ($) | % of Initial Pool Balance (%) | Previous Securitization | ||||||||||
| 2 | Barclays | Mall of Louisiana | Baton Rouge | LA | Retail | $50,000,000 | 7.1 | % | MLMT 2006-C1 | |||||||||
| 3 | WFB | Marketplace at Millcreek | Buford | GA | Retail | 39,600,000 | 5.6 | BACM 2007-3 | ||||||||||
| 4 | RMF | SAVA Holdings IHG Portfolio | Various | TX | Hospitality | 37,000,000 | 5.2 | JPMBB 2013-C12 | ||||||||||
| 7 | WFB | Winslow Bay Commons | Mooresville | NC | Retail | 25,800,000 | 3.7 | BACM 2007-3 | ||||||||||
| 9 | WFB | Pleasant Prairie Premium Outlets | Pleasant Prairie | WI | Retail | 25,000,000 | 3.5 | WBCMT 2006-C23; WBCMT 2006-C25; JPMCC 2007-CB18 | ||||||||||
| 12 | Barclays | 45 Eisenhower Drive | Paramus | NJ | Office | 19,949,869 | 2.8 | PFP 2014-1 | ||||||||||
| 14 | Barclays | Sentinel Business Center | San Antonio | TX | Industrial | 17,455,975 | 2.5 | BSCMS 2007-PW18 | ||||||||||
| 15 | Barclays | Southridge Plaza Austin | Austin | TX | Retail | 14,200,000 | 2.0 | MLCFC 2007-8 | ||||||||||
| 16 | RMF | Magnolia Hotel Denver | Denver | CO | Hospitality | 13,925,501 | 2.0 | GSMS 2007-GG10 | ||||||||||
| 17 | WFB | North Point Village | Alpharetta | GA | Retail | 13,000,000 | 1.8 | CSMC 2007-C3 | ||||||||||
| 19 | Barclays | Blossom Business Center | San Antonio | TX | Industrial | 10,972,327 | 1.6 | BSCMS 2007-PW18 | ||||||||||
| 20 | WFB | Hampton Inn - Frederick | Frederick | MD | Hospitality | 10,232,399 | 1.5 | MLMT 2008-C1 | ||||||||||
| 21.01 | Barclays | Larkspur Landing Sunnyvale | Sunnyvale | CA | Hospitality | 590,158 | 0.1 | COMM 2013-CR7 | ||||||||||
| 21.02 | Barclays | Larkspur Landing Milpitas | Milpitas | CA | Hospitality | 497,273 | 0.1 | COMM 2013-CR7 | ||||||||||
| 21.03 | Barclays | Larkspur Landing Campbell | Campbell | CA | Hospitality | 437,238 | 0.1 | COMM 2013-CR7 | ||||||||||
| 21.04 | Barclays | Larkspur Landing San Francisco | South San Francisco | CA | Hospitality | 360,212 | 0.1 | COMM 2013-CR7 | ||||||||||
| 21.05 | Barclays | Larkspur Landing Pleasanton | Pleasanton | CA | Hospitality | 352,283 | 0.0 | COMM 2013-CR7 | ||||||||||
| 21.06 | Barclays | Larkspur Landing Bellevue | Bellevue | WA | Hospitality | 313,769 | 0.0 | COMM 2013-CR7 | ||||||||||
| 21.07 | Barclays | Larkspur Landing Sacramento | Sacramento | CA | Hospitality | 234,477 | 0.0 | COMM 2013-CR7 | ||||||||||
| 21.09 | Barclays | Larkspur Landing Hillsboro | Hillsboro | OR | Hospitality | 228,814 | 0.0 | COMM 2013-CR7 | ||||||||||
| 21.10 | Barclays | Larkspur Landing Renton | Renton | WA | Hospitality | 226,548 | 0.0 | COMM 2013-CR7 | ||||||||||
| 21.11 | Barclays | Holiday Inn Arlington Northeast Rangers Ballpark | Arlington | TX | Hospitality | 217,486 | 0.0 | WFCM 2012-LC5 | ||||||||||
| 21.13 | Barclays | Residence Inn Williamsburg | Williamsburg | VA | Hospitality | 206,159 | 0.0 | WFRBS 2013-C11 | ||||||||||
| 21.14 | Barclays | Hampton Inn Suites Waco South | Waco | TX | Hospitality | 190,301 | 0.0 | WFCM 2012-LC5 | ||||||||||
| 21.15 | Barclays | Holiday Inn Louisville Airport Fair Expo | Louisville | KY | Hospitality | 186,902 | 0.0 | WFRBS 2012-C10 | ||||||||||
| 21.16 | Barclays | Courtyard Tyler | Tyler | TX | Hospitality | 183,504 | 0.0 | WFCM 2012-LC5 | ||||||||||
| 21.17 | Barclays | Hilton Garden Inn Edison Raritan Center | Edison | NJ | Hospitality | 183,504 | 0.0 | WFRBS 2013-C11 | ||||||||||
| 21.20 | Barclays | Peoria, AZ Residence Inn | Peoria | AZ | Hospitality | 177,840 | 0.0 | GSMS 2012-GCJ9 | ||||||||||
| 21.25 | Barclays | Courtyard Wichita Falls | Wichita Falls | TX | Hospitality | 159,717 | 0.0 | WFCM 2012-LC5 | ||||||||||
| 21.26 | Barclays | Hampton Inn Morehead | Morehead City | NC | Hospitality | 155,186 | 0.0 | CSMC 2008-C1 | ||||||||||
| 21.28 | Barclays | Courtyard Lufkin | Lufkin | TX | Hospitality | 143,858 | 0.0 | WFCM 2012-LC5 | ||||||||||
| 21.29 | Barclays | Hampton Inn Carlisle | Carlisle | PA | Hospitality | 142,725 | 0.0 | WFRBS 2013-C11 | ||||||||||
| 21.30 | Barclays | Springhill Suites Williamsburg | Williamsburg | VA | Hospitality | 142,725 | 0.0 | WFRBS 2013-C11 | ||||||||||
| 21.32 | Barclays | Waco Residence Inn | Waco | TX | Hospitality | 138,194 | 0.0 | GSMS 2012-GCJ9 | ||||||||||
| 21.33 | Barclays | Holiday Inn Express Fishers | Fishers | IN | Hospitality | 129,133 | 0.0 | WFRBS 2012-C10 | ||||||||||
| 21.34 | Barclays | Larkspur Landing Folsom | Folsom | CA | Hospitality | 125,734 | 0.0 | COMM 2013-CR7 | ||||||||||
| 21.36 | Barclays | Holiday Inn Express & Suites Paris | Paris | TX | Hospitality | 117,805 | 0.0 | WFCM 2012-LC5 | ||||||||||
THE INFORMATION IN THIS STRUCTURAL AND COLLATERAL TERM SHEET IS NOT COMPLETE AND MAY BE AMENDED PRIOR TO THE TIME OF SALE. THIS TERM SHEET IS NOT AN OFFER TO SELL THESE SECURITIES AND IT IS NOT A SOLICITATION OF AN OFFER TO BUY THESE SECURITIES IN ANY JURISDICTION WHERE THE OFFER OR SALE IS NOT PERMITTED.
9
| Wells Fargo Commercial Mortgage Trust 2017-C40 | Characteristics of the Mortgage Pool |
| Loan No. | Mortgage Loan Seller | Mortgage Loan or Mortgaged Property Name | City | State | Property Type | Mortgage Loan or Mortgaged Property Cut-off Date Balance ($) | % of Initial Pool Balance (%) | Previous Securitization | ||||||||||
| 21.37 | Barclays | Toledo Homewood Suites | Maumee | OH | Hospitality | 117,805 | 0.0 | GSMS 2012-GCJ9 | ||||||||||
| 21.38 | Barclays | Grand Rapids Homewood Suites | Grand Rapids | MI | Hospitality | 114,407 | 0.0 | GSMS 2012-GCJ9 | ||||||||||
| 21.39 | Barclays | Fairfield Inn Laurel | Laurel | MD | Hospitality | 106,478 | 0.0 | WFRBS 2013-C11 | ||||||||||
| 21.40 | Barclays | Cheyenne Fairfield Inn and Suites | Cheyenne | WY | Hospitality | 106,478 | 0.0 | GSMS 2012-GCJ9 | ||||||||||
| 21.41 | Barclays | Courtyard Akron Stow | Stow | OH | Hospitality | 104,212 | 0.0 | WFRBS 2012-C10 | ||||||||||
| 21.43 | Barclays | Larkspur Landing Roseville | Roseville | CA | Hospitality | 98,549 | 0.0 | COMM 2013-CR7 | ||||||||||
| 21.44 | Barclays | Hampton Inn Danville | Danville | PA | Hospitality | 97,416 | 0.0 | WFRBS 2013-C11 | ||||||||||
| 21.45 | Barclays | Holiday Inn Norwich | Norwich | CT | Hospitality | 96,283 | 0.0 | WFRBS 2013-C11 | ||||||||||
| 21.46 | Barclays | Hampton Inn Suites Longview North | Longview | TX | Hospitality | 95,150 | 0.0 | WFCM 2012-LC5 | ||||||||||
| 21.48 | Barclays | Hampton Inn Suites Buda | Buda | TX | Hospitality | 94,018 | 0.0 | WFCM 2012-LC5 | ||||||||||
| 21.49 | Barclays | Shawnee Hampton Inn | Shawnee | OK | Hospitality | 94,018 | 0.0 | GSMS 2012-GCJ9 | ||||||||||
| 21.50 | Barclays | Racine Fairfield Inn | Racine | WI | Hospitality | 91,752 | 0.0 | GSMS 2012-GCJ9 | ||||||||||
| 21.51 | Barclays | Hampton Inn Selinsgrove Shamokin Dam | Shamokin Dam | PA | Hospitality | 89,487 | 0.0 | WFRBS 2013-C11 | ||||||||||
| 21.52 | Barclays | Holiday Inn Express & Suites Terrell | Terrell | TX | Hospitality | 84,956 | 0.0 | WFCM 2012-LC5 | ||||||||||
| 21.53 | Barclays | Westchase Homewood Suites | Houston | TX | Hospitality | 82,228 | 0.0 | GSMS 2012-GCJ9 | ||||||||||
| 21.54 | Barclays | Holiday Inn Express & Suites Tyler South | Tyler | TX | Hospitality | 81,557 | 0.0 | WFCM 2012-LC5 | ||||||||||
| 21.55 | Barclays | Holiday Inn Express & Suites Huntsville | Huntsville | TX | Hospitality | 78,159 | 0.0 | WFCM 2012-LC5 | ||||||||||
| 21.56 | Barclays | Hampton Inn Sweetwater | Sweetwater | TX | Hospitality | 71,363 | 0.0 | WFCM 2012-LC5 | ||||||||||
| 21.57 | Barclays | Comfort Suites Buda Austin South | Buda | TX | Hospitality | 60,035 | 0.0 | WFCM 2012-LC5 | ||||||||||
| 21.58 | Barclays | Fairfield Inn & Suites Weatherford | Weatherford | TX | Hospitality | 56,637 | 0.0 | WFCM 2012-LC5 | ||||||||||
| 21.59 | Barclays | Holiday Inn Express & Suites Altus | Altus | OK | Hospitality | 45,895 | 0.0 | WFCM 2012-LC5 | ||||||||||
| 21.60 | Barclays | Comfort Inn & Suites Paris | Paris | TX | Hospitality | 40,779 | 0.0 | WFCM 2012-LC5 | ||||||||||
| 21.61 | Barclays | Hampton Inn Suites Decatur | Decatur | TX | Hospitality | 39,022 | 0.0 | WFCM 2012-LC5 | ||||||||||
| 21.62 | Barclays | Holiday Inn Express & Suites Texarkana East | Texarkana | AR | Hospitality | 36,136 | 0.0 | WFCM 2012-LC5 | ||||||||||
| 21.63 | Barclays | Mankato Fairfield Inn | Mankato | MN | Hospitality | 32,383 | 0.0 | GSMS 2012-GCJ9 | ||||||||||
| 21.64 | Barclays | Candlewood Suites Texarkana | Texarkana | TX | Hospitality | 25,037 | 0.0 | WFCM 2012-LC5 | ||||||||||
| 21.65 | Barclays | Country Inn & Suites Houston Intercontinental Airport East | Humble | TX | Hospitality | 23,777 | 0.0 | WFCM 2012-LC5 | ||||||||||
| 23 | WFB | St. Louis Ground Lease | St. Louis | MO | Other | 9,526,304 | 1.4 | CSMC 2007-C5 | ||||||||||
| 24 | WFB | Shady Willow Plaza | Brentwood | CA | Retail | 9,150,000 | 1.3 | BSCMS 2007-PW18 | ||||||||||
| 26 | WFB | 215 South Brea Boulevard | Brea | CA | Mixed Use | 8,270,439 | 1.2 | JPMCC 2007-LD11 | ||||||||||
| 31 | RMF | Salida & Manteca Secured Storage Portfolio | Various | CA | Self Storage | 6,300,000 | 0.9 | MLCFC 2007-9 | ||||||||||
| 32 | RMF | Hampton Inn - Farmville | Farmville | VA | Hospitality | 6,153,606 | 0.9 | CMLT 2008-LS1 | ||||||||||
| 33 | Barclays | Heacock Business Center | Moreno Valley | CA | Office | 5,991,508 | 0.8 | BSCMS 2007-PW18 | ||||||||||
| 35 | CIIICM | Douglasville Center | Douglasville | GA | Retail | 5,950,000 | 0.8 | MLCFC 2007-8 | ||||||||||
| 36 | CIIICM | Wanamaker Crossing | Topeka | KS | Retail | 5,771,950 | 0.8 | CSMC 2007-C3 | ||||||||||
| 38 | RMF | Battlefield Square Shoppes | Springfield | MO | Retail | 5,028,685 | 0.7 | MSC 2007-HQ13 | ||||||||||
| 52 | CIIICM | Kaysville Business Park | Kaysville | UT | Industrial | 3,288,321 | 0.5 | BACM 2008-1 | ||||||||||
| 58 | CIIICM | Cypress Self Storage | Cypress | TX | Self Storage | 2,591,069 | 0.4 | BSCMS 2007-PW18 | ||||||||||
| 61 | WFB | Creekview Apartments | Chico | CA | Multifamily | 2,000,000 | 0.3 | BSCMS 2007-T28 | ||||||||||
THE INFORMATION IN THIS STRUCTURAL AND COLLATERAL TERM SHEET IS NOT COMPLETE AND MAY BE AMENDED PRIOR TO THE TIME OF SALE. THIS TERM SHEET IS NOT AN OFFER TO SELL THESE SECURITIES AND IT IS NOT A SOLICITATION OF AN OFFER TO BUY THESE SECURITIES IN ANY JURISDICTION WHERE THE OFFER OR SALE IS NOT PERMITTED.
10
| Wells Fargo Commercial Mortgage Trust 2017-C40 | Characteristics of the Mortgage Pool |
| Loan No. | Mortgage Loan Seller | Mortgage Loan or Mortgaged Property Name | City | State | Property Type | Mortgage Loan or Mortgaged Property Cut-off Date Balance ($) | % of Initial Pool Balance (%) | Previous Securitization | ||||||||||
| 62 | WFB | Pomona Townhomes | Chico | CA | Multifamily | 1,900,000 | 0.3 | BSCMS 2007-T28 | ||||||||||
| 65 | CIIICM | Lloyds MHC | Bradenton | FL | Manufactured Housing Community | 1,293,835 | 0.2 | JPMCC 2007-LDP12 | ||||||||||
| Total | $358,257,350 | 50.8 | % | |||||||||||||||
| (1) | The table above represents the most recent securitization with respect to the mortgaged property securing the related mortgage loan, based on information provided by the related borrower or obtained through searches of a third-party database. While loans secured by the above mortgaged properties may have been securitized multiple times in prior transactions, mortgage loans in this securitization are only listed in the above chart if the mortgage loan paid off a loan in another securitization. The information has not otherwise been confirmed by the mortgage loan sellers. |
THE INFORMATION IN THIS STRUCTURAL AND COLLATERAL TERM SHEET IS NOT COMPLETE AND MAY BE AMENDED PRIOR TO THE TIME OF SALE. THIS TERM SHEET IS NOT AN OFFER TO SELL THESE SECURITIES AND IT IS NOT A SOLICITATION OF AN OFFER TO BUY THESE SECURITIES IN ANY JURISDICTION WHERE THE OFFER OR SALE IS NOT PERMITTED.
11
| Wells Fargo Commercial Mortgage Trust 2017-C40 | Characteristics of the Mortgage Pool |
| E. | Property Type Distribution(1) |
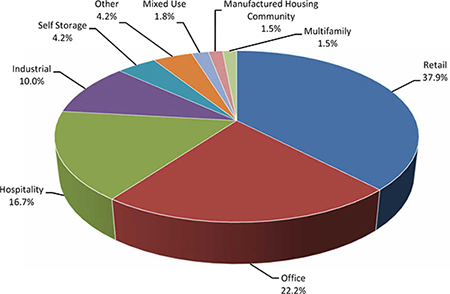
| Property Type | Number of Mortgaged Properties | Aggregate Balance ($) | % of Initial Pool Balance (%) | Weighted Average Cut-off Date LTV Ratio (%) | Weighted Average Balloon or ARD LTV Ratio (%) | Weighted Average U/W NCF DSCR (x) | Weighted Average U/W NOI Debt Yield (%) | Weighted Average U/W NCF Debt Yield (%) | Weighted Average Mortgage Rate (%) | ||||||||||||||||||
| Retail | 24 | $267,225,432 | 37.9 | % | 56.2 | % | 51.4 | % | 2.22 | x | 11.1 | % | 10.4 | % | 4.166 | % | |||||||||||
| Anchored | 4 | 84,600,000 | 12.0 | 52.3 | 51.7 | 2.73 | 12.0 | 10.9 | 3.953 | ||||||||||||||||||
| Super Regional Mall | 2 | 75,000,000 | 10.6 | 51.3 | 46.1 | 2.35 | 11.7 | 11.2 | 3.875 | ||||||||||||||||||
| Unanchored | 10 | 53,823,505 | 7.6 | 68.2 | 56.8 | 1.41 | 9.5 | 8.9 | 4.681 | ||||||||||||||||||
| Outlet Center | 1 | 25,000,000 | 3.5 | 50.0 | 50.0 | 2.66 | 11.2 | 10.8 | 3.995 | ||||||||||||||||||
| Shadow Anchored | 5 | 18,463,214 | 2.6 | 67.7 | 56.9 | 1.53 | 10.5 | 9.6 | 4.782 | ||||||||||||||||||
| Single Tenant | 2 | 10,338,713 | 1.5 | 56.4 | 51.7 | 1.54 | 8.3 | 8.2 | 4.660 | ||||||||||||||||||
| Office | 6 | 156,491,377 | 22.2 | 49.1 | 46.5 | 2.49 | 11.2 | 10.5 | 4.072 | ||||||||||||||||||
| CBD | 1 | 60,000,000 | 8.5 | 31.3 | 31.3 | 3.27 | 12.6 | 12.1 | 3.651 | ||||||||||||||||||
| Suburban | 3 | 58,791,377 | 8.3 | 59.4 | 54.2 | 2.07 | 10.9 | 10.0 | 4.321 | ||||||||||||||||||
| Medical | 2 | 37,700,000 | 5.3 | 61.3 | 58.9 | 1.91 | 9.6 | 8.9 | 4.355 | ||||||||||||||||||
| Hospitality | 76 | 117,972,942 | 16.7 | 59.2 | 50.7 | 1.88 | 13.3 | 11.9 | 5.002 | ||||||||||||||||||
| Limited Service | 45 | 42,694,630 | 6.1 | 61.9 | 51.6 | 1.99 | 14.1 | 12.5 | 4.972 | ||||||||||||||||||
| Select Service | 2 | 31,905,023 | 4.5 | 57.1 | 47.7 | 1.70 | 12.1 | 10.8 | 4.879 | ||||||||||||||||||
| Extended Stay | 25 | 28,947,116 | 4.1 | 59.1 | 51.8 | 2.07 | 14.1 | 12.7 | 5.062 | ||||||||||||||||||
| Full Service | 4 | 14,426,173 | 2.0 | 56.3 | 52.6 | 1.62 | 12.0 | 10.7 | 5.243 | ||||||||||||||||||
| Industrial | 11 | 70,707,684 | 10.0 | 65.8 | 55.4 | 1.63 | 11.0 | 9.8 | 4.426 | ||||||||||||||||||
| Warehouse | 4 | 39,955,975 | 5.7 | 68.5 | 59.2 | 1.54 | 10.2 | 9.2 | 4.340 | ||||||||||||||||||
| Flex | 7 | 30,751,709 | 4.4 | 62.3 | 50.5 | 1.75 | 12.1 | 10.6 | 4.537 | ||||||||||||||||||
| Self Storage | 10 | 29,671,066 | 4.2 | 61.7 | 54.9 | 1.82 | 10.1 | 9.9 | 4.751 | ||||||||||||||||||
| Self Storage | 10 | 29,671,066 | 4.2 | 61.7 | 54.9 | 1.82 | 10.1 | 9.9 | 4.751 | ||||||||||||||||||
| Other | 13 | 29,526,304 | 4.2 | 60.1 | 54.1 | 1.91 | 9.2 | 9.2 | 3.964 | ||||||||||||||||||
| Leased Fee | 13 | 29,526,304 | 4.2 | 60.1 | 54.1 | 1.91 | 9.2 | 9.2 | 3.964 | ||||||||||||||||||
| Mixed Use | 2 | 12,515,141 | 1.8 | 62.0 | 54.6 | 1.33 | 8.6 | 8.3 | 4.734 | ||||||||||||||||||
| Multifamily/Retail | 2 | 12,515,141 | 1.8 | 62.0 | 54.6 | 1.33 | 8.6 | 8.3 | 4.734 | ||||||||||||||||||
| Manufactured Housing Community | 4 | 10,670,154 | 1.5 | 61.1 | 48.8 | 1.53 | 10.2 | 10.0 | 4.909 | ||||||||||||||||||
| Manufactured Housing Community | 4 | 10,670,154 | 1.5 | 61.1 | 48.8 | 1.53 | 10.2 | 10.0 | 4.909 | ||||||||||||||||||
| Multifamily | 4 | 10,599,416 | 1.5 | 54.1 | 41.9 | 1.67 | 14.1 | 13.1 | 4.687 | ||||||||||||||||||
| Garden | 4 | 10,599,416 | 1.5 | 54.1 | 41.9 | 1.67 | 14.1 | 13.1 | 4.687 | ||||||||||||||||||
| Total/Weighted Average: | 150 | $705,379,517 | 100.0 | % | 56.6 | % | 50.7 | % | 2.10 | x | 11.4 | % | 10.5 | % | 4.357 | % | |||||||||||
| (1) | Because this table presents information relating to the mortgaged properties and not the mortgage loans, (a) the information for mortgage loans secured by more than one mortgaged property (other than through cross-collateralization with other mortgage loans) is based on allocated amounts (allocating the principal balance of the mortgage loan to each of those properties according to the relative appraised values of the mortgaged properties or the allocated loan amounts or property-specific release prices set forth in the related mortgage loan documents or such other allocation as the related mortgage loan seller deemed appropriate) and (b) the information for each mortgaged property that relates to a mortgage loan that is cross-collateralized or cross-defaulted with other mortgage loans is based upon the principal balance of that mortgage loan, except that the applicable loan-to-value ratio, debt service coverage ratio and debt yield for each such mortgage loan is based upon the ratio or yield (as applicable) for the aggregate indebtedness evidenced by all loans in the group (without regard to any limitation on the amount of indebtedness secured by any mortgaged property in such cross-collateralized group). On an individual basis, without regard to the cross-collateralization feature, any mortgage loan that is part of a cross-collateralized group of mortgage loans may have a higher loan-to-value ratio, lower debt service coverage ratio and/or lower debt yield than is presented herein. With respect to any mortgage loan that is part of a whole loan, the loan-to-value ratio, debt service coverage ratio and debt yield calculations include the related pari passu companion loan(s) but exclude any related subordinate secured loan(s) (unless otherwise stated). With respect to each mortgage loan, debt service coverage ratio, debt yield and loan-to-value ratio information do not take into account of any subordinate debt (whether or not secured by the related mortgaged property) that currently exists or is allowed under the terms of such mortgage loan. See Annex A-1 to the Preliminary Prospectus. |
THE INFORMATION IN THIS STRUCTURAL AND COLLATERAL TERM SHEET IS NOT COMPLETE AND MAY BE AMENDED PRIOR TO THE TIME OF SALE. THIS TERM SHEET IS NOT AN OFFER TO SELL THESE SECURITIES AND IT IS NOT A SOLICITATION OF AN OFFER TO BUY THESE SECURITIES IN ANY JURISDICTION WHERE THE OFFER OR SALE IS NOT PERMITTED.
12
| Wells Fargo Commercial Mortgage Trust 2017-C40 | Characteristics of the Mortgage Pool |
| F. | Geographic Distribution(1)(2) |
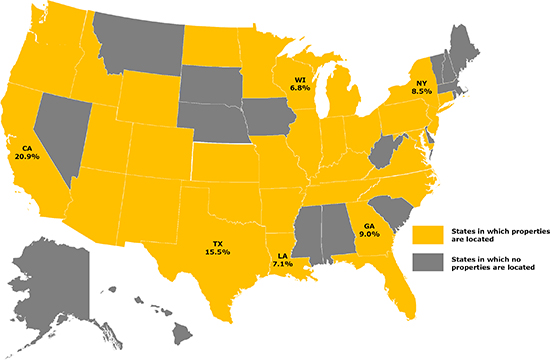
| Location | Number of Mortgaged Properties | Aggregate Cut-off Date Balance ($) | % of Initial Pool Balance (%) | Weighted Average Cut-off Date LTV Ratio (%) | Weighted Average Balloon or ARD LTV Ratio (%) | Weighted Average U/W NCF DSCR (x) | Weighted Average U/W NOI Debt Yield (%) | Weighted Average U/W NCF Debt Yield (%) | Weighted Average Mortgage Rate (%) | ||||||||||||||||||
| California | 26 | $147,441,696 | 20.9 | % | 54.0 | % | 52.2 | % | 2.28 | x | 10.6 | % | 10.1 | % | 4.209 | % | |||||||||||
| Southern | 8 | 114,108,867 | 16.2 | 52.4 | 51.4 | 2.37 | 10.7 | 10.1 | 4.146 | ||||||||||||||||||
| Northern | 18 | 33,332,829 | 4.7 | 59.3 | 54.6 | 1.97 | 10.5 | 10.1 | 4.422 | ||||||||||||||||||
| Texas | 35 | 109,055,949 | 15.5 | 62.9 | 54.0 | 1.80 | 11.9 | 10.8 | 4.773 | ||||||||||||||||||
| Georgia | 5 | 63,342,577 | 9.0 | 59.7 | 55.6 | 2.25 | 10.8 | 9.8 | 4.115 | ||||||||||||||||||
| New York | 1 | 60,000,000 | 8.5 | 31.3 | 31.3 | 3.27 | 12.6 | 12.1 | 3.651 | ||||||||||||||||||
| Louisiana | 1 | 50,000,000 | 7.1 | 57.0 | 49.3 | 1.85 | 11.1 | 10.6 | 3.984 | ||||||||||||||||||
| Wisconsin | 6 | 47,911,840 | 6.8 | 57.3 | 54.5 | 2.15 | 10.7 | 10.1 | 4.100 | ||||||||||||||||||
| Other(3) | 76 | 227,627,454 | 32.3 | 61.0 | 51.5 | 1.83 | 11.6 | 10.5 | 4.642 | ||||||||||||||||||
| Total/Weighted Average | 150 | $705,379,517 | 100.0 | % | 56.6 | % | 50.7 | % | 2.10 | x | 11.4 | % | 10.5 | % | 4.357 | % | |||||||||||
| (1) | The mortgaged properties are located in 33 states. |
| (2) | Because this table presents information relating to the mortgaged properties and not the mortgage loans, (a) the information for mortgage loans secured by more than one mortgaged property (other than through cross-collateralization with other mortgage loans) is based on allocated amounts (allocating the principal balance of the mortgage loan to each of those properties according to the relative appraised values of the mortgaged properties or the allocated loan amounts or property-specific release prices set forth in the related mortgage loan documents or such other allocation as the related mortgage loan seller deemed appropriate), and (b) the information for each mortgaged property that relates to a mortgage loan that is cross-collateralized or cross-defaulted with other mortgage loans is based upon the principal balance of that mortgage loan, except that the applicable loan-to-value ratio, debt service coverage ratio and debt yield for each such mortgage loan is based upon the ratio or yield (as applicable) for the aggregate indebtedness evidenced by all loans in the group (without regard to any limitation on the amount of indebtedness secured by any mortgaged property in such cross-collateralized group). On an individual basis, without regard to the cross-collateralization feature, any mortgage loan that is part of a cross-collateralized group of mortgage loans may have a higher loan-to-value ratio, lower debt service coverage ratio and/or lower debt yield than is presented herein. With respect to any mortgage loan that is part of a whole loan, the loan-to-value ratio, debt service coverage ratio and debt yield calculations include the relatedpari passucompanion loan(s) but exclude any related subordinate secured loan(s) (unless otherwise stated). With respect to each mortgage loan, debt service coverage ratio, debt yield and loan-to-value ratio information do not take into account of any subordinate debt (whether or not secured by the related mortgaged property) that currently exists or is allowed under the terms of such mortgage loan.See Annex A-1 to the Preliminary Prospectus. |
| (3) | Includes 27 other states. |
THE INFORMATION IN THIS STRUCTURAL AND COLLATERAL TERM SHEET IS NOT COMPLETE AND MAY BE AMENDED PRIOR TO THE TIME OF SALE. THIS TERM SHEET IS NOT AN OFFER TO SELL THESE SECURITIES AND IT IS NOT A SOLICITATION OF AN OFFER TO BUY THESE SECURITIES IN ANY JURISDICTION WHERE THE OFFER OR SALE IS NOT PERMITTED.
13
| Wells Fargo Commercial Mortgage Trust 2017-C40 | Characteristics of the Mortgage Pool |
| G. | Characteristics of the Mortgage Pool(1) |
| CUT-OFF DATE BALANCE | |||||||
| Range of Cut-off Date Balances ($) | Number of Mortgage Loans | Aggregate Cut- off Date Balance | Percent by Aggregate Cut- off Date Pool Balance (%) | ||||
| 1,293,835 - 2,000,000 | 6 | $10,707,694 | 1.5 | % | |||
| 2,000,001 - 3,000,000 | 6 | 15,304,192 | 2.2 | ||||
| 3,000,001 - 4,000,000 | 10 | 34,756,548 | 4.9 | ||||
| 4,000,001 - 5,000,000 | 7 | 31,734,667 | 4.5 | ||||
| 5,000,001 - 6,000,000 | 6 | 33,867,240 | 4.8 | ||||
| 6,000,001 - 7,000,000 | 3 | 18,944,667 | 2.7 | ||||
| 7,000,001 - 8,000,000 | 1 | 7,050,000 | 1.0 | ||||
| 8,000,001 - 9,000,000 | 2 | 16,970,439 | 2.4 | ||||
| 9,000,001 - 10,000,000 | 4 | 38,676,304 | 5.5 | ||||
| 10,000,001 - 15,000,000 | 6 | 73,306,898 | 10.4 | ||||
| 15,000,001 - 20,000,000 | 4 | 77,310,867 | 11.0 | ||||
| 20,000,001 - 30,000,000 | 5 | 127,300,000 | 18.0 | ||||
| 30,000,001 - 50,000,000 | 4 | 159,450,000 | 22.6 | ||||
| 50,000,001 - 60,000,000 | 1 | 60,000,000 | 8.5 | ||||
| Total: | 65 | $705,379,517 | 100.0 | % | |||
| Average | $10,851,993 | ||||||
| UNDERWRITTEN NOI DEBT SERVICE COVERAGE RATIO | |||||||
| Range of U/W NOI DSCRs (x) | Number of Mortgage Loans | Aggregate Cut- off Date Balance | Percent by Aggregate Cut- off Date Pool Balance (%) | ||||
| 1.28 | 1 | $1,706,163 | 0.2 | % | |||
| 1.29 - 1.40 | 6 | 22,885,155 | 3.2 | ||||
| 1.41 - 1.50 | 14 | 79,028,606 | 11.2 | ||||
| 1.51 - 1.60 | 4 | 13,985,272 | 2.0 | ||||
| 1.61 - 1.70 | 7 | 49,601,200 | 7.0 | ||||
| 1.71 - 1.80 | 7 | 86,992,926 | 12.3 | ||||
| 1.81 - 1.90 | 2 | 12,823,901 | 1.8 | ||||
| 1.91 - 2.00 | 4 | 64,772,995 | 9.2 | ||||
| 2.01 - 2.50 | 11 | 142,542,240 | 20.2 | ||||
| 2.51 - 3.00 | 4 | 70,641,061 | 10.0 | ||||
| 3.01 - 3.50 | 4 | 134,600,000 | 19.1 | ||||
| 3.51 - 3.57 | 1 | 25,800,000 | 3.7 | ||||
| Total: | 65 | $705,379,517 | 100.0 | % | |||
| Weighted Average: | 2.26x | ||||||
UNDERWRITTEN NCF DEBT SERVICE COVERAGE RATIO | |||||||
Range of U/W NCF DSCRs (x) | Number of Mortgage Loans | Aggregate Cut- off Date Balance | Percent by Aggregate Cut- off Date Pool Balance (%) | ||||
| 1.16 | 1 | $1,706,163 | 0.2 | % | |||
| 1.17 - 1.30 | 2 | 3,884,904 | 0.6 | ||||
| 1.31 - 1.40 | 16 | 86,939,916 | 12.3 | ||||
| 1.41 - 1.50 | 9 | 67,074,269 | 9.5 | ||||
| 1.51 - 1.60 | 10 | 93,885,557 | 13.3 | ||||
| 1.61 - 1.70 | 1 | 7,050,000 | 1.0 | ||||
| 1.71 - 1.80 | 4 | 22,676,308 | 3.2 | ||||
| 1.81 - 1.90 | 3 | 58,579,099 | 8.3 | ||||
| 1.91 - 2.00 | 2 | 40,195,455 | 5.7 | ||||
| 2.01 - 2.50 | 10 | 131,687,846 | 18.7 | ||||
| 2.51 - 3.00 | 4 | 80,900,000 | 11.5 | ||||
| 3.01 - 3.34 | 3 | 110,800,000 | 15.7 | ||||
| Total: | 65 | $705,379,517 | 100.0 | % | |||
| Weighted Average: | 2.10x | ||||||
| LOAN PURPOSE | |||||||
| Loan Purpose | Number of Mortgage Loans | Aggregate Cut- off Date Balance | Percent by Aggregate Cut- off Date Pool Balance (%) | ||||
| Refinance | 50 | $523,753,394 | 74.3 | % | |||
| Recapitalization | 3 | 95,000,000 | 13.5 | ||||
| Acquisition | 12 | 86,626,123 | 12.3 | ||||
| Total: | 65 | $705,379,517 | 100.0 | % | |||
| MORTGAGE RATE | |||||||
| Range of Mortgage Rates (%) | Number of Mortgage Loans | Aggregate Cut- off Date Balance | Percent by Aggregate Cut- off Date Pool Balance (%) | ||||
| 3.651 - 3.750 | 2 | $85,000,000 | 12.1 | % | |||
| 3.751 - 4.000 | 5 | 160,400,000 | 22.7 | ||||
| 4.001 - 4.250 | 5 | 78,736,963 | 11.2 | ||||
| 4.251 - 4.500 | 11 | 109,913,920 | 15.6 | ||||
| 4.501 - 4.750 | 16 | 105,237,348 | 14.9 | ||||
| 4.751 - 5.000 | 15 | 74,690,525 | 10.6 | ||||
| 5.001 - 5.250 | 5 | 51,816,287 | 7.3 | ||||
| 5.251 - 5.500 | 5 | 37,878,311 | 5.4 | ||||
| 5.501 - 6.000 | 1 | 1,706,163 | 0.2 | ||||
| Total: | 65 | $705,379,517 | 100.0 | % | |||
| Weighted Average: | 4.357% | ||||||
| UNDERWRITTEN NOI DEBT YIELD | |||||||
| Range of U/W NOI Debt Yields (%) | Number of Mortgage Loans | Aggregate Cut- off Date Balance | Percent by Aggregate Cut- off Date Pool Balance (%) | ||||
| 7.9 | 1 | $7,050,000 | 1.0 | % | |||
| 8.0 - 9.0 | 7 | 63,206,209 | 9.0 | ||||
| 9.1 - 10.0 | 19 | 102,198,061 | 14.5 | ||||
| 10.1 - 11.0 | 13 | 152,871,171 | 21.7 | ||||
| 11.1 - 12.0 | 7 | 146,935,969 | 20.8 | ||||
| 12.1 - 13.0 | 7 | 117,319,355 | 16.6 | ||||
| 13.1 - 14.0 | 6 | 84,479,742 | 12.0 | ||||
| 14.1 - 15.0 | 1 | 5,991,508 | 0.8 | ||||
| 15.1 - 16.0 | 3 | 23,621,337 | 3.3 | ||||
| 16.1 - 28.1 | 1 | 1,706,163 | 0.2 | ||||
| Total: | 65 | $705,379,517 | 100.0 | % | |||
| Weighted Average: | 11.4% | ||||||
| UNDERWRITTEN NCF DEBT YIELD | |||||||
| Range of U/W NCF Debt Yields (%) | Number of Mortgage Loans | Aggregate Cut- off Date Balance | Percent by Aggregate Cut- off Date Pool Balance (%) | ||||
| 7.7 | 1 | $7,050,000 | 1.0 | % | |||
| 7.8 - 9.0 | 17 | 119,667,697 | 17.0 | ||||
| 9.1 - 10.0 | 21 | 197,313,910 | 28.0 | ||||
| 10.1 - 11.0 | 9 | 158,935,899 | 22.5 | ||||
| 11.1 - 12.0 | 2 | 12,721,759 | 1.8 | ||||
| 12.1 - 13.0 | 11 | 184,362,752 | 26.1 | ||||
| 13.1 - 14.0 | 2 | 17,467,731 | 2.5 | ||||
| 14.1 - 15.0 | 1 | 6,153,606 | 0.9 | ||||
| 15.1 - 25.5 | 1 | 1,706,163 | 0.2 | ||||
| Total: | 65 | $705,379,517 | 100.0 | % | |||
| Weighted Average: | 10.5% | ||||||
| ORIGINAL TERM TO MATURITY OR ARD | |||||||
Range of Original Terms to | Number of Mortgage Loans | Aggregate Cut- off Date Balance | Percent by Aggregate Cut- off Date Pool Balance (%) | ||||
| 60 - 84 | 2 | $22,195,940 | 3.1 | % | |||
| 85 - 120 | 62 | 681,477,413 | 96.6 | ||||
| 121 - 240 | 1 | 1,706,163 | 0.2 | ||||
| Total: | 65 | $705,379,517 | 100.0 | % | |||
| Weighted Average: | 118 months | ||||||
| (1) | The information for each mortgaged property that relates to a mortgage loan that is cross-collateralized or cross-defaulted with one or more other mortgage loans is based upon the principal balance of that mortgage loan, except that the applicable loan-to-value ratio, debt service coverage ratio, and debt yield for each such mortgage loan is based upon the ratio or yield (as applicable) for the aggregate indebtedness evidenced by all loans in the group (without regard to any limitation on the amount of indebtedness secured by any mortgaged property in such cross-collateralized group). With respect to any mortgage loan that is part of a whole loan, the loan-to-value ratio, debt service coverage ratio and debt yield calculations include the relatedpari passu companion loan(s) but exclude any related subordinate companion loan(s) (unless otherwise stated). With respect to each mortgage loan, debt service coverage ratio, debt yield and loan-to-value ratio information do not take into account any subordinate debt (whether or not secured by the related mortgaged property) that currently exists or is allowed under the terms of such mortgage loan. See Annex A-1 to the Preliminary Prospectus. Prepayment provisions for each mortgage loan reflects the entire life of the loan (from origination to maturity or ARD) and may be currently prepayable. |
THE INFORMATION IN THIS STRUCTURAL AND COLLATERAL TERM SHEET IS NOT COMPLETE AND MAY BE AMENDED PRIOR TO THE TIME OF SALE. THIS TERM SHEET IS NOT AN OFFER TO SELL THESE SECURITIES AND IT IS NOT A SOLICITATION OF AN OFFER TO BUY THESE SECURITIES IN ANY JURISDICTION WHERE THE OFFER OR SALE IS NOT PERMITTED.
14
| Wells Fargo Commercial Mortgage Trust 2017-C40 | Characteristics of the Mortgage Pool |
| REMAINING TERM TO MATURITY OR ARD | |||||||
| Range of Remaining Terms to Maturity or ARD (months) | Number of Mortgage Loans | Aggregate Cut- off Date Balance | Percent by Aggregate Cut- off Date Pool Balance (%) | ||||
| 55 - 60 | 2 | $22,195,940 | 3.1 | % | |||
| 61 - 84 | 1 | 1,706,163 | 0.2 | ||||
| 85 - 120 | 62 | 681,477,413 | 96.6 | ||||
| Total: | 65 | $705,379,517 | 100.0 | % | |||
| Weighted Average: | 116 months | ||||||
| ORIGINAL AMORTIZATION TERM(2) | |||||||
| Range of Original Amortization Terms (months) | Number of Mortgage Loans | Aggregate Cut- off Date Balance | Percent by Aggregate Cut- off Date Pool Balance (%) | ||||
| Non- Amortizing | 13 | $298,925,000 | 42.4 | % | |||
| 240 | 3 | 12,526,302 | 1.8 | ||||
| 241 - 300 | 3 | 19,293,062 | 2.7 | ||||
| 301 - 360 | 46 | 374,635,153 | 53.1 | ||||
| Total: | 65 | $705,379,517 | 100.0 | % | |||
| Weighted Average(3): | 353 months | ||||||
| (2) | The original amortization term shown for any mortgage loan that is interest-only for part of its term does not include the number of months in its interest-only period and reflects only the number of months as of the commencement of amortization remaining from the end of such interest-only period. |
| (3) | Excludes the non-amortizing mortgage loans. |
| REMAINING AMORTIZATION TERM(4) | |||||||
| Range of Remaining Amortization Terms (months) | Number of Mortgage Loans | Aggregate Cut- off Date Balance | Percent by Aggregate Cut- off Date Pool Balance (%) | ||||
| Non-Amortizing | 13 | $298,925,000 | 42.4 | % | |||
| 61 - 120 | 1 | 1,706,163 | 0.2 | ||||
| 121 - 240 | 2 | 10,820,139 | 1.5 | ||||
| 241 - 300 | 3 | 19,293,062 | 2.7 | ||||
| 301 - 360 | 46 | 374,635,153 | 53.1 | ||||
| Total: | 65 | $705,379,517 | 100.0 | % | |||
| Weighted Average(5): | 352 months | ||||||
| (4) | The remaining amortization term shown for any mortgage loan that is interest-only for part of its term does not include the number of months in its interest-only period and reflects only the number of months as of the commencement of amortization remaining from the end of such interest-only period. |
| (5) | Excludes the non-amortizing mortgage loans. |
| LOCKBOXES | |||||||
| Type of Lockbox | Number of Mortgage Loans | Aggregate Cut- off Date Balance | Percent by Aggregate Cut- off Date Pool Balance (%) | ||||
| Springing | 44 | $340,992,508 | 48.3 | % | |||
| Hard/Springing Cash Management | 13 | 273,639,785 | 38.8 | ||||
| Hard/Upfront Cash Management | 2 | 59,500,000 | 8.4 | ||||
| None | 5 | 21,247,224 | 3.0 | ||||
| Soft/Springing Cash Management | 1 | 10,000,000 | 1.4 | ||||
| Total: | 65 | $705,379,517 | 100.0 | % | |||
| PREPAYMENT PROVISION SUMMARY(6) | |||||||
| Prepayment Provision | Number of Mortgage Loans | Aggregate Cut- off Date Balance | Percent by Aggregate Cut- off Date Pool Balance (%) | ||||
| Lockout / Defeasance / Open | 53 | $624,920,938 | 88.6 | % | |||
| Lockout / GRTR 1% or YM / Open | 8 | 54,852,416 | 7.8 | ||||
| Lockout / GRTR 1% or YM or Defeasance / Open | 3 | 23,900,000 | 3.4 | ||||
| Lockout / Defeasance / GRTR 1% or YM / Open | 1 | 1,706,163 | 0.2 | ||||
| Total: | 65 | $705,379,517 | 100.0 | % | |||
| (6) | As a result of property releases or the application of funds in a performance reserve, partial principal prepayments could occur during a period that voluntary principal prepayments are otherwise prohibited. |
CUT-OFF DATE LOAN-TO-VALUE RATIO | |||||||
| Range of Cut-off Date LTV Ratios (%) | Number of Mortgage Loans | Aggregate Cut- off Date Balance | Percent by Aggregate Cut- off Date Pool Balance (%) | ||||
| 21.9 - 30.0 | 1 | $1,706,163 | 0.2 | % | |||
| 30.1 - 35.0 | 1 | 60,000,000 | 8.5 | ||||
| 35.1 - 40.0 | 1 | 25,000,000 | 3.5 | ||||
| 40.1 - 45.0 | 3 | 18,782,569 | 2.7 | ||||
| 45.1 - 50.0 | 5 | 64,817,806 | 9.2 | ||||
| 50.1 - 55.0 | 3 | 46,686,365 | 6.6 | ||||
| 55.1 - 60.0 | 15 | 244,489,043 | 34.7 | ||||
| 60.1 - 65.0 | 8 | 42,172,504 | 6.0 | ||||
| 65.1 - 70.0 | 17 | 101,823,531 | 14.4 | ||||
| 70.1 - 74.4 | 11 | 99,901,536 | 14.2 | ||||
| Total: | 65 | $705,379,517 | 100.0 | % | |||
| Weighted Average: | 56.6% | ||||||
BALLOON OR ARD LOAN-TO-VALUE RATIO | |||||||
| Range of Balloon or ARD LTV Ratios (%) | Number of Mortgage Loans | Aggregate Cut- off Date Balance | Percent by Aggregate Cut- off Date Pool Balance (%) | ||||
| 1.3 - 25.0 | 1 | $1,706,163 | 0.2 | % | |||
| 25.1 - 30.0 | 1 | 9,526,304 | 1.4 | ||||
| 30.1 - 35.0 | 2 | 66,491,061 | 9.4 | ||||
| 35.1 - 40.0 | 5 | 36,776,845 | 5.2 | ||||
| 40.1 - 45.0 | 4 | 16,675,078 | 2.4 | ||||
| 45.1 - 50.0 | 8 | 180,579,390 | 25.6 | ||||
| 50.1 - 55.0 | 12 | 105,418,833 | 14.9 | ||||
| 55.1 - 60.0 | 23 | 209,051,803 | 29.6 | ||||
| 60.1 - 65.0 | 8 | 59,154,040 | 8.4 | ||||
| 65.1 - 65.6 | 1 | 20,000,000 | 2.8 | ||||
| Total: | 65 | $705,379,517 | 100.0 | % | |||
| Weighted Average: | 50.7% | ||||||
AMORTIZATION TYPE | |||||||
| Amortization Type | Number of Mortgage Loans | Aggregate Cut- off Date Balance | Percent by Aggregate Cut- off Date Pool Balance (%) | ||||
| Interest-only, Balloon | 12 | $278,925,000 | 39.5 | % | |||
| Amortizing Balloon | 34 | 228,448,354 | 32.4 | ||||
| Interest-only, Amortizing Balloon | 17 | 176,300,000 | 25.0 | ||||
| Interest-only, ARD | 1 | 20,000,000 | 2.8 | ||||
| Fully Amortizing | 1 | 1,706,163 | 0.2 | ||||
| Total: | 65 | $705,379,517 | 100.0 | % | |||
ORIGINAL TERM OF INTEREST-ONLY PERIOD FOR PARTIAL IO LOANS | |||||||
| IO Terms (months) | Number of Mortgage Loans | Aggregate Cut- off Date Balance | Percent by Aggregate Cut- off Date Pool Balance (%) | ||||
| 12 | 1 | $4,125,000 | 0.6 | % | |||
| 18 | 1 | 5,000,000 | 0.7 | ||||
| 24 | 12 | 85,525,000 | 12.1 | ||||
| 36 | 2 | 59,150,000 | 8.4 | ||||
| 60 | 1 | 22,500,000 | 3.2 | ||||
| Total: | 17 | $176,300,000 | 25.0 | % | |||
| Weighted Average: | 32 months | ||||||
SEASONING | |||||||
| Seasoning (months) | Number of Mortgage Loans | Aggregate Cut- off Date Balance | Percent by Aggregate Cut- off Date Pool Balance (%) | ||||
| 0 | 3 | $38,450,000 | 5.5 | % | |||
| 1 | 24 | 296,262,567 | 42.0 | ||||
| 2 | 20 | 158,599,358 | 22.5 | ||||
| 3 | 10 | 48,530,904 | 6.9 | ||||
| 4 | 4 | 114,905,023 | 16.3 | ||||
| 5 | 2 | 26,925,501 | 3.8 | ||||
| 6 | 1 | 20,000,000 | 2.8 | ||||
| 179 | 1 | 1,706,163 | 0.2 | ||||
| Total: | 65 | $705,379,517 | 100.0 | % | |||
| Weighted Average: | 3 months | ||||||
THE INFORMATION IN THIS STRUCTURAL AND COLLATERAL TERM SHEET IS NOT COMPLETE AND MAY BE AMENDED PRIOR TO THE TIME OF SALE. THIS TERM SHEET IS NOT AN OFFER TO SELL THESE SECURITIES AND IT IS NOT A SOLICITATION OF AN OFFER TO BUY THESE SECURITIES IN ANY JURISDICTION WHERE THE OFFER OR SALE IS NOT PERMITTED.
15
(THIS PAGE INTENTIONALLY LEFT BLANK)
THE INFORMATION IN THIS STRUCTURAL AND COLLATERAL TERM SHEET IS NOT COMPLETE AND MAY BE AMENDED PRIOR TO THE TIME OF SALE. THIS TERM SHEET IS NOT AN OFFER TO SELL THESE SECURITIES AND IT IS NOT A SOLICITATION OF AN OFFER TO BUY THESE SECURITIES IN ANY JURISDICTION WHERE THE OFFER OR SALE IS NOT PERMITTED.
16
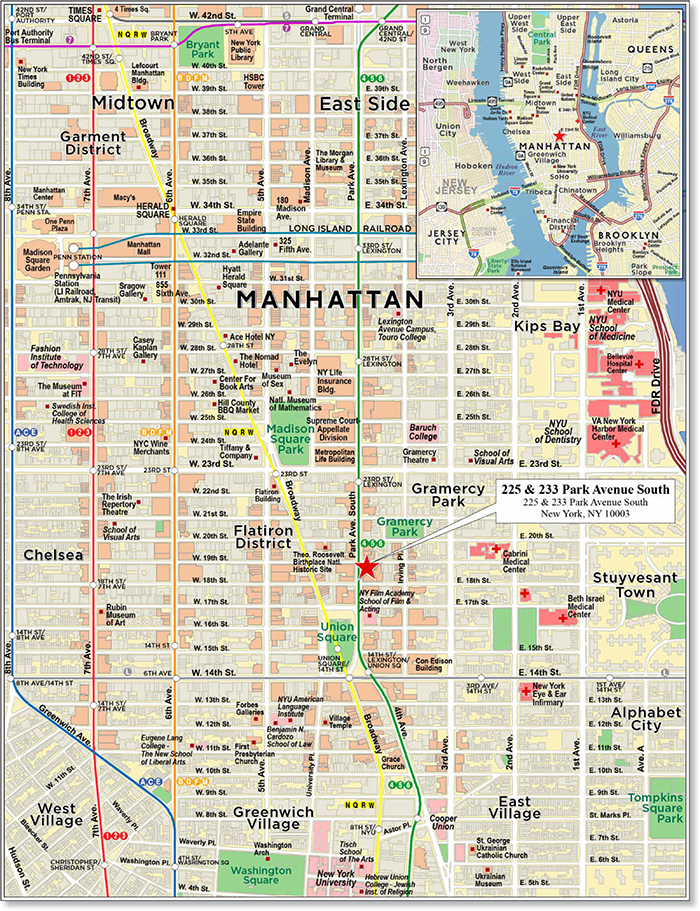
225 & 233 PARK AVENUE SOUTH
THE INFORMATION IN THIS STRUCTURAL AND COLLATERAL TERM SHEET IS NOT COMPLETE AND MAY BE AMENDED PRIOR TO THE TIME OF SALE. THIS TERM SHEET IS NOT AN OFFER TO SELL THESE SECURITIES AND IT IS NOT A SOLICITATION OF AN OFFER TO BUY THESE SECURITIES IN ANY JURISDICTION WHERE THE OFFER OR SALE IS NOT PERMITTED.
17
225 & 233 PARK AVENUE SOUTH
THE INFORMATION IN THIS STRUCTURAL AND COLLATERAL TERM SHEET IS NOT COMPLETE AND MAY BE AMENDED PRIOR TO THE TIME OF SALE. THIS TERM SHEET IS NOT AN OFFER TO SELL THESE SECURITIES AND IT IS NOT A SOLICITATION OF AN OFFER TO BUY THESE SECURITIES IN ANY JURISDICTION WHERE THE OFFER OR SALE IS NOT PERMITTED.
18
225 & 233 PARK AVENUE SOUTH
THE INFORMATION IN THIS STRUCTURAL AND COLLATERAL TERM SHEET IS NOT COMPLETE AND MAY BE AMENDED PRIOR TO THE TIME OF SALE. THIS TERM SHEET IS NOT AN OFFER TO SELL THESE SECURITIES AND IT IS NOT A SOLICITATION OF AN OFFER TO BUY THESE SECURITIES IN ANY JURISDICTION WHERE THE OFFER OR SALE IS NOT PERMITTED.
19
| No. 1 – 225 & 233 Park Avenue South | ||||||||
| Loan Information | Property Information | |||||||
| Mortgage Loan Seller: | Barclays Bank PLC | Single Asset/Portfolio: | Single Asset | |||||
| Credit Assessment (Fitch/KBRA/Moody’s): | BBB+/A/NR | Property Type: | Office | |||||
| Original Principal Balance(1): | $60,000,000 | Specific Property Type: | CBD | |||||
| Cut-off Date Balance(1): | $60,000,000 | Location: | New York, NY | |||||
| % of Initial Pool Balance: | 8.5% | Size: | 675,756 SF | |||||
| Loan Purpose: | Refinance | Cut-off Date Balance Per SF(1): | $347.76 | |||||
| Borrower Name: | 225 Fourth LLC | Year Built/Renovated: | 1909/2017 | |||||
| Borrower Sponsor: | Orda Management Corporation | Title Vesting: | Fee | |||||
| Mortgage Rate: | 3.6514% | Property Manager: | Self-Managed | |||||
| Note Date: | May 31, 2017 | 4thMost Recent Occupancy (As of)(5): | 100.0% (12/31/2013) | |||||
| Anticipated Repayment Date: | NAP | 3rdMost Recent Occupancy (As of)(5): | 95.8% (12/31/2014) | |||||
| Maturity Date: | June 6, 2027 | 2ndMost Recent Occupancy (As of)(5): | 49.2% (12/31/2015) | |||||
| IO Period: | 120 months | Most Recent Occupancy (As of)(5): | 96.6% (12/31/2016) | |||||
| Loan Term (Original): | 120 months | Current Occupancy (As of)(5)(6)(7): | 97.9% (5/24/2017) | |||||
| Seasoning: | 4 months | |||||||
| Amortization Term (Original): | NAP | Underwriting and Financial Information: | ||||||
| Loan Amortization Type: | Interest-only, Balloon | 4thMost Recent NOI (As of)(8): | $21,053,461 (12/31/2014) | |||||
| Interest Accrual Method: | Actual/360 | 3rdMost Recent NOI (As of)(8): | $22,749,971 (12/31/2015) | |||||
| Call Protection(2): | L(28),D(87),O(5) | 2ndMost Recent NOI (As of)(8): | $16,244,360 (12/31/2016) | |||||
| Lockbox Type: | Hard/Springing Cash Management | Most Recent NOI (As of)(8): | $15,248,156 (TTM 3/31/2017) | |||||
| Additional Debt(1): | Yes | |||||||
| Additional Debt Type(1)(3): | Pari Passu; Mezzanine; Future Mezzanine | |||||||
| U/W Revenues: | $48,106,942 | |||||||
| U/W Expenses: | $18,601,103 | |||||||
| U/W NOI(8): | $29,505,839 | |||||||
| Escrows and Reserves(4): | U/W NCF: | $28,439,583 | ||||||
| U/W NOI DSCR(1)(7): | 3.39x | |||||||
| Type: | Initial | Monthly | Cap (If Any) | U/W NCF DSCR(1)(7): | 3.27x | |||
| Taxes | $0 | Springing | NAP | U/W NOI Debt Yield(1)(7): | 12.6% | |||
| Insurance | $0 | Springing | NAP | U/W NCF Debt Yield(1)(7): | 12.1% | |||
| Replacement Reserves | $0 | Springing | NAP | As-Is Appraised Value(9): | $750,000,000 | |||
| TI/LC Reserve | $8,106,455 | Springing | NAP | As-Is Appraisal Valuation Date: | April 1, 2017 | |||
| Remaining Capital Expenditures | $11,529,288 | $0 | NAP | Cut-off Date LTV Ratio(1)(9): | 31.3% | |||
| Free Rent Reserve | $14,864,252 | $0 | NAP | LTV Ratio at Maturity or ARD(1)(9): | 31.3% | |||
| Buzzfeed Rollover Reserve | $0 | Springing | $13,000,000 | |||||
| (1) | See “The Mortgage Loan” section. All statistical information related to balances per square foot, loan-to-value ratios, debt service coverage ratios and debt yields are based on the 225 & 233 Park Avenue South Whole Loan (as defined below). The Cut-off Date LTV Ratio, U/W NCF DSCR and U/W NOI Debt Yield based on the 225 & 233 Park Avenue South Total Debt (as defined below), including the 225 & 233 Park Avenue South Mezzanine Loan (as defined below), are 57.3%, 1.59x and 6.9%, respectively. |
| (2) | The lockout period will be at least 28 payments, beginning with and including the first payment date of July 6, 2017. Defeasance of the 225 & 233 Park Avenue South Mortgage Loan is permitted at any time after the earlier to occur of (i) May 31, 2020 or (ii) two years after the closing date of the securitization that includes the last note to be securitized. |
| (3) | See “Subordinate and Mezzanine Indebtedness” section. |
| (4) | See “Escrows” section. |
| (5) | See “Historical Occupancy” section. |
| (6) | Current Occupancy includes the Facebook Expansion Space (as defined below) and Facebook’s 8th floor space (40,397 square feet), which have lease commencement dates of July 1, 2018 and June 1, 2017, respectively. The tenant is currently building out both spaces. The tenant expects to take occupancy of the 8th floor space in November 2017. All free rent amounts attributable to both spaces were deposited into escrow by the borrower on the origination date. |
| (7) | In September 2017, the borrower indicated that two tenants, Florian Café and Ainsworth, comprising in the aggregate, 2.8% of the net rentable area and 2.6% of the underwritten rent, have vacated their respective spaces. Excluding these two tenants, the U/W NOI DSCR, U/W NCF DSCR, U/W NOI Debt Yield and U/W NCF Debt Yield is 3.29x, 3.17x, 12.2% and 11.7%, respectively. Per the borrower, it is in negotiations with two restaurant tenants for the available space, with one of the spaces expected to be signed at a similar rental rate and the other expected to be signed at a higher rental rate. |
| (8) | See “Cash Flow Analysis” section. |
| (9) | See “Appraisal” section. The As-Is Appraised Value reflects the “As-is assuming holdbacks” value for the 225 & 233 Park Avenue South Property (as defined below) which assumes that all outstanding amounts for TI/LCs, free rent and capital expenditures are deposited into escrow on the origination date. The borrower deposited all such amounts into escrow on the origination date. The “As-is” appraised value is $720,000,000, which represents a Cut-off Date LTV Ratio and an LTV at Maturity or ARD for the 225 & 233 Park Avenue South Whole Loan and 225 & 233 Park Avenue South Total Debt of 32.6% and 59.7%, respectively. |
The Mortgage Loan.The mortgage loan (the “225 & 233 Park Avenue South Mortgage Loan”) is part of a whole loan (the “225 & 233 Park Avenue South Whole Loan”) evidenced by fourpari passu notes secured by a first mortgage encumbering the fee interest in two, contiguous office buildings located on Park Avenue South between East 18th and East 19th streets in Manhattan, New York (the “225 & 233 Park Avenue South Property”). The 225 & 233 Park Avenue South Whole Loan was originated on May 31, 2017 by Barclays Bank PLC. The 225 & 233 Park Avenue South Whole Loan had an original principal balance of $235,000,000, has an
THE INFORMATION IN THIS STRUCTURAL AND COLLATERAL TERM SHEET IS NOT COMPLETE AND MAY BE AMENDED PRIOR TO THE TIME OF SALE. THIS TERM SHEET IS NOT AN OFFER TO SELL THESE SECURITIES AND IT IS NOT A SOLICITATION OF AN OFFER TO BUY THESE SECURITIES IN ANY JURISDICTION WHERE THE OFFER OR SALE IS NOT PERMITTED.
20
225 & 233 PARK AVENUE SOUTH
outstanding principal balance as of the Cut-off Date of $235,000,000 and accrues interest at an interest rate of 3.6514%per annum. The 225 & 233 Park Avenue South Whole Loan had an initial term of 120 months, has a remaining term of 116 months as of the Cut-off Date and requires payments of interest-only through the term of the 225 & 233 Park Avenue South Whole Loan. The 225 & 233 Park Avenue South Whole Loan matures on June 6, 2027.
Note A-3, which will be contributed to the WFCM 2017-C40 Trust, had an original principal balance of $60,000,000, has an outstanding principal balance as of the Cut-off Date of $60,000,000 and represents the non-controlling interest in the 225 & 233 Park Avenue South Whole Loan. The controlling Note A-1, had an original principal balance of $70,000,000, has an outstanding principal balance as of the Cut-off Date of $70,000,000 and was contributed to the WFCM 2017-C39 Trust. The non-controlling Note A-2, had an original principal balance of $60,000,000, has an outstanding principal balance as of the Cut-off Date of $60,000,000, is currently held by Barclays Bank PLC and is expected to be contributed to the CGCMT 2017-P8 Trust. The non-controlling Note A-4, had an original principal balance of $45,000,000, has an outstanding principal balance as of the Cut-off Date of $45,000,000 and was contributed to the WFCM 2017-C38 Trust. Each of the mortgage loans evidenced by Note A-1, A-2 and A-4 are referred to herein as the “225 & 233 Park Avenue South Companion Loans”. See“Description of the Mortgage Pool—The Whole Loans—The Serviced Whole Loans” and“Pooling and Servicing Agreement” in the Preliminary Prospectus.
Note Summary
| Notes | Original Balance | Note Holder | Controlling Interest | |
| A-1 | $70,000,000 | WFCM 2017-C39 | Yes | |
| A-2 | $60,000,000 | CGCMT 2017-P8 (expected) | No | |
| A-3 | $60,000,000 | WFCM 2017-C40 | No | |
| A-4 | $45,000,000 | WFCM 2017-C38 | No | |
| Total | $235,000,000 |
Following the lockout period, on any date before February 6, 2027 the borrower has the right to defease the 225 & 233 Park Avenue South Whole Loan in whole, but not in part. The lockout period will expire on the earlier to occur of (i) two years after the closing date of the securitization that includes the last note to be securitized or (ii) May 31, 2020. The 225 & 233 Park Avenue South Whole Loan is prepayable without penalty on or after February 6, 2027.
Sources and Uses
| Sources | Uses | |||||||
| Original whole loan amount | $235,000,000 | 54.7% | Loan payoff | $226,370,056 | 52.6% | |||
| Mezzanine Loan | 195,000,000 | 45.3 | Return of equity | 159,383,488 | 37.1 | |||
| Reserves | 34,499,995 | 8.0 | ||||||
| Closing costs | 9,746,461 | 2.3 | ||||||
| Total Sources | $430,000,000 | 100.0% | Total Uses | $430,000,000 | 100.0% |
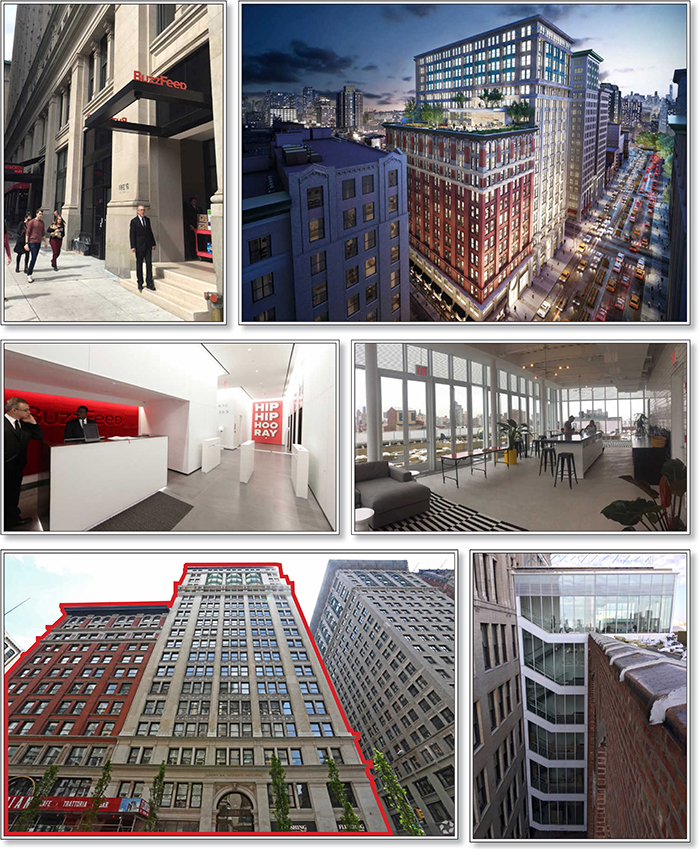
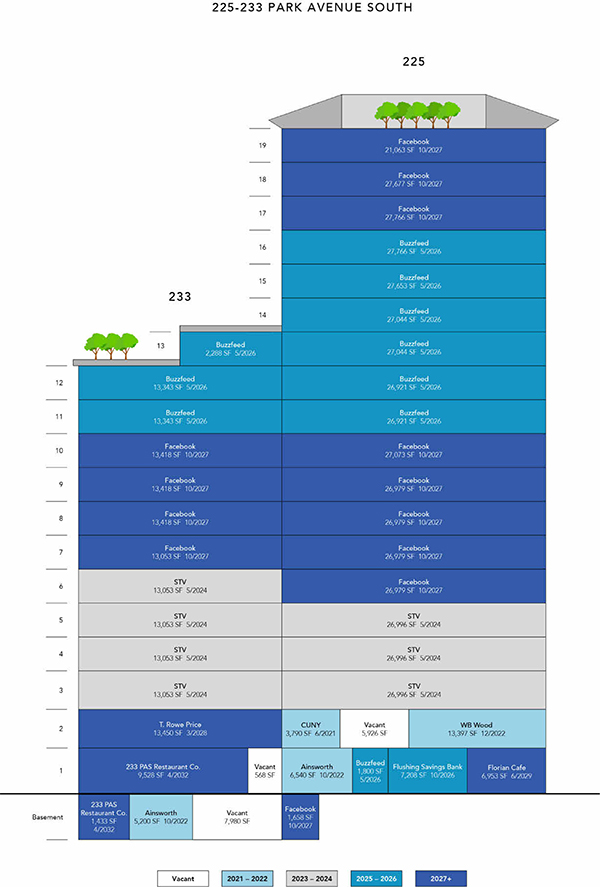
The Property.The 225 & 233 Park Avenue South Property comprises two contiguous Class A office buildings, totaling 675,756 square feet, located on Park Avenue South, between East 18th and East 19th Streets in Manhattan, New York. 225 Park Avenue South is a 19-story Class A office building with 503,104 square feet built in 1910. 233 Park Avenue South is a 13-story Class A office building built in 1909 with 172,652 square feet. The two buildings operate as a single property, as they are interconnected on each floor. The 225 & 233 Park Avenue South Property provides various amenities, including, but not limited to, exclusive outdoor spaces on the roof of each building, bike storage and separate entrances, one on Park Avenue South and one on East 18th Street. The 225 & 233 Park Avenue South Property is located one block north of Union Square and one block south of Gramercy Park. According to the appraisal, the 225 & 233 Park Avenue South Property is considered to be located in a trendy, upscale neighborhood with access to restaurants, nightclubs, galleries, theaters and universities. As of May 24, 2017, the 225 & 233 Park Avenue South Property was 97.9% leased to 10 tenants.
Prior to 2014, the 225 & 233 Park Avenue South Property was 100.0% occupied by the Port Authority of New York and New Jersey (the “Port Authority”), STV and a few other tenants. Once the Port Authority elected to leave the building in 2015, the borrower sponsor commenced an approximately $133 million capital improvement plan for the 225 & 233 Park Avenue South Property. Of the $133 million, approximately $113.6 million had been spent as of the origination date on various hard and soft improvements and tenant improvements and leasing costs for Facebook, Buzzfeed, T. Rowe Price and the new ground floor restaurant. The remaining $19.6 million was deposited into escrow by the borrower on the origination date. The outstanding hard and soft improvements include upgrading the elevators, building out the 19th floor garden courtyard/rooftop and finishing the build-out of the ground floor retail.
The 225 & 233 Park Avenue South Property’s largest tenant is Facebook, a technology company whose platforms allow users to communicate with family, friends and coworkers. Facebook utilizes the 225 & 233 Park Avenue South Property as its marketing headquarters and leases 39.4% of net rentable area through October 2027. Facebook has been a tenant at the 225 & 233 Park Avenue South Property since October 2016 and has invested approximately $60 million in excess of its initial tenant improvement allowance into its respective space. The build-out includes a sit-down restaurant and garden courtyard/rooftop on the 19thfloor, a contiguous staircase between the 8th, 9th and 10th floors and interior design by Frank Gehry. On May 26, 2017, Facebook exercised an expansion option to lease a portion of the 6th floor and the entire 7th floor, an increase of 67,011 square feet. The tenant is currently engaged in the build-out of the expansion space and is expected to take occupancy in July 2018. As of December 31, 2016, Facebook had approximately 1.23 billion daily active users.
THE INFORMATION IN THIS STRUCTURAL AND COLLATERAL TERM SHEET IS NOT COMPLETE AND MAY BE AMENDED PRIOR TO THE TIME OF SALE. THIS TERM SHEET IS NOT AN OFFER TO SELL THESE SECURITIES AND IT IS NOT A SOLICITATION OF AN OFFER TO BUY THESE SECURITIES IN ANY JURISDICTION WHERE THE OFFER OR SALE IS NOT PERMITTED.
21
225 & 233 PARK AVENUE SOUTH
The second largest tenant, Buzzfeed, leases 28.7% of net rentable area through May 2026 (see “Escrows” below). Buzzfeed is an independent digital media company delivering news and entertainment to millions of users globally. Buzzfeed, who has its headquarters at 225 & 233 Park Avenue South, has been a tenant at the 225 & 233 Park Avenue South Property since June 2015 and has spent approximately $23.9 million in excess of its initial tenant improvement allowance into its space. Buzzfeed has its own separate building entrance on East 18th street and has a garden courtyard/rooftop on the 13th floor (the top floor of the 233 Park Avenue South Property). As of November 2016, Buzzfeed raised approximately $200 million from NBCUniversal, increasing the company’s investment in Buzzfeed to approximately $400 million. Based on the terms of the NBCUniversal investment, Buzzfeed would be valued at approximately $1.7 billion.
The third largest tenant is STV, a firm offering engineering, architectural, planning, environmental and construction management services. STV leases 19.7% of net rentable area through May 2024, has been a tenant at the 225 & 233 Park Avenue South Property since 1983 and recently expanded into a portion of the fourth floor totaling 13,053 square feet.
The following table presents certain information relating to the tenancy at the 225 & 233 Park Avenue South Property:
Major Tenants
| Tenant Name | Credit Rating /S&P)(1) | Tenant NRSF | % of NRSF | Annual U/W Base Rent PSF | Annual U/W Base Rent | % of Total Annual U/W Base Rent | Lease Expiration Date |
| Major Tenants | |||||||
| Facebook(2)(3) | NR/NR/NR | 266,460 | 39.4% | $79.36 | $21,146,899 | 45.1% | 10/31/2027(4)(5) |
| Buzzfeed(6)(7) | NR/NR/NR | 194,123 | 28.7% | $76.28 | $14,808,325 | 31.6% | 5/31/2026 |
| STV | NR/NR/NR | 133,200 | 19.7% | $45.33 | $6,037,948 | 12.9% | 5/31/2024(8) |
| 233 PAS Restaurant Co.(9) | NR/NR/NR | 10,961 | 1.6% | $100.36 | $1,100,000 | 2.3% | 4/30/2032(10) |
| T. Rowe Price(11) | NR/NR/NR | 13,450 | 2.0% | $78.00 | $1,049,100 | 2.2% | 3/31/2028(12) |
| Total Major Tenants | 618,194 | 91.5% | $71.41 | $44,142,272 | 94.2% | ||
| Non-Major Tenants | 43,088 | 6.4% | $63.64 | $2,742,314 | 5.8% | ||
| Occupied Collateral Total | 661,282 | 97.9% | $70.90 | $46,884,586 | 100.0% | ||
| Vacant Space | 14,474 | 2.1% | |||||
| Collateral Total | 675,756 | 100.0% | |||||
| (1) | Certain ratings are those of the parent company whether or not the parent guarantees the lease. |
| (2) | Facebook recently exercised its expansion option at the 225 & 233 Park Avenue South Property for a portion of the 6th floor and the entire 7th floor totaling 67,011 square feet (the “Facebook Expansion Space”). |
| (3) | Facebook is entitled to 19 months of free rent through December 2018 for the Facebook Expansion Space (9.9% of net rentable area), 12 months of free rent through May 2018 for the 8thfloor, totaling 40,397 square feet (6.0% of net rentable area) and five months of free rent through October 2017 for the 18th and 19th floors, totaling 48,740 square feet (7.2% of net rentable area). Such free rent amount was deposited into escrow by the borrower on the origination date. |
| (4) | Facebook has one five-year lease renewal option on the (i) 8th, 9th, 10th, 17th, 18th and 19th floors, (ii) 9th and 10th floors, (iii) 17th, 18th and 19th floors or (iv) 9th, 10th, 17th, 18th and 19thfloors. |
| (5) | Facebook has a one-time right to terminate its lease effective March 31, 2024 by providing 18 months’ written notice and delivering a termination payment of $32,991,937. However, the termination payment will be increased by seven months of fixed rent with respect to the Facebook Expansion Space and the unamortized value of the transaction costs with respect to the Facebook Expansion Space amortized at a 6% interest rate over the term of the Facebook Expansion Space. |
| (6) | Buzzfeed currently subleases the entire 11th floor of the 225 building (26,921 square feet) to Teacher Synergy, LLC, through June 30, 2019. The sublease will automatically renew on a month-to-month basis after the expiration date until either Buzzfeed or Teacher Synergy, LLC give six months’ termination notice to one another. |
| (7) | Buzzfeed is entitled to 16 months of free rent through September 2018 on 2,288 square feet (0.3% of the net rentable area). Such free rent amount was deposited into escrow by the borrower on the origination date. |
| (8) | STV has one, ten-year lease renewal option. The renewal may apply to all or a part of the STV premises, provided that the renewal may not consist of less than two full contiguous floors within the 225 & 233 Park Avenue South Property. |
| (9) | 233 PAS Restaurant Co. is entitled to 10 months of free rent through March 2018 on 9,488 square feet (1.4% of net rentable area). Such free rent amount was deposited into escrow by the borrower on the origination date. |
| (10) | 233 PAS Restaurant Co. has one, five-year lease renewal option. |
| (11) | T. Rowe Price is entitled to nine months of free rent through February 2018 on 13,450 square feet (2.0% of net rentable area). Such free rent amount was deposited into escrow by the borrower on the origination date. |
| (12) | T. Rowe Price has one, five-year lease renewal option. |
THE INFORMATION IN THIS STRUCTURAL AND COLLATERAL TERM SHEET IS NOT COMPLETE AND MAY BE AMENDED PRIOR TO THE TIME OF SALE. THIS TERM SHEET IS NOT AN OFFER TO SELL THESE SECURITIES AND IT IS NOT A SOLICITATION OF AN OFFER TO BUY THESE SECURITIES IN ANY JURISDICTION WHERE THE OFFER OR SALE IS NOT PERMITTED.
22
225 & 233 PARK AVENUE SOUTH
The following table presents certain information relating to the lease rollover schedule at the 225 & 233 Park Avenue South Property:
Lease Expiration Schedule(1)(2)
| Year Ending December 31, | No. of Leases Expiring | Expiring NRSF | % of Total NRSF | Cumulative Expiring NRSF | Cumulative % of Total NRSF | Annual U/W Base Rent | % of Annual U/W Base Rent | Annual U/W Base Rent PSF |
| MTM | 0 | 0 | 0.0% | 0 | 0.0% | $0 | 0.0% | $0.00 |
| 2017 | 0 | 0 | 0.0% | 0 | 0.0% | $0 | 0.0% | $0.00 |
| 2018 | 0 | 0 | 0.0% | 0 | 0.0% | $0 | 0.0% | $0.00 |
| 2019 | 0 | 0 | 0.0% | 0 | 0.0% | $0 | 0.0% | $0.00 |
| 2020 | 0 | 0 | 0.0% | 0 | 0.0% | $0 | 0.0% | $0.00 |
| 2021 | 1 | 3,790 | 0.6% | 3,790 | 0.6% | $287,547 | 0.6% | $75.87 |
| 2022 | 2 | 25,137 | 3.7% | 28,927 | 4.3% | $1,353,139 | 2.9% | $53.83 |
| 2023 | 0 | 0 | 0.0% | 28,927 | 4.3% | $0 | 0.0% | $0.00 |
| 2024 | 1 | 133,200 | 19.7% | 162,127 | 24.0% | $6,037,948 | 12.9% | $45.33 |
| 2025 | 0 | 0 | 0.0% | 162,127 | 24.0% | $0 | 0.0% | $0.00 |
| 2026 | 2 | 201,331 | 29.8% | 363,458 | 53.8% | $15,309,953 | 32.7% | $76.04 |
| 2027 | 1 | 266,460 | 39.4% | 629,918 | 93.2% | $21,146,899 | 45.1% | $79.36 |
| Thereafter | 3 | 31,364 | 4.6% | 661,282 | 97.9% | $2,749,100 | 5.9% | $87.65 |
| Vacant | 0 | 14,474 | 2.1% | 675,756 | 100.0% | $0 | 0.0% | $0.00 |
| Total/Weighted Average | 10 | 675,756 | 100.0% | $46,884,586 | 100.0% | $70.90 |
| (1) | Information obtained from the underwritten rent roll and includes rent steps through April 2018. |
| (2) | Certain tenants may have lease termination or contraction options that are exercisable prior to the originally stated expiration date of the subject lease and that are not considered in the Lease Expiration Schedule. |
The following table presents historical occupancy percentages at the 225 & 233 Park Avenue South Property:
Historical Occupancy
12/31/2013(1) | 12/31/2014(1)(2) | 12/31/2015(1)(2) | 12/31/2016(1) | 5/24/2017(3)(4)(5) |
| 100.0% | 95.8% | 49.2% | 96.6% | 97.9% |
| (1) | Information obtained from the borrower. |
| (2) | The decrease in occupancy from year-end 2014 to year-end 2015 is a result of Port Authority vacating its premises at the 225 & 233 Park Avenue South Property, except for Floors 4 and 8 in the 233 Park Avenue South building. The borrower sponsor commenced gut renovating the space made available after Port Authority vacated. |
| (3) | Information obtained from the underwritten rent roll. |
| (4) | Current Occupancy includes the Facebook Expansion Space and Facebook’s 8th floor space (40,397 square feet), which have a lease commencement date of July 1, 2018 and June 1, 2017, respectively. The tenant is currently building out both spaces. The tenant expects to take occupancy of the 8th floor space in November 2017. All free rent amounts attributable to both spaces were deposited into escrow by the borrower on the origination date. |
| (5) | In September 2017, the borrower indicated that two tenants, Florian Café and Ainsworth, comprising in the aggregate 2.8% of the net rentable area and 2.6% of the underwritten rent, have vacated their respective spaces. Per the borrower, it is in negotiations with two restaurant tenants for the available space, with one of the spaces expected to be signed at a similar rental rate and the other expected to be signed at a higher rental rate. |
THE INFORMATION IN THIS STRUCTURAL AND COLLATERAL TERM SHEET IS NOT COMPLETE AND MAY BE AMENDED PRIOR TO THE TIME OF SALE. THIS TERM SHEET IS NOT AN OFFER TO SELL THESE SECURITIES AND IT IS NOT A SOLICITATION OF AN OFFER TO BUY THESE SECURITIES IN ANY JURISDICTION WHERE THE OFFER OR SALE IS NOT PERMITTED.
23
225 & 233 PARK AVENUE SOUTH
Operating History and Underwritten Net Cash Flow. The following table presents certain information relating to the historical operating performance and the underwritten net cash flow at the 225 & 233 Park Avenue South Property:
Cash Flow Analysis
| 2014 | 2015(1) | 2016(1)(2) | TTM 3/31/2017(2) | U/W(3) | % of U/W Effective Gross Income | U/W $ per SF | ||||||||
| Base Rent(4) | $34,757,905 | $36,390,135 | $30,962,652 | $31,901,632 | $45,723,854 | 95.0% | $67.66 | |||||||
| Grossed Up Vacant Space | 0 | 0 | 0 | 0 | 977,863 | 2.0 | 1.45 | |||||||
| Rent Steps | 0 | 0 | 0 | 0 | 445,767 | 0.9 | 0.66 | |||||||
| Total Reimbursables | 5,329,836 | 5,220,534 | 4,283,556 | 2,896,654 | 2,082,476 | 4.3 | 3.08 | |||||||
| Other Income(5) | 311,227 | 271,394 | 248,411 | 245,387 | 245,387 | 0.5 | 0.36 | |||||||
| Less Vacancy & Credit Loss | 0 | 0 | 0 | 0 | (1,368,405) | (2.8) | (2.02) | |||||||
| Effective Gross Income | $40,398,967 | $41,882,063 | $35,494,619 | $35,043,673 | 48,106,942 | 100.0% | $71.19 | |||||||
| Total Operating Expenses | $19,345,506 | $19,132,092 | $19,250,259 | $19,795,518 | $18,601,103 | 38.7% | $27.53 | |||||||
| Net Operating Income | $21,053,461 | $22,749,971 | $16,244,360 | $15,248,156 | $29,505,839 | 61.3% | $43.66 | |||||||
| TI/LC | 0 | 0 | 0 | 0 | 991,923 | 2.1 | 1.47 | |||||||
| Capital Expenditures | 0 | 0 | 0 | 0 | 74,333 | 0.2 | 0.11 | |||||||
| Net Cash Flow | $21,053,461 | $22,749,971 | $16,244,360 | $15,248,156 | $28,439,583 | 59.1% | $42.09 | |||||||
| NOI DSCR(6) | 2.42x | 2.61x | 1.87x | 1.75x | 3.39x | |||||||||
| NCF DSCR(6) | 2.42x | 2.61x | 1.87x | 1.75x | 3.27x | |||||||||
| NOI DY(6) | 9.0% | 9.7% | 6.9% | 6.5% | 12.6% | |||||||||
| NCF DY(6) | 9.0% | 9.7% | 6.9% | 6.5% | 12.1% |
| (1) | The decrease in Net Operating Income from 2015 to 2016 is primarily due to the Port Authority of New York and New Jersey vacating its premises in March 2015, with the exception of Floors 4 and 8. The Port Authority of New York and New Jersey previously occupied 305,426 square feet and at rental rates between $56 and $62 per square foot on a modified gross basis. |
| (2) | The decrease in Net Operating Income from 2016 to TTM 3/31/2017 is a result of the borrower sponsor’s gut renovation of the space previously occupied by the Port Authority of New York and New Jersey. Additionally, two tenants, Buzzfeed and Facebook, totaling 186,368 square feet (27.6% of the net rentable area) were in free rent periods. |
| (3) | The increase in Effective Gross Income from TTM 3/31/2017 to U/W is primarily due to (i) Facebook’s signed-not-occupied rent of $8,163,008 for the Facebook Expansion Space and its space on the 8th floor, (ii) three tenants (Buzzfeed, Facebook and STV) totaling 198,791 square feet (29.4% of net rentable area) concluding their rent abatement period and (iii) rent steps taken through April 2018. |
| (4) | Underwritten Base Rent is inclusive of a rent credit of $714,965 for Facebook who is reimbursed $2.70 per square foot for cleaning costs. |
| (5) | Other Income consists of cleaning income and other miscellaneous items. |
| (6) | Debt service coverage ratios and debt yields are based on the 225 & 233 Park Avenue South Whole Loan. |
Appraisal.As of the appraisal valuation date of April 1, 2017 the 225 & 233 Park Avenue South Property had an “as-is” appraised value of $720,000,000, which equates to an “as-is” Cut-off Date LTV of 32.6% and 59.7% for the 225 & 233 Park Avenue South Whole Loan and the 225 & 233 Park Avenue South Total Debt, respectively. The appraiser also concluded to an “as-is assuming holdbacks” value of $750,000,000 as of April 1, 2017, which equates to an “as-is assuming holdbacks” Cut-off Date LTV Ratio of 31.3% and 57.3% for the 225 & 233 Park Avenue South Whole Loan and the 225 & 233 Park Avenue South Total Debt, respectively. The “as-is assuming holdbacks” value presumes that all outstanding amounts related to the TI/LCs, free rent and capital expenditures are deposited into escrow on the origination date. The borrower deposited all such amounts into escrow on the origination date.
Environmental Matters. According to a Phase I environmental site assessment dated April 13, 2017, there was no evidence of any recognized environmental conditions at the 225 & 233 Park Avenue South Property.
Market Overview and Competition.The 225 & 233 Park Avenue South Property is located in the Madison/Union Square office submarket of the Midtown South Manhattan market, a block north of Union Square and a few blocks south of Madison Square Park. The 225 & 233 Park Avenue South Property is located within “Silicon Alley”, the stretch of Broadway from the Flatiron District to SoHo, and is also considered a hub for startups and tech companies. A few of the corporate neighbors to the 225 & 233 Park Avenue South Property are Tumblr, Sony, MasterCard and Digitas. The 225 & 233 Park Avenue South Property also benefits from its vicinity to numerous retailers and various fine and casual dining options. Proximity to Union Square provides access to multiple subway lines, including the 4, 5, 6, N, Q, R, W and L, all of which connect to various parts of New York City.
As of the first quarter of 2017, the Madison/Union Square office submarket had approximately 32.0 million square feet of office inventory, direct weighted average Class A asking rents of $84.23 per square foot and a vacancy rate of 3.9%. According to the appraisal, average Class A office rents in the Madison/Union Square submarket are $81.83 per square foot, with multiple spaces in the market exceeding $90.00 per square foot.
THE INFORMATION IN THIS STRUCTURAL AND COLLATERAL TERM SHEET IS NOT COMPLETE AND MAY BE AMENDED PRIOR TO THE TIME OF SALE. THIS TERM SHEET IS NOT AN OFFER TO SELL THESE SECURITIES AND IT IS NOT A SOLICITATION OF AN OFFER TO BUY THESE SECURITIES IN ANY JURISDICTION WHERE THE OFFER OR SALE IS NOT PERMITTED.
24
225 & 233 PARK AVENUE SOUTH
The following table presents certain information relating to comparable leases to the 225 & 233 Park Avenue South Property:
Comparable Leases(1)
| Property Name/Location | Year Built | Stories | Floor | Total GLA (SF) | Distance from Subject | Tenant Name | Lease Date/Term | Lease Area (SF) | Annual Base Rent PSF | Lease Type |
412 West 13th Street New York, NY | 1900/2001 | 8 | 3 – 6 | 80,330 | 1.5 miles | Bumble & Bumble | Feb 2017 / 15 Yrs | 41,210 | $93.00 | Gross |
853 Broadway New York, NY | 1929 | 21 | 21 | 126,000 | 0.3 miles | 21stCentury Fox / True XMedia | Jan 2017 / 10 Yrs | 5,864 | $110.00 | Gross |
413 West 14th Street New York, NY | 2017 | 5 | 3, 4, PH | 110,358 | 1.4 miles | Argo Group | Feb 2017 / 15 Yrs | 45,495 | $92.00 | Gross |
430 West 15th Street New York, NY | 1950/2016 | 7 | 2 – 7 | 98,087 | 1.4 miles | Live Nation Entertainment, Inc. | Jan 2017 / 15 Yrs | 76,915 | $98.66 | Gross |
315 Park Avenue South New York, NY | 1928/2007 | 20 | 11 – 12 | 276,000 | 0.3 miles | BDG Media | Nov 2016 / 10 Yrs | 34,100 | $85.00 | Gross |
330 Hudson Street New York, NY | 2013 | 13 | Pt. 9 - 10 | 394,315 | 2.0 miles | Deloitte Digital | Nov 2016 / 12 Yrs | 37,356 | $80.00 | Gross |
250 Hudson Street New York, NY | 1928 | 14 | 8 | 30,000 | 2.3 miles | Lieff Cabraser Heimann & Bernstein | Sept 2016 / 10 Yrs | 27,778 | $78.00 | Gross |
315 Park Avenue South New York, NY | 1928/2007 | 20 | 19 – 20 | 276,000 | 0.3 miles | Winton Capital | July 2016 / 10 Yrs | 34,844 | $100.00 | Gross |
200 Park Avenue South New York, NY | 1908 | 17 | 6 – 7 | 225,000 | 0.05 miles | Elizabeth Arden | Mar 2016 / 10 Yrs | 35,698 | $64.00 | Gross |
770 Broadway New York, NY | 1905 | 15 | 14 | 911,213 | 0.5 miles | Feb. 2016 / 12 Yrs | 79,998 | $105.00 | Gross |
| (1) | Information obtained from the appraisal. |
The Borrower.The borrower for the 225 & 233 Park Avenue South Whole Loan is 225 Fourth LLC, a Delaware limited liability company and a special purpose entity with two independent directors. Legal counsel to the borrower delivered a non-consolidation opinion in connection with the origination of the 225 & 233 Park Avenue South Whole Loan. Morton F. Silver and Orda Management Corporation are the guarantors of certain nonrecourse carveouts under the 225 & 233 Park Avenue South Whole Loan. Morton F. Silver’s carveouts under the 225 & 233 Park Avenue South Whole Loan are limited to transfers of the 225 & 233 Park Avenue South Property and bankruptcy.
The Borrower Sponsor.The borrower sponsor is Orda Management Corporation (“ORDA”). ORDA is a New York-based family-owned business organized in New York in 1952 as a company and incorporated in 1956. ORDA predominantly develops, manages and owns residential and commercial real estate in the New York metropolitan area. ORDA has also gained a reputation for developing and renovating historic buildings. ORDA, in conjunction with the Related Companies, has developed the Armory, The Sierra, the Tate and the Westport.
Escrows.The loan documents provide for upfront reserves in the amount of $14,864,252 for free rent, $11,529,288 for remaining base building costs and fees and $8,106,455 for outstanding tenant improvements and leasing commissions.
The loan documents do not require monthly reserve deposits for real estate taxes, replacement reserves and TI/LCs so long as no Trigger Period (as defined below) has occurred and is continuing. The loan documents do not require ongoing monthly escrows for insurance premiums as long as (i) no Trigger Period is in effect and (ii) the borrower provides the lender with evidence that the 225 & 233 Park Avenue South Property is insured via an acceptable blanket insurance policy and such policy is in full force and effect. Following the occurrence and during the continuance of a Trigger Period, the borrower is required to make monthly deposits of one-twelfth of the real estate taxes due, one-twelfth of the estimated insurance premiums, $11,176 (approximately $0.20 per square foot annually) for replacement reserves and $55,878 (approximately $1.00 per square foot annually) for TI/LCs.
The borrower is required, no later than one business day after receipt of the Facebook lease termination payment, to deposit such lease termination payment into the TI/LC reserve (“Facebook Rollover Reserve Fund”). The Facebook Rollover Reserve Fund will be used for tenant improvements and leasing commissions incurred in connection with the re-leasing of the Facebook space.
On the payment date occurring in June 2018 and each payment date thereafter prior to the occurrence of a Buzzfeed Trigger Period (as defined below), the borrower will be required to deposit $112,623 into a reserve (the “Buzzfeed Rollover Reserve”) and on each payment date during the continuation of a Buzzfeed Trigger Period, the borrower will be required to sweep all excess cash flow from the 225 & 233 Park Avenue South Property into the Buzzfeed Rollover Reserve until the amounts on deposit equal or exceed $13,000,000 (the “Buzzfeed Rollover Cap”).
THE INFORMATION IN THIS STRUCTURAL AND COLLATERAL TERM SHEET IS NOT COMPLETE AND MAY BE AMENDED PRIOR TO THE TIME OF SALE. THIS TERM SHEET IS NOT AN OFFER TO SELL THESE SECURITIES AND IT IS NOT A SOLICITATION OF AN OFFER TO BUY THESE SECURITIES IN ANY JURISDICTION WHERE THE OFFER OR SALE IS NOT PERMITTED.
25
225 & 233 PARK AVENUE SOUTH
A “Trigger Period” means the occurrence of a (i) Default Trigger Period, (ii) Buzzfeed Trigger Period, (iii) Mezzanine Trigger Period or (iv) DSCR Trigger Period.
A “Default Trigger Period” will commence upon the occurrence and continuance of an event of default under the 225 & 233 Park Avenue South Whole Loan documents and expire upon the cure of such event of default.
A “Buzzfeed Trigger Period” will commence on April 1, 2025, the date that is 14 months prior to the scheduled expiration of the Buzzfeed lease, and terminate upon (i) Buzzfeed renewing or extending its lease in accordance with the 225 & 233 Park Avenue South Whole Loan documents and (a) Buzzfeed paying full, unabated rent under such renewed or extended lease or (b) Buzzfeed being obligated to begin paying full unabated rent under such renewed or extended lease if the borrower reserves with the lender the amount equal to the aggregate amount of the rent that would accrue during such free rent period, (ii) (1) the borrower leasing the entire Buzzfeed space to one or more tenants pursuant to replacement lease(s) acceptable to the lender, (2) such tenants being in physical occupancy of their space, (3) such tenants being open for business and the landlord’s leasing obligations for such replacement lease(s) having been paid and (4) the applicable replacement tenant(s) paying full, unabated rent equaling or exceeding the rent payable under the Buzzfeed lease or (iii) the amount reserved in the Buzzfeed Rollover Reserve equaling or exceeding the Buzzfeed Rollover Cap. However, if clauses (i) and (ii) above occur prior to April 1, 2025, a Buzzfeed Trigger Period will not commence.
A “Mezzanine Trigger Period” will commence upon the date that the lender has received written notice from the mezzanine lender that an event of default under the 225 & 233 Park Avenue South Mezzanine Loan exists and expire upon the date that the lender has received written notice from the mezzanine lender that such event of default no longer exists.
A “DSCR Trigger Period” will commence upon the debt service coverage ratio (on the 225 & 233 Park Avenue South Total Debt), as calculated in the loan documents, being less than 1.20x and expire upon the date that the debt service coverage ratio (on the 225 & 233 Park Avenue South Total Debt) is equal to or greater than 1.25x for two consecutive quarters.
Lockbox and Cash Management.The 225 & 233 Park Avenue South Whole Loan is structured with a hard lockbox and springing cash management. The borrower was required at origination to deliver letters to all tenants at the 225 & 233 Park Avenue South Property directing them to pay all rents directly into a lender-controlled lockbox account. All funds received by the borrower or manager are required to be deposited in the lockbox account within two business days following receipt, unless a Trigger Period has occurred, in which event such funds are required to be swept each business day into the cash management account controlled by the lender and disbursed on each payment date in accordance with the loan documents.
Property Management. The 225 & 233 Park Avenue South Property is managed by an affiliate of the borrower.
Assumption.The borrower has, at any time (other than the period 90 days prior to a securitization of a note or the period 90 days after a securitization of a note) the right to transfer the 225 & 233 Park Avenue South Property, provided that certain conditions are satisfied, including: (i) no event of default has occurred and is continuing, (ii) the borrower has provided the lender with 30 days’ prior written notice, (iii) the proposed transferee qualifies as a qualified transferee under the loan documents, (iv) the payment of an assumption fee of $136,628 for the first such assumption of the 225 & 233 Park Avenue South Whole Loan and $273,256 for each subsequent assumption of the 225 & 233 Park Avenue South Whole Loan, and (v) the lender has received confirmation from KBRA, Fitch and Moody’s that such assumption will not result in a downgrade of the respective ratings assigned to the Series 2017-C40 certificates and similar confirmations from each rating agency rating any securities backed by any of the 225 & 233 Park Avenue South Companion Loans.
Partial Release. Not permitted.
Real Estate Substitution.Not permitted.
Subordinate and Mezzanine Indebtedness.Barclays Bank PLC funded a $195,000,000 mezzanine loan (the “225 & 233 Park Avenue South Mezzanine Loan” and together with the 225 & 233 Park Avenue South Whole Loan, the “225 & 233 Park Avenue South Total Debt”) with the origination of the 225 & 233 Park Avenue South Whole Loan. Of the $195,000,000, $153,000,000 was sold to Hangang US Real Estate Fund No.2 and Barclays currently holds the remaining $42,000,000 and expects to sell the remaining portion to one or more third party investors. The 225 & 233 Park Avenue South Mezzanine Loan was further split into a mezzanine A loan equal to $80,000,000, a mezzanine B loan equal to $75,000,000 and a mezzanine C loan equal to $40,000,000. The 225 & 233 Park Avenue South mezzanine loans are coterminous with the 225 & 233 Park Avenue South Whole Loan and accrue interest at a blended fixedper annum rate equal to 4.6700%. The Cut-off Date LTV, UW NCF DSCR and UW NOI Debt Yield on the 225 & 233 Park Avenue South Total Debt is 57.3%, 1.59x and 6.9%, respectively. An intercreditor agreement is in place with respect to the 225 & 233 Park Avenue South Whole Loan and the 225 & 233 Park Avenue South Mezzanine Loan.
Provided no event of default has occurred and is continuing, the borrower is permitted to incur future mezzanine indebtedness, provided (a) prior written notice of not less than 45 days, but not more than 90 days, is provided to the lender specifying the origination date of the permitted mezzanine loan, (b) the mezzanine lender enters into an intercreditor agreement acceptable to the rating agencies and reasonably acceptable to the lender, (c) the mezzanine loan will have a term that is at least coterminous with the 225 & 233 Park Avenue South Whole Loan, (d) the mezzanine loan will be current pay and will not be a payment in kind structure, (e) the combined loan-to-value ratio for the 225 & 233 Park Avenue South Total Debt and permitted mezzanine loan will not be greater than 54.46%, (f) the debt service coverage ratio of the 225 & 233 Park Avenue South Total Debt and the permitted mezzanine loan is equal to or greater than 1.67x, (g) if the mezzanine loan is floating rate, the borrower is required to acquire and maintain an interest rate cap or swap agreement from a counterparty reasonably acceptable to the lender, (h) a rating agency confirmation from each of KBRA, Fitch and Moody’s that the future mezzanine indebtedness will not result in a downgrade, withdrawal or qualification of the respective ratings assigned to the Series 2017-C40 Certificates and similar ratings confirmations
THE INFORMATION IN THIS STRUCTURAL AND COLLATERAL TERM SHEET IS NOT COMPLETE AND MAY BE AMENDED PRIOR TO THE TIME OF SALE. THIS TERM SHEET IS NOT AN OFFER TO SELL THESE SECURITIES AND IT IS NOT A SOLICITATION OF AN OFFER TO BUY THESE SECURITIES IN ANY JURISDICTION WHERE THE OFFER OR SALE IS NOT PERMITTED.
26
225 & 233 PARK AVENUE SOUTH
from each rating agency rating any securities backed by the 225 & 233 Park Avenue South Companion Loans with respect to the ratings of such securities, and (i) any other requirements as stated under the 225 & 233 Park Avenue South Whole Loan documents are met.
Ground Lease.None.
Terrorism Insurance. The 225 & 233 Park Avenue South Whole Loan documents require that the “all risk” insurance policy required to be maintained by the borrower provide coverage for terrorism in an amount equal to the full replacement cost of the 225 & 233 Park Avenue South Property, or that if the Terrorism Risk Insurance Program Reauthorization Act is no longer in effect and such policies contain an exclusion for acts of terrorism, the borrower will obtain, to the extent available, a stand-alone policy that provides the same coverage as the policies would have if such exclusion did not exist.
THE INFORMATION IN THIS STRUCTURAL AND COLLATERAL TERM SHEET IS NOT COMPLETE AND MAY BE AMENDED PRIOR TO THE TIME OF SALE. THIS TERM SHEET IS NOT AN OFFER TO SELL THESE SECURITIES AND IT IS NOT A SOLICITATION OF AN OFFER TO BUY THESE SECURITIES IN ANY JURISDICTION WHERE THE OFFER OR SALE IS NOT PERMITTED.
27
(THIS PAGE INTENTIONALLY LEFT BLANK)
THE INFORMATION IN THIS STRUCTURAL AND COLLATERAL TERM SHEET IS NOT COMPLETE AND MAY BE AMENDED PRIOR TO THE TIME OF SALE. THIS TERM SHEET IS NOT AN OFFER TO SELL THESE SECURITIES AND IT IS NOT A SOLICITATION OF AN OFFER TO BUY THESE SECURITIES IN ANY JURISDICTION WHERE THE OFFER OR SALE IS NOT PERMITTED.
28
| MALL OF LOUISIANA |
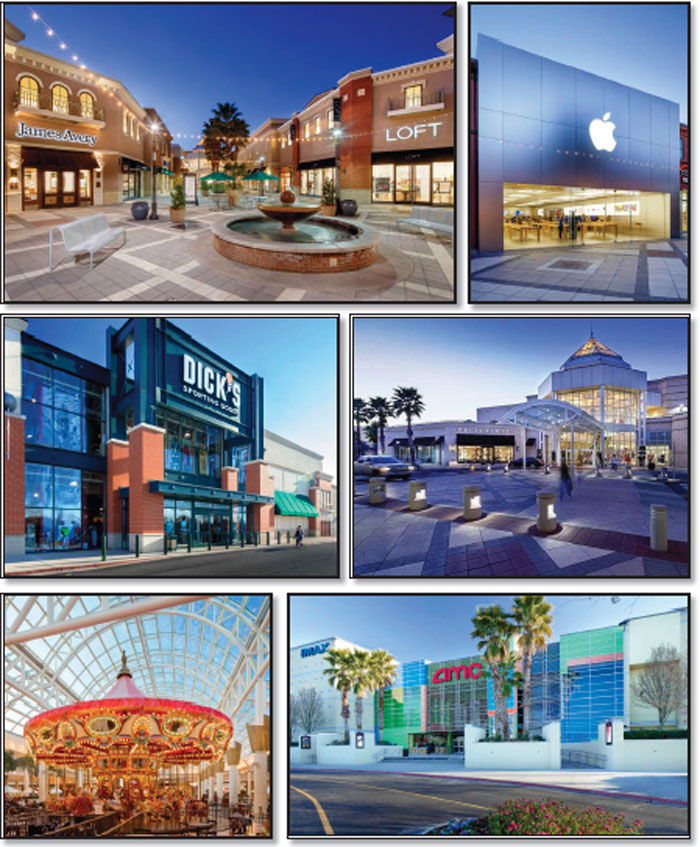
THE INFORMATION IN THIS STRUCTURAL AND COLLATERAL TERM SHEET IS NOT COMPLETE AND MAY BE AMENDED PRIOR TO THE TIME OF SALE. THIS TERM SHEET IS NOT AN OFFER TO SELL THESE SECURITIES AND IT IS NOT A SOLICITATION OF AN OFFER TO BUY THESE SECURITIES IN ANY JURISDICTION WHERE THE OFFER OR SALE IS NOT PERMITTED.
29
| MALL OF LOUISIANA |
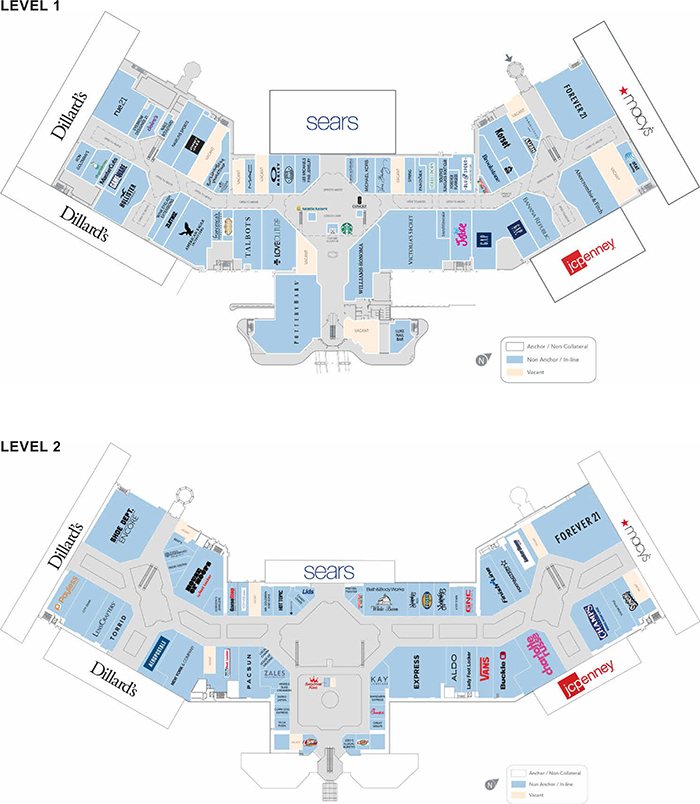
THE INFORMATION IN THIS STRUCTURAL AND COLLATERAL TERM SHEET IS NOT COMPLETE AND MAY BE AMENDED PRIOR TO THE TIME OF SALE. THIS TERM SHEET IS NOT AN OFFER TO SELL THESE SECURITIES AND IT IS NOT A SOLICITATION OF AN OFFER TO BUY THESE SECURITIES IN ANY JURISDICTION WHERE THE OFFER OR SALE IS NOT PERMITTED.
30
| MALL OF LOUISIANA |
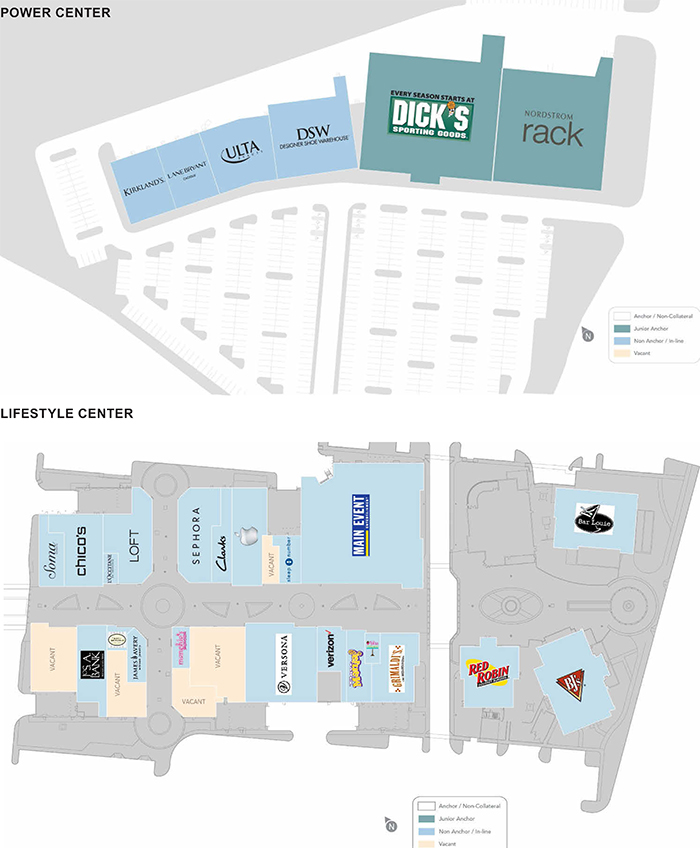
THE INFORMATION IN THIS STRUCTURAL AND COLLATERAL TERM SHEET IS NOT COMPLETE AND MAY BE AMENDED PRIOR TO THE TIME OF SALE. THIS TERM SHEET IS NOT AN OFFER TO SELL THESE SECURITIES AND IT IS NOT A SOLICITATION OF AN OFFER TO BUY THESE SECURITIES IN ANY JURISDICTION WHERE THE OFFER OR SALE IS NOT PERMITTED.
31
| MALL OF LOUISIANA |
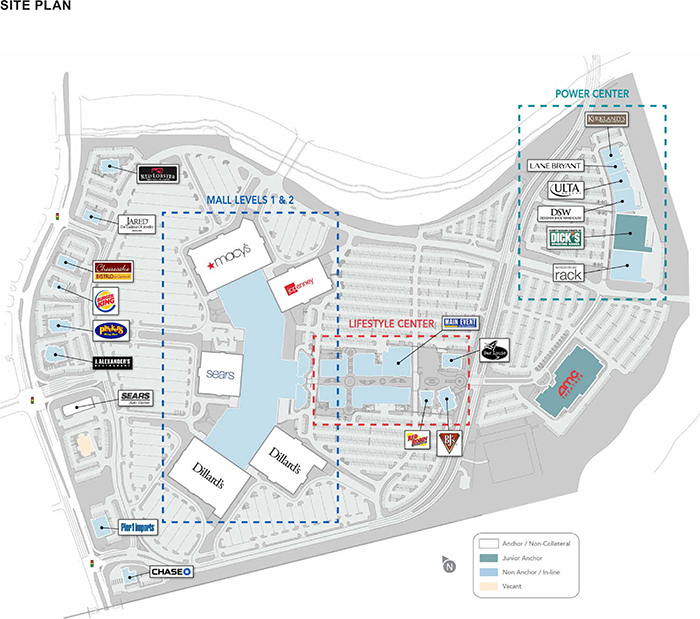
THE INFORMATION IN THIS STRUCTURAL AND COLLATERAL TERM SHEET IS NOT COMPLETE AND MAY BE AMENDED PRIOR TO THE TIME OF SALE. THIS TERM SHEET IS NOT AN OFFER TO SELL THESE SECURITIES AND IT IS NOT A SOLICITATION OF AN OFFER TO BUY THESE SECURITIES IN ANY JURISDICTION WHERE THE OFFER OR SALE IS NOT PERMITTED.
32
| MALL OF LOUISIANA |
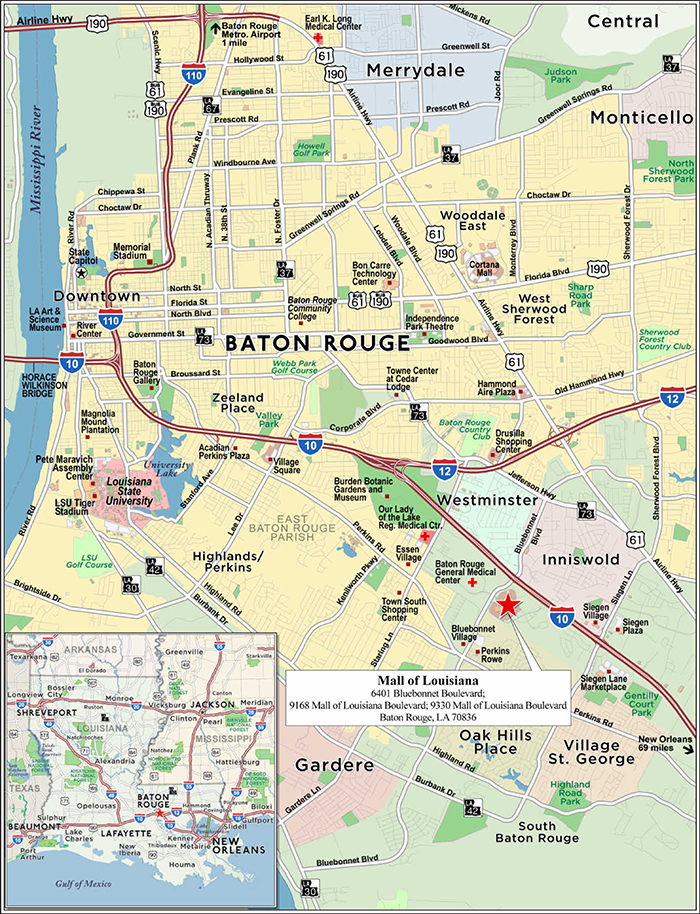
THE INFORMATION IN THIS STRUCTURAL AND COLLATERAL TERM SHEET IS NOT COMPLETE AND MAY BE AMENDED PRIOR TO THE TIME OF SALE. THIS TERM SHEET IS NOT AN OFFER TO SELL THESE SECURITIES AND IT IS NOT A SOLICITATION OF AN OFFER TO BUY THESE SECURITIES IN ANY JURISDICTION WHERE THE OFFER OR SALE IS NOT PERMITTED.
33
| No. 2 – Mall of Louisiana | |||||||
| Loan Information | Property Information | ||||||
| Mortgage Loan Seller: | Barclays Bank PLC | Single Asset/Portfolio: | Single Asset | ||||
Credit Assessment (Fitch/KBRA/Moody’s): | NR/NR/NR | Property Type: | Retail | ||||
| Original Principal Balance(1): | $50,000,000 | Specific Property Type: | Super Regional Mall | ||||
| Cut-off Date Balance(1): | $50,000,000 | Location: | Baton Rouge, LA | ||||
| % of Initial Pool Balance: | 7.1% | Size: | 776,789 SF | ||||
| Loan Purpose: | Recapitalization | Cut-off Date Balance Per SF(1): | $418.39 | ||||
| Borrower Name: | Mall of Louisiana, LLC; Mall of Louisiana Land, LLC | Year Built/Renovated: | 1997/2008 | ||||
| Sponsor: | GGP Real Estate Holding I, Inc. | Title Vesting: | Fee | ||||
| Mortgage Rate: | 3.984% | Property Manager: | Self-managed | ||||
| Note Date: | July 26, 2017 | 4thMost Recent Occupancy (As of)(4): | 93.9% (12/31/2013) | ||||
| Anticipated Repayment Date: | NAP | 3rdMost Recent Occupancy (As of)(4): | 96.5% (12/31/2014) | ||||
| Maturity Date: | August 1, 2027 | 2ndMost Recent Occupancy (As of(4): | 96.6% (12/31/2015) | ||||
| IO Period: | 36 months | Most Recent Occupancy (As of)(4): | 94.4% (12/31/2016) | ||||
| Loan Term (Original): | 120 months | Current Occupancy (As of)(4): | 91.8% (6/30/2017) | ||||
| Seasoning: | 2 months | ||||||
| Amortization Term (Original): | 360 months | Underwriting and Financial Information: | |||||
| Loan Amortization Type: | Interest-only, Amortizing Balloon | ||||||
| Interest Accrual Method: | Actual/360 | 4thMost Recent NOI (As of): | $33,541,166 (12/31/2014) | ||||
| Call Protection(2): | L(26),D(90),O(4) | 3rdMost Recent NOI (As of): | $34,580,536 (12/31/2015) | ||||
| Lockbox Type: | Hard/Springing Cash Management | 2ndMost Recent NOI (As of): | $35,038,477 (12/31/2016) | ||||
| Additional Debt(1): | Yes | Most Recent NOI (As of): | $34,995,624 (TTM 4/30/2017) | ||||
| Additional Debt Type(1): | Pari Passu | ||||||
| U/W Revenues: | $43,215,234 | ||||||
| U/W Expenses: | $7,152,311 | ||||||
| U/W NOI: | $36,062,923 | ||||||
| U/W NCF: | $34,433,637 | ||||||
| U/W NOI DSCR(1): | 1.94x | ||||||
| U/W NCF DSCR(1): | 1.85x | ||||||
| Escrows and Reserves(3): | U/W NOI Debt Yield(1): | 11.1% | |||||
| Type: | Initial | Monthly | Cap (If Any) | U/W NCF Debt Yield(1): | 10.6% | ||
| Taxes | $0 | Springing | NAP | As-Is Appraised Value: | $570,000,000 | ||
| Insurance | $0 | Springing | NAP | As-Is Appraisal Valuation Date: | June 23, 2017 | ||
| Replacement Reserves | $0 | Springing | $155,169 | Cut-off Date LTV Ratio(1): | 57.0% | ||
| TI/LC Reserve | $0 | Springing | $1,551,690 | LTV Ratio at Maturity or ARD(1): | 49.3% | ||
| (1) | See “The Mortgage Loan” section. All statistical financial information related to balance per square foot, loan-to-value ratios, debt service coverage ratios and debt yields are based on the funded outstanding principal balance of the Mall of Louisiana Whole Loan (as defined below). |
| (2) | The defeasance lockout period will be at least 26 payment dates beginning with and including the first payment date of September 1, 2017. Defeasance of the Mall of Louisiana Whole Loan is permitted after the date that is the earlier to occur of (i) two years after the closing date of the securitization that includes the last note to be securitized, and (ii) August 1, 2020. The assumed lockout period of 26 payments is based on the expected WFCM 2017-C40 Trust closing date in October 2017. |
| (3) | See “Escrows” section. |
| (4) | Current Occupancy includes Main Event (6.0% of NRA) which has a signed lease but is not expected to take occupancy until August 2018 and excludes temporary tenants. The Mall of Louisiana Whole Loan guarantor has provided a guaranty for all outstanding landlord obligations and fifteen months of gap rent specific to Main Event. |
The Mortgage Loan. The mortgage loan (the “Mall of Louisiana Mortgage Loan”) is part of a whole loan (the “Mall of Louisiana Whole Loan”) evidenced by ninepari passu promissory notes, secured by the fee interest in a 776,789 square foot portion of a super-regional mall and adjacent power center in Baton Rouge, Louisiana (the “Mall of Louisiana Property”). The Mall of Louisiana Whole Loan was co-originated on July 26, 2017 by Barclays Bank PLC, Bank of America, N.A. and Citi Real Estate Funding Inc. The Mall of Louisiana Whole Loan had an original principal balance of $325,000,000, has an outstanding principal balance as of the Cut-off Date of $325,000,000 and accrues interest at an interest rate of 3.984%per annum. The Mall of Louisiana Whole Loan had an initial term of 120 months, has a remaining term of 118 months as of the Cut-off Date and requires payments of interest-only until August 1, 2020, after which payments of interest and principal based on a 30-year amortization schedule are required through its term. The Mall of Louisiana Whole Loan matures on August 1, 2027.
Notes A-6 and A-7, which will be contributed to the WFCM 2017-C40 Trust, had an aggregate original principal balance of $50,000,000, have an aggregate outstanding principal balance as of the Cut-off Date of $50,000,000 and represent non-controlling interests in the Mall of Louisiana Whole Loan. The controlling Note A-1 had an original principal balance of $65,000,000, has an outstanding principal balance as of the Cut-off Date of $65,000,000, is currently held by Bank of America, N.A. and is expected to be contributed to the BANK 2017-BNK7 Trust. The non-controlling Notes A-3-1 and A-5-2 had an aggregate original principal balance of $47,000,000, have an aggregate outstanding principal balance as of the Cut-off Date of $47,000,000, are currently held by Barclays Bank PLC and Citi Real Estate Funding Inc., respectively, and are expected to be contributed to the CGCMT 2017-P8 Trust. The non-
THE INFORMATION IN THIS STRUCTURAL AND COLLATERAL TERM SHEET IS NOT COMPLETE AND MAY BE AMENDED PRIOR TO THE TIME OF SALE. THIS TERM SHEET IS NOT AN OFFER TO SELL THESE SECURITIES AND IT IS NOT A SOLICITATION OF AN OFFER TO BUY THESE SECURITIES IN ANY JURISDICTION WHERE THE OFFER OR SALE IS NOT PERMITTED.
34
| MALL OF LOUISIANA |
controlling Note A-4 had an original principal balance of $50,000,000, has an outstanding principal balance as of the Cut-off Date of $50,000,000, is currently held by Citi Real Estate Funding Inc. and is expected to be contributed to the COMM 2017-COR2 Trust. The remaining Notes A-2, A-3-2 and A-5-1 from the Mall of Louisiana Whole Loan, which had an aggregate original principal balance of $113,000,000, are expected to be contributed to future securitization trusts. The following table presents a summary of the promissory notes comprising the Mall of Louisiana Whole Loan. The lender provides no assurances that any non-securitized notes will not be split further. See “Description of the Mortgage Pool—The Whole Loans—The Non-Serviced Pari Passu Whole Loans” in the Preliminary Prospectus.
Note Summary
| Notes | Original Balance | Note Holder | Controlling Interest | |
| A-1 | $65,000,000 | BANK 2017-BNK7 (expected) | Yes | |
| A-2 | $44,000,000 | Bank of America, N.A. | No | |
| A-3-1 and A-5-2 | $47,000,000 | CGCMT 2017-P8 (expected) | No | |
| A-4 | $50,000,000 | COMM 2017-COR2 (expected) | No | |
| A-3-2 | $28,000,000 | Citi Real Estate Funding Inc. | No | |
| A-5-1 | $41,000,000 | Barclays Bank PLC | No | |
| A-6 and A-7 | $50,000,000 | WFCM 2017-C40 | No | |
| Total | $325,000,000 |
Following the lockout period, the Mall of Louisiana Borrower has the right to defease the Mall of Louisiana Whole Loan in whole, but not in part. In addition, the Mall of Louisiana Whole Loan is prepayable without penalty on or after May 1, 2027. The lockout period will expire on the earlier to occur of (i) two years after the closing date of the securitization that includes the last note to be securitized and (ii) August 1, 2020.
Sources and Uses
| Sources | Uses | |||||||
| Original whole loan amount | $325,000,000 | 100.0% | Closing costs | $1,411,459 | 0.4% | |||
| Return of equity(1) | 323,588,541 | 99.6 | ||||||
| Total Sources | $325,000,000 | 100.0% | Total Uses | $325,000,000 | 100.0% |
| (1) | The Mall of Louisiana Property was previously unencumbered. The Mall of Louisiana Whole Loan sponsor acquired the Mall of Louisiana Property for approximately $265 million in 2004 and including the $100 million spent on the 2008 property expansion, maintains a cost basis of approximately $413 million. |
The Property. The Mall of Louisiana Property consists of a two-story enclosed super-regional mall known as Mall of Louisiana, which contains a total of 1,593,545 square feet and is anchored by non-collateral anchors Dillard’s, Dillard’s Men’s & Home, JC Penney, Macy’s and Sears. The 776,789 square foot portion of the Mall of Louisiana that serves as collateral for the Mall of Louisiana Whole Loan was 91.8% leased as of June 30, 2017 by 135 retail and restaurant tenants. The largest tenants by size are AMC Theatres (9.6% of NRA, 5.9% of underwritten base rent, expiring July 2026), Dick’s Sporting Goods (9.5% of NRA, 3.3% of underwritten base rent, expiring January 2019), Nordstrom Rack (3.9% of NRA, 2.0% of underwritten base rent, expiring September 2025) and Forever 21 (3.5% of NRA, 5.1% of underwritten base rent, expiring January 2019). Main Event (6.0% of NRA, 4.0% of underwritten base rent, expiring June 2028) has a signed lease but is not expected to take occupancy until August 2018. The Mall of Louisiana Whole Loan guarantor has provided a guaranty for all outstanding landlord obligations and fifteen months of gap rent specific to Main Event.
No other tenant represents more than 1.9% of NRA or 2.6% of underwritten rent. Other notable tenants at the Mall of Louisiana Property include: Apple, DSW, Lush Handmade Cosmetics, Michael Kors, Pandora, Pottery Barn and Williams Sonoma. The Mall of Louisiana Property features an 11-bay food court and nine full service restaurants. Inline sales at the Mall of Louisiana Property as of May 31, 2017 were approximately $183 million with an average of $585 PSF ($496 PSF excluding Apple), resulting in an occupancy cost of 13.6% (16.1% excluding Apple).
The Mall of Louisiana Property was built in 1997 and renovated in 2008 with a $100 million expansion project which added over 330,000 square feet, comprised of a 125,000 square foot lifestyle component, a 140,000 square foot power center and 15-screen stadium seating cinema with IMAX – 3D. The Mall of Louisiana features the only Sears within 40 miles and the only Macy’s, Dick’s Sporting Goods and Nordstrom Rack within 60 miles. The Mall of Louisiana Property includes 8,404 surface parking spaces (approximately 5.3 per 1,000 square feet).
THE INFORMATION IN THIS STRUCTURAL AND COLLATERAL TERM SHEET IS NOT COMPLETE AND MAY BE AMENDED PRIOR TO THE TIME OF SALE. THIS TERM SHEET IS NOT AN OFFER TO SELL THESE SECURITIES AND IT IS NOT A SOLICITATION OF AN OFFER TO BUY THESE SECURITIES IN ANY JURISDICTION WHERE THE OFFER OR SALE IS NOT PERMITTED.
35
| MALL OF LOUISIANA |
The following table presents certain information relating to the tenancy at the Mall of Louisiana Property:
Major Tenants
| Tenant Name | Credit Rating (Fitch/Moody’s/ S&P)(1) | Tenant NRSF(2)(3) | % of NRSF(2) | Annual U/W Base Rent PSF(4) | Annual U/W Base Rent(4) | % of Total Annual U/W Base Rent | 5/30/2017 TTM Sales PSF(3) | 5/30/2017 TTM Occupancy Cost | Lease Expiration Date |
| Major Tenants | |||||||||
| AMC Theatres | B/B1/B+ | 74,400 | 9.6% | $23.38 | $1,739,472 | 5.9% | $560,583(5) | 22.6% | 7/21/2026 |
| Forever 21 | NR/NR/NR | 26,885 | 3.5% | $55.20 | $1,483,980 | 5.1% | $183 | 28.6% | 1/31/2019 |
| Main Event(6) | NR/NR/NR | 46,900 | 6.0% | $25.00 | $1,172,500 | 4.0% | N/A | N/A | 6/30/2028 |
| Dick’s Sporting Goods | NR/NR/NR | 74,061 | 9.5% | $13.00 | $962,793 | 3.3% | $131 | 11.9% | 1/31/2019 |
| Nordstrom Rack | BBB+/Baa1/BBB+ | 30,002 | 3.9% | $19.25 | $577,500 | 2.0% | N/A | N/A | 9/30/2025 |
| Total Major Tenants | 252,248 | 32.5% | $23.53 | $5,936,245 | 20.2% | ||||
| Other Tenants | 460,886 | 59.3% | $50.73 | $23,378,585 | 79.8% | ||||
| Occupied Total | 713,134 | 91.8% | $41.11 | $29,314,830 | 100.0% | ||||
| Vacant Retail Space | 63,655 | 8.2% | |||||||
| Collateral Total | 776,789 | 100.0% | |||||||
| Non-Collateral Anchor Tenants | |||||||||
| Dillard’s / Dillard’s Men’s and Home(7) | BBB-/Baa3/BBB- | 370,655 | $148 | N/A | N/A | ||||
| Macy’s | BBB/Baa3/BBB- | 204,890 | $166 | N/A | N/A | ||||
| JC Penney | B+/B1/B+ | 116,568 | $309 | N/A | N/A | ||||
| Sears / Sears Auto Center | CC/Caa2/CCC+ | 113,517 | $123 | N/A | N/A | ||||
| (1) | Certain ratings are those of the parent company whether or not the parent company guarantees the lease. |
| (2) | Tenant NSRF and % of NSFR are based on the underwritten rent roll. |
| (3) | Tenant NRSF and Sales PSF for the Non-Collateral Anchor Tenants are as of 2016 as reported in the appraisal. |
| (4) | Annual U/W Base Rent includes contractual rent increases through August 2018. |
| (5) | Sales PSF is shown as Sales per screen (15 screens). |
| (6) | Main Event has an executed lease but is not expected to take occupancy until August 2018. The Mall of Louisiana Whole Loan guarantor has provided a guaranty for all outstanding landlord obligations and fifteen months of gap rent specific to Main Event. |
| (7) | Dillard’s / Dillard’s Men’s and Home stores have been combined for this table. |
The following table presents certain information relating to the historical sales and occupancy costs at the Mall of Louisiana Property:
Historical Tenant Sales (PSF) and Occupancy Costs
Historical Tenant Sales (PSF) | |||||
| 2014 | 2015 | 2016 | 5/31/2017 TTM | 5/31/2017 TTM Occupancy Cost | |
| Total In-Line | |||||
| Comparable Sales PSF w/Apple | $557 | $568 | $571 | $585 | 13.6% |
| Comparable Sales PSF w/o Apple | $481 | $493 | $488 | $496 | 16.1% |
THE INFORMATION IN THIS STRUCTURAL AND COLLATERAL TERM SHEET IS NOT COMPLETE AND MAY BE AMENDED PRIOR TO THE TIME OF SALE. THIS TERM SHEET IS NOT AN OFFER TO SELL THESE SECURITIES AND IT IS NOT A SOLICITATION OF AN OFFER TO BUY THESE SECURITIES IN ANY JURISDICTION WHERE THE OFFER OR SALE IS NOT PERMITTED.
36
| MALL OF LOUISIANA |
The following table presents certain information relating to the lease rollover schedule at the Mall of Louisiana Property:
Lease Expiration Schedule(1)(2)
| Year Ending December 31, | No. of Leases Expiring | Expiring NRSF | % of Total NRSF | Cumulative Expiring NRSF | Cumulative % of Total NRSF | Annual U/W Base Rent | % of Total Annual U/W Base Rent | Annual U/W Base Rent PSF(3) |
| 2017 | 11 | 27,967 | 3.6% | 27,967 | 3.6% | $2,330,756 | 8.0% | $83.34 |
| 2018 | 23 | 82,248 | 10.6% | 110,215 | 14.2% | $3,354,434 | 11.4% | $40.78 |
| 2019 | 17 | 165,390 | 21.3% | 275,605 | 35.5% | $4,979,391 | 17.0% | $30.11 |
| 2020 | 14 | 43,189 | 5.6% | 318,794 | 41.0% | $2,581,653 | 8.8% | $59.78 |
| 2021 | 16 | 60,190 | 7.7% | 378,984 | 48.8% | $2,840,401 | 9.7% | $47.19 |
| 2022 | 10 | 32,000 | 4.1% | 410,984 | 52.9% | $1,317,420 | 4.5% | $41.17 |
| 2023 | 11 | 39,863 | 5.1% | 450,847 | 58.0% | $2,544,415 | 8.7% | $63.83 |
| 2024 | 7 | 32,366 | 4.2% | 483,213 | 62.2% | $1,357,288 | 4.6% | $41.94 |
| 2025 | 9 | 58,878 | 7.6% | 542,091 | 69.8% | $1,792,374 | 6.1% | $30.44 |
| 2026 | 6 | 88,514 | 11.4% | 630,605 | 81.2% | $2,885,732 | 9.8% | $32.60 |
| 2027 | 6 | 11,360 | 1.5% | 641,965 | 82.6% | $1,081,295 | 3.7% | $95.18 |
| Thereafter | 5 | 71,169 | 9.2% | 713,134 | 91.8% | $2,249,670 | 7.7% | $31.61 |
| Vacant | 0 | 63,655 | 8.2% | 776,789 | 100.0% | $0 | 0.0% | $0.00 |
| Total/Wtd. Avg. | 135 | 776,789 | 100.0% | $29,314,830 | 100.0% | $41.11 |
| (1) | Information obtained from the underwritten rent roll. |
| (2) | Certain tenants may have lease termination or contraction options that are exercisable prior to the originally stated expiration date of the subject lease and that are not considered in the Lease Expiration Schedule. |
| (3) | Weighted Average Annual U/W Base Rent PSF excludes vacant space. |
The following table presents historical occupancy percentages at the Mall of Louisiana Property:
Historical Occupancy
12/31/2014(1) | 12/31/2015(1) | 12/31/2016(1) | 6/30/2017(2) |
| 96.5% | 96.6% | 94.4% | 91.8% |
| (1) | Information obtained from the Mall of Louisiana Borrower and includes temporary tenants. |
| (2) | Information obtained from the underwritten rent roll and includes Main Event (6.0% of NRA) which has a signed lease but is not expected to take occupancy until August 2018 and excludes temporary tenants. |
Operating History and Underwritten Net Cash Flow. The following table presents certain information relating to the historical operating performance and underwritten net cash flow at the Mall of Louisiana Property:
Cash Flow Analysis
| 2014 | 2015 | 2016 | TTM 4/30/2017 | U/W | % of U/W Effective Gross Income | U/W $ per SF | |||||||||
| Base Rent(1) | $27,008,300 | $27,841,212 | $28,448,668 | $28,641,673 | $30,002,849(2) | 69.4% | $38.62 | ||||||||
| Grossed Up Vacant Space | 0 | 0 | 0 | 0 | 3,395,375 | 7.9 | 4.37 | ||||||||
| Total Reimbursables | 10,554,704 | 10,707,373 | 10,410,615 | 10,242,969 | 10,408,010 | 24.1 | 13.40 | ||||||||
| Specialty Leasing | 3,089,790 | 3,046,453 | 3,044,110 | 2,921,431 | 2,956,431 | 6.8 | 3.81 | ||||||||
| Other Income(3) | 402,762 | 384,936 | 331,822 | 399,049 | 384,049 | 0.9 | 0.49 | ||||||||
| Less Vacancy & Credit Loss | 0 | 0 | 0 | 0 | (3,931,479) | (9.1) | (5.06) | ||||||||
| Effective Gross Income | $41,055,555 | $41,979,974 | $42,235,214 | $42,205,123 | $43,215,234 | 100.0% | $55.63 | ||||||||
| 0.00 | |||||||||||||||
| Total Operating Expenses | 7,514,389 | 7,399,438 | 7,196,737 | 7,209,498 | 7,152,311 | 16.6 | 9.21 | ||||||||
| Net Operating Income | $33,541,166 | $34,580,536 | $35,038,477 | $34,995,624 | $36,062,923 | 83.4% | $46.43 | ||||||||
| TI/LC | 0 | 0 | 0 | 0 | 1,473,928 | 3.4 | 1.90 | ||||||||
| Capital Expenditures | 0 | 0 | 0 | 0 | 155,358 | 0.4 | 0.20 | ||||||||
| Net Cash Flow | $33,541,166 | $34,580,536 | $35,038,477 | $34,995,624 | $34,433,637 | 79.7% | $44.33 | ||||||||
| NOI DSCR(4) | 1.80x | 1.86x | 1.89x | 1.88x | 1.94x | ||||||||||
| NCF DSCR(4) | 1.80x | 1.86x | 1.89x | 1.88x | 1.85x | ||||||||||
| NOI DY(4) | 10.3% | 10.6% | 10.8% | 10.8% | 11.1% | ||||||||||
| NCF DY(4) | 10.3% | 10.6% | 10.8% | 10.8% | 10.6% |
| (1) | Base Rent includes percentage rent. |
| (2) | U/W Base Rent includes all tenants with signed leases and contractual rent steps through August 2018. |
| (3) | Other Income includes carousel revenue, rebates, and miscellaneous non-rental income. |
| (4) | Based on the Mall of Louisiana Whole Loan amount of $325,000,000. |
THE INFORMATION IN THIS STRUCTURAL AND COLLATERAL TERM SHEET IS NOT COMPLETE AND MAY BE AMENDED PRIOR TO THE TIME OF SALE. THIS TERM SHEET IS NOT AN OFFER TO SELL THESE SECURITIES AND IT IS NOT A SOLICITATION OF AN OFFER TO BUY THESE SECURITIES IN ANY JURISDICTION WHERE THE OFFER OR SALE IS NOT PERMITTED.
37
| MALL OF LOUISIANA |
Appraisal.As of the appraisal valuation date of June 23, 2017, the Mall of Louisiana Property had an “as-is” appraised value of $570,000,000.
Environmental Matters.According to the Phase I environmental report dated July 24, 2017, there was no evidence of any recognized environmental conditions at the Mall of Louisiana Property.
Market Overview and Competition.The Mall of Louisiana Property is located in East Baton Rouge Parish within the greater Baton Rouge metropolitan statistical area (“MSA”) of Louisiana. The Mall of Louisiana Property is located approximately six miles southeast of the Baton Rouge central business district, immediately south of Interstate 10, which connects to Interstate 12 approximately three miles north and connects to the New Orleans metropolitan area to the southeast. East Baton Rouge Parish includes the City of Baton Rouge and other established neighborhoods including Mid-City, the Garden District and Spanish Town, and is home of the capital of Louisiana, Louisiana State University, Southern University and Baton Rouge Community College. There are two hospitals located within approximately two miles of the Mall of Louisiana Property: Baton Rouge General Medical Center and Our Lady of the Lake Regional Medical Center. East Baton Rouge Parish’s top employers include Turner Industries Group LLC (9,875 employees), LSU System (6,250 employees), Performance Contractors (5,500 employees), Our Lady of the Lake Regional Medical Center (4,500 employees) and ExxonMobil (4,214 employees). IBM recently developed a $55 million office and residential building in downtown Baton Rouge and has committed to maintain 800 new jobs through 2023 in downtown Baton Rouge. The Baton Rouge MSA had a 2016 unemployment rate of 5.2% continuing year over year declines since 2011.
According to the appraisal, the primary trade area for the Mall of Louisiana Property encompasses an approximately fifteen-mile radius. The estimated 2016 population within a five-, ten- and fifteen-mile radius around the Mall of Louisiana Property was 169,831, 406,664 and 603,052, respectively. The estimated 2016 average household income within the same radii was $90,572, $76,294 and $74,587, respectively. The 2016 fifteen-mile radius population and average household income reflects a compound annual growth rate from 2000-2016 of 1.0% and 2.4%, respectively. Estimated 2016 average retail sales per household within a fifteen-mile radius of the Mall of Louisiana Property was $48,449.
The Mall of Louisiana Property is located in the Baton Rouge retail market which had 2017 first quarter-end average asking rents of $11.32 per square foot and a vacancy rate of 4.5%, a 1.3% decrease from the first quarter-end 2016, with only 11,581 square feet vacant in the market. There are currently six lifestyle centers and regional malls in the Baton Rouge retail market with 2017 first quarter-end average asking rents of $19.61 per square foot and a vacancy rate of 8.6%, a 1.7% decrease from the first quarter-end 2016, with 74,739 square feet of positive absorption. There is no proposed new competitive supply noted by the appraisal.
The following table presents certain information relating to competitive properties for the Mall of Louisiana Property:
Competitive Properties(1)
| Property / Location | Property Type | Year Built/ Renovated | Total GLA (SF) | Est. Sales PSF | Occupancy | Distance | Major/Anchor Tenants | |
Mall of Louisiana Baton Rouge, LA | Super Regional Mall | 1997/2008 | 776,789(1) | $585(1)(2) | 91.8%(1)(3) | -- | Dillard’s (non-collateral), Dillard’s Men’s (non-collateral), JC Penney (non-collateral), Macy’s (non-collateral), Sears (non-collateral), AMC Theatres | |
Perkins Rowe Baton Rouge, LA | Lifestyle Center | 2006/N/A | 749,300 | $420 | 85% | 1.5 miles | Cinemark, LA Fitness, Barnes & Noble, Fresh Market | |
Town Center at Cedar Lodge Baton Rouge, LA | Lifestyle Center | 2007/N/A | 410,000 | $400 | 98% | 5.0 miles | Whole Foods, Books A Million, LOFT, Gap | |
Siegen Lane Marketplace Baton Rouge, LA | Power Center | 1994/2002 | 462,150 | N/A | 100% | 3.0 miles | Walmart, Lowes, Bed Bath Beyond, TJMaxx | |
Cortana Mall(4) Baton Rouge, LA
| Super Regional Mall | 1976/2010 | 1,360,000 | $250 | 30% | 6.5 miles | Dillard’s, JC Penney | |
| (1) | Information obtained from the appraisal and underwritten rent roll for the subject collateral. Total GLA, Est. Sales PSF and Occupancy are shown for the collateral portion of the Mall of Louisiana. |
| (2) | Comparable inline sales shown as of May 2017. Comparable inline sales excluding Apple for that period were $496 per square foot. |
| (3) | Occupancy as of June 30, 2017 and includes Main Event (6.0% of NRA) which has a signed lease but is not expected to take occupancy until August 2018 and excludes temporary tenants. The Mall of Louisiana Whole Loan guarantor has provided a guaranty for all outstanding landlord obligations and fifteen months of gap rent specific to Main Event. |
| (4) | Cortana Mall is the only other enclosed shopping mall in Baton Rouge. Only two of the six anchor units at Cortana Mall are currently occupied and approximately 45 of 110 inline stores are occupied. |
THE INFORMATION IN THIS STRUCTURAL AND COLLATERAL TERM SHEET IS NOT COMPLETE AND MAY BE AMENDED PRIOR TO THE TIME OF SALE. THIS TERM SHEET IS NOT AN OFFER TO SELL THESE SECURITIES AND IT IS NOT A SOLICITATION OF AN OFFER TO BUY THESE SECURITIES IN ANY JURISDICTION WHERE THE OFFER OR SALE IS NOT PERMITTED.
38
| MALL OF LOUISIANA |
The Borrower.The borrowers are Mall of Louisiana, LLC and Mall of Louisiana Land, LLC (individually and collectively, the “Mall of Louisiana Borrower”), each a single-purpose Delaware limited liability company, with at least two independent directors. Legal counsel to the Mall of Louisiana Borrower delivered a non-consolidation opinion in connection with the origination of the Mall of Louisiana Whole Loan.
The Sponsor.The loan sponsor and nonrecourse carveout guarantor is GGP Real Estate Holding I, Inc., wholly owned by GGP Inc. GGP Inc. (NYSE: GGP) is an S&P 500 company focused exclusively on owning, managing, leasing and redeveloping retail properties throughout the United States. GGP Inc.’s portfolio as of March 2017 included 127 properties (121 million square feet) in 40 states with an enterprise value of approximately $39 billion. See“Description of the Mortgage Pool— Loan Purpose; Default History, Bankruptcy Issues and Other Proceedings”in the Preliminary Prospectus.
GGP Real Estate Holding I, Inc. has provided a guaranty for payment of $1,726,914 in unfunded tenant allowances for ten various tenants and a guaranty related to the tenant Main Event for payment of $8,519,922 comprised of unfunded tenant allowances ($3,986,500), landlord work ($3,067,797) and gap rent ($1,465,625).
Escrows.During a Trigger Period (as defined below), unless there are sufficient funds in the lockbox account to make the deposits, the Mall of Louisiana Borrower is required to deposit monthly (i) 1/12th of the estimated annual real estate taxes and 1/12th of the estimated annual insurance premiums (unless the Mall of Louisiana Property is covered by a blanket insurance policy and the premiums for the blanket policy are prepaid for at least one year in advance), (ii) $12,931 to a replacement reserve subject to a cap of $155,169 and (iii) $129,308 to a tenant improvement and leasing commissions reserve subject to a cap of $1,551,690.
A “Trigger Period” will commence upon (i) an event of default or (ii) the debt service coverage ratio being less than 1.15x. A Trigger Period will end upon (i) the cure or waiver of the event of default and (ii) the debt service coverage ratio being equal to or greater than 1.15x.
Lockbox and Cash Management.A hard lockbox is in place with respect to the Mall of Louisiana Whole Loan. Funds deposited to the lockbox will be swept daily to the Mall of Louisiana Borrower’s operating account unless a Trigger Period exists. During a Trigger Period, funds in the lockbox are required to be transferred daily to a cash management account under the sole control of the lender for the payment of, among other things, debt service, monthly escrows and operating expenses with all excess cash being deposited to an excess cash reserve to be held as additional security for the Mall of Louisiana Whole Loan.
Property Management.The Mall of Louisiana Property is managed by an affiliate of the Mall of Louisiana Borrower.
Assumption.The Mall of Louisiana Borrower has the right to transfer the Mall of Louisiana Propertyprovided that certain conditions are satisfied, including (i) no event of default has occurred and is continuing; (ii) the Mall of Louisiana Property will be managed by a qualifying manager; (iii) a replacement guarantor has assumed the obligations of the Mall of Louisiana Whole Loan guarantor; (iv) the lender has received a non-consolidation opinion; and (v) the transferee is a qualified transferee.
Partial Release.The Mall of Louisiana Borrower may obtain the release of any vacant, non-income producing, unimproved parcel or outlot (including “air rights” parcels), any expansion parcel or the Picardy Street Extension Parcel (as defined below) in connection with a transfer to a person other than a person owned or controlled by the Mall of Louisiana Borrower, provided among other conditions that the following are satisfied: (i) no event of default has occurred and is continuing, and (ii)(A) as it relates to any parcel release other than an expansion parcel release: (a) the lender receives evidence that the parcel is not necessary for the operation of the Mall of Louisiana Property and that it may be readily separated from the Mall of Louisiana Property without material diminution of the value of the Mall of Louisiana Property, (b) lender receives rating agency confirmation (except with respect to a release of the Picardy Street Expansion Parcel so long as it remains vacant, non-income producing and unimproved), (c) the loan to value ratio for the remaining property is less than or equal to 125% provided that the Mall of Louisiana Borrower may prepay the Mall of Louisiana Whole Loan and pay the associated yield maintenance premium in order to meet the required loan to value ratio, or (B) as it relates to the release of an expansion parcel: (x) lender receives evidence that (I) during the time that the expansion parcel was a part of the Mall of Louisiana Property, any tenants that were relocated to the expansion parcel from other areas of the Mall of Louisiana Property have been replaced with tenants of comparable credit quality and paying equal or better rent than the relocated tenants or (II) to the extent existing tenants proposed to be relocated to the expansion parcel after its release, the Mall of Louisiana Borrower has entered into fully executed replacement leases with replacement tenants of comparable credit quality and on rental terms equal or better than the existing tenant, and (y) the release of the expansion parcel does not have a material adverse effect on the use or value of the Mall of Louisiana Property, the priority of the lien of the mortgage, the enforcement of the Mall of Louisiana Whole Loan documents, or the Mall of Louisiana Borrower’s ability to repay the Mall of Louisiana Whole Loan.
The “Picardy Street Extension Parcel” is the portion of land subject to the extension and/or widening of Picardy Street by the City of Baton Rouge.
Real Estate Substitution.The Mall of Louisiana Borrower may obtain the release of a vacant, non-income producing, unimproved parcel, provided among other conditions that the following are satisfied: (i) no event of default has occurred or is continuing, (ii) simultaneous with the substitution, the Mall of Louisiana Borrower acquires an exchange parcel at or adjacent to the Mall of Louisiana Property of reasonably equivalent value to the release parcel, (iii) rating agency confirmation is obtained, and (iv) the loan to value ratio immediately after the substitution is less than or equal to 125%, provided that the Mall of Louisiana Borrower may prepay the Mall of Louisiana Whole Loan and pay the associated yield maintenance premium in order to meet the required loan to value ratio.
Real Estate Expansion.The Mall of Louisiana Borrower may acquire one or more expansion parcels,provided among other conditions that the following are satisfied: (i) no event of default has occurred or is continuing, and (ii) the Mall of Louisiana Borrower acquires fee simple or leasehold interest in the expansion parcel. Any expansion parcel may be released (see “Partial Release” above.)
THE INFORMATION IN THIS STRUCTURAL AND COLLATERAL TERM SHEET IS NOT COMPLETE AND MAY BE AMENDED PRIOR TO THE TIME OF SALE. THIS TERM SHEET IS NOT AN OFFER TO SELL THESE SECURITIES AND IT IS NOT A SOLICITATION OF AN OFFER TO BUY THESE SECURITIES IN ANY JURISDICTION WHERE THE OFFER OR SALE IS NOT PERMITTED.
39
| MALL OF LOUISIANA |
Subordinate and Mezzanine Indebtedness.Not permitted.
Ground Lease. None.
Terrorism Insurance.The Mall of Louisiana Borrower is required to obtain and maintain property insurance, commercial general liability insurance and business interruption insurance that covers acts of terrorism in an amount determined by the lender in its sole discretion (but not to exceed the full replacement cost of the Mall of Louisiana Property and 18-months of business interruption insurance),provided that if the Terrorism Risk Insurance Program Reauthorization Act of 2015 or any extension thereof or substantially similar program (“TRIPRA”) is in effect, the Mall of Louisiana Whole Loan documents provide for an annual terrorism premium cap of two times the cost of the annual premiums for property and business interruption insurance required under the related Mall of Louisiana Whole Loan documents.
THE INFORMATION IN THIS STRUCTURAL AND COLLATERAL TERM SHEET IS NOT COMPLETE AND MAY BE AMENDED PRIOR TO THE TIME OF SALE. THIS TERM SHEET IS NOT AN OFFER TO SELL THESE SECURITIES AND IT IS NOT A SOLICITATION OF AN OFFER TO BUY THESE SECURITIES IN ANY JURISDICTION WHERE THE OFFER OR SALE IS NOT PERMITTED.
40
(THIS PAGE INTENTIONALLY LEFT BLANK)
THE INFORMATION IN THIS STRUCTURAL AND COLLATERAL TERM SHEET IS NOT COMPLETE AND MAY BE AMENDED PRIOR TO THE TIME OF SALE. THIS TERM SHEET IS NOT AN OFFER TO SELL THESE SECURITIES AND IT IS NOT A SOLICITATION OF AN OFFER TO BUY THESE SECURITIES IN ANY JURISDICTION WHERE THE OFFER OR SALE IS NOT PERMITTED.
41
| MARKETPLACE AT MILLCREEK |
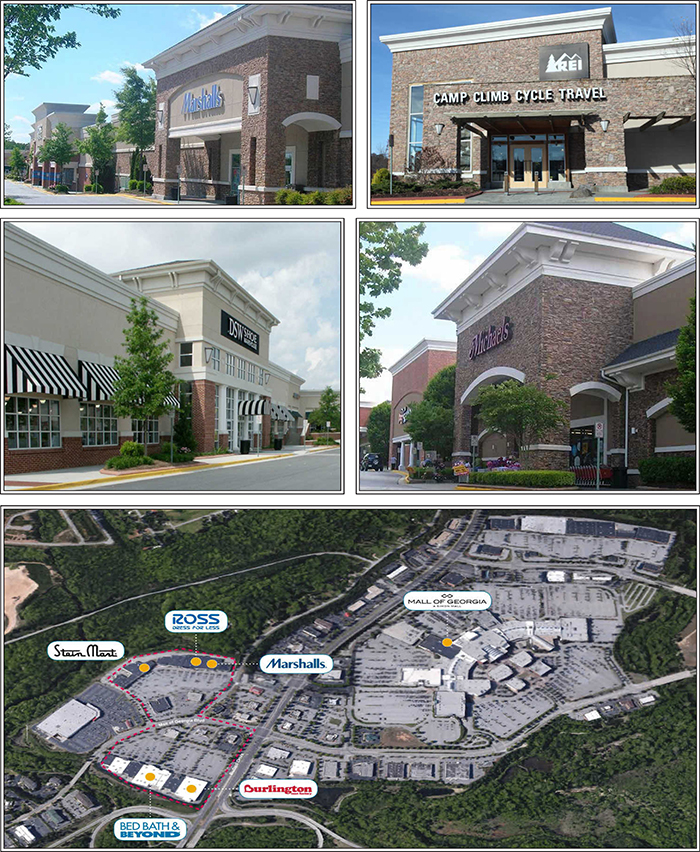
THE INFORMATION IN THIS STRUCTURAL AND COLLATERAL TERM SHEET IS NOT COMPLETE AND MAY BE AMENDED PRIOR TO THE TIME OF SALE. THIS TERM SHEET IS NOT AN OFFER TO SELL THESE SECURITIES AND IT IS NOT A SOLICITATION OF AN OFFER TO BUY THESE SECURITIES IN ANY JURISDICTION WHERE THE OFFER OR SALE IS NOT PERMITTED.
42
| MARKETPLACE AT MILLCREEK |
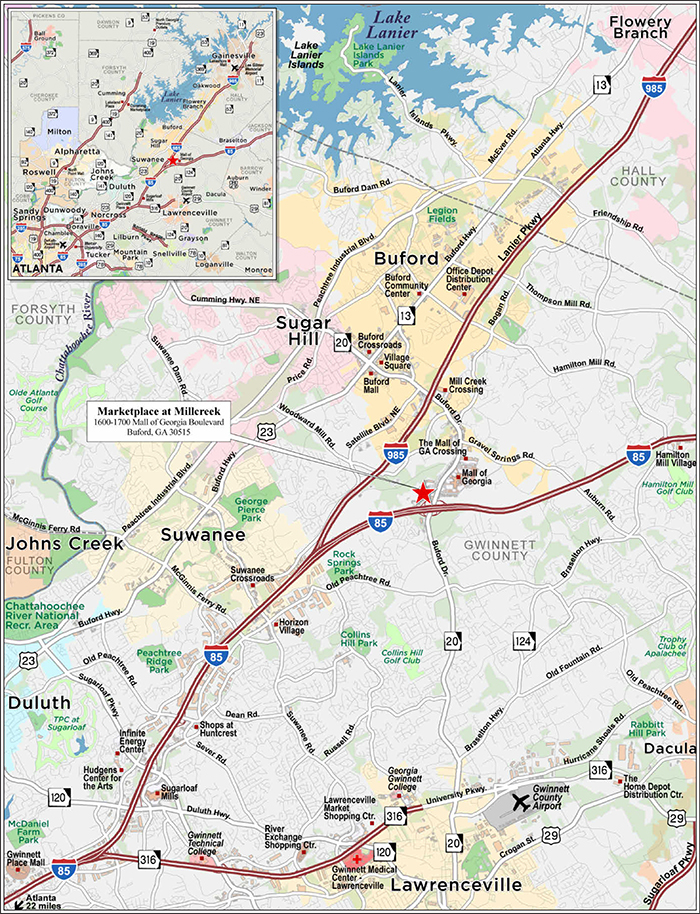
THE INFORMATION IN THIS STRUCTURAL AND COLLATERAL TERM SHEET IS NOT COMPLETE AND MAY BE AMENDED PRIOR TO THE TIME OF SALE. THIS TERM SHEET IS NOT AN OFFER TO SELL THESE SECURITIES AND IT IS NOT A SOLICITATION OF AN OFFER TO BUY THESE SECURITIES IN ANY JURISDICTION WHERE THE OFFER OR SALE IS NOT PERMITTED.
43
| No. 3 – Marketplace at Millcreek | ||||||
| Loan Information | Property Information | |||||
| Mortgage Loan Seller: | Wells Fargo Bank, National Association | Single Asset/Portfolio: | Single Asset | |||
Credit Assessment (Fitch/KBRA/Moody’s) | NR/NR/NR | Property Type: | Retail | |||
| Original Principal Balance: | $39,600,000 | Specific Property Type: | Anchored | |||
| Cut-off Date Balance: | $39,600,000 | Location: | Buford, GA | |||
| % of Initial Pool Balance: | 5.6% | Size: | 401,947 SF | |||
| Loan Purpose: | Refinance | Cut-off Date Balance Per SF: | $98.52 | |||
| Borrower: | DDRTC Marketplace at Mill Creek LLC | Year Built/Renovated: | 2003/NAP | |||
| Borrower Sponsors: | DDR & TIAA-CREFF JV | Title Vesting: | Fee | |||
| Mortgage Rate: | 3.820% | Property Manager: | Self-managed | |||
| Note Date: | August 14, 2017 | 4thMost Recent Occupancy (As of): | 97.7% (12/31/2013) | |||
| Anticipated Repayment Date: | NAP | 3rdMost Recent Occupancy (As of): | 92.3% (12/31/2014) | |||
| Maturity Date: | September 11, 2027 | 2ndMost Recent Occupancy (As of): | 100.0% (12/31/2015) | |||
| IO Period: | 120 months | Most Recent Occupancy (As of): | 100.0% (10/6/2016) | |||
| Loan Term (Original): | 120 months | Current Occupancy (As of): | 97.2% (7/6/2017) | |||
| Seasoning: | 1 month | |||||
| Amortization Term (Original): | NAP | Underwriting and Financial Information: | ||||
| Loan Amortization Type: | Interest-only, Balloon | |||||
| Interest Accrual Method: | Actual/360 | 4thMost Recent NOI (As of): | $4,362,551 (12/31/2014) | |||
| Call Protection: | L(25),D(88),O(7) | 3rdMost Recent NOI (As of): | $4,452,382 (12/31/2015) | |||
| Lockbox Type: | Springing | 2ndMost Recent NOI (As of): | $4,891,676 (12/31/2016) | |||
| Additional Debt: | None | Most Recent NOI (As of): | $4,913,376 (TTM 6/30/2017) | |||
| Additional Debt Type: | NAP | U/W Revenues: | $6,395,033 | |||
| U/W Expenses: | $1,669,652 | |||||
| U/W NOI: | $4,725,381 | |||||
| U/W NCF: | $4,251,374 | |||||
| U/W NOI DSCR: | 3.08x | |||||
| U/W NCF DSCR: | 2.77x | |||||
| Escrows and Reserves(1): | U/W NOI Debt Yield: | 11.9% | ||||
| U/W NCF Debt Yield: | 10.7% | |||||
| Type: | Initial | Monthly | Cap (If Any) | As-Is Appraised Value: | $75,800,000 | |
| Taxes | $0 | Springing | NAP | As-Is Appraisal Valuation Date: | July 9, 2017 | |
| Insurance | $0 | Springing | NAP | Cut-off Date LTV Ratio: | 52.2% | |
| Replacement Reserve | $0 | Springing | NAP | LTV Ratio at Maturity: | 52.2% | |
| (1) | See “Escrows” section. |
The Mortgage Loan. The mortgage loan (the “Marketplace at Millcreek Mortgage Loan”) is evidenced by a single promissory note that is secured by a first mortgage encumbering the fee interest in an anchored retail center located in Buford, Georgia (the “Marketplace at Millcreek Property”). The Marketplace at Millcreek Mortgage Loan was originated on August 14, 2017 by Wells Fargo Bank, National Association. The Marketplace at Millcreek Mortgage Loan had an original principal balance of $39,600,000, has an outstanding principal balance as of the Cut-off Date of $39,600,000 and accrues interest at an interest rate of 3.820%per annum. The Marketplace at Millcreek Mortgage Loan had an initial term of 120 months, has a remaining term of 119 months as of the Cut-off Date and requires interest-only payments through the term of the Marketplace at Millcreek Mortgage Loan. The Marketplace at Millcreek Mortgage Loan matures on September 11, 2027.
Following the lockout period, the borrower has the right to defease the Marketplace at Millcreek Mortgage Loan in whole, but not in part, on any date before March 11, 2027. In addition, the Marketplace at Millcreek Mortgage Loan is prepayable without penalty on or after March 11, 2027.
Sources and Uses
| Sources | Uses | |||||||
| Original loan amount | $39,600,000 | 68.7% | Loan payoff(1) | $57,307,446 | 99.4% | |||
| Borrower sponsors’ new cash contribution | 18,042,994 | 31.3 | Closing costs | 335,548 | 0.6 | |||
| Total Sources | $57,642,994 | 100.0% | Total Uses | $57,642,994 | 100.0% |
| (1) | The Marketplace at Millcreek Property was previously securitized in BACM 2007-3. |
THE INFORMATION IN THIS STRUCTURAL AND COLLATERAL TERM SHEET IS NOT COMPLETE AND MAY BE AMENDED PRIOR TO THE TIME OF SALE. THIS TERM SHEET IS NOT AN OFFER TO SELL THESE SECURITIES AND IT IS NOT A SOLICITATION OF AN OFFER TO BUY THESE SECURITIES IN ANY JURISDICTION WHERE THE OFFER OR SALE IS NOT PERMITTED.
44
| MARKETPLACE AT MILLCREEK |
The Property. The Marketplace at Millcreek Property is a 401,947 square foot anchored retail center situated on a 54.6-acre site and located in Buford, Georgia approximately 30 miles northeast of Atlanta central business district. Constructed in 2003, the Marketplace at Millcreek Property is situated directly across from the Simon-owned Mall of Georgia, which is the largest shopping mall in the state of Georgia in terms of leasable retail space, and is rated “A” by a third party research report. The Marketplace at Millcreek Property is anchored by Ross Dress for Less, Marshalls, Burlington Coat Factory (currently subleasing the Toys “R” Us space), Bed Bath & Beyond, and Stein Mart. The Marketplace at Millcreek Property is also shadow anchored by Costco, which is not part of the collateral. The remainder of the rent roll is granular with 24 tenants comprising no more than 5.9% of the net rentable area or 7.2% of the annual base rent, individually. The Marketplace at Millcreek Property contains 2,214 surface parking spaces, resulting in a parking ratio of 5.5 spaces per 1,000 square feet. As of July 6, 2017, the Marketplace at Millcreek Property was 97.2% occupied by 29 tenants. Since 2007, the Marketplace at Millcreek Property has averaged 95.4% occupancy.
The following table presents certain information relating to the tenancy at the Marketplace at Millcreek Property:
Major Tenants(1)
| Tenant Name | Credit Rating (Fitch/Moody’s / S&P)(2) | Tenant NRSF | % of NRSF | Annual U/W Base Rent PSF | Annual U/W Base Rent | % of Total Annual U/W Base Rent | Sales PSF | Occupancy Cost | Lease Expiration Date |
| Shadow Anchor | |||||||||
| Costco | A+/A1/A+ | Shadow Anchor – Not Part of the Collateral | |||||||
| Anchor Tenants | |||||||||
| Ross Dress for Less | NR/A3/A- | 30,093 | 7.5% | $11.75 | $353,593 | 7.2% | NAV | NAV | 1/31/2023(3) |
| Marshalls | NR/A2/A+ | 30,000 | 7.5% | $11.00 | $330,000 | 6.7% | $259(4) | 5.6%(4) | 5/31/2022(5) |
| Toys “R” Us(6) | CC/B3/CCC- | 50,000 | 12.4% | $5.88(6) | $294,250(6) | 6.0% | NAV | NAV | 1/31/2020(7) |
| Stein Mart | NR/NR/NR | 30,000 | 7.5% | $9.25 | $277,500 | 5.6% | $135(8) | 9.5%(8) | 9/30/2023(9) |
| Bed Bath & Beyond | NR/Baa1/BBB+ | 33,889 | 8.4% | $8.00 | $271,112 | 5.5% | NAV | NAV | 1/31/2020(9) |
| Total Anchor Tenants | 173,982 | 43.3% | $8.77 | $1,526,455 | 30.9% | ||||
| Major Tenants | |||||||||
| DSW | NR/NR/NR | 23,783 | 5.9% | $15.00 | $356,745 | 7.2% | $174(10) | 10.6%(10) | 1/31/2024(11) |
| Michael’s | NR/NR/BB- | 23,582 | 5.9% | $13.06 | $307,981 | 6.2% | $189(8) | 8.8%(8) | 2/29/2020(11) |
| Cost Plus World Market | NR/Baa1/BBB+ | 18,225 | 4.5% | $16.75 | $305,269 | 6.2% | NAV | NAV | 1/31/2018(11) |
| Total Major Tenants | 65,590 | 16.3% | $14.79 | $969,995 | 19.6% | ||||
| Non-Major Tenants | 151,176 | 37.6% | $16.15 | $2,441,259 | 49.4% | ||||
| Occupied Collateral Total | 390,748 | 97.2% | $12.64 | $4,937,708 | 100.0% | ||||
| Vacant Space | 11,199 | 2.8% | |||||||
| Collateral Total | 401,947 | 100.0% | |||||||
| (1) | Information obtained from the underwritten rent roll. |
| (2) | Certain ratings are those of the parent company whether or not the parent company guarantees the lease. |
| (3) | Ross Dress for Less has two, five-year extension option. |
| (4) | Sales PSF and Occupancy Costs are for the trailing twelve months as of January 31, 2017. |
| (5) | Marshalls has one, five-year extension option. |
| (6) | Toys “R” Us currently subleases its space to Burlington Coat Factory. The Annual U/W Base Rent and Annual U/W Base Rent PSF is based on the rent Toys “R” Us paying to the borrower. The appraiser concluded to a market rent of $10.00 per square foot for the Toys “R” us space, which is approximately 70% higher than the underwritten base rent. Toys “R” Us filed for Chapter 11 bankruptcy protection on or about September 19, 2017. See“Risk Factors – Risks Related to the Mortgage Loans – Performance of the Mortgage Loan Will Be Highly Dependent on the Performance of Tenants and Tenant Leases – Tenant Bankruptcy Could Result in a Rejection of the Related Lease”in the Preliminary Prospectus.. |
| (7) | Toys “R” Us has five, five-year extension options. |
| (8) | Sales PSF and Occupancy costs are for the trailing 12 months as of December 31, 2016 |
| (9) | Tenant has four, five-year extension options. |
| (10) | Sales PSF and Occupancy Costs are for the trailing twelve months as of May 31, 2017. |
| (11) | Tenant has two, five-year extension options. |
THE INFORMATION IN THIS STRUCTURAL AND COLLATERAL TERM SHEET IS NOT COMPLETE AND MAY BE AMENDED PRIOR TO THE TIME OF SALE. THIS TERM SHEET IS NOT AN OFFER TO SELL THESE SECURITIES AND IT IS NOT A SOLICITATION OF AN OFFER TO BUY THESE SECURITIES IN ANY JURISDICTION WHERE THE OFFER OR SALE IS NOT PERMITTED.
45
| MARKETPLACE AT MILLCREEK |
The following table presents certain information relating to the lease rollover schedule at the Marketplace at Millcreek Property:
Lease Expiration Schedule(1)
| Year Ending December 31, | No. of Leases Expiring | Expiring NRSF | % of Total NRSF | Cumulative Expiring NRSF | Cumulative % of Total NRSF | Annual U/W Base Rent | % of Total Annual U/W Base Rent | Annual U/W Base Rent PSF(2) |
| MTM | 1 | 1,473 | 0.4% | 1,473 | 0.4% | $32,627 | 0.7% | $22.15 |
| 2017 | 2 | 33,072 | 8.2% | 34,545 | 8.6% | $417,141 | 8.4% | $12.61 |
| 2018 | 1 | 18,225 | 4.5% | 52,770 | 13.1% | $305,269 | 6.2% | $16.75 |
| 2019 | 3 | 24,197 | 6.0% | 76,967 | 19.1% | $355,766 | 7.2% | $14.70 |
| 2020 | 9 | 146,662 | 36.5% | 223,629 | 55.6% | $1,572,438 | 31.8% | $10.72 |
| 2021 | 2 | 4,611 | 1.1% | 228,240 | 56.8% | $100,236 | 2.0% | $21.74 |
| 2022 | 4 | 40,759 | 10.1% | 268,999 | 66.9% | $543,185 | 11.0% | $13.33 |
| 2023 | 2 | 60,093 | 15.0% | 329,092 | 81.9% | $631,093 | 12.8% | $10.50 |
| 2024 | 2 | 29,264 | 7.3% | 358,356 | 89.2% | $493,712 | 10.0% | $16.87 |
| 2025 | 1 | 4,787 | 1.2% | 363,143 | 90.3% | $86,166 | 1.7% | $18.00 |
| 2026 | 1 | 23,450 | 5.8% | 386,593 | 96.2% | $304,850 | 6.2% | $13.00 |
| 2027 | 0 | 0 | 0.0% | 386,593 | 96.2% | $0 | 0.0% | $0.00 |
| Thereafter | 1 | 4,155 | 1.0% | 390,748 | 97.2% | $95,226 | 1.9% | $22.92 |
| Vacant | 0 | 11,199 | 2.8% | 401,947 | 100.0% | $0 | 0.0% | $0.00 |
| Total/Weighted Average | 29 | 401,947 | 100.0% | $4,937,708 | 100.0% | $12.64 |
| (1) | Information obtained from the underwritten rent roll. |
| (2) | Total Annual U/W Base Rent PSF excludes vacant space. |
The following table presents historical occupancy percentages at the Marketplace at Millcreek Property:
Historical Occupancy
12/31/2013(1) | 12/31/2014(1) | 12/31/2015(1) | 10/6/2016(1) | 7/6/2017(2) |
| 97.7% | 92.3% | 100.0% | 100.0% | 97.2% |
| (1) | Information obtained from the borrower. |
| (2) | Information obtained from the underwritten rent roll. |
Operating History and Underwritten Net Cash Flow. The following table presents certain information relating to the historical operating performance and the underwritten net cash flow at The Marketplace at Millcreek Property:
Cash Flow Analysis
| 2014 | 2015 | 2016 | TTM 6/30/2017 | U/W | % of U/W Effective Gross Income | U/W $ per SF | |
| Base Rent | $4,658,124 | $4,650,491 | $5,102,916 | $5,141,903 | $5,190,468 | 81.2% | $12.91 |
| Percent Rent | 54,897 | 68,659 | 70,168 | 69,511 | 69,511 | 1.1 | 0.17 |
| Total Reimbursables | 1,119,345 | 1,107,802 | 1,111,941 | 1,096,567 | 1,343,158 | 21.0 | 3.34 |
| Other Income | 41,714 | 111,257 | 38,957 | 13,751 | 51,420 | 0.8 | 0.13 |
| Less Vacancy & Credit Loss | 0 | 0 | 0 | 0 | (259,523)(1) | (4.1) | (0.65) |
| Effective Gross Income | $5,874,080 | $5,938,209 | $6,323,982 | $6,321,731 | $6,395,033 | 100.0% | $15.91 |
| Total Operating Expenses | $1,511,529 | $1,485,827 | $1,432,307 | $1,408,354 | $1,669,652 | 26.1% | $4.15 |
| Net Operating Income | $4,362,551 | $4,452,382 | $4,891,676 | $4,913,376 | $4,725,381 | 73.9% | $11.76 |
| Replacement Reserves | 0 | 0 | 0 | 0 | 148,720 | 2.3 | 0.37 |
| TI/LC | 0 | 0 | 0 | 0 | 325,287 | 5.1 | 0.81 |
| Net Cash Flow | $4,362,551 | $4,452,382 | $4,891,676 | $4,913,376 | $4,251,374 | 66.5% | $10.58 |
| NOI DSCR | 2.84x | 2.90x | 3.19x | 3.20x | 3.08x | ||
| NCF DSCR | 2.84x | 2.90x | 3.19x | 3.20x | 2.77x | ||
| NOI DY | 11.0% | 11.2% | 12.4% | 12.4% | 11.9% | ||
| NCF DY | 11.0% | 11.2% | 12.4% | 12.4% | 10.7% |
| (1) | The underwritten economic vacancy is 5.0%. Marketplace at Millcreek Property was 97.2% physically occupied as of July 6, 2017. |
Appraisal.As of the appraisal valuation date of July 9, 2017, the Marketplace at Millcreek Property had an “as-is” appraised value of $75,800,000.
Market Overview and Comparable Properties.The Marketplace at Millcreek Property is located in the city of Buford, Georgia, approximately 30.0 miles northeast of the Atlanta central business district. The Marketplace at Millcreek Property is located along Buford Drive, and directly across from the Simon-owned Mall of Georgia, which is rated “A” by a third party research report. Mall of Georgia is a 1.7 million square foot super regional mall with more than 200 local, national and international stores, and is the largest shopping mall in the state of Georgia in terms of leasable retail space. The Marketplace at Millcreek Property benefits from its location along Buford Drive, which connects with Interstate 85 and Lawrenceville to the south, and Interstate 985 and Sugar Hill to the north. According to the appraisal, the surrounding neighborhood is part of the rapidly expanding commercial development along
THE INFORMATION IN THIS STRUCTURAL AND COLLATERAL TERM SHEET IS NOT COMPLETE AND MAY BE AMENDED PRIOR TO THE TIME OF SALE. THIS TERM SHEET IS NOT AN OFFER TO SELL THESE SECURITIES AND IT IS NOT A SOLICITATION OF AN OFFER TO BUY THESE SECURITIES IN ANY JURISDICTION WHERE THE OFFER OR SALE IS NOT PERMITTED.
46
| MARKETPLACE AT MILLCREEK |
Interstate 85, and residential development is concentrated in all directions around the Marketplace at Millcreek Property. The population within the surrounding neighborhood has shown moderate growth over the past seven years and experienced substantial growth from 2000 to 2010.
According to the appraisal, the 2017 estimated population within a one-, three- and five-mile radius of the Marketplace at Millcreek Property was 3,145, 51,522 and 146,855, respectively; while the 2017 estimated average household income within the same radii was $78,807, $92,199 and $92,933, respectively. According to a third party market research report, the Marketplace at Millcreek Property is located within the Gwinnett Mall/Duluth submarket which contains approximately 16.9 million square feet of retail space with a 6.8% vacancy rate and an average asking rental rate of $16.03 per square foot, gross.
The following table presents certain information relating to comparable properties to the Marketplace at Millcreek Property:
Competitive Properties(1)
| Marketplace at Millcreek (Subject) | Mill Creek Station | Mill Creek Crossing | Mall of Georgia Shops | Lawrenceville Market | North Point Market Center | |
| Location | Buford, GA | Buford, GA | Buford, GA | Buford, GA | Lawrenceville, GA | Alpharetta, GA |
| Distance from Subject | -- | 0.9 miles | 1.9 miles | Adjacent | 8.5 miles | 21.0 miles |
| Year Built/Renovated | 2003/NAP | 2000/NAP | 1998/NAP | 2003/NAP | 1995/NAP | 1994/NAP |
| Anchors | Ross Dress for Less, Marshalls, Toys “R” Us, Stein Mart, Bed Bath & Beyond | NAP | Walmart, Lowes | NAP | Home Depot, Target, Hobby Lobby, AMC, Marshalls, Old Navy, PetsMart, Ross Dress for Less | Babies “R” Us, Dick’s Sporting Goods, Marshalls, Bed Bath & Beyond |
| Total GLA | 401,947 SF(2) | 35,975 SF | 383,532 SF | 18,430 SF | 499,749 SF | 427,053 SF |
| Total Occupancy | 97.2%(2) | 100.0% | 99.0% | 94.0% | 100.0% | 95.0% |
| (1) | Information obtained from the appraisal. |
| (2) | Information obtained from the underwritten rent roll. |
The Borrower. The borrower is DDRTC Marketplace at Mill Creek LLC, a Delaware limited liability company and single purpose entity with one independent director. DDRTC Marketplace at Mill Creek LLC is 100.0% indirectly owned by DDRTC Core Retail Fund, LLC, a joint venture between TREA Retail Property Portfolio 2006 LLC (“TREA”), a wholly-owned subsidiary of Teachers Insurance and Annuity Association (“TIAA”) (85.0% membership interest), and DDR TC LLC, a wholly-owned subsidiary of DDR Corp. (“DDR”) (15.0% membership interest). Legal counsel to the borrower delivered a non-consolidation opinion in connection with the origination of the Marketplace at Millcreek Mortgage Loan. DDRTC Core Retail Fund, LLC is the guarantor of certain nonrecourse carveouts under the Marketplace at Millcreek Mortgage Loan.
The Borrower Sponsors.The borrower sponsor is DDR & TIAA CREFF JV. DDR (NYSE: DDR) is a self-administered and self-managed real estate investment trust in the business of acquiring, owning, developing, redeveloping, expanding, leasing and managing shopping centers. Headquartered in Beachwood, Ohio, DDR’s shopping center portfolio features open-air, value-oriented neighborhood and community centers, mixed-use centers and lifestyle centers located in prime markets with stable populations and high-growth potential. As of February 10, 2017, DDR’s portfolio consisted of 317 shopping centers (including 152 centers owned through joint ventures) and more than 650 acres of undeveloped land (of which approximately 100 acres are owned through unconsolidated joint ventures) throughout 35 states as well as Puerto Rico (14 assets). TIAA serves approximately 5.0 million active and retired employees participating at more than 15,000 institutions and had over $938.0 billion in combined assets under management as of the first quarter of 2017. As of June 30, 2017, TIAA’s Real Estate Account had $24.8 billion in net assets.
Escrows.The loan documents do not require ongoing monthly escrows for taxes as long as (i) no event of default has occurred and is continuing and (ii) the borrower provides the lender with evidence that the Marketplace at Millcreek Property taxes have been paid. The loan documents do not require ongoing monthly escrows for insurance premiums as long as (i) no event of default has occurred and is continuing and (ii) the borrower provides the lender with evidence that the Marketplace at Millcreek Property is insured via an acceptable blanket insurance policy and such policy is in full force and effect. The loan documents do not require ongoing monthly escrows for replacement reserves as long as (i) no event of default has occurred and is continuing, and (ii) the Marketplace at Millcreek Property is being adequately maintained as determined by the lender based on annual site inspections.
Lockbox and Cash Management.Upon the occurrence and during the continuance of a Cash Trap Event Period (as defined below), the borrower will be required to establish a lender-controlled lockbox account and direct all tenants to deposit all rents directly into such lockbox account. Additionally, all revenues and other monies received by the borrower or property manager relating to the Marketplace at Millcreek Property are required to be deposited into the lockbox account within one business day of receipt. During a Cash Trap Event Period, all excess cash flow after payment of all sums due and payable under the Marketplace at Millcreek Mortgage Loan documents and all operating expenses will be retained by the lender as additional collateral.
A “Cash Trap Event Period” means the occurrence of (i) an event of default or (ii) the trailing 12-month net operating income (“NOI”) debt yield falling below 7.75% for two consecutive calendar quarters. A Cash Trap Event Period will end, with respect to clause (i), upon the cure of such event of default, and with respect to clause (ii), upon the trailing 12-month NOI debt yield being greater than or equal to 8.25% for two consecutive calendar quarters.
THE INFORMATION IN THIS STRUCTURAL AND COLLATERAL TERM SHEET IS NOT COMPLETE AND MAY BE AMENDED PRIOR TO THE TIME OF SALE. THIS TERM SHEET IS NOT AN OFFER TO SELL THESE SECURITIES AND IT IS NOT A SOLICITATION OF AN OFFER TO BUY THESE SECURITIES IN ANY JURISDICTION WHERE THE OFFER OR SALE IS NOT PERMITTED.
47
| MARKETPLACE AT MILLCREEK |
In lieu of a cash flow sweep, the borrower may provide a letter of credit, or a guaranty from DDRTC Core Retail Fund, LLC, or post cash, equal to an amount that would have otherwise been swept in a cash flow sweep event, but not less than the amount swept assuming an NOI that yields a 7.75% NOI debt yield, refreshed annually on the anniversary of the trigger event.
Property Management.The Marketplace at Millcreek Property is managed by an affiliate of the borrower.
Assumption.The borrower has the two-time right to transfer the Marketplace at Millcreek Property provided that certain conditions are satisfied, including (i) no event of default under the Marketplace at Millcreek Mortgage Loan documents has occurred and is continuing; (ii) in the event that in connection with such transfer, the manager will not thereafter continue to manage the Marketplace at Millcreek Property, then a replacement management agreement with a qualified manager must be executed acceptable to lender; (iii) the lender reasonably determines that the proposed transferee and guarantor satisfy the lender’s credit review and underwriting standards, taking into consideration the transferee’s experience, financial strength and general business standing; and (iv) if requested by lender, rating agency confirmation from Fitch, KBRA and Moody’s that such assumption will not result in a downgrade, withdrawal or qualification of the respective ratings assigned to the WFCM 2017-C40 certificates.
Partial Release.Not permitted
Real Estate Substitution.Not permitted
Subordinate and Mezzanine Indebtedness.Not permitted
Ground Lease.None.
Terrorism Insurance.The loan documents require that the “all risk” insurance policy required to be maintained by the borrower provide coverage for terrorism in an amount equal to the full replacement cost of the Marketplace at Millcreek Property, as well as business interruption insurance covering no less than an amount equal to 100% of the projected gross income from the Marketplace at Millcreek Property on an actual loss sustained basis for a period beginning on the date of business interruption and continuing until the restoration of the Marketplace at Millcreek Property is completed, or the 18-month period following the occurrence of a casualty event, together with a twelve-month extended period of indemnity.
THE INFORMATION IN THIS STRUCTURAL AND COLLATERAL TERM SHEET IS NOT COMPLETE AND MAY BE AMENDED PRIOR TO THE TIME OF SALE. THIS TERM SHEET IS NOT AN OFFER TO SELL THESE SECURITIES AND IT IS NOT A SOLICITATION OF AN OFFER TO BUY THESE SECURITIES IN ANY JURISDICTION WHERE THE OFFER OR SALE IS NOT PERMITTED.
48
(THIS PAGE INTENTIONALLY LEFT BLANK)
THE INFORMATION IN THIS STRUCTURAL AND COLLATERAL TERM SHEET IS NOT COMPLETE AND MAY BE AMENDED PRIOR TO THE TIME OF SALE. THIS TERM SHEET IS NOT AN OFFER TO SELL THESE SECURITIES AND IT IS NOT A SOLICITATION OF AN OFFER TO BUY THESE SECURITIES IN ANY JURISDICTION WHERE THE OFFER OR SALE IS NOT PERMITTED.
49
| SAVA HOLDINGS IHG PORTFOLIO |
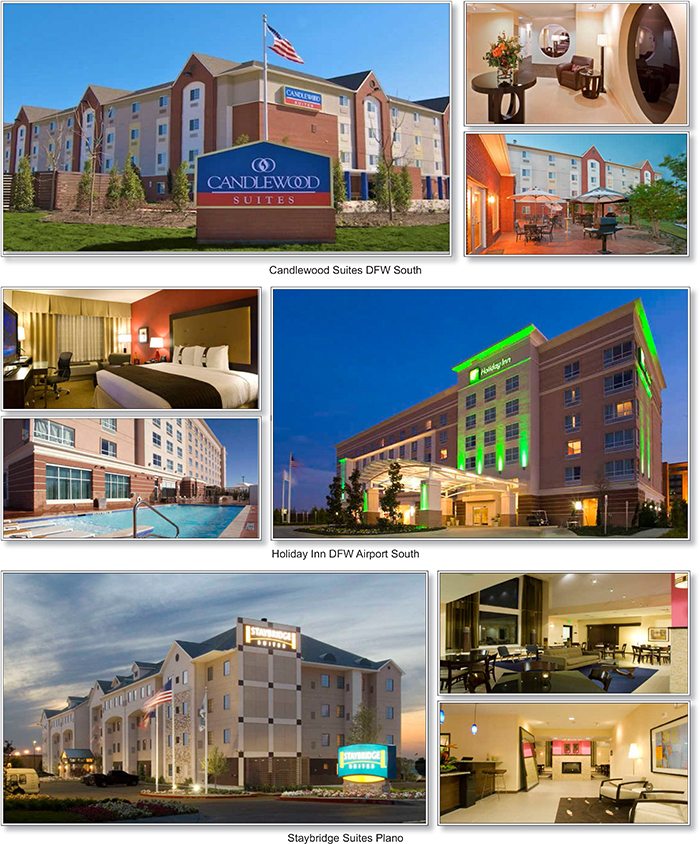
THE INFORMATION IN THIS STRUCTURAL AND COLLATERAL TERM SHEET IS NOT COMPLETE AND MAY BE AMENDED PRIOR TO THE TIME OF SALE. THIS TERM SHEET IS NOT AN OFFER TO SELL THESE SECURITIES AND IT IS NOT A SOLICITATION OF AN OFFER TO BUY THESE SECURITIES IN ANY JURISDICTION WHERE THE OFFER OR SALE IS NOT PERMITTED.
50
| SAVA HOLDINGS IHG PORTFOLIO |
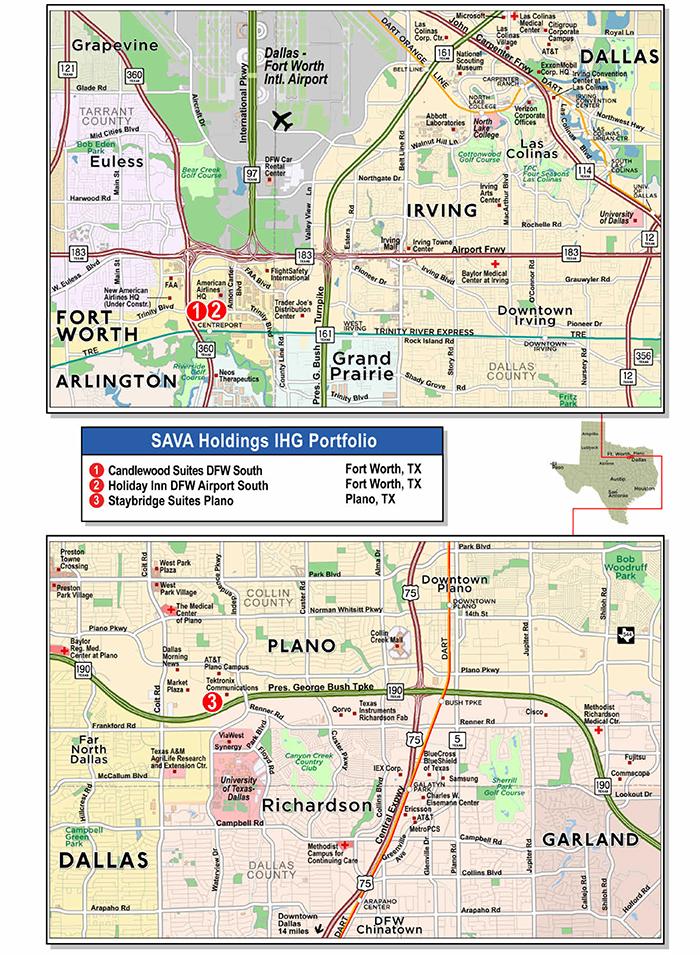
THE INFORMATION IN THIS STRUCTURAL AND COLLATERAL TERM SHEET IS NOT COMPLETE AND MAY BE AMENDED PRIOR TO THE TIME OF SALE. THIS TERM SHEET IS NOT AN OFFER TO SELL THESE SECURITIES AND IT IS NOT A SOLICITATION OF AN OFFER TO BUY THESE SECURITIES IN ANY JURISDICTION WHERE THE OFFER OR SALE IS NOT PERMITTED.
51
| No. 4 – SAVA Holdings IHG Portfolio | ||||||||
| Loan Information | Property Information | |||||||
| Mortgage Loan Seller: | Rialto Mortgage Finance, LLC | Single Asset/Portfolio: | Portfolio | |||||
| Credit Assessment (Fitch/KBRA/Moody’s): | NR/NR/NR | Property Type: | Hospitality | |||||
| Original Principal Balance: | $37,000,000 | Specific Property Type: | Various | |||||
| Cut-off Date Balance: | $37,000,000 | Location: | Various | |||||
| % of Initial Pool Balance: | 5.2% | Size: | 429 Rooms | |||||
| Loan Purpose: | Refinance | Cut-off Date Balance Per Room: | $86,247 | |||||
| Borrower Name: | Four2nine Holdings, LLC | Year Built/Renovated: | Various | |||||
| Borrower Sponsor: | Suhas S. Naik | Title Vesting: | Fee | |||||
| Mortgage Rate: | 5.0100% | Property Manager: | Self-managed | |||||
| 4thMost Recent Occupancy (As of): | NAV | |||||||
| Note Date: | August 31, 2017 | 3rdMost Recent Occupancy (As of): | 85.3% (12/31/2014) | |||||
| Anticipated Repayment Date: | NAP | 2ndMost Recent Occupancy (As of): | 87.0% (12/31/2015) | |||||
| Maturity Date: | September 6, 2027 | Most Recent Occupancy (As of): | 90.0% (12/31/2016) | |||||
| IO Period: | 24 months | Current Occupancy (As of): | 89.9% (TTM 7/31/2017) | |||||
| Loan Term (Original): | 120 months | |||||||
| Seasoning: | 1 month | Underwriting and Financial Information: | ||||||
| Amortization Term (Original): | 360 months | 4thMost Recent NOI (As of): | $4,047,326 (12/31/2014) | |||||
| Loan Amortization Type: | Interest-only, Amortizing Balloon | 3rdMost Recent NOI (As of): | $4,712,578 (12/31/2015) | |||||
| Interest Accrual Method: | Actual/360 | 2ndMost Recent NOI (As of): | $5,180,258 (12/31/2016) | |||||
| Call Protection: | L(25),D(91),O(4) | Most Recent NOI (As of): | $5,226,587 (TTM 7/31/2017) | |||||
| Lockbox Type: | Hard/Upfront Cash Management | |||||||
| Additional Debt: | None | U/W Revenues: | $13,439,151 | |||||
| Additional Debt Type: | NAP | U/W Expenses: | $8,261,742 | |||||
| U/W NOI: | $5,177,409 | |||||||
| U/W NCF: | $4,639,843 | |||||||
| U/W NOI DSCR: | 2.17x | |||||||
| Escrows and Reserves(1): | U/W NCF DSCR: | 1.94x | ||||||
| U/W NOI Debt Yield: | 14.0% | |||||||
| Type: | Initial | Monthly | Cap (If Any) | U/W NCF Debt Yield: | 12.5% | |||
| Taxes | $470,193 | $49,756 | NAP | As-Is Appraised Value(2): | $64,900,000 | |||
| Insurance | $96,409 | Springing | NAP | As-Is Appraisal Valuation Dates: | Various | |||
| FF&E | $0 | $44,797 | NAP | Cut-off Date LTV Ratio(2): | 57.0% | |||
| PIP Reserve | $4,507,400 | NAP | NAP | LTV Ratio at Maturity or ARD: | 49.3% | |||
| Seasonality Reserve | $67,129 | Springing | NAP | |||||
| (1) | See “Escrows” section. |
| (2) | See “Appraisal” section. |
The Mortgage Loan. The mortgage loan (the “SAVA Holdings IHG Portfolio Mortgage Loan”) is evidenced by a single promissory note that is secured by a first mortgage encumbering three select service hotel properties located in Fort Worth, Texas and Plano, Texas (the “SAVA Holdings IHG Portfolio Properties”). The SAVA Holdings IHG Porfolio Mortgage Loan was originated on August 31, 2017 by Rialto Mortgage Finance, LLC. The SAVA Holdings IHG Portfolio Mortgage Loan had an original principal balance of $37,000,000, has an outstanding principal balance as of the Cut-off Date of $37,000,000 and accrues interest at an interest rate of 5.0100%per annum. The SAVA Holdings IHG Portfolio Mortgage Loan had an initial term of 120 months, has a remaining term of 119 months as of the Cut-off Date and requires payments of interest-only for the first 24 payments following origination and thereafter requires payments of principal and interest based on a 30-year amortization schedule. The SAVA Holdings IHG Portfolio Mortgage Loan matures on September 6, 2027.
Following the lockout period, the borrower has the right to defease the SAVA Holdings IHG Portfolio Mortgage Loan in whole, and in part (see “Partial Release” section), on any date before June 6, 2027. In addition, the SAVA Holdings IHG Portfolio Mortgage Loan is prepayable without penalty on or after June 6, 2027.
THE INFORMATION IN THIS STRUCTURAL AND COLLATERAL TERM SHEET IS NOT COMPLETE AND MAY BE AMENDED PRIOR TO THE TIME OF SALE. THIS TERM SHEET IS NOT AN OFFER TO SELL THESE SECURITIES AND IT IS NOT A SOLICITATION OF AN OFFER TO BUY THESE SECURITIES IN ANY JURISDICTION WHERE THE OFFER OR SALE IS NOT PERMITTED.
52
| SAVA HOLDINGS IHG PORTFOLIO |
Sources and Uses
| Sources | Uses | |||||||
| Original loan amount | $37,000,000 | 80.4% | Loan Payoff | $28,476,419 | 61.9% | |||
| Borrower sponsor’s new cash contribution | 9,014,365 | 19.6 | Reserves | 5,141,131 | 11.2 | |||
| Closing costs | 1,104,469 | 2.4 | ||||||
| Membership buyout(1) | 11,292,346 | 24.5 | ||||||
| Total Sources | $46,014,365 | 100.0% | Total Uses | $46,014,365 | 100.0% |
| (1) | $11.29 million was used to buy out a previous member and admit a new preferred member of indirect equity, who contributed the borrower sponsor’s new cash contribution at the Sava Holdings IHG Portfolio Mortgage Loan origination. |
The Properties.The SAVA Holdings IHG Portfolio Properties are comprised of one extended stay hotel, one select service hotel and one limited service hotel built between 2007 and 2008 totaling 429 rooms that as of July 31, 2017, were 89.9% occupied with individual hotel occupancies ranging from 85.4% to 94.7%.
The following table presents certain information relating to the unit mix of the SAVA Holdings IHG Portfolio Properties:
| Property Name – Location | Allocated Cut-off Date Balance | % of Portfolio Cut-off Date Balance | Occupancy | Year Built/ Renovated | No. of Units | Appraised Value(1) | Allocated Cut-off Date LTV |
| Candlewood Suites DFW South | $13,000,000 | 35.1% | 94.7% | 2007/NAP | 174 | $25,800,000 | 50.4% |
| Holiday Inn DFW Airport South | $12,000,000 | 32.4% | 85.4% | 2008/NAP | 143 | $19,100,000 | 62.8% |
| Staybridge Suites Plano | $12,000,000 | 32.4% | 88.1% | 2007/NAP | 112 | $20,000,000 | 60.0% |
| Total/Weighted Average | $37,000,000 | 100.0% | 89.9% | 429 | $64,900,000 | 57.0% |
| (1) | The Appraised Value for the Candlewood Suites DFW South property and the Staybridge Suites Plano property is based on the “as complete” value. See “Appraisal” section. |
Candlewood Suites DFW South
The Candlewood Suites DFW South property is a 174-room, four-story, extended-stay hotel located in Fort Worth, Texas. The Candlewood Suites DFW South property is situated on a 4.3-acre lot and has 140 parking spaces, resulting in a parking ratio of approximately 0.8 spaces per room. The Candlewood Suites DFW South property opened in 2007. The Candlewood Suites DFW South property largely accommodates training programs for American Airlines, as 100 of the 174 rooms are under contract by American Airlines Group since the hotel’s opening. The most recent contract with American Airlines Group has a three-year term for the period of November 1, 2017 through October 31, 2020. The Candlewood Suites DFW South property has a required property improvement plan (“PIP”) to be completed from 2017 through 2019 at an estimated cost of $1,113,853 ($6,401 per room), for which $1,280,931 ($7,362 per room) was reserved upfront.
The Candlewood Suites DFW South property guestroom configuration includes 158 studio suites and 16 one-bedroom suites. Guestroom amenities include a kitchenette, a refrigerator, a coffeemaker and a safe. Other amenities include a large fitness room, lobby workstation, market pantry, lending locker, guest laundry area and an outdoor patio and barbecue area. The Candlewood Suites DFW South property also provides an 800 square foot meeting room.
The franchise agreement expires June 8, 2032.
Holiday Inn DFW Airport South
The Holiday Inn DFW Airport South property is a 143-room, six-story select-service hotel located in Fort Worth, Texas. The Holiday Inn DFW Airport South property is situated on a 3.0-acre lot and has 145 parking spaces, resulting in a parking ratio of approximately 1.0 space per room. The Holiday Inn DFW Airport South property opened in 2008. The Holiday Inn DFW Airport South Property has a required property improvement plan (“PIP”) to be completed in 2019 at an estimated cost of $1,395,863 ($9,761 per room), for which $1,605,242 ($11,225 per room) was reserved upfront.
The Holiday Inn DFW Airport South property guestroom configuration includes 84 king rooms, 49 double-queen rooms and 10 one-bedroom suites. Guest room amenities include a mini-refrigerator, microwave, coffeemaker and a safe. The Holiday Inn DFW Airport South property features a market pantry and One Bar & Bistro restaurant with seating capacity of 90. Other amenities include a fitness center, business center, outdoor swimming pool, and guest laundry area and airport/local shuttle. The Holiday Inn DFW Airport South property also provides two meeting rooms, a 2,100 square foot meeting room that can be divided into three separate rooms and a 350 square foot meeting room.
The franchise agreement expires November 5, 2018. The sponsor is in process of extending the franchise agreement for a period of 15 years. The SAVA Holdings IHG Portfolio Mortgage Loan will be full recourse if the franchise agreement is not renewed or is terminated for any reason.
Staybridge Suites Plano
The Staybridge Suites Plano property is a 112-room, four-story, limited-service hotel located in Plano, Texas. The Staybridge Suites Plano property is situated on a 2.6-acre lot and has 114 parking spaces, resulting in a parking ratio of 1.0 space per room. The
THE INFORMATION IN THIS STRUCTURAL AND COLLATERAL TERM SHEET IS NOT COMPLETE AND MAY BE AMENDED PRIOR TO THE TIME OF SALE. THIS TERM SHEET IS NOT AN OFFER TO SELL THESE SECURITIES AND IT IS NOT A SOLICITATION OF AN OFFER TO BUY THESE SECURITIES IN ANY JURISDICTION WHERE THE OFFER OR SALE IS NOT PERMITTED.
53
| SAVA HOLDINGS IHG PORTFOLIO |
Staybridge Suites Plano property opened in 2007. The Staybridge Suites Plano property has a required property improvement plan (“PIP”) to be completed in 2018 and 2019 at an estimated cost of $1,409,763 ($12,587 per room), for which $1,621,227 ($14,475 per room) was reserved upfront.
The Staybridge Suites Plano property guestroom configuration includes 62 queen rooms, 25 one-bedroom suites, 10 king rooms, eight double rooms and seven two-bedroom suites. Guest room amenities include a mini-kitchen equipped with a refrigerator, dishwasher, a two-burner stove, a microwave and a coffeemaker. The Staybridge Suites Plano property features a market pantry and a 40-seat complimentary services area which serves daily complimentary breakfast and a complimentary evening manager’s reception Monday-Wednesday. Other amenities include an indoor swimming pool and whirlpool, fitness room, guest laundry area, business center, a sport court, outdoor patio and barbecue area and guest storage rooms. The Staybridge Suites Plano property also provides a 1,200 square foot meeting room and a 240 square foot meeting room.
The franchise agreement expires March 19, 2032.
2017 Accommodated Room Night Demand(1)
Property | Commercial | Group | Contract | Leisure | Extended Stay | ||||||
| Candlewood Suites DFW South | 15% | 0% | 15% | 10% | 60% | ||||||
| Holiday Inn DFW Airport South | 50% | 10% | 10% | 30% | 0% | ||||||
| Staybridge Suites Plano | 25% | 10% | 0% | 15% | 50% | ||||||
| (1) | Information obtained from the appraisals dated from May 22, 2017 through May 23, 2017. |
Operating History and Underwritten Net Cash Flow.The following table presents certain information relating to the historical operating performance and underwritten net cash flow at the SAVA Holdings IHG Portfolio Properties:
Cash Flow Analysis
| 2014 | 2015 | 2016 | TTM 7/31/2017 | U/W | % of U/W Total Revenue | U/W $ per Room(1) | |
| Occupancy | 85.3% | 87.0% | 90.0% | 89.9% | 86.2% | ||
| ADR | $82.31 | $86.35 | $88.78 | $89.50 | $93.31 | ||
| RevPAR | $70.19 | $75.11 | $79.90 | $80.44 | $80.44 | ||
| Room Revenue | $10,990,667 | $11,761,635 | $12,511,152 | $12,595,275 | $12,595,275 | 93.7% | $29,360 |
| F&B Revenue | 560,309 | 638,151 | 613,577 | 641,835 | 641,835 | 4.8 | 1,496 |
| Other Revenue(2) | 228,285 | 219,209 | 200,442 | 202,041 | 202,041 | 1.5 | 471 |
| Total Department Expenses | 3,222,916 | 3,349,047 | 3,439,892 | 3,399,181 | 3,399,181 | 25.3 | 7,923 |
| Gross Operating Profit | $8,556,345 | $9,269,948 | $9,885,279 | $10,039,970 | $10,039,970 | 74.7% | $23,403 |
| Total Undistributed Expenses | 3,879,861 | 3,925,622 | 4,026,167 | 4,127,633 | 4,127,763 | 30.7 | 9,622 |
| Profit Before Fixed Charges | $4,676,484 | $5,344,326 | $5,859,112 | $5,912,337 | $5,912,207 | 44.0% | $13,781 |
| Total Fixed Charges | 629,158 | 631,748 | 678,854 | 685,750 | 734,798 | 5.5 | 1,713 |
| Net Operating Income | $4,047,326 | $4,712,578 | $5,180,258 | $5,226,587 | $5,177,409 | 38.5% | $12,069 |
| FF&E | 0 | 0 | 0 | 0 | 537,566 | 4.0 | 1,253 |
| Net Cash Flow | $4,047,326 | $4,712,578 | $5,180,258 | $5,226,587 | $4,639,843 | 34.5% | $10,815 |
| NOI DSCR | 1.70x | 1.97x | 2.17x | 2.19x | 2.17x | ||
| NCF DSCR | 1.70x | 1.97x | 2.17x | 2.19x | 1.94x | ||
| NOI DY | 10.9% | 12.7% | 14.0% | 14.1% | 14.0% | ||
| NCF DY | 10.9% | 12.7% | 14.0% | 14.1% | 12.5% | ||
| (1) | Based on 429 rooms. |
| (2) | Other Revenue consists of revenue from meeting rooms, sundry shop, telephone, and guest laundry. |
Appraisal.As of the appraisal valuation dates of May 9, 2017 through May 10, 2017, the SAVA Holdings IHG Portfolio Properties had a portfolio aggregate “as-is” appraised value of $59,400,000. The appraiser also concluded a portfolio aggregate “when complete” appraised value of $67,800,000 for the SAVA Holdings IHG Portfolio Properties as of June 1, 2018. For purposes of calculating the Cut-off Date LTV Ratio and LTV Ratio at Maturity or ARD, the “as-is” value of $19,100,000 was used for the Holiday Inn DFW Airport South property and “as-complete” values of $25,800,000 and $20,000,000 for the Candlewood Suites DFW South property and Staybridge Suites Plano property, respectively, were used. Based on the “as-is” appraised value of each of the individual Mortgaged Properties, the Cut-off Date LTV Ratio and LTV Ratio at Maturity, based on the sum of each individual “as-is” value (which value is $59,400,000), are 62.3% and 53.9%, respectively.
Environmental Matters.According to Phase I environmental assessments, each dated May 5, 2017, there was no evidence of any recognized environmental conditions at the SAVA Holdings IHG Portfolio Properties.
Market Overview and Competition.The SAVA Holdings IHG Portfolio Properties are located in two diverse markets.
THE INFORMATION IN THIS STRUCTURAL AND COLLATERAL TERM SHEET IS NOT COMPLETE AND MAY BE AMENDED PRIOR TO THE TIME OF SALE. THIS TERM SHEET IS NOT AN OFFER TO SELL THESE SECURITIES AND IT IS NOT A SOLICITATION OF AN OFFER TO BUY THESE SECURITIES IN ANY JURISDICTION WHERE THE OFFER OR SALE IS NOT PERMITTED.
54
| SAVA HOLDINGS IHG PORTFOLIO |
Candlewood Suites DFW South
The Candlewood Suites DFW South property is located in Fort Worth, Tarrant County, Texas, within the Dallas-Fort Worth, TX-OK metropolitan statistical area. Arlington is the seventh-largest city in Texas and is located twelve miles east of Downtown Fort Worth and 20 miles west of Downtown Dallas. Major employers include AMR/American Airlines, Lockheed Martin, Fort Worth Independent School District, Texas Health Resources, NAS-Fort Worth-JRB and Arlington Independent School District. Other businesses in the area include Globe Life Park in Arlington, Six Flags Over Texas, Six Flags Hurricane Harbor, The University of Texas at Arlington, and the AT&T Stadium. According to the appraisal, the 2017 estimated population within a one-, three-, and five-mile radius of the Candlewood Suites DFW South property was 9,459, 67,930, and 233,065, respectively. The estimated average household income within the same radii is $55,620, $64,366, and $70,032.
Primary regional access routes serving the Dallas/Fort Worth Metroplex include Interstates 20, 30, 35, and 45, as well as U.S. Highways 67, 75, and 287. Interstate 20 traverses the southern sector of the metro area and extends to such cities as Abilene and Midland to the west and Shreveport, Louisiana to the east. Interstate 30 commences in west Fort Worth and, after serving as a major east/west route through the metro area, extends in a northeasterly direction to Greenville and Texarkana. Interstate 35, which divides into eastern and western sections when passing through the respective Dallas and Fort Worth metro areas, provides access to Oklahoma City to the north and Austin and San Antonio to the south. Interstate 45 commences near Downtown Dallas and extends in a southeasterly direction, providing access to the Houston metropolitan area. Primary access to the Candlewood Suites DFW South property is provided by Reggis Court. Access is also available from Center Station Drive. The Candlewood Suites DFW South property is located near the intersection of State Highways 360 and 183, which are the nearest major highways. Overall, the Candlewood Suites DFW South property benefits from very good accessibility and good visibility attributes. The Candlewood Suites DFW South property’s neighborhood is generally defined by State Highway 183 to the north, State Highway 161 to the east, the DART rail lines to the south, and State Highway 360 to the west. The neighborhood is characterized by quick-service restaurants, hotels, office buildings, and multi-family housing. Other businesses and entities in the area include Bank of America mortgage call center, Kubota Tractor Corporation, AT&T Stadium and Six Flags Over Texas. In addition, American Airlines operation center is located just west of the Candlewood Suites DFW South property’s neighborhood. Restaurants located near the Candlewood Suites DFW South property include Taco Bell, McDonald’s, and Starbucks. Hotels near the Candlewood Suites DFW South property include Hampton Inn & Suites, Candlewood Suites, and Marriott.
Holiday Inn DFW Airport South
The Holiday Inn DFW Airport South property is located in Fort Worth, Tarrant County, Texas, within the Dallas-Fort Worth, TX-OK metropolitan statistical area. Arlington is the seventh-largest city in Texas and is located twelve miles east of Downtown Fort Worth and 20 miles west of Downtown Dallas. Major employers include AMR/American Airlines, Lockheed Martin, Fort Worth Independent School District, Texas Health Resources, NAS-Fort Worth-JRB and Arlington Independent School District. Oher businesses in the area include Globe Life Park in Arlington, Six Flags Over Texas, Six Flags Hurricane Harbor, The University of Texas at Arlington, and the AT&T Stadium. According to the appraisal, the 2017 estimated population within a one-, three-, and five-mile radius of the Holiday Inn DFW Airport South property was 7,777, 69,003 and 236,953, respectively. The estimated average household income within the same radii is $56,409, $64,237, and $69,446.
Primary regional access routes serving the Dallas/Fort Worth Metroplex include Interstates 20, 30, 35, and 45, as well as U.S. Highways 67, 75, and 287. Interstate 20 traverses the southern sector of the metro area and extends to such cities as Abilene and Midland to the west and Shreveport, Louisiana to the east. Interstate 30 commences in west Fort Worth and, after serving as a major east/west route through the metro area, extends in a northeasterly direction to Greenville and Texarkana. Interstate 35, which divides into eastern and western sections when passing through the respective Dallas and Fort Worth metro areas, provides access to Oklahoma City to the north and Austin and San Antonio to the south. Interstate 45 commences near Downtown Dallas and extends in a southeasterly direction, providing access to the Houston metropolitan area. Primary access to the Holiday Inn DFW Airport South property is provided by Center Station Drive. Access is also available from Centreport Drive. The Holiday Inn DFW Airport South property is located near a busy intersection and is relatively simple to locate from State Highways 360 and 183, which are the nearest major highways. Overall, the Holiday Inn DFW Airport South property benefits from very good accessibility and good visibility attributes. The Holiday Inn DFW Airport South property’s neighborhood is generally defined by State Highway 183 to the north, State Highway 161 to the east, the DART rail lines to the south, and State Highway 360 to the west. The neighborhood is characterized by quick-service restaurants, hotels, office buildings, and multi-family housing. Other businesses and entities in the area include AMR corporate headquarters, Bank of America mortgage call center, Kubota Tractor Corporation, AT&T Stadium and Six Flags Over Texas. In addition, American Airlines operation center is located just west of the Holiday Inn DFW Airport South property’s neighborhood. Restaurants located near the Holiday Inn DFW Airport South property include Taco Bell, McDonald’s, and Starbucks. Hotels near the Holiday Inn DFW Airport South property include Hampton Inn & Suites, Candlewood Suites, and Marriott.
Staybridge Suites Plano
The Staybridge Suites Plano property is located in Plano, Collin County, Texas, within the Dallas-Fort Worth-Arlington, TX metropolitan statistical area. Plano is located between the suburbs of Richardson and Frisco. The area features a unique combination of office towers, upscale shopping, urban residential communities, and restaurants. This region is home to a multitude of global corporate headquarters and technology-related companies. Major employers include Plano ISD, Capital One Finance, Bank of America Home Loans, HP Enterprise Services, and Ericsson. Other businesses in the greater Plano area include J.C. Penney Company, Dr. Pepper Snapple Group (DPS), and Frito-Lay, PepsiCo, FedEx, Toyota Motor Company. According to the appraisal, the 2017 estimated population within a one-, three-, and five-mile radius of the Staybridge Suites Plano property was 8,196, 119,999 and 342,337, respectively. The estimated average household income within the same radii is $66,089, $106,940 and $102,318.
THE INFORMATION IN THIS STRUCTURAL AND COLLATERAL TERM SHEET IS NOT COMPLETE AND MAY BE AMENDED PRIOR TO THE TIME OF SALE. THIS TERM SHEET IS NOT AN OFFER TO SELL THESE SECURITIES AND IT IS NOT A SOLICITATION OF AN OFFER TO BUY THESE SECURITIES IN ANY JURISDICTION WHERE THE OFFER OR SALE IS NOT PERMITTED.
55
| SAVA HOLDINGS IHG PORTFOLIO |
Primary regional access routes serving the Dallas/Fort Worth Metroplex include Interstates 20, 30, 35, and 45, as well as U.S. Highways 67, 75, and 287. Interstate 20 traverses the southern sector of the metro area and extends to such cities as Abilene and Midland to the west and Shreveport, Louisiana, to the east. Interstate 30 commences in west Fort Worth and, after serving as a major east/west route through the metro area, extends in a northeasterly direction to Greenville and Texarkana. Interstate 35, which divides into eastern and western sections when passing through the respective Dallas and Fort Worth metro areas. Interstate 45 commences near Downtown Dallas and extends in a southeasterly direction, providing access to the Houston metropolitan area. Primary access to the Staybridge Suites Plano property is provided by Silverglen Drive. The Staybridge Suites Plano property is located near a major north/south arterial in Plano and is accessible via the Dallas North Tollway, U.S. Highway 75, and President George Bush Turnpike. The Staybridge Suites Plano property is served by the Dallas/Fort Worth International Airport and Dallas Love Field airport, which is located approximately 14 miles to the southwest approximately eleven miles southwest of the hotel, respectively. The Staybridge Suites Plano property’s neighborhood is generally defined by Park Boulevard to the north, Dallas North Tollway to the west, Campbell Road to the south, and Custer Road to the east. The neighborhood is characterized by restaurants, hospitals, office buildings, higher-education institutions, apartment complexes, single-family homes, and retail shopping centers. Other businesses and entities in the area include Atmos Energy, Collin County Community College, The University of Texas at Dallas, and Baylor Scott & White Medical Center - Plano. Restaurants located near the Staybridge Suites Plano property include Cafe Brazil, Geisha Steak & Sushi, and McDonald’s. Hotels near the Staybridge Suites Plano property include the existing Hilton Garden Inn Dallas/Richardson and a Residence Inn by Marriott which is under construction.
The following tables present certain information relating to the SAVA Holdings IHG Portfolio Properties historical occupancy, ADR RevPAR and penetration rates:
Historical Occupancy, ADR and RevPAR(1)
TTM July 2015 | TTM July 2016 | TTM July 2017 | ||||||||||||||||
Property | Occupancy | ADR | RevPAR | Occupancy | ADR | RevPAR | Occupancy | ADR | RevPAR | |||||||||
| Candlewood Suites DFW South | 92.6% | $61.62 | $57.07 | 93.0% | $64.52 | $59.99 | 94.3% | $67.41 | $63.5 | |||||||||
| Holiday Inn DFW Airport South | 77.9% | $103.71 | $80.76 | 85.2% | $101.60 | $86.55 | 85.4% | $102.66 | $87.6 | |||||||||
| Staybridge Suites Plano | 83.1% | $104.79 | $87.08 | 86.9% | $109.84 | $95.41 | 88.1% | $111.15 | $97.9 | |||||||||
| (1) | Information obtained from a third party hospitality research report dated August 16, 2017. |
Historical Penetration Rates(1)
TTM July 2015 | TTM July 2016 | TTM July 2017 | |||||||
Property | Occupancy | ADR | RevPAR | Occupancy | ADR | RevPAR | Occupancy | ADR | RevPAR |
| Candlewood Suites DFW South | 135.6% | 68.6% | 93.0% | 121.9% | 69.0% | 84.1% | 121.7% | 71.1% | 86.5% |
| Holiday Inn DFW Airport South | 107.5% | 86.3% | 92.8% | 115.4% | 81.1% | 93.6% | 116.6% | 81.0% | 94.4% |
| Staybridge Suites Plano | 106.1% | 100.0% | 106.0% | 105.4% | 99.6% | 105.0% | 112.0% | 100.9% | 113.1% |
| (1) | Information obtained from a third party hospitality research report dated August 16, 2017. |
The Borrower.The borrower is Four2nine Holdings, LLC, a single purpose Delaware limited liability company, with two independent directors in its organizational structure. The borrower is owned by Three429, LLC, the sole member and manager of the borrower. Three429, LLC is managed by Suhas S. Naik and Ajay Kothari. Suhas S. Naik, is the guarantor of certain nonrecourse carveouts under the SAVA Holdings IHG Portfolio Mortgage Loan and the full recourse guarantor of a portion of the loan equal to $9,250,000.
The Borrower Sponsor.The borrower sponsor of the SAVA Holdings IHG Portfolio Mortgage Loan is Suhas S. Naik. Mr. Naik has more than 25 years of real estate experience. Sava Holdings, Ltd. is a boutique hotel development company headquartered in Irving, Texas with 745 rooms currently under management in the Dallas Fort Worth Metroplex and another 427 rooms under construction. The company specializes in the acquisition, design, development, construction, and management of hospitality projects. Entities controlled by Suhas S. Naik filed Chapter 11 bankruptcy in 2010 in connection with a maturity default on the construction financing on three hotels, including two of the Sava Hotel IHG Portfolio Properties (the Candlewood Suites DFW South property and the Staybridge Suites Plano property). See “Description of the Mortgage Pool-Loan Purpose, Default History, Bankruptcy Issues and Other Proceedings” in the Preliminary Prospectus.
Escrows.The loan documents provided for upfront escrows in the amount of $470,193 for real estate taxes, $96,409 for insurance, $67,129 for a seasonality reserve, and $4,507,400 for a PIP reserve. The loan documents also provide for monthly escrows in the amount of $49,756 for real estate taxes and the applicable seasonality reserve monthly deposit (as defined below). The loan documents do not require monthly escrows for insurance provided that the SAVA Holdings IHG Portfolio Properties are (i) insured via an acceptable blanket insurance policy and the borrower provides the lender with evidence of renewal of the insurance policies and proof of payment of the insurance premiums when due; and (ii) no event of default exists.
The borrower is required to pay monthly seasonality reserves commencing in 2018 for the months of January – November of each year for the term of the SAVA Holdings IHG Portfolio Mortgage Loan. The monthly amount will be equal to the quotient of (i) the aggregate amount of monthly net cash flow shortfall of the most recent trailing 12-month period through January multiplied by 1.20, divided by (ii) 11.
THE INFORMATION IN THIS STRUCTURAL AND COLLATERAL TERM SHEET IS NOT COMPLETE AND MAY BE AMENDED PRIOR TO THE TIME OF SALE. THIS TERM SHEET IS NOT AN OFFER TO SELL THESE SECURITIES AND IT IS NOT A SOLICITATION OF AN OFFER TO BUY THESE SECURITIES IN ANY JURISDICTION WHERE THE OFFER OR SALE IS NOT PERMITTED.
56
| SAVA HOLDINGS IHG PORTFOLIO |
The borrower is required to pay monthly FF&E reserves of (i) an amount equal to one-twelfth 4% of gross income and (ii) the aggregate amount, if any, required to be reserved under the management agreement and the franchise agreement. During the initial 24 months of the SAVA Holdings IHG Portfolio Mortgage Loan a portion of the monthly FF&E reserves equal to 2% of the gross income shall be retained by the lender and will not be disbursed to the borrower until after (i) the initial 24 month period; (ii) delivery of an officer’s certificate and other documentation confirming completion of all property improvement plan work for each individual property; and (iii) no event of default exists.
Lockbox and Cash Management.The SAVA Holdings IHG Portfolio Mortgage Loan requires a lender-controlled lockbox account, which is already in place. The borrower has directed all tenants to pay their rents and all credit card companies under merchant agreements to pay receipts directly into such lockbox account. Funds in the lockbox are transferred daily into the cash management account, where they are applied in accordance with the loan documents. All excess cash flow will be applied as follows (i) to the property improvement plan reserve account following loan closing until the renewal of the Holiday Inn DFW Airport South property franchise agreement and completion of the related PIP Work, and following the occurrence and continuance of a Franchise Trigger Event; (ii) to the excess cash flow subaccount during any other Cash Sweep Event (as defined below), and/or (iii) if no Cash Sweep Event period is continuing, excess funds are released to the Borrower.
Additionally, following the completion of all the property improvement for all the individual properties, the borrower may request any remaining property improvement reserve funds be released to the borrower provided that (i) no Cash Sweep Event period is continuing, and (ii) the debt yield for the SAVA Holdings IHG Portfolio Mortgage Loan is not less than 12.0%.
A “Cash Sweep Event” will commence upon the occurrence of (i) an event of default; (ii) any bankruptcy action of borrower, guarantor or property manager; (iii) a Cash Sweep DSCR Trigger Event (as defined below) or (iv) the occurrence of a Franchise Trigger Event. A Cash Sweep Event will expire, with respect to clause (i) when such event of default has been cured or waived; and with respect to clause (ii), when such bankruptcy petition has been discharged, stayed, or dismissed within 30 days of such filing among other conditions for the borrower or guarantor and within 120 days for the property manager. Clause (ii) may also be cured when the borrower has replaced the property manager with a qualified property manager acceptable to the lender. Clause (iii) may be cured, once the trailing 12-month amortizing net operating income debt service coverage ratio (based on the current amortization schedule) is greater than 1.15x for two consecutive quarters or the date on which the low debt service coverage ratio cure shall have occurred, among other conditions. Clause (iv) may be cured if the Cash Sweep Event is caused solely by the occurrence by a Franchise Trigger Event (as defined below), which may be cured by the occurrence of the applicable Franchise Trigger Event cure (as defined below).
A “Cash Sweep DSCR Trigger Event” occurs upon any date the amortizing net operating income debt service coverage ratio based on the trailing 12-month period immediately preceding the date of such determination, is less than 1.15x.
A “Franchise Trigger Event” will occur (i) twelve months prior to the applicable expiration date under the franchise agreement; (ii) any failure to complete any property improvement plan work for the Candlewood Suites DFW South property or the Staybridge Suites Plano property by the earlier of (a) the date required by the franchisor and (b) the date that is twelve months after the origination date, and (iii) for the Holiday Inn DFW Airport South property (a) by the date required by the franchisor, or (b) from and after the origination date until the cure of a Cash Sweep Event.
A Franchise Trigger Event will expire, if the lender has received an acceptable comfort letter from the franchisor and, (A) with respect clause (i), (ii) or (iii) borrower has entered into an extension of the existing franchise agreement or a new franchise agreement has been executed with franchisor or a replacement franchisor acceptable to the lender and all related property improvement plan requirements have been completed and paid in full or (B) with respect to clause (ii) all related property improvement plan work being completed and paid in full.
Property Management.The SAVA Holdings IHG Portfolio Properties are managed by Aquila Lodging, LLC an affiliate of the borrower.
Assumption.The borrower has a right to transfer the SAVA Holdings IHG Portfolio Properties, provided that no event of default has occurred and is continuing and certain other conditions are satisfied, including (i) the lender’s reasonable determination that the proposed transferee and guarantor satisfy the lender’s credit review and underwriting standards, taking into consideration transferee experience, financial strength and general business standing; (ii) execution of a recourse guaranty and an environmental indemnity by an affiliate of the transferee; and (iii) if requested by the lender, rating agency confirmation from Fitch, KBRA and Moody’s that the transfer will not result in a downgrade, withdrawal or qualification of the respective ratings assigned to the Series 2017-C40 Certificates.
Partial Release.Following the second anniversary of the issuance of the WFCM Series 2017-C40 Certificates and prior to June 6, 2027, the borrower is permitted to obtain the release of one or more individual properties in connection with a partial defeasance, subject to certain conditions, including (i) no event of default has occurred and is continuing; (ii) delivery of defeasance collateral in an amount equal to 120.0% of the released property’s original allocated loan balance; (iii) the amortizing debt service coverage ratio (based upon the trailing 12-month period immediately preceding the date of such determination) with respect to the remaining properties will be no less than the greater of (a) 1.94x and (b) the amortizing debt service coverage ratio immediately prior to the release; and (iv) the loan to value ratio with respect to the remaining properties will be no greater than the lesser of (a) 57.0% and (b) the loan to value ratio immediately prior to the release.
Real Estate Substitution.Not permitted.
Subordinate and Mezzanine Indebtedness.Not permitted.
Ground Lease.None.
THE INFORMATION IN THIS STRUCTURAL AND COLLATERAL TERM SHEET IS NOT COMPLETE AND MAY BE AMENDED PRIOR TO THE TIME OF SALE. THIS TERM SHEET IS NOT AN OFFER TO SELL THESE SECURITIES AND IT IS NOT A SOLICITATION OF AN OFFER TO BUY THESE SECURITIES IN ANY JURISDICTION WHERE THE OFFER OR SALE IS NOT PERMITTED.
57
| SAVA HOLDINGS IHG PORTFOLIO |
Terrorism Insurance.The loan documents require that the “all risk” insurance policy required to be maintained by the borrowers provide coverage for terrorism in an amount equal to the full replacement cost of the SAVA Holdings IHG Portfolio Properties, as well as business interruption insurance covering no less than the 18-month period following the occurrence of a casualty event, together with a 12-month extended period of indemnity.
THE INFORMATION IN THIS STRUCTURAL AND COLLATERAL TERM SHEET IS NOT COMPLETE AND MAY BE AMENDED PRIOR TO THE TIME OF SALE. THIS TERM SHEET IS NOT AN OFFER TO SELL THESE SECURITIES AND IT IS NOT A SOLICITATION OF AN OFFER TO BUY THESE SECURITIES IN ANY JURISDICTION WHERE THE OFFER OR SALE IS NOT PERMITTED.
58
(THIS PAGE INTENTIONALLY LEFT BLANK)
THE INFORMATION IN THIS STRUCTURAL AND COLLATERAL TERM SHEET IS NOT COMPLETE AND MAY BE AMENDED PRIOR TO THE TIME OF SALE. THIS TERM SHEET IS NOT AN OFFER TO SELL THESE SECURITIES AND IT IS NOT A SOLICITATION OF AN OFFER TO BUY THESE SECURITIES IN ANY JURISDICTION WHERE THE OFFER OR SALE IS NOT PERMITTED.
59
WILSHIRE PACIFIC PLAZA
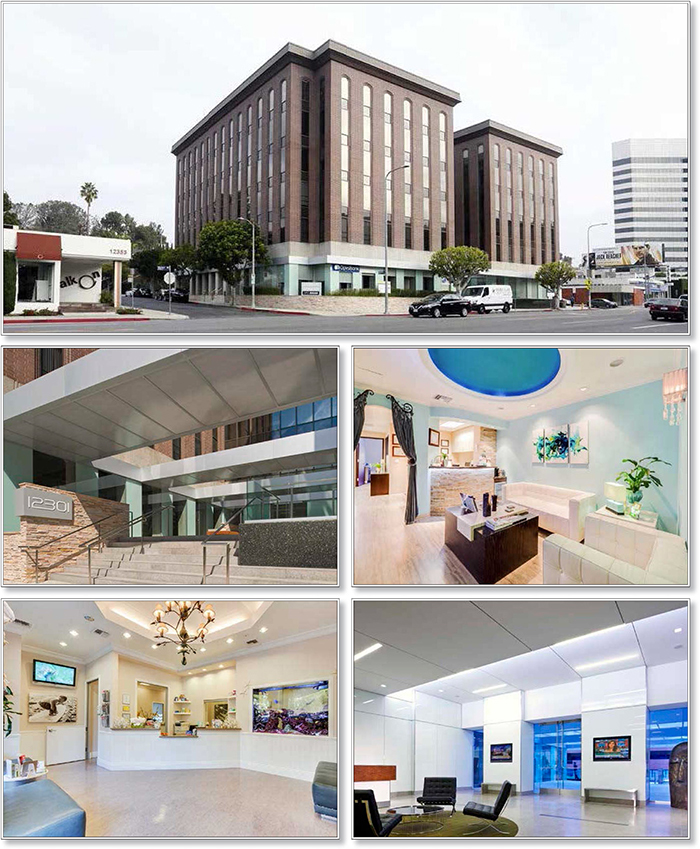
THE INFORMATION IN THIS STRUCTURAL AND COLLATERAL TERM SHEET IS NOT COMPLETE AND MAY BE AMENDED PRIOR TO THE TIME OF SALE. THIS TERM SHEET IS NOT AN OFFER TO SELL THESE SECURITIES AND IT IS NOT A SOLICITATION OF AN OFFER TO BUY THESE SECURITIES IN ANY JURISDICTION WHERE THE OFFER OR SALE IS NOT PERMITTED.
60
WILSHIRE PACIFIC PLAZA
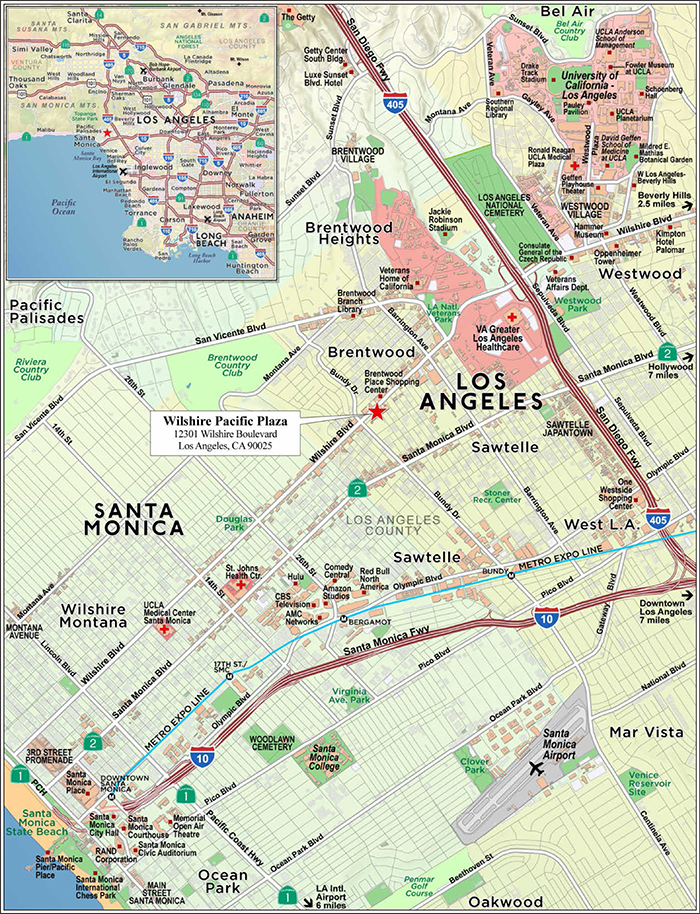
THE INFORMATION IN THIS STRUCTURAL AND COLLATERAL TERM SHEET IS NOT COMPLETE AND MAY BE AMENDED PRIOR TO THE TIME OF SALE. THIS TERM SHEET IS NOT AN OFFER TO SELL THESE SECURITIES AND IT IS NOT A SOLICITATION OF AN OFFER TO BUY THESE SECURITIES IN ANY JURISDICTION WHERE THE OFFER OR SALE IS NOT PERMITTED.
61
| No. 5 – Wilshire Pacific Plaza | |||||||
| Loan Information | Property Information | ||||||
| Mortgage Loan Seller: | Wells Fargo Bank, National Association | Single Asset/Portfolio: | Single Asset | ||||
Credit Assessment (Fitch/KBRA/Moody’s): | NR/NR/NR | Property Type: | Office | ||||
| Original Principal Balance: | $32,850,000 | Specific Property Type: | Suburban | ||||
| Cut-off Date Balance: | $32,850,000 | Location: | Los Angeles, CA | ||||
| % of Initial Pool Balance: | 4.7% | Size: | 107,737 SF | ||||
| Loan Purpose: | Refinance | Cut-off Date Balance Per SF: | $304.91 | ||||
| Borrower Names(1): | Various | Year Built/Renovated: | 1974/2010 | ||||
| Borrower Sponsors: | Bruce Abrams; Robert Hanasab; Paul Minoo; Robert Hanasab as trustee of the Robert Hanasab Trust | Title Vesting: | Fee | ||||
| Mortgage Rate: | 4.100% | Property Manager: | Self-managed | ||||
| Note Date: | August 30, 2017 | 4thMost Recent Occupancy (As of): | 81.0% (12/31/2014) | ||||
| Anticipated Repayment Date: | NAP | 3rdMost Recent Occupancy (As of): | 78.0% (12/31/2015) | ||||
| Maturity Date: | September 11, 2027 | 2ndMost Recent Occupancy (As of): | 81.0% (12/31/2016) | ||||
| IO Period: | 120 Months | Current Occupancy (As of): | 92.7% (9/1/2017) | ||||
| Loan Term (Original): | 120 months | ||||||
| Seasoning: | 1 month | Underwriting and Financial Information: | |||||
| Amortization Term (Original): | NAP | 4thMost Recent NOI(3): | NAV | ||||
| Loan Amortization Type: | Interest-only, Balloon | 3rdMost Recent NOI (As of): | $2,395,745 (12/31/2015) | ||||
| Interest Accrual Method: | Actual/360 | 2ndMost Recent NOI (As of): | $2,520,352 (12/31/2016) | ||||
| Call Protection: | L(25),D(90),O(5) | Most Recent NOI (As of)(4): | $2,888,235 (TTM 7/31/2017) | ||||
| Lockbox Type: | Springing | U/W Revenues: | $4,696,734 | ||||
| Additional Debt: | None | U/W Expenses: | $1,265,398 | ||||
| Additional Debt Type: | NAP | U/W NOI(4): | $3,431,335 | ||||
| U/W NCF: | $3,298,854 | ||||||
| U/W NOI DSCR: | 2.51x | ||||||
| Escrows and Reserves(2): | U/W NCF DSCR: | 2.42x | |||||
| Type: | Initial | Monthly | Cap (If Any) | U/W NOI Debt Yield: | 10.4% | ||
| Taxes | $257,898 | $42,983 | NAP | U/W NCF Debt Yield: | 10.0% | ||
| Insurance | $0 | Springing | NAP | As-Is Appraised Value: | $59,000,000 | ||
| Replacement Reserves | $0 | $2,243 | $80,730 | As-Is Appraisal Valuation Date: | July 18, 2017 | ||
| TI/LC Reserve | $500,000 | $13,455 | $500,000 | Cut-off Date LTV Ratio: | 55.7% | ||
| Rent Concession Reserve | $122,576 | $0 | NAP | LTV Ratio at Maturity or ARD: | 55.7% | ||
| (1) | See “The Borrowers” section. |
| (2) | See “Escrows” section. |
| (3) | Historical operating history prior to 2015 is not available as the borrower acquired the property in 2014 and such information was not provided by the seller. |
| (4) | See “Cash Flow Analysis” section. |
The Mortgage Loan. The mortgage loan (the “Wilshire Pacific Plaza Mortgage Loan”) is evidenced by a single promissory note secured by a first mortgage encumbering an office building located in Los Angeles, California (the “Wilshire Pacific Plaza Property”). The Wilshire Pacific Plaza Mortgage Loan was originated on August 30, 2017 by Wells Fargo Bank, National Association. The Wilshire Pacific Plaza Mortgage Loan had an original principal balance of $32,850,000, has an outstanding principal balance as of the Cut-off Date of $32,850,000 and accrues interest at an interest rate of 4.100%per annum. The Wilshire Pacific Plaza Mortgage Loan had an initial term of 120 months, has a remaining term of 119 months as of the Cut-off Date and requires interest-only payments through the loan term. The Wilshire Pacific Plaza Mortgage Loan matures on September 11, 2027.
Following the lockout period, the borrower has the right to defease the Wilshire Pacific Plaza Mortgage Loan in whole, but not in part, on any date before May 11, 2027. In addition, the Wilshire Pacific Plaza Mortgage Loan is prepayable without penalty on or after May 11, 2027.
Sources and Uses
| Sources | Uses | |||||||
| Original loan amount | $32,850,000 | 100.0% | Loan payoff | $25,583,228 | 77.9% | |||
| Upfront reserves | 880,474 | 2.7 | ||||||
| Closing costs | 271,864 | 0.8 | ||||||
| Return of equity | 6,114,434 | 18.6 | ||||||
| Total Sources | $32,850,000 | 100.0% | Total Uses | $32,850,000 | 100.0% |
THE INFORMATION IN THIS STRUCTURAL AND COLLATERAL TERM SHEET IS NOT COMPLETE AND MAY BE AMENDED PRIOR TO THE TIME OF SALE. THIS TERM SHEET IS NOT AN OFFER TO SELL THESE SECURITIES AND IT IS NOT A SOLICITATION OF AN OFFER TO BUY THESE SECURITIES IN ANY JURISDICTION WHERE THE OFFER OR SALE IS NOT PERMITTED.
62
WILSHIRE PACIFIC PLAZA
The Property.The Wilshire Pacific Plaza Property comprises a six-story office building totaling 107,737 square feet of rentable area and located in the Brentwood District of West Los Angeles, California, approximately 14.0 miles west of the Los Angeles central business district (“CBD”). Built in 1974 and renovated in 2010, the Wilshire Pacific Plaza Property is situated on a 0.8-acre parcel that also includes a three-level subterranean parking garage. The 2010 renovation totaled approximately $4.2 million and consisted of significant interior and exterior upgrades, including a modern glass façade on the ground floor, elevator modernization, completely renovated lobby and upgrades to the common areas and outdoor plaza. The Wilshire Pacific Plaza Property has a diverse tenant base, which includes medical offices, dental offices, law firms, private equity firms, and a ground floor bank branch. Approximately 18.7% of the net rentable area of the Wilshire Pacific Plaza Property is occupied by medical office tenants. The Wilshire Pacific Plaza Property features 45 surface parking spaces and 169 parking spaces in the below-grade parking structure, resulting in 214 total parking spaces and a parking ratio of 2.0 spaces per 1,000 square feet of net rentable area. As of September 1, 2017, the Wilshire Pacific Plaza Property was 92.7% occupied by 48 tenants.
The largest tenant at the Wilshire Pacific Plaza Property is Open Road Films, LLC (“Open Road Films”), which is headquartered at the property (11.8% of net rentable area; 12.1% of underwritten base rent). Open Road Films is a leading independent motion picture company that was founded in 2011 by AMC Entertainment Inc. and Regal Entertainment Group, the two largest theatrical exhibition companies in the United States. The company is known as a filmmaker-focused distributor that supports both box office hits and top prestige titles. Other than Open Road Films, no tenant accounts for more than 7.5% of the total net rentable area or 7.8% of total rent.
The following table presents certain information relating to the tenancy at the Wilshire Pacific Plaza Property:
Major Tenants
| Tenant Name | Credit Rating (Fitch/Moody’s/ S&P)(1) | Tenant NRSF | % of NRSF | Annual U/W Base Rent PSF(2) | Annual U/W Base Rent(2) | % of Total Annual U/W Base Rent | Lease Expiration Date |
| Major Tenants | |||||||
| Open Road Films | NR/NR/NR | 12,740 | 11.8% | $39.51 | $503,361 | 12.1% | 7/31/2018(3) |
| Atkins North America(4) | NR/NR/BBB | 8,049 | 7.5% | $40.44 | $325,502 | 7.8% | 3/31/2019 |
| Biren Law Group | NR/NR/NR | 5,062 | 4.7% | $43.80 | $221,716 | 5.3% | 4/30/2028 |
| American Bullion, LLC | NR/NR/NR | 4,726 | 4.4% | $36.00 | $170,136 | 4.1% | 10/31/2018 |
| Cramer & Tynan, LLP | NR/NR/NR | 3,748 | 3.5% | $34.80 | $130,430 | 3.1% | 7/31/2020 |
| Total Major Tenants | 34,325 | 31.9% | $39.36 | $1,351,145 | 32.4% | ||
| Non-Major Tenants | 65,504 | 60.8% | $42.95 | $2,813,071 | 67.6% | ||
| Occupied Collateral Total | 99,829 | 92.7% | $41.71 | $4,164,216 | 100.0% | ||
| Vacant Space | 7,908 | 7.3% | |||||
| Collateral Total | 107,737 | 100.0% | |||||
| (1) | Certain ratings are those of the parent company whether or not the parent company guarantees the lease. |
| (2) | Annual U/W Base Rent PSF and Annual U/W Base Rent include contractual rent steps through September 2018 of $102,226. |
| (3) | Open Road Films has two, five-year renewal options at 95% of fair market rent. |
| (4) | Atkins North America subleases its 8,049 square foot space to OmniForce, LLC, which pays $23.40 per square foot and has a lease expiration date of March 31, 2019, which is coterminous with Atkins North America’s lease. The appraisal concluded to a market rent of $44.40 per square foot for this space. The Annual U/W Base Rent PSF and Annual U/W Base Rent are based on the rent paid by Atkins North America to the borrower. |
THE INFORMATION IN THIS STRUCTURAL AND COLLATERAL TERM SHEET IS NOT COMPLETE AND MAY BE AMENDED PRIOR TO THE TIME OF SALE. THIS TERM SHEET IS NOT AN OFFER TO SELL THESE SECURITIES AND IT IS NOT A SOLICITATION OF AN OFFER TO BUY THESE SECURITIES IN ANY JURISDICTION WHERE THE OFFER OR SALE IS NOT PERMITTED.
63
WILSHIRE PACIFIC PLAZA
The following table presents certain information relating to the lease rollover schedule at the Wilshire Pacific Plaza Property:
Lease Expiration Schedule(1)
| Year Ending December 31, | No. of Leases Expiring | Expiring NRSF | % of Total NRSF | Cumulative Expiring NRSF | Cumulative % of Total NRSF | Annual U/W Base Rent | % of Total Annual U/W Base Rent | Annual U/W Base Rent PSF(2) |
| MTM | 5 | 1,087 | 1.0% | 1,087 | 1.0% | $28,500 | 0.7% | $26.22 |
| 2017 | 2 | 2,554 | 2.4% | 3,641 | 3.4% | $95,795 | 2.3% | $37.51 |
| 2018 | 14 | 29,841 | 27.7% | 33,482 | 31.1% | $1,116,820 | 26.8% | $37.43 |
| 2019 | 9 | 14,193 | 13.2% | 47,675 | 44.3% | $577,478 | 13.9% | $40.69 |
| 2020 | 3 | 7,681 | 7.1% | 55,356 | 51.4% | $299,200 | 7.2% | $38.95 |
| 2021 | 9 | 19,384 | 18.0% | 74,740 | 69.4% | $898,290 | 21.6% | $46.34 |
| 2022 | 4 | 6,444 | 6.0% | 81,184 | 75.4% | $291,915 | 7.0% | $45.30 |
| 2023 | 5 | 5,867 | 5.4% | 87,051 | 80.8% | $259,033 | 6.2% | $44.15 |
| 2024 | 0 | 0 | 0.0% | 87,051 | 80.8% | $0 | 0.0% | $0.00 |
| 2025 | 2 | 2,739 | 2.5% | 89,790 | 83.3% | $135,412 | 3.3% | $49.44 |
| 2026 | 0 | 0 | 0.0% | 89,790 | 83.3% | $0 | 0.0% | $0.00 |
| 2027 | 2 | 1,382 | 1.3% | 91,172 | 84.6% | $70,948 | 1.7% | $51.34 |
| Thereafter | 2 | 8,657 | 8.0% | 99,829 | 92.7% | $390,824 | 9.4% | $45.15 |
| Vacant | 0 | 7,908 | 7.3% | 107,737 | 100.0% | $0 | 0.0% | $0.00 |
| Total/Weighted Average | 57(3) | 107,737 | 100.0% | $4,164,216 | 100.0% | $41.71 |
| (1) | Information obtained from the underwritten rent roll. |
| (2) | Weighted Average Annual U/W Base Rent PSF excludes vacant space. |
| (3) | The Wilshire Pacific Plaza Property is occupied by 48 tenants operating on 57 leases. |
The following table presents historical occupancy percentages at the Wilshire Pacific Plaza Property:
Historical Occupancy
12/31/2014(1) | 12/31/2015(1) | 12/31/2016(1) | 9/1/2017(2) |
| 81.0% | 78.0% | 81.0% | 92.7% |
| (1) | Information obtained from historical occupancy report |
| (2) | Information obtained from the underwrittenrent roll. |
Operating History and Underwritten Net Cash Flow. The following table presents certain information relating to the historical operating performance and underwritten net cash flow at the Wilshire Pacific Plaza Property:
Cash Flow Analysis
| 2015 | 2016 | TTM 7/31/2017 | U/W | % of U/W Effective Gross Income | U/W $ per SF | ||||||||
| Base Rent(1) | $3,151,318 | $3,179,463 | $3,495,462 | $4,164,216 | 88.7% | $38.65 | |||||||
| Grossed Up Vacant Space | 0 | 0 | 0 | 351,115 | 7.5 | 3.26 | |||||||
| Total Reimbursables | 184,143 | 183,878 | 188,887 | 107,359 | 2.3 | 1.00 | |||||||
| Other Income(2) | 19,582 | 17,523 | 12,823 | 10,308 | 0.2 | 0.10 | |||||||
| Parking Income(3) | 338,053 | 400,583 | 502,887 | 515,268 | 11.0 | 4.78 | |||||||
| Less Vacancy & Credit Loss | 0 | 0 | 0 | (451,533)(4) | (9.6) | (4.19) | |||||||
| Effective Gross Income | $3,693,096 | $3,781,447 | $4,200,059 | $4,696,734 | 100.0% | $43.59 | |||||||
| Total Operating Expenses | $1,297,352 | $1,261,095 | $1,311,824 | $1,265,398 | 26.9% | $11.75 | |||||||
| Net Operating Income | $2,395,745 | $2,520,352 | $2,888,235 | $3,431,335 | 73.1% | $31.85 | |||||||
| TI/LC | 0 | 0 | 0 | 110,934 | 2.4 | 1.03 | |||||||
| Replacement Reserves | 0 | 0 | 0 | 21,547 | 0.5 | 0.20 | |||||||
| Net Cash Flow | $2,395,745 | $2,520,352 | $2,888,235 | $3,298,854 | 70.2% | $30.62 | |||||||
| NOI DSCR | 1.75x | 1.85x | 2.12x | 2.51x | |||||||||
| NCF DSCR | 1.75x | 1.85x | 2.12x | 2.42x | |||||||||
| NOI DY | 7.3% | 7.7% | 8.8% | 10.4% | |||||||||
| NCF DY | 7.3% | 7.7% | 8.8% | 10.0% |
| (1) | The increase in Base Rent from TTM 7/31/2017 to U/W is due to new leases totaling $579,765 and contractual rent steps through September 2018 totaling $102,226. |
| (2) | Other Income consists of signage income, late charges, key fees, and miscellaneous income. |
| (3) | Parking Income is based on the garage income of $311,268 for the period TTM July 31, 2017 plus the $17,000 per month rental rate of United Valet Parking to operate the surface parking lot. |
| (4) | The underwritten economic vacancy is 10.0%. The Wilshire Pacific Plaza Property was 92.7% physically occupied as of September 1, 2017. |
THE INFORMATION IN THIS STRUCTURAL AND COLLATERAL TERM SHEET IS NOT COMPLETE AND MAY BE AMENDED PRIOR TO THE TIME OF SALE. THIS TERM SHEET IS NOT AN OFFER TO SELL THESE SECURITIES AND IT IS NOT A SOLICITATION OF AN OFFER TO BUY THESE SECURITIES IN ANY JURISDICTION WHERE THE OFFER OR SALE IS NOT PERMITTED.
64
WILSHIRE PACIFIC PLAZA
Appraisal.As of the appraisal valuation date of July 18, 2017, the Wilshire Pacific Plaza Property had an “as-is” appraised value of $59,000,000.
Environmental Matters.According to the Phase I environmental report dated July 25, 2017, there was no evidence of any recognized environmental conditions at the Wilshire Pacific Plaza Property.
Market Overview and Competition.The Wilshire Pacific Plaza Property is located at 12301 Wilshire Boulevard in the Brentwood District of West Los Angeles, California, approximately 2.2 miles east of Santa Monica, 4.8 miles west of Beverly Hills, 9.3 miles north of the Los Angeles International Airport, and 14.0 miles west of the Los Angeles CBD. Access to the neighborhood is provided by Wilshire Boulevard, the primary east-west roadway and main commercial corridor in the area, which runs from Santa Monica to the west and downtown Los Angeles to the east. Additionally, the Wilshire Pacific Plaza Property is located two blocks north of Santa Monica Boulevard, which serves most neighborhoods of West Los Angeles and runs east to downtown Los Angeles. The Wilshire Pacific Plaza Property is also located 1.5 miles west of Interstate-405 (the primary north-south thoroughfare in the region) and 3.5 miles north of Interstate-10 (the primary east-west thoroughfare in the region). Interstate-405 and Interstate-10 provide access to the Wilshire Pacific Plaza Property from all outlying areas of Los Angeles.
According to the appraisal, the Brentwood District is recognized as one of the most prestigious and desirable commercial and residential markets in Los Angeles. According to the appraisal, the Wilshire Pacific Plaza Property has a prominent location within the Brentwood District along Wilshire Boulevard, and has good visibility, as well as convenient access to Santa Monica, Westwood, and numerous west Los Angeles submarkets. The estimated 2016 population within a one-, three- and five-mile radius of the Wilshire Pacific Plaza Property was 44,421, 267,265, 507,174, respectively; and the estimated 2016 average household income within the same radii was $113,545, $128,399 and $128,394, respectively.
According to a third party market research report, the Wilshire Pacific Plaza Property is located in the Brentwood office submarket, which is part of the West Los Angeles office submarket cluster. As of the second quarter of 2017, the Brentwood submarket was comprised of 67 buildings totaling 4.2 million square feet and reported an 8.2% vacancy rate and an average asking rent of $46.69 per square foot gross. In addition, the appraiser identified a comp set comprising eight office buildings totaling approximately 691,614 square feet with an average occupancy rate of 93.8%.
The following table presents certain information relating to comparable office leases for the Wilshire Pacific Plaza Property:
Comparable Leases(1)
| Property Name/Location | Year Built/ Renovated | Stories | Total GLA (SF) | Total Occupancy | Distance from Subject | Tenant Name | Lease Date/Term (Months) | Lease Area (SF) | Annual Base Rent PSF | Lease Type |
Wells Fargo Center Brentwood, CA | 1983 | 25 | 500,475 | 88.1% | 0.9 mile | NAV | Q3 2017 / 80 Months | 4,182 | $45.00 | FSG |
Wilshire Landmark II Los Angeles, CA | 1989 | 17 | 412,944 | 94.0% | 0.6 mile | NAV | Q2 2016 / 60 Months | 4,932 | $43.20 | FSG |
Wilshire Landmark I Los Angeles, CA | 1986 | 24 | 328,331 | 92.8% | 0.6 mile | NAV | Q4 2016 / 39 Months | 5,727 | $56.40 | FSG |
12100 Wilshire Los Angeles, CA | 1985 | 19 | 365,000 | 82.7% | 0.1 mile | NAV | Q1 2017 / 61 Months | 3,793 | $48.72 | FSG |
| Wilshire Brentwood Plaza | 1985 | 15 | 500,475 | 89.7% | 0.1 mile | NAV | Q2 2016 / 96 Months | 15,413 | $43.80 | FSG |
Gateway LA Los Angeles, CA | 1986 | 14 | 147,815 | 92.6% | 0.1 mile | NAV | Q2 2017 / 42 Months | 2,994 | $42.00 | FSG |
| (1) | Information obtained from the appraisal and third party market research reports. |
The Borrowers.The borrowers comprise five tenants-in-common: 12301 Wilshire Building I, LLC; 12301 Wilshire Building II, LLC; Ekeve I Investment, LLC; Ekeve II Investment, LLC; and One Wilshire Pacific Holdings, LLC. 12301 Wilshire Building I, LLC and 12301 Wilshire Building II, LLC, each of which are California limited liability companies; and Ekeve I Investment, LLC, Ekeve II Investment, LLC, and One Wilshire Pacific Holdings, LLC, each of which are Delaware limited liability companies. Each tenant-in-common is a single purpose entity, and the managing members of each tenant-in-common are the guarantors of certain nonrecourse carveouts under the Wilshire Pacific Plaza Mortgage Loan.
The Borrower Sponsors.The borrower sponsors are Bruce Abrams, Paul Minoo, Robert Hanasab, and Robert Hanasab as trustee of the Robert Hanasab Trust. Bruce Abrams founded the Sunrise Real Estate Group, LLC, a privately-held commercial real estate company based in Los Angeles. Robert Hanasab oversees all aspects of operations for Robhana Inc. and M & Y Management, which owns and/or manages over 2,000,000 square feet of commercial real estate and 50 apartment units, and Partners Capital, which specializes in deal sourcing, acquisitions and asset management. Paul Minoo is the president of 4M Investment Corp, a private equity investment firm based in Los Angeles. Paul Minoo was involved in a mortgage default related to a construction loan on an industrial property. See“Description of the Mortgage Pool – Loan Purpose; Default History, Bankruptcy Issues and Other Proceedings” in the Preliminary Prospectus.
THE INFORMATION IN THIS STRUCTURAL AND COLLATERAL TERM SHEET IS NOT COMPLETE AND MAY BE AMENDED PRIOR TO THE TIME OF SALE. THIS TERM SHEET IS NOT AN OFFER TO SELL THESE SECURITIES AND IT IS NOT A SOLICITATION OF AN OFFER TO BUY THESE SECURITIES IN ANY JURISDICTION WHERE THE OFFER OR SALE IS NOT PERMITTED.
65
WILSHIRE PACIFIC PLAZA
Escrows.The loan documents provide for upfront reserves of $257,898 for real estate taxes, $500,000 for tenant improvements and leasing commissions (“TI/LC”), and $122,576 for outstanding rent concessions related to multiple leases. The loan documents also provide for ongoing monthly reserves of $42,983 for real estate taxes, $2,243 for replacement reserves (subject to a cap of $80,730), and $13,455 for TI/LC (subject to a cap of $500,000, which will be increased to $1.15 million during a Cash Trap Event Period (as defined below) if the borrower deposits $800,000 in cash or provides a letter of credit in the amount of $800,000). The loan documents do not require monthly escrows for insurance premiums as long as (i) no event of default has occurred and is continuing; (ii) the Wilshire Pacific Plaza Property is insured under an acceptable blanket insurance policy; and (iii) the borrower provides the lender with evidence of renewal of the policies and timely proof of the payment of insurance premiums.
Lockbox and Cash Management.Upon the occurrence and continuance of a Cash Trap Event Period, the borrower will be required to establish a lender-controlled lockbox account and direct all tenants to deposit all rents directly into such lockbox account. During a Cash Trap Event Period, all excess cash flow after payment of all sums due and payable under the Wilshire Pacific Plaza Mortgage Loan documents and all operating expenses will be retained by the lender.
A “Cash Trap Event Period” will commence upon (i) the occurrence and continuance of an event of default or (ii) the amortizing debt service coverage ratio (based on a hypothetical 30-year amortization period) being less than 1.10x (equivalent to a 1.53x debt service coverage ratio on an interest-only basis) at the end of any quarter. A Cash Trap Event Period will end, with respect to clause (i), upon the cure of such event of default and with respect to clause (ii), upon (a) the amortizing debt service coverage ratio (based on a hypothetical 30-year amortization period) being at least 1.15x (equivalent to a 1.60x debt service coverage ratio on an interest-only basis) for two consecutive calendar quarters, or (b) the date in which the borrowers deposit $800,000 in the leasing reserve or deliver to the lender a letter of credit in the amount of $800,000, provided no event of default has occurred and is continuing.
Property Management.The Wilshire Pacific Plaza Property is managed by an affiliate of the borrower.
Assumption.The borrower has the two-time right to transfer the Wilshire Pacific Plaza Property, provided that certain conditions are satisfied, including (i) no event of default has occurred and is continuing; (ii) the lender has reasonably determined that the proposed transferee and guarantor satisfy the lender’s credit review and underwriting standards, taking into consideration the transferee’s experience, financial strength and general business standing; and (iii) if required by the lender, rating agency confirmation from Fitch, KBRA and Moody’s that the transfer will not result in a downgrade, withdrawal or qualification of the respective ratings assigned to the Series 2017-C40 Certificates.
Partial Release.Not permitted.
Real Estate Substitution.Not permitted.
Subordinate and Mezzanine Indebtedness. Not permitted.
Ground Lease. None.
Terrorism Insurance.The loan documents require that the “all risk” insurance policy required to be maintained by the borrower provide coverage for terrorism in an amount equal to the full replacement cost of the Wilshire Pacific Plaza Property (provided that the borrower is not required to pay terrorism insurance premiums in excess of two times the premium for all risk and business interruption coverage if the Terrorism Risk Insurance Program Reauthorization Act is no longer in effect). The loan documents also require business interruption insurance covering no less than the 18-month period following the occurrence of a casualty event, together with a six-month extended period of indemnity.
Earthquake Insurance.The loan documents do not require earthquake insurance. The seismic report indicated a probable maximum loss of 17.0% for the Wilshire Pacific Plaza Property.
THE INFORMATION IN THIS STRUCTURAL AND COLLATERAL TERM SHEET IS NOT COMPLETE AND MAY BE AMENDED PRIOR TO THE TIME OF SALE. THIS TERM SHEET IS NOT AN OFFER TO SELL THESE SECURITIES AND IT IS NOT A SOLICITATION OF AN OFFER TO BUY THESE SECURITIES IN ANY JURISDICTION WHERE THE OFFER OR SALE IS NOT PERMITTED.
66
(THIS PAGE INTENTIONALLY LEFT BLANK)
THE INFORMATION IN THIS STRUCTURAL AND COLLATERAL TERM SHEET IS NOT COMPLETE AND MAY BE AMENDED PRIOR TO THE TIME OF SALE. THIS TERM SHEET IS NOT AN OFFER TO SELL THESE SECURITIES AND IT IS NOT A SOLICITATION OF AN OFFER TO BUY THESE SECURITIES IN ANY JURISDICTION WHERE THE OFFER OR SALE IS NOT PERMITTED.
67
(THIS PAGE INTENTIONALLY LEFT BLANK)
THE INFORMATION IN THIS STRUCTURAL AND COLLATERAL TERM SHEET IS NOT COMPLETE AND MAY BE AMENDED PRIOR TO THE TIME OF SALE. THIS TERM SHEET IS NOT AN OFFER TO SELL THESE SECURITIES AND IT IS NOT A SOLICITATION OF AN OFFER TO BUY THESE SECURITIES IN ANY JURISDICTION WHERE THE OFFER OR SALE IS NOT PERMITTED.
68
| PINNACLE MEDICAL PLAZA |
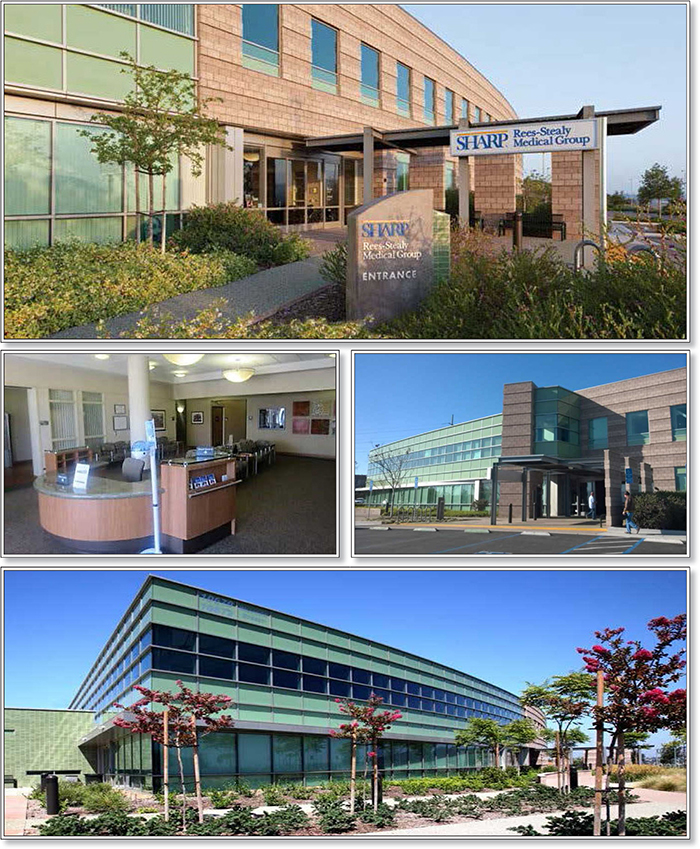
THE INFORMATION IN THIS STRUCTURAL AND COLLATERAL TERM SHEET IS NOT COMPLETE AND MAY BE AMENDED PRIOR TO THE TIME OF SALE. THIS TERM SHEET IS NOT AN OFFER TO SELL THESE SECURITIES AND IT IS NOT A SOLICITATION OF AN OFFER TO BUY THESE SECURITIES IN ANY JURISDICTION WHERE THE OFFER OR SALE IS NOT PERMITTED.
69
| PINNACLE MEDICAL PLAZA |
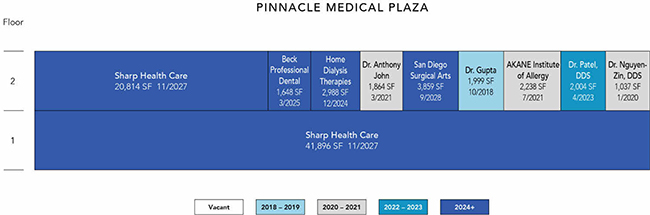
THE INFORMATION IN THIS STRUCTURAL AND COLLATERAL TERM SHEET IS NOT COMPLETE AND MAY BE AMENDED PRIOR TO THE TIME OF SALE. THIS TERM SHEET IS NOT AN OFFER TO SELL THESE SECURITIES AND IT IS NOT A SOLICITATION OF AN OFFER TO BUY THESE SECURITIES IN ANY JURISDICTION WHERE THE OFFER OR SALE IS NOT PERMITTED.
70
| PINNACLE MEDICAL PLAZA |
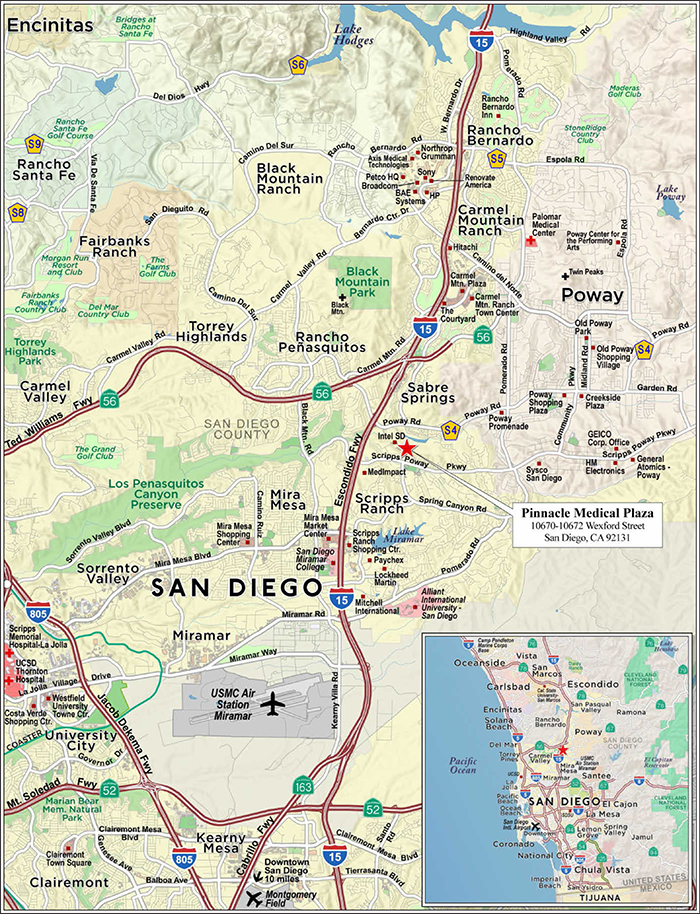
THE INFORMATION IN THIS STRUCTURAL AND COLLATERAL TERM SHEET IS NOT COMPLETE AND MAY BE AMENDED PRIOR TO THE TIME OF SALE. THIS TERM SHEET IS NOT AN OFFER TO SELL THESE SECURITIES AND IT IS NOT A SOLICITATION OF AN OFFER TO BUY THESE SECURITIES IN ANY JURISDICTION WHERE THE OFFER OR SALE IS NOT PERMITTED.
71
| No. 6 - Pinnacle Medical Plaza | |||||||
| Loan Information | Property Information | ||||||
| Mortgage Loan Seller: | Wells Fargo Bank, National Association | Single Asset/Portfolio: | Single Asset | ||||
Credit Assessment (Fitch/KBRA/Moody’s): | NR/NR/NR | Property Type: | Office | ||||
| Original Principal Balance: | $29,000,000 | Specific Property Type: | Medical | ||||
| Cut-off Date Balance: | $29,000,000 | Location: | San Diego, CA | ||||
| % of Initial Pool Balance: | 4.1% | Size: | 80,402 SF | ||||
| Loan Purpose: | Refinance | Cut-off Date Balance Per SF: | $360.69 | ||||
| Borrower Name: | LP Scripps Lot I LLC | Year Built/Renovated: | 2008/NAP | ||||
| Borrower Sponsor: | Reza Paydar; Robert V. Lankford; Alex Roudi; JW Investments Trust; Lankford Family Trust; The Zayanderoudi Family Trust | Title Vesting: | Fee | ||||
| Mortgage Rate: | 4.300% | Property Manager: | Self-managed | ||||
| Note Date: | August 30, 2017 | 4thMost Recent Occupancy (As of): | 84.0% (12/31/2013) | ||||
| Anticipated Repayment Date: | NAP | 3rdMost Recent Occupancy (As of): | 88.0% (12/31/2014) | ||||
| Maturity Date: | September 11, 2027 | 2ndMost Recent Occupancy (As of): | 100.0% (12/31/2015) | ||||
| IO Period: | 120 months | Most Recent Occupancy (As of): | 100.0% (12/31/2016) | ||||
| Loan Term (Original): | 120 months | Current Occupancy (As of): | 100.0% (8/1/2017) | ||||
| Seasoning: | 1 month | ||||||
| Amortization Term (Original): | NAP | Underwriting and Financial Information: | |||||
| Loan Amortization Type: | Interest-only, Balloon | ||||||
| Interest Accrual Method: | Actual/360 | 4thMost Recent NOI (As of)(2): | $1,647,903 (12/31/2014) | ||||
| Call Protection: | L(25),D(91),O(4) | 3rdMost Recent NOI (As of)(2): | $2,318,062 (12/31/2015) | ||||
| Lockbox Type: | Springing | 2ndMost Recent NOI (As of): | $2,740,438 (12/31/2016) | ||||
| Additional Debt: | None | Most Recent NOI (As of): | $2,794,493 (TTM 4/30/2017) | ||||
| Additional Debt Type: | NAP | ||||||
| U/W Revenues: | $3,668,639 | ||||||
| U/W Expenses: | $862,149 | ||||||
| U/W NOI: | $2,806,490 | ||||||
| U/W NCF: | $2,627,524 | ||||||
| U/W NOI DSCR: | 2.22x | ||||||
| Escrows and Reserves(1): | U/W NCF DSCR: | 2.08x | |||||
| U/W NOI Debt Yield: | 9.7% | ||||||
| Type: | Initial | Monthly | Cap (If Any) | U/W NCF Debt Yield: | 9.1% | ||
| Taxes | $187,218 | $31,203 | NAP | As-Is Appraised Value: | $49,950,000 | ||
| Insurance | $0 | Springing | NAP | As-Is Appraisal Valuation Date: | May 24, 2017 | ||
| TI/LC Reserve | $0 | $6,700 | $250,000(1) | Cut-off Date LTV Ratio: | 58.1% | ||
| Replacement Reserves | $0 | $1,340 | $50,000(1) | LTV Ratio at Maturity: | 58.1% | ||
| (1) | See “Escrow” section. |
| (2) | See “Cash Flow Analysis” section. |
The Mortgage Loan. The mortgage loan (the “Pinnacle Medical Plaza Mortgage Loan”) is evidenced by a promissory note secured by a first mortgage encumbering a class A medical office property located in San Diego, California (“Pinnacle Medical Plaza Property”). The Pinnacle Medical Plaza Mortgage Loan was originated on August 30, 2017 by Wells Fargo Bank, National Association. The Pinnacle Medical Plaza Mortgage Loan had an original principal balance of $29,000,000, has an outstanding principal balance as of the Cut-off Date of $29,000,000 and accrues interest at an interest rate of 4.300%per annum. The Pinnacle Medical Plaza Mortgage Loan had an initial term of 120 months, has a remaining term of 119 months as of the Cut-off Date and requires interest-only payments through the loan term. The Pinnacle Medical Plaza Mortgage Loan matures on September 11, 2027.
Following the lockout period, the borrower has the right to defease Pinnacle Medical Plaza Mortgage Loan in whole, but not in part, on any date before June 11, 2027. In addition, the Pinnacle Medical Plaza Mortgage Loan is prepayable without penalty on or after June 11, 2027.
THE INFORMATION IN THIS STRUCTURAL AND COLLATERAL TERM SHEET IS NOT COMPLETE AND MAY BE AMENDED PRIOR TO THE TIME OF SALE. THIS TERM SHEET IS NOT AN OFFER TO SELL THESE SECURITIES AND IT IS NOT A SOLICITATION OF AN OFFER TO BUY THESE SECURITIES IN ANY JURISDICTION WHERE THE OFFER OR SALE IS NOT PERMITTED.
72
| PINNACLE MEDICAL PLAZA |
Sources and Uses
| Sources | Uses | |||||||
| Original Mortgage Loan amount | $29,000,000 | 100.0% | Loan payoff | $25,632,152 | 88.5% | |||
| Reserves | 187218 | 0.6 | ||||||
| Closing costs | 717,482 | 2.5 | ||||||
| Return of equity | 2,463,148 | 8.5 | ||||||
| Total Sources | $29,000,000 | 100.0% | Total Uses | $29,000,000 | 100.0% |
The Property.The Pinnacle Medical Plaza Property is a two-story, class A medical office building totaling 80,402 square feet located in San Diego, California, approximately 18.0 miles northeast of the San Diego central business district. The Pinnacle Medical Plaza Property was built by the sponsor in 2008 and is situated on a 9.8-acre site including 402 surface parking spaces, resulting in a parking ratio of 5.0 spaces per 1,000 square feet of rentable area. Since construction, the sponsor has invested approximately $6.5 million ($81 per square foot) of capital improvements into the Pinnacle Medical Plaza Property, consisting primarily of dentistry and medical office build-outs. As of August 1, 2017, Pinnacle Medical Plaza Property was 100.0% occupied by nine tenants.
The largest tenant at the Pinnacle Medical Plaza Property is Sharp Health Care (“Sharp”; rated ‘Aa3’/’AA-’ by Moody’s/S&P), a not-for-profit regional health care delivery system headquartered in San Diego, California. Sharp initially signed a 10-year lease for 41,896 square feet in 2008 and expanded three times in 2012, 2015 and 2016. Sharp currently occupies 62,710 square feet at the Pinnacle Medical Plaza Property, representing 78.0% of the net rentable area and 79.7% of the underwritten base rent. The Sharp network includes four acute-care hospitals, three specialty hospitals and three affiliated medical groups with a total of 3,135 beds. In total, Sharp has more than 18,000 employees, including 2,600 physicians on staff and more than 1,500 physicians in affiliated medical groups. Sharp offers 36 diversified services and programs such as cancer treatment, heart and vascular care, orthopedics, mental health and pregnancy/childbirth. At the Pinnacle Medical Plaza Property, Sharp offers services in various fields, including pediatrics, OB/GYN, family medicine, gastroenterology, urology, dermatology and neurology, among others.
Sharp has successfully increased revenues from approximately $1.8 billion in 2006 to $3.4 billion in 2015, representing a compounded annual growth rate of approximately 6.6%. The Pinnacle Medical Plaza Property is located within 13.0 miles of three Sharp Hospitals totaling over 1,000 beds: Sharp Memorial Hospital (656 beds), Sharp Mary Birch Hospital for Women & Newborns (206 beds) and Sharp Mesa Vista Hospital (158 beds).
The following table presents certain information relating to the tenancy at Pinnacle Medical Plaza Property:
Major Tenants
| Tenant Name | Credit Rating (Fitch/Moody’s/ S&P) | Tenant NRSF | % of NRSF | Annual U/W Base Rent PSF | Annual U/W Base Rent | % of Total Annual U/W Base Rent | Lease Expiration Date |
| Major Tenants | |||||||
| Sharp | NR/Aa3/AA- | 62,710 | 78.0% | $38.39(1) | $2,407,495(1) | 79.7% | 11/30/2027(2) |
| San Diego Surgical Arts | NR/NR/NR | 3,859 | 4.8% | $29.50 | $113,855 | 3.8% | 9/30/2028(3) |
| Home Dialysis Therapies | NR/NR/NR | 2,988 | 3.7% | $33.09 | $98,873 | 3.3% | 12/31/2024(4) |
| Total Major Tenants | 69,557 | 86.5% | $37.67 | $2,620,223 | 86.8% | ||
| Non-Major Tenants | 10,845 | 13.5% | $36.82 | $399,366 | 13.2% | ||
| Occupied Collateral Total | 80,402 | 100.0% | $37.56 | $3,019,589 | 100.0% | ||
| Vacant Space | 0 | 0.0% | |||||
| Collateral Total | 80,402 | 100.0% | |||||
| (1) | Sharp’s Annual U/W Base Rent represents its average rent over the term of the Pinnacle Medical Plaza Mortgage Loan. Sharp has a current Annual U/W Base Rent of $34.76 per square foot. |
| (2) | Sharp has three, five-year renewal options. |
| (3) | San Diego Surgical Arts has two, five-year renewal options. |
| (4) | Home Dialysis Therapies has one, five-year renewal option. |
THE INFORMATION IN THIS STRUCTURAL AND COLLATERAL TERM SHEET IS NOT COMPLETE AND MAY BE AMENDED PRIOR TO THE TIME OF SALE. THIS TERM SHEET IS NOT AN OFFER TO SELL THESE SECURITIES AND IT IS NOT A SOLICITATION OF AN OFFER TO BUY THESE SECURITIES IN ANY JURISDICTION WHERE THE OFFER OR SALE IS NOT PERMITTED.
73
| PINNACLE MEDICAL PLAZA |
The following table presents certain information relating to the lease rollover schedule at Pinnacle Medical Plaza Property:
Lease Expiration Schedule(1)
| Year Ending December 31, | No. of Leases Expiring | Expiring NRSF | % of Total NRSF | Cumulative Expiring NRSF | Cumulative % of Total NRSF | Annual U/W Base Rent | % of Total Annual U/W Base Rent | Annual U/W Base Rent PSF |
| MTM | 1 | 55 | 0.1% | 55 | 0.1% | $0 | 0.0% | $0.00 |
| 2017 | 0 | 0 | 0.0% | 55 | 0.1% | $0 | 0.0% | $0.00 |
| 2018 | 1 | 1,999 | 2.5% | 2,054 | 2.6% | $79,160 | 2.6% | $39.60 |
| 2019 | 0 | 0 | 0.0% | 2,054 | 2.6% | $0 | 0.0% | $0.00 |
| 2020 | 1 | 1,037 | 1.3% | 3,091 | 3.8% | $41,065 | 1.4% | $39.60 |
| 2021 | 2 | 4,102 | 5.1% | 7,193 | 8.9% | $141,519 | 4.7% | $34.50 |
| 2022 | 0 | 0 | 0.0% | 7,193 | 8.9% | $0 | 0.0% | $0.00 |
| 2023 | 1 | 2,004 | 2.5% | 9,197 | 11.4% | $72,361 | 2.4% | $36.11 |
| 2024 | 1 | 2,988 | 3.7% | 12,185 | 15.2% | $98,873 | 3.3% | $33.09 |
| 2025 | 1 | 1,648 | 2.0% | 13,833 | 17.2% | $65,261 | 2.2% | $39.60 |
| 2026 | 0 | 0 | 0.0% | 13,833 | 17.2% | $0 | 0.0% | $0.00 |
| 2027 | 2 | 62,710 | 78.0% | 76,543 | 95.2% | $2,407,495 | 79.7% | $38.39 |
| Thereafter | 1 | 3,859 | 4.8% | 80,402 | 100.0% | $113,855 | 3.8% | $29.50 |
| Vacant | 0 | 0 | 0.0% | 80,402 | 100.0% | $0 | 0.0% | $0.00 |
| Total/Weighted Average | 11 | 80,402 | 100.0% | $3,019,589 | 100.0% | $37.56 |
| (1) | Information obtained from the underwritten rent roll. |
The following table presents historical occupancy percentages at Pinnacle Medical Plaza Property:
Historical Occupancy
12/31/2013(1) | 12/31/2014(1) | 12/31/2015(1) | 12/31/2016(1) | 8/1/2017(2) |
| 84.0% | 88.0% | 100.0% | 100.0% | 100.0% |
| (1) | Information obtained from the borrower. |
| (2) | Information obtained from the underwritten rent roll. |
Operating History and Underwritten Net Cash Flow. The following table presents certain information relating to the historical operating performance and the underwritten net cash flow at Pinnacle Medical Plaza Property:
Cash Flow Analysis
| 2014(1) | 2015(1) | 2016 | TTM 4/30/2016 | U/W | % of U/W Effective Gross Income | U/W $ per SF | |||||||||
| Base Rent | $1,808,323 | $2,370,642 | $2,756,182 | $2,761,912 | $2,864,324(2) | 78.1% | $35.63 | ||||||||
| Grossed Up Vacant Space | 0 | 0 | 0 | 0 | 155,264(3) | 4.2 | 1.93 | ||||||||
| Total Reimbursables | 605,543 | 788,884 | 857,654 | 872,118 | 804,315 | 21.9 | 10.00 | ||||||||
| Other Income | 60 | 95 | 0 | 19,112 | 0 | 0.0 | 0.00 | ||||||||
| Less Vacancy & Credit Loss | 0 | 0 | 0 | 0 | (155,264)(3) | (4.2) | (1.93) | ||||||||
| Effective Gross Income | $2,413,926 | $3,159,621 | $3,613,836 | $3,653,142 | $3,668,639 | 100.0% | $45.63 | ||||||||
| Total Operating Expenses | $766,023 | $841,559 | $873,398 | $858,649 | $862,149 | 23.5% | $10.72 | ||||||||
| Net Operating Income | $1,647,903 | $2,318,062 | $2,740,438 | $2,794,493 | $2,806,490 | 76.5% | $34.91 | ||||||||
| TI/LC | 0 | 0 | 0 | 0 | 162,885 | 4.4 | 2.03 | ||||||||
| Capital Expenditures | 0 | 0 | 0 | 0 | 16,080 | 0.4 | 0.20 | ||||||||
| Net Cash Flow | $1,647,903 | $2,318,062 | $2,740,438 | $2,794,493 | $2,627,524 | 71.6% | $32.68 | ||||||||
| NOI DSCR | 1.30x | 1.83x | 2.17x | 2.21x | 2.22x | ||||||||||
| NCF DSCR | 1.30x | 1.83x | 2.17x | 2.21x | 2.08x | ||||||||||
| NOI DY | 5.7% | 8.0% | 9.4% | 9.6% | 9.7% | ||||||||||
| NCF DY | 5.7% | 8.0% | 9.4% | 9.6% | 9.1% |
| (1) | The Net Operating Income increased from 2014 to 2015 because Sharp received 18 months of 50.0% rent abatement following its expansion in 2012. In addition, San Diego Surgical Arts began its lease in 2014 and was provided 10 months of rental abatements. |
| (2) | U/W Base Rent includes Sharp’s average rent over the term of the Pinnacle Medical Plaza Mortgage Loan. |
| (3) | The underwritten economic vacancy is 5.1%. The Pinnacle Medical Plaza Property was 100.0% physically occupied as of August 1, 2017. |
Appraisal.As of the appraisal valuation date of May 24, 2017, Pinnacle Medical Plaza Property had an “as-is” appraised value of $49,950,000.
Environmental Matters. According to a Phase I environmental site assessment dated May 31, 2017, there was no evidence of any recognized environmental conditions at Pinnacle Medical Plaza Property.
Market Overview and Competition.The Pinnacle Medical Plaza Property is located in northern San Diego, California, approximately 17.9 miles northeast of the San Diego central business district, along Interstate-15. The Pinnacle Medical Plaza
THE INFORMATION IN THIS STRUCTURAL AND COLLATERAL TERM SHEET IS NOT COMPLETE AND MAY BE AMENDED PRIOR TO THE TIME OF SALE. THIS TERM SHEET IS NOT AN OFFER TO SELL THESE SECURITIES AND IT IS NOT A SOLICITATION OF AN OFFER TO BUY THESE SECURITIES IN ANY JURISDICTION WHERE THE OFFER OR SALE IS NOT PERMITTED.
74
| PINNACLE MEDICAL PLAZA |
Property is located in the 266-acre Scripps Ranch Business Park, which is part of the larger 4,365-acre Scripps Ranch master-planned community. Large corporate users within the Scripps Ranch Business Park include Lockheed, MedImpact, Hitachi, Mitchell International, and Paychex, among others. According to the appraisal, Pinnacle Medical Plaza Property is one of the few class A medical and dental office properties in the Scripps Ranch submarket. According to the appraisal, the 2016 estimated population within a one-, three- and five- mile radius of Pinnacle Medical Plaza Property was 12,651, 136,188 and 246,143, respectively; and the average household income within the same radii was $141,252, $122,604 and $123,871, respectively.
According to the appraisal, the Pinnacle Medical Plaza Property is located within the Central County area of the San Diego County Medical Office Building market. As of the first quarter of 2017, the Central County area comprised approximately 113 medical office properties totaling 4.0 million square feet with a 5.7% vacancy rate. The appraiser concluded to market rents for the Pinnacle Medical Plaza Property of $37.80 per square foot, triple-net, for medical office space less than 10,000 square feet; and $33.00 per square foot, triple-net, for medical office space greater than 10,000 square feet, all with 3.0% annual escalations. Overall, the appraiser concluded that the in-place rent at Pinnacle Medical Plaza Property is 0.1% below market levels.
The following table presents certain information relating to comparable medical office leases for Pinnacle Medical Plaza Property:
Comparable Leases(1)
| Property Name/Location | Year Built/ Renovated | Total GLA (SF) | Total Occupancy | Distance from Subject | Tenant Name | Lease Date/ Term | Lease Area (SF) | Annual Base Rent PSF | Lease Type |
Genesee Plaza San Diego, CA | 1983/NAP | 161,184 | 97% | 10.5 miles | Roy Davis, MD | Feb. 2017 / 10.4 Years | 5,315 | $45.00 | Modified Gross |
Genesee Plaza San Diego, CA | 1983/NAP | 161,184 | 97% | 10.5 miles | Scripps Health | Feb. 2016 / 4.0 Years | 6,957 | $47.40 | Modified Gross |
Torrey Reserve San Diego, CA | 1999/NAP | 10,774 | 71% | 11.2 miles | Rady Children’s Hospital | Feb. 2016 / 5.0 Years | 7,612 | $45.00 | NNN |
Chancellor Park San Diego, CA | 1989/NAP | 195,733 | 95% | 10.1 miles | UCSD Health | Mar. 2015 / 10.0 Years | 34,316 | $37.80 | Modified Gross |
Pacific Medical Plaza San Diego, CA | 2009/NAP | 50,925 | 100% | 8.6 miles | UCSD MC/Family Practice | Dec. 2013 / 10.0 Years | 17,794 | $39.00 | NNN |
Lewis Medical Building San Diego, CA | 1992/NAP | 22,461 | 100% | 15.9 miles | Regents of the University of CA | Oct. 2015 / 10.0 Years | 22,461 | $34.20 | NNN |
University Pacific Center San Diego, CA | 1986/NAP | 51,367 | 63% | 17.1 miles | The Regents of UCSD | May. 2015 / 10.0 Years | 15,601 | $45.00 | Modified Gross |
| (1) | Information obtained from the appraisal. |
The Borrower.The borrower is LP Scripps Lot I LLC, a Delaware limited liability company. Reza Paydar, Robert V. Lankford, Alex Roudi, JW Investments Trust, Lankford Family Trust and The Zayanderoudi Family Trust are the guarantors of certain nonrecourse carveouts under the Pinnacle Medical Plaza Mortgage Loan.
The Borrower Sponsors.The borrower sponsors are Reza Paydar, Robert V. Lankford, Alex Roudi, JW Investments Trust, Lankford Family Trust, and The Zayanderoudi Family Trust. Mr. Paydar is a founding partner of Interwest Capital Corporation (“ICC”). Established in 2003, ICC’s commercial real estate portfolio consists of over $700.0 million in assets including more than 4,000 multifamily units and 1,000 hotel rooms. Mr. Paydar is a claimant in an arbitration proceeding alleging breach of contract by an affiliate of Mr. Roudi, unrelated to the Pinnacle Medical Plaza Property (see “Description of the Mortgage Pool – Litigation and Other Considerations” in the Preliminary Prospectus).
Escrows.The Pinnacle Medical Plaza Mortgage Loan documents provide for an upfront escrow at origination in the amount of $187,218 for real estate taxes. The Pinnacle Medical Plaza Mortgage Loan documents provide for ongoing monthly escrows of $31,203 for real estate taxes, $6,700 for tenant improvements and leasing commissions (subject to a cap of $250,000 so long as no event of default is continuing and the debt yield is no less than 7.0%), $1,340 for replacement reserves (subject to a cap of $50,000 so long as no event of default is continuing and the Pinnacle Medical Plaza Property is being adequately maintained as reasonably determined by the lender). The Pinnacle Medical Plaza Mortgage Loan documents do not require ongoing monthly escrows for insurance premiums as long as (i) no event of default has occurred and is continuing and (ii) the borrower provides the lender with evidence that the Pinnacle Medical Plaza Property’s insurance coverage is included in a blanket policy and such policy is in full force and effect and (iii) the borrower pays all applicable insurance premiums and provides the lender with evidence of renewals.
Lockbox and Cash Management.Upon the occurrence and during the continuance of a Cash Trap Event Period (as defined below), the Pinnacle Medical Plaza Mortgage Loan documents requires that the borrower establish a lockbox account and direct all tenants to deposit all rents directly into such lockbox account. Additionally, all revenues and other monies received by the borrower or property manager relating to the Pinnacle Medical Plaza Property will be deposited into the lockbox account. During a Cash Trap Event Period, all excess cash flow after payment of all sums due and payable under the Pinnacle Medical Plaza Mortgage Loan documents and all operating expenses will be retained by the lender.
THE INFORMATION IN THIS STRUCTURAL AND COLLATERAL TERM SHEET IS NOT COMPLETE AND MAY BE AMENDED PRIOR TO THE TIME OF SALE. THIS TERM SHEET IS NOT AN OFFER TO SELL THESE SECURITIES AND IT IS NOT A SOLICITATION OF AN OFFER TO BUY THESE SECURITIES IN ANY JURISDICTION WHERE THE OFFER OR SALE IS NOT PERMITTED.
75
| PINNACLE MEDICAL PLAZA |
A “Cash Trap Event Period” will commence upon the earlier of (i) the occurrence and continuance of an event of default; (ii) the debt yield being less than 7.0% at the end of any calendar quarter; (iii) the date Sharp provides notice of its intention not to renew its lease or fails to exercise its extension option or renew its lease prior to May 31, 2025; (iv) the date that Sharp discontinues its business (i.e. “goes dark”) at the Pinnacle Medical Plaza Property; or (v) a decline in Sharp’s credit rating below ‘BBB-’ (or equivalent) by any of Fitch, Moody’s, S&P, Kroll, Morningstar or DBRS. A Cash Trap Event Period will end, with respect to clause (i), upon the cure of such event of default; with respect to clause (ii), upon the debt yield being equal to or greater than 7.0% for two consecutive calendar quarters; with respect to clause (iii), either (A) the occurrence of a Sharp Re-Tenanting Event (as defined below) or (B) the lender receiving satisfactory evidence that Sharp has exercised its extension or renewal option pursuant to the terms reasonably satisfactory to the lender; with respect to clause (iv), either (A) the occurrence of a Sharp Re-Tenanting Event (as defined below) or Sharp resuming its normal business operations at the Pinnacle Medical Plaza Property for two consecutive calendar quarters; and with respect to clause (v), upon the date the credit rating of Sharp has been restored to investment-grade by the relevant rating agencies. If the Cash Trap Event Period is continuing solely as a result of clause (iii) or clause (iv), then the sum of all excess cash flow held by the lender and the amount of funds then on deposit in the tenant improvements and leasing commissions reserve account is subject to a cap of $4,500,000 and all swept funds above the cap are required to be disbursed to the borrower.
A “Sharp Re-Tenanting Event” shall mean that the lender has received satisfactory evidence that the entire Sharp space has been leased to one or more satisfactory replacement tenants that have taken occupancy of the applicable space, are conducting normal business operations in such space and are paying full, unabated rent pursuant to the terms of a lease reasonably satisfactory to the lender under which all tenant improvement costs and leasing commissions have been paid or are adequately reserved for by the lender, such evidence to include, without limitation, a satisfactory estoppel from each such replacement tenant(s) affirming the foregoing.
Property Management. Pinnacle Medical Plaza Property is managed by an affiliate of the borrower.
Assumption.The borrower has the right to transfer the Pinnacle Medical Plaza Property provided that certain conditions are satisfied, including (i) no event of default under the Pinnacle Medical Plaza Mortgage Loan documents has occurred and is continuing; (ii) in the event that in connection with such transfer, the manager will not thereafter continue to manage the Pinnacle Medical Plaza Property, then a replacement management agreement with a qualified manager must be executed acceptable to the lender; (iii) the lender reasonably determines that the proposed transferee and guarantor satisfy the lender’s credit review and underwriting standards, taking into consideration the transferee’s experience, financial strength and general business standing; and (iv) if requested by the lender, rating agency confirmation from Fitch, KBRA and Moody’s that such assumption will not result in a downgrade, withdrawal or qualification of the respective ratings assigned to the WFCM 2017-C40 certificates.
Rights of First Offer.Sharp has a right of first offer to purchase the Pinnacle Medical Plaza Property if the borrower markets the property for sale (the “Sharp ROFO”). The Sharp ROFO is not extinguished by foreclosure; however, the Sharp ROFO does not apply to foreclosure or deed-in-lieu thereof.
Partial Release. Not permitted.
Real Estate Substitution.Not permitted.
Subordinate and Mezzanine Indebtedness.Not permitted.
Ground Lease. None.
Terrorism Insurance.The Pinnacle Medical Plaza Mortgage Loan documents require that the “all risk” insurance policy required to be maintained by the borrower provide coverage for terrorism in an amount equal to the full replacement cost of the Pinnacle Medical Plaza Property, as well as loss of rents and/or business interruption insurance for a period no less than 12 months following the occurrence of a casualty event together with a six-month extended period of indemnity.
Windstorm and Flood Insurance. The loan documents require windstorm and flood insurance covering the full replacement cost of Pinnacle Medical Plaza Property during the loan term. At the time of loan closing, Pinnacle Medical Plaza Property had windstorm insurance coverage and flood insurance in the maximum limit available under the National Flood Insurance Program together with excess coverage.
Earthquake Insurance.The loan documents do not require earthquake insurance. The seismic report indicated a probable maximum loss of 5.0% for the Pinnacle Medical Plaza Property.
THE INFORMATION IN THIS STRUCTURAL AND COLLATERAL TERM SHEET IS NOT COMPLETE AND MAY BE AMENDED PRIOR TO THE TIME OF SALE. THIS TERM SHEET IS NOT AN OFFER TO SELL THESE SECURITIES AND IT IS NOT A SOLICITATION OF AN OFFER TO BUY THESE SECURITIES IN ANY JURISDICTION WHERE THE OFFER OR SALE IS NOT PERMITTED.
76
(THIS PAGE INTENTIONALLY LEFT BLANK)
THE INFORMATION IN THIS STRUCTURAL AND COLLATERAL TERM SHEET IS NOT COMPLETE AND MAY BE AMENDED PRIOR TO THE TIME OF SALE. THIS TERM SHEET IS NOT AN OFFER TO SELL THESE SECURITIES AND IT IS NOT A SOLICITATION OF AN OFFER TO BUY THESE SECURITIES IN ANY JURISDICTION WHERE THE OFFER OR SALE IS NOT PERMITTED.
77
(THIS PAGE INTENTIONALLY LEFT BLANK)
THE INFORMATION IN THIS STRUCTURAL AND COLLATERAL TERM SHEET IS NOT COMPLETE AND MAY BE AMENDED PRIOR TO THE TIME OF SALE. THIS TERM SHEET IS NOT AN OFFER TO SELL THESE SECURITIES AND IT IS NOT A SOLICITATION OF AN OFFER TO BUY THESE SECURITIES IN ANY JURISDICTION WHERE THE OFFER OR SALE IS NOT PERMITTED.
78
| WINSLOW BAY COMMONS |
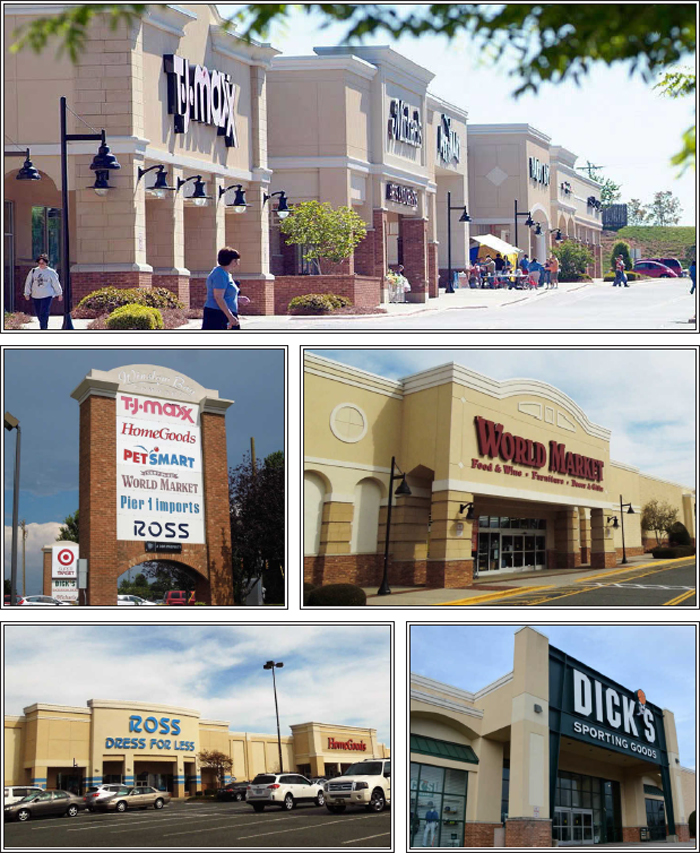
THE INFORMATION IN THIS STRUCTURAL AND COLLATERAL TERM SHEET IS NOT COMPLETE AND MAY BE AMENDED PRIOR TO THE TIME OF SALE. THIS TERM SHEET IS NOT AN OFFER TO SELL THESE SECURITIES AND IT IS NOT A SOLICITATION OF AN OFFER TO BUY THESE SECURITIES IN ANY JURISDICTION WHERE THE OFFER OR SALE IS NOT PERMITTED.
79
| WINSLOW BAY COMMONS |
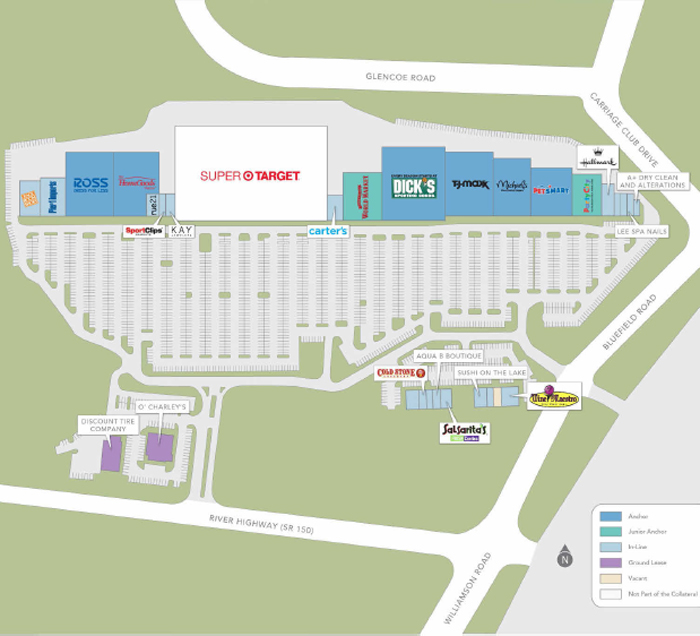
THE INFORMATION IN THIS STRUCTURAL AND COLLATERAL TERM SHEET IS NOT COMPLETE AND MAY BE AMENDED PRIOR TO THE TIME OF SALE. THIS TERM SHEET IS NOT AN OFFER TO SELL THESE SECURITIES AND IT IS NOT A SOLICITATION OF AN OFFER TO BUY THESE SECURITIES IN ANY JURISDICTION WHERE THE OFFER OR SALE IS NOT PERMITTED.
80
| WINSLOW BAY COMMONS |
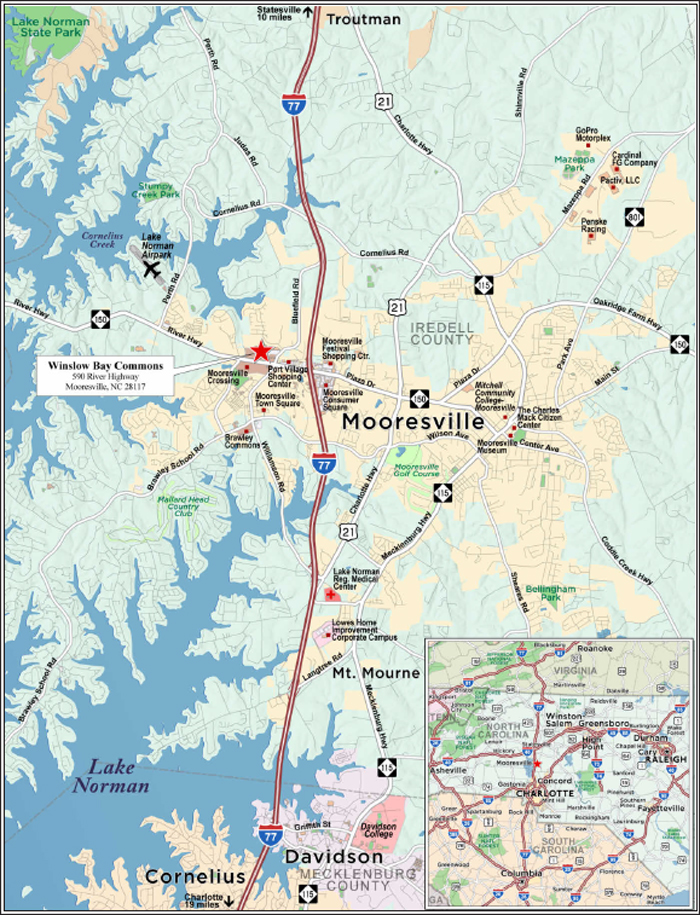
THE INFORMATION IN THIS STRUCTURAL AND COLLATERAL TERM SHEET IS NOT COMPLETE AND MAY BE AMENDED PRIOR TO THE TIME OF SALE. THIS TERM SHEET IS NOT AN OFFER TO SELL THESE SECURITIES AND IT IS NOT A SOLICITATION OF AN OFFER TO BUY THESE SECURITIES IN ANY JURISDICTION WHERE THE OFFER OR SALE IS NOT PERMITTED.
81
| No. 7 – Winslow Bay Commons | ||||||
| Loan Information | Property Information | |||||
| Mortgage Loan Seller: | Wells Fargo Bank, National Association | Single Asset/Portfolio: | Single Asset | |||
Credit Assessment (Fitch/KBRA/Moody’s): | NR/NR/NR | Property Type: | Retail | |||
| Original Principal Balance: | $25,800,000 | Specific Property Type: | Anchored | |||
| Cut-off Date Balance: | $25,800,000 | Location: | Mooresville, NC | |||
| % of Initial Pool Balance: | 3.7% | Size: | 255,598 SF | |||
| Loan Purpose: | Refinance | Cut-off Date Balance Per SF: | $100.94 | |||
| Borrower Name: | DDRTC Winslow Bay Commons LLC | Year Built/Renovated: | 2003/NAP | |||
| Borrower Sponsors: | DDRTC Core Retail Fund, LLC | Title Vesting: | Fee | |||
| Mortgage Rate: | 3.820% | Property Manager: | Self-managed | |||
| Note Date: | August 14, 2017 | 4thMost Recent Occupancy (As of): | 98.9% (12/31/2013) | |||
| Anticipated Repayment Date: | NAP | 3rdMost Recent Occupancy (As of): | 97.7% (12/31/2014) | |||
| Maturity Date: | September 11, 2027 | 2ndMost Recent Occupancy (As of): | 97.6% (12/31/2015) | |||
| IO Period: | 120 months | Most Recent Occupancy (As of): | 98.6% (9/30/2016) | |||
| Loan Term (Original): | 120 months | Current Occupancy (As of): | 99.4% (7/6/2017) | |||
| Seasoning: | 1 month | |||||
| Amortization Term (Original): | NAP | Underwriting and Financial Information: | ||||
| Loan Amortization Type: | Interest-only, Balloon | |||||
| Interest Accrual Method: | Actual/360 | 4thMost Recent NOI (As of): | $3,521,217 (12/31/2014) | |||
| Call Protection: | L(25),D(88),O(7) | 3rdMost Recent NOI (As of): | $3,509,635 (12/31/2015) | |||
| Lockbox Type: | Springing | 2ndMost Recent NOI (As of): | $3,578,409 (12/31/2016) | |||
| Additional Debt: | None | Most Recent NOI (As of): | $3,552,567 (TTM 6/30/2017) | |||
| Additional Debt Type: | NAP | U/W Revenues: | $4,485,287 | |||
| U/W Expenses: | $914,550 | |||||
| U/W NOI: | $3,570,737 | |||||
| U/W NCF: | $3,258,501 | |||||
| U/W NOI DSCR: | 3.57x | |||||
| U/W NCF DSCR: | 3.26x | |||||
| Escrows and Reserves(1): | U/W NOI Debt Yield: | 13.8% | ||||
| U/W NCF Debt Yield: | 12.6% | |||||
| Type: | Initial | Monthly | Cap (If Any) | As-Is Appraised Value: | $56,350,000 | |
| Taxes | $0 | Springing | NAP | As-Is Appraisal Valuation Date: | July 17, 2017 | |
| Insurance | $0 | Springing | NAP | Cut-off Date LTV Ratio: | 45.8% | |
| Replacement Reserves | $0 | Springing | $0 | LTV Ratio at Maturity: | 45.8% | |
| (1) | See “Escrows” section. |
The Mortgage Loan. The mortgage loan (“Winslow Bay Commons Mortgage Loan”) is evidenced by a single promissory note that is secured by a first mortgage encumbering the fee interest in an anchored retail center located in Mooresville, North Carolina (“Winslow Bay Commons Property”). The Winslow Bay Commons Mortgage Loan was originated on August 14, 2017 by Wells Fargo Bank, National Association. The Winslow Bay Commons Mortgage Loan had an original principal balance of $25,800,000, has an outstanding principal balance as of the Cut-off Date of $25,800,000 and accrues interest at an interest rate of 3.820%per annum. Winslow Bay Commons Mortgage Loan had an initial term of 120 months, has a remaining term of 119 months as of the Cut-off Date and requires interest-only payments throughout the term of the Winslow Bay Commons Mortgage Loan. The Winslow Bay Commons Mortgage Loan matures on September 11, 2027.
Following the lockout period, the borrower has the right to defease Winslow Bay Commons Mortgage Loan in whole, but not in part, on any date before March 11, 2027. In addition, the Winslow Bay Commons Mortgage Loan is prepayable without penalty on or after March 11, 2027.
Sources and Uses
| Sources | Uses | |||||||
| Original Mortgage Loan amount | $25,800,000 | 68.0% | Loan payoff(1) | $37,680,787 | 99.4% | |||
| Borrower sponsor’s new cash equity | 12,117,347 | 32.0 | Closing costs | 236,560 | 0.6 | |||
| Total Sources | $37,917,347 | 100.0% | Total Uses | $37,917,347 | 100.0% |
| (1) | The previous loan on the Subject was securitized in BACM 2007-3. |
THE INFORMATION IN THIS STRUCTURAL AND COLLATERAL TERM SHEET IS NOT COMPLETE AND MAY BE AMENDED PRIOR TO THE TIME OF SALE. THIS TERM SHEET IS NOT AN OFFER TO SELL THESE SECURITIES AND IT IS NOT A SOLICITATION OF AN OFFER TO BUY THESE SECURITIES IN ANY JURISDICTION WHERE THE OFFER OR SALE IS NOT PERMITTED.
82
| WINSLOW BAY COMMONS |
The Property.The Winslow Bay Commons Property is a 255,598 square foot anchored retail center situated on a 39.1-acre site and located in Mooresville, North Carolina. The Winslow Bay Commons Property consists of six buildings, five of which were built in 2003 and one of which was built in 2005. The Winslow Bay Commons Property is anchored by Dick’s Sporting Goods and Ross Dress for Less, and other major tenants include Cost Plus World Market, T.J. Maxx, HomeGoods, Petsmart and Michaels. The remainder of the rent roll is granular with no other tenant making up more than 5.0% of the underwritten income. The Winslow Bay Commons Property is also shadow anchored by a SuperTarget, which is not part of the collateral. Investment grade tenants account for approximately 40.2% of the net rentable area and 30.5% of the underwritten rent at the Winslow Bay Commons Property. The Winslow Bay Commons Property has 1,456 surface parking spaces, resulting in a parking ratio of 5.7 spaces per 1,000 square feet. As of July 6, 2017, the Winslow Bay Commons Property was 99.4% occupied by 29 tenants. Since 2007, the Winslow Bay Commons Property has averaged 97.0% occupancy.
The following table presents certain information relating to the tenancy at Winslow Bay Commons Property:
Major Tenants
| Tenant Name | Credit Rating (Fitch/Moody’s/ S&P)(1) | Tenant NRSF | % of NRSF | Annual U/W Base Rent PSF | Annual U/W Base Rent | % of Total Annual U/W Base Rent | Sales PSF(2) | Occupancy Cost(2) | Lease Expiration Date |
| Shadow Anchor | |||||||||
| SuperTarget | A-/A2/A | Shadow Anchor – Not Part of the Collateral | |||||||
| Anchor Tenants | |||||||||
| Dick’s Sporting Goods | NR/NR/NR | 45,644 | 17.9% | $12.75 | $581,961 | 15.0% | NAV | NAV | 1/31/2019(3) |
| Ross Dress For Less | NR/A3/A- | 30,187 | 11.8% | $11.00 | $332,057 | 8.6% | NAV | NAV | 1/31/2019(4) |
| Total Anchor Tenants | 75,831 | 29.7% | $12.05 | $914,018 | 23.6% | ||||
| Major Tenants | |||||||||
| Cost Plus World Market | NR/Baa1/BBB+ | 18,300 | 7.2% | $17.00 | $311,100 | 8.0% | $149 | 13.3% | 1/31/2019(5) |
| T.J. Maxx | NR/A2/A+ | 30,000 | 11.7% | $9.35 | $280,500 | 7.3% | $358 | 3.4% | 3/31/2018(6) |
| HomeGoods | NR/A2/A+ | 24,335 | 9.5% | $10.50 | $255,518 | 6.6% | $235 | 5.6% | 4/30/2022(7) |
| Petsmart | NR/B1/B+ | 19,435 | 7.6% | $12.95 | $251,683 | 6.5% | NAV | NAV | 1/31/2019(8) |
| Michaels | NR/NR/BB- | 21,300 | 8.3% | $11.75 | $250,275 | 6.5% | $213 | 6.6% | 3/31/2023(9) |
| Total Major Tenants | 113,370 | 44.4% | $11.90 | 1,349,076 | 34.9% | ||||
| In Place Tenants | 64,897 | 25.4% | $24.72 | $1,604,562 | 41.5% | ||||
| Occupied Collateral Total | 254,098 | 99.4% | $15.22 | $3,867,656 | 100.0% | ||||
| Vacant Space | 1,500 | 0.6% | |||||||
| Collateral Total | 255,598 | 100.0% | |||||||
| (1) | Certain ratings are those of the parent company whether or not the parent company guarantees the lease. |
| (2) | Sales PSF and Occupancy Costs are for the trailing 12 months as of December 31, 2016. |
| (3) | Dick’s Sporting Goods has four, five-year renewal options. |
| (4) | Ross Dress for Less has three, five-year renewal options. |
| (5) | Cost Plus World Market has two, five-year renewal option. |
| (6) | T.J. Maxx has two, five-year renewal option. |
| (7) | HomeGoods has four, five-year renewal options. |
| (8) | Petsmart has four, five-year renewal options. |
| (9) | Michaels has two, five-year renewal options. |
THE INFORMATION IN THIS STRUCTURAL AND COLLATERAL TERM SHEET IS NOT COMPLETE AND MAY BE AMENDED PRIOR TO THE TIME OF SALE. THIS TERM SHEET IS NOT AN OFFER TO SELL THESE SECURITIES AND IT IS NOT A SOLICITATION OF AN OFFER TO BUY THESE SECURITIES IN ANY JURISDICTION WHERE THE OFFER OR SALE IS NOT PERMITTED.
83
| WINSLOW BAY COMMONS |
The following table presents certain information relating to the lease rollover schedule at Winslow Bay Commons Property:
Lease Expiration Schedule(1)
| Year Ending December 31, | No. of Leases Expiring | Expiring NRSF | % of Total NRSF | Cumulative Expiring NRSF | Cumulative % of Total NRSF | Annual U/W Base Rent | % of Total Annual U/W Base Rent | Annual U/W Base Rent PSF(2) |
| MTM | 1 | 1,400 | 0.5% | 1,400 | 0.5% | $38,472 | 1.0% | $27.48 |
| 2017 | 0 | 0 | 0.0% | 1,400 | 0.5% | $0 | 0.0% | $0.00 |
| 2018 | 6 | 61,772 | 24.2% | 63,172 | 24.7% | $884,262 | 22.9% | $14.31 |
| 2019 | 13 | 132,866 | 52.0% | 196,038 | 76.7% | $1,934,717 | 50.0% | $14.56 |
| 2020 | 1 | 1,400 | 0.5% | 197,438 | 77.2% | $35,000 | 0.9% | $25.00 |
| 2021 | 1 | 1,400 | 0.5% | 198,838 | 77.8% | $49,896 | 1.3% | $35.64 |
| 2022 | 2 | 25,735 | 10.1% | 224,573 | 87.9% | $277,358 | 7.2% | $10.78 |
| 2023 | 3 | 25,525 | 10.0% | 250,098 | 97.8% | $431,579 | 11.2% | $16.91 |
| 2024 | 1 | 0 | 0.0% | 250,098 | 97.8% | $108,372 | 2.8% | $0.00 |
| 2025 | 0 | 0 | 0.0% | 250,098 | 97.8% | $0 | 0.0% | $0.00 |
| 2026 | 0 | 0 | 0.0% | 250,098 | 97.8% | $0 | 0.0% | $0.00 |
| 2027 | 1 | 4,000 | 1.6% | 254,098 | 99.4% | $108,000 | 2.8% | $27.00 |
| Thereafter | 0 | 0 | 0.0% | 254,098 | 99.4% | $0 | 0.0% | $0.00 |
| Vacant | 0 | 1,500 | 0.6% | 255,598 | 100.0% | $0 | 0.0% | $0.00 |
| Total/Weighted Average | 29 | 255,598 | 100.0% | $3,867,656 | 100.0% | $15.22 |
| (1) | Information obtained from the underwritten rent roll. |
| (2) | Weighted Average Annual U/W Base Rent PSF excludes vacant space. |
The following table presents historical occupancy percentages at Winslow Bay Commons Property:
Historical Occupancy
12/31/2013(1) | 12/31/2014(1) | 12/31/2015(1) | 9/30/2016(1)(2) | 7/6/2017(3) | ||||
| 98.9% | 97.7% | 97.6% | 98.6% | 99.4% |
| (1) | Information obtained from the borrower. |
| (2) | 2016 historical vacancy is taken as of third quarter. |
| (3) | Information obtained from the underwritten rent roll. |
Operating History and Underwritten Net Cash Flow. The following table presents certain information relating to the historical operating performance and the underwritten net cash flow at Winslow Bay Commons Property:
Cash Flow Analysis
| 2014 | 2015 | 2016 | TTM 6/30/2017 | U/W | % of U/W Effective Gross Income | U/W $ per SF | |||||||||
| Base Rent | $3,726,712 | $3,739,956 | $3,749,355 | $3,777,884 | $3,867,656 | 86.2% | $15.13 | ||||||||
| Grossed Up Vacant Space | 0 | 0 | 0 | 0 | $42,900 | 1.0 | .17 | ||||||||
| Total Reimbursables | 551,517 | 581,729 | 604,843 | 626,341 | 698,382 | 15.6 | 2.73 | ||||||||
| Other Income | 26,055 | 20,455 | 72,708 | 71,878 | 71,878 | 1.6 | 0.28 | ||||||||
| Less Vacancy & Credit Loss | 0 | 0 | 0 | 0 | (195,528)(1) | (4.4) | (.76) | ||||||||
| Effective Gross Income | $4,304,283 | $4,342,140 | $4,426,906 | $4,476,103 | $ 4,485,287 | 100.0% | $17.55 | ||||||||
| Total Operating Expenses | $783,067 | $832,505 | $848,497 | $923,536 | $914,550 | 20.4% | $3.58 | ||||||||
| Net Operating Income | $3,521,217 | $3,509,635 | $3,578,409 | $3,552,567 | $ 3,570,737 | 79.6% | $13.97 | ||||||||
| TI/LC | 0 | 0 | 0 | 0 | 225,293 | 5.0 | 0.88 | ||||||||
| Replacement Reserves | 0 | 0 | 0 | 0 | 86,943 | 1.9 | 0.34 | ||||||||
| Net Cash Flow | $3,521,217 | $3,509,635 | $3,578,409 | $3,552,567 | $3,258,501 | 72.6% | $12.75 | ||||||||
| NOI DSCR | 3.52x | 3.51x | 3.58x | 3.56x | 3.57x | ||||||||||
| NCF DSCR | 3.52x | 3.51x | 3.58x | 3.56x | 3.26x | ||||||||||
| NOI DY | 13.6% | 13.6% | 13.9% | 13.8% | 13.8% | ||||||||||
| NCF DY | 13.6% | 13.6% | 13.9% | 13.8% | 12.6% |
| (1) | The underwritten economic vacancy is 5.0%. The Winslow Bay Commons Property was 99.4% physically occupied as of July 6, 2017. |
Appraisal.As of the appraisal valuation date of July 17, 2017, The Winslow Bay Commons Property had an “as-is” appraised value of $56,350,000. The appraised value includes $750,000 attributed to the Release Parcel (see “Partial Release” section).
Environmental Matters. According to a Phase I environmental site assessment dated November 11, 2016, there was no evidence of any recognized environmental conditions at the Winslow Bay Commons Property.
Market Overview and Competition.The Winslow Bay Commons Property is located in Mooresville, North Carolina, approximately 27.9 miles north of Charlotte, North Carolina. The Winslow Bay Commons Property benefits from its location at the intersection of
THE INFORMATION IN THIS STRUCTURAL AND COLLATERAL TERM SHEET IS NOT COMPLETE AND MAY BE AMENDED PRIOR TO THE TIME OF SALE. THIS TERM SHEET IS NOT AN OFFER TO SELL THESE SECURITIES AND IT IS NOT A SOLICITATION OF AN OFFER TO BUY THESE SECURITIES IN ANY JURISDICTION WHERE THE OFFER OR SALE IS NOT PERMITTED.
84
| WINSLOW BAY COMMONS |
Interstate 77 and Route 150, which experiences an average daily traffic count of 28,000 vehicles. The surrounding area is improved with complementary retail and commercial uses, including Sam’s Club, Lowe’s and a Walmart Superstore. According to a third party market research report, the 2017 estimated population within a one-, three- and five-mile radius of the Winslow Bay Commons Property was 4,988, 28,593, and 65,502, respectively. The 2017 estimated average household income within the same radii was $102,869, $89,644, and $90,508, respectively. Per the appraisal, the surrounding area is a very attractive residential area for commuters to Charlotte and those wanting to live on or near Lake Norman. Homes on Lake Norman and within developments with lake access are some of the most desired neighborhoods in the Charlotte region with approximately 195 homes priced above $1 million within a three-mile radius of the Winslow Bay Commons Property.
According to the appraisal, the Winslow Bay Commons Property is located in the Iredell County submarket of the Charlotte retail market. As of mid-year 2017, the submarket reported total inventory of approximately 10.5 million square feet with a current vacancy rate of 5.1%. The appraiser concluded to market rents for the Winslow Bay Commons Property of $12.00 per square foot for anchor space, $16.50 per square foot for junior anchor space, $20.00 per square foot for in-line space over 4,000 square feet, and $25.00 per square foot for in-line space less than 2,500 square feet, all on a triple-net basis. In total, the appraiser concluded that the in-place rents at the Winslow Bay Commons Property are approximately 2.7% below market.
The following table presents certain information relating to comparable properties the Winslow Bay Commons Property:
Comparable Properties(1)
| Winslow Bay Commons (Subject) | Mooresville Crossing I & II | Plantation Pointe | Mooresville Crossings | Consumer Square | Mooresville Festival | |
| Location | Mooresville, NC | Mooresville, NC | Mooresville, NC | Mooresville, NC | Mooresville, NC | Mooresville, NC |
| Distance from Subject | -- | 0.1 miles | 0.1 miles | 0.3 miles | 0.8 miles | 0.8 miles |
| Year Built/Renovated | 2003 | 2007/2009 | 2005/2014 | 1998/2016 | 1999/NAP | 1990/2004 |
| Anchors | Target, (Shadow Anchor), Dick’s Sporting Goods, Ross Dress for Less | Best Buy, Bed, Bath & Beyond, Old Navy, Staples, Petco, Ashley Furniture | Sam’s Club | Lowe’s Home Improvement, Hobby Lobby | Walmart, Gander Mountain, Ollie’s Bargain Outlet, Planet Fitness, Rugged Wearhouse, Dollar Tree, Jo-Ann | Belk, Kohl’s, Big Lots
|
| Total GLA | 255,598 SF(2) | 238,698 SF | 154,730 SF | 178,827 SF | 579,391 SF | 215,935 SF |
| Total Occupancy | 99.4%(2) | 99.0% | 100.0% | 100.0% | 96.0% | 97.0% |
| (1) | Information obtained from the appraisal. |
| (2) | Information obtained from underwritten rent roll. |
The Borrower. The borrower is DDRTC Winslow Bay Commons LLC, a Delaware limited liability company and single purpose entity with one independent director. DDRTC Winslow Bay Commons LLC is 100.0% indirectly owned by DDRTC Core Retail Fund, LLC, a joint venture between TREA Retail Property Portfolio 2006 LLC (“TREA”), a wholly-owned subsidiary of Teachers Insurance and Annuity Association (“TIAA”) (85.0% membership interest), and DDR TC LLC, a wholly-owned subsidiary of DDR Corp. (“DDR”) (15.0% membership interest). DDRTC Core Retail Fund, LLC is the guarantor of certain nonrecourse carveouts under the Winslow Bay Commons Mortgage Loan.
The Borrower Sponsors.The borrower sponsors are DDRTC Core Retail Fund, LLC. DDR is a self-administered and self-managed real estate investment trust in the business of acquiring, owning, developing, redeveloping, expanding, leasing and managing shopping centers. Headquartered in Beachwood, Ohio, DDR’s shopping center portfolio features open-air, value-oriented neighborhood and community centers, mixed-use centers and lifestyle centers located in prime markets with stable populations and high-growth potential. As of February 10, 2017, DDR’s portfolio consisted of 317 shopping centers (including 152 centers owned through joint ventures) and more than 650 acres of undeveloped land (of which approximately 100 acres are owned through unconsolidated joint ventures) throughout 35 states as well as Puerto Rico (14 assets). TIAA serves approximately 5.0 million active and retired employees participating at more than 15,000 institutions and had over $938.0 billion in combined assets under management as of the first quarter of 2017. As of June 30, 2017, TIAA’s Real Estate Account had $24.8 billion in net assets.
Escrows.The Winslow Bay Commons Mortgage Loan documents do not require ongoing monthly escrows for taxes as long as (i) no event of default has occurred and is continuing and (ii) the borrower provides the lender with evidence that the Winslow Bay Commons Property taxes have been paid. The Winslow Bay Commons Mortgage Loan documents do not require ongoing monthly escrows for insurance premiums as long as (i) no event of default has occurred and is continuing and (ii) the borrower provides the lender with evidence that the Winslow Bay Commons Property is insured via an acceptable blanket insurance policy and such policy is in full force and effect. The Winslow Bay Commons Mortgage Loan documents do not require ongoing monthly escrows for replacement reserves as long as (i) no event of default has occurred and is continuing, and (ii) the Winslow Bay Commons Property is being adequately maintained as determined by the lender based on annual site inspections.
Lockbox and Cash Management.Upon the occurrence and during the continuance of a Cash Trap Event Period (as defined below), the borrower will be required to establish a lender-controlled lockbox account and direct all tenants to deposit all rents directly into such lockbox account. Additionally, all revenues and other monies received by the borrower or property manager relating to the Winslow Bay Commons Property will be deposited into the lockbox account within one business day of receipt. During a Cash Trap
THE INFORMATION IN THIS STRUCTURAL AND COLLATERAL TERM SHEET IS NOT COMPLETE AND MAY BE AMENDED PRIOR TO THE TIME OF SALE. THIS TERM SHEET IS NOT AN OFFER TO SELL THESE SECURITIES AND IT IS NOT A SOLICITATION OF AN OFFER TO BUY THESE SECURITIES IN ANY JURISDICTION WHERE THE OFFER OR SALE IS NOT PERMITTED.
85
| WINSLOW BAY COMMONS |
Event Period, all excess cash flow after payment of all sums due and payable under the Winslow Bay Commons Mortgage Loan documents and all operating expenses will be retained by the lender as additional collateral.
A “Cash Trap Event Period” means the occurrence of (i) an event of default or (ii) the trailing 12-month net operating income (“NOI”) debt yield falling below 7.75% for two consecutive calendar quarters. A Cash Trap Event Period will end, with respect to clause (i), upon the cure of such event of default, and with respect to clause (ii), upon the trailing 12-month NOI debt yield being greater than or equal to 8.25% for two consecutive calendar quarters.
In lieu of a cash flow sweep, the borrower may provide a letter of credit, or a guaranty from DDRTC Core Retail Fund, LLC, or post cash, equal to an amount that would have otherwise been swept in a cash flow sweep event, but not less than the amount swept assuming an NOI that yields a 7.75% NOI debt yield, refreshed annually on the anniversary of the trigger event.
Property Management. The Winslow Bay Commons Property is managed by an affiliate of the borrower.
Assumption.The borrower has the two-time right to transfer Winslow Bay Commons Property provided that certain conditions are satisfied, including (i) no event of default has occurred and is continuing; (ii) the lender reasonably determines that the proposed transferee and guarantor satisfy the lender’s credit review and underwriting standards, taking into consideration the transferee’s experience, financial strength and general business standing; and (iii) if requested by lender, rating agency confirmation that the sale and assumption will not result in a downgrade, withdrawal or qualification of the respective ratings assigned to the Series 2017-C40 certificates.
Partial Release. As long as no event of default has occurred and is continuing, the borrower has the right to the free release of a certain unimproved outparcel (the “Release Parcel”) at the Winslow Bay Commons Property in connection with the sale of the Release Parcel (see “Appraisal” section).
Real Estate Substitution.Not permitted.
Subordinate and Mezzanine Indebtedness.Not permitted.
Ground Lease. None.
Terrorism Insurance.The Winslow Bay Commons Mortgage Loan documents require that the “all risk” insurance policy required to be maintained by the borrower provide coverage for terrorism in an amount equal to the full replacement cost of the Winslow Bay Commons Property, as well as business interruption insurance covering no less than an amount equal to 100% of the projected gross income from the Winslow Bay Commons Property on an actual loss sustained basis for a period beginning on the date of business interruption and continuing until the restoration of the Winslow Bay Commons Property is completed, or the 18-month period following the occurrence of a casualty event, together with a twelve-month extended period of indemnity.
THE INFORMATION IN THIS STRUCTURAL AND COLLATERAL TERM SHEET IS NOT COMPLETE AND MAY BE AMENDED PRIOR TO THE TIME OF SALE. THIS TERM SHEET IS NOT AN OFFER TO SELL THESE SECURITIES AND IT IS NOT A SOLICITATION OF AN OFFER TO BUY THESE SECURITIES IN ANY JURISDICTION WHERE THE OFFER OR SALE IS NOT PERMITTED.
86
(THIS PAGE INTENTIONALLY LEFT BLANK)
THE INFORMATION IN THIS STRUCTURAL AND COLLATERAL TERM SHEET IS NOT COMPLETE AND MAY BE AMENDED PRIOR TO THE TIME OF SALE. THIS TERM SHEET IS NOT AN OFFER TO SELL THESE SECURITIES AND IT IS NOT A SOLICITATION OF AN OFFER TO BUY THESE SECURITIES IN ANY JURISDICTION WHERE THE OFFER OR SALE IS NOT PERMITTED.
87
(THIS PAGE INTENTIONALLY LEFT BLANK)
THE INFORMATION IN THIS STRUCTURAL AND COLLATERAL TERM SHEET IS NOT COMPLETE AND MAY BE AMENDED PRIOR TO THE TIME OF SALE. THIS TERM SHEET IS NOT AN OFFER TO SELL THESE SECURITIES AND IT IS NOT A SOLICITATION OF AN OFFER TO BUY THESE SECURITIES IN ANY JURISDICTION WHERE THE OFFER OR SALE IS NOT PERMITTED.
88
DEL AMO FASHION CENTER

THE INFORMATION IN THIS STRUCTURAL AND COLLATERAL TERM SHEET IS NOT COMPLETE AND MAY BE AMENDED PRIOR TO THE TIME OF SALE. THIS TERM SHEET IS NOT AN OFFER TO SELL THESE SECURITIES AND IT IS NOT A SOLICITATION OF AN OFFER TO BUY THESE SECURITIES IN ANY JURISDICTION WHERE THE OFFER OR SALE IS NOT PERMITTED.
89
DEL AMO FASHION CENTER
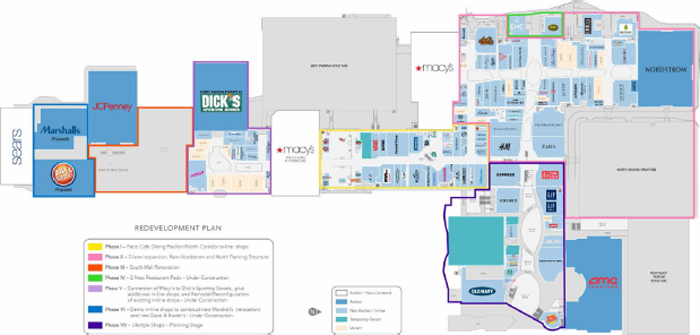
THE INFORMATION IN THIS STRUCTURAL AND COLLATERAL TERM SHEET IS NOT COMPLETE AND MAY BE AMENDED PRIOR TO THE TIME OF SALE. THIS TERM SHEET IS NOT AN OFFER TO SELL THESE SECURITIES AND IT IS NOT A SOLICITATION OF AN OFFER TO BUY THESE SECURITIES IN ANY JURISDICTION WHERE THE OFFER OR SALE IS NOT PERMITTED.
90
DEL AMO FASHION CENTER
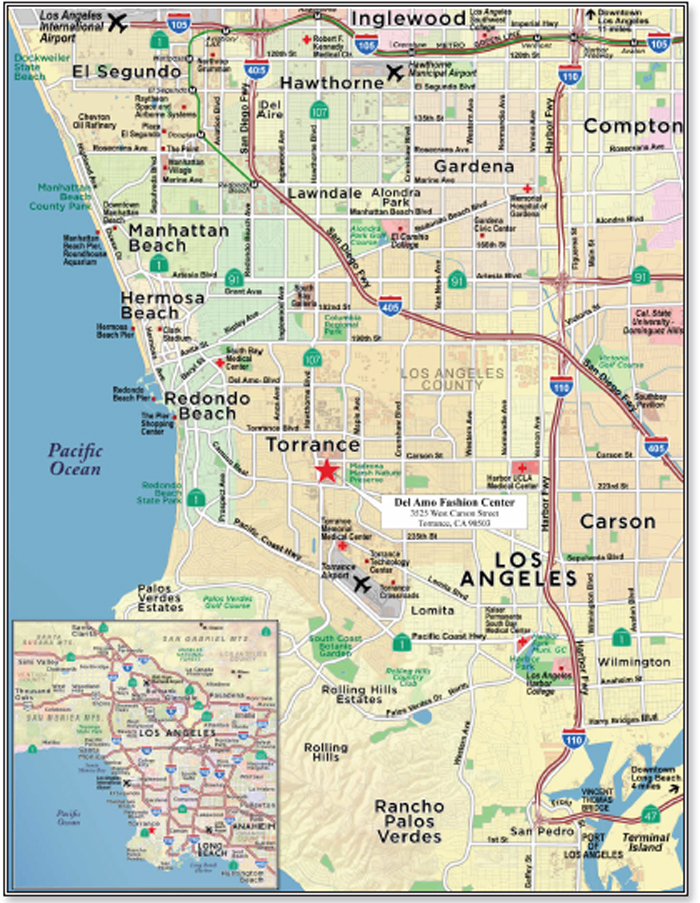
THE INFORMATION IN THIS STRUCTURAL AND COLLATERAL TERM SHEET IS NOT COMPLETE AND MAY BE AMENDED PRIOR TO THE TIME OF SALE. THIS TERM SHEET IS NOT AN OFFER TO SELL THESE SECURITIES AND IT IS NOT A SOLICITATION OF AN OFFER TO BUY THESE SECURITIES IN ANY JURISDICTION WHERE THE OFFER OR SALE IS NOT PERMITTED.
91
| No. 8 – Del Amo Fashion Centerr | |||||||
| Loan Information | Property Information | ||||||
| Mortgage Loan Seller: | Barclays Bank PLC | Single Asset/Portfolio: | Single Asset | ||||
| Credit Assessment (Fitch/KBRA/Moody’s): | AA-/BBB-/Baa1 | Property Type: | Retail | ||||
| Original Principal Balance(1): | $25,000,000 | Specific Property Type: | Super Regional Mall | ||||
| Cut-off Date Balance(1): | $25,000,000 | Location: | Torrance, CA | ||||
| % of Initial Pool Balance: | 3.5% | Size: | 1,769,525 SF | ||||
| Loan Purpose: | Refinance | Cut-off Date Balance Per SF(1): | $259.56 | ||||
| Borrower Names: | Del Amo Fashion Center Operating Company, L.L.C. | Year Built/Renovated: | 1961/2017 | ||||
| Borrower Sponsor: | Simon Property Group, L.P.; Commingled Pension Trust Fund (Strategic Property) of JPMorgan Chase Bank, N.A. | Title Vesting: | Fee | ||||
| Mortgage Rate: | 3.6575% | Property Manager: | Self-managed | ||||
| Note Date: | May 12, 2017 | 4thMost Recent Occupancy (As of)(3): | 93.5% (12/31/2014) | ||||
| Anticipated Repayment Date: | NAP | 3rdMost Recent Occupancy (As of)(3): | 86.1% (12/31/2015) | ||||
| Maturity Date: | June 1, 2027 | 2ndMost Recent Occupancy (As of)(3): | 91.5% (12/31/2016) | ||||
| IO Period: | 120 months | Most Recent Occupancy (As of)(3): | 85.2% (5/15/2017) | ||||
| Loan Term (Original): | 120 months | Current Occupancy (As of)(3): | 85.2% (5/15/2017) | ||||
| Seasoning: | 4 months | ||||||
| Amortization Term (Original): | NAP | Underwriting and Financial Information: | |||||
| Loan Amortization Type: | Interest-only, Balloon | ||||||
| Interest Accrual Method: | Actual/360 | 4thMost Recent NOI (As of): | $28,984,156 (12/31/2014) | ||||
| Call Protection: | L(28),D(85),O(7) | 3rdMost Recent NOI (As of): | $35,039,436 (12/31/2015) | ||||
| Lockbox Type: | Hard/Springing Cash Management | 2ndMost Recent NOI (As of): | $51,101,092 (12/31/2016) | ||||
| Additional Debt(1): | Yes | Most Recent NOI (As of): | $53,218,707 (TTM 3/31/2017) | ||||
| Additional Debt Type(1): | Pari Passu;Subordinate Secured Debt | ||||||
| U/W Revenues: | $81,259,520 | ||||||
| U/W Expenses: | $21,915,628 | ||||||
| U/W NOI(4): | $59,343,892 | ||||||
| U/W NCF(4): | $56,965,434 | ||||||
| Escrows and Reserves(2): | U/W NOI DSCR(1): | 3.48x | |||||
| U/W NCF DSCR(1): | 3.34x | ||||||
| Type: | Initial | Monthly | Cap (If Any) | U/W NOI Debt Yield(1): | 12.9% | ||
| Taxes | $0 | Springing | NAP | U/W NCF Debt Yield(1): | 12.4% | ||
| Insurance | $0 | Springing | NAP | As-Is Appraised Value(5): | $1,155,000,000 | ||
| Replacement Reserves | $0 | Springing | $446,400 | As-Is Appraisal Valuation Date(5): | April 23, 2017 | ||
| TI/LC Reserve | $0 | Springing | $6,465,600 | Cut-off Date LTV Ratio(1)(5): | 39.8% | ||
| Other | $8,071,240 | $0 | NAP | LTV Ratio at Maturity or ARD(1)(5): | 39.8% | ||
| (1) | See “The Mortgage Loan” section. All statistical financial information related to balance per square foot, loan-to-value ratios, debt service coverage ratios and debt yields are based on the funded outstanding principal balance of the Del Amo Fashion Center Senior Loan (as defined below). |
| (2) | See “Escrows” section. |
| (3) | See “Historical Occupancy” section. |
| (4) | See “Cash Flow Analysis” section. |
| (5) | As of the appraisal valuation date of April 23, 2017, the Del Amo Fashion Center Property had an “as-is” appraised value of $1,155,000,000. The appraiser also concluded to an “as-stabilized” value of $1,255,000,000 as of May 1, 2019, which equates to an “as-stabilized” loan-to-value-ratio of 36.6% and an “as-stabilized” loan-to-value ratio at maturity of 36.6%. |
The Mortgage Loan. The mortgage loan (the “Del Amo Fashion Center Mortgage Loan”) is part of a whole loan (the “Del Amo Fashion Center Whole Loan”) that is evidenced by 17pari passu promissory A-notes in the aggregate original principal amount of $375,800,000, which arepari passu with each other, 17 promissory B-Notes in the aggregate original amount of $83,500,000, which are subordinate to the A-Notes andpari passu with each other (such A-Notes and B-Notes, collectively, the “Del Amo Fashion Center Senior Loan”) and twelve subordinate promissory notes in the aggregate original principal amount of $125,700,000, which are evidenced by four notes from each of three tranches (C-Notes, D-Notes and E-Notes, each of which is subordinate to the Del Amo Fashion Center Senior Loan and to each other such tranche with a prior alphabetical designation (collectively, the “Del Amo Fashion Center Subordinate Loan”), which are secured by a first priority fee mortgage encumbering 1,769,525 square feet of a super regional mall in Torrance, California (the “Del Amo Fashion Center Property”). Promissory Notes A-2-4 and B-2-4, in the aggregate principal amount of $25,000,000, are from each of the A and B tranches ofpari passu components that comprise the Del Amo Fashion Center Senior Loan and represent the Del Amo Fashion Center Mortgage Loan and will be included in the WFCM 2017-C40 Trust.
The Del Amo Fashion Center Whole Loan was co-originated on May 12, 2017 by Wells Fargo Bank, National Association, Bank of America, N.A., Barclays Bank PLC, and Société Générale. The Del Amo Fashion Center Whole Loan had an original principal balance
THE INFORMATION IN THIS STRUCTURAL AND COLLATERAL TERM SHEET IS NOT COMPLETE AND MAY BE AMENDED PRIOR TO THE TIME OF SALE. THIS TERM SHEET IS NOT AN OFFER TO SELL THESE SECURITIES AND IT IS NOT A SOLICITATION OF AN OFFER TO BUY THESE SECURITIES IN ANY JURISDICTION WHERE THE OFFER OR SALE IS NOT PERMITTED.
92
DEL AMO FASHION CENTER
of $585,000,000, has an outstanding principal balance as of the Cut-off Date of $585,000,000 and accrues interest at an interest rate of 3.6575%per annum. The Del Amo Fashion Center Whole Loan had an initial term of 120 months, has a remaining term of 116 months as of the Cut-off Date and requires payments of interest only through the term of the Del Amo Fashion Center Whole Loan. The Del Amo Fashion Center Whole Loan matures on June 1, 2027.
Notes A-2-4 and B-2-4, which will be contributed to the WFCM 2017-C40 Trust, had an aggregate original principal balance of $25,000,000, have an aggregate outstanding principal balance as of the Cut-off Date of $25,000,000 and represent a non-controlling interest in the Del Amo Fashion Center Whole Loan. The following table presents a summary of the promissory notes comprising the Del Amo Fashion Center Whole Loan. The Del Amo Fashion Center Whole Loan is expected to be serviced pursuant to the trust and servicing agreement for the DAFC 2017-AMO transaction. See “Description of the Mortgage Pool—The Whole Loans—The Non-Serviced AB Whole Loans—The Del Amo Fashion Center Whole Loan” in the Preliminary Prospectus.
Note Summary(1)(2)
| Notes | Original Balance | Note Holder | Controlling Interest | |
| A-1-1 | $12,125,000 | DAFC 2017-AMO | Yes | |
| A-1-2 | $36,821,000 | BANK 2017-BNK5 | No | |
| A-1-3 | $24,547,000 | BANK 2017-BNK6 | No | |
| A-1-4 | $20,457,000 | CGCMT 2017-B1 | No | |
| A-2-1 | $12,125,000 | DAFC 2017-AMO | No | |
| A-2-2-A | $24,547,333 | WFCM 2017-C39 | No | |
| A-2-2-B | $12,273,667 | Barclays Bank PLC | No | |
| A-2-3 | $24,547,000 | WFCM 2017-C38 | No | |
| A-2-4 | $20,457,000 | WFCM 2017-C40 | No | |
| A-3-1 | $12,125,000 | DAFC 2017-AMO | No | |
| A-3-2 | $40,912,500 | UBS 2017-C3 | No | |
| A-3-3 | $36,821,250 | UBS 2017-C2 | No | |
| A-3-4 | $4,091,250 | UBS 2017-C4 (expected) | No | |
| A-4-1 | $12,125,000 | DAFC 2017-AMO | No | |
| A-4-2 | $36,821,000 | BANK 2017-BNK5 | No | |
| A-4-3 | $24,547,000 | WFCM 2017-C38 | No | |
| A-4-4 | $20,457,000 | BANK 2017-BNK6 | No | |
| B-1-1 | $2,700,000 | DAFC 2017-AMO | No | |
| B-1-2 | $8,179,000 | BANK 2017-BNK5 | No | |
| B-1-3 | $5,453,000 | BANK 2017-BNK6 | No | |
| B-1-4 | $4,543,000 | BANK 2017-BNK6 | No | |
| B-2-1 | $2,700,000 | DAFC 2017-AMO | No | |
| B-2-2-A | $5,452,667 | WFCM 2017-C39 | No | |
| B-2-2-B | $2,726,333 | Barclays Bank PLC | No | |
| B-2-3 | $5,453,000 | WFCM 2017-C38 | No | |
| B-2-4 | $4,543,000 | WFCM 2017-C40 | No | |
| B-3-1 | $2,700,000 | DAFC 2017-AMO | No | |
| B-3-2 | $9,087,500 | UBS 2017-C3 | No | |
| B-3-3 | $8,178,750 | UBS 2017-C2 | No | |
| B-3-4 | $908,750 | UBS 2017-C4 (expected) | No | |
| B-4-1 | $2,700,000 | DAFC 2017-AMO | No | |
| B-4-2 | $8,179,000 | BANK 2017-BNK5 | No | |
| B-4-3 | $5,453,000 | WFCM 2017-C38 | No | |
| B-4-4 | $4,543,000 | BANK 2017-BNK6 | No | |
| Subordinate Loan | $125,700,000 | DAFC 2017-AMO | No | |
| Total | $585,000,000 |
| (1) | The promissory notes currently held by Wells Fargo Bank, National Association, Bank of America, N.A., Barclays Bank PLC, and Société Générale and are expected to be contributed to future securitization transactions or may be otherwise transferred at any time. The lender provides no assurances that any non-securitizedpari passunote will not be split further. |
| (2) | The B-Notes are subordinate to the A-Notes. |
Following the lockout period, the borrower has the right to defease the Del Amo Fashion Center Whole Loan in whole, but not in part, on any date before December 1, 2026. In addition, the Del Amo Fashion Center Whole Loan is prepayable without penalty on or after December 1, 2026. The lockout period will expire on the earlier to occur of (i) two years after the closing date of the securitization that includes the last note to be securitized and (ii) May 2, 2020.
Sources and Uses
| Sources | Uses | |||||||
| Original whole loan amount(1) | $585,000,000 | 100.0% | Loan payoff | $511,127,344 | 87.4% | |||
| Closing costs | 3,288,487 | 0.6 | ||||||
| Return of equity | 70,584,168 | 12.1 | ||||||
| Total Sources | $585,000,000 | 100.0% | Total Uses | $585,000,000 | 100.0% |
| (1) | The Del Amo Fashion Center Mortgage Loan is part of the Del Amo Fashion Center Whole Loan, which is comprised of seventeen promissory A-Notes (which arepari passu with each other) with an aggregate principal balance of $375,800,000, seventeen promissory B-Notes (which are subordinate to the A-Notes andpari passu with each other) with an aggregate principal balance of $83,500,000, and twelve subordinate mortgage notes with an aggregate principal balance of $125,700,000. |
THE INFORMATION IN THIS STRUCTURAL AND COLLATERAL TERM SHEET IS NOT COMPLETE AND MAY BE AMENDED PRIOR TO THE TIME OF SALE. THIS TERM SHEET IS NOT AN OFFER TO SELL THESE SECURITIES AND IT IS NOT A SOLICITATION OF AN OFFER TO BUY THESE SECURITIES IN ANY JURISDICTION WHERE THE OFFER OR SALE IS NOT PERMITTED.
93
DEL AMO FASHION CENTER
The Property.The Del Amo Fashion Center Property consists of 1,769,525 square feet of traditional mall, open air lifestyle and entertainment space which together with the non-collateral Macy’s and Sears anchors comprise the 2.51 million square feet Del Amo Fashion Center mall, the largest shopping center in the western United States. The Del Amo Fashion Center Property is located in the suburban community of Torrance, California, at the intersection of Hawthorne and Sepulveda Boulevards. Hawthorne Boulevard is a ten-lane arterial providing access to the Pacific Coast Highway to the south and I-105 to the north. Sepulveda Boulevard is an eight-lane thoroughfare that provides access between Redondo Beach and I-110.
The Del Amo Fashion Center Property is a two-level super regional mall with a diverse tenancy including large chain stores such as Dick’s Sporting Goods, H&M, XXI Forever and Crate & Barrel, restaurants including P.F. Chang’s China Bistro, Lazy Dog Cafe, Great Maple and Din Tai Fung (a Michelin-starred restaurant), entertainment options including the 18-screen AMC Theatres and Dave & Buster’s (not yet open), as well as over 100 in-line retailers and brands including 25 first-to-market brands including Arhaus Furniture, Kate Spade New York, Hugo Boss, J. Crew, Lululemon and Michael Kors. Collateral anchors include J.C. Penney and Nordstrom. The Del Amo Fashion Center Property was 85.2% leased as of May 15, 2017 to 208 retail and restaurant tenants. Included in the collateral are 11,892 parking spaces (approximately 6.7 spaces per 1,000 square feet).
The Del Amo Fashion Center Property is currently undergoing a $423 million redevelopment that started in 2013. The multi-phased project includes (i) the renovation of the north mall area and creation of the new Patio Café Dining Pavilion which opened in 2014 and includes ten eateries, seating for 700, floor to ceiling living plant walls, skylights and lounge areas with complimentary Wi-Fi, (ii) the addition of approximately 350,000 square feet of in-line shops, the Nordstrom anchor and a multi-level parking deck, delivered in 2015, (iii) the renovation of the south mall area, completed in November 2016, (iv) the construction of the Dick’s Sporting Goods store, which opened in June 2017, and additional adjacent in-line stores and renovation of neighboring in-line stores, which construction and renovation was expected to have been completed in May 2017, (v) the build-out of two restaurant pads, BRIO Tuscan Grille and EMC Seafood & Raw Bar (which is expected to be completed in 2017), and (vi) the construction of the Marshalls and Dave & Buster’s which is expected to be completed in May 2018. The remaining cost of the redevelopment has not been reserved for under the Del Amo Fashion Center Whole Loan documents and such redevelopment is not required to be completed by the Del Amo Fashion Center Borrower.
THE INFORMATION IN THIS STRUCTURAL AND COLLATERAL TERM SHEET IS NOT COMPLETE AND MAY BE AMENDED PRIOR TO THE TIME OF SALE. THIS TERM SHEET IS NOT AN OFFER TO SELL THESE SECURITIES AND IT IS NOT A SOLICITATION OF AN OFFER TO BUY THESE SECURITIES IN ANY JURISDICTION WHERE THE OFFER OR SALE IS NOT PERMITTED.
94
DEL AMO FASHION CENTER
The following table presents certain information relating to the tenancy at the Del Amo Fashion Center Property:
Major Tenants
| Tenant Name | Credit Rating (Fitch/Moody’s/ S&P)(1) | Tenant NRSF | % of NRSF | Annual U/W Base Rent PSF(2) | Annual U/W Base Rent(2) | % of Total Annual U/W Base Rent | Sales PSF(3) | Occupancy Cost(3) | Lease Expiration Date |
| Anchor Tenants – Not Part of Collateral | |||||||||
| Macy’s | BBB/Baa3/BBB- | 423,307 | ANCHOR OWNED – NOT PART OF THE COLLATERAL | ||||||
| Sears | CC/Caa2/CCC+ | 313,495 | |||||||
| Anchor Tenants | |||||||||
| J.C. Penney | B+/B1/B+ | 163,346 | 9.2% | $2.80 | $457,325 | 0.9% | $129 | N/A | 12/31/2018 |
| Nordstrom | BBB+/Baa1/BBB+ | 138,000 | 7.8% | $0(4) | $0(4) | 0.0%(4) | $373 | N/A | 2/28/2031 |
| AMC Theaters | NR/B1/NR | 76,800 | 4.3% | $39.93 | $3,066,624 | 6.1% | $961,500(6) | 17.7% | 9/30/2021 |
| Total Anchor Tenants | 378,146 | 21.4% | $14.67(5) | $3,523,949 | 7.0% | ||||
| Major Tenants | |||||||||
| LA Fitness | NR/NR/NR | 47,137 | 2.7% | $38.02 | $1,792,237 | 3.6% | N/A | N/A | 1/31/2022 |
| Dave & Buster’s(7) | NR/NR/NR | 42,336 | 2.4% | $34.00 | $1,439,424 | 2.9% | N/A | N/A | 4/30/2033 |
| Dick’s Sporting Goods | NR/NR/NR | 83,210 | 4.7% | $16.25 | $1,352,163 | 2.7% | N/A | N/A | 4/30/2027 |
| H&M | NR/NR/NR | 25,086 | 1.4% | $42.90 | $1,076,189 | 2.1% | N/A | N/A | 1/31/2026 |
| Zara | NR/NR/NR | 26,802 | 1.5% | $39.20 | $1,050,625 | 2.1% | $328 | 12.0% | 10/31/2027 |
| Burlington Coat Factory | NR/NR/NR | 60,000 | 3.4% | $14.00 | $840,000 | 1.7% | N/A | N/A | 1/31/2025(8) |
| Marshalls(7) | NR/A2/A+ | 30,716 | 1.7% | $24.50 | $752,542 | 1.5% | N/A | N/A | 2/29/2028 |
| Express | NR/NR/NR | 11,208 | 0.6% | $66.19 | $741,858 | 1.5% | N/A | N/A | 1/31/2026 |
| Old Navy | BB+/Baa2/BB+ | 17,990 | 1.0% | $39.62 | $712,799 | 1.4% | $433 | 9.7% | 1/31/2024 |
| XXI Forever | NR/NR/NR | 20,217 | 1.1% | $35.00 | $707,595 | 1.4% | $377 | 13.4% | 1/31/2018 |
| Total Major Tenants | 364,702 | 20.6% | $28.70 | 10,465,431 | 20.8% | ||||
| Non-Major Tenants(9) | 764,810 | 43.2% | $47.61 | $36,415,851 | 72.2% | ||||
| Occupied Collateral Total | 1,507,658 | 85.2% | $33.43 | $50,405,231 | 100.0% | ||||
| Vacant Space | 261,867 | 14.8% | |||||||
| Collateral Total | 1,769,525 | 100.0% | |||||||
| (1) | Certain ratings are those of the parent company whether or not the parent guarantees the lease. |
| (2) | Annual U/W Base Rent PSF and Annual U/W Base Rent include contractual rent steps through July 1, 2018. |
| (3) | Sales PSF and Occupancy Costs are for the trailing 12-month period ending March 31, 2017 for Old Navy and XXI Forever, and 2016 for all other tenants. |
| (4) | Nordstrom opened in October 2015 and does not pay base rent but pays percentage rent equivalent to 2% of sales over a $60.0 million breakpoint. |
| (5) | The Total Anchor Tenants Annual U/W Base Rent PSF excludes Nordstrom square footage. Including Nordstrom, the Annual U/W Base Rent PSF is $9.32. |
| (6) | Sales PSF represents Sales per screen, based on 18 screens. |
| (7) | Dave & Buster’s and Marshalls have executed leases with expected May 2018 commencement dates. The Del Amo Fashion Center Whole Loan guarantor has signed a ten-year master lease which provides for the annual rent obligations for these tenants. |
| (8) | Burlington Coat Factory has the option to terminate its lease at any time upon at least 270 days’ prior written notice. |
| (9) | Non-Major Tenants include eleven tenants (2.1% of NRA and 3.4% of underwritten rent) with signed leases with future commencement dates (June 13, 2017 to January 1, 2018). |
As of the trailing-twelve-month period that ended on March 31, 2017, the Del Amo Fashion Center Property had total comparable in-line sales of $124.3 million, with average in-line sales of $611 PSF and an occupancy cost of 13.7%. While the renovations and redevelopment have been ongoing at the Del Amo Fashion Center Property since 2013, in-line sales per square foot have grown from $441 per square foot to $611 per square foot, representing a 39% increase from 2013 to the trailing twelve month period that ended on March 31, 2017.
THE INFORMATION IN THIS STRUCTURAL AND COLLATERAL TERM SHEET IS NOT COMPLETE AND MAY BE AMENDED PRIOR TO THE TIME OF SALE. THIS TERM SHEET IS NOT AN OFFER TO SELL THESE SECURITIES AND IT IS NOT A SOLICITATION OF AN OFFER TO BUY THESE SECURITIES IN ANY JURISDICTION WHERE THE OFFER OR SALE IS NOT PERMITTED.
95
DEL AMO FASHION CENTER
The following table presents a summary of historical comparable in-line sales at the Del Amo Fashion Center Property:
Comparable In-Line Sales Summary(1)
| 2013 | 2014 | 2015 | 2016 | 3/31/2017 TTM | |
| In-Line Sales PSF | $441 | $449 | $499 | $560 | $611 |
| Occupancy Cost | 14.3% | 14.7% | 15.9% | 14.4% | 13.7% |
| (1) | Information as provided by the borrower sponsor and only include tenants reporting comparable sales. |
The following table presents certain information relating to the historical anchor sales at the Del Amo Fashion Center Property:
Anchor Sales Summary
| Tenant Name | 2014 | 2015 | 2016 | Sales PSF(1) |
| Macy’s (non-collateral)(2)(3) | $75,100,000 | $62,000,000 | $73,895,000 | $175 |
| Sears (non-collateral)(2)(4) | $32,500,000 | $30,200,000 | NAV(5) | $96 |
| Nordstrom(6) | NAV | NAV | $51,480,000 | $373 |
| J.C. Penney | $23,689,000 | $24,372,000 | $21,061,000 | $129 |
| AMC Theaters(7) | $17,979,000 | $18,114,000 | $17,307,000 | $961,500 |
| (1) | Sales (PSF) reflects most recent year-end sales figures available. |
| (2) | Sales figures reflect estimates for non-collateral anchors. |
| (3) | Macy’s currently operates two stores at the Del Amo Fashion Center Property, totaling 423,307 square feet. Sales figures are representative of both stores. The 2014 sales figures represents three Macy’s stores. |
| (4) | Sears occupies 313,495 square feet, with approximately two levels being used for merchandizing and one level being used for office space. When excluding the office space, the adjusted estimated Sales figure is approximately $144 per square feet. |
| (5) | 2016 sales data not yet available. |
| (6) | Nordstrom opened in October 2015. |
| (7) | AMC Theaters Sales PSF reflects sales per screen, based on 18 screens. |
The following table presents certain information relating to the lease rollover schedule at the Del Amo Fashion Center Property:
Lease Expiration Schedule(1)(2)
| Year Ending December 31, | No. of Leases Expiring | Expiring NRSF | % of Total NRSF | Cumulative Expiring NRSF | Cumulative % of Total NRSF | Annual U/W Base Rent | % of Total Annual U/W Base Rent | Annual U/W Base Rent PSF(3) |
| MTM/2017 | 8 | 26,342 | 1.5% | 26,342 | 1.5% | $1,040,552 | 2.1% | $39.50 |
| 2018 | 11 | 204,233 | 11.5% | 230,575 | 13.0% | $2,054,097 | 4.1% | $10.06 |
| 2019 | 16 | 45,696 | 2.6% | 276,271 | 15.6% | $2,051,118 | 4.1% | $44.89 |
| 2020 | 12 | 88,993 | 5.0% | 365,264 | 20.6% | $2,174,566 | 4.3% | $24.44 |
| 2021 | 10 | 115,598 | 6.5% | 480,862 | 27.2% | $4,593,303 | 9.1% | $39.74 |
| 2022 | 11 | 67,982 | 3.8% | 548,844 | 31.0% | $3,243,680 | 6.4% | $47.71 |
| 2023 | 4 | 75,763 | 4.3% | 624,607 | 35.3% | $1,365,309 | 2.7% | $18.02 |
| 2024 | 17 | 51,974 | 2.9% | 676,581 | 38.2% | $3,595,680 | 7.1% | $69.18 |
| 2025 | 44 | 176,862 | 10.0% | 853,443 | 48.2% | $8,913,244 | 17.7% | $50.40 |
| 2026 | 56 | 222,472 | 12.6% | 1,075,915 | 60.8% | $11,548,229 | 22.9% | $51.91 |
| 2027 | 22 | 202,821 | 11.5% | 1,278,736 | 72.3% | $6,772,847 | 13.4% | $33.39 |
| Thereafter | 6 | 228,922 | 12.9% | 1,507,658 | 85.2% | $3,052,606 | 6.1% | $13.33 |
| Vacant | 0 | 261,867 | 14.8% | 1,769,525 | 100.0% | $0 | 0.0% | $0.00 |
| Total/Weighted Average | 217 | 1,769,525 | 100.0% | $50,405,231 | 100.0% | $33.43 |
| (1) | Information was obtained from the underwritten rent roll and includes ten tenants (1.7% of NRA and 2.5% of underwritten rent) with signed leases with future commencement dates (June 13, 2017 to January 1, 2018) and three tenants (4.5% of NRA and 5.3% of underwritten rent) with signed leases that are not yet in occupancy (Dave & Buster’s (expected lease commencement date of May 2018), Marshalls (expected lease commencement date of May 2018) and EMC Seafood & Raw Bar (expected lease commencement date of January 2018)), for which a ten-year master lease was signed by the Del Amo Fashion Center Whole Loan guarantor which provides for annual rent equivalent to the tenants’ combined annual rent. |
| (2) | Certain tenants may have lease termination options that are exercisable prior to the originally stated expiration date of the subject lease and that are not considered in the Lease Expiration Schedule. |
| (3) | Weighted Average Annual U/W Base Rent PSF excludes vacant space. |
The following table presents historical occupancy percentages at the Del Amo Fashion Center Property:
Historical Occupancy
12/31/2014(1) | 12/31/2015(1) | 12/31/2016(1) | 5/15/2017(2)(3) |
| 93.5% | 86.1% | 91.5% | 85.2% |
| (1) | Information obtained from the borrower. |
| (2) | Information obtained from the underwritten rent roll. |
| (3) | The May 15, 2017 underwritten rent roll includes ten tenants (1.7% of NRA and 2.5% of underwritten rent) with signed leases with future commencement dates (June 13, 2017 to January 1, 2018). It also includes three tenants (4.5% of NRA and 5.3% of underwritten rent) with signed leases not yet in occupancy: Dave & Buster’s (expected lease commencement date of May 2018), Marshalls (expected lease commencement date of May 2018) and EMC Seafood & Raw Bar (expected lease commencement date of January 2018), for which a ten-year master lease was signed by the Del Amo Fashion Center Whole Loan guarantor which provides for annual rent equivalent to the tenants’ combined annual rent. |
THE INFORMATION IN THIS STRUCTURAL AND COLLATERAL TERM SHEET IS NOT COMPLETE AND MAY BE AMENDED PRIOR TO THE TIME OF SALE. THIS TERM SHEET IS NOT AN OFFER TO SELL THESE SECURITIES AND IT IS NOT A SOLICITATION OF AN OFFER TO BUY THESE SECURITIES IN ANY JURISDICTION WHERE THE OFFER OR SALE IS NOT PERMITTED.
96
DEL AMO FASHION CENTER
Operating History and Underwritten Net Cash Flow. The following table presents certain information relating to the historical operating performance and the underwritten net cash flow at the Del Amo Fashion Center Property:
Cash Flow Analysis
| 2014 | 2015 | 2016 | TTM 3/31/2017 | U/W | % of U/W Effective Gross Income | U/W $ per SF | |||||||||
| Base Rent(1)(2) | $29,467,993 | $33,241,859 | $45,831,077 | $46,804,573 | $51,545,895 | 63.4% | $29.13 | ||||||||
| Grossed Up Vacant Space(3) | 0 | 0 | 0 | 0 | 11,430,694 | 14.1 | 6.46 | ||||||||
| Total Reimbursables | 12,142,979 | 15,224,540 | 25,514,526 | 26,374,801 | 25,211,150 | 31.0 | 14.25 | ||||||||
| Specialty Leasing Income(4) | 1,960,645 | 2,348,117 | 3,373,175 | 3,266,342 | 3,366,899 | 4.1 | 1.90 | ||||||||
| Other Income(5) | 584,173 | 964,983 | 1,396,597 | 1,359,783 | 1,135,576 | 1.4 | 0.64 | ||||||||
| Less Vacancy & Credit Loss | (316,274) | (134,368) | (441,700) | (630,344) | (11,430,694) | (14.1) | (6.46) | ||||||||
| Effective Gross Income | $43,839,516 | $51,645,131 | $75,673,675 | $77,175,155 | $81,259,520 | 100.0% | $45.92 | ||||||||
| Total Operating Expenses | $14,855,360 | $16,605,695 | $24,572,583 | $23,956,448 | $21,915,628 | 27.0% | $12.39 | ||||||||
| Net Operating Income | $28,984,156 | $35,039,436 | $51,101,092 | $53,218,707 | $59,343,892 | 73.0% | $33.54 | ||||||||
| Capital Expenditures | 0 | 0 | 0 | 0 | 223,460 | 0.3 | 0.13 | ||||||||
| TI/LC | 0 | 0 | 0 | 0 | 2,154,999 | 2.7 | 1.22 | ||||||||
| Net Cash Flow | $28,984,156 | $35,039,436 | $51,101,092 | $53,218,707 | $56,965,434 | 70.1% | $32.19 | ||||||||
| NOI DSCR(6) | 1.70x | 2.06x | 3.00x | 3.12x | 3.48x | ||||||||||
| NCF DSCR(6) | 1.70x | 2.06x | 3.00x | 3.12x | 3.34x | ||||||||||
| NOI DY(6) | 6.3% | 7.6% | 11.1% | 11.6% | 12.9% | ||||||||||
| NCF DY(6) | 6.3% | 7.6% | 11.1% | 11.6% | 12.4% |
| (1) | U/W Base Rent includes contractual rent steps through July 1, 2018. |
| (2) | The increase in U/W Base Rent from TTM 3/31/2017 Base Rent is partially due to the inclusion of ten tenants (1.7% of NRA and 2.5% of underwritten rent) with signed leases with future commencement dates (June 13, 2017 to January 1, 2018) and three tenants (4.5% of NRA and 5.3% of underwritten rent) with signed leases not yet in occupancy: Dave & Buster’s (expected lease commencement date of May 2018), Marshalls (expected lease commencement date of May 2018) and EMC Seafood & Raw Bar (expected lease commencement date of January 2018), for which a ten-year master lease was signed by the Del Amo Fashion Center Whole Loan guarantor which provides for annual rent equivalent to the tenants’ combined annual rent. |
| (3) | Grossed up vacant space includes gross-up rent and recoveries. |
| (4) | Specialty leasing income includes income from temporary rental of available in-line space, kiosks, and carts as well as miscellaneous sources such as special events. |
| (5) | Other income includes income from storage, stroller rentals, ATMs and other miscellaneous rental income. |
| (6) | Debt service coverage ratios and debt yields are based on the Del Amo Fashion Center Senior Loan and exclude the Del Amo Fashion Center Subordinate Loan. |
Appraisal.As of the appraisal valuation date of April 23, 2017, the Del Amo Fashion Center Property had an “as-is” appraised value of $1,155,000,000. The appraiser also concluded to an “as-stabilized” value of $1,255,000,000 as of May 1, 2019, which equates to an “as-stabilized” loan-to-value-ratio of 36.6%.
Environmental Matters. According to a Phase I environmental site assessment dated April 17, 2017, there was no evidence of any recognized environmental conditions at the Del Amo Fashion Center Property.
Market Overview and Competition.The Del Amo Fashion Center Property is located in Torrance, California, in the coastal area of Los Angeles’ South Bay. Family-friendly destinations such as Disneyland Resort and Santa Catalina Island as well as the numerous local beaches provide tourist attractions within a short distance of Torrance. Torrance is also the U.S. home base for the Japanese corporations Honda, Mitsuwa and All Nippon Airways, as well as Honeywell and Robinson Helicopters.
According to the appraisal, the Del Amo Fashion Center Property is located within 4.5 miles of the Kings Harbor Marina, within 10.5 miles of the Los Angeles Airport (LAX), in close proximity to I-110 and I-405, and near high income demographic areas including Palos Verdes Peninsula, Redondo Beach, Hermosa and Manhattan Beach. Demographics surrounding the Del Amo Fashion Center Property include a 5-mile radius population of 504,851 with an average household income of $112,287 as of December 2016.
The Del Amo Fashion Center Property is located in the South Bay/Torrance submarket of Los Angeles, which as of year-end 2016 contained 6,154,000 square feet (9.1% of the broader Los Angeles retail market inventory) with a vacancy rate of 3.9% and average asking rents of $35.43 per square foot, as compared to the Los Angeles retail market which had a vacancy rate of 6.2% and average asking rents of $32.00 per square foot. According to the appraisal, there is no proposed new competitive supply within the submarket and none of the proposed supply within the broader Los Angeles market would be competitive with the Del Amo Fashion Center Property.
THE INFORMATION IN THIS STRUCTURAL AND COLLATERAL TERM SHEET IS NOT COMPLETE AND MAY BE AMENDED PRIOR TO THE TIME OF SALE. THIS TERM SHEET IS NOT AN OFFER TO SELL THESE SECURITIES AND IT IS NOT A SOLICITATION OF AN OFFER TO BUY THESE SECURITIES IN ANY JURISDICTION WHERE THE OFFER OR SALE IS NOT PERMITTED.
97
DEL AMO FASHION CENTER
The following table presents certain information relating to comparable properties to the Del Amo Fashion Center Property:
Competitive Set(1)
Del Amo Fashion Center (Subject) | South Bay Galleria | Promenade on the Peninsula | Manhattan Village | South Bay Pavilion | |
| Location | Torrance, CA | Redondo Beach, CA | Rancho Palos Verdes, CA | Manhattan Beach, CA | Carson, CA |
| Distance from Subject | -- | 3.5 miles | 5.4 miles | 7.5 miles | 8.5 miles |
| Property Type | Super Regional Mall | Super Regional Mall | Regional Center | Super Regional Mall | Super Regional Mall |
| Year Built/Renovated | 1961/2017 | 1984/2014 | 1981/NAP | 1981/NAP | 1973/NAP |
| Anchors | Macy’s (non-collateral), Sears (non-collateral), Nordstrom, J.C. Penney | Macy’s, Kohl’s, Cinemas | Equinox Fitness, Cinemas | Macy’s, Fry’s Electronics, Ralph’s/CVS | J.C. Penney, Target, IKEA, 24-Hour Fitness, Cinemas |
| Total GLA | 1,769,525 SF | 960,200 SF | 374,186 SF | 620,008 SF | 1,016,554 SF |
| Total Occupancy | 85.2%(2) | 84.9% | 80.6% | 99.4% | 82.2% |
| (1) | Information obtained from the appraisal. |
| (2) | As of May 15, 2017 which includes (i) ten tenants (1.7% of NRA and 2.5% of underwritten rent) with signed leases with future commencement dates (June 13, 2017 to January 1, 2018) and (ii) three tenants (4.5% of NRA and 5.3% of underwritten rent) with signed leases not yet in occupancy: Dave & Buster’s (expected lease commencement date of May 2018), Marshalls (expected lease commencement date of May 2018) and EMC Seafood & Raw Bar (expected lease commencement date of January 2018), for which a ten-year master lease was signed by the Del Amo Fashion Center Whole Loan guarantor which provides for annual rent equivalent to the tenants’ combined annual rent. See “Cash Flow Analysis” section. |
The Borrower.The borrower is Del Amo Fashion Center Operating Company, L.L.C. (the “Del Amo Fashion Center Borrower”), a Delaware limited liability company and single-purpose entity with at least two independent directors. Legal counsel to the borrower delivered a non-consolidation opinion in connection with the origination of the Del Amo Fashion Center Whole Loan. Simon Property Group, L.P. is the non-recourse carveout guarantor. The Del Amo Fashion Center Whole Loan will be recourse to the guarantor pursuant to standard non-recourse carveouts, however, the non-recourse carveout guaranty and the environmental indemnity agreement provide that so long as Simon Property Group, L.P. is the guarantor (or SPF (as defined below) or certain affiliates of SPF should it be a replacement guarantor), its liability may not exceed $117,000,000 plus all reasonable out-of-pocket costs and expenses incurred by the lender in the enforcement of the guaranty and the environmental indemnity agreement or the preservation of the lender’s rights thereunder. See“Description of the Mortgage Pool—Non-Recourse Carveout Limitations”in the Preliminary Prospectus.
The Borrower Sponsor.The sponsor is a 50/50 joint venture between subsidiaries of Simon Property Group, L.P. and Commingled Pension Trust Fund (Strategic Property) of J.P. Morgan Chase Bank, N.A. (“SPF”).
Simon Property Group, L.P. is the operating partnership of Simon Property Group, Inc. (“Simon”) (NYSE: SPG, rated A3/A by Moody’s and S&P). Simon is a publicly-traded, self-administered and self-managed real estate investment trust focused on retail property ownership and management. Simon is one of the largest publicly-traded owners, operators and developers of retail assets in the United States. As of March 31, 2017, Simon owned or had an interest in 206 properties consisting of 108 malls, 67 Premium Outlet-branded centers, 14 Mills-branded centers, four lifestyle centers and thirteen other retail properties in 37 states and Puerto Rico, as well as redevelopment and expansion projects underway at 25 properties in the United States, Canada and Europe. Simon has sponsored other real estate projects that have been the subject of mortgage loan defaults, foreclosure proceedings and deeds-in-lieu of foreclosure. See “Description of the Mortgage Pool—Loan Purpose, Default History, Bankruptcy Issues and Other Proceedings” in the Preliminary Prospectus.
SPF is a JPMorgan Asset Management fund with a reported net asset value of approximately $30.9 billion and a gross asset value of approximately $41.7 billion as of March 31, 2017. SPF’s investment portfolio focuses on office, retail, residential and industrial investments.
Escrows.No upfront escrows were collected at origination.
During either an event of default or a DSCR Reserve Trigger Period (as defined below), the Del Amo Fashion Center Borrower is required to deposit monthly escrows for real estate taxes, insurance premiums (unless the Del Amo Fashion Center Property is insured under an acceptable blanket insurance policy), $18,600 for replacement reserves, capped at $446,400, and $179,600 for tenant improvement and leasing commissions, capped at $6,465,600. The Del Amo Fashion Center Borrower will additionally be required to deposit monthly escrows for real estate taxes if the Del Amo Fashion Center Borrower fails to provide evidence that the real estate taxes have been paid prior to the assessment of any penalty for late charges.
At loan origination, the Del Amo Fashion Center Whole Loan guarantor provided guarantees in the amount of $7,242,346 for outstanding landlord obligations relating to fourteen tenants and $828,894 for abated rent periods relating to eleven tenants which continue through as late as February 1, 2018.
A “DSCR Reserve Trigger Period” will commence upon the debt service coverage ratio for the Del Amo Fashion Center Whole Loan being less than 1.50x for two consecutive quarters based on the trailing four quarters and will end (provided no event of default has occurred and is continuing) upon the debt service coverage ratio for the Del Amo Fashion Center Whole Loan being equal to or greater than 1.50x for two consecutive quarters based on the trailing four quarters.
THE INFORMATION IN THIS STRUCTURAL AND COLLATERAL TERM SHEET IS NOT COMPLETE AND MAY BE AMENDED PRIOR TO THE TIME OF SALE. THIS TERM SHEET IS NOT AN OFFER TO SELL THESE SECURITIES AND IT IS NOT A SOLICITATION OF AN OFFER TO BUY THESE SECURITIES IN ANY JURISDICTION WHERE THE OFFER OR SALE IS NOT PERMITTED.
98
DEL AMO FASHION CENTER
Lockbox and Cash Management.The Del Amo Fashion Center Whole Loan requires a lender-controlled lockbox account, which is already in place, and that the borrower directs tenants to pay all rents directly into such lockbox account. The loan documents also require that all rents received by the borrower or the property manager be deposited into the lockbox account within two business day of receipt. Upon the occurrence of a Lockbox Event (as defined below), the Del Amo Fashion Center Borrower is required to establish a lender-controlled cash management account to which all amounts in the lockbox account are required to be automatically transferred weekly for the payment of, among other things, debt service, monthly escrows and operating expenses pursuant to an approved annual budget, with all excess cash being deposited to an excess cash reserve to be held as additional collateral for the Del Amo Fashion Center Whole Loan until the Lockbox Event ends.
A “Lockbox Event” will occur upon (i) an event of default, (ii) a bankruptcy action involving the Del Amo Fashion Center Borrower, (iii) a bankruptcy action involving Simon Management Associates II, LLC (or a borrower-affiliated manager) without the manager being replaced within 60 days, (iv) a DSCR Trigger Period, or (v) a Nordstrom Trigger Event (as defined below).
A Lockbox Event will end, provided no event of default is continuing, upon, as applicable, (i) the lender’s acceptance of a cure of the event of default, (ii) Simon Management Associates II, LLC (or a borrower-affiliated manager) being replaced with a qualified manager or the bankruptcy involving the manager being discharged or dismissed, (iii) the end of a DSCR Trigger Period, or (iv) the end of a Nordstrom Trigger Event. A Lockbox Event may not be cured if triggered by a bankruptcy action of the Del Amo Fashion Center Borrower.
A “DSCR Trigger Period” will commence upon the debt service coverage ratio for the Del Amo Fashion Center Whole Loan being less than 1.40x for two consecutive quarters based on the trailing four quarters and will end upon the debt service coverage ratio for the Del Amo Fashion Center Whole Loan being equal to or greater than 1.40x for two consecutive quarters based on the trailing four quarters.
A “Nordstrom Trigger Event” will occur upon Nordstrom (i) vacating or terminating or giving notice to vacate or terminate its lease or (ii) commencing to exercise remedies pursuant to its lease in connection with the Del Amo Fashion Center Borrower’s failure to complete the removal of the former TJ Maxx/Marshalls space from the Del Amo Fashion Center Property, and will end upon the earlier of (i) at least 75% of Nordstrom’s leased space being re-leased to one or more replacement tenants, which tenant(s) are in occupancy, open for business and paying full unabated rent with no outstanding landlord obligations, or (ii) the balance collected to the excess cash flow reserve during the Nordstrom Trigger Event being equal to or greater than $1,380,000.
Property Management. The Del Amo Fashion Center Property is managed by an affiliate of the borrower.
Assumption.The borrower has the right to transfer the Del Amo Fashion Center Property provided that certain conditions are satisfied, including (i) no event of default has occurred and is continuing; (ii) in the event that in connection with such transfer, the manager will not thereafter continue to manage the Del Amo Fashion Center Property, then a replacement management agreement with a qualified manager must be executed acceptable to lender; (iii) the transferee must not have been a party to any bankruptcy action within the previous seven years and there is no material litigation or regulatory action pending against the transferee unreasonable to lender; and (iv) the transferee is a qualified transferee meeting the requirements set forth in the loan documents or the lender receives rating agency confirmation that the sale and assumption will not result in a downgrade, withdrawal or qualification of the respective ratings assigned to the Series 2017-C40 certificates and similar confirmations from each rating agency rating any securities backed by any of the Del Amo Fashion Center Companion Loans with respect to the ratings of such securities.
Partial Release. The borrower is permitted to release certain unimproved, non-incoming producing parcels of the Del Amo Fashion Center Property, subject to certain conditions including (i) no event of default has occurred and is continuing; (ii) the proposed release not having a material adverse effect on property value, the borrower’s business operations or financial condition, or borrower’s ability to repay the Del Amo Fashion Center Whole Loan; (iii) a borrower certificate that such release will not violate any major lease or reciprocal easement-related provisions; and (iv) an opinion of counsel a that the REMIC trust will not fail to maintain its REMIC status due to the unimproved property free release, among other things.
Real Estate Substitution.Not permitted.
Subordinate and Mezzanine Indebtedness.The Del Amo Fashion Center Whole Loan includes twelve subordinate promissory notes in the aggregate original principal amount of $125,700,000 that are expected to be contributed to the DAFC 2017-AMO transaction. See “Description of the Mortgage Pool—The Whole Loans—The Non-Serviced AB Whole Loans—Del Amo Fashion Center Whole Loan” in the Preliminary Prospectus.
Ground Lease. None.
Terrorism Insurance.The loan documents require that the “all risk” insurance policy required to be maintained by the borrower provide coverage for terrorism in an amount equal to the full replacement cost of Del Amo Fashion Center Property. The loan documents also require business interruption insurance covering no less than the 24-month period following the occurrence of a casualty event, together with a 365-day extended period of indemnity. Should the policy contain an exclusion for acts of terrorism, the loan documents require the borrower to obtain to the extent available a stand-alone policy providing the same coverage as previously in place prior to the exclusion, with a premium cap of two times the then current annual insurance premiums for the policy insuring the Del Amo Fashion Center Property only (excluding the wind, flood and earthquake components of the premiums) on a stand-alone basis, with a deductible no greater than $5,000,000.
THE INFORMATION IN THIS STRUCTURAL AND COLLATERAL TERM SHEET IS NOT COMPLETE AND MAY BE AMENDED PRIOR TO THE TIME OF SALE. THIS TERM SHEET IS NOT AN OFFER TO SELL THESE SECURITIES AND IT IS NOT A SOLICITATION OF AN OFFER TO BUY THESE SECURITIES IN ANY JURISDICTION WHERE THE OFFER OR SALE IS NOT PERMITTED.
99
(THIS PAGE INTENTIONALLY LEFT BLANK)
THE INFORMATION IN THIS STRUCTURAL AND COLLATERAL TERM SHEET IS NOT COMPLETE AND MAY BE AMENDED PRIOR TO THE TIME OF SALE. THIS TERM SHEET IS NOT AN OFFER TO SELL THESE SECURITIES AND IT IS NOT A SOLICITATION OF AN OFFER TO BUY THESE SECURITIES IN ANY JURISDICTION WHERE THE OFFER OR SALE IS NOT PERMITTED.
100
| PLEASANT PRAIRIE PREMIUM OUTLETS |
THE INFORMATION IN THIS STRUCTURAL AND COLLATERAL TERM SHEET IS NOT COMPLETE AND MAY BE AMENDED PRIOR TO THE TIME OF SALE. THIS TERM SHEET IS NOT AN OFFER TO SELL THESE SECURITIES AND IT IS NOT A SOLICITATION OF AN OFFER TO BUY THESE SECURITIES IN ANY JURISDICTION WHERE THE OFFER OR SALE IS NOT PERMITTED.
101
| PLEASANT PRAIRIE PREMIUM OUTLETS |
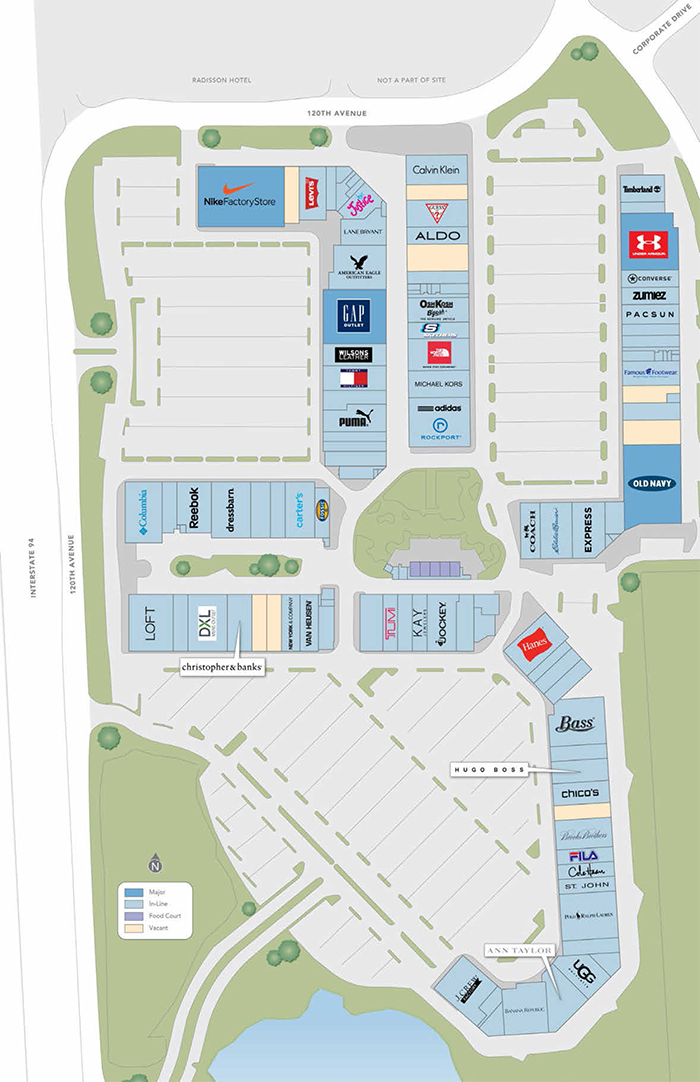
THE INFORMATION IN THIS STRUCTURAL AND COLLATERAL TERM SHEET IS NOT COMPLETE AND MAY BE AMENDED PRIOR TO THE TIME OF SALE. THIS TERM SHEET IS NOT AN OFFER TO SELL THESE SECURITIES AND IT IS NOT A SOLICITATION OF AN OFFER TO BUY THESE SECURITIES IN ANY JURISDICTION WHERE THE OFFER OR SALE IS NOT PERMITTED.
102
| PLEASANT PRAIRIE PREMIUM OUTLETS |

THE INFORMATION IN THIS STRUCTURAL AND COLLATERAL TERM SHEET IS NOT COMPLETE AND MAY BE AMENDED PRIOR TO THE TIME OF SALE. THIS TERM SHEET IS NOT AN OFFER TO SELL THESE SECURITIES AND IT IS NOT A SOLICITATION OF AN OFFER TO BUY THESE SECURITIES IN ANY JURISDICTION WHERE THE OFFER OR SALE IS NOT PERMITTED.
103
| No. 9 – Pleasant Prairie Premium Outlets | |||||||
| Loan Information | Property Information | ||||||
| Mortgage Loan Seller: | Wells Fargo Bank, National Association | Single Asset/Portfolio: | Single Asset | ||||
Credit Assessment (Fitch/KBRA/Moody’s): | NR/NR/NR | Property Type: | Retail | ||||
| Original Principal Balance(1): | $25,000,000 | Specific Property Type: | Outlet Center | ||||
| Cut-off Date Balance(1): | $25,000,000 | Location: | Pleasant Prairie, WI | ||||
| % of Initial Pool Balance: | 3.5% | Size: | 402,615 SF | ||||
| Loan Purpose: | Recapitalization | Cut-off Date Balance Per SF(1): | $360.15 | ||||
| Borrower Name: | Pleasant Prairie Premium Outlets, LLC | Year Built/Renovated: | 1987/NAP | ||||
| Borrower Sponsor: | Simon Property Group, L.P. | Title Vesting: | Fee | ||||
| Mortgage Rate: | 3.995% | Property Manager: | Self-managed | ||||
| Note Date: | August 16, 2017 | 4thMost Recent Occupancy (As of): | 100.0% (12/31/2013) | ||||
| Anticipated Repayment Date: | NAP | 3rdMost Recent Occupancy (As of): | 97.0% (12/31/2014) | ||||
| Maturity Date: | September 1, 2027 | 2ndMost Recent Occupancy (As of): | 96.3% (12/31/2015) | ||||
| IO Period: | 120 months | Most Recent Occupancy (As of): | 96.1% (12/31/2016) | ||||
| Loan Term (Original): | 120 months | Current Occupancy (As of): | 93.0% (7/26/2017) | ||||
| Seasoning: | 1 month | ||||||
| Amortization Term (Original): | NAP | ||||||
| Loan Amortization Type: | Interest-only, Balloon | Underwriting and Financial Information: | |||||
| Interest Accrual Method: | Actual/360 | ||||||
| Call Protection: | L(25),D(88),O(7) | 4thMost Recent NOI (As of): | $13,920,618 (12/31/2014) | ||||
| Lockbox Type: | Hard/Springing Cash Management | 3rdMost Recent NOI (As of): | $14,589,102(12/31/2015) | ||||
| Additional Debt(1): | Yes | 2ndMost Recent NOI (As of): | $15,157,388(12/31/2016) | ||||
| Additional Debt Type(1): | Pari Passu | Most Recent NOI (As of): | $15,826,567 (TTM 6/30/2017) | ||||
| U/W Revenues: | $22,589,594 | ||||||
| U/W Expenses: | $6,316,284 | ||||||
| U/W NOI: | $16,273,310 | ||||||
| U/W NCF: | $15,604,536 | ||||||
| Escrows and Reserves(2): | U/W NOI DSCR(1): | 2.77x | |||||
| U/W NCF DSCR(1): | 2.66x | ||||||
| Type: | Initial | Monthly | Cap (If Any) | U/W NOI Debt Yield(1): | 11.2% | ||
| Taxes | $0 | Springing | NAP | U/W NCF Debt Yield(1): | 10.8% | ||
| Insurance | $0 | Springing | NAP | As-Is Appraised Value: | $290,000,000 | ||
| Replacement Reserve | $0 | Springing | NAP | As-Is Appraisal Valuation Date: | July 20, 2017 | ||
| TI/LC Reserve | $0 | Springing | NAP | Cut-off Date LTV Ratio(1): | 50.0% | ||
| LTV Ratio at Maturity(1): | 50.0% | ||||||
| (1) | See “The Mortgage Loan” section. All statistical financial information related to balances per square foot, loan-to-value ratios, debt service coverage ratios and debt yields are based on the Pleasant Prairie Premium Outlets Whole Loan (as defined below). |
| (2) | See “Escrows” section. |
The Mortgage Loan. The mortgage loan (the “Pleasant Prairie Premium Outlets Mortgage Loan”) is part of a whole loan (the “Pleasant Prairie Premium Outlets Whole Loan”) evidenced by fourpari passupromissory notes, secured by the fee interest in a 402,615 square foot outlet center located in Pleasant Prairie, Wisconsin (the “Pleasant Prairie Premium Outlets Property”). The Pleasant Prairie Premium Outlets Whole Loan was co-originated on August 16, 2017 by Citi Real Estate Funding Inc. and Wells Fargo Bank, National Association. The Pleasant Prairie Premium Outlets Whole Loan had an original principal balance of $145,000,000, has an outstanding principal balance as of the Cut-off Date of $145,000,000 and accrues interest at an interest rate of 3.995%per annum. The Pleasant Prairie Premium Outlets Whole Loan had an initial term of 120 months, has a remaining term of 119 months as of the Cut-off Date and requires payments of interest only through its term. The Pleasant Prairie Premium Outlets Whole Loan matures on September 1, 2027.
The Pleasant Prairie Premium Outlets Mortgage Loan, evidenced by Note A-4, will be contributed to the WFCM 2017-C40 Trust, had an original principal balance of $25,000,000 and has an outstanding principal balance as of the Cut-off Date of $25,000,000. The controlling Note A-1 had an original principal balance of $34,000,000 and is expected to be contributed to the CGCMT 2017-P8 Trust. Notes A-2 and A-3, with an aggregate original principal balance of $86,000,000, are currently held by Citi Real Estate Funding Inc. and Wells Fargo Bank, National Association, respectively, and are expected to contributed to one or more future securitizations. Each of the mortgage loans evidenced by Note A-1, A-2 and A-3 are referred to herein as the “Pleasant Prairie Premium Outlets Companion Loans”. The lender provides no assurances that any non-securitized notes will not be split further. See “Description of the Mortgage Pool—The Whole Loans—The Non-Serviced Whole Loans” in the Preliminary Prospectus. The following table presents a summary of the promissory notes comprising the Pleasant Prairie Premium Outlets Whole Loan.
THE INFORMATION IN THIS STRUCTURAL AND COLLATERAL TERM SHEET IS NOT COMPLETE AND MAY BE AMENDED PRIOR TO THE TIME OF SALE. THIS TERM SHEET IS NOT AN OFFER TO SELL THESE SECURITIES AND IT IS NOT A SOLICITATION OF AN OFFER TO BUY THESE SECURITIES IN ANY JURISDICTION WHERE THE OFFER OR SALE IS NOT PERMITTED.
104
| PLEASANT PRAIRIE PREMIUM OUTLETS |
Note Summary(1)
| Notes | Original Balance | Note Holder | Controlling Interest | |
| A-1 | $34,000,000 | CGCMT 2017-P8 (expected) | Yes | |
| A-2 | $41,000,000 | Citi Real Estate Funding Inc. | No | |
| A-3 | $45,000,000 | Wells Fargo Bank, National Association | No | |
| A-4 | $25,000,000 | WFCM 2017-C40 | No | |
| Total | $145,000,000 |
Following the lockout period, the borrower has the right to defease the Pleasant Prairie Premium Outlets Whole Loan in whole, but not in part, on any date before March 1, 2027. In addition, The Pleasant Prairie Premium Outlets Premium Outlets Property Whole Loan is prepayable without penalty on or after March 1, 2027. The lockout period will expire on the earlier to occur of (i) two years after the closing date of the securitization that includes the last note to be securitized and (ii) October 1, 2020. If October 1, 2020 occurs prior to two years after securitization of the last note, the borrower has the right to prepay the Pleasant Prairie Premium Outlets Whole Loan prior to the expiration of the lockout period with payment of the greater of 1.0% or a yield maintenance premium, provided the remaining notes are defeased at the same time.
Sources and Uses
| Sources | Uses | |||||||
| Original loan amount | $145,000,000 | 100.0% | Recapitalization(1) | $144,317,359 | 99.5% | |||
| Closing costs | 682,641 | 0.5 | ||||||
| Total Sources | $145,000,000 | 100.0% | Total Uses | $145,000,000 | 100.0% |
| (1) | The Pleasant Prairie Premium Outlets Property was previously unencumbered. |
The Property. The Pleasant Prairie Premium Outlets Property is a 402,615 square foot outlet center located in Pleasant Prairie, Wisconsin, approximately 12.3 miles north of Chicago’s northern suburbs and 38.6 miles south of Milwaukee. The Pleasant Prairie Premium Outlets Property was built in three phases in 1987, 1989 and 2006. The five largest tenants by underwritten base rent are The North Face, Nike Factory Store, Gap Outlet, Under Armour and Banana Republic Factory; and additional tenants include Brooks Brothers, Hugo Boss, Kate Spade, Lacoste, Michael Kors, Polo Ralph Lauren and Tumi. The Pleasant Prairie Premium Outlets Property is positioned along the east side of Interstate-94 (which runs south from Wisconsin to Indiana and through downtown Chicago) and benefits from the local sales tax rate of 5.50% compared to Chicago’s sales tax rate of 10.25%. For the trailing 12-month period ending June 30, 2017, the Pleasant Prairie Premium Outlets Property reported overall sales of $509 per square foot, which equates to an 11.7% occupancy cost. The Pleasant Prairie Premium Outlets Property has 2,134 surface parking spaces, resulting in a parking ratio of 5.3 spaces per 1,000 square feet. As of July 26, 2017, the Pleasant Prairie Premium Outlets Property was 93.0% occupied by 85 tenants.
THE INFORMATION IN THIS STRUCTURAL AND COLLATERAL TERM SHEET IS NOT COMPLETE AND MAY BE AMENDED PRIOR TO THE TIME OF SALE. THIS TERM SHEET IS NOT AN OFFER TO SELL THESE SECURITIES AND IT IS NOT A SOLICITATION OF AN OFFER TO BUY THESE SECURITIES IN ANY JURISDICTION WHERE THE OFFER OR SALE IS NOT PERMITTED.
105
| PLEASANT PRAIRIE PREMIUM OUTLETS |
The following table presents certain information relating to the tenancy at the Pleasant Prairie Premium Outlets Property:
Major Tenants(1)
| Tenant Name | Credit Rating (Fitch/Moody’s/ S&P)(2) | Tenant NRSF | % of NRSF | Annual U/W Base Rent PSF(3) | Annual U/W Base Rent(3) | % of Total Annual U/W Base Rent | Sales PSF(4) | Occupancy Cost(4) | Lease Expiration Date |
| Major Tenants | |||||||||
| The North Face | NR/A3/A | 6,500 | 1.6% | $103.92 | $675,481(5) | 4.6% | $1,604 | 8.6% | 9/30/2026 |
| Nike Factory Store | NR/A1/AA- | 20,200 | 5.0% | $28.84 | $582,495(6) | 4.0% | $893(7) | 5.5%(7) | 1/31/2028 |
| Gap Outlet | BB+/Baa2/BB+ | 11,000 | 2.7% | $52.31 | $575,460(8) | 3.9% | $451 | 11.7% | 1/31/2022 |
| Under Armour | NR/Baa2/BB+ | 11,250 | 2.8% | $50.23 | $565,051(9) | 3.9% | $751 | 9.9% | 9/30/2025 |
| Banana Republic Factory | BB+/Baa2/BB+ | 7,800 | 1.9% | $57.12 | $445,517(10) | 3.0% | $466 | 16.5% | 3/31/2021 |
| Old Navy | BB+/Baa2/BB+ | 16,115 | 4.0% | $26.40 | $425,436(11) | 2.9% | $487 | 9.4% | 1/31/2022 |
| Michael Kors | NR/NR/NR | 5,500 | 1.4% | $76.38 | $420,116 | 2.9% | $1,299 | 8.0% | 9/30/2025 |
| Adidas/Rockport | NR/NR/NR | 10,000 | 2.5% | $31.93 | $319,300 | 2.2% | $654 | 8.5% | 1/31/2027 |
| Columbia Sportswear Company | NR/NR/NR | 7,500 | 1.9% | $41.75 | $313,125 | 2.1% | $706 | 8.8% | 1/31/2019 |
| Total Major Tenants | 95,865 | 23.8% | $45.08 | $4,321,981 | 29.5% | ||||
| Non-Major Tenants | 278,651 | 69.2% | $37.15 | $10,351,539 | 70.5% | ||||
| Occupied Collateral Total | 374,516 | 93.0% | $39.18 | $14,673,520 | 100.0% | ||||
| Vacant Space | 28,099 | 7.0% | |||||||
| Collateral Total | 402,615 | 100.0% | |||||||
| (1) | Information obtained from the underwritten rent roll. |
| (2) | Certain ratings are those of the parent company whether or not the parent company guarantees the lease. |
| (3) | Annual U/W Base Rent PSF and Annual U/W Base Rent include contractual rent steps totaling $806,485. Approximately $589,092 is attributed to the net present value of certain tenants’ rent steps through the lesser of the tenant’s lease expiration term or the Pleasant Prairie Premium Outlets Whole Loan Maturity Date. |
| (4) | Sales PSF and Occupancy Cost are for the trailing 12-month period ending in June 30, 2017, unless otherwise noted. |
| (5) | The North Face’s Annual U/W Base Rent includes the net present value of rent steps through its lease expiration, which total $116,481. The North Face pays a current base rent of $86.00 per square foot. |
| (6) | Nike Factory Store’s Annual U/W Base Rent includes the net present value of rent steps through the Pleasant Prairie Premium Outlets Whole Loan Maturity Date, which total $163,547. Nike Factory Store pays a current base rent of $20.74 per square foot. |
| (7) | Nike Factory Store’s Sales PSF and Occupancy Cost are based on the trailing 12-month period ending April 30, 2017. |
| (8) | Gap Outlet’s Annual U/W Base Rent includes the net present value of rent steps through its lease expiration, which total $53,950. Gap Outlet pays a current base rent of $47.41 per square foot. |
| (9) | Under Armour’s Annual U/W Base Rent includes the net present value of rent steps through its lease expiration, which total $89,964. Under Armour pays a current base rent of $42.23 per square foot. |
| (10) | Banana Republic Factory’s Annual U/W Base Rent includes the net present value of rent steps through its lease expiration, which total $22,289. Banana Republic Factory pays a current base rent of $54.26 per square foot. |
| (11) | Old Navy’s Annual U/W Base Rent includes the net present value of rent steps through its lease expiration, which total $32,554. Old Navy pays a current base rent of $24.38 per square foot. |
THE INFORMATION IN THIS STRUCTURAL AND COLLATERAL TERM SHEET IS NOT COMPLETE AND MAY BE AMENDED PRIOR TO THE TIME OF SALE. THIS TERM SHEET IS NOT AN OFFER TO SELL THESE SECURITIES AND IT IS NOT A SOLICITATION OF AN OFFER TO BUY THESE SECURITIES IN ANY JURISDICTION WHERE THE OFFER OR SALE IS NOT PERMITTED.
106
| PLEASANT PRAIRIE PREMIUM OUTLETS |
The following table presents certain information relating to the lease rollover schedule at the Pleasant Prairie Premium Outlets Property:
Lease Expiration Schedule(1)(2)
| Year Ending December 31, | No. of Leases Expiring | Expiring NRSF | % of Total NRSF | Cumulative Expiring NRSF | Cumulative % of Total NRSF | Annual U/W Base Rent | % of Total Annual U/W Base Rent | Annual U/W Base Rent PSF(3) |
| MTM | 1 | 1,022 | 0.3% | 1,022 | 0.3% | $60,000 | 0.4% | $58.71 |
| 2017 | 7 | 23,080 | 5.7% | 24,102 | 6.0% | $752,305 | 5.1% | $32.60 |
| 2018 | 6 | 31,472 | 7.8% | 55,574 | 13.8% | $1,063,371 | 7.2% | $33.79 |
| 2019 | 12 | 40,200 | 10.0% | 95,774 | 23.8% | $1,463,976 | 10.0% | $36.42 |
| 2020 | 5 | 16,385 | 4.1% | 112,159 | 27.9% | $539,781 | 3.7% | $32.94 |
| 2021 | 20 | 82,892 | 20.6% | 195,051 | 48.4% | $3,270,185 | 22.3% | $39.45 |
| 2022 | 8 | 54,211 | 13.5% | 249,262 | 61.9% | $1,938,839 | 13.2% | $35.76 |
| 2023 | 6 | 29,081 | 7.2% | 278,343 | 69.1% | $1,168,923 | 8.0% | $40.20 |
| 2024 | 0 | 0 | 0.0% | 278,343 | 69.1% | $0 | 0.0% | $0.00 |
| 2025 | 2 | 16,750 | 4.2% | 295,093 | 73.3% | $985,167 | 6.7% | $58.82 |
| 2026 | 7 | 26,693 | 6.6% | 321,786 | 79.9% | $1,624,204 | 11.1% | $60.85 |
| 2027 | 10 | 32,530 | 8.1% | 354,316 | 88.0% | $1,224,274 | 8.3% | $37.64 |
| Thereafter | 1 | 20,200 | 5.0% | 374,516 | 93.0% | $582,495 | 4.0% | $28.84 |
| Vacant | 0 | 28,099 | 7.0% | 402,615 | 100.0% | $0 | 0.0% | $0.00 |
| Total/Weighted Average | 85 | 402,615 | 100.0% | $14,673,520 | 100.0% | $39.18 |
| (1) | Information obtained from the underwritten rent roll. |
| (2) | Certain tenants may have lease termination options that are exercisable prior to the originally stated expiration date of the subject lease and that are not considered in the Lease Expiration Schedule. |
| (3) | Weighted Average Annual U/W Base Rent PSF excludes vacant space. |
The following table presents historical occupancy percentages at the Pleasant Prairie Premium Outlets Property:
Historical Occupancy
12/31/2013(1) | 12/31/2014(1) | 12/31/2015(1) | 12/31/2016(1) | 7/26/2017(2) |
| 100.0% | 97.0% | 96.3% | 96.1% | 93.0% |
| (1) | Information obtained from the borrower. |
| (2) | Information obtained from the underwritten rent roll. |
Operating History and Underwritten Net Cash Flow.The following table presents certain information relating to the historical operating performance and underwritten net cash flow at the Pleasant Prairie Premium Outlets Property:
Cash Flow Analysis
| 2014 | 2015 | 2016 | TTM 6/30/2017 | U/W | % of U/W Effective Gross Income | U/W $ per SF | |
| Base Rent | $12,212,614 | $12,488,959 | $13,535,045 | $13,825,230 | $15,343,467(1) | 67.9% | $38.11 |
| Total Reimbursables | 6,543,670 | 6,659,008 | 6,720,028 | 6,837,527 | 7,320,293 | 32.4 | 18.18 |
| Other Income | 301,921 | 296,661 | 335,867 | 446,774 | 433,881 | 1.9 | 1.08 |
| Percentage Rent | 1,222,636 | 1,378,887 | 645,234 | 685,673 | 533,877 | 2.4 | 1.33 |
| Less Vacancy & Credit Loss | (3,279) | 12,646 | (88,773) | (126,881) | (1,041,923)(2) | (4.6) | (2.59) |
| Effective Gross Income | $20,277,562 | $20,836,161 | $21,147,401 | $21,668,323 | $22,589,594 | 100.0% | $56.11 |
| Total Operating Expenses | $6,356,944 | $6,247,059 | $5,990,013 | $5,841,756 | $6,316,284 | 28.0% | $15.69 |
| Net Operating Income | $13,920,618 | $14,589,102 | $15,157,388 | $15,826,567 | $16,273,310 | 72.0% | $40.42 |
| Replacement Reserves | 0 | 0 | 0 | 0 | 80,523 | 0.4 | 0.20 |
| TI/LC | 0 | 0 | 0 | 0 | 588,251 | 2.6 | 1.46 |
| Net Cash Flow | $13,920,618 | $14,589,102 | $15,157,388 | $15,826,567 | $15,604,536 | 69.1% | $38.76 |
| NOI DSCR(3) | 2.37x | 2.48x | 2.58x | 2.69x | 2.77x | ||
| NCF DSCR(3) | 2.37x | 2.48x | 2.58x | 2.69x | 2.66x | ||
| NOI DY(3) | 9.6% | 10.1% | 10.5% | 10.9% | 11.2% | ||
| NCF DY(3) | 9.6% | 10.1% | 10.5% | 10.9% | 10.8% |
| (1) | U/W Base Rent includes contractual rent steps totaling $806,485, approximately $589,092 of which is attributed to the net present value of certain tenants’ rent steps through the lesser of the tenant’s lease expiration term or the Pleasant Prairie Premium Outlets Whole Loan Maturity Date. |
| (2) | The underwritten economic vacancy is 4.5%. The Pleasant Prairie Premium Outlets Property was 93.0% physically occupied as of July 26, 2017. |
| (3) | The debt service coverage ratios and debt yields are based on the Pleasant Prairie Premium Outlets Whole Loan. |
THE INFORMATION IN THIS STRUCTURAL AND COLLATERAL TERM SHEET IS NOT COMPLETE AND MAY BE AMENDED PRIOR TO THE TIME OF SALE. THIS TERM SHEET IS NOT AN OFFER TO SELL THESE SECURITIES AND IT IS NOT A SOLICITATION OF AN OFFER TO BUY THESE SECURITIES IN ANY JURISDICTION WHERE THE OFFER OR SALE IS NOT PERMITTED.
107
| PLEASANT PRAIRIE PREMIUM OUTLETS |
Appraisal.As of the appraisal valuation date of July 20, 2017, the Pleasant Prairie Premium Outlets Property had an “as-is” appraised value of $290,000,000.
Environmental Matters. According to the Phase I environmental report dated July 28, 2017, there was no evidence of any recognized environmental conditions at the Pleasant Prairie Premium Outlets Property.
Market Overview and Competition.The Pleasant Prairie Premium Outlets Property is located in Pleasant Prairie, Wisconsin, within Kenosha County. Kenosha’s economy is primarily driven by the healthcare and manufacturing industries, and according to the appraisal, notable employers include United Hospital System, Aurora Health Care, Snap-on, and Birchwood Foods. Recently there has been significant development occurring in Kenosha that is enhancing the local economy. Amazon recently completed construction on a 1.5 million square foot distribution center located approximately 6.7 miles north of the Pleasant Prairie Premium Outlets Property along Interstate-94 at a total cost of approximately $250.0 million. Amazon has hired more than 1,500 new full- and part-time employees for this distribution center. Meijer also recently completed a large distribution center as it expands operations into Wisconsin. Finally, Uline, a global shipping specialization company, is headquartered in Kenosha County and is located directly across Interstate-94 from the Pleasant Prairie Premium Outlets Property.
The 2017 estimated population and average household income within a five-mile radius of the Pleasant Prairie Premium Outlets Property was 29,255 and $103,225, respectively. Additionally, the Pleasant Prairie Premium Outlets Property benefits from its location near Chicago, which has a population of approximately 9.7 million people, and Milwaukee, which has a population of approximately 1.6 million people. The Pleasant Prairie Premium Outlets Property is located approximately 38.6 miles south of Milwaukee, 12.3 miles north of Chicago’s northern suburbs and 50.9 miles north of downtown Chicago. The Pleasant Prairie Premium Outlets Property benefits from its location near the border of Illinois as the sales tax rate of 5.5% in Wisconsin is significantly lower than the sales tax rate of 10.25% in Chicago, which is a positive demand driver for shoppers to travel from Illinois to Wisconsin. The Pleasant Prairie Premium Outlets Property is adjacent to Interstate-94, which runs south from Wisconsin to Indiana and through downtown Chicago and has an average daily traffic count of 96,300 vehicles near the Pleasant Prairie Premium Outlets Property. The Pleasant Prairie Premium Outlets Property also has multiple access points from the east, north and west.
According to the appraisal, the Pleasant Prairie Premium Outlets Property is located within the Kenosha East retail submarket. As of the second quarter of 2017, the submarket reported total inventory of approximately 9.9 million square feet with a 4.6% vacancy rate. The appraiser concluded to market rents for the Pleasant Prairie Premium Outlets Property ranging from $38.00 to $100.00 per square foot.
The following table presents certain information relating to comparable properties to the Pleasant Prairie Premium Outlets Premium Outlets Property:
Competitive Properties(1)
Pleasant Prairie (Subject) | Outlet at the Dells | Johnson Creek Premium Outlets | The Outlet Shoppes at Oshkosh | Chicago Premium Outlets | Lighthouse Premium Outlets | |
| Location | Pleasant Prairie, WI | Baraboo, WI | Johnson Creek, WI | Oshkosh, WI | Aurora, IL | Michigan City, IN |
| Distance from Subject | -- | 141 miles | 72 miles | 119 miles | 70 miles | 113 miles |
| Year Built/Renovated | 1987/NAP | 2006 | 1998 | 1970 | 2004 | 1987/1997 |
| Anchors | The North Face, Nike Factory Store, Gap Outlet, Under Armour | Nike, Levi’s, J. Crew, GAP | GAP, Nike, Ann Taylor, Columbia | GAP, Nike, Famous Footwear, The North Face | GAP, J. Crew, Lands’ End, Levi’s, Nike | GAP, Levi’s, Nike, The North Face |
| Total GLA (SF)(1) | 402,615 | 264,929 | 277,585 | 271,007 | 911,765 | 456,466 |
| Total Occupancy(1) | 93.0% | 96.8% | 97.5% | 98.7% | 97.9% | 100.0% |
| (1) | Information obtained from the appraisal and underwritten rent roll. |
The Borrower.The borrower is Pleasant Prairie Premium Outlets, LLC, a Delaware limited liability company and single purpose entity with one independent director. Pleasant Prairie Premium Outlets, LLC, is 100.0% directly owned by Simon Property Group, L.P. (“Simon”). Legal counsel to the borrower delivered a non-consolidation opinion in connection with the origination of the Pleasant Prairie Premium Outlets Whole Loan. Simon is the guarantor of certain nonrecourse carveouts under the Pleasant Prairie Premium Outlets Whole Loan. Simon’s obligations under the guaranty are capped at $29 million; however, the liability cap does not apply to a replacement guarantor.
The Borrower Sponsor.The borrower sponsor is Simon, a self-administered and self-managed real estate investment trust. Simon owns, develops, and manages retail real estate properties, which consist primarily of malls, Premium Outlets and The Mills. As of December 31, 2016, Simon owned or held an interest in 206 income-producing properties in the United States, which consisted of 108 malls, 67 Premium Outlets, 14 Mills, four lifestyle centers, and 13 other retail properties in 37 states and Puerto Rico. Simon has sponsored other real estate projects over the last 10 years that have been the subject of mortgage loan defaults. See “Description of the Mortgage Pool-Loan Purpose, Default History, Bankruptcy Issues and Other Proceedings” in the Preliminary Prospectus.
Escrows.The loan documents do not require upfront escrows. The borrower provided a guaranty for outstanding tenant improvements and leasing commissions related to tenants DXL ($177,000), Asics ($105,600), Starbucks ($79,975) and Fila ($54,000).
THE INFORMATION IN THIS STRUCTURAL AND COLLATERAL TERM SHEET IS NOT COMPLETE AND MAY BE AMENDED PRIOR TO THE TIME OF SALE. THIS TERM SHEET IS NOT AN OFFER TO SELL THESE SECURITIES AND IT IS NOT A SOLICITATION OF AN OFFER TO BUY THESE SECURITIES IN ANY JURISDICTION WHERE THE OFFER OR SALE IS NOT PERMITTED.
108
| PLEASANT PRAIRIE PREMIUM OUTLETS |
The loan documents do not require ongoing monthly escrows for replacement reserves and rollover reserves as long as (i) no event of default has occurred and is continuing, and (ii) the trailing four calendar quarter debt service coverage ratio (“DSCR”) is greater than or equal to 1.95x for two consecutive calendar quarters. The loan documents do not require ongoing monthly escrows for taxes as long as (a) no event of default has occurred and is continuing, (b) the DSCR is greater than or equal to 1.95x for two consecutivecalendar quarters and (c) the borrower provides the lender with evidence that the Pleasant Prairie Premium Outlets Property taxes have been paid. The loan documents do not require ongoing monthly escrows for insurance premiums as long as (1) no event of default has occurred and is continuing, (2) the DSCR is greater than or equal to 1.95x for two consecutive calendar quarters and (3) borrower provides the lender with evidence that the Pleasant Prairie Premium Outlets Property is insured via an acceptable blanket insurance policy and such policy is in full force and effect.
Lockbox and Cash Management.The Pleasant Prairie Premium Outlets Whole Loan requires a lender-controlled lockbox, which is already in place, and that the borrower direct all tenants to deposit all rents directly into such lockbox account. The loan documents also require that all rents received by the borrower or the property manager be deposited into the lockbox account within two business day of receipt. Prior to the occurrence of a Lockbox Event Period (as defined below), all funds are required to be distributed to the borrower. During a Lockbox Event Period, all rents are required to be swept to a lender-controlled cash management account.
A “Lockbox Event Period” means the occurrence of (i) an event of default, (ii) the trailing four calendar quarter DSCR falling below 1.70x for two consecutive calendar quarters, or (iii) any bankruptcy of the borrower or manager. A Lockbox Event Period will end, with respect to clause (i), upon the cure of such event of default; with respect to clause (ii), the trailing four calendar quarter DSCR remaining equal to or greater than 1.70x for two consecutive calendar quarters; and with respect to clause (iii), the dismissal of such bankruptcy without any adverse consequences to the Pleasant Prairie Premium Outlets Property or manager’s ability to perform in accordance with the loan documents.
Property Management. The Pleasant Prairie Premium Outlets Property is managed by an affiliate of the borrower.
Assumption.The borrower has the right to transfer the Pleasant Prairie Premium Outlets Property provided that certain conditions are satisfied, including (i) no event of default under the Pleasant Prairie Premium Outlets Whole Loan documents has occurred and is continuing; (ii) in the event that in connection with such transfer, the manager will not thereafter continue to manage the Pleasant Prairie Premium Outlets Property, then a replacement management agreement with a qualified manager must be executed acceptable to lender; (iii) the lender reasonably determines that the proposed transferee and guarantor satisfy the lender’s credit review and underwriting standards, taking into consideration the transferee’s experience, financial strength and general business standing; and (iv) if requested by lender, rating agency confirmation that the sale and assumption will not result in a downgrade, withdrawal or qualification of the respective ratings assigned to the WFCM 2017-C40 certificates and similar confirmations from each rating agency rating any securities backed by any of the Pleasant Prairie Premium Outlets Property Companion Loans.
Partial Release. Not permitted.
Real Estate Substitution.Not permitted.
Additional Subordinate and Mezzanine Indebtedness.Not permitted.
Ground Lease. None.
Terrorism Insurance.The loan documents require that the “all risk” insurance policy required to be maintained by the borrower provide coverage for terrorism in an amount equal to the full replacement cost of the Pleasant Prairie Premium Outlets Property, subject to a cap of two times the annual insurance premiums (excluding the wind, flood and earthquake components of such insurance premiums), as well as business interruption insurance covering no less than an amount equal to 100% of the projected gross income from the Pleasant Prairie Premium Outlets Property on an actual loss sustained basis for a period beginning on the date of business interruption and continuing until the restoration of the Pleasant Prairie Premium Outlets Property is completed, or the 18-month period following the occurrence of a casualty event, together with a 12-month extended period of indemnity.
THE INFORMATION IN THIS STRUCTURAL AND COLLATERAL TERM SHEET IS NOT COMPLETE AND MAY BE AMENDED PRIOR TO THE TIME OF SALE. THIS TERM SHEET IS NOT AN OFFER TO SELL THESE SECURITIES AND IT IS NOT A SOLICITATION OF AN OFFER TO BUY THESE SECURITIES IN ANY JURISDICTION WHERE THE OFFER OR SALE IS NOT PERMITTED.
109
GEHL FOODS PORTFOLIO
THE INFORMATION IN THIS STRUCTURAL AND COLLATERAL TERM SHEET IS NOT COMPLETE AND MAY BE AMENDED PRIOR TO THE TIME OF SALE. THIS TERM SHEET IS NOT AN OFFER TO SELL THESE SECURITIES AND IT IS NOT A SOLICITATION OF AN OFFER TO BUY THESE SECURITIES IN ANY JURISDICTION WHERE THE OFFER OR SALE IS NOT PERMITTED.
110
GEHL FOODS PORTFOLIO
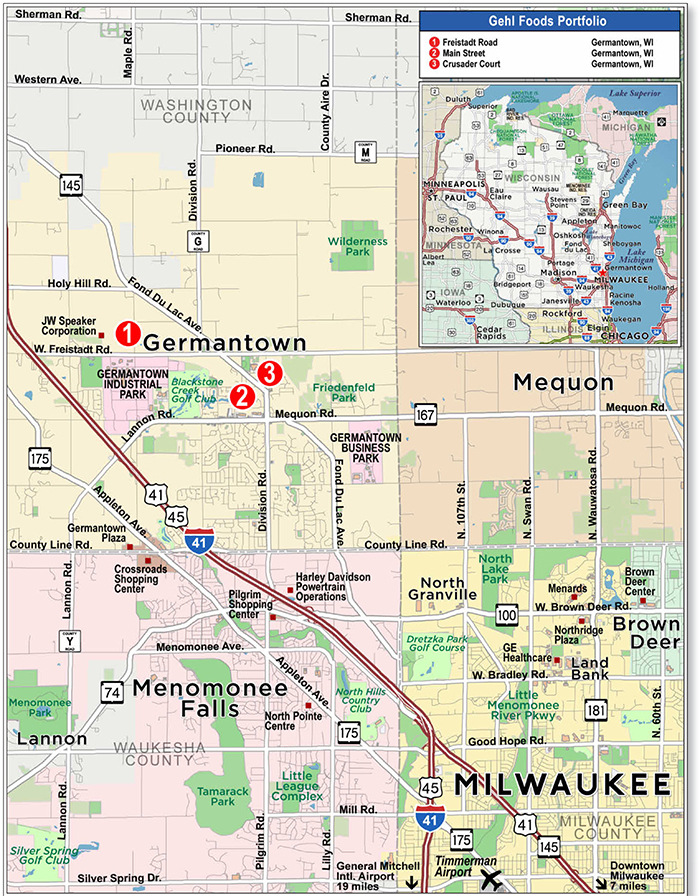
THE INFORMATION IN THIS STRUCTURAL AND COLLATERAL TERM SHEET IS NOT COMPLETE AND MAY BE AMENDED PRIOR TO THE TIME OF SALE. THIS TERM SHEET IS NOT AN OFFER TO SELL THESE SECURITIES AND IT IS NOT A SOLICITATION OF AN OFFER TO BUY THESE SECURITIES IN ANY JURISDICTION WHERE THE OFFER OR SALE IS NOT PERMITTED.
111
| No. 10 – Gehl Foods Portfolio | ||||||
| Loan Information | Property Information | |||||
| Mortgage Loan Seller: | Wells Fargo Bank, National Association | Single Asset/Portfolio: | Portfolio | |||
Credit Assessment (Fitch/KBRA/Moody’s): | NR/NR/NR | Property Type: | Industrial | |||
| Original Principal Balance: | $22,500,000 | Specific Property Type: | Warehouse | |||
| Cut-off Date Balance: | $22,500,000 | Location: | Germantown, WI | |||
| % of Initial Pool Balance: | 3.2% | Size: | 628,657 SF | |||
| Loan Purpose: | Acquisition | Cut-off Date Balance Per SF: | $35.79 | |||
| Borrower: | AGNL Dairy, L.L.C. | Year Built/Renovated: | Various – See Table | |||
| Borrower Sponsors: | AG Net Lease III Corp.; AG Net Lease III (SO) Corp. | Title Vesting: | Fee | |||
| Mortgage Rate: | 4.220% | Property Manager: | Self-managed | |||
| Note Date: | September 14, 2017 | 4thMost Recent Occupancy(3): | NAV | |||
| Anticipated Repayment Date: | NAP | 3rdMost Recent Occupancy(3): | NAV | |||
| Maturity Date: | October 11, 2027 | 2ndMost Recent Occupancy(3): | NAV | |||
| IO Period: | 60 months | Most Recent Occupancy(3): | NAV | |||
| Loan Term (Original): | 120 months | Current Occupancy (As of): | 100.0% (10/1/2017) | |||
| Seasoning: | 0 months | |||||
| Amortization Term (Original): | 360 months | Underwriting and Financial Information: | ||||
| Loan Amortization Type: | Interest-only, Amortizing Balloon | |||||
| Interest Accrual Method: | Actual/360 | 4thMost Recent NOI(3): | NAV | |||
| Call Protection: | L(24),GRTR 1% or YM(92),O(4) | 3rdMost Recent NOI(3): | NAV | |||
| Lockbox Type: | Hard/Upfront Cash Management | 2ndMost Recent NOI(3): | NAV | |||
| Additional Debt(1): | Yes | Most Recent NOI(3): | NAV | |||
| Additional Debt Type(1): | Future Mezzanine | U/W Revenues: | $2,958,752 | |||
| U/W Expenses: | $664,174 | |||||
| U/W NOI: | $2,294,578 | |||||
| U/W NCF: | $2,110,139 | |||||
| U/W NOI DSCR: | 1.73x | |||||
| U/W NCF DSCR: | 1.59x | |||||
| Escrows and Reserves(2): | U/W NOI Debt Yield: | 10.2% | ||||
| U/W NCF Debt Yield: | 9.4% | |||||
| Type: | Initial | Monthly | Cap (If Any) | As-Is Appraised Value: | $34,500,000 | |
| Taxes | $0 | Springing | NAP | As-Is Appraisal Valuation Date: | July 13, 2017 | |
| Insurance | $0 | Springing | NAP | Cut-off Date LTV Ratio: | 65.2% | |
| Replacement Reserve | $0 | Springing | $188,597 | LTV Ratio at Maturity: | 59.4% | |
| (1) | See “Subordinate and Mezzanine Indebtedness” section. |
| (2) | See “Escrows” section. |
| (3) | The borrower sponsors recently acquired the Gehl Foods Portfolio Properties from the tenant and a lease was not previously in-place. |
The Mortgage Loan. The mortgage loan (the “Gehl Foods Portfolio Mortgage Loan”) is evidenced by a single promissory note that is secured by a first mortgage encumbering the fee interest in three industrial warehouse facilities in Germantown, Wisconsin (collectively the “Gehl Foods Portfolio Properties”). The Gehl Foods Portfolio Mortgage Loan was originated on September 14, 2017 by Wells Fargo Bank, National Association. The Gehl Foods Portfolio Mortgage Loan had an original principal balance of $22,500,000, has an outstanding principal balance as of the Cut-off Date of $22,500,000 and accrues interest at an interest rate of 4.220%per annum. The Gehl Foods Portfolio Mortgage Loan had an initial term of 120 months, has a remaining term of 120 months as of the Cut-off Date and requires interest-only payments during the first 60 payment periods, followed by payments of principal and interest based on a 30-year amortization schedule. The Gehl Foods Portfolio Mortgage Loan matures on October 11, 2027.
Following the lockout period, the borrower has the right to prepay the Gehl Foods Portfolio Mortgage Loan in whole, or in part (see “Partial Release” section), on any date before July 11, 2027, provided that the borrower pays the greater of a yield maintenance premium or a prepayment premium equal to 1.0% of the principal amount being prepaid. In addition, the Gehl Foods Portfolio Mortgage Loan is prepayable without penalty on or after July 11, 2027.
THE INFORMATION IN THIS STRUCTURAL AND COLLATERAL TERM SHEET IS NOT COMPLETE AND MAY BE AMENDED PRIOR TO THE TIME OF SALE. THIS TERM SHEET IS NOT AN OFFER TO SELL THESE SECURITIES AND IT IS NOT A SOLICITATION OF AN OFFER TO BUY THESE SECURITIES IN ANY JURISDICTION WHERE THE OFFER OR SALE IS NOT PERMITTED.
112
GEHL FOODS PORTFOLIO
Sources and Uses
| Sources | Uses | |||||||
| Original loan amount | $22,500,000 | 64.4% | Purchase price | $34,420,000 | 98.6% | |||
| Borrower sponsors’ new cash contribution | 12,416,733 | 35.6 | Closing costs | 496,733 | 1.4 | |||
| Total Sources | $34,916,733 | 100.0% | Total Uses | $34,916,733 | 100.0% |
The Properties. The Gehl Foods Portfolio Properties comprise three industrial warehouse buildings totaling approximately 628,657 square feet and located in Germantown, Wisconsin, approximately 18 miles northwest of Milwaukee. As of October 1, 2017 the properties were 100.0% occupied by Gehl Foods LLC (“Gehl Foods”) under a triple net master lease (the “Gehl Foods Lease”). The Gehl Foods Lease commenced on May 4, 2017 and has an initial term of 20 years expiring June 30, 2037, along with four, five-year renewal options that extend the lease to 2057.
Gehl Foods is known for its technical expertise in aseptic food and beverage processing, a capital-intensive process that allows food products to maintain a longer shelf life without refrigeration or preservatives. The company has two primary segments: the beverage segment and the cheese sauce segment. Gehl Foods’ beverage segment includes nutritional protein drinks, weight loss shakes, sports drinks, organic milk, pudding, and iced coffees, which are either private label or co-manufactured. Gehl Foods has an estimated 5%-15% market share in the beverage segment. Gehl Foods’ cheese sauce segment includes products that are sold to convenience stores, food service distributors, concession providers, cinemas, and restaurants. Gehl Foods is a top producer in the cheese sauce segment with an estimated 30%-40% market share.
The Gehl Foods Portfolio Properties are mission-critical facilities that represent the tenant’s entire production and distribution footprint. Over the last 10 years, Gehl Foods has invested over $100 million in equipment at the Gehl Foods Portfolio Properties, including $20 million in 2017 for an additional bottling and labeling line. The Gehl Foods Portfolio Properties comprise the Crusader Court, Main Street and Freistadt Road properties (see table below). The Crusader Court property is used for storage and mixing of raw materials that are then transported to the Main Street property. After batching and bottling at the Main Street property, all products are then transported to the Freistadt Road property for labeling, storage and distribution.
In March 2015, Wind Point Partners (“Wind Point”), a private equity firm based in Chicago, acquired Gehl Foods from the Gehl family. Since 1984, Wind Point has raised over $3 billion in commitments and acquired more than 100 companies. Wind Point is an experienced investor in the food and beverage industry with a current portfolio that also includes Nonni’s and Evans Food Group.
TheFreistadt Road property comprises 287,863 square feet of rentable area and is situated on a 29.7-acre site. Built in 2005, the Freistadt Road property contains 1.1% office space, 22-foot clear heights and 13 dock high overhead doors. The Freistadt Road property comprises 83 surface parking spaces, equating to a parking ratio of 0.3 spaces per 1,000 square feet of rentable area.
TheMain Street property comprises 233,652 square feet of rentable area and is situated on a 10.1-acre site. Built in phases from 1917 to 2012, the Main Street property contains 3.9% office space, 12- to 20-foot clear heights and 13 dock high overhead doors. The Main Street property comprises 172 surface parking spaces, equating to a parking ratio of 0.7 spaces per 1,000 square feet of rentable area.
TheCrusader Court property comprises 107,142 square feet of rentable area and is situated on a 7.2-acre site. Built in 2002, the Crusader Court property contains 5.3% office space, 14- to 20-foot clear heights and 8 dock high overhead doors. The Crusader Court property comprises 45 parking spaces, equating to a parking ratio of 0.4 spaces per 1,000 square feet of rentable area.
The following table presents certain information relating to the Gehl Foods Portfolio Properties:
| Property Name | Location | Allocated Cut- Off Date Principal Balance | % of Portfolio Cut-off Date Principal Balance | Occupancy | Year Built/ Renovated | Net Rentable Area (SF) | Appraised Value | Allocated LTV |
| Freistadt Road | Germantown, WI | $10,700,000 | 47.6% | 100.0% | 2005/NAP | 287,863 | $16,450,000 | 65.0% |
| Main Street | Germantown, WI | $7,800,000 | 34.7% | 100.0% | 1917/NAP | 233,652 | $11,950,000 | 65.3% |
| Crusader Court | Germantown, WI | $4,000,000 | 17.8% | 100.0% | 2002/NAP | 107,142 | $6,100,000 | 65.6% |
| Total/Weighted Average | $22,500,000 | 100.0% | 100.0% | 628,657 | $34,500,000 | |||
THE INFORMATION IN THIS STRUCTURAL AND COLLATERAL TERM SHEET IS NOT COMPLETE AND MAY BE AMENDED PRIOR TO THE TIME OF SALE. THIS TERM SHEET IS NOT AN OFFER TO SELL THESE SECURITIES AND IT IS NOT A SOLICITATION OF AN OFFER TO BUY THESE SECURITIES IN ANY JURISDICTION WHERE THE OFFER OR SALE IS NOT PERMITTED.
113
GEHL FOODS PORTFOLIO
Major Tenant
| Tenant Name | Credit Rating (Fitch/Moody’s/ S&P) | Tenant NRSF | % of NRSF | Annual U/W Base Rent PSF | Annual U/W Base Rent | % of Total Annual U/W Base Rent | Lease Expiration Date |
| Major Tenant | |||||||
| Gehl Foods | NR/NR/NR | 628,657 | 100.0% | $3.84(1) | $ 2,415,345 | 100.0% | 6/30/2037(2) |
| Occupied Collateral Total | 628,657 | 100.0% | $3.84 | $ 2,415,345 | 100.00% | ||
| Vacant Space | 0 | 0.0% | |||||
| Collateral Total | 628,657 | 100.00% | |||||
| (1) | The Annual U/W Base Rent PSF shown represents allocated rental rates of $4.00 per square foot for the Crusader Court and Freistadt Road properties and $3.58 per square foot for the Main Street property. |
| (2) | Gehl Foods has four, 5-year lease extension options. |
The following table presents certain information relating to the lease rollover schedule at the Gehl Foods Portfolio Properties:
Lease Expiration Schedule(1)
| Year Ending December 31, | No. of Leases Expiring | Expiring NRSF | % of Total NRSF | Cumulative Expiring NRSF | Cumulative % of Total NRSF | Annual U/W Base Rent | % of Total Annual U/W Base Rent | Annual U/W Base Rent PSF(3) |
| MTM | 0 | 0 | 0.0% | 0 | 0.0% | $0 | 0.0% | $0.00 |
| 2017 | 0 | 0 | 0.0% | 0 | 0.0% | $0 | 0.0% | $0.00 |
| 2018 | 0 | 0 | 0.0% | 0 | 0.0% | $0 | 0.0% | $0.00 |
| 2019 | 0 | 0 | 0.0% | 0 | 0.0% | $0 | 0.0% | $0.00 |
| 2020 | 0 | 0 | 0.0% | 0 | 0.0% | $0 | 0.0% | $0.00 |
| 2021 | 0 | 0 | 0.0% | 0 | 0.0% | $0 | 0.0% | $0.00 |
| 2022 | 0 | 0 | 0.0% | 0 | 0.0% | $0 | 0.0% | $0.00 |
| 2023 | 0 | 0 | 0.0% | 0 | 0.0% | $0 | 0.0% | $0.00 |
| 2024 | 0 | 0 | 0.0% | 0 | 0.0% | $0 | 0.0% | $0.00 |
| 2025 | 0 | 0 | 0.0% | 0 | 0.0% | $0 | 0.0% | $0.00 |
| 2026 | 0 | 0 | 0.0% | 0 | 0.0% | $0 | 0.0% | $0.00 |
| 2027 | 0 | 0 | 0.0% | 0 | 0.0% | $0 | 0.0% | $0.00 |
| Thereafter | 3 | 628,657 | 100.0% | 628,657 | 100.0% | $2,415,345 | 100.0% | $3.84 |
| Vacant | 0 | 0 | 0.0% | 628,657 | 100.0% | $0 | 0.0% | $0.00 |
| Total/Weighted Average | 3 | 628,657 | 100.0% | $2,415,345 | 100.0% | $3.84 |
| (1) | Information obtained from the underwritten rent roll. |
The following table presents historical occupancy percentages at the Gehl Foods Portfolio Properties:
Historical Occupancy
12/31/2013(1) | 12/31/2014(1) | 12/31/2015(1) | 12/31/2016(1) | 10/1/2017(2) |
| NAV | NAV | NAV | NAV | 100.0% |
| (1) | The borrower sponsors recently acquired the Gehl Foods Portfolio Properties from the tenant and a lease was not previously in-place. |
| (2) | Information obtained from the underwritten rent roll. |
THE INFORMATION IN THIS STRUCTURAL AND COLLATERAL TERM SHEET IS NOT COMPLETE AND MAY BE AMENDED PRIOR TO THE TIME OF SALE. THIS TERM SHEET IS NOT AN OFFER TO SELL THESE SECURITIES AND IT IS NOT A SOLICITATION OF AN OFFER TO BUY THESE SECURITIES IN ANY JURISDICTION WHERE THE OFFER OR SALE IS NOT PERMITTED.
114
GEHL FOODS PORTFOLIO
Operating History and Underwritten Net Cash Flow. The following table presents certain information relating to the underwritten net cash flow at the Gehl Foods Portfolio Properties:
Cash Flow Analysis(1)
| U/W | % of U/W Effective Gross Income | U/W $ per SF | |
| Base Rent | $2,415,345 | 81.6% | $3.84 |
| Total Reimbursables | 664,174 | 22.4 | 1.06 |
| Less Vacancy & Credit Loss | (120,767)(2) | (4.1) | (0.19) |
| Effective Gross Income | $2,958,752 | 100.0% | $4.71 |
| Total Operating Expenses | $664,174 | 22.4% | $1.06 |
| Net Operating Income | $2,294,578 | 77.6% | $3.65 |
| Replacement Reserves | 94,299 | 3.2 | 0.15 |
| TI/LC | 90,141 | 3.0 | 0.14 |
| Net Cash Flow | $2,110,139 | 71.3% | $3.36 |
| NOI DSCR | 1.73x | ||
| NCF DSCR | 1.59x | ||
| NOI DY | 10.2% | ||
| NCF DY | 9.4% |
| (1) | Historical statements are unavailable as the borrower sponsors recently acquired the Gehl Foods Portfolio Properties from the tenant and a lease was not previously in-place. |
| (2) | The underwritten economic vacancy is 5.0%. The Gehl Foods Portfolio Properties were 100.0% physically occupied as of October 1, 2017. |
Appraisal.As of the appraisal valuation date of July 13, 2017, the Gehl Foods Portfolio Properties had an aggregate “as-is” appraised value of $34,500,000. As of the same date, the appraiser also concluded to an aggregate “go-dark” appraised value for the Gehl Foods Portfolio Properties of $23,450,000.
Environmental Matters.According to the Phase I environmental site assessment (“ESA”) reports dated March 6, 2017, March 10, 2017 and March 13, 2017, there was no evidence of any recognized environmental conditions at the Gehl Foods Portfolio Property. The ESAs did, however, identify a controlled recognized environmental condition due to prior on-site site industrial operations and former underground storage tanks. A Phase II ESA conducted in 2014 revealed residual contamination at the Main Street property, but no contamination at the Crusader Court property. The Wisconsin Department of Natural Resources (“WDNR”) issued a final case closure letter in May 2017 for the Main Street property and the Crusader Court property that notes no further investigation or remediation is required at this time and imposed certain conditions to maintaining closure status, including (i) managing contaminated soil if disturbed; (ii) paving over or establishing engineered barriers over contamination areas; (iii) WDNR’s approving any changes in use to the affected sites and any well installed on the affected properties; and (iv) keeping a maintenance plan and inspection log on-site for annual submission to and inspection by WDNR.
Market Overview and Comparable Properties.The Gehl Foods Portfolio Properties are located in the city of Germantown, Wisconsin, approximately 18 miles northwest of the Milwaukee central business district. All three of the Gehl Foods Portfolio Properties are located within three miles of Interstate 41 (the Freistadt Road property is approximately 1.5 miles east of Interstate 41, while the Main Street and Crusader Court properties are approximately 2.7 miles east of Interstate 41); and the three properties are all within 2.0 miles of one another (the Main Street and Crusader Court properties are adjacent to one another, while the Freistadt Road property is approximately 2.0 miles northwest). Within a five-mile radius of the Gehl Foods Portfolio Properties, the 2017 estimated population ranged from 41,186 to 46,186; and within the same radius, the average household income ranged from $91,984 to $95,147.
According to a third party market research report, the Gehl Foods Portfolio Properties are located within the Washington submarket of the Milwaukee industrial market. As of the second quarter of 2017, the submarket reported total inventory of 19.7 million square feet with a 3.4% vacancy rate and average asking rent of $4.13 per square foot. For the same period, the overall Milwaukee industrial market reported total inventory of 198.2 million square feet with a 4.5% vacancy rate and average asking rent of $3.95 per square foot. In addition, according to a third party research provider, within a three-mile radius of the Gehl Foods Portfolio Properties (radius measured from the Crusader Court property), there are 181 industrial properties totaling 7.1 million square feet with an average occupancy rate of 99.2%. Further, over the past five years, the average industrial occupancy rate within the same three-mile radius has averaged 97.3%.
THE INFORMATION IN THIS STRUCTURAL AND COLLATERAL TERM SHEET IS NOT COMPLETE AND MAY BE AMENDED PRIOR TO THE TIME OF SALE. THIS TERM SHEET IS NOT AN OFFER TO SELL THESE SECURITIES AND IT IS NOT A SOLICITATION OF AN OFFER TO BUY THESE SECURITIES IN ANY JURISDICTION WHERE THE OFFER OR SALE IS NOT PERMITTED.
115
GEHL FOODS PORTFOLIO
The following table presents certain information relating to comparable industrial leases to the Gehl Foods Portfolio Properties:
Comparable Leases(1)
| Property Name/Location | Year Built | Tenant Name | Total SF | Distance to Subject | Clear Height (ft) | Dock Doors | Rent PSF | Lease Type |
| Former Harley Davidson Warehouse / Franklin, WI | 1996 | Baptista’s Bakery | 246,348 | 30.3 miles | 30-31’ | 22 ext | $3.79 | NNN |
| 5401 W. Donges Bay Rd. / Mequon, WI | 1971 | Almo Distribution | 442,188 | 7.9 miles | 24-26’ | 41 ext | $3.50 | NNN |
| Former Sam’s Club / Milwaukee, WI | 1991 | Sellars Absorbant Materials, Inc. | 138,330 | 9.7 miles | 16-24’ | 6 ext | $3.00 | NNN |
| West Bend Distribution Facility / West Bend, WI | 2004 | Gardner Pet Group, Inc. | 160,000 | 17.2 miles | 28-28’ | 15 ext | $3.75 | NNN |
| 1630 Enterprise / Sturtevant, WI | 1998 | Goodwill Retail | 237,900 | 45.1 miles | 24’ | 16 ext | $4.50 | NNN |
| (1) | Information obtained from the appraisal. |
The Borrower.The borrower is AGNL Dairy, L.L.C. a Delaware limited liability company and single purpose entity with one independent director. Legal counsel to the borrower delivered a non-consolidation opinion in connection with the origination of the Gehl Foods Portfolio Mortgage Loan. AG Net Lease III Corp. and AG Net Lease III (SO) Corp. are the guarantors of certain nonrecourse carveouts under the Gehl Foods Portfolio Mortgage Loan. The guarantors’ liability related to environmental matters is capped at $22.5 million.
The Borrower Sponsors.The sponsors are AG Net Lease III Corp. and AG Net Lease III (SO) Corp., which are each owned and controlled by Angelo, Gordon & Co, L.P. (“Angelo Gordon”). Founded in 1988, Angelo Gordon is a privately-held registered investment advisor with approximately $28.0 billion assets under management. Angelo Gordon engages in all aspects of real estate investment and management, including acquisition, financing, disposition, leasing and construction management. The firm has real estate professionals in New York, Los Angeles, London, Hong Kong, Seoul, Tokyo and Shanghai and since 1993 has acquired properties valued at over $13.0 billion.
Escrows.The loan documents do not require ongoing monthly escrows for taxes as long as (i) no event of default has occurred and is continuing, (ii) the borrower provides the lender with evidence that the Gehl Foods Portfolio Properties’ taxes have been paid and (iii) the Gehl Foods Lease is not in full force and effect. The loan documents do not require ongoing monthly escrows for insurance premiums as long as (a) no event of default has occurred and is continuing, (b) the borrower provides the lender with evidence that the Gehl Foods Portfolio Properties are insured via an acceptable blanket insurance policy and such policy is in full force and effect and (c) the Gehl Foods Lease is not in full force and effect. The loan documents do not require ongoing replacement reserves as long as no Cash Trap Event Period (as defined below) has occurred and is continuing, subject to a cap of $188,597.
Lockbox and Cash Management. The Gehl Foods Portfolio Mortgage Loan requires a lender-controlled lockbox account, which is already in-place, and that the borrower directs the tenant to pay its rents directly into such lockbox account. The loan documents also require that all rents received by the borrower or the property manager be deposited into the lockbox account within one business day of receipt. Prior to the occurrence of a Cash Trap Event Period, all excess cash flow is required to be distributed to the borrower. During a Cash Trap Event Period, all excess funds will be retained by the lender as additional collateral for the Gehl Foods Portfolio Mortgage Loan.
A “Cash Trap Event Period” will commence upon the earlier of: (i) an event of default or; (ii) the amortizing debt service coverage ratio being less than 1.20x for one calendar quarter; (iii) the date that Gehl Foods discontinues its business (i.e. “goes dark”) at 50% of the total leasable area of either the Freistadt Road or Main Street properties; (iv) the date that Gehl Foods (or its parent) becomes insolvent or a debtor in any action or proceeding under any existing or future law of any jurisdiction, domestic or foreign, relating to bankruptcy, insolvency, reorganization, conservatorship, arrangement, adjustment, winding-up, liquidation, dissolution, composition or other relief with respect to its debts or debtors; or (v) the Gehl Foods Lease is terminated as a result of a default beyond any applicable notice and cure period set forth in such lease.
A Cash Trap Event Period will end, with respect to clause (i), upon the cure of such event of default; with respect to clause (ii), upon the amortizing debt service coverage ratio being equal to or greater than 1.20x for one calendar quarter; with respect to clause (iii) upon the occurrence of a Gehl Foods Go Dark Trigger Cure Event (as defined below); with respect to clause (iv) upon the occurrence of a Gehl Foods Bankruptcy Trigger Cure Event (as defined below); or with respect to clause (v) upon the occurrence of a Gehl Foods Lease Cure Event (as defined below).
A “Gehl Foods Go Dark Trigger Cure Event” will occur upon the earlier of (i) a Gehl Foods Lease Cure Event; (ii) recommencement of operations by Gehl Foods at the applicable property; (iii) the deposits of excess cash flow equaling two years of underwritten base rent and recoveries under the Gehl Foods Lease; or (iv) the borrower depositing with the lender a letter of credit in the amount of rent and reimbursements under the Gehl Foods Lease for the succeeding 18-month period.
THE INFORMATION IN THIS STRUCTURAL AND COLLATERAL TERM SHEET IS NOT COMPLETE AND MAY BE AMENDED PRIOR TO THE TIME OF SALE. THIS TERM SHEET IS NOT AN OFFER TO SELL THESE SECURITIES AND IT IS NOT A SOLICITATION OF AN OFFER TO BUY THESE SECURITIES IN ANY JURISDICTION WHERE THE OFFER OR SALE IS NOT PERMITTED.
116
GEHL FOODS PORTFOLIO
A “Gehl Foods Bankruptcy Trigger Cure Event” will occur upon the earlier of (i) the date on which the borrower has delivered evidence to the lender that the Gehl Foods Lease has been assumed by or assigned to one or more replacement tenants satisfactory to the lender, without any modifications to the Gehl Foods Lease, pursuant to a valid bankruptcy court order; (ii) the date on which Gehl Foods ceases to be a debtor in any action or proceeding under creditors rights laws and has not otherwise rejected the Gehl Foods Lease; or (iii) in the event the Gehl Foods Lease is rejected by Gehl Foods in any action or proceeding under creditors rights laws, upon a Gehl Foods Lease Cure Event.
A “Gehl Foods Lease Cure Event” will occur upon (A) the borrower entering into one or more leases with one or more replacement tenants acceptable to the lender, each at a net effective rental rate of not less than the net effective rental rate under the Gehl Foods Lease, for a term of not less than the term remaining under the Gehl Foods Lease, (B) the borrower delivering to the lender a copy of each replacement lease and a subordination, non-disturbance and attornment agreement from each replacement tenant, (C) each replacement tenant occupying all of its space, being open for business and paying full unabated rent, (D) all tenant improvement work to be performed by borrower has been completed and paid in full and (E) the borrower having paid all leasing brokerage commissions in connection with each replacement lease.
Property Management.The Gehl Foods Portfolio Properties are managed by an affiliate of the borrower.
Assumption.The borrower has the three-time right to transfer the Gehl Foods Portfolio Properties, provided that certain other conditions are satisfied, including, but not limited to: (i) no event of default has occurred and is continuing; (ii) the lender’s reasonable determination that the proposed transferee and guarantor satisfy the lender’s credit review and underwriting standards, taking into consideration transferee experience, financial strength and general business standing; and (iii) if requested by the lender, rating agency confirmation from Fitch, KBRA and Moody’s that the transfer will not result in a downgrade, withdrawal or qualification of the respective ratings assigned to the Series 2017-C40 Certificates.
Partial Release.The Gehl Foods Portfolio Mortgage Loan permits the release of any of the Gehl Foods Portfolio Properties in connection with a sale of such property, upon satisfaction of the following conditions (among others): (i) payment of a release price equal to 115% of the allocated amount for the release property (along with any applicable yield maintenance); (ii) the debt service coverage ratio following the release is no less than the greater of the debt service coverage ratio immediately preceding the release and 1.40x; (iii) the LTV following the release is no greater than the lesser of the LTV prior to the release and 65.0%; and (iv) the debt yield following the release is no less than the greater of the debt yield prior to the release and 8.5%.
Real Estate Substitution.Not permitted.
Subordinate and Mezzanine Indebtedness.Provided no event of default has occurred and is continuing, the borrower is permitted to incur future mezzanine indebtedness, provided (i) prior written notice of 30 days is provided to the lender specifying the origination date of the permitted mezzanine loan, (ii) the mezzanine lender enters into an intercreditor agreement acceptable to the rating agencies and reasonably acceptable to the lender, (iii) the mezzanine loan will have a term that is at least coterminous with the Gehl Foods Portfolio Mortgage Loan, (iv) the combined loan-to-value ratio for the Gehl Foods Portfolio Mortgage Loan and permitted mezzanine loan will not be greater than 65%, (v) the debt service coverage ratio of the Gehl Foods Portfolio Mortgage Loan and the permitted mezzanine loan is equal to or greater than 1.20x, (vi) the combined debt yield for the Gehl Foods Portfolio Mortgage Loan and permitted mezzanine loan is equal to or greater than 8.0%; and (vii) a rating agency confirmation from each of Fitch, KBRA, and Moody’s that the future mezzanine indebtedness will not result in a downgrade, withdrawal or qualification of the respective ratings assigned to the Series 2017-C40 Certificates.
Ground Lease.None.
Terrorism Insurance.The loan documents require that the “all risk” insurance policy required to be maintained by the borrower provide coverage for terrorism in an amount equal to the full replacement cost of the Gehl Foods Portfolio Properties (provided that the borrower is not required to pay terrorism insurance premiums in excess of two times the premium for all risk and business interruption coverage if the Terrorism Risk Insurance Program Reauthorization Act is no longer in effect). The loan documents also require business interruption insurance covering no less than an amount equal to 100% of the projected gross income from the Gehl Foods Portfolio Properties on actual loss sustained basis for a period beginning on the date of business interruption and continuing until the restoration of the Gehl Foods Portfolio Properties is completed, or the 12-month period following the occurrence of a casualty event, together with a six-month extended period of indemnity.
THE INFORMATION IN THIS STRUCTURAL AND COLLATERAL TERM SHEET IS NOT COMPLETE AND MAY BE AMENDED PRIOR TO THE TIME OF SALE. THIS TERM SHEET IS NOT AN OFFER TO SELL THESE SECURITIES AND IT IS NOT A SOLICITATION OF AN OFFER TO BUY THESE SECURITIES IN ANY JURISDICTION WHERE THE OFFER OR SALE IS NOT PERMITTED.
117
| No. 11 – iStar Leased Fee Portfolio | ||||||
| Loan Information | Property Information | |||||
| Mortgage Loan Seller: | Barclays Bank PLC | Single Asset/Portfolio: | Portfolio | |||
| Credit Assessment (Fitch/KBRA/Moody’s): | NR/NR/NR | Property Type: | Other | |||
| Original Principal Balance(1): | $20,000,000 | Specific Property Type: | Leased Fee | |||
| Cut-off Date Balance(1): | $20,000,000 | Location(6): | Various | |||
| % of Initial Pool Balance: | 2.8% | Size(6): | Various | |||
| Loan Purpose: | Recapitalization | Cut-off Date Balance Per SF/Room: | NAP | |||
| Borrowers: | Various | Year Built/Renovated(6): | Various/Various | |||
| Borrower Sponsor(2): | iStar Inc. | Title Vesting(6): | Various | |||
| Mortgage Rate: | 3.795% | Property Manager: | NAP | |||
| Note Date: | March 30, 2017 | 4thMost Recent Occupancy: | NAP | |||
| Anticipated Repayment Date: | April 6, 2027 | 3rdMost Recent Occupancy: | NAP | |||
| Maturity Date: | April 6, 2028 | 2ndMost Recent Occupancy: | NAP | |||
| IO Period: | 120 months | Current Occupancy: | NAP | |||
| Loan Term (Original): | 120 months | |||||
| Seasoning: | 6 months | Underwriting and Financial Information: | ||||
| Amortization Term (Original): | NAP | |||||
| Loan Amortization Type: | Interest-only, ARD | 4thMost Recent NOI: | NAP | |||
| Interest Accrual Method: | Actual/360 | 3rdMost Recent NOI: | NAP | |||
| Call Protection: | L(30),GRTR 1% or YM or D(85),O(5) | 2ndMost Recent NOI: | NAP | |||
| Lockbox Type: | Hard/Springing Cash Management | Most Recent NOI: | NAP | |||
| Additional Debt(1): | Yes | |||||
| Additional Debt Type(1): | Pari Passu | U/W Revenues(7): | NAP | |||
| U/W Expenses(7): | NAP | |||||
| U/W NOI(7): | $18,511,396 | |||||
| U/W NCF(7): | $18,511,396 | |||||
| U/W NOI DSCR(1): | 2.12x | |||||
| U/W NCF DSCR(1): | 2.12x | |||||
| Escrows and Reserves: | U/W NOI Debt Yield(1): | 8.2% | ||||
| U/W NCF Debt Yield(1): | 8.2% | |||||
| Type: | Initial | Monthly | Cap (If Any) | As-Is Appraised Value(8): | $346,160,000 | |
| Taxes(3) | $0 | Springing | NAP | As-Is Appraisal Valuation Date(8): | Various | |
| Insurance(4) | $0 | Springing | NAP | Cut-off Date LTV Ratio(1)(8): | 65.6% | |
| Ground Rent Funds(5) | $0 | Springing | NAP | LTV Ratio at Maturity(1)(8): | 65.6% | |
| (1) | See “The Mortgage Loan” section. All statistical information related to loan-to-value ratios, debt service coverage ratios and debt yields are based on the iStar Leased Fee Portfolio Whole Loan (as defined below). |
| (2) | The guarantor of certain nonrecourse carveouts under the iStar Leased Fee Portfolio Whole Loan is iStar Inc. The iStar Leased Fee Portfolio Whole Loan documents provide for Safety, Income and Growth Inc. (“SAFE”) to become the non-recourse carveout guarantor under the iStar Leased Fee Portfolio Whole Loan in lieu of iStar Inc., provided that SAFE has a market capitalization in excess of $500,000,000 or net worth in excess of $250,000,000. There can be no assurance as to whether, or when, any of these transactions will occur. See“Description of the Mortgage Pool—Certain Terms of the Mortgage Loans—Non-Recourse Carveout Limitations”in the Preliminary Prospectus. |
| (3) | During the continuance of a Trigger Period (as defined in the iStar Leased Fee Portfolio Whole Loan documents) (and to the extent that a Borrower Reserve Period (as defined in the iStar Leased Fee Portfolio Whole Loan documents) caused by a Tax Reserve Trigger Event (as defined in the iStar Leased Fee Portfolio Whole Loan documents) or a Ground Lease Termination Event (as defined in the iStar Leased Fee Portfolio Whole Loan documents) is continuing), the iStar Leased Fee Portfolio Borrowers are required to escrow monthly 1/12th of the annual estimated tax payments with respect to each individual property for which a Borrower Reserve Period caused by a Tax Reserve Trigger Event or a Ground Lease Termination Event is continuing. |
| (4) | During the continuance of a Trigger Period (and to the extent that a Borrower Reserve Period caused by an Insurance Reserve Trigger Event (as defined in the iStar Leased Fee Portfolio Whole Loan documents) or a Ground Lease Termination Event is continuing), the iStar Leased Fee Portfolio Borrowers are required to escrow monthly 1/12th of the annual estimated insurance premiums (unless the iStar Leased Fee Portfolio Borrowers maintain an acceptable blanket policy) with respect to each individual property for which a Borrower Reserve Period caused by an Insurance Reserve Trigger Event or a Ground Lease Termination Event is continuing. |
| (5) | During the continuance of a Trigger Period (and to the extent that a Borrower Reserve Period caused by a Ground Rent Reserve Trigger Event (as defined in the iStar Leased Fee Portfolio Whole Loan documents) or a Ground Lease Termination Event is continuing), the iStar Leased Fee Portfolio Borrowers are required to escrow monthly 1/12th of the amount that would be sufficient to pay the ground rent payable during the next 12 months with respect to each individual property for which a Borrower Reserve Period caused by a Ground Rent Reserve Trigger Event or a Ground Lease Termination Event is continuing. |
| (6) | See “The Properties” section. |
| (7) | See “Cash Flow Analysis” section. Underwriting and Financial Information is based on the current annual ground lease payments due under the ground leases described under “The Properties” below and is inclusive of approximately $1,256,456 of straight line rent representing the present value of contractual rent increases through the term of each respective ground lease based on a 6.0% discount rate. The estimated “Look Through” DSCR and “Look Through” DY based on the U/W estimated NOI of the non-collateral improvements on the iStar Leased Fee Portfolio Properties is approximately 7.26x and 27.9% respectively. |
| (8) | The iStar Leased Fee Portfolio Properties valued individually reflect a cumulative “as-is” appraised value of $346,160,000. The appraiser also concluded to an appraised value of $360,100,000 for the portfolio if sold in its entirety to a single buyer, which would result in a Cut-off Date LTV Ratio of 63.0%. Additionally, the appraiser concluded to an estimated fee simple appraised value of $714,450,000 (i.e. assuming that the iStar Leased Fee Portfolio Properties were unencumbered by the ground leases), which would result in a Cut-off Date LTV Ratio of 31.8%. |
The mortgage loan (the “iStar Leased Fee Portfolio Mortgage Loan”) is part of a whole loan (the “iStar Leased Fee Portfolio Whole Loan”), that is evidenced by six seniorpari passu notes (Notes A-1-1, A-1-2, A-1-3-1, A-1-3-2, A-2 and A-3) secured by (a) a first priority fee mortgage encumbering the land under seven hotel properties, three office properties, one multifamily property and one
THE INFORMATION IN THIS STRUCTURAL AND COLLATERAL TERM SHEET IS NOT COMPLETE AND MAY BE AMENDED PRIOR TO THE TIME OF SALE. THIS TERM SHEET IS NOT AN OFFER TO SELL THESE SECURITIES AND IT IS NOT A SOLICITATION OF AN OFFER TO BUY THESE SECURITIES IN ANY JURISDICTION WHERE THE OFFER OR SALE IS NOT PERMITTED.
118
| ISTAR LEASED FEE PORTFOLIO |
self storage property and (b) a first priority fee and leasehold mortgage encumbering a leasehold interest and a portion of the fee interest in the land under one hotel site, all of which land is encumbered by ground leases (collectively, the “iStar Leased Fee Portfolio Properties”). The iStar Leased Fee Portfolio Whole Loan was originated on March 30, 2017 by Barclays Bank PLC, JPMorgan Chase Bank, National Association and Bank of America, N.A. The iStar Leased Fee Portfolio Whole Loan had an original principal balance of $227,000,000, has an outstanding principal balance as of the Cut-off Date of $227,000,000 and and accrues interest at an interest rate of 3.795%per annum(the “Initial Interest Rate”). The iStar Leased Fee Portfolio Whole Loan had an initial term of 120 months, has a remaining term of 114 months as of the Cut-off Date and requires interest-only payments through the anticipated repayment date (“ARD”). The ARD is April 6, 2027 and the final maturity date is April 6, 2028. In the event that the iStar Leased Fee Portfolio Whole Loan is not repaid in full on or prior to the ARD, the iStar Leased Fee Portfolio Whole Loan will accrue interest at aper annumrate equal to the greater of (i) 3.0% above the interpolated U.S. treasury swap rate, (ii) 3.0% above the interpolated U.S. treasury rate and (iii) 6.795%. (the “Adjusted Interest Rate”);however, interest accrued at the excess of the Adjusted Interest Rate over the Initial Interest Rate (the “Accrued Interest”) will be deferred. In addition, from and after the ARD, all excess cash flow from the iStar Leased Fee Portfolio Properties after the payment of reserves, interest calculated at the Initial Interest Rate and operating expenses will be applied (a)firstto repay the principal balance of the iStar Leased Fee Portfolio Whole Loan until paid in full and (b)second to the payment of Accrued Interest.
Note A-1-3-2, which will be contributed to the WFCM 2017-C40 Trust, had an original principal balance of $20,000,000 and has an outstanding principal balance as of the Cut-off Date of $20,000,000 and represents a non-controlling interest in the iStar Leased Fee Portfolio Whole Loan. Note A-1-1, which had an original principal balance of $55,000,000 was contributed to the MSC 2017-H1 Trust. Note A-1-1 represents the controlling interest in the iStar Leased Fee Portfolio Whole Loan. The non-controlling Note A-1-2, which had an original principal balance of $40,600,000, was contributed to the WFCM 2017-C38 Trust. The non-controlling Note A-1-3-1, which had an original principal balance of $20,600,000, was contributed to the WFCM 2017-C39 Trust. The non-controlling Note A-2, which had an original principal balance of $45,400,000, was contributed to the DBJPM 2017-C6 Trust. The non-controlling Note A-3, which had an original principal balance of $45,400,000, was contributed to the BANK 2017-BNK5 Trust. Notes A-1-1, A-1-2, A-1-3-1, A-1-3-2, A-2 and A-3 are collectively referred to as the “iStar Leased Fee PortfolioPari Passu Companion Loans”. The See “Description of the Mortgage Pool—The Whole Loans—The Non-Serviced Pari Passu Whole Loans” and “Pooling and Servicing Agreement” in the Prospectus.
Note Summary(1)
| Notes | Original Balance | Note Holder | Controlling Interest |
| A-1-1 | $55,000,000 | MSC 2017-H1 | Yes |
| A-1-2 | $40,600,000 | WFCM 2017-C38 | No |
| A-1-3-1 | $20,600,000 | WFCM 2017-C39 | No |
| A-1-3-2 | $20,000,000 | WFCM 2017-C40 | No |
| A-2 | $45,400,000 | DBJPM 2017-C6 | No |
| A-3 | $45,400,000 | BANK 2017-BNK5 | No |
| Total | $227,000,000 |
Following the lockout period, the borrower has the right to defease the iStar Leased Fee Portfolio Whole Loan in whole on any date before November 9, 2026. The lockout period will expire on the earlier to occur of (i) two years after the closing date of the securitization that includes the last note to be securitized and (ii) March 30, 2020. In addition, following the lockout period, on any date prior to November 9, 2026, the borrower has the right to prepay the iStar Leased Fee Portfolio Whole Loan in whole as long as such prepayment is accompanied with the payment of the greater of a yield maintenance premium or 1.0% of the amount being prepaid. Following the lockout period, the iStar Leased Fee Portfolio may be prepaid in part in connection with a partial release (see “Partial Release” section). The iStar Leased Fee Portfolio Whole Loan is prepayable without penalty on or after November 9, 2026.
Sources and Uses(1)
| Sources | Uses | |||||
| Original whole loan amount | $227,000,000 | 100.0% | Return of equity | $221,757,129 | 97.7% | |
| Closing costs | 5,242,871 | 2.3 | ||||
| Total Sources | $227,000,000 | 100.0% | Total Uses | $227,000,000 | 100.0% |
| (1) | Immediately after loan origination, 51.0% of the equity interest in the borrowers was sold to two entities, GIC (Realty) Private Limited and Lubert-Adler, L.P. in two separate transactions, for an aggregate purchase price of $57.5 million or an implied value of the iStar Leased Fee Portfolio Properties of approximately $339.7 million, which would result in a Cut-off Date LTV Ratio of 66.8% and a Maturity Date or ARD LTV ratio of 66.8%. |
The iStar Leased Fee Portfolio Properties are located in ten different states and underlie improvements consisting of seven hotels (2,488 keys, 78.1% of allocated loan amount (“ALA”)), three offices (1,169,928 SF, 19.7% of ALA), one multifamily complex (207 units, 1.6% of ALA) and one self-storage facility (104,000 SF, 0.6% of ALA). Five of the properties (74.6% of the ALA) (the “Hilton Properties”) are ground leased under a single lease to HLT Operate DTWC LLC. Park Intermediate Holdings LLC is the guarantor of the master lease from the borrower to HLT Operate DTWC LLC. Park Intermediate Holdings LLC is a subsidiary of Park Hotels & Resorts Inc. and one of two Hilton Worldwide Holdings Inc. spin-offs. The Hilton Properties lease will expire in approximately nine years on December 31, 2025 and may be extended with respect to any or all of the Hilton Properties, with two additional five year extension periods remaining. One Ally Center (14.1% of ALA) is ground leased to 500 Webward LLC with an initial lease expiration date in March 2114 with two 30 year renewal options. No other leasehold owner accounts for more than 3.3% of ALA. The iStar Leased Fee Portfolio Properties have a weighted average age of approximately 18 years and an average remaining initial ground lease term of approximately 28 years, or approximately 48 years when fully extended.
THE INFORMATION IN THIS STRUCTURAL AND COLLATERAL TERM SHEET IS NOT COMPLETE AND MAY BE AMENDED PRIOR TO THE TIME OF SALE. THIS TERM SHEET IS NOT AN OFFER TO SELL THESE SECURITIES AND IT IS NOT A SOLICITATION OF AN OFFER TO BUY THESE SECURITIES IN ANY JURISDICTION WHERE THE OFFER OR SALE IS NOT PERMITTED.
119
| ISTAR LEASED FEE PORTFOLIO |
The following table presents certain information relating to the iStar Leased Fee Portfolio Properties:
| Property Name | Whole Loan Cut-off Date ALA | Ownership Interest | Leasehold Owner | Initial Leasehold Expiration | Final Leasehold Expiration | Leased Fee NOI | Leased Fee Appraised Value |
| Hilton Salt Lake | $55,312,000 | Fee | HLT Operate DTWC LLC | 12/31/2025(2) | 12/31/2035 | $3,300,706 | $79,900,000 |
| DoubleTree Seattle Airport | $40,000,000 | Fee / Leasehold(1) | HLT Operate DTWC LLC | 12/31/2025(2) | 12/31/2035 | $5,374,280 | $75,700,000 |
| DoubleTree Mission Valley | $38,084,000 | Fee | HLT Operate DTWC LLC | 12/31/2025(2) | 12/31/2035 | $1,776,034 | $55,000,000 |
| One Ally Center | $31,961,000 | Fee | 500 Webward LLC | 3/31/2114(3) | 3/31/2174 | $3,353,970 | $46,140,000 |
| DoubleTree Sonoma | $19,300,000 | Fee | HLT Operate DTWC LLC | 12/31/2025(2) | 12/31/2035 | $1,157,870 | $27,700,000 |
| DoubleTree Durango | $16,604,000 | Fee | HLT Operate DTWC LLC | 12/31/2025(2) | 12/31/2035 | $1,155,514 | $24,400,000 |
| Northside Forsyth Hospital Medical Center | $7,577,000 | Fee | Forsyth Physicians Center SPE 1, LLC | 4/25/2115(4) | 4/25/2175 | $654,595 | $11,000,000 |
| NASA/JPSS Headquarters | $5,190,000 | Fee | DRV Greentec, LLC | 10/31/2075(5) | 10/31/2105 | $472,292 | $7,550,000 |
Dallas Market Center: Sheraton Suites | $4,151,000 | Fee | Dallas Suites RE, LLC | 9/30/2114 | 9/30/2114 | $524,334 | $6,000,000 |
Dallas Market Center: Marriott Courtyard | $3,736,000 | Fee | ARC Hospitality Portfolio I DLGL Owner, LP | 1/2/2026(6) | 1/2/2066 | $297,000 | $5,400,000 |
| The Buckler Apartments | $3,633,000 | Fee | CA / Phoenix 401 Property Owner, LLC | 11/30/2112 | 11/30/2112 | $312,186 | $5,300,000 |
| Lock-Up Self Storage Facility | $1,452,000 | Fee | Lock Up - Evergreen Development Series LLC | 9/30/2037 | 9/30/2037 | $132,615 | $2,070,000 |
| Total: | $227,000,000 | $18,511,396 | $346,160,000 |
| (1) | The DoubleTree Seattle Airport collateral is comprised of both a portion of the fee interest and a leasehold interest in the fee portion that is not collateral, which together are leased to HLT Operate DTWC LLC which operates the hotel. The portion of the collateral which consists of a leasehold interest is owned in fee by a third party and underlies the majority of the DoubleTree Seattle Airport hotel’s improvements. The fee collateral includes approximately a third of the hotel parking and one wing of rooms which contains a total of 180 rooms and the leasehold collateral includes the remainder of the property. |
| (2) | HLT Operate DTWC LLC has two, five year renewal options. |
| (3) | 500 Webward LLC has two, 30 year renewal options. |
| (4) | Forsyth Physicians Center SPE 1, LLC has two, 30 year renewal options. |
| (5) | DRV Greentec LLC has two, 15 year renewal options. |
| (6) | ARC Hospitality Portfolio I DLGL Owner, LP has four, 10 year renewal options. |
The following table presents certain information relating to the improvements which underlie the iStar Leased Fee Portfolio Properties:
| Property Name | Location | Property Type | Year Built / Renovated | Look-Through NOI | Units / SF / Rooms | Look Through Most Recent Occupancy(1) | Fee Simple Appraised Value(2) |
| Hilton Salt Lake | Salt Lake City, UT | Hotel | 1983 / 2012 | $9,778,443 | 499 | 72.0% | $105,100,000 |
| DoubleTree Seattle Airport | Seattle, WA | Hotel | 1969 / 2011 | $14,682,914 | 850 | 85.0% | $140,000,000 |
| DoubleTree Mission Valley | San Diego, CA | Hotel | 1991 / 2012 | $7,804,702 | 300 | 87.0% | $82,000,000 |
| One Ally Center | Detroit, MI | Office | 1992 / NAP | $13,920,739 | 957,355 | 100.0% | $174,620,000 |
| DoubleTree Sonoma | Rohnert Park, CA | Hotel | 1987 / 2016 | $4,153,633 | 245 | 75.0% | $41,600,000 |
| DoubleTree Durango | Durango, CO | Hotel | 1986 / 2009 | $3,379,284 | 159 | 79.0% | $36,400,000 |
| Northside Forsyth Hospital Medical Center | Cumming, GA | Office | 2017 / NAP | $901,501 | 92,573 | 95.0% | $15,730,000 |
| NASA/JPSS Headquarters | Lanham, MD | Office | 1994 / NAP | $1,221,724 | 120,000 | 100.0% | $17,100,000 |
| Dallas Market Center: Sheraton Suites | Dallas, TX | Hotel | 1989 / 2017 | $2,438,398 | 251 | 79.0% | $20,900,000 |
| Dallas Market Center: Marriott Courtyard | Dallas, TX | Hotel | 1989 / 2015 | $2,254,686 | 184 | 72.0% | $27,300,000 |
| The Buckler Apartments | Milwaukee, WI | Multifamily | 1977 / 2016 | $2,103,422 | 207 | 75.0% | $39,900,000 |
| Lock-Up Self Storage Facility | Bloomington, MN | Self Storage | 2008 / NAP | $754,685 | 104,000 | 84.0% | $13,800,000 |
| Total: | $63,394,131 | $714,450,000 |
| (1) | The hotel occupancy rates shown are the average occupancy rates of the hotels for the 12 months ending December 31, 2016. Construction at Northside Forsyth Hospital Medical Center was recently completed and occupancy reflects pre-leased percentage as of December 31, 2016. The occupancy rate of The Buckler Apartments is as of March 15, 2017. The occupancy rate of Lock-Up Self Storage Facility is as of June 30, 2016. |
| (2) | The Fee Simple Appraised Value assumes the properties are unencumbered by the ground leases. |
THE INFORMATION IN THIS STRUCTURAL AND COLLATERAL TERM SHEET IS NOT COMPLETE AND MAY BE AMENDED PRIOR TO THE TIME OF SALE. THIS TERM SHEET IS NOT AN OFFER TO SELL THESE SECURITIES AND IT IS NOT A SOLICITATION OF AN OFFER TO BUY THESE SECURITIES IN ANY JURISDICTION WHERE THE OFFER OR SALE IS NOT PERMITTED.
120
| ISTAR LEASED FEE PORTFOLIO |
Underwritten Net Cash Flow. The following table presents certain information relating to the underwritten net cash flow at the iStar Leased Fee Portfolio Properties:
Cash Flow Analysis
| Property Name | U/W Base Rent(1) | Overage Rent(2) | U/W NOI | % of U/W NOI | U/W NOI DSCR | “Look Through” Fee Simple U/W NOI | “Look Through” Fee Simple U/W NOI DSCR |
| Hilton Salt Lake | $2,687,691 | $613,015 | $3,300,706 | 17.8% | 1.55x | $9,778,443 | 4.59x |
| DoubleTree Seattle Airport | $4,503,580 | $870,700 | $5,374,280 | 29.0% | 3.49x | $14,682,914 | 9.54x |
| DoubleTree Mission Valley | $1,122,198 | $653,836 | $1,776,034 | 9.6% | 1.21x | $7,804,702 | 5.33x |
| One Ally Center | $3,353,970 | $0 | $3,353,970 | 18.1% | 2.73x | $13,920,739 | 11.32x |
| DoubleTree Sonoma | $733,106 | $424,764 | $1,157,870 | 6.3% | 1.56x | $4,153,633 | 5.59x |
| DoubleTree Durango | $860,668 | $294,846 | $1,155,514 | 6.2% | 1.81x | $3,379,284 | 5.29x |
| Northside Forsyth Hospital Medical Center | $654,595 | $0 | $654,595 | 3.5% | 2.25x | $901,501 | 3.09x |
| NASA/JPSS Headquarters | $472,292 | $0 | $472,292 | 2.6% | 2.37x | $1,221,724 | 6.12x |
| Dallas Market Center: Sheraton Suites | $524,334 | $0 | $524,334 | 2.8% | 3.28x | $2,438,398 | 15.27x |
| Dallas Market Center: Marriott Courtyard | $125,000 | $172,000 | $297,000 | 1.6% | 2.07x | $2,254,686 | 15.68x |
| The Buckler Apartments | $312,186 | $0 | $312,186 | 1.7% | 2.23x | $2,103,422 | 15.05x |
| Lock-Up Self Storage Facility | $132,615 | $0 | $132,615 | 0.7% | 2.37x | $754,685 | 13.51x |
| Total: | $15,482,235 | $3,029,161 | $18,511,396 | 100.0% | 2.12x | $63,394,131 | 7.26x |
| (1) | U/W Base Rent is inclusive of approximately $1,256,456 of straight line rent representing the present value of contractual rent increases through the term of each respective ground lease based on a 6.0% discount rate. |
| (2) | Overage Rent is based on 7.5% of gross sales over a breakpoint of $32,979,294 for DoubleTree Seattle Airport, $20,688,611 for Hilton Salt Lake, $12,392,794 for DoubleTree Mission Valley, $9,293,520 for DoubleTree Sonoma and $6,037,795 for DoubleTree Durango. Overage Rent for Dallas Market Center: Marriott Courtyard is calculated as 5.0% of gross room sales in excess of $125,000. |
The iStar Leased Fee Portfolio is comprised of 12 properties located in ten states and eleven distinct markets, listed below by descending Allocated Cut-off Date Loan Amount.
| Property Name | Address | Estimated 2016 Population (five-mile radius)(1) | Estimated Average 2016 Household Income (five-mile radius)(1) |
| Hilton Salt Lake | 255 South West Temple, Salt Lake City, UT | 230,805 | $69,217 |
| DoubleTree Seattle Airport | 18740 International Boulevard, Seattle, WA | 219,802 | $70,608 |
| DoubleTree Mission Valley | 7450 Hazard Center Drive, San Diego, CA | 520,204 | $75,313 |
| One Ally Center | 500 Woodward Avenue, Detroit, MI | 189,959 | $36,581 |
| DoubleTree Sonoma | 1 DoubleTree Drive, Rohnert Park, CA | 118,400 | $74,918 |
| DoubleTree Durango | 501 Camino Del Rio, Durango, CO | 23,216 | $72,938 |
| Northside Forsyth Hospital Medical Center | 4150 Deputy Bill Cantrell Memorial Road, Cumming, GA | 98,372 | $113,511 |
| NASA/JPSS Headquarters | 7700 and 7720 Hubble Drive, Lanham, MD | 170,176 | $101,951 |
| Dallas Market Center: Sheraton Suites | 2101 North Stemmons Freeway, Dallas, TX | 351,125 | $94,722 |
| Dallas Market Center: Marriott Courtyard | 2150 Market Center Boulevard, Dallas, TX | 351,125 | $94,722 |
| The Buckler Apartments | 401 West Michigan Street, Milwaukee, WI | 457,329 | $53,318 |
| Lock-Up Self Storage Facility | 221 American Boulevard West, Bloomington, MN | 232,507 | $97,793 |
| (1) | Based on various appraisal reports for the iStar Leased Fee Portfolio Properties. |
THE INFORMATION IN THIS STRUCTURAL AND COLLATERAL TERM SHEET IS NOT COMPLETE AND MAY BE AMENDED PRIOR TO THE TIME OF SALE. THIS TERM SHEET IS NOT AN OFFER TO SELL THESE SECURITIES AND IT IS NOT A SOLICITATION OF AN OFFER TO BUY THESE SECURITIES IN ANY JURISDICTION WHERE THE OFFER OR SALE IS NOT PERMITTED.
121
| No. 12 – 45 Eisenhower Drive | ||||||
| Loan Information | Property Information | |||||
| Mortgage Loan Seller: | Barclays Bank PLC | Single Asset/Portfolio: | Single Asset | |||
| Credit Assessment (Fitch/KBRA/Moody’s): | NR/NR/NR | Property Type: | Office | |||
| Original Principal Balance: | $19,975,000 | Specific Property Type: | Suburban | |||
| Cut-off Date Balance: | $19,949,869 | Location: | Paramus, NJ | |||
| % of Initial Pool Balance: | 2.8% | Size: | 174,912 SF | |||
| Loan Purpose: | Refinance | Cut-off Date Balance Per SF: | $114.06 | |||
| Borrower: | 45 Eisenhower Venture, LLC | Year Built/Renovated: | 1986/2016 | |||
| Borrower Sponsors: | Steven Bergman; Michael Bergman | Title Vesting: | Leasehold | |||
| Mortgage Rate: | 4.750% | Property Manager: | Self-managed | |||
| Note Date: | September 8, 2017 | 4thMost Recent Occupancy(4): | 83.9% (12/31/2013) | |||
| Anticipated Repayment Date: | NAP | 3rdMost Recent Occupancy(4): | 78.1% (12/31/2014) | |||
| Maturity Date: | September 6, 2027 | 2ndMost Recent Occupancy(4): | 77.5% (12/31/2015) | |||
| IO Period: | NAP | Most Recent Occupancy (As of)(4): | 79.9% (12/31/2016) | |||
| Loan Term (Original): | 120 months | Current Occupancy (As of)(4)(5): | 90.0% (7/1/2017) | |||
| Seasoning: | 1 month | |||||
| Amortization Term (Original): | 360 months | Underwriting and Financial Information: | ||||
| Loan Amortization Type: | Amortizing Balloon | |||||
| Interest Accrual Method: | Actual/360 | 4thMost Recent NOI(4): | $1,889,063 (12/31/2014) | |||
| Call Protection: | L(25),D(91),O(4) | 3rdMost Recent NOI(4): | $1,730,813 (12/31/2015) | |||
| Lockbox Type: | Hard/Springing Cash Management | 2ndMost Recent NOI(4): | $1,751,577 (12/31/2016) | |||
| Additional Debt: | None | Most Recent NOI(4): | $2,193,727 (TTM 7/31/2017) | |||
| Additional Debt Type: | NAP | |||||
| U/W Revenues: | $3,991,814 | |||||
| U/W Expenses: | $1,833,588 | |||||
| Escrows and Reserves: | U/W NOI: | $2,158,225 | ||||
| U/W NCF: | $1,863,413 | |||||
| Type: | Initial | Monthly | Cap (If Any) | U/W NOI DSCR: | 1.73x | |
| Taxes | $69,175 | $34,587 | NAP | U/W NCF DSCR: | 1.49x | |
| Insurance(1) | $0 | Springing | NAP | U/W NOI Debt Yield: | 10.8% | |
| Replacement Reserves | $0 | $2,915 | NAP | U/W NCF Debt Yield: | 9.3% | |
| TI/LC Reserve(2) | $900,000 | $21,864 | $900,000 | As-Is Appraised Value: | $28,400,000 | |
| Deferred Maintenance | $9,375 | $0 | NAP | As-Is Appraisal Valuation Date: | June 13, 2017 | |
| Ground Rent Reserve | $76,089 | $0 | NAP | Cut-off Date LTV Ratio: | 70.2% | |
| Other(3) | $143,901 | $0 | NAP | LTV Ratio at Maturity or ARD: | 57.3% | |
| (1) | Ongoing monthly reserves for insurance are not required so long as (i) no event of default has occurred and is continuing, (ii) insurance requirements are being satisfied by a blanket policy acceptable to the lender; and (iii) the borrower provides the lender with evidence of renewal of the policies and timely proof of payment of the insurance premiums. |
| (2) | Ongoing monthly TI/LC reserves are not required so long as no event of default has occurred and is continuing and to the extent that the balance of the TI/LC reserves is at least (i) $900,000 prior to the satisfaction of the M&T Renewal Criteria (as defined) or (ii) $700,000 after the satisfaction of the M&T Renewal Criteria. A “M&T Renewal Criteria” will mean that the lender will have received (i) reasonably satisfactory evidence that M&T Bank has renewed its lease in accordance with the term set forth in such lease for a term of not less than five years and (ii) an updated tenant estoppel certificate from M&T Bank confirming that, among other things (a) such renewal and terms of such renewal, (b) the M&T Bank lease is in full force and effect, (c) M&T Bank is in physical occupancy of its respectable space and paying full contractual rent and (d) there is no default by the borrower under the M&T Bank lease. |
| (3) | The Upfront Other Reserve represents $35,182 for outstanding gap and free rent for M&T Bank and $108,719 for outstanding tenant improvements. |
| (4) | See “Historical Occupancy” and “Cash Flow Analysis” sections. |
| (5) | Current Occupancy includes 4,308 square feet occupied by M&T Bank (the “Expansion Space”), which has a lease commencement date of August 1, 2017; however, the tenant is in the process of building out the space. The tenant expects to take occupancy by October 15, 2017, but no later than December 1, 2017. M&T Bank will also receive one month of free rent. All gap and free rent amounts were deposited into escrow by the borrower on the origination date. |
The mortgage loan is evidenced by a single promissory note secured by the leasehold interest in a suburban office building located in Paramus, New Jersey (the “45 Eisenhower Drive Property”), approximately 12.0 miles west of midtown Manhattan. The 45 Eisenhower Drive Property was built in 1986, and according to the borrower, renovated between 2004 and 2016 at a cost of approximately $2.3 million, and is situated on a 9.7-acre site. Major tenants at the 45 Eisenhower Drive Property include M&T Bank/Hudson Savings (“M&T Bank”), Koch Modular Process Systems (“KMPS”) and Camerican International (“Camerican”). The property serves as the northern New Jersey headquarters for M&T Bank, and serves as the headquarters for KMPS and Camerican. Amenities at the property include a full-service café with patio seating, a day-care center (which is also a tenant at the 45 Eisenhower Drive Property), on-site property management and full-time lobby personnel. The 45 Eisenhower Drive Property contains 664 surface parking spaces, resulting in a parking ratio of 3.8 spaces per 1,000 square feet of rentable area. As of July 1, 2017, the 45 Eisenhower Drive Property was 90.0% occupied by 21 tenants.
THE INFORMATION IN THIS STRUCTURAL AND COLLATERAL TERM SHEET IS NOT COMPLETE AND MAY BE AMENDED PRIOR TO THE TIME OF SALE. THIS TERM SHEET IS NOT AN OFFER TO SELL THESE SECURITIES AND IT IS NOT A SOLICITATION OF AN OFFER TO BUY THESE SECURITIES IN ANY JURISDICTION WHERE THE OFFER OR SALE IS NOT PERMITTED.
122
| 45 EISENHOWER DRIVE |
The 45 Eisenhower Drive Property is located in Paramus, New Jersey, adjacent to the Garden State Parkway, 0.7 miles from Route 17 and 12.0 miles west of Manhattan. Additional access to the 45 Eisenhower Drive Property is provided by State Route 4 located to the south. State Route 17 and State Route 4 connect the property to Interstate 80, which provides east/west access to the surrounding area. The 45 Eisenhower Drive Property is located proximate to the Arcola Country Club, the Ridgewood Country Club, the Paramus Golf Course and the Garden State Plaza Shopping Center. According to the appraisal, the estimated 2017 population within a three- and five-mile radius of the 45 Eisenhower Drive Property was 149,073, and 566,159, respectively. The estimated 2017 median household income within the same radii was $88,655 and $71,508, respectively. According to a third party market research report, the 45 Eisenhower Drive Property is located in the Route 4/17 office submarket within the Bergen Central office submarket cluster in the Northern New Jersey office market. As of the first quarter of 2017, the Route 4/17 office submarket comprised 193 buildings totaling 6.1 million square feet with a reported vacancy rate of 12.4% and an asking rent of $27.57 PSF. For the same period, the Route 4/17 class B office submarket comprised 82 buildings totaling 2.4 million square feet with a reported vacancy rate of 6.5% and an asking rent of $25.05 PSF. As of the first quarter of 2017, the Bergen Central submarket cluster reported an overall inventory of 11.0 million square feet with a reported vacancy rate of 12.9%. The appraiser concluded to a market rent of $24.00 per square foot, modified gross, with $0.50 per square foot annual rent increase.
Sources and Uses(1)
| Sources | Uses | |||||
| Original loan amount | $19,975,000 | 100.0% | Loan payoff | $17,906,675 | 89.6% | |
| Reserves | 1,198,540 | 6.0 | ||||
| Closing costs | 452,776 | 2.3 | ||||
| Return of equity | 417,010 | 2.1 | ||||
| Total Sources | $19,975,000 | 100.0% | Total Uses | $19,975,000 | 100.0% |
| (1) | The 45 Eisenhower Property was previously securitized in the PFP 2014-1 transaction. |
The following table presents certain information relating to the tenancy at the 45 Eisenhower Drive Property:
Major Tenant
| Tenant Name | Credit Rating (Fitch/Moody’s/ S&P)(1) | Tenant NRSF | % of NRSF | Annual U/W Base Rent PSF(2) | Annual U/W Base Rent(2) | % of Total Annual U/W Base Rent | Lease Expiration Date | |
| Major Tenant | ||||||||
| M&T Bank(3)(4) | NR/NR/A- | 42,609 | 24.4% | $24.50 | $1,043,921 | 27.6% | 7/31/2019(5)(6) | |
| KMPS | NR/NR/NR | 20,564 | 11.8% | $24.00 | $493,536 | 13.0% | 2/28/2023(7) | |
| Camerican | NR/NR/NR | 16,363 | 9.4% | $19.75 | $323,169 | 8.5% | 9/30/2026(8)(9) | |
| Cloud Akademie / Lightbridge | NR/NR/NR | 12,728 | 7.3% | $24.00 | $305,472 | 8.1% | 2/28/2031(10) | |
| Wealth Preservation | NR/NR/NR | 8,098 | 4.6% | $24.50 | $198,401 | 5.2% | 8/31/2023(11) | |
| Total Major Tenants | 100,362 | 57.4% | $23.56 | $2,364,499 | 62.5% | |||
| Non-Major Tenants | 57,078 | 32.6% | $24.86 | $1,418,801 | 37.5% | |||
| Occupied Collateral Total | 157,440 | 90.0% | $24.03 | $3,783,300 | 100.0% | |||
| Vacant Space | 17,472 | 10.0% | ||||||
| Collateral Total | 174,912 | 100.0% | ||||||
| (1) | Certain ratings are those of the parent company whether or not the parent guarantees the lease. |
| (2) | Annual U/W Base Rent PSF and Annual U/W Base Rent include contractual rent steps through August 2018, totaling $33,479. |
| (3) | M&T Bank recently expanded at the 45 Eisenhower Drive Property for a portion of the 5thfloor totaling 4,308 square feet. |
| (4) | M&T Bank is entitled to one month of free rent for the Expansion Space. |
| (5) | A cash flow sweep will commence if the borrower fails to satisfy the M&T Renewal Criteria on or before the date that is 12 months prior to the expiration of the M&T Bank lease. |
| (6) | M&T Bank has two, five-year lease renewal options on its fourth floor space (38,301 square feet). |
| (7) | KMPS has one, five-year lease renewal option. |
| (8) | Camerican has the one-time right to terminate its lease as of the end of the 84th month of the lease term (September 30, 2023), with 12 months’ written notice and a termination fee equal to the unamortized tenant improvements and leasing costs, amortized over the original term of the lease at a 5% interest rate. |
| (9) | Camerican has one, five-year lease renewal option. |
| (10) | Cloud Akademie / Lightbridge has two, five-year lease renewal options. |
| (11) | Wealth Preservation has one, five-year lease renewal option. |
THE INFORMATION IN THIS STRUCTURAL AND COLLATERAL TERM SHEET IS NOT COMPLETE AND MAY BE AMENDED PRIOR TO THE TIME OF SALE. THIS TERM SHEET IS NOT AN OFFER TO SELL THESE SECURITIES AND IT IS NOT A SOLICITATION OF AN OFFER TO BUY THESE SECURITIES IN ANY JURISDICTION WHERE THE OFFER OR SALE IS NOT PERMITTED.
123
| 45 EISENHOWER DRIVE |
The following table presents certain information relating to the lease rollover schedule at the 45 Eisenhower Drive Property:
Lease Expiration Schedule(1)(2)
| Year Ending December 31, | No. of Leases Expiring | Expiring NRSF | % of Total NRSF | Cumulative Expiring NRSF | Cumulative % of Total NRSF | Annual U/W Base Rent | % of Total Annual U/W Base Rent | Annual U/W Base Rent PSF(3) |
| MTM | 1 | 1 | 0.0% | 1 | 0.0% | $2,400 | 0.1% | $2,400.00 |
| 2017 | 0 | 0 | 0.0% | 1 | 0.0% | $0 | 0.0% | $0.00 |
| 2018 | 3 | 11,714 | 6.7% | 11,715 | 6.7% | $318,821 | 8.4% | $27.22 |
| 2019(4) | 2 | 45,532 | 26.0% | 57,247 | 32.7% | $1,116,996 | 29.5% | $24.53 |
| 2020 | 2 | 7,080 | 4.0% | 64,327 | 36.8% | $177,183 | 4.7% | $25.03 |
| 2021 | 4 | 13,752 | 7.9% | 78,079 | 44.6% | $328,709 | 8.7% | $23.90 |
| 2022 | 2 | 6,561 | 3.8% | 84,640 | 48.4% | $156,375 | 4.1% | $23.83 |
| 2023 | 3 | 31,419 | 18.0% | 116,059 | 66.4% | $756,727 | 20.0% | $24.08 |
| 2024 | 2 | 12,290 | 7.0% | 128,349 | 73.4% | $297,449 | 7.9% | $24.20 |
| 2025 | 0 | 0 | 0.0% | 128,349 | 73.4% | $0 | 0.0% | $0.00 |
| 2026 | 1 | 16,363 | 9.4% | 144,712 | 82.7% | $323,169 | 8.5% | $19.75 |
| 2027 | 0 | 0 | 0.0% | 144,712 | 82.7% | $0 | 0.0% | $0.00 |
| Thereafter | 1 | 12,728 | 7.3% | 157,440 | 90.0% | $305,472 | 8.1% | $24.00 |
| Vacant | 0 | 17,472 | 10.0% | 174,912 | 100.0% | $0 | 0.0% | $0.00 |
| Total/Weighted Average | 21 | 174,912 | 100.0% | $3,783,300 | 100.0% | $24.03 |
| (1) | Information obtained from the underwritten rent roll. |
| (2) | Certain tenants may have lease termination options that are exercisable prior to the originally stated expiration date of the subject lease and that are not considered in the Lease Expiration Schedule. |
| (3) | Weighted Average U/W Base Rent PSF excludes vacant space. |
| (4) | The roll in 2019 is driven by M&T Bank’s lease expiration. A cash flow sweep will commence if the borrower fails to satisfy the M&T Renewal Criteria on or before the date that is 12 months prior to the expiration of the M&T Bank lease. |
The following table presents historical occupancy percentages at the 45 Eisenhower Drive Property:
Historical Occupancy
12/31/2013(1)(2) | 12/31/2014(1)(2) | 12/31/2015(1) | 12/31/2016(1)(3) | 7/1/2017(3)(4)(5) |
| 83.9% | 78.1% | 77.5% | 79.9% | 90.0% |
| (1) | Information obtained from the borrower. |
| (2) | The decrease in occupancy from 2013 to 2014 is driven by two tenants vacating, SuperMedia (14,030 square feet), who had filed for bankruptcy and Trans Systems (14,000 square feet), whose business model forced them to move to a more urban location, Newark, New Jersey. |
| (3) | The increase in occupancy from 2016 to July 1, 2017 is primarily due to three new leases executed by the borrower totaling 9,940 square feet and M&T Bank executing a lease for the Expansion Space. |
| (4) | Information obtained from the underwritten rent roll. |
| (5) | Occupancy as of July 1, 2017 includes 4,308 square feet occupied by M&T Bank, which has a lease commencement date of August 1, 2017; however, the tenant is in the process of building out the space. The tenant expects to take occupancy by October 15, 2017, but no later than December 1, 2017. M&T Bank will also receive one month of free rent. All gap and free rent amounts were deposited into escrow by the borrower on the origination date. |
THE INFORMATION IN THIS STRUCTURAL AND COLLATERAL TERM SHEET IS NOT COMPLETE AND MAY BE AMENDED PRIOR TO THE TIME OF SALE. THIS TERM SHEET IS NOT AN OFFER TO SELL THESE SECURITIES AND IT IS NOT A SOLICITATION OF AN OFFER TO BUY THESE SECURITIES IN ANY JURISDICTION WHERE THE OFFER OR SALE IS NOT PERMITTED.
124
| 45 EISENHOWER DRIVE |
Operating History and Underwritten Net Cash Flow. The following table presents certain information relating to the underwritten net cash flow at the 45 Eisenhower Drive Property:
Cash Flow Analysis
| 2014(1) | 2015(1) | 2016(2) | TTM 7/31/2017(2) | U/W | % of U/W Effective Gross Income | U/W $ per SF | |
| Base Rent(3) | $3,410,111 | $3,185,883 | $3,147,768 | $3,609,213 | $3,783,300 | 94.8% | $21.63 |
| Grossed Up Vacant | 0 | 0 | 0 | 0 | 418,576 | 10.5 | 2.39 |
| Total Reimbursables | 253,923 | 329,121 | 356,797 | 400,902 | 311,651 | 7.8 | 1.78 |
| Other Income(4) | 39,483 | 35,664 | 22,510 | 22,625 | 22,625 | 0.6 | 0.13 |
| Less Vacancy & Credit | 0 | 0 | 0 | 0 | (544,338)(5) | (13.6) | (3.11) |
| Effective Gross | $3,703,518 | $3,550,669 | $3,527,075 | $4,032,740 | $3,991,814 | 100.0% | $22.82 |
| Total Operating Expenses | $1,814,455 | $1,819,856 | $1,775,498 | $1,839,013 | $1,833,588 | 45.9% | $10.48 |
| Net Operating Income | $1,889,063 | $1,730,813 | $1,751,577 | $2,193,727 | $2,158,225 | 54.1% | $12.34 |
| TI/LC | 0 | 0 | 0 | 0 | 259,830(6) | 6.5 | 1.49 |
| Capital Expenditures | 0 | 0 | 0 | 0 | 34,982 | 0.9 | 0.20 |
| Net Cash Flow | $1,889,063 | $1,730,813 | $1,751,577 | $2,193,727 | $1,863,413 | 46.7% | $10.65 |
| NOI DSCR | 1.51x | 1.38x | 1.40x | 1.75x | 1.73x | ||
| NCF DSCR | 1.51x | 1.38x | 1.40x | 1.75x | 1.49x | ||
| NOI DY | 9.5% | 8.7% | 8.8% | 11.0% | 10.8% | ||
| NCF DY | 9.5% | 8.7% | 8.8% | 11.0% | 9.3% |
| (1) | The decrease in Net Operating Income from 2014 to 2015 is attributable to two tenants vacating, SuperMedia (14,030 square feet), who had filed for bankruptcy and Trans Systems (14,000 square feet), whose business model forced them to move to a more urban location, Newark, New Jersey. |
| (2) | The increase in Net Operating Income from 2016 to TTM 7/31/2017 is primarily driven by three new leases executed by the borrower totaling $234,701 in base rent. |
| (3) | U/W Base Rent includes include contractual rent steps through August 2018, totaling $33,479. |
| (4) | Other Income comprises antenna income from Nextel/Sprint. |
| (5) | The underwritten economic vacancy is 12.0%. The 45 Eisenhower Drive Property was 90.0% leased as of July 1, 2017. |
| (6) | U/W TI/LC is inclusive of a TI/LC credit equivalent to one-tenth of the upfront TI/LC reserve of $90,000. |
The following table presents certain information relating to comparable office leases for the 45 Eisenhower Drive Property:
Comparable Leases(1)
| Property Name/Location | Year Built/ Renovated | Stories | Total GLA (SF) | Class | Distance from Subject | Tenant Name | Lease Date/Term | Lease Area (SF) | Annual Base Rent PSF | Lease Type |
Heights Plaza 777 Terrace Ave. Hasbrouck Heights, NJ | 1980/NAP | 6 | 199,000 | A | 5.3 miles | WTEC Energy | April 2017 / 10.6 Yrs | 17,215 | $22.50 | MG |
461 From Road 461 From Road Paramus, NJ | 1988/NAP | 5 | 253,554 | A | 2.9 miles | IBM | May 2016 / 5.6 Yrs | 7,884 | $26.50 | MG |
The Atrium 80 Route 4 East Paramus, NJ | 1984/NAP | 4 | 165,212 | B | 1.8 miles | Worldwide Logistic | April 2016 / 7.6 Yrs | 9,620 | $22.00 | MG |
Two University Plaza 2 University Plaza Hackensack, NJ | 1978/NAP | 6 | 148,403 | A | 4.4 miles | Osen, LLC | April 2015 / 3.0 Yrs | 3,500 | $22.50 | MG |
Park 80 West Plaza I & II 250 Pehle Ave. Saddle Brook, NJ | 1972/2005 | 6 | 493,856 | A | 4.2 miles | JP Morgan | April 2015 / 10.0 Yrs | 13,633 | $26.50 | MG |
| (1) | Information obtained from the appraisal and third party reports. |
Ground Lease.The 45 Eisenhower Drive Property is subject to a ground lease with Quad Associates. The ground lease at 45 Eisenhower Drive Property expires on January 1, 2058 and the borrower is obligated to pay an annual ground rent of $304,075. The ground rent is subject to escalations every five years equal to the percentage increase in the Consumer’s Price Index; however, the escalation will not exceed 10.0% for any adjustment period. See“Description of the Mortgage Pool – Mortgage Pool Characteristics – Fee & Leasehold Estates; Ground Leases” in the Preliminary Prospectus.
THE INFORMATION IN THIS STRUCTURAL AND COLLATERAL TERM SHEET IS NOT COMPLETE AND MAY BE AMENDED PRIOR TO THE TIME OF SALE. THIS TERM SHEET IS NOT AN OFFER TO SELL THESE SECURITIES AND IT IS NOT A SOLICITATION OF AN OFFER TO BUY THESE SECURITIES IN ANY JURISDICTION WHERE THE OFFER OR SALE IS NOT PERMITTED.
125
| No. 13 – Hilton Garden Inn Chicago/North Loop | |||||||
| Loan Information | Property Information | ||||||
| Mortgage Loan Seller: | Wells Fargo Bank, National Association | Single Asset/Portfolio: | Single Asset | ||||
| Credit Assessment (Fitch/KBRA/Moody’s): | NR/NR/NR | Property Type: | Hospitality | ||||
| Original Principal Balance(1): | $20,000,000 | Specific Property Type: | Select Service | ||||
| Cut-off Date Balance(1): | $19,905,023 | Location: | Chicago, IL | ||||
| % of Initial Pool Balance: | 2.8% | Size: | 191 Rooms | ||||
| Loan Purpose: | Acquisition | Cut-off Date Balance Per Room(1): | $177,165 | ||||
| Borrower Name: | AFP 110 Corp.; AFP Thirty Eight LLC; AFP Thirty Nine LLC | Year Built/Renovated: | 2015/NAP | ||||
| Sponsor: | United Capital Corp. | Title Vesting: | Fee | ||||
| Mortgage Rate: | 4.800% | Property Manager: | Self-managed | ||||
| Note Date: | June 7, 2017 | 3rdMost Recent Occupancy(4): | NAV | ||||
| Anticipated Repayment Date: | NAP | 2ndMost Recent Occupancy(4): | NAV | ||||
| Maturity Date: | June 11, 2027 | Most Recent Occupancy (As of): | 75.7% (12/31/2016) | ||||
| IO Period: | NAP | Current Occupancy (As of): | 77.1% (6/30/2017) | ||||
| Loan Term (Original): | 120 months | ||||||
| Seasoning: | 4 months | Underwriting and Financial Information: | |||||
| Amortization Term (Original): | 360 months | ||||||
| Loan Amortization Type: | Amortizing Balloon | 4thMost Recent NOI(4): | NAV | ||||
| Interest Accrual Method: | Actual/360 | 3rdMost Recent NOI(4): | NAV | ||||
| Call Protection: | L(28),D(88),O(4) | 2ndMost Recent NOI (As of): | $3,601,992 (12/31/2016) | ||||
| Lockbox Type: | Hard/Springing Cash Management | Most Recent NOI (As of): | $3,739,909 (TTM 6/30/2017) | ||||
| Additional Debt(1): | Yes | U/W Revenues: | $10,141,170 | ||||
| Additional Debt Type(1): | Pari Passu | U/W Expenses: | $6,423,078 | ||||
| U/W NOI: | $3,718,092 | ||||||
| U/W NCF: | $3,312,445 | ||||||
| U/W NOI DSCR(1): | 1.74x | ||||||
| Escrows and Reserves: | U/W NCF DSCR(1): | 1.55x | |||||
| U/W NOI Debt Yield(1): | 11.0% | ||||||
| Type: | Initial | Monthly | Cap (If Any) | U/W NCF Debt Yield(1): | 9.8% | ||
| Taxes | $118,556 | $44,449 | NAP | As-Is Appraised Value: | $59,300,000 | ||
| Insurance | $0 | Springing(2) | NAP | As-Is Appraisal Valuation Date: | April 21, 2017 | ||
| Replacement Reserve | $0 | $33,648 | NAP | Cut-off Date LTV Ratio(1): | 57.1% | ||
| Seasonality Reserve | $0 | Springing(3) | NAP | LTV Ratio at Maturity or ARD(1): | 46.8% | ||
| (1) | The Hilton Garden Inn Chicago/North Loop Whole Loan (as defined below), which had an original principal balance of $34,000,000, is comprised of twopari passu notes (Notes A-1 and A-2). The controlling Note A-1 had an original principal balance of $20,000,000, has an outstanding principal balance of $19,905,023 as of the Cut-Off Date and will be contributed to the WFCM 2017-C40 Trust. The non-controlling Note A-2 had an original principal balance of $14,000,000 and was contributed to the WFCM 2017-C39 Trust. All statistical information related to balances per square foot, loan-to-value ratios, debt service coverage ratios and debt yields are based on the Hilton Garden Inn Chicago/North Loop Whole Loan. |
| (2) | Ongoing monthly reserves for insurance are not required so long as (i) no event of default has occurred and is continuing; (ii) Hilton Garden Inn Chicago/North Loop Property is insured via an acceptable blanket insurance policy; and (iii) the borrower provides the lender with evidence of renewal of the insurance policies and timely proof of payment of insurance premiums. |
| (3) | Monthly seasonality reserves of $178,386 from August through October are not required so long as (i) no event of default has occurred and is continuing and (ii) the amortizing debt service coverage ratio from the preceding December through February is greater than or equal to 1.00x. |
| (4) | The Hilton Garden Inn Chicago/North Loop Property was built in 2015. |
The Hilton Garden Inn Chicago/North Loop Mortgage Loan is part of a whole loan (the “Hilton Garden Inn/North Loop Whole Loan”) that is evidenced by two promissory notes (Notes A-1 and A-2) secured by a first mortgage encumbering the fee interest in a 191-room select service hotel located in Chicago, Illinois (the “Hilton Garden Inn Chicago/North Loop Property”).
The Hilton Garden Inn Chicago/North Loop Property was built in 2015 and is situated on a 0.1-acre site. The Hilton Garden Inn Chicago/North Loop Property is comprised of 39 standard double queen guestrooms and 152 standard king guestrooms. The guestrooms are equipped with a desk with chair, dresser, lounge chair, flat-screen television, mini-fridge, microwave and coffee maker. Amenities at the Hilton Garden Inn Chicago/North Loop Property include a restaurant and lounge, 24-hour grab-and-go Pavilion Pantry market, approximately 266 square feet of meeting space, fitness center and business center. The Hilton Garden Inn Chicago/North Loop Property is located in downtown Chicago, along the southern bank of the Chicago River in the North Loop neighborhood of the central business district. According to the appraisal, the market segmentation at the Hilton Garden Inn Chicago/North Loop Property is 55% corporate, 10% meeting and group, and 35% leisure. The franchise agreement expires on March 31, 2035.
THE INFORMATION IN THIS STRUCTURAL AND COLLATERAL TERM SHEET IS NOT COMPLETE AND MAY BE AMENDED PRIOR TO THE TIME OF SALE. THIS TERM SHEET IS NOT AN OFFER TO SELL THESE SECURITIES AND IT IS NOT A SOLICITATION OF AN OFFER TO BUY THESE SECURITIES IN ANY JURISDICTION WHERE THE OFFER OR SALE IS NOT PERMITTED.
126
| HILTON GARDEN INN CHICAGO/NORTH LOOP |
Note Summary
| Notes | Original Balance | Note Holder | Controlling Interest | |
| A-1 | $20,000,000 | WFCM 2017-C40 | Yes | |
| A-2 | $14,000,000 | WFCM 2017-C39 | No | |
| Total | $34,000,000 |
Sources and Uses
| Sources | Uses | |||||||
| Original loan amount | $34,000,000 | 58.3% | Purchase Price | $58,000,000 | 99.4% | |||
| Borrower sponsors’ new cash contribution | 24,326,504 | 41.7 | Closing Costs | 326,504 | 0.6 | |||
| Total Sources | $58,326,504 | 100.0% | Total Uses | $58,326,504 | 100.0% |
Subject and Market Historical Occupancy, ADR and RevPAR(1)
Competitive Set | Hilton Garden Inn | Penetration Factor | |||||||
Year | Occupancy | ADR | RevPAR | Occupancy | ADR | RevPAR | Occupancy | ADR | RevPAR |
| TTM 6/30/2017 | 78.8% | $190.31 | $150.00 | 77.1% | $179.30 | $138.23 | 97.8% | 94.2% | 92.2% |
| TTM 6/30/2016 | 76.8% | $190.35 | $146.12 | 63.7% | $183.57 | $116.97 | 83.0% | 96.4% | 80.1% |
| TTM 6/30/2015(2) | 80.4% | $191.43 | $153.89 | NAV | NAV | NAV | NAV | NAV | NAV |
| (1) | Information obtained from a third party hospitality report dated July 18, 2017. The competitive set includes the following hotels: Courtyard Chicago Downtown River North, Hilton Garden Inn Chicago Downtown Magnificent Mile, Hampton Inn Majestic Chicago Theatre District, aloft Hotel Chicago City Center, Comfort Suites Michigan Avenue Loop Chicago, Hyatt Place Chicago Downtown River North, and Hampton Inn Chicago Downtown North Loop Michigan Avenue. |
| (2) | The Hilton Garden Inn Chicago/North Loop Property was built in 2015. |
Operating History and Underwritten Net Cash Flow.The following table presents certain information relating to the historical operating performance and underwritten net cash flow at the Hilton Garden Inn Chicago/North Loop Property:
Cash Flow Analysis
| 2016 | TTM 6/30/2017 | U/W |
% of U/W | U/W $ per Room | |
| Occupancy | 75.7% | 77.1% | 77.1% | ||
| ADR | $179.58 | $177.91 | $177.91 | ||
| RevPAR | $135.95 | $137.23 | $137.23 | ||
| Room Revenue | $9,477,968 | $9,567,147 | $9,567,147 | 94.3% | $50,090 |
| F&B Revenue | 245,152 | 273,288 | 273,288 | 2.7 | 1,431 |
| Other Revenue(1) | 169,543 | 300,735 | 300,735 | 3.0 | 1,575 |
| Total Revenue | $9,892,663 | $10,141,170 | $10,141,170 | 100.0% | $53,095 |
| Total Department Expenses | 2,596,410 | 2,589,924 | 2,589,924 | 25.5 | 13,560 |
| Gross Operating Profit | $7,296,253 | $7,551,246 | $7,551,246 | 74.5% | $39,535 |
| Total Undistributed Expenses | 2,590,100 | 2,700,153 | 2,721,970 | 26.8 | 14,251 |
| Profit Before Fixed Charges | $4,706,153 | $4,851,093 | $4,829,276 | 47.6% | $25,284 |
| Total Fixed Charges | 1,104,161 | 1,111,184 | 1,111,184 | 11.0 | 5,818 |
| Net Operating Income | $3,601,992 | $3,739,909 | $3,718,092 | 36.7% | $19,466 |
| FF&E | 0 | 0 | 405,647 | 4.0 | 2,124 |
| Net Cash Flow | $3,601,992 | $3,739,909 | $3,312,445 | 32.7% | $17,343 |
| NOI DSCR | 1.68x | 1.75x | 1.74x | ||
| NCF DSCR | 1.68x | 1.75x | 1.55x | ||
| NOI DY | 10.6% | 11.1% | 11.0% | ||
| NCF DY | 10.6% | 11.1% | 9.8% | ||
| (1) | Other Revenue includes parking revenue (guest fees for off-site valet parking), no shows, gift shop, meeting room rental, telephone, and miscellaneous items. |
THE INFORMATION IN THIS STRUCTURAL AND COLLATERAL TERM SHEET IS NOT COMPLETE AND MAY BE AMENDED PRIOR TO THE TIME OF SALE. THIS TERM SHEET IS NOT AN OFFER TO SELL THESE SECURITIES AND IT IS NOT A SOLICITATION OF AN OFFER TO BUY THESE SECURITIES IN ANY JURISDICTION WHERE THE OFFER OR SALE IS NOT PERMITTED.
127
| No. 14 – Sentinel Business Center | ||||||
| Loan Information | Property Information | |||||
| Mortgage Loan Seller: | Barclays Bank PLC | Single Asset/Portfolio: | Single Asset | |||
Credit Assessment (Fitch/KBRA/Moody’s) | NR/NR/NR | Property Type: | Industrial | |||
| Original Principal Balance: | $17,500,000 | Specific Property Type: | Warehouse | |||
| Cut-off Date Balance: | $17,455,975 | Location: | San Antonio, TX | |||
| % of Initial Pool Balance: | 2.5% | Size: | 328,412 SF | |||
| Loan Purpose: | Refinance | Cut-off Date Balance Per SF: | $53.15 | |||
| Borrower: | Sentinel Business Owner, LLC | Year Built/Renovated: | 1980/2007 | |||
| Borrower Sponsor: | Forester Investments | Title Vesting: | Fee | |||
| Mortgage Rate: | 4.495% | Property Manager: | Self-Managed | |||
| Note Date: | August 4, 2017 | 4thMost Recent Occupancy (As of)(2): | 92.4% (12/31/2013) | |||
| Anticipated Repayment Date: | NAP | 3rdMost Recent Occupancy (As of)(2): | 82.8% (12/31/2014) | |||
| Maturity Date: | August 6, 2027 | 2ndMost Recent Occupancy (As of): | 100.0% (12/31/2015) | |||
| IO Period: | NAP | Most Recent Occupancy (As of): | 91.7% (12/31/2016) | |||
| Loan Term (Original): | 120 months | Current Occupancy (As of): | 97.4% (8/1/2017) | |||
| Seasoning: | 2 months | |||||
| Amortization Term (Original): | 360 months | Underwriting and Financial Information: | ||||
| Loan Amortization Type: | Amortizing Balloon | |||||
| Interest Accrual Method: | Actual/360 | 4thMost Recent NOI (As of): | $1,534,152 (12/31/2014) | |||
| Call Protection: | L(26),D(90),O(4) | 3rdMost Recent NOI (As of): | $1,512,618 (12/31/2015) | |||
| Lockbox Type: | Springing | 2ndMost Recent NOI (As of): | $1,738,290 (12/31/2016) | |||
| Additional Debt: | None | Most Recent NOI (As of)(3): | $1,599,638 (TTM 3/31/2017) | |||
| Additional Debt Type: | NAP | |||||
| U/W Revenues: | $2,440,438 | |||||
| U/W Expenses: | $673,128 | |||||
| U/W NOI(3): | $1,767,310 | |||||
| U/W NCF: | $1,566,988 | |||||
| U/W NOI DSCR: | 1.66x | |||||
| Escrows and Reserves: | U/W NCF DSCR: | 1.47x | ||||
| U/W NOI Debt Yield: | 10.1% | |||||
| Type: | Initial | Monthly | Cap (If Any) | U/W NCF Debt Yield: | 9.0% | |
| Taxes | $70,781 | $35,391 | NAP | As-Is Appraised Value: | $24,000,000 | |
| Insurance(1) | $0 | Springing | NAP | As-Is Appraisal Valuation Date: | July 14, 2017 | |
| Replacement Reserve | $340,219 | $4,105 | NAP | Cut-off Date LTV Ratio: | 72.7% | |
| TI/LC Reserve | $164,000 | $13,684 | $493,000 | LTV Ratio at Maturity: | 58.9% | |
| (1) | Ongoing monthly reserves for insurance are not required so long as the Sentinel Business Center Property (as defined below) is insured via an acceptable blanket insurance policy. |
| (2) | The decrease from 4th Most Recent Occupancy to 3rd Most Recent Occupancy is primarily attributable to tenant roll in the second half of 2014 and the subsequent re-tenanting in 2015 to 100.0% occupancy. Based on a monthly average, the Sentinel Business Center Property was 91.4% occupied in 2014 and 91.9% occupied in 2015. |
| (3) | The increase from Most Recent NOI to U/W NOI is primarily attributable to SERVPRO (representing 30,050 square feet) and CFI Delivery LTD (representing 11,278 square feet) which executed new leases in May 2017 representing an aggregate $203,379 of underwritten base rent. |
The mortgage loan is evidenced by a single promissory note that is secured by a first mortgage encumbering the fee interest in a 328,412 square foot industrial warehouse facility known as the Sentinel Business Center located in San Antonio, Texas (the “Sentinel Business Center Property”) approximately 14 miles north of the San Antonio central business district and directly north of the San Antonio International Airport. The Sentinel Business Center Property consist of six buildings built in 1980, feature clear heights ranging from 16 to 18 feet, have approximately 25.0% office finishes and is situated on four parcels totaling approximately 18.5-acres. Major tenants at the Sentinel Business Center Property include Travis Tile Sales, SERVPRO, Dynamex, Inc., Allegiance Floors / Wagner and Printed Supply, Inc. No single tenant represents more than 9.5% of the net rentable area or 7.5% of the annual underwritten base rent. As of August 1, 2017, the Sentinel Business Center Property was 97.4% occupied by 34 tenants.
The Sentinel Business Center Property is located within Bexar County in the city of San Antonio, approximately 14 miles north of the San Antonio central business district and directly north of the San Antonio International Airport. According to the appraisal, the 2017 population within a one-, three- and five-mile radius of the Sentinel Business Center Property was 6,087, 84,640 and 268,773, respectively; and the average household income within the same radii was $71,856, $79,037 and $82,349, respectively. The Sentinel Business Center Property benefits from its proximity to several transportation arteries, including Interstate Highway 35 and Loop 1604 which circles San Antonio and provides access to all other major highways. According to a third party market research report, the Sentinel Business Center Property industrial submarket reported a total inventory of approximately 16.9 million square feet with a 4.0% vacancy rate and an average asking rent of $8.85 per square foot as of the second quarter of 2017.
THE INFORMATION IN THIS STRUCTURAL AND COLLATERAL TERM SHEET IS NOT COMPLETE AND MAY BE AMENDED PRIOR TO THE TIME OF SALE. THIS TERM SHEET IS NOT AN OFFER TO SELL THESE SECURITIES AND IT IS NOT A SOLICITATION OF AN OFFER TO BUY THESE SECURITIES IN ANY JURISDICTION WHERE THE OFFER OR SALE IS NOT PERMITTED.
128
SENTINEL BUSINESS CENTER |
Sources and Uses
| Sources | Uses | |||||||
| Original loan amount | $17,500,000 | 100.0% | Loan payoff(1) | $12,491,130 | 71.4% | |||
| Return of equity | 4,167,486 | 23.8 | ||||||
| Reserves | 575,000 | 3.3 | ||||||
| Closing costs | 266,384 | 1.5 | ||||||
| Total Sources | $17,500,000 | 100.0% | Total Uses | $17,500,000 | 100.0% |
| (1) | The Sentinel Business Center Property was previously securitized in the BSCMS 2007-PW18 transaction. Loan Payoff represents the allocated loan amount of the previously existing debt to the Sentinel Business Center Property. |
The following table presents certain information relating to the tenancy at the Sentinel Business Center Property:
Major Tenants
| Tenant Name | Credit Rating (Fitch/ Moody’s/ S&P) | Tenant NRSF | % of NRSF | Annual U/W Base Rent PSF(1) | Annual U/W Base Rent(1) | % of Total Annual U/W Base Rent | Lease Expiration Date |
| Major Tenants | |||||||
| Travis Tile Sales | NR/NR/NR | 31,127 | 9.5% | $4.50 | $140,072 | 7.5% | 10/31/2024 |
| SERVPRO | NR/NR/NR | 30,050 | 9.2% | $4.61 | $138,531 | 7.4% | 8/31/2022 |
| Dynamex, Inc. | NR/NR/NR | 26,400 | 8.0% | $4.25 | $112,200 | 6.0% | 7/31/2018(2) |
| Allegiance Floors / Wagner | NR/NR/NR | 17,200 | 5.2% | $5.75 | $98,900 | 5.3% | 12/31/2020(3) |
| Printed Supply, Inc | NR/NR/NR | 13,500 | 4.1% | $6.44 | $86,940 | 4.7% | 3/31/2020 |
| Total Major Tenants | 118,277 | 36.0% | $4.88 | $576,642 | 31.0% | ||
| Non-Major Tenants | 201,435 | 61.3% | $6.38 | $1,284,621 | 69.0% | ||
| Occupied Collateral Total | 319,712 | 97.4% | $5.82 | $1,861,263 | 100.0% | ||
| Vacant Space | 8,700 | 2.6% | |||||
| Collateral Total | 328,412 | 100.0% | |||||
| (1) | Annual U/W Base Rent PSF and Annual U/W Base Rent include contractual rent steps through September 2018 totaling $38,781. |
| (2) | Dynamex, Inc. has two, three-year lease renewal options. |
| (3) | Allegiance Floors / Wagner has one, five-year lease renewal option. |
The following table presents certain information relating to the lease rollover schedule at the Sentinel Business Center Property:
Lease Expiration Schedule(1)(2)
| Year Ending December 31, | No. of Leases Expiring | Expiring NRSF | % of Total NRSF | Cumulative Expiring NRSF | Cumulative % of Total NRSF | Annual U/W Base Rent | % of Total Annual U/W Base Rent | Annual U/W Base Rent PSF(3) |
| MTM | 0 | 0 | 0.0% | 0 | 0.0% | $0 | 0.0% | $0.00 |
| 2017 | 0 | 0 | 0.0% | 0 | 0.0% | $0 | 0.0% | $0.00 |
| 2018 | 8 | 64,057 | 19.5% | 64,057 | 19.5% | $381,021 | 20.5% | $5.95 |
| 2019 | 6 | 41,909 | 12.8% | 105,966 | 32.3% | $275,148 | 14.8% | $6.57 |
| 2020 | 9 | 92,866 | 28.3% | 198,832 | 60.5% | $565,045 | 30.4% | $6.08 |
| 2021 | 5 | 31,032 | 9.4% | 229,864 | 70.0% | $193,951 | 10.4% | $6.25 |
| 2022 | 3 | 40,843 | 12.4% | 270,707 | 82.4% | $207,519 | 11.1% | $5.08 |
| 2023 | 2 | 17,878 | 5.4% | 288,585 | 87.9% | $98,509 | 5.3% | $5.51 |
| 2024 | 1 | 31,127 | 9.5% | 319,712 | 97.4% | $140,072 | 7.5% | $4.50 |
| 2025 | 0 | 0 | 0.0% | 319,712 | 97.4% | $0 | 0.0% | $0.00 |
| 2026 | 0 | 0 | 0.0% | 319,712 | 97.4% | $0 | 0.0% | $0.00 |
| 2027 | 0 | 0 | 0.0% | 319,712 | 97.4% | $0 | 0.0% | $0.00 |
| Thereafter | 0 | 0 | 0.0% | 319,712 | 97.4% | $0 | 0.0% | $0.00 |
| Vacant | 0 | 8,700 | 2.6% | 328,412 | 100.0% | $0 | 0.0% | $0.00 |
| Total/Weighted Average | 34 | 328,412 | 100.0% | $1,861,263 | 100.0% | $5.82 |
| (1) | Information obtained from the underwritten rent roll. |
| (2) | Certain tenants may have lease termination options that are exercisable prior to the originally stated expiration date of the subject lease and that are not considered in the Lease Expiration Schedule. |
| (3) | Weighted Average Annual U/W Base Rent PSF excludes vacant space. |
THE INFORMATION IN THIS STRUCTURAL AND COLLATERAL TERM SHEET IS NOT COMPLETE AND MAY BE AMENDED PRIOR TO THE TIME OF SALE. THIS TERM SHEET IS NOT AN OFFER TO SELL THESE SECURITIES AND IT IS NOT A SOLICITATION OF AN OFFER TO BUY THESE SECURITIES IN ANY JURISDICTION WHERE THE OFFER OR SALE IS NOT PERMITTED.
129
SENTINEL BUSINESS CENTER |
The following table presents historical occupancy percentages at the Sentinel Business Center Property:
Historical Occupancy
12/31/2013(1)(2) | 12/31/2014(1)(2) | 12/31/2015(1)(2) | 12/31/2016(1) | 8/1/2017(3) |
| 92.4% | 82.8% | 100.0% | 91.7% | 97.4% |
| (1) | Information obtained from the borrower. |
| (2) | The decrease from 12/31/2013 Occupancy to 12/31/2014 Occupancy and increase from 12/31/2014 Occupancy to 12/31/2015 Occupancy is primarily attributable to tenant roll in the second half of 2014 and the subsequent re-tenanting in 2015 to 100.0% occupancy. Based on a monthly average, the Sentinel Business Center Property was 91.4% occupied in 2014 and 91.9% occupied in 2015. |
| (3) | Information obtained from the underwritten rent roll. |
Operating History and Underwritten Net Cash Flow. The following table presents certain information relating to the historical operating performance and the underwritten net cash flow at the Sentinel Business Center Property:
Cash Flow Analysis
| 2014 | 2015 | 2016 | TTM 3/31/2017 | U/W | % of U/W Effective Gross Income | U/W $ per SF | |
| Base Rent | $1,571,613 | $1,591,794 | $1,746,924 | $1,679,925 | $1,861,263(1) | 76.3% | $5.67 |
| Grossed Up Vacant Space | 0 | 0 | 0 | 0 | 53,884 | 2.2 | 0.16 |
| Total Reimbursables | 551,724 | 665,066 | 700,324 | 696,733 | 617,584 | 25.3 | 1.88 |
| Other Income(2) | 38,493 | 30,035 | 39,923 | 34,600 | 36,150 | 1.5 | 0.11 |
| Less Vacancy & Credit Loss | 0 | 0 | 0 | 0 | (128,444)(3) | (5.3) | (0.39) |
| Effective Gross Income | $2,161,830 | $2,286,895 | $2,487,171 | $2,411,258 | $2,440,438 | 100.0% | $7.43 |
| Total Operating Expenses | $627,678 | $774,277 | $748,881 | $811,620 | $673,128 | 27.6% | $2.05 |
| Net Operating Income(4) | $1,534,152 | $1,512,618 | $1,738,290 | $1,599,638 | $1,767,310 | 72.4% | $5.38 |
| TI/LC | 0 | 0 | 0 | 0 | 167,480 | 6.9 | 0.51 |
| Capital Expenditures | 0 | 0 | 0 | 0 | 49,262 | 2.0 | 0.15 |
| Free Rent Expense | 0 | 0 | 0 | 0 | (16,421) | (0.7) | (0.05) |
| Net Cash Flow | $1,534,152 | $1,512,618 | $1,738,290 | $1,599,638 | $1,566,988 | 64.2% | $4.77 |
| NOI DSCR | 1.44x | 1.42x | 1.63x | 1.50x | 1.66x | ||
| NCF DSCR | 1.44x | 1.42x | 1.63x | 1.50x | 1.47x | ||
| NOI DY | 8.8% | 8.6% | 9.9% | 9.1% | 10.1% | ||
| NCF DY | 8.8% | 8.6% | 9.9% | 9.1% | 9.0% |
| (1) | U/W Base Rent include contractual rent steps through September 2018 totaling $38,781. |
| (2) | Other Income includes late fees and other charges. |
| (3) | The underwritten economic vacancy is 5.0%. The Sentinel Business Center Property was 97.4% physically occupied as of August 1, 2017. |
| (4) | The increase from TTM 3/31/2017 NOI to U/W NOI is primarily attributable to SERVPRO (representing 30,050 square feet) and CFI Delivery LTD (representing 11,278 square feet) which executed new leases in May 2017 representing an aggregate $203,379 of base rent. |
THE INFORMATION IN THIS STRUCTURAL AND COLLATERAL TERM SHEET IS NOT COMPLETE AND MAY BE AMENDED PRIOR TO THE TIME OF SALE. THIS TERM SHEET IS NOT AN OFFER TO SELL THESE SECURITIES AND IT IS NOT A SOLICITATION OF AN OFFER TO BUY THESE SECURITIES IN ANY JURISDICTION WHERE THE OFFER OR SALE IS NOT PERMITTED.
130
(THIS PAGE INTENTIONALLY LEFT BLANK)
THE INFORMATION IN THIS STRUCTURAL AND COLLATERAL TERM SHEET IS NOT COMPLETE AND MAY BE AMENDED PRIOR TO THE TIME OF SALE. THIS TERM SHEET IS NOT AN OFFER TO SELL THESE SECURITIES AND IT IS NOT A SOLICITATION OF AN OFFER TO BUY THESE SECURITIES IN ANY JURISDICTION WHERE THE OFFER OR SALE IS NOT PERMITTED.
131
| No. 15 – Southridge Plaza Austin | ||||||
| Loan Information | Property Information | |||||
| Mortgage Loan Seller: | Barclays Bank PLC | Single Asset/Portfolio: | Single Asset | |||
Credit Assessment (Fitch/KBRA/Moody’s) | NR/NR/NR | Property Type: | Retail | |||
| Original Principal Balance: | $14,200,000 | Specific Property Type: | Anchored | |||
| Cut-off Date Balance: | $14,200,000 | Location: | Austin, TX | |||
| % of Initial Pool Balance: | 2.0% | Size: | 144,285 SF | |||
| Loan Purpose: | Refinance | Cut-off Date Balance Per SF: | $98.42 | |||
| Borrower: | Southridge Plaza WC Properties, LLC | Year Built/Renovated: | 1978/NAP | |||
| Borrower Sponsor: | Starpoint Commercial Properties | Title Vesting: | Fee | |||
| Mortgage Rate: | 4.200% | Property Manager: | Self-Managed | |||
| Note Date: | August 28, 2017 | 4thMost Recent Occupancy (As of): | 93.8% (12/31/2013) | |||
| Anticipated Repayment Date: | NAP | 3rdMost Recent Occupancy (As of): | 97.8% (12/31/2014) | |||
| Maturity Date: | September 6, 2027 | 2ndMost Recent Occupancy (As of): | 92.3% (12/31/2015) | |||
| IO Period: | 120 months | Most Recent Occupancy (As of): | 92.3% (12/31/2016) | |||
| Loan Term (Original): | 120 months | Current Occupancy (As of): | 92.3% (7/31/2017) | |||
| Seasoning: | 1 month | |||||
| Amortization Term (Original): | NAP | Underwriting and Financial Information: | ||||
| Loan Amortization Type: | Interest-only, Balloon | |||||
| Interest Accrual Method: | Actual/360 | 4thMost Recent NOI (As of): | $1,434,468 (12/31/2014) | |||
| Call Protection: | L(25),D(91),O(4) | 3rdMost Recent NOI (As of): | $1,215,562 (12/31/2015) | |||
| Lockbox Type: | Hard/Springing Cash Management | 2ndMost Recent NOI (As of): | $1,354,481 (12/31/2016) | |||
| Additional Debt: | None | Most Recent NOI (As of): | $1,308,435 (TTM 5/31/2017) | |||
| Additional Debt Type: | NAP | |||||
| U/W Revenues: | $2,358,838 | |||||
| U/W Expenses: | $925,089 | |||||
| U/W NOI: | $1,433,749 | |||||
| U/W NCF: | $1,306,308 | |||||
| Escrows and Reserves: | U/W NOI DSCR: | 2.37x | ||||
| U/W NCF DSCR: | 2.16x | |||||
| Type: | Initial | Monthly | Cap (If Any) | U/W NOI Debt Yield: | 10.1% | |
| Taxes | $282,929 | $40,418 | NAP | U/W NCF Debt Yield: | 9.2% | |
| Insurance(1) | $0 | Springing | NAP | As-Is Appraised Value: | $24,000,000 | |
| Deferred Maintenance | $155,675 | $0 | NAP | As-Is Appraisal Valuation Date: | April 24, 2017 | |
| Replacement Reserve(2) | $344,325 | $1,804 | $100,000 | Cut-off Date LTV Ratio: | 59.2% | |
| TI/LC Reserve(3) | $250,000 | $7,815 | $100,000 | LTV Ratio at Maturity: | 59.2% | |
| (1) | Ongoing monthly reserves for insurance are not required so long as the Southridge Plaza Austin Property (as defined below) is insured via an acceptable blanket insurance policy. |
| (2) | Ongoing monthly reserves for replacement reserves are not required to the extent that the balance of the Replacement Reserve is at least $100,000. |
| (3) | Ongoing monthly reserves for tenant improvements and leasing commissions are not required to the extent that the balance of the TI/LC Reserve is at least $100,000. |
The mortgage loan is evidenced by a single promissory note that is secured by a first mortgage encumbering the fee interest in a 144,285 square foot anchored retail center located in Austin, Texas (the “Southridge Plaza Austin Property”), approximately 7.0 miles south of Austin’s central business district. The Southridge Plaza Austin Property was built in 1978 and is situated on a 13.0-acre site. Major tenants at the Southridge Plaza Austin Property include HEB Grocery, Dollar Tree, Kidz Dental, Family Dollar Stores and Rent-A-Center. The Southridge Plaza Austin Property contains 638 surface parking spaces, resulting in a parking ratio of 4.4 spaces per 1,000 square feet of rentable area. As of July 31, 2017, the Southridge Plaza Austin Property was 92.3% occupied by 26 tenants.
The Southridge Plaza Austin Property is located within Travis County, within the Austin, Texas metropolitan statistical area. According to the appraisal, the 2016 population within a one-, three- and five-mile radius of the Southridge Plaza Austin Property was 20,827, 129,313 and 289,660, respectively; and the average household income within the same radii was $52,455, $60,181 and $72,512, respectively. The Southridge Plaza Austin Property benefits from its location at the intersection of two primary thoroughfares in the neighborhood, West William Cannon Drive and South 1st Street. These provide access to several transportation arteries, including Intestate Highway 35 and Ben White Boulevard, which connects the Southridge Plaza Austin Property with San Antonio to the south and with Waco to the north. According to a third party market research report, the Southridge Plaza Austin Property is located within the South submarket of the Austin retail market. As of the first quarter of 2017, the submarket reported a total inventory of approximately 12.9 million square feet, with a 2.6% vacancy rate and an average asking rent of $24.07 per square foot.
THE INFORMATION IN THIS STRUCTURAL AND COLLATERAL TERM SHEET IS NOT COMPLETE AND MAY BE AMENDED PRIOR TO THE TIME OF SALE. THIS TERM SHEET IS NOT AN OFFER TO SELL THESE SECURITIES AND IT IS NOT A SOLICITATION OF AN OFFER TO BUY THESE SECURITIES IN ANY JURISDICTION WHERE THE OFFER OR SALE IS NOT PERMITTED.
132
| SOUTHRIDGE PLAZA AUSTIN |
Sources and Uses
| Sources | Uses | ||||||||
| Original loan amount | $14,200,000 | 99.6% | Loan payoff(1) | $12,762,042 | 89.6% | ||||
| Borrower Sponsor’s new cash contribution | 50,000 | 0.4 | Reserves | 1,032,929 | 7.2 | ||||
| Closing costs | 455,029 | 3.2 | |||||||
| Total Sources | $14,250,000 | 100.0% | Total Uses | $14,250,000 | 100.0% | ||||
| (1) | The Southridge Plaza Austin Property was previously securitized in the MLCFC 2007-8 transaction. Prior to the origination of the Southridge Plaza Austin Mortgage Loan, the previously existing debt was in maturity default but was paid off in full. |
The following table presents certain information relating to the tenancy at the Southridge Plaza Austin Property:
Major Tenants
| Tenant Name | Credit Rating Moody’s/ S&P) | Tenant NRSF | % of NRSF | Annual U/W Base Rent PSF(1) | Annual U/W Base Rent(1) | % of Total Annual U/W Base Rent | Lease Expiration Date |
| Major Tenants | |||||||
| HEB Grocery | NR/NR/NR | 46,096 | 31.9% | $8.62 | $397,126 | 25.0% | 01/31/2023(2) |
| Dollar Tree | NR/Ba1/BB+ | 13,975 | 9.7% | $8.00 | $111,800 | 7.0% | 09/30/2018 |
| Kidz Dental | NR/NR/NR | 13,544 | 9.4% | $5.19 | $70,274 | 4.4% | 05/31/2018(3) |
| Family Dollar Stores | NR/Baa3/NR | 11,400 | 7.9% | $9.50 | $108,300 | 6.8% | 12/31/2019 |
| Rent-A-Center | NR/B2/B- | 6,000 | 4.2% | $12.50 | $75,000 | 4.7% | 10/31/2021(4) |
| Total Major Tenants | 91,015 | 63.1% | $8.38 | $762,501 | 48.0% | ||
| Non-Major Tenants | 42,166 | 29.2% | $19.56 | $824,606 | 52.0% | ||
| Occupied Collateral Total | 133,181 | 92.3% | $11.92 | $1,587,107 | 100.0% | ||
| Vacant Space | 11,104 | 7.7% | |||||
| Collateral Total | 144,285 | 100.0% | |||||
| (1) | Annual U/W Base Rent PSF and Annual U/W Base Rent include contractual rent steps through September 2018 totaling $18,826. |
| (2) | HEB Grocery has two, five-year lease renewal options. |
| (3) | Kidz Dental has three, five-year lease renewal options. |
| (4) | Rent-A-Center has one, five-year lease renewal option. |
The following table presents certain information relating to the lease rollover schedule at the Southridge Plaza Austin Property:
Lease Expiration Schedule(1)(2)
| Year Ending December 31, | No. of Leases Expiring | Expiring NRSF | % of Total NRSF | Cumulative Expiring NRSF | Cumulative % of Total NRSF | Annual U/W Base Rent | % of Total Annual U/W Base Rent | Annual U/W Base Rent PSF(3) |
| MTM | 1 | 1,250 | 0.9% | 1,250 | 0.9% | $26,731 | 1.7% | $21.38 |
| 2017 | 0 | 0 | 0.0% | 1,250 | 0.9% | $0 | 0.0% | $0.00 |
| 2018 | 7 | 35,171 | 24.4% | 36,421 | 25.2% | $350,415 | 22.1% | $9.96 |
| 2019 | 7 | 26,484 | 18.4% | 62,905 | 43.6% | $335,239 | 21.1% | $12.66 |
| 2020 | 4 | 11,519 | 8.0% | 74,424 | 51.6% | $224,209 | 14.1% | $19.46 |
| 2021 | 3 | 6,000 | 4.2% | 80,424 | 55.7% | $120,120 | 7.6% | $20.02 |
| 2022 | 3 | 6,661 | 4.6% | 87,085 | 60.4% | $133,267 | 8.4% | $20.01 |
| 2023 | 1 | 46,096 | 31.9% | 133,181 | 92.3% | $397,126 | 25.0% | $8.62 |
| 2024 | 0 | 0 | 0.0% | 133,181 | 92.3% | $0 | 0.0% | $0.00 |
| 2025 | 0 | 0 | 0.0% | 133,181 | 92.3% | $0 | 0.0% | $0.00 |
| 2026 | 0 | 0 | 0.0% | 133,181 | 92.3% | $0 | 0.0% | $0.00 |
| 2027 | 0 | 0 | 0.0% | 133,181 | 92.3% | $0 | 0.0% | $0.00 |
| Thereafter | 0 | 0 | 0.0% | 133,181 | 92.3% | $0 | 0.0% | $0.00 |
| Vacant | 0 | 11,104 | 7.7% | 144,285 | 100.0% | $0 | 0.0% | $0.00 |
| Total/Weighted Average | 26 | 144,285 | 100.0% | $1,587,107 | 100.0% | $11.92 |
| (1) | Information obtained from the underwritten rent roll. |
| (2) | Certain tenants may have lease termination options that are exercisable prior to the originally stated expiration date of the subject lease and that are not considered in the Lease Expiration Schedule. |
| (3) | Weighted Average Annual U/W Base Rent PSF excludes vacant space. |
THE INFORMATION IN THIS STRUCTURAL AND COLLATERAL TERM SHEET IS NOT COMPLETE AND MAY BE AMENDED PRIOR TO THE TIME OF SALE. THIS TERM SHEET IS NOT AN OFFER TO SELL THESE SECURITIES AND IT IS NOT A SOLICITATION OF AN OFFER TO BUY THESE SECURITIES IN ANY JURISDICTION WHERE THE OFFER OR SALE IS NOT PERMITTED.
133
| SOUTHRIDGE PLAZA AUSTIN |
The following table presents historical occupancy percentages at the Southridge Plaza Austin Property:
Historical Occupancy
12/31/2013(1) | 12/31/2014(1) | 12/31/2015(1) | 12/31/2016(1) | 7/31/2017(2) |
| 93.8% | 97.8% | 92.3% | 92.3% | 92.3% |
| (1) | Information obtained from the borrower. |
| (2) | Information obtained from the underwritten rent roll. |
Operating History and Underwritten Net Cash Flow. The following table presents certain information relating to the historical operating performance and the underwritten net cash flow at the Southridge Plaza Austin Property:
Cash Flow Analysis
| 2014 | 2015 | 2016 | TTM 5/31/2017 | U/W | % of U/W Effective Gross Income | U/W $ per SF | |
| Base Rent | $1,532,263 | $1,489,836 | $1,493,827 | $1,516,209 | $1,587,107(1) | 67.3% | $11.00 |
| Grossed Up Vacant Space | 0 | 0 | 0 | 0 | 244,288 | 10.4 | 1.69 |
| Percentage Rent(2) | 34,642 | 50,091 | 48,053 | 53,669 | 51,665 | 2.2 | 0.36 |
| Total Reimbursables | 472,720 | 396,851 | 638,163 | 596,007 | 838,849 | 35.6 | 5.81 |
| Other Income(3) | 284 | 132 | 0 | 0 | 0 | 0.0 | 0.00 |
| Less Vacancy & Credit Loss | 0 | 0 | 0 | 0 | (363,072)(4) | (15.4) | (2.52) |
| Effective Gross Income | $2,039,909 | $1,936,910 | $2,180,043 | $2,165,885 | $2,358,838 | 100.0% | $16.35 |
| Total Operating Expenses | $605,441 | $721,348 | $825,562 | $857,450 | $925,089 | 39.2% | $6.41 |
| Net Operating Income | $1,434,468 | $1,215,562 | $1,354,481 | $1,308,435 | $1,433,749 | 60.8% | $9.94 |
| TI/LC | 0 | 0 | 0 | 0 | 127,441(5) | 5.4 | 0.88 |
| Capital Expenditures | 0 | 0 | 0 | 0 | 0(6) | 0.0 | 0.00 |
| Net Cash Flow | $1,434,468 | $1,215,562 | $1,354,481 | $1,308,435 | $1,306,308 | 55.4% | $9.05 |
| NOI DSCR | 2.37x | 2.01x | 2.24x | 2.16x | 2.37x | ||
| NCF DSCR | 2.37x | 2.01x | 2.24x | 2.16x | 2.16x | ||
| NOI DY | 10.1% | 8.6% | 9.5% | 9.2% | 10.1% | ||
| NCF DY | 10.1% | 8.6% | 9.5% | 9.2% | 9.2% |
| (1) | U/W Base Rent include contractual rent steps through September 2018 totaling $18,826. |
| (2) | Percentage Rent represents 1% of HEB Grocery’s sales over the breakpoint of $20.0MM. As of January 2017, HEB reported trailing-12 sales of $25,166,502. |
| (3) | Other Income includes late fees and other charges. |
| (4) | The underwritten economic vacancy is 13.3%. The Southridge Plaza Austin Property was 92.3% physically occupied as of July 31, 2017. |
| (5) | Includes a $25,000 credit for one-tenth of the upfront TI/LC reserve. |
| (6) | Includes a full $20,672 credit for Capital Expenditures, as one-tenth of the upfront capital expenditures reserve is in excess of the amount underwritten for Capital Expenditures. |
THE INFORMATION IN THIS STRUCTURAL AND COLLATERAL TERM SHEET IS NOT COMPLETE AND MAY BE AMENDED PRIOR TO THE TIME OF SALE. THIS TERM SHEET IS NOT AN OFFER TO SELL THESE SECURITIES AND IT IS NOT A SOLICITATION OF AN OFFER TO BUY THESE SECURITIES IN ANY JURISDICTION WHERE THE OFFER OR SALE IS NOT PERMITTED.
134
| Wells Fargo Commercial Mortgage Trust 2017-C40 | Transaction Contact Information |
VI. Transaction Contact Information
Questions regarding this Structural and Collateral Term Sheet may be directed to any of the following individuals:
| Wells Fargo Securities, LLC | |
| Brigid Mattingly | Tel. (312) 269-3062 |
| A.J. Sfarra | Tel. (212) 214-5613 |
| Alex Wong | Tel. (212) 214-5615 |
| Barclays Capital Inc. | |
| Daniel Vinson | Tel. (212) 528-8224 |
| Brian Wiele | Tel. (212) 412-5780 |
| Brian La Belle | Tel. (212) 526-1809 |
THE INFORMATION IN THIS STRUCTURAL AND COLLATERAL TERM SHEET IS NOT COMPLETE AND MAY BE AMENDED PRIOR TO THE TIME OF SALE. THIS TERM SHEET IS NOT AN OFFER TO SELL THESE SECURITIES AND IT IS NOT A SOLICITATION OF AN OFFER TO BUY THESE SECURITIES IN ANY JURISDICTION WHERE THE OFFER OR SALE IS NOT PERMITTED.
135