Wells Fargo Commercial Mortgage Securities
Filed: 23 Apr 18, 12:00am
| FREE WRITING PROSPECTUS | ||
| FILED PURSUANT TO RULE 433 | ||
| REGISTRATION FILE NO.: 333-206677-24 | ||
 |  |
Free Writing Prospectus
Structural and Collateral Term Sheet
$766,689,123
(Approximate Initial Pool Balance)
$654,560,000
(Approximate Aggregate Certificate Balance of Offered Certificates)
Wells Fargo Commercial Mortgage Trust 2018-C44
as Issuing Entity
Wells Fargo Commercial Mortgage Securities, Inc.
as Depositor
Wells Fargo Bank, National Association
Barclays Bank PLC
Ladder Capital Finance LLC
Argentic Real Estate Finance LLC
as Sponsors and Mortgage Loan Sellers
Commercial Mortgage Pass-Through Certificates
Series 2018-C44
April 23, 2018
WELLS FARGO SECURITIES Co-Lead Manager and Joint Bookrunner | BARCLAYS Co-Lead Manager and Joint Bookrunner | |
Academy Securities Co-Manager |
STATEMENT REGARDING THIS FREE WRITING PROSPECTUS
The depositor has filed a registration statement (including a prospectus) with the Securities and Exchange Commission (‘‘SEC’’) (SEC File No. 333-206677) for the offering to which this communication relates. Before you invest, you should read the prospectus in the registration statement and other documents the depositor has filed with the SEC for more complete information about the depositor, the issuing entity and this offering. You may get these documents for free by visiting EDGAR on the SEC Web site at www.sec.gov. Alternatively, the depositor, any underwriter, or any dealer participating in the offering will arrange to send you the prospectus after filing if you request it by calling toll free 1-800-745-2063 (8 a.m. – 5 p.m. EST) or by emailing wfs.cmbs@wellsfargo.com.
Nothing in this document constitutes an offer of securities for sale in any jurisdiction where the offer or sale is not permitted. The information contained herein is preliminary as of the date hereof, supersedes any such information previously delivered to you and will be superseded by any such information subsequently delivered and ultimately by the final prospectus relating to the securities. These materials are subject to change, completion, supplement or amendment from time to time.
This free writing prospectus has been prepared by the underwriters for information purposes only and does not constitute, in whole or in part, a prospectus for the purposes of Directive 2003/71/EC (as amended) and/or Part VI of the Financial Services and Markets Act 2000, as amended, or other offering document.
STATEMENT REGARDING ASSUMPTIONS AS TO SECURITIES, PRICING ESTIMATES AND OTHER INFORMATION
The attached information contains certain tables and other statistical analyses (the “Computational Materials”) which have been prepared in reliance upon information furnished by the Mortgage Loan Sellers. Numerous assumptions were used in preparing the Computational Materials, which may or may not be reflected herein. As such, no assurance can be given as to the Computational Materials’ accuracy, appropriateness or completeness in any particular context; or as to whether the Computational Materials and/or the assumptions upon which they are based reflect present market conditions or future market performance. The Computational Materials should not be construed as either projections or predictions or as legal, tax, financial or accounting advice. You should consult your own counsel, accountant and other advisors as to the legal, tax, business, financial and related aspects of a purchase of these securities. Any weighted average lives, yields and principal payment periods shown in the Computational Materials are based on prepayment and/or loss assumptions, and changes in such prepayment and/or loss assumptions may dramatically affect such weighted average lives, yields and principal payment periods. In addition, it is possible that prepayments or losses on the underlying assets will occur at rates higher or lower than the rates shown in the attached Computational Materials. The specific characteristics of the securities may differ from those shown in the Computational Materials due to differences between the final underlying assets and the preliminary underlying assets used in preparing the Computational Materials. The principal amount and designation of any security described in the Computational Materials are subject to change prior to issuance. None of Wells Fargo Securities, LLC, Barclays Capital Inc., Academy Securities, Inc., or any of their respective affiliates, make any representation or warranty as to the actual rate or timing of payments or losses on any of the underlying assets or the payments or yield on the securities. The information in this presentation is based upon management forecasts and reflects prevailing conditions and management’s views as of this date, all of which are subject to change. In preparing this presentation, we have relied upon and assumed, without independent verification, the accuracy and completeness of all information available from public sources or which was provided to us by or on behalf of the Mortgage Loan Sellers or which was otherwise reviewed by us.
This free writing prospectus contains certain forward-looking statements. If and when included in this free writing prospectus, the words “expects”, “intends”, “anticipates”, “estimates” and analogous expressions and all statements that are not historical facts, including statements about our beliefs or expectations, are intended to identify forward-looking statements. Any forward-looking statements are made subject to risks and uncertainties which could cause actual results to differ materially from those stated. Those risks and uncertainties include, among other things, declines in general economic and business conditions, increased competition, changes in demographics, changes in political and social conditions, regulatory initiatives and changes in customer preferences, many of which are beyond our control and the control of any other person or entity related to this offering. The forward-looking statements made in this free writing prospectus are made as of the date stated on the cover. We have no obligation to update or revise any forward-looking statement.
Wells Fargo Securities is the trade name for the capital markets and investment banking services of Wells Fargo & Company and its subsidiaries, including but not limited to Wells Fargo Securities, LLC, a member of NYSE, FINRA, NFA and SIPC, Wells Fargo Prime Services, LLC, a member of FINRA, NFA and SIPC, and Wells Fargo Bank, N.A. Wells Fargo Securities, LLC and Wells Fargo Prime Services, LLC are distinct entities from affiliated banks and thrifts.
IMPORTANT NOTICE REGARDING THE OFFERED CERTIFICATES
The information herein is preliminary and may be supplemented or amended prior to the time of sale. In addition, the Offered Certificates referred to in these materials and the asset pool backing them are subject to modification or revision (including the possibility that one or more classes of certificates may be split, combined or eliminated at any time prior to issuance or availability of a final prospectus) and are offered on a “when, as and if issued” basis.
The underwriters described in these materials may from time to time perform investment banking services for, or solicit investment banking business from, any company named in these materials. The underwriters and/or their affiliates or respective employees may from time to time have a long or short position in any security or contract discussed in these materials.
The information contained herein supersedes any previous such information delivered to any prospective investor and will be superseded by information delivered to such prospective investor prior to the time of sale.
IMPORTANT NOTICE RELATING TO AUTOMATICALLY-GENERATED EMAIL DISCLAIMERS
Any legends, disclaimers or other notices that may appear at the bottom of any email communication to which this free writing prospectus is attached relating to (1) these materials not constituting an offer (or a solicitation of an offer), (2) any representation that these materials are accurate or complete and may not be updated or (3) these materials possibly being confidential, are not applicable to these materials and should be disregarded. Such legends, disclaimers or other notices have been automatically generated as a result of these materials having been sent via Bloomberg or another system.
THE INFORMATION IN THIS STRUCTURAL AND COLLATERAL TERM SHEET IS NOT COMPLETE AND MAY BE AMENDED PRIOR TO THE TIME OF SALE. THIS TERM SHEET IS NOT AN OFFER TO SELL THESE SECURITIES AND IT IS NOT A SOLICITATION OF AN OFFER TO BUY THESE SECURITIES IN ANY JURISDICTION WHERE THE OFFER OR SALE IS NOT PERMITTED.
2
| Wells Fargo Commercial Mortgage Trust 2018-C44 | Certificate Structure |
I. Certificate Structure
| Class | Expected Ratings (DBRS/Fitch/Moody’s)(1) | Approximate Initial Certificate Balance or Notional Amount(2) | Approx. Initial Credit Support(3) | Pass-Through Rate Description | Weighted Average Life (Years)(4) | Expected Principal Window(4) | Certificate Principal to Value Ratio(5) | Certificate Principal U/W NOI Debt Yield(6) | ||
| Offered Certificates | ||||||||||
| A-1 | AAA(sf)/AAAsf/Aaa(sf) | $20,962,000 | 30.000% | (7) | 2.81 | 06/18 - 03/23 | 44.0% | 14.8% | ||
| A-2 | AAA(sf)/AAAsf/Aaa(sf) | $27,202,000 | 30.000% | (7) | 4.93 | 03/23 - 05/23 | 44.0% | 14.8% | ||
| A-3 | AAA(sf)/AAAsf/Aaa(sf) | $6,828,000 | 30.000% | (7) | 7.99 | 05/26 – 05/26 | 44.0% | 14.8% | ||
| A-SB | AAA(sf)/AAAsf/Aaa(sf) | $37,620,000 | 30.000% | (7) | 7.40 | 05/23 – 01/28 | 44.0% | 14.8% | ||
| A-4 | AAA(sf)/AAAsf/Aaa(sf) | (8) | 30.000% | (7) | (8) | (8) | 44.0% | 14.8% | ||
| A-5 | AAA(sf)/AAAsf/Aaa(sf) | (8) | 30.000% | (7) | (8) | (8) | 44.0% | 14.8% | ||
| X-A | AAA(sf)/AAAsf/Aaa(sf) | $536,682,000(9) | N/A | Variable(10) | N/A | N/A | N/A | N/A | ||
| X-B | A(high)(sf)/A-sf/NR | $117,878,000(11) | N/A | Variable(12) | N/A | N/A | N/A | N/A | ||
| A-S | AAA(sf)/AAAsf/Aa2(sf) | $43,126,000 | 24.375% | (7) | 9.91 | 04/28 – 04/28 | 47.5% | 13.7% | ||
| B | AA(sf)/AA-sf/NR | $36,418,000 | 19.625% | (7) | 9.91 | 04/28 – 04/28 | 50.5% | 12.9% | ||
| C | A(sf)/A-sf/NR | $38,334,000 | 14.625% | (7) | 9.91 | 04/28 – 04/28 | 53.7% | 12.1% | ||
| Non-Offered Certificates | ||||||||||
| X-D(13) | BBB(high)(sf)/BBB-sf/NR | $32,086,000(14) | N/A | Variable(15) | N/A | N/A | N/A | N/A | ||
| D(13) | BBB(sf)/BBB-sf/NR | $32,086,000 | 10.440% | (7) | 9.91 | 04/28 – 04/28 | 56.3% | 11.6% | ||
| Risk Retention Certificates | ||||||||||
| E-RR(13) | BBB(low)(sf)/BBB-sf/NR | $12,957,000 | 8.750% | (7) | 9.96 | 04/28 – 05/28 | 57.4% | 11.4% | ||
| F-RR | BB(sf)/BB-sf/NR | $21,084,000 | 6.000% | (7) | 9.99 | 05/28 – 05/28 | 59.1% | 11.0% | ||
| G-RR | B(high)(sf)/B-sf/NR | $8,626,000 | 4.875% | (7) | 9.99 | 05/28 – 05/28 | 59.8% | 10.9% | ||
| H-RR | NR/NR/NR | $37,376,123 | 0.000% | (7) | 9.99 | 05/28 – 05/28 | 62.9% | 10.4% | ||
| Notes: | ||||||||||
| (1) | The expected ratings presented are those of DBRS, Inc. (“DBRS”), Fitch Ratings, Inc. (“Fitch”) and Moody’s Investors Service, Inc. (“Moody’s”), which the depositor hired to rate the Offered Certificates. One or more other nationally recognized statistical rating organizations that were not hired by the depositor may use information they receive pursuant to Rule 17g-5 under the Securities Exchange Act of 1934, as amended (the “Exchange Act”) or otherwise, to rate or provide market reports and/or published commentary related to the Offered Certificates. We cannot assure you as to what ratings a non-hired nationally recognized statistical rating organization would assign or that its reports will not express differing, possibly negative, views of the mortgage loans and/or the Offered Certificates. The ratings of each class of Offered Certificates address the likelihood of the timely distribution of interest and, except in the case of the Class X-A, X-B and X-D Certificates, the ultimate distribution of principal due on those classes on or before the Rated Final Distribution Date. See “Risk Factors—Other Risks Relating to the Certificates—Nationally Recognized Statistical Rating Organizations May Assign Different Ratings to the Certificates; Ratings of the Certificates Reflect Only the Views of the Applicable Rating Agencies as of the Dates Such Ratings Were Issued; Ratings May Affect ERISA Eligibility; Ratings May Be Downgraded” and “Ratings” in the Preliminary Prospectus, expected to be dated April 24, 2018 (the “Preliminary Prospectus”). DBRS, Fitch and Moody’s have informed us that the “sf” designation in their ratings represents an identifier for structured finance product ratings. | |||||||||
| (2) | The certificate balances and notional amounts set forth in the table are approximate. The actual initial certificate balances and notional amounts may be larger or smaller depending on the initial pool balance of the mortgage loans definitively included in the pool of mortgage loans, which aggregate cut-off date balance may be as much as 5% larger or smaller than the amount presented in the Preliminary Prospectus. In addition, the notional amounts of the Class X-A, X-B and X-D certificates may vary depending upon the final pricing of the classes of principal balance certificates whose certificate balances comprise such notional amounts, and, if, as a result of such pricing, the pass-through rate of the Class X-A, X-B or X-D certificates, as applicable, would be equal to zero at all times, such class of certificates may not be issued on the closing date of this securitization. | |||||||||
| (3) | The approximate initial credit support with respect to the Class A-1, A-2, A-3, A-SB, A-4 and A-5 Certificates represents the approximate credit enhancement for the Class A-1, A-2, A-3, A-SB, A-4 and A-5 Certificates in the aggregate. | |||||||||
| (4) | Weighted Average Lives and Expected Principal Windows are calculated based on an assumed prepayment rate of 0% CPR and the “Structuring Assumptions” described under “Yield and Maturity Considerations—Weighted Average Life” in the Preliminary Prospectus. | |||||||||
| (5) | The Certificate Principal to Value Ratio for each Class of Certificates (other than the Class A-1, A-2, A-3, A-SB, A-4 and A-5 Certificates) is calculated as the product of (a) the weighted average Cut-off Date LTV Ratio for the mortgage loans and (b) a fraction, the numerator of which is the total initial Certificate Balance of such Class of Certificates and all Classes of Principal Balance Certificates (as defined in the Preliminary Prospectus) senior to such Class of Certificates and the denominator of which is the total initial Certificate Balance of all of the Principal Balance Certificates. The Certificate Principal to Value Ratio for each of the Class A-1, A-2, A-3, A-SB, A-4 and A-5 Certificates is calculated in the aggregate for those Classes as if they were a single Class and is calculated as the product of (a) the weighted average Cut-off Date LTV Ratio for the mortgage loans and (b) a fraction, the numerator of which is the total initial aggregate Certificate Balances of such Classes of Certificates and the denominator of which is the total initial Certificate Balance of all of the Principal Balance Certificates. In any event, however, excess mortgaged property value associated with a mortgage loan will not be available to offset losses on any other mortgage loan. | |||||||||
| (6) | The Certificate Principal U/W NOI Debt Yield for each Class of Certificates (other than the Class A-1, A-2, A-3, A-SB, A-4 and A-5 Certificates) is calculated as the product of (a) the weighted average U/W NOI Debt Yield for the mortgage loans and (b) a fraction, the numerator of which is the total initial Certificate Balance of all of the Classes of Principal Balance Certificates and the denominator of which is the total initial Certificate Balance for such Class of Certificates and all Classes of Principal Balance Certificates senior to such Class of Certificates. The Certificate Principal U/W NOI Debt Yield for each of the Class A-1, A-2, A-3, A-SB, A-4 and A-5 Certificates is calculated in the aggregate for those Classes as if they were a single Class and is calculated as the product of (a) the weighted average U/W NOI Debt Yield for the mortgage loans and (b) a fraction, the numerator of which is the total initial Certificate Balance of all of the Classes of Principal Balance Certificates and the denominator of which is the total aggregate initial Certificate Balances for the Class A-1, A-2, A-3, A-SB, A-4 and A-5 Certificates. In any event, however, cash flow from each mortgaged property supports only the related mortgage loan and will not be available to support any other mortgage loan. | |||||||||
| (7) | The pass-through rates for the Class A-1, A-2, A-3, A-SB, A-4, A-5, A-S, B, C, D, E-RR, F-RR, G-RR and H-RR Certificates in each case will be one of the following: (i) a fixed rateper annum, (ii) a variable rate per annum equal to the weighted average of the net mortgage interest rates on the mortgage loans for the related distribution date, (iii) a variable rateper annum equal to the lesser of (a) a fixed rate and (b) the weighted average of the net mortgage interest rates on the mortgage loans for the related distribution date or (iv) a variable rateper annum equal to the weighted average of the net mortgage interest rates on the mortgage loans for the related | |||||||||
THE INFORMATION IN THIS STRUCTURAL AND COLLATERAL TERM SHEET IS NOT COMPLETE AND MAY BE AMENDED PRIOR TO THE TIME OF SALE. THIS TERM SHEET IS NOT AN OFFER TO SELL THESE SECURITIES AND IT IS NOT A SOLICITATION OF AN OFFER TO BUY THESE SECURITIES IN ANY JURISDICTION WHERE THE OFFER OR SALE IS NOT PERMITTED.
3
| Wells Fargo Commercial Mortgage Trust 2018-C44 | Certificate Structure |
| distribution date minus a specified percentage. For purposes of the calculation of the weighted average of the net mortgage interest rates on the mortgage loans for each distribution date, the mortgage interest rates will be adjusted as necessary to a 30/360 basis. | ||
| (8) | The exact initial certificate balances of the Class A-4 and A-5 Certificates are unknown and will be determined based on the final pricing of those classes of certificates. However, the respective initial certificate balances, final distribution dates, weighted average lives and principal windows of the Class A-4 and A-5 Certificates are expected to be within the applicable ranges reflected in the following chart. The aggregate initial certificate balance of the Class A-4 and A-5 Certificates is expected to be approximately $444,070,000, subject to a variance of plus or minus 5%. |
| Class of Certificates | Expected Range of Approximate Initial Certificate Balance | Expected Range of Weighted Average Life (Years) | Expected Range of Principal Window | |||
| Class A-4 | $100,000,000 - $220,000,000 | 9.77 – 9.83 | 01/28 – 03/28 / 01/28 – 04/28 | |||
| Class A-5 | $224,070,000 - $344,070,000 | 9.90 – 9.91 | 03/28 – 04/28 / 04/28 – 04/28 |
| (9) | The Class X-A Certificates are notional amount certificates. The Notional Amount of the Class X-A Certificates will be equal to the aggregate Certificate Balance of the Class A-1, A-2, A-3, A-SB, A-4 and A-5 Certificates outstanding from time to time. The Class X-A Certificates will not be entitled to distributions of principal. | |
| (10) | The pass-through rate for the Class X-A Certificates for any distribution date will be aper annum rate equal to the excess, if any, of (a) the weighted average of the net mortgage interest rates on the mortgage loans for the related distribution date, over (b) the weighted average of the pass-through rates on the Class A-1, A-2, A-3, A-SB, A-4 and A-5 Certificates for the related distribution date, weighted on the basis of their respective Certificate Balances outstanding immediately prior to that distribution date. For purposes of the calculation of the weighted average of the net mortgage interest rates on the mortgage loans for each distribution date, the mortgage interest rates will be adjusted as necessary to a 30/360 basis. | |
| (11) | The Class X-B Certificates are notional amount certificates. The Notional Amount of the Class X-B Certificates will be equal to the aggregate Certificate Balance of the Class A-S, B and C Certificates outstanding from time to time. The Class X-B Certificates will not be entitled to distributions of principal. | |
| (12) | The pass-through rate for the Class X-B Certificates for any distribution date will be aper annum rate equal to the excess, if any, of (a) the weighted average of the net mortgage interest rates on the mortgage loans for the related distribution date, over (b) the weighted average of the pass-through rates on the Class A-S, B and C Certificates for the related distribution date, weighted on the basis of their respective Certificate Balances outstanding immediately prior to that distribution date. For purposes of the calculation of the weighted average of the net mortgage interest rates on the mortgage loans for each distribution date, the mortgage interest rates will be adjusted as necessary to a 30/360 basis. | |
| (13) | The initial notional amount of the X-D certificates and the initial certificate balance of each of the Class D and E-RR certificates are subject to change based on final pricing of all certificates and the final determination of the Class E-RR, F-RR, G-RR and H-RR Certificates (collectively, the “horizontal risk retention certificates”) that will be retained by the retaining sponsor through a third party purchaser as part of the U.S. risk retention requirements. For more information regarding the methodology and key inputs and assumptions used to determine the sizing of the horizontal risk retention certificates, see “Credit Risk Retention” in the Preliminary Prospectus. | |
| (14) | The Class X-D Certificates are notional amount certificates. The Notional Amount of the Class X-D Certificates will be equal to the Certificate Balance of the Class D Certificates outstanding from time to time. The Class X-D Certificates will not be entitled to distributions of principal. | |
| (15) | The pass-through rate for the Class X-D Certificates for any distribution date will be aper annum rate equal to the excess, if any, of (a) the weighted average of the net mortgage interest rates on the mortgage loans for the related distribution date, over (b) the pass-through rate on the Class D Certificates for the related distribution date. For purposes of the calculation of the weighted average of the net mortgage interest rates on the mortgage loans for each distribution date, the mortgage interest rates will be adjusted as necessary to a 30/360 basis. | |
THE INFORMATION IN THIS STRUCTURAL AND COLLATERAL TERM SHEET IS NOT COMPLETE AND MAY BE AMENDED PRIOR TO THE TIME OF SALE. THIS TERM SHEET IS NOT AN OFFER TO SELL THESE SECURITIES AND IT IS NOT A SOLICITATION OF AN OFFER TO BUY THESE SECURITIES IN ANY JURISDICTION WHERE THE OFFER OR SALE IS NOT PERMITTED.
4
| Wells Fargo Commercial Mortgage Trust 2018-C44 | Transaction Highlights |
II. Transaction Highlights
Mortgage Loan Sellers:
| Mortgage Loan Seller | Number of Mortgage Loans | Number of Mortgaged Properties | Aggregate Cut-off Date Balance | % of Initial Pool Balance | |||||
| Wells Fargo Bank, National Association | 14 | 22 | $310,143,327 | 40.5 | % | ||||
| Barclays Bank PLC | 8 | 8 | 196,985,481 | 25.7 | |||||
| Ladder Capital Finance LLC | 17 | 18 | 193,944,528 | 25.3 | |||||
| Argentic Real Estate Finance LLC | 5 | 7 | 65,615,788 | 8.6 | |||||
| Total | 44 | 55 | $766,689,123 | 100.0 | % | ||||
Loan Pool:
| Initial Pool Balance: | $766,689,123 |
| Number of Mortgage Loans: | 44 |
| Average Cut-off Date Balance per Mortgage Loan: | $17,424,753 |
| Number of Mortgaged Properties: | 55 |
| Average Cut-off Date Balance per Mortgaged Property(1): | $13,939,802 |
| Weighted Average Mortgage Interest Rate: | 4.858% |
| Ten Largest Mortgage Loans as % of Initial Pool Balance: | 52.2% |
| Weighted Average Original Term to Maturity or ARD (months): | 118 |
| Weighted Average Remaining Term to Maturity or ARD (months): | 117 |
| Weighted Average Original Amortization Term (months)(2): | 349 |
| Weighted Average Remaining Amortization Term (months)(2): | 349 |
| Weighted Average Seasoning (months): | 1 |
| (1) | Information regarding mortgage loans secured by multiple properties is based on an allocation according to relative appraised values or the allocated loan amounts or property-specific release prices set forth in the related loan documents or such other allocation as the related mortgage loan seller deemed appropriate. |
| (2) | Excludes any mortgage loan that does not amortize. |
Credit Statistics:
| Weighted Average U/W Net Cash Flow DSCR(1): | 1.71x |
| Weighted Average U/W Net Operating Income Debt Yield(1): | 10.4% |
| Weighted Average Cut-off Date Loan-to-Value Ratio(1): | 62.9% |
| Weighted Average Balloon or ARD Loan-to-Value Ratio(1): | 57.5% |
| % of Mortgage Loans with Additional Subordinate Debt(2): | 10.0% |
| % of Mortgage Loans with Single Tenants(3): | 25.9% |
| (1) | With respect to any mortgage loan that is part of a whole loan, loan-to-value ratio, debt service coverage ratio and debt yield calculations include the relatedpari passu companion loan(s) but exclude any related subordinate debt (unless otherwise stated). The debt service coverage ratio, debt yield and loan-to-value ratio information do not take into account any subordinate debt (whether or not secured by the related mortgaged property), that currently exists or is allowed under the terms of any mortgage loan. See “Description of the Mortgage Pool—Mortgage Pool Characteristics” in the Preliminary Prospectus and Annex A-1 to the Preliminary Prospectus. |
| (2) | The percentage figure expressed as “% of Mortgage Loans with Additional Subordinate Debt” is determined as a percentage of the initial pool balance and does not take into account any future subordinate debt (whether or not secured by the mortgaged property), if any, that may be permitted under the terms of any mortgage loan or the pooling and servicing agreement. See “Description of the Mortgage Pool—Additional Indebtedness—Other Unsecured Indebtedness” in the Preliminary Prospectus. |
| (3) | Excludes mortgage loans that are secured by multiple single tenant properties. |
THE INFORMATION IN THIS STRUCTURAL AND COLLATERAL TERM SHEET IS NOT COMPLETE AND MAY BE AMENDED PRIOR TO THE TIME OF SALE. THIS TERM SHEET IS NOT AN OFFER TO SELL THESE SECURITIES AND IT IS NOT A SOLICITATION OF AN OFFER TO BUY THESE SECURITIES IN ANY JURISDICTION WHERE THE OFFER OR SALE IS NOT PERMITTED.
5
| Wells Fargo Commercial Mortgage Trust 2018-C44 | Transaction Highlights |
Loan Structural Features:
Amortization:Based on the Initial Pool Balance, 56.3% of the mortgage pool (27 mortgage loans) has scheduled amortization, as follows:
34.9% (13 mortgage loans) provides for an interest-only period followed by an amortization period; and
21.4% (14 mortgage loans) requires amortization during the entire loan term.
Interest-Only:Based on the Initial Pool Balance, 43.7% of the mortgage pool (17 mortgage loans) provides for interest-only payments during the entire loan term through maturity or ARD. The Weighted Average Cut-off Date Loan-to-Value Ratio and Weighted Average U/W Net Cash Flow DSCR for those mortgage loans are 59.3% and 1.89x, respectively.
Hard Lockboxes: Based on the Initial Pool Balance, 69.0% of the mortgage pool (24 mortgage loans) have hard lockboxes in place.
Reserves: The mortgage loans require amounts to be escrowed monthly as follows (excluding any mortgage loans with springing provisions):
| Real Estate Taxes: | 83.9% of the pool |
| Insurance: | 43.1% of the pool |
| Capital Replacements: | 83.8% of the pool |
| TI/LC: | 69.7% of the pool(1) |
| (1) The percentage of Initial Pool Balance for mortgage loans with TI/LC reserves is based on the aggregate principal balance allocable to loans that include retail, office, mixed use and industrial properties. | |
Call Protection/Defeasance: Based on the Initial Pool Balance, the mortgage pool has the following call protection and defeasance features:
93.9% of the mortgage pool (41 mortgage loans) features a lockout period, then defeasance only until an open period;
3.9% of the mortgage pool (1 mortgage loan) features a lockout period, then the greater of a prepayment premium or yield maintenance, then the greater of a prepayment premium or yield maintenance or defeasance until an open period;
2.1% of the mortgage pool (1 mortgage loan) features a lockout period, then the greater of a prepayment premium or yield maintenance until an open period; and
0.1% of the mortgage pool (1 mortgage loan) features yield maintenance, then yield maintenance or defeasance until an open period;
Prepayment restrictions for each mortgage loan reflect the entire life of the mortgage loan. Please refer to Annex A-1 to the Preliminary Prospectus and the footnotes related thereto for further information regarding individual loan call protection.
THE INFORMATION IN THIS STRUCTURAL AND COLLATERAL TERM SHEET IS NOT COMPLETE AND MAY BE AMENDED PRIOR TO THE TIME OF SALE. THIS TERM SHEET IS NOT AN OFFER TO SELL THESE SECURITIES AND IT IS NOT A SOLICITATION OF AN OFFER TO BUY THESE SECURITIES IN ANY JURISDICTION WHERE THE OFFER OR SALE IS NOT PERMITTED.
6
| Wells Fargo Commercial Mortgage Trust 2018-C44 | Issue Characteristics |
| III. | Issue Characteristics |
| Securities Offered: | $654,560,000 approximate monthly pay, multi-class, commercial mortgage REMIC pass-through certificates consisting of eleven classes (Classes A-1, A-2, A-3, A-SB, A-4, A-5, A-S, B, C, X-A and X-B), which are offered pursuant to a registration statement filed with the SEC (such classes of certificates, the “Offered Certificates”). | |
| Mortgage Loan Sellers: | Wells Fargo Bank, National Association (“WFB”), Barclays Bank PLC (“Barclays”), Ladder Capital Finance LLC (“LCF”) and Argentic Real Estate Finance LLC (“AREF”). | |
| Joint Bookrunners and Co-Lead Managers: | Wells Fargo Securities, LLC and Barclays Capital Inc. | |
| Co-Manager: | Academy Securities, Inc. | |
| Rating Agencies: | DBRS, Inc., Fitch Ratings, Inc. and Moody’s Investors Service, Inc. | |
| Master Servicer: | Wells Fargo Bank, National Association | |
| Special Servicer: | Rialto Capital Advisors, LLC | |
| Certificate Administrator: | Wells Fargo Bank, National Association | |
| Trustee: | Wilmington Trust, National Association | |
| Operating Advisor: | Pentalpha Surveillance LLC | |
| Asset Representations Reviewer: | Pentalpha Surveillance LLC | |
| Initial Majority Controlling Class Certificateholder: | RREF III-D AIV RR H, LLC or an affiliate | |
| U.S. Credit Risk Retention: | For a discussion on the manner in which the U.S. credit risk retention requirements will be satisfied by Wells Fargo Bank, National Association, as the retaining sponsor, see “Credit Risk Retention” in the Preliminary Prospectus.
This transaction is being structured with a “third party purchaser” that will acquire an “eligible horizontal residual interest”, which will be comprised of the Class E-RR, F-RR, G-RR and H-RR certificates (the “horizontal risk retention certificates”). RREF III-D AIV RR H, LLC (in satisfaction of the retention obligations of Wells Fargo Bank, National Association, as the retaining sponsor) will be contractually obligated to retain the horizontal risk retention certificates for a minimum of five years after the closing date, subject to certain permitted exceptions provided for under the risk retention rules. During this time, RREF III-D AIV RR H, LLC will agree to comply with hedging, transfer and financing restrictions that are applicable to third party purchasers under the credit risk retention rules. For additional information, see “Credit Risk Retention” in the Preliminary Prospectus. | |
| EU Credit Risk Retention | None of the sponsors, the depositor or the issuing entity intends to retain a material net economic interest in the securitization constituted by the issue of the Offered Certificates in accordance with the EU risk retention and due diligence requirements or to take any other action which may be required by EEA-regulated investors for the purposes of their compliance with the EU risk retention and due diligence requirements or similar requirements. | |
| Cut-off Date: | The Cut-off Date with respect to each mortgage loan is the due date for the monthly debt service payment that is due in May 2018 (or, in the case of any mortgage loan that has its first due date in June 2018, the date that would have been its due date in May 2018 under the terms of that mortgage loan if a monthly debt service payment were scheduled to be due in that month). | |
| Expected Closing Date: | On or about May 17, 2018. | |
| Determination Dates: | The 11th day of each month (or if that day is not a business day, the next succeeding business day), commencing in June 2018. | |
| Distribution Dates: | The fourth business day following the Determination Date in each month, commencing in June 2018. | |
| Rated Final Distribution Date: | The Distribution Date in May 2051. | |
| Interest Accrual Period: | With respect to any Distribution Date, the calendar month immediately preceding the month in which such Distribution Date occurs. |
THE INFORMATION IN THIS STRUCTURAL AND COLLATERAL TERM SHEET IS NOT COMPLETE AND MAY BE AMENDED PRIOR TO THE TIME OF SALE. THIS TERM SHEET IS NOT AN OFFER TO SELL THESE SECURITIES AND IT IS NOT A SOLICITATION OF AN OFFER TO BUY THESE SECURITIES IN ANY JURISDICTION WHERE THE OFFER OR SALE IS NOT PERMITTED.
7
| Wells Fargo Commercial Mortgage Trust 2018-C44 | Issue Characteristics |
| Day Count: | The Offered Certificates will accrue interest on a 30/360 basis. | |
| Minimum Denominations: | $10,000 for each Class of Offered Certificates (other than the Class X-A and X-B Certificates) and $1,000,000 for the Class X-A and X-B Certificates. Investments may also be made in any whole dollar denomination in excess of the applicable minimum denomination. | |
| Clean-up Call: | 1.0% | |
| Delivery: | DTC, Euroclear and Clearstream Banking | |
| ERISA/SMMEA Status: | Each Class of Offered Certificates is expected to be eligible for exemptive relief under ERISA. No Class of Offered Certificates will be SMMEA eligible. | |
| Risk Factors: | THE CERTIFICATES INVOLVE CERTAIN RISKS AND MAY NOT BE SUITABLE FOR ALL INVESTORS. SEE THE “RISK FACTORS” SECTION OF THE PRELIMINARY PROSPECTUS. | |
| Bond Analytics Information: | The Certificate Administrator will be authorized to make distribution date statements, CREFC® reports and certain supplemental reports (other than confidential information) available to certain financial modeling and data provision services, including Bloomberg, L.P., Trepp, LLC, Intex Solutions, Inc., Markit Group Limited, Interactive Data Corp., BlackRock Financial Management, Inc., CMBS.com, Inc., Moody’s Analytics, MBS Data, LLC and Thomson Reuters Corporation. |
THE INFORMATION IN THIS STRUCTURAL AND COLLATERAL TERM SHEET IS NOT COMPLETE AND MAY BE AMENDED PRIOR TO THE TIME OF SALE. THIS TERM SHEET IS NOT AN OFFER TO SELL THESE SECURITIES AND IT IS NOT A SOLICITATION OF AN OFFER TO BUY THESE SECURITIES IN ANY JURISDICTION WHERE THE OFFER OR SALE IS NOT PERMITTED.
8
| Wells Fargo Commercial Mortgage Trust 2018-C44 | Characteristics of the Mortgage Pool |
| IV. | Characteristics of the Mortgage Pool(1) |
| A. | Ten Largest Mortgage Loans |
| Mortgage Loan Seller | Mortgage Loan Name | City | State | Number of Mortgage Loans / Mortgaged Properties | Mortgage Loan Cut-off Date Balance ($) | % of Initial Pool Balance (%) | Property Type | Number of SF/Rooms | Cut-off Date Balance Per SF/Room | Cut-off Date LTV Ratio (%) | Balloon or ARD LTV Ratio (%) | U/W NCF DSCR (x) | U/W NOI Debt Yield (%) |
| WFB | Village at Leesburg | Leesburg | VA | 1 | $66,000,000 | 8.6% | Retail | 546,107(2) | $240(2) | 58.1% | 53.4% | 1.28x | 8.4% |
| Barclays | 3495 Deer Creek Road | Palo Alto | CA | 1 | 50,000,000 | 6.5 | Office | 81,031 | 617 | 55.5 | 55.5 | 1.65 | 8.9 |
| WFB | Airport Business Center | Irvine | CA | 1 | 47,000,000 | 6.1 | Industrial | 1,170,571 | 128 | 61.3 | 61.3 | 2.12 | 9.8 |
| Barclays | Dulaney Center | Towson | MD | 1 | 47,000,000 | 6.1 | Office | 316,348 | 149 | 69.8 | 61.5 | 1.54 | 11.2 |
| WFB | Northwest Hotel Portfolio | Various | Various | 7 | 39,833,178 | 5.2 | Hospitality | 818 | 138,179 | 65.1 | 48.8 | 1.78 | 13.8 |
| LCF | Konica Minolta Business Solutions HQ | Ramsey | NJ | 1 | 33,250,000 | 4.3 | Mixed Use | 277,942 | 120 | 68.3 | 68.3 | 1.83 | 9.1 |
| Barclays | 181 Fremont Street | San Francisco | CA | 1 | 30,000,000 | 3.9 | Office | 436,332 | 573 | 39.6 | 39.6 | 3.14 | 11.8 |
| LCF | Re/Max Plaza | Denver | CO | 1 | 30,000,000 | 3.9 | Office | 242,497 | 270 | 56.5 | 56.5 | 1.99 | 10.1 |
| AREF | Prince and Spring Street Portfolio | New York | NY | 3 | 30,000,000 | 3.9 | Mixed Use | 32,260 | 1,271 | 62.1 | 62.1 | 1.20 | 6.5 |
| Barclays | 100 Domain Drive | Exeter | NH | 1 | 27,000,000 | 3.5 | Office | 257,360 | 105 | 69.4 | 60.9 | 1.75 | 11.9 |
| Top Three Total/Weighted Average | 3 / 3 | $163,000,000 | 21.3% | 58.2% | 56.3% | 1.64x | 9.0% | ||||||
| Top Five Total/Weighted Average | 5 / 11 | $249,833,178 | 32.6% | 61.5% | 56.1% | 1.64x | 10.2% | ||||||
| Top Ten Total/Weighted Average | 10 / 18 | $400,083,178 | 52.2% | 60.6% | 56.7% | 1.77x | 10.0% | ||||||
| Non-Top Ten Total/Weighted Average | 34 / 37 | $366,605,945 | 47.8% | 65.3% | 58.3% | 1.64x | 10.7% | ||||||
| (1) | With respect to any mortgage loan that is part of a whole loan, Cut-off Date Balance Per SF/Room, loan-to-value ratio, debt service coverage ratio and debt yield calculations include the relatedpari passu companion loan(s) but exclude any related subordinate debt (unless otherwise stated). With respect to each mortgage loan, debt service coverage ratio, debt yield and loan-to-value ratio information do not take into account subordinate debt (whether or not secured by the related mortgaged property), if any, that currently exists or is allowed under the terms of such mortgage loan. |
| (2) | The Number of SF/Rooms and Cut-off Date Balance Per SF/Room assume the completion of the 12,297 square foot expansion related to Cobb Theatres. Excluding the expansion space, the Number of SF/Rooms and Cut-off Date Balance Per SF/Room are 533,810 and $245.87, respectively. |
THE INFORMATION IN THIS STRUCTURAL AND COLLATERAL TERM SHEET IS NOT COMPLETE AND MAY BE AMENDED PRIOR TO THE TIME OF SALE. THIS TERM SHEET IS NOT AN OFFER TO SELL THESE SECURITIES AND IT IS NOT A SOLICITATION OF AN OFFER TO BUY THESE SECURITIES IN ANY JURISDICTION WHERE THE OFFER OR SALE IS NOT PERMITTED.
9
| Wells Fargo Commercial Mortgage Trust 2018-C44 | Characteristics of the Mortgage Pool |
| B. | Summary of the Whole Loans |
| Property Name | Mortgage Loan Seller in WFCM 2018-C44 | Note(s)(1) | Original Balance | Holder of Note(1) | Lead Servicer for Whole Loan | Master Servicer Under Lead Securitization Servicing Agreement | Special Servicer Under Lead Securitization Servicing Agreement |
| Village at Leesburg | WFB | A-1 | $66,000,000 | WFCM 2018-C44 | Yes | Wells Fargo Bank, National Association | Rialto Capital Advisors, LLC |
| A-2 | $65,250,000 | WFB | No | ||||
| Airport Business Center | WFB | A-1 | $53,000,000 | BANK 2018-BNK11 | Yes(2) | Wells Fargo Bank, National Association(2) | Midland Loan Services, a Division of PNC Bank, National Association(2) |
| A-2 | $50,000,000 | WFCM 2018-C43 | No | ||||
| A-3 | $47,000,000 | WFCM 2018-C44 | No | ||||
| Northwest Hotel Portfolio | WFB | A-1 | $39,900,000 | WFCM 2018-C44 | Yes | Wells Fargo Bank, National Association | Rialto Capital Advisors, LLC |
| A-2 | $40,326,936 | BANK 2018-BNK11 | No(2) | ||||
| A-3 | $32,993,322 | WFB | No | ||||
| 181 Fremont Street | Barclays | A-1 | $50,000,000 | Deutsche Bank AG, New York Branch | Yes(3) | Wells Fargo Bank, National Association(3) | Rialto Capital Advisors, LLC(3) |
| A-2 | $50,000,000 | Deutsche Bank AG, New York Branch | No | ||||
| A-3 | $30,000,000 | Deutsche Bank AG, New York Branch | No | ||||
| A-4 | $30,000,000 | Deutsche Bank AG, New York Branch | No | ||||
| A-5 | $40,000,000 | Deutsche Bank AG, New York Branch | No | ||||
| A-6-1 | $30,000,000 | WFCM 2018-C44 | No | ||||
| A-6-2 | $20,000,000 | Barclays | No | ||||
| Re/Max Plaza | LCF | A-1 | $35,550,000 | LCF | Yes(3) | Wells Fargo Bank, National Association(3) | Rialto Capital Advisors, LLC(3) |
| A-2 | $25,000,000 | WFCM 2018-C44 | No | ||||
| A-3 | $5,000,000 | WFCM 2018-C44 | No | ||||
| Prince and Spring Street Portfolio | AREF | A-1 | $30,000,000 | WFCM 2018-C44 | Yes | Wells Fargo Bank, National Association | Rialto Capital Advisors, LLC |
| A-2 | $11,000,000 | AREF | No | ||||
| Stony Creek Marketplace | AREF | A-1 | $13,600,000 | WFCM 2018-C44 | Yes | Wells Fargo Bank, National Association | Rialto Capital Advisors, LLC |
| A-2 | $8,000,000 | AREF | No |
| (1) | Unless otherwise indicated, each note not currently held by a securitization trust is expected to be contributed to a future securitization. No assurance can be provided that any such note will not be split further. |
| (2) | The BANK 2018-BNK11 transaction is expected to close on April 26, 2018. |
| (3) | The related whole loan is expected to initially be serviced under the WFCM 2018-C44 pooling and servicing agreement until the securitization of the related “lead” pari passu note (namely, the related pari passu note marked “Yes” in the column entitled “Lead Servicer for Whole Loan”), after which the related whole loan will be serviced under the pooling and servicing agreement governing such securitization of the related “lead” pari passu note. The master servicer and special servicer for such securitization will be identified in a notice, report or statement to holders of the WFCM 2018-C44 certificates after the closing of such securitization. |
THE INFORMATION IN THIS STRUCTURAL AND COLLATERAL TERM SHEET IS NOT COMPLETE AND MAY BE AMENDED PRIOR TO THE TIME OF SALE. THIS TERM SHEET IS NOT AN OFFER TO SELL THESE SECURITIES AND IT IS NOT A SOLICITATION OF AN OFFER TO BUY THESE SECURITIES IN ANY JURISDICTION WHERE THE OFFER OR SALE IS NOT PERMITTED.
10
| Wells Fargo Commercial Mortgage Trust 2018-C44 | Characteristics of the Mortgage Pool |
| C. | Mortgage Loans with Additional Secured and Mezzanine Financing(1) |
| Loan No. | Mortgage Loan Seller | Mortgage Loan Name | Mortgage Loan Cut-off Date Balance ($) | % of Initial Pool Balance (%) | Sub Debt Cut-off Date Balance ($) | Mezzanine Debt Cut-off Date Balance ($) | Total Debt Interest Rate (%)(2) | Mortgage Loan U/W NCF DSCR (x)(3) | Total Debt U/W NCF DSCR (x) | Mortgage Loan Cut-off Date U/W NOI Debt Yield (%)(3) | Total Debt Cut-off Date U/W NOI Debt Yield (%) | Mortgage Loan Cut-off Date LTV Ratio (%)(3) | Total Debt Cut-off Date LTV Ratio (%) |
| 3 | WFB | Airport Business Center | $47,000,000 | 6.1% | NAP | $20,000,000 | 4.7081% | 2.12x | 1.74x | 9.8% | 8.6% | 61.3% | 69.5% |
| 7 | Barclays | 181 Fremont Street | 30,000,000 | 3.9 | NAP | 225,000,000 | 4.4340 | 3.14 | 1.38 | 11.8 | 6.2 | 39.6 | 75.2 |
| Total/Weighted Average | $77,000,000 | 10.0% | $245,000,000 | 4.6013% | 2.52x | 1.60x | 10.6% | 7.7% | 52.8% | 71.7% | |||
| (1) | Mortgage Loans with Additional Secured and Mezzanine Financing does not include Springhill Suites – Norfolk, VA. The Springhill Suites – Norfolk, VA property is encumbered by a $3,230,000 subordinate mortgage (the “Junior Mortgage”) between the borrower and Village Ventures, L.L.C. As part of the tax incentive financing to develop the Springhill Suites – Norfolk, VA property, the Junior Mortgage was created for tax purposes as a secondary mortgage with a 0.2% interest rate per annum. At the origination of the Springhill Suites – Norfolk, VA mortgage loan, the borrower escrowed the total debt service estimated by the lender to become due on the Junior Mortgage during the term of the Springhill Suites – Norfolk, VA mortgage loan. |
| (2) | Total Debt Interest Rate for any specified mortgage loan reflects the weighted average of the interest rates on the respective components of the total debt. |
| (3) | With respect to any mortgage loan that is part of a whole loan, the loan-to-value ratio, debt service coverage ratio and debt yield calculations include the related pari passu companion loan(s). |
THE INFORMATION IN THIS STRUCTURAL AND COLLATERAL TERM SHEET IS NOT COMPLETE AND MAY BE AMENDED PRIOR TO THE TIME OF SALE. THIS TERM SHEET IS NOT AN OFFER TO SELL THESE SECURITIES AND IT IS NOT A SOLICITATION OF AN OFFER TO BUY THESE SECURITIES IN ANY JURISDICTION WHERE THE OFFER OR SALE IS NOT PERMITTED.
11
| Wells Fargo Commercial Mortgage Trust 2018-C44 | Characteristics of the Mortgage Pool |
| D. | Previous Securitization History(1) |
| Loan No. | Mortgage Loan Seller | Mortgage Loan or Mortgaged Property Name | City | State | Property Type | Mortgage Loan or Mortgaged Property Cut-off Date Balance ($) | % of Initial Pool Balance (%) | Previous Securitization |
| 3 | WFB | Airport Business Center | Irvine | CA | Industrial | $47,000,000 | 6.1% | MSBAM 2014-C19 |
| 13 | LCF | Waysons MHC | Lothian | MD | Manufactured Housing Community | 22,000,000 | 2.9 | FCRE 2016-1A |
| 20.01 | LCF | Grand View | Grand Chute | WI | Retail | 8,700,482 | 1.1 | WFCM 2014-LC16 |
| 21 | AREF | Stony Creek Marketplace | Noblesville | IN | Retail | 13,600,000 | 1.8 | JPMCC 2009-IWST |
| Total | $91,300,482 | 11.9% |
| (1) | The table above represents the most recent securitization with respect to the mortgaged property securing the related mortgage loan, based on information provided by the related borrower or obtained through searches of a third-party database. While loans secured by the above mortgaged properties may have been securitized multiple times in prior transactions, mortgage loans in this securitization are only listed in the above chart if the mortgage loan paid off a loan in another securitization. The information has not otherwise been confirmed by the mortgage loan sellers. |
THE INFORMATION IN THIS STRUCTURAL AND COLLATERAL TERM SHEET IS NOT COMPLETE AND MAY BE AMENDED PRIOR TO THE TIME OF SALE. THIS TERM SHEET IS NOT AN OFFER TO SELL THESE SECURITIES AND IT IS NOT A SOLICITATION OF AN OFFER TO BUY THESE SECURITIES IN ANY JURISDICTION WHERE THE OFFER OR SALE IS NOT PERMITTED.
12
| Wells Fargo Commercial Mortgage Trust 2018-C44 | Characteristics of the Mortgage Pool |
| E. | Mortgage Loans with Scheduled Balloon Payments and Related Classes |
| Class A-2(1) | ||||||||||||||||
| Loan No. | Mortgage Loan Seller | Mortgage Loan Name | State | Property Type | Mortgage Loan Cut-off Date Balance ($) | % of Initial Pool Balance (%) | Mortgage Loan Balance at Maturity or ARD ($) | % of Class A-2 Certificate Principal Balance (%)(2) | Units/ SF | Loan per SF ($) | U/W NCF DSCR(x) | U/W NOI Debt Yield (%) | Cut-off Date LTV Ratio (%) | Balloon Or ARD LTV Ratio (%) | Rem. IO Period (mos.) | Rem. Term to Maturity or ARD (mos.) |
| 25 | LCF | 1442 Lexington Ave | NY | Multifamily | $11,600,000 | 1.5% | $11,600,000 | 42.6% | 16 | $725,000 | 1.18x | 6.8% | 64.4% | 64.4% | 60 | 60 |
| 27 | LCF | Riverside Business Center | PA | Industrial | 9,537,000 | 1.2 | 9,012,130 | 33.1 | 423,879 | 23 | 1.43 | 11.8 | 72.8 | 68.8 | 10 | 58 |
| 36 | AREF | Arlington Downs Tower | TX | Office | 5,120,000 | 0.7 | 4,793,627 | 17.6 | 85,718 | 60 | 1.50 | 12.1 | 62.4 | 58.5 | 0 | 60 |
| Total/Weighted Average | $26,257,000 | 3.4% | $25,405,757 | 93.4% | 1.33x | 9.6% | 67.1% | 64.8% | 30 | 59 | ||||||
| (1) | The table above presents the mortgage loan(s) whose balloon payments would be applied to pay down the principal balance of the Class A-2 Certificates, assuming a 0% CPR and applying the “Structuring Assumptions” described in the Preliminary Prospectus, including the assumptions that (i) none of the mortgage loans in the pool experience prepayments prior to maturity (or, in the case of an ARD loan, its anticipated repayment date), defaults or losses; (ii) there are no extensions of maturity dates of any mortgage loans in the pool; and (iii) each mortgage loan in the pool is paid in full on its stated maturity date (or, in the case of an ARD loan, its anticipated repayment date). Each Class of Certificates evidences undivided ownership interests in the entire pool of mortgage loans. Debt service coverage ratio, debt yield and loan-to-value ratio information do not take into account subordinate debt (whether or not secured by the related mortgaged property), if any, that currently exists or is allowed under the terms of any mortgage loan. See Annex A-1 to the Preliminary Prospectus. |
| (2) | Reflects the percentage equal to the Balloon Balance divided by the initial Class A-2 Certificate Balance. |
| Class A-3(1) | ||||||||||||||||
| Loan No. | Mortgage Loan Seller | Mortgage Loan Name | State | Property Type | Mortgage Loan Cut-off Date Balance ($) | % of Initial Pool Balance (%) | Mortgage Loan Balance at Maturity or ARD ($) | % of Class A-3 Certificate Principal Balance (%)(2) | Rooms | Loan per | U/W NCF DSCR (x) | U/W NOI Debt Yield (%) | Cut-off Date LTV Ratio (%) | Balloon Or ARD LTV Ratio (%) | Rem. IO Period (mos.) | Rem. Term to Maturity or ARD (mos.) |
| 30 | LCF | Holiday Inn Express North Scottsdale | AZ | Hospitality | $8,733,933 | 1.1% | $6,828,875 | 100.0% | 104 | $83,980 | 2.22x | 18.0% | 50.8% | 39.7% | 0 | 96 |
| Total/Weighted Average | $8,733,933 | 1.1% | $6,828,875 | 100.0% | 2.22x | 18.0% | 50.8% | 39.7% | 0 | 96 | ||||||
| (1) | The table above presents the mortgage loan(s) whose balloon payments would be applied to pay down the principal balance of the Class A-3 Certificates, assuming a 0% CPR and applying the “Structuring Assumptions” described in the Preliminary Prospectus, including the assumptions that (i) none of the mortgage loans in the pool experience prepayments prior to maturity (or, in the case of an ARD loan, its anticipated repayment date), defaults or losses; (ii) there are no extensions of maturity dates of any mortgage loans in the pool; and (iii) each mortgage loan in the pool is paid in full on its stated maturity date (or, in the case of an ARD loan, its anticipated repayment date). Each Class of Certificates evidences undivided ownership interests in the entire pool of mortgage loans. Debt service coverage ratio, debt yield and loan-to-value ratio information do not take into account subordinate debt (whether or not secured by the related mortgaged property), if any, that currently exists or is allowed under the terms of any mortgage loan. See Annex A-1 to the Preliminary Prospectus. |
| (2) | Reflects the percentage equal to the Balloon Balance divided by the initial Class A-3 Certificate Balance. |
THE INFORMATION IN THIS STRUCTURAL AND COLLATERAL TERM SHEET IS NOT COMPLETE AND MAY BE AMENDED PRIOR TO THE TIME OF SALE. THIS TERM SHEET IS NOT AN OFFER TO SELL THESE SECURITIES AND IT IS NOT A SOLICITATION OF AN OFFER TO BUY THESE SECURITIES IN ANY JURISDICTION WHERE THE OFFER OR SALE IS NOT PERMITTED.
13
| Wells Fargo Commercial Mortgage Trust 2018-C44 | Characteristics of the Mortgage Pool |
| F. | Property Type Distribution(1) |
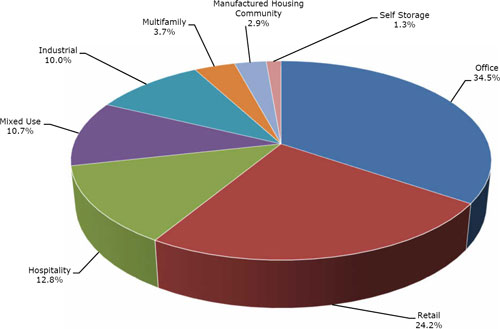
| Property Type | Number of Mortgaged Properties | Aggregate Balance ($) | % of Initial Pool Balance (%) | Weighted Average Cut-off Date LTV Ratio (%) | Weighted Average Balloon or ARD LTV Ratio (%) | Weighted Average U/W NCF DSCR (x) | Weighted Average U/W NOI Debt Yield (%) | Weighted Average U/W NCF Debt Yield (%) | Weighted Average Mortgage Rate (%) |
| Office | 13 | $264,267,465 | 34.5% | 61.9% | 57.1% | 1.85x | 10.7% | 9.8% | 4.701% |
| Suburban | 10 | 214,917,465 | 28.0 | 64.7 | 59.0 | 1.70 | 10.7 | 9.7 | 4.813 |
| CBD | 2 | 43,200,000 | 5.6 | 46.3 | 46.3 | 2.66 | 10.8 | 10.6 | 4.088 |
| Medical | 1 | 6,150,000 | 0.8 | 75.0 | 65.1 | 1.33 | 9.4 | 8.7 | 5.128 |
| Retail | 13 | 185,866,612 | 24.2 | 61.8 | 56.7 | 1.51 | 9.4 | 8.9 | 4.864 |
| Anchored | 7 | 145,102,824 | 18.9 | 61.5 | 55.9 | 1.50 | 9.5 | 8.9 | 4.792 |
| Single Tenant | 4 | 26,168,000 | 3.4 | 61.0 | 61.0 | 1.59 | 8.0 | 8.0 | 4.969 |
| Shadow Anchored | 2 | 14,595,788 | 1.9 | 65.7 | 56.8 | 1.52 | 10.9 | 10.2 | 5.386 |
| Hospitality | 12 | 97,963,129 | 12.8 | 63.1 | 49.4 | 1.89 | 14.7 | 13.3 | 5.167 |
| Limited Service | 12 | 97,963,129 | 12.8 | 63.1 | 49.4 | 1.89 | 14.7 | 13.3 | 5.167 |
| Mixed Use | 8 | 81,785,702 | 10.7 | 64.3 | 62.0 | 1.51 | 8.3 | 8.1 | 5.057 |
| Office/Industrial | 1 | 33,250,000 | 4.3 | 68.3 | 68.3 | 1.83 | 9.1 | 9.0 | 4.862 |
| Retail/Multifamily | 3 | 30,000,000 | 3.9 | 62.1 | 62.1 | 1.20 | 6.5 | 6.5 | 5.340 |
| Office/Retail | 2 | 8,615,702 | 1.1 | 56.5 | 47.7 | 1.46 | 10.2 | 9.4 | 5.049 |
| Office/Multifamily | 1 | 6,720,000 | 0.9 | 62.6 | 51.2 | 1.33 | 9.3 | 8.4 | 4.820 |
| Retail/Office | 1 | 3,200,000 | 0.4 | 67.1 | 58.0 | 1.54 | 10.4 | 9.9 | 4.940 |
| Industrial | 3 | 76,337,000 | 10.0 | 63.6 | 63.1 | 1.96 | 9.9 | 9.2 | 4.572 |
| Flex | 3 | 76,337,000 | 10.0 | 63.6 | 63.1 | 1.96 | 9.9 | 9.2 | 4.572 |
| Multifamily | 3 | 28,219,216 | 3.7 | 67.7 | 63.4 | 1.29 | 8.2 | 8.0 | 5.273 |
| Garden | 2 | 16,619,216 | 2.2 | 70.1 | 62.7 | 1.36 | 9.2 | 8.8 | 4.981 |
| Mid Rise | 1 | 11,600,000 | 1.5 | 64.4 | 64.4 | 1.18 | 6.8 | 6.8 | 5.690 |
| Manufactured Housing Community | 1 | 22,000,000 | 2.9 | 67.9 | 59.9 | 1.27 | 8.1 | 8.0 | 4.875 |
| Manufactured Housing Community | 1 | 22,000,000 | 2.9 | 67.9 | 59.9 | 1.27 | 8.1 | 8.0 | 4.875 |
| Self Storage | 2 | 10,250,000 | 1.3 | 62.4 | 57.4 | 1.63 | 9.3 | 9.2 | 5.211 |
| Self Storage | 2 | 10,250,000 | 1.3 | 62.4 | 57.4 | 1.63 | 9.3 | 9.2 | 5.211 |
| Total/Weighted Average: | 55 | $766,689,123 | 100.0% | 62.9% | 57.5% | 1.71x | 10.4% | 9.7% | 4.858% |
| (1) | Because this table presents information relating to the mortgaged properties and not the mortgage loans, the information for mortgage loans secured by more than one mortgaged property is based on allocated amounts (allocating the principal balance of the mortgage loan to each of those properties according to the relative appraised values of the mortgaged properties or the allocated loan amounts or property-specific release prices set forth in the related mortgage loan documents or such other allocation as the related mortgage loan seller deemed appropriate). With respect to any mortgage loan that is part of a whole loan, the loan-to-value ratio, debt service coverage ratio and debt yield calculations include the related pari passu companion loan(s) but exclude any related subordinate debt (unless otherwise stated). With respect to each mortgage loan, debt service coverage ratio, debt yield and loan-to-value ratio information do not take into account any subordinate debt (whether or not secured by the related mortgaged property) that currently exists or is allowed under the terms of such mortgage loan. See Annex A-1 to the Preliminary Prospectus. |
THE INFORMATION IN THIS STRUCTURAL AND COLLATERAL TERM SHEET IS NOT COMPLETE AND MAY BE AMENDED PRIOR TO THE TIME OF SALE. THIS TERM SHEET IS NOT AN OFFER TO SELL THESE SECURITIES AND IT IS NOT A SOLICITATION OF AN OFFER TO BUY THESE SECURITIES IN ANY JURISDICTION WHERE THE OFFER OR SALE IS NOT PERMITTED.
14
| Wells Fargo Commercial Mortgage Trust 2018-C44 | Characteristics of the Mortgage Pool |
| G. | Geographic Distribution(1)(2) |
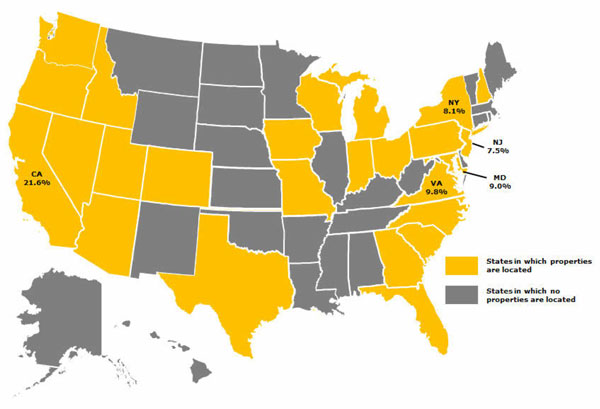
| Location | Number of Mortgaged Properties | Aggregate Cut-off Date Balance ($) | % of Initial Pool Balance (%) | Weighted Average Cut-off Date LTV Ratio (%) | Weighted Average Balloon or ARD LTV Ratio (%) | Weighted Average U/W NCF DSCR (x) | Weighted Average U/W NOI Debt Yield (%) | Weighted Average U/W NCF Debt Yield (%) | Weighted Average Mortgage Rate (%) |
| California | 6 | $165,500,000 | 21.6% | 56.0% | 56.0% | 2.07x | 9.7% | 9.2% | 4.533% |
| Northern | 4 | 105,300,000 | 13.7 | 53.0 | 53.0 | 2.11 | 9.7 | 9.4 | 4.551 |
| Southern | 2 | 60,200,000 | 7.9 | 61.3 | 61.3 | 2.00 | 9.5 | 9.1 | 4.501 |
| Virginia | 2 | 74,900,000 | 9.8 | 58.2 | 52.9 | 1.33 | 9.0 | 8.4 | 4.844 |
| Maryland | 2 | 69,000,000 | 9.0 | 69.2 | 61.0 | 1.45 | 10.2 | 9.2 | 4.806 |
| New York | 6 | 62,300,000 | 8.1 | 62.2 | 62.2 | 1.38 | 7.4 | 7.3 | 5.266 |
| New Jersey | 4 | 57,525,000 | 7.5 | 70.9 | 65.7 | 1.85 | 10.8 | 10.1 | 4.743 |
| Other(3) | 35 | 337,464,123 | 44.0 | 64.7 | 56.2 | 1.70 | 11.5 | 10.6 | 4.976 |
| Total/Weighted Average | 55 | $766,689,123 | 100.0% | 62.9% | 57.5% | 1.71x | 10.4% | 9.7% | 4.858% |
| (1) | The mortgaged properties are located in 25 states. |
| (2) | Because this table presents information relating to the mortgaged properties and not the mortgage loans, the information for mortgage loans secured by more than one mortgaged property is based on allocated amounts (allocating the principal balance of the mortgage loan to each of those properties according to the relative appraised values of the mortgaged properties or the allocated loan amounts or property-specific release prices set forth in the related mortgage loan documents or such other allocation as the related mortgage loan seller deemed appropriate). With respect to any mortgage loan that is part of a whole loan, the loan-to-value ratio, debt service coverage ratio and debt yield calculations include the relatedpari passu companion loan(s) but exclude any related subordinate debt (unless otherwise stated). With respect to each mortgage loan, debt service coverage ratio, debt yield and loan-to-value ratio information do not take into account any subordinate debt (whether or not secured by the related mortgaged property) that currently exists or is allowed under the terms of such mortgage loan. See Annex A-1 to the Preliminary Prospectus. |
| (3) | Includes 20 other states. |
THE INFORMATION IN THIS STRUCTURAL AND COLLATERAL TERM SHEET IS NOT COMPLETE AND MAY BE AMENDED PRIOR TO THE TIME OF SALE. THIS TERM SHEET IS NOT AN OFFER TO SELL THESE SECURITIES AND IT IS NOT A SOLICITATION OF AN OFFER TO BUY THESE SECURITIES IN ANY JURISDICTION WHERE THE OFFER OR SALE IS NOT PERMITTED.
15
| Wells Fargo Commercial Mortgage Trust 2018-C44 | Characteristics of the Mortgage Pool |
| H. | Characteristics of the Mortgage Pool(1) |
| CUT-OFF DATE BALANCE | ||||||||
| Range of Cut-off Date Balances ($) | Number of Mortgage Loans | Aggregate Cut- off Date Balance | Percent by Aggregate Cut- off Date Pool Balance (%) | |||||
| 868,000 - 3,000,000 | 1 | $868,000 | 0.1 | % | ||||
| 3,000,001 - 4,000,000 | 2 | 6,895,788 | 0.9 | |||||
| 4,000,001 - 5,000,000 | 5 | 22,809,918 | 3.0 | |||||
| 5,000,001 - 6,000,000 | 3 | 16,170,000 | 2.1 | |||||
| 6,000,001 - 8,000,000 | 3 | 19,357,069 | 2.5 | |||||
| 8,000,001 - 9,000,000 | 2 | 17,633,933 | 2.3 | |||||
| 9,000,001 - 10,000,000 | 2 | 18,837,000 | 2.5 | |||||
| 10,000,001 - 15,000,000 | 8 | 102,663,305 | 13.4 | |||||
| 15,000,001 - 20,000,000 | 4 | 70,900,000 | 9.2 | |||||
| 20,000,001 - 30,000,000 | 8 | 207,470,933 | 27.1 | |||||
| 30,000,001 - 50,000,000 | 5 | 217,083,178 | 28.3 | |||||
| 50,000,001 - 66,000,000 | 1 | 66,000,000 | 8.6 | |||||
| Total: | 44 | $766,689,123 | 100.0 | % | ||||
| Weighted Average | $17,424,753 | |||||||
| UNDERWRITTEN NOI DEBT SERVICE COVERAGE RATIO | ||||||||
| Range of U/W NOI DSCRs (x) | Number of Mortgage Loans | Aggregate Cut- off Date Balance | Percent by Aggregate Cut- off Date Pool Balance (%) | |||||
| 1.18 - 1.20 | 2 | $41,600,000 | 5.4 | % | ||||
| 1.21 - 1.30 | 3 | 38,625,000 | 5.0 | |||||
| 1.31 - 1.40 | 3 | 89,390,702 | 11.7 | |||||
| 1.41 - 1.50 | 4 | 33,870,000 | 4.4 | |||||
| 1.51 - 1.60 | 4 | 39,490,465 | 5.2 | |||||
| 1.61 - 1.70 | 4 | 36,520,000 | 4.8 | |||||
| 1.71 - 1.80 | 4 | 120,939,824 | 15.8 | |||||
| 1.81 - 1.90 | 5 | 67,838,471 | 8.8 | |||||
| 1.91 - 2.00 | 7 | 126,283,178 | 16.5 | |||||
| 2.01 - 2.50 | 5 | 122,044,414 | 15.9 | |||||
| 2.51 - 3.00 | 2 | 20,087,069 | 2.6 | |||||
| 3.01 - 3.15 | 1 | 30,000,000 | 3.9 | |||||
| Total: | 44 | $766,689,123 | 100.0 | % | ||||
| Weighted Average | 1.82x | |||||||
| UNDERWRITTEN NCF DEBT SERVICE COVERAGE RATIO | ||||||||
| Range of U/W NCF DSCRs (x) | Number of Mortgage Loans | Aggregate Cut- off Date Balance | Percent by Aggregate Cut- off Date Pool Balance (%) | |||||
| 1.18 - 1.20 | 2 | $41,600,000 | 5.4 | % | ||||
| 1.21 - 1.30 | 5 | 109,015,702 | 14.2 | |||||
| 1.31 - 1.40 | 4 | 48,070,000 | 6.3 | |||||
| 1.41 - 1.50 | 5 | 52,579,465 | 6.9 | |||||
| 1.51 - 1.60 | 5 | 69,768,000 | 9.1 | |||||
| 1.61 - 1.70 | 8 | 122,891,295 | 16.0 | |||||
| 1.71 - 1.80 | 2 | 66,833,178 | 8.7 | |||||
| 1.81 - 1.90 | 4 | 93,225,000 | 12.2 | |||||
| 1.91 - 2.00 | 3 | 44,850,000 | 5.8 | |||||
| 2.01 - 2.50 | 4 | 81,369,414 | 10.6 | |||||
| 2.51 - 3.00 | 1 | 6,487,069 | 0.8 | |||||
| 3.01 - 3.14 | 1 | 30,000,000 | 3.9 | |||||
| Total: | 44 | $766,689,123 | 100.0 | % | ||||
| Weighted Average | 1.71x | |||||||
| LOAN PURPOSE | ||||||||
| Loan Purpose | Number of Mortgage Loans | Aggregate Cut- off Date Balance | Percent by Aggregate Cut- off Date Pool Balance (%) | |||||
| Refinance | 24 | $349,867,999 | 45.6 | % | ||||
| Acquisition | 18 | 331,821,125 | 43.3 | |||||
| Recapitalization | 2 | 85,000,000 | 11.1 | |||||
| Total: | 44 | $766,689,123 | 100.0 | % | ||||
| MORTGAGE RATE | ||||||||
| Range of Mortgage Rates (%) | Number of Mortgage Loans | Aggregate Cut- off Date Balance | Percent by Aggregate Cut- off Date Pool Balance (%) | |||||
| 3.709 - 4.250 | 1 | $30,000,000 | 3.9 | % | ||||
| 4.251 - 4.500 | 1 | 47,000,000 | 6.1 | |||||
| 4.501 - 4.750 | 6 | 118,900,000 | 15.5 | |||||
| 4.751 - 5.000 | 18 | 388,348,454 | 50.7 | |||||
| 5.001 - 5.250 | 6 | 80,742,111 | 10.5 | |||||
| 5.251 - 5.500 | 6 | 63,386,489 | 8.3 | |||||
| 5.501 - 6.000 | 4 | 26,705,000 | 3.5 | |||||
| 6.001 - 6.500 | 1 | 5,120,000 | 0.7 | |||||
| 6.501 - 6.705 | 1 | 6,487,069 | 0.8 | |||||
| Total: | 44 | $766,689,123 | 100.0 | % | ||||
| Weighted Average | 4.858% | |||||||
| UNDERWRITTEN NOI DEBT YIELD | ||||||||
| Range of U/W NOI Debt Yields (%) | Number of Mortgage Loans | Aggregate Cut- off Date Balance | Percent by Aggregate Cut- off Date Pool Balance (%) | |||||
| 6.5 - 8.0 | 4 | $61,400,000 | 8.0 | % | ||||
| 8.1 - 9.0 | 9 | 196,715,702 | 25.7 | |||||
| 9.1 - 10.0 | 10 | 173,660,465 | 22.7 | |||||
| 10.1 - 11.0 | 4 | 53,400,000 | 7.0 | |||||
| 11.1 - 12.0 | 7 | 126,152,003 | 16.5 | |||||
| 12.1 - 13.0 | 4 | 55,096,292 | 7.2 | |||||
| 13.1 - 14.0 | 3 | 73,008,178 | 9.5 | |||||
| 14.1 - 17.0 | 1 | 12,035,481 | 1.6 | |||||
| 17.1 - 18.0 | 1 | 8,733,933 | 1.1 | |||||
| 18.1 - 27.3 | 1 | 6,487,069 | 0.8 | |||||
| Total: | 44 | $766,689,123 | 100.0 | % | ||||
| Weighted Average | 10.4% | |||||||
| UNDERWRITTEN NCF DEBT YIELD | ||||||||
| Range of U/W NCF Debt Yields (%) | Number of Mortgage Loans | Aggregate Cut- off Date Balance | Percent by Aggregate Cut- off Date Pool Balance (%) | |||||
| 6.5 - 8.0 | 8 | $174,525,000 | 22.8 | % | ||||
| 8.1 - 9.0 | 11 | 166,578,702 | 21.7 | |||||
| 9.1 - 10.0 | 9 | 191,309,465 | 25.0 | |||||
| 10.1 - 11.0 | 6 | 72,312,684 | 9.4 | |||||
| 11.1 - 12.0 | 6 | 94,873,612 | 12.4 | |||||
| 12.1 - 13.0 | 1 | 39,833,178 | 5.2 | |||||
| 13.1 - 16.0 | 1 | 12,035,481 | 1.6 | |||||
| 16.1 - 17.0 | 1 | 8,733,933 | 1.1 | |||||
| 17.1 - 25.0 | 1 | 6,487,069 | 0.8 | |||||
| Total: | 44 | $766,689,123 | 100.0 | % | ||||
| Weighted Average | 9.7% | |||||||
| ORIGINAL TERM TO MATURITY OR ARD | ||||||||
| Original Terms to Maturity or ARD (months) | Number of Mortgage Loans | Aggregate Cut- off Date Balance | Percent by Aggregate Cut- off Date Pool Balance (%) | |||||
| 60 | 3 | $26,257,000 | 3.4 | % | ||||
| 120 | 41 | 740,432,123 | 96.6 | |||||
| Total: | 44 | $766,689,123 | 100.0 | % | ||||
| Weighted Average | 118 | |||||||
| (1) | With respect to any mortgage loan that is part of a whole loan, the loan-to-value ratio, debt service coverage ratio and debt yield calculations include the relatedpari passucompanion loan(s) but exclude any related subordinate debt (unless otherwise stated). With respect to each mortgage loan, debt service coverage ratio, debt yield and loan-to-value ratio information do not take into account any subordinate debt (whether or not secured by the related mortgaged property) that currently exists or is allowed under the terms of such mortgage loan. See Annex A-1 to the Preliminary Prospectus. Prepayment provisions for each mortgage loan reflects the entire life of the loan (from origination to maturity or ARD). |
THE INFORMATION IN THIS STRUCTURAL AND COLLATERAL TERM SHEET IS NOT COMPLETE AND MAY BE AMENDED PRIOR TO THE TIME OF SALE. THIS TERM SHEET IS NOT AN OFFER TO SELL THESE SECURITIES AND IT IS NOT A SOLICITATION OF AN OFFER TO BUY THESE SECURITIES IN ANY JURISDICTION WHERE THE OFFER OR SALE IS NOT PERMITTED.
16
| Wells Fargo Commercial Mortgage Trust 2018-C44 | Characteristics of the Mortgage Pool |
| REMAINING TERM TO MATURITY OR ARD | ||||||||
| Range of Remaining Terms to Maturity or ARD (months) | Number of Mortgage Loans | Aggregate Cut- off Date Balance | Percent by Aggregate Cut- off Date Pool Balance (%) | |||||
| 58 - 84 | 3 | $26,257,000 | 3.4 | % | ||||
| 85 - 120 | 41 | 740,432,123 | 96.6 | |||||
| Total: | 44 | $766,689,123 | 100.0 | % | ||||
| Weighted Average | 117 months | |||||||
| ORIGINAL AMORTIZATION TERM(2) | ||||||||
| Original Amortization Terms (months) | Number of Mortgage Loans | Aggregate Cut- off Date Balance | Percent by Aggregate Cut- off Date Pool Balance (%) | |||||
| Non- Amortizing | 17 | $335,368,000 | 43.7 | % | ||||
| 240 | 1 | 6,487,069 | 0.8 | |||||
| 300 | 3 | 62,969,935 | 8.2 | |||||
| 360 | 23 | 361,864,119 | 47.2 | |||||
| Total: | 44 | $766,689,123 | 100.0 | % | ||||
| Weighted Average(3) | 349 months | |||||||
| (2) The original amortization term shown for any mortgage loan that is interest-only for part of its term does not include the number of months in its interest-only period and reflects only the number of months as of the commencement of amortization remaining from the end of such interest-only period. | ||||||||
| (3) Excludes the non-amortizing mortgage loans. | ||||||||
| REMAINING AMORTIZATION TERM(4) | ||||||||
| Range of Remaining Amortization Terms (months) | Number of Mortgage Loans | Aggregate Cut- off Date Balance | Percent by Aggregate Cut- off Date Pool Balance (%) | |||||
| Non- Amortizing | 17 | $335,368,000 | 43.7 | % | ||||
| 239 - 240 | 1 | $6,487,069 | 0.8 | |||||
| 241 - 300 | 3 | 62,969,935 | 8.2 | |||||
| 301 - 360 | 23 | 361,864,119 | 47.2 | |||||
| Total: | 44 | $766,689,123 | 100.0 | % | ||||
| Weighted Average(5) | 349 months | |||||||
| (4) The remaining amortization term shown for any mortgage loan that is interest-only for part of its term does not include the number of months in its interest-only period and reflects only the number of months as of the commencement of amortization remaining from the end of such interest-only period. | ||||||||
| (5) Excludes the non-amortizing mortgage loans. | ||||||||
| LOCKBOXES | ||||||||
| Type of Lockbox | Number of Mortgage Loans | Aggregate Cut- off Date Balance | Percent by Aggregate Cut- off Date Pool Balance (%) | |||||
| Hard/Springing Cash Management | 15 | $282,298,741 | 36.8 | % | ||||
| Hard/Upfront Cash Management | 9 | 246,718,000 | 32.2 | |||||
| Springing | 13 | 168,335,702 | 22.0 | |||||
| Soft/Springing Cash Management | 4 | 54,722,465 | 7.1 | |||||
| None | 3 | 14,614,216 | 1.9 | |||||
| Total: | 44 | $766,689,123 | 100.0 | % | ||||
| PREPAYMENT PROVISION SUMMARY(6) | ||||||||
| Prepayment Provision | Number of Mortgage Loans | Aggregate Cut- off Date Balance | Percent by Aggregate Cut- off Date Pool Balance (%) | |||||
| Lockout / Defeasance / Open | 41 | $719,921,123 | 93.9 | % | ||||
| Lockout / GRTR 1% or YM / GRTR 1% or YM or Defeasance / Open | 1 | 30,000,000 | 3.9 | |||||
| Lockout / GRTR 1% or YM / Open | 1 | 15,900,000 | 2.1 | |||||
| YM / YM or Defeasance / Open | 1 | 868,000 | 0.1 | |||||
| Total: | 44 | $766,689,123 | 100.0 | % | ||||
| (6) As a result of property releases or the application of funds in a performance reserve, partial principal prepayments could occur during a period that voluntary principal prepayments are otherwise prohibited. | ||||||||
| CUT-OFF DATE LOAN-TO-VALUE RATIO | ||||||||
| Range of Cut-off Date LTV Ratios (%) | Number of Mortgage Loans | Aggregate Cut- off Date Balance | Percent by Aggregate Cut- off Date Pool Balance (%) | |||||
| 39.6 - 45.0 | 1 | $30,000,000 | 3.9 | % | ||||
| 45.1 - 50.0 | 2 | 10,712,069 | 1.4 | |||||
| 50.1 - 55.0 | 1 | 8,733,933 | 1.1 | |||||
| 55.1 - 60.0 | 7 | 179,652,824 | 23.4 | |||||
| 60.1 - 65.0 | 15 | 212,861,971 | 27.8 | |||||
| 65.1 - 70.0 | 13 | 250,867,859 | 32.7 | |||||
| 70.1 - 75.0 | 5 | 73,860,468 | 9.6 | |||||
| Total: | 44 | $766,689,123 | 100.0 | % | ||||
| Weighted Average | 62.9% | |||||||
| BALLOON OR ARD LOAN-TO-VALUE RATIO | ||||||||
| Range of Balloon or ARD LTV Ratios (%) | Number of Mortgage Loans | Aggregate Cut- off Date Balance | Percent by Aggregate Cut- off Date Pool Balance (%) | |||||
| 30.6 - 35.0 | 1 | $6,487,069 | 0.8 | % | ||||
| 35.1 - 40.0 | 2 | 38,733,933 | 5.1 | |||||
| 40.1 - 45.0 | 2 | 18,627,824 | 2.4 | |||||
| 45.1 - 50.0 | 2 | 48,733,178 | 6.4 | |||||
| 50.1 - 55.0 | 5 | 92,841,971 | 12.1 | |||||
| 55.1 - 60.0 | 13 | 204,160,149 | 26.6 | |||||
| 60.1 - 65.0 | 14 | 295,375,000 | 38.5 | |||||
| 65.1 - 70.0 | 5 | 61,730,000 | 8.1 | |||||
| Total: | 44 | $766,689,123 | 100.0 | % | ||||
| Weighted Average | 57.5% | |||||||
| AMORTIZATION TYPE | ||||||||
| Amortization Type | Number of Mortgage Loans | Aggregate Cut- off Date Balance | Percent by Aggregate Cut- off Date Pool Balance (%) | |||||
| Interest-only, Balloon | 15 | $304,500,000 | 39.7 | % | ||||
| Interest-only, Amortizing Balloon | 13 | 267,412,000 | 34.9 | |||||
| Amortizing Balloon | 14 | 163,909,123 | 21.4 | |||||
| Interest-only, ARD | 2 | 30,868,000 | 4.0 | |||||
| Total: | 44 | $766,689,123 | 100.0 | % | ||||
| ORIGINAL TERM OF INTEREST-ONLY PERIOD FOR PARTIAL IO LOANS | ||||||||
| IO Terms (months) | Number of Mortgage Loans | Aggregate Cut- off Date Balance | Percent by Aggregate Cut- off Date Pool Balance (%) | |||||
| 12 | 2 | $33,812,000 | 4.4 | % | ||||
| 24 | 5 | 43,475,000 | 5.7 | |||||
| 36 | 3 | 96,000,000 | 12.5 | |||||
| 48 | 1 | 16,200,000 | 2.1 | |||||
| 60 | 2 | 77,925,000 | 10.2 | |||||
| Total: | 13 | $267,412,000 | 34.9 | % | ||||
| Weighted Average | 39 | |||||||
| SEASONING | ||||||||
| Seasoning (months) | Number of Mortgage Loans | Aggregate Cut- off Date Balance | Percent by Aggregate Cut- off Date Pool Balance (%) | |||||
| 0 | 8 | $100,808,000 | 13.1 | % | ||||
| 1 | 23 | 508,966,665 | 66.4 | |||||
| 2 | 9 | 83,180,526 | 10.8 | |||||
| 3 | 2 | 60,200,000 | 7.9 | |||||
| 4 | 1 | 4,800,000 | 0.6 | |||||
| 24 | 1 | 8,733,933 | 1.1 | |||||
| Total: | 44 | $766,689,123 | 100.0 | % | ||||
| Weighted Average | 1 month | |||||||
THE INFORMATION IN THIS STRUCTURAL AND COLLATERAL TERM SHEET IS NOT COMPLETE AND MAY BE AMENDED PRIOR TO THE TIME OF SALE. THIS TERM SHEET IS NOT AN OFFER TO SELL THESE SECURITIES AND IT IS NOT A SOLICITATION OF AN OFFER TO BUY THESE SECURITIES IN ANY JURISDICTION WHERE THE OFFER OR SALE IS NOT PERMITTED.
17
| Wells Fargo Commercial Mortgage Trust 2018-C44 | Certain Terms and Conditions |
V. Certain Terms and Conditions
| Interest Entitlements: | The interest entitlement of each Class of Certificates on each Distribution Date generally will be the interest accrued during the related Interest Accrual Period on the related Certificate Balance or Notional Amount at the related pass-through rate, net of any prepayment interest shortfalls allocated to that Class for such Distribution Date as described below. If prepayment interest shortfalls arise from voluntary prepayments (without Master Servicer consent) on particular non-specially serviced loans during any collection period, the Master Servicer is required to make a compensating interest payment to offset those shortfalls, generally up to an amount equal to the portion of its master servicing fees that accrue at 0.25 basis pointsper annum. The remaining amount of prepayment interest shortfalls will be allocated to reduce the interest entitlement on all Classes of Certificates entitled to interest, on apro rata basis, based on their respective amounts of accrued interest for the related Distribution Date. If a Class receives less than the entirety of its interest entitlement on any Distribution Date, then the shortfall (excluding any shortfall due to prepayment interest shortfalls), together with interest thereon, will be added to its interest entitlement for the next succeeding Distribution Date. |
| Principal Distribution Amount: | The Principal Distribution Amount for each Distribution Date generally will be the aggregate amount of principal received or advanced in respect of the mortgage loans, net of any non-recoverable advances and interest thereon and workout-delayed reimbursement amounts that are reimbursed to the Master Servicer, the Special Servicer or the Trustee during the related collection period. Non-recoverable advances and interest thereon are reimbursable from principal collections and advances before reimbursement from other amounts. Workout-delayed reimbursement amounts are reimbursable from principal collections. |
| Subordination, Allocation of Losses and Certain Expenses | The chart below describes the manner in which the payment rights of certain Classes of Certificates will be senior or subordinate, as the case may be, to the payment rights of other Classes of Certificates. The chart also shows the corresponding entitlement to receive principal and/or interest of certain Classes of Certificates (other than excess interest that accrues on each mortgage loan that has an anticipated repayment date) on any distribution date in descending order. It also shows the manner in which losses are allocated to certain Classes of Certificates in ascending order (beginning with the Non-Offered Certificates, and other than the Class V and R certificates) to reduce the balance of each such class to zero;provided that no principal payments or mortgage loan losses will be allocated to the Class X-A, X-B, X-D, V or R Certificates, although principal payments and losses may reduce the notional amounts of the Class X-A, X-B and X-D certificates and, therefore, the amount of interest they accrue. |
THE INFORMATION IN THIS STRUCTURAL AND COLLATERAL TERM SHEET IS NOT COMPLETE AND MAY BE AMENDED PRIOR TO THE TIME OF SALE. THIS TERM SHEET IS NOT AN OFFER TO SELL THESE SECURITIES AND IT IS NOT A SOLICITATION OF AN OFFER TO BUY THESE SECURITIES IN ANY JURISDICTION WHERE THE OFFER OR SALE IS NOT PERMITTED.
18
| Wells Fargo Commercial Mortgage Trust 2018-C44 | Certain Terms and Conditions |
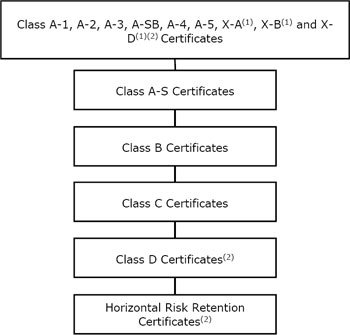 | ||
(1) The Class X-A, X-B and X-D Certificates are interest-only certificates. (2) Non-Offered Certificates. | ||
| Distributions: | On each Distribution Date, funds available for distribution from the mortgage loans, net of specified trust fees, expenses and reimbursements will generally be distributed in the following amounts and order of priority (in each case to the extent of remaining available funds): | |
| 1. Class A-1, A-2, A-3, A-SB, A-4, A-5, X-A, X-B and X-D Certificates: To interest on the Class A-1, A-2, A-3, A-SB, A-4, A-5, X-A, X-B and X-D Certificates,pro rata, according to their respective interest entitlements. | ||
| 2. Class A-1, A-2, A-3, A-SB, A-4 and A-5 Certificates: To principal on the Class A-1, A-2, A-3, A-SB, A-4 and A-5 Certificates in the following amounts and order of priority: (i) first, to principal on the Class A-SB Certificates, in an amount up to the Principal Distribution Amount for such Distribution Date until their Certificate Balance is reduced to the Class A-SB Planned Principal Balance for such Distribution Date; (ii) second, to principal on the Class A-1 Certificates until their Certificate Balance is reduced to zero, up to the remainder of the Principal Distribution Amount for such Distribution Date; (iii) third, to principal on the Class A-2 Certificates until their Certificate Balance is reduced to zero, up to the remainder of the Principal Distribution Amount for such Distribution Date; (iv) fourth, to principal on the Class A-3 Certificates, until their Certificate Balance is reduced to zero, up to the remainder of the Principal Distribution Amount for such Distribution Date; (v) fifth, to principal on the Class A-4 Certificates until their Certificate Balance is reduced to zero, up to the remainder of the Principal Distribution Amount for such Distribution Date; (vi) sixth, to principal on the Class A-5 Certificates until their Certificate Balance is reduced to zero, up to the remainder of the Principal Distribution Amount for such Distribution Date; and (vii) seventh, to principal on the Class A-SB Certificates until their Certificate Balance is reduced to zero, up to the remainder of the Principal Distribution Amount for such Distribution Date. However, if the Certificate Balance of each Class of Principal Balance Certificates, other than the Class A-1, A-2, A-3, A-SB, A-4 and A-5 Certificates, has been reduced to zero as a result of the allocation of Mortgage Loan losses and expenses and any of the Class A-1, A-2, A-3, A-SB, A-4 and A-5 Certificates remains outstanding, then the Principal Distribution Amount will be distributed to the Class A-1, A-2, A-3, A-SB, A-4 and A-5 Certificates,pro rata, based on their respective outstanding Certificate Balances, until their Certificate Balances have been reduced to zero. | ||
| 3. Class A-1, A-2, A-3, A-SB, A-4 and A-5 Certificates: To reimburse the holders of the Class A-1, A-2, A-3, A-SB, A-4 and A-5 Certificates,pro rata, on the basis of previously allocated unreimbursed losses, for any previously unreimbursed losses (plus interest thereon) on the mortgage loans that were previously allocated in reduction of the Certificate Balances of such Classes. |
THE INFORMATION IN THIS STRUCTURAL AND COLLATERAL TERM SHEET IS NOT COMPLETE AND MAY BE AMENDED PRIOR TO THE TIME OF SALE. THIS TERM SHEET IS NOT AN OFFER TO SELL THESE SECURITIES AND IT IS NOT A SOLICITATION OF AN OFFER TO BUY THESE SECURITIES IN ANY JURISDICTION WHERE THE OFFER OR SALE IS NOT PERMITTED.
19
| Wells Fargo Commercial Mortgage Trust 2018-C44 | Certain Terms and Conditions |
4. Class A-S Certificates: To make distributions on the Class A-S Certificates as follows: (a) first, to interest on the Class A-S Certificates in the amount of the interest entitlement for that Class; (b) next, to the extent of the portion of the Principal Distribution Amount remaining after distributions in respect of principal to each Class with a higher distribution priority (in this case, the Class A-1, A-2, A-3, A-SB, A-4 and A-5 Certificates), to principal on the Class A-S Certificates until their Certificate Balance is reduced to zero; and (c) next, to reimburse the holders of the Class A-S Certificates for any previously unreimbursed losses (plus interest thereon) on the mortgage loans that were previously allocated to that Class in reduction of their Certificate Balance. 5. Class B Certificates: To make distributions on the Class B Certificates as follows: (a) first, to interest on the Class B Certificates in the amount of the interest entitlement for that Class; (b) next, to the extent of the portion of the Principal Distribution Amount remaining after distributions in respect of principal to each Class with a higher distribution priority (in this case, the Class A-1, A-2, A-3, A-SB, A-4, A-5 and A-S Certificates), to principal on the Class B Certificates until their Certificate Balance is reduced to zero; and (c) next, to reimburse the holders of the Class B Certificates for any previously unreimbursed losses (plus interest thereon) on the mortgage loans that were previously allocated to that Class in reduction of their Certificate Balance. 6. Class C Certificates: To make distributions on the Class C Certificates as follows: (a) first, to interest on the Class C Certificates in the amount of the interest entitlement for that Class; (b) next, to the extent of the portion of the Principal Distribution Amount remaining after distributions in respect of principal to each Class with a higher distribution priority (in this case, the Class A-1, A-2, A-3, A-SB, A-4, A-5, A-S and B Certificates), to principal on the Class C Certificates until their Certificate Balance is reduced to zero; and (c) next, to reimburse the holders of the Class C Certificates for any previously unreimbursed losses (plus interest thereon) on the mortgage loans that were previously allocated to that Class in reduction of their Certificate Balance. 7. After the Class A-1, A-2, A-3, A-SB, A-4, A-5, X-A, X-B, X-D, A-S, B and C Certificates are paid all amounts to which they are entitled, the remaining funds available for distribution will be used to pay interest, principal and loss reimbursement amounts on the Class D, E-RR, F-RR, G-RR and H-RR Certificates sequentially in that order in a manner analogous to the Class C Certificates. | ||
| Allocation of Yield Maintenance and Prepayment Premiums: | If any yield maintenance charge or prepayment premium is collected during any particular collection period with respect to any mortgage loan, then on the Distribution Date corresponding to that collection period, the certificate administrator will pay that yield maintenance charge or prepayment premium (net of liquidation fees payable therefrom) in the following manner: (1) to each of the Class A-1, A-2, A-3, A-SB, A-4, A-5, A-S, B, C and D Certificates, the product of (a) the yield maintenance charge or prepayment premium, (b) the related Base Interest Fraction (as defined in the Preliminary Prospectus) for such Class, and (c) a fraction, the numerator of which is equal to the amount of principal distributed to such Class for that Distribution Date, and the denominator of which is the total amount of principal distributed to all Principal Balance Certificates for that Distribution Date, (2) to the Class X-A Certificates, the excess, if any, of (a) the product of (i) such yield maintenance charge or prepayment premium and (ii) a fraction, the numerator of which is equal to the amount of principal distributed to the Class A-1, A-2, A-3, A-SB, A-4 and A-5 Certificates for that Distribution Date, and the denominator of which is the total amount of principal distributed to all Principal Balance Certificates for that Distribution Date, over (b) the amount of such yield maintenance charge or prepayment premium distributed to the Class A-1, A-2, A-3, A-SB, A-4 and A-5 Certificates as described above, and (3) to the Class X-B Certificates, any remaining portion of such yield maintenance charge or prepayment premium not distributed as described above.
No prepayment premiums or yield maintenance charges will be distributed to the holders of the Class X-D, E-RR, F-RR, G-RR, H-RR, V or R certificates. For a description of when prepayment premiums and yield maintenance charges are generally required on the mortgage loans, see Annex A-1 to the Preliminary Prospectus. See also “Risk Factors—Risks Relating to the Mortgage Loans—Risks Relating to Enforceability of Yield Maintenance Charges, Prepayment Premiums or Defeasance Provisions” and “Risk Factors—Other Risks Relating to the Certificates—Your Yield May Be Affected by Defaults, Prepayments and Other Factors” in the Preliminary Prospectus. Prepayment premiums and yield maintenance charges will be distributed on each Distribution Date only to the extent they are actually received on the mortgage loans as of the related Determination Date.
| |
| Realized Losses: | The Certificate Balances of the Class A-1, A-2, A-3, A-SB, A-4, A-5, A-S, B, C, D, E-RR, F-RR, G-RR and H-RR Certificates will be reduced without distribution on any Distribution Date as a write-off to the extent of any losses realized on the mortgage loans allocated to such Class on |
THE INFORMATION IN THIS STRUCTURAL AND COLLATERAL TERM SHEET IS NOT COMPLETE AND MAY BE AMENDED PRIOR TO THE TIME OF SALE. THIS TERM SHEET IS NOT AN OFFER TO SELL THESE SECURITIES AND IT IS NOT A SOLICITATION OF AN OFFER TO BUY THESE SECURITIES IN ANY JURISDICTION WHERE THE OFFER OR SALE IS NOT PERMITTED.
20
| Wells Fargo Commercial Mortgage Trust 2018-C44 | Certain Terms and Conditions |
such Distribution Date. Such losses will be applied in the following order, in each case until the related Certificate Balance is reduced to zero: first, to the Class H-RR Certificates; second, to the Class G-RR Certificates; third, to the Class F-RR Certificates; fourth, to the Class E-RR Certificates; fifth, to the Class D Certificates; sixth, to the Class C Certificates; seventh, to the Class B Certificates; eighth, to the Class A-S Certificates; and, finally,pro rata, to the Class A-1, A-2, A-3, A-SB, A-4 and A-5 Certificates based on their outstanding Certificate Balances.
The notional amount of the Class X-A Certificates will be reduced by the amount of all losses that are allocated to the Class A-1, A-2, A-3, A-SB, A-4 or A-5 Certificates as write-offs in reduction of their Certificate Balances. The notional amount of the Class X-B Certificates will be reduced by the amount of all losses that are allocated to the Class A-S, B or C Certificates as write-offs in reduction of their Certificate Balances. The notional amount of the Class X-D Certificates will be reduced by the amount of all losses that are allocated to the Class D Certificates as write-offs in reduction of its Certificate Balance. | ||
| P&I Advances: | The Master Servicer or, if the Master Servicer fails to do so, the Trustee, will be obligated to advance delinquent debt service payments (other than balloon payments, excess interest and default interest) and assumed debt service payments on mortgage loans with delinquent balloon payments (excluding any related companion loan), except to the extent any such advance is deemed non-recoverable from collections on the related mortgage loan. In addition, if an Appraisal Reduction Amount exists for a given mortgage loan, the interest portion of any P&I advance for such mortgage loan will be reduced, which will have the effect of reducing the amount of interest available for distribution to the Certificates in reverse alphabetical order of their Class designations (except that interest payments on the Class A-1, A-2, A-3, A-SB, A-4, A-5, X-A, X-B and X-D Certificates would be affected on apari passu basis). | |
| Servicing Advances: | The Master Servicer or, if the Master Servicer fails to do so, the Trustee, will be obligated to make servicing advances, including the payment of delinquent property taxes, insurance premiums and ground rent, except to the extent that those advances are deemed non-recoverable from collections on the related mortgage loan. The Master Servicer or the Trustee, as applicable, will have the primary obligation to make any required servicing advances with respect to any serviced whole loan. With respect to any non-serviced whole loan, the master servicer or trustee, as applicable, under the related lead securitization servicing agreement will have the primary obligation to make any required servicing advances with respect to such non-serviced whole loan. | |
Appraisal Reduction Amounts and Collateral Deficiency Amounts:
| An “Appraisal Reduction Amount” generally will be created in the amount, if any, by which the principal balance of a required appraisal loan (which is a mortgage loan with respect to which certain defaults, modifications or insolvency events have occurred as further described in the Preliminary Prospectus) plus other amounts overdue or advanced in connection with such mortgage loan exceeds 90% of the appraised value of the related mortgaged property plus certain escrows and reserves (including letters of credit) held with respect to the mortgage loan. With respect to any whole loan, any Appraisal Reduction Amount will be allocated,pro rata, to the related mortgage loan and the relatedpari passu companion loan(s).
A mortgage loan will cease to be a required appraisal loan when the same has ceased to be a specially serviced loan (if applicable), has been brought current for at least three consecutive months and no other circumstances exist that would cause such mortgage loan to be a required appraisal loan.
A “Collateral Deficiency Amount” will exist with respect to any mortgage loan that is modified into an AB loan structure and remains a corrected mortgage loan and will generally equal the excess of (i) the stated principal balance of such AB modified loan (taking into account the related junior note(s) and anypari passu notes included therein), over (ii) the sum of (in the case of a whole loan, solely to the extent allocable to the subject mortgage loan) (x) the most recent appraised value of the related mortgaged property plus (y) solely to the extent not reflected or taken into account in such appraised value and to the extent on deposit with, or otherwise under the control of, the lender as of the date of such determination, any capital or additional collateral contributed by the related borrower at the time the mortgage loan (and as part of the modification thereto) became an AB modified loan plus (z) any other escrows or reserves (in addition to any amounts set forth in the immediately preceding clause (y)) held with respect to the mortgage loan as of the date of such determination.
A “Cumulative Appraisal Reduction Amount” with respect to any mortgage loan will be the sum of any Appraisal Reduction Amount and any Collateral Deficiency Amount.
Appraisal Reduction Amounts will affect the amount of debt service advances in respect of the related mortgage loan. Additionally, Cumulative Appraisal Reduction Amounts will be taken into account in the determination of the identity of the Class whose majority constitutes the “majority controlling class certificateholder” and is entitled to appoint the directing |
THE INFORMATION IN THIS STRUCTURAL AND COLLATERAL TERM SHEET IS NOT COMPLETE AND MAY BE AMENDED PRIOR TO THE TIME OF SALE. THIS TERM SHEET IS NOT AN OFFER TO SELL THESE SECURITIES AND IT IS NOT A SOLICITATION OF AN OFFER TO BUY THESE SECURITIES IN ANY JURISDICTION WHERE THE OFFER OR SALE IS NOT PERMITTED.
21
| Wells Fargo Commercial Mortgage Trust 2018-C44 | Certain Terms and Conditions |
| certificateholder. | ||
Clean-Up Call and Exchange Termination:
| On each Distribution Date occurring after the aggregate unpaid principal balance of the pool of mortgage loans is less than 1.0% of the principal balance of the mortgage loans as of the cut-off date, certain specified persons will have the option to purchase all of the remaining mortgage loans (and the trust’s interest in all property acquired through exercise of remedies in respect of any mortgage loan) at the price specified in the Preliminary Prospectus. Exercise of the option will terminate the trust and retire the then-outstanding certificates.
If the aggregate Certificate Balances of each of the Class A-1, A-2, A-3, A-SB, A-4, A-5, A-S, B, C and D Certificates have been reduced to zero, the trust may also be terminated in connection with an exchange of all the then-outstanding certificates (other than the Class V and Class R Certificates) for the mortgage loans and REO properties then remaining in the issuing entity, subject to payment of a price specified in the Preliminary Prospectus, but all of the holders of those outstanding Classes (other than the Class V and R Certificates) of certificates would have to voluntarily participate in the exchange. | |
| Liquidation Loan Waterfall: | Following the liquidation of any loan or property, the net liquidation proceeds generally will be applied (after reimbursement of advances and certain trust fund expenses), first, as a recovery of accrued interest, other than delinquent interest that was not advanced as a result of Appraisal Reduction Amounts, second, as a recovery of principal until all principal has been recovered, and then as a recovery of delinquent interest that was not advanced as a result of Appraisal Reduction Amounts. Please see “Description of the Certificates—Distributions—Application Priority of Mortgage Loan Collections or Whole Loan Collections” in the Preliminary Prospectus. | |
| Control Eligible Certificates: | The Class G-RR and H-RR Certificates. | |
| Directing Certificateholder/ Controlling Class: | A directing certificateholder may be appointed by the “majority controlling class certificateholder”, which will be the holder(s) of a majority of the “controlling class”, which means the most subordinate class of Certificates among the Control Eligible Certificates.
The “Controlling Class” will be, as of any time of determination, the most subordinate class of Control Eligible Certificates then outstanding that has an aggregate Certificate Balance (as notionally reduced by any Cumulative Appraisal Reduction Amounts allocable to such class(es)) at least equal to 25% of the initial Certificate Balance of that class;provided,however, that if at any time the Certificate Balances of the certificates other than the Control Eligible Certificates have been reduced to zero as a result of principal payments on the Mortgage Loans, then the Controlling Class will be the most subordinate class of Control Eligible Certificates that has a Certificate Balance greater than zero without regard to any Cumulative Appraisal Reduction Amounts. The Controlling Class as of the Closing Date will be the Class H-RR Certificates. | |
| Control and Consultation: | The rights of various parties to replace the Special Servicer and approve or consult with respect to major actions of the Special Servicer will vary according to defined periods.
A “Control Termination Event” will occur when (i) the Class G-RR Certificates have a Certificate Balance (taking into account the application of any Cumulative Appraisal Reduction Amounts to notionally reduce the Certificate Balance of such class) of less than 25% of the initial Certificate Balance of that class or (ii) a holder of a majority of the Class G-RR Certificates is the majority Controlling Class Certificateholder and has irrevocably waived its right, in writing, to exercise any of the rights of the Controlling Class Certificateholder and such rights have not been reinstated to a successor controlling class certificateholder as described below;provided,however, that a Control Termination Event will not be deemed continuing in the event that the Certificate Balances of the certificates other than the Control Eligible Certificates have been reduced to zero as a result of principal payments on the Mortgage Loans.
A “Consultation Termination Event” will occur when (i) there is no class of Control Eligible Certificates that has a then-outstanding Certificate Balance at least equal to 25% of the initial Certificate Balance of that class, in each case, without regard to the application of any Cumulative Appraisal Reduction Amounts; or (ii) a holder of a majority of the Class G-RR certificates is the majority Controlling Class Certificateholder and has irrevocably waived its right, in writing, to exercise any of the rights of the Controlling Class Certificateholder and such rights have not been reinstated to a successor controlling class certificateholder pursuant to the terms of the WFCM 2018-C44 pooling and servicing agreement;provided that no Consultation Termination Event resulting solely from the operation of clause (ii) will be deemed to have existed or be in continuance with respect to a successor holder of the Class G-RR certificates that has not irrevocably waived its right to exercise any of the rights of the Controlling Class Certificateholder;provided,however, that a Consultation Termination Event will not be deemed continuing in the event that the Certificate Balances of the certificates other than the Control Eligible Certificates have been reduced to zero as a result of principal payments on the |
THE INFORMATION IN THIS STRUCTURAL AND COLLATERAL TERM SHEET IS NOT COMPLETE AND MAY BE AMENDED PRIOR TO THE TIME OF SALE. THIS TERM SHEET IS NOT AN OFFER TO SELL THESE SECURITIES AND IT IS NOT A SOLICITATION OF AN OFFER TO BUY THESE SECURITIES IN ANY JURISDICTION WHERE THE OFFER OR SALE IS NOT PERMITTED.
22
| Wells Fargo Commercial Mortgage Trust 2018-C44 | Certain Terms and Conditions |
Mortgage Loans.
If no Control Termination Event has occurred and is continuing, except with respect to the Excluded Loans (as defined below) with respect to the directing certificateholder and except with respect to Servicing Shift Whole Loans (as defined below) (i) the directing certificateholder will be entitled to grant or withhold approval of asset status reports prepared, and material servicing actions proposed, by the Special Servicer, and (ii) the directing certificateholder will be entitled to terminate and replace the Special Servicer with or without cause, and appoint itself or another person as the successor special servicer. It will be a condition to such appointment that DBRS, Fitch and Moody’s (and any rating agency rating any securities backed by anypari passu companion loan(s) serviced under this transaction) confirm that the appointment would not result in a qualification, downgrade or withdrawal of any of their then-current ratings of certificates (and any certificates backed by anypari passu companion loan(s) serviced under this transaction).
If a Control Termination Event has occurred and is continuing but no Consultation Termination Event has occurred and is continuing, the Special Servicer will be required to consult with the directing certificateholder (other than with respect to Excluded Loans as to such party and except with respect to Servicing Shift Whole Loans (as defined below)) and the Operating Advisor in connection with asset status reports and material special servicing actions.
If a Consultation Termination Event has occurred and is continuing, the Special Servicer must seek to consult with the Operating Advisor in connection with asset status reports and material special servicing actions, and, in general, no directing certificateholder will be recognized or have any right to terminate the Special Servicer or approve, direct or consult with respect to servicing matters.
With respect to each serviced whole loan that is not a Servicing Shift Whole Loan, the rights of the directing certificateholder described above will be subject to the consultation rights of the holders of the relatedpari passu companion loans. Those consultation rights will generally extend to asset status reports and material special servicing actions involving the related whole loan, will be as set forth in the related intercreditor agreement, and will be in addition to the rights of the directing certificateholder in this transaction described above.
With respect to each whole loan marked with footnote (3) under “IV. Characteristics of the Mortgage Pool—B. Summary of the Whole Loans” (each, a “Servicing Shift Whole Loan”), prior to date of securitization of the related controllingpari passucompanion loan (such date, a “Servicing Shift Securitization Date”), the holder of the related controllingpari passu companion loan will have certain control rights regarding the servicing of the related whole loan under the WFCM 2018-C44 pooling and servicing agreement, including the right to approve or disapprove various material servicing actions involving the related whole loan.
With respect to (x) each non-serviced whole loan and (y) each Servicing Shift Whole Loan after its Servicing Shift Securitization Date, the applicable servicing agreement for the related controllingpari passu companion loan(s) generally grants (or will grant) the directing certificateholder under the related securitization control rights that may include the right to approve or disapprove various material servicing actions involving the related whole loan. The directing certificateholder for this securitization (so long as no Consultation Termination Event has occurred and is occurring) generally will nonetheless have the right to be consulted on a non-binding basis with respect to such actions. For purposes of the servicing of any such whole loan contemplated by this paragraph, the occurrence and continuance of a Control Termination Event or Consultation Termination Event under this securitization will not limit the control or other rights of the directing certificateholder (or equivalent) under the securitization of the related controllingpari passu companion loan(s).
The control rights and consent and consultation rights described in the three preceding paragraphs are subject to various limitations, conditions and exceptions as described in the Preliminary Prospectus.
Notwithstanding any contrary description set forth above, in the event that, with respect to any mortgage loan, if the majority controlling class certificateholder or the directing certificateholder is a Borrower Party, the majority controlling class certificateholder and the directing certificateholder will have no right to receive asset status reports or such other information as may be specified in the WFCM 2018-C44 pooling and servicing agreement, to grant or withhold approval of, or consult with respect to, asset status reports prepared, and material servicing actions proposed, by the Special Servicer, with respect to such mortgage loan, and such mortgage loan will be referred to as an “Excluded Loan” as to such party.
In addition, notwithstanding any contrary description set forth above, in the event that, with respect to any mortgage loan, a controlling class certificateholder is a Borrower Party, such controlling class certificateholder will have no right to receive asset status reports or such other |
THE INFORMATION IN THIS STRUCTURAL AND COLLATERAL TERM SHEET IS NOT COMPLETE AND MAY BE AMENDED PRIOR TO THE TIME OF SALE. THIS TERM SHEET IS NOT AN OFFER TO SELL THESE SECURITIES AND IT IS NOT A SOLICITATION OF AN OFFER TO BUY THESE SECURITIES IN ANY JURISDICTION WHERE THE OFFER OR SALE IS NOT PERMITTED.
23
| Wells Fargo Commercial Mortgage Trust 2018-C44 | Certain Terms and Conditions |
information as may be specified in the WFCM 2018-C44 pooling and servicing agreement with respect to such mortgage loan, and such controlling class certificateholder will be referred to as an “excluded controlling class holder”.
“Borrower Party” means a borrower, a mortgagor or a manager of a mortgaged property, an Accelerated Mezzanine Loan Lender, or any Borrower Party Affiliate. “Accelerated Mezzanine Loan Lender” means a mezzanine lender under a mezzanine loan that has been accelerated or as to which foreclosure or enforcement proceedings have been commenced against the equity collateral pledged to secure such mezzanine loan. “Borrower Party Affiliate” means, with respect to a borrower, a mortgagor, a manager of a Mortgaged Property or an Accelerated Mezzanine Loan Lender, (x) any other person controlling or controlled by or under common control with such borrower, mortgagor, manager or Accelerated Mezzanine Loan Lender, as applicable, or (y) any other person owning, directly or indirectly, 25% or more of the beneficial interests in such borrower, mortgagor, manager or Accelerated Mezzanine Loan Lender. | ||
| Replacement of Special Servicer: | If a Control Termination Event has occurred and is continuing, the Special Servicer (other than with respect to a Servicing Shift Whole Loan) may be removed and replaced without cause upon the affirmative direction of certificate owners holding not less than 66-2/3% of a certificateholder quorum, following a proposal from certificate owners holding not less than 25% of the appraisal-reduced voting rights of all Certificates. The certificateholders who initiate a vote on a termination and replacement of the Special Servicer without cause must cause DBRS, Fitch and Moody’s to confirm the then-current ratings of the certificates (or decline to review the matter) and cause the payment of the fees and expenses incurred in the replacement. If no Control Termination Event has occurred and is continuing, the Special Servicer (other than with respect to a Servicing Shift Whole Loan) may be replaced by the directing certificateholder, subject to DBRS, Fitch and Moody’s (and any Rating Agency rating any securities backed by anypari passu companion loan(s) serviced under this transaction) confirming the then-current ratings of the Certificates (and any certificates backed by anypari passucompanion loans serviced under this transaction) or declining to review the matter.
In addition, if at any time the Operating Advisor determines, in its sole discretion exercised in good faith, that (i) the Special Servicer is not performing its duties as required under the pooling and servicing agreement in accordance with the Servicing Standard and (ii) the replacement of the Special Servicer would be in the best interest of the certificateholders as a collective whole, then, the Operating Advisor will have the right to recommend the replacement of the Special Servicer and will submit its formal recommendation to the Trustee and the Certificate Administrator (along with its rationale, its proposed replacement special servicer and other relevant information justifying its recommendation).
The Operating Advisor’s recommendation to replace the Special Servicer must be confirmed by an affirmative vote of holders of Principal Balance Certificates evidencing at least a majority of a quorum of certificateholders (which, for this purpose, is the holders of Principal Balance Certificates that (i) evidence at least 20% of the Voting Rights (taking into account the application of any cumulative appraisal reduction amounts to notionally reduce the respective Certificate Balances) of all Principal Balance Certificates on an aggregate basis, and (ii) consist of at least three certificateholders or certificate owners that are not risk retention affiliated with each other). In the event the holders of Principal Balance Certificates evidencing at least a majority of a quorum of certificateholders elect to remove and replace the Special Servicer (which requisite affirmative votes must be received within 180 days of the posting of the notice of the Operating Advisor’s recommendation to replace the Special Servicer to the Certificate Administrator’s website), the Certificate Administrator will be required to receive a Rating Agency Confirmation from each of the Rating Agencies at that time. | |
| Excluded Special Servicer: | In the event that, with respect to any mortgage loan, the Special Servicer is a Borrower Party, the Special Servicer will be required to resign as special servicer of such mortgage loan (referred to as an “excluded special servicer loan”). If no Control Termination Event has occurred and is continuing, the directing certificateholder will be entitled to appoint (and may replace with or without cause) a separate special servicer that is not a Borrower Party (referred to as an “excluded special servicer”) with respect to such excluded special servicer loan unless such excluded special servicer loan is also an excluded loan. Otherwise, upon resignation of the Special Servicer with respect to an excluded special servicer loan, the resigning Special Servicer will be required to appoint the excluded special servicer. | |
| Appraisal Remedy: | If the Class of Certificates comprising the controlling class loses its status as controlling class because of the application of an Appraisal Reduction Amount or Collateral Deficiency Amount, the holders of a majority of the voting rights of such Class may require the Special Servicer to order a second appraisal for any mortgage loan in respect of which an Appraisal Reduction Amount or Collateral Deficiency Amount has been applied. The Special Servicer must thereafter determine whether, based on its assessment of such second appraisal, any recalculation of the Appraisal Reduction Amount or Collateral Deficiency Amount is warranted. |
THE INFORMATION IN THIS STRUCTURAL AND COLLATERAL TERM SHEET IS NOT COMPLETE AND MAY BE AMENDED PRIOR TO THE TIME OF SALE. THIS TERM SHEET IS NOT AN OFFER TO SELL THESE SECURITIES AND IT IS NOT A SOLICITATION OF AN OFFER TO BUY THESE SECURITIES IN ANY JURISDICTION WHERE THE OFFER OR SALE IS NOT PERMITTED.
24
| Wells Fargo Commercial Mortgage Trust 2018-C44 | Certain Terms and Conditions |
Such Class will not be able to exercise any direction, control, consent and/or similar rights of the controlling class unless and until reinstated as the controlling class through such determination; and pending such determination, the rights of the controlling class will be exercised by the Control Eligible Certificates, if any, that would be the controlling class taking into account the subject appraisal reduction amount. | ||
| Sale of Defaulted Assets: | There will be no “fair value” purchase option. Instead, the WFCM 2018-C44 pooling and servicing agreement will authorize the Special Servicer to sell defaulted mortgage loans serviced by such Special Servicer to the highest bidder in a manner generally similar to sales of REO properties.
The sale of a defaulted loan (other than a non-serviced whole loan) for less than par plus accrued interest and certain other fees and expenses owed on the loan will be subject to consent or consultation rights of the directing certificateholder and/or Operating Advisor, as described in the Preliminary Prospectus. Generally speaking, the holder of apari passu companion loan will have consent and/or consultation rights, as described in the Preliminary Prospectus.
With respect to (x) any serviced whole loan and (y) any Servicing Shift Whole Loan prior to its Servicing Shift Securitization Date, if such whole loan becomes a defaulted loan under the WFCM 2018-C44 pooling and servicing agreement, the Special Servicer will generally be required to sell both the mortgage loan and the relatedpari passu companion loan(s) as a single whole loan.
With respect to (x) each non-serviced whole loan and (y) each Servicing Shift Whole Loan after its related Servicing Shift Securitization Date, the applicable servicing agreement governing the servicing of such whole loan generally will provide that, if the relatedpari passu companion loan(s) serviced under such agreement become a defaulted loan under such servicing agreement, then the related special servicer may offer to sell to any person (or may offer to purchase) for cash such whole loan during such time as such applicablepari passucompanion loan(s) constitute a defaulted loan under such servicing agreement. Generally speaking, in connection with any such sale, the related special servicer is required to sell both the mortgage loan and the related pari passu companion loan(s) as a whole loan. The directing certificateholder for this securitization generally will have consent and/or consultation rights as the holder of an interest in the related mortgage loan, as described in the Preliminary Prospectus.
The procedures for the sale of any whole loan that becomes a defaulted whole loan, and any associated consultation rights, are subject to various limitations, conditions and exceptions as described in the Preliminary Prospectus. | |
| “As-Is” Appraisals: | Appraisals must be conducted on an “as-is” basis, and must be no more than 12 months old, for purposes of determining Appraisal Reduction Amounts and market value in connection with REO sales. Required appraisals may consist of updates of prior appraisals. Internal valuations by the Special Servicer are permitted if the principal balance of a mortgage loan is less than $2,000,000. | |
| Operating Advisor: | The Operating Advisor will have certain review and consultation rights relating to the performance of the Special Servicer and with respect to its actions taken in connection with the resolution and/or liquidation of Specially Serviced Loans. With respect to each mortgage loan or Serviced Whole Loan (in each case, other than a Non-Serviced Mortgage Loan), the Operating Advisor will be responsible for:
● reviewing the actions of the Special Servicer with respect to any Specially Serviced Loan;
● reviewing (i) all reports by the Special Servicer made available to Privileged Persons on the Certificate Administrator’s website and (ii) each Asset Status Report (as defined in the Preliminary Prospectus) (after the occurrence and during the continuance of an Operating Advisor Consultation Event (as defined below)) and Final Asset Status Report (as defined in the Preliminary Prospectus);
● recalculating and verifying the accuracy of the mathematical calculations and the corresponding application of the non-discretionary portion of the applicable formulas required to be utilized in connection with Appraisal Reduction Amounts, Collateral Deficiency Amounts and net present value calculations used in the Special Servicer’s determination of what course of action to take in connection with the workout or liquidation of a Specially Serviced Loan; and
● preparing an annual report (if any mortgage loan (other than any Non-Serviced Mortgage Loan) or Serviced Whole Loan was a Specially Serviced Loan at any time during the prior calendar year or an Operating Advisor Consultation Event (as defined |
THE INFORMATION IN THIS STRUCTURAL AND COLLATERAL TERM SHEET IS NOT COMPLETE AND MAY BE AMENDED PRIOR TO THE TIME OF SALE. THIS TERM SHEET IS NOT AN OFFER TO SELL THESE SECURITIES AND IT IS NOT A SOLICITATION OF AN OFFER TO BUY THESE SECURITIES IN ANY JURISDICTION WHERE THE OFFER OR SALE IS NOT PERMITTED.
25
| Wells Fargo Commercial Mortgage Trust 2018-C44 | Certain Terms and Conditions |
below) occurred during the prior calendar year) that sets forth whether the Operating Advisor believes, in its sole discretion exercised in good faith, that the Special Servicer is operating in compliance with the Servicing Standard with respect to its performance of its duties under the pooling and servicing agreement with respect to Specially Serviced Loans (and, after the occurrence and continuance of an Operating Advisor Consultation Event (as defined below), with respect to major decisions on non-Specially Serviced Loans) during the prior calendar year on a “trust-level basis”. The Operating Advisor will identify (1) which, if any, standards the Operating Advisor believes, in its sole discretion exercised in good faith, the Special Servicer has failed to comply with and (2) any material deviations from the Special Servicer’s obligations under the pooling and servicing agreement with respect to the resolution or liquidation of any Specially Serviced Loan or REO Property (other than with respect to any REO Property related to any Non-Serviced Mortgage Loan or any Servicing Shift Mortgage Loan). In preparing any Operating Advisor Annual Report (as defined in the Preliminary Prospectus), the Operating Advisor will not be required to report on instances of non-compliance with, or deviations from, the Servicing Standard or the Special Servicer’s obligations under the pooling and servicing agreement that the Operating Advisor determines, in its sole discretion exercised in good faith, to be immaterial.
With respect to each mortgage loan (other than any Non-Serviced Mortgage Loan) or Serviced Whole Loan, after the Operating Advisor has received notice that an Operating Advisor Consultation Event (as defined below) has occurred and is continuing, in addition to the duties described above, the Operating Advisor will be required to perform the following additional duties:
● to consult (on a non-binding basis) with the Special Servicer in respect of asset status reports and
● to consult (on a non-binding basis) with the Special Servicer with respect to “major decisions” processed by the Special Servicer.
An “Operating Advisor Consultation Event” will occur when the Certificate Balances of the Class E-RR, F-RR, G-RR and H-RR Certificates in the aggregate (taking into account the application of any Cumulative Appraisal Reduction Amounts to notionally reduce the Certificate Balances of such classes) is 25% or less of the initial Certificate Balances of such classes in the aggregate. | ||
| Asset Representations Reviewer: | The Asset Representations Reviewer will be required to review certain delinquent mortgage loans after a specified delinquency threshold has been exceeded (an “Asset Review Trigger”) and the required percentage of certificateholders vote to direct a review of such delinquent loans. An Asset Review Trigger will occur when either (1) mortgage loans with an aggregate outstanding principal balance of 25.0% or more of the aggregate outstanding principal balance of all of the mortgage loans (including any REO loans (or a portion of any REO loan in the case of a whole loan)) held by the issuing entity as of the end of the applicable collection period are delinquent loans or (2) at least 15 mortgage loans are delinquent loans as of the end of the applicable collection period and the outstanding principal balance of such delinquent loans in the aggregate constitutes at least 20.0% of the aggregate outstanding principal balance of all of the mortgage loans (including any REO loans (or a portion of any REO loan in the case of a whole loan)) held by the issuing entity as of the end of the applicable collection period. See “Pooling and Servicing Agreement—The Asset Representations Reviewer—Asset Review” in the Preliminary Prospectus.
The Asset Representations Reviewer may be terminated and replaced without cause. Upon (i) the written direction of certificateholders evidencing not less than 25% of the voting rights (without regard to the application of any Cumulative Appraisal Reduction Amounts) requesting a vote to terminate and replace the Asset Representations Reviewer with a proposed successor Asset Representations Reviewer that is an eligible asset representations reviewer, and (ii) payment by such holders to the certificate administrator of the reasonable fees and expenses to be incurred by the certificate administrator in connection with administering such vote, the certificate administrator will promptly provide notice to all certificateholders and the Asset Representations Reviewer of such request by posting such notice on its internet website, and by mailing such notice to all certificateholders and the Asset Representations Reviewer. Upon the written direction of certificateholders evidencing at least 75% of a certificateholder quorum (without regard to the application of any Cumulative Appraisal Reduction Amounts), the Trustee will terminate all of the rights and obligations of the Asset Representations Reviewer under the WFCM 2018-C44 pooling and servicing agreement by written notice to the Asset Representations Reviewer, and the proposed successor Asset Representations Reviewer will be appointed. See “Pooling and Servicing Agreement—The Asset Representations Reviewer” in the Preliminary Prospectus. |
THE INFORMATION IN THIS STRUCTURAL AND COLLATERAL TERM SHEET IS NOT COMPLETE AND MAY BE AMENDED PRIOR TO THE TIME OF SALE. THIS TERM SHEET IS NOT AN OFFER TO SELL THESE SECURITIES AND IT IS NOT A SOLICITATION OF AN OFFER TO BUY THESE SECURITIES IN ANY JURISDICTION WHERE THE OFFER OR SALE IS NOT PERMITTED.
26
| Wells Fargo Commercial Mortgage Trust 2018-C44 | Certain Terms and Conditions |
| Dispute Resolution Provisions: | The mortgage loan sellers will be subject to the dispute resolution provisions set forth in the WFCM 2018-C44 pooling and servicing agreement to the extent those provisions are triggered with respect to any mortgage loan sold to the depositor by a mortgage loan seller and such mortgage loan seller will be obligated under the related mortgage loan purchase agreement to comply with all applicable provisions and to take part in any mediation or arbitration proceedings that may result.
Generally, in the event that a Repurchase Request (as defined in the Preliminary Prospectus) is not “Resolved” (as defined below) within 180 days after the related mortgage loan seller receives such Repurchase Request, then the enforcing servicer will be required to send a notice to the “Initial Requesting Certificateholder” (if any) and the Certificate Administrator indicating the enforcing servicer’s intended course of action with respect to the Repurchase Request. If (a) the enforcing servicer’s intended course of action with respect to the Repurchase Request does not involve pursuing further action to exercise rights against the related mortgage loan seller with respect to the Repurchase Request and the Initial Requesting Certificateholder, if any, or any other certificateholder or certificate owner wishes to exercise its right to refer the matter to mediation (including non-binding arbitration) or arbitration, or (b) the enforcing servicer’s intended course of action is to pursue further action to exercise rights against the related mortgage loan seller with respect to the Repurchase Request but the Initial Requesting Certificateholder, if any, or any other certificateholder or certificate owner does not agree with the dispute resolution method selected by the enforcing servicer, then the Initial Requesting Certificateholder, if any, or such other certificateholder or certificate owner may deliver a written notice to the Special Servicer indicating its intent to exercise its right to refer the matter to either mediation or arbitration.
“Resolved” means, with respect to a Repurchase Request, (i) that the related Material Defect has been cured, (ii) the related mortgage loan has been repurchased in accordance with the related mortgage loan purchase agreement, (iii) a mortgage loan has been substituted for the related mortgage loan in accordance with the related mortgage loan purchase agreement, (iv) the applicable mortgage loan seller has made a Loss of Value Payment (as defined in the Preliminary Prospectus), (v) a contractually binding agreement is entered into between the enforcing servicer, on behalf of the issuing entity, and the related mortgage loan seller that settles the related mortgage loan seller’s obligations under the related mortgage loan purchase agreement or (vi) the related mortgage loan is no longer property of the issuing entity as a result of a sale or other disposition in accordance with the WFCM 2018-C44 pooling and servicing agreement. See “Pooling and Servicing Agreement—Dispute Resolution Provisions” in the Preliminary Prospectus. | |
| Investor Communications: | The certificate administrator is required to include on any Form 10–D any request received from a certificateholder to communicate with other certificateholders related to certificateholders exercising their rights under the terms of the WFCM 2018-C44 pooling and servicing agreement. Any certificateholder wishing to communicate with other certificateholders regarding the exercise of its rights under the terms of the WFCM 2018-C44 pooling and servicing agreement will be able to deliver a written request signed by an authorized representative of the requesting investor to the certificate administrator. | |
| Certain Fee Offsets: | If a workout fee is earned by the Special Servicer following a loan default with respect to any mortgage loan that it services, then certain limitations will apply based on modification fees paid by the borrower. The modification fee generally must not exceed 1% of the principal balance of the loan as modified in any 12-month period. In addition, if the loan re-defaults, any subsequent workout fee on that loan must be reduced by a portion of the modification fees paid by the borrower in the previous 12-months. Likewise, liquidation fees collected in connection with a liquidation or partial liquidation of a mortgage loan must be reduced by a portion of the modification fees paid by the borrower in the previous 12 months. | |
| Deal Website: | The Certificate Administrator will be required to maintain a deal website, which will include, among other items: (a) summaries of asset status reports prepared by the Special Servicer, (b) inspection reports, (c) appraisals, (d) various “special notices” described in the Preliminary Prospectus, (e) the “Investor Q&A Forum”, (f) a voluntary “Investor Registry” and (g) the “Risk Retention” tab. Investors may access the deal website following execution of a certification and confidentiality agreement. | |
| Initial Majority Controlling Class Certificateholder: | It is expected that RREF III-D AIV RR H, LLC or an affiliate will be the initial majority controlling class certificateholder. | |
| Whole Loans: | Each of the mortgaged properties identified above under “IV. Characteristics of the Mortgage Pool—B. Summary of the Whole Loans” secures both a mortgage loan to be included in the trust fund and one or more other mortgage loans that will not be included in the trust fund, each of which will bepari passu or subordinate in right of payment with the mortgage loan included in the trust fund. We refer to each such group of mortgage loans as a “whole loan”. Such “—Summary of the Whole Loans” section includes further information regarding the |
THE INFORMATION IN THIS STRUCTURAL AND COLLATERAL TERM SHEET IS NOT COMPLETE AND MAY BE AMENDED PRIOR TO THE TIME OF SALE. THIS TERM SHEET IS NOT AN OFFER TO SELL THESE SECURITIES AND IT IS NOT A SOLICITATION OF AN OFFER TO BUY THESE SECURITIES IN ANY JURISDICTION WHERE THE OFFER OR SALE IS NOT PERMITTED.
27
| Wells Fargo Commercial Mortgage Trust 2018-C44 | Certain Terms and Conditions |
various notes in each whole loan, the holders of such notes, the lead servicing agreement for each such whole loan, and the master servicer and special servicer under such lead servicing agreement. |
THE INFORMATION IN THIS STRUCTURAL AND COLLATERAL TERM SHEET IS NOT COMPLETE AND MAY BE AMENDED PRIOR TO THE TIME OF SALE. THIS TERM SHEET IS NOT AN OFFER TO SELL THESE SECURITIES AND IT IS NOT A SOLICITATION OF AN OFFER TO BUY THESE SECURITIES IN ANY JURISDICTION WHERE THE OFFER OR SALE IS NOT PERMITTED.
28
(THIS PAGE INTENTIONALLY LEFT BLANK)
THE INFORMATION IN THIS STRUCTURAL AND COLLATERAL TERM SHEET IS NOT COMPLETE AND MAY BE AMENDED PRIOR TO THE TIME OF SALE. THIS TERM SHEET IS NOT AN OFFER TO SELL THESE SECURITIES AND IT IS NOT A SOLICITATION OF AN OFFER TO BUY THESE SECURITIES IN ANY JURISDICTION WHERE THE OFFER OR SALE IS NOT PERMITTED.
29
(THIS PAGE INTENTIONALLY LEFT BLANK)
THE INFORMATION IN THIS STRUCTURAL AND COLLATERAL TERM SHEET IS NOT COMPLETE AND MAY BE AMENDED PRIOR TO THE TIME OF SALE. THIS TERM SHEET IS NOT AN OFFER TO SELL THESE SECURITIES AND IT IS NOT A SOLICITATION OF AN OFFER TO BUY THESE SECURITIES IN ANY JURISDICTION WHERE THE OFFER OR SALE IS NOT PERMITTED.
30
VILLAGE AT LEESBURG |
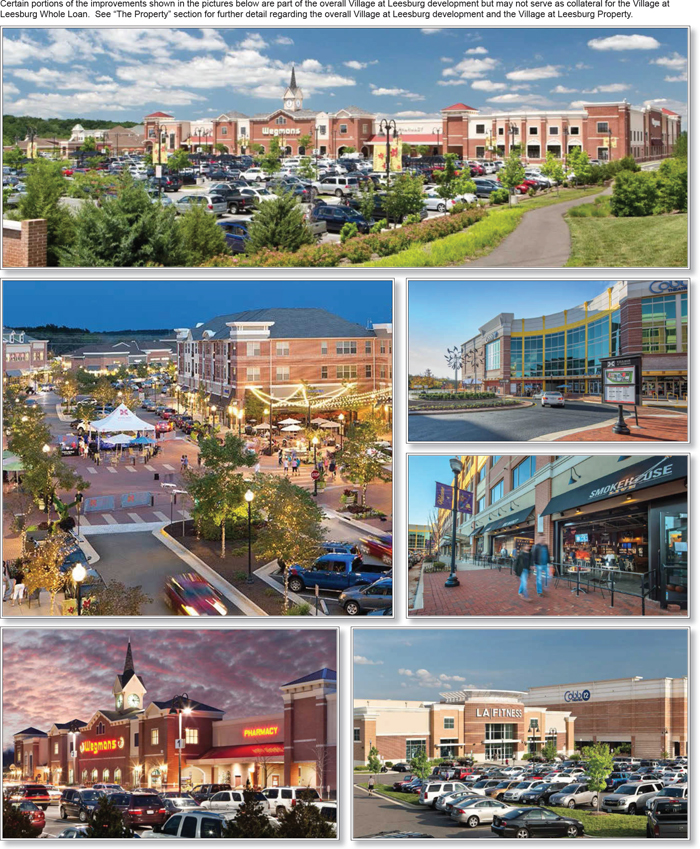
THE INFORMATION IN THIS STRUCTURAL AND COLLATERAL TERM SHEET IS NOT COMPLETE AND MAY BE AMENDED PRIOR TO THE TIME OF SALE. THIS TERM SHEET IS NOT AN OFFER TO SELL THESE SECURITIES AND IT IS NOT A SOLICITATION OF AN OFFER TO BUY THESE SECURITIES IN ANY JURISDICTION WHERE THE OFFER OR SALE IS NOT PERMITTED.
31
VILLAGE AT LEESBURG |
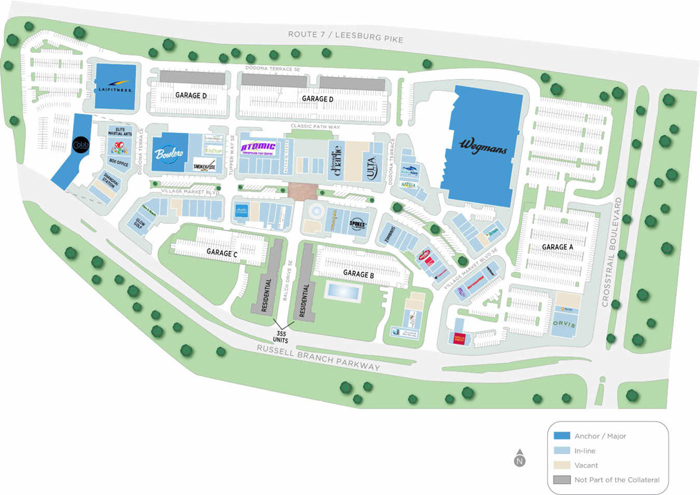
THE INFORMATION IN THIS STRUCTURAL AND COLLATERAL TERM SHEET IS NOT COMPLETE AND MAY BE AMENDED PRIOR TO THE TIME OF SALE. THIS TERM SHEET IS NOT AN OFFER TO SELL THESE SECURITIES AND IT IS NOT A SOLICITATION OF AN OFFER TO BUY THESE SECURITIES IN ANY JURISDICTION WHERE THE OFFER OR SALE IS NOT PERMITTED.
32
VILLAGE AT LEESBURG |

THE INFORMATION IN THIS STRUCTURAL AND COLLATERAL TERM SHEET IS NOT COMPLETE AND MAY BE AMENDED PRIOR TO THE TIME OF SALE. THIS TERM SHEET IS NOT AN OFFER TO SELL THESE SECURITIES AND IT IS NOT A SOLICITATION OF AN OFFER TO BUY THESE SECURITIES IN ANY JURISDICTION WHERE THE OFFER OR SALE IS NOT PERMITTED.
33
| No. 1 – Village at Leesburg | |||||||
| Loan Information | Property Information | ||||||
| Mortgage Loan Seller: | Wells Fargo Bank, National Association | Single Asset/Portfolio: | Single Asset | ||||
| Credit Assessment (DBRS/Fitch/Moody’s): | NR/NR/NR | Property Type: | Retail | ||||
| Original Principal Balance(1): | $66,000,000 | Specific Property Type: | Anchored | ||||
| Cut-off Date Balance(1): | $66,000,000 | Location: | Leesburg, VA | ||||
| % of Initial Pool Balance: | 8.6% | Size(4): | 546,107 SF | ||||
| Loan Purpose(2): | Recapitalization | Cut-off Date Balance Per SF(1)(4): | $240.34 | ||||
| Borrower Name: | CRP/TRC Leesburg Retail Owner, L.L.C. | Year Built/Renovated: | 2009/2018 | ||||
| Sponsors: | Gary D. Rappaport | Title Vesting: | Fee | ||||
| Mortgage Rate: | 4.7580% | Property Manager: | Self-managed | ||||
| Note Date: | March 9, 2018 | 4thMost Recent Occupancy (As of): | 78.7% (12/31/2014) | ||||
| Anticipated Repayment Date: | NAP | 3rdMost Recent Occupancy (As of): | 82.1% (12/31/2015) | ||||
| Maturity Date: | April 1, 2028 | 2ndMost Recent Occupancy (As of): | 88.4% (12/31/2016) | ||||
| IO Period: | 60 months | Most Recent Occupancy (As of): | 93.6% (12/31/2017) | ||||
| Loan Term (Original): | 120 months | Current Occupancy (As of)(4): | 91.6% (3/9/2018) | ||||
| Seasoning: | 1 month | ||||||
| Amortization Term (Original): | 360 months | Underwriting and Financial Information: | |||||
| Loan Amortization Type: | Interest-only, Amortizing Balloon | ||||||
| Interest Accrual Method: | Actual/360 | 4thMost Recent NOI (As of)(5): | $6,914,642 (12/31/2014) | ||||
| Call Protection: | L(25),D(91),O(4) | 3rdMost Recent NOI (As of)(5): | $6,200,743 (12/31/2015) | ||||
| Lockbox Type: | Hard/Upfront Cash Management | 2ndMost Recent NOI (As of)(5): | $7,766,054 (12/31/2016) | ||||
| Additional Debt(1): | Yes | Most Recent NOI (As of)(5): | $8,685,899 (12/31/2017) | ||||
| Additional Debt Type(1): | Pari Passu | ||||||
| U/W Revenues: | $14,588,909 | ||||||
| U/W Expenses: | $3,574,353 | ||||||
| Escrows and Reserves(3): | U/W NOI(4): | $11,014,555 | |||||
| U/W NCF: | $10,531,133 | ||||||
| Type: | Initial | Monthly | Cap (If Any) | U/W NOI DSCR(1): | 1.34x | ||
| Taxes | $560,062 | $112,013 | NAP | U/W NCF DSCR(1): | 1.28x | ||
| Insurance | $0 | Springing | NAP | U/W NOI Debt Yield(1): | 8.4% | ||
| Immediate Repairs | $28,125 | $0 | NAP | U/W NCF Debt Yield(1): | 8.0% | ||
| Replacement Reserve | $0 | $6,801 | $244,818 | Appraised Value(6): | $226,000,000 | ||
| Leasing Reserve | $0 | $45,894 | $2,010,135(3) | Appraisal Valuation Date(6): | December 1, 2018 | ||
| Rent Concession Reserve | $842,933 | $0 | NAP | Cut-off Date LTV Ratio(1)(6): | 58.1% | ||
| Existing TI/LC Reserve | $7,649,629 | $0 | NAP | LTV Ratio at Maturity or ARD(1)(6): | 53.4% | ||
| (1) | See “The Mortgage Loan” section. All statistical financial information related to balance per square foot, loan-to-value ratios, debt service coverage ratios and debt yields are based on the funded outstanding principal balance of the Village at Leesburg Whole Loan (as defined below). |
| (2) | The Village at Leesburg Property (as defined below) was previously majority owned by an affiliate of the Carlyle Group, which originally developed the overall Village at Leesburg community in 2009. At the time of origination, an entity related to Rappaport (see “Borrower Sponsor” section) acquired a 60% equity ownership interest in the Village at Leesburg Property with the Carlyle Group maintaining a 40% equity ownership interest. |
| (3) | See “Escrows” section. |
| (4) | The Size, Cut-off Date Balance per SF and Current Occupancy assume the completion of the 12,297 square foot expansion related to Cobb Theatres (see “The Property” section). Excluding the expansion space, the Size, Cut-off Date Balance per SF and Current Occupancy are 533,810, $245.87 and 91.4%, respectively. |
| (5) | See “Cash Flow Analysis” section. |
| (6) | The Appraised Value and LTV Ratios shown are based on the appraiser’s Prospective Market Value Upon Completion, which assumes the completion of planned renovations and an expansion related to Cobb Theatres. Cobb Theatres is expected to renovate all existing auditoriums and add two new auditoriums with all work projected to be completed by November 2018 (see “The Property” section). Cobb Theatres is required to commence paying rent on its expanded premises once the tenant is open for business in such space. The underwritten base rent for Cobb Theatres is based on its expanded premises, and the difference between the tenant’s underwritten base rent and current base rent through December 31, 2018 was reserved upon origination of the Village at Leesburg Whole Loan (see “Major Tenants” section). In addition, outstanding tenant improvement obligations related to Cobb Theatres were reserved upon origination of the Village at Leesburg Whole Loan (see “Escrows” section). Based on the as-is appraised value of $205,000,000 (as of February 2, 2018), the Cut-off Date LTV Ratio and LTV Ratio at Maturity are 64.0% and 58.8%, respectively. |
The Mortgage Loan. The mortgage loan (the “Village at Leesburg Mortgage Loan”) is part of a whole loan (the “Village at Leesburg Whole Loan”) evidenced by twopari passu notes secured by a first mortgage encumbering the fee interest in an anchored retail shopping center located in Leesburg, Virginia (the “Village at Leesburg Property”). The Village at Leesburg Whole Loan was originated on March 9, 2018 by Wells Fargo Bank, National Association. The Village at Leesburg Whole Loan had an original principal balance of $131,250,000, has an outstanding principal balance as of the Cut-off Date of $131,250,000 and accrues interest at an interest rate of 4.7580%per annum. The Village at Leesburg Whole Loan had an initial term of 120 months, has a remaining term of 119 months as of the Cut-off Date and requires interest-only payments for the first 60 months following origination and, thereafter, requires payments of principal and interest based on a 30-year amortization schedule. The Village at Leesburg Whole Loan matures on April 1, 2028.
THE INFORMATION IN THIS STRUCTURAL AND COLLATERAL TERM SHEET IS NOT COMPLETE AND MAY BE AMENDED PRIOR TO THE TIME OF SALE. THIS TERM SHEET IS NOT AN OFFER TO SELL THESE SECURITIES AND IT IS NOT A SOLICITATION OF AN OFFER TO BUY THESE SECURITIES IN ANY JURISDICTION WHERE THE OFFER OR SALE IS NOT PERMITTED.
34
VILLAGE AT LEESBURG |
The controlling Note A-1, which will be contributed to the WFCM 2018-C44 securitization trust, had an original principal balance of $66,000,000 and has an outstanding principal balance as of the Cut-off Date of $66,000,000. The non-controlling Note A-2, which had an original principal balance of $65,250,000, is currently held by Wells Fargo Bank, National Association and is expected to be contributed to a future securitization trust. The mortgage loan evidenced by Note A-2 is referred to herein as the “Village at Leesburg Companion Loan”. The lender provides no assurances that the non-securitizedpari passu note will not be split further. See “Description of the Mortgage Pool—The Whole Loans—The Serviced Whole Loans” and “Pooling and Servicing Agreement” in the Preliminary Prospectus.
Note Summary
| Notes | Original Balance | Note Holder | Controlling Interest | |
| A-1 | $66,000,000 | WFCM 2018-C44 | Yes | |
| A-2 | $65,250,000 | Wells Fargo Bank, National Association | No | |
| Total | $131,250,000 |
Following the lockout period, on any date before January 1, 2028, the borrower has the right to defease the Village at Leesburg Whole Loan in whole, but not in part. In addition, the Village at Leesburg Whole Loan is prepayable without penalty on or after January 1, 2028. The lockout period will expire on the earlier to occur of (i) two years after the closing date of the securitization that includes the last note to be securitized and (ii) May 1, 2021.
Sources and Uses
| Sources | Uses | |||||||
| Original whole loan amount | $131,250,000 | 100.0% | Loan payoff(1): | $112,394,408 | 85.6% | |||
| Upfront reserves: | 9,080,749 | 6.9 | ||||||
| Closing costs: | 1,181,685 | 0.9 | ||||||
| Return of equity: | 8,593,158 | 6.5 | ||||||
| Total Sources | $131,250,000 | 100.0% | Total Uses | $131,250,000 | 100.0% |
| (1) | Prior to the origination of the Village at Leesburg Whole Loan, the Village at Leesburg Property was majority owned by an affiliate of the Carlyle Group, which originally developed the overall Village at Leesburg community in 2009. At the time of origination, an entity related to Rappaport (see “Borrower Sponsor” section) acquired a 60% equity ownership interest in the Village at Leesburg Property with the Carlyle Group maintaining a 40% equity ownership interest. The loan payoff shown represents a mortgage loan related to the Carlyle Group’s prior majority ownership of the Village at Leesburg Property. |
The Property.The Village at Leesburg Property consists of 546,107 square feet of retail, open-air lifestyle and entertainment space within the Village at Leesburg development in Leesburg, Virginia. The Village at Leesburg Property is situated on 55.0 acres of land and encompasses 16 one- and two-story buildings. In addition to the Village at Leesburg Property, the overall Village at Leesburg development contains office and multifamily components, which do not serve as collateral for the Village at Leesburg Whole Loan. The non-collateral office component comprises approximately 120,000 square feet of class A office space above the street level retail space and was 91.2% occupied as of April 2018, while the non-collateral multifamily component comprises 335 class A rental units with monthly rental rates for one-bedroom units starting at approximately $1,571. The Village at Leesburg Property was built in 2009, and in 2016, the Village at Leesburg development underwent a $6.6 million common area maintenance project that included upgrades to landscaping, patio seating, and the addition of a fountain and fire-pit. The Village at Leesburg Property hosts entertainment and cultural events throughout the year, including the Winter Ice Festival and ice carving in January, the Leesburg Fine Arts Festival in May, movie nights throughout the summer, Halloween activities and an annual holiday tree lighting in December. The Village at Leesburg Property has exclusive use of 3,128 surface and garage parking spaces, resulting in a parking ratio of 5.7 spaces per 1,000 square feet of rentable area (the overall Village at Leesburg development contains 3,732 surface and garage parking spaces, of which 604 spaces are for the exclusive use of the non-collateral multifamily units).
As of March 9, 2018, the Village at Leesburg Property was 91.6% leased to 66 tenants. In addition to the Wegmans grocery anchor, the tenant mix at the Village at Leesburg Property consists of entertainment options, including Cobb Theatres, Bowlero bowling alley, Atomic Trampoline and Luv2Play Indoor Playground; restaurant tenants, including Firebirds Wood Fire Grill, Travinia Italian Kitchen, Eggspectations, Noodles & Company, BurgerFi and Bon Chon Chicken; and national retail tenants including Ulta, Verizon Wireless, AT&T, European Wax Center, Massage Envy, Visionworks and GNC.
The Village at Leesburg Property is anchored by a Wegmans grocery store (Rated ‘BBB+’ by S&P, 142,692 square feet, 26.1% of net rentable area and 10.1% of underwritten base rent), which is subject to a ground lease with a lease expiration date in July 2034 with five, five-year renewal options. Wegmans is a regional supermarket chain with 96 stores in the northeastern United States. The company reported 2017 sales of approximately $8.7 billion and was ranked 31stof the top 75 supermarkets in the country based on sales volume by an industry news publication. The store provides customers with the convenience of an in-store pharmacy, a Market Café with take-out and in-store dining, a cheese shop, a sub shop, a fresh sushi shop, a salad bar, a pizza shop, a floral shop and a pastry shop.
The second largest tenant is Cobb Theatres (63,564 square feet, 11.6% of net rentable area and 15.0% of underwritten base rent), which currently features 12 screens with approximately 1,900 seats. Cobb Theatres is currently renovating its existing auditoriums with new, reclining seats and is expected to add two new auditoriums (for a total of 14 screens) with a total estimated renovation and construction cost of approximately $7.6 million. The existing auditorium renovations began in January 2018 and are expected to be completed by September 2018; while the expansion work is expected to begin by May 2018 and is expected to be completed by November 2018. With respect to Cobb Theatres, all outstanding tenant improvement costs and gap rent through December 31, 2018 were reserved upon origination of the Village at Leesburg Whole Loan. Cobb Theatres recently exercised a 10-year lease renewal and has a lease expiration date in December 2028 with three, five-year renewal options.
THE INFORMATION IN THIS STRUCTURAL AND COLLATERAL TERM SHEET IS NOT COMPLETE AND MAY BE AMENDED PRIOR TO THE TIME OF SALE. THIS TERM SHEET IS NOT AN OFFER TO SELL THESE SECURITIES AND IT IS NOT A SOLICITATION OF AN OFFER TO BUY THESE SECURITIES IN ANY JURISDICTION WHERE THE OFFER OR SALE IS NOT PERMITTED.
35
VILLAGE AT LEESBURG |
The third largest tenant is LA Fitness (45,000 square feet, 8.2% of net rentable area and 9.1% of underwritten base rent). LA Fitness is a privately-owned American health club with headquarters in Irvine, California. LA Fitness has 675 locations across 27 states in the U.S. and Canada, serving over 3.8 million members. The LA Fitness at the Village at Leesburg Property features basketball courts, group fitness classes, indoor cycling, an indoor pool, a kids club, personal training, a racquetball court, a sauna, a whirlpool spa and a juice bar.
The fourth largest tenant is Bowlero (21,564 square feet, 3.9% net rentable area and 4.2% underwritten base rent). Bowlmor AMF, the owner of Bowlero, is the largest ten-pin bowling center operator in the world with over 300 locations. Bowlero leased the former King Pinz bowling alley space at the Village at Leesburg Property with a lease that commenced in March 2017.
The Village at Leesburg Property comprises two retail condominium units consisting of the Wegmans leased fee parcel (excluding the improvements), and the remaining retail space within the related project (having a 58.06% voting rights interest in each of (i) a condominium regime governing the common elements of the related mixed use buildings within the overall Village at Leesburg development and (ii) a master condominium regime governing the common areas within the overall Village of Leesburg development, including parking garages and structures and private streets). The loan documents provide for springing full recourse to the borrower and guarantors resulting from the condominium regime’s being withdrawn or terminated, or the master owners’ association regime being terminated. See“Description of the Mortgage Pool—Mortgage Pool Characteristics—Condominium Interests”in the Preliminary Prospectus.
The following table presents certain information relating to the tenancy at the Village at Leesburg Property:
Major Tenants
| Tenant Name | Credit Rating (Fitch/Moody’s/ S&P)(1) | Tenant NRSF | % of NRSF | Annual U/W Base Rent PSF(2) | Annual U/W Base Rent(2) | % of Total Annual U/W Base Rent | Sales | Occupancy Cost | Lease Expiration Date | |||||||||
| Anchor Tenant | ||||||||||||||||||
| Wegmans (Ground Lease) | NR/NR/BBB+ | 142,692 | 26.1% | $8.30(3) | $1,184,921(3) | 10.1% | NAV | NAV | 7/31/2034(4) | |||||||||
| Total Anchor Tenant | 142,692 | 26.1% | $8.30 | $1,184,921 | 100.0% | |||||||||||||
| Major Tenants | ||||||||||||||||||
| Cobb Theatres | NR/NR/NR | 63,564(5) | 11.6% | $27.50(5) | $1,748,010(5) | 15.0% | $516,260(6) | 24.4%(6) | 12/31/2028(7) | |||||||||
| LA Fitness | NR/NR/NR | 45,000 | 8.2% | $23.67 | $1,065,042 | 9.1% | NAV | NAV | 3/31/2026(8) | |||||||||
| Bowlero | NR/B3/B | 21,564 | 3.9% | $22.49 | $485,000 | 4.2% | NAV | NAV | 3/31/2027(9) | |||||||||
| Wells Fargo (Ground Lease) | AA-/Aa2/A+ | (10) | (10) | (10) | $430,532(11) | 3.7% | NAV | NAV | 11/14/2029(12) | |||||||||
| Atomic Trampoline | NR/NR/NR | 16,653 | 3.0% | $19.26 | $320,736 | 2.7% | NAV | NAV | 8/31/2026(13) | |||||||||
| Total Major Tenants | 289,473 | 53.0% | $16.59(14) | $5,234,241 | 44.8% | |||||||||||||
| Non-Major Tenants | 210,864 | 38.6% | $30.59(14) | $6,451,262 | 55.2% | |||||||||||||
| Occupied Collateral Total | 500,337 | 91.6% | $22.49(14) | $11,685,503 | 100.0% | |||||||||||||
| Vacant Space | 45,770 | 8.4% | ||||||||||||||||
| Collateral Total | 546,107 | 100.0% | ||||||||||||||||
| (1) | Certain ratings are those of the parent company whether or not the parent company guarantees the lease. |
| (2) | Annual U/W Base Rent PSF and Annual U/W Base Rent include contractual rent steps totaling $147,163 through January 2019 and straight-line rent averaging for investment grade tenants over the loan term for Wegmans and Wells Fargo (totaling $165,453) and over the remaining lease term for Charles Schwab (totaling $28,642). |
| (3) | Wegman’s Annual U/W Base Rent PSF and Annual U/W Base Rent are based on the tenant’s average rental rate over the loan term. Wegman’s current annual base rent is $1,065,000 ($7.46 per square foot). Commencing on August 1, 2019, Wegman’s annual base rent will increase to $1,164,367 ($8.16 per square foot) and commencing on August 1, 2024, Wegman’s annual base rent will increase to $1,265,678 ($8.87 per square foot). |
| (4) | Wegmans hasfive, five-year renewal options, with nine months’ notice, at rental rates as specified in the lease. |
| (5) | Cobb Theatres’ Tenant NRSF, Annual U/W Base Rent PSF and Annual U/W Base Rent assume the completion of the planned renovation and expansion, which are expected to be completed by November 2018 (see “The Property” section). The tenant’s current net rentable square footage, annual base rent per square foot and annual base rent are 51,267, $23.10 and $1,184,961, respectively. The tenant is required to begin paying rent on its expanded premises once it is open for business in such space, and the difference between the tenant’s underwritten base rent and current base rent through December 31, 2018 was reserved at origination of the Village at Leesburg Whole Loan. We cannot assure you that such renovation or expansion work will be completed or that the tenant will begin paying rent on such expansion space. |
| (6) | Sales and Occupancy Cost are for the trailing 12-month period ending December 31, 2017. Sales shown are per screen and based on the tenant’s current 12 screens; and occupancy cost shown is based on the tenant’s current annual base rent of $1,184,961 and underwritten reimbursements. |
| (7) | Cobb Theatres has three five-year renewal options, with nine months’ notice, at rental rates as specified in the lease. |
| (8) | LA Fitness has three five-year renewal options, with six months’ notice, at rental rates calculated in accordance with the Consumer Price Index or 12.0% greater than the minimum rent in effect immediately prior to the extension. |
| (9) | Bowlero has two five-year renewal options, with 180 days’ notice, at rental rates as specified in the lease. |
| (10) | Wells Fargo is subject to a ground lease and owns its improvements with no attributed square footage. |
| (11) | Wells Fargo’s Annual U/W Base Rent is based on the tenant’s average rental rate over the loan term. Wells Fargo’s current annual base rent is $385,000. Commencing on December 1, 2019, Wells Fargo’s annual base rent will increase to $423,519 and commencing on December 1, 2024, Wells Fargo’s annual base rent will increase to $465,838. |
| (12) | Wells Fargo has four five-year renewal options, with 270 days’ notice, at rental rates as specified in the lease. |
| (13) | Atomic Trampoline has one five-year renewal option, with 12 months’ notice, at rental rates as specified in the lease. |
THE INFORMATION IN THIS STRUCTURAL AND COLLATERAL TERM SHEET IS NOT COMPLETE AND MAY BE AMENDED PRIOR TO THE TIME OF SALE. THIS TERM SHEET IS NOT AN OFFER TO SELL THESE SECURITIES AND IT IS NOT A SOLICITATION OF AN OFFER TO BUY THESE SECURITIES IN ANY JURISDICTION WHERE THE OFFER OR SALE IS NOT PERMITTED.
36
VILLAGE AT LEESBURG |
| (14) | Annual U/W Base Rent PSF for Total Major Tenants, Non-Major Tenants and Occupied Collateral Total excludes Annual U/W Base Rent related to Wells Fargo, which is on a ground lease and owns its improvements with no attributed square footage. |
The following table presents certain information relating to the lease rollover schedule at the Village at Leesburg Property:
Lease Expiration Schedule(1)(2)
| Year Ending December 31, | No. of Leases Expiring | Expiring NRSF | % of Total NRSF | Cumulative Expiring NRSF | Cumulative % of Total NRSF | Annual U/W Base Rent | % of Total Annual U/W Base Rent | Annual U/W Base Rent PSF(3)(4) |
| MTM | 0 | 0 | 0.0% | 0 | 0.0% | $0 | 0.0% | $0.00 |
| 2018 | 2 | 5,819 | 1.1% | 5,819 | 1.1% | $171,678 | 1.5% | $29.50 |
| 2019 | 4 | 10,544 | 1.9% | 16,363 | 3.0% | $270,722 | 2.3% | $25.68 |
| 2020 | 13 | 35,568 | 6.5% | 51,931 | 9.5% | $1,566,326 | 13.4% | $44.04 |
| 2021 | 8 | 35,416 | 6.5% | 87,347 | 16.0% | $878,891 | 7.5% | $24.82 |
| 2022 | 4 | 16,161 | 3.0% | 103,508 | 19.0% | $455,520 | 3.9% | $28.19 |
| 2023 | 3 | 14,127 | 2.6% | 117,635 | 21.5% | $369,802 | 3.2% | $26.18 |
| 2024 | 4 | 17,290 | 3.2% | 134,925 | 24.7% | $402,174 | 3.4% | $23.26 |
| 2025 | 7 | 24,061 | 4.4% | 158,986 | 29.1% | $774,013 | 6.6% | $32.17 |
| 2026 | 6 | 76,309 | 14.0% | 235,295 | 43.1% | $1,955,297 | 16.7% | $25.62 |
| 2027 | 8 | 43,074 | 7.9% | 278,369 | 51.0% | $1,115,539 | 9.5% | $25.90 |
| 2028 | 4 | 79,276 | 14.5% | 357,645 | 65.5% | $2,110,088 | 18.1% | $26.62 |
| Thereafter | 2 | 142,692 | 26.1% | 500,337 | 91.6% | $1,615,453 | 13.8% | $11.32 |
| Vacant | 0 | 45,770 | 8.4% | 546,107 | 100.0% | $0 | 0.0% | $0.00 |
| Total/Weighted Average | 65 | 546,107 | 100.0% | $11,685,503 | 100.0% | $22.49 |
| (1) | Information obtained from the underwritten rent roll. |
| (2) | Certain tenants may have lease termination options that are exercisable prior to the originally stated expiration date of the subject lease and that are not considered in the Lease Expiration Schedule. |
| (3) | Weighted Average Annual U/W Base Rent PSF and Total Annual U/W Base Rent exclude vacant space. |
| (4) | Annual U/W Base Rent PSF excludes Annual U/W Base Rent related to Wells Fargo, which is on a ground lease and owns its improvements. |
The following table presents historical occupancy percentages at the Village at Leesburg Mortgaged Property:
Historical Occupancy
12/31/2014(1) | 12/31/2015(1) | 12/31/2016(1) | 12/31/2017(1) | 3/9/2018(2) | |||||
| 78.7% | 82.1% | 88.4% | 93.6% | 91.6% |
| (1) | Information obtained from the borrower. |
| (2) | Information obtained from the underwritten rent roll. Occupancy assumes the completion of the 12,297 square foot expansion related to Cobb Theatres (see “The Property” section). Excluding the expansion space, the physical occupancy as of March 9, 2018 was 91.4%. |
THE INFORMATION IN THIS STRUCTURAL AND COLLATERAL TERM SHEET IS NOT COMPLETE AND MAY BE AMENDED PRIOR TO THE TIME OF SALE. THIS TERM SHEET IS NOT AN OFFER TO SELL THESE SECURITIES AND IT IS NOT A SOLICITATION OF AN OFFER TO BUY THESE SECURITIES IN ANY JURISDICTION WHERE THE OFFER OR SALE IS NOT PERMITTED.
37
VILLAGE AT LEESBURG |
Operating History and Underwritten Net Cash Flow. The following table presents certain information relating to the historical operating performance and the underwritten net cash flow at the Village at Leesburg Property:
Cash Flow Analysis
| 2014 | 2015(2) | 2016(3) | 2017(4) | U/W(5) | % of U/W Effective Gross Income | U/W $ per SF | |||||||||
| Base Rent | $8,506,614 | $7,561,648 | $8,431,880 | $9,277,247 | $11,685,503 | 80.1% | $21.40 | ||||||||
| Grossed Up Vacant Space | 0 | 0 | 0 | 0 | 1,532,967 | 10.5 | 2.81 | ||||||||
| Percentage Rent | 181,679 | 194,854 | 153,795 | 72,657 | 55,276 | 0.4 | 0.10 | ||||||||
| Total Reimbursables | 2,416,951 | 2,643,318 | 2,832,773 | 2,846,697 | 2,843,935 | 19.5 | 5.21 | ||||||||
| Other Income(1) | 89,005 | 49,684 | 129,044 | 179,020 | 4,195 | 0.0 | 0.01 | ||||||||
| Less Vacancy & Credit Loss | 0 | 0 | 0 | 0 | (1,532,967)(6) | (10.5) | (2.81) | ||||||||
| Effective Gross Income | $11,194,249 | $10,449,504 | $11,547,492 | $12,375,621 | $14,588,909 | 100.0% | $26.71 | ||||||||
| Total Operating Expenses | $4,279,607 | $4,248,761 | $3,781,438 | $3,689,722 | $3,574,353 | 24.5% | $6.55 | ||||||||
| Net Operating Income | $6,914,642 | $6,200,743 | $7,766,054 | $8,685,899 | $11,014,555 | 75.5% | $20.17 | ||||||||
| TI/LC | 0 | 0 | 0 | 0 | 403,415 | 2.8 | 0.74 | ||||||||
| Capital Expenditures | 0 | 0 | 0 | 0 | 80,007 | 0.5 | 0.15 | ||||||||
| Net Cash Flow | $6,914,642 | $6,200,743 | $7,766,054 | $8,685,899 | $10,531,133 | 72.2% | $19.28 | ||||||||
| NOI DSCR(7) | 0.84x | 0.75x | 0.94x | 1.06x | 1.34x | ||||||||||
| NCF DSCR(7) | 0.84x | 0.75x | 0.94x | 1.06x | 1.28x | ||||||||||
| NOI DY(7) | 5.3% | 4.7% | 5.9% | 6.6% | 8.4% | ||||||||||
| NCF DY(7) | 5.3% | 4.7% | 5.9% | 6.6% | 8.0% |
| (1) | Other income includes income from storage, stroller rentals, ATMs and other miscellaneous rental income. |
| (2) | The decline in Base Rent and Net Operating Income from 2014 to 2015 was driven partly by bad debt expense in 2015 from multiple tenants totaling $730,948. |
| (3) | The increase in Net Operating Income from 2015 to 2016 was primarily driven by an increase in Base Rent and decrease in Total Operating Expenses. The increase in Base Rent from 2015 to 2016 was driven by 13 new leases (10.6% of net rentable area, 12.6% of underwritten base rent) signed from March 2015 to December 2016 and three renewal leases (1.9% of net rentable area, 3.4% of underwritten base rent) signed from March 2015 to November 2015. The decrease in Total Operating Expenses from 2015 to 2016 was primarily driven by reduced expenses for snow removal, advertising and holiday decorating. |
| (4) | The increase in Base Rent and Net Operating Income from 2016 to 2017 was driven by eight new leases (7.2% of net rentable area, 10.1% of underwritten base rent) signed from January 2017 to July 2017 and two renewal leases (0.9% of net rentable area, 1.7% of underwritten base rent) signed from May 2017 to November 2017. |
| (5) | The increase in Net Operating Income from 2017 to U/W was driven by (i) three new leases(2.9% of net rentable area, 3.1% of underwritten base rent) and three renewal leases (1.8% of net rentable area, 2.4% of underwritten base rent) signed since January 2018; (ii) the inclusion of increased base rent for Cobb Theatres assuming the completion of the tenant’s planned renovation and expansion (annual base rent increase of $563,049; see “The Property” and “Major Tenants” sections); (iii) the inclusion ofcontractual rent steps totaling $147,163 through January 2019 and straight-line rent averaging for investment grade tenants over the lesser of the loan term and remaining lease term (totaling $194,095); and (iv) bad debt expenses in 2017 from multiple tenants totaling approximately $1.0 million. |
| (6) | The underwritten economic vacancy is 11.6%. The Village at Leesburg Property was 91.6% leased as of March 9, 2018. |
| (7) | The debt service coverage ratios and debt yields shown are based on the Village at Leesburg Whole Loan. |
Appraisal.The appraiser concluded to a Prospective Market Value Upon Completion for the Village at Leesburg Property of $226,000,000 as of December 1, 2018, which assumes the completion of the renovation and expansion related to Cobb Theatres.
Environmental Matters. According to a Phase I environmental site assessment dated February 23, 2018, there was no evidence of any recognized environmental conditions at the Village at Leesburg Property.
Market Overview and Competition.The Village at Leesburg Property is located in Leesburg, Loudoun County, Virginia, approximately 38.1 miles northwest of the Washington, D.C. central business district, 14.4 miles northwest of Washington Dulles International Airport and 1.7 miles southeast of U.S. Route 15. Per U.S. Census Bureau estimates, Loudoun County has the highest median household income of any county in the United States, and according to a third party market research report, the 2017 estimated average household income within a three- and five-mile radius of the Village at Leesburg Property was $144,117 and $151,624, respectively. According to the appraisal, Loudoun County has grown faster than any other Virginia jurisdiction since 1990, and the county’s population grew by approximately 3.7% annually from 2006 to 2016. According to a third party market research report, the estimated 2017 population within a three- and five-mile radius of the Village at Leesburg Property was 74,657 and 137,723, respectively.
The Metropolitan Washington Airports Authority is constructing a 23-mile extension of the existing Metrorail system, branching from the East Falls Church Station in Arlington, Virginia to the Washington Dulles International Airport and west to eastern Loudoun County. Phase 2 of the extension, expected to be completed in 2020, is expected to continue 11 miles from Wiehle Avenue to eastern Loudoun County. This phase will add six stations, including stops in Reston, Herndon, Dulles Airport, and Ashburn. The Ashburn Station is expected to be located approximately 9.7 miles southeast of the Village at Leesburg Property.
According to a third party market research report, the Village at Leesburg Property is situated within the Loudoun County submarket of the Suburban Virginia retail market. As of year-end 2017, the submarket reported total inventory of approximately 6.8 million square feet with a 3.0% vacancy rate and an average asking net rental rate of $29.13 per square foot. Submarket vacancy has decreased from 6.6% in 2012 and has averaged 4.4% in the last six years. The appraiser concluded to a weighted average net market rent for the Village at Leesburg Property of $22.89 per square foot.
THE INFORMATION IN THIS STRUCTURAL AND COLLATERAL TERM SHEET IS NOT COMPLETE AND MAY BE AMENDED PRIOR TO THE TIME OF SALE. THIS TERM SHEET IS NOT AN OFFER TO SELL THESE SECURITIES AND IT IS NOT A SOLICITATION OF AN OFFER TO BUY THESE SECURITIES IN ANY JURISDICTION WHERE THE OFFER OR SALE IS NOT PERMITTED.
38
VILLAGE AT LEESBURG |
The table below presents certain information relating to five comparable properties to the Village at Leesburg Property identified by the appraiser:
Competitive Set(1)
Village at Leesburg (Subject) | Marketplace at Potomac Station | Fort Evan Plaza I | Fort Evans Plaza II | Battlefield Shopping Center | Leesburg Plaza | |||||||
| Location | Leesburg, VA | Leesburg, VA | Leesburg, VA | Leesburg, VA | Leesburg, VA | Leesburg, VA | ||||||
| Distance from Subject | -- | 1.1 miles | 2.1 miles | 1.8 miles | 2.3 miles | 2.4 miles | ||||||
| Property Type | Lifestyle Center | Community Center | Community Center | Community Center | Power Center | Community Center | ||||||
| Year Built/Renovated | 2009/2018 | 2004/NAP | 1999/NAP | 2008/NAP | 1991/NAP | 1956/1992 | ||||||
| Anchors | Wegmans, Cobb Theatres, LA Fitness, Bowlero | Giant Food, Best Buy | Home Depot, Hobby Lobby | Marshall’s, Bed, Bath & Beyond, Walgreens, Jo-Ann Stores | Dick’s Sporting Goods, DSW, Ross Dress for Less, Staples, Stein Mart, Michael’s | Giant Food, Office Depot, PetSmart, Party City | ||||||
| Total GLA | 546,107 SF | 143,176 SF | 214,477 SF | 228,529 SF | 296,140 SF | 228,878 SF | ||||||
| Total Occupancy | 91.6%(2) | 92.0% | 97.0% | 100.0% | 97.0% | 96.0% |
| (1) | Information obtained from the appraisal. In total, the appraiser identified 10 comparable properties totaling approximately 2.7 million square feet with an average occupancy rate of approximately 96.0% and minimum occupancy rate of 90.0%. |
| (2) | Information obtained from underwritten rent roll. |
The Borrower.The borrower is CRP/TRC Leesburg Retail Owner, L.L.C., a Delaware limited liability company and single purpose entity with two independent directors. Legal counsel to the borrower delivered a non-consolidation opinion in connection with the origination of the Village at Leesburg Whole Loan. Gary D. Rappaport and the Gary D. Rappaport Revocable Trust, individually and/or collectively, are the guarantors of certain nonrecourse carveouts under the Village at Leesburg Whole Loan.
The Borrower Sponsor.The borrower sponsor is Gary D. Rappaport, the chief executive officer of Rappaport, a retail real estate company founded in 1984. Rappaport’s portfolio includes more than 50 shopping centers and ground floor retail spaces in approximately 125 mixed-use properties, both residential and office, located primarily throughout the mid-Atlantic region of the United States. Mr. Rappaport is the former chairman and trustee of the International Council of Shopping Centers and is the principal partner for approximately 4.3 million square feet of the shopping centers managed by Rappaport. At the time of origination of the Village at Leesburg Whole Loan, an entity related to Rappaport acquired a 60% equity interest in the Village at Leesburg Property. Gary D. Rappaport and affiliates owned an indirect and non-controlling 10% interest in an entity that defaulted on a loan that was the subject of a foreclosure in 2009. See“Description of the Mortgage Pool— Loan Purpose; Default History, Bankruptcy Issues and Other Proceedings”in the Preliminary Prospectus.
The remaining 40% equity interest in the Village at Leesburg Property is held by an affiliate of the Carlyle Group (“Carlyle”). Carlyle was the original developer of the overall Village at Leesburg community and was the majority owner of the Village at Leesburg Property prior to the origination of the Village at Leesburg Whole Loan. Founded in 1987 in Washington, D.C., Carlyle currently has approximately $195 billion of assets under management and more than 1,600 professionals operating in 31 offices in North America, South America, Europe, the Middle East, Africa, Asia and Australia. Carlyle’s real estate division has made more than 850 investments in 397 metropolitan statistical areas around the world. As of December 31, 2017, Carlyle’s real estate funds reported more than $18 billion in assets under management.
Escrows.The loan documents provide for upfront reserves of $560,062 for real estate taxes, $28,125 for immediate repairs, $842,933 for outstanding rent concessions and gap rent related to multiple tenants (including $520,190 related to the Cobb Theatres expansion) and $7,649,629 for existing tenant improvements and leasing commissions (“TI/LC”) related to multiple tenants (including $6,455,836 related to the Cobb Theatres renovation and expansion). The loan documents also provide for ongoing monthly reserves of $112,013 for real estate taxes, $6,801 for replacement reserves (subject to a cap of $244,818), and $45,894 for general TI/LCs (subject to a cap of $2,010,135 so long as no event of default exists and the net cash flow debt service coverage ratio is equal to or greater than 1.20x).
The loan documents do not require ongoing monthly escrows for insurance premiums as long as (i) no event of default has occurred and is continuing; (ii) the borrower provides the lender with evidence that the Village at Leesburg Property’s insurance coverage is included in a blanket policy and such policy is in full force and effect; and (iii) the borrower pays all applicable insurance premiums and provides the lender with evidence of renewals.
Lockbox and Cash Management.The Village at Leesburg Whole Loan requires a lender-controlled lockbox account, which is already in place, and that the borrower directs tenants to pay all rents directly into such lockbox account. The loan documents also require that all rents received by the borrower or the property manager be deposited into the lockbox account within one business day of receipt. All funds in the lockbox account are required to be swept each business day into the cash management account controlled by the lender and disbursed on each payment date in accordance with the loan documents. Prior to the occurrence of a Cash Trap Event Period (as defined below), all excess funds are required to be distributed to the borrower. During a Cash Trap Event Period, all excess funds are required to be swept to an excess cash flow subaccount.
THE INFORMATION IN THIS STRUCTURAL AND COLLATERAL TERM SHEET IS NOT COMPLETE AND MAY BE AMENDED PRIOR TO THE TIME OF SALE. THIS TERM SHEET IS NOT AN OFFER TO SELL THESE SECURITIES AND IT IS NOT A SOLICITATION OF AN OFFER TO BUY THESE SECURITIES IN ANY JURISDICTION WHERE THE OFFER OR SALE IS NOT PERMITTED.
39
VILLAGE AT LEESBURG |
A “Cash Trap Event Period” will commence upon the earlier of the following:
| (i) | the occurrence of an event of default; |
| (ii) | the amortizing net cash flow debt service coverage ratio falling below 1.15x at the end of any calendar quarter; or |
| (iii) | the occurrence of a Lease Expiration Cash Trap Event Period (as defined below). |
A Cash Trap Event Period will end upon the occurrence of the following:
| ● | with regard to clause (i), the cure of such event of default; |
| ● | with regard to clause (ii), the amortizing net cash flow debt service coverage ratio being equal to or greater than 1.20x for two consecutive calendar quarters; or |
| ● | with regard to clause (iii), a Lease Expiration Cash Trap Event Period Cure (as defined below). |
A “Lease Expiration Cash Trap Event Period” will commence upon the earlier of the following:
| (i) | either Wegmans or Cobb Theatres giving notice of its intent to terminate its lease or vacate its space; |
| (ii) | either Wegmans or Cobb Theatres failing to be in actual, physical occupancy of its entire space, failing to be open to the public during customary hours or going dark; |
| (iii) | either Wegmans or Cobb Theatres becoming insolvent or filing for bankruptcy; or |
| (iv) | Cobb Theatres failing to extend its lease nine months prior to expiration upon terms and conditions reasonably satisfactory to the lender. |
A “Lease Expiration Cash Trap Event Period Cure” will occur upon the following:
| ● | with regard to clause (i), a Qualified Re-Leasing Event (as defined below); |
| ● | with regard to clause (ii), Wegmans or Cobb Theatres, as applicable, being in actual, physical possession of its entire space, being open to the public during customary hours and no longer being dark; |
| ● | with regard to clause (iii), Wegmans or Cobb Theatres, as applicable, being no longer insolvent or subject to any bankruptcy or insolvency proceedings and its lease having been affirmed or assigned pursuant to a final and non-appealable order of a court of competent jurisdiction; or |
| ● | with regard to clause (iv), Cobb Theatres extending its lease upon terms and conditions reasonably satisfactory to the lender. |
A “Qualified Re-Leasing Event” will occur upon one or more replacement tenants reasonably acceptable to the lender executing leases covering all of the space currently occupied by Wegmans or Cobb Theatres, as applicable, and delivering an estoppel certificate confirming such replacement tenants having taken physical occupancy of the entire space, commencing normal business operations and paying full unabated rent.
Property Management. The Village at Leesburg Property is managed by Rappaport Management Company, an affiliate of the borrower.
Assumption. The borrower has the two-time right to transfer the Village at Leesburg Property, provided that certain conditions are satisfied, including (i) no event of default has occurred and is continuing; (ii) the lender has reasonably determined that the proposed transferee and guarantor satisfy the lender’s credit review and underwriting standards, taking into consideration the transferee’s experience, financial strength and general business standing; and (iii) if required by the lender, rating agency confirmation from DBRS, Fitch and Moody’s that the transfer will not result in a downgrade, withdrawal or qualification of the respective ratings assigned to the Series WFCM 2018-C44 certificates and similar confirmations from each rating agency rating any securities backed by the Village at Leesburg Companion Loan with respect to the ratings of such securities.
Partial Release. Not permitted.
Real Estate Substitution.Not permitted.
Subordinate and Mezzanine Indebtedness.Not permitted.
Ground Lease. None.
Terrorism Insurance.The loan documents require that the “all risk” insurance policies required to be maintained by the borrower provide coverage for terrorism in an amount equal to the full replacement cost of the Village at Leesburg Property. The loan documents also require business interruption insurance covering no less than the 18-month period following the occurrence of a casualty event, together with a six-month extended period of indemnity.
THE INFORMATION IN THIS STRUCTURAL AND COLLATERAL TERM SHEET IS NOT COMPLETE AND MAY BE AMENDED PRIOR TO THE TIME OF SALE. THIS TERM SHEET IS NOT AN OFFER TO SELL THESE SECURITIES AND IT IS NOT A SOLICITATION OF AN OFFER TO BUY THESE SECURITIES IN ANY JURISDICTION WHERE THE OFFER OR SALE IS NOT PERMITTED.
40
(THIS PAGE INTENTIONALLY LEFT BLANK)
THE INFORMATION IN THIS STRUCTURAL AND COLLATERAL TERM SHEET IS NOT COMPLETE AND MAY BE AMENDED PRIOR TO THE TIME OF SALE. THIS TERM SHEET IS NOT AN OFFER TO SELL THESE SECURITIES AND IT IS NOT A SOLICITATION OF AN OFFER TO BUY THESE SECURITIES IN ANY JURISDICTION WHERE THE OFFER OR SALE IS NOT PERMITTED.
41
| 3495 DEER CREEK ROAD |
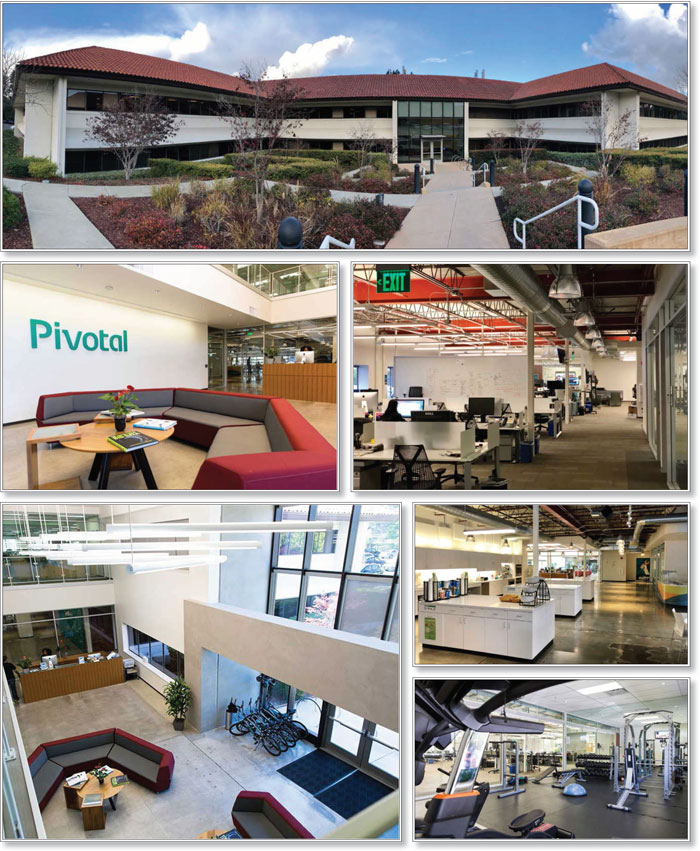
THE INFORMATION IN THIS STRUCTURAL AND COLLATERAL TERM SHEET IS NOT COMPLETE AND MAY BE AMENDED PRIOR TO THE TIME OF SALE. THIS TERM SHEET IS NOT AN OFFER TO SELL THESE SECURITIES AND IT IS NOT A SOLICITATION OF AN OFFER TO BUY THESE SECURITIES IN ANY JURISDICTION WHERE THE OFFER OR SALE IS NOT PERMITTED.
42
| 3495 DEER CREEK ROAD |
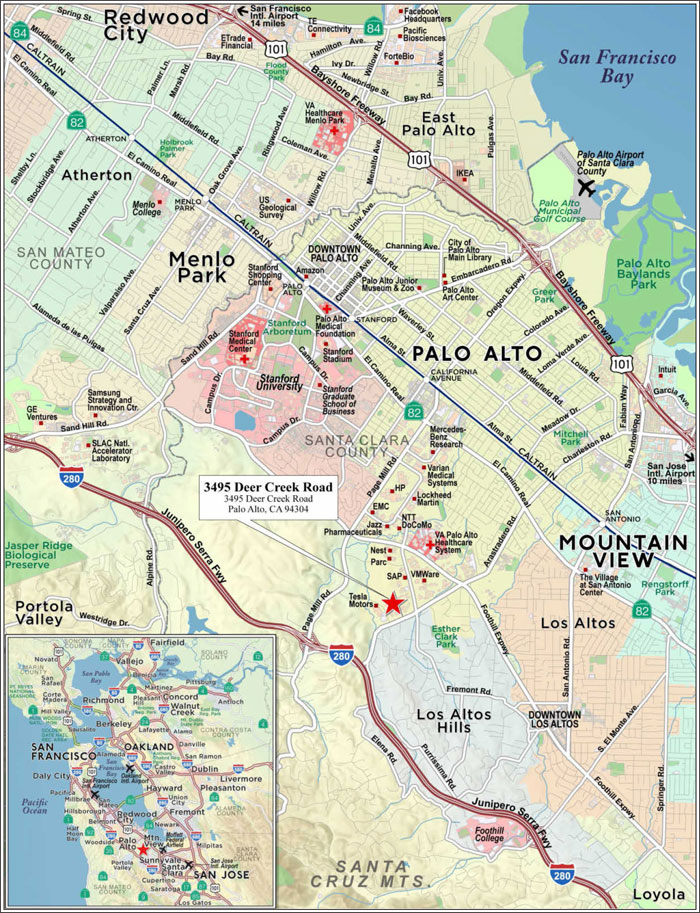
THE INFORMATION IN THIS STRUCTURAL AND COLLATERAL TERM SHEET IS NOT COMPLETE AND MAY BE AMENDED PRIOR TO THE TIME OF SALE. THIS TERM SHEET IS NOT AN OFFER TO SELL THESE SECURITIES AND IT IS NOT A SOLICITATION OF AN OFFER TO BUY THESE SECURITIES IN ANY JURISDICTION WHERE THE OFFER OR SALE IS NOT PERMITTED.
43
| No. 2 – 3495 Deer Creek Road | ||||||||
| Loan Information | Property Information | |||||||
| Mortgage Loan Seller: | Barclays Bank PLC | Single Asset/Portfolio: | Single Asset | |||||
| Credit Assessment | Property Type: | Office | ||||||
| (DBRS/Fitch/Moody’s): | NR/NR/NR | Specific Property Type: | Suburban | |||||
| Original Principal Balance: | $50,000,000 | Location: | Palo Alto, CA | |||||
| Cut-off Date Balance: | $50,000,000 | Size: | 81,031 SF | |||||
| % of Initial Pool Balance: | 6.5% | Cut-off Date Balance Per SF: | $617.05 | |||||
| Loan Purpose: | Refinance | Year Built/Renovated: | 1977/2014 | |||||
| Borrower Name: | 3495 Deer Creek Owner LLC | Title Vesting: | Leasehold | |||||
| Borrower Sponsor: | James M. Pollock | Property Manager: | Self-managed | |||||
| Mortgage Rate: | 4.9550% | 4thMost Recent Occupancy (As of): | 100.0% (12/31/2014) | |||||
| Note Date: | March 28, 2018 | 3rdMost Recent Occupancy (As of): | 100.0% (12/31/2015) | |||||
| Anticipated Repayment Date: | NAP | 2ndMost Recent Occupancy (As of): | 100.0% (12/31/2016) | |||||
| Maturity Date: | April 6, 2028 | Most Recent Occupancy (As of): | 100.0% (12/31/2017) | |||||
| IO Period: | 120 months | Current Occupancy (As of): | 100.0% (5/1/2018) | |||||
| Loan Term (Original): | 120 months | |||||||
| Seasoning: | 1 month | |||||||
| Amortization Term (Original): | NAP | Underwriting and Financial Information: | ||||||
| Loan Amortization Type: | Interest-only, Balloon | 4thMost Recent NOI (As of): | $2,985,071 (12/31/2014) | |||||
| Interest Accrual Method: | Actual/360 | 3rdMost Recent NOI (As of): | $3,255,518 (12/31/2015) | |||||
| Call Protection: | L(25),D(89),O(6) | 2ndMost Recent NOI (As of): | $3,362,398 (12/31/2016) | |||||
| Lockbox Type: | Hard/Springing Cash Management | Most Recent NOI (As of)(2): | $3,031,424 (12/31/2017) | |||||
| Additional Debt: | No | |||||||
| Additional Debt Type: | NAP | |||||||
| U/W Revenues: | $6,250,558 | |||||||
| U/W Expenses: | $1,790,156 | |||||||
| U/W NOI(2): | $4,460,402 | |||||||
| Escrows and Reserves(1): | U/W NCF: | $4,141,874 | ||||||
| U/W NOI DSCR: | 1.78x | |||||||
| Type: | Initial | Monthly | Cap (If Any) | U/W NCF DSCR: | 1.65x | |||
| Taxes | $52,478 | $52,478 | NAP | U/W NOI Debt Yield: | 8.9% | |||
| Insurance | $0 | Springing | NAP | U/W NCF Debt Yield: | 8.3% | |||
| TI/LC Reserve | $0 | $10,125 | NAP | As-Is Appraised Value: | $90,150,000 | |||
| Replacement Reserve | $0 | $1,486 | NAP | As-Is Appraisal Valuation Date: | February 26, 2018 | |||
| Ground Rent Reserve | $0 | $30,379 | NAP | Cut-off Date LTV Ratio: | 55.5% | |||
| Free Rent Reserve | $1,380,736 | $0 | NAP | LTV Ratio at Maturity or ARD: | 55.5% | |||
| (1) | See “Escrows” section. |
| (2) | The increase from Most Recent NOI to U/W NOI is attributable to the sole tenant executing a new lease that began in January 2018. |
The Mortgage Loan.The mortgage loan (the “3495 Deer Creek Road Mortgage Loan”) is evidenced by a single promissory note secured by a first mortgage encumbering the leasehold interest in a single-tenant office building, located in Palo Alto, California (the “3495 Deer Creek Road Property”). The 3495 Deer Creek Road Mortgage Loan was originated on March 28, 2018 by Barclays Bank PLC. The 3495 Deer Creek Road Mortgage Loan had an original principal balance of $50,000,000, has an outstanding principal balance as of the Cut-off Date of $50,000,000 and accrues interest at an interest rate of 4.955%per annum. The 3495 Deer Creek Road Mortgage Loan had an initial term of 120 months, has a remaining term of 119 months as of the Cut-off Date and requires interest-only payments through the full term of the 3495 Deer Creek Road Mortgage Loan. The 3495 Deer Creek Road Mortgage Loan matures on April 6, 2028.
Following the lockout period, on any date before November 6, 2027, the borrower has the right to defease the 3495 Deer Creek Road Mortgage Loan in whole, but not in part. The 3495 Deer Creek Road Mortgage Loan is prepayable without penalty on or after November 6, 2027.
THE INFORMATION IN THIS STRUCTURAL AND COLLATERAL TERM SHEET IS NOT COMPLETE AND MAY BE AMENDED PRIOR TO THE TIME OF SALE. THIS TERM SHEET IS NOT AN OFFER TO SELL THESE SECURITIES AND IT IS NOT A SOLICITATION OF AN OFFER TO BUY THESE SECURITIES IN ANY JURISDICTION WHERE THE OFFER OR SALE IS NOT PERMITTED.
44
| 3495 DEER CREEK ROAD |
Sources and Uses
| Sources | Uses | |||||||
| Original Loan amount | $50,000,000 | 100.0% | Loan payoff | $30,472,913 | 60.9% | |||
| Return of equity | 16,672,542 | 33.3 | ||||||
| Reserves | 1,433,214 | 2.9 | ||||||
| Closing costs | 1,421,331 | 2.8 | ||||||
| Total Sources | $50,000,000 | 100.0% | Total Uses | $50,000,000 | 100.0% |
The Property.The 3495 Deer Creek Road Property is a single-tenant office building totaling 81,031 square feet situated on a 6.0 acre site in the Stanford Research Park in Palo Alto, California. As of May 1, 2018, the 3495 Deer Creek Road Property was 100.0% leased to Pivotal Software, Inc. (“Pivotal”), a wholly-owned subsidiary of Dell Technologies Inc. (“Dell”) on a triple-net basis through December 2027, with one, five-year extension option and no early termination options. Dell (NYSE:DVMT; S&P/Fitch/Moody’s: BB+/BB+/NR) fully guarantees Pivotal’s lease. According to the borrower sponsor, between 2013 and 2014, Pivotal spent approximately $10,250,000 on tenant improvements and renovations at the 3495 Deer Creek Road Property. The 3495 Deer Creek Road Property offers amenities such as a cafeteria set up for catered food service, an exercise room, a space for pool and ping-pong tables and bike storage. There are 289 parking spaces, resulting in a parking ratio of 3.6 spaces per 1,000 square feet of net rentable area.
Pivotal is a provider of application and data infrastructure software, agile development services, and data science consulting. Pivotal’s cloud-native platform enables companies to build, deploy and operate software, including enterprises in the automotive, financial services, industrial, insurance, media, retail, technology and telecommunications sectors. Pivotal was formed in April 2013 from a partnership in which Dell EMC and VMware transferred teams and contributed assets and technology. Following the acquisition of EMC Corporation by Dell in September 2016, Dell became Pivotal’s majority stockholder. On March 23, 2018, Pivotal filed a form S-1 with the Securities and Exchange Commission for an initial public offering (“IPO”). Upon the completion of the IPO, it is expected that Dell will remain the majority shareholder of Pivotal. Pivotal’s total revenue was $280.9 million, $416.3 million and $509.4 million for 2016, 2017 and 2018 fiscal years respectively.
The following table presents certain information relating to the tenancy at the 3495 Deer Creek Road Property:
Major Tenants
| Tenant Name | Credit Rating (Fitch/Moody’s/S&P)(1) | Tenant NRSF | % of NRSF | Annual U/W Base Rent PSF(2) | Annual U/W Base Rent(2) | % of Total Annual U/W Base Rent | Lease Expiration Date |
| Major Tenant | |||||||
| Pivotal | BB+/NR/BB+ | 81,031 | 100.0% | $69.00 | $5,591,139 | 100.0% | 12/31/2027(3) |
| Total Major Tenant | 81,031 | 100.0% | $69.00 | $5,591,139 | 100.0% | ||
| Vacant Space | 0 | 0.0% | |||||
| Collateral Total | 81,031 | 100.0% | |||||
| (1) | Credit Rating is for Dell, which fully guarantees the Pivotal lease. |
| (2) | Pivotal has $232,967 of abated rent per month through June 30, 2018 and $152,467 of abated rent per month from July 1, 2018 through December 31, 2018. All abated rent was reserved at origination. |
| (3) | Pivotal has one, five-year lease renewal option. |
THE INFORMATION IN THIS STRUCTURAL AND COLLATERAL TERM SHEET IS NOT COMPLETE AND MAY BE AMENDED PRIOR TO THE TIME OF SALE. THIS TERM SHEET IS NOT AN OFFER TO SELL THESE SECURITIES AND IT IS NOT A SOLICITATION OF AN OFFER TO BUY THESE SECURITIES IN ANY JURISDICTION WHERE THE OFFER OR SALE IS NOT PERMITTED.
45
| 3495 DEER CREEK ROAD |
The following table presents certain information relating to the lease rollover schedule at the 3495 Deer Creek Road Property:
Lease Expiration Schedule(1)
| Year Ending December 31, | No. of Leases Expiring | Expiring NRSF | % of Total NRSF | Cumulative Expiring NRSF | Cumulative % of Total NRSF | Annual U/W Base Rent(2) | % of Annual U/W Base Rent(2) | Annual U/W Base Rent PSF(2) |
| MTM | 0 | 0 | 0.0% | 0 | 0.0% | $0 | 0.0% | $0.00 |
| 2018 | 0 | 0 | 0.0% | 0 | 0.0% | $0 | 0.0% | $0.00 |
| 2019 | 0 | 0 | 0.0% | 0 | 0.0% | $0 | 0.0% | $0.00 |
| 2020 | 0 | 0 | 0.0% | 0 | 0.0% | $0 | 0.0% | $0.00 |
| 2021 | 0 | 0 | 0.0% | 0 | 0.0% | $0 | 0.0% | $0.00 |
| 2022 | 0 | 0 | 0.0% | 0 | 0.0% | $0 | 0.0% | $0.00 |
| 2023 | 0 | 0 | 0.0% | 0 | 0.0% | $0 | 0.0% | $0.00 |
| 2024 | 0 | 0 | 0.0% | 0 | 0.0% | $0 | 0.0% | $0.00 |
| 2025 | 0 | 0 | 0.0% | 0 | 0.0% | $0 | 0.0% | $0.00 |
| 2026 | 0 | 0 | 0.0% | 0 | 0.0% | $0 | 0.0% | $0.00 |
| 2027 | 1 | 81,031 | 100.0% | 81,031 | 100.0% | $5,591,139 | 100.0% | $69.00 |
| 2028 | 0 | 0 | 0.0% | 81,031 | 100.0% | $0 | 0.0% | $0.00 |
| Thereafter | 0 | 0 | 0.0% | 81,031 | 100.0% | $0 | 0.0% | $0.00 |
| Vacant | 0 | 0 | 0.0% | 81,031 | 100.0% | $0 | 0.0% | $0.00 |
| Total/Weighted Average | 1 | 81,031 | 100.0% | $5,591,139 | 100.0% | $69.00 |
| (1) | Information obtained from the underwritten rent roll. |
The following table presents historical occupancy percentages at the 3495 Deer Creek Road Property:
Historical Occupancy
12/31/2014(1) | 12/31/2015(1) | 12/31/2016(1) | 12/31/2017(1) | 5/1/2018(2) | ||||
| 100.0% | 100.0% | 100.0% | 100.0% | 100.0% |
| (1) | Information obtained from the borrower. |
| (2) | Information obtained from the underwritten rent roll. |
Underwritten Net Cash Flow. The following table presents certain information relating to the underwritten net cash flow at the 3495 Deer Creek Road Property:
Cash Flow Analysis
| 2014 | 2015 | 2016 | 2017 | U/W | % of U/W Effective Gross Income | U/W $ per SF | |
| Base Rent(1) | $3,518,217 | $3,658,835 | $3,805,303 | $3,615,670 | $5,591,139 | 89.5% | $69.00 |
| Grossed Up Vacant Space | 0 | 0 | 0 | 0 | 0 | 0.0 | 0.00 |
| Total Reimbursables | 930,834 | 937,290 | 892,445 | 895,408 | 968,596 | 15.5 | 11.95 |
| Other Income(2) | 19,650 | 19,800 | 21,440 | 16,500 | 19,800 | 0.3 | 0.24 |
| Less Vacancy & Credit Loss(3) | 0 | 0 | 0 | 0 | (328,977) | (5.3) | (4.06) |
| Effective Gross Income | 4,468,701 | 4,615,925 | 4,719,188 | 4,527,578 | $6,250,558 | 100.0% | $77.14 |
| Total Operating Expenses | $1,483,629 | $1,360,407 | $1,356,790 | $1,496,155 | $1,790,156 | 28.6% | $22.09 |
| Net Operating Income | $2,985,071 | $3,255,518 | $3,362,398 | $3,031,424 | $4,460,402 | 71.4% | $55.05 |
| TI/LC | 0 | 0 | 0 | 0 | 300,701 | 4.8 | 3.71 |
| Capital Expenditures | 0 | 0 | 0 | 0 | 17,827 | 0.3 | 0.22 |
| Net Cash Flow | $2,985,071 | $3,255,518 | $3,362,398 | $3,031,424 | $4,141,874 | 66.3% | $51.11 |
| NOI DSCR | 1.19x | 1.30x | 1.34x | 1.21x | 1.78x | ||
| NCF DSCR | 1.19x | 1.30x | 1.34x | 1.21x | 1.65x | ||
| NOI DY | 6.0% | 6.5% | 6.7% | 6.1% | 8.9% | ||
| NCF DY | 6.0% | 6.5% | 6.7% | 6.1% | 8.3% |
| (1) | The increase in Base Rent from 2017 to U/W is attributable to Pivotal executing a new lease that began in January 2018. |
| (2) | Other income represents income from a Sprint Antenna License Agreement. |
| (3) | The underwritten economic vacancy is 5.0%. The 3495 Deer Creek Road Property has been 100.0% occupied since 2006. |
Appraisal.As of the appraisal valuation date of February 26, 2018 the 3495 Deer Creek Road Property had an “as-is” appraised value of $90,150,000. The appraiser also concluded to a “hypothetical go dark” appraised value of $81,500,000.
Environmental Matters. According to a Phase I environmental site assessment dated February 22, 2018, there was no evidence of any recognized environmental conditions at the 3495 Deer Creek Road Property.
THE INFORMATION IN THIS STRUCTURAL AND COLLATERAL TERM SHEET IS NOT COMPLETE AND MAY BE AMENDED PRIOR TO THE TIME OF SALE. THIS TERM SHEET IS NOT AN OFFER TO SELL THESE SECURITIES AND IT IS NOT A SOLICITATION OF AN OFFER TO BUY THESE SECURITIES IN ANY JURISDICTION WHERE THE OFFER OR SALE IS NOT PERMITTED.
46
| 3495 DEER CREEK ROAD |
Market Overview and Competition.The 3495 Deer Creek Road Property is located within the Stanford Research Park in Palo Alto, California, midway between San Francisco and San Jose in Silicon Valley. Established in 1951 by Stanford University, the Stanford Research Park is one of the first technology-oriented office parks in the world and currently is home to approximately 150 companies and 23,000 employees. The Stanford Research Park’s relationship with Stanford University provides for a number of both formal and informal connections for technology companies and professional service firms with Stanford Unviersity. According to the appraisal, Stanford University has ties to many of the most successful businesses in Silicon Valley, including Cisco Systems, Yahoo!, Google and Sun Microsystems. The Stanford Research Park contains approximately 700 acres and is improved with approximately 10.0 million square feet of office space in 162 buildings, consisting of mostly single-tenant spaces. According to the appraisal, as of the fourth quarter of 2017, the overall vacancy in Silicon Valley and the Palo Alto submarket was 10.3% and 3.9%, respectively. As of the fourth quarter of 2017, the total office average asking rent for the Palo Alto submarket was $100.68 per square foot.
The following table presents certain information relating to comparable leases to the 3495 Deer Creek Road Property:
Comparable Leases(1)
| Property Location | Year Built | Distance (miles) | Occupancy | Total GLA (SF) | Tenant Name | Lease Date | Lease Area (SF) | Annual Base | Lease Type |
1530 Page Mill Rd, Palo Alto, CA | 1972 | 1.4 | 51.0% | 45,346 | Toyota Research Institute | July 2016 | 22,392 | $78.00 | NNN |
1450 Page Mill Rd, Palo Alto, CA | 2017 | 1.5 | 100.0% | 77,634 | Undisclosed | July 2018 | 77,634 | $81.60 | NNN |
3181 Porter Dr, Palo Alto, CA | 2018 | 0.9 | 100.0% | 99,415 | Jazz Pharmaceuticals, Inc. | September 2018 | 99,415 | $87.00 | NNN |
1001 N Shoreline Blvd, Mountain View, CA | 2017 | 4.0 | 100.0% | 111,443 | Google, Inc. | December 2018 | 111,443 | $78.00 | NNN |
100 Independence Dr, Menlo Park, CA | 2018 | 6.0 | 100.0% | 252,000 | February 2018 | 205,224 | $78.00 | NNN | |
162 Jefferson Dr, Menlo Park, CA | 2016 | 6.0 | 100.0% | 135,308 | May 2017 | 135,308 | $72.00 | NNN |
| (1) | Information obtained from the appraisal. |
The Borrower.The borrower for the 3495 Deer Creek Road Mortgage Loan is 3495 Deer Creek Owner LLC, a Delaware limited liability company and a special purpose entity with two independent directors. Legal counsel to the borrower delivered a non-consolidation opinion in connection with the origination of the 3495 Deer Creek Road Mortgage Loan. James M. Pollock is the guarantor of certain nonrecourse carveouts under the 3495 Deer Creek Road Mortgage Loan.
The Borrower Sponsor.The borrower sponsor is James M. Pollock, the President and CEO of Pollock Realty Corporation. James M. Pollock has been investing in suburban office buildings, industrial properties, shopping center and apartments since 1966. Through Pollock Realty Corporation and other entities, James M. Pollock has purchased or developed over 90 real estate projects on behalf of his clients, approximately 82 of which have been sold and approximately 12 of which are still under ownership. Since 2006, Pollock Realty Corporation has acquired and is managing approximately $200.0 million of real estate in Menlo Park, Santa Mateo, Sunnyvale, Redwood Shores and Palo Alto. The borrower disclosed one deed in lieu sale, which occurred on July 14, 2010. See “Description of the Mortgage Pool—Loan Purpose; Default History, Bankruptcy Issues and Other Proceedings” in the Preliminary Prospectus
Escrows.The 3495 Deer Creek Road Mortgage Loan documents provide for upfront reserves in the amount of $1,380,736 for outstanding free rent and $52,478 for real estate taxes.
The 3495 Deer Creek Road Mortgage Loan documents provide for ongoing monthly escrows of (a) $1,486 for capital expenditures, (b) $10,125 for tenant improvements and leasing commissions, (c) one-twelfth of the real estate taxes the lender estimates will be payable during the next 12 months (initially $52,478) and (d) one-twelfth of the ground rent the lender estimates will be payable during the next 12 months (initially $30,379). The loan documents do not require monthly reserves for insurance premiums as long as the 3495 Deer Creek Road Property is insured under an acceptable blanket insurance policy.
Lockbox and Cash Management.The 3495 Deer Creek Road Mortgage Loan is structured with a hard lockbox and springing cash management. The borrower was required at origination to deliver letters to the tenants at the 3495 Deer Creek Road Property directing them to pay all rents directly into a lender-controlled lockbox account. All funds received by the borrower or manager are required to be deposited in the lockbox account within one business day following receipt. During the occurrence and continuance of a Trigger Period (as defined below), all funds are required to be swept each business day into the cash management account controlled by the lender and disbursed on each payment date in accordance with the 3495 Deer Creek Road Mortgage Loan documents, with all excess cash flow to be deposited to an excess cash reserve to be held as additional security for the 3495 Deer Creek Road Mortgage Loan.
A “Trigger Period” will commence following the earliest to occur of any of the following:
| (i) | an event of default under the 3495 Deer Creek Road Mortgage Loan, |
| (ii) | the Debt Service Coverage Ratio (as defined below) falling below 1.15x, or |
| (iii) | the commencement of a Pivotal Lease Trigger Period (as defined below). |
THE INFORMATION IN THIS STRUCTURAL AND COLLATERAL TERM SHEET IS NOT COMPLETE AND MAY BE AMENDED PRIOR TO THE TIME OF SALE. THIS TERM SHEET IS NOT AN OFFER TO SELL THESE SECURITIES AND IT IS NOT A SOLICITATION OF AN OFFER TO BUY THESE SECURITIES IN ANY JURISDICTION WHERE THE OFFER OR SALE IS NOT PERMITTED.
47
| 3495 DEER CREEK ROAD |
A Trigger Period will end if:
| (a) | with respect to the matters described in clause (i) above, such event of default has been cured and no other event of default has occurred and is continuing, |
| (b) | with respect to the matter described in clause (ii) above, the 3495 Deer Creek Road Property has achieved a Debt Service Coverage Ratio of at least 1.20x for two consecutive calendar quarters or has posted a letter of credit acceptable to the lender in an amount equal to satisfy a Debt Service Coverage Ratio of at least 1.20x, or |
| (c) | with respect to the matter described in clause (iii) above, such Pivotal Lease Trigger Period has ended. |
“Debt Service Coverage Ratio” means, as of the date of calculation, a ratio calculated by the lender in which the numerator is the net operating income for the twelve full calendar month period preceding the date of calculation and the denominator is the aggregate amount of debt service due for such twelve full calendar month period calculated by lender (A) based upon the greater of (i) the actual amount of debt service due for such period and (ii) an imputed amount of debt service which would be due for such period assuming an interest rate equal to 4.955% and an amortization period of 30 years and (B) assuming the 3495 Deer Creek Road Mortgage Loan has been in place for entirety of such period.
A “Pivotal Lease Trigger Period” will commence following the earliest to occur of any of the following:
| (i) | the date Pivotal discontinues its business at its premises (i.e.,”goes dark”) or vacates or abandons the 3495 Deer Creek Road Property, |
| (ii) | the date Pivotal or Dell becomes delinquent in any payment of rent beyond all applicable notice and cure periods, |
| (iii) | the occurrence of a bankruptcy action with respect to Pivotal or Dell, or |
| (iv) | the date that is six months prior to the expiration of the term of the Pivotal lease if Pivotal has not renewed the term of the Pivotal lease for a term acceptable to the lender. |
A Pivotal Lease Trigger Period will end upon:
| (a) | with respect to the matters described in clause (i) above, the date on which the lender has received satisfactory evidence that either (x) Pivotal is paying full contractual rent without any free rent, leasing commission or tenant improvement obligations outstanding or (y) the entire space demised to Pivotal is leased to one or more replacement tenants acceptable to the lender and each tenant is in occupancy and paying full contractual rent with no free rent, leasing commission or tenant improvement obligations outstanding, |
| (b) | with respect to the matters described in clause (ii) above, the cure by Pivotal or Dell of all defaults of the payment of rent under the Pivotal lease, |
| (c) | with respect to the matters described in clause (iii) above, such bankruptcy action being dismissed without any adverse consequences to the Pivotal lease, the 3495 Deer Creek Road Mortgage Loan or the 3495 Deer Creek Road Property, or |
| (d) | with respect to the matters described in clause (iv) above, (1) Pivotal having renewed the term of the Pivotal lease for a term, and upon terms and conditions, acceptable to the lender or (2) the execution of a lease with a replacement tenant upon terms and condition acceptable to the lender and such tenant being in occupancy and paying full unabated rent. |
Property Management. The 3495 Deer Creek Road Property is managed by an affiliate of the borrower.
Assumption.The borrower has, at any time after 90 days following the securitization of the 3495 Deer Creek Road Mortgage Loan, the right to transfer the 3495 Deer Creek Road Property, provided that certain conditions are satisfied, including: (i) no event of default under the 3495 Deer Creek Road Mortgage Loan documents has occurred and is continuing, (ii) the borrower has provided the lender with prior written notice, (iii) the proposed transferee qualifies as a qualified transferee under the 3495 Deer Creek Road Mortgage Loan documents, (iv) the payment of a transfer fee of 0.5% of the then outstanding principal balance of the 3495 Deer Creek Road Mortgage Loan in the case of the first transfer, and 1.0% of the then outstanding principal balance of the 3495 Deer Creek Road Mortgage Loan in the case of any subsequent transfer, and (v) the lender has received rating agency confirmation that such assumption will not result in a downgrade of the respective ratings assigned to the Series WFCM 2018-C44 certificates.
Partial Release. Not permitted.
Real Estate Substitution.Not permitted.
Ground Lease. The 3495 Deer Creek Road Property is subject to a ground lease with the Board of Trustees of the Leland Stanford Junior University. The ground lease at the 3495 Deer Creek Road Property commenced in September 1978 and expires in December 2055. The borrower is currently obligated to pay ground rent at the rate of $4,750 per month plus percentage rent equal to 10.0% of the amount that the adjusted gross income exceeds the minimum annual rent due for each year, increasing to 15.0% in 2019. The underwritten ground rent is underwritten to the 10 year average of the appraiser’s forecasted ground lease payments. The lessor under the ground lease has a right of first offer to purchase the 3495 Deer Creek Road Property and/or the mortgagor’s leasehold estate. Pursuant to a tri-party agreement, the lessor has agreed that such right of first offer will not apply to a foreclosure, deed-in-lieu of foreclosure, assignment-in-lieu of foreclosure, or any transfer or proposed transfer of the 3495 Deer Creek Road Mortgage Loan by the lender. Pursuant to the tri-party agreement, the lessor has further agreed that as a condition to any such purchase option, the 3495 Deer Creek Mortgage Loan will be repaid in full by the mortgagor with the funds to be paid by the lessor to the mortgagor in connection with the exercise of such right or purchase option. See“Description of the Mortgage Pool – Mortgage Pool Characteristics – Fee & Leasehold Estates; Ground Leases” in the Preliminary Prospectus.
THE INFORMATION IN THIS STRUCTURAL AND COLLATERAL TERM SHEET IS NOT COMPLETE AND MAY BE AMENDED PRIOR TO THE TIME OF SALE. THIS TERM SHEET IS NOT AN OFFER TO SELL THESE SECURITIES AND IT IS NOT A SOLICITATION OF AN OFFER TO BUY THESE SECURITIES IN ANY JURISDICTION WHERE THE OFFER OR SALE IS NOT PERMITTED.
48
| 3495 DEER CREEK ROAD |
Terrorism Insurance.The 3495 Deer Creek Road Mortgage Loan documents require that the “all risk” insurance policy required to be maintained by the borrower provide coverage for terrorism in an amount equal to the full replacement cost of the 3495 Deer Creek Road Property, or that if the Terrorism Risk Insurance Program Reauthorization Act is no longer in effect and such policies contain an exclusion for acts of terrorism, the borrower will obtain, to the extent available, a stand-alone policy that provides the same coverage as the policies would have if such exclusion did not exist.
Earthquake Insurance.The loan documents do not require earthquake insurance. The property is located in Seismic Zone 4. The seismic report indicated scenario expected loss for the property is 19%.
THE INFORMATION IN THIS STRUCTURAL AND COLLATERAL TERM SHEET IS NOT COMPLETE AND MAY BE AMENDED PRIOR TO THE TIME OF SALE. THIS TERM SHEET IS NOT AN OFFER TO SELL THESE SECURITIES AND IT IS NOT A SOLICITATION OF AN OFFER TO BUY THESE SECURITIES IN ANY JURISDICTION WHERE THE OFFER OR SALE IS NOT PERMITTED.
49
(THIS PAGE INTENTIONALLY LEFT BLANK)
THE INFORMATION IN THIS STRUCTURAL AND COLLATERAL TERM SHEET IS NOT COMPLETE AND MAY BE AMENDED PRIOR TO THE TIME OF SALE. THIS TERM SHEET IS NOT AN OFFER TO SELL THESE SECURITIES AND IT IS NOT A SOLICITATION OF AN OFFER TO BUY THESE SECURITIES IN ANY JURISDICTION WHERE THE OFFER OR SALE IS NOT PERMITTED.
50
| AIRPORT BUSINESS CENTER |
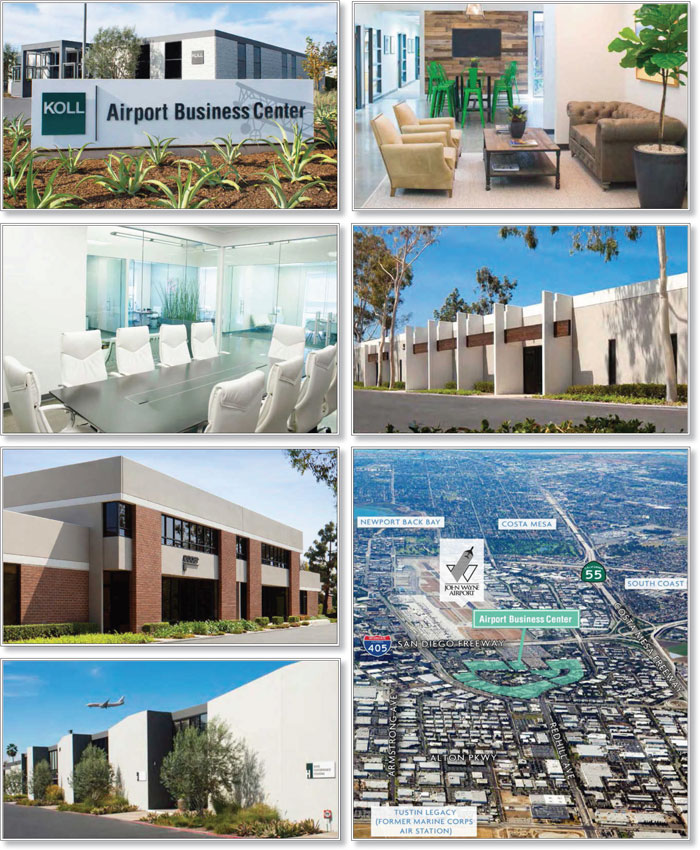
THE INFORMATION IN THIS STRUCTURAL AND COLLATERAL TERM SHEET IS NOT COMPLETE AND MAY BE AMENDED PRIOR TO THE TIME OF SALE. THIS TERM SHEET IS NOT AN OFFER TO SELL THESE SECURITIES AND IT IS NOT A SOLICITATION OF AN OFFER TO BUY THESE SECURITIES IN ANY JURISDICTION WHERE THE OFFER OR SALE IS NOT PERMITTED.
51
| AIRPORT BUSINESS CENTER |
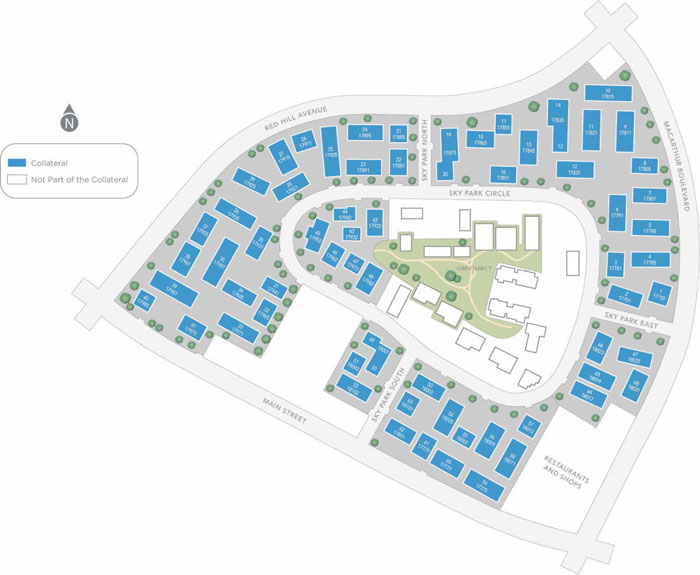
THE INFORMATION IN THIS STRUCTURAL AND COLLATERAL TERM SHEET IS NOT COMPLETE AND MAY BE AMENDED PRIOR TO THE TIME OF SALE. THIS TERM SHEET IS NOT AN OFFER TO SELL THESE SECURITIES AND IT IS NOT A SOLICITATION OF AN OFFER TO BUY THESE SECURITIES IN ANY JURISDICTION WHERE THE OFFER OR SALE IS NOT PERMITTED.
52
| AIRPORT BUSINESS CENTER |
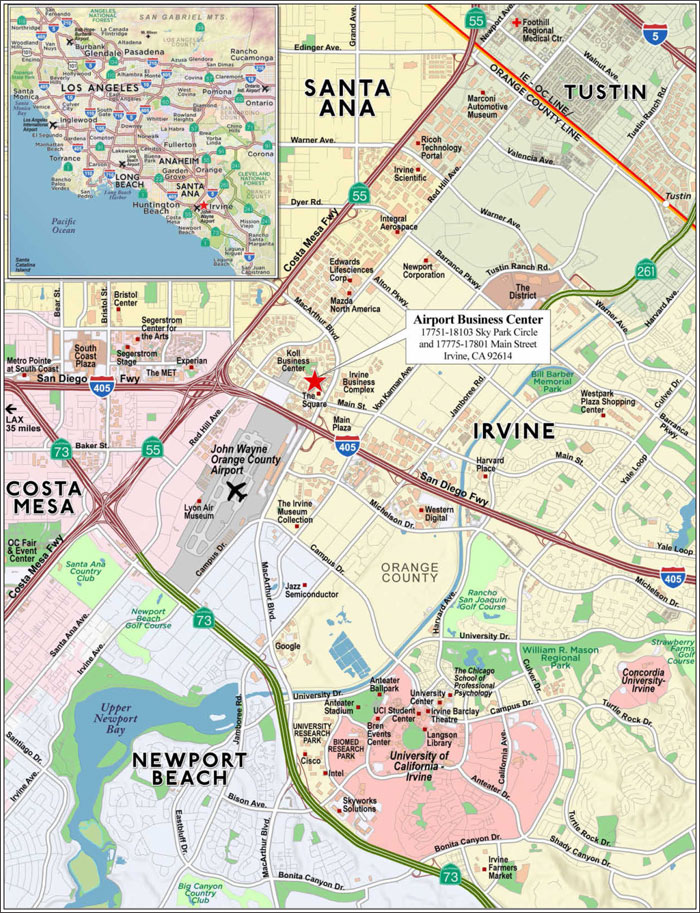
THE INFORMATION IN THIS STRUCTURAL AND COLLATERAL TERM SHEET IS NOT COMPLETE AND MAY BE AMENDED PRIOR TO THE TIME OF SALE. THIS TERM SHEET IS NOT AN OFFER TO SELL THESE SECURITIES AND IT IS NOT A SOLICITATION OF AN OFFER TO BUY THESE SECURITIES IN ANY JURISDICTION WHERE THE OFFER OR SALE IS NOT PERMITTED.
53
| No. 3 – Airport Business Center | ||||||
| Loan Information | Property Information | |||||
| Mortgage Loan Seller: | Wells Fargo Bank, National Association | Single Asset/Portfolio: | Single Asset | |||
| Credit Assessment (DBRS/Fitch/Moody’s): | NR/NR/NR | Property Type: | Industrial | |||
| Original Principal Balance(1): | $47,000,000 | Specific Property Type: | Flex | |||
| Cut-off Date Balance(1): | $47,000,000 | Location: | Irvine, CA | |||
| % of Initial Pool Balance: | 6.1% | Size: | 1,170,571 SF | |||
| Loan Purpose: | Refinance | Cut-off Date Balance Per SF(1)(2): | $128.14 | |||
| Borrower Name: | AIC Owner, LLC | Year Built/Renovated: | 1969/2005 | |||
| Borrower Sponsor: | DK Properties, L.P. | Title Vesting: | Fee | |||
| Mortgage Rate: | 4.3750% | Property Manager: | Self-managed | |||
| Note Date: | January 24, 2018 | 4thMost Recent Occupancy (As of): | 91.0% (12/31/2013) | |||
| Anticipated Repayment Date: | NAP | 3rdMost Recent Occupancy (As of): | 93.0% (12/31/2014) | |||
| Maturity Date: | February 7, 2028 | 2rdMost Recent Occupancy (As of): | 96.0% (12/31/2015) | |||
| IO Period: | 120 months | Most Recent Occupancy (As of): | 97.0% (12/31/2016) | |||
| Loan Term (Original): | 120 months | Current Occupancy (As of): | 96.8% (1/31/2018) | |||
| Seasoning: | 3 months | |||||
| Amortization Term (Original): | NAP | Underwriting and Financial Information: | ||||
| Loan Amortization Type: | Interest-only, Balloon | |||||
| Interest Accrual Method: | Actual/360 | 4thMost Recent NOI (As of): | $11,321,411 (12/31/2014) | |||
| Call Protection: | L(27),D(89),O(4) | 3rdMost Recent NOI (As of): | $12,153,147 (12/31/2015) | |||
| Lockbox Type: | Hard/Upfront Cash Management | 2ndMost Recent NOI (As of): | $12,904,375 (12/31/2016) | |||
| Additional Debt(1)(2): | Yes | Most Recent NOI (As of): | $13,635,662 (TTM 10/31/17) | |||
| Additional Debt Type(1)(2): | Pari Passu;Mezzanine | |||||
| U/W Revenues: | $18,889,349 | |||||
| U/W Expenses: | $4,222,532 | |||||
| U/W NOI: | $14,666,817 | |||||
| U/W NCF: | $14,116,649 | |||||
| U/W NOI DSCR(1)(2): | 2.20x | |||||
| Escrows and Reserves(3): | U/W NCF DSCR(1)(2): | 2.12x | ||||
| U/W NOI Debt Yield(1)(2): | 9.8% | |||||
| Type: | Initial | Monthly | Cap (If Any) | U/W NCF Debt Yield(1)(2): | 9.4% | |
| Taxes | $52,146 | $52,144 | NAP | As-Is Appraised Value: | $244,600,000 | |
| Insurance | $31,883 | $17,474 | NAP | As-Is Appraisal Valuation Date: | December 13, 2017 | |
| Replacement Reserves | $0 | $21,418 | $525,000 | Cut-off Date LTV Ratio(1)(2): | 61.3% | |
| TI/LC Reserves | $0 | $73,015 | NAP | LTV Ratio at Maturity(1)(2): | 61.3% | |
| (1) | See “The Mortgage Loan” section. All statistical information related to balances per square foot, loan-to-value (“LTV”) ratios, debt service coverage ratios and debt yields are based on the Airport Business Center Whole Loan (as defined below). |
| (2) | See “Subordinate and Mezzanine Indebtedness” section. The equity interest in the borrower has been pledged to secure mezzanine indebtedness with an original principal balance of $20,000,000. All statistical information related to the balance per square foot, LTV ratios, debt service coverage ratios and debt yields are based solely on the Airport Business Center Whole Loan. As of the Cut-off Date, the U/W NOI DSCR, U/W NCF DSCR, U/W NOI Debt Yield, U/W NCF Debt Yield, Cut-off Date LTV Ratio and LTV Ratio at Maturity based on the Airport Business Center Total Debt (as defined below) are 1.81x, 1.74x, 8.6%, 8.3%, 69.5% and 69.5%, respectively. |
| (3) | See “Escrows” section. |
The Mortgage Loan. The mortgage loan (the “Airport Business Center Mortgage Loan”) is part of a whole loan (the “Airport Business Center Whole Loan”) evidenced by threepari passu notes secured by a first mortgage encumbering the fee interest in an industrial flex business park located in Irvine, California (the “Airport Business Center Property”). The Airport Business Center Whole Loan was originated on January 24, 2018 by Wells Fargo Bank, National Association. The Airport Business Center Whole Loan had an original principal balance of $150,000,000, has an outstanding principal balance as of the Cut-off Date of $150,000,000 and accrues interest at an interest rate of 4.3750%per annum. The Airport Business Center Whole Loan had an initial term of 120 months, has a remaining term of 117 months as of the Cut-off Date and requires payments of interest only through the loan term. The Airport Business Center Whole Loan matures on February 7, 2028.
Note A-3, which will be contributed to the WFCM 2018-C44 securitization trust, had an original principal balance of $47,000,000 and has an outstanding principal balance as of the Cut-off Date of $47,000,000 and represents a non-controlling interest in the Airport Business Center Whole Loan. The controlling Note A-1 had an original principal balance of $53,000,000, has an outstanding principal balance as of the Cut-off Date of $53,000,000 and is expected to be contributed to the BANK 2018-BNK11 trust. The non-controlling Note A-2 had an original principal balance of $50,000,000, has an outstanding principal balance as of the Cut-off Date of $50,000,000 and was contributed to the WFCM 2018-C43 trust. The mortgage loans evidenced by Notes A-1 and A-2 are collectively referred to herein as the “Airport Business Center Companion Loans”. See “Description of the Mortgage Pool—The Whole Loans—The Serviced Whole Loans” and “Pooling and Servicing Agreement” in the Preliminary Prospectus.
THE INFORMATION IN THIS STRUCTURAL AND COLLATERAL TERM SHEET IS NOT COMPLETE AND MAY BE AMENDED PRIOR TO THE TIME OF SALE. THIS TERM SHEET IS NOT AN OFFER TO SELL THESE SECURITIES AND IT IS NOT A SOLICITATION OF AN OFFER TO BUY THESE SECURITIES IN ANY JURISDICTION WHERE THE OFFER OR SALE IS NOT PERMITTED.
54
| AIRPORT BUSINESS CENTER |
Note Summary
| Notes | Original Balance | Note Holder | Controlling Interest | |
| A-1 | $53,000,000 | BANK 2018-BNK11(1) | Yes | |
| A-2 | $50,000,000 | WFCM 2018-C43 | No | |
| A-3 | $47,000,000 | WFCM 2018-C44 | No | |
| Total | $150,000,000 |
| (1) | The BANK 2018-BNK11 transaction is expected to close on April 26, 2018. |
Following the lockout period, on any date before November 7, 2027, the borrower has the right to defease the Airport Business Center Whole Loan in whole, but not in part. In addition, the Airport Business Center Whole Loan is prepayable without penalty on or after November 7, 2027. The lockout period will expire two years after the closing date of the WFCM 2018-C44 securitization trust.
Sources and Uses
| Sources | Uses | |||||||
| Original whole loan amount | $150,000,000 | 88.2% | Loan payoff(1) | $166,738,568 | 98.1% | |||
| Mezzanine debt(2) | 20,000,000 | 11.8 | Upfront reserves | 84,029 | 0.0 | |||
| Closing costs | 1,652,636 | 1.0 | ||||||
| Return of equity | 1,524,767 | 0.9 | ||||||
| Total Sources | $170,000,000 | 100.0% | Total Uses | $170,000,000 | 100.0% | |||
| (1) | The Airport Business Center Property was previously securitized in the MSBAM 2014-C19 transaction. Loan payoff includes the prior senior loan ($138,323,068) and prior mezzanine loan ($28,415,500). |
| (2) | See “Subordinate and Mezzanine Indebtedness” section. |
The Property. The Airport Business Center Property is a class B industrial/flex and office development totaling 1,170,571 square feet and located in Irvine, California. Originally built by the borrower sponsor in phases between 1969 and 1978 and most recently renovated in 2005, the Airport Business Center Property comprises 68 one- and two-story buildings spanning approximately 76.6 acres. The Airport Business Center Property is situated within the approximate 4,000-acre Irvine Business Complex, a master planned business park spanning five Orange County cities. The net rentable area of the Airport Business Center Property contains approximately 73.9% industrial/flex, 23.5% office and 2.1% retail tenants. Clear heights at the Airport Business Center Property range from 11 feet, 4 inches to 16 feet, 10 inches. The Airport Business Center Property comprises 2,985 surface parking spaces, resulting in a parking ratio of 2.6 spaces per 1,000 square feet of rentable area.
As of January 31, 2018, the Airport Business Center Property was 96.8% occupied by approximately 440 tenants with no single tenant accounting for more than 1.8% of the net rentable area or 1.5% of underwritten base rent. The Airport Business Center Property has averaged 94.8% occupancy over the past five years and 90.8% occupancy since 1990.
THE INFORMATION IN THIS STRUCTURAL AND COLLATERAL TERM SHEET IS NOT COMPLETE AND MAY BE AMENDED PRIOR TO THE TIME OF SALE. THIS TERM SHEET IS NOT AN OFFER TO SELL THESE SECURITIES AND IT IS NOT A SOLICITATION OF AN OFFER TO BUY THESE SECURITIES IN ANY JURISDICTION WHERE THE OFFER OR SALE IS NOT PERMITTED.
55
| AIRPORT BUSINESS CENTER |
The following table presents certain information relating to the tenancy at the Airport Business Center Property:
Major Tenants
| Tenant Name | Credit Rating (Fitch/ Moody’s/ S&P) | Tenant NRSF | % of NRSF | Annual U/W Base Rent PSF(1) | Annual U/W Base Rent(1) | % of Total Annual U/W Base Rent | Lease Expiration Date |
| Major Tenants | |||||||
| Just Food For Dogs, LLC | NR/NR/NR | 18,142 | 1.5% | $15.13(2) | $274,531 | 1.5% | 6/30/2028 |
| American Pacific Printers College, Inc. | NR/NR/NR | 21,240 | 1.8% | $12.54(3) | $266,400 | 1.4% | Various(3) |
| AIDS Services Foundation | NR/NR/NR | 12,520 | 1.1% | $17.64(4) | $220,792 | 1.2% | Various(4) |
| Southwind Kayak Center, Inc. | NR/NR/NR | 10,431 | 0.9% | $17.03(5) | $177,623 | 1.0% | Various(5) |
| PAS MRO, Inc. | NR/NR/NR | 13,817 | 1.2% | $12.29(6) | $169,857 | 0.9% | Various(6) |
| Total Major Tenants | 76,150 | 6.5% | $14.57 | $1,109,203 | 6.0% | ||
| Non-Major Tenants | 1,057,087 | 90.3% | $16.55(7) | $17,314,800 | 94.0% | ||
| Occupied Collateral Total | 1,133,237 | 96.8% | $16.42(7) | $18,424,003 | 100.0% | ||
| Vacant Space | 37,334 | 3.2% | |||||
| Collateral Total | 1,170,571 | 100.0% | |||||
| (1) | Annual U/W Base Rent PSF and Annual U/W Base Rent include contractual rent steps through February 2019 totaling $555,991. |
| (2) | Just Food For Dogs, LLC leases two spaces: 9,914 square feet with an Annual U/W Base Rent PSF of $14.40 and Lease Expiration Date of June 30, 2028; and 8,228 square feet with an Annual U/W Base Rent PSF of $16.01 and Lease Expiration Date of June 30, 2028. The lease covering the 9,914 square foot space has a free rent period that expires on June 30, 2018. |
| (3) | American Pacific Printers College, Inc. leases three spaces: 2,040 square feet on a month-to-month basis with an U/W Base Rent PSF of $12.00; 4,800 square feet with an Annual U/W Base Rent PSF of $12.60 and Lease Expiration Date of January 31, 2019; and 14,400 square feet with an Annual U/W Base Rent PSF of $12.60 and Lease Expiration Date of February 28, 2019. |
| (4) | AIDS Services Foundation leases two spaces: 11,787 square feet with an Annual U/W Base Rent PSF of $17.40 and Lease Expiration Date of April 30, 2021; and 733 square feet with an Annual U/W Base Rent PSF of $21.42 and Lease Expiration Date of October 14, 2018. |
| (5) | Southwind Kayak Center, Inc. leases three spaces: 4,750 square feet with an Annual U/W Base Rent PSF of $18.00 and Lease Expiration Date of September 30, 2019; and 1,186 square feet with an Annual U/W Base Rent PSF of $14.00 and Lease Expiration Date of September 30, 2019; and 4,495 square feet with an Annual U/W Base Rent PSF of $16.80 and Lease Expiration Date of March 31, 2025. |
| (6) | PAS MRO, Inc. leases three spaces: 9,726 square feet with an Annual U/W Base Rent PSF of $11.04 and Lease Expiration Date of May 31, 2018; 1,466 square feet with an Annual U/W Base Rent PSF of $11.04 and Lease Expiration Date of May 31, 2018; and 2,625 square feet with an Annual U/W Base Rent PSF of $17.64 and Lease Expiration Date of January 31, 2020; |
| (7) | Non-Major Tenants includes approximately 10,962 square feet related to the management office and engineer office, which have no attributed Annual U/W Base Rent. The Annual U/W Base Rent PSF for Non-Major Tenants and Occupied Collateral Total excludes the space related to the management office and engineer office. |
The following table presents certain information relating to the lease rollover schedule at the Airport Business Center Property:
Lease Expiration Schedule(1)(2)
| Year Ending December 31, | No. of Leases Expiring | Expiring NRSF | % of Total NRSF | Cumulative Expiring NRSF | Cumulative % of Total NRSF | Annual U/W Base Rent | % of Total Annual U/W Base Rent | Annual U/W Base Rent PSF |
| MTM(3) | 49 | 86,232 | 7.4% | 86,232 | 7.4% | $1,187,293 | 6.4% | $15.77(3) |
| 2018 | 141 | 303,924 | 26.0% | 390,156 | 33.3% | $4,842,038 | 26.3% | $15.93 |
| 2019 | 132 | 264,446 | 22.6% | 654,602 | 55.9% | $4,424,563 | 24.0% | $16.73 |
| 2020 | 92 | 218,474 | 18.7% | 873,076 | 74.6% | $3,584,549 | 19.5% | $16.41 |
| 2021 | 30 | 112,022 | 9.6% | 985,098 | 84.2% | $1,871,113 | 10.2% | $16.70 |
| 2022 | 33 | 87,897 | 7.5% | 1,072,995 | 91.7% | $1,550,280 | 8.4% | $17.64 |
| 2023 | 11 | 32,831 | 2.8% | 1,105,826 | 94.5% | $531,625 | 2.9% | $16.19 |
| 2024 | 0 | 0 | 0.0% | 1,105,826 | 94.5% | $0 | 0.0% | $0.00 |
| 2025 | 1 | 4,495 | 0.4% | 1,110,321 | 94.9% | $75,516 | 0.4% | $16.80 |
| 2026 | 0 | 0 | 0.0% | 1,110,321 | 94.9% | $0 | 0.0% | $0.00 |
| 2027 | 2 | 4,774 | 0.4% | 1,115,095 | 95.3% | $82,495 | 0.4% | $17.28 |
| 2028 | 2 | 18,142 | 1.5% | 1,133,237 | 96.8% | $274,531 | 1.5% | $15.13 |
| Thereafter | 0 | 0 | 0.0% | 1,133,237 | 96.8% | $0 | 0.0% | $0.00 |
| Vacant | 0 | 37,334 | 3.2% | 1,170,571 | 100.0% | $0 | 0.0% | $0.00 |
| Total/Weighted Average | 493 | 1,170,571 | 100.0% | $18,424,003 | 100.0% | $16.42(4) |
| (1) | Information obtained from the underwritten rent roll. |
| (2) | Certain tenants may have lease termination options that are exercisable prior to the originally stated expiration date of the subject lease and that are not considered in the Lease Expiration Schedule. |
| (3) | MTM includes approximately 10,962 square feet related to the management office and engineer office, which have no leases and no attributed Annual U/W Base Rent. The Annual U/W Base Rent PSF for MTM excludes the space related to the management office and engineer office. |
| (4) | Weighted Average Annual U/W Base Rent PSF excludes vacant, management office and engineer office spaces. |
THE INFORMATION IN THIS STRUCTURAL AND COLLATERAL TERM SHEET IS NOT COMPLETE AND MAY BE AMENDED PRIOR TO THE TIME OF SALE. THIS TERM SHEET IS NOT AN OFFER TO SELL THESE SECURITIES AND IT IS NOT A SOLICITATION OF AN OFFER TO BUY THESE SECURITIES IN ANY JURISDICTION WHERE THE OFFER OR SALE IS NOT PERMITTED.
56
| AIRPORT BUSINESS CENTER |
The following table presents historical occupancy percentages at the Airport Business Center Property:
Historical Occupancy
12/31/2013(1) | 12/31/2014(1) | 12/31/2015(1) | 12/31/2016(1) | 1/31/2018(2) |
| 91.0% | 93.0% | 96.0% | 97.0% | 96.8% |
| (1) | Information obtained from the borrower. |
| (2) | Information obtained from the underwritten rent roll. |
Operating History and Underwritten Net Cash Flow. The following table presents certain information relating to the historical operating performance and underwritten net cash flow at the Airport Business Center Property:
Cash Flow Analysis
| 2014 | 2015 | 2016 | TTM 10/31/2017 | U/W | % of U/W Effective Gross Income | U/W $ per SF | |||||||||
| Base Rent | $13,840,135 | $15,111,231 | $15,773,702 | $16,464,277 | 18,424,003(1) | 97.5% | $15.74 | ||||||||
| Grossed Up Vacant Space | 0 | 0 | 0 | 0 | 606,526 | 3.2 | 0.52 | ||||||||
| Total Recoveries | 1,010,672 | 1,091,842 | 1,217,145 | 1,293,413 | 1,283,612 | 6.8 | 1.10 | ||||||||
| Other Income | 241,346 | 131,003 | 155,864 | 159,400 | 159,400 | 0.8 | 0.14 | ||||||||
| Less Vacancy & Credit Loss | 0 | 0 | 0 | 0 | (1,584,192)(2) | (8.4) | (1.35) | ||||||||
| Effective Gross Income | $15,092,153 | $16,334,076 | $17,146,711 | $17,917,090 | $18,889,349 | 100.0% | $16.14 | ||||||||
| Total Operating Expenses | 3,770,742 | 4,180,929 | 4,242,336 | 4,281,428 | 4,222,532 | 22.4% | 3.61 | ||||||||
| Net Operating Income | $11,321,411 | $12,153,147 | $12,904,375 | $13,635,662 | $14,666,817 | 77.6% | $12.53 | ||||||||
| TI/LC | 0 | 0 | 0 | 0 | 292,643 | 1.5 | 0.25 | ||||||||
| Capital Expenditures | 0 | 0 | 0 | 0 | 257,526 | 1.4 | 0.22 | ||||||||
| Net Cash Flow | $11,321,411 | $12,153,147 | $12,904,375 | $13,635,662 | $14,116,648 | 74.7% | $12.06 | ||||||||
| NOI DSCR(3) | 1.70x | 1.83x | 1.94x | 2.05x | 2.20x | ||||||||||
| NCF DSCR(3) | 1.70x | 1.83x | 1.94x | 2.05x | 2.12x | ||||||||||
| NOI DY(3) | 7.5% | 8.1% | 8.6% | 9.1% | 9.8% | ||||||||||
| NCF DY(3) | 7.5% | 8.1% | 8.6% | 9.1% | 9.4% |
| (1) | U/W Base Rent is higher than TTM 10/31/2017 due to the inclusion of rent bumps through February 2019 totaling $555,991 in addition to the borrower sponsor signing 205 renewal leases totaling 42.4% of underwritten base rent and 7 new leases totaling 2.4% of underwritten base rent since January 2017. |
| (2) | The underwritten economic vacancy is 8.3%. The Airport Business Center Property was 96.8% physically occupied as of January 31, 2018. |
| (3) | The debt service coverage ratios and debt yields shown are based on the Airport Business Center Whole Loan. |
Appraisal.As of the appraisal valuation date of December 13, 2017, the Airport Business Center Property had an “as-is” appraised value of $244,600,000. The appraiser also concluded to a land value of $158,500,000 as of December 13, 2017.
Environmental Matters. According to the Phase I environmental site assessment dated January 18, 2018, there was no evidence of any recognized environmental conditions at the Airport Business Center Property.
Market Overview and Competition. The Airport Business Center Property is located in Irvine, California, within the Irvine Business Complex and approximately one mile northeast of John Wayne Airport. The Irvine Business Complex encompasses approximately 4,000 acres within the cities of Irvine, Newport Beach, Santa Ana, Costa Mesa and Tustin. The Airport Business Center Property is situated to the southeast of the intersection of Macarthur Boulevard and Red Hill Avenue with access to Costa Mesa Freeway (State Route 55) approximately 0.5 mile to the northwest, and access to the San Diego Freeway (Interstate 405) approximately 0.75 mile to the south.
The Airport Business Center Property is situated approximately 3.8 miles northwest of the University of California-Irvine, which had a 2017 total enrollment of approximately 36,000 students. In addition, the Airport Business Center Property is situated approximately 3.0 miles east of South Coast Plaza (one of the five highest grossing shopping malls in the United States) and 9.3 miles west of Irvine Spectrum Center (an outdoor shopping center with various shopping, restaurant and entertainment options). According to a third-party market research report, the estimated 2017 population within a one-, three- and five-mile radius of the Airport Business Center Property was approximately 4,339, 180,021, and 617,144, respectively; while the 2017 estimated average household income within the same radii was $103,619, $98,864, and $96,263, respectively.
According to the appraisal, the Airport Business Center Property is situated within the Airport Area submarket of the Orange County market. As of the third quarter of 2017, the submarket reported a total inventory of 1,590industrial buildings totaling approximately 52.9 million square feet with a 2.6% vacancy rate and 245office buildings totaling approximately 18.9 million square feet with an 11.4% vacancy rate. The appraiser identified five comparableindustrial buildings for the Airport Business Center Property totaling 493,464 square feet, which reported an average occupancy rate of approximately 97.9%; and the appraiser identified four comparableoffice buildings for the Airport Business Center Property totaling 179,262 square feet, which reported an average occupancy rate of approximately 99.4%. The appraiser concluded to market rents for the Airport Business Center Property of $19.20 per square foot for all spaces less than 1,000 square feet, $16.20 per square foot for industrial spaces from 1,000 square feet to 3,999 square feet, $16.20 per square foot for office spaces from 1,000 square feet to 6,999 square feet, $15.00 per square foot for industrial spaces from 4,000 square feet to 6,999 square feet and $14.40 per square foot for all spaces over 7,000 square feet.
THE INFORMATION IN THIS STRUCTURAL AND COLLATERAL TERM SHEET IS NOT COMPLETE AND MAY BE AMENDED PRIOR TO THE TIME OF SALE. THIS TERM SHEET IS NOT AN OFFER TO SELL THESE SECURITIES AND IT IS NOT A SOLICITATION OF AN OFFER TO BUY THESE SECURITIES IN ANY JURISDICTION WHERE THE OFFER OR SALE IS NOT PERMITTED.
57
| AIRPORT BUSINESS CENTER |
The following tables present certain information relating to comparable industrial properties and leases to the Airport Business Center Property:
Comparable Properties (Industrial)(1)
| McFadden Centre | Grand Commerce Center | Alton Plaza | Holland Business Center | Main & Red Hill Business Center | |
| Location | Santa Ana, CA | Santa Ana, CA | Irvine, CA | Irvine, CA | Irvine, CA |
| Distance from Subject | 4.0 miles | 4.1 miles | 9.9 miles | 10.3 miles | 1.0 mile |
| Year Built/Renovated | 1988/NAV | 1980/NAV | 1989/NAV | 2005/NAV | 1981/NAV |
| Total GLA | 184,737 SF | 99,160 SF | 15,100 SF | 10,575 SF | 183,892 SF |
| Total Occupancy | 100% | 95% | 100% | 100% | 97% |
| (1) | Information obtained from the appraisal. |
Comparable Leases (Industrial)(1)
| Property Name | Tenant Name | Lease Date/ Term | Lease Area (SF) | Annual Base Rent PSF | Tenant Improvements PSF | Lease Type |
| McFadden Centre | American Stitch Design | Apr. 2017 / 3.0 Years | 3,210 | $14.52 | $0.00 | Modified Gross |
| Grand Commerce Center | Mid America Sales | Feb. 2017 / 3.0 Years | 1,635 | $13.20 | $0.00 | Modified Gross |
| Alton Plaza | Wachter, Inc. | Feb. 2016 / 5.3 Years | 5,238 | $14.16 | $0.00 | NNN |
| Holland Business Center | Evets Corporation | May 2016 / 3.0 Years | 5,070 | $16.80 | $0.00 | Modified Gross |
| Main & Red Hill Business Center | Confidential | Sept. 2017 / 4.1 Years | 4,012 | $13.80 | $0.00 | NNN |
| (1) | Information obtained from the appraisal. |
The following tables present certain information relating to comparable office properties and lease to the Airport Business Center Property:
Comparable Properties (Office)(1)
| 16530 Bake Pkwy | Centerpointe 1, 2, 3 & 6 | Executive Park III | 15300 Barranca Parkway | |
| Location | Irvine, CA | Irvine, CA | Irvine, CA | Irvine, CA |
| Distance from Subject | 9.0 miles | 3.0 miles | 0.7 mile | 9.2 miles |
| Year Built/Renovated | 2006/NAV | 1979/NAV | 1985/NAV | 1997/NAV |
| Total GLA | 19,998 SF | 105,577 SF | 21,271 SF | 32,416 SF |
| Total Occupancy | 100% | 99% | 100% | 100% |
| (1) | Information obtained from the appraisal. |
Comparable Leases (Office)(1)
| Property Name | Tenant Name | Lease Date/ Term | Lease Area (SF) | Annual Base Rent PSF | Tenant Improvements PSF | Lease Type |
| 16530 Bake Pkwy | Roka Sports | Mar. 2017 / 3.2 Years | 3,363 | $24.00 | $10.00 | Gross |
| Centerpointe 1, 2, 3 & 6 | Sims Law Firm | Feb. 2017 / 4.1 Years | 2,889 | $26.40 | $0.00 | Gross |
| Executive Park III | Langan Engineering | Dec. 2016 / 3.0 Years | 1,001 | $26.40 | $0.00 | Gross |
| 15300 Barranca Parkway | BBMC Mortgage | Mar. 2017 / 3.8 Years | 8,376 | $22.20 | $0.00 | Gross |
| (1) | Information obtained from the appraisal. |
THE INFORMATION IN THIS STRUCTURAL AND COLLATERAL TERM SHEET IS NOT COMPLETE AND MAY BE AMENDED PRIOR TO THE TIME OF SALE. THIS TERM SHEET IS NOT AN OFFER TO SELL THESE SECURITIES AND IT IS NOT A SOLICITATION OF AN OFFER TO BUY THESE SECURITIES IN ANY JURISDICTION WHERE THE OFFER OR SALE IS NOT PERMITTED.
58
| AIRPORT BUSINESS CENTER |
The Borrower.The borrower is AIC Owner, LLC, a Delaware limited liability company and single purpose entity with two independent directors. Legal counsel to the borrower delivered a non-consolidation opinion in connection with the origination of the Airport Business Center Whole Loan. DK Properties, L.P. is the guarantor of certain nonrecourse carveouts under the Airport Business Center Whole Loan.
The Borrower Sponsor.The borrower sponsor is DK Properties, L.P., which is an affiliate of The Koll Company (“Koll”), a privately held full service real estate firm based in Irvine, California. Since formation in 1962, Koll has acquired and developed, in partnership with institutional and private investors, over 100 million square feet of office, industrial, retail and resort properties throughout multiple markets. One of Koll’s primary focuses is on the acquisition and management of multi-tenant industrial properties. Koll has had continued ownership and management of the Airport Business Center Property since the company purchased the land and initiated construction in 1969.
Escrows.The loan documents provide for upfront escrows in the amount of $52,146 for real estate taxes and $31,883 for insurance premiums. The loan documents also provide for ongoing monthly escrows in an amount equal to $52,144 for real estate taxes, $17,474 for insurance premiums, $73,015 for tenant improvements and leasing commissions (“TI/LCs”) and $21,418 for capital expenditures (subject to a cap of $525,000). The borrower has the right to use funds in the TI/LC reserve account for preparation of tenant-ready speculative spaces in an amount equal to no more than $10 per rentable square foot of such tenant-ready speculative space and no more than $250,000 in any 12-month period, subject to certain conditions outlined in the loan documents.
Lockbox and Cash Management.The Airport Business Center Whole Loan requires a lender-controlled lockbox account, which is already in-place, and that the borrower direct all tenants to pay rent directly into such lockbox account. The loan documents also require that all rents received by the borrower or the property manager be deposited into the lockbox account within one business day of receipt. All funds in the lockbox account are required to be swept each business day into the cash management account controlled by the lender and disbursed on each payment date in accordance with the loan documents. Prior to the occurrence of a Cash Trap Event Period (as defined below), all excess funds are required to be distributed to the borrower. During a Cash Trap Event Period, all excess funds are required to be swept to an excess cash flow subaccount.
A “Cash Trap Event Period” will commence upon the earlier of the following:
| (i) | the occurrence of an event of default under the Airport Business Center Whole Loan or the Airport Business Center Mezzanine Loan (see “Subordinate and Mezzanine Indebtedness” section); |
| (ii) | the debt yield based on the Airport Business Center Total Debt (see “Subordinate and Mezzanine Indebtedness” section) falling below 6.50% at the end of any fiscal quarter; or |
| (iii) | the property manager becoming insolvent or filing for bankruptcy. |
A Cash Trap Event Period will end upon the occurrence of the following:
| ● | with regard to clause (i), the cure of such event of default; |
| ● | with regard to clause (ii), the debt yield based on the Airport Business Center Total Debt being equal to or greater than 6.75% for two consecutive fiscal quarters; or |
| ● | with regard to clause (iii), the bankruptcy or insolvency proceedings having terminated or (b) a new approved property manager being appointed in accordance with the loan documents. |
Property Management.The Airport Business Center Property is managed by an affiliate of the borrower.
Assumption.The Airport Business Center borrower has a one-time right to transfer the Airport Business Center Property, provided that certain other conditions are satisfied, including, but not limited to: (i) no event of default or monetary default has occurred and is continuing; (ii) the lender’s reasonable determination that the proposed transferee and guarantor satisfy the lender’s credit review and underwriting standards, taking into consideration transferee experience, financial strength and general business standing; (iii) if requested by the lender, rating agency confirmation from DBRS, Fitch, and Moody’s that the transfer will not result in a downgrade, withdrawal or qualification of the respective ratings assigned to the Series WFCM 2018-C44 certificates and similar confirmations from each rating agency rating any securities backed by any of the Airport Business Center Companion Loans with respect to the ratings of such securities; and (iv) the entire Airport Business Center Mezzanine Loan (see “Subordinate and Mezzanine Indebtedness” section) has been simultaneously defeased.
Partial Release.Not permitted.
Real Estate Substitution.Not permitted.
Subordinate and Mezzanine Indebtedness.BSREF Holdings LLC, a Delaware limited liability company related to Brookfield Real Estate Financial Partners LLC, funded a $20,000,000 mezzanine loan (the “Airport Business Center Mezzanine Loan”) to AIC Mezz, LLC, a Delaware limited liability company (the “Airport Business Center Mezzanine Borrower”) (collectively, the Airport Business Center Whole Loan and the Airport Business Center Mezzanine Loan are referred to herein as the “Airport Business Center Total Debt”). The Airport Business Center Mezzanine Loan is secured by a pledge of the Airport Business Center Mezzanine Borrower’s interest in the borrower under the Airport Business Center Whole Loan. The Airport Business Center Mezzanine Loan accrues interest at a rate of 7.206%per annumand requires interest-only payments through the maturity date of February 7, 2028 (co-terminous with the Airport Business Center Whole Loan).
Ground Lease.None.
Terrorism Insurance.The Airport Business Center Whole Loan documents require that the “all risk” insurance policies required to be maintained by the borrower provide coverage for terrorism in an amount equal to the full replacement cost of the Airport Business Center Property, as well as business interruption insurance covering no less than the 12-month period following the occurrence of a
THE INFORMATION IN THIS STRUCTURAL AND COLLATERAL TERM SHEET IS NOT COMPLETE AND MAY BE AMENDED PRIOR TO THE TIME OF SALE. THIS TERM SHEET IS NOT AN OFFER TO SELL THESE SECURITIES AND IT IS NOT A SOLICITATION OF AN OFFER TO BUY THESE SECURITIES IN ANY JURISDICTION WHERE THE OFFER OR SALE IS NOT PERMITTED.
59
| AIRPORT BUSINESS CENTER |
casualty event, together with a 12-month extended period of indemnity (provided that if TRIPRA or a similar statute is not in effect, the borrower will not be obligated to pay terrorism insurance premiums in excess of two times the premium for the casualty and business interruption coverage on a stand-alone basis).
Earthquake Insurance.The loan documents do not require earthquake insurance. The seismic report indicated a probable maximum loss for the entire Airport Business Center Property of 8.0%.
THE INFORMATION IN THIS STRUCTURAL AND COLLATERAL TERM SHEET IS NOT COMPLETE AND MAY BE AMENDED PRIOR TO THE TIME OF SALE. THIS TERM SHEET IS NOT AN OFFER TO SELL THESE SECURITIES AND IT IS NOT A SOLICITATION OF AN OFFER TO BUY THESE SECURITIES IN ANY JURISDICTION WHERE THE OFFER OR SALE IS NOT PERMITTED.
60
(THIS PAGE INTENTIONALLY LEFT BLANK)
THE INFORMATION IN THIS STRUCTURAL AND COLLATERAL TERM SHEET IS NOT COMPLETE AND MAY BE AMENDED PRIOR TO THE TIME OF SALE. THIS TERM SHEET IS NOT AN OFFER TO SELL THESE SECURITIES AND IT IS NOT A SOLICITATION OF AN OFFER TO BUY THESE SECURITIES IN ANY JURISDICTION WHERE THE OFFER OR SALE IS NOT PERMITTED.
61
DULANEY CENTER
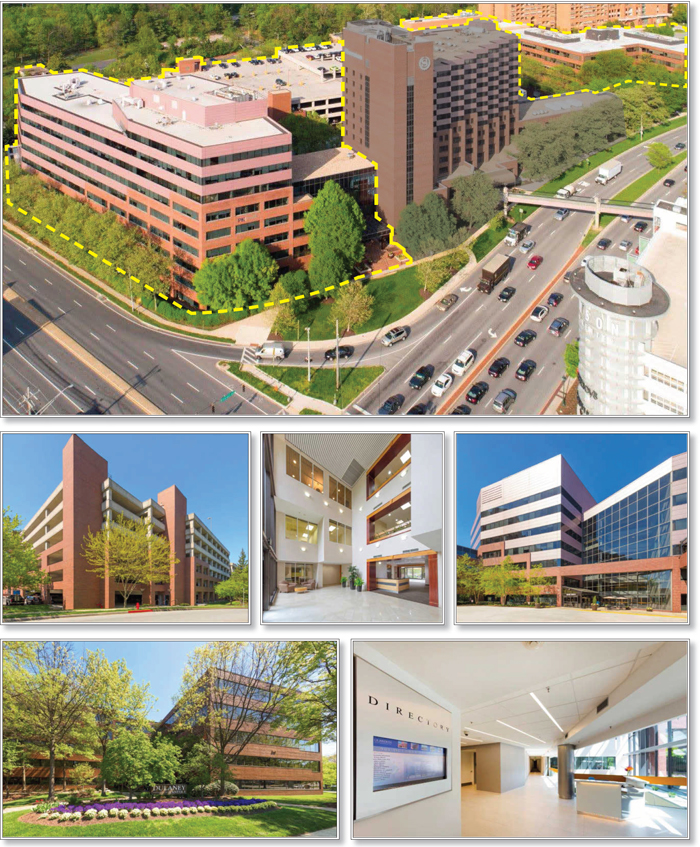
THE INFORMATION IN THIS STRUCTURAL AND COLLATERAL TERM SHEET IS NOT COMPLETE AND MAY BE AMENDED PRIOR TO THE TIME OF SALE. THIS TERM SHEET IS NOT AN OFFER TO SELL THESE SECURITIES AND IT IS NOT A SOLICITATION OF AN OFFER TO BUY THESE SECURITIES IN ANY JURISDICTION WHERE THE OFFER OR SALE IS NOT PERMITTED.
62
DULANEY CENTER
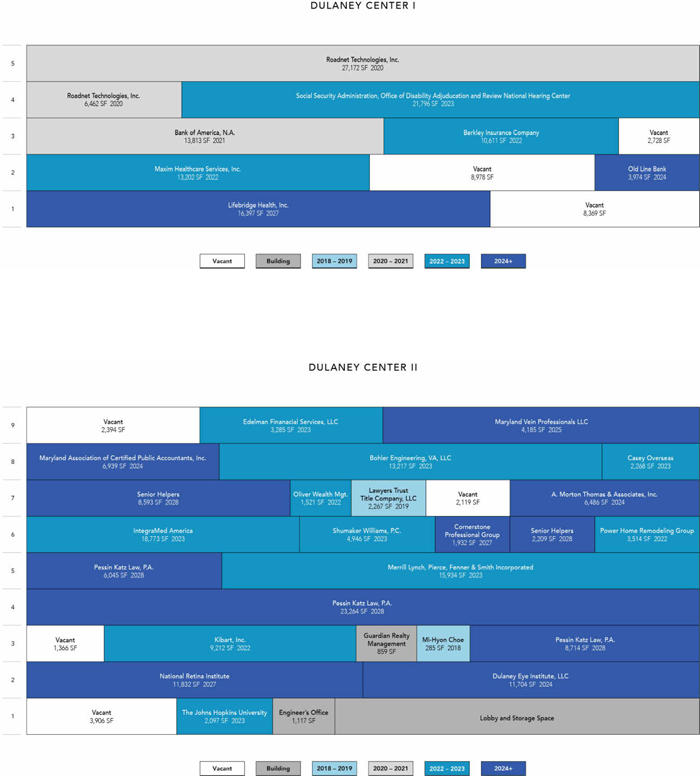
THE INFORMATION IN THIS STRUCTURAL AND COLLATERAL TERM SHEET IS NOT COMPLETE AND MAY BE AMENDED PRIOR TO THE TIME OF SALE. THIS TERM SHEET IS NOT AN OFFER TO SELL THESE SECURITIES AND IT IS NOT A SOLICITATION OF AN OFFER TO BUY THESE SECURITIES IN ANY JURISDICTION WHERE THE OFFER OR SALE IS NOT PERMITTED.
63
DULANEY CENTER
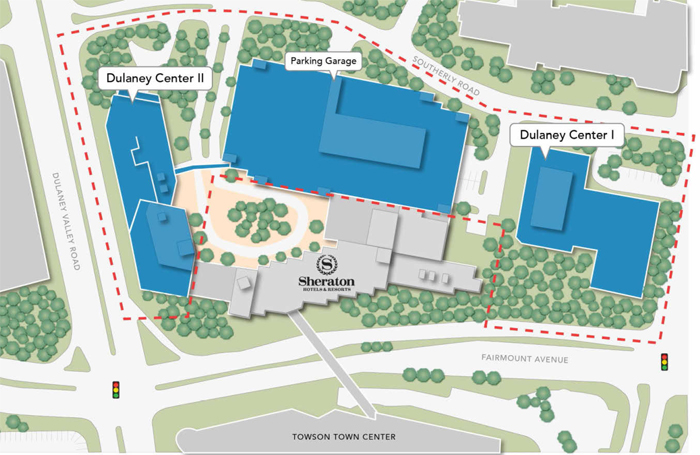
THE INFORMATION IN THIS STRUCTURAL AND COLLATERAL TERM SHEET IS NOT COMPLETE AND MAY BE AMENDED PRIOR TO THE TIME OF SALE. THIS TERM SHEET IS NOT AN OFFER TO SELL THESE SECURITIES AND IT IS NOT A SOLICITATION OF AN OFFER TO BUY THESE SECURITIES IN ANY JURISDICTION WHERE THE OFFER OR SALE IS NOT PERMITTED.
64
DULANEY CENTER
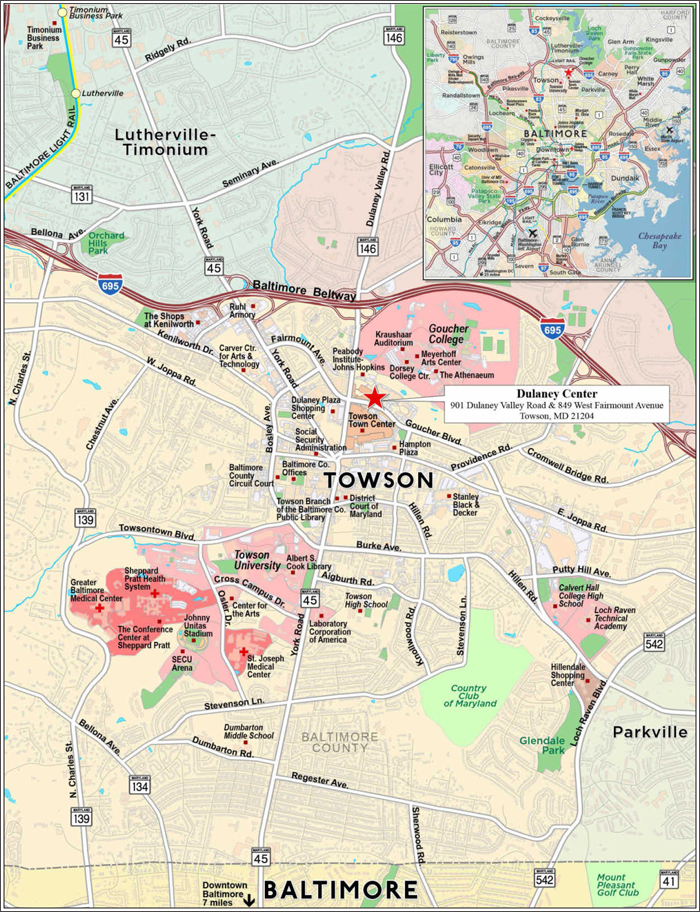
THE INFORMATION IN THIS STRUCTURAL AND COLLATERAL TERM SHEET IS NOT COMPLETE AND MAY BE AMENDED PRIOR TO THE TIME OF SALE. THIS TERM SHEET IS NOT AN OFFER TO SELL THESE SECURITIES AND IT IS NOT A SOLICITATION OF AN OFFER TO BUY THESE SECURITIES IN ANY JURISDICTION WHERE THE OFFER OR SALE IS NOT PERMITTED.
65
| No. 4 – Dulaney Center | ||||||
| Loan Information | Property Information | |||||
| Mortgage Loan Seller: | Barclays Bank PLC | Single Asset/Portfolio: | Single Asset | |||
| Credit Assessment (DBRS/Fitch/Moody’s): | NR/NR/NR | Property Type: | Office | |||
| Original Principal Balance: | $47,000,000 | Specific Property Type: | Suburban | |||
| Cut-off Date Balance: | $47,000,000 | Location: | Towson, MD | |||
| % of Initial Pool Balance: | 6.1% | Size: | 316,348 SF | |||
| Loan Purpose: | Acquisition | Cut-off Date Balance Per SF: | $148.57 | |||
| Borrower: | Dulaney Center Business Trust | Year Built/Renovated: | 1983/2016 | |||
| Borrower Sponsors: | Ten Capital Management and | Title Vesting: | Fee | |||
| Pembroke IV LLC | Property Manager: | CBRE, Inc. | ||||
| Mortgage Rate: | 4.7730% | 4thMost Recent Occupancy: | 89.5% (12/31/2014) | |||
| Note Date: | April 13, 2018 | 3rdMost Recent Occupancy: | 89.2% (12/31/2015) | |||
| Anticipated Repayment Date: | NAP | 2ndMost Recent Occupancy: | 85.8% (12/31/2016) | |||
| Maturity Date: | May 6, 2028 | Most Recent Occupancy: | 89.0% (12/31/2017) | |||
| IO Period: | 36 months | Current Occupancy: | 90.0% (3/28/2018) | |||
| Loan Term (Original): | 120 months | |||||
| Seasoning: | 0 months | Underwriting and Financial Information: | ||||
| Amortization Term (Original): | 360 months | |||||
| Loan Amortization Type: | Interest-only, Amortizing Balloon | 4thMost Recent NOI (As of): | $4,713,758 (12/31/2014) | |||
| Interest Accrual Method: | Actual/360 | 3rdMost Recent NOI (As of): | $4,658,539 (12/31/2015) | |||
| Call Protection: | L(24),D(91),O(5) | 2ndMost Recent NOI (As of): | $4,611,604 (12/31/2016) | |||
| Lockbox Type: | Hard/Springing Cash Management | Most Recent NOI (As of)(2): | $4,690,618 (12/31/2017) | |||
| Additional Debt: | None | |||||
| Additional Debt Type: | NAP | U/W Revenues: | $8,410,766 | |||
| U/W Expenses: | $3,152,549 | |||||
| Escrows and Reserves(1): | U/W NOI(2): | $5,258,218 | ||||
| U/W NCF: | $4,536,471 | |||||
| Type: | Initial | Monthly | Cap | U/W NOI DSCR: | 1.78x | |
| Taxes | $408,895 | $45,433 | NAP | U/W NCF DSCR: | 1.54x | |
| Insurance | $0 | Springing | NAP | U/W NOI Debt Yield: | 11.2% | |
| Replacement Reserves | $1,106,795 | $10,018 | NAP | U/W NCF Debt Yield: | 9.7% | |
| TI/LC Reserve | $534,008 | $39,544 | NAP | Appraised Value: | $67,300,000 | |
| Deferred Maintenance | $4,500 | NAP | NAP | Appraisal Valuation Date: | March 27, 2018 | |
| Tenant Specific TI/LC Reserves | $1,191,097 | NAP | NAP | Cut-off Date LTV Ratio: | 69.8% | |
| Tenant Specific Free Rent Reserves | $144,742 | NAP | NAP | LTV Ratio at Maturity: | 61.5% | |
| (1) | See “Escrows” section. |
| (2) | The increase from Most Recent NOI to U/W NOI is primarily attributable to eight tenants totaling 51,285 square feet signing new or renewal leases in 2018 and the inclusion of abated rent in historical financials. |
The Mortgage Loan.The mortgage loan (the “Dulaney Center Mortgage Loan”) is evidenced by a promissory note secured by a first mortgage encumbering the fee simple interest in two Class A office buildings totaling 316,348 square feet and a seven-story parking garage located in Towson, Maryland (the “Dulaney Center Property”). The Dulaney Center Mortgage Loan was originated on April 13, 2018 by Barclays Bank PLC. The Dulaney Center Mortgage Loan had an original principal balance of $47,000,000, has an outstanding principal balance as of the Cut-off Date of $47,000,000 and accrues interest at an interest rate of 4.7730% per annum. The Dulaney Center Mortgage Loan had an initial term of 120 months, has a remaining term of 120 months as of the Cut-off Date and requires payments of interest only until May 6, 2021, after which payments of interest and principal based on a 30-year amortization schedule are required through the term of the Dulaney Center Mortgage Loan. The Dulaney Center Mortgage Loan matures on May 6, 2028.
Following the lockout period, on any date before January 6, 2028, the borrower has the right to defease the Dulaney Center Mortgage Loan in whole, but not in part. The Dulaney Center Mortgage Loan is prepayable without penalty on or after January 6, 2028.
THE INFORMATION IN THIS STRUCTURAL AND COLLATERAL TERM SHEET IS NOT COMPLETE AND MAY BE AMENDED PRIOR TO THE TIME OF SALE. THIS TERM SHEET IS NOT AN OFFER TO SELL THESE SECURITIES AND IT IS NOT A SOLICITATION OF AN OFFER TO BUY THESE SECURITIES IN ANY JURISDICTION WHERE THE OFFER OR SALE IS NOT PERMITTED.
66
DULANEY CENTER
Sources and Uses
| Sources | Uses | |||||
| Original loan amount | $47,000,000 | 67.4% | Purchase price(1) | $65,410,145 | 93.8% | |
| Borrower sponsors’ new cash contribution | 22,710,343 | 32.6 | Reserves | 3,390,037 | 4.9 | |
| Closing costs | 910,161 | 1.3 | ||||
| Total Sources | $69,710,343 | 100.0% | Total Uses | $69,710,343 | 100.0% |
| (1) | Barclays Bank PLC provided a bridge loan to the seller of the Dulaney Center Property in December 2017 (the “Dulaney Center Bridge Loan”). The seller, Guardian Fund II – Dulaney LLC, is currently retaining a 21.3767% ownership interest in the borrower. The transfer of Guardian Fund II – Dulaney LLC’s remaining equity interest in the borrower is permitted upon the satisfaction of requirements set forth in the Dulaney Center Mortgage Loan documents. See “Description of the Mortgage Pool—Loan Purpose; Default History, Bankruptcy Issues and Other Proceedings” in the Preliminary Prospectus. |
The Property.The Dulaney Center Property consists of two Class A office buildings (Dulaney Center I and Dulaney Center II) totaling 316,348 square feet and a seven-story parking garage located in Towson, Maryland. Dulaney Center I is a five-story, Class A office building, was built in 1983 and consists of 133,502 square feet. Dulaney Center II is a nine-story, Class A office building, was built in 1987 and consists of 182,846 square feet. The Dulaney Center Property has undergone approximately $2.8 million worth of renovations since 2008, including new building lobbies in 2016, common area renovations, facade restoration, upgrades to energy management systems and electrical improvements. Immediately across the street from the Dulaney Center Property is the Towson Town Center, a 1.0 million square foot super-regional mall, which is connected to the Dulaney Center Property by a pedestrian walking bridge through the adjacent 248-room Sheraton Hotel. The Dulaney Center Property sits on a 6.1-acre site, which features a parking garage with a total of 1,558 spaces (approximately 4.9 per 1,000 square feet) and 23 additional onsite ground parking spaces. Pursuant to a Declaration of Easements, Covenants, Conditions and Restrictions, the neighboring Sheraton Hotel is entitled to the use of 400 parking spaces for guests and the use of 16 parking spaces as valet parking spaces. The Sheraton Hotel reimburses the borrower for 25.0% of the garage operating costs.
The Dulaney Center Property is leased to 28 tenants across a range of industries, including government, healthcare, legal, financial services, technology and engineering. The largest tenants at the Dulaney Center Property include Pessin Katz Law, P.A. (14.0% of U/W base rent), Roadnet Technologies (10.2% of U/W base rent), and GSA-Social Security Administration (7.3% of U/W base rent). No other tenant accounts for more than 6.8% of U/W base rent. Pessin Katz Law, P.A. has been a tenant at the Dulaney Center Property for approximately 24 years and recently extended its lease term through December 2028. According to the borrower sponsors, Pessin Katz Law, P.A. is the tenth largest law firm in the Baltimore region with over 60 lawyers, law clerks and paralegals. Roadnet Technologies is a worldwide provider of fleet management software tools and GPS tracking solutions for vehicles in a range of industries. Roadnet Technologies was formerly known as UPS Logistics Technologies Inc. and changed its name to Roadnet Technologies Inc. in 2011. Roadnet Technologies currently operates as a subsidiary of Omnitracs, LLC. GSA-Social Security Administration (Fitch/Moody’s/S&P: AAA/Aaa/AA+) utilizes its space at the Dulaney Center Property as a National Hearing Center for the Office of Disability Adjudication and Review, which is responsible for holding hearings, issuing decisions, and reviewing appeals as part of the Social Security Administration’s process for determining whether or not a person may receive benefits. As of March 28, 2018, the Dulaney Center Property was 90.0% occupied by 28 tenants.
THE INFORMATION IN THIS STRUCTURAL AND COLLATERAL TERM SHEET IS NOT COMPLETE AND MAY BE AMENDED PRIOR TO THE TIME OF SALE. THIS TERM SHEET IS NOT AN OFFER TO SELL THESE SECURITIES AND IT IS NOT A SOLICITATION OF AN OFFER TO BUY THESE SECURITIES IN ANY JURISDICTION WHERE THE OFFER OR SALE IS NOT PERMITTED.
67
DULANEY CENTER
The following table presents certain information relating to the tenancy at the Dulaney Center Property:
Major Tenants
| Tenant Name |
| Credit Rating (Fitch/Moody’s/ S&P)(1) | Tenant NRSF | % of NRSF | Annual U/W Base Rent PSF(2) | Annual U/W Base Rent(2) | % of Total Annual U/W Base Rent | Lease Expiration Date |
| Major Tenant | ||||||||
| Pessin Katz Law, P.A. | NR/NR/NR | 38,023 | 12.0% | $27.82 | $1,057,728 | 14.0% | 12/31/2028(3) | |
| Roadnet Technologies | NR/B2/B | 33,634 | 10.6% | $23.01(4) | $773,848(4) | 10.2% | 5/31/2020(4) | |
| GSA-Social Security Administration | AAA/Aaa/AA+ | 21,796 | 6.9% | $25.50 | $555,835 | 7.3% | 8/28/2023(5) | |
| IntegraMed America | NR/NR/NR | 18,773 | 5.9% | $27.87 | $523,262 | 6.9% | 11/30/2023(6) | |
| Lifebridge Health, Inc | NR/NR/NR | 16,397 | 5.2% | $24.16 | $396,152 | 5.2% | 3/31/2027(7) | |
| Merrill Lynch | A/A3/A- | 15,934 | 5.0% | $27.00 | $430,142 | 5.7% | 8/31/2023(8) | |
| Bank of America | A/A3/A- | 13,813 | 4.4% | $31.14 | $430,137 | 5.7% | 6/30/2021(9) | |
| Bohler Engineering, VA LLC | NR/NR/NR | 13,217 | 4.2% | $27.16 | $359,007 | 4.7% | 6/30/2023(10) | |
| Maxim Healthcare Services | NR/NR/NR | 13,202 | 4.2% | $27.66 | $365,195 | 4.8% | 12/31/2022(11) | |
| National Retina Institute | NR/NR/NR | 11,832 | 3.7% | $27.28 | $322,777 | 4.3% | 12/31/2027(12) | |
| Total Major Tenants | 196,621 | 62.2% | $26.52 | $5,214,081 | 68.8% | |||
| Non-Major Tenants | 88,004 | 27.8% | $26.84 | $2,362,049 | 31.2% | |||
| Occupied Collateral Total | 284,625 | 90.0% | $26.62 | $7,576,130 | 100.0% | |||
| Vacant Space | 31,723 | 10.0% | ||||||
| Collateral Total | 316,348 | 100.0% | ||||||
| (1) | Certain ratings are those of the parent company whether or not the parent guarantees the lease. |
| (2) | Annual U/W Base Rent PSF and Annual U/W Base Rent include contractual rent steps through April 2019. |
| (3) | Pessin Katz Law, P.A. has two, five-year lease renewal options. Pessin Katz Law, P.A. has a one-time contraction option, related to a 8,714 square foot portion of the space, effective December 31, 2025 with six months written notice. Pessin Katz Law, P.A. has abated rent for 8,714 square feet of space through June 2018, all of which was reserved for upfront. |
| (4) | According to the borrower sponsors, Roadnet Technologies is currently utilizing 75.0% of their space, primarily due to employees working in the field. Annual U/W Base Rent and Annual U/W Base Rent PSF assumes a 75.0% credit to their in-place rent of $943,743. Tenant NRSF is based on Roadnet Technologies’ fully leased space. Roadnet Technologies has one, five-year lease renewal option. |
| (5) | GSA-Social Security Administration may terminate the lease in whole or in part at any time after August 2018 with 90 days’ written notice. |
| (6) | IntegraMed America has two, five-year lease renewal options. |
| (7) | Lifebridge Health, Inc. has one, five-year lease renewal option. |
| (8) | Merrill Lynch has two, five-year lease renewal options. Merrill Lynch has a right to terminate its lease at any time with 12 months’ written notice. Merrill Lynch has two months of abated rent in 2018, all of which was reserved for upfront. |
| (9) | Bank of America has two, five-year lease renewal options. Bank of America has a one-time right to terminate effective as of March 31, 2019 with nine months’ written notice. |
| (10) | Bohler Engineering, VA LLC has one, five-year lease renewal option. |
| (11) | Maxim Healthcare Services has one, five-year lease renewal option. Maxim Healthcare Services has a one-time right to terminate effective as of December 2020 with 210 days’ written notice. |
| (12) | National Retina Institute has one, five-year lease renewal option. |
THE INFORMATION IN THIS STRUCTURAL AND COLLATERAL TERM SHEET IS NOT COMPLETE AND MAY BE AMENDED PRIOR TO THE TIME OF SALE. THIS TERM SHEET IS NOT AN OFFER TO SELL THESE SECURITIES AND IT IS NOT A SOLICITATION OF AN OFFER TO BUY THESE SECURITIES IN ANY JURISDICTION WHERE THE OFFER OR SALE IS NOT PERMITTED.
68
DULANEY CENTER
The following table presents certain information relating to the lease rollover schedule at the Dulaney Center Property:
Lease Expiration Schedule(1)(2)
| Year Ending December 31, | No. of Leases Expiring | Expiring NRSF | % of Total NRSF | Cumulative Expiring NRSF | Cumulative % of Total NRSF | Annual U/W Base Rent | % of Total Annual U/W Base Rent | Annual U/W Base Rent PSF(3) |
| MTM | 0 | 0 | 0.0% | 0 | 0.0% | $0 | 0.0% | $0.00 |
| 2018 | 2 | 1,144 | 0.4% | 1,144 | 0.4% | $32,458 | 0.4% | $28.37 |
| 2019 | 1 | 2,267 | 0.7% | 3,411 | 1.1% | $65,572 | 0.9% | $28.92 |
| 2020 | 1 | 33,634 | 10.6% | 37,045 | 11.7% | $773,848 | 10.2% | $23.01 |
| 2021 | 1 | 13,813 | 4.4% | 50,858 | 16.1% | $430,137 | 5.7% | $31.14 |
| 2022 | 5 | 38,060 | 12.0% | 88,918 | 28.1% | $1,038,721 | 13.7% | $27.29 |
| 2023 | 8 | 82,316 | 26.0% | 171,234 | 54.1% | $2,213,701 | 29.2% | $26.89 |
| 2024 | 4 | 29,103 | 9.2% | 200,337 | 63.3% | $783,803 | 10.3% | $26.93 |
| 2025 | 1 | 4,185 | 1.3% | 204,522 | 64.7% | $124,002 | 1.6% | $29.63 |
| 2026 | 0 | 0 | 0.0% | 204,522 | 64.7% | $0 | 0.0% | $0.00 |
| 2027 | 3 | 30,161 | 9.5% | 234,683 | 74.2% | $773,818 | 10.2% | $25.66 |
| 2028 | 2 | 48,825 | 15.4% | 283,508 | 89.6% | $1,340,071 | 17.7% | $27.45 |
| Thereafter(4) | 0 | 1,117 | 0.4% | 284,625 | 90.0% | $0 | 0.0% | $0.00 |
| Vacant | 0 | 31,723 | 10.0% | 316,348 | 100.0% | $0 | 0.0% | $0.00 |
| Total/Wtd. Average | 28 | 316,348 | 100.0% | $7,576,130 | 100.0% | $26.62 |
| (1) | Information obtained from the underwritten rent roll. |
| (2) | Certain tenants may have lease termination options that are exercisable prior to the originally stated expiration date of the subject lease and that are not considered in the Lease Expiration Schedule. |
| (3) | Weighted Average U/W Base Rent PSF excludes vacant space. |
| (4) | “Thereafter” represents an engineer’s office that has no attributable rent. |
The following table presents historical occupancy percentages at the Dulaney Center Property:
Historical Occupancy(1)
12/31/2014(2) | 12/31/2015(2) | 12/31/2016(2) | 12/31/2017(2) | 3/28/2018(3) |
| 89.5% | 89.2% | 85.8% | 89.0% | 90.0% |
| (1) | The Dulaney Center Property has been 90.3% occupied on average between 2007 and 2017. |
| (2) | Information obtained from the borrower. |
| (3) | Information obtained from the underwritten rent roll. |
THE INFORMATION IN THIS STRUCTURAL AND COLLATERAL TERM SHEET IS NOT COMPLETE AND MAY BE AMENDED PRIOR TO THE TIME OF SALE. THIS TERM SHEET IS NOT AN OFFER TO SELL THESE SECURITIES AND IT IS NOT A SOLICITATION OF AN OFFER TO BUY THESE SECURITIES IN ANY JURISDICTION WHERE THE OFFER OR SALE IS NOT PERMITTED.
69
DULANEY CENTER
Operating History and Underwritten Net Cash Flow. The following table presents certain information relating to the underwritten net cash flow at the Dulaney Center Property:
Cash Flow Analysis
| 2014 | 2015 | 2016 | 2017 | U/W | % of U/W Effective Gross Income | U/W $ per SF | |
| Base Rent(1) | $7,073,139 | $6,920,115 | $6,880,536 | $6,889,917 | $7,576,133 | 90.1% | $23.95 |
| Grossed Up Vacant Space | 0 | 0 | 0 | 0 | 847,350 | 10.1 | 2.68 |
| Total Reimbursables | 81,126 | 123,903 | 121,404 | 85,162 | 68,564 | 0.8 | 0.22 |
| Other Income(2) | 653,962 | 769,256 | 711,634 | 876,106 | 766,069 | 9.1 | 2.42 |
| Less Vacancy & Credit Loss | 0 | 0 | 0 | 0 | (847,350)(3) | (10.1) | (2.68) |
| Effective Gross Income | $7,808,227 | $7,813,274 | $7,713,574 | $7,851,185 | $8,410,766 | 100.0% | $26.59 |
| Total Operating Expenses | $3,094,469 | $3,154,735 | $3,101,970 | $3,160,567 | $3,152,549 | 37.5% | $9.97 |
| Net Operating Income | $4,713,758 | $4,658,539 | $4,611,604 | $4,690,618 | $5,258,218 | 62.5% | $16.62 |
| TI/LC | 0 | 0 | 0 | 0 | 601,534(4) | 7.2 | 1.90 |
| Capital Expenditures | 0 | 0 | 0 | 0 | 120,212 | 1.4 | 0.38 |
| Net Cash Flow | $4,713,758 | $4,658,539 | $4,611,604 | $4,690,618 | $4,536,471 | 53.9% | $14.34 |
| NOI DSCR | 1.60x | 1.58x | 1.56x | 1.59x | 1.78x | ||
| NCF DSCR | 1.60x | 1.58x | 1.56x | 1.59x | 1.54x | ||
| NOI DY | 10.0% | 9.9% | 9.8% | 10.0% | 11.2% | ||
| NCF DY | 10.0% | 9.9% | 9.8% | 10.0% | 9.7% |
| (1) | Historical Base Rent is net of abated rent. 2014 abated rent was $76,926, 2015 abated rent was $347,523, 2016 abated rent was $282,490 and 2017 abated rent was $429,226. U/W Base Rent includes contractual rent steps through April 2019. The increase from 2017 base rent to U/W base rent is primarily attributable to eight tenants totaling 80,594 square feet signing new or renewal leases in 2018 and the inclusion of abated rent in 2017. |
| (2) | Other Income consists primarily of parking income and storage income. Pursuant to a Declaration of Easements, Covenants, Conditions and Restrictions, the neighboring Sheraton Hotel is entitled to the use of 400 parking spaces for guests and the use of 16 parking space as valet parking spaces. The Sheraton Hotel reimburses the borrower for 25.0% of the garage operating costs. |
| (3) | The underwritten economic vacancy is 9.2%. The Dulaney Center Property was 90.0% leased as of March 28, 2018. |
| (4) | U/W TI/LC is inclusive of a TI/LC credit equivalent to one-tenth of the upfront TI/LC reserve of $534,008. |
Appraisal.As of the appraisal valuation date of March 27, 2018, the Dulaney Center Property had an “as-is” appraised value of $67,300,000.
Environmental Matters. According to a Phase I environmental site assessment dated April 5, 2018, there was no evidence of any recognized environmental conditions at the Dulaney Center Property.
Market Overview and Competition.The Dulaney Center Property is located in the community of Towson, Maryland, approximately two miles north of the Baltimore City line. The surrounding area in Towson is home to Goucher College, Towson University, the Country Club of Maryland and the Greater Baltimore Medical Center. Immediately across the street from the Dulaney Center Property is the Towson Town Center, a 1.0 million square foot super-regional mall anchored by Macy’s and Nordstrom’s with a current occupancy rate of over 95.0%. The Dulaney Center Property is in the Towson/Timonium submarket within the broader Metropolitan Baltimore Area office market. As of the fourth quarter of 2017, the Towson/Timonium office submarket had approximately 6.4 million square feet of office inventory, average asking rents of $22.22 per square foot and a vacancy rate of 10.6%. According to the appraisal, the 2017 estimated population within a one-, three- and five-mile radius of the Dulaney Center Property was 17,501, 108,590 and 291,745, respectively; while the 2017 estimated average household income within the same radii was $78,713, $97,885 and $93,064, respectively.
THE INFORMATION IN THIS STRUCTURAL AND COLLATERAL TERM SHEET IS NOT COMPLETE AND MAY BE AMENDED PRIOR TO THE TIME OF SALE. THIS TERM SHEET IS NOT AN OFFER TO SELL THESE SECURITIES AND IT IS NOT A SOLICITATION OF AN OFFER TO BUY THESE SECURITIES IN ANY JURISDICTION WHERE THE OFFER OR SALE IS NOT PERMITTED.
70
DULANEY CENTER
The following table presents certain information relating to comparable office leases for the Dulaney Center Property:
Comparable Leases(1)
| Property Name/Location | Year Built | Occupancy | Net Rentable Area | Base Rent (PSF) |
The Exchange / 1122 Kenilworth Drive Towson, MD | 1982 | 100% | 89,968 | $24.47 - $29.00 |
Creighton Center / 1400 Front Avenue Lutherville, MD | 1986 | 100% | 38,741 | $22.12 - $26.23 |
100 West / 100 West Road Towson, MD | 1988 | 100% | 120,234 | $24.99 - $25.00 |
Cromwell Center / 809 Gleneagles Court Towson, MD | 1981 | 98% | 60,000 | $22.50 - $23.29 |
Galleria Atrium / 1407 York Road Lutherville, MD | 1987 | 70% | 89,175 | $26.97 |
| (1) | Information obtained from the appraisal. |
The Borrower.The borrower for the Dulaney Center Mortgage Loan is Dulaney Center Business Trust, a Maryland business trust and a special purpose entity. The borrower’s sole trustee is a newly-formed special purpose entity with two independent directors. Legal counsel to the borrower delivered a non-consolidation opinion in connection with the origination of the Dulaney Center Mortgage Loan. John B. Vander Zwaag, Benjamin Adams, Richard C. Hamlin, Jeffrey J. Irmer, Pembroke IV LLC, TCM Dulaney LLC and TCM Dulaney GP LLC are the guarantors of certain nonrecourse carveouts under the Dulaney Center Mortgage Loan.
The Borrower Sponsors.The borrower sponsors are Ten Capital Management and Pembroke IV LLC. Ten Capital Management is a privately held real estate investment management company, which invests in a broad spectrum of real estate strategies. The firm currently manages capital on behalf of high net worth individuals and institutions, including family offices and registered investment advisors. Pembroke IV LLC was founded in 2007 and invests in commercial real estate, specifically where short to intermediate capital market inefficiencies create opportunities. John B. Vander Zwaag, the founder of Pembroke IV, has completed over $3.0 billion of transactions in the United States and Canada over his 30 years in real estate finance and investment. John B. Vander Zwaag has assembled and managed nationally focused acquisitions, asset management and investment banking teams for four separate organizations.
Escrows.The Dulaney Center Mortgage Loan documents provide for upfront reserves in the amount of $1,191,097 for outstanding tenant specific tenant improvements and leasing commission (“TI/LC”) obligations for seven specified tenants, $1,106,795 for replacement reserves (which funds may also be used by the borrower for certain specified lighting retrofit replacements and renovations), $534,008 for general TI/LCs, $408,895 for real estate taxes, $144,742 for outstanding free rent related to three tenants and $4,500 for deferred maintenance.
The Dulaney Center Mortgage Loan documents require monthly reserve deposits for (a) real estate taxes in an amount equal to one-twelfth of an amount which would be sufficient to pay the taxes payable during the next ensuing 12 months (initially $45,433); (b) TI/LCs in an amount equal to $39,544 and (c) replacement reserves in an amount equal to $10,018. The Dulaney Center Mortgage Loan documents do not require ongoing monthly escrows for insurance premiums as long as the borrower provides the lender with evidence that the Dulaney Center Property is insured via an acceptable blanket insurance policy and such policy is in full force and effect.
Lockbox and Cash Management.The Dulaney Center Mortgage Loan is structured with a hard lockbox and springing cash management. The borrower was required at origination of the Dulaney Center Bridge Loan to deliver letters to the tenants at the Dulaney Center Property directing them to pay all rents directly into a lender-controlled lockbox account, which was in place at the origination of the Dulaney Center Mortgage Loan. All other funds received by the borrower or manager are required to be deposited in the lockbox account within one business day following receipt. During the occurrence and continuance of a Triggering Event (as defined below), all funds are required to be swept each business day into the cash management account controlled by the lender and disbursed on each payment date in accordance with the Dulaney Center Mortgage Loan documents, with all excess cash flow to be deposited to an excess cash reserve to be held as additional security for the Dulaney Center Mortgage Loan.
A “Triggering Event” will commence upon the earlier of the following:
| (i) | the occurrence and continuance of an event of default or |
| (ii) | the net cash flow debt service coverage ratio being less than 1.20x. |
A “Triggering Event” will end:
| (a) | with regard to clause (i), upon the cure of such event of default and |
| (b) | with regard to clause (ii), upon the net cash flow debt service coverage ratio being equal to or greater than 1.25x for any two consecutive calendar quarters. |
THE INFORMATION IN THIS STRUCTURAL AND COLLATERAL TERM SHEET IS NOT COMPLETE AND MAY BE AMENDED PRIOR TO THE TIME OF SALE. THIS TERM SHEET IS NOT AN OFFER TO SELL THESE SECURITIES AND IT IS NOT A SOLICITATION OF AN OFFER TO BUY THESE SECURITIES IN ANY JURISDICTION WHERE THE OFFER OR SALE IS NOT PERMITTED.
71
DULANEY CENTER
Property Management.The Dulaney Center Property is managed by CBRE, Inc.
Assumption.The borrower has the one-time right to transfer the Dulaney Center Property, provided that certain conditions are satisfied, including: (i) no event of default has occurred and is continuing, (ii) the borrower has provided the lender with at least 60 days prior written notice, (iii) the proposed transferee qualifies as a qualified transferee under the Dulaney Center Mortgage Loan documents and (iv) the lender has received confirmation from DBRS, Fitch and Moody’s that such assumption will not result in a downgrade of the respective ratings assigned to the Series WFCM 2018-C44 certificates.
Real Estate Substitution.Not permitted.
Ground Lease.None.
Terrorism Insurance. The Dulaney Center Mortgage Loan documents require that the “all risk” insurance policies required to be maintained by the borrower provide coverage for terrorism in an amount equal to the full replacement cost of the Dulaney Center Property, or that if the Terrorism Risk Insurance Program Reauthorization Act is no longer in effect and such policies contain an exclusion for acts of terrorism, the borrower will obtain, to the extent available, a stand-alone policy that provides the same coverage as the policies would have if such exclusion did not exist.
THE INFORMATION IN THIS STRUCTURAL AND COLLATERAL TERM SHEET IS NOT COMPLETE AND MAY BE AMENDED PRIOR TO THE TIME OF SALE. THIS TERM SHEET IS NOT AN OFFER TO SELL THESE SECURITIES AND IT IS NOT A SOLICITATION OF AN OFFER TO BUY THESE SECURITIES IN ANY JURISDICTION WHERE THE OFFER OR SALE IS NOT PERMITTED.
72
(THIS PAGE INTENTIONALLY LEFT BLANK)
THE INFORMATION IN THIS STRUCTURAL AND COLLATERAL TERM SHEET IS NOT COMPLETE AND MAY BE AMENDED PRIOR TO THE TIME OF SALE. THIS TERM SHEET IS NOT AN OFFER TO SELL THESE SECURITIES AND IT IS NOT A SOLICITATION OF AN OFFER TO BUY THESE SECURITIES IN ANY JURISDICTION WHERE THE OFFER OR SALE IS NOT PERMITTED.
73
NORTHWEST HOTEL PORTFOLIO
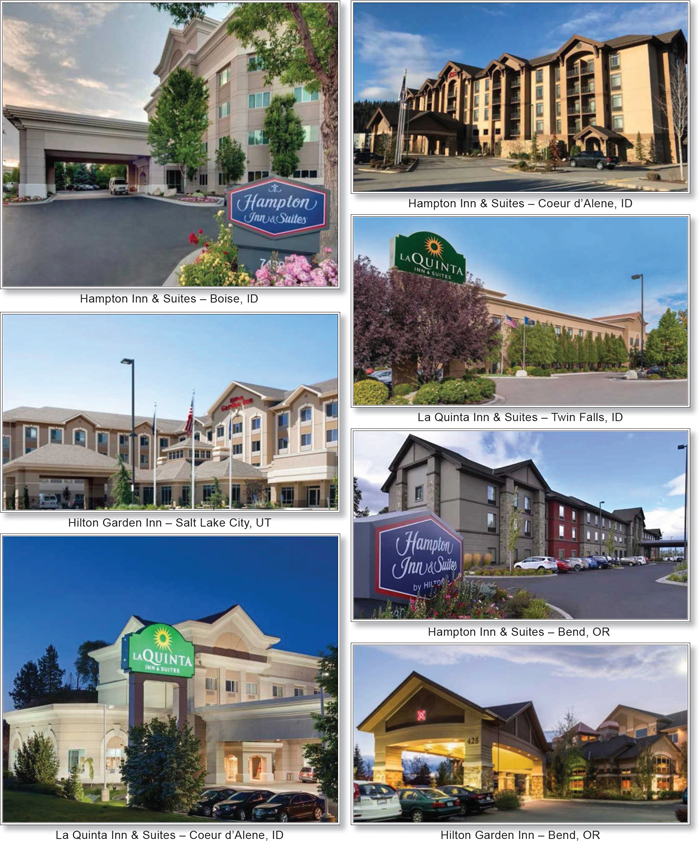
THE INFORMATION IN THIS STRUCTURAL AND COLLATERAL TERM SHEET IS NOT COMPLETE AND MAY BE AMENDED PRIOR TO THE TIME OF SALE. THIS TERM SHEET IS NOT AN OFFER TO SELL THESE SECURITIES AND IT IS NOT A SOLICITATION OF AN OFFER TO BUY THESE SECURITIES IN ANY JURISDICTION WHERE THE OFFER OR SALE IS NOT PERMITTED.
74
NORTHWEST HOTEL PORTFOLIO
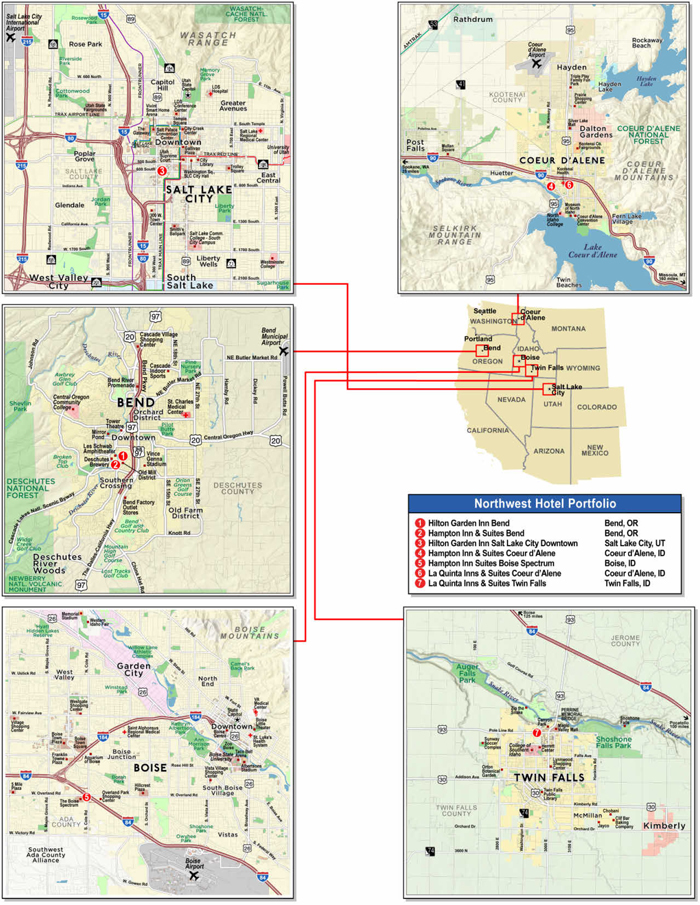
THE INFORMATION IN THIS STRUCTURAL AND COLLATERAL TERM SHEET IS NOT COMPLETE AND MAY BE AMENDED PRIOR TO THE TIME OF SALE. THIS TERM SHEET IS NOT AN OFFER TO SELL THESE SECURITIES AND IT IS NOT A SOLICITATION OF AN OFFER TO BUY THESE SECURITIES IN ANY JURISDICTION WHERE THE OFFER OR SALE IS NOT PERMITTED.
75
| No. 5 – Northwest Hotel Portfolio | |||||||
| Loan Information | Property Information | ||||||
| Mortgage Loan Seller: | Wells Fargo Bank, National Association | Single Asset/Portfolio: | Portfolio | ||||
Credit Assessment (DBRS/Fitch/Moody’s): | NR/NR/NR | Property Type: | Hospitality | ||||
| Original Principal Balance(1): | $39,900,000 | Specific Property Type: | Limited Service | ||||
| Cut-off Date Balance(1): | $39,833,178 | Location: | Various | ||||
| % of Initial Pool Balance: | 5.2% | Size: | 818 Rooms | ||||
| Loan Purpose: | Acquisition | Cut-off Date Balance Per Room(1): | $138,179 | ||||
| Borrower Names: | 600 South Salt Lake City Hotel, LLC; Bluff Bend Hotel, LLC; Columbia Bend Hotel, LLC; Ironwood Coeur d’Alene Hotel, LLC; Overland Boise Hotel, LLC; Pole Line Twin Falls Hotel, LLC; Riverstone Coeur d’Alene Hotel, LLC | Year Built/Renovated: | Various/Various | ||||
| Borrower Sponsors: | Jason R. Kotter; Ryan N. Van Alfen | Title Vesting: | Fee | ||||
| Mortgage Rate: | 5.0180% | Property Manager(4): | Self-managed | ||||
| Note Date: | March 22, 2018 | 4thMost Recent Occupancy (As of): | 65.6% (12/31/2014) | ||||
| Anticipated Repayment Date: | NAP | 3rdMost Recent Occupancy (As of): | 77.6% (12/31/2015) | ||||
| Maturity Date: | April 11, 2028 | 2ndMost Recent Occupancy (As of): | 80.5% (12/31/2016) | ||||
| IO Period: | 0 months | Most Recent Occupancy (As of): | 79.4% (12/31/2017) | ||||
| Loan Term (Original): | 120 months | ||||||
| Seasoning: | 1 month | ||||||
| Amortization Term (Original): | 300 months | Underwriting and Financial Information: | |||||
| Loan Amortization Type: | Amortizing Balloon | 4thMost Recent NOI (As of)(5): | $9,599,553 (12/31/2014) | ||||
| Interest Accrual Method: | Actual/360 | 3rdMost Recent NOI (As of)(5)(6): | $13,721,067 (12/31/2015) | ||||
| Call Protection(2): | L(25),D(91),O(4) | 2ndMost Recent NOI (As of)(6): | $15,834,792 (12/31/2016) | ||||
| Lockbox Type: | Hard/Springing Cash Management | Most Recent NOI (As of): | $15,647,504 (12/31/2017) | ||||
| Additional Debt(1): | Yes | U/W Revenues: | $35,830,406 | ||||
| Additional Debt Type(1): | Pari Passu | U/W Expenses: | $20,267,527 | ||||
| U/W NOI: | $15,562,879 | ||||||
| U/W NCF: | $14,129,663 | ||||||
| Escrows and Reserves(3): | U/W NOI DSCR(1): | 1.96x | |||||
| U/W NCF DSCR(1): | 1.78x | ||||||
| Type: | Initial | Monthly | Cap (If Any) | U/W NOI Debt Yield(1): | 13.8% | ||
| Taxes | $518,257 | $94,555 | NAP | U/W NCF Debt Yield(1): | 12.5% | ||
| Insurance | $46,636 | $15,546 | NAP | As-Is Appraised Value(7): | $173,500,000 | ||
| FF&E Reserve | $0 | $119,435 | NAP | As-Is Appraisal Valuation Date(7): | Various | ||
| Seasonality | $163,000 | (3) | NAP | Cut-off Date LTV Ratio(1)(7): | 65.1% | ||
| PIP Reserve | $14,116,206 | $0 | NAP | LTV Ratio at Maturity or ARD(1)(7): | 48.8% | ||
| (1) | The Northwest Hotel Portfolio Mortgage Loan (as defined below) is part of the Northwest Hotel Portfolio Whole Loan (as defined below), which comprises three pari passu notes with an aggregate original principal balance of $113,220,258. The Cut-off Date Balance per Room, Maturity Date Balance per Room, UW NOI Debt Yield, UW NOI Debt Yield at Maturity, UW NCF DSCR, Cut-off Date LTV Ratio and Maturity Date LTV Ratio numbers presented are based on the Northwest Hotel Portfolio Whole Loan. |
| (2) | Defeasance of the Northwest Hotel Portfolio Whole Loan is permitted at any time after the earlier of (i) May 11, 2022 and (ii) two years from the closing date of the securitization that includes the last pari passu note of the Northwest Hotel Portfolio Whole Loan to be securitized. The assumed lockout period of 25 payments is based on the closing date of this transaction in May 2018. |
| (3) | See “Escrows” section for further discussion of reserve requirements. |
| (4) | See “Property Management” section below. |
| (5) | The increase in Rooms Revenue and Net Operating Income from 2014 to 2015 was due to Hampton Inn & Suites Bend not opening until September 2014. In addition, La Quinta Inns & Suites Coeur d’Alene was rebranded from an Ameritel Inn in May 2014 (see “Operating History and Underwritten Net Cash Flow” section). |
| (6) | The increase in NOI from 2015 to 2016 was due to an increase in Occupancy and ADR (see “Operating History and Underwritten Net Cash Flow” section). |
| (7) | The Appraised Value and LTVs shown are based on the “as-is” appraised value (as of October 1, 2017) for two of the Northwest Hotel Portfolio Properties (as defined below) and the “when complete” appraised value (as of October 1, 2018) for five of the Northwest Hotel Portfolio Properties, which assumes certain outstanding PIP work has been completed (see “The Properties” section). The related PIP work was reserved for upon the origination of the Northwest Hotel Portfolio Whole Loan (see “Escrows” section). Based on the “as-is” appraised value for all of the Northwest Hotel Portfolio Properties of $155,700,000 (as of October 1, 2017), the Cut-off Date LTV Ratio and Maturity Date LTV Ratio are approximately 72.6% and 54.4%, respectively. |
The Mortgage Loan. The mortgage loan (the “Northwest Hotel Portfolio Mortgage Loan”) is part of a whole loan (the “Northwest Hotel Portfolio Whole Loan”) evidenced by threepari passu notes secured by a first mortgage encumbering the fee interest in an portfolio of seven limited-service hospitality properties located in Idaho, Utah and Oregon (the “Northwest Hotel Portfolio Properties”). The Northwest Hotel Portfolio Whole Loan was originated on March 22, 2018 by Wells Fargo Bank, National Association. The Northwest Hotel Portfolio Whole Loan had an original principal balance of $113,220,258, has an outstanding principal balance as of the Cut-off Date of $113,030,645 and accrues interest at an interest rate of 5.0180%per annum. The Northwest Hotel Portfolio
THE INFORMATION IN THIS STRUCTURAL AND COLLATERAL TERM SHEET IS NOT COMPLETE AND MAY BE AMENDED PRIOR TO THE TIME OF SALE. THIS TERM SHEET IS NOT AN OFFER TO SELL THESE SECURITIES AND IT IS NOT A SOLICITATION OF AN OFFER TO BUY THESE SECURITIES IN ANY JURISDICTION WHERE THE OFFER OR SALE IS NOT PERMITTED.
76
NORTHWEST HOTEL PORTFOLIO
Whole Loan had an initial term of 120 months, has a remaining term of 119 months as of the Cut-off Date and requires payments of principal and interest based on a 25-year amortization schedule. The Northwest Hotel Portfolio Whole Loan matures on April 11, 2028.
Note A-1, which will be contributed to the WFCM 2018-C44 securitization trust, had an original principal balance of $39,900,000 and has an outstanding principal balance as of the Cut-off Date of $39,833,178. The non-controlling Note A-2 had an original principal balance of $40,326,936, had an outstanding principal balance as of the Cut-off Date of $40,261,900, and is expected to be contributed to the BANK 2018-BNK11 Trust. The non-controlling Note A-3 had an original principal balance of $32,993,322, had an outstanding principal balance as of the Cut-off Date of $32,897,619, and is currently held by Wells Fargo Bank, National Association and is expected to be contributed to a future securitization trust. The mortgage loans evidenced by Notes A-2 and A-3 are collectively referred to herein as the “Northwest Hotel Portfolio Companion Loans”. The Northwest Hotel Portfolio Whole Loan is expected to be initially serviced pursuant to the pooling and servicing agreement for the BANK 2018-BNK11 securitization trust, and from and after the securitization of the controlling Note A-1, will be serviced pursuant to the pooling and servicing agreement for the WFCM 2018-C44 securitization trust. The lender provides no assurances that any non-securitizedpari passu notes will not be split further. See “Description of the Mortgage Pool—The Whole Loans—The Serviced Whole Loans” and “Pooling and Servicing Agreement” in the Preliminary Prospectus.
Note Summary
| Notes | Original Balance | Note Holder | Controlling Interest | |
| A-1 | $39,900,000 | WFCM 2018-C44 | Yes | |
| A-2 | $40,326,936 | BANK 2018-BNK11(1) | No | |
| A-3 | $32,993,322 | Wells Fargo Bank, National Association | No | |
| Total | $113,220,258 |
| (1) | The BANK 2018-BNK11 transaction is expected to close on April 26, 2018. |
Following the lockout period, on any date before January 11, 2028, the borrower has the right to defease the Northwest Hotel Portfolio Whole Loan in whole or in part (see “Partial Release” section). In addition, the Northwest Hotel Portfolio Whole Loan is prepayable without penalty on or after January 11, 2028. The lockout period will expire on the earlier to occur of (i) two years after the closing date of the securitization that includes the last note to be securitized and (ii) May 11, 2022.
Sources and Uses
| Sources | Uses | |||||||
| Loan amount | $113,220,258 | 68.3% | Purchase price | $146,852,823 | 88.6% | |||
| Borrower’s equity: | 52,507,853 | 31.7 | Upfront reserves | 14,844,099 | 9.0 | |||
| Closing costs | 4,031,189 | 2.4 | ||||||
| Total Sources | $165,728,111 | 100.0% | Total Uses | $165,728,111 | 100.0% | |||
The Properties.The Northwest Hotel Portfolio Properties comprise seven limited-service hotels built between 1997 and 2014 totaling 818 rooms that, as of December 31, 2017, reported a weighted average occupancy rate of 79.4% with individual hotel occupancies ranging from 67.3% to 85.4%. The Northwest Hotel Portfolio Borrower is required to complete a property improvement plan (“PIP”) at each of the Northwest Hotel Portfolio Properties at a total estimated cost of $14,905,802 ($18,222 per room). At origination of the Northwest Hotel Portfolio Whole Loan, $14,116,206 was reserved for planned PIP renovations, which represents 110% of the total estimated cost at six of the Northwest Hotel Portfolio Properties, plus a portion of the estimated cost at the Hilton Garden Inn Salt Lake City Downtown property, where a portion of the planned PIP work has already been completed and certain FF&E and soft goods related to the PIP have already been purchased at origination. Each of the Northwest Hotel Portfolio Properties has a franchise agreement extending at least 15 years from the origination date of the Northwest Hotel Portfolio Whole Loan. If any of the franchise agreements terminates, or upon notice to terminate by either the franchisor or franchisee, the Northwest Hotel Portfolio Whole Loan will spring full recourse to the guarantors in the amount of 125% of the allocated loan amount of the applicable property or properties until such time as the Northwest Hotel Portfolio Borrower enters into a replacement franchise agreement satisfactory to the lender.
THE INFORMATION IN THIS STRUCTURAL AND COLLATERAL TERM SHEET IS NOT COMPLETE AND MAY BE AMENDED PRIOR TO THE TIME OF SALE. THIS TERM SHEET IS NOT AN OFFER TO SELL THESE SECURITIES AND IT IS NOT A SOLICITATION OF AN OFFER TO BUY THESE SECURITIES IN ANY JURISDICTION WHERE THE OFFER OR SALE IS NOT PERMITTED.
77
NORTHWEST HOTEL PORTFOLIO
The following table presents certain information relating to the Northwest Hotel Portfolio Properties:
| Property Name – Location | Allocated Cut-off Date Balance(1) | % of Portfolio Cut-off Date Balance | Occupancy (as of 12/31/2017) | Year Built/ Renovated | No. of Rooms | Appraised Value | UW Net Cash Flow | Allocated Cut-off Date LTV |
| Hilton Garden Inn Bend – Bend, OR | $19,804,793 | 17.5% | 85.4% | 2004/2012 | 96 | $30,400,000(2) | $2,387,736 | 65.1% |
| Hampton Inn & Suites Bend – Bend, OR | $19,674,498 | 17.4% | 80.0% | 2014/NAP | 114 | $30,200,000 | $2,367,646 | 65.1% |
| Hilton Garden Inn Salt Lake City Downtown – Salt Lake City, UT | $19,023,025 | 16.8% | 81.9% | 2006/NAP | 132 | $29,200,000(3) | $2,373,620 | 65.1% |
| Hampton Inn & Suites Coeur d’Alene – Coeur d’Alene, ID | $18,892,730 | 16.7% | 80.2% | 2007/NAP | 124 | $29,000,000(4) | $2,343,628 | 65.1% |
| Hampton Inn & Suites Boise Spectrum – Boise, ID | $18,045,815 | 16.0% | 80.7% | 1998/2011 | 133 | $27,700,000(5) | $2,125,491 | 65.1% |
| La Quinta Inns & Suites Coeur d’Alene –Coeur d’Alene, ID | $9,120,630 | 8.1% | 67.3% | 1997/2014 | 118 | $14,000,000 | $1,397,480 | 65.1% |
| La Quinta Inns & Suites Twin Falls – Twin Falls, ID | $8,469,155 | 7.5% | 77.0% | 2008/NAP | 101 | $13,000,000(6) | $1,134,062 | 65.1% |
| Total/Weighted Average | $113,030,645 | 100.0% | 79.4% | 818 | $173,500,000(7) | $14,129,663 | 65.1% |
| (1) | Balances shown are for the Northwest Hotel Portfolio Whole Loan. |
| (2) | The appraised value shown is the “when complete” market value conclusion as of October 1, 2018. The “as is” market value as of October 1, 2017 is $27,700,000. |
| (3) | The appraised value shown is the “when complete” market value conclusion as of October 1, 2018. The “as is” market value as of October 1, 2017 is $24,700,000. |
| (4) | The appraised value shown is the “when complete” market value conclusion as of October 1, 2018. The “as is” market value as of October 1, 2017 is $24,900,000. |
| (5) | The appraised value shown is the “when complete” market value conclusion as of October 1, 2018. The “as is” market value as of October 1, 2017 is $23,400,000. |
| (6) | The appraised value shown is the “when complete” market value conclusion as of October 1, 2018. The “as is” market value as of October 1, 2017 is $10,800,000. |
| (7) | The total appraised value shown comprises the “when complete” market value conclusion as of October 1, 2018, where footnoted above. The total “as is” market value as of October 1, 2017 is $155,700,000. |
Hilton Garden Inn Bend
The Hilton Garden Inn Bend property is a 96-room, three-story, limited-service hotel located in Bend, Oregon. The Hilton Garden Inn Bend property is situated on a 2.3-acre parcel and contains 94 surface parking spaces, resulting in a parking ratio of approximately 1.0 space per room. The Hilton Garden Inn Bend property opened in 2004 as an Ameritel Inn and was renovated and rebranded as a Hilton Garden Inn in 2012. The hotel features the Garden Grill & Bar, adjacent to the lobby, where breakfast and dinner are served daily. The Northwest Hotel Portfolio Borrower is required to complete a PIP at the Hilton Garden Inn Bend property at an estimated cost of $1,936,652 ($20,173 per room), for which $2,130,317 was reserved at origination of the Northwest Hotel Portfolio Whole Loan. Planned PIP work includes upgrades to the guest bedrooms, guest bathrooms, pantry, business center, front desk, public restrooms, pool area and the parking lot. PIP work is required to be completed within 24 months of loan origination. The franchise agreement with Hilton Franchise Holding LLC (“Hilton Franchisor”) expires on March 31, 2033. The appraisal identified one proposed 120-room limited service hotel (the Best Western Premier) that is anticipated to open in October 2018 and is expected to compete directly with the Hilton Garden Inn Bend property.
The Hilton Garden Inn Bend property guestroom configuration includes 49 king rooms, 30 double-queen rooms and 17 suites. Amenities include a fitness center, business center, indoor swimming pool and whirlpool, market pantry, guest laundry area and a casual restaurant and lounge. The Hilton Garden Inn Bend property also provides two divisible meeting rooms, totaling 2,040 square feet, on the first floor.
Hampton Inn & Suites Bend
The Hampton Inn & Suites Bend property is a 114-room, three-story, limited-service hotel located in Bend, Oregon. The Hampton Inn & Suites Bend property is situated on a 3.0-acre parcel and contains 114 surface parking spaces, resulting in a parking ratio of approximately 1.0 space per room. The Hampton Inn & Suites Bend property opened in 2014. The Northwest Hotel Portfolio Borrower is required to complete a PIP at the Hampton Inn & Suites Bend property at an estimated cost of $50,000 ($439 per room), for which $55,000 was reserved at origination of the Northwest Hotel Portfolio Whole Loan. Planned PIP work includes upgrades to guestrooms, corridors and public restrooms. PIP work is required to be completed within 12 months of loan origination. The franchise agreement with Hilton Franchisor expires on August 31, 2034.
The Hampton Inn & Suites Bend property guestroom configuration includes 24 king rooms, 64 double-queen rooms and 26 suites. Amenities include a fitness center, business center, indoor swimming pool and whirlpool, market pantry, guest laundry area and complimentary hot breakfast. The Hampton Inn & Suites Bend property also provides one divisible meeting room, totaling 2,263 square feet, on the first floor.
THE INFORMATION IN THIS STRUCTURAL AND COLLATERAL TERM SHEET IS NOT COMPLETE AND MAY BE AMENDED PRIOR TO THE TIME OF SALE. THIS TERM SHEET IS NOT AN OFFER TO SELL THESE SECURITIES AND IT IS NOT A SOLICITATION OF AN OFFER TO BUY THESE SECURITIES IN ANY JURISDICTION WHERE THE OFFER OR SALE IS NOT PERMITTED.
78
NORTHWEST HOTEL PORTFOLIO
Hilton Garden Inn Salt Lake City Downtown
The Hilton Garden Inn Salt Lake City Downtown property is a 132-room, four-story, limited-service hotel located in Salt Lake City, Utah. The Hilton Garden Inn Salt Lake City Downtown property is situated on a 2.3-acre parcel and contains 91 surface parking spaces, resulting in a parking ratio of approximately 0.7 spaces per room. The Hilton Garden Inn Salt Lake City Downtown property opened in 2006. The hotel features the Garden Grill restaurant, adjacent to the lobby, where breakfast and dinner are served daily. The Northwest Hotel Portfolio Borrower is required to complete a PIP at the Hilton Garden Inn Salt Lake City Downtown property at an estimated cost of $3,756,579 ($28,459 per room), for which $1,852,061 was reserved at origination of the Northwest Hotel Portfolio Whole Loan (a portion of the PIP work has already been completed and FF&E and soft goods related to the PIP were already purchased at loan origination). Planned PIP work includes upgrades to the guest bedrooms, guest bathrooms, lobby, public restrooms, exercise room, restaurant and landscaping. PIP work is required to be completed within 12 months of loan origination. The franchise agreement with Hilton Franchisor expires on March 31, 2033.
The Hilton Garden Inn Salt Lake City Downtown property guestroom configuration includes 64 king rooms, 58 double-queen rooms and ten suites. Amenities include a fitness room, business center, indoor swimming pool and whirlpool, market pantry, guest laundry area and casual restaurant. The Hilton Garden Inn Salt Lake City Downtown property also provides one meeting room and one boardroom, totaling 3,255 square feet, on the first floor.
Hampton Inn & Suites Coeur d’Alene
The Hampton Inn & Suites Coeur d’Alene property is a 124-room, five-story, limited-service hotel located in Coeur d’Alene, Idaho. The Hampton Inn & Suites Coeur d’Alene property is situated on a 3.1-acre parcel and contains 154 surface parking spaces, resulting in a parking ratio of approximately 1.2 spaces per room. The Hampton Inn & Suites Coeur d’Alene property opened in 2007. The Northwest Hotel Portfolio Borrower is required to complete a PIP at the Hampton Inn & Suites Coeur d’Alene property at an estimated cost of $3,343,050 ($26,960 per room), for which $3,677,355 was reserved at origination of the Northwest Hotel Portfolio Whole Loan. Planned PIP work includes upgrades to the guest bedrooms, guest bathrooms, breakfast area, guest laundry, meeting rooms, exercise room and the parking lot. PIP work is required to be completed within 36 months of loan origination. The franchise agreement with Hilton Franchisor expires on March 31, 2033.
The Hampton Inn & Suites Coeur d’Alene property guestroom configuration includes 38 king rooms, 49 double-queen rooms and 37 suites. Amenities include a fitness room, business center, indoor swimming pool and whirlpool, market pantry, guest laundry area and complimentary hot breakfast. The Hampton Inn & Suites Coeur d’Alene property also provides one meeting room and one boardroom, totaling 3,424 square feet, on the first floor.
Hampton Inn & Suites Boise Spectrum
The Hampton Inn & Suites Boise Spectrum property is a 133-room, four-story, limited-service hotel located in Boise, Idaho. The Hampton Inn & Suites Boise Spectrum property is situated on a 2.9-acre parcel and contains 125 surface parking spaces, resulting in a parking ratio of approximately 0.9 spaces per room. The Hampton Inn & Suites Boise Spectrum property opened in 1998 and was renovated and rebranded to a Hampton Inn & Suites in 2011. The Northwest Hotel Portfolio Borrower is required to complete a PIP at the Hampton Inn & Suites Boise Spectrum property at an estimated cost of $3,754,121 ($28,226 per room), for which $4,129,533 was reserved at origination of the Northwest Hotel Portfolio Whole Loan. Planned PIP work includes upgrades to the guest bedrooms, guest bathrooms, front desk, breakfast area, corridors, exercise room and the building exterior. PIP work is required to be completed within 24 months of loan origination. The franchise agreement with Hilton Franchisor expires on March 31, 2033.
The Hampton Inn & Suites Boise Spectrum property guestroom configuration includes 49 king rooms, 55 double-queen rooms and 29 suites. Amenities include a fitness room, business center, indoor swimming pool and whirlpool, market pantry, guest laundry area, airport shuttle and complimentary hot breakfast. The Hampton Inn & Suites Boise Spectrum property also provides three meeting rooms, totaling 3,480 square feet, on the first floor.
La Quinta Inns & Suites Coeur d’Alene
The La Quinta Inns & Suites Coeur d’Alene property is a 118-room, four-story, limited-service hotel located in Coeur d’Alene, Idaho. La Quinta Inns & Suites Coeur d’Alene property is situated on a 2.1-acre parcel and contains 120 surface parking spaces, resulting in a parking ratio of approximately 1.0 space per room. The La Quinta Inns & Suites Coeur d’Alene property opened in 1997 as an Ameritel Inn and was renovated and rebranded to a La Quinta Inns & Suites in 2014. The Northwest Hotel Portfolio Borrower is required to complete a PIP at the La Quinta Inns & Suites Coeur d’Alene property at an estimated cost of $315,400 ($2,673 per room), for which $346,940 was reserved at origination of the Northwest Hotel Portfolio Whole Loan. Planned PIP work includes upgrades to the guest bedrooms, guest bathrooms, lobby, board room, pool area and fitness center. The franchise agreement with La Quinta Franchising LLC (“La Quinta Franchisor”) expires in March 2038. The franchisor and franchisee each have the right to terminate the franchise agreement on the 5th, 10th and 15th anniversary of the effective date (March 2018) with 12 months’ notice.
The La Quinta Inns & Suites Coeur d’Alene property guestroom configuration includes 62 king rooms, 44 double-queen rooms and 12 suites. Amenities include a fitness room, indoor swimming pool and whirlpool, guest laundry area and complimentary hot breakfast. The La Quinta Inns & Suites Coeur d’Alene property also provides one divisible meeting room, totaling 1,500 square feet, on the first floor.
THE INFORMATION IN THIS STRUCTURAL AND COLLATERAL TERM SHEET IS NOT COMPLETE AND MAY BE AMENDED PRIOR TO THE TIME OF SALE. THIS TERM SHEET IS NOT AN OFFER TO SELL THESE SECURITIES AND IT IS NOT A SOLICITATION OF AN OFFER TO BUY THESE SECURITIES IN ANY JURISDICTION WHERE THE OFFER OR SALE IS NOT PERMITTED.
79
| Northwest Hotel Portfolio |
La Quinta Inns & Suites Twin Falls
The La Quinta Inns & Suites Twin Falls property is a 101-room, three-story limited-service hotel located in Twin Falls, Idaho. The La Quinta Inns & Suites Twin Falls property is situated on a 2.9-acre parcel and contains 121 surface parking spaces, resulting in a parking ratio of approximately 1.2 spaces per room. The La Quinta Inns & Suites Twin Falls property opened in 2008 as an Ameritel Inn and was rebranded to a La Quinta Inns & Suites in 2010. The Northwest Hotel Portfolio Borrower is required to complete a PIP at the La Quinta Inns & Suites Twin Falls property at an estimated cost of $1,750,000 ($17,327 per room), for which $1,925,000 was reserved at origination of the Northwest Hotel Portfolio Whole Loan. Planned PIP work includes upgrades to the lobby, breakfast area, business center, stairways, guest bedrooms, guest bathrooms and landscaping. The franchise agreement with La Quinta Franchisor expires in March 2038. The franchisor and franchisee each have the right to terminate the franchise agreement on the 5th, 10th and 15th anniversary of the effective date (March 2018) with 12 months’ notice.
The La Quinta Inns & Suites Twin Falls property guestroom configuration includes 54 king rooms, 39 double-queen rooms and 8 suites. Amenities include a fitness room, business center, indoor swimming pool and whirlpool, market pantry, guest laundry area and complimentary breakfast. The La Quinta Inns & Suites Twin Falls property also provides two meeting rooms, totaling 2,706 square feet, on the first floor.
2017 Accommodated Room Night Demand(1)
Property | Commercial/ | Meeting/Group | Leisure | ||||||
| Hilton Garden Inn Bend | 50% | 20% | 30% | ||||||
| Hampton Inn & Suites Bend | 55% | 10% | 35% | ||||||
| Hilton Garden Inn Salt Lake City Downtown | 60% | 25% | 15% | ||||||
| Hampton Inn & Suites Coeur d’Alene | 30% | 10% | 60% | ||||||
| Hampton Inn & Suites Boise Spectrum | 65% | 15% | 20% | ||||||
| La Quinta Inns & Suites Coeur d’Alene | 35% | 15% | 50% | ||||||
| La Quinta Inns & Suites Twin Falls | 65% | 15% | 20% | ||||||
| (1) | Information obtained from the appraisals. |
The following table presents historical occupancy, ADR RevPAR and penetration rates at the Northwest Hotel Portfolio Properties:
Historical Occupancy, ADR and RevPAR(1)
2015 | 2016 | 2017 | |||||||
Property | Occupancy | ADR | RevPAR | Occupancy | ADR | RevPAR | Occupancy | ADR | RevPAR |
| Hilton Garden Inn Bend | 85.9% | $162.17 | $139.24 | 88.7% | $176.25 | $156.30 | 85.5% | $180.15 | $153.95 |
| Hampton Inn & Suites Bend | 78.4% | $138.39 | $108.44 | 84.5% | $155.25 | $131.21 | 79.8% | $163.00 | $130.03 |
| Hilton Garden Inn Salt Lake City | 81.0% | $143.98 | $116.61 | 81.0% | $144.63 | $117.08 | 81.7% | $148.82 | $121.61 |
| Hampton Inn & Suites Coeur d’Alene | 74.0% | $140.25 | $103.76 | 79.7% | $141.16 | $112.50 | 80.3% | $144.18 | $115.83 |
| Hampton Inn & Suites Boise | 82.9% | $121.71 | $100.96 | 83.9% | $131.51 | $110.36 | 80.9% | $136.30 | $110.23 |
| La Quinta Inns & Suites Coeur d’Alene | 62.7% | $116.88 | $73.27 | 63.8% | $119.40 | $76.13 | 68.2% | $123.11 | $83.93 |
| La Quinta Inns & Suites Twin Falls | 77.9% | $100.11 | $78.00 | 80.6% | $108.66 | $87.54 | 78.6% | $111.13 | $87.32 |
| (1) | Information obtained from third party hospitality research reports dated January 18, 2018. |
THE INFORMATION IN THIS STRUCTURAL AND COLLATERAL TERM SHEET IS NOT COMPLETE AND MAY BE AMENDED PRIOR TO THE TIME OF SALE. THIS TERM SHEET IS NOT AN OFFER TO SELL THESE SECURITIES AND IT IS NOT A SOLICITATION OF AN OFFER TO BUY THESE SECURITIES IN ANY JURISDICTION WHERE THE OFFER OR SALE IS NOT PERMITTED.
80
| Northwest Hotel Portfolio |
Historical Penetration Rates(1)
2015 | 2016 | 2017 | |||||||
Property | Occupancy | ADR | RevPAR | Occupancy | ADR | RevPAR | Occupancy | ADR | RevPAR |
| Hilton Garden Inn Bend(2) | 108.9% | 126.8% | 138.0% | 110.1% | 127.8% | 140.7% | 115.6% | 126.4% | 146.1% |
| Hampton Inn & Suites Bend(3) | 99.0% | 111.4% | 110.3% | 103.4% | 116.7% | 120.6% | 105.8% | 117.7% | 124.5% |
| Hilton Garden Inn Salt Lake City(4) | 110.7% | 113.6% | 125.8% | 110.6% | 113.0% | 124.9% | 106.3% | 111.8% | 118.8% |
| Hampton Inn & Suites Coeur d’Alene(5) | 100.4% | 111.8% | 112.2% | 105.0% | 111.3% | 116.9% | 103.4% | 111.6% | 115.4% |
| Hampton Inn & Suites Boise(6) | 108.9% | 104.5% | 113.8% | 106.7% | 107.1% | 114.3% | 101.7% | 107.9% | 109.7% |
| La Quinta Inns & Suites Coeur d’Alene(7) | 102.8% | 103.8% | 106.7% | 104.7% | 105.3% | 110.3% | 111.5% | 104.7% | 116.8% |
| La Quinta Inns & Suites Twin Falls(8) | 107.7% | 103.5% | 111.5% | 103.4% | 101.9% | 105.4% | 101.4% | 105.0% | 106.5% |
| (1) | Information obtained from third party hospitality research reports dated January 18, 2018. |
| (2) | The competitive set for Hilton Garden Inn Bend comprises four limited service hotels totaling 367 rooms: Holiday Inn Express & Suites Bend (99 rooms), TownePlace Suites Bend Near Mount Bachelor (71 rooms), DoubleTree Bend (117 rooms) and Fairfield Inn & Suites Bend Downtown (80 rooms). |
| (3) | The competitive set for Hampton Inn & Suites Bend comprises five limited service hotels totaling 432 rooms: La Quinta Inns & Suites Bend (65 rooms), Holiday Inn Express & Suites Bend (99 rooms), TownePlace Suites Bend Near Mount Bachelor (71 rooms), DoubleTree Bend (117 rooms) and Fairfield Inn & Suites Bend Downtown (80 rooms). |
| (4) | The competitive set for Hilton Garden Inn Salt Lake City comprises six limited service hotels totaling 828 rooms: Holiday Inn Express Salt Lake City Downtown (212 rooms), Fairfield Inn & Suites Salt Lake City Downtown (120 rooms), Hampton Inn Salt Lake City Downtown (158 rooms), Homewood Suites Salt Lake City Downtown (124 rooms), Springhill Suites Salt Lake City Downtown (86 rooms) and Hyatt Place Salt Lake City Downtown The Gateway (128 rooms). |
| (5) | The competitive set for Hampton Inn & Suites Coeur d’Alene comprises three limited service hotels totaling 341 rooms: Best Western Plus Coeur d’Alene Inn (122 rooms), Holiday Inn Express & Suites Coeur d’Alene I 90 (101 rooms) and Springhill Suites Coeur d’Alene (118 rooms) |
| (6) | The competitive set for Hampton Inn & Suites Boise comprises six limited service hotels totaling 773 rooms: Hampton Inn Boise Airport (63 rooms), Hampton Inn Suites Boise Meridian (128 rooms), Oxford Suites Boise (132 rooms), Courtyard Boise West Meridian (145 rooms), Hampton Inn Suites Boise Downtown (186 rooms) and Holiday Inn Boise Airport (119 rooms). |
| (7) | The competitive set for La Quinta Inns & Suites Coeur d’Alene comprises four limited service hotels totaling 413 rooms: Best Western Plus Coeur d’Alene Inn (122 rooms), Quality Inn & Suites Coeur d’Alene (51 rooms), Shilo Inn Suites Coeur d’Alene (139 rooms) and Holiday Inn Express & Suites Coeur d’Alene (101 rooms). |
| (8) | The competitive set for La Quinta Inns & Suites Twin Falls comprises four limited service hotels totaling 378 rooms: Best Western Plus Twin Falls Hotel (120 rooms), Hampton Inn Twin Falls (75 rooms), Holiday Inn Express & Suites Twin Falls (91 rooms) and Fairfield Inn & Suites Twin Falls (92 rooms). |
Operating History and Underwritten Net Cash Flow. The following table presents certain information relating to the historical operating performance and underwritten net cash flow at the Northwest Hotel Portfolio Properties:
Cash Flow Analysis
| 2014(1) | 2015(1)(2) | 2016(2) | 2017 | UW | UW per Room | |
| Occupancy | 65.6% | 77.6% | 80.5% | 79.4% | 79.4% | |
| ADR | $124.89 | $132.07 | $139.19 | $143.40 | $143.40 | |
| RevPAR | $90.29 | $102.43 | $112.11 | $113.84 | $113.84 | |
| Rooms Revenue | $24,457,602 | $30,582,242 | $33,549,147 | $33,990,444 | $33,990,444 | $41,553 |
| Food & Beverage | $1,153,365 | $1,341,412 | $1,317,979 | $1,310,934 | $1,310,934 | $1,603 |
| Other Income(3) | $347,361 | $504,104 | $503,988 | $529,028 | $529,028 | $647 |
| Total Revenue | $25,958,328 | $32,427,758 | $35,371,115 | $35,830,406 | $35,830,406 | $43,802 |
| Total Expenses | $16,358,775 | $18,706,692 | $19,536,323 | $20,182,901 | $20,267,527 | $24,777 |
| Net Operating Income | $9,599,553 | $13,721,067 | $15,834,792 | $15,647,504 | $15,562,879 | $19,026 |
| FF&E | $0 | $0 | $0 | $0 | $1,433,216 | $1,752 |
| Net Cash Flow | $9,599,553 | $13,721,067 | $15,834,792 | $15,647,504 | $14,129,663 | $17,273 |
| NOI DSCR(4) | 1.21x | 1.72x | 1.99x | 1.97x | 1.96x | |
| NCF DSCR(4) | 1.21x | 1.72x | 1.99x | 1.97x | 1.78x | |
| NOI Debt Yield(4) | 8.5% | 12.1% | 14.0% | 13.8% | 13.7% | |
| NCF Debt Yield(4) | 8.5% | 12.1% | 14.0% | 13.8% | 12.5% | |
| (1) | The increase in Rooms Revenue and Net Operating Income from 2014 to 2015 was due to Hampton Inn & Suites Bend not opening until September 2014. In addition, La Quinta Inns & Suites Coeur d’Alene was rebranded from an Ameritel Inn in May 2014. |
| (2) | The increase in Rooms Revenue and Net Operating Income from 2015 to 2016 was primarily due to an increase in Occupancy and ADR. |
| (3) | Other Income consists of valet, guest laundry, gift shop sales and miscellaneous other income. |
| (4) | The debt service coverage ratios and debt yields shown are based on the Northwest Hotel Portfolio Whole Loan. |
Appraisal.The appraiser concluded to an “as-is” appraised value for two of the Northwest Hotel Portfolio Properties with a valuation date of October 1, 2017 and a “when complete” appraised value for five of the Northwest Hotel Portfolio Properties with a valuation date of October 1, 2018, in the aggregate amount of $173,500,000, which assumes certain outstanding PIP work has been completed (see “The Properties” section). The related PIP work was reserved for upon the origination of the Northwest Hotel Portfolio Whole Loan.
Environmental Matters.According to the Phase I environmental reports dated February 7, 2018 and February 20, 2018, there was no evidence of any recognized environmental conditions at any of the Northwest Hotel Portfolio Properties.
THE INFORMATION IN THIS STRUCTURAL AND COLLATERAL TERM SHEET IS NOT COMPLETE AND MAY BE AMENDED PRIOR TO THE TIME OF SALE. THIS TERM SHEET IS NOT AN OFFER TO SELL THESE SECURITIES AND IT IS NOT A SOLICITATION OF AN OFFER TO BUY THESE SECURITIES IN ANY JURISDICTION WHERE THE OFFER OR SALE IS NOT PERMITTED.
81
| Northwest Hotel Portfolio |
Market Overview and Competition.The Northwest Hotel Portfolio Properties are located in five distinct markets:
Hampton Inn & Suites Bend and Hilton Garden Inn Bend
The Hampton Inn & Suites Bend property and the Hilton Garden Inn Bend property are located in Bend, Deschutes County, Oregon, within the Bend-Redmond, Oregon metropolitan statistical area. Bend is located approximately 100 miles southeast of Portland, Oregon, situated on the Deschutes River. In 2016, the United States Census Bureau reported that the Bend-Redmond Metropolitan Area was the eighth fastest-growing metropolitan area in the nation. Major employers include St. Charles Medical Centers, Bend Memorial Clinic and Safeway. In 2016, St. Charles Bend announced plans to add a new $66-million patient tower in response to increasing demand. The project is expected to be completed in 2019. The tourism industry employs more than 9,200 residents in Central Oregon as of 2016 and is driven by the year-round recreational activities. According to the appraisal, the 2017 market segmentation for the Hampton Inn & Suites Bend property was approximately 55% commercial/government, 10% meeting & group and 35% leisure and the 2017 market segmentation for the Hilton Garden Inn Bend property was approximately 50% commercial/government, 20% meeting & group and 30% leisure.
The Hampton Inn & Suites Bend property is located in the Old Mill District, in the northeast quadrant of the intersection formed by Southwest Columbia Street and Southwest Shevlin Hixon Drive, along the Deschutes River and approximately 0.9 miles west of Highway 97. The Hilton Garden Inn Bend property is located west of the intersection formed by Southwest Bluff Drive and Southwest Wilson Avenue, approximately 0.5 miles west of Highway 97 and approximately 0.6 miles northeast of the Hampton Inn & Suites Bend property. The neighborhood is characterized by restaurants, retail stores, recreational facilities, and entertainment venues, as well as low-rise offices, residences and hotels. The area includes Les Schwab Amphitheater, OSU-Cascades Graduate Research Center, and Bend Park & Recreation District Office. Bend is served by the Redmond Municipal Airport, which is located approximately 14 miles northeast of both properties. According to the appraisal, the 2017 estimated population within a three-, and five-mile radius of the Hampton Inn & Suites Bend property was 66,863, and 96,282, respectively. The estimated average household income within the same radii was, $82,787, and $82,201, respectively. The 2017 estimated population within a three-, and five-mile radius of the Hilton Garden Inn Bend property was 71,037, and 96,765, respectively. The estimated average household income within the same radii was $81,077, and $82,285, respectively.
Hilton Garden Inn Salt Lake City Downtown
The Hilton Garden Inn Salt Lake City Downtown property is located in Salt Lake City, Salt Lake County, Utah, within the central business district submarket. Salt Lake City is the capital of Utah and the largest city in the state. The city’s major sectors include transportation, healthcare, education, and government, as well as the technology, finance, tourism and leisure industries. Major employers include Delta Airlines, Goldman Sachs, Intermountain Healthcare and Chevron. According to a third-party market research report, the 2017 estimated population within a three-, and five-mile radius of the Hilton Garden Inn Salt Lake City Downtown property was 140,661, and 249,984, respectively. The estimated average household income within the same radii was $65,927, and $70,023, respectively. According to the appraisal, the 2017 market segmentation for the Hilton Garden Inn Salt Lake City Downtown property was approximately 60% commercial/government, 25% meeting & group and 15% leisure.
The Hilton Garden Inn Salt Lake City Downtown property is located in the northeast quadrant of the intersection formed by West 600 South and 300 West, approximately 0.7 mile east of Interstates 80 and 15. The neighborhood is characterized by restaurants, office and mixed-use buildings, hotels, multi-family residences, and retail centers, including the Salt Palace Convention Center, Zions Bancorporation, The Church of Jesus Christ of Latter-day Saints headquarters and City Creek Center. According to the appraisal, Overstock.com announced plans to construct its global headquarters in Midvale, approximately 10.9 miles south of the Hilton Garden Inn Salt Lake City Downtown property. The estimated $100-million office project opened for business in October 2016. Salt Lake City International Airport is located approximately five miles to the northwest of the Hilton Garden Inn Salt Lake City Downtown property.
Hampton Inn & Suites Coeur d’Alene and La Quinta Inns & Suites Coeur d’Alene
The Hampton Inn & Suites Coeur d’Alene property and the La Quinta Inns & Suites Coeur d’Alene property are located in Coeur d’Alene, Kootenai County, Idaho, within the Coeur d’Alene metropolitan statistical area. Coeur d’Alene is the economic and political center of and the largest city in Kootenai County. The city features Lake Coeur d’Alene, one of the three largest inland bodies of water in the Pacific Northwest, and numerous outdoor recreational opportunities, including fishing, boating, golf, hiking, and camping. Major employers include Hagadone Corporation, Kootenai Health and the State of Idaho. Kootenai Health is a nonprofit community hospital serving over 13,000 inpatients and 180,000 outpatients each year. In the fall of 2014, construction began on the hospital’s first expansion in 30 years. According to the appraisal, by the time the facilities are anticipated to be at full capacity in 2018, the hospital expects to hire 100 to 150 new employees. Hagadone Corporation is a private corporation made up of many subsidiaries primarily focused on the publishing, newspaper, and hospitality industries. According to the appraisal, the 2017 market segmentation for the Hampton Inn & Suites Coeur d’Alene property was approximately 30% commercial/government, 10% meeting & group and 60% leisure; and the 2017 market segmentation for the La Quinta Inns & Suites Coeur d’Alene property was approximately 35% commercial/government, 15% meeting & group and 50% leisure.
The Hampton Inn & Suites Coeur d’Alene property is located in the Riverstone mixed-use development, in the southern quadrant of the intersection formed by West Riverstone Drive and North Beebe Boulevard, approximately 700 feet northeast of the Spokane River and 0.7 mile south of Interstate 90. The La Quinta Inns & Suites Coeur d’Alene property is located along the I-90 commercial corridor, southeast of the interchange formed by U.S. Highway 95 and Interstate 90 and approximately 1.0 mile east of the Hampton Inn & Suites Coeur d’Alene property. The neighborhood is characterized by restaurants, retail shops, hotels, and recreational facilities, as well as low-rise office buildings and multi-family residences and includes Coeur d’Alene Golf Club, Kootenai Health, and Umpqua Bank. Coeur d’Alene is served by the Spokane International Airport, which is located approximately 30 miles to the west of both the Hampton Inn & Suites Coeur d’Alene property and the La Quinta Inns & Suites Coeur d’Alene property. According to a third
THE INFORMATION IN THIS STRUCTURAL AND COLLATERAL TERM SHEET IS NOT COMPLETE AND MAY BE AMENDED PRIOR TO THE TIME OF SALE. THIS TERM SHEET IS NOT AN OFFER TO SELL THESE SECURITIES AND IT IS NOT A SOLICITATION OF AN OFFER TO BUY THESE SECURITIES IN ANY JURISDICTION WHERE THE OFFER OR SALE IS NOT PERMITTED.
82
| Northwest Hotel Portfolio |
party market research report, the 2017 estimated population within a three-, and five-mile radius of the Hampton Inn & Suites Coeur d’Alene property was 47,095 and 79,927, respectively. The estimated average household income within the same radii was $58,096 and $64,484. The 2017 estimated population within a three-, and five-mile radius of the La Quinta Inns & Suites Coeur d’Alene property was 49,578 and 77,327, respectively. The estimated average household income within the same radii was $58,506 and $64,631, respectively.
Hampton Inn & Suites Boise Spectrum
The Hampton Inn & Suites Boise Spectrum property is located in Boise, Ada County, Idaho, within the Boise-Nampa metropolitan statistical area. Boise is the capital of Idaho and the largest city in the state. Major employers include St. Luke’s Health Systems, Micron Technology, Inc., West Ada School District, Boise School District and Boise State University, the state’s largest post-secondary institution. According to a third-party market research report, the 2017 estimated population within a three-, and five-mile radius of the Hampton Inn & Suites Boise Spectrum property was 87,701 and 221,502, respectively. The estimated average household income within the same radii was $60,058, and $64,917, respectively. According to the appraisal, the 2017 market segmentation for the Hampton Inn & Suites Boise Spectrum property was approximately 65% commercial/government, 15% meeting & group and 20% leisure.
The Hampton Inn & Suites Boise Spectrum property is located in the Boise Spectrum Center, in the southwest quadrant of the intersection formed by West Overland Road and South Cole Road. Interstate 84 is approximately 450 feet to the northeast and Interstate 184 is approximately 1.7 miles to the northwest. The Boise Spectrum Center features the Edwards Boise 21 & IMAX Theater and Cracker Barrel Restaurant. The Hampton Inn & Suites Boise Spectrum property is served by the Boise Airport, which is located approximately three miles to the southeast. The neighborhood is characterized by entertainment and retail shopping centers, as well as restaurants along the primary thoroughfares, with light-industrial and residential areas located along the secondary roadways.
La Quinta Inns & Suites Twin Falls
The La Quinta Inns & Suites Twin Falls property is located in Twin Falls, Twin Falls County, Idaho, within the Twin Falls submarket. The city of Twin Falls is located in south-central Idaho, approximately 125 miles southeast of Boise. As the largest city within Idaho’s Magic Valley region, Twin Falls serves as the regional commercial hub for south-central Idaho and northeastern Nevada. The Magic Valley denotes an agricultural region in south-central Idaho that is located along the Snake River Plain and Snake River, which serves as a water and power source for the region. One of the area’s largest employers is Chobani Yogurt, which opened the world’s largest yogurt production facility in December 2012, approximately 6.5 miles southeast of the La Quinta Inns & Suites Twin Falls property. According to a third-party market research report, the 2017 estimated population within a three-, and five-mile radius of the La Quinta Inns & Suites Twin Falls property was 39,824 and 55,944, respectively. The estimated average household income within the same radii was $58,358 and $60,263, respectively. According to the appraisal, the 2017 market segmentation for the La Quinta Inns & Suites Twin Falls property was approximately 65% commercial/government, 15% meeting & group and 20% leisure. Primary commercial demand generators for this market include major food-processing companies in the area, such as Chobani Yogurt, Clif Bar and Glanbia Food USA, as well as the healthcare sector.
The La Quinta Inns & Suites Twin Falls property is located in the northeast quadrant of the intersection formed by Pole Line Road (Highway 93) and Harrison Street. Snake River is located approximately 2.0 miles to the north and Interstate 84 is approximately 4.8 miles to the northeast. Twin Falls has outdoor recreation options, including activities at Snake River, Shoshone Falls and Sawtooth National Forest. Canyon Park West, approximately 1.5 miles northeast of the La Quinta Inns & Suites Twin Falls property, opened in 2016 and features major retailers such as Ross, Ulta Beauty, Dick’s Sporting Goods, and Petco, as well as restaurants including Noodles & Company. The La Quinta Inns & Suites Twin Falls property is served by the Magic Valley Regional Airport, which is located approximately seven miles to the south.
The Borrowers.The borrowers are 600 South Salt Lake City Hotel, LLC; Bluff Bend Hotel, LLC; Columbia Bend Hotel, LLC; Ironwood Coeur d’Alene Hotel, LLC; Overland Boise Hotel, LLC; Pole Line Twin Falls Hotel, LLC; and Riverstone Coeur d’Alene Hotel, LLC (collectively, the “Northwest Hotel Portfolio Borrower”), each a single-purpose Delaware limited liability company structured to be bankruptcy remote with two independent directors. Legal counsel to the Northwest Hotel Portfolio Borrower delivered a non-consolidation opinion in connection with the origination of the Northwest Hotel Portfolio Whole Loan.
The Borrower Sponsors.The two borrower sponsors and non-recourse carveout guarantors, Jason R. Kotter and Ryan N. Van Alfen, are co-founders of Athlos Academies based in Boise, Idaho. Athlos Academies was founded in 2007 to provide charter schools with the financial tools necessary to acquire real estate and construct school buildings. As of June 2017, Athlos had completed 29 schools (for over $525 million), sold 20 schools and announced plans to expand into Louisiana, Utah and Minnesota.
Escrows.At origination, the Northwest Hotel Portfolio Borrower deposited upfront reserves of $518,257 for real estate taxes, $46,636 for insurance premiums, $14,116,206 ($17,257 per room) for planned PIP renovations and $163,000 for seasonality reserves. The Northwest Hotel Portfolio Whole Loan documents also provide for ongoing monthly reserves of $94,555 for real estate taxes, $15,546 for insurance premiums and $119,435 for furnishings, fixtures and equipment (“FF&E”).
The Northwest Hotel Portfolio Borrower is required to make annual deposits into the seasonality reserve of an amount equal to the net cash flow deficiency, calculated as the net cash flow shortfall, after debt service less the FF&E reserve monthly deposits, during each of the first and fourth calendar quarter of the preceding calendar year, less any seasonality reserve funds on deposit with the lender from the prior year for the applicable quarter. If at any time additional PIP work is required by the franchisor under any franchise agreement, the Northwest Hotel Portfolio Borrower is required to deposit an amount equal to the PIP Reserve Shortfall (as defined below) within 15 days after receipt of notice from the franchisor.
THE INFORMATION IN THIS STRUCTURAL AND COLLATERAL TERM SHEET IS NOT COMPLETE AND MAY BE AMENDED PRIOR TO THE TIME OF SALE. THIS TERM SHEET IS NOT AN OFFER TO SELL THESE SECURITIES AND IT IS NOT A SOLICITATION OF AN OFFER TO BUY THESE SECURITIES IN ANY JURISDICTION WHERE THE OFFER OR SALE IS NOT PERMITTED.
83
| Northwest Hotel Portfolio |
The “PIP Reserve Shortfall” means an amount equal to 110% of the estimated costs to complete the applicable PIP, as reasonably determined by the lender, less (i) the amount of FF&E reserve funds then on deposit with the lender and (ii) the amount of Franchise Trigger Event Reserve Funds (see “Lockbox and Cash Management” section below) then on deposit with the lender.
Lockbox and Cash Management.The Northwest Hotel Portfolio Whole Loan requires a lender-controlled lockbox account, which is already in place, and that the Northwest Hotel Portfolio Borrower deposits all rent and directs all credit card companies to pay all amounts due directly into such lockbox account. The loan documents also require that all rents received by the Northwest Hotel Portfolio Borrower or the property manager be deposited into the lockbox account within one business day of receipt. Prior to the occurrence of a Cash Trap Event Period (as defined below), all funds in the lockbox account are required to be distributed to the Northwest Hotel Portfolio Borrower. During a Cash Trap Event Period, funds in the lockbox account are required to be swept to a lender-controlled cash management account and all excess funds are required to be swept to an excess cash flow subaccount controlled by the lender (provided, however, any excess cash flow swept in accordance with a Franchise Trigger Event Period (as defined below) will be deposited into a separate Franchise Trigger Event reserve funds subaccount (subject to a cap of 110% of contracted PIP work as long as (i) no event of default is continuing; (ii) the Northwest Hotel Portfolio Borrower has entered into a written contract with the franchisor for such work; and (iii) the sum of all excess cash flow held by the lender and PIP reserve funds is greater than 110% of such work)).
A “Cash Trap Event Period” will commence upon the earlier of the following:
| (i) | the occurrence of an event of default under the Northwest Hotel Portfolio Whole Loan; |
| (ii) | the aggregate net cash flow debt yield falling below 10.25%; or |
| (iii) | a Franchise Trigger Event Period (as defined below). |
A Cash Trap Event Period will end upon the occurrence of the following:
| ● | with regard to clause (i), the cure of such event of default; |
| ● | with regard to clause (ii), the net cash flow debt yield being equal to or greater than 10.25% for two consecutive calendar quarters; or |
| ● | with regard to clause (iii), a Franchise Trigger Event Period Cure (as defined below). |
A “Franchise Trigger Event Period” will commence upon the earlier of the following:
| (i) | the occurrence of a default or an event of default under any franchise agreement; or |
| (ii) | the cancellation, termination or expiration of any franchise agreement or notice to terminate any franchise agreement by either franchisor or franchisee. |
A “Franchise Trigger Event Period Cure” will occur upon the following:
| ● | with regard to Franchise Trigger Event Period clause (i), (A) the lender’s receipt of satisfactory evidence that such event of default has been cured, such cure has been accepted by franchisor and that franchisee has remained in good standing under the franchise agreement, or (B) the Northwest Hotel Portfolio Borrower having entered into a replacement franchise agreement satisfactory to the lender and in accordance with the loan documents; or |
| ● | with regard to Franchise Trigger Event Period clause (ii), (A) the lender’s receipt of satisfactory evidence that such cancellation, termination or expiration has been nullified and/or any notice thereof has been retracted, franchisee has regained good standing status under the franchise agreement and that said franchise agreement is in full force and effect, or (B) the Northwest Hotel Portfolio Borrower having entered into a replacement franchise agreement satisfactory to the lender and in accordance with the loan documents. |
Property Management.In conjunction with the acquisition of the Northwest Hotel Portfolio Properties, the borrower sponsor entered into a sub-management agreement with Ameritel Inns, Inc. (“Ameritel”), the seller of the Northwest Hotel Portfolio Properties, with an initial term of three months with three, one-month extension options. Following the expiration of such sub-management agreement, the Northwest Hotel Portfolio Properties is required to be managed by Hotel Management Services, LLC (the “Northwest Hotel Portfolio Manager”), an affiliate of the Northwest Hotel Portfolio Borrower. The Northwest Hotel Portfolio Whole Loan documents require that either or both of J. Scott Ableman and Charles W. Everett are employed as Chief Financial Officer and Vice President of Operations, respectively, of the Northwest Hotel Portfolio Manager. Mr. Ableman is the Chief Financial Officer of Ameritel. Mr. Everett oversees management operations for Ameritel and also serves as the public relations director.
Assumption.The borrower has the two-time right, commencing 12 months after loan origination, to transfer the Northwest Hotel Portfolio Property, provided that certain conditions are satisfied, including (i) no event of default has occurred and is continuing; (ii) the lender has reasonably determined that the proposed transferee and guarantor satisfy the lender’s credit review and underwriting standards, taking into consideration the transferee’s experience, financial strength and general business standing; and (iii) if required by the lender, rating agency confirmation from DBRS, Fitch and Moody’s that the transfer will not result in a downgrade, withdrawal or qualification of the respective ratings assigned to the Series WFCM 2018-C44 certificates.
Partial Release.Any time after the expiration of the defeasance lockout period, the Northwest Hotel Portfolio Borrower may obtain the release of any of the Northwest Hotel Portfolio Properties on up to six occasions, provided that, among other things, and in accordance with the Northwest Hotel Portfolio Whole Loan documents, (a) no event of default has occurred and is continuing, (b) the loan is defeased in an amount equal to the applicable Release Amount (as defined below), (c) a legal opinion covering compliance in all respects with all laws, rules and regulations governing REMICs has been delivered, and (d) rating agency confirmation that the sale and release will not result in a downgrade, withdrawal or qualification of the respective ratings assigned to the Series WFCM 2018-C44 certificates and similar confirmations from each rating agency rating any securities backed by the Northwest Hotel Portfolio Companion Loans have been delivered.
THE INFORMATION IN THIS STRUCTURAL AND COLLATERAL TERM SHEET IS NOT COMPLETE AND MAY BE AMENDED PRIOR TO THE TIME OF SALE. THIS TERM SHEET IS NOT AN OFFER TO SELL THESE SECURITIES AND IT IS NOT A SOLICITATION OF AN OFFER TO BUY THESE SECURITIES IN ANY JURISDICTION WHERE THE OFFER OR SALE IS NOT PERMITTED.
84
| Northwest Hotel Portfolio |
The “Release Amount” for any property being released is an amount equal to the greatest of (a) 100% of the net sales proceeds for such release property, (b) 125% of the Allocated Cut-off Date Balance of such release property (identified in “The Properties” section chart above), (c) an amount that would result in the net cash flow debt service coverage ratio, after giving effect to the release of such property, being not less than the greater of (i) the net cash flow debt service coverage ratio for the Northwest Hotel Portfolio Whole Loan (including such release property) immediately prior to such release and (ii) 1.80x, (d) an amount that would result in the net cash flow debt yield, after giving effect to the release of such property, being not less than the greater of (i) the net cash flow debt yield for the Northwest Hotel Portfolio Whole Loan (including the release property) immediately prior to such release and (ii) 12.5% and (e) an amount that would result in the loan-to-value ratio, after giving effect to the release of such property, being not greater than the lesser of (i) the loan-to-value ratio for the Northwest Hotel Portfolio Whole Loan (including the release property) immediately prior to such release and (ii) 65.0%.
Real Estate Substitution.Not permitted.
Subordinate and Mezzanine Indebtedness. Not permitted.
Ground Lease. None.
Terrorism Insurance.The Northwest Hotel Portfolio Whole Loan documents require that the “all risk” insurance policies required to be maintainedby the Northwest Hotel Portfolio Borrower provide coverage for terrorism in an amount equal to the full replacement cost of the Northwest Hotel Portfolio Properties. The loan documents also require business interruption insurance covering no less than the eighteen month period following the occurrence of a casualty event, together with a six month extended period of indemnity.
THE INFORMATION IN THIS STRUCTURAL AND COLLATERAL TERM SHEET IS NOT COMPLETE AND MAY BE AMENDED PRIOR TO THE TIME OF SALE. THIS TERM SHEET IS NOT AN OFFER TO SELL THESE SECURITIES AND IT IS NOT A SOLICITATION OF AN OFFER TO BUY THESE SECURITIES IN ANY JURISDICTION WHERE THE OFFER OR SALE IS NOT PERMITTED.
85
KONICA MINOLTA BUSINESS SOLUTIONS HQ
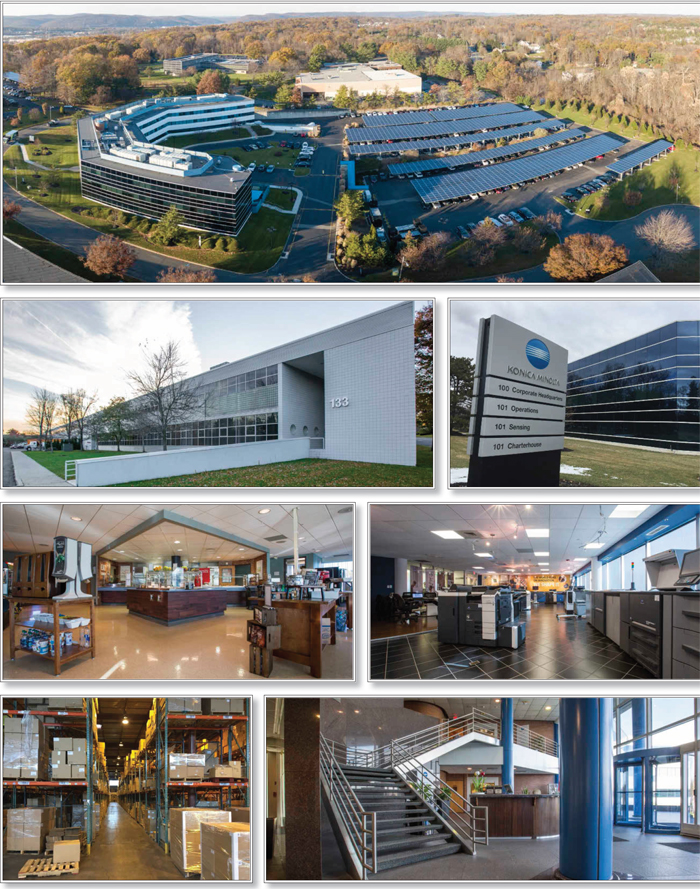
THE INFORMATION IN THIS STRUCTURAL AND COLLATERAL TERM SHEET IS NOT COMPLETE AND MAY BE AMENDED PRIOR TO THE TIME OF SALE. THIS TERM SHEET IS NOT AN OFFER TO SELL THESE SECURITIES AND IT IS NOT A SOLICITATION OF AN OFFER TO BUY THESE SECURITIES IN ANY JURISDICTION WHERE THE OFFER OR SALE IS NOT PERMITTED.
86
KONICA MINOLTA BUSINESS SOLUTIONS HQ
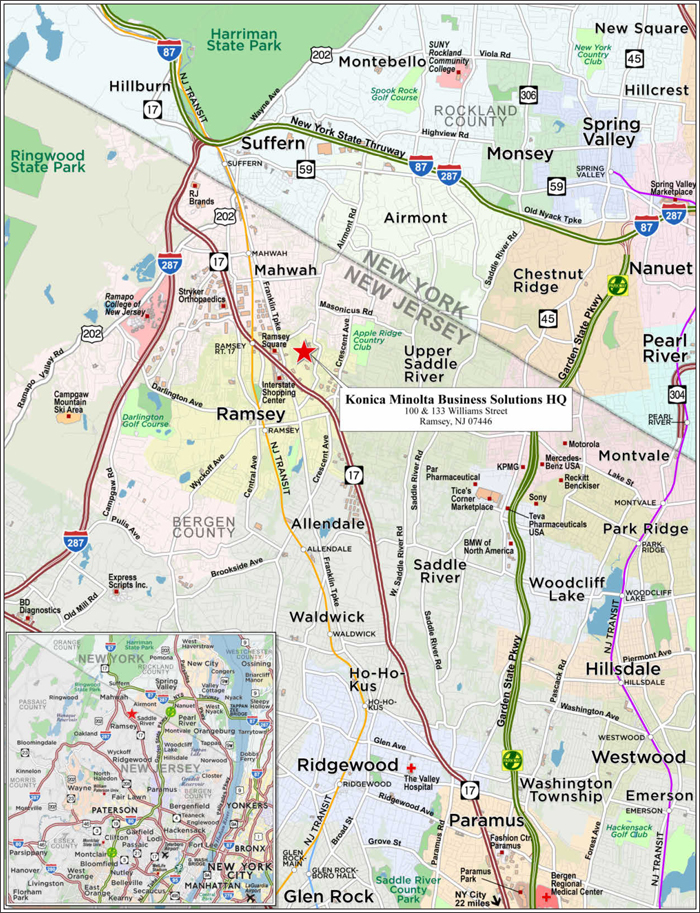
THE INFORMATION IN THIS STRUCTURAL AND COLLATERAL TERM SHEET IS NOT COMPLETE AND MAY BE AMENDED PRIOR TO THE TIME OF SALE. THIS TERM SHEET IS NOT AN OFFER TO SELL THESE SECURITIES AND IT IS NOT A SOLICITATION OF AN OFFER TO BUY THESE SECURITIES IN ANY JURISDICTION WHERE THE OFFER OR SALE IS NOT PERMITTED.
87
| No. 6 – Konica Minolta Business Solutions HQ | |||||||
| Loan Information | Property Information | ||||||
| Mortgage Loan Seller: | Ladder Capital Finance LLC | Single Asset/Portfolio: | Single Asset | ||||
| Credit Assessment (DBRS/Fitch/Moody’s): | NR/NR/NR | Property Type: | Mixed Use | ||||
| Original Principal Balance: | $33,250,000 | Specific Property Type: | Office/ Industrial | ||||
| Cut-off Date Balance: | $33,250,000 | Location: | Ramsey, NJ | ||||
| % of Initial Pool Balance: | 4.3% | Size: | 277,942 SF | ||||
| Loan Purpose: | Acquisition | Cut-off Date Balance Per SF: | $119.63 | ||||
| Borrower Name: | LCN KMI Ramsey NJ LLC | Year Built/Renovated: | 1980, 1988/NAP | ||||
| Borrower Sponsor: | LCN North American Fund II REIT | Title Vesting: | Fee | ||||
| Mortgage Rate: | 4.8620% | Property Manager: | Self-managed | ||||
| Note Date: | March 19, 2018 | 4th Most Recent Occupancy (As of)(3): | NAV | ||||
| Anticipated Repayment Date: | NAP | 3rd Most Recent Occupancy (As of)(3): | 100.0% (12/31/2015) | ||||
| Maturity Date: | April 6, 2028 | 2nd Most Recent Occupancy (As of)(3): | 100.0% (12/31/2016) | ||||
| IO Period(1): | 120 months | Most Recent Occupancy (As of)(3): | 100.0% (12/31/2017) | ||||
| Loan Term (Original): | 120 months | Current Occupancy (As of): | 100.0% (5/1/2018) | ||||
| Seasoning: | 1 month | ||||||
| Amortization Term (Original): | NAP | Underwriting and Financial Information: | |||||
| Loan Amortization Type: | Interest-only, Balloon | ||||||
| Interest Accrual Method: | Actual/360 | 4th Most Recent NOI (As of)(4): | NAV | ||||
| Call Protection: | L(25), D(90), O(5) | 3rd Most Recent NOI (As of)(4): | NAV | ||||
| Lockbox Type: | Hard/Upfront Cash Management | 2nd Most Recent NOI (As of)(4): | NAV | ||||
| Additional Debt: | No | Most Recent NOI (As of)(4): | NAV | ||||
| Additional Debt Type: | NAP | ||||||
| U/W Revenues: | $3,113,857 | ||||||
| U/W Expenses: | $77,846 | ||||||
| U/W NOI: | $3,036,010 | ||||||
| U/W NCF: | $2,994,319 | ||||||
| Escrows and Reserves(2): | U/W NOI DSCR: | 1.85x | |||||
| U/W NCF DSCR: | 1.83x | ||||||
| Type: | Initial | Monthly | Cap (If Any) | U/W NOI Debt Yield: | 9.1% | ||
| Taxes | $0 | Springing | NAP | U/W NCF Debt Yield: | 9.0% | ||
| Insurance | $0 | Springing | NAP | As-Is Appraised Value: | $48,700,000 | ||
| Replacement Reserves | $0 | Springing | NAP | As-Is Appraisal Valuation Date: | March 1, 2018 | ||
| TI/LC Reserve | $0 | $0 | NAP | Cut-off Date LTV Ratio: | 68.3% | ||
| Quarterly Rent Reserve | $0 | $0 | NAP | LTV Ratio at Maturity or ARD: | 68.3% | ||
| (1) | During any period when the related sole tenant, Konica Minolta Business Solutions U.S.A., Inc. (or any tenant under any replacement lease) (in any such case, if rated), and the related lease guarantor (or any guarantor of any replacement lease) have their respective senior unsecured debt ratings downgraded below an Investment Grade Rating, the Konica Minolta Business Solutions HQ Mortgage Loan will begin to amortize on a 30-year schedule as set forth under the related loan documents, but only for such time as their respective senior unsecured debt ratings remain below an Investment Grade Rating. An “Investment Grade Rating” means, with respect to the current related lease guarantor, a senior unsecured debt rating by Rating and Investment Information, Inc. and Japan Credit Rating Agency of at least the equivalent of a “BBB-” rating by S&P or, with respect to any other person, a senior unsecured debt rating of at least “BBB-” by S&P. |
| (2) | See “Escrows” section. |
| (3) | See “Historical Occupancy” table. |
| (4) | See “Cash Flow Analysis” table. |
The Mortgage Loan.The mortgage loan (the “Konica Minolta Business Solutions HQ Mortgage Loan”) is evidenced by a single promissory note that is secured by a first mortgage encumbering the fee interest in a mixed-use office and industrial property located in Ramsey, New Jersey (the “Konica Minolta Business Solutions HQ Property”). The Konica Minolta Business Solutions HQ Mortgage Loan was originated on March 19, 2018 by Ladder Capital Finance LLC. The Konica Minolta Business Solutions HQ Mortgage Loan had an original principal balance of $33,250,000, has an outstanding principal balance as of the Cut-off Date of $33,250,000 and accrues interest at an interest rate of 4.862% per annum. The Konica Minolta Business Solutions HQ Mortgage Loan had an initial term of 120 months, has a remaining term of 119 months as of the Cut-off Date and, subject to the discussion in footnote (1) to the table above, requires payments of interest-only through the term of the Konica Minolta Business Solutions HQ Mortgage Loan. The Konica Minolta Business Solutions HQ Mortgage Loan matures on April 6, 2028.
THE INFORMATION IN THIS STRUCTURAL AND COLLATERAL TERM SHEET IS NOT COMPLETE AND MAY BE AMENDED PRIOR TO THE TIME OF SALE. THIS TERM SHEET IS NOT AN OFFER TO SELL THESE SECURITIES AND IT IS NOT A SOLICITATION OF AN OFFER TO BUY THESE SECURITIES IN ANY JURISDICTION WHERE THE OFFER OR SALE IS NOT PERMITTED.
88
KONICA MINOLTA BUSINESS SOLUTIONS HQ
Following the lockout period, the borrower has the right to defease the Konica Minolta Business Solutions HQ Mortgage Loan in whole, but not in part, on any payment date before December 6, 2027. In addition, the Konica Minolta Business Solutions HQ Mortgage Loan is prepayable without penalty on or after December 6, 2027.
Sources and Uses
| Sources | Uses | |||||
| Original mortgage loan amount | $33,250,000 | 69.9% | Purchase price | $47,500,000 | 99.8% | |
| Borrower sponsor’s new cash contribution | 14,341,331 | 30.1 | Closing costs | 91,331 | 0.2 | |
| Total Sources | $47,591,331 | 100.0% | Total Uses | $47,591,331 | 100.0% |
The Property.The Konica Minolta Business Solutions HQ Property was built in 1980 and 1988, respectively, and as of May 1, 2018 is 100% leased to Konica Minolta Business Solutions (“KMBS”) on a triple-net basis through September 2034 with four, five-year extension options and no early termination options. The Konica Minolta Business Solutions HQ Property is comprised of a three-story, 106,400 square foot Class B office building built in 1988 on an 8.9 acre site and a 171,542 square foot industrial warehouse building, with small second story office space built in 1980. The industrial warehouse is on a 14.8 acre site and features 26-foot clear ceiling heights, twelve dock doors and four drive-through doors. The Konica Minolta Business Solutions HQ Property features 458 parking spaces for a combined parking ratio of 1.65 spaces per 1,000 square feet. The Konica Minolta Business Solutions HQ Property is located along Route 17 in Ramsey, New Jersey within Bergen County, which is approximately 2.5 miles from the New York/New Jersey border and approximately 25.0 miles northwest of New York City.
The Konica Minolta Business Solutions HQ Property is the North American headquarters for KMBS, which has owned and occupied the office portion of the Konica Minolta Business Solutions HQ Property since 1989. In connection with the origination of the Konica Minolta Business Solutions HQ Mortgage Loan, the borrower acquired the office portion of the Konica Minolta Business Solutions HQ Property from KMBS as part of a sale-leaseback transaction. At origination of the Konica Minolta Business Solutions HQ Mortgage Loan, KMBS executed a new 16.5 year triple net lease for 100.0% of the Konica Minolta Business Solutions HQ Property. Konica Minolta Inc. (rated A+ by the Japan Credit Rating Agency), which is the parent company of KMBS, guarantees payment under the lease. KMBS has announced that it is consolidating its Northeast operations and closing its Connecticut distribution facility to relocate a majority of these operations to three buildings in New Jersey, two of which are collateral for the Konica Minolta Business Solutions HQ Mortgage Loan. As part of this initiative, KMBS reportedly plans to invest $20,000,000 and add over 400 jobs to New Jersey.
KMBS provides document management and information technology services as well as the manufacturing of office systems, printers, production print systems, digital presses, multifunctional products, and managed print software solutions. KMBS also provides information technology services that include managed services, cloud computing, helpdesk support, strategic planning, staff augmentation, network and server monitoring, application visualizing, desktop support, network design and implantation, virtualization design and implementation, security assessments, among other services. KMBS is also a leader in industrial and commercial printing and packing solutions. As of May 1, 2018 the Konica Minolta Business Solutions HQ Property was 100.0% leased.
THE INFORMATION IN THIS STRUCTURAL AND COLLATERAL TERM SHEET IS NOT COMPLETE AND MAY BE AMENDED PRIOR TO THE TIME OF SALE. THIS TERM SHEET IS NOT AN OFFER TO SELL THESE SECURITIES AND IT IS NOT A SOLICITATION OF AN OFFER TO BUY THESE SECURITIES IN ANY JURISDICTION WHERE THE OFFER OR SALE IS NOT PERMITTED.
89
KONICA MINOLTA BUSINESS SOLUTIONS HQ
The following table presents certain information relating to the tenancy at the Konica Minolta Business Solutions HQ Property:
Major Tenants
| Tenant Name | Credit Rating (Fitch/Moody’s/S&P)(1) | Tenant NRSF | % of NRSF | Annual U/W Base Rent PSF(2) | Annual U/W Base Rent(2) | % of Total Annual U/W Base Rent | Lease Expiration Date | |
| Major Tenant | ||||||||
| KMBS(3) | NR/NR/NR | 277,942 | 100.0% | $11.36 | $3,158,206 | 100.0% | 9/30/2034 | |
| Total Major Tenant | 277,942 | 100.0% | $11.36 | $3,158,206 | 100.0% | |||
| Vacant Space | 0 | 0.0% | ||||||
| Collateral Total | 277,942 | 100.0% | ||||||
| (1) | Konica Minolta Inc., the parent company of KMBS and the guarantor under the KMBS lease, is rated A+ by the Japan Credit Rating Agency. |
| (2) | Annual U/W Base Rent PSF and Annual U/W Base Rent include $296,270 of straight line rent for KMBS. |
| (3) | A 6,800 square foot office portion of the industrial warehouse building is subleased to A.L. Solutions U.S., Inc., which is expected to move out by the fourth quarter of 2018 while the space is being renovated. KMBS is subsequently expected to occupy the renovated space. |
The following table presents certain information relating to the lease rollover schedule at the Konica Minolta Business Solutions HQ
Property:
Lease Expiration Schedule(1)
| Year Ending December 31, | No. of Leases Expiring | Expiring NRSF | % of Total NRSF | Cumulative Expiring NRSF | Cumulative % of Total NRSF | Annual U/W Base Rent(2) | % of Total Annual U/W Base Rent | Annual U/W Base Rent PSF(2) |
| MTM | 0 | 0 | 0.0% | 0 | 0.0% | $0 | 0.0% | $0.00 |
| 2018 | 0 | 0 | 0.0% | 0 | 0.0% | $0 | 0.0% | $0.00 |
| 2019 | 0 | 0 | 0.0% | 0 | 0.0% | $0 | 0.0% | $0.00 |
| 2020 | 0 | 0 | 0.0% | 0 | 0.0% | $0 | 0.0% | $0.00 |
| 2021 | 0 | 0 | 0.0% | 0 | 0.0% | $0 | 0.0% | $0.00 |
| 2022 | 0 | 0 | 0.0% | 0 | 0.0% | $0 | 0.0% | $0.00 |
| 2023 | 0 | 0 | 0.0% | 0 | 0.0% | $0 | 0.0% | $0.00 |
| 2024 | 0 | 0 | 0.0% | 0 | 0.0% | $0 | 0.0% | $0.00 |
| 2025 | 0 | 0 | 0.0% | 0 | 0.0% | $0 | 0.0% | $0.00 |
| 2026 | 0 | 0 | 0.0% | 0 | 0.0% | $0 | 0.0% | $0.00 |
| 2027 | 0 | 0 | 0.0% | 0 | 0.0% | $0 | 0.0% | $0.00 |
| 2028 | 0 | 0 | 0.0% | 0 | 0.0% | $0 | 0.0% | $0.00 |
| Thereafter | 1 | 277,942 | 100.0% | 277,942 | 100.0% | $3,158,206 | 100.0% | $11.36 |
| Vacant | 0 | 0 | 0.0% | 277,942 | 100.0% | $0 | 0.0% | $0.00 |
| Total/Weighted Average | 1 | 277,942 | 100.0% | $3,158,206 | 100.0% | $11.36 |
| (1) | Information obtained from the underwritten rent roll. |
| (2) | Annual U/W Base Rent PSF and Annual U/W Base Rent include $296,270 of straight line rent for KMBS. |
The following table presents historical occupancy percentages at the Konica Minolta Business Solutions HQ Property:
Historical Occupancy
12/31/2014(1) | 12/31/2015(1) | 12/31/2016(1) | 12/31/2017(1) | 5/1/2018(2)(3) |
| NAV | 100.0% | 100.0% | 100.0% | 100.0% |
| (1) | Information obtained from the borrower. Historically the office building and industrial warehouse were owner occupied. |
| (2) | Information obtained from the underwritten rent roll. |
| (3) | A 6,800 square foot office portion of the industrial warehouse building is subleased to A.L. Solutions U.S., Inc., which is expected to move out by the fourth quarter of 2018 while the space is being renovated. KMBS is subsequently expected to occupy the renovated space. |
THE INFORMATION IN THIS STRUCTURAL AND COLLATERAL TERM SHEET IS NOT COMPLETE AND MAY BE AMENDED PRIOR TO THE TIME OF SALE. THIS TERM SHEET IS NOT AN OFFER TO SELL THESE SECURITIES AND IT IS NOT A SOLICITATION OF AN OFFER TO BUY THESE SECURITIES IN ANY JURISDICTION WHERE THE OFFER OR SALE IS NOT PERMITTED.
90
KONICA MINOLTA BUSINESS SOLUTIONS HQ
Operating History and Underwritten Net Cash Flow. The following table presents certain information relating to the underwritten net cash flow at the Konica Minolta Business Solutions HQ Property:
Cash Flow Analysis(1)
| U/W | % of U/W Effective Gross Income | U/W $ per SF | |||||||
| Base Rent(2) | $3,158,206 | 101.4 | % | $11.36 | |||||
| Grossed Up Vacant | 0 | 0.0 | 0.00 | ||||||
| Expense Recoveries | 119,538 | 3.8 | 0.43 | ||||||
| Less Vacancy & Credit | (163,887 | )(3) | (5.3 | ) | (0.59 | ) | |||
| Effective Gross Income | $3,113,857 | 100.0 | % | $11.20 | |||||
| Total Operating Expenses | $77,846 | 2.5 | % | $0.28 | |||||
| Net Operating Income | $3,036,010 | 97.5 | % | $10.92 | |||||
| TI/LC | 0 | 0.0 | 0.00 | ||||||
| Capital Expenditures | 41,691 | 1.3 | 0.15 | ||||||
| Net Cash Flow | $2,994,319 | 96.2 | % | $10.77 | |||||
| NOI DSCR | 1.85 | x | |||||||
| NCF DSCR | 1.83 | x | |||||||
| NOI DY | 9.1 | % | |||||||
| NCF DY | 9.0 | % | |||||||
| (1) | Historical financials are not available as the Konica Minolta Business Solutions HQ Property was recently acquired. |
| (2) | U/W Base Rent includes $296,270 of straight line rent for KMBS. |
| (3) | The underwritten economic vacancy is 5.0%. The Konica Minolta Business Solutions HQ Property was 100.0% leased as of May 1, 2018. |
Appraisal. As of the appraisal valuation date of March 1, 2018 the Konica Minolta Business Solutions HQ Property had an “as-is” appraised value of $48,700,000. In addition, the appraisal for the Konica Minolta Business Solutions HQ Property set forth a “hypothetical go-dark” appraised value of $28,900,000 as of March 1, 2018, which equates to a “hypothetical go-dark” loan-to-value ratio of 115.1%.
Environmental Matters. According to the Phase I environmental site assessment dated February 26, 2018, there are no recognized environmental conditions at the Konica Minolta Business Solutions HQ Property.
Market Overview and Competition.The Konica Minolta Business Solutions HQ Property is located in the northeastern portion of Ramsey, New Jersey, which is part of the Northern Bergen County office and industrial submarkets. According to the appraisal, Bergen County reported an estimated 2017 population of 950,113, which represents an approximately 0.7% annual growth rate from the reported 2010 population of 905,116. The Bergen County annual population growth rate exceeded the State of New Jersey annual growth rate of 0.5%. As of April 2017, Bergen County had an unemployment rate of 3.2%, which is less than the 3.9% unemployment rate of New Jersey.
The Konica Minolta Business Solutions HQ Property is located in the North New Jersey metropolitan statistical area. According to the appraisal, the North New Jersey metropolitan statistical area class B/C office market reported a 21.0% vacancy rate in 2017 and an effective market rent of $24.52 per square foot. Also according to the appraisal, the North New Jersey metropolitan statistical area industrial market reported a market vacancy of 8.9% in 2017 and an effective market rent of $5.67 per square foot. The Konica Minolta Business Solutions Property is 100.0% leased with an underwritten base rent of $11.36 per square foot. According to a third party market research report, the estimated 2017 population within a one-, three- and five-mile radius of the Konica Minolta Business Solutions HQ Property was 8,960, 65,828 and 165,531, respectively, and the 2017 estimated median household income within the same radii was $110,683, $115,221 and $106,456, respectively.
THE INFORMATION IN THIS STRUCTURAL AND COLLATERAL TERM SHEET IS NOT COMPLETE AND MAY BE AMENDED PRIOR TO THE TIME OF SALE. THIS TERM SHEET IS NOT AN OFFER TO SELL THESE SECURITIES AND IT IS NOT A SOLICITATION OF AN OFFER TO BUY THESE SECURITIES IN ANY JURISDICTION WHERE THE OFFER OR SALE IS NOT PERMITTED.
91
KONICA MINOLTA BUSINESS SOLUTIONS HQ
The following tables present certain information relating to comparable office leases and comparable industrial leases for the Konica Minolta Business Solutions HQ Property:
Comparable Office Leases(1)
| Property Name/Location | Distance from Subject | Tenant Name | Lease Date/Term | Lease Area (SF) | Annual Base Rent PSF |
100 Paragon Drive Montvale, NJ | 4.0 miles | Sharp Electronics Corporation | Aug. 2016 / 12.3 Yrs. | 83,377 | $21.00 |
10 Sharp Plaza Mahwah, NJ | 3.0 miles | Jaguar Land Rover North | Jul. 2016 / 21.0 Yrs. | 147,000 | $15.00 |
Mountainview Executive Park Upper Saddle River, NJ | 0.9 miles | Stryker | May 2016 / 4.1 Yrs. | 22,081 | $22.50 |
The Atrium Paramus, NJ | 11.1 miles | Hanjin-NYCNA | May 2016 / 5 Yrs. | 25,637 | $22.50 |
| (1) | Information obtained from the appraisal. |
Comparable Industrial Leases(1)
| Property Name/Location | Distance from Subject | Tenant Name | Lease Date/Term | Lease Area (SF) | Annual Base Rent PSF |
1200 Valley Brook Avenue Lyndhurst, NJ | 18.9 miles | UPS | Nov. 2017 / 7.0 Yrs. | 115,095 | $8.50 |
600 Gotham Parkway Carlstadt, NJ | 17.2 miles | Mass Movement | Jun. 2017 / 5.0 Yrs. | 51,095 | $7.40 |
Harmon Cove Industrial Park – 550 Secaucus, NJ | 20.6 miles | Zara | Sept. 2016 / 3.0 Yrs. | 83,000 | $7.75 |
25 & 41 Madison Road Totowa, NJ | 12.6 miles | Corbion | Mar. 2016 / 5.0 Yrs. | 66,157 | $8.50 |
Bergen Logistics North Bergen, NJ | 19.2 miles | Bergen Shippers Corp. | Jan. 2016 / 12.1 Yrs. | 130,000 | $6.25 |
| (1) | Information obtained from the appraisal. |
The Borrower.The borrower is LCN KMI Ramsey NJ LLC, a single purpose Delaware limited liability company with one independent director. Legal counsel to the borrower delivered a non-consolidation opinion in connection with the origination of the Konica Minolta Business Solutions HQ Mortgage Loan. LCN North American Fund II REIT is the guarantor of certain nonrecourse carveouts under the Konica Minolta Business Solutions HQ Mortgage Loan.
The Borrower Sponsor. The borrower sponsor is LCN North American Fund II REIT (“LCN”), which specializes in sale-leaseback and build-to-suit markets. Founded in 2011, LCN has over $1.2 billion in discretionary equity capital committed and owns over $2.0 billion in real estate assets. Edward LaPuma is the co-founder and managing partner of LCN. Prior to co-founding LCN, Mr. LaPuma originated, negotiated and closed over $2.3 billion in sale-leaseback and net lease investments across North America, Europe and Asia. LCN’s portfolio is comprised of office, industrial, retail, and special purpose properties with lease terms of generally greater than 15 years on a triple net basis.
Escrows.The Konica Minolta Business Solutions HQ Mortgage Loan documents require monthly reserve deposits for real estate taxes upon any of the following occurring: (i) an event of default, (ii) the KMBS lease no longer being in full force and effect, (iii) KMBS failing to pay taxes prior to delinquency, or (iv) the KMBS lease not being triple net, with all expenses being paid directly or maintained by the tenant. The Konica Minolta Business Solutions HQ Mortgage Loan documents require monthly reserve deposits for insurance premiums upon any of the following occurring: (i) an event of default, (ii) the KMBS lease no longer being in full force and effect, (iii) the borrower not providing proof of timely payment at least ten days prior to the scheduled policy expiration date or (iv) the KMBS lease not being triple net, with all expenses being paid directly or maintained by the tenant. The Konica Minolta Business Solutions HQ Mortgage Loan documents require monthly reserve deposits for replacement reserves upon any of the following occurring: (i) an event of default (ii) the KMBS lease no longer being in full force and effect, or (iii) lender’s reasonable determination that the Konica Minolta Business Solutions HQ Property is not being maintained by the tenant in accordance with the lease or as required by the loan documents (subject, in each case, to a 30 day cure period). On each monthly payment date when KMBS makes its quarterly rent payment, the borrower is required to deposit into the reserve account the projected monthly debt service payment for the two succeeding monthly payment dates.
Lockbox and Cash Management. The Konica Minolta Business Solutions HQ Mortgage Loan requires a lender-controlled lockbox account (the “Konica Minolta Business Solutions HQ Loan Lockbox”), which is already in place with upfront cash management. Unless a Cash Flow Sweep Event Period (defined below) exists, all excess cash flow in the Konica Minolta Business Solutions HQ Mortgage
THE INFORMATION IN THIS STRUCTURAL AND COLLATERAL TERM SHEET IS NOT COMPLETE AND MAY BE AMENDED PRIOR TO THE TIME OF SALE. THIS TERM SHEET IS NOT AN OFFER TO SELL THESE SECURITIES AND IT IS NOT A SOLICITATION OF AN OFFER TO BUY THESE SECURITIES IN ANY JURISDICTION WHERE THE OFFER OR SALE IS NOT PERMITTED.
92
KONICA MINOLTA BUSINESS SOLUTIONS HQ
Loan Lockbox after payment of all sums due and payable under the Konica Minolta Business Solutions HQ Mortgage Loan documents will be remitted to the borrower. During a Cash Flow Sweep Event Period, all excess cash flow in the Konica Minolta Business Solutions HQ Mortgage Loan Lockbox after payment of all sums due and payable under the Konica Minolta Business Solutions HQ Mortgage Loan documents will be retained by the lender as additional collateral. Notwithstanding the foregoing, if the Cash Flow Sweep Event Period is caused solely with regard to an event described in clause (v) below, when the amount of excess cash flow held by the lender is equal to or greater than an amount equal to (x) the outstanding principal balance of the Konica Minolta Business Solutions HQ Mortgage Loan less (y) the “dark value” of the Konica Minolta Business Solutions HQ Property (as set forth in an updated appraisal), all additional excess cash flow shall be remitted to the borrower.
A “Cash Flow Sweep Event Period” will commence upon the earliest to occur of any of the following: (i) an event of default under the loan agreement or management agreement; (ii) the net cash flow debt service coverage ratio for the Konica Minolta Business Solutions HQ Property falling below 1.15x; (iii) KMBS going dark, ceasing to conduct, or giving notice of its intent to cease to conduct, its normal business operations; (iv) KMBS (or its parent) becoming insolvent or filing for bankruptcy;(v) KMBS subleasing substantially all of its leased premises at a rent that is less than 75% of the in-place KMBS rent at the time and either of KMBS (if rated) or Konica Minolta Inc. having its senior unsecured debt rating fall below an Investment Grade Rating provided that the amount of excess cash flow swept shall be limited to the difference between the outstanding loan amount and the dark value of the Konica Minolta Business Solutions HQ Property (established by an updated appraisal obtained by the lender); and/or (vi) a material default by the tenant under the KMBS lease or any replacement lease. A Cash Flow Sweep Event Period will end: with regard to clause (i), upon the cure of such event of default; with regard to clause (ii), upon the net cash flow debt service coverage ratio being at least 1.20x for one calendar quarter; with regard to clause (iii), upon (1) KMBS revoking such notices, if applicable, and reoccupying at least 75% of the Konica Minolta Business Solutions HQ Property, the net cash flow debt service coverage ratio being at least 1.50x, and KMBS having paid full, unabated rent with respect to such space for one quarter and having delivered an acceptable estoppel certificate,(2) the Konica Minolta Business Solutions HQ Property having been re-tenanted in accordance with the Konica Minolta Business Solutions HQ Mortgage Loan documents or (3) the borrower having delivered and continuing to deliver on an advance rolling 12 month basis a letter of credit in the amount of projected excess cash flow for the succeeding 12-month period for the lender to hold as additional collateral for the loan; with regard to clause (iv), upon KMBS (or its parent) having become solvent for one quarter or no longer being a debtor in a bankruptcy action and having affirmed its lease; with regard to clause (v), upon KMBS or Konica Minolta Inc. having achieved its Investment Grade Rating status for one quarter and paying full rent as evidenced by an acceptable estoppel or the Konica Minolta Business Solutions HQ Property having been re-tenanted in accordance with the loan documents; and with regard to clause (vi), upon the default having been cured and no other default having occurred under the lease for one quarter or the Konica Minolta Business Solutions HQ Property having been re-tenanted in accordance with the loan documents.
Property Management. The Konica Minolta Business Solutions HQ Property is self-managed.
Assumption. The borrower has an unlimited right to transfer the Konica Minolta Business Solutions HQ Property, provided that certain conditions are satisfied, including that (i) no event of default has occurred and is continuing; (ii) the lender reasonably determines that the proposed transferee and guarantor satisfy the lender’s credit review and underwriting standards, taking into consideration the transferee’s experience, financial strength and general business standing and (iii) the lender has received confirmation from, the applicable rating agencies that such assumption will not result in a downgrade, withdrawal or qualification of the respective ratings assigned to the Series WFCM 2018-C44 certificates.
Partial Release. Not permitted.
Real Estate Substitution.Not permitted.
Subordinate and Mezzanine Indebtedness.Not permitted.
Ground Lease. None.
Right of First Offer.KMBS has an ongoing right of first offer to purchase the Konica Minolta Business Solutions HQ Property if the borrower decides to market the Konica Minolta Business Solutions HQ Property for sale. The right of first offer is not extinguished by foreclosure or transfer in lieu of foreclosure (unless the event of default that resulted in such foreclosure or transfer in lieu of foreclosure was directly caused by an event of default under the KMBS lease); however, the right of first offer does not apply to a foreclosure or transfer in lieu of foreclosure with respect to the Konica Minolta Business Solutions HQ Mortgage Loan or the first conveyance thereafter.
Terrorism Insurance.The Konica Minolta Business Solutions HQ Mortgage Loan documents require that the “all risk” insurance policy required to be maintained by the borrower provide coverage for terrorism in an amount equal to the full replacement cost of the Konica Minolta Business Solutions HQ Property, as well as loss of rents and/or business interruption insurance for a period no less than 18 months following the occurrence of a casualty event together with a twelve -month extended period of indemnity.
THE INFORMATION IN THIS STRUCTURAL AND COLLATERAL TERM SHEET IS NOT COMPLETE AND MAY BE AMENDED PRIOR TO THE TIME OF SALE. THIS TERM SHEET IS NOT AN OFFER TO SELL THESE SECURITIES AND IT IS NOT A SOLICITATION OF AN OFFER TO BUY THESE SECURITIES IN ANY JURISDICTION WHERE THE OFFER OR SALE IS NOT PERMITTED.
93
(THIS PAGE INTENTIONALLY LEFT BLANK)
THE INFORMATION IN THIS STRUCTURAL AND COLLATERAL TERM SHEET IS NOT COMPLETE AND MAY BE AMENDED PRIOR TO THE TIME OF SALE. THIS TERM SHEET IS NOT AN OFFER TO SELL THESE SECURITIES AND IT IS NOT A SOLICITATION OF AN OFFER TO BUY THESE SECURITIES IN ANY JURISDICTION WHERE THE OFFER OR SALE IS NOT PERMITTED.
94
| 181 FREMONT STREET |

THE INFORMATION IN THIS STRUCTURAL AND COLLATERAL TERM SHEET IS NOT COMPLETE AND MAY BE AMENDED PRIOR TO THE TIME OF SALE. THIS TERM SHEET IS NOT AN OFFER TO SELL THESE SECURITIES AND IT IS NOT A SOLICITATION OF AN OFFER TO BUY THESE SECURITIES IN ANY JURISDICTION WHERE THE OFFER OR SALE IS NOT PERMITTED.
95
| 181 FREMONT STREET |
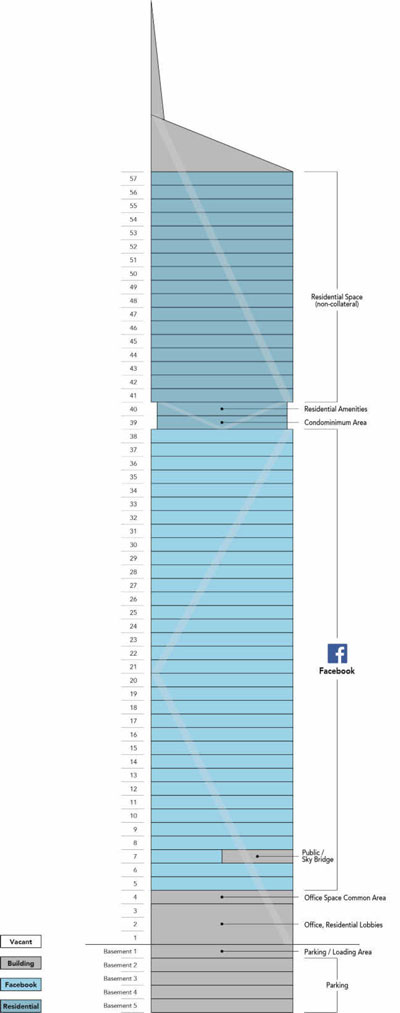
THE INFORMATION IN THIS STRUCTURAL AND COLLATERAL TERM SHEET IS NOT COMPLETE AND MAY BE AMENDED PRIOR TO THE TIME OF SALE. THIS TERM SHEET IS NOT AN OFFER TO SELL THESE SECURITIES AND IT IS NOT A SOLICITATION OF AN OFFER TO BUY THESE SECURITIES IN ANY JURISDICTION WHERE THE OFFER OR SALE IS NOT PERMITTED.
96
| 181 FREMONT STREET |
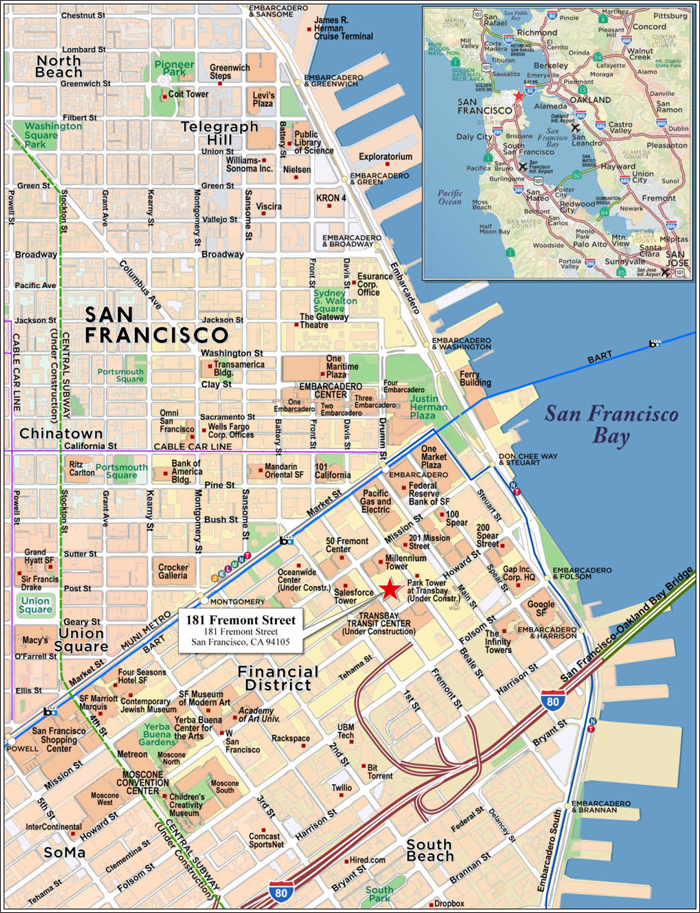
THE INFORMATION IN THIS STRUCTURAL AND COLLATERAL TERM SHEET IS NOT COMPLETE AND MAY BE AMENDED PRIOR TO THE TIME OF SALE. THIS TERM SHEET IS NOT AN OFFER TO SELL THESE SECURITIES AND IT IS NOT A SOLICITATION OF AN OFFER TO BUY THESE SECURITIES IN ANY JURISDICTION WHERE THE OFFER OR SALE IS NOT PERMITTED.
97
| No. 7 – 181 Fremont Street | ||||||||
| Loan Information | Property Information | |||||||
| Mortgage Loan Seller: | Barclays Bank PLC | Single Asset/Portfolio: | Single Asset | |||||
| Credit Assessment | Property Type: | Office | ||||||
| (DBRS/Fitch/Moody’s): | (AA/BBB-/NR) | Specific Property Type: | CBD | |||||
| Original Principal Balance(1): | $30,000,000 | Location: | San Francisco, CA | |||||
| Cut-off Date Balance(1): | $30,000,000 | Size: | 436,332 SF | |||||
| % of Initial Pool Balance: | 3.9% | Cut-off Date Balance Per SF(1): | $572.96 | |||||
| Loan Purpose: | Refinance | Year Built/Renovated: | 2018/NAP | |||||
| Borrower Name: | 181 Fremont Office LLC | Title Vesting: | Fee | |||||
| Borrower Sponsor: | Joseph K. Paul | Property Manager: | Self-managed | |||||
| Mortgage Rate: | 3.7086% | 4thMost Recent Occupancy (As of)(5): | NAP | |||||
| Note Date: | March 29, 2018 | 3rdMost Recent Occupancy (As of)(5): | NAP | |||||
| Anticipated Repayment Date: | April 6, 2028 | 2ndMost Recent Occupancy (As of)(5): | NAP | |||||
| Maturity Date: | April 6, 2031 | Most Recent Occupancy (As of)(5): | NAP | |||||
| IO Period: | 120 months | Current Occupancy (As of): | 100.0% (5/1/2018) | |||||
| Loan Term (Original): | 120 months | |||||||
| Seasoning: | 1 month | |||||||
| Amortization Term (Original): | NAP | Underwriting and Financial Information: | ||||||
| Loan Amortization Type: | Interest-only, ARD | 4thMost Recent NOI (As of)(5): | NAP | |||||
| Interest Accrual Method: | Actual/360 | 3rdMost Recent NOI (As of)(5): | NAP | |||||
| Call Protection(2): | L(23),GRTR 1% or YM(2),GRTR 1% | 2ndMost Recent NOI (As of)(5): | NAP | |||||
| or YM or D(88),O(7) | Most Recent NOI (As of)(5): | NAP | ||||||
| Lockbox Type: | Hard/Upfront Cash Management | |||||||
| Additional Debt(1): | Yes | |||||||
| Additional Debt Type(1)(3): | Pari Passu; Mezzanine | U/W Revenues: | $43,664,053 | |||||
| U/W Expenses: | $14,094,390 | |||||||
| U/W NOI: | $29,569,663 | |||||||
| U/W NCF: | $29,482,397 | |||||||
| Escrows and Reserves(4): | U/W NOI DSCR(1): | 3.15x | ||||||
| U/W NCF DSCR(1): | 3.14x | |||||||
| Type: | Initial | Monthly | Cap (If Any) | U/W NOI Debt Yield(1): | 11.8% | |||
| Taxes | $0 | $509,418 | NAP | U/W NCF Debt Yield(1): | 11.8% | |||
| Insurance | $0 | Springing | NAP | Appraised Value(6): | $632,000,000 | |||
| Replacement Reserves | $0 | Springing | NAP | Appraisal Valuation Date(6): | March 1, 2021 | |||
| Rent Concessions Reserve | $68,379,092 | $0 | NAP | Cut-off Date LTV Ratio(1): | 39.6% | |||
| TI/LC Reserve | $42,717,266 | $0 | NAP | LTV Ratio at ARD(1): | 39.6% | |||
| (1) | See “The Mortgage Loan” section. All statistical information related to balance per square foot, loan-to-value ratios, debt service coverage ratios and debt yields are based on the 181 Fremont Street Whole Loan (as defined below). The Cut-off Date LTV Ratio, LTV Ratio at ARD, U/W NCF DSCR and U/W NOI Debt Yield based on the 181 Fremont Street Whole Loan and the 181 Fremont Street Mezzanine Loans (as defined below) (together, the “181 Fremont Street Total Debt”), are 75.2%, 75.2%, 1.38x and 6.2%, respectively. |
| (2) | Defeasance of the 181 Fremont Street Mortgage Loan (as defined below) is permitted at any time after the earlier to occur of (i) two years after the closing date of the securitization that includes the last note to be securitized or (ii) March 29, 2021. The assumed lockout period applicable to defeasance of 25 payments is based on the expected WFCM 2018-C44 securitization trust closing date in May 2018. |
| (3) | See “Subordinate and Mezzanine Indebtedness” section. |
| (4) | See “Escrows” section. |
| (5) | Historical occupancy, operating and financial information is unavailable as the 181 Fremont Street Property (as defined below) was built in 2018. |
| (6) | See “Appraisal” section. The appraised value shown is a prospective market value that assumes the 181 Fremont Street Property is complete and/or achieves stabilization as of March 1, 2021, the date upon which all free rent burns off. The As-Is Appraised Value is $461,000,000 as of February 28, 2018 and is inclusive of deductions for free rent, tenant improvement and leasing commission (“TI/LC”) obligations, equating to a Cut-off Date LTV Ratio and LTV Ratio at ARD of 54.2%.The borrower deposited upfront reserves totaling $111,096,358 for such contractual TI/LC obligations and free rent (see “Escrows” section). |
The Mortgage Loan.The mortgage loan (the “181 Fremont Street Mortgage Loan”) is part of a whole loan (the “181 Fremont Street Whole Loan”) evidenced by sevenpari passu notes secured by a first mortgage encumbering the fee simple interest in the Class A office condominium portion of 181 Fremont Street in San Francisco, California (the “181 Fremont Street Property”). The 181 Fremont Street Whole Loan was co-originated on March 29, 2018 by Barclays Bank PLC and Deutsche Bank AG, acting through its New York Branch. The 181 Fremont Street Whole Loan had an original principal balance of $250,000,000, has an outstanding principal balance as of the Cut-off Date of $250,000,000 and accrues interest at an interest rate of 3.70860%per annum(the “Initial Interest Rate”) through the anticipated repayment date (the “ARD”). The ARD is April 6, 2028 and the final maturity date is April 6, 2031. In the event that the 181 Fremont Street Whole Loan is not repaid in full on or prior to the ARD, the 181 Fremont Street Whole Loan will accrue interest at aper annumrate equal to the greater of (a) the Initial Interest Rate plus 1.5000%, (b) the swap rate as determined in the 181 Fremont Street Whole Loan documents on the ARD plus 2.4146% or (c) when applicable, the default rate as defined in the 181 Fremont Street Whole Loan documents (the “Adjusted Interest Rate”); however, interest accrued at the excess of the Adjusted Interest Rate over the Initial Interest Rate (the “Accrued Interest”) will be deferred. In addition, from and after the ARD, all excess cash flow from the 181 Fremont Street Property after the payment of reserves, interest calculated at the
THE INFORMATION IN THIS STRUCTURAL AND COLLATERAL TERM SHEET IS NOT COMPLETE AND MAY BE AMENDED PRIOR TO THE TIME OF SALE. THIS TERM SHEET IS NOT AN OFFER TO SELL THESE SECURITIES AND IT IS NOT A SOLICITATION OF AN OFFER TO BUY THESE SECURITIES IN ANY JURISDICTION WHERE THE OFFER OR SALE IS NOT PERMITTED.
98
| 181 FREMONT STREET |
Initial Interest Rate, debt service on the 181 Fremont Street Mezzanine Loans and operating expenses will be applied (i)firstto repay the principal balance of the 181 Fremont Street Whole Loan and (ii)second to the payment of Accrued Interest. See “Description of the Mortgage Pool—The Whole Loans—The Serviced Pari Passu Whole Loans—the 181 Fremont Street Whole Loan” and “Pooling and Servicing Agreement” in the Preliminary Prospectus.
Note A-6-1, which will be contributed to the WFCM 2018-C44 Trust, had an original principal balance of $30,000,000, has an outstanding principal balance as of the Cut-off Date of $30,000,000 and represents a non-controlling interest in the 181 Fremont Street Whole Loan. The controlling Note A-1 and the non-controlling Notes A-2, A-3, A-4 and A-5 had an aggregate original principal balance of $200,000,000, have an aggregate outstanding principal balance as of the Cut-off Date of $200,000,000, are currently held by Deutsche Bank AG, New York Branch and are expected to be contributed to one or more future securitizations. The non-controlling Note A-6-2 had an original principal balance of $20,000,000, has an outstanding principal balance as of the Cut-off Date of $20,000,000, is currently held by Barclays Bank PLC and is expected to be contributed to one or more future securitizations. The mortgage loans evidenced by Notes A-1, A-2, A-3, A-4, A-5 and A-6-2 are collectively referred to herein as the “181 Fremont Street Companion Loans”. The lender provides no assurances that any non-securitized notes will not be split further. See“Description of the Mortgage Pool—The Whole Loans—The Serviced Pari Passu Whole Loans” in the Preliminary Prospectus.
Note Summary(1)
| Notes | Original Balance | Note Holder | Controlling Interest | |
| A-1 | $50,000,000 | Deutsche Bank AG, New York Branch | Yes | |
| A-2 | $50,000,000 | Deutsche Bank AG, New York Branch | No | |
| A-3 | $30,000,000 | Deutsche Bank AG, New York Branch | No | |
| A-4 | $30,000,000 | Deutsche Bank AG, New York Branch | No | |
| A-5 | $40,000,000 | Deutsche Bank AG, New York Branch | No | |
| A-6-1 | $30,000,000 | WFCM 2018-C44 | No | |
| A-6-2 | $20,000,000 | Barclays Bank PLC | No | |
| Total | $250,000,000 |
(1) The lender provides no assurances that any non-securitizedpari passu note will not be split further.
Following the earlier to occur of (i) two years after the closing date of the securitization that includes the last note to be securitized or (ii) March 29, 2021, on any date before October 6, 2027, the borrower has the right to defease the 181 Fremont Street Whole Loan in whole, but not in part. On April 6, 2020 and on any business day thereafter, the borrower has the right to prepay the 181 Fremont Street Whole Loan in whole, provided that the borrower pays the greater of a yield maintenance premium or a prepayment premium equal to 1.0% of the principal amount being prepaid. The 181 Fremont Street Whole Loan is prepayable without penalty on or after October 6, 2027.
Sources and Uses
| Sources | Uses | |||||||
| Original whole loan amount | $250,000,000 | 52.6% | Loan payoff | $362,943,921 | 76.3% | |||
| Mezzanine loans | 225,000,000 | 47.3 | Reserves | 111,096,358 | 23.4 | |||
| Borrower sponsors’ new cash contribution | 695,692 | 0.1 | Closing costs | 1,655,413 | 0.3 | |||
| Total Sources | $475,695,692 | 100.0% | Total Uses | $475,695,692 | 100.0% |
The Property.The 181 Fremont Street Property comprises the office condominium portion of a 57-story Class A, LEED Platinum tower constructed in 2018 and located in downtown San Francisco, California (see “Condominium” section below). The 181 Fremont Street tower consists of 654,698 square feet of total gross building area, with 436,332 square feet allocated to office space on the first 38 stories (collateral for the 181 Fremont Street Whole Loan) and 120,457 square feet of space allocated to 67 luxury market rate residential units on floors 39 to 57 (non-collateral). The 181 Fremont Street tower is over 800 feet tall and offers unobstructed views of the San Francisco Bay and the waterfront. As of May 1, 2018, the 181 Fremont Street Property was 100.0% leased to Facebook, Inc. (“Facebook”) on a triple-net basis through February 2031, with two, five-year extension options and no early termination options.
The 181 Fremont Street Property is located in the South Financial District, three blocks from the San Francisco Bay and within two blocks of Market Street. According to the appraisal, the San Francisco Financial District is the most concentrated employment center in northern California with an employment base that supports a wide variety of commercial use. The 181 Fremont Street Property offers direct access to the new Transbay Transit Center and its elevated 5.4 acre park via a 7th floor skybridge. The new public transportation hub is expected to connect eight Bay Area counties through 11 transit systems, expected to open by 2019. The first phase of the project includes the five-story structure, active bus terminal, elevated park and over 100,000 square feet of retail space including dining, shopping and entertainment.
As of the origination date, Facebook has taken possession of the 181 Fremont Street Property and commenced the build out of its space. Outstanding rent concessions and tenant improvement allowances related to the Facebook lease were deposited into escrow by the borrower on the origination date (See “Escrows” section). According to the borrower sponsor, Facebook is expected to occupy the 181 Fremont Street Property in three phases with floors five through 13 being occupied in February 2019, floors 14 through 25 being occupied in March 2020 and floors 26 through 38 being occupied in March 2021. Floors two and three are partially open to the
THE INFORMATION IN THIS STRUCTURAL AND COLLATERAL TERM SHEET IS NOT COMPLETE AND MAY BE AMENDED PRIOR TO THE TIME OF SALE. THIS TERM SHEET IS NOT AN OFFER TO SELL THESE SECURITIES AND IT IS NOT A SOLICITATION OF AN OFFER TO BUY THESE SECURITIES IN ANY JURISDICTION WHERE THE OFFER OR SALE IS NOT PERMITTED.
99
| 181 FREMONT STREET |
first floor and also consist of residential storage and security offices. The fourth floor features bicycle storage, showers, storage and laundry areas.
Facebook is a technology company whose platforms allow users to communicate with family, friends and coworkers. Facebook currently shuttles thousands of employees to its Silicon Valley headquarters and is now adding a San Francisco footprint, as other technology companies have done, including Google and Apple. The 181 Fremont Street Property will be Facebook’s first outpost in San Francisco, housing between 2,000 and 3,000 employees by 2021 to support its growth. One of Facebook’s fast-growing divisions, Instagram, will be one of the groups to move a team into the 181 Fremont Street Property. Daily and monthly active users across Facebook’s platforms were up approximately 14.0% in 2017 year-over-year. As of December 2017, there were 2.1 billion active users on Facebook each month, as of January 2018 there were 1.5 billion active users on WhatsApp (owned by Facebook) each month, and as of September 2017 there were 800 million active users on Instagram each month. Facebook reported 2017 revenue of approximately $40.7 billion, up approximately 47.1% over 2016, which is primarily attributable to approximately $39.9 billion of advertising revenue. Additionally, Facebook reported net income of approximately $15.9 billion in 2017, up approximately 56.0% from 2016.
The following table presents certain information relating to the tenancy at the 181 Fremont Street Property:
Major Tenants
| Tenant Name | Credit Rating (Fitch/Moody’s/S&P) | Tenant NRSF | % of NRSF | Annual U/W Base Rent PSF(1)(2) | Annual U/W Base Rent(1)(2) | % of Total Annual U/W Base Rent(1)(2) | Lease Expiration Date |
| Major Tenant | |||||||
| Facebook, Inc. | NR/NR/NR | 436,332 | 100.0% | $72.22 | $31,511,897 | 100.0% | 2/28/2031(3) |
| Total Major Tenant | 436,332 | 100.0% | $72.22 | $31,511,897 | 100.0% | ||
| Vacant Space | 0 | 0.0% | |||||
| Collateral Total | 436,332 | 100.0% | |||||
| (1) | Annual U/W Base Rent PSF and Annual U/W Base Rent include $4,546,579 of straight-line rent through the maturity date of the Facebook lease. |
| (2) | Facebook has rent abatements through 2021, all of which were deposited into escrow on the origination date. |
| (3) | Facebook has two, five-year lease renewal options. |
The following table presents certain information relating to the lease rollover schedule at the 181 Fremont Street Property:
Lease Expiration Schedule(1)
| Year Ending December 31, | No. of Leases Expiring | Expiring NRSF | % of Total NRSF | Cumulative Expiring NRSF | Cumulative % of Total NRSF | Annual U/W Base Rent(2) | % of Annual U/W Base Rent(2) | Annual U/W Base Rent PSF(2) |
| MTM | 0 | 0 | 0.0% | 0 | 0.0% | $0 | 0.0% | $0.00 |
| 2018 | 0 | 0 | 0.0% | 0 | 0.0% | $0 | 0.0% | $0.00 |
| 2019 | 0 | 0 | 0.0% | 0 | 0.0% | $0 | 0.0% | $0.00 |
| 2020 | 0 | 0 | 0.0% | 0 | 0.0% | $0 | 0.0% | $0.00 |
| 2021 | 0 | 0 | 0.0% | 0 | 0.0% | $0 | 0.0% | $0.00 |
| 2022 | 0 | 0 | 0.0% | 0 | 0.0% | $0 | 0.0% | $0.00 |
| 2023 | 0 | 0 | 0.0% | 0 | 0.0% | $0 | 0.0% | $0.00 |
| 2024 | 0 | 0 | 0.0% | 0 | 0.0% | $0 | 0.0% | $0.00 |
| 2025 | 0 | 0 | 0.0% | 0 | 0.0% | $0 | 0.0% | $0.00 |
| 2026 | 0 | 0 | 0.0% | 0 | 0.0% | $0 | 0.0% | $0.00 |
| 2027 | 0 | 0 | 0.0% | 0 | 0.0% | $0 | 0.0% | $0.00 |
| 2028 | 0 | 0 | 0.0% | 0 | 0.0% | $0 | 0.0% | $0.00 |
| Thereafter | 1 | 436,332 | 100.0% | 436,332 | 100.0% | $31,511,897 | 100.0% | $72.22 |
| Vacant | 0 | 0 | 0.0% | 436,332 | 100.0% | $0 | 0.0% | $0.00 |
| Total/Weighted Average | 1 | 436,332 | 100.0% | $31,511,897 | 100.0% | $72.22 |
| (1) | Information obtained from the underwritten rent roll. |
| (2) | Annual U/W Base Rent, % of Annual U/W Base Rent and Annual U/W Base Rent PSF include $4,546,579 of straight-line rent through the maturity date of the Facebook lease. |
THE INFORMATION IN THIS STRUCTURAL AND COLLATERAL TERM SHEET IS NOT COMPLETE AND MAY BE AMENDED PRIOR TO THE TIME OF SALE. THIS TERM SHEET IS NOT AN OFFER TO SELL THESE SECURITIES AND IT IS NOT A SOLICITATION OF AN OFFER TO BUY THESE SECURITIES IN ANY JURISDICTION WHERE THE OFFER OR SALE IS NOT PERMITTED.
100
| 181 FREMONT STREET |
The following table presents historical occupancy percentages at the 181 Fremont Street Property:
Historical Occupancy
12/31/2014(1) | 12/31/2015(1) | 12/31/2016(1) | 12/31/2017(1) | 5/1/2018(2) |
| NAP | NAP | NAP | NAP | 100.0% |
| (1) | Historical Occupancy prior to 5/1/2018 is not applicable as the 181 Fremont Street Property was built in 2018. |
| (2) | Information obtained from the underwritten rent roll. |
Underwritten Net Cash Flow. The following table presents certain information relating to the underwritten net cash flow at the 181 Fremont Street Property:
Cash Flow Analysis(1)
| U/W | % of U/W Effective Gross Income | U/W $ per SF | |
| Base Rent(2) | $31,511,897 | 72.2% | $72.22 |
| Grossed Up Vacant Space | 0 | 0.0 | 0.00 |
| Total Reimbursables | 13,502,591 | 30.9 | 30.95 |
| Less Vacancy & Credit Loss(3) | (1,350,435) | (3.1) | (3.09) |
| Effective Gross Income | $43,664,053 | 100.0% | $100.07 |
| Total Operating Expenses | $14,094,390 | 32.3% | $32.30 |
| Net Operating Income | $29,569,663 | 67.7% | $67.77 |
| TI/LC | 0 | 0.0 | 0.00 |
| Capital Expenditures | 87,266 | 0.2 | 0.20 |
| Net Cash Flow | $29,482,397 | 67.5% | $67.57 |
| NOI DSCR(4) | 3.15x | ||
| NCF DSCR(4) | 3.14x | ||
| NOI DY(4) | 11.8% | ||
| NCF DY(4) | 11.8% |
| (1) | Historical Cash Flows are not available as the 181 Fremont Street Property was built in 2018. |
| (2) | U/W Base Rent includes $4,546,579 of straight-line rent through the maturity date of the Facebook lease. |
| (3) | The underwritten economic vacancy is 3.0%. The 181 Fremont Street Property was 100.0% leased as of May 1, 2018. |
| (4) | Debt service coverage ratios and debt yields are based on the 181 Fremont Street Whole Loan. |
Appraisal.The appraiser concluded to an appraised value of $632,000,000 with a valuation date of March 1, 2021 which assumes the 181 Fremont Street Property is complete and/or achieves stabilization. Facebook is expected to be in full occupancy of their leased space by March 2021. As of the appraisal valuation date of February 28, 2018 the 181 Fremont Street Property had an “as-is” appraised value of $461,000,000 and is inclusive of deductions for free rent, tenant improvement and leasing commission (“TI/LC”) obligations. The borrower deposited upfront reserves totaling $111,096,358 for such contractual TI/LC obligations and free rent (see “Escrows” section). The appraiser also concluded to a “hypothetical go dark” appraised value of $522,000,000, equating to a Cut-off Date LTV Ratio and LTV Ratio at ARD of 47.9%.
Environmental Matters. According to a Phase I environmental site assessment dated March 7, 2018, there was no evidence of any recognized environmental conditions at the 181 Fremont Street Property.
Market Overview and Competition.The 181 Fremont Street Property is located in the South Financial District of downtown San Francisco, California, three blocks from the San Francisco Bay and within two blocks of Market Street. According to the appraisal, the area immediately surrounding the 181 Fremont Street Property is approximately 98% built up, predominantly consisting of mid- and high-rise office and residential buildings, with few redevelopment sites available for re-use. Immediately north of the 181 Fremont Street Property is the Transbay Terminal, which is currently under construction and expected to open by 2019. Once complete, the Transbay Terminal is expected to be the bus and rail transportation hub of the Bay Area and has been proposed to be the termination point for the high-speed rail system planned between San Francisco and Los Angeles.
According to the appraisal, the 181 Fremont Street Property is located within the South Financial District office submarket. The South Financial District office submarket had fourth quarter 2017 inventory of approximately 15,384,000 square feet with a 7.6% vacancy rate and average asking rents of $72.94 PSF, as compared to the broader San Francisco office market which had a 9.8% vacancy rate and average asking rents of $56.66 PSF for the same period. The estimated 2017 population within a 1.0-, 3.0- and 5.0-mile radius around the 181 Fremont Street Property was 66,410, 369,991 and 636,799, respectively, reflective of a population compound growth rate from 2010 to 2017 of 1.6%, 1.5% and 1.3%, respectively. The estimated 2017 median household income within the same radii was $59,179, $78,089 and $82,936, respectively.
THE INFORMATION IN THIS STRUCTURAL AND COLLATERAL TERM SHEET IS NOT COMPLETE AND MAY BE AMENDED PRIOR TO THE TIME OF SALE. THIS TERM SHEET IS NOT AN OFFER TO SELL THESE SECURITIES AND IT IS NOT A SOLICITATION OF AN OFFER TO BUY THESE SECURITIES IN ANY JURISDICTION WHERE THE OFFER OR SALE IS NOT PERMITTED.
101
| 181 FREMONT STREET |
The following table presents certain information relating to comparable leases to the 181 Fremont Street Property:
Comparable Leases(1)
| Property Name/Location | Year Built | Stories | Total GLA (SF) | Tenant Name | Lease Date/Term | Lease Area (SF) | Annual Base Rent PSF | Lease Type |
Salesforce Tower San Francisco, CA | 2018 | 61 | 1,400,000 | Accenture | March 2017 / 61 Months | 100,630 | $52.00 | Net |
Two Rincon San Francisco, CA | 1989 | 6 | 326,001 | March 2017 / 132 Months | 166,460 | $52.00 | Net | |
Foundry Square IV San Francisco, CA | 2003 | 10 | 247,238 | Slack | January 2017 / 120 Months | 228,998 | $56.50 | Net |
Charles Schwab Plaza San Francisco, CA | 1973 | 17 | 417,266 | Charles Schwab | December 2016 / 120 Months | 359,000 | $50.00 | Net |
First Market Tower San Francisco, CA | 1973 | 39 | 1,034,329 | Merrill Lynch | December 2016 / 72 Months | 121,000 | $40.00 | Net |
350 Bush San Francisco, CA | 2018 | 19 | 386,907 | Twitch | November 2017 / 120 Months | 178,000 | $62.00 | Net |
| Confidential | May 2018 / 136 Months | 145,217 | $67.00 | Net | ||||
| Confidential | October 2018 / 128 Months | 52,880 | $69.00 | Net |
(1) Information obtained from the appraisal.
The Borrower.The borrower for the 181 Fremont Street Whole Loan is 181 Fremont Office LLC, a Delaware limited liability company and a special purpose entity with two independent directors. Legal counsel to the borrower delivered a non-consolidation opinion in connection with the origination of the 181 Fremont Street Whole Loan. Paul Guarantor LLC, a Delaware limited liability company, is the guarantor of certain nonrecourse carveouts under the 181 Fremont Street Whole Loan (the “181 Fremont Street Guarantor”). The 181 Fremont Street Guarantor is wholly owned by the Jay Paul Revocable Living Trust, of which Jay Paul is trustee and grantor. The 181 Fremont Street Guarantor will be required to maintain a minimum net worth, excluding its interest in the 181 Fremont Street Property, of $475,000,000 and liquidity of at least $15,000,000.
The Borrower Sponsor.The borrower sponsor is Joseph K. Paul, the founder of the Jay Paul Company, a privately held, opportunity-driven real estate firm based in San Francisco, California. Founded in 1975, the Jay Paul Company concentrates on the acquisition, development, and management of commercial properties throughout California. The Jay Paul Company has developed over 11.0 million square feet of institutional quality space with an additional 6.0 million square feet of space in their development pipeline. The Jay Paul Company has built projects for Google, Apple, Amazon, Motorola, Microsoft, Northrop Grumman, HP, Ariba, Synopsys, Rambus, Nokia and Dreamworks, among others.
Escrows.The 181 Fremont Street Whole Loan documents provide for upfront reserves in the amount of $68,379,092 for outstanding rent concessions due under the Facebook lease and $42,717,266 for outstanding tenant improvements and leasing commissions relating to the Facebook space.
The 181 Fremont Street Whole Loan documents require monthly reserve deposits for real estate taxes in an amount equal to one-twelfth of the real estate taxes that the lender estimates will be payable during the next twelve months (initially $509,418). The 181 Fremont Street Whole Loan documents do not require ongoing monthly escrows for insurance premiums as long as the borrower provides the lender with evidence that the 181 Fremont Street Property is insured via an acceptable blanket insurance policy or insured under the condominium association policy, and in either case, such policy is in full force and effect. During the continuance of a Trigger Period (as defined below), the 181 Fremont Street Whole Loan documents require monthly reserve deposits for capital expenditures equal to $7,272 and the monthly amount due for common charges due to the condominium association.
Lockbox and Cash Management.The 181 Fremont Street Whole Loan is structured with a hard lockbox and an upfront cash management. The borrower was required at origination to deliver letters to all tenants at the 181 Fremont Street Property directing them to pay all rents directly into a lender-controlled lockbox account. All funds received by the borrower or the manager are required to be deposited in the lockbox account within one business day following receipt. Funds on deposit in the lockbox account are required to be swept on each business day into a lender-controlled cash management account and applied on each payment date to the payment of debt service, the funding of required reserves, budgeted monthly operating expenses, debt service on the 181 Fremont Street Mezzanine Loans (as defined below) and, during a Lease Sweep Period (as defined below), to the payment of an amount equal to $636,318 to fund a lease sweep reserve account (the “Lease Sweep Reserve Account”) until the aggregate funds swept in the Lease Sweep Reserve Account during such lease sweep equals the Lease Sweep Reserve Threshold (as defined below) and then to the debt service reserve account until the aggregate funds transferred to the Lease Sweep Reserve Account and the debt service reserve account during such lease sweep equals the Lease Sweep and Debt Service Reserve Cap (as defined below). Provided no Trigger Period (as defined below) is continuing, excess cash in the deposit account will be disbursed to the borrower in accordance with the 181 Fremont Street Whole Loan documents. If a Trigger Period is continuing (other than a Trigger Period due to a Lease Sweep Period), excess cash in the deposit account will be transferred to an account (the “Cash Collateral Account”) held by the lender as additional collateral for the 181 Fremont Street Whole Loan.
THE INFORMATION IN THIS STRUCTURAL AND COLLATERAL TERM SHEET IS NOT COMPLETE AND MAY BE AMENDED PRIOR TO THE TIME OF SALE. THIS TERM SHEET IS NOT AN OFFER TO SELL THESE SECURITIES AND IT IS NOT A SOLICITATION OF AN OFFER TO BUY THESE SECURITIES IN ANY JURISDICTION WHERE THE OFFER OR SALE IS NOT PERMITTED.
102
| 181 FREMONT STREET |
A “Trigger Period” will commence upon the earlier of the following:
| (i) | the ARD; |
| (ii) | an event of default under the 181 Fremont Street Whole Loan; |
| (iii) | as of the last day of any calendar quarter during the term of the 181 Fremont Street Whole Loan (a) the 181 Fremont Street Property not being fully leased to either Facebook or an investment grade tenant pursuant to a lease that is substantially on the same or better terms as the Facebook lease and (b) the debt service coverage ratio falling below 2.84x based on the 181 Fremont Street Whole Loan or 1.25x based on the 181 Fremont Street Total Debt (a “Low Debt Service Period”); |
| (iv) | the commencement of a Lease Sweep Period; or |
| (v) | an event of default under the 181 Fremont Street Mezzanine Loans. |
A Trigger Period will end:
| (a) | with regard to clause (i) above, upon the 181 Fremont Street Whole Loan being repaid in full, |
| (b) | with regard to clause (ii) and (v) above, upon the cure of such event of default; |
| (c) | with regard to clause (iii) above, upon the date that the debt service coverage ratio is at least 2.84x based on the 181 Fremont Street Whole Loan and 1.25x based on the 181 Fremont Street Total Debt for two consecutive calendar quarters; and |
| (d) | with regard to clause (iv) above, upon the ending of such Lease Sweep Period. |
A “Lease Sweep Period” will commence following the earliest to occur of any of the following (each a “Lease Sweep Trigger”):
| (i) | the date on which, with respect to any Lease Sweep Lease (as defined below), (a) a Lease Sweep Tenant Party (as defined below) cancels or terminates its Lease Sweep Lease with respect to all or a Material Termination Portion (as defined below) of the Lease Sweep Space (as defined below) subject to such Lease Sweep Lease prior to the then current expiration date under such Lease Sweep Lease, or (b) a Lease Sweep Tenant Party delivers to the borrower notice that it is canceling or terminating its Lease Sweep Lease with respect to all or a Material Termination Portion of the Lease Sweep Space subject to such Lease Sweep Lease (the affected space being the “Terminated Space”); provided, however, no Lease Sweep Period will commence pursuant to this clause (i) if, in connection with such termination or cancellation (or delivery of notice of termination or cancellation), the borrower simultaneously enters into a replacement lease with an entity or a wholly-owned subsidiary of an entity rated “BBB-” or equivalent by at least two of Fitch, Moody’s and S&P (an “Investment Grade Entity”) covering the Terminated Space, provided that such replacement lease is a qualified lease and the occupancy conditions, as specified in the 181 Fremont Street Whole Loan documents, are satisfied with respect to such replacement lease on or prior to the date of such termination or cancellation (or delivery of notice of termination or cancellation); |
| (ii) | the date on which, with respect to any Lease Sweep Lease, a Lease Sweep Tenant Party ceases operating its business (i.e., “goes dark”) at 20.0% or more of its Lease Sweep Space on a rentable square foot basis (a “Dark Period Event” and the affected space, the “Dark Space”), provided, however, that if the Lease Sweep Tenant Party either (a) is Facebook, (b) is an Investment Grade Entity or (c) has subleased the Dark Space portion of its premises to an Investment Grade Entity who has accepted delivery thereof (i.e., the lease has commenced) and is paying unabated rent at a contract rate no less than the contract rate required under the Lease Sweep Lease, such Lease Sweep Tenant Party will not be deemed to have “gone dark” for purposes of this clause (ii) and no Lease Sweep Period will commence pursuant to this clause (ii); |
| (iii) | an event of default under a Lease Sweep Lease by the tenant thereunder that continues beyond any applicable notice and cure period; |
| (iv) | a Lease Sweep Tenant Party being subject to an insolvency proceeding; or |
| (v) | the date on which Facebook becomes rated by at least two of Fitch, Moody’s and S&P and thereafter is no longer rated as an Investment Grade Entity (a “Facebook Downgrade Event”). |
A Lease Sweep Period (other than a Lease Sweep Period triggered by clause (iv) above) will not be triggered (or, if already triggered, may be terminated) if the borrower delivers to the lender an acceptable letter of credit in an amount equal to the applicable Lease Sweep and Debt Service Reserve Cap (as defined below).
A Lease Sweep Period will end on the earliest of the applicable of the following to occur:
| (a) | with regard to clauses (i) above, the date on which, with respect to each applicable Lease Sweep Space, one or more replacement tenants acceptable to the lender (in its sole but good faith discretion) execute and deliver replacement lease(s) covering the Requisite Lease Sweep Space (as defined below), provided that such replacement lease(s) are qualified leases and the occupancy conditions, as specified in the 181 Fremont Street Whole Loan documents, are satisfied; |
| (b) | with regard to clauses (ii) and (v) above, the date on which either (1) one or more replacement tenants acceptable to the lender (in its sole but good faith discretion) execute and deliver replacement lease(s) covering the Requisite Lease Sweep Space, provided that such replacement tenant(s) and lease(s) are qualified leases and the occupancy conditions, as specified in the 181 Fremont Street Whole Loan documents, are satisfied or (2) for a Dark Period Event or a Facebook Downgrade Event, Facebook is restored as an Investment Grade Entity or the entirety of the Lease Sweep Space has been sublet to an Investment Grade Entity who has accepted delivery thereof (i.e., the lease has commenced) and is paying unabated rent at a contract rate no less than the contract rate required under the Lease Sweep Lease; |
THE INFORMATION IN THIS STRUCTURAL AND COLLATERAL TERM SHEET IS NOT COMPLETE AND MAY BE AMENDED PRIOR TO THE TIME OF SALE. THIS TERM SHEET IS NOT AN OFFER TO SELL THESE SECURITIES AND IT IS NOT A SOLICITATION OF AN OFFER TO BUY THESE SECURITIES IN ANY JURISDICTION WHERE THE OFFER OR SALE IS NOT PERMITTED.
103
| 181 FREMONT STREET |
| (c) | with regard to clause (iii) above, the date on which the event of default has been cured and no other event of default under such Lease Sweep Lease occurs for a period of three consecutive months following such cure; |
| (d) | with regard to clause (iv) above, the Lease Sweep Tenant Party insolvency proceeding having terminated and the applicable Lease Sweep Lease having been affirmed, assumed or assigned in a manner satisfactory to the lender; and |
| (e) | with regard to clauses (i), (ii), (iii), and (v) above, the date on which the aggregate amount of funds transferred into the Lease Sweep Reserve Account and the debt service reserve account equals the applicable Lease Sweep and Debt Reserve Cap (as defined below) and if a Lease Sweep Period is continuing due to the occurrence of more than one Lease Sweep Trigger, the aggregate amount of funds required to be transferred over the course of the Lease Sweep Period will be equal to the amount of the largest Lease Sweep and Debt Service Reserve Cap applicable to all then-continuing Lease Sweep Periods, such that each Lease Sweep Period will be treated as concurrent and not duplicative or independent of another. |
The “Lease Sweep Reserve Threshold” means (a) with respect to a Lease Sweep Period continuing solely pursuant to clauses (iii) and/or (v) above, $15,271,620 ($35.00 per square foot) or (b) with respect to a Lease Sweep Period continuing solely pursuant to clause (i) and/or (ii) above, $35.00 per square foot of the Dark Space or Terminated Space.
The “Lease Sweep and Debt Service Reserve Cap” means (a) with respect to a Lease Sweep Period continuing solely pursuant to clause (iii) above, $15,271,620 ($35.00 per square foot), (b) with respect to a Lease Sweep Period continuing solely pursuant to clause (i) above, $35.00 per square foot of the Terminated Space, (c) with respect to a Lease Sweep Period continuing pursuant to clause (ii) above, whether or not a Lease Sweep Period pursuant to clauses (i) and/or (iii) above is concurrently continuing, $50.00 per square foot of Dark Space or (d) with respect to clause (v) above, whether or not a Lease Sweep Period pursuant to clauses (i), (ii) and/or (iii) above is concurrently continuing, $21,816,600 ($50.00 per square foot).
The “Lease Sweep Space” means the space demised under a Lease Sweep Lease.
A “Lease Sweep Lease” is the Facebook lease or any replacement lease or leases which cover at least 75.0% of the rentable square feet demised under the Facebook lease (the “Requisite Lease Sweep Space”).
A “Lease Sweep Tenant Party” means any tenant under a Lease Sweep Lease or its direct or indirect parent company.
A “Material Termination Portion” is, with respect to any space under a Lease Sweep Lease, if the tenant under a Lease Sweep Lease cancels or terminates its Lease Sweep Lease with respect to at least 20,000 square feet of space (or, if a full floor of space is less than 20,000 square feet, a full floor of space) but less than the entirety of the space under such Lease Sweep Lease, the portion of space under the Lease Sweep Lease affected by such cancellation or termination.
Property Management. The 181 Fremont Street Property is managed by an affiliate of the borrower.
Assumption.The borrower has, at any time following the securitization of the 181 Fremont Street Whole Loan and prior to the ARD, the right to transfer the 181 Fremont Street Property (no more than twice through the term of the 181 Fremont Street Whole Loan), provided that certain conditions are satisfied, including: (i) no event of default under the 181 Fremont Street Whole Loan documents or mezzanine loan documents has occurred and is continuing, (ii) the borrower has provided the lender with 60 days’ prior written notice, (iii) the proposed transferee qualifies as a qualified transferee under the 181 Fremont Street Whole Loan documents and (iv) the lender has received rating agency confirmation that such assumption will not result in a downgrade of the respective ratings assigned to the Series WFCM 2018-C44 certificates and similar confirmations from each rating agency rating any securities backed by any of the 181 Fremont Street Companion Loans.
Partial Release. Not permitted.
Real Estate Substitution.Not permitted.
Subordinate and Mezzanine Indebtedness.Barclays Bank PLC and Deutsche Bank AG, acting through its New York Branch funded $225,000,000 of mezzanine debt (the “181 Fremont Street Mezzanine Loans”). The 181 Fremont Street Mezzanine Loans consist of a $175,000,000 senior mezzanine loan and a $50,000,000 junior mezzanine loan. The senior mezzanine loan has a 4.8800% coupon and the junior mezzanine loan has a 6.5000% coupon. The 181 Fremont Street Mezzanine Loans are interest-only for the full term of the loans and are coterminous with the 181 Fremont Street Whole Loan. Including the 181 Fremont Street Mezzanine Loans, the cumulative cut-off date LTV, cumulative UW NCF DSCR and cumulative UW NOI Debt Yield are 75.2%, 1.38x and 6.2%, respectively. The mortgage lenders and the mezzanine lenders have entered into an intercreditor agreement. The 181 Fremont Street Mezzanine Loans have been or are expected to be sold to institutional investors. The rights of the lender of the 181 Fremont Street Mezzanine Loans are further described under “Description of the Mortgage Pool—Additional Indebtedness—Mezzanine Indebtedness” in the Preliminary Prospectus.
Ground Lease.None.
Condominium.The 181 Fremont Street Property is subject to a condominium regime. The 181 Fremont Street Property consists of a two-parcel condominium; with the commercial parcel owned by the borrower as collateral for the 181 Fremont Street Whole Loan. The commercial parcel consists of the five basement levels, floors 1 through 38, the bridge connecting 181 Fremont to the Transbay Terminal Rooftop Park and the roof of the 181 Fremont Street tower. The residential parcel, inclusive of the 67 luxury market rate residential units on floors 39 to 57, is not owned by the borrower and is not collateral for the 181 Fremont Street Whole Loan. The owner of the commercial parcel will have 140 votes out of 200 votes in the condominium association and the owner of the residential
THE INFORMATION IN THIS STRUCTURAL AND COLLATERAL TERM SHEET IS NOT COMPLETE AND MAY BE AMENDED PRIOR TO THE TIME OF SALE. THIS TERM SHEET IS NOT AN OFFER TO SELL THESE SECURITIES AND IT IS NOT A SOLICITATION OF AN OFFER TO BUY THESE SECURITIES IN ANY JURISDICTION WHERE THE OFFER OR SALE IS NOT PERMITTED.
104
| 181 FREMONT STREET |
parcel shall have 60 votes out of the 200 votes in the condominium association. See “Description of the Mortgage Pool — Mortgage Pool Characteristics — Condominium Interest” in the Preliminary Prospectus.
Terrorism Insurance.The 181 Fremont Street Whole Loan documents require that the “all risk” insurance policy required to be maintained by the borrower provide coverage for terrorism in an amount equal to the full replacement cost of the 181 Fremont Street Property, or that if the Terrorism Risk Insurance Program Reauthorization Act is no longer in effect and such policies contain an exclusion for acts of terrorism, the borrower will obtain, to the extent available, a stand-alone policy that provides the same coverage as the policies would have if such exclusion did not exist.
Earthquake Insurance.The loan documents require earthquake insurance. The property is located in Seismic Zone 4. The seismic report indicated scenario expected loss for the property is 12%.
THE INFORMATION IN THIS STRUCTURAL AND COLLATERAL TERM SHEET IS NOT COMPLETE AND MAY BE AMENDED PRIOR TO THE TIME OF SALE. THIS TERM SHEET IS NOT AN OFFER TO SELL THESE SECURITIES AND IT IS NOT A SOLICITATION OF AN OFFER TO BUY THESE SECURITIES IN ANY JURISDICTION WHERE THE OFFER OR SALE IS NOT PERMITTED.
105
RE/MAX PLAZA
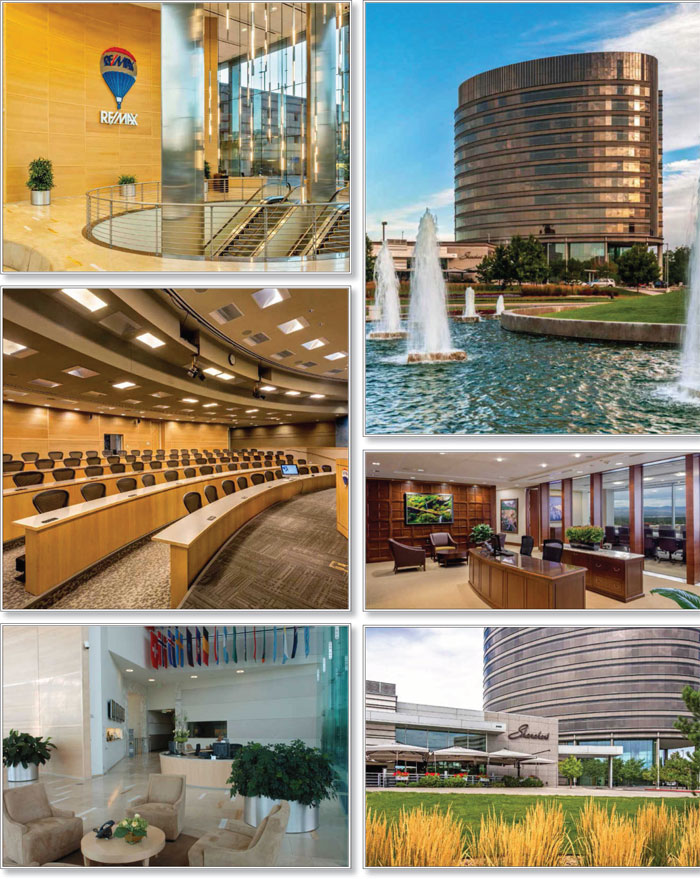
THE INFORMATION IN THIS STRUCTURAL AND COLLATERAL TERM SHEET IS NOT COMPLETE AND MAY BE AMENDED PRIOR TO THE TIME OF SALE. THIS TERM SHEET IS NOT AN OFFER TO SELL THESE SECURITIES AND IT IS NOT A SOLICITATION OF AN OFFER TO BUY THESE SECURITIES IN ANY JURISDICTION WHERE THE OFFER OR SALE IS NOT PERMITTED.
106
RE/MAX PLAZA
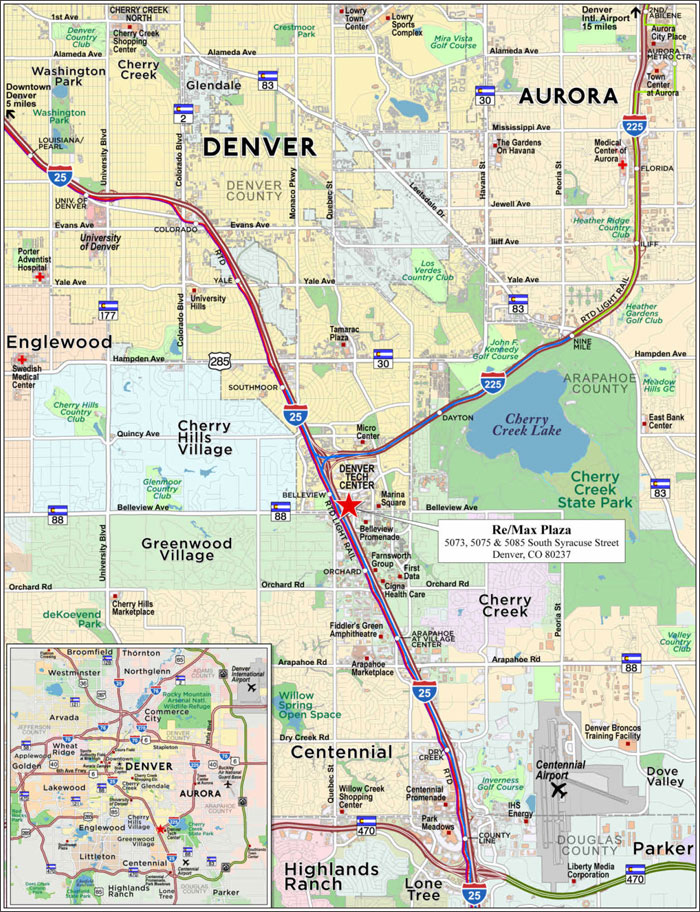
THE INFORMATION IN THIS STRUCTURAL AND COLLATERAL TERM SHEET IS NOT COMPLETE AND MAY BE AMENDED PRIOR TO THE TIME OF SALE. THIS TERM SHEET IS NOT AN OFFER TO SELL THESE SECURITIES AND IT IS NOT A SOLICITATION OF AN OFFER TO BUY THESE SECURITIES IN ANY JURISDICTION WHERE THE OFFER OR SALE IS NOT PERMITTED.
107
| No. 8 – Re/Max Plaza | |||||||
| Loan Information | Property Information | ||||||
| Mortgage Loan Seller: | Ladder Capital Finance LLC | Single Asset/Portfolio: | Single Asset | ||||
| Credit Assessment (DBRS/Fitch/Moody’s): | NR/NR/NR | Property Type: | Office | ||||
| Original Principal Balance(1): | $30,000,000 | Specific Property Type: | Suburban | ||||
| Cut-off Date Balance(1): | $30,000,000 | Location: | Denver, CO | ||||
| % of Initial Pool Balance: | 3.9% | Size(4): | 242,497 SF | ||||
| Loan Purpose: | Acquisition | Cut-off Date Balance Per SF(1)(4): | $270.31 | ||||
| Borrower Name: | KORE 5075 Syracuse, LLC | Year Built/Renovated: | 2006/NAP | ||||
| Borrower Sponsor: | Jack Kim | Title Vesting: | Fee | ||||
| Mortgage Rate: | 4.6810% | Property Manager: | Self-managed | ||||
| Note Date: | March 15, 2018 | 4th Most Recent Occupancy: | 100.0% (12/31/2014) | ||||
| Anticipated Repayment Date: | NAP | 3rd Most Recent Occupancy: | 100.0% (12/31/2015) | ||||
| Maturity Date: | April 6, 2028 | 2nd Most Recent Occupancy: | 100.0% (12/31/2016) | ||||
| IO Period: | 120 months | Most Recent Occupancy (As of): | 100.0% (12/31/2017) | ||||
| Loan Term (Original): | 120 months | Current Occupancy (As of): | 100.0% (5/1/2018) | ||||
| Seasoning: | 1 month | ||||||
| Amortization Term (Original): | NAP | Underwriting and Financial Information: | |||||
| Loan Amortization Type: | Interest-only, Balloon | ||||||
| Interest Accrual Method: | Actual/360 | 4th Most Recent NOI(As of): | NAV | ||||
| Call Protection(2): | L(25), D(90), O(5) | 3rd Most Recent NOI(As of): | $6,874,800 (12/31/2015) | ||||
| Lockbox Type: | Hard/Upfront Cash Management | 2nd Most Recent NOI(As of): | $7,035,371 (12/31/2016) | ||||
| Additional Debt(1): | Yes | Most Recent NOI(As of): | $7,188,953 (TTM 8/31/2017) | ||||
| Additional Debt Type(1): | Pari Passu | ||||||
| U/W Revenues: | $6,810,404 | ||||||
| U/W Expenses: | $204,312 | ||||||
| U/W NOI: | $6,606,092 | ||||||
| U/W NCF: | $6,205,057 | ||||||
| Escrows and Reserves(3): | U/W NOI DSCR(1): | 2.12x | |||||
| U/W NCF DSCR(1): | 1.99x | ||||||
| Type: | Initial | Monthly | Cap (If Any) | U/W NOI Debt Yield(1): | 10.1% | ||
| Taxes | $0 | Springing | NAP | U/W NCF Debt Yield(1): | 9.5% | ||
| Insurance | $0 | Springing | NAP | As-Is Appraised Value: | $116,000,000 | ||
| Replacement Reserves | $0 | Springing | NAP | As-Is Appraisal Valuation Date: | October 17, 2017 | ||
| TI/LC Reserve | $0 | Springing | NAP | Cut-off Date LTV Ratio(1): | 56.5% | ||
| LTV Ratio at Maturity or ARD(1): | 56.5% | ||||||
| (1) | See “The Mortgage Loan” section. All statistical information related to balance per square foot, loan-to-value ratios, debt service coverage ratios and debt yields are based on the funded outstanding principal balance of the Re/Max Plaza Whole Loan (as defined below) as of the Cut-off Date. |
| (2) | Prior to the open prepayment date of December 6, 2027, the Re/Max Plaza Whole Loan can be defeased after the earlier to occur of (i) March 15, 2021 and (ii) the first monthly payment date following the end of the two-year period commencing on the closing date of the securitization of the last Re/Max Plaza Whole Loan promissory note to be securitized. The lockout period for defeasance will be at least 25 payment dates beginning with and including the payment date of May 6, 2018. For the purposes of this term sheet, the assumed lockout period of 25 months is based on the expected WFCM 2018-C44 securitization closing date in May 2018. The actual lockout period may be longer. |
| (3) | See “Escrows” section. |
| (4) | The Size and Cut-off Date Balance per SF do not include or take into account, as applicable, the parking garage that includes 759 spaces. |
The Mortgage Loan.The mortgage loan (the “Re/Max Plaza Mortgage Loan”) is part of a whole loan (the “Re/Max Plaza Whole Loan”) that is evidenced by three pari passu promissory notes (Notes A-1, A-2 and A-3) secured by a first mortgage encumbering the fee interest in an office complex located in Denver, Colorado (the “Re/Max Plaza Property”). See, however, “Ground Lease” section below. The Re/Max Plaza Whole Loan was originated on March 15, 2018 by Ladder Capital Finance LLC (“LCF”). The Re/Max Plaza Whole Loan had an original principal balance of $65,550,000, has an outstanding principal balance as of the Cut-off Date of $65,550,000 and accrues interest at an interest rate of 4.6810% per annum. The Re/Max Plaza Whole Loan had an initial term of approximately 120 months, has a remaining term of 119 months as of the Cut-off Date and requires payments of interest-only through the loan term of the Re/Max Plaza Whole Loan. The maturity date of the Re/Max Plaza Whole Loan is April 6, 2028.
The Re/Max Plaza Mortgage Loan, evidenced by the non-controlling Notes A-2 and A-3, will be contributed to the WFCM 2018-C44 Trust, had an aggregate original principal balance of $30,000,000 and has an aggregate outstanding principal balance as of the Cut-off Date of $30,000,000. The controlling Note A-1 is expected to be contributed to one or more future securitization trusts. The lender provides no assurances that any non-securitized notes will not be split further or replaced by new notes with reallocated balances. The Re/Max Plaza Whole Loan will be serviced under the WFCM 2018-C44 pooling and servicing agreement until the securitization of the controlling Note A-1, at which time servicing will shift to the pooling and servicing agreement governing that future securitization. See “Description of the Mortgage Pool—The Whole Loans—The Serviced Whole Loans” and “—The Non-Serviced Pari Passu Whole Loans” and “Pooling and Servicing Agreement” in the Preliminary Prospectus.
THE INFORMATION IN THIS STRUCTURAL AND COLLATERAL TERM SHEET IS NOT COMPLETE AND MAY BE AMENDED PRIOR TO THE TIME OF SALE. THIS TERM SHEET IS NOT AN OFFER TO SELL THESE SECURITIES AND IT IS NOT A SOLICITATION OF AN OFFER TO BUY THESE SECURITIES IN ANY JURISDICTION WHERE THE OFFER OR SALE IS NOT PERMITTED.
108
RE/MAX PLAZA
Note Summary
| Notes | Original Balance | Note Holder | Controlling Note | |
| A-1 | $35,550,000 | LCF or an affiliate | Yes | |
| A-2 | $25,000,000 | WFCM 2018-C44 | No | |
| A-3 | $5,000,000 | WFCM 2018-C44 | No | |
| Total | $65,550,000 |
Following the lockout period, the borrower has the right to defease the Re/Max Plaza Whole Loan in whole, but not in part, on any payment date before December 6, 2027. In addition, the Re/Max Plaza Whole Loan is prepayable without penalty on or after December 6, 2027.
Sources and Uses
| Sources | Uses | |||||
Original whole loan amount | $65,550,000 | 58.5% | Purchase price | $111,086,075 | 99.1% | |
| Sponsor’s new cash contribution | 46,571,638 | 41.5 | Closing costs | 1,035,563 | 0.9 | |
| Total Sources | $112,121,638 | 100.0% | Total Uses | $112,121,638 | 100.0% |
The Property.The Re/Max Plaza Property was built to suit for Re/Max International, Inc. (“Re/Max”) in 2006 and as of May 1, 2018 was 100% leased to Re/Max on a triple-net basis through April 2028 with two, ten-year extension options and no early termination options. The Re/Max Plaza Property is comprised of a Class A office building, two smaller single-story retail buildings totaling 14,500 square feet, a 759 space three story parking garage and 67 surface parking spots. The Re/Max Plaza Property has a total of 826 parking spaces, resulting in a parking ratio of 3.41 spaces per 1,000 square feet of rentable area. Re/Max utilizes the space as their global headquarters and the two single-story retail buildings are subleased to Shanahan’s Steakhouse and Snooze. Re/Max is a global real estate franchisor with over 115,000 real estate agents in over 100 countries and territories. The global real estate network is based on franchisee-owned and –operated offices. Re/Max specializes in advice on home buying and selling through its network of agents.
The Re/Max Plaza Property is located at the northwest corner of E. Belleview Avenue and S. Syracuse Street in Denver, Colorado with access to I-25 and I-225. I-25 and I-225 provide the Re/Max Plaza Property access to the rest of Colorado, including other portions of Denver and the cities of Fort Collins and Colorado Springs. I-225 is a partial beltway that connects I-25 to I-70 through the city of Aurora. The Re/Max Plaza Property has access to public transportation through the Regional Transportation District (“RTD”) located 10.1 miles from the subject property. The RTD operates a bus and a light rail system throughout the Denver metro area. The Re/Max Plaza Property is located approximately 0.25 miles from the Belleview light rail system, which provides transportation to 35 stations on five lines and serves approximately 60,000 passengers daily. The current light rail system reaches major metropolitan areas including downtown, South Denver and University of Denver. The E and F trains connect the I-25 corridor to Union Station and the Denver central business district. The Re/Max Plaza Property is located 12 miles from the Denver central business district. The Re/Max Plaza Property is also located approximately 25.0 miles from the Denver International Airport.
The following table presents certain information relating to the tenancy at the Re/Max Plaza Property:
Major Tenants
| Tenant Name | Credit Rating (Fitch/Moody’s/S&P)(1) | Tenant NRSF | % of NRSF | Annual U/W Base Rent PSF(2) | Annual U/W Base Rent(2) | % of Total Annual U/W Base Rent | Lease Expiration Date | |
| Major Tenant | ||||||||
| Re/Max(3) | NAP/Ba3/BB | 242,497 | 100.0% | $29.56 | $7,168,846 | 100.0% | 4/30/2028(4) | |
| Total Major Tenant | 242,497 | 100.0% | $29.56 | $7,168,846 | 100.0% | |||
| Vacant Space | 0 | 0.0% | ||||||
| Collateral Total | 242,497 | 100.0% | ||||||
| (1) | Certain ratings are those of the parent company whether or not the parent guarantees the lease. |
| (2) | Annual U/W Base Rent PSF and Annual U/W Base Rent includes mark to market rent adjustments of $2.72 per square foot. The appraiser considered the in-place base rent of $32.28 above market. |
| (3) | Re/Max subleases 10,500 square feet to Shanahan’s Steakhouse for $535,946 ($51.04 per square foot) per year in base rent pursuant to a sublease that expires April 15, 2020. Re/Max subleases 4,033 square feet to Snooze for $151,238 ($37.50 per square foot) per year in base rent pursuant to a sublease that expires in April 30, 2028. Re/Max subleases 6,783 square feet to Kinross Gold for $288,104 ($42.47 per square foot) per year in base rent pursuant to a sublease that expires in December 31, 2024. There is a termination option for the Kinross Gold sublease as of January 1, 2021. Re/Max subleases 21,730 square feet to Icon Group for $391,140 ($18.00 per square foot) per year in base rent pursuant to a sublease that expires in January 31, 2025. |
| (4) | Re/Max has two, ten-year lease extension options. |
THE INFORMATION IN THIS STRUCTURAL AND COLLATERAL TERM SHEET IS NOT COMPLETE AND MAY BE AMENDED PRIOR TO THE TIME OF SALE. THIS TERM SHEET IS NOT AN OFFER TO SELL THESE SECURITIES AND IT IS NOT A SOLICITATION OF AN OFFER TO BUY THESE SECURITIES IN ANY JURISDICTION WHERE THE OFFER OR SALE IS NOT PERMITTED.
109
RE/MAX PLAZA
The following table presents certain information relating to the lease rollover schedule at the Re/Max Plaza Property:
Lease Expiration Schedule(1)
| Year Ending December 31, | No. of Leases Expiring | Expiring NRSF | % of Total NRSF | Cumulative Expiring NRSF | Cumulative % of Total NRSF | Annual U/W Base Rent | % of Total Annual U/W Base Rent | Annual U/W Base Rent PSF |
| MTM | 0 | 0 | 0.0% | 0 | 0.0% | $0 | 0.0% | $0.00 |
| 2018 | 0 | 0 | 0.0% | 0 | 0.0% | $0 | 0.0% | $0.00 |
| 2019 | 0 | 0 | 0.0% | 0 | 0.0% | $0 | 0.0% | $0.00 |
| 2020 | 0 | 0 | 0.0% | 0 | 0.0% | $0 | 0.0% | $0.00 |
| 2021 | 0 | 0 | 0.0% | 0 | 0.0% | $0 | 0.0% | $0.00 |
| 2022 | 0 | 0 | 0.0% | 0 | 0.0% | $0 | 0.0% | $0.00 |
| 2023 | 0 | 0 | 0.0% | 0 | 0.0% | $0 | 0.0% | $0.00 |
| 2024 | 0 | 0 | 0.0% | 0 | 0.0% | $0 | 0.0% | $0.00 |
| 2025 | 0 | 0 | 0.0% | 0 | 0.0% | $0 | 0.0% | $0.00 |
| 2026 | 0 | 0 | 0.0% | 0 | 0.0% | $0 | 0.0% | $0.00 |
| 2027 | 0 | 0 | 0.0% | 0 | 0.0% | $0 | 0.0% | $0.00 |
| 2028 | 1 | 242,497 | 100.0% | 242,497 | 100.0% | $7,168,846 | 100.0% | $29.56 |
| Thereafter | 0 | 0 | 0.0% | 242,497 | 100.0% | $0 | 0.0% | $0.00 |
| Vacant | 0 | 0 | 0.0% | 242,497 | 100.0% | $0 | 0.0% | $0.00 |
| Total/Weighted Average | 1 | 242,497 | 100.0% | $7,168,846 | 100.0% | $29.56 |
| (1) | Information obtained from the underwritten rent roll. |
The following table presents historical occupancy percentages at the Re/Max Plaza Property:
Historical Occupancy
12/31/2014(1) | 12/31/2015(1) | 12/31/2016(1) | 12/31/2017(1) | 5/1/2018(2) |
| 100.0% | 100.0% | 100.0% | 100.0% | 100.0% |
| (1) | Information obtained from the borrower. |
| (2) | Information obtained from the underwrittern rent roll. |
Operating History and Underwritten Net Cash Flow. The following table presents certain information relating to the underwritten net cash flow at the Re/Max Plaza Property:
Cash Flow Analysis
| 12/31/2015 | 12/31/2016 | TTM 8/31/2017(4) | U/W | % of U/W Effective Gross Income | U/W $ per SF | |||||||
| Base Rent | $7,094,757 | $7,307,600 | $7,453,036 | $7,827,803 | 114.9% | $32.28 | ||||||
| Grossed Up Vacant Space | 0 | 0 | 0 | 0 | 0.0 | 0.00 | ||||||
| Mark to Market(1) | 0 | 0 | 0 | (658,957) | (9.7) | (2.72) | ||||||
| Less Vacancy & Credit Loss(2) | 0 | 0 | 0 | (358,442) | (5.3) | (1.48) | ||||||
| Effective Gross Income | $7,094,757 | $7,307,600 | $7,453,036 | $6,810,404 | 100.0% | $28.08 | ||||||
| Total Operating Expenses | $219,957 | $272,229 | $264,083 | $204,312 | 3.0% | $0.84 | ||||||
| Net Operating Income | $6,874,800 | $7,035,371 | $7,188,953 | $6,606,092 | 97.0% | $27.24 | ||||||
| TI/LC | 0 | 0 | 0 | 364,660 | 5.4 | 1.50 | ||||||
| Capital Expenditures | 0 | 0 | 0 | 36,375 | 0.5 | 0.15 | ||||||
| Net Cash Flow | $6,874,800 | $7,035,371 | $7,188,953 | $6,205,057 | 91.1% | $25.59 | ||||||
| NOI DSCR(3) | 2.21x | 2.26x | 2.31x | 2.12x | ||||||||
| NCF DSCR(3) | 2.21x | 2.26x | 2.31x | 1.99x | ||||||||
| NOI DY(3) | 10.5% | 10.7% | 11.0% | 10.1% | ||||||||
| NCF DY(3) | 10.5% | 10.7% | 11.0% | 9.5% |
| (1) | A mark to market rent adjustment was taken based on the appraiser’s market rent conclusion of $2.72 per square foot. The appraiser considered the base rent above market. |
| (2) | UW Occupancy % is based on underwritten economic vacancy of 5.0%. The Re/Max Plaza Property was 100.0% leased as of May 1, 2018. |
| (3) | The debt service coverage ratios and debt yields are based on the Re/Max Plaza Whole Loan. |
| (4) | More recent figures are unavailable because the Re/Max Plaza Property is triple- net leased to a single tenant. |
Appraisal. As of the appraisal valuation date of October 17, 2017, the Re/Max Plaza Property had an “as-is” appraised value of $116,000,000. In addition, the appraisal for the Re/Max Plaza Property set forth a “hypothetical go-dark” appraised value of $78,000,000 as of October 17, 2017 resulting in a “dark” loan-to-value ratio of 84.0%.
THE INFORMATION IN THIS STRUCTURAL AND COLLATERAL TERM SHEET IS NOT COMPLETE AND MAY BE AMENDED PRIOR TO THE TIME OF SALE. THIS TERM SHEET IS NOT AN OFFER TO SELL THESE SECURITIES AND IT IS NOT A SOLICITATION OF AN OFFER TO BUY THESE SECURITIES IN ANY JURISDICTION WHERE THE OFFER OR SALE IS NOT PERMITTED.
110
RE/MAX PLAZA
Environmental Matters. According to the Phase I environmental site assessment dated August 17, 2017, there are no recognized environmental conditions at the Re/Max Plaza Property.
Market Overview and Competition. The Re/Max Plaza Property is located in the Denver metropolitan statistical area (“MSA”). The Denver MSA had an estimated population of 2,897,681 as of 2017, which represents an average annual increase of 1.9% since 2010. According to the appraisal, between 2006 and 2017 employment increased by 214,100 jobs, which was an approximately 17.3% increase over the period, while the state of Colorado saw an approximately 13.1% increase in employment over the same period.
The Re/Max Plaza Property is located in the Southeast Denver submarket, within the Denver metro area. According to the appraisal, the Southeast Denver submarket reported a vacancy of 14.6% and a market rental rate for Class A office space of $26.74 per square foot. The Re/Max Plaza Property is currently 100% occupied and the appraiser’s market rent conclusion was $26.50 per square foot for the office space, $40.00 per square foot for the retail space and $2.25 per square foot for the parking space, which blend to the underwritten base rent of $29.56 factoring in the underwritten mark to market rent adjustment. According to a third party market research report, the estimated 2017 population within a one-, three- and five-mile radius of the Re/Max Plaza Property was 16,122, 103,625 and 318,788, respectively, and the 2017 estimated average household income within the same one-, three- and five-mile radius was $67,959, $72,915 and $66,145, respectively.
The following table presents certain information relating to comparable office leases for the Re/Max Plaza Property:
Comparable Leases(1)
| Property Name/Location | Distance from Subject | Tenant Name | Lease Date/Term | Lease Area (SF) | Annual Base Rent PSF |
One Belleview Station Denver, CO | 0.2 miles | Western Union | January 2019 / 12.7 Yrs | 249,552 | $24.50 |
Village Center Station II Greenwood Village, CO | 1.9 miles | Charter | February 2018 / 10 Yrs. | 306,000 | $23.00 |
One DTC West Denver, CO | 0.5 miles | Kentwood | September 2017 / 12.3 Yrs. | 20,665 | $25.00 |
Granite Place at Village Greenwood Village, CO | 1.6 miles | Charter | September 2017 / 12 Yrs. | 256,844 | $23.45 |
Granite Place at Village Greenwood Village, CO | 1.6 miles | CSG | October 2017 / 10 Yrs. | 42,174 | $23.40 |
CoBank Center Greenwood Village, CO | 1.6 miles | CoBank | November 2015 / 15 Yrs. | 274,287 | $22.00 |
| (1) | Information obtained from the appraisal. |
The Borrower.The borrower is KORE 5075 Syracuse, LLC, a single purpose Delaware limited liability company with two independent directors. Legal counsel to the borrower delivered a non-consolidation opinion in connection with the origination of the Re/Max Plaza Whole Loan. Jack Kim is the guarantor of certain nonrecourse carveouts under the Re/Max Plaza Whole Loan.
The Borrower Sponsor. The borrower sponsor is Jack Kim, founder of KORE Investments, LLC. KORE Investments (“KORE”) is a Denver based private full-service real estate company, specializing in acquisitions, development, asset management, and property management for office, industrial, retail and multifamily properties. KORE’s business philosophy is to provide an attractive return to their investors through below market acquisitions, active on-site local management, asset appreciation and cash flow distributions. KORE’s investment opportunities are provided to accredited investors, family offices and institutions seeking fundamentally sound investments focused mainly on real estate. Since inception in 2002, KORE and its JV partners have held interests in over $250 million of real estate totaling over 400 multifamily units, 910,000 square feet in office, retail and industrial properties as well as over 100 acres of vacant land. The portfolio is primarily made up of assets in the Denver metropolitan area with other holdings in Ohio, Illinois, California, North Carolina, and South Carolina.
Escrows.The Re/Max Plaza Whole Loan documents require monthly reserve deposits for real estate taxes in an amount equal to one-twelfth of the real estate taxes that the lender estimates will be payable during the next twelve months, but the borrower’s obligation to make such deposits will be suspended so long as: (i) no event of default is continuing; (ii) the Re/Max lease is in full force and effect and Re/Max is obligated under the Re/Max lease to pay taxes directly; and (iii) the borrower provides evidence that taxes have been paid at least three days prior to the delinquency date. In addition, the Re/Max Plaza Whole Loan documents require monthly reserve deposits for insurance premiums, but the borrower’s obligation to make such deposits will be suspended so long as: (i) no event of default is continuing; (ii) the Re/Max lease is in full force and effect and RE/Max is obligated under the Re/Max lease to pay insurance premiums directly and maintain insurance coverage that satisfies the requirements of the loan documents; and (iii) the borrower delivers to the lender at least ten days prior to the scheduled expiration date thereof evidence that Re/Max has paid the applicable insurance premiums and is maintaining the insurance coverages required under the Re/Max lease and the loan documents. The Re/Max Plaza Whole Loan documents require monthly reserve deposits for replacement reserves (initially $3,038) during the continuance of a Cash Sweep Event Period (as defined below). The Re/Max Plaza Whole Loan documents also require monthly reserve deposits for TI/LC reserves (initially $30,388) commencing on the monthly payment date occurring in May 2023.
THE INFORMATION IN THIS STRUCTURAL AND COLLATERAL TERM SHEET IS NOT COMPLETE AND MAY BE AMENDED PRIOR TO THE TIME OF SALE. THIS TERM SHEET IS NOT AN OFFER TO SELL THESE SECURITIES AND IT IS NOT A SOLICITATION OF AN OFFER TO BUY THESE SECURITIES IN ANY JURISDICTION WHERE THE OFFER OR SALE IS NOT PERMITTED.
111
RE/MAX PLAZA
Lockbox and Cash Management. The Re/Max Plaza Whole Loan documents require a lender-controlled lockbox account (the “Re/Max Plaza Whole Loan Lockbox”), which is already in place with upfront cash management. Unless a Cash Sweep Event Period exists, all excess cash flow in the Re/Max Plaza Whole Loan Lockbox after payment of all sums due and payable under the loan documents will be remitted to the borrower. During a Cash Sweep Event Period, all excess cash flow in the Re/Max Plaza Whole Loan Lockbox after payment of all sums due and payable under the loan documents will be retained by the lender as additional collateral.
A “Cash Sweep Event Period” will commence upon the earlier of: (i) an event of default under the Re/Max Plaza Whole Loan, (ii) any event of default under the management agreement; (iii) the debt service coverage ratio for the Re/Max Plaza Property falling below 1.90x; or (iv) the occurrence of a Cash Sweep Significant Trigger Event (as defined below). A Cash Sweep Event Period will end: with regard to clause (i), on the date on which a cure of the event of default under the Re/Max Plaza Whole Loan which gave rise to such Cash Sweep Event Period is accepted by the lender in its sole and absolute discretion; with regard to clause (ii), on (a) the date on which the event of default under the management agreement has been cured to the lender’s reasonable satisfaction, or (b) the date on which the borrower has entered into a replacement management agreement with a qualified manager in accordance with the terms of the loan documents; with regard to clause (iii), upon the net cash flow debt service coverage ratio being at least 2.00x for two consecutive calendar quarters; and with regard to clause (iv), upon the occurrence of a Cash Sweep Significant Trigger Event Cure (as defined below).
A “Cash Sweep Significant Trigger Event” means: (a) Re/Max vacates, surrenders or ceases to conduct its normal business operations at substantially all of its demised premises or otherwise “goes dark”, (b) Re/Max gives notice in writing that it intends to vacate, surrender or cease to conduct its normal business operations at substantially all of its demised premises or otherwise “go dark”, (c) Re/Max (or such tenant’s parent) becomes insolvent or files for bankruptcy; and/or (d) the earlier to occur of (x) the first date the Re/Max lease being in the last twelve months of its stated term or (y) May 6, 2027, unless Re/Max has renewed the Re/Max lease or entered into a new lease, in each case subject to and in compliance with the terms and conditions of the related loan agreement, in each case for substantially all of its demised premises. A “Cash Sweep Significant Trigger Event Cure” means: with regard to clause (a), Re/Max or a replacement tenant acceptable to the lender for substantially all of the premises demised pursuant to the Re/Max lease has (1) reopened for business and conducted normal business operations at substantially all of its demised premises and (2) paid full, unabated rent under its lease, for two consecutive quarters, and the borrower has delivered to the lender an estoppel certificate from Re/Max or the replacement tenant certifying, among other things, the foregoing and reaffirming the lease as being in full force and effect; with regard to clause (b), Re/Max has (1) irrevocably revoked or rescinded any such notice and (2) been open for business and conducted normal business operations at substantially all of its demised premises and paid full, unabated rent under its lease, for two consecutive quarters following such revocation or rescission, and the borrower has delivered to the lender an estoppel certificate from Re/Max; with regard to clause (c), Re/Max or its parent company, as the case may be, becomes solvent to the lender’s satisfaction for two consecutive quarters or is no longer a debtor in any bankruptcy action and has affirmed the Re/Max lease pursuant to a final non-appealable order of a court of competent jurisdiction; and with regard to clause (d), Re/Max has (1) renewed the Re/Max lease in accordance with its terms or entered into a new lease for substantially all of its demised premises and (2) paid full, unabated rent for two (2) consecutive quarters under its lease (unless the borrower has deposited with the lender an amount equal to the full amount of any free or abated rent under any such replacement lease), and the borrower has delivered to the lender an estoppel certificate from Re/Max.
Property Management. The Re/Max Plaza Property is managed by an affiliate of the borrower.
Assumption. The borrower has an unlimited right to transfer the Re/Max Plaza Property provided that the applicable conditions are satisfied. The borrower has the right to transfer the Re/Max Plaza Property to a permitted transferee and have such permitted transferee assume the Re/Max Plaza Whole Loan, and the sole member has the right to transfer 100% of the direct ownership interest in the borrower to a permitted transferee with the borrower continuing as the borrower under the Re/Max Plaza Whole Loan, provided that certain conditions precedent are satisfied, including: (i) no event of default has occurred and is continuing; (ii) the lender reasonably determines that the proposed transferee and guarantor satisfy the lender’s credit review and underwriting standards, taking into consideration the transferee’s experience, financial strength and general business standing; and (iii) receipt of customary opinions including a REMIC opinion; and (iv) the lender has received confirmation from the applicable rating agencies that such assumption will not result in a downgrade, withdrawal or qualification of the respective ratings assigned to the Series WFCM 2018-C44 certificates and similar confirmations from each rating agency rating any securities backed by the Re/Max companion loans with respect to the ratings of such securities.
Partial Release. None permitted.
Real Estate Substitution.Not permitted.
Subordinate and Mezzanine Indebtedness.Not permitted.
Ground Lease. There is a ground lease in place at the Re/Max Plaza Property that covers a small portion of the sidewalk and water feature of the property. The lease is between Goldsmith Metropolitan District, which is a quasi-municipal corporation and political subdivision of the State of Colorado, as ground lessor, and the borrower, as ground lessee. The lease commenced on September 12, 2008 and has a 99-year term through September 11, 2107. The ground lease is triple net with a base rent of $1,200/year. Re/Max is responsible for all rent and additional rent under the ground lease. There have been no known expenses, including taxes, associated with the ground leased parcel. The ground lease lacks certain customary mortgagee protection provisions. However, the ground leased parcel has no improvements built thereon and is not necessary for the Re/Max Plaza Property to satisfy zoning and insurance requirements.
Terrorism Insurance.The Re/Max Plaza Whole Loan documents require that the “all risk” insurance policies required to be maintained by the borrower provide coverage for terrorism in an amount equal to the full replacement cost of the Re/Max Plaza
THE INFORMATION IN THIS STRUCTURAL AND COLLATERAL TERM SHEET IS NOT COMPLETE AND MAY BE AMENDED PRIOR TO THE TIME OF SALE. THIS TERM SHEET IS NOT AN OFFER TO SELL THESE SECURITIES AND IT IS NOT A SOLICITATION OF AN OFFER TO BUY THESE SECURITIES IN ANY JURISDICTION WHERE THE OFFER OR SALE IS NOT PERMITTED.
112
RE/MAX PLAZA
Property, as well as loss of rents and/or business interruption insurance for a period no less than 18 months following the occurrence of a casualty event together with a twelve-month extended period of indemnity.
THE INFORMATION IN THIS STRUCTURAL AND COLLATERAL TERM SHEET IS NOT COMPLETE AND MAY BE AMENDED PRIOR TO THE TIME OF SALE. THIS TERM SHEET IS NOT AN OFFER TO SELL THESE SECURITIES AND IT IS NOT A SOLICITATION OF AN OFFER TO BUY THESE SECURITIES IN ANY JURISDICTION WHERE THE OFFER OR SALE IS NOT PERMITTED.
113
| PRINCE AND SPRING STREET PORTFOLIO |

THE INFORMATION IN THIS STRUCTURAL AND COLLATERAL TERM SHEET IS NOT COMPLETE AND MAY BE AMENDED PRIOR TO THE TIME OF SALE. THIS TERM SHEET IS NOT AN OFFER TO SELL THESE SECURITIES AND IT IS NOT A SOLICITATION OF AN OFFER TO BUY THESE SECURITIES IN ANY JURISDICTION WHERE THE OFFER OR SALE IS NOT PERMITTED.
114
| PRINCE AND SPRING STREET PORTFOLIO |
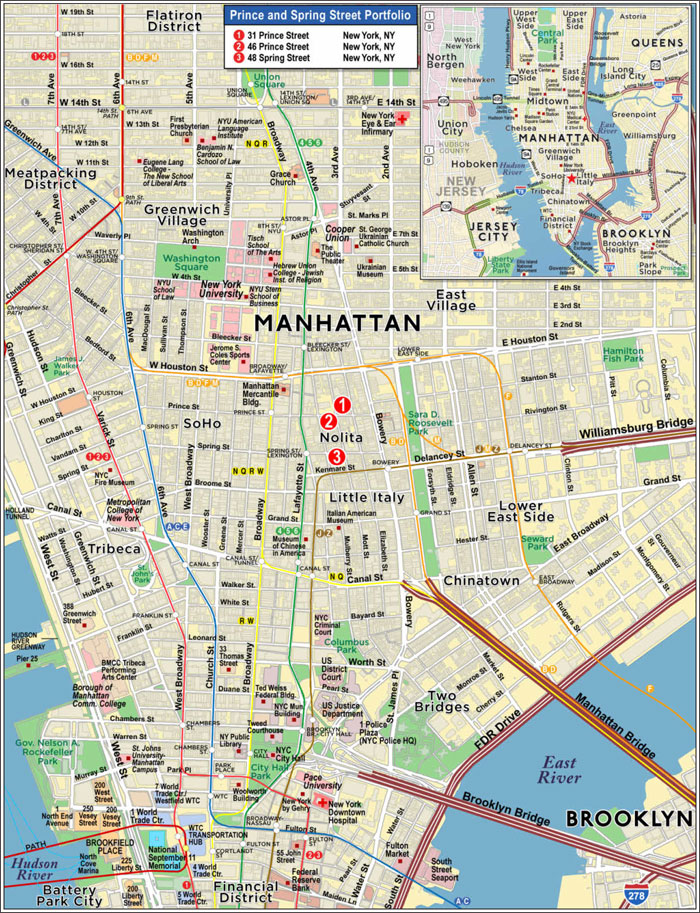
THE INFORMATION IN THIS STRUCTURAL AND COLLATERAL TERM SHEET IS NOT COMPLETE AND MAY BE AMENDED PRIOR TO THE TIME OF SALE. THIS TERM SHEET IS NOT AN OFFER TO SELL THESE SECURITIES AND IT IS NOT A SOLICITATION OF AN OFFER TO BUY THESE SECURITIES IN ANY JURISDICTION WHERE THE OFFER OR SALE IS NOT PERMITTED.
115
| No. 9 – Prince and Spring Street Portfolio |
| Loan Information | Property Information | ||||||
| Mortgage Loan Seller: | Argentic Real Estate Finance LLC | Single Asset/Portfolio: | Portfolio | ||||
| Credit Assessment (DBRS/Fitch/Moody’s): | NR/NR/NR | Property Type: | Mixed Use | ||||
| Original Principal Balance(1): | $30,000,000 | Specific Property Type: | Retail/Multifamily | ||||
| Cut-off Date Balance(1): | $30,000,000 | Location: | New York, NY | ||||
| % of Initial Pool Balance: | 3.9% | Size(4): | 32,260 SF | ||||
| Loan Purpose: | Refinance | Cut-off Date Balance Per Unit(1): | $1,270.92 | ||||
| Borrowers: | Wah Kok Realty Corp.; 31 Prince Street, LLC | Year Built/Renovated: | Various | ||||
| Borrower Sponsor: | Edmond Li | Title Vesting: | Fee | ||||
| Mortgage Rate: | 5.340% | Property Manager: | Self-managed | ||||
| Note Date: | March 13, 2018 | 4th Most Recent Occupancy (As of)(5): | 98.1% (12/31/2014) | ||||
| Anticipated Repayment Date: | NAP | 3rd Most Recent Occupancy (As of)(5): | 99.2% (12/31/2015) | ||||
| Maturity Date: | April 6, 2028 | 2nd Most Recent Occupancy (As of)(5): | 97.7% (12/31/2016) | ||||
| IO Period: | 120 months | Most Recent Occupancy (As of)(5): | 95.0% (12/31/2017) | ||||
| Loan Term (Original): | 120 months | Current Occupancy (As of)(5)(6): | 97.2% (3/31/2018) | ||||
| Seasoning: | 1 month | ||||||
| Amortization Term (Original): | NAP | Underwriting and Financial Information: | |||||
| Loan Amortization Type: | Interest-only, Balloon | ||||||
| Interest Accrual Method: | Actual/360 | 4th Most Recent NOI (As of): | NAV | ||||
| Call Protection: | L(25),D(91),O(4) | 3rd Most Recent NOI (As of)(7): | $2,393,111 (12/31/2015) | ||||
| Lockbox Type: | Springing | 2nd Most Recent NOI (As of)(7): | $2,401,121 (12/31/2016) | ||||
| Additional Debt: | Yes | Most Recent NOI (As of)(7): | $2,386,441 (12/31/2017) | ||||
| Additional Debt Type(1): | Pari Passu | ||||||
| U/W Revenues: | $4,031,021 | ||||||
| U/W Expenses: | $1,359,059 | ||||||
| U/W NOI: | $2,671,962 | ||||||
| Escrows and Reserves(2): | U/W NCF: | $2,657,789 | |||||
| U/W NOI DSCR(1): | 1.20x | ||||||
| Type: | Initial | Monthly | Cap (If Any) | U/W NCF DSCR(1): | 1.20x | ||
| Taxes | $388,662 | $86,369 | NAP | U/W NOI Debt Yield(1): | 6.5% | ||
| Insurance | $28,391 | $4,056 | NAP | U/W NCF Debt Yield(1): | 6.5% | ||
| Replacement Reserves | $0 | $1,181 | NAP | As-Is Appraised Value: | $66,000,000 | ||
| TI/LC Reserves | $35,000 | $667 | $35,000 | As-Is Appraisal Valuation Date: | December 5, 2017 | ||
| Free Rent Reserve(3) | $90,000 | $0 | NAP | Cut-off Date LTV Ratio(1): | 62.1% | ||
| Immediate Repair Reserve | $10,938 | $0 | NAP | LTV Ratio at Maturity or ARD(1): | 62.1% | ||
| (1) | See “The Mortgage Loan” section. All statistical information related to balances per unit, loan-to-value ratios, debt service coverage ratios and debt yields are based on the Prince & Spring Street Portfolio Whole Loan (as defined below). |
| (2) | See “Escrows” section. |
| (3) | After the origination of the Prince and Spring Street Portfolio Whole Loan, $90,000 in free rent associated with the Mulberry Burger lease was escrowed with the lender. |
| (4) | The Prince and Spring Street Portfolio Properties consist of 24,260 square feet of multifamily space and 8,000 square feet of retail space. |
| (5) | See section “Historical Occupancy”. |
| (6) | Occupancy is based on the square footage of the retail and multifamily spaces. |
| (7) | See section “Cash Flow Analysis”. |
The Mortgage Loan.The mortgage loan (the “Prince and Spring Street Portfolio Mortgage Loan”) is part of a whole loan (the “Prince and Spring Street Portfolio Whole Loan”), which is evidenced by twopari passupromissory notes (Notes A-1 and A-2) and secured by a first mortgage encumbering the fee interests in three mixed use retail and multifamily buildings located in New York, New York (the “Prince and Spring Street Portfolio Properties”). The Prince and Spring Street Portfolio Whole Loan was originated on March 13, 2018 by Argentic Real Estate Finance LLC. The Prince and Spring Street Portfolio Whole Loan had an original principal balance of $41,000,000, has an outstanding principal balance as of the Cut-off Date of $41,000,000, and accrues interest at a rate of 5.340%per annum. The Prince and Spring Street Portfolio Whole Loan had an initial term of 120 months, has a remaining term of 119 months as of the Cut-off Date and requires interest-only payments through the term of the Prince and Spring Street Portfolio Whole Loan. The Prince and Spring Street Portfolio Whole Loan matures on April 6, 2028.
The Prince and Spring Street Mortgage Loan, which is evidenced by the controlling Note A-1 and will be contributed to the WFCM 2018-C44 Trust, had an original principal balance of $30,000,000 and has an outstanding principal balance as of the Cut-off Date of $30,000,000. The non-controlling Note A-2, which had an original principal balance of $11,000,000, is currently held by Argentic Real Estate Finance LLC and is expected to be contributed to a future securitization trust or trusts. The lender provides no assurances that any non-securitizedpari passu notes will not be split further. See “Description of the Mortgage Pool-The Whole Loans-The Serviced Whole Loans” in the Prospectus.
THE INFORMATION IN THIS STRUCTURAL AND COLLATERAL TERM SHEET IS NOT COMPLETE AND MAY BE AMENDED PRIOR TO THE TIME OF SALE. THIS TERM SHEET IS NOT AN OFFER TO SELL THESE SECURITIES AND IT IS NOT A SOLICITATION OF AN OFFER TO BUY THESE SECURITIES IN ANY JURISDICTION WHERE THE OFFER OR SALE IS NOT PERMITTED.
116
| PRINCE AND SPRING STREET PORTFOLIO |
Note Summary(1)
| Notes | Original Balance | Note Holder | Controlling Interest |
| A-1 | $30,000,000 | WFCM 2018-C44 | Yes |
| A-2 | $11,000,000 | Argentic Real Estate Finance LLC | No |
| Total | $41,000,000 |
| (1) | The lender provides no assurances that any non-securitizedpari passu note will not be split further. |
Following the lockout period, the borrower has the right to defease the Prince and Spring Street Portfolio Whole Loan in whole, or in part, on any date before January 6, 2028. In addition, the Prince and Spring Street Portfolio Whole Loan is prepayable without penalty on or after January 6, 2028. The lockout period will expire on the earlier to occur of (i) two years after the closing date of the securitization that includes the last note to be securitized and (ii) March 13, 2022.
Sources and Uses
| Sources | Uses | |||||||
| Original whole loan amount | $41,000,000 | 100.0% | Loan Payoff | $37,727,031 | 92.0% | |||
| Return of Equity | 1,717,859 | 4.2 | ||||||
| Closing costs | 1,002,119 | 2.4 | ||||||
| Reserves | 552,991 | 1.3 | ||||||
| Total Sources | $41,000,000 | 100.0% | Total Uses | $41,000,000 | 100.0% |
The Mortgaged Properties. The Prince and Spring Street Portfolio Properties consist of three mixed use, multifamily buildings with ground floor retail located in New York, New York (individually, the “31 Prince Street Property”, the “46 Prince Street Property”, and the “48 Spring Street Property”). The Prince and Spring Street Portfolio Properties were built between 1900 and 1910 and renovated between 2015 and 2016. Individual units feature modern amenities and upgrades such as in-unit washer/dryer (select units), upgraded stainless steel kitchen appliances, heated bathroom floors (select units), through-wall air conditioning and heating, elevated ceilings, walk-in showers, room key access and virtual doorman. The Prince and Spring Street Portfolio Properties consist of 24,260 square feet of multifamily space (75.2% of net rentable area (“NRA”) and 44.5% of underwritten base income) over 48 units and 8,000 square feet of retail space (24.8% of NRA and 55.5% of underwritten base income). As of March 31, 2018, the multifamily units were 100% leased and 96.3% occupied and the retail space was 100.0% leased for a combined total occupancy of 97.2%. Nine of the 48 multifamily units are currently subject to New York rent control or rent stabilization laws. See “Risk Factors—Risks Relating to the Mortgage Loans—Multifamily Properties Have Special Risks” in the Preliminary Prospectus.
Riverside Management, a third party, executed leases for two vacant multifamily units at the 48 Spring Street Property (“the Riverside Leases”). The terms of the Riverside Leases include a rental rate of $3,400 per unit per month and lease expirations of March 12, 2019. The Riverside Leases cannot be terminated, modified, or amended without the lender’s prior written consent. Pursuant to the related Mortgage Loan documents, Riverside Management may only be released from its obligations under the Riverside Leases in the event that the borrower obtains a third-party replacement tenant for each of the two vacant units. The related Mortgage Loan documents require that each such third-party replacement tenant’s lease be for a term of at least one year and a monthly rental amount of at least $3,400 per unit. If including the Riverside Leases, the multifamily units are 100.0% leased. There were no adjustments made to the underwritten cash flows based on the Riverside Leases.
The 31 Prince Street Property is a six-story, approximately 9,300 square foot mixed use, multifamily building containing 17 residential units covering over 7,300 square feet and 2,000 square feet of retail space on the ground floor. The building was constructed in 1910 and renovated in 2015. The residential units are all one-bedroom units with an average size of 400 square feet. The penthouse unit has a private terrace and roof access. Of the 17 residential units, four units are currently subject to New York rent control or rent stabilization laws. The residential units are 100.0% occupied. The retail space is 100.0% occupied by three commercial tenants, SNK Prince Street (“Space NK”), Café Gitane (Pee Wee & Tyson) (“Café Gitane”), and Diptyque Mott Street, LLC (“Diptyque”). Space NK is a luxury beauty retailer that offers a bespoke curation of innovative products, including skincare, cosmetics, and gadgets. Café Gitane is a French café that has been in occupancy at the 31 Prince Street Property since 2004. Diptyque is a Paris-based luxury goods company that produces a high-end line of scented candles, perfumes, and face and body care products.
The 46 Prince Street Property is a six-story, approximately 9,500 square foot mixed use, multifamily building containing 15 residential units totaling over 7,500 square feet and 2,000 square feet of retail space on the ground floor. The building was constructed in 1900 and renovated in 2016. The residential units consist of 10 one-bedroom units and five, two-bedroom units, with an average unit size of 500 square feet. Of the 15 residential units, one unit is subject to New York rent control or rent stabilization laws. The residential units are 100.0% occupied. The retail space is 100.0% occupied by two commercial tenants, Torrisi and John Fluevog Boots & Shoes. Torrisi was an Italian restaurant that was owned by The Major Food Group, which in turn is owned by renowned chefs Rich Torrisi, Jeff Zalaznick, and Mario Carbone. In 2015, Torrisi’s space was converted from a traditional restaurant to a test kitchen for The Major Food Group’s other restaurants (The Grill, Lobster Club, The Pool, and the revamped Four Seasons) and is periodically used for special events. John Fluevog Boots & Shoes is a Canadian designer shoe store with 25 locations including Montreal, Toronto, Chicago, Los Angeles, San Francisco, and New York. John Fluevog Boots & Shoes has been in occupancy at the 46 Prince Street Property since 2001.
The 48 Spring Street Property is a five-story, approximately 13,460 square foot mixed use, multifamily building containing 16 residential units totaling over 9,460 square feet and 4,000 square feet of retail space on the ground floor. The building was constructed in 1900 and renovated in 2015. The residential units consist of nine, one-bedroom units with an average size of 536 square feet and seven, two-bedroom units with an average size of 663 square feet. Of the 16 residential units, four units are subject
THE INFORMATION IN THIS STRUCTURAL AND COLLATERAL TERM SHEET IS NOT COMPLETE AND MAY BE AMENDED PRIOR TO THE TIME OF SALE. THIS TERM SHEET IS NOT AN OFFER TO SELL THESE SECURITIES AND IT IS NOT A SOLICITATION OF AN OFFER TO BUY THESE SECURITIES IN ANY JURISDICTION WHERE THE OFFER OR SALE IS NOT PERMITTED.
117
| PRINCE AND SPRING STREET PORTFOLIO |
toNew York rent control or rent stabilization laws. The occupancy of the residential units is 87.5%, however, including the Riverside Leases, the 48 Spring Street Property is 100.0% leased. The retail space is 100.0% leased by two commercial tenants, Mulberry Burger and Spring Lounge. Mulberry Burger, a restaurant, has recently executed a 10-year lease with a lease commencement date of April 15, 2018. The owner of Mulberry Burger has been successfully operating as a pop-up/temporary restaurant (“pop-up”) at various locations in the North of Little Italy (“Nolita”)/South of Houston (“Soho”) area while searching for a permanent location. Mulberry Burger will operate as a pop-up at the 48 Spring Street Property while building out its space, which it will be able to do simultaneously given the existence of two separate entrances to the subgrade and ground level space. Mulberry Burger backfilled the space shortly after the previous tenant, Tartinery, vacated at the end of March 2018. Tartinery was a French restaurant and was in occupancy at the 48 Spring Street Property since 2008. The Mulberry Burger lease is fully guaranteed by the borrower until the earlier of (i) April 15, 2023 (five years from the Mulberry Burger lease commencement date) or (ii) such time as the lender has received evidence that Mulberry Burger has achieved $4,000,000 of sales based on the tenant’s most recent trailing 12-month financial statement. The other retail tenant is Spring Lounge, which is a neighborhood bar that has been in occupancy at the 48 Spring Street Property since the 1920s.
The following table presents certain information relating to the unit mix of the Prince and Spring Street Portfolio Properties:
Property Summary
| Property Name | Allocated Cut-off Date Balance | % of Portfolio Cut-off Date Balance | Occupancy(1) | Year Built/ Renovated | Net Rentable Area (SF) | As-Is Appraised Value | Allocated Cut-off Date LTV |
| 31 Prince Street Property | $16,000,000 | 39.0% | 100.0% | 1910/2015 | 9,300 | $26,000,000 | 61.5% |
| 46 Prince Street Property | $14,300,000 | 34.9% | 100.0% | 1900/2016 | 9,500 | $19,000,000 | 75.3% |
| 48 Spring Street Property | $10,700,000 | 26.1% | 93.7% | 1900/2015 | 13,460 | $21,000,000 | 51.0% |
| Total/Weighted Average | $41,000,000 | 100.0% | 97.2% | 32,260 | $66,000,000 | 62.1% |
| (1) | Occupancy as of March 31, 2018. Occupancy consists of both multifamily and retail spaces. If including the Riverside Leases, the occupancy would be 100.0%. |
The following table presents certain information relating to the apartment unit mix of the Prince and Spring Street Portfolio Properties:
Apartment Unit Summary
| Unit Type(1) | No. of Units(1) | % of Total Units | Average Unit Size (SF)(1) | Average Monthly Contract Rent per Unit(1) | Average Monthly Market Rent per Unit(2) |
| 31 Prince Street - One Bedroom | 12 | 25.0% | 400 | $3,495 | $3,500 |
| 31 Prince Street - One Bedroom (Rent Regulated) | 4 | 8.3% | 400 | $1,221 | $3,500 |
| 31 Prince Street - One Bedroom Penthouse | 1 | 2.1% | 900 | $7,650 | $7,750 |
| 46 Prince Street - One Bedroom | 9 | 18.8% | 500 | $3,037 | $3,500 |
| 46 Prince Street - One Bedroom (Rent Regulated) | 1 | 2.1% | 500 | $244 | $3,500 |
| 46 Prince Street - Two Bedroom | 5 | 10.4% | 500 | $3,548 | $3,800 |
| 48 Spring Street - One Bedroom | 7 | 14.6% | 517 | $3,450(3) | $3,500 |
| 48 Spring Street - One Bedroom (Rent Regulated) | 2 | 4.2% | 600 | $1,222 | $3,500 |
| 48 Spring Street - Two Bedroom | 5 | 10.4% | 664 | $3,780 | $3,800 |
| 48 Spring Street - Two Bedroom (Rent Regulated) | 2 | 4.2% | 660 | $503 | $3,800 |
| Total/Weighted Average | 48 | 100.0% | 505 | $3,048 | $3,664 |
| (1) | Information obtained from the Borrower rent roll dated March 31, 2018. |
| (2) | Information obtained from the appraisal. |
| (3) | Calculation includes the rental rate from 2 Riverside Leases of $3,400 per unit per month. |
THE INFORMATION IN THIS STRUCTURAL AND COLLATERAL TERM SHEET IS NOT COMPLETE AND MAY BE AMENDED PRIOR TO THE TIME OF SALE. THIS TERM SHEET IS NOT AN OFFER TO SELL THESE SECURITIES AND IT IS NOT A SOLICITATION OF AN OFFER TO BUY THESE SECURITIES IN ANY JURISDICTION WHERE THE OFFER OR SALE IS NOT PERMITTED.
118
| PRINCE AND SPRING STREET PORTFOLIO |
The following table presents certain information relating to the retail tenants of the Prince and Spring Street Portfolio Properties:
Retail Tenants
| Tenant Name | Credit Rating (Fitch/Moody’s/ S&P)(1) | Tenant NRSF | % of NRSF | Annual U/W Base Rent PSF(2) | Annual U/W Base Rent(2) | % of Total Annual U/W Base Rent | Lease Expiration Date | |
| SNK Prince Street | NR/NR/NR | 800 | 10.0% | $566.85 | $453,482 | 20.7% | 5/31/2025 | |
| Spring Lounge | NR/NR/NR | 2,000 | 25.0% | $221.38 | $442,755 | 20.2% | 4/30/2022 | |
| Mulberry Burger(3) | NR/NR/NR | 2,000 | 25.0% | $180.00 | $360,000 | 16.5% | 4/30/2028 | |
| John Fluevog Boots & Shoes | NR/NR/NR | 1,000 | 12.5% | $358.49 | $358,493 | 16.4% | 1/31/2020 | |
| Café Gitane | NR/NR/NR | 700 | 8.8% | $397.47 | $278,226 | 12.7% | 6/30/2023 | |
| Diptyque | NR/NR/NR | 500 | 6.3% | $315.23 | $157,615 | 7.2% | 3/1/2023 | |
| Torrisi | NR/NR/NR | 1,000 | 12.5% | $136.81 | $136,811 | 6.3% | 7/31/2019 | |
| Total Tenants | 8,000 | 100.0% | $273.42 | $2,187,382 | 100.0% | |||
| Occupied Retail Collateral Total | 8,000 | 100.0% | $273.42 | $2,187,382 | 100.0% | |||
| Vacant Space | 0 | 0.0% | ||||||
| Retail Collateral Total | 8,000 | 100.0% | ||||||
| (1) | Certain ratings are those of the parent company whether or not the parent guarantees the lease. |
| (2) | Annual U/W Base Rent PSF and Annual U/W Base Rent include contractual rent escalations of $54,907 through March 2019. |
| (3) | The Mulberry Burger lease is fully guaranteed by the borrower until the earlier of (i) April 15, 2023 (five years from the Mulberry Burger lease commencement date) or (ii) such time as the lender has received evidence that Mulberry Burger has achieved $4,000,000 of sales based on the tenant’s most recent trailing 12-month financial statement. |
The following table presents certain information relating to the lease rollover schedule of the retail space at the Prince and Spring Street Portfolio Properties:
Lease Expiration Schedule(1)(2)
| Year Ending December 31, | No. of Leases Expiring | Expiring NRSF | % of Total NRSF | Cumulative Expiring NRSF | Cumulative % of Total NRSF | Annual U/W Base Rent | % of Total Annual U/W Base Rent | Annual U/W Base Rent PSF(3) |
| MTM | 0 | 0 | 0.0% | 0 | 0.0% | $0 | 0.0% | $0.00 |
| 2018 | 0 | 0 | 0.0% | 0 | 0.0% | $0 | 0.0% | $0.00 |
| 2019 | 1 | 1,000 | 12.5% | 1,000 | 12.5% | $136,811 | 6.3% | $136.81 |
| 2020 | 1 | 1,000 | 12.5% | 2,000 | 25.0% | $358,493 | 16.4% | $358.49 |
| 2021 | 0 | 0 | 0.0% | 2,000 | 25.0% | $0 | 0.0% | $0.00 |
| 2022 | 1 | 2,000 | 25.0% | 4,000 | 50.0% | $442,755 | 20.2% | $221.38 |
| 2023 | 2 | 1,200 | 15.0% | 5,200 | 65.0% | $435,841 | 19.9% | $363.20 |
| 2024 | 0 | 0 | 0.0% | 5,200 | 65.0% | $0 | 0.0% | $0.00 |
| 2025 | 1 | 800 | 10.0% | 6,000 | 75.0% | $453,482 | 20.7% | $566.85 |
| 2026 | 0 | 0 | 0.0% | 6,000 | 75.0% | $0 | 0.0% | $0.00 |
| 2027 | 0 | 0 | 0.0% | 6,000 | 75.0% | $0 | 0.0% | $0.00 |
| 2028 | 1 | 2000 | 25.0% | 8,000 | 100.0% | $360,000 | 16.5% | $180.00 |
| Thereafter | 0 | 0 | 0.0% | 8,000 | 100.0% | $0 | 0.0% | $0.00 |
| Vacant | 0 | 0 | 0.0% | 8,000 | 100.0% | $0 | 0.0% | $0.00 |
| Total/Weighted Average | 7 | 8,000 | 100.0% | $2,187,382 | 100.0% | $273.42 |
| (1) | Information obtained from the underwritten rent roll. |
| (2) | Certain tenants may have lease termination options that are exercisable prior to the originally stated expiration date of the subject lease and that are not considered in the Lease Expiration Schedule. |
| (3) | Weighted Average Annual U/W Base Rent PSF excludes vacant space. |
THE INFORMATION IN THIS STRUCTURAL AND COLLATERAL TERM SHEET IS NOT COMPLETE AND MAY BE AMENDED PRIOR TO THE TIME OF SALE. THIS TERM SHEET IS NOT AN OFFER TO SELL THESE SECURITIES AND IT IS NOT A SOLICITATION OF AN OFFER TO BUY THESE SECURITIES IN ANY JURISDICTION WHERE THE OFFER OR SALE IS NOT PERMITTED.
119
| PRINCE AND SPRING STREET PORTFOLIO |
The following table presents historical occupancy percentages at the Prince and Spring Street Portfolio Properties:
Retail Historical Occupancy(1)
12/31/2014(2) | 12/31/2015(2) | 12/31/2016(2) | 12/31/2017(2) | 3/31/2018(3) | |
| 31 Prince Street Property | 100.0% | 100.0%(4) | 100.0% | 100.0% | 100.0% |
| 46 Prince Street Property | 100.0% | 100.0% | 100.0% | 100.0% | 100.0% |
48 Spring Street Property | 100.0% | 100.0% | 100.0% | 100.0% | 100.0% |
| Weighted Average | 100.0% | 100.0% | 100.0% | 100.0% | 100.0% |
| (1) | Occupancy is based on the retail units only. |
| (2) | Information obtained from the borrower. |
| (3) | Information obtained from underwritten rent roll. |
| (4) | SNK Prince Street executed a lease in June 2015. The space was previously occupied by Ralph Lauren, which vacated in early 2015. |
Multifamily Historical Occupancy(1)(2)
12/31/2014(2) | 12/31/2015(2) | 12/31/2016(2) | 12/31/2017(2) | 3/31/2018(3) | |
| 31 Prince Street Property | 100.0% | 99.5% | 95.0% | 98.5% | 100.0% |
| 46 Prince Street Property | 100.0% | 100.0% | 97.7% | 94.8% | 100.0% |
48 Spring Street Property | 93.4% | 97.7% | 97.8% | 88.3% | 90.5% |
| Weighted Average | 97.4% | 99.0% | 96.9% | 93.4%(4) | 96.3% |
| (1) | Occupancy is based on the residential units only. |
| (2) | Information obtained from the borrower. |
| (3) | Information obtained from the underwritten rent roll. |
| (4) | Occupancy of the Prince and Spring Street Portfolio Properties decreased between 2016 and 2017 as some units were taken offline for renovations. |
Operating History and Underwritten Net Cash Flow.The following table presents certain information relating to the historical operating performance and underwritten net cash flow at the Prince and Spring Street Portfolio Properties:
Cash Flow Analysis
| 2015 | 2016 | 2017 | U/W | % of U/W Effective Gross Income | U/W $ per Unit | |
| Residential Base Rent | $1,370,050 | $1,422,278 | $1,455,627 | $1,755,464(1) | 43.5% | $54.42 |
| Retail Base Rent | 1,869,379 | 1,927,077 | 1,986,563 | 2,187,382(2) | 54.3 | 67.80 |
| Other Income(3) | 43,943 | 30,290 | 36,638 | 36,638 | 0.9 | 1.14 |
| Total Reimbursables | 245,750 | 293,975 | 274,760 | 261,767 | 6.5 | 8.11 |
| Less Vacancy & Credit Loss | 0 | 0 | 0 | (210,231)(4) | (5.2) | (6.52) |
| Effective Gross Income | $3,529,122 | $3,673,620 | $3,753,588 | $4,031,021 | 100.0% | $124.95 |
| Total Operating Expenses | $1,136,011 | $1,272,499 | $1,367,147 | $1,359,059 | 33.7% | $42.13 |
| ||||||
| Net Operating Income | $2,393,111 | $2,401,121 | $2,386,441 | $2,671,962 | 66.3% | $82.83 |
| Capital Expenditures | 0 | 0 | 0 | 14,173 | 0.4 | 0.44 |
| Net Cash Flow | $2,393,111 | $2,401,121 | $2,386,441 | $2,657,789(5) | 65.9% | $82.39 |
|
|
|
|
|
| |
| NOI DSCR(6) | 1.08x | 1.08x | 1.08x | 1.20x | ||
| NCF DSCR(6) | 1.08x | 1.08x | 1.08x | 1.20x | ||
| NOI DY(6) | 5.8% | 5.9% | 5.8% | 6.5% | ||
| NCF DY(6) | 5.8% | 5.9% | 5.8% | 6.5% |
| (1) | The U/W Residential Base Rent increased from 2017 primarily due to a number of units being offline for renovations in 2017 but subsequently re-leased at market rental rates in early 2018. |
| (2) | The U/W Retail Base Rent increased from 2017 primarily due to an increase in rent associated with the new Mulberry Burger lease. |
| (3) | Other Income consists of antenna income. |
| (4) | The underwritten economic vacancy is 5.0%. As of March 31, 2018, the apartment units were 96.3% physically occupied and the commercial units were 100.0% physically occupied. |
| (5) | Assuming Torrisi vacates its premise and no additional U/W vacancy factor is applied to the retail income, the resulting U/W Net Cash Flow would be $2,601,748. |
| (6) | DSCR and DY calculations are based on the Prince and Spring Street Portfolio Whole Loan. |
Appraisal.As of the appraisal valuation date of December 5, 2017, the Prince and Spring Street Portfolio Properties had an aggregate total “as-is” appraised value of $66,000,000. The individual “as-is” appraised values are $26,000,000, $19,000,000, and $21,000,000 for the 31 Prince Street Property, the 46 Prince Street Property, and the 48 Spring Street Property, respectively.
THE INFORMATION IN THIS STRUCTURAL AND COLLATERAL TERM SHEET IS NOT COMPLETE AND MAY BE AMENDED PRIOR TO THE TIME OF SALE. THIS TERM SHEET IS NOT AN OFFER TO SELL THESE SECURITIES AND IT IS NOT A SOLICITATION OF AN OFFER TO BUY THESE SECURITIES IN ANY JURISDICTION WHERE THE OFFER OR SALE IS NOT PERMITTED.
120
| PRINCE AND SPRING STREET PORTFOLIO |
Environmental Matters. According to a Phase I environmental assessments dated December 11, 2017, December 21, 2017, and December 11, 2017 for the 31 Prince Street Property, the 46 Prince Street Property, and the 48 Spring Street Property, respectively, there are no recognized environmental conditions at any of the Prince and Spring Street Portfolio Properties.
Market Overview and Competition. The Prince and Spring Street Portfolio Properties are located in the Nolita neighborhood of New York City, New York. Nolita is bounded on the north by Houston Street, on the east by the Bowery, on the south roughly by Broome Street, and on the west by Lafayette Street. The district is serviced by the B, D, F, and M trains at the Broadway-Lafayette subway station, the N and R trains at the Prince Street subway station, and the 4 and 6 trains at Spring Street-Lexington Avenue subway station. In addition, several bus routes run through the area. There is access to New Jersey via the Holland Tunnel and New York’s outer boroughs via the Manhattan and Williamsburg Bridges, which can each be reached in less than 10 minutes.
The Nolita neighborhood is largely characterized by ground level retail boutiques restaurants and bars. The local area is comprised almost entirely of residential buildings with ground level retail spaces. An exception is St. Patrick’s Old Cathedral located directly across Mott Street to the immediate west of the Prince and Spring Street Portfolio Properties. To the north, east, and south are multi-story residential apartment buildings with ground level retail spaces. Approximately two blocks west of the Prince and Spring Street Portfolio Properties is the area referred to as SoHo, well-known for its galleries and boutique shopping. Immediately south of the area is Little Italy, which contains a string of well-known restaurants that begin along Mulberry Street, three blocks south of the Prince and Spring Street Portfolio Properties at Broome Street. Slightly further south is Chinatown. Chinatown is the center of New York City’s Chinese ethnic community, with a large concentration of restaurants, ethnic food markets and retail/discount shops selling gold, diamonds, watches, leather goods, and other personal goods.
The weighted average U/W Base Rent for the multifamily tenants at the Prince and Spring Street Portfolio Properties was $3,048 per unit per month including rents from the nine rent regulated units and $3,531 per unit per month excluding rents from the nine rent regulated units. The appraiser concluded to a weighted average market rent of $3,664 per unit per month for the multifamily units at the Prince and Spring Street Portfolio Properties.
The retail space at the Prince and Spring Street Portfolio Properties is fully occupied, and the retail tenants have a weighted average U/W Base Rent of $273 per square foot gross. The appraiser concluded to $500 per square foot for ground floor corner suites and $400 per square foot for suites along the street.
THE INFORMATION IN THIS STRUCTURAL AND COLLATERAL TERM SHEET IS NOT COMPLETE AND MAY BE AMENDED PRIOR TO THE TIME OF SALE. THIS TERM SHEET IS NOT AN OFFER TO SELL THESE SECURITIES AND IT IS NOT A SOLICITATION OF AN OFFER TO BUY THESE SECURITIES IN ANY JURISDICTION WHERE THE OFFER OR SALE IS NOT PERMITTED.
121
| PRINCE AND SPRING STREET PORTFOLIO |
The following table presents certain information relating to comparable multifamily properties for the Prince and Spring Street Portfolio Properties:
Competitive Set(1)
| Location | Distance to Subject | Average Square Footage | Average Monthly Market Rent Per Unit(2) | Average Monthly Market Rent Per SF(3) | |
| One Bedroom | |||||
Prince and Spring Street Portfolio (Subject)
| New York, NY | -- | 463(4) | $2,886(4)(5) | $6.35 |
101 Delancey Street
| New York, NY | 0.5 miles | 525 | $3,100 | $5.90 |
154 Attorney Street
| New York, NY | 0.8 miles | 775 | $3,800 | $4.90 |
37 East 4th Street
| New York, NY | 0.4 miles | N/A | $3,100 | N/A |
| Two Bedrooms | |||||
Prince and Spring Street Portfolio (Subject)
| New York, NY | -- | 595 | $3,137(5) | $5.23 |
101 Delancey Street
| New York, NY | 0.5 miles | 700 | $4,100 | $5.86 |
15 Rivington Street
| New York, NY | 0.2 miles | 2,300 | $20,000 | $8.70 |
153 Bowery
| New York, NY | 0.3 miles | 1,320 | $8,500 | $6.44 |
202 Bowery
| New York, NY | 0.3 miles | 1,350 | $7,250 | $5.37 |
232 Mott Street
| New York, NY | 230 feet | N/A | $6,039 | N/A |
37 East 4th Street
| New York, NY | 0.4 miles | N/A | $6,530 | N/A |
| (1) | Information obtained from the appraisal. |
| (2) | Information based upon actual rents and occupied units according to the March 31, 2018 rent roll for Prince and Spring Street Portfolio and quoted rents for the competitive set. Average Monthly Market Rent for one bedroom units per Unit inclusive of the penthouse unit is $3,018. |
| (3) | Based on weighted average unit size and quoted rate per month. |
| (4) | Calculation excludes 1 one bedroom penthouse unit. |
| (5) | Excluding rent regulated units, the Average Monthly Market Rent for the Prince and Spring Street Portfolio is $3,337 for one bedroom and $3,664 for two bedrooms. |
THE INFORMATION IN THIS STRUCTURAL AND COLLATERAL TERM SHEET IS NOT COMPLETE AND MAY BE AMENDED PRIOR TO THE TIME OF SALE. THIS TERM SHEET IS NOT AN OFFER TO SELL THESE SECURITIES AND IT IS NOT A SOLICITATION OF AN OFFER TO BUY THESE SECURITIES IN ANY JURISDICTION WHERE THE OFFER OR SALE IS NOT PERMITTED.
122
| PRINCE AND SPRING STREET PORTFOLIO |
The following table presents certain information relating to comparable retail properties to the Prince and Spring Street Portfolio Properties:
Comparable Retail Leases(1)
| Property Name/Location | Distance from Subject | Tenant Name | Lease Date | Ground Floor Lease Area (SF) | Annual Ground Floor Base Rent PSF |
Prince and Spring Street Portfolio(Subject)
| - | Pee Wee & Tyson, Inc., John Fluevog Shoes, Spring Lounge | 3,700 | ||
68 Prince Street, New York, NY
| 0.1 miles | E-Commerce Shoe Brand | 3Q2017 | 950 | $171 |
129 Prince Street, New York, NY
| 0.3 miles | UNTUCKit | 3Q2017 | 1,425 | $505 |
151 Prince Street, New York, NY
| 0.4 miles | Happy Socks | 3Q2017 | 542 | $664 |
121 Spring Street, New York, NY
| 0.4 miles | Valentino’s | 3Q2017 | 2,186 | $236 |
28 Prince Street, New York, NY
| 115 feet | Everlane | 2Q2017 | 2,800 | $150 |
160 Prince Street, New York, NY
| 0.4 miles | Coco Pazzo | 2Q2017 | 1,800 | $173 |
20 Spring Street, New York, NY
| 0.1 miles | Jean George | 2Q2017 | 2,000 | $148 |
50 Spring Street, New York, NY
| 0.2 miles | Cava Grill | 2Q2017 | 1,904 | $284 |
72 Spring Street, New York, NY
| 0.2 miles | Amazon | 2Q2017 | 5,200 | $250 |
101 Prince Street, New York, NY
| 0.3 miles | Shinola | 1Q2017 | 2,000 | $600 |
143 Prince Street, New York, NY
| 0.4 miles
| Coach | 1Q2017 | 2,500 | $670 |
148 Spring Street, New York, NY
| 0.4 miles
| Dr. Marten’s | 1Q2017 | 1,279 | $755 |
155 Spring Street, New York, NY
| 0.5 miles | APM Monoco | 1Q2017 | 1,065 | $750
|
160 Spring Street, New York, NY
| 0.5 miles | Chords | 1Q2017 | 564 | $670
|
| (1) | Information obtained from the appraisal. |
The Borrower. The borrower consists of 31 Prince, LLC, a New York limited liability company, and Wah Kok Realty Corp., a New York corporation, each a single purpose entity with one independent director. Legal counsel to the borrower delivered a non-consolidation opinion in connection with the origination of the Prince and Spring Street Portfolio Whole Loan. Edmond Li is the guarantor of certain non-recourse carveouts under the Prince and Spring Street Portfolio Whole Loan documents.
The Borrower Sponsor. The borrower sponsor is Edmond Li, the managing partner of Veracity Equities. Edmond Li is a real estate professional with experience in development, investing, advisory, leasing, and brokerage. Edmond Li specializes in the New York City downtown market and in commercial and residential properties. Edmond Li has been developing real estate since 1994, is responsible for the development of over 15 properties in the New York City area (including the Prince and Spring Street Portfolio Properties), and owns 10 separate properties (mostly mixed use properties) located specifically in the downtown/Nolita neighborhood of Manhattan. In addition, Mr. Li has been involved in the leasing of over 35 properties in New York City, including retail, office, government, and warehouse spaces.
Escrows. Upfront escrows were collected in the amounts of $388,662 for real estate taxes, $28,391 for insurance premiums, $35,000 for tenant improvements and leasing commissions (“TI/LC”) and $10,938 for immediate repairs. The related Mortgage Loan documents also provide for ongoing monthly reserves of $86,369 for real estate taxes, $4,056 for insurance premiums, $1,181 for replacement reserves and $667 for TI/LC. The TI/LC escrow is capped at $35,000. However, upon the occurrence and continuance of a Cash Management Trigger Event (as defined below), the borrower is required to make monthly deposits irrespective of the $35,000 cap. After the origination of the Prince and Spring Street Portfolio Mortgage Loan, $90,000 in free rent associated with the Mulberry Burger lease was escrowed with the lender.
THE INFORMATION IN THIS STRUCTURAL AND COLLATERAL TERM SHEET IS NOT COMPLETE AND MAY BE AMENDED PRIOR TO THE TIME OF SALE. THIS TERM SHEET IS NOT AN OFFER TO SELL THESE SECURITIES AND IT IS NOT A SOLICITATION OF AN OFFER TO BUY THESE SECURITIES IN ANY JURISDICTION WHERE THE OFFER OR SALE IS NOT PERMITTED.
123
| PRINCE AND SPRING STREET PORTFOLIO |
Lockbox and Cash Management.Upon the occurrence and continuance of a Cash Management Trigger Event (as defined below) the borrower is required to establish a lender-controlled lockbox account and instruct non-residential tenants to deposit rents into such lockbox account (with residential rents being collected by the borrower or property manager and deposited into the lockbox account).
A “Cash Management Trigger Event” will commence if: (i) an event of default has occurred or is continuing; (ii) the net cash flow debt service coverage ratio (“NCF DSCR”) for the Prince and Spring Street Portfolio Properties falls below 1.15x; (iii) the occupancy is less than 80.0%; (iv) the failure of Riverside to make any of the Riverside Lease payments in a timely manner; or (v) a Lease Sweep Period (as defined below) commences. A Cash Management Trigger Event will end: with respect to clause (i), upon the cure of the event of default being accepted by lender in its sole absolute discretion; with respect to clause (ii), when the Prince and Spring Street Portfolio Properties achieve a NCF DSCR above 1.20x for two consecutive calendar quarters; with respect to clause (iii), upon the occupancy being at least 85.0% for two consecutive calendar quarters; and with respect to clause (iv), upon the lender receiving evidence that the Riverside Leases have been leased to third-party tenants on rental terms at least equal to the rental terms under the Riverside Leases. To the extent that a Cash Management Trigger Event relating to clauses (ii), (iii), or (v) is triggered solely due to circumstances relating to the Mulberry Burger lease, no such Cash Management Trigger Event would be deemed triggered or effective until September 14, 2018; provided that after such date if the circumstances that will have otherwise created a Cash Management Trigger Event still exist, a Cash Management Trigger Event will then commence.
A “Lease Sweep Period” will commence upon the occurrence of any of the following: (i) the date that is 12 months prior to the end of the term of any lease which accounts for 20.0% or more of the total annual rental income derived from the retail portion of the Prince and Spring Street Portfolio Properties or the percentage of the NRA for the retail portion of the Prince and Spring Street Portfolio Properties (“Major Lease”); (ii) an event of default under any Major Lease by the applicable tenant under such Major Lease (a “Major Tenant”); (iii) a non-renewal of a Major Lease; (iv) any Major Lease being surrendered, cancelled or terminated; (v) any Major Tenant discontinuing operations at its related premises or giving notice of such intention; or (vi) a Major Tenant insolvency proceeding.
Property Management. The Prince and Spring Street Portfolio Property is self-managed.
Assumption.The borrower has an unlimited right to transfer the Prince and Spring Street Portfolio Properties, provided that certain conditions are satisfied, including, but not limited to: (i) no mortgage loan default or event of default has occurred and is continuing; (ii) the lender’s reasonable determination that the proposed transferee and guarantor satisfy the lender’s credit review and underwriting standards, taking into consideration the transferee’s experience, financial strength and general business standing; (iii) execution of a recourse guaranty and an environmental indemnity by an acceptable replacement guarantor; (iv) receipt of a rating agency confirmation from the applicable rating agencies; (v) delivery of opinions of counsel required by the lender; and (vi) delivery of an amendment to the title policy.
Partial Release. Following the lockout period, the borrower is permitted to obtain a partial release of one of the Prince and Spring Street Portfolio Properties (the “Prince and Spring Street Portfolio Release Parcel”) from the lien of the Prince and Spring Street Whole Loan subject to certain conditions, including, but not limited to: (i) partial defeasance in an amount equal to the greater of 100.0% of net sales proceeds with respect to the Prince and Spring Street Portfolio Release Parcel or 125.0% of the allocated loan amount for the Prince and Spring Street Portfolio Release Parcel; (ii) the debt yield of the remaining mortgaged properties is not less than the greater of 6.5% and the debt yield prior to the release; and (iii) the loan-to-value ratio of the remaining mortgaged properties is no greater than the lesser of 62.1% and the loan-to-value ratio prior to the release.
Real Estate Substitution. Not permitted.
Subordinate and Mezzanine Indebtedness. Not permitted.
Ground Lease. None.
Insurance.The related Mortgage Loan documents require that the “all risk” insurance policy to be maintained by the borrower provide coverage for terrorism in an amount equal to the full replacement cost of the Prince and Spring Street Portfolio Properties. The related Mortgage Loan documents also require business interruption insurance covering no less than the 12-month period following the occurrence of a casualty event, together with a 12-month extended period of indemnity.
THE INFORMATION IN THIS STRUCTURAL AND COLLATERAL TERM SHEET IS NOT COMPLETE AND MAY BE AMENDED PRIOR TO THE TIME OF SALE. THIS TERM SHEET IS NOT AN OFFER TO SELL THESE SECURITIES AND IT IS NOT A SOLICITATION OF AN OFFER TO BUY THESE SECURITIES IN ANY JURISDICTION WHERE THE OFFER OR SALE IS NOT PERMITTED.
124
(THIS PAGE INTENTIONALLY LEFT BLANK)
THE INFORMATION IN THIS STRUCTURAL AND COLLATERAL TERM SHEET IS NOT COMPLETE AND MAY BE AMENDED PRIOR TO THE TIME OF SALE. THIS TERM SHEET IS NOT AN OFFER TO SELL THESE SECURITIES AND IT IS NOT A SOLICITATION OF AN OFFER TO BUY THESE SECURITIES IN ANY JURISDICTION WHERE THE OFFER OR SALE IS NOT PERMITTED.
125
(THIS PAGE INTENTIONALLY LEFT BLANK)
THE INFORMATION IN THIS STRUCTURAL AND COLLATERAL TERM SHEET IS NOT COMPLETE AND MAY BE AMENDED PRIOR TO THE TIME OF SALE. THIS TERM SHEET IS NOT AN OFFER TO SELL THESE SECURITIES AND IT IS NOT A SOLICITATION OF AN OFFER TO BUY THESE SECURITIES IN ANY JURISDICTION WHERE THE OFFER OR SALE IS NOT PERMITTED.
126
| 100 DOMAIN DRIVE |
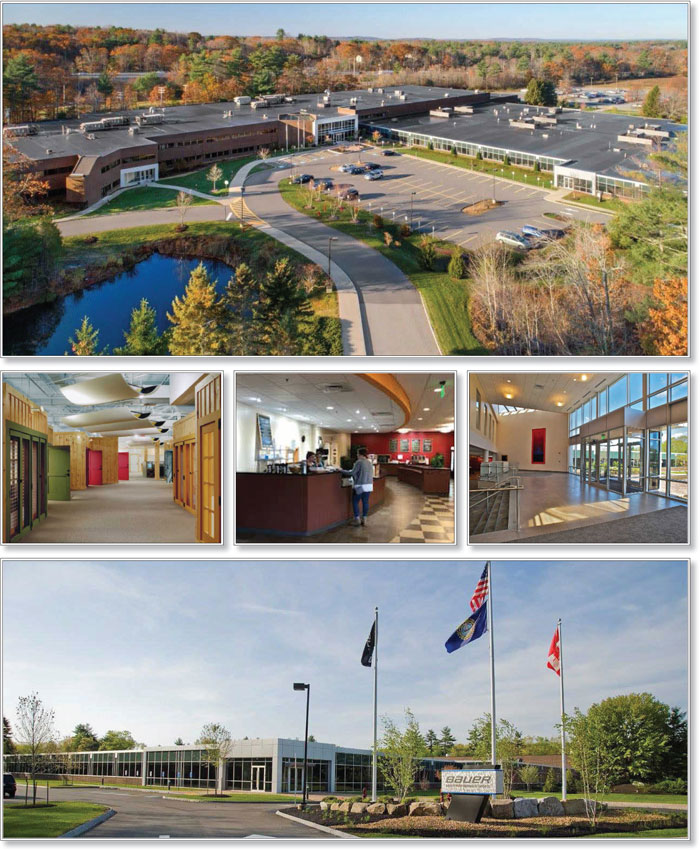
THE INFORMATION IN THIS STRUCTURAL AND COLLATERAL TERM SHEET IS NOT COMPLETE AND MAY BE AMENDED PRIOR TO THE TIME OF SALE. THIS TERM SHEET IS NOT AN OFFER TO SELL THESE SECURITIES AND IT IS NOT A SOLICITATION OF AN OFFER TO BUY THESE SECURITIES IN ANY JURISDICTION WHERE THE OFFER OR SALE IS NOT PERMITTED.
127
| 100 DOMAIN DRIVE |
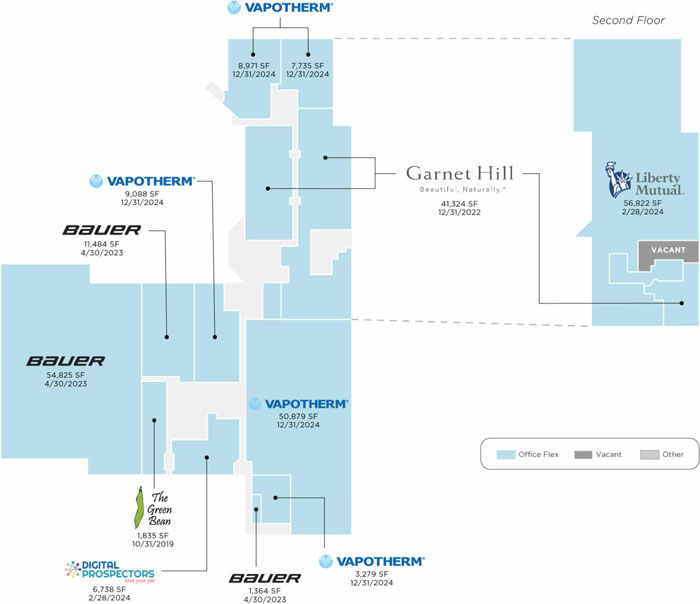
THE INFORMATION IN THIS STRUCTURAL AND COLLATERAL TERM SHEET IS NOT COMPLETE AND MAY BE AMENDED PRIOR TO THE TIME OF SALE. THIS TERM SHEET IS NOT AN OFFER TO SELL THESE SECURITIES AND IT IS NOT A SOLICITATION OF AN OFFER TO BUY THESE SECURITIES IN ANY JURISDICTION WHERE THE OFFER OR SALE IS NOT PERMITTED.
128
| 100 DOMAIN DRIVE |
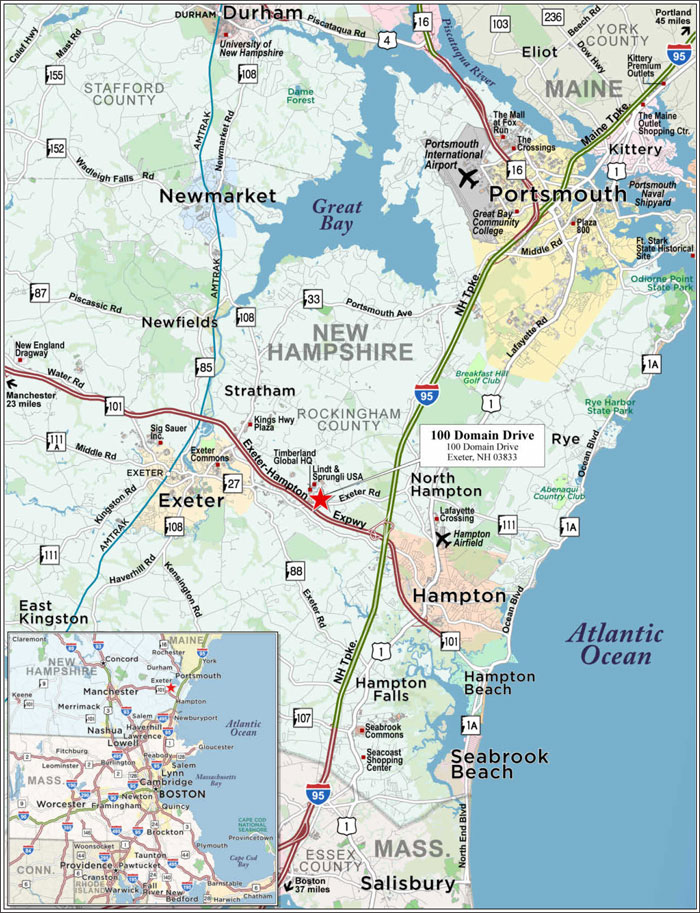
THE INFORMATION IN THIS STRUCTURAL AND COLLATERAL TERM SHEET IS NOT COMPLETE AND MAY BE AMENDED PRIOR TO THE TIME OF SALE. THIS TERM SHEET IS NOT AN OFFER TO SELL THESE SECURITIES AND IT IS NOT A SOLICITATION OF AN OFFER TO BUY THESE SECURITIES IN ANY JURISDICTION WHERE THE OFFER OR SALE IS NOT PERMITTED.
129
| No. 10 – 100 Domain Drive | ||||||
| Loan Information | Property Information | |||||
| Mortgage Loan Seller: | Barclays Bank PLC | Single Asset/Portfolio: | Single Asset | |||
| Credit Assessment (DBRS/Fitch/Moody’s): | NR/NR/NR | Property Type: | Office | |||
| Original Principal Balance: | $27,000,000 | Specific Property Type: | Suburban | |||
| Cut-off Date Balance: | $27,000,000 | Location: | Exeter, NH | |||
| % of Initial Pool Balance: | 3.5% | Size: | 257,360 SF | |||
| Loan Purpose: | Acquisition | Cut-off Date Balance Per SF: | $104.91 | |||
| Borrowers: | 100 Domain Drive DD LLC; 100 Domain Drive EI LLC | Year Built/Renovated: | 1984/2012 | |||
| Borrower Sponsors(1): | Various | Title Vesting: | Fee | |||
| Mortgage Rate: | 4.565% | Property Manager: | Boulos Property Management | |||
| Note Date: | April 3, 2018 | 4th Most Recent Occupancy(3): | 92.2% (12/31/2014) | |||
| Anticipated Repayment Date: | NAP | 3rd Most Recent Occupancy(3): | 92.2% (12/31/2015) | |||
| Maturity Date: | April 6, 2028 | 2nd Most Recent Occupancy(3): | 76.6% (12/31/2016) | |||
| IO Period: | 36 months | Most Recent Occupancy (As of)(3): | 98.9% (12/31/2017) | |||
| Loan Term (Original): | 120 months | Current Occupancy (As of)(3): | 98.8% (4/1/2018) | |||
| Seasoning: | 1 month | |||||
| Amortization Term (Original): | 360 months | Underwriting and Financial Information: | ||||
| Loan Amortization Type: | Interest-only, Amortizing Balloon | |||||
| Interest Accrual Method: | Actual/360 | 4th Most Recent NOI (As of)(4): | $1,139,812 (12/31/2014) | |||
| Call Protection: | L(25),D(89),O(6) | 3rd Most Recent NOI (As of)(4): | $1,390,997 (Annualized 9/30/2015) | |||
| Lockbox Type: | Hard/Springing Cash Management | 2nd Most Recent NOI (As of)(4): | $1,728,928 (12/31/2016) | |||
| Additional Debt: | No | Most Recent NOI (As of)(4): | $2,703,784 (12/31/2017) | |||
| Additional Debt Type: | NAP | |||||
| U/W Revenues: | $5,211,683 | |||||
| U/W Expenses: | $2,001,847 | |||||
| U/W NOI(4): | $3,209,836 | |||||
| U/W NCF: | $2,887,494 | |||||
| Escrows and Reserves(2): | U/W NOI DSCR: | 1.94x | ||||
| Type: | Initial | Monthly | Cap (If Any) | U/W NCF DSCR: | 1.75x | |
| Taxes | $142,432 | $28,486 | NAP | U/W NOI Debt Yield: | 11.9% | |
| Insurance | $5,714 | $5,714 | NAP | U/W NCF Debt Yield: | 10.7% | |
| Replacement Reserves | $0 | $3,217 | NAP | As-Is Appraised Value: | $38,900,000 | |
| TI/LC Reserve | $0 | $21,447 | $1,286,800 | As-Is Appraisal Valuation Date: | February 7, 2018 | |
| Immediate Repair Reserve | $142,000 | $0 | NAP | Cut-off Date LTV Ratio: | 69.4% | |
| Free Rent Reserve | $29,548 | $0 | NAP | LTV Ratio at Maturity or ARD: | 60.9% | |
| (1) | See “The Borrower Sponsors” section. |
| (2) | See “Escrows” section. |
| (3) | See “Historical Occupancy” section. |
| (4) | See “Cash Flow Analysis” section. |
The Mortgage Loan.The mortgage loan (the “100 Domain Drive Mortgage Loan”) is evidenced by a promissory note secured by a first mortgage encumbering the fee simple interest in a 257,360 square foot, Class A office building located in Exeter, New Hampshire (the “100 Domain Drive Property”). The 100 Domain Drive Mortgage Loan was originated on April 3, 2018 by Barclays Bank PLC. The 100 Domain Drive Mortgage Loan had an original principal balance of $27,000,000, has an outstanding principal balance as of the Cut-off Date of $27,000,000 and accrues interest at an interest rate of 4.565%per annum. The 100 Domain Drive Mortgage Loan had an initial term of 120 months, has a remaining term of 119 months as of the Cut-off Date and requires payments of interest-only until April 6, 2021, after which payments of interest and principal based on a 30-year amortization schedule are required through the term of the 100 Domain Drive Mortgage Loan. The 100 Domain Drive Mortgage Loan matures on April 6, 2028.
Following the lockout period, on any date before November 6, 2027, the borrowers have the right to defease the 100 Domain Drive Mortgage Loan in whole, but not in part. The 100 Domain Drive Mortgage Loan is prepayable without penalty on or after November 6, 2027.
THE INFORMATION IN THIS STRUCTURAL AND COLLATERAL TERM SHEET IS NOT COMPLETE AND MAY BE AMENDED PRIOR TO THE TIME OF SALE. THIS TERM SHEET IS NOT AN OFFER TO SELL THESE SECURITIES AND IT IS NOT A SOLICITATION OF AN OFFER TO BUY THESE SECURITIES IN ANY JURISDICTION WHERE THE OFFER OR SALE IS NOT PERMITTED.
130
| 100 DOMAIN DRIVE |
Sources and Uses
| Sources | Uses | |||||
| Original loan amount | $27,000,000 | 68.9% | Purchase price(1) | $37,498,979 | 95.7% | |
| Borrower sponsors’ new cash contribution | $12,170,626 | 31.1 | Closing costs | 1,351,954 | 3.5 | |
| Reserves | 319,694 | 0.8 | ||||
| Total Sources | $39,170,626 | 100.0% | Total Uses | $39,170,626 | 100.0% |
| (1) | The purchase price is net of purchaser and seller credits. |
The Property.The 100 Domain Drive Property consists of a 257,360 square foot, Class A office building located in Exeter, New Hampshire, one mile from Interstate 95 and off the interchange of Routes 101 and 111. The 100 Domain Drive Property is located within a larger, one-million square foot corporate campus that is home to several companies’ headquarters or global mission critical locations. Originally constructed in 1984 as a single-tenant building, the 100 Domain Drive Property has undergone an approximate $10.0 million renovation over the past ten years to become a multi-tenant Class A building. The renovations included mechanical upgrades, new roofs and HVAC units, façade improvements, a parking lot redesign and an atrium lobby. Additional amenities at the 100 Domain Drive Property include a fitness center and cafeteria. The 100 Domain Drive Property sits on a 32.6-acre site and features 968 parking spaces (approximately 3.8 per 1,000 square foot).
The 100 Domain Drive Property is leased to six tenants, two of which have headquarters at the property. The largest tenant at the 100 Domain Drive Property is Vapotherm (41.8% of U/W base rent). Vapotherm has been a tenant at the 100 Domain Drive Property since December 2016 and recently expanded its space by 29,073 square feet in February 2018. Founded in 1999, Vapotherm is a privately-owned company that develops, manufactures and markets respiratory devices. The second largest tenant at the 100 Domain Drive Property is Bauer Hockey (“Bauer”) and is headquartered at the property, utilizing its space for sales and research and development. The tenant has its own, dedicated entry, showers, locker room and cafeteria. Bauer is a manufacturer of ice hockey equipment, fitness and recreational skates and apparel. Bauer has been at the 100 Domain Drive Property since May 2011 and expanded its space in February 2015. The third largest tenant at the 100 Domain Drive Property is Liberty Mutual Insurance Co. (“Liberty Mutual Insurance”), leasing 56,822 square feet through February 2024. According to the borrower sponsors, the tenant invested their own money into the layout, case goods and finishes of their space when they exercised an early extension of their lease. Liberty Mutual Insurance is a Fortune 500 company employing more than 50,000 people globally across 800 offices. As of April 1, 2018, the 100 Domain Drive Property was 98.8% occupied by six tenants.
The following table presents certain information relating to the tenancy at the 100 Domain Drive Property:
Major Tenants
| Tenant Name | Credit Rating (Fitch/Moody’s/ S&P)(1) | Tenant NRSF | % of NRSF | Annual U/W Base Rent PSF(2) | Annual U/W Base Rent(2) | % of Total Annual U/W Base Rent | Lease Expiration Date | |
| Major Tenant | ||||||||
| Vapotherm | NR/NR/NR | 79,952 | 31.1% | $18.68 | $1,493,519 | 41.8% | 12/31/2024(3) | |
| Bauer | NR/NR/NR | 67,673 | 26.3% | $9.51 | $643,908 | 18.0% | 4/30/2023(4) | |
| Liberty Mutual Insurance | BBB+/A2/A | 56,822 | 22.1% | $14.08 | $800,241 | 22.4% | 2/28/2024(5) | |
| Garnet Hill | NR/NR/BB | 41,324 | 16.1% | $12.55 | $518,616 | 14.5% | 12/31/2022(6) | |
| Digital Prospectors | NR/NR/NR | 6,738 | 2.6% | $16.80 | $113,209 | 3.2% | 2/28/2024(7) | |
| Green Bean | NR/NR/NR | 1,835 | 0.7% | $1.31 | $2,400 | 0.1% | 10/31/2019(8) | |
| Total Major Tenants | 254,344 | 98.8% | $14.04 | $3,571,894 | 100.0% | |||
| Vacant Space | 3,016 | 1.2% | ||||||
| Collateral Total | 257,360 | 100.0% | ||||||
| (1) | Certain ratings are those of the parent company whether or not the parent guarantees the lease. |
| (2) | Annual U/W Base Rent PSF and Annual U/W Base Rent include contractual rent steps through March 2019, totaling $28,801 and straight-lined rent for one investment grade tenant, Liberty Mutual Insurance. |
| (3) | Vapotherm has two five-year lease renewal options. |
| (4) | Bauer has two five-year lease renewal options. Bauer has the option to terminate its lease effective May 1, 2021, upon one year’s notice and the payment of a termination fee equal to the unamortized costs tenant improvements and leasing commissions, approximately $485,213. |
| (5) | Liberty Mutual Insurance has one five-year lease renewal option. |
| (6) | Garnet Hill has two five-year lease renewal options. |
| (7) | Digital Prospectors has two five-year lease renewal options. |
| (8) | Green Bean has one five-year lease renewal option. |
THE INFORMATION IN THIS STRUCTURAL AND COLLATERAL TERM SHEET IS NOT COMPLETE AND MAY BE AMENDED PRIOR TO THE TIME OF SALE. THIS TERM SHEET IS NOT AN OFFER TO SELL THESE SECURITIES AND IT IS NOT A SOLICITATION OF AN OFFER TO BUY THESE SECURITIES IN ANY JURISDICTION WHERE THE OFFER OR SALE IS NOT PERMITTED.
131
| 100 DOMAIN DRIVE |
The following table presents certain information relating to the lease rollover schedule at the 100 Domain Drive Property:
Lease Expiration Schedule(1)(2)
| Year Ending December 31, | No. of Leases Expiring | Expiring NRSF | % of Total NRSF | Cumulative Expiring NRSF | Cumulative % of Total NRSF | Annual U/W Base Rent | % of Total Annual U/W Base Rent | Annual U/W Base Rent PSF(3) |
| MTM | 0 | 0 | 0.0% | 0 | 0.0% | $0 | 0.0% | $0.00 |
| 2018 | 0 | 0 | 0.0% | 0 | 0.0% | $0 | 0.0% | $0.00 |
| 2019 | 1 | 1,835 | 0.7% | 1,835 | 0.7% | $2,400 | 0.1% | $1.31 |
| 2020 | 0 | 0 | 0.0% | 1,835 | 0.7% | $0 | 0.0% | $0.00 |
| 2021 | 0 | 0 | 0.0% | 1,835 | 0.7% | $0 | 0.0% | $0.00 |
| 2022 | 1 | 41,324 | 16.1% | 43,159 | 16.8% | $518,616 | 14.5% | $12.55 |
| 2023(4) | 1 | 67,673 | 26.3% | 110,832 | 43.1% | $643,908 | 18.0% | $9.51 |
| 2024(4) | 3 | 143,512 | 55.8% | 254,344 | 98.8% | $2,406,970 | 67.4% | $16.77 |
| 2025 | 0 | 0 | 0.0% | 254,344 | 98.8% | $0 | 0.0% | $0.00 |
| 2026 | 0 | 0 | 0.0% | 254,344 | 98.8% | $0 | 0.0% | $0.00 |
| 2027 | 0 | 0 | 0.0% | 254,344 | 98.8% | $0 | 0.0% | $0.00 |
| 2028 | 0 | 0 | 0.0% | 254,344 | 98.8% | $0 | 0.0% | $0.00 |
| Thereafter | 0 | 0 | 0.0% | 254,344 | 98.8% | $0 | 0.0% | $0.00 |
| Vacant | 0 | 3,016 | 1.2% | 257,360 | 100.0% | $0 | 0.0% | $0.00 |
| Total/Wtd. Average | 6 | 257,360 | 100.0% | $3,571,894 | 100.0% | $14.04 |
| (1) | Information obtained from the underwritten rent roll. |
| (2) | Certain tenants may have lease termination options that are exercisable prior to the originally stated expiration date of the subject lease and that are not considered in the Lease Expiration Schedule. |
| (3) | Weighted Average Annual U/W Base Rent PSF excludes vacant space. |
| (4) | See the “Lockbox and Cash Management” section for cash flow sweeps for Vapotherm and/or Bauer. |
The following table presents historical occupancy percentages at the 100 Domain Drive Property:
Historical Occupancy
12/31/2014(1) | 12/31/2015(1) | 12/31/2016(1)(2) | 12/31/2017(1) | 4/1/2018(3) |
| 92.2% | 92.2% | 76.6% | 98.9% | 98.8% |
| (1) | Information obtained from the borrower. |
| (2) | After the prior owner bought the 100 Domain Drive Property, one tenant vacated its space and another adjacent tenant was bought out by the prior owner for Vapotherm’s expansion. |
| (3) | Information obtained from the underwritten rent roll. |
THE INFORMATION IN THIS STRUCTURAL AND COLLATERAL TERM SHEET IS NOT COMPLETE AND MAY BE AMENDED PRIOR TO THE TIME OF SALE. THIS TERM SHEET IS NOT AN OFFER TO SELL THESE SECURITIES AND IT IS NOT A SOLICITATION OF AN OFFER TO BUY THESE SECURITIES IN ANY JURISDICTION WHERE THE OFFER OR SALE IS NOT PERMITTED.
132
| 100 DOMAIN DRIVE |
Operating History and Underwritten Net Cash Flow. The following table presents certain information relating to the underwritten net cash flow at the 100 Domain Drive Property:
Cash Flow Analysis
| 2014 | 2015(1) | 2016(2) | 2017(2)(3) | U/W(3) | % of U/W Effective Gross Income | U/W $ per SF | |||||||||
| Base Rent | $1,674,820 | $1,796,871 | $2,137,431(4) | $2,936,072 | $3,571,893(5) | 68.5% | $13.88 | ||||||||
| Grossed Up Vacant Space | 0 | 0 | 0 | 0 | 42,224 | 0.8 | 0.16 | ||||||||
| Total Reimbursables | 819,626 | 1,137,471 | 1,083,961 | 1,683,655 | 1,871,865 | 35.9 | 7.27 | ||||||||
| Less Vacancy & Credit Loss | 0 | 0 | 0 | 0 | (274,299)(6) | (5.3) | (1.07) | ||||||||
| Effective Gross Income | $2,494,446 | $2,934,341 | $3,221,391 | $4,619,727 | $5,211,683 | 100.0% | $20.25 | ||||||||
| Total Operating Expenses | $1,354,634 | $1,543,345 | $1,492,463 | $1,915,943 | $2,001,847 | 38.4% | $7.78 | ||||||||
| Net Operating Income | $1,139,812 | $1,390,997 | $1,728,928 | $2,703,784 | $3,209,836 | 61.6% | $12.47 | ||||||||
| TI/LC | 0 | 0 | 0 | 0 | 270,869 | 5.2 | 1.05 | ||||||||
| Capital Expenditures | 0 | 0 | 0 | 0 | 51,472 | 1.0 | 0.20 | ||||||||
| Net Cash Flow | $1,139,812 | $1,390,997 | $1,728,928 | $2,703,784 | $2,887,494 | 55.4% | $11.22 | ||||||||
| NOI DSCR | 0.69x | 0.84x | 1.05x | 1.63x | 1.94x | ||||||||||
| NCF DSCR | 0.69x | 0.84x | 1.05x | 1.63x | 1.75x | ||||||||||
| NOI DY | 4.2% | 5.2% | 6.4% | 10.0% | 11.9% | ||||||||||
| NCF DY | 4.2% | 5.2% | 6.4% | 10.0% | 10.7% |
| (1) | 2015 cash flows represent September 2015 year-to-date annualized, as the prior owner of the 100 Domain Drive Property acquired the 100 Domain Drive Property in 2015. |
| (2) | The increase in net cash flow from 2016 to 2017 is a result of Vapotherm commencing its lease at the 100 Domain Drive Property. |
| (3) | The increase in net cash flow from 2017 to Underwritten is a result of Vapotherm expanding its space by 29,073 square feet at the 100 Domain Drive Property. |
| (4) | The 2016 Base Rent is net of a collection loss of $20,836. |
| (5) | U/W Base Rent includes contractual rent steps through April 2019, totaling $28,801 and straight-lined rent for one investment grade tenant, Liberty Mutual Insurance. |
| (6) | The underwritten economic vacancy is 5.0%. The 100 Domain Drive Property was 98.8% occupied as of April 1, 2018. |
Appraisal. As of the appraisal valuation date of February 7, 2018, the 100 Domain Drive Property had an “as-is” appraised value of $38,900,000.
Environmental Matters. According to a Phase I environmental site assessment dated February 1, 2018, there was no evidence of any recognized environmental conditions at the 100 Domain Drive Property.
Market Overview and Competition.The 100 Domain Drive Property is located in Exeter, New Hampshire (Rockingham County) in the seacoast region of Southern New Hampshire, approximately 30 miles east of Manchester, New Hampshire and 53 miles northeast of Boston. The 100 Domain Drive Property is located off Exit 12 at the interchange of Routes 101 and 111 and is one mile from Interstate 95, the main thoroughfare of the eastern seaboard. The 100 Domain Drive Property is also located 8 miles north of Interstate 495, which provides access to Boston and Portsmouth. The 100 Domain Drive Property is located within the Southern New Hampshire office submarket of the New Hampshire office market. According to the appraisal, Rockingham County is expected to remain one of the region’s strongest economies as a result of its favorable tax climate and firms relocating to Rockingham. As of the third quarter of 2017, the Southern New Hampshire office submarket had approximately 14.8 million square feet of office inventory, average asking rents of $19.02 per square foot and a direct vacancy rate of 4.2%. According to the appraisal, the 2017 population within a one-, three- and five-mile radius of the 100 Domain Drive Property was 2,228, 13,636 and 40,622, respectively; while the 2017 estimated average household income within the same radii was $109,860, $112,984 and $114,863, respectively.
THE INFORMATION IN THIS STRUCTURAL AND COLLATERAL TERM SHEET IS NOT COMPLETE AND MAY BE AMENDED PRIOR TO THE TIME OF SALE. THIS TERM SHEET IS NOT AN OFFER TO SELL THESE SECURITIES AND IT IS NOT A SOLICITATION OF AN OFFER TO BUY THESE SECURITIES IN ANY JURISDICTION WHERE THE OFFER OR SALE IS NOT PERMITTED.
133
| 100 DOMAIN DRIVE |
The following table presents certain information relating to comparable office leases for the 100 Domain Drive Property:
Comparable Leases(1)
| Property Name/Location | Year Built | Occupancy | Tenant Name | Lease Date / Term | Lease Area (SF) | Base Rent (PSF) | Lease Type |
John Hancock Call Centre 163 Corporate Drive Portsmouth, NH | 2001 | 100% | John Hancock | Aug 2016 / 10.0 Yrs | 102,400 | $8.25 | NNN |
100 Aboretum Drive, Portsmouth, NH | 1999 | 93% | Wheelbrator Baker, Newman & Noyes Long Term Care Partners | Jan 2016 / 10.3 Yrs Sept 2015 / 5.6 Yrs Jun 2015 / 4.4 Yrs | 29,658 4,950 12,140 | $17.00 $16.00 $16.00 | NNN NNN NNN |
11 Trafalgar Square, Nashua, NH | 1986 | 70% | Wells Fargo Advisors | Jun 2016 / 10.0 Yrs | 9,678 | $16.25 | Mod Gross |
2 International Drive Portsmouth, NH | 1998 | 85% | Coldwell Bank | Mar 2016 / 5.1 Yrs | 5,607 | $21.50 | Mod Gross |
Confidential Medical Office Bedford, NH | 2017 | 100% | Confidential | Sept 2017 / 15.0 Yrs | 58,016 | $26.00 | Absolute Net |
166 Corporate Drive, Portsmouth, NH | 2001 | 100% | Lonza | Nov 2016 / 6.8 Yrs | 102,400 | $6.75 | NNN |
253 Abbey Road, Manchester, NH | 1997 | 100% | Symmetry Medical | Nov 2015 / 16.0 Yrs | 112,403 | $7.91 | NNN |
162 Corporate Drive, Portsmouth, NH | 2002 | 100% | Teledyne | Jun 2017 / 10.0 Yrs | 102,400 | $6.75 | NNN |
| (1) | Information obtained from the appraisal. |
The Borrowers.The borrowers for the 100 Domain Drive Mortgage Loan are 100 Domain Drive DD LLC and 100 Domain Drive EI LLC, each a Delaware limited liability company and a special purpose entity. The managing member of each borrower is a newly-formed, special purpose entity with one independent director. The borrowers own the 100 Domain Drive Property as tenants-in-common. Both borrowers have waived their right of partition. Legal counsel to the borrowers delivered a non-consolidation opinion in connection with the origination of the 100 Domain Drive Mortgage Loan. Jennie Garofalo, John Garofalo, Vincent MacNutt and Tom Sibley are the guarantors of certain nonrecourse carveouts under the 100 Domain Drive Mortgage Loan.
The Borrower Sponsors.The borrower sponsors are Danielle DeBenedictis, Emerson Investors and Arris Partners, LLC. Danielle DeBenedictis is a principal and partner at the law firm DeBenedictis, Miller & Blum, P.A. specializing in the litigation of business and personal cases. Danielle DeBenedictis is the sole individual member of the 100 Domain Drive DD LLC borrowing entity (approximately 89% of the equity of the tenant-in-common). The 100 Domain Drive EI LLC borrowing entity (approximately 11% of the equity of the tenant-in-common) is a joint venture between Emerson Investors and Arris Partners, LLC. Emerson Investors acquires and operates residential real estate and was co-founded by Vincent MacNutt. Arris Partners, LLC is a privately-held real estate investment firm headquartered in Massachusetts that focuses on opportunistic investments in New England. Arris Partners, LLC was co-founded by John Garofalo and Thomas Sibley.
Escrows.The 100 Domain Drive Mortgage Loan documents provide for upfront reserves in the amount of $142,000 for immediate repairs, $29,548 for free rent for Vapotherm, $142,432 for real estate taxes and $5,714 for insurance.
The 100 Domain Drive Mortgage Loan documents require monthly reserve deposits for (a) real estate taxes in an amount equal to one-twelfth of an amount which would be sufficient to pay the taxes payable during the next ensuing twelve months (initially $28,486), (b) insurance premiums equal to one-twelfth of the amount that the lender estimates will be payable for the renewal of the insurance policy (initially $5,714), (c) tenant improvements and leasing commissions (“TI/LCs”) in an amount equal to $21,447 and any lease termination payments subject to a cap of $1,286,800 (the lease termination payments will not be included in the calculation of the TI/LC cap) and (d) replacement reserves in an amount equal to $3,217.
Lockbox and Cash Management.The 100 Domain Drive Mortgage Loan is structured with a hard lockbox and springing cash management. The borrower was required at origination to deliver letters to all tenants at the 100 Domain Drive Property directing them to pay all rents directly into a lender-controlled lockbox account. All other funds received by the borrower or manager are required to be deposited in the lockbox account within two business days following receipt. During the occurrence and continuance of a Trigger Period (as defined below), all funds are required to be swept each business day into the cash management account controlled by the lender and disbursed on each payment date in accordance with the loan documents, with all excess cash flow to be deposited to an excess cash reserve to be held as additional security for the 100 Domain Drive Mortgage Loan.
THE INFORMATION IN THIS STRUCTURAL AND COLLATERAL TERM SHEET IS NOT COMPLETE AND MAY BE AMENDED PRIOR TO THE TIME OF SALE. THIS TERM SHEET IS NOT AN OFFER TO SELL THESE SECURITIES AND IT IS NOT A SOLICITATION OF AN OFFER TO BUY THESE SECURITIES IN ANY JURISDICTION WHERE THE OFFER OR SALE IS NOT PERMITTED.
134
| 100 DOMAIN DRIVE |
A “Trigger Period” will commence upon the earlier of the following:
| (i) | the occurrence and continuance of an event of default; |
| (ii) | the amortizing debt service coverage ratio being less than 1.20x; |
| (iii) | one or more of the following having occurred (a) Vapotherm not giving written notice of lease renewal (or giving notice of its intent not to renew its lease) to the borrowers prior to January 28, 2024, provided that a Vapotherm Re-Tenanting Event (as defined below) has not occurred, (b) Vapotherm having abandoned its space or gone dark, (c) Vapotherm having filed for bankruptcy or (d) the Vapotherm lease having been terminated, provided a Vapotherm Re-Tenanting Event has not then occurred (a “Vapotherm Trigger Event”); or |
| (iv) | one or more of the following having occurred (a) Bauer not giving written notice of lease renewal (or giving notice of its intent not to renew its lease) to the borrowers prior to April 30, 2022, provided that a Bauer Re-Tenanting Event (as defined below) has not occurred, (b) Bauer having abandoned any material or substantial portion of its space or gone dark with respect to any material or substantial portion of its space (as determined in the lender’s discretion), (c) Bauer having filed for bankruptcy or (d) the Bauer lease having been terminated, provided a Bauer Re-Tenanting Event has not then occurred (a “Bauer Trigger Event”). |
A “Trigger Period” will end:
| (a) | with regard to clause (i), upon the cure of such event of default; |
| (b) | with regard to clause (ii), upon the amortizing debt service coverage ratio being equal to or greater than 1.25x for any two consecutive calendar quarters; |
| (c) | with regard to clause (iii), upon a Vapotherm Re-Tenanting Event; and |
| (d) | with regard to clause (iv), upon a Bauer Re-Tenanting Event. |
A “Vapotherm Re-Tenanting Event” will occur when the borrowers have delivered to the lender:
| (i) | evidence satisfactory to the lender that (x) Vapotherm has given written notice of renewal on or before January 28, 2024 at a rental rate of $18 per square foot and which otherwise constitutes a qualified replacement lease as defined in the loan documents, (y) the Vapotherm leased space has been re-tenanted under one or more qualified replacement leases as defined in the loan documents or (z) the Vapotherm lease is affirmed by Vapotherm in a bankruptcy proceeding; and |
| (ii) | tenant estoppel(s) satisfactory to the lender confirming that each tenant is in physical occupancy of and operating in the space demised under the qualified replacement lease and paying full unabated rent. |
A “Bauer Re-Tenanting Event” will occur when the borrowers have delivered to the lender:
| (i) | evidence satisfactory to the lender that (x) Bauer has given written notice of renewal on or before April 30, 2022 at a rental rate of $9 per square foot and which otherwise constitutes a qualified replacement lease as defined in the loan documents, (y) the Bauer leased space has been re-tenanted under one or more qualified replacement leases as defined in the loan documents or (z) the Bauer lease is affirmed by Bauer in a bankruptcy proceeding; and |
| (ii) | tenant estoppel(s) satisfactory to the lender confirming that each tenant is in physical occupancy of and operating in the space demised under the qualified replacement lease and paying full unabated rent. |
Property Management. The 100 Domain Drive Property is managed by Boulos Property Management, a Maine corporation, d/b/a CBRE Boulos Asset Management.
Assumption. The borrowers have the right to transfer the 100 Domain Drive Property, at any time, provided that certain conditions are satisfied, including: (i) no event of default has occurred and is continuing, (ii) the borrowers have provided the lender with prior written notice, (iii) the proposed transferee qualifies as a qualified transferee under the 100 Domain Drive Mortgage Loan documents and (iv) the lender has received confirmation from DBRS, Fitch and Moody’s that such assumption will not result in a downgrade of the respective ratings assigned to the Series WFCM 2018-C44 certificates.
Real Estate Substitution.Not permitted.
Future Mezzanine Indebtedness.Not permitted.
Ground Lease.None.
Terrorism Insurance. The 100 Domain Drive Mortgage Loan documents require that the “all risk” insurance policy required to be maintained by the borrowers provide coverage for terrorism in an amount equal to the full replacement cost of the 100 Domain Drive Property, provided that, if the Terrorism Risk Insurance Program Reauthorization Act of 2015 (or a subsequent statute, extension or reauthorization) is not in effect and such policies contain an exclusion for acts of terrorism, the borrower will obtain, to the extent available, a stand-alone policy that provides the coverage equal to the lesser of the (i) full replacement cost of the 100 Domain Drive Property and (ii) $38,000,000, plus rental/income loss in an amount equal to 100% of the projected gross income from the 100 Domain Drive Property for 18 months. The 100 Domain Drive Mortgage Loan documents also require business interruption insurance covering no less than an amount equal to 100% of the projected gross income from the 100 Domain Drive Property on an actual loss sustained basis for a 18-month period following the occurrence of a casualty event.
THE INFORMATION IN THIS STRUCTURAL AND COLLATERAL TERM SHEET IS NOT COMPLETE AND MAY BE AMENDED PRIOR TO THE TIME OF SALE. THIS TERM SHEET IS NOT AN OFFER TO SELL THESE SECURITIES AND IT IS NOT A SOLICITATION OF AN OFFER TO BUY THESE SECURITIES IN ANY JURISDICTION WHERE THE OFFER OR SALE IS NOT PERMITTED.
135
| No. 11 – 2M Office Portfolio | |||||||
| Loan Information | Property Information | ||||||
| Mortgage Loan Seller: | Wells Fargo Bank, National Association | Single Asset/Portfolio: | Portfolio | ||||
| Credit Assessment (DBRS/Fitch/Moody’s): | NR/NR/NR | Property Type: | Office | ||||
| Original Principal Balance: | $24,275,000 | Specific Property Type: | Suburban | ||||
| Cut-off Date Principal Balance: | $24,275,000 | Location: | Various | ||||
| % of Initial Pool Balance: | 3.2% | Size: | 304,732 SF | ||||
| Loan Purpose: | Acquisition | Cut-off Date Balance Per SF:
| $79.66 | ||||
| Borrower Name: | ND XXV LLC; ND XXVI LLC; ND XXVII LLC | Year Built/Renovated: | Various/2012 | ||||
| Borrower Sponsor: | Ariel Nessel | Title Vesting: | Fee | ||||
| Mortgage Rate: | 4.5800% | Property Manager: | CBRE, Inc. | ||||
| Note Date: | March, 23, 2018 | 4th Most Recent Occupancy (As of): | 85.0% (12/31/2014) | ||||
| Anticipated Repayment Date: | NAP | 3rd Most Recent Occupancy (As of): | 87.9% (12/31/2015) | ||||
| Maturity Date: | April 11, 2028 | 2nd Most Recent Occupancy (As of): | 94.0% (12/31/2016) | ||||
| IO Period: | 12 months | Most Recent Occupancy (As of): | 93.4% (12/31/2017) | ||||
| Loan Term (Original): | 120 months | Current Occupancy (As of): | 93.7% (3/12/2018) | ||||
| Seasoning: | 1 month | ||||||
| Amortization Term (Original): | 360 months | Underwriting and Financial Information: | |||||
| Loan Amortization Type: | Interest-only, Amortizing Balloon | 4th Most Recent NOI (As of)(5): | $2,321,088 (12/31/2015) | ||||
| Interest Accrual Method: | Actual/360 | 3rd Most Recent NOI (As of)(5): | $2,879,790 (12/31/2016) | ||||
| Call Protection: | L(25),D(89),O(6) | 2nd Most Recent NOI (As of)(5): | $2,562,775 (12/31/2017) | ||||
| Lockbox Type: | Springing | Most Recent NOI (As of)(5): | $2,606,662 (TTM 2/28/2018) | ||||
| Additional Debt: | None | ||||||
| Additional Debt Type: | NAP | U/W Revenues: | $6,046,723 | ||||
| U/W Expenses: | $2,848,747 | ||||||
| U/W NOI(5): | $3,197,976 | ||||||
| Escrows and Reserves: | U/W NCF: | $2,804,872 | |||||
| Type: | Initial | Monthly | Cap(If Any) | U/W NOI DSCR : | 2.15x | ||
| Taxes | $0 | $62,825 | NAP | U/W NCF DSCR : | 1.88x | ||
| Insurance | $0 | Springing(1) | NAP | U/W NOI Debt Yield : | 13.2% | ||
| Replacement Reserves | $0 | $7,403 | NAP | U/W NCF Debt Yield : | 11.6% | ||
| General TI/LC Reserves | $250,000 | $50,789(2) | $750,000 | As-Is Appraised Value: | $32,600,000 | ||
| Springing TI/LC Reserve | $0 | Springing(3) | NAP | As-Is Appraisal Valuation Date: | Various | ||
| Roof Replacement Reserve | $328,250(4) | $0 | NAP | Cut-off Date LTV Ratio: | 74.5% | ||
| Deferred Maintenance | $81,570 | $0 | NAP | LTV Ratio at Maturity or ARD: | 62.1% | ||
| (1) | The loan documents do not require ongoing monthly escrows for insurance premiums as long as (i) no event of default has occurred and is continuing; (ii) the borrower provides the lender with evidence that the 2M Office Portfolio Properties’ insurance coverage is included in a blanket policy and such policy is in full force and effect; and (iii) the borrower pays all applicable insurance premiums and provides the lender with evidence of renewals. |
| (2) | The loan documents provide for ongoing monthly escrows for general TI/LC reserves in an amount equal to (x) for the monthly payment dates occurring in May 2018 up to and including the monthly payment date occurring in April 2023, one-twelfth of $2.00 per square foot for the 2M Office Portfolio Properties ($50,789 as of loan origination); and (y) for the monthly payment dates occurring in May 2023 and thereafter, one-twelfth of $1.50 per square foot for the 2M Office Portfolio Properties ($38,092 as of loan origination); provided however, that if a Major Tenant Event Period (as defined below) is continuing on the monthly payment date occurring in May 2023, then there shall be no change to the amount of the leasing reserve monthly deposit (i.e., the amount shall continue to be based on $2.00 per square foot until such time as no Major Tenant Event Period is continuing). A “Major Tenant Event Period” will commence upon the earlier of the following (for clauses (a) through (e), the term ‘Liberty Mutual’ includes any successors or replacement tenants occupying at least 30,000 square feet of the space currently occupied by Liberty Mutual): (a) Liberty Mutual defaults under its lease (beyond any applicable notice and/or cure period); (b) Liberty Mutual goes dark, vacates or fails to continuously occupy its space or gives notice thereof; (c) Liberty Mutual becomes insolvent or files for bankruptcy; (d) Liberty Mutual exercises any option to terminate its lease or reduce the amount of space demised thereunder; or (e) Liberty Mutual fails to renew or extend its lease on or before the deadline prescribed under its lease in accordance with the terms thereof or otherwise reasonably satisfactory to the lender (Liberty Mutual currently has one, 5-year renewal option with 12 months’ notice). A Major Tenant Event Period shall end, with regard to clause (a), upon the lender having received evidence that the default has been cured and no further default has occurred for a period of three consecutive calendar months; with regard to clause (b), upon Liberty Mutual having resumed occupancy of, and resumed normal business operations in its space and being open during customary hours for a period of three consecutive calendar months; with regard to clause (c), upon the bankruptcy or insolvency proceedings having terminated and the lease having been affirmed in a manner satisfactory to the lender; with regard to clause (e), upon Liberty Mutual having renewed or extended its lease on terms and conditions acceptable to the lender in accordance with the terms of the loan documents; and with regard to clauses (a) through (e), upon a Major Tenant Re-Tenanting Event (as defined below) having occurred. A “Major Tenant Re-Tenanting Event” will occur upon one or more replacement tenants acceptable to the lender executing leases covering all of the space leased to Liberty Mutual as of the loan closing date with (i) such replacement tenants having taken occupancy of such space, conducting normal business operations and paying full unabated rent or any such abatement has been reserved; (ii) all tenant improvements and leasing commissions having been paid or reserved; and (iii) such replacement tenants having delivered a satisfactory estoppel certificate affirming the foregoing conditions. |
| (3) | In the event that the borrower obtains the release of the 2000 Crawford Place property, the borrower is required to deposit an amount equal to $575,000 in the form of cash or a letter of credit into the Springing TI/LC Reserve account. |
| (4) | Relates to roof replacement expenses at the 701A and 701C Route 73 South and 3000 Atrium Way properties. |
| (5) | See “Cash Flow Analysis” section. |
THE INFORMATION IN THIS STRUCTURAL AND COLLATERAL TERM SHEET IS NOT COMPLETE AND MAY BE AMENDED PRIOR TO THE TIME OF SALE. THIS TERM SHEET IS NOT AN OFFER TO SELL THESE SECURITIES AND IT IS NOT A SOLICITATION OF AN OFFER TO BUY THESE SECURITIES IN ANY JURISDICTION WHERE THE OFFER OR SALE IS NOT PERMITTED.
136
| 2M OFFICE PORTFOLIO |
The mortgage loan (the “2M Office Portfolio Mortgage Loan”) is evidenced by a single promissory note secured by a first mortgage encumbering the borrower’s fee interest in three office properties located in Mount Laurel and Marlton, New Jersey (the “2M Office Portfolio Properties”). The 2M Office Portfolio Properties comprise three office properties with four separate buildings totaling 304,732 square feet located within four miles of one another in Mount Laurel and Marlton, New Jersey. The 2M Office Properties were developed between 1986 and 1987, and renovated in 2012.
The 701A and 701C Route 73 South property consists of two office buildings, collectively the Marlton Executive Park, totaling 121,568 square feet located on Route 73 South in Marlton, New Jersey. The 701A building is a four-story office building containing 93,766 square feet, and the adjacent 701C building is a one-story office building containing 27,802 square feet. The property contains 714 surface parking spaces, resulting in a parking ratio of 5.9 spaces per 1,000 square feet. The 2000 Crawford Place property and the 3000 Atrium Way property are both located within the Horizon Corporate Center, in Mount Laurel, New Jersey, approximately four miles north of the 701A and 701C Route 73 South property. The Horizon Corporate Center is located along Route 73, and includes low to mid-rise office buildings and various hotels. The 2000 Crawford Place Property is a one-story office building totaling 74,013 square feet with 252 surface parking spaces, resulting in a parking ratio of 3.4 spaces per 1,000 square feet. The 3000 Atrium Way Property is a five-story office building that contains 109,151 square feet and 450 surface parking spaces, resulting in a parking ratio of 4.1 spaces per 1,000 square feet.
As of March 12, 2018, the 2M Office Portfolio Properties were 93.7% occupied by 30 tenants with investment grade tenants accounting for 55.1% of the net rentable area and 67.8% of underwritten base rent. The largest tenants at the 2M Office Portfolio Properties include Liberty Mutual (26.5% of net rentable area and 42.3% of underwritten base rent; rated BBB+/Baa1/A by Fitch/Moody’s/S&P), TD Bank North (13.8% of net rentable area and 11.9% of underwritten base rent; rated AA-/Aa2/AA- by Fitch/Moody’s/S&P), and Virtua Health, Inc. (9.4% of net rentable area and 8.0% of underwritten base rent; rated AA-/AA- by Fitch/S&P), and aside from these tenants, no other tenant accounts for more than 7.0% of the net rentable area or 5.5% of the underwritten base rent. Additional tenants at the 2M Office Portfolio Properties include Siemens Corp., State Farm and RBC Capital Markets.
The 2M Office Portfolio Properties are located in Mount Laurel and Marlton, New Jersey, within 16 miles of downtown Philadelphia. The 2M Office Portfolio Properties are situated along Route 73, which serves as the primary north-south roadway of the area with access to multiple institutional office buildings and parks, shopping centers, and housing developments. Route 73 also provides access to Route 70, Route 38, the New Jersey Turnpike, Interstate 295 and the Atlantic City Expressway. Within a five-mile radius of the 2M Office Portfolio Properties, the 2017 average household income ranged from $119,360 to $121,517; and within the same radius, the estimated 2017 population ranged from 159,711 to 197,328.
According to a third party market research report, the 2M Office Portfolio Properties are located within the South Burlington Office Submarket of the Philadelphia Office Market. As of the first quarter of 2018, the South Burlington Office Submarket contained approximately 8.9 million square feet with an 8.6% vacancy rate and average asking rents of $22.71, gross. Liberty Mutual, Fox & Roach LP and GSA (49.2% of underwritten base rent) are on gross leases at the 2M Office Portfolio Properties with a weighted average current base rent of $22.71 per square foot and underwritten base rent of $23.97 per square foot (inclusive of straight line rent averaging due to investment grade ratings), while the remaining office tenants at the 2M Office Portfolio Properties (50.2% of underwritten base rent) are on net leases with a weighted average underwritten base rent of $12.26 per square foot.
Sources and Uses
| Sources | Uses | ||||||||
| Original loan amount | $24,275,000 | 72.4 | % | Purchase Price | $31,400,000 | 93.6% | |||
| Borrower Sponsor’s new cash contribution | $9,265,626 | 27.6 | Upfront reserves | 659,820 | 2.0 | ||||
| Closing costs | 1,480,806 | 4.4 | |||||||
| Total Sources | $33,540,626 | 100.0 | % | Total Uses | $33,540,626 | 100.0% |
The following table presents certain information relating to the 2M Office Portfolio Properties:
| Property Name – Location | Allocated Cut-off Date Balance | % of Portfolio Cut-off Date Balance | Occupancy | Year Built/ Renovated | Net Rentable Area (SF) | As-Is Appraised Value | Allocated Cut-off Date LTV |
701A and 701C Route 73 South Marlton, NJ | $10,700,000 | 44.1% | 99.7% | 1987/2012 | 121,568 | $14,500,000 | 73.8% |
3000 Atrium Way Mount Laurel, NJ | $8,625,000 | 35.5% | 96.2% | 1987/2012 | 109,151 | $11,500,000 | 75.0% |
2000 Crawford Place Mount Laurel, NJ | $4,950,000 | 20.4% | 80.2% | 1986/2012 | 74,013 | $6,600,000 | 75.0% |
| Total/Weighted Average | $24,275,000 | 100.0% | 93.7% | 304,732 | $32,600,000 | 74.5% |
THE INFORMATION IN THIS STRUCTURAL AND COLLATERAL TERM SHEET IS NOT COMPLETE AND MAY BE AMENDED PRIOR TO THE TIME OF SALE. THIS TERM SHEET IS NOT AN OFFER TO SELL THESE SECURITIES AND IT IS NOT A SOLICITATION OF AN OFFER TO BUY THESE SECURITIES IN ANY JURISDICTION WHERE THE OFFER OR SALE IS NOT PERMITTED.
137
| 2M OFFICE PORTFOLIO |
The following table presents certain information relating to the tenancy at the 2M Office Portfolio Properties:
Major Tenants
| Tenant Name | Credit Rating (Fitch/ Moody’s/ S&P)(1) | Property Location | Tenant NRSF | % of NRSF | Annual U/W Base Rent PSF(2) | Annual U/W Base Rent(2) | % of Total Annual U/W Base Rent | Lease Expiration Date |
| Major Tenants | ||||||||
| Liberty Mutual | BBB+/Baa1/A | 701A/701C | 80,699 | 26.5% | $24.17(3) | $1,950,705 | 42.3% | 8/31/2023(4)(5) |
| TD Bank North | AA-/Aa2/AA- | 3000 | 42,022 | 13.8% | $13.06 | $548,913 | 11.9% | 11/30/2020(6) |
| Virtua Health, Inc. | AA-/NR/AA- | 2000 | 28,650 | 9.4% | $12.82 | $367,394 | 8.0% | 7/31/2024(7)(8) |
| 3000 Atrium Executive Suites LLC | NR/NR/NR | 3000 | 21,345 | 7.0% | $11.94 | $254,859 | 5.5% | 12/31/2024(9) |
| Fox & Roach LP | NR/NR/NR | 701A/701C | 8,547 | 2.8% | $22.00 | $188,034 | 4.1% | 1/31/2020(10) |
| Total Major Tenants | 181,263 | 59.5% | $18.26 | $3,309,906 | 71.7% | |||
| Non-Major Tenants | 104,317 | 34.2% | $12.52 | $1,306,308 | 28.3% | |||
| Occupied Collateral Total | 285,580 | 93.7% | $16.16(11) | $4,616,214 | 100.0% | |||
| Vacant Space | 19,152 | 6.3% | ||||||
| Collateral Total | 304,732 | 100.0% | ||||||
| (1) | Certain ratings are those of the parent company whether or not the parent guarantees the lease. |
| (2) | Annual U/W Base Rent PSF and Annual U/W Base Rent include contractual rent steps through March 2019 and rent averaging for four investment grade tenants over the lesser of the remaining lease term or loan term totaling $234,081. |
| (3) | Liberty Mutual occupies 67,257 square feet at the 701A South Property with an underwritten base rent of $24.38 per square foot, and 13,442 square feet at the 701C South Property with an underwritten base rent of $23.11 per square foot. |
| (4) | Liberty Mutual has one, 5-year renewal option, with 12 months’ notice, at 95% of fair market rental rate. |
| (5) | Liberty Mutual has (a) the one-time option to surrender up to an entire floor of contiguous space at the 701A building (up to 24,935 square feet) on either September 1, 2021 or September 1, 2022 with 270 days’ notice and payment of a termination fee equal to unamortized tenant improvement costs plus two months’ rent;or (b) the one-time option to terminate its lease at the 701C building (13,422 square feet) on either September 30, 2021 or September 30, 2022 with 270 days’ notice and payment of a termination fee equal to unamortized tenant improvement costs plus two months’ rent. Liberty Mutual has the right to exercise only one of the aforementioned options. By way of example, if the tenant exercises its 2021 surrender option, the 2022 surrender option and both the 2021 and 2022 termination options will no longer be exercisable. |
| (6) | TD Bank North has one, 5-year renewal option, with 270 days’ notice, at market rental rate. |
| (7) | Virtua Heath, Inc. has two, 5-year renewal options, with 120 days’ notice, at market rent but no less than the annual rent in effect immediately preceding the renewal term. |
| (8) | Virtua Health, Inc. has (a) the right to terminate its lease at the 2000 Crawford property (18,650 square feet) on July 31, 2019; and (b) the right to terminate its 10,000 square foot expansion space at the 2000 Crawford property on April 30, 2020. In order to exercise either of the aforementioned termination options, the tenant is required to provide nine-months’ notice and, with respect to clause (a) a termination fee equal to six months’ base rent plus unamortized leasing costs and rent abatements and, with respect to clause (b) a termination fee equal to $60,000 plus unamortized leasing costs. |
| (9) | 3000 Atrium Executive Suites LLC has two, 5-year renewal options, with 365 days’ notice, at market rental rate. |
| (10) | Fox & Roach LP has two, 5-year renewal option, with 270 days’ notice, at market rent but no less than the annual rent in effect immediately preceding the renewal term. |
| (11) | Liberty Mutual, Fox & Roach LP and GSA (49.2% of underwritten base rent) are on gross leases at the 2M Office Portfolio Properties with a weighted average current base rent of $22.71 per square foot and underwritten base rent of $23.97 per square foot (inclusive of straight line rent averaging due to investment grade ratings), while the remaining office tenants at the 2M Office Portfolio Properties (50.2% of underwritten base rent) are on net leases with a weighted average underwritten base rent of $12.26 per square foot. |
THE INFORMATION IN THIS STRUCTURAL AND COLLATERAL TERM SHEET IS NOT COMPLETE AND MAY BE AMENDED PRIOR TO THE TIME OF SALE. THIS TERM SHEET IS NOT AN OFFER TO SELL THESE SECURITIES AND IT IS NOT A SOLICITATION OF AN OFFER TO BUY THESE SECURITIES IN ANY JURISDICTION WHERE THE OFFER OR SALE IS NOT PERMITTED.
138
| 2M OFFICE PORTFOLIO |
The following table presents certain information relating to the lease rollover schedule at the 2M Office Portfolio Properties:
Lease Expiration Schedule(1)(2)
| Year Ending December 31, 2017 | No. of Leases Expiring | Expiring NRSF | % of Total NRSF | Cumulative Expiring NRSF | Cumulative % of Total NRSF | Annual U/W Base Rent | % of Total Annual U/W Base Rent | Annual U/W Base Rent PSF(3) |
| MTM | 1 | 300 | 0.1% | 300 | 0.1% | $4,500 | 0.1% | $15.00 |
| 2018 | 2 | 5,413 | 1.8% | 5,713 | 1.9% | $64,756 | 1.4% | $11.96 |
| 2019 | 3 | 14,808 | 4.9% | 20,521 | 6.7% | $184,172 | 4.0% | $12.44 |
| 2020 | 10 | 89,466 | 29.4% | 109,987 | 36.1% | $1,187,285 | 25.7% | $13.27 |
| 2021 | 3 | 18,991 | 6.2% | 128,978 | 42.3% | $218,879 | 4.7% | $11.53 |
| 2022 | 5 | 18,688 | 6.1% | 147,666 | 48.5% | $249,438 | 5.4% | $13.35 |
| 2023 | 1 | 80,699 | 26.5% | 228,365 | 74.9% | $1,950,705 | 42.3% | $24.17 |
| 2024 | 2 | 49,995 | 16.4% | 278,360 | 91.3% | $622,253 | 13.5% | $12.45 |
| 2025 | 1 | 5,589 | 1.8% | 283,949 | 93.2% | $134,225 | 2.9% | $24.02 |
| 2026 | 0 | 0 | 0.0% | 283,949 | 93.2% | $0 | 0.0% | $0.00 |
| 2027 | 0 | 0 | 0.0% | 283,949 | 93.2% | $0 | 0.0% | $0.00 |
| 2028 | 0 | 0 | 0.0% | 283,949 | 93.2% | $0 | 0.0% | $0.00 |
| Thereafter | 2 | 1,631 | 0.5% | 285,580 | 93.7% | $0 | 0.0% | $0.00 |
| Vacant | 0 | 19,152 | 6.3% | 304,732 | 100.0% | $0 | 0.0% | $0.00 |
| Total/Weighted Average | 30 | 304,732 | 100.0% | $4,616,214 | 100.0% | $16.16 |
| (1) | Information obtained from the underwritten rent roll. |
| (2) | Certain tenants may have lease termination options that are exercisable prior to the originally stated expiration date of the subject lease and that are not considered in the Lease Expiration Schedule. |
| (3) | Weighted Average Annual U/W Base Rent PSF excludes vacant space. |
The following table presents historical occupancy percentages at the 2M Office Portfolio Properties:
Historical Occupancy
12/31/2014(1) | 12/31/2015(1) | 12/31/2016(1) | 12/31/2017(1) | 3/12/2018(2) |
| 85.0% | 87.9% | 94.0% | 93.4% | 93.7% |
| (1) | Information obtained from the borrower. |
| (2) | Information obtained from the underwritten rent roll. |
Operating History and Underwritten Net Cash Flow.The following table presents certain information relating to the historical operating performance and underwritten net cash flow at the 2M Office Portfolio Properties:
Cash Flow Analysis
| 2015(1) | 2016(1) | 2017 | TTM 2/28/2018(2) | U/W(2) | % of U/W Effective Gross Income | U/W $ per SF | ||||||||
| Base Rent | $3,367,093 | $3,953,744 | $3,802,741 | $3,865,409 | $4,616,214 | 76.3% | $15.15 | |||||||
| Grossed Up Vacant Space | 0 | 0 | 0 | 0 | 170,686 | 2.8 | 0.56 | |||||||
| Total Reimbursement | 1,775,920 | 1,711,354 | 1,561,009 | 1,592,122 | 1,718,212 | 28.4 | 5.64 | |||||||
| Other Income | 8,555 | 5,239 | 2,802 | 2,601 | 2,601 | 0.0 | 0.01 | |||||||
| Less Vacancy & Credit Loss | 0 | 0 | 0 | 0 | (460,990)(3) | (7.6) | (1.51) | |||||||
| Effective Gross Income | $5,151,568 | $5,670,337 | $5,366,553 | $5,460,131 | $6,046,723 | 100.0% | $19.84 | |||||||
| Total Operating Expenses | $2,830,480 | $2,790,547 | $2,803,778 | $2,853,470 | $2,848,747 | 47.1% | $9.35 | |||||||
| Net Operating Income | $2,321,088 | $2,879,790 | $2,562,775 | $2,606,662 | $3,197,976 | 52.9% | $10.49 | |||||||
| Replacement Reserves | 0 | 0 | 0 | 0 | 88,372 | 1.4 | 0.29 | |||||||
| Tenant Improvements | 0 | 0 | 0 | 0 | 152,366 | 2.5 | 0.50 | |||||||
| Leasing Commissions | 0 | 0 | 0 | 0 | 152,366 | 2.5 | 0.50 | |||||||
| Net Cash Flow | $2,321,088 | $2,879,790 | $2,562,775 | $2,606,662 | $2,804,872 | 46.4% | $9.20 | |||||||
| NOI DSCR | 1.56x | 1.93x | 1.72x | 1.75x | 2.15x | |||||||||
| NCF DSCR | 1.56x | 1.93x | 1.72x | 1.75x | 1.88x | |||||||||
| NOI DY | 9.6% | 11.9% | 10.6% | 10.7% | 13.2% | |||||||||
| NCF DY | 9.6% | 11.9% | 10.6% | 10.7% | 11.6% |
| (1) | The increase in Base Rent and Net Operating Income from 2015 to 2016 was driven by (i) Liberty Mutual expanding its space by 13,442 square feet in March 2016 (underwritten base rent of $310,694) and (ii) TD Bank expanding its space by 22,718 square feet in September and November 2015 (underwritten base rent of $296,754). |
| (2) | The increase in Base Rent and Net Operating Income from TTM 2/28/2018 to U/W is driven by (i) the inclusion of contractual rent steps through March 2019 and straight line rent averaging over the lesser of the loan term or remaining lease term for investment grade tenants totaling $234,081; (ii) free rent periods during the TTM 2/28/2018 period totaling $160,088; and (iii) recent leasing including one new lease signed in May 2017 (0.5% of underwritten base rent) and three renewal leases signed from November 2017 through February 2018 (1.7% of underwritten base rent). |
| (3) | The underwritten economic vacancy is 9.6%. The 2M Office Portfolio Properties was 93.7% physically occupied as of March 12, 2018. |
THE INFORMATION IN THIS STRUCTURAL AND COLLATERAL TERM SHEET IS NOT COMPLETE AND MAY BE AMENDED PRIOR TO THE TIME OF SALE. THIS TERM SHEET IS NOT AN OFFER TO SELL THESE SECURITIES AND IT IS NOT A SOLICITATION OF AN OFFER TO BUY THESE SECURITIES IN ANY JURISDICTION WHERE THE OFFER OR SALE IS NOT PERMITTED.
139
| 2M OFFICE PORTFOLIO |
The following table presents certain information relating to comparable office leases for the 2M Office Portfolio Properties:
Comparable Office Leases(1)(2)
| Property Name/Location | Lease Date / Term | Lease Area (SF) | Annual Base Rent PSF | Lease Type |
East Gate Corporate Center 308 Harper Dr. Moorestown, NJ | November 2017 / 3.0 Yrs | 2,500 | $13.50 | Gross |
1000 Midlantic Drive Mount Laurel, NJ | October 2017 / 5.0 Yrs | 5,000 | $14.50 | Gross |
Office Building 6000 Midlantic Drive Mount Laurel, NJ | May 2017 / 5.0 Yrs | 6,043 | $12.50 | Gross |
2000 Midlantic Drive Mount Laurel, NJ | May 2017 / 3.0 Yrs | 17,800 | $13.00 | Gross |
200 Century Parkway Mount Laurel, NJ | November 2017 / 7.0 Yrs | 12,000 | $11.50 | Gross |
Office Building 1 Executive Dr. Moorestown, NJ | October 2017 / 2.0 Yrs | 1,800 | $11.75 | Gross |
350 Fellowship Road Mount Laurel, NJ | October 2017 / 7.0 Yrs | 29,650 | $12.50 | Gross |
Office Building 5000 Dearborn Cir. Mount Laurel, NJ | October 2017 / 3.0 Yrs | 8,700 | $10.00 | Gross |
| (1) | Information obtained from the appraisal and a third party research report. |
| (2) | Liberty Mutual, Fox & Roach LP and GSA (49.2% of underwritten base rent) are on gross leases at the 2M Office Portfolio Properties with a weighted average current base rent of $22.71 per square foot and underwritten base rent of $23.97 per square foot (inclusive of straight line rent averaging due to investment grade ratings), while the remaining office tenants at the 2M Office Portfolio Properties (50.2% of underwritten base rent) are on net leases with a weighted average underwritten base rent of $12.26 per square foot. |
THE INFORMATION IN THIS STRUCTURAL AND COLLATERAL TERM SHEET IS NOT COMPLETE AND MAY BE AMENDED PRIOR TO THE TIME OF SALE. THIS TERM SHEET IS NOT AN OFFER TO SELL THESE SECURITIES AND IT IS NOT A SOLICITATION OF AN OFFER TO BUY THESE SECURITIES IN ANY JURISDICTION WHERE THE OFFER OR SALE IS NOT PERMITTED.
140
(THIS PAGE INTENTIONALLY LEFT BLANK)
THE INFORMATION IN THIS STRUCTURAL AND COLLATERAL TERM SHEET IS NOT COMPLETE AND MAY BE AMENDED PRIOR TO THE TIME OF SALE. THIS TERM SHEET IS NOT AN OFFER TO SELL THESE SECURITIES AND IT IS NOT A SOLICITATION OF AN OFFER TO BUY THESE SECURITIES IN ANY JURISDICTION WHERE THE OFFER OR SALE IS NOT PERMITTED.
141
| No. 12 – Marnell Corporate Center | |||||||
| Loan Information | Property Information | ||||||
| Mortgage Loan Seller: | Wells Fargo Bank, National Association | Single Asset/Portfolio: | Single Asset | ||||
| Credit Assessment (DBRS/Fitch/Moody’s): | NR/NR/NR | Property Type: | Office | ||||
| Original Principal Balance: | $22,250,000 | Specific Property Type: | Suburban | ||||
| Cut-off Date Principal Balance: | $22,222,465 | Location: | Las Vegas, NV | ||||
| % of Initial Pool Balance: | 2.9% | Size: | 93,650 SF | ||||
| Loan Purpose: | Acquisition | Cut-off Date Balance Per SF: | $237.29 | ||||
| Borrower Name: | Preh Austi PKWY LLC; MRK Airport, LLC | Year Built/Renovated: | 2006/NAP | ||||
| Sponsors: | Ryan Tedder; Keith Kantrowitz | Title Vesting: | Fee | ||||
| Mortgage Rate: | 4.8400% | Property Manager: | SKR Real Estate Services, LLC | ||||
| Note Date: | April 3, 2018 | 4th Most Recent Occupancy (As of): | 83.0% (12/31/2014) | ||||
| Anticipated Repayment Date: | NAP | 3rd Most Recent Occupancy (As of): | 95.0% (12/31/2015) | ||||
| Maturity Date: | April 11, 2028 | 2nd Most Recent Occupancy (As of)(3): | 95.0% (12/31/2016) | ||||
| IO Period: | 0 months | Most Recent Occupancy (As of)(3): | 88.0% (12/31/2017) | ||||
| Loan Term (Original): | 120 months | Current Occupancy (As of): | 85.8% (4/17/2018) | ||||
| Seasoning: | 1 month | ||||||
| Amortization Term (Original): | 360 months | Underwriting and Financial Information: | |||||
| Loan Amortization Type: | Amortizing Balloon | 4th Most Recent NOI (As of): | $1,851,055 (12/31/2015) | ||||
| Interest Accrual Method: | Actual/360 | 3re Most Recent NOI (As of): | $1,842,261 (12/31/2016) | ||||
| Call Protection: | L(25),D(91),O(4) | 2nd Most Recent NOI (As of): | $1,901,768 (12/31/2017) | ||||
| Lockbox Type: | Soft/Springing Cash Management | Most Recent NOI (As of)(4): | $1,941,900 (TTM 2/28/2018) | ||||
| Additional Debt: | None | ||||||
| Additional Debt Type: | NAP | U/W Revenues: | $2,888,585 | ||||
| U/W Expenses: | $737,939 | ||||||
| U/W NOI(4): | $2,150,646 | ||||||
| U/W NCF: | $2,069,703 | ||||||
| Escrows and Reserves: | U/W NOI DSCR : | 1.53x | |||||
| U/W NCF DSCR : | 1.47x | ||||||
| Type: | Initial | Monthly | Cap(If Any) | U/W NOI Debt Yield : | 9.7% | ||
| Taxes | $126,537 | $12,654 | NAP | U/W NCF Debt Yield : | 9.3% | ||
| Insurance | $0 | $2,000 | NAP | Appraised Value(5): | $31,800,000 | ||
| Replacement Reserve | $0 | $1,561 | $100,000 | Appraisal Valuation Date(5): | February 22, 2019 | ||
| Leasing Reserve | $500,000 | $7,804 | (1) | Cut-off Date LTV Ratio(5): | 69.9% | ||
| Dornin Rent Reserve(2) | $1,000,000 | $0 | NAP | LTV Ratio at Maturity or ARD(5): | 57.2% | ||
| (1) | Commencing April 3, 2023, any funds in the leasing reserve shall be released to the borrower in excess of $30 per square foot for any leases maturing during the remaining term of the Marnell Corporate Center mortgage loan as long as the following conditions are satisfied: (i) GSA-TSA (or an acceptable replacement tenant) executes a 10-year lease renewal and (ii) Machine Zone (or an acceptable replacement tenant) exercised their first 5-year renewal option. |
| (2) | Dornin Investment Group (“Dornin”), an affiliate of the seller of the Marnell Corporate Center Property (as defined below) signed a lease effective August 1, 2018 on the space currently occupied by Aerotek, which has a lease expiring on July 31, 2018. As long as the Release Conditions (as defined below) have been satisfied, the lender is required to disburse the Dornin Rent Reserve funds to the deposit account on the first day of each month in the following amounts: (i) beginning on September 1, 2018 and continuing until and including December 1, 2018, an amount equal $15,974.75; and (ii) commencing on January 1, 2019 and continuing until the earlier of (a) the Dornin Rent Reserve being equal to $0.00, and (b) the expiration of the term of the Dornin lease, an amount equal to monthly base rent and any additional rent. If at any time prior to August 1, 2018, the space currently occupied by Aerotek is leased to a bona fide third party tenant approved by lender, other than Dornin, lender will release the Dornin Rent Reserve to Dornin upon satisfaction of the Release Conditions. “Release Conditions” will mean delivery to the lender of a tenant estoppel certificate certifying (1) that the tenant’s lease is in full force and effect, (2) landlord is not in default under the lease, (3) all tenant improvements required of the landlord under the lease have been completed, (4) all conditions to the tenant’s acceptance of possession of the demised space have been satisfied, (5) the tenant has commenced the payment of unabated rent without any offset rights or rent credits, and (6) the tenant is in actual occupancy of the space. |
| (3) | The decrease in occupancy from 2016 to 2017 is due, in part, to American Family surrendering 6,460 square feet (6.9% of net rentable area) in December 2017. |
| (4) | See “Cash Flow Analysis” section. |
| (5) | The Appraised Value and LTV Ratios shown are based on the appraiser’s prospective market value as stabilized, which assumes the Marnell Corporate Center Property achieves a stabilized occupancy of 90.0% by February 22, 2019. Based on the as-is appraised value of $30,750,000 (as of February 22, 2018), the Cut-off Date LTV Ratio and LTV Ratio at Maturity are 72.3% and 59.2%, respectively. |
The Marnell Corporate Center mortgage loan is evidenced by a single promissory note that is secured by a first mortgage encumbering the borrower’s fee interest in a 93,650 square foot, class A, four-story suburban office building located in Las Vegas, Nevada (the “Marnell Corporate Center Property”). The Marnell Corporate Center Property was developed in 2006 and is situated on a 4.3-acre site with 348 open and covered parking spaces resulting in a parking ratio of 3.7 spaces per 1,000 square feet of rentable area. As of April 17, 2018 the Marnell Corporate Center Property was 85.8% occupied by 5 tenants, and has averaged 88.7% occupancy over the past five years.
THE INFORMATION IN THIS STRUCTURAL AND COLLATERAL TERM SHEET IS NOT COMPLETE AND MAY BE AMENDED PRIOR TO THE TIME OF SALE. THIS TERM SHEET IS NOT AN OFFER TO SELL THESE SECURITIES AND IT IS NOT A SOLICITATION OF AN OFFER TO BUY THESE SECURITIES IN ANY JURISDICTION WHERE THE OFFER OR SALE IS NOT PERMITTED.
142
MARNELL CORPORATE CENTER
The largest tenant at the Marnell Corporate Center Property is GSA-TSA (rated AAA/Aaa/AA+ by Fitch/Moody’s/S&P), which accounts for 29.1% of net rentable area and 32.2% of underwritten base rent with a September 2022 lease expiration. GSA-TSA has been a tenant at the Marnell Corporate Center Property since 2009 and expanded its space by 4,385 square feet in March 2018.
The Marnell Corporate Center Property is located approximately 1.5 miles north of Interstate 215, 1.7 miles east of Interstate 15, 2.7 miles southwest of the McCarran International Airport and 5.2 miles south of the Las Vegas Strip. According to the appraisal, as of 2017, the Las Vegas-Henderson-Paradise metropolitan statistical area had an estimated population of approximately 2.2 million people with an estimated average household income of $55,000. According to a third-party market research report, the estimated 2017 population within a three- and five-mile radius of the Marnell Corporate Center Property was approximately 70,687, and 346,926, respectively; while the 2017 estimated average household income within the same radii was $68,125, and $67,216, respectively.
The Marnell Corporate Center Property is located within the Marnell Corporate Center, a six-building corporate campus totaling approximately 390,000 square feet situated on 37.0 acres within the Airport submarket with a 10.8% direct vacancy rate and an average direct vacancy rate of 11.9% since 2014. Per a third party market research report, as of year-end 2017, the submarket reported a total inventory of approximately 12.6 million square feet with an 11.2% vacancy rate and net absorption of 420,292 square feet. Submarket vacancy has decreased from 19.8% in 2011. The appraiser concluded to market rents for the Marnell Corporate Center Property of $32.40 per square foot, gross.
Sources and Uses
| Sources | Uses | |||||||
| Original loan amount | $22,250,000 | 67.6% | Purchase price | $30,750,000 | 93.4% | |||
| Borrower sponsor’s new cash equity | 10,686,962 | 32.4 | Upfront reserves | 1,626,537 | 4.9 | |||
| Closing costs | 560,425 | 1.7 | ||||||
| Total Sources | $32,936,962 | 100.0% | Total Uses | $32,936,962 | 100.0% |
The following table presents certain information relating to the tenancy at the Marnell Corporate Center Property:
Major Tenants
| Tenant Name | Credit Rating (Fitch/ Moody’s/ S&P)(1) | Tenant NRSF | % of NRSF | Annual U/W Base Rent PSF(2) | Annual U/W Base Rent(2) | % of Total Annual U/W Base Rent | Lease Expiration Date |
| Tenants | |||||||
| GSA-TSA | AAA/Aaa/AA+ | 27,219 | 29.1% | $30.90 | $841,025 | 32.2% | 9/23/2022(3) |
| Machine Zone | NR/NR/NR | 24,223 | 25.9% | $33.74 | $817,201 | 31.2% | 2/28/2022(4) |
| HDR Engineering | NR/NR/NR | 13,667 | 14.6% | $33.36 | $455,931 | 17.4% | 9/30/2020(5) |
| American Family | NR/NR/NR | 9,392 | 10.0% | $33.00 | $309,936 | 11.8% | 10/31/2023(6) |
| Dornin(7) | NR/NR/NR | 5,809 | 6.2% | $33.00(7) | $191,697(7) | 7.3% | 8/31/2023(8) |
| Occupied Collateral Total | 80,310 | 85.8% | $32.57 | $2,615,790 | 100.0% | ||
| Vacant Space | 13,340 | 14.2% | |||||
| Collateral Total | 93,650 | 100.0% | |||||
| (1) | Certain ratings are those of the parent company whether or not the parent guarantees the lease. |
| (2) | Annual U/W Base Rent PSF and Annual U/W Base Rent include contractual rent steps through June 2019 totaling $40,815. |
| (3) | GSA-TSA has a termination option for 22,834 square feet of its space (Block A), effective at any time during the lease, with 180 days’ notice. GSA-TSA has no termination option for the remaining 4,385 square feet of its space (Block B). GSA-TSA expanded its space by 4,385 square feet in March 2018. |
| (4) | Machine Zone has two 5-year renewal options, with nine months’ notice, at market rental rates as determined in the lease. |
| (5) | HDR Engineering has one 5-year renewal option, with nine months’ notice, at market rental rates as determined in the lease. |
| (6) | American Family has one 5-year renewal option, with nine months’ notice, at market rental rates as determined in the lease. |
| (7) | The space is currently occupied by Aerotek with in place Base Rent PSF of $33.60 and a lease expiration date of July 31, 2018. At closing, Dornin, which is an affiliate of the seller of the Marnell Corporate Center Property, executed a lease to occupy the space beginning August 1, 2018, with an U/W Base Rent PSF of $33.00. Dornin will have one month of free rent in August 2018. At loan origination, $1,000,000 was escrowed for the approximate amount of future rent due over Dornin’s lease term. In the event that on or before July 31, 2018, Aerotek, executes an amendment approved by the borrower to extend its current lease for a term of not less than five years, commencing on August 1, 2018, with base rent equal to no less than $33.00 per rentable square foot on a full service gross basis, the lease with Dornin will be void and of no further force and effect. |
| (8) | Dornin has one 5-year renewal option, with nine months’ notice, at rental rates as outlined in the lease. |
THE INFORMATION IN THIS STRUCTURAL AND COLLATERAL TERM SHEET IS NOT COMPLETE AND MAY BE AMENDED PRIOR TO THE TIME OF SALE. THIS TERM SHEET IS NOT AN OFFER TO SELL THESE SECURITIES AND IT IS NOT A SOLICITATION OF AN OFFER TO BUY THESE SECURITIES IN ANY JURISDICTION WHERE THE OFFER OR SALE IS NOT PERMITTED.
143
MARNELL CORPORATE CENTER
The following table presents certain information relating to the lease rollover schedule at the Marnell Corporate Center Property:
Lease Expiration Schedule(1)(2)
| Year Ending December 31, 2017 | No. of Leases Expiring | Expiring NRSF | % of Total NRSF | Cumulative Expiring NRSF | Cumulative % of Total NRSF | Annual U/W Base Rent | % of Total Annual U/W Base Rent | Annual U/W Base Rent PSF(3) |
| MTM | 0 | 0 | 0.0% | 0 | 0.0% | $0 | 0.0% | $0.00 |
| 2018 | 0 | 0 | 0.0% | 0 | 0.0% | $0 | 0.0% | $0.00 |
| 2019 | 0 | 0 | 0.0% | 0 | 0.0% | $0 | 0.0% | $0.00 |
| 2020 | 1 | 13,667 | 14.6% | 13,667 | 14.6% | $455,931 | 17.4% | $33.36 |
| 2021 | 0 | 0 | 0.0% | 13,667 | 14.6% | $0 | 0.0% | $0.00 |
| 2022 | 2 | 51,442 | 54.9% | 65,109 | 69.5% | $1,658,226 | 63.4% | $32.23 |
| 2023 | 2 | 15,201 | 16.2% | 80,310 | 85.8% | $501,633 | 19.2% | $33.00 |
| 2024 | 0 | 0 | 0.0% | 80,310 | 85.8% | $0 | 0.0% | $0.00 |
| 2025 | 0 | 0 | 0.0% | 80,310 | 85.8% | $0 | 0.0% | $0.00 |
| 2026 | 0 | 0 | 0.0% | 80,310 | 85.8% | $0 | 0.0% | $0.00 |
| 2027 | 0 | 0 | 0.0% | 80,310 | 85.8% | $0 | 0.0% | $0.00 |
| 2028 | 0 | 0 | 0.0% | 80,310 | 85.8% | $0 | 0.0% | $0.00 |
| Thereafter | 0 | 0 | 0.0% | 80,310 | 85.8% | $0 | 0.0% | $0.00 |
| Vacant | 0 | 13,340 | 14.2% | 93,650 | 100.0% | $0 | 0.0% | $0.00 |
| Total/Weighted Average | 5 | 93,650 | 100.0% | $2,615,790 | 100.0% | $32.57 |
| (1) | Information obtained from the underwritten rent roll. |
| (2) | Certain tenants may have lease termination options that are exercisable prior to the originally stated expiration date of the subject lease and that are not considered in the Lease Expiration Schedule. |
| (3) | Weighted Average Annual U/W Base Rent PSF excludes vacant space. |
The following table presents historical occupancy percentages at the Marnell Corporate Center Property:
Historical Occupancy
12/31/2014(1) | 12/31/2015(1) | 12/31/2016(1)(2) | 12/31/2017(1)(2) | 4/17/2018(3) |
| 83.0% | 95.0% | 95.0% | 88.0% | 85.8% |
| (1) | Information obtained from underwriting and third party market research reports. |
| (2) | The decrease in occupancy from 2016 to 2017 occupancy is due, in part, to American Family surrendering 6,460 square feet (6.9% of net rentable area) in December 2017. |
| (3) | Information obtained from the underwritten rent roll. |
Operating History and Underwritten Net Cash Flow.The following table presents certain information relating to the historical operating performance and underwritten net cash flow at the Marnell Corporate Center Property:
Cash Flow Analysis
| 2015 | 2016 | 2017 | TTM 2/2018 | U/W | % of U/W Effective Gross Income | U/W $ per SF | ||||||||
| Base Rent | $2,263,028 | $2,278,385 | $2,396,664 | $2,451,004 | $2,615,790 | 90.6% | $27.93 | |||||||
| Grossed Up Vacant Space | 0 | 0 | 0 | 0 | $432,216 | 15.0 | 4.62 | |||||||
| Total Reimbursement | 255,295 | 283,869 | 271,737 | 279,043 | 264,785 | 9.2 | 2.83 | |||||||
| Parking/Garage/Other | 10,800 | 9,697 | 8,010 | 8,100 | 8,010 | 0.3 | 0.09 | |||||||
| Less Vacancy & Credit Loss | 0 | 0 | 0 | 0 | (432,216)(2) | (15.0) | (4.62) | |||||||
| Effective Gross Income | $2,529,123 | $2,571,951 | $2,676,410 | $2,738,147 | $2,888,585 | 100.0% | $30.84 | |||||||
| Total Operating Expenses | $678,068 | $729,690 | $774,643 | $796,247 | $737,939 | 25.5% | $7.88 | |||||||
| Net Operating Income | $1,851,055 | $1,842,261 | $1,901,768 | $1,941,900(1) | $2,150,646(1) | 74.5% | $22.96 | |||||||
| Replacement Reserves | 0 | 0 | 0 | 0 | 18,730 | 0.6 | 0.20 | |||||||
| Tenant Improvements | 0 | 0 | 0 | 0 | 37,847 | 1.3 | 0.40 | |||||||
| Leasing Commissions | 0 | 0 | 0 | 0 | 24,367 | 0.8 | 0.26 | |||||||
| Net Cash Flow | $1,851,055 | $1,842,261 | $1,901,768 | $1,941,900 | $2,069,703 | 71.7% | $22.10 | |||||||
| NOI DSCR | 1.32x | 1.31x | 1.35x | 1.38x | 1.53x | |||||||||
| NCF DSCR | 1.32x | 1.31x | 1.35x | 1.38x | 1.47x | |||||||||
| NOI DY | 8.3% | 8.3% | 8.6% | 8.7% | 9.7% | |||||||||
| NCF DY | 8.3% | 8.3% | 8.6% | 8.7% | 9.3% |
| (1) | The increase in Net Operating Income from TTM 2/28/2018 to U/W is driven by GSA-TSA expanding its space by 4,385 square feet in March 2018 ($131,259 of annual underwritten base rent). |
| (2) | The underwritten economic vacancy is 14.2%. The Marnell Corporate Center Property was 85.8% physically occupied as of April 17, 2018. |
THE INFORMATION IN THIS STRUCTURAL AND COLLATERAL TERM SHEET IS NOT COMPLETE AND MAY BE AMENDED PRIOR TO THE TIME OF SALE. THIS TERM SHEET IS NOT AN OFFER TO SELL THESE SECURITIES AND IT IS NOT A SOLICITATION OF AN OFFER TO BUY THESE SECURITIES IN ANY JURISDICTION WHERE THE OFFER OR SALE IS NOT PERMITTED.
144
MARNELL CORPORATE CENTER
The following table presents certain information relating to comparable Office leases for the Marnell Corporate Center Property:
Comparable Set(1)
| Property Name/Location | Total Property Occupancy | Distance from Subject | Lease Date/ Term(2) | Lease Area (SF)(2) | Annual Base Rent PSF(2) | Lease Type |
Marnell Corporate Center 2 6700 Via Austi Parkway, Las Vegas, NV | 95.0% | <0.1 mile | NAV | NAV | $30.00 | FSG |
Marnell Corporate Center 3 6725 Via Austi Parkway, Las Vegas, NV | 69.0% | <0.1 mile | Dec. 2015 – May 2017 / 3.0 – 40.0 Yrs | 2,350 – 10,000 | $30.00 - $32.40 | FSG |
Marnell Corporate Center 5 6720 Via Austi Parkway, Las Vegas, NV | 93.0% | <0.1 mile | Apr. 2016 – Jan. 2018 / 2.0 – 5.4 Yrs | 3,485 – 6,572 | $28.80 - $30.00 | FSG |
Rainbow Sunset- Building B 6385 South Rainbow Boulevard, Las Vegas, NV | 95.0% | 5.0 miles | Jun. 2017 – Jan. 2018 / 6.3 – 10.8 Yrs | 3,887 – 22,145 | $32.40 - $33.60 | FSG |
Rainbow Sunset Pavilion 6325 South Rainbow Boulevard, Las Vegas, NV | 100.0% | 5.0 miles | Jan. 2016 – Sep. 2017 / 5.0 – 10.0 Yrs | 4,892 – 7,427 | $25.80 - $33.00 | Modified Gross |
Town Square (Office) 6605 - 6671 South Las Vegas Boulevard, Las Vegas, NV | 90.0% | 1.7 miles | Oct. 2017 – Apr. 2018 / 3.0 – 7.4 Yrs | 6,702 – 28,862 | $28.80 - $30.60 | Modified Gross |
One Summerlin 1980 Festival Plaza Drive, Las Vegas, NV | 97.0% | 14.4 miles | Jul. 2017 – Jan. 2018 / 3.3 – 5.4 Yrs | 2,789 – 4,066 | $36.60 - $37.68 | FSG |
The Gramercy 9205 - 9275 West Russell Road, Las Vegas, NV | 99.0% | 9.2 miles | Mar. 2017 – Oct. 2017 / 2.0 – 7.1 Yrs | 1,474 – 3,384 | $25.80 - $30.60 | Modified Gross |
| (1) | Information obtained from the appraisal. |
| (2) | The appraiser provided multiple comparable leases for each of the seven properties (excluding the Marnell Corporate Center 2 mortgaged property) shown on the table above. The information shown, as available, represents the ranges of such leases. |
THE INFORMATION IN THIS STRUCTURAL AND COLLATERAL TERM SHEET IS NOT COMPLETE AND MAY BE AMENDED PRIOR TO THE TIME OF SALE. THIS TERM SHEET IS NOT AN OFFER TO SELL THESE SECURITIES AND IT IS NOT A SOLICITATION OF AN OFFER TO BUY THESE SECURITIES IN ANY JURISDICTION WHERE THE OFFER OR SALE IS NOT PERMITTED.
145
| No. 13 – Waysons MHC | ||||||||
| Loan Information | Property Information | |||||||
| Mortgage Loan Seller: | Ladder Capital Finance LLC | Single Asset/Portfolio: | Single Asset | |||||
| Credit Assessment (DBRS/Fitch/Moody’s): | NR/NR/NR | Property Type: | Manufactured Housing Community | |||||
| Original Principal Balance: | $22,000,000 | Specific Property Type: | Manufactured Housing Community | |||||
| Cut-off Date Balance: | $22,000,000 | Location: | Lothian, MD | |||||
| % of Initial Pool Balance: | 2.9% | Size(3): | 289 Pads | |||||
| Loan Purpose: | Refinance | Cut-off Date Balance Per Pad: | $76,124.57 | |||||
| Borrower Name: | Waysons MHC, LLC | Year Built/Renovated: | 1950/2000 | |||||
| Borrower Sponsor: | Ross H. Partrich | Title Vesting: | Fee | |||||
| Mortgage Rate: | 4.8750% | Property Manager: | Self-managed | |||||
| Note Date: | March, 19, 2018 | 4thMost Recent Occupancy (As of): | NAV | |||||
| Anticipated Repayment Date: | NAP | 3rdMost Recent Occupancy (As of)(4): | 89.6% (3/31/2016) | |||||
| Maturity Date: | April 6, 2028 | 2ndMost Recent Occupancy (As of)(4): | 90.0% (12/31/2016) | |||||
| IO Period: | 36 months | Most Recent Occupancy (As of)(4): | 95.2% (12/31/2017) | |||||
| Loan Term (Original): | 120 months | Current Occupancy (As of)(4): | 95.9% (3/1/2018) | |||||
| Seasoning: | 1 month | |||||||
| Amortization Term (Original): | 360 months | Underwriting and Financial Information: | ||||||
| Loan Amortization Type: | Interest-only, Amortizing Balloon | |||||||
| Interest Accrual Method: | Actual/360 | 4th Most Recent NOI (As of)(5): | NAP | |||||
| Call Protection: | L(25),D(91),O(4) | 3rd Most Recent NOI (As of)(5): | NAP | |||||
| Lockbox Type: | Springing | 2nd Most Recent NOI (As of)(5): | $1,499,530 (12/31/2016 – 10 Months Annualized) | |||||
| Additional Debt: | Yes(1) | Most Recent NOI (As of)(5): | $1,575,249 (12/31/2017) | |||||
| Additional Debt Type: | Future Mezzanine(1) | |||||||
| U/W Revenues: | $2,612,736 | |||||||
| U/W Expenses: | $827,449 | |||||||
| U/W NOI(5): | $1,785,287 | |||||||
| U/W NCF: | $1,770,837 | |||||||
| U/W NOI DSCR: | 1.28x | |||||||
| Escrows and Reserves: | U/W NCF DSCR: | 1.27x | ||||||
| U/W NOI Debt Yield: | 8.1% | |||||||
| Type: | Initial | Monthly | Cap (If Any) | U/W NCF Debt Yield: | 8.0% | |||
| Taxes | $111,308 | $18,551 | NAP | As-Is Appraised Value: | $32,400,000 | |||
| Insurance | $0 | Springing(2) | NAP | As-Is Appraisal Valuation Date: | February 28, 2018 | |||
| Replacement Reserves | $0 | $1,204 | $57,800 | Cut-off Date LTV Ratio: | 67.9% | |||
| Environmental Reserve | $25,938 | $0 | NAP | LTV Ratio at Maturity or ARD: | 59.9% | |||
| (1) | The loan documents permit mezzanine financing subject to certain conditions, including: (i) no event of default under the related loan documents has occurred and is continuing; (ii) the execution of an intercreditor agreement in form and substance acceptable to the lender; (iii) the combined loan-to-value ratio is not greater than the lesser of 75.0% and the loan-to-value ratio at origination; (iv) the combined amortizing debt service coverage ratio is not less than the greater of 1.25x and the amortizing debt service coverage ratio at origination; and (v) receipt of rating agency confirmation from each of Fitch, DBRS and Moody’s that the mezzanine financing will not result in a downgrade, withdrawal or qualification of the respective ratings assigned to the Series WFCM 2018-C44 certificates. |
| (2) | Ongoing monthly reserves for insurance are not required so long as insurance requirements are being satisfied by a blanket policy acceptable to the lender. |
| (3) | The Waysons MHC Property (as defined below) includes approximately 15.2 acres of land zoned for commercial use that (a) is in part ground leased to eight commercial tenants and (b) contains two vacant unimproved outparcels totaling approximately 1.69 acres. The borrower is permitted to obtain the release of the two vacant outparcels subject to the satisfaction of certain conditions contained in the loan agreement, including but not limited to: (i) no event of default under the related loan documents has occurred and is continuing or will result from the release; (ii) the lender’s receipt of a request 30 days in advance of the requested release; (iii) evidence that the remaining property continues to comply with zoning and other applicable legal requirements; (iv)the remaining property will not be in violation of any leases or reciprocal easement agreements; (v) any necessary easements will be entered into; (vi) recordation of restrictive covenants against the outparcels which may result in a breach of any lease or reciprocal easement agreement; (vii) in no event may the released parcels be used as a bingo hall; and (viii) delivery of a REMIC opinion. |
| (4) | Exclusive of commercial tenants. See “Historical Occupancy” table |
| (5) | See “Cash Flow Analysis” table. |
The Waysons MHC mortgage loan is evidenced by a single promissory note that is secured by a first mortgage note encumbering a 289-pad manufactured housing community located in Lothian, Maryland (the “Waysons MHC Property”), with approximately 15 acres of land zoned for commercial use. Built in 1950 and renovated in 2000 the Waysons MHC Property is located approximately 12 miles southwest of Annapolis, and 24 miles southeast of Washington, D.C. According to a third party market research report, the estimated 2017 population within a one-, three- and five-mile radius of the Waysons MHC Property was 2,934, 9,205 and 32,429, respectively, and the 2017 estimated average household income within the same one-, three- and five-mile radius was $89,470, $107,433 and $125,019, respectively. As of March 1, 2018, the Waysons MHC Property was 95.9% occupied with no sponsor owned homes.
THE INFORMATION IN THIS STRUCTURAL AND COLLATERAL TERM SHEET IS NOT COMPLETE AND MAY BE AMENDED PRIOR TO THE TIME OF SALE. THIS TERM SHEET IS NOT AN OFFER TO SELL THESE SECURITIES AND IT IS NOT A SOLICITATION OF AN OFFER TO BUY THESE SECURITIES IN ANY JURISDICTION WHERE THE OFFER OR SALE IS NOT PERMITTED.
146
WAYSONS MHC
Sources and Uses
| Sources | Uses | |||||||
| Original loan amount | $22,000,000 | 100.0% | Loan payoff(1) | $13,627,083 | 61.9% | |||
| Reserves | 137,246 | 0.6 | ||||||
| Closing costs | 397,185 | 1.8 | ||||||
| Return of equity | 7,838,487 | 35.6 | ||||||
| Total Sources | $22,000,000 | 100.0% | Total Uses | $22,000,000 | 100.0% |
| (1) | The Waysons MHC Property was previously securitized in the FCRE 2016-1A transaction. |
The following table presents historical occupancy percentages at the Waysons MHC Property:
Historical Occupancy(1)(2)
3/31/2016(3) | 12/31/2016(3) | 12/31/2017(3) | 3/1/2018(4) |
| 89.6% | 90.0% | 95.2% | 95.9% |
| (1) | Historical occupancy is not available prior to 2016 because the borrower acquired the property in March 2016 without prior occupancy information. |
| (2) | Exclusive of commercial tenants. |
| (3) | Information obtained from the borrower. |
| (4) | Information obtained from the underwritten rent roll. |
Operating History and Underwritten Net Cash Flow.The following table presents certain information relating to the historical operating performance and underwritten net cash flow at the Waysons MHC Property:
Cash Flow Analysis
| 2016 T-10 Annualized(1) | 2017 | U/W | % of U/W Effective Gross Income | U/W $ per Unit | |||||||
| Base Rent | $1,670,146 | $1,788,396 | $1,984,218 | 75.9% | $6,866 | ||||||
| Grossed Up Vacant Space | 230,550 | 190,890 | 108,150 | 4.1 | 374 | ||||||
| Other Income(2) | 702,564 | 707,493 | 628,518 | 24.1 | 2,175 | ||||||
| Less Vacancy & Credit Loss | (230,550) | (190,890) | (108,150)(3) | (4.1) | (374) | ||||||
| Effective Gross Income | $2,372,710 | $2,495,889 | $2,612,736 | 100.0% | $9,041 | ||||||
| Total Operating Expenses | $873,179 | $920,641 | $827,449 | 31.7% | $2,863 | ||||||
| Net Operating Income | $1,499,530(4) | $1,575,249(4) | $1,785,287(4) | 68.3% | $6,177 | ||||||
| Capital Expenditures | 0 | 0 | 14,450 | 0.6 | 50 | ||||||
| Net Cash Flow | $1,499,530 | $1,575,249 | $1,770,837 | 67.8% | $6,127 | ||||||
| NOI DSCR | 1.07x | 1.13x | 1.28x | ||||||||
| NCF DSCR | 1.07x | 1.13x | 1.27x | ||||||||
| NOI DY | 6.8% | 7.2% | 8.1% | ||||||||
| NCF DY | 6.8% | 7.2% | 8.0% |
| (1) | Historical financial information prior to 2016 is not available because the Waysons MHC Property was acquired in March 2016 and the sellers did not provide January and February 2016 financial statements. |
| (2) | Other Income consists of land zoned for commercial use, currently ground leased to eight tenants, as well as three single-family homes. Other Income also includes application fees, late fees, and miscellaneous income. |
| (3) | The underwritten economic vacancy is 5.2%. The Waysons MHC Property was 95.9% physically occupied as of March 1, 2018. |
| (4) | The U/W Net Operating Income is higher than 2017 because the Waysons MHC Property was 89.6% leased when the borrower sponsor acquired the property in February 2016. Since the acquisition the borrower sponsor has invested over $400,000 in capital improvements, increased occupancy to 95.9% and effectuated two rent increases. |
THE INFORMATION IN THIS STRUCTURAL AND COLLATERAL TERM SHEET IS NOT COMPLETE AND MAY BE AMENDED PRIOR TO THE TIME OF SALE. THIS TERM SHEET IS NOT AN OFFER TO SELL THESE SECURITIES AND IT IS NOT A SOLICITATION OF AN OFFER TO BUY THESE SECURITIES IN ANY JURISDICTION WHERE THE OFFER OR SALE IS NOT PERMITTED.
147
| No. 14 – Aloft Hotel Raleigh | |||||||
| Loan Information | Property Information | ||||||
| Mortgage Loan Seller: | Wells Fargo Bank, National Association | Single Asset/Portfolio: | Single Asset | ||||
| Credit Assessment (DBRS/Fitch/Moody’s): | NR/NR/NR | Property Type: | Hospitality | ||||
| Original Principal Balance: | $22,000,000 | Specific Property Type: | Limited Service | ||||
| Cut-off Date Balance: | $21,973,468 | Location: | Raleigh, NC | ||||
| % of Initial Pool Balance: | 2.9% | Size: | 135 Rooms | ||||
| Loan Purpose: | Refinance | Cut-off Date Balance Per Room: | $162,766 | ||||
| Borrower Name: | Bell View Partners, LLC | Year Built/Renovated: | 2015/NAP | ||||
| Borrower Sponsors: | Adam K. Bernstein | Title Vesting: | Leasehold | ||||
| Mortgage Rate: | 4.9800% | Property Manager: | Self-managed | ||||
| Note Date: | March 23, 2018 | 4thMost Recent Occupancy(3): | NAP | ||||
| Anticipated Repayment Date: | NAP | 3rd Most Recent Occupancy(3): | NAP | ||||
| Maturity Date: | April 11, 2028 | 2nd Most Recent Occupancy (As of): | 62.5% (12/31/2016) | ||||
| IO Period: | 0 months | Most Recent Occupancy (As of): | 70.1% (12/31/2017) | ||||
| Loan Term (Original): | 120 months | Current Occupancy (As of): | 70.5% (2/28/2018) | ||||
| Seasoning: | 1 month | ||||||
| Amortization Term (Original): | 360 months | Underwriting and Financial Information: | |||||
| Loan Amortization Type: | Amortizing Balloon | ||||||
| Interest Accrual Method: | Actual/360 | 4th Most Recent NOI(3): | NAP | ||||
| Call Protection: | L(25),D(91),O(4) | 3rd Most Recent NOI (As of): | $2,012,835 (12/31/2016) | ||||
| Lockbox Type: | Hard/Springing Cash Management | 2nd Most Recent NOI (As of): | $2,610,176 (12/31/2017) | ||||
| Additional Debt: | None | Most Recent NOI (As of): | $2,663,756 (TTM 2/28/2018) | ||||
| Additional Debt Type: | NAP | ||||||
| U/W Revenues: | $6,539,039 | ||||||
| U/W Expenses: | $3,876,687 | ||||||
| U/W NOI: | $2,662,352 | ||||||
| U/W NCF: | $2,400,790 | ||||||
| U/W NOI DSCR: | 1.88x | ||||||
| Escrows and Reserves: | U/W NCF DSCR: | 1.70x | |||||
| U/W NOI Debt Yield: | 12.1% | ||||||
| Type: | Initial | Monthly | Cap (If Any) | U/W NCF Debt Yield: | 10.9% | ||
| Taxes | $76,172 | $19,043 | NAP | As-Is Appraised Value: | $30,500,000 | ||
| Insurance | $0 | Springing(1) | NAP | As-Is Appraisal Valuation Date: | February 14, 2018 | ||
| FF&E Reserve | $0 | $21,591 | NAP | Cut-off Date LTV Ratio: | 72.0% | ||
| Ground Rent Reserve | $0 | Springing(2) | NAP | LTV Ratio at Maturity or ARD: | 59.3% | ||
| (1) | Ongoing monthly reserves for insurance are not required as long as (i) no event of default has occurred and is continuing; (ii) the Aloft Hotel Raleigh Property (as defined below) is insured via an acceptable blanket insurance policy; and (iii) the borrower provides the lender with evidence of renewal of the insurance policies and timely proof of payment of insurance premiums. |
| (2) | During the continuance of the Cash Trap Event Period (as defined below), the borrower is required to deposit an amount equal to the ground rent payable for the succeeding month into the ground rent reserve. A “Cash Trap Event Period” will commence upon the earlier of the following: (i) the occurrence of an event of default; (ii) the net cash flow debt yield falling below 9.0% at the end of any fiscal quarter; (iii) the occurrence of a default or an event of default under any franchise agreement; or (iv) the cancellation, termination or expiration of any franchise agreement. |
| (3) | Historical occupancy and financials prior to 2016 are not applicable, as the Aloft Hotel Raleigh Property opened in October 2015. |
The Aloft Hotel Raleigh mortgage loan is evidenced by a single promissory note that is secured by a first mortgage encumbering the borrower’s leasehold interest in a seven-story, 135-room limited service hotel located in Raleigh, North Carolina (the “Aloft Hotel Raleigh Property”). The Aloft Hotel Raleigh Property is situated on Hillsborough Street and directly adjacent to North Carolina State University, a public university with a total Fall 2017 enrollment of over 34,000 students. The Aloft Hotel Raleigh Property was developed by the sponsor and opened in October 2015. The guestroom configuration consists of 58 king rooms, 30 double rooms, 17 handicap accessible rooms, and 30 suites. All guestrooms feature 40-inch flat-screen televisions, desks with ergonomic chairs, and refrigerator. The Aloft Hotel Raleigh Property features complimentary breakfast, bar with open-air terrace, approximately 2,350 square feet of meeting space, fitness center, outdoor swimming pool, 24/7 convenience mart and business center. A two-story parking garage is attached to the Aloft Hotel Raleigh Property with 98 parking spaces, resulting in a parking ratio of 0.7 spaces per room. According to the appraisal, the Aloft Hotel Raleigh Property generates approximately 35% of its room revenue from leisure and 65% from commercial and group demand. The franchise agreement with The Sheraton LLC. expires on October 26, 2035.
The Aloft Hotel Raleigh Property has two ground floor retail tenants: GT&T-Aloft, Inc. (the “Gonza Tacos y Taquila”) and Jubala Village Coffee, Inc. (the “Jubala Coffee”). Gonza Tacos y Tequila is a Mexican restaurant that is on a 10-year lease through October 31, 2025 with current annual base rent of $84,911. Jubala Coffee is a coffeehouse that is on a 10-year lease through January 14,
THE INFORMATION IN THIS STRUCTURAL AND COLLATERAL TERM SHEET IS NOT COMPLETE AND MAY BE AMENDED PRIOR TO THE TIME OF SALE. THIS TERM SHEET IS NOT AN OFFER TO SELL THESE SECURITIES AND IT IS NOT A SOLICITATION OF AN OFFER TO BUY THESE SECURITIES IN ANY JURISDICTION WHERE THE OFFER OR SALE IS NOT PERMITTED.
148
ALOFT HOTEL RALEIGH
2026 with current annual base rent of $48,866. In total, the two retail tenants account for 2.0% of the underwritten total revenue at the Aloft Hotel Raleigh Property.
The Aloft Hotel Raleigh Property is located in Raleigh, the capital of North Carolina. The Aloft Hotel Raleigh Property is within approximately 3.0 miles of I-401, I-70, I-40, and I-440 (Raleigh’s inner beltline) and is approximately 14.0 miles southeast of Raleigh-Durham International Airport. The Aloft Hotel Raleigh Property is adjacent to North Carolina State University and situated approximately 5.0 miles from Carter-Finley football stadium (home of the North Carolina State University Wolfpack football team, with a capacity of 57,583 people) and PNC Arena (home to the NHL’s Carolina Hurricanes). The Aloft Hotel Raleigh Property is located within the Research Triangle Park, which has approximately 2.25 million square feet of office and job space and is the home to over 200 companies (including IBM, Cisco Systems, and GlaxoSmithKline). The Raleigh Convention Center is located in Downtown Raleigh, approximately 2.7 miles from the Aloft Hotel Raleigh Property, and features over 150,000 square feet of exhibition space, 20 meeting rooms, and an approximately 32,000 square feet ballroom, holding approximately 250 to 350 conventions per year. According to a third-party research provider, the estimated 2017 population within a three-, and five-mile radius of the Aloft Hotel Raleigh Property was 100,144, and 214,076, respectively; and the average household income within the same radii was $77,081 and $74,358, respectively.
The Aloft Hotel Raleigh Property is subject to a ground lease with Bell Tower Holdings LLC, a company established by North Carolina State University to manage its real property, as ground lessor and expiration date of December 31, 2063. The ground lease has a current annual rental rate of $68,400, which increases to $91,520 on January 1, 2024 through the remainder of the term of the Aloft Hotel Raleigh mortgage loan.
Sources and Uses
| Sources | Uses | |||||||
| Original whole loan amount | $22,000,000 | 100.0% | Loan payoff | $16,641,023 | 75.6% | |||
| Closing costs | 285,360 | 1.3 | ||||||
| Reserves | 76,172 | 0.4 | ||||||
| Return of equity | 4,997,445 | 22.7 | ||||||
| Total Sources | $22,000,000 | 100.0% | Total Uses | $22,000,000 | 100.0% |
Operating History and Underwritten Net Cash Flow.The following table presents certain information relating to the historical operating performance and underwritten net cash flow at the Aloft Hotel Raleigh Property:
Cash Flow Analysis(1)
| 2016 | 2017 | TTM 2/28/2018 | U/W | % of U/W Total Revenue | U/W $ per Room | |
| Occupancy | 62.5% | 70.1% | 70.5% | 70.5% | ||
| ADR | $154.59 | $163.29 | $164.09 | $164.09 | ||
| RevPAR | $96.55 | $114.46 | $115.67 | $115.67 | ||
| Room Revenue | $4,770,411 | $5,640,254 | $5,699,829 | $5,699,829 | 87.2% | $42,221 |
| F&B Revenue | 520,568 | 547,490 | 555,939 | 555,939 | 8.5 | 4,118 |
| Other Revenue(2) | 231,024 | 277,169 | 283,271 | 283,271 | 4.3 | 2,098 |
| Total Revenue | $5,522,003 | $6,464,913 | $6,539,039 | $6,539,039 | 100.0% | $48,437 |
| Total Department Expenses | 1,296,138 | 1,381,659 | 1,387,273 | 1,387,273 | 21.2 | 10,276 |
| Gross Operating Profit | $4,225,865 | $5,083,254 | $5,151,766 | $5,151,766 | 78.8% | 38,161 |
| Total Undistributed Expenses | 1,860,856 | 2,090,049 | 2,105,730 | 2,105,243 | 32.2 | 15,594 |
| Profit Before Fixed Charges | $2,365,009 | $2,993,205 | $3,046,036 | $3,046,523 | 46.6% | $22,567 |
| Total Fixed Charges | 352,174 | 383,029 | 382,280 | 384,171 | 5.9 | $2,846 |
| Net Operating Income | $2,012,835 | $2,610,176 | $2,663,756 | $2,662,352 | 40.7% | $19,721 |
| FF&E | 0 | 0 | 0 | 261,562 | 4.0 | 1,937 |
| Net Cash Flow | $2,012,835 | $2,610,176 | $2,663,756 | $2,400,790 | 36.7% | $17,784 |
| NOI DSCR | 1.42x | 1.85x | 1.88x | 1.88x | ||
| NCF DSCR | 1.42x | 1.85x | 1.88x | 1.70x | ||
| NOI DY | 9.2% | 11.9% | 12.1% | 12.1% | ||
| NCF DY | 9.2% | 11.9% | 12.1% | 10.9% | ||
| (1) | Historical financials prior to 2016 are not available, as the Aloft Hotel Raleigh Property opened in October 2015. |
| (2) | Other Revenue includes rents from two retail tenants (Gonza Tacos y Tequila and Jubala Coffee), guest laundry and dry cleaning, and miscellaneous items. |
THE INFORMATION IN THIS STRUCTURAL AND COLLATERAL TERM SHEET IS NOT COMPLETE AND MAY BE AMENDED PRIOR TO THE TIME OF SALE. THIS TERM SHEET IS NOT AN OFFER TO SELL THESE SECURITIES AND IT IS NOT A SOLICITATION OF AN OFFER TO BUY THESE SECURITIES IN ANY JURISDICTION WHERE THE OFFER OR SALE IS NOT PERMITTED.
149
ALOFT HOTEL RALEIGH
The following table presents certain information relating to the Aloft Hotel Raleigh Property’s competitive set:
Subject and Market Historical Occupancy, ADR and RevPAR(1)(2)
Competitive Set | Aloft Hotel Raleigh | Penetration Factor | |||||||
Year | Occupancy | ADR | RevPAR | Occupancy | ADR | RevPAR | Occupancy | ADR | RevPAR |
| TTM 1/31/2018 | 72.3% | $128.58 | $92.95 | 69.9% | $161.09 | $112.57 | 96.7% | 125.3% | 121.1% |
| TTM 1/31/2017 | 72.6% | $127.48 | $92.61 | 63.7% | $154.86 | $98.67 | 87.7% | 121.5% | 106.5% |
| (1) | Information obtained from a third party hospitality report dated February 19, 2018 competitive set includes the following hotels: Holiday Inn Raleigh Downtown, Doubletree Raleigh Brownstone University, Hyatt Place North Raleigh Midtown and Hampton Inn Suites Raleigh Downtown. |
| (2) | Information prior to TTM 1/31/2017 is not applicable, as the Aloft Hotel Raleigh Property opened in October 2015. |
THE INFORMATION IN THIS STRUCTURAL AND COLLATERAL TERM SHEET IS NOT COMPLETE AND MAY BE AMENDED PRIOR TO THE TIME OF SALE. THIS TERM SHEET IS NOT AN OFFER TO SELL THESE SECURITIES AND IT IS NOT A SOLICITATION OF AN OFFER TO BUY THESE SECURITIES IN ANY JURISDICTION WHERE THE OFFER OR SALE IS NOT PERMITTED.
150
(THIS PAGE INTENTIONALLY LEFT BLANK)
THE INFORMATION IN THIS STRUCTURAL AND COLLATERAL TERM SHEET IS NOT COMPLETE AND MAY BE AMENDED PRIOR TO THE TIME OF SALE. THIS TERM SHEET IS NOT AN OFFER TO SELL THESE SECURITIES AND IT IS NOT A SOLICITATION OF AN OFFER TO BUY THESE SECURITIES IN ANY JURISDICTION WHERE THE OFFER OR SALE IS NOT PERMITTED.
151
| No. 15 – 3200 North First Street | ||||||
| Loan Information | Property Information | |||||
| Mortgage Loan Seller: | Wells Fargo Bank, National Association | Single Asset/Portfolio: | Single Asset | |||
| Credit Assessment (DBRS/Fitch/Moody’s): | NR/NR/NR | Property Type: | Industrial | |||
| Original Principal Balance: | $19,800,000 | Specific Property Type: | Flex | |||
| Cut-off Date Principal Balance: | $19,800,000 | Location: | San Jose, CA | |||
| % of Initial Pool Balance: | 2.6% | Size: | 85,017 SF | |||
| Loan Purpose: | Acquisition | Cut-off Date Balance Per SF:
| $232.89 | |||
| Borrower Name: | SPI 3200 N First LP | Year Built/Renovated: | 1997/2016 | |||
| Sponsors: | Dennis J. Wong | Title Vesting: | Fee | |||
| Mortgage Rate: | 4.590% | Property Manager: | Self-managed | |||
| Note Date: | February 27, 2018 | 4thMost Recent Occupancy (As of): | NAV | |||
| Anticipated Repayment Date: | NAP | 3rdMost Recent Occupancy (As of): | 100.0% (12/31/2015) | |||
| Maturity Date: | March 11, 2028 | 2ndMost Recent Occupancy (As of): | 100.0% (12/31/2016) | |||
| IO Period: | 120 months | Most Recent Occupancy (As of): | 100.0% (12/31/2017) | |||
| Loan Term (Original): | 120 months | Current Occupancy (As of): | 100.0% (5/1/2018) | |||
| Seasoning: | 2 months | |||||
| Amortization Term (Original): | NAP | Underwriting and Financial Information: | ||||
| Loan Amortization Type: | Interest-only, Balloon | 4thMost Recent NOI(3): | NAV | |||
| Interest Accrual Method: | Actual/360 | 3rdMost Recent NOI(3): | NAV | |||
| Call Protection: | L(26),D(90),O(4) | 2ndMost Recent NOI (As of)(4): | $1,225,775 (12/31/2016) | |||
| Lockbox Type: | Hard/Upfront Cash Management | Most Recent NOI (As of)(4): | $1,698,398 (12/31/2017) | |||
| Additional Debt: | None | |||||
| Additional Debt Type: | NAP | U/W Revenues: | $2,424,149 | |||
| U/W Expenses: | $622,203 | |||||
| U/W NOI: | $1,801,946 | |||||
| U/W NCF: | $1,691,661 | |||||
| Escrows and Reserves: | U/W NOI DSCR : | 1.96x | ||||
| U/W NCF DSCR : | 1.84x | |||||
| Type: | Initial | Monthly | Cap(If Any) | U/W NOI Debt Yield : | 9.1% | |
| Taxes | $32,091 | $32,091 | NAP | U/W NCF Debt Yield : | 8.5% | |
| Insurance | $0 | Springing(1) | NAP | As-Is Appraised Value(5): | $30,600,000 | |
| Replacement Reserves | $188,000 | $5,660 | $459,680(2) | As-Is Appraisal Valuation Date(5): | February 5, 2018 | |
| Leasing Commission Reserves | $0 | $6,447 | NAP | Cut-off Date LTV Ratio(5): | 64.7% | |
| Rent Concession Reserve | $166,633 | $0 | NAP | LTV Ratio at Maturity or ARD(5): | 64.7% | |
| (1) | Ongoing monthly reserves for insurance are not required so long as (i) no event of default has occurred and is continuing; (ii) the 3200 North First Street Property is insured via an acceptable blanket insurance policy; and (iii) the borrower provides the lender with evidence of renewal of the insurance policies and timely proof of payment of insurance premiums. |
| (2) | Springing monthly reserves for replacement reserves are required above the cap upon (i) the occurrence and continuance of an event of default or (ii) the lender determines the borrower is not properly maintaining the property. |
| (3) | Historical financial information is not available as the 3200 North First Street Property (as defined below) was not occupied by Nextev (dba NIO) (“NIO”) until October 2015. |
| (4) | See “Cash Flow Analysis” section. |
| (5) | The Appraised Value and LTV’s shown are based on the appraiser’s hypothetical market value as stabilized, which assumes all remaining free rent has expired. All outstanding free rent was reserved upon the origination of the 3200 North First Street mortgage loan. Based on the as-is appraised value of $30,450,000 (as of February 5, 2018), the Cut-off Date LTV Ratio is 65.0%. |
The 3200 North First Street mortgage loan is evidenced by a single promissory note that is secured by a first mortgage encumbering the borrower’s fee interest in an industrial flex building totaling 85,017 square feet located in San Jose, California (the “3200 North First Street Property”). Built in 1997 and renovated in 2016, the 3200 North First Street Property is situated on a 4.8-acre parcel and contains 270 surface parking spaces, resulting in a parking ratio of 3.2 spaces per 1,000 square feet of rentable area. The 3200 North First Street Property comprises a two-story building, built out as a combination of open office area, conference rooms, private offices, a manufacturing area totaling approximately 14,950 square feet, shipping/receiving area with two grade-level loading doors, and an outdoor amenity area. The 3200 North First Street Property is 100.0% leased to NIO through September 30, 2023 with two, five-year extension options. NIO specializes in designing and developing electric vehicles and has more than 2,000 employees in San Jose, Shanghai, Munich, London and eight other locations. The 3200 North First Street Property serves as NIO’s North American headquarters and global software development center and houses approximately 450 employees.
The 3200 North First Street Property is located in north San Jose, in the “Golden Triangle” of Silicon Valley, and is proximate to State Highway 237, Interstate 880, and U.S. Highway 101. According to the appraisal, the 2017 population and median household income within a five-mile radius of the property was approximately 426,326 and $96,865, respectively. The 3200 North First Street Property is located within the South Bay/San Jose industrial market, which, as of the fourth quarter of 2017, contained a total inventory of
THE INFORMATION IN THIS STRUCTURAL AND COLLATERAL TERM SHEET IS NOT COMPLETE AND MAY BE AMENDED PRIOR TO THE TIME OF SALE. THIS TERM SHEET IS NOT AN OFFER TO SELL THESE SECURITIES AND IT IS NOT A SOLICITATION OF AN OFFER TO BUY THESE SECURITIES IN ANY JURISDICTION WHERE THE OFFER OR SALE IS NOT PERMITTED.
152
| 3200 NORTH FIRST STREET |
2,441 buildings totaling approximately 104.9 million square feet with an 8.5% vacancy rate and average asking rent of $25.28 per square foot, net. The appraiser analyzed five comparable properties and concluded to a market rent for the 3200 North First Street Property of $28.20 per square foot, net.
Sources and Uses
| Sources | Uses | |||||||
| Original loan amount | $19,800,000 | 64.2% | Purchase Price(1) | $30,050,000 | 97.5% | |||
| Borrower’s Equity | 11,027,712 | 35.8 | Reserves | 386,724 | 1.3 | |||
| Closing costs | 390,988 | 1.2 | ||||||
| Total Sources | $30,827,712 | 100.0% | Total Uses | $30,827,712 | 100.0% |
| (1) | The borrower acquired the 3200 North First Street Property in February 2018 in an all cash transaction. The 3200 North First Street mortgage loan served to recapitalize the borrower. |
The following table presents certain information relating to the tenancy at the 3200 North First Street Property:
Major Tenant
| Tenant Name | Credit Rating (Fitch/ Moody’s/ S&P) | Tenant NRSF | % of NRSF | Annual U/W Base Rent PSF(1) | Annual U/W Base Rent(1) | % of Total Annual U/W Base Rent | Lease Expiration Date |
| Major Tenant | |||||||
| NIO | NR/NR/NR | 85,017 | 100.0% | $23.52 | $1,999,600 | 100.0% | 9/30/2023(2) |
| Total Major Tenant | 85,017 | 100.0% | $23.52 | $1,999,600 | 100.0% | ||
| Vacant Space | 0 | 0.0% | |||||
| Collateral Total | 85,017 | 100.0% | |||||
| |||||||
| (1) | Annual U/W Base Rent PSF and Annual U/W Base Rent include contractual rent steps through October 2018 totaling $51,010. NIO’s current rental rate is $22.92 per square foot. |
| (2) | NIO has two, five-year renewal options, with nine and 12 months’ notice, respectively, at fair market rental rate. |
The following table presents certain information relating to the lease rollover schedule at the 3200 North First Street Property:
Lease Expiration Schedule(1)
| Year Ending December 31, 2017 | No. of Leases Expiring | Expiring NRSF | % of Total NRSF | Cumulative Expiring NRSF | Cumulative % of Total NRSF | Annual U/W Base Rent | % of Total Annual U/W Base Rent | Annual U/W Base Rent PSF |
| MTM | 0 | 0 | 0.0% | 0 | 0.0% | $0 | 0.0% | $0.00 |
| 2018 | 0 | 0 | 0.0% | 0 | 0.0% | $0 | 0.0% | $0.00 |
| 2019 | 0 | 0 | 0.0% | 0 | 0.0% | $0 | 0.0% | $0.00 |
| 2020 | 0 | 0 | 0.0% | 0 | 0.0% | $0 | 0.0% | $0.00 |
| 2021 | 0 | 0 | 0.0% | 0 | 0.0% | $0 | 0.0% | $0.00 |
| 2022 | 0 | 0 | 0.0% | 0 | 0.0% | $0 | 0.0% | $0.00 |
| 2023 | 1 | 85,017 | 100.0% | 85,017 | 100.0% | $1,999,600 | 100.0% | $23.52 |
| 2024 | 0 | 0 | 0.0% | 85,017 | 100.0% | $0 | 0.0% | $0.00 |
| 2025 | 0 | 0 | 0.0% | 85,017 | 100.0% | $0 | 0.0% | $0.00 |
| 2026 | 0 | 0 | 0.0% | 85,017 | 100.0% | $0 | 0.0% | $0.00 |
| 2027 | 0 | 0 | 0.0% | 85,017 | 100.0% | $0 | 0.0% | $0.00 |
| 2028 | 0 | 0 | 0.0% | 85,017 | 100.0% | $0 | 0.0% | $0.00 |
| Thereafter | 0 | 0 | 0.0% | 85,017 | 100.0% | $0 | 0.0% | $0.00 |
| Vacant | 0 | 0 | 0.0% | 85,017 | 100.0% | $0 | 0.0% | $0.00 |
| Total/Weighted Average | 1 | 85,017 | 100.0% | $1,999,600 | 100.0% | $23.52 |
| (1) | Information obtained from the underwritten rent roll. |
The following table presents historical occupancy percentages at the 3200 North First Street Property:
Historical Occupancy
12/31/2015(1) | 12/31/2016(1) | 12/31/2017(1) | 5/1/2018(2) |
| 100.0% | 100.0% | 100.0% | 100.0% |
| (1) | Information obtained from the borrower. |
| (2) | Information obtained from the underwritten rent roll. |
THE INFORMATION IN THIS STRUCTURAL AND COLLATERAL TERM SHEET IS NOT COMPLETE AND MAY BE AMENDED PRIOR TO THE TIME OF SALE. THIS TERM SHEET IS NOT AN OFFER TO SELL THESE SECURITIES AND IT IS NOT A SOLICITATION OF AN OFFER TO BUY THESE SECURITIES IN ANY JURISDICTION WHERE THE OFFER OR SALE IS NOT PERMITTED.
153
| 3200 NORTH FIRST STREET |
Operating History and Underwritten Net Cash Flow.The following table presents certain information relating to the historical operating performance and underwritten net cash flow at the 3200 North First Street Property:
Cash Flow Analysis
| 2016 | 2017 | U/W | % of U/W Effective Gross Income | U/W $ per SF | |||||||
| Base Rent(1) | $1,313,594 | $1,747,782 | $1,999,600 | 82.5% | $23.52 | ||||||
| Grossed Up Vacant Space | 0 | 0 | 0 | 0.0 | 0.00 | ||||||
| Total Reimbursement | 339,472 | 467,168 | 574,519 | 23.7 | 6.76 | ||||||
| Less Vacancy & Credit Loss | 0 | 0 | (149,970)(2) | (6.2) | (1.76) | ||||||
| Effective Gross Income | $1,653,066 | $2,214,950 | $2,424,149 | 100.0% | $28.51 | ||||||
| Total Operating Expenses | $427,291 | $516,552 | $622,203 | 25.7% | $7.32 | ||||||
| Net Operating Income(1) | $1,225,775 | $1,698,398 | $ 1,801,946 | 74.3% | $21.20 | ||||||
| Replacement Reserves | 0 | 0 | 25,505 | 1.1 | 0.30 | ||||||
| Tenant Improvements | 0 | 0 | 35,950 | 1.5 | 0.42 | ||||||
| Leasing Commissions | 0 | 0 | 48,830 | 2.0 | 0.57 | ||||||
| Net Cash Flow | $1,225,775 | $1,698,398 | $1,691,661 | 69.8% | $19.90 | ||||||
| NOI DSCR | 1.33x | 1.84x | 1.96x | ||||||||
| NCF DSCR | 1.33x | 1.84x | 1.84x | ||||||||
| NOI DY | 6.2% | 8.6% | 9.1% | ||||||||
| NCF DY | 6.2% | 8.6% | 8.5% | ||||||||
| (1) | The increase in Base Rent and Net Operating income from 2016 to 2017 and 2017 to U/W was due in part to NIO’s rent not commencing until March 2016 and contractual rental rate increases in October 2016 and October 2017. NIO began paying rent of $22.20 per square foot in October 2016, which then increased to $22.92 per square foot in October 2017. The tenant’s underwritten base rent of $23.52 per square foot is reflective of its contractual rent escalation in October 2018. |
| (2) | The underwritten economic vacancy is 7.5%. The 3200 North First Street Property was 100.0% physically occupied as of May 1, 2018. |
The following table presents certain information relating to comparable office leases for the 3200 North First Street Property:
Comparable Office Leases(1)
| Property Name/Location | Year Built/ Renovated | Stories | Total GLA (SF) | Distance from Subject | Lease Date
/ Term
| Lease Area (SF) | Annual Base Rent PSF | Lease Type |
2811 Orchard Parkway 2811 Orchard Pky. San Jose, CA | 1981/2016 | 2 | 84,560 | 1.0 mile | November 2017 / 7.6 Yrs | 84,560 | $29.76 | NNN |
408 E Plumeria 408 E Plumeria Dr. San Jose, CA | 1985/2017 | 1 | 58,289 | 1.0 mile | December 2017 / 7.3 Yrs | 58,289 | $27.60 | NNN |
2300 Orchard Parkway 2300 Orchard Pky. San Jose, CA | 1997/NAP | 2 | 118,000 | 1.9 miles | August 2017 / 10.0 Yrs | 116,381 | $30.24 | NNN |
2755-2777 Orchard Parkway 2755-2777 Orchard Pky. San Jose, CA | 2017/NAP | 2 | 238,530 | 1.3 miles | October 2017 / 10.0 Yrs | 36,383 | $31.20 | NNN |
Rose Orchard Tech Park 110-180 Rose Orchard Way San Jose, CA | 1985/2015 | 2 | 798,890 | 1.8 miles | January 2017 / 8.3 Yrs
| 60,002 | $25.80 | NNN |
| (1) | Information obtained from the appraisal and a third party research report. |
THE INFORMATION IN THIS STRUCTURAL AND COLLATERAL TERM SHEET IS NOT COMPLETE AND MAY BE AMENDED PRIOR TO THE TIME OF SALE. THIS TERM SHEET IS NOT AN OFFER TO SELL THESE SECURITIES AND IT IS NOT A SOLICITATION OF AN OFFER TO BUY THESE SECURITIES IN ANY JURISDICTION WHERE THE OFFER OR SALE IS NOT PERMITTED.
154
| Wells Fargo Commercial Mortgage Trust 2018-C44 | Transaction Contact Information |
VI. Transaction Contact Information
Questions regarding this Structural and Collateral Term Sheet may be directed to any of the following individuals:
| Wells Fargo Securities, LLC | |
| Brigid Mattingly | Tel. (312) 269-3062 |
| A.J. Sfarra | Tel. (212) 214-5613 |
| Alex Wong | Tel. (212) 214-5615 |
| Barclays Capital Inc. | |
| Daniel Vinson | Tel. (212) 528-8224 |
| Brian Wiele | Tel. (212) 412-5780 |
| Brian La Belle | Tel. (212) 526-1809 |
THE INFORMATION IN THIS STRUCTURAL AND COLLATERAL TERM SHEET IS NOT COMPLETE AND MAY BE AMENDED PRIOR TO THE TIME OF SALE. THIS TERM SHEET IS NOT AN OFFER TO SELL THESE SECURITIES AND IT IS NOT A SOLICITATION OF AN OFFER TO BUY THESE SECURITIES IN ANY JURISDICTION WHERE THE OFFER OR SALE IS NOT PERMITTED.
155