| FREE WRITING PROSPECTUS | ||
| FILED PURSUANT TO RULE 433 | ||
| REGISTRATION FILE NO.: 333-206677-26 | ||
 |  |  |
Free Writing Prospectus
Structural and Collateral Term Sheet
$944,189,953
(Approximate Initial Pool Balance)
$801,676,000
(Approximate Aggregate Certificate Balance of Offered Certificates)
BANK 2018-BNK13
as Issuing Entity
Wells Fargo Commercial Mortgage Securities, Inc.
as Depositor
Morgan Stanley Mortgage Capital Holdings LLC
Bank of America, National Association
Wells Fargo Bank, National Association
National Cooperative Bank, N.A.
as Sponsors and Mortgage Loan Sellers
Commercial Mortgage Pass-Through Certificates
Series 2018-BNK13
July 18, 2018
| WELLS FARGO SECURITIES | BofA MERRILL LYNCH | MORGAN STANLEY |
Co-Lead Manager and Joint Bookrunner | Co-Lead Manager and Joint Bookrunner | Co-Lead Manager and Joint Bookrunner |
Academy Securities, Inc. Co-Manager | Drexel Hamilton Co-Manager |
STATEMENT REGARDING THIS FREE WRITING PROSPECTUS
The depositor has filed a registration statement (including a prospectus) with the Securities and Exchange Commission (’’SEC’’) (SEC File No. 333-206677) for the offering to which this communication relates. Before you invest, you should read the prospectus in the registration statement and other documents the depositor has filed with the SEC for more complete information about the depositor, the issuing entity and this offering. You may get these documents for free by visiting EDGAR on the SEC Web site at www.sec.gov. Alternatively, the depositor, any underwriter, or any dealer participating in the offering will arrange to send you the prospectus after filing if you request it by calling toll free 1-800-745-2063 (8 a.m. – 5 p.m. EST) or by emailing wfs.cmbs@wellsfargo.com.
Nothing in this document constitutes an offer of securities for sale in any jurisdiction where the offer or sale is not permitted. The information contained herein is preliminary as of the date hereof, supersedes any such information previously delivered to you and will be superseded by any such information subsequently delivered and ultimately by the final prospectus relating to the securities. These materials are subject to change, completion, supplement or amendment from time to time.
This free writing prospectus has been prepared by the underwriters for information purposes only and does not constitute, in whole or in part, a prospectus for the purposes of Directive 2003/71/EC (as amended) and/or Part VI of the Financial Services and Markets Act 2000, as amended, or other offering document.
STATEMENT REGARDING ASSUMPTIONS AS TO SECURITIES, PRICING ESTIMATES AND OTHER INFORMATION
The attached information contains certain tables and other statistical analyses (the “Computational Materials”) which have been prepared in reliance upon information furnished by the Mortgage Loan Sellers. Numerous assumptions were used in preparing the Computational Materials, which may or may not be reflected herein. As such, no assurance can be given as to the Computational Materials’ accuracy, appropriateness or completeness in any particular context; or as to whether the Computational Materials and/or the assumptions upon which they are based reflect present market conditions or future market performance. The Computational Materials should not be construed as either projections or predictions or as legal, tax, financial or accounting advice. You should consult your own counsel, accountant and other advisors as to the legal, tax, business, financial and related aspects of a purchase of these securities. Any weighted average lives, yields and principal payment periods shown in the Computational Materials are based on prepayment and/or loss assumptions, and changes in such prepayment and/or loss assumptions may dramatically affect such weighted average lives, yields and principal payment periods. In addition, it is possible that prepayments or losses on the underlying assets will occur at rates higher or lower than the rates shown in the attached Computational Materials. The specific characteristics of the securities may differ from those shown in the Computational Materials due to differences between the final underlying assets and the preliminary underlying assets used in preparing the Computational Materials. The principal amount and designation of any security described in the Computational Materials are subject to change prior to issuance. None of Wells Fargo Securities, LLC, Merrill Lynch, Pierce, Fenner & Smith Incorporated, Morgan Stanley & Co. LLC, Academy Securities, Inc., Drexel Hamilton, LLC or any of their respective affiliates, make any representation or warranty as to the actual rate or timing of payments or losses on any of the underlying assets or the payments or yield on the securities. The information in this presentation is based upon management forecasts and reflects prevailing conditions and management’s views as of this date, all of which are subject to change. In preparing this presentation, we have relied upon and assumed, without independent verification, the accuracy and completeness of all information available from public sources or which was provided to us by or on behalf of the Mortgage Loan Sellers or which was otherwise reviewed by us.
This free writing prospectus contains certain forward-looking statements. If and when included in this free writing prospectus, the words “expects”, “intends”, “anticipates”, “estimates” and analogous expressions and all statements that are not historical facts, including statements about our beliefs or expectations, are intended to identify forward-looking statements. Any forward-looking statements are made subject to risks and uncertainties which could cause actual results to differ materially from those stated. Those risks and uncertainties include, among other things, declines in general economic and business conditions, increased competition, changes in demographics, changes in political and social conditions, regulatory initiatives and changes in customer preferences, many of which are beyond our control and the control of any other person or entity related to this offering. The forward-looking statements made in this free writing prospectus are made as of the date stated on the cover. We have no obligation to update or revise any forward-looking statement.
Wells Fargo Securities is the trade name for the capital markets and investment banking services of Wells Fargo & Company and its subsidiaries, including but not limited to Wells Fargo Securities, LLC, a member of NYSE, FINRA, NFA and SIPC, Wells Fargo Prime Services, LLC, a member of FINRA, NFA and SIPC, and Wells Fargo Bank, N.A. Wells Fargo Securities, LLC and Wells Fargo Prime Services, LLC are distinct entities from affiliated banks and thrifts.
IMPORTANT NOTICE REGARDING THE OFFERED CERTIFICATES
The information herein is preliminary and may be supplemented or amended prior to the time of sale. In addition, the Offered Certificates referred to in these materials and the asset pool backing them are subject to modification or revision (including the possibility that one or more classes of certificates may be split, combined or eliminated at any time prior to issuance or availability of a final prospectus) and are offered on a “when, as and if issued” basis.
The underwriters described in these materials may from time to time perform investment banking services for, or solicit investment banking business from, any company named in these materials. The underwriters and/or their affiliates or respective employees may from time to time have a long or short position in any security or contract discussed in these materials.
The information contained herein supersedes any previous such information delivered to any prospective investor and will be superseded by information delivered to such prospective investor prior to the time of sale.
IMPORTANT NOTICE RELATING TO AUTOMATICALLY-GENERATED EMAIL DISCLAIMERS
Any legends, disclaimers or other notices that may appear at the bottom of any email communication to which this free writing prospectus is attached relating to (1) these materials not constituting an offer (or a solicitation of an offer), (2) any representation that these materials are accurate or complete and may not be updated or (3) these materials possibly being confidential, are not applicable to these materials and should be disregarded. Such legends, disclaimers or other notices have been automatically generated as a result of these materials having been sent via Bloomberg or another system.
THE INFORMATION IN THIS STRUCTURAL AND COLLATERAL TERM SHEET IS NOT COMPLETE AND MAY BE AMENDED PRIOR TO THE TIME OF SALE. THIS TERM SHEET IS NOT AN OFFER TO SELL THESE SECURITIES AND IT IS NOT A SOLICITATION OF AN OFFER TO BUY THESE SECURITIES IN ANY JURISDICTION WHERE THE OFFER OR SALE IS NOT PERMITTED.
2
| BANK 2018-BNK13 | Certificate Structure |
| I. | Certificate Structure |
| Class | Expected Ratings (DBRS/Fitch/S&P)(1) | Approximate Initial Certificate Balance or Notional Amount(2) | Approx. Initial | Pass-Through Rate Description | Weighted Average Life (Years)(4) | Expected Principal Window(4) | Certificate Principal to Value Ratio(5) | Certificate Principal U/W NOI Debt Yield(6) | ||||||||||
| Offered Certificates | ||||||||||||||||||
| A-1 | AAA(sf)/AAAsf/AAA(sf) | $63,326,000 | 30.000% | (7) | 2.49 | 09/18 - 05/23 | 38.1% | 18.9% | ||||||||||
| A-2 | AAA(sf)/AAAsf/AAA(sf) | $73,996,000 | 30.000% | (7) | 4.84 | 05/23 - 07/23 | 38.1% | 18.9% | ||||||||||
| A-3 | AAA(sf)/AAAsf/AAA(sf) | $9,903,000 | 30.000% | (7) | 8.75 | 04/27 - 05/27 | 38.1% | 18.9% | ||||||||||
| A-SB | AAA(sf)/AAAsf/AAA(sf) | $35,858,000 | 30.000% | (7) | 6.74 | 07/23 - 04/28 | 38.1% | 18.9% | ||||||||||
| A-4 | AAA(sf)/AAAsf/AAA(sf) | (8) | 30.000% | (7) | (8) | (8) | 38.1% | 18.9% | ||||||||||
| A-5 | AAA(sf)/AAAsf/AAA(sf) | (8) | 30.000% | (7) | (8) | (8) | 38.1% | 18.9% | ||||||||||
| X-A | AAA(sf)/AAAsf/AAA(sf) | $627,886,000(9) | N/A | Variable(10) | N/A | N/A | N/A | N/A | ||||||||||
| X-B | A(sf)/A-sf/NR | $173,790,000(11) | N/A | Variable(12) | N/A | N/A | N/A | N/A | ||||||||||
| A-S | AAA(sf)/AAAsf/AA+(sf) | $86,334,000 | 20.375% | (7) | 9.95 | 07/28 - 07/28 | 43.3% | 16.6% | ||||||||||
| B | AA(sf)/AA-sf/AA-(sf) | $49,334,000 | 14.875% | (7) | 9.95 | 07/28 - 07/28 | 46.3% | 15.6% | ||||||||||
| C | A(low)(sf)/A-sf/NR | $38,122,000 | 10.625% | (7) | 9.95 | 07/28 - 07/28 | 48.6% | 14.8% | ||||||||||
| Non-Offered Certificates | ||||||||||||||||||
| X-D | BBB(sf)/BBB-sf/NR | $41,485,000(13) | N/A | Variable(14) | N/A | N/A | N/A | N/A | ||||||||||
| X-E | BB(sf)/BB-sf/NR | $15,697,000(15) | N/A | Variable(16) | N/A | N/A | N/A | N/A | ||||||||||
| X-F | B(sf)/B-sf/NR | $10,091,000(17) | N/A | Variable(18) | N/A | N/A | N/A | N/A | ||||||||||
| X-G | NR/NR/NR | $28,031,455(19) | N/A | Variable(20) | N/A | N/A | N/A | N/A | ||||||||||
| D | BBB(low)(sf)/BBB-sf/NR | $41,485,000 | 6.000% | (7) | 9.99 | 07/28 - 08/28 | 51.2% | 14.1% | ||||||||||
| E | BB(low)(sf)/BB-sf/NR | $15,697,000 | 4.250% | (7) | 10.04 | 08/28 - 08/28 | 52.1% | 13.8% | ||||||||||
| F | B(low)(sf)/B-sf/NR | $10,091,000 | 3.125% | (7) | 10.04 | 08/28 - 08/28 | 52.7% | 13.7% | ||||||||||
| G | NR/NR/NR | $28,031,455 | 0.000% | (7) | 10.04 | 08/28 - 08/28 | 54.4% | 13.3% | ||||||||||
| Non-Offered Eligible Vertical Interest | ||||||||||||||||||
| RR Interest | NR/NR/NR | $47,209,497.67 | N/A | WAC(21) | 8.81 | 09/18 - 08/28 | N/A | N/A | ||||||||||
Notes:
| (1) | The expected ratings presented are those of DBRS, Inc (“DBRS”), Fitch Ratings, Inc. (“Fitch”) and S&P Global Ratings, acting through Standard & Poor’s Financial Services LLC (“S&P”), which the depositor hired to rate the Offered Certificates. One or more other nationally recognized statistical rating organizations that were not hired by the depositor may use information they receive pursuant to Rule 17g-5 under the Securities Exchange Act of 1934, as amended (the “Exchange Act”) or otherwise, to rate or provide market reports and/or published commentary related to the Offered Certificates. We cannot assure you as to what ratings a non-hired nationally recognized statistical rating organization would assign or that its reports will not express differing, possibly negative, views of the mortgage loans and/or the Offered Certificates. The ratings of each Class of Offered Certificates address the likelihood of the timely distribution of interest and, except in the case of the Class X-A and X-B Certificates, the ultimate distribution of principal due on those Classes on or before the Rated Final Distribution Date. See “Risk Factors—Other Risks Relating to the Certificates—Nationally Recognized Statistical Rating Organizations May Assign Different Ratings to the Certificates; Ratings of the Certificates Reflect Only the Views of the Applicable Rating Agencies as of the Dates Such Ratings Were Issued; Ratings May Affect ERISA Eligibility; Ratings May Be Downgraded” and “Ratings” in the Preliminary Prospectus, expected to be dated July 18, 2018 (the “Preliminary Prospectus”). DBRS, Fitch and S&P have informed us that the “sf” designation in their ratings represents an identifier for structured finance product ratings. |
| (2) | The certificate balances and notional amounts set forth in the table are approximate. The actual initial certificate balances and notional amounts may be larger or smaller depending on the initial pool balance of the mortgage loans definitively included in the pool of mortgage loans, which aggregate cut-off date balance may be as much as 5% larger or smaller than the amount presented in the Preliminary Prospectus. In addition, the notional amounts of the Class X-A, Class X-B, Class X-D, Class X-E, Class X-F and Class X-G certificates (collectively referred to herein as Class X certificates) may vary depending upon the final pricing of the classes of principal balance certificates whose certificate balances comprise such notional amounts and, if as a result of such pricing the pass-through rate of any class of the Class X certificates would be equal to zero at all times, such class of certificates will not be issued on the closing date of this securitization. |
| (3) | The approximate initial credit support with respect to the Class A-1, A-2, A-3, A-SB, A-4 and A-5 Certificates represents the approximate credit enhancement for the Class A-1, A-2, A-3, A-SB, A-4 and A-5 Certificates in the aggregate. The RR Interest only provides credit support to the limited extent that losses incurred on the underlying mortgage loans are allocated to it, on the one hand, and to the Offered Certificates and the Non-Offered Certificates, on the other hand,pro rata, in accordance with their respective Percentage Allocation Entitlements. |
| (4) | Weighted Average Lives and Expected Principal Windows are calculated based on an assumed prepayment rate of 0% CPR and the “Structuring Assumptions” described under “Yield and Maturity Considerations—Weighted Average Life” in the Preliminary Prospectus. |
| (5) | The Certificate Principal to Value Ratio for each Class of Certificates (other than the Class A-1, A-2, A-3, A-SB, A-4 and A-5 Certificates) is calculated as the product of (a) the weighted average Cut-off Date LTV Ratio for the mortgage loans and (b) a fraction, the numerator of which is the total initial Certificate Balance of such Class of Certificates and all Classes of Principal Balance Certificates senior to such Class of Certificates and the denominator of which is the total initial Certificate Balance of all of the Principal Balance Certificates (other than the RR Interest). The Certificate Principal to Value Ratio for each of the Class A-1, A-2, A-3, A-SB, A-4 and A-5 Certificates is calculated in the aggregate for those Classes as if they were a single Class and is calculated as the product of (a) the weighted average Cut-off Date LTV Ratio for the mortgage loans and (b) a fraction, the numerator of which is the total initial aggregate Certificate Balances of such Classes of Certificates and the denominator of which is the total initial Certificate Balance of all of the Principal Balance Certificates (other than the RR Interest). In any event, however, excess mortgaged property value associated with a mortgage loan will not be available to offset losses on any other mortgage loan. |
THE INFORMATION IN THIS STRUCTURAL AND COLLATERAL TERM SHEET IS NOT COMPLETE AND MAY BE AMENDED PRIOR TO THE TIME OF SALE. THIS TERM SHEET IS NOT AN OFFER TO SELL THESE SECURITIES AND IT IS NOT A SOLICITATION OF AN OFFER TO BUY THESE SECURITIES IN ANY JURISDICTION WHERE THE OFFER OR SALE IS NOT PERMITTED.
3
| BANK 2018-BNK13 | Certificate Structure |
| (6) | The Certificate Principal U/W NOI Debt Yield for each Class of Certificates (other than the Class A-1, A-2, A-3, A-SB, A-4 and A-5 Certificates) is calculated as the product of (a) the weighted average U/W NOI Debt Yield for the mortgage loans and (b) a fraction, the numerator of which is the total initial Certificate Balance of all of the Classes of Principal Balance Certificates (other than the RR Interest) and the denominator of which is the total initial Certificate Balance for such Class of Certificates and all Classes of Principal Balance Certificates senior to such Class of Certificates. The Certificate Principal U/W NOI Debt Yield for each of the Class A-1, A-2, A-3, A-SB, A-4 and A-5 Certificates is calculated in the aggregate for those Classes as if they were a single Class and is calculated as the product of (a) the weighted average U/W NOI Debt Yield for the mortgage loans and (b) a fraction, the numerator of which is the total initial Certificate Balance of all of the Classes of Principal Balance Certificates (other than the RR Interest) and the denominator of which is the total aggregate initial Certificate Balances for the Class A-1, A-2, A-3, A-SB, A-4 and A-5 Certificates. In any event, however, cash flow from each mortgaged property supports only the related mortgage loan and will not be available to support any other mortgage loan. |
| (7) | The pass-through rates for the Class A-1, A-2, A-3, A-SB, A-4, A-5, A-S, B, C, D, E, F and G Certificates will be one of the following: (i) a fixed rateper annum, (ii) a variable rateper annum equal to the weighted average of the net mortgage interest rates on the mortgage loans for the related distribution date, (iii) a variable rateper annum equal to the lesser of (a) a fixed rate and (b) the weighted average of the net mortgage interest rates on the mortgage loans for the related distribution date or (iv) a variable rateper annum equal to the weighted average of the net mortgage interest rates on the mortgage loans for the related distribution date minus a specified percentage. For purposes of the calculation of the weighted average of the net mortgage interest rates on the mortgage loans for each distribution date, the mortgage interest rates will be adjusted as necessary to a 30/360 basis. |
| (8) | The exact initial certificate balances of the Class A-4 and A-5 Certificates are unknown and will be determined based on the final pricing of those classes of certificates. However, the respective initial certificate balances, weighted average lives and principal windows of the Class A-4 and A-5 Certificates are expected to be within the applicable ranges reflected in the following chart. The aggregate initial certificate balance of the Class A-4 and A-5 Certificates is expected to be approximately $444,803,000, subject to a variance of plus or minus 5%. |
Class of | Expected Range of | Expected Range of | Expected Range of | |||
| Class A-4 | $180,000,000 - $200,000,000 | 9.78 – 9.78 | 04/28 – 05/28 / 04/28 – 06/28 | |||
| Class A-5 | $244,803,000 - $264,803,000 | 9.89 – 9.90 | 06/28 – 07/28 / 05/28 – 07/28 |
| (9) | The Class X-A Certificates are notional amount certificates. The Notional Amount of the Class X-A Certificates will be equal to the aggregate Certificate Balance of the Class A-1, A-2, A-3, A-SB, A-4 and A-5 Certificates outstanding from time to time. The Class X-A Certificates will not be entitled to distributions of principal. |
| (10) | The pass-through rate for the Class X-A Certificates for any distribution date will be aper annum rate equal to the excess, if any, of (a) the weighted average of the net mortgage interest rates on the mortgage loans for the related distribution date, over (b) the weighted average of the pass-through rates on the Class A-1, A-2, A-3, A-SB, A-4 and A-5 Certificates for the related distribution date, weighted on the basis of their respective Certificate Balances outstanding immediately prior to that distribution date. For purposes of the calculation of the weighted average of the net mortgage interest rates on the mortgage loans for each distribution date, the mortgage interest rates will be adjusted as necessary to a 30/360 basis. |
| (11) | The Class X-B Certificates are notional amount certificates. The Notional Amount of the Class X-B Certificates will be equal to the aggregate Certificate Balance of the Class A-S, B and C Certificates outstanding from time to time. The Class X-B Certificates will not be entitled to distributions of principal. |
| (12) | The pass-through rate for the Class X-B Certificates for any distribution date will be aper annum rate equal to the excess, if any, of (a) the weighted average of the net mortgage interest rates on the mortgage loans for the related distribution date, over (b) the weighted average of the pass-through rates on the Class A-S, B and C Certificates for the related distribution date, weighted on the basis of their respective Certificate Balances outstanding immediately prior to that distribution date. For purposes of the calculation of the weighted average of the net mortgage interest rates on the mortgage loans for each distribution date, the mortgage interest rates will be adjusted as necessary to a 30/360 basis. |
| (13) | The Class X-D Certificates are notional amount certificates. The Notional Amount of the Class X-D Certificates will be equal to the Certificate Balance of the Class D Certificates outstanding from time to time. The Class X-D Certificates will not be entitled to distributions of principal. |
| (14) | The pass-through rate for the Class X-D Certificates for any distribution date will be aper annum rate equal to the excess, if any, of (a) the weighted average of the net mortgage interest rates on the mortgage loans for the related distribution date, over (b) the pass-through rate on the Class D Certificates for the related distribution date. For purposes of the calculation of the weighted average of the net mortgage interest rates on the mortgage loans for each distribution date, the mortgage interest rates will be adjusted as necessary to a 30/360 basis. |
| (15) | The Class X-E Certificates are notional amount certificates. The Notional Amount of the Class X-E Certificates will be equal to the Certificate Balance of the Class E Certificates outstanding from time to time. The Class X-E Certificates will not be entitled to distributions of principal. |
| (16) | The pass-through rate for the Class X-E Certificates for any distribution date will be aper annum rate equal to the excess, if any, of (a) the weighted average of the net mortgage interest rates on the mortgage loans for the related distribution date, over (b) the pass-through rate on the Class E Certificates for the related distribution date. For purposes of the calculation of the weighted average of the net mortgage interest rates on the mortgage loans for each distribution date, the mortgage interest rates will be adjusted as necessary to a 30/360 basis. |
| (17) | The Class X-F Certificates are notional amount certificates. The Notional Amount of the Class X-F Certificates will be equal to the Certificate Balance of the Class F Certificates outstanding from time to time. The Class X-F Certificates will not be entitled to distributions of principal. |
| (18) | The pass-through rate for the Class X-F Certificates for any distribution date will be aper annum rate equal to the excess, if any, of (a) the weighted average of the net mortgage interest rates on the mortgage loans for the related distribution date, over (b) the pass-through rate on the Class F Certificates for the related distribution date. For purposes of the calculation of the weighted average of the net mortgage interest rates on the mortgage loans for each distribution date, the mortgage interest rates will be adjusted as necessary to a 30/360 basis. |
| (19) | The Class X-G Certificates are notional amount certificates. The Notional Amount of the Class X-G Certificates will be equal to the Certificate Balance of the Class G Certificates outstanding from time to time. The Class X-G Certificates will not be entitled to distributions of principal. |
| (20) | The pass-through rate for the Class X-G Certificates for any distribution date will be aper annum rate equal to the excess, if any, of (a) the weighted average of the net mortgage interest rates on the mortgage loans for the related distribution date, over (b) the pass-through rate on the Class G Certificates for the related distribution date. For purposes of the calculation of the weighted average of the net mortgage interest rates on the mortgage loans for each distribution date, the mortgage interest rates will be adjusted as necessary to a 30/360 basis. |
| (21) | The effective interest rate for the RR Interest will be a variable rateper annum (described in the table as “WAC”) equal to the weighted average of the net mortgage interest rates on the mortgage loans for the related distribution date. For purposes of calculation of the weighted average of the net mortgage interest rates on the mortgage loans for each distribution date, the mortgage interest rates will be adjusted as necessary to a 30/360 basis. |
THE INFORMATION IN THIS STRUCTURAL AND COLLATERAL TERM SHEET IS NOT COMPLETE AND MAY BE AMENDED PRIOR TO THE TIME OF SALE. THIS TERM SHEET IS NOT AN OFFER TO SELL THESE SECURITIES AND IT IS NOT A SOLICITATION OF AN OFFER TO BUY THESE SECURITIES IN ANY JURISDICTION WHERE THE OFFER OR SALE IS NOT PERMITTED.
4
| BANK 2018-BNK13 | Transaction Highlights |
| II. | Transaction Highlights |
Mortgage Loan Sellers:
Mortgage Loan Seller | Number | Number of | Aggregate Cut-off Date | % of Initial | ||||||||
| Morgan Stanley Mortgage Capital Holdings LLC | 10 | 11 | $299,324,882 | 31.7 | % | |||||||
| Bank of America, National Association | 18 | 35 | 295,234,992 | 31.3 | ||||||||
| Wells Fargo Bank, National Association | 14 | 14 | 282,684,503 | 29.9 | ||||||||
| National Cooperative Bank, N.A. | 20 | 20 | 66,945,577 | 7.1 | ||||||||
Total | 62 | 80 | $944,189,953 | 100.0 | % | |||||||
Loan Pool:
| Initial Pool Balance: | $944,189,953 |
| Number of Mortgage Loans: | 62 |
| Average Cut-off Date Balance per Mortgage Loan: | $15,228,870 |
| Number of Mortgaged Properties: | 80 |
| Average Cut-off Date Balance per Mortgaged Property(1): | $11,802,374 |
| Weighted Average Mortgage Interest Rate: | 4.557% |
| Ten Largest Mortgage Loans as % of Initial Pool Balance: | 57.2% |
| Weighted Average Original Term to Maturity or ARD (months): | 112 |
| Weighted Average Remaining Term to Maturity or ARD (months): | 110 |
| Weighted Average Original Amortization Term (months)(2): | 301 |
| Weighted Average Remaining Amortization Term (months)(2): | 299 |
| Weighted Average Seasoning (months): | 2 |
| (1) | Information regarding mortgage loans secured by multiple properties is based on an allocation according to relative appraised values or the allocated loan amounts or property-specific release prices set forth in the related loan documents or such other allocation as the related mortgage loan seller deemed appropriate. |
| (2) | Excludes any mortgage loan that does not amortize. |
Credit Statistics:
| Weighted Average U/W Net Cash Flow DSCR(1): | 2.28x |
| Weighted Average U/W Net Operating Income Debt Yield(1): | 13.3% |
| Weighted Average Cut-off Date Loan-to-Value Ratio(1): | 54.4% |
| Weighted Average Balloon or ARD Loan-to-Value Ratio(1): | 48.3% |
| % of Mortgage Loans with Additional Subordinate Debt(2): | 14.6% |
| % of Mortgage Loans with Single Tenants(3): | 12.4% |
| (1) | With respect to any mortgage loan that is part of a whole loan, loan-to-value ratio, debt service coverage ratio and debt yield calculations include the relatedpari passucompanion loan(s) but exclude any related subordinate companion loan(s) (unless otherwise stated). For mortgaged properties securing residential cooperative mortgage loans, the debt service coverage ratio and debt yield for each such mortgaged property are calculated using U/W Net Operating Income or U/W Net Cash Flow, as applicable, for the related residential cooperative property which is the projected net operating income or net cash flow, as applicable, reflected in the most recent appraisal obtained by or otherwise in the possession of the related mortgage loan seller as of the cut-off date, and the loan-to-value ratio is calculated based upon the appraised value of the residential cooperative property determined as if such residential cooperative property is operated as a residential cooperative, inclusive of the amount of the underlying debt encumbering such residential cooperative property. The debt service coverage ratio, debt yield and loan-to-value ratio information do not take into account any subordinate debt (whether or not secured by the related mortgaged property), that currently exists or is allowed under the terms of any mortgage loan. See “Description of the Mortgage Pool—Mortgage Pool Characteristics” in the Preliminary Prospectus and Annex A-1 to the Preliminary Prospectus. |
| (2) | Fifteen (15) of the mortgage loans, each of which is secured by a residential cooperative property, currently have in place subordinate secured lines of credit to the related mortgage borrowers that permit future advances (such loans, collectively, the “Subordinate Coop LOCs”). The percentage figure expressed as “% of Mortgage Loans with Additional Subordinate Debt” is determined as a percentage of the initial pool balance and does not take into account any future subordinate debt (whether or not secured by the mortgaged property), if any, that may be permitted under the terms of any mortgage loan or the pooling and servicing agreement. See “Description of the Mortgage Pool—Additional Indebtedness—Other Unsecured Indebtedness” and “Description of the Mortgage Pool—Additional Debt Financing for Mortgage Loans Secured by Residential Cooperatives” in the Preliminary Prospectus. |
| (3) | Excludes mortgage loans that are secured by multiple single tenant properties. |
THE INFORMATION IN THIS STRUCTURAL AND COLLATERAL TERM SHEET IS NOT COMPLETE AND MAY BE AMENDED PRIOR TO THE TIME OF SALE. THIS TERM SHEET IS NOT AN OFFER TO SELL THESE SECURITIES AND IT IS NOT A SOLICITATION OF AN OFFER TO BUY THESE SECURITIES IN ANY JURISDICTION WHERE THE OFFER OR SALE IS NOT PERMITTED.
5
| BANK 2018-BNK13 | Transaction Highlights |
Loan Structural Features:
Amortization:Based on the Initial Pool Balance, 35.9% of the mortgage pool (39 mortgage loans) has scheduled amortization, as follows:
28.4% (32 mortgage loans) requires amortization during the entire loan term; and
7.5% (7 mortgage loans) provides for an interest-only period followed by an amortization period.
Interest-Only:Based on the Initial Pool Balance, 64.1% of the mortgage pool (23 mortgage loans) provides for interest-only payments during the entire loan term. The weighted average Cut-off Date Loan-to-Value Ratio and weighted average U/W Net Cash Flow DSCR for those mortgage loans are 56.7% and 2.14x, respectively.
Hard Lockboxes: Based on the Initial Pool Balance, 69.2% of the mortgage pool (19 mortgage loans) has hard lockboxes in place.
Reserves: The mortgage loans require amounts to be escrowed monthly as follows (excluding any mortgage loans with springing provisions):
| Real Estate Taxes: | 69.4% of the pool |
| Insurance: | 28.2% of the pool |
| Capital Replacements: | 47.7% of the pool |
| TI/LC: | 29.8% of the pool(1) |
| (1) The percentage of Initial Pool Balance for mortgage loans with TI/LC reserves is based on the aggregate principal balance allocable to loans that include office, retail and industrial properties. | |
Call Protection/Defeasance: Based on the Initial Pool Balance, the mortgage pool has the following call protection and defeasance features:
63.5% of the mortgage pool (33 mortgage loans) features a lockout period, then defeasance only until an open period;
15.6% of the mortgage pool (6 mortgage loans) features a lockout period, then the greater of a prepayment premium or yield maintenance until an open period;
11.5% of the mortgage pool (2 mortgage loans) features a lockout period, then the greater of a prepayment premium or yield maintenance or defeasance until an open period;
7.1% of the mortgage pool (20 mortgage loans) features no lockout period, but requires greater of a prepayment premium or yield maintenance, then prepayment premium until an open period; and
2.3% of the mortgage pool (1 mortgage loan) features a lockout period, then the greater of a prepayment premium or yield maintenance, then the greater of a prepayment premium or yield maintenance or defeasance until an open period.
Prepayment restrictions for each mortgage loan reflect the entire life of the mortgage loan. Please refer to Annex A-1 to the Preliminary Prospectus and the footnotes related thereto for further information regarding individual loan call protection.
THE INFORMATION IN THIS STRUCTURAL AND COLLATERAL TERM SHEET IS NOT COMPLETE AND MAY BE AMENDED PRIOR TO THE TIME OF SALE. THIS TERM SHEET IS NOT AN OFFER TO SELL THESE SECURITIES AND IT IS NOT A SOLICITATION OF AN OFFER TO BUY THESE SECURITIES IN ANY JURISDICTION WHERE THE OFFER OR SALE IS NOT PERMITTED.
6
| BANK 2018-BNK13 | Issue Characteristics |
| III. | Issue Characteristics |
| Securities Offered: | $801,676,000 approximate monthly pay, multi-class, commercial mortgage REMIC pass-through certificates consisting of eleven classes (Classes A-1, A-2, A-3, A-SB, A-4, A-5, A-S, B, C, X-A and X-B), which are offered pursuant to a registration statement filed with the SEC (such classes of certificates, the “Offered Certificates”). |
| Mortgage Loan Sellers: | Morgan Stanley Mortgage Capital Holdings LLC (“MSMCH”), Bank of America, National Association (“BANA”), Wells Fargo Bank, National Association (“WFB”) and National Cooperative Bank, N.A. (“NCB”). |
| Joint Bookrunners and Co-Lead Managers: | Wells Fargo Securities, LLC, Merrill Lynch, Pierce, Fenner & Smith Incorporated and Morgan Stanley & Co. LLC |
| Co-Manager: | Academy Securities, Inc. and Drexel Hamilton, LLC |
| Rating Agencies: | DBRS, Inc., Fitch Ratings, Inc. and S&P Global Ratings, acting through Standard & Poor’s Financial Services LLC |
| Master Servicers: | Wells Fargo Bank, National Association and National Cooperative Bank, N.A. |
| Special Servicers: | Torchlight Loan Services, LLC and National Cooperative Bank, N.A. |
| Certificate Administrator: | Wells Fargo Bank, National Association |
| Trustee: | Wilmington Trust, National Association |
| Operating Advisor: | Pentalpha Surveillance LLC |
| Asset Representations Reviewer: | Pentalpha Surveillance LLC |
| U.S. Credit Risk Retention: | For a discussion of the manner in which the U.S. credit risk retention requirements are being addressed by Wells Fargo Bank, National Association, as the retaining sponsor, see “Credit Risk Retention” in the Preliminary Prospectus. |
| EU Risk Retention: | None of the sponsors, the depositor or the issuing entity intends to retain a material net economic interest in the securitization constituted by the issue of the Offered Certificates in accordance with the EU risk retention and due diligence requirements or to take any other action which may be required by EEA-regulated investors for the purposes of their compliance with the EU risk retention and due diligence requirements or similar requirements. |
| Risk Retention Consultation Party: | Wells Fargo Bank, National Association |
| Initial Majority Controlling Class Certificateholder: | Torchlight Investors, LLC or another affiliate of Torchlight Loan Services, LLC. |
| Cut-off Date: | The Cut-off Date with respect to each mortgage loan is the due date for the monthly debt service payment that is due in August 2018 (or, in the case of any mortgage loan that has its first due date in September 2018, the date that would have been its due date in August 2018 under the terms of that mortgage loan if a monthly debt service payment were scheduled to be due in that month). |
| Expected Closing Date: | On or about August 2, 2018. |
| Determination Dates: | The 11th day of each month (or if that day is not a business day, the next succeeding business day), commencing in September 2018. |
| Distribution Dates: | The fourth business day following the Determination Date in each month, commencing in September 2018. |
| Rated Final Distribution Date: | The Distribution Date in August 2061. |
| Interest Accrual Period: | With respect to any Distribution Date, the calendar month immediately preceding the month in which such Distribution Date occurs. |
| Day Count: | The Offered Certificates will accrue interest on a 30/360 basis. |
THE INFORMATION IN THIS STRUCTURAL AND COLLATERAL TERM SHEET IS NOT COMPLETE AND MAY BE AMENDED PRIOR TO THE TIME OF SALE. THIS TERM SHEET IS NOT AN OFFER TO SELL THESE SECURITIES AND IT IS NOT A SOLICITATION OF AN OFFER TO BUY THESE SECURITIES IN ANY JURISDICTION WHERE THE OFFER OR SALE IS NOT PERMITTED.
7
| BANK 2018-BNK13 | Issue Characteristics |
| Minimum Denominations: | $10,000 for each Class of Offered Certificates (other than the Class X-A and X-B Certificates) and $1,000,000 for the Class X-A and X-B Certificates. Investments may also be made in any whole dollar denomination in excess of the applicable minimum denomination. |
| Clean-up Call: | 1.0% |
| Delivery: | DTC, Euroclear and Clearstream Banking |
| ERISA/SMMEA Status: | Each Class of Offered Certificates is expected to be eligible for exemptive relief under ERISA. No Class of Offered Certificates will be SMMEA eligible. |
| Risk Factors: | THE CERTIFICATES INVOLVE CERTAIN RISKS AND MAY NOT BE SUITABLE FOR ALL INVESTORS. SEE THE “RISK FACTORS” SECTION OF THE PRELIMINARY PROSPECTUS. |
| Bond Analytics Information: | The Certificate Administrator will be authorized to make distribution date statements, CREFC® reports and certain supplemental reports (other than confidential information) available to certain financial modeling and data provision services, including Bloomberg, L.P., Trepp, LLC, Intex Solutions, Inc., Markit Group Limited, Interactive Data Corp., BlackRock Financial Management, Inc., CMBS.com, Inc., Moody’s Analytics and Thomson Reuters Corporation. |
THE INFORMATION IN THIS STRUCTURAL AND COLLATERAL TERM SHEET IS NOT COMPLETE AND MAY BE AMENDED PRIOR TO THE TIME OF SALE. THIS TERM SHEET IS NOT AN OFFER TO SELL THESE SECURITIES AND IT IS NOT A SOLICITATION OF AN OFFER TO BUY THESE SECURITIES IN ANY JURISDICTION WHERE THE OFFER OR SALE IS NOT PERMITTED.
8
| BANK 2018-BNK13 | Characteristics of the Mortgage Pool |
| IV. | Characteristics of the Mortgage Pool(1) |
| A. | Ten Largest Mortgage Loans |
| Mortgage Loan Seller | Mortgage Loan Name | City | State | Number of Mortgage Loans / Mortgaged Properties | Mortgage Loan Cut-off Date Balance ($) | % of Initial Pool Balance (%) | Property Type | Number of | Cut-off Date | Cut-off Date LTV Ratio (%) | Balloon or ARD LTV Ratio (%) | U/W NCF DSCR (x) | U/W NOI Debt Yield (%) | ||||||||||||||||||
| WFB | 1745 Broadway | New York | NY | 1 / 1 | $94,000,000 | 9.96 | % | Office | 684,515 | $466 | 50.5 | % | 50.5 | % | 3.00 | x | 11.6 | % | |||||||||||||
| BANA | Griffin Portfolio II | Various | Various | 1 / 4 | 85,000,000 | 9.00 | Various | 2,726,080 | 92 | 60.2 | 60.2 | 2.01 | 9.3 | ||||||||||||||||||
| MSMCH | Pfizer Building | New York | NY | 1 / 1 | 65,000,000 | 6.88 | Office | 823,623 | 152 | 59.5 | 2.1 | 1.00 | 18.4 | ||||||||||||||||||
| WFB | Showcase II | Las Vegas | NV | 1 / 1 | 50,000,000 | 5.30 | Retail | 41,407 | 3,091 | 54.0 | 54.0 | 1.62 | 8.1 | ||||||||||||||||||
| BANA | ExchangeRight Net Leased Portfolio #22 | Various | Various | 1 / 15 | 43,521,600 | 4.61 | Various | 229,251 | 190 | 59.1 | 59.1 | 2.12 | 9.6 | ||||||||||||||||||
| BANA | The Galleria | Metairie | LA | 1 / 1 | 42,000,000 | 4.45 | Office | 470,540 | 89 | 62.2 | 62.2 | 2.48 | 12.2 | ||||||||||||||||||
| MSMCH | Broadway Plaza | Chula Vista | CA | 1 / 1 | 40,950,000 | 4.34 | Retail | 356,335 | 115 | 70.0 | 70.0 | 1.64 | 8.0 | ||||||||||||||||||
| MSMCH | Plaza Frontenac | Frontenac | MO | 1 / 1 | 40,000,000 | 4.24 | Retail | 351,006 | 285 | 47.6 | 47.6 | 2.09 | 10.0 | ||||||||||||||||||
| WFB | Town Center Aventura | Aventura | FL | 1 / 1 | 40,000,000 | 4.24 | Retail | 186,138 | 430 | 60.0 | 60.0 | 1.60 | 8.1 | ||||||||||||||||||
| MSMCH | Florida Hotel & Conference Center | Orlando | FL | 1 / 1 | 40,000,000 | 4.24 | Hospitality | 511 | 78,278 | 61.3 | 61.3 | 2.42 | 16.2 | ||||||||||||||||||
| Top Three Total/Weighted Average | 3 / 6 | $244,000,000 | 25.8 | % | 56.3 | % | 41.0 | % | 2.12 | x | 12.6 | % | |||||||||||||||||||
| Top Five Total/Weighted Average | 5 / 22 | $337,521,600 | 35.7 | % | 56.3 | % | 45.2 | % | 2.05 | x | 11.6 | % | |||||||||||||||||||
| Top Ten Total/Weighted Average | 10 / 27 | $540,471,600 | 57.2 | % | 57.8 | % | 50.9 | % | 2.05 | x | 11.3 | % | |||||||||||||||||||
| Non-Top Ten Total/Weighted Average | 52 / 53 | $403,718,353 | 42.8 | % | 49.9 | % | 44.7 | % | 2.59 | x | 15.9 | % | |||||||||||||||||||
| (1) | With respect to any mortgage loan that is part of a whole loan, Cut-off Date Balance Per SF/Room loan-to-value ratio, debt service coverage ratio and debt yield calculations include the relatedpari passu companion loan(s) but exclude any related subordinate companion loan(s) (unless otherwise stated). With respect to each mortgage loan, debt service coverage ratio, debt yield and loan-to-value ratio information do not take into account subordinate debt (whether or not secured by the related mortgaged property), if any, that currently exists or is allowed under the terms of such mortgage loan. |
THE INFORMATION IN THIS STRUCTURAL AND COLLATERAL TERM SHEET IS NOT COMPLETE AND MAY BE AMENDED PRIOR TO THE TIME OF SALE. THIS TERM SHEET IS NOT AN OFFER TO SELL THESE SECURITIES AND IT IS NOT A SOLICITATION OF AN OFFER TO BUY THESE SECURITIES IN ANY JURISDICTION WHERE THE OFFER OR SALE IS NOT PERMITTED.
9
| BANK 2018-BNK13 | Characteristics of the Mortgage Pool |
| B. | Summary of the Whole Loans |
| Property Name | Mortgage Loan Seller in BANK 2018-BNK13 | Note(s)(1) | Original Balance | Holder of Note | Lead Servicer for Whole Loan | Master Servicer Under Lead Securitization Servicing Agreement | Special Servicer Under Lead Securitization Servicing Agreement |
| 1745 Broadway | WFB | A-1, A-2, A-3, A-4 | $175,000,000 | WFCM 2018-1745 | Yes | Wells Fargo Bank, National Association | AEGON USA Realty Advisors, LLC |
| A-5, A-6 | $94,000,000 | BANK 2018-BNK13 | No | ||||
| A-7, A-8 | $50,000,000 | WFB | No | ||||
| Griffin Portfolio II | BANA | A-1-1, A-1-2-2 | $85,000,000 | BANK 2018-BNK13 | Yes | Wells Fargo Bank, National Association | Torchlight Loan Services, LLC |
| A-1-2-1, A-2-2-1 | $80,000,000 | MSC 2018-H3 | No | ||||
| A-2-1 | $60,000,000 | KeyBank National Association | No | ||||
| A-2-2-2, A-2-3 | $25,000,000 | UBS 2018-C11 | No | ||||
| Pfizer Building | MSMCH | A-1, A-4, A-5 | $65,000,000 | BANK 2018-BNK13 | Yes | Wells Fargo Bank, National Association | Torchlight Loan Services, LLC |
| A-2, A-3 | $60,000,000 | Morgan Stanley Bank, N.A. | No | ||||
| Showcase II | WFB | A-1 | $50,000,000 | BANK 2018-BNK13 | Yes | Wells Fargo Bank, National Association | Torchlight Loan Services, LLC |
| A-2, A-3 | $78,000,000 | WFB | No | ||||
| Plaza Frontenac | MSMCH | A-1 | $60,000,000 | Morgan Stanley Bank, N.A.(2) | Yes(2) | Wells Fargo Bank, National Association | Torchlight Loan Services, LLC |
| A-2 | $40,000,000 | BANK 2018-BNK13 | No | ||||
| Town Center Aventura | WFB | A-1 | $40,000,000 | BANK 2018-BNK13 | Yes | Wells Fargo Bank, National Association | Torchlight Loan Services, LLC |
| A-2 | $40,000,000 | WFB | No | ||||
| Fair Oaks Mall | BANA | A-1-1 | $80,000,000 | BANK 2018-BNK12 | Yes | Wells Fargo Bank, National Association | AEGON USA Realty Advisors, LLC |
| A-1-2 | $33,750,000 | BANK 2018-BNK13 | No | ||||
| A-2-1, A-2-2, A-2-3 | $61,250,000 | Barclays Bank PLC | No | ||||
| B-1, B-2 | $85,000,000 | Annaly CRE LLC(3) | No | ||||
| Anderson Towne Center | MSMCH | A-1 | $25,000,000 | BANK 2018-BNK13 | Yes | Wells Fargo Bank, National Association | Torchlight Loan Services, LLC |
| A-2 | $17,415,000 | Morgan Stanley Bank, N.A. | No | ||||
| 181 Fremont Street | WFB | A-1, A-4 | $80,000,000 | BMARK 2018-B4 | Yes | Wells Fargo Bank, National Association | CWCapital Asset Management LLC |
| A-2 | $58,000,000 | BANK 2018-BNK12 | No | ||||
| A-3 | $22,000,000 | BANK 2018-BNK13 | No | ||||
| A-5 | $40,000,000 | Deutsche Bank AG, New York Branch | No | ||||
| A-6-1 | $30,000,000 | WFCM 2018-C44 | No | ||||
| A-6-2 | $20,000,000 | WFCM 2018-C45 | No |
| (1) | No assurance can be provided that any unsecuritized note will not be split further. |
| (2) | The related whole loan is serviced under the BANK 2018-BNK13 pooling and servicing agreement until the securitization of the related control note, after which the related whole loan will be serviced under the pooling and servicing agreement governing such securitization of the related control note. The master servicer and special servicer for such securitization will be identified in a notice, report or statement to holders of the BANK 2018-BNK13 certificates after the closing of such securitization. |
| (3) | The holder of the Fair Oaks Mall B Notes (Notes B-1 and B-2) will have certain control rights with respect to the Fair Oaks Mall Whole Loan and the right to appoint the special servicer with respect to the Fair Oaks Whole Loan; provided that after a control appraisal period exists with respect to the Fair Oaks Mall B Notes, then the directing certificateholder for the BANK 2018-BNK12 securitization trust will have such rights. |
THE INFORMATION IN THIS STRUCTURAL AND COLLATERAL TERM SHEET IS NOT COMPLETE AND MAY BE AMENDED PRIOR TO THE TIME OF SALE. THIS TERM SHEET IS NOT AN OFFER TO SELL THESE SECURITIES AND IT IS NOT A SOLICITATION OF AN OFFER TO BUY THESE SECURITIES IN ANY JURISDICTION WHERE THE OFFER OR SALE IS NOT PERMITTED.
10
| BANK 2018-BNK13 | Characteristics of the Mortgage Pool |
| C. | Summary of the Whole Loans (continued) |
| Property Name | Mortgage Loan Seller in BANK 2018-BNK13 | Note(s)(1) | Original Balance | Holder of Note | Lead Servicer for Whole Loan | Master Servicer Under Lead Securitization Servicing Agreement | Special Servicer Under Lead Securitization Servicing Agreement |
| Shoppes at Chino Hills | MSMCH | A-1 | $40,000,000 | MSC 2018–H3 | Yes | Wells Fargo Bank, National Association | LNR Partners, LLC |
| A-2 | $22,000,000 | BANK 2018–BNK13 | No | ||||
| A-3, A-4 | $48,000,000 | Morgan Stanley Bank, N.A. | No | ||||
| CoolSprings Galleria | WFB | A-1, A-2 | $90,000,000 | BANK 2018-BNK12 | Yes | Wells Fargo Bank, National Association | Midland Loan Services, a Division of PNC Bank, National Association |
| A-3 | $20,000,000 | WFCM 2018-C45 | No | ||||
| A-4-1 | $30,000,000 | WFB | No | ||||
| A-4-2 | $15,000,000 | BANK 2018-BNK13 | No |
| (1) | No assurance can be provided that any unsecuritized note will not be split further. |
THE INFORMATION IN THIS STRUCTURAL AND COLLATERAL TERM SHEET IS NOT COMPLETE AND MAY BE AMENDED PRIOR TO THE TIME OF SALE. THIS TERM SHEET IS NOT AN OFFER TO SELL THESE SECURITIES AND IT IS NOT A SOLICITATION OF AN OFFER TO BUY THESE SECURITIES IN ANY JURISDICTION WHERE THE OFFER OR SALE IS NOT PERMITTED.
11
| BANK 2018-BNK13 | Characteristics of the Mortgage Pool |
| D. | Mortgage Loans with Additional Secured and Mezzanine Financing(1) |
| Loan No. | Mortgage Loan Seller | Mortgage Loan Name | Mortgage Loan Cut-off Date Balance ($) | % of Initial Pool Balance (%) | Subordinate Debt Cut-off Date Balance ($) | Mezzanine Debt Cut-off Date Balance ($) | Total Debt Interest Rate (%)(2) | Mortgage Loan U/W NCF DSCR (x)(3) | Total Debt U/W NCF DSCR (x) | Mortgage Loan Cut-off Date U/W NOI Debt Yield (%)(3) | Total Debt Cut-off Date U/W NOI Debt Yield (%) | Mortgage Loan Cut-off Date LTV Ratio (%)(3) | Total Debt Cut-off Date LTV Ratio (%) |
| 4 | WFB | Showcase II | $50,000,000 | 5.3% | NAP | $37,000,000 | 5.3680% | 1.62x | 1.15x | 8.1% | 6.3% | 54.0% | 69.6% |
| 12 | BANA | Fair Oaks Mall | 33,644,821 | 3.6 | $84,735,106 | NAP | 5.3179 | 2.89 | 1.64 | 17.1 | 11.5 | 32.0 | 47.5 |
| 14 | WFB | 181 Fremont Street | 22,000,000 | 2.3 | NAP | 225,000,000 | 4.4340 | 3.14 | 1.38 | 11.8 | 6.2 | 39.6 | 75.2 |
| Total/Weighted Average | $105,644,821 | 11.2% | $84,735,106 | $262,000,000 | 5.1575% | 2.34x | 1.35x | 11.7% | 7.9% | 44.0% | 63.7% | ||
| (1) | In addition, fifteen (15) of the mortgage loans, each of which is secured by a residential cooperative property, currently have in place Subordinate Coop LOCs, that permit future advances. See “Description of the Mortgage Pool—Additional Indebtedness—Other Unsecured Indebtedness” and “Description of the Mortgage Pool—Additional Debt Financing for Mortgage Loans Secured by Residential Cooperatives” in the Preliminary Prospectus. |
| (2) | Total Debt Interest Rate for any specified mortgage loan reflects the weighted average of the interest rates on the respective components of the total debt. |
| (3) | With respect to any loan that is part of a whole loan, the loan-to-value ratio, debt service coverage ratio and debt yield calculations include the relatedpari passu companion loan(s). |
THE INFORMATION IN THIS STRUCTURAL AND COLLATERAL TERM SHEET IS NOT COMPLETE AND MAY BE AMENDED PRIOR TO THE TIME OF SALE. THIS TERM SHEET IS NOT AN OFFER TO SELL THESE SECURITIES AND IT IS NOT A SOLICITATION OF AN OFFER TO BUY THESE SECURITIES IN ANY JURISDICTION WHERE THE OFFER OR SALE IS NOT PERMITTED.
12
| BANK 2018-BNK13 | Characteristics of the Mortgage Pool |
| E. | Previous Securitization History(1) |
| Loan No. | Mortgage Loan Seller | Mortgage Loan or Mortgaged Property Name | City | State | Property Type | Mortgage Loan or Mortgaged Property Cut-off Date Balance ($) | % of Initial Pool Balance (%) | Previous Securitization |
| 8 | MSMCH | Plaza Frontenac | Frontenac | MO | Retail | $40,000,000 | 4.2% | COMM 2013-LC13 |
| 10 | MSMCH | Florida Hotel & Conference Center | Orlando | FL | Hospitality | 40,000,000 | 4.2 | MSBAM 2013-C12 |
| 15 | MSMCH | Shoppes at Chino Hills | Chino Hills | CA | Retail | 22,000,000 | 2.3 | GSMS 2011-GC5 |
| 21 | WFB | Staybridge Suites Orlando Airport South | Orlando | FL | Hospitality | 13,100,000 | 1.4 | GSMS 2014-GC20 |
| 26 | NCB | Bon Aire Residents, Inc. | Suffern | NY | Multifamily | 9,413,691 | 1.0 | CSFB 2005-C3 |
| 36 | WFB | 100 Grove Road | West Deptford | NJ | Office | 3,812,671 | 0.4 | CSFB 2005-C5 |
| 51 | NCB | Chapel Owners Corp. | Great Neck | NY | Multifamily | 2,044,763 | 0.2 | MSC 2006-IQ11 |
| Total | $130,371,126 | 13.8% |
| (1) | The table above represents the most recent securitization with respect to the mortgaged property securing the related mortgage loan, based on information provided by the related borrower or obtained through searches of a third-party database. While loans secured by the above mortgaged properties may have been securitized multiple times in prior transactions, mortgage loans in this securitization are only listed in the above chart if the mortgage loan paid off a loan in another securitization. The information has not otherwise been confirmed by the mortgage loan sellers. |
THE INFORMATION IN THIS STRUCTURAL AND COLLATERAL TERM SHEET IS NOT COMPLETE AND MAY BE AMENDED PRIOR TO THE TIME OF SALE. THIS TERM SHEET IS NOT AN OFFER TO SELL THESE SECURITIES AND IT IS NOT A SOLICITATION OF AN OFFER TO BUY THESE SECURITIES IN ANY JURISDICTION WHERE THE OFFER OR SALE IS NOT PERMITTED.
13
| BANK 2018-BNK13 | Characteristics of the Mortgage Pool |
F. Mortgage Loans with Scheduled Balloon Payments and Related Classes
| Class A-2(1) | ||||||||||||||||
| Loan No. | Mortgage Loan Seller | Mortgage Loan Name | State | Property Type | Mortgage Loan Cut-off Date Balance ($) | % of Initial Pool Balance (%) | Mortgage Loan Balance at Maturity ($) | % of Class A-2 Certificate Principal Balance (%)(2) | SF / Rooms | Loan Per | U/W NCF DSCR (x) | U/W NOI Debt Yield (%) | Cut-off Date LTV Ratio (%) | Balloon LTV Ratio (%) | Rem. IO Period (mos.) | Rem. Term to Maturity (mos.) |
| 10 | MSMCH | Florida Hotel & Conference Center | FL | Hospitality | $40,000,000 | 4.2% | $40,000,000 | 54.1% | 511 | $78,278 | 2.42x | 16.2% | 61.3% | 61.3% | 58 | 58 |
| 12 | BANA | Fair Oaks Mall | VA | Retail | 33,644,821 | 3.6 | 31,274,436 | 42.3 | 779,949 | $224 | 2.89 | 17.1 | 32.0 | 29.7 | 0 | 57 |
| 41 | BANA | Darien Pointe Plaza | IL | Retail | 2,997,408 | 0.3 | 2,800,448 | 3.8 | 14,494 | $207 | 1.59 | 11.6 | 58.8 | 54.9 | 0 | 59 |
| Total/Weighted Average | $76,642,229 | 8.1% | $74,074,884 | 100.1% | 2.59x | 16.4% | 48.3% | 47.2% | 30 | 58 | ||||||
| (1) | The table above presents the mortgage loan whose balloon payments would be applied to pay down the principal balance of the Class A-2 Certificates, assuming a 0% CPR and applying the “Structuring Assumptions” described in the Preliminary Prospectus, including the assumptions that (i) none of the mortgage loans in the pool experience prepayments prior to maturity (or, in the case of an ARD loan, its anticipated repayment date), defaults or losses; (ii) there are no extensions of maturity dates of any mortgage loans in the pool; and (iii) each mortgage loan in the pool is paid in full on its stated maturity date (or, in the case of an ARD loan, its anticipated repayment date). Each Class of Certificates evidences undivided ownership interests in the entire pool of mortgage loans. Debt service coverage ratio, debt yield and loan-to-value ratio information do not take into account subordinate debt (whether or not secured by the related mortgaged property), if any, that currently exists or is allowed under the terms of any mortgage loan. See Annex A-1 to the Preliminary Prospectus. |
| (2) | Reflects the percentage equal to the Balloon Balance divided by the initial Class A-2 Certificate Balance. |
| Class A-3(1) | ||||||||||||||||
| Loan No. | Mortgage Loan Seller | Mortgage Loan Name | State | Property Type | Mortgage Loan Cut-off Date Balance ($) | % of Initial Pool Balance (%) | Mortgage Loan Balance at Maturity ($) | % of Class A-3 Certificate Principal Balance (%)(2) | Rooms /SFs | Loan Per | U/W NCF DSCR (x) | U/W NOI Debt Yield (%) | Cut-off Date LTV Ratio (%) | Balloon LTV Ratio (%) | Rem. IO Period (mos.) | Rem. Term to Maturity (mos.) |
| 28 | WFB | Holiday Inn Express - Oregon, OH | OH | Hospitality | $7,673,203 | 0.8% | $6,465,238 | 65.3% | 85 | $90,273 | 1.79x | 12.6% | 71.0% | 59.9% | 0 | 105 |
| 35 | WFB | 32nd Street Retail | AZ | Retail | 3,960,000 | 0.4 | 3,960,000 | 40.0 | 13,868 | 286 | 2.23 | 11.4 | 54.2 | 54.2 | 104 | 104 |
| Total/Weighted Average | $11,633,203 | 1.2% | $10,425,238 | 105.3% | 1.94x | 12.2% | 65.3% | 58.0% | 35 | 105 | ||||||
(1) The table above presents the mortgage loan(s) whose balloon payments would be applied to pay down the principal balance of the Class A-3 Certificates, assuming a 0% CPR and applying the “Structuring Assumptions” described in the Preliminary Prospectus, including the assumptions that (i) none of the mortgage loans in the pool experience prepayments prior to maturity (or, in the case of an ARD loan, its anticipated repayment date), defaults or losses; (ii) there are no extensions of maturity dates of any mortgage loans in the pool; and (iii) each mortgage loan in the pool is paid in full on its stated maturity date (or, in the case of an ARD loan, its anticipated repayment date). Each Class of Certificates evidences undivided ownership interests in the entire pool of mortgage loans. Debt service coverage ratio, debt yield and loan-to-value ratio information do not take into account subordinate debt (whether or not secured by the related mortgaged property), if any, that currently exists or is allowed under the terms of any mortgage loan. See Annex A-1 to the Preliminary Prospectus. (2) Reflects the percentage equal to the Balloon Balance divided by the initial Class A-3 Certificate Balance. | ||||||||||||||||
THE INFORMATION IN THIS STRUCTURAL AND COLLATERAL TERM SHEET IS NOT COMPLETE AND MAY BE AMENDED PRIOR TO THE TIME OF SALE. THIS TERM SHEET IS NOT AN OFFER TO SELL THESE SECURITIES AND IT IS NOT A SOLICITATION OF AN OFFER TO BUY THESE SECURITIES IN ANY JURISDICTION WHERE THE OFFER OR SALE IS NOT PERMITTED.
14
| BANK 2018-BNK13 | Characteristics of the Mortgage Pool |
G. Property Type Distribution(1)
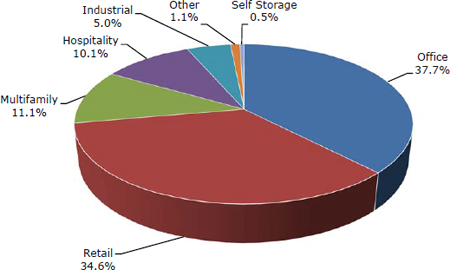
| Property Type | Number of Mortgaged Properties | Aggregate Cut-off Date Balance ($) | % of Initial Pool Balance (%) | Weighted Average Cut-off Date LTV Ratio (%) | Weighted Average Balloon or ARD LTV Ratio (%) | Weighted Average U/W NCF DSCR (x) | Weighted Average U/W NOI Debt Yield (%) | Weighted Average U/W NCF Debt Yield (%) | Weighted Average Mortgage Rate (%) | |||||||||||||||||
| Office | 13 | $355,798,671 | 37.7 | % | 56.8 | % | 45.7 | % | 2.11 | x | 12.1 | % | 11.7 | % | 4.182 | % | ||||||||||
| CBD | 5 | 228,430,000 | 24.2 | 54.0 | 37.4 | 2.12 | 13.0 | 12.8 | 4.026 | |||||||||||||||||
| Suburban | 5 | 114,478,671 | 12.1 | 62.0 | 60.7 | 2.08 | 10.5 | 9.7 | 4.441 | |||||||||||||||||
| Medical | 3 | 12,890,000 | 1.4 | 60.9 | 60.9 | 2.10 | 10.7 | 9.9 | 4.641 | |||||||||||||||||
| Retail | 24 | 326,273,600 | 34.6 | 56.2 | 53.9 | 1.85 | 10.0 | 9.5 | 4.736 | |||||||||||||||||
| Anchored | 5 | 195,871,433 | 20.7 | 59.3 | 57.8 | 1.67 | 8.6 | 8.3 | 4.802 | |||||||||||||||||
| Super Regional Mall | 2 | 48,588,898 | 5.1 | 36.9 | 32.6 | 2.59 | 15.8 | 15.0 | 4.437 | |||||||||||||||||
| Single Tenant | 13 | 36,381,600 | 3.9 | 59.1 | 59.1 | 2.12 | 9.6 | 9.3 | 4.320 | |||||||||||||||||
| Lifestyle Center | 1 | 22,000,000 | 2.3 | 62.5 | 62.5 | 1.55 | 8.5 | 8.1 | 5.175 | |||||||||||||||||
| Movie Theater | 1 | 16,474,261 | 1.7 | 62.6 | 46.8 | 1.45 | 10.7 | 10.1 | 4.930 | |||||||||||||||||
| Shadow Anchored | 1 | 3,960,000 | 0.4 | 54.2 | 54.2 | 2.23 | 11.4 | 11.0 | 4.840 | |||||||||||||||||
| Unanchored | 1 | 2,997,408 | 0.3 | 58.8 | 54.9 | 1.59 | 11.6 | 11.3 | 5.840 | |||||||||||||||||
| Multifamily | 30 | 104,959,297 | 11.1 | 32.0 | 28.5 | 4.53 | 27.3 | 26.7 | 4.600 | |||||||||||||||||
| Cooperative | 20 | 66,945,577 | 7.1 | 19.9 | 16.2 | 5.99 | 36.5 | 35.8 | 4.399 | |||||||||||||||||
| Garden | 10 | 38,013,720 | 4.0 | 53.4 | 50.0 | 1.95 | 11.0 | 10.5 | 4.954 | |||||||||||||||||
| Hospitality | 6 | 95,150,646 | 10.1 | 64.1 | 58.8 | 2.10 | 14.8 | 12.9 | 5.351 | |||||||||||||||||
| Full Service | 1 | 40,000,000 | 4.2 | 61.3 | 61.3 | 2.42 | 16.2 | 13.8 | 5.600 | |||||||||||||||||
| Limited Service | 3 | 25,825,646 | 2.7 | 69.1 | 57.8 | 1.82 | 13.4 | 12.0 | 5.222 | |||||||||||||||||
| Select Service | 1 | 16,225,000 | 1.7 | 59.9 | 54.3 | 1.79 | 13.0 | 11.7 | 5.110 | |||||||||||||||||
| Extended Stay | 1 | 13,100,000 | 1.4 | 67.9 | 58.9 | 2.07 | 15.2 | 13.6 | 5.145 | |||||||||||||||||
| Industrial | 4 | 47,263,187 | 5.0 | 56.3 | 53.1 | 2.05 | 11.1 | 10.1 | 4.348 | |||||||||||||||||
| Warehouse/Distribution | 2 | 35,734,000 | 3.8 | 60.2 | 60.2 | 2.01 | 9.3 | 8.8 | 4.315 | |||||||||||||||||
| Flex | 1 | 8,229,187 | 0.9 | 47.0 | 28.8 | 1.97 | 17.6 | 14.7 | 4.280 | |||||||||||||||||
| Warehouse | 1 | 3,300,000 | 0.3 | 36.9 | 36.9 | 2.68 | 14.1 | 13.3 | 4.880 | |||||||||||||||||
| Other | 1 | 10,000,000 | 1.1 | 46.3 | 46.3 | 2.01 | 9.9 | 9.8 | 4.810 | |||||||||||||||||
| Parking Garage | 1 | 10,000,000 | 1.1 | 46.3 | 46.3 | 2.01 | 9.9 | 9.8 | 4.810 | |||||||||||||||||
| Self Storage | 2 | 4,744,552 | 0.5 | 50.7 | 33.9 | 1.53 | 13.0 | 12.7 | 4.978 | |||||||||||||||||
| Self Storage | 2 | 4,744,552 | 0.5 | 50.7 | 33.9 | 1.53 | 13.0 | 12.7 | 4.978 | |||||||||||||||||
| Total/Weighted Average: | 80 | $944,189,953 | 100.0 | % | 54.4 | % | 48.3 | % | 2.28 | x | 13.3 | % | 12.6 | % | 4.557 | % | ||||||||||
| (1) | Because this table presents information relating to the mortgaged properties and not the mortgage loans, the information for mortgage loans secured by more than one mortgaged property is based on allocated amounts (allocating the principal balance of the mortgage loan to each of those properties according to the relative appraised values of the mortgaged properties or the allocated loan amounts or property-specific release prices set forth in the related mortgage loan documents or such other allocation as the related mortgage loan seller deemed appropriate). For mortgaged properties securing residential cooperative mortgage loans, the debt service coverage ratio and debt yield for each such mortgaged property is calculated using U/W Net Operating Income or U/W Net Cash Flow, as applicable, for the related residential cooperative property which is the projected net operating income or net cash flow, as applicable, reflected in the most recent appraisal obtained by or otherwise in the possession of the related mortgage loan seller as of the cut-off date and the loan-to-value ratio, is calculated based upon the appraised value of the residential cooperative property determined as if such residential cooperative property is operated as a residential cooperative, inclusive of the amount of the underlying debt encumbering such residential cooperative property. With respect to any mortgage loan that is part of a whole loan, the loan-to-value ratio, debt service coverage ratio and debt yield calculations include the relatedpari passu companion loan(s) but exclude any related subordinate companion loan(s) (unless otherwise stated). With respect to each mortgage loan, debt service coverage ratio, debt yield and loan-to-value ratio information do not take into account any subordinate debt (whether or not secured by the related mortgaged property) that currently exists or is allowed under the terms of such mortgage loan. See Annex A-1 to the Preliminary Prospectus. |
THE INFORMATION IN THIS STRUCTURAL AND COLLATERAL TERM SHEET IS NOT COMPLETE AND MAY BE AMENDED PRIOR TO THE TIME OF SALE. THIS TERM SHEET IS NOT AN OFFER TO SELL THESE SECURITIES AND IT IS NOT A SOLICITATION OF AN OFFER TO BUY THESE SECURITIES IN ANY JURISDICTION WHERE THE OFFER OR SALE IS NOT PERMITTED.
15
| BANK 2018-BNK13 | Characteristics of the Mortgage Pool |
| H. | Geographic Distribution(1)(2) |
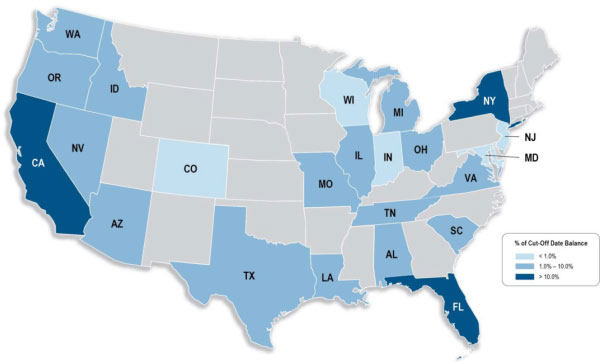
| Location | Number of Mortgaged Properties | Aggregate | % of Initial Pool Balance (%) | Weighted Average Cut-off Date LTV Ratio (%) | Weighted Average Balloon or ARD LTV Ratio (%) | Weighted Average U/W NCF DSCR (x) | Weighted Average U/W NOI Debt Yield (%) | Weighted Average U/W NCF Debt Yield (%) | Weighted Average Mortgage Rate (%) | ||||||||||||||||||
| New York | 24 | $273,445,577 | 29.0 | % | 46.4 | % | 31.8 | % | 2.99 | x | 18.7 | % | 18.4 | % | 4.145 | % | |||||||||||
| California | 5 | 110,350,000 | 11.7 | 60.3 | 59.4 | 1.92 | 9.3 | 9.1 | 4.651 | ||||||||||||||||||
| Southern | 3 | 82,350,000 | 8.7 | 66.5 | 65.3 | 1.57 | 8.5 | 8.3 | 4.891 | ||||||||||||||||||
| Northern | 2 | 28,000,000 | 3.0 | 42.1 | 42.1 | 2.93 | 11.6 | 11.5 | 3.947 | ||||||||||||||||||
| Florida | 6 | 98,959,000 | 10.5 | 61.8 | 60.4 | 2.01 | 12.5 | 11.2 | 5.221 | ||||||||||||||||||
| Nevada | 3 | 68,256,552 | 7.2 | 54.7 | 53.8 | 1.71 | 8.7 | 8.5 | 4.764 | ||||||||||||||||||
| Ohio | 5 | 55,587,837 | 5.9 | 66.0 | 59.2 | 1.66 | 9.8 | 9.1 | 4.816 | ||||||||||||||||||
| Other(3) | 37 | 337,590,987 | 35.8 | 54.9 | 51.5 | 2.11 | 11.8 | 11.0 | 4.579 | ||||||||||||||||||
| Total/Weighted Average | 80 | $944,189,953 | 100.0 | % | 54.4 | % | 48.3 | % | 2.28 | x | 13.3 | % | 12.6 | % | 4.557 | % | |||||||||||
| (1) | The mortgaged properties are located in 23 states. |
| (2) | Because this table presents information relating to the mortgaged properties and not the mortgage loans, the information for mortgage loans secured by more than one mortgaged property is based on allocated amounts (allocating the principal balance of the mortgage loan to each of those properties according to the relative appraised values of the mortgaged properties or the allocated loan amounts or property-specific release prices set forth in the related mortgage loan documents or such other allocation as the related mortgage loan seller deemed appropriate). For mortgaged properties securing residential cooperative mortgage loans, the debt service coverage ratio and debt yield for each such mortgaged property is calculated using U/W Net Operating Income or U/W Net Cash Flow, as applicable, for the related residential cooperative property, which is the projected net operating income or net cash flow, as applicable, reflected in the most recent appraisal obtained by or otherwise in the possession of the related mortgage loan seller as of the cut-off date, and the loan-to-value ratio, is calculated based upon the appraised value of the residential cooperative property determined as if such residential cooperative property is operated as a residential cooperative, inclusive of the amount of the underlying debt encumbering such residential cooperative property. With respect to any mortgage loan that is part of a whole loan, the loan-to-value ratio, debt service coverage ratio and debt yield calculations include the relatedpari passu companion loan(s) but exclude any related subordinate companion loan(s) (unless otherwise stated). With respect to each mortgage loan, debt service coverage ratio, debt yield and loan-to-value ratio information do not take into account any subordinate debt (whether or not secured by the related mortgaged property) that currently exists or is allowed under the terms of such mortgage loan. See Annex A-1 to the Preliminary Prospectus. |
| (3) | Includes 18 other states. |
THE INFORMATION IN THIS STRUCTURAL AND COLLATERAL TERM SHEET IS NOT COMPLETE AND MAY BE AMENDED PRIOR TO THE TIME OF SALE. THIS TERM SHEET IS NOT AN OFFER TO SELL THESE SECURITIES AND IT IS NOT A SOLICITATION OF AN OFFER TO BUY THESE SECURITIES IN ANY JURISDICTION WHERE THE OFFER OR SALE IS NOT PERMITTED.
16
| BANK 2018-BNK13 | Characteristics of the Mortgage Pool |
| I. | Characteristics of the Mortgage Pool(1) |
| CUT-OFF DATE BALANCE | |||||||
| Range of Cut-off Date Balances ($) | Number of Mortgage Loans | Aggregate Cut- off Date Balance | % of Initial Pool Balance | ||||
| 998,813 - 1,000,000 | 2 | $1,997,627 | 0.2 | % | |||
| 1,000,001 - 2,000,000 | 9 | 14,940,293 | 1.6 | ||||
| 2,000,001 - 3,000,000 | 11 | 28,854,380 | 3.1 | ||||
| 3,000,001 - 4,000,000 | 6 | 21,729,175 | 2.3 | ||||
| 4,000,001 - 5,000,000 | 2 | 9,250,000 | 1.0 | ||||
| 5,000,001 - 7,000,000 | 3 | 17,244,906 | 1.8 | ||||
| 7,000,001 - 8,000,000 | 2 | 15,073,092 | 1.6 | ||||
| 8,000,001 - 9,000,000 | 1 | 8,229,187 | 0.9 | ||||
| 9,000,001 - 10,000,000 | 3 | 29,343,691 | 3.1 | ||||
| 10,000,001 - 15,000,000 | 5 | 64,890,486 | 6.9 | ||||
| 15,000,001 - 20,000,000 | 3 | 52,099,261 | 5.5 | ||||
| 20,000,001 - 30,000,000 | 3 | 68,921,433 | 7.3 | ||||
| 30,000,001 - 50,000,000 | 9 | 367,616,421 | 38.9 | ||||
| 50,000,001 - 80,000,000 | 1 | 65,000,000 | 6.9 | ||||
| 80,000,001 - 90,000,000 | 1 | 85,000,000 | 9.0 | ||||
| 90,000,001 - 94,000,000 | 1 | 94,000,000 | 10.0 | ||||
| Total: | 62 | $944,189,953 | 100.0 | % | |||
| Average: | $15,228,870 | ||||||
| UNDERWRITTEN NOI DEBT SERVICE COVERAGE RATIO | |||||||
| Range of U/W NOI DSCRs (x) | Number of Mortgage Loans | Aggregate Cut- off Date Balance | % of Initial Pool Balance | ||||
| 1.00 - 1.40 | 1 | $65,000,000 | 6.9 | % | |||
| 1.41 - 1.50 | 3 | 81,821,433 | 8.7 | ||||
| 1.51 - 1.60 | 3 | 21,218,813 | 2.2 | ||||
| 1.61 - 1.90 | 7 | 168,936,127 | 17.9 | ||||
| 1.91 - 2.00 | 3 | 28,148,203 | 3.0 | ||||
| 2.01 - 2.50 | 18 | 274,299,977 | 29.1 | ||||
| 2.51 - 3.00 | 5 | 91,370,645 | 9.7 | ||||
| 3.01 - 3.50 | 4 | 159,058,512 | 16.8 | ||||
| 3.51 - 30.17 | 18 | 54,336,241 | 5.8 | ||||
| Total: | 62 | $944,189,953 | 100.0 | % | |||
| Weighted Average: | 2.39x | ||||||
| UNDERWRITTEN NCF DEBT SERVICE COVERAGE RATIO | |||||||
| Range of U/W NCF DSCRs (x) | Number of Mortgage Loans | Aggregate Cut- off Date Balance | % of Initial Pool Balance | ||||
| 1.00 - 1.20 | 1 | $65,000,000 | 6.9 | % | |||
| 1.21 - 1.30 | 1 | 24,921,433 | 2.6 | ||||
| 1.31 - 1.40 | 1 | 37,500,000 | 4.0 | ||||
| 1.41 - 1.50 | 3 | 37,764,261 | 4.0 | ||||
| 1.51 - 1.60 | 6 | 80,840,679 | 8.6 | ||||
| 1.61 - 1.70 | 2 | 90,950,000 | 9.6 | ||||
| 1.71 - 1.80 | 3 | 28,148,203 | 3.0 | ||||
| 1.81 - 1.90 | 4 | 31,895,114 | 3.4 | ||||
| 1.91 - 2.00 | 2 | 23,173,263 | 2.5 | ||||
| 2.01 - 2.50 | 15 | 304,106,600 | 32.2 | ||||
| 2.51 - 3.00 | 4 | 134,140,466 | 14.2 | ||||
| 3.01 - 3.50 | 2 | 31,413,691 | 3.3 | ||||
| 3.51 - 29.64 | 18 | 54,336,241 | 5.8 | ||||
| Total: | 62 | $944,189,953 | 100.0 | % | |||
| Weighted Average: | 2.28x | ||||||
| LOAN PURPOSE | |||||||
| Loan Purpose | Number of Mortgage Loans | Aggregate Cut- off Date Balance | % of Initial Pool Balance | ||||
| Refinance | 51 | $634,178,145 | 67.2 | % | |||
| Acquisition | 11 | 310,011,808 | 32.8 | ||||
| Total: | 62 | $944,189,953 | 100.0 | % | |||
| MORTGAGE RATE | |||||||
| Range of Mortgage Rates (%) | Number of Mortgage Loans | Aggregate Cut- off Date Balance | % of Initial Pool Balance | ||||
| 3.585 - 3.750 | 2 | $87,000,000 | 9.2 | % | |||
| 3.751 - 4.000 | 1 | 94,000,000 | 10.0 | ||||
| 4.001 - 4.250 | 3 | 53,120,155 | 5.6 | ||||
| 4.251 - 4.500 | 16 | 251,826,298 | 26.7 | ||||
| 4.501 - 4.750 | 8 | 55,344,732 | 5.9 | ||||
| 4.751 - 5.000 | 16 | 189,624,812 | 20.1 | ||||
| 5.001 - 5.250 | 9 | 86,952,671 | 9.2 | ||||
| 5.251 - 5.500 | 4 | 77,828,971 | 8.2 | ||||
| 5.501 - 5.750 | 2 | 45,494,906 | 4.8 | ||||
| 5.751 - 5.840 | 1 | 2,997,408 | 0.3 | ||||
| Total: | 62 | $944,189,953 | 100.0 | % | |||
| Weighted Average: | 4.557% | ||||||
| UNDERWRITTEN NOI DEBT YIELD | |||||||
| Range of U/W NOI Debt Yields (%) | Number of Mortgage Loans | Aggregate Cut- off Date Balance | % of Initial Pool Balance | ||||
| 7.8 - 8.0 | 2 | $78,450,000 | 8.3 | % | |||
| 8.1 - 9.0 | 3 | 112,000,000 | 11.9 | ||||
| 9.1 - 10.0 | 8 | 228,983,033 | 24.3 | ||||
| 10.1 - 11.0 | 3 | 32,712,981 | 3.5 | ||||
| 11.1 - 12.0 | 9 | 141,457,408 | 15.0 | ||||
| 12.1 - 13.0 | 5 | 82,742,279 | 8.8 | ||||
| 13.1 - 14.0 | 4 | 29,275,208 | 3.1 | ||||
| 14.1 - 15.0 | 3 | 11,649,458 | 1.2 | ||||
| 15.1 - 16.0 | 1 | 13,100,000 | 1.4 | ||||
| 16.1 - 17.0 | 2 | 43,195,645 | 4.6 | ||||
| 17.1 - 18.0 | 2 | 41,874,008 | 4.4 | ||||
| 18.1 - 19.0 | 1 | 65,000,000 | 6.9 | ||||
| 19.1 - 163.8 | 19 | 63,749,933 | 6.8 | ||||
| Total: | 62 | $944,189,953 | 100.0 | % | |||
| Weighted Average: | 13.3% | ||||||
| UNDERWRITTEN NCF DEBT YIELD | |||||||
| Range of U/W NCF Debt Yields (%) | Number of Mortgage Loans | Aggregate Cut- off Date Balance | % of Initial Pool Balance | ||||
| 7.2 - 8.0 | 4 | $168,450,000 | 17.8 | % | |||
| 8.1 - 9.0 | 4 | 136,171,433 | 14.4 | ||||
| 9.1 - 10.0 | 6 | 125,050,320 | 13.2 | ||||
| 10.1 - 11.0 | 8 | 84,734,261 | 9.0 | ||||
| 11.1 - 12.0 | 8 | 156,925,611 | 16.6 | ||||
| 12.1 - 13.0 | 5 | 39,784,191 | 4.2 | ||||
| 13.1 - 14.0 | 3 | 56,400,000 | 6.0 | ||||
| 14.1 - 15.0 | 2 | 11,083,739 | 1.2 | ||||
| 15.1 - 16.0 | 1 | 3,195,645 | 0.3 | ||||
| 16.1 - 18.0 | 1 | 33,644,821 | 3.6 | ||||
| 18.1 - 19.0 | 1 | 65,000,000 | 6.9 | ||||
| 19.1 - 20.0 | 1 | 9,413,691 | 1.0 | ||||
| 20.1 - 160.9 | 18 | 54,336,241 | 5.8 | ||||
| Total: | 62 | $944,189,953 | 100.0 | % | |||
| Weighted Average: | 12.6% | ||||||
| (1) | For mortgaged properties securing residential cooperative mortgage loans, the debt service coverage ratio and debt yield for each such mortgaged property is calculated using U/W Net Operating Income or U/W Net Cash Flow, as applicable, for the related residential cooperative property, which is the projected net operating income or net cash flow, as applicable, reflected in the most recent appraisal obtained by or otherwise in the possession of the related mortgage loan seller as of the cut-off date, and the loan-to-value ratio is calculated based upon the appraised value of the residential cooperative property determined as if such residential cooperative property is operated as a residential cooperative, inclusive of the amount of the underlying debt encumbering such residential cooperative property. With respect to any mortgage loan that is part of a whole loan, the loan-to-value ratio, debt service coverage ratio and debt yield calculations include the relatedpari passu companion loan(s) but exclude any related subordinate companion loan(s) (unless otherwise stated). With respect to each mortgage loan, debt service coverage ratio, debt yield and loan-to-value ratio information do not take into account any subordinate debt (whether or not secured by the related mortgaged property), that currently exists or is allowed under the terms of such mortgage loan. See Annex A-1 to the Preliminary Prospectus. Prepayment provisions for each mortgage loan reflects the entire life of the loan (from origination to maturity). |
THE INFORMATION IN THIS STRUCTURAL AND COLLATERAL TERM SHEET IS NOT COMPLETE AND MAY BE AMENDED PRIOR TO THE TIME OF SALE. THIS TERM SHEET IS NOT AN OFFER TO SELL THESE SECURITIES AND IT IS NOT A SOLICITATION OF AN OFFER TO BUY THESE SECURITIES IN ANY JURISDICTION WHERE THE OFFER OR SALE IS NOT PERMITTED.
17
| BANK 2018-BNK13 | Characteristics of the Mortgage Pool |
| ORIGINAL TERM TO MATURITY OR ARD | |||||||
| Original Terms to Maturity or ARD (months) | Number of Mortgage Loans | Aggregate Cut- off Date Balance | % of Initial Pool Balance | ||||
| 60 | 3 | $76,642,229 | 8.1 | % | |||
| 72 | 1 | 65,000,000 | 6.9 | ||||
| 120 | 58 | 802,547,724 | 85.0 | ||||
| Total: | 62 | $944,189,953 | 100.0 | % | |||
| Weighted Average: | 112 months | ||||||
| REMAINING TERM TO MATURITY OR ARD | |||||||
| Range of Remaining Terms to Maturity or ARD (months) | Number of Mortgage Loans | Aggregate Cut- off Date Balance | % of Initial Pool Balance | ||||
| 57 - 60 | 3 | $76,642,229 | 8.1 | % | |||
| 61 - 84 | 1 | 65,000,000 | 6.9 | ||||
| 85 - 120 | 58 | 802,547,724 | 85.0 | ||||
| Total: | 62 | $944,189,953 | 100.0 | % | |||
| Weighted Average: | 110 months | ||||||
| ORIGINAL AMORTIZATION TERM(2) | |||||||
| Original Amortization Terms (months) | Number of Mortgage Loans | Aggregate Cut- off Date Balance | % of Initial Pool Balance | ||||
| Non-Amortizing | 23 | $605,006,600 | 64.1 | % | |||
| 75 | 1 | 65,000,000 | 6.9 | ||||
| 180 | 2 | 4,144,659 | 0.4 | ||||
| 240 | 1 | 8,229,187 | 0.9 | ||||
| 300 | 2 | 30,424,415 | 3.2 | ||||
| 360 | 28 | 214,918,374 | 22.8 | ||||
| 480 | 5 | 16,466,718 | 1.7 | ||||
| Total: | 62 | $944,189,953 | 100.0 | % | |||
| Weighted Average(3): | 301 months | ||||||
| REMAINING AMORTIZATION TERM(4) | |||||||
| Range of Remaining Amortization Terms (months) | Number of Mortgage Loans | Aggregate Cut- off Date Balance | % of Initial Pool Balance | ||||
| Non-Amortizing | 23 | $605,006,600 | 64.1 | % | |||
| 75 - 120 | 1 | 65,000,000 | 6.9 | ||||
| 121 - 180 | 2 | 4,144,659 | 0.4 | ||||
| 181 - 240 | 1 | 8,229,187 | 0.9 | ||||
| 241 - 300 | 2 | 30,424,415 | 3.2 | ||||
| 301 - 420 | 28 | 214,918,374 | 22.8 | ||||
| 421 - 479 | 5 | 16,466,718 | 1.7 | ||||
| Total: | 62 | $944,189,953 | 100.0 | % | |||
| Weighted Average(3): | 299 months | ||||||
| LOCKBOXES | |||||||
| Type of Lockbox | Number of Mortgage Loans | Aggregate Cut- off Date Balance | % of Initial Pool Balance | ||||
| Hard/Springing Cash Management | 13 | $467,145,442 | 49.5 | % | |||
| Hard/Upfront Cash Management | 6 | 186,454,906 | 19.7 | ||||
| Springing | 18 | 171,786,805 | 18.2 | ||||
| None | 23 | 74,990,129 | 7.9 | ||||
| Soft/Upfront Cash Management | 2 | 43,812,671 | 4.6 | ||||
| Total: | 62 | $944,189,953 | 100.0 | % | |||
| PREPAYMENT PROVISION SUMMARY | |||||||
| Prepayment Provision | Number of Mortgage Loans | Aggregate Cut- off Date Balance | % of Initial Pool Balance | ||||
| Lockout / Defeasance / Open | 33 | $599,305,663 | 63.5 | % | |||
| Lockout / GRTR 1% or YM / Open | 6 | 146,994,637 | 15.6 | ||||
| Lockout / GRTR 1% or YM or Defeasance / Open | 2 | 108,944,076 | 11.5 | ||||
| GRTR 1% or YM / 1% / Open | 20 | 66,945,577 | 7.1 | ||||
| Lockout / GRTR 1% or YM / GRTR 1% or YM or Defeasance / Open | 1 | 22,000,000 | 2.3 | ||||
| Total: | 62 | $944,189,953 | 100.0 | % | |||
| (2) | The original amortization term shown for any mortgage loan that is interest-only for part of its term does not include the number of months in its interest-only period and reflects only the number of months as of the commencement of amortization remaining from the end of such interest-only period. |
| (3) | Excludes the non-amortizing mortgage loans. |
| (4) | The remaining amortization term shown for any mortgage loan that is interest-only for part of its term does not include the number of months in its interest-only period and reflects only the number of months as of the commencement of amortization remaining from the end of such interest-only period. |
| CUT-OFF DATE LOAN-TO-VALUE RATIO | |||||||
| Range of Cut-off Date LTV Ratios (%) | Number of Mortgage Loans | Aggregate Cut- off Date Balance | % of Initial Pool Balance | ||||
| 2.7 - 20.0 | 14 | $42,178,479 | 4.5 | % | |||
| 20.1 - 30.0 | 2 | 7,460,859 | 0.8 | ||||
| 30.1 - 35.0 | 4 | 48,952,355 | 5.2 | ||||
| 35.1 - 40.0 | 4 | 30,153,258 | 3.2 | ||||
| 40.1 - 45.0 | 2 | 7,800,000 | 0.8 | ||||
| 45.1 - 50.0 | 5 | 75,373,263 | 8.0 | ||||
| 50.1 - 55.0 | 6 | 168,448,720 | 17.8 | ||||
| 55.1 - 60.0 | 6 | 177,674,008 | 18.8 | ||||
| 60.1 - 65.0 | 10 | 272,899,261 | 28.9 | ||||
| 65.1 - 70.0 | 7 | 101,763,877 | 10.8 | ||||
| 70.1 - 74.8 | 2 | 11,485,874 | 1.2 | ||||
| Total: | 62 | $944,189,953 | 100.0 | % | |||
| Weighted Average: | 54.4% | ||||||
| BALLOON OR ARD LOAN-TO-VALUE RATIO | |||||||
| Range of Balloon or ARD LTV Ratios (%) | Number of Mortgage Loans | Aggregate Cut- off Date Balance | % of Initial Pool Balance | ||||
| 2.0 - 25.0 | 18 | $117,493,889 | 12.4 | % | |||
| 25.1 - 30.0 | 3 | 51,287,699 | 5.4 | ||||
| 30.1 - 35.0 | 3 | 7,892,549 | 0.8 | ||||
| 35.1 - 40.0 | 3 | 40,244,076 | 4.3 | ||||
| 40.1 - 45.0 | 3 | 18,038,720 | 1.9 | ||||
| 45.1 - 50.0 | 4 | 68,674,261 | 7.3 | ||||
| 50.1 - 55.0 | 8 | 187,362,408 | 19.8 | ||||
| 55.1 - 60.0 | 9 | 169,518,680 | 18.0 | ||||
| 60.1 - 65.0 | 10 | 242,727,671 | 25.7 | ||||
| 65.1 - 70.0 | 1 | 40,950,000 | 4.3 | ||||
| Total: | 62 | $944,189,953 | 100.0 | % | |||
| Weighted Average: | 48.3% | ||||||
| AMORTIZATION TYPE | |||||||
| Type of Amortization | Number of Mortgage Loans | Aggregate Cut- off Date Balance | % of Initial Pool Balance | ||||
| Interest-only, Balloon | 21 | $542,056,600 | 57.4 | % | |||
| Amortizing Balloon | 31 | 203,215,150 | 21.5 | ||||
| Interest-only, Amortizing Balloon | 7 | 70,968,203 | 7.5 | ||||
| Self-Amortizing | 1 | 65,000,000 | 6.9 | ||||
| Interest-only, ARD | 2 | 62,950,000 | 6.7 | ||||
| Total: | 62 | $944,189,953 | 100.0 | % | |||
| ORIGINAL TERM OF INTEREST-ONLY PERIOD FOR PARTIAL IO LOANS | |||||||
| IO Terms (months) | Number of Mortgage Loans | Aggregate Cut- off Date Balance | % of Initial Pool Balance | ||||
| 12 | 1 | $7,673,203 | 0.8 | % | |||
| 24 | 3 | 17,740,000 | 1.9 | ||||
| 36 | 1 | 9,930,000 | 1.1 | ||||
| 48 | 1 | 16,225,000 | 1.7 | ||||
| 60 | 1 | 19,400,000 | 2.1 | ||||
| Total: | 7 | $70,968,203 | 7.5 | % | |||
| Weighted Average: | 40 months | ||||||
| SEASONING | |||||||
| Seasoning (months) | Number of Mortgage Loans | Aggregate Cut- off Date Balance | % of Initial Pool Balance | ||||
| 0 | 3 | $142,500,000 | 15.1 | % | |||
| 1 | 33 | 312,843,406 | 33.1 | ||||
| 2 | 14 | 232,240,342 | 24.6 | ||||
| 3 | 9 | 222,973,002 | 23.6 | ||||
| 4 | 1 | 22,000,000 | 2.3 | ||||
| 15 | 1 | 7,673,203 | 0.8 | ||||
| 16 | 1 | 3,960,000 | 0.4 | ||||
| Total: | 62 | $944,189,953 | 100.0 | % | |||
| Weighted Average: | 2 months | ||||||
THE INFORMATION IN THIS STRUCTURAL AND COLLATERAL TERM SHEET IS NOT COMPLETE AND MAY BE AMENDED PRIOR TO THE TIME OF SALE. THIS TERM SHEET IS NOT AN OFFER TO SELL THESE SECURITIES AND IT IS NOT A SOLICITATION OF AN OFFER TO BUY THESE SECURITIES IN ANY JURISDICTION WHERE THE OFFER OR SALE IS NOT PERMITTED.
18
| BANK 2018-BNK13 | Certain Terms and Conditions |
V. Certain Terms and Conditions
| Allocation Between the RR Interest and the Non-Retained Certificates: | Amounts available for distributions to the holders of the Certificates (including the RR Interest) will be allocated between amounts available for distribution to the holders of the RR Interest, on the one hand, and to all other Certificates, referred to herein as the “Non-Retained Certificates”, on the other hand. The portion of such amount allocable to (a) the RR Interest will at all times be the product of such amount multiplied by 5% and (b) the Non-Retained Certificates will at all times be the product of such amount multiplied by 95% (each, the respective “Percentage Allocation Entitlement”). |
| Interest Entitlements: | The interest entitlement of each Class of Non-Retained Certificates on each Distribution Date generally will be the interest accrued during the related Interest Accrual Period on the related Certificate Balance or Notional Amount at the related pass-through rate, net of any prepayment interest shortfalls allocated to that Class for such Distribution Date as described below. If prepayment interest shortfalls arise from voluntary prepayments (without the applicable Master Servicer consent) on particular non-specially serviced loans during any collection period, the applicable Master Servicer is required to make a compensating interest payment to offset those shortfalls, generally up to an amount equal to the portion of its master servicing fees that accrue at 0.25 basis pointsper annum. The remaining amount of prepayment interest shortfalls will be allocated between the RR Interest, on one hand, and the Non-Retained Certificates, on the other hand, in accordance with their respective Percentage Allocation Entitlements. The prepayment interest shortfalls allocated to the Non-Retained Certificates (other than the Class V and Class R Certificates) will be allocated among such Classes of Certificates entitled to interest, on apro ratabasis, based on their respective amounts of accrued interest for the related Distribution Date, to reduce the interest entitlement on each such Class of Certificates. If a Class receives less than the entirety of its interest entitlement on any Distribution Date, then the shortfall (excluding any shortfall due to prepayment interest shortfalls), together with interest thereon, will be added to its interest entitlement for the next succeeding Distribution Date. |
| Aggregate Principal Distribution Amount: | The Aggregate Principal Distribution Amount for each Distribution Date generally will be the aggregate amount of principal received or advanced in respect of the mortgage loans, net of any non-recoverable advances and interest thereon and workout-delayed reimbursement amounts that are reimbursed to the applicable Master Servicer, the Special Servicer or the Trustee during the related collection period. Non-recoverable advances and interest thereon are reimbursable from principal collections and advances before reimbursement from other amounts. Workout-delayed reimbursement amounts are reimbursable from principal collections. The Non-Retained Certificates will be entitled to the portion of the Aggregate Principal Distribution Amount equal to their Percentage Allocation Entitlement, which is referred to herein as the “Principal Distribution Amount”. |
| Subordination, Allocation of Losses and Certain Expenses | The chart below describes the manner in which the payment rights of certain Classes of Non-Retained Certificates will be senior or subordinate, as the case may be, to the payment rights of other Classes of Non-Retained Certificates. The chart also shows the allocation between the RR Interest and the Non-Retained Certificates and the corresponding entitlement to receive principal and/or interest of certain Classes of Non-Retained Certificates (other than excess interest that accrues on each mortgage loan that has an anticipated repayment date) on any distribution date in descending order. It also shows the manner in which losses are allocated between the RR Interest and the Non-Retained Certificates and the manner in which the Non-Retained Certificate allocations are further allocated to certain Classes of those Certificates in ascending order (beginning with the Non-Offered Certificates, other than the Class V and Class R certificates and the RR Interest) to reduce the balance of each such class to zero;provided that no principal payments or mortgage loan losses will be allocated to the Class X-A, Class X-B, Class X-D, Class X-E, Class X-F, Class X-G, Class V or Class R Certificates, although principal payments and losses may reduce the notional amounts of the Class X-A, Class X-B, Class X-D, Class X-E, Class X-F and Class X-G certificates and, therefore, the amount of interest they accrue. |
THE INFORMATION IN THIS STRUCTURAL AND COLLATERAL TERM SHEET IS NOT COMPLETE AND MAY BE AMENDED PRIOR TO THE TIME OF SALE. THIS TERM SHEET IS NOT AN OFFER TO SELL THESE SECURITIES AND IT IS NOT A SOLICITATION OF AN OFFER TO BUY THESE SECURITIES IN ANY JURISDICTION WHERE THE OFFER OR SALE IS NOT PERMITTED.
19
| BANK 2018-BNK13 | Certain Terms and Conditions |
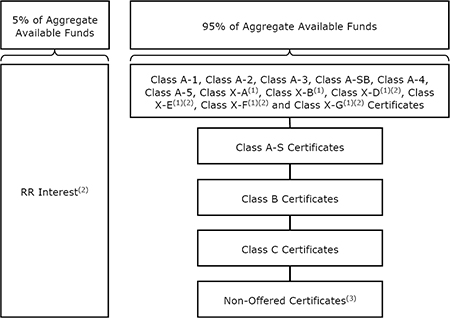 | |||
| (1) | The Class X-A, Class X-B, Class X-D, Class X-E, Class X-F and Class X-G Certificates are interest-only certificates. | ||
| (2) | The Class X-D, Class X-E, Class X-F and Class X-G Certificates and the RR Interest are Non-Offered Certificates. | ||
| (3) | Other than the Class X-D, Class X-E, Class X-F, Class X-G, Class V and Class R Certificates and the RR Interest. | ||
| Distributions: | On each Distribution Date, funds available for distribution from the mortgage loans, net of specified trust fees, expenses and reimbursements that are allocable to the Non-Retained Certificates will generally be distributed in the following amounts and order of priority (in each case to the extent of remaining available funds): |
| 1. | Class A-1, A-2, A-3, A-SB, A-4, A-5, X-A, X-B, X-D, X-E, X-F and X-G Certificates: To interest on the Class A-1, A-2, A-3, A-SB, A-4, A-5, X-A, X-B, X-D, X-E, X-F and X-G Certificates,pro rata, according to their respective interest entitlements. | |
| 2. | Class A-1, A-2, A-3, A-SB, A-4 and A-5 Certificates: To principal on the Class A-1, A-2, A-3, A-SB, A-4 and A-5 Certificates in the following amounts and order of priority: (i) first, to principal on the Class A-SB Certificates, in an amount up to the Principal Distribution Amount for such Distribution Date until their Certificate Balance is reduced to the Class A-SB Planned Principal Balance for such Distribution Date; (ii) second, to principal on the Class A-1 Certificates until their Certificate Balance is reduced to zero, up to the remainder of the Principal Distribution Amount for such Distribution Date; (iii) third, to principal on the Class A-2 Certificates until their Certificate Balance is reduced to zero, up to the remainder of the Principal Distribution Amount for such Distribution Date; (iv) fourth, to principal on the Class A-3 Certificates, until their Certificate Balance is reduced to zero, up to the remainder of the Principal Distribution Amount for such Distribution Date; (v) fifth, to principal on the Class A-4 Certificates until their Certificate Balance is reduced to zero, up to the remainder of the Principal Distribution Amount for such Distribution Date; (vi) sixth, to principal on the Class A-5 Certificates, until their Certificate Balance is reduced to zero, up to the remainder of the Principal Distribution Amount for such Distribution Date; and (vii) seventh, to principal on the Class A-SB Certificates until their Certificate Balance is reduced to zero, up to the remainder of the Principal Distribution Amount for such Distribution Date. However, if the Certificate Balance of each and every Class of Principal Balance Certificates, other than the Class A-1, A-2, A-3, A-SB, A-4 and A-5 Certificates and the RR Interest, has been reduced to zero as a result of the allocation of Mortgage Loan losses and expenses and any of the Class A-1, A-2, A-3, A-SB, A-4 and A-5 Certificates remains outstanding, then the Principal Distribution Amount will be distributed to the Class A-1, A-2, A-3, A-SB, A-4 and A-5 Certificates,pro rata, based on their respective outstanding Certificate Balances, until their Certificate Balances have been reduced to zero. |
THE INFORMATION IN THIS STRUCTURAL AND COLLATERAL TERM SHEET IS NOT COMPLETE AND MAY BE AMENDED PRIOR TO THE TIME OF SALE. THIS TERM SHEET IS NOT AN OFFER TO SELL THESE SECURITIES AND IT IS NOT A SOLICITATION OF AN OFFER TO BUY THESE SECURITIES IN ANY JURISDICTION WHERE THE OFFER OR SALE IS NOT PERMITTED.
20
| BANK 2018-BNK13 | Certain Terms and Conditions |
| 3. | Class A-1, A-2, A-3, A-SB, A-4 and A-5 Certificates: To reimburse the holders of the Class A-1, A-2, A-3, A-SB, A-4 and A-5 Certificates,pro rata, on the basis of previously allocated unreimbursed losses, for any previously unreimbursed losses (plus interest thereon) on the mortgage loans that were previously allocated in reduction of the Certificate Balances of such Classes. | |
| 4. | Class A-S Certificates: To make distributions on the Class A-S Certificates as follows: (a) first, to interest on the Class A-S Certificates in the amount of the interest entitlement for that Class; (b) next, to the extent of the portion of the Principal Distribution Amount remaining after distributions in respect of principal to each Class with a higher distribution priority (in this case, the Class A-1, A-2, A-3, A-SB, A-4 and A-5 Certificates), to principal on the Class A-S Certificates until their Certificate Balance is reduced to zero; and (c) next, to reimburse the holders of the Class A-S Certificates for any previously unreimbursed losses (plus interest thereon) on the mortgage loans that were previously allocated to that Class in reduction of their Certificate Balance. | |
| 5. | Class B Certificates: To make distributions on the Class B Certificates as follows: (a) first, to interest on the Class B Certificates in the amount of the interest entitlement for that Class; (b) next, to the extent of the portion of the Principal Distribution Amount remaining after distributions in respect of principal to each Class with a higher distribution priority (in this case, the Class A-1, A-2, A-3, A-SB, A-4, A-5 and A-S Certificates), to principal on the Class B Certificates until their Certificate Balance is reduced to zero; and (c) next, to reimburse the holders of the Class B Certificates for any previously unreimbursed losses (plus interest thereon) on the mortgage loans that were previously allocated to that Class in reduction of their Certificate Balance. | |
| 6. | Class C Certificates: To make distributions on the Class C Certificates as follows: (a) first, to interest on the Class C Certificates in the amount of the interest entitlement for that Class; (b) next, to the extent of the portion of the Principal Distribution Amount remaining after distributions in respect of principal to each Class with a higher distribution priority (in this case, the Class A-1, A-2, A-3, A-SB, A-4, A-5, A-S and B Certificates), to principal on the Class C Certificates until their Certificate Balance is reduced to zero; and (c) next, to reimburse the holders of the Class C Certificates for any previously unreimbursed losses (plus interest thereon) on the mortgage loans that were previously allocated to that Class in reduction of their Certificate Balance. | |
| 7. | After the Class A-1, A-2, A-3, A-SB, A-4, A-5, A-S, B and C Certificates are paid all amounts to which they are entitled, the remaining funds available for distribution will be used to pay interest, principal and loss reimbursement amounts on the Class D, E, F and G Certificates sequentially in that order in a manner analogous to the Class C Certificates. |
| Allocation of Yield Maintenance and Prepayment Premiums: | If any yield maintenance charge or prepayment premium is collected during any particular collection period with respect to any mortgage loan, then on the Distribution Date corresponding to that collection period, the certificate administrator will pay that yield maintenance charge or prepayment premium (net of liquidation fees payable therefrom) in the following manner: (x)(1) to each of the Class A-1, A-2, A-3, A-SB, A-4, A-5, A-S, B, C and D Certificates, the product of (a) the Non-Retained Certificates’ Percentage Allocation Entitlement of the yield maintenance charge or prepayment premium, (b) the related Base Interest Fraction (as defined in the Preliminary Prospectus) for such Class, and (c) a fraction, the numerator of which is equal to the amount of principal distributed to such Class for that Distribution Date, and the denominator of which is the total amount of principal distributed to all Principal Balance Certificates (other than the RR Interest) for that Distribution Date, (2) to the Class X-A Certificates, the excess, if any, of (a) the product of (i) the Non-Retained Certificates’ Percentage Allocation Entitlement of such yield maintenance charge or prepayment premium and (ii) a fraction, the numerator of which is equal to the amount of principal distributed to the Class A-1, A-2, A-3, A-SB, A-4 and A-5 Certificates for that Distribution Date, and the denominator of which is the total amount of principal distributed to all Principal Balance Certificates (other than the RR Interest) for that Distribution Date, over (b) the amount of such yield maintenance charge or prepayment premium distributed to the Class A-1, A-2, A-3, A-SB, A-4 and A-5 Certificates as described above, and (3) to the Class X-B Certificates, any remaining portion of the Non-Retained Percentage of such yield maintenance charge or prepayment premium not distributed as described above, and (y) to the RR Interest, its Percentage Allocation Entitlement of the yield maintenance charge or prepayment premium.
No prepayment premiums or yield maintenance charges will be distributed to the holders of the Class X-D, X-E, X-F, X-G, E, F, G, V or R Certificates. For a description of when prepayment premiums and yield maintenance charges are generally required on the mortgage loans, see |
THE INFORMATION IN THIS STRUCTURAL AND COLLATERAL TERM SHEET IS NOT COMPLETE AND MAY BE AMENDED PRIOR TO THE TIME OF SALE. THIS TERM SHEET IS NOT AN OFFER TO SELL THESE SECURITIES AND IT IS NOT A SOLICITATION OF AN OFFER TO BUY THESE SECURITIES IN ANY JURISDICTION WHERE THE OFFER OR SALE IS NOT PERMITTED.
21
| BANK 2018-BNK13 | Certain Terms and Conditions |
| Annex A-1 to the Preliminary Prospectus. See also “Risk Factors—Risks Relating to the Mortgage Loans—Risks Relating to Enforceability of Yield Maintenance Charges, Prepayment Premiums or Defeasance Provisions” and “Risk Factors—Other Risks Relating to the Certificates—Your Yield May Be Affected by Defaults, Prepayments and Other Factors” in the Preliminary Prospectus. Prepayment premiums and yield maintenance charges will be distributed on each Distribution Date only to the extent they are actually received on the mortgage loans as of the related Determination Date. | |
| Realized Losses: | The Certificate Balances of the Class A-1, A-2, A-3, A-SB, A-4, A-5, A-S, B, C, D, E, F and G Certificates, will be reduced without distribution on any Distribution Date as a write-off to the extent of the Non-Retained Certificates’ Percentage Allocation Entitlement of any losses realized on the mortgage loans allocated to such Class on such Distribution Date. Such losses will be applied in the following order, in each case until the related Certificate Balance is reduced to zero: first, to the Class G Certificates; second, to the Class F Certificates; third, to the Class E Certificates; fourth, to the Class D Certificates; fifth, to the Class C Certificates; sixth, to the Class B Certificates; seventh, to the Class A-S Certificates; and, finally,pro rata, to the Class A-1, A-2, A-3, A-SB, A-4 and A-5 Certificates based on their outstanding Certificate Balances.
The notional amount of the Class X-A Certificates will be reduced by the amount of all losses that are allocated to the Class A-1, A-2, A-3, A-SB, A-4 or A-5 Certificates as write-offs in reduction of their Certificate Balances. The notional amount of the Class X-B Certificates will be reduced by the amount of all losses that are allocated to the Class A-S, B or C Certificates as write-offs in reduction of their Certificate Balances. The notional amount of the Class X-D Certificates will be reduced by the amount of all losses that are allocated to the Class D Certificates as write-offs in reduction of their Certificate Balance. The notional amount of the Class X-E Certificates will be reduced by the amount of all losses that are allocated to the Class E Certificates as write-offs in reduction of their Certificate Balance. The notional amount of the Class X-F Certificates will be reduced by the amount of all losses that are allocated to the Class F Certificates as write-offs in reduction of their Certificate Balance. The notional amount of the Class X-G Certificates will be reduced by the amount of all losses that are allocated to the Class G Certificates as write-offs in reduction of their Certificate Balance.
|
| P&I Advances: | Each Master Servicer or, if such Master Servicer fails to do so, the Trustee, will be obligated to advance delinquent debt service payments with respect to the mortgage loans it services (other than balloon payments, excess interest and default interest) and assumed debt service payments on mortgage loans with delinquent balloon payments (excluding any related companion loan), except to the extent any such advance is deemed non-recoverable from collections on the related mortgage loan. In addition, if an Appraisal Reduction Amount exists for a given mortgage loan, the interest portion of any P&I advance for such mortgage loan will be reduced, which will have the effect of reducing the amount of interest available for distribution to the Certificates, which with respect to the Non-Retained Certificates will be applied in reverse alphabetical order of their Class designations (except that interest payments on the Class A-1, A-2, A-3, A-SB, A-4, A-5, X-A, X-B, X-D, X-E, X-F and X-G Certificates would be affected on apari passu basis). |
| Servicing Advances: | Each Master Servicer or, if such Master Servicer fails to do so, the Trustee, will be obligated to make servicing advances, including the payment of delinquent property taxes, insurance premiums and ground rent, except to the extent that those advances are deemed non-recoverable from collections on the related mortgage loan. The related Master Servicer or the Trustee, as applicable, will have the primary obligation to make any required servicing advances with respect to any serviced whole loan. With respect to any non-serviced whole loan, the master servicer or trustee, as applicable, under the related lead securitization servicing agreement will have the primary obligation to make any required servicing advances with respect to such non-serviced whole loan. |
Appraisal Reduction Amounts and Collateral Deficiency Amounts:
| An Appraisal Reduction Amount generally will be created in the amount, if any, by which the principal balance of a required appraisal loan (which is a mortgage loan with respect to which certain defaults, modifications or insolvency events have occurred as further described in the Preliminary Prospectus) plus other amounts overdue or advanced in connection with such mortgage loan exceeds 90% of the appraised value of the related mortgaged property plus certain escrows and reserves (including letters of credit) held with respect to the mortgage loan. With respect to any whole loan, any Appraisal Reduction Amount will be allocated first to the related subordinate companion loan, if any, and then to the related mortgage loan and the relatedpari passu companion loan(s).
A mortgage loan will cease to be a required appraisal loan when the same has ceased to be a specially serviced loan (if applicable), has been brought current for at least three consecutive months and no other circumstances exist that would cause such mortgage loan to be a required appraisal loan. |
THE INFORMATION IN THIS STRUCTURAL AND COLLATERAL TERM SHEET IS NOT COMPLETE AND MAY BE AMENDED PRIOR TO THE TIME OF SALE. THIS TERM SHEET IS NOT AN OFFER TO SELL THESE SECURITIES AND IT IS NOT A SOLICITATION OF AN OFFER TO BUY THESE SECURITIES IN ANY JURISDICTION WHERE THE OFFER OR SALE IS NOT PERMITTED.
22
| BANK 2018-BNK13 | Certain Terms and Conditions |
| A Collateral Deficiency Amount will exist with respect to any mortgage loan that is modified into an AB loan structure and remains a corrected mortgage loan and will generally equal the excess of (i) the stated principal balance of such AB modified loan (taking into account the related junior note(s) and anypari passu notes included therein), over (ii) the sum of (in the case of a whole loan, solely to the extent allocable to the subject mortgage loan) (x) the most recent appraised value of the related mortgaged property plus (y) solely to the extent not reflected or taken into account in such appraised value (or in the calculation of any related Appraisal Reduction Amount) and to the extent on deposit with, or otherwise under the control of, the lender as of the date of such determination, any capital or additional collateral contributed by the related borrower at the time the mortgage loan (and as part of the modification thereto) became an AB modified loan plus (z) any other escrows or reserves (in addition to any amounts set forth in the immediately preceding clause (y) and solely to the extent not reflected or taken into account in the calculation of any related Appraisal Reduction Amount) held by the lender with respect to the mortgage loan as of the date of such determination. | |
| A Cumulative Appraisal Reduction Amount with respect to any mortgage loan will be the sum of any Appraisal Reduction Amount and any Collateral Deficiency Amount.
Appraisal Reduction Amounts will affect the amount of debt service advances in respect of the related mortgage loan. Additionally, Cumulative Appraisal Reduction Amounts will be taken into account in the determination of the identity of the Class whose majority constitutes the “majority controlling class certificateholder” and is entitled to appoint the directing certificateholder. | |
Clean-Up Call and Exchange Termination:
| On each Distribution Date occurring after the aggregate unpaid principal balance of the pool of mortgage loans is less than 1.0% of the principal balance of the mortgage loans as of the cut-off date, certain specified persons will have the option to purchase all of the remaining mortgage loans (and the trust’s interest in all property acquired through exercise of remedies in respect of any mortgage loan) at the price specified in the Preliminary Prospectus. Exercise of the option will terminate the trust and retire the then-outstanding certificates.
If the aggregate Certificate Balances of each of the Class A-1, A-2, A-3, A-SB, A-4, A-5, A-S, B, C and D Certificates have been reduced to zero, the trust may also be terminated in connection with an exchange of all the then-outstanding certificates (other than the Class R Certificates and the RR Interest) for the mortgage loans and REO properties then remaining in the issuing entity, subject to payment of a price specified in the Preliminary Prospectus, but all of the holders of those outstanding Classes (other than the Class V, Class R Certificates and the RR Interest) of certificates would have to voluntarily participate in the exchange.
|
| Liquidation Loan Waterfall: | Following the liquidation of any loan or property, the net liquidation proceeds generally will be applied (after reimbursement of advances and certain trust fund expenses), first, as a recovery of accrued interest, other than delinquent interest that was not advanced as a result of Appraisal Reduction Amounts, second, as a recovery of principal until all principal has been recovered, and then as a recovery of delinquent interest that was not advanced as a result of Appraisal Reduction Amounts. Please see “Description of the Certificates—Distributions—Application Priority of Mortgage Loan Collections or Whole Loan Collections” in the Preliminary Prospectus. |
| Control Eligible Certificates: | The Class E, F and G Certificates. |
| Directing Certificateholder/ Controlling Class: | A directing certificateholder (other than with respect to a Servicing Shift Whole Loan (as defined below)) may be appointed by the “majority controlling class certificateholder”, which will be the holder(s) of a majority of the “controlling class”, which means the most subordinate class of Certificates among the Control Eligible Certificates.
The “Controlling Class” will be, as of any time of determination, the most subordinate class of Control Eligible Certificates then-outstanding that has an aggregate Certificate Balance (as notionally reduced by any Cumulative Appraisal Reduction Amounts allocable to such class) at least equal to 25% of the initial Certificate Balance of that class;provided,however, that if at any time the Certificate Balances of the certificates other than the Control Eligible Certificates and the RR Interest have been reduced to zero as a result of principal payments on the Mortgage Loans, then the Controlling Class will be the most subordinate class of Control Eligible Certificates that has a Certificate Balance greater than zero without regard to any Cumulative Appraisal Reduction Amounts. The Controlling Class as of the Closing Date will be the Class G Certificates.
|
| Control and Consultation/ Replacement of Special Servicer by Directing Certificateholder: | The rights of various parties to replace the Special Servicer and approve or consult with respect to major actions of the Special Servicer will vary according to defined periods.
A “Control Termination Event” will occur when (i) the Class E Certificates have a Certificate Balance (taking into account the application of any Cumulative Appraisal Reduction Amounts to notionally reduce the Certificate Balance of such class) of less than 25% of the initial Certificate |
THE INFORMATION IN THIS STRUCTURAL AND COLLATERAL TERM SHEET IS NOT COMPLETE AND MAY BE AMENDED PRIOR TO THE TIME OF SALE. THIS TERM SHEET IS NOT AN OFFER TO SELL THESE SECURITIES AND IT IS NOT A SOLICITATION OF AN OFFER TO BUY THESE SECURITIES IN ANY JURISDICTION WHERE THE OFFER OR SALE IS NOT PERMITTED.
23
| BANK 2018-BNK13 | Certain Terms and Conditions |
Balance of that class or (ii) a holder of the Class E Certificates is the majority Controlling Class Certificateholder and has irrevocably waived its right, in writing, to exercise any of the rights of the Controlling Class Certificateholder and such rights have not been reinstated to a successor controlling class certificateholder as described below;provided,however, that a Control Termination Event will not be deemed continuing in the event that the Certificate Balances of the certificates other than the Control Eligible Certificates and the RR Interest have been reduced to zero as a result of principal payments on the Mortgage Loans.
A “Consultation Termination Event” will occur when (i) there is no class of Control Eligible Certificates that has a then-outstanding Certificate Balance at least equal to 25% of the initial Certificate Balance of that class, in each case, without regard to the application of any Cumulative Appraisal Reduction Amounts; or (ii) a holder of a majority of the Class E Certificates is the majority Controlling Class Certificateholder and has irrevocably waived its right, in writing, to exercise any of the rights of the Controlling Class Certificateholder and such rights have not been reinstated to a successor controlling class certificateholder pursuant to the terms of the BANK 2018-BNK13 pooling and servicing agreement;provided that no Consultation Termination Event resulting solely from the operation of clause (ii) will be deemed to have existed or be in continuance with respect to a successor holder of the Class E Certificates that has not irrevocably waived its right to exercise any of the rights of the Controlling Class Certificateholder;provided,however, that a Consultation Termination Event will not be deemed continuing in the event that the Certificate Balances of the certificates other than the Control Eligible Certificates and the RR Interest have been reduced to zero as a result of principal payments on the Mortgage Loans.
If no Control Termination Event has occurred and is continuing, except with respect to the Excluded Loans (as defined below) with respect to the directing certificateholder (i) the directing certificateholder will be entitled to grant or withhold approval of asset status reports prepared, and material servicing actions proposed, by the Special Servicer, and (ii) the directing certificateholder will be entitled to terminate and replace the Special Servicer with or without cause, and appoint itself or another person as the successor special servicer. It will be a condition to such appointment that DBRS, Fitch and S&P (and any Rating Agency rating any securities backed by anypari passu companion loan(s) serviced under this transaction) confirm that the appointment would not result in a qualification, downgrade or withdrawal of any of their then-current ratings of certificates (and any certificates backed by anypari passu companion loan(s) serviced under this transaction).
If a Control Termination Event has occurred and is continuing but no Consultation Termination Event has occurred and is continuing, the Special Servicer will be required to consult with the directing certificateholder (other than with respect to Excluded Loans as to such party) and the Operating Advisor in connection with asset status reports and material special servicing actions.
If a Consultation Termination Event has occurred and is continuing, the Special Servicer must seek to consult with the Operating Advisor in connection with asset status reports and material special servicing actions, and, in general, no directing certificateholder will be recognized or have any right to terminate the Special Servicer or approve, direct or consult with respect to servicing matters.
With respect to each serviced whole loan that is not a Servicing Shift Whole Loan, the rights of the directing certificateholder described above will be subject to the consultation rights of the holders of the relatedpari passu companion loans. Those consultation rights will generally extend to asset status reports and material special servicing actions involving the related whole loan, will be as set forth in the related intercreditor agreement, and will be in addition to the rights of the directing certificateholder in this transaction described above.
With respect to the whole loan marked with footnote (2) under “IV. Characteristics of the Mortgage Pool—B. Summary of the Whole Loans” (a “Servicing Shift Whole Loan”), prior to date of securitization of the related controllingpari passu companion loan (such date, a “Servicing Shift Securitization Date”), the holder of the related controllingpari passu companion loan will be the directing certificateholder and will have certain control rights regarding the servicing of the related whole loan under the BANK 2018-BNK13 pooling and servicing agreement, including the right to approve or disapprove various material servicing actions involving the related whole loan.
With respect to each non-serviced whole loan, the applicable servicing agreement for the related controllingpari passu companion loan(s) generally grants (or will grant) the directing certificateholder under the related securitization control rights that may include the right to approve or disapprove various material servicing actions involving the related whole loan. The directing certificateholder for this securitization (so long as no Consultation Termination Event has occurred and is occurring) generally will nonetheless have the right to be consulted on a non-binding basis with respect to such actions. For purposes of the servicing of any such whole loan contemplated by this paragraph, the occurrence and continuance of a Control Termination |
THE INFORMATION IN THIS STRUCTURAL AND COLLATERAL TERM SHEET IS NOT COMPLETE AND MAY BE AMENDED PRIOR TO THE TIME OF SALE. THIS TERM SHEET IS NOT AN OFFER TO SELL THESE SECURITIES AND IT IS NOT A SOLICITATION OF AN OFFER TO BUY THESE SECURITIES IN ANY JURISDICTION WHERE THE OFFER OR SALE IS NOT PERMITTED.
24
| BANK 2018-BNK13 | Certain Terms and Conditions |
Event or Consultation Termination Event under this securitization will not limit the control or other rights of the directing certificateholder (or equivalent) under the securitization of the related controllingpari passu companion loan(s).
The control rights and consent and consultation rights described in the three preceding paragraphs are subject to various limitations, conditions and exceptions as described in the Preliminary Prospectus.
Notwithstanding any contrary description set forth above, in the event that, with respect to any mortgage loan, if the majority controlling class certificateholder or the directing certificateholder is a Borrower Party, the majority controlling class certificateholder and the directing certificateholder will have no right to receive asset status reports or such other information as may be specified in the BANK 2018-BNK13 pooling and servicing agreement, to grant or withhold approval of, or consult with respect to, asset status reports prepared, and material servicing actions proposed, by the Special Servicer, with respect to such mortgage loan, and such mortgage loan will be referred to as an “Excluded Loan” as to such party.
In addition, notwithstanding any contrary description set forth above, in the event that, with respect to any mortgage loan, a controlling class certificateholder is a Borrower Party, such controlling class certificateholder will have no right to receive asset status reports or such other information as may be specified in the BANK 2018-BNK13 pooling and servicing agreement with respect to such mortgage loan, and such controlling class certificateholder will be referred to as an “excluded controlling class holder”.
“Borrower Party” means a borrower, a mortgagor or a manager of a mortgaged property, an Accelerated Mezzanine Loan Lender, or any Borrower Party Affiliate. “Accelerated Mezzanine Loan Lender” means a mezzanine lender under a mezzanine loan that has been accelerated or as to which foreclosure or enforcement proceedings have been commenced against the equity collateral pledged to secure such mezzanine loan. “Borrower Party Affiliate” means, with respect to a borrower, a mortgagor, a manager of a Mortgaged Property or an Accelerated Mezzanine Loan Lender, (x) any other person controlling or controlled by or under common control with such borrower, mortgagor, manager or Accelerated Mezzanine Loan Lender, as applicable, or (y) any other person owning, directly or indirectly, 25% or more of the beneficial interests in such borrower, mortgagor, manager or Accelerated Mezzanine Loan Lender. With respect to a mortgage loan secured by a residential cooperative property, a person will not be considered a “Borrower Party” solely by reason of such person holding one or more cooperative unit loans that are secured by direct equity interests in the related borrower or owning one or more residential cooperative units comprising the related mortgaged property as a result of any foreclosure, transfer in lieu of foreclosure or other exercise of remedies with respect to any such unit loan(s).
| |
| Risk Retention Consultation Party: | A risk retention consultation party may be appointed by the holder or holders of more than 50% of the RR Interest, by Certificate Balance. The majority RR Interest holder will have a continuing right to appoint, remove or replace the risk retention consultation party in its sole discretion. This right may be exercised at any time and from time to time.
Except with respect to an Excluded Loan as to such party, the risk retention consultation party will be entitled to consult with each Special Servicer, upon request of the risk retention consultation party, with respect to certain material servicing actions proposed by such Special Servicer.
|
| Replacement of Special Servicer by General Vote of Certificateholders: | If a Control Termination Event has occurred and is continuing, either Special Servicer may be removed and replaced without cause upon the affirmative direction of certificate owners holding not less than 66-2/3% of a certificateholder quorum, following a proposal from certificate owners holding not less than 25% of the appraisal-reduced voting rights of all Principal Balance Certificates other than the RR Interest. The certificateholders who initiate a vote on a termination and replacement of a Special Servicer without cause must cause DBRS, Fitch and S&P to confirm the then-current ratings of the certificates (or decline to review the matter) and cause the payment of the fees and expenses incurred in the replacement. If no Control Termination Event has occurred and is continuing, either Special Servicer may be replaced by the directing certificateholder, subject to DBRS, Fitch and S&P (and any Rating Agency rating any securities backed by anypari passu companion loan(s) serviced under this transaction) confirming the then-current ratings of the Certificates (and any certificates backed by anypari passucompanion loans serviced under this transaction) or declining to review the matter. |
| Excluded Special Servicer: | In the event that, with respect to any mortgage loan, a Special Servicer is a Borrower Party, such Special Servicer will be required to resign as special servicer of such mortgage loan (referred to as an “excluded special servicer loan”). If no Control Termination Event has occurred and is continuing, the directing certificateholder will be entitled to appoint (and may replace with or without cause) a separate special servicer that is not a Borrower Party (referred |
THE INFORMATION IN THIS STRUCTURAL AND COLLATERAL TERM SHEET IS NOT COMPLETE AND MAY BE AMENDED PRIOR TO THE TIME OF SALE. THIS TERM SHEET IS NOT AN OFFER TO SELL THESE SECURITIES AND IT IS NOT A SOLICITATION OF AN OFFER TO BUY THESE SECURITIES IN ANY JURISDICTION WHERE THE OFFER OR SALE IS NOT PERMITTED.
25
| BANK 2018-BNK13 | Certain Terms and Conditions |
| to as an “excluded special servicer”) with respect to such excluded special servicer loan unless such excluded special servicer loan is also an excluded loan. Otherwise, upon resignation of the applicable Special Servicer with respect to an excluded special servicer loan, such resigning Special Servicer will be required to use reasonable efforts to appoint the excluded special servicer. | |
| Appraisal Remedy: | If the Class of Certificates comprising the controlling class loses its status as controlling class because of the application of an Appraisal Reduction Amount or Collateral Deficiency Amount, the holders of a majority of the voting rights of such Class may require the applicable Special Servicer to order a second appraisal for any mortgage loan in respect of which an Appraisal Reduction Amount or Collateral Deficiency Amount has been applied. Such Special Servicer must thereafter determine whether, based on its assessment of such second appraisal, any recalculation of the Appraisal Reduction Amount or Collateral Deficiency Amount is warranted, and if so warranted, the Special Servicer will recalculate such Appraisal Reduction Amount or Collateral Deficiency Amount. Such Class will not be able to exercise any direction, control, consent and/or similar rights of the controlling class unless and until reinstated as the controlling class through such determination; and pending such determination, the rights of the controlling class will be exercised by the Control Eligible Certificates, if any, that would be the controlling class taking into account the subject appraisal reduction amount. |
| Sale of Defaulted Assets: | There will be no “fair value” purchase option. Instead, the BANK 2018-BNK13 pooling and servicing agreement will authorize the Special Servicer to sell defaulted mortgage loans serviced by such Special Servicer to the highest bidder in a manner generally similar to sales of REO properties.
The sale of a defaulted loan (other than a non-serviced whole loan) for less than par plus accrued interest and certain other fees and expenses owed on the loan will be subject to consent or consultation rights of the directing certificateholder and/or Operating Advisor, as described in the Preliminary Prospectus. Generally speaking, the directing certificateholder for any securitization holding apari passu companion loan will have consent and/or consultation rights as the holder of an interest in the related mortgage loan, as described in the Preliminary Prospectus.
With respect to any serviced whole loan, if such whole loan becomes a defaulted loan under the BANK 2018-BNK13 pooling and servicing agreement, the Special Servicer will generally be required to sell both the mortgage loan and the relatedpari passu companion loan(s) as a single whole loan. If the subject whole loan includes one or more subordinate companion loans, those subordinate companion loans may be included in such sale as well.
With respect to each non-serviced whole loan, the applicable servicing agreement governing the servicing of such whole loan generally will provide that, if the relatedpari passu companion loan(s) serviced under such agreement become a defaulted loan under such servicing agreement, then the related special servicer may offer to sell to any person (or may offer to purchase) for cash such whole loan during such time as such applicablepari passu companion loan(s) constitute a defaulted loan under such servicing agreement. Generally speaking, in connection with any such sale, the related special servicer is required to sell both the mortgage loan and the relatedpari passu companion loan(s) as a whole loan. The directing certificateholder for this securitization generally will have consent and/or consultation rights as the holder of an interest in the related mortgage loan, as described in the Preliminary Prospectus. If the subject whole loan includes one or more subordinate companion loans, those subordinate companion loans may be included in such sale as well.
The procedures for the sale of any whole loan that becomes a defaulted whole loan, and any associated consultation rights, are subject to various limitations, conditions and exceptions as described in the Preliminary Prospectus.
|
| “As-Is” Appraisals: | Appraisals must be conducted on an “as-is” basis, and must be no more than 12 months old, for purposes of determining Appraisal Reduction Amounts and market value in connection with REO sales. Required appraisals may consist of updates of prior appraisals. Internal valuations by the applicable Special Servicer are permitted if the principal balance of a mortgage loan is less than $2,000,000. |
| Operating Advisor: | The Operating Advisor will perform certain review duties if a Control Termination Event has occurred and is continuing, which will generally include a limited annual review of, and the delivery of a report regarding, certain actions of each Special Servicer with respect to the resolution and/or liquidation of specially serviced loans to the Certificate Administrator. The review and report generally will be based on any asset status reports and additional information delivered to the Operating Advisor by each Special Servicer. In addition, if a Control Termination Event has occurred and is continuing, each Special Servicer must seek to consult with the Operating Advisor (in addition to the directing certificateholder if no Consultation |
THE INFORMATION IN THIS STRUCTURAL AND COLLATERAL TERM SHEET IS NOT COMPLETE AND MAY BE AMENDED PRIOR TO THE TIME OF SALE. THIS TERM SHEET IS NOT AN OFFER TO SELL THESE SECURITIES AND IT IS NOT A SOLICITATION OF AN OFFER TO BUY THESE SECURITIES IN ANY JURISDICTION WHERE THE OFFER OR SALE IS NOT PERMITTED.
26
| BANK 2018-BNK13 | Certain Terms and Conditions |
Termination Event has occurred and is continuing) in connection with material special servicing actions with respect to specially serviced loans serviced by such Special Servicer. Furthermore, under certain circumstances, but only if a Consultation Termination Event has occurred and is continuing, the Operating Advisor may recommend the replacement of a Special Servicer, in which case the Certificate Administrator will deliver notice of such recommendation to the certificateholders, and certificateholders with specified percentages of the voting rights may direct the replacement of such Special Servicer at their expense.
If a Consultation Termination Event has occurred and is continuing, the Operating Advisor may be removed and replaced without cause upon the affirmative direction of certificate owners holding at least 75% of the appraisal-reduced voting rights of all Certificates (other than the RR Interest), following a proposal from certificate owners holding not less than 25% of the appraisal-reduced voting rights of all Principal Balance Certificates (other than the RR Interest). The certificateholders who initiate a vote on a termination and replacement of the Operating Advisor without cause must cause DBRS, Fitch and S&P to confirm the then-current ratings of the certificates (or decline to review the matter) and cause the payment of the fees and expenses incurred in the replacement. The Operating Advisor generally may be discharged from its duties if and when the Class A-1, A-2, A-3, A-SB, A-4, A-5, A-S, B, C and D Certificates are retired.
| |
| Asset Representations Reviewer: | The Asset Representations Reviewer will be required to review certain delinquent mortgage loans after a specified delinquency threshold has been exceeded (an “Asset Review Trigger”) and the required percentage of certificateholders vote to direct a review of such delinquent loans. An Asset Review Trigger will occur when either (1) mortgage loans with an aggregate outstanding principal balance of 25.0% or more of the aggregate outstanding principal balance of all of the mortgage loans (including any REO loans (or a portion of any REO loan in the case of a whole loan)) held by the issuing entity as of the end of the applicable collection period are delinquent loans or (2) at least 15 mortgage loans are delinquent loans as of the end of the applicable collection period and the outstanding principal balance of such delinquent loans in the aggregate constitutes at least 20.0% of the aggregate outstanding principal balance of all of the mortgage loans (including any REO loans (or a portion of any REO loan in the case of a whole loan)) held by the issuing entity as of the end of the applicable collection period. See “Pooling and Servicing Agreement—The Asset Representations Reviewer—Asset Review” in the Preliminary Prospectus.
The Asset Representations Reviewer may be terminated and replaced without cause. Upon (i) the written direction of certificateholders evidencing not less than 25% of the voting rights (without regard to the application of any Appraisal Reduction Amounts) requesting a vote to terminate and replace the Asset Representations Reviewer with a proposed successor Asset Representations Reviewer that is an eligible asset reviewer, and (ii) payment by such holders to the certificate administrator of the reasonable fees and expenses to be incurred by the certificate administrator in connection with administering such vote, the certificate administrator will promptly provide notice to all certificateholders and the Asset Representations Reviewer of such request by posting such notice on its internet website, and by mailing such notice to all certificateholders and the Asset Representations Reviewer. Upon the written direction of certificateholders evidencing at least 75% of a certificateholder quorum (without regard to the application of any Appraisal Reduction Amounts), the Trustee will terminate all of the rights and obligations of the Asset Representations Reviewer under the BANK 2018-BNK13 pooling and servicing agreement by written notice to the Asset Representations Reviewer, and the proposed successor Asset Representations Reviewer will be appointed. See “Pooling and Servicing Agreement—The Asset Representations Reviewer” in the Preliminary Prospectus.
|
| Dispute Resolution Provisions: | The mortgage loan sellers will be subject to the dispute resolution provisions set forth in the BANK 2018-BNK13 pooling and servicing agreement to the extent those provisions are triggered with respect to any mortgage loan sold to the depositor by a mortgage loan seller and such mortgage loan seller will be obligated under the related mortgage loan purchase agreement to comply with all applicable provisions and to take part in any mediation or arbitration proceedings that may result.
Generally, in the event that a Repurchase Request (as defined in the Preliminary Prospectus) is not “Resolved” (as defined below) within 180 days after the related mortgage loan seller receives such Repurchase Request, then the enforcing servicer will be required to send a notice to the “Initial Requesting Certificateholder” (if any) and the Certificate Administrator indicating the enforcing servicer’s intended course of action with respect to the Repurchase Request. If (a) the enforcing servicer’s intended course of action with respect to the Repurchase Request does not involve pursuing further action to exercise rights against the related mortgage loan seller with respect to the Repurchase Request and the Initial Requesting Certificateholder, if any, or any other certificateholder or certificate owner wishes to exercise its right to refer the matter to mediation (including non-binding arbitration) or arbitration, or (b) the enforcing |
THE INFORMATION IN THIS STRUCTURAL AND COLLATERAL TERM SHEET IS NOT COMPLETE AND MAY BE AMENDED PRIOR TO THE TIME OF SALE. THIS TERM SHEET IS NOT AN OFFER TO SELL THESE SECURITIES AND IT IS NOT A SOLICITATION OF AN OFFER TO BUY THESE SECURITIES IN ANY JURISDICTION WHERE THE OFFER OR SALE IS NOT PERMITTED.
27
| BANK 2018-BNK13 | Certain Terms and Conditions |
servicer’s intended course of action is to pursue further action to exercise rights against the related mortgage loan seller with respect to the Repurchase Request but the Initial Requesting Certificateholder, if any, or any other certificateholder or certificate owner does not agree with the dispute resolution method selected by the enforcing servicer, then the Initial Requesting Certificateholder, if any, or such other certificateholder or certificate owner may deliver a written notice to the applicable Special Servicer indicating its intent to exercise its right to refer the matter to either mediation or arbitration.
“Resolved” means, with respect to a Repurchase Request, (i) that the related Material Defect has been cured, (ii) the related mortgage loan has been repurchased in accordance with the related mortgage loan purchase agreement, (iii) a mortgage loan has been substituted for the related mortgage loan in accordance with the related mortgage loan purchase agreement, (iv) the applicable mortgage loan seller has made a Loss of Value Payment (as defined in the Preliminary Prospectus), (v) a contractually binding agreement is entered into between the enforcing servicer, on behalf of the issuing entity, and the related mortgage loan seller that settles the related mortgage loan seller’s obligations under the related mortgage loan purchase agreement, or (vi) the related mortgage loan is no longer property of the issuing entity as a result of a sale or other disposition in accordance with the BANK 2018-BNK13 pooling and servicing agreement. See “Pooling and Servicing Agreement—Dispute Resolution Provisions” in the Preliminary Prospectus. | |
| Investor Communications: | The certificate administrator is required to include on any Form 10–D any request received from a certificateholder to communicate with other certificateholders related to certificateholders exercising their rights under the terms of the BANK 2018-BNK13 pooling and servicing agreement. Any certificateholder wishing to communicate with other certificateholders regarding the exercise of its rights under the terms of the BANK 2018-BNK13 pooling and servicing agreement will be able to deliver a written request signed by an authorized representative of the requesting investor to the certificate administrator. |
| Certain Fee Offsets: | If a workout fee is earned by a Special Servicer following a loan default with respect to any mortgage loan that it services, then certain limitations will apply based on modification fees paid by the borrower. The modification fee generally must not exceed 1% of the principal balance of the loan as modified in any 12-month period. In addition, if the loan re-defaults, any subsequent workout fee on that loan must be reduced by a portion of the modification fees paid by the borrower in the previous 12 months. Likewise, liquidation fees collected in connection with a liquidation or partial liquidation of a mortgage loan must be reduced by a portion of the modification fees paid by the borrower in the previous 12 months. |
| Deal Website: | The Certificate Administrator will be required to maintain a deal website, which will include, among other items: (a) summaries of asset status reports prepared by each Special Servicer, (b) inspection reports, (c) appraisals, (d) various “special notices” described in the Preliminary Prospectus, (e) the “Investor Q&A Forum”, (f) a voluntary “Investor Registry” and (g) the “Risk Retention Special Notices” tab. Investors may access the deal website following execution of a certification and confidentiality agreement. |
| Initial Majority Controlling Class Certificateholder: | It is expected that Torchlight Investors, LLC or another affiliate of Torchlight Loan Services will be the initial majority controlling class certificateholder. |
| Whole Loans: | Each of the mortgaged properties identified above under “IV. Characteristics of the Mortgage Pool—B. Summary of the Whole Loans” secures both a mortgage loan to be included in the trust fund and one or more other mortgage loans that will not be included in the trust fund, each of which will bepari passu or subordinate in right of payment with the mortgage loan included in the trust fund. We refer to each such group of mortgage loans as a “whole loan”. Such “—Summary of the Whole Loans” section includes further information regarding the various notes in each whole loan, the holders of such notes, the lead servicing agreement for each such whole loan, and the applicable master servicer and applicable special servicer under such lead servicing agreement. |
THE INFORMATION IN THIS STRUCTURAL AND COLLATERAL TERM SHEET IS NOT COMPLETE AND MAY BE AMENDED PRIOR TO THE TIME OF SALE. THIS TERM SHEET IS NOT AN OFFER TO SELL THESE SECURITIES AND IT IS NOT A SOLICITATION OF AN OFFER TO BUY THESE SECURITIES IN ANY JURISDICTION WHERE THE OFFER OR SALE IS NOT PERMITTED.
28
(THIS PAGE INTENTIONALLY LEFT BLANK)
THE INFORMATION IN THIS STRUCTURAL AND COLLATERAL TERM SHEET IS NOT COMPLETE AND MAY BE AMENDED PRIOR TO THE TIME OF SALE. THIS TERM SHEET IS NOT AN OFFER TO SELL THESE SECURITIES AND IT IS NOT A SOLICITATION OF AN OFFER TO BUY THESE SECURITIES IN ANY JURISDICTION WHERE THE OFFER OR SALE IS NOT PERMITTED.
29
| 1745 Broadway |
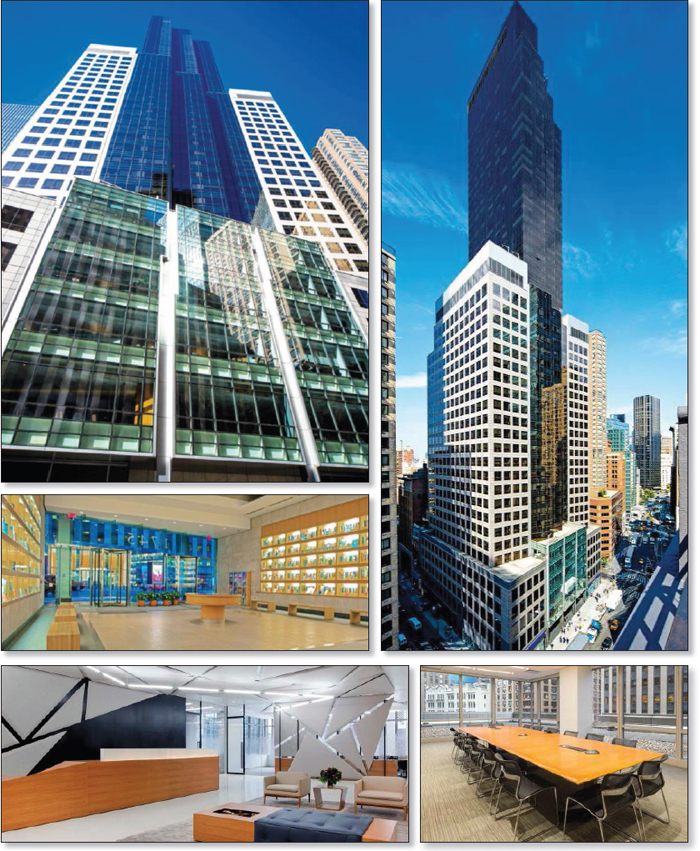
THE INFORMATION IN THIS STRUCTURAL AND COLLATERAL TERM SHEET IS NOT COMPLETE AND MAY BE AMENDED PRIOR TO THE TIME OF SALE. THIS TERM SHEET IS NOT AN OFFER TO SELL THESE SECURITIES AND IT IS NOT A SOLICITATION OF AN OFFER TO BUY THESE SECURITIES IN ANY JURISDICTION WHERE THE OFFER OR SALE IS NOT PERMITTED.
30
| 1745 Broadway |
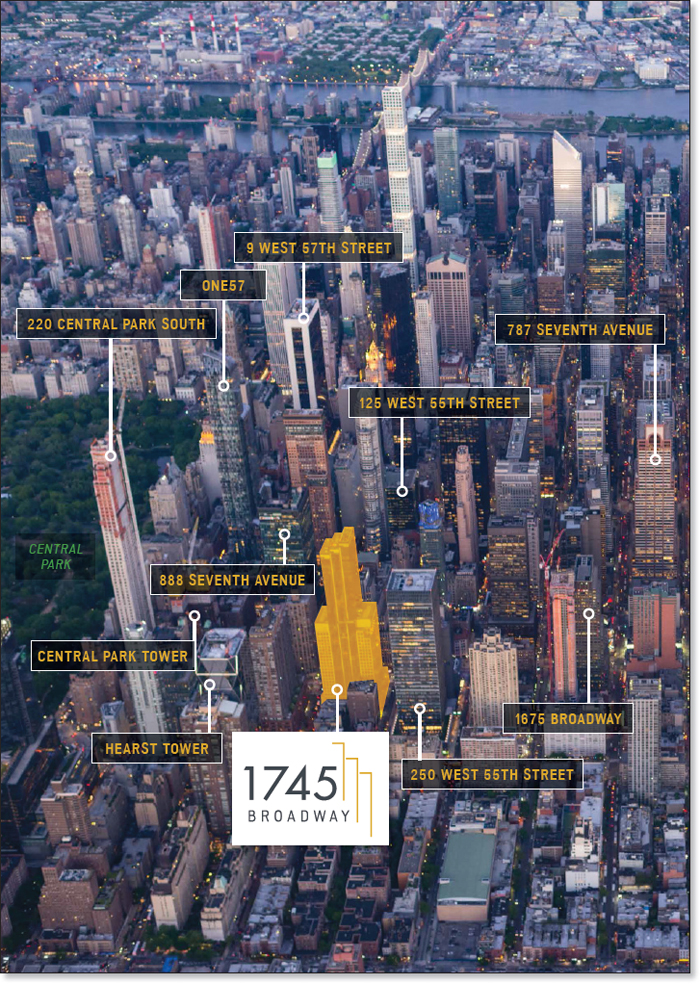
THE INFORMATION IN THIS STRUCTURAL AND COLLATERAL TERM SHEET IS NOT COMPLETE AND MAY BE AMENDED PRIOR TO THE TIME OF SALE. THIS TERM SHEET IS NOT AN OFFER TO SELL THESE SECURITIES AND IT IS NOT A SOLICITATION OF AN OFFER TO BUY THESE SECURITIES IN ANY JURISDICTION WHERE THE OFFER OR SALE IS NOT PERMITTED.
31
| 1745 Broadway |
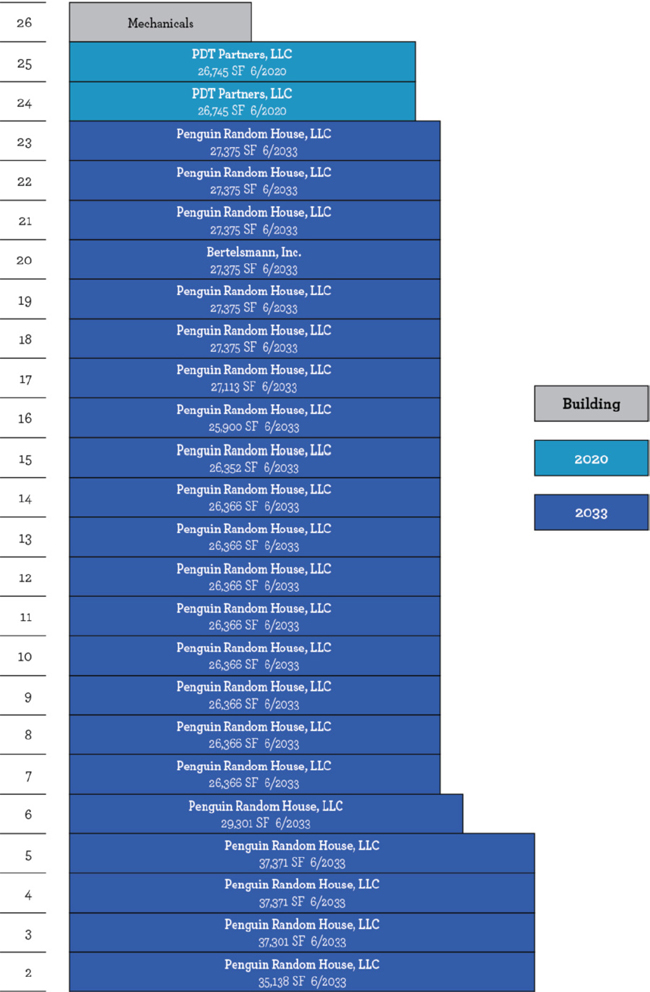
THE INFORMATION IN THIS STRUCTURAL AND COLLATERAL TERM SHEET IS NOT COMPLETE AND MAY BE AMENDED PRIOR TO THE TIME OF SALE. THIS TERM SHEET IS NOT AN OFFER TO SELL THESE SECURITIES AND IT IS NOT A SOLICITATION OF AN OFFER TO BUY THESE SECURITIES IN ANY JURISDICTION WHERE THE OFFER OR SALE IS NOT PERMITTED.
32
| 1745 Broadway |
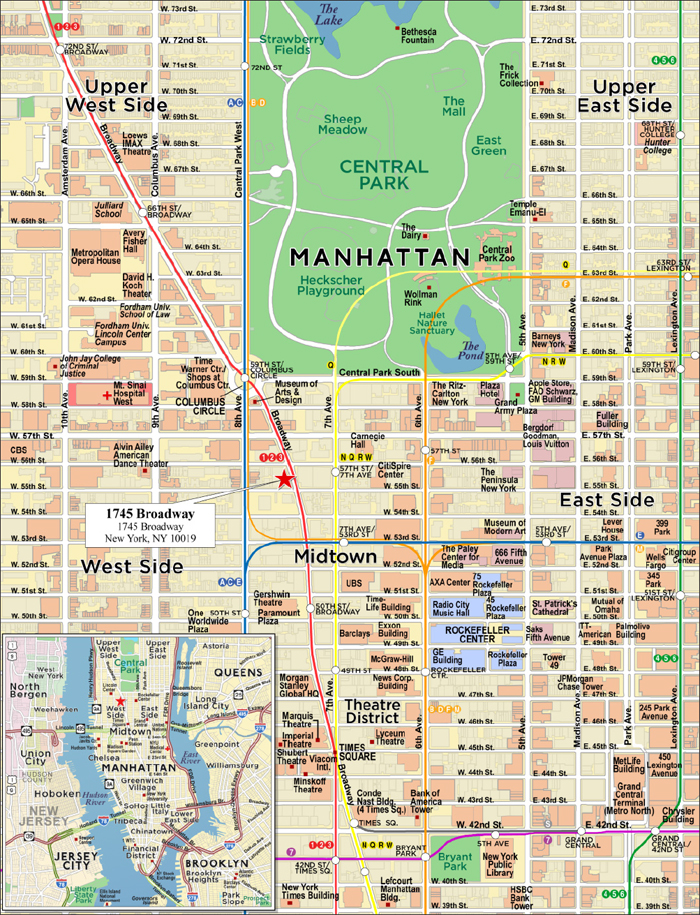
THE INFORMATION IN THIS STRUCTURAL AND COLLATERAL TERM SHEET IS NOT COMPLETE AND MAY BE AMENDED PRIOR TO THE TIME OF SALE. THIS TERM SHEET IS NOT AN OFFER TO SELL THESE SECURITIES AND IT IS NOT A SOLICITATION OF AN OFFER TO BUY THESE SECURITIES IN ANY JURISDICTION WHERE THE OFFER OR SALE IS NOT PERMITTED.
33
| No. 1 – 1745 Broadway | ||||||
| Loan Information | Property Information | |||||
| Mortgage Loan Seller: | Wells Fargo Bank, National Association | Single Asset/Portfolio: | Single Asset | |||
Credit Assessment (DBRS/Fitch/S&P): | BBB(high)/BBB-sf/BBB+ | Property Type: | Office | |||
| Original Principal Balance(1): | $94,000,000 | Specific Property Type: | CBD | |||
| Cut-off Date Balance(1): | $94,000,000 | Location: | New York, NY | |||
| % of Initial Pool Balance: | 9.96% | Size: | 684,515 SF | |||
| Loan Purpose: | Acquisition | Cut-off Date Balance Per SF(1): | $466.02 | |||
| Borrower Name: | 1745 Broadway Owner, LLC | Year Built/Renovated: | 2003/NAP | |||
| Borrower Sponsor: | QSuper Board as trustee for QSuper | Title Vesting(3): | Leasehold | |||
| Mortgage Rate: | 3.7680% | Property Manager: | Cushman & Wakefield U.S., Inc. | |||
| Note Date: | May 24, 2018 | 4thMost Recent Occupancy (As of): | 100.0% (12/31/2014) | |||
| Anticipated Repayment Date: | NAP | 3rdMost Recent Occupancy (As of): | 100.0% (12/31/2015) | |||
| Maturity Date: | June 11, 2028 | 2ndMost Recent Occupancy (As of): | 100.0% (12/31/2016) | |||
| IO Period: | 120 months | Most Recent Occupancy (As of): | 100.0% (12/31/2017) | |||
| Loan Term (Original): | 120 months | Current Occupancy (As of): | 100.0% (7/1/2018) | |||
| Seasoning: | 2 months | |||||
| Amortization Term (Original): | NAP | Underwriting and Financial Information: | ||||
| Loan Amortization Type: | Interest-only, Balloon | |||||
| Interest Accrual Method: | Actual/360 | 4thMost Recent NOI(4): | NAV | |||
| Call Protection: | L(26),GRTR 1% or YM or D(87),O(7) | 3rdMost Recent NOI(4): | NAV | |||
| Lockbox Type: | Hard/Springing Cash Management | 2ndMost Recent NOI(4): | NAV | |||
| Additional Debt(1): | Yes | Most Recent NOI(4): | NAV | |||
| Additional Debt Type(1): | Pari Passu | |||||
| U/W Revenues: | $60,711,276 | |||||
| U/W Expenses: | $23,764,145 | |||||
| Escrows and Reserves(2): | U/W NOI: | $36,947,131 | ||||
| U/W NCF: | $36,605,053 | |||||
| Type: | Initial | Monthly | Cap (If Any) | U/W NOI DSCR(1): | 3.03x | |
| Taxes | $0 | Springing | NAP | U/W NCF DSCR(1): | 3.00x | |
| Insurance | $0 | Springing | NAP | U/W NOI Debt Yield(1): | 11.6% | |
| Replacement Reserve | $0 | Springing | NAP | U/W NCF Debt Yield(1): | 11.5% | |
| TI/LC Reserve | $0 | Springing | NAP | As-Is Appraised Value: | $632,000,000 | |
| Upfront TI/LC Reserve | $21,981,606 | $0 | NAP | As-Is Appraisal Valuation Date: | April 18, 2018 | |
| Rent Concession Reserve | $16,184,976 | $0 | NAP | Cut-off Date LTV Ratio(1): | 50.5% | |
| Ground Rent Reserve | $0 | Springing | NAP | LTV Ratio at Maturity or ARD(1): | 50.5% | |
| (1) | See “The Mortgage Loan” section. All statistical financial information related to balance per square foot, loan-to-value ratios, debt service coverage ratios and debt yields are based on the funded outstanding principal balance of the 1745 Broadway Whole Loan (as defined below). |
| (2) | See “Escrows” section. |
| (3) | See “Ground Lease” section. |
| (4) | Historical operating statements are not available, as the 1745 Broadway Property was recently acquired and such information was not provided by the seller. |
The Mortgage Loan. The mortgage loan (the “1745 Broadway Mortgage Loan”) is part of a whole loan (the “1745 Broadway Whole Loan”) evidenced by eightpari passu notes secured by a first mortgage encumbering the leasehold interest in a 684,515 square foot office portion of a 52-story, LEED-certified, Class A tower located in New York, New York (the “1745 Broadway Property”). The 1745 Broadway Whole Loan was originated on May 24, 2018 by Wells Fargo Bank, National Association. The 1745 Broadway Whole Loan had an original principal balance of $319,000,000, has an outstanding principal balance as of the Cut-off Date of $319,000,000 and accrues interest at an interest rate of 3.7680%per annum. The 1745 Broadway Whole Loan had an initial term of 120 months, has a remaining term of 118 months as of the Cut-off Date and requires payments of interest only through the loan term. The 1745 Broadway Whole Loan matures on June 11, 2028.
The non-controlling Notes A-5 and A-6, which will be contributed to the BANK-2018-BNK13 securitization trust, had an original aggregate principal balance of $94,000,000 and have an outstanding aggregate principal balance as of the Cut-off Date of $94,000,000. The controlling Note A-1 and the non-controlling Notes A-2, A-3 and A-4 had an aggregate original principal balance of $175,000,000 and were contributed to the WFCM 2018-1745 securitization trust. The remaining non-controlling Notes A-7 and A-8, which had an aggregate original principal balance of $50,000,000, are currently held by Wells Fargo Bank, National Association and are expected to be contributed to future securitization trusts. The mortgage loans evidenced by Notes A-1, A-2, A-3, A-4, A-7 and A-8 are collectively referred to herein as the “1745 Broadway Companion Loans”. The lender provides no assurances that any non-securitizedpari passu notes will not be split further. See “Description of the Mortgage Pool—The Whole Loans—The Non-Serviced Pari Passu Whole Loans” and “Pooling and Servicing Agreement” in the Preliminary Prospectus.
THE INFORMATION IN THIS STRUCTURAL AND COLLATERAL TERM SHEET IS NOT COMPLETE AND MAY BE AMENDED PRIOR TO THE TIME OF SALE. THIS TERM SHEET IS NOT AN OFFER TO SELL THESE SECURITIES AND IT IS NOT A SOLICITATION OF AN OFFER TO BUY THESE SECURITIES IN ANY JURISDICTION WHERE THE OFFER OR SALE IS NOT PERMITTED.
34
| 1745 Broadway |
Note Summary
| Notes | Original Balance | Note Holder | Controlling Interest | |
| A-1 | $50,000,000 | WFCM 2018-1745 | Yes | |
| A-2 | $50,000,000 | WFCM 2018-1745 | No | |
| A-3 | $50,000,000 | WFCM 2018-1745 | No | |
| A-4 | $25,000,000 | WFCM 2018-1745 | No | |
| A-5 | $50,000,000 | BANK 2018-BNK13 | No | |
| A-6 | $44,000,000 | BANK 2018-BNK13 | No | |
| A-7 | $30,000,000 | Wells Fargo Bank, National Association | No | |
| A-8 | $20,000,000 | Wells Fargo Bank, National Association | No | |
| Total | $319,000,000 |
At any time after the earlier of (i) June 11, 2021 and (ii) two years from the closing date of the securitization that includes the lastpari passu note of the 1745 Broadway Whole Loan to be securitized, the borrower has the right to either (a) defease the 1745 Broadway Whole Loan in whole, but not in part, or (b) prepay the 1745 Broadway Whole Loan in whole, but not in part, provided that the borrower pays the greater of a yield maintenance premium or a prepayment premium equal to 1.0% of the principal amount being prepaid. No prepayment premium shall apply on or after December 11, 2027. The assumed lockout period of 26 payments is based on the closing date of this transaction in August 2018.
Sources and Uses
| Sources | Uses | |||||||
| Original loan amount | $319,000,000 | 50.0% | Purchase price | $633,000,000 | 99.2% | |||
| Borrower sponsor’s new cash equity | 318,950,998 | 50.0 | Seller Credit | (37,885,153)(1) | (5.9) | |||
| Upfront reserves | 38,166,582 | 6.0 | ||||||
| Closing costs | 4,669,569 | 0.7 | ||||||
| Total Sources | $637,950,998 | 100.0% | Total Uses | $637,950,998 | 100.0% | |||
| (1) | The Seller Credit represents unfunded tenant improvements and free rent periods at the time of the borrower sponsor’s acquisition. |
The Property. The 1745 Broadway Property is a 684,515 square foot, 25-story, LEED-certified, Class A office portion of a 52-story mixed-use tower (the “1745 Broadway Tower”) located in New York, New York, occupying the entire block front between West 55th and West 56th Streets. Constructed in 2003 and situated on a 0.7-acre site, the 1745 Broadway Property is part of a larger tower that also contains residential and retail components (which do not serve as collateral for the 1745 Broadway Whole Loan), which each have dedicated entrances and mechanical systems. As of July 1, 2018, the 1745 Broadway Property was 100.0% occupied by three tenants. Approximately 92.2% of the net rentable area and 90.8% of underwritten base rent at the 1745 Broadway Property is attributed to investment grade tenants.
The 1745 Broadway Property is situated on floors 2 through 25 of the 1745 Broadway Tower and has a dedicated lobby entrance on Broadway as well as various mechanical and storage areas in the subcellar, cellar and 26th floor mezzanines. Additional features include virtually column-free floorplates for large-format single users, 13-foot standard slab-to-slab ceiling heights, floor-to-ceiling windows and approximately 8,500 square feet of useable outdoor terrace space across multiple floors. The non-collateral retail component of the 1745 Broadway Tower comprises 60,876 square feet of ground floor retail space as well as below-grade parking for 124 vehicles and dedicated vehicular/freight elevators. The non-collateral residential component of the 1745 Broadway Tower consists of 111 luxury condominium units known as Park Imperial condominiums with recent average sale prices of approximately $3,000 per square foot. The entrance and lobby for the residential component are situated along West 56th Street.
Since its completion in 2003, the 1745 Broadway Property has served as the global headquarters for Penguin Random House, LLC (“PRH”) or its predecessor. PRH is the largest tenant at the 1745 Broadway Property and accounts for 88.2% of the net rentable area and 86.5% of the underwritten base rent with a June 2033 lease expiration. PRH was formed in 2013 when Random House merged with The Penguin Group, creating the largest consumer book publisher in the world. PRH is the fifth largest book publisher globally, and is majority owned by the German media conglomerate Bertelsmann SE & Co. KGaA (rated BBB+/Baa1/BBB+ by Fitch/Moody’s/S&P), which is publicly traded on the Frankfurt Stock Exchange and guarantees PRH’s lease at the 1745 Broadway Property. PRH comprises approximately 250 editorially independent individual publishers on six continents that together publish approximately 15,000 new books each year. PRH is expected to consolidate certain New York City operations to the 1745 Broadway Property, including legacy locations (345 and 375 Hudson Street) from prior to its 2013 merger with Random House. By 2019, PRH anticipates employing approximately 2,400 employees at the 1745 Broadway Property. PRH executed a 15-year lease renewal in August 2016 that commenced July 1, 2018.
The second largest tenant at the 1745 Broadway Property is PDT Partners, LLC (“PDT Partners”), which accounts for 7.8% of the net rentable area and 9.2% of underwritten base rent with a June 2020 lease expiration. PDT Partners is a global asset management firm with more than $4.0 billion of assets under management. Founded by Peter Muller in 1993 as a quantitative proprietary trading group within Morgan Stanley, PDT Partners became an independent investment manager in 2013. PDT Partners has approximately 150 investment professionals with offices in New York and London. PDT Partners has been a tenant at the 1745 Broadway Property since October 2011.
THE INFORMATION IN THIS STRUCTURAL AND COLLATERAL TERM SHEET IS NOT COMPLETE AND MAY BE AMENDED PRIOR TO THE TIME OF SALE. THIS TERM SHEET IS NOT AN OFFER TO SELL THESE SECURITIES AND IT IS NOT A SOLICITATION OF AN OFFER TO BUY THESE SECURITIES IN ANY JURISDICTION WHERE THE OFFER OR SALE IS NOT PERMITTED.
35
| 1745 Broadway |
The third largest tenant at the 1745 Broadway Property is Bertelsmann, Inc. (“Bertelsmann”), which is the parent company of PRH. Founded in 1835, Bertelsmann is a media conglomerate employing approximately 119,000 people globally. Bertelsmann’s principal subsidiaries include the RTL Group (a European television broadcaster operating in 30 countries) and PRH. In addition, Bertelsmann owns magazine publisher Gruner + Jahr, services unit Arvato, the music business BMG, Bertelsmann Printing Group, Bertelsmann Education Group and Bertelsmann Investments (an international network of funds). Bertelsmann’s lease is fully guaranteed by investment grade-rated Bertelsmann SE & Co. KGaA. Bertelsmann executed a 15-year lease renewal in August 2016 that commenced July 1, 2018.
Condominium Regime.The 1745 Broadway Property and the retail component of the 1745 Broadway Tower, together, are known as The Random House Condominium. The 1745 Broadway Property has a 92.5% undivided interest in the common elements of The Random House Condominium, with the remaining 7.5% interest owned by the owners of the retail component. See“Description of the Mortgage Pool—Mortgage Pool Characteristics—Condominium and Other Shared Interests”in the Preliminary Prospectus.
The following table presents certain information relating to the tenancy at the 1745 Broadway Property:
Major Tenants
| Tenant Name | Credit Rating (Fitch/ Moody’s/ S&P)(1) | Tenant NRSF | % of NRSF | Annual U/W Base Rent PSF | Annual U/W Base Rent | % of Total Annual U/W Base Rent | Lease Expiration Date |
| Penguin Random House, LLC (“PRH”) | BBB+/Baa1/BBB+ | 603,650 | 88.2% | $78.15(2)(3) | $47,172,630(2)(3) | 86.5% | 6/30/2033(4)(5) |
| PDT Partners, LLC | NR/NR/NR | 53,490 | 7.8% | $94.00(6) | $5,028,060 | 9.2% | 6/30/2020(7) |
| Bertelsmann, Inc. | BBB+/Baa1/BBB+ | 27,375 | 4.0% | $85.00(8)(9) | $2,326,875(8)(9) | 4.3% | 6/30/2033(10) |
| Total Major Tenant | 684,515 | 100.0% | $79.66 | $54,527,565 | 100.0% | ||
| Vacant Space | 0 | 0.0% | |||||
| Collateral Total | 684,515 | 100.0% | |||||
| (1) | The ratings shown are for Bertelsmann SE & Co. KGaA, which guarantees the PRH and Bertelsmann leases. |
| (2) | The Annual U/W Base Rent PSF and Annual U/W Base Rent shown represent PRH’s current contractual rental rate. Commencing on July 1, 2023, PRH’s annual base rent will increase to $51,191,299 ($84.80 per square foot) and commencing on July 1, 2028, PRH’s annual base rent will increase to $54,589,325 ($90.43 per square foot). The lender’s underwriting gives separate credit for straight-line rent averaging over the remaining lease term for PRH and Bertelsmann (see “Cash Flow Analysis” section). |
| (3) | PRH is currently in a full rent abatement period through April 2019 for only the leased premises on floors 16-19 and 21-23 (such abatement accounting for 36.2% of the tenant’s underwritten base rent). All remaining rent credits and abatements were reserved at the origination of the 1745 Broadway Whole Loan (see “Escrows” section). |
| (4) | PRH has one 5-year renewal option, with 24 months’ notice, at the fair market rental rate. |
| (5) | PRH has a one-time right to contract its leased premises by the entire rentable area of the 23rd floor (27,375 rentable square feet; 4.5% of the tenant’s total net rentable area) effective June 30, 2023. With respect to the contraction option, PRH is required to provide 12 months’ notice, not be in default under its lease at the time of notice and pay a contraction fee of $1,002,746. |
| (6) | Annual U/W Base Rent PSF and Annual U/W Base Rent include the $213,960 contractual rent step for PDT Partners in July 2019. |
| (7) | PDT Partners has one 1-year renewal option, with 10 months’ notice, at the base rental rate of $98.00 per square foot. |
| (8) | The Annual U/W Base Rent PSF and Annual U/W Base Rent shown represent Bertelsmann’s current contractual rental rate. Commencing on July 1, 2023, Bertelsmann’s annual base rent will increase to $2,518,500 ($92.00 per square foot) and commencing on July 1, 2028, Bertelsmann’s annual base rent will increase to $2,710,125 ($99.00 per square foot). The lender’s underwriting gives separate credit for straight-line rent averaging over the remaining lease term for PRH and Bertelsmann (see “Cash Flow Analysis” section). |
| (9) | Bertelsmann is currently in a full rent abatement period through April 2019. All remaining rent credits and abatements were reserved at the origination of the 1745 Broadway Whole Loan (see “Escrows” section). |
| (10) | Bertelsmann has one 5-year renewal option, with 24 months’ notice, at the fair market rental rate. |
THE INFORMATION IN THIS STRUCTURAL AND COLLATERAL TERM SHEET IS NOT COMPLETE AND MAY BE AMENDED PRIOR TO THE TIME OF SALE. THIS TERM SHEET IS NOT AN OFFER TO SELL THESE SECURITIES AND IT IS NOT A SOLICITATION OF AN OFFER TO BUY THESE SECURITIES IN ANY JURISDICTION WHERE THE OFFER OR SALE IS NOT PERMITTED.
36
| 1745 Broadway |
The following table presents certain information relating to the lease rollover schedule at the 1745 Broadway Property:
Lease Expiration Schedule(1)(2)
| Year Ending December 31, | No. of Leases Expiring | Expiring NRSF | % of Total NRSF | Cumulative Expiring NRSF | Cumulative % of Total NRSF | Annual U/W Base Rent | % of Total Annual U/W Base Rent | Annual U/W Base Rent PSF |
| MTM | 0 | 0 | 0.0% | 0 | 0.0% | $0 | 0.0% | $0.00 |
| 2018 | 0 | 0 | 0.0% | 0 | 0.0% | $0 | 0.0% | $0.00 |
| 2019 | 0 | 0 | 0.0% | 0 | 0.0% | $0 | 0.0% | $0.00 |
| 2020 | 1 | 53,490 | 7.8% | 53,490 | 7.8% | $5,028,060 | 9.2% | $94.00 |
| 2021 | 0 | 0 | 0.0% | 53,490 | 7.8% | $0 | 0.0% | $0.00 |
| 2022 | 0 | 0 | 0.0% | 53,490 | 7.8% | $0 | 0.0% | $0.00 |
| 2023 | 0 | 0 | 0.0% | 53,490 | 7.8% | $0 | 0.0% | $0.00 |
| 2024 | 0 | 0 | 0.0% | 53,490 | 7.8% | $0 | 0.0% | $0.00 |
| 2025 | 0 | 0 | 0.0% | 53,490 | 7.8% | $0 | 0.0% | $0.00 |
| 2026 | 0 | 0 | 0.0% | 53,490 | 7.8% | $0 | 0.0% | $0.00 |
| 2027 | 0 | 0 | 0.0% | 53,490 | 7.8% | $0 | 0.0% | $0.00 |
| 2028 | 0 | 0 | 0.0% | 53,490 | 7.8% | $0 | 0.0% | $0.00 |
| Thereafter | 2 | 631,025 | 92.2% | 684,515 | 100.0% | $49,499,505 | 90.8% | $78.44 |
| Vacant | 0 | 0 | 0.0% | 684,515 | 100.0% | $0 | 0.0% | $0.00 |
| Total/Weighted Average | 3 | 684,515 | 100.0% | $54,527,565 | 100.0% | $79.66 |
| (1) | Information obtained from the underwritten rent roll. |
| (2) | Certain tenants may have lease termination options that are exercisable prior to the originally stated expiration date of the subject lease and that are not considered in the Lease Expiration Schedule. |
The following table presents historical occupancy percentages at the 1745 Broadway Property:
Historical Occupancy
12/31/2014(1) | 12/31/2015(1) | 12/31/2016(1) | 12/31/2017(1) | 7/1/2018(2) | ||||
| 100.0% | 100.0% | 100.0% | 100.0% | 100.0% |
| (1) | Information obtained from tenant leases. |
| (2) | Information obtained from the underwrittenrent roll. |
Operating History and Underwritten Net Cash Flow. The following table presents certain information relating to the underwritten net cash flow at the 1745 Broadway Property:
Cash Flow Analysis(1)
| U/W | % of U/W Effective Gross Income | U/W $ per SF | |
| Base Rent | $54,527,565 | 89.8% | $79.66 |
| Rent Average Benefit(2) | 4,003,413 | 6.6 | 5.85 |
| Grossed Up Vacant Space | 0 | 0.0 | 0.00 |
| Total Reimbursables | 2,863,730 | 4.7 | 4.18 |
| Other Income | 103,000 | 0.2 | 0.15 |
| Less Vacancy & Credit Loss | (786,432)(3) | (1.3) | (1.15) |
| Effective Gross Income | $60,711,276 | 100.0% | $88.69 |
| Total Operating Expenses | $23,764,145 | 39.1% | $34.72 |
|
|
| |
| Net Operating Income | $36,947,131 | 60.9% | $53.98 |
| TI/LC | 205,175 | 0.3 | 0.30 |
| Capital Expenditures | 136,903 | 0.2 | 0.20 |
| Net Cash Flow | $36,605,053 | 60.3% | $53.48 |
| NOI DSCR(4) | 3.03x | ||
| NCF DSCR(4) | 3.00x | ||
| NOI DY(4) | 11.6% | ||
| NCF DY(4) | 11.5% |
| (1) | Historical operating statements are not available, as the 1745 Broadway Property was recently acquired and such information was not provided by the seller. |
| (2) | Represents straight-line rent averaging for PRH and Bertelsmann over the respective remaining lease terms (see “Major Tenants” table). |
| (3) | The underwritten economic vacancy is 1.3%. The 1745 Broadway Property was 100.0% physically occupied as of July 1, 2018. |
| (4) | The debt service coverage ratios and debt yields are based on the 1745 Broadway Whole Loan. |
THE INFORMATION IN THIS STRUCTURAL AND COLLATERAL TERM SHEET IS NOT COMPLETE AND MAY BE AMENDED PRIOR TO THE TIME OF SALE. THIS TERM SHEET IS NOT AN OFFER TO SELL THESE SECURITIES AND IT IS NOT A SOLICITATION OF AN OFFER TO BUY THESE SECURITIES IN ANY JURISDICTION WHERE THE OFFER OR SALE IS NOT PERMITTED.
37
| 1745 Broadway |
Appraisal.As of the appraisal valuation date of April 18, 2018, the 1745 Broadway Property had an “as-is” appraised value of $632,000,000.
Environmental Matters. According to a Phase I environmental site assessment dated April 6, 2018, there was no evidence of any recognized environmental conditions at the 1745 Broadway Property.
Market Overview and Competition. The 1745 Broadway Property is located in New York, New York and occupies the entire block front between West 55th and West 56th Streets. The 1745 Broadway Property is located in the Midtown neighborhood of Manhattan, approximately three blocks south of Central Park and Columbus Circle, three blocks west of the Plaza District and The Museum of Modern Art, one block southwest of Carnegie Hall, one block southwest of the entrance for the N, Q and R subway lines and three blocks south of the entrance for the A, B, C and D subway lines. The 1745 Broadway Property is located approximately 1.1 miles northeast of Penn Station, 1.2 miles northwest of Grand Central Station, 0.4 miles northeast of Times Square, 0.7 miles northwest of Rockefeller Center, 7.3 miles southwest of LaGuardia Airport and 15.9 miles northwest of John F. Kennedy International Airport. According to a third party market research provider, the estimated 2018 population within a three- and five-mile radius of the 1745 Broadway Property was 1,299,418 and 2,639,587, respectively; and the estimated 2018 average household income within the same radii was $130,943 and $112,722, respectively.
Per the appraisal, the 1745 Broadway Property is located within the Midtown West office submarket. As of first quarter 2018, the submarket reported a total inventory of 41.3 million square feet with a 7.6% vacancy rate. The appraiser identified eight directly competitive office properties totaling approximately 6.8 million square feet with an average occupancy rate of 95.6% and direct asking rents ranging from $75.00 to $138.00 per square foot, gross. The appraiser concluded to a market rent at the 1745 Broadway Property of $83.37 per square foot, gross.
The following table presents certain information relating to comparable office leases for the 1745 Broadway Property:
Comparable Leases(1)
| Property Name/Location | Year Built/ Renovated | Total GLA (SF) | Distance from Subject | Tenant Name | Lease Date/Term | Lease Area (SF) | Annual Base Rent PSF | Lease Type |
1114 Avenue of the Americas New York, New York | 1971/NAV | 1,310,000 | 0.8 miles | Campari | January 2018/ 11.0 Yrs | 64,648 | $82.00 | Gross |
620 Eighth Avenue New York, New York | 2007/NAV | 1,500,000 | 0.8 miles | Liquidnet | January 2018/ 15.0 Yrs | 139,510 | $74.00 | Gross |
787 Seventh Avenue New York, New York | 1985/NAV | 1,429,610 | 0.3 miles | Sidley Austin | December 2017/ 15.0 Yrs | 347,672 | $84.00 | Gross |
40 West 57th Street New York, New York | 1972/NAV | 604,936 | 0.4 miles | Tocqueville Asset Management | November 2017/ 10.0 Yrs | 25,000 | $100.00 | Gross |
1633 Broadway New York, New York | 1972/NAV | 2,240,000 | 0.2 miles | Travel Leaders Group (aka TZell) | August 2017/ 15.0 Yrs | 105,876 | $75.50 | Gross |
1301 Avenue of the Americas New York, New York | 1964/NAV | 1,764,411 | 0.4 miles | Arent Fox | August 2017/ 15.0 Yrs | 75,937 | $84.00 | Gross |
4 Times Square New York, New York | 1999/NAV | 1,477,631 | 0.7 miles | HedgeServ Corporation | August 2017/ 10.0 Yrs | 47,756 | $79.00 | Gross |
1740 Broadway New York, New York | 1950/NAV | 413,704 | 0.1 miles | Regus | August 2017/ 10.0 Yrs | 23,212 | $74.00 | Gross |
55 Hudson Yards New York, New York | 2018/NAV | 1,434,100 | 1.7 miles | Silver Lake | June 2017/ 15.0 Yrs | 61,024 | $102.50 | Gross |
50 Hudson Yards New York, New York | 2022/NAV | 2,900,000 | 1.7 miles | BlackRock | May 2017/ 15.0 Yrs | 847,000 | $91.00 | Net (Grossed Up) |
| (1) | Information obtained from the appraisal. |
The Borrower.The borrower is 1745 Broadway Owner, LLC, a Delaware limited liability company and single purpose entity with two independent directors. Legal counsel to the borrower delivered a non-consolidation opinion in connection with the origination of the 1745 Broadway Whole Loan.
The Borrower Sponsor.The borrower sponsor is QSuper Board as trustee for QSuper (“QSuper”), which was founded in 1912. Based in Brisbane, Australia, QSuper is a superannuation benefits fund with approximately AUD $95.2 billion in assets as of June 30, 2017. QSuper provides its services to employees of Queensland Government departments, authorities, and enterprises. QSuper invests in public equity, fixed income markets, cash and properties in Australia and around the globe.
Invesco is currently acting as investment advisor on behalf of QSuper. Invesco is an independent investment management firm, managing more than $934.2 billion in assets on behalf of clients worldwide as of March 31, 2018. Invesco has specialized investment teams managing investments across a comprehensive range of asset classes, investment styles and geographies. The company has
THE INFORMATION IN THIS STRUCTURAL AND COLLATERAL TERM SHEET IS NOT COMPLETE AND MAY BE AMENDED PRIOR TO THE TIME OF SALE. THIS TERM SHEET IS NOT AN OFFER TO SELL THESE SECURITIES AND IT IS NOT A SOLICITATION OF AN OFFER TO BUY THESE SECURITIES IN ANY JURISDICTION WHERE THE OFFER OR SALE IS NOT PERMITTED.
38
| 1745 Broadway |
nearly 7,000 employees focused on client needs across the globe, including an on-the-ground presence in 25 countries. Invesco is listed on the New York Stock Exchange and is investment-grade rated (NYSE: IVZ US; rated A-/A by Fitch/S&P).
Escrows.The 1745 Broadway Whole Loan documents provide for upfront escrows in the amount of $16,184,976 for outstanding rent concessions related to PRH ($14,245,913) and Bertelsmann ($1,939,063), and $21,981,606 for upfront tenant improvements and leasing commissions (“TI/LCs”) related to PRH ($20,475,980) and Bertelsmann ($1,505,626).
The 1745 Broadway Whole Loan documents do not require ongoing monthly escrows for insurance premiums as long as (i) no event of default has occurred and is continuing; (ii) the borrower provides the lender with evidence that the 1745 Broadway Property’s insurance coverage is included in a blanket policy and such policy is in full force and effect; and (iii) the borrower pays all applicable insurance premiums and provides the lender with evidence of renewals. The 1745 Broadway Whole Loan documents do not require ongoing monthly escrows for real estate taxes as long as (i) all taxes and other assessments are paid by the borrower prior to any late payment charges or delinquency, and upon request, the borrower promptly provides evidence thereof to the lender; and (ii) no Cash Trap Event Period (as defined in the “Lockbox and Cash Management” section) has occurred or is continuing.
The 1745 Broadway Whole Loan documents do not require ongoing monthly escrows for replacement reserves, rollover reserves or ground lease reserves as long as no Cash Trap Event Period has occurred or is continuing.
Lockbox and Cash Management.The 1745 Broadway Whole Loan is structured with a hard lockbox and springing cash management, and the loan documents require that the borrower direct the tenants to pay rent directly into such lockbox account. The loan documents also require that all rents received by the borrower or the property manager be deposited into the lockbox account within two business days of receipt. Prior to the occurrence of a Cash Trap Event Period, all funds are required to be distributed to the borrower. During a Cash Trap Event Period, all excess funds after applying funds to the required reserves deposits as described in the “Escrows” section, monthly debt service, approved operating expenses and other items as outlined in the loan documents, are required to be swept to a lender-controlled cash management account.
A “Cash Trap Event Period” will commence upon the earlier of the following:
| (i) | the occurrence of an event of default; |
| (ii) | the net operating income debt yield being less than or equal to 7.0% at the end of any calendar quarter; |
| (iii) | the occurrence of a PRH Trigger Period (as defined below); |
| (iv) | the property manager becoming insolvent or filing for bankruptcy, unless the property manager is replaced by a qualified property manager within 60 days and in accordance with the loan documents; or |
| (v) | the borrower becoming insolvent or filing for bankruptcy. |
A Cash Trap Event Period will end upon the occurrence of the following:
| ● | with regard to clause (i), the cure of such event of default; |
| ● | with regard to clause (ii), (x) the net operating income debt yield being greater than 7.0% for two consecutive calendar quarters or (y) the borrower delivering to the lender a letter of credit or cash collateral for deposit in an amount (or face amount for a letter of credit) such that, if applied to reduce the principal balance of the loan on a dollar-for-dollar basis, will cause the net operating income debt yield to be equal to at least 7.0%; |
| ● | with regard to clause (iii), a PRH Trigger Period Cure (as defined below); or |
| ● | with regard to clause (iv), the date that (x) the property manager is replaced with a qualified property manager in accordance with the loan agreement or (y) such bankruptcy action is dismissed or discharged without any adverse consequences to the 1745 Broadway Property or the loan. |
A “PRH Trigger Period” will commence upon the earlier of the following:
| (i) | PRH defaulting under its lease beyond any applicable notice and cure period; |
| (ii) | PRH delivering notice of its intent to terminate its lease; |
| (iii) | PRH going dark in 50% or more of its space and Bertelsmann and/or Bertelsmann SE & Co. KGaA no longer having a rating of at least “BBB-” or its equivalent by (x) S&P and (y) either Moody’s, Fitch, DBRS, Kroll, Morningstar or any other nationally-recognized statistical rating agency which has been approved by lender (individually or collectively as the context may require, “Investment-Grade Rating”); or |
| (iv) | any bankruptcy or insolvency of PRH or Bertelsmann. |
A “PRH Trigger Period Cure” will occur upon the following:
| ● | with regard to clauses (i) or (ii), (x) a Qualified Re-Leasing Event (as defined below) or (y) PRH having revoked or rescinded all termination or cancellation notices with respect to its lease and having re-affirmed its lease in writing as being in full force and effect as evidenced by an estoppel certificate reasonably acceptable to lender; |
| ● | with regard to clause (iii), (x) a Qualified Re-Leasing Event or (y) PRH being in actual, physical possession of at least 50% of its space, actively using such premises for business purposes during customary business hours and not being dark in such space and/or Bertelsmann’s and/or Bertelsmann SE & Co. KGaA’s Investment-Grade Rating being reinstated; or |
| ● | with regard to clause (iv), (x) a Qualified Re-Leasing Event or (y) PRH having assumed its lease in the related bankruptcy or insolvency proceedings. |
A “Qualified Re-Leasing Event” will occur upon one or more replacement tenants satisfactory to lender executing leases covering all of the space currently occupied by PRH in accordance with the loan documents with (i) such replacement tenants having unconditionally accepted the leased premises, taken actual, physical occupancy of such space and paying full unabated rent or any such abatement having been reserved and (ii) all TI/LCs or other similar landlord obligations having been paid or reserved.
THE INFORMATION IN THIS STRUCTURAL AND COLLATERAL TERM SHEET IS NOT COMPLETE AND MAY BE AMENDED PRIOR TO THE TIME OF SALE. THIS TERM SHEET IS NOT AN OFFER TO SELL THESE SECURITIES AND IT IS NOT A SOLICITATION OF AN OFFER TO BUY THESE SECURITIES IN ANY JURISDICTION WHERE THE OFFER OR SALE IS NOT PERMITTED.
39
| 1745 Broadway |
Property Management.The 1745 Broadway Property is managed by Cushman & Wakefield U.S., Inc.
Assumption.The borrower has the right to transfer the 1745 Broadway Property, provided that certain conditions are satisfied, including, but not limited to: (i) no event of default has occurred and is continuing; (ii) the lender’s receipt of an additional non-consolidation opinion which may be relied upon by lender, rating agencies and their respective counsel; (iii) either (x) the transferee is a Qualified Transferee (as defined below) or (y) the lender reasonably determines that the proposed transferee and guarantor satisfy the lender’s credit review and underwriting standards, taking into consideration transferee experience, financial strength and general business standing; (iv) the person who will manage the 1745 Broadway Property following a transfer must be a Qualified Manager (as defined below) and (v) if requested by the lender, rating agency confirmation from DBRS, Fitch, and S&P that the transfer will not result in a downgrade, withdrawal or qualification of the respective ratings assigned to the Series BANK 2018-BNK13 Certificates and similar confirmations from each rating agency rating any securities backed by any of the 1745 Broadway Companion Loans with respect to the ratings of such securities.
“Qualified Transferee” means either (a) any person or its affiliate (provided such person owns, directly or indirectly, more than 50% of such affiliate) who (i) owns and operates office properties with similar scope, class and use and similar or greater size and value as the 1745 Broadway Property and located in central business districts of major urban centers of the United States totaling at least in the aggregate 2,500,000 square feet of gross leasable area (exclusive of the 1745 Broadway Property), (ii) has total assets in excess of $1,500,000,000 and (iii) has a net worth in excess of $750,000,000; or (b) any person with regard to which lender will have received a rating agency confirmation. In no event, however, will a person be deemed to be a Qualified Transferee if such person (A) is an embargoed person, (B) is or has during the previous seven years been the subject of a bankruptcy action or (C) has been convicted in a criminal proceeding for a felony or any crime involving moral turpitude or is an organized crime figure or is reputed to have substantial business or other affiliations with any organized crime figure.
“Qualified Manager” means either (a) Cushman & Wakefield U.S., Inc., together with its affiliates; (b) a reputable and experienced professional management organization which (x) is not subject to a bankruptcy, insolvency or similar proceeding, and (y) manages, together with its affiliates, office properties with similar size, scope, class, use and value as the 1745 Broadway Property and located in central business districts of major urban centers of the United States totaling at least in the aggregate 2,500,000 square feet of gross leasable area (exclusive of the 1745 Broadway Property); or (c) a manager approved by the lender and for which the lender will have received a rating agency confirmation.
Partial Release.Not permitted.
Real Estate Substitution.Not permitted.
Subordinate and Mezzanine Indebtedness.Not permitted.
Ground Lease. The 1745 Broadway Property is subject to a ground lease with AMSI Investors, Sheila Engel and 1741 Broadway Associates LP. The ground lease at the 1745 Broadway Property commenced December 14, 1999 and the initial term expires March 31, 2098. The ground lease has 10, five-year renewal options, with 36 months’ notice for the original term and 12 months’ notice for any subsequent extension, at the fair market rental rate. The borrower is currently obligated to pay ground rent at the rate of $2,566,449 per year ($3.75 per square foot), with approximately 1.8% average annual rent increases during the initial term. See“Description of the Mortgage Pool—Mortgage Pool Characteristics—Fee & Leasehold Estates; Ground Leases”in the Preliminary Prospectus.
Terrorism Insurance.The 1745 Broadway Whole Loan documents require that the “all risk” insurance policy required to be maintained by the borrower provide coverage for terrorism in an amount equal to the full replacement cost of the 1745 Broadway Property, as well as business interruption insurance covering no less than the 18-month period following the occurrence of a casualty event, together with a 12-month extended period of indemnity (provided that if TRIPRA or a similar statute is not in effect, the borrower will not be obligated to pay terrorism insurance premiums in excess of two times the premium for the casualty and business interruption coverage on a stand-alone basis).
THE INFORMATION IN THIS STRUCTURAL AND COLLATERAL TERM SHEET IS NOT COMPLETE AND MAY BE AMENDED PRIOR TO THE TIME OF SALE. THIS TERM SHEET IS NOT AN OFFER TO SELL THESE SECURITIES AND IT IS NOT A SOLICITATION OF AN OFFER TO BUY THESE SECURITIES IN ANY JURISDICTION WHERE THE OFFER OR SALE IS NOT PERMITTED.
40
(THIS PAGE INTENTIONALLY LEFT BLANK)
THE INFORMATION IN THIS STRUCTURAL AND COLLATERAL TERM SHEET IS NOT COMPLETE AND MAY BE AMENDED PRIOR TO THE TIME OF SALE. THIS TERM SHEET IS NOT AN OFFER TO SELL THESE SECURITIES AND IT IS NOT A SOLICITATION OF AN OFFER TO BUY THESE SECURITIES IN ANY JURISDICTION WHERE THE OFFER OR SALE IS NOT PERMITTED.
41
GRIFFIN PORTFOLIO II
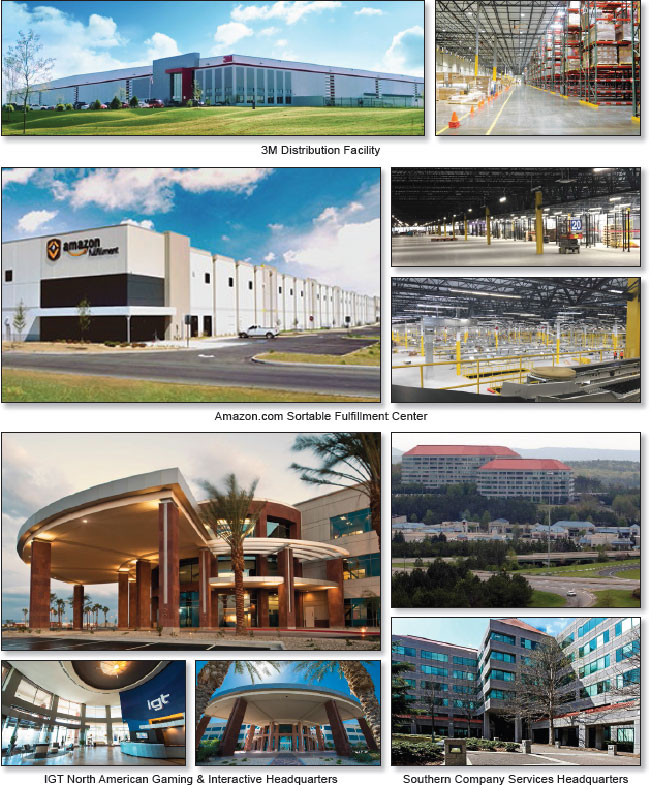
THE INFORMATION IN THIS STRUCTURAL AND COLLATERAL TERM SHEET IS NOT COMPLETE AND MAY BE AMENDED PRIOR TO THE TIME OF SALE. THIS TERM SHEET IS NOT AN OFFER TO SELL THESE SECURITIES AND IT IS NOT A SOLICITATION OF AN OFFER TO BUY THESE SECURITIES IN ANY JURISDICTION WHERE THE OFFER OR SALE IS NOT PERMITTED.
42
GRIFFIN PORTFOLIO II
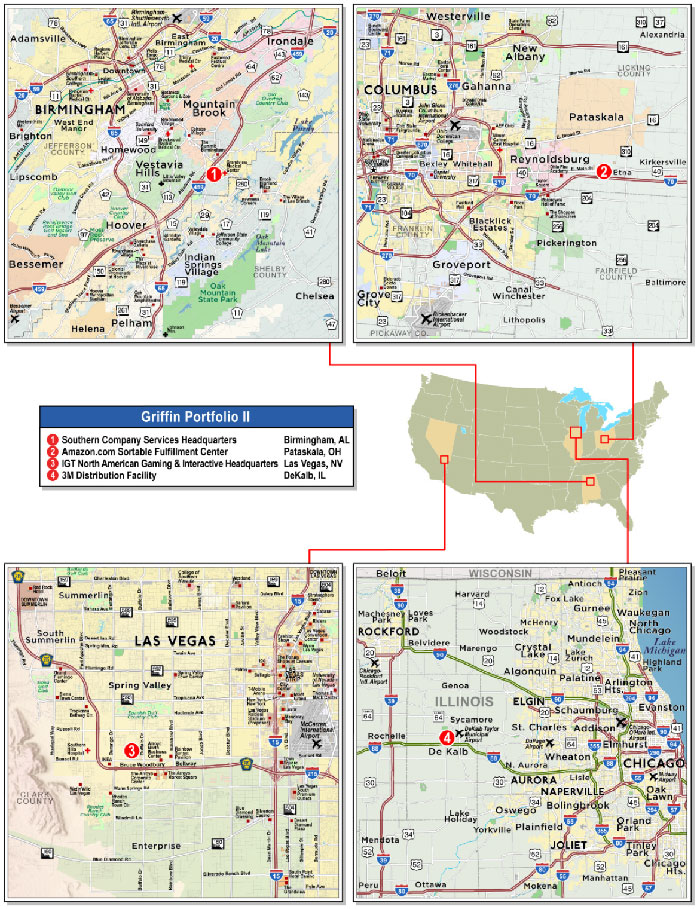
THE INFORMATION IN THIS STRUCTURAL AND COLLATERAL TERM SHEET IS NOT COMPLETE AND MAY BE AMENDED PRIOR TO THE TIME OF SALE. THIS TERM SHEET IS NOT AN OFFER TO SELL THESE SECURITIES AND IT IS NOT A SOLICITATION OF AN OFFER TO BUY THESE SECURITIES IN ANY JURISDICTION WHERE THE OFFER OR SALE IS NOT PERMITTED.
43
| No. 2 – Griffin Portfolio II | |||||||
| Loan Information | Property Information | ||||||
| Mortgage Loan Seller: | Bank of America, National Association | Single Asset/Portfolio: | Portfolio | ||||
Credit Assessment (DBRS/Fitch/S&P): | NR/NR/NR | Property Type(5): | Various | ||||
| Original Principal Balance(1): | $85,000,000 | Specific Property Type(5): | Various | ||||
| Cut-off Date Balance(1): | $85,000,000 | Location(5): | Various | ||||
| % of Initial Pool Balance: | 9.00% | Size: | 2,726,080 SF | ||||
| Loan Purpose: | Refinance | Cut-off Date Balance Per SF(1): | $91.71 | ||||
| Borrower Names(2): | Various | Year Built/Renovated(5): | Various | ||||
| Borrower Sponsor: | Griffin Capital Company, LLC | Title Vesting: | Fee | ||||
| Mortgage Rate: | 4.3150% | Property Manager: | Griffin Capital Essential Asset Property Management II, LLC (borrower-related) | ||||
| Note Date: | April 27, 2018 | 4thMost Recent Occupancy(6): | NAV | ||||
| Anticipated Repayment Date: | NAP | 3rdMost Recent Occupancy(6): | NAV | ||||
| Maturity Date: | May 1, 2028 | 2ndMost Recent Occupancy(6): | NAV | ||||
| IO Period: | 120 months | Most Recent Occupancy (As of)(7): | 100.0% (12/31/2017) | ||||
| Loan Term (Original): | 120 months | Current Occupancy (As of): | 100.0% (8/1/2018) | ||||
| Seasoning: | 3 months | ||||||
| Amortization Term (Original): | NAP | ||||||
| Loan Amortization Type: | Interest-only, Balloon | Underwriting and Financial Information: | |||||
| Interest Accrual Method: | Actual/360 | ||||||
| Call Protection: | L(24),GRTR 1% or YM(90),O(6) | 4thMost Recent NOI (As of)(6): | NAV | ||||
| Lockbox Type: | Hard/Springing Cash Management | 3rdMost Recent NOI (As of)(6): | NAV | ||||
| Additional Debt(1)(3): | Yes | 2ndMost Recent NOI (As of)(6): | NAV | ||||
| Additional Debt Type(1)(3): | Pari Passu | Most Recent NOI (As of)(8): | $15,300,404 (12/31/2017) | ||||
| U/W Revenues: | $30,710,040 | ||||||
| U/W Expenses: | $7,482,500 | ||||||
| U/W NOI(8): | $23,227,540 | ||||||
| U/W NCF: | $21,958,766 | ||||||
| Escrows and Reserves(4): | U/W NOI DSCR(1): | 2.12x | |||||
| U/W NCF DSCR(1): | 2.01x | ||||||
| Type: | Initial | Monthly | Cap (If Any) | U/W NOI Debt Yield(1): | 9.3% | ||
| Taxes | $90,000 | $45,000 | NAP | U/W NCF Debt Yield(1): | 8.8% | ||
| Insurance | $0 | Springing | NAP | As-Is Appraised Value(9): | $415,500,000 | ||
| Replacement Reserve | $0 | Springing | (4) | As-Is Appraisal Valuation Date(9): | Various | ||
| TI/LC Reserve | $0 | Springing | (4) | Cut-off Date LTV Ratio(1)(9): | 60.2% | ||
| Landlord Obligations Reserve | $1,900,229 | $0 | NAP | LTV Ratio at Maturity or ARD(1)(9): | 60.2% | ||
| (1) | The Griffin Portfolio II Mortgage Loan (as defined below) is part of the Griffin Portfolio II Whole Loan (as defined below), which is comprised of sevenpari passu promissory notes with an aggregate original principal balance of $250,000,000. The Cut-off Date Balance per SF, U/W NOI DSCR, U/W NCF DSCR, U/W NOI Debt Yield, U/W NCF Debt Yield, Cut-off Date LTV Ratio and LTV Ratio at Maturity presented above are based on the aggregate principal balance of the promissory notes comprising the Griffin Portfolio II Whole Loan. |
| (2) | The borrowers are Griffin (Las Vegas Buffalo) Essential Asset REIT II, LLC, Griffin (DeKalb) Essential Asset REIT II, LLC, Griffin (Etna) Essential Asset REIT II, LLC and Griffin (Birmingham) Essential Asset REIT II, LLC. |
| (3) | See “The Mortgage Loan” section. |
| (4) | See “Escrows” section. |
| (5) | See “The Properties” section. |
| (6) | Historical information is not available prior to 2017, as the Griffin Portfolio II Properties were acquired between October and December 2016. |
| (7) | Most Recent Occupancy is reflective of the Griffin Portfolio II Properties being 100.0% leased. One of the four Griffin Portfolio II Properties, Southern Company Services Headquarters, is 100.0% leased, but has been undergoing an extensive renovation and phased-in physical occupancy since 2016. |
| (8) | 2017 NOI is less than U/W NOI due primarily to the fact that Southern Company Services, Inc. has been paying rent only on its occupied space during its phased-in occupancy since 2016. The U/W NOI includes full rental payments for Southern Company Services, Inc. as under a master escrow agreement with the Southern Company Services Headquarters property’s seller, the seller is obligated through December 31, 2018 to provide to the borrowers all base rent and expense reimbursements to the extent not obligated to be paid by the tenant during its phased-in occupancy period, and Southern Company Services, Inc. is obligated to begin paying full rent beginning January 2019. |
| (9) | The appraiser provided a bulk portfolio value for the Griffin Portfolio II Properties of $415,500,000, which includes a portfolio premium of $19,810,000 over the aggregate “As Is” appraised values for the individual Griffin Portfolio II Properties. The aggregate “As Is” appraised values for the individual Griffin Portfolio II Properties is $395,690,000, which results in a Cut-off Date LTV Ratio and an LTV Ratio at Maturity of 63.2% and 63.2%, respectively. |
THE INFORMATION IN THIS STRUCTURAL AND COLLATERAL TERM SHEET IS NOT COMPLETE AND MAY BE AMENDED PRIOR TO THE TIME OF SALE. THIS TERM SHEET IS NOT AN OFFER TO SELL THESE SECURITIES AND IT IS NOT A SOLICITATION OF AN OFFER TO BUY THESE SECURITIES IN ANY JURISDICTION WHERE THE OFFER OR SALE IS NOT PERMITTED.
44
GRIFFIN PORTFOLIO II
The Mortgage Loan. The mortgage loan (the “Griffin Portfolio II Mortgage Loan”) is part of a whole loan (the “Griffin Portfolio II Whole Loan”) that is evidenced by sevenpari passu promissory notes secured by a portfolio of two single-tenant office properties and two single-tenant warehouse and distribution facilities located in four different states and totaling 2,726,080 square feet (the “Griffin Portfolio II Properties”). The Griffin Portfolio II Whole Loan was originated on April 27, 2018 by Bank of America, National Association and KeyBank National Association. The Griffin Portfolio II Whole Loan had an original principal balance of $250,000,000, has an outstanding principal balance as of the Cut-off Date of $250,000,000 and accrues interest at an interest rate of 4.3150%per annum. The Griffin Portfolio II Whole Loan had an initial term of 120 months, has a remaining term of 117 months as of the Cut-off Date and requires payments of interest-only through its maturity date of May 1, 2028.
The Griffin Portfolio II Mortgage Loan, evidenced by the controlling Note A-1-1 and the non-controlling Note A-1-2-2 being contributed to the BANK 2018-BNK13 trust, had an original aggregate principal balance of $85,000,000 and has an outstanding aggregate principal balance as of the Cut-off Date of $85,000,000.
The non-controlling Notes A-2-2-2 and A-2-3 with an original aggregate principal balance of $25,000,000 were contributed to the UBS 2018-C11 trust. The non-controlling Notes A-1-2-1 and A-2-2-1, with an original aggregate principal balance of $80,000,000, were contributed to the MSC 2018-H3 trust. The non-controlling Note A-2-1, with an original principal balance of $60,000,000, is currently held by KeyBank National Association and is expected to be contributed to a future trust or trusts. The lender provides no assurances that the non-securitizedpari passu note will not be split further. See “Description of the Mortgage Pool—The Whole Loans—The Serviced Whole Loans” and “Pooling and Servicing Agreement” in the Preliminary Prospectus.
Note Summary
| Notes | Original Balance | Note Holder | Controlling Interest | |
| A-1-1 | $80,000,000 | BANK 2018-BNK13 | Yes | |
| A-1-2-1 | $40,000,000 | MSC 2018-H3 | No | |
| A-1-2-2 | $5,000,000 | BANK 2018-BNK13 | No | |
| A-2-1 | $60,000,000 | KeyBank National Association | No | |
| A-2-2-1 | $40,000,000 | MSC 2018-H3 | No | |
| A-2-2-2 | $5,000,000 | UBS 2018-C11 | No | |
| A-2-3 | $20,000,000 | UBS 2018-C11 | No | |
| Total | $250,000,000 |
As early as June 1, 2020, the borrowers have the right to prepay the Griffin Portfolio II Whole Loan in whole through yield maintenance or the right to prepay the Griffin Portfolio II Whole Loan in part as described below under “Partial Release”. In addition, the Griffin Portfolio II Whole Loan is prepayable without penalty on or after November 1, 2027, in whole or in part.
Sources and Uses
| Sources | Uses | |||||||
| Original loan amount(1) | $250,000,000 | 98.9% | Loan payoff(2) | $249,757,720 | 98.8% | |||
| Borrower equity | 2,896,561 | 1.1 | Reserves | 1,990,229 | 0.8 | |||
| Closing costs | 1,148,612 | 0.5 | ||||||
| Total Sources | $252,896,561 | 100.0% | Total Uses | $252,896,561 | 100.0% |
| (1) | The Griffin Portfolio II Mortgage Loan is part of the Griffin Portfolio II Whole Loan, which is comprised of sevenpari passu promissory notes with an aggregate original principal balance of $250,000,000. |
| (2) | Proceeds from the Griffin Portfolio II Whole Loan were used primarily to return equity to the borrower sponsor to pay down a portion of the borrower sponsor’s credit facility. The borrower sponsor acquired the Griffin Portfolio II Properties in separate transactions in 2016 for an aggregate purchase price of $356,342,060. |
THE INFORMATION IN THIS STRUCTURAL AND COLLATERAL TERM SHEET IS NOT COMPLETE AND MAY BE AMENDED PRIOR TO THE TIME OF SALE. THIS TERM SHEET IS NOT AN OFFER TO SELL THESE SECURITIES AND IT IS NOT A SOLICITATION OF AN OFFER TO BUY THESE SECURITIES IN ANY JURISDICTION WHERE THE OFFER OR SALE IS NOT PERMITTED.
45
GRIFFIN PORTFOLIO II
The Properties. The Griffin Portfolio II Properties are comprised of two single-tenant office properties and two single-tenant warehouse and distribution facilities located in Alabama, Ohio, Nevada and Illinois totaling 2,726,080 square feet.
The following table presents certain information relating to the Griffin Portfolio II Properties:
Griffin Portfolio II Property Summary
| Property Name Address | Property Type | Year Built/ Renovated | SF | Allocated Loan Amount (“ALA”) | % of ALA | Appraised Value | % of Appraised Value | UW NOI | % of UW NOI |
Southern Company Services Headquarters 3525 & 3535 Colonnade Parkway
| Office | 1988/2018 | 669,438 | $99,600,000 | 39.8% | $153,250,000 | 38.7% | $8,472,959 | 36.5% |
Amazon.com Sortable Fulfillment Center 11999 National Road
| Industrial | 2016/NAP | 856,254 | $61,500,000 | 24.6% | $94,600,000 | 23.9% | $5,922,167 | 25.5% |
IGT North American Gaming & Interactive Headquarters 6355 South Buffalo Drive
| Office | 2007/NAP | 222,268 | $45,300,000 | 18.1% | $75,540,000 | 19.1% | $4,494,930 | 19.4% |
3M Distribution Facility 1650 Macom Drive
| Industrial | 2016/NAP | 978,120 | $43,600,000 | 17.4% | $72,300,000 | 18.3% | $4,337,484 | 18.7% |
| Total | 2,726,080 | $250,000,000 | 100.0% | $415,500,000(1) | 100.0% | $23,227,540 | 100.0% |
| (1) | The aggregate of the “As Is” appraised values for the individual Griffin Portfolio II Properties is $395,690,000. The appraiser provided a bulk portfolio value for the Griffin Portfolio II Properties of $415,500,000, which includes a portfolio premium of $19,810,000. |
The Griffin Portfolio II Properties are leased under long-term leases to credit-rated tenants from a range of industries that includes consumer services, retail, gaming and capital goods. All of the leases have built-in rental increases and none of the leases include any termination or contraction options. The office tenants use the properties as their corporate or regional headquarters and the industrial tenants occupy build-to-suit distribution centers.
Southern Company Services Headquarters(669,438 SF, 24.6% of SF, 39.8% ALA). The Southern Company Services Headquarters property is comprised of a nine-story office building and a seven-story office building, which total 669,438 square feet, that are fully leased by Southern Company Services, Inc. through March 17, 2044 and are utilized as the main regional offices for Southern Company Services, Inc. and an affiliate, Southern Nuclear. The lease provides for 2.0% annual rent escalations commencing January 1, 2019, and one ten-year renewal option at fair market rent followed by 2.0% annual rent escalations. The lease does not provide any termination or contraction options. The lease requires that Southern Company Services, Inc. maintain during its lease term an investment grade credit rating from either S&P, Moody’s, or Fitch or provide to the landlord (i) an annual, automatic renewal letter of credit from a bank rated at least A- in an amount equal to the lesser of (a) $55 million (equal to approximately 3.5 years of maximum base rent and operating expense obligations) or (b) the remaining base rent and operating expense obligations for the balance of the lease term or (ii) a guaranty from its parent, Southern Company, provided that Southern Company maintains an investment grade credit rating.
The Southern Company Services Headquarters property is located in Birmingham, Alabama, and was built in 1988 on a 19.8-acre site. Southern Company Services, Inc.’s lease commenced in March 2016, and the tenant is in the process of a renovation, including mechanical systems replacements, roof resealing, parking deck resurfacing, window replacement, updates to the elevators, lighting, HVAC, fire-life safety and ADA requirements, and complete interior refinishing and repurposing. Southern Company Services, Inc. received $40 million in tenant improvements and has contributed an additional $50 million to the renovation, with completion and full tenant occupancy expected by October 2018. The sponsor acquired the Southern Company Services Headquarters property in 2016. Under a master escrow agreement with the seller, the seller is obligated to provide to the borrowers all base rent and expense reimbursements to the extent not obligated to be paid by the tenant during its phased-in occupancy period. The master escrow agreement provides such payments through December 31, 2018 after which time the tenant is required by its lease to commence full rental payments. All of borrowers’ right, title and interest in the master escrow agreement has been assigned to the lender.
Southern Company Services, Inc. is a subsidiary of Southern Company (NYSE: SO). Southern Company provides energy services to approximately 9.0 million customers through its subsidiaries. Southern Company Services, Inc. provides the operations, executive and advisory services, construction and advisory services, construction and plant management, general engineering, information technology, finance, accounting and treasury, marketing, and human resource services to Southern Company and its affiliates. Southern Company Services, Inc. is rated A- by S&P. Southern Company is rated A-, Baa2 and BBB+ by S&P, Moody’s and Fitch, respectively.
THE INFORMATION IN THIS STRUCTURAL AND COLLATERAL TERM SHEET IS NOT COMPLETE AND MAY BE AMENDED PRIOR TO THE TIME OF SALE. THIS TERM SHEET IS NOT AN OFFER TO SELL THESE SECURITIES AND IT IS NOT A SOLICITATION OF AN OFFER TO BUY THESE SECURITIES IN ANY JURISDICTION WHERE THE OFFER OR SALE IS NOT PERMITTED.
46
GRIFFIN PORTFOLIO II
Amazon.com Sortable Fulfillment Center (856,254 SF, 31.4% of SF, 24.6% ALA). The Amazon.com Sortable Fulfillment Center property is an 856,254 square foot single story (with four mezzanine levels), Class A distribution warehouse facility fully leased by and built-to-suit for Amazon.com. The initial 15-year lease with Amazon.com.dedc LLC is guaranteed by its parent, Amazon.com, Inc., and extends through August 2031. The lease provides for 1.5% annual rental rate escalations and four five-year renewal options at fair market rent, which will be no less than 85% and no more than 110% of the then-current base rent. The lease does not provide any termination or contraction options. If the borrowers offer or receive an offer for the sale of the Amazon.com Sortable Fulfillment Center property during the lease term, Amazon.com.dedc LLC has an ongoing right of first offer to purchase the property and an ongoing right of first refusal to purchase the property if a proposed purchaser is a tenant competitor.
The Amazon.com Sortable Fulfillment Center property is a sortable products fulfillment center built in 2016 on a 96.0-acre site with 42-foot clear heights and 66 dock doors. The Amazon.com Sortable Fulfillment Center property was designed to Amazon.com, Inc.’s specifications, and includes multi-level storage mezzanine spaces and advanced software and robotics to stow and pick inventory. The Amazon.com Sortable Fulfillment Center property houses over one million SKU’s and is expected to fulfill approximately seven million items each week.
The Amazon.com Sortable Fulfillment Center property benefits from a community reinvestment area real estate tax abatement from 2017 through 2031. Taxes are assessed only on the land (not the improvements), subject to certain conditions, including the employment of approximately 100 to 450 full-time employees.
Amazon.com, Inc. operates as a large online retailer. Amazon.com, Inc. designs its websites to enable products to be sold directly and by third parties. Amazon.com, Inc. also manufactures and sells electronic devices, and serves developers and enterprises through Amazon Web Services. Amazon.com, Inc. (NASDAQ: AMZN) is rated AA-, Baa1 and A+ from S&P, Moody’s and Fitch, respectively.
IGT North American Gaming & Interactive Headquarters (222,268 SF, 8.2% of SF, 18.1% ALA). The IGT North American Gaming & Interactive Headquarters property is a 222,268 square foot three-story, Class A office building fully leased to and built to suit for International Game Technology (“IGT”). The initial 15-year lease is guaranteed by IGT’s parent company, International Game Technology PLC (NYSE: IGT), and extends through December 31, 2030. The lease provides for 1.75% annual rental rate escalations and two five-year renewal options at fair market rent. The lease does not provide any termination or contraction options.
The IGT North American Gaming & Interactive Headquarters property was built in 2007 on a 15.2-acre site and serves as the headquarters for IGT’s North American Gaming and Interactive business unit, housing the engineering, sales, sound, corporate communications and software departments, and its executive management team. In 2015, the IGT North American Gaming & Interactive Headquarters property underwent a renovation, which included a new cafeteria and fitness center, conversion of the floorplans to an open-concept office build-out, and replacement of fixtures, flooring, wall coverings and restrooms.
IGT is a wholly owned subsidiary of International Game Technology PLC, a large developer of technology-based products and services and associated content for worldwide gaming and lottery markets. International Game Technology PLC is rated BB+ and Ba2 by S&P and Moody’s, respectively.
3M Distribution Facility (978,120 SF, 35.9% of SF, 17.4% ALA). The 3M Distribution Facility property is a 978,120 square foot single story Class A distribution and warehouse facility fully leased by and built-to-suit for 3M Company (NYSE: MMM), with a ten-year initial term through October 31, 2026. The lease provides for 2.0% annual rent escalations and two five-year renewal options each at 2.0% over the preceding contractual rate and each requiring a 12-month notice. The lease does not provide any termination or contraction options. If the borrowers offer or receive an offer for the sale of the 3M Distribution Facility property during the lease term, 3M Company has an ongoing right of first offer to purchase the property.
The 3M Distribution Facility property was built in 2016 on a 49.7-acre site and is 3M Company’s largest regional distribution facility and among its largest distribution facilities nationally. The 3M Distribution Facility property is located within the Park 88 Business Park, a 565-acre master-planned business park, adjacent to two other contiguous 3M Company distribution centers: a 410,400 square foot distribution center built in 2007 and a 650,760 square foot regional distribution center built in 2011. These three facilities provide 3M Company with over 2.0 million square feet of distribution space. The 3M Distribution Facility property features 32.5-foot clear heights, 137 dock doors, T-5 and LED lighting, 387 car parking spaces, 348 trailer parking spaces, and specialized cold storage, red label, and aerosol rooms which contain additional sprinklers and fire protection, special containment floors, and explosion-resistant walls. 3M Company has over 60,000 products sold in markets worldwide, and it is estimated that approximately two-thirds of these products will be stored and distributed from the 3M Distribution Facility property.
The 3M Distribution Facility property benefits from a City of DeKalb real estate tax abatement from 2017 through 2021. Taxes are abated 80% for 2018 and 50% for 2019 through 2021, subject to certain conditions including full occupancy of the 3M Distribution Facility property, the employment of 250 fulltime permanent employees, and minimum wages for those employees during the duration of the agreement.
3M Company is a worldwide diversified technology company with products sold through a number of distribution channels, including wholesalers, retailers, jobbers, distributors, dealers, and directly to users, in a variety of industries. 3M Company has been a component of the Dow Jones Industrial Average since 1976. 3M Company is rated AA- and A1 by S&P and Moody’s, respectively.
THE INFORMATION IN THIS STRUCTURAL AND COLLATERAL TERM SHEET IS NOT COMPLETE AND MAY BE AMENDED PRIOR TO THE TIME OF SALE. THIS TERM SHEET IS NOT AN OFFER TO SELL THESE SECURITIES AND IT IS NOT A SOLICITATION OF AN OFFER TO BUY THESE SECURITIES IN ANY JURISDICTION WHERE THE OFFER OR SALE IS NOT PERMITTED.
47
GRIFFIN PORTFOLIO II
The following table presents certain information relating to the tenancy at Griffin Portfolio II Properties:
Tenant Summary(1)
| Tenant Name | Credit Rating (S&P/Moody’s/ Fitch)(2) | Tenant NRSF | % of NRSF | Annual U/W Base Rent PSF | Annual U/W Base Rent | % of Total Annual U/W Base Rent | Lease Expiration Date | Renewal Options |
| Southern Company Services, Inc. | A-/Baa2/BBB+ | 669,438 | 24.6% | $12.73 | $8,518,764 | 36.2% | 3/17/2044 | 1 x 10 Yrs |
| Amazon.com | AA-/Baa1/A+ | 856,254 | 31.4% | $6.68 | $5,723,934 | 24.3% | 8/31/2031 | 4 x 5 Yrs |
| International Game Technology | BB+/Ba2/NR | 222,268 | 8.2% | $21.48 | $4,774,317 | 20.3% | 12/31/2030 | 2 x 5 Yrs |
| 3M Company | AA-/A1/NR | 978,120 | 35.9% | $4.63 | $4,528,579 | 19.2% | 10/31/2026 | 2 x 5 Yrs |
| Subtotal/Wtd. Avg. | 2,726,080 | 100.0% | $8.64 | $23,545,594 | 100.0% | |||
| Vacant Space | 0 | 0.0% | ||||||
| Total | 2,726,080 | 100.0% | ||||||
| (1) | Information is based on the underwritten rent roll. |
| (2) | Certain ratings are those of the parent company whether or not the parent guarantees the lease. |
The weighted average remaining lease term for the Griffin Portfolio II Properties is 16.7 years.
The following table presents certain information relating to the lease rollover schedule at the Griffin Portfolio II Properties:
Lease Expiration Schedule(1)
| Year Ending December 31, | No. of Leases Expiring | Expiring NRSF | % of Total NRSF | Cumulative Expiring NRSF | Cumulative % of Total NRSF | Annual U/W Base Rent | % of Total Annual U/W Base Rent | Annual U/W Base Rent PSF |
| 2018 | 0 | 0 | 0.0% | 0 | 0.0% | $0 | 0.0% | $0.00 |
| 2019 | 0 | 0 | 0.0% | 0 | 0.0% | $0 | 0.0% | $0.00 |
| 2020 | 0 | 0 | 0.0% | 0 | 0.0% | $0 | 0.0% | $0.00 |
| 2021 | 0 | 0 | 0.0% | 0 | 0.0% | $0 | 0.0% | $0.00 |
| 2022 | 0 | 0 | 0.0% | 0 | 0.0% | $0 | 0.0% | $0.00 |
| 2023 | 0 | 0 | 0.0% | 0 | 0.0% | $0 | 0.0% | $0.00 |
| 2024 | 0 | 0 | 0.0% | 0 | 0.0% | $0 | 0.0% | $0.00 |
| 2025 | 0 | 0 | 0.0% | 0 | 0.0% | $0 | 0.0% | $0.00 |
| 2026 | 1 | 978,120 | 35.9% | 978,120 | 35.9% | $4,528,579 | 19.2% | $4.63 |
| 2027 | 0 | 0 | 0.0% | 978,120 | 35.9% | $0 | 0.0% | $0.00 |
| 2028 | 0 | 0 | 0.0% | 978,120 | 35.9% | $0 | 0.0% | $0.00 |
| Thereafter | 3 | 1,747,960 | 64.1% | 2,726,080 | 100.0% | $19,017,015 | 80.8% | $10.88 |
| Vacant | 0 | 0 | 0.0% | 2,726,080 | 100.0% | $0 | 0.0% | $0.00 |
| Total/Wtd. Avg. | 4 | 2,726,080 | 100.0% | $23,545,594 | 100.0% | $8.64 |
| (1) | Information obtained from the underwritten rent roll. |
The following table presents historical occupancy percentages at the Griffin Portfolio II Properties:
Historical Occupancy
12/31/2014(1) | 12/31/2015(1) | 12/31/2016(1) | 12/31/2017(2) | 8/1/2018 |
| NAV | NAV | NAV | 100.0% | 100.0% |
| (1) | Historical occupancy is not available prior to 2017, as the Griffin Portfolio II Properties were acquired between October and December 2016. |
| (2) | 12/31/2017 is reflective of the Griffin Portfolio II Properties being 100.0% leased. Southern Company Services Headquarters is 100.0% leased, but has been undergoing an extensive renovation and phased-in physical occupancy since 2016. |
THE INFORMATION IN THIS STRUCTURAL AND COLLATERAL TERM SHEET IS NOT COMPLETE AND MAY BE AMENDED PRIOR TO THE TIME OF SALE. THIS TERM SHEET IS NOT AN OFFER TO SELL THESE SECURITIES AND IT IS NOT A SOLICITATION OF AN OFFER TO BUY THESE SECURITIES IN ANY JURISDICTION WHERE THE OFFER OR SALE IS NOT PERMITTED.
48
GRIFFIN PORTFOLIO II
Underwritten Net Cash Flow.The following table presents certain information relating to the underwritten net cash flow at the Griffin Portfolio II Properties:
Cash Flow Analysis(1)
| 2017 | U/W | % of U/W Effective Gross Income | U/W $ per SF | |
| Base Rent(2) | $15,720,597 | $23,545,594 | 76.7% | $8.64 |
| Straight-Lined Rent(3) | 0 | 1,375,674 | 4.5 | 0.50 |
| Reimbursements(4) | 1,886,896 | 6,878,135 | 22.4 | 2.52 |
| Other Income(5) | (91,865) | 0 | 0.0 | 0.00 |
| Vacancy(6) | 0 | (1,089,362) | (3.4) | (0.40) |
| Effective Gross Income | $17,515,628 | $30,710,040 | 100.0% | $11.27 |
| Total Operating Expenses(4) | $2,215,224 | $7,482,500 | 24.4% | $2.74 |
| Net Operating Income | $15,300,404 | $23,227,540 | 75.6% | $8.52 |
| TI/LC | 0 | 996,165 | 3.2 | 0.37 |
| Capital Expenditures | 0 | 272,608 | 0.9 | 0.10 |
| Net Cash Flow | $15,300,404 | $21,958,766 | 71.5% | $8.06 |
| NOI DSCR(7) | 1.40x | 2.12x | ||
| NCF DSCR(7) | 1.40x | 2.01x | ||
| NOI DY(7) | 6.1% | 9.3% | ||
| NCF DY(7) | 6.1% | 8.8% |
| (1) | Historical information is not available prior to 2017, as the Griffin Portfolio II Properties were acquired between October and December 2016. |
| (2) | U/W Base Rent includes rent increases through May 2019 equal to $253,403 and full rent for Southern Company Services, Inc. Southern Company Services, Inc. has been undergoing a renovation and phased-in occupancy of its space since 2016 during which time it has been paying rent only on its occupied area. Under a master escrow agreement with the Southern Company Services Headquarters property’s seller, the seller is obligated through December 31, 2018 to provide to the borrowers supplemental rent of all base rent and expense reimbursements to the extent not obligated to be paid by the tenant during its phased-in occupancy period, and Southern Company Services, Inc. is obligated to begin paying full rent beginning January 2019. All of borrowers’ right, title and interest in the master escrow agreement has been assigned to the lender. |
| (3) | Rent was straight-lined through the earlier of the lease or the loan term for investment-grade rated tenants: Southern Company Services, Inc., Amazon.com and 3M Company. |
| (4) | Reimbursements and Total Operating Expenses are based on actual real estate taxes for the land (and assuming that the real estate tax abatement remains in effect and consequently there are no taxes on the improvements) for Amazon.com, and average taxes over the loan term (after giving effect to the partial tax abatements through 2021) for 3M Company. |
| (5) | Other Income represents an adjustment to the seller’s rent receivable in connection with the Southern Company Services Headquarters property supplemental rent contribution. |
| (6) | U/W Vacancy is 3.4%. The Griffin Portfolio II Properties are currently 100.0% leased. |
| (7) | Debt service coverage ratios and debt yields are based on the Griffin Portfolio II Whole Loan. |
Appraisal.As of the appraisal valuation date of April 26, 2018, the Griffin Portfolio II Properties had an “as-portfolio” bulk appraised value of $415,500,000, which includes a portfolio premium of $19,810,000. The sum of the individual “as-is” appraised values, with valuation dates from April 9, 2018 through April 11, 2018, is $395,690,000.
Environmental Matters. According to the Phase I environmental site assessments dated April 17, 2018, there are no recognized environmental conditions at the Griffin Portfolio II Properties except with respect to the Southern Company Services Headquarters property, for which the Phase I environmental site assessment identified a historical recognized environmental condition due to two underground storage tanks that were removed in 1994. Following the removal of the tanks, remediation was conducted and No Further Action letters were issued by Alabama Department of Environmental Management.
Market Overview. The Griffin Portfolio II Properties are located in four states: Alabama, Ohio, Nevada and Illinois.
Southern Company Services Headquarters, Birmingham, Alabama. The Southern Company Services Headquarters property is utilized as the main regional offices for Southern Company Services, Inc. and an affiliate, Southern Nuclear. The Southern Company Services Headquarters property is located in Birmingham, Alabama, approximately five miles southeast of the Birmingham central business district along US Highway 280, approximately one-half mile southeast of its intersection with Interstate 459.
Amazon.com Sortable Fulfillment Center, Pataskala, Ohio. The Amazon.com Sortable Fulfillment Center property is a distribution warehouse facility fully leased by and built-to-suit for Amazon.com. The Amazon.com Sortable Fulfillment Center property is located in Pataskala, Ohio, approximately 20 miles east of the Columbus central business district, between Interstate 70 and U.S. Highway 40, which puts the Amazon.com Sortable Fulfillment Center property within a ten-hour drive of more than 50% of both the United States and Canadian populations. The Amazon.com Sortable Fulfillment Center property is located in an industrial area 20 miles northeast of Rickenbacker International Airport, an international multimodal cargo airport, U.S. Foreign-Trade Zone and high-speed international logistics hub that is open full time with no noise restrictions.
THE INFORMATION IN THIS STRUCTURAL AND COLLATERAL TERM SHEET IS NOT COMPLETE AND MAY BE AMENDED PRIOR TO THE TIME OF SALE. THIS TERM SHEET IS NOT AN OFFER TO SELL THESE SECURITIES AND IT IS NOT A SOLICITATION OF AN OFFER TO BUY THESE SECURITIES IN ANY JURISDICTION WHERE THE OFFER OR SALE IS NOT PERMITTED.
49
GRIFFIN PORTFOLIO II
IGT North American Gaming & Interactive Headquarters, Las Vegas, Nevada. The IGT North American Gaming & Interactive Headquarters property serves as the headquarters for IGT’s North American Gaming and Interactive business unit, housing the engineering, sales, sound, corporate communications and software departments, and its executive management team. The IGT North American Gaming & Interactive Headquarters property is located in Las Vegas, Nevada, approximately 15 miles southwest of the Las Vegas central business district, just north of the 215 Beltway and approximately five miles west of Interstate 15.
3M Distribution Facility, Dekalb, Illinois. The 3M Distribution Facility property is a distribution and warehouse facility built-to-suit for 3M Company. The 3M Distribution Facility property is located at the interchange of I-88 and U.S. 23, approximately 60 miles west of the Chicago central business district within the I-39 Logistics Corridor, 20 miles west of Aurora and 14 miles east of I-39. The 3M Distribution Facility property’s location provides access to major interstate highways in Illinois (I-88, I-55, I-74, I-57, I-90, I-80 and I-94), to major Midwest distribution hubs, including Chicago, Indianapolis, Milwaukee, Minneapolis, St. Louis, Detroit and the Ohio Valley, and to the Union Pacific Global III Intermodal Rail Facility located 19 miles to the west of the 3M Distribution Facility property.
The following table presents detailed demographic information for the Griffin Portfolio II Properties.
Demographic Summary(1)
| Property Name | City, State | 1-mile Population | 3-mile Population | 5-mile Population | 1-mileAverage Household Income | 3-mile Average Household Income | 5-mile Average Household Income | |
| Southern Company Services Headquarters | Birmingham, AL | 4,402 | 43,170 | 119,756 | $91,353 | $117,193 | $125,495 | |
| Amazon.com Sortable Fulfillment Center | Pataskala, OH | 972 | 15,208 | 77,139 | $97,597 | $99,425 | $90,996 | |
| IGT North American Gaming & Interactive Headquarters | Las Vegas, NV | 8,131 | 138,546 | 318,800 | $74,914 | $76,759 | $74,195 | |
| 3M Distribution Facility | Dekalb, IL | 524 | 33,769 | 55,492 | $51,778 | $63,728 | $60,788 |
| (1) | Information obtained from the appraisals. |
The Borrowers.The borrowers are Griffin (Las Vegas Buffalo) Essential Asset REIT II, LLC, Griffin (DeKalb) Essential Asset REIT II, LLC, Griffin (Etna) Essential Asset REIT II, LLC and Griffin (Birmingham) Essential Asset REIT II, LLC, each a Delaware limited liability company structured to be bankruptcy-remote with at least two independent directors. Legal counsel to the borrowers delivered a non-consolidation opinion in connection with the origination of the Griffin Portfolio II Whole Loan.
Substantially all of the equity ownership in the borrowers is indirectly held by Griffin Capital Essential Asset REIT II, Inc., a Maryland corporation. Griffin Capital Essential Asset REIT II, Inc. is the nonrecourse carveout guarantor for the Griffin Portfolio II Whole Loan and is a real estate investment trust that invests in office and industrial properties net leased on long term leases to corporate tenants. As of March 31, 2018, Griffin Capital Essential Asset REIT II, Inc. had a real estate portfolio consisting of 27 office, industrial, distribution and data center properties, totaling approximately 7.3 million square feet that was 100.0% leased.
Should Griffin Capital Essential Asset REIT II, Inc. fail to maintain a minimum net worth of $250,000,000 during the loan term, the Griffin Portfolio II Whole Loan documents permit the borrowers to substitute a replacement guarantor with a net worth of at least $175,000,000 that is acceptable to the lender based on receipt of searches, satisfaction of underwriting criteria and evaluation of the replacement guarantor’s experience.
The Borrower Sponsor.The borrower sponsor is Griffin Capital Company, LLC, formerly known as Griffin Capital Corporation. Griffin Capital Company, LLC is an alternative investment asset manager with approximately $10.5 billion in assets under management as of March 31, 2018.
Escrows.The borrowers deposited at loan origination $1,900,229 for leasing commissions related to the Southern Company Services Headquarters property and are required to deposit monthly any additional amount due for free rent, tenant improvements or leasing commissions under any lease at the Griffin Portfolio II Properties for any 12-month succeeding period following the applicable payment date.
The borrowers deposited at loan origination $90,000 to a tax reserve and are generally required to deposit monthly (i) 1/12th of the estimated annual property taxes (currently estimated to be $45,000) and (ii) 1/12th of the estimated annual insurance premiums (unless the Griffin Portfolio II Properties are covered by an acceptable blanket policy). However, provided that neither an event of default nor a Debt Yield Sweep Period (as defined below) is continuing, monthly deposits for property taxes and insurance premiums will be waived to the extent such property taxes or insurance premiums are directly paid by a tenant pursuant to its lease and such tenant is not subject to bankruptcy proceedings or in default under its lease.
During a Debt Yield Sweep Period (as defined below), the borrowers are required to deposit monthly to a replacement reserve (i) 1/12th of $0.10per annum PSF of industrial space and (ii) 1/12th of $0.20per annum PSF of office space, capped at two years’ worth of such deposits (currently estimated to be $723,557). Additionally, beginning on May 1, 2023 (regardless of whether the deposits described in the preceding sentence are then required), the borrowers are required to deposit monthly into the replacement reserve (i) 1/12th of $0.10per annum PSF of industrial space and (ii) 1/12th of $0.20per annum PSF of office space, capped at one years’ worth of such deposits (currently estimated to be $361,779). Notwithstanding the foregoing, at any time the reserve balance falls below the applicable cap or an event of default exists, the borrowers are required to resume monthly deposits to the replacement reserve until the applicable cap is reached or exceeded or until the event of default ceases to exist.
During a Debt Yield Sweep Period (as defined below), the borrowers are required to deposit monthly to a tenant improvement and leasing commissions reserve (i) 1/12th of $0.50per annum PSF of industrial space and (ii) 1/12th of $1.00per annum PSF of office
THE INFORMATION IN THIS STRUCTURAL AND COLLATERAL TERM SHEET IS NOT COMPLETE AND MAY BE AMENDED PRIOR TO THE TIME OF SALE. THIS TERM SHEET IS NOT AN OFFER TO SELL THESE SECURITIES AND IT IS NOT A SOLICITATION OF AN OFFER TO BUY THESE SECURITIES IN ANY JURISDICTION WHERE THE OFFER OR SALE IS NOT PERMITTED.
50
GRIFFIN PORTFOLIO II
space, capped at two years’ worth of such deposits (currently estimated to be $3,617,786). Additionally, beginning on May 1, 2023 (regardless of whether the deposits described in the preceding sentence are then required), the borrowers are required to deposit monthly into the tenant improvement and leasing commissions reserve (i) 1/12th of $0.50per annum PSF of industrial space and (ii) 1/12th of $1.00per annumPSF of office space, capped at one year’s worth of such deposits (currently estimated to be $1,808,893). Notwithstanding the foregoing, at any time the reserve balance falls below the applicable cap or an event of default exists, the borrowers are required to resume monthly deposits to the tenant improvement and leasing commissions reserve until the applicable cap is reached or exceeded or until the event of default ceases to exist.
A “Debt Yield Sweep Period” will commence upon the debt yield being less than 7.5% in a calendar quarter, and end upon the debt yield being equal to or greater than 7.5% in a calendar quarter.
Lockbox and Cash Management.A hard lockbox is in place with respect to the Griffin Portfolio II Whole Loan, with springing cash management upon the occurrence of a Cash Sweep Period (as defined below). During the continuance of a Cash Sweep Period, all funds in the lockbox account are required to be swept each business day to a lender-controlled cash management account and disbursed in accordance with the Griffin Portfolio II Whole Loan documents. During the continuation of a Cash Sweep Period, all excess cash flow will be required to be held as additional security for the Griffin Portfolio II Whole Loan until the discontinuance of the Cash Sweep Period;providedthat if a Cash Sweep Period is cured by either a Southern Company Services Cash Trap Cap Cure (as defined below) or a 3M Cash Trap Cap Cure (as defined below), the lender is required to continue to hold the excess cash and will not disburse such excess cash to the borrowers until the Southern Company Services Cure Conditions (as defined below) or the 3M Cure Conditions (as defined below) are satisfied.
A “Cash Sweep Period” means any of (a) a Debt Yield Sweep Period, (b) a 3M Sweep Period (as defined below), (c) a Southern Company Services Sweep Period (as defined below), or (d) any period of time during which an event of default is continuing.
A “3M Sweep Period” means the period (A) commencing on the first to occur of (i) 3M Company being in monetary default under its lease beyond notice and cure periods, (ii) 3M Company terminating its lease, vacating or going dark in 50% or more of its space, or giving written notice that it intends to terminate, vacate or go dark in 50% or more of its space, (iii) any termination or cancellation of the 3M Company lease (including rejection in any insolvency proceeding) and/or the 3M Company lease failing to otherwise be in full force and effect, (iv) any bankruptcy or similar insolvency of 3M Company or its assets and (v) 3M Company failing to extend or renew its lease on or prior to October 31, 2025, and (B) expiring on the first to occur of the lender’s receipt of (1) the satisfaction of the 3M Cure Conditions (as defined below) or (2) in the event the 3M Sweep Period exists solely pursuant to clauses (ii) or (v) above, at least 85% of the 3M Distribution Facility property being re-leased under lease terms acceptable to the lender to an acceptable replacement tenant who is in physical occupancy and paying full rent (or sufficient funds are deposited with the lender to cover all rent abatement under any such replacement lease). Notwithstanding the foregoing, a 3M Sweep Period will be deemed to have been cured at such time as $6.00 PSF for the 3M Distribution Facility property is on deposit in the excess cash reserve (a “3M Cash Trap Cap Cure”).
“3M Cure Conditions” means, as applicable, (i) 3M Company has cured all defaults under its lease, (ii) 3M Company has revoked all termination or cancellation notices and has re-affirmed its lease, (iii) if triggered by clause (v) of the definition of 3M Sweep Period, 3M Company has renewed or extended its lease, (iv) 3M Company is no longer insolvent or subject to any bankruptcy proceedings and 3M Company has affirmed its lease pursuant to final, non-appealable order of a court and (v) 3M Company is paying full, unabated rent (or if rent is abated, the borrowers have deposited such amount of abated rent in a reserve with the lender).
A “Southern Company Services Sweep Period” means the period (A) commencing on the first to occur of (i) Southern Company Services, Inc. being in monetary default under its lease beyond notice and cure periods, (ii) Southern Company Services, Inc. terminating its lease, vacating or going dark in 50% or more of its space, or giving written notice that it intends to terminate, vacate or go dark in 50% or more of its space, (iii) any termination or cancellation of the Southern Company Services, Inc. lease (including rejection in any insolvency proceeding) and/or the Southern Company Services, Inc. lease failing to otherwise be in full force and effect, or (iv) any bankruptcy or similar insolvency of Southern Company Services, Inc. or its assets and (B) expiring on the first to occur of the lender’s receipt of (1) the satisfaction of the Southern Company Services Cure Conditions (as defined below) or (2) in the event the Southern Company Services Sweep Period exists solely pursuant to clause (ii) above, at least 85% of the Southern Company Services Headquarters property being re-leased under lease terms acceptable to the lender to an acceptable replacement tenant who is in physical occupancy of the space and paying full rent (or sufficient funds are deposited with the lender to cover all rent abatement under any such replacement lease). Notwithstanding the foregoing, a Southern Company Services Sweep Period will be deemed to have been cured at such time as $35.00 PSF for the Southern Company Services Headquarters property is on deposit in the excess cash reserve (a “Southern Company Services Cash Trap Cap Cure”).
“Southern Company Services Cure Conditions” means, as applicable, (i) Southern Company Services, Inc. has cured all defaults under its lease, (ii) Southern Company Services, Inc. has revoked all termination or cancellation notices and has re-affirmed its lease, (iii) Southern Company Services, Inc. is no longer insolvent or subject to any bankruptcy proceedings and Southern Company Services, Inc. has affirmed its lease pursuant to final, non-appealable order of a court and (iv) Southern Company Services, Inc. is paying full, unabated rent (or if rent is abated, the borrowers have deposited such amount of abated rent in a reserve with the lender.)
Property Management.The Griffin Portfolio II Properties are currently managed by Griffin Capital Essential Asset Property Management II, LLC, an affiliate of the borrowers.
THE INFORMATION IN THIS STRUCTURAL AND COLLATERAL TERM SHEET IS NOT COMPLETE AND MAY BE AMENDED PRIOR TO THE TIME OF SALE. THIS TERM SHEET IS NOT AN OFFER TO SELL THESE SECURITIES AND IT IS NOT A SOLICITATION OF AN OFFER TO BUY THESE SECURITIES IN ANY JURISDICTION WHERE THE OFFER OR SALE IS NOT PERMITTED.
51
GRIFFIN PORTFOLIO II
Assumption.After October 27, 2018, the borrowers have the right to transfer the Griffin Portfolio II Properties in their entirety, provided that certain other conditions are satisfied, including, but not limited to: (i) no event of default has occurred and is continuing; (ii) the lender’s reasonable determination that the proposed transferee and guarantor satisfy the lender’s credit review and underwriting standards, taking into consideration transferee experience and net worth and liquidity; (iii) if required by the lender, a REMIC opinion and new non-consolidation opinion are provided; and (iv) if required by the lender, rating agency confirmation from Fitch, DBRS and S&P that the transfer will not result in a downgrade, withdrawal or qualification of the respective ratings assigned to the BANK 2018-BNK13 Certificates.
Partial Release.After May 31, 2020, the borrowers may obtain the release of one or more individual properties in connection with an arms-length saleprovided that among other conditions (i) no event of default is continuing, (ii) the lender receives payment of a release price equal to 110% of the allocated loan amount for the release property plus payment of any applicable yield maintenance premium, (iii) the debt yield after the individual property release is not less than the greater of (a) 7.9% and (b) the debt yield immediately prior to such release, and (iv) satisfaction of customary REMIC requirements.
Notwithstanding the foregoing, if a tenant has vacated its premises, cancelled or terminated its lease, given notice of its intent to cancel or terminate its lease, or an event of default has occurred with respect to an individual property such that a material adverse effect would result, such individual property may be released without the requirement of an arms-length saleprovided that, among other conditions, (i) the lender receives payment of a release price equal to 120% of the allocated loan amount for the applicable individual property and (ii) the aggregate allocated loan amounts for all released properties during the term of the Griffin Portfolio II Whole Loan must not exceed $56,250,000.
Real Estate Substitution.Following the earlier of (a) the date of the securitization of the last of the Griffin Portfolio IIpari passucompanion loans and (b) the second anniversary of the note date or as otherwise consented to by the lender in its reasonable discretion, the borrowers may substitute one or more individual properties with one or more replacement properties that is a similar Class A office or industrial property provided no event of default is continuing andprovided further that among other conditions, (i) the replaced property has less than two years remaining on the term of the lease encumbering the property or the substitution of the property is during a Cash Sweep Period, (ii) the aggregated allocated loan amounts for all replaced properties during the term of the Griffin Portfolio II Whole Loan must not exceed $56,250,000, (iii) the replacement property has net operating income equal to or greater than the net operating income of the replaced property immediately prior to the substitution, (iv) the replacement property is owned in fee, (v) the replacement property has an average remaining lease term of no less than five years and is leased to a tenant with credit (or whose guarantor has credit) that is better than or equal to the tenant leasing the replaced property, (vi) the replacement property is located in a top ten metropolitan statistical area or a metropolitan statistical area equal to or greater than that in which the replaced property is located, (vii) the lender has received rating agency confirmation, (viii) any tenant at a remaining property will not have the right to lease space at the replaced property and (ix) satisfaction of customary REMIC requirements.
Subordinate and Mezzanine Indebtedness.Not permitted.
Right of First Refusal / Offer.Amazon.com.dedc LLC has an ongoing right of first offer to purchase the Amazon.com Sortable Fulfillment Center property if the borrowers offer or receive an offer for its sale during the lease term. Amazon.com.dedc LLC also has an ongoing right of first refusal to purchase the Amazon.com Sortable Fulfillment Center property if a proposed purchaser is a tenant competitor. 3M Company has an ongoing right of first offer to purchase the 3M Distribution Facility property if the borrowers offer or receive an offer for its sale during the lease term. See “Description of the Mortgage Pool—Tenant Leases—Purchase Options and Rights of First Refusal” in the Preliminary Prospectus.
Ground Lease. None.
Terrorism Insurance.The borrowers are required to obtain and maintain property insurance that covers perils of terrorism and acts of terrorism in an amount equal to the full replacement cost of the Griffin Portfolio II Properties and business interruption insurance for 24 months with a 12 month extended period of indemnity,provided, if the Terrorism Risk Insurance Program Reauthorization Act of 2007 or subsequent statute is not in effect, the borrowers will not be required to pay annual premiums in excess of two times the premium for a separate property insurance policy and business interruption insurance policy insuring only the Griffin Portfolio II Properties on a stand-alone basis. See“Risk Factors—Risks Relating to the Mortgage Loans—Terrorism Insurance May Not Be Available for All Mortgaged Properties” in the Preliminary Prospectus.
THE INFORMATION IN THIS STRUCTURAL AND COLLATERAL TERM SHEET IS NOT COMPLETE AND MAY BE AMENDED PRIOR TO THE TIME OF SALE. THIS TERM SHEET IS NOT AN OFFER TO SELL THESE SECURITIES AND IT IS NOT A SOLICITATION OF AN OFFER TO BUY THESE SECURITIES IN ANY JURISDICTION WHERE THE OFFER OR SALE IS NOT PERMITTED.
52
(THIS PAGE INTENTIONALLY LEFT BLANK)
THE INFORMATION IN THIS STRUCTURAL AND COLLATERAL TERM SHEET IS NOT COMPLETE AND MAY BE AMENDED PRIOR TO THE TIME OF SALE. THIS TERM SHEET IS NOT AN OFFER TO SELL THESE SECURITIES AND IT IS NOT A SOLICITATION OF AN OFFER TO BUY THESE SECURITIES IN ANY JURISDICTION WHERE THE OFFER OR SALE IS NOT PERMITTED.
53
(THIS PAGE INTENTIONALLY LEFT BLANK)
THE INFORMATION IN THIS STRUCTURAL AND COLLATERAL TERM SHEET IS NOT COMPLETE AND MAY BE AMENDED PRIOR TO THE TIME OF SALE. THIS TERM SHEET IS NOT AN OFFER TO SELL THESE SECURITIES AND IT IS NOT A SOLICITATION OF AN OFFER TO BUY THESE SECURITIES IN ANY JURISDICTION WHERE THE OFFER OR SALE IS NOT PERMITTED.
54
PFIZER BUILDING
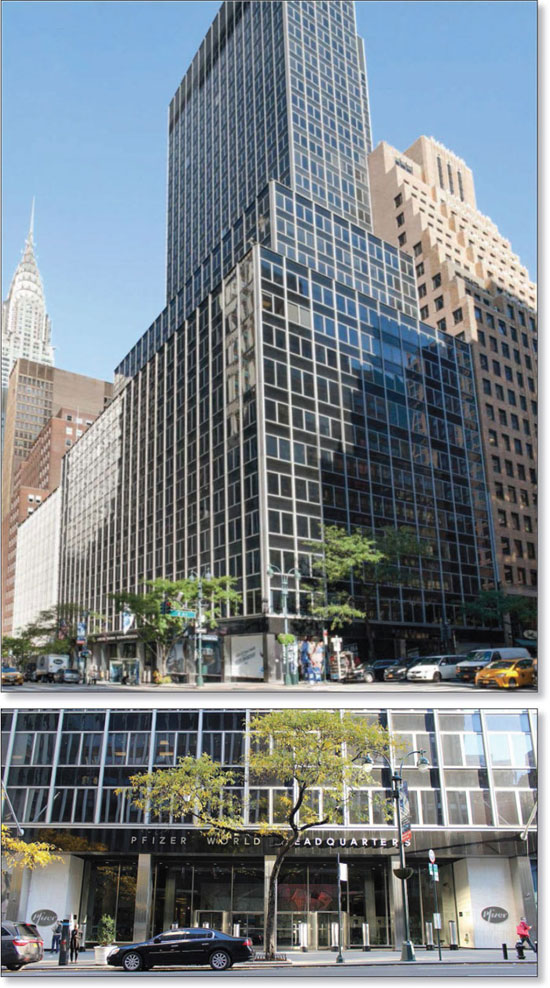
THE INFORMATION IN THIS STRUCTURAL AND COLLATERAL TERM SHEET IS NOT COMPLETE AND MAY BE AMENDED PRIOR TO THE TIME OF SALE. THIS TERM SHEET IS NOT AN OFFER TO SELL THESE SECURITIES AND IT IS NOT A SOLICITATION OF AN OFFER TO BUY THESE SECURITIES IN ANY JURISDICTION WHERE THE OFFER OR SALE IS NOT PERMITTED.
55
PFIZER BUILDING
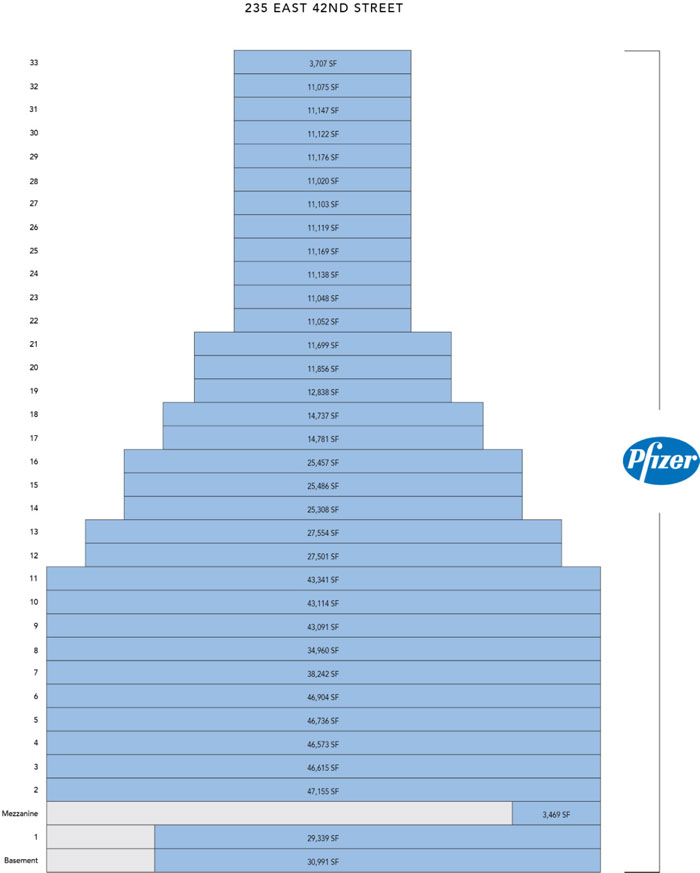
THE INFORMATION IN THIS STRUCTURAL AND COLLATERAL TERM SHEET IS NOT COMPLETE AND MAY BE AMENDED PRIOR TO THE TIME OF SALE. THIS TERM SHEET IS NOT AN OFFER TO SELL THESE SECURITIES AND IT IS NOT A SOLICITATION OF AN OFFER TO BUY THESE SECURITIES IN ANY JURISDICTION WHERE THE OFFER OR SALE IS NOT PERMITTED.
56
PFIZER BUILDING
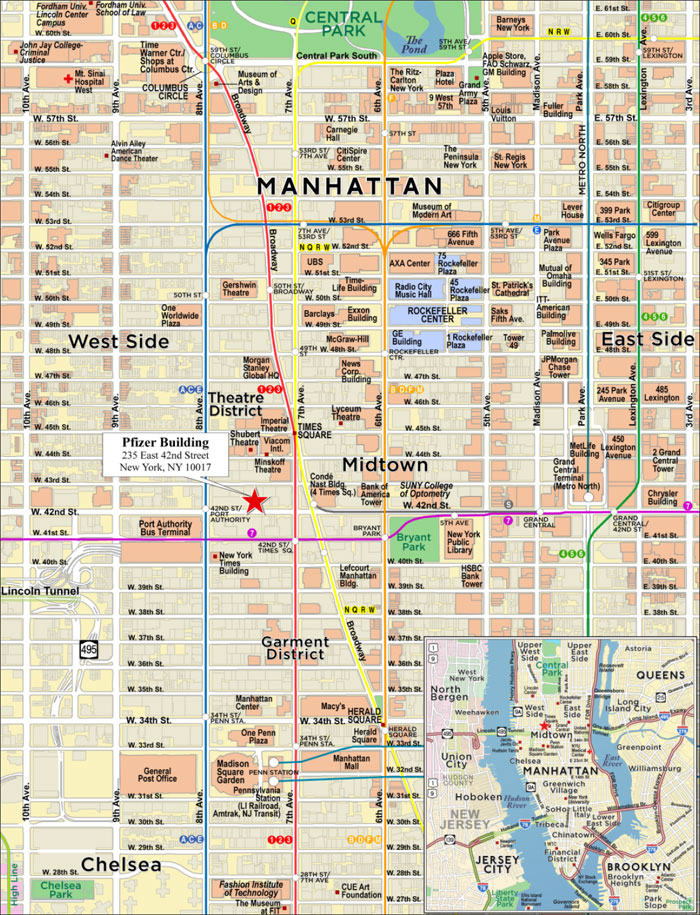
THE INFORMATION IN THIS STRUCTURAL AND COLLATERAL TERM SHEET IS NOT COMPLETE AND MAY BE AMENDED PRIOR TO THE TIME OF SALE. THIS TERM SHEET IS NOT AN OFFER TO SELL THESE SECURITIES AND IT IS NOT A SOLICITATION OF AN OFFER TO BUY THESE SECURITIES IN ANY JURISDICTION WHERE THE OFFER OR SALE IS NOT PERMITTED.
57
| No. 3 – Pfizer Building | ||||||||
| Loan Information | Property Information | |||||||
| Mortgage Loan Seller: | Morgan Stanley Mortgage Capital Holdings LLC | Single Asset/Portfolio: | Single Asset | |||||
Credit Assessment (DBRS/Fitch/S&P): | AAA(sf)/Asf/AA(sf) | Property Type: | Office | |||||
| Specific Property Type: | CBD | |||||||
| Original Principal Balance(1): | $65,000,000 | Location: | New York, NY | |||||
| Cut-off Date Balance(1): | $65,000,000 | Size: | 823,623 SF | |||||
| % of Initial Pool Balance: | 6.88% | Cut-off Date Balance Per SF(1): | $151.77 | |||||
| Loan Purpose: | Acquisition | Year Built/Renovated: | 1960/2004 | |||||
| Borrower Name: | 42nd& Second Holding Co. LLC | Title Vesting: | Leasehold | |||||
| Borrower Sponsor: | David Werner | Property Manager: | Self-managed | |||||
| Mortgage Rate: | 3.5850% | 4thMost Recent Occupancy (As of)(5): | 100.0% (12/31/2014) | |||||
| Note Date: | July 11, 2018 | 3rdMost Recent Occupancy (As of)(5): | 100.0% (12/31/2015) | |||||
| Anticipated Repayment Date: | NAP | 2ndMost Recent Occupancy (As of)(5): | 100.0% (12/31/2016) | |||||
| Maturity Date: | August 8, 2024 | Most Recent Occupancy (As of)(5): | 100.0% (12/31/2017) | |||||
| IO Period: | 0 months | Current Occupancy (As of): | 100.0% (8/1/2018) | |||||
| Loan Term (Original): | 72 months | |||||||
| Seasoning: | 0 months | |||||||
| Amortization Term (Original)(2): | 75 months | Underwriting and Financial Information: | ||||||
| Loan Amortization Type(2): | Self-Amortizing | 4thMost Recent NOI(5): | NAP | |||||
| Interest Accrual Method: | Actual/360 | 3rdMost Recent NOI(5): | NAP | |||||
| Call Protection(3): | L(24),D(43),O(5) | 2ndMost Recent NOI(5): | NAP | |||||
| Lockbox Type: | Hard/Upfront Cash Management | Most Recent NOI(5): | NAP | |||||
| Additional Debt(1): | Yes | |||||||
| Additional Debt Type(1): | Pari Passu | |||||||
| U/W Revenues: | $32,944,920 | |||||||
| U/W Expenses: | $9,900,000 | |||||||
| U/W NOI: | $23,044,920 | |||||||
| Escrows and Reserves(4): | U/W NCF: | $23,044,920 | ||||||
| U/W NOI DSCR(1): | 1.00x | |||||||
| Type: | Initial | Monthly | Cap (If Any) | U/W NCF DSCR(1): | 1.00x | |||
| Taxes | $0 | Springing | NAP | U/W NOI Debt Yield(1): | 18.4% | |||
| Insurance | $4,700 | Springing | NAP | U/W NCF Debt Yield(1): | 18.4% | |||
| Ground Rent Reserve | $0 | $816,667 | NAP | As-Is Appraised Value(6): | $210,000,000 | |||
| As-Is Appraisal Valuation Date: | March 26, 2018 | |||||||
| Cut-off Date LTV Ratio(1)(6): | 59.5% | |||||||
| LTV Ratio at Maturity or ARD(1)(6): | 2.1% | |||||||
| (1) | See “The Mortgage Loan” section. All statistical financial information related to balances per square foot, loan-to-value ratios, debt service coverage ratios and debt yields are based on the Pfizer Building Whole Loan (as defined below). |
| (2) | The Pfizer Building Whole Loan amortizes based on a specific amortization schedule, which is set forth in Annex A-4 of the Preliminary Prospectus. |
| (3) | The lockout period will be at least 24 payments, beginning with and including the first payment date of September 8, 2018. Defeasance of the Pfizer Building Mortgage Loan (as defined below) is permitted at any time after the earlier to occur of (i) two years after the closing date of the securitization that includes the last note to be securitized or (ii) January 11, 2022. The assumed lockout period of 24 payments is based on the expected BANK 2018-BNK13 Trust closing date in August 2018. |
| (4) | See “Escrows” section. |
| (5) | On the day prior to origination of the Pfizer Building Whole Loan, Pfizer Inc. transferred the ground leasehold interest in the Pfizer Building Property to the Pfizer Building Borrower (as defined below) and entered into a lease of the Pfizer Building expiring July 9, 2024. Prior to such date, the Pfizer Building Property was owned and occupied by Pfizer Inc. Accordingly, historical NOI is not applicable and historical occupancy percentages are based on Pfizer’s physical occupancy of its ground leasehold interest. Pfizer Inc. plans to vacate the Pfizer Building Property at the end of its lease term. |
| (6) | In addition, the appraiser concluded to a prospective market value assuming an extended ground lease of $415,000,000 as of June 23, 2018, equating to a Cut-off Date LTV Ratio of 30.1% and LTV Ratio at Maturity or ARD of 1.0%. The “as is” and “Prospective Market Value-Extended Ground Lease” values both assume that Pfizer vacates the Pfizer Building Property at the expiration of the Pfizer lease and that $100.0 million is invested to redevelop the Pfizer Building Property. No funds have been reserved for redevelopment of the Pfizer Building Property. See “Appraisal” and “Ground Lease” sections below. |
The Mortgage Loan.The mortgage loan (the “Pfizer Building Mortgage Loan”) is part of a whole loan (the “Pfizer Building Whole Loan”) evidenced by fivepari passu notes secured by a first mortgage encumbering the ground leasehold interest in a Class A office building fully leased to Pfizer Inc. (“Pfizer”) located in New York, New York (the “Pfizer Building Property”). The Pfizer Building Whole Loan was originated on July 11, 2018 by Morgan Stanley Bank, N.A. The Pfizer Building Whole Loan had an original principal balance of $125,000,000, has an outstanding principal balance as of the Cut-off Date of $125,000,000 and accrues interest at an interest rate of 3.5850%per annum. The Pfizer Building Whole Loan had an initial term of 72 months, has a remaining term of 72 months as of the Cut-off Date and requires payment of principal and interest based on a specific amortization schedule provided in Annex A-4 of the Preliminary Prospectus, which provides for amortization of substantially all of the principal of the Pfizer Building Whole Loan by
THE INFORMATION IN THIS STRUCTURAL AND COLLATERAL TERM SHEET IS NOT COMPLETE AND MAY BE AMENDED PRIOR TO THE TIME OF SALE. THIS TERM SHEET IS NOT AN OFFER TO SELL THESE SECURITIES AND IT IS NOT A SOLICITATION OF AN OFFER TO BUY THESE SECURITIES IN ANY JURISDICTION WHERE THE OFFER OR SALE IS NOT PERMITTED.
58
PFIZER BUILDING
its maturity date, subject to a final payment of $4,332,390 on the maturity date. The Pfizer Building Whole Loan matures on August 8, 2024.
The Pfizer Building Mortgage Loan has an original and Cut-off Date principal balance of $65,000,000 and is evidenced by the controlling Note A-1, which had an original principal balance of $30,000,000, the non-controlling Note A-4, which had an original principal balance of $20,000,000, and the non-controlling Note A-5, which had an original principal balance of $15,000,000. The non-controlling Notes A-2, and A-3, which have an aggregate original principal balance of $60,000,000, are currently held by Morgan Stanley Bank, N.A. or an affiliate and are expected to be contributed to one or more future securitization trusts. The lender provides no assurance that any non-securitizedpari passu notes will not be split further. See“Description of the Mortgage Pool—The Whole Loans—The Serviced Pari Passu Whole Loans” and “Pooling and Servicing Agreement” in the Preliminary Prospectus.
Note Summary
| Notes | Original Balance | Note Holder | Controlling Interest | |
| A-1 | $30,000,000 | BANK 2018-BNK13 | Yes | |
| A-2 | $30,000,000 | Morgan Stanley Bank, N.A. | No | |
| A-3 | $30,000,000 | Morgan Stanley Bank, N.A. | No | |
| A-4 | $20,000,000 | BANK 2018-BNK13 | No | |
| A-5 | $15,000,000 | BANK 2018-BNK13 | No | |
| Total | $125,000,000 |
Following the lockout period, on any date before April 8, 2024, the Pfizer Building Borrower has the right to defease the Pfizer Building Whole Loan in whole, but not in part. The lockout period will expire on the earlier to occur of (i) two years after the closing date of the securitization that includes the last note to be securitized or (ii) January 11, 2022. The Pfizer Building Whole Loan is prepayable without penalty on or after April 8, 2024.
Sources and Uses
| Sources | Uses | |||||||
| Original whole loan amount | $125,000,000 | 43.1% | Purchase Price | $228,000,000 | 78.6% | |||
| Cash Equity | 165,098,546 | 56.9 | Ground lease extension | 50,000,000 | 17.2 | |||
| Closing costs | 12,093,846 | 4.2 | ||||||
| Reserves | 4,700 | 0.0 | ||||||
| Total Sources | $290,098,546 | 100.0% | Total Uses | $290,098,546 | 100.0% |
The Property.The Pfizer Building Property is a 33-story Class A office building totaling 823,623 square feet in New York, New York. The Pfizer Building Property is located in Midtown Manhattan with frontage along East 43rd Street, East 42nd Street and Second Avenue. The Pfizer Building Property is 100.0% leased to Pfizer, and has served as the global headquarters of Pfizer since it was built in 1960. The Pfizer Building Property features 16 passenger elevators and floor plates ranging from 34,960 to 47,155 square feet on the 2nd through 11th floor, 11,699 to 27,554 square feet on the 12th through 21st floor, and 11,020 to 11,176 square feet on the 22nd to 32nd floor, with a 3,707 square foot 33rd floor penthouse. Additionally, there is 30,991 square feet of lower level basement space that houses mechanical systems and is used as storage space for Pfizer. The Pfizer lease expires July 9, 2024. Pfizer plans to vacate the Pfizer Building Property and move to an office building at Hudson Yards, as to which Pfizer has already signed a lease, at the end of the term of the Pfizer lease.
Pfizer (NYSE: PFE; rated A+/A1/AA by Fitch/Moody’s/S&P) is a large biopharmaceutical company which develops and manufactures healthcare products. Pfizer’s products include medicines and vaccines, as well as consumer healthcare products. For the year ending December 31, 2017, Pfizer reported $52.5 billion in total revenue. This resulted in a reported $16.5 billion of net cash flow from operations over the same period.
The Pfizer Building Property is located within close proximity to Grand Central Terminal, which provides access to transportation, including subway service along the nearby 4, 5, 6, 7 and S lines and Metro-North Railroad. Penn Station and the Port Authority Terminal are also accessible via the subway, connecting the Pfizer Building Property to major rail lines in the tristate area, including the Long Island Rail Road and the New Jersey Transit.
Prior to the origination of the Pfizer Building Mortgage Loan, Pfizer owned and occupied two adjacent buildings: the Pfizer Building Property, located at 235 East 42nd Street, in which it owned the ground leasehold interest, and an adjacent property located at 219 East 42nd Street (the “219 Building”), in which it owned the fee interest. In conjunction with its planned move to Hudson Yards, Pfizer sought to sell the Pfizer Building Property and the 219 Building and to enter into a single short-term lease of both buildings. Accordingly, on the day prior to the origination date of the Pfizer Building Whole Loan, Pfizer sold the Pfizer Building Property and the 219 Building to a joint venture, 219/235 East LLC (the “JV”), owned 99% by the Pfizer Building Borrower and 1% by ARE-NY Region No. 1, LLC (“219 Fee Owner”), an entity affiliated with Alexandria Real Estate Equities. Simultaneously therewith, the JV entered into a single lease to Pfizer (the “Pfizer Lease”) of both the Pfizer Building Property and the 219 Building. Immediately prior to the origination of the Pfizer Building Mortgage Loan, the following transactions were entered into:
| ● | The JV entered into leases with itself, as both landlord and tenant, of (i) the Pfizer Building Property (the “235 Lease”) and (ii) the 219 Building (the “219 Lease”, and together with the 235 Lease, the “JV Leases”). The Pfizer Lease has priority over the JV Leases. |
THE INFORMATION IN THIS STRUCTURAL AND COLLATERAL TERM SHEET IS NOT COMPLETE AND MAY BE AMENDED PRIOR TO THE TIME OF SALE. THIS TERM SHEET IS NOT AN OFFER TO SELL THESE SECURITIES AND IT IS NOT A SOLICITATION OF AN OFFER TO BUY THESE SECURITIES IN ANY JURISDICTION WHERE THE OFFER OR SALE IS NOT PERMITTED.
59
PFIZER BUILDING
| ● | The JV simultaneously conveyed (i) the ground leasehold interest in the Pfizer Building Property and the landlord’s interest under the 235 Lease to the Pfizer Building Borrower, and (ii) fee title in the 219 Building and the landlord’s interest in the 219 Lease to the 219 Fee Owner. The JV retained the landlord’s interest under the Pfizer Lease, but granted a present assignment to (x) the Pfizer Building Borrower of the landlord’s interest in the Pfizer Lease with respect to the Pfizer Building Property effective as of the origination date of the Pfizer Building Mortgage Loan with respect to the period following the expiration or earlier termination of the 235 Lease (the “Pfizer Lease 235 Building Residual Interest”), pursuant to which the Pfizer Building Borrower assumed the obligations of the landlord under the Pfizer Lease with respect to the Pfizer Building Property effective as of the date on which the 235 Lease expires or is earlier terminated as more particularly set forth in the limited liability operating agreement of the JV (the “Pfizer Building JV Agreement”) and (y) 219 Fee Owner of the landlord’s interest in the Pfizer Lease with respect to the 219 Building with respect to the period following the expiration or earlier termination of the 219 Lease (the “Pfizer Lease 219 Building Residual Interest”), pursuant to which 219 Fee Owner assumed the obligations of the landlord under the Pfizer Lease with respect to the 219 Building effective as of the date on which the 219 Lease expires or is earlier terminated as more particularly set forth in the Pfizer Building JV Agreement. The provisions of the assignment of the Pfizer Lease 235 Residual Interest and the assignment of the Pfizer Lease 219 Residual Interest provide that the Pfizer Building Borrower and the 219 Fee Owner, as applicable, accept the assignments of such interests in the Pfizer Lease subject to the requirement that they assume the obligations in respect of the Pfizer Building Mortgaged Property or the 219 Building, as applicable, pursuant to the terms, covenants and conditions set forth in the Pfizer Building JV Agreement as applicable to them in respect of the assigned interests in the Pfizer Lease, mutatis mutandis. |
| ● | The 235 Lease provides for payment by the JV of rent in an amount certain which is equal to 70.181% (the “235 Percentage”) of the rent under the Pfizer Lease and the 219 Lease provides for payment by the JV of rent in an amount certain which is equal to the remaining 29.819% (the “219 Percentage”) of the rent under the Pfizer Lease. Such percentages are equal to the relative square feet of the Pfizer Building Property and the 219 Building. |
| ● | The Pfizer Building JV Agreement provides generally that the Pfizer Building Borrower will control the day to day operations of the JV; however the Pfizer Building Borrower has the right to make all decisions relating solely to the Pfizer Building Property and the 219 Fee Owner has the right to make all decisions relating solely to the 219 Building. The Pfizer Building JV Agreement provides that neither the Pfizer Lease nor the 235 Lease may be amended, modified or terminated without the lender’s prior written consent, and that the lender is a third party beneficiary of such provision. |
Further, on the origination date, the Pfizer Building Borrower granted the mortgage lender a mortgage on the ground leasehold interest comprising the Pfizer Building Property, an assignment of leases and rents of the landlord’s interest in the 235 Lease and the Pfizer Lease 235 Building Residual Interest, and a pledge of its 99% equity interest in the JV.
The following table presents certain information relating to the tenancy at the Pfizer Building Property:
Major Tenant
| Tenant Name | Credit Rating (Fitch/Moody’s/S&P)(1) | Tenant NRSF | % of NRSF | Annual U/W Base Rent PSF | Annual U/W Base Rent | % of Total Annual U/W Base Rent | Lease Expiration Date |
| Major Tenant | |||||||
| Pfizer(2) | A+/A1/AA | 823,623 | 100.0% | $40.00 | $32,944,920 | 100.0% | 7/9/2024(3) |
| Total Major Tenant | 823,623 | 100.0% | $40.00 | $32,944,920 | 100.0% | ||
| Vacant Space | 0 | 0.0% | |||||
| Collateral Total | 823,623 | 100.0% | |||||
| (1) | Certain ratings are those of the parent company whether or not the parent company guarantees the lease. |
| (2) | The JV leases the Pfizer Building Property to Pfizer, and the Pfizer Building Borrower owns the landlord’s interest under the 235 Lease, as described above. |
| (3) | Pfizer has one, one-year lease renewal option; however, Pfizer has indicated its intent to vacate the premises upon expiration of its current lease term. |
THE INFORMATION IN THIS STRUCTURAL AND COLLATERAL TERM SHEET IS NOT COMPLETE AND MAY BE AMENDED PRIOR TO THE TIME OF SALE. THIS TERM SHEET IS NOT AN OFFER TO SELL THESE SECURITIES AND IT IS NOT A SOLICITATION OF AN OFFER TO BUY THESE SECURITIES IN ANY JURISDICTION WHERE THE OFFER OR SALE IS NOT PERMITTED.
60
PFIZER BUILDING
The following table presents certain information relating to the lease rollover schedule at the Pfizer Building Property:
Lease Expiration Schedule(1)
| Year Ending December 31, | No. of Leases Expiring | Expiring NRSF | % of Total NRSF | Cumulative Expiring NRSF | Cumulative % of Total NRSF | Annual U/W Base Rent | % of Annual U/W Base Rent | Annual U/W Base Rent PSF |
| MTM | 0 | 0 | 0.0% | 0 | 0.0% | $0 | 0.0% | $0.00 |
| 2018 | 0 | 0 | 0.0% | 0 | 0.0% | $0 | 0.0% | $0.00 |
| 2019 | 0 | 0 | 0.0% | 0 | 0.0% | $0 | 0.0% | $0.00 |
| 2020 | 0 | 0 | 0.0% | 0 | 0.0% | $0 | 0.0% | $0.00 |
| 2021 | 0 | 0 | 0.0% | 0 | 0.0% | $0 | 0.0% | $0.00 |
| 2022 | 0 | 0 | 0.0% | 0 | 0.0% | $0 | 0.0% | $0.00 |
| 2023 | 0 | 0 | 0.0% | 0 | 0.0% | $0 | 0.0% | $0.00 |
| 2024 | 1 | 823,623 | 100.0% | 823,623 | 100.0% | $32,944,920 | 100.0% | $40.00 |
| 2025 | 0 | 0 | 0.0% | 823,623 | 100.0% | $0 | 0.0% | $0.00 |
| 2026 | 0 | 0 | 0.0% | 823,623 | 100.0% | $0 | 0.0% | $0.00 |
| 2027 | 0 | 0 | 0.0% | 823,623 | 100.0% | $0 | 0.0% | $0.00 |
| 2028 | 0 | 0 | 0.0% | 823,623 | 100.0% | $0 | 0.0% | $0.00 |
| Thereafter | 0 | 0 | 0.0% | 823,623 | 100.0% | $0 | 0.0% | $0.00 |
| Vacant | 0 | 0 | 0.0% | 823,623 | 100.0% | $0 | 0.0% | $0.00 |
| Total | 1 | 823,623 | 100.0% | $32,944,920 | 100.0% | $40.00 |
| (1) | Information obtained from the underwritten rent roll. |
The following table presents historical occupancy percentages at the Pfizer Building Property:
Historical Occupancy(1)
12/31/2014 | 12/31/2015 | 12/31/2016 | 12/1/2017 | 8/1/2018 |
| 100.0% | 100.0% | 100.0% | 100.0% | 100.0% |
| (1) | Prior to the origination of the Pfizer Building Mortgage Loan, Pfizer both owned and occupied the Pfizer Building Property. |
Underwritten Net Cash Flow. The following table presents certain information relating to the underwritten net cash flow at the Pfizer Building Property:
Cash Flow Analysis(1)
| U/W | % of U/W Effective Gross Income | U/W $ per SF | ||||||
| Base Rent | $32,944,920 | 100.0 | % | $40.00 | ||||
| Grossed Up Vacant Space | 0 | 0.0 | 0.00 | |||||
| Total Reimbursables | 0 | 0.0 | 0.00 | |||||
| Less Vacancy & Credit Loss | 0 | 0.0 | 0.00 | |||||
| Effective Gross Income | $32,944,920 | 100.0 | % | $40.00 | ||||
| Insurance | 100,000 | 0.3 | 0.12 | |||||
| Ground Rent(2) | 9,800,000 | 29.7 | 11.90 | |||||
| Total Operating Expenses | $9,900,000 | 30.1 | % | $12.02 | ||||
| Net Operating Income | $23,044,920 | 69.9 | % | $27.98 | ||||
| TI/LC | 0 | 0.0 | 0.00 | |||||
| Capital Expenditures | 0 | 0.0 | 0.00 | |||||
| Net Cash Flow | $23,044,920 | 69.9 | % | $27.98 | ||||
| NOI DSCR(3) | 1.00x | |||||||
| NCF DSCR(3) | 1.00x | |||||||
| NOI DY(3) | 18.4% | |||||||
| NCF DY(3) | 18.4% | |||||||
| (1) | Prior to the day preceding the loan origination date, the Pfizer Building Property was owned and occupied by Pfizer. Accordingly, historical NOI is not applicable. |
| (2) | The ground rent increases to $11,050,000 on May 1, 2022. The scheduled monthly debt service payment reduces to $1,816,243 in April 2022 and thereafter in an amount which generally offsets such ground rent increase. |
| (3) | Debt service coverage ratios and debt yields are based on the Pfizer Building Whole Loan. |
THE INFORMATION IN THIS STRUCTURAL AND COLLATERAL TERM SHEET IS NOT COMPLETE AND MAY BE AMENDED PRIOR TO THE TIME OF SALE. THIS TERM SHEET IS NOT AN OFFER TO SELL THESE SECURITIES AND IT IS NOT A SOLICITATION OF AN OFFER TO BUY THESE SECURITIES IN ANY JURISDICTION WHERE THE OFFER OR SALE IS NOT PERMITTED.
61
PFIZER BUILDING
Appraisal.As of the appraisal valuation date of March 26, 2018 the Pfizer Building Property had an “as-is” appraised value of $210,000,000. The appraiser also concluded to a “Prospective Market Value-Extended Ground Lease” appraised value of $415,000,000. This prospective market value assumes that the second $50.0 million ground lease extension option payment will be made in year three of the extended ground lease (by July 11, 2021), and the ground lease will be extended to December 31, 2117. The Pfizer Building Borrower is not obligated to exercise its option to extend the ground lease and the foregoing payment has not been reserved for. The Pfizer Building Borrower made an initial option payment of $50.0 million on the loan origination date. The “as is” and “Prospective Market Value-Extended Ground Lease” values both assume that Pfizer vacates the Pfizer Building Property at the expiration of the Pfizer Lease and that $100.0 million is invested to redevelop the Pfizer Building Property. No funds have been reserved for redevelopment of the Pfizer Building Property. See “Ground Lease” section below.
Environmental Matters. According to the Phase I environmental report dated March 30, 2018, there was no evidence of any recognized environmental conditions at the Pfizer Building Property.
Market Overview and Competition.The Pfizer Building Property has frontage along East 43rd Street, East 42nd Street and Second Avenue in the Grand Central office submarket of Midtown Manhattan. According to the appraisal, the Pfizer Building Property is located within a heavily trafficked office market, within close proximity to several public attractions such as Grand Central Terminal, Bryant Park and the United Nations Headquarters, as well as retail corridors such as Madison and Fifth Avenues. The Pfizer Building Property is surrounded by New York landmarks, restaurants, hotels, retail shops and tourist attractions. FDR Drive and the Queens Midtown Tunnel are also accessible from the Pfizer Building Property.
The 112.5 million square foot Grand Central office submarket is Manhattan’s largest, according to a third-party industry report, and as of the fourth quarter of 2017 had a vacancy rate of 9.3% and an average asking rent of $75.49 per square foot, second-highest among Manhattan submarkets. As of the fourth quarter of 2017, the Grand Central office submarket contained approximately 72.3 million SF of Class A office space with a vacancy rate of 8.4% and average asking rents of $86.26 per square foot.
The estimated 2017 population within a quarter-, half- and one-mile radius of the Pfizer Building Property is 19,836, 51,150 and 149,661, respectively, according to the appraisal. The estimated 2017 average household income within a quarter-, half- and one-mile radius of the Pfizer Building Property is $119,968, $114,015 and $111,820, respectively.
Office buildings under construction in the Grand Central office submarket include the 1,800,000 square foot One Vanderbilt, with a 2021 completion date forecast and the 670,000 square foot 425 Park Avenue, with a 2019 completion date forecast.
The following table presents certain information relating to comparable leases to the Pfizer Building Property:
Comparable Leases(1)
| Property Name/Location | Year Built | Stories | Total GLA (SF) | Tenant Name | Lease Date/Term | Lease Area (SF) | Annual Base Rent PSF | Lease Type |
292 Madison Avenue New York, NY
| 1923 | 26 | 205,000 | CFA Institute | Sep. 2017 / 170 Mos. | 11,113 | $72.50 | Mod. Gross |
285 Madison Avenue New York, NY
| 1926 | 26 | 510,232 | Misys International Banking System | Aug. 2017 / 144 Mos. | 34,767 | $83.00 | Mod. Gross |
605 Third Avenue New York, NY
| 1964 | 43 | 1,043,055 | Meridiam Infrastructure | Jul. 2017 / 131 Mos. | 11,823 | $77.50 | Mod. Gross |
100 Park Avenue New York, NY
| 1950/2007 | 36 | 887,818 | ABN AMRO Holdings USA | Apr. 2017 / 124 Mos. | 54,037 | $79.00 | Mod. Gross |
140 East 45th Street New York, NY
| 1983/2013 | 44 | 700,000 | Mesirow Financial Holdings | Jan. 2017 / 120 Mos. | 7,576 | $74.00 | Mod. Gross |
450 Lexington Avenue New York, NY
| 1992 | 40 | 950,048 | PSP Investments USA LLC | Dec. 2016 / 124 Mos. | 13,720 | $122.00 | Mod. Gross |
605 Third Avenue New York, NY
| 1964 | 43 | 1,043,055 | Consulate General of Finland | Nov 2016 / 194 Mos. | 19,110 | $77.00 | Mod. Gross |
390 Madison Avenue New York, NY
| 1953/2018 | 32 | 862,154 | Hogan Lovells US LLP | Nov 2016 / 195 Mos. | 206,720 | $82.00 | Mod. Gross |
600 Lexington Avenue New York, NY
| 1983/2013 | 36 | 303,515 | MKP Capital Management | Oct. 2016 / 120 Mos. | 25,995 | $80.00 | Mod. Gross |
1 Dag Hammarskjold Plaza New York, NY | 1972/2007 | 50 | 782,928 | Memorial Hospital for Cancer & Allied Diseases | Apr. 2016 / 118 Mos. | 46,194 | $69.00 | Mod. Gross |
| (1) | Information obtained from the appraisal. |
The Borrower.The borrower for the Pfizer Building Whole Loan is 42nd & Second Holding Co. LLC, a Delaware limited liability company and a special purpose entity with two independent directors (the “Pfizer Building Borrower”). Legal counsel to the Pfizer Building Borrower delivered a non-consolidation opinion in connection with the origination of the Pfizer Building Whole Loan. David Werner is the guarantor of certain nonrecourse carveouts under the Pfizer Building Whole Loan.
THE INFORMATION IN THIS STRUCTURAL AND COLLATERAL TERM SHEET IS NOT COMPLETE AND MAY BE AMENDED PRIOR TO THE TIME OF SALE. THIS TERM SHEET IS NOT AN OFFER TO SELL THESE SECURITIES AND IT IS NOT A SOLICITATION OF AN OFFER TO BUY THESE SECURITIES IN ANY JURISDICTION WHERE THE OFFER OR SALE IS NOT PERMITTED.
62
PFIZER BUILDING
The State of Wisconsin Investment Board (“SWIB”) has a 75.0% indirect equity interest in the Pfizer Building Borrower. David Werner has a 9.3% indirect equity interest in the Pfizer Building Borrower. SWIB, created in 1951, is responsible for managing the assets of the Wisconsin Retirement System, the State Investment Fund and other state trust funds.
The Borrower Sponsor.The borrower sponsor is David Werner, of David Werner Real Estate Investments. David Werner Real Estate Investments is a privately-owned commercial real estate owner, operator and investor. David Werner has over 30 years of experience working in commercial real estate and is currently a principal owner of more than 15,000,000 SF of commercial real estate properties.
Escrows.The Pfizer Building Borrower is required to deposit monthly 1/12th of the estimated annual real estate taxes; provided that the Pfizer Building Borrower will not be required to make such deposits so long as (i) the Pfizer Lease (or other lease approved by the lender) expressly obligates the related tenant thereunder to directly pay taxes to the applicable governmental authority (which the Pfizer Lease satisfies as of the loan origination date), (ii) the Pfizer Lease or such other lease remains in full force and effect, (iii) no monetary or material non-monetary event of default is continuing under the Pfizer Building Whole Loan, (iv) (A) Pfizer is not then in default in the payment of taxes then due and payable under the Pfizer Lease, the 235 Lease and the Pfizer Building Ground Lease (as defined below) beyond any applicable grace periods or (B) such other tenant is not then in default in the payment of taxes then due and payable in accordance with the terms of the applicable lease (or to the extent applicable, the Pfizer Lease, the 235 Lease and the Pfizer Building Ground Lease) beyond any applicable grace periods and in either case pays such taxes prior to interest or penalties being incurred, and (v) the Pfizer Building Borrower delivers to the lender evidence of payment of such taxes prior to delinquency. The Pfizer Building Borrower is required to deposit monthly 1/12th of the estimated annual insurance premiums, provided that the Pfizer Building Borrower will not be required to make such deposits so long as (i) there is no continuing event of default under the Pfizer Building Whole Loan, and (ii) the Pfizer Building Property is covered by a blanket policy reasonably approved by the lender or being maintained by Pfizer pursuant to and in accordance with the Pfizer Lease, in each case with evidence of renewal of the policies and timely proof of payment of the insurance premiums. The Pfizer Building Borrower is required to deposit on August 8, 2018 and monthly thereafter, an amount equal to the ground rent payable under the Pfizer Building Ground Lease for the immediately succeeding month.
Lockbox and Cash Management.The Pfizer Building Mortgage Loan provides for a hard lockbox and upfront cash management. Pursuant to a lockbox agreement among the JV, the Pfizer Building Borrower, the 219 Fee Owner and the lockbox bank, the lockbox account is for the benefit of (i) the lender, with respect to the 235 Percentage of funds therein and Pfizer Building Subaccount (as defined below) and (ii) the 219 Fee Owner, with respect to the 219 Percentage of funds therein and 219 Building Subaccount (as defined below). The lockbox agreement provides that the 235 Percentage of the funds in the lockbox account will be allocated to a subaccount relating to the Pfizer Building Property (the “Pfizer Building Subaccount”) and the 219 Percentage of such funds will be allocated to a subaccount relating to the 219 Building (the “219 Building Subaccount”). The Pfizer Building Borrower is required to direct, or cause the JV to direct, Pfizer and all other tenants (if any) of the Pfizer Building Property to pay rents (including rents related to the 219 Building) directly into the lockbox account, and the Pfizer Building Borrower is required to deposit any rents received by it, notwithstanding such direction, within two business days of receipt. All funds in the Pfizer Building Subaccount are required to be swept to a lender-controlled cash management account and applied to the payment of, among other things, monthly escrows, debt service, operating expenses set forth in the lender-approved annual budget and extraordinary expenses approved by the lender, and to pay any remainder (i) if no Cash Sweep Event Period (as defined below) is continuing, into the insurance reserve, and (ii) if a Cash Sweep Event Period is continuing, into an excess cash flow account to be held as additional security for the Pfizer Building Whole Loan during the continuance of such Cash Sweep Event Period. Notwithstanding the foregoing, upon an event of default, the lender will have the right to apply funds in the cash management account to amounts due under the Pfizer Building Whole Loan in its sole discretion.
A “Cash Sweep Event Period” means the period commencing upon the occurrence of an event of default under the Pfizer Building Whole Loan and ending upon the cure (if applicable) of such event of default.
Property Management.The Pfizer Building Property is managed by an affiliate of the Pfizer Building Borrower.
Assumption.The Pfizer Building Borrower has a two-time right to transfer the Pfizer Building Property provided that certain conditions are satisfied, including (i) no event of default under the Pfizer Building Whole Loan documents has occurred and is continuing; (ii) the lender reasonably determines that the proposed transferee satisfies the lender’s credit review and underwriting standards, taking into consideration the transferee’s experience (unless the existing guarantor agrees to reaffirm its non-recourse carveout guaranty and environmental indemnity, notwithstanding the assumption), financial strength and general business standing; (iii) a replacement guarantor reasonably acceptable to the lender assumes the obligations of the Pfizer Building guarantor under the non-recourse carveout guaranty and environmental indemnity; and (iv) rating agency confirmation from each rating agency rating the Series 2018-BNK13 Certificates that such assumption will not result in a downgrade, withdrawal or qualification of the respective ratings assigned to the Series 2018-BNK13 Certificates.
Partial Release.Not permitted.
Real Estate Substitution.Not permitted.
Subordinate and Mezzanine Indebtedness.Not permitted.
Ground Lease.The Pfizer Building Property consists of a ground leasehold interest pursuant to a ground lease (the “Pfizer Building Ground Lease”) between Seaver Realty LLC, a New York limited liability company, as successor-in-interest to Seaver Realty Company, together with its successors and/or assigns, as ground lessor (the “Pfizer Building Ground Lessor”) and the Pfizer Building Borrower, as assignee of the original ground lessee, as ground lessee. The Pfizer Building Ground Lease expires December 31, 2057. Annual rent under the Pfizer Building Ground Lease is $9,800,000 through April 30, 2022, $11,050,000 from May 1, 2022 through
THE INFORMATION IN THIS STRUCTURAL AND COLLATERAL TERM SHEET IS NOT COMPLETE AND MAY BE AMENDED PRIOR TO THE TIME OF SALE. THIS TERM SHEET IS NOT AN OFFER TO SELL THESE SECURITIES AND IT IS NOT A SOLICITATION OF AN OFFER TO BUY THESE SECURITIES IN ANY JURISDICTION WHERE THE OFFER OR SALE IS NOT PERMITTED.
63
PFIZER BUILDING
April 30, 2027, $12,300,000 from May 1, 2027 through April 30, 2032 and $13,550,000 from May 1, 2032 through April 30, 2037. The Pfizer Building Ground Lease requires that either (i) on or prior to June 30, 2036, the Pfizer Building Ground Lessor and the ground lessee must agree on the net rent payable from May 1, 2037 through April 30, 2049 or (ii) the annual rent will be equal to 5.5% of the Pfizer Building Land Value (as defined below) but not less than the rent for the lease year ending April 30, 2037. The Pfizer Building Ground Lease further requires that either (i) on or prior to June 30, 2048, the Pfizer Building Ground Lessor and the ground lessee must agree on the net rent payable from May 1, 2049 through December 31, 2057 or (ii) the annual rent will be equal to 5.5% of the Pfizer Building Land Value but not less than the rent for the lease year ending April 30, 2049.
The “Pfizer Building Land Value” means the fair market value of the land (which is deemed to be 37,650 square feet and zoned to permit erection of a building with floor area equal to the greater of (x) the maximum as-of-right floor area ratio then allowable under applicable building and zoning laws and (y) an assumed floor area ratio of 15 (such assumed floor area ratio, the “FAR Floor”), at its highest and best use (but excluding any residential condominium use) considered as vacant and unimproved land and free and clear of all encumbrances, including the Pfizer Building Ground Lease, as of the date of the determination of such value;provided,however, that from and after January 1, 2058, the FAR Floor is deemed to be 16.4). In the event of any dispute regarding the Pfizer Building Land Value between the Pfizer Building Ground Lessor and the ground lessee, such value is required to be determined by arbitration procedures set forth in the Pfizer Building Ground Lease.
The Pfizer Building Borrower has an option (the “Pfizer Ground Lease Extension Option”) to extend the term of the Pfizer Building Ground Lease through December 31, 2117, which option must be exercised by July 11, 2021. On or prior to the closing of the Pfizer Building Whole Loan, $50,000,000 was paid to the Pfizer Building Ground Lessor in consideration of the granting of the Pfizer Ground Lease Extension Option. The Pfizer Ground Lease Extension Option is exercisable upon payment of a second option payment of $50,000,000 plus a supplemental payment (the “Supplemental Payment”) equal to accrued interest on such $50,000,000 amount from the date of the option agreement to the date of exercise of the Pfizer Ground Lease Extension Option at a rate of 2.5%per annum. If the Pfizer Ground Lease Extension Option is exercised, the combined $100,000,000 option payment will be deemed to be additional prepaid rent over the extension term. In addition, if transfer and/or occupancy taxes are actually due and payable in connection with the exercise of the Pfizer Ground Lease Extension Option, the Supplemental Payment will be decreased (but not below zero) either (i) dollar for dollar in the case of any occupancy tax that may be due from and payable by the Pfizer Building Borrower, as ground lessee, in connection with the exercise of the Pfizer Ground Lease Extension Option or (ii) by 50% of any transfer tax that may be due from and payable by the Pfizer Building Borrower, as ground lessee in connection with the exercise of the Pfizer Ground Lease Extension Option. The Pfizer Building Whole Loan documents do not obligate the Pfizer Building Borrower to exercise the Pfizer Ground Lease Extension Option. In the event the Pfizer Ground Lease Extension Option is exercised, the rent payable thereunder is initially determined based on a formula similar to that for the period from May 1, 2049 through December 31, 2057 (the “Land Value Formula”) for the period from January 1, 2058 through December 31, 2062 and is also determined pursuant to the Land Value Formula for, the period from January 1, 2083 through December 31, 2087 and the period from January 1, 2108 through December 31, 2112 (each a “Land Value Reset Period”), and increases by 10% for each four year period after a Land Value Reset Period and prior to the next land Value Reset Period.
Terrorism Insurance.The loan documents require that the “all risk” insurance policy required to be maintained by the Pfizer Building Borrower provide coverage for terrorism in an amount equal to the full replacement cost of the Pfizer Building Property, as well as 24 months of business interruption insurance; provided that so long as TRIPRA (or extension thereof or similar government program) is in effect and continues to cover both domestic and foreign acts of terrorism, the lender is required to accept terrorism insurance which covers “covered acts” as defined in TRIPRA. The Pfizer Building Borrower may rely on insurance (including self-insurance) provided by Pfizer in accordance with the Pfizer Lease for terrorism coverage, as to which the Pfizer Lease does not require business interruption coverage.
THE INFORMATION IN THIS STRUCTURAL AND COLLATERAL TERM SHEET IS NOT COMPLETE AND MAY BE AMENDED PRIOR TO THE TIME OF SALE. THIS TERM SHEET IS NOT AN OFFER TO SELL THESE SECURITIES AND IT IS NOT A SOLICITATION OF AN OFFER TO BUY THESE SECURITIES IN ANY JURISDICTION WHERE THE OFFER OR SALE IS NOT PERMITTED.
64
(THIS PAGE INTENTIONALLY LEFT BLANK)
THE INFORMATION IN THIS STRUCTURAL AND COLLATERAL TERM SHEET IS NOT COMPLETE AND MAY BE AMENDED PRIOR TO THE TIME OF SALE. THIS TERM SHEET IS NOT AN OFFER TO SELL THESE SECURITIES AND IT IS NOT A SOLICITATION OF AN OFFER TO BUY THESE SECURITIES IN ANY JURISDICTION WHERE THE OFFER OR SALE IS NOT PERMITTED.
65
(THIS PAGE INTENTIONALLY LEFT BLANK)
THE INFORMATION IN THIS STRUCTURAL AND COLLATERAL TERM SHEET IS NOT COMPLETE AND MAY BE AMENDED PRIOR TO THE TIME OF SALE. THIS TERM SHEET IS NOT AN OFFER TO SELL THESE SECURITIES AND IT IS NOT A SOLICITATION OF AN OFFER TO BUY THESE SECURITIES IN ANY JURISDICTION WHERE THE OFFER OR SALE IS NOT PERMITTED.
66
SHOWCASE II
The picture below is an artist’s rendering of the Showcase II Property as it is generally proposed to be completed, and is not an actual photograph or depiction of the current construction status of the related improvements. Furthermore, such rendering may differ in material aspects from the final design or the final, as-built condition of the completed improvements.

THE INFORMATION IN THIS STRUCTURAL AND COLLATERAL TERM SHEET IS NOT COMPLETE AND MAY BE AMENDED PRIOR TO THE TIME OF SALE. THIS TERM SHEET IS NOT AN OFFER TO SELL THESE SECURITIES AND IT IS NOT A SOLICITATION OF AN OFFER TO BUY THESE SECURITIES IN ANY JURISDICTION WHERE THE OFFER OR SALE IS NOT PERMITTED.
67
SHOWCASE II
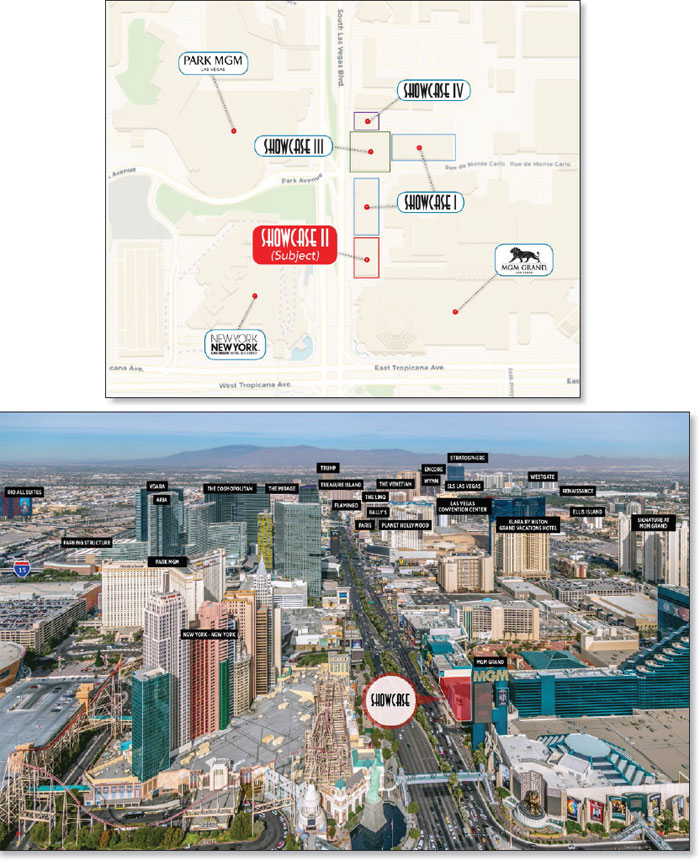
THE INFORMATION IN THIS STRUCTURAL AND COLLATERAL TERM SHEET IS NOT COMPLETE AND MAY BE AMENDED PRIOR TO THE TIME OF SALE. THIS TERM SHEET IS NOT AN OFFER TO SELL THESE SECURITIES AND IT IS NOT A SOLICITATION OF AN OFFER TO BUY THESE SECURITIES IN ANY JURISDICTION WHERE THE OFFER OR SALE IS NOT PERMITTED.
68
SHOWCASE II
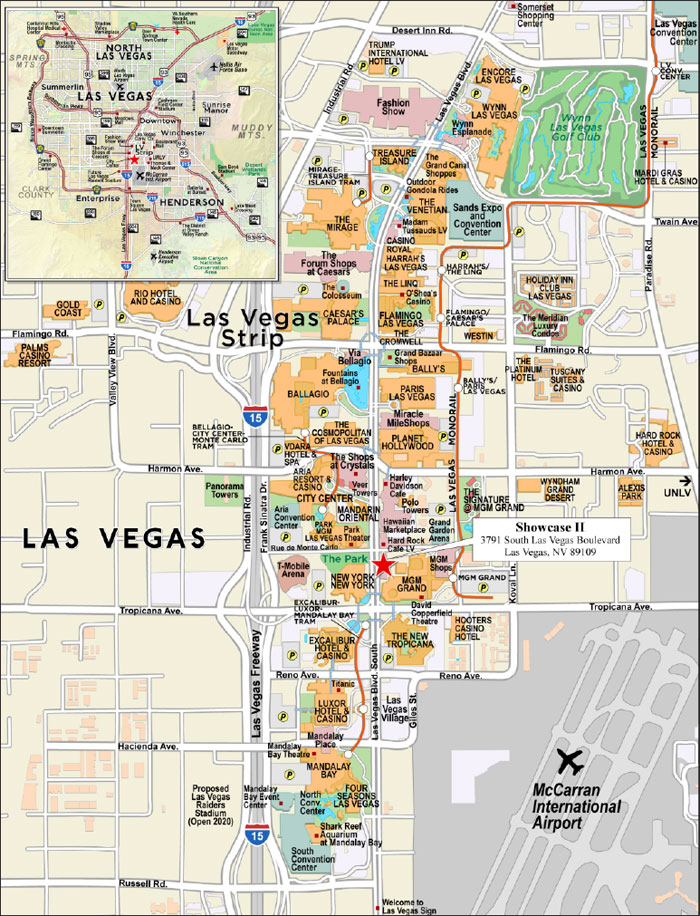
THE INFORMATION IN THIS STRUCTURAL AND COLLATERAL TERM SHEET IS NOT COMPLETE AND MAY BE AMENDED PRIOR TO THE TIME OF SALE. THIS TERM SHEET IS NOT AN OFFER TO SELL THESE SECURITIES AND IT IS NOT A SOLICITATION OF AN OFFER TO BUY THESE SECURITIES IN ANY JURISDICTION WHERE THE OFFER OR SALE IS NOT PERMITTED.
69
| No. 4 – Showcase II | |||||||
| Loan Information | Property Information | ||||||
| Mortgage Loan Seller: | Wells Fargo Bank, National Association | Single Asset/Portfolio: | Single Asset | ||||
Credit Assessment (DBRS/Fitch/S&P): | NR/NR/NR | Property Type: | Retail | ||||
| Original Principal Balance(1): | $50,000,000 | Specific Property Type: | Anchored | ||||
| Cut-off Date Balance(1): | $50,000,000 | Location: | Las Vegas, NV | ||||
| % of Initial Pool Balance: | 5.30% | Size: | 41,407 SF | ||||
| Loan Purpose: | Refinance | Cut-off Date Balance Per SF(1): | $3,091.26 | ||||
| Borrower Names: | SG Island Plaza LLC; Nakash Showcase II, LLC; Nakash Holding Island Plaza LLC; EG Island Plaza LLC; JG Island Plaza LLC | Year Built/Renovated: | 2001/2018 | ||||
| Borrower Sponsors: | Nakash Properties LLC; Nakash Holding LLC; Eli Gindi; Jeffrey Gindi | Title Vesting: | Fee | ||||
| Mortgage Rate: | 4.8963% | Property Manager: | Self-managed | ||||
| Note Date: | April 24, 2018 | 4thMost Recent Occupancy (As of): | 100.0% (12/31/2014) | ||||
| Anticipated Repayment Date: | NAP | 3rdMost Recent Occupancy (As of): | 100.0% (12/31/2015) | ||||
| Maturity Date: | May 11, 2028 | 2ndMost Recent Occupancy (As of): | 100.0% (12/31/2016) | ||||
| IO Period: | 120 months | Most Recent Occupancy (As of)(4): | 76.8% (12/31/2017) | ||||
| Loan Term (Original): | 120 months | Current Occupancy (As of): | 100.0% (7/1/2018) | ||||
| Seasoning: | 3 months | ||||||
| Amortization Term (Original): | NAP | Underwriting and Financial Information: | |||||
| Loan Amortization Type: | Interest-only, Balloon | ||||||
| Interest Accrual Method: | Actual/360 | 4thMost Recent NOI(5): | NAV | ||||
| Call Protection: | L(27),D(89),O(4) | 3rdMost Recent NOI(5): | NAV | ||||
| Lockbox Type: | Hard/Upfront Cash Management | 2ndMost Recent NOI(5): | NAV | ||||
| Additional Debt(2): | Yes | Most Recent NOI(5): | NAV | ||||
| Additional Debt Type(2): | Pari Passu; Mezzanine | ||||||
| U/W Revenues: | $11,287,376 | ||||||
| U/W Expenses: | $890,855 | ||||||
| U/W NOI: | $10,396,521 | ||||||
| Escrows and Reserves(3): | U/W NCF: | $10,302,429 | |||||
| U/W NOI DSCR(1): | 1.64x | ||||||
| U/W NCF DSCR(1): | 1.62x | ||||||
| Type: | Initial | Monthly | Cap (If Any) | U/W NOI Debt Yield(1): | 8.1% | ||
| Taxes | $26,118 | $8,706 | NAP | U/W NCF Debt Yield(1): | 8.0% | ||
| Insurance | $41,517 | $6,920 | NAP | As-Stabilized Appraised Value(6): | $237,000,000 | ||
| Replacement Reserve | $0 | $6,909 | NAP | As-Stabilized Appraisal Valuation Date(6): | April 1, 2019 | ||
| Rent Concession Reserve | $1,116,622 | $0 | NAP | Cut-off Date LTV Ratio(1)(6): | 54.0% | ||
| Existing TI/LC Reserve | $8,563,335 | $0 | NAP | LTV Ratio at Maturity or ARD(1)(6): | 54.0% | ||
| (1) | The Showcase II Mortgage Loan (as defined below) is part of the Showcase II Whole Loan (as defined below), which comprises three pari passu notes with an aggregate original principal balance of $128,000,000. All statistical information related to the Cut-off Date Balance per SF, U/W NOI Debt Yield, U/W NCF Debt Yield, U/W NOI DSCR, U/W NCF DSCR, Cut-off Date LTV Ratio and LTV Ratio at Maturity or ARD are based on the Showcase II Whole Loan. |
| (2) | The equity interest in the Showcase II Borrower (as defined below) has been pledged to secure mezzanine indebtedness with an original principal balance of $37,000,000. As of the Cut-off Date, the U/W NOI Debt Yield, U/W NCF DSCR and Cut-off Date LTV Ratio based on the Showcase II Total Debt (as defined below) are 6.3%, 1.15x and 69.6%, respectively. See “Subordinate and Mezzanine Indebtedness”. |
| (3) | See “Escrows” section. |
| (4) | See “Historical Occupancy” section. |
| (5) | See “Cash Flow Analysis” section. |
| (6) | The Appraised Value, Cut-off Date LTV Ratio and LTV Ratio at Maturity or ARD are based on the appraiser’s “Prospective Market Value Upon Stabilization” as of April 1, 2019, which assumes that tenants with executed leases have opened for business and that contractual tenant improvement and leasing commission (“TI/LC”) obligations and landlord work expenditures have been fulfilled. The Showcase II Borrower deposited upfront reserves totaling $8,563,335 for such contractual TI/LC and landlord work obligations and $1,116,622 for gap rent for tenants with rent abatement periods through September 2018 (see “Escrows” section). The appraiser concluded to an “as-is” Appraised Value of $215,000,000 (as of February 27, 2018), which would result in a Cut-off Date LTV Ratio of 59.5% based on the Showcase II Whole Loan and a Cut-off Date LTV Ratio of 76.7% based on the Showcase II Total Debt. |
The Mortgage Loan. The mortgage loan (the “Showcase II Mortgage Loan”) is part of a whole loan (the “Showcase II Whole Loan”) evidenced by threepari passu notes secured by a first mortgage encumbering the fee interest in an anchored retail shopping center located in Las Vegas, Nevada (the “Showcase II Property”). The Showcase II Whole Loan was originated on April 24, 2018 by Wells Fargo Bank, National Association. The Showcase II Whole Loan had an original principal balance of $128,000,000, has an outstanding principal balance as of the Cut-off Date of $128,000,000 and accrues interest at an interest rate of 4.8963%per annum. The Showcase II Whole Loan had an initial term of 120 months, has a remaining term of 117 months as of the Cut-off Date and requires payments of interest-only through the loan term. The Showcase II Whole Loan matures on May 11, 2028.
THE INFORMATION IN THIS STRUCTURAL AND COLLATERAL TERM SHEET IS NOT COMPLETE AND MAY BE AMENDED PRIOR TO THE TIME OF SALE. THIS TERM SHEET IS NOT AN OFFER TO SELL THESE SECURITIES AND IT IS NOT A SOLICITATION OF AN OFFER TO BUY THESE SECURITIES IN ANY JURISDICTION WHERE THE OFFER OR SALE IS NOT PERMITTED.
70
SHOWCASE II
The controlling Note A-1, which will be contributed to the BANK 2018-BNK13 securitization trust, had an original principal balance of $50,000,000 and has an outstanding principal balance as of the Cut-off Date of $50,000,000. The non-controlling Notes A-2 and A-3, which had an aggregate original principal balance of $78,000,000, are currently held by Wells Fargo Bank, National Association and are expected to be contributed to future securitization trusts. The mortgage loans evidenced by Notes A-2 and A-3 are collectively referred to herein as the “Showcase II Companion Loans”. The lender provides no assurances that any non-securitizedpari passu notes will not be split further. See “Description of the Mortgage Pool—The Whole Loans—The Serviced Pari Passu Whole Loans” and “Pooling and Servicing Agreement” in the Preliminary Prospectus.
Note Summary
| Notes | Original Balance | Note Holder | Controlling Interest | |
| A-1 | $50,000,000 | BANK 2018-BNK13 | Yes | |
| A-2 | $33,000,000 | Wells Fargo Bank, National Association | No | |
| A-3 | $45,000,000 | Wells Fargo Bank, National Association | No | |
| Total | $128,000,000 |
Following the lockout period, on any date before February 11, 2028, the borrower has the right to defease the Showcase II Whole Loan in whole, but not in part. In addition, the Showcase II Whole Loan is prepayable without penalty on or after February 11, 2028. The lockout period will expire on the earlier to occur of (i) two years after the closing date of the securitization that includes the last note to be securitized and (ii) June 11, 2022.
Sources and Uses
| Sources | Uses | |||||||
| Original whole loan amount | $128,000,000 | 77.6% | Loan payoff(1) | $76,289,680 | 46.2% | |||
| Mezzanine debt(2) | $37,000,000 | 22.4 | Upfront reserves | 9,747,592 | 5.9 | |||
| Closing costs | 2,435,150 | 1.5 | ||||||
| Return of equity | 76,527,578 | 46.4 | ||||||
| Total Sources | $165,000,000 | 100.0% | Total Uses | $165,000,000 | 100.0% |
| (1) | Loan payoff includes an existing senior loan ($61,158,880) and existing mezzanine loan ($15,130,800). |
| (2) | See “Subordinate and Mezzanine Indebtedness” section. |
The Property.The Showcase II Property consists of 41,407 square feet of specialty retail space within the larger Showcase retail development in Las Vegas, Nevada. The Showcase II Property is situated on 0.7 acres of land and comprises a two-story retail center featuring direct frontage, exposure and tenant access from the Las Vegas Strip (“The Strip”). The building is currently being renovated and is expected to feature a 32-foot front façade height to maximize signage and exposure from The Strip. The overall Showcase retail development, which is owned by affiliates of the Showcase II Borrower, comprises four phases totaling approximately 350,917 square feet of specialty and entertainment retail space (of which approximately 309,510 square feet does not serve as collateral for the Showcase II Whole Loan) with tenants and attractions including World of Coca-Cola, M&M’s World and Hard Rock Café. As of July 1, 2018, the Showcase II Property was 100.0% leased to six tenants.
Following the borrower sponsor’s acquisition of the Showcase II Property in December 2015, the borrower sponsor has been renovating and redeveloping the existing improvements and has spent over $44.9 million on tenant buyouts, tenant allowances and capital and legal expenditures. Prior to a recent reconfiguration, the Showcase II Property was fully occupied by two tenants with Grand Canyon Shops occupying 52.8% of the net rentable area (22,190 square feet) and Adidas occupying the remaining 47.2% of net rentable area (19,835 square feet). In 2016, the borrower sponsor negotiated a mutual release and discharge and terminated Grand Canyon Shops’ lease in exchange for a $20.8 million termination payment and also negotiated a downsizing of the Adidas space to 10,350 square feet. The Showcase II Property now comprises five retail suites and a sidewalk kiosk.
The Showcase II Property does not contain on-site parking; however, parking is available within both the adjacent parking garage at the non-collateral portion of the Showcase development and the MGM Grand garage (located approximately 0.5 miles east of the Showcase II Property). Per the zoning report, parking requirements are satisfied via these neighboring garages.
Major Tenants. The largest tenant at the Showcase II Property by underwritten rent is T-Mobile (S&P: BBB+; 29.2% of underwritten base rent). T-Mobile recently announced a proposed $26 billion dollar acquisition of Sprint, which was under review by the Federal Communications Commission as of July 3, 2018. The Showcase II Property location is T-Mobile’s first two-story store and the company’s fifth signature-style store (after New York, Chicago, Miami and Santa Monica). The store has a nightclub theme and features a virtual reality headset demo area, a photo booth, a bar serving non-alcoholic beverages, a concierge desk with tickets to events at the nearby T-Mobile Arena and access to 25 portable phone chargers for in-store use. T-Mobile opened for business at the Showcase II Property in January 2018.
The second largest tenant by underwritten rent is American Eagle (23.6% of underwritten base rent), which is expected to operate a flagship store at the Showcase II Property. American Eagle has taken possession of its space, commenced paying rent and is expected to open by November 2018.
The third largest tenant by underwritten rent is Adidas (21.9% of underwritten base rent). The Adidas store at the Showcase II Property was recently updated into a new design inspired by high school and college stadiums. The store features a test area that uses Run Genie, a tablet based software that helps employees recommend shoes based on how a customer runs. Adidas has been a tenant at the Showcase II Property since 2004.
THE INFORMATION IN THIS STRUCTURAL AND COLLATERAL TERM SHEET IS NOT COMPLETE AND MAY BE AMENDED PRIOR TO THE TIME OF SALE. THIS TERM SHEET IS NOT AN OFFER TO SELL THESE SECURITIES AND IT IS NOT A SOLICITATION OF AN OFFER TO BUY THESE SECURITIES IN ANY JURISDICTION WHERE THE OFFER OR SALE IS NOT PERMITTED.
71
SHOWCASE II
The fourth largest tenant is Aerie (American Eagle’s lingerie brand; 13.7% of underwritten base rent), and the fifth largest tenant is US Polo (8.2% of underwritten base rent), both of which have taken possession of their spaces but have not yet opened for business. The anticipated rent commencement date for both US Polo and Aerie is October 2, 2018 with estimated opening dates for US Polo in October 2018 and for Aerie by November 2018. All outstanding tenant improvement costs and gap rent through September 30, 2018 were reserved upon origination of the Showcase II Whole Loan (see “Escrows” section).
The following table presents certain information relating to the tenancy at the Showcase II Property:
Major Tenants
| Tenant Name | Credit Rating (Fitch/Moody’s/ S&P)(1) | Tenant NRSF | % of NRSF | Annual U/W Base Rent PSF(2) | Annual U/W Base Rent(2) | % of Total Annual U/W Base Rent | Lease Expiration Date |
| Major Tenants | |||||||
| T-Mobile | BBB+/Baa1/BBB+ | 10,249 | 24.8% | $311.25 | $3,190,000 | 29.2% | 1/31/2028(3) |
| American Eagle(4) | NR/NR/NR | 10,960 | 26.5% | $234.95 | $2,575,000 | 23.6% | 1/31/2028(5) |
| Adidas | NR/NR/NR | 10,350 | 25.0% | $231.59 | $2,397,000 | 21.9% | 9/30/2027(6) |
| Aerie(4)(7) | NR/NR/NR | 5,669 | 13.7% | $264.60(7) | $1,500,000(7) | 13.7% | 5/31/2028(8) |
| US Polo(9)(10) | NR/NR/NR | 3,923 | 9.5% | $229.42(9) | $900,000(9) | 8.2% | 5/31/2028(11) |
| Total Major Tenants | 41,151 | 99.4% | $256.66 | $10,562,000 | 96.7% | ||
| Non-Major Tenant(12) | 256 | 0.6% | $1421.19 | $363,825 | 3.3% | ||
| Vacant Space | 0 | 0.0% | |||||
| Collateral Total | 41,407 | 100.0% | $263.86 | $10,925,825 | 100.0% | ||
| (1) | Certain ratings are those of the parent company whether or not the parent company guarantees the lease. |
| (2) | Annual U/W Base Rent PSF and Annual U/W Base Rent include contractual rent steps through January 2019 totaling $212,000. |
| (3) | T-Mobile has three, five-year renewal options, with 12 months’ notice, at rental rates as specified in the lease. |
| (4) | American Eagle and Aerie are affiliated with Schottenstein, which holds a 25.0% equity interest in the Showcase II Borrower (see “The Borrowers and Borrower Sponsors” section). |
| (5) | American Eagle has taken possession of its space, commenced paying rent and is expected to open for business by November 2018. American Eagle has one, five-year renewal option, with 12 months’ notice, at rental rates as specified in the lease. |
| (6) | Adidas has two, five-year renewal options, with six months’ notice, at rental rates as specified in the lease. |
| (7) | Aerie has taken possession of its space and is anticipated to begin paying rent on October 2, 2018 and open for business by November 2018. At origination of the Showcase II Whole Loan, a gap rent reserve was required to cover rental payments through the anticipated rent commencement date (see “Escrows” section). |
| (8) | Aerie has one, five-year renewal option, with 12 months’ notice, at rental rates as specified in the lease. |
| (9) | US Polo has taken possession of its space and is anticipated to begin paying rent on October 2, 2018 and open for business in October 2018. At origination of the Showcase II Whole Loan, a gap rent reserve was required to cover rental payments through the anticipated rent commencement date. |
| (10) | US Polo is affiliated with Nakash Properties LLC and Nakash Holding LLC, which serve as borrower sponsors for the Showcase II Whole Loan. |
| (11) | US Polo has one, five-year renewal option, with 12 months’ notice, at rental rates as specified in the lease. |
| (12) | The Non-Major Tenant is Vegas.com, a kiosk tenant with a March 31, 2019 lease expiration. Vegas.com has one remaining, three-year renewal option, with six months’ notice, at a rental rate 5.0% greater than its current fixed minimum rent. |
The following table presents certain information relating to the lease rollover schedule at the Showcase II Property:
Lease Expiration Schedule(1)(2)
| Year Ending December 31, | No. of Leases Expiring | Expiring NRSF | % of Total NRSF | Cumulative Expiring NRSF | Cumulative % of Total NRSF | Annual U/W Base Rent | % of Total Annual U/W Base Rent | Annual U/W Base Rent PSF |
| MTM | 0 | 0 | 0.0% | 0 | 0.0% | $0 | 0.0% | $0.00 |
| 2018 | 0 | 0 | 0.0% | 0 | 0.0% | $0 | 0.0% | $0.00 |
| 2019 | 1 | 256 | 0.6% | 256 | 0.6% | $363,825 | 3.3% | $1,421.19 |
| 2020 | 0 | 0 | 0.0% | 256 | 0.6% | $0 | 0.0% | $0.00 |
| 2021 | 0 | 0 | 0.0% | 256 | 0.6% | $0 | 0.0% | $0.00 |
| 2022 | 0 | 0 | 0.0% | 256 | 0.6% | $0 | 0.0% | $0.00 |
| 2023 | 0 | 0 | 0.0% | 256 | 0.6% | $0 | 0.0% | $0.00 |
| 2024 | 0 | 0 | 0.0% | 256 | 0.6% | $0 | 0.0% | $0.00 |
| 2025 | 0 | 0 | 0.0% | 256 | 0.6% | $0 | 0.0% | $0.00 |
| 2026 | 0 | 0 | 0.0% | 256 | 0.6% | $0 | 0.0% | $0.00 |
| 2027 | 1 | 10,350 | 25.0% | 10,606 | 25.6% | $2,397,000 | 21.9% | $231.59 |
| 2028 | 4 | 30,801 | 74.4% | 41,407 | 100.0% | $8,165,000 | 74.7% | $265.09 |
| Thereafter | 0 | 0 | 0.0% | 41,407 | 100.0% | $0 | 0.0% | $0.00 |
| Vacant | 0 | 0 | 0.0% | 41,407 | 100.0% | $0 | 0.0% | $0.00 |
| Total/Weighted Average | 6 | 41,407 | 100.0% | $10,925,825 | 100.0% | $263.86 |
| (1) | Information obtained from the underwritten rent roll. |
| (2) | Certain tenants may have lease termination options that are exercisable prior to the originally stated expiration date of the subject lease and that are not considered in the Lease Expiration Schedule. |
THE INFORMATION IN THIS STRUCTURAL AND COLLATERAL TERM SHEET IS NOT COMPLETE AND MAY BE AMENDED PRIOR TO THE TIME OF SALE. THIS TERM SHEET IS NOT AN OFFER TO SELL THESE SECURITIES AND IT IS NOT A SOLICITATION OF AN OFFER TO BUY THESE SECURITIES IN ANY JURISDICTION WHERE THE OFFER OR SALE IS NOT PERMITTED.
72
SHOWCASE II
The following table presents historical occupancy percentages at the Showcase II Property:
Historical Occupancy
12/31/2014(1) | 12/31/2015(1) | 12/31/2016(1) | 12/31/2017(2) | 7/1/2018(3) |
| 100.0% | 100.0% | 100.0% | 76.8% | 100.0% |
| (1) | Information obtained from a third-party market research provider. |
| (2) | Occupancy as of December 31, 2017 includes T-Mobile, American Eagle, Adidas and the kiosk tenant. Aerie and US Polo each had a lease commencement date in June 2018. |
| (3) | Information obtained from the underwritten rent roll. |
Operating History and Underwritten Net Cash Flow. The following table presents certain information relating to the underwritten net cash flow at the Showcase II Property:
Cash Flow Analysis(1)
| U/W | % of U/W Effective Gross Income | U/W $ per SF | |
| Base Rent | $10,925,825 | 96.8% | $263.86 |
| Total Recoveries | 710,645 | 6.3 | 17.16 |
| Less Vacancy & Credit Loss | (349,094)(2) | (3.2) | (8.43) |
| Effective Gross Income | $11,287,376 | 100.0% | $272.60 |
| Total Operating Expenses | $890,855 | 7.9% | $21.51 |
| Net Operating Income | $10,396,521 | 92.1% | $251.08 |
| Replacement Reserves | 11,180 | 0.1 | 0.27 |
| TI/LC | 82,912 | 0.7 | 2.00 |
| Net Cash Flow | $10,302,429 | 91.3% | $248.81 |
| NOI DSCR(3) | 1.64x | ||
| NCF DSCR(3) | 1.62x | ||
| NOI Debt Yield(3) | 8.1% | ||
| NCF Debt Yield(3) | 8.0% |
| (1) | Historical operating statements are not applicable as the Showcase II Property has undergone significant recent renovations and reconfiguration (see “The Property” section). |
| (2) | The underwritten economic vacancy is 3.2%. The Showcase II Property was 100.0% leased as of July 1, 2018. |
| (3) | The debt service coverage ratios and debt yields are based on the Showcase II Whole Loan. |
Appraisal.The appraiser concluded to a “Prospective Market Value Upon Stabilization” for the Showcase II Property of $237,000,000 as of April 1, 2019, which assumes that leased tenants have opened for business and contractual TI/LC obligations and landlord work expenditures have been fulfilled. The Showcase II Borrower deposited upfront reserves totaling $8,563,335 for such contractual TI/LC and landlord work obligations and $1,116,622 for gap rent for tenants with rent abatement periods through September 2018 (see “Escrows” section). The appraiser concluded to an “as-is” Appraised Value of $215,000,000 as of February 27, 2018.
Environmental Matters. According to a Phase I environmental site assessment dated February 28, 2018, there was no evidence of any recognized environmental conditions at the Showcase II Property.
Market Overview and Competition.The Showcase II Property is located in Las Vegas, Nevada, approximately 0.1 miles north of the intersection of Las Vegas Boulevard and Tropicana Avenue, which is the site of four major resorts and casinos including the MGM Grand, New York-New York Hotel and Casino (“New York-New York”), Excalibur Hotel and Casino (“Excalibur”) and Tropicana Las Vegas (“Tropicana”), totaling over 12,500 combined rooms. The MGM Grand is the largest single hotel in the U.S. and the third-largest hotel complex in the world with 5,124 rooms. According to the appraisal, Monte Carlo Resort and Casino, located approximately 0.3 miles northwest of the Showcase II Property, is being transformed from a historically mid-level hotel fronting The Strip into a renovated development. Monte Carlo owner MGM Resorts International is partnering with New York hotelier Sydell Group for the ongoing approximately $450 million renovation project. Average foot traffic and traffic count along South Las Vegas Boulevard adjacent to the Showcase II Property is approximately 50,000 pedestrians and 55,000 vehicles, respectively. The Showcase II Property is located approximately 1.4 miles east of Interstate 15 and approximately 1.9 miles northwest of McCarran International Airport.
The Showcase II Property is situated 0.2 miles southeast of The Park, a plaza and outdoor retail and dining area that features multiple restaurants and bars as well as a live music venue that features events every Tuesday and Wednesday evening. Immediately adjacent to The Park is the Park Theater at Park MGM, which features 5,200 seats, a 140-foot wide stage, nine projectors and seven bars and terraces with views of The Strip and The Park. The Park Theater can accommodate configurations for concerts, award shows, combat sports, conventions and basketball. The Park connects The Strip to T-Mobile Arena, located approximately 0.5 miles west of the Showcase II Property. Built in April 2016, T-Mobile Arena is home to the National Hockey
THE INFORMATION IN THIS STRUCTURAL AND COLLATERAL TERM SHEET IS NOT COMPLETE AND MAY BE AMENDED PRIOR TO THE TIME OF SALE. THIS TERM SHEET IS NOT AN OFFER TO SELL THESE SECURITIES AND IT IS NOT A SOLICITATION OF AN OFFER TO BUY THESE SECURITIES IN ANY JURISDICTION WHERE THE OFFER OR SALE IS NOT PERMITTED.
73
SHOWCASE II
League’s (NHL) Vegas Golden Knights and is expected to host 100 to 150 events per year, including concerts, award shows, college basketball games, boxing and major MMA events.
According to the Las Vegas Convention & Visitors Authority, Las Vegas achieved a record 42.9 million visitors in 2016, with average per-trip visitor shopping expenses of $157. Additionally, between 2012 and 2016, the Las Vegas metro area’s annual job growth averaged 3.3%. According to a third-party market research report, the estimated 2017 population within a three- and five-mile radius of the Showcase II Property was approximately 132,125, and 367,283, respectively; while the 2017 estimated average household income within the same radii was $48,706, and $58,830, respectively.
According to a third-party market research report, the Showcase II Property is situated within the Central East Las Vegas Retail submarket. As of year-end 2017, the submarket reported a total inventory of 15.8 million square feet with a 10.6% vacancy rate. Submarket vacancy has decreased from 13.6% in 2011 and has averaged 11.8% over the last six years. The appraiser identified four primary competitive properties for the Showcase II Property totaling approximately 3.8 million square feet, which reported an average occupancy rate of approximately 91.5%. The appraiser concluded to market rents for the Showcase II Property of $250.00 per square foot, net, for retail tenants and $1,400.00 per square foot gross for the kiosk tenant.
The following table presents certain information relating to comparable leases for the Showcase II Property:
Comparable Leases(1)
| Tenant Name | Tenant Description | Size (SF) | Tenant Opening Date | Base Rent (PSF) | Reimbursements (PSF) | Gross-Equivalent Rent (PSF) |
| Confidential | Specialty food tenant | 698 | Jun-17 | $250.00 | $23.75 | $273.75 |
| Confidential | Specialty food tenant | 4,046 | Dec-16 | $104.85 | $24.75 | $129.60 |
| Confidential | Cosmetics retail tenant | 768 | Aug-16 | $250.00 | $65.96 | $315.96 |
| Confidential | Luxury menswear retailer | 2,500 | Dec-15 | $200.00 | $95.42 | $295.42 |
| Confidential | Specialty chocolates | 492 | Dec-15 | $356.00 | $60.00 | $416.00 |
| Confidential | Specialty retail tenant | 1,400 | Nov-15 | $250.00 | $23.75 | $273.75 |
| Confidential | Upscale shoes | 1,442 | Sep-15 | $225.00 | $95.00 | $320.00 |
| Confidential | Specialty footwear retailer | 3,017 | Sep-15 | $130.00 | $62.69 | $192.69 |
| Confidential | Specialty retail/accessories | 3,733 | Sep-15 | $218.47 | $45.00 | $263.47 |
| Confidential | Specialty food tenant | 11,797 | Sep-15 | $103.81 | $25.75 | $129.56 |
| Confidential | Upscale watches and accessories | 1,276 | Jan-15 | $475.00 | $95.00 | $570.00 |
| Confidential | Specialty jewelry | 731 | Jan-15 | $307.07 | $62.69 | $369.76 |
| Confidential | Specialty food tenant | 1,158 | Sep-14 | $377.47 | $48.27 | $425.74 |
| Confidential | Upscale fashion and accessory retailer | 5,251 | May-14 | $300.00 | $95.00 | $395.00 |
| Confidential | Restaurant/Bar space | 786 | May-14 | $301.39 | $95.00 | $396.39 |
| Confidential | Specialty travel | 938 | May-14 | $243.00 | $23.06 | $266.06 |
| Confidential | Specialty food tenant | 774 | Apr-14 | $255.00 | $23.75 | $278.75 |
| Confidential | Specialty upscale retailer | 715 | Nov-13 | $300.00 | $66.86 | $366.86 |
| Confidential | Upscale watches and accessories | 4,500 | Jul-13 | $300.00 | $95.00 | $395.00 |
| Confidential | Specialty food and coffee | 1,184 | May-13 | $422.30 | $86.00 | $508.30 |
| Confidential | Specialty retail tenant | 1,421 | Jan-12 | $288.75 | $23.75 | $312.50 |
| Confidential | Luxury watch retailer | 789 | Mar-11 | $450.00 | $85.00 | $535.00 |
| Confidential | Women’s apparel and accessories | 5,418 | Feb-10 | $235.00 | $95.00 | $330.00 |
| Weighted Average | $252.94 | $60.10 | $313.05 |
| (1) | Information obtained from the appraisal. |
THE INFORMATION IN THIS STRUCTURAL AND COLLATERAL TERM SHEET IS NOT COMPLETE AND MAY BE AMENDED PRIOR TO THE TIME OF SALE. THIS TERM SHEET IS NOT AN OFFER TO SELL THESE SECURITIES AND IT IS NOT A SOLICITATION OF AN OFFER TO BUY THESE SECURITIES IN ANY JURISDICTION WHERE THE OFFER OR SALE IS NOT PERMITTED.
74
SHOWCASE II
The table below presents certain information relating to four comparable retail properties to the Showcase II Property identified by the appraiser:
Competitive Set(1)
Showcase II (Subject) | Showcase | Miracle Mile Shops | Fashion Show Mall | Town Square Las Vegas | |
| Location | Las Vegas, NV | Las Vegas, NV | Las Vegas, NV | Las Vegas, NV | Las Vegas, NV |
| Distance from Subject | -- | Adjacent | 0.5 miles | 1.7 miles | 2.5 miles |
| Property Type | Retail/Anchored | Specialty Retail | Fashion/Specialty Center | Super-Regional Center | Lifestyle Center |
| Year Built/Renovated | 2001/2018 | 1997/2013 | 2000/2008 | 1981/2015 | 2007/2015 |
| Anchors | Adidas, American Eagle, T-Mobile, Aerie, US Polo | Coca-Cola, Ross Dress For Less, Hard Rock Café, “M&M’s” | -- | Neiman Marcus, Dillard’s, Macy’s, Saks, Forever 21, Nordstrom, Dick’s Sporting Goods | Saks Off Fifth Avenue, Container Store, H&M, Cinema, Old Navy, Whole Foods |
| Total GLA | 41,407 SF | 347,281 SF | 503,000 SF | 1,875,400 SF | 1,123,000 SF |
| Total Occupancy | 100.0% | 96.0% | 90.0% | 95.0% | 85.0% |
| (1) | Information obtained from the appraisal and the underwritten rent roll. |
The Borrowers and Borrower Sponsors.The borrowers comprise five tenants-in-common: Nakash Showcase II, LLC; Nakash Holding Island Plaza, LLC; SG Island Plaza, LLC; EG Island Plaza LLC; JG Island Plaza LLC (collectively, the “Showcase II Borrower”), each a Delaware limited liability company and single purpose entity with two independent directors. Legal counsel to the Showcase II Borrower delivered a non-consolidation opinion in connection with the origination of the Showcase II Whole Loan. The nonrecourse carve-out guarantors of the Showcase II Whole Loan are Nakash Properties LLC, Nakash Holding LLC, Eli Gindi and Jeffrey Gindi.
Schottenstein Realty LLC (“Schottenstein”) holds a 25.0% equity interest in the Showcase II Borrower. Schottenstein is a vertically-integrated owner, operator, acquirer and redeveloper of high quality, power/big box, community and neighborhood shopping centers in major population areas throughout the U.S. Schottenstein owns an interest in a portfolio of more than 156 properties in 27 states in excess of 21 million square feet of gross leasable area.
The borrower sponsors are Nakash Properties LLC, Nakash Holding LLC (“Nakash Holdings”), Eli Gindi and Jeffrey Gindi. Nakash Holdings is the private investment office of the Nakash family, which manages a multi-billion dollar portfolio of investments including aviation, retail, agriculture, transportation, manufacturing and real estate located throughout the world. Eli and Jeffrey Gindi are part of the founding family of the Century 21 department stores and are the managing members in a variety of retail, multifamily and hospitality assets located throughout the United States. Eli and Jeffrey Gindi are also the co-founders and principals of Gindi Capital, a family holding company that invests in commercial real estate.
Affiliates of the Showcase II Borrower acquired phases I, II and III of the Showcase retail development in separate transactions in 2014 and 2015, as well as phase IV (the former Smith & Wollensky building) in 2017 for a total purchase price of approximately $426.9 million (phases I, III and IV do not serve as collateral for the Showcase II Whole Loan).
Escrows.The loan documents provide for upfront reserves of $26,118 for real estate taxes, $41,517 for insurance premiums, $1,116,622 for gap rent related to Aerie ($695,518) and US Polo ($421,105) and $8,563,335 for existing TI/LCs related to American Eagle ($3,500,000), Adidas ($1,018,043), Aerie ($2,654,072) and US Polo ($1,391,220). The loan documents provide for ongoing monthly escrows in an amount equal to one-twelfth of the real estate taxes that the lender estimates will be payable during the next twelve months (initially $8,706), one-twelfth of the insurance premiums that the lender estimates will be payable during the next twelve months (initially $6,920) and $6,909 for capital expenditures.
Lockbox and Cash Management.The Showcase II Whole Loan requires a lender-controlled lockbox account, which is already in place, and that the Showcase II Borrower direct all tenants to pay rent directly into such lockbox account. The loan documents also require that all rents received by the borrower or the property manager be deposited into the lockbox account within three business day of receipt. All funds in the lockbox account are required to be swept each business day into the cash management account controlled by the lender and disbursed on each payment date in accordance with the loan documents. Prior to the occurrence of a Cash Trap Event Period (as defined below), all excess funds are required to be distributed to the borrower. During a Cash Trap Event Period, all excess funds are required to be swept to an excess cash flow subaccount controlled by the lender.
A “Cash Trap Event Period” will commence upon the earlier of the following:
| (i) | the occurrence of an event of default under the Showcase II Whole Loan; |
| (ii) | the net cash flow debt service coverage ratio for the Showcase II Total Debt (see “Subordinate and Mezzanine Indebtedness” section) falling below 1.10x at the end of any calendar quarter; or |
| (iii) | the occurrence of a Major Tenant Cash Trap Event Period (as defined below). |
A Cash Trap Event Period will end upon the occurrence of the following:
| ● | with regard to clause (i), the cure of such event of default; |
| ● | with regard to clause (ii), the net cash flow debt service coverage ratio for the Showcase II Total Debt being equal to or greater than 1.10x for two consecutive calendar quarters; or |
THE INFORMATION IN THIS STRUCTURAL AND COLLATERAL TERM SHEET IS NOT COMPLETE AND MAY BE AMENDED PRIOR TO THE TIME OF SALE. THIS TERM SHEET IS NOT AN OFFER TO SELL THESE SECURITIES AND IT IS NOT A SOLICITATION OF AN OFFER TO BUY THESE SECURITIES IN ANY JURISDICTION WHERE THE OFFER OR SALE IS NOT PERMITTED.
75
SHOWCASE II
| ● | with regard to clause (iii), a Major Tenant Cash Trap Event Period Cure (as defined below). |
A “Major Tenant Cash Trap Event Period” will commence upon the earlier of the following:
| (i) | any Major Tenant (as defined below) failing to extend or renew its lease (A) on or prior to the extension or renewal date set forth in its lease or (B) 12 months prior to lease expiration; |
| (ii) | any Major Tenant (A) terminating or cancelling its lease (including, without limitation, rejection in any bankruptcy or similar insolvency proceeding) or (B) failing to otherwise have its lease be in full force and effect; or |
| (iii) | any Major Tenant becoming insolvent or filing for bankruptcy; |
A “Major Tenant Cash Trap Event Period Cure” will occur upon the following:
| ● | with regard to clause (i), (x) such Major Tenant having renewed or extended its lease in accordance with the loan documents and delivered an estoppel in form and substance acceptable to lender, or (y) a Qualified Re-Leasing Event (as defined below); |
| ● | with regard to clause (ii), such Major Tenant, as applicable, having revoked or rescinded all termination or cancellation notices with respect to its lease and having re-affirmed the applicable lease as being in full force and effect; or |
| ● | with regard to clause (iii), such Major Tenant, as applicable, being no longer insolvent or subject to any bankruptcy or insolvency proceedings and its lease having been affirmed pursuant to a final and non-appealable order of a court of competent jurisdiction. |
A “Qualified Re-Leasing Event” will occur upon one or more replacement tenants acceptable to the lender executing leases covering all of the space currently occupied by any Major Tenant in accordance with the loan documents, as applicable, and delivering an estoppel certificate confirming such replacement tenants having accepted its premises, taken possession thereof and paying full unabated rent. After giving effect to the rents paid under such leases, the net cash flow debt service coverage ratio for the Showcase II Total Debt is required to be equal to or greater than 1.10x for two consecutive calendar quarters.
“Major Tenant” will mean (i) any tenant that accounts for 20.0% or more of the total rental income for the Showcase II Property, (ii) any lease which contains any option, offer, right of first refusal or other similar entitlement to acquire the fee interest in all or any portion of the Showcase II Property, or (iii) any instrument guaranteeing or providing credit support for any lease meeting the requirements of (i) or (ii) above.
Property Management. The Showcase II Property is managed by an affiliate of the borrower.
Assumption.The borrower has the two-time right, commencing 12 months after loan origination, to transfer the Showcase II Property, provided that certain conditions are satisfied, including (i) no event of default has occurred and is continuing; (ii) the lender has reasonably determined that the proposed transferee and guarantor satisfy the lender’s credit review and underwriting standards, taking into consideration the transferee’s experience, financial strength and general business standing; (iii) to the extent there is a tenant-in-common interest after such transfer (x) the transfer must not create more than five tenant-in-common owners of the Showcase II Property and (y) each tenant-in-common owner must be at least 51% owned and controlled by sponsorship approved by lender; and (iv) if required by the lender, rating agency confirmation from DBRS, Fitch and S&P that the transfer will not result in a downgrade, withdrawal or qualification of the respective ratings assigned to the Series BANK 2018-BNK13 Certificates and similar confirmations from each rating agency rating any securities backed by the Showcase II Companion Loans with respect to the ratings of such securities.
Partial Release. Not permitted.
Real Estate Substitution.Not permitted.
Subordinate and Mezzanine Indebtedness.Wells Fargo Bank, National Association, funded and placed with Nonghyup Bank, as the Trustee of Vestas Qualified Investors Private Real Estate Fund Investment Trust No. 35, a $37,000,000 mezzanine loan (the “Showcase II Mezzanine Loan”) to five tenants-in-common: Nakash Showcase II Mezz LLC; Nakash Holding Island Plaza Mezz LLC; SG Island Plaza Mezz LLC; EG Island Plaza Mezz LLC; and JG Island Plaza Mezz LLC, each a Delaware limited liability company (collectively, the Showcase II Whole Loan and the Showcase II Mezzanine Loan are referred to herein as the “Showcase II Total Debt”). The Showcase II Mezzanine Loan is secured by 100.0% of the direct equity interest in the Showcase II Borrower. The Showcase II Mezzanine Loan accrues interest at a rate of 7.0000% per annum and requires payments of interest-only through the maturity date of May 11, 2028 (co-terminus with the Showcase II Whole Loan).
Ground Lease. None.
Terrorism Insurance.The Showcase II Whole Loan documents require that the “all risk” insurance policy required to be maintained by the borrower provide coverage for terrorism in an amount equal to the full replacement cost of the Showcase II Las Vegas Retail Property, as well as business interruption insurance covering no less than the 18-month period following the occurrence of a casualty event, together with a 6-month extended period of indemnity (provided that if TRIPRA or a similar statute is not in effect, the borrower will not be obligated to pay terrorism insurance premiums in excess of two times the premium for the casualty and business interruption coverage on a stand-alone basis).
THE INFORMATION IN THIS STRUCTURAL AND COLLATERAL TERM SHEET IS NOT COMPLETE AND MAY BE AMENDED PRIOR TO THE TIME OF SALE. THIS TERM SHEET IS NOT AN OFFER TO SELL THESE SECURITIES AND IT IS NOT A SOLICITATION OF AN OFFER TO BUY THESE SECURITIES IN ANY JURISDICTION WHERE THE OFFER OR SALE IS NOT PERMITTED.
76
(THIS PAGE INTENTIONALLY LEFT BLANK)
THE INFORMATION IN THIS STRUCTURAL AND COLLATERAL TERM SHEET IS NOT COMPLETE AND MAY BE AMENDED PRIOR TO THE TIME OF SALE. THIS TERM SHEET IS NOT AN OFFER TO SELL THESE SECURITIES AND IT IS NOT A SOLICITATION OF AN OFFER TO BUY THESE SECURITIES IN ANY JURISDICTION WHERE THE OFFER OR SALE IS NOT PERMITTED.
77
EXCHANGERIGHT NET LEASED PORTFOLIO #22
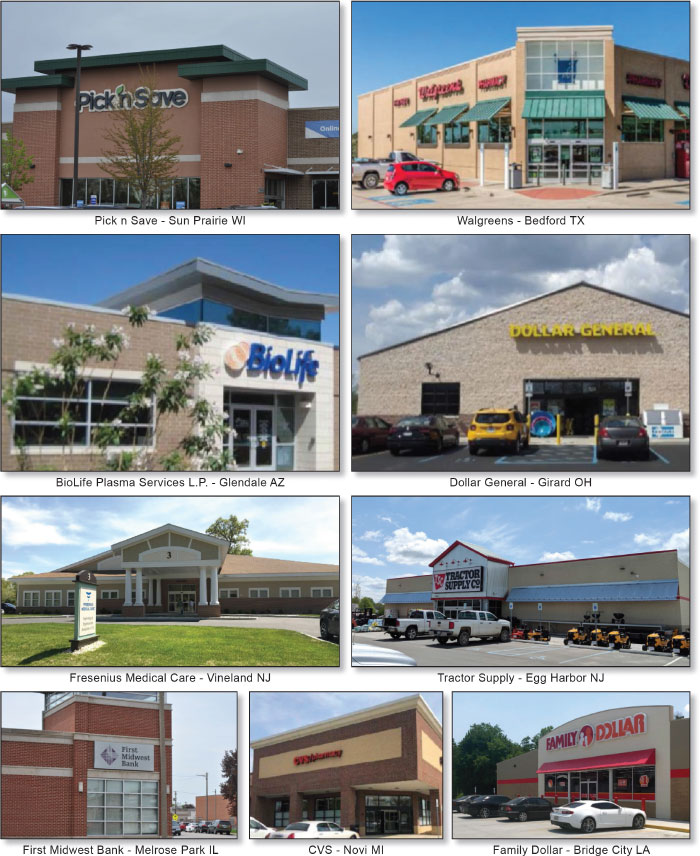
THE INFORMATION IN THIS STRUCTURAL AND COLLATERAL TERM SHEET IS NOT COMPLETE AND MAY BE AMENDED PRIOR TO THE TIME OF SALE. THIS TERM SHEET IS NOT AN OFFER TO SELL THESE SECURITIES AND IT IS NOT A SOLICITATION OF AN OFFER TO BUY THESE SECURITIES IN ANY JURISDICTION WHERE THE OFFER OR SALE IS NOT PERMITTED.
78
EXCHANGERIGHT NET LEASED PORTFOLIO #22
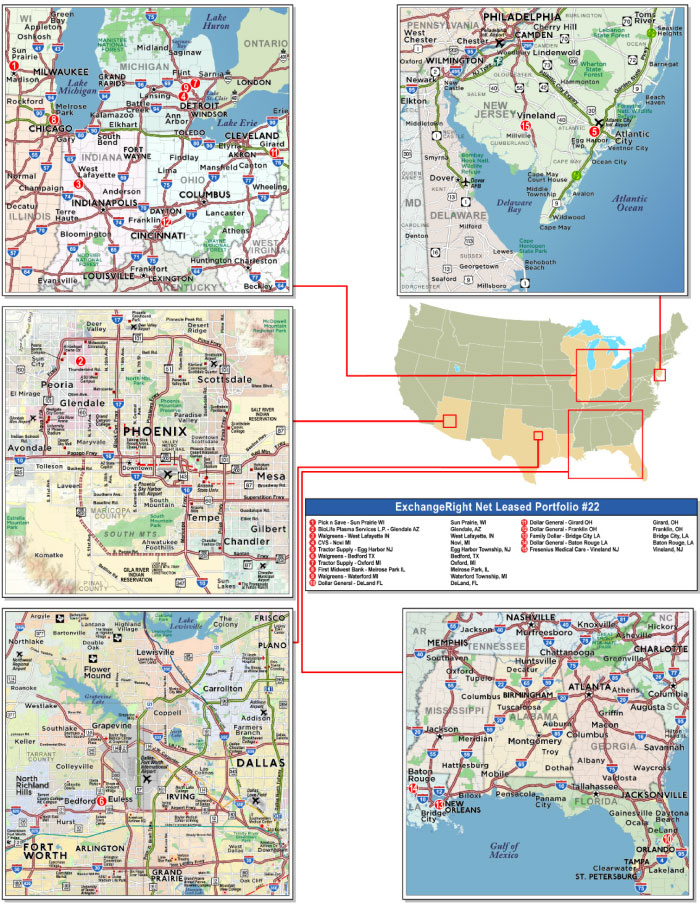
THE INFORMATION IN THIS STRUCTURAL AND COLLATERAL TERM SHEET IS NOT COMPLETE AND MAY BE AMENDED PRIOR TO THE TIME OF SALE. THIS TERM SHEET IS NOT AN OFFER TO SELL THESE SECURITIES AND IT IS NOT A SOLICITATION OF AN OFFER TO BUY THESE SECURITIES IN ANY JURISDICTION WHERE THE OFFER OR SALE IS NOT PERMITTED.
79
| No. 5 – ExchangeRight Net Leased Portfolio #22 | |||||||
| Loan Information | Property Information | ||||||
| Mortgage Loan Seller: | Bank of America, National Association | Single Asset/Portfolio: | Portfolio | ||||
| Credit Assessment (DBRS/Fitch/S&P): | NR/NR/NR | Property Type(3): | Various | ||||
| Original Principal Balance: | $43,521,600 | Specific Property Type(3): | Various | ||||
| Cut-off Date Balance: | $43,521,600 | Location(3): | Various | ||||
| % of Initial Pool Balance: | 4.61% | Size: | 229,251 SF | ||||
| Loan Purpose: | Acquisition | Cut-off Date Balance Per SF: | $189.84 | ||||
| Borrower Name(1): | ExchangeRight Net Leased Portfolio 22 DST | Year Built/Renovated(3): | Various/NAP | ||||
| Borrower Sponsor: | ExchangeRight Real Estate, LLC | Title Vesting: | Fee | ||||
| Mortgage Rate: | 4.3200% | Property Manager: | NLP Management, LLC (borrower-related) | ||||
| Note Date: | June 7, 2018 | 4thMost Recent Occupancy(4): | NAV | ||||
| Anticipated Repayment Date: | NAP | 3rdMost Recent Occupancy(4): | NAV | ||||
| Maturity Date: | July 1, 2028 | 2ndMost Recent Occupancy(4): | NAV | ||||
| IO Period: | 120 months | Most Recent Occupancy(4): | NAV | ||||
| Current Occupancy (As of): | 100.0% (8/1/2018) | ||||||
| Loan Term (Original): | 120 months | ||||||
| Seasoning: | 1 month | ||||||
| Amortization Term (Original): | NAP | ||||||
| Loan Amortization Type: | Interest-only, Balloon | Underwriting and Financial Information: | |||||
| Interest Accrual Method: | Actual/360 | 4thMost Recent NOI(4): | NAV | ||||
| Call Protection: | L(25),D(91),O(4) | 3rdMost Recent NOI(4): | NAV | ||||
| Lockbox Type: | Hard/Springing Cash Management | 2ndMost Recent NOI(4): | NAV | ||||
| Additional Debt: | None | Most Recent NOI(4): | NAV | ||||
| Additional Debt Type: | NAP | ||||||
| U/W Revenues: | $4,304,538 | ||||||
| U/W Expenses: | $107,613 | ||||||
| U/W NOI: | $4,196,925 | ||||||
| Escrows and Reserves(2): | U/W NCF: | $4,037,623 | |||||
| Type: | Initial | Monthly | Cap | U/W NOI DSCR: | 2.20x | ||
| Taxes | $111,991 | $16,668 | NAP | U/W NCF DSCR: | 2.12x | ||
| Insurance | $607 | $202 | NAP | U/W NOI Debt Yield : | 9.6% | ||
| Deferred Maintenance | $45,521 | $0 | NAP | U/W NCF Debt Yield: | 9.3% | ||
| Replacement Reserve | $96,665 | $0 | NAP | As-Is Appraised Value: | $73,580,000 | ||
| TI/LC Reserve | $500,000 | Springing | NAP | As-Is Appraisal Valuation Date: | Various | ||
| Condominium Assessments Reserve | $0 | Springing | NAP | Cut-off Date LTV Ratio: | 59.1% | ||
| BioLife Rollover Reserve | $0 | Springing | NAP | LTV Ratio at Maturity or ARD: | 59.1% | ||
| (1) | See “The Borrower” section. |
| (2) | See “Escrows” section. |
| (3) | See “The Properties” section. |
| (4) | Historical occupancy and NOI are unavailable as the ExchangeRight Properties (as defined below) were acquired by the borrower sponsor between May and June 2018. |
The Mortgage Loan. The mortgage loan (the “ExchangeRight Mortgage Loan”) is evidenced by a single promissory note secured by the fee interests in fifteen cross-collateralized, triple-net leased, single-tenant retail and medical office properties located across ten states (the “ExchangeRight Properties”). The ExchangeRight Mortgage Loan had an original principal balance of $43,521,600, has an outstanding principal balance as of the Cut-off Date of $43,521,600 and accrues interest at an interest rate of 4.3200%per annum. The ExchangeRight Mortgage Loan had an initial term of 120 months, has a remaining term of 119 months as of the Cut-off Date and requires payments of interest-only through the maturity date of July 1, 2028.
Following the REMIC lockout period, the borrower has the right to defease the ExchangeRight Mortgage Loan in whole, but not in part. In addition, the ExchangeRight Mortgage Loan is prepayable without penalty on or after April 1, 2028.
THE INFORMATION IN THIS STRUCTURAL AND COLLATERAL TERM SHEET IS NOT COMPLETE AND MAY BE AMENDED PRIOR TO THE TIME OF SALE. THIS TERM SHEET IS NOT AN OFFER TO SELL THESE SECURITIES AND IT IS NOT A SOLICITATION OF AN OFFER TO BUY THESE SECURITIES IN ANY JURISDICTION WHERE THE OFFER OR SALE IS NOT PERMITTED.
80
EXCHANGERIGHT NET LEASED PORTFOLIO #22
Sources and Uses
| Sources | Uses | |||||||||||
| Original loan amount | $43,521,600 | 59.0 | % | Purchase price(1) | $72,387,683 | 98.1 | % | |||||
| Borrower equity | 30,245,087 | 41.0 | Closing costs | 1,379,004 | 1.9 | |||||||
| Reserves | 754,784 | 1.0 | ||||||||||
| Total Sources | $73,766,687 | 100.0 | % | Total Uses | $73,766,687 | 100.0 | % | |||||
| (1) | The borrower sponsor purchased the ExchangeRight Properties in separate transactions between May 14, 2018 and June 7, 2018 for an aggregate purchase price of $72,387,683. |
The Properties.The ExchangeRight Properties are comprised of thirteen single-tenant retail and two medical office properties totaling 229,251 square feet and located across ten states. The ExchangeRight Properties are located in Wisconsin (one property, 26.0% of NRA), Michigan (three properties, 21.3% of NRA), New Jersey (two properties, 13.2% of NRA), Ohio (two properties, 8.6% of NRA) and Louisiana (two properties, 6.9% of NRA), with the five remaining properties located in Arizona, Indiana, Texas, Florida and Illinois. Built between 1998 and 2018, with eight of the fifteen properties built within the last two years, the ExchangeRight Properties range in size from 3,000 square feet to 59,500 square feet. As of August 1, 2018, the ExchangeRight Properties were 100.0% occupied.
The ExchangeRight Properties are leased to nationally recognized tenants in diverse retail segments including Kroger (d/b/a) Pick n Save, BioLife Plasma Services, LP, Walgreens, CVS Pharmacy, Tractor Supply, First Midwest Bank, Dollar General, Family Dollar and Fresenius Medical Care. Eight of the nine tenants are investment grade-rated (occupying thirteen of the fifteen properties, 82.1% of NRA and 86.0% of underwritten base rent). The ExchangeRight Properties have a weighted average remaining lease term of approximately 11.9 years. Leases representing 57.1% of the net rentable area and 59.0% of the underwritten base rent expire after the ExchangeRight Mortgage Loan maturity date.
THE INFORMATION IN THIS STRUCTURAL AND COLLATERAL TERM SHEET IS NOT COMPLETE AND MAY BE AMENDED PRIOR TO THE TIME OF SALE. THIS TERM SHEET IS NOT AN OFFER TO SELL THESE SECURITIES AND IT IS NOT A SOLICITATION OF AN OFFER TO BUY THESE SECURITIES IN ANY JURISDICTION WHERE THE OFFER OR SALE IS NOT PERMITTED.
81
EXCHANGERIGHT NET LEASED PORTFOLIO #22
The following table presents certain information relating to the ExchangeRight Properties:
Tenant Name City/State | Year Built/ Renovated | NRSF | % of Portfolio | Lease | Appraised Value(3) | % of Portfolio Appraised Value | Annual UW Base Rent | Annual UW Base Rent PSF | % of Annual UW Base Rent | |||||||||
Pick n Save(1) Sun Prairie, WI | 2007 / NAP | 59,500 | 26.0% | 12/31/2027 | $12,300,000 | 16.7% | $766,360 | $12.88 | 16.9% | |||||||||
BioLife Plasma Services, LP(2) Glendale, AZ | 2018 / NAP | 15,230 | 6.6% | 4/30/2033 | $11,500,000 | 15.6% | $682,648 | $44.82 | 15.0% | |||||||||
Walgreens(3) West Lafayette, IN | 2001 / NAP | 14,175 | 6.2% | 12/31/2031 | $7,660,000 | 10.4% | $480,000 | $33.86 | 10.6% | |||||||||
CVS Pharmacy(4) Novi, MI | 2005 / NAP | 13,013 | 5.7% | 1/31/2028 | $6,730,000 | 9.1% | $421,881 | $32.42 | 9.3% | |||||||||
Tractor Supply(5) Egg Harbor Township, NJ | 2017 / NAP | 19,097 | 8.3% | 10/31/2032 | $5,900,000 | 8.0% | $355,968 | $18.64 | 7.8% | |||||||||
Walgreens(6) Bedford, TX | 2002 / NAP | 13,650 | 6.0% | 12/1/2028 | $4,880,000 | 6.6% | $293,000 | $21.47 | 6.5% | |||||||||
Tractor Supply(7) Oxford, MI | 2017 / NAP | 21,930 | 9.6% | 2/28/2032 | $4,500,000 | 6.1% | $279,300 | $12.74 | 6.2% | |||||||||
First Midwest Bank(8) Melrose Park, IL | 2007 / NAP | 3,000 | 1.3% | 10/31/2027 | $4,460,000 | 6.1% | $273,456 | $91.15 | 6.0% | |||||||||
Walgreens(9) Waterford Township, MI | 1998 / NAP | 13,905 | 6.1% | 2/29/2028 | $4,380,000 | 6.0% | $275,319 | $19.80 | 6.1% | |||||||||
Dollar General(10) DeLand, FL | 2011 / NAP | 9,026 | 3.9% | 8/31/2027 | $1,950,000 | 2.7% | $121,670 | $13.48 | 2.7% | |||||||||
Dollar General(11) Girard, OH | 2017 / NAP | 10,566 | 4.6% | 3/31/2033 | $1,800,000 | 2.4% | $115,803 | $10.96 | 2.6% | |||||||||
Dollar General(12) Franklin, OH | 2017 / NAP | 9,100 | 4.0% | 4/30/2032 | $1,560,000 | 2.1% | $101,192 | $11.12 | 2.2% | |||||||||
Family Dollar(13) Bridge City, LA | 2018 / NAP | 8,320 | 3.6% | 7/31/2033 | $1,340,000 | 1.8% | $87,000 | $10.46 | 1.9% | |||||||||
Dollar General(14) Baton Rouge, LA | 2017 / NAP | 7,489 | 3.3% | 9/30/2032 | $1,220,000 | 1.7% | $80,357 | $10.73 | 1.8% | |||||||||
Fresenius Medical Care(15)(16)(17) Vineland, NJ | 2016 / NAP | 11,250 | 4.9% | 5/31/2031 | $3,400,000 | 4.6% | $202,500 | $18.00 | 4.5% | |||||||||
| Total/Weighted Average | 2010 / NAP | 229,251 | 100.0% | $73,580,000 | 100.0% | $4,536,454 | $19.79 | 100.0% |
| (1) | Pick n Save has a rent increase to $13.08 per square foot effective January 2023. Pick n Save has four five-year renewal options upon six months’ notice at fixed rents. Pick n Save has a right of first refusal to purchase its leased property. |
| (2) | BioLife Plasma Services, LP has three five-year renewal options upon 180 days’ notice at a 5% increase in rent. BioLife Plasma Services, LP has an ongoing termination right with 30 days’ notice and payment of the present value (discounted at 8.25%) of all remaining lease payments through lease maturity. BioLife Plasma Services, LP also has a re-letting restriction for the two-year period after the expiration or earlier termination of its lease whereby the landlord may not sell or lease the related property to any operator of a plasmapheresis center or other competing business to BioLife Plasma Services, LP. Should BioLife Plasma Services, LP terminate its lease, the ExchangeRight Mortgage Loan Documents require the termination fee to be deposited to a BioLife rollover reserve. See “Escrows” section. |
| (3) | Walgreens has a termination right on January 2022 and January 2027 with 6 months’ notice. Walgreens has a right of first refusal to purchase its leased property. |
| (4) | CVS Pharmacy has a rent increase to $32.99 per square foot effective April 2020. CVS Pharmacy has four five-year renewal options upon 180 days’ notice at fixed rents. |
| (5) | Tractor Supply has a rent increase to $19.57 per square foot effective May 2022. Tractor Supply has four five-year renewal options upon 90 days’ notice at fixed rents. Tractor Supply has a right of first refusal to purchase its leased property. |
| (6) | Walgreens has a termination right on February 28, 2028 with 6 months’ notice. Walgreens has a right of first refusal to purchase its leased property. |
| (7) | Tractor Supply has a rent increase to $13.37 per square foot effective July 2021. Tractor Supply has four five-year renewal options upon 90 days’ notice at fixed rents. Tractor Supply has a right of first refusal to purchase its leased property. |
| (8) | First Midwest Bank has an annual consumer price index increase (no less than 2.0% and no greater than 5.0%) in rent. First Midwest Bank has four five-year renewal options upon 12 months’ notice at market rent. |
| (9) | Walgreens has one ten-year renewal option. Walgreens has a termination right on February 28, 2023 and on February 29, 2028 with 6 months’ notice. Walgreens has a right of first refusal to purchase its leased property. |
| (10) | Dollar General has four five-year renewal options upon 180 days’ notice at fixed rents. |
| (11) | Dollar General has four five-year renewal options upon 180 days’ notice at fixed rents. |
| (12) | Dollar General has three five-year renewal options upon 180 days’ notice at fixed rents. |
| (13) | Family Dollar has a rent increase to $10.96 per square foot effective April 2028. Family Dollar has six five-year renewal options upon 180 days’ notice at fixed rents. Family Dollar has a right of first refusal to purchase its leased property. |
| (14) | Dollar General has three five-year renewal options upon 180 days’ notice at fixed rents. |
| (15) | The Fresenius Medical Care – Vineland NJ property is comprised of a 25% non-controlling interest in a four-unit condominium. The lender has been assigned all rights, easements, rights of way, reservations and powers of the borrower under the condominium documents. |
| (16) | Fresenius Medical Care has sublet 1,492 square feet to a complimentary user, Nephrology and Hypertension Associates of New Jersey, LLC through May 7, 2020 at a base monthly rental rate of $18.00 per square foot plus $7.69 per square foot for tenant improvements. The sublease includes two five-year renewal options at fair market value. |
| (17) | Fresenius Medical Care has a rent increase to $19.81 per square foot effective June 2021. Fresenius Medical Care has three five-year renewal options upon 210 days’ notice at fair market rent. |
THE INFORMATION IN THIS STRUCTURAL AND COLLATERAL TERM SHEET IS NOT COMPLETE AND MAY BE AMENDED PRIOR TO THE TIME OF SALE. THIS TERM SHEET IS NOT AN OFFER TO SELL THESE SECURITIES AND IT IS NOT A SOLICITATION OF AN OFFER TO BUY THESE SECURITIES IN ANY JURISDICTION WHERE THE OFFER OR SALE IS NOT PERMITTED.
82
EXCHANGERIGHT NET LEASED PORTFOLIO #22
The following table presents certain information relating to the tenancy at the ExchangeRight Properties:
Major Tenants
| Tenant Name | Credit Rating (Fitch/Moody’s/S&P)(1) | No. of Properties | NRSF | % of Total NRSF | Annual Rent PSF | Annual U/W Base Rent | % of Total Annual U/W | |||||||
| Pick n Save | BBB/Baa1/BBB | 1 | 59,500 | 26.0% | $12.88 | $766,360 | 16.9% | |||||||
| Walgreens | BBB/Baa2/BBB | 3 | 41,730 | 18.2% | $25.12 | $1,048,319 | 23.1% | |||||||
| Tractor Supply | NR/NR/NR | 2 | 41,027 | 17.9% | $15.48 | $635,268 | 14.0% | |||||||
| Dollar General | NR/Baa2/BBB | 4 | 36,181 | 15.8% | $11.58 | $419,022 | 9.2% | |||||||
| BioLife Plasma Services, LP | NR/Baa3/NR | 1 | 15,230 | 6.6% | $44.82 | $682,648 | 15.0% | |||||||
| CVS Pharmacy | NR/Baa1/BBB | 1 | 13,013 | 5.7% | $32.42 | $421,881 | 9.3% | |||||||
| Fresenius Medical Care | BBB-/Baa3/BBB- | 1 | 11,250 | 4.9% | $18.00 | $202,500 | 4.5% | |||||||
| Family Dollar | NR/Baa3/NR | 1 | 8,320 | 3.6% | $10.46 | $87,000 | 1.9% | |||||||
| First Midwest Bank | NR/Baa2/BBB- | 1 | 3,000 | 1.3% | $91.15 | $273,456 | 6.0% | |||||||
| Occupied Collateral Subtotal/Wtd. Avg. | 15 | 229,251 | 100.0% | $19.79 | $4,536,454 | 100.0% | ||||||||
| Vacant Space | 0 | 0.0% | ||||||||||||
| Total | 229,251 | 100.0% | ||||||||||||
| (1) | Certain ratings are those of the parent company whether or not the parent guarantees the lease. |
The following table presents certain information relating to the lease rollover schedule at the ExchangeRight Properties:
Lease Expiration Schedule(1)
| Year Ending December 31, | No. of Leases Expiring | Expiring NRSF | % of Total NRSF | Cumulative Expiring NRSF | Cumulative NRSF | Annual Base Rent | % of Annual U/W Base Rent | Annual U/W PSF | |||||||||
| 2018 | 0 | 0 | 0.0% | 0 | 0.0% | $0 | 0.0% | $0.00 | |||||||||
| 2019 | 0 | 0 | 0.0% | 0 | 0.0% | $0 | 0.0% | $0.00 | |||||||||
| 2020 | 0 | 0 | 0.0% | 0 | 0.0% | $0 | 0.0% | $0.00 | |||||||||
| 2021 | 0 | 0 | 0.0% | 0 | 0.0% | $0 | 0.0% | $0.00 | |||||||||
| 2022 | 0 | 0 | 0.0% | 0 | 0.0% | $0 | 0.0% | $0.00 | |||||||||
| 2023 | 0 | 0 | 0.0% | 0 | 0.0% | $0 | 0.0% | $0.00 | |||||||||
| 2024 | 0 | 0 | 0.0% | 0 | 0.0% | $0 | 0.0% | $0.00 | |||||||||
| 2025 | 0 | 0 | 0.0% | 0 | 0.0% | $0 | 0.0% | $0.00 | |||||||||
| 2026 | 0 | 0 | 0.0% | 0 | 0.0% | $0 | 0.0% | $0.00 | |||||||||
| 2027 | 3 | 71,526 | 31.2% | 71,526 | 31.2% | $1,161,486 | 25.6% | $16.24 | |||||||||
| 2028 | 3 | 40,568 | 17.7% | 112,094 | 48.9% | $990,200 | 21.8% | $24.41 | |||||||||
| Thereafter | 9 | 117,157 | 51.1% | 229,251 | 100.0% | $2,384,768 | 52.6% | $20.36 | |||||||||
| Vacant | 0 | 0 | 0.0% | 229,251 | 100.0% | $0 | 0.0% | $0.00 | |||||||||
| Total/Weighted Average | 15 | 229,251 | 100.0% | $4,536,454 | 100.0% | $19.79 |
| (1) | Information obtained from the underwritten rent roll. |
The following table presents historical occupancy percentages at the ExchangeRight Properties:
Historical Occupancy
12/31/2013(1) | 12/31/2014(1) | 12/31/2015(1) | 12/31/2016(1) | 8/1/2018 |
| NAV | NAV | NAV | NAV | 100.0% |
| (1) | The ExchangeRight Properties were acquired by the borrower sponsor between May and June 2018. Accordingly, historical occupancy is not available. |
THE INFORMATION IN THIS STRUCTURAL AND COLLATERAL TERM SHEET IS NOT COMPLETE AND MAY BE AMENDED PRIOR TO THE TIME OF SALE. THIS TERM SHEET IS NOT AN OFFER TO SELL THESE SECURITIES AND IT IS NOT A SOLICITATION OF AN OFFER TO BUY THESE SECURITIES IN ANY JURISDICTION WHERE THE OFFER OR SALE IS NOT PERMITTED.
83
EXCHANGERIGHT NET LEASED PORTFOLIO #22
Underwritten Net Cash Flow.The following table presents certain information relating to the underwritten net cash flow at the ExchangeRight Properties:
Cash Flow Analysis(1)
| U/W | % of U/W Effective Gross Income | U/W $ per SF | ||||||||
| Base Rent(2) | $4,531,093 | 105.3 | % | $19.76 | ||||||
| Less Vacancy(3) | (226,555) | (5.3 | ) | (0.99) | ||||||
| Effective Gross Income | $4,304,538 | 100.0 | % | $18.78 | ||||||
| Total Operating Expenses(4) | $107,613 | 2.5 | % | $0.47 | ||||||
| Net Operating Income | $4,196,925 | 97.5 | % | $18.31 | ||||||
| TI/LC | 144,846 | 3.4 | 0.63 | |||||||
| Replacement Reserves | 14,456 | 0.3 | 0.06 | |||||||
| Net Cash Flow | $4,037,623 | 93.8 | % | $17.61 | ||||||
| NOI DSCR | 2.20x | |||||||||
| NCF DSCR | 2.12x | |||||||||
| NOI DY | 9.6% | |||||||||
| NCF DY | 9.3% | |||||||||
| (1) | The ExchangeRight Properties were acquired by the borrower sponsor between May and June 2018. Accordingly, historical operating statements are not available. |
| (2) | U/W Base Rent is inclusive of $22,500 related to the Fresenius Medical Care June 2019 rent step. |
| (3) | U/W Vacancy is 5.0%. The ExchangeRight Properties are currently 100.0% occupied. |
| (4) | Total Operating Expenses consist of a 2.5% property management fee. |
Appraisal.The ExchangeRight Properties were valued individually, with the individual values reflecting a cumulative “as-is” appraised value of $73,580,000. The appraisals are dated from March 9, 2018 to May 17, 2018.
Environmental Matters.According to the Phase I environmental assessments dated January 31, 2018 to May 22, 2018 there was no evidence of any recognized environmental conditions at the ExchangeRight Properties except for the Walgreens - West Lafayette IN property, which according to a Phase II environmental assessment dated May 14, 2018, had low level impacts to soil vapor likely associated with the former on-site commercial dry cleaning operations, that were not considered likely to present a vapor intrusion concern. The Phase II environmental assessment concluded that no additional investigation or action appears warranted.
The Borrower.The borrower is ExchangeRight Net Leased Portfolio 22 DST, a Delaware statutory trust (the “ExchangeRight Borrower”) with one trustee which is an independent director. At loan origination, the ExchangeRight Properties were conveyed and assumed from ExchangeRight Net Leased Portfolio 22, LLC to and by the ExchangeRight Borrower.
The ExchangeRight Borrower has master leased the ExchangeRight Properties to a master tenant owned by ExchangeRight Real Estate, LLC, which is owned by the ExchangeRight Mortgage Loan guarantors. The master tenant has one independent director. The master lease obligates the master tenant to operate the ExchangeRight Properties and make decisions on behalf of the ExchangeRight Borrower and to make all repairs other than capital expenses (however replacement reserves under the ExchangeRight Mortgage Loan may be made available to the master tenant.) The master tenant’s interest in all tenant rents are assigned to the ExchangeRight Borrower, which in turn assigned its interest to the lender. The master lease is subordinate to the ExchangeRight Mortgage Loan and the lender has the ability to cause the ExchangeRight Borrower to terminate the master lease. A default under the master lease is an event of default under the ExchangeRight Mortgage Loan and gives rise to recourse liability to the guarantors for losses unless such default is solely for the purpose of paying rent under the master lease if the ExchangeRight Properties do not generate sufficient gross income from operations.
The lender has the ability to cause the ExchangeRight Borrower to convert from a Delaware statutory trust to a limited liability company upon (i) an event of default or the lender’s determination of imminent default, (ii) the lender’s determination that the ExchangeRight Borrower will be unable to make a material decision or take a material action required in connection with the operation and maintenance of any individual property, (iii) 90 days prior to the ExchangeRight Mortgage Loan maturity date if an executed commitment from an institutional lender to refinance the ExchangeRight Mortgage Loan is not delivered to the lender.
Anytime after December 7, 2018, the ExchangeRight Borrower has the right to a “Qualified Transfer” of all of its ownerships interests to an Approved Transferee (as defined below) and to replace the guarantors with an affiliate of the Approved Transferee acceptable to the lender provided that certain conditions are satisfied, including: (i) no event of default has occurred and is continuing, (ii) the Approved Transferee owns at least 51% of the beneficial ownership interests in the ExchangeRight Borrower and master tenant, (iii) the delivery of a REMIC opinion, an insolvency opinion and other opinions required by the lender and (iv) the receipt of rating agency confirmation that such assumption will not result in a downgrade of the respective ratings assigned to the BANK 2018-BNK13 Certificates. Should the ExchangeRight Borrower fail to make such Qualified Transfer by July 1, 2025 (36 months prior to the ExchangeRight Mortgage Loan maturity date), a Cash Sweep Period will be triggered (see “Lockbox and Cash Management” section.)
THE INFORMATION IN THIS STRUCTURAL AND COLLATERAL TERM SHEET IS NOT COMPLETE AND MAY BE AMENDED PRIOR TO THE TIME OF SALE. THIS TERM SHEET IS NOT AN OFFER TO SELL THESE SECURITIES AND IT IS NOT A SOLICITATION OF AN OFFER TO BUY THESE SECURITIES IN ANY JURISDICTION WHERE THE OFFER OR SALE IS NOT PERMITTED.
84
EXCHANGERIGHT NET LEASED PORTFOLIO #22
“Approved Transferee” means (A) an eligible institution wholly-owned and controlled by a bank, savings and loan association, investment bank, insurance company, trust company, real estate investment trust, commercial credit corporation, pension plan, pension fund or pension advisory firm, mutual fund, government entity or plan or institution similar to any of the foregoing or (B) any person that (1)(i) has never been indicted or convicted of, or plead guilty or no contest to a felony, (ii) has never been indicted or convicted of, or plead guilty or no contest to a Patriot Act offense and is not on any government watch list, (iii) has never been the subject of a voluntary or involuntary bankruptcy proceeding and (iv) has no material outstanding judgments against it, (2) is regularly engaged in the business of owning or operating commercial properties, or interests therein, which are similar to the ExchangeRight Properties, (3) owns interests in, or operates, at least five properties with a minimum of 750,000 square feet and (4) has total assets of at least $100,000,000.
Legal counsel to the ExchangeRight Borrower delivered a non-consolidation opinion in connection with the origination of the ExchangeRight Mortgage Loan.
David Fisher, Joshua Ungerecht and Warren Thomas, the owners of ExchangeRight Real Estate, LLC, are the guarantors of certain nonrecourse carveouts under the ExchangeRight Mortgage Loan. See“Description of the Mortgage Pool—Mortgage Pool Characteristics—Delaware Statutory Trusts”in the Preliminary Prospectus.
The Borrower Sponsor.The borrower sponsor is ExchangeRight Real Estate, LLC. ExchangeRight Real Estate, LLC has more than $1.2 billion of assets and more than 11 million square feet under management. ExchangeRight Real Estate, LLC has more than 425 investment-grade retail and Class B/B+ multifamily properties located across 30 states.
Escrows.The ExchangeRight Mortgage Loan documents provide for upfront reserves in the amount of (i) $111,991 for real estate taxes, (ii) $607 for flood insurance premiums, (iii) $45,521 for deferred maintenance, (iv) $96,665 for replacement reserves, and (v) $500,000 for tenant improvements and leasing commissions.
Upon an event of default, and when the debt service coverage ratio is less than 1.45x based on the trailing twelve-month period, the borrower is required to deposit monthly $27,701 plus any termination fees received for tenant improvements and leasing commissions, which reserved amounts will be released to the borrower, provided no event of default is continuing, when the debt service coverage ratio equals or exceeds 1.45x based on the trailing twelve-month period.
Upon any of (i) an event of default, (ii) an event of default under a tenant lease, (iii) a tenant no longer being liable for paying property taxes directly to the taxing authority, or (iv) the borrower failing to provide evidence that such property taxes have been paid in full on or prior to when due, the borrower will be required to make monthly deposits for real estate taxes in an amount equal to 1/12th of the estimated annual amount due, initially $16,668.
The ExchangeRight Mortgage Loan documents require monthly deposits for property and liability insurance premiums in an amount equal to 1/12th of the estimated annual amount due, unless waived (as currently) due to a blanket policy being in place. The ExchangeRight Mortgage Loan documents require monthly deposits for flood insurance premiums, initially $202.
Upon the Fresenius Medical Care lease guarantor no longer being investment grade-rated, the borrower is required to immediately deposit $7,819 for condominium reserves, or some other lender-estimated amount such that the balance of the condominium reserves is at all times equal to at least the aggregate amount of condominium assessments due with respect to the Fresenius Medical Care – Vineland NJ property for the following six-month period.
Upon BioLife Plasma Services, LP exercising a termination option, the borrower is required to immediately deposit the termination fee received (equal to the present value, discounted at 8.25%, of all remaining lease payments through lease maturity of April 30, 2033) less one month of BioLife Plasma Services, LP rent to the BioLife rollover reserve, which reserve will be released monthly, provided no event of default is continuing, to the borrower to replace the revenue lost as a result of the BioLife Plasma Services, LP termination, unless a Cash Sweep Period (as defined below) is continuing, in which case such funds will be transferred to the lockbox account and disbursed in accordance with the ExchangeRight Mortgage Loan documents.
Lockbox and Cash Management.The ExchangeRight Mortgage Loan is structured with a hard lockbox and springing cash management. During the occurrence and continuance of a Cash Sweep Period (as defined below), all funds are required to be swept on each business day into the cash management account controlled by the lender and disbursed on each payment date in accordance with the ExchangeRight Mortgage Loan documents, with all excess cash flow to be held as additional security for the ExchangeRight Mortgage Loan until the discontinuance of the Cash Sweep Period. Notwithstanding the foregoing, if a Cash Sweep Period occurs twice during the ExchangeRight Mortgage Loan term, the Cash Sweep Period will continue for the remainder of the ExchangeRight Mortgage Loan term and the borrower will not be entitled to any disbursement of excess cash.
A “Cash Sweep Period” will exist (A) when the debt service coverage ratio is less than 1.50x for one quarter based on the preceding twelve months, ending when the debt service coverage ratio is equal to or greater than 1.55x for two consecutive calendar quarters based on the preceding twelve months or (B) beginning July 1, 2025 (36 months prior to the loan maturity date), ending on a Qualified Transfer Trigger Event Cure (as defined below).
A “Qualified Transfer Trigger Event Cure” means the occurrence of a Qualified Transfer (see “The Borrower” section above); provided, however, for purposes of this definition, the Approved Transferee additionally (i) at all times maintains a minimum net worth of at least $200,000,000 and total assets of at least $400,000,000, (ii) executes and delivers to the lender a full recourse guaranty for the entire outstanding principal balance of the ExchangeRight Mortgage Loan, (iii) owns 100% of the legal and beneficial ownership interests in the borrower, and (iv) is not a Delaware statutory trust.
Property Management.The ExchangeRight Properties are managed by NLP Management, LLC, an affiliate of the borrower.
THE INFORMATION IN THIS STRUCTURAL AND COLLATERAL TERM SHEET IS NOT COMPLETE AND MAY BE AMENDED PRIOR TO THE TIME OF SALE. THIS TERM SHEET IS NOT AN OFFER TO SELL THESE SECURITIES AND IT IS NOT A SOLICITATION OF AN OFFER TO BUY THESE SECURITIES IN ANY JURISDICTION WHERE THE OFFER OR SALE IS NOT PERMITTED.
85
EXCHANGERIGHT NET LEASED PORTFOLIO #22
Assumption.After December 7, 2018, the borrower has the right to transfer the ExchangeRight Properties in their entirety provided that certain conditions are satisfied, including: (i) no event of default has occurred and is continuing, (ii) a REMIC opinion, an insolvency opinion and other opinions required by the lender have been provided and (iii) rating agency confirmation from Fitch, DBRS and S&P that such assumption will not result in a downgrade , withdrawal or qualification of the respective ratings assigned to the BANK 2018-BNK13 Certificates.
Partial Release.Not permitted.
Real Estate Substitution.Not permitted.
Subordinate and Mezzanine Indebtedness.Not permitted.
Right of First Refusal / Offer.Seven tenants: Pick n Save, Walgreens (at the Walgreens - West Lafayette IN property), Tractor Supply (at the Tractor Supply - Egg Harbor NJ property), Walgreens (at the Walgreens – Bedford TX property), Tractor Supply (at the Tractor Supply – Oxford MI property), Walgreens (at the Walgreens - Waterford MI property) and Family Dollar, have rights of first refusal to purchase their leased properties. See “Description of the Mortgage Pool—Tenant Leases—Purchase Options and Rights of First Refusal” in the Preliminary Prospectus.
Ground Lease. None.
Terrorism Insurance. The ExchangeRight Mortgage Loan documents require that the property insurance policy required to be maintained by the borrower provide coverage for perils and acts of terrorism in an amount equal to 100% of the full replacement cost of the ExchangeRight Properties. The ExchangeRight Mortgage Loan documents also require business interruption insurance covering no less than the 18-month period following the occurrence of a casualty event, together with a 6-month extended period of indemnity. See“Risk Factors—Risks Relating to the Mortgage Loans—Terrorism Insurance May Not Be Available for All Mortgaged Properties” in the Preliminary Prospectus.
THE INFORMATION IN THIS STRUCTURAL AND COLLATERAL TERM SHEET IS NOT COMPLETE AND MAY BE AMENDED PRIOR TO THE TIME OF SALE. THIS TERM SHEET IS NOT AN OFFER TO SELL THESE SECURITIES AND IT IS NOT A SOLICITATION OF AN OFFER TO BUY THESE SECURITIES IN ANY JURISDICTION WHERE THE OFFER OR SALE IS NOT PERMITTED.
86
(THIS PAGE INTENTIONALLY LEFT BLANK)
THE INFORMATION IN THIS STRUCTURAL AND COLLATERAL TERM SHEET IS NOT COMPLETE AND MAY BE AMENDED PRIOR TO THE TIME OF SALE. THIS TERM SHEET IS NOT AN OFFER TO SELL THESE SECURITIES AND IT IS NOT A SOLICITATION OF AN OFFER TO BUY THESE SECURITIES IN ANY JURISDICTION WHERE THE OFFER OR SALE IS NOT PERMITTED.
87
(THIS PAGE INTENTIONALLY LEFT BLANK)
THE INFORMATION IN THIS STRUCTURAL AND COLLATERAL TERM SHEET IS NOT COMPLETE AND MAY BE AMENDED PRIOR TO THE TIME OF SALE. THIS TERM SHEET IS NOT AN OFFER TO SELL THESE SECURITIES AND IT IS NOT A SOLICITATION OF AN OFFER TO BUY THESE SECURITIES IN ANY JURISDICTION WHERE THE OFFER OR SALE IS NOT PERMITTED.
88
| THE GALLERIA |

THE INFORMATION IN THIS STRUCTURAL AND COLLATERAL TERM SHEET IS NOT COMPLETE AND MAY BE AMENDED PRIOR TO THE TIME OF SALE. THIS TERM SHEET IS NOT AN OFFER TO SELL THESE SECURITIES AND IT IS NOT A SOLICITATION OF AN OFFER TO BUY THESE SECURITIES IN ANY JURISDICTION WHERE THE OFFER OR SALE IS NOT PERMITTED.
89
| THE GALLERIA |
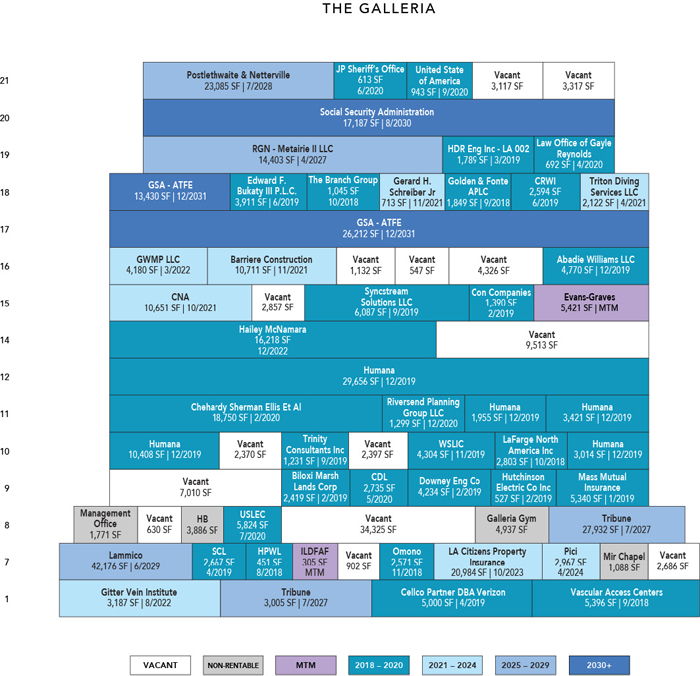
THE INFORMATION IN THIS STRUCTURAL AND COLLATERAL TERM SHEET IS NOT COMPLETE AND MAY BE AMENDED PRIOR TO THE TIME OF SALE. THIS TERM SHEET IS NOT AN OFFER TO SELL THESE SECURITIES AND IT IS NOT A SOLICITATION OF AN OFFER TO BUY THESE SECURITIES IN ANY JURISDICTION WHERE THE OFFER OR SALE IS NOT PERMITTED.
90
| THE GALLERIA |
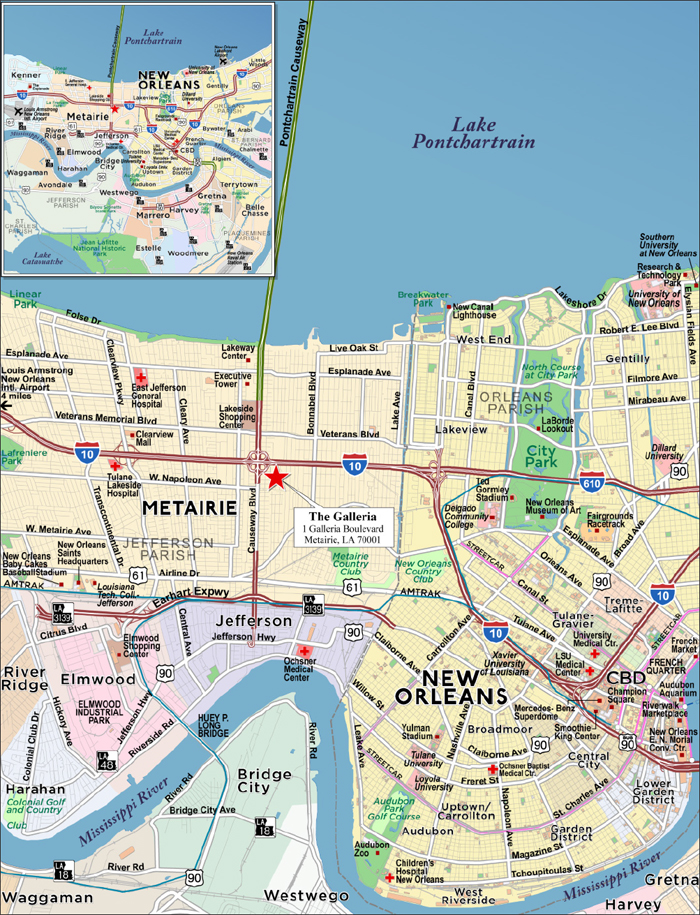
THE INFORMATION IN THIS STRUCTURAL AND COLLATERAL TERM SHEET IS NOT COMPLETE AND MAY BE AMENDED PRIOR TO THE TIME OF SALE. THIS TERM SHEET IS NOT AN OFFER TO SELL THESE SECURITIES AND IT IS NOT A SOLICITATION OF AN OFFER TO BUY THESE SECURITIES IN ANY JURISDICTION WHERE THE OFFER OR SALE IS NOT PERMITTED.
91
| No. 6 – The Galleria | ||||||
| Loan Information | Property Information | |||||
| Mortgage Loan Seller: | Bank of America, National Association | Single Asset/Portfolio: | Single Asset | |||
| Credit Assessment (DBRS/Fitch/S&P): | NR/NR/NR | Property Type: | Office | |||
| Original Principal Balance: | $42,000,000 | Specific Property Type: | Suburban | |||
| Cut-off Date Balance: | $42,000,000 | Location: | Metairie, LA | |||
| % of Initial Pool Balance: | 4.45% | Size: | 470,540 SF | |||
| Loan Purpose: | Refinance | Cut-off Date Balance Per SF: | $89.26 | |||
| Borrower Name: | Galleria Operating Co. LLC | Year Built/Renovated: | 1986/NAP | |||
| Borrower Sponsor: | Jeffrey Feil | Title Vesting: | Fee | |||
| Mortgage Rate: | 4.2500% | Property Manager: | Broadwall Management Corp. (borrower-related) | |||
| Note Date: | May 30, 2018 | |||||
| Anticipated Repayment Date: | NAP | 4thMost Recent Occupancy (As of): | 97.8% (12/31/2014) | |||
| Maturity Date: | June 1, 2028 | 3rdMost Recent Occupancy (As of): | 95.0% (12/31/2015) | |||
| IO Period: | 120 months | 2ndMost Recent Occupancy (As of): | 95.8% (12/31/2016) | |||
| Loan Term (Original): | 120 months | Most Recent Occupancy (As of)(2): | 84.9% (12/31/2017) | |||
| Seasoning: | 2 months | Current Occupancy (As of): | 84.0% (6/1/2018) | |||
| Amortization Term (Original): | NAP | |||||
| Loan Amortization Type: | Interest-only, Balloon | Underwriting and Financial Information: | ||||
| Interest Accrual Method: | Actual/360 | |||||
| Call Protection: | L(26),D(89),O(5) | 4thMost Recent NOI (As of): | $5,966,923 (12/31/2015) | |||
| Lockbox Type: | Hard/Springing Cash Management | 3rdMost Recent NOI (As of): | $5,844,782 (12/31/2016) | |||
| Additional Debt: | None | 2ndMost Recent NOI (As of): | $5,379,430 (12/31/2017) | |||
| Additional Debt Type: | NAP | Most Recent NOI (As of)(2): | $5,258,829 (5/31/2018 TTM) | |||
| U/W Revenues: | $10,090,164 | |||||
| U/W Expenses: | $4,972,101 | |||||
| Escrows and Reserves(1): | U/W NOI: | $5,118,063 | ||||
| U/W NCF: | $4,485,781 | |||||
| Type: | Initial | Monthly | Cap (If Any) | U/W NOI DSCR: | 2.83x | |
| Taxes | $494,746 | $70,678 | NAP | U/W NCF DSCR: | 2.48x | |
| Insurance | $1,013 | $84 | NAP | U/W NOI Debt Yield: | 12.2% | |
| Replacement Reserve | $0 | $12,548 | NAP | U/W NCF Debt Yield: | 10.7% | |
| TI/LC Reserve | $1,000,000 | $39,212 | $2,000,000 | As-Is Appraised Value(3): | $67,570,000 | |
| Landlord Obligation Reserve | $941,054 | $0 | NAP | As-Is Appraisal Valuation Date(3): | April 24, 2018 | |
| Cut-off Date LTV Ratio(3): | 62.2% | |||||
| LTV Ratio at Maturity or ARD(3): | 62.2% | |||||
| (1) | See “Escrows” section. |
| (2) | The decrease in December 31, 2017 occupancy and NOI is reflective of the University of Phoenix tenant vacating 34,194 square feet in April 2017. |
| (3) | The appraiser concluded to an “As Is” appraised value of $67,570,000 with a valuation date of April 24, 2018. The appraiser also concluded to an “As Stabilized” appraised value of $73,580,000 with a valuation date of May 1, 2020, which assumes 34,325 square feet of additional leasing at The Galleria Property, achieving a stabilized occupancy rate of 92.0%. The Cut-off Date LTV Ratio and the LTV Ratio at Maturity assuming the “As Stabilized” appraised value is 57.1% and 57.1%, respectively. |
The Mortgage Loan. The mortgage loan (“The Galleria Mortgage Loan”) is evidenced by a promissory note secured by a first mortgage encumbering the fee interest in a 470,540 square foot, 21-story, Class A, office building located in Metairie, Louisiana (“The Galleria Property”). The Galleria Mortgage Loan had an original principal balance of $42,000,000, has an outstanding principal balance as of the Cut-off Date of $42,000,000 and accrues interest at an interest rate of 4.2500%per annum. The Galleria Mortgage Loan had an initial term of 120 months, has a remaining term of 118 months as of the Cut-off Date and requires payments of interest-only through the maturity date of June 1, 2028.
Following the REMIC lockout period, the borrower has the right to defease The Galleria Mortgage Loan in whole, but not in part. In addition, The Galleria Mortgage Loan is prepayable without penalty on or after February 1, 2028.
THE INFORMATION IN THIS STRUCTURAL AND COLLATERAL TERM SHEET IS NOT COMPLETE AND MAY BE AMENDED PRIOR TO THE TIME OF SALE. THIS TERM SHEET IS NOT AN OFFER TO SELL THESE SECURITIES AND IT IS NOT A SOLICITATION OF AN OFFER TO BUY THESE SECURITIES IN ANY JURISDICTION WHERE THE OFFER OR SALE IS NOT PERMITTED.
92
| THE GALLERIA |
Sources and Uses
| Sources | Uses | |||||||
| Original loan amount | $42,000,000 | 100.0% | Loan payoff | $33,672,192 | 80.2% | |||
| Return of equity | 5,676,234 | 13.5 | ||||||
| Reserves | 2,436,814 | 5.8 | ||||||
| Closing costs | 214,760 | 0.5 | ||||||
| Total Sources | $42,000,000 | 100.0% | Total Uses | $42,000,000 | 100.0% | |||
The Property. The Galleria Property is a sixteen-story, Class A, office building totaling 470,540 square feet above a five-story 1,964-space above-ground parking garage located in Metairie, Louisiana. Built in 1986 on 4.3-acres, The Galleria Property is situated on a dual corner site fronting the southeastern corner of Galleria Boulevard and South I-10 Service Road East as well as the northeastern corner of Galleria Boulevard and 34th Street. The Galleria Property includes 13,583 square feet of ground floor retail space, a 4,937 square foot gym and 24-hour manned security for its tenants. The borrower sponsor acquired The Galleria Property in 2005 for a purchase price of $56,500,000 and from 2014 through 2017, has invested a total of $8,308,920 in property improvements, tenant improvements and leasing commissions.
As of June 1, 2018, The Galleria Property was occupied by 48 different tenants with 22 tenants (representing 55.7% of net rentable area and 67.4% of underwritten base rent) having been in occupancy at The Galleria Property since 2008 or earlier. Major tenants at The Galleria Property include Humana Health Benefit, a health care delivery and plan administration company (47,590 square feet, 10.1% of NRA, 12.8% of underwritten base rent), LAMMICO, the largest medical malpractice insurance company in Louisiana and headquartered at The Galleria Property, (42,176 square feet, 9.0% of NRA, 10.1% of underwritten base rent), GSA – ATFE (Bureau of Alcohol, Tobacco, Firearms & Explosives) (39,642 square feet, 8.4% of NRA, 11.8% of underwritten base rent), Tribune Television New Orleans (d/b/a WGNO ABC26/ WNOL WB38) a television and radio broadcaster headquartered at The Galleria Property and a subsidiary of Tribune Television Company (30,937 square feet, 6.6% of NRA, 7.1% of underwritten base rent), and Postlethwaite & Netterville, a Top 100 U.S. accounting firm, (23,085 square feet, 4.9% of NRA, 5.7% of underwritten base rent), with no other tenant representing more than 4.5% of net rentable area or 5.4% of underwritten base rent.
The following table presents certain information relating to the major tenants at The Galleria Property:
Major Tenants
| Tenant Name | Credit Rating (Fitch/ Moody’s/ S&P)(1) | Tenant NRSF | % of NRSF | Annual U/W Base Rent PSF | Annual U/W Base Rent | % of Total Annual U/W Base Rent | Lease Start Date | Lease Expiration Date | Renewal Options |
| Major Tenant | |||||||||
| Humana Health Benefit | BBB+/Baa3/BBB+ | 47,590 | 10.1% | $24.50 | $1,165,955 | 12.8% | 6/1/1998 | 12/31/2019 | 1x5 Yrs |
| LAMMICO(2) | NR/NR/NR | 42,176 | 9.0% | $21.75 | $917,328 | 10.1% | 4/12/2003 | 6/30/2029 | 1x5 Yrs |
| GSA – ATFE(3) | AAA/Aaa/AA+ | 39,642 | 8.4% | $27.05 | $1,072,514 | 11.8% | 12/27/2006 | 12/26/2031 | NAP |
| Tribune Television of New Orleans(4) | NR/B1/BB- | 30,937 | 6.6% | $21.06 | $651,598 | 7.1% | 8/1/2007 | 7/31/2027 | 2x10 Yrs |
| Postlethwaite & Netterville | NR/NR/NR | 23,085 | 4.9% | $22.50 | $519,413 | 5.7% | 6/4/2010 | 7/31/2028 | 1x5 Yrs |
| Subtotal/Wtd. Avg. | 183,430 | 39.0% | $23.59 | $4,326,808 | 47.4% | ||||
| Other Tenants | 200,299 | 42.6% | $23.93 | $4,793,552 | 52.6% | ||||
| Non-Leased Space(5) | 11,682 | 2.5% | $0.00 | $0 | 0.0% | ||||
| Vacant Space | 75,129 | 16.0% | |||||||
| Total | 470,540 | 100.0% | |||||||
| (1) | Certain ratings are those of the parent company whether or not the parent guarantees the lease. |
| (2) | LAMMICO has a termination right on June 30, 2026 upon 9 months’ prior notice and payment of a termination fee equal to $720,408. |
| (3) | GSA-ATFE has a termination right at any time after December 26, 2026 upon 120 days’ prior notice. |
| (4) | Tribune Television of New Orleans’ rent will increase to $21.48 per SF effective August 1, 2022 |
| (5) | Non-Leased Space includes 4,937 square feet for the building gym, 3,886 square feet for a hurricane bunker, 1,771 square feet for the property management office and 1,088 square feet for a chapel, for which no rent is collected. |
THE INFORMATION IN THIS STRUCTURAL AND COLLATERAL TERM SHEET IS NOT COMPLETE AND MAY BE AMENDED PRIOR TO THE TIME OF SALE. THIS TERM SHEET IS NOT AN OFFER TO SELL THESE SECURITIES AND IT IS NOT A SOLICITATION OF AN OFFER TO BUY THESE SECURITIES IN ANY JURISDICTION WHERE THE OFFER OR SALE IS NOT PERMITTED.
93
| THE GALLERIA |
The following table presents certain information relating to the lease rollover schedule at The Galleria Property:
Lease Expiration Schedule(1)(2)
| Year Ending December 31, | No. of Leases Expiring | Expiring NRSF | % of Total NRSF | Cumulative Expiring NRSF | Cumulative % of Total NRSF | Annual U/W Base Rent | % of Total Annual U/W Base Rent | Annual U/W Base Rent PSF |
| MTM | 4 | 5,742 | 1.2% | 5,742 | 1.2% | $142,683 | 1.6% | $24.85 |
| 2018 | 5 | 8,719 | 1.9% | 14,461 | 3.1% | $204,991 | 2.2% | $23.51 |
| 2019 | 15 | 93,853 | 19.9% | 108,314 | 23.0% | $2,203,122 | 24.2% | $23.47 |
| 2020 | 7 | 30,856 | 6.6% | 139,170 | 29.6% | $762,271 | 8.4% | $24.70 |
| 2021 | 6 | 29,593 | 6.3% | 168,763 | 35.9% | $652,507 | 7.2% | $22.05 |
| 2022 | 3 | 23,585 | 5.0% | 192,348 | 40.9% | $544,441 | 6.0% | $23.08 |
| 2023 | 1 | 20,984 | 4.5% | 213,332 | 45.3% | $487,878 | 5.3% | $23.25 |
| 2024 | 1 | 2,967 | 0.6% | 216,299 | 46.0% | $71,208 | 0.8% | $24.00 |
| 2025 | 0 | 0 | 0.0% | 216,299 | 46.0% | $0 | 0.0% | $0.00 |
| 2026 | 0 | 0 | 0.0% | 216,299 | 46.0% | $0 | 0.0% | $0.00 |
| 2027 | 2 | 45,340 | 9.6% | 261,639 | 55.6% | $1,004,472 | 11.0% | $22.15 |
| 2028 | 1 | 23,085 | 4.9% | 284,724 | 60.5% | $519,413 | 5.7% | $22.50 |
| Thereafter | 3 | 99,005 | 21.0% | 383,729 | 81.6% | $2,527,373 | 27.7% | $25.53 |
| Non-Leased Space(3) | 0 | 11,682 | 2.5% | 395,411 | 84.0% | $0 | 0.0% | $0.00 |
| Vacant | 0 | 75,129 | 16.0% | 470,540 | 100.0% | $0 | 0.0% | $0.00 |
| Total/Weighted Average(4) | 48 | 470,540 | 100.0% | $9,120,360 | 100.0% | $23.77 |
| (1) | Information obtained from the underwritten rent roll. |
| (2) | Certain tenants may have multiple leases which have been consolidated for purposes of this Lease Expiration Schedule. |
| (3) | Non-Leased Space includes 4,937 square feet for the building gym, 3,886 square feet for a hurricane bunker, 1,771 square feet for the property management office and 1,088 square feet for a chapel, for which no rent is collected. |
| (4) | Total/Weighted Average Annual U/W Base Rent PSF excludes Non-Leased Space and Vacant space. |
The following table presents historical occupancy percentages at The Galleria Property:
Historical Occupancy
12/31/2013 | 12/31/2014 | 12/31/2015 | 12/31/2016 | 12/31/2017(1) | 6/1/2018(2) |
| 96.9% | 97.8% | 95.0% | 95.8% | 84.9% | 84.0% |
| (1) | The decrease in December 31, 2017 occupancy is reflective of the University of Phoenix tenant vacating 34,194 square feet in April 2017. |
| (2) | Information obtained from the underwrittenrent roll. |
Operating History and Underwritten Net Cash Flow. The following table presents certain information relating to the operating history and underwritten net cash flow at The Galleria Property:
Cash Flow Analysis
| 2015 | 2016 | 2017 | 5/31/2018 TTM | U/W | % of U/W Effective Gross Income | U/W $ per SF | |
| Base Rent | $9,485,913 | $9,423,041 | $9,085,120 | $9,014,490 | $10,824,654(1) | 107.3% | $23.00 |
| Total Reimbursables | 816,138 | 569,210 | 328,448 | 285,201 | 256,180 | 2.5 | 0.54 |
| Parking Income | 640,443 | 722,903 | 775,449 | 772,339 | 749,760 | 7.4 | 1.59 |
| Other Income(2) | 32,874 | 20,661 | 15,580 | 24,186 | 4,770 | 0.0 | 0.01 |
| Less Vacancy & Credit Loss | 0 | 0 | 0 | 0 | (1,745,200)(3) | (17.3) | (3.71) |
| Effective Gross Income | $10,975,368 | $10,735,815 | $10,204,597 | $10,096,216 | $10,090,164 | 100.0% | $21.44 |
| Total Operating Expenses | $5,008,445 | $4,891,033 | $4,825,167 | $4,837,387 | $4,972,101 | 49.3% | $10.57 |
|
|
|
|
|
|
| |
| Net Operating Income | $5,966,923 | $5,844,782 | $5,379,430 | $5,258,829 | $5,118,063 | 50.7% | $10.88 |
| TI/LC | 0 | 0 | 0 | 0 | 481,709 | 4.8 | 1.02 |
| Capital Expenditures | 0 | 0 | 0 | 0 | 150,573 | 1.5 | 0.32 |
| Net Cash Flow | $5,966,923 | $5,844,782 | $5,379,430 | $5,258,829 | $4,485,781 | 44.5% | $9.53 |
| NOI DSCR | 3.30x | 3.23x | 2.97x | 2.91x | 2.83x | ||
| NCF DSCR | 3.30x | 3.23x | 2.97x | 2.91x | 2.48x | ||
| NOI DY | 14.2% | 13.9% | 12.8% | 12.5% | 12.2% | ||
| NCF DY | 14.2% | 13.9% | 12.8% | 12.5% | 10.7% |
| (1) | U/W Base Rent includes grossed up vacant space and rent bumps through 7/1/2019 equal to $127,690. |
| (2) | Other Income includes forfeited deposits, antennae and signage income, late charges, after-hour utility charges and other miscellaneous income. |
| (3) | U/W Vacancy includes month-to-month tenants marked as vacant. The Galleria Property was 84.0% leased as of June 1, 2018 and has averaged 94.1% from 2013 through 2017. |
THE INFORMATION IN THIS STRUCTURAL AND COLLATERAL TERM SHEET IS NOT COMPLETE AND MAY BE AMENDED PRIOR TO THE TIME OF SALE. THIS TERM SHEET IS NOT AN OFFER TO SELL THESE SECURITIES AND IT IS NOT A SOLICITATION OF AN OFFER TO BUY THESE SECURITIES IN ANY JURISDICTION WHERE THE OFFER OR SALE IS NOT PERMITTED.
94
| THE GALLERIA |
Appraisal.The appraiser concluded to an “As Is” appraised value of $67,570,000 with a valuation date of April 24, 2018. The appraiser also concluded to an “As Stabilized” appraised value of $73,580,000 with a valuation date of May 1, 2020, which assumes 34,325 square feet of additional leasing at The Galleria Property, achieving a stabilized occupancy rate of 92.0%. The Cut-off Date LTV Ratio and the LTV Ratio at Maturity assuming the “As Stabilized” appraised value is 57.1% and 57.1%, respectively.
Environmental Matters. According to the Phase I Environmental Assessment dated April 25, 2018, there are no recognized environmental conditions at The Galleria Property.
Market Overview and Competition. The Galleria Property is located in Metairie, Louisiana, approximately five miles northwest of the New Orleans central business district. Primary access to The Galleria Property is provided by Interstate Highway 10, an eight-lane highway connecting to the City of New Orleans to the east and southeast and to the Louis Armstrong (New Orleans) International Airport to the west. Additional access is provided by Veterans Memorial Boulevard which, according to the appraisal, is considered a primary retail and commercial corridor for the New Orleans metropolitan area, anchored by the one million square foot Lakeside Shopping Center Mall located less than one mile north of The Galleria Property, and by Clearview Parkway and Causeway Boulevard.
Metairie is home to the NFL franchise New Orleans Saints offices and practice fields. Major employers in Metairie include East Jefferson General Hospital (3,000 employees), Audubon Engineering Company (950 employees) and Favrot & Shane AIA Architects (361 employees). The 2017 year-end unemployment rate for New Orleans-Metairie was 3.7%.
According to the appraiser, the estimated 2017 population within a one-, three- and five-mile radius was 18,805, 130,985 and 297,803, respectively, and the estimated 2017 average household income within the same radii was $79,767, $80,985, and $77,949, respectively.
The Galleria Property is located in the Airport/Metairie/Kenner office submarket of the New Orleans/Metairie/Kenner office market, which had a year-end 2017 vacancy rate of 6.5% and quoted rental rates of $19.34 per square foot. Within the Airport/Metairie/Kenner submarket The Galleria Property is further designated as part of East Metairie by a third party providing local statistics. East Metairie contains five Class A office properties and 28 non-Class A office properties and had a 2017 vacancy rate of 10.8% with average rental rates of $21.55 per square foot.
The following table presents certain information relating to comparable office properties to The Galleria Property:
Comparable Properties(1)
| Property Name/Location | Occupancy | Year Built/ Renovated | Total GLA (SF) | Distance from Subject |
Annual Base Rent |
The Galleria 1 Galleria Boulevard Metairie, LA | 84%(2) | 1986/NAP | 470,540(2) | N/A | $23.77(2) |
Heritage Plaza(3) 111 Veterans Boulevard Metairie, LA | 95% | 1983/2007 | 353,003 | 2.1 miles | $22.00-$23.00 |
Lakeway I, II and III(3) 3900 North Causeway Metairie, LA | 95% | 1983/NAV | 1,221,870 | 2.2 miles | $24.00-$25.00 |
Causeway Plaza I, II & III(3) 3300 West Esplanade Metairie, LA | 91% | 1983/NAV | 335,425 | 2.3 miles | $20.00 |
Executive Tower 3500 N. Causeway Boulevard Metairie, LA | 82% | 1972/NAV | 184,609 | 2.0 miles | $18.50 |
| (1) | Information obtained from the appraisal. |
| (2) | Information obtained from the underwritten rent roll. |
| (3) | The Galleria borrower sponsor also owns the fee interest in Heritage Plaza and the fee and leasehold interests in Lakeway I, II and III and Causeway Plaza I, II & III. |
The Borrower.The borrower is Galleria Operating Co. LLC, a Delaware limited liability company and single purpose entity with at least one independent director. Legal counsel to the borrower delivered a non-consolidation opinion in connection with the origination of The Galleria Mortgage Loan.
The Borrower Sponsor.The borrower sponsor and guarantor of certain nonrecourse carveouts is Jeffrey Feil. Jeffrey Feil is the CEO of The Feil Organization. The Feil Organization is an investment, development and management firm with a portfolio of over 26 million square feet of retail, commercial and industrial properties, over 5,000 residential rental units, hundreds of net leased properties and thousands of acres of undeveloped land across the United States.
The Galleria Mortgage Loan documents permit the guarantor to be replaced during The Galleria Mortgage Loan term by Feil Properties L.L.C., a New York limited liability company, provided that it maintains a net worth of not less than $27,000,000 and liquidity of not less than $3,000,000.
THE INFORMATION IN THIS STRUCTURAL AND COLLATERAL TERM SHEET IS NOT COMPLETE AND MAY BE AMENDED PRIOR TO THE TIME OF SALE. THIS TERM SHEET IS NOT AN OFFER TO SELL THESE SECURITIES AND IT IS NOT A SOLICITATION OF AN OFFER TO BUY THESE SECURITIES IN ANY JURISDICTION WHERE THE OFFER OR SALE IS NOT PERMITTED.
95
| THE GALLERIA |
Escrows.The Galleria Mortgage Loan documents provide for upfront escrows in the amount of (i) $494,746 for real estate taxes, (ii) $1,013 for flood insurance premiums, (iii) $1,000,000 for tenant improvements and leasing commissions and (iv) $941,054 for outstanding landlord obligations relating to four tenants.
The Galleria Mortgage Loan documents require monthly escrows of (i) 1/12th of the estimated annual property taxes (currently $70,678), (ii) 1/12th of the estimated annual flood insurance premiums (currently $84) and 1/12th of the estimated annual all-risk insurance premiums due (unless the latter is waived due to a blanket policy being in place), (iii) $12,548 for replacement reserves, and (iv) $39,212 for tenant improvements and leasing commissions (until the tenant improvement and leasing commissions reserve has reached $2,000,000).
Lockbox and Cash Management.The Galleria Mortgage Loan requires a hard lockbox with springing cash management. Upon a Cash Sweep Period (as defined below), funds in the lockbox account are required to be transferred daily to the lender-controlled cash management account to be disbursed according to The Galleria Mortgage Loan documents. Also during the continuance of a Cash Sweep Period, all excess cash will be collected and held as additional security for The Galleria Mortgage loan.
A “Cash Sweep Period” will exist upon either (a) a Critical Tenant Trigger Period (as defined below) or (b) the debt service coverage ratio being less than 1.50x until either (x) the debt service coverage ratio equals or exceeds 1.60x for two consecutive calendar quarters or (y) the lender receives an amount that if applied to the reduction of the principal amount of The Galleria Mortgage Loan, would cause the debt service coverage ratio to be equal to or greater than 1.50x.
A “Critical Tenant Trigger Period” will commence upon:
(i) any Critical Tenant (as defined below) vacating or giving notice of its intent to vacate its leased space,
(ii) any Critical Tenant’s lease being terminated,
(iii) the date that is six months prior to the final expiration of any Critical Tenant’s lease,
(iv) the date that any Critical Tenant fails to exercise its option to renew or extend its lease as required under its lease,
(v) any Critical Tenant defaulting in rent, or
(vi) any Critical Tenant, or any guarantor of the Critical Tenant’s lease, becoming the subject of any bankruptcy proceeding.
A “Critical Tenant Trigger Period” will end upon:
(i) if triggered solely by (i) above, the date that (1) the Critical Tenant is conducting its normal business operations in its leased space and has irrevocably revoked such notice to vacate or (2) a Critical Tenant Space Re-tenanting Event (as defined below) has occurred,
(ii) if triggered solely by any of (ii), (iii) or (iv) above, the date that (1) the Critical Tenant has renewed its lease for all of its leased space and all tenant improvement costs, leasing commissions and other material costs and expenses related thereto have been satisfied or deposited into the tenant improvements and leasing commissions reserve, or (2) a Critical Tenant Space Re-tenanting Event has occurred,
(iii) if triggered solely by (v) above, upon a cure of the applicable event of default, and
(iv) if triggered solely by (vi) above, the date that the Critical Tenant’s lease, or the guaranty of the lease, is assumed without alteration of any material terms thereto (as ordered by the bankruptcy court) or the assets of Critical Tenant, or any guarantor of the lease, are no longer subject to bankruptcy.
A “Critical Tenant” is any tenant including Humana Health Benefit, LAMMICO and GSA-ATFE, and any replacement tenant thereof.
A “Critical Tenant Space Re-tenanting Event” means, with respect to a lease with any Critical Tenant, the date upon which all of the following conditions have been satisfied: (i) the entire leased space is leased to one or more replacement tenants on terms and conditions acceptable to the lender, (ii) all tenant improvement costs, leasing commissions and other material costs and expenses have been paid in full or deposited into the tenant improvements and leasing commissions reserve, and (iii) the replacement tenant(s) are conducting normal business operations at the related space.
Property Management.The Galleria Property is managed by Broadwall Management Corp., an affiliate of the borrower.
Assumption.Beginning six months after the loan origination date, the borrower has the right to transfer The Galleria Property, provided that certain other conditions are satisfied, including, but not limited to: (i) no event of default has occurred and is continuing; (ii) the lender’s reasonable determination that the proposed transferee satisfies the lender’s credit review and underwriting standards, taking into consideration transferee experience, financial strength and general business standing; (iii) a REMIC opinion, a non-consolidation opinion and other opinions required by the lender are provided; and (iv) if required by the lender, rating agency confirmation from DBRS, Fitch, and S&P that such transfer will not result in a downgrade, withdrawal or qualification of the respective ratings assigned to the Series 2018-BNK13 Certificates.
Partial Release.Not permitted.
Real Estate Substitution.Not permitted.
Subordinate and Mezzanine Indebtedness.Not permitted.
Ground Lease.None.
Terrorism Insurance.The Galleria Mortgage Loan documents require that the property insurance policy required to be maintained provide coverage for perils and acts of terrorism in an amount equal to the full replacement cost of The Galleria Property, as well as business interruption insurance covering no less than the 18-month period following the occurrence of a casualty event, together with a 6-month extended period of indemnity. See“Risk Factors—Risks Relating to the Mortgage Loans—Terrorism Insurance May Not Be Available for All Mortgaged Properties” in the Preliminary Prospectus.
THE INFORMATION IN THIS STRUCTURAL AND COLLATERAL TERM SHEET IS NOT COMPLETE AND MAY BE AMENDED PRIOR TO THE TIME OF SALE. THIS TERM SHEET IS NOT AN OFFER TO SELL THESE SECURITIES AND IT IS NOT A SOLICITATION OF AN OFFER TO BUY THESE SECURITIES IN ANY JURISDICTION WHERE THE OFFER OR SALE IS NOT PERMITTED.
96
(THIS PAGE INTENTIONALLY LEFT BLANK)
THE INFORMATION IN THIS STRUCTURAL AND COLLATERAL TERM SHEET IS NOT COMPLETE AND MAY BE AMENDED PRIOR TO THE TIME OF SALE. THIS TERM SHEET IS NOT AN OFFER TO SELL THESE SECURITIES AND IT IS NOT A SOLICITATION OF AN OFFER TO BUY THESE SECURITIES IN ANY JURISDICTION WHERE THE OFFER OR SALE IS NOT PERMITTED.
97
(THIS PAGE INTENTIONALLY LEFT BLANK)
THE INFORMATION IN THIS STRUCTURAL AND COLLATERAL TERM SHEET IS NOT COMPLETE AND MAY BE AMENDED PRIOR TO THE TIME OF SALE. THIS TERM SHEET IS NOT AN OFFER TO SELL THESE SECURITIES AND IT IS NOT A SOLICITATION OF AN OFFER TO BUY THESE SECURITIES IN ANY JURISDICTION WHERE THE OFFER OR SALE IS NOT PERMITTED.
98
| BROADWAY PLAZA |
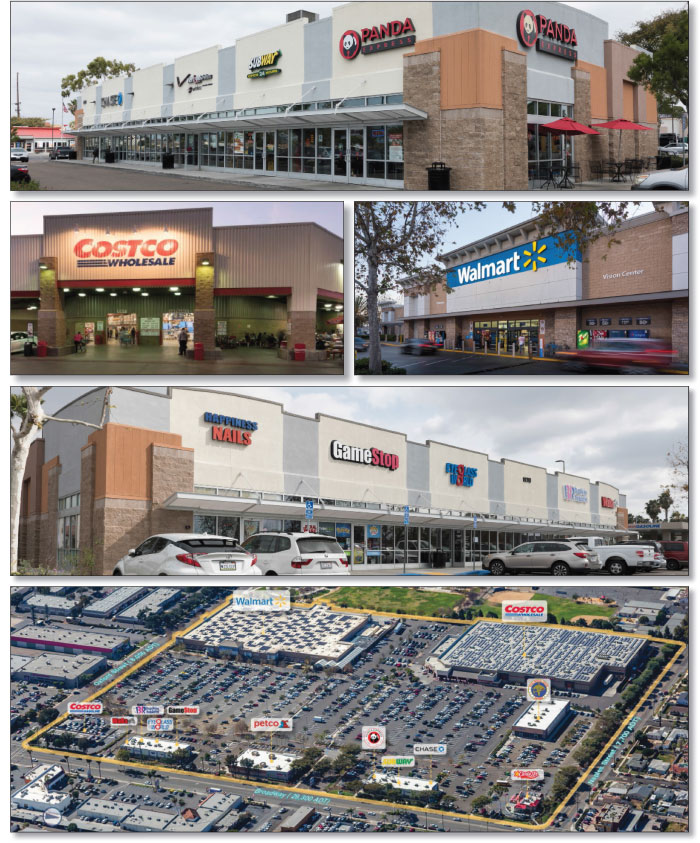
THE INFORMATION IN THIS STRUCTURAL AND COLLATERAL TERM SHEET IS NOT COMPLETE AND MAY BE AMENDED PRIOR TO THE TIME OF SALE. THIS TERM SHEET IS NOT AN OFFER TO SELL THESE SECURITIES AND IT IS NOT A SOLICITATION OF AN OFFER TO BUY THESE SECURITIES IN ANY JURISDICTION WHERE THE OFFER OR SALE IS NOT PERMITTED.
99
| BROADWAY PLAZA |
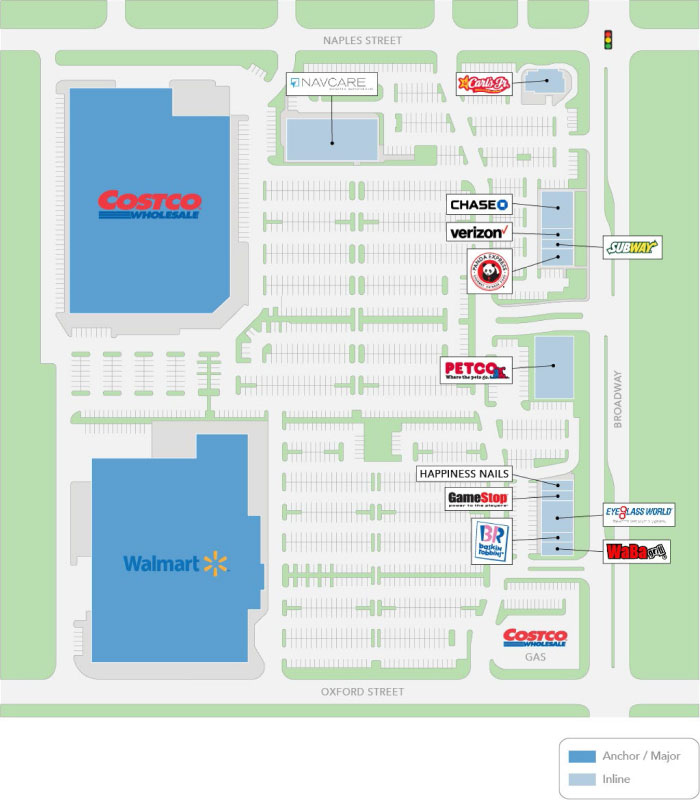
THE INFORMATION IN THIS STRUCTURAL AND COLLATERAL TERM SHEET IS NOT COMPLETE AND MAY BE AMENDED PRIOR TO THE TIME OF SALE. THIS TERM SHEET IS NOT AN OFFER TO SELL THESE SECURITIES AND IT IS NOT A SOLICITATION OF AN OFFER TO BUY THESE SECURITIES IN ANY JURISDICTION WHERE THE OFFER OR SALE IS NOT PERMITTED.
100
| BROADWAY PLAZA |
THE INFORMATION IN THIS STRUCTURAL AND COLLATERAL TERM SHEET IS NOT COMPLETE AND MAY BE AMENDED PRIOR TO THE TIME OF SALE. THIS TERM SHEET IS NOT AN OFFER TO SELL THESE SECURITIES AND IT IS NOT A SOLICITATION OF AN OFFER TO BUY THESE SECURITIES IN ANY JURISDICTION WHERE THE OFFER OR SALE IS NOT PERMITTED.
101
| No. 7 – Broadway Plaza | ||||||
| Loan Information | Property Information | |||||
| Mortgage Loan Seller: | Morgan Stanley Mortgage Capital Holdings LLC | Single Asset/Portfolio: | Single Asset | |||
Credit Assessment | (NR/NR/NR) | Property Type: | Retail | |||
| Original Principal Balance: | $40,950,000 | Specific Property Type: | Anchored | |||
| Cut-off Date Balance: | $40,950,000 | Location: | Chula Vista, CA | |||
| % of Initial Pool Balance: | 4.34% | Size: | 356,335 SF | |||
| Loan Purpose: | Acquisition | Cut-off Date Balance Per SF: | $114.92 | |||
| Borrower Name: | PPW Broadway, LLC | Year Built/Renovated: | 2005/NAP | |||
| Borrower Sponsors: | Jeffrey Essakow; Yehudi Gaffen | Title Vesting: | Fee | |||
| Mortgage Rate: | 4.6720% | Property Manager: | Self-managed | |||
| Note Date: | June 21, 2018 | 4thMost Recent Occupancy (As of): | 100.0% (12/31/2014) | |||
| Anticipated Repayment Date: | July 1, 2028 | 3rdMost Recent Occupancy (As of): | 98.2% (12/31/2015) | |||
| Maturity Date: | November 1, 2029 | 2ndMost Recent Occupancy (As of): | 100.0% (12/31/2016) | |||
| IO Period(1): | 120 months | Most Recent Occupancy (As of): | 100.0% (12/31/2017) | |||
| Loan Term (Original)(1): | 120 months | Current Occupancy (As of): | 100.0% (4/15/2018) | |||
| Seasoning: | 1 month | |||||
| Amortization Term (Original): | NAP | Underwriting and Financial Information: | ||||
| Loan Amortization Type: | Interest-only, ARD | |||||
| Interest Accrual Method: | Actual/360 | 4thMost Recent NOI (As of): | $3,062,875 (12/31/2015) | |||
| Call Protection(1): | L(25),D(90),O(5) | 3rdMost Recent NOI (As of): | $2,984,959 (12/31/2016) | |||
| Lockbox Type: | Hard/Springing Cash Management | 2ndMost Recent NOI (As of): | $3,169,714 (12/31/2017) | |||
| Additional Debt: | None | Most Recent NOI (As of): | $3,149,930 (TTM 4/30/2018) | |||
| Additional Debt Type: | NAP | |||||
| Escrows and Reserves(2): | U/W Revenues: | $4,627,369 | ||||
| U/W Expenses: | $1,363,716 | |||||
| Type: | Initial | Monthly | Cap (If Any) | U/W NOI: | $3,263,654 | |
| Taxes | $74,639 | $12,440 | NAP | U/W NCF: | $3,178,032 | |
| Insurance | $0 | Springing | NAP | U/W NOI DSCR: | 1.68x | |
| Replacement Reserve | $0 | $402 | $4,819 | U/W NCF DSCR: | 1.64x | |
| TI/LC Reserve | $0 | Springing | $391,968 | U/W NOI Debt Yield: | 8.0% | |
| U/W NCF Debt Yield: | 7.8% | |||||
| As-Is Appraised Value: | $58,500,000 | |||||
| As-Is Appraisal Valuation Date: | May 14, 2018 | |||||
| Cut-off Date LTV Ratio: | 70.0% | |||||
| LTV Ratio at Maturity or ARD: | 70.0% | |||||
| (1) | Based on term to Anticipated Repayment Date. |
| (2) | See “Escrows” section. |
The Mortgage Loan.The mortgage loan (the “Broadway Plaza Mortgage Loan”) is evidenced by a single promissory note that is secured by a first mortgage encumbering the fee interest in an anchored retail center located in Chula Vista, California (the “Broadway Plaza Property”). The Broadway Plaza Mortgage Loan was originated on June 21, 2018 by Morgan Stanley Bank, N.A. The Broadway Plaza Mortgage Loan had an original principal balance of $40,950,000, has an outstanding principal balance as of the Cut-off Date of $40,950,000 and accrues interest at an interest rate (the “Initial Interest Rate”) of 4.6720%per annum until its anticipated repayment date (the “ARD”). The Broadway Plaza Mortgage Loan had an initial term to the ARD of 120 months, has a remaining term to the ARD of 119 months as of the Cut-off Date and requires interest-only payments through the ARD. The ARD is July 1, 2028 and the final maturity date is November 1, 2029. In the event the Broadway Plaza Mortgage Loan is not repaid in full on or before the ARD, the interest rate on the Broadway Plaza Mortgage Loan will increase to a rateper annum (the “Revised Rate”) equal to the greater of (i) the Initial Interest Rate plus 2.75% and (ii) the sum of (a) the 10-year U.S. swap rate as of the ARD, (b) 1.82% and (c) 2.75%. Following the ARD, interest-only payments at the Initial Interest Rate will be continue to be due and payable, and interest accrued at the excess of the Revised Rate over the Initial Interest Rate will be deferred until the principal of the Broadway Plaza Mortgage Loan is repaid in full. The ARD automatically triggers a Cash Sweep Event Period (see “Lockbox and Cash Management” below) whereby all excess cash flow will be used to pay down the principal balance of the Broadway Plaza Mortgage Loan.
THE INFORMATION IN THIS STRUCTURAL AND COLLATERAL TERM SHEET IS NOT COMPLETE AND MAY BE AMENDED PRIOR TO THE TIME OF SALE. THIS TERM SHEET IS NOT AN OFFER TO SELL THESE SECURITIES AND IT IS NOT A SOLICITATION OF AN OFFER TO BUY THESE SECURITIES IN ANY JURISDICTION WHERE THE OFFER OR SALE IS NOT PERMITTED.
102
| BROADWAY PLAZA |
Following the lockout period, the Broadway Plaza Borrower has the right to defease the Broadway Plaza Mortgage Loan in whole, but not in part, on any date before March 1, 2028. The Broadway Plaza Mortgage Loan is prepayable without penalty on or after March 1, 2028.
The Property.The Broadway Plaza Property is a 356,335-square foot anchored retail center located in Chula Vista, California, approximately 12 miles south of downtown San Diego and five miles north of the Mexico border. Comprised of seven buildings situated on a 31.3-acre site, the Broadway Plaza Property was 100.0% occupied by 14 tenants, as of April 15, 2018. The Broadway Plaza Property has been 100.0% occupied as of December 31st every year since 2014, except for 2015 when it was 98.2% occupied. The Broadway Plaza Property is anchored by Costco (43.4% of the net rentable area and 28.0% of underwritten base rent), and Walmart (43.1% of the net rentable area and 22.5% of underwritten base rent); both of which are on ground leases and have been tenants at the Broadway Plaza Property since it was built in 2005. The Broadway Plaza Property includes 1,713 surface parking spaces (4.81 spaces per 1,000 square feet).
The tenants at the Broadway Plaza Property have a weighted average remaining lease term of 8.4 years. Excluding Costco and Walmart, 48.5% of NRA has been in occupancy for a minimum of 10 years. Over the past 24 months, there have been five lease renewals at the Broadway Plaza Property, ranging in size from 1,132 to 14,850 square feet, with underwritten rents ranging from $20.90 to $53.15 per square foot. There were no tenant improvements or free rent offered on these five renewals and each tenant renewed at a higher rent.
Sources and Uses
| Sources | Uses | |||||||
| Original loan amount | $40,950,000 | 69.1% | Purchase Price | $58,500,000 | 98.7% | |||
| Sponsor’s new cash contribution | 18,307,507 | 30.9 | Closing Costs | 682,868 | 1.2 | |||
| Reserves | 74,639 | 0.1 | ||||||
| Total Sources | $59,257,507 | 100.0% | Total Uses | $59,257,507 | 100.0% |
The following table presents certain information relating to the tenancy at Broadway Plaza Property:
Major Tenants
Tenant Name
| Credit Rating DBRS)(1) | Tenant NRSF | % of NRSF | Annual U/W Base Rent PSF | Annual U/W Base Rent | % of Total Annual U/W Base Rent | Lease Expiration Date |
| Anchor Tenants | |||||||
| Costco | A+/A+/AH | 154,569 | 43.4% | $6.34 | $980,100 | 28.0% | 10/31/2029(2) |
| Walmart | AA/AA/AA | 153,578 | 43.1% | $5.12 | $786,620 | 22.5% | 10/15/2025(3) |
| Total Anchor Tenants | 308,147 | 86.5% | $5.73 | $1,766,720 | 50.5% | ||
| Major Tenants | |||||||
| Navcare | NR/NR/NR | 14,580 | 4.1% | $20.90 | $304,722 | 8.7% | 1/22/2020 |
| Petco | NR/NR/NR | 13,200 | 3.7% | $32.67 | $431,244 | 12.3% | 4/30/2020(4) |
| JP Morgan Chase Bank | AA-/A-/AAL | 4,584 | 1.3% | $53.15 | $243,640 | 7.0% | 8/31/2023(5) |
| Total Major Tenants | 32,364 | 9.1% | $30.27 | $979,606 | 28.0% | ||
| Non-Major Tenants | 15,824 | 4.4% | $47.47 | $751,105 | 21.5% | ||
| Occupied Collateral Total | 356,335 | 100.0% | $9.82 | $3,497,431 | 100.0% | ||
| Vacant Space | 0 | 0.0% | |||||
| Collateral Total | 356,335 | 100.0% | |||||
| (1) | Certain ratings are those of the parent company whether or not the parent guarantees the lease. |
| (2) | Costco leases the land on which its store is located pursuant to a ground lease and owns its improvements. Costco has five, ten-year renewal options. |
| (3) | Walmart leases the land on which its store is located pursuant to a ground lease and owns its improvements. Walmart has 12, five-year renewal options. |
| (4) | Petco has one, five-year renewal option. |
| (5) | JP Morgan Chase Bank has one, five-year renewal option. |
THE INFORMATION IN THIS STRUCTURAL AND COLLATERAL TERM SHEET IS NOT COMPLETE AND MAY BE AMENDED PRIOR TO THE TIME OF SALE. THIS TERM SHEET IS NOT AN OFFER TO SELL THESE SECURITIES AND IT IS NOT A SOLICITATION OF AN OFFER TO BUY THESE SECURITIES IN ANY JURISDICTION WHERE THE OFFER OR SALE IS NOT PERMITTED.
103
| BROADWAY PLAZA |
The following table presents certain information relating to the lease rollover schedule at Broadway Plaza Property:
Lease Expiration Schedule(1)(2)
| Year Ending December 31, | No. of Leases Expiring | Expiring NRSF | % of Total NRSF | Cumulative Expiring NRSF | Cumulative % of Total NRSF | Annual U/W Base Rent | % of Total Annual U/W Base Rent | Annual U/W Base Rent PSF |
| MTM | 0 | 0 | 0.0% | 0 | 0.0% | $0 | 0.0% | $0.00 |
| 2018 | 0 | 0 | 0.0% | 0 | 0.0% | $0 | 0.0% | $0.00 |
| 2019 | 1 | 1,132 | 0.3% | 1,132 | 0.3% | $51,827 | 1.5% | $45.78 |
| 2020 | 3 | 29,640 | 8.3% | 30,772 | 8.6% | $823,880 | 23.6% | $27.80 |
| 2021 | 1 | 1,320 | 0.4% | 32,092 | 9.0% | $64,931 | 1.9% | $49.19 |
| 2022 | 2 | 2,350 | 0.7% | 34,442 | 9.7% | $103,233 | 3.0% | $43.93 |
| 2023 | 1 | 4,584 | 1.3% | 39,026 | 11.0% | $243,640 | 7.0% | $53.15 |
| 2024 | 1 | 2,600 | 0.7% | 41,626 | 11.7% | $168,090 | 4.8% | $64.65 |
| 2025 | 1 | 153,578 | 43.1% | 195,204 | 54.8% | $786,620 | 22.5% | $5.12 |
| 2026 | 3 | 6,562 | 1.8% | 201,766 | 56.6% | $275,110 | 7.9% | $41.92 |
| 2027 | 0 | 0 | 0.0% | 201,766 | 56.6% | $0 | 0.0% | $0.00 |
| 2028 | 0 | 0 | 0.0% | 201,766 | 56.6% | $0 | 0.0% | $0.00 |
| Thereafter | 1 | 154,569 | 43.4% | 356,335 | 100.0% | $980,100 | 28.0% | $6.34 |
| Vacant | 0 | 0 | 0.0% | 356,335 | 100.0% | $0 | 0.0% | $0.00 |
| Total/Weighted Average | 14 | 356,335 | 100.0% | $3,497,431 | $9.82 |
| (1) | Information obtained from the underwritten rent roll. |
| (2) | Certain tenants may have lease termination options that are exercisable prior to the originally stated expiration date of the subject lease and that are not considered in the Lease Expiration Schedule. |
The following table presents historical occupancy percentages at Broadway Plaza Property:
Historical Occupancy
12/31/2014(1) | 12/31/2015(1) | 12/31/2016(1) | 12/31/2017(1) | 4/15/2018(2) |
| 100.0% | 98.2% | 100.0% | 100.0% | 100.0% |
| (1) | Information obtained from the borrower. |
| (2) | Information obtained from the underwritten rent roll. |
Operating History and Underwritten Net Cash Flow. The following table presents certain information relating to the historical operating performance and underwritten net cash flow at Broadway Plaza Property:
Cash Flow Analysis
| 2015 | 2016 | 2017 | TTM 4/30/2018 | U/W | % of U/W Effective Gross Income | U/W $ per SF | |
| Base Rent | $3,300,735 | $3,341,368 | $3,453,309 | $3,454,133 | $3,497,431(1) | 75.6% | $9.82 |
| Total Reimbursables | 774,163 | 706,620 | 785,291 | 780,521 | 1,084,951 | 23.4 | 3.04 |
| Other Income | 4,935 | 9,023 | 12,301 | 13,086 | 146,561(2) | 3.2 | 0.41 |
| Less Vacancy & Credit Loss | 0 | 0 | 0 | 0 | (101,574)(3) | (2.2) | (0.29) |
| Effective Gross Income | $4,079,833 | $4,057,011 | $4,250,901 | $4,247,740 | $4,627,369 | 100.0% | $12.99 |
| Total Operating Expenses | $1,016,958 | $1,072,052 | $1,081,187 | $1,097,810 | $1,363,716 | 29.5% | $3.83 |
| Net Operating Income | $3,062,875 | $2,984,959 | $3,169,714 | $3,149,930 | $3,263,654 | 70.5% | $9.16 |
| Replacement Reserves | 0 | 0 | 0 | 0 | 7,228 | 0.2 | 0.02 |
| TI/LC | 0 | 0 | 0 | 0 | 78,394 | 1.7 | 0.22 |
| Net Cash Flow | $3,062,875 | $2,984,959 | $3,169,714 | $3,149,930 | $3,178,032 | 68.7% | $8.92 |
| NOI DSCR | 1.58x | 1.54x | 1.63x | 1.62x | 1.68x | ||
| NCF DSCR | 1.58x | 1.54x | 1.63x | 1.62x | 1.64x | ||
| NOI DY | 7.5% | 7.3% | 7.7% | 7.7% | 8.0% | ||
| NCF DY | 7.5% | 7.3% | 7.7% | 7.7% | 7.8% |
|
| (1) | Base rent has been underwritten based on the April 15, 2018 rent roll and includes contractual rent steps through June 2019 totaling $30,092. |
| (2) | Underwritten Other Income includes straight-lined rent for Costco through the final maturity date totaling $137,052. |
| (3) | The underwritten economic vacancy is 2.5%. The Broadway Plaza Property was 100.0% physically occupied as of April 15, 2018. |
Appraisal.As of the appraisal valuation date of May 14, 2018, the Broadway Plaza Property had an “as-is” appraised value of $58,500,000.
Environmental Matters. According to the Phase I environmental report dated May 22, 2018, there was no evidence of any recognized environmental conditions at the Broadway Plaza Property.
Earthquake Insurance.The loan documents do not require earthquake insurance. The seismic report indicated a scenario expected loss for the entire Broadway Plaza Property of 7.0%.
THE INFORMATION IN THIS STRUCTURAL AND COLLATERAL TERM SHEET IS NOT COMPLETE AND MAY BE AMENDED PRIOR TO THE TIME OF SALE. THIS TERM SHEET IS NOT AN OFFER TO SELL THESE SECURITIES AND IT IS NOT A SOLICITATION OF AN OFFER TO BUY THESE SECURITIES IN ANY JURISDICTION WHERE THE OFFER OR SALE IS NOT PERMITTED.
104
| BROADWAY PLAZA |
Market Overview and Competition.The Broadway Plaza Property is situated directly adjacent to Interstate 15, on the southwest corner of Broadway and Naples Street, in Chula Vista, California. Interstate 15 provides the Broadway Plaza Property with direct access to downtown San Diego (12 miles) and the Mexico border (five miles). According to the appraisal, Broadway and Naples streets are major arterials in the trade area and the corner of Broadway and Naples Street averages traffic counts of 29,300 vehicles per day.
The Broadway Plaza Property is located in the Chula Vista retail submarket of the San Diego retail market. According to a third party market report, as of the first quarter of 2018, the vacancy rate in the Chula Vista retail submarket was approximately 3.0%, with average non-anchor asking rents of $28.25 per square foot. According to a third party market report, as of the first quarter of 2018, the vacancy rate in the San Diego retail submarket was approximately 3.7%, with average non-anchor asking rents of $28.62 per square foot. The appraiser concluded to market rents for Broadway Plaza Property of $12.00 per square foot for the anchor space, $24.00 to $33.00 per square foot for junior anchor space, $66.00 per square foot for fast food space and, $45.00 to $48.00 per square foot for inline shop space, all on a triple net basis.
According to the appraisal, the 2017 estimated population within a one-, three- and five-mile radius is 24,242, 201,237 and 371,797, respectively. The 2017 estimated average household income within a one-, three- and five-mile radius is $47,667, $61,426 and $69,846, respectively.
The following table presents certain information relating to comparable retail property sales for the Broadway Plaza Property:
Comparable Sales(1)
| Property Name/Location | Sale Date | Year Built / Renovated | SF | Total Occupancy | Sale Price (millions) | Sales Price PSF |
Broadway Plaza Property Chula Vista, CA | June 2018 | 2005 / NAP | 356,335(2) | 100.0%(2) | $58.5 | $164.17 |
The Terraces Rancho Palos Verdes, CA | Mar. 2017 | 1959 / 2016 | 172,922 | 89.0% | $54.1 | $312.86 |
Riverside Plaza Riverside, CA | Apr. 2017 | 1957 / 2004 | 409,075 | 95.0% | $165.8 | $405.18 |
Gateway Marketplace Chula Vista, CA | Jul. 2017 | 1997 / 2016 | 127,861 | 99.0% | $42.0 | $328.48 |
Chino Spectrum Towne Center Chino, CA | Jul. 2017 | 2002 / NAP | 459,969 | 96.0% | $144.0 | $313.06 |
Oxnard Vineyards Oxnard, CA | Sep. 2017 | 1986 / 2013 | 102,139 | 100.0% | $24.5 | $239.87 |
Gateway Towne Center Compton, CA | Mar. 2018 | 2007 / NAP | 281,000 | 100.0% | $86.0 | $306.05 |
| (1) | Information obtained from the appraisal. |
| (2) | As of the April 15, 2018 underwritten rent roll. |
The following table presents certain information relating to comparable properties to Broadway Plaza Property:
Comparable Leases(1)
| Property Name/Location | Tenant Name | Lease Date / Term | Lease Area (SF) | Annual Base Rent PSF | Lease Type |
7655 Clairemont Mesa Boulevard San Diego, CA | Zion Market | Nov. 2012 / 11.0 Yrs | 94,500 | $12.00 | NNN |
Rio Vista Shopping Center San Diego, CA | Living Spaces | Dec. 2012 / 10.0 Yrs | 113,395 | $18.00 | NNN |
5500 Grossmont Center Drive La Mesa, CA | Walmart | Jul. 2013 / 10.0 Yrs | 143,564 | $12.00 | NNN |
8879 Villa La Jolla Drive San Diego, CA | Nordstrom Rack | Oct 2015 / 10.0 Yrs | 32,000 | $32.52 | NNN |
910 Eastlake Parkway Chula Vista, CA | Crunch Fitness | Mar. 2016 / 10.0 Yrs | 12,500 | $30.00 | NNN |
2644 El Cajon Boulevard San Diego, CA | Starbucks | Jul. 2016 / 10.0 Yrs | 1,825 | $82.19 | NNN |
The Marketplace at Windingwalk Chula Vista, CA | Los Panchos | Nov. 2016 / 10.0 Yrs | 1,786 | $48.00 | NNN |
Palomar Trolley Center Chula Vista, CA | AT&T | May. 2016 / 10.0 Yrs | 2,400 | $42.00 | NNN |
Bonita Point Plaza Chula Vista, CA | Sleep Number | Jan. 2016 / 5.0 Yrs | 2,500 | $45.00 | NNN |
| (1) | Information obtained from the appraisal. |
The Borrower. The borrower is PPW Broadway, LLC, a Delaware limited liability company and single purpose entity with one independent director (the “Broadway Plaza Borrower”). Legal counsel to the Broadway Plaza Borrower delivered a non-consolidation opinion in connection with the origination of the Broadway Plaza Mortgage Loan. Jeffrey Essakow and Yehudi Gaffen are the guarantors of certain nonrecourse carveouts under the Broadway Plaza Mortgage Loan. The Broadway Plaza Borrower is indirectly owned by PrimeWest Broadway Plaza Trust (50%), and Protea Broadway Investment Group (50%).
THE INFORMATION IN THIS STRUCTURAL AND COLLATERAL TERM SHEET IS NOT COMPLETE AND MAY BE AMENDED PRIOR TO THE TIME OF SALE. THIS TERM SHEET IS NOT AN OFFER TO SELL THESE SECURITIES AND IT IS NOT A SOLICITATION OF AN OFFER TO BUY THESE SECURITIES IN ANY JURISDICTION WHERE THE OFFER OR SALE IS NOT PERMITTED.
105
| BROADWAY PLAZA |
The Borrower Sponsors.The borrower sponsors are Jeffrey Essakow and Yehudi Gaffen. Jeffrey Essakow and Yehudi Gaffen co-founded Protea Holdings, a San Diego based property investment, development and management group with over 30 years of experience in retail, office and residential markets. Collectively, the guarantors have an approximate 3.0% equity interest in the Broadway Plaza Borrower.
Escrows.The loan documents provide for an upfront reserve at closing in the amount of $74,639 for real estate taxes. The Broadway Plaza Borrower is required to deposit monthly (i) 1/12th of the estimated annual real estate taxes (currently $12,440) and 1/12th of the estimated annual insurance premiums (unless there is no continuing event of default under the loan documents and the Broadway Plaza Property is covered by a blanket policy reasonably approved by the lender with evidence of renewal of the policies and timely proof of payment of the insurance premiums), (ii) $402 to a replacement reserve, subject to a cap of $4,819 (provided during a Debt Yield Trigger Period (as defined below), the Broadway Plaza Borrower will be required to make additional monthly deposits to the replacement reserve until the amount then on deposit therein equals a cap of $9,638), and (iii) solely if a Debt Yield Trigger Period or an event of default is continuing, $16,332 to a tenant improvement and leasing commissions reserve, subject to a cap of $391,968.
A “Debt Yield Trigger Period” means the period commencing upon the debt yield falling below 7.5% for the immediately preceding six consecutive calendar months based on the trailing six month period and ending when the debt yield equals at least 7.7% for the immediately preceding six consecutive calendar months based on the trailing six month period. Upon the termination of a Debt Yield Trigger Period, provided no event of default is continuing, all funds in the replacement reserve in excess of $4,819, and all funds in the tenant improvement and leasing commissions reserve, are required to be released to the Broadway Plaza Borrower.
Lockbox and Cash Management. The Broadway Plaza Mortgage Loan provides for a hard lockbox and springing cash management. The Broadway Plaza Borrower is required to direct all tenants to pay rents directly into the lockbox account, and the Broadway Plaza Borrower and property manager are required to deposit any rents received by them, notwithstanding such direction, within one business day of receipt. If no Cash Sweep Event Period (as defined below) is continuing, funds in the lockbox account are required to be released to the Broadway Plaza Borrower. Upon the first occurrence of a Cash Sweep Event Period, the lender is required to establish, and the Broadway Plaza Borrower is required to cooperate with the cash management bank to establish, a lender-controlled cash management account. During the continuance of a Cash Sweep Event Period, all funds in the lockbox account are required to be swept to such cash management account and applied to the payment of, among other things, monthly escrows, debt service, operating expenses set forth in the lender-approved annual budget, extraordinary expenses approved by the lender, and to pay any remainder into an excess cash flow account to be (i) prior to the ARD, held as additional security for the Broadway Plaza Mortgage Loan during the continuance of such Cash Sweep Event Period and (ii) on and after the ARD applied to repay principal of the Broadway Plaza Mortgage Loan until repaid in full and then applied to pay interest accrued at the excess of the Revised Rate over the Initial Interest Rate.
A “Cash Sweep Event Period” means the period:
| i. | commencing upon the occurrence of an event of default under the Broadway Plaza Mortgage Loan and ending if no event of default exists; or |
| ii. | commencing upon the debt service coverage ratio of the Broadway Plaza Mortgage Loan (assuming a 30-year amortization schedule), based on the trailing six months operating statements and rent rolls, falling below 1.15x for six consecutive calendar months and ending upon the debt service coverage ratio (assuming a 30-year amortization schedule) being at least 1.15x for the immediately preceding six calendar months; or |
| iii. | commencing upon a Major Tenant (as defined below) making a bankruptcy filing or being the subject of a bankruptcy filing and ending upon either of (a) the Major Tenant’s lease being affirmed in bankruptcy and the Broadway Plaza Borrower delivering to the lender a reasonably acceptable estoppel from the Major Tenant stating that it is in occupancy of the entirety of its space, open for business and paying full unabated contractual rent (an “Acceptable Estoppel”), and (b) the leasing of the entirety of the space previously occupied by the Major Tenant to one or more replacement tenants under replacement leases, in each case acceptable to the lender in its sole discretion, and the Broadway Plaza Borrower delivering to the lender an Acceptable Estoppel from each of such replacement tenant(s) (a “Replacement Tenant Cure”); or |
| iv. | commencing upon the earlier of (a) the date any Major Tenant gives notice to vacate or exercises any termination option under such Major Tenant’s lease, and (b) the date which is six months prior to the expiration of any Major Tenant’s lease unless such Major Tenant has renewed or extended such Major Tenant’s lease on terms and conditions acceptable to the lender and ending upon either (a) the Major Tenant renewing its lease on terms and conditions acceptable to the lender and the Broadway Plaza Borrower delivering to the lender an Acceptable Estoppel from the Major Tenant or (b) a Replacement Tenant Cure; or |
| v. | commencing upon a Major Tenant vacating or “going dark” in its space or terminating (or giving written notice of its intention to terminate) its lease and ending upon either (a) the Major Tenant occupying the entirety of its space and the Broadway Plaza Borrower delivering to the lender an Acceptable Estoppel from the Major Tenant or (b) a Replacement Tenant Cure; or |
| vi. | commencing upon the ARD and continuing thereafter. |
“Major Tenant” means each of (i) Costco, (ii) Walmart, and (iii) any tenant which occupies all or a portion of the space leased by either of the foregoing pursuant to a replacement lease.
Property Management.The Broadway Plaza Property is managed by an affiliate of the Broadway Plaza Borrower.
THE INFORMATION IN THIS STRUCTURAL AND COLLATERAL TERM SHEET IS NOT COMPLETE AND MAY BE AMENDED PRIOR TO THE TIME OF SALE. THIS TERM SHEET IS NOT AN OFFER TO SELL THESE SECURITIES AND IT IS NOT A SOLICITATION OF AN OFFER TO BUY THESE SECURITIES IN ANY JURISDICTION WHERE THE OFFER OR SALE IS NOT PERMITTED.
106
| BROADWAY PLAZA |
Assumption.The Broadway Plaza Borrower has the two-time right to transfer the Broadway Plaza Property provided that certain conditions are satisfied, including (i) no event of default under the Broadway Plaza Mortgage Loan documents has occurred and is continuing; (ii) in the event that in connection with such transfer, the manager will not thereafter continue to manage the Broadway Plaza Property, then a replacement management agreement with a manager approved by the lender must be executed acceptable to the lender; (iii) the lender reasonably determines that the proposed transferee satisfies the lender’s credit review and underwriting standards, taking into consideration the transferee’s experience, financial strength and general business standing; (iv) a replacement guarantor acceptable to the lender assumes the obligations of the Broadway Plaza guarantor under the non-recourse carveout guaranty and environmental indemnity; and (v) if requested by the lender, rating agency confirmation from each rating agency rating the BANK 2018-BNK13 certificates that such assumption will not result in a downgrade, withdrawal or qualification of the respective ratings assigned to the BANK 2018-BNK13 certificates.
Partial Release.Not permitted.
Master Lease. The Broadway Plaza Borrower is permitted to master lease to an affiliate the parcel on which 14,580 square feet currently leased to NavCare is located, in which event the lender is required to subordinate the lien of the mortgage to such master lease, provided that certain conditions are satisfied, including but not limited to (i) the master tenant being responsible for the expansion and/or modification of the improvements located on such parcel, and all insurance, maintenance, utility, repair and other similar obligations with respect to such improvements, (ii) the non-recourse carveout guarantor providing a completion guaranty with respect to such expansion and/or modification, (iii) the master lease having a term at least five years beyond the maturity date of the Broadway Plaza Mortgage Loan and market rental rates (but not less than the rent payable under the NavCare lease or any replacement lease), and being guaranteed by the non-recourse carveout guarantor, (iv) satisfaction of REMIC requirements, and (v) if required by the lender, rating agency confirmation. The master tenant will be permitted to obtain financing secured by its leasehold interest.
Real Estate Substitution.Not permitted.
Subordinate and Mezzanine Indebtedness.Not permitted.
Ground Lease.None.
Terrorism Insurance.The loan documents require that the “all risk” insurance policy required to be maintained by the Broadway Plaza Borrower provide coverage for terrorism in an amount equal to the full replacement cost of the Broadway Plaza Property, as well as twelve months of business interruption insurance; provided that so long as TRIPRA (or extension thereof or similar government program) is in effect and continues to cover both domestic and foreign acts of terrorism, the lender is required to accept terrorism insurance which covers “covered acts” as defined in TRIPRA.
THE INFORMATION IN THIS STRUCTURAL AND COLLATERAL TERM SHEET IS NOT COMPLETE AND MAY BE AMENDED PRIOR TO THE TIME OF SALE. THIS TERM SHEET IS NOT AN OFFER TO SELL THESE SECURITIES AND IT IS NOT A SOLICITATION OF AN OFFER TO BUY THESE SECURITIES IN ANY JURISDICTION WHERE THE OFFER OR SALE IS NOT PERMITTED.
107
PLAZA Frontenac

THE INFORMATION IN THIS STRUCTURAL AND COLLATERAL TERM SHEET IS NOT COMPLETE AND MAY BE AMENDED PRIOR TO THE TIME OF SALE. THIS TERM SHEET IS NOT AN OFFER TO SELL THESE SECURITIES AND IT IS NOT A SOLICITATION OF AN OFFER TO BUY THESE SECURITIES IN ANY JURISDICTION WHERE THE OFFER OR SALE IS NOT PERMITTED.
108
PLAZA Frontenac
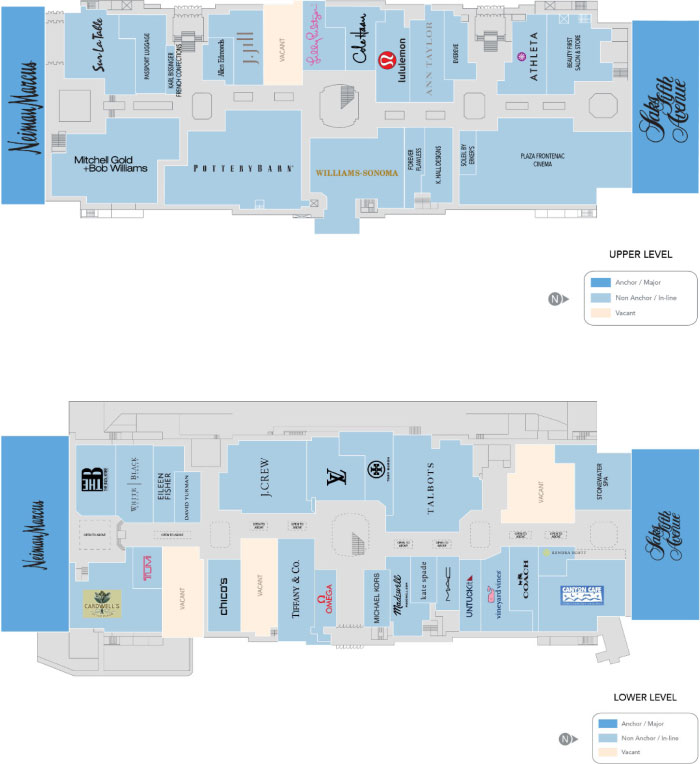
THE INFORMATION IN THIS STRUCTURAL AND COLLATERAL TERM SHEET IS NOT COMPLETE AND MAY BE AMENDED PRIOR TO THE TIME OF SALE. THIS TERM SHEET IS NOT AN OFFER TO SELL THESE SECURITIES AND IT IS NOT A SOLICITATION OF AN OFFER TO BUY THESE SECURITIES IN ANY JURISDICTION WHERE THE OFFER OR SALE IS NOT PERMITTED.
109
PLAZA Frontenac
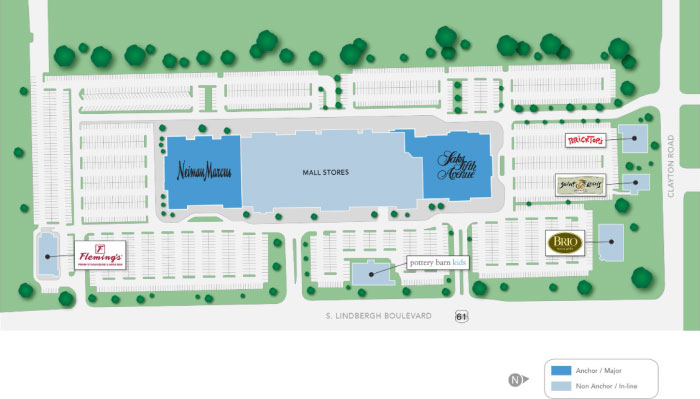
THE INFORMATION IN THIS STRUCTURAL AND COLLATERAL TERM SHEET IS NOT COMPLETE AND MAY BE AMENDED PRIOR TO THE TIME OF SALE. THIS TERM SHEET IS NOT AN OFFER TO SELL THESE SECURITIES AND IT IS NOT A SOLICITATION OF AN OFFER TO BUY THESE SECURITIES IN ANY JURISDICTION WHERE THE OFFER OR SALE IS NOT PERMITTED.
110
PLAZA Frontenac

THE INFORMATION IN THIS STRUCTURAL AND COLLATERAL TERM SHEET IS NOT COMPLETE AND MAY BE AMENDED PRIOR TO THE TIME OF SALE. THIS TERM SHEET IS NOT AN OFFER TO SELL THESE SECURITIES AND IT IS NOT A SOLICITATION OF AN OFFER TO BUY THESE SECURITIES IN ANY JURISDICTION WHERE THE OFFER OR SALE IS NOT PERMITTED.
111
| No. 8 – Plaza Frontenac | ||||||
| Loan Information | Property Information | |||||
| Mortgage Loan Seller: | Morgan Stanley Mortgage Capital Holdings LLC | Single Asset/Portfolio: | Single Asset | |||
Credit Assessment (DBRS/Fitch/S&P): | (NR/NR/NR) | Property Type: | Retail | |||
| Original Principal Balance(1): | $40,000,000 | Specific Property Type: | Anchored | |||
| Cut-off Date Balance(1): | $40,000,000 | Location: | Frontenac, MO | |||
| % of Initial Pool Balance: | 4.24% | Size(5): | 351,006 SF | |||
| Loan Purpose: | Refinance | Cut-off Date Balance Per SF(1): | $284.90 | |||
| Borrower Name: | Plaza Frontenac Acquisition, LLC | Year Built/Renovated: | 1974/1994 | |||
| Borrower Sponsors: | General Growth Properties; Canada Pension Plan Investment Board | Title Vesting: | Fee | |||
| Mortgage Rate: | 4.4330% | Property Manager: | Self-managed | |||
| Note Date: | July 2, 2018 | 4thMost Recent Occupancy (As of): | 98.6% (12/31/2014) | |||
| Anticipated Repayment Date: | NAP | 3rdMost Recent Occupancy (As of): | 98.0% (12/31/2015) | |||
| Maturity Date: | August 1, 2028 | 2ndMost Recent Occupancy (As of): | 98.5% (12/31/2016) | |||
| IO Period: | 120 months | Most Recent Occupancy (As of): | 95.7% (12/31/2017) | |||
| Loan Term (Original): | 120 months | Current Occupancy (As of): | 96.5% (3/1/2018) | |||
| Seasoning: | 0 months | |||||
| Amortization Term (Original): | NAP | Underwriting and Financial Information: | ||||
| Loan Amortization Type: | Interest-only, Balloon | |||||
| Interest Accrual Method: | Actual/360 | 4thMost Recent NOI (As of): | $8,860,498 (12/31/2014) | |||
| Call Protection(2)(3): | L(24),D(92),O(4) | 3rdMost Recent NOI (As of): | $9,496,000 (12/31/2015) | |||
| Lockbox Type: | Hard/Springing Cash Management | 2ndMost Recent NOI (As of): | $9,783,836 (12/31/2016) | |||
| Additional Debt(1): | Yes | Most Recent NOI (As of): | $9,885,268 (12/31/2017) | |||
| Additional Debt Type(1): | Pari Passu | |||||
| Escrows and Reserves(4): | U/W Revenues: | $14,299,486 | ||||
| U/W Expenses: | $4,277,252 | |||||
| Type: | Initial | Monthly | Cap (If Any) | U/W NOI: | $10,022,234 | |
| Taxes | $0 | Springing | NAP | U/W NCF: | $9,391,583 | |
| Insurance | $0 | Springing | NAP | U/W NOI DSCR(1): | 2.23x | |
| Replacement Reserve | $0 | Springing | NAP | U/W NCF DSCR(1): | 2.09x | |
| TI/LC Reserve | $0 | Springing | NAP | U/W NOI Debt Yield(1): | 10.0% | |
| U/W NCF Debt Yield(1): | 9.4% | |||||
| As-Is Appraised Value: | $210,000,000 | |||||
| As-Is Appraisal Valuation Date: | May 20, 2018 | |||||
| Cut-off Date LTV Ratio(1): | 47.6% | |||||
| LTV Ratio at Maturity or ARD(1): | 47.6% | |||||
| (1) | See “The Mortgage Loan” section. All statistical financial information related to balances per square foot, loan-to-value ratios, debt service coverage ratios and debt yields are based on the Plaza Frontenac Whole Loan (as defined below). |
| (2) | The lockout period will be at least 24 payments, beginning with and including the first payment date of September 1, 2018. Defeasance of the Plaza Frontenac Whole Loan is permitted at any time after the earlier to occur of (i) two years after the closing date of the last securitization involving any portion of the loan or (ii) 36 months after the loan origination date. The assumed lockout period of 24 payments is based on the expected BANK 2018-BNK13 Trust closing date in August 2018. |
| (3) | The Plaza Frontenac Whole Loan may also be prepaid in part in the amount of $6,500,000, together with, if prior to the open period, a prepayment fee equal to the greater of 1% of the amount prepaid and a yield maintenance premium, in connection with a release of the Saks parcel. See “Partial Release” section. |
| (4) | See “Escrows” section. |
| (5) | The Plaza Frontenac Property (as defined below) is part of a larger retail center which also includes a 135,044 square foot non-collateral parcel owned by Neiman Marcus. |
The Mortgage Loan.The mortgage loan (the “Plaza Frontenac Mortgage Loan”) is part of a whole loan (the “Plaza Frontenac Whole Loan”) evidenced by twopari passu promissory notes, secured by the fee interest in a 351,006 square foot anchored retail center in Frontenac, Missouri (the “Plaza Frontenac Property”). The Plaza Frontenac Whole Loan was originated on July 2, 2018 by Morgan Stanley Bank, N.A. The Plaza Frontenac Whole Loan had an original principal balance of $100,000,000, has an outstanding principal balance as of the Cut-off Date of $100,000,000 and accrues interest at an interest rate of 4.4330%per annum. The Plaza Frontenac Whole Loan had an initial term of 120 months, has a remaining term of 120 months as of the Cut-off Date and requires payments of interest only through the term of the Plaza Frontenac Whole Loan. The Plaza Frontenac Whole Loan matures on August 1, 2028.
The Plaza Frontenac Mortgage Loan, evidenced by Note A-2, will be contributed to the BANK 2018-BNK13 securitization trust, had an original principal balance of $40,000,000, has an outstanding principal balance as of the Cut-off Date of $40,000,000 and represents apari passu non-controlling interest in the Plaza Frontenac Whole Loan. The controlling Note A-1 in the original principal balance of $60,000,000 is currently held by Morgan Stanley Bank, N.A. or an affiliate and is expected to be contributed to one or more future
THE INFORMATION IN THIS STRUCTURAL AND COLLATERAL TERM SHEET IS NOT COMPLETE AND MAY BE AMENDED PRIOR TO THE TIME OF SALE. THIS TERM SHEET IS NOT AN OFFER TO SELL THESE SECURITIES AND IT IS NOT A SOLICITATION OF AN OFFER TO BUY THESE SECURITIES IN ANY JURISDICTION WHERE THE OFFER OR SALE IS NOT PERMITTED.
112
PLAZA FRONTENAC
securitization trusts.The lender provides no assurance that any non-securitizedpari passu note will not be split further. See “Description of the Mortgage Pool—The Whole Loans—The Serviced Pari Passu Whole Loans” and “—The Non-Serviced Pari Passu Loans” and ”Pooling and Servicing Agreement” in the Preliminary Prospectus.
Note Summary
| Notes | Original Balance | Note Holder | Controlling Interest |
| A-1 | $60,000,000 | Morgan Stanley Bank, N.A. | Yes |
| A-2 | $40,000,000 | BANK 2018–BNK13 | No |
| Total | $100,000,000 |
Following the lockout period, the Plaza Frontenac Borrower has the right to defease the Plaza Frontenac Whole Loan in whole, or at any time may prepay the Plaza Frontenac Whole Loan in part as described below under “Partial Release”. In addition, the Plaza Frontenac Whole Loan is prepayable without penalty on or after May 1, 2028.
The Property.The Plaza Frontenac Property is a 351,006 square feet anchored retail center comprised of six buildings located in Frontenac, Missouri. Built in 1974, the Plaza Frontenac Property sits on 26.1 acres and is part of a larger shopping center that is comprised of approximately 485,000 square feet of retail space, including the separately owned Neiman Marcus (135,044 square feet) that sits on 7.5 acres and is not part of the collateral. Neiman Marcus is not party to an operating covenant. Another anchor tenant, Saks Fifth Avenue, was constructed on a ground-leased parcel and contains 125,669 square feet (35.8% of the net rentable area and 0.4% of underwritten base rent). The Plaza Frontenac Property contains a total of 2,409 parking spaces (4.97 spaces per 1,000 square feet of NRA, including Neiman Marcus). As of March 1, 2018, the Plaza Frontenac Property was 96.5% leased by a mix of 55 national and local retail tenants. No tenant accounts for more than 7.7% of underwritten rent and apart from Saks Fifth Avenue, no tenant accounts for more than 4.1% of NRA. Comparable inline sales, represented by 34 tenants with at least one full year of sales, were $725 per square foot as of the April 2018 TTM period, while four pad site tenants with at least 12 months of operations reported sales of $719 per square foot. The Plaza Frontenac Property’s in-line tenants that reported sales reported $71.6 million ($598 per square feet), $77.5 million ($647 per square feet) and $86.8 million ($725 per square feet) in sales for 2015, 2016 and 2017, respectively. The Plaza Frontenac Property is currently 96.5% occupied across all collateral tenants. Historically, overall occupancy at the Plaza Frontenac Property has averaged 97.7% since 2014.
The tenants at the Plaza Frontenac Property have a weighted average remaining lease term of 4.9 years and 67.0% of NRA has been in occupancy for a minimum of five years. Over the past 24 months, there have been five lease renewals at the Plaza Frontenac Property, ranging in size from 12,692 to 2,400 square feet, with new yearly rental rates ranging from $40.00 to $74.16 per square foot. Each tenant, except for one, renewed at a higher rent. Since December 2014, there have been eight new leases signed at the Plaza Frontenac Property, ranging in size from 10,055 to 654 square feet, with yearly rates ranging from $30.36 to $148.50 per square foot.
Sources and Uses
| Sources | Uses | |||||||
| Original whole loan amount | $100,000,000 | 100.0% | Loan Payoff | $52,133,931 | 52.1% | |||
| Return of Equity | 47,081,971 | 47.1 | ||||||
| Closing Costs | 784,098 | 0.8 | ||||||
| Total Sources | $100,000,000 | 100.0% | Total Uses | $100,000,000 | 100.0% |
THE INFORMATION IN THIS STRUCTURAL AND COLLATERAL TERM SHEET IS NOT COMPLETE AND MAY BE AMENDED PRIOR TO THE TIME OF SALE. THIS TERM SHEET IS NOT AN OFFER TO SELL THESE SECURITIES AND IT IS NOT A SOLICITATION OF AN OFFER TO BUY THESE SECURITIES IN ANY JURISDICTION WHERE THE OFFER OR SALE IS NOT PERMITTED.
113
PLAZA FRONTENAC
The following table presents certain information relating to the tenancy at Plaza Frontenac Property:
Major Tenants
| Tenant Name | Credit Rating (Fitch/Moody’s/ S&P)(1) | Tenant NRSF | % of NRSF | Annual U/W Base Rent PSF(2) | Annual U/W Base Rent(2) | % of Total Annual U/W Base Rent | 4/30/2018 TTM Sales PSF | 4/30/2018 TTM Occupancy Cost(3) | Lease Expiration Date |
| Anchor Tenant | |||||||||
| Saks Fifth Avenue | NR/NR/NR | 125,669 | 35.8% | $0.28 | $35,187 | 0.4% | $209 | 2.5% | 11/30/2023 |
| Total Anchor Tenant | 125,669 | 35.8% | $0.28 | $35,187 | 0.4% | ||||
| Major Tenants | |||||||||
| Plaza Frontenac Cinema | NR/NR/NR | 14,307 | 4.1% | $23.00 | $329,061 | 3.5% | $166 | 25.4% | 5/7/2023 |
| Pottery Barn | NR/NR/NR | 12,962 | 3.7% | $54.11 | $701,374 | 7.4% | $504 | 11.9% | 1/31/2029 |
| Pottery Barn Kids/PB Teen | NR/NR/NR | 12,000 | 3.4% | $14.18 | $170,160 | 1.8% | $206 | 11.7% | 11/30/2021 |
| Mitchell Gold+Bob William | NR/NR/NR | 10,055 | 2.9% | $34.33 | $345,188 | 3.6% | $168 | 23.2% | 11/30/2024 |
| Major Tenants Total | 49,324 | 14.1% | $31.34 | $1,545,783 | 16.3% | ||||
| In-line Tenants | |||||||||
| Stonewater Spa | NR/NR/NR | 9,141 | 2.6% | $38.26 | $349,735 | 3.7% | $283 | 15.5% | 7/31/2023 |
| Talbots | NR/NR/B- | 9,140 | 2.6% | $79.91 | $730,377 | 7.7% | $384 | 26.4% | 3/31/2024 |
| Williams Sonoma | NR/NR/NR | 8,670 | 2.5% | $43.67 | $378,619 | 4.0% | $375 | 13.3% | 1/31/2029 |
| Tiffany & Co. | BBB+/ Baa2/ BBB+ | 4,750 | 1.4% | $93.14 | $442,415 | 4.7% | $1,228 | 9.3% | 9/30/2022 |
| Louis Vuitton | NR/NR/A+ | 4,000 | 1.1% | $104.89 | $419,560 | 4.4% | $2,724 | 4.9% | 7/31/2024 |
| Athleta | NR/NR/NR | 3,756 | 1.1% | $84.43 | $317,116 | 3.3% | $1,547 | 8.6% | 5/31/2023 |
| In-line Tenants Total | 39,457 | 11.2% | $66.85 | $2,637,822 | 27.8% | ||||
| Other Tenants | 124,341 | 35.4% | $42.30 | $5,259,560 | 55.5% | ||||
| Occupied Total | 338,791 | 96.5% | $27.98 | $9,478,352 | 100.0% | ||||
| Vacant Space | 12,215 | 3.5% | |||||||
| Collateral Total | 351,006 | 100.0% | |||||||
| (1) | Certain ratings are those of the parent company whether or not the parent guarantees the lease. |
| (2) | Annual U/W Base Rent includes contractual rent steps equal to $296,073 through June 30, 2019. |
| (3) | Occupancy Cost is based on the total UW rent as of the March 1, 2018 rent roll and underwritten reimbursements divided by most recently reported sales. |
THE INFORMATION IN THIS STRUCTURAL AND COLLATERAL TERM SHEET IS NOT COMPLETE AND MAY BE AMENDED PRIOR TO THE TIME OF SALE. THIS TERM SHEET IS NOT AN OFFER TO SELL THESE SECURITIES AND IT IS NOT A SOLICITATION OF AN OFFER TO BUY THESE SECURITIES IN ANY JURISDICTION WHERE THE OFFER OR SALE IS NOT PERMITTED.
114
PLAZA FRONTENAC
The following table presents certain information relating to the lease rollover schedule at Plaza Frontenac Property:
Lease Expiration Schedule(1)(2)
| Year Ending December 31, | No. of Leases Expiring | Expiring NRSF | % of Total NRSF | Cumulative Expiring NRSF | Cumulative % of Total NRSF | Annual U/W Base Rent | % of Total Annual U/W Base Rent | Annual U/W Base Rent PSF(3) |
| MTM | 0 | 0 | 0.0% | 0 | 0.0% | $0 | 0.0% | $0.00 |
| 2018 | 8 | 30,913 | 8.8% | 30,913 | 8.8% | $897,100 | 9.5% | $29.02 |
| 2019 | 8 | 18,545 | 5.3% | 49,458 | 14.1% | $479,049 | 5.1% | $25.83 |
| 2020 | 4 | 6,795 | 1.9% | 56,253 | 16.0% | $355,927 | 3.8% | $52.38 |
| 2021 | 5 | 28,213 | 8.0% | 84,466 | 24.1% | $698,607 | 7.4% | $24.76 |
| 2022 | 8 | 19,809 | 5.6% | 104,275 | 29.7% | $1,195,259 | 12.6% | $60.34 |
| 2023 | 5 | 154,186 | 43.9% | 258,461 | 73.6% | $1,111,893 | 11.7% | $7.21 |
| 2024 | 7 | 34,234 | 9.8% | 292,695 | 83.4% | $2,224,384 | 23.5% | $64.98 |
| 2025 | 2 | 6,601 | 1.9% | 299,296 | 85.3% | $253,902 | 2.7% | $38.46 |
| 2026 | 3 | 4,194 | 1.2% | 303,490 | 86.5% | $409,724 | 4.3% | $97.69 |
| 2027 | 3 | 7,927 | 2.3% | 311,417 | 88.7% | $528,302 | 5.6% | $66.65 |
| 2028 | 1 | 5,742 | 1.6% | 317,159 | 90.4% | $244,212 | 2.6% | $42.53 |
| Thereafter | 2 | 21,632 | 6.2% | 338,791 | 96.5% | $1,079,993 | 11.4% | $49.93 |
| Vacant | 0 | 12,215 | 3.5% | 351,006 | 100.0% | $0 | 0.0% | $0.00 |
| Total/Weighted Average | 56 | 351,006 | 100.0% | $9,478,352 | 100.0% | $27.98 |
| (1) | Information obtained from the underwritten rent roll. |
| (2) | Certain tenants may have lease termination options that are exercisable prior to the originally stated expiration date of the subject lease and that are not considered in the Lease Expiration Schedule. |
| (3) | Weighted Average Annual U/W Base Rent PSF excludes vacant space. |
The following table presents historical occupancy percentages at Plaza Frontenac Property:
Historical Occupancy
12/31/2014(1) | 12/31/2015(1) | 12/31/2016(1) | 12/31/2017(1) | 3/1/2018(2) |
| 98.6% | 98.0% | 98.5% | 95.7% | 96.5% |
| (1) | Information obtained from the Plaza Frontenac Borrower. |
| (2) | Information obtained from the underwritten rent roll. |
Operating History and Underwritten Net Cash Flow. The following table presents certain information relating to the underwritten net cash flow at Plaza Frontenac Property:
Cash Flow Analysis
| 2014 | 2015 | 2016 | 2017 | U/W | % of U/W Effective Gross Income | U/W $ per SF | |||||||||||||||
| Base Rent | $8,228,539 | $8,955,305 | $9,254,390 | $9,286,610 | $9,478,352(1) | 66.3 | % | $27.00 | |||||||||||||
| Overage Rent/Percent in Lieu(2) | 378,419 | 320,202 | 259,092 | 485,173 | 691,837 | 4.8 | 1.97 | ||||||||||||||
| Specialty Leasing/Other | 417,929 | 315,454 | 336,495 | 327,190 | 327,190 | 2.3 | 0.93 | ||||||||||||||
| Reimbursements | 4,194,855 | 4,155,651 | 4,109,736 | 4,014,103 | 3,797,107 | 26.6 | 10.82 | ||||||||||||||
| Other Income(3) | 9,568 | 8,689 | 5,458 | 5,000 | 5,000 | 0.0 | 0.01 | ||||||||||||||
| Effective Gross Income | $13,229,309 | $13,755,300 | $13,965,170 | $14,118,075 | $14,299,486 | 100.0 | % | $40.74 | |||||||||||||
| Total Operating Expenses | $4,368,811 | $4,259,300 | $4,181,335 | $4,232,807 | $4,277,252 | 29.9 | % | $12.19 | |||||||||||||
| Net Operating Income | $8,860,498 | $9,496,000 | $9,783,836 | $9,885,268 | $10,022,234 | 70.1 | % | $28.55 | |||||||||||||
| Replacement Reserves | 0 | 0 | 0 | 0 | 52,651 | 0.4 | 0.15 | ||||||||||||||
| TI/LC | 0 | 0 | 0 | 0 | 578,000 | 4.0 | 1.65 | ||||||||||||||
| Net Cash Flow | $8,860,498 | $9,496,000 | $9,783,836 | $9,885,268 | $9,391,583 | 65.7 | % | $26.76 | |||||||||||||
| NOI DSCR(4) | 1.97x | 2.11x | 2.18x | 2.20x | 2.23x | ||||||||||||||||
| NCF DSCR(4) | 1.97x | 2.11x | 2.18x | 2.20x | 2.09x | ||||||||||||||||
| NOI DY(4) | 8.9% | 9.5% | 9.8% | 9.9% | 10.0% | ||||||||||||||||
| NCF DY(4) | 8.9% | 9.5% | 9.8% | 9.9% | 9.4% | ||||||||||||||||
| (1) | Base rent is underwritten to current physical vacancy of 3.5% as of March 1, 2018. |
| (2) | Overage Rent/Percent in Lieu is comprised of $446,065 of overage rent and $245,772 of percentage in lieu. |
| (3) | Other Income includes gift card revenue and non-tenant revenue. |
| (4) | Debt service coverage ratios and debt yields are based on the Plaza Frontenac Whole Loan. |
Appraisal.As of the appraisal valuation date of May 20, 2018, the Plaza Frontenac Property had an “as-is” appraised value of $210,000,000.
Environmental Matters. According to the Phase I environmental report dated May 30, 2018, there was no evidence of any recognized environmental conditions at the Plaza Frontenac Property.
THE INFORMATION IN THIS STRUCTURAL AND COLLATERAL TERM SHEET IS NOT COMPLETE AND MAY BE AMENDED PRIOR TO THE TIME OF SALE. THIS TERM SHEET IS NOT AN OFFER TO SELL THESE SECURITIES AND IT IS NOT A SOLICITATION OF AN OFFER TO BUY THESE SECURITIES IN ANY JURISDICTION WHERE THE OFFER OR SALE IS NOT PERMITTED.
115
PLAZA FRONTENAC
Market Overview and Comparable Properties.The Plaza Frontenac Property is located south of Interstate 64 at the corner of Lindbergh Boulevard and Clayton Road in Frontenac, St. Louis County, Missouri. Lambert St. Louis International Airport is a medium-hub airport owned and operated by the city of St. Louis. Airport traffic has continued to improve, with 14.7 million travelers in 2017, a level not seen since 2007. In addition, the Plaza Frontenac Property is located near four interstate highways and home to six Class I railroads.
The Plaza Frontenac Property is located in the St. Louis metropolitan area. According to a third-party report, the second quarter of 2018’s overall retail vacancy rate for the St. Louis retail market was approximately 5.0%, while the market rental rate was approximately $15.11 per square foot. According to a third-party report, there were 707,036 square feet of retail under construction during the second quarter of 2018 in the St. Louis metropolitan area. The Plaza Frontenac Property is located in the Mid County retail submarket, which contains approximately 10.0% of the St. Louis metropolitan area square feet inventory. The Mid County retail submarket had a vacancy rate of 3.2% and a market rental rate of $24.73 per square foot. As of the second quarter of 2018, the Mid County retail submarket had approximately 171,007 square feet under construction.
According to the appraisal, the 2017 estimated population within a one-, three- and five-mile radius is 2,647, 51,096 and 200,140, respectively. The 2017 estimated average household income within a one-, three- and five-mile radius is $234,521, $173,378 and $127,681, respectively.
The following table presents certain information relating to competitive properties to Plaza Frontenac Property:
Competitive Properties(1)
| Property Name/Location | Year Built/Year Renovated | Total GLA (SF) | Anchor Tenants | Occupancy |
St. Louis Galleria(2) 1155 St. Louis Galleria Blvd. Richmond Heights, MO | 1986/2006 | 1,182,625 | Nordstrom Dillard’s Macy’s | 99.4% |
West County Center 80 West County Center Des Peres, MO | 1969/2002 | 1,211,996 | Macy’s Nordstrom JCPenney | 98.0% |
Chesterfield Mall 30 Chesterfield Mall Dr. Chesterfield, MO | 1976/2006 | 1,283,503 | Dillard’s Macy’s Sears | 92.1% |
South County Center 85 So. County Center Way St. Louis, MO | 1963/2002 | 884,714 | Dillard’s Macy’s JCPenney Sears | 96.1% |
| (1) | Information obtained from the appraisal. |
| (2) | St. Louis Galleria is also owned by the Plaza Frontenac Property guarantor. |
The Borrower. The borrower is Plaza Frontenac Acquisition, LLC (the “Plaza Frontenac Borrower”), a Delaware limited liability company and single purpose entity with two independent directors. Legal counsel to the borrower delivered a non-consolidation opinion in connection with the origination of the Plaza Frontenac Whole Loan. GGP-CPP Venture, LP is the guarantor of certain nonrecourse carveouts under the Plaza Frontenac Whole Loan. The guarantor is the indirect owner of two properties, the Plaza Frontenac Property and the St. Louis Galleria Mall.
The Borrower Sponsors.The borrower sponsors are General Growth Properties (“GGP”) and Canada Pension Plan Investment Board (“CPPIB”). GGP is an S&P 500 real estate company focused exclusively on owning, managing, leasing, and redeveloping high-quality retail properties throughout the United States. GGP manages 125 properties making up approximately 121 million square feet of space across 40 states. CPPIB is a professional investment organization with a commercial, investment-only mandate, as outlined in the CPPIB Act. CPPIB has a 45% interest in the Plaza Frontenac Property and GGP has a 55% interest. GGP previously filed for bankruptcy in 2009 and emerged from bankruptcy in 2010. See “Description of the Mortgage Pool—Loan Purpose; Default History, Bankruptcy Issues and Other Proceedings” in the Preliminary Prospectus. GGP has entered into a merger agreement with Brookfield Property Partners, L.P. (“BPY”). Currently, BPY is the beneficial owner of approximately 34% of the outstanding equity interests in GGP, and BPY is a controlled affiliate of Brookfield Asset Management Inc. (“BAM”), a global alternative asset manager that is traded on the New York and Toronto Stock Exchanges. There is no assurance that the merger will occur.
Escrows. During the continuance of a Cash Management Period (as defined below), the Plaza Frontenac Borrower is required to deposit monthly into escrow 1/12 of the annual estimated real estate tax payments and 1/12 of the annual estimated insurance premiums (unless an acceptable blanket insurance policy is in place and evidence is delivered to lender of the timely payment of insurance premiums). During the continuance of a Cash Management Period, the Plaza Frontenac Borrower is required to deposit monthly $7,294 into a capital expenditure reserve; provided that such deposit is not required at any time the amount on deposit in such reserve equals or exceeds $87,527. During the continuance of a Cash Management Period, the Plaza Frontenac Borrower is required to deposit monthly $29,176 into a tenant improvements and leasing commissions reserve; provided that such deposit is not required at any time the amount on deposit in such reserve equals or exceeds $350,110. If a Cash Management Period is no longer continuing, all funds in the tax and insurance escrows, capital expenditure reserve and tenant improvements and leasing commissions reserve are required to be released to the Plaza Frontenac Borrower.
THE INFORMATION IN THIS STRUCTURAL AND COLLATERAL TERM SHEET IS NOT COMPLETE AND MAY BE AMENDED PRIOR TO THE TIME OF SALE. THIS TERM SHEET IS NOT AN OFFER TO SELL THESE SECURITIES AND IT IS NOT A SOLICITATION OF AN OFFER TO BUY THESE SECURITIES IN ANY JURISDICTION WHERE THE OFFER OR SALE IS NOT PERMITTED.
116
PLAZA FRONTENAC
A “Cash Management Period” means a period (i) commencing upon an event of default under the Plaza Frontenac Whole Loan and ending if such event of default is thereafter cured or waived or (ii) commencing upon a determination that the net operating income debt yield is less than 7.75% and ending upon the net operating income debt yield being equal to or in excess of 7.75% for two consecutive calendar quarters.
Lockbox and Cash Management. A hard lockbox is in place with respect to the Plaza Frontenac Whole Loan. The Plaza Frontenac Borrower is required to notify and advise each tenant, other than tenants under leases or licenses having a maximum term of one year (“Seasonal Leases”), to send rent payments directly to the lockbox account. In addition, the Plaza Frontenac Borrower is required to deposit into the lockbox account all rents or other revenue received by it from the Plaza Frontenac Property within two business days after receipt. The Plaza Frontenac Whole Loan has springing cash management (i.e., cash management is required only after the initial occurrence and during the continuance of a Cash Management Period). Provided a Cash Management Period is not continuing, funds in the lockbox account are required to be transferred to an account designated by the Plaza Frontenac Borrower. Upon the first occurrence of a Cash Management Period, the Plaza Frontenac Borrower is required to establish a lender-controlled cash management account. During the continuance of a Cash Management Period, funds in the lockbox account are required to be transferred on each second business day to such lender-controlled cash management account and applied on each monthly payment date (i) to make deposits into the tax and insurance escrows as described above under “Escrows and Reserves”, (ii) to pay debt service on the Plaza Frontenac Whole Loan, (iii) if no event of default is continuing with respect to the Plaza Frontenac Whole Loan as to which the lender has taken an Enforcement Action (as defined below) to pay (1) the greater of (x) operating expenses and capital expenditures set forth in the approved annual budget or (y) the actual amount of such expenses for the related calendar month (but not in excess of 110% of the budgeted amount unless reasonably approved by the lender), and (2) extraordinary expenses approved by the lender, (iv) to fund the required deposits to the capital expenditures reserve and tenant improvements and leasing commissions reserve, as described above under “Escrows”, and (v) to pay any remainder (1) if no Cash Sweep Period (as defined below) is continuing, to the operating account of the Plaza Frontenac Borrower, and (2) otherwise, into an excess cash flow account to be held by the lender as additional security for the Plaza Frontenac Whole Loan during the continuance of the Cash Sweep Period (provided that amounts in such account may be used on subsequent monthly payment dates to make the payments set forth in clauses (i) through (iv) above). An “Enforcement Action” means any initiation by the lender of foreclosure proceedings or proceedings for the appointment of a receiver (or the initiation by the lender of any judicial action in respect of the promissory notes as a predicate to any such proceedings).
Notwithstanding the preceding requirements, Non-Core Income is not required to be deposited into the lockbox account. “Non-Core Income” means (i) certain de minimis amounts of rents received directly by the Plaza Frontenac Borrower from miscellaneous revenue items such as holiday photos and change retrieved from fountains (but does not include rent from Seasonal Leases) and (ii) certain rents generated pursuant to multi-property sponsorship and advertising programs which are directly attributable to the Plaza Frontenac Property.
A “Cash Sweep Period” means a period (i) commencing upon an event of default under the Plaza Frontenac Whole Loan and ending if such event of default is thereafter cured or waived or (ii) commencing upon a determination that the net operating income debt yield is less than 7.00% and ending upon the net operating income debt yield being equal to or in excess of 7.00% for two consecutive calendar quarters.
Property Management.The Plaza Frontenac Property is managed by an affiliate of the Plaza Frontenac Borrower.
Assumption.The Plaza Frontenac Borrower has an unlimited right to transfer the Plaza Frontenac Property provided that certain conditions are satisfied, including (i) no event of default under the Plaza Frontenac Whole Loan documents is continuing; (ii) the proposed transferee is controlled by a “permitted owner,” as defined in the Plaza Frontenac Whole Loan documents; (iii) a guarantor reasonably acceptable to the lender assumes the obligations of the Plaza Frontenac guarantor under the non-recourse carveout guaranty and any indemnity agreement given by the Plaza Frontenac guarantor in connection with the Plaza Frontenac Mortgage Loan; (iv) the transferee is a special purpose entity and its organizational documents are reasonably acceptable (as confirmed in writing) to each rating agency rating the Series 2018-BNK13 Certificates and (v) after the transfer, the Plaza Frontenac Property is managed by a qualifying manager, as defined below.
A “permitted owner” includes a qualified equityholder (as defined in the Plaza Frontenac Whole Loan documents, and which includes entities that meet certain net worth and/or assets tests and entities controlled and 50% owned by the foregoing entities), (ii) an affiliate of a qualified equityholder that is controlled and 50% owned by such qualified equityholder, (iii) any other person or entity reasonably approved by the lender, (iv) any person or entity as to which rating agency confirmation is delivered, (v) any of GGP, BAM, Brookfield Property Partners L.P., BPY, and/or one or more entities who succeeds, whether by merger, acquisition, or other legal means of succession, to all or substantially all of the business or assets of GGP Inc., BPY, or BAM, or any affiliate of any of the foregoing entities that is controlled and 50% owned by such entity, and (vi) a qualified institutional lender (as defined in the Plaza Frontenac Whole Loan documents, and which includes entities that meet certain net worth and/or assets tests and entities controlling, controlled by or under common control with the foregoing entities) or an affiliate thereof that controls and 50% owns such qualified institutional lender. A “qualifying manager” includes the current property manager, affiliates of GGP, BAM and BPY or their successors, General Growth Services, Inc. or any affiliate wholly owned by it, GGP Real Estate Holding I, Inc. or any affiliate wholly owned by it, or a reputable and experienced management organization that manages at least five shopping centers in the United States having an aggregate square footage of at least 1,500,000 square feet.
Mezzanine Loan and Preferred Equity. Not permitted.
Partial Release.The Plaza Frontenac Borrower has the right to obtain the release of the parcel (or substantially all of such parcel) leased to the Saks Fifth Avenue anchor (the “Saks Parcel”) upon transfer of such parcel to a Pre-Approved Saks Parcel Transferee (as defined below) or another non-borrower-affiliated transferee reasonably approved by the lender, upon prepayment of a release price equal to $6,500,000, together with, prior to the open period, a prepayment fee equal to the greater of 1.00% of the amount prepaid
THE INFORMATION IN THIS STRUCTURAL AND COLLATERAL TERM SHEET IS NOT COMPLETE AND MAY BE AMENDED PRIOR TO THE TIME OF SALE. THIS TERM SHEET IS NOT AN OFFER TO SELL THESE SECURITIES AND IT IS NOT A SOLICITATION OF AN OFFER TO BUY THESE SECURITIES IN ANY JURISDICTION WHERE THE OFFER OR SALE IS NOT PERMITTED.
117
PLAZA FRONTENAC
and a yield maintenance premium. The right to obtain such release is subject to certain conditions, including but not limited to: (i) at the time of the release, the improvements on the Saks Parcel are not then occupied and open for business with the public (unless (1) the proposed release is in conjunction with a sale to Saks Inc. or an affiliate, (2) the Saks lease is within six months of expiring pursuant to its terms, and (3) Saks Inc. has communicated to the borrower that the fee simple acquisition of the Saks Parcel is a condition to its continuing operation at the Plaza Frontenac Property); (ii) the transferee enters into a reciprocal easement agreement (“REA”) with the borrower on terms reasonably acceptable to the lender, including a prohibition on the owner of the Saks Parcel leasing or offering to lease any space at the Saks Parcel to tenants leasing space at the remaining Mortgaged Property and a requirement that substantially all of the Saks Parcel be operated by no more than a single user for a period of ten years after release, (iii) compliance with separate legal parcel and tax lots requirements, (iv) the Saks Parcel is not necessary for zoning, parking, other legal requirements, access, driveways or utilities (or if it is necessary, an REA is entered into which allows the use of the Saks Parcel for the necessary purpose), (v) if the release is expected to materially adversely affect lender’s rights under the title insurance policy (other than as to the Saks Parcel), updated title endorsements, (vi) compliance with leases, REAs, and similar agreements affecting the Mortgaged Property, and the release does not trigger any co-tenancy not already arising from vacancy of the Saks Parcel or other extrinsic circumstance, and (vii) compliance with REMIC related conditions. Saks Fifth Avenue represents approximately 35.8% of the NRA and 0.4% of the underwritten annual rent at the Plaza Frontenac Property and has a lease expiration on November 30, 2023.
“Pre-Approved Saks Parcel Transferee” means a national department store of one of the following classifications: (i) luxury, (ii) upscale, or (iii) middle-market, but in no event including any discount store or off-price retailer.
The Plaza Frontenac Borrower may also obtain the release of (x) one or more vacant, non-income producing and unimproved parcels, and (y) previously acquired Plaza Frontenac Expansion Parcels (as defined below), in connection with a transfer to a third party and the development of the Mortgaged Property, without prepayment or defeasance, upon satisfaction of the following conditions, among others: (i) the borrower delivers to the lender (a) evidence that (1) the release parcel is not necessary to the use or operation of, and may be readily separated without material diminution in value of, the Mortgaged Property, (2) compliance with separate legal parcel and tax lot requirements and other legal requirements, (3) the release parcel is not necessary for zoning, parking, other legal requirements, access, driveways or utilities (or if necessary, an REA is entered into which allows the use of the release parcel for the necessary purpose), (b) if the release would reasonably be expected to materially adversely affect lender’s rights under its title insurance policy as to the remaining property, updated title endorsements, and (c) any required approvals of third parties holding interests in the Plaza Frontenac Property, (ii) such release is in compliance with leases and other agreements affecting the Plaza Frontenac Property, (iii) except in the case of release of a previously acquired Expansion Parcel or if the rating agencies waive review or fail to respond within 30 days of a request, rating agency confirmation is obtained, and (iv) compliance with REMIC related conditions.
Addition of Property. The Plaza Frontenac Borrower also has the right to acquire one or more parcels of land, together with the improvements thereon, that constitute an integral part of, adjoin to, or are proximately located near, the related shopping center (each a “Plaza Frontenac Expansion Parcel”); provided that the following conditions, among others, are satisfied: (i) the Plaza Frontenac Borrower acquires fee simple or leasehold title to the Plaza Frontenac Expansion Parcel, (ii) the Plaza Frontenac Borrower delivers (a) an officer’s certificate regarding certain property-related representations as to the Plaza Frontenac Expansion Parcel (subject to title exceptions), (b) a mortgage, assignment of leases and UCC-1 financing statements (“Substitute Loan Documents”) with respect to the Plaza Frontenac Expansion Parcel, and a title insurance policy or endorsement insuring the lien of the Substitute Loan Documents as a first mortgage lien, subject to permitted encumbrances and standard exceptions, (c) evidence of authority to complete the acquisition and an enforceability opinion as to the Substitute Loan Documents (unless they amend existing loan documents), (d) an environmental report, and if the report shows any hazardous substance, the cost of remediation of which is reasonably likely to exceed $6,300,000 for such individual Plaza Frontenac Expansion Parcel (the “Threshold Amount”), either a deposit of 125% of the estimated remediation cost or an Additional Indemnity (as defined below), (e) if the Plaza Frontenac Expansion Parcel is improved, a property condition report indicating that it is in good condition and free of damage, or if any repairs are recommended which are estimated to exceed the Threshold Amount, either a deposit of 125% of the estimated repair cost or an Additional Indemnity, (f) evidence that the Plaza Frontenac Expansion Parcel constitutes or will constitute a separate tax lot or part of a tax lot that is part of the existing property, and (iii) compliance with REMIC related conditions.
An “Additional Indemnity” means an indemnity for the specified costs from the non-recourse carveout guarantor, an affiliate thereof, or a qualified transferee (as defined in the loan documents), each of which satisfies certain requirements in the loan documents.
Substitution of Property. The Plaza Frontenac Borrower may also obtain the release of one or more portions of the Plaza Frontenac Property (each an “Exchange Parcel”) in exchange for the acquisition and encumbrance by the loan documents of a substitute parcel (each a “Substitute Parcel”), provided that the following conditions, among others, are satisfied: (i) the Exchange Parcel is vacant, non-income producing and unimproved, (ii) the conditions set forth in clauses (i) through (iii) of the first sentence under “Addition of Property” above are satisfied with respect to the Substitute Parcel (provided that the separate tax parcel condition will also apply to the Exchange Parcel), (iii) the Exchange Parcel is conveyed to a person other than the Plaza Frontenac Borrower, (iv) the Substitute Parcel is at or adjacent to the related shopping center and reasonably equivalent in value to the Exchange Parcel, as established by a letter of value from an appraiser, (v) if the Substitute Parcel is ground leased, the ground lease and estoppel satisfies all of the then-current criteria of S&P for financeable ground leases and (vi) rating agency confirmation is obtained.
Ground Lease.None.
Terrorism Insurance.The Plaza Frontenac Borrower is required to obtain all risk and business income insurance against acts of terrorism to the extent such insurance is available in an amount determined by the lender (but in no event more than an amount equal to the sum of 100% of the full replacement cost and 18 months of business income insurance); provided that so long as the Terrorism Risk Insurance Act of 2002 (as extended and modified by the Terrorism Risk Insurance Program Reauthorization Act of 2015) (“TRIPRA”) is in effect (or any extension thereof or other federal government program with substantially similar protection),
THE INFORMATION IN THIS STRUCTURAL AND COLLATERAL TERM SHEET IS NOT COMPLETE AND MAY BE AMENDED PRIOR TO THE TIME OF SALE. THIS TERM SHEET IS NOT AN OFFER TO SELL THESE SECURITIES AND IT IS NOT A SOLICITATION OF AN OFFER TO BUY THESE SECURITIES IN ANY JURISDICTION WHERE THE OFFER OR SALE IS NOT PERMITTED.
118
PLAZA FRONTENAC
the lender is required to accept terrorism insurance which covers “covered acts” (as defined by such statute or other program), as full compliance with the foregoing, so long as such statute or other program covers both domestic and foreign acts of terrorism. If TRIPRA or such other program is not in effect, the Plaza Frontenac Borrower is not required to pay insurance premiums with respect to terrorism insurance in excess of the Terrorism Cap (defined below).
“Terrorism Cap” means two times the amount of the then-current annual insurance premiums payable by the Plaza Frontenac Borrower for the property and business income insurance policies required under the Plaza Frontenac Whole Loan documents (excluding the earthquake and terrorism components of such insurance premiums) on a stand-alone basis. See “Risk Factors— Risks Relating to the Mortgage Loans—Terrorism Insurance May Not Be Available for All Mortgaged Properties” in the Preliminary Prospectus.
THE INFORMATION IN THIS STRUCTURAL AND COLLATERAL TERM SHEET IS NOT COMPLETE AND MAY BE AMENDED PRIOR TO THE TIME OF SALE. THIS TERM SHEET IS NOT AN OFFER TO SELL THESE SECURITIES AND IT IS NOT A SOLICITATION OF AN OFFER TO BUY THESE SECURITIES IN ANY JURISDICTION WHERE THE OFFER OR SALE IS NOT PERMITTED.
119
(THIS PAGE INTENTIONALLY LEFT BLANK)
THE INFORMATION IN THIS STRUCTURAL AND COLLATERAL TERM SHEET IS NOT COMPLETE AND MAY BE AMENDED PRIOR TO THE TIME OF SALE. THIS TERM SHEET IS NOT AN OFFER TO SELL THESE SECURITIES AND IT IS NOT A SOLICITATION OF AN OFFER TO BUY THESE SECURITIES IN ANY JURISDICTION WHERE THE OFFER OR SALE IS NOT PERMITTED.
120
TOWN CENTER AVENTURA
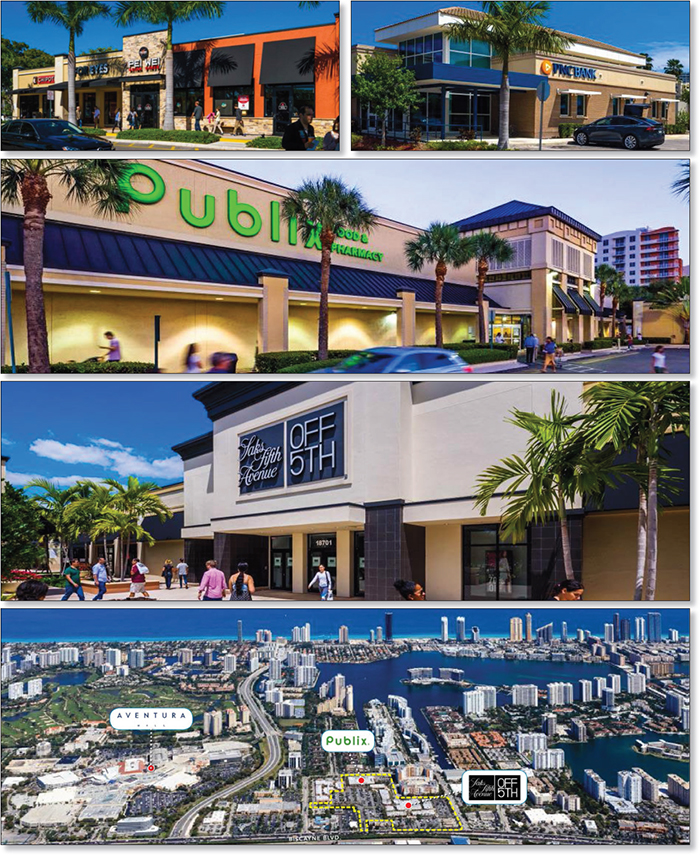
THE INFORMATION IN THIS STRUCTURAL AND COLLATERAL TERM SHEET IS NOT COMPLETE AND MAY BE AMENDED PRIOR TO THE TIME OF SALE. THIS TERM SHEET IS NOT AN OFFER TO SELL THESE SECURITIES AND IT IS NOT A SOLICITATION OF AN OFFER TO BUY THESE SECURITIES IN ANY JURISDICTION WHERE THE OFFER OR SALE IS NOT PERMITTED.
121
TOWN CENTER AVENTURA
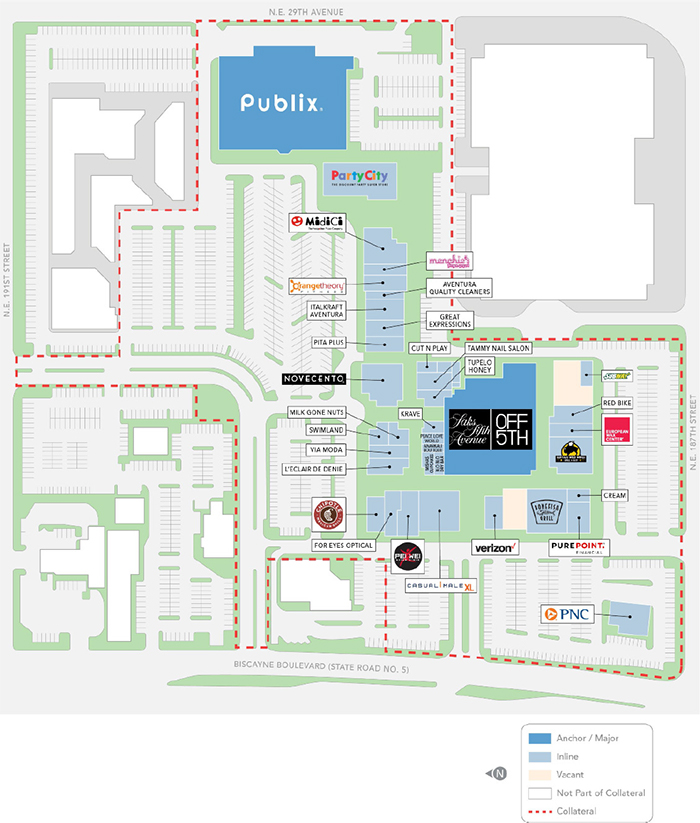
THE INFORMATION IN THIS STRUCTURAL AND COLLATERAL TERM SHEET IS NOT COMPLETE AND MAY BE AMENDED PRIOR TO THE TIME OF SALE. THIS TERM SHEET IS NOT AN OFFER TO SELL THESE SECURITIES AND IT IS NOT A SOLICITATION OF AN OFFER TO BUY THESE SECURITIES IN ANY JURISDICTION WHERE THE OFFER OR SALE IS NOT PERMITTED.
122
TOWN CENTER AVENTURA
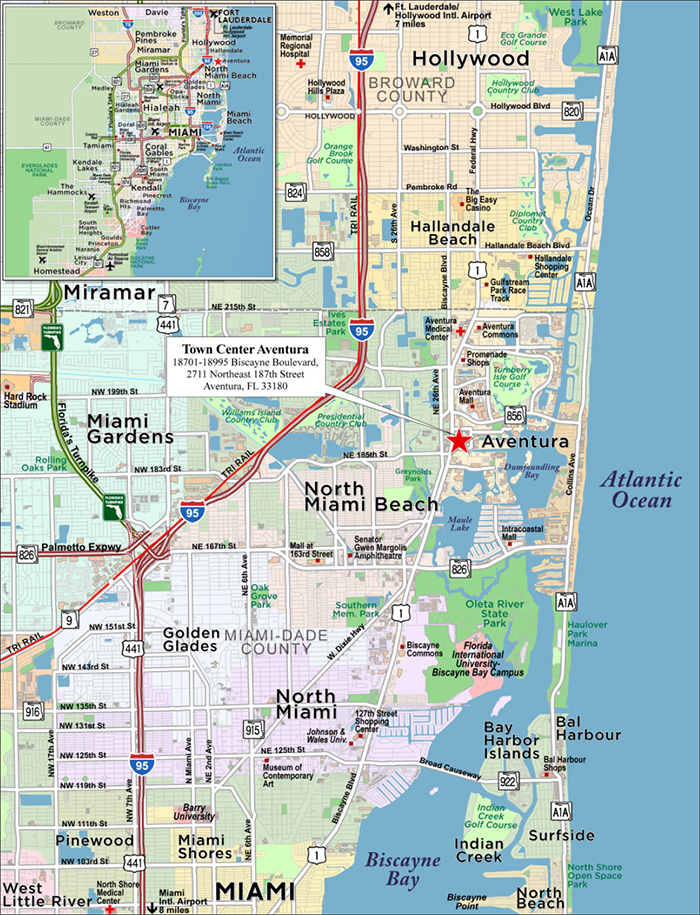
THE INFORMATION IN THIS STRUCTURAL AND COLLATERAL TERM SHEET IS NOT COMPLETE AND MAY BE AMENDED PRIOR TO THE TIME OF SALE. THIS TERM SHEET IS NOT AN OFFER TO SELL THESE SECURITIES AND IT IS NOT A SOLICITATION OF AN OFFER TO BUY THESE SECURITIES IN ANY JURISDICTION WHERE THE OFFER OR SALE IS NOT PERMITTED.
123
| No. 9 – Town Center Aventura | ||||||
| Loan Information | Property Information | |||||
| Mortgage Loan Seller: | Wells Fargo Bank, National Association | Single Asset/Portfolio: | Single Asset | |||
Credit Assessment (DBRS/Fitch/S&P): | NR/NR/NR | Property Type: | Retail | |||
| Original Principal Balance(1): | $40,000,000 | Specific Property Type: | Anchored | |||
| Cut-off Date Balance(1): | $40,000,000 | Location: | Aventura, FL | |||
| % of Initial Pool Balance: | 4.24% | Size: | 186,138 SF | |||
| Loan Purpose: | Refinance | Cut-off Date Balance Per SF(1): | $429.79 | |||
| Borrower Name: | Aventura Fashion Island, L.P. | Year Built/Renovated: | 1979/2013 | |||
| Borrower Sponsor: | Jacquelyn Soffer | Title Vesting: | Fee | |||
| Mortgage Rate: | 4.8900% | Property Manager: | Self-managed | |||
| Note Date: | July 2, 2018 | 4thMost Recent Occupancy (As of): | 98.1% (12/31/2014) | |||
| Anticipated Repayment Date: | NAP | 3rdMost Recent Occupancy (As of): | 96.6% (12/31/2015) | |||
| Maturity Date: | July 11, 2028 | 2ndMost Recent Occupancy (As of: | 94.6% (12/31/2016) | |||
| IO Period: | 120 months | Most Recent Occupancy (As of): | 97.9% (12/31/2017) | |||
| Loan Term (Original): | 120 months | Current Occupancy (As of): | 93.8% (5/16/2018) | |||
| Seasoning: | 1 month | |||||
| Amortization Term (Original): | NAP | Underwriting and Financial Information: | ||||
| Loan Amortization Type: | Interest-only, Balloon | |||||
| Interest Accrual Method: | Actual/360 | 4thMost Recent NOI (As of): | $5,220,611 (12/31/2015) | |||
| Call Protection: | L(25),D(88),O(7) | 3rdMost Recent NOI (As of)(3): | $5,394,064 (12/31/2016) | |||
| Lockbox Type: | Hard/Upfront Cash Management | 2ndMost Recent NOI (As of)(3): | $6,113,549 (12/31/2017) | |||
| Additional Debt(1): | Yes | Most Recent NOI (As of): | $6,087,656 (TTM 5/31/2018) | |||
| Additional Debt Type(1): | Pari Passu | |||||
| U/W Revenues: | $8,337,806 | |||||
| U/W Expenses: | $1,872,202 | |||||
| U/W NOI: | $6,465,604 | |||||
| U/W NCF: | $6,331,486 | |||||
| Escrows and Reserves(2): | U/W NOI DSCR(1): | 1.63x | ||||
| Type: | Initial | Monthly | Cap (If Any) | U/W NCF DSCR(1): | 1.60x | |
| Taxes | $451,415 | $56,427 | NAP | U/W NOI Debt Yield(1): | 8.1% | |
| Insurance | $0 | Springing | NAP | U/W NCF Debt Yield(1): | 7.9% | |
| Replacement Reserve | $0 | $3,102 | $74,456 | As-Is Appraised Value: | $133,400,000 | |
| TI/LC Reserve | $600,000 | $15,512 | $372,000 | As-Is Appraisal Valuation Date: | May 11, 2018 | |
| Tenant Specific TI/LC Reserve | $309,507 | $0 | NAP | Cut-off Date LTV Ratio(1): | 60.0% | |
| Rent Concession Reserve | $129,259 | $0 | NAP | LTV Ratio at Maturity or ARD(1): | 60.0% | |
| (1) | See “The Mortgage Loan” section. All statistical financial information related to balances per square foot, loan-to-value ratios, debt service coverage ratios and debt yields are based on the Town Center Aventura Whole Loan (as defined below). |
| (2) | See “Escrows” section. |
| (3) | See “Cash Flow Analysis” section. The increase in in NOI from 2016 to 2017 is partly due to four new tenants taking occupancy between December 2016 and October 2017, which account for 4.8% of net rentable area and 10.9% of underwritten base rent. |
The Mortgage Loan. The mortgage loan (the “Town Center Aventura Mortgage Loan”) is part of a whole loan (the “Town Center Aventura Whole Loan”) evidenced by twopari passu promissory notes, secured by the fee interest in a 186,138 square foot anchored retail center in Aventura, Florida (the “Town Center Aventura Property”). The Town Center Aventura Whole Loan was originated on July 2, 2018 by Wells Fargo Bank, National Association. The Town Center Aventura Whole Loan had an original principal balance of $80,000,000, has an outstanding principal balance as of the Cut-off Date of $80,000,000 and accrues interest at an interest rate of 4.8900%per annum. The Town Center Aventura Whole Loan had an initial term of 120 months, has a remaining term of 119 months as of the Cut-off Date and requires payments of interest only through the loan term. The Town Center Aventura Whole Loan matures on July 11, 2028.
The Town Center Aventura Mortgage Loan, evidenced by the controlling Note A-1, will be contributed to the BANK 2018-BNK13 securitization trust, had an original principal balance of $40,000,000 and has an outstanding principal balance as of the Cut-off Date of $40,000,000. The non-controlling Note A-2 had an original principal balance of $40,000,000, is currently held by Wells Fargo Bank National Association and is expected to be contributed to a future securitization trust. The mortgage loan evidenced by Note A-2 is referred to herein as the “Town Center Aventura Companion Loan”. The lender provides no assurances that the non-securitizedpari passu note will not be split further. See “Description of the Mortgage Pool—The Whole Loans—The Serviced Pari Passu Whole Loans” in the Preliminary Prospectus.
THE INFORMATION IN THIS STRUCTURAL AND COLLATERAL TERM SHEET IS NOT COMPLETE AND MAY BE AMENDED PRIOR TO THE TIME OF SALE. THIS TERM SHEET IS NOT AN OFFER TO SELL THESE SECURITIES AND IT IS NOT A SOLICITATION OF AN OFFER TO BUY THESE SECURITIES IN ANY JURISDICTION WHERE THE OFFER OR SALE IS NOT PERMITTED.
124
TOWN CENTER AVENTURA
Note Summary
| Notes | Original Balance | Note Holder | Controlling Interest |
| A-1 | $40,000,000 | BANK 2018-BNK13 | Yes |
| A-2 | $40,000,000 | Wells Fargo Bank, National Association | No |
| Total | $80,000,000 |
Following the lockout period, the borrower has the right to defease the Town Center Aventura Whole Loan in whole, but not in part, on any date prior to January 11, 2028. In addition, the Town Center Aventura Whole Loan is prepayable without penalty on or after January 11, 2028. The lockout period will expire on the earlier to occur of (i) two years after the closing date of the securitization that includes the last note to be securitized and (ii) August 11, 2021. The assumed lockout period of 25 payments is based on the closing date of this transaction in August 2018.
Sources and Uses
| Sources | Uses | |||||||
| Original whole loan amount | $80,000,000 | 87.7% | Loan payoff (senior loan) | $60,949,379 | 66.8% | |||
| Borrower sponsor’s new cash contribution | 11,264,808 | 12.3 | Loan payoff (mezzanine loan) | 28,511,470 | 31.2 | |||
| Upfront reserves | 1,490,181 | 1.6 | ||||||
| Closing costs | 313,778 | 0.3 | ||||||
| Total Sources | $91,264,808 | 100.0% | Total Uses | $91,264,808 | 100.0% | |||
The Property. The Town Center Aventura Property is a 10-building grocery anchored retail center totaling 186,138 square feet of rentable area and located in Aventura, Florida. The Town Center Aventura Property is situated on Biscayne Boulevard, approximately 0.5 miles south of Aventura Mall. Situated on a 19.9-acre parcel, the Town Center Aventura Property was built in 1979 and most recently renovated in 2013. The 2013 renovations totaled approximately $11.0 million and included the creation of a second entrance to the Saks Fifth Avenue Off 5th(“Saks Off 5th”) tenant space as well as landscaping projects (including construction of a gazebo), painting and sealing the parking lot. The Town Center Aventura Property contains approximately 1,025 surface parking spaces, equating to a parking ratio of 5.5 spaces per 1,000 square feet of rentable area. As of May 16, 2018, the Town Center Aventura Property was 93.8% occupied by 35 national and local retail and restaurant tenants and has averaged 94.6% occupancy since 2006.
The Town Center Aventura Property is anchored by Publix Supermarket (“Publix”; 6.2% of underwritten base rent) and Saks Off 5th (13.5% of underwritten base rent). Publix has been a tenant at the Town Center Aventura Property since 1993 and executed a 5-year lease renewal in February 2018. Publix has a current base rental rate of $8.00 per square foot (approximately 46.7% below the appraiser’s concluded market rent of $15.00 per square foot for the Publix space) and has two, 5-year extension options remaining, also with fixed base rental rates of $8.00 per square foot. Publix reported sales of approximately $1,265 per square foot for the trailing 12-month period ending December 2017 (1.7% occupancy cost), which represents an increase of approximately 18.4% over 2016 sales and 26.7% over 2015. Saks Off 5th has been a tenant at the Town Center Aventura Property since 2013 and reported sales of approximately $366 per square foot for the trailing 12-month period ending December 2017 (7.4% occupancy cost), which represents an increase of approximately 2.9% over 2016 sales. Additional tenants at the Town Center Aventura Property include PNC Bank, Casual Male Big & Tall, Bonefish Grill, Purepoint Financial, Buffalo Wild Wings and Party City.
THE INFORMATION IN THIS STRUCTURAL AND COLLATERAL TERM SHEET IS NOT COMPLETE AND MAY BE AMENDED PRIOR TO THE TIME OF SALE. THIS TERM SHEET IS NOT AN OFFER TO SELL THESE SECURITIES AND IT IS NOT A SOLICITATION OF AN OFFER TO BUY THESE SECURITIES IN ANY JURISDICTION WHERE THE OFFER OR SALE IS NOT PERMITTED.
125
TOWN CENTER AVENTURA
The following table presents certain information relating to the tenancy at the Town Center Aventura Property:
Major Tenants
| Tenant Name | Credit Rating (Fitch/Moody’s/ S&P)(1) | Tenant NRSF | % of NRSF | Annual U/W Base Rent PSF(2) | Annual U/W Base Rent(2) | % of Total | Sales | Occupancy Cost(3) | Lease Expiration Date |
| Anchor Tenants | |||||||||
| Saks Off 5th | NR/B3/B | 34,627 | 18.6% | $24.02 | $831,908 | 13.5% | $366 | 7.4% | 8/31/2023(4) |
| Publix | NR/NR/NR | 47,813 | 25.7% | $8.00 | $382,504 | 6.2% | $1,265 | 1.7% | 11/30/2023(5) |
| Total Anchor Tenants | 82,440 | 44.3% | $14.73 | $1,214,412 | 19.6% | ||||
| Major Tenants | |||||||||
| PNC Bank | A+/A3/A- | 4,171 | 2.2% | $120.24 | $501,511 | 8.1% | NAV | NAV | 4/30/2032(6) |
| Casual Male Big & Tall | NR/NR/NR | 6,500 | 3.5% | $67.53 | $438,948 | 7.1% | $247 | 31.3% | 2/28/2019 |
| Bonefish Grill | NR/Ba2/BB | 6,454 | 3.5% | $59.92 | $386,724 | 6.3% | $529 | 14.0% | 1/31/2025(7) |
| Purepoint Financial | NR/NR/NR | 2,850 | 1.5% | $132.61 | $377,946 | 6.1% | NAV | NAV | 12/31/2021 |
| Buffalo Wild Wings | NR/Ba2/NR | 5,592 | 3.0% | $61.76 | $345,362 | 5.6% | $394 | 16.5% | 12/31/2023(8) |
| Party City | NR/B2/B- | 10,206 | 5.5% | $33.00 | $336,798 | 5.4% | $260 | 17.5% | 1/31/2023(9) |
| Major Tenants Total | 35,773 | 19.2% | $66.73 | $2,387,288 | 38.6% | ||||
| Non-Major Tenants | 56,459 | 30.3% | $45.69 | $2,579,826 | 41.7% | ||||
| Occupied Collateral Total | 174,672 | 93.8% | $35.39 | $6,181,526 | 100.0% | ||||
| Vacant Space | 11,466 | 6.2% | |||||||
| Collateral Total | 186,138 | 100.0% | |||||||
| (1) | Certain ratings are those of the parent company whether or not the parent company guarantees the lease. |
| (2) | Annual U/W Base Rent PSF and U/W Base Rent include contractual rent steps totaling $195,883 through June 2019. |
| (3) | Sales PSF and Occupancy Cost shown are as of the trailing 12-month period ending December 31, 2017. |
| (4) | Saks Off 5th has two, five-year lease extension options with 12 months’ notice at $26.43 per square foot for the first extension option. |
| (5) | Publix has two, five-year lease extension options with 6 months’ notice at a fixed rental rate of $8.00 per square foot. |
| (6) | PNC Bank has two, five-year lease extension options with 9 months’ notice. |
| (7) | Bonefish Grill has two, five-year lease extension options with 6 months’ notice. |
| (8) | Buffalo Wild Wings has two, five-year lease extension options with 6 months’ notice. |
| (9) | Party City has two, five-year lease extension options with 6 months’ notice. |
The following table presents certain information relating to the historical sales and occupancy costs at the Town Center Aventura Property:
Historical Tenant Sales (PSF)
| 2015 | 2016 | 2017 | 2017 Occupancy Cost | |
| Anchor Tenants | ||||
| Saks Off 5th | $365 | $360 | $366 | 7.4% |
| Publix | $998 | $1,069 | $1,265 | 1.7% |
| Comparable In-Line Tenants(1) | ||||
| In-Line Sales PSF | $398 | $421 | $411 | |
| Occupancy Cost(2) | 17.0% | 15.7% | 16.4% |
| (1) | Comparable in-line sales are based on 22 tenants totalling 70,606 square feet (68.1% of total in-line net rentable area) that have been in occupancy since 2015. |
| (2) | Occupancy Costs shown are based on underwritten base rent and reimbursements. |
THE INFORMATION IN THIS STRUCTURAL AND COLLATERAL TERM SHEET IS NOT COMPLETE AND MAY BE AMENDED PRIOR TO THE TIME OF SALE. THIS TERM SHEET IS NOT AN OFFER TO SELL THESE SECURITIES AND IT IS NOT A SOLICITATION OF AN OFFER TO BUY THESE SECURITIES IN ANY JURISDICTION WHERE THE OFFER OR SALE IS NOT PERMITTED.
126
TOWN CENTER AVENTURA
The following table presents certain information relating to the lease rollover schedule at the Town Center Aventura Property:
Lease Expiration Schedule(1)(2)
| Year Ending December 31, | No. of Leases Expiring | Expiring NRSF | % of Total NRSF | Cumulative Expiring NRSF | Cumulative % of Total NRSF | Annual U/W Base Rent | % of Total Annual U/W Base Rent | Annual U/W Base Rent PSF(3) |
| MTM | 0 | 0 | 0.0% | 0 | 0.0% | $0 | 0.0% | $0.00 |
| 2018 | 1 | 1,431 | 0.8% | 1,431 | 0.8% | $75,333 | 1.2% | $52.64 |
| 2019 | 8 | 18,165 | 9.8% | 19,596 | 10.5% | $934,028 | 15.1% | $51.42 |
| 2020 | 4 | 11,929 | 6.4% | 31,525 | 16.9% | $402,356 | 6.5% | $33.73 |
| 2021 | 5 | 10,153 | 5.5% | 41,678 | 22.4% | $757,663 | 12.3% | $74.62 |
| 2022 | 3 | 5,669 | 3.0% | 47,347 | 25.4% | $230,199 | 3.7% | $40.61 |
| 2023 | 5 | 99,329 | 53.4% | 146,676 | 78.8% | $1,953,486 | 31.6% | $19.67 |
| 2024 | 1 | 2,006 | 1.1% | 148,682 | 79.9% | $104,648 | 1.7% | $52.17 |
| 2025 | 3 | 10,949 | 5.9% | 159,631 | 85.8% | $719,224 | 11.6% | $65.69 |
| 2026 | 1 | 871 | 0.5% | 160,502 | 86.2% | $52,671 | 0.9% | $60.47 |
| 2027 | 2 | 4,746 | 2.5% | 165,248 | 88.8% | $224,529 | 3.6% | $47.31 |
| 2028 | 1 | 5,253 | 2.8% | 170,501 | 91.6% | $225,879 | 3.7% | $43.00 |
| Thereafter | 1 | 4,171 | 2.2% | 174,672 | 93.8% | $501,511 | 8.1% | $120.24 |
| Vacant | 0 | 11,466 | 6.2% | 186,138 | 100.0% | $0 | 0.0% | $0.00 |
| Total/Wtd. Avg. | 35 | 186,138 | 100.0% | $6,181,526 | 100.0% | $35.39 |
| (1) | Information obtained from the underwritten rent roll. |
| (2) | Certain tenants may have lease termination or contraction options that are exercisable prior to the originally stated expiration date of the subject lease and that are not considered in the Lease Expiration Schedule. |
| (3) | Weighted Average Annual U/W Base Rent PSF excludes vacant space. |
The following table presents historical occupancy percentages at the Town Center Aventura Property:
Historical Occupancy(1)
12/31/2014(2) | 12/31/2015(2) | 12/31/2016(2) | 12/31/2017(2) | 5/16/2018(3) |
| 98.1% | 96.6% | 94.6% | 97.9% | 93.8% |
| (1) | The Town Center Aventura Property has averaged 94.6% occupancy since 2006. |
| (2) | Information obtained from the borrower. |
| (3) | Information obtained from the underwritten rent roll. |
Operating History and Underwritten Net Cash Flow. The following table presents certain information relating to the historical operating performance and underwritten net cash flow at the Town Center Aventura Property:
Cash Flow Analysis
| 2015 | 2016(1) | 2017(1) | TTM 5/31/2018 | U/W | % of U/W Effective Gross Income | U/W $ per SF | |
| Base Rent | $5,368,555 | $5,283,200 | $5,959,089 | $5,836,776 | $6,181,526(2) | 74.1% | $33.21 |
| Grossed Up Vacant Space | 0 | 0 | 0 | 0 | 698,477 | 8.4 | 3.75 |
| Percentage Rent | 230,959 | 205,809 | 243,742 | 241,094 | 377,178 | 4.5 | 2.03 |
| Total Recoveries | 1,536,960 | 1,626,163 | 1,696,443 | 1,810,436 | 1,752,194 | 21.0 | 9.41 |
| Other Income(3) | 7,444 | 26,208 | 26,908 | 39,085 | 26,908 | 0.3 | 0.14 |
| Less Vacancy & Credit Loss | 0 | 0 | 0 | 0 | (698,477)(4) | (8.4)(4) | (3.75) |
| Effective Gross Income | $7,143,919 | $7,141,380 | $7,926,182 | $7,927,391 | $8,337,806 | 100.0% | $44.79 |
| Total Operating Expenses | 1,923,308 | 1,747,316 | 1,812,633 | 1,839,735 | 1,872,202 | 22.5 | 10.06 |
| Net Operating Income | $5,220,611 | $5,394,064 | $6,113,549 | $6,087,656 | $6,465,604 | 77.5% | $34.74 |
| Capital Expenditures | 0 | 0 | 0 | 0 | 37,228 | 0.4 | 0.20 |
| TI/LC | 0 | 0 | 0 | 0 | 96,890 | 1.2 | 0.52 |
| Net Cash Flow | $5,220,611 | $5,394,064 | $6,113,549 | $6,087,656 | $6,331,486 | 75.9% | $34.02 |
| NOI DSCR(5) | 1.32x | 1.36x | 1.54x | 1.53x | 1.63x | ||
| NCF DSCR(5) | 1.32x | 1.36x | 1.54x | 1.53x | 1.60x | ||
| NOI DY(5) | 6.5% | 6.7% | 7.6% | 7.6% | 8.1% | ||
| NCF DY(5) | 6.5% | 6.7% | 7.6% | 7.6% | 7.9% |
| (1) | The increase in Base Rent and Net Operating Income from 2016 to 2017 is partly due to four new tenants taking occupancy between December 2016 and October 2017, totaling $674,963 in underwritten base rent: Purepoint Financial, Red Bike, Great Expressions, and Milk Gone Nuts. |
| (2) | U/W Base Rentincludes contractual rent steps totaling $195,883 through June 2019. |
| (3) | Other Income includes late charges and other miscellaneous non-rental income. |
| (4) | The underwritten economic vacancy is 10.2%. The Town Center Aventura Property was 93.8% physically occupied as of May 16, 2018. |
| (5) | Debt service coverage ratios and debt yields are based on the Town Center Aventura Whole Loan. |
Appraisal.As of the appraisal valuation date of May 11, 2018, the Town Center Aventura Property had an “as-is” appraised value of $133,400,000. The appraisal also concluded to a land value of $90,300,000.
THE INFORMATION IN THIS STRUCTURAL AND COLLATERAL TERM SHEET IS NOT COMPLETE AND MAY BE AMENDED PRIOR TO THE TIME OF SALE. THIS TERM SHEET IS NOT AN OFFER TO SELL THESE SECURITIES AND IT IS NOT A SOLICITATION OF AN OFFER TO BUY THESE SECURITIES IN ANY JURISDICTION WHERE THE OFFER OR SALE IS NOT PERMITTED.
127
TOWN CENTER AVENTURA
Environmental Matters.According to the Phase I environmental report dated October 6, 2017, there was no evidence of any recognized environmental conditions at the Town Center Aventura Property.
Market Overview and Competition.The Town Center Aventura Property is located in Aventura, Florida, along Biscayne Boulevard, approximately 13.7 miles north of the Miami central business district, 17.2 miles northeast of the Miami International Airport, and 0.5 miles south of Aventura Mall. Aventura Mall, which is owned by Simon Property Group and Turnberry (see “Borrower Sponsor” section), contains approximately 2.0 million square feet of rentable area, is anchored by Bloomingdales, Macy’s, Nordstrom, JCPenney, and Sears, and is one of the highest grossing shopping centers in the United States. Biscayne Boulevard is a primary commercial corridor with a daily traffic count of approximately 74,000 vehicles, and the immediate surrounding area serves as a regional shopping destination.
According to the appraisal, the Town Center Aventura Property is located in an affluent suburban neighborhood that is characterized by luxury high-rise condominiums and estate homes. According to the appraisal, the neighborhood benefits from its close proximity to major business districts, employments centers and regional transportation links. Access to the surrounding area is provided via Interstate Highway 95, Biscayne Boulevard (US Highway No. 1), the William Lehman Causeway (State Road 856/NE 192nd Street) and Ocean Boulevard (State Road AIA/Collins Avenue). Interstate Highway 95 is the major north/south expressway providing direct access to the southeastern and northeastern areas of Miami-Dade County, as well as Broward County to the north. According to the appraisal, the estimated 2017 population within a three- and five-mile radius of the Town Center Aventura Property was 181,453 and 414,798, respectively; while the estimated average household income within the same radii was $74,098 and $68,108, respectively.
According to a third-party market report, the Town Center Aventura Property is situated within the Aventura submarket of the Miami-Dade County retail market. As of the first quarter of 2018, the submarket reported a total inventory of approximately 6.6 million square feet of retail space with a 1.1% vacancy rate. The appraiser identified five primary competitive properties within 2.7 miles of the Town Center Aventura Property totaling approximately 587,423 square feet, which reported an average occupancy rate of approximately 93.8%. The appraiser concluded to the following market rent estimates for the Town Center Aventura Property: $15.00 per square foot for the Publix space; $21.85 per square foot for non-Publix anchor space; $26.00 per square foot for junior anchor space; $47.00 per square foot for Saks/courtyard retail; $40.00 per square foot for in-line; $69.00 per square foot for Biscayne retail; $102.00 per square foot for bank branch space; and $48.50 per square foot for restaurant space, all on a triple net basis. The appraiser concluded that current in-place rents at the Town Center Aventura Property are, on average, approximately 6.7% below market rent.
The table below presents certain information relating to comparable properties to the Town Center Aventura Property identified by the appraiser:
Competitive Set(1)
Town Center Aventura (Subject) | Promenade Shoppes | Aventura Shopping Center | Aventura Square | Biscayne Harbor Shops | The Arena Shops | |
| Location | Aventura, FL | Aventura, FL | Aventura, FL | Aventura, FL | Aventura, FL | North Miami Beach, FL |
| Distance from Subject | -- | 1.4 miles | 1.2 miles | 0.3 miles | 0.5 miles | 2.7 miles |
| Property Type | Anchored | Anchored | Anchored | Anchored | Unanchored | Anchored |
| Year Built/Renovated | 1979/2013 | 1988/1993 | 2017/NAP | 1998/NAP | 1981/NAP | 1993/2006 |
| Anchors | Saks Fifth Avenue Off 5th, Publix | Nordstrom Rack, Marshall’s/Home Goods, Winn Dixie, Michael’s | Publix, CVS | Bed Bath & Beyond, DSW, Jewelry Exchange, Old Navy | NAP | Total Wine & More |
| Total GLA | 186,138 SF | 291,281 SF | 95,190 SF | 113,450 SF | 49,252 SF | 38,250 SF |
| Quoted Rental Rate | $35.39 PSF(2) | $45.00 - $60.00 PSF | $60.00 - $70.00 PSF | $75.00 - $121.00 PSF | $60.00 - $70.00 PSF | $40.00 - $50.00 PSF |
| Lease Type | NNN | NNN | NNN | NNN | NNN | NNN |
| Total Occupancy | 93.8%(3) | 99.0% | 99.0% | 74.0%(4) | 97.0% | 100.0% |
| (1) | Information obtained from the appraisal. |
| (2) | Represents the average U/W Base Rent PSF. |
| (3) | Information obtained from the underwritten rent roll. |
| (4) | According to the appraisal, the Aventura Square property has one vacant 29,800 square foot box and is otherwise fully occupied. The vacant box was previously occupied by Toys R Us and Babies R Us until 2018. |
The Borrower.The borrower is Aventura Fashion Island, L.P.; a Florida limited partnership and single-purpose entity required to have at least two independent directors. Legal counsel to the borrower delivered a non-consolidation opinion in connection with the origination of the Town Center Aventura Whole Loan. Jacquelyn Soffer is the guarantor of certain nonrecourse carveouts under the Town Center Aventura Whole Loan.
The Borrower Sponsor.The borrower sponsor is Jacquelyn Soffer, the chairman and chief executive officer of Turnberry, a real estate development and hospitality group founded more than 50 years ago in South Florida. Turnberry specializes in large-scale lifestyle developments within the hospitality, retail, residential, and commercial sectors. Ms. Soffer helped transform Aventura Mall (approximately 0.7 miles from the Town Center Aventura Property) from a classic regional shopping mall into a lifestyle destination with retailers including Louis Vuitton, Givenchy, Cartier, Gucci and Fendi, among others. In addition to her day-to-day responsibilities for Turnberry, Ms. Soffer serves as an Independent Director on the Board of Washington Prime Group, a retail real estate investment
THE INFORMATION IN THIS STRUCTURAL AND COLLATERAL TERM SHEET IS NOT COMPLETE AND MAY BE AMENDED PRIOR TO THE TIME OF SALE. THIS TERM SHEET IS NOT AN OFFER TO SELL THESE SECURITIES AND IT IS NOT A SOLICITATION OF AN OFFER TO BUY THESE SECURITIES IN ANY JURISDICTION WHERE THE OFFER OR SALE IS NOT PERMITTED.
128
TOWN CENTER AVENTURA
trust with a portfolio of approximately 120 enclosed regional malls and open-air lifestyle community centers. Ms. Soffer is also a member of the Dean’s Leadership Council at the Harvard University Graduate School of Design; a member of the University of Miami Board of Trustees; and the Board of Trustees for the Institute of Contemporary Art, Miami. Ms. Soffer has been involved in various litigation and foreclosures. Ms. Soffer was involved in various litigation matters involving claims resulting from the Fontainebleau Las Vegas project filing for Chapter 11 bankruptcy protection in mid-2009, as well as other matters. The majority of lawsuits related to the Fontainebleau Las Vegas project were settled in 2013, with a global settlement reached in 2014 and fully documented and dismissed in 2015. In addition, Ms. Soffer was involved the foreclosure of a shopping center in 2011. See “Description of the Mortgage Pool─Loan Purpose; Default History, Bankruptcy Issues and Other Proceedings” in the Preliminary Prospectus.
Escrows.The Town Center Aventura Whole Loan documents require upfront reserves of $451,415 for real estate taxes, $600,000 for general tenant improvements and leasing commissions (“TI/LCs”), $309,507 for tenant specific TI/LCs related to MidiCi ($115,566), Great Expressions ($87,200), Purepoint Financial ($56,741), and Milk Gone Nuts ($50,000) and $129,259 for outstanding rent concessions related to Verizon. The Town Center Aventura Whole Loan documents also provide for ongoing monthly reserves of $56,427 for real estate taxes, $3,102 for replacement reserves (subject to a cap of $74,456) and $15,512 for general TI/LCs (subject to a cap of $372,000).
The Town Center Aventura Whole Loan documents do not require ongoing monthly escrows for insurance premiums so long as (i) no event of default has occurred and is continuing; (ii) the borrower provides the lender with evidence that the Town Center Aventura Property’s insurance coverage is included in a blanket policy and such policy in in full force and effect; (iii) the borrower pays all applicable insurance premiums and provides the lender with evidence of renewals at least 15 days prior to the expiration date of such policy.
Lockbox and Cash Management.The Town Center Aventura Whole Loan requires a hard lockbox with upfront cash management, and that the borrower directs the tenants to pay their rent directly into such lockbox account. The loan documents also require that all rents received by the borrower or the property manager be deposited into the lockbox account within one business day of receipt. All proceeds in the lockbox account are required to be swept each business day into a lender-controlled cash management account. Prior to the occurrence of a Cash Trap Event Period (as defined below), all excess funds are required to be distributed to the borrower. During a Cash Trap Event Period, all excess funds are required to be held by the lender as additional collateral for the Town Center Aventura Whole Loan.
A “Cash Trap Event Period” will commence upon the earlier of the following:
| (i) | the occurrence of an event of default under the Town Center Aventura Whole Loan; |
| (ii) | the occurrence of a Major Tenant Event Period (as defined below); or |
| (iii) | the debt service coverage ratio falling below 1.25x at the end of any calendar quarter; provided, however, that the borrower has the option to deposit with lender a letter of credit or cash collateral in an amount, which, if applied to the outstanding principal balance of the Town Center Aventura Whole Loan, would satisfy the foregoing ratio. |
A Cash Trap Event Period will end upon the occurrence of the following:
| ● | with regard to clause (i), the cure of such event of default; |
| ● | with regard to clause (ii), a Major Tenant Cure Event (as defined below); or |
| ● | with regard to clause (iii), the debt service coverage ratio being equal to 1.30x or greater for two consecutive calendar quarters. |
A “Major Tenant Event Period” will commence upon the earlier of the following (the term “Major Tenant” includes Publix, Saks Off 5th, and any replacement tenant that leases all, or substantially all, of the spaces currently occupied by Publix or Saks Off 5th):
| (i) | Any Major Tenant goes dark, vacates, fails to occupy its space, or gives notice of its intent to cancel or terminate its lease; |
| (ii) | Any Major Tenant becomes insolvent or files for bankruptcy; or |
| (iii) | the earlier of (a) six months prior to the scheduled expiration date of any Major Tenant lease or (b) the date on which notice of renewal is required to be provided pursuant to the tenant lease (based on current leases, Publix and Saks Off 5th have renewal notice periods of six months and 12 months, respectively). |
A “Major Tenant Cure Event” will occur upon the following:
| ● | with regard to clause (i), (a) a Major Tenant Re-Leasing Event (as defined below), (b) the applicable Major Tenant has resumed its normal business operations in its space and is open during customary hours for two consecutive calendar quarters, or (c) the borrower having deposited with lender the Major Tenant Event Period Cure Deposit (as defined below); |
| ● | with regard to clause (ii), (a) a Major Tenant Re-Leasing Event, (b) the bankruptcy or insolvency proceedings having terminated and the lease having been affirmed or assigned in a manner satisfactory to the lender, or (c) the borrower having deposited with lender the Major Tenant Event Period Cure Deposit; |
| ● | with regard to clause (iii), (a) a Major Tenant Re-Leasing Event, (b) lender receives satisfactory evidence the applicable Major Tenant has renewed its lease pursuant to terms and conditions satisfactory to lender, or (c) the borrower having deposited with lender the Major Tenant Event Period Cure Deposit. |
A “Major Tenant Re-Leasing Event” will occur upon the lender receiving satisfactory evidence that (a) the applicable Major Tenant space has been leased to one or more replacement tenants reasonably acceptable to lender, (b) such replacement tenant has taken occupancy, is open for business and is paying rent, and (c) that all tenant improvement costs and leasing commissions provided in each such replacement tenant lease have been paid or have been reserved.
The “Major Tenant Event Period Cure Deposit” is an amount equal to $800,000 (in the form of cash or a letter of credit) with respect to each affected Major Tenant lease.
THE INFORMATION IN THIS STRUCTURAL AND COLLATERAL TERM SHEET IS NOT COMPLETE AND MAY BE AMENDED PRIOR TO THE TIME OF SALE. THIS TERM SHEET IS NOT AN OFFER TO SELL THESE SECURITIES AND IT IS NOT A SOLICITATION OF AN OFFER TO BUY THESE SECURITIES IN ANY JURISDICTION WHERE THE OFFER OR SALE IS NOT PERMITTED.
129
TOWN CENTER AVENTURA
Property Management.The Town Center Aventura Property is managed by an affiliate of the borrower.
Assumption.The borrower has the right to transfer the Town Center Aventura Property provided that certain conditions are satisfied, including (i) no event of default has occurred and is continuing; (ii) the lender’s reasonable determination that the proposed transferee and guarantor satisfy the lender’s credit review and underwriting standards, taking into consideration transferee experience, financial strength and general business standing; and (iii) if requested by the lender, rating agency confirmation from DBRS, Fitch, and S&P that the transfer will not result in a downgrade, withdrawal or qualification of the respective ratings assigned to the Series 2018-BNK13 Certificates and similar confirmations from each rating agency rating any securities backed by the Town Center Aventura Companion Loan with respect to the ratings of such securities.
Partial Release.Not permitted.
Real Estate Substitution.Not permitted.
Subordinate and Mezzanine Indebtedness.Not permitted.
Ground Lease. None.
Terrorism Insurance.The loan documents require that the “all risk” insurance policies required to be maintained by the borrower provide coverage for terrorism in an amount equal to the full replacement cost of the Town Center Aventura Property. The loan documents also require business interruption insurance covering no less than the 18-month period following the occurrence of a casualty event, together with a six-month extended period of indemnity.
Windstorm Insurance. The Town Center Aventura Whole Loan documents require windstorm and flood insurance covering the full replacement cost of the Town Center Aventura Property during the loan term. At the time of loan closing, Town Center Aventura Property had windstorm insurance coverage and flood insurance in the maximum limit available under the National Flood Insurance Program together with excess coverage.
THE INFORMATION IN THIS STRUCTURAL AND COLLATERAL TERM SHEET IS NOT COMPLETE AND MAY BE AMENDED PRIOR TO THE TIME OF SALE. THIS TERM SHEET IS NOT AN OFFER TO SELL THESE SECURITIES AND IT IS NOT A SOLICITATION OF AN OFFER TO BUY THESE SECURITIES IN ANY JURISDICTION WHERE THE OFFER OR SALE IS NOT PERMITTED.
130
(THIS PAGE INTENTIONALLY LEFT BLANK)
THE INFORMATION IN THIS STRUCTURAL AND COLLATERAL TERM SHEET IS NOT COMPLETE AND MAY BE AMENDED PRIOR TO THE TIME OF SALE. THIS TERM SHEET IS NOT AN OFFER TO SELL THESE SECURITIES AND IT IS NOT A SOLICITATION OF AN OFFER TO BUY THESE SECURITIES IN ANY JURISDICTION WHERE THE OFFER OR SALE IS NOT PERMITTED.
131
FLORIDA HOTEL & CONFERENCE CENTER

THE INFORMATION IN THIS STRUCTURAL AND COLLATERAL TERM SHEET IS NOT COMPLETE AND MAY BE AMENDED PRIOR TO THE TIME OF SALE. THIS TERM SHEET IS NOT AN OFFER TO SELL THESE SECURITIES AND IT IS NOT A SOLICITATION OF AN OFFER TO BUY THESE SECURITIES IN ANY JURISDICTION WHERE THE OFFER OR SALE IS NOT PERMITTED.
132
FLORIDA HOTEL & CONFERENCE CENTER
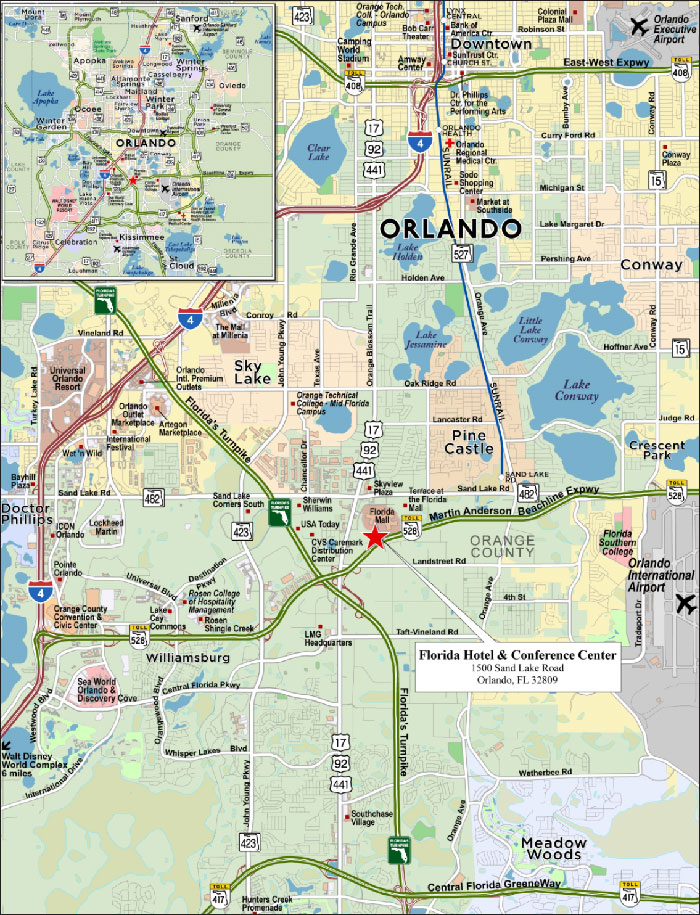
THE INFORMATION IN THIS STRUCTURAL AND COLLATERAL TERM SHEET IS NOT COMPLETE AND MAY BE AMENDED PRIOR TO THE TIME OF SALE. THIS TERM SHEET IS NOT AN OFFER TO SELL THESE SECURITIES AND IT IS NOT A SOLICITATION OF AN OFFER TO BUY THESE SECURITIES IN ANY JURISDICTION WHERE THE OFFER OR SALE IS NOT PERMITTED.
133
| No. 10 – Florida Hotel & Conference Center | |||||||
| Loan Information | Property Information | ||||||
| Mortgage Loan Seller: | Morgan Stanley Mortgage Capital Holdings LLC | Single Asset/Portfolio: | Single Asset | ||||
| Credit Assessment (DBRS/Fitch/S&P): | NR/NR/NR | Property Type: | Hospitality | ||||
| Original Principal Balance: | $40,000,000 | Specific Property Type: | Full Service | ||||
| Cut-off Date Balance: | $40,000,000 | Location: | Orlando, FL | ||||
| % of Initial Pool Balance: | 4.24% | Size: | 511 Rooms | ||||
| Loan Purpose: | Refinance | Cut-off Date Balance Per Room: | $78,278 | ||||
| Borrower Name: | Tantallon Orlando, LLC | Year Built/Renovated: | 1986/2017 | ||||
| Borrower Sponsor: | Tariq M. Shaikh | Title Vesting: | Fee | ||||
| Mortgage Rate: | 5.6000% | Property Manager: | Self-managed | ||||
| Note Date: | June 1, 2018 | 4thMost Recent Occupancy (As of): | 71.5% (12/31/2014) | ||||
| Anticipated Repayment Date: | NAP | 3rdMost Recent Occupancy (As of): | 76.8% (12/31/2015) | ||||
| Maturity Date: | June 1, 2023 | 2ndMost Recent Occupancy (As of): | 72.4% (12/31/2016) | ||||
| IO Period: | 60 months | Most Recent Occupancy (As of): | 78.7% (12/31/2017) | ||||
| Loan Term (Original): | 60 months | Current Occupancy (As of): | 79.8% (4/30/2018) | ||||
| Seasoning: | 2 months | ||||||
| Amortization Term (Original): | NAP | Underwriting and Financial Information: | |||||
| Loan Amortization Type: | Interest-only, Balloon | ||||||
| Interest Accrual Method: | Actual/360 | 4thMost Recent NOI (As of): | $6,353,666 (12/31/2015) | ||||
| Call Protection: | L(26),D(29),O(5) | 3rdMost Recent NOI (As of): | $5,827,117 (12/31/2016) | ||||
| Lockbox Type(1): | Soft/Upfront Cash Management | 2ndMost Recent NOI (As of): | $6,016,159 (12/31/2017) | ||||
| Additional Debt: | None | Most Recent NOI (As of): | $6,265,399 (TTM 4/30/2018) | ||||
| Additional Debt Type: | NAP | ||||||
| U/W Revenues: | $24,121,341 | ||||||
| Escrows and Reserves(2): | U/W Expenses: | $17,651,046 | |||||
| U/W NOI: | $6,470,294 | ||||||
| Type: | Initial | Monthly | Cap (If Any) | U/W NCF: | $5,505,440 | ||
| Taxes | $402,000 | $50,250 | NAP | U/W NOI DSCR: | 2.85x | ||
| Insurance | $0 | Springing | NAP | U/W NCF DSCR: | 2.42x | ||
| Replacement Reserve | $5,500,000 | (3) | NAP | U/W NOI Debt Yield: | 16.2% | ||
| U/W NCF Debt Yield: | 13.8% | ||||||
| As-Is Appraised Value: | $65,300,000 | ||||||
| As-Is Appraisal Valuation Date: | April 12, 2018 | ||||||
| Cut-off Date LTV Ratio: | 61.3% | ||||||
| LTV Ratio at Maturity or ARD: | 61.3% | ||||||
| (1) | See “Lockbox and Cash Management” below. |
| (2) | See “Escrows” below. |
| (3) | Monthly Replacement Reserves are required to be equal to 4.0% of operating income. |
The Mortgage Loan. The mortgage loan (the “Florida Hotel & Conference Center Mortgage Loan”) is evidenced by a single promissory note secured by a first mortgage encumbering a fee interest in a 511-room full service hotel located in Orlando, Florida (the “Florida Hotel & Conference Center Property”). The Florida Hotel & Conference Center Mortgage Loan was originated on June 1, 2018 by Morgan Stanley Bank, N.A. The Florida Hotel & Conference Center Mortgage Loan had an original principal balance of $40,000,000, has an outstanding principal balance as of the Cut-off Date of $40,000,000 and accrues interest at an interest rate of 5.6000%per annum. The Florida Hotel & Conference Center Mortgage Loan had an initial term of 60 months, has a remaining term of 58 months as of the Cut-off Date and requires payments of interest-only through the term of the Florida Hotel & Conference Center Mortgage Loan. The Florida Hotel & Conference Center Mortgage Loan matures on June 1, 2023.
Following the lockout period, the Florida Hotel & Conference Center Borrower has the right to defease the Florida Hotel & Conference Center Mortgage Loan in whole, but not in part, on any date before February 1, 2023. The Florida Hotel & Conference Center Mortgage Loan is prepayable without penalty on or after February 1, 2023.
THE INFORMATION IN THIS STRUCTURAL AND COLLATERAL TERM SHEET IS NOT COMPLETE AND MAY BE AMENDED PRIOR TO THE TIME OF SALE. THIS TERM SHEET IS NOT AN OFFER TO SELL THESE SECURITIES AND IT IS NOT A SOLICITATION OF AN OFFER TO BUY THESE SECURITIES IN ANY JURISDICTION WHERE THE OFFER OR SALE IS NOT PERMITTED.
134
FLORIDA HOTEL & CONFERENCE CENTER
Sources and Uses
| Sources | Uses | |||||||
| Original loan amount | $40,000,000 | 99.8% | Loan Payoff | $33,827,502 | 84.4% | |||
| Sponsor’s new cash contribution | 61,400 | 0.2 | Reserves | 5,902,000 | 14.7 | |||
| Closing costs | 331,898 | 0.8 | ||||||
| Total Sources | $40,061,400 | 100.0% | Total Uses | $40,061,400 | 100.0% |
The Property.The Florida Hotel & Conference Center Property is an 11-story, full service hotel located in Orlando, Florida. Built in 1986 and most recently renovated in 2017, the Florida Hotel & Conference Center Property is situated on a 10.8-acre site and contains 511 rooms, including 407 double/double guestrooms, 98 king guestrooms, three junior suites, two presidential suites and one, one-bedroom suite. Amenities at the Florida Hotel & Conference Center Property include an outdoor swimming pool and whirlpool, a fitness center, a business center, a gift shop, room service, an airport/local shuttle, 50,234 square feet of meeting space and 455 surface parking spaces. Additionally, the Florida Hotel & Conference Center Property features a 98-seat restaurant, 78-seat bar and a Starbucks. The Florida Hotel & Conference Center Property is directly attached to The Florida Mall, a 1.7 million square foot super regional mall that is owned by Simon Property Group and attracts more than more than 20 million visitors annually.
Upgrades since 2014 total approximately $8.7 million ($17,025 per room) and focused on guestroom and corridor renovation. The Florida Hotel & Conference Center Borrower has $5.85 million of planned renovations, of which $5.50 million has been reserved for. Approximately $2.5 million is allocated to guest room renovation, $400,000 to guest floor corridors and $2.0 million to roof replacement, with the remaining $600,000 of the reserve allocated to contingencies related to the foregoing. The Florida Hotel & Conference Center Borrower is not obligated to make such renovations, but will not receive funds from the foregoing reserve unless it does so.
According to the appraisal, the 2017 market mix of the Florida Hotel & Conference Center Property was 32% commercial, 34% meeting and group, and 34% transient. The Florida Hotel & Conference Center Property was acquired in 2004. In 2016, the Florida Hotel & Conference Center Borrower entered into a distribution agreement with Best Western International, Inc. (“BWI”) pursuant to which reservations for the Florida Hotel & Conference Center Property may be made through BWI’s reservations system, BWI agrees to use reasonable efforts to market the hotel as a Best Western Premier Collection hotel and the hotel benefits from certain BWI rewards programs and is allowed to use certain BWI trademarks during the term of the agreement. The distribution agreement is dated April 1, 2016 and has a term of four years that automatically renews for successive four-year terms unless either party provides notice of non-renewal at least 60 days prior to the end of the then-current term. In addition, either party may cancel the distribution agreement without cause upon one year’s notice to the other party and with cause upon 15 days’ notice to the other party. The distribution agreement is not assignable and does not inure to the benefit of the lender if it takes title to the Florida Hotel & Conference Center Property.
THE INFORMATION IN THIS STRUCTURAL AND COLLATERAL TERM SHEET IS NOT COMPLETE AND MAY BE AMENDED PRIOR TO THE TIME OF SALE. THIS TERM SHEET IS NOT AN OFFER TO SELL THESE SECURITIES AND IT IS NOT A SOLICITATION OF AN OFFER TO BUY THESE SECURITIES IN ANY JURISDICTION WHERE THE OFFER OR SALE IS NOT PERMITTED.
135
FLORIDA HOTEL & CONFERENCE CENTER
Operating History and Underwritten Net Cash Flow. The following table presents certain information relating to the historical operating performance and the underwritten net cash flow at the Florida Hotel & Conference Center Property:
Cash Flow Analysis
| 2015(1) | 2016(1) | 2017(1) | TTM 4/30/2018(1) | U/W | % of U/W Total Revenue | U/W $ per Room | |
| Occupancy | 76.80% | 72.40% | 78.70% | 79.80% | 79.80% | ||
| ADR | $107.57 | $108.28 | $108.90 | $109.74 | $109.74 | ||
| RevPAR | $82.61 | $78.39 | $85.70 | $87.57 | $87.57 | ||
| Room Revenue | $15,399,767 | $14,623,155 | $15,980,319 | $16,334,729 | $16,333,589 | 67.7% | $31,964 |
| F&B Revenue | 7,269,806 | 7,220,735 | 6,904,204 | 7,208,214 | 7,208,214 | 29.9 | 14,106 |
| Other Revenue(2) | 676,391 | 548,452 | 590,598 | 579,538 | 579,538 | 2.4 | 1,134 |
| Total Revenue | $23,345,964 | $22,392,342 | $23,475,121 | $24,122,481 | $24,121,341 | 100.0% | $47,204 |
| Total Department Expenses | 9,489,927 | 9,451,052 | 9,915,251 | 10,169,121 | 10,168,640 | 42.2 | 19,899 |
| Gross Operating Profit | $13,856,037 | $12,941,290 | $13,559,870 | $13,953,360 | $13,952,700 | 57.8% | $27,305 |
| Total Undistributed Expenses | 5,279,215 | 5,077,660 | 5,357,184 | 5,500,766 | 5,500,766 | 22.8 | 10,765 |
| Profit Before Fixed Charges | $8,576,822 | $7,863,630 | $8,202,686 | $8,452,594 | $8,451,934 | 35.0% | $16,540 |
| Total Fixed Charges | 2,223,156 | 2,036,513 | 2,186,527 | 2,187,195 | 1,981,640 | 8.2 | 3,878 |
| Net Operating Income | $6,353,666 | $5,827,117 | $6,016,159 | $6,265,399 | $6,470,294 | 26.8% | $12,662 |
| FF&E | 1,076,432 | 895,651 | 1,058,171 | 964,899 | 964,854 | 4.0 | 1,888 |
| Net Cash Flow | $5,277,234 | $4,931,466 | $4,957,988 | $5,300,500 | $5,505,440 | 22.8% | $10,774 |
| NOI DSCR | 2.80x | 2.57x | 2.65x | 2.76x | 2.85x | ||
| NCF DSCR | 2.32x | 2.17x | 2.18x | 2.33x | 2.42x | ||
| NOI DY | 15.9% | 14.6% | 15.0% | 15.7% | 16.2% | ||
| NCF DY | 13.2% | 12.3% | 12.4% | 13.3% | 13.8% | ||
| (1) | Occupancy, ADR and RevPAR figures are based on the underwriting, which have been taken from financial statements provided by the Florida Hotel & Conference Center Borrower. Variances between the underwriting and the Subject and Market Historical Occupancy, ADR and RevPAR table with respect to Occupancy, ADR and RevPAR at the Florida Hotel & Conference Center Property are attributable to variances in reporting methodologies and/or timing differences. |
| (2) | Other revenues consist of departmental revenue and miscellaneous income. |
Appraisal.As of the appraisal valuation date of April 12, 2018, the Florida Hotel & Conference Center Property had an “as-is” appraised value of $65,300,000.
Environmental Matters. According to the Phase I environmental site assessment dated April 19, 2018, there was no evidence of any recognized environmental conditions at the Florida Hotel & Conference Center Property.
Market Overview and Competition. The Florida Hotel & Conference Center Property is centrally located around the Orlando International Airport, Disney World, Universal Studios and SeaWorld Orlando. Orlando’s popularity as a year-round tourism destination contributes to the area’s overall economy. The Florida Hotel & Conference Center Property’s surrounding neighborhood is characterized by restaurants, office buildings and retail shopping centers along the primary thoroughfares. The Florida Hotel & Conference Center Property is directly attached to The Florida Mall, a 1.7 million square foot super regional mall that is owned by Simon Property Group and attracts more than 20 million visitors annually. The Florida Mall is rated A+ by an industry research report and features more than 250 retail, dining and entertainment options including Macy’s, Apple, H&M, ZARA, the Crayola Experience attraction, the M&M’s World store, Carlo’s Bakery and a dining pavilion, with more than 1,400 indoor and outdoor seating options at 23 restaurants and eateries. Major employers in the area include the Walt Disney World Resort (74,000 employees), Universal Orlando (21,000), Adventist Health Systems/Florida Hospital (20,413), Publix (19,783), and Orlando International Airport (18,000).
According to the appraisal, the Florida Hotel & Conference Center Property competes directly with four hotels totaling 1,877 rooms. While a variety of new hotel projects are planned, underway or proposed in the greater Orlando market, none are expected to compete directly with the Florida Hotel & Conference Center Property, according to the appraisal.
According to a third-party research provider, the estimated 2018 population within a one-, three-, and five-mile radius of the Florida Hotel & Conference Center Property was 6,572, 69,627, and 191,147, respectively; and the average household income within the same radii was $52,888, $54,113 and $61,750, respectively.
THE INFORMATION IN THIS STRUCTURAL AND COLLATERAL TERM SHEET IS NOT COMPLETE AND MAY BE AMENDED PRIOR TO THE TIME OF SALE. THIS TERM SHEET IS NOT AN OFFER TO SELL THESE SECURITIES AND IT IS NOT A SOLICITATION OF AN OFFER TO BUY THESE SECURITIES IN ANY JURISDICTION WHERE THE OFFER OR SALE IS NOT PERMITTED.
136
FLORIDA HOTEL & CONFERENCE CENTER
Subject and Market Historical Occupancy, ADR and RevPAR(1)
Competitive Set | Florida Hotel & Conference Center(2) | Penetration Factor | |||||||
Year | Occupancy | ADR | RevPAR | Occupancy | ADR | RevPAR | Occupancy | ADR | RevPAR |
| 12/31/2016 | 81.66% | $116.36 | $95.02 | 73.53% | $123.16 | $90.55 | 90.03% | 105.84% | 95.29% |
| 12/31/2017 | 80.91% | $125.31 | $101.38 | 76.29% | $124.76 | $95.18 | 94.29% | 99.56% | 93.88% |
| 3/31/2018 | 88.15% | $132.79 | $117.06 | 82.36% | $126.28 | $104.01 | 93.43% | 95.10% | 88.85% |
| (1) | Information obtained from a third party hospitality research report dated April 17, 2018. The competitive set includes: Doubletree @ The Entrance To Universal Orlando, Marriott Orlando Airport Lakeside, Wyndham Orlando Resort International Drive, Econo Lodge Inn & Suites Near Florida Mall, Renaissance Orlando Airport Hotel, Days Inn & Suites Orlando Airport, Crowne Plaza Orlando Universal Resort Area, Hampton Inn & Suites Orlando Airport @ Gateway Village and Wyndham Garden Hotel Lake Buena Vista Disney Springs Resort Area. |
| (2) | Variances between the underwriting and the above table with respect to Occupancy, ADR and RevPAR at the Florida Hotel & Conference Center Property are attributable to variances in reporting methodologies and/or timing differences. |
The Borrower.The borrower is Tantallon Orlando, LLC (the “Florida Hotel & Conference Center Borrower”), a Delaware limited liability company and single purpose entity with two independent directors. Legal counsel to the Florida Hotel & Conference Center Borrower delivered a non-consolidation opinion in connection with the origination of the Florida Hotel & Conference Center Mortgage Loan. Tariq M. Shaikh is the guarantor of certain nonrecourse carveouts under the Florida Hotel & Conference Center Mortgage Loan.
The Borrower Sponsor.The borrower sponsor is Tariq M. Shaikh. Tariq M. Shaikh is the president of Edinburgh Management, LLC. Edinburgh Management, LLC is a privately-held hospitality investment, development, and management company that was founded in 2003 and is headquartered in Houston, Texas. Edinburgh Management, LLC owns and manages nearly 1,000 hotel rooms and 95,000 square feet of meeting space, and its senior management team has over 35 years of hospitality experience in markets across the United States.
Escrows. The Florida Hotel & Conference Center Borrower deposited at loan origination $5,500,000 for budgeted capital improvements (including $2,500,000 for guest room renovations, $400,000 for corridor repairs, $2,000,000 for roof repairs and $600,000 for contingencies related to any of the foregoing) and $402,000 for real estate taxes and is required to deposit monthly 1/12th the estimated annual real estate taxes. Additionally, the Florida Hotel & Conference Center Borrower is required to deposit monthly 1/12th of the estimated annual insurance premiums, unless (i) there is no event of default under the loan documents; and (ii) insurance requirements are being satisfied by a blanket policy reasonably approved by the lender with evidence of renewal of the policies and timely proof of payment of the insurance premiums. The Florida Hotel & Conference Center Borrower is required to cause the property manager to deposit from hotel revenues collected by it into a separate lockbox account for furniture, fixtures and equipment reserves (the “FF&E Lockbox”), on each monthly payment date, an amount equal to 4.0% of gross operating income (the “FF&E Deposit”). The property manager has access to such account and may use the funds in such account until (i) the property management agreement has terminated, (ii) the property manager is in default under the property management agreement, or (iii) an event of default has occurred under the Florida Hotel & Conference Center Mortgage Loan. In the event of the occurrence of any of the foregoing events, the lender has the right to terminate the property manager’s access to the FF&E Lockbox, and the Florida Hotel & Conference Center Borrower will be required to make the monthly FF&E Deposit into a reserve maintained by the lender.
Lockbox and Cash Management. The Florida Hotel & Conference Center Mortgage Loan provides for a soft lockbox and upfront cash management. For so long as the current property management agreement is in effect, the property manager is required to collect hotel revenues and deposit them into a hotel operating account maintained by the property manager, and is required to deposit monthly into a lockbox account all sums in the hotel operating account that are payable to the Florida Hotel & Conference Center Borrower under the property management agreement. Such sums are equal to hotel revenues deposited by the property manager into the hotel operating account, net of operating expenses, bad debt reserves, working capital reserves, management fees and the amount required to be deposited by the property manager into the FF&E Lockbox as described under “Escrows” above. If the property management agreement is no longer in effect, the Florida Hotel & Conference Center Borrower and property manager will be required (i) to cause all credit card receipts to be deposited directly into the lockbox account, and (ii) to deposit into the lockbox account any hotel revenues received by them within one business day of receipt. Funds in the lockbox account are required to be transferred weekly into a lender-controlled cash management account and applied to pay monthly escrows, as described above under “Escrows”, debt service, and if the property management agreement is no longer in effect and a Cash Sweep Event Period (as defined below) is continuing, operating expenses set forth in the annual budget (which is required to be approved by the lender), and extraordinary expenses approved by the lender, to pay the Florida Hotel & Conference Center Borrower an amount equal to operating expenses payable by it which are not paid by the property manager pursuant to the property management agreement, and to pay all excess cash (i) if a Cash Sweep Event Period is continuing, to an excess cash reserve to be held as additional security for the Florida Hotel & Conference Center Mortgage Loan for so long as a Cash Sweep Event Period exists, and (ii) otherwise, to the Florida Hotel & Conference Center Borrower.
A “Cash Sweep Event Period” means a period:
| i. | commencing upon the occurrence of an event of default under the Florida Hotel & Conference Center Mortgage Loan agreement and ending upon the cure (if applicable) of such event of default; or |
| ii. | commencing upon the debt service coverage ratio (calculated based on the trailing twelve-month period and assuming a 30-year amortization schedule) being less than 1.25x for two consecutive calendar quarters and ending upon the date that the debt service coverage ratio (calculated in the same manner) is at least 1.85x for two consecutive calendar quarters; or |
| iii. | commencing upon the date the property management agreement is terminated or cancelled and ending upon the date a replacement property management agreement acceptable to the lender is in full force and effect. |
THE INFORMATION IN THIS STRUCTURAL AND COLLATERAL TERM SHEET IS NOT COMPLETE AND MAY BE AMENDED PRIOR TO THE TIME OF SALE. THIS TERM SHEET IS NOT AN OFFER TO SELL THESE SECURITIES AND IT IS NOT A SOLICITATION OF AN OFFER TO BUY THESE SECURITIES IN ANY JURISDICTION WHERE THE OFFER OR SALE IS NOT PERMITTED.
137
FLORIDA HOTEL & CONFERENCE CENTER
Property Management. The Florida Hotel & Conference Center Property is currently managed by an affiliate of the Florida Hotel & Conference Center Borrower.
Assumption. The Florida Hotel & Conference Center Borrower has the right to transfer the Florida Hotel & Conference Center Property provided that certain conditions are satisfied, including (i) no event of default has occurred and is continuing; (ii) the lender reasonably determines that the proposed transferee satisfies the lender’s credit review and underwriting standards, taking into consideration transferee experience, financial strength and general business standing; (iii) a replacement guarantor acceptable to the lender assumes the obligations of the Florida Hotel & Conference Center guarantor under the non-recourse carveout guaranty and environmental indemnity; and (iv) if required by the lender, the lender receives confirmation from each rating agency assigned to rate the Series 2018-BNK13 Certificates that such assumption will not result in a downgrade, withdrawal or qualification of the respective ratings assigned to the Series 2018-BNK13 Certificates.
Partial Release. Not permitted.
Real Estate Substitution. Not permitted.
Subordinate and Mezzanine Indebtedness. Not permitted.
Terrorism Insurance. The Florida Hotel & Conference Center Mortgage Loan documents require that the “all risk” insurance policy required to be maintained by the Florida Hotel & Conference Center Borrower provide coverage for acts of terrorism in an amount equal to the full replacement cost of the Florida Hotel & Conference Center Property and 12 months of business interruption insurance, provided that so long as the Terrorism Risk Insurance Act of 2002, as extended and modified by the Terrorism Risk Insurance Program Reauthorization Act of 2015 (TRIPRA) is in effect (including any extensions thereof or if another federal governmental program is in effect relating to “acts of terrorism” which provides substantially similar protections as TRIPRA), and covers both domestic and foreign acts of terrorism, the lender will be required to accept insurance which covers against “covered acts” as defined by TRIPRA or such other program.
Ground Lease. None.
THE INFORMATION IN THIS STRUCTURAL AND COLLATERAL TERM SHEET IS NOT COMPLETE AND MAY BE AMENDED PRIOR TO THE TIME OF SALE. THIS TERM SHEET IS NOT AN OFFER TO SELL THESE SECURITIES AND IT IS NOT A SOLICITATION OF AN OFFER TO BUY THESE SECURITIES IN ANY JURISDICTION WHERE THE OFFER OR SALE IS NOT PERMITTED.
138
(THIS PAGE INTENTIONALLY LEFT BLANK)
THE INFORMATION IN THIS STRUCTURAL AND COLLATERAL TERM SHEET IS NOT COMPLETE AND MAY BE AMENDED PRIOR TO THE TIME OF SALE. THIS TERM SHEET IS NOT AN OFFER TO SELL THESE SECURITIES AND IT IS NOT A SOLICITATION OF AN OFFER TO BUY THESE SECURITIES IN ANY JURISDICTION WHERE THE OFFER OR SALE IS NOT PERMITTED.
139
| No. 11 – Ditson Building | |||||||
| Loan Information | Property Information | ||||||
| Mortgage Loan Seller: | Morgan Stanley Mortgage Capital Holdings LLC | Single Asset/Portfolio: | Single Asset | ||||
Credit Assessment (DBRS/Fitch/S&P): | NR/NR/NR | Property Type: | Office | ||||
| Original Principal Balance: | $37,500,000 | Specific Property Type: | CBD | ||||
| Cut-off Date Balance: | $37,500,000 | Location: | New York, NY | ||||
| % of Initial Pool Balance: | 3.97% | Size: | 58,850 SF | ||||
| Loan Purpose: | Refinance | Cut-off Date Balance Per SF: | $637.21 | ||||
| Borrower Name: | 10East34th, LLC | Year Built/Renovated: | 1907/2016 | ||||
| Borrower Sponsors: | Elena Gilman; Simeon Derenshteyn | Title Vesting: | Fee | ||||
| Mortgage Rate: | 5.4300% | Property Manager: | ABS Partners Real Estate LLC | ||||
| Note Date: | July 6, 2018 | 4thMost Recent Occupancy (As of)(3): | NAV | ||||
| Anticipated Repayment Date: | NAP | 3rdMost Recent Occupancy (As of)(3): | NAV | ||||
| Maturity Date: | August 1, 2028 | 2ndMost Recent Occupancy (As of): | 90.1% (12/31/2016) | ||||
| IO Period: | 120 months | Most Recent Occupancy (As of): | 90.1% (12/31/2017) | ||||
| Loan Term (Original): | 120 months | Current Occupancy (As of): | 100.0% (4/1/2018) | ||||
| Seasoning: | 0 months | ||||||
| Amortization Term (Original): | NAP | Underwriting and Financial Information: | |||||
| Loan Amortization Type: | Interest-only, Balloon | ||||||
| Interest Accrual Method: | Actual/360 | 4thMost Recent NOI(3): | NAV | ||||
| Call Protection: | L(24),D(91),O(5) | 3rdMost Recent NOI (As of): | $312,754 (12/31/2016) | ||||
| Lockbox Type: | Hard/Springing Cash Management | 2ndMost Recent NOI (As of): | $1,638,129 (12/31/2017) | ||||
| Additional Debt: | None | Most Recent NOI (As of)(4): | $1,752,720 (TTM 3/31/2018) | ||||
| Additional Debt Type: | NAP | U/W Revenues: | $3,982,585 | ||||
| U/W Expenses: | $1,073,285 | ||||||
| Escrows and Reserves: | U/W NOI(4): | $2,909,301 | |||||
| U/W NCF: | $2,718,188 | ||||||
| Type: | Initial | Monthly | Cap (If Any) | U/W NOI DSCR: | 1.41x | ||
| Taxes | $85,160 | $42,580 | NAP | U/W NCF DSCR: | 1.32x | ||
| Insurance | $26,250 | $3,750 | NAP | U/W NOI Debt Yield: | 7.8% | ||
| Deferred Maintenance | $75,000 | $0 | NAP | U/W NCF Debt Yield: | 7.2% | ||
| TI/LC Reserve(1) | $0 | $9,800 | $235,200 | As-Is Appraised Value: | $62,000,000 | ||
| Replacement Reserve | $0 | $980 | NAP | As-Is Appraisal Valuation Date: | April 20, 2018 | ||
| Outstanding TI/LC Obligations(2) | $1,576,871 | $0 | NAP | Cut-off Date LTV Ratio: | 60.5% | ||
| Rent Concession | $241,369 | $0 | NAP | LTV Ratio at Maturity or ARD: | 60.5% | ||
| TTC Pre-Paid Rent | $794,153 | $0 | NAP | ||||
| (1) | Monthly TI/LC Reserves payments are not required at any time the amount on deposit in such reserve equals or exceeds $235,200. |
| (2) | The Outstanding TI/LC obligation of $1,576,871 includes (i) $1,253,126 for tenant improvements to the VR Worldwide, Inc. space, (ii) $127,650 for tenant improvements to the TTC (as defined below) 4th floor space, (iii) $127,650 for tenant improvements to the TTC 10th floor space and (iv) $68,445 for brokerage commissions in connection with the TTC 10th floor space. |
| (3) | Historical occupancy and financial information are not available prior to 2016 as the borrower acquired the Ditson Building Property in February 2016. |
| (4) | The increase in U/W NOI compared to historical NOI is attributable to rent being included for two tenants, TTC on the 10th and 4th floor and VR Worldwide, Inc., who are not yet in occupancy of their space (or a portion of it) and have rent abatement periods for all or a portion of their space. |
The mortgage loan (the “Ditson Building Mortgage Loan”) is evidenced by a single promissory note secured by a first mortgage encumbering the fee interest in a Class B office building located in New York, New York (the “Ditson Building Property”). The Ditson Building Mortgage Loan was originated on July 6, 2018 by Morgan Stanley Bank, N.A. The Ditson Building Mortgage Loan had an original principal balance of $37,500,000, has an outstanding principal balance as of the Cut-off Date of $37,500,000 and accrues interest at an interest rate of 5.4300%per annum. The Ditson Building Mortgage Loan had an initial term of 120 months, has a remaining term of 120 months as of the Cut-off Date and requires interest-only payments throughout the loan term. The Ditson Building Mortgage Loan matures on August 1, 2028.
Following the lockout period, the borrower has the right to defease the Ditson Building Mortgage Loan in whole, but not in part, on any date before April 1, 2028. The Ditson Building Mortgage Loan is prepayable without penalty on or after April 1, 2028.
THE INFORMATION IN THIS STRUCTURAL AND COLLATERAL TERM SHEET IS NOT COMPLETE AND MAY BE AMENDED PRIOR TO THE TIME OF SALE. THIS TERM SHEET IS NOT AN OFFER TO SELL THESE SECURITIES AND IT IS NOT A SOLICITATION OF AN OFFER TO BUY THESE SECURITIES IN ANY JURISDICTION WHERE THE OFFER OR SALE IS NOT PERMITTED.
140
DITSON BUILDING
Sources and Uses
| Sources | Uses | |||||||
| Original loan amount | $37,500,000 | 100.0% | Loan payoff | $33,518,896 | 89.4% | |||
| Reserves | 2,798,803 | 7.5 | ||||||
| Return of Equity | 751,141 | 2.0 | ||||||
| Closing costs | 431,160 | 1.1 | ||||||
| Total Sources | $37,500,000 | 100.0% | Total Uses | $37,500,000 | 100.0% |
The Ditson Building Property is a 10-story, Class B office building totaling 58,850 square feet located in New York, New York. Situated on a 0.12-acre parcel, the Ditson Building Property was constructed in 1907 and renovated in 2016. The Ditson Building Property is 100% leased to four tenants and includes 5,604 square feet of ground floor retail space and 3,296 square feet of basement space. The borrower acquired the Ditson Building Property in February 2016. At the time the borrower acquired the Ditson Building Property it was approximately 78.8% leased. Shortly after the acquisition, the occupancy at the Ditson Building Property decreased to approximately 60.0%. Since acquiring the Ditson Building Property in 2016, the borrower has executed new leases and tenant expansions totaling 47,750 square feet (81.1% of NRA). Additionally, the borrower has spent approximately $2 million on capital expenditures focused on capital improvements, elevator repairs and exterior upgrades since 2016.
The largest tenant, TTC USA Consulting (“TTC”) (33,300 square feet, 56.6% of net rentable area) operates its space as a Turkish Trade Center location at the Ditson Building Property, where it provides showroom space to Turkish companies to enable them to have a physical presence in New York City. TTC is not always in physical occupancy. The space is used for tradeshows that are held four times each year. TTC originally signed a lease for five floors (27,750 square feet) in September of 2016 and expanded their space to an additional floor (5,550 square feet) in April of 2018. TTC is not yet in occupancy of the 4th and 10th floors. TTC is expected to take possession of the 10th floor in August 2018 and to commence a build out afterwards. TTC has three months of free rent commencing August 2018 (which has been reserved for). In addition, TTC is not yet in occupancy of the 4th floor space. Rent commenced in March 2018 and the tenant is expected to complete its buildout and take physical occupancy in August 2018. The second largest tenant, Research Foundation of the City of New York (11,100 square feet, 18.9% of net rentable area), has been a tenant at the Ditson Building Property since 2013 and was established as a not-for-profit educational corporation chartered by the State of New York in 1963, the function of which is to assist the City University of New York to apply for and monitor government and other research grants. Research Foundation of the City of New York originally signed a lease for the fifth floor in 2013 (5,550 square feet) and expanded their space to the sixth floor (an additional 5,550 square feet) in 2017. The third largest tenant, VR Worldwide, Inc. (8,900 square feet, 15.1% of net rentable area) includes 5,604 square feet of ground floor retail space and 3,296 square feet of basement retail space, and is expected to operate its space as a virtual reality center. VR Worldwide, Inc. recently executed a lease for the ground floor space and took possession of the space in April 2018. The tenant is expected to be in physical occupancy and open for business no later than October 2018 and will receive 196 days of free rent, which has been reserved for. Rent payments are expected to commence in October 2018. VR Worldwide, Inc. signed its lease at the Ditson Building Property in April of 2018. The fourth largest tenant, Digital Enlightenment (5,550 square feet, 9.4% of net rentable area), has been a tenant at the Ditson Building Property since 2014.
The Ditson Building Property is located along the south side of East 34th Street between Madison and Fifth Avenues in the Herald Square neighborhood of Manhattan within the 34th Street Business Improvement District. The Ditson Building Property is located one block east of Macy’s flagship department store, two blocks east of Penn Station and less than one block from the Empire State Building. This immediate area is predominantly developed with retail, office, hotel and residential properties. Multi-level retail space is also located along West 34th Street, Broadway, Sixth and Seventh Avenues. According to the appraisal, the hourly peak pedestrian flow along the subject’s corner averages nearly 10,000 in the morning, 5,000 in the afternoon, and 12,500 in the evening and the Ditson Building Property is situated near the 34th Street subway station located at Sixth Avenue which has seven subway lines and the PATH train, along with 14 intersecting city bus routes. Herald Square attracts 100 million people a year and attendance at Madison Square Garden events tops five million annually. In addition, Penn Station is the country’s busiest commuter hub with over 550,000 people commuting through it daily.
The Ditson Building Property is located in the Murray Hill submarket of the Midtown market of Manhattan according to the appraisal. According to the appraisal, as of the first quarter of 2018, the Midtown market is comprised of approximately 280,400,000 square feet of office space with an availability rate of 12.0%, average asking rent of $80.51 per square foot and approximately 10,200,000 square feet currently under construction. The Murray Hill submarket is comprised of approximately 7.8 million square feet of office space with an availability rate of 8.6%, asking rent of $56.56 per square foot and no office space currently under construction. Asking rents have grown annually at an average of 3.7% over the past eight years.
According to a third-party research provider, the estimated 2017 population within a quarter-, half-, and one-mile radius of the Ditson Building Property was 13,882, 47,044, and 193,841, respectively; and the median household income within the same radii was $109,195, $108,118 and $104,933, respectively.
THE INFORMATION IN THIS STRUCTURAL AND COLLATERAL TERM SHEET IS NOT COMPLETE AND MAY BE AMENDED PRIOR TO THE TIME OF SALE. THIS TERM SHEET IS NOT AN OFFER TO SELL THESE SECURITIES AND IT IS NOT A SOLICITATION OF AN OFFER TO BUY THESE SECURITIES IN ANY JURISDICTION WHERE THE OFFER OR SALE IS NOT PERMITTED.
141
DITSON BUILDING
The following table presents certain information relating to the tenants at the Ditson Building Property:
Major Tenants(1)
| Tenant Name | Credit Rating (Fitch/ Moody’s/ S&P) | Tenant NRSF | % of NRSF | Annual U/W Base Rent PSF | Annual Rent | % of Total Annual U/W Base Rent | Lease Expiration Date |
| Major Tenants | |||||||
| TTC USA Consulting(2) | NR/NR/NR | 33,300 | 56.6% | $64.88 | $2,160,529 | 52.5% | 12/1/2021 |
| Research Foundation of the City of NY | NR/NR/NR | 11,100 | 18.9% | $59.42 | $659,611 | 16.0% | 9/1/2026 |
| VR Worldwide, Inc.(3) | NR/NR/NR | 8,900 | 15.1% | $111.19 | $989,612 | 24.0% | 3/1/2028 |
| Digital Enlightenment | NR/NR/NR | 5,550 | 9.4% | $55.73 | $309,307 | 7.5% | 6/1/2019 |
| Total Major Tenants | 58,850 | 100.0% | $69.99 | $4,119,059 | 100.0% | ||
| Vacant Space | 0 | 0.0% | |||||
| Collateral Total | 58,850 | 100.0% | |||||
| (1) | Information obtained from the underwritten rent roll. |
| (2) | TTC has one, five-year renewal option, with nine months’ notice. TTC leases the 3rd, 4th, 8th, 9th and 10th floors, and is not yet in occupancy of the 4th and 10th floors. The 10th floor was leased to The New York Foundation, which recently vacated at lease expiration in June 2018. TTC is expected to take possession in August 2018 and to commence build out afterwards. TTC has three months of free rent commencing August 2018. In addition, TTC is not yet in occupancy of the 4th floor space. The tenant has taken possession of such space and is completing its buildout. Rent for the 4th floor commenced in March 2018 and the tenant is expected to complete its buildout and take physical occupancy in August 2018. |
| (3) | VR Worldwide, Inc. includes 5,604 square feet of ground floor space and 3,296 square feet of basement space. VR Worldwide, Inc. recently executed a lease for the ground floor space and took possession of the space in April 2018. The tenant is expected to be in physical occupancy and open for business no later than October 2018 and will receive 196 days of free rent, which has been reserved for. Rent payments are expected to commence in October 2018. |
The following table presents certain information relating to the lease rollover schedule at the Ditson Building Property:
Lease Expiration Schedule(1)(2)
| Year Ending December 31, | No. of Leases Expiring | Expiring NRSF | % of Total NRSF | Cumulative Expiring NRSF | Cumulative % of Total NRSF | Annual U/W Base Rent | % of Total Annual U/W Base Rent | Annual U/W Base Rent PSF |
| MTM | 0 | 0 | 0.0% | 0 | 0.0% | $0 | 0.0% | $0.00 |
| 2018 | 0 | 0 | 0.0% | 0 | 0.0% | $0 | 0.0% | $0.00 |
| 2019 | 1 | 5,550 | 9.4% | 5,550 | 9.4% | $309,307 | 7.5% | $55.73 |
| 2020 | 0 | 0 | 0.0% | 5,550 | 9.4% | $0 | 0.0% | $0.00 |
| 2021 | 1 | 33,300 | 56.6% | 38,850 | 66.0% | $2,160,529 | 52.5% | $64.88 |
| 2022 | 0 | 0 | 0.0% | 38,850 | 66.0% | $0 | 0.0% | $0.00 |
| 2023 | 0 | 0 | 0.0% | 38,850 | 66.0% | $0 | 0.0% | $0.00 |
| 2024 | 0 | 0 | 0.0% | 38,850 | 66.0% | $0 | 0.0% | $0.00 |
| 2025 | 0 | 0 | 0.0% | 38,850 | 66.0% | $0 | 0.0% | $0.00 |
| 2026 | 1 | 11,100 | 18.9% | 49,950 | 84.9% | $659,611 | 16.0% | $59.42 |
| 2027 | 0 | 0 | 0.0% | 49,950 | 84.9% | $0 | 0.0% | $0.00 |
| 2028 | 1 | 8,900 | 15.1% | 58,850 | 100.0% | $989,612 | 24.0% | $111.19 |
| Thereafter | 0 | 0 | 0.0% | 58,850 | 100.0% | $0 | 0.0% | $0.00 |
| Vacant | 0 | 0 | 0.0% | 58,850 | 100.0% | $0 | 0.0% | $0.00 |
| Total/Weighted Average | 4 | 58,850 | 100.0% | $4,119,059 | 100.0% | $69.99 |
| (1) | Information obtained from the underwritten rent roll. |
| (2) | Certain tenants may have lease termination options that are exercisable prior to the stated expiration date of the subject lease and that are not considered in the Lease Expiration Schedule. |
The following table presents historical occupancy percentages at the Ditson Building Property:
Historical Occupancy(1)
12/31/2016 | 12/31/2017 | 4/1/2018 |
| 90.1% | 90.1% | 100.0% |
| (1) | Information obtained from the underwritten rent roll. |
THE INFORMATION IN THIS STRUCTURAL AND COLLATERAL TERM SHEET IS NOT COMPLETE AND MAY BE AMENDED PRIOR TO THE TIME OF SALE. THIS TERM SHEET IS NOT AN OFFER TO SELL THESE SECURITIES AND IT IS NOT A SOLICITATION OF AN OFFER TO BUY THESE SECURITIES IN ANY JURISDICTION WHERE THE OFFER OR SALE IS NOT PERMITTED.
142
DITSON BUILDING
The following table presents certain information relating to the historical operating performance and the underwritten net cash flow at the Ditson Building Property:
Cash Flow Analysis
| 2016 | 2017 | TTM 3/31/2018 | U/W | % of U/W Effective Gross Income | U/W $ per SF | |
| Base Rent(2) | $1,122,203 | $2,461,621 | $2,750,525 | $ 4,119,059(1) | 103.4% | $69.99 |
| Total Reimbursable | 25,875 | 75,098 | 74,315 | 73,136 | 1.8 | 1.24 |
| Other Income(3) | 0 | 295 | 458 | 0 | 0.0 | 0.00 |
| Less Vacancy & Credit Loss | 0 | 0 | 0 | (209,610)(4) | (5.3) | (3.56) |
| Effective Gross Income | $1,148,078 | $2,537,015 | $2,825,297 | $3,982,585 | 100.0% | $67.67 |
| Total Operating Expenses | $835,324 | $898,885 | $1,072,577 | $1,073,285 | 26.9% | $18.24 |
| Net Operating Income(2) | $312,754 | $1,638,129 | $1,752,720 | $2,909,301 | 73.1% | $49.44 |
| TI/LC | 0 | 0 | 0 | 179,493 | 4.5 | 3.05 |
| Capital Expenditures | 0 | 0 | 0 | 11,620 | 0.3 | 0.20 |
| Net Cash Flow | $312,754 | $1,638,129 | $1,752,720 | $2,718,188 | 68.3% | $46.19 |
| NOI DSCR | 0.15x | 0.79x | 0.85x | 1.41x | ||
| NCF DSCR | 0.15x | 0.79x | 0.85x | 1.32x | ||
| NOI DY | 0.8% | 4.4% | 4.7% | 7.8% | ||
| NCF DY | 0.8% | 4.4% | 4.7% | 7.2% |
| (1) | U/W Base Rent includes rent steps totaling $137,621 through April 1, 2019 and rent for two tenants, TTC on the 10th and 4th floor and VR Worldwide, Inc., who are not yet in occupancy of their space (or a portion of it) and have rent abatement periods for all or a portion of their space. |
| (2) | The increase in Base Rent and Net Operating Income from TTM 3/31/2018 to U/W is due to a significant increase in leasing activity, including the leases to the tenants identified in footnote (1). |
| (3) | Other Income is comprised of primarily of administrative fees. |
| (4) | The underwritten economic vacancy is 5.0%. As of April 1, 2018 the Ditson Building Property was 100.0% occupied. |
The following table presents certain information relating to comparable office property sales for the Ditson Building Property:
Comparable Sales(1)
| Property Name/Location | Sale Date | Year Built | SF | Total Occupancy | Sale Price (millions) | Sales Price PSF |
Ditson Building Property Midtown, NY | Feb. 2016 | 1907 | 58,850(2) | 100.0%(2) | $51.7 | $878.50 |
305 East 46th Street Eastside, NY | April 2018 | 1928/2008 | 180,565 | 100.0% | $118.5 | $656.27 |
9 East 40th Street Grand Central, NY | Feb. 2018 | 1913 | 98,029 | 74.0% | $70.3 | $716.62 |
30-32 Howard Street SoHo, NY | Jan. 2018 | 1910/2007 | 42,031 | 31.0% | $46.0 | $1,094.43 |
218 West 18th Street Chelsea, NY | Oct. 2017 | 1912 | 167,670 | 100.0% | $178.0 | $1,061.61 |
333 West 34th Street Penn Station, NY | Oct. 2017 | 1954 | 346,728 | 100.0% | $255.0 | $735.45 |
670 Broadway NoHo, NY | Sept. 2016 | 1893/2015 | 76,160 | 78.0% | $112.0 | $1,470.59 |
61 West 23rd Street Chelsea, NY | Sept. 2016 | 1920 | 52,751 | 97.0% | $65.0 | $1,232.20 |
| (1) | Information obtained from the appraisal. |
| (2) | As of the April 1, 2018 underwritten rent roll. |
THE INFORMATION IN THIS STRUCTURAL AND COLLATERAL TERM SHEET IS NOT COMPLETE AND MAY BE AMENDED PRIOR TO THE TIME OF SALE. THIS TERM SHEET IS NOT AN OFFER TO SELL THESE SECURITIES AND IT IS NOT A SOLICITATION OF AN OFFER TO BUY THESE SECURITIES IN ANY JURISDICTION WHERE THE OFFER OR SALE IS NOT PERMITTED.
143
DITSON BUILDING
The following tables present certain information relating to comparable leases for the Ditson Building Property:
Comparable Office Leases(1)
| Property Name/Location | Year Built | Total Office GLA (SF) | Tenant Name | Lease Date/Term | Lease Area (SF) | Annual Base Rent PSF | Lease Type |
15 West 34th Street Penn Station, New York | 1907 | 56,000 | Fashion Accessory Bazaar, LLC | January 2018 / 180 mos. | 19,662 | $77.65 | Gross |
111 West 33rd Street Penn Station, New York | 1954 | 743,283 | Owner IQ, Inc. | December 2017 / 88 mos. | 7,018 | $63.00 | Gross |
1370 Broadway Times Square South, New York | 1922 | 274,500 | SI Holdings LLC | November 2017 / 129 mos. | 12,292 | $56.50 | Gross |
330 West 34th Street Penn Station, New York | 1925 | 688,881 | HomeAdvisor.com | May 2017 / 128 mos. | 43,000 | $62.00 | Gross |
330 West 34th Street Penn Station, New York | 1925 | 688,881 | ContextMedia Health, LLC | January 2017 / 88 mos. | 55,758 | $73.00 | Gross |
14 East 38th Street Murray Hill, New York | 1923 | 79,994 | Vista Imaging Group, LLC | January 2017 / 119 mos. | 4,500 | $80.00 | Gross |
41-45 West 34th Street Penn Station, New York | 1907 | 149,500 | CREATE Architecture Planning & Design | April 2017 / 120 mos. | 11,500 | $68.00 | Gross |
7 Penn Plaza Penn Station, New York | 1921 | 368,000 | comScore, Inc | January 2017 / 132 mos. | 39,005 | $60.00 | Gross |
8 West 38th Street Times Square South, New York | 1913 | 112,120 | Grubhub | May 2016 / 97 mos. | 11,750 | $55.00 | Gross |
| (1) | Information obtained from the appraisal. |
Partial Release. The Ditson Building borrower has the right to obtain the release of all transferable air development rights appurtenant to the Ditson Building Property, without prepayment or defeasance, provided that certain conditions relating to zoning, title and payment of lender’s expenses (up to a cap of $3,000) are satisfied.
THE INFORMATION IN THIS STRUCTURAL AND COLLATERAL TERM SHEET IS NOT COMPLETE AND MAY BE AMENDED PRIOR TO THE TIME OF SALE. THIS TERM SHEET IS NOT AN OFFER TO SELL THESE SECURITIES AND IT IS NOT A SOLICITATION OF AN OFFER TO BUY THESE SECURITIES IN ANY JURISDICTION WHERE THE OFFER OR SALE IS NOT PERMITTED.
144
(THIS PAGE INTENTIONALLY LEFT BLANK)
THE INFORMATION IN THIS STRUCTURAL AND COLLATERAL TERM SHEET IS NOT COMPLETE AND MAY BE AMENDED PRIOR TO THE TIME OF SALE. THIS TERM SHEET IS NOT AN OFFER TO SELL THESE SECURITIES AND IT IS NOT A SOLICITATION OF AN OFFER TO BUY THESE SECURITIES IN ANY JURISDICTION WHERE THE OFFER OR SALE IS NOT PERMITTED.
145
| No. 12 – Fair Oaks Mall | ||||||
| Loan Information | Property Information | |||||
| Mortgage Loan Seller: | Bank of America, National Association | Single Asset/Portfolio: | Single Asset | |||
Credit Assessment (DBRS/Fitch/S&P): | (A/BBB-sf/BBB(sf)) | Property Type: | Retail | |||
| Original Principal Balance(1): | $33,750,000 | Specific Property Type: | Super Regional Mall | |||
| Cut-off Date Balance(1): | $33,644,821 | Location: | Fairfax, VA | |||
| % of Initial Pool Balance: | 3.56% | Size: | 779,949 SF | |||
| Loan Purpose: | Refinance | Cut-off Date Balance Per SF(1): | $223.67 | |||
| Borrower Name: | Fairfax Company of Virginia L.L.C. | Year Built/Renovated: | 1980 / 2014 | |||
| Borrower Sponsors: | The Taubman Realty Group Limited Partnership; Morton Olshan | Title Vesting: | Fee | |||
| Mortgage Rate: | 4.2580% | Property Manager: | The Taubman Company LLC (borrower-related) | |||
| Note Date: | April 27, 2018 | 4thMost Recent Occupancy (As of)(5): | 89.8% (12/31/2014) | |||
| Anticipated Repayment Date: | NAP | 3rdMost Recent Occupancy (As of)(5): | 90.3% (12/31/2015) | |||
| Maturity Date: | May 10, 2023 | 2ndMost Recent Occupancy (As of)(5): | 92.3% (12/31/2016) | |||
| IO Period: | 0 months | Most Recent Occupancy (As of)(5): | 90.7% (12/31/2017) | |||
| Loan Term (Original): | 60 months | Current Occupancy (As of)(5)(6): | 91.6% (2/1/2018) | |||
| Seasoning: | 3 months | |||||
| Amortization Term (Original): | 360 months | Underwriting and Financial Information: | ||||
| Loan Amortization Type: | Amortizing Balloon | |||||
| Interest Accrual Method: | Actual/360 | 4thMost Recent NOI (As of): | $34,145,183 (12/31/2014) | |||
| Call Protection(2): | L(27),D(29),O(4) | 3rdMost Recent NOI (As of): | $34,350,362 (12/31/2015) | |||
| Lockbox Type: | Hard/Springing Cash Management | 2ndMost Recent NOI (As of): | $34,902,573 (12/31/2016) | |||
| Additional Debt(1): | Yes | Most Recent NOI (As of): | $32,296,326 (12/31/2017) | |||
| Additional Debt Type(1): | Pari Passu /Subordinate Secured Debt | |||||
| Escrows and Reserves: | U/W Revenues: | $45,095,362 | ||||
| U/W Expenses: | $15,187,457 | |||||
| Type: | Initial | Monthly | Cap (If Any) | U/W NOI: | $29,907,905 | |
| Taxes | $0 | Springing(3) | NAP | U/W NCF: | $28,398,064 | |
| Insurance | $0 | Springing(3) | NAP | U/W NOI DSCR(1): | 3.05x | |
| Replacement Reserve | $0 | Springing(3) | $434,772 | U/W NCF DSCR(1): | 2.89x | |
| TI/LC Reserve | $3,954,170 | Springing(3) | $4,094,748 | U/W NOI Debt Yield(1): | 17.1% | |
| Gap Rent Reserve | $1,183,388 | $0 | NAP | U/W NCF Debt Yield(1): | 16.3% | |
| Macy’s Deposit | $0 | Springing(4) | NAP | As-Is Appraised Value: | $545,600,000 | |
| As-Is Appraisal Valuation Date: | February 3, 2018 | |||||
| Cut-off Date LTV Ratio(1): | 32.0% | |||||
| LTV Ratio at Maturity or ARD(1): | 29.7% | |||||
| (1) | The Fair Oaks Mall Mortgage Loan (as defined below) is part of the Fair Oaks Mall Whole Loan (as defined below), which is comprised of fivepari passu senior promissory notes with an aggregate original principal balance of $175,000,000 (collectively, the “Fair Oaks Mall Senior Loan”) and twopari passu subordinate promissory notes with an aggregate original principal balance of $85,000,000 (collectively, the “Fair Oaks Mall B Notes”). The Cut-off Date Balance per SF, U/W NOI DSCR, U/W NCF DSCR, U/W NOI Debt Yield, U/W NCF Debt Yield, Cut-off Date LTV Ratio and LTV Ratio at Maturity presented above are based on the Fair Oaks Mall Senior Loan. The Cut-off Date Balance per SF, U/W NOI DSCR, U/W NCF DSCR, U/W NOI Debt Yield, U/W NCF Debt Yield, Cut-off Date LTV Ratio and LTV Ratio at Maturity based on the Fair Oaks Mall Whole Loan are $332, 1.72x, 1.64x, 11.5%, 11.0%, 47.5% and 44.2%, respectively. |
| (2) | Defeasance of the Fair Oaks Mall Whole Loan is permitted any time after the earlier of (i) April 27, 2022, or (ii) two years from the closing date of the securitization that includes the lastpari passusenior note of the Fair Oaks Mall Whole Loan to be securitized. The assumed lockout period of 27 payments is based on the closing date of this transaction in August 2018. |
| (3) | During a cash management period, the borrower is required to deposit monthly (i) 1/12th of the estimated annual real estate taxes, (ii) 1/12th of the estimated annual insurance premiums (except to the extent that the insurance required is maintained under a blanket insurance policy), (iii) $12,077 for replacement reserves until a cap of $434,772 is reached and (iv) $113,743 for tenant improvements until a cap of $4,094,748 is reached. |
| (4) | The Fair Oaks Mall Whole Loan documents permit the borrower to terminate the lease with the collateral Macy’s subject to certain conditions including (i) the lender’s consent, (ii) the lender’s receipt of a binding letter(s) or intent with replacement tenant(s) for at least 35.0% of the space and annual rents not less than $550,000 and (iii) the lender’s receipt of a deposit or letter of credit in the amount of (a) the product of $91,667 times the number of months remaining from the date of the termination of the Macy’s lease through February 1, 2026, for the purpose of simulating payments of the Macy’s rent during such period (the “Macy’s Deposit”) plus (b) $10,000,000 for tenant improvement and leasing commissions with respect to the space. |
| (5) | Current Occupancy, Most Recent Occupancy, 2nd Most Recent Occupancy, 3rd Most Recent Occupancy and 4th Most Recent Occupancy including temporary tenants was 96.9%, 95.6%, 96.7%, 96.2% and 92.8%, respectively. |
| (6) | Current Occupancy includes eleven tenants (3.1% of NRA) with executed leases but who are not yet in occupancy. The lender reserved 100.0% of the rent associated with each tenant from the loan origination date through each lease’s scheduled commencement date. |
The mortgage loan (the “Fair Oaks Mall Mortgage Loan”) is part of a whole loan (the “Fair Oaks Mall Whole Loan”) that is evidenced by fivepari passusenior notes and twopari passusubordinate notes secured by a 779,949 square foot portion of a 1,531,650 square foot super regional mall located in Fairfax, Virginia (the “Fair Oaks Mall Property”). The Fair Oaks Mall Whole Loan was
THE INFORMATION IN THIS STRUCTURAL AND COLLATERAL TERM SHEET IS NOT COMPLETE AND MAY BE AMENDED PRIOR TO THE TIME OF SALE. THIS TERM SHEET IS NOT AN OFFER TO SELL THESE SECURITIES AND IT IS NOT A SOLICITATION OF AN OFFER TO BUY THESE SECURITIES IN ANY JURISDICTION WHERE THE OFFER OR SALE IS NOT PERMITTED.
146
FAIR OAKS MALL
originated on April 27, 2018 by Bank of America, National Association and Barclays Bank PLC. The Fair Oaks Mall Whole Loan had an original aggregate principal balance of $260,000,000, has an outstanding aggregate principal balance as of the Cut-off Date of $259,189,735 and accrues interest at a rate of 5.31788461538462%per annum. The Fair Oaks Mall Whole Loan had an initial term of 60 months, has a remaining term of 57 months as of the Cut-off Date and requires payments of principal and interest through its maturity date of May 10, 2023.
Note A-1-2, which will be contributed to the BANK 2018-BNK13 securitization trust, had an original principal balance of $33,750,000, has an outstanding principal balance of $33,644,821 as of the Cut-off Date and represents a non-controlling interest in the Fair Oaks Mall Whole Loan. The controlling Note A-1-1, which had an original principal balance of $80,000,000, was contributed to the BANK 2018-BNK12 securitization trust. The non-controlling Notes A-2-1, A-2-2 and A-2-3 in the original aggregate principal balance of $61,250,000, are currently being held by Barclays Bank PLC and are expected to be contributed to one or more future securitization trusts. Notes B-1 and B-2 in the aggregate principal balance of $85,000,000, are currently being held by Annaly CRE LLC.
Note Summary
| Notes | Original Balance | Note Holder | Controlling Interest(1) | |
| A-1-1 | $80,000,000 | BANK 2018-BNK12 | Yes | |
| A-1-2 | $33,750,000 | BANK 2018-BNK13 | No | |
| A-2-1 | $20,000,000 | Barclays Bank PLC | No | |
| A-2-2 | $20,625,000 | Barclays Bank PLC | No | |
| A-2-3 | $20,625,000 | Barclays Bank PLC | No | |
| B-1 | $55,250,000 | Annaly CRE LLC | No | |
| B-2 | $29,750,000 | Annaly CRE LLC | No | |
| Total | $260,000,000 |
| (1) | The holder of the Fair Oaks Mall B Notes (Notes B-1 and B-2) will have certain control rights with respect to the Fair Oaks Mall Whole Loan and the right to appoint the special servicer with respect to the Fair Oaks Whole Loan;provided that after a control appraisal period exists with respect to the Fair Oaks Mall B Notes, then the directing certificateholder for the BANK 2018-BNK12 securitization trust will have such rights. |
Defeasance of the Fair Oaks Mall Whole Loan is permitted any time after the earlier of (i) April 27, 2022, or (ii) two years from the closing date of the securitization that includes the lastpari passu senior note of the Fair Oaks Mall Whole Loan to be securitized. The assumed lockout period of 27 payments is based on the closing date of this transaction in August 2018. In addition, the Fair Oaks Mall Loan is prepayable without penalty on or after February 10, 2023.
Sources and Uses
| Sources | Uses | |||||||
| Original loan amount | $260,000,000 | 97.7% | Loan Payoff | $259,397,855 | 97.5% | |||
| Borrower equity | 6,133,376 | 2.3 | Upfront Reserves | 5,137,558 | 1.9 | |||
| Closing Costs | 1,597,963 | 0.6 | ||||||
| Total Sources | $266,133,376 | 100.0% | Total Uses | $266,133,376 | 100.0% |
The Fair Oaks Mall Property consists of a 779,949 square foot portion of the two-story 1,531,650 square foot Fair Oaks Mall, located in Fairfax, Virginia. The Fair Oaks Mall is anchored by Macy’s and non-collateral anchors Macy’s (with Furniture Gallery), Sears, JC Penney and Lord & Taylor. The five anchor tenants generate approximately $130.8 million in annual sales. Other large retailers include XXI Forever, H&M, Express and Victoria’s Secret, with no other tenant occupying more than 1.4% of NRA or representing more than 2.4% of underwritten base rent. The Fair Oaks Mall Property features over 160 specialty in-line stores including Abercrombie & Fitch, Altar’d State, Ann Taylor, Apple, Banana Republic, Coach, Gap, J. Crew, J. Jill, L’Occitane en Provence, M.A.C, Michael Kors, Pandora, PINK by Victoria’s Secret, Pottery Barn, Sephora, Swarovski, Vera Bradley and Williams-Sonoma. Additionally, the Fair Oaks Mall Property includes dining options such as Brio Tuscan Grille, The Cheesecake Factory, Kona Grill, On The Border Mexican Grill and Cantina and Texas de Brazil. The Fair Oaks Mall Property regularly hosts family centered events including Lunar New Year, Mall-O-Ween for Halloween, Santa’s Academy and Summer of Science, and features a number of children’s retailers including Gap Kids/Baby Gap, Hanna Andersson, Hollister, Janie and Jack and Pottery Barn Kids. Included in the collateral are 7,724 parking spaces (approximately 4.97 spaces per 1,000 square feet).
The Fair Oaks Mall Property was built in 1980 by the borrower sponsors, expanded in 1986, and between 2013 and 2014 underwent a $23.8 million renovation which included new mall entrances, exterior signage and landscaping, all new interior lighting, signage, landscaping and paint, all new seating areas and flooring (including technology tables, cafe and lounge seating), a new play area, a new customer service desk and added/upgraded Wi-Fi throughout the mall.
The Fair Oaks Mall Property was 91.6% leased as of February 1, 2018 to 148 permanent retail and restaurant tenants, and 96.9% leased including temporary tenants. Year-end historical occupancy at the Fair Oaks Mall Property averaged 91.3% between 2013 and 2017 (95.5% including temporary tenants). Total inline sales at the Fair Oaks Mall Property for the year ending December 31, 2017 were approximately $164.9 million with an average of $529 PSF ($404 PSF excluding Apple), resulting in an occupancy cost of 16.5% (21.4% excluding Apple).
The Fair Oaks Mall Property is located at the intersection of Lee Jackson Memorial Highway (Route 50) (110,000 average daily traffic count), and Interstate 66, a main commuter route providing linkage to Fairfax County Parkway, Chain Bridge Road, the Capital
THE INFORMATION IN THIS STRUCTURAL AND COLLATERAL TERM SHEET IS NOT COMPLETE AND MAY BE AMENDED PRIOR TO THE TIME OF SALE. THIS TERM SHEET IS NOT AN OFFER TO SELL THESE SECURITIES AND IT IS NOT A SOLICITATION OF AN OFFER TO BUY THESE SECURITIES IN ANY JURISDICTION WHERE THE OFFER OR SALE IS NOT PERMITTED.
147
FAIR OAKS MALL
Beltway and downtown Washington, D.C. Access to the Fair Oaks Mall Property is available from two direct ramps from Interstate 66 and US 50 as well as two additional entrances along US 50 and one along Fair Oaks Parkway.
The Fair Oaks Mall Property is located in Fairfax, Fairfax County, Virginia, approximately 14 miles west of the Washington, D.C. central business district. Fairfax County is the third highest ranked county in the United States based on average household income and is a top 30 county based on median household value. Fairfax County had a 3.0% unemployment rate as of March 2017 and is the location for 49 corporate headquarters including eight Fortune 500 companies: Freddie Mac, General Dynamics, Northrop Grumman, CSC, Hilton Worldwide, Capital One, NVR and Booz Allen Hamilton. Within a five-mile radius of the Fair Oaks Mall Property, there is an estimated 16 million square feet of office space, which is greater than 90% leased.
According to the appraisal, the estimated 2017 population within a three-, five- and ten-mile radius of the Fair Oaks Mall Property was 109,867, 257,286 and 850,767, respectively. The estimated 2017 average household income within a three-, five- and ten-mile radius was $164,748, $158,616 and $156,511, respectively. The appraiser considers the five-mile radius to be the Fair Oaks Mall Property’s primary trade area. From 2000 to 2017, the trade area experienced compound annual growth in population of 1.2% and in average household income of 2.6%. The trade area had 2017 average retail sales per household of $81,952, as compared to the national average retail sales per household of $59,289. The Fair Oaks Mall Property is a part of the Suburban Fairfax County submarket of the Suburban Virginia retail market. The Suburban Fairfax County submarket contains approximately 12.8 million square feet of retail space which as of the first quarter of 2018 had a vacancy rate of 4.7% and asking rents of $34.58 PSF. There is no proposed new competitive supply noted by the appraisal.
The following table presents certain information relating to the tenancy at the Fair Oaks Mall Property:
Major Tenants(1)
| Tenant Name | Credit Rating | Tenant NRSF | % of NRSF | Annual U/W Base Rent PSF | Annual U/W Base Rent | % of Total Annual U/W Base Rent | 12/31/2017 TTM Sales | Lease Expiration Date | |||||
| $ | PSF | Occ. Cost | |||||||||||
| Major Tenants | |||||||||||||
| Macy’s(3) | BBB/Baa3/BBB- | 215,000 | 27.6% | $4.10 | $881,733 | 3.6% | $25,700,000 | $120 | 4.3% | 2/1/2026 | |||
| XXI Forever | NR/NR/NR | 51,317 | 6.6% | $25.81 | $1,324,402 | 5.5% | $4,563,152 | $89 | 48.9% | 1/31/2022 | |||
| H&M(4) | NR/NR/NR | 20,265 | 2.6% | $29.94 | $606,773 | 2.5% | $4,681,675 | $234 | 10.1% | 1/31/2029 | |||
| Express | NR/NR/NR | 12,278 | 1.6% | $36.61 | $449,452 | 1.9% | $2,515,806 | $205 | 41.5% | 1/31/2024 | |||
| Victoria’s Secret | BB+/Ba1/BB+ | 12,170 | 1.6% | $65.00 | $791,050 | 3.3% | $6,337,380 | $521 | 19.6% | 1/31/2026 | |||
| The Cheesecake Factory | NR/NR/NR | 10,982 | 1.4% | $46.00 | $505,172 | 2.1% | $9,909,884 | $902 | 7.7% | 1/31/2027 | |||
| Talbots(5) | NR/B2/B- | 10,589 | 1.4% | $50.00 | $529,450 | 2.2% | $2,794,392 | $264 | 34.0% | 1/31/2018 | |||
| Texas de Brazil(6) | NR/NR/NR | 10,043 | 1.3% | $58.81 | $590,592 | 2.4% | $5,409,804 | $539 | 19.4% | 1/31/2019 | |||
| Total Major Tenants | 342,644 | 43.9% | $16.57 | $5,678,623 | 23.4% | ||||||||
| Other Tenants | 371,910 | 47.7% | $49.91 | $18,560,255 | 76.6% | $164,892,000(7) | $529(7) | 16.5%(7) | |||||
| Occupied Collateral Total | 714,554 | 91.6% | $33.92 | $24,238,878 | 100.0% | ||||||||
| Temporary Tenants | 40,931 | 5.2% | |||||||||||
| Vacant Space | 24,464 | 3.1% | |||||||||||
| Collateral Total | 779,949 | 100.0% | |||||||||||
| Non-Collateral Tenants | |||||||||||||
| Macy’s (with Furniture Gallery) | BBB/Baa3/BBB- | 229,064 | NAV | NAV | NAV | NAV | |||||||
| Sears | CC/Ca/CCC- | 209,547 | NAV | NAV | NAV | NAV | |||||||
| JC Penney | B+/B1/B+ | 190,090 | NAV | NAV | NAV | NAV | |||||||
| Lord & Taylor | NR/B3/B | 123,000 | NAV | NAV | NAV | NAV | |||||||
| (1) | Information is based on the underwritten rent roll dated February 1, 2018. |
| (2) | Certain ratings are those of the parent company whether or not the parent guarantees the lease. |
| (3) | Macy’s Sales $, Sales PSF and Occ. Cost are for the 2016 period as reported by the borrower sponsor. Macy’s has seven ten-year extension options. |
| (4) | H&M has a termination option if it fails to achieve gross sales of at least $6,000,000 for the period March 28, 2021 to March 29, 2022, effective as of March 29, 2023. H&M has five, two year renewal options upon 270 days prior written notice. |
| (5) | Talbots is currently in renewal discussions with the borrower regarding a six-year renewal lease. |
| (6) | Texas de Brazil executed a ten-year renewal on July 9, 2018. The total rent charges are projected to be $599,296.99. |
| (7) | Sales $, Sales PSF and Occ. Cost % represent total comparable in-line sales including Apple. |
THE INFORMATION IN THIS STRUCTURAL AND COLLATERAL TERM SHEET IS NOT COMPLETE AND MAY BE AMENDED PRIOR TO THE TIME OF SALE. THIS TERM SHEET IS NOT AN OFFER TO SELL THESE SECURITIES AND IT IS NOT A SOLICITATION OF AN OFFER TO BUY THESE SECURITIES IN ANY JURISDICTION WHERE THE OFFER OR SALE IS NOT PERMITTED.
148
FAIR OAKS MALL
The following table presents certain information relating to the lease rollover schedule at the Fair Oaks Mall Property:
Lease Expiration Schedule(1)(2)
| Year Ending December 31, | No. of Leases Expiring | Expiring NRSF | % of Total NRSF | Cumulative Expiring NRSF | Cumulative % of Total NRSF | Annual U/W Base Rent | % of Total Annual U/W Base Rent | Annual U/W Base Rent PSF(3) | |
| 2018 / MTM | 5 | 19,920 | 2.6% | 19,920 | 2.6% | $1,190,571 | 4.9% | $59.77 | |
| 2019 | 23 | 79,830 | 10.2% | 99,750 | 12.8% | $3,901,594 | 16.1% | $48.87 | |
| 2020 | 14 | 33,124 | 4.2% | 132,874 | 17.0% | $1,307,271 | 5.4% | $39.47 | |
| 2021 | 16 | 39,396 | 5.1% | 172,270 | 22.1% | $2,103,741 | 8.7% | $53.40 | |
| 2022 | 22 | 103,015 | 13.2% | 275,285 | 35.3% | $4,260,618 | 17.6% | $41.36 | |
| 2023 | 18 | 56,565 | 7.3% | 331,850 | 42.5% | $3,136,650 | 12.9% | $55.45 | |
| 2024 | 9 | 33,355 | 4.3% | 365,205 | 46.8% | $1,523,464 | 6.3% | $45.67 | |
| 2025 | 8 | 23,497 | 3.0% | 388,702 | 49.8% | $1,198,695 | 4.9% | $51.01 | |
| 2026 | 9 | 249,217 | 32.0% | 637,919 | 81.8% | $2,900,681 | 12.0% | $11.64 | |
| 2027 | 11 | 30,529 | 3.9% | 668,448 | 85.7% | $1,547,715 | 6.4% | $50.70 | |
| 2028 | 6 | 10,211 | 1.3% | 678,659 | 87.0% | $243,037 | 1.0% | $23.80 | |
| Thereafter | 7 | 35,895 | 4.6% | 714,554 | 91.6% | $924,841 | 3.8% | $25.77 | |
| Vacant | 0 | 65,395 | 8.4% | 779,949 | 100.0% | $0 | 0.0% | $0.00 | |
| Total/Weighted Average | 148 | 779,949 | 100.0% | $24,238,878 | 100.0% | $33.92 | |||
| (1) | Information obtained from the underwritten rent roll dated February 1, 2018. |
| (2) | Certain tenants may have lease termination options that are exercisable prior to the originally stated expiration date of the subject lease and that are not considered in the Lease Expiration Schedule. |
| (3) | Weighted Average Annual U/W Base Rent PSF excludes vacant space. |
The following table presents historical in-line sales at the Fair Oaks Mall Property:
Historical In-line Tenant Sales Summary(1)
| Year | Sales PSF w/ Apple | Occupancy Cost w/ Apple | Sales PSF w/o Apple | Occupancy Cost w/o Apple | |||
| 2015 | $528 | 16.9% | $433 | 20.5% | |||
| 2016 | $518 | 16.7% | $417 | 20.7% | |||
| 2017(2) | $529 | 16.5% | $404 | 21.4% | |||
| (1) | Information as provided by the borrower sponsor and only includes tenants reporting comparable sales. |
| (2) | Sales information for Verizon Wireless is excluded from the 2017 figures, as the tenant signed a renewal and is no longer required to report sales. The indicative 2017 Sales PSF w/Apple and Sales PSF w/o Apple using the most recent reported sales figure for Verizon Wireless are $545 and $421, respectively. |
The following table presents historical anchor sales at the Fair Oaks Mall Property:
Historical Anchor Tenant Sales Summary(1)
| Year | Macy’s Sales $ mil / Sales PSF | Macy’s (with Furniture Gallery)(2) Sales $ mil / Sales PSF | Sears(2) Sales $ mil / Sales PSF | JC Penney(2) Sales $ mil / Sales PSF | Lord & Taylor(2) Sales $ mil / Sales PSF |
| 2014 | $28.9 / $134 | $45.0 / $196 | $34.2 / $155 | $18.0 / $94 | $19.0 / $154 |
| 2015 | $26.2 / $122 | $45.0 / $196 | $32.0 / $145 | $19.0 / $99 | $19.0 / $154 |
| 2016 | $25.7 / $120 | $44.1 / $193 | $24.0 / $115(3) | $19.0 / $100 | $18.0 / $146 |
| (1) | Information is estimated and as provided by the borrower sponsor. |
| (2) | Anchors are non-collateral tenants. |
| (3) | Reduced 2016 sales are a result of Sears store operations being consolidated to the first floor space in anticipation of its owner, Seritage Growth Properties, leasing the recaptured second floor space to Dave & Buster’s and a restaurant concept, Season 52. |
THE INFORMATION IN THIS STRUCTURAL AND COLLATERAL TERM SHEET IS NOT COMPLETE AND MAY BE AMENDED PRIOR TO THE TIME OF SALE. THIS TERM SHEET IS NOT AN OFFER TO SELL THESE SECURITIES AND IT IS NOT A SOLICITATION OF AN OFFER TO BUY THESE SECURITIES IN ANY JURISDICTION WHERE THE OFFER OR SALE IS NOT PERMITTED.
149
FAIR OAKS MALL
Operating History and Underwritten Net Cash Flow. The following table presents certain information relating to the historical operating performance and underwritten net cash flow at the Fair Oaks Mall Property:
Cash Flow Analysis
| 2014 | 2015 | 2016 | 2017 | U/W | % of U/W Effective Gross Income | U/W $ per SF | |
| Base Rent(1) | $24,516,411 | $23,635,712 | $23,991,476 | $22,835,334 | $21,638,878 | 48.0% | $27.74 |
| Vacant Space | 0 | 0 | 0 | 0 | 5,431,849 | 12.0 | 6.96 |
| Percentage Rent | 421,000 | 444,000 | 338,000 | 326,000 | 334,234 | 0.7 | 0.43 |
| Total Recoveries | 17,947,302 | 18,542,644 | 19,579,844 | 17,953,404 | 17,429,362 | 38.7 | 22.35 |
| Specialty Leasing | 2,179,737 | 2,383,555 | 2,523,588 | 2,051,140 | 2,051,140 | 4.5 | 2.63 |
| Other Income(2) | 4,123,343 | 4,134,048 | 4,491,452 | 4,443,609 | 4,187,578 | 9.3 | 5.37 |
| Less Vacancy(3) | (612,764) | (405) | (543,309) | (300,621) | (5,977,679) | (13.3) | (7.66) |
| Effective Gross Income | $48,575,029 | $49,139,554 | $50,381,051 | $47,308,867 | $45,095,362 | 100.0% | $57.82 |
| Total Operating Expenses | $14,429,846 | $14,789,192 | $15,478,478 | $15,012,540 | $15,187,457 | 33.7% | $19.47 |
|
|
|
|
|
|
| |
| Net Operating Income | $34,145,183 | $34,350,362 | $34,902,573 | $32,296,326 | $29,907,905 | 66.3% | $38.35 |
| Capital Expenditures | 0 | 0 | 0 | 0 | 144,930 | 0.3 | $0.19 |
| TI/LC | 0 | 0 | 0 | 0 | 1,364,911 | 3.0 | $1.75 |
| Net Cash Flow | $34,145,183 | $34,350,362 | $34,902,573 | $32,296,326 | $28,398,064 | 63.0% | $36.41 |
| NOI DSCR(4) | 3.48x | 3.50x | 3.55x | 3.29x | 3.05x | ||
| NCF DSCR(4) | 3.48x | 3.50x | 3.55x | 3.29x | 2.89x | ||
| NOI DY(4) | 19.6% | 19.7% | 20.0% | 18.5% | 17.1% | ||
| NCF DY(4) | 19.6% | 19.7% | 20.0% | 18.5% | 16.3% |
| (1) | U/W Base Rent includes contractual rent steps through March 2019 totaling $309,021. U/W Base rent also includes a rent adjustment to 20% of sales for the tenants XXI Forever, Talbots and Texas de Brazil, and for tenants under 10,000 square feet that have lease expirations prior to December 31, 2020 unless such tenant has recently executed a new or renewed lease. |
| (2) | Other Income includes income from electric recovery, central plant recovery, recovery of tenant services and miscellaneous other income. |
| (3) | U/W Vacancy includes any tenants that are bankrupt totaling $545,830. |
| (4) | Debt service coverage ratios and debt yields are based on the Fair Oaks Mall Senior Loan. |
The following table presents certain information relating to comparable properties to the Fair Oaks Mall Property:
Comparable Properties(1)
| Property, Location | Property Type | Year Built/ Renovated | Size (SF) | Occ. | Sales PSF(3) | Anchor Tenants | Distance to Subject (mi.) |
Fair Oaks Mall Property
Fairfax, VA
| Super Regional Mall | 1980/2014 | 1,531,650 | 91.6%(2) | $529 | Macy’s, JC Penney (non-collateral), Lord & Taylor (non-collateral), Macy’s (with Furniture Gallery) (non-collateral), Sears (non-collateral) | NAP |
| Primary Competition | |||||||
| Tysons Corner McLean, VA | Super Regional Mall | 1968/2005 | 1,985,179 | 97% | $825 | Bloomingdales, Lord & Taylor, Macy’s Nordstrom, Cinema | 10.5 |
| Tysons Galleria McLean, VA | Super Regional Mall | 1988/2000 | 812,615 | 96% | $875 | Macy’s, Neiman Marcus, Saks Fifth Avenue | 11.3 |
| The Fashion Centre at Pentagon City Arlington, VA | Super Regional Mall | 1989/2002 | 990,074 | 98% | $900 | Macy’s, Nordstrom | 18.4 |
| Secondary Competition | |||||||
| Dulles Town Center Sterling, VA | Super Regional Mall | 1999/2003 | 1,436,703 | 90% | $400 | Dick’s Sporting Goods, JC Penney, Lord & Taylor, Macy’s, Sears | 18.7 |
| Westfield - Montgomery Bethesda, MD | Super Regional Mall | 1968/2001 | 1,275,111 | 96% | $560 | Macy’s, Macy’s Home, Nordstrom, Sears, Cinema | 19.1 |
| Manassas Mall Manassas, VA | Super Regional Mall | 1972/2000 | 900,877 | 80% | $385 | At Home, Autobahn Speedway, Macy’s, Sears, Walmart | 13.1 |
| Springfield Town Center Springfield, VA | Super Regional Mall | 1973/2014 | 1,300,000 | 88% | $500 | Macy’s, Target, JC Penney, Dick’s Sporting Goods, Nordstrom Rack, Saks Off 5th, Cinema | 10.9 |
| (1) | Information obtained from the appraisal and underwritten rent roll. |
| (2) | Occupancy as of February 1, 2018 includes eleven tenants (3.1% of NRA) with executed leases but who are not yet in occupancy at the Fair Oaks Mall Property. |
| (3) | Comparable inline sales shown as of December 31, 2017. |
THE INFORMATION IN THIS STRUCTURAL AND COLLATERAL TERM SHEET IS NOT COMPLETE AND MAY BE AMENDED PRIOR TO THE TIME OF SALE. THIS TERM SHEET IS NOT AN OFFER TO SELL THESE SECURITIES AND IT IS NOT A SOLICITATION OF AN OFFER TO BUY THESE SECURITIES IN ANY JURISDICTION WHERE THE OFFER OR SALE IS NOT PERMITTED.
150
FAIR OAKS MALL
Release of Property. The borrower is permitted to release one or more non-income producing outparcels or ring road outparcels to a third partyprovided among other conditions: (i) such release does not result in a material adverse effect to the remaining property, (ii) before such release or immediately after, no event of default has occurred and is continuing, (iii) the lender’s determination of the loan to value after taking into account the contemplated release does not exceed 125% which can be satisfied through the borrower’s prepayment of the Fair Oaks Mall Whole Loan (together with any yield maintenance premium), (iv) such release does not cause the BANK 2018-BNK13 securitization trust to lose its REMIC status, and (v) with respect to the release of a ring road outparcel, the borrower will deposit the entire net sales proceeds resulting from the outparcel sale to the tenant improvement reserve held by the lender. Notwithstanding the foregoing, if the release is of a non-income producing outparcel, it will be permitted only in connection with the expansion or other development of the Fair Oaks Mall Property or in connection with the demolition and redevelopment of non-collateral anchor space.
Solely in connection with the acquisition and redevelopment of non-collateral anchor space, the release of a non-income producing outparcel is permitted to a borrower affiliate, provided the borrower has agreed to comply with the anti-poaching conditions prohibiting it from (x) soliciting any then-existing tenant to lease or otherwise occupy space in any such redeveloped anchor space or (y) terminating or reducing the term of any then-existing lease in order to solicit any tenant to occupy space in any such redeveloped anchor space.
THE INFORMATION IN THIS STRUCTURAL AND COLLATERAL TERM SHEET IS NOT COMPLETE AND MAY BE AMENDED PRIOR TO THE TIME OF SALE. THIS TERM SHEET IS NOT AN OFFER TO SELL THESE SECURITIES AND IT IS NOT A SOLICITATION OF AN OFFER TO BUY THESE SECURITIES IN ANY JURISDICTION WHERE THE OFFER OR SALE IS NOT PERMITTED.
151
| No. 13 – Anderson Towne Center | ||||||||
| Loan Information | Property Information | |||||||
| Mortgage Loan Seller: | Morgan Stanley Mortgage Capital Holdings LLC | Single Asset/Portfolio: | Single Asset | |||||
Credit Assessment (DBRS/Fitch/S&P): | (NR/NR/NR) | Property Type: | Retail | |||||
| Original Principal Balance(1): | $25,000,000 | Specific Property Type: | Anchored | |||||
| Cut-off Date Balance(1): | $24,921,433 | Location: | Cincinnati, OH | |||||
| % of Initial Pool Balance: | 2.64% | Size: | 347,622 SF | |||||
| Loan Purpose: | Refinance | Cut-off Date Balance Per SF(1): | $121.63 | |||||
| Borrower: | Anderson Investors OH, LLC | Year Built/Renovated: | 1967/2017 | |||||
| Borrower Sponsor: | Victory Real Estate Investments, LLC | Title Vesting: | Fee | |||||
| Mortgage Rate: | 5.2800% | Property Manager: | Victory Commercial Real Estate, Inc. | |||||
| Note Date: | April 26, 2018 | 4th Most Recent Occupancy (As of)(3): | 98.4% (12/31/2014) | |||||
| Anticipated Repayment Date: | NAP | 3rd Most Recent Occupancy (As of)(3): | 64.6% (12/31/2015) | |||||
| Maturity Date: | May 1, 2028 | 2nd Most Recent Occupancy (As of)(3): | 78.1% (12/31/2016) | |||||
| IO Period: | 0 months | Most Recent Occupancy (As of)(3): | 92.1% (12/31/2017) | |||||
| Loan Term (Original): | 120 months | Current Occupancy (As of)(3): | 95.5% (4/19/2018) | |||||
| Seasoning: | 3 months | |||||||
| Amortization Term (Original): | 360 months | Underwriting and Financial Information: | ||||||
| Loan Amortization Type: | Amortizing Balloon | |||||||
| Interest Accrual Method: | Actual/360 | 4th Most Recent NOI (As of)(3): | $1,966,724 (12/31/2014) | |||||
| Call Protection: | L(23),GRTR 1% or YM(93),O(4) | 3rd Most Recent NOI (As of)(3): | $1,511,809 (12/31/2015) | |||||
| Lockbox Type: | Springing | 2nd Most Recent NOI (As of)(3): | $1,198,082 (12/31/2016) | |||||
| Additional Debt(1): | Yes | Most Recent NOI (As of)(3): | $2,921,701 (12/31/2017) | |||||
| Additional Debt Type(1): | Pari Passu | |||||||
| Escrows and Reserves: | U/W Revenues: | $5,958,446 | ||||||
| U/W Expenses: | $1,987,433 | |||||||
| Type: | Initial | Monthly | Cap (If Any) | U/W NOI: | $3,971,012 | |||
| Taxes | $0 | $94,956 | NAP | U/W NCF: | $3,623,390 | |||
| Insurance(2) | $0 | Springing | NAP | U/W NOI DSCR(1): | 1.41x | |||
| Replacement Reserve | $0 | $4,345 | NAP | U/W NCF DSCR(1): | 1.28x | |||
| Deferred Maintenance | $49,882 | $0 | NAP | U/W NOI Debt Yield(1): | 9.4% | |||
| TI/LC Reserve | $0 | $17,959 | $1,000,000 | U/W NCF Debt Yield(1): | 8.6% | |||
| Existing TI/LC Reserve Funds | $980,000 | $0 | NAP | As-Is Appraised Value: | $60,600,000 | |||
| Outstanding Free Rent | $73,649 | $0 | NAP | As-Is Appraisal Valuation Date: | March 8, 2018 | |||
| Cut-off Date LTV Ratio(1): | 69.8% | |||||||
| LTV Ratio at Maturity(1): | 58.1% | |||||||
| (1) | The Anderson Towne Center Mortgage Loan (as defined below) is part of the Anderson Towne Center Whole Loan (as defined below), which is comprised of twopari passu promissory notes with an aggregate original principal balance of $42,415,000. The Cut-off Date Balance Per SF, U/W NOI DSCR, U/W NCF DSCR, U/W NOI Debt Yield, U/W NCF Debt Yield, Cut-off Date LTV Ratio and LTV Ratio at Maturity Date numbers presented above are based on the aggregate principal balance of the promissory notes comprising the Anderson Towne Center Whole Loan. |
| (2) | Ongoing monthly escrows for insurance premiums are not required as long as (i) there is no event of default under the Anderson Towne Center Whole Loan documents; and (ii) insurance requirements are being satisfied by a blanket policy reasonably approved by the lender with evidence of renewal of the policies and timely proof of payment of the insurance premiums. |
| (3) | The increase in occupancy in Most Recent Occupancy and Current Occupancy compared to historical occupancy, and the increase in 2017 and U/W NOI compared to historical NOI is attributable to the lease up associated with the recent redevelopment at the Anderson Towne Center Property that occurred between 2015 and 2017. |
The mortgage loan (the “Anderson Towne Center Mortgage Loan”) is part of a whole loan (the “Anderson Towne Center Whole Loan”) evidenced by twopari passu promissory notes (Note A-1 and Note A-2) secured by a first mortgage encumbering the borrower’s fee interest in a 347,622 square foot anchored retail center located in Cincinnati, Ohio (the “Anderson Towne Center Property”). The Anderson Towne Center Whole Loan was originated on April 26, 2018 by Morgan Stanley Bank, N.A. The Anderson Towne Center Whole Loan had an original principal balance of $42,415,000, has an outstanding balance as of the Cut-off Date of $42,281,704 and accrues interest at an interest rate of 5.2800%per annum.The Anderson Towne Center Whole Loan had an initial term of 120 months, has a remaining term of 117 months as of the Cut-off Date and requires payments of principal and interest based on a 30-year amortization schedule. The Anderson Towne Center Whole Loan matures on May 1, 2028.
Note A-1, which will be contributed to the BANK 2018-BNK13 securitization trust, has an original principal balance of $25,000,000, has an outstanding principal balance of $24,921,433 as of the Cut-off Date and represents the controlling interest in the Anderson
THE INFORMATION IN THIS STRUCTURAL AND COLLATERAL TERM SHEET IS NOT COMPLETE AND MAY BE AMENDED PRIOR TO THE TIME OF SALE. THIS TERM SHEET IS NOT AN OFFER TO SELL THESE SECURITIES AND IT IS NOT A SOLICITATION OF AN OFFER TO BUY THESE SECURITIES IN ANY JURISDICTION WHERE THE OFFER OR SALE IS NOT PERMITTED.
152
| ANDERSON TOWNE CENTER |
Towne Center Whole Loan. The non-controlling Note A-2, which had an original principal balance of $17,415,000, is currently being held by Morgan Stanley Bank, N.A. and is expected to be contributed to one or more future securitizations.
Note Summary
| Notes | Original Balance | Note Holder | Controlling Interest | |
| A-1 | $25,000,000 | BANK 2018 – BNK13 | Yes | |
| A-2 | $17,415,000 | Morgan Stanley Bank, N.A. | No | |
| Total | $42,415,000 |
Sources and Uses
| Sources | Uses | |||||||
| Original whole loan amount | $42,415,000 | 100.0% | Loan Payoff | $37,631,860 | 88.7% | |||
| Return of Equity | $2,921,969 | 6.9 | ||||||
| Reserves | $1,103,531 | 2.6 | ||||||
| Closing Costs | $757,639 | 1.8 | ||||||
| Total Sources | $42,415,000 | 100.0% | Total Uses | $42,415,000 | 100.0% |
The Anderson Towne Center Property is a 347,622 square feet open-air retail anchored center comprised of 13 buildings located in Cincinnati, Ohio. The Anderson Towne Center Property sits on 29.0 acres and is comprised of 347,622 SF of retail space (95.9% occupied by 45 tenants as of April 19, 2018). Originally built as an enclosed mall in 1967, the Anderson Towne Center Property was redeveloped into an open-air shopping center in 2005 and further redeveloped between 2015 and 2017. The first phase of the redevelopment was completed in 2006 at a cost of approximately $14.8 million and the second phase of the redevelopment was completed in 2017 at a cost of approximately $22.7 million. In 2015, the sponsor demolished a portion of a property formerly leased to Kmart (which vacated in 2015) and redeveloped it into the space now occupied by Crunch Fitness, Skyzone and Carmike Cinema (a subsidiary of AMC Theatres).
As of April 19, 2018, the Anderson Towne Center Property was 95.5% leased by a mix of mostly national and regional tenants, including Macy’s, Carmike Cinema (AMC Theatres), Crunch Fitness, Skyzone, CVS, Bar Louie, Carrabba’s, PNC Bank and Starbucks. As of August 1, 2018, the weighted average remaining lease term at the Anderson Towne Center Property was 8.21 years. With the exception of 2027, when 14.2% of net rentable area rolls (spread across four leases), no more than 7.3% of net rentable area rolls in any given year of the Anderson Towne Center Whole Loan term. The Anderson Towne Center Property contains a total of 1,435 parking spaces (4.13 spaces per 1,000 square feet of NRA). The Anderson Towne Center Property is shadow anchored by a 105,114 square foot Kroger grocery store.
The largest tenant, Macy’s (114,478 square feet, 32.9% of net rentable area, 6.6% of underwritten rent) has been a tenant, through its predecessors, at the Anderson Towne Center Property since it was built in 1967. Macy’s exercised a 10 year renewal in January of 2018 and has four, 10-year renewal options remaining at its current rent ($2.70 per square foot). The appraiser concluded to a market rent of $6.00 per square foot for the Macy’s space.
The second largest tenant, Carmike Cinema (48,907 square feet, 14.1% of net rentable area, 21.5% of underwritten rent), is a nine-screen “dine-in” theatre with a full service bar area, recliner seating and a reserved seating program that opened at the Anderson Towne Center Property in 2017. Carmike Cinema was acquired by AMC in 2016, making AMC the largest cinema chain in the United States. Carmike Cinema has a lease expiration of December 29, 2031 and has three five-year renewal options.
The third largest tenant, Crunch Fitness (25,000 square feet, 7.2% of net rentable area, 7.8% of underwritten rent), is a fitness club that was founded in 1989 and has 177 locations across the United States. Crunch Fitness offers a variety of membership options, group fitness classes, personal training and tanning at the Anderson Towne Center Property. Crunch Fitness took occupancy in 2017, after the second phase of redevelopment at the Anderson Towne Center Property and has a lease expiration of April 30, 2027 and two five-year renewal options.
The Anderson Towne Center Property is located on the signalized northeast corner of Beechmont Avenue and Five Mile Road, approximately 10 miles southeast of the Cincinnati, Ohio central business district. According to the appraisal, Beechmont Avenue, in the vicinity of the Anderson Towne Center Property, averages traffic counts between 29,000 and 30,000 vehicles per day while Five Mile Road averages between 25,000 and 30,000 vehicles per day. According to the appraisal, interstate 275 averages traffic counts between 62,000 and 63,000 vehicles per day approximately one mile south of the Anderson Towne Center Property.
The Anderson Towne Center Property is located in the Downtown/SE Hamilton submarket of Cincinnati, Ohio. According to a third party industry report, as of the fourth quarter of 2017, the overall retail vacancy rate for neighborhood and community shopping centers in the Cincinnati retail market was approximately 11.8%, while the market rental rate was approximately $15.77 per square foot. According to a third party industry report, as of the fourth quarter of 2017, the overall retail vacancy rate for neighborhood and community shopping centers in the Downtown/SE Hamilton submarket was approximately 9.8%, while the market rental rate was approximately $23.32 per square foot.
The estimated 2017 population within a one-, three- and five-mile radius of the Anderson Towne Center Property was 9,850, 58,374 and 96,893, respectively, according to the appraisal. The estimated 2017 average household income within a one-, three- and five-mile radius of the Anderson Towne Center Property was $95,623, $103,557 and $100,004, respectively.
THE INFORMATION IN THIS STRUCTURAL AND COLLATERAL TERM SHEET IS NOT COMPLETE AND MAY BE AMENDED PRIOR TO THE TIME OF SALE. THIS TERM SHEET IS NOT AN OFFER TO SELL THESE SECURITIES AND IT IS NOT A SOLICITATION OF AN OFFER TO BUY THESE SECURITIES IN ANY JURISDICTION WHERE THE OFFER OR SALE IS NOT PERMITTED.
153
| ANDERSON TOWNE CENTER |
The following table presents certain information relating to the tenancy at Anderson Towne Center Property:
Major Tenants(1)
| Tenant Name | Credit Rating (Fitch/ Moody’s/ S&P)(2) | Tenant NRSF | % of NRSF | Annual U/W Base Rent PSF(3) | Annual U/W Base Rent(4) | % of Total Annual U/W Base Rent | 12/31/2017 TTM Sales | Lease Expiration Date | ||
| $ | PSF | Occ. Cost(5) | ||||||||
| Major Tenants | ||||||||||
| Carmike Cinema | B/B2/B+ | 48,907 | 14.1% | $20.60 | $1,007,484 | 21.5% | NAV | NAV | NAV | 12/29/2031 |
| Crunch Fitness | NR/NR/NR | 25,000 | 7.2 | $14.50 | 362,500 | 7.8 | NAV | NAV | NAV | 4/30/2027 |
| Macy’s | BBB/Baa3/BBB- | 114,478 | 32.9 | $2.70 | 309,091 | 6.6 | $12,158,578 | $106 | 3.6% | 1/31/2029 |
| Skyzone | NR/NR/NR | 20,055 | 5.8 | $14.20 | 284,781 | 6.1 | NAV | NAV | NAV | 7/31/2027 |
| CVS | NR/Baa1/BBB | 10,858 | 3.1 | $2.76 | 30,000 | 0.6 | NAV | NAV | NAV | 1/31/2026 |
| Total Major Tenants | 219,298 | 63.1% | $9.09 | $1,993,856 | 42.6% | |||||
| Non-Major Tenants | 112,824 | 32.5% | $23.78 | $2,682,979 | 57.4% | |||||
| Occupied Collateral Total | 332,122 | 95.5% | $14.08 | $4,676,835 | 100.0% | |||||
| Vacant Space | 15,500 | 4.5% | ||||||||
| Collateral Total | 347,622 | 100.0% | ||||||||
| (1) | Information is based on the underwritten rent roll as of April 19, 2018. |
| (2) | Certain ratings are those of the parent company whether or not the parent guarantees the lease. |
| (3) | Wtd. Avg. Annual U/W Base Rent PSF excludes vacant space. |
| (4) | Annual U/W Base Rent includes contractual rent steps equal to $13,582 through April 1, 2019. |
| (5) | Occ. Cost % is based on the underwritten rent as of the April 19, 2018 rent roll and underwritten reimbursements divided by most recently reported sales. |
The following table presents certain information relating to the lease rollover schedule at Anderson Towne Center Property:
Lease Expiration Schedule(1)(2)
| Year Ending December 31, | No. of Leases Expiring | Expiring NRSF | % of Total NRSF | Cumulative Expiring NRSF | Cumulative % of Total NRSF | Annual U/W Base Rent | % of Total Annual U/W Base Rent | Annual U/W Base Rent PSF(3) |
| MTM | 0 | 0 | 0.0% | 0 | 0.0% | $0 | 0.0% | $0.00 |
| 2018 | 0 | 0 | 0.0% | 0 | 0.0% | $0 | 0.0% | $0.00 |
| 2019 | 7 | 15,396 | 4.4% | 15,396 | 4.4% | $295,783 | 6.3% | $19.21 |
| 2020 | 3 | 11,361 | 3.3% | 26,757 | 7.7% | $264,879 | 5.7% | $23.31 |
| 2021 | 9 | 23,112 | 6.6% | 49,869 | 14.3% | $454,129 | 9.7% | $19.65 |
| 2022 | 5 | 16,594 | 4.8% | 66,463 | 19.1% | $378,763 | 8.1% | $22.83 |
| 2023 | 4 | 6,650 | 1.9% | 73,113 | 21.0% | $170,538 | 3.6% | $25.64 |
| 2024 | 3 | 11,850 | 3.4% | 84,963 | 24.4% | $252,645 | 5.4% | $21.32 |
| 2025 | 0 | 0 | 0.0% | 84,963 | 24.4% | $0 | 0.0% | $0.00 |
| 2026 | 5 | 25,209 | 7.3% | 110,172 | 31.7% | $464,583 | 9.9% | $18.43 |
| 2027 | 4 | 49,365 | 14.2% | 159,537 | 45.9% | $813,391 | 17.4% | $16.48 |
| 2028 | 3 | 9,200 | 2.6% | 168,737 | 48.5% | $265,550 | 5.7% | $28.86 |
| Thereafter | 2 | 163,385 | 47.0% | 332,122 | 95.5% | $1,316,575 | 28.2% | $8.06 |
| Vacant | 0 | 15,500 | 4.5% | 347,622 | 100.0% | $0 | 0.0% | $0.00 |
| Total/Wtd. Avg. | 45 | 347,622 | 100.0% | $4,676,835 | 100.0% | $14.08 |
| (1) | Information is based on the underwritten rent roll as of April 19, 2018. |
| (2) | Certain tenants may have lease termination options that are exercisable prior to the stated expiration date of the subject lease or leases which are not considered in the lease rollover schedule. |
| (3) | Wtd. Avg. Annual U/W Base Rent PSF Rolling excludes vacant space. |
THE INFORMATION IN THIS STRUCTURAL AND COLLATERAL TERM SHEET IS NOT COMPLETE AND MAY BE AMENDED PRIOR TO THE TIME OF SALE. THIS TERM SHEET IS NOT AN OFFER TO SELL THESE SECURITIES AND IT IS NOT A SOLICITATION OF AN OFFER TO BUY THESE SECURITIES IN ANY JURISDICTION WHERE THE OFFER OR SALE IS NOT PERMITTED.
154
| ANDERSON TOWNE CENTER |
Operating History and Underwritten Net Cash Flow. The following table presents certain information relating to the underwritten net cash flow at Anderson Towne Center Property:
Cash Flow Analysis(1)
| 2015 | 2016 | 2017 | U/W | % of U/W Effective Gross Income | U/W $ per SF | |
| Base Rent(1) | $2,165,274 | $1,985,091 | $3,779,043 | $5,022,503 | 84.3% | $14.45 |
| Total Recoveries | 463,756 | 310,419 | 961,298 | 1,281,611 | 21.5 | 3.69 |
| Other Income(2) | 1,145 | 6,470 | 3,205 | 0 | 0.0 | 0.00 |
| Less Vacancy & Credit Loss | 0 | (16,427) | 0 | (345,668) | (5.8) | (0.99) |
| Effective Gross Income | $2,630,175 | $2,285,552 | $4,743,546 | $5,958,446 | 100.0% | $17.14 |
| Total Operating Expenses | $1,118,366 | $1,087,470 | $1,821,845 | $1,987,433 | 33.4% | $5.72 |
| Net Operating Income | $1,511,809 | $1,198,082 | $2,921,701 | $3,971,012 | 66.6% | $11.42 |
| Capital Expenditures | 0 | 0 | 0 | 52,143 | 0.9 | 0.15 |
| TI/LC | 0 | 0 | 0 | 295,479 | 5.0 | 0.85 |
| Net Cash Flow | $1,511,809 | $1,198,082 | $2,921,701 | $3,623,390 | 60.8% | $10.42 |
| NOI DSCR(3) | 0.54x | 0.42x | 1.04x | 1.41x | ||
| NCF DSCR(3) | 0.54x | 0.42x | 1.04x | 1.28x | ||
| NOI DY(3) | 3.6% | 2.8% | 6.9% | 9.4% | ||
| NCF DY(3) | 3.6% | 2.8% | 6.9% | 8.6% |
| (1) | U/W Base Rent is based on the rent roll dated April 19, 2018 and includes rent steps through April 1, 2019 totaling $13,582. The increase in 2017 and U/W Base Rent and Net Operating Income over historical Base Rent and Net Operating Income is attributable to the lease up associated with the recent redevelopment at the Anderson Towne Center Property that occurred between 2015 and 2017. |
| (2) | Other Income is comprised of late fees, returned check fees, merchants association fees and miscellaneous income. |
| (3) | The debt service coverage ratios and debt yields are based on the Anderson Towne Center Whole Loan. |
The following table presents certain information relating to comparable properties to Anderson Towne Center Property:
Comparable Leases(1)
Property Name City, State | Year Built | Size (SF) | Tenant | Lease Area (SF) | Lease Date | Lease Term (Yrs.) | Base Rent PSF | Reimbursements |
Liberty Towne Center Liberty Township, OH | 2015 | 637,000 | Cobb Theaters | 77,133 | Oct. 15 | 15.0 | $25.50 | Net |
Parkway Center East Grove City, OH | 2007 | 181,332 | AMC Theaters 14 | 55,332 | Feb. 12 | 10.0 | $23.13 | Net |
Market at Polaris Columbus, OH | 2001 | 208,457 | Big Sandy Superstore | 50,000 | Feb. 16 | 10.0 | $8.50 | Net |
Hobby Lobby Cincinnati, OH | 2015 | 55,000 | Hobby Lobby | 55,000 | Jan. 16 | 15.0 | $9.00 | Net |
Kenwood Square Cincinnati, OH | 1966 | 463,120 | Michaels | 27,667 | Mar. 18 | 10.0 | $14.00 | Net |
King’s Mall Cincinnati, OH | 1986 | 61,864 | Altitude Trampoline Park | 30,386 | Mar. 18 | 10.0 | $11.00 | Net |
7635 Beechmont Avenue Cincinnati, OH | 2004 | 11,200 | First Watch | 3,938 | Jun. 17 | 5.0 | $24.00 | Net |
Eastgate Crossing Cincinnati, OH | 1991 | 171,628 | Bentley’s Pet Stuff | 2,426 | Jun. 17 | 5.0 | $21.00 | Net |
Cherry Grove Cincinnati, OH | 1983 | 195,513 | Rose & Remington | 4,180 | Aug. 16 | 7.0 | $18.00 | Net |
32 East Cincinnati, OH | 1990 | 3,210 | Hand & Stone Message and Facial Spa | 3,210 | Aug. 17 | 10.0 | $33.00 | Net |
| (1) | Source: Appraisal. |
Partial Release. The borrower has the right to obtain the release of the 1.577-acre parcel on which Macy’s is located, upon prepayment of a release price equal to $4,700,000, together with, if prior to the open period, a prepayment fee equal to the greater of 1.00% of the amount prepaid and a yield maintenance premium. The right to obtain such release is subject to certain conditions, including without limitation (i) the debt yield of the Anderson Towne Center Whole Loan following the release must be equal to the greater of the debt yield preceding the release and 8.2%, (ii) compliance with the terms of existing leases and operating agreements, zoning, separate tax lot and legal requirements, (iii) the owner of the remaining portion of the Anderson Towne Center Property will continue to be able to use the release parcel to the extent necessary for the uses of such remaining Anderson Towne Center Property, including without limitation, access, driveways, parking utilities and drainage, (iv) satisfaction of REMIC related conditions, (v) if required by the lender, the borrower delivers a rating agency confirmation and (vi) payment of the lender’s expenses. The Anderson Towne Center Whole Loan documents require that the parcel be transferred to an affiliate of the borrower and continue to be held by a borrower affiliate until the Anderson Towne Center Whole Loan is repaid.
THE INFORMATION IN THIS STRUCTURAL AND COLLATERAL TERM SHEET IS NOT COMPLETE AND MAY BE AMENDED PRIOR TO THE TIME OF SALE. THIS TERM SHEET IS NOT AN OFFER TO SELL THESE SECURITIES AND IT IS NOT A SOLICITATION OF AN OFFER TO BUY THESE SECURITIES IN ANY JURISDICTION WHERE THE OFFER OR SALE IS NOT PERMITTED.
155
| No. 14 – 181 Fremont Street | ||||||||
| Loan Information | Property Information | |||||||
| Mortgage Loan Seller: | Wells Fargo Bank, National Association | Single Asset/Portfolio: | Single Asset | |||||
Credit Assessment (DBRS/Fitch/S&P): | AA/BBB-sf/NR | Property Type: | Office | |||||
| Original Principal Balance(1): | $22,000,000 | Specific Property Type: | CBD | |||||
| Cut-off Date Balance(1): | $22,000,000 | Location: | San Francisco, CA | |||||
| % of Initial Pool Balance: | 2.33% | Size: | 436,332 SF | |||||
| Loan Purpose: | Refinance | Cut-off Date Balance Per SF(1): | $572.96 | |||||
| Borrower Name: | 181 Fremont Office LLC | Year Built/Renovated: | 2018/NAP | |||||
| Borrower Sponsor: | Joseph K. Paul | Title Vesting: | Fee | |||||
| Mortgage Rate: | 3.7086% | Property Manager: | Self-managed | |||||
| Note Date: | March 29, 2018 | 4th Most Recent Occupancy(5): | NAP | |||||
| Anticipated Repayment Date: | April 6, 2028 | 3rd Most Recent Occupancy(5): | NAP | |||||
| Maturity Date: | April 6, 2031 | 2nd Most Recent Occupancy(5): | NAP | |||||
| IO Period: | 120 months | Most Recent Occupancy(5): | NAP | |||||
| Loan Term (Original): | 120 months | Current Occupancy (As of): | 100.0% (8/1/2018) | |||||
| Seasoning: | 4 months | |||||||
| Amortization Term (Original): | NAP | |||||||
| Loan Amortization Type: | Interest-only, ARD | Underwriting and Financial Information: | ||||||
| Interest Accrual Method: | Actual/360 | 4th Most Recent NOI(5): | NAP | |||||
| Call Protection(2): | L(23),GRTR 1% or YM(5),GRTR 1% | 3rd Most Recent NOI(5): | NAP | |||||
| or YM or D(85),O(7) | 2nd Most Recent NOI(5): | NAP | ||||||
| Lockbox Type: | Hard/Upfront Cash Management | Most Recent NOI(5): | NAP | |||||
| Additional Debt(1): | Yes | |||||||
| Additional Debt Type(1)(3): | Pari Passu; Mezzanine | |||||||
| U/W Revenues: | $43,664,053 | |||||||
| U/W Expenses: | $14,094,390 | |||||||
| U/W NOI: | $29,569,663 | |||||||
| U/W NCF: | $29,482,397 | |||||||
| Escrows and Reserves(4): | U/W NOI DSCR(1): | 3.15x | ||||||
| U/W NCF DSCR(1): | 3.14x | |||||||
| Type: | Initial | Monthly | Cap (If Any) | U/W NOI Debt Yield(1): | 11.8% | |||
| Taxes | $0 | $509,418 | NAP | U/W NCF Debt Yield(1): | 11.8% | |||
| Insurance | $0 | Springing | NAP | As-Stabilized Appraised Value(6): | $632,000,000 | |||
| Replacement Reserves | $0 | Springing | NAP | As-Stabilized Appraisal Valuation Date(6): | March 1, 2021 | |||
| Rent Concessions Reserve | $68,379,092 | $0 | NAP | Cut-off Date LTV Ratio(1): | 39.6% | |||
| TI/LC Reserve | $42,717,266 | $0 | NAP | LTV Ratio at ARD(1): | 39.6% | |||
| (1) | See “The Mortgage Loan” section. All statistical information related to balance per square foot, loan-to-value ratios, debt service coverage ratios and debt yields are based on the 181 Fremont Street Whole Loan (as defined below). Collectively, the 181 Fremont Street Whole Loan and the 181 Fremont Street Mezzanine Loans are referred to herein as the “181 Fremont Street Total Debt” (see “Subordinate and Mezzanine Indebtedness” section). The Cut-off Date LTV Ratio, LTV Ratio at ARD, U/W NCF DSCR and U/W NOI Debt Yield based on the 181 Fremont Street Total Debt are 75.2%, 75.2%, 1.38x and 6.2%, respectively. |
| (2) | Defeasance of the 181 Fremont Street Mortgage Loan (as defined below) is permitted at any time after the earlier to occur of (i) two years after the closing date of the securitization that includes the last note to be securitized or (ii) March 29, 2021. The assumed lockout period applicable to defeasance of 28 payments is based on the expected BANK 2018-BNK13 securitization trust closing date in August 2018. |
| (3) | See “Subordinate and Mezzanine Indebtedness” section. |
| (4) | See “Escrows” section. |
| (5) | Historical occupancy, operating and financial information is unavailable as the 181 Fremont Street Property (as defined below) was built in 2018. |
| (6) | See “Appraisal” section. The Appraised Value, Cut-off Date LTV Ratio and ARD LTV Ratio are based on the appraiser’s Market Value at Stabilization, which is a prospective value that assumes the contractual tenant improvement and leasing commission (“TI/LC”) obligations have been fulfilled, there is no outstanding free rent, and the 181 Fremont Street Property achieves stabilization as of March 1, 2021. The 181 Fremont Street Borrower (as defined below) deposited upfront reserves totaling $42,717,266 for such contractual TI/LC obligations and $68,379,092 for such free rent obligations (see “Escrows” section). The appraiser concluded to an as-is Appraised Value of $461,000,000 (as of February 28, 2018) that is inclusive of deductions for free rent and TI/LC obligations, which would result in a Cut-off Date LTV Ratio and ARD LTV Ratio of 54.2%. The appraiser also concluded to a Hypothetical Market Value (Go Dark Value) of $522,000,000 as of February 28, 2018, which assumes the completion of all tenant improvement work associated with the Facebook lease. |
The Mortgage Loan.The mortgage loan (the “181 Fremont Street Mortgage Loan”) is part of a whole loan (the “181 Fremont Street Whole Loan”) evidenced by sevenpari passu notes secured by a first mortgage encumbering the fee simple interest in the Class A office condominium portion of 181 Fremont Street in San Francisco, California (the “181 Fremont Street Property”). The 181 Fremont Street Whole Loan was co-originated on March 29, 2018 by Barclays Bank PLC (“Barclays”) and Deutsche Bank AG, acting through its New York Branch (“DBNY”). The 181 Fremont Street Mortgage Loan, evidenced by Note A-3, was purchased by Wells Fargo Bank, National Association (“Wells Fargo”) from DBNY.
THE INFORMATION IN THIS STRUCTURAL AND COLLATERAL TERM SHEET IS NOT COMPLETE AND MAY BE AMENDED PRIOR TO THE TIME OF SALE. THIS TERM SHEET IS NOT AN OFFER TO SELL THESE SECURITIES AND IT IS NOT A SOLICITATION OF AN OFFER TO BUY THESE SECURITIES IN ANY JURISDICTION WHERE THE OFFER OR SALE IS NOT PERMITTED.
156
181 FREMONT STREET
The 181 Fremont Street Whole Loan had an original principal balance of $250,000,000, has an outstanding principal balance as of the Cut-off Date of $250,000,000 and accrues interest at an interest rate of 3.7086%per annum(the “Initial Interest Rate”) through the anticipated repayment date (the “ARD”). The ARD is April 6, 2028 and the final maturity date is April 6, 2031. In the event that the 181 Fremont Street Whole Loan is not repaid in full on or prior to the ARD, the 181 Fremont Street Whole Loan will accrue interest at aper annumrate equal to the greater of (a) the Initial Interest Rate plus 1.5000%, (b) the swap rate as determined in the 181 Fremont Street Whole Loan documents on the ARD plus 2.4146% or (c) when applicable, the default rate as defined in the 181 Fremont Street Whole Loan documents (the “Adjusted Interest Rate”); however, interest accrued at the excess of the Adjusted Interest Rate over the Initial Interest Rate (the “Accrued Interest”) will be deferred. In addition, from and after the ARD, all excess cash flow from the 181 Fremont Street Property after the payment of reserves, interest calculated at the Initial Interest Rate, debt service on the 181 Fremont Street Mezzanine Loans and operating expenses will be applied (i)firstto repay the principal balance of the 181 Fremont Street Whole Loan and (ii)second to the payment of Accrued Interest. See “Description of the Mortgage Pool—The Whole Loans—The Non-Serviced Pari Passu Whole Loans” and “Pooling and Servicing Agreement” in the Prospectus.
Note A-3, which will be contributed to the BANK 2018-BNK13 Trust, had an original principal balance of $22,000,000, has an outstanding principal balance as of the Cut-off Date of $22,000,000 and represents a non-controlling interest in the 181 Fremont Street Whole Loan. The controlling Note A-1 and the non-controlling Note A-4 had an aggregate original principal balance of $80,000,000, have an aggregate outstanding principal balance as of the Cut-off Date of $80,000,000, and were contributed to the Benchmark 2018-B4 Trust. The non-controlling Note A-2 had an original principal balance of $58,000,000, has an outstanding principal balance as of the Cut-off Date of $58,000,000 and was contributed to the BANK 2018-BNK12 Trust. The non-controlling Note A-6-1 had an original principal balance of $30,000,000, has an outstanding principal balance as of the Cut-off Date of $30,000,000 and was contributed to the WFCM 2018-C44 Trust. The non-controlling Note A-6-2 had an original principal balance of $20,000,000, has an outstanding principal balance as of the Cut-off Date of $20,000,000 and was contributed to the WFCM 2018-C45 Trust. The non-controlling Note A-5 had an original principal balance of $40,000,000, has an outstanding principal balance as of the Cut-off Date of $40,000,000, is currently held by DBNY and is expected to be contributed to one or more future securitizations. The mortgage loans evidenced by Notes A-1, A-2, A-4, A-5, A-6-1, and A-6-2 are collectively referred to herein as the “181 Fremont Street Companion Loans”. The lender provides no assurances that any non-securitized notes will not be split further. See“Description of the Mortgage Pool—The Whole Loans—The Non-Serviced Pari Passu Whole Loans” in the Prospectus.
Note Summary(1)
| Notes | Original Balance | Note Holder | Controlling Interest | |
| A-1 | $50,000,000 | BMARK 2018-B4 | Yes | |
| A-2 | $58,000,000 | BANK 2018-BNK12 | No | |
| A-3 | $22,000,000 | BANK 2018-BNK13 | No | |
| A-4 | $30,000,000 | BMARK 2018-B4 | No | |
| A-5 | $40,000,000 | Deutsche Bank AG, New York Branch | No | |
| A-6-1 | $30,000,000 | WFCM 2018-C44 | No | |
| A-6-2 | $20,000,000 | WFCM 2018-C45 | No | |
| Total | $250,000,000 |
| (1) | The lender provides no assurances that any non-securitizedpari passu note will not be split further. |
Following the earlier to occur of (i) two years after the closing date of the securitization that includes the last note to be securitized or (ii) March 29, 2021, on any date before October 6, 2027, the borrower has the right to defease the 181 Fremont Street Whole Loan in whole, but not in part. On April 6, 2020 and on any business day thereafter, the borrower has the right to prepay the 181 Fremont Street Whole Loan in whole, provided that the borrower pays the greater of a yield maintenance premium or a prepayment premium equal to 1.0% of the principal amount being prepaid. The 181 Fremont Street Whole Loan is prepayable without penalty on or after October 6, 2027.
Sources and Uses
| Sources | Uses | |||||||
| Original whole loan amount | $250,000,000 | 52.6% | Loan payoff | $362,943,921 | 76.3% | |||
| Mezzanine loans | 225,000,000 | 47.3 | Reserves | 111,096,358 | 23.4 | |||
| Borrower sponsors’ new cash contribution | 695,692 | 0.1 | Closing costs | 1,655,413 | 0.3 | |||
| Total Sources | $475,695,692 | 100.0% | Total Uses | $475,695,692 | 100.0% |
The Property.The 181 Fremont Street Property comprises the office condominium portion of a 57-story Class A, LEED Platinum tower constructed in 2018 and located in downtown San Francisco, California (see “Condominium” section below). The 181 Fremont Street tower consists of 654,698 square feet of total gross building area, with 436,332 square feet allocated to office space on the first 38 stories (collateral for the 181 Fremont Street Whole Loan) and 120,457 square feet of space allocated to 67 luxury market rate residential units on floors 39 to 57 (non-collateral). The 181 Fremont Street tower is over 800 feet tall and offers unobstructed views of the San Francisco Bay and the waterfront. As of August 1, 2018, the 181 Fremont Street Property was 100.0% leased to Facebook, Inc. (“Facebook”) on a triple-net basis through February 2031, with two, five-year extension options and no early termination options.
The 181 Fremont Street Property is located in the South Financial District, three blocks from the San Francisco Bay and within two blocks of Market Street. According to the appraisal, the San Francisco Financial District is the most concentrated employment center
THE INFORMATION IN THIS STRUCTURAL AND COLLATERAL TERM SHEET IS NOT COMPLETE AND MAY BE AMENDED PRIOR TO THE TIME OF SALE. THIS TERM SHEET IS NOT AN OFFER TO SELL THESE SECURITIES AND IT IS NOT A SOLICITATION OF AN OFFER TO BUY THESE SECURITIES IN ANY JURISDICTION WHERE THE OFFER OR SALE IS NOT PERMITTED.
157
181 FREMONT STREET
in northern California with an employment base that supports a wide variety of commercial use. The 181 Fremont Street Property offers direct access to the new Transbay Transit Center and its elevated 5.4 acre park via a 7th floor skybridge. The new public transportation hub is expected to connect eight Bay Area counties through 11 transit systems, expected to open by 2019. The first phase of the project includes the five-story structure, active bus terminal, elevated park and over 100,000 square feet of retail space including dining, shopping and entertainment.
As of the origination date, Facebook has taken possession of the 181 Fremont Street Property and commenced the build out of its space. Outstanding rent concessions and tenant improvement allowances related to the Facebook lease were deposited into escrow by the borrower on the origination date (See “Escrows” section). According to the borrower sponsor, Facebook is expected to occupy the 181 Fremont Street Property in three phases with floors five through 13 being occupied in February 2019, floors 14 through 25 being occupied in March 2020 and floors 26 through 38 being occupied in March 2021. Floors two and three are partially open to the first floor and also consist of residential storage and security offices. The fourth floor features bicycle storage, showers, storage and laundry areas.
Facebook is a technology company whose platforms allow users to communicate with family, friends and coworkers. Facebook currently shuttles thousands of employees to its Silicon Valley headquarters and is now adding a San Francisco footprint, as other technology companies have done, including Google and Apple. The 181 Fremont Street Property will be Facebook’s first outpost in San Francisco, housing between 2,000 and 3,000 employees by 2021 to support its growth. One of Facebook’s fast-growing divisions, Instagram, will be one of the groups to move a team into the 181 Fremont Street Property. Daily and monthly active users across Facebook’s platforms were up approximately 14.0% in 2017 year-over-year. As of December 2017, there were 2.1 billion active users on Facebook each month, as of January 2018 there were 1.5 billion active users on WhatsApp (owned by Facebook) each month, and as of September 2017 there were 800 million active users on Instagram each month. Facebook reported 2017 revenue of approximately $40.7 billion, up approximately 47.1% over 2016, which is primarily attributable to approximately $39.9 billion of advertising revenue. Additionally, Facebook reported net income of approximately $15.9 billion in 2017, up approximately 56.0% from 2016.
The following table presents certain information relating to the tenancy at the 181 Fremont Street Property:
Major Tenants
| Tenant Name | Credit Rating | Tenant NRSF | % of NRSF | Annual U/W Base Rent PSF(1)(2) | Annual U/W Base Rent(1)(2) | % of Total Annual U/W Base Rent(1)(2) | Lease Expiration Date |
| Major Tenant | |||||||
| Facebook, Inc. | NR/NR/NR | 436,332 | 100.0% | $72.22 | $31,511,897 | 100.0% | 2/28/2031(3) |
| Total Major Tenant | 436,332 | 100.0% | $72.22 | $31,511,897 | 100.0% | ||
| Vacant Space | 0 | 0.0% | |||||
| Collateral Total | 436,332 | 100.0% | |||||
| (1) | Annual U/W Base Rent PSF and Annual U/W Base Rent include $4,546,579 of straight-line rent through the maturity date of the Facebook lease. |
| (2) | Facebook has rent abatements through 2021, all of which were deposited into escrow on the origination date. |
| (3) | Facebook has two, five-year lease renewal options. |
The following table presents certain information relating to the lease rollover schedule at the 181 Fremont Street Property:
Lease Expiration Schedule(1)
| Year Ending December 31, | No. of Leases Expiring | Expiring NRSF | % of Total NRSF | Cumulativ Expiring NRSF | Cumulative % of Total NRSF | Annual U/W Base Rent(2) | % of Annual U/W Base Rent(2) | Annual U/W Base Rent PSF(2) | |||||||||||||||||
| MTM | 0 | 0 | 0.0 | % | 0 | 0.0 | % | $0 | 0.0 | % | $0.00 | ||||||||||||||
| 2018 | 0 | 0 | 0.0 | % | 0 | 0.0 | % | $0 | 0.0 | % | $0.00 | ||||||||||||||
| 2019 | 0 | 0 | 0.0 | % | 0 | 0.0 | % | $0 | 0.0 | % | $0.00 | ||||||||||||||
| 2020 | 0 | 0 | 0.0 | % | 0 | 0.0 | % | $0 | 0.0 | % | $0.00 | ||||||||||||||
| 2021 | 0 | 0 | 0.0 | % | 0 | 0.0 | % | $0 | 0.0 | % | $0.00 | ||||||||||||||
| 2022 | 0 | 0 | 0.0 | % | 0 | 0.0 | % | $0 | 0.0 | % | $0.00 | ||||||||||||||
| 2023 | 0 | 0 | 0.0 | % | 0 | 0.0 | % | $0 | 0.0 | % | $0.00 | ||||||||||||||
| 2024 | 0 | 0 | 0.0 | % | 0 | 0.0 | % | $0 | 0.0 | % | $0.00 | ||||||||||||||
| 2025 | 0 | 0 | 0.0 | % | 0 | 0.0 | % | $0 | 0.0 | % | $0.00 | ||||||||||||||
| 2026 | 0 | 0 | 0.0 | % | 0 | 0.0 | % | $0 | 0.0 | % | $0.00 | ||||||||||||||
| 2027 | 0 | 0 | 0.0 | % | 0 | 0.0 | % | $0 | 0.0 | % | $0.00 | ||||||||||||||
| 2028 | 0 | 0 | 0.0 | % | 0 | 0.0 | % | $0 | 0.0 | % | $0.00 | ||||||||||||||
| Thereafter | 1 | 436,332 | 100.0 | % | 436,332 | 100.0 | % | $31,511,897 | 100.0 | % | $72.22 | ||||||||||||||
| Vacant | 0 | 0 | 0.0 | % | 436,332 | 100.0 | % | $0 | 0.0 | % | $0.00 | ||||||||||||||
| Total/Weighted Average | 1 | 436,332 | 100.0 | % | $31,511,897 | 100.0 | % | $72.22 | |||||||||||||||||
| (1) | Information obtained from the underwritten rent roll. |
| (2) | Annual U/W Base Rent, % of Annual U/W Base Rent and Annual U/W Base Rent PSF include $4,546,579 of straight-line rent through the maturity date of the Facebook lease. |
THE INFORMATION IN THIS STRUCTURAL AND COLLATERAL TERM SHEET IS NOT COMPLETE AND MAY BE AMENDED PRIOR TO THE TIME OF SALE. THIS TERM SHEET IS NOT AN OFFER TO SELL THESE SECURITIES AND IT IS NOT A SOLICITATION OF AN OFFER TO BUY THESE SECURITIES IN ANY JURISDICTION WHERE THE OFFER OR SALE IS NOT PERMITTED.
158
181 FREMONT STREET
The following table presents historical occupancy percentages at the 181 Fremont Street Property:
Historical Occupancy
12/31/2014(1) | 12/31/2015(1) | 12/31/2016(1) | 12/31/2017(1) | 8/1/2018(2) |
| NAP | NAP | NAP | NAP | 100.0% |
| (1) | Historical Occupancy prior to 8/1/2018 is not applicable as the 181 Fremont Street Property was built in 2018. |
| (2) | Information obtained from the underwritten rent roll. |
Underwritten Net Cash Flow. The following table presents certain information relating to the underwritten net cash flow at the 181 Fremont Street Property:
Cash Flow Analysis(1)
| U/W | % of U/W Effective Gross Income | U/W $ per SF | |
| Base Rent(2) | $31,511,897 | 72.2% | $72.22 |
| Grossed Up Vacant Space | 0 | 0.0 | 0.00 |
| Total Reimbursables | 13,502,591 | 30.9 | 30.95 |
| Less Vacancy & Credit Loss(3) | (1,350,435) | (3.1) | (3.09) |
| Effective Gross Income | $43,664,053 | 100.0% | $100.07 |
| Total Operating Expenses | $14,094,390 | 32.3% | $32.30 |
| Net Operating Income | $29,569,663 | 67.7% | $67.77 |
| TI/LC | 0 | 0.0 | 0.00 |
| Capital Expenditures | 87,266 | 0.2 | 0.20 |
| Net Cash Flow | $29,482,397 | 67.5% | $67.57 |
| NOI DSCR(4) | 3.15x | ||
| NCF DSCR(4) | 3.14x | ||
| NOI DY(4) | 11.8% | ||
| NCF DY(4) | 11.8% |
| (1) | Historical Cash Flows are not available as the 181 Fremont Street Property was built in 2018. |
| (2) | U/W Base Rent includes $4,546,579 of straight-line rent through the maturity date of the Facebook lease. |
| (3) | The underwritten economic vacancy is 3.0%. The 181 Fremont Street Property was 100.0% leased as of August 1, 2018. |
| (4) | Debt service coverage ratios and debt yields are based on the 181 Fremont Street Whole Loan. |
Appraisal. The appraiser concluded to an appraised value of $632,000,000 with a valuation date of March 1, 2021 which assumes the 181 Fremont Street Property is complete and/or achieves stabilization. Facebook is expected to be in full occupancy of their leased space by March 2021. As of the appraisal valuation date of February 28, 2018 the 181 Fremont Street Property had an “as-is” appraised value of $461,000,000 and is inclusive of deductions for free rent, tenant improvement and leasing commission (“TI/LC”) obligations. The borrower deposited upfront reserves totaling $111,096,358 for such contractual TI/LC obligations and free rent (see “Escrows” section). The appraiser also concluded to a “hypothetical go dark” appraised value of $522,000,000, equating to a Cut-off Date LTV Ratio and LTV Ratio at ARD of 47.9%.
Environmental Matters. According to a Phase I environmental site assessment dated March 7, 2018, there was no evidence of any recognized environmental conditions at the 181 Fremont Street Property.
Market Overview and Competition.The 181 Fremont Street Property is located in the South Financial District of downtown San Francisco, California, three blocks from the San Francisco Bay and within two blocks of Market Street. According to the appraisal, the area immediately surrounding the 181 Fremont Street Property is approximately 98% built up, predominantly consisting of mid- and high-rise office and residential buildings, with few redevelopment sites available for re-use. Immediately north of the 181 Fremont Street Property is the Transbay Terminal, which is currently under construction and expected to open by 2019. Once complete, the Transbay Terminal is expected to be the bus and rail transportation hub of the Bay Area and has been proposed to be the termination point for the high-speed rail system planned between San Francisco and Los Angeles.
According to the appraisal, the 181 Fremont Street Property is located within the South Financial District office submarket. The South Financial District office submarket had fourth quarter 2017 inventory of approximately 15,384,000 square feet with a 7.6% vacancy rate and average asking rents of $72.94 PSF, as compared to the broader San Francisco office market which had a 9.8% vacancy rate and average asking rents of $56.66 PSF for the same period. The estimated 2017 population within a 1.0-, 3.0- and 5.0-mile radius around the 181 Fremont Street Property was 66,410, 369,991 and 636,799, respectively, reflective of a population compound growth rate from 2010 to 2017 of 1.6%, 1.5% and 1.3%, respectively. The estimated 2017 median household income within the same radii was $59,179, $78,089 and $82,936, respectively.
THE INFORMATION IN THIS STRUCTURAL AND COLLATERAL TERM SHEET IS NOT COMPLETE AND MAY BE AMENDED PRIOR TO THE TIME OF SALE. THIS TERM SHEET IS NOT AN OFFER TO SELL THESE SECURITIES AND IT IS NOT A SOLICITATION OF AN OFFER TO BUY THESE SECURITIES IN ANY JURISDICTION WHERE THE OFFER OR SALE IS NOT PERMITTED.
159
181 FREMONT STREET
The following table presents certain information relating to comparable leases to the 181 Fremont Street Property:
Comparable Leases(1)
| Property Name/Location | Year Built | Stories | Total GLA (SF) | Tenant Name | Lease Date/Term | Lease Area (SF) | Annual Base Rent PSF | Lease Type |
Salesforce Tower San Francisco, CA | 2018 | 61 | 1,400,000 | Accenture | March 2017 / 61 Months | 100,630 | $52.00 | Net |
Two Rincon San Francisco, CA | 1989 | 6 | 326,001 | March 2017 / 132 Months | 166,460 | $52.00 | Net | |
Foundry Square IV San Francisco, CA | 2003 | 10 | 247,238 | Slack | January 2017 / 120 Months | 228,998 | $56.50 | Net |
Charles Schwab Plaza San Francisco, CA | 1973 | 17 | 417,266 | Charles Schwab | December 2016 / 120 Months | 359,000 | $50.00 | Net |
First Market Tower San Francisco, CA | 1973 | 39 | 1,034,329 | Merrill Lynch | December 2016 / 72 Months | 121,000 | $40.00 | Net |
350 Bush San Francisco, CA | 2018 | 19 | 386,907 | Twitch | November 2017 / 120 Months | 178,000 | $62.00 | Net |
350 Bush San Francisco, CA | 2018 | 19 | 386,907 | Confidential | May 2018 / 136 Months | 145,217 | $67.00 | Net |
350 Bush San Francisco, CA | 2018 | 19 | 386,907 | Confidential | October 2018 / 128 Months | 52,880 | $69.00 | Net |
| (1) | Information obtained from the appraisal. |
The Borrower.The borrower for the 181 Fremont Street Whole Loan is 181 Fremont Office LLC, a Delaware limited liability company and a special purpose entity with two independent directors. Legal counsel to the borrower delivered a non-consolidation opinion in connection with the origination of the 181 Fremont Street Whole Loan. Paul Guarantor LLC, a Delaware limited liability company, is the guarantor of certain nonrecourse carveouts under the 181 Fremont Street Whole Loan (the “181 Fremont Street Guarantor”). The 181 Fremont Street Guarantor is wholly owned by the Jay Paul Revocable Living Trust, of which Jay Paul is trustee and grantor. The 181 Fremont Street Guarantor will be required to maintain a minimum net worth, excluding its interest in the 181 Fremont Street Property, of $475,000,000 and liquidity of at least $15,000,000.
The Borrower Sponsor.The borrower sponsor is Joseph K. Paul, the founder of the Jay Paul Company, a privately held, opportunity-driven real estate firm based in San Francisco, California. Founded in 1975, the Jay Paul Company concentrates on the acquisition, development, and management of commercial properties throughout California. The Jay Paul Company has developed over 11.0 million square feet of institutional quality space with an additional 6.0 million square feet of space in their development pipeline. The Jay Paul Company has built projects for Google, Apple, Amazon, Motorola, Microsoft, Northrop Grumman, HP, Ariba, Synopsys, Rambus, Nokia and Dreamworks, among others.
Escrows.The 181 Fremont Street Whole Loan documents provide for upfront reserves in the amount of $68,379,092 for outstanding rent concessions due under the Facebook lease and $42,717,266 for outstanding tenant improvements and leasing commissions relating to the Facebook space.
The 181 Fremont Street Whole Loan documents require monthly reserve deposits for real estate taxes in an amount equal to one-twelfth of the real estate taxes that the lender estimates will be payable during the next twelve months (initially $509,418). The 181 Fremont Street Whole Loan documents do not require ongoing monthly escrows for insurance premiums as long as the borrower provides the lender with evidence that the 181 Fremont Street Property is insured via an acceptable blanket insurance policy or insured under the condominium association policy, and in either case, such policy is in full force and effect. During the continuance of a Trigger Period (as defined below), the 181 Fremont Street Whole Loan documents require monthly reserve deposits for capital expenditures equal to $7,272 and the monthly amount due for common charges due to the condominium association.
Lockbox and Cash Management.The 181 Fremont Street Whole Loan is structured with a hard lockbox and an upfront cash management. The borrower was required at origination to deliver letters to all tenants at the 181 Fremont Street Property directing them to pay all rents directly into a lender-controlled lockbox account. All funds received by the borrower or the manager are required to be deposited in the lockbox account within one business day following receipt. Funds on deposit in the lockbox account are required to be swept on each business day into a lender-controlled cash management account and applied on each payment date to the payment of debt service, the funding of required reserves, budgeted monthly operating expenses, debt service on the 181 Fremont Street Mezzanine Loans (as defined below) and, during a Lease Sweep Period (as defined below), to the payment of an amount equal to $636,318 to fund a lease sweep reserve account (the “Lease Sweep Reserve Account”) until the aggregate funds swept in the Lease Sweep Reserve Account during such lease sweep equals the Lease Sweep Reserve Threshold (as defined below) and then to the debt service reserve account until the aggregate funds transferred to the Lease Sweep Reserve Account and the debt service reserve account during such lease sweep equals the Lease Sweep and Debt Service Reserve Cap (as defined below). Provided no Trigger Period (as defined below) is continuing, excess cash in the deposit account will be disbursed to the borrower in accordance with the 181 Fremont Street Whole Loan documents. If a Trigger Period is continuing (other than a Trigger Period due to a Lease Sweep Period), excess cash in the deposit account will be transferred to an account (the “Cash Collateral Account”) held by the lender as additional collateral for the 181 Fremont Street Whole Loan.
THE INFORMATION IN THIS STRUCTURAL AND COLLATERAL TERM SHEET IS NOT COMPLETE AND MAY BE AMENDED PRIOR TO THE TIME OF SALE. THIS TERM SHEET IS NOT AN OFFER TO SELL THESE SECURITIES AND IT IS NOT A SOLICITATION OF AN OFFER TO BUY THESE SECURITIES IN ANY JURISDICTION WHERE THE OFFER OR SALE IS NOT PERMITTED.
160
181 FREMONT STREET
A “Trigger Period” will commence upon the earlier of the following:
| (i) | the ARD; |
| (ii) | an event of default under the 181 Fremont Street Whole Loan; |
| (iii) | as of the last day of any calendar quarter during the term of the 181 Fremont Street Whole Loan (a) the 181 Fremont Street Property not being fully leased to either Facebook or an investment grade tenant pursuant to a lease that is substantially on the same or better terms as the Facebook lease and (b) the debt service coverage ratio falling below 2.84x based on the 181 Fremont Street Whole Loan or 1.25x based on the 181 Fremont Street Total Debt (a “Low Debt Service Period”); |
| (iv) | the commencement of a Lease Sweep Period; or |
| (v) | an event of default under the 181 Fremont Street Mezzanine Loans. |
A Trigger Period will end:
| (a) | with regard to clause (i) above, upon the 181 Fremont Street Whole Loan being repaid in full, |
| (b) | with regard to clause (ii) and (v) above, upon the cure of such event of default; |
| (c) | with regard to clause (iii) above, upon the date that the debt service coverage ratio is at least 2.84x based on the 181 Fremont Street Whole Loan and 1.25x based on the 181 Fremont Street Total Debt for two consecutive calendar quarters; and |
| (d) | with regard to clause (iv) above, upon the ending of such Lease Sweep Period. |
A “Lease Sweep Period” will commence following the earliest to occur of any of the following (each a “Lease Sweep Trigger”):
| (i) | the date on which, with respect to any Lease Sweep Lease (as defined below), (a) a Lease Sweep Tenant Party (as defined below) cancels or terminates its Lease Sweep Lease with respect to all or a Material Termination Portion (as defined below) of the Lease Sweep Space (as defined below) subject to such Lease Sweep Lease prior to the then current expiration date under such Lease Sweep Lease, or (b) a Lease Sweep Tenant Party delivers to the borrower notice that it is canceling or terminating its Lease Sweep Lease with respect to all or a Material Termination Portion of the Lease Sweep Space subject to such Lease Sweep Lease (the affected space being the “Terminated Space”); provided, however, no Lease Sweep Period will commence pursuant to this clause (i) if, in connection with such termination or cancellation (or delivery of notice of termination or cancellation), the borrower simultaneously enters into a replacement lease with an entity or a wholly-owned subsidiary of an entity rated “BBB-” or equivalent by at least two of Fitch, Moody’s and S&P (an “Investment Grade Entity”) covering the Terminated Space, provided that such replacement lease is a qualified lease and the occupancy conditions, as specified in the 181 Fremont Street Whole Loan documents, are satisfied with respect to such replacement lease on or prior to the date of such termination or cancellation (or delivery of notice of termination or cancellation); |
| (ii) | the date on which, with respect to any Lease Sweep Lease, a Lease Sweep Tenant Party ceases operating its business (i.e., “goes dark”) at 20.0% or more of its Lease Sweep Space on a rentable square foot basis (a “Dark Period Event” and the affected space, the “Dark Space”), provided, however, that if the Lease Sweep Tenant Party either (a) is Facebook, (b) is an Investment Grade Entity or (c) has subleased the Dark Space portion of its premises to an Investment Grade Entity who has accepted delivery thereof (i.e., the lease has commenced) and is paying unabated rent at a contract rate no less than the contract rate required under the Lease Sweep Lease, such Lease Sweep Tenant Party will not be deemed to have “gone dark” for purposes of this clause (ii) and no Lease Sweep Period will commence pursuant to this clause (ii); |
| (iii) | an event of default under a Lease Sweep Lease by the tenant thereunder that continues beyond any applicable notice and cure period; |
| (iv) | a Lease Sweep Tenant Party being subject to an insolvency proceeding; or |
| (v) | the date on which Facebook becomes rated by at least two of Fitch, Moody’s and S&P and thereafter is no longer rated as an Investment Grade Entity (a “Facebook Downgrade Event”). |
A Lease Sweep Period (other than a Lease Sweep Period triggered by clause (iv) above) will not be triggered (or, if already triggered, may be terminated) if the borrower delivers to the lender an acceptable letter of credit in an amount equal to the applicable Lease Sweep and Debt Service Reserve Cap (as defined below).
A Lease Sweep Period will end on the earliest of the applicable of the following to occur:
| (a) | with regard to clauses (i) above, the date on which, with respect to each applicable Lease Sweep Space, one or more replacement tenants acceptable to the lender (in its sole but good faith discretion) execute and deliver replacement lease(s) covering the Requisite Lease Sweep Space (as defined below), provided that such replacement lease(s) are qualified leases and the occupancy conditions, as specified in the 181 Fremont Street Whole Loan documents, are satisfied; |
| (b) | with regard to clauses (ii) and (v) above, the date on which either (1) one or more replacement tenants acceptable to the lender (in its sole but good faith discretion) execute and deliver replacement lease(s) covering the Requisite Lease Sweep Space, provided that such replacement tenant(s) and lease(s) are qualified leases and the occupancy conditions, as specified in the 181 Fremont Street Whole Loan documents, are satisfied or (2) for a Dark Period Event or a Facebook Downgrade Event, Facebook is restored as an Investment Grade Entity or the entirety of the Lease Sweep Space has been sublet to an Investment Grade Entity who has accepted delivery thereof (i.e., the lease has commenced) and is paying unabated rent at a contract rate no less than the contract rate required under the Lease Sweep Lease; |
THE INFORMATION IN THIS STRUCTURAL AND COLLATERAL TERM SHEET IS NOT COMPLETE AND MAY BE AMENDED PRIOR TO THE TIME OF SALE. THIS TERM SHEET IS NOT AN OFFER TO SELL THESE SECURITIES AND IT IS NOT A SOLICITATION OF AN OFFER TO BUY THESE SECURITIES IN ANY JURISDICTION WHERE THE OFFER OR SALE IS NOT PERMITTED.
161
181 FREMONT STREET
| (c) | with regard to clause (iii) above, the date on which the event of default has been cured and no other event of default under such Lease Sweep Lease occurs for a period of three consecutive months following such cure; |
| (d) | with regard to clause (iv) above, the Lease Sweep Tenant Party insolvency proceeding having terminated and the applicable Lease Sweep Lease having been affirmed, assumed or assigned in a manner satisfactory to the lender; and |
| (e) | with regard to clauses (i), (ii), (iii), and (v) above, the date on which the aggregate amount of funds transferred into the Lease Sweep Reserve Account and the debt service reserve account equals the applicable Lease Sweep and Debt Reserve Cap (as defined below) and if a Lease Sweep Period is continuing due to the occurrence of more than one Lease Sweep Trigger, the aggregate amount of funds required to be transferred over the course of the Lease Sweep Period will be equal to the amount of the largest Lease Sweep and Debt Service Reserve Cap applicable to all then-continuing Lease Sweep Periods, such that each Lease Sweep Period will be treated as concurrent and not duplicative or independent of another. |
The “Lease Sweep Reserve Threshold” means (a) with respect to a Lease Sweep Period continuing solely pursuant to clauses (iii) and/or (v) above, $15,271,620 ($35.00 per square foot) or (b) with respect to a Lease Sweep Period continuing solely pursuant to clause (i) and/or (ii) above, $35.00 per square foot of the Dark Space or Terminated Space.
The “Lease Sweep and Debt Service Reserve Cap” means (a) with respect to a Lease Sweep Period continuing solely pursuant to clause (iii) above, $15,271,620 ($35.00 per square foot), (b) with respect to a Lease Sweep Period continuing solely pursuant to clause (i) above, $35.00 per square foot of the Terminated Space, (c) with respect to a Lease Sweep Period continuing pursuant to clause (ii) above, whether or not a Lease Sweep Period pursuant to clauses (i) and/or (iii) above is concurrently continuing, $50.00 per square foot of Dark Space or (d) with respect to clause (v) above, whether or not a Lease Sweep Period pursuant to clauses (i), (ii) and/or (iii) above is concurrently continuing, $21,816,600 ($50.00 per square foot).
The “Lease Sweep Space” means the space demised under a Lease Sweep Lease.
A “Lease Sweep Lease” is the Facebook lease or any replacement lease or leases which cover at least 75.0% of the rentable square feet demised under the Facebook lease (the “Requisite Lease Sweep Space”).
A “Lease Sweep Tenant Party” means any tenant under a Lease Sweep Lease or its direct or indirect parent company.
A “Material Termination Portion” is, with respect to any space under a Lease Sweep Lease, if the tenant under a Lease Sweep Lease cancels or terminates its Lease Sweep Lease with respect to at least 20,000 square feet of space (or, if a full floor of space is less than 20,000 square feet, a full floor of space) but less than the entirety of the space under such Lease Sweep Lease, the portion of space under the Lease Sweep Lease affected by such cancellation or termination.
Property Management. The 181 Fremont Street Property is managed by an affiliate of the borrower.
Assumption. The borrower has, at any time following the securitization of the 181 Fremont Street Whole Loan and prior to the ARD, the right to transfer the 181 Fremont Street Property (no more than twice through the term of the 181 Fremont Street Whole Loan), provided that certain conditions are satisfied, including: (i) no event of default under the 181 Fremont Street Whole Loan documents or mezzanine loan documents has occurred and is continuing, (ii) the borrower has provided the lender with 60 days’ prior written notice, (iii) the proposed transferee qualifies as a qualified transferee under the 181 Fremont Street Whole Loan documents and (iv) the lender has received rating agency confirmation that such assumption will not result in a downgrade of the respective ratings assigned to the Series BANK 2018-BNK13 certificates and similar confirmations from each rating agency rating any securities backed by any of the 181 Fremont Street Companion Loans.
Partial Release. Not permitted.
Real Estate Substitution.Not permitted.
Subordinate and Mezzanine Indebtedness.Barclays and DBNY funded $225,000,000 of mezzanine debt (the “181 Fremont Street Mezzanine Loans”). The 181 Fremont Street Mezzanine Loans consist of a $175,000,000 senior mezzanine loan and a $50,000,000 junior mezzanine loan. The senior mezzanine loan has a 4.8800% coupon and the junior mezzanine loan has a 6.5000% coupon. The 181 Fremont Street Mezzanine Loans are interest-only for the full term of the loans and are coterminous with the 181 Fremont Street Whole Loan. Including the 181 Fremont Street Mezzanine Loans, the cumulative cut-off date LTV, cumulative UW NCF DSCR and cumulative UW NOI Debt Yield are 75.2%, 1.38x and 6.2%, respectively. The mortgage lenders and the mezzanine lenders have entered into an intercreditor agreement. The 181 Fremont Street Mezzanine Loans have been or are expected to be sold to institutional investors. The rights of the lender of the 181 Fremont Street Mezzanine Loans are further described under “Description of the Mortgage Pool—Additional Indebtedness—Mezzanine Indebtedness” in the Prospectus.
Ground Lease.None.
Condominium. The 181 Fremont Street Property is subject to a condominium regime. The 181 Fremont Street Property consists of a two-parcel condominium; with the commercial parcel owned by the borrower as collateral for the 181 Fremont Street Whole Loan. The commercial parcel consists of the five basement levels, floors 1 through 38, the bridge connecting 181 Fremont to the Transbay Terminal Rooftop Park and the roof of the 181 Fremont Street tower. The residential parcel, inclusive of the 67 luxury market rate residential units on floors 39 to 57, is not owned by the borrower and is not collateral for the 181 Fremont Street Whole Loan. The owner of the commercial parcel will have 140 votes out of 200 votes in the condominium association and the owner of the residential parcel will have 60 votes out of the 200 votes in the condominium association. See “Description of the Mortgage Pool — Mortgage Pool Characteristics — Condominium and Other Shared Interests” in the Prospectus.
THE INFORMATION IN THIS STRUCTURAL AND COLLATERAL TERM SHEET IS NOT COMPLETE AND MAY BE AMENDED PRIOR TO THE TIME OF SALE. THIS TERM SHEET IS NOT AN OFFER TO SELL THESE SECURITIES AND IT IS NOT A SOLICITATION OF AN OFFER TO BUY THESE SECURITIES IN ANY JURISDICTION WHERE THE OFFER OR SALE IS NOT PERMITTED.
162
181 FREMONT STREET
Terrorism Insurance. The 181 Fremont Street Whole Loan documents require that the “all risk” insurance policy required to be maintained by the borrower provide coverage for terrorism in an amount equal to the full replacement cost of the 181 Fremont Street Property, or that if the Terrorism Risk Insurance Program Reauthorization Act is no longer in effect and such policies contain an exclusion for acts of terrorism, the borrower will obtain, to the extent available, a stand-alone policy that provides the same coverage as the policies would have if such exclusion did not exist.
Earthquake Insurance.The loan documents require earthquake insurance. The property is located in Seismic Zone 4. The seismic report indicated scenario expected loss for the property is 12%.
THE INFORMATION IN THIS STRUCTURAL AND COLLATERAL TERM SHEET IS NOT COMPLETE AND MAY BE AMENDED PRIOR TO THE TIME OF SALE. THIS TERM SHEET IS NOT AN OFFER TO SELL THESE SECURITIES AND IT IS NOT A SOLICITATION OF AN OFFER TO BUY THESE SECURITIES IN ANY JURISDICTION WHERE THE OFFER OR SALE IS NOT PERMITTED.
163
| No. 15 – Shoppes at Chino Hills | ||||||
| Loan Information | Property Information | |||||
| Mortgage Loan Seller: | Morgan Stanley Mortgage Capital Holdings LLC | Single Asset/Portfolio: | Single Asset | |||
Credit Assessment (DBRS/Fitch/Moody’s): | (NR/NR/NR) | Property Type: | Retail | |||
| Original Principal Balance(1): | $22,000,000 | Specific Property Type: | Lifestyle Center | |||
| Cut-off Date Balance(1): | $22,000,000 | Location: | Chino Hills, CA | |||
| % of Initial Pool Balance: | 2.33% | Size: | 378,676 SF | |||
| Loan Purpose: | Refinance | Cut-off Date Balance Per SF(1): | $290.49 | |||
| Borrower: | Chino Dunhill LLC | Year Built/Renovated: | 2008/NAP | |||
| Borrower Sponsors(2): | Dunhill Partners, Inc. | Title Vesting: | Fee | |||
| Mortgage Rate: | 5.1750% | Property Manager: | DPM Pacific, Inc. | |||
| Note Date: | May 9, 2018 | 4thMost Recent Occupancy (As of): | 94.0% (12/31/2014) | |||
| Anticipated Repayment Date: | NAP | 3rdMost Recent Occupancy(As of): | 92.5% (12/31/2015) | |||
| Maturity Date: | June 1, 2028 | 2ndMost Recent Occupancy(As of): | 94.5% (12/31/2016) | |||
| IO Period: | 120 months | Most Recent Occupancy(As of): | 92.5% (12/31/2017) | |||
| Loan Term (Original): | 120 months | Current Occupancy (As of): | 94.6% (4/1/2018) | |||
| Seasoning: | 2 months | |||||
| Amortization Term (Original): | NAP | Underwriting and Financial Information: | ||||
| Loan Amortization Type: | Interest-only, Balloon | |||||
| Interest Accrual Method: | Actual/360 | 4thMost Recent NOI: | NAV | |||
| Call Protection(3): | L(26),D(89),O(5) | 3rdMost Recent NOI (As of)(6): | $7,456,373 (12/31/2014) | |||
| Lockbox Type: | Springing | 2ndMost Recent NOI (As of): | $7,677,471 (12/31/2016) | |||
| Additional Debt(1): | Yes | Most Recent NOI (As of): | $8,220,704 (12/31/2017) | |||
| Additional Debt Type(1): | Pari Passu | |||||
| Escrows and Reserves: | U/W Revenues: | $13,847,197 | ||||
| U/W Expenses: | $4,492,149 | |||||
| Type: | Initial | Monthly | Cap (If Any) | U/W NOI: | $9,355,048 | |
| Taxes | $458,924 | $152,975 | NAP | U/W NCF: | $8,943,800 | |
| Insurance(4) | $0 | Springing | NAP | U/W NOI DSCR(1): | 1.62x | |
| Replacement Reserve | $0 | $5,840 | NAP | U/W NCF DSCR(1): | 1.55x | |
| Deferred Maintenance | $11,250 | $0 | NAP | U/W NOI Debt Yield(1): | 8.5% | |
| TI/LC Reserve(5) | $2,000,000 | $31,557 | $2,000,000 | U/W NCF Debt Yield(1): | 8.1% | |
| Outstanding TI/LC Reserve | $1,139,828 | $0 | NAP | As-Is Appraised Value: | $176,000,000 | |
| Rent Concession Reserve | $234,643 | $0 | NAP | As-Is Appraisal Valuation Date: | April 14, 2018 | |
| Cut-off Date LTV Ratio(1): | 62.5% | |||||
| LTV Ratio at Maturity or ARD(1): | 62.5% | |||||
| (1) | The Shoppes at Chino Hills Mortgage Loan (as defined below) is part of the Shoppes at Chino Hills Whole Loan (as defined below), which is comprised of fourpari passu promissory notes with an aggregate principal balance of $110,000,000. The Cut-off Date Balance PSF, U/W NOI Debt Yield, U/W NCF DSCR, Cut-off Date LTV Ratio and LTV Ratio at Maturity or ARD numbers presented above are based on the aggregate principal balance of the promissory notes comprising the Shoppes at Chino Hills Whole Loan. |
| (2) | The non-recourse carveout guarantor is William L. Hutchinson, the president and founder of Dunhill Partners, Inc. Mr. Hutchinson indirectly owns approximately 2.1% of the borrower. |
| (3) | Defeasance of the Shoppes at Chino Hills Whole Loan is permitted at any time after the earlier of (i) January 1, 2022, or (ii) two years from the closing date of the securitization that includes the lastpari passunote of the Shoppes at Chino Hills Whole Loan to be securitized. The assumed lockout period of 26 payments is based on the closing date of this transaction in August 2018. |
| (4) | Ongoing monthly escrows for insurance premiums are not required as long as (i) there is no event of default under the Shoppes at Chino Hills Mortgage Loan documents; (ii) insurance requirements are being satisfied by a blanket policy reasonably approved by the lender with evidence of renewal of the policies and timely proof of payment of the insurance premiums. |
| (5) | Ongoing monthly TI/LC reserves are not required so long as the TI/LC reserve balance is above $2,000,000 (inclusive of the initial deposit). Upon the TI/LC reserve balance falling below $2,000,000, the borrower must make a monthly deposit into the TI/LC account of $31,557. |
| (6) | Financial information for 2015 is not available due to the sponsor’s midyear acquisition of the Shoppes at Chino Hills Property (as defined below). |
The mortgage loan (the “Shoppes at Chino Hills Mortgage Loan”) is part of a whole loan (the “Shoppes at Chino Hills Whole Loan”) evidenced by fourpari passu promissory notes (Note A-1, Note A-2, Note A-3 and Note A-4) secured by a first mortgage encumbering the borrower’s fee interest in a 378,676 square foot lifestyle center located in Chino Hills, California (the “Shoppes at Chino Hills Property”). The Shoppes at Chino Hills Whole Loan was originated on May 9, 2018 by Morgan Stanley Bank, N.A. The Shoppes at Chino Hills Whole Loan had an original principal balance of $110,000,000, has an outstanding balance as of the Cut-off Date of $110,000,000 and accrues interest at an interest rate of 5.1750%per annum.The Shoppes at Chino Hills Whole Loan had an initial term of term of 120 months, has a remaining term of 118 months as of the Cut-off Date and requires interest-only payments through maturity. The Shoppes at Chino Hills Whole Loan matures on June 1, 2028.
THE INFORMATION IN THIS STRUCTURAL AND COLLATERAL TERM SHEET IS NOT COMPLETE AND MAY BE AMENDED PRIOR TO THE TIME OF SALE. THIS TERM SHEET IS NOT AN OFFER TO SELL THESE SECURITIES AND IT IS NOT A SOLICITATION OF AN OFFER TO BUY THESE SECURITIES IN ANY JURISDICTION WHERE THE OFFER OR SALE IS NOT PERMITTED.
164
SHOPPES AT CHINO HILLS
Note A-2, which will be contributed to the BANK 2018-BNK13 securitization trust, has an original principal balance of $22,000,000, has an outstanding principal balance of $22,000,000 as of the Cut-off Date and represents the non-controlling interest in the Shoppes at Chino Hills Whole Loan. The controlling Note A-1, which had an original principal balance of $40,000,000, was contributed to the MSC 2018-H3 securitization trust. The non-controlling Notes A-3 and A-4 are currently being held by Morgan Stanley Bank, N.A. and are expected to be contributed to one or more future securitizations.
Note Summary
| Notes | Original Balance | Note Holder | Controlling Interest | |
| A-1 | $40,000,000 | MSC 2018-H3 | Yes | |
| A-2 | $22,000,000 | BANK 2018-BNK13 | No | |
| A-3 | $35,000,000 | Morgan Stanley Bank, N.A. | No | |
| A-4 | $13,000,000 | Morgan Stanley Bank, N.A. | No | |
| Total | $110,000,000 |
Sources and Uses
| Sources | Uses | |||||||
| Original whole loan amount | $110,000,000 | 99.6% | Loan Payoff | $105,263,000 | 95.3% | |||
| Borrower Equity | 476,809 | 0.4 | Reserves | 3,844,645 | 3.5 | |||
| Closing Costs | 1,369,163 | 1.2 | ||||||
| Total Sources | $110,476,809 | 100.0% | Total Uses | $110,476,809 | 100.0% |
The Shoppes at Chino Hills Property is a 378,676 SF outdoor lifestyle center comprised of 13 buildings with a second floor office component located in Chino Hills, California. Built in 2008, the Shoppes at Chino Hills Property sits on 25.7 acres and is comprised of 315,519 SF of retail space (93.5% occupied by 75 tenants as of April 1, 2018) and 63,157 SF of second floor office space (100.0% occupied by 10 tenants as of April 1, 2018). The Shoppes at Chino Hills Property contains a total of 1,820 parking spaces (4.81 spaces per 1,000 SF of NRA).
The Shoppes at Chino Hills Property has averaged an occupancy of 92.5% between 2011 and 2017, with the majority of the tenants being national retail and restaurant tenants, including Trader Joe’s, H&M, Barnes & Noble, Forever 21, Old Navy, Victoria’s Secret, Banana Republic, Yard House, P.F. Chang’s, California Pizza Kitchen and Chipotle. 33 tenants (57.3% of NRA) have been tenants since the Shoppes at Chino Hills Property opened in 2008 and 20 tenants (30.2% of NRA) have recently exercised renewal options, averaging a 2.3% increase in rent per extension. Of the Shoppes at Chino Hills Property’s 55 retail tenants that report most recent sales, with “as-of” dates ranging between April 30, 2017 and February 28, 2018, 19 (17.9% of NRA and 27.1% of underwritten base rent) had sales of at least $500 PSF. The Shoppes at Chino Hills Property’s tenants that reported sales reported $81.6 million ($373 PSF), $89.1 million ($390 PSF) and $90.7 million ($372 PSF) in sales for 2015, 2016 and most recent trailing 12 months with “as-of” dates ranging between April 30, 2017 and February 28, 2018, respectively.
The Shoppes at Chino Hills Property is located on the southeast corner of Grand Avenue and Peyton Drive, directly off of California State Highway 71, providing access from Los Angeles, Orange, Riverside, and San Bernardino counties. The city of Chino Hills is a master-planned community that includes a total land area of 26,799 acres. According to the appraisal, one of the primary goals of the city is to maintain a large supply of open space with 48.7% of the land designated for open space. 464 acres are designated for general commercial land and 81 are designated for business parks. Additionally, the Shoppes at Chino Hills Property is part of an approximately 100 acre, specifically planned development that includes a police station, city hall, civic center and community park.
The Shoppes at Chino Hills Property is located in the Inland Empire retail market and West End retail submarket. According to the appraisal, as of the fourth quarter of 2017, the overall retail vacancy rate for the Inland Empire retail market was approximately 8.0%, while the market rental rate was approximately $25.20 PSF. As of the fourth quarter of 2017, the Inland Empire retail market had approximately 421,725 SF of retail space under construction, representing approximately 0.4% of total SF in the Inland Empire retail market. According to the appraisal, as of the fourth quarter of 2017, the overall retail vacancy rate for the West End retail submarket was approximately 7.7%, while the market rental rate was approximately $27.48 PSF. As of the fourth quarter of 2017, the West End retail submarket had approximately 234,135 SF of retail space under construction, representing approximately 0.8% of total SF in the West End retail submarket.
The estimated 2017 population within a three-, five- and ten-mile radius of the Shoppes at Chino Hills Property was 112,768, 323,758 and 1,075,081, respectively, according to the appraisal. The estimated 2017 average household income within a one-, five- and ten-mile radius of the Shoppes at Chino Hills Property was $103,827, $95,643 and $101,707, respectively.
THE INFORMATION IN THIS STRUCTURAL AND COLLATERAL TERM SHEET IS NOT COMPLETE AND MAY BE AMENDED PRIOR TO THE TIME OF SALE. THIS TERM SHEET IS NOT AN OFFER TO SELL THESE SECURITIES AND IT IS NOT A SOLICITATION OF AN OFFER TO BUY THESE SECURITIES IN ANY JURISDICTION WHERE THE OFFER OR SALE IS NOT PERMITTED.
165
SHOPPES AT CHINO HILLS
The following table presents certain information relating to the tenancy at Shoppes at Chino Hills Property:
Major Tenants(1)
| Tenant Name | Credit Rating (Fitch/ Moody’s/ S&P)(2) | Tenant NRSF | % of NRSF | Annual U/W Base Rent PSF(3) | Annual U/W Base Rent(4) | % of Total Annual U/W Base Rent | 2/28/2018 TTM Sales(5) | Lease Expiration Date | ||
| $ | PSF | Occ Cost(6) | ||||||||
| Major Retail Tenants | ||||||||||
| Barnes & Noble | NR/NR/NR | 28,129 | 7.4% | $18.24 | $513,128 | 4.6% | $4,711,391 | $167 | 10.9% | 6/30/2023 |
| Forever 21(7) | NR/NR/NR | 21,169 | 5.6% | $14.82 | $313,752 | 2.8% | $4,183,364 | $198 | 7.5% | 12/31/2023 |
| Old Navy | BB+/Baa2/BB+ | 14,534 | 3.8% | $16.22 | $235,676 | 2.1% | $5,386,786 | $371 | 7.7% | 9/25/2021 |
| Trader Joe’s(8) | NR/NR/NR | 12,538 | 3.3% | $24.20 | $303,420 | 2.7% | NAV | NAV | NAV | 7/31/2022 |
| H&M(9) | NR/NR/NR | 10,501 | 2.8% | $19.94 | $209,412 | 1.9% | $2,326,797 | $222 | 9.0% | 1/31/2019 |
| Subtotal/Wtd. Avg. | 86,871 | 22.9% | $18.13 | $1,575,388 | 14.3% | $16,608,339 | $223 | 8.7% | ||
| Other Retail Tenants | 208,107 | 55.0% | $37.39 | $7,782,072 | 70.5% | $74,084,780 | $437 | 10.4% | ||
| Vacant Retail Space | 20,541 | 5.4% | $0.00 | $0 | 0.0% | |||||
| Retail Subtotal/Wtd. Avg. | 315,519 | 83.3% | $31.72 | $9,357,460 | 84.8% | $90,693,119 | $372 | 10.1% | ||
| Major Office Tenants | ||||||||||
| Jacuzzi Brands | NR/NR/NR | 32,458 | 8.6% | $25.14 | $815,994 | 7.4% | 10/31/2019 | |||
| People’s Care Inc. | NR/NR/NR | 8,656 | 2.3% | $26.74 | $231,486 | 2.1% | 2/28/2021 | |||
| Apollo Insurance Services | NR/NR/NR | 6,984 | 1.8% | $27.24 | $190,244 | 1.7% | 6/30/2022 | |||
| Subtotal/Wtd. Avg. | 48,098 | 12.7% | $25.73 | $1,237,724 | 11.2% | |||||
| Other Office Tenants | 15,059 | 4.0% | $29.42 | $442,997 | 4.0% | |||||
| Vacant Office Space | 0 | 0.0% | $0.00 | $0 | 0.0% | |||||
| Office Subtotal/Wtd. Avg. | 63,157 | 16.7% | $26.61 | $1,680,721 | 15.2% | |||||
| Total/Wtd. Avg. | 378,676 | 100.0% | $30.82 | $11,038,181 | 100.0% | |||||
| (1) | Information is based on the underwritten rent roll as of April 1, 2018. |
| (2) | Certain ratings are those of the parent company whether or not the parent guarantees the lease. |
| (3) | Wtd. Avg. Annual U/W Base Rent PSF excludes vacant space. |
| (4) | Annual U/W Base Rent includes contractual rent steps equal to $305,435 through May 1, 2019, $368,998 of overage rent and $1,015,596 of percent in lieu. |
| (5) | Reflects most recently reported sales on a trailing twelve month basis as of February 28, 2018. Most recently reported sales date varies by tenant and ranges from April 30, 2017 to February 28, 2018. |
| (6) | Occ. Cost % is based on the underwritten rent as of the April 1, 2018 rent roll, underwritten reimbursements, overage rent and Percent in Lieu divided by most recently reported sales. |
| (7) | Forever 21 pays 7.5% of gross sales in lieu of base rent. Forever 21 Annual U/W Base rent is based on most recently reported annual sales. |
| (8) | Trader Joe’s is not required to report sales. |
| (9) | H&M pays 9.0% of gross sales in lieu of base rent. H&M Annual U/W Base rent is based on most recently reported annual sales. |
THE INFORMATION IN THIS STRUCTURAL AND COLLATERAL TERM SHEET IS NOT COMPLETE AND MAY BE AMENDED PRIOR TO THE TIME OF SALE. THIS TERM SHEET IS NOT AN OFFER TO SELL THESE SECURITIES AND IT IS NOT A SOLICITATION OF AN OFFER TO BUY THESE SECURITIES IN ANY JURISDICTION WHERE THE OFFER OR SALE IS NOT PERMITTED.
166
SHOPPES AT CHINO HILLS
The following table presents certain information relating to the lease rollover schedule at Shoppes at Chino Hills Property:
Lease Expiration Schedule(1)(2)
| Year Ending December 31, | No. of Leases Expiring | Expiring NRSF | % of Total NRSF | Cumulative Expiring NRSF | Cumulative % of Total NRSF | Annual U/W Base Rent | % of Total Annual U/W Base Rent | Annual U/W Base Rent PSF(3) |
| MTM | 1 | 1,634 | 0.4% | 1,634 | 0.4% | $36,694 | 0.3% | $22.46 |
| 2018 | 3 | 5,101 | 1.3% | 6,735 | 1.8% | $136,086 | 1.2% | $26.68 |
| 2019 | 8 | 69,117 | 18.3% | 75,852 | 20.0% | $1,683,159 | 15.2% | $24.35 |
| 2020 | 10 | 22,180 | 5.9% | 98,032 | 25.9% | $669,016 | 6.1% | $30.16 |
| 2021 | 15 | 52,191 | 13.8% | 150,223 | 39.7% | $1,356,740 | 12.3% | $26.00 |
| 2022 | 12 | 36,416 | 9.6% | 186,639 | 49.3% | $1,081,322 | 9.8% | $29.69 |
| 2023 | 25 | 122,257 | 32.3% | 308,896 | 81.6% | $4,066,176 | 36.8% | $33.26 |
| 2024 | 2 | 7,822 | 2.1% | 316,718 | 83.6% | $245,632 | 2.2% | $31.40 |
| 2025 | 2 | 3,975 | 1.0% | 320,693 | 84.7% | $114,807 | 1.0% | $28.88 |
| 2026 | 1 | 1,064 | 0.3% | 321,757 | 85.0% | $44,688 | 0.4% | $42.00 |
| 2027 | 1 | 5,500 | 1.5% | 327,257 | 86.4% | $156,877 | 1.4% | $28.52 |
| 2028 | 3 | 16,478 | 4.4% | 343,735 | 90.8% | $667,596 | 6.0% | $40.51 |
| Thereafter | 3 | 14,400 | 3.8% | 358,135 | 94.6% | $779,388 | 7.1% | $54.12 |
| Vacant | 0 | 20,541 | 5.4% | 378,676 | 100.0% | $0 | 0.0% | $0.00 |
| Total/Wtd. Avg. | 86 | 378,676 | 100.0% | $11,038,181 | 100.0% | $30.82 |
| (1) | Information is based on the underwritten rent roll as of April 1, 2018. |
| (2) | Certain tenants may have lease termination options that are exercisable prior to the stated expiration date of the subject lease or leases which are not considered in the lease rollover schedule. |
| (3) | Wtd. Avg. Annual U/W Base Rent PSF Rolling excludes vacant space. |
The following table presents historical sales at Shoppes at Chino Hills Property:
Historical Sales Summary(1)
2015 Sales | 2016 Sales | 2/28/2018 TTM Sales(2) | ||||||||||
| Tenant | Sales ($) | Sales (PSF) | Sales ($) | Sales (PSF) | Sales ($) | Sales (PSF) | ||||||
| Total/Wtd. Avg. | $81,571,472 | $373 | $89,058,949 | $390 | $90,693,119 | $372 | ||||||
| (1) | Information is based on the underwritten rent roll as of April 1, 2018. |
| (2) | Reflects most recently reported sales on a trailing twelve-months basis as of February 28, 2018. Most recently reported sales date varies by tenant and ranges from April 30, 2017 to February 28, 2018. |
THE INFORMATION IN THIS STRUCTURAL AND COLLATERAL TERM SHEET IS NOT COMPLETE AND MAY BE AMENDED PRIOR TO THE TIME OF SALE. THIS TERM SHEET IS NOT AN OFFER TO SELL THESE SECURITIES AND IT IS NOT A SOLICITATION OF AN OFFER TO BUY THESE SECURITIES IN ANY JURISDICTION WHERE THE OFFER OR SALE IS NOT PERMITTED.
167
SHOPPES AT CHINO HILLS
Operating History and Underwritten Net Cash Flow. The following table presents certain information relating to the underwritten net cash flow at Shoppes at Chino Hills Property:
Cash Flow Analysis(1)
| 2014 | 2016 | 2017 | U/W | % of U/W Effective Gross Income | U/W $ per SF | |||||||||||||
| Base Rent(2) | $8,284,022 | $8,870,750 | $9,101,930 | $9,653,586 | 69.7 | % | $25.49 | |||||||||||
| Total Recoveries | 1,605,058 | 2,390,775 | 2,486,019 | 2,514,277 | 18.2 | 6.64 | ||||||||||||
| Percentage Rent(3) | 977,916 | 967,021 | 884,265 | 1,384,595 | 10.0 | 3.66 | ||||||||||||
| Other Income(4) | 262,121 | 335,741 | 296,166 | 294,740 | 2.1 | 0.78 | ||||||||||||
| Free Rent | (9,113) | (1,727) | (7,045) | 0 | 0.0 | 0.00 | ||||||||||||
| Effective Gross Income | $11,120,004 | $12,562,560 | $12,761,335 | $13,847,197 | 100.0 | % | $36.57 | |||||||||||
| Total Operating Expenses | $3,663,631 | $4,885,089 | $4,540,632 | $4,492,149 | 32.4 | % | $11.86 | |||||||||||
| Net Operating Income | $7,456,373 | $7,677,471 | $8,220,704 | $9,355,048 | 67.6 | % | $24.70 | |||||||||||
| Capital Expenditures | 0 | 0 | 0 | 63,117 | 0.5 | 0.17 | ||||||||||||
| TI/LC | 0 | 0 | 0 | 348,131 | 2.5 | 0.92 | ||||||||||||
| Net Cash Flow | $7,456,373 | $7,677,471 | $8,220,704 | $8,943,800 | 64.6 | % | $23.62 | |||||||||||
| NOI DSCR(5) | 1.29x | 1.33x | 1.42x | 1.62x | ||||||||||||||
| NCF DSCR(5) | 1.29x | 1.33x | 1.42x | 1.55x | ||||||||||||||
| NOI DY(5) | 6.8% | 7.0% | 7.5% | 8.5% | ||||||||||||||
| NCF DY(5) | 6.8% | 7.0% | 7.5% | 8.1% | ||||||||||||||
| (1) | Financial information for 2015 is not available due to the sponsor’s mid-year acquisition of the Shoppes at Chino Hills Property. |
| (2) | U/W Base Rent is based on the rent roll dated April 1, 2018 and includes rent steps through May 1, 2019 totaling $305,435. The increase in UW Base Rent over 2017 is attributable to rent steps, new lease signings and 20 tenants (30.2% of the NRA) recently exercising renewal options for an average of a 2.3% increase in rent per extension. |
| (3) | U/W Percentage Rent is comprised of $368,998 of Overage Rent and $1,015,596 of Percent in Lieu. |
| (4) | Other Income is comprised of parking, storage, signage, marketing, and lease buyout revenue. |
| (5) | The debt service coverage ratios and debt yields are based on the Shoppes at Chino Hills Whole Loan. |
The following table presents certain information relating to comparable properties to Shoppes at Chino Hills Property:
Comparable Leases(1)
Property Name City, State | Year Built | Size (SF) | Total Occupancy | Tenant | Lease Area (SF) | Lease Date | Lease Term (Yrs.) | Base Rent PSF | Reimbursements |
Chino Spectrum Town Center Chino, CA | 2002 | 740,646 | 97% | SalonCentric Ichi Poki Salad Bar DSW Shoes | 1,708 1,890 17,756 | Mar - 17 Apr - 16 Nov - 15 | 5.0 5.0 10.0 | $21.96 $41.40 $14.52 | NNN NNN NNN |
Crossroads Entertainment Center Chino Hills, CA | 2006 | 90,879 | 100% | Albertos Mexican Food | 2,151 | Jan - 16 | 0.0 | $32.64 | NNN |
Crossroads Marketplace At Chino Hills Chino Hills, CA | 1998 | 663,538 | 55% | Inline Retail Tenant Inline Retail Tenant Inline Restaurant Tenant Inline Restaurant Tenant | 1,500 1,700 1,400 1,500 | Jul - 16 Jul - 16 Apr - 16 Jan - 16 | 5.0 6.7 5.0 5.0 | $36.00 $43.56 $40.80 $41.04 | NNN NNN NNN NNN |
The Commons At Chino Hills Chino Hills, CA | 2008 | 432,000 | 97% | Wayback Burgers Orange Theory Fitness Tastea Dog Haus | 1,456 3,500 1,200 2,250 | Jan - 17 Jun - 16 Feb - 16 Aug - 15 | 10.0 5.5 5.0 5.0 | $51.84 $33.00 $30.00 $36.00 | NNN NNN NNN NNN |
Laband Village Shopping Center Chino Hills, CA | 2002 | 73,352 | 92% | Whiz Kids Montessori School Hayden Yi Hair Story One | 4,240 972 1,233 | Jun - 17 Mar - 17 Feb - 17 | 5.0 5.0 5.0 | $26.88 $28.68 $25.44 | NNN NNN NNN |
Chino Promenade Chino, CA | 1991 | 136,017 | 81% | Hibachi China Buffet Ice Cream Shop | 6,373 1,188 | Jun - 16 Apr - 16 | 5.0 5.0 | $23.40 $22.20 | NNN NNN |
| (1) | Source: Appraisal. |
THE INFORMATION IN THIS STRUCTURAL AND COLLATERAL TERM SHEET IS NOT COMPLETE AND MAY BE AMENDED PRIOR TO THE TIME OF SALE. THIS TERM SHEET IS NOT AN OFFER TO SELL THESE SECURITIES AND IT IS NOT A SOLICITATION OF AN OFFER TO BUY THESE SECURITIES IN ANY JURISDICTION WHERE THE OFFER OR SALE IS NOT PERMITTED.
168
| BANK 2018-BNK13 | Transaction Contact Information |
| VI. | Transaction Contact Information |
Questions regarding this Structural and Collateral Term Sheet may be directed to any of the following individuals:
| Wells Fargo Securities, LLC | |
| Brigid Mattingly | Tel. (312) 269-3062 |
| A.J. Sfarra | Tel. (212) 214-5613 |
| Alex Wong | Tel. (212) 214-5615 |
| BofA Merrill Lynch | |
| Leland Bunch | Tel. (646) 855-3953 |
| Danielle Caldwell | Tel. (646) 855-3421 |
| Morgan Stanley & Co. | |
| Nishant Kapur | Tel. (212) 761-1483 |
| Jane Lam | Tel. (212) 296-8567 |
| Brandon Atkins | Tel. (212) 761-4846 |
THE INFORMATION IN THIS STRUCTURAL AND COLLATERAL TERM SHEET IS NOT COMPLETE AND MAY BE AMENDED PRIOR TO THE TIME OF SALE. THIS TERM SHEET IS NOT AN OFFER TO SELL THESE SECURITIES AND IT IS NOT A SOLICITATION OF AN OFFER TO BUY THESE SECURITIES IN ANY JURISDICTION WHERE THE OFFER OR SALE IS NOT PERMITTED.
169