| FREE WRITING PROSPECTUS | ||
| FILED PURSUANT TO RULE 433 | ||
| REGISTRATION FILE NO.: 333-226486-02 | ||
 |  |
Free Writing Prospectus
Structural and Collateral Term Sheet
$833,933,944
(Approximate Initial Pool Balance)
$722,395,000
(Approximate Aggregate Certificate Balance of Offered Certificates)
Wells Fargo Commercial Mortgage Trust 2018-C48
as Issuing Entity
Wells Fargo Commercial Mortgage Securities, Inc.
as Depositor
Argentic Real Estate Finance LLC
Wells Fargo Bank, National Association
Barclays Bank PLC
Basis Real Estate Capital II, LLC
BSPRT CMBS Finance, LLC
as Sponsors and Mortgage Loan Sellers
Commercial Mortgage Pass-Through Certificates
Series 2018-C48
November 30, 2018
WELLS FARGO SECURITIES Co-Lead Manager and Joint Bookrunner | BARCLAYS Co-Lead Manager and Joint Bookrunner | |
Academy Securities Co-Manager
| Drexel Hamilton Co-Manager |
STATEMENT REGARDING THIS FREE WRITING PROSPECTUS
The depositor has filed a registration statement (including a prospectus) with the Securities and Exchange Commission (‘‘SEC’’) (SEC File No. 333-226486) for the offering to which this communication relates. Before you invest, you should read the prospectus in the registration statement and other documents the depositor has filed with the SEC for more complete information about the depositor, the issuing entity and this offering. You may get these documents for free by visiting EDGAR on the SEC Web site at www.sec.gov. Alternatively, the depositor, any underwriter, or any dealer participating in the offering will arrange to send you the prospectus after filing if you request it by calling toll free 1-800-745-2063 (8 a.m. – 5 p.m. EST) or by emailing wfs.cmbs@wellsfargo.com.
Nothing in this document constitutes an offer of securities for sale in any jurisdiction where the offer or sale is not permitted. The information contained herein is preliminary as of the date hereof, supersedes any such information previously delivered to you and will be superseded by any such information subsequently delivered and ultimately by the final prospectus relating to the securities. These materials are subject to change, completion, supplement or amendment from time to time.
This free writing prospectus has been prepared by the underwriters for information purposes only and does not constitute, in whole or in part, a prospectus for the purposes of Directive 2003/71/EC (as amended) and/or Part VI of the Financial Services and Markets Act 2000, as amended, or other offering document.
STATEMENT REGARDING ASSUMPTIONS AS TO SECURITIES, PRICING ESTIMATES AND OTHER INFORMATION
The attached information contains certain tables and other statistical analyses (the “Computational Materials”) which have been prepared in reliance upon information furnished by the Mortgage Loan Sellers. Numerous assumptions were used in preparing the Computational Materials, which may or may not be reflected herein. As such, no assurance can be given as to the Computational Materials’ accuracy, appropriateness or completeness in any particular context; or as to whether the Computational Materials and/or the assumptions upon which they are based reflect present market conditions or future market performance. The Computational Materials should not be construed as either projections or predictions or as legal, tax, financial or accounting advice. You should consult your own counsel, accountant and other advisors as to the legal, tax, business, financial and related aspects of a purchase of these securities. Any weighted average lives, yields and principal payment periods shown in the Computational Materials are based on prepayment and/or loss assumptions, and changes in such prepayment and/or loss assumptions may dramatically affect such weighted average lives, yields and principal payment periods. In addition, it is possible that prepayments or losses on the underlying assets will occur at rates higher or lower than the rates shown in the attached Computational Materials. The specific characteristics of the securities may differ from those shown in the Computational Materials due to differences between the final underlying assets and the preliminary underlying assets used in preparing the Computational Materials. The principal amount and designation of any security described in the Computational Materials are subject to change prior to issuance. None of Wells Fargo Securities, LLC, Barclays Capital Inc., Academy Securities, Inc., Drexel Hamilton, LLC, or any of their respective affiliates, make any representation or warranty as to the actual rate or timing of payments or losses on any of the underlying assets or the payments or yield on the securities. The information in this presentation is based upon management forecasts and reflects prevailing conditions and management’s views as of this date, all of which are subject to change. In preparing this presentation, we have relied upon and assumed, without independent verification, the accuracy and completeness of all information available from public sources or which was provided to us by or on behalf of the Mortgage Loan Sellers or which was otherwise reviewed by us.
This free writing prospectus contains certain forward-looking statements. If and when included in this free writing prospectus, the words “expects”, “intends”, “anticipates”, “estimates” and analogous expressions and all statements that are not historical facts, including statements about our beliefs or expectations, are intended to identify forward-looking statements. Any forward-looking statements are made subject to risks and uncertainties which could cause actual results to differ materially from those stated. Those risks and uncertainties include, among other things, declines in general economic and business conditions, increased competition, changes in demographics, changes in political and social conditions, regulatory initiatives and changes in customer preferences, many of which are beyond our control and the control of any other person or entity related to this offering. The forward-looking statements made in this free writing prospectus are made as of the date stated on the cover. We have no obligation to update or revise any forward-looking statement.
Wells Fargo Securities is the trade name for the capital markets and investment banking services of Wells Fargo & Company and its subsidiaries, including but not limited to Wells Fargo Securities, LLC, a member of NYSE, FINRA, NFA and SIPC, Wells Fargo Prime Services, LLC, a member of FINRA, NFA and SIPC, and Wells Fargo Bank, N.A. Wells Fargo Securities, LLC and Wells Fargo Prime Services, LLC are distinct entities from affiliated banks and thrifts.
IMPORTANT NOTICE REGARDING THE OFFERED CERTIFICATES
The information herein is preliminary and may be supplemented or amended prior to the time of sale. In addition, the Offered Certificates referred to in these materials and the asset pool backing them are subject to modification or revision (including the possibility that one or more classes of certificates may be split, combined or eliminated at any time prior to issuance or availability of a final prospectus) and are offered on a “when, as and if issued” basis.
The underwriters described in these materials may from time to time perform investment banking services for, or solicit investment banking business from, any company named in these materials. The underwriters and/or their affiliates or respective employees may from time to time have a long or short position in any security or contract discussed in these materials.
The information contained herein supersedes any previous such information delivered to any prospective investor and will be superseded by information delivered to such prospective investor prior to the time of sale.
IMPORTANT NOTICE RELATING TO AUTOMATICALLY-GENERATED EMAIL DISCLAIMERS
Any legends, disclaimers or other notices that may appear at the bottom of any email communication to which this free writing prospectus is attached relating to (1) these materials not constituting an offer (or a solicitation of an offer), (2) any representation that these materials are accurate or complete and may not be updated or (3) these materials possibly being confidential, are not applicable to these materials and should be disregarded. Such legends, disclaimers or other notices have been automatically generated as a result of these materials having been sent via Bloomberg or another system.
THE INFORMATION IN THIS STRUCTURAL AND COLLATERAL TERM SHEET IS NOT COMPLETE AND MAY BE AMENDED PRIOR TO THE TIME OF SALE. THIS TERM SHEET IS NOT AN OFFER TO SELL THESE SECURITIES AND IT IS NOT A SOLICITATION OF AN OFFER TO BUY THESE SECURITIES IN ANY JURISDICTION WHERE THE OFFER OR SALE IS NOT PERMITTED.
2
| Wells Fargo Commercial Mortgage Trust 2018-C48 | Certificate Structure |
| I. | Certificate Structure |
| Class | Expected Ratings (Fitch/KBRA/Moody’s)(1) | Approximate Initial Certificate Balance or Notional Amount(2) | Approx. Initial Credit Support(3) | Pass-Through Rate Description | Weighted Average Life (Years)(4) | Expected Principal Window(4) | Certificate Principal to Value Ratio(5) | Certificate Principal U/W NOI Debt Yield(6) | ||
| Offered Certificates | ||||||||||
| A-1 | AAAsf/AAA(sf)/Aaa(sf) | $18,490,000 | 30.000% | (7) | 2.37 | 01/19 – 05/23 | 42.5% | 15.9% | ||
| A-2 | AAAsf/AAA(sf)/Aaa(sf) | $36,431,000 | 30.000% | (7) | 4.70 | 05/23 – 10/23 | 42.5% | 15.9% | ||
| A-3 | AAAsf/AAA(sf)/Aaa(sf) | $23,767,000 | 30.000% | (7) | 6.90 | 11/25 – 11/25 | 42.5% | 15.9% | ||
| A-SB | AAAsf/AAA(sf)/Aaa(sf) | $32,713,000 | 30.000% | (7) | 7.20 | 10/23 – 04/28 | 42.5% | 15.9% | ||
| A-4 | AAAsf/AAA(sf)/Aaa(sf) | (8) | 30.000% | (7) | (8) | (8) | 42.5% | 15.9% | ||
| A-5 | AAAsf/AAA(sf)/Aaa(sf) | (8) | 30.000% | (7) | (8) | (8) | 42.5% | 15.9% | ||
| X-A | AAAsf/AAA(sf)/Aaa(sf) | $583,753,000(9) | N/A | Variable(10) | N/A | N/A | N/A | N/A | ||
| X-B | A-sf/AAA(sf)/NR | $138,642,000(11) | N/A | Variable(12) | N/A | N/A | N/A | N/A | ||
| A-S | AAAsf/AAA(sf)/Aa2(sf) | $59,418,000 | 22.875% | (7) | 9.99 | 12/28 – 12/28 | 46.8% | 14.4% | ||
| B | AA-sf/AA+(sf)/NR | $40,654,000 | 18.000% | (7) | 9.99 | 12/28 – 12/28 | 49.8% | 13.5% | ||
| C | A-sf/A(sf)/NR | $38,570,000 | 13.375% | (7) | 9.99 | 12/28 – 12/28 | 52.6% | 12.8% | ||
| Non-Offered Certificates | ||||||||||
| X-D(13) | BBB-sf/BBB+(sf)/NR | $31,848,000(14) | N/A | Variable(15) | N/A | N/A | N/A | N/A | ||
| D(13) | BBB-sf/BBB+(sf)/NR | $31,848,000 | 9.556% | (7) | 9.99 | 12/28 – 12/28 | 54.9% | 12.3% | ||
| Risk Retention Certificates | ||||||||||
| E-RR(13) | BBB-sf/BBB-(sf)/NR | $14,018,000 | 7.875% | (7) | 9.99 | 12/28 – 12/28 | 55.9% | 12.0% | ||
| F-RR | BB-sf/BB(sf)/NR | $20,848,000 | 5.375% | (7) | 9.99 | 12/28 – 12/28 | 57.4% | 11.7% | ||
| G-RR | B-sf/B(sf)/NR | $9,382,000 | 4.250% | (7) | 9.99 | 12/28 – 12/28 | 58.1% | 11.6% | ||
| H-RR | NR/NR/NR | $35,442,944 | 0.000% | (7) | 9.99 | 12/28 – 12/28 | 60.7% | 11.1% | ||
| Notes: |
| (1) | The expected ratings presented are those of Fitch Ratings, Inc. (“Fitch”), Kroll Bond Rating Agency, Inc. (“KBRA”) and Moody’s Investors Service, Inc. (“Moody’s”), which the depositor hired to rate the Offered Certificates. One or more other nationally recognized statistical rating organizations that were not hired by the depositor may use information they receive pursuant to Rule 17g-5 under the Securities Exchange Act of 1934, as amended (the “Exchange Act”) or otherwise, to rate or provide market reports and/or published commentary related to the Offered Certificates. We cannot assure you as to what ratings a non-hired nationally recognized statistical rating organization would assign or that its reports will not express differing, possibly negative, views of the mortgage loans and/or the Offered Certificates. The ratings of each class of Offered Certificates address the likelihood of the timely distribution of interest and, except in the case of the Class X-A, X-B and X-D Certificates, the ultimate distribution of principal due on those classes on or before the Rated Final Distribution Date. See “Risk Factors—Other Risks Relating to the Certificates—Nationally Recognized Statistical Rating Organizations May Assign Different Ratings to the Certificates; Ratings of the Certificates Reflect Only the Views of the Applicable Rating Agencies as of the Dates Such Ratings Were Issued; Ratings May Affect ERISA Eligibility; Ratings May Be Downgraded” and “Ratings” in the Preliminary Prospectus, expected to be dated November 30, 2018 (the “Preliminary Prospectus”). Fitch, KBRA and Moody’s have informed us that the “sf” designation in their ratings represents an identifier for structured finance product ratings. |
| (2) | The certificate balances and notional amounts set forth in the table are approximate. The actual initial certificate balances and notional amounts may be larger or smaller depending on the initial pool balance of the mortgage loans definitively included in the pool of mortgage loans, which aggregate cut-off date balance may be as much as 5% larger or smaller than the amount presented in the Preliminary Prospectus. In addition, the notional amounts of the Class X-A, X-B and X-D certificates may vary depending upon the final pricing of the classes of principal balance certificates whose certificate balances comprise such notional amounts, and, if, as a result of such pricing, the pass-through rate of the Class X-A, X-B or X-D certificates, as applicable, would be equal to zero at all times, such class of certificates may not be issued on the closing date of this securitization. |
| (3) | The approximate initial credit support with respect to the Class A-1, A-2, A-3, A-SB, A-4 and A-5 Certificates represents the approximate credit enhancement for the Class A-1, A-2, A-3, A-SB, A-4 and A-5 Certificates in the aggregate. |
| (4) | Weighted Average Lives and Expected Principal Windows are calculated based on an assumed prepayment rate of 0% CPR and the “Structuring Assumptions” described under “Yield and Maturity Considerations—Weighted Average Life” in the Preliminary Prospectus. |
| (5) | The Certificate Principal to Value Ratio for each Class of Certificates (other than the Class A-1, A-2, A-3, A-SB, A-4 and A-5 Certificates) is calculated as the product of (a) the weighted average Cut-off Date LTV Ratio for the mortgage loans and (b) a fraction, the numerator of which is the total initial Certificate Balance of such Class of Certificates and all Classes of Principal Balance Certificates (as defined in the Preliminary Prospectus) senior to such Class of Certificates and the denominator of which is the total initial Certificate Balance of all of the Principal Balance Certificates. The Certificate Principal to Value Ratio for each of the Class A-1, A-2, A-3, A-SB, A-4 and A-5 Certificates is calculated in the aggregate for those Classes as if they were a single Class and is calculated as the product of (a) the weighted average Cut-off Date LTV Ratio for the mortgage loans and (b) a fraction, the numerator of which is the total initial aggregate Certificate Balances of such Classes of Certificates and the denominator of which is the total initial Certificate Balance of all of the Principal Balance Certificates. In any event, however, excess mortgaged property value associated with a mortgage loan will not be available to offset losses on any other mortgage loan. |
| (6) | The Certificate Principal U/W NOI Debt Yield for each Class of Certificates (other than the Class A-1, A-2, A-3, A-SB, A-4 and A-5 Certificates) is calculated as the product of (a) the weighted average U/W NOI Debt Yield for the mortgage loans and (b) a fraction, the numerator of which is the total initial Certificate Balance of all of the Classes of Principal Balance Certificates and the denominator of which is the total initial Certificate Balance for such Class of Certificates and all Classes of Principal Balance Certificates senior to such Class of Certificates. The Certificate Principal U/W NOI Debt Yield for each of the Class A-1, A-2, A-3, A-SB, A-4 and A-5 Certificates is calculated in the aggregate for those Classes as if they were a single Class and is calculated as the product of (a) the weighted average U/W NOI Debt Yield for the mortgage loans and (b) a fraction, the numerator of which is the total initial Certificate Balance of all of the Classes of Principal Balance Certificates and the denominator of which is the total aggregate initial Certificate Balances for the Class A-1, A-2, A-3, A-SB, A-4 and A-5 Certificates. In any event, however, cash flow from each mortgaged property supports only the related mortgage loan and will not be available to support any other mortgage loan. |
THE INFORMATION IN THIS STRUCTURAL AND COLLATERAL TERM SHEET IS NOT COMPLETE AND MAY BE AMENDED PRIOR TO THE TIME OF SALE. THIS TERM SHEET IS NOT AN OFFER TO SELL THESE SECURITIES AND IT IS NOT A SOLICITATION OF AN OFFER TO BUY THESE SECURITIES IN ANY JURISDICTION WHERE THE OFFER OR SALE IS NOT PERMITTED.
3
| Wells Fargo Commercial Mortgage Trust 2018-C48 | Certificate Structure |
| (7) | The pass-through rates for the Class A-1, A-2, A-3, A-SB, A-4, A-5, A-S, B, C, D, E-RR, F-RR, G-RR and H-RR Certificates in each case will be one of the following: (i) a fixed rateper annum, (ii) a variable rate per annum equal to the weighted average of the net mortgage interest rates on the mortgage loans for the related distribution date, (iii) a variable rateper annum equal to the lesser of (a) a fixed rate and (b) the weighted average of the net mortgage interest rates on the mortgage loans for the related distribution date or (iv) a variable rateper annum equal to the weighted average of the net mortgage interest rates on the mortgage loans for the related distribution date minus a specified percentage. For purposes of the calculation of the weighted average of the net mortgage interest rates on the mortgage loans for each distribution date, the mortgage interest rates will be adjusted as necessary to a 30/360 basis. |
| (8) | The exact initial certificate balances of the Class A-4 and A-5 Certificates are unknown and will be determined based on the final pricing of those classes of certificates. However, the respective initial certificate balances, weighted average lives and principal windows of the Class A-4 and A-5 Certificates are expected to be within the applicable ranges reflected in the following chart. The aggregate initial certificate balance of the Class A-4 and A-5 Certificates is expected to be approximately $472,352,000, subject to a variance of plus or minus 5%. |
Class of | Expected Range of | Expected Range of | Expected Range of | |||
| Class A-4 | $100,000,000 - $230,000,000 | 9.60 – 9.72 | 04/28 – 09/28 / 04/28 – 10/28 | |||
| Class A-5 | $242,352,000 - $372,352,000 | 9.87 – 9.91 | 09/28 – 12/28 / 10/28 – 12/28 |
| (9) | The Class X-A Certificates are notional amount certificates. The Notional Amount of the Class X-A Certificates will be equal to the aggregate Certificate Balance of the Class A-1, A-2, A-3, A-SB, A-4 and A-5 Certificates outstanding from time to time. The Class X-A Certificates will not be entitled to distributions of principal. |
| (10) | The pass-through rate for the Class X-A Certificates for any distribution date will be aper annum rate equal to the excess, if any, of (a) the weighted average of the net mortgage interest rates on the mortgage loans for the related distribution date, over (b) the weighted average of the pass-through rates on the Class A-1, A-2, A-3, A-SB, A-4 and A-5 Certificates for the related distribution date, weighted on the basis of their respective Certificate Balances outstanding immediately prior to that distribution date. For purposes of the calculation of the weighted average of the net mortgage interest rates on the mortgage loans for each distribution date, the mortgage interest rates will be adjusted as necessary to a 30/360 basis. |
| (11) | The Class X-B Certificates are notional amount certificates. The Notional Amount of the Class X-B Certificates will be equal to the aggregate Certificate Balance of the Class A-S, B and C Certificates outstanding from time to time. The Class X-B Certificates will not be entitled to distributions of principal. |
| (12) | The pass-through rate for the Class X-B Certificates for any distribution date will be aper annum rate equal to the excess, if any, of (a) the weighted average of the net mortgage interest rates on the mortgage loans for the related distribution date, over (b) the weighted average of the pass-through rates on the Class A-S, B and C Certificates for the related distribution date, weighted on the basis of their respective Certificate Balances outstanding immediately prior to that distribution date. For purposes of the calculation of the weighted average of the net mortgage interest rates on the mortgage loans for each distribution date, the mortgage interest rates will be adjusted as necessary to a 30/360 basis. |
| (13) | The initial notional amount of the X-D certificates and the initial certificate balance of each of the Class D and E-RR certificates are subject to change based on final pricing of all certificates and the final determination of the Class E-RR, F-RR, G-RR and H-RR Certificates (collectively, the “horizontal risk retention certificates”) that will be retained by the retaining sponsor through a third party purchaser as part of the U.S. risk retention requirements. For more information regarding the methodology and key inputs and assumptions used to determine the sizing of the horizontal risk retention certificates, see “Credit Risk Retention” in the Preliminary Prospectus. |
| (14) | The Class X-D Certificates are notional amount certificates. The Notional Amount of the Class X-D Certificates will be equal to the Certificate Balance of the Class D Certificates outstanding from time to time. The Class X-D Certificates will not be entitled to distributions of principal. |
| (15) | The pass-through rate for the Class X-D Certificates for any distribution date will be aper annum rate equal to the excess, if any, of (a) the weighted average of the net mortgage interest rates on the mortgage loans for the related distribution date, over (b) the pass-through rate on the Class D Certificates for the related distribution date. For purposes of the calculation of the weighted average of the net mortgage interest rates on the mortgage loans for each distribution date, the mortgage interest rates will be adjusted as necessary to a 30/360 basis. |
THE INFORMATION IN THIS STRUCTURAL AND COLLATERAL TERM SHEET IS NOT COMPLETE AND MAY BE AMENDED PRIOR TO THE TIME OF SALE. THIS TERM SHEET IS NOT AN OFFER TO SELL THESE SECURITIES AND IT IS NOT A SOLICITATION OF AN OFFER TO BUY THESE SECURITIES IN ANY JURISDICTION WHERE THE OFFER OR SALE IS NOT PERMITTED.
4
| Wells Fargo Commercial Mortgage Trust 2018-C48 | Transaction Highlights |
| II. | Transaction Highlights |
Mortgage Loan Sellers:
Mortgage Loan Seller | Number | Number of | Aggregate Cut- | % of Initial |
| Argentic Real Estate Finance LLC | 16 | 18 | $300,741,141 | 36.1% |
| Wells Fargo Bank, National Association | 16 | 44 | 168,585,000 | 20.2 |
| Barclays Bank PLC | 8 | 10 | 161,953,431 | 19.4 |
| Basis Real Estate Capital II, LLC | 7 | 9 | 109,604,372 | 13.1 |
| BSPRT CMBS Finance, LLC | 5 | 14 | 93,050,000 | 11.2 |
Total | 52 | 95 | $833,933,944 | 100.0% |
Loan Pool:
| Initial Pool Balance: | $833,933,944 |
| Number of Mortgage Loans: | 52 |
| Average Cut-off Date Balance per Mortgage Loan: | $16,037,191 |
| Number of Mortgaged Properties: | 95 |
| Average Cut-off Date Balance per Mortgaged Property(1): | $8,778,252 |
| Weighted Average Mortgage Interest Rate: | 5.139% |
| Ten Largest Mortgage Loans as % of Initial Pool Balance: | 45.0% |
| Weighted Average Original Term to Maturity or ARD (months): | 116 |
| Weighted Average Remaining Term to Maturity or ARD (months): | 115 |
| Weighted Average Original Amortization Term (months)(2): | 352 |
| Weighted Average Remaining Amortization Term (months)(2): | 351 |
| Weighted Average Seasoning (months): | 1 |
| (1) | Information regarding mortgage loans secured by multiple properties is based on an allocation according to relative appraised values or the allocated loan amounts or property-specific release prices set forth in the related loan documents or such other allocation as the related mortgage loan seller deemed appropriate. |
| (2) | Excludes any mortgage loan that does not amortize. |
Credit Statistics:
| Weighted Average U/W Net Cash Flow DSCR(1): | 1.81x |
| Weighted Average U/W Net Operating Income Debt Yield(1): | 11.1% |
| Weighted Average Cut-off Date Loan-to-Value Ratio(1): | 60.7% |
| Weighted Average Balloon or ARD Loan-to-Value Ratio(1): | 56.1% |
| % of Mortgage Loans with Additional Subordinate Debt(2): | 16.7% |
| % of Mortgage Loans with Single Tenants(3): | 11.2% |
| (1) | With respect to any mortgage loan that is part of a whole loan, loan-to-value ratio, debt service coverage ratio and debt yield calculations include the relatedpari passucompanion loan(s) but exclude any related subordinate debt (unless otherwise stated). The debt service coverage ratio, debt yield and loan-to-value ratio information do not take into account any subordinate debt (whether or not secured by the related mortgaged property), that currently exists or is allowed under the terms of any mortgage loan. See “Description of the Mortgage Pool—Mortgage Pool Characteristics” in the Preliminary Prospectus and Annex A-1 to the Preliminary Prospectus. |
| (2) | The percentage figure expressed as “% of Mortgage Loans with Additional Subordinate Debt” is determined as a percentage of the initial pool balance and does not take into account any future subordinate debt (whether or not secured by the mortgaged property), if any, that may be permitted under the terms of any mortgage loan or the pooling and servicing agreement. See “Description of the Mortgage Pool—Additional Indebtedness—Other Unsecured Indebtedness” in the Preliminary Prospectus. |
| (3) | Excludes mortgage loans that are secured by multiple single tenant properties. |
THE INFORMATION IN THIS STRUCTURAL AND COLLATERAL TERM SHEET IS NOT COMPLETE AND MAY BE AMENDED PRIOR TO THE TIME OF SALE. THIS TERM SHEET IS NOT AN OFFER TO SELL THESE SECURITIES AND IT IS NOT A SOLICITATION OF AN OFFER TO BUY THESE SECURITIES IN ANY JURISDICTION WHERE THE OFFER OR SALE IS NOT PERMITTED.
5
| Wells Fargo Commercial Mortgage Trust 2018-C48 | Transaction Highlights |
Loan Structural Features:
Amortization:Based on the Initial Pool Balance, 51.9% of the mortgage pool (31 mortgage loans) has scheduled amortization, as follows:
23.7% (17 mortgage loans) provides for an interest-only period followed by an amortization period;
21.6% (12 mortgage loans) requires amortization during the entire loan term;
3.5% (1 mortgage loan) provides for an amortizing ARD period; and
3.1% (1 mortgage loan) requires amortization, followed by an interest-only period, followed by an amortization period.
Interest-Only:Based on the Initial Pool Balance, 48.1% of the mortgage pool (21 mortgage loans) provides for interest-only payments during the entire loan term through maturity or ARD. The Weighted Average Cut-off Date Loan-to-Value Ratio and Weighted Average U/W Net Cash Flow DSCR for those mortgage loans are 56.8% and 2.12x, respectively.
Hard Lockboxes: Based on the Initial Pool Balance, 39.5% of the mortgage pool (17 mortgage loans) have hard lockboxes in place.
Reserves: The mortgage loans require amounts to be escrowed monthly as follows (excluding any mortgage loans with springing provisions):
| Real Estate Taxes: | 74.1% of the pool |
| Insurance: | 42.0% of the pool |
| Capital Replacements: | 80.3% of the pool |
| TI/LC: | 57.6% of the pool(1) |
| (1) | The percentage of Initial Pool Balance for mortgage loans with TI/LC reserves is based on the aggregate principal balance allocable to loans that include retail, office, mixed use and industrial properties. |
Call Protection/Defeasance: Based on the Initial Pool Balance, the mortgage pool has the following call protection and defeasance features:
87.9% of the mortgage pool (48 mortgage loans) features a lockout period, then defeasance only until an open period;
5.5% of the mortgage pool (2 mortgage loans) features a lockout period, then the greater of a prepayment premium (1%) or yield maintenance until an open period;
3.6% of the mortgage pool (1 mortgage loan) features a lockout period, then the greater of a prepayment premium (1%) or yield maintenance, then the greater of a prepayment premium (1%) or yield maintenance or defeasance until an open period; and
3.0% of the mortgage pool (1 mortgage loan) features a lockout period, then the greater of a prepayment premium (1%) or yield maintenance or defeasance until an open period;
Prepayment restrictions for each mortgage loan reflect the entire life of the mortgage loan. Please refer to Annex A-1 to the Preliminary Prospectus and the footnotes related thereto for further information regarding individual loan call protection.
THE INFORMATION IN THIS STRUCTURAL AND COLLATERAL TERM SHEET IS NOT COMPLETE AND MAY BE AMENDED PRIOR TO THE TIME OF SALE. THIS TERM SHEET IS NOT AN OFFER TO SELL THESE SECURITIES AND IT IS NOT A SOLICITATION OF AN OFFER TO BUY THESE SECURITIES IN ANY JURISDICTION WHERE THE OFFER OR SALE IS NOT PERMITTED.
6
| Wells Fargo Commercial Mortgage Trust 2018-C48 | Issue Characteristics |
| III. | Issue Characteristics |
| Securities Offered: | $722,395,000 approximate monthly pay, multi-class, commercial mortgage REMIC pass-through certificates consisting of eleven classes (Classes A-1, A-2, A-3, A-SB, A-4, A-5, A-S, B, C, X-A and X-B), which are offered pursuant to a registration statement filed with the SEC (such classes of certificates, the “Offered Certificates”). |
| Mortgage Loan Sellers: | Argentic Real Estate Finance LLC (“AREF”), Wells Fargo Bank, National Association (“WFB”), Barclays Bank PLC (“Barclays”), Basis Real Estate Capital II, LLC (“Basis”) and BSPRT CMBS Finance, LLC (“BSPRT”). |
| Joint Bookrunners and Co-Lead Managers: | Wells Fargo Securities, LLC and Barclays Capital Inc. |
| Co-Manager: | Academy Securities, Inc. and Drexel Hamilton, LLC |
| Rating Agencies: | Fitch Ratings, Inc., Kroll Bond Rating Agency, Inc. and Moody’s Investors Service, Inc. |
| Master Servicer: | Wells Fargo Bank, National Association |
| Special Servicer: | LNR Partners, LLC |
| Certificate Administrator: | Wells Fargo Bank, National Association |
| Trustee: | Wilmington Trust, National Association |
| Operating Advisor: | Pentalpha Surveillance LLC |
| Asset Representations Reviewer: | Pentalpha Surveillance LLC |
| Initial Majority Controlling Class Certificateholder: | Argentic Securities Holdings Cayman Limited or an affiliate |
| U.S. Credit Risk Retention: | For a discussion on the manner in which the U.S. credit risk retention requirements will be satisfied by Argentic Real Estate Finance LLC, as the retaining sponsor, see “Credit Risk Retention” in the Preliminary Prospectus.
A majority-owned affiliate of Argentic Real Estate Finance LLC, as retaining sponsor, will acquire an “eligible horizontal residual interest” comprised of the Class E-RR, F-RR, G-RR and H-RR certificates (the “horizontal risk retention certificates”). Under the credit risk retention rules, AREF or such majority-owned affiliate will be permitted to transfer the horizontal risk retention certificates to a subsequent third-party purchaser. For additional information, see “Credit Risk Retention” in the Preliminary Prospectus.
|
| EU Credit Risk Retention | None of the sponsors, the depositor or the issuing entity intends to retain a material net economic interest in the securitization constituted by the issue of the Offered Certificates in accordance with the EU risk retention and due diligence requirements or to take any other action which may be required by EEA-regulated investors for the purposes of their compliance with the EU risk retention and due diligence requirements or similar requirements. |
| Cut-off Date: | The Cut-off Date with respect to each mortgage loan is the due date for the monthly debt service payment that is due in December 2018 (or, in the case of any mortgage loan that has its first due date in January 2019, the date that would have been its due date in December 2018 under the terms of that mortgage loan if a monthly debt service payment were scheduled to be due in that month). |
| Expected Closing Date: | On or about December 20, 2018. |
| Determination Dates: | The 11th day of each month (or if that day is not a business day, the next succeeding business day), commencing in January 2019. |
| Distribution Dates: | The fourth business day following the Determination Date in each month, commencing in January 2019. |
| Rated Final Distribution Date: | The Distribution Date in January 2052. |
| Interest Accrual Period: | With respect to any Distribution Date, the calendar month immediately preceding the month in which such Distribution Date occurs. |
| Day Count: | The Offered Certificates will accrue interest on a 30/360 basis. |
THE INFORMATION IN THIS STRUCTURAL AND COLLATERAL TERM SHEET IS NOT COMPLETE AND MAY BE AMENDED PRIOR TO THE TIME OF SALE. THIS TERM SHEET IS NOT AN OFFER TO SELL THESE SECURITIES AND IT IS NOT A SOLICITATION OF AN OFFER TO BUY THESE SECURITIES IN ANY JURISDICTION WHERE THE OFFER OR SALE IS NOT PERMITTED.
7
| Wells Fargo Commercial Mortgage Trust 2018-C48 | Issue Characteristics |
| Minimum Denominations: | $10,000 for each Class of Offered Certificates (other than the Class X-A and X-B Certificates) and $1,000,000 for the Class X-A and X-B Certificates. Investments may also be made in any whole dollar denomination in excess of the applicable minimum denomination. |
| Clean-up Call: | 1.0% |
| Delivery: | DTC, Euroclear and Clearstream Banking |
| ERISA/SMMEA Status: | Each Class of Offered Certificates is expected to be eligible for exemptive relief under ERISA. No Class of Offered Certificates will be SMMEA eligible. |
| Risk Factors: | THE CERTIFICATES INVOLVE CERTAIN RISKS AND MAY NOT BE SUITABLE FOR ALL INVESTORS. SEE THE “RISK FACTORS” SECTION OF THE PRELIMINARY PROSPECTUS. |
| Bond Analytics Information: | The Certificate Administrator will be authorized to make distribution date statements, CREFC® reports and certain supplemental reports (other than confidential information) available to certain financial modeling and data provision services, including Bloomberg, L.P., Trepp, LLC, Intex Solutions, Inc., Interactive Data Corp., Markit Group Limited, BlackRock Financial Management, Inc., CMBS.com, Inc., Moody’s Analytics, MBS Data, LLC and Thomson Reuters Corporation. |
| Tax Treatment | For U.S. federal income tax purposes, the issuing entity will consist of one or more REMICs and the Offered Certificates will represent REMIC regular interests. |
THE INFORMATION IN THIS STRUCTURAL AND COLLATERAL TERM SHEET IS NOT COMPLETE AND MAY BE AMENDED PRIOR TO THE TIME OF SALE. THIS TERM SHEET IS NOT AN OFFER TO SELL THESE SECURITIES AND IT IS NOT A SOLICITATION OF AN OFFER TO BUY THESE SECURITIES IN ANY JURISDICTION WHERE THE OFFER OR SALE IS NOT PERMITTED.
8
| Wells Fargo Commercial Mortgage Trust 2018-C48 | Characteristics of the Mortgage Pool |
| IV. | Characteristics of the Mortgage Pool(1) |
| A. | Ten Largest Mortgage Loans |
| Mortgage Loan Seller | Mortgage Loan Name | City | State | Number of Mortgage Loans / Mortgaged Properties | Mortgage Loan Cut-off Date Balance ($) | % of Initial Pool Balance (%) | Property Type | Number of Rooms/SF/Units | Cut-off Date Balance Per Room/SF/Unit | Cut-off Date LTV Ratio (%) | Balloon or ARD LTV Ratio (%) | U/W NCF DSCR (x) | U/W NOI Debt Yield (%) |
| Barclays | Miami Industrial Portfolio | Miami | FL | 1 / 1 | $66,100,000 | 7.9% | Industrial | 745,597 | $89 | 63.3% | 63.3% | 1.77x | 9.9% |
| AREF | Sheraton Grand Nashville Downtown | Nashville | TN | 1 / 1 | 60,000,000 | 7.2 | Hospitality | 482 | 331,950 | 57.9 | 57.9 | 2.48 | 13.9 |
| WFB | Walgreens - Ginsberg Portfolio | Various | Various | 1 / 6 | 40,000,000 | 4.8 | Retail | 87,049 | 460 | 70.3 | 58.3 | 1.26 | 8.4 |
| AREF | Riverworks | Watertown | MA | 1 / 1 | 38,629,000 | 4.6 | Office | 201,417 | 192 | 51.2 | 51.2 | 2.02 | 10.6 |
| AREF | 1000 Windward Concourse | Alpharetta | GA | 1 / 1 | 30,500,000 | 3.7 | Office | 251,425 | 121 | 63.5 | 59.7 | 1.66 | 11.7 |
| WFB | Starwood Hotel Portfolio | Various | Various | 1 / 22 | 30,000,000 | 3.6 | Hospitality | 2,943 | 90,044 | 66.1 | 66.1 | 2.07 | 12.5 |
| AREF | Franklin Towne Center | Franklin Park | NJ | 1 / 1 | 29,000,000 | 3.5 | Retail | 138,364 | 210 | 60.7 | 42.6 | 1.57 | 12.5 |
| Barclays | Christiana Mall | Newark | DE | 1 / 1 | 28,000,000 | 3.4 | Retail | 779,084 | 434 | 32.5 | 32.5 | 3.15 | 13.8 |
| BSP | Bella at Norcross | Norcross | GA | 1 / 1 | 27,000,000 | 3.2 | Multifamily | 318 | 84,906 | 64.3 | 59.8 | 1.30 | 9.2 |
| Basis | 1600 Terrell Mill Road | Marietta | GA | 1 / 1 | 26,000,000 | 3.1 | Office | 251,710 | 103 | 65.0 | 56.7 | 1.30 | 10.0 |
| Top Three Total/Weighted Average | 3 / 8 | $166,100,000 | 19.9% | 63.0% | 60.1% | 1.90x | 11.0% | ||||||
| Top Five Total/Weighted Average | 5 / 10 | $235,229,000 | 28.2% | 61.2% | 58.6% | 1.89x | 11.0% | ||||||
| Top Ten Total/Weighted Average | 10 / 36 | $375,229,000 | 45.0% | 59.9% | 56.0% | 1.89x | 11.3% | ||||||
| Non-Top Ten Total/Weighted Average | 42 / 59 | $458,704,944 | 55.0% | 61.4% | 56.2% | 1.74x | 11.0% | ||||||
| (1) | With respect to any mortgage loan that is part of a whole loan, Cut-off Date Balance Per Room/SF/Unit, loan-to-value ratio, debt service coverage ratio and debt yield calculations include the relatedpari passu companion loan(s) but exclude any related subordinate debt (unless otherwise stated). With respect to each mortgage loan, debt service coverage ratio, debt yield and loan-to-value ratio information do not take into account subordinate debt (whether or not secured by the related mortgaged property), if any, that currently exists or is allowed under the terms of such mortgage loan. |
THE INFORMATION IN THIS STRUCTURAL AND COLLATERAL TERM SHEET IS NOT COMPLETE AND MAY BE AMENDED PRIOR TO THE TIME OF SALE. THIS TERM SHEET IS NOT AN OFFER TO SELL THESE SECURITIES AND IT IS NOT A SOLICITATION OF AN OFFER TO BUY THESE SECURITIES IN ANY JURISDICTION WHERE THE OFFER OR SALE IS NOT PERMITTED.
9
| Wells Fargo Commercial Mortgage Trust 2018-C48 | Characteristics of the Mortgage Pool |
| B. | Summary of the Whole Loans |
| Property Name | Mortgage Loan Seller in WFCM 2018-C48 | Note(s)(1) | Original Balance | Holder of Note(1) | Lead Servicer for Whole Loan | Master Servicer Under Lead Securitization Servicing Agreement | Special Servicer Under Lead Securitization Servicing Agreement |
| Sheraton Grand Nashville Downtown | AREF | A-1 | $30,000,000 | CSAIL 2018-C14 | No | Wells Fargo Bank, National Association | LNR Partners, LLC |
| A-2 | $30,000,000 | WFCM 2018-C48 | Yes | ||||
| A-3 | $25,000,000 | AREF | No | ||||
| A-4 | $25,000,000 | AREF | No | ||||
| A-5 | $20,000,000 | WFCM 2018-C48 | No | ||||
| A-6 | $15,000,000 | AREF | No | ||||
| A-7 | $10,000,000 | WFCM 2018-C48 | No | ||||
| A-8 | $5,000,000 | AREF | No | ||||
| Starwood Hotel Portfolio | WFB | A-1 | $70,000,000 | WFCM 2018-C47 | Yes | Wells Fargo Bank, National Association | Midland Loan Services |
| A-2 | $65,000,000 | BANK 2018-BNK14 | No | ||||
| A-3 | $100,000,000 | BANK 2018-BNK15 | No | ||||
| A-4 | $30,000,000 | WFCM 2018-C48 | No | ||||
| Christiana Mall | Barclays | A-1-A | $36,160,000 | BBCMS 2018-CHRS | Yes | Wells Fargo Bank, National Association | Wells Fargo Bank, National Association |
| A-1-B | $50,000,000 | WFCM 2018-C47 | No | ||||
| A-1-C | $40,000,000 | BBCMS 2018-C2(2) | No | ||||
| A-1-D | $28,000,000 | WFCM 2018-C48 | No | ||||
| A-1-E | $14,840,000 | BBCMS 2018-C2(2) | No | ||||
| A-2-A | $21,696,000 | BBCMS 2018-CHRS | No | ||||
| A-2-B | $30,000,000 | UBS 2018-C13 | No | ||||
| A-2-C | $30,000,000 | UBS 2018-C14(3) | No | ||||
| A-2-D | $10,000,000 | Société Générale | No | ||||
| A-2-E | $9,704,000 | Société Générale | No | ||||
| A-3-A | $14,464,000 | BBCMS 2018-CHRS | No | ||||
| A-3-B | $30,000,000 | DBGS 2018-C1 | No | ||||
| A-3-C | $23,136,000 | DBGS 2018-C1 | No | ||||
| B-1 | $106,000,000 | BBCMS 2018-CHRS | No | ||||
| B-2 | $63,600,000 | BBCMS 2018-CHRS | No | ||||
| B-3 | $42,400,000 | BBCMS 2018-CHRS | No | ||||
| Prudential – Digital Realty Portfolio | BSP | A-1 | $70,000,000 | BANK 2018-BNK14 | Yes | Wells Fargo Bank, National Association | Rialto Capital Advisors, LLC |
| A-2-1 | $26,000,000 | BANK 2018-BNK15 | No | ||||
| A-2-2 | $10,000,000 | WFB | No | ||||
| A-3 | $70,000,000 | CSAIL 2018-C14 | No | ||||
| A-4 | $11,000,000 | Column Financial, Inc. | No | ||||
| A-5 | $25,000,000 | WFCM 2018-C48 | No |
THE INFORMATION IN THIS STRUCTURAL AND COLLATERAL TERM SHEET IS NOT COMPLETE AND MAY BE AMENDED PRIOR TO THE TIME OF SALE. THIS TERM SHEET IS NOT AN OFFER TO SELL THESE SECURITIES AND IT IS NOT A SOLICITATION OF AN OFFER TO BUY THESE SECURITIES IN ANY JURISDICTION WHERE THE OFFER OR SALE IS NOT PERMITTED.
10
| Wells Fargo Commercial Mortgage Trust 2018-C48 | Characteristics of the Mortgage Pool |
| Property Name | Mortgage Loan Seller in WFCM 2018-C48 | Note(s)(1) | Original Balance | Holder of Note(1) | Lead Servicer for Whole Loan | Master Servicer Under Lead Securitization Servicing Agreement | Special Servicer Under Lead Securitization Servicing Agreement |
| Danbury Commerce Portfolio | AREF | A-1 | $15,200,000 | CGCMT 2018-C6 | No | Wells Fargo Bank, National Association | LNR Partners, LLC |
| A-2 | $22,800,000 | WFCM 2018-C48 | Yes | ||||
| Aventura Mall | WFB | A-1-A, A-1-B, A-1-C, A-1-D | $406,700,000 | Aventura Mall Trust 2018-AVM | Yes | Wells Fargo Bank, National Association | CWCapital Asset Management LLC |
| A-2-A-1, A-2-B-3 | $115,000,000 | BMARK 2018-B4 | No | ||||
| A-2-A-2, A-2-B-2-A | $103,000,000 | BMARK 2018-B5 | No | ||||
| A-2-A-3 | $50,000,000 | BMARK 2018-B7 | No | ||||
| A-2-A-4, A-2-B-4 | $110,000,000 | BMARK 2018-B6 | No | ||||
| A-2-A-5 | $75,000,000 | JPMorgan Chase Bank, N.A. | No | ||||
| A-2-B-1 | $60,000,000 | CD 2018-CD7 | No | ||||
| A-2-C-1 | $60,000,000 | MSC 2018-L1 | No | ||||
| A-2-C-2, A-2-D-1 | $100,000,000 | BANK 2018-BNK14 | No | ||||
| A-2-C-3, A-2-C-5 | $60,000,000 | Morgan Stanley Bank, N.A. | No | ||||
| A-2-C-4, A-2-D-4 | $100,000,000 | BANK 2018-BNK15 | No | ||||
| A-2-B-2-B, A-2-B-2-C, A-2-B-5 | $47,000,000 | DBGS 2018-C1 | No | ||||
| A-2-D-3 | $50,000,000 | WFCM 2018-C47 | No | ||||
| A-2-D-5 | $20,000,000 | WFCM 2018-C48 | No | ||||
| A-2-D-2 | $50,000,000 | CSAIL 2018-CX12 | No | ||||
| B-1, B-2, B-3, B-4 | $343,300,000 | Aventura Mall Trust 2018-AVM | No | ||||
| Lakeside Pointe & Fox Club Apartments | AREF | A-1 | $16,000,000 | WFCM 2018-C48 | Yes | Wells Fargo Bank, National Association | LNR Partners, LLC |
| A-2 | $16,000,000 | AREF | No | ||||
| Virginia Beach Hotel Portfolio | Barclays | A-1 | $45,000,000 | WFCM 2018-C47 | Yes | Wells Fargo Bank, National Association | Midland Loan Services |
| A-2 | $30,000,000 | BBCMS 2018-C2(2) | No | ||||
| A-3 | $15,000,000 | WFCM 2018-C48 | No | ||||
| Home Depot Technology Center | Barclays | A-1 | $30,000,000 | BBCMS 2018-C2(2) | Yes | Wells Fargo Bank, National Association | LNR Partners, LLC |
| A-2 | $14,300,000 | WFCM 2018-C48 | No | ||||
| Liberty Portfolio | Barclays | A-1 | $30,000,000 | BMARK 2018-B7 | Yes | KeyBank National Association | LNR Partners, LLC |
| A-2 | $30,000,000 | CGCMT 2018-C6 | No | ||||
| A-3 | $20,000,000 | BMARK 2018-B7 | No | ||||
| A-4 | $25,000,000 | BBCMS 2018-C2(2) | No | ||||
| A-5 | $12,850,000 | WFCM 2018-C48 | No | ||||
| A-6 | $25,000,000 | BBCMS 2018-C2(2) | No | ||||
| A-7 | $12,850,000 | CGCMT 2018-C6 | No | ||||
| A-8 | $10,000,000 | Citi Real Estate Funding, Inc. | No |
THE INFORMATION IN THIS STRUCTURAL AND COLLATERAL TERM SHEET IS NOT COMPLETE AND MAY BE AMENDED PRIOR TO THE TIME OF SALE. THIS TERM SHEET IS NOT AN OFFER TO SELL THESE SECURITIES AND IT IS NOT A SOLICITATION OF AN OFFER TO BUY THESE SECURITIES IN ANY JURISDICTION WHERE THE OFFER OR SALE IS NOT PERMITTED.
11
| Wells Fargo Commercial Mortgage Trust 2018-C48 | Characteristics of the Mortgage Pool |
| Property Name | Mortgage Loan Seller in WFCM 2018-C48 | Note(s)(1) | Original Balance | Holder of Note(1) | Lead Servicer for Whole Loan | Master Servicer Under Lead Securitization Servicing Agreement | Special Servicer Under Lead Securitization Servicing Agreement | |
| Fair Oaks Mall | Barclays | A-1-1 | $80,000,000 | BANK 2018-BNK12 | Yes | Wells Fargo Bank, National Association | AEGON USA Realty Advisors, LLC(4) | |
| A-1-2 | $33,750,000 | BANK 2018-BNK13 | No | |||||
| A-2-1 | $20,000,000 | WFCM 2018-C46 | No | |||||
| A-2-2 | $20,625,000 | WFCM 2018-C46 | No | |||||
| A-2-3 | $11,000,000 | BBCMS 2018-C2(2) | No | |||||
| A-2-4 | $9,625,000 | WFCM 2018-C48 | No | |||||
| B-1 | $55,250,000 | Annaly CRE LLC | No | |||||
| B-2 | $29,750,000 | Annaly CRE LLC | No | |||||
| (1) | Unless otherwise indicated, each note not currently held by a securitization trust is expected to be contributed to a future securitization. No assurance can be provided that any such note will not be split further. |
| (2) | The BBCMS 2018-C2 securitization is expected to close on or about December 18, 2018. |
| (3) | The UBS 2018-C14 securitization is expected to close on or about December 12, 2018. |
| (4) | AEGON USA Realty Advisors, LLC acts as the “Fair Oaks Mall Special Servicer” under the BANK 2018-BNK12 pooling and servicing agreement. |
THE INFORMATION IN THIS STRUCTURAL AND COLLATERAL TERM SHEET IS NOT COMPLETE AND MAY BE AMENDED PRIOR TO THE TIME OF SALE. THIS TERM SHEET IS NOT AN OFFER TO SELL THESE SECURITIES AND IT IS NOT A SOLICITATION OF AN OFFER TO BUY THESE SECURITIES IN ANY JURISDICTION WHERE THE OFFER OR SALE IS NOT PERMITTED.
12
| Wells Fargo Commercial Mortgage Trust 2018-C48 | Characteristics of the Mortgage Pool |
| C. | Mortgage Loans with Additional Secured and Mezzanine Financing |
| Loan No. | Mortgage Loan Seller | Mortgage Loan Name | Mortgage Loan Cut-off Date Balance ($) | % of Initial Pool Balance (%) | Sub Debt Cut-off Date Balance ($) | Mezzanine Debt Cut-off Date Balance ($) | Total Debt Interest Rate (%)(1) | Mortgage Loan U/W NCF DSCR (x)(2) | Total Debt U/W NCF DSCR (x) | Mortgage Loan Cut-off Date U/W NOI Debt Yield (%)(2) | Total Debt Cut-off Date U/W NOI Debt Yield (%) | Mortgage Loan Cut-off Date LTV Ratio (%)(2) | Total Debt Cut-off Date LTV Ratio (%) |
| 8 | Barclays | Christiana Mall | $28,000,000 | 3.4% | $212,000,000 | NAP | 4.2775% | 3.15x | 1.93x | 13.8% | 8.5% | 32.5% | 52.9% |
| 11 | Basis | Memphis Industrial Portfolio | 25,600,000 | 3.1 | NAP | $5,500,000 | 5.9894 | 1.40 | 1.10 | 11.4 | 9.4 | 59.5 | 72.3 |
| 14 | AREF | Danbury Commerce Portfolio | 22,800,000 | 2.7 | NAP | 7,000,000 | 6.3900 | 1.48 | 1.61 | 9.0 | 7.6 | 62.2 | 73.6 |
| 15 | Basis | 35 Claver Place | 21,330,000 | 2.6 | NAP | 2,500,000 | 6.0163 | 1.35 | 1.07 | 7.3 | 6.6 | 66.7 | 74.5 |
| 16 | WFB | Aventura Mall | 20,000,000 | 2.4 | 343,300,000 | NAP | 4.1213 | 2.58 | 2.07 | 11.0 | 8.8 | 40.8 | 50.7 |
| 26 | BSP | Argenta Flats | 11,900,000 | 1.4 | NAP | 1,100,000 | 5.9300 | 1.28 | 1.11 | 9.0 | 8.2 | 62.6 | 68.4 |
| 31 | Barclays | Fair Oaks Mall | 9,553,431 | 1.1 | 84,367,961 | NAP | 5.3179 | 2.89 | 1.64 | 17.2 | 11.6 | 31.8 | 47.3 |
| Total/Weighted Average | $139,183,431 | 16.7% | $639,667,961 | $16,100,000 | 5.3952% | 2.02x | 1.52x | 11.0% | 8.5% | 51.3% | 63.8% | ||
| (1) | Total Debt Interest Rate for any specified mortgage loan reflects the weighted average of the interest rates on the respective components of the total debt. |
| (2) | With respect to any mortgage loan that is part of a whole loan, the loan-to-value ratio, debt service coverage ratio and debt yield calculations include the related pari passu companion loan(s). |
THE INFORMATION IN THIS STRUCTURAL AND COLLATERAL TERM SHEET IS NOT COMPLETE AND MAY BE AMENDED PRIOR TO THE TIME OF SALE. THIS TERM SHEET IS NOT AN OFFER TO SELL THESE SECURITIES AND IT IS NOT A SOLICITATION OF AN OFFER TO BUY THESE SECURITIES IN ANY JURISDICTION WHERE THE OFFER OR SALE IS NOT PERMITTED.
13
| Wells Fargo Commercial Mortgage Trust 2018-C48 | Characteristics of the Mortgage Pool |
| D. | Previous Securitization History(1) |
| Loan No. | Mortgage Loan Seller | Mortgage Loan or Mortgaged Property Name | City | State | Property Type | Mortgage Loan or Mortgaged Property Cut-off Date Balance ($) | % of Initial Pool Balance (%) | Previous Securitization |
| 1 | Barclays | Miami Industrial Portfolio | Miami | FL | Industrial | $66,100,000 | 7.9% | WFRBS 2014-LC14 |
| 2 | AREF | Sheraton Grand Nashville Downtown | Nashville | TN | Hospitality | 60,000,000 | 7.2 | COMM 2012-CR3 |
| 6 | WFB | Starwood Hotel Portfolio | Various | Various | Hospitality | 30,000,000 | 3.6 | CGCMT 2015-SSHP; WFRBS 2013-C18 |
| 7 | AREF | Franklin Towne Center | Franklin Park | NJ | Retail | 29,000,000 | 3.5 | UBSBB 2012-C3 |
| 8 | Barclays | Christiana Mall | Newark | DE | Retail | 28,000,000 | 3.4 | MSC 2011-C1 |
| 9 | BSP | Bella at Norcross | Norcross | GA | Multifamily | 27,000,000 | 3.2 | BSPRT 2017-FL2 |
| 10 | Basis | 1600 Terrell Mill Road | Marietta | GA | Office | 26,000,000 | 3.1 | WFRBS 2011-C3 |
| 11 | Basis | Memphis Industrial Portfolio | Memphis | TN | Industrial | 25,600,000 | 3.1 | COMM 2014-LC17 |
| 14.01 | AREF | Delaware Commerce Park | Danbury | CT | Industrial | 18,120,000 | 2.2 | LBUBS 2005-C3 |
| 14.02 | AREF | 34 Executive Drive | Danbury | CT | Industrial | 4,680,000 | 0.6 | MSC 2015-UBS8 |
| 16 | WFB | Aventura Mall | Aventura | FL | Retail | 20,000,000 | 2.4 | AVMT 2013-AVM |
| 20.01 | Barclays | Hilton Virginia Beach Oceanfront | Virginia Beach | VA | Hospitality | 9,754,601 | 1.2 | JPMBB 2014-C21 |
| 27 | AREF | Century Town Center | Vero Beach | FL | Retail | 11,900,000 | 1.4 | GSMS 2012-GCJ7 |
| 42 | Barclays | Fairmont Crossing | Pasadena | TX | Mixed Use | 5,900,000 | 0.7 | WFRBS 2013-UBS1 |
| 46 | BSP | Walgreens - Georgetown, TX | Georgetown | TX | Retail | 4,350,000 | 0.5 | WFRBS 2013-C18 |
| Total | $366,404,601 | 43.9% |
| (1) | The table above represents the most recent securitization with respect to the mortgaged property securing the related mortgage loan, based on information provided by the related borrower or obtained through searches of a third-party database. While loans secured by the above mortgaged properties may have been securitized multiple times in prior transactions, mortgage loans in this securitization are only listed in the above chart if the mortgage loan paid off a loan in another securitization. The information has not otherwise been confirmed by the mortgage loan sellers. |
THE INFORMATION IN THIS STRUCTURAL AND COLLATERAL TERM SHEET IS NOT COMPLETE AND MAY BE AMENDED PRIOR TO THE TIME OF SALE. THIS TERM SHEET IS NOT AN OFFER TO SELL THESE SECURITIES AND IT IS NOT A SOLICITATION OF AN OFFER TO BUY THESE SECURITIES IN ANY JURISDICTION WHERE THE OFFER OR SALE IS NOT PERMITTED.
14
| Wells Fargo Commercial Mortgage Trust 2018-C48 | Characteristics of the Mortgage Pool |
| E. | Mortgage Loans with Scheduled Balloon Payments and Related Classes |
| Class A-2(1) | ||||||||||||||||
| Loan No. | Mortgage Loan Seller | Mortgage Loan Name | State | Property Type | Mortgage Loan Cut-off Date Balance ($) | % of Initial Pool Balance (%) | Mortgage Loan Balance at Maturity or ARD ($) | % of Class A-2 Certificate Principal Balance (%)(2) | SF | Loan per SF ($) | U/W NCF DSCR (x) | U/W NOI Debt Yield (%) | Cut-off Date LTV Ratio (%) | Balloon or ARD LTV Ratio (%) | Rem. IO Period (mos.) | Rem. Term to Maturity or ARD (mos.) |
| 12 | BSP | Prudential - Digital Realty Portfolio | Various | Other | $25,000,000 | 3.0% | $25,000,000 | 68.6% | 1,042,933 | $203 | 2.50x | 11.9% | 54.7% | 54.7% | 58 | 58 |
| 31 | Barclays | Fair Oaks Mall | VA | Retail | 9,553,431 | 1.1 | 8,919,006 | 24.5 | 779,949 | $223 | 2.89 | 17.2 | 31.8 | 29.7 | 0 | 53 |
| Total/Weighted Average | $34,553,431 | 4.1% | $33,919,006 | 93.1% | 2.61x | 13.4% | 48.4% | 47.8% | 42 | 57 | ||||||
| (1) | The table above presents the mortgage loan(s) whose balloon payments would be applied to pay down the principal balance of the Class A-2 Certificates, assuming a 0% CPR and applying the “Structuring Assumptions” described in the Preliminary Prospectus, including the assumptions that (i) none of the mortgage loans in the pool experience prepayments prior to maturity (or, in the case of an ARD loan, its anticipated repayment date), defaults or losses; (ii) there are no extensions of maturity dates of any mortgage loans in the pool; and (iii) each mortgage loan in the pool is paid in full on its stated maturity date (or, in the case of an ARD loan, its anticipated repayment date). Each Class of Certificates evidences undivided ownership interests in the entire pool of mortgage loans. Debt service coverage ratio, debt yield and loan-to-value ratio information do not take into account subordinate debt (whether or not secured by the related mortgaged property), if any, that currently exists or is allowed under the terms of any mortgage loan. See Annex A-1 to the Preliminary Prospectus. |
| (2) | Reflects the percentage equal to the Balloon Balance divided by the initial Class A-2 Certificate Balance. |
| Class A-3(1) | ||||||||||||||||
| Loan No. | Mortgage Loan Seller | Mortgage Loan Name | State | Property Type | Mortgage Loan Cut-off Date Balance ($) | % of Initial Pool Balance (%) | Mortgage Loan Balance at Maturity or ARD ($) | % of Class A-3 Certificate Principal Balance (%)(2) | SF | Loan per SF ($) | U/W NCF DSCR (x) | U/W NOI Debt Yield (%) | Cut-off Date LTV Ratio (%) | Balloon or ARD LTV Ratio (%) | Rem. IO Period (mos.) | Rem. Term to Maturity or ARD (mos.) |
| 21 | Barclays | Home Depot Technology Center | GA | Office | $14,300,000 | 1.7% | $14,300,000 | 60.2% | 347,498 | $127 | 1.77x | 9.3% | 66.5% | 66.5% | 83 | 83 |
| 30 | Barclays | 1400 Flat Gap Road | TN | Industrial | 10,250,000 | 1.2 | 9,467,422 | 39.8 | 485,977 | $21 | 1.96 | 14.2 | 49.9 | 46.1 | 23 | 83 |
| Total/Weighted Average | $24,550,000 | 2.9% | $23,767,422 | 100.0% | 1.85x | 11.3% | 59.6% | 58.0% | 58 | 83 | ||||||
| (1) | The table above presents the mortgage loan(s) whose balloon payments would be applied to pay down the principal balance of the Class A-3 Certificates, assuming a 0% CPR and applying the “Structuring Assumptions” described in the Preliminary Prospectus, including the assumptions that (i) none of the mortgage loans in the pool experience prepayments prior to maturity (or, in the case of an ARD loan, its anticipated repayment date), defaults or losses; (ii) there are no extensions of maturity dates of any mortgage loans in the pool; and (iii) each mortgage loan in the pool is paid in full on its stated maturity date (or, in the case of an ARD loan, its anticipated repayment date). Each Class of Certificates evidences undivided ownership interests in the entire pool of mortgage loans. Debt service coverage ratio, debt yield and loan-to-value ratio information do not take into account subordinate debt (whether or not secured by the related mortgaged property), if any, that currently exists or is allowed under the terms of any mortgage loan. See Annex A-1 to the Preliminary Prospectus. |
| (2) | Reflects the percentage equal to the Balloon Balance divided by the initial Class A-3 Certificate Balance. |
THE INFORMATION IN THIS STRUCTURAL AND COLLATERAL TERM SHEET IS NOT COMPLETE AND MAY BE AMENDED PRIOR TO THE TIME OF SALE. THIS TERM SHEET IS NOT AN OFFER TO SELL THESE SECURITIES AND IT IS NOT A SOLICITATION OF AN OFFER TO BUY THESE SECURITIES IN ANY JURISDICTION WHERE THE OFFER OR SALE IS NOT PERMITTED.
15
| Wells Fargo Commercial Mortgage Trust 2018-C48 | Characteristics of the Mortgage Pool |
| F. | Property Type Distribution(1) |
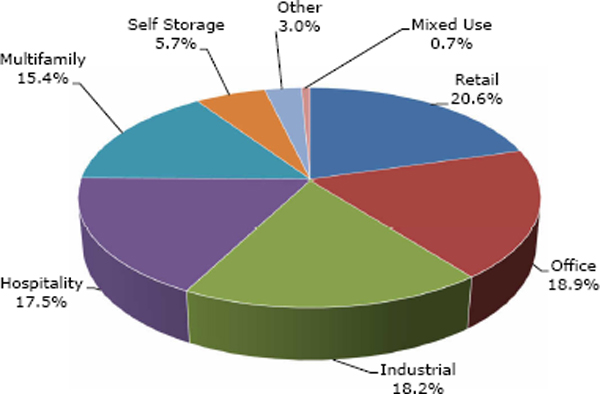
| Property Type | Number of Mortgaged Properties | Aggregate Cut-off Date Balance ($) | % of Initial Pool Balance (%) | Weighted Average Cut- off Date LTV Ratio (%) | Weighted Average Balloon or ARD LTV Ratio (%) | Weighted Average U/W NCF DSCR (x) | Weighted Average U/W NOI Debt Yield (%) | Weighted Average U/W NCF Debt Yield (%) | Weighted Average Mortgage Rate (%) |
| Retail | 18 | $171,438,431 | 20.6% | 54.4% | 47.2% | 1.99x | 11.6% | 11.3% | 4.916% |
| Anchored | 6 | 64,535,000 | 7.7 | 60.8 | 49.6 | 1.66 | 12.1 | 11.6 | 5.267 |
| Super Regional Mall | 3 | 57,553,431 | 6.9 | 35.3 | 34.9 | 2.91 | 13.4 | 13.1 | 4.220 |
| Single Tenant | 8 | 47,850,000 | 5.7 | 68.5 | 58.4 | 1.32 | 8.5 | 8.5 | 5.258 |
| Unanchored | 1 | 1,500,000 | 0.2 | 58.3 | 52.2 | 2.25 | 16.4 | 15.4 | 5.550 |
| Office | 10 | 157,850,538 | 18.9 | 62.5 | 58.7 | 1.71 | 10.6 | 9.8 | 5.062 |
| Suburban | 8 | 141,500,538 | 17.0 | 61.7 | 58.0 | 1.69 | 10.4 | 9.6 | 5.028 |
| Medical | 1 | 8,700,000 | 1.0 | 64.9 | 64.9 | 2.22 | 12.2 | 11.6 | 5.145 |
| CBD | 1 | 7,650,000 | 0.9 | 74.3 | 64.7 | 1.50 | 11.7 | 10.3 | 5.595 |
| Industrial | 9 | 151,380,000 | 18.2 | 60.3 | 57.9 | 1.69 | 10.4 | 9.4 | 5.189 |
| Warehouse/Showroom | 1 | 66,100,000 | 7.9 | 63.3 | 63.3 | 1.77 | 9.9 | 8.9 | 4.981 |
| Flex | 5 | 55,430,000 | 6.6 | 61.0 | 55.1 | 1.43 | 10.2 | 9.1 | 5.530 |
| Warehouse | 2 | 23,250,000 | 2.8 | 51.1 | 49.4 | 1.97 | 12.1 | 11.2 | 5.046 |
| Cold Storage/Manufacturing | 1 | 6,600,000 | 0.8 | 56.9 | 56.9 | 2.05 | 10.7 | 10.2 | 4.900 |
| Hospitality | 29 | 146,337,241 | 17.5 | 63.2 | 58.9 | 2.12 | 13.4 | 12.0 | 5.215 |
| Full Service | 7 | 85,452,989 | 10.2 | 60.9 | 59.2 | 2.32 | 13.6 | 12.2 | 5.028 |
| Limited Service | 10 | 36,595,524 | 4.4 | 65.6 | 56.3 | 1.82 | 13.8 | 12.3 | 5.708 |
| Extended Stay | 6 | 17,509,692 | 2.1 | 68.2 | 60.0 | 1.80 | 12.3 | 10.9 | 5.123 |
| Select Service | 6 | 6,779,036 | 0.8 | 66.1 | 66.1 | 2.07 | 12.5 | 10.8 | 5.150 |
| Multifamily | 11 | 128,307,734 | 15.4 | 66.3 | 60.6 | 1.33 | 9.2 | 8.8 | 5.471 |
| Garden | 7 | 84,040,234 | 10.1 | 66.0 | 58.9 | 1.33 | 9.3 | 9.0 | 5.390 |
| Low Rise | 3 | 37,330,000 | 4.5 | 66.3 | 64.0 | 1.33 | 8.5 | 8.2 | 5.600 |
| Student Housing | 1 | 6,937,500 | 0.8 | 70.1 | 63.0 | 1.40 | 10.5 | 9.8 | 5.750 |
| Self Storage | 9 | 47,720,000 | 5.7 | 59.1 | 54.0 | 1.84 | 10.9 | 10.6 | 5.214 |
| Self Storage | 9 | 47,720,000 | 5.7 | 59.1 | 54.0 | 1.84 | 10.9 | 10.6 | 5.214 |
| Other | 8 | 25,000,000 | 3.0 | 54.7 | 54.7 | 2.50 | 11.9 | 11.6 | 4.558 |
| Data Center | 8 | 25,000,000 | 3.0 | 54.7 | 54.7 | 2.50 | 11.9 | 11.6 | 4.558 |
| Mixed Use | 1 | 5,900,000 | 0.7 | 60.0 | 55.5 | 1.57 | 11.0 | 10.4 | 5.245 |
| Office/Retail | 1 | 5,900,000 | 0.7 | 60.0 | 55.5 | 1.57 | 11.0 | 10.4 | 5.245 |
| Total/Weighted Average: | 95 | $833,933,944 | 100.0% | 60.7% | 56.1% | 1.81x | 11.1% | 10.4% | 5.139% |
| (1) | Because this table presents information relating to the mortgaged properties and not the mortgage loans, the information for mortgage loans secured by more than one mortgaged property is based on allocated amounts (allocating the principal balance of the mortgage loan to each of those properties according to the relative appraised values of the mortgaged properties or the allocated loan amounts or property-specific release prices set forth in the related mortgage loan documents or such other allocation as the related mortgage loan seller deemed appropriate). With respect to any mortgage loan that is part of a whole loan, the loan-to-value ratio, debt service coverage ratio and debt yield calculations include the related pari passu companion loan(s) but exclude any related subordinate debt (unless otherwise stated). With respect to each mortgage loan, debt service coverage ratio, debt yield and loan-to-value ratio information do not take into account any subordinate debt (whether or not secured by the related mortgaged property) that currently exists or is allowed under the terms of such mortgage loan. See Annex A-1 to the Preliminary Prospectus. |
THE INFORMATION IN THIS STRUCTURAL AND COLLATERAL TERM SHEET IS NOT COMPLETE AND MAY BE AMENDED PRIOR TO THE TIME OF SALE. THIS TERM SHEET IS NOT AN OFFER TO SELL THESE SECURITIES AND IT IS NOT A SOLICITATION OF AN OFFER TO BUY THESE SECURITIES IN ANY JURISDICTION WHERE THE OFFER OR SALE IS NOT PERMITTED.
16
| Wells Fargo Commercial Mortgage Trust 2018-C48 | Characteristics of the Mortgage Pool |
| G. | Geographic Distribution(1) |
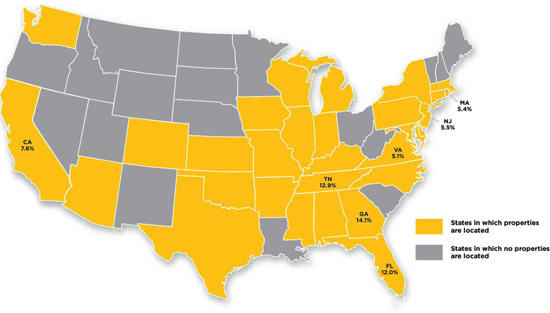
| Location | Number of Mortgaged Properties | Aggregate Cut-off Date Balance ($) | % of Initial Pool Balance (%) | Weighted Average Cut-off Date LTV Ratio (%) | Weighted Average Balloon or ARD LTV Ratio (%) | Weighted Average U/W NCF DSCR (x) | Weighted Average U/W NOI Debt Yield (%) | Weighted Average U/W NCF Debt Yield (%) | Weighted Average Mortgage Rate (%) |
| Georgia | 8 | $117,878,205 | 14.1% | 64.6% | 59.7% | 1.52x | 10.3% | 9.5% | 5.220% |
| Tennessee | 5 | 107,750,000 | 12.9 | 58.8 | 54.7 | 2.09 | 13.1 | 11.7 | 5.149 |
| Florida | 4 | 100,480,906 | 12.0 | 59.2 | 58.6 | 1.92 | 10.4 | 9.5 | 4.818 |
| California | 10 | 63,755,189 | 7.6 | 55.7 | 51.5 | 1.97 | 11.1 | 10.7 | 5.010 |
| Southern California | 7 | 55,300,000 | 6.6 | 55.9 | 51.0 | 1.89 | 11.0 | 10.5 | 5.079 |
| Northern California | 3 | 8,455,189 | 1.0 | 54.7 | 54.7 | 2.50 | 11.9 | 11.6 | 4.558 |
| New Jersey | 3 | 46,034,008 | 5.5 | 62.2 | 47.7 | 1.72 | 13.1 | 12.5 | 5.529 |
| Massachusetts | 2 | 44,776,000 | 5.4 | 53.8 | 52.2 | 1.92 | 10.3 | 9.7 | 4.911 |
| Virginia | 7 | 42,402,167 | 5.1 | 58.0 | 51.6 | 2.08 | 12.8 | 12.0 | 4.768 |
| Connecticut | 3 | 34,300,000 | 4.1 | 61.3 | 59.6 | 1.48 | 9.3 | 9.0 | 5.559 |
| Texas | 6 | 31,464,308 | 3.8 | 63.3 | 56.5 | 1.68 | 10.8 | 10.3 | 5.292 |
| Michigan | 4 | 28,028,538 | 3.4 | 65.0 | 54.5 | 1.43 | 10.2 | 9.7 | 5.317 |
| Delaware | 1 | 28,000,000 | 3.4 | 32.5 | 32.5 | 3.15 | 13.8 | 13.6 | 4.278 |
| Pennsylvania | 3 | 22,798,546 | 2.7 | 67.9 | 61.0 | 1.78 | 11.1 | 10.5 | 5.212 |
| Oklahoma | 5 | 22,755,287 | 2.7 | 71.9 | 66.7 | 1.39 | 9.8 | 9.2 | 5.436 |
| New York | 1 | 21,330,000 | 2.6 | 66.7 | 66.7 | 1.35 | 7.3 | 7.3 | 5.315 |
| Arizona | 3 | 16,810,000 | 2.0 | 60.0 | 58.1 | 1.99 | 11.2 | 10.5 | 4.769 |
| Illinois | 5 | 16,803,908 | 2.0 | 67.2 | 64.3 | 1.66 | 10.7 | 9.9 | 5.528 |
| Indiana | 2 | 16,000,000 | 1.9 | 65.7 | 60.4 | 1.30 | 10.2 | 9.3 | 5.980 |
| Arkansas | 1 | 11,900,000 | 1.4 | 62.6 | 54.8 | 1.28 | 9.0 | 8.7 | 5.460 |
| Colorado | 2 | 9,290,700 | 1.1 | 60.2 | 53.4 | 1.63 | 11.5 | 10.9 | 5.386 |
| North Carolina | 3 | 7,983,482 | 1.0 | 69.5 | 59.7 | 1.41 | 9.2 | 8.8 | 5.231 |
| Maryland | 3 | 7,723,502 | 0.9 | 69.4 | 60.0 | 1.43 | 9.3 | 8.9 | 5.229 |
| Kentucky | 1 | 7,650,000 | 0.9 | 74.3 | 64.7 | 1.50 | 11.7 | 10.3 | 5.595 |
| Missouri | 3 | 7,308,401 | 0.9 | 66.1 | 66.1 | 2.07 | 12.5 | 10.8 | 5.150 |
| Rhode Island | 1 | 6,000,000 | 0.7 | 70.6 | 64.0 | 1.49 | 10.5 | 9.7 | 5.120 |
| Washington | 1 | 3,500,000 | 0.4 | 53.8 | 53.8 | 1.76 | 10.1 | 9.4 | 5.260 |
| Kansas | 4 | 3,128,786 | 0.4 | 66.1 | 66.1 | 2.07 | 12.5 | 10.8 | 5.150 |
| Iowa | 1 | 2,678,430 | 0.3 | 66.1 | 66.1 | 2.07 | 12.5 | 10.8 | 5.150 |
| Alabama | 1 | 2,282,696 | 0.3 | 64.3 | 49.2 | 1.26 | 10.0 | 9.3 | 5.400 |
| Mississippi | 1 | 1,785,620 | 0.2 | 66.1 | 66.1 | 2.07 | 12.5 | 10.8 | 5.150 |
| Wisconsin | 1 | 1,335,265 | 0.2 | 66.1 | 66.1 | 2.07 | 12.5 | 10.8 | 5.150 |
| Total/Weighted Average | 95 | $833,933,944 | 100.0% | 60.7% | 56.1% | 1.81x | 11.1% | 10.4% | 5.139% |
| (1) | Because this table presents information relating to the mortgaged properties and not the mortgage loans, the information for mortgage loans secured by more than one mortgaged property is based on allocated amounts (allocating the principal balance of the mortgage loan to each of those properties according to the relative appraised values of the mortgaged properties or the allocated loan amounts or property-specific release prices set forth in the related mortgage loan documents or such other allocation as the related mortgage loan seller deemed appropriate). With respect to any mortgage loan that is part of a whole loan, the loan-to-value ratio, debt service coverage ratio and debt yield calculations include the relatedpari passu companion loan(s) but exclude any related subordinate debt (unless otherwise stated). With respect to each mortgage loan, debt service coverage ratio, debt yield and loan-to-value ratio information do not take into account any subordinate debt (whether or not secured by the related mortgaged property) that currently exists or is allowed under the terms of such mortgage loan. See Annex A-1 to the Preliminary Prospectus. |
THE INFORMATION IN THIS STRUCTURAL AND COLLATERAL TERM SHEET IS NOT COMPLETE AND MAY BE AMENDED PRIOR TO THE TIME OF SALE. THIS TERM SHEET IS NOT AN OFFER TO SELL THESE SECURITIES AND IT IS NOT A SOLICITATION OF AN OFFER TO BUY THESE SECURITIES IN ANY JURISDICTION WHERE THE OFFER OR SALE IS NOT PERMITTED.
17
| Wells Fargo Commercial Mortgage Trust 2018-C48 | Characteristics of the Mortgage Pool |
H. Characteristics of the Mortgage Pool(1)
| CUT-OFF DATE BALANCE | |||||||||
| Range of Cut-off Date Balances ($) | Number of Mortgage Loans | Aggregate Cut- off Date Balance | Percent by Aggregate Cut- off Date Pool Balance (%) | ||||||
| 1,500,000 - 2,000,000 | 1 | $1,500,000 | 0.2 | % | |||||
| 2,000,001 - 3,000,000 | 1 | 2,282,696 | 0.3 | ||||||
| 3,000,001 - 4,000,000 | 4 | 14,560,000 | 1.7 | ||||||
| 4,000,001 - 5,000,000 | 1 | 4,350,000 | 0.5 | ||||||
| 5,000,001 - 6,000,000 | 6 | 34,410,000 | 4.1 | ||||||
| 6,000,001 - 7,000,000 | 3 | 20,237,500 | 2.4 | ||||||
| 7,000,001 - 8,000,000 | 4 | 30,513,138 | 3.7 | ||||||
| 8,000,001 - 9,000,000 | 1 | 8,700,000 | 1.0 | ||||||
| 9,000,001 - 10,000,000 | 1 | 9,553,431 | 1.1 | ||||||
| 10,000,001 - 15,000,000 | 11 | 139,895,641 | 16.8 | ||||||
| 15,000,001 - 20,000,000 | 4 | 73,172,538 | 8.8 | ||||||
| 20,000,001 - 30,000,000 | 10 | 259,530,000 | 31.1 | ||||||
| 30,000,001 - 50,000,000 | 3 | 109,129,000 | 13.1 | ||||||
| 50,000,001 - 66,100,000 | 2 | 126,100,000 | 15.1 | ||||||
| Total: | 52 | $833,933,944 | 100.0 | % | |||||
| Weighted Average | $16,037,191 | ||||||||
| UNDERWRITTEN NOI DEBT SERVICE COVERAGE RATIO | |||||||||
| Range of U/W NOI DSCRs (x) | Number of Mortgage Loans | Aggregate Cut- off Date Balance | Percent by Aggregate Cut- off Date Pool Balance (%) | ||||||
| 1.26 - 1.30 | 2 | $59,028,538 | 7.1 | % | |||||
| 1.31 - 1.40 | 5 | 69,212,696 | 8.3 | ||||||
| 1.41 - 1.50 | 6 | 103,381,500 | 12.4 | ||||||
| 1.51 - 1.60 | 4 | 46,371,538 | 5.6 | ||||||
| 1.61 - 1.70 | 4 | 68,150,000 | 8.2 | ||||||
| 1.71 - 1.80 | 4 | 28,613,138 | 3.4 | ||||||
| 1.81 - 1.90 | 5 | 73,050,000 | 8.8 | ||||||
| 1.91 - 2.00 | 4 | 84,360,000 | 10.1 | ||||||
| 2.01 - 2.50 | 11 | 151,253,103 | 18.1 | ||||||
| 2.51 - 3.00 | 4 | 108,960,000 | 13.1 | ||||||
| 3.01 - 3.50 | 2 | 37,553,431 | 4.5 | ||||||
| 3.51 - 3.73 | 1 | 4,000,000 | 0.5 | ||||||
| Total: | 52 | $833,933,944 | 100.0 | % | |||||
| Weighted Average | 1.93x | ||||||||
| UNDERWRITTEN NCF DEBT SERVICE COVERAGE RATIO | |||||||||
| Range of U/W NCF DSCRs (x) | Number of Mortgage Loans | Aggregate Cut- off Date Balance | Percent by Aggregate Cut- off Date Pool Balance (%) | ||||||
| 1.25 - 1.30 | 7 | $142,211,234 | 17.1 | % | |||||
| 1.31 - 1.40 | 6 | 103,511,500 | 12.4 | ||||||
| 1.41 - 1.50 | 5 | 61,171,538 | 7.3 | ||||||
| 1.51 - 1.60 | 4 | 47,113,138 | 5.6 | ||||||
| 1.61 - 1.70 | 5 | 63,150,000 | 7.6 | ||||||
| 1.71 - 1.80 | 7 | 115,010,000 | 13.8 | ||||||
| 1.81 - 1.90 | 2 | 29,074,103 | 3.5 | ||||||
| 1.91 - 2.00 | 2 | 23,250,000 | 2.8 | ||||||
| 2.01 - 2.50 | 9 | 183,929,000 | 22.1 | ||||||
| 2.51 - 3.00 | 3 | 33,513,431 | 4.0 | ||||||
| 3.01 - 3.50 | 1 | 28,000,000 | 3.4 | ||||||
| 3.51 - 3.68 | 1 | 4,000,000 | 0.5 | ||||||
| Total: | 52 | $833,933,944 | 100.0 | % | |||||
| Weighted Average | 1.81x | ||||||||
| LOAN PURPOSE | |||||||||
| Loan Purpose | Number of Mortgage Loans | Aggregate Cut- off Date Balance | Percent by Aggregate Cut- off Date Pool Balance (%) | ||||||
| Refinance | 32 | $565,575,306 | 67.8 | % | |||||
| Acquisition | 16 | 198,098,638 | 23.8 | ||||||
| Refinance/Acquisition | 1 | 40,000,000 | 4.8 | ||||||
| Recapitalization | 3 | 30,260,000 | 3.6 | ||||||
| Total: | 52 | $833,933,944 | 100.0 | % | |||||
| MORTGAGE RATE | |||||||||
Range of Mortgage Rates (%) | Number of Mortgage Loans | Aggregate Cut- off Date Balance | Percent by Aggregate Cut- off Date Pool Balance (%) | ||||||
| 4.121 - 4.250 | 1 | $20,000,000 | 2.4 | % | |||||
| 4.251 - 4.500 | 2 | 37,553,431 | 4.5 | ||||||
| 4.501 - 4.750 | 1 | 25,000,000 | 3.0 | ||||||
| 4.751 - 5.000 | 10 | 198,139,000 | 23.8 | ||||||
| 5.001 - 5.250 | 15 | 265,963,538 | 31.9 | ||||||
| 5.251 - 5.500 | 11 | 160,403,234 | 19.2 | ||||||
| 5.501 - 5.750 | 10 | 96,800,638 | 11.6 | ||||||
| 5.751 - 5.980 | 2 | 30,074,103 | 3.6 | ||||||
| Total: | 52 | $833,933,944 | 100.0 | % | |||||
| Weighted Average | 5.139% | ||||||||
| UNDERWRITTEN NOI DEBT YIELD | |||||||||
Range of U/W NOI Debt Yields (%) | Number of Mortgage Loans | Aggregate Cut- off Date Balance | Percent by Aggregate Cut- off Date Pool Balance (%) | ||||||
| 7.3 - 8.0 | 1 | $21,330,000 | 2.6 | % | |||||
| 8.1 - 9.0 | 5 | 98,078,538 | 11.8 | ||||||
| 9.1 - 10.0 | 12 | 218,526,696 | 26.2 | ||||||
| 10.1 - 11.0 | 11 | 137,288,038 | 16.5 | ||||||
| 11.1 - 12.0 | 6 | 106,650,000 | 12.8 | ||||||
| 12.1 - 13.0 | 6 | 90,360,000 | 10.8 | ||||||
| 13.1 - 14.0 | 5 | 118,363,138 | 14.2 | ||||||
| 14.1 - 16.0 | 2 | 24,324,103 | 2.9 | ||||||
| 16.1 - 17.0 | 1 | 1,500,000 | 0.2 | ||||||
| 17.1 - 18.0 | 1 | 9,553,431 | 1.1 | ||||||
| 18.1 - 18.4 | 2 | 7,960,000 | 1.0 | ||||||
| Total: | 52 | $833,933,944 | 100.0 | % | |||||
| Weighted Average | 11.1% | ||||||||
| UNDERWRITTEN NCF DEBT YIELD | |||||||||
| Range of U/W NCF Debt Yields (%) | Number of Mortgage Loans | Aggregate Cut- off Date Balance | Percent by Aggregate Cut- off Date Pool Balance (%) | ||||||
| 7.3 - 8.0 | 1 | $21,330,000 | 2.6 | % | |||||
| 8.1 - 9.0 | 10 | 244,328,538 | 29.3 | ||||||
| 9.1 - 10.0 | 15 | 195,164,734 | 23.4 | ||||||
| 10.1 - 11.0 | 9 | 131,950,000 | 15.8 | ||||||
| 11.1 - 12.0 | 7 | 73,323,138 | 8.8 | ||||||
| 12.1 - 13.0 | 4 | 106,750,000 | 12.8 | ||||||
| 13.1 - 15.0 | 2 | 42,074,103 | 5.0 | ||||||
| 15.1 - 16.0 | 1 | 1,500,000 | 0.2 | ||||||
| 16.1 - 18.0 | 2 | 13,513,431 | 1.6 | ||||||
| 18.1 - 18.2 | 1 | 4,000,000 | 0.5 | ||||||
| Total: | 52 | $833,933,944 | 100.0 | % | |||||
| Weighted Average | 10.4% | ||||||||
| ORIGINAL TERM TO MATURITY or ARD | |||||||||
| Range of Original Terms to Maturity or ARD (months) | Number of Mortgage Loans | Aggregate Cut- off Date Balance | Percent by Aggregate Cut- off Date Pool Balance (%) | ||||||
| 60 | 2 | $34,553,431 | 4.1 | % | |||||
| 61 - 84 | 2 | 24,550,000 | 2.9 | ||||||
| 85 - 120 | 48 | 774,830,513 | 92.9 | ||||||
| Total: | 52 | $833,933,944 | 100.0 | % | |||||
| Weighted Average | 116 months | ||||||||
| (1) | With respect to any mortgage loan that is part of a whole loan, the loan-to-value ratio, debt service coverage ratio and debt yield calculations include the relatedpari passucompanion loan(s) but exclude any related subordinate debt (unless otherwise stated). With respect to each mortgage loan, debt service coverage ratio, debt yield and loan-to-value ratio information do not take into account any subordinate debt (whether or not secured by the related mortgaged property) that currently exists or is allowed under the terms of such mortgage loan. See Annex A-1 to the Preliminary Prospectus. Prepayment provisions for each mortgage loan reflects the entire life of the loan (from origination to maturity or ARD). |
THE INFORMATION IN THIS STRUCTURAL AND COLLATERAL TERM SHEET IS NOT COMPLETE AND MAY BE AMENDED PRIOR TO THE TIME OF SALE. THIS TERM SHEET IS NOT AN OFFER TO SELL THESE SECURITIES AND IT IS NOT A SOLICITATION OF AN OFFER TO BUY THESE SECURITIES IN ANY JURISDICTION WHERE THE OFFER OR SALE IS NOT PERMITTED.
18
| Wells Fargo Commercial Mortgage Trust 2018-C48 | Characteristics of the Mortgage Pool |
| REMAINING TERM TO MATURITY or ARD | |||||||||
| Range of Remaining Terms to Maturity or ARD (months) | Number of Mortgage Loans | Aggregate Cut- off Date Balance | Percent by Aggregate Cut- off Date Pool Balance (%) | ||||||
| 53 - 60 | 2 | $34,553,431 | 4.1 | % | |||||
| 61 - 84 | 2 | 24,550,000 | 2.9 | ||||||
| 85 - 120 | 48 | 774,830,513 | 92.9 | ||||||
| Total: | 52 | $833,933,944 | 100.0 | % | |||||
| Weighted Average | 115 months | ||||||||
| ORIGINAL AMORTIZATION TERM(2) | |||||||||
| Range of Original Amortization Terms (months) | Number of Mortgage Loans | Aggregate Cut- off Date Balance | Percent by Aggregate Cut- off Date Pool Balance (%) | ||||||
| Non-Amortizing | 21 | $401,509,000 | 48.1 | % | |||||
| 264 - 300 | 3 | 39,145,834 | 4.7 | ||||||
| 301 - 360 | 28 | 393,279,110 | 47.2 | ||||||
| Total: | 52 | $833,933,944 | 100.0 | % | |||||
| Weighted Average(3) | 352 months | ||||||||
| (2) | The original amortization term shown for any mortgage loan that is interest-only for part of its term does not include the number of months in its interest-only period and reflects only the number of months as of the commencement of amortization remaining from the end of such interest-only period. |
| (3) | Excludes the non-amortizing mortgage loans. |
| REMAINING AMORTIZATION TERM(4) | |||||||||
| Range of Remaining Amortization Terms (months) | Number of Mortgage Loans | Aggregate Cut- off Date Balance | Percent by Aggregate Cut- off Date Pool Balance (%) | ||||||
| Non-Amortizing | 21 | $401,509,000 | 48.1 | % | |||||
| 264 - 300 | 3 | 39,145,834 | 4.7 | ||||||
| 301 - 360 | 28 | 393,279,110 | 47.2 | ||||||
| Total: | 52 | $833,933,944 | 100.0 | % | |||||
| Weighted Average(5) | 351 months | ||||||||
| (4) | The remaining amortization term shown for any mortgage loan that is interest-only for part of its term does not include the number of months in its interest-only period and reflects only the number of months as of the commencement of amortization remaining from the end of such interest-only period. |
| (5) | Excludes the non-amortizing mortgage loans. |
| LOCKBOXES | |||||||||
| Type of Lockbox | Number of Mortgage Loans | Aggregate Cut- off Date Balance | Percent by Aggregate Cut- off Date Pool Balance (%) | ||||||
| Hard/Springing Cash Management | 17 | $329,517,107 | 39.5 | % | |||||
| Springing | 19 | 285,310,337 | 34.2 | ||||||
| Soft/Springing Cash Management | 6 | 120,881,500 | 14.5 | ||||||
| None | 8 | 63,525,000 | 7.6 | ||||||
| Soft/Upfront Cash Management | 2 | 34,700,000 | 4.2 | ||||||
| Total: | 52 | $833,933,944 | 100.0 | % | |||||
| PREPAYMENT PROVISION SUMMARY(6) | |||||||||
| Prepayment Provision | Number of Mortgage Loans | Aggregate Cut- off Date Balance | Percent by Aggregate Cut- off Date Pool Balance (%) | ||||||
| Lockout / Defeasance / Open | 48 | $733,033,944 | 87.9 | % | |||||
| Lockout / GRTR 1% or YM / Open | 2 | 45,900,000 | 5.5 | ||||||
| Lockout / GRTR 1% or YM / GRTR 1% or YM or Defeasance / Open | 1 | 30,000,000 | 3.6 | ||||||
| Lockout / GRTR 1% or YM or Defeasance / Open | 1 | 25,000,000 | 3.0 | ||||||
| Total: | 52 | $833,933,944 | 100.0 | % | |||||
| (6) | As a result of property releases or the application of funds in a performance reserve, partial principal prepayments could occur during a period that voluntary principal prepayments are otherwise prohibited. |
| CUT-OFF DATE LOAN-TO-VALUE RATIO | |||||||||
| Range of Cut-off Date LTV Ratios (%) | Number of Mortgage Loans | Aggregate Cut- off Date Balance | Percent by Aggregate Cut- off Date Pool Balance (%) | ||||||
| 31.8 - 35.0 | 2 | $37,553,431 | 4.5 | % | |||||
| 35.1 - 40.0 | 1 | 4,000,000 | 0.5 | ||||||
| 40.1 - 45.0 | 2 | 23,960,000 | 2.9 | ||||||
| 45.1 - 50.0 | 2 | 16,250,000 | 1.9 | ||||||
| 50.1 - 55.0 | 5 | 85,814,000 | 10.3 | ||||||
| 55.1 - 60.0 | 9 | 129,200,000 | 15.5 | ||||||
| 60.1 - 65.0 | 13 | 272,032,696 | 32.6 | ||||||
| 65.1 - 70.0 | 12 | 179,692,317 | 21.5 | ||||||
| 70.1 - 74.3 | 6 | 85,431,500 | 10.2 | ||||||
| Total: | 52 | $833,933,944 | 100.0 | % | |||||
| Weighted Average | 60.7% | ||||||||
| BALLOON or ARD LOAN-TO-VALUE RATIO | |||||||||
| Range of Balloon or ARD LTV Ratios (%) | Number of Mortgage Loans | Aggregate Cut- off Date Balance | Percent by Aggregate Cut- off Date Pool Balance (%) | ||||||
| 29.7 - 30.0 | 1 | $9,553,431 | 1.1 | % | |||||
| 30.1 - 35.0 | 1 | 28,000,000 | 3.4 | ||||||
| 35.1 - 40.0 | 2 | 7,960,000 | 1.0 | ||||||
| 40.1 - 45.0 | 2 | 49,000,000 | 5.9 | ||||||
| 45.1 - 50.0 | 6 | 57,317,696 | 6.9 | ||||||
| 50.1 - 55.0 | 9 | 137,692,138 | 16.5 | ||||||
| 55.1 - 60.0 | 15 | 284,899,179 | 34.2 | ||||||
| 60.1 - 65.0 | 12 | 175,737,500 | 21.1 | ||||||
| 65.1 - 67.3 | 4 | 83,774,000 | 10.0 | ||||||
| Total: | 52 | $833,933,944 | 100.0 | % | |||||
| Weighted Average | 56.1% | ||||||||
| AMORTIZATION TYPE | |||||||||
| Amortization Type | Number of Mortgage Loans | Aggregate Cut- off Date Balance | Percent by Aggregate Cut- off Date Pool Balance (%) | ||||||
| Interest-only, Balloon | 20 | $387,209,000 | 46.4 | % | |||||
| Interest-only, Amortizing Balloon | 18 | 223,641,500 | 26.8 | ||||||
| Amortizing Balloon | 12 | 179,783,444 | 21.6 | ||||||
| Amortizing ARD | 1 | 29,000,000 | 3.5 | ||||||
| Interest-only, ARD | 1 | 14,300,000 | 1.7 | ||||||
| Total: | 52 | $833,933,944 | 100.0 | % | |||||
| ORIGINAL TERM OF INTEREST-ONLY PERIOD FOR PARTIAL IO LOANS | |||||||||
| IO Terms (months) | Number of Mortgage Loans | Aggregate Cut- off Date Balance | Percent by Aggregate Cut- off Date Pool Balance (%) | ||||||
| 12 | 1 | $5,075,000 | 0.6 | % | |||||
| 20 | 1 | 7,650,000 | 0.9 | ||||||
| 24 | 4 | 63,150,000 | 7.6 | ||||||
| 30 | 1 | 5,685,000 | 0.7 | ||||||
| 36 | 3 | 15,137,500 | 1.8 | ||||||
| 48 | 2 | 22,000,000 | 2.6 | ||||||
| 60 | 5 | 74,444,000 | 8.9 | ||||||
| 72 | 1 | 30,500,000 | 3.7 | ||||||
| Total: | 18 | $223,641,500 | 26.8 | % | |||||
| Weighted Average | 45 months | ||||||||
| SEASONING | |||||||||
| Seasoning (months) | Number of Mortgage Loans | Aggregate Cut- off Date Balance | Percent by Aggregate Cut- off Date Pool Balance (%) | ||||||
| 0 | 18 | $327,610,000 | 39.3 | % | |||||
| 1 | 21 | 251,628,638 | 30.2 | ||||||
| 2 | 6 | 130,830,641 | 15.7 | ||||||
| 3 | 2 | 45,000,000 | 5.4 | ||||||
| 4 | 1 | 28,000,000 | 3.4 | ||||||
| 5 | 2 | 22,282,696 | 2.7 | ||||||
| 7 | 1 | 9,553,431 | 1.1 | ||||||
| 8 | 1 | 19,028,538 | 2.3 | ||||||
| Total: | 52 | $833,933,944 | 100.0 | % | |||||
| Weighted Average | 1 month | ||||||||
THE INFORMATION IN THIS STRUCTURAL AND COLLATERAL TERM SHEET IS NOT COMPLETE AND MAY BE AMENDED PRIOR TO THE TIME OF SALE. THIS TERM SHEET IS NOT AN OFFER TO SELL THESE SECURITIES AND IT IS NOT A SOLICITATION OF AN OFFER TO BUY THESE SECURITIES IN ANY JURISDICTION WHERE THE OFFER OR SALE IS NOT PERMITTED.
19
| Wells Fargo Commercial Mortgage Trust 2018-C48 | Certain Terms and Conditions |
V. Certain Terms and Conditions
| Interest Entitlements: | The interest entitlement of each Class of Certificates on each Distribution Date generally will be the interest accrued during the related Interest Accrual Period on the related Certificate Balance or Notional Amount at the related pass-through rate, net of any prepayment interest shortfalls allocated to that Class for such Distribution Date as described below. If prepayment interest shortfalls arise from voluntary prepayments (without Master Servicer consent) on particular non-specially serviced loans during any collection period, the Master Servicer is required to make a compensating interest payment to offset those shortfalls, generally up to an amount equal to the portion of its master servicing fees that accrue at 0.25 basis pointsper annum. The remaining amount of prepayment interest shortfalls will be allocated to reduce the interest entitlement on all Classes of Certificates entitled to interest, on apro rata basis, based on their respective amounts of accrued interest for the related Distribution Date. If a Class receives less than the entirety of its interest entitlement on any Distribution Date, then the shortfall (excluding any shortfall due to prepayment interest shortfalls), together with interest thereon, will be added to its interest entitlement for the next succeeding Distribution Date. |
| Principal Distribution Amount: | The Principal Distribution Amount for each Distribution Date generally will be the aggregate amount of principal received or advanced in respect of the mortgage loans, net of any non-recoverable advances and interest thereon and workout-delayed reimbursement amounts that are reimbursed to the Master Servicer, the Special Servicer or the Trustee during the related collection period. Non-recoverable advances and interest thereon are reimbursable from principal collections and advances before reimbursement from other amounts. Workout-delayed reimbursement amounts are reimbursable from principal collections. |
| Subordination, Allocation of Losses and Certain Expenses | The chart below describes the manner in which the payment rights of certain Classes of Certificates will be senior or subordinate, as the case may be, to the payment rights of other Classes of Certificates. The chart also shows the corresponding entitlement to receive principal and/or interest of certain Classes of Certificates (other than excess interest that accrues on each mortgage loan that has an anticipated repayment date) on any distribution date in descending order. It also shows the manner in which losses are allocated to certain Classes of Certificates in ascending order (beginning with the Non-Offered Certificates, and other than the Class V and Class R certificates) to reduce the balance of each such class to zero;provided that no principal payments or mortgage loan losses will be allocated to the Class X-A, X-B, X-D, V or R Certificates, although principal payments and losses may reduce the notional amounts of the Class X-A, X-B and X-D certificates and, therefore, the amount of interest they accrue. |
THE INFORMATION IN THIS STRUCTURAL AND COLLATERAL TERM SHEET IS NOT COMPLETE AND MAY BE AMENDED PRIOR TO THE TIME OF SALE. THIS TERM SHEET IS NOT AN OFFER TO SELL THESE SECURITIES AND IT IS NOT A SOLICITATION OF AN OFFER TO BUY THESE SECURITIES IN ANY JURISDICTION WHERE THE OFFER OR SALE IS NOT PERMITTED.
20
| Wells Fargo Commercial Mortgage Trust 2018-C48 | Certain Terms and Conditions |
(1) The Class X-A, X-B and X-D Certificates are interest-only certificates. | |
| Distributions: | On each Distribution Date, funds available for distribution from the mortgage loans, net of specified trust fees, expenses and reimbursements will generally be distributed in the following amounts and order of priority (in each case to the extent of remaining available funds): |
| 1. Class A-1, A-2, A-3, A-SB, A-4, A-5, X-A, X-B and X-D Certificates: To interest on the Class A-1, A-2, A-3, A-SB, A-4, A-5, X-A, X-B and X-D Certificates,pro rata, according to their respective interest entitlements. | |
| 2. Class A-1, A-2, A-3, A-SB, A-4 and A-5 Certificates: To principal on the Class A-1, A-2, A-3, A-SB, A-4 and A-5 Certificates in the following amounts and order of priority: (i) first, to principal on the Class A-SB Certificates, in an amount up to the Principal Distribution Amount for such Distribution Date until their Certificate Balance is reduced to the Class A-SB Planned Principal Balance for such Distribution Date; (ii) second, to principal on the Class A-1 Certificates until their Certificate Balance is reduced to zero, up to the remainder of the Principal Distribution Amount for such Distribution Date; (iii) third, to principal on the Class A-2 Certificates until their Certificate Balance is reduced to zero, up to the remainder of the Principal Distribution Amount for such Distribution Date; (iv) fourth, to principal on the Class A-3 Certificates until their Certificate Balance is reduced to zero, up to the remainder of the Principal Distribution Amount for such Distribution Date; (v) fifth, to principal on the Class A-4 Certificates until their Certificate Balance is reduced to zero, up to the remainder of the Principal Distribution Amount for such Distribution Date; (vi) sixth, to principal on the Class A-5 Certificates until their Certificate Balance is reduced to zero, up to the remainder of the Principal Distribution Amount for such Distribution Date; and (vii) seventh, to principal on the Class A-SB Certificates until their Certificate Balance is reduced to zero, up to the remainder of the Principal Distribution Amount for such Distribution Date. However, if the Certificate Balance of each Class of Principal Balance Certificates, other than the Class A-1, A-2, A-3, A-SB, A-4 and A-5 Certificates, has been reduced to zero as a result of the allocation of Mortgage Loan losses and expenses and any of the Class A-1, A-2, A-3, A-SB, A-4 and A-5 Certificates remains outstanding, then the Principal Distribution Amount will be distributed to the Class A-1, A-2, A-3, A-SB, A-4 and A-5 Certificates,pro rata, based on their respective outstanding Certificate Balances, until their Certificate Balances have been reduced to zero. | |
| 3. Class A-1, A-2, A-3, A-SB, A-4 and A-5 Certificates: To reimburse the holders of the Class A-1, A-2, A-3, A-SB, A-4 and A-5 Certificates,pro rata, on the basis of previously allocated unreimbursed losses, for any previously unreimbursed losses (plus interest thereon) on the mortgage loans that were previously allocated in reduction of the Certificate Balances of such Classes. |
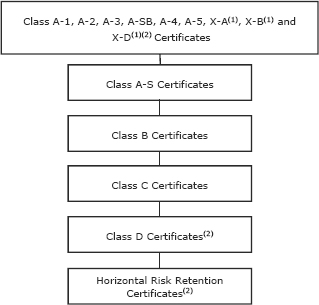
THE INFORMATION IN THIS STRUCTURAL AND COLLATERAL TERM SHEET IS NOT COMPLETE AND MAY BE AMENDED PRIOR TO THE TIME OF SALE. THIS TERM SHEET IS NOT AN OFFER TO SELL THESE SECURITIES AND IT IS NOT A SOLICITATION OF AN OFFER TO BUY THESE SECURITIES IN ANY JURISDICTION WHERE THE OFFER OR SALE IS NOT PERMITTED.
21
| Wells Fargo Commercial Mortgage Trust 2018-C48 | Certain Terms and Conditions |
4. Class A-S Certificates: To make distributions on the Class A-S Certificates as follows: (a) first, to interest on the Class A-S Certificates in the amount of the interest entitlement for that Class; (b) next, to the extent of the portion of the Principal Distribution Amount remaining after distributions in respect of principal to each Class with a higher distribution priority (in this case, the Class A-1, A-2, A-3, A-SB, A-4 and A-5 Certificates), to principal on the Class A-S Certificates until their Certificate Balance is reduced to zero; and (c) next, to reimburse the holders of the Class A-S Certificates for any previously unreimbursed losses (plus interest thereon) on the mortgage loans that were previously allocated to that Class in reduction of their Certificate Balance. 5. Class B Certificates: To make distributions on the Class B Certificates as follows: (a) first, to interest on the Class B Certificates in the amount of the interest entitlement for that Class; (b) next, to the extent of the portion of the Principal Distribution Amount remaining after distributions in respect of principal to each Class with a higher distribution priority (in this case, the Class A-1, A-2, A-3, A-SB, A-4, A-5 and A-S Certificates), to principal on the Class B Certificates until their Certificate Balance is reduced to zero; and (c) next, to reimburse the holders of the Class B Certificates for any previously unreimbursed losses (plus interest thereon) on the mortgage loans that were previously allocated to that Class in reduction of their Certificate Balance. 6. Class C Certificates: To make distributions on the Class C Certificates as follows: (a) first, to interest on the Class C Certificates in the amount of the interest entitlement for that Class; (b) next, to the extent of the portion of the Principal Distribution Amount remaining after distributions in respect of principal to each Class with a higher distribution priority (in this case, the Class A-1, A-2, A-3, A-SB, A-4, A-5, A-S and B Certificates), to principal on the Class C Certificates until their Certificate Balance is reduced to zero; and (c) next, to reimburse the holders of the Class C Certificates for any previously unreimbursed losses (plus interest thereon) on the mortgage loans that were previously allocated to that Class in reduction of their Certificate Balance. 7. After the Class A-1, A-2, A-3, A-SB, A-4, A-5, X-A, X-B, X-D, A-S, B and C Certificates are paid all amounts to which they are entitled, the remaining funds available for distribution will be used to pay interest, principal and loss reimbursement amounts on the Class D, E-RR, F-RR, G-RR and H-RR Certificates sequentially in that order in a manner analogous to the Class C Certificates.
| |
| Allocation of Yield Maintenance Charges and Prepayment Premiums: | If any yield maintenance charge or prepayment premium is collected during any particular collection period with respect to any mortgage loan, then on the Distribution Date corresponding to that collection period, the certificate administrator will pay that yield maintenance charge or prepayment premium (net of liquidation fees payable therefrom) in the following manner: (1) to each of the Class A-1, A-2, A-3, A-SB, A-4, A-5, A-S, B, C and D Certificates, the product of (a) the yield maintenance charge or prepayment premium, (b) the related Base Interest Fraction (as defined in the Preliminary Prospectus) for such Class, and (c) a fraction, the numerator of which is equal to the amount of principal distributed to such Class for that Distribution Date, and the denominator of which is the total amount of principal distributed to all Principal Balance Certificates for that Distribution Date, (2) to the Class X-A Certificates, the excess, if any, of (a) the product of (i) such yield maintenance charge or prepayment premium and (ii) a fraction, the numerator of which is equal to the amount of principal distributed to the Class A-1, A-2, A-3, A-SB, A-4 and A-5 Certificates for that Distribution Date, and the denominator of which is the total amount of principal distributed to all Principal Balance Certificates for that Distribution Date, over (b) the amount of such yield maintenance charge or prepayment premium distributed to the Class A-1, A-2, A-3, A-SB, A-4 and A-5 Certificates as described above, and (3) to the Class X-B Certificates, any remaining portion of such yield maintenance charge or prepayment premium not distributed as described above.
No prepayment premiums or yield maintenance charges will be distributed to the holders of the Class X-D, E-RR, F-RR, G-RR, H-RR, V or R certificates. For a description of when prepayment premiums and yield maintenance charges are generally required on the mortgage loans, see Annex A-1 to the Preliminary Prospectus. See also “Risk Factors—Risks Relating to the Mortgage Loans—Risks Relating to Enforceability of Yield Maintenance Charges, Prepayment Premiums or Defeasance Provisions” and “Risk Factors—Other Risks Relating to the Certificates—Your Yield May Be Affected by Defaults, Prepayments and Other Factors” in the Preliminary Prospectus. Prepayment premiums and yield maintenance charges will be distributed on each Distribution Date only to the extent they are actually received on the mortgage loans as of the related Determination Date.
|
| Realized Losses: | The Certificate Balances of the Class A-1, A-2, A-3, A-SB, A-4, A-5, A-S, B, C, D, E-RR, F-RR, G-RR and H-RR Certificates will be reduced without distribution on any Distribution Date as a write-off to the extent of any losses realized on the mortgage loans allocated to such Class on such Distribution Date. Such losses will be applied in the following order, in each case until the related Certificate Balance is reduced to zero: first, to the Class H-RR Certificates; second, to the Class |
THE INFORMATION IN THIS STRUCTURAL AND COLLATERAL TERM SHEET IS NOT COMPLETE AND MAY BE AMENDED PRIOR TO THE TIME OF SALE. THIS TERM SHEET IS NOT AN OFFER TO SELL THESE SECURITIES AND IT IS NOT A SOLICITATION OF AN OFFER TO BUY THESE SECURITIES IN ANY JURISDICTION WHERE THE OFFER OR SALE IS NOT PERMITTED.
22
| Wells Fargo Commercial Mortgage Trust 2018-C48 | Certain Terms and Conditions |
G-RR Certificates; third, to the Class F-RR Certificates; fourth, to the Class E-RR Certificates; fifth, to the Class D Certificates; sixth, to the Class C Certificates; seventh, to the Class B Certificates; eighth, to the Class A-S Certificates; and, finally,pro rata, to the Class A-1, A-2, A-3, A-SB, A-4 and A-5 Certificates based on their outstanding Certificate Balances.
The notional amount of the Class X-A Certificates will be reduced by the amount of all losses that are allocated to the Class A-1, A-2, A-3, A-SB, A-4 or A-5 Certificates as write-offs in reduction of their Certificate Balances. The notional amount of the Class X-B Certificates will be reduced by the amount of all losses that are allocated to the Class A-S, B or C Certificates as write-offs in reduction of their Certificate Balances. The notional amount of the Class X-D Certificates will be reduced by the amount of all losses that are allocated to the Class D Certificates as write-offs in reduction of its Certificate Balance.
| |
| P&I Advances: | The Master Servicer or, if the Master Servicer fails to do so, the Trustee, will be obligated to advance delinquent debt service payments (other than balloon payments, excess interest and default interest) and assumed debt service payments on mortgage loans with delinquent balloon payments (excluding any related companion loan), except to the extent any such advance is deemed non-recoverable from collections on the related mortgage loan. In addition, if an Appraisal Reduction Amount exists for a given mortgage loan, the interest portion of any P&I advance for such mortgage loan will be reduced, which will have the effect of reducing the amount of interest available for distribution to the Certificates in reverse alphabetical order of their Class designations (except that interest payments on the Class A-1, A-2, A-3, A-SB, A-4, A-5, X-A, X-B and X-D Certificates would be affected on apari passu basis). |
| Servicing Advances: | The Master Servicer or, if the Master Servicer fails to do so, the Trustee, will be obligated to make servicing advances, including the payment of delinquent property taxes, insurance premiums and ground rent, except to the extent that those advances are deemed non-recoverable from collections on the related mortgage loan. The Master Servicer or the Trustee, as applicable, will have the primary obligation to make any required servicing advances with respect to any serviced whole loan. With respect to any non-serviced whole loan, the master servicer or trustee, as applicable, under the related lead securitization servicing agreement will have the primary obligation to make any required servicing advances with respect to such non-serviced whole loan. |
Appraisal Reduction Amounts and Collateral Deficiency Amounts:
| An “Appraisal Reduction Amount” generally will be created in the amount, if any, by which the principal balance of a required appraisal loan (which is a mortgage loan (other than a non-serviced mortgage loan) with respect to which certain defaults, modifications or insolvency events have occurred as further described in the Preliminary Prospectus) plus other amounts overdue or advanced in connection with such mortgage loan exceeds 90% of the appraised value of the related mortgaged property plus certain escrows and reserves (including letters of credit) held with respect to the mortgage loan. With respect to any serviced whole loan, any Appraisal Reduction Amount will be allocated,pro rata, to the related mortgage loan and the relatedpari passu companion loan(s). With respect to any non-serviced mortgage loan, appraisal reduction amounts are expected to be calculated in a similar manner under the related non-serviced pooling and servicing agreement.
A mortgage loan will cease to be a required appraisal loan when the same has ceased to be a specially serviced loan (if applicable), has been brought current for at least three consecutive months and no other circumstances exist that would cause such mortgage loan to be a required appraisal loan.
A “Collateral Deficiency Amount” will exist with respect to any mortgage loan that is modified into an AB loan structure and remains a corrected mortgage loan and will generally equal the excess of (i) the stated principal balance of such AB modified loan (taking into account the related junior note(s) and anypari passu notes included therein), over (ii) the sum of (in the case of a whole loan, solely to the extent allocable to the subject mortgage loan) (x) the most recent appraised value of the related mortgaged property plus (y) solely to the extent not reflected or taken into account in such appraised value and to the extent on deposit with, or otherwise under the control of, the lender as of the date of such determination, any capital or additional collateral contributed by the related borrower at the time the mortgage loan (and as part of the modification thereto) became an AB modified loan plus (z) any other escrows or reserves (in addition to any amounts set forth in the immediately preceding clause (y)) held with respect to the mortgage loan as of the date of such determination.
A “Cumulative Appraisal Reduction Amount” with respect to any mortgage loan will be the sum of any Appraisal Reduction Amount and any Collateral Deficiency Amount.
Appraisal Reduction Amounts will affect the amount of debt service advances in respect of the related mortgage loan. Additionally, Cumulative Appraisal Reduction Amounts will be taken into account in the determination of the identity of the Class whose majority constitutes the “majority controlling class certificateholder” and is entitled to appoint the directing certificateholder.
|
THE INFORMATION IN THIS STRUCTURAL AND COLLATERAL TERM SHEET IS NOT COMPLETE AND MAY BE AMENDED PRIOR TO THE TIME OF SALE. THIS TERM SHEET IS NOT AN OFFER TO SELL THESE SECURITIES AND IT IS NOT A SOLICITATION OF AN OFFER TO BUY THESE SECURITIES IN ANY JURISDICTION WHERE THE OFFER OR SALE IS NOT PERMITTED.
23
| Wells Fargo Commercial Mortgage Trust 2018-C48 | Certain Terms and Conditions |
Clean-Up Call and Exchange Termination:
| On each Distribution Date occurring after the aggregate unpaid principal balance of the pool of mortgage loans (solely for the purposes of this calculation, if such right is being exercised after the distribution date in January 2029 and the Franklin Towne Center mortgage loan is still an asset of the issuing entity, then such mortgage loan will be excluded from the then-aggregate stated principal balance of the pool of mortgage loans and from the initial pool balance) is less than 1.0% of the principal balance of the mortgage loans as of the cut-off date, certain specified persons will have the option to purchase all of the remaining mortgage loans (and the trust’s interest in all property acquired through exercise of remedies in respect of any mortgage loan) at the price specified in the Preliminary Prospectus. Exercise of the option will terminate the trust and retire the then-outstanding certificates.
If the aggregate Certificate Balances of each of the Class A-1, A-2, A-3, A-SB, A-4, A-5, A-S, B, C and D Certificates have been reduced to zero, the trust may also be terminated in connection with an exchange of all the then-outstanding certificates (other than the Class V and Class R Certificates) for the mortgage loans and REO properties then remaining in the issuing entity, subject to payment of a price specified in the Preliminary Prospectus, but all of the holders of those outstanding Classes (other than the Class V and Class R Certificates) of certificates would have to voluntarily participate in the exchange.
|
| Liquidation Loan Waterfall: | Following the liquidation of any loan or property, the net liquidation proceeds generally will be applied (after reimbursement of advances and certain trust fund expenses), first, as a recovery of accrued interest, other than delinquent interest that was not advanced as a result of Appraisal Reduction Amounts, second, as a recovery of principal until all principal has been recovered, and then as a recovery of delinquent interest that was not advanced as a result of Appraisal Reduction Amounts. Please see “Description of the Certificates—Distributions—Application Priority of Mortgage Loan Collections or Whole Loan Collections” in the Preliminary Prospectus. |
| Control Eligible Certificates: | The Class E-RR, F-RR, G-RR and H-RR Certificates. |
| Directing Certificateholder/ Controlling Class: | A directing certificateholder may be appointed by the “majority controlling class certificateholder”, which will be the holder(s) of a majority of the “controlling class”, which means the most subordinate class of Certificates among the Control Eligible Certificates.
The “Controlling Class” will be, as of any time of determination, the most subordinate class of Control Eligible Certificates then outstanding that has an aggregate Certificate Balance (as notionally reduced by any Cumulative Appraisal Reduction Amounts allocable to such class(es)) at least equal to 25% of the initial Certificate Balance of that class;provided,however, that if at any time the Certificate Balances of the certificates other than the Control Eligible Certificates have been reduced to zero as a result of principal payments on the Mortgage Loans, then the Controlling Class will be the most subordinate class of Control Eligible Certificates that has a Certificate Balance greater than zero without regard to any Cumulative Appraisal Reduction Amounts. The Controlling Class as of the Closing Date will be the Class H-RR Certificates.
|
| Control and Consultation: | The rights of various parties to replace the Special Servicer and approve or consult with respect to major actions of the Special Servicer will vary according to defined periods.
A “Control Termination Event” will occur when the Class E-RR Certificates have a Certificate Balance (taking into account the application of any Cumulative Appraisal Reduction Amounts to notionally reduce the Certificate Balance of such class) of less than 25% of the initial Certificate Balance of that class;provided,however, that a Control Termination Event will not be deemed continuing in the event that the Certificate Balances of the certificates other than the Control Eligible Certificates have been reduced to zero as a result of principal payments on the Mortgage Loans.
A “Consultation Termination Event” will occur when there is no class of Control Eligible Certificates that has a then-outstanding Certificate Balance at least equal to 25% of the initial Certificate Balance of that class, in each case, without regard to the application of any Cumulative Appraisal Reduction Amounts;provided,however, that a Consultation Termination Event will not be deemed continuing in the event that the Certificate Balances of the certificates other than the Control Eligible Certificates have been reduced to zero as a result of principal payments on the Mortgage Loans.
If no Control Termination Event has occurred and is continuing, except with respect to the Excluded Loans (as defined below) (i) the directing certificateholder will be entitled to grant or withhold approval of asset status reports prepared, and material servicing actions proposed, by the Special Servicer, and (ii) the directing certificateholder will be entitled to terminate and replace the Special Servicer with or without cause, and appoint itself or another person as the successor special servicer. It will be a condition to such appointment that KBRA, Fitch and Moody’s (and any rating agency rating any securities backed by anypari passu companion loan(s) serviced under this transaction) confirm that the appointment would not result in a qualification, downgrade or withdrawal of any of their then-current ratings of certificates (and any certificates backed by anypari passu companion loan(s) serviced under this transaction). |
THE INFORMATION IN THIS STRUCTURAL AND COLLATERAL TERM SHEET IS NOT COMPLETE AND MAY BE AMENDED PRIOR TO THE TIME OF SALE. THIS TERM SHEET IS NOT AN OFFER TO SELL THESE SECURITIES AND IT IS NOT A SOLICITATION OF AN OFFER TO BUY THESE SECURITIES IN ANY JURISDICTION WHERE THE OFFER OR SALE IS NOT PERMITTED.
24
| Wells Fargo Commercial Mortgage Trust 2018-C48 | Certain Terms and Conditions |
If a Control Termination Event has occurred and is continuing but no Consultation Termination Event has occurred and is continuing, the Special Servicer will be required to consult with the directing certificateholder (other than with respect to Excluded Loans) in connection with asset status reports and material special servicing actions.
If a Consultation Termination Event has occurred and is continuing, no directing certificateholder will be recognized or have any right to terminate the Special Servicer or approve, direct or consult with respect to servicing matters.
With respect to each serviced whole loan, the rights of the directing certificateholder described above will be subject to the consultation rights of the holders of the related pari passu companion loans. Those consultation rights will generally extend to asset status reports and material special servicing actions involving the related whole loan, will be as set forth in the related intercreditor agreement, and will be in addition to the rights of the directing certificateholder in this transaction described above.
With respect to each non-serviced whole loan, the applicable servicing agreement for the related controllingpari passucompanion loan(s) generally grants (or will grant) the directing certificateholder under the related securitization control rights that may include the right to approve or disapprove various material servicing actions involving the related whole loan. The directing certificateholder for this securitization (so long as no Consultation Termination Event has occurred and is occurring) generally will nonetheless have the right to be consulted on a non-binding basis with respect to such actions. For purposes of the servicing of any such whole loan contemplated by this paragraph, the occurrence and continuance of a Control Termination Event or Consultation Termination Event under this securitization will not limit the control or other rights of the directing certificateholder (or equivalent) under the securitization of the related controllingpari passu companion loan(s).
The control rights and consent and consultation rights described in the three preceding paragraphs are subject to various limitations, conditions and exceptions as described in the Preliminary Prospectus.
Notwithstanding any contrary description set forth above, in the event that, with respect to any mortgage loan, if the majority controlling class certificateholder or the directing certificateholder is a Borrower Party, the majority controlling class certificateholder and the directing certificateholder will have no right to receive asset status reports or such other information as may be specified in the WFCM 2018-C48 pooling and servicing agreement, to grant or withhold approval of, or consult with respect to, asset status reports prepared, and material servicing actions proposed, by the Special Servicer, with respect to such mortgage loan, and such mortgage loan will be referred to as an “Excluded Loan” as to such party.
In addition, notwithstanding any contrary description set forth above, in the event that, with respect to any mortgage loan, a controlling class certificateholder is a Borrower Party, such controlling class certificateholder will have no right to receive asset status reports or such other information as may be specified in the WFCM 2018-C48 pooling and servicing agreement with respect to such mortgage loan, and such controlling class certificateholder will be referred to as an “excluded controlling class holder”.
“Borrower Party” means a borrower, a mortgagor or a manager of a mortgaged property, an Accelerated Mezzanine Loan Lender, or any Borrower Party Affiliate. “Accelerated Mezzanine Loan Lender” means a mezzanine lender under a mezzanine loan that has been accelerated or as to which foreclosure or enforcement proceedings have been commenced against the equity collateral pledged to secure such mezzanine loan. “Borrower Party Affiliate” means, with respect to a borrower, a mortgagor, a manager of a Mortgaged Property or an Accelerated Mezzanine Loan Lender, (x) any other person controlling or controlled by or under common control with such borrower, mortgagor, manager or Accelerated Mezzanine Loan Lender, as applicable, or (y) any other person owning, directly or indirectly, 25% or more of the beneficial interests in such borrower, mortgagor, manager or Accelerated Mezzanine Loan Lender.
| |
| Replacement of Special Servicer: | If a Control Termination Event has occurred and is continuing, the Special Servicer may be removed and replaced without cause upon the affirmative direction of certificate owners holding not less than 66-2/3% of a certificateholder quorum, following a proposal from certificate owners holding not less than 25% of the appraisal-reduced voting rights of all Certificates. The certificateholders who initiate a vote on a termination and replacement of the Special Servicer without cause must cause KBRA, Fitch and Moody’s to confirm the then-current ratings of the certificates (or decline to review the matter) and cause the payment of the fees and expenses incurred in the replacement. If no Control Termination Event has occurred and is continuing, the Special Servicer may be replaced by the directing certificateholder, subject to KBRA, Fitch and Moody’s (and any Rating Agency rating any securities backed by anypari passu companion loan(s) serviced under this transaction) confirming the then-current ratings of the Certificates |
THE INFORMATION IN THIS STRUCTURAL AND COLLATERAL TERM SHEET IS NOT COMPLETE AND MAY BE AMENDED PRIOR TO THE TIME OF SALE. THIS TERM SHEET IS NOT AN OFFER TO SELL THESE SECURITIES AND IT IS NOT A SOLICITATION OF AN OFFER TO BUY THESE SECURITIES IN ANY JURISDICTION WHERE THE OFFER OR SALE IS NOT PERMITTED.
25
| Wells Fargo Commercial Mortgage Trust 2018-C48 | Certain Terms and Conditions |
(and any certificates backed by anyparipassu companion loans serviced under this transaction) or declining to review the matter.
In addition, if at any time the Operating Advisor determines, in its sole discretion exercised in good faith, that (i) the Special Servicer is not performing its duties as required under the pooling and servicing agreement in accordance with the Servicing Standard and (ii) the replacement of the Special Servicer would be in the best interest of the certificateholders as a collective whole, then, the Operating Advisor will have the right to recommend the replacement of the Special Servicer and will submit its formal recommendation to the Trustee and the Certificate Administrator (along with its rationale, its proposed replacement special servicer and other relevant information justifying its recommendation).
The Operating Advisor’s recommendation to replace the Special Servicer must be confirmed by an affirmative vote of holders of Principal Balance Certificates evidencing at least a majority of a quorum of certificateholders (which, for this purpose, is the holders of Principal Balance Certificates that (i) evidence at least 20% of the Voting Rights (taking into account the application of any cumulative appraisal reduction amounts to notionally reduce the respective Certificate Balances) of all Principal Balance Certificates on an aggregate basis, and (ii) consist of at least three certificateholders or certificate owners that are not risk retention affiliated with each other). In the event the holders of Principal Balance Certificates evidencing at least a majority of a quorum of certificateholders elect to remove and replace the Special Servicer (which requisite affirmative votes must be received within 180 days of the posting of the notice of the Operating Advisor’s recommendation to replace the Special Servicer to the Certificate Administrator’s website), the Certificate Administrator will be required to receive a Rating Agency Confirmation from each of the Rating Agencies at that time.
| |
| Excluded Special Servicer: | In the event that, with respect to any mortgage loan, the Special Servicer is a Borrower Party, the Special Servicer will be required to resign as special servicer of such mortgage loan (referred to as an “excluded special servicer loan”). If no Control Termination Event has occurred and is continuing, the directing certificateholder will be entitled to appoint (and may replace with or without cause) a separate special servicer that is not a Borrower Party (referred to as an “excluded special servicer”) with respect to such excluded special servicer loan unless such excluded special servicer loan is also an excluded loan. Otherwise, upon resignation of the Special Servicer with respect to an excluded special servicer loan, the resigning Special Servicer will be required to appoint the excluded special servicer. |
| Appraisal Remedy: | If the Class of Certificates comprising the controlling class loses its status as controlling class because of the application of an Appraisal Reduction Amount or Collateral Deficiency Amount, the holders of a majority of the voting rights of such Class may require the Special Servicer to order a second appraisal for any mortgage loan in respect of which an Appraisal Reduction Amount or Collateral Deficiency Amount has been applied. The Special Servicer must thereafter determine whether, based on its assessment of such second appraisal, any recalculation of the Appraisal Reduction Amount or Collateral Deficiency Amount is warranted. Such Class will not be able to exercise any direction, control, consent and/or similar rights of the controlling class unless and until reinstated as the controlling class through such determination; and pending such determination, the rights of the controlling class will be exercised by the Control Eligible Certificates, if any, that would be the controlling class taking into account the subject appraisal reduction amount. |
| Sale of Defaulted Assets: | There will be no “fair value” purchase option. Instead, the WFCM 2018-C48 pooling and servicing agreement will authorize the Special Servicer to sell defaulted mortgage loans serviced by such Special Servicer to the highest bidder in a manner generally similar to sales of REO properties.
The sale of a defaulted loan (other than a non-serviced whole loan) for less than par plus accrued interest and certain other fees and expenses owed on the loan will be subject to consent or consultation rights of the directing certificateholder and/or Operating Advisor, as described in the Preliminary Prospectus. Generally speaking, the holder of apari passucompanion loan will have consent and/or consultation rights, as described in the Preliminary Prospectus.
With respect to any serviced whole loan, if such whole loan becomes a defaulted loan under the WFCM 2018-C48 pooling and servicing agreement, the Special Servicer will generally be required to sell both the mortgage loan and the related pari passu companion loan(s) as a single whole loan.
With respect to each non-serviced whole loan, the applicable servicing agreement governing the servicing of such whole loan generally provides (or will provide) that, if the relatedpari passu companion loan(s) serviced under such agreement become a defaulted loan under such servicing agreement, then the related special servicer may offer to sell to any person (or may offer to purchase) for cash such whole loan during such time as such applicablepari passucompanion loan(s) constitutes a defaulted loan under such servicing agreement. Generally speaking, in connection with any such sale, the related special servicer is required to sell both the mortgage |
THE INFORMATION IN THIS STRUCTURAL AND COLLATERAL TERM SHEET IS NOT COMPLETE AND MAY BE AMENDED PRIOR TO THE TIME OF SALE. THIS TERM SHEET IS NOT AN OFFER TO SELL THESE SECURITIES AND IT IS NOT A SOLICITATION OF AN OFFER TO BUY THESE SECURITIES IN ANY JURISDICTION WHERE THE OFFER OR SALE IS NOT PERMITTED.
26
| Wells Fargo Commercial Mortgage Trust 2018-C48 | Certain Terms and Conditions |
loan and the related pari passu companion loan(s) as a whole loan. The directing certificateholder for this securitization generally will have consent and/or consultation rights as the holder of an interest in the related mortgage loan, as described in the Preliminary Prospectus.
The procedures for the sale of any whole loan that becomes a defaulted whole loan, and any associated consultation rights, are subject to various limitations, conditions and exceptions as described in the Preliminary Prospectus.
| |
| “As-Is” Appraisals: | Appraisals must be conducted on an “as-is” basis, and must be no more than 12 months old, for purposes of determining Appraisal Reduction Amounts and market value in connection with REO sales. Required appraisals may consist of updates of prior appraisals. Internal valuations by the Special Servicer are permitted if the principal balance of a mortgage loan is less than $2,000,000. |
| Operating Advisor: | The Operating Advisor will have certain review and consultation rights relating to the performance of the Special Servicer and with respect to its actions taken in connection with the resolution and/or liquidation of Specially Serviced Loans. With respect to each mortgage loan (other than a Non-Serviced Mortgage Loan) or serviced whole loan, the Operating Advisor will be responsible for:
● reviewing the actions of the Special Servicer with respect to any Specially Serviced Loan;
● reviewing (i) all reports by the Special Servicer made available to Privileged Persons on the Certificate Administrator’s website and (ii) each Asset Status Report (as defined in the Preliminary Prospectus) (after the occurrence and during the continuance of an Operating Advisor Consultation Event (as defined below)) and Final Asset Status Report (as defined in the Preliminary Prospectus);
● recalculating and reviewing for the accuracy and consistency with the WFCM 2018-C48 pooling and servicing agreement the mathematical calculations by the special servicer and the corresponding application of the non-discretionary portion of the applicable formulas required to be utilized in connection with Appraisal Reduction Amounts, Collateral Deficiency Amounts and net present value calculations used in the Special Servicer’s determination of what course of action to take in connection with the workout or liquidation of a Specially Serviced Loan; and
● preparing an annual report (if any mortgage loan (other than any Non-Serviced Mortgage Loan) or serviced whole loan was a Specially Serviced Loan at any time during the prior calendar year or an Operating Advisor Consultation Event (as defined below) occurred during the prior calendar year) that sets forth whether the Operating Advisor believes, in its sole discretion exercised in good faith, that the Special Servicer is operating in compliance with the Servicing Standard with respect to its performance of its duties under the pooling and servicing agreement with respect to Specially Serviced Loans (and, after the occurrence and continuance of an Operating Advisor Consultation Event (as defined below), with respect to major decisions on non-Specially Serviced Loans) during the prior calendar year on a “trust-level basis”. The Operating Advisor will identify (1) which, if any, standards the Operating Advisor believes, in its sole discretion exercised in good faith, the Special Servicer has failed to comply with and (2) any material deviations from the Special Servicer’s obligations under the pooling and servicing agreement with respect to the resolution or liquidation of any Specially Serviced Loan or REO Property (other than with respect to any REO Property related to any Non-Serviced Mortgage Loan). In preparing any Operating Advisor Annual Report (as defined in the Preliminary Prospectus), the Operating Advisor will not be required to report on instances of non-compliance with, or deviations from, the Servicing Standard or the Special Servicer’s obligations under the pooling and servicing agreement that the Operating Advisor determines, in its sole discretion exercised in good faith, to be immaterial.
With respect to each mortgage loan (other than any Non-Serviced Mortgage Loan) or serviced whole loan, after the Operating Advisor has received notice that an Operating Advisor Consultation Event (as defined below) has occurred and is continuing, in addition to the duties described above, the Operating Advisor will be required to perform the following additional duties:
● to consult (on a non-binding basis) with the Special Servicer in respect of asset status reports and
● to consult (on a non-binding basis) with the Special Servicer with respect to “major decisions” processed by the Special Servicer. |
THE INFORMATION IN THIS STRUCTURAL AND COLLATERAL TERM SHEET IS NOT COMPLETE AND MAY BE AMENDED PRIOR TO THE TIME OF SALE. THIS TERM SHEET IS NOT AN OFFER TO SELL THESE SECURITIES AND IT IS NOT A SOLICITATION OF AN OFFER TO BUY THESE SECURITIES IN ANY JURISDICTION WHERE THE OFFER OR SALE IS NOT PERMITTED.
27
| Wells Fargo Commercial Mortgage Trust 2018-C48 | Certain Terms and Conditions |
| An “Operating Advisor Consultation Event” will occur when the Certificate Balances of the Class E-RR, F-RR, G-RR and H-RR Certificates in the aggregate (taking into account the application of any Cumulative Appraisal Reduction Amounts to notionally reduce the Certificate Balances of such classes) is 25% or less of the initial Certificate Balances of such classes in the aggregate. | |
| Asset Representations Reviewer: | The Asset Representations Reviewer will be required to review certain delinquent mortgage loans after a specified delinquency threshold has been exceeded (an “Asset Review Trigger”) and the required percentage of certificateholders vote to direct a review of such delinquent loans. An Asset Review Trigger will occur when either (1) mortgage loans with an aggregate outstanding principal balance of 25.0% or more of the aggregate outstanding principal balance of all of the mortgage loans (including any REO loans (or a portion of any REO loan in the case of a whole loan)) held by the issuing entity as of the end of the applicable collection period are delinquent loans or (2) at least 15 mortgage loans are delinquent loans as of the end of the applicable collection period and the outstanding principal balance of such delinquent loans in the aggregate constitutes at least 20.0% of the aggregate outstanding principal balance of all of the mortgage loans (including any REO loans (or a portion of any REO loan in the case of a whole loan)) held by the issuing entity as of the end of the applicable collection period. See “Pooling and Servicing Agreement—The Asset Representations Reviewer—Asset Review” in the Preliminary Prospectus.
The Asset Representations Reviewer may be terminated and replaced without cause. Upon (i) the written direction of certificateholders evidencing not less than 25% of the voting rights (without regard to the application of any Cumulative Appraisal Reduction Amounts) requesting a vote to terminate and replace the Asset Representations Reviewer with a proposed successor Asset Representations Reviewer that is an eligible asset representations reviewer, and (ii) payment by such holders to the certificate administrator of the reasonable fees and expenses to be incurred by the certificate administrator in connection with administering such vote, the certificate administrator will promptly provide notice to all certificateholders and the Asset Representations Reviewer of such request by posting such notice on its internet website, and by mailing such notice to all certificateholders and the Asset Representations Reviewer. Upon the written direction of certificateholders evidencing at least 75% of a certificateholder quorum (without regard to the application of any Cumulative Appraisal Reduction Amounts), the Trustee will terminate all of the rights and obligations of the Asset Representations Reviewer under the WFCM 2018-C48 pooling and servicing agreement by written notice to the Asset Representations Reviewer, and the proposed successor Asset Representations Reviewer will be appointed. See “Pooling and Servicing Agreement—The Asset Representations Reviewer” in the Preliminary Prospectus.
|
| Dispute Resolution Provisions: | The mortgage loan sellers will be subject to the dispute resolution provisions set forth in the WFCM 2018-C48 pooling and servicing agreement to the extent those provisions are triggered with respect to any mortgage loan sold to the depositor by a mortgage loan seller and such mortgage loan seller will be obligated under the related mortgage loan purchase agreement to comply with all applicable provisions and to take part in any mediation or arbitration proceedings that may result.
Generally, in the event that a Repurchase Request (as defined in the Preliminary Prospectus) is not “Resolved” (as defined below) within 180 days after the related mortgage loan seller receives such Repurchase Request, then the enforcing servicer will be required to send a notice to the “Initial Requesting Certificateholder” (if any) and the Certificate Administrator indicating the enforcing servicer’s intended course of action with respect to the Repurchase Request. If (a) the enforcing servicer’s intended course of action with respect to the Repurchase Request does not involve pursuing further action to exercise rights against the related mortgage loan seller with respect to the Repurchase Request and the Initial Requesting Certificateholder, if any, or any other certificateholder or certificate owner wishes to exercise its right to refer the matter to mediation (including non-binding arbitration) or arbitration, or (b) the enforcing servicer’s intended course of action is to pursue further action to exercise rights against the related mortgage loan seller with respect to the Repurchase Request but the Initial Requesting Certificateholder, if any, or any other certificateholder or certificate owner does not agree with the dispute resolution method selected by the enforcing servicer, then the Initial Requesting Certificateholder, if any, or such other certificateholder or certificate owner may deliver a written notice to the Special Servicer indicating its intent to exercise its right to refer the matter to either mediation or arbitration.
“Resolved” means, with respect to a Repurchase Request, (i) that the related Material Defect has been cured, (ii) the related mortgage loan has been repurchased in accordance with the related mortgage loan purchase agreement, (iii) a mortgage loan has been substituted for the related mortgage loan in accordance with the related mortgage loan purchase agreement, (iv) the applicable mortgage loan seller has made a Loss of Value Payment (as defined in the Preliminary Prospectus), (v) a contractually binding agreement is entered into between the enforcing servicer, on behalf of the issuing entity, and the related mortgage loan seller that settles the related mortgage loan seller’s obligations under the related mortgage loan purchase agreement
|
THE INFORMATION IN THIS STRUCTURAL AND COLLATERAL TERM SHEET IS NOT COMPLETE AND MAY BE AMENDED PRIOR TO THE TIME OF SALE. THIS TERM SHEET IS NOT AN OFFER TO SELL THESE SECURITIES AND IT IS NOT A SOLICITATION OF AN OFFER TO BUY THESE SECURITIES IN ANY JURISDICTION WHERE THE OFFER OR SALE IS NOT PERMITTED.
28
| Wells Fargo Commercial Mortgage Trust 2018-C48 | Certain Terms and Conditions |
| or (vi) the related mortgage loan is no longer property of the issuing entity as a result of a sale or other disposition in accordance with the WFCM 2018-C48 pooling and servicing agreement. See “Pooling and Servicing Agreement—Dispute Resolution Provisions” in the Preliminary Prospectus. | |
| Investor Communications: | The certificate administrator is required to include on any Form 10–D any request received from a certificateholder to communicate with other certificateholders related to certificateholders exercising their rights under the terms of the WFCM 2018-C48 pooling and servicing agreement. Any certificateholder wishing to communicate with other certificateholders regarding the exercise of its rights under the terms of the WFCM 2018-C48 pooling and servicing agreement will be able to deliver a written request signed by an authorized representative of the requesting investor to the certificate administrator. |
| Certain Fee Offsets: | If a workout fee is earned by the Special Servicer following a loan default with respect to any mortgage loan that it services, then certain limitations will apply based on modification fees paid by the borrower. The modification fee generally must not exceed 1% of the principal balance of the loan as modified in any 12-month period. In addition, if the loan re-defaults, any subsequent workout fee on that loan must be reduced by a portion of the modification fees paid by the borrower in the previous 12-months. Likewise, liquidation fees collected in connection with a liquidation or partial liquidation of a mortgage loan must be reduced by a portion of the modification fees paid by the borrower in the previous 12 months. |
| Deal Website: | The Certificate Administrator will be required to maintain a deal website, which will include, among other items: (a) summaries of asset status reports prepared by the Special Servicer, (b) inspection reports, (c) appraisals, (d) various “special notices” described in the Preliminary Prospectus, (e) the “Investor Q&A Forum”, (f) a voluntary “Investor Registry” and (g) the “Risk Retention Special Notices” tab. Investors may access the deal website following execution of a certification and confidentiality agreement. |
| Initial Majority Controlling Class Certificateholder: | It is expected that Argentic Securities Holdings Cayman Limited or an affiliate will be the initial majority controlling class certificateholder. |
| Whole Loans: | Each of the mortgaged properties identified above under “IV. Characteristics of the Mortgage Pool—B. Summary of the Whole Loans” secures both a mortgage loan to be included in the trust fund and one or more other mortgage loans that will not be included in the trust fund, each of which will bepari passu or subordinate in right of payment with the mortgage loan included in the trust fund. We refer to each such group of mortgage loans as a “whole loan”. Such “—Summary of the Whole Loans” section includes further information regarding the various notes in each whole loan, the holders of such notes, the lead servicing agreement for each such whole loan, and the master servicer and special servicer under such lead servicing agreement. |
THE INFORMATION IN THIS STRUCTURAL AND COLLATERAL TERM SHEET IS NOT COMPLETE AND MAY BE AMENDED PRIOR TO THE TIME OF SALE. THIS TERM SHEET IS NOT AN OFFER TO SELL THESE SECURITIES AND IT IS NOT A SOLICITATION OF AN OFFER TO BUY THESE SECURITIES IN ANY JURISDICTION WHERE THE OFFER OR SALE IS NOT PERMITTED.
29
(THIS PAGE INTENTIONALLY LEFT BLANK)
THE INFORMATION IN THIS STRUCTURAL AND COLLATERAL TERM SHEET IS NOT COMPLETE AND MAY BE AMENDED PRIOR TO THE TIME OF SALE. THIS TERM SHEET IS NOT AN OFFER TO SELL THESE SECURITIES AND IT IS NOT A SOLICITATION OF AN OFFER TO BUY THESE SECURITIES IN ANY JURISDICTION WHERE THE OFFER OR SALE IS NOT PERMITTED.
30
| MIAMI INDUSTRIAL PORTFOLIO |
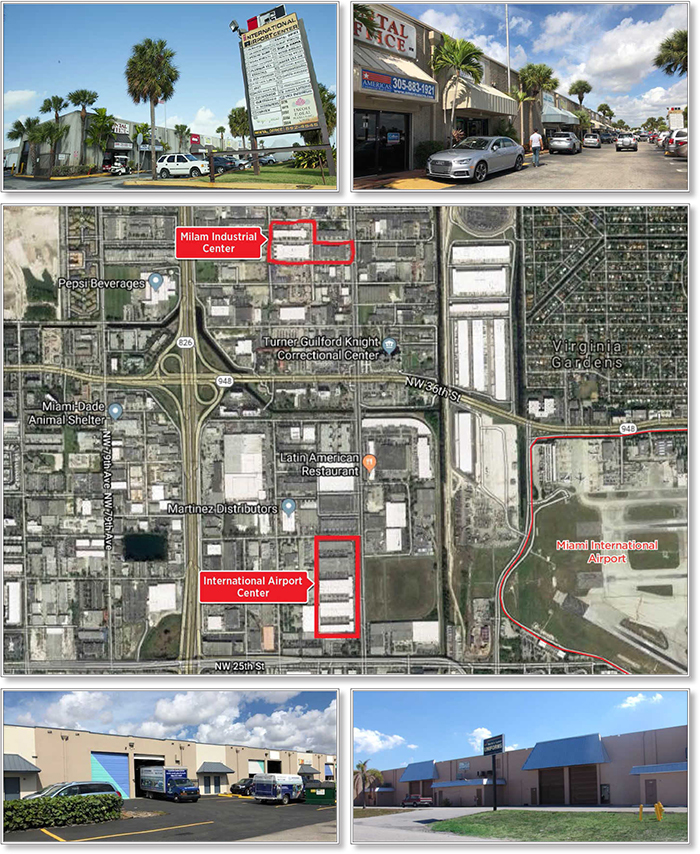
THE INFORMATION IN THIS STRUCTURAL AND COLLATERAL TERM SHEET IS NOT COMPLETE AND MAY BE AMENDED PRIOR TO THE TIME OF SALE. THIS TERM SHEET IS NOT AN OFFER TO SELL THESE SECURITIES AND IT IS NOT A SOLICITATION OF AN OFFER TO BUY THESE SECURITIES IN ANY JURISDICTION WHERE THE OFFER OR SALE IS NOT PERMITTED.
31
| MIAMI INDUSTRIAL PORTFOLIO |
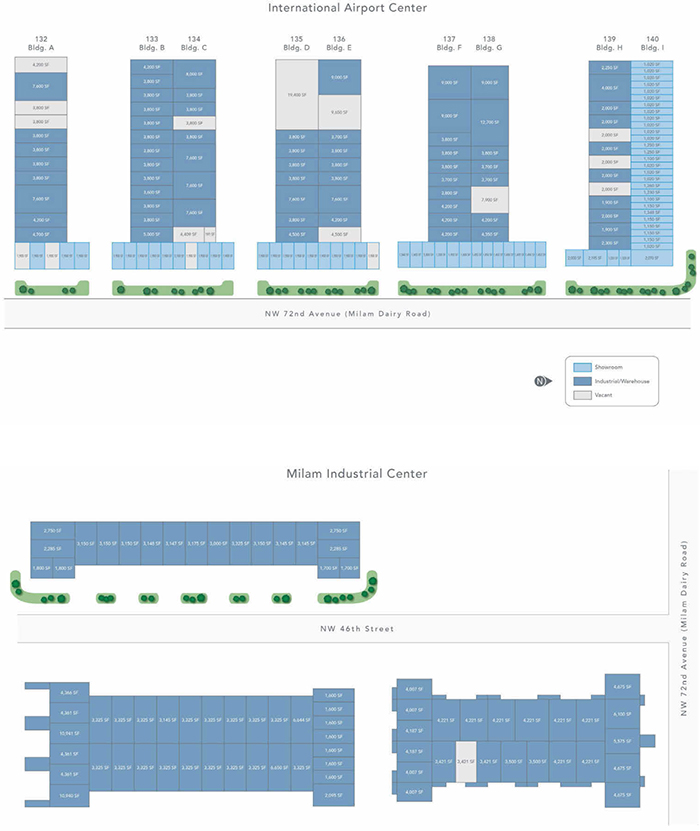
THE INFORMATION IN THIS STRUCTURAL AND COLLATERAL TERM SHEET IS NOT COMPLETE AND MAY BE AMENDED PRIOR TO THE TIME OF SALE. THIS TERM SHEET IS NOT AN OFFER TO SELL THESE SECURITIES AND IT IS NOT A SOLICITATION OF AN OFFER TO BUY THESE SECURITIES IN ANY JURISDICTION WHERE THE OFFER OR SALE IS NOT PERMITTED.
32
| MIAMI INDUSTRIAL PORTFOLIO |
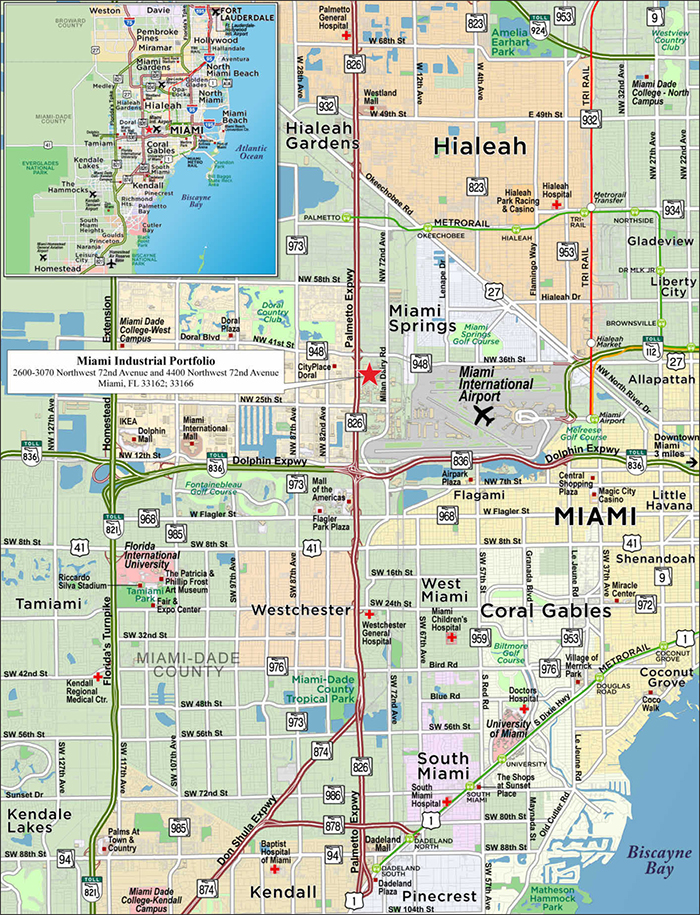
THE INFORMATION IN THIS STRUCTURAL AND COLLATERAL TERM SHEET IS NOT COMPLETE AND MAY BE AMENDED PRIOR TO THE TIME OF SALE. THIS TERM SHEET IS NOT AN OFFER TO SELL THESE SECURITIES AND IT IS NOT A SOLICITATION OF AN OFFER TO BUY THESE SECURITIES IN ANY JURISDICTION WHERE THE OFFER OR SALE IS NOT PERMITTED.
33
| No. 1 – Miami Industrial Portfolio | ||||||
| Loan Information | Property Information | |||||
| Mortgage Loan Seller: | Barclays Bank PLC | Single Asset/Portfolio(3): | Single Asset | |||
| Credit Assessment (Fitch/KBRA/Moody’s): | NR/NR/NR | Property Type: | Industrial | |||
| Original Principal Balance: | $66,100,000 | Specific Property Type: | Warehouse/Showroom | |||
| Cut-off Date Balance: | $66,100,000 | Location: | Miami, FL | |||
| % of Initial Pool Balance: | 7.9% | Size: | 745,597 SF | |||
| Loan Purpose: | Refinance | Cut-off Date Balance Per SF: | $88.65 | |||
| Borrower Names(1): | Various | Year Built/Renovated: | Various/NAP | |||
| Borrower Sponsor: | Francis Greenburger | Title Vesting: | Fee | |||
| Mortgage Rate: | 4.981% | Property Manager: | Pointe Group Management, Inc. | |||
| Note Date: | November 16, 2018 | 4th Most Recent Occupancy (As of): | 90.4% (12/31/2014) | |||
| Anticipated Repayment Date: | NAP | 3rd Most Recent Occupancy (As of): | 91.8% (12/31/2015) | |||
| Maturity Date: | December 6, 2028 | 2nd Most Recent Occupancy (As of): | 91.3% (12/31/2016) | |||
| IO Period: | 120 months | Most Recent Occupancy (As of): | 95.4% (12/31/2017) | |||
| Loan Term (Original): | 120 months | Current Occupancy (As of): | 89.4% (10/31/2018) | |||
| Seasoning: | 0 months | |||||
| Amortization Term (Original): | NAP | Underwriting and Financial Information: | ||||
| Loan Amortization Type: | Interest-only, Balloon | |||||
| Interest Accrual Method: | Actual/360 | 4th Most Recent NOI (As of): | $5,426,154 (12/31/2015) | |||
| Call Protection: | L(24),D(92),O(4) | 3rd Most Recent NOI (As of): | $5,960,266 (12/31/2016) | |||
| Lockbox Type: | Springing | 2nd Most Recent NOI (As of): | $6,319,225 (12/31/2017) | |||
| Additional Debt: | No | Most Recent NOI (As of): | $6,528,242 (TTM 9/30/2018) | |||
| Additional Debt Type: | None | |||||
| U/W Revenues: | $8,353,124 | |||||
| U/W Expenses: | $1,829,524 | |||||
| U/W NOI: | $6,523,600 | |||||
| U/W NCF: | $5,905,852 | |||||
| Escrows and Reserves(2): | U/W NOI DSCR: | 1.95x | ||||
| U/W NCF DSCR: | 1.77x | |||||
| Type: | Initial | Monthly | Cap (If Any) | U/W NOI Debt Yield: | 9.9% | |
| Taxes | $115,875 | $57,937 | NAP | U/W NCF Debt Yield: | 8.9% | |
| Insurance | $0 | Springing | NAP | As-Is Appraised Value: | $104,400,000 | |
| Replacement Reserves | $0 | $12,427 | NAP | As-Is Appraisal Valuation Date: | October 15, 2018 | |
| TI/LC Reserve | $300,000 | $31,067 | $300,000 | Cut-off Date LTV Ratio: | 63.3% | |
| Outstanding TI/LC Reserve | $97,587 | $0 | NAP | LTV Ratio at Maturity: | 63.3% | |
| (1) | The borrowers of the Miami Industrial Portfolio Mortgage Loan (as defined below) are Miami Airport Industrial Equities LLC, Maiden Miami Airport Industrial Equities LLC, Smithridge Miami Airport Industrial Equities LLC, WEEG II Miami Airport Industrial Equities LLC, CH Miami Airport Industrial Equities LLC, and Miami Airport Exchange Equities LLC, as tenants-in-common. |
| (2) | See “Escrows” section. |
| (3) | The Miami Industrial Portfolio comprises two industrial properties located approximately one mile apart, which are owned and operated as a single asset by the sponsor. |
The Mortgage Loan.The mortgage loan (the “Miami Industrial Portfolio Mortgage Loan”) is evidenced by a single promissory note secured by a first mortgage encumbering the fee interest in two industrial properties that are operated as a single asset located in Miami, Florida (the “Miami Industrial Portfolio Properties”). The Miami Industrial Portfolio Mortgage Loan was originated on November 16, 2018 by Barclays Bank PLC. The Miami Industrial Portfolio Mortgage Loan had an original principal balance of $66,100,000, has an outstanding principal balance as of the Cut-off Date of $66,100,000 and accrues interest at an interest rate of 4.981%per annum. The Miami Industrial Portfolio Mortgage Loan had an initial term of 120 months, has a remaining term of 120 months as of the Cut-off Date and requires payments of interest only through the loan term. The Miami Industrial Portfolio Mortgage Loan matures on December 6, 2028.
Following the lockout period, on any date before September 6, 2028, the borrower has the right to defease the Miami Industrial Portfolio Mortgage Loan in whole, but not in part. In addition, the Miami Industrial Portfolio Mortgage Loan is prepayable without penalty on or after September 6, 2028.
THE INFORMATION IN THIS STRUCTURAL AND COLLATERAL TERM SHEET IS NOT COMPLETE AND MAY BE AMENDED PRIOR TO THE TIME OF SALE. THIS TERM SHEET IS NOT AN OFFER TO SELL THESE SECURITIES AND IT IS NOT A SOLICITATION OF AN OFFER TO BUY THESE SECURITIES IN ANY JURISDICTION WHERE THE OFFER OR SALE IS NOT PERMITTED.
34
| MIAMI INDUSTRIAL PORTFOLIO |
Sources and Uses
| Sources | Uses | |||||||
| Original mortgage loan amount | $66,100,000 | 100.0% | Loan payoff(1) | $49,508,582 | 74.9% | |||
| Upfront reserves | 513,462 | 0.8 | ||||||
| Closing costs | 671,257 | 1.0 | ||||||
| Return of equity | 15,406,699 | 23.3 | ||||||
| Total Sources | $66,100,000 | 100.0% | Total Uses | $66,100,000 | 100.0% | |||
| (1) | The loan payoff is inclusive of a $44.5 million payoff of the existing debt from WFRBS 2014-LC14 and a $5.0 million payoff of the preferred equity note. |
The Property. The Miami Industrial Portfolio Properties are two industrial warehouse distribution and showroom properties operating as a single asset and totaling 745,597 square feet located approximately one mile apart along Northwest 72nd Avenue in Miami, Florida. The Miami Industrial Portfolio Properties consist of eleven buildings situated on approximately 28.3 total acres of land. Overall, the net rentable area of the Miami Industrial Portfolio Properties is 85.3% industrial warehouse and 14.7% showroom space. The Miami Industrial Portfolio Properties feature 880 total parking spaces, resulting in a parking ratio of 1.2 spaces per 1,000 square feet of rentable area. As of October 31, 2018, the Miami Industrial Portfolio Properties were 89.4% occupied by approximately 180 tenants with no single tenant accounting for more than 2.9% of the net rentable area or 2.3% of underwritten base rent. The Miami Industrial Portfolio Properties have averaged 91.7% occupancy over the past five years and averaged 86.3% occupancy since 2007.
International Airport Center
The International Airport Center contains eight industrial and showroom buildings totaling 486,853 square feet (65.3% of the net rentable area). The property was built in phases between 1984 and 1987. The industrial spaces include 20 foot clear ceiling heights, 14 foot bay heights, and 120 bay doors. Approximately 109,703 square feet (22.5% of net rentable area of the property) is showroom or wholesale suites. The showroom space ranges from about 1,000 to 3,000 square feet with frontage along Northwest 72ndAvenue, a main thoroughfare in the area, and are mainly occupied by electronics wholesalers and retailers. The International Airport Center is directly west of the Miami International Airport and about one mile south of the Milam Industrial Center. As of October 31, 2018, the International Airport Center was 84.5% occupied.
Milam Industrial Center
The Milam Industrial Center contains three industrial warehouse buildings totaling 258,744 square feet (34.7% of the net rentable area). The property was built between 1977 and 1979. The buildings are entirely industrial warehouse space with 20 foot clear ceiling heights, 14 foot bay heights, and 84 bay doors. The tenancy at the Milam Industrial Center property is mainly comprised of welders, storage, and home improvement design companies. The Milam Industrial Center property is located approximately one mile north of the International Airport Center property. As of October 31, 2018, the Milam Industrial Center was 98.7% occupied.
The following table presents certain information relating to the Miami Industrial Portfolio Properties:
| Property | Year Built | Total Building SF | % of Total Building SF | Annual U/W Base Rent(1) | Annual U/W Base Rent PSF(1) | Occupancy | Appraised Value | % of Appraised Value |
| International Airport Center | 1984-1987 | 486,853 | 65.3% | $5,761,186 | $14.06 | 84.5% | $75,400,000 | 72.2% |
| Milam Industrial Center | 1977-1979 | 258,744 | 34.7% | $2,405,712 | $9.42 | 98.7% | $29,000,000 | 27.8% |
| Total/Weighted Average | 745,597 | 100.0% | $8,166,898 | $12.28 | 89.4% | $104,400,000 | 100.0% |
| (1) | Annual U/W Base Rent and Annual U/W Base Rent PSF exclude vacant space and a 1,900 square foot management office with no attributable U/W Base Rent. |
THE INFORMATION IN THIS STRUCTURAL AND COLLATERAL TERM SHEET IS NOT COMPLETE AND MAY BE AMENDED PRIOR TO THE TIME OF SALE. THIS TERM SHEET IS NOT AN OFFER TO SELL THESE SECURITIES AND IT IS NOT A SOLICITATION OF AN OFFER TO BUY THESE SECURITIES IN ANY JURISDICTION WHERE THE OFFER OR SALE IS NOT PERMITTED.
35
| MIAMI INDUSTRIAL PORTFOLIO |
The following table presents certain information relating to the tenancy at the Miami Industrial Portfolio Properties:
Major Tenants
| Tenant Name | Credit Rating (Fitch/ Moody’s/ S&P) | Tenant NRSF | % of NRSF | Annual U/W Base Rent PSF(1) | Annual U/W Base Rent(1) | % of Total Annual U/W Base Rent | Lease Expiration Date |
| Major Tenants | |||||||
| Ezone 2.0 LLC | NR/NR/NR | 21,881 | 2.9% | $8.47 | $185,332 | 2.3% | 6/30/2021 |
| Giovanni & Sons | NR/NR/NR | 20,846 | 2.8% | $8.72(2) | $181,713 | 2.2% | Various(2) |
| Purchase One Corp | NR/NR/NR | 19,950 | 2.7% | $8.49 | $169,376 | 2.1% | 2/29/2020 |
| A.R. Express LLC | NR/NR/NR | 12,700 | 1.7% | $9.94 | $126,238 | 1.5% | 9/30/2021(3) |
| Pool Designs by Laly, LLC | NR/NR/NR | 10,250 | 1.4% | $8.74 | $89,585 | 1.1% | 8/31/2020 |
| Total Major Tenants | 85,627 | 11.5% | $8.79 | $752,244 | 9.2% | ||
| Non-Major Tenants(4) | 581,299 | 78.0% | $12.76 | $7,414,654 | 90.8% | ||
| Occupied Collateral Total | 666,926 | 89.4% | $12.28(5) | $8,166,898 | 100.0% | ||
| Vacant Space | 78,671 | 10.6% | |||||
| Collateral Total | 745,597 | 100.0% | |||||
| (1) | Annual U/W Base Rent PSF and Annual U/W Base Rent include contractual rent steps through December 2019 totaling $167,410. |
| (2) | Giovanni & Sons leases two separate spaces: 16,625 square feet with an Annual U/W Base Rent PSF of $8.64 and Lease Expiration Date of September 30, 2019 and 4,221 square feet with an Annual U/W Base Rent PSF of $9.02 and Lease Expiration Date of November 30, 2020. |
| (3) | A.R. Express LLC has one, three-year renewal option. |
| (4) | Non-Major Tenants includes a 1,900 square foot management office with no attributable Annual U/W Base Rent. |
| (5) | Annual U/W Base Rent PSF excludes vacant space and a 1,900 management office with no attributable U/W Base Rent. |
The following table presents certain information relating to the lease rollover schedule at theMiami Industrial Portfolio Properties:
Lease Expiration Schedule(1)(2)
| Year Ending December 31, | No. of Leases Expiring | Expiring NRSF | % of Total NRSF | Cumulative Expiring NRSF | Cumulative % of Total NRSF | Annual U/W Base Rent | % of Total Annual U/W Base Rent | Annual U/W Base Rent PSF(3) |
| MTM | 0 | 0 | 0.0% | 0 | 0.0% | $0 | 0.0% | $0.00 |
| 2018 | 12 | 32,532 | 4.4% | 32,532 | 4.4% | $418,453 | 5.1% | $12.86 |
| 2019 | 65 | 222,210 | 29.8% | 254,742 | 34.2% | $2,669,174 | 32.7% | $12.01 |
| 2020 | 58 | 210,264 | 28.2% | 465,006 | 62.4% | $2,610,597 | 32.0% | $12.42 |
| 2021 | 41 | 175,176 | 23.5% | 640,182 | 85.9% | $2,136,073 | 26.2% | $12.19 |
| 2022 | 2 | 10,444 | 1.4% | 650,626 | 87.3% | $95,763 | 1.2% | $9.17 |
| 2023 | 3 | 12,500 | 1.7% | 663,126 | 88.9% | $204,538 | 2.5% | $16.36 |
| 2024 | 1 | 1,900 | 0.3% | 665,026 | 89.2% | $32,300 | 0.4% | $17.00 |
| 2025 | 0 | 0 | 0.0% | 665,026 | 89.2% | $0 | 0.0% | $0.00 |
| 2026 | 0 | 0 | 0.0% | 665,026 | 89.2% | $0 | 0.0% | $0.00 |
| 2027 | 0 | 0 | 0.0% | 665,026 | 89.2% | $0 | 0.0% | $0.00 |
| 2028 | 0 | 0 | 0.0% | 665,026 | 89.2% | $0 | 0.0% | $0.00 |
| Thereafter(4) | 1 | 1,900 | 0.3% | 666,926 | 89.4% | $0 | 0.0% | $0.00 |
| Vacant | 0 | 78,671 | 10.6% | 745,597 | 100.0% | $0 | 0.0% | $0.00 |
| Total/Weighted Average | 183 | 745,597 | 100.0% | $8,166,898 | 100.0% | $12.28 |
| (1) | Information obtained from the underwritten rent roll. |
| (2) | Certain tenants may have lease termination options that are exercisable prior to the originally stated expiration date of the subject lease and that are not considered in the Lease Expiration Schedule. |
| (3) | Annual U/W Base Rent PSF excludes vacant space and a 1,900 square foot management office with no attributable U/W Base Rent. |
| (4) | “Thereafter” includes a 1,900 square foot management office, which has no attributable Annual U/W Base Rent. |
The following table presents historical occupancy percentages at the Miami Industrial Portfolio Properties:
Historical Occupancy
12/31/2014(1) | 12/31/2015(1) | 12/31/2016(1) | 12/31/2017(1) | 10/31/2018(2)(3) |
| 90.4% | 91.8% | 91.3% | 95.4% | 89.4% |
| (1) | Information obtained from the borrower. |
| (2) | Information obtained from the underwritten rent roll. |
| (3) | The recent decrease in occupancy is due to an approximately 20,000 square foot tenant vacating the property in March 2018. The tenant had a large refrigeration component, which the borrower has been remodeling the space since the tenant vacated and has been receiving indications of interest for the space upon completion. |
THE INFORMATION IN THIS STRUCTURAL AND COLLATERAL TERM SHEET IS NOT COMPLETE AND MAY BE AMENDED PRIOR TO THE TIME OF SALE. THIS TERM SHEET IS NOT AN OFFER TO SELL THESE SECURITIES AND IT IS NOT A SOLICITATION OF AN OFFER TO BUY THESE SECURITIES IN ANY JURISDICTION WHERE THE OFFER OR SALE IS NOT PERMITTED.
36
| MIAMI INDUSTRIAL PORTFOLIO |
Operating History and Underwritten Net Cash Flow. The following table presents certain information relating to the historical operating performance and underwritten net cash flow at the Miami Industrial Portfolio Property:
Cash Flow Analysis
| 2015 | 2016 | 2017 | TTM 9/30/2018 | U/W | % of U/W Effective Gross Income | U/W $ per SF | ||||||||||||||||
| Base Rent | $7,172,965 | $7,678,091 | $8,115,905 | $8,101,768 | $8,166,898 | 97.8 | % | $10.95 | ||||||||||||||
| Grossed Up Vacant Space | 0 | 0 | 0 | 0 | 897,289 | 10.7 | 1.20 | |||||||||||||||
| Total Recoveries | 75,858 | 85,246 | 29,041 | 165,760 | 92,318 | 1.1 | 0.12 | |||||||||||||||
| Other Income(1) | 59,112 | 105,533 | 57,110 | 93,908 | 93,908 | 1.1 | 0.13 | |||||||||||||||
| Less Vacancy & Credit Loss | (120,539) | (173,626) | (155,657) | (103,770) | (897,289)(2) | (10.7) | (1.20) | |||||||||||||||
| Effective Gross Income | $7,187,395 | $7,695,244 | $8,046,400 | $8,257,666 | $8,353,124 | 100.0 | % | $11.20 | ||||||||||||||
| Total Operating Expenses | 1,761,240 | 1,734,977 | 1,727,175 | 1,729,424 | 1,829,524 | 21.9 | % | 2.45 | ||||||||||||||
| Net Operating Income(3) | $5,426,154 | $5,960,266 | $6,319,225 | $6,528,242 | $6,523,600 | 78.1 | % | $8.75 | ||||||||||||||
| TI/LC(4) | 0 | 0 | 0 | 0 | 468,629 | 5.6 | 0.63 | |||||||||||||||
| Capital Expenditures | 0 | 0 | 0 | 0 | 149,119 | 1.8 | 0.20 | |||||||||||||||
| Net Cash Flow | $5,426,154 | $5,960,266 | $6,319,225 | $6,528,242 | $5,905,852 | 70.7 | % | $7.92 | ||||||||||||||
| NOI DSCR | 1.63x | 1.79x | 1.89x | 1.96x | 1.95x | |||||||||||||||||
| NCF DSCR | 1.63x | 1.79x | 1.89x | 1.96x | 1.77x | |||||||||||||||||
| NOI DY | 8.2% | 9.0% | 9.6% | 9.9% | 9.9% | |||||||||||||||||
| NCF DY | 8.2% | 9.0% | 9.6% | 9.9% | 8.9% | |||||||||||||||||
| (1) | Other income consists of forfeited deposit income, keys/locks/card income, late fee income, NSF fee income, termination fee income, legal fees, bad debt collections, and other miscellaneous income. |
| (2) | The underwritten economic vacancy is 9.9%. The Miami Industrial Portfolio Properties were 89.4% physically occupied as of October 31, 2018. |
| (3) | 2014 Net Operating Income was $4,629,899. |
| (4) | U/W TI/LC is inclusive of a credit of $30,000 equal to 1/10th of the upfront TI/LC reserve of $300,000. |
Appraisal.As of the appraisal valuation date of October 15, 2018, the Miami Industrial Portfolio Properties had an “as-is” appraised value of $104,400,000.
Environmental Matters.According to the Phase I environmental site assessments dated October 24, 2018, there was no evidence of any recognized environmental conditions at the Miami Industrial Portfolio Properties.
Market Overview and Competition. The Miami Industrial Portfolio Properties are located approximately one mile apart along 72ndAvenue in Miami, Florida. The Miami airport area is one of the most desirable and active industrial markets in the country due to the proximity to the airport and major expressway linkages. Within three-to-five miles of the Miami Industrial Portfolio Properties are the Florida Turnpike, the Palmetto Expressway, and the Dolphin Expressway. The Florida Turnpike and the Palmetto Expressway are major north/south arteries providing access throughout western Miami-Dade County, as well as areas of Broward County further north. The Palmetto Expressway provides access to U.S. Highway 1 to the south and Interstate 75 to the north.
The Miami Industrial Portfolio Properties are located approximately 0.25 miles from the Miami International Airport. The Miami International Airport is America’s second busiest airport for international travelers with over 100 air carriers and is the top U.S. airport for international freight. The airport is an economic engine for Miami-Dade County, generating $33.7 billion of business revenue in the area annually. The Miami Industrial Portfolio Properties are also surrounded by other industrial parks, including the Miami Free Trade Zone, a 47-acre federal free trade zone comprised of 850,000 square feet of warehouses, executive offices, and showrooms and the Doral Marble and Tile District, an industrial/showroom warehouse district that is one of the largest collection of home remodeling and construction material retailers in the country. According to the appraisal, the estimated 2018 population within a one-, three- and five-mile radius of the Miami Industrial Portfolio Properties was approximately 8,357, 114,502, and 511,191, respectively; while the 2018 estimated median household income within the same radii was $62,831, $39,524, and $40,482, respectively.
According to the appraisal, the Miami Industrial Portfolio Properties are situated within the Airport West submarket of the Miami-Dade industrial market, one of the strongest industrial markets in the country. As of the third quarter of 2018, the Miami-Dade industrial market reported a total inventory of approximately 213.8 million square feet with a 3.7% vacancy rate and average asking rents of $7.73 per square foot. As of the third quarter of 2018, the Airport West industrial submarket reported a total inventory of approximately 69.4 million square feet with a 2.7% vacancy rate and an average asking rent of $8.56 per square foot. Additionally, the Airport West submarket and other smaller neighborhoods surrounding the Miami International Airport comprise the second largest employment center in Miami-Dade County after the Miami Central Business District.
THE INFORMATION IN THIS STRUCTURAL AND COLLATERAL TERM SHEET IS NOT COMPLETE AND MAY BE AMENDED PRIOR TO THE TIME OF SALE. THIS TERM SHEET IS NOT AN OFFER TO SELL THESE SECURITIES AND IT IS NOT A SOLICITATION OF AN OFFER TO BUY THESE SECURITIES IN ANY JURISDICTION WHERE THE OFFER OR SALE IS NOT PERMITTED.
37
| MIAMI INDUSTRIAL PORTFOLIO |
The following tables present certain information relating to comparable industrial and retail/showroom leases to the Miami Industrial Portfolio Properties:
Comparable Leases (Industrial)(1)
| Property Name | Property Type | Tenant Name | Lease Start Term | Lease Area (SF) | Annual Base Rent PSF | Lease Type |
| 1424 NW 82nd Ave | Industrial | Confidential | Aug. 2018 / 1.9 Years | 5,000 | $11.75 | Modified Gross |
| Beacon Centre – Bldg. 3 | Industrial | Confidential | Sep. 2018 / 4.1 Years | 7,440 | $11.50 | Modified Gross |
| 1701-2089 NW 87th Ave | Industrial | Confidential | Oct. 2018 / 3.0 Years | 7,227 | $11.50 | Modified Gross |
| 3399 NW 72nd Ave #118 | Showroom | Bocas Chicken Miami | Nov. 2016 / 5.4 Years | 3,240 | $27.58 | Modified Gross |
| 3399 NW 72nd Ave #118 | Showroom | Angel Hand Face and Body LLC | Mar. 2017 / 5.3 Years | 1,320 | $20.60 | Modified Gross |
| 8726 NW 26th Street | Showroom | Confidential | Jul. 2018 / 3.0 Years | 1,786 | $25.00 | Modified Gross |
| (1) | Information obtained from the appraisal. |
The Borrower.The borrowers are Miami Airport Industrial Equities LLC, Maiden Miami Airport Industrial Equities LLC, Smithridge Miami Airport Industrial Equities LLC, WEEG II Miami Airport Industrial Equities LLC, CH Miami Airport Industrial Equities LLC, and Miami Airport Exchange Equities LLC, six separate limited liability companies as tenants-in-common, each of which is a single purpose entity. All six tenants-in-common are affiliates of Time Equities, Inc. and are ultimately controlled by the sponsor. Legal counsel to the borrower delivered a non-consolidation opinion in connection with the origination of the Miami Industrial Portfolio Mortgage Loan. Francis Greenburger is the guarantor of certain nonrecourse carveouts under the Miami Industrial Portfolio Mortgage Loan.
The Borrower Sponsor.The borrower sponsor is Francis Greenburger, the founder and Chief Executive Officer of Time Equities, Inc. Founded in 1966, Time Equities, Inc. currently has a portfolio of approximately 31.1 million square feet of residential, industrial, office, and retail property, with an additional 1.4 million square feet of properties in development and pre-development phases. Time Equities, Inc. holds properties in 30 states, five Canadian provinces, Germany, the Netherlands and Anguilla, with high concentrations in the Northeast, Southeast, Midwest, and West Coast of the United States. Francis Greenburger has been a subject of defaults, deeds-in-lieu of foreclosure, restructurings, and one partnership bankruptcy dating back to the savings and loan crisis in the 1990s. See “Description of the Mortgage Pool – Loan Purpose; Bankruptcy Issues and Other Proceedings” in the Preliminary Prospectus.
Escrows.The loan documents provide for upfront escrows in the amount of $115,875 for real estate taxes, $300,000 for future tenant improvements and leasing commissions, and $97,587 for outstanding TI/LC obligations. The loan documents also provide for ongoing monthly escrows in an amount equal to $57,937 for real estate taxes, $31,067 for tenant improvements and leasing commissions (subject to a cap of $300,000) and $12,427 for capital expenditures. The Miami Industrial Portfolio Mortgage Loan documents do not require monthly escrows for insurance premiums as long as (i) the blanket insurance policy required under the documents and maintained by the borrower is in full force and effect and (ii) the borrower delivers to the lender within 15 days prior to the expiration of the blanket insurance policy, the certificates of insurance evidencing coverage accompanied by evidence of payment of the insurance premiums due under the policy.
Lockbox and Cash Management.A springing lockbox is required with respect to the Miami Industrial Portfolio Properties. The springing lockbox will be established upon the occurrence of a Cash Management Trigger Event (as defined below). During the occurrence of a Cash Management Trigger Event, the Miami Industrial Portfolio Borrowers will deliver a tenant instruction notice to each tenant instructing them to make all rents payable to the lockbox account, and all rents received by the borrower or the property manager to be deposited into the lockbox account within two business days of receipt. All funds in the lockbox account are required to be swept each business day into the cash management account controlled by the lender and disbursed on each payment date in accordance with the Miami Industrial Portfolio Mortgage Loan documents, with all excess cash flow to be deposited to an excess cash flow reserve to be held as an additional security for the Miami Industrial Portfolio Mortgage Loan.
A “Cash Management Trigger Event” will commence upon the earlier of the following:
| (i) | the occurrence of an event of default under the Miami Industrial Portfolio Mortgage Loan documents beyond any applicable grace period; |
| (ii) | the Miami Industrial Portfolio Mortgage Loan debt service coverage ratio based on the trailing 12-month period being less than 1.15x as of the last day of the calendar quarter; or |
| (iii) | the borrower or guarantor becoming insolvent or filing for bankruptcy. |
A Cash Management Trigger Event will end upon the occurrence of the following:
| (x) | with regard to clause (i) above, the cure of such event of default; |
| (y) | with regard to clause (ii) above, the Miami Industrial Portfolio Mortgage Loan debt service coverage ratio based upon the trailing 12-month period being greater than 1.20x for two consecutive calendar quarters; |
| (z) | with regard to clause (iii) above, such bankruptcy action being discharged, stayed, or dismissed within 60 days. |
THE INFORMATION IN THIS STRUCTURAL AND COLLATERAL TERM SHEET IS NOT COMPLETE AND MAY BE AMENDED PRIOR TO THE TIME OF SALE. THIS TERM SHEET IS NOT AN OFFER TO SELL THESE SECURITIES AND IT IS NOT A SOLICITATION OF AN OFFER TO BUY THESE SECURITIES IN ANY JURISDICTION WHERE THE OFFER OR SALE IS NOT PERMITTED.
38
| MIAMI INDUSTRIAL PORTFOLIO |
Property Management.The Miami Industrial Portfolio Properties are managed by Pointe Group Management, Inc., a commercial real estate property management firm and a subsidiary of Colliers International Group Inc. Colliers International Group Inc. is one of the world’s largest real estate services and investment management companies, with 2017 corporate revenues of $2.3 billion.
Assumption.The Miami Industrial Portfolio borrowers have the right to transfer the Miami Industrial Portfolio Properties, provided that certain other conditions are satisfied, including, but not limited to: (i) no event of default has occurred and is continuing; (ii) the lender’s reasonable determination that the proposed transferee and guarantor satisfy the lender’s credit review and underwriting standards, taking into consideration transferee experience, financial strength and general business standing; and (iii) if requested by the lender, rating agency confirmation that the transfer will not result in a downgrade, withdrawal or qualification of the respective ratings assigned to the Series WFCM 2018-C48 certificates.
Partial Release.Not permitted.
Real Estate Substitution.Not permitted.
Subordinate and Mezzanine Indebtedness.Not permitted.
Ground Lease.None.
Terrorism Insurance.The Miami Industrial Portfolio Mortgage Loan documents require that the “all risk” insurance policies required to be maintained by the borrower provide coverage for terrorism in an amount equal to the full replacement cost of the Miami Industrial Portfolio Properties, as well as business interruption insurance covering no less than the 18-month period following the occurrence of a casualty event, together with a 12-month extended period of indemnity. At the time of closing, the Miami Industrial Portfolio Properties had windstorm insurance coverage in place.
THE INFORMATION IN THIS STRUCTURAL AND COLLATERAL TERM SHEET IS NOT COMPLETE AND MAY BE AMENDED PRIOR TO THE TIME OF SALE. THIS TERM SHEET IS NOT AN OFFER TO SELL THESE SECURITIES AND IT IS NOT A SOLICITATION OF AN OFFER TO BUY THESE SECURITIES IN ANY JURISDICTION WHERE THE OFFER OR SALE IS NOT PERMITTED.
39
| SHERATON GRAND NASHVILLE DOWNTOWN |

THE INFORMATION IN THIS STRUCTURAL AND COLLATERAL TERM SHEET IS NOT COMPLETE AND MAY BE AMENDED PRIOR TO THE TIME OF SALE. THIS TERM SHEET IS NOT AN OFFER TO SELL THESE SECURITIES AND IT IS NOT A SOLICITATION OF AN OFFER TO BUY THESE SECURITIES IN ANY JURISDICTION WHERE THE OFFER OR SALE IS NOT PERMITTED.
40
| SHERATON GRAND NASHVILLE DOWNTOWN |

THE INFORMATION IN THIS STRUCTURAL AND COLLATERAL TERM SHEET IS NOT COMPLETE AND MAY BE AMENDED PRIOR TO THE TIME OF SALE. THIS TERM SHEET IS NOT AN OFFER TO SELL THESE SECURITIES AND IT IS NOT A SOLICITATION OF AN OFFER TO BUY THESE SECURITIES IN ANY JURISDICTION WHERE THE OFFER OR SALE IS NOT PERMITTED.
41
| No. 2 – Sheraton Grand Nashville Downtown | |||||||
| Loan Information | Property Information | ||||||
| Mortgage Loan Seller: | Argentic Real Estate Finance LLC | Single Asset/Portfolio: | Single Asset | ||||
| Credit Assessment (Fitch/KBRA/Moody's): | NR/NR/NR | Property Type: | Hospitality | ||||
| Original Principal Balance(1): | $60,000,000 | Specific Property Type: | Full Service | ||||
| Cut-off Date Balance(1): | $60,000,000 | Location: | Nashville, TN | ||||
| % of Initial Pool Balance: | 7.2% | Size: | 482 Rooms | ||||
| Loan Purpose: | Refinance | Cut-off Date Balance Per Room(1): | $331,950 | ||||
| Borrower Name: | Nashville Hospitality, LLC | Year Built/Renovated: | 1975 / 2017 | ||||
| Borrower Sponsor: | James M. Lippman; JRK-Holdings, Limited Partnership | Title Vesting: | Fee | ||||
| Mortgage Rate: | 5.035% | Property Manager: | Self-managed | ||||
| Note Date: | October 4, 2018 | 4thMost Recent Occupancy (As of): | NAV | ||||
| Anticipated Repayment Date: | NAP | 3rdMost Recent Occupancy (As of): | 77.8% (12/31/2015) | ||||
| Maturity Date: | October 6, 2028 | 2ndMost Recent Occupancy (As of): | 77.9% (12/31/2016) | ||||
| IO Period: | 120 months | Most Recent Occupancy (As of): | 79.5% (12/31/2017) | ||||
| Loan Term (Original): | 120 months | Current Occupancy (As of): | 79.8% (8/31/2018) | ||||
| Seasoning: | 2 months | ||||||
| Amortization Term (Original): | NAP | ||||||
| Loan Amortization Type: | Interest-only, Balloon | Underwriting and Financial Information: | |||||
| Interest Accrual Method: | Actual/360 | 4thMost Recent NOI (As of): | $17,997,162 (12/31/2015) | ||||
| Call Protection: | L(26),D(88),O(6) | 3rdMost Recent NOI (As of): | $19,940,428 (12/31/2016) | ||||
| Lockbox Type: | Hard/Springing Cash Management | 2ndMost Recent NOI (As of): | $21,577,133 (12/31/2017) | ||||
| Additional Debt(1): | Yes | Most Recent NOI (As of): | $22,384,613 (TTM 8/31/2018) | ||||
| Additional Debt Type(1): | Pari Passu | U/W Revenues: | $49,212,571 | ||||
| U/W Expenses: | $27,006,315 | ||||||
| U/W NOI: | $22,206,255 | ||||||
| U/W NCF: | $20,237,752 | ||||||
| U/W NOI DSCR(1): | 2.72x | ||||||
| U/W NCF DSCR(1): | 2.48x | ||||||
| U/W NOI Debt Yield(1): | 13.9% | ||||||
| Escrows and Reserves(2): | U/W NCF Debt Yield(1): | 12.6% | |||||
| Type: | Initial | Monthly | Cap (If Any) | As-Is Appraised Value(3): | $276,500,000 | ||
| Taxes | $1,166,485 | $129,609 | NAP | As-Is Appraisal Valuation Date: | September 13, 2018 | ||
| Insurance | $0 | Springing | NAP | Cut-off Date LTV Ratio(1): | 57.9% | ||
| FF&E | $1,000,000 | $164,042 | NAP | LTV Ratio at Maturity or ARD(1): | 57.9% | ||
| (1) | The Sheraton Grand Nashville Downtown Mortgage Loan (as defined below) is part of the Sheraton Grand Nashville Downtown Whole Loan (as defined below), which consists of eight pari passu notes with an aggregate original principal balance of $160,000,000. The Cut-off Date Balance per Room, U/W NOI DSCR, U/W NCF DSCR, U/W NOI Debt Yield, U/W NCF Debt Yield, U/W NCF DSCR, Cut-off Date LTV Ratio and LTV Ratio at Maturity or ARD numbers presented are based on the Sheraton Grand Nashville Downtown Whole Loan (as defined below). |
| (2) | See “Escrows” section. |
| (3) | The appraised value represents the aggregate value of the hotel component and parking garage which are $253,450,000 and $23,050,000, respectively. |
The Mortgage Loan. The mortgage loan (the “Sheraton Grand Nashville Downtown Mortgage Loan”) is part of a whole loan (the “Sheraton Grand Nashville Downtown Whole Loan”), which is evidenced by eightpari passupromissory notes (Notes A-1, A-2, A-3, A-4, A-5, A-6, A-7 and A-8) and secured by a first mortgage encumbering the fee interest of a 482-room full-service hotel property located in Nashville, Tennessee (the “Sheraton Grand Nashville Downtown Property”). The Sheraton Grand Nashville Downtown Whole Loan was originated on October 4, 2018 by Argentic Real Estate Finance LLC. The Sheraton Grand Nashville Downtown Whole Loan had an original principal balance of $160,000,000, has an outstanding principal balance as of the Cut-off Date of $160,000,000 and accrues interest at a rate of 5.035%per annum. The Sheraton Grand Nashville Downtown Whole Loan had an initial term of 120 months, has a remaining term of 118 months as of the Cut-off Date and requires interest-only payments through the term of the Sheraton Grand Nashville Downtown Whole Loan. The Sheraton Grand Nashville Downtown Whole Loan matures on October 6, 2028.
The Sheraton Grand Nashville Downtown Mortgage Loan, which is evidenced by the controlling Note A-2 and non-controlling Notes A-5 and A-7 and will be contributed to the Wells Fargo Commercial Mortgage Trust 2018-C48, had an aggregate original principal balance of $60,000,000 and has an aggregate outstanding principal balance as of the Cut-off Date of $60,000,000. The non-controlling Note A-1, which had an original principal balance of $30,000,000, is expected to be contributed to the CSAIL 2018-C14 Commercial Mortgage Trust. The non-controlling Notes A-3, A-4, A-6 and A-8, which had an aggregate original principal balance of $70,000,000 are currently held by Argentic Real Estate Finance LLC and are expected to be contributed to a future securitization trust or trusts. The lender provides no assurances that any non-securitizedpari passu notes will not be split further. See “Description of the Mortgage Pool-The Whole Loans-The Serviced Whole Loans” in the Preliminary Prospectus.
THE INFORMATION IN THIS STRUCTURAL AND COLLATERAL TERM SHEET IS NOT COMPLETE AND MAY BE AMENDED PRIOR TO THE TIME OF SALE. THIS TERM SHEET IS NOT AN OFFER TO SELL THESE SECURITIES AND IT IS NOT A SOLICITATION OF AN OFFER TO BUY THESE SECURITIES IN ANY JURISDICTION WHERE THE OFFER OR SALE IS NOT PERMITTED.
42
| SHERATON GRAND NASHVILLE DOWNTOWN |
Note Summary(1)
| Notes | Original Principal Balance | Note Holder | Controlling Interest | |
| A-1 | $30,000,000 | CSAIL 2018-C14 | No | |
| A-2 | 30,000,000 | WFCM 2018-C48 | Yes | |
| A-3 | 25,000,000 | Argentic Real Estate Finance, LLC | No | |
| A-4 | 25,000,000 | Argentic Real Estate Finance, LLC | No | |
| A-5 | 20,000,000 | WFCM 2018-C48 | No | |
| A-6 | 15,000,000 | Argentic Real Estate Finance, LLC | No | |
| A-7 | 10,000,000 | WFCM 2018-C48 | No | |
| A-8 | 5,000,000 | Argentic Real Estate Finance, LLC | No | |
| Total | $160,000,000 |
| (1) | The lender provides no assurances that any non-securitizedpari passu note will not be split further. |
Following the lockout period, the borrower has the right to defease the Sheraton Grand Nashville Downtown Whole Loan in whole, or in part, on any date before May 6, 2028. In addition, the Sheraton Grand Nashville Downtown Whole Loan is prepayable without penalty on or after May 6, 2028. The lockout period will expire on the earlier to occur of (i) two years after the closing date of the securitization that includes the last note to be securitized and (ii) October 4, 2022.
Sources and Uses
| Sources | Uses | |||||||
| Original loan amount(1) | $160,000,000 | 100.0% | Loan payoff | $58,467,202 | 36.5% | |||
| Return of equity(1) | 98,529,336 | 61.6 | ||||||
| Reserves | 2,166,485 | 1.4 | ||||||
| Closing costs | 836,977 | 0.5 | ||||||
| Total Sources | $160,000,000 | 100.0% | Total Uses | $160,000,000 | 100.0% |
| (1) | The borrower sponsors have owned the property since 2012 and have invested approximately $36.2 million in upgrades to the property since acquisition. Since acquisition, the net cash flow at the property increased from approximately $7.2 million to $20.4 million as of TTM August 2018. |
The Property.The Sheraton Grand Nashville Downtown Property is a 482-key, full-service hotel property with an adjacent parking garage located in downtown Nashville, Tennessee on a 1.1-acre site. The Sheraton Grand Nashville Downtown Property was originally constructed in 1975 as a Hyatt hotel and reportedly operated as a Crowne Plaza hotel prior to its conversion to a Sheraton flagged hotel in 1999/2000. The Sheraton Grand Nashville Downtown Property was subsequently renovated between 2014 and 2017. In 2014, all guestrooms and most public areas were completely renovated. The Skye meeting room and ballroom, located on the top floor and offering a 360-degree view of Nashville, were added in early 2017. The total cost of the renovations was $36,200,000, or $75,104 per room. Post renovations, the Sheraton Grand Nashville Downtown Property received the Sheraton Grand designation (an elite classification for full service hotels in the Sheraton brand) in 2017 and is one of five Sheraton Grand hotels in the United States. The hotel offers 482 guestrooms, a restaurant, a lounge, an indoor pool, a fitness center, a business center, a sundry shop, and approximately 23,554 SF of dedicated meeting space. The 482 guestrooms are located on floors 3 through 25 and include 475 standard king or double-double rooms, six executive or one-bedroom suites, and a presidential suite. All rooms feature Sheraton’s Sweet Sleeper Bed, wired and wireless high speed Internet access, oversized work desks, LCD televisions, and in-room movies. The 24th floor contains a two-bay Sheraton Club lounge.
The top floor of the hotel was formerly a revolving restaurant that was converted to a bar and meeting room called Skye in 2017. Skye is open nightly for cocktails. The 23,554 SF meeting space is spread amongst 10 rooms, the largest of which is 10,680 SF. A 455-space, eight-level parking garage is located adjacent to and attached to the hotel. Parking is operated under a short term parking agreement with a local parking/valet company. Currently, parking rates for guests are $39.00 for overnight valet or self-parking. As of the trailing twelve months ending August 31, 2018, parking revenue totaled $2.3 million.
The Sheraton Grand Nashville Downtown Property’s main entrance is along Union Street, with primary entrance to the parking structure along 7th Avenue North across a large park (Legislative Plaza) from the state capitol. The neighborhood is dominated by government buildings, most notably the Tennessee State Capitol. The surrounding buildings include the Military Branch Museum, Tennessee Performing Arts Center, Nashville Public Library, and a number of office buildings.
THE INFORMATION IN THIS STRUCTURAL AND COLLATERAL TERM SHEET IS NOT COMPLETE AND MAY BE AMENDED PRIOR TO THE TIME OF SALE. THIS TERM SHEET IS NOT AN OFFER TO SELL THESE SECURITIES AND IT IS NOT A SOLICITATION OF AN OFFER TO BUY THESE SECURITIES IN ANY JURISDICTION WHERE THE OFFER OR SALE IS NOT PERMITTED.
43
| SHERATON GRAND NASHVILLE DOWNTOWN |
Operating History and Underwritten Net Cash Flow.The following table presents certain information relating to the historical operating performance and underwritten net cash flow at the Sheraton Grand Nashville Downtown Property:
Cash Flow Analysis
| 2015(1) | 2016(1) | 2017(1) | TTM 8/31/2018(1) | U/W | % of U/W Total Revenue | U/W $ per Room | |
| Occupancy | 77.8% | 77.9% | 79.5% | 79.8% | 79.8% | ||
| ADR | $211.27 | $241.40 | $240.40 | $236.45 | $236.45 | ||
| RevPAR | $164.36 | $188.15 | $191.12 | $188.58 | $188.58 | ||
| Room Revenue | $28,916,672 | $33,191,112 | $33,622,909 | $33,176,739 | $33,176,739 | 67.4% | $68,831 |
| F&B Revenue(2) | 7,433,620 | 8,487,011 | 10,505,293 | 11,426,423 | 11,426,423 | 23.2 | 23,706 |
| Parking Revenue | 2,263,076 | 2,275,618 | 2,267,665 | 2,285,149 | 2,285,149 | 4.6 | 4,741 |
| Other Revenue(3) | 1,651,253 | 1,395,596 | 1,994,595 | 2,324,260 | 2,324,260 | 4.7 | 4,822 |
| Total Revenue | $40,264,621 | $45,349,337 | $48,390,462 | $49,212,571 | $49,212,571 | 100.0% | $102,101 |
| Total Department Expenses | 10,402,618 | 12,214,935 | 12,980,312 | 13,014,677 | 13,014,677 | 26.4 | 27,001 |
| Gross Operating Profit | $29,862,003 | $33,134,402 | $35,410,150 | $36,197,894 | $36,197,894 | 73.6% | $75,099 |
| Total Undistributed Expenses | 10,782,355 | 12,057,580 | $12,139,625 | $11,977,935 | $12,082,854 | 24.6 | 25,068 |
| Profit Before Fixed Charges | $19,079,648 | $21,076,822 | $23,270,525 | $24,219,959 | $24,115,040 | 49.0% | 50,031 |
| Total Fixed Charges | 1,082,486 | 1,136,394 | 1,693,392 | 1,835,346 | 1,908,785 | 3.9 | 3,960 |
| Net Operating Income | $17,997,162 | $19,940,428 | $21,577,133 | $22,384,613 | $22,206,255 | 45.1% | $46,071 |
| FF&E | 1,610,585 | 1,813,973 | 1,935,618 | 1,968,503 | 1,968,503 | 4.0 | 4,084 |
| Net Cash Flow | $16,386,577 | $18,126,455 | $19,641,515 | $20,416,110 | $20,237,752 | 41.1% | $41,987 |
| NOI DSCR(4) | 2.20x | 2.44x | 2.64x | 2.74x | 2.72x | ||
| NCF DSCR(4) | 2.01x | 2.22x | 2.40x | 2.50x | 2.48x | ||
| NOI DY(4) | 11.2% | 12.5% | 13.5% | 14.0% | 13.9% | ||
| NCF DY(4) | 10.2% | 11.3% | 12.3% | 12.8% | 12.6% | ||
| (1) | The borrower sponsors have owned the property since 2012 and invested approximately $36.2 million since acquisition in upgrades to the property. Since acquisition, the net cash flow at the property increased from approximately $7.2 million to $20.4 million as of TTM August 2018. |
| (2) | Food and Beverage Revenue accounts for approximately 23.2% of U/W Total Revenue. |
| (3) | Other Revenue includes parking expense and Information and Telecom Systems expense. |
| (4) | The debt service coverage ratios and debt yields are based on the Sheraton Grand Nashville Downtown Whole Loan. |
Appraisal.As of the appraisal valuation date of September 13, 2018, the Sheraton Grand Nashville Downtown Property had an “as-is” appraised value of $276,500,000.
Environmental Matters.According to the Phase I environmental report dated September 25, 2018, there was no evidence of any recognized environmental conditions at the Sheraton Grand Nashville Downtown Property.
Market Overview and Competition.The Sheraton Grand Nashville Downtown Property is located in Nashville, Tennessee in the downtown Nashville area. Nashville is home to a variety of industries and companies, making for a relatively diverse economy. According to the appraisal, leading employment sectors in the Nashville metropolitan statistical area include professional and business services (16.3% of total employment), education and health services (15.3%), government (11.9%), leisure & hospitality services (11.3%) and retail trade (10.1%). Furthermore, according to the Nashville Convention & Visitors Corp, Nashville welcomed an estimated 14.5 million visitors in 2017, a 4.6% increase over 2016’s previous record of 13.9 million visitors. This represented the ninth consecutive year of positive year-over-year growth in visitor volume since 2008, at a compound growth rate of 5.8%. Furthermore, according to a third party report, the population in the Nashville-Davidson-Murfreesboro-Franklin MSA increased by a compound annual rate of 2.0% from 2012 through 2017. As of February 2018, Nashville had an unemployment rate of 2.7%, the U.S.’s lowest unemployment rate for cities greater than 1 million people according to the Bureau of Labor Statistics.
The Sheraton Grand Nashville Downtown Property offers a convenient location in downtown Nashville, proximate to the Tennessee State Capitol and numerous government office buildings and within walking distance of the Nashville Music City Center (city convention center), Country Music Hall of Fame and Museum, Bridgestone Arena and Broadway, the main thoroughfare through downtown Nashville. The Sheraton Grand Nashville Downtown Property is across the street from the Tennessee State Capitol, including Legislative Plaza and the Tennessee Performing Arts Center. Additionally, a new $195 million federal courthouse is currently under construction one block south of the Sheraton Grand Nashville Downtown Property (south of Church Street). The Sheraton Grand Nashville Downtown Property is also proximate to Capitol View, which is a 32-acre mixed-use development located in the North Gulch area of downtown just west of the Tennessee State Capitol and will include 1.1 million SF of office space, 130,000 SF of specialty retail and restaurants, 378 upscale multi-family apartment units, a 2.5-acre urban activity park and community space and jogging and bike trails connected to the Nashville Greenway system.
According to a third party report, the Downtown submarket (where the Sheraton Grand Nashville Downtown Property is located) has over 9.4 million square feet of office space as of the second quarter of 2018 with a total vacancy rate of 8.9% and approximately 1.0 million square feet under construction. Recent major employment announcements for Nashville includes Amazon, which reportedly will be putting an operations center in downtown Nashville, and announced that it anticipates bringing 5,000 employees housed in one
THE INFORMATION IN THIS STRUCTURAL AND COLLATERAL TERM SHEET IS NOT COMPLETE AND MAY BE AMENDED PRIOR TO THE TIME OF SALE. THIS TERM SHEET IS NOT AN OFFER TO SELL THESE SECURITIES AND IT IS NOT A SOLICITATION OF AN OFFER TO BUY THESE SECURITIES IN ANY JURISDICTION WHERE THE OFFER OR SALE IS NOT PERMITTED.
44
| SHERATON GRAND NASHVILLE DOWNTOWN |
million square feet of office space, $230 million in investments and an estimated incremental tax revenue of more than $1 billion over to Nashville the next 10 years (based on various news outlets). AllianceBernstein Holding LP also announced in May 2018 that it will be relocating its headquarters to the central business district in Nashville with a total expected headcount of 1,050 by 2022. Additionally, Cherry Bekaert, which in 2017 bought Frazier Dean & Howard to enter the Nashville market, signed a long-term lease to take a section of the 12th floor at 222 2nd Avenue South. Cherry Bekaert is expected to relocate all employees from the current West End Avenue location in the 4th quarter of 2018. In early 2018, Asurion, a global technology company, announced that it would create 400 information technology jobs as it consolidates operations into a new corporate headquarters in downtown Nashville, with the construction of a new office to begin in the first quarter of 2019 and open in the third quarter of 2021.
The Sheraton Grand Nashville Downtown Property’s demand segmentation is 47.0% meeting and group, 25.0% commercial, and 28.0% leisure versus market demand segmentation of 41.6% meeting and group, 31.1% commercial, and 27.3% leisure. Meeting and group demand is primarily generated by corporate groups that visit the area. Additional demand is generated by youth sports teams that travel to the area for various tournaments and sports fields. Commercial demand is generated by headquarters and large regional offices, especially in the professional & business services and health care industries. Additionally, theSheraton Grand Nashville Downtown Property currently accommodates airline crew business from United Airlines and British Airlines. Other top clientele include Deloitte, PricewaterhouseCoopers, KPMG, Accenture, Ernst & Young, Google, and Bank of America. Leisure demand is generated by leisure attractions in the immediate downtown area, including the Country Music Hall of Fame & Museum, Bridgestone Arena, Ryman Auditorium and The Johnny Cash Museum & Café, among others.
The following table presents certain information relating to the Sheraton Grand Nashville Downtown Property’s competitive set:
Subject and Market Historical Occupancy, ADR and RevPAR
Competitive Set(1) | Sheraton Grand Downtown | Penetration Factor | |||||||
Year | Occupancy | ADR | RevPAR | Occupancy | ADR | RevPAR | Occupancy | ADR | RevPAR |
| TTM(3) | 86.1% | $243.89 | $209.89 | 79.8% | $236.45 | $188.58 | 92.7% | 96.9% | 89.8% |
| 2017 | 85.5% | $245.05 | $209.44 | 79.5% | $240.40 | $191.12 | 93.0% | 98.1% | 91.2% |
| 2016 | 84.3% | $239.33 | $201.82 | 77.9% | $241.40 | $188.15 | 92.4% | 100.9% | 93.2% |
| 2015 | 82.5% | $224.16 | $185.03 | 77.8% | $211.27 | $164.36 | 94.3% | 94.2% | 88.8% |
| (1) | Information obtained from third party hospitality research reports from July 2018. The competitive set includes the following hotels: Renaissance Nashville Hotel, Holiday Inn Express Nashville Downtown Conference Center, Hilton Nashville Downtown, Hotel Indigo Nashville and Hyatt Place Nashville Downtown. |
| (2) | Information obtained from the borrower's financials. |
| (3) | The TTM represents the trailing twelve month period ending July 31, 2018 for the Competitive Set and the trailing twelve month period ending August 31, 2018 for the Sheraton Grand Nashville Downtown Property. |
The Borrower.The borrower is Nashville Hospitality, LLC, a Delaware limited liability company and special purpose entity. The borrowing entity is 99.99%-owned by individual investor members and no single individual investor member directly or indirectly owns 20% or more of the interests. The remaining 0.01% interest is primarily owned by James M. Lippman.
The Borrower Sponsors.The borrower sponsors and nonrecourse carve-out guarantors are JRK-Holdings, Limited Partnership, and James M. Lippman. James M. Lippman is the founder, Chairman, and Chief Executive Officer at JRK Property Holdings (“JRK”), which he founded in 1991. JRK currently owns and operates over $6.0 billion in real estate and has been recognized by both the National Multi-Housing Council and Multifamily Executive Magazine as one of the largest multifamily owners and managers in the United States. In addition to JRK’s presence in the multifamily sector, JRK Hotel Group, the hotel management subsidiary of JRK Property Holdings, is involved in the hospitality market as well, with a portfolio of luxury boutiques and flag hotels in Manhattan, Santa Monica, San Francisco, Portland and Nashville. The borrower sponsors have been in several mortgage loan defaults, which resulted in foreclosure or deed-in-lieu. See “Description of the Mortgage Pool – Loan Purpose; Default History, Bankruptcy Issues and Other Proceedings” in the Preliminary Prospectus.
Escrows.The Sheraton Grand Nashville Downtown Whole Loan documents provide for upfront reserves in the amount of $1,000,000 for FF&E and $1,166,485 for real estate taxes. The Sheraton Grand Nashville Downtown Whole Loan documents also provide for ongoing monthly reserves of $129,609 for real estate taxes, $164,042 for FF&E, and $28,989 for insurance during the occurrence of (i) event of default and (ii) borrower fails to maintain and deliver a blanket insurance policy.
Lockbox and Cash Management.A hard lockbox is in place with respect to the Sheraton Grand Nashville Downtown Whole Loan. The Sheraton Grand Nashville Downtown Whole Loan has springing cash management that will be opened upon the occurrence of a Cash Management Period. The borrower is required to cause all rents including, without limitation, all credit card company payments, to be transmitted directly into the applicable lockbox account. During the continuance of a Cash Management Period (as defined below), all funds in the lockbox account are required to be swept daily to a cash management account under the control of the lender and disbursed during each interest period of the term of the loan in accordance with the Sheraton Grand Nashville Downtown Whole Loan documents.
A “Cash Management Period” will commence upon (i) an event of default under the Sheraton Grand Nashville Downtown Whole Loan documents; or (ii) the failure by the borrower, as of the end of two consecutive calendar quarters, to maintain a debt service coverage ratio of at least 1.50x; and will end, with respect to clause (i) above, once the event of default has been cured and with respect to clause (ii) above, once the debt service coverage ratio has been at least 1.50x for at least two consecutive calendar quarters. The borrower has the right at any time to deliver to the lender either cash or an acceptable letter of credit in an amount that, when applied to reduce the then-outstanding principal, would cause the debt service coverage ratio to be at least equal to 1.50x (such amount, the “Minimum DSCR Maintenance Amount”) in order to avoid or end a Cash Management Period.
THE INFORMATION IN THIS STRUCTURAL AND COLLATERAL TERM SHEET IS NOT COMPLETE AND MAY BE AMENDED PRIOR TO THE TIME OF SALE. THIS TERM SHEET IS NOT AN OFFER TO SELL THESE SECURITIES AND IT IS NOT A SOLICITATION OF AN OFFER TO BUY THESE SECURITIES IN ANY JURISDICTION WHERE THE OFFER OR SALE IS NOT PERMITTED.
45
| SHERATON GRAND NASHVILLE DOWNTOWN |
The borrower has the right, three times during the term of the Sheraton Grand Nashville Downtown Whole Loan, to request that the lender apply funds in the cash collateral account (other than any minimum DSCR maintenance amount then on deposit) to any debt service shortfall.
Property Management. The Sheraton Grand Nashville Downtown Property is managed by an affiliate of the borrower sponsors.
Assumption.The borrower has an unlimited right to transfer the Sheraton Grand Nashville Downtown Property, provided that certain conditions are satisfied, including (i) no event of default has occurred and is continuing; (ii) the lender has reasonably determined that the proposed transferee and guarantor satisfy the lender’s credit review and underwriting standards, taking into consideration the transferee’s experience, financial strength and general business standing; and (iii) if required by the lender, rating agency confirmation has been obtained from KBRA, Fitch and Moody’s that the transfer will not result in a downgrade, withdrawal or qualification of the respective ratings assigned to the Series WFCM 2018-C48 certificates.
Partial Release.Not permitted
Real Estate Substitution.Not permitted.
Subordinate and Mezzanine Indebtedness.Not permitted
Ground Lease.None
Terrorism Insurance.The Sheraton Grand Nashville Downtown Borrower is required to obtain and maintain property insurance, commercial general liability insurance and business interruption insurance that covers acts of terrorism in an amount determined by the lender in its sole discretion (but not to exceed the full replacement cost of the Sheraton Grand Nashville Downtown Property and 18-months of business interruption insurance),provided that if the Terrorism Risk Insurance Program Reauthorization Act of 2015 or any extension thereof or substantially similar program is in effect, the Sheraton Grand Nashville Downtown Whole Loan documents provide for an annual terrorism premium cap of two times the cost of the annual premiums for property and business interruption insurance required under the related Sheraton Grand Nashville Downtown Whole Loan documents.
THE INFORMATION IN THIS STRUCTURAL AND COLLATERAL TERM SHEET IS NOT COMPLETE AND MAY BE AMENDED PRIOR TO THE TIME OF SALE. THIS TERM SHEET IS NOT AN OFFER TO SELL THESE SECURITIES AND IT IS NOT A SOLICITATION OF AN OFFER TO BUY THESE SECURITIES IN ANY JURISDICTION WHERE THE OFFER OR SALE IS NOT PERMITTED.
46
(THIS PAGE INTENTIONALLY LEFT BLANK)
THE INFORMATION IN THIS STRUCTURAL AND COLLATERAL TERM SHEET IS NOT COMPLETE AND MAY BE AMENDED PRIOR TO THE TIME OF SALE. THIS TERM SHEET IS NOT AN OFFER TO SELL THESE SECURITIES AND IT IS NOT A SOLICITATION OF AN OFFER TO BUY THESE SECURITIES IN ANY JURISDICTION WHERE THE OFFER OR SALE IS NOT PERMITTED.
47
Walgreens – Ginsberg Portfolio
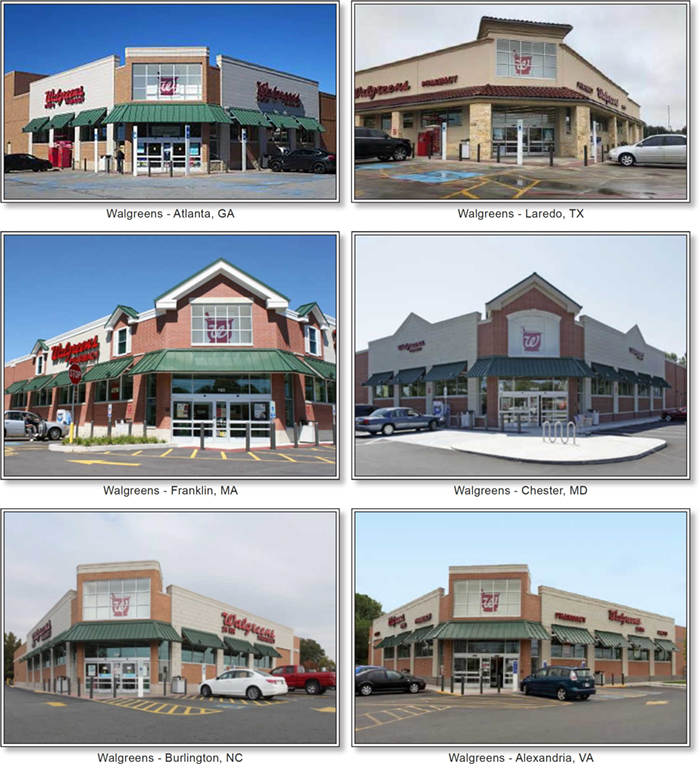
THE INFORMATION IN THIS STRUCTURAL AND COLLATERAL TERM SHEET IS NOT COMPLETE AND MAY BE AMENDED PRIOR TO THE TIME OF SALE. THIS TERM SHEET IS NOT AN OFFER TO SELL THESE SECURITIES AND IT IS NOT A SOLICITATION OF AN OFFER TO BUY THESE SECURITIES IN ANY JURISDICTION WHERE THE OFFER OR SALE IS NOT PERMITTED.
48
Walgreens – Ginsberg Portfolio
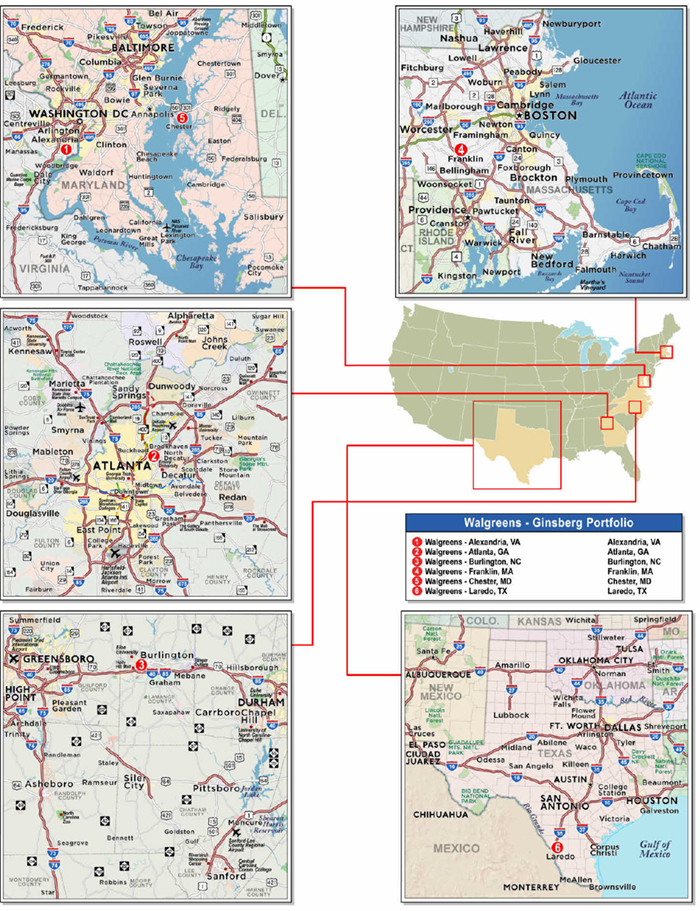
THE INFORMATION IN THIS STRUCTURAL AND COLLATERAL TERM SHEET IS NOT COMPLETE AND MAY BE AMENDED PRIOR TO THE TIME OF SALE. THIS TERM SHEET IS NOT AN OFFER TO SELL THESE SECURITIES AND IT IS NOT A SOLICITATION OF AN OFFER TO BUY THESE SECURITIES IN ANY JURISDICTION WHERE THE OFFER OR SALE IS NOT PERMITTED.
49
| No. 3 – Walgreens – Ginsberg Portfolio | ||||||
| Loan Information | Property Information | |||||
| Mortgage Loan Seller: | Wells Fargo Bank, National Association | Single Asset/Portfolio: | Portfolio | |||
| Credit Assessment (Fitch/KBRA/Moody’s): | NR/NR/NR | Property Type: | Retail | |||
| Original Principal Balance: | $40,000,000 | Specific Property Type: | Single Tenant | |||
| Cut-off Date Balance: | $40,000,000 | Location: | Various – See Table | |||
| % of Initial Pool Balance: | 4.8% | Size: | 87,049 SF | |||
| Loan Purpose(1): | Refinance/Acquisition | Cut-off Date Balance Per SF: | $459.51 | |||
| Borrower Name(2): | Various | Year Built/Renovated: | Various – See Table | |||
| Borrower Sponsor: | Morton Ginsberg | Title Vesting: | Fee | |||
| Mortgage Rate: | 5.250% | Property Manager: | Self-managed | |||
| Note Date: | November 16, 2018 | 4th Most Recent Occupancy (As of): | 100.0% (12/31/2014) | |||
| Anticipated Repayment Date: | NAP | 3rd Most Recent Occupancy (As of): | 100.0% (12/31/2015) | |||
| Maturity Date: | December 11, 2028 | 2nd Most Recent Occupancy(As of): | 100.0% (12/31/2016) | |||
| IO Period: | 0 months | Most Recent Occupancy (As of): | 100.0% (12/31/2017) | |||
| Loan Term (Original): | 120 months | Current Occupancy (As of): | 100.0% (12/1/2018) | |||
| Seasoning: | 0 months | |||||
| Amortization Term (Original): | 360 months | Underwriting and Financial Information: | ||||
| Loan Amortization Type: | Amortizing Balloon | |||||
| Interest Accrual Method: | Actual/360 | 4th Most Recent NOI: | NAV | |||
| Call Protection: | L(24),GRTR 1% or YM(92),O(4) | 3rd Most Recent NOI: | NAV | |||
| Lockbox Type: | Springing | 2nd Most Recent NOI (As of): | $3,351,000 (12/31/2016) | |||
| Additional Debt: | None | Most Recent NOI (As of): | $3,351,000 (12/31/2017) | |||
| Additional Debt Type: | NAP | |||||
| U/W Revenues: | $3,351,000 | |||||
| U/W Expenses: | $0 | |||||
| U/W NOI: | $3,351,000 | |||||
| U/W NCF: | $3,351,000 | |||||
| U/W NOI DSCR: | 1.26x | |||||
| Escrows and Reserves(3): | U/W NCF DSCR: | 1.26x | ||||
| U/W NOI Debt Yield: | 8.4% | |||||
| Type: | Initial | Monthly | Cap (If Any) | U/W NCF Debt Yield: | 8.4% | |
| Taxes | $0 | Springing | NAP | As-Is Appraised Value(4): | $56,905,000 | |
| Insurance | $0 | Springing | NAP | As-Is Appraisal Valuation Date(4): | Various – See Table | |
| Replacement Reserves | $0 | Springing | NAP | Cut-off Date LTV Ratio: | 70.3% | |
| Leasing Reserve | $0 | Springing | NAP | LTV Ratio at Maturity or ARD: | 58.3% | |
| (1) | Proceeds from the Walgreens – Ginsberg Portfolio Mortgage Loan (as defined below) were used to refinance five properties and acquire the Walgreens – Laredo, TX property. |
| (2) | The borrower comprises six limited liability companies. See “The Borrowers” section. |
| (3) | See “Escrows” section. |
| (4) | See “Appraisal” section. |
The Mortgage Loan. The mortgage loan (the “Walgreens – Ginsberg Portfolio Mortgage Loan”) is evidenced by a single promissory note that is secured by a first mortgage encumbering the fee interest in a portfolio of six single-tenant Walgreens properties located in six states (the “Walgreens – Ginsberg Portfolio Properties”). The Walgreens – Ginsberg Portfolio Mortgage Loan was originated on November 16, 2018 by Wells Fargo Bank, National Association. The Walgreens – Ginsberg Portfolio Mortgage Loan had an original principal balance of $40,000,000, has an outstanding principal balance as of the Cut-off Date of $40,000,000 and accrues interest at an interest rate of 5.250%per annum. The Walgreens – Ginsberg Portfolio Mortgage Loan had an initial term of 120 months, has a remaining term of 120 months as of the Cut-off Date and requires payments of principal and interest based on a 30-year amortization schedule. The Walgreens – Ginsberg Portfolio Mortgage Loan matures on December 11, 2028.
Following January 11, 2021, the borrower has the right to prepay the Walgreens – Ginsberg Portfolio Mortgage Loan in whole, or in part (see ”Partial Release” section), on any day upon payment of a yield maintenance premium, provided that no prepayment will be payable on or after September 11, 2028.
THE INFORMATION IN THIS STRUCTURAL AND COLLATERAL TERM SHEET IS NOT COMPLETE AND MAY BE AMENDED PRIOR TO THE TIME OF SALE. THIS TERM SHEET IS NOT AN OFFER TO SELL THESE SECURITIES AND IT IS NOT A SOLICITATION OF AN OFFER TO BUY THESE SECURITIES IN ANY JURISDICTION WHERE THE OFFER OR SALE IS NOT PERMITTED.
50
Walgreens – Ginsberg Portfolio
Sources and Uses
| Sources | Uses | ||||||
| Original loan amount | $40,000,000 | 93.6% | Loan payoff (five properties)(1) | $34,333,987 | 80.4% | ||
| Borrower cash equity | 2,725,230 | 6.4 | Purchase price (Walgreens – Laredo, TX)(1) | 7,785,714 | 18.2 | ||
| Closing costs | 605,530 | 1.4 | |||||
| Total Sources | $42,725,230 | 100.0% | Total Uses | $42,725,230 | 100.0% |
| (1) | The proceeds of the Walgreens – Ginsberg Portfolio Mortgage Loan were used to refinance five properties and acquire one property. |
The Properties.The Walgreens – Ginsberg Portfolio Properties comprise six single tenant Walgreens properties totaling 87,049 rentable square feet located in six states: Georgia, Maryland, Massachusetts, North Carolina, Texas and Virginia. Built between 2008 and 2010, the Walgreens – Ginsberg Portfolio Properties range in size from 14,110 square feet to 14,820 square feet and were 100.0% occupied by Walgreens as of December 1, 2018.
Walgreens is one of the largest drugstore chains in the U.S., with approximately 9,560 stores located in all 50 states, the District of Columbia, Puerto Rico and the U.S. Virgin Islands, as of August 31, 2018. In December 2014, Walgreens completed its strategic merger with Alliance Boots to establish Walgreens Boots Alliance, Inc. (“WBA”) (NASDAQ: WBA; rated BBB/Baa2/BBB by Fitch/Moody’s/S&P) and is now part of the Retail Pharmacy USA division of WBA. In March 2018, WBA acquired 1,932 Rite Aid stores for approximately $4.2 billion.
The following table presents certain information relating to the Walgreens – Ginsberg Portfolio Properties:
| Property Name – Location | Allocated Cut-off Date Balance | % of Portfolio Cut-off Date Balance | Occupancy | Year Built/ Renovated | Net Rentable Area (SF) | Appraised Value | Allocated LTV |
| Walgreens – Alexandria, VA | $9,311,000 | 23.3% | 100.0% | 2008/NAP | 14,469 | $13,000,000 | 71.6% |
| Walgreens – Atlanta, GA | $6,744,000 | 16.9% | 100.0% | 2010/NAP | 14,110 | $9,825,000 | 68.6% |
| Walgreens – Burlington, NC | $6,506,000 | 16.3% | 100.0% | 2008/NAP | 14,550 | $9,080,000 | 71.7% |
| Walgreens – Franklin, MA | $6,147,000 | 15.4% | 100.0% | 2010/NAP | 14,550 | $8,200,000 | 75.0% |
| Walgreens – Chester, MD | $6,088,000 | 15.2% | 100.0% | 2010/NAP | 14,550 | $8,900,000 | 68.4% |
| Walgreens – Laredo, TX | $5,204,000 | 13.0% | 100.0% | 2008/NAP | 14,820 | $7,900,000 | 65.9% |
| Total/Weighted Average | $40,000,000 | 100.0% | 100.0% | 87,049 | $56,905,000 | 70.3% |
The following table presents certain information relating to tenancy at the Walgreens – Ginsberg Portfolio Properties:
Major Tenant
| Tenant Name | Credit Rating (Fitch/ Moody’s/S&P) | Tenant NRSF | % of NRSF | Annual U/W Base Rent PSF | Annual U/W Base Rent | % of Total Annual U/W Base Rent | Lease Expiration Date |
| Major Tenant | |||||||
| Walgreens | BBB/Baa2/BBB(1) | 87,049(2) | 100.0%(2) | $38.50(2) | $3,351,000(2) | 100.0%(2) | Various(2) |
| Vacant Space | 0 | 0.0% | |||||
| Collateral Total | 87,049 | 100.0% | |||||
| (1) | The entity on the lease for the Walgreens – Ginsberg Portfolio Properties is Walgreen Co., which is the rated entity. |
| (2) | The Walgreens – Ginsberg Portfolio Properties have lease expiration dates from 2083 through 2095, and each lease contains a termination option occurring in 2033 through 2035. See “Lease Detail” table for property level information. |
THE INFORMATION IN THIS STRUCTURAL AND COLLATERAL TERM SHEET IS NOT COMPLETE AND MAY BE AMENDED PRIOR TO THE TIME OF SALE. THIS TERM SHEET IS NOT AN OFFER TO SELL THESE SECURITIES AND IT IS NOT A SOLICITATION OF AN OFFER TO BUY THESE SECURITIES IN ANY JURISDICTION WHERE THE OFFER OR SALE IS NOT PERMITTED.
51
Walgreens – Ginsberg Portfolio
The following table presents certain information relating to the leases at the Walgreens – Ginsberg Portfolio Properties:
Lease Detail
| Property Name – Location | Tenant NRSF | % of Portfolio NRSF | Annual U/W Base Rent PSF | Annual U/W Base Rent | % of Portfolio U/W Base Rent | Lease Start Date | Termination Option Date(1) | Lease Expiration Date |
| Walgreens – Alexandria, VA | 14,469 | 16.6% | $53.91 | $780,000 | 23.3% | 10/27/2008 | 10/31/2033 | 10/31/2083 |
| Walgreens – Atlanta, GA | 14,110 | 16.2% | $40.04 | $565,000 | 16.9% | 3/8/2010 | 3/31/2035 | 3/31/2095 |
| Walgreens – Burlington, NC | 14,550 | 16.7% | $37.46 | $545,000 | 16.3% | 12/1/2008 | 11/30/2033 | 11/30/2083 |
| Walgreens – Franklin, MA | 14,550 | 16.7% | $35.40 | $515,000 | 15.4% | 1/25/2010 | 1/31/2035 | 1/31/2085 |
| Walgreens – Chester, MD | 14,550 | 16.7% | $35.05 | $510,000 | 15.2% | 4/19/2010 | 4/30/2035 | 4/30/2085 |
| Walgreens – Laredo, TX | 14,820 | 17.0% | $29.42 | $436,000 | 13.0% | 4/6/2009 | 4/30/2034 | 4/30/2084 |
| Total/Weighted Average | 87,049 | 100.0% | $38.50 | $3,351,000 | 100.0% |
| (1) | The Walgreens leases have 75 to 85 year terms with termination options following the initial 25 years of the lease, each with a required notice period of 12 months. |
The following table presents certain information relating to the lease rollover schedule at the Walgreens – Ginsberg Portfolio Properties:
Lease Expiration Schedule(1)
| Year Ending December 31, | No. of Leases Expiring | Expiring NRSF | % of Total NRSF | Cumulative Expiring NRSF | Cumulative % of Total NRSF | Annual U/W Base Rent | % of Total Annual U/W Base Rent | Annual U/W Base Rent PSF |
| MTM | 0 | 0 | 0.0% | 0 | 0.0% | $0 | 0.0% | $0.00 |
| 2018 | 0 | 0 | 0.0% | 0 | 0.0% | $0 | 0.0% | $0.00 |
| 2019 | 0 | 0 | 0.0% | 0 | 0.0% | $0 | 0.0% | $0.00 |
| 2020 | 0 | 0 | 0.0% | 0 | 0.0% | $0 | 0.0% | $0.00 |
| 2021 | 0 | 0 | 0.0% | 0 | 0.0% | $0 | 0.0% | $0.00 |
| 2022 | 0 | 0 | 0.0% | 0 | 0.0% | $0 | 0.0% | $0.00 |
| 2023 | 0 | 0 | 0.0% | 0 | 0.0% | $0 | 0.0% | $0.00 |
| 2024 | 0 | 0 | 0.0% | 0 | 0.0% | $0 | 0.0% | $0.00 |
| 2025 | 0 | 0 | 0.0% | 0 | 0.0% | $0 | 0.0% | $0.00 |
| 2026 | 0 | 0 | 0.0% | 0 | 0.0% | $0 | 0.0% | $0.00 |
| 2027 | 0 | 0 | 0.0% | 0 | 0.0% | $0 | 0.0% | $0.00 |
| 2028 | 0 | 0 | 0.0% | 0 | 0.0% | $0 | 0.0% | $0.00 |
| Thereafter | 6 | 87,049 | 100.0% | 87,049 | 100.0% | $3,351,000 | 100.0% | $38.50 |
| Vacant | 0 | 0 | 0.0% | 87,049 | 100.0% | $0 | 0.0% | $0.00 |
| Total/Weighted Average | 6 | 87,049 | 100.0% | $3,351,000 | 100.0% | $38.50 |
| (1) | Information obtained from the underwritten rent roll. |
The following table presents historical occupancy percentages at the Walgreens – Ginsberg Portfolio Properties:
Historical Occupancy
12/31/2014(1) | 12/31/2015(1) | 12/31/2016(1) | 12/31/2017(1) | 12/1/2018(2) |
| 100.0% | 100.0% | 100.0% | 100.0% | 100.0% |
| (1) | Information obtained from the leases. |
| (2) | Information obtained from the underwritten rent roll. |
THE INFORMATION IN THIS STRUCTURAL AND COLLATERAL TERM SHEET IS NOT COMPLETE AND MAY BE AMENDED PRIOR TO THE TIME OF SALE. THIS TERM SHEET IS NOT AN OFFER TO SELL THESE SECURITIES AND IT IS NOT A SOLICITATION OF AN OFFER TO BUY THESE SECURITIES IN ANY JURISDICTION WHERE THE OFFER OR SALE IS NOT PERMITTED.
52
Walgreens – Ginsberg Portfolio
Operating History and Underwritten Net Cash Flow. The following table presents certain information relating to the historical operating performance and underwritten net cash flow at the Walgreens – Ginsberg Portfolio Properties:
Cash Flow Analysis(1)
| 2016 | 2017 | U/W | % of U/W Effective Gross Income | U/W $ per SF | |
| Base Rent | $3,351,000 | $3,351,000 | $3,351,000 | 100.0% | $38.50 |
| Grossed Up Vacant Space | 0 | 0 | 0 | 0.0 | 0.00 |
| Total Reimbursables(2) | 0 | 0 | 0 | 0.0 | 0.00 |
| Other Income | 0 | 0 | 0 | 0.0 | 0.00 |
| Less Vacancy & Credit Loss | 0 | 0 | 0(3) | (0.0) | (0.00) |
| Effective Gross Income | $3,351,000 | $3,351,000 | $3,351,000 | 100.0% | $38.50 |
| Total Operating Expenses | $0 | $0 | $0 | 0.0% | $0.00 |
|
|
|
|
| |
| Net Operating Income | $3,351,000 | $3,351,000 | $3,351,000 | 100.0% | $38.50 |
| TI/LC | 0 | 0 | 0 | 0.0 | 0.00 |
| Capital Expenditures | 0 | 0 | 0 | 0.0 | 0.00 |
| Net Cash Flow | $3,351,000 | $3,351,000 | $3,351,000 | 100.0% | $38.50 |
| NOI DSCR | 1.26x | 1.26x | 1.26x | ||
| NCF DSCR | 1.26x | 1.26x | 1.26x | ||
| NOI DY | 8.4% | 8.4% | 8.4% | ||
| NCF DY | 8.4% | 8.4% | 8.4% |
| (1) | Operating history prior to 2016 is not available. |
| (2) | Reimbursements are not included as the tenants are responsible for paying for real estate taxes, insurance premiums and CAM expenses directly. |
| (3) | The underwritten economic vacancy is 0.0%. The Walgreens – Ginsberg Portfolio Properties were 100.0% physically occupied as of December 1, 2018. |
Appraisals. As of the appraisal valuation dates ranging from October 11, 2018 to October 21, 2018, the Walgreens – Ginsberg Portfolio Properties had an aggregate “as-is” appraised value of $56,905,000.
Environmental Matters.According to the Phase I environmental reports dated December 8, 2017 and October 24, 2018, there was no evidence of any recognized environmental conditions at any of the Walgreens – Ginsberg Portfolio Properties.
Market Overview and Competition. The Walgreens – Ginsberg Portfolio Properties are located in six states. Within a five-mile radius of the Walgreens – Ginsberg Portfolio Properties, the average estimated population and average household income are 168,682 and $103,655, respectively (see table below). The respective submarkets of each of the Walgreens – Ginsberg Portfolio Properties reported an average vacancy rate of approximately 3.9% as of year-to-date November 2018.
The following table presents certain demographic information with respect to the Walgreens – Ginsberg Portfolio Properties:
Demographic Summary(1)
| Property | 2017 Population (within one- ,three- , five-mile radius) | 2017 Average Household Income (within one- ,three- , five-mile radius) |
| Walgreens – Alexandria, VA | 19,969, 127,525, 366,642 | $115,018, $140,007, $132,518 |
| Walgreens – Atlanta, GA | 17,711, 143,119, 347,873 | $89,865, $108,666, $113,900 |
| Walgreens – Burlington, NC | 6,215, 45,158, 89,623 | $78,670, $66,100, $57,495 |
| Walgreens – Franklin, MA | 9,440, 33,098, 68,160 | $111,137, $138,526, $141,377 |
| Walgreens – Chester, MD | 2,631, 11,944, 17,109 | $108,927, $111,709, $113,376 |
| Walgreens – Laredo, TX | 11,586, 81,146, 178,344 | $95,862, $84,109, $63,266 |
| (1) | Information obtained from the appraisal. |
The following table presents certain submarket information with respect to the Walgreens – Ginsberg Portfolio Properties:
Submarket Summary(1)
| Property Name – Location | Submarket | YTD Nov. 2018 Retail Inventory (SF) | YTD Nov. 2018 Vacancy Rate | Actual In-Place Rental Rate PSF | Appraiser’s Concluded Market Rate PSF |
| Walgreens – Alexandria, VA | Huntington/Mt. Vernon | 4,204,409 | 1.8% | $53.91 | $54.00 |
| Walgreens – Atlanta, GA | Northlake/I-85 | 7,597,360 | 5.8% | $40.04 | $40.00 |
| Walgreens – Burlington, NC | West Burlington/Airport | 5,249,518 | 4.4% | $37.46 | $37.46 |
| Walgreens – Franklin, MA | I-95 Corridor South | 9,389,783 | 3.1% | $35.40 | $37.50 |
| Walgreens – Chester, MD | Queen Anne’s County | 2,499,928 | 4.2% | $35.05 | $35.00 |
| Walgreens – Laredo, TX | Laredo(2) | 11,046,008(2) | 4.0%(2) | $29.42 | $29.42 |
| (1) | Information obtained from the appraisal and third party market research reports. |
| (2) | Submarket data was unavailable for the Walgreens – Laredo, TX Property. Figures for the greater Laredo market are included. |
The Borrowers. The borrowers are MLG Alexandria LLC, MLG Atlanta LLC; MLG Burlington LLC, MLG Holding 160 East Central Street LLC, MLG Chester LLC, and MLG Laredo LLC (collectively, the “Walgreens – Ginsberg Portfolio Borrower”), each a single-purpose
THE INFORMATION IN THIS STRUCTURAL AND COLLATERAL TERM SHEET IS NOT COMPLETE AND MAY BE AMENDED PRIOR TO THE TIME OF SALE. THIS TERM SHEET IS NOT AN OFFER TO SELL THESE SECURITIES AND IT IS NOT A SOLICITATION OF AN OFFER TO BUY THESE SECURITIES IN ANY JURISDICTION WHERE THE OFFER OR SALE IS NOT PERMITTED.
53
Walgreens – Ginsberg Portfolio
Delaware (or solely in the case of MLG Holding 160 East Central Street LLC, a Massachusetts) limited liability company structured to be bankruptcy remote with one independent director. Legal counsel to the Walgreens – Ginsberg Portfolio Borrower delivered a non-consolidation opinion in connection with the origination of the Walgreens – Ginsberg Portfolio Mortgage Loan. Morton Ginsberg is the guarantor of certain nonrecourse carveouts under the Walgreens – Ginsberg Portfolio Mortgage Loan.
The Borrower Sponsor. The borrower sponsor and non-recourse carveout guarantor is Morton Ginsberg. Mr. Ginsberg is a real estate investor and former real estate attorney. In addition to the Walgreens – Ginsberg Portfolio Properties, Mr. Ginsberg owns an apartment project in Jersey City, New Jersey; a 45.0% interest in an apartment development located in Florida; and a 46.0% interest in an apartment/retail development located in Boca Raton, Florida.
Escrows. During a Cash Trap Event Period (as defined below), the Walgreens – Ginsberg Portfolio Borrower is required to deposit monthly (i) 1/12th of the estimated annual real estate taxes, (ii) 1/12th of the estimated annual insurance premiums, unless the following conditions are satisfied: (x) no event of default has occurred and is continuing, (y) the Walgreens – Ginsberg Portfolio Borrower or any affiliate provides the lender with evidence that Walgreens – Ginsberg Portfolio Properties’ insurance coverage is included in a blanket policy and such policy is in full force and effect and (z) the Walgreens – Ginsberg Portfolio Borrower pays all applicable insurance premiums and provides the lender with evidence of timely payment of insurance premiums/renewals, (iii) $4,062 to a replacement reserve, and (iv) an amount reasonably determined by the lender for potential tenant improvement and leasing commissions.
Lockbox and Cash Management. Upon the occurrence of a Cash Trap Event Period, the Walgreens – Ginsberg Portfolio Mortgage Loan requires the Walgreens – Ginsberg Portfolio Borrower to establish a lender-controlled lockbox account and instruct tenants to deposit rents into such lockbox account. During the continuance of a Cash Trap Even Period, all funds in the lockbox account are required to be swept into the cash management account controlled by the lender and disbursed on each payment date in accordance with the Walgreens – Ginsberg Portfolio Mortgage Loan documents and all excess funds are required to be swept to an excess cash flow subaccount controlled by the lender.
A “Cash Trap Event Period” will commence upon the earliest to occur of the following:
| (i) | an event of default; or |
| (ii) | a Major Tenant Event Period (as defined below). |
A Cash Trap Event Period will end upon the occurrence of:
| ● | with regard to clause (i) above, the cure of such event of default; |
| ● | with regard to clause (ii) above, a Major Tenant Event Period Cure (as defined below). |
A “Major Tenant Event Period” will commence upon the earliest to occur of the following:
| (i) | more than one Major Tenant (as defined below) (or if only one Walgreens – Ginsberg Portfolio Property remains, one Major Tenant) failing to continuously occupy its entire space or be open for business at the related Walgreens – Ginsberg Portfolio Property during customary hours, or gives notices of its intent to commence either of the foregoing (a “Go-Dark Event”); |
| (ii) | a monetary default, beyond any notice and grace period, under any lease with a Major Tenant; |
| (iii) | the downgrade, withdrawal or qualification of the long-term debt rating of Walgreen Co. below “BBB-” by S&P; |
| (iv) | any Major Tenant filing, as a debtor, a bankruptcy or similar insolvency proceeding, or otherwise becoming involved, as a debtor, in a bankruptcy or any similar insolvency proceeding; or |
| (v) | any Major Tenant terminating or canceling its lease (or such lease otherwise fails to be in full force and effect), or giving notice of, or commencing a legal proceeding asserting any of the foregoing. |
A “Major Tenant Event Period Cure” will occur upon:
| ● | with regard to clause (i) above, (x) a Major Tenant Re-Tenanting Event (as defined below) having occurred with respect to each affected Walgreens – Ginsberg Portfolio Property or (y) the applicable Major Tenant having resumed normal business operations in its entire space and being open during customary hours for a period of two consecutive calendar quarters, in each case of clauses (x) and (y), such that no more than one Walgreens – Ginsberg Portfolio Property is subject to a Go-Dark Event (or if only one Walgreens – Ginsberg Portfolio Property remains, clause (x) or clause (y) having been satisfied with respect to such Walgreens – Ginsberg Portfolio Property); |
| ● | with regard to clause (ii) above, (x) a Major Tenant Re-Tenanting Event having occurred with respect to each affected Walgreens – Ginsberg Portfolio Property or (y) the applicable Major Tenant having cured such monetary default under its lease and no additional monetary defaults beyond any notice and grace period has occurred for a period of two consecutive calendar quarters; |
| ● | with regard to clause (iii) above, (x) a Major Tenant Re-Tenanting Event having occurred for all Walgreens – Ginsberg Portfolio Properties or (y) the long-term debt rating of Walgreen Co. being rated “BBB-“ or higher by S&P; |
| ● | with regard to clause (iv) above, (x) a Major Tenant Re-Tenanting Event having occurred for all Walgreens – Ginsberg Portfolio Properties or (y) the bankruptcy or insolvency proceeding having been terminated in a manner satisfactory to the lender, the related lease having been affirmed, and the terms of such lease, as affirmed, being satisfactory to the lender; or |
| ● | with regard to clause (v) above, a Major Tenant Re-Tenanting Event having occurred with respect to each affected Walgreens – Ginsberg Portfolio Property. |
A “Major Tenant Re-Tenanting Event” will occur upon the lender receiving satisfactory evidence (including, without limitation, a satisfactory estoppel certificate from each such replacement tenant affirming the following): (i) the applicable Major Tenant’s space has been leased to one or more satisfactory replacement tenants pursuant to a satisfactory replacement lease, (ii) each such tenant is in occupancy of its premises, is open for business and is paying full, unabated rent pursuant to the terms of its lease, and (iii) all tenant improvement costs and leasing commissions provided in each such replacement lease have been paid.
THE INFORMATION IN THIS STRUCTURAL AND COLLATERAL TERM SHEET IS NOT COMPLETE AND MAY BE AMENDED PRIOR TO THE TIME OF SALE. THIS TERM SHEET IS NOT AN OFFER TO SELL THESE SECURITIES AND IT IS NOT A SOLICITATION OF AN OFFER TO BUY THESE SECURITIES IN ANY JURISDICTION WHERE THE OFFER OR SALE IS NOT PERMITTED.
54
Walgreens – Ginsberg Portfolio
“Major Tenant” means Walgreens, it successors or assigns, and any replacement tenant that enters into a lease in accordance with the Walgreens – Ginsberg Portfolio Mortgage Loan documents.
Property Management.The Walgreens – Ginsberg Portfolio Properties are self-managed.
Assumption. The Walgreens – Ginsberg Portfolio Borrower has a two-time right, commencing 12 months after loan origination, to transfer the Walgreens – Ginsberg Portfolio Properties, provided that certain conditions are satisfied, including (i) no event of default has occurred and is continuing; (ii) the lender has reasonably determined that the proposed transferee and guarantor satisfy the lender’s credit review and underwriting standards, taking into consideration transferee experience, financial strength and general business standing; (iii) the execution of a recourse guaranty and an environmental indemnity by an affiliate of the transferee; and (iv) if requested by the lender, rating agency confirmation has been obtained from Fitch, KBRA and Moody’s that the transfer will not result in a downgrade, withdrawal or qualification of the respective ratings assigned to the Series 2018-C48 Certificates.
Right of First Refusal. Walgreens has a right of first refusal (“ROFR”) to purchase any of the Walgreens – Ginsberg Portfolio Properties occupied by Walgreens. The ROFR is not extinguished by a foreclosure of the Walgreens – Ginsberg Portfolio Properties.
Partial Release.Following the prepayment lockout period, and in connection with a bona-fide sale, the Walgreens – Ginsberg Portfolio Borrower is permitted to partially release any of the Walgreens – Ginsberg Portfolio Properties, provided that, among other things, and in accordance with the Walgreens – Ginsberg Portfolio Mortgage Loan documents (i) no event of default has occurred and is continuing, (ii) the Walgreens – Ginsberg Portfolio Mortgage Loan is prepaid in an amount equal to the applicable Release Amount (as defined below) together with any applicable yield maintenance premium or interest shortfall relating to such prepayment; (iii) the lender receives rating agency confirmation from Fitch, KBRA and Moody’s that the sale and release will not result in a downgrade, withdrawal or qualification of the respective ratings assigned to the Series 2018-C48 Certificates; and (iv) the lender receives a legal opinion covering compliance in all respects with all laws, rules and regulations governing REMICs has been delivered.
The “Release Amount” for any Walgreens – Ginsberg Portfolio Property being released is an amount equal to the greatest of (a) 90% of the net sales proceeds for such released Walgreens – Ginsberg Portfolio Property, as reasonably determined by the lender, (b) 115% of the Allocated Cut-off Date Balance of such released Walgreens – Ginsberg Portfolio Property (identified in “The Properties” section above), (c) an amount that would result in the net operating income debt yield, after giving effect to the release of such Walgreens – Ginsberg Portfolio Property, being not less than 8.4% and (d) an amount that would result in the loan-to-value ratio, after giving effect to the release of such property, being not greater than the lesser of (i) the loan-to-value ratio for the Walgreens – Ginsberg Portfolio Mortgage Loan (including the release property) immediately prior to such release and (ii) 70.3%.
Real Estate Substitution.Not permitted.
Subordinate and Mezzanine Indebtedness.None.
Additional Indebtedness.Not permitted.
Terrorism Insurance.Subject to the suspension of such borrower insurance requirements and upon satisfaction of certain conditions outlined in the Walgreens – Ginsberg Portfolio Mortgage Loan documents, including but not limited to the Walgreens – Ginsberg Portfolio Borrower providing evidence to the lender that Walgreens has satisfied all insurance requirements under each applicable lease and Walgreens maintaining an S&P rating of at least ‘BBB’, the Walgreens – Ginsberg Portfolio Mortgage Loan documents require that the “all risk” insurance policy required to be maintained by the borrower provide coverage for terrorism in an amount equal to the full replacement cost of the Walgreens – Ginsberg Portfolio Properties and business interruption insurance covering no less than the 18-month period following the occurrence of a casualty event, together with a six-month extended period of indemnity.
THE INFORMATION IN THIS STRUCTURAL AND COLLATERAL TERM SHEET IS NOT COMPLETE AND MAY BE AMENDED PRIOR TO THE TIME OF SALE. THIS TERM SHEET IS NOT AN OFFER TO SELL THESE SECURITIES AND IT IS NOT A SOLICITATION OF AN OFFER TO BUY THESE SECURITIES IN ANY JURISDICTION WHERE THE OFFER OR SALE IS NOT PERMITTED.
55
(THIS PAGE INTENTIONALLY LEFT BLANK)
THE INFORMATION IN THIS STRUCTURAL AND COLLATERAL TERM SHEET IS NOT COMPLETE AND MAY BE AMENDED PRIOR TO THE TIME OF SALE. THIS TERM SHEET IS NOT AN OFFER TO SELL THESE SECURITIES AND IT IS NOT A SOLICITATION OF AN OFFER TO BUY THESE SECURITIES IN ANY JURISDICTION WHERE THE OFFER OR SALE IS NOT PERMITTED.
56
Riverworks
THE INFORMATION IN THIS STRUCTURAL AND COLLATERAL TERM SHEET IS NOT COMPLETE AND MAY BE AMENDED PRIOR TO THE TIME OF SALE. THIS TERM SHEET IS NOT AN OFFER TO SELL THESE SECURITIES AND IT IS NOT A SOLICITATION OF AN OFFER TO BUY THESE SECURITIES IN ANY JURISDICTION WHERE THE OFFER OR SALE IS NOT PERMITTED.
57
Riverworks
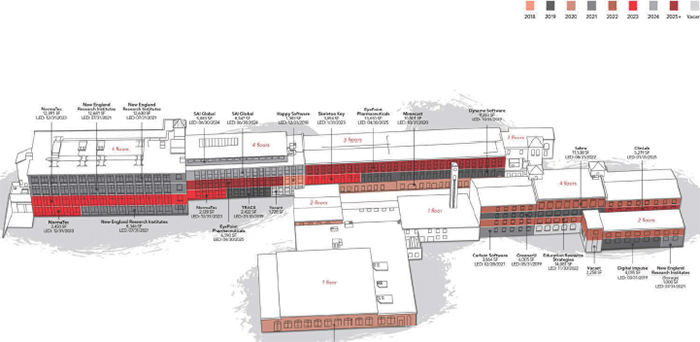
THE INFORMATION IN THIS STRUCTURAL AND COLLATERAL TERM SHEET IS NOT COMPLETE AND MAY BE AMENDED PRIOR TO THE TIME OF SALE. THIS TERM SHEET IS NOT AN OFFER TO SELL THESE SECURITIES AND IT IS NOT A SOLICITATION OF AN OFFER TO BUY THESE SECURITIES IN ANY JURISDICTION WHERE THE OFFER OR SALE IS NOT PERMITTED.
58
Riverworks

THE INFORMATION IN THIS STRUCTURAL AND COLLATERAL TERM SHEET IS NOT COMPLETE AND MAY BE AMENDED PRIOR TO THE TIME OF SALE. THIS TERM SHEET IS NOT AN OFFER TO SELL THESE SECURITIES AND IT IS NOT A SOLICITATION OF AN OFFER TO BUY THESE SECURITIES IN ANY JURISDICTION WHERE THE OFFER OR SALE IS NOT PERMITTED.
59
| No. 4 – Riverworks | |||||||
| Loan Information | Property Information | ||||||
| Mortgage Loan Seller: | Argentic Real Estate Finance LLC | Single Asset/Portfolio: | Single Asset | ||||
| Credit Assessment | Property Type: | Office | |||||
| (Fitch/KBRA/Moody's): | NR/NR/NR | Specific Property Type: | Suburban | ||||
| Original Principal Balance: | $38,629,000 | Location: | Watertown, MA | ||||
| Cut-off Date Balance: | $38,629,000 | Size: | 201,417 SF | ||||
| % of Initial Pool Balance: | 4.6% | Cut-off Date Balance Per SF: | $191.79 | ||||
| Loan Purpose: | Acquisition | Year Built/Renovated: | 1907/2013 | ||||
| Borrower Name: | GRE Riverworks, LLC | Title Vesting: | Fee | ||||
| Borrower Sponsors: | GEM Realty Evergreen Fund, L.P.; GEM Realty Evergreen Fund PF-NM, L.P. | Property Manager: | Self-managed | ||||
| Mortgage Rate: | 4.857% | 4th Most Recent Occupancy (As of): | NAV | ||||
| Note Date: | October 15, 2018 | 3rd Most Recent Occupancy (As of): | 92.0% (12/31/2015) | ||||
| Anticipated Repayment Date: | NAP | 2nd Most Recent Occupancy (As of): | 94.0% (12/31/2016) | ||||
| Maturity Date: | November 6, 2028 | Most Recent Occupancy (As of): | 92.0% (12/31/2017) | ||||
| IO Period: | 120 months | Current Occupancy (As of): | 96.3% (9/27/2018) | ||||
| Loan Term (Original): | 120 months | ||||||
| Seasoning: | 1 month | ||||||
| Amortization Term (Original): | NAP | Underwriting and Financial Information: | |||||
| Loan Amortization Type: | Interest-only, Balloon | 4th Most Recent NOI (As of): | $2,237,613 (12/31/2015) | ||||
| Interest Accrual Method: | Actual/360 | 3rd Most Recent NOI (As of)(5): | $2,343,400 (12/31/2016) | ||||
| Call Protection: | L(25),D(90),O(5) | 2nd Most Recent NOI (As of)(5): | $2,716,452 (12/31/2017) | ||||
| Lockbox Type: | Hard/Springing Cash Management | Most Recent NOI (As of)(5): | $2,745,420 (TTM 8/31/2018) | ||||
| Additional Debt(1): | Yes | ||||||
| Additional Debt Type(1): | Mezzanine | ||||||
| U/W Revenues: | $6,361,090 | ||||||
| U/W Expenses: | $2,847,258 | ||||||
| U/W NOI(5): | $3,513,832 | ||||||
| Escrows and Reserves(2): | U/W NCF: | $3,282,203 | |||||
| U/W NOI DSCR(6): | 2.16x | ||||||
| Type: | Initial | Monthly | Cap (If Any) | U/W NCF DSCR(6): | 2.02x | ||
| Taxes | $137,443 | $68,721 | NAP | U/W NOI Debt Yield(6): | 10.6% | ||
| Insurance | $22,647 | Springing | NAP | U/W NCF Debt Yield(6): | 9.9% | ||
| TI/LC Reserve | $2,000,000(3) | Springing | NAP | As-Is Appraised Value: | $64,400,000 | ||
| Replacement Reserve | $0 | $2,518 | NAP | As-Is Appraisal Valuation Date: | September 19, 2018 | ||
| Free Rent Reserve | $584,518(4) | $0 | NAP | Cut-off Date LTV Ratio(6): | 51.2% | ||
| Outstanding TI Reserve | $308,530(4) | $0 | NAP | LTV Ratio at Maturity or ARD(6): | 51.2% | ||
| (1) | Future mezzanine debt is permitted as long as (i) the combined LTV with the Riverworks Mortgage Loan is less than 70.0%, (ii) the combined minimum debt service coverage ratio with the Riverworks Mortgage Loan is no less than 1.50x, (iii) a rating agency confirmation is obtained, and (iv) lender approval is obtained. |
| (2) | See “Escrows” section. |
| (3) | At closing, the borrower delivered an evergreen letter of credit in the amount of $2,000,000 in lieu of cash for the TI/LC reserve. |
| (4) | The Free Rent and Outstanding TI Reserve are associated with the Eyepoint Pharmaceuticals, Inc. and SAI Global tenants. |
| (5) | Based on information obtained from the borrower sponsor, the increase in NOI in 2017 against 2016 was primarily due to the decrease in real estate taxes resulting from a land sale that took place as well as a parcel reconfiguration by the previous owner. Furthermore, the increase in NOI from TTM 8/31/2018 to the underwritten number is primarily attributed to the Evepoint Pharmaceuticals, Inc. and Education Resource Strategies, Inc. expansions and rent steps totalling $188,343. |
| (6) | The U/W NOI DSCR, U/W NCF DSCR, U/W NOI Debt Yield, U/W NCF Debt Yield, Cut-off Date LTV Ratio, and LTV Ratio at Maturity or ARD were calculated based on the Cut-off Date Balance net of a $5,629,000 letter of credit, which the borrower delivered as additional collateral for the Riverworks Mortgage Loan, in lieu of an earnout holdback by the lender at origination. Assuming the full holdback balance is not applied to pay down the full loan amount, the U/W NOI DSCR, U/W NCF DSCR, U/W NOI Debt Yield, U/W NCF Debt Yield, Cut-off Date LTV Ratio, and LTV Ratio at Maturity or ARD would be 1.85x, 1.73x, 9.1%, 8.5%, 60.0% and 60.0%, respectively. See “Escrows” section. |
The Mortgage Loan.The mortgage loan (the “Riverworks Mortgage Loan”) is evidenced by a single promissory note secured by a first mortgage encumbering the fee simple interest in a multi-tenant office building located in Watertown, Massachusetts (the “Riverworks Property”). The Riverworks Mortgage Loan was originated on October 15, 2018 by Argentic Real Estate Finance LLC. The Riverworks Mortgage Loan had an original principal balance of $38,629,000, has an outstanding principal balance as of the Cut-off Date of $38,629,000 and accrues interest at an interest rate of 4.857%per annum. The Riverworks Mortgage Loan had an initial term of 120 months, has a remaining term of 119 months as of the Cut-off Date and requires interest-only payments through the full term of the Riverworks Mortgage Loan. The Riverworks Mortgage Loan matures on November 6, 2028.
Followingthe lockout period, the borrower has the right to defease the Riverworks Mortgage Loan in whole, but not in part. The Riverworks Mortgage Loan is prepayable without penalty on or after July 6, 2028.
THE INFORMATION IN THIS STRUCTURAL AND COLLATERAL TERM SHEET IS NOT COMPLETE AND MAY BE AMENDED PRIOR TO THE TIME OF SALE. THIS TERM SHEET IS NOT AN OFFER TO SELL THESE SECURITIES AND IT IS NOT A SOLICITATION OF AN OFFER TO BUY THESE SECURITIES IN ANY JURISDICTION WHERE THE OFFER OR SALE IS NOT PERMITTED.
60
Riverworks
Sources and Uses
| Sources | Uses | |||||||
| Original loan amount | $38,629,000 | 58.5% | Purchase price | $63,800,000 | 96.6% | |||
| Borrower equity | 27,413,498 | 41.5 | Closing costs | 1,189,360 | 1.8 | |||
| Reserves | 1,053,138 | 1.6 | ||||||
| Total Sources | $66,042,498 | 100.0% | Total Uses | $66,042,498 | 100.0% |
The Property. The Riverworks Property is a multi-tenant office building totaling 201,417 square feet situated on a 9.37 acre site in Watertown, Massachusetts. The Riverworks Property is accessible via major thoroughfares, including I-90 (1 mile), Route 20 (1 mile), and I-95 (4 miles), and is proximate to Cambridge (6 miles), Boston (10 miles), and Waltham (2 miles). The Riverworks Property is comprised of three buildings built as textile mills starting in 1907 and was last renovated in 2013. The Riverworks Property was once occupied by Boston Scientific Corporation until the company relocated in 2007. The Riverworks Property currently consists of three, three/four story buildings of office space with a common cafeteria and a fitness center. The Riverworks Property also includes 664 parking spaces with a parking ratio of 3.30 spaces per 1,000 square feet of net rentable area. Approximately 6,454 square feet of the space at the Riverworks Property is associated with a café, a fitness center, a management office and a landlord office. Since 2012, the Riverworks Property has undergone approximately $11.2 million of capital expenditures and approximately $8.4 million of tenant improvements.
As of September 27, 2018, the Riverworks Property was 96.3% leased to 14 tenants. The historical occupancy at the Riverworks Property has not been below 92.0% in the last three years.
The largest tenant is Mimecast North America, Inc. (“Mimecast”), a company that delivers cloud-based email management, which leases 44,170 square feet or 21.9% of net rentable area which has different lease rates based on the space. Due to its relocation to Lexington, Massachusetts, Mimecast is no longer in occupancy at the Riverworks Property and subleases 100.0% of its space to two sub-tenants, Markforged, Inc. and InCrowd, Inc. Markforged, Inc. subleases 36,291 square feet (which may include additional square footage of mezzanine space) at $29.00 per square foot, which will increase to $35.00 per square foot in July 2019 (in comparison with in-place rents to Mimecast of $26.50 per square foot). InCrowd, Inc. subleases 10,501 square feet at $37.50 per square foot (in comparison with in-place rents to Mimecast of $36.50 per square foot). Both subleases are co-terminus with Mimecast’s lease expiring in October 2020. The Mimecast lease provides that the landlord would be entitled to 50.0% of any additional rent over the lease rate in the direct lease in the event Mimecast subleases its space (“Bonus Rent”). As such, AREF underwrote $88,626 of Bonus Rent associated with the Markforged, Inc. sublease. See “Cash Flow Analysis”.
The second largest tenant is New England Research Institutes, Inc. (“NERI”), which leases 33,657 square feet or 16.7% of net rentable area at a base rent of $27.15 per square foot until July 2021. NERI is a contract research organization that provides customized research and clinical trial solutions to private companies and public-sector organizations. NERI offers public health research, clinical trials management, survey research, epidemiology, and media and dissemination research services. NERI has been at the Riverworks Property since 2014 and has two, five-year renewal options remaining.
The third largest tenant is EyePoint Pharmaceuticals, Inc. (“EyePoint”) which leases 20,240 square feet or 10.0% of net rentable area at a base rent of $36.00 per square foot until April 2025. EyePoint is a specialty biopharmaceutical company that develops and commercializes innovative ophthalmic products. EyePoint has developed five FDA-approved sustained-release treatments in ophthalmology and currently has another under review. EyePoint has been at the Riverworks Property since March 2014, recently expanded by an additional 6,590 square feet and extended its lease to April 2025. EyePoint has one, five-year renewal option.
THE INFORMATION IN THIS STRUCTURAL AND COLLATERAL TERM SHEET IS NOT COMPLETE AND MAY BE AMENDED PRIOR TO THE TIME OF SALE. THIS TERM SHEET IS NOT AN OFFER TO SELL THESE SECURITIES AND IT IS NOT A SOLICITATION OF AN OFFER TO BUY THESE SECURITIES IN ANY JURISDICTION WHERE THE OFFER OR SALE IS NOT PERMITTED.
61
Riverworks
The following table presents certain information relating to the tenancy at the Riverworks Property:
Major Tenants
| Tenant Name | Credit Rating (Fitch/Moody’s/S&P)(1) | Tenant NRSF | % of NRSF | Annual U/W Base Rent PSF(2) | Annual U/W Base Rent(2) | % of Total Annual U/W Base Rent | Lease Expiration Date |
| Major Tenant | |||||||
| Mimecast North America, Inc.(3) | NR / NR / NR | 44,170 | 21.9% | $28.88 | $1,275,515 | 22.3% | 10/15/2020 |
| New England Research Institutes | NR / NR / NR | 33,657 | 16.7% | $27.15 | $913,788 | 15.9% | 7/31/2021(4) |
| Eyepoint Pharmaceuticals, Inc. | NR / NR / NR | 20,240 | 10.0% | $36.00 | $728,640 | 12.7% | 4/30/2025(5) |
| NormaTec Industries, LP | NR / NR / NR | 16,969 | 8.4% | $31.91 | $541,421 | 9.4% | 12/31/2023(6) |
| SAI Global | NR / NR / NR | 14,230 | 7.1% | $34.00(7) | $483,820 | 8.4% | 6/30/2024(7) |
| Total Major Tenant | 129,266 | 64.2% | $30.50 | $3,943,184 | 68.8% | ||
| Non Major Tenants | 64,656(8) | 32.1% | $30.70(9) | $1,786,693 | 31.2% | ||
| Occupied Collateral Total | 193,922 | 96.3% | $29.55 | $5,729,877 | 100.0% | ||
| Vacant Space | 7,495 | 3.7% | |||||
| Collateral Total | 201,417 | 100.0% | |||||
| (1) | Certain ratings are those of the parent company whether or not the parent company guarantees the lease. |
| (2) | Annual U/W Base Rent PSF and Annual U/W Base Rent include contractual rent steps totaling $188,343 through September 2019. |
| (3) | Mimecast North America, Inc. subleases 100.0% of its space to two sub-tenants. The Annual U/W Base Rent for Mimecast North America, Inc. represents the base rent under the direct lease. |
| (4) | New England Research Institutes has two, five-year extension options. |
| (5) | Eyepoint Pharmaceuticals, Inc. received a four-month rent abatement in connection with its recent renewal and expansion. Eyepoint Pharmaceuticals, Inc. has one, five-year extension option. |
| (6) | NormaTec Industries, LP has one, five-year extension option. |
| (7) | SAI Global received a 12-month rent abatement on its entire premises and another six-month rent abatement on 3,230 square feet of its premises following the initial abatement period in connection with its recent new lease. SAI Global has one, five-year extension option. |
| (8) | The Tenant NRSF for Non Major Tenants includes 6,454 SF of management and amenity tenants who do not pay rent. |
| (9) | The Annual U/W Base Rent PSF for Non Major Tenants does not include the 6,454 SF of management and amenity tenants who do not pay rent. |
The following table presents certain information relating to the lease rollover schedule at the Riverworks Property:
Lease Expiration Schedule(1)
| Year Ending December 31, | No. of Leases Expiring | Expiring NRSF | % of Total NRSF | Cumulative Expiring NRSF | Cumulative % of Total NRSF | Annual U/W Base Rent | % of Annual U/W Base Rent | Annual U/W Base Rent PSF(3) |
| MTM(2) | 3 | 6,454 | 3.2% | 6,454 | 3.2% | $0 | 0.0% | $0.00 |
| 2018 | 0 | 0 | 0.0% | 6,454 | 3.2% | $0 | 0.0% | $0.00 |
| 2019 | 4 | 21,772 | 10.8% | 28,226 | 14.0% | $579,454 | 10.1% | $26.61 |
| 2020 | 1 | 44,170 | 21.9% | 72,396 | 35.9% | $1,275,515 | 22.3% | $28.88 |
| 2021 | 3 | 39,249 | 19.5% | 111,645 | 55.4% | $1,074,528 | 18.8% | $27.38 |
| 2022 | 2 | 25,619 | 12.7% | 137,264 | 68.1% | $874,272 | 15.3% | $34.13 |
| 2023 | 1 | 16,969 | 8.4% | 154,233 | 76.6% | $541,421 | 9.4% | $31.91 |
| 2024 | 1 | 14,230 | 7.1% | 168,463 | 83.6% | $483,820 | 8.4% | $34.00 |
| 2025 | 2 | 25,459 | 12.6% | 193,922 | 96.3% | $900,867 | 15.7% | $35.39 |
| 2026 | 0 | 0 | 0.0% | 193,922 | 96.3% | $0 | 0.0% | $0.00 |
| 2027 | 0 | 0 | 0.0% | 193,922 | 96.3% | $0 | 0.0% | $0.00 |
| 2028 | 0 | 0 | 0.0% | 193,922 | 96.3% | $0 | 0.0% | $0.00 |
| Thereafter | 0 | 0 | 0.0% | 193,922 | 96.3% | $0 | 0.0% | $0.00 |
| Vacant | 0 | 7,495 | 3.7% | 201,417 | 100.0% | $0 | 0.0% | $0.00 |
| Total/Weighted Average | 14 | 201,417 | 100.0% | $5,729,877 | 100.0% | $29.55 |
| (1) | Information obtained from the underwritten rent roll. |
| (2) | The MTM tenants reflect amenity and management tenants who do not pay rent. These tenants are not reflected in the total number of leases expiring. |
| (3) | Excludes vacant space. |
THE INFORMATION IN THIS STRUCTURAL AND COLLATERAL TERM SHEET IS NOT COMPLETE AND MAY BE AMENDED PRIOR TO THE TIME OF SALE. THIS TERM SHEET IS NOT AN OFFER TO SELL THESE SECURITIES AND IT IS NOT A SOLICITATION OF AN OFFER TO BUY THESE SECURITIES IN ANY JURISDICTION WHERE THE OFFER OR SALE IS NOT PERMITTED.
62
Riverworks
The following table presents historical occupancy percentages at the Riverworks Property:
Historical Occupancy
12/31/2015(1)(2) | 12/31/2016(1)(2) | 12/31/2017(1)(2) | 9/27/2018(3) |
| 92.0% | 94.0% | 92.0% | 96.3% |
| (1) | Information obtained from the borrower. |
| (2) | Occupancy represents the year-end occupancy for 2015, 2016, and 2017. |
| (3) | Information obtained from the underwritten rent roll. |
Underwritten Net Cash Flow. The following table presents certain information relating to the underwritten net cash flow at the Riverworks Property:
Cash Flow Analysis
| 2015 | 2016 | 2017 | TTM 8/31/2018 | U/W | % of U/W Effective Gross Income | U/W $ per SF | |
| Base Rent(1) | $4,031,725 | $4,621,125 | $4,515,500 | $4,884,907 | $5,729,877 | 90.1% | $28.45 |
| Grossed Up Vacant Space | 0 | 0 | 0 | 0 | 281,063 | 4.4 | 1.40 |
| Total Reimbursables | 1,158,979 | 757,252 | 846,399 | 524,047 | 577,371 | 9.1 | 2.87 |
| Other Income(2) | 99,979 | 84,094 | 65,731 | 54,201 | 106,626 | 1.7 | 0.53 |
| Less Vacancy & Credit Loss(3) | 0 | 0 | 0 | 0 | (333,847) | (5.2) | (1.66) |
| Effective Gross Income | 5,290,683 | 5,462,471 | 5,427,630 | 5,463,154 | $6,361,090 | 100.0% | $31.58 |
| Total Operating Expenses(4) | $3,053,070 | $3,119,070 | $2,711,178 | $2,717,734 | $2,847,258 | 44.8% | $14.14 |
| Net Operating Income(5) | $2,237,613 | $2,343,400 | $2,716,452 | $2,745,420 | $3,513,832 | 55.2% | $17.45 |
| TI/LC | 0 | 0 | 0 | 0 | 201,417 | 3.2 | 1.00 |
| Capital Expenditures | 0 | 0 | 0 | 0 | 30,213 | 0.5 | 0.15 |
| Net Cash Flow | $2,237,613 | $2,343,400 | $2,716,452 | $2,745,420 | $3,282,203 | 51.6% | $16.30 |
| NOI DSCR | 1.38x | 1.44x | 1.67x | 1.69x | 2.16x(6) | ||
| NCF DSCR | 1.38x | 1.44x | 1.67x | 1.69x | 2.02x(6) | ||
| NOI DY | 6.8% | 7.1% | 8.2% | 8.3% | 10.6%(6) | ||
| NCF DY | 6.8% | 7.1% | 8.2% | 8.3% | 9.9%(6) |
| (1) | U/W Base Rent includes contractual rent steps totaling $188,343 through September 2019. |
| (2) | Other income includes $88,626 of Bonus Rent from the Markforged, Inc. sublease in connection with Mimecast's space and $18,000 of storage rent. |
| (3) | The underwritten economic vacancy is 5.0%. The Riverworks Property was 96.3% physically occupied as of September 27, 2018. |
| (4) | Based on information obtained from the sponsor, the decrease in Total Operating Expenses in 2017 against 2016 was primarily due to decrease in real estate taxes resulting from a land sale that took place as well as a parcel reconfiguration by the previous owner. |
| (5) | The increase in NOI from TTM 8/31/2018 to the underwritten number is primarily attributed to the Eyepoint Pharmaceuticals and Education Resource Strategies expansions and rent steps totalling $188,343. |
| (6) | The U/W NOI DSCR, U/W NCF DSCR, U/W NOI Debt Yield, U/W NCF Debt Yield, Cut-off Date LTV Ratio, and LTV Ratio at Maturity or ARD were calculated based on the Cut-off Date Balance net of a $5,629,000 letter of credit, which the borrower delivered as additional collateral for the Riverworks Mortgage Loan, in lieu of an earnout holdback by the lender at origination. Assuming the full holdback balance is not applied to pay down the full loan amount, the U/W NOI DSCR, U/W NCF DSCR, U/W NOI Debt Yield, U/W NCF Debt Yield, Cut-off Date LTV Ratio, and LTV Ratio at Maturity or ARD would be 1.85x, 1.73x, 9.1%, 8.5%, 60.0% and 60.0%, respectively. |
Appraisal. As of the appraisal valuation date of September 19, 2018, the Riverworks Property had an “as-is” appraised value of $64,400,000. The appraiser also concluded a prospective “as-stabilized” appraised value of $73,700,000 as of November 1, 2021, as a projected estimate of when the Riverworks Property is to be leased closer to market levels due to well below-market leasing currently in place.
Environmental Matters. According to a Phase I environmental site assessment dated September 27, 2018, there was no evidence of any recognized environmental conditions at the Riverworks Property.
Market Overview and Competition. The Riverworks Property is located in Watertown, Massachusetts, which is bordered by Brighton (Boston), Cambridge and Newton on the east and south, Waltham on the west, and Belmont on the north. Watertown is located six miles northwest of Boston and within twenty minutes travel to all major highways in eastern Massachusetts, including the Massachusetts Turnpike and Routes 128, 95, 93, 2, 16 and 20. In addition, Watertown is serviced by rail lines and commuter bus lines, and has easy access to Logan International Airport in Boston. Watertown is a member of the Massachusetts Bay Transportation Authority (MBTA), which provides fixed route service to neighboring communities and to Harvard and Central Stations, with travel times of less than 20 minutes to Harvard Square and downtown Boston. The Riverworks Property is located along Pleasant Street just west of Watertown Square. Land uses within the immediate neighborhood of the Riverworks Property consist of a mixture of commercial and residential development.
According to the appraisal, the Riverworks Property is situated in the Route 128/West office submarket, which totals 31.6 million square feet and reported a 2nd quarter 2018 vacancy rate of 12.8% and an average asking lease rate of $34.19 per square foot. The submarket recorded 213,465 square feet of absorption year-to-date. There are two projects currently under construction within the subject’s submarket: 485 Arsenal Street (Arsenal Yards) in Watertown is a 107,442 square foot, two-story, class A office building, which is planned to deliver in the 4th quarter of 2019, and 500 Totten Pond Road in Waltham is a six-story, 211,000 square foot class A office building, which is 64% pre-leased and is scheduled to deliver in the 3rd quarter of 2019. According to the appraisal, neither of these properties would be considered direct competitors to the Riverworks Property.
THE INFORMATION IN THIS STRUCTURAL AND COLLATERAL TERM SHEET IS NOT COMPLETE AND MAY BE AMENDED PRIOR TO THE TIME OF SALE. THIS TERM SHEET IS NOT AN OFFER TO SELL THESE SECURITIES AND IT IS NOT A SOLICITATION OF AN OFFER TO BUY THESE SECURITIES IN ANY JURISDICTION WHERE THE OFFER OR SALE IS NOT PERMITTED.
63
Riverworks
The appraiser concluded $36.00 PSF on a modified gross basis for the office space and $20.00 PSF for lower level office at the Riverworks Property.
The following table presents certain information relating to comparable leases to the Riverworks Property:
Comparable Leases(1)
| Property Location | Year Built | Distance (miles) | Total GLA (SF) | Tenant Name | Lease Date | Lease Area (SF) | Annual Base Rent PSF | Lease Type |
| 65 Grove Street Watertown, MA | 2016 | 3.1 | 114,373 | Olink | June 2018 | 6,296 | $44.00 | NNN |
| 2221 Washington Street Newton, MA | 1977 | 4.3 | 44,800 | Acresta | March 2019 | 5,385 | $44.00 | Gross |
| 260 Charles Street Waltham, MA | 1920 | 2.4 | 53,683 | Lightwave Partners Boathouse Group | December 2018 August 2018 | 3,150 13,518 | $32.50 $32.50 | Gross MSG |
625 Mount Auburn Street Cambridge, MA | 1962 | 2.8 | 137,421 | Mt. Auburn Hospital | September 2019 | 20,259 | $39.90 | Gross |
221-257 Crescent Street Waltham, MA | 1854 | 2.2 | 177,000 | Radius/Jabil | September 2017 | 13,215 | $34.25 | Gross |
| (1) | Information obtained from the appraisal. |
The Borrower.The borrower for the Riverworks Mortgage Loan is GRE Riverworks, LLC, a Delaware limited liability company and special purpose entity with two independent directors. Legal counsel to the borrower delivered a non-consolidation opinion in connection with the origination of the Riverworks Mortgage Loan. GEM Realty Evergreen Fund, L.P. and GEM Realty Evergreen Fund PF-NM, L.P. are the guarantors of certain nonrecourse carveouts under the Riverworks Mortgage Loan.
The Borrower Sponsor.The borrower sponsors are GEM Realty Evergreen Fund, L.P. and GEM Realty Evergreen Fund PF-NM, L.P., which are funds managed by GEM Realty Capital, Inc. (“GEM”). Founded in 1994, GEM is an integrated real estate investment company that invests in private-market real estate assets and publicly traded real estate securities through two lines of business, GEM Realty Properties and GEM Realty Securities. Through GEM Realty Properties, GEM invests directly in private-market real estate assets, including properties and loans. Through GEM Realty Securities, GEM employs hedged strategies to invest in publicly traded real estate securities, including REITs, real estate operating companies and homebuilders. GEM has approximately $3.5 billion of assets under management.
Escrows.The Riverworks Mortgage Loan documents provide for upfront reserves in the amount of $584,518 for free rent, $308,530 for outstanding tenant improvement and leasing commissions, $137,443 for real estate taxes, and $22,647 for insurance. Furthermore, in lieu of cash, the borrower provided evergreen letters of credit in the amounts of $2,000,000 for a TI/LC reserve (the “TI/LC Letter of Credit”) and $5,629,000 for an earnout reserve (the “Earnout Letter of Credit”). The borrower has the right to reduce the face amount of the TI/LC Letter of Credit from time to time in accordance with the terms and provisions of the Riverworks Mortgage Loan documents, by an amount equal to $2.00 for every $1.00 that the borrower expends towards approved leasing expenses. The borrower has the right to obtain a release of the TI/LC Letter of Credit by depositing with lender funds in an amount equal to 50.0% of the face amount of the TI/LC Letter of Credit then being released. In addition, the borrower has the right, at any time prior to the Earnout Release Deadline (as defined below), to obtain a release of the Earnout Letter of Credit by depositing with the lender funds in an amount equal to the face amount of the Earnout Letter of Credit then being released.
During the Earnout Partial Release Open Period (as defined below), if no event of default has occurred and is continuing and the Earnout Debt Yield (as defined below) is greater than 10.0%, the borrower may, from time to time (but no more than once per calendar month), reduce the amount of the Earnout Letter of Credit by delivering to the lender a replacement letter of credit in lieu of the Earnout Letter of Credit, in an amount that would result in the Earnout Debt Yield being equal to 10.0%. If, by the Earnout Release Deadline, the Riverworks Property has not achieved an Earnout Debt Yield equal to or greater than 10%, the lender will be required to use funds drawn on the letter of credit to permanently prepay the Riverworks Mortgage Loan, subject to applicable prepayment penalties.
“Earnout Debt Yield” means the percentage obtained by dividing (i) the net operating income by (ii) the positive difference (if any) between (x) the original principal balance of the Riverworks Mortgage Loan minus (y) the then-current remaining amount on the Earnout Letter of Credit.
“Earnout Partial Release Open Period” means the period (i) commencing upon the earlier to occur of (x) 60 days after the Closing Date and (y) March 1, 2019, and (ii) ending on the Earnout Release Deadline.
“Earnout Release Deadline” means October 15, 2021.
The Riverworks Mortgage Loan documents provide for ongoing monthly escrows of (a) $2,518 for replacement reserves, (b) one-twelfth of the real estate taxes that the lender estimates will be payable during the next 12 months (initially $68,721), (c) during the occurrence of (i) an event of default, (ii) the borrower failing to maintain and deliver an acceptable blanket insurance policy, or (iii) the borrower failing to deliver periodic evidence of acceptable renewals and timely-paid insurance premiums, one-twelfth of the insurance premiums that the lender estimates will be payable during the next 12 months (initially $3,775), and (d) during the occurrence of (i) an event of default or (ii) failure to maintain a debt service coverage ratio of at least 1.20x, one-twelfth of the TI/LC reserves (initially $16,785).
THE INFORMATION IN THIS STRUCTURAL AND COLLATERAL TERM SHEET IS NOT COMPLETE AND MAY BE AMENDED PRIOR TO THE TIME OF SALE. THIS TERM SHEET IS NOT AN OFFER TO SELL THESE SECURITIES AND IT IS NOT A SOLICITATION OF AN OFFER TO BUY THESE SECURITIES IN ANY JURISDICTION WHERE THE OFFER OR SALE IS NOT PERMITTED.
64
Riverworks
Lockbox and Cash Management.The Riverworks Mortgage Loan is structured with a hard lockbox and springing cash management. The borrower was required at origination to deliver letters to the tenants at the Riverworks Property directing them to pay all rents directly into a lender-controlled lockbox account. All funds received by the borrower or property manager are required to be deposited in the lockbox account within two business days following receipt. During the occurrence and continuance of a Cash Management Period (as defined below), all funds are required to be swept each business day into the cash management account controlled by the lender and disbursed on each payment date in accordance with the Riverworks Mortgage Loan documents, with all excess cash flow to be deposited to an excess cash reserve to be held as additional security for the Riverworks Mortgage Loan.
A “Cash Management Period” will commence following the earliest to occur of any of the following:
| (i) | an event of default under the Riverworks Mortgage Loan; or |
| (ii) | the debt service coverage ratio falling below 1.20x. |
A Cash Management Period will end if:
| (a) | with respect clause (i) above, such event of default has been cured and no other event of default has occurred and is continuing; and |
| (b) | with respect clause (ii) above, the Riverworks Property has achieved a debt service coverage ratio of at least 1.20x for one calendar quarter. |
Property Management. The Riverworks Property is managed by an affiliate of the borrower sponsor.
Assumption. The borrower has the right to transfer the Riverworks Property, provided that certain conditions are satisfied, including: (i) no event of default under the Riverworks Mortgage Loan documents has occurred and is continuing, (ii) the borrower has provided the lender with prior written notice, (iii) the proposed transferee qualifies as a qualified transferee under the Riverworks Mortgage Loan documents, (iv) the payment of a transfer fee of 0.25% of the then outstanding principal balance of the Riverworks Mortgage Loan for the first transfer and 0.5% of then outstanding principal balance for each transfer thereafter and (v) the lender has received a rating agency confirmation that such assumption will not result in a downgrade of the respective ratings assigned to the WFCM Series 2018-C48 certificates.
Partial Release. Not permitted.
Real Estate Substitution.Not permitted.
Terrorism Insurance.The borrower is required to obtain and maintain property insurance, commercial general liability insurance and business interruption insurance that covers acts of terrorism in an amount determined by the lender in its sole discretion (but not to exceed the full replacement cost of the Riverworks Property and 18-months of business interruption insurance), provided that if the Terrorism Risk Insurance Program Reauthorization Act of 2015 or any of its renewal or successor acts is not renewed, the Riverworks Mortgage Loan documents provide for an annual terrorism premium cap that is the lesser of (x) two times the cost of the annual premiums required in connection with the Riverworks Mortgage Loan, (y) the amount of terrorism coverage that the borrower can purchase to provide terrorism coverage for the outstanding principal balance of the Riverworks Mortgage Loan, or (z) the amount of terrorism coverage that the borrower can purchase for an amount equal to one-half (1/2) of the premium that the borrower is currently paying for the all-risk or special causes of loss property insurance required under the Riverworks Mortgage Loan documents with a terrorism exclusion.
THE INFORMATION IN THIS STRUCTURAL AND COLLATERAL TERM SHEET IS NOT COMPLETE AND MAY BE AMENDED PRIOR TO THE TIME OF SALE. THIS TERM SHEET IS NOT AN OFFER TO SELL THESE SECURITIES AND IT IS NOT A SOLICITATION OF AN OFFER TO BUY THESE SECURITIES IN ANY JURISDICTION WHERE THE OFFER OR SALE IS NOT PERMITTED.
65
(THIS PAGE INTENTIONALLY LEFT BLANK)
THE INFORMATION IN THIS STRUCTURAL AND COLLATERAL TERM SHEET IS NOT COMPLETE AND MAY BE AMENDED PRIOR TO THE TIME OF SALE. THIS TERM SHEET IS NOT AN OFFER TO SELL THESE SECURITIES AND IT IS NOT A SOLICITATION OF AN OFFER TO BUY THESE SECURITIES IN ANY JURISDICTION WHERE THE OFFER OR SALE IS NOT PERMITTED.
66
1000 WINDWARD CONCOURSE
THE INFORMATION IN THIS STRUCTURAL AND COLLATERAL TERM SHEET IS NOT COMPLETE AND MAY BE AMENDED PRIOR TO THE TIME OF SALE. THIS TERM SHEET IS NOT AN OFFER TO SELL THESE SECURITIES AND IT IS NOT A SOLICITATION OF AN OFFER TO BUY THESE SECURITIES IN ANY JURISDICTION WHERE THE OFFER OR SALE IS NOT PERMITTED.
67
1000 WINDWARD CONCOURSE
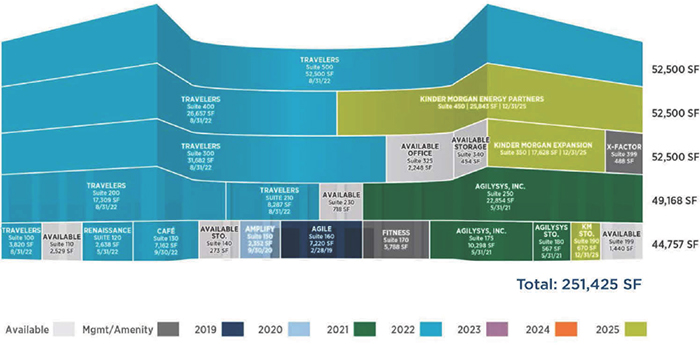
THE INFORMATION IN THIS STRUCTURAL AND COLLATERAL TERM SHEET IS NOT COMPLETE AND MAY BE AMENDED PRIOR TO THE TIME OF SALE. THIS TERM SHEET IS NOT AN OFFER TO SELL THESE SECURITIES AND IT IS NOT A SOLICITATION OF AN OFFER TO BUY THESE SECURITIES IN ANY JURISDICTION WHERE THE OFFER OR SALE IS NOT PERMITTED.
68
1000 WINDWARD CONCOURSE
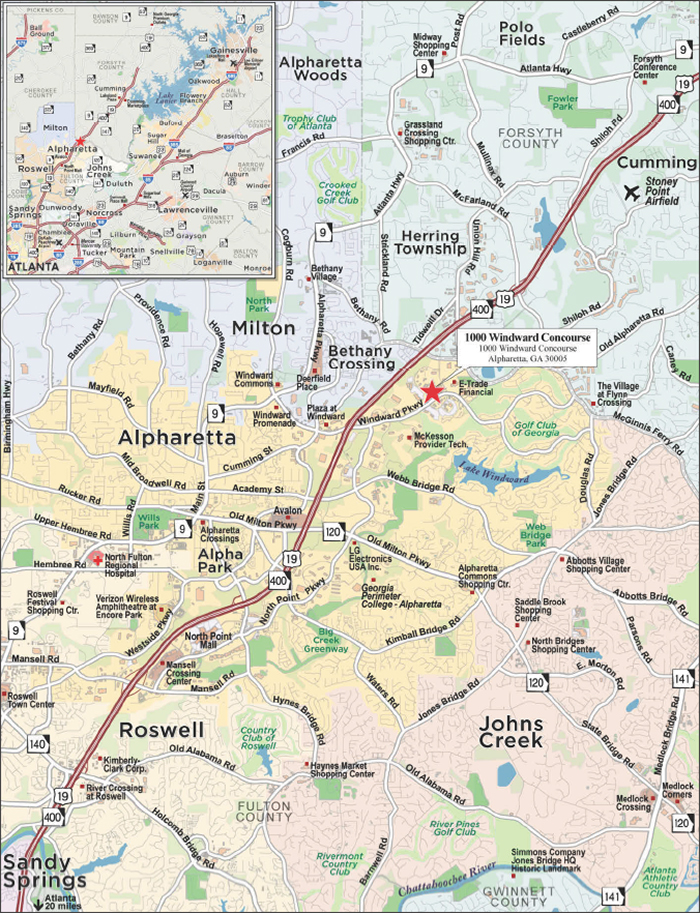
THE INFORMATION IN THIS STRUCTURAL AND COLLATERAL TERM SHEET IS NOT COMPLETE AND MAY BE AMENDED PRIOR TO THE TIME OF SALE. THIS TERM SHEET IS NOT AN OFFER TO SELL THESE SECURITIES AND IT IS NOT A SOLICITATION OF AN OFFER TO BUY THESE SECURITIES IN ANY JURISDICTION WHERE THE OFFER OR SALE IS NOT PERMITTED.
69
| No. 5 – 1000 Windward Concourse | |||||||
| Loan Information | Property Information | ||||||
| Mortgage Loan Seller: | Argentic Real Estate Finance LLC | Single Asset/Portfolio: | Single Asset | ||||
| Credit Assessment | Property Type: | Office | |||||
| (Fitch/KBRA/Moody’s): | NR/NR/NR | Specific Property Type: | Suburban | ||||
| Original Principal Balance: | $30,500,000 | Location: | Alpharetta, GA | ||||
| Cut-off Date Balance: | $30,500,000 | Size: | 251,425 SF | ||||
| % of Initial Pool Balance: | 3.7% | Cut-off Date Balance Per SF: | $121.31 | ||||
| Loan Purpose: | Acquisition | Year Built/Renovated: | 1997/NAP | ||||
| Borrower Name: | Windward Acquisition Delaware, LLC | Title Vesting: | Fee | ||||
| Borrower Sponsors: | Sebastian Barbagallo | Property Manager: | Self-managed | ||||
| Mortgage Rate: | 4.995% | 4thMost Recent Occupancy (As of): | 99.1% (12/31/2014) | ||||
| Note Date: | October 17, 2018 | 3rdMost Recent Occupancy (As of): | 97.0% (12/31/2015) | ||||
| Anticipated Repayment Date: | NAP | 2ndMost Recent Occupancy (As of): | 93.8% (12/31/2016) | ||||
| Maturity Date: | November 6, 2028 | Most Recent Occupancy (As of): | 94.8% (12/31/2017) | ||||
| IO Period: | 72 months | Current Occupancy (As of): | 96.8% (10/12/2018) | ||||
| Loan Term (Original): | 120 months | ||||||
| Seasoning: | 1 month | ||||||
| Amortization Term (Original): | 360 months | Underwriting and Financial Information: | |||||
| Loan Amortization Type: | Interest-only, Amortizing Balloon | 4thMost Recent NOI (As of)(4): | $329,408 (12/31/2015) | ||||
| Interest Accrual Method: | Actual/360 | 3rdMost Recent NOI (As of)(4): | $2,297,677 (12/31/2016) | ||||
| Call Protection: | L(25),D(92),O(3) | 2ndMost Recent NOI (As of)(4): | $3,080,532 (12/31/2017) | ||||
| Lockbox Type: | Springing | Most Recent NOI (As of)(4): | $3,492,031 (TTM 8/31/2018) | ||||
| Additional Debt: | No | ||||||
| Additional Debt Type: | NAP | ||||||
| U/W Revenues: | $5,312,875 | ||||||
| U/W Expenses: | $1,746,183 | ||||||
| U/W NOI: | $3,566,691 | ||||||
| U/W NCF: | $3,263,142 | ||||||
| Escrows and Reserves(1): | U/W NOI DSCR: | 1.82x | |||||
| U/W NCF DSCR: | 1.66x | ||||||
| Type: | Initial | Monthly | Cap (If Any) | U/W NOI Debt Yield: | 11.7% | ||
| Taxes | $30,578 | $30,578 | NAP | U/W NCF Debt Yield: | 10.7% | ||
| Insurance | $12,732 | $2,546 | NAP | As-Is Appraised Value: | $48,000,000 | ||
| TI/LC Reserve | $0 | $20,952 | $251,425(2) | As-Is Appraisal Valuation Date: | September 11, 2018 | ||
| Replacement Reserve | $0 | $4,400 | NAP | Cut-off Date LTV Ratio: | 63.5% | ||
| Travelers Rollover Reserve | $0 | $16,563(3) | NAP | LTV Ratio at Maturity or ARD: | 59.7% | ||
| (1) | See “Escrows” section. |
| (2) | Beginning December 2023, the borrower will only be required to make monthly TI/LC deposit if the TI/LC reserve is less than $251,425. |
| (3) | The monthly collections for Travelers Rollover Reserve will be deposited into the TI/LC reserve. |
| (4) | The increase in Net Operating Income from 2015 to TTM 8/31/2018 is primarily due to expiring rent abatements for Kinder Morgan, Inc. and The Travelers Indemnity Company, increase in base rent for new and renewal leases, and contractual rent increases. |
The Mortgage Loan.The mortgage loan (the “1000 Windward Concourse Mortgage Loan”) is evidenced by a single promissory note secured by a first mortgage encumbering the fee interest in a multi-tenant office building, located in Alpharetta, Georgia (the “1000 Windward Concourse Property”). The 1000 Windward Concourse Mortgage Loan was originated on October 17, 2018 by Argentic Real Estate Finance LLC. The 1000 Windward Concourse Mortgage Loan had an original principal balance of $30,500,000, has an outstanding principal balance as of the Cut-off Date of $30,500,000 and accrues interest at an interest rate of 4.995%per annum. The 1000 Windward Concourse Mortgage Loan had an initial term of 120 months, has a remaining term of 119 months as of the Cut-off Date and requires interest-only payments for the initial 72 payments of the loan term of the 1000 Windward Concourse Mortgage Loan. The 1000 Windward Concourse Mortgage Loan matures on November 6, 2028.
Following the lockout period (on any date after December 6, 2020), the borrower has the right to defease the 1000 Windward Concourse Mortgage Loan in whole, but not in part. The 1000 Windward Concourse Mortgage Loan is prepayable without penalty on or after September 6, 2028.
THE INFORMATION IN THIS STRUCTURAL AND COLLATERAL TERM SHEET IS NOT COMPLETE AND MAY BE AMENDED PRIOR TO THE TIME OF SALE. THIS TERM SHEET IS NOT AN OFFER TO SELL THESE SECURITIES AND IT IS NOT A SOLICITATION OF AN OFFER TO BUY THESE SECURITIES IN ANY JURISDICTION WHERE THE OFFER OR SALE IS NOT PERMITTED.
70
1000 WINDWARD CONCOURSE
Sources and Uses
| Sources | Uses | |||||||
| Original Loan amount | $30,500,000 | 68.5% | Purchase Price | $43,935,000 | 98.6% | |||
| Borrower Equity | 14,053,107 | 31.5 | Closing Costs | 574,797 | 1.3 | |||
| Reserves | 43,310 | 0.1 | ||||||
| Total Sources | $44,553,107 | 100.0% | Total Uses | $44,553,107 | 100.0% |
The Property The 1000 Windward Concourse Property is a Class A, multi-tenant office building totaling 251,425 square feet situated on a 19.9 acre site in Alpharetta, Georgia. The 1000 Windward Concourse Property is approximately 23 miles north of the Atlanta central business district and is located just east of the GA 400 and US-19 highways. The 1000 Windward Concourse Property was built in 1997 and is located in a master-planned office park development known as the Windward Parkway Corridor. The 1000 Windward Concourse Property currently consists of a single five-story office building that consists of a bi-wing design, offering approximately 50,000 square foot floor plates. The 1000 Windward Concourse Property amenities include a café, a fitness center, a basketball court and walking trails. The 1000 Windward Concourse Property also includes 1,044 parking spaces with a parking ratio of 4.15 space per 1,000 square feet of the net rentable area.
As of October 12, 2018, the 1000 Windward Concourse Property was 96.8% leased to seven tenants.
The largest tenant is The Travelers Indemnity Company (“Travelers”), which leases 140,225 square feet or 55.8% of the net rentable area at a base rent of $22.78 per square foot until August 2022. Travelers operates as a property and casualty insurance company that provides a range of personal and business insurance products. The employees at the 1000 Windward Property are reportedly primarily using the space for claims management for various product lines and focused on sale of commercial products and marketing. Furthermore, this location is reportedly one of two locations in the country that manage over two million square feet of Travelers’ (owned and leased) space across the country. Travelers extended its lease term for an additional 6.5 years in 2015 to August 2022. Travelers has two, five-year renewal options remaining and is entitled to a renewal tenant improvement allowance of $27 per square foot if a renewal option is exercised in 2022. In addition, Travelers has one-time right to surrender and return to the landlord up to 10.0% of the then-rentable area of the premises, at any time after December 31, 2019, with nine months’ prior written notice and a contraction fee of unamortized leasing cost at 7.0% of the then rentable area. The lease was executed by Travelers.
The second largest tenant is Kinder Morgan, Inc. (“Kinder Morgan”), which leases 44,141 square feet or 17.6% of the net rentable area at a base rent of $22.63 per square foot until December 2025. Kinder Morgan is one of the largest energy infrastructure companies in North America and specializes in owning and controlling oil and gas pipelines and terminations. The 1000 Windward Concourse Property is the headquarters for Kinder Morgan’s Plantation Pipe Line Company, one of the largest refined petroleum product pipelines in the United States, delivering an estimated 700,000 barrels a day of gasoline, jet fuel, diesel and biodiesel through its approximately 3,180-mile pipeline network. Kinder Morgan has been at the 1000 Windward Concourse Property since 2015, recently expanded into an additional 17,628 square feet in October 2016 and has two, five-year renewal options. The lease was executed by Kinder Morgan Energy Partners, L.P.
The third largest tenant is Agilysys, Inc. (“Agilysys”), which leases 33,719 square feet or 13.4% of the net rentable area at a base rent of $23.94 per square foot until May 2021. Agilysys is a developer and marketer of software-enabled solutions and services to the hospitality industry, including support, maintenance, and subscription and professional services in North America, Europe and Asia. Agilysys offers point-of-sale, property management, reservation and table management, inventory and procurement, workforce management, analytics, document management, and mobile and wireless solutions to streamline operations. As of November 26, 2018, Agilysys had a reported market cap of $378.81 million. Agilysys is headquartered at the 1000 Windward Concourse Property and has been in occupancy since 2011. Agilysys recently renewed its lease on the 10,298 square feet of space for an additional 38 months and has one, five-year renewal option associated with 22,854 square feet of original space. The lease was executed by Agilysys.
Approximately 12,950 square feet of the 1000 Windward Concourse Property space is associated with a café and a fitness facility.
THE INFORMATION IN THIS STRUCTURAL AND COLLATERAL TERM SHEET IS NOT COMPLETE AND MAY BE AMENDED PRIOR TO THE TIME OF SALE. THIS TERM SHEET IS NOT AN OFFER TO SELL THESE SECURITIES AND IT IS NOT A SOLICITATION OF AN OFFER TO BUY THESE SECURITIES IN ANY JURISDICTION WHERE THE OFFER OR SALE IS NOT PERMITTED.
71
1000 WINDWARD CONCOURSE
The following table presents certain information relating to the tenancy at the 1000 Windward Concourse Property:
Major Tenants
| Tenant Name | Credit Rating (Fitch/Moody’s/S&P)(1) | Tenant NRSF | % of NRSF | Annual U/W Base Rent PSF(2) | Annual U/W Base Rent(2) | % of Total Annual U/W Base Rent | Lease Expiration Date | |||||||||||
| Major Tenant | ||||||||||||||||||
| The Travelers Indemnity Company | NR/Aa2/AA | 140,255 | 55.8 | % | $22.78 | $3,195,192 | 60.3 | % | 8/31/2022(3) | |||||||||
| Kinder Morgan, Inc. | NR/Baa3/BBB- | 44,141 | 17.6 | % | $22.63 | $999,068 | 18.8 | % | 12/31/2025(4) | |||||||||
| Agilysys, Inc. | NR/NR/NR | 33,719 | 13.4 | % | $23.94 | $807,107 | 15.2 | % | 5/31/2021(5) | |||||||||
| Agile Resources Inc | NR/NR/NR | 7,220 | 2.9 | % | $23.67 | $170,897 | 3.2 | % | 2/28/2019(6) | |||||||||
| Total Major Tenant | 225,335 | 89.6 | % | $22.95 | $5,172,264 | 97.6 | % | |||||||||||
| Non-Major Tenants | 17,940 | (7) | 7.1 | % | $23.51 | (8) | $129,315 | 2.4 | % | |||||||||
| Occupied Collateral Total | 243,275 | 96.8 | % | $22.97 | (8) | $5,301,579 | 100.0 | % | ||||||||||
| Vacant Space | 8,150 | 3.2 | % | |||||||||||||||
| Collateral Total | 251,425 | 100.0 | % | |||||||||||||||
| (1) | Certain ratings are those of the parent company whether or not the parent company guarantees the lease. |
| (2) | Annual U/W Base Rent PSF and Annual U/W Base Rent include contractual rent steps totaling $137,292 through April 2019. |
| (3) | Travelers has two, five-year lease extension options. Travelers has a one-time right to surrender and return to the landlord up to 25.0% of the then rentable area of the premises, at any time after 12/31/2019, with nine months prior written notice and a contraction fee of unamortized leasing costs at 7.0% of the then rentable area. |
| (4) | Kinder Morgan, Inc. has two, five-year lease extension options. |
| (5) | Agilysys, Inc. has one, five-year lease extension option associated with 22,854 square feet of original leased space. |
| (6) | Agile Resources Inc. has one, five-year leases extension option. |
| (7) | The Tenant NRSF for Non-Major Tenants includes 5,788 square feet and 7,162 square feet of fitness space and café space, respectively. |
| (8) | The Annual U/W Base Rent PSF for Non-Major Tenants and Occupied Collateral Total does not include the 5,788 square feet of a fitness facility that does not pay rent or the 7,162 square feet of café space that pays $12,000/year in base rent. |
The following table presents certain information relating to the lease rollover schedule at the 1000 Windward Concourse Property:
Lease Expiration Schedule(1)
| Year Ending December 31, | No. of Leases Expiring | Expiring NRSF | % of Total NRSF | Cumulative Expiring NRSF | Cumulative % of Total NRSF | Annual U/W Base Rent | % of Annual U/W Base Rent | Annual U/W Base Rent PSF(2) |
| MTM(3) | 2 | 12,950 | 5.2% | 12,950 | 5.2% | $12,000 | 0.2% | N/A |
| 2018 | 0 | 0 | 0.0% | 12,950 | 5.2% | $0 | 0.0% | $0.00 |
| 2019 | 1 | 7,220 | 2.9% | 20,170 | 8.0% | $170,897 | 3.2% | $23.67 |
| 2020 | 1 | 2,352 | 0.9% | 22,522 | 9.0% | $54,636 | 1.0% | $23.23 |
| 2021 | 1 | 33,719 | 13.4% | 56,241 | 22.4% | $807,107 | 15.2% | $23.94 |
| 2022 | 2 | 142,893 | 56.8% | 199,134 | 79.2% | $3,257,871 | 61.5% | $22.80 |
| 2023 | 0 | 0 | 0.0% | 199,134 | 79.2% | $0 | 0.0% | $0.00 |
| 2024 | 0 | 0 | 0.0% | 199,134 | 79.2% | $0 | 0.0% | $0.00 |
| 2025 | 1 | 44,141 | 17.6% | 243,275 | 96.8% | $999,068 | 18.8% | $22.63 |
| 2026 | 0 | 0 | 0.0% | 243,275 | 96.8% | $0 | 0.0% | $0.00 |
| 2027 | 0 | 0 | 0.0% | 243,275 | 96.8% | $0 | 0.0% | $0.00 |
| 2028 | 0 | 0 | 0.0% | 243,275 | 96.8% | $0 | 0.0% | $0.00 |
| Thereafter | 0 | 0 | 0.0% | 243,275 | 96.8% | $0 | 0.0% | $0.00 |
| Vacant | 0 | 8,150 | 3.2% | 251,425 | 100.0% | $0 | 0.0% | $0.00 |
| Total/Weighted Average | 8 | 251,425 | 100.0% | $5,301,579 | 100.0% | $22.97 |
| (1) | Information obtained from the underwritten rent roll. |
| (2) | The Annual U/W Base Rent PSF does not include the 5,788 square feet of a fitness facility that does not pay rent or the 7,162 square feet of café space that pays $12,000/year in base rent. |
| (3) | Represents the fitness facility that does not pay rent and the 7,162 square feet of café space that pays $12,000/year. The café’s lease expires in September 2022. |
The following table presents historical occupancy percentages at the 1000 Windward Concourse Property:
Historical Occupancy
12/31/2015(1) | 12/31/2016(1) | 12/31/2017(1) | 10/12/2018(2) |
| 97.0% | 93.8% | 94.8% | 96.8% |
| (1) | Information obtained from the borrower. |
| (2) | Information obtained from the underwritten rent roll. |
THE INFORMATION IN THIS STRUCTURAL AND COLLATERAL TERM SHEET IS NOT COMPLETE AND MAY BE AMENDED PRIOR TO THE TIME OF SALE. THIS TERM SHEET IS NOT AN OFFER TO SELL THESE SECURITIES AND IT IS NOT A SOLICITATION OF AN OFFER TO BUY THESE SECURITIES IN ANY JURISDICTION WHERE THE OFFER OR SALE IS NOT PERMITTED.
72
1000 WINDWARD CONCOURSE
Underwritten Net Cash Flow. The following table presents certain information relating to the underwritten net cash flow at the 1000 Windward Concourse Property:
Cash Flow Analysis
| 2015 | 2016 | 2017 | TTM 8/31/2018 | U/W | % of U/W Effective Gross Income | U/W $ per SF | |||||||||||||||
| Base Rent(1) | $1,785,312 | $3,813,507 | $4,549,787 | $4,998,060 | $5,301,579 | 99.8 | % | $21.09 | |||||||||||||
| Straight-line Rent(2) | 0 | 0 | 0 | 0 | 185,446 | 3.5 | 0.74 | ||||||||||||||
| Grossed Up Vacant Space | 0 | 0 | 0 | 0 | 199,655 | 3.8 | 0.79 | ||||||||||||||
| Total Reimbursables | 14,634 | 30,827 | 81,444 | 70,438 | 170,872 | 3.2 | 0.68 | ||||||||||||||
| Other Income(3) | 44,043 | 26,100 | 39,777 | 41,078 | 41,078 | 0.8 | 0.16 | ||||||||||||||
| Less Vacancy & Credit Loss(4) | 0 | 0 | 0 | 0 | (585,755 | ) | (11.0 | ) | (2.33 | ) | |||||||||||
| Effective Gross Income | $1,843,989 | $3,870,434 | $4,671,009 | $5,109,576 | $5,312,875 | 100.0 | % | $21.13 | |||||||||||||
| Total Operating Expenses | $1,514,581 | $1,572,757 | $1,590,477 | $1,617,544 | $1,746,183 | 32.9 | % | $6.95 | |||||||||||||
| Net Operating Income(5) | $329,408 | $2,297,677 | $3,080,532 | $3,492,031 | $3,566,691 | 67.1 | % | $14.19 | |||||||||||||
| TI/LC | 0 | 0 | 0 | 0 | 251,425 | 4.7 | 1.00 | ||||||||||||||
| Capital Expenditures | 0 | 0 | 0 | 0 | 52,124 | 1.0 | 0.21 | ||||||||||||||
| Net Cash Flow | $329,408 | $2,297,677 | $3,080,532 | $3,492,031 | $3,263,142 | 61.4 | % | $12.98 | |||||||||||||
| NOI DSCR | 0.17x | 1.17x | 1.57x | 1.78x | 1.82x | ||||||||||||||||
| NCF DSCR | 0.17x | 1.17x | 1.57x | 1.78x | 1.66x | ||||||||||||||||
| NOI DY | 1.1% | 7.5% | 10.1% | 11.4% | 11.7% | ||||||||||||||||
| NCF DY | 1.1% | 7.5% | 10.1% | 11.4% | 10.7% | ||||||||||||||||
| (1) | U/W Base Rent includes contractual rent steps totaling $137,292 through October 2019. |
| (2) | Straight-line rent for The Travelers Indemnity Company ($98,507), Kinder Morgan, Inc. ($85,038) and Renaissance Life & Health Ins. ($1,901) due to investment grade tenancy. |
| (3) | Other income represents income from the telecommunications lease with Level 3 Communication and tenant electrical billings. |
| (4) | The underwritten economic vacancy is 10.0%. The 1000 Windward Concourse Property was 96.8% physically occupied as of October 12, 2018. |
| (5) | The increase in Net Operating Income from 2015 to TTM 8/31/2018 is primarily due to expiring rent abatements for Kinder Morgan, Inc. and The Travelers Indemnity Company, increase in base rent for new and renewal leases, and contractual rent increases. The December 31, 2015 occupancy at the 1000 Windward Concourse Property was 97.0%. |
Appraisal.As of the appraisal valuation date of September 11, 2018, the 1000 Windward Concourse Property had an “as-is” appraised value of $48,000,000.
Environmental Matters. According to a Phase I environmental site assessment dated August 15, 2018, there was no evidence of any recognized environmental conditions at the 1000 Windward Concourse Property.
Market Overview and Competition.The 1000 Windward Concourse Property is located within the city of Alpharetta, Georgia, in Fulton County. The 1000 Windward Concourse Property is located within the Windward Parkway Corridor, a master-planned development that features a business district, golf clubs, and executive communities. The immediate area surrounding the 1000 Windward Concourse Property is a newer area of development consisting of various uses. Land uses within the neighborhood consist of a mixture of residential, retail and office developments. According to the appraisal, the 2018 population within a one-, three-, and five-mile radius were 7,022, 70,828 and 172,666, respectively, and the 2018 median household income within a one-, three-, and five-mile radius were $92,627, $100,128, and $106,231, respectively.
According to the appraisal, the 1000 Windward Concourse Property is located in the North Fulton office submarket. As of the second quarter of 2018, the North Fulton office submarket had an existing supply of approximately 26 million square feet with a vacancy rate of 14.0% and an average asking lease rate of $23.37 per square foot. In the North Fulton submarket, there are 45 Class A office buildings of greater than 150,000 square feet, with an aggregate of 9.3 million square feet and a vacancy of 7.7%. Furthermore, the appraiser concluded to a market rent of $25.00 per square foot for the office space at the 1000 Windward Concourse Property, which is over 10% higher than the current in place rents at the 1000 Windward Concourse Property.
THE INFORMATION IN THIS STRUCTURAL AND COLLATERAL TERM SHEET IS NOT COMPLETE AND MAY BE AMENDED PRIOR TO THE TIME OF SALE. THIS TERM SHEET IS NOT AN OFFER TO SELL THESE SECURITIES AND IT IS NOT A SOLICITATION OF AN OFFER TO BUY THESE SECURITIES IN ANY JURISDICTION WHERE THE OFFER OR SALE IS NOT PERMITTED.
73
1000 WINDWARD CONCOURSE
The following table presents certain information relating to comparable leases to the 1000 Windward Concourse Property:
Comparable Leases(1)
| Property Location | Year Built | Occupancy | Distance (miles) | Total GLA (SF) | Tenant Name | Lease Date | Lease Area (SF) | Annual Base Rent PSF | Lease Type |
1355 Windward Concourse Alpharetta, GA | 1997 | 85.0% | 0.1 | 102,569 | CodeForce 360 Quoted | January 2018 N/A | 2,923 N/A | $22.75 $23.50 | FSG N/A |
1725 Windward Concourse Alpharetta, GA | 1998 | 72.0% | 0.5 | 101,239 | Quoted | N/A | N/A | $24.75 | FSG |
3015 and 3025 Windward Plaza Drive Alpharetta, GA | 1997 | 87.0% | 0.4 | 283,662 | Carousel Industries HomeGoods Quoted | June 2018 June 2017 N/A | 3,916 3,943 N/A | $26.25 $24.50 $24.50-$25.50 | FSG FSG N/A |
5900 Windward Parkway Alpharetta, GA | 1996 | 75.0% | 0.7 | 131,792 | Lueder Law Firm Compu-Link Quoted | April 2016 February 2016 N/A | 3,654 2,634 N/A | $23.66 $21.00 $25.50 | FSG FSG N/A |
13560 Morris Road Alpharetta, GA | 1999 | 96.0% | 1.8 | 528,162 | Quoted | N/A | N/A | $25.50 | FSG |
12600 Deerfield Parkway Alpharetta, GA | 2000 | 89.0% | 1.8 | 121,969 | Regus Atrium Hospitality Quoted | November 2017 October 2015 N/A | 44,377 18,000 N/A | $22.75 $21.75 $26.50-$27.50 | FSG FSG N/A |
11700 Great Oaks Way Alpharetta, GA | 2000 | 90.0% | 2.8 | 308,101 | Ultimate Software Quoted | February 2018 N/A | 55,404 N/A | $25.00 $28.00 | FSG FSG |
| (1) | Information obtained from the appraisal. |
The Borrower.The borrower for the 1000 Windward Concourse Mortgage Loan is Windward Acquisition Delaware, LLC, a Delaware limited liability company and a special purpose entity with one independent director. Legal counsel to the borrower delivered a non-consolidation opinion in connection with the origination of the 1000 Windward Concourse Mortgage Loan. Sebastian Barbagallo is the guarantor of certain nonrecourse carveouts under the 1000 Windward Concourse Mortgage Loan.
The Borrower Sponsor.The borrower sponsor is Sebastian Barbagallo, a partner in B Developments, a Miami, FL based commercial real estate investment/development firm focused exclusively on office, multi-family and single tenant development, acquisition and repositioning. B Developments is family-owned and the senior management team (including the borrower sponsor) has over 30 years of experience in commercial real estate development and management. Through its affiliate B&L Management Group Corp., B Developments manages office, multi-family and hospitality properties in excess of 2.0 million square feet in Miami, Tampa Bay, Orlando and Atlanta. The borrower sponsor was involved in a foreclosure. See“Description of the Mortgage Pool – Loan Purpose; Default History, Bankruptcy Issues and other Proceedings” in the Preliminary Prospectus.
Escrows.The 1000 Windward Concourse Mortgage Loan documents provide for upfront reserves in the amount of $30,578 for real estate taxes and $12,732 for insurance premiums.
The 1000 Windward Concourse Mortgage Loan documents provide for ongoing monthly escrows of (a) $4,400 for capital expenditures, (b) $20,952 for tenant improvements and leasing commissions, subject to a cap of $251,425 from and after December 6, 2023, (c) additional deposits of $16,563 for tenant improvements and leasing commissions until the earlier to occur of (x) the scheduled expiration of the lease with Travelers or (z) the date on which the borrower delivers evidence reasonably satisfactory to the lender that (i) Travelers has renewed its lease and all related leasing expenses have been paid and (ii) Travelers is in occupancy, open for business and paying normal monthly unabated rent, (d) one-twelfth of the real estate taxes that the lender estimates will be payable during the next 12 months (initially $30,578) and (e) one-twelfth of the insurance premiums that the lender estimates will be payable during the next 12 months (initially $2,546).
Lockbox and Cash Management.The 1000 Windward Concourse Mortgage Loan is structured with a springing lockbox and springing cash management. The borrower was required at origination to deliver tenant payment-direction letters (one for each tenant at the 1000 Windward Concourse Property) to the lender. Following the occurrence of the initial Cash Management Period (as defined below), (i) the lender will deliver the letters to the tenants at the 1000 Windward Concourse Property directing them to pay all rents directly into a lender-controlled lockbox account and (ii) all funds received by the borrower or manager are required to be deposited in the lockbox account within one business day following receipt. During the occurrence and continuance of a Cash Management Period (as defined below), all funds are required to be swept on each business day into the cash management account controlled by the lender and disbursed on each payment date in accordance with the 1000 Windward Concourse Mortgage Loan documents, with all excess cash flow to be deposited to an excess cash reserve to be held as additional security for the 1000 Windward Concourse Mortgage Loan.
A “Cash Management Period” will commence following the earliest to occur of:
| (i) | an event of default under the 1000 Windward Concourse Mortgage Loan; |
| (ii) | the debt service coverage ratio falling below 1.20x (on an amortizing basis); or |
| (iii) | the commencement of a Lease Sweep Period (as defined below). |
THE INFORMATION IN THIS STRUCTURAL AND COLLATERAL TERM SHEET IS NOT COMPLETE AND MAY BE AMENDED PRIOR TO THE TIME OF SALE. THIS TERM SHEET IS NOT AN OFFER TO SELL THESE SECURITIES AND IT IS NOT A SOLICITATION OF AN OFFER TO BUY THESE SECURITIES IN ANY JURISDICTION WHERE THE OFFER OR SALE IS NOT PERMITTED.
74
1000 WINDWARD CONCOURSE
A Cash Management Period will end if:
| (a) | with respect to clause (i) above, such event of default has been cured and no other event of default has occurred and is continuing; |
| (b) | with respect to clause (ii) above, the 1000 Windward Concourse Property has achieved a debt service coverage ratio of at least 1.25x (on an amortizing basis) for two consecutive calendar quarters; or |
| (c) | with respect to clause (iii) above, such Lease Sweep Period has ended. |
A “Lease Sweep Period” will commence following the earliest to occur of:
| (i) | (a) with respect toAgilysys, six months prior to the end of the term of its lease (“Agilysys Lease”) or (b) with respect to Kinder Morgan, Travelers or any other tenant that leases more than 10.0% of the net rentable area or contributes more than 10.0% of the total base rent (each such tenant, together with Agilysys, a “Major Tenant”), nine months prior to the end of the term of its lease (including any renewal terms) (each such lease, together with the Agilysys Lease, a “Major Lease”); |
| (ii) | the date (a) required under a Major Lease by which the applicable Major Tenant is required to give notice to renew thereunder (and such renewal has not been so exercised) or (b) upon which any Major Tenant gives notice of its intention not to renew or extend its Major Lease; |
| (iii) | a Major Lease being surrendered, cancelled or terminated prior to its then current expiration date; |
| (iv) | a Major Tenant discontinuing or giving notice to discontinue its business in its leased premises (i.e., “goes dark”); |
| (v) | the occurrence and continuance (beyond any applicable notice and cure periods) of a default under a Major Lease by the applicable Major Tenant; or |
| (vi) | the occurrence of a Major Tenant insolvency proceeding. |
A Lease Sweep Period will end upon:
| (a) | the date on which $750,000 for Agilysys ($22.24 per Agilysys’ square footage), $1,350,000 for Travelers ($9.63 per Travelers’ square footage), or $900,000 for Kinder Morgan ($20.39 per Kinder Morgan’s square footage) or in the case of any other Major Tenant sufficient funds, have been collected in the rollover reserve necessary to pay for all anticipated expenses in connection with the re-leasing of the applicable space including any anticipated shortfalls of payments required in relation to the 1000 Windward Concourse Mortgage Loan due to down-time or free rent periods (such amount, a “Lease Sweep Threshold Amount”), or |
| (b) | the occurrence of any of the following: |
| (1) | with respect to clauses (i), (ii) or (iii) above, the earlier to occur of (A) the date on which the subject Major Tenant exercises its renewal or extension option for a period of at least three years with respect to either all of the space demised under its Major Lease or such portion of the space demised under its Major Lease such that the debt yield (based on the then outstanding principal balance) is greater than or equal to 9.0%, which renewal or extension is at an annual rental rate that is reasonably acceptable to the lender, and funds have been accumulated in the rollover reserve (during the continuance of the subject Lease Sweep Period) in an amount equal to the appropriate Lease Sweep Threshold Amount, or (B) the date on which either all of the space demised under the subject Major Lease that gave rise to the subject Lease Sweep Period, or such portion of the space demised under the subject Major Lease that gave rise to the subject Lease Sweep Period as will result in the debt yield (based on the then outstanding principal balance) being equal to or greater than 9.0%, has been fully leased pursuant to one or more replacement leases, each applicable tenant is in occupancy and paying unabated rent, all leasing expenses have been paid in full and each applicable tenant delivers an acceptable estoppel certificate (a “Tenant Space Re-Tenanting Event”); |
| (2) | with respect to clause (iv) above, either (A) (i) the Major Tenant recommencing operations in accordance with the terms of its Major Lease and paying full unabated monthly rent and (ii) the Major Tenant having executed and provided to the lender an acceptable estoppel certificate or (B) a Tenant Space Re-Tenanting Event; |
| (3) | with respect to clause (v) above, the subject Major Tenant default having been cured, and no other default with respect to the Major Tenant having occurred for a period of six consecutive months following such cure; or |
| (4) | with respect to clause (vi) above, (A) the bankruptcy-related event having been terminated, (B) the applicable Major Lease having been affirmed, assumed or assigned in a manner satisfactory to the lender and (C) the applicable Major Tenant having provided to the lender an acceptable estoppel certificate. |
Property Management. The 1000 Windward Concourse Property is managed by an affiliate of the borrower sponsor.
Assumption.The borrower has the right to transfer the 1000 Windward Concourse Property, provided that certain conditions are satisfied, including: (i) no event of default under the 1000 Windward Concourse Mortgage Loan documents has occurred and is continuing, (ii) the borrower has provided the lender with prior written notice, (iii) the proposed transferee qualifies as a qualified transferee under the 1000 Windward Concourse Mortgage Loan documents, (iv) the payment of a transfer fee of 1.0% of the then outstanding principal balance of the 1000 Windward Concourse Mortgage Loan and (v) the lender has received a rating agency confirmation that such assumption will not result in a downgrade of the respective ratings assigned to the WFCM Series 2018-C48 certificates.
Partial Release. Not permitted.
Terrorism Insurance. The 1000 Windward Concourse Mortgage Loan documents require that the “all risk” insurance policy required to be maintained by the borrower provides coverage for terrorism in an amount equal to the full replacement cost of the 1000 Windward Concourse Property, or that if the Terrorism Risk Insurance Program Reauthorization Act of 2015 is no longer in effect and such policies contain an exclusion for acts of terrorism, the borrower will obtain, to the extent available, a stand-alone policy that provides the same coverage as the policies would have if such exclusion did not exist.
THE INFORMATION IN THIS STRUCTURAL AND COLLATERAL TERM SHEET IS NOT COMPLETE AND MAY BE AMENDED PRIOR TO THE TIME OF SALE. THIS TERM SHEET IS NOT AN OFFER TO SELL THESE SECURITIES AND IT IS NOT A SOLICITATION OF AN OFFER TO BUY THESE SECURITIES IN ANY JURISDICTION WHERE THE OFFER OR SALE IS NOT PERMITTED.
75
| STARWOOD HOTEL PORTFOLIO |

THE INFORMATION IN THIS STRUCTURAL AND COLLATERAL TERM SHEET IS NOT COMPLETE AND MAY BE AMENDED PRIOR TO THE TIME OF SALE. THIS TERM SHEET IS NOT AN OFFER TO SELL THESE SECURITIES AND IT IS NOT A SOLICITATION OF AN OFFER TO BUY THESE SECURITIES IN ANY JURISDICTION WHERE THE OFFER OR SALE IS NOT PERMITTED.
76
| STARWOOD HOTEL PORTFOLIO |
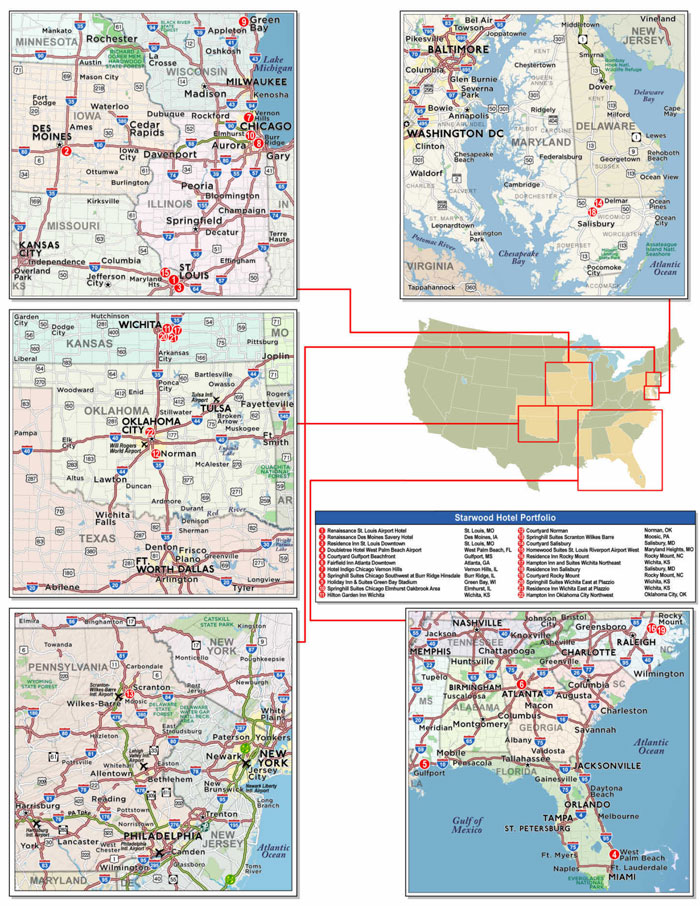
THE INFORMATION IN THIS STRUCTURAL AND COLLATERAL TERM SHEET IS NOT COMPLETE AND MAY BE AMENDED PRIOR TO THE TIME OF SALE. THIS TERM SHEET IS NOT AN OFFER TO SELL THESE SECURITIES AND IT IS NOT A SOLICITATION OF AN OFFER TO BUY THESE SECURITIES IN ANY JURISDICTION WHERE THE OFFER OR SALE IS NOT PERMITTED.
77
| No. 6 – Starwood Hotel Portfolio | |||||||
| Loan Information | Property Information | ||||||
| Mortgage Loan Seller: | Wells Fargo Bank, National Association | Single Asset/Portfolio: | Portfolio | ||||
Credit Assessment (Fitch/KBRA/Moody’s): | NR/NR/NR | Property Type: | Hospitality | ||||
| Original Principal Balance(1): | $30,000,000 | Specific Property Type: | Various | ||||
| Cut-off Date Balance(1): | $30,000,000 | Location: | Various | ||||
| % of Initial Pool Balance: | 3.6% | Size: | 2,943 Rooms | ||||
| Loan Purpose: | Refinance | Cut-off Date Balance Per Room(1): | $90,044 | ||||
| Borrower Names(2): | Various | Year Built/Renovated: | Various – See Table | ||||
| Borrower Sponsor: | SCG Hotel Investors Holdings L.P. | Title Vesting: | Fee | ||||
| Mortgage Rate: | 5.150% | Property Manager: | Schulte Hospitality Group, Inc. | ||||
| Note Date: | August 16, 2018 | 4thMost Recent Occupancy (As of): | 73.0% (12/31/2014) | ||||
| Anticipated Repayment Date: | NAP | 3rdMost Recent Occupancy (As of): | 72.4% (12/31/2015) | ||||
| Maturity Date: | September 11, 2028 | 2ndMost Recent Occupancy (As of)(5): | 71.5% (12/31/2016) | ||||
| IO Period: | 120 months | Most Recent Occupancy (As of)(5): | 72.0% (12/31/2017) | ||||
| Loan Term (Original): | 120 months | Current Occupancy (As of)(5): | 72.5% (5/31/2018) | ||||
| Seasoning: | 3 months | ||||||
| Amortization Term (Original): | NAP | Underwriting and Financial Information: | |||||
| Loan Amortization Type: | Interest-only, Balloon | 4thMost Recent NOI (As of): | $32,310,013 (12/31/2015) | ||||
| Interest Accrual Method: | Actual/360 | 3rdMost Recent NOI (As of)(6): | $29,372,183 (12/31/2016) | ||||
| Call Protection(3): | L(11),GRTR 1% or YM(16),GRTR 1% or YM or D(86),O(7) | 2ndMost Recent NOI (As of)(6): | $29,477,118 (12/31/2017) | ||||
| Most Recent NOI (As of)(6): | $29,954,374 (TTM 5/31/2018) | ||||||
| Lockbox Type: | Soft/Springing Cash Management | U/W Revenues: | $106,614,582 | ||||
| Additional Debt(1): | Yes | U/W Expenses: | $73,391,622 | ||||
| Additional Debt Type(1): | Pari Passu | U/W NOI(6): | $33,222,960 | ||||
| U/W NCF: | $28,658,491 | ||||||
| U/W NOI DSCR(1): | 2.40x | ||||||
| U/W NCF DSCR(1): | 2.07x | ||||||
| Escrows and Reserves(4): | U/W NOI Debt Yield(1): | 12.5% | |||||
| Type: | Initial | Monthly | Cap (If Any) | U/W NCF Debt Yield(1): | 10.8% | ||
| Taxes | $0 | Springing | NAP | As-Is Appraised Value(7): | $401,000,000 | ||
| Insurance | $0 | Springing | NAP | As-Is Appraisal Valuation Date(7) : | Various | ||
| FF&E Reserve | $0 | $330,760 | NAP | Cut-off Date LTV Ratio(1)(7) : | 66.1% | ||
| PIP Reserve | $5,408,895 | $0 | NAP | LTV Ratio at Maturity(1)(7): | 66.1% | ||
| (1) | The Starwood Hotel Portfolio Mortgage Loan (as defined below) is part of the Starwood Hotel Portfolio Whole Loan (as defined below), which comprises fourpari passu notes with an aggregate original principal balance of $265,000,000. The Cut-off Date Balance per Room, Maturity Date Balance per Room, UW NOI Debt Yield, UW NOI Debt Yield at Maturity, UW NCF DSCR, Cut-off Date LTV Ratio and Maturity Date LTV Ratio numbers presented are based on the Starwood Hotel Portfolio Whole Loan. |
| (2) | See “The Borrower” Section. |
| (3) | Prepayment of the Starwood Hotel Portfolio Whole Loan is permitted at any time on or after September 11, 2019 (the “Prepayment Lockout Date”). Defeasance of the Starwood Hotel Portfolio Whole Loan is permitted at any time after the earlier of (i) October 11, 2021 and (ii) two years from the closing date of the securitization that includes the lastpari passu note of the Starwood Hotel Portfolio Whole Loan to be securitized (the “Defeasance Lockout Date”). The assumed defeasance lockout period of 27 payments is based on the closing date of this transaction in December 2018. |
| (4) | See “Escrows” section. |
| (5) | The Renaissance Des Moines Savery Hotel property (the “RDM Property”) was closed for renovations from August 2016 through mid-October 2018, and was therefore excluded from the total portfolio historic occupancy in 2016, 2017 and May 31, 2018. |
| (6) | The increase from Most Recent NOI to UW NOI was due to the inclusion of the RDM Property in underwriting. The RDM Property was closed for renovations from August 2016 through mid-October 2018, and was therefore excluded from the historical 2016, 2017 and TTM 5/31/2018 cash flows. The RDM Property’s underwritten cash flows are based on cash flow estimates set forth in the related appraisal. See “The Properties” and “Cash Flow Analysis” below. |
| (7) | The individual property level appraised values total $377,700,000, which would equate to a Cut-off Date LTV Ratio and LTV Ratio at Maturity of 70.2%; however, the appraisal concluded to a portfolio value of $401,000,000 based on the assumption that the entire portfolio is marketed to a single purchaser. |
The Mortgage Loan.The mortgage loan (the “Starwood Hotel Portfolio Mortgage Loan”) is part of a whole loan (the “Starwood Hotel Portfolio Whole Loan”) evidenced by fourpari passu promissory notes in the aggregate original principal balance of $265,000,000, which are secured by the first priority fee interest in a portfolio of 22 hospitality properties (the “Starwood Hotel Portfolio Properties”). The Starwood Hotel Portfolio Whole Loan was originated on August 16, 2018 by Wells Fargo Bank, National Association. The Starwood Hotel Portfolio Whole Loan had an original principal balance of $265,000,000, has an outstanding principal balance as of the Cut-off Date of $265,000,000 and accrues interest at an interest rate of 5.150%per annum. The Starwood Hotel Portfolio Whole Loan had an initial term of 120 months, has a remaining term of 117 months as of the Cut-off Date and requires payments of interest only through the loan term. The Starwood Hotel Portfolio Whole Loan matures on September 11, 2028.
The Starwood Hotel Portfolio Mortgage Loan, evidenced by the non-controlling Note A-4, will be contributed to the WFCM 2018-C48 securitization trust, had an original principal balance of $30,000,000 and has an outstanding principal balance as of the Cut-off Date of $30,000,000. The controlling Note A-1 had an original principal balance of $70,000,000, has an outstanding principal balance as of the Cut-off Date of $70,000,000 and was contributed to the WFCM 2018-C47 securitization trust. The non-controlling Note A-2 had an
THE INFORMATION IN THIS STRUCTURAL AND COLLATERAL TERM SHEET IS NOT COMPLETE AND MAY BE AMENDED PRIOR TO THE TIME OF SALE. THIS TERM SHEET IS NOT AN OFFER TO SELL THESE SECURITIES AND IT IS NOT A SOLICITATION OF AN OFFER TO BUY THESE SECURITIES IN ANY JURISDICTION WHERE THE OFFER OR SALE IS NOT PERMITTED.
78
| Starwood Hotel Portfolio |
original principal balance of $65,000,000, has an outstanding principal balance as of the Cut-off Date of $65,000,000 and wascontributed to the BANK 2018-BNK14 securitization trust. The non-controlling Note A-3 had an original principal balance of $100,000,000, has an outstanding principal balance as of the Cut-off Date of $100,000,000 and was contributed to the BANK 2018-BNK15 securitization trust. The mortgage loans evidenced by Notes A-1, A-2, and A-3 are collectively referred to herein as the “Starwood Hotel Portfolio Companion Loans”. See “Description of the Mortgage Pool—The Whole Loans—The Serviced Pari Passu Whole Loans” and “Pooling and Servicing Agreement” in the Prospectus.
Note Summary
| Notes | Original Principal Balance | Note Holder | Controlling Interest | |
| A-1 | $70,000,000 | WFCM 2018-C47 | Yes | |
| A-2 | $65,000,000 | BANK 2018-BNK14 | No | |
| A-3 | $100,000,000 | BANK 2018-BNK15 | No | |
| A-4 | $30,000,000 | WFCM 2018-C48 | No | |
| Total | $265,000,000 |
Prepayment of the Starwood Hotel Portfolio Whole Loan is permitted at any time on or after September 11, 2019 (the “Prepayment Lockout Date”). Defeasance of the Starwood Hotel Portfolio Whole Loan is permitted at any time after the earlier of (i) October 11, 2021 and (ii) two years from the closing date of the securitization that includes the lastpari passunote of the Starwood Hotel Portfolio Whole Loan to be securitized (the “Defeasance Lockout Date”). The assumed defeasance lockout period of 27 payments is based on the closing date of this transaction in December 2018.
Sources and Uses
| Sources | Uses | |||||||
| Original loan amount | $265,000,000 | 100.0% | Loan payoff | $245,817,666 | 92.8% | |||
| Closing costs | 11,487,269 | 4.3 | ||||||
| Reserves | 5,408,895 | 2.0 | ||||||
| Return of equity | 2,286,170 | 0.9 | ||||||
| Total Sources | $265,000,000 | 100.0% | Total Uses | $265,000,000 | 100.0% |
The Properties.The Starwood Hotel Portfolio Properties comprise 22 hotels offering a range of amenities across limited service, select service, full service and extended stay properties. The largest individual property (Renaissance St. Louis Airport Hotel) accounts for 13.4% of total rooms and 12.1% of underwritten net cash flow, and no other individual property accounts for more than 7.1% of total rooms or 10.5% of underwritten net cash flow. All of the Starwood Hotel Portfolio Properties have been built or renovated since 2012, with 19 properties representing 89.6% of underwritten net cash flow having been renovated since 2015. The hotels range in size from 77 to 393 rooms with an average room count of 134 rooms.
Approximately $81.5 million ($27,693 per room) of capital expenditures have been made at the Starwood Hotel Portfolio Properties since 2015, and the Starwood Hotel Portfolio Borrower has budgeted for approximately $31.9 million ($10,836 per room) in additional capital expenditures through 2022. Of the $31.9 million of budgeted capital expenditures, approximately $5.4 million ($1,838 per room) relates to brand-mandated renovations required by the related franchise agreements, which were reserved for at origination. The remainder of the budgeted expenditures relate to elective renovations and are not required to be completed by the Starwood Hotel Portfolio Whole Loan documents and were not reserved for.
The RDM Property is an 11-story, 209-room, full service hotel originally built in 1887 that had been offline for renovations from August 2016 until partially re-opening on October 15, 2018 and is expected to be fully open in December 2018. Such renovations total approximately $33.2 million ($158,753 per room) and included complete guest-facing upgrades and updating all mechanical, electrical and HVAC systems. The RDM Property accounts for 8.9% of the allocated loan amount, 7.1% of total rooms, and 9.3% of underwritten net cash flow.
THE INFORMATION IN THIS STRUCTURAL AND COLLATERAL TERM SHEET IS NOT COMPLETE AND MAY BE AMENDED PRIOR TO THE TIME OF SALE. THIS TERM SHEET IS NOT AN OFFER TO SELL THESE SECURITIES AND IT IS NOT A SOLICITATION OF AN OFFER TO BUY THESE SECURITIES IN ANY JURISDICTION WHERE THE OFFER OR SALE IS NOT PERMITTED.
79
| Starwood Hotel Portfolio |
The following table presents certain information relating to the Starwood Hotel Portfolio Properties:
| Property Name | City / State | Year Built / Renovated | No. of Rooms | Allocated Cut-off Date Balance(1) | % of Portfolio Cut-off Date Balance | Appraised Value | Allocated Cut-off Date LTV | UW Net Cash Flow | % of UW NCF | 5/31/18 Occ.(2) | TTM 5/31/18 RevPAR Pen.(2) |
| Renaissance St. Louis Airport Hotel | St. Louis, MO | 1987 / 2015 | 393 | $34,965,762 | 13.2% | $50,100,000 | 69.8% | $3,480,137 | 12.1% | 70.5% | 109.2% |
| Renaissance Des Moines Savery Hotel | Des Moines, IA | 1887 / 2018 | 209 | $23,659,468 | 8.9% | $33,600,000(3) | 70.4%(3) | $2,673,235(3) | 9.3%(3) | (3) | (3) |
| Residence Inn St. Louis Downtown | St. Louis, MO | 2006 / 2017 | 188 | $22,193,837 | 8.4% | $31,800,000 | 69.8% | $2,381,957 | 8.3% | 75.5% | 123.0% |
| Doubletree Hotel West Palm Beach Airport | West Palm Beach, FL | 1987 / 2015 | 175 | $21,914,669 | 8.3% | $29,700,000 | 73.8% | $3,016,297 | 10.5% | 87.7% | 104.4% |
| Courtyard Gulfport Beachfront | Gulfport, MS | 1972 / 2015 | 149 | $15,772,979 | 6.0% | $22,600,000 | 69.8% | $1,428,547 | 5.0% | 65.7% | 106.6% |
| Fairfield Inn Atlanta Downtown | Atlanta, GA | 1915 / 2012 | 156 | $14,656,308 | 5.5% | $21,000,000 | 69.8% | $1,413,835 | 4.9% | 69.5% | 87.0% |
| Hotel Indigo Chicago Vernon Hills | Vernon Hills, IL | 1997 / 2015 | 127 | $13,469,845 | 5.1% | $19,300,000 | 69.8% | $1,291,636 | 4.5% | 68.4% | 92.6% |
| Springhill Suites Chicago Southwest at Burr Ridge Hinsdale | Burr Ridge, IL | 2000 / 2015 | 128 | $12,074,006 | 4.6% | $17,300,000 | 69.8% | $1,432,507 | 5.0% | 70.8% | 126.3% |
| Holiday Inn & Suites Green Bay Stadium | Green Bay, WI | 2007 / 2015 | 118 | $11,794,838 | 4.5% | $16,900,000 | 69.8% | $1,314,971 | 4.6% | 72.1% | 98.6% |
| Springhill Suites Chicago Elmhurst Oakbrook Area | Elmhurst, IL | 2000 / 2015 | 128 | $10,817,751 | 4.1% | $15,500,000 | 69.8% | $1,223,279 | 4.3% | 77.5% | 146.3% |
| Hilton Garden Inn Wichita | Wichita, KS | 2000 / 2016 | 103 | $9,421,912 | 3.6% | $13,500,000 | 69.8% | $1,198,180 | 4.2% | 78.5% | 144.5% |
| Courtyard Norman | Norman, OK | 2009 / 2016 | 113 | $8,095,865 | 3.1% | $11,600,000 | 69.8% | $827,823 | 2.9% | 65.4% | 115.2% |
| Springhill Suites Scranton Wilkes Barre | Moosic, PA | 2012 / NAP | 102 | $7,746,905 | 2.9% | $11,100,000 | 69.8% | $829,052 | 2.9% | 73.9% | 94.9% |
| Courtyard Salisbury | Salisbury, MD | 2006 / 2015 | 106 | $7,467,738 | 2.8% | $10,700,000 | 69.8% | $636,356 | 2.2% | 66.1% | 118.4% |
| Homewood Suites St. Louis Riverport Airport West | Maryland Heights, MO | 2007 / 2017 | 104 | $7,397,946 | 2.8% | $10,600,000 | 69.8% | $662,010 | 2.3% | 76.3% | 129.2% |
| Residence Inn Rocky Mount | Rocky Mount, NC | 1999 / 2016 | 77 | $7,397,946 | 2.8% | $10,600,000 | 69.8% | $784,222 | 2.7% | 72.7% | 121.2% |
| Hampton Inn and Suites Wichita Northeast | Wichita, KS | 2009 / 2017 | 102 | $7,048,986 | 2.7% | $10,100,000 | 69.8% | $898,704 | 3.1% | 72.1% | 128.8% |
| Residence Inn Salisbury | Salisbury, MD | 2007 / 2015 | 84 | $6,979,194 | 2.6% | $10,000,000 | 69.8% | $585,659 | 2.0% | 77.0% | 125.3% |
| Courtyard Rocky Mount | Rocky Mount, NC | 2000 / 2015 | 90 | $5,653,147 | 2.1% | $8,100,000 | 69.8% | $614,727 | 2.1% | 67.6% | 97.0% |
| Springhill Suites Wichita East at Plazzio | Wichita, KS | 2009 / 2016 | 102 | $5,583,355 | 2.1% | $8,000,000 | 69.8% | $628,629 | 2.2% | 69.1% | 99.0% |
| Residence Inn Wichita East at Plazzio | Wichita, KS | 2005 / 2013 | 93 | $5,583,355 | 2.1% | $8,000,000 | 69.8% | $736,422 | 2.6% | 73.3% | 109.6% |
| Hampton Inn Oklahoma City Northwest | Oklahoma City, OK | 1997 / 2016 | 96 | $5,304,188 | 2.0% | $7,600,000 | 69.8% | $600,304 | 2.1% | 70.3% | 102.2% |
| Total/Weighted Average | 2,943 | $265,000,000 | 100.0% | $401,000,000(4) | 66.1% | $28,658,491 | 100.0% | 72.5%(3) | 112.5%(3) |
| (1) | Balances shown are for the Starwood Hotel Portfolio Whole Loan. |
| (2) | Occupancy shown was obtained from borrower operating statements, and RevPAR Penetration Rates were obtained from various third party reports. |
| (3) | The RDM Property is excluded from the total portfolio weighted averages for occupancy and RevPAR penetration, as it was closed for renovations from August 2016 through mid-October 2018. The RDM Property partially re-opened on October 15, 2018 and is expected to be fully open in December 2018. The UW Net Cash Flow for the RDM Property is based on assumptions set forth in the related appraisal. The appraised value shown represents the as if complete value as of July 6, 2018. The as-is appraised value as of July 6, 2018 is $27,700,000, which would equate to an allocated Cut-off Date LTV of 85.4%. |
(4) | The individual property level appraised values total $377,700,000, which would equate to a Cut-off Date LTV Ratio and LTV Ratio at Maturity of 70.2%; however, the appraisal concluded to a portfolio value of $401,000,000 based on the assumption that the entire portfolio is marketed to a single purchaser. |
THE INFORMATION IN THIS STRUCTURAL AND COLLATERAL TERM SHEET IS NOT COMPLETE AND MAY BE AMENDED PRIOR TO THE TIME OF SALE. THIS TERM SHEET IS NOT AN OFFER TO SELL THESE SECURITIES AND IT IS NOT A SOLICITATION OF AN OFFER TO BUY THESE SECURITIES IN ANY JURISDICTION WHERE THE OFFER OR SALE IS NOT PERMITTED.
80
| Starwood Hotel Portfolio |
The following table presents certain information relating to the property sub-types of the Starwood Hotel Portfolio Properties:
Property Sub-Type
| Property Sub-Type | # of Hotels | # of Rooms | UW NCF | % of Total UW NCF | Appraised Value | Appraised Value Per Room | 5/31/2018 |
| Extended Stay | 5 | 546 | $5,150,270 | 18.0% | $71,000,000 | $130,037 | 122.0% |
| Full Service | 4 | 895 | $10,484,640 | 36.6% | $130,300,000 | $145,587 | 106.2%(2) |
| Select Service | 6 | 688 | $5,997,269 | 20.9% | $85,800,000 | $124,709 | 111.7% |
| Limited Service | 7 | 814 | $7,026,310 | 24.5% | $90,600,000 | $111,302 | 112.0% |
| Total/Weighted Average | 22 | 2,943 | $28,658,491 | 100.0% | $401,000,000(3) |
| (1) | Information obtained from various third party reports. |
| (2) | The RevPAR Penetration for Full Service Hotels excludes the RDM Property, which had been closed for renovations since August 2016. |
| (3) | The individual property level appraised values total $377,700,000, which would equate to a Cut-off Date LTV Ratio and LTV Ratio at Maturity of 70.2%; however, the appraisal concluded to a portfolio value of $401,000,000 based on the assumption that the entire portfolio is marketed to a single purchaser. |
The following table presents certain information relating to the historical and budgeted capital expenditures at the Starwood Hotel Portfolio Properties:
Historical and Budgeted Capital Expenditures
| 2012 | 2013 | 2014 | 2015 | 2016 | 2017 | 2018 YTD | 2018 Budget(2) | 2019 Budget(2) | 2020 Budget(2) | 2021 Budget(2) | 2022 Budget(2) | Total | |
| Cap Ex(1) | $77 | $177 | $1,671 | $25,620 | $24,743 | $25,991 | $5,146 | $7,134 | $2,625 | $1,758 | $3,945 | $16,428 | $115,315 |
| Per Room | $26 | $60 | $568 | $8,705 | $8,407 | $8,831 | $1,749 | $2,424 | $892 | $597 | $1,340 | $5,582 | $39,183 |
| (1) | The capital expenditures are shown in thousands. |
| (2) | Of the budgeted capital expenditures shown for 2018 through 2022, approximately $5.4 million relates to brand-mandated renovations required by the related franchise agreements, which were reserved at origination. The remainder of the budgeted expenditures relate to elective renovations and are not required to be completed by the Starwood Hotel Portfolio Whole Loan documents and have not been reserved. |
The following table presents certain information relating to the flags and brands of the Starwood Hotel Portfolio Properties:
Property Flags and Brands
| Brand | # of Hotels | # of Rooms | % of Rooms | Allocated Cut-off Date Balance(1) | Allocated Cut-off Date Balance Per Room | UW Net Cash Flow | % of Total UW NCF | Appraised Value | LTV |
| Marriott | |||||||||
| Renaissance | 2 | 602 | 20.5% | $58,625,230 | $97,384 | $6,153,372(2) | 21.5%(2) | $83,700,000 | 70.0% |
| Residence Inn | 4 | 442 | 15.0% | $42,154,332 | $95,372 | $4,488,260 | 15.7% | $60,400,000 | 69.8% |
| Courtyard | 4 | 458 | 15.6% | $36,989,729 | $80,764 | $3,507,453 | 12.2% | $53,000,000 | 69.8% |
| Springhill Suites | 4 | 460 | 15.6% | $36,222,017 | $78,744 | $4,113,467 | 14.4% | $51,900,000 | 69.8% |
| Fairfield Inn | 1 | 156 | 5.3% | $14,656,308 | $93,951 | $1,413,835 | 4.9% | $21,000,000 | 69.8% |
| Total Marriott | 15 | 2,118 | 72.0% | $188,647,616 | $89,069 | $19,676,387 | 68.7% | $270,000,000 | 69.9% |
| Hilton | |||||||||
| Homewood Suites | 1 | 104 | 3.5% | $7,397,946 | $71,134 | $662,010 | 2.3% | $10,600,000 | 69.8% |
| Hampton Inn | 2 | 198 | 6.7% | $12,353,174 | $62,390 | $1,499,008 | 5.2% | $17,700,000 | 69.8% |
| Hilton Garden Inn | 1 | 103 | 3.5% | $9,421,912 | $91,475 | $1,198,180 | 4.2% | $13,500,000 | 69.8% |
| Doubletree | 1 | 175 | 5.9% | $21,914,669 | $125,227 | $3,016,297 | 10.5% | $29,700,000 | 73.8% |
| Total Hilton | 5 | 580 | 19.7% | $51,087,701 | $88,082 | $6,375,495 | 22.2% | $71,500,000 | 71.5% |
| Intercontinental | |||||||||
| Holiday Inn & Suites | 1 | 118 | 4.0% | $11,794,838 | $99,956 | $1,314,971 | 4.6% | $16,900,000 | 69.8% |
| Hotel Indigo | 1 | 127 | 4.3% | $13,469,845 | $106,062 | $1,291,636 | 4.5% | $19,300,000 | 69.8% |
| Total Intercontinental | 2 | 245 | 8.3% | $25,264,683 | $103,121 | $2,606,607 | 9.1% | $36,200,000 | 69.8% |
| Total/Weighted Average | 22 | 2,943 | $265,000,000 | $90,044 | 28,658,491 | 100.0% | $401,000,000(3) |
| (1) | Balances shown are for the Starwood Hotel Portfolio Whole Loan. |
| (2) | The RDM Property has been offline for renovations since August 2016, partially re-opened on October 15, 2018, and is expected to be fully open in December 2018. The UW Net Cash Flow for the RDM Property is based on the assumptions set forth in the appraisal. |
| (3) | The individual property level appraised values total $377,700,000, which would equate to a Cut-off Date LTV Ratio and LTV Ratio at Maturity of 70.2%; however, the appraisal concluded to a portfolio value of $401,000,000 based on the assumption that the entire portfolio is marketed to a single purchaser. |
THE INFORMATION IN THIS STRUCTURAL AND COLLATERAL TERM SHEET IS NOT COMPLETE AND MAY BE AMENDED PRIOR TO THE TIME OF SALE. THIS TERM SHEET IS NOT AN OFFER TO SELL THESE SECURITIES AND IT IS NOT A SOLICITATION OF AN OFFER TO BUY THESE SECURITIES IN ANY JURISDICTION WHERE THE OFFER OR SALE IS NOT PERMITTED.
81
| Starwood Hotel Portfolio |
The following table presents certain information relating to the franchise agreement expirations of the Starwood Hotel Portfolio Properties:
Franchise Expiration Summary
Year | # Hotels | # Rooms | % Rooms | Cumulative # of Rooms Expiring | Cumulative % of Rooms Expiring | UW NCF | % UW NCF |
| 2018 | 0 | 0 | 0.0% | 0 | 0.0% | $0 | 0.0% |
| 2019 | 0 | 0 | 0.0% | 0 | 0.0% | $0 | 0.0% |
| 2020 | 0 | 0 | 0.0% | 0 | 0.0% | $0 | 0.0% |
| 2021 | 0 | 0 | 0.0% | 0 | 0.0% | $0 | 0.0% |
| 2022 | 0 | 0 | 0.0% | 0 | 0.0% | $0 | 0.0% |
| 2023 | 0 | 0 | 0.0% | 0 | 0.0% | $0 | 0.0% |
| 2024(1) | 2 | 256 | 8.7% | 256 | 8.7% | $2,655,786 | 9.3% |
| 2025 | 0 | 0 | 0.0% | 256 | 8.7% | $0 | 0.0% |
| 2026(2) | 1 | 106 | 3.6% | 362 | 12.3% | $636,356 | 2.2% |
| 2027 | 1 | 84 | 2.9% | 446 | 15.2% | $585,659 | 2.0% |
| 2028(3) | 2 | 267 | 9.1% | 713 | 24.2% | $2,743,518 | 9.6% |
| 2029 & Beyond | 16 | 2,230 | 75.8% | 2,943 | 100.0% | $22,037,170 | 76.9% |
| Total/Weighted Average | 22 | 2,943 | 100.0% | $28,658,491 | 100.0% |
| (1) | The franchise agreements for SpringHill Suites Elmhurst Oakbrook Area and SpringHill Suites Chicago Southwest at Burr Ridge Hinsdale each include extension options to either 2029 or 2034 subject to certain property improvement plan requirements outlined in the respective franchise agreements. |
| (2) | The franchise agreement for Courtyard Salisbury has one, 10-year renewal option subject to certain terms outlined in the franchise agreement. |
| (3) | The franchise agreement for Courtyard Gulfport Beachfront has one, 10-year renewal option subject to certain terms outlined in the franchise agreement. |
Operating History and Underwritten Net Cash Flow.The following table presents certain information relating to the historical operating performance and the underwritten net cash flow at the Starwood Hotel Portfolio Properties:
Cash Flow Analysis(1)
| 2015 | 2016(1) | 2017(1) | TTM (1)(2) | UW Excluding RDM | UW RDM Only | UW(2) | % of U/W Total Revenue | U/W $ per Room | |||||||||||||||||||
| Occupancy | 72.4% | 71.5% | 72.0% | 72.5% | 72.5% | 65.0% | 71.9% | ||||||||||||||||||||
| ADR | $112.51 | $114.55 | $116.14 | $116.97 | $116.97 | $170.98 | $120.44 | ||||||||||||||||||||
| RevPAR | $81.42 | $81.85 | $83.62 | $84.77 | $84.77 | $111.14 | $86.64 | ||||||||||||||||||||
| Room Revenue | $87,465,272 | $81,899,359 | $83,441,436 | $84,593,757 | $84,593,757 | �� | $8,478,071 | $93,071,828 | 87.3% | $31,625 | |||||||||||||||||
| F&B Revenue | 9,250,986 | 8,103,985 | 7,697,959 | 7,829,732 | 7,829,732 | 3,016,524 | 10,846,256 | 10.2 | 3,685 | ||||||||||||||||||
| Other Revenue(3) | 2,669,481 | 2,511,951 | 2,252,133 | 2,284,070 | 2,284,070 | 412,428 | 2,696,498 | 2.5 | 916 | ||||||||||||||||||
| Total Revenue | $99,385,739 | $92,515,295 | $93,391,528 | $94,707,559 | $94,707,559 | $11,907,023 | $106,614,582 | 100.0% | $36,226 | ||||||||||||||||||
| Total Department Expenses | 27,992,309 | 25,950,306 | 26,623,065 | 27,010,784 | 27,010,784 | 4,035,966 | 31,046,750 | 29.1 | 10,549 | ||||||||||||||||||
| Gross Operating Income | $71,393,430 | $66,564,989 | $66,768,463 | $67,696,775 | $67,696,775 | $7,871,057 | $75,567,832 | 70.9% | 25,677 | ||||||||||||||||||
| Total Undistributed Expenses | 33,118,817 | 31,281,406 | 31,633,726 | 32,120,237 | 32,120,237 | 3,923,822 | 36,044,059 | 33.8 | 12,247 | ||||||||||||||||||
| Gross Operating Profit | $38,274,613 | $35,283,583 | $35,134,737 | 35,576,538 | 35,576,538 | $3,947,235 | $39,523,773 | 37.1% | 13,430 | ||||||||||||||||||
| Total Fixed Charges | 5,964,600 | 5,911,400 | 5,657,619 | 5,622,164 | 5,622,164 | 678,649 | 6,300,813 | 5.9 | 2,141 | ||||||||||||||||||
| Net Operating Income | $32,310,013 | $29,372,183 | $29,477,118 | $29,954,374 | 29,954,374 | $3,268,586 | $33,222,960 | 31.2% | $11,289 | ||||||||||||||||||
| FF&E | 0 | 0 | 0 | 0 | 3,969,118 | 595,351 | 4,564,469 | 4.3 | 1,551 | ||||||||||||||||||
| Net Cash Flow | $32,310,013 | $29,372,183 | $29,477,118 | $29,954,374 | $25,985,256 | $2,673,235 | $28,658,491 | 26.9% | $9,738 | ||||||||||||||||||
| NOI DSCR | 2.34x | 2.12x | 2.13x | 2.16x | 2.16x | NAP | 2.40x | ||||||||||||||||||||
| NCF DSCR | 2.34x | 2.12x | 2.13x | 2.16x | 1.88x | NAP | 2.07x | ||||||||||||||||||||
| NOI DY | 12.2% | 11.1% | 11.1% | 11.3% | 11.3% | NAP | 12.5% | ||||||||||||||||||||
| NCF DY | 12.2% | 11.1% | 11.1% | 11.3% | 9.8% | NAP | 10.8% | ||||||||||||||||||||
| (1) | The RDM Property is excluded from Occupancy, ADR and RevPAR statistics and historical cash flows for 2016, 2017 and TTM 5/31/2018, as it was closed for renovations from August 2016 through mid-October 2018. The RDM Property partially re-opened on October 15, 2018, is expected to be fully open in December 2018, and is included in the UW. The underwriting for the RDM Property is based on the cash flow estimates set forth in the related appraisal. |
| (2) | The increase from TTM 5/31/2018 NOI to UW NOI results from the inclusion of the RDM Property. |
| (3) | Other Income consists of guest laundry/dry cleaning, ATM commissions, vending machines commissions, cancellation/attrition fees, convenience store sales, pet fees, telephone revenue, parking revenue and other miscellaneous income. |
| (4) | The debt service coverage ratios and debt yields shown are based on the Starwood Hotel Portfolio Whole Loan. |
Appraisal.The appraiser concluded to an “as is” appraised value for the Starwood Hotel Portfolio Properties of $401,000,000.
Environmental Matters.According to the Phase I environmental site assessments, there are no recognized environmental conditions at the Starwood Hotel Portfolio Properties.
THE INFORMATION IN THIS STRUCTURAL AND COLLATERAL TERM SHEET IS NOT COMPLETE AND MAY BE AMENDED PRIOR TO THE TIME OF SALE. THIS TERM SHEET IS NOT AN OFFER TO SELL THESE SECURITIES AND IT IS NOT A SOLICITATION OF AN OFFER TO BUY THESE SECURITIES IN ANY JURISDICTION WHERE THE OFFER OR SALE IS NOT PERMITTED.
82
| Starwood Hotel Portfolio |
Market Overview and Competition. The portfolio is located across 16 cities in 12 states, with the largest concentrations in Missouri (23.3% of rooms, 22.8% of underwritten net cash flow), Kansas (13.6% of rooms, 12.1% of underwritten net cash flow) and Illinois (13.0% of rooms, 13.8% of underwritten net cash flow).
Excluding the RDM Property (which has been closed for renovations since August 2016, partially re-opened on October 15, 2018, and is expected to be fully open in December 2018), the Starwood Hotel Portfolio Properties reported weighted average occupancy, ADR and RevPAR penetration rates each in excess of 105% for 2015 through the trailing 12-month period ending May 31, 2018. Additionally, excluding the RDM Property, approximately 74.6% of the Starwood Hotel Portfolio Properties based on room count achieved a RevPAR penetration in excess of 100.0% for the trailing 12-month period ending May 31, 2018.
The following tables present certain information relating to the weighted average historical occupancy, ADR, RevPAR and penetration rates of the Starwood Hotel Portfolio Properties:
Historical Occupancy, ADR and RevPAR(1)(2)
| Starwood Hotel Portfolio | Penetration Rates | |||||
| Year | Occupancy | ADR | RevPAR | Occupancy | ADR | RevPAR |
| 2015 | 71.9% | $112.45 | $80.92 | 105.8% | 106.7% | 113.1% |
| 2016 | 71.5% | $114.70 | $81.90 | 105.6% | 106.4% | 112.2% |
| 2017 | 72.3% | $115.77 | $83.78 | 105.5% | 106.2% | 111.9% |
| TTM May 2018 | 72.7% | $116.50 | $84.92 | 105.3% | 106.8% | 112.5% |
| (1) | Information obtained from various third party reports. |
| (2) | The RDM Property has been closed for renovations since August 2016 and is excluded from the weighted average portfolio historic occupancy, ADR, RevPAR and penetration rates. |
The Borrowers.The borrowers comprise 22 single-purpose Delaware limited partnerships, each of which is structured to be bankruptcy remote with two independent directors (collectively, the “Starwood Hotel Portfolio Borrower”). Each of the 22 borrower entities is indirectly owned by a Real Estate Investment Trust (“REIT”), which requires each borrower entity to lease the related hotel via an operating lease to a taxable REIT subsidiary. Legal counsel to the Starwood Hotel Portfolio Borrower delivered a non-consolidation opinion in connection with the origination of the Starwood Hotel Portfolio Whole Loan.
The Borrower Sponsor.The borrower sponsor and nonrecourse guarantor is SCG Hotel Investors Holdings L.P., an affiliate of Starwood Capital Group (“Starwood”). Starwood is a private alternative investment firm with a core focus on global real estate, energy infrastructure, and oil and gas. Starwood and its affiliates have raised over $45 billion of equity capital since its inception in 1991, currently manage approximately $56 billion in assets, and have more than 3,800 employees in 11 offices around the world. Over the past 26 years, Starwood has acquired approximately $92 billion of assets across various real estate classes. As of April 2018, SCG Hotel Investors Holdings L.P. indirectly owned 276 hotels totaling more than 23,990 keys across 40 states.
Escrows.At origination, the Starwood Hotel Portfolio Borrower deposited upfront reserves of $5,408,895 for property improvement plans related to the Fairfield Inn Atlanta Downtown ($983,740), Courtyard Rocky Mount ($184,616), and Renaissance Des Moines Savery Hotel ($4,240,539). The Starwood Hotel Portfolio Whole Loan documents also provide for ongoing monthly reserves for furniture, fixtures and equipment (“FF&E”) equal to the greater of (i) 1/12th of 4% of aggregate gross revenue for the 12-month period ending in the month that is two months prior to the applicable payment date and (ii) the aggregate monthly deposit amount required under the franchise agreements for FF&E work (currently $330,760).
The Starwood Hotel Portfolio Whole Loan documents do not require ongoing monthly escrows for insurance premiums as long as (i) no Cash Trap Event Period (as defined below) has occurred and is continuing; (ii) the Starwood Hotel Portfolio Borrower provides the lender with evidence that the insurance coverage for the Starwood Hotel Portfolio Properties is included in a blanket policy and such policy is in full force and effect; and (iii) the Starwood Hotel Portfolio Borrower pays all applicable insurance premiums and provides the lender with evidence of renewals. The Starwood Hotel Portfolio Whole Loan documents do not require ongoing monthly escrows for taxes as long as no Cash Trap Event Period has occurred and is continuing. Upon the continuance of a Cash Trap Event Period, ongoing tax and insurance reserves are required in an amount equal to 1/12th of the estimated property taxes and insurance premiums payable during the ensuing 12 months.
Lockbox and Cash Management.A soft lockbox with springing cash management is in place with respect to the Starwood Hotel Portfolio Whole Loan. The Starwood Hotel Portfolio Borrower, property manager and operating lessee are required to deposit property income into the lockbox account within three business days after receipt, and commercial tenants and credit card providers are required to deposit rents and income directly into the lockbox during the continuance of an event of default. During a Cash Trap Event Period, all excess cash flow is required to be held in the excess cash flow sub account as additional security for the Starwood Hotel Portfolio Whole Loan.
A “Cash Trap Event Period” will commence upon the earliest of the following:
| (i) | the occurrence of an event of default under the Starwood Hotel Portfolio Whole Loan; |
| (ii) | the net cash flow debt yield falling below 8.0% for the immediately preceding calendar quarter; or |
| (iii) | two or more franchise agreements having expired or having been terminated at any given overlapping time during the loan term. |
THE INFORMATION IN THIS STRUCTURAL AND COLLATERAL TERM SHEET IS NOT COMPLETE AND MAY BE AMENDED PRIOR TO THE TIME OF SALE. THIS TERM SHEET IS NOT AN OFFER TO SELL THESE SECURITIES AND IT IS NOT A SOLICITATION OF AN OFFER TO BUY THESE SECURITIES IN ANY JURISDICTION WHERE THE OFFER OR SALE IS NOT PERMITTED.
83
| Starwood Hotel Portfolio |
A Cash Trap Event Period will end upon the occurrence of the following:
| ● | with regard to clause (i), the cure of such event of default; |
| ● | with regard to clause (ii), the net cash flow debt yield being equal to or greater than 8.0% for two consecutive calendar quarters (which may be achieved by a prepayment or delivery of a letter of credit in an amount which, if applied to the Starwood Hotel Portfolio Whole Loan balance, would satisfy such debt yield test); and |
| ● | with regard to clause (iii), (A) the replacement of at least one of the applicable expired or terminated franchise agreements in accordance with the loan documents, or (B) the release of the applicable individual property in accordance with the loan documents (see “Partial Release”). |
Property Management. Each of the Starwood Hotel Portfolio Properties is subject to an individual management agreement with Schulte Hospitality Group, Inc. (“Schulte”). As of 2018, Schulte was the 12th largest hotel management company in the United States, with 108 hotels under management totaling over 15,320 keys across 26 states. Schulte has completed 62 renovations and 18 ground-up constructions since inception in 1999.
Assumption. The Starwood Hotel Portfolio Borrower has the right to transfer any of the Starwood Hotel Portfolio Propertiesprovided that certain conditions are satisfied, including (i) no event of default has occurred and is continuing; (ii) the lender’s reasonable determination that the proposed transferee and guarantor satisfy the lender’s credit review and underwriting standards, taking into consideration of transferee experience, financial strength and general business standing; and (iii) if requested by the lender, rating agency confirmation from Fitch, KBRA and Moody’s that the transfer will not result in a downgrade, withdrawal or qualification of the respective ratings assigned to the Series 2018-C48 Certificates and similar confirmations from each rating agency rating any securities backed by the Starwood Hotel Portfolio Companion Loans with respect to the ratings of such securities.
Partial Release.After the Defeasance Lockout Date or Prepayment Lockout Date (as applicable), the Starwood Hotel Portfolio Borrower may obtain the release of any of the Starwood Hotel Portfolio Properties,provided that, among other things, and in accordance with the Starwood Hotel Portfolio Whole Loan documents, (a) no event of default has occurred and is continuing (unless a non-monetary default specifically related to the released property is ongoing, in which event the Starwood Hotel Portfolio Borrower may obtain the release of such property under certain conditions, which if exercised prior to the Prepayment Lockout Date may be by partial prepayment only along with any applicable yield maintenance premium); (b) the Starwood Hotel Portfolio Whole Loan is either partially defeased or partially prepaid (along with any applicable yield maintenance premium) in an amount equal to the Release Price (as defined below); (c) the net cash flow debt yield for the remaining Starwood Hotel Portfolio Properties immediately following the release is equal to or greater than the greater of (i) 10.81% and (ii) the net cash flow debt yield immediately prior to the release;provided, however, that the Starwood Hotel Portfolio Borrower has the right to partially defease or prepay the Starwood Hotel Portfolio Whole Loan further or deliver cash or a letter of credit as additional collateral in order to meet such debt yield test; (d) a legal opinion covering compliance in all respects with all laws, rules and regulations governing REMICs has been delivered; and (e) with respect to a partial defeasance, rating agency confirmation is received. All releases subsequent to the first release are required to match the release format, prepayment or partial defeasance, selected for the first release. The allocated loan amount for each of the Starwood Hotel Portfolio Properties is subject topro rata reduction by the release premium and prepayment or non-release prepayment to account for previous prepayments and partial defeasances.
“Release Price” is an amount equal to the following amounts;provided, however, that if the release of any individual property would cause the aggregate amount partially defeased or prepaid to exceed either the 10% or 20% thresholds outlined below, then the Release Price for such property would be equal to the product of the allocated loan amount and thepro rata weighted average of the release prices outlined below:
| ● | 105% of the allocated loan amount for such property if less than or equal to 10% of the original principal balance of the Starwood Hotel Portfolio Whole Loan has been partially defeased or prepaid; |
| ● | 110% of the allocated loan amount for such property if more than 10% but less than or equal to 20% of the original principal balance of the Starwood Hotel Portfolio Whole Loan has been partially defeased or prepaid; and |
| ● | 115% of the allocated loan amount for such property if more than 20% of the original principal balance of the Starwood Hotel Portfolio Whole Loan has been partially defeased or prepaid. |
The allocated loan amount for each property is subject topro rata reduction to account for previous prepayments under the Starwood Hotel Portfolio Whole Loan, including in connection with prior partial releases and partial defeasances.
Real Estate Substitution.Not permitted.
Subordinate and Mezzanine Indebtedness.Not permitted.
Ground Lease.None.
Terrorism Insurance.The Starwood Hotel Portfolio Whole Loan documents require that the “all risk” insurance policy required to be maintained by the Starwood Hotel Portfolio Borrower provides coverage for terrorism in an amount equal to the full replacement cost of the Starwood Hotel Portfolio Properties. The loan documents also require business interruption insurance covering no less than the 18 month period following the occurrence of a casualty event, together with a 12 month extended period of indemnity (provided that if TRIPRA or a similar statute is not in effect, the Starwood Hotel Portfolio Borrower will not be obligated to pay terrorism insurance premiums in excess of two times the premium for the casualty and business interruption coverage on a stand-alone basis). See “Risk Factors—Risks Relating to the Mortgage Loans—Terrorism Insurance May Not Be Available for All Mortgaged Properties” in the Prospectus.
Windstorm Insurance.The Starwood Hotel Portfolio Whole Loan documents require windstorm and flood insurance covering the full replacement cost of the Starwood Hotel Portfolio Properties during the loan term. At the time of loan closing, Starwood Hotel Portfolio Properties had windstorm insurance coverage and flood insurance in the maximum limit available under the National Flood Insurance Program together with excess coverage.
THE INFORMATION IN THIS STRUCTURAL AND COLLATERAL TERM SHEET IS NOT COMPLETE AND MAY BE AMENDED PRIOR TO THE TIME OF SALE. THIS TERM SHEET IS NOT AN OFFER TO SELL THESE SECURITIES AND IT IS NOT A SOLICITATION OF AN OFFER TO BUY THESE SECURITIES IN ANY JURISDICTION WHERE THE OFFER OR SALE IS NOT PERMITTED.
84
(THIS PAGE INTENTIONALLY LEFT BLANK)
THE INFORMATION IN THIS STRUCTURAL AND COLLATERAL TERM SHEET IS NOT COMPLETE AND MAY BE AMENDED PRIOR TO THE TIME OF SALE. THIS TERM SHEET IS NOT AN OFFER TO SELL THESE SECURITIES AND IT IS NOT A SOLICITATION OF AN OFFER TO BUY THESE SECURITIES IN ANY JURISDICTION WHERE THE OFFER OR SALE IS NOT PERMITTED.
85
| Franklin Towne Center |
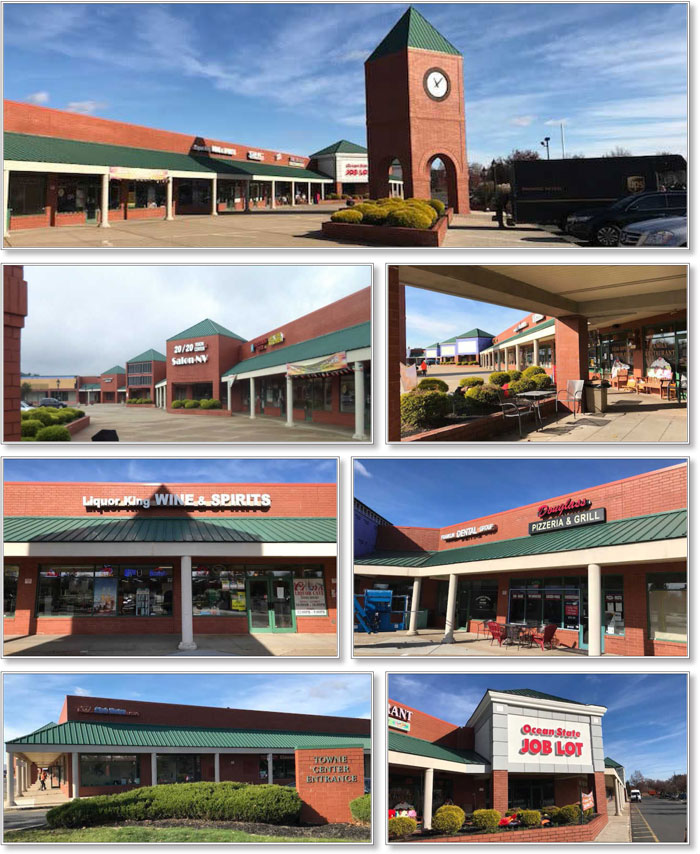
THE INFORMATION IN THIS STRUCTURAL AND COLLATERAL TERM SHEET IS NOT COMPLETE AND MAY BE AMENDED PRIOR TO THE TIME OF SALE. THIS TERM SHEET IS NOT AN OFFER TO SELL THESE SECURITIES AND IT IS NOT A SOLICITATION OF AN OFFER TO BUY THESE SECURITIES IN ANY JURISDICTION WHERE THE OFFER OR SALE IS NOT PERMITTED.
86
| Franklin Towne Center |

THE INFORMATION IN THIS STRUCTURAL AND COLLATERAL TERM SHEET IS NOT COMPLETE AND MAY BE AMENDED PRIOR TO THE TIME OF SALE. THIS TERM SHEET IS NOT AN OFFER TO SELL THESE SECURITIES AND IT IS NOT A SOLICITATION OF AN OFFER TO BUY THESE SECURITIES IN ANY JURISDICTION WHERE THE OFFER OR SALE IS NOT PERMITTED.
87
| No. 7 – Franklin Towne Center | |||||||
| Loan Information | Property Information | ||||||
| Mortgage Loan Seller: | Argentic Real Estate Finance LLC | Single Asset/Portfolio: | Single Asset | ||||
Credit Assessment | Property Type: | Retail | |||||
| (Fitch/KBRA/Moody’s): | NR/NR/NR | Specific Property Type: | Anchored | ||||
| Original Principal Balance: | $29,000,000 | Location: | Franklin Park, NJ | ||||
| Cut-off Date Balance: | $29,000,000 | Size: | 138,364 SF | ||||
| % of Initial Pool Balance: | 3.5% | Cut-off Date Balance Per SF: | $209.59 | ||||
| Loan Purpose: | Refinance | Year Built/Renovated: | 1993/NAP | ||||
| Borrower Name: | Franklin Norse, LLC | Title Vesting: | Fee(2) | ||||
| Borrower Sponsors: | Michael Levine; Uri Moche | Property Manager: | Self-managed | ||||
| Mortgage Rate: | 5.410% | 4thMost Recent Occupancy (As of)(3): | 100.0% (12/31/2014) | ||||
| Note Date: | November 20, 2018 | 3rdMost Recent Occupancy (As of)(3): | 100.0% (12/31/2015) | ||||
| Anticipated Repayment Date: | October 6, 2028 | 2ndMost Recent Occupancy (As of)(3): | 100.0% (12/31/2016) | ||||
| Maturity Date: | December 6, 2030 | Most Recent Occupancy (As of)(3): | 100.0% (12/31/2017) | ||||
| IO Period: | 0 months | Current Occupancy (As of)(3): | 100.0% (12/1/2018) | ||||
| Loan Term (Original): | 118 months | ||||||
| Seasoning: | 0 months | ||||||
| Amortization Term (Original): | 264 months | Underwriting and Financial Information: | |||||
| Loan Amortization Type: | Amortizing ARD | 4thMost Recent NOI (As of): | $3,162,500 (12/31/2015) | ||||
| Interest Accrual Method: | Actual/360 | 3rdMost Recent NOI (As of)(3): | $3,120,000 (12/31/2016) | ||||
| Call Protection: | L(24),D(90),O(4) | 2ndMost Recent NOI (As of)(3): | $3,212,500 (12/31/2017) | ||||
| Lockbox Type: | Hard/Springing Cash Management | Most Recent NOI (As of)(3): | $3,400,000 (TTM 9/30/2018) | ||||
| Additional Debt: | No | ||||||
| Additional Debt Type: | NAP | ||||||
| U/W Revenues: | $3,758,236 | ||||||
| U/W Expenses: | $131,538 | ||||||
| U/W NOI: | $3,626,698 | ||||||
| U/W NCF: | $3,536,761 | ||||||
| U/W NOI DSCR: | 1.61x | ||||||
| Escrows and Reserves: | U/W NCF DSCR: | 1.57x | |||||
| U/W NOI Debt Yield: | 12.5% | ||||||
| Type: | Initial | Monthly | Cap (If Any) | U/W NCF Debt Yield: | 12.2% | ||
| Taxes | $0 | Springing | NAP | As-Is Appraised Value(4): | $47,800,000 | ||
| Insurance | $0 | Springing | NAP | As-Is Appraisal Valuation Date: | September 18, 2018 | ||
| TI/LC Reserve | $0 | $0 | NAP | Cut-off Date LTV Ratio(4): | 60.7% | ||
| Replacement Reserve | $0 | $2,883(1) | NAP | LTV Ratio at Maturity or ARD(5): | 42.6% | ||
| (1) | The monthly replacement reserve is conditionally waived as of Cut-off Date. Please see “Escrows” below. |
| (2) | The Franklin Towne Center Mortgage Loan (as defined below) is secured by the borrower’s fee interest in the Franklin Towne Center Property (as defined below) but does not include the related improvements. Please see “Collateral” below. |
| (3) | The information shown here is based solely on the terms of the master lease to Stop & Shop (as defined below). |
| (4) | Cut-off Date LTV and LTV Ratio at Maturity or ARD are based on the As-Is Appraised Value of $47,800,000, which includes the improvements. The borrower owns both the land and improvements, however, the lien of the Franklin Towne Center Property (as defined below) does not include the improvements. Please see “Collateral” below. |
| (5) | The balance at the Maturity Date, assuming no additional hyper-amortization after the Stop & Shop lease expiration date in October 2030 of approximately $14.2 million, net of the total excess cash flow collected under a Stop & Shop Non-Renewal Cash Flow Sweep (as defined below) of approximately $1.8 million would be equal to approximately $12.4 million (“Net Loan Exposure at Maturity”). Based on the Net Loan Exposure at Maturity, the LTV Ratio would be approximately 25.8% or $89.28 per square foot. |
The Mortgage Loan. The mortgage loan (the “Franklin Towne Center Mortgage Loan”) is evidenced by a single promissory note secured by the borrower’s fee interest in the land but does not include the related improvements (although such improvements are owned by the borrower) underlying a 138,364 square foot anchored retail center that is 100% master leased to Stop & Shop Supermarket Company, LLC (“Stop & Shop”) through October 31, 2030, located in Franklin Park, New Jersey (the “Franklin Towne Center Property”). The lease is guaranteed by Koninklijke Ahold Delhaize N.V. (rated BBB/Baa1/BBB by Fitch/Moody’s/S&P), Stop & Shop’s parent company. The Franklin Towne Center Mortgage Loan was originated on November 20, 2018 by Argentic Real Estate Finance LLC (“AREF”). The Franklin Towne Center Mortgage Loan had an original principal balance of $29,000,000, has an outstanding principal balance as of the Cut-off Date of $29,000,000 and accrues interest at an interest rate of 5.410%per annum. The Franklin Towne Center Mortgage Loan had an initial term of 118 months, has a remaining term of 118 months as of the Cut-off Date and requires payments of principal and interest based on a 22-year amortization schedule. The Franklin Towne Center Mortgage Loan has an anticipated repayment date (“ARD”) of October 6, 2028 and a stated maturity date of December 6, 2030 (the “Stated Maturity Date”). In the event the Franklin Towne Center Mortgage Loan is not repaid in full by the ARD, then, from and after the ARD, the Franklin Towne Center Mortgage Loan will accrue interest at a per annum rate equal to the greater of (i) the Initial Interest Rate plus 3% or (ii) the Treasury rate plus 3%; provided that interest accrued after the ARD will continue to be currently payable at the Initial Interest Rate with payment of the excess interest to be deferred until the outstanding principal balance of the Franklin Towne Center Mortgage Loan is paid in full. See “Description of the Mortgage Pool – Certain Terms of the Mortgage Loans – ARD Loans” in the Preliminary Prospectus.
THE INFORMATION IN THIS STRUCTURAL AND COLLATERAL TERM SHEET IS NOT COMPLETE AND MAY BE AMENDED PRIOR TO THE TIME OF SALE. THIS TERM SHEET IS NOT AN OFFER TO SELL THESE SECURITIES AND IT IS NOT A SOLICITATION OF AN OFFER TO BUY THESE SECURITIES IN ANY JURISDICTION WHERE THE OFFER OR SALE IS NOT PERMITTED.
88
| Franklin Towne Center |
Following the lockout period, on any date before July 26, 2028, the borrower has the right to defease the Franklin Towne Center Mortgage Loan in whole, but not in part. The Franklin Towne Center Mortgage Loan is prepayable without penalty on or after July 6, 2028.
Sources and Uses
| Sources | Uses | |||||||
| Original Loan amount | $29,000,000 | 98.9% | Loan payoff | $28,648,019 | 97.7% | |||
| Cash In | 327,882 | 1.1 | Closing costs | 679,863 | 2.3 | |||
| Total Sources | $29,327,882 | 100.0% | Total Uses | $29,327,882 | 100.0% |
The Property.The Franklin Towne Center Property is a 138,364 square foot retail shopping center located in Franklin Park, New Jersey. The Franklin Towne Center Property was built in 1993 and is situated on a 15.0 acre site. The Franklin Towne Center Property is located at the intersection of Route 27 and S. Middlebush Road, with multiple entrances along both roadways. Traffic counts along Lincoln Highway between S. Middlebush Road and Vliet Road are approximately 52,751 vehicles per day.
The Franklin Towne Center Property has an “L” shape and consists of 48,000 square feet of anchor space, 45,036 square feet of junior anchor space and 45,328 square feet of inline space. The Franklin Towne Center Property also contains 624 parking spaces, representing a 4.5 per 1,000 square foot ratio.
The Franklin Towne Center Property is 100% master leased by Stop & Shop; however, Stop & Shop does not physically occupy the Franklin Towne Center Property. Stop & Shop was the former grocery anchor tenant for the Franklin Towne Center Property but in 2005, relocated to a free-standing supermarket across the street on Route 27. Stop & Shop master leased the entire Franklin Towne Center Property reportedly to prevent a competing grocer from moving into its former location. The Stop & Shop lease has a 25-year lease term that commenced in October 2005 and expires in October 2030. The lease also provides for 11, five-year renewals which term will be automatically extended unless Stop & Shop provides at least 12-months’ notice. Each renewal option period includes annual rent steps averaging over 2.6% per year. Furthermore, the lease has a corporate guaranty from the tenant’s parent company, Koninklijke Ahold Delhaize N.V. (rated BBB/Baa1/BBB by Fitch/Moody’s/S&P), an international food retail conglomerate based in the Netherlands.
Under the terms of the master lease, Stop & Shop is responsible for performing all obligations of the landlord under each of the existing leases and also for entering into a property management agreement at its cost. Accordingly, the borrower’s operating statements are comprised only of rental payments from the master lessee (Stop & Shop), and net operating income is equal to the rental income paid. Stop & Shop is not required to and does not provide property-level operating revenue and expense detail to the borrower. At the time the master lease was executed, Stop & Shop was the anchor tenant and the Franklin Towne Center Property was nearly 100% occupied. Based on the site inspection conducted by AREF on November 14, 2018, a mix of retail and service tenants currently occupy approximately 90% of the inline space. Overall vacancy was estimated at 40% or 55,500 square feet, of which 48,000 vacant square feet is the former Stop & Shop box. The tenant roster includes Ocean State Job Lots, Franklin Dental Group, GNC, Club Metro Fitness, 20/20 Vision Center, Franklin Public Library and Nuevo Mexican Restaurant.
The following table presents certain information relating to the tenancy at the Franklin Towne Center Property:
Major Tenant(1)
| Tenant Name | Credit Rating (Fitch/Moody’s/S&P)(2) | Tenant NRSF | % of NRSF | Annual U/W Base Rent PSF(3) | Annual U/W Base Rent(3) | % of Total Annual U/W Base Rent | Lease Expiration Date |
| Major Tenant | |||||||
| Stop & Shop | BBB/Baa1/BBB | 138,364 | 100.0% | $27.64 | $3,824,500 | 100.0% | 10/31/2030 |
| Total Major Tenant | 138,364 | 100.0% | $27.64 | $3,824,500 | 100.0% | ||
| Non Major Tenants | 0 | 0.0% | $0.00 | 0 | 0.0% | ||
| Occupied Collateral Total | 138,364 | 100.0% | $27.64 | $3,824,500 | 100.0% | ||
| Vacant Space | 0 | 0.0% | |||||
| Collateral Total | 138,364 | 100.0% | |||||
| (1) | The information shown here is based solely on the terms of the master lease to Stop & Shop. |
| (2) | The ratings are those of the parent company, Koninklijke Ahold N.V., which guarantees the lease. |
| (3) | Annual U/W Base Rent PSF and Annual U/W Base Rent include contractual rent steps totalling $374,500 through October 2019. |
THE INFORMATION IN THIS STRUCTURAL AND COLLATERAL TERM SHEET IS NOT COMPLETE AND MAY BE AMENDED PRIOR TO THE TIME OF SALE. THIS TERM SHEET IS NOT AN OFFER TO SELL THESE SECURITIES AND IT IS NOT A SOLICITATION OF AN OFFER TO BUY THESE SECURITIES IN ANY JURISDICTION WHERE THE OFFER OR SALE IS NOT PERMITTED.
89
| Franklin Towne Center |
The following table presents certain information relating to the lease rollover schedule at the Franklin Towne Center Property:
Lease Expiration Schedule(1)(2)
| Year Ending December 31, | No. of Leases Expiring | Expiring NRSF | % of Total NRSF | Cumulative Expiring NRSF | Cumulative % of Total NRSF | Annual U/W Base Rent | % of Annual U/W Base Rent | Annual U/W Base Rent PSF |
| MTM | 0 | 0 | 0.0% | 0 | 0.0% | $0 | 0.0% | $0.00 |
| 2018 | 0 | 0 | 0.0% | 0 | 0.0% | $0 | 0.0% | $0.00 |
| 2019 | 0 | 0 | 0.0% | 0 | 0.0% | $0 | 0.0% | $0.00 |
| 2020 | 0 | 0 | 0.0% | 0 | 0.0% | $0 | 0.0% | $0.00 |
| 2021 | 0 | 0 | 0.0% | 0 | 0.0% | $0 | 0.0% | $0.00 |
| 2022 | 0 | 0 | 0.0% | 0 | 0.0% | $0 | 0.0% | $0.00 |
| 2023 | 0 | 0 | 0.0% | 0 | 0.0% | $0 | 0.0% | $0.00 |
| 2024 | 0 | 0 | 0.0% | 0 | 0.0% | $0 | 0.0% | $0.00 |
| 2025 | 0 | 0 | 0.0% | 0 | 0.0% | $0 | 0.0% | $0.00 |
| 2026 | 0 | 0 | 0.0% | 0 | 0.0% | $0 | 0.0% | $0.00 |
| 2027 | 0 | 0 | 0.0% | 0 | 0.0% | $0 | 0.0% | $0.00 |
| 2028 | 0 | 0 | 0.0% | 0 | 0.0% | $0 | 0.0% | $0.00 |
| Thereafter | 1 | 138,364 | 100.0% | 138,364 | 100.0% | $3,824,500 | 100.0% | $27.64 |
| Vacant | 0 | 0 | 0.0% | 138,364 | 100.0% | $0 | 0.0% | $0.00 |
| Total/Weighted Average | 1 | 138,364 | 100.0% | $3,824,500 | 100.0% | $27.64 |
| (1) | Information obtained from the underwritten rent roll. |
| (2) | The information shown here is based solely on the master lease to Stop & Shop. |
The following table presents historical occupancy percentages at the Franklin Towne Center Property:
Historical Occupancy
12/31/2015(1) | 12/31/2016(1) | 12/31/2017(1) | 12/1/2018(1) |
| 100.0% | 100.0% | 100.0% | 100.0% |
| (1) | Information obtained from the underwritten rent roll and is based on the terms of the master lease to Stop & Shop. |
Underwritten Net Cash Flow. The following table presents certain information relating to the underwritten net cash flow at the Franklin Towne Center Property:
Cash Flow Analysis(1)
| 2015 | 2016 | 2017 | TTM 9/30/2018 | U/W | % of U/W Effective Gross Income | U/W $ per SF | |
| Base Rent | $3,162,500 | $3,120,000 | $3,212,500 | $3,400,000 | $3,824,500(2) | 101.8% | $27.64 |
| Grossed Up Vacant Space | 0 | 0 | 0 | 0 | 0 | 0 | 0 |
| Total Reimbursables | 97,809 | 96,495 | 99,356 | 105,155 | 131,538 | 3.5 | 0.95 |
| Other Income | 0 | 0 | 0 | 0 | 0 | 0 | 0 |
| Less Vacancy & Credit Loss | 0 | 0 | 0 | 0 | (197,802)(3) | (5.3) | (1.43) |
| Effective Gross Income | $3,260,309 | $3,216,495 | $3,311,856 | $3,505,155 | $3,758,236 | 100.0% | $27.16 |
| Total Operating Expenses | $97,809 | $96,495 | $99,356 | $105,155 | $131,538 | 3.5% | $0.95 |
| Net Operating Income | $3,162,500 | $3,120,000 | $3,212,500 | $3,400,000 | $3,626,698 | 96.5% | $26.21 |
| Capital Expenditures | 0 | 0 | 0 | 0 | 20,755 | 0.6 | 0.15 |
| TI/LC | 0 | 0 | 0 | 0 | 69,182 | 1.8 | 0.50 |
| Net Cash Flow | $3,162,500 | $3,120,000 | $3,212,500 | $3,400,000 | $3,536,761 | 94.1% | $25.56 |
| NOI DSCR | 1.40x | 1.38x | 1.42x | 1.51x | 1.61x | ||
| NCF DSCR | 1.40x | 1.38x | 1.42x | 1.51x | 1.57x | ||
| NOI DY | 10.9% | 10.8% | 11.1% | 11.7% | 12.5% | ||
| NCF DY | 10.9% | 10.8% | 11.1% | 11.7% | 12.2% |
| (1) | The information shown here is based solely on the master lease to Stop & Shop. |
| (2) | Includes $374,500 in average contractual rent steps over the Franklin Towne Center Mortgage Loan term. |
| (3) | Economic vacancy was underwritten at 5.0%, however, the Franklin Towne Center Property is 100.0% master leased by Stop & Shop as of December 1, 2018. |
Appraisal.As of the appraisal valuation date of September 18, 2018, the Franklin Towne Center Property had an “as-is” appraised value of $47,800,000. The appraiser also concluded to a “go dark” appraised value of $28,000,000 and a “hypothetical scenario – land value only at reversion” appraised value of $35,500,000.
Environmental Matters. According to a Phase I environmental site assessment dated October 1, 2018, there was no evidence of any recognized environmental conditions at the Franklin Towne Center Property except in connection with historic operations of both a dry cleaning facility and filling and service station at the Franklin Towne Center Property. See “Risk Factors—Risks Relating to the
THE INFORMATION IN THIS STRUCTURAL AND COLLATERAL TERM SHEET IS NOT COMPLETE AND MAY BE AMENDED PRIOR TO THE TIME OF SALE. THIS TERM SHEET IS NOT AN OFFER TO SELL THESE SECURITIES AND IT IS NOT A SOLICITATION OF AN OFFER TO BUY THESE SECURITIES IN ANY JURISDICTION WHERE THE OFFER OR SALE IS NOT PERMITTED.
90
| Franklin Towne Center |
Mortgage Loans—Adverse Environmental Conditions at or Near Mortgaged Properties May Result InLosses” in the Preliminary Prospectus.
Market Overview and Competition.The Franklin Towne Center Property is located in Franklin Park, New Jersey within the Somerset County in Central New Jersey, which is approximately 45 miles southwest of Midtown Manhattan and approximately 30 miles southwest of Newark-Liberty International Airport.
There are a number of residential developments proximate to the Franklin Towne Center Property, including garden apartment rentals and owned single family homes. Additionally, the Franklin Towne Center Property is located less than one half mile from the free-standing Stop & Shop, a Sonic Drive-In and a Chase Bank. According to the appraisal, estimated 2017 population within a one-, three-and five-mile radius from the Franklin Towne Center Property was 12,623, 47,160, and 114,779, respectively. The estimated 2017 median household income within the same radii was $112,813, $107,913, and $115,374, respectively.
According to a third party report, the Franklin Towne Center Property is located in the Central New Jersey retail submarket, which has an inventory of 35.3 million square feet, average gross rent per square feet of $20.99 and a vacancy rate of 11.5% as of the second quarter of 2018.
The following table presents certain information relating to comparable leases to the Franklin Towne Center Property:
Comparable Leases - Anchor(1)
| Property Location | Year Built | Occupancy | Distance (miles) | Total GLA (SF) | Tenant Name | Lease Date | Lease Area (SF) | Annual | Lease Type |
Tano Mall 1199 Amboy Avenue Edison, NJ | 1973 | NAV | 13.5 | 110,000 | Confidential | April 2018 | 49,757 | $14.00 | NNN |
Plainsboro Plaza 10 Schalks Crossing Road Plainsboro, NJ | 1987 | NAV | 6.5 | 218,653 | Key Foods | November 2017 | 43,153 | $10.00 | NNN |
District at Metuchen 645 Middlesex Avenue Metuchen, NJ | 2016/2017 | NAV | 13.0 | 66,510 | Whole Foods | October 2017 | 43,500 | $25.00 | NNN |
Edison Plaza 775 Route One South Edison, NJ | 1970 | NAV | 11.0 | 103,996 | Shop Rite | March 2017 | 62,346 | $16.00 | NNN |
Wick Shopping Plaza 561 Route 1 South Edison, NJ | 1987 | NAV | 10.3 | 212,000 | 99 Ranch Market | January 2016 | 58,500 | $18.62 | NNN |
| (1) | Information obtained from the appraisal. |
Comparable Leases - Inline(1)
| Property Location | Year Built | Occupancy | Distance (miles) | Total GLA (SF) | Tenant Name | Lease Date | Lease Area (SF) | Annual | Lease Type |
Somerset Plaza Shopping 3151 Route 27 Franklin Park, NJ | 1987 | NAV | 1.2 | 67,358 | Bombay Talk Restaurant | March 2018 | 1,600 | $18.75 | NNN |
Edison Plaza 775 Route One South | 1970 | NAV | 11.1 | 103,996 | Confidential | January 2018 | 3,000 | $34.00 | NNN |
District at Metuchen 645 Middlesex Avenue Metuchen, NJ | 2016/2017 | NAV | 13.0 | 66,510 | Manime Nail Salon | December 2017 | 2,114 | $31.56 | NNN |
Rutger’s Plaza 922-982 Easton Avenue Somerset, NJ | 1973 | NAV | 7.0 | 185,986 | Flame Kabob House | December 2017 | 1,500 | $18.00 | NNN |
Edison Woods Shopping 1010 Route 1 Edison, NJ | 1992 | NAV | 12.0 | 195,527 | BestRentNJ | November 2017 | 2,306 | $25.95 | NNN |
706 US Highway 206 706 US Highway 206 Hillsborough, NJ | 1984 | NAV | 6.4 | 27,071 | Vivi Nail & Spa | July 2017 | 1,488 | $23.00 | NNN |
2245-2267 Woodbridge 2245-2267 Woodbridge Piscataway, NJ | 1997 | NAV | 10.4 | 10,080 | S&J Laundries, Inc. | April 2017 | 1,477 | $17.00 | NNN |
| (1) | Information obtained from the appraisal. |
THE INFORMATION IN THIS STRUCTURAL AND COLLATERAL TERM SHEET IS NOT COMPLETE AND MAY BE AMENDED PRIOR TO THE TIME OF SALE. THIS TERM SHEET IS NOT AN OFFER TO SELL THESE SECURITIES AND IT IS NOT A SOLICITATION OF AN OFFER TO BUY THESE SECURITIES IN ANY JURISDICTION WHERE THE OFFER OR SALE IS NOT PERMITTED.
91
| Franklin Towne Center |
The Borrower.The borrower for the Franklin Towne Center Mortgage Loan is Franklin Norse, LLC, a Delaware limited liability company and a special purpose entity with one independent director. Legal counsel to the borrower delivered a non-consolidation opinion in connection with the origination of the Franklin Towne Center Mortgage Loan. Michael Levine and Uri Moche are the guarantors of certain nonrecourse carveouts under the Franklin Towne Center Mortgage Loan.
The Borrower Sponsors.The borrower sponsors are Michael Levine and Uri Moche, the managers of Franklin Norse, LLC and Levittown Norse Associates, LLC. In 1962, Michael Levine co-founded Norse Realty Group, a family-run commercial real estate company based in New York. Norse Realty Group specializes in the development, redevelopment, ownership and management of commercial real estate throughout the New York City metropolitan area. The Norse Realty Group’s portfolio includes 18 commercial retail and office properties totaling approximately 500,000 square feet.
Escrows.The Franklin Towne Center Mortgage Loan documents do not provide for any upfront reserves.
The Franklin Towne Center Mortgage Loan documents provide for ongoing monthly escrows of $2,883 for replacement reserves, which is waived as of Cut-Off Date and will be waived by the lender if (i) no Trigger Period (as defined below) exists, (ii) the Reserve Waiver Conditions (as defined below) have been satisfied, and (iii) the Specified Tenant (as defined below) lease obligates Specified Tenant to pay for all replacements at the Franklin Towne Center Property and has provided satisfactory evidence to the lender that the Specified Tenant is in compliance with its obligations to perform and pay for all replacements. Under the Franklin Towne Center Mortgage Loan documents, monthly reserves for real estate taxes or insurance premiums will be conditionally waived, provided that Stop & Shop is obligated to maintain and pay in full (a) all real estate taxes and assessments directly to the applicable municipality and (b) the premiums for acceptable insurance policies.
“Reserve Waiver Conditions” mean (i) no event of default has occurred and is continuing, (ii) Specified Tenant’s lease is in full force and effect with no continuing defaults, (iii) the Specified Tenant continues to make the payments and perform the obligations required under the Specified Tenant’s lease, in each case, relating to the obligations and liabilities for which the replacement reserve was established and delivers evidence of the same by no later than the dates required under the loan documents, (iv) the Specified Tenant is not bankrupt or insolvent and (v) the Specified Tenant has not terminated, canceled or defaulted under the Specified Tenant’s Lease (including, without limitation, in connection with any rejection in any bankruptcy or similar insolvency proceeding).
Lockbox and Cash Management.The Franklin Towne Center Mortgage Loan is structured with a hard lockbox and springing cash management. The borrower was required at origination to deliver letters to the tenant at the Franklin Towne Center Property directing it to pay all rents directly into a lender-controlled lockbox account. All funds received by the borrower or manager are required to be deposited in the lockbox account within one business day following receipt. During the occurrence and continuance of a Trigger Period (as defined below), all funds are required to be swept each business day into the cash management account controlled by the lender and disbursed on each payment date in accordance with the Franklin Towne Center Mortgage Loan documents, with all excess cash flow to be deposited to an excess cash reserve to be held as additional security for the Franklin Towne Center Mortgage Loan.
A “Trigger Period” will commence following the earliest to occur of any of the following:
| (i) | an event of default under the Franklin Towne Center Mortgage Loan; |
| (ii) | the debt yield falling below 8.0x; |
| (iii) | the commencement of a Specified Tenant Trigger Period (as defined below); |
| (iv) | an election by Stop & Shop to demolish the improvements and not rebuild the improvements following a casualty; |
| (v) | December 6, 2027, unless the Stop & Shop lease has been renewed for a period not less than five years after the Franklin Towne Center Mortgage Loan stated maturity date and in accordance with certain other requirements in the Franklin Towne Center Mortgage Loan documents (“Stop & Shop Non-Renewal Cash Flow Sweep”); and |
| (vi) | the ARD on October 6, 2028. |
From and after the ARD, no Trigger Period will be deemed to have expired. Prior to the ARD, a Trigger Period will only be deemed to have expired upon the occurrence of the following:
| (a) | with respect to the matters described in clause (i) above, such event of default has been cured and no other event of default having occurred and being continuing; |
| (b) | with respect to the matter described in clause (ii) above, the Franklin Towne Center Property has achieved a debt yield of at least 8.0% for two consecutive calendar quarters; |
| (c) | with respect to the matter described in clause (iii) above, such Specified Tenant Trigger Period (as defined below) having ended; or |
| (d) | with respect to the matter described in clause (v) above, unless the lender has determined that that (a) the Stop & Shop lease has been renewed for a period ending not less than five years after the Stated Maturity Date, and (b) the Stop & Shop lease, as so renewed, requires payment of rent equal to the greater of (i) not less than ninety percent (90%) of the aggregate gross rents payable under the Stop & Shop lease immediately prior to the commencement of such renewal term, and (ii) an amount sufficient to generate a DSCR of 1.25x. |
THE INFORMATION IN THIS STRUCTURAL AND COLLATERAL TERM SHEET IS NOT COMPLETE AND MAY BE AMENDED PRIOR TO THE TIME OF SALE. THIS TERM SHEET IS NOT AN OFFER TO SELL THESE SECURITIES AND IT IS NOT A SOLICITATION OF AN OFFER TO BUY THESE SECURITIES IN ANY JURISDICTION WHERE THE OFFER OR SALE IS NOT PERMITTED.
92
| Franklin Towne Center |
A “Specified Tenant Trigger Period” will commence following the earliest to occur of any of the following:
| (i) | a Specified Tenant (as defined below) being in monetary or material non-monetary default under its lease beyond any applicable notice and cure periods; |
| (ii) | Specified Tenant giving notice that it is terminating its lease for any material portion of its space; |
| (iii) | any termination or cancellation of any Specified Tenant lease; |
| (iv) | any bankruptcy or similar insolvency of Specified Tenant; |
| (v) | a Specified Tenant failing to extend or renew its lease upon the earlier of the required renewal notice period or the date which is 12 months prior to the expiration of the then applicable term; or |
| (vi) | a lease guarantor ceasing to maintain a long-term unsecured debt rating of at least “Baa3” from Moody's and an equivalent rating from each of the other rating agencies which rate such entity. In the event that the lease guarantor’s rating remains at least “Ba1” or “Ba2” from Moody’s and an equivalent rating from each of the other rating agencies which rate such entity, 25.0% of all available excess cash flow will be swept, and in the event the rating remains at least “Ba3” from Moody’s and an equivalent rating from each of the other rating agencies which rate such entity, 50.0% of all available excess cash flow will be swept, in each such case subject to a $3,500,000 cap. |
A “Specified Tenant Trigger Period” will end if the applicable Specified Tenant:
| (a) | has cured all defaults under the applicable Specified Tenant lease; |
| (b) | is in actual, physical possession of the Specified Tenant space (or applicable portion thereof), open to the public for business during customary hours and not “dark;” |
| (c) | has revoked or rescinded all termination or cancellation notices with respect to the applicable Specified Tenant lease and has reaffirmed the applicable Specified Tenant lease as being in full force and effect; |
| (d) | if applicable, has renewed or extended the applicable Specified Tenant lease in accordance with the requirements of the Franklin Towne Center Mortgage Loan documents; |
| (e) | if applicable, is no longer insolvent or subject to any bankruptcy or insolvency proceedings and has affirmed the applicable Specified Tenant lease; |
| (f) | is paying full, unabated rent under the applicable Specified Tenant lease; and |
| (e) | if related to a failure to satisfy certain credit rating conditions, satisfies such requirements under the Franklin Towne Center Mortgage Loan documents. |
A “Specified Tenant” means, as applicable, (i) Stop & Shop and (ii) any other lessee(s) of that portion of the Franklin Towne Center Property initially occupied by Stop & Shop (or any portion thereof) and any guarantor(s) of any related lease (s).
Property Management. The Franklin Towne Center Property is managed by CSC Global, an affiliate of the borrower.
Assumption.The borrower has, at any time after 60 days following the securitization of the Franklin Towne Center Mortgage Loan, the right to transfer the Franklin Towne Center Property, not more than two times and provided that certain conditions are satisfied, including: (i) no event of default under the Franklin Towne Center Mortgage Loan documents has occurred and is continuing, (ii) the borrower has provided the lender with prior written notice, (iii) the proposed transferee qualifies as a qualified transferee under the Franklin Towne Center Mortgage Loan documents, (iv) the payment of a transfer fee of 0.5% of the then outstanding principal balance of the Franklin Towne Center Mortgage Loan in the case of the first transfer, and 1.0% of the then outstanding principal balance of the Franklin Towne Center Mortgage Loan in the case of the second transfer, and (v) the lender has received rating agency confirmation that such assumption will not result in a downgrade of the respective ratings assigned to the WFCM Series 2018-C48 certificates.
Partial Release. Not permitted.
Real Estate Substitution.Not permitted.
Ground Lease. None.
Collateral. The collateral for the Franklin Towne Center Mortgage Loan consists of the borrower's interest in the land and related interests, but the mortgage lien on the Franklin Towne Center Property does not include the related improvements as required pursuant to the Stop and Shop lease. The appraisal concluded a value for the collateral specifically secured by the mortgage lien on the Franklin Towne Center Property of $35,500,000. Based on that appraised value, the Cut-off Date LTV and Balloon LTV would be 81.7% and 57.3%, respectively. The borrower has covenanted, in a declaration that was recorded by the lender, not to encumber the improvements, and to convey those improvements to the lender upon a foreclosure on the Franklin Towne Center Property or delivery of a deed-in-lieu of foreclosure. If the borrower breaches either of those covenants, the Franklin Towne Center Mortgage Loan is fully recourse to the borrower and the borrower sponsors. However, because a REMIC cannot acquire foreclosure property if a mortgage lien did not exist on such property immediately before default on the related loan was imminent, the trust fund will be required to obtain, prior to acquiring the improvements, an opinion of counsel that the acquisition and ownership of such improvements will not cause the REMIC to fail to qualify as a REMIC. As a result, in connection with the exercise of remedies following a default, the lender may be required to simultaneously foreclose on the Franklin Towne Center Property and direct the conveyance of the improvements
THE INFORMATION IN THIS STRUCTURAL AND COLLATERAL TERM SHEET IS NOT COMPLETE AND MAY BE AMENDED PRIOR TO THE TIME OF SALE. THIS TERM SHEET IS NOT AN OFFER TO SELL THESE SECURITIES AND IT IS NOT A SOLICITATION OF AN OFFER TO BUY THESE SECURITIES IN ANY JURISDICTION WHERE THE OFFER OR SALE IS NOT PERMITTED.
93
| Franklin Towne Center |
to a third party purchaser, or to sell the Franklin Towne Center Mortgage Loan, which could result in the trust fund realizing less proceeds than would have occurred had it been able to foreclose on the land and improvements. See “Description of the Mortgage Pool—Mortgage Pool Characteristics—Property Types—Retail Properties” in the Preliminary Prospectus.
Terrorism Insurance.The borrower owns the land and improvements but the collateral security of the Franklin Towne Center Mortgage Loan documents does not include the improvements. Pursuant to its related lease, the sole tenant at the Franklin Towne Center Property, Stop & Shop, is permitted to provide the insurance for the improvements. As of the origination date, terrorism insurance is provided by the tenant, provided, however, the related lease does not require the tenant to maintain such terrorism insurance. In addition, Stop & Shop may self-insure property and liability coverages provided that Stop & Shop maintains a net worth in excess of $100,000,000. In the event the Stop & Shop lease terminates, the Franklin Towne Center Mortgage Loan documents require that the “all risk” insurance policy required to be maintained by the borrower provide coverage for terrorism in an amount equal to the full replacement cost of the Franklin Towne Center Property.
THE INFORMATION IN THIS STRUCTURAL AND COLLATERAL TERM SHEET IS NOT COMPLETE AND MAY BE AMENDED PRIOR TO THE TIME OF SALE. THIS TERM SHEET IS NOT AN OFFER TO SELL THESE SECURITIES AND IT IS NOT A SOLICITATION OF AN OFFER TO BUY THESE SECURITIES IN ANY JURISDICTION WHERE THE OFFER OR SALE IS NOT PERMITTED.
94
(THIS PAGE INTENTIONALLY LEFT BLANK)
THE INFORMATION IN THIS STRUCTURAL AND COLLATERAL TERM SHEET IS NOT COMPLETE AND MAY BE AMENDED PRIOR TO THE TIME OF SALE. THIS TERM SHEET IS NOT AN OFFER TO SELL THESE SECURITIES AND IT IS NOT A SOLICITATION OF AN OFFER TO BUY THESE SECURITIES IN ANY JURISDICTION WHERE THE OFFER OR SALE IS NOT PERMITTED.
95
| CHRISTIANA MALL |

THE INFORMATION IN THIS STRUCTURAL AND COLLATERAL TERM SHEET IS NOT COMPLETE AND MAY BE AMENDED PRIOR TO THE TIME OF SALE. THIS TERM SHEET IS NOT AN OFFER TO SELL THESE SECURITIES AND IT IS NOT A SOLICITATION OF AN OFFER TO BUY THESE SECURITIES IN ANY JURISDICTION WHERE THE OFFER OR SALE IS NOT PERMITTED.
96
| CHRISTIANA MALL |
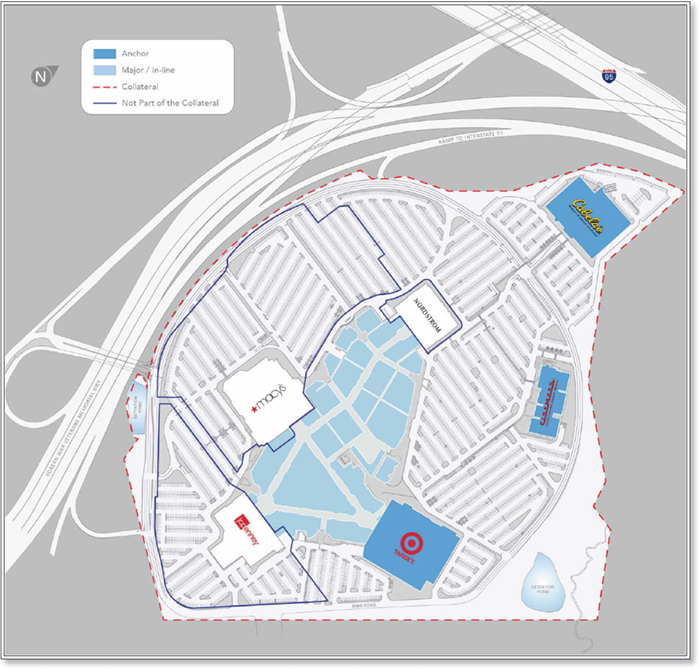
THE INFORMATION IN THIS STRUCTURAL AND COLLATERAL TERM SHEET IS NOT COMPLETE AND MAY BE AMENDED PRIOR TO THE TIME OF SALE. THIS TERM SHEET IS NOT AN OFFER TO SELL THESE SECURITIES AND IT IS NOT A SOLICITATION OF AN OFFER TO BUY THESE SECURITIES IN ANY JURISDICTION WHERE THE OFFER OR SALE IS NOT PERMITTED.
97
| CHRISTIANA MALL |
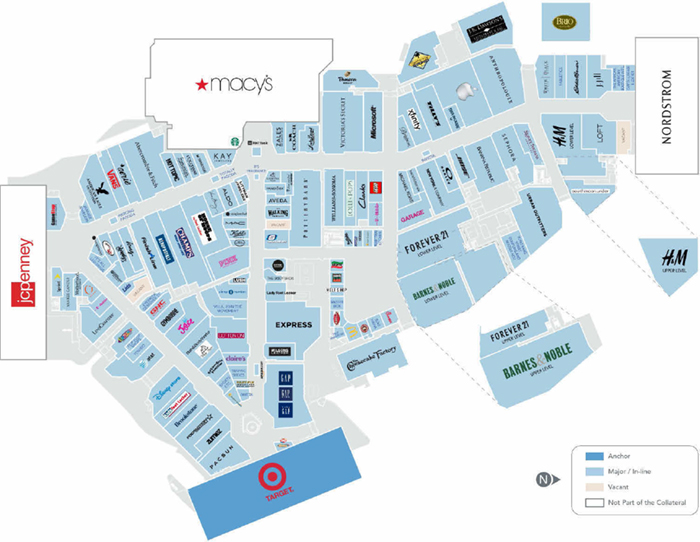
THE INFORMATION IN THIS STRUCTURAL AND COLLATERAL TERM SHEET IS NOT COMPLETE AND MAY BE AMENDED PRIOR TO THE TIME OF SALE. THIS TERM SHEET IS NOT AN OFFER TO SELL THESE SECURITIES AND IT IS NOT A SOLICITATION OF AN OFFER TO BUY THESE SECURITIES IN ANY JURISDICTION WHERE THE OFFER OR SALE IS NOT PERMITTED.
98
| CHRISTIANA MALL |
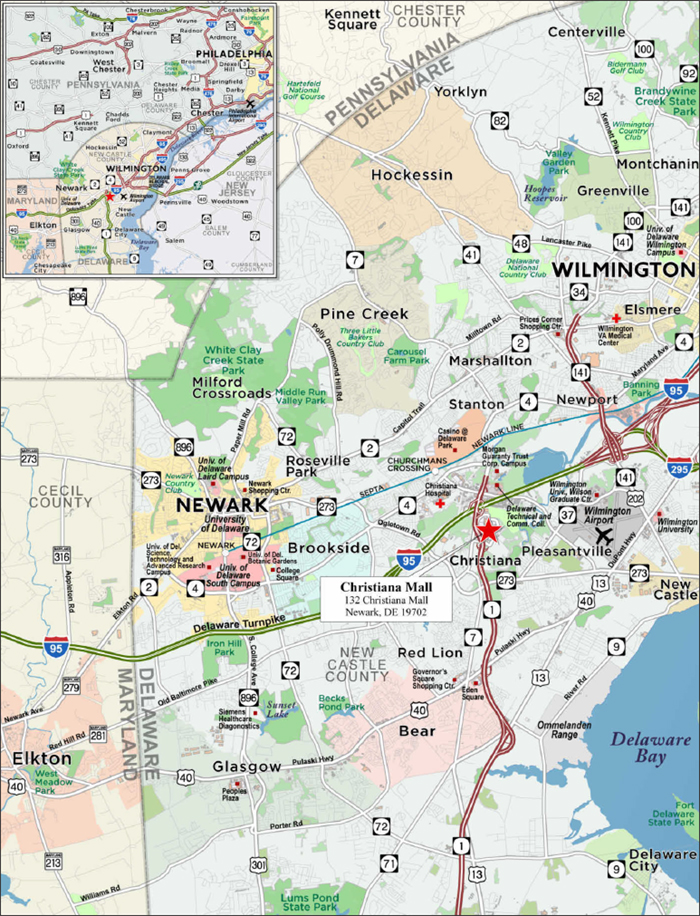
THE INFORMATION IN THIS STRUCTURAL AND COLLATERAL TERM SHEET IS NOT COMPLETE AND MAY BE AMENDED PRIOR TO THE TIME OF SALE. THIS TERM SHEET IS NOT AN OFFER TO SELL THESE SECURITIES AND IT IS NOT A SOLICITATION OF AN OFFER TO BUY THESE SECURITIES IN ANY JURISDICTION WHERE THE OFFER OR SALE IS NOT PERMITTED.
99
| No. 8 – Christiana Mall |
| Loan Information | Property Information | ||||||
| Mortgage Loan Seller: | Barclays Bank PLC | Single Asset/Portfolio: | Single Asset | ||||
| Credit Assessment (Fitch/KBRA/Moody’s): | AA-/AA+/A3 | Property Type: | Retail | ||||
| Original Principal Balance(1): | $28,000,000 | Specific Property Type: | Super Regional Mall | ||||
| Cut-off Date Balance(1): | $28,000,000 | Location: | Newark, DE | ||||
| % of Initial Pool Balance: | 3.4% | Size: | 779,084 SF | ||||
| Loan Purpose: | Refinance | Cut-off Date Balance Per SF(1): | $433.84 | ||||
| Borrower Name: | Christiana Mall LLC | Year Built/Renovated: | 1978/2014 | ||||
| Sponsors: | GGP Inc.; PPF Retail, LLC | Title Vesting: | Fee/Leasehold | ||||
| Mortgage Rate: | 4.2775% | Property Manager: | Self-managed | ||||
| Note Date: | July 12, 2018 | 4th Most Recent Occupancy (As of)(5): | 99.2% (12/31/2014) | ||||
| Anticipated Repayment Date: | NAP | 3rd Most Recent Occupancy (As of)(5): | 99.3% (12/31/2015) | ||||
| Maturity Date: | August 1, 2028 | 2nd Most Recent Occupancy (As of)(5): | 99.8% (12/31/2016) | ||||
| IO Period: | 120 months | Most Recent Occupancy (As of)(5): | 99.0% (12/31/2017) | ||||
| Loan Term (Original): | 120 months | Current Occupancy (As of)(5): | 98.3% (5/31/2018) | ||||
| Seasoning: | 4 months | ||||||
| Amortization Term (Original): | NAP | Underwriting and Financial Information: | |||||
| Loan Amortization Type: | Interest-only, Balloon | ||||||
| Interest Accrual Method: | Actual/360 | 4th Most Recent NOI (As of): | $41,918,054 (12/31/2015) | ||||
| Call Protection(2): | L(28),D(85),O(7) | 3rd Most Recent NOI (As of): | $43,957,559 (12/31/2016) | ||||
| Lockbox Type: | Hard/Springing Cash Management | 2nd Most Recent NOI (As of): | $43,514,169 (12/31/2017) | ||||
| Additional Debt(1)(3): | Yes | Most Recent NOI (As of): | $43,550,426 (TTM 5/31/2018) | ||||
| Additional Debt Type(1)(3): | Pari Passu; Subordinate Secured Debt; Future Mezzanine | ||||||
| U/W Revenues: | $56,260,022 | ||||||
| U/W Expenses: | $9,514,932 | ||||||
| U/W NOI: | $46,745,090 | ||||||
| U/W NCF: | $46,104,564 | ||||||
| Escrows and Reserves(4): | U/W NOI DSCR(1): | 3.19x | |||||
| U/W NCF DSCR(1): | 3.15x | ||||||
| Type: | Initial | Monthly | Cap (If Any) | U/W NOI Debt Yield(1): | 13.8% | ||
| Taxes | $0 | Springing | NAP | U/W NCF Debt Yield(1): | 13.6% | ||
| Insurance | $0 | Springing | NAP | As-Is Appraised Value: | $1,040,000,000 | ||
| Replacement Reserve | $0 | Springing | $241,565 | As-Is Appraisal Valuation Date: | June 5, 2018 | ||
| TI/LC Reserve | $0 | Springing | $1,449,387 | Cut-off Date LTV Ratio(1): | 32.5% | ||
| Outstanding TI/LC Reserve | $1,804,093 | $0 | NAP | LTV Ratio at Maturity or ARD(1): | 32.5% | ||
| (1) | See “The Mortgage Loan” section. The Cut-off Date Balance per SF, U/W NOI DSCR, U/W NCF DSCR, U/W NOI Debt Yield, U/W NCF Debt Yield, Cut-off Date LTV Ratio and LTV Ratio at Maturity or ARD presented above are based on the Christiana Mall Senior Loan (as defined below). The Cut-off Date Balance per SF, U/W NOI DSCR, U/W NCF DSCR, U/W NOI Debt Yield, U/W NCF Debt Yield, Cut-off Date LTV Ratio and LTV Ratio at Maturity or ARD based on the Christiana Mall Whole Loan (as defined below) are $706, 1.96x, 1.93x, 8.5%, 8.4%, 52.9% and 52.9%, respectively. |
| (2) | The lockout period will be at least 28 payments, beginning with and including the first payment date of September 1, 2018. Defeasance of the Christiana Mall Whole Loan is permitted at any time after the earlier to occur of (i) two years after the closing date of the securitization that includes the last note to be securitized or (ii) July 12, 2021. The assumed lockout period of 28 payments is based on the expected WFCM 2018-C48 securitization trust closing date in December 2018. |
| (3) | See “Subordinate and Mezzanine Indebtedness” section. |
| (4) | See “Escrows” section. |
| (5) | See “Historical Occupancy” table. |
The Mortgage Loan. The mortgage loan (the “Christiana Mall Mortgage Loan”) is part of a whole loan (the “Christiana Mall Whole Loan”) in the aggregate original principal amount of $550,000,000, evidenced by thirteenpari passu senior notes with an aggregate original principal balance of $338,000,000 (the “Christiana Mall Senior Loan”) and threepari passusubordinate notes with an original principal balance of $212,000,000 (the “Christiana Mall B Notes”) secured by a first mortgage encumbering the fee and leasehold interest in 779,084 square feet of a 1,275,084 square foot super regional mall located in Newark, Delaware (the “Christiana Mall Property”). The Christiana Mall Whole Loan was co-originated on July 12, 2018 by Barclays Bank PLC, SociétéGénérale, and Deutsche Bank AG, New York Branch. The Christiana Mall Senior Loan had an original principal balance of $338,000,000, has an outstanding principal balance as of the Cut-off Date of $338,000,000 and accrues interest at a rate of 4.2775%per annum. The Christiana Mall B Notes had an original principal balance of $212,000,000, have an outstanding principal balance as of the Cut-off Date of $212,000,000, and accrue interest at a rate of 4.2775% per annum. The Christiana Mall Whole Loan had an initial term of 120 months, has a remaining term of 116 months as of the Cut-off Date and requires interest only payments for the entirety of the term. The Christiana Mall Whole Loan matures on August 1, 2028.
THE INFORMATION IN THIS STRUCTURAL AND COLLATERAL TERM SHEET IS NOT COMPLETE AND MAY BE AMENDED PRIOR TO THE TIME OF SALE. THIS TERM SHEET IS NOT AN OFFER TO SELL THESE SECURITIES AND IT IS NOT A SOLICITATION OF AN OFFER TO BUY THESE SECURITIES IN ANY JURISDICTION WHERE THE OFFER OR SALE IS NOT PERMITTED.
100
| CHRISTIANA MALL |
The non-controlling Note A-1-D, which will be contributed to the WFCM 2018-C48 securitization trust, had an original principal balance of $28,000,000 and has an outstanding principal balance as of the Cut-off Date of $28,000,000. The controlling Note A-1-A and non-controlling Notes A-2-A and A-3-A, which have been contributed to the BBCMS 2018-CHRS securitization trust, had an aggregate original principal balance of $72,320,000 and have an aggregate outstanding principal balance as of the Cut-off Date of $72,320,000. The non-controlling Notes A-1-C and A-1-E had an original principal balance of $54,840,000, have an aggregate outstanding principal balance as of the Cut-off Date of $54,840,000, and are expected to be contributed to the BBCMS 2018-C2 securitization trust. The non-controlling note A-2-B had an original principal balance of $30,000,000, has an outstanding principal balance of $30,000,000, and was contributed to the UBS 2018-C13 securitization trust. The non-controlling Notes A-3-B and A-3-C had an aggregate original principal balance of $53,136,000, have an aggregate outstanding principal balance as of the Cut-off Date of $53,136,000, and were contributed to the DBGS 2018-C1 securitization trust. The non-controlling Note A-2-C had an original principal balance of $30,000,000, has an outstanding principal balance as of the Cut-off Date of $30,000,000, and is expected to be contributed to the UBS 2018-C14 securitization trust. The non-controlling Notes A-2-D and A-2-E had an aggregate original principal balance of $19,704,000, have an aggregate outstanding principal balance as of the Cut-off Date of $19,704,000, are held by SociétéGénéraleand are expected to be contributed to one or more future securitization transactions. The Christiana Mall B Notes, which have been contributed to the BBCMS 2018-CHRS securitization trust, had an aggregate original principal balance of $212,000,000 and have an aggregate outstanding principal balance as of the Cut-off Date of $212,000,000. The lender provides no assurances that the non-securitizedpari passu notes will not be split further. See “Description of the Mortgage Pool—The Whole Loans—The AB Whole Loans—The Christiana Mall Whole Loan” and “Pooling and Servicing Agreement” in the Prospectus.
Note Summary
| Christiana Mall Whole Loan ($550,000,000) | |||||||
| Christiana MallPari PassuCompanion Notes ($338,000,000) | |||||||
Companion A BBCMS 2018-
$72,320,000 Notes A-1-A, A-2-A, A-3-A | Companion A WFCM 2018-
$28,000,000 Note A-1-D | Companion A UBS 2018-
$30,000,000 Note A-2-B
| Companion A WFCM 2018-
$50,000,000 Note A-1-B | Companion A DBGS 2018-
$53,136,000 Notes A-3-B, A-3-C | Companion A UBS 2018-
$30,000,000 Note A-2-C | Companion A BBCMS 2018-
$54,840,000 Notes A-1-C, A-1-E | Companion A Future Conduit
$19,704,000 Notes A-2-D and A-2-E |
| Christiana Mall Subordinate Companion Notes ($212,000,000) | |||||||
Subordinate Companion B Notes BBCMS 2018-CHRS $212,000,000 Notes B-1, B-2, B-3 | |||||||
Following the lockout period, on any date before February 1, 2028, the borrower has the right to defease the Christiana Mall Whole Loan in whole, but not in part. In addition, the Christiana Mall Whole Loan is prepayable without penalty on or after February 1, 2028. The lockout period will expire on the earlier to occur of (i) two years after the closing date of the securitization that includes the last note to be securitized and (ii) July 12, 2021.
Sources and Uses
| Sources | Uses | |||||||
| Original whole loan amount(1) | $550,000,000 | 100.0% | Loan payoff | $235,182,023 | 42.8% | |||
| Upfront reserves | 1,804,093 | 0.3 | ||||||
| Closing costs | 3,253,713 | 0.6 | ||||||
| Return of Equity | 309,760,172 | 56.3 | ||||||
| Total Sources | $550,000,000 | 100.0% | Total Uses | $550,000,000 | 100.0% |
| (1) | The Christiana Mall Whole Loan proceeds were used to retire an approximately $235.2 million outstanding loan (inclusive of defeasance costs) previously securitized in the MSC 2011-C1 transaction, pay closing costs and return of equity to the borrower. |
The Property.The Christiana Mall Property consists of a 779,084 square foot portion of the two-story, 1,275,084 square foot Christiana Mall, located in Newark, Delaware. The Christiana Mall Property is anchored by Target, Cabela’s, and Cinemark and non-collateral anchors include Macy’s, JCPenney, and Nordstrom. Target and Cabela’s each own their improvements and ground lease the land from the borrower. The collateral and non-collateral anchor tenants generate approximately $198.8 million in annual sales. The Christiana Mall Property features over 130 specialty in-line stores including Apple, Anthropologie, Banana Republic, Barnes & Noble, Express, Finish Line, H&M, Microsoft, Pottery Barn, Sephora, Urban Outfitters, Victoria’s Secret, Williams-Sonoma, and XXI Forever. Additionally, the Christiana Mall Property includes dining options such as a 10-bay food court and restaurants including Brio, California Pizza Kitchen, The Cheesecake Factory, J.B. Dawson’s Restaurant, and Panera Bread. Included in the collateral are 6,628 parking spaces (approximately 5.2 spaces per 1,000 SF). Excluding the anchor tenants, no other tenant occupies more than 4.7% of NRA or represents more than 6.0% of underwritten base rent.
The Christiana Mall Property was built in 1978, and underwent an expansion phase from 2007 to 2014. Over $200.0 million was invested, adding several large format tenants including Nordstrom, Target, Cabela’s, and Cinemark, as well as over 160,000 square feet of in-line, restaurant, and exterior facing in-line space.
The Christiana Mall Property was 98.3% leased as of May 31, 2018 to 131 permanent retail and restaurant tenants, and the entire 1,275,084 square feet of the Christiana Mall was 98.9% leased as of May 31, 2018. Since 2014, Christiana Mall has maintained an average occupancy of approximately 99.5% including anchor tenants, with no year-end occupancy falling below 98.9%. As of TTM April 30, 2018, sales for in-line tenants occupying less than 10,000 square feet of space were $885 per square foot with occupancy cost of 13.4% (including Apple and its 10,705 square feet of space, the Christiana Mall Property generated sales per square foot of $2,504 with an occupancy cost of 4.7%).
THE INFORMATION IN THIS STRUCTURAL AND COLLATERAL TERM SHEET IS NOT COMPLETE AND MAY BE AMENDED PRIOR TO THE TIME OF SALE. THIS TERM SHEET IS NOT AN OFFER TO SELL THESE SECURITIES AND IT IS NOT A SOLICITATION OF AN OFFER TO BUY THESE SECURITIES IN ANY JURISDICTION WHERE THE OFFER OR SALE IS NOT PERMITTED.
101
| CHRISTIANA MALL |
The following table presents certain information relating to the tenancy at the Christiana Mall Property:
Major Tenants(1)
| Tenant Name | Credit | Tenant NRSF | % of NRSF | Annual U/W Base Rent PSF | Annual U/W Base Rent(3) | % of Total Annual U/W Base Rent | April 30, 2018 TTM Sales(4) | Lease Expiration Date | |||
| $ | PSF | Occ. Cost | |||||||||
| Major Tenants | |||||||||||
| Target | A-/A2/A | 145,312 | 18.7% | $0.00 | $0 | 0.0% | $52,000,000 | $358 | NAP | 12/31/2036(5) | |
| Cabela’s | NR/NR/NR | 100,000 | 12.8% | $10.21 | $1,021,250 | 2.8% | $50,782,999 | $508 | 2.0% | 1/31/2035(6) | |
| Cinemark | NR/NR/BB | 50,643 | 6.5% | $22.30 | $1,129,339 | 3.1% | $7,251,437 | $604,286(7) | 15.6% | 11/30/2029(8) | |
| Barnes & Noble Bookseller | NR/NR/NR | 36,803 | 4.7% | $20.38 | $750,000 | 2.1% | $7,894,999 | $215 | 9.5% | 1/31/2020(9) | |
| XXI Forever | NR/NR/NR | 27,300 | 3.5% | $78.21 | $2,135,133 | 6.0% | $6,494,724 | $238 | 32.9% | 1/31/2020 | |
| H&M | NR/NR/NR | 20,160 | 2.6% | $45.60 | $919,371 | 2.6% | $6,381,061 | $317 | 14.4% | 2/28/2021(10) | |
| Anthropologie | NR/NR/NR | 10,967 | 1.4% | $68.43 | $750,455 | 2.1% | $1,637,845 | $149 | 45.8% | 1/31/2021(11) | |
| Victoria’s Secret | NR/NR/NR | 10,830 | 1.4% | $60.00 | $649,800 | 1.8% | $6,484,521 | $599 | 10.0% | 1/31/2024 | |
| Apple | NR/Aa1/AA+ | 10,705 | 1.4% | $109.85 | $1,175,974 | 3.3% | $488,995,320 | $45,679 | 0.2% | 1/31/2023 | |
| Gap/Gap Kids/Baby Gap | NR/Baa2/BB+ | 10,583 | 1.4% | $59.12 | $625,698 | 1.7% | $3,157,328 | $298 | 19.8% | 5/31/2024 | |
| Express | NR/NR/NR | 10,008 | 1.3% | $45.75 | $457,913 | 1.3% | $3,175,091 | $317 | 14.4% | 1/31/2024 | |
| Urban Outfitters | NR/NR/NR | 10,000 | 1.3% | $42.00 | $420,000 | 1.2% | $2,445,323 | $245 | 17.2% | 1/31/2021(12) | |
| Total Major Tenants | 443,311 | 56.9% | $33.67(13) | $10,034,934 | 28.0% | ||||||
| Other Tenants(14) | 322,372 | 41.4% | $82.30 | $25,834,705 | 72.0% | $250,347,499 | $885(15) | 13.4%(15) | |||
| Occupied Collateral Total | 765,683 | 98.3% | $58.62(13)(14) | $35,869,639 | 100.0% | ||||||
| Vacant Space | 13,401 | 1.7% | |||||||||
| Collateral Total | 779,084 | 100.0% | |||||||||
| Non-Collateral Tenants | |||||||||||
| Macy’s | BBB/Baa3/BBB- | 215,000 | NAP | NAP | NAP | $48,000,000 | $223 | NAP | 12/31/2028 | ||
| JCPenney | B/B3/B- | 158,000 | NAP | NAP | NAP | $21,000,000 | $133 | NAP | 12/31/2028 | ||
| Nordstrom | BBB+/Baa1/BBB+ | 123,000 | NAP | NAP | NAP | $19,707,999 | $160 | NAP | 12/31/2028 | ||
| (1) | Information is based on the underwritten rent roll dated May 31, 2018. |
| (2) | Certain ratings are those of the parent company whether or not the parent guarantees the lease. |
| (3) | U/W Base Rent includes contractual rent steps of $1,226,247 taken through July 2019. |
| (4) | Sales figures for Macy’s, JCPenney, Target, Nordstrom, and Barnes & Noble Bookseller represent 2017 borrower estimates. |
| (5) | See “Target Purchase and Put Options” section. |
| (6) | Cabela’s has eight five-year renewal options with six months’ written notice. Additionally, Cabela’s has a right to raze its leased premises, so long as it restores the building pad back to the condition at which time the lease premises were delivered, caps utilities at their in-place levels and otherwise leaves its leased premises in good condition. Upon substantial completion of this razing, the Cabela’s lease will terminate. |
| (7) | Sales PSF for Cinemark reflects sales per screen (12 screens). |
| (8) | Cinemark has three five-year renewal options with six months’ written notice. |
| (9) | Barnes & Noble has two five-year renewal options with 180 days’ written notice. |
| (10) | H&M has one five-year renewal option with 180 days’ written notice. |
| (11) | Anthropologie has one five-year renewal option with 180 days’ written notice. |
| (12) | Urban Outfitters has one five-year renewal option with 180 days’ written notice. |
| (13) | Target’s square footage is excluded from this calculation as it has no attributable U/W base rent. |
| (14) | Other Tenants include 1,553 square feet for one temporary tenant with an expiration date in May 2019 and 6,907 square feet of kiosk, antenna, and storage tenants with no attributable U/W base rent, and are excluded from the U/W Base Rent PSF calculation. |
| (15) | Other Tenants Sales PSF and Occupancy Cost figures reflect only comparable in-line tenants less than 10,000 square feet. |
THE INFORMATION IN THIS STRUCTURAL AND COLLATERAL TERM SHEET IS NOT COMPLETE AND MAY BE AMENDED PRIOR TO THE TIME OF SALE. THIS TERM SHEET IS NOT AN OFFER TO SELL THESE SECURITIES AND IT IS NOT A SOLICITATION OF AN OFFER TO BUY THESE SECURITIES IN ANY JURISDICTION WHERE THE OFFER OR SALE IS NOT PERMITTED.
102
| CHRISTIANA MALL |
The following table presents certain information relating to the lease rollover schedule at the Christiana Mall Property:
Lease Expiration Schedule(1)(2)(3)
| Year Ending December 31, | No. of Leases Expiring | Expiring NRSF | % of Total NRSF | Cumulative Expiring NRSF | Cumulative % of Total NRSF | Annual U/W Base Rent(4) | % of Total Annual U/W Base Rent(4) | Annual U/W Base Rent PSF(4)(5) |
| 2018/MTM | 5 | 9,964 | 1.3% | 9,964 | 1.3% | $910,842 | 2.5% | $91.41 |
| 2019(5) | 14 | 21,935 | 2.8% | 31,899 | 4.1% | $2,084,627 | 5.8% | $102.28 |
| 2020 | 18 | 114,468 | 14.7% | 146,367 | 18.8% | $6,063,941 | 16.9% | $52.97 |
| 2021 | 21 | 105,128 | 13.5% | 251,495 | 32.3% | $6,432,376 | 17.9% | $61.19 |
| 2022 | 9 | 19,976 | 2.6% | 271,471 | 34.8% | $2,099,539 | 5.9% | $105.10 |
| 2023 | 13 | 33,728 | 4.3% | 305,199 | 39.2% | $3,132,006 | 8.7% | $92.86 |
| 2024 | 12 | 50,843 | 6.5% | 356,042 | 45.7% | $3,842,731 | 10.7% | $75.58 |
| 2025 | 13 | 37,189 | 4.8% | 393,231 | 50.5% | $3,715,274 | 10.4% | $99.90 |
| 2026 | 14 | 39,768 | 5.1% | 432,999 | 55.6% | $3,914,722 | 10.9% | $98.44 |
| 2027 | 3 | 9,078 | 1.2% | 442,077 | 56.7% | $480,791 | 1.3% | $52.96 |
| 2028 | 3 | 4,742 | 0.6% | 446,819 | 57.4% | $459,072 | 1.3% | $96.81 |
| Thereafter(6) | 6 | 311,957 | 40.0% | 758,776 | 97.4% | $2,733,718 | 7.6% | $16.40 |
| Other(7) | 0 | 6,907 | 0.9% | 765,683 | 98.3% | $0 | 0.0% | $0.00 |
| Vacant | 0 | 13,401 | 1.7% | 779,084 | 100.0% | $0 | 0.0% | $0.00 |
| Total/Weighted Average | 131 | 779,084 | 100.0% | $35,869,639 | 100.0% | $58.62 |
| (1) | Information obtained from the underwritten rent roll for leases in place as of May 31, 2018. |
| (2) | Certain tenants may have lease termination options that are exercisable prior to the originally stated expiration date of the subject lease and that are not considered in the Lease Expiration Schedule. |
| (3) | Includes executed leases that have not yet commenced as of May 31, 2018. |
| (4) | U/W Base Rent includes contractual rent steps of $1,226,247 taken through July 2019. |
| (5) | Square footage of 2019 includes a 1,553 SF temporary tenant with an expiration date of May 31, 2019 and no attributable U/W base rent and is excluded from the calculation for U/W Base Rent PSF. |
| (6) | U/W Base Rent PSF excludes Target’s space (145,312 square feet) from the calculation. |
| (7) | 6,907 square feet of kiosk, antenna, and storage tenants was included with no annual U/W base rent and are excluded from the calculation for U/W Base Rent PSF. |
The following table presents historical occupancy percentages at the Christiana Mall Property:
Historical Occupancy(1)
12/31/2014(2) | 12/31/2015(2) | 12/31/2016(2) | 12/31/2017(2) | 5/31/2018(3)(4)(5) |
| 99.2% | 99.3% | 99.8% | 99.0% | 98.3% |
| (1) | Historical occupancy of the entire 1,275,084 square feet of the Christiana Mall was 99.5%, 99.5%, 99.9%, 99.4%, and 98.9% respectively. |
| (2) | Information obtained from the borrower. |
| (3) | Information obtained from the underwritten rent roll. |
| (4) | Current occupancy figure includes five tenants (11,868 square feet) who have signed their lease but are not currently occupying their space. |
| (5) | Current occupancy figure excludes four tenants (5,820 square feet) who have either filed for bankruptcy or are completely dark. Including those tenants in occupancy would result in a current Christiana Mall occupancy of 99.4%, a current Christiana Mall Property (including collateral anchors) occupancy of 99.0%, and a current Christiana Mall Property (excluding collateral anchors) occupancy of 98.4%. |
The following table presents historical in-line sales at the Christiana Mall Property:
Historical In-line Tenant Sales Summary(1)(2)
| Year | Sales PSF w/ Apple | Occupancy Cost w/ Apple | Sales PSF w/o Apple | Occupancy Cost w/o Apple | |||
| 2014 | $3,733 | 2.8% | $699 | 14.8% | |||
| 2015 | $2,750 | 3.9% | $786 | 13.8% | |||
| 2016 | $1,660 | 6.8% | $821 | 13.8% | |||
| 2017 | $2,038 | 5.8% | $887 | 13.4% | |||
| TTM 4/30/2018 | $2,504 | 4.7% | $885 | 13.4% | |||
| (1) | Information as provided by the borrower sponsors and only includes tenants reporting comparable sales. |
| (2) | Christiana Mall and the Christiana Mall Property sales total fluctuations are primarily driven by the Apple store, which has reported sales ranging between $273.0 million and $944.5 million. According to the appraisal, the results may be partially attributed to changes in accounting methodology. The same trend has been observed at other Apple mall locations. |
THE INFORMATION IN THIS STRUCTURAL AND COLLATERAL TERM SHEET IS NOT COMPLETE AND MAY BE AMENDED PRIOR TO THE TIME OF SALE. THIS TERM SHEET IS NOT AN OFFER TO SELL THESE SECURITIES AND IT IS NOT A SOLICITATION OF AN OFFER TO BUY THESE SECURITIES IN ANY JURISDICTION WHERE THE OFFER OR SALE IS NOT PERMITTED.
103
| CHRISTIANA MALL |
The following table presents historical anchor sales at the Christiana Mall Property:
Historical Anchor Tenant Sales Summary(1)
| Year | Macy’s Sales $ mil / Sales PSF(2)(3) | JCPenney’s Sales $ mil / Sales PSF(2)(3) | Target’s Sales $ mil / Sales PSF(3) | Nordstrom Sales $ mil / Sales PSF(2)(3) | Cabela’s Sales $ mil / Sales PSF | Cinemark Sales $ mil / Sales PSF(4) |
| 2014 | $56.0/$260 | $22.0/$139 | $56.0/$385 | $25.1/$204 | NAV | NAV |
| 2015 | $57.0/$265 | $22.0/$139 | $60.0/$413 | $25.0/$203 | $57.9/$579 | $8.0/$665,953 |
| 2016 | $52.0/$242 | $20.0/$127 | $52.0/$358 | $24.1/$196 | $50.6/$506 | $8.4/$697,866 |
| 2017 | $48.0/$223 | $21.0/$133 | $52.0/$358 | $19.7/$160 | $50.8/$508 | $7.3/$604,286 |
| TTM 4/30/2018 | $48.0/$223 | $21.0/$133 | $52.0/$358 | $19.7/$160 | $50.8/$508 | $7.3/$604,286 |
| (1) | Information is estimated and as provided by the borrower sponsors. |
| (2) | Anchors are non-collateral tenants. |
| (3) | Sales figures for Macy’s, JCPenney, and Target represent borrower estimates. TTM April 2018 sales were not available for Macy’s, JCPenney, and Target, thus 2017 estimates were utilized. Additionally, Nordstrom reports sales on an annual basis, thus TTM April 2018 sales figures on this table reflect 2017 sales. |
| (4) | Cinemark Sales PSF represent sales per screen (12 screens). |
Operating History and Underwritten Net Cash Flow. The following table presents certain information relating to the historical operating performance and the underwritten net cash flow at the Christiana Mall Property:
Cash Flow Analysis
| 2015 | 2016 | 2017 | TTM 5/31/2018 | U/W | % of U/W Effective Gross Income | U/W $ per SF | |
| Base Rent(1)(2) | $32,684,203 | $34,240,787 | $34,477,828 | $34,558,591 | $35,869,639 | 63.8% | $46.04 |
| Vacant Space | 0 | 0 | 0 | 0 | 1,638,466 | 2.9 | 2.10 |
| Percentage Rent | 0 | 0 | 6,575 | 7,770 | 0 | 0.0 | 0.00 |
| Total Recoveries | 13,257,802 | 13,807,251 | 13,491,109 | 13,425,783 | 14,157,327 | 25.2 | 18.17 |
| Specialty Leasing | 2,714,827 | 2,749,431 | 2,713,432 | 2,759,788 | 2,876,610 | 5.1 | 3.69 |
| Other Income(3) | 3,469,234 | 3,343,004 | 3,369,589 | 3,277,797 | 3,356,447 | 6.0 | 4.31 |
| Less Vacancy(4) | 0 | 0 | 0 | 0 | (1,638,466) | (2.9) | (2.10) |
| Effective Gross Income | $52,126,066 | $54,140,474 | $54,058,534 | $54,029,729 | $56,260,022 | 100.0% | $72.21 |
| Total Operating Expenses | $10,208,012 | $10,182,915 | $10,544,365 | $10,479,303 | $9,514,932 | 16.9% | $12.21 |
| Net Operating Income | $41,918,054 | $43,957,559 | $43,514,169 | $43,550,426 | $46,745,090 | 83.1% | $60.00 |
| Capital Expenditures | 0 | 0 | 0 | 0 | 106,754 | 0.2 | 0.14 |
| TI/LC | 0 | 0 | 0 | 0 | 533,772 | 0.9 | 0.69 |
| Net Cash Flow | $41,918,054 | $43,957,559 | $43,514,169 | $43,550,426 | $46,104,564 | 81.9% | $59.18 |
| NOI DSCR(5) | 2.86x | 3.00x | 2.97x | 2.97x | 3.19x | ||
| NCF DSCR(5) | 2.86x | 3.00x | 2.97x | 2.97x | 3.15x | ||
| NOI DY(5) | 12.4% | 13.0% | 12.9% | 12.9% | 13.8% | ||
| NCF DY(5) | 12.4% | 13.0% | 12.9% | 12.9% | 13.6% |
| (1) | U/W Base Rent includes contractual rent steps of $1,226,247 taken through July 2019. |
| (2) | U/W Base Rent includes $643,284 for tenants who have signed leases but have not occupied their space as of May 31, 2018 including Tilly’s (4,999 SF), Xfinity (4,014 SF), Lolli and Pops (2,400 SF), Jamba Juice (246 SF), and Bath and Body Works (209 SF). XFinity has since moved into their space. U/W Base Rent excludes bankrupt tenants as of May 31, 2018 including Icing by Claire’s (1,979 SF), Claire’s (1,239 SF), and the Walking Company (1,582 SF) and also excludes Teavana (1,020 SF) who is currently dark and not occupying their space. Walking Company has since emerged from bankruptcy. |
| (3) | Other income includes overage rent and storage and other income. |
| (4) | The underwritten economic vacancy is 2.9%. The Christiana Mall Property was 98.3% physically leased as of May 31, 2018. |
| (5) | The debt service coverage ratios and debt yields shown are based on the Christiana Mall Senior Loan. |
Appraisal.As of the appraisal valuation date of June 5, 2018, the Christiana Mall Property had an “as-is” appraised value of $1,040,000,000.
Environmental Matters.According to a Phase I environmental site assessment dated June 11, 2018, there was no evidence of any recognized environmental conditions at the Christiana Mall Property.
Market Overview and Competition. The Christiana Mall Property is located in the southeast quadrant of the intersection of Route 7 and Interstate 95 in Newark, Delaware. Delaware is one of the only five U.S. states with no sales tax, and the Christiana Mall Property benefits from being the closest super regional shopping center to several surrounding states with sales tax. According to the appraisal, Interstate 95 is the most important limited access highway serving the region and offers direct access to Philadelphia and New York City to the north and Baltimore and Washington D.C. to the south. Christiana Mall is directly off Interstate 95 with over 200,000 vehicles passing by daily. A $150.0 million upgrade to Interstate 95 has been completed, including the addition of an exit dedicated to Christiana Mall. The mall is popular for out-of-state shoppers since it is only approximately 10 miles from Maryland, Pennsylvania, and New Jersey. US Highway 1, DE Routes 2, 7, and 273, and Interstates 95, 295, and 495 all serve the area. Interstate 295, with access to the Delaware Memorial Bridge, leading to New Jersey, New York, and New England, lies approximately four miles northeast of the mall.
THE INFORMATION IN THIS STRUCTURAL AND COLLATERAL TERM SHEET IS NOT COMPLETE AND MAY BE AMENDED PRIOR TO THE TIME OF SALE. THIS TERM SHEET IS NOT AN OFFER TO SELL THESE SECURITIES AND IT IS NOT A SOLICITATION OF AN OFFER TO BUY THESE SECURITIES IN ANY JURISDICTION WHERE THE OFFER OR SALE IS NOT PERMITTED.
104
| CHRISTIANA MALL |
According to the appraisal, the Christiana Mall Property is located in a growing, suburban area, which benefits from access to the major traffic arteries connecting the surrounding metropolitan area. Christiana Mall caters to two large universities within a seven-mile radius, University of Delaware and Wilmington University, which are home to a combined 38,000 students and 5,000 employees. Another draw to the area is the Christiana Hospital, housing 907 licensed beds, 22 hospital-based operating rooms and 10 outpatient rooms, which is located a short distance south. It is home to Delaware’s only level 3 neonatal intensive care unit and the state’s largest maternity center. The Christiana Hospital Campus is also home to the Center for Heart & Vascular Health and the Helen F. Graham Cancer Center. The Christiana Mall Property is located in the Philadelphia metropolitan statistical area, which is home to 14 Fortune 500 companies of which two (Dupont and Chemours) are located in Wilmington, Delaware.
According to the appraisal, the estimated 2017 population within the Christiana Mall Property’s primary trade area was 680,683. The estimated 2017 average household income in the trade area was $90,061. The primary trade area has been established by zip codes based on a shopper intercept survey. From 2000 to 2017, the trade area experienced compound annual population growth rate of approximately 0.9% and an annual household income growth rate of approximately 2.0%.
The table below presents certain information relating to seven comparable properties to the Christiana Mall Property identified by the appraisal:
Comparable Properties(1)
| Property, Location | Property Type | Year Built/ Renovated | Size (SF) | Occ. | Sales PSF | Anchor Tenants | Distance to Subject (mi.) |
Christiana Mall Property Newark, DE | Super Regional Mall | 1978/2014 | 1,275,084 | 98.9%(2) | $885(3) | Macy’s, JC Penney, Target, Nordstrom, Cabela’s, Cinemark(3) | NAP |
| Primary Competition | |||||||
Concord Mall Wilmington, DE | Super Regional Mall | 1969/1984 | 960,000 | 86.0% | $395 | Boscov’s, Macy’s Sears | 13.5 |
Springfield Mall Springfield, PA | Super Regional Mall | 1964/1997 | 610,582 | 97.0% | $424 | Macy’s, Target | 26.6 |
Exton Square Mall Exton, PA | Super Regional Mall | 1973/2000 | 1,088,000 | 84.0% | $316 | Boscov’s, Macy’s, Main Line Health Center, Sears, Round 1 | 30.2 |
| Secondary Competition | |||||||
Dover Mall Dover, DE | Super Regional Mall | 1982/1997 | 928,194 | 93.0% | $410 | AMC Cinema, Boscov’s, Dick’s Sporting Goods, JCPenney, Macy’s, Sears | 39.2 |
King of Prussia Mall King of Prussia, PA | Super Regional Mall | 1962/1995 | 2,391,105 | 96.0% | $805 | Bloomingdales, JCPenney, Lord & Taylor, Macy’s, Neiman Marcus, Nordstrom, Sears | 41.6 |
Cherry Hill Mall Cherry Hill, NJ | Super Regional Mall | 1961/2009 | 1,305,813 | 97.0% | $659 | JCPenney, Macy’s, Nordstrom | 44.3 |
Towson Town Center Towson, MD | Super Regional Mall | 1958/2007 | 1,063,549 | 92.0% | $495 | Macy’s, Nordstrom, Crate & Barrel, Nordstrom Rack | 63.6 |
| (1) | Information obtained from the appraisal and underwritten rent roll. |
| (2) | This occupancy reflects the entire Christiana Mall as of May 31, 2018. The 779,084 square feet of collateral was 98.3% occupied as of May 31, 2018. |
| (3) | Based on TTM April 2018 sales for comparable in-line tenants occupying less than 10,000 square feet. |
The Borrower.The borrower is Christiana Mall LLC, a single-purpose Delaware limited liability company structured to be bankruptcy remote with at least two independent directors. Legal counsel to the borrower delivered a non-consolidation opinion in connection with the origination of the Christiana Mall Whole Loan. GGP Nimbus, LP and PPF Retail, LLC are the guarantors under the Christiana Mall Whole Loan. The borrower is currently a 50/50 joint venture that is indirectly owned and controlled by GGP and Morgan Stanley’s Prime Property Fund.
The Borrower Sponsors.The borrower sponsors are GGP Inc. (“GGP”) and PPF Retail, LLC. GGP (NYSE: GGP) is a retail real estate company headquartered in Chicago, Illinois and is one of the largest owners and operators of real estate in the United States. According to the borrower, GGP owns, manages, leases and develops retail properties throughout the United States. As of March 31, 2018, GGP owned, either entirely or with joint venture partners, 125 retail properties located throughout the United States comprising approximately 122.5 million square feet of gross leasable area, which was 95.3% leased. GGP’s portfolio includes Ala Moana Center in Honolulu, Hawaii, Fashion Show in Las Vegas, Nevada, Tysons Galleria in McLean, Virginia, Glendale Galleria in Glendale, California, and Water Tower Place in Chicago, Illinois. On March 26, 2018, an affiliate of Brookfield, Brookfield Properties Partners, L.P. (“BPY”) announced that BPY and GGP entered into an agreement for BPY to acquire all of the outstanding shares of common stock of GGP other than those shares that were already held by BPY and its affiliates, and the transaction was completed on August 28, 2018. BPY is one of the world’s largest commercial real estate companies, with approximately $68.0 billion in total assets. GGP is currently in the final stages of transferring a 24.995% indirect interest in the borrower to Institutional Mall Investors LLC. GGP had previously filed for bankruptcy on April 16, 2009. For more details, please see “Description of the Mortgage Pool – Loan Purpose; Bankruptcy Issues and Other Proceedings” in the Preliminary Prospectus. PPF Retail, LLC is Morgan Stanley’s Prime Property Fund, which is a diversified core real estate fund managed by Morgan Stanley Real Estate. The fund’s assets include office, retail, multifamily, industrial self-storage
THE INFORMATION IN THIS STRUCTURAL AND COLLATERAL TERM SHEET IS NOT COMPLETE AND MAY BE AMENDED PRIOR TO THE TIME OF SALE. THIS TERM SHEET IS NOT AN OFFER TO SELL THESE SECURITIES AND IT IS NOT A SOLICITATION OF AN OFFER TO BUY THESE SECURITIES IN ANY JURISDICTION WHERE THE OFFER OR SALE IS NOT PERMITTED.
105
| CHRISTIANA MALL |
and hotel properties located in major real estate markets throughout the United States. As of March 31, 2018, the Prime Property Fund had over $20.0 billion in net asset value.
Escrows.The Christiana Mall Whole Loan documents provide for upfront reserves of $1,804,093 for outstanding tenant improvements and/or leasing commissions. During a Cash Sweep Event Period (as defined below) the borrower is required to deposit monthly (i) 1/12thof the estimated annual real estate taxes, (ii) 1/12th of the estimated annual insurance premiums (except to the extent that the insurance required is maintained under a blanket insurance policy), (iii) $10,065 for replacement reserves until a cap of $241,565 is reached and (iv) $60,391 for tenant improvements and leasing commissions until a cap of $1,449,387 is reached.
Lockbox and Cash Management.The Christiana Mall Whole Loan is structured to have a hard lockbox and springing cash management. The Christiana Mall Whole Loan documents require the lender to deliver written instructions to tenants to deposit all rents payable under such leases directly into a clearing account. The Christiana Mall Whole Loan documents require that all rents received by the borrower or the property manager be deposited into the lockbox account within three business days of receipt. Funds in the lockbox account, absent the continuance of a Cash Sweep Event Period (as defined below), are required to be transferred daily to a borrower operating account. Upon the first occurrence of a Cash Sweep Event Period, the borrower is required to establish a cash management account under the sole control of the lender, to which during a Cash Sweep Event Period all amounts in the lockbox account are required to be automatically transferred daily for the payment of, among other things, debt service, monthly escrows, default interest and late payment charges. Any remaining funds after such disbursements are required to be distributed to the borrower if no event of default has occurred and is continuing.
A “Cash Sweep Event Period” will occur during the earliest of:
| (i) | an event of default under the Christiana Mall Mortgage Loan; |
| (ii) | any bankruptcy action of the borrower; |
| (iii) | any bankruptcy action of the guarantors or any replacement guarantor or guarantors; and |
| (iv) | the debt service coverage ratio falling below 1.35x for two consecutive quarters. |
A “Cash Sweep Event Period” will end if:
| (w) | with respect to clause (i) above, such event of default has been cured and no other event of default has occurred and is continuing, |
| (x) | with respect to clause (ii) above, such bankruptcy action is discharged, |
| (y) | with respect to clause (iii) above, (A) the borrower replaces the guarantor subject to such bankruptcy action with either (x) a replacement guarantor having an aggregate net worth of at least $500,000,000 and liquidity of at least $25,000,000, in each case exclusive of such person’s interest in the Christiana Mall Property or otherwise acceptable to lender or (y) PPF Retail, LLC or (so long as Institutional Mall Investors LLC is a qualified equityholder (as defined in the loan documents) and has an aggregate net worth of $500,000,000 exclusive of any interest in the Christiana Mall Property), Institutional Mall Investors LLC and one such substitute guarantor has assumed all obligations of such guarantor under each guaranty and environmental indemnity or executed an acceptable replacement guaranty, the borrower has delivered an insolvency opinion, a rating agency confirmation if required by the lender, and a credit check acceptable to the lender as reasonably required by the lender or (B) such bankruptcy action is discharged, stayed, or dismissed within 90 days of filing provided that such filing does not materially affect guarantor’s ability to pay and perform its obligations in the lender’s reasonable discretion, and |
| (z) | with respect to clause (iv) above, the Christiana Mall Property has achieved a debt service coverage ratio of at least 1.35x for two consecutive quarters. |
Property Management.The Christiana Mall Property is managed by an affiliate of the borrower.
Assumption.Following the six month anniversary of the first monthly payment date, the borrower has the right to transfer the Christiana Mall Property without the lender’s consent provided that certain conditions are satisfied, including, but not limited to, (i) no event of default has occurred and is continuing; (ii) the lender has reasonably determined that the proposed transferee and guarantor satisfy the lender’s credit review and underwriting standards, taking into consideration the transferee’s experience, financial strength and general business standing; and (iii) receipt of rating agency confirmation that the transfer will not result in a downgrade, withdrawal or qualification of the respective ratings assigned to the Series WFCM 2018-C48 Certificates.
Partial Release.If no event of default is continuing, the borrower is permitted to release from the lien of the mortgage the Cabela’s parcel and/or the Cinemark parcel (each, an “Outlot Parcel”) (or a portion thereof) in connection with the transfer of the fee simple interest in such Outlot Parcel (or portion thereof) to a transferee which is not an affiliate of the borrower that is either a national tenant or approved by the lender in its reasonable discretion, upon the borrower’s satisfaction of certain conditions, including, among other things:
| (i) | The borrower must make a partial prepayment of the Mortgage Loan by an amount equal to the greatest of (i) 125% of the allocated loan amount (i.e., $8,400,000 with respect to the Cabela’s parcel and $6,600,000 with respect to the Cinemark parcel) for such Outlot Parcel, (ii) the net sales proceeds received by the borrower with respect to such transfer and (iii) any “qualified amount” necessary to comply with any applicable REMIC requirement described in clause (iii) below, which partial prepayment, if made prior to the open period, must be accompanied by a payment of the yield maintenance premium payment (calculated based upon the amount prepaid); provided, however, in lieu of making any such prepayment, at the borrower’s election prior to the release of the Outlot Parcel in question, the borrower may either (a) deposit cash with the lender in the amount of such prepayment (exclusive of the yield maintenance premium payment) as additional reserve funds, which the lender will hold in an additional reserve account, or (b) deliver to the lender a letter of credit in the amount of such prepayment (exclusive of the yield maintenance premium payment). The borrower will have the option of having such reserve funds or letter of credit, as applicable, returned to the borrower with the payment to the lender of the amounts |
THE INFORMATION IN THIS STRUCTURAL AND COLLATERAL TERM SHEET IS NOT COMPLETE AND MAY BE AMENDED PRIOR TO THE TIME OF SALE. THIS TERM SHEET IS NOT AN OFFER TO SELL THESE SECURITIES AND IT IS NOT A SOLICITATION OF AN OFFER TO BUY THESE SECURITIES IN ANY JURISDICTION WHERE THE OFFER OR SALE IS NOT PERMITTED.
106
| CHRISTIANA MALL |
| required pursuant to this clause (i) with respect to the Outlot Parcel in question (inclusive of any yield maintenance premium payment that may be due and payable as of the date of such prepayment); |
| (ii) | upon request by lender, delivery of a REMIC opinion; |
| (iii) | the loan-to-value ratio immediately after the release of the applicable Outlot Parcel is less than or equal to 125%, provided that the borrower may prepay the “qualified amount” (with payment of the yield maintenance premium calculated based upon the amount prepaid), in order to meet the foregoing loan-to-value ratio; and |
| (iv) | delivery of rating agency confirmation. |
Real Estate Substitution.If no event of default is continuing, the borrower may substitute the fee or leasehold interest to a parcel of real property at or adjacent to the related mall (each an “Acquired Parcel”) in connection with the release of one or more parcels of the Christiana Mall Property (each, an “Exchange Parcel”), provided that, among other conditions, (i) the borrower provides at least 20 days’ prior written notice, (ii) the Acquired Parcel is reasonably equivalent in value to the Exchange Parcel, (iii) the Exchange Parcel must be vacant, non-income producing and unimproved or improved only by landscaping, utility facilities that are readily relocatable or surface parking areas, (iv) the borrower pays the lender a fee in the amount of $10,000, along with any reasonable out-of-pocket expenses, (v) the borrower delivers a satisfactory environmental report covering the Acquired Parcel (unless the Acquired Parcel is covered by the environmental report received by the lender in connection with the origination of the mortgage loan) and (vi) after giving effect to such substitution, the loan-to-value ratio is less than or equal to 125%, provided that the borrower may prepay the “qualified amount” in order to meet such loan-to-value ratio.
Target Purchase and Put Options.Target constructed its own store on a 10.15-acre site which is ground leased from the borrower. The ground lease agreement with Target provides that Target has a fair market value purchase option to acquire the fee interest from the borrower in the Target property at any time during the ground lease term. The ground lease with Target has an initial term which runs through December 2036 and also includes five, 10-year and one final, 5-year renewal option. The Target lease does not have any minimum rent but does require Target to make a contribution (currently $139,557 per year) towards the common area maintenance (“CAM”). The Target lease states that, should Target exercise its purchase option, Target would still be obligated to pay its CAM contribution to the borrower through its lease term. The appraisal concluded that the exclusion of Target from the Christiana Mall Property in the appraisal would not affect the value of the Christiana Mall Property.
The lender will release the Target parcel from the lien of the mortgage if and when Target exercises its purchase option pursuant to the terms of the Target lease upon satisfaction of certain conditions, which include, but are not limited to, the following:
| (i) | the purchase option will not be exercised in the event that (a) the borrower, or controlling affiliate of the borrower, acquires Target’s interest under its lease and (b) such option had not therefore been exercised in accordance with Target’s lease; |
| (ii) | the loan-to-value ratio immediately after the release of the Target parcel must be less than or equal to 125% and the borrower must repay the “qualified amount” (with payment of the yield maintenance premium amount calculated based upon the amount prepaid), in order to meet the foregoing loan-to-value ratio; |
| (iii) | the borrower must cause all proceeds from the sale of the Target parcel to be deposited into the clearing account to be applied in the same manner as rents; and |
| (iv) | the borrower must pay a fee in the amount of $10,000. |
Pursuant to the terms set forth in the Target lease, Target has the unilateral right to require the borrower to purchase the improvements located on the Target parcel owned by Target (the “Target Improvements”) and/or, if Target is then the fee owner of the Target parcel (pursuant to the exercise of its purchase option or otherwise), the fee interest in the Target parcel, for the lesser of fair market value or book value (the “Put Option”). On or prior to the anticipated date of the conveyance of the Target Improvements pursuant to the exercise by Target of the Put Option, the borrower must execute and deliver to the lender any amendment or modification to the mortgage or similar documents reasonably necessary in order to confirm that the lien of the mortgage attaches to the Target Improvements, in form and substance reasonably satisfactory to the lender.
Subordinate and Mezzanine Indebtedness.Barclays Bank PLC, SociétéGénéraleand Deutsche Bank AG, New York Branch funded the subordinate Christiana Mall B Notes to Christiana Mall LLC, a Delaware limited liability company. The Christiana Mall B Notes accrue interest at a rate of 4.2775% per annum. The Christiana Mall B Notes are coterminous with the Christiana Mall Senior Loan. The holders of the Christiana Mall Senior Loan and the Christiana Mall B Notes have entered into a co-lender agreement which sets forth the allocation of collections on the Christiana Mall Whole Loan.
The borrower has the one-time right to obtain a mezzanine loan subject to terms and conditions set forth in the loan documents including that (i) no event of default is continuing, (ii) the principal amount of the permitted mezzanine debt cannot be greater than an amount equal to the amount which will yield (x) an aggregate LTV ratio that does not exceed 95.0% of the origination date LTV ratio and (y) an aggregate forward looking DSCR ratio that is not less than 105.0% of the origination date DSCR as determined by the lender, (iii) the lender has received a rating agency confirmation, (iv) the execution of a market intercreditor agreement acceptable to the lender, (v) the mezzanine loan will be interest-only and coterminous with the Christiana Mall Whole Loan maturity date, and (vi) the mezzanine borrower must acquire and maintain an interest rate cap or swap agreement if the mezzanine loan bears a floating interest rate.
Ground Lease.The Christiana Mall property is subject to a ground lease with Macy’s Retail Holdings, Inc. effective through December 31, 2028. The 4.154-acre portion of the parking lot is owned by Macy’s (non-collateral tenant of 215,000 square feet) and ground leased to the borrower pursuant to a parking lease agreement dated as of July 30, 2010. Macy’s can terminate the parking lease at any time with 12 months’ notice. The tenant is not obligated to pay a monthly or annual rent under the ground lease.
Terrorism Insurance.The Christiana Mall borrower is required to obtain and maintain property insurance for full replacement cost, public liability insurance, and rental loss and/or business interruption insurance for 36 months plus 12 months of extended indemnity that covers perils of terrorism and acts of terrorism, provided, in the event that the Terrorism Risk Insurance Program Reauthorization Act of 2007 or similar is not in effect, the borrower will only be obligated to carry terrorism insurance if commercially available and, in such event, subject to a cap equal to two times the premium for the property and business interruption and rental loss coverage.
THE INFORMATION IN THIS STRUCTURAL AND COLLATERAL TERM SHEET IS NOT COMPLETE AND MAY BE AMENDED PRIOR TO THE TIME OF SALE. THIS TERM SHEET IS NOT AN OFFER TO SELL THESE SECURITIES AND IT IS NOT A SOLICITATION OF AN OFFER TO BUY THESE SECURITIES IN ANY JURISDICTION WHERE THE OFFER OR SALE IS NOT PERMITTED.
107
| BELLA AT NORCROSS |
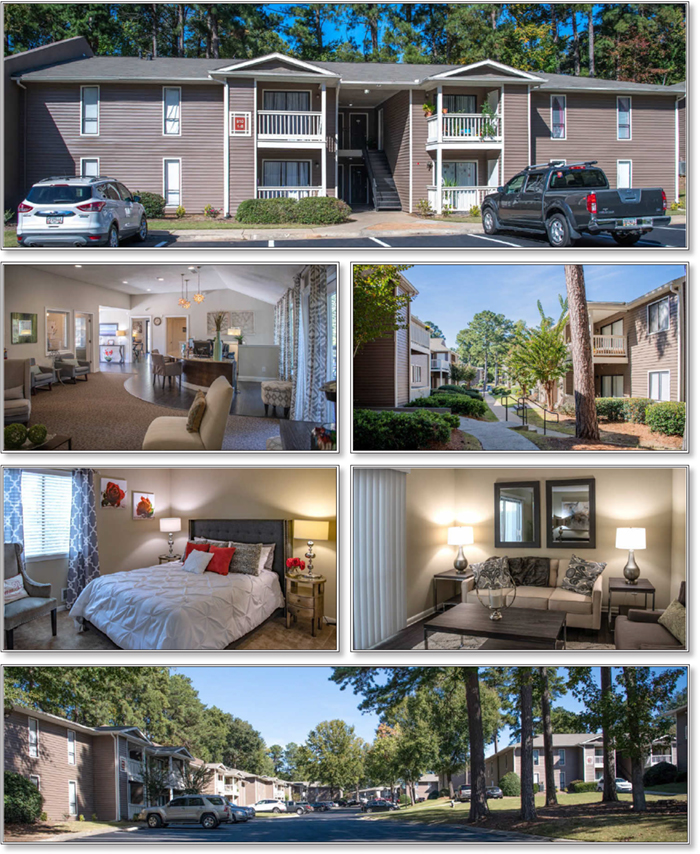
THE INFORMATION IN THIS STRUCTURAL AND COLLATERAL TERM SHEET IS NOT COMPLETE AND MAY BE AMENDED PRIOR TO THE TIME OF SALE. THIS TERM SHEET IS NOT AN OFFER TO SELL THESE SECURITIES AND IT IS NOT A SOLICITATION OF AN OFFER TO BUY THESE SECURITIES IN ANY JURISDICTION WHERE THE OFFER OR SALE IS NOT PERMITTED.
108
| BELLA AT NORCROSS |
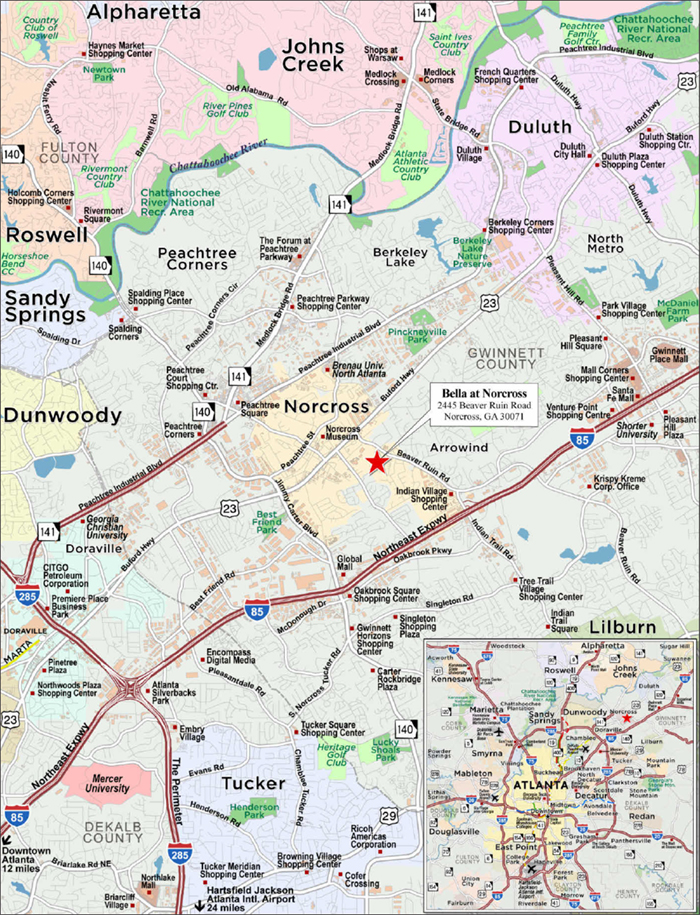
THE INFORMATION IN THIS STRUCTURAL AND COLLATERAL TERM SHEET IS NOT COMPLETE AND MAY BE AMENDED PRIOR TO THE TIME OF SALE. THIS TERM SHEET IS NOT AN OFFER TO SELL THESE SECURITIES AND IT IS NOT A SOLICITATION OF AN OFFER TO BUY THESE SECURITIES IN ANY JURISDICTION WHERE THE OFFER OR SALE IS NOT PERMITTED.
109
| No. 9 – Bella at Norcross | |||||||
| Loan Information | Property Information | ||||||
| Mortgage Loan Seller: | BSPRT CMBS Finance, LLC | Single Asset/Portfolio: | Single Asset | ||||
Credit Assessment (Fitch/KBRA/Moody’s): | NR/NR/NR | Property Type: | Multifamily | ||||
| Original Principal Balance: | $27,000,000 | Specific Property Type: | Garden | ||||
| Cut-off Date Balance: | $27,000,000 | Location: | Norcross, GA | ||||
| % of Initial Pool Balance: | 3.2% | Size: | 318 Units | ||||
| Loan Purpose: | Refinance | Cut-off Date Balance Per Unit: | $84,906 | ||||
| Borrower Name: | Bella SPE 2017, LLC | Year Built/Renovated: | 1972/2018 | ||||
| Borrower Sponsor: | Gideon D. Levy | Title Vesting: | Fee | ||||
| Mortgage Rate: | 5.540% | Property Manager: | Self-managed | ||||
| Note Date: | November 9, 2018 | 4thMost Recent Occupancy(As of): | 93.5% (12/31/2014) | ||||
| Anticipated Repayment Date: | NAP | 3rdMost Recent Occupancy (As of): | 93.5% (12/31/2015) | ||||
| Maturity Date: | December 6, 2028 | 2ndMost Recent Occupancy (As of): | 95.2% (12/31/2016) | ||||
| IO Period: | 60 months | Most Recent Occupancy (As of): | 96.7% (12/31/2017) | ||||
| Loan Term (Original): | 120 months | Current Occupancy (As of): | 95.6% (9/24/2018) | ||||
| Seasoning: | 0 months | ||||||
| Amortization Term (Original): | 360 months | Underwriting and Financial Information: | |||||
| Loan Amortization Type: | Interest-only, Amortizing Balloon | 4thMost Recent NOI (As of): | $1,237,602 (12/31/2015) | ||||
| Interest Accrual Method: | Actual/360 | 3rdMost Recent NOI (As of): | $1,500,874 (12/31/2016) | ||||
| Call Protection: | L(24),D(89),O(7) | 2ndMost Recent NOI (As of): | $1,649,204 (TTM 5/31/2017) | ||||
| Lockbox Type: | None/NAP | Most Recent NOI (As of): | $2,503,897 (TTM 9/30/2018) | ||||
| Additional Debt: | None | ||||||
| Additional Debt Type: | NAP | U/W Revenues: | $3,919,238 | ||||
| U/W Expenses: | $1,432,725 | ||||||
| U/W NOI: | $2,486,513 | ||||||
| U/W NCF: | $2,407,013 | ||||||
| U/W NOI DSCR: | 1.35x | ||||||
| U/W NCF DSCR: | 1.30x | ||||||
| Escrows and Reserves(1): | U/W NOI Debt Yield: | 9.2% | |||||
| U/W NCF Debt Yield: | 8.9% | ||||||
| Type: | Initial | Monthly | Cap (If Any) | As-Is Appraised Value: | $42,000,000 | ||
| Taxes | $83,569 | $27,856 | NAP | As-Is Appraisal Valuation Date: | October 18, 2018 | ||
| Insurance | $58,772 | $7,347 | NAP | Cut-off Date LTV Ratio: | 64.3% | ||
| Replacement Reserve | $0 | $6,625 | NAP | LTV Ratio at Maturity or ARD: | 59.8% | ||
| (1) | See “Escrows” section. |
The Mortgage Loan. The mortgage loan (the “Bella at Norcross Mortgage Loan”) is evidenced by a single promissory note that is secured by a first mortgage encumbering the fee interest in a multifamily garden community located in Norcross, Georgia (the “Bella at Norcross Property”). The Bella at Norcross Mortgage Loan was originated on November 9, 2018 by BSPRT CMBS Finance, LLC. The Bella at Norcross Mortgage Loan has an original principal balance as of the Cut-off Date of $27,000,000 and accrues interest at a rate of 5.54%per annum.The Bella at Norcross Mortgage Loan had an initial term of 120 months, has a remaining term of 120 months as of the Cut-off Date and requires interest-only payments for the first 60 payments following loan origination and, thereafter, requires payments of principal and interest based on a 30-year amortization schedule. The Bella at Norcross Mortgage Loan matures on December 6, 2028.
Following the lockout period, on any date before June 6, 2028, the borrower has the right to defease the Bella at Norcross Mortgage Loan in whole, but not in part. In addition, the Bella at Norcross Mortgage Loan is prepayable without penalty on or after June 6, 2028.
Sources and Uses
| Sources | Uses | |||||||
| Original loan amount | $27,000,000 | 100.0% | Loan payoff(1) | $25,631,511 | 94.9% | |||
| Reserves | 142,341 | 0.5 | ||||||
| Closing costs | 493,785 | 1.9 | ||||||
| Return of equity | 732,363 | 2.7 | ||||||
| Total Sources | $27,000,000 | 100.0% | Total Uses | $27,000,000 | 100.0% |
| (1) | Previous debt was originated by Benefit Street Partners Operating Partnership, LP and was securitized in the BSPRT 2017-FL2 Mortgage Trust. |
The Property. The Bella at Norcross Property is a Class B, 318-unit garden, multifamily complex located in Norcross, Georgia, approximately 2.1 miles northeast of downtown Buckhead and 21.3 miles northeast of the central business district of Atlanta. Unit mix at the Bella at Norcross Property consists of 48 one-bedroom, one-bathroom units, 81 two-bedroom, one-bathroom units (ranging in size from 910 to 976 square feet), 54 two-story, townhouse style two-bedroom, one-and-a-half bathroom units (ranging in size from
THE INFORMATION IN THIS STRUCTURAL AND COLLATERAL TERM SHEET IS NOT COMPLETE AND MAY BE AMENDED PRIOR TO THE TIME OF SALE. THIS TERM SHEET IS NOT AN OFFER TO SELL THESE SECURITIES AND IT IS NOT A SOLICITATION OF AN OFFER TO BUY THESE SECURITIES IN ANY JURISDICTION WHERE THE OFFER OR SALE IS NOT PERMITTED.
110
BELLA AT NORCROSS
986 to 1,140 square feet), 39 two-bedroom, two-bathroom units and 96 three-bedroom, two-bathroom units (ranging in size from 1,136 to 1,270 square feet). Unit features at the Bella at Norcross Property include a fully equipped kitchen, a patio/balcony, washer/dryer connections in select units, in-unit storage space and air conditioning/heating. Community amenities at the Bella at
Norcross Property include high-speed Internet access, a swimming pool, a splash pad, a playground and a fitness center. The Bella at Norcross Property provides open parking spaces for 668 vehicles, representing 2.1 spaces per unit.
The Bella at Norcross Property was originally developed in 1972 and was most recently renovated in 2018. Since 2011, the Bella at Norcross Property has had approximately $8.0 million invested in capital expenditures. Renovations at the Bella at Norcross Property over the past seven years include interior unit upgrades to 299 units, exterior painting, landscaping, repairs to roofing, windows and enclosures and parking lot improvements. Since 2014, the Bella at Norcross Property has had an average occupancy of 94.9%. As of September 24, 2018, the Bella at Norcross Property was 95.6% occupied.
The following table presents certain information relating to the unit mix of the Bella at Norcross Property:
Unit Mix Summary(1)
| Unit Type(3) | Total No. of Units(2) | % of Total Units | Average Unit Size (SF) | Average Monthly Rent per Unit(2) |
| 1 Bedroom / 1 Bathroom | 48 | 15.1% | 634 | $777 |
| 2 Bedroom / 1 Bathroom | 81 | 25.5% | 927 | $869 |
| Townhouse 2 Bedroom / 1.5 Bathroom | 54 | 17.0% | 1,123 | $958 |
| 2 Bedroom / 2 Bathroom | 39 | 12.3% | 1,002 | $938 |
| 3 Bedroom / 2 Bathroom | 96 | 30.2% | 1,192 | $1,073 |
| Total/Weighted Average | 318 | 100.0% | 1,005 | $939 |
| (1) | Information obtained from underwritten rent roll dated September 24, 2018. |
| (2) | Calculations of Average Monthly Rent per Unit exclude vacant units. |
The following table presents historical occupancy at the Bella at Norcross Property:
Historical Occupancy
12/31/2014(1) | 12/31/2015(1) | 12/31/2016(1) | 12/31/2017(1) | 9/24/2018(2) |
| 93.5% | 93.5% | 95.2% | 96.7% | 95.6% |
| (1) | Information obtained from the borrower. |
| (2) | Information obtained from the underwritten rent roll dated September 24, 2018. |
THE INFORMATION IN THIS STRUCTURAL AND COLLATERAL TERM SHEET IS NOT COMPLETE AND MAY BE AMENDED PRIOR TO THE TIME OF SALE. THIS TERM SHEET IS NOT AN OFFER TO SELL THESE SECURITIES AND IT IS NOT A SOLICITATION OF AN OFFER TO BUY THESE SECURITIES IN ANY JURISDICTION WHERE THE OFFER OR SALE IS NOT PERMITTED.
111
BELLA AT NORCROSS
Operating History and Underwritten Net Cash Flow.The following table presents certain information relating to the historical operating performance and underwritten net cash flow at the Bella at Norcross Property:
Cash Flow Analysis
| 2015 | 2016 | TTM 5/31/2017 | TTM 9/30/2018 | U/W | % of U/W Effective Gross Income | U/W $ per Unit | |
| Base Rent | $2,852,361 | $2,991,940 | $3,059,579 | $3,465,540 | $3,598,512 | 91.8% | $11,316 |
| Less Vacancy & Credit Loss | ($237,027) | ($165,951) | ($128,816) | ($230,211)(1) | ($179,926) | (4.6%) | ($566) |
| Other Income(2) | 355,739 | 450,895 | 475,892 | 500,651 | 500,651 | 12.8% | $1,574 |
| Effective Gross Income | $2,971,072 | $3,276,883 | $3,406,655 | $3,735,980 | $3,919,238 | 100.0% | $12,325 |
| Total Operating Expenses | $1,733,470 | $1,776,009 | $1,757,451(3) | $1,232,083(3) | $1,432,725 | 36.6% | $4,505 |
|
|
|
|
|
|
| |
| Net Operating Income | $1,237,602 | $1,500,874 | $1,649,204(3) | $2,503,897(3) | $2,486,513 | 63.4% | $7,819 |
| Capital Expenditures | 79,500 | 79,500 | 79,500 | 79,500 | 79,500 | 2.0% | $250 |
| Net Cash Flow | $1,158,102 | $1,421,374 | $1,569,704 | $2,424,397 | $2,407,013 | 61.4% | $7,569 |
| NOI DSCR | 0.67x | 0.81x | 0.89x | 1.36x | 1.35x | ||
| NCF DSCR | 0.63x | 0.77x | 0.85x | 1.31x | 1.30x | ||
| NOI DY | 4.6% | 5.6% | 6.1% | 9.3% | 9.2% | ||
| NCF DY | 4.3% | 5.3% | 5.8% | 9.0% | 8.9% |
| (1) | For TTM 9/30/2018, vacancy is sourced from various borrower rent rolls dated December 31, 2017, March 30, 2018 and June 30, 2018. |
| (2) | Other income includes water reimbursements, rental fee income, trash reimbursements and other miscellaneous income items. |
| (3) | The increase in Net Operating Income from TTM 5/31/2017 to TTM 9/30/2018 is primarily due to a reduction in Total Operating Expenses at the Mortgaged Property.The decrease in Total Operating Expenses from TTM 5/31/2017 to TTM 9/30/2018 is primarily driven by an approximately 70.0% reduction in repairs and maintenance, attributable to a comprehensive capital expenditure plan, an approximately 70.0% reduction in general and administrative expenses, and an approximately 31.0% reduction in payroll. |
Appraisal. As of the appraisal valuation date of October 18, 2018, the Bella at Norcross Property had an “as-is” appraised value of $42,000,000.
Environmental Matters. According to a Phase I environmental site assessment dated October 26, 2018, there was no evidence of any recognized environmental conditions at the Bella at Norcross Property.
Market Overview and Competition.The Bella at Norcross Property is located in Norcross, Georgia, within Gwinnett County, the second most populous county in Georgia, and within the Atlanta-Sandy Springs-Roswell Metropolitan Statistical Area (“Atlanta MSA”). Gwinnett County has a diverse economic base and is home to a number of large companies, including AGCO, an agricultural technology company, the NCR Corporation, a business solutions IT firm, Primerica, an insurance and financial services firm, and WestRock, a packaging company. As of July 2018, the unemployment rate in Gwinnett County was 3.5%, lower than the Atlanta MSA’s unemployment rate of 3.8%. Highway accessibility to the area is provided by Interstate 85, located less than two miles south of the Bella at Norcross Property, and public transportation is provided by the Metropolitan Atlanta Rapid Transit Authority (“MARTA”), with the Doraville MARTA train station located about six miles southwest of the Bella at Norcross Property. Additionally, the DeKalb Peachtree Airport is located approximately 10 miles southwest of the Bella at Norcross Property.
The Bella at Norcross Property is conveniently located near several retail centers, including Sugarloaf Mills (located approximately 9 miles northeast of the Bella at Norcross Property), which features 1.2 million square feet of indoor retail space with over 180 stores, including Saks Fifth Avenue Off Fifth, Neiman Marcus Last Call, an 18 screen AMC movie theater and The Forum on Peachtree, (located approximately 4 miles north of the Bella at Norcross Property) an outdoor shopping and dining complex with 84 tenants, including HomeGoods, Trader Joe’s and Williams-Sonoma.
According to a third party market research report, the Bella at Norcross Property is located in the North Gwinnett submarket. The North Gwinnett Class B/C submarket has experienced year-over-year rent growth since 2010, and, as of the second quarter of 2018, the submarket had 7,888 units online, with a vacancy rate of 3.3% and an average asking rent of $980 per unit. According to the appraisal, the population within a one-, three- and five-mile radius from the Bella at Norcross Property was 11,788, 79,700, and 259,172, respectively, and the median household income within a one-, three- and five-mile radius was $53,319, $52,515 and $51,890, respectively. The population in the surrounding area is anticipated to increase by 7.7%, 7.6% and 6.6%, in a one-, three- and five-mile radius, respectively, through 2023.
THE INFORMATION IN THIS STRUCTURAL AND COLLATERAL TERM SHEET IS NOT COMPLETE AND MAY BE AMENDED PRIOR TO THE TIME OF SALE. THIS TERM SHEET IS NOT AN OFFER TO SELL THESE SECURITIES AND IT IS NOT A SOLICITATION OF AN OFFER TO BUY THESE SECURITIES IN ANY JURISDICTION WHERE THE OFFER OR SALE IS NOT PERMITTED.
112
BELLA AT NORCROSS
The following table presents certain information relating to comparable multifamily properties for the Bella at Norcross Property:
Comparable Sales
| Bella at Norcross (Subject) | Celebration at Sandy Springs(1) | 347 Discovery at River Bend(1) | Rosemont Berkeley Lake(1) | Ansley Place(1) | The Reserve at Gwinnett(1) | Centre at Peachtree Corners(1) | |
| Location | Norcross, GA | Atlanta, GA | Duluth, GA | Duluth, GA | Sandy Springs, GA | Norcross, GA | Norcross, GA |
| Distance to Subject | -- | 13.0 miles | 7.0 miles | 5.5 Miles | 13.0 miles | 5.0 miles | 3.4 miles |
| Property Type | Garden | Garden | Garden | Garden | Garden | Garden | Garden |
| Year Built/Renovated | 1972/2018 | 1968/NAP | 1985/NAP | 1996/NAP | 1985/NAP | 1999/NAP | 1972/NAP |
| Number of Units | 318 | 250 | 256 | 660 | 219 | 370 | 272 |
| Sale Price | $42,000,000(2) | $32,750,000 | $37,650,000 | $94,250,000 | $28,850,000 | $51,000,000 | $32,640,000 |
| Price per unit | $132,075(2) | $131,000 | $147,070 | $142,803 | $131,735 | $137,838 | $120,000 |
| Net operating income | $2,486,513(3) | $1,637,500 | NAV | $5,183,640 | $1,549,206 | $2,677,320 | $1,729,920 |
| NOI per unit | $7,819(3) | $6,550 | NAV | $7,854 | $7,074 | $7,236 | $6,360 |
| Occupancy | 95.6%(4) | 97.0% | 100.0% | 100.0% | 98.0% | 94.0% | 96.0% |
| (1) | Information obtained from the appraisal. |
| (2) | Represents the “as is” appraised value as of October 18, 2018 and the “as is” appraised value per unit. |
| (3) | Represents the Underwritten Net Operating Income. For historical cash flows, please see Cash Flow Analysis herein. |
| (4) | Information obtained from the underwritten rent roll dated September 24, 2018. |
The Borrower.The borrower for the Bella at Norcross Mortgage Loan is Bella SPE 2017, LLC, a Delaware limited liability company and a special purpose entity with one independent director. Legal counsel to the borrower delivered a non-consolidation opinion in connection with the origination of the Bella at Norcross Mortgage Loan. Gideon D. Levy is the guarantor of certain nonrecourse carveouts under the Bella at Norcross Mortgage Loan.
The Borrower Sponsor.The borrower sponsor is Gideon D. Levy, a seasoned real estate professional with a track record of acquiring, owning and operating multifamily assets in the Atlanta MSA. In 1989, Gideon D. Levy founded GDE Renovations (“GDE”), a full service renovation company specializing in exterior renovations of apartment communities. GDE has renovated over 100,000 units for clients such as Post Properties, Greystar and Lincoln Property Company and has a general contractor’s license in 25 states. Additionally, in 1993, Gideon Levy founded Sabra Real Estate Acquisitions (“SABRA”) which focuses on the acquisition of multifamily communities. Currently, SABRA owns and manages more than 25 multifamily and residential properties, representing over 3,100 multifamily units, all of which are located in and around Atlanta. The sponsor previously had loans that reached maturity default between July 2010 and March 2013. For more details, please see “Description of the Mortgage Pool – Loan Purpose; Bankruptcy Issues and Other Proceedings” in the Preliminary Prospectus.
Escrows.The Bella at Norcross Mortgage Loan documents provide for upfront reserves in the amount of $83,569 for real estate taxes and $58,772 for insurance premiums.
Additionally, the Bella at Norcross Mortgage Loan documents require monthly deposits for (a) real estate taxes in an amount equal to one-twelfth of an amount sufficient to pay taxes payable during the next ensuing twelve months, initially reserved to be $27,856, (b) one-twelfth of an amount which would be sufficient to pay the insurance premiums payable during the next ensuing twelve months, initially reserved to be $7,347 and (c) on-going replacement reserves of $6,625, representing approximately $250 per unit in capital expenditures per year.
Lockbox and Cash Management.The Bella at Norcross Mortgage Loan documents do not require a lockbox or cash management for the Bella at Norcross Mortgage Loan.
Property Management. The Bella at Norcross Property is managed by an affiliate of the borrower sponsor.
Assumption. The borrower may transfer the Bella at Norcross Property at any time, provided that certain conditions are satisfied, including, but not limited to: (i) that no event of default has occurred and is continuing, (ii) the borrower has provided the lender with a written notice of the terms of such prospective transfer not less than 30 days’ prior to closing, (iii) delivery of a new non-consolidation opinion, and (iv) payment of an assumption fee, equal to (a) in connection with the first transfer, 0.5% of the then outstanding principal balance of the Bella at Norcross Mortgage Loan, or (b) in connection with each subsequent transfer, 1.0% of the then outstanding principal balance of the Bella at Norcross Mortgage Loan.
Real Estate Substitution.Not permitted.
Subordinate and Mezzanine Indebtedness.None.
Ground Lease.None.
Terrorism Insurance. The Bella at Norcross Mortgage Loan documents require that the “all risk” insurance policy required to be maintained by the borrower provides coverage for terrorism in an amount equal to the full replacement cost of the Bella at Norcross Property. The Bella at Norcross Mortgage Loan documents also require business interruption insurance covering no less than an amount equal to 100% of the projected gross rents from the Bella at Norcross Property for a 12-month period following the occurrence of a casualty event.
THE INFORMATION IN THIS STRUCTURAL AND COLLATERAL TERM SHEET IS NOT COMPLETE AND MAY BE AMENDED PRIOR TO THE TIME OF SALE. THIS TERM SHEET IS NOT AN OFFER TO SELL THESE SECURITIES AND IT IS NOT A SOLICITATION OF AN OFFER TO BUY THESE SECURITIES IN ANY JURISDICTION WHERE THE OFFER OR SALE IS NOT PERMITTED.
113
| 1600 TERRELL MILL ROAD |
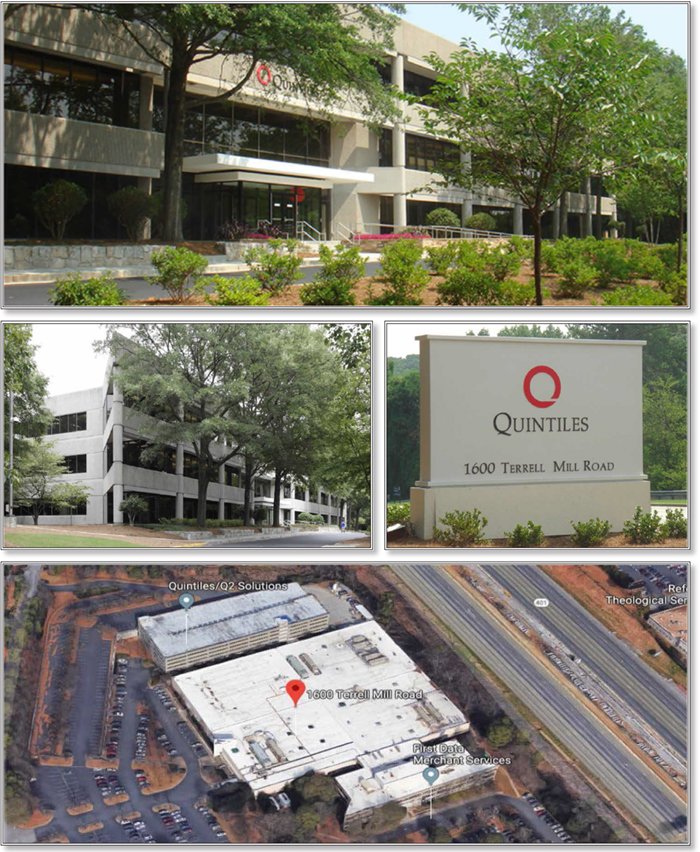
THE INFORMATION IN THIS STRUCTURAL AND COLLATERAL TERM SHEET IS NOT COMPLETE AND MAY BE AMENDED PRIOR TO THE TIME OF SALE. THIS TERM SHEET IS NOT AN OFFER TO SELL THESE SECURITIES AND IT IS NOT A SOLICITATION OF AN OFFER TO BUY THESE SECURITIES IN ANY JURISDICTION WHERE THE OFFER OR SALE IS NOT PERMITTED.
114
| 1600 TERRELL MILL ROAD |
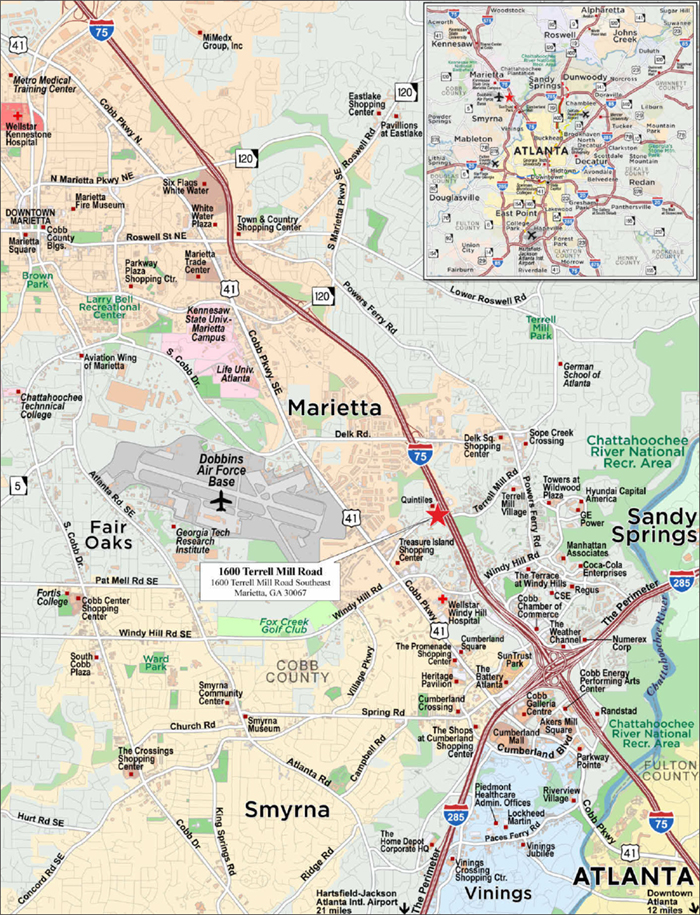
THE INFORMATION IN THIS STRUCTURAL AND COLLATERAL TERM SHEET IS NOT COMPLETE AND MAY BE AMENDED PRIOR TO THE TIME OF SALE. THIS TERM SHEET IS NOT AN OFFER TO SELL THESE SECURITIES AND IT IS NOT A SOLICITATION OF AN OFFER TO BUY THESE SECURITIES IN ANY JURISDICTION WHERE THE OFFER OR SALE IS NOT PERMITTED.
115
| No. 10 – 1600 Terrell Mill Road | ||||||
| Loan Information | Property Information | |||||
| Mortgage Loan Seller: | Basis Real Estate Capital II, LLC | Single Asset/Portfolio: | Single Asset | |||
| Credit Assessment (Fitch/KBRA/Moody’s): | NR/NR/NR | Property Type: | Office | |||
| Original Principal Balance: | $26,000,000 | Specific Property Type: | Suburban | |||
| Cut-off Date Balance: | $26,000,000 | Location: | Marietta, GA | |||
| % of Initial Pool Balance: | 3.1% | Size: | 251,710 SF | |||
| Loan Purpose: | Refinance | Cut-off Date Balance Per SF: | $103.29 | |||
| Borrower Name: | Terrell Mill LLC | Year Built/Renovated: | 1980/2008 | |||
| Borrower Sponsor: | Asher Roshanzamir (aka Asher Zamir) | Title Vesting(3): | Fee | |||
| Mortgage Rate: | 5.330% | Property Manager: | Greenway USA, LLC | |||
| Note Date: | November 16, 2018 | 4thMost Recent Occupancy (As of): | NAV | |||
| Anticipated Repayment Date: | NAP | 3rdMost Recent Occupancy (As of): | 90.8% (12/31/2015) | |||
| Maturity Date: | December 6, 2028 | 2ndMost Recent Occupancy (As of): | 90.1% (12/31/2016) | |||
| IO Period(1): | 24 months | Most Recent Occupancy (As of): | 80.1% (12/31/2017) | |||
| Loan Term (Original): | 120 months | Current Occupancy (As of): | 100.0% (11/20/2018) | |||
| Seasoning: | 0 months | |||||
| Amortization Term (Original): | 360 months | Underwriting and Financial Information: | ||||
| Loan Amortization Type: | Interest-only, Amortizing Balloon | 4thMost Recent NOI (As of): | NAV | |||
| Interest Accrual Method: | Actual/360 | 3rdMost Recent NOI (As of)(4): | $2,892,855 (12/31/2016) | |||
| Call Protection: | L(24),D(93),O(3) | 2ndMost Recent NOI (As of)(4): | $1,576,469 (12/31/2017) | |||
| Lockbox Type: | Hard/Springing Cash Management | Most Recent NOI (As of)(4): | $2,424,597 (TTM 9/30/2018) | |||
| Additional Debt: | No | |||||
| Additional Debt Type: | NAP | U/W Revenues: | $3,668,419 | |||
| U/W Expenses: | $1,078,701 | |||||
| Escrows and Reserves(2): | U/W NOI(3): | $2,589,718 | ||||
| U/W NCF: | $2,262,513 | |||||
| Type: | Initial | Monthly | Cap (If Any) | U/W NOI DSCR: | 1.49x | |
| Taxes | $93,480 | $31,160 | NAP | U/W NCF DSCR: | 1.30x | |
| Insurance | $23,371 | $2,921 | NAP | U/W NOI Debt Yield: | 10.0% | |
| Replacement Reserve | $0 | $4,195 | NAP | U/W NCF Debt Yield: | 8.7% | |
| Rent Abatement Reserve | $178,557 | $0 | NAP | Appraised Value: | $40,000,000 | |
| TI/LC Reserve | $1,529,160 | $25,417 | NAP | Appraisal Valuation Date: | October 23, 2018 | |
| Anchor Tenant Rollover Reserve | $0 | Springing | $7,300,000 | Cut-off Date LTV Ratio: | 65.0% | |
| Deferred Maintenance | $3,438 | $0 | NAP | LTV Ratio at Maturity or ARD: | 56.7% | |
| (1) | Interest only payments commence August 2022 through July 2024. |
| (2) | See “Escrows” section. |
| (3) | See “Ground Lease” section. |
| (4) | See “Cash Flow Analysis” section. |
The Mortgage Loan.The mortgage loan (the “1600 Terrell Mill Road Mortgage Loan”) is evidenced by a single promissory note that is secured by a first mortgage encumbering the fee interest in an office building located in Marietta, Georgia (the “1600 Terrell Mill Road Property”). The 1600 Terrell Mill Road Mortgage Loan was originated on November 16, 2018 by Basis Real Estate Capital II, LLC. The 1600 Terrell Mill Road Mortgage Loan had an original principal balance of $26,000,000, has an outstanding principal balance as of the Cut-off Date of $26,000,000 and accrues interest at a rate of 5.330%per annum. The 1600 Terrell Mill Road Mortgage Loan had an initial term of 120 months, has a remaining term of 120 months as of the Cut-off Date and requires interest only payments for 24 months commencing on August 6, 2022 through July 6, 2024 (the “interest only period”); prior to and following the interest only period, the 1600 Terrell Mill Road Mortgage Loan requires payments of principal and interest based on a 30-year amortization schedule. The 1600 Terrell Mill Road Mortgage Loan matures on December 6, 2028.
Following the lockout period, on any date before October 6, 2028, the borrower has the right to defease the 1600 Terrell Mill Road Mortgage Loan in whole, but not in part. In addition, the 1600 Terrell Mill Road Mortgage Loan is prepayable without penalty on or after October 6, 2028.
THE INFORMATION IN THIS STRUCTURAL AND COLLATERAL TERM SHEET IS NOT COMPLETE AND MAY BE AMENDED PRIOR TO THE TIME OF SALE. THIS TERM SHEET IS NOT AN OFFER TO SELL THESE SECURITIES AND IT IS NOT A SOLICITATION OF AN OFFER TO BUY THESE SECURITIES IN ANY JURISDICTION WHERE THE OFFER OR SALE IS NOT PERMITTED.
116
1600Terrell Mill Road
Sources and Uses
| Sources | Uses | |||||||
| Original loan amount | $26,000,000 | 100.0% | Existing Debt | $20,151,844 | 77.5% | |||
| Closing costs | 328,515 | 1.3 | ||||||
| Reserves | 1,828,005 | 7.0 | ||||||
| Return of equity | 3,691,635 | 14.2 | ||||||
| Total Sources | $26,000,000 | 100.0% | Total Uses | $26,000,000 | 100.0% |
The Property.The 1600 Terrell Mill Road Property is a 251,710 square foot office property located in Marietta, Georgia. Built in 1980 and renovated in 2008, the 1600 Terrell Mill Road Property is situated on three contiguous parcels on a 16.6-acre site consisting of three buildings. The 1600 Terrell Mill Road Property includes a 726 space covered parking garage and 566 surface parking spaces resulting in a parking ratio of 5.13 spaces per 1,000 square feet of rentable area.
As of November 20, 2018, the 1600 Terrell Mill Road Property was 100.0% leased to two tenants: Q Squared Solutions LLC (f/k/a Quintiles Inc.) (55.2% of underwritten net rentable area) and First Data Corporation (44.8% of underwritten net rentable area)
The following table presents certain information relating to the tenancy at the 1600 Terrell Mill Road Property:
Major Tenants
| Tenant Name | Credit Rating (Fitch/ Moody’s/ S&P)(1) | Tenant NRSF | % of NRSF | Annual U/W Base Rent PSF | Annual U/W Base Rent (2) | % of Total Annual U/W Base Rent | Lease Expiration Date |
| Major Tenants | |||||||
| Q Squared Solutions LLC (f/k/a Quintiles Inc) | NR/NR/BB+ | 138,981 | 55.2% | $12.34 | $1,715,026 | 57.2% | 9/30/2023 |
| First Data Corporation | BB-/Ba3/BB- | 112,729 | 44.8% | $11.37 | $1,282,292 | 42.8% | Various(2) |
| Total Major Tenants | 251,710 | 100.0% | $11.91 | $2,997,317 | 100.0% | ||
| Vacant Space | 0 | 0.0% | |||||
| Collateral Total | 251,710 | 100.0% | |||||
| (1) | Certain ratings are those of the parent company, whether or not the parent company guarantees the lease. |
| (2) | August 31, 2023 as to 61,757 NRSF and August 31, 2026 as to an additional 50,972 NRSF (the “Expansion Space”). Tenant has a one-time right to terminate its lease of the Expansion Space on 8/31/2023 with 12 months’ written notice and payment of a termination fee equal to any unamortized expansion tenant improvement allowance, landlord work and leasing commissions. The Expansion Space lease provides for one month of free rent during the month of June for each year of the lease term. An initial reserve equal to $178,557 was established at origination. |
THE INFORMATION IN THIS STRUCTURAL AND COLLATERAL TERM SHEET IS NOT COMPLETE AND MAY BE AMENDED PRIOR TO THE TIME OF SALE. THIS TERM SHEET IS NOT AN OFFER TO SELL THESE SECURITIES AND IT IS NOT A SOLICITATION OF AN OFFER TO BUY THESE SECURITIES IN ANY JURISDICTION WHERE THE OFFER OR SALE IS NOT PERMITTED.
117
1600Terrell Mill Road
The following table presents certain information relating to the lease rollover schedule at the 1600 Terrell Mill Road Property:
Lease Expiration Schedule(1) (2)
| Year Ending December 31, | No. of Leases Expiring | Expiring NRSF | % of Total NRSF | Cumulative Expiring NRSF | Cumulative % of Total NRSF | Annual U/W Base Rent | % of Total Annual U/W Base Rent | Annual U/W Base Rent PSF |
| MTM | 0 | 0 | 0.0% | 0 | 0.0% | $0 | 0.0% | $0.00 |
| 2018 | 0 | 0 | 0.0% | 0 | 0.0% | $0 | 0.0% | $0.00 |
| 2019 | 0 | 0 | 0.0% | 0 | 0.0% | $0 | 0.0% | $0.00 |
| 2020 | 0 | 0 | 0.0% | 0 | 0.0% | $0 | 0.0% | $0.00 |
| 2021 | 0 | 0 | 0.0% | 0 | 0.0% | $0 | 0.0% | $0.00 |
| 2022 | 0 | 0 | 0.0% | 0 | 0.0% | $0 | 0.0% | $0.00 |
| 2023 | 2 | 200,738 | 79.7% | 200,738 | 79.7% | $2,477,403 | 82.7% | $12,34 |
| 2024 | 0 | 0 | 0.0% | 200,738 | 79.7% | $0 | 0.0% | $0.00 |
| 2025 | 0 | 0 | 0.0% | 200,738 | 79.7% | $0 | 0.0% | $0.00 |
| 2026 | 1 | 50,972 | 20.3% | 251,710 | 100.0% | $519,914 | 17.3% | $10.20 |
| 2027 | 0 | 0 | 0.0% | 251,710 | 100.0% | $0 | 0.0% | $0.00 |
| 2028 | 0 | 0 | 0.0% | 251,710 | 100.0% | $0 | 0.0% | $0.00 |
| Thereafter | 0 | 0 | 0.0% | 251,710 | 100.0% | $0 | 0.0% | $0.00 |
| Vacant | 0 | 0 | 0.0% | 251,710 | 100.0% | $0 | 0.0% | $0.00 |
| Total/Weighted Average | 3 | 251,710 | 100.0% | $2,997,317 | 100.0% | $11.91 |
| (1) | Information obtained from the underwritten rent roll. |
| (2) | Certain tenants may have lease termination options that are exercisable prior to the originally stated expiration date of the subject lease and that are not considered in the Lease Expiration Schedule. |
Thefollowing table presents historical occupancy percentages at the 1600 Terrell Mill Road Property:
Historical Occupancy
12/31/2015(1) | 12/31/2016(1) | 12/31/2017(1) | 11/20/2018(1)(2) |
| 90.8% | 90.1% | 80.1% | 100.0% |
| (1) | Information obtained from the borrower. |
| (2) | Information obtained from the underwritten rent roll. |
THE INFORMATION IN THIS STRUCTURAL AND COLLATERAL TERM SHEET IS NOT COMPLETE AND MAY BE AMENDED PRIOR TO THE TIME OF SALE. THIS TERM SHEET IS NOT AN OFFER TO SELL THESE SECURITIES AND IT IS NOT A SOLICITATION OF AN OFFER TO BUY THESE SECURITIES IN ANY JURISDICTION WHERE THE OFFER OR SALE IS NOT PERMITTED.
118
1600Terrell Mill Road
Operating History and Underwritten Net Cash Flow.The following table presents certain information relating to the historical operating performance and underwritten net cash flow at the 1600 Terrell Mill Road Property:
Cash Flow Analysis
| 2016 | 2017 | TTM 9/30/2018 | U/W | % of U/W Effective Gross Income | U/W $ per SF | |
| Base Rent | $2,980,261 | $1,888,320 | $2,442,063 | $2,997,320 | 81.7% | $11.91 |
| Grossed Up Vacant Space | 0 | 0 | 0 | 0 | 0.0 | 0.00 |
| Total Reimbursement | 581,164 | 595,729 | 1,038,465 | 1,078,701 | 29.4 | 4.29 |
| Other Income(1) | 180,000 | 0 | 0 | 0 | 0.0 | 0.00 |
| Less Vacancy & Credit Loss(2) | 0 | 0 | 0 | (407,602) | (11.1) | (1.62) |
| Effective Gross Income | $3,741,425 | $2,484,049 | $3,480,528 | $3,668,419 | 100.0% | $14.57 |
| Total Operating Expenses | 848,571 | 907,579 | 1,055,931 | 1,078,701 | 29.4% | $4.29 |
|
|
|
|
|
| |
| Net Operating Income(3) | $2,892,855 | $1,576,469 | $2,424,597 | $2,589,718 | 70.6% | $10.29 |
| Replacement Reserves | 665 | 490 | 0 | 50,342 | 1.4 | 0.20 |
| Tenant Improvements | 0 | 0 | 0 | 189,191 | 5.2 | 0.75 |
| Leasing Commissions | 1,849 | 0 | 0 | 87,672 | 2.4 | 0.35 |
| Net Cash Flow | $2,890,341 | $1,575,979 | $2,424,597 | $2,262,513 | 61.7% | $8.99 |
| NOI DSCR | 1.66x | 0.91x | 1.39x | 1.49x | ||
| NCF DSCR | 1.66x | 0.91x | 1.39x | 1.30x | ||
| NOI DY | 11.1% | 6.1% | 9.3% | 10.0% | ||
| NCF DY | 11.1% | 6.1% | 9.3% | 8.7% | ||
| (1) | Other income in 2016 represents income earned from a lease buyout. |
| (2) | The underwritten economic vacancy is 10.0%. The 1600 Terrell Mill Road Property was 100.0% leased as of November 8, 2018. |
| (3) | The decrease in Net Operating Income from 2016-2017 can be attributed to Q Squared Solutions LLC (f/k/a Quintiles Inc.) vacating 64,643 square feet in August 2016 and Corinthian College vacating 24,714 square feet in January of 2017 causing a drop in occupancy from 90.1% to 80.1% at that time. The increase in Net Operating Income from 2017 to TTM 9/30/2018 and TTM 9/30/2018 to UW can be attributed to 50,972 square feet of new leasing (20.3% of net rentable area) in May 2018. |
Appraisal. As of the appraisal valuation date of October 23, 2018, the 1600 Terrell Mill Road Property had an “as-is” appraised value of $40,000,000.
Environmental Matters. According to a Phase I environmental site assessment dated October 24, 2018, there was no evidence of recognized environmental conditions at the 1600 Terrell Mill Road Property.
Market Overview and Competition. The 1600 Terrell Mill Road Property is located approximately 12 miles northwest of the Atlanta central business district and 2.6 miles west of I-75. The 1600 Terrell Mill Road Property is located 2.9 miles northwest of The Cobb Galleria Centre, which offers 320,000 gross square feet of conference space. Nearby shopping centers include Treasure Island Shopping Center (0.6 miles southwest of the 1600 Terrell Mill Road Property), Target (1.5 miles south of the 1600 Terrell Mill Road Property), Walmart (0.5 miles southwest of the 1600 Terrell Mill Road Property), and Ollie’s Bargain Outlet (0.6 miles southwest of the 1600 Terrell Mill Road Property). There are also several apartment complexes within 0.1 miles of the 1600 Terrell Mill Road Property. The 1600 Terrell Mill Road Property is also 1.7 miles northwest of SunTrust Park, which opened in 2017 and is home to the Atlanta Braves. SunTrust Park is 0.2 miles northeast of The Battery Atlanta, a mixed use development which features restaurants, bars, retail space, a 9-story office tower, a 264-room Omni Hotel, and a 531-unit apartment building. According to the appraisal report, Thyssenkrupp Elevator is planning to build an additional 420 foot tall, 235,000 square foot office tower near The Battery and SunTrust Park. The 1600 Terrell Mill Road Property is 1.4 miles east of Dobbins Air Reserve Base (the “Base”), home to the Lockheed Martin Plant and the Georgia National Guard Headquarters. According to the appraisal, the Base employs more than 2,500 people and supports nearly 10,000 service members, including the 94th Airlift Wing. There are also several colleges and universities in the area. Life University, a private chiropractic school established in 1974 with more than 2,500 students is located 3.1 miles northwest of the 1600 Terrell Mill Road Property and Kennesaw State University’s Marietta campus is located 3.7 miles northwest of the 1600 Terrell Mill Road Property. Kennesaw State is the third largest public university in Georgia, with more than 35,000 students.
According to the appraisal, the 1600 Terrell Mill Road Property is located in the Northwest Atlanta Submarket of Atlanta. Per a third party marketing consultant report,as of the third quarter of 2018, the Northwest Atlanta Office Submarket reported an occupancy rate and rent of 88.0% and $23.50 (Gross) per square foot. The appraisal included an estimated market population within a one, three, and five mile radius of the 1600 Terrill Mill Road Property of 13,687, 91,483, and 220,139, respectively; and an estimated average household income within the same radii of $60,186, $87,867, and $106,741, respectively.
THE INFORMATION IN THIS STRUCTURAL AND COLLATERAL TERM SHEET IS NOT COMPLETE AND MAY BE AMENDED PRIOR TO THE TIME OF SALE. THIS TERM SHEET IS NOT AN OFFER TO SELL THESE SECURITIES AND IT IS NOT A SOLICITATION OF AN OFFER TO BUY THESE SECURITIES IN ANY JURISDICTION WHERE THE OFFER OR SALE IS NOT PERMITTED.
119
1600Terrell Mill Road
The following table presents certain information relating to comparable office leases for the 1600 Terrell Mill Road Property:
Comparable Leases(1)
| Property Name/Location | Year Built/ Renovated | Total Property Occupancy | Total GLA (SF) | Distance from Subject (Miles) | Largest Tenant Name | Lease Date/ Term (Years) | Lease Area (SF) | Annual Base Rent PSF | Lease Type |
The Gold Building at Windy Hill Atlanta, GA 30339 | 1975 | 94.0% | 66,869 | 0.6 | UL Transaction Security | Mar. 2016 /7.0 | 7,006 | $17.50 | Full Service |
Marietta Tech Center 2121 Newmarket Pkwy SE | 1983 | 68.0% | 85,685 | 0.9 | Professional Office | Mar. 2018 /5.0 | 4,103 | $11.50 | NNN |
The Exchange 1765 The Exchange SE Atlanta, GA 30339 | 1982 | 100.0% | 100,000 | 0.2 | Asking Lease | Oct. 2018 /10.0 | 100,000 | $19.00 | Full Service |
Northwest Business Center 2253 Northwest Pkwy SE | 1981 | 70.0% | 70,815 | 0.5 | Asking Lease | Oct. 2018 /5.0 | 30,000 | $9.75 | NNN |
The Triangle Building 1775 The Exchange SE Atlanta, GA 30339 | 1974 | 70.0% | 96,038 | 0.2 | The Yates Companies | Dec. 2017 /10.0 | 5,426 | 18.85 | Full Service |
Corporate Plaza 1950 Spectrum Cir Marietta, GA 30067 | 1982 | 88.0% | 187,471 | 1.0 | BlueLinx Corp | Apr. 2018 /10.0 | 68,023 | 19.00 | Full Service |
| (1) | Information obtained from the appraisal. |
The Borrower.The borrower is Terrell Mill LLC a Delaware limited liability company and single purpose entity. Asher Roshanzamir is the non-recourse carveout guarantor on the 1600 Terrell Mill Road Mortgage Loan.
The Borrower Sponsor.Asher Roshanzamir (also known as Asher Zamir) is the Chairman and CEO of Zamir Equities a privately-held real estate equity firm based in New York City, founded in 2003. Currently, Zamir Equities owns and manages a portfolio in excess of $300 million and properties totaling over 1.5 million square feet with assets primarily located in New York and New Jersey. With respect to the 1600 Terrell Mill Road Mortgage Loan, the guarantor recently settled several tax liens relating to the disposition of a non-performing asset and pursuant to a review of a 1031 exchange by the New York State Attorney General. The guarantor has paid all back taxes and settled the matter with the State of New York. See“Description of the Mortgage Pool—Litigation and Other Considerations” in the Preliminary Prospectus.
Escrows.The 1600 Terrell Mill Road Mortgage loan documents provide for upfront escrows at origination in the amounts of $93,480 for taxes, $23,371 for insurance, $3,438 for an immediate repair reserve held by the lender, $1,529,160 for tenant improvements relating to tenant First Data Corporation and $178,557 for rent abatements. The 1600 Terrell Mill Road Mortgage loan documents require ongoing monthly escrows of $31,160 for taxes, $2,921 for insurance premiums, $4,195 for replacement reserves, and $25,417 for tenant improvements and leasing commissions. The rent abatement reserve of $178,577 relates to a tenant, First Data Corporation, which was granted a rent abatement for 50,972 square feet of its space equal to free rent for the first two months of the lease term and then one month of free rent applied each June through the end of the lease term.
Lockbox and Cash Management.The 1600 Terrell Mill Road Mortgage Loan is structured with a hard lockbox and springing cash management. The 1600 Terrell Mill Road Mortgage Loan documents require the borrower to direct all tenants to pay rent directly into the lender-controlled lockbox account, and also require that all rents received by the borrower or the property manager be deposited into the lockbox account within one business day of receipt. Prior to the occurrence of a Cash Sweep Period (as defined below), all funds in the lockbox account are distributed to the borrower. During a Cash Sweep Period, all funds in the lockbox account are swept to a lender-controlled cash management account on a daily basis and applied as provided in the loan documents.
A ”Cash Sweep Period” will commence upon the occurrence of (i) an event of default, (ii) the net cash flow debt service coverage ratio falling below 1.20x for the immediately preceding two (2) consecutive calendar quarters calculated at lender’s discretion (a “Cash Sweep DSCR Trigger Event”); (iii) the date on which Q Squared Solutions LLC (f/k/a Quintiles) and/or First Data Corporation (each an “Anchor Tenant”) provides notice of its intent to terminate its lease; (iv) the date on which an Anchor Tenant becomes insolvent or a debtor in a bankruptcy action; (v) an Anchor Tenant failing to provide notice of its intent to renew its lease at least twelve months prior to the expiration of an Anchor Tenant lease; (vi) any Anchor Tenant defaulting under its lease; or (vii) an Anchor Tenant providing notice of its intent to close its business to the general public (clauses (iii) through (vii) each is referred to as “Anchor Tenant Trigger Event”). During a Cash Sweep Period, funds will be available to pay real estate taxes, insurance premiums, loan principal and interest payments, property operating expenses, approved capital improvements, and required reserves. During the continuation of a Cash Sweep Period caused by a Cash Sweep DSCR Trigger Event, all excess cash flow will be retained and held by the lender as additional security for the 1600 Terrell Mill Road Mortgage Loan. During a Cash Sweep Period caused by an Anchor Tenant Trigger Event all excess cash will be swept into the anchor tenant rollover reserve to be used exclusively for the re-tenanting of the Anchor Tenant that caused the Anchor Tenant Trigger Event up to the following required amounts specific to each Anchor Tenant: $4,000,000 for Q Squared Solutions LLC or $3,300,000 for First Data Corporation (the “Required Amounts”).
If the lender, after the occurrence of an Anchor Tenant Trigger Event, determines that sufficient excess cash flow is not available to escrow the Required Amounts within twelve months of an Anchor Tenant Trigger Event then the borrower and guarantor will be required to post cash or an acceptable Letter of Credit within fifteen business days after lender’s written request, in the required anchor tenant rollover contribution less any amounts then held in the anchor tenant rollover reserve. The borrower may avoid a Cash Sweep Period
THE INFORMATION IN THIS STRUCTURAL AND COLLATERAL TERM SHEET IS NOT COMPLETE AND MAY BE AMENDED PRIOR TO THE TIME OF SALE. THIS TERM SHEET IS NOT AN OFFER TO SELL THESE SECURITIES AND IT IS NOT A SOLICITATION OF AN OFFER TO BUY THESE SECURITIES IN ANY JURISDICTION WHERE THE OFFER OR SALE IS NOT PERMITTED.
120
1600Terrell Mill Road
caused solely by an Anchor Tenant Trigger Event by voluntarily posting with lender cash or an acceptable Letter of Credit on no less than ten days prior written notice to lender.
A Cash Sweep Period will end upon: with regard to clause (i), the lender’s acceptance of a cure of the applicable event of default; with respect to clause (ii), the property achieving a net cash flow debt service coverage ratio of 1.25x or greater for two consecutive quarters calculated at lender’s discretion; with respect to clauses (iii), (v) through (vii), such Anchor Tenant or another acceptable tenant(s) (A) being in occupancy of its space and (B) being open for business to the general public in said Anchor Tenant premises and paying the full, unabated rent under its lease, or (C) the borrower and borrower guarantor having deposited cash or a letter of credit in the amount of the Required Amounts; with respect to clause (iv), such Anchor Tenant having affirmed the Anchor Tenant lease in bankruptcy and certified to lender that the Anchor Tenant lease is in full force and effect with no existing defaults, physically occupied by such Anchor Tenant and open for business to the general public and paying full unabated rent.
Property Management. The 1600 Terrell Mill Road Mortgage Loan is managed by Greenway USA, LLC, a third party property management firm.
Assumption. The borrower has the right to transfer the 1600 Terrell Mill Road Mortgage Loan; provided that certain conditions are satisfied, including, without limitation: (i) no event of default has occurred and is continuing; (ii) payment of a transfer fee equal to 0.5% of the then outstanding principal amount of the 1600 Terrell Mill Road Mortgage Loan with respect to the first transfer and a fee equal to 1% of the then outstanding principal amount of the 1600 Terrell Mill Road Mortgage Loan for each subsequent transfer; (iii) the lender reasonably determines that the proposed transferee and guarantor satisfy the lender’s credit review and underwriting standards, taking into consideration the transferee’s experience, financial strength and general business standing; and (iv) receipt of rating agency confirmation that the sale and assumption will not result in a downgrade, withdrawal or qualification of the respective ratings assigned to the Series 2018-C48 certificates.
Partial Release. Not applicable.
Real Estate Substitution.Not permitted.
Subordinate and Mezzanine Indebtedness.None.
Ground Lease. In connection with receiving certain tax abatements through the PILOT program offered through the Development Authority of Cobb County, Georgia (the “Development Authority”), the borrower transferred its fee interest in the portion of the 1600 Terrell Mill Road Property occupied by the largest tenant to the Development Authority and the Development Authority then entered into a ground lease with the borrower for the same portion of the 1600 Terrell Mill Road Property. The Development Authority also consented to granting the lender an interest in the fee interest of the ground leased property. At origination, lender had a perfected security interest in the fee and leasehold interests located at the 1600 Terrell Mill Property. In addition, upon termination of these tax abatements on December 1, 2018, the borrower is required to purchase the fee interest in this portion of the 1600 Terrell Mill Road Property back from the Development Authority for $100.
Tax Abatement: See “Ground Lease” section.
Terrorism Insurance.The loan documents require that the “all risk” insurance policy required to be maintained by the borrower provide coverage with no exclusion for terrorism in an amount equal to the full replacement cost of the 1600 Terrell Mill Road Property as well as business interruption covering no less than the 18 month period following the occurrence of a casualty event, together with a 365 day extended period of indemnity.
THE INFORMATION IN THIS STRUCTURAL AND COLLATERAL TERM SHEET IS NOT COMPLETE AND MAY BE AMENDED PRIOR TO THE TIME OF SALE. THIS TERM SHEET IS NOT AN OFFER TO SELL THESE SECURITIES AND IT IS NOT A SOLICITATION OF AN OFFER TO BUY THESE SECURITIES IN ANY JURISDICTION WHERE THE OFFER OR SALE IS NOT PERMITTED.
121
| No. 11 – Memphis Industrial Portfolio | |||||||
| Loan Information | Property Information | ||||||
| Mortgage Loan Seller: | Basis Real Estate Capital II, LLC | Single Asset/Portfolio: | Portfolio | ||||
| Credit Assessment (Fitch/KBRA/Moody’s): | NR/NR/NR | Property Type: | Industrial | ||||
| Original Principal Balance: | $25,600,000 | Specific Property Type: | Flex | ||||
| Cut-off Date Balance: | $25,600,000 | Location: | Memphis, TN | ||||
| % of Initial Pool Balance: | 3.1% | Size: | 467,949 SF | ||||
| Loan Purpose: | Refinance | Cut-off Date Balance Per SF: | $54.71 | ||||
| Borrower Names(2): | Stage Hills Holdings, LLC; Wolf Lake Holdings, LLC | Year Built/Renovated: | Various – See Table | ||||
| Sponsor(3): | D. Curtis Wegener | Title Vesting: | Fee | ||||
| Mortgage Rate: | 5.450% | Property Manager: | Colliers Management Services – Memphis, LLC | ||||
| Note Date: | November 19, 2018 | 4thMost Recent Occupancy (As of): | 84.2% (12/31/2015) | ||||
| Anticipated Repayment Date: | NAP | 3rdMost Recent Occupancy (As of): | 89.9% (12/31/2016) | ||||
| Maturity Date: | December 1, 2028 | 2ndMost Recent Occupancy (As of): | 89.9% (12/31/2017) | ||||
| IO Period: | 0 months | Most Recent Occupancy (As of): | 91.3% (9/30/2018) | ||||
| Loan Term (Original): | 120 months | Current Occupancy (As of): | 92.6% (11/19/2018) | ||||
| Seasoning: | 0 months | ||||||
| Amortization Term (Original): | 360 | Underwriting and Financial Information: | |||||
| Loan Amortization Type: | Amortizing Balloon | ||||||
| Interest Accrual Method: | Actual/360 | 4thMost Recent NOI(4): | NAV | ||||
| Call Protection: | L(24),D(93),O(3) | 3rdMost Recent NOI(4): | $2,647,011 (12/31/2016) | ||||
| Lockbox Type: | Hard/Springing Cash Management | 2ndMost Recent NOI (As of)(4): | $2,737,368 (12/31/2017) | ||||
| Additional Debt(1): | Yes | Most Recent NOI (As of)(4): | $2,811,943 (TTM 9/30/2018) | ||||
| Additional Debt Type(1): | Mezzanine | ||||||
| U/W Revenues: | $3,992,373 | ||||||
| U/W Expenses: | $1,074,797 | ||||||
| U/W NOI: | $2,917,576 | ||||||
| U/W NCF: | $2,430,587 | ||||||
| Escrows and Reserves: | U/W NOI DSCR(1): | 1.68x | |||||
| U/W NCF DSCR(1): | 1.40x | ||||||
| Type: | Initial | Monthly | Cap (If Any) | U/W NOI Debt Yield(1): | 11.4% | ||
| Taxes | $0 | $41,998 | NAP | U/W NCF Debt Yield(1): | 9.5% | ||
| Insurance | $87,077 | $7,916 | NAP | As-Is Appraised Value: | $43,000,000 | ||
| Replacement Reserve | $0 | $7,799 | NAP | As-Is Appraisal Valuation Date: | October 15, 2018 | ||
| TI/LC Reserve | $250,000 | $32,653 | $1,500,000 | Cut-off Date LTV Ratio(1): | 59.5% | ||
| Deferred Maintenance | $63,000 | $0 | NAP | LTV Ratio at Maturity or ARD: | 49.7% | ||
| (1) | The equity interest in the borrowers has been pledged to secure mezzanine indebtedness with an original principal balance of $5,500,000 (the “Memphis Industrial Portfolio Mezzanine Loan”) originated by BIG Real Estate Capital I, LLC (the “Memphis Industrial Portfolio Mezzanine Lender”), a Delaware limited liability company and an affiliate of Basis Real Estate Capital II, LLC. The Memphis Industrial Portfolio Mezzanine Loan is subject to an intercreditor agreement between the lender and the Memphis Industrial Portfolio Mezzanine Lender. The Memphis Industrial Portfolio Mezzanine Loan has an initial term of 120 months and has a remaining term as of the Cut-off Date of 120 months. The Memphis Industrial Portfolio Mezzanine Loan accrues interest at an interest rate of 12.500% per annum and requires interest-only payments at a minimum current pay rate of 8.500% with the difference accruing, through maturity. All statistical information related to the balance per square foot, loan-to-value ratios, debt service coverage ratios and debt yields are based solely on the Memphis Industrial Portfolio Mortgage Loan (as defined below). As of the Cut-off Date, the combined U/W NOI DSCR, U/W NCF DSCR, U/W NOI Debt Yield, U/W NCF Debt Yield, Cut-off Date LTV Ratio and LTV Ratio at Maturity or ARD were 1.32x, 1.10x, 9.4%, 7.8%, 72.3% and 62.5%, respectively. |
| (2) | The borrowers are Stage Hills Holdings, LLC and Wolf Lake Holdings, LLC. Each borrower is a Delaware limited liability company having one independent director. |
| (3) | The borrower sponsor and guarantor, D. Curtis Wegener, disclosed prior bankruptcies of entities that he controlled. See “Description of the Mortgage Pool—Loan Purpose; Default History, Bankruptcy Issues and Other Proceedings” in the Preliminary Prospectus. |
| (4) | See “Cash Flow Analysis” table. 4th Most Recent NOI was not available for all of the Memphis Industrial Portfolio Properties (as defined below). |
The Mortgage Loan. The mortgage loan (the “Memphis Industrial Portfolio Mortgage Loan”) is evidenced by a single promissory note that is secured by a first mortgage encumbering the fee interest in two industrial properties totaling 467,949 square feet located in Memphis, Tennessee (the “Memphis Industrial Portfolio Properties”). The Memphis Industrial Portfolio Mortgage Loan was originated on November 19, 2018 by Basis Real Estate Capital II, LLC. The Memphis Industrial Portfolio Mortgage Loan had an original principal balance of $25,600,000, has an outstanding principal balance as of the Cut-off Date of $25,600,000 and accrues interest at an interest rate of 5.450%per annum. The Memphis Industrial Portfolio Mortgage Loan had an initial term of 120 months and has a remaining term of 120 months as of the Cut-off Date based on a 30-year amortization schedule. The Memphis Industrial Portfolio Mortgage Loan matures on December 1, 2028.
THE INFORMATION IN THIS STRUCTURAL AND COLLATERAL TERM SHEET IS NOT COMPLETE AND MAY BE AMENDED PRIOR TO THE TIME OF SALE. THIS TERM SHEET IS NOT AN OFFER TO SELL THESE SECURITIES AND IT IS NOT A SOLICITATION OF AN OFFER TO BUY THESE SECURITIES IN ANY JURISDICTION WHERE THE OFFER OR SALE IS NOT PERMITTED.
122
MEMPHIS INDUSTRIAL PORTFOLIO
Following the lockout period, the borrowers have the right to defease the Memphis Industrial Portfolio Mortgage Loan on any date before October 1, 2028. In addition, the Memphis Industrial Portfolio Mortgage Loan is prepayable without penalty on or after October 1, 2028.
Sources and Uses
| Sources | Uses | |||||||
| Original loan amount | $25,600,000 | 82.3 | % | Defeasance Securities | $23,800,000 | 76.5% | ||
| Mezzanine loan | 5,500,000 | 17.7 | Partner Pay Off | 5,556,576 | 17.9 | |||
| Closing Costs | 1,243,347 | 4.0 | ||||||
| Reserves | 500,077 | 1.6 | ||||||
| Return of Equity Capital | 0 | 0.0 | ||||||
| Total Sources | $31,100,000 | 100.0% | Total Uses | $31,100,000 | 100.0% |
The Properties.The Memphis Industrial Portfolio Properties are comprised of two industrial/flex properties known as the Wolf Lake mortgaged property (the “Wolf Lake Property”) and the Stage Hills mortgaged property (the “Stage Hills Property”), totaling 467,949 square feet. The Memphis Industrial Portfolio Properties are located in Memphis, Tennessee. As of November 19, 2018, the Memphis Industrial Portfolio Properties are 92.6% occupied by 68 tenants. The Memphis Industrial Portfolio Properties are located within the Memphis Industrial market and the Northeast Memphis Industrial submarket. Asking rental rates continue to rise in the market as overall rental rates have increased $0.25-$0.30 per square foot since the beginning of 2018. According to a third party marketing consulting company, the submarket reports an 11.6% vacancy rate for industrial flex properties as of September 30, 2018 with year-to-date absorption of 91,503 square feet, while the submarket’s total industrial market reports a vacancy rate of 5.2% and year to date net absorption of 271,226 square feet. Overall, the Memphis industrial market reports a 6.6% vacancy rate and 3.57 million square feet of net absorption, year to date.
The Wolf Lake Property was built starting in 2001 and is comprised of six buildings totaling 229,674 square feet. As of November 19, 2018, the Wolf Lake Property was 97.9% occupied by 27 tenants. The six buildings range in size from 28,080 square feet to 47,424 square feet and feature clear ceiling heights ranging from 16 feet to 18 feet. Approximately 63.7% of the net rentable space of the Wolf Lake Property is allocated for office use with the balance being used primarily for the purposes of distribution loading and unloading and warehousing.
The Stage Hills Property was built starting in 1992 and is comprised of eight buildings totaling 238,275 square feet. As of November 19, 2018, the Stage Hills Property was 87.5% occupied by 41 tenants and has 14’ clear ceiling height. Approximately 58.1% of the net rentable space of the Stage Hills Property is allocated for office use with the balance being used primarily for the purposes of distribution loading and unloading and warehousing.
The following table presents certain information relating to the Memphis Industrial Portfolio Properties:
Property Name – Location | Specific Property Type | Allocated Cut-off Date Principal Balance | % of Portfolio Cut-off Date Principal Balance | Occupancy | Year Built/ Renovated | Net Rentable Area (SF) | Appraised Value | Allocated LTV |
Wolf Lake - Memphis, TN | Flex | $13,150,000 | 51.4% | 97.9% | 2001 /NAP | 229,674 | $21,800,000 | 60.3% |
Stage Hills - Memphis, TN | Flex | $12,450,000 | 48.6% | 87.5% | 1992 /NAP | 238,275 | $21,200,000 | 58.7% |
| Total/Weighted Average | $25,600,000 | 100.0% | 92.6% | 467,949 | $43,000,000 | 59.5% | ||
THE INFORMATION IN THIS STRUCTURAL AND COLLATERAL TERM SHEET IS NOT COMPLETE AND MAY BE AMENDED PRIOR TO THE TIME OF SALE. THIS TERM SHEET IS NOT AN OFFER TO SELL THESE SECURITIES AND IT IS NOT A SOLICITATION OF AN OFFER TO BUY THESE SECURITIES IN ANY JURISDICTION WHERE THE OFFER OR SALE IS NOT PERMITTED.
123
MEMPHIS INDUSTRIAL PORTFOLIO
The following table presents certain information relating to the tenancy at the Memphis Industrial Portfolio Properties:
Major Tenants
| Tenant Name | Property Name | Credit Rating (Fitch/ Moody’s/ S&P) | Tenant NRSF | % of NRSF | Annual U/W Base Rent PSF | Annual U/W Base Rent | % of Total Annual U/W Occupied Base Rent | Lease Expiration Date |
| Major Tenants | ||||||||
| Experitec | Wolf Lake | NR/NR/NR | 31,320 | 6.7% | $11.14 | $348,905 | 8.5% | 4/30/2024 |
| Enteroptyx | Wolf Lake | NR/NR/NR | 36,000 | 7.7% | $8.90 | $320,400 | 7.8% | 6/30/2022 |
| Crown Manufacturing | Wolf Lake | NR/NR/NR | 29,160 | 6.2% | $6.65 | $193,914 | 4.7% | 2/28/2020 |
| Surface Dynamics, LLC | Stage Hills | NR/NR/NR | 19,440 | 4.2% | $8.20 | $159,408 | 3.9% | 8/31/2021 |
| Chrysler Group | Wolf Lake | NR/NR/NR | 10,800 | 2.3% | $11.80 | $127,440 | 3.1% | 4/30/2022 |
| ADT | Wolf Lake | NR/NR/NR | 13,500 | 2.9% | $9.25 | $124,875 | 3.0% | 6/30/2025 |
| IBA Dosimetry America | Stage Hills | NR/NR/NR | 12,600 | 2.7% | $9.65 | $121,590 | 3.0% | 6/30/2021 |
| OfficeScapes | Wolf Lake | NR/NR/NR | 12,150 | 2.6% | $8.75 | $106,313 | 2.6% | 10/31/2021 |
| Southern Fastening Systems, Inc | Stage Hills | NR/NR/NR | 12,960 | 2.8% | $8.00 | $103,680 | 2.5% | 10/31/2020 |
| Behind The Scenes | Stage Hills | NR/NR/NR | 12,500 | 2.7% | $8.00 | $100,000 | 2.4% | 2/28/2022 |
| Total Major Tenants | 190,430 | 40.7% | $8.96 | $1,706,524 | 41.5% | |||
| Non-Major Tenants(1) | 242,834 | 51.9% | $9.91 | $2,407,430 | 58.5% | |||
| Occupied Collateral Total | 433,264 | 92.6% | $9.50 | $4,113,954 | 100.0% | |||
| Vacant Space | 34,685 | 7.4% | ||||||
| Collateral Total | 467,949 | 100.0% | ||||||
| (1) | There are three owner occupied tenants totalling 8,520 square feet. The borrower sponsor and guarantor of the Memphis Industrial Portfolio Mortgage Loan signed new 12-year leases and provided a separate master lease/guarantee for these three spaces. |
The following table presents certain information relating to the lease rollover schedule at the Memphis Industrial Portfolio Properties:
Lease Expiration Schedule(1)
| Year Ending December 31, | No. of Leases Expiring | Expiring NRSF | % of Total NRSF | Cumulative Expiring NRSF | Cumulative % of Total NRSF | Annual U/W Base Rent | % of Total Annual U/W Base Rent | Annual U/W Base Rent PSF(2) |
| MTM | 4 | 15,700 | 3.4% | 15,700 | 3.4% | $151,895 | 3.7% | $9.67 |
| 2019(3) | 17 | 65,761 | 14.1% | 81,461 | 17.4% | $659,556 | 16.0% | $10.03 |
| 2020 | 6 | 57,506 | 12.3% | 138,967 | 29.7% | $440,572 | 10.7% | $7.66 |
| 2021 | 21 | 105,324 | 22.5% | 244,291 | 52.2% | $1,013,304 | 24.6% | $9.62 |
| 2022 | 6 | 74,378 | 15.9% | 318,669 | 68.1% | $712,176 | 17.3% | $9.58 |
| 2023 | 3 | 16,010 | 3.4% | 334,679 | 71.5% | $153,086 | 3.7% | $9.56 |
| 2024 | 4 | 48,510 | 10.4% | 383,189 | 81.9% | $518,105 | 12.6% | $10.68 |
| 2025 | 2 | 23,895 | 5.1% | 407,084 | 87.0% | $205,436 | 5.0% | $8.60 |
| 2026 | 1 | 9,810 | 2.1% | 416,894 | 89.1% | $94,176 | 2.3% | $9.60 |
| 2027 | 0 | 0 | 0.0% | 416,894 | 89.1% | $0 | 0.0% | $0.00 |
| 2028 | 1 | 7,850 | 1.7% | 424,744 | 90.8% | $77,323 | 1.9% | $9.85 |
| Thereafter | 3 | 8,520 | 1.8% | 433,264 | 92.6% | $88,328 | 2.1% | $10.37 |
| Vacant | 0 | 34,685 | 7.4% | 467,949 | 100.0% | $0 | 0.0% | $0.00 |
| Total/Weighted Average | 68 | 467,949 | 100.0% | $4,113,954 | 100.0% | $9.50 |
| (1) | Information obtained from the underwritten rent roll. |
| (2) | Weighted Average Annual U/W Base Rent PSF excludes vacant space. |
| (3) | There are 11 tenants comprising 39,216 square feet that have lease expirations prior to June 30, 2019. The borrower sponsor signed a master lease/guarantee at origination, in an amount equal to the rent due under these 11 leases. Upon a tenant signing a minimum 3-year renewal lease term at market terms, the rent obligation for this tenant would then be removed from the master lease. |
THE INFORMATION IN THIS STRUCTURAL AND COLLATERAL TERM SHEET IS NOT COMPLETE AND MAY BE AMENDED PRIOR TO THE TIME OF SALE. THIS TERM SHEET IS NOT AN OFFER TO SELL THESE SECURITIES AND IT IS NOT A SOLICITATION OF AN OFFER TO BUY THESE SECURITIES IN ANY JURISDICTION WHERE THE OFFER OR SALE IS NOT PERMITTED.
124
MEMPHIS INDUSTRIAL PORTFOLIO
The following table presents historical occupancy percentages at the Memphis Industrial Portfolio Properties:
Historical Occupancy
12/31/2016(1) | 12/31/2017(1) | 9/30/2018(1) | 11/19/2018(2) |
| 89.9% | 89.9% | 91.3% | 92.6% |
| (1) | Information obtained from the borrower. |
| (2) | Information obtained from the underwritten rent roll. |
Operating History and Underwritten Net Cash Flow. The following table presents certain information relating to the historical operating performance and the underwritten net cash flow at the Memphis Industrial Portfolio Properties:
Cash Flow Analysis
2016 | 2017 | TTM 9/30/2018 | U/W | % of U/W Effective Gross Income | U/W $ per SF | |
| Base Rent | $3,544,700 | $3,822,138 | $3,928,556 | $4,113,954 | 103.0% | $8.79 |
| Grossed Up Vacant Space | 0 | 0 | 0 | 366,616 | 9.2 | 0.78 |
| Total Reimbursables | 60,227 | 36,504 | 46,822 | 46,822 | 1.2 | 0.10 |
| Other Income | 3,740 | 8,912 | 3,721 | 0 | 0.0 | 0.00 |
| Less Vacancy & Free Rent(1) | 0 | 0 | 0 | (535,020) | (13.4) | (1.14) |
| Effective Gross Income | $3,608,667 | $3,867,554 | $3,979,098 | $3,992,373 | 100.0% | $8.53 |
| Total Operating Expenses | $961,655 | $1,130,186 | $1,167,155 | $1,074,797 | 26.9% | $2.30 |
| Net Operating Income | $2,647,011 | $2,737,368 | $2,811,943 | $2,917,576 | 73.1% | $6.23 |
| TI/LC | 0 | 0 | 0 | 393,399 | 9.9 | 0.84 |
| Capital Expenditures | 0 | 0 | 0 | 93,590 | 2.3 | 0.20 |
| Net Cash Flow | $2,647,011 | $2,737,368 | $2,811,943 | $2,430,587 | 60.9% | $5.19 |
| NOI DSCR | 1.53x | 1.58x | 1.62x | 1.68x | ||
| NCF DSCR | 1.53x | 1.58x | 1.62x | 1.40x | ||
| NOI DY | 10.3% | 10.7% | 11.0% | 11.4% | ||
| NCF DY | 10.3% | 10.7% | 11.0% | 9.5% |
| (1) | The underwritten economic vacancy is 11.8%. The Memphis Industrial Portfolio Properties were 92.6% occupied as of November 19, 2018. |
THE INFORMATION IN THIS STRUCTURAL AND COLLATERAL TERM SHEET IS NOT COMPLETE AND MAY BE AMENDED PRIOR TO THE TIME OF SALE. THIS TERM SHEET IS NOT AN OFFER TO SELL THESE SECURITIES AND IT IS NOT A SOLICITATION OF AN OFFER TO BUY THESE SECURITIES IN ANY JURISDICTION WHERE THE OFFER OR SALE IS NOT PERMITTED.
125
| No. 12 – Prudential – Digital Realty Portfolio | ||||||
| Loan Information | Property Information | |||||
| Mortgage Loan Seller: | BSPRT CMBS Finance, LLC | Single Asset/Portfolio: | Portfolio | |||
| Credit Assessment (Fitch/KBRA/Moody’s) | NR/NR/NR | Property Type: | Other | |||
| Original Principal Balance(1): | $25,000,000 | Specific Property Type: | Data Center | |||
| Cut-off Date Balance(1): | $25,000,000 | Location: | Various | |||
| % of Initial Pool Balance: | 3.0% | Size: | 1,042,933 SF | |||
| Loan Purpose: | Refinance | Cut-off Date Balance Per SF(1): | $203.27 | |||
| Borrower Names: | Digital-PR Toyama, LLC; Digital-PR Old Ironsides 1, LLC; Digital-PR Old Ironsides 2, LLC; Digital-PR FAA, LLC; BNY-Somerset NJ, LLC; Digital-PR Mason King Court, LLC; Digital-PR Beaumeade Circle, LLC; Digital-PR Devin Shafron E, LLC | Year Built/Renovated: | Various/Various | |||
| Borrower Sponsor: | Digital Realty Trust, L.P. | Title Vesting: | Fee | |||
| Mortgage Rate: | 4.5575% | Property Manager: | Self-managed | |||
| Note Date: | September 7, 2018 | 4th Most Recent Occupancy (As of): | 100.0% (12/31/2015) | |||
| Anticipated Repayment Date: | NAP | 3rd Most Recent Occupancy (As of): | 100.0% (12/31/2016) | |||
| Maturity Date: | October 6, 2023 | 2nd Most Recent Occupancy (As of): | 100.0% (12/31/2017) | |||
| IO Period: | 60 months | Most Recent Occupancy (As of): | 100.0% (6/30/2018) | |||
| Loan Term (Original): | 60 months | Current Occupancy (As of): | 100.0% (12/6/2018) | |||
| Seasoning: | 2 months | |||||
| Amortization Term (Original): | NAP | Underwriting and Financial Information: | ||||
| Loan Amortization Type: | Interest-only, Balloon | |||||
| Interest Accrual Method: | Actual/360 | 4th Most Recent NOI: | $24,670,744 (12/31/2015) | |||
| Call Protection(2): | L(26), GRTR 1% or YM or D(27), O(7) | 3rd Most Recent NOI: | $24,935,956 (12/31/2016) | |||
| Lockbox Type: | Soft/Springing Cash Management | 2nd Most Recent NOI: | $25,488,503 (12/31/2017) | |||
| Additional Debt(1): | Yes | Most Recent NOI: | $25,861,704 (TTM 6/30/2018) | |||
| Additional Debt Type(1): | Pari Passu | |||||
| U/W Revenues: | $31,435,055 | |||||
| U/W Expenses: | $6,299,432 | |||||
| U/W NOI: | $25,135,623 | |||||
| U/W NCF: | $24,509,864 | |||||
| U/W NOI DSCR(1): | 2.57x | |||||
| Escrows and Reserves: | U/W NCF DSCR(1): | 2.50x | ||||
| U/W NOI Debt Yield(1): | 11.9% | |||||
| Type: | Initial | Monthly | Cap (If Any) | U/W NCF Debt Yield(1): | 11.6% | |
| Taxes | $0 | Springing | NAP | As-Is Appraised Value(3): | $387,600,000 | |
| Insurance | $0 | Springing | NAP | As-Is Appraisal Valuation Date(3): | Various | |
| Replacement Reserve | $0 | Springing | $417,173 | Cut-off Date LTV Ratio(1): | 54.7% | |
| TI/LC Reserve | $0 | Springing | NAP | LTV Ratio at Maturity or ARD(1): | 54.7% | |
| (1) | The Prudential – Digital Realty Portfolio Mortgage Loan (as defined below) is part of the Prudential – Digital Realty Portfolio Whole Loan (as defined below), which comprises sixpari passu notes with an aggregate original principal balance of $212,000,000. All statistical information related to the Cut-off Date Balance per SF, U/W NOI Debt Yield, U/W NCF Debt Yield, U/W NOI DSCR, U/W NCF DSCR, Cut-off Date LTV Ratio and LTV Ratio at Maturity or ARD are based on the Prudential – Digital Realty Portfolio Whole Loan. |
| (2) | Following the prepayment lockout date or defeasance lockout date (as applicable), the borrower of the Prudential – Digital Realty Portfolio Whole Loan (as defined below) may obtain the release of one or more of the properties, provided that, among other conditions and in accordance with the Prudential – Digital Realty Portfolio Whole Loan documents, (i) no event of default has occurred and is continuing; (ii) the Prudential – Digital Realty Portfolio Whole Loan is either partially defeased or partially prepaid (along with any applicable yield maintenance premium) in an amount equal to the greater of (a) 110.0% of the allocated loan amount of the Prudential –Digital Realty Portfolio Property (as defined below) being released and (b) the amount needed to satisfy the Debt Yield Test (as defined below), (iii) the net cash flow debt yield for the remaining Prudential – Digital Realty Portfolio Property immediately following the release is equal to or greater than the greater of (a) 11.0% and (b) the net cash flow debt yield immediately prior to the release (the “Debt Yield Test”), (iv) in connection with a partial defeasance, a legal opinion covering compliance in all respects with all laws, rules and regulations governing REMICs has been delivered and (v) in connection with a partial defeasance, rating agency confirmation is received. The allocated loan amount for each of the remaining Prudential – Digital Realty Portfolio Properties is subject topro ratareduction by the release premium to account for previous prepayments and partial defeasances. Allocated loan amounts may also be reduced in connection with mandatory prepayments. |
| (3) | The appraiser concluded to an aggregate hypothetical “go dark” value of $336,300,000 with valuation dates between July 6, 2018 and July 16, 2018. |
The Mortgage Loan.The whole loan (the “Prudential – Digital Realty Portfolio Whole Loan”) is evidenced by sixpari passu notes secured by a first priority fee interest in a portfolio of eight data center properties (the “Prudential – Digital Realty Portfolio Properties”) located in California (3), Virginia (3), Texas (1) and New Jersey (1). The Prudential – Digital Realty Portfolio Whole Loan was co-originated on September 7, 2018 by Wells Fargo Bank, National Association and Column Financial, Inc. The Prudential – Digital Realty Portfolio Whole Loan had an original principal balance of $212,000,000, has an outstanding principal balance as of the Cut-off Date of $212,000,000 and accrues interest at an interest rate of 4.5575%per annum. The Prudential – Digital Realty Portfolio Whole Loan
THE INFORMATION IN THIS STRUCTURAL AND COLLATERAL TERM SHEET IS NOT COMPLETE AND MAY BE AMENDED PRIOR TO THE TIME OF SALE. THIS TERM SHEET IS NOT AN OFFER TO SELL THESE SECURITIES AND IT IS NOT A SOLICITATION OF AN OFFER TO BUY THESE SECURITIES IN ANY JURISDICTION WHERE THE OFFER OR SALE IS NOT PERMITTED.
126
PRUDENTIAL – DIGITAL REALTY PORTFOLIO
had an initial term of 60 months, has a remaining term of 60 months as of the Cut-off Date and requires payments of interest only through the loan term. The Prudential – Digital Realty Portfolio Whole Loan matures on October 6, 2023.
The mortgage loan (the “Prudential – Digital Realty Portfolio Mortgage Loan”) is evidenced by the non-controlling Note A-5 of the Prudential – Digital Realty Portfolio Whole Loan. The Note A-5 was purchased by BSPRT CMBS Finance LLC and is being contributed to the WFCM 2018-C48 securitization trust. The Prudential – Digital Realty Portfolio Mortgage Loan had an original principal balance of $25,000,000 and has an outstanding principal balance as of the Cut-off Date of $25,000,000.
The controlling Note A-1 had an original principal balance of $70,000,000, had an outstanding principal balance as of the Cut-off Date of $70,000,000 and has been contributed to the BANK 2018-BNK14 securitization trust. The non-controlling Note A-2-1 had an original principal balance of $26,000,000, has an outstanding principal balance as of the Cut-off Date of $26,000,000 and has been contributed to the BANK 2018-BNK15 securitization trust. The non-controlling Note A-2-2 had an original principal balance of $10,000,000, has an outstanding principal balance as of the Cut-off Date of $10,000,000, is currently held by Wells Fargo Bank, National Association and is expected to be contributed to future securitization trusts or may be otherwise transferred at any time. The non-controlling Note A-3 had an original principal balance of $70,000,000, has an outstanding principal balance as of the Cut-off Date of $70,000,000 and has been contributed to the CSAIL 2018-C14 securitization trust. The non-controlling Note A-4 had an original principal balance of $11,000,000, has an outstanding principal balance as of the Cut-off Date of $11,000,000, is currently held by Column Financial, Inc. and is expected to be contributed to future securitization trusts or may be otherwise transferred at any time. See “Description of the Mortgage Pool—The Whole Loans— The Serviced Pari Passu Whole Loans” and “Pooling and Servicing Agreement” in the Preliminary Prospectus.
Note Summary
| Notes | Original Balance | Note Holder | Controlling Interest |
| A-1 | $70,000,000 | BANK 2018-BNK14 | Yes |
| A-2-1 | $26,000,000 | BANK 2018-BNK15 | No |
| A-2-2 | $10,000,000 | Wells Fargo Bank, National Association | No |
| A-3 | $70,000,000 | CSAIL 2018-C14 | No |
| A-4 | $11,000,000 | Column Financial, Inc. | No |
| A-5 | $25,000,000 | WFCM 2018-C48 | No |
| Total | $212,000,000 |
Following the lockout period, on any date after the earlier to occur of (i) November 6, 2021 and (ii) two years from the closing date of the securitization that includes the lastpari passu note of the Prudential – Digital Realty Portfolio Whole Loan to be securitized, the borrower has the right to either (a) defease the Prudential – Digital Realty Whole Loan or (b) prepay the Prudential – Digital Realty Portfolio Whole Loanprovidedthat, among other conditions, the borrower pays the greater of (a) the yield maintenance premium or (b) the prepayment premium equal to 1.0% of the principal balance being prepaid. In addition, the Prudential – Digital Realty Portfolio Whole Loan is prepayable without penalty on or after April 6, 2023.
Sources and Uses
| Sources | Uses | ||||
| Original whole loan amount | $212,000,000 | 100.0% | Loan payoff | $208,217,519 | 98.2% |
| Closing costs | 2,295,145 | 1.1 | |||
| Return of equity | 1,487,336 | 0.7 | |||
| Total Sources | $212,000,000 | 100.0% | Total Uses | $212,000,000 | 100.0% |
The Properties.The Prudential – Digital Realty Portfolio Properties consist of eight Tier III powered shell data centers built between 1977 and 2012, totaling 1,042,933 SF. As of December 6, 2018, the Prudential – Digital Realty Portfolio Properties, were 100.0% occupied by four tenants subject to eight, triple-net leases.
The Prudential – Digital Realty Portfolio Properties represent wholesale data centers (powered shell space) in which the landlord delivered the subject buildings in shell condition but had the power and fiber connectivity already brought to the respective sites. The respective tenants were then required to invest their own capital to build out the internal infrastructure and improvements. Six of the eight Prudential – Digital Realty Portfolio Properties are currently being utilized by their respective tenants as colocation facilities while the remaining two are used as data center space for the use of their respective tenants. According to the appraisal, the Prudential – Digital Realty Portfolio Properties are all estimated to be Tier III shell data centers.
THE INFORMATION IN THIS STRUCTURAL AND COLLATERAL TERM SHEET IS NOT COMPLETE AND MAY BE AMENDED PRIOR TO THE TIME OF SALE. THIS TERM SHEET IS NOT AN OFFER TO SELL THESE SECURITIES AND IT IS NOT A SOLICITATION OF AN OFFER TO BUY THESE SECURITIES IN ANY JURISDICTION WHERE THE OFFER OR SALE IS NOT PERMITTED.
127
PRUDENTIAL – DIGITAL REALTY PORTFOLIO
The following tables present certain information relating to the Prudential – Digital Realty Portfolio Properties:
| Property Name – Location | Allocated Cut-off Date Balance(1) | % of Portfolio Cut-off Date Balance | Size (SF) | Occupancy (as of 12/6/2018) | Year Built/ Renovated | UW Net Cash Flow | % of UW Net Cash Flow | Appraised Value | Allocated Cut-Off Date LTV |
| 14901 FAA Boulevard – Fort Worth, TX | $42,800,000
| 20.2%
| 263,700
| 100.0%
| 2000/N/A
| $5,402,268
| 22.0%
| $78,300,000
| 54.7%
|
| 4650 Old Ironsides Drive – Santa Clara, CA | $37,400,000
| 17.6%
| 124,383
| 100.0%
| 1977/2012
| $4,032,392
| 16.5%
| $68,400,000
| 54.7%
|
| 43790 Devin Shafron Drive – Ashburn, VA | $30,200,000
| 14.2%
| 152,138
| 100.0%
| 2011/N/A
| $3,536,651
| 14.4%
| $55,300,000
| 54.6%
|
| 636 Pierce Street – Somerset, NJ | $25,100,000
| 11.8%
| 108,336
| 100.0%
| 2001/2003
| $3,102,133
| 12.7%
| $45,800,000
| 54.8%
|
| 21551 Beaumeade Circle – Ashburn, VA | $22,600,000
| 10.7%
| 152,504
| 100.0%
| 2012/N/A
| $2,188,529
| 8.9%
| $41,300,000
| 54.7%
|
| 7505 Mason King Court – Manassas, VA | $19,600,000
| 9.2%
| 109,650
| 100.0%
| 2003/N/A
| $2,073,396
| 8.5%
| $35,900,000
| 54.6%
|
| 4700 Old Ironsides Drive – Santa Clara, CA | $19,100,000
| 9.0%
| 90,139
| 100.0%
| 1993/1997
| $2,057,661
| 8.4%
| $34,900,000
| 54.7%
|
| 444 Toyama Drive – Sunnyvale, CA | $15,200,000
| 7.2%
| 42,083
| 100.0%
| 1999/N/A
| $2,116,835
| 8.6%
| $27,700,000
| 54.9%
|
| Total/Weighted Average | $212,000,000 | 100.0% | 1,042,933 | 100.0% | $24,509,864 | 100.0% | $387,600,000 | 54.7% |
| (1) | Balances shown are for the Prudential – Digital Realty Portfolio Whole Loan. |
Property Name – Location | Region | Tenant | Size (SF) | Lease Expiration | Annual UW Rent PSF | Facility Type | Power (Gross) | Power Density(1) |
| 14901 FAA Boulevard – Fort Worth, TX | Dallas | Cyxtera | 263,700 | 2/2/2022 | $22.82 | Colocation | 24.0 MW | 91 W/SF |
| 4650 Old Ironsides Drive – Santa Clara, CA | Silicon Valley | Cyxtera | 124,383 | 4/30/2027 | $38.41 | Colocation | 10.0 MW | 80 W/SF |
| 43790 Devin Shafron Drive – Ashburn, VA | Northern VA | VADATA | 152,138 | 5/31/2021 | $25.34 | Colocation | 10.0 MW | 66 W/SF |
| 636 Pierce Street. – Somerset, NJ | NY/NJ | BNY Mellon | 108,336 | 4/30/2023 | $31.94 | Data Center | 8.0 MW | 74 W/SF |
| 21551 Beaumeade Circle – Ashburn, VA | Northern VA | Equinix | 152,504 | 12/31/2023 | $16.35 | Colocation | 7.0 MW | 46 W/SF |
| 7505 Mason King Court – Manassas, VA | Northern VA | VADATA(2) | 109,650 | 12/31/2023 | $19.72 | Colocation | 20.0 MW | 182 W/SF |
| 4700 Old Ironsides Drive – Santa Clara, CA | Silicon Valley | Cyxtera | 90,139 | 4/30/2027 | $27.26 | Colocation | 10.0 MW | 110 W/SF |
| 444 Toyama Drive – Sunnyvale, CA | Silicon Valley | Equinix | 42,083 | 7/31/2022 | $55.09 | Data Center | 6.2 MW | 147 W/SF |
| (1) | Power Density is calculated by dividing Power (Gross) by Size (SF). One MW is equal to one million watts. |
| (2) | VADATA has a one-time right to terminate its lease at the 7505 Mason King Court property effective December 31, 2020, with nine months’ prior written notice, subject to a termination fee equal to unamortized tenant improvement costs and leasing commissions. |
The 14901 FAA Boulevard property is a 263,700 SF, single-story powered shell data center with 180,000 SF of raised floor space (an elevated floor that creates space that can be used for cooling, electrical and mechanical services). The building is situated on a 11.5-acre site, and contains 222 parking spaces, and is currently provided with 24.0 megawatts (“MW”) of power (gross), indicating a power density of 91 watts/SF.
The 4650 Old Ironsides Drive property is a 124,383 SF, single-story powered shell data center, with 80,000 SF of raised floor space. The building is situated on a 6.5-acre site, contains 78 parking spaces and is currently provided with 10.0 MW of power (gross), indicating a power density of 80 watts/SF.
The 43790 Devin Shafron Drive property is a 152,138 SF, single-story powered shell data center, with 106,000 SF of raised floor space. The building is situated on a 4.6-acre site and contains 59 parking spaces. The 43790 Devin Shafron Drive property is currently provided with 10.0 MW of power (gross), indicating a power density of 66 watts/SF. The 43790 Devin Shafron Drive property is a freestanding building that is part of a land condominium. The borrower has 50.0% of the voting rights in the related owners’ associations. The condominium documents provide that each owner is responsible for maintenance of its respective building. The Prudential – Digital Realty Portfolio Whole Loan documents provide for recourse to the borrower and guarantor for losses in connection with any termination or material modification of the condominium documents or termination or subdivision of the condominium without the lender’s consent. See “Description of the Mortgage Pool—Mortgage Pool Characteristics—Condominium and Other Shared Interests” in the Preliminary Prospectus.
The 636 Pierce Street property is a 108,336 SF, single-story powered shell data center with 61,990 SF of raised floor space. The building is situated on a 19.6-acre site, contains 281 parking spaces and is currently provided with 8.0 MW of power (gross), indicating a power density of 74 watts/PSF.
The 21551 Beaumeade Circle property is a 152,504 SF, single-story powered shell data center with approximately 107,000 SF of raised floor space. The building is situated on a 10.7-acre site, contains 102 parking spaces and is currently provided with 7.0 MW of power (gross), indicating a power density of 46 watts/SF.
The 7505 Mason King Court property is a 109,650 SF, single-story powered shell data center with approximately 76,000 SF of raised floor space. The building is situated on a 7.7-acre site, contains 117 parking spaces and is currently provided with 20.0 MW of power (gross), indicating a power density of 182 watts/SF.
The 4700 Old Ironsides Drive property is a 90,139 SF, single-story powered shell data center with approximately 88,000 SF of raised floor space. The building is situated on a 6.5-acre site, contains 257 parking spaces and is currently provided with 10.0 MW of power (gross), indicating a power density of 110 watts/SF.
THE INFORMATION IN THIS STRUCTURAL AND COLLATERAL TERM SHEET IS NOT COMPLETE AND MAY BE AMENDED PRIOR TO THE TIME OF SALE. THIS TERM SHEET IS NOT AN OFFER TO SELL THESE SECURITIES AND IT IS NOT A SOLICITATION OF AN OFFER TO BUY THESE SECURITIES IN ANY JURISDICTION WHERE THE OFFER OR SALE IS NOT PERMITTED.
128
PRUDENTIAL – DIGITAL REALTY PORTFOLIO
The 444 Toyama Drive property is a 42,083 SF, two-story powered shell data center with approximately 32,000 SF of raised floor space. The building is situated on a 2.3-acre site, contains 281 parking spaces and is currently provided with 6.2 MW of power (gross), indicating a power density of 147 watts/SF.
The 4650 Old Ironsides Drive property, the 4700 Old Ironsides Drive property and the 444 Toyama Drive property are located within the Silicon Valley data center market. According to the appraisal, Silicon Valley is the third largest multi-tenant data center market in the United States, with nearly 3.7 million SF of space currently in operation and 240 MW of power. The appraisal concluded to market rents for the 4650 Old Ironsides Drive property, 4700 Old Ironsides Drive property, and 444 Toyama Drive property of $39.00 PSF, $27.00 PSF and $45.00 PSF, respectively, all on a net basis.
The 43790 Devin Shafron Drive property, the 21551 Beaumeade Circle property and the 7505 Mason King Court property are located within the Northern Virginia data center market. According to the appraisal, Northern Virginia is the largest multi-tenant data market center in the United States with over 4.8 million SF of space currently in operation and 666 MW of power. The appraisal concluded to market rents for the 43790 Devin Shafron Drive property, the 21551 Beaumeade Circle property and 7505 Mason King Court property of $27.00 PSF, $24.00 PSF and $24.00 PSF, respectively, all on a net basis.
The 14901 FAA Boulevard property is located within the Dallas/Fort Worth data center market. According to the appraisal, Dallas/Fort Worth is the fourth largest multi-tenant data center market in the United States, with approximately 3.4 million SF of space currently in operation and 364 MW of power. The appraisal concluded to a market rent for the 14901 FAA Boulevard property of $22.20 PSF, net.
The 636 Pierce Street property is located within the Northern New Jersey/New York data center market. According to the appraisal, the Northern New Jersey/New York data center market is the second largest multi-tenant data center market in the United States with approximately 4.2 million SF of space currently in operation and 473 MW of power. The appraiser concluded to a market rent for the 636 Pierce Street property of $30.00 PSF, on a net basis.
The following table presents certain information relating to the tenancy at the Prudential – Digital Realty Portfolio Properties:
Major Tenants
| Tenant Name | Credit Rating (Fitch/Moody's/ S&P)(1) | Tenant NRSF | Approx.% of NRSF | Annual U/W Base Rent(2) | % of Total Annual U/W Base | Annual U/W Base Rent PSF(2) | Lease Expiration | Renewal Options |
| Cyxtera – 14901 FAA Boulevard | NR/B1/B | 263,700 | 25.3% | $6,016,374 | 21.8% | $22.82 | 2/2/2022 | 3, 5-year |
| Cyxtera – 4650 Old Ironsides Drive | NR/B1/B | 124,383 | 11.9% | $4,777,054 | 17.3% | $38.41 | 4/30/2027 | 3, 5-year |
| Cyxtera – 4700 Old Ironsides Drive | NR/B1/B | 90,139 | 8.6% | $2,457,588 | 8.9% | $27.26 | 4/30/2027 | 3, 5-year |
| Cyxtera Total | 478,222 | 45.9% | $13,251,017 | 47.9% | $27.71 | |||
| VADATA (Amazon) – 43790 Devin Shafron | A+/Baa1/AA- | 152,138 | 14.6% | $3,865,908 | 14.0% | $25.41 | 5/31/2021 | 3, 5-year |
| VADATA (Amazon) – 7505 Mason King Court | A+/Baa1/AA- | 109,650 | 10.5% | $2,264,945 | 8.2% | $20.66 | 12/31/2023(3) | 3, 5-year |
| VADATA (Amazon) Total | 261,788 | 25.1% | $6,130,853 | 22.2% | $23.42 | |||
| Equinix – 21551 Beaumeade Circle | BB/Ba3/BB+ | 152,504 | 14.6% | $2,492,794 | 9.0% | $16.35 | 12/31/2023 | 3, 5-year |
| Equinix – 444 Toyama Drive | BB/Ba3/BB+ | 42,083 | 4.0% | $2,318,412 | 8.4% | $55.09 | 7/31/2022 | 2, 5-year |
| Equinix Total | 194,587 | 18.7% | $4,811,206 | 17.4% | $24.73 | |||
| BNY Mellon | AA-/A1/A | 108,336 | 10.4% | $3,460,000 | 12.5% | $31.94 | 4/30/2023 | 2, 1-year |
| Total Tenants | 1,042,933 | 100.0% | $27,653,076 | 100.0% | $26.51 | |||
| Vacant Space | 0 | 0.0% | $0 | 0.0% | $0.00 | |||
| Collateral Total | 1,042,933 | 100.0% | $27,653,076 | 100.0% | $26.51 | |||
| (1) | Certain ratings are those of the parent company whether or not the parent guarantees the lease. |
| (2) | Annual U/W Base Rent PSF and Annual U/W Base Rent include contractual rent steps through September 2019 totaling $651,441 and straight-line rent averaging over the remaining lease term for VADATA totaling $114,197. VADATA’s current rental rate is $19.23 PSF at the 7505 Mason King Court property and $24.60 PSF at the 43790 Devin Shafron Drive property (weighted average of $22.35 PSF). |
| (3) | VADATA has a one-time right to terminate its lease at only the 7505 Mason King Court property effective December 31, 2020, with 9 months’ prior written notice, subject to a termination fee equal to unamortized tenant improvement costs and leasing commissions. |
THE INFORMATION IN THIS STRUCTURAL AND COLLATERAL TERM SHEET IS NOT COMPLETE AND MAY BE AMENDED PRIOR TO THE TIME OF SALE. THIS TERM SHEET IS NOT AN OFFER TO SELL THESE SECURITIES AND IT IS NOT A SOLICITATION OF AN OFFER TO BUY THESE SECURITIES IN ANY JURISDICTION WHERE THE OFFER OR SALE IS NOT PERMITTED.
129
PRUDENTIAL – DIGITAL REALTY PORTFOLIO
The following table presents certain information relating to the lease rollover schedule at the Prudential – Digital Realty Portfolio Properties:
Lease Expiration Schedule(1)(2)
Year | # of Leases Rolling | SF Rolling | Annual UW Rent PSF Rolling | Approx. % of Total SFRolling | Approx. Cumulative % of SF Rolling | Total UW Rent Rolling | Approx. % of Total Rent Rolling | Approx. Cumulative % of Total Rent Rolling |
| MTM | 0 | 0 | $0.00 | 0.0% | 0.0% | $0 | 0.0% | 0.0% |
| 2018 | 0 | 0 | $0.00 | 0.0% | 0.0% | $0 | 0.0% | 0.0% |
| 2019 | 0 | 0 | $0.00 | 0.0% | 0.0% | $0 | 0.0% | 0.0% |
| 2020 | 0 | 0 | $0.00 | 0.0% | 0.0% | $0 | 0.0% | 0.0% |
| 2021 | 1 | 152,138 | $25.41 | 14.6% | 14.6% | $3,865,908 | 14.0% | 14.0% |
| 2022 | 2 | 305,783 | $27.26 | 29.3% | 43.9% | $8,334,786 | 30.1% | 44.1% |
| 2023 | 3 | 370,490 | $22.18 | 35.5% | 79.4% | $8,217,739 | 29.7% | 73.8% |
| 2024 & Beyond | 2 | 214,522 | $33.72 | 20.6% | 100.0% | $7,234,643 | 26.2% | 100.0% |
| Vacant | 0 | 0 | $0.00 | 0.0% | 100.0% | $0 | 0.0% | 100.0% |
| Total/Weighted Average | 8 | 1,042,933 | $26.51 | 100.0% | $27,653,076 | 100.0% |
| (1) | Information is based on the underwritten rent roll. |
| (2) | Certain tenants may have lease termination options that are exercisable prior to the originally stated expiration date of the subject lease and that are not considered in the Lease Expiration Schedule. The following table presents historical occupancy percentages at the Prudential – Digital Realty Portfolio Properties: |
The following table presents historical occupancy percentages at the Prudential – Digital Realty Portfolio Properties:
Historical Occupancy
| 12/31/2015(1) | 12/31/2016(1) | 12/31/2017(1) | 6/30/2018(1) | 12/6/2018(2) |
| 100.0% | 100.0% | 100.0% | 100.0% | 100.0% |
| (1) | Information obtained from the leases. |
| (2) | Information obtained from the underwritten rent roll. |
Operating History and Underwritten Net Cash Flow.The following table presents certain information relating to the underwritten net cash flow at the Prudential – Digital Realty Portfolio Properties:
Cash Flow Analysis(1)
| 2015 | 2016 | 2017 | 6/30/2018 TTM | UW | UW PSF | ||||||
| Gross Potential Base Rent | $24,586,150 | $25,180,137 | $25,790,795 | $26,147,281 | $27,653,075 | $26.51 | |||||
| Total Recoveries | 3,747,608 | 4,973,838 | 5,218,267 | 5,470,766 | 5,436,457 | 5.21 | |||||
| Less Vacancy & Credit Loss | 0 | 0 | 0 | 0 | (1,654,477)(2) | (1.59)(2) | |||||
| Effective Gross Income | $28,333,758 | $30,153,975 | $31,009,062 | $31,618,047 | $31,435,055 | $30.14 | |||||
| Total Operating Expenses | 3,663,014 | 5,218,019 | 5,520,559 | 5,756,343 | 6,299,432 | 6.04 | |||||
| Net Operating Income | $24,670,744 | $24,935,956 | $25,488,503 | $25,861,704 | $25,135,623 | $24.10 | |||||
| TI/LC | 0 | 0 | 0 | 0 | 521,467 | 0.50 | |||||
| Capital Expenditures | 0 | 0 | 0 | 0 | 104,293 | 0.10 | |||||
| Net Cash Flow | $24,670,744 | $24,935,956 | $25,488,503 | $25,861,704 | $24,509,864 | $23.50 | |||||
Occupancy % | 100.0% | 100.0% | 100.0% | 100.0% | 95.0%(2) | ||||||
| NOI DSCR(3) | 2.52x | 2.55x | 2.60x | 2.64x | 2.57x | ||||||
| NCF DSCR(3) | 2.52x | 2.55x | 2.60x | 2.64x | 2.50x | ||||||
| NOI Debt Yield(3) | 11.6% | 11.8% | 12.0% | 12.2% | 11.9% | ||||||
| NCF Debt Yield(3) | 11.6% | 11.8% | 12.0% | 12.2% | 11.6% |
| (1) | UW Gross Potential Base Rent PSF and UW Gross Potential Base Rent include contractual rent steps through September 2019 totalling $651,441 and straight line rent averaging over the remaining lease term for VADATA (Amazon) totalling $114,197. |
| (2) | The underwritten economic vacancy is 5.0%. The Prudential – Digital Realty Portfolio Properties were 100.0% physically occupied as of December 6, 2018. |
| (3) | The debt service coverage ratios and debt yields shown are based on the Prudential – Digital Realty Portfolio Whole Loan. |
THE INFORMATION IN THIS STRUCTURAL AND COLLATERAL TERM SHEET IS NOT COMPLETE AND MAY BE AMENDED PRIOR TO THE TIME OF SALE. THIS TERM SHEET IS NOT AN OFFER TO SELL THESE SECURITIES AND IT IS NOT A SOLICITATION OF AN OFFER TO BUY THESE SECURITIES IN ANY JURISDICTION WHERE THE OFFER OR SALE IS NOT PERMITTED.
130
(THIS PAGE INTENTIONALLY LEFT BLANK)
THE INFORMATION IN THIS STRUCTURAL AND COLLATERAL TERM SHEET IS NOT COMPLETE AND MAY BE AMENDED PRIOR TO THE TIME OF SALE. THIS TERM SHEET IS NOT AN OFFER TO SELL THESE SECURITIES AND IT IS NOT A SOLICITATION OF AN OFFER TO BUY THESE SECURITIES IN ANY JURISDICTION WHERE THE OFFER OR SALE IS NOT PERMITTED.
131
| No. 13 – California Mixed Use Portfolio | ||||||||
| Loan Information | Property Information | |||||||
| Mortgage Loan Seller: | BSPRT CMBS Finance, LLC | Single Asset/Portfolio: | Portfolio | |||||
| Credit Assessment (Fitch/KBRA/Moody’s): | NR/NR/NR | Property Type(4): | Various | |||||
| Original Principal Balance: | $24,800,000 | Specific Property Type(4): | Various | |||||
| Cut-off Date Principal Balance: | $24,800,000 | Location: | Various, CA | |||||
| % of Initial Pool Balance: | 3.0% | Size: | 607,004 SF | |||||
| Loan Purpose: | Recapitalization | Cut-off Date Principal Balance Per SF:
| $40.86 | |||||
| Borrower Names(1): | Absolute Storage Thousand Palms Varner Road LP; Perris Citrus Avenue Storage LP | Year Built/Renovated: | Various | |||||
| Borrower Sponsor: | DT GRAT LM, LLC | Title Vesting: | Fee | |||||
| Mortgage Rate: | 5.190% | Property Manager: | Dominion Storage Group, Inc. (d/b/a Platinum Storage Group) | |||||
| Note Date: | November 16, 2018 | 4thMost Recent Occupancy (As of) | NAV | |||||
| Anticipated Repayment Date: | NAP | 3rdMost Recent Occupancy (As of): | NAV | |||||
| Maturity Date: | December 6, 2028 | 2ndMost Recent Occupancy (As of)(5): | 89.8% (12/31/2016) | |||||
| IO Period: | 0 months | Most Recent Occupancy (As of)(5): | 90.9% (12/31/2017) | |||||
| Loan Term (Original): | 120 months | Current Occupancy (As of): | 93.8% (Various) | |||||
| Seasoning: | 0 months | |||||||
| Amortization Term (Original): | 360 months | Underwriting and Financial Information: | ||||||
| Loan Amortization Type: | Amortizing Balloon | 4thMost Recent NOI (As of): | NAV | |||||
| Interest Accrual Method: | Actual/360 | 3rdMost Recent NOI (As of): | $2,259,255 (12/31/2016) | |||||
| Call Protection(2): | L(24),D(92),O(4) | 2ndMost Recent NOI (As of): | $2,440,771 (12/31/2017) | |||||
| Lockbox Type(3): | Soft/Springing Cash Management | Most Recent NOI (As of): | $2,483,855 (TTM 9/30/2018) | |||||
| Additional Debt: | None | |||||||
| Additional Debt Type: | NAP | |||||||
| U/W Revenues: | $3,614,462 | |||||||
| U/W Expenses: | $1,186,005 | |||||||
| U/W NOI: | $2,428,457 | |||||||
| U/W NCF: | $2,273,303 | |||||||
| Escrows and Reserves: | U/W NOI DSCR: | 1.49x | ||||||
| U/W NCF DSCR: | 1.39x | |||||||
| Type: | Initial | Monthly | Cap (If Any) | U/W NOI Debt Yield: | 9.8% | |||
| Taxes | $114,994 | $28,749 | NAP | U/W NCF Debt Yield: | 9.2% | |||
| Insurance | $53,164 | $3,544 | NAP | As-Is Appraised Value: | $39,700,000 | |||
| Replacement Reserves | $0 | $5,058 | NAP | As-Is Appraisal Valuation Date: | October 10, 2018 | |||
| Deferred Maintenance | $18,313 | $0 | NAP | Cut-off Date LTV Ratio: | 62.5% | |||
| TI/LC Reserves | $350,000 | $10,788 | NAP | LTV Ratio at Maturity or ARD: | 51.7% | |||
| (1) | Absolute Storage Thousand Palms Varner Road LP is the owner of the Absolute Self Storage Property (as defined below) and Perris Citrus Avenue Storage LP is the owner of the Daytona Business Park Property (as defined below) and the Daytona RV & Boat Storage Property (as defined below). |
| (2) | Following the lockout period and prior to September 6, 2028, the borrowers are permitted to obtain the release of the Absolute Self-Storage Property in connection with a partial defeasance, subject to certain conditions, including, (i) no event of default has occurred and is continuing; (ii) payment of a release price equal to the greater of (x) 120.0% of the allocated loan amount for the release property and (y) the net sales proceeds of the release property, (iii) after giving effect to the release, a DSCR equal to or greater than (x) the DSCR in effect immediately prior to release and (y) the DSCR in effect as of the origination date, and (iv) after giving effect to the release, an LTV no greater than the lesser of (x) the LTV in effect immediately prior to release and (y) the LTV in effect as of the origination date. |
| (3) | The California Mixed Use Portfolio Mortgage Loan (as defined below) documents require a hard lockbox for its commercial tenants and a soft lockbox for the self-storage and RV/boat storage tenants at the properties. |
| (4) | With respect to the Daytona RV & Boat Storage Property and the Absolute Self Storage Property, the property type is self storage. With respect to the Daytona Business Park Property, the property type is industrial flex. |
| (5) | Historical Occupancy is based on the Daytona RV & Boat Storage and Absolute Self Storage properties only. Historical Occupancy is unavailable for the Daytona Business Park Property. |
The Mortgage Loan. The mortgage loan (the “California Mixed Use Portfolio Mortgage Loan”) is evidenced by a single promissory note that is jointly secured by two first priority lien mortgages that collectively encumber two self-storage properties and an industrial property. One such mortgage solely encumbers the Absolute Self Storage property (the “Absolute Self Storage Property”) in Thousand Palms, California, while the other mortgage encumbers both the Daytona RV & Boat Storage property (the “Daytona RV & Boat Storage Property”) and the Daytona Business Park property (the “Daytona Business Park Property”, and together with the Absolute Self Storage Property and the Daytona RV & Boat Storage Property, the “California Mixed Use Portfolio Properties”), which are both located in Perris, California. The California Mixed Use Portfolio Mortgage Loan was originated on November 16, 2018 by BSPRT CMBS Finance, LLC. The California Mixed Use Portfolio Mortgage Loan had an original principal balance of $24,800,000, has an outstanding principal balance as of the Cut-off Date of $24,800,000 and accrues interest at a rate of 5.190%per annum. The California Mixed Use Portfolio Mortgage Loan had an initial term of 120 months, has a remaining term of 120 months as of the Cut-off Date and requires payments of principal
THE INFORMATION IN THIS STRUCTURAL AND COLLATERAL TERM SHEET IS NOT COMPLETE AND MAY BE AMENDED PRIOR TO THE TIME OF SALE. THIS TERM SHEET IS NOT AN OFFER TO SELL THESE SECURITIES AND IT IS NOT A SOLICITATION OF AN OFFER TO BUY THESE SECURITIES IN ANY JURISDICTION WHERE THE OFFER OR SALE IS NOT PERMITTED.
132
CALIFORNIA MIXED USE PORTFOLIO
and interest based on a 30-year amortization schedule. The California Mixed Use Portfolio Mortgage Loan matures on December 6, 2028.
Following the lockout period, the borrower has the right to defease the California Mixed Use Portfolio Mortgage Loan in whole or in part, on any date before September 6, 2028. In addition, the California Mixed Use Portfolio Mortgage Loan is prepayable without penalty on or after September 6, 2028.
Sources and Uses
| Sources | Uses | |||||||
| Original loan amount | $24,800,000 | 100.0% | Return of equity | $23,773,692 | 95.8% | |||
| Reserves | 536,471 | 2.2 | ||||||
| Closing costs | 489,837 | 2.0 | ||||||
| Total Sources | $24,800,000 | 100.0% | Total Uses | $24,800,000 | 100.0% |
The Properties.The California Mixed Use Portfolio Properties are comprised of two self-storage properties totaling 407,846 square feet and one industrial property totaling 199,158 square feet, all of which are located in California. The Absolute Self Storage Property is located in Thousand Palms, California, and is directly off of Interstate 10 on Varner Road. The Daytona RV & Boat Storage Property and the Daytona Business Park Property are located in Perris, California, and are west of Interstate 215 on Harvill Avenue.
The California Mixed Use Portfolio Properties contain a total of 978 self-storage units between the Absolute Self Storage Property and the Daytona RV & Boat Storage Property. The Absolute Self Storage Property is a traditional self-storage property comprised of 322 drive up units, 36 climate controlled units, 128 non-climate controlled units and 17 interior storage units. The Absolute Self Storage Property features a guest parking area, an electronic security gate with key coded access, concrete paved driving surfaces, video surveillance and a management office. The Absolute Self Storage Property is 97.1% occupied with an average unit rent of $139 ($0.82 PSF).
The Daytona RV & Boat Storage Property is a non-traditional storage facility with larger than average unit sizes to accommodate recreational vehicles (“RVs”) and boats. The Daytona RV & Boat Storage Property contains 416 drive up units, 36 interior units and 23 outside RV parking spaces. Approximately 75.0% of units at the Daytona RV & Boat Storage Property are occupied with RVs or boats and the remaining 25.0% of the units are used by commercial storage tenants. Similar to the Absolute Self Storage Property, the Daytona RV & Boat Storage Property features a guest parking area, an electronic security gate with key coded access and video surveillance. Additionally, each unit features electricity and lighting, 14 foot roll-up doors, and an on-site dump station. The Daytona RV & Boat Storage Property is 98.3% occupied with an average unit rent of $334 ($0.49 PSF). The Absolute Self Storage Property and the Daytona RV & Boat Storage Property have a combined occupancy of 97.7% and average rent of $234 ($0.56 PSF).
The Daytona Business Park Property is an eight-building, 199,158 square foot industrial park, occupied by 18 tenants and was 85.1% occupied as of September 30, 2018. Tenant use of space at the Daytona Business Park Property is approximately 80.0% warehouse use and 20.0% office use. Multiple tenant spaces at the Daytona Business Park Property include an office area that interconnects with the warehouse area. Since January 2016, 17 tenants have leased or exercised an extension at the Daytona Business Park Property and tenancy at the Daytona Business Park Property covers a wide array of industries. The largest tenant at the Daytona Business Park Property is the County of Riverside, which houses a mission-critical station of its sheriff’s department along with various emergency response vehicles. The second largest tenant at the Daytona Business Park Property is Axiom Trading International Inc. (”Axiom”). Axiom is a wholesaler of mattresses and other home goods and occupies two separate spaces at the Daytona Business Park Property. Axiom utilizes 17,473 square feet of space as a showroom for its products and 21,000 square feet of space as a warehouse for older and wholesale products. The third largest tenant at the Daytona Business Park Property is SoCal Custom Rigs, LLC (“SoCal”). SoCal, founded in 2000, is an auto-body shop that does welding, plasma cutting, powder-coating, fabrication and electrical work on show cars and vintage vehicles.
The California Mixed Use Portfolio Properties are located in the Inland Empire, which encompasses Riverside and San Bernardino counties and is the fifth-largest industrial market in the nation in terms of inventory. The Inland Empire benefits from its proximity to the coastal regions of Los Angeles and Orange County, specifically the Ports of Los Angeles and Long Beach, and serves as a key distribution and manufacturing epicenter in the area. The trade, transportation and utilities sector in the Inland Empire represents approximately 24.5% of employment, the government sector represents approximately 17.0% of employment and the construction sector represents approximately 7% of employment.
According to a third party market research report, the Daytona Business Park Property is located within the San Bernardino/Riverside industrial market, which features approximately 298,000,000 square feet of inventory, an average asking rent of $5.78 per square foot and a vacancy of 5.9%. With respect to the Absolute Self Storage Property and the Daytona RV & Boat Storage Property the submarket vacancy within a three-mile radius of each property is 7.4% and 6.1%, respectively. Within a three-mile radius of the Absolute Self Storage Property and the Daytona RV & Boat Storage Property, there are no new self storage facilities under development.
The 2017 population in a one-, three- and five- mile radius of the Absolute Self Storage Property was 4,325, 20,628 and 86,816, respectively, and the 2017 average household income in a one-, three- and five-mile radius of the Absolute Self Storage Property was $56,000, $98,344 and $85,816, respectively. The 2017 population in a one-, three- and five- mile radius of the Daytona Business Park Property was 12,029, 65,275, and 142,537, respectively, and the 2017 average household income in a one-, three- and five- mile radius was $68,485, $65,907 and $63,843, respectively. The 2017 population in a one-, three- and five- mile radius of the Daytona RV & Boat Storage Property was 4,793, 68,830, and 114,937, respectively, and the 2017 average household income in a one-, three- and five- mile radius was $55,012, $59,014 and $62,068, respectively.
THE INFORMATION IN THIS STRUCTURAL AND COLLATERAL TERM SHEET IS NOT COMPLETE AND MAY BE AMENDED PRIOR TO THE TIME OF SALE. THIS TERM SHEET IS NOT AN OFFER TO SELL THESE SECURITIES AND IT IS NOT A SOLICITATION OF AN OFFER TO BUY THESE SECURITIES IN ANY JURISDICTION WHERE THE OFFER OR SALE IS NOT PERMITTED.
133
CALIFORNIA MIXED USE PORTFOLIO
The following table presents certain information relating to the California Mixed Use Portfolio Properties:
Portfolio Summary
| Property Name- Location | Location | Property Type | Allocated Cut-off Date Balance | % of Portfolio Cut-off Date Balance | Occupancy | Year Built/ Renovated | Net Rentable Area (SF) | As-Is Appraised Value | Allocated Cut-off Date LTV |
| Daytona RV & Boat Storage | Perris, CA | Self Storage | $12,270,000 | 49.5% | 98.3% | 2005-2009/ NAP | 322,622 | $20,400,000 | 60.1% |
| Daytona Business Park | Perris, CA | Industrial (Flex) | $7,030,000 | 28.3% | 85.1% | 2005-2013/ NAP | 199,158 | $11,500,000 | 61.1% |
| Absolute Self Storage | Thousand Palms, CA | Self Storage | $5,500,000 | 22.2% | 97.1% | 2007/ NAP | 85,224 | $7,800,000 | 70.5% |
Total/Weighted Average | $24,800,000 | 100.0% | 93.8% | 607,004 | $39,700,000 | 62.5% |
The following table presents certain information relating to the tenancies at the Daytona Business Park Property:
Major Tenants
Tenant Name | Credit Rating (Fitch/Moody’s/ | Tenant NRSF | % of NRSF | Annual U/W Base Rent PSF(4) | Annual U/W | % of Total Annual U/W Base Rent | Lease Expiration Date |
| Major Tenants | |||||||
| County of Riverside | A+/A2/AA(1) | 55,625 | 27.9% | $4.73 | $262,942 | 26.1% | 6/11/2019 |
| Axiom Trading International, Inc. | NR/NR/NR | 38,473 | 19.3% | $6.30 | $242,460 | 24.1% | Various(2) |
| SoCal Custom Rigs, LLC | NR/NR/NR | 10,170 | 5.1% | $3.54 | $36,000 | 3.6% | 4/30/2019 |
| GHH Ministries | NR/NR/NR | 8,000 | 4.0% | $6.60 | $52,800 | 5.2% | 10/14/2022 |
| Swedish Speed, Inc | NR/NR/NR | 6,000 | 3.0% | $7.44 | $44,640 | 4.4% | 4/30/2019(3) |
| Total Major Tenants | 118,268 | 59.4% | $5.40 | $638,842 | 63.5% | ||
| Non-Major Tenants | 51,240 | 25.7% | $7.17 | $367,500 | 36.5% | ||
| Occupied Collateral Total | 169,508 | 85.1% | $5.94 | $1,006,342 | 100.0% | ||
| Vacant Space | 29,650 | 14.9% | |||||
| Collateral Total | 199,158 | 100.0% | |||||
| (1) | The credit rating reflects the ratings associated with revenue bonds issued by the County of Riverside. |
| (2) | Axiom Trading International, Inc. leases two spaces in the Daytona Business Park Property, each under a separate lease. One space is comprised of 21,000 square feet under a lease that expires on May 31, 2021. The second space is comprised of 17,473 square feet expiring on September 30, 2022 subject to one, two-year renewal option with written notice at least two months prior to lease expiration. |
| (3) | Swedish Speed, Inc has one, three-year renewal option with written notice provided at least three months prior to lease expiration. |
| (4) | Annual U/W Base Rent PSF and Annual U/W Base Rent include contractual rent steps through October 2019 totalling $10,860. |
THE INFORMATION IN THIS STRUCTURAL AND COLLATERAL TERM SHEET IS NOT COMPLETE AND MAY BE AMENDED PRIOR TO THE TIME OF SALE. THIS TERM SHEET IS NOT AN OFFER TO SELL THESE SECURITIES AND IT IS NOT A SOLICITATION OF AN OFFER TO BUY THESE SECURITIES IN ANY JURISDICTION WHERE THE OFFER OR SALE IS NOT PERMITTED.
134
CALIFORNIA MIXED USE PORTFOLIO
The following table presents certain information relating to the lease rollover schedule at the Daytona Business Park Property:
Lease Expiration Schedule(1)
| Year Ending December 31, | No. of Leases Expiring | Expiring NRSF | % of Total NRSF | Cumulative Expiring NRSF | Cumulative % of Total NRSF | Annual U/W Base Rent | % of Total Annual U/W Base Rent | Annual U/W Base Rent PSF(2) |
| MTM | 0 | 0 | 0.0% | 0 | 0.0% | $0 | 0.0% | $0.00 |
| 2018 | 0 | 0 | 0.0% | 0 | 0.0% | $0 | 0.0% | $0.00 |
| 2019 | 10 | 98,635 | 49.5% | 98,635 | 49.5% | $533,362 | 53.0% | $5.41 |
| 2020 | 4 | 16,000 | 8.0% | 114,635 | 57.6% | $114,540 | 11.4% | $7.16 |
| 2021 | 2 | 25,500 | 12.8% | 140,135 | 70.4% | $140,940 | 14.0% | $5.53 |
| 2022 | 3 | 29,373 | 14.7% | 169,508 | 85.1% | $217,500 | 21.6% | $7.40 |
| 2023 | 0 | 0 | 0.0% | 169,508 | 85.1% | $0 | 0.0% | $0.00 |
| 2024 | 0 | 0 | 0.0% | 169,508 | 85.1% | $0 | 0.0% | $0.00 |
| 2025 | 0 | 0 | 0.0% | 169,508 | 85.1% | $0 | 0.0% | $0.00 |
| 2026 | 0 | 0 | 0.0% | 169,508 | 85.1% | $0 | 0.0% | $0.00 |
| 2027 | 0 | 0 | 0.0% | 169,508 | 85.1% | $0 | 0.0% | $0.00 |
| 2028 | 0 | 0 | 0.0% | 169,508 | 85.1% | $0 | 0.0% | $0.00 |
| Thereafter | 0 | 0 | 0.0% | 169,508 | 85.1% | $0 | 0.0% | $0.0 |
| Vacant | 0 | 29,650 | 14.9% | 199,158 | 100.0% | $0 | 0.0% | $0.00 |
| Total/Weighted Average | 19 | 199,158 | 100.0% | $1,006,342 | 100.0% | $5.94 |
| (1) | Information obtained from the underwritten rent roll. |
| (2) | Weighted Average Annual U/W Base Rent PSF excludes vacant space. |
The following table presents historical occupancy percentages at the California Mixed Use Portfolio Properties:
Historical Occupancy
2014(1) | 2015(1) | 2016(2)(3) | 2017(2)(3) | Various(4) |
| NAV | NAV | 89.8% | 90.9% | 93.8% |
| (1) | Historical Occupancy, operating and financial information is unavailable for the properties as the related borrower provided the related mortgage loan seller with limited prior operating history for the Mortgaged Property. |
| (2) | Information obtained from the borrowers. |
| (3) | Historical Occupancy for 2016 and 2017 is based on the Daytona RV & Boat Storage Property and the Absolute Self Storage Property. Historical occupancy is unavailable for the Daytona Business Park Property for 2016 and 2017 as the related borrower provided the related mortgage seller with limited prior operating history for the Mortgaged Property. |
| (4) | Information obtained from the underwritten rent roll. For the Daytona RV & Boat Storage Property and the Absolute Self Storage Property, the underwritten rent roll is dated as of October 8, 2018. For the Daytona Business Park Property, the underwritten rent roll is dated as of September 30, 2018. |
THE INFORMATION IN THIS STRUCTURAL AND COLLATERAL TERM SHEET IS NOT COMPLETE AND MAY BE AMENDED PRIOR TO THE TIME OF SALE. THIS TERM SHEET IS NOT AN OFFER TO SELL THESE SECURITIES AND IT IS NOT A SOLICITATION OF AN OFFER TO BUY THESE SECURITIES IN ANY JURISDICTION WHERE THE OFFER OR SALE IS NOT PERMITTED.
135
CALIFORNIA MIXED USE PORTFOLIO
Operating History and Underwritten Net Cash Flow.The following table presents certain information relating to the historical operating performance and Underwritten Net Cash Flow at the California Mixed Use Portfolio Properties:
Cash Flow Analysis
| 2016 | 2017 | TTM 9/30/2018 | U/W |
% of U/W Effective | U/W $ per SF | |
| Base Rent | $3,241,872 | $3,366,992 | $3,434,638 | $3,856,263 | 106.7% | $6.35 |
| Grossed Up Vacant Space | 0 | 0 | 0 | 0 | 0.0 | 0.00 |
| Reimbursements | 35,043 | 59,699 | 42,381 | 35,100 | 1.0 | 0.06 |
| Other Income(1) | 105,356 | 114,750 | 133,378 | 134,493 | 3.7 | 0.22 |
| Less Vacancy & Credit Loss | (59,091) | (53,655) | (63,047) | (411,394)(2) | (11.4) | (0.68) |
| Effective Gross Income | $3,323,180 | $3,487,786 | $3,547,350 | $3,614,462 | 100.0% | $5.95 |
| Total Operating Expenses | $1,063,925 | $1,047,015 | $1,063,495 | $1,186,005 | 32.8% | $1.95 |
| Net Operating Income | $2,259,255 | $2,440,771 | $2,483,855 | $2,428,457 | 67.2% | $4.00 |
| TI/LC | 36,060 | 42,622 | 3,000 | 94,453(3) | 2.6 | 0.16 |
| Capital Expenditures | 0 | 0 | 0 | 60,700 | 1.7 | 0.10 |
| Net Cash Flow | $2,223,196 | $2,398,150 | $2,480,855 | $2,273,303 | 62.9% | $3.75 |
| NOI DSCR | 1.38x | 1.50x | 1.52x | 1.49x | ||
| NCF DSCR | 1.36x | 1.47x | 1.52x | 1.39x | ||
| NOI DY | 9.1% | 9.8% | 10.0% | 9.8% | ||
| NCF DY | 9.0% | 9.7% | 10.0% | 9.2% |
| (1) | Other Income consists of parking income, admin fees, merchandise sales and other miscellaneous income for the California Mixed Use Portfolio Properties. |
| (2) | The underwritten vacancy is 10.5%. The Absolute Self Storage Property and the Daytona RV & Boat Storage Property were 97.1% and 98.3% physically occupied respectively as of October 8, 2018. The Daytona Business Park property was 85.1% occupied as of September 30, 2018. |
| (3) | U/W TI/LC is inclusive of a TI/LC credit equivalent to one-tenth of the upfront TI/LC reserve of $350,000. |
THE INFORMATION IN THIS STRUCTURAL AND COLLATERAL TERM SHEET IS NOT COMPLETE AND MAY BE AMENDED PRIOR TO THE TIME OF SALE. THIS TERM SHEET IS NOT AN OFFER TO SELL THESE SECURITIES AND IT IS NOT A SOLICITATION OF AN OFFER TO BUY THESE SECURITIES IN ANY JURISDICTION WHERE THE OFFER OR SALE IS NOT PERMITTED.
136
(THIS PAGE INTENTIONALLY LEFT BLANK)
THE INFORMATION IN THIS STRUCTURAL AND COLLATERAL TERM SHEET IS NOT COMPLETE AND MAY BE AMENDED PRIOR TO THE TIME OF SALE. THIS TERM SHEET IS NOT AN OFFER TO SELL THESE SECURITIES AND IT IS NOT A SOLICITATION OF AN OFFER TO BUY THESE SECURITIES IN ANY JURISDICTION WHERE THE OFFER OR SALE IS NOT PERMITTED.
137
| No. 14 – Danbury Commerce Portfolio | |||||||
| Loan Information | Property Information | ||||||
| Mortgage Loan Seller: | Argentic Real Estate Finance LLC | Single Asset/Portfolio: | Portfolio | ||||
| Credit Assessment (Fitch/KBRA/Moody’s): | NR/NR/NR | Property Type: | Industrial | ||||
| Original Principal Balance(1): | $22,800,000 | Specific Property Type: | Flex | ||||
| Cut-off Date Principal Balance(1): | $22,800,000 | Location: | Danbury, CT | ||||
| % of Initial Pool Balance: | 2.7% | Size: | 468,711 SF | ||||
| Loan Purpose: | Refinance | Cut-off Date Balance Per SF(1): | $81.07 | ||||
| Borrower Name: | Delaware Commerce Park, LLC; MME Danbury, LLC | Year Built/Renovated: | Various | ||||
| Borrower Sponsors: | Melvyn J. Powers; Mary P. Powers | Title Vesting: | Fee | ||||
| Mortgage Rate: | 5.725% | Property Manager: | MMP Management Company; The Powers Construction Company | ||||
| Note Date: | October 26, 2018 | 4thMost Recent Occupancy (As of): | 100.0% (12/31/2014) | ||||
| Anticipated Repayment Date: | NAP | 3rdMost Recent Occupancy (As of): | 100.0% (12/31/2015) | ||||
| Maturity Date: | November 6, 2028 | 2ndMost Recent Occupancy(As of): | 100.0% (12/31/2016) | ||||
| IO Period: | 120 months | Most Recent Occupancy(As of): | 100.0% (12/31/2017) | ||||
| Loan Term (Original): | 120 months | Current Occupancy (As of): | 100.0% (Various) | ||||
| Seasoning: | 1 month | ||||||
| Amortization Term (Original): | NAP | Underwriting and Financial Information: | |||||
| Loan Amortization Type: | Interest-only, Balloon | ||||||
| Interest Accrual Method: | Actual/360 | 4thMost Recent NOI (As of): | $3,599,141 (12/31/2015) | ||||
| Call Protection: | L(25),D(91),O(4) | 3rdMost Recent NOI (As of): | $3,656,737 (12/31/2016) | ||||
| Lockbox Type: | Soft/Upfront Cash Management | 2ndMost Recent NOI (As of): | $3,605,036 (12/31/2017) | ||||
| Additional Debt(1): | Yes | Most Recent NOI (As of): | $3,673,522 (Annualized 6/30/2018) | ||||
| Additional Debt Type(1)(2): | Mezzanine;Pari Passu | ||||||
| U/W Revenues: | $4,731,872 | ||||||
| U/W Expenses: | $1,312,233 | ||||||
| U/W NOI: | $3,419,639 | ||||||
| Escrows and Reserves: | U/W NCF: | $3,272,646 | |||||
| U/W NOI DSCR(1): | 1.55x | ||||||
| Type: | Initial | Monthly | Cap (If Any) | U/W NCF DSCR(1): | 1.48x | ||
| Taxes | $120,237 | $40,079(3) | NAP | U/W NOI Debt Yield(1): | 9.0% | ||
| Insurance | $0 | $4,038(4) | NAP | U/W NCF Debt Yield(1): | 8.6% | ||
| Replacement Reserves | $0 | $3,906 | NAP | As-Is Appraised Value: | $61,100,000 | ||
| TI/LC Reserves | $250,000 | $7,812 | NAP | As-Is Appraisal Valuation Date: | August 1, 2018 | ||
| Excess Flood Insurance Reserve | $50,000 | $0 | NAP | Cut-off Date LTV Ratio(1): | 62.2% | ||
| Immediate Repair Reserve | $478,650 | $0 | NAP | LTV Ratio at Maturity or ARD(1): | 62.2% | ||
| (1) | See “The Mortgage Loan” section. All statistical financial information related to balance per square foot, loan-to-value ratios, debt service coverage ratios and debt yields are based on the outstanding principal balance of the Danbury Commerce Portfolio Whole Loan (as defined below). |
| (2) | The equity interest in the borrower has been pledged to secure mezzanine indebtedness with an original principal balance of $7,000,000. All statistical information related to the balance per square foot, loan-to-value ratios, debt service coverage ratios and debt yields are based solely on the Danbury Commerce Portfolio Mortgage Loan (as defined below). As of the Cut-off Date, the combined U/W NOI DSCR, U/W NCF DSCR, U/W NOI Debt Yield, U/W NCF Debt Yield, Cut-off Date LTV Ratio and LTV Ratio at Maturity were 1.68x, 1.61x, 7.6%, 7.3%, 73.6% and 73.6%, respectively. |
| (3) | The monthly taxes do not include amounts attributable to the taxes on the Lorad/Hologic, Entegris/ATMI and Wells Fargo portions of the Danbury Commerce Portfolio Properties (as defined below) for so long as (i) no trigger period exists, (ii) such tenants continue to pay all taxes attributable to such portions of the Danbury Commerce Portfolio Properties directly to the applicable taxing authority, and (iii) the lender receives evidence of the same by no later than the tax payment date. |
| (4) | The monthly insurance (i) will not include amounts attributable to insurance coverage on the portions of the Danbury Commerce Portfolio Properties occupied by Lorad/Hologic and Entegris/ATMI for so long as (i) no trigger period exists, (ii) the tenant insurance conditions are satisfied, and (iii) the lender receives evidence of the same by no later than the insurance payment date. |
The Mortgage Loan. The mortgage loan (the “Danbury Commerce Portfolio Mortgage Loan”) is part of a whole loan (the “Danbury Commerce Portfolio Whole Loan”) that is evidenced by twopari passu promissory notes (Notes A-1 and A-2) that are secured by a first mortgage encumbering 16 industrial buildings located at two Mortgaged Properties in Danbury, Connecticut identified as 34 Executive Drive (the “34 Executive Drive Mortgaged Property”) and Delaware Commerce Park (the “Delaware Commerce Park Mortgaged Property”), totaling 468,711 square feet (the 34 Executive Drive Mortgaged Property and the Delaware Commerce Park Mortgaged Property collectively, the “Danbury Commerce Portfolio Properties”). The Danbury Commerce Portfolio Whole Loan was co-originated on October 26, 2018 by Argentic Real Estate Finance LLC and Citi Real Estate Funding Inc. The Danbury Commerce Portfolio Whole Loan has an original principal balance of $38,000,000, has an outstanding principal balance as of the Cut-off Date of $38,000,000 and accrues interest at an interest rate of 5.725%per annum. The Danbury Commerce Portfolio Whole Loan has an initial term of 120
THE INFORMATION IN THIS STRUCTURAL AND COLLATERAL TERM SHEET IS NOT COMPLETE AND MAY BE AMENDED PRIOR TO THE TIME OF SALE. THIS TERM SHEET IS NOT AN OFFER TO SELL THESE SECURITIES AND IT IS NOT A SOLICITATION OF AN OFFER TO BUY THESE SECURITIES IN ANY JURISDICTION WHERE THE OFFER OR SALE IS NOT PERMITTED.
138
| DANBURY COMMERCE PORTFOLIO |
months, has a remaining term of 119 months as of the Cut-off Date and requires interest-only payments through the term of the Danbury Commerce Portfolio Whole Loan. The Danbury Commerce Portfolio Whole Loan matures on November 6, 2028.
The Danbury Commerce Portfolio Mortgage Loan is evidenced by Note A-2, which will be contributed to the Wells Fargo Commercial Mortgage Trust 2018-C48 securitization trust, had an original principal balance of $22,800,000, has an outstanding principal balance as of the Cut-off Date of $22,800,000 and represents the controlling interest in the Danbury Commerce Portfolio Whole Loan. The non-controlling Note A-1 had an original principal balance of $15,200,000, has an outstanding principal balance as of the Cut-off Date of $15,200,000 and is expected to be contributed to the Citigroup Commercial Mortgage Trust 2018-C6 securitization trust. See“Description of the Mortgage Pool—The Whole Loans—The Serviced Whole Loans” and“Pooling and Servicing Agreement”in the Preliminary Prospectus.
Note Summary
| Notes | Original Balance | Note Holder | Controlling Interest | |
| A-1 | $15,200,000 | CGCMT 2018-C6 | No | |
| A-2 | $22,800,000 | WFCM 2018-C48 | Yes | |
| Total | $38,000,000 |
Following the lockout period, the borrowers have the right to defease the Danbury Commerce Portfolio Whole Loan in whole or in part before August 6, 2028. In addition, the Danbury Commerce Portfolio Whole Loan is prepayable without penalty on or after August 6, 2028. The lockout period will expire on the earlier to occur of (i) two years after the closing date of the securitization that includes the last note to be securitized and (ii) October 26, 2021.
| Sources | Uses | |||||||
| Original loan amount | $38,000,000 | 83.7% | Loan payoff | $41,924,946 | 92.4% | |||
| Mezzanine loan amount | 7,000,000 | 15.4 | Closing costs | 1,366,665 | 3.0 | |||
| Sponsor’s new cash contribution | 377,998 | 0.8 | Reserves | 2,086,387 | 4.6 | |||
| Total Sources | $45,377,998 | 100.0% | Total Uses | $45,377,998 | 100.0% |
The Properties. The Danbury Commerce Portfolio Properties consist of 16 industrial buildings totaling 468,711 square feet, which are located in Danbury, Connecticut. The Danbury Commerce Portfolio Properties were built between 1956 and 1982 and are comprised of approximately 60.2% R&D/warehouse space and 39.8% office space. The Danbury Commerce Portfolio Properties have 16’-20’ clear heights with a combined 19 loading docks.
As of May 1, 2018 (Delaware Commerce Park Mortgaged Property) and July 1, 2018 (34 Executive Drive Mortgaged Property), the Danbury Commerce Portfolio Properties were 100% leased to 30 tenants, and, according to the borrower sponsor, have averaged a 95% occupancy over the last ten years. The top five tenants have been in occupancy for an average of 15 years, with two of the top five tenants having been in occupancy since the 1990s.
The largest tenant at the Delaware Commerce Park Mortgaged Property, Entegris/ATMI (rated Ba1/BB+ by Moody’s/S&P), accounts for 15.5% of net rentable area and 16.4% of underwritten base rent of the Delaware Commerce Park Mortgaged Property with a December 2021 lease expiration. Entegris/ATMI develops, manufactures, and supplies microcontamination control products, specialty chemicals, and advanced materials handling solutions for manufacturing processes in the semiconductor and other high-technology industries worldwide. Entegris/ATMI has been at the Delaware Commerce Park Mortgaged Property since 1995 and has renewed its lease five times.
The largest tenant at the 34 Executive Drive Mortgaged Property, R.K Manufacturing Company, accounts for 14.4% of net rentable area and 16.4% of underwritten base rent of the 34 Executive Drive Mortgaged Property with a November 2029 lease expiration. R.K Manufacturing Company specializes in structure processing equipment design and manufacturing, and contracts manufacturing of medical devices such as sutures, ferrules, bone screws and tight ropes. R.K Manufacturing Company has been at the 34 Executive Drive Mortgaged Property since 2008, expanded into an additional 13,160 SF in 2013 and signed a new nine-year lease to expand into an additional 11,790 SF in December 2019.
The Danbury Commerce Portfolio Properties are located in Fairfield County, the most populous county in Connecticut. The Danbury Commerce Portfolio Properties are surrounded by four major highways, I-84 and US Route 6, 202 and 7, allowing for easy access to the Tristate area. As of the second quarter of 2018, the Fairfield County industrial market had approximately 60.3 million square feet of inventory, with a reported vacancy of 5.9% and an average asking rent of $9.57 per square foot. According to the appraisal, the 2017 population within a one-, three-, and five-mile radius of the Danbury Commerce Portfolio Properties was 5,903, 76,054, and 119,535 respectively. According to the appraisal, the 2017 median household income within a one-, three-, and five-mile radius of the Danbury Commerce Portfolio Properties was $77,406, $69,863, and $80,111, respectively.
THE INFORMATION IN THIS STRUCTURAL AND COLLATERAL TERM SHEET IS NOT COMPLETE AND MAY BE AMENDED PRIOR TO THE TIME OF SALE. THIS TERM SHEET IS NOT AN OFFER TO SELL THESE SECURITIES AND IT IS NOT A SOLICITATION OF AN OFFER TO BUY THESE SECURITIES IN ANY JURISDICTION WHERE THE OFFER OR SALE IS NOT PERMITTED.
139
| DANBURY COMMERCE PORTFOLIO |
The following table presents certain information relating to the tenancy at the Danbury Commerce Portfolio Properties:
Major Tenants(1)
| Property Name | Credit Rating (Fitch/ Moody’s/ S&P)(2) | Tenant NRSF | % of NRSF | Annual U/W Base Rent PSF(3) | Annual U/W Base Rent(3) | % of Total Annual U/W Base Rent | Lease Expiration Date | |
| Major Tenants | ||||||||
| Entegris/ATMI | Delaware Commerce Park | NR/Ba1/BB+ | 72,710 | 15.5% | $8.66 | $630,000 | 16.4% | 12/31/2021 |
| R.K. Manufacturing | 34 Executive Drive | NR/NR/NR | 67,550 | 14.4% | $9.33 | $630,432 | 16.4% | 11/30/2029 |
| Lorad/Hologic | Delaware Commerce Park | NR/Ba2/BB+ | 60,000 | 12.8% | $10.53 | $631,957 | 16.4% | 12/31/2021 |
| Amphenol | Delaware Commerce Park | NR/Baa1/BBB+ | 45,750 | 9.8% | $5.65 | $258,488 | 6.7% | 8/31/2023 |
| Kimchuk | Delaware Commerce Park | NR/NR/NR | 24,255 | 5.2% | $6.15 | $149,278 | 3.9% | 1/31/2019(4) |
| Major Tenants Total | 270,265 | 57.7% | $8.51 | $2,300,154 | 59.9% | |||
| Non Major Tenants | 198,446 | 42.3% | $7.77 | $1,542,709 | 40.1% | |||
| Occupied Collateral Total | 468,711 | 100.0% | $8.20 | $3,842,863 | 100.0% | |||
| Vacant Space | 0 | 0.0% | ||||||
| Collateral Total | 468,711 | 100.0% | ||||||
| (1) | Information obtained from the underwritten rent roll. |
| (2) | Credit ratings are those of the parent company whether or not the parent company guarantees the lease. |
| (3) | Annual U/W Base Rent PSF and Annual U/W Base Rent include contractual rent steps through July 2019, totaling $10,471. |
| (4) | 18,025 square feet expires in January 2019 and 6,230 square feet expires in August 2019. |
The following table presents certain information relating to the lease rollover schedule at the Danbury Commerce Portfolio Properties:
Lease Expiration Schedule(1)
| Year Ending December 31, | No. of Leases Expiring | Expiring NRSF | % of Total NRSF | Cumulative Expiring NRSF | Cumulative % of Total NRSF | Annual U/W Base Rent | % of Total Annual U/W Base Rent | Annual U/W Base Rent PSF |
| MTM | 0 | 0 | 0.0% | 0 | 0.0% | $0 | 0.0% | $0.00 |
| 2018 | 0 | 0 | 0.0% | 0 | 0.0% | $0 | 0.0% | $0.00 |
| 2019 | 7 | 57,775 | 12.3% | 57,775 | 12.3% | $399,100 | 10.4% | $6.91 |
| 2020 | 2 | 12,000 | 2.6% | 69,775 | 14.9% | $184,000 | 4.8% | $15.33 |
| 2021 | 10 | 192,864 | 41.1% | 262,639 | 56.0% | $1,747,931 | 45.5% | $9.06 |
| 2022 | 5 | 37,840 | 8.1% | 300,479 | 64.1% | $242,580 | 6.3% | $6.41 |
| 2023 | 3 | 67,082 | 14.3% | 367,561 | 78.4% | $407,838 | 10.6% | $6.08 |
| 2024 | 2 | 21,700 | 4.6% | 389,261 | 83.0% | $152,359 | 4.0% | $7.02 |
| 2025 | 1 | 6,400 | 1.4% | 395,661 | 84.4% | $36,000 | 0.9% | $5.63 |
| 2026 | 1 | 5,500 | 1.2% | 401,161 | 85.6% | $42,625 | 1.1% | $7.75 |
| 2027 | 0 | 0 | 0.0% | 401,161 | 85.6% | $0 | 0.0% | $0.00 |
| 2028 | 0 | 0 | 0.0% | 401,161 | 85.6% | $0 | 0.0% | $0.00 |
| Thereafter | 3 | 67,550 | 14.4% | 468,711 | 100.0% | $630,432 | 16.4% | $9.33 |
| Vacant | 0 | 0 | 0.0% | 468,711 | 100.0% | $0 | 0.0% | $0.00 |
| Total/Weighted Average | 34 | 468,711 | $3,842,863 | 100.0% | $8.20 |
| (1) | Information obtained from the underwritten rent roll. |
The following table presents historical occupancy percentages at Danbury Commerce Portfolio Properties:
Historical Occupancy
12/31/2015(1) | 12/31/2016(1) | 12/31/2017(1) | Various(2) | |||
| 100.0% | 100.0% | 100.0% | 100.0% |
| (1) | Information obtained from the borrower. |
| (2) | Information obtained from the underwritten rent roll dated May 1, 2018 (Delaware Commerce Park Mortgaged Property) and July 1, 2018 (34 Executive Drive Mortgaged Property). |
THE INFORMATION IN THIS STRUCTURAL AND COLLATERAL TERM SHEET IS NOT COMPLETE AND MAY BE AMENDED PRIOR TO THE TIME OF SALE. THIS TERM SHEET IS NOT AN OFFER TO SELL THESE SECURITIES AND IT IS NOT A SOLICITATION OF AN OFFER TO BUY THESE SECURITIES IN ANY JURISDICTION WHERE THE OFFER OR SALE IS NOT PERMITTED.
140
| DANBURY COMMERCE PORTFOLIO |
Operating History and Underwritten Net Cash Flow. The following table presents certain information relating to the historical operating performance and the underwritten net cash flow at the Danbury Commerce Portfolio Properties:
Cash Flow Analysis
| 2015 | 2016 | 2017 | Annualized 6/30/2018 | U/W | % of U/W Effective Gross Income | U/W $ per SF | |||||||
| Base Rent(1) | $3,727,600 | $3,788,727 | $3,732,453 | $3,805,580 | $3,842,863 | 81.2% | $8.20 | ||||||
| Grossed Up Vacant Space | 0 | 0 | 0 | 0 | 0 | 0.0 | 0.00 | ||||||
| Total Reimbursables | 554,351 | 610,948 | 514,772 | 596,350 | 1,124,938 | 23.8 | 2.40 | ||||||
| Other Income | 0 | 0 | 0 | 0 | 0 | 0.0 | 0.00 | ||||||
| Less Vacancy & Free Rent | 0 | 0 | 0 | 0 | (235,929) | (5.0) | (0.50) | ||||||
| Effective Gross Income | $4,281,951 | $4,399,675 | $4,247,225 | $4,401,930 | $4,731,872 | 100.0% | $10.10 | ||||||
| Total Operating Expenses | $682,810 | $742,938 | $642,189 | $728,408 | $1,312,233 | 27.7 | 2.80 | ||||||
| Net Operating Income | $3,599,141 | $3,656,737 | $3,605,036 | $3,673,522 | $3,419,639 | 72.3% | $7.30 | ||||||
| TI/LC | 0 | 0 | 0 | 0 | 100,122 | 2.1 | 0.21 | ||||||
| Capital Expenditures | 0 | 0 | 0 | 0 | 46,871 | 1.0 | 0.10 | ||||||
| Net Cash Flow | $3,599,141 | $3,656,737 | $3,605,036 | $3,673,522 | $3,272,646 | 69.2% | $6.98 | ||||||
| NOI DSCR(3) | 1.63x | 1.66x | 1.63x | 1.67x | 1.55x | ||||||||
| NCF DSCR(3) | 1.63x | 1.66x | 1.63x | 1.67x | 1.48x | ||||||||
| NOI DY(3) | 9.5% | 9.6% | 9.5% | 9.7% | 9.0% | ||||||||
| NCF DY(3) | 9.5% | 9.6% | 9.5% | 9.7% | 8.6% |
| (1) | U/W Base Rent includes contractual rent steps through July 2019 totalling $10,471. |
| (2) | The underwritten economic vacancy is 5.0%. The Danbury Commerce Portfolio Properties were 100.0% occupied as of May 1, 2018 (Delaware Commerce Park Mortgaged Property) and July 1, 2018 (34 Executive Drive Mortgaged Property). |
| (3) | The debt service coverage ratios and debt yields are based on the Danbury Commerce Portfolio Whole Loan. |
THE INFORMATION IN THIS STRUCTURAL AND COLLATERAL TERM SHEET IS NOT COMPLETE AND MAY BE AMENDED PRIOR TO THE TIME OF SALE. THIS TERM SHEET IS NOT AN OFFER TO SELL THESE SECURITIES AND IT IS NOT A SOLICITATION OF AN OFFER TO BUY THESE SECURITIES IN ANY JURISDICTION WHERE THE OFFER OR SALE IS NOT PERMITTED.
141
| No. 15 – 35 Claver Place | ||||||
| Loan Information | Property Information | |||||
| Mortgage Loan Seller: | Basis Real Estate Capital II, LLC | Single Asset/Portfolio: | Single Asset | |||
| Credit Assessment (Fitch/KBRA/Moody’s): | NR/NR/NR | Property Type: | Multifamily | |||
| Original Principal Balance(1): | $21,330,000 | Specific Property Type: | Low Rise | |||
| Cut-off Date Balance(1): | $21,330,000 | Location: | Brooklyn, NY | |||
| % of Initial Pool Balance: | 2.6% | Size: | 44 Units | |||
| Loan Purpose: | Refinance | Cut-off Date Balance Per Unit: | $484,773 | |||
| Borrower Name: | Claver NY LLC | Year Built/Renovated: | 1930/2018 | |||
| Sponsors: | Perl Weisz; Joseph Banda | Title Vesting: | Fee | |||
| Mortgage Rate: | 5.315% | Property Manager: | Ranco Mgmt NY LLC | |||
| Note Date: | November 1, 2018 | 4thMost Recent Occupancy(As of)(2): | NAV | |||
| Anticipated Repayment Date: | NAP | 3rdMost Recent Occupancy (As of)(2): | NAV | |||
| Maturity Date: | November 1, 2028 | 2ndMost Recent Occupancy (As of)(2): | NAV | |||
| IO Period: | 120 months | Most Recent Occupancy (As of)(2): | NAV | |||
| Loan Term (Original): | 120 months | Current Occupancy (As of): | 97.7% (10/31/2018) | |||
| Seasoning: | 1 month | |||||
| Amortization Term (Original): | NAP | |||||
| Loan Amortization Type: | Interest-only, Balloon | Underwriting and Financial Information: | ||||
| Interest Accrual Method: | Actual/360 | 4thMost Recent NOI (As of)(2): | NAV | |||
| Call Protection: | L(25),D(92),O(3) | 3rdMost Recent NOI (As of)(2): | NAV | |||
| Lockbox Type: | Springing | 2ndMost Recent NOI (As of)(2): | NAV | |||
| Additional Debt(1): | Yes | Most Recent NOI (As of): | NAV | |||
| Additional Debt Type(1): | Mezzanine | |||||
| U/W Revenues: | $1,806,615 | |||||
| U/W Expenses: | $243,195 | |||||
| U/W NOI: | $1,563,420 | |||||
| U/W NCF: | $1,552,420 | |||||
| Escrows and Reserves: | U/W NOI DSCR: | 1.36x | ||||
| U/W NCF DSCR: | 1.35x | |||||
| Type: | Initial | Monthly | Cap (If Any) | U/W NOI Debt Yield: | 7.3% | |
| Taxes | $36,568 | $6,095 | NAP | U/W NCF Debt Yield: | 7.3% | |
| Insurance | $4,936 | $2,468 | NAP | As-Is Appraised Value: | $32,000,000 | |
| RE Tax Abatement Reserve | $315,000 | $0 | NAP | As-Is Appraisal Valuation Date: | October 14, 2018 | |
| Deferred Maintenance | $3,125 | $0 | NAP | Cut-off Date LTV Ratio: | 66.7% | |
| Replacement Reserve | $0 | $917 | NAP | LTV Ratio at Maturity or ARD: | 66.7% | |
| (1) | The equity interest in the borrower has been pledged to secure mezzanine indebtedness with an original principal balance of $2,500,000 (the “35 Claver Place Mezzanine Loan”) originated by BIG Real Estate Capital I, LLC a Delaware limited liability company (the “35 Claver Place Mezzanine Lender”) and an affiliate of Basis Real Estate Capital II, LLC (the “35 Claver Place Lender”). The 35 Claver Mezzanine Loan is subject to an intercreditor agreement between the 35 Claver Place Lender and the 35 Claver Place Mezzanine Lender. The 35 Claver Place Mezzanine Loan has an initial term of 120 months and has a remaining term as of the Cut-off Date of 119 months. The 35 Claver Place Mezzanine Loan accrues interest at an interest rate of 12.00% per annum. All statistical information related to the balance per square foot, loan-to-value ratios, debt service coverage ratios and debt yields are based solely on the 35 Claver Place Mortgage Loan. As of the Cut-off Date, the combined UW NCF DSCR, U/W NCF Debt Yield, Cut-off Date LTV Ratio and LTV Ratio at Maturity were 1.07x, 6.5%, 74.5% and 74.5%, respectively. |
| (2) | The 35 Claver Place Property (as defined below) was gut renovated in 2018. Lease-up began in August 2018 as such historical occupancy and historical financials are not available. |
The Mortgage Loan.The mortgage loan (the “35 Claver Place Mortgage Loan”) is evidenced by a single promissory note that is secured by a first mortgage encumbering the borrower’s fee interest in a four-story, 44-unit multifamily building (the “35 Claver Place Property”). The 35 Claver Place Property was built in 1930 and is located in the Bedford Stuyvesant neighborhood of Brooklyn in New York City. The 35 Claver Place Property is located within two blocks of the Franklin Avenue subway station, providing the neighborhood access to the rest of Brooklyn and Manhattan. The 35 Claver Place Property is located between Jefferson Avenue and Fulton Street on Claver Place. The 35 Claver Place Property is located 0.40 miles from a Key Food Supermarket and down the block from a Family Dollar. As of October 31, 2018, the 35 Claver Place Property was 97.7% occupied.
Sources and Uses
| Sources | Uses | ||||||
| Original loan amount | $21,330,000 | 89.5% | Loan payoff (senior and 2nd) | $16,206,693 | 68.0% | ||
| Mezzanine loan | 2,500,000 | 10.5 | Reserves | 359,629 | 1.5 | ||
| Return of equity | 6,752,090 | 28.3 | |||||
| Closing costs | 511,587 | 2.1 | |||||
| Total Sources | $23,830,000 | 100.0% | Total Uses | $23,830,000 | 100.0% |
THE INFORMATION IN THIS STRUCTURAL AND COLLATERAL TERM SHEET IS NOT COMPLETE AND MAY BE AMENDED PRIOR TO THE TIME OF SALE. THIS TERM SHEET IS NOT AN OFFER TO SELL THESE SECURITIES AND IT IS NOT A SOLICITATION OF AN OFFER TO BUY THESE SECURITIES IN ANY JURISDICTION WHERE THE OFFER OR SALE IS NOT PERMITTED.
142
| 35 CLAVER PLACE |
The following table presents certain information relating to the unit mix of the 35 Claver Place Property:
Unit Mix Summary(1)
| Unit Type | No. of Units | % of Total Units | Average Unit Size (SF) | Average Monthly Contract Rent per Unit | Average Monthly Market Rent per Unit |
| Studio | 4 | 9.1% | 554 | $2,750 | $3,300-$3,500 |
| One Bedroom | 13 | 29.5% | 612 | $3,442 | $3,300-$3,500 |
| Two Bedroom | 23 | 52.3% | 648 | $3,661 | $3,500-$4,000 |
| Three Bedroom | 4 | 9.1% | 788 | $4,550 | $4,200-$4,600 |
| Total/Weighted Average | 44 | 100.0% | $3,594 |
| (1) | Information obtained from the appraisal. |
The following table presents historical occupancy percentages at the 35 Claver Place Property:
Historical Occupancy
12/31/2015(1) | 12/31/2016(1) | 12/31/2017(1) | 10/31/2018(2) | |||
| NAV | NAV | NAV | 97.7% |
| (1) | Historical occupancy, operating and financial information is unavailable at the 35 Claver Place Property due to a recent gut renovation of the 35 Claver Place Property. |
| (2) | Information obtained from the underwritten rent roll |
Operating History and Underwritten Net Cash Flow.The following table presents certain information relating to the historical operating performance and underwritten net cash flow at the 35 Claver Place Property:
Cash Flow Analysis
| U/W | % of U/W Effective Gross Income | U/W $ per Unit | ||||
| Base Rent | $1,901,700 | 105.3% | $43,220 | |||
| Less Vacancy & Credit Loss(1) | (95,085) | (5.3) | (2,161) | |||
| Other Income(2) | 0 | 0.0 | 0 | |||
| Effective Gross Income | $1,806,615 | 100.0% | $41,059 | |||
| Total Operating Expenses | $243,195 | 13.5% | $5,527 | |||
| Net Operating Income | $1,563,420 | 86.5% | $35,532 | |||
| Capital Expenditures | 11,000 | 0.6 | 250 | |||
| Net Cash Flow | $1,552,420 | 85.9% | $35,282 | |||
| NOI DSCR(3) | 1.36x | |||||
| NCF DSCR(3) | 1.35x | |||||
| NOI DY(3) | 7.3% | |||||
| NCF DY(3) | 7.3% |
| (1) | The underwritten economic vacancy is 5.0%. The 35 Claver Place Property was 97.7% physically occupied as of October 31, 2018. |
THE INFORMATION IN THIS STRUCTURAL AND COLLATERAL TERM SHEET IS NOT COMPLETE AND MAY BE AMENDED PRIOR TO THE TIME OF SALE. THIS TERM SHEET IS NOT AN OFFER TO SELL THESE SECURITIES AND IT IS NOT A SOLICITATION OF AN OFFER TO BUY THESE SECURITIES IN ANY JURISDICTION WHERE THE OFFER OR SALE IS NOT PERMITTED.
143
| 35 CLAVER PLACE |
The following table presents certain information relating to some comparable multifamily properties for the 35 Claver Place Property:
Competitive Set(1)
| Location | Distance to Subject | Average Monthly Market Rent Per Unit | |
| Studio(2) | |||
| 35 Claver Place (Subject) | New York, NY | -- | $3,300 - $3,500 |
| 1007 Atlantic Avenue | New York, NY | 0.7 miles | $2,275 |
| 309 Washington Avenue | New York, NY | 0.9 miles | $2,100 |
| 31 Brooklyn Avenue | New York, NY | 0.9 miles | $2,050 |
| 100 Stueben Street | New York, NY | 1.8 miles | $2,400 |
| One Bedroom(3) | |||
| 35 Claver Place (Subject) | New York, NY | -- | $3,300 - $3,500 |
| 1007 Atlantic Avenue | New York, NY | 0.7 miles | $2,650 |
| 309 Washington Avenue | New York, NY | 0.9 miles | $2,750 |
| 31 Brooklyn Avenue | New York, NY | 0.9 miles | $2,700 |
| 100 Stueben Street | New York, NY | 1.8 miles | $2,955 |
| 525 Clinton Avenue | New York, NY | 0.6 miles | $3,300 |
| 109 Greene Avenue | New York, NY | 0.8 miles | $3,025 |
| 74 Grand Avenue | New York, NY | 1.4 miles | $2,700 |
| 379 Washington Avenue | New York, NY | 0.7 miles | $3,300 |
| Two Bedroom(3) | |||
| 35 Claver Place (Subject) | New York, NY | -- | $3,500 - $4,000 |
| 1007 Atlantic Avenue | New York, NY | 0.7 miles | $3,850 |
| 100 Stueben Street | New York, NY | 1.8 miles | $4,225 |
| 525 Clinton Avenue | New York, NY | 0.6 miles | $4,266 |
| 74 Grand Avenue | New York, NY | 1.4 miles | $3,485 |
| 887 Beregen Street | New York, NY | 0.4 miles | $3,599 |
387 Franklin Avenue 411 Herkimer Street | New York, NY New York, NY | 0.4 miles 1.3 miles | $3,700 $3,500 |
| Three Bedroom(3) | |||
| 35 Claver Place (Subject) | New York, NY | -- | $4,200 - $4,600 |
| 525 Clinton Avenue | New York, NY | 0.6 miles | $5,400 |
| 392 Clinton Avenue | New York, NY | 0.8 miles | $4,892 |
| 74 Grand Avenue | New York, NY | 1.4 miles | $4,100 |
| 379 Washington Avenue | New York, NY | 0.7 miles | $4,929 |
| 863 Atlantic Avenue | New York, NY | 0.8 miles | $4,250 |
| (1) | Information obtained from the appraisal. |
| (2) | The studio units are closer in size to the typical one-bedroom units in the neighborhood; therefore, the appraiser concluded at the low end of the one-bedroom range for the subject’s studio units. |
| (3) | The “flex” 1-bedroom, 2-bedroom, and 3-bedroom units have layouts that allow for tenants to create an additional sleeping area and still have a living room; therefore, the appraiser concluded towards the higher end of or slightly above the range for these units. This is further supported by the recent leasing within the property. |
THE INFORMATION IN THIS STRUCTURAL AND COLLATERAL TERM SHEET IS NOT COMPLETE AND MAY BE AMENDED PRIOR TO THE TIME OF SALE. THIS TERM SHEET IS NOT AN OFFER TO SELL THESE SECURITIES AND IT IS NOT A SOLICITATION OF AN OFFER TO BUY THESE SECURITIES IN ANY JURISDICTION WHERE THE OFFER OR SALE IS NOT PERMITTED.
144
| Wells Fargo Commercial Mortgage Trust 2018-C48 | Transaction Contact Information |
| VI. | Transaction Contact Information |
Questions regarding this Structural and Collateral Term Sheet may be directed to any of the following individuals:
| Wells Fargo Securities, LLC | |
| Brigid Mattingly | Tel. (312) 269-3062 |
| A.J. Sfarra | Tel. (212) 214-5613 |
| Alex Wong | Tel. (212) 214-5615 |
| Barclays Capital Inc. | |
| Daniel Vinson | Tel. (212) 528-8224 |
| Brian Wiele | Tel. (212) 412-5780 |
THE INFORMATION IN THIS STRUCTURAL AND COLLATERAL TERM SHEET IS NOT COMPLETE AND MAY BE AMENDED PRIOR TO THE TIME OF SALE. THIS TERM SHEET IS NOT AN OFFER TO SELL THESE SECURITIES AND IT IS NOT A SOLICITATION OF AN OFFER TO BUY THESE SECURITIES IN ANY JURISDICTION WHERE THE OFFER OR SALE IS NOT PERMITTED.
145