| FREE WRITING PROSPECTUS | ||
| FILED PURSUANT TO RULE 433 | ||
| REGISTRATION FILE NO.: 333-226486-04 | ||
 |  |
Free Writing Prospectus
Structural and Collateral Term Sheet
$774,228,768
(Approximate Initial Pool Balance)
Wells Fargo Commercial Mortgage Trust 2019-C49
as Issuing Entity
Wells Fargo Commercial Mortgage Securities, Inc.
as Depositor
Wells Fargo Bank, National Association
Ladder Capital Finance LLC
Rialto Mortgage Finance, LLC
Barclays Capital Real Estate Inc.
C-III Commercial Mortgage LLC
as Sponsors and Mortgage Loan Sellers
Commercial Mortgage Pass-Through Certificates
Series 2019-C49
February 6, 2019
WELLS FARGO SECURITIES Co-Lead Manager and Joint Bookrunner
| BARCLAYS Co-Lead Manager and Joint Bookrunner
| |
Academy Securities Co-Manager | Drexel Hamilton Co-Manager |
STATEMENT REGARDING THIS FREE WRITING PROSPECTUS
The depositor has filed a registration statement (including a prospectus) with the Securities and Exchange Commission (‘‘SEC’’) (SEC File No. 333-226486) for the offering to which this communication relates. Before you invest, you should read the prospectus in the registration statement and other documents the depositor has filed with the SEC for more complete information about the depositor, the issuing entity and this offering. You may get these documents for free by visiting EDGAR on the SEC Web site at www.sec.gov. Alternatively, the depositor, any underwriter, or any dealer participating in the offering will arrange to send you the prospectus after filing if you request it by calling toll free 1-800-745-2063 (8 a.m. – 5 p.m. EST) or by emailing wfs.cmbs@wellsfargo.com.
Nothing in this document constitutes an offer of securities for sale in any jurisdiction where the offer or sale is not permitted. The information contained herein is preliminary as of the date hereof, supersedes any such information previously delivered to you and will be superseded by any such information subsequently delivered and ultimately by the final prospectus relating to the securities. These materials are subject to change, completion, supplement or amendment from time to time.
This free writing prospectus has been prepared by the underwriters for information purposes only and does not constitute, in whole or in part, a prospectus for the purposes of Directive 2003/71/EC (as amended) and/or Part VI of the Financial Services and Markets Act 2000, as amended, or other offering document.
STATEMENT REGARDING ASSUMPTIONS AS TO SECURITIES, PRICING ESTIMATES AND OTHER INFORMATION
The attached information contains certain tables and other statistical analyses (the “Computational Materials”) which have been prepared in reliance upon information furnished by the Mortgage Loan Sellers. Numerous assumptions were used in preparing the Computational Materials, which may or may not be reflected herein. As such, no assurance can be given as to the Computational Materials’ accuracy, appropriateness or completeness in any particular context; or as to whether the Computational Materials and/or the assumptions upon which they are based reflect present market conditions or future market performance. The Computational Materials should not be construed as either projections or predictions or as legal, tax, financial or accounting advice. You should consult your own counsel, accountant and other advisors as to the legal, tax, business, financial and related aspects of a purchase of these securities. Any weighted average lives, yields and principal payment periods shown in the Computational Materials are based on prepayment and/or loss assumptions, and changes in such prepayment and/or loss assumptions may dramatically affect such weighted average lives, yields and principal payment periods. In addition, it is possible that prepayments or losses on the underlying assets will occur at rates higher or lower than the rates shown in the attached Computational Materials. The specific characteristics of the securities may differ from those shown in the Computational Materials due to differences between the final underlying assets and the preliminary underlying assets used in preparing the Computational Materials. The principal amount and designation of any security described in the Computational Materials are subject to change prior to issuance. None of Wells Fargo Securities, LLC, Barclays Capital Inc., Academy Securities, Inc., Drexel Hamilton, LLC, or any of their respective affiliates, make any representation or warranty as to the actual rate or timing of payments or losses on any of the underlying assets or the payments or yield on the securities. The information in this presentation is based upon management forecasts and reflects prevailing conditions and management’s views as of this date, all of which are subject to change. In preparing this presentation, we have relied upon and assumed, without independent verification, the accuracy and completeness of all information available from public sources or which was provided to us by or on behalf of the Mortgage Loan Sellers or which was otherwise reviewed by us.
This free writing prospectus contains certain forward-looking statements. If and when included in this free writing prospectus, the words “expects”, “intends”, “anticipates”, “estimates” and analogous expressions and all statements that are not historical facts, including statements about our beliefs or expectations, are intended to identify forward-looking statements. Any forward-looking statements are made subject to risks and uncertainties which could cause actual results to differ materially from those stated. Those risks and uncertainties include, among other things, declines in general economic and business conditions, increased competition, changes in demographics, changes in political and social conditions, regulatory initiatives and changes in customer preferences, many of which are beyond our control and the control of any other person or entity related to this offering. The forward-looking statements made in this free writing prospectus are made as of the date stated on the cover. We have no obligation to update or revise any forward-looking statement.
Wells Fargo Securities is the trade name for the capital markets and investment banking services of Wells Fargo & Company and its subsidiaries, including but not limited to Wells Fargo Securities, LLC, a member of NYSE, FINRA, NFA and SIPC, Wells Fargo Prime Services, LLC, a member of FINRA, NFA and SIPC, and Wells Fargo Bank, N.A. Wells Fargo Securities, LLC and Wells Fargo Prime Services, LLC are distinct entities from affiliated banks and thrifts.
IMPORTANT NOTICE REGARDING THE OFFERED CERTIFICATES
The information herein is preliminary and may be supplemented or amended prior to the time of sale. In addition, the Offered Certificates referred to in these materials and the asset pool backing them are subject to modification or revision (including the possibility that one or more classes of certificates may be split, combined or eliminated at any time prior to issuance or availability of a final prospectus) and are offered on a “when, as and if issued” basis.
The underwriters described in these materials may from time to time perform investment banking services for, or solicit investment banking business from, any company named in these materials. The underwriters and/or their affiliates or respective employees may from time to time have a long or short position in any security or contract discussed in these materials.
The information contained herein supersedes any previous such information delivered to any prospective investor and will be superseded by information delivered to such prospective investor prior to the time of sale.
IMPORTANT NOTICE RELATING TO AUTOMATICALLY-GENERATED EMAIL DISCLAIMERS
Any legends, disclaimers or other notices that may appear at the bottom of any email communication to which this free writing prospectus is attached relating to (1) these materials not constituting an offer (or a solicitation of an offer), (2) any representation that these materials are accurate or complete and may not be updated or (3) these materials possibly being confidential, are not applicable to these materials and should be disregarded. Such legends, disclaimers or other notices have been automatically generated as a result of these materials having been sent via Bloomberg or another system.
THE INFORMATION IN THIS STRUCTURAL AND COLLATERAL TERM SHEET IS NOT COMPLETE AND MAY BE AMENDED PRIOR TO THE TIME OF SALE. THIS TERM SHEET IS NOT AN OFFER TO SELL THESE SECURITIES AND IT IS NOT A SOLICITATION OF AN OFFER TO BUY THESE SECURITIES IN ANY JURISDICTION WHERE THE OFFER OR SALE IS NOT PERMITTED.
2
| Wells Fargo Commercial Mortgage Trust 2019-C49 | Transaction Highlights |
A. Transaction Highlights
Mortgage Loan Sellers:
Mortgage Loan Seller | Number of Loans | Number of | Aggregate Cut-off Date Balance | % of Initial Pool | ||||
| Wells Fargo Bank, National Association | 20 | 23 | $291,272,404 | 37.6% | ||||
| Ladder Capital Finance LLC | 14 | 15 | 169,669,884 | 21.9 | ||||
| Rialto Mortgage Finance, LLC | 13 | 13 | 150,175,367 | 19.4 | ||||
| Barclays Capital Real Estate Inc. | 9 | 9 | 119,703,524 | 15.5 | ||||
| C-III Commercial Mortgage LLC | 8 | 11 | 43,407,589 | 5.6 | ||||
Total | 64 | 71 | $774,228,768 | 100.0% |
Loan Pool:
| Initial Pool Balance: | $774,228,768 |
| Number of Mortgage Loans: | 64 |
| Average Cut-off Date Balance per Mortgage Loan: | $12,097,324 |
| Number of Mortgaged Properties: | 71 |
| Average Cut-off Date Balance per Mortgaged Property(1): | $10,904,631 |
| Weighted Average Mortgage Interest Rate: | 5.158% |
| Ten Largest Mortgage Loans as % of Initial Pool Balance: | 46.0% |
| Weighted Average Original Term to Maturity or ARD (months): | 116 |
| Weighted Average Remaining Term to Maturity or ARD (months): | 115 |
| Weighted Average Original Amortization Term (months)(2): | 354 |
| Weighted Average Remaining Amortization Term (months)(2): | 353 |
| Weighted Average Seasoning (months): | 2 |
| (1) | Information regarding mortgage loans secured by multiple properties is based on an allocation according to relative appraised values or the allocated loan amounts or property-specific release prices set forth in the related loan documents or such other allocation as the related mortgage loan seller deemed appropriate. |
| (2) | Excludes any mortgage loan that does not amortize. |
Credit Statistics:
| Weighted Average U/W Net Cash Flow DSCR(1): | 1.76x |
| Weighted Average U/W Net Operating Income Debt Yield(1): | 10.9% |
| Weighted Average Cut-off Date Loan-to-Value Ratio(1): | 62.8% |
| Weighted Average Balloon or ARD Loan-to-Value Ratio(1): | 58.3% |
| % of Mortgage Loans with Additional Subordinate Debt(2): | 0.0% |
| % of Mortgage Loans with Single Tenants(3): | 8.9% |
| (1) | With respect to any mortgage loan that is part of a whole loan, loan-to-value ratio, debt service coverage ratio and debt yield calculations include the relatedpari passucompanion loan(s) (unless otherwise stated). The debt service coverage ratio, debt yield and loan-to-value ratio information do not take into account any subordinate debt (whether or not secured by the related mortgaged property), that currently exists or is allowed under the terms of any mortgage loan. See “Description of the Mortgage Pool—Mortgage Pool Characteristics” in the Preliminary Prospectus and Annex A-1 to the Preliminary Prospectus. |
| (2) | The percentage figure expressed as “% of Mortgage Loans with Additional Subordinate Debt” is determined as a percentage of the initial pool balance and does not take into account any future subordinate debt (whether or not secured by the mortgaged property), if any, that may be permitted under the terms of any mortgage loan or the pooling and servicing agreement. See “Description of the Mortgage Pool—Additional Indebtedness—Other Unsecured Indebtedness” in the Preliminary Prospectus. |
| (3) | Excludes mortgage loans that are secured by multiple single tenant properties. |
THE INFORMATION IN THIS STRUCTURAL AND COLLATERAL TERM SHEET IS NOT COMPLETE AND MAY BE AMENDED PRIOR TO THE TIME OF SALE. THIS TERM SHEET IS NOT AN OFFER TO SELL THESE SECURITIES AND IT IS NOT A SOLICITATION OF AN OFFER TO BUY THESE SECURITIES IN ANY JURISDICTION WHERE THE OFFER OR SALE IS NOT PERMITTED.
3
| Wells Fargo Commercial Mortgage Trust 2019-C49 | Characteristics of the Mortgage Pool |
B. Summary of the Whole Loans
| Loan Name | Mortgage Loan Seller in WFCM 2019-C49 | Note(s)(1) | Original Balance | Holder of Note | Lead Servicer for Whole Loan | Master Servicer Under Lead Securitization Servicing Agreement | Special Servicer Under Lead Securitization Servicing Agreement |
| Dominion Tower | LCF | A-1 | $30,350,000 | LCF | Yes | Wells Fargo Bank, National Association(2) | Midland Loan Services, a Division of PNC Bank, National Association(2) |
| A-2A | $15,650,000 | LCF | No | ||||
| A-3A | $15,350,000 | WFCM 2019-C49 | No | ||||
| One River Place | Barclays | A-1 | $15,000,000 | BBCMS 2018-C2 | Yes | Wells Fargo Bank, National Association | LNR Partners, LLC |
| A-2 | $10,000,000 | WFCM 2019-C49 | No |
| (1) | Unless otherwise indicated, each note not currently held by a securitization trust is expected to be contributed to a future securitization. No assurance can be provided that any such note will not be split further. |
| (2) | The related whole loan is expected to initially be serviced under the WFCM 2019-C49 pooling and servicing agreement until the securitization of the related “lead” pari passu note (namely, the related pari passu note marked “Yes” in the column entitled “Lead Servicer for Whole Loan”), after which the related whole loan will be serviced under the pooling and servicing agreement governing such securitization of the related “lead” pari passu note. The master servicer and special servicer for such securitization will be identified in a notice, report or statement to holders of the WFCM 2019-C49 certificates after the closing of such securitization. |
THE INFORMATION IN THIS STRUCTURAL AND COLLATERAL TERM SHEET IS NOT COMPLETE AND MAY BE AMENDED PRIOR TO THE TIME OF SALE. THIS TERM SHEET IS NOT AN OFFER TO SELL THESE SECURITIES AND IT IS NOT A SOLICITATION OF AN OFFER TO BUY THESE SECURITIES IN ANY JURISDICTION WHERE THE OFFER OR SALE IS NOT PERMITTED.
4
| Wells Fargo Commercial Mortgage Trust 2019-C49 | Characteristics of the Mortgage Pool |
C. Property Type Distribution(1)
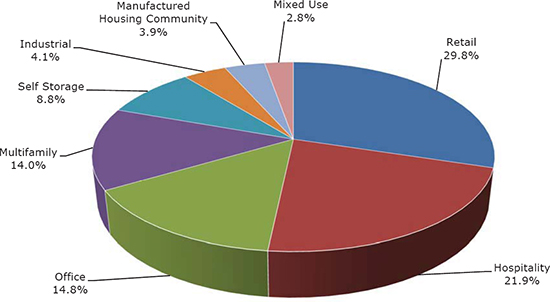
| Property Type | Number of Mortgaged Properties | Aggregate Cut-off Date Balance ($) | % of Initial Pool Balance (%) | Weighted Average Cut-off Date LTV Ratio (%) | Weighted Average Balloon LTV Ratio (%) | Weighted Average U/W NCF DSCR (x) | Weighted Average U/W NOI Debt Yield (%) | Weighted Average U/W NCF Debt Yield (%) | Weighted Average Mortgage Rate (%) |
| Retail | 17 | $230,671,236 | 29.8% | 64.1% | 60.5% | 1.69x | 10.0% | 9.5% | 5.055% |
| Anchored | 7 | 158,929,896 | 20.5 | 64.6 | 62.3 | 1.68 | 9.6 | 9.1 | 5.035 |
| Shadow Anchored | 2 | 34,487,500 | 4.5 | 65.4 | 58.4 | 1.73 | 11.5 | 11.0 | 4.919 |
| Single Tenant | 6 | 26,629,277 | 3.4 | 57.8 | 52.8 | 1.78 | 10.6 | 10.5 | 5.245 |
| Unanchored | 2 | 10,624,564 | 1.4 | 69.0 | 59.5 | 1.44 | 9.4 | 9.1 | 5.330 |
| Hospitality | 9 | 169,452,609 | 21.9 | 62.6 | 54.4 | 1.97 | 13.9 | 12.5 | 5.361 |
| Full Service | 4 | 88,091,940 | 11.4 | 63.0 | 52.5 | 1.90 | 14.4 | 12.7 | 5.334 |
| Extended Stay | 3 | 65,784,928 | 8.5 | 62.0 | 57.7 | 2.15 | 13.6 | 12.4 | 5.316 |
| Limited Service | 2 | 15,575,741 | 2.0 | 62.7 | 51.0 | 1.57 | 12.8 | 11.3 | 5.697 |
| Office | 10 | 114,667,011 | 14.8 | 65.3 | 61.9 | 1.97 | 11.8 | 10.6 | 4.959 |
| Suburban | 7 | 87,767,011 | 11.3 | 66.4 | 63.3 | 1.96 | 11.7 | 10.4 | 4.927 |
| CBD | 2 | 25,350,000 | 3.3 | 62.6 | 57.9 | 1.91 | 11.8 | 10.9 | 5.071 |
| R&D | 1 | 1,550,000 | 0.2 | 43.1 | 43.1 | 3.26 | 16.9 | 16.5 | 4.985 |
| Multifamily | 10 | 108,372,091 | 14.0 | 62.7 | 59.8 | 1.38 | 8.4 | 8.1 | 5.290 |
| Garden | 7 | 65,672,091 | 8.5 | 64.4 | 61.0 | 1.42 | 8.7 | 8.4 | 5.258 |
| Mid-Rise | 1 | 17,700,000 | 2.3 | 56.4 | 56.4 | 1.39 | 7.6 | 7.5 | 5.320 |
| Student Housing | 1 | 14,100,000 | 1.8 | 61.6 | 54.9 | 1.29 | 8.9 | 8.6 | 5.350 |
| Mid Rise | 1 | 10,900,000 | 1.4 | 64.5 | 64.5 | 1.29 | 7.1 | 7.0 | 5.355 |
| Self Storage | 9 | 67,846,128 | 8.8 | 61.7 | 57.8 | 1.83 | 10.5 | 10.3 | 4.953 |
| Self Storage | 9 | 67,846,128 | 8.8 | 61.7 | 57.8 | 1.83 | 10.5 | 10.3 | 4.953 |
| Industrial | 3 | 31,900,000 | 4.1 | 56.4 | 56.4 | 1.83 | 9.8 | 9.6 | 5.180 |
| Warehouse | 2 | 17,500,000 | 2.3 | 51.2 | 51.2 | 1.95 | 10.3 | 10.1 | 5.131 |
| Manufacturing/ Warehouse | 1 | 14,400,000 | 1.9 | 62.6 | 62.6 | 1.69 | 9.2 | 9.0 | 5.239 |
| Manufactured Housing Community | 10 | 29,969,692 | 3.9 | 65.7 | 56.8 | 1.40 | 9.6 | 9.4 | 5.408 |
| Manufactured Housing Community | 10 | 29,969,692 | 3.9 | 65.7 | 56.8 | 1.40 | 9.6 | 9.4 | 5.408 |
| Mixed Use | 3 | 21,350,000 | 2.8 | 46.0 | 44.6 | 1.70 | 10.4 | 9.8 | 5.336 |
| Retail/Office | 2 | 15,800,000 | 2.0 | 45.1 | 45.1 | 1.64 | 9.5 | 9.0 | 5.401 |
| Industrial/Office | 1 | 5,550,000 | 0.7 | 48.3 | 42.9 | 1.85 | 13.1 | 12.1 | 5.150 |
| Total/Weighted Average: | 71 | $774,228,768 | 100.0% | 62.8% | 58.3% | 1.76x | 10.9% | 10.2% | 5.158% |
| (1) | Because this table presents information relating to the mortgaged properties and not the mortgage loans, the information for mortgage loans secured by more than one mortgaged property is based on allocated amounts (allocating the principal balance of the mortgage loan to each of those properties according to the relative appraised values of the mortgaged properties or the allocated loan amounts or property-specific release prices set forth in the related mortgage loan documents or such other allocation as the related mortgage loan seller deemed appropriate). With respect to any mortgage loan that is part of a whole loan, the loan-to-value ratio, debt service coverage ratio and debt yield calculations include the relatedpari passu companion loan(s) (unless otherwise stated). With respect to each mortgage loan, debt service coverage ratio, debt yield and loan-to-value ratio information do not take into account any subordinate debt (whether or not secured by the related mortgaged property) that currently exists or is allowed under the terms of such mortgage loan. See Annex A-1 to the Preliminary Prospectus. |
THE INFORMATION IN THIS STRUCTURAL AND COLLATERAL TERM SHEET IS NOT COMPLETE AND MAY BE AMENDED PRIOR TO THE TIME OF SALE. THIS TERM SHEET IS NOT AN OFFER TO SELL THESE SECURITIES AND IT IS NOT A SOLICITATION OF AN OFFER TO BUY THESE SECURITIES IN ANY JURISDICTION WHERE THE OFFER OR SALE IS NOT PERMITTED.
5
| Wells Fargo Commercial Mortgage Trust 2019-C49 | Certain Terms and Conditions |
D. Large Loan Summaries
THE INFORMATION IN THIS STRUCTURAL AND COLLATERAL TERM SHEET IS NOT COMPLETE AND MAY BE AMENDED PRIOR TO THE TIME OF SALE. THIS TERM SHEET IS NOT AN OFFER TO SELL THESE SECURITIES AND IT IS NOT A SOLICITATION OF AN OFFER TO BUY THESE SECURITIES IN ANY JURISDICTION WHERE THE OFFER OR SALE IS NOT PERMITTED.
6
| No. 1 – Innisfree Portfolio | |||||||
| Mortgage Loan Information | Mortgaged Property Information | ||||||
| Mortgage Loan Seller: | Ladder Capital Finance LLC | Single Asset/Portfolio: | Portfolio | ||||
Credit Assessment (DBRS/Fitch/Moody’s): | NR/NR/NR | Property Type – Subtype: | Hospitality – Full Service | ||||
| Original Principal Balance: | $58,500,000 | Location: | Fort Walton Beach, FL | ||||
| Cut-off Date Balance: | $58,415,464 | Size: | 330 Rooms | ||||
| % of Initial Pool Balance: | 7.5% | Cut-off Date Balance Per Room | $177,017 | ||||
| Loan Purpose: | Refinance | Maturity Date Balance Per Room: | $146,725 | ||||
| Year Built/Renovated: | Various/NAP | ||||||
| Borrower Sponsor: | Julian MacQueen | Title Vesting(2): | Leasehold | ||||
| Guarantor: | Julian MacQueen | Property Manager: | Self-managed | ||||
| Mortgage Rate: | 5.2100% | Current Occupancy (As of): | 85.2% (11/30/2018) | ||||
| Note Date: | January 29, 2019 | YE 2017 Occupancy(3): | 80.9% | ||||
| Seasoning: | 1 month | YE 2016 Occupancy(3): | NAV | ||||
| Maturity Date: | February 6, 2029 | YE 2015 Occupancy(3): | NAV | ||||
| IO Period: | 0 months | YE 2014 Occupancy(3): | NAV | ||||
| Loan Term (Original): | 120 months | Appraised Value: | $94,800,000 | ||||
| Amortization Term (Original): | 360 months | Appraised Value Per Room: | $287,273 | ||||
| Loan Amortization Type: | Amortizing Balloon | Appraisal Valuation Date: | August 21, 2018 | ||||
| Call Protection: | L(25),D(91),O(4) | ||||||
| Lockbox Type: | Hard/Springing Cash Management | ||||||
| Additional Debt: | None | Underwriting and Financial Information | |||||
| Additional Debt Type (Balance): | NAP | TTM NOI (11/30/2018)(3): | $8,652,214 | ||||
| YE 2017 NOI(3): | $6,094,140 | ||||||
| YE 2016 NOI(3): | $3,248,699 | ||||||
| YE 2015 NOI(3): | NAV | ||||||
| U/W Revenues: | $21,874,518 | ||||||
| Escrows and Reserves(1) | U/W Expenses: | $13,502,902 | |||||
| Initial | Monthly | Cap | U/W NOI: | $8,371,616 | |||
| Taxes | $131,683 | $43,894 | NAP | U/W NCF: | $7,496,635 | ||
| Insurance | $213,199 | $23,689 | NAP | U/W DSCR based on NOI/NCF: | 2.17x / 1.94x | ||
| FF&E Reserve | $0 | (1) | NAP | U/W Debt Yield based on NOI/NCF: | 14.3% / 12.8% | ||
| PIP Reserve | $0 | (1) | NAP | U/W Debt Yield at Maturity based on NOI/NCF: | 17.3% / 15.5% | ||
| Seasonality Reserve | $0 | (1) | NAP | Cut-off Date LTV Ratio: | 61.6% | ||
| Ground Lease Reserve | $0 | (1) | NAP | LTV Ratio at Maturity: | 51.1% | ||
| Sources and Uses | |||||||||
| Sources | Uses | ||||||||
| Original loan amount | $58,500,000 | 100.0% | Loan payoff | $48,731,340 | 83.3 | % | |||
| Upfront reserves | 344,882 | 0.6 | |||||||
| Closing costs | 1,180,859 | 2.0 | |||||||
| Return of equity | 8,242,919 | 14.1 | |||||||
| Total Sources | $58,500,000 | 100.0% | Total Uses | $58,500,000 | 100.0 | % | |||
| (1) | See “Escrows” section below. |
| (2) | See “Ground Lease” section below. |
| (3) | Occupancy information and historical operating statements for periods prior to 2017 are not available with respect to the entire portfolio because the Hilton Garden Inn Fort Walton Beach property was built and began operations in May 2017. The increase in NOI from YE 2017 to TTM (11/30/2018) can be attributed to the YE 2017 NOI only including income from the Hilton Garden Inn Fort Walton Beach property for the portion of 2017 since it began operations. See “Cash Flow Analysis” section below. |
The Mortgage Loan. The mortgage loan (the “Innisfree Portfolio Mortgage Loan”) is evidenced by three promissory notes secured by a first mortgage encumbering the leasehold interest in two full service hotels, the Hilton Garden Inn Fort Walton Beach and the Holiday Inn Fort Walton Beach, located in Fort Walton Beach, Florida (each an “Innisfree Portfolio Property” and together, the “Innisfree Portfolio Properties”).
THE INFORMATION IN THIS STRUCTURAL AND COLLATERAL TERM SHEET IS NOT COMPLETE AND MAY BE AMENDED PRIOR TO THE TIME OF SALE. THIS TERM SHEET IS NOT AN OFFER TO SELL THESE SECURITIES AND IT IS NOT A SOLICITATION OF AN OFFER TO BUY THESE SECURITIES IN ANY JURISDICTION WHERE THE OFFER OR SALE IS NOT PERMITTED.
7
| Hospitality – Full Service | Loan #1 | Cut-off Date Balance: | $58,415,464 | |
| 1299 & 1297 Miracle Strip Parkway Southeast | Innisfree Portfolio | Cut-off Date LTV: | 61.6% | |
| Fort Walton Beach, FL 32548 | U/W NCF DSCR: | 1.94x | ||
| U/W NOI Debt Yield: | 14.3% |
The Borrower and Borrower Sponsor.The borrowers under the Innisfree Portfolio Mortgage Loan are Emerald Breeze Resort Group, LLC (the “Emerald I Borrower”) and Emerald Breeze Resort Group II LLC (the “Emerald II Borrower”), each a Florida limited liability company with an independent director. Legal counsel to the borrower delivered a non-consolidation opinion in connection with the origination of the Innisfree Portfolio Mortgage Loan. The nonrecourse carve-out guarantor of the Innisfree Portfolio Mortgage Loan is Julian MacQueen.
Mr. MacQueen is the chairman and founder of Innisfree Hotels and has over 30 years of real estate experience. Innisfree Hotels owns or manages over 3,300 hotel rooms and has over 1,500 employees. Since 2011, the company has developed 870 new beachfront rooms along the Gulf Coast.
The Properties.The Innisfree Portfolio Properties include two adjacent beachfront hotels, comprised of a total of 330-rooms located in Fort Walton Beach, Florida on an approximately 17.1 acre site. The Innisfree Portfolio Properties are located in southern Okaloosa County, along the south side of Choctawhatchee Bay and along the Gulf of Mexico, off U.S. Highway 98, which provides access across the Florida Panhandle. The Innisfree Portfolio Properties are 7.3 miles from Destin-Fort Walton Beach Airport, which had a passenger count of 915,650 in 2016, the highest passenger count in its 60-year history and an 18 percent increase over 2015. In 2017, the airport set a new record with 1,134,209 passengers, accounting for an approximately 24% increase over 2016.
The Hilton Garden Inn Fort Walton Beach is a 178-room, full service, five-story oceanfront hotel with a unit mix consisting of 139 double queen rooms, 36 king rooms and 3 king suites. Amenities at the property include an indoor and outdoor pool, a whirlpool, a rock climbing wall, a fitness room, outdoor fire pits, a business center and self-guest laundry facilities. The Holiday Inn Fort Walton Beach is a 152-room, full service, five-story oceanfront hotel with a unit mix consisting of 106 double queen rooms , 30 king rooms and 16 king suites. Amenities at the property include an indoor and outdoor pool, a whirlpool, a fitness room, a gaming room, a business center, and self-guest laundry facilities. Both hotels share the Riptides Grill, a Lobby Bar and the Gilligan’s Tiki Bar. The Innisfree Portfolio Properties are subject to a 50-year ground lease with approximately forty-four years remaining before expiration on October 30, 2062. The monthly ground lease base rent for each hotel is the greater of $12,500 (subject to future upward adjustment based on the Consumer Price Index for all Urban Consumers) and 3.25% of the respective hotel’s monthly revenue.
The surrounding area, referred to as the South Walton Beaches, has several major demand drivers including the area beaches, Wild Willy’s Adventure Zone (0.4 miles), the Air Force Armament Museum (7.0 miles), Big Kahuna’s Water and Adventure Park (7.6 miles), and the Indian Bayou Golf and Country Club (8.3 miles). In addition, the Innisfree Portfolio Properties are located approximately 5.2 miles from Destin Harbor Boardwalk. The Destin Harbor neighborhood features one of the largest commercial sport-fishing fleets on the Gulf Coast.
| Property | Year Built/Renovated | Rooms | Allocated Cut-off Date Principal Balance | % of Portfolio Date Principal Balance | Cut-off Date Principal Balance Per Room | Appraised Value | % of Appraised Value |
| Hilton Garden Inn Fort Walton Beach | 2017/NAP | 178 | $34,500,000 | 59.0% | $193,820 | $54,700,000 | 57.7% |
| Holiday Inn Fort Walton Beach | 2014/NAP | 152 | $24,000,000 | 41.0% | $157,895 | $40,100,000 | 42.3% |
| Total/Average | 330 | $58,500,000 | 100.0% | $177,273 | $94,800,000 | 100.0% |
The following table presents certain information relating to the 2017 demand analysis with respect to the Innisfree Portfolio Properties based on market segmentation, as provided in the appraisal:
2017 Market Segmentation
(Hilton Garden Inn Fort Walton Beach)
Corporate | Meeting/Group | Leisure |
| 15.0% | 20.0% | 65.0% |
THE INFORMATION IN THIS STRUCTURAL AND COLLATERAL TERM SHEET IS NOT COMPLETE AND MAY BE AMENDED PRIOR TO THE TIME OF SALE. THIS TERM SHEET IS NOT AN OFFER TO SELL THESE SECURITIES AND IT IS NOT A SOLICITATION OF AN OFFER TO BUY THESE SECURITIES IN ANY JURISDICTION WHERE THE OFFER OR SALE IS NOT PERMITTED.
8
| Hospitality – Full Service | Loan #1 | Cut-off Date Balance: | $58,415,464 | |
| 1299 & 1297 Miracle Strip Parkway Southeast | Innisfree Portfolio | Cut-off Date LTV: | 61.6% | |
| Fort Walton Beach, FL 32548 | U/W NCF DSCR: | 1.94x | ||
| U/W NOI Debt Yield: | 14.3% |
2017 Market Segmentation
(Holiday Inn Fort Walton Beach)
Corporate | Meeting/Group | Leisure |
| 10.0% | 10.0% | 80.0% |
Operating History and Underwritten Net Cash Flow. The following table presents certain information relating to the historical operating performance and the underwritten net cash flow at the Innisfree Portfolio Properties:
Cash Flow Analysis
| 2017(1) | TTM 11/30/2018 | U/W | % of U/W Total Revenue(2) | U/W $ per Room | |
| Occupancy | 80.9% | 85.2% | 85.2% | ||
| ADR | $172.96 | $180.59 | $180.59 | ||
| RevPAR | $140.01 | $153.84 | $153.84 | ||
| Room Revenue | $13,599,337 | $18,529,991 | $18,529,991 | 84.7% | $56,151 |
| F&B Revenue | 1,661,142 | 2,658,427 | 2,658,427 | 12.2 | 8,056 |
| Other Revenue(3) | 540,156 | 686,100 | 686,100 | 3.1 | 2,079 |
| Total Revenue(1) | $15,800,635 | $21,874,518 | $21,874,518 | 100.0% | $66,286 |
| Room Expense | 2,724,182 | 3,587,261 | 3,587,261 | 16.4 | 10,870 |
| F&B Expense | 1,603,394 | 2,210,506 | 2,210,506 | 10.1 | 6,699 |
| Other Department Expense | 124,237 | 122,771 | 122,771 | 0.6 | 372 |
| Total Department Expenses | 4,451,813 | 5,920,538 | 5,920,538 | 27.1 | 17,941 |
| Gross Operating Income | $11,348,823 | $15,953,980 | $15,953,980 | 72.9% | $48,345 |
| Total Undistributed Expenses | 4,307,515 | 6,026,377 | 6,144,114 | 28.1 | 18,619 |
| Gross Operating Profit | $7,041,308 | $9,927,603 | $9,809,866 | 44.8% | $29,727 |
| Total Fixed Charges | 947,168 | 1,275,388 | 1,438,250 | 6.6 | 4,358 |
| Total Operating Expenses | $9,706,495 | $13,222,304 | $13,502,902 | 61.7% | $40,918 |
| Net Operating Income(1) | $6,094,140 | $8,652,214 | $8,371,616 | 38.3% | $25,369 |
| FF&E | 0 | 0 | 874,981 | 4.0 | 2,651 |
| Net Cash Flow | $6,094,140 | $8,652,214 | $7,496,635 | 34.3% | $22,717 |
| NOI DSCR | 1.58x | 2.24x | 2.17x | ||
| NCF DSCR | 1.58x | 2.24x | 1.94x | ||
| NOI DY | 10.4% | 14.8% | 14.3% | ||
| NCF DY | 10.4% | 14.8% | 12.8% | ||
| (1) | Historical operating statements for periods prior to 2017 are not available with respect to the entire portfolio because the Hilton Garden Inn Fort Walton Beach property was built and began operations in May 2017. The increase in Total Revenue and NOI from 2017 to TTM 11/30/2018 can be attributed to the 2017 Total Revenue and 2017 NOI only including income from the Hilton Garden Inn Fort Walton Beach property for the portion of 2017 since it began operations. |
| (2) | % of U/W Total Revenue for Room Expense, F&B Expense and Other Department Expenses are based on their corresponding revenue line items. |
| (3) | Other Revenue includes income generated from miscellaneous fees, telephone, and ground lease pass through. The ground lease pass through is collected from guests to offset ground rent charged under the Ground Lease (defined below) to the government. The majority but not all of the lease fee is passed through. |
Appraisal.The appraiser for the Holiday Inn Fort Walton Beach property concluded to an “as-is” appraised value of $40,100,000 with an appraisal valuation date of August 21, 2018. The appraiser for the Hilton Garden Inn Fort Walton Beach property concluded to an “as-is” appraised value of $54,700,000 with an appraisal valuation date of August 21, 2018.
Environmental Matters. According to the Phase I environmental assessments dated August 30, 2018, there was no evidence of any recognized environmental conditions at the Holiday Inn Fort Walton Beach property or the Hilton Garden Inn Fort Walton Beach property.
Market Overview and Competition.The Innisfree Portfolio Properties are located in Fort Walton Beach, Florida along the Gulf of Mexico. In 2016, the Destin-Fort Walton Beach Airport had the highest passenger count in its 60 year history (915,650 people), accounting for an approximately 18% increase over 2015. In 2017, the airport set a new record with 1,134,209 passengers, accounting for an approximately 24% increase over 2016. South Walton, which encompasses a strand of 16 distinct beach neighborhoods, is known for its turquoise waters and sugar sand beaches. The Innisfree Portfolio Properties are located 5.2 miles from Destin Harbor,
THE INFORMATION IN THIS STRUCTURAL AND COLLATERAL TERM SHEET IS NOT COMPLETE AND MAY BE AMENDED PRIOR TO THE TIME OF SALE. THIS TERM SHEET IS NOT AN OFFER TO SELL THESE SECURITIES AND IT IS NOT A SOLICITATION OF AN OFFER TO BUY THESE SECURITIES IN ANY JURISDICTION WHERE THE OFFER OR SALE IS NOT PERMITTED.
9
| Hospitality – Full Service | Loan #1 | Cut-off Date Balance: | $58,415,464 | |
| 1299 & 1297 Miracle Strip Parkway Southeast | Innisfree Portfolio | Cut-off Date LTV: | 61.6% | |
| Fort Walton Beach, FL 32548 | U/W NCF DSCR: | 1.94x | ||
| U/W NOI Debt Yield: | 14.3% |
which, according to the appraisal, is known as “The World’s Luckiest Fishing Village” and features one of the largest commercial sport-fishing fleets on the Gulf Coast.
Estimated population in 2018 within a one-, three-, and five- mile radius of the Innisfree Portfolio Properties was 2,435, 19,187, and 64,233, respectively. Estimated average household income in 2018 within the same one-, three-, and five- mile radius was $75,275, $70,887, and $71,301, respectively.
The following table presents historical occupancy, ADR, RevPAR and penetration rates relating to the Hilton Garden Inn Fort Walton Beach’s competitive set:
Subject and Market Historical Occupancy, ADR and RevPAR(1)
(Hilton Garden Inn Fort Walton Beach)
Competitive Set | Hilton Garden Inn Fort Walton Beach | Penetration Factor | |||||||
Year | Occupancy | ADR | RevPAR | Occupancy | ADR | RevPAR | Occupancy | ADR | RevPAR |
| TTM 11/30/2018 | 74.1% | $164.68 | $122.08 | 84.2% | $195.44 | $164.47 | 113.5% | 118.7% | 134.7% |
| 12/31/2017 | 73.7% | $161.28 | $118.82 | 72.5% | $187.95 | $136.32 | 98.4% | 116.5% | 114.7% |
| 12/31/2016 | NAP | NAP | NAP | NAP | NAP | NAP | NAP | NAP | NAP |
| 12/31/2015 | NAP | NAP | NAP | NAP | NAP | NAP | NAP | NAP | NAP |
| (1) | Information obtained from third party hospitality research reports dated December 19, 2018 and January 18, 2018. The competitive set includes the following hotels: Four Points by Sheraton Destin Fort Walton Beach, Hampton Inn Fort Walton Beach, Holiday Inn Resort Fort Walton Beach and Courtyard Fort Walton Beach West Destin. |
The following table presents historical occupancy, ADR, RevPAR and penetration rates relating to the Holiday Inn Fort Walton Beach’s competitive set:
Subject and Market Historical Occupancy, ADR and RevPAR(1)
(Holiday Inn Fort Walton Beach)
Competitive Set | Holiday Inn Fort Walton Beach | Penetration Factor | |||||||
Year | Occupancy | ADR | RevPAR | Occupancy | ADR | RevPAR | Occupancy | ADR | RevPAR |
| TTM 11/30/2018 | 60.8% | $169.55 | $103.02 | 85.9% | $171.12 | $146.91 | 141.3% | 100.9% | 142.6% |
| 12/31/2017 | 60.5% | $165.97 | $100.35 | 86.9% | $164.96 | $143.39 | 143.8% | 99.4% | 142.9% |
| 12/31/2016 | 66.0% | $156.68 | $103.36 | 82.7% | $172.33 | $142.56 | 125.4% | 110.0% | 137.9% |
| 12/31/2015 | 61.7% | $155.77 | $96.07 | 82.2% | $169.46 | $139.25 | 133.2% | 108.8% | 145.0% |
| (1) | Information obtained from third party hospitality research reports dated December 18, 2018 and January 18, 2018. The competitive set includes the following hotels: Four Points by Sheraton Destin Fort Walton Beach, Ramada Plaza Fort Walton Beach Resort Destin (12/31/2017, 12/31/2016, 12/31/2015 only), The Island by Hotel RL (TTM 11/30/2018 only), Wyndham Garden Hotel Fort Walton Beach, Best Western Fort Walton Beachfront and Hampton Inn Fort Walton Beach. |
The appraiser for the Hilton Garden Inn Fort Walton Beach property identified four comparable hotel properties ranging from 85 rooms to 216 rooms that were constructed between 1961 and 2016. The competitive set reported a weighted average occupancy of approximately 72.1%, with average daily rates ranging from $145.00 to $175.00. The competitive set’s weighted average revenue per room was $116.79. The appraiser for the Holiday Inn Fort Walton Beach property identified five comparable hotel properties ranging from 100 rooms to 222 rooms that were constructed between 1961 and 2000. The competitive set reported a weighted average occupancy of approximately 57%, with average daily rates ranging from $145.00 to $180.00. The competitive set’s weighted average revenue per room was $97.
The following tables present TTM 7/31/2018 occupancy, estimated ADR and estimated RevPAR relating to each Innisfree Portfolio Property’s primary competitive set according to the appraisal:
THE INFORMATION IN THIS STRUCTURAL AND COLLATERAL TERM SHEET IS NOT COMPLETE AND MAY BE AMENDED PRIOR TO THE TIME OF SALE. THIS TERM SHEET IS NOT AN OFFER TO SELL THESE SECURITIES AND IT IS NOT A SOLICITATION OF AN OFFER TO BUY THESE SECURITIES IN ANY JURISDICTION WHERE THE OFFER OR SALE IS NOT PERMITTED.
10
| Hospitality – Full Service | Loan #1 | Cut-off Date Balance: | $58,415,464 | |
| 1299 & 1297 Miracle Strip Parkway Southeast | Innisfree Portfolio | Cut-off Date LTV: | 61.6% | |
| Fort Walton Beach, FL 32548 | U/W NCF DSCR: | 1.94x | ||
| U/W NOI Debt Yield: | 14.3% |
Primary Competitive Set(1)
Property Name | Location | Rooms | Year Built/Renov. | TTM 7/31/2018 Occupancy | Estimated TTM 7/31/2018 ADR | Estimated TTM 7/31/2018 RevPAR |
| Hilton Garden Inn Fort Walton Beach – Subject(1) | Fort Walton Beach, FL | 178 | 2017/NAP | 84.3% | $193.85 | $163.43 |
| Four Points by Sheraton Destin Fort Walton Beach | Destin, FL | 216 | 1961/NAV | 60.0% - 65.0% | $165.00 - $175.00 | $105.00 – $110.00 |
| Hampton Inn Fort Walton Beach | Fort Walton Beach, FL | 100 | 2000/NAV | 75.0% - 80.0% | $145.00 - $155.00 | $115.00 – $120.00 |
| Holiday Inn Fort Walton Beach | Fort Walton Beach, FL | 152 | 2014/NAV | 80.0% - 85.0% | $160.00 - $170.00 | $135.00 - $140.00 |
| Courtyard Fort Walton Beach – West Destin | Fort Walton Beach, FL | 85 | 2016/NAV | 65.0% - 70.0% | $145.00 - $155.00 | $100.00 - $105.00 |
| (1) | Information obtained from the appraisal, other than for the Hilton Garden Inn Fort Walton Beach – Subject, for which information was obtained from the TTM 11/30/2018 underwriting. |
Primary Competitive Set(1)
Property Name | Location | Rooms | Year Built/Renov. | TTM 7/31/2018 Occupancy | Estimated TTM 7/31/2018 ADR | Estimated TTM 7/31/2018 RevPAR |
| Holiday Inn Fort Walton Beach – Subject(1) | Fort Walton Beach, FL | 152 | 2014/NAP | 86.2% | $165.40 | $142.61 |
| Four Points by Sheraton Destin Fort Walton Beach | Destin, FL | 216 | 1961/NAV | 60.0% - 65.0% | $165.00 - $175.00 | $105.00 – $110.00 |
| The Island by Hotel RL | Fort Walton Beach, FL | 222 | 1971/NAV | 35.0% - 40.0% | $165.00 - $175.00 | $60.00 – $65.00 |
| Wyndham Garden Fort Walton Beach Destin | Pensacola Beach, FL | 195 | 1974/NAV | 70.0% - 75.0% | $170.00 - $180.00 | $120.00 - $125.00 |
Best Western Fort Walton Beachfront | Fort Walton Beach, FL | 100 | 1998/NAV | 65.0% - 70.0% | $170.00 - $180.00 | $115.00 - $120.00 |
| Hampton Inn Fort Walton Beach | Fort Walton Beach, FL | 100 | 2000/NAV | 75.0% - 80.0% | $145.00 - $155.00 | $115.00 - $120.00 |
| (1) | Information obtained from the appraisal, other than for Holiday Inn Fort Walton Beach – Subject, for which information was obtained from the TTM 11/30/2018 underwriting. |
Escrows.
Real Estate Taxes – The Innisfree Portfolio Mortgage Loan documents require an upfront real estate tax reserve of $131,683 and ongoing monthly real estate tax reserves in an amount equal to one-twelfth of the real estate taxes that the lender estimates will be payable during the next twelve months (initially $43,894).
Insurance – The Innisfree Portfolio Mortgage Loan documents require an upfront insurance premiums reserve of $213,199 and ongoing monthly insurance premiums in an amount equal to one-twelfth of the insurance premiums that the lender estimates will be payable during the next twelve months (initially $23,689).
FF&E Reserve – The Innisfree Portfolio Mortgage Loan documents require ongoing monthly FF&E Reserves of 4.0% of the total revenue from the Innisfree Portfolio Properties (the initial estimated FF&E monthly deposit is $72,915).
Seasonality Reserve – The Innisfree Portfolio Mortgage Loan documents require springing monthly deposits for seasonality. As to both Innisfree Portfolio Properties, on monthly payment dates from May to August, the borrowers will be required to deposit an aggregate of $1,121,917 (representing the sum of the four months of deposits) and then will disburse an aggregate of $1,121,917 in the months November through February to cover any shortfalls. Amounts are subject to change and adjusted on an annual basis based on lender discretion
Ground Lease Rent Reserve –The Innisfree Portfolio Mortgage Loan documents require that on each monthly payment date the borrowers will be required to deposit the amount payable under the Ground Lease for the month immediately following the month in which such monthly payment date occurs. This amount is expected to be, for each Innisfree Portfolio Property, the greater of $12,500 per month and 3.25% of such property’s gross revenues for the applicable month. The minimum deposit is $300,000 each year for both Innisfree Portfolio Properties in the aggregate under the Ground Lease and Sublease (as definted below), collectively.
PIP Reserve– The Innisfree Portfolio Mortgage Loan documents require that if at any time, any additional PIP work is required under the franchise agreements, the borrower shall deposit an amount equal to 125% of the estimated costs to complete such additional PIP work.
THE INFORMATION IN THIS STRUCTURAL AND COLLATERAL TERM SHEET IS NOT COMPLETE AND MAY BE AMENDED PRIOR TO THE TIME OF SALE. THIS TERM SHEET IS NOT AN OFFER TO SELL THESE SECURITIES AND IT IS NOT A SOLICITATION OF AN OFFER TO BUY THESE SECURITIES IN ANY JURISDICTION WHERE THE OFFER OR SALE IS NOT PERMITTED.
11
| Hospitality – Full Service | Loan #1 | Cut-off Date Balance: | $58,415,464 | |
| 1299 & 1297 Miracle Strip Parkway Southeast | Innisfree Portfolio | Cut-off Date LTV: | 61.6% | |
| Fort Walton Beach, FL 32548 | U/W NCF DSCR: | 1.94x | ||
| U/W NOI Debt Yield: | 14.3% |
Lockbox and Cash Management.A hard lockbox is in place with respect to the Innisfree Portfolio Mortgage Loan. The Innisfree Portfolio Mortgage Loan has springing cash management that will commence upon the occurrence of a Sweep Period (defined below). The borrowers are required to cause all rents including, without limitation, all credit card company payments, to be transmitted directly into the applicable lockbox account, provided, however, that any cash and other sums received at the hotels may be deposited by the borrowers or manager within one (1) business day of receipt. During the continuance of a Sweep Period (as defined below), all funds in the lockbox account are required to be swept daily to a cash management account under the control of the lender and disbursed during each interest period of the loan term in accordance with the Innisfree Portfolio Mortgage Loan documents.
A “Sweep Period” will commence upon the earliest of the following:
| (i) | the occurrence and continuance of an event of default under the Innisfree Portfolio Mortgage Loan; or |
| (ii) | the debt service coverage ratio being less than 1.20x; or |
| (iii) | the date on which the property manager becomes insolvent or a debtor in a bankruptcy action; or |
| (iv) | the delivery of notice by the franchisor/manager of any breach or default by a borrower under the franchise/management agreement that, with the passage of time or delivery of notice, could result in the termination of such agreement. |
A Sweep Period will end upon the occurrence of the following, in each case provided no other cash management period is continuing (and no event of default has occurred and is continuing):
| ● | with regard to clause (i), the lender’s acceptance of a cure or waiver of such event of default; or |
| ● | with regard to clause (ii), the debt service coverage ratio being greater than 1.35x for two consecutive calendar quarters; or |
| ● | with regard to clause (iii), the borrowers having entered into a replacement management agreement with a qualified manager; or |
| ● | with regard to clause (iv), the lenders acceptance of a cure of such event of default under the franchise agreement or management agreement, the borrowers having delivered evidence reasonably satisfactory to the lender, which may include a “good standing” or similar letter from the franchisor, indicating that the franchise agreement is in full force and effect. |
Property Management.The Innisfree Portfolio Properties are managed by an affiliate of the borrower.
Partial Release.Not permitted.
Real Estate Substitution.Not permitted.
Subordinate and Mezzanine Indebtedness.Not permitted.
Ground Lease.The Innisfree Portfolio Properties are subject to a ground lease (the “Ground Lease”) with the United States government through the Secretary of the Air Force, as lessor. The Emerald I Borrower owns a leasehold interest in the Innisfree Portfolio Properties by way of a 50-year ground lease, which expires in October 2062. In 2016, a sublease (the “Sublease”) was entered into for the Hilton Garden Inn Fort Walton Beach Property between the Emerald I Borrower, as sublandlord, and the Emerald II Borrower, as subtenant. The Innisfree Portfolio Properties are located adjacent to each other on the same parcel. The Sublease expires in September 2062 (one month prior to expiration of the Ground Lease). Monthly base rent under the Ground Lease is, as to each Innisfree Portfolio Property, the greater of $12,500 (subject to future upward adjustment based on the Consumer Price Index for all Urban Consumers) and 3.25% of such property’s monthly gross revenue. Base rent under the Sublease is equal to the base rent under the Ground Lease.
The Innisfree Portfolio Properties have a ground lease rent pass through, which consists of collected fees from the guests to offset ground rent charged under the Ground Lease by the United States government. The majority but not all the lease fee is passed through to the guests as a fee at checkout.
Terrorism Insurance.The Innisfree Portfolio Mortgage Loan documents require that the “all risk” insurance policy required to be maintained by the borrower provide coverage for terrorism in an amount equal to the full replacement cost of Innisfree Portfolio Properties, as well as business interruption insurance covering no less than the 18-month period following the occurrence of a casualty event, together with a twelve-month extended period of indemnity (provided that if TRIPRA or a similar statute is not in effect, the borrower will not be obligated to pay terrorism insurance premiums in excess of two times the premium for the casualty and business interruption coverage on a stand-alone basis).
THE INFORMATION IN THIS STRUCTURAL AND COLLATERAL TERM SHEET IS NOT COMPLETE AND MAY BE AMENDED PRIOR TO THE TIME OF SALE. THIS TERM SHEET IS NOT AN OFFER TO SELL THESE SECURITIES AND IT IS NOT A SOLICITATION OF AN OFFER TO BUY THESE SECURITIES IN ANY JURISDICTION WHERE THE OFFER OR SALE IS NOT PERMITTED.
12
| No. 2 – Bristow Center | |||||||
| Mortgage Loan Information | Mortgaged Property Information | ||||||
| Mortgage Loan Seller: | Wells Fargo Bank, National Association | Single Asset/Portfolio: | Single Asset | ||||
Credit Assessment (DBRS/Fitch/Moody’s): | NR/NR/NR | Property Type – Subtype: | Retail – Anchored | ||||
| Original Principal Balance: | $53,000,000 | Location: | Bristow, VA | ||||
| Cut-off Date Balance: | $53,000,000 | Size: | 158,082 SF | ||||
| % of Initial Pool Balance: | 6.8% | Cut-off Date Balance Per SF: | $335.27 | ||||
| Loan Purpose: | Refinance | Maturity Date Balance Per SF: | $335.27 | ||||
| Borrower Sponsor: | Gary D. Rappaport | Year Built/Renovated: | 2007/NAP | ||||
| Guarantors: | Gary D. Rappaport; Gary D. Rappaport Revocable Trust | Title Vesting: | Fee | ||||
| Mortgage Rate: | 5.1000% | Property Manager: | Self-managed | ||||
| Note Date: | January 3, 2019 | Current Occupancy (As of): | 96.1% (11/1/2018) | ||||
| Seasoning: | 1 month | YE 2017 Occupancy: | 98.6% | ||||
| Maturity Date: | February 1, 2029 | YE 2016 Occupancy: | 100.0% | ||||
| IO Period: | 120 months | YE 2015 Occupancy: | 99.7% | ||||
| Loan Term (Original): | 120 months | YE 2014 Occupancy: | 95.8% | ||||
| Amortization Term (Original): | NAP | Appraised Value: | $78,600,000 | ||||
| Loan Amortization Type: | Interest-only, Balloon | Appraised Value Per SF: | $497.21 | ||||
| Call Protection: | L(25),D(91),O(4) | Appraisal Valuation Date: | November 26, 2018 | ||||
| Lockbox Type: | Hard/Upfront Cash Management | ||||||
| Additional Debt: | None | Underwriting and Financial Information | |||||
| Additional Debt Type (Balance): | NAP | TTM NOI (10/31/2018): | $4,319,793 | ||||
| YE 2017 NOI: | $4,370,425 | ||||||
| YE 2016 NOI: | $4,299,886 | ||||||
| YE 2015 NOI: | NAV | ||||||
| U/W Revenues: | $5,812,402 | ||||||
| U/W Expenses: | $1,521,164 | ||||||
| Escrows and Reserves(1) | U/W NOI: | $4,291,238 | |||||
| Initial | Monthly | Cap | U/W NCF: | $4,142,011 | |||
| Taxes | $112,298 | $56,150 | NAP | U/W DSCR based on NOI/NCF: | 1.56x / 1.51x | ||
| Insurance | $0 | Springing | NAP | U/W Debt Yield based on NOI/NCF: | 8.1% / 7.8% | ||
| Replacement Reserve | $0 | $1,581 | NAP | U/W Debt Yield at Maturity based on NOI/NCF: | 8.1% / 7.8% | ||
| TI/LC Reserve | $250,000(2) | $13,174(2) | $500,000(2) | Cut-off Date LTV Ratio: | 67.4% | ||
| Economic Holdback | (2) | $0 | NAP | LTV Ratio at Maturity: | 67.4% | ||
| Sources and Uses | ||||||||
| Sources | Uses | |||||||
| Original loan amount | $53,000,000 | 98.2% | Loan payoff | $32,108,185 | 59.5% | |||
| Cash equity contribution | 985,353 | 1.8 | Partner buyout(3) | 19,190,086 | 35.5 | |||
| Upfront reserves | 1,862,298 | 3.4 | ||||||
| Closing costs | 824,784 | 1.5 | ||||||
| Total Sources | $53,985,353 | 100.0% | Total Uses | $53,985,353 | 100.0% | |||
| (1) | See “Escrows” section below. |
| (2) | At origination, the Bristow Center Mortgage Loan (as defined below) was structured with an economic holdback totaling $1,750,000, which was to be released to the Bristow Center Borrower (as defined below) upon the Bristow Center Property (as defined below) achieving a net operating income debt yield equal to or greater than 8.1%. As of the securitization cut-off date, $1,500,000 of the economic holdback funds were disbursed to the Bristow Center Borrower due to the Bristow Center Property achieving an 8.1% net operating income debt yield. Simultaneously with such disbursement, the remaining $250,000 of the economic holdback funds were deposited into the TI/LC Reserve account. |
| (3) | The borrower sponsor used a portion of the Bristow Center Mortgage Loan to buyout its institutional joint venture partner, Principal Real Estate Investors. |
The Mortgage Loan. The mortgage loan (the “Bristow Center Mortgage Loan”) is evidenced by a single promissory note secured by a first mortgage encumbering the fee interest in an anchored retail shopping center located in Bristow, Virginia (the “Bristow Center Property”).
The Borrower and Borrower Sponsor.The borrower is BLJV, LLC (the “Bristow Center Borrower”), a Virginia limited liability company and single purpose entity with one independent director. Legal counsel to the Bristow Center Borrower delivered a non-consolidation opinion in connection with the origination of the Bristow Center Mortgage Loan. The borrower sponsor is Gary D. Rappaport, and the
THE INFORMATION IN THIS STRUCTURAL AND COLLATERAL TERM SHEET IS NOT COMPLETE AND MAY BE AMENDED PRIOR TO THE TIME OF SALE. THIS TERM SHEET IS NOT AN OFFER TO SELL THESE SECURITIES AND IT IS NOT A SOLICITATION OF AN OFFER TO BUY THESE SECURITIES IN ANY JURISDICTION WHERE THE OFFER OR SALE IS NOT PERMITTED.
13
| Retail - Anchored | Loan #2 | Cut-off Date Balance: | $53,000,000 | |
| 10250-10492 Bristow Center Drive | Bristow Center | Cut-off Date LTV: | 67.4% | |
| Bristow, VA 20136 | U/W NCF DSCR: | 1.51x | ||
| U/W NOI Debt Yield: | 8.1% |
nonrecourse carve-out guarantors of the Bristow Center Mortgage Loan are Gary D. Rappaport and the Gary D. Rappaport Revocable Trust.
Mr. Rappaport is the Chief Executive Officer of Rappaport, a real estate company he founded in 1984. Rappaport provides leasing, tenant representation, management, and development services for more than 14.5 million square feet of commercial real estate. Rappaport’s portfolio includes more than 60 shopping centers and ground floor retail in approximately 100 mixed-use properties located primarily throughout the mid-Atlantic region.
The Property.The Bristow Center Property is a grocery anchored retail center totaling 158,082 square feet and located in Bristow, Virginia, approximately 30.0 miles southwest of the Washington, D.C. central business district. The Bristow Center Property is anchored by a Harris Teeter grocery store, which is subject to a ground lease and owns its improvements. In addition to Harris Teeter, there are four ground lease tenants at the Bristow Center Property with unowned improvements, including PNC Bank, BB&T, Fauquier Bank and Minnieland Private Day School (“Minnieland”). The Bristow Center Property was constructed by the borrower sponsor in 2007 at a total cost of approximately $60.0 million. The Bristow Center Property is situated on a 25.4-acre site with 915 surface parking spaces resulting in a parking ratio of approximately 5.8 spaces per 1,000 square feet of rentable area. As of November 1, 2018, the Bristow Center Property was 96.1% leased to 33 tenants. The four largest tenants at the Bristow Center Property, totaling approximately 48.8% of the net rentable area and 44.2% of underwritten base rent, are investment grade rated.
Minnieland, which is subject to a ground lease and accounts for 2.7% of underwritten base rent, temporarily closed its facility at the Bristow Center Property in June 2018 following allegations of criminal activity involving an assistant teacher at the school. Minnieland remained current on rent payments and was back in physical occupancy of its space as of January 2019. See “Description of the Mortgage Pool—Litigation and Other Considerations” in the Preliminary Prospectus.
Major Tenants.
Largest Tenant: Harris Teeter (Baa1/BBB by Moody’s/S&P; 56,298 square feet; 35.6% of net rentable area; 19.5% of underwritten base rent; 5/31/2027 lease expiration) – According to a third party market report, Harris Teeter is a part of The Kroger Co. (NYSE: KR) family of stores, which collectively employs approximately 450,000 people in 2,782 supermarkets and multi-department stores in 35 states and the District of Columbia under local banner names including Kroger, City Market, Dillons, Food 4 Less, Fred Meyer, Fry’s, Harris Teeter, Jay C, King Soopers, QFC, Ralphs and Smith’s. Harris Teeter is an original tenant at the Bristow Center Property on a 20-year ground lease and has four, 5-year renewal options following its May 2027 lease expiration.
2ndLargest Tenant: CVS (Baa2/BBB by Moody’s/S&P; 12,900 square feet; 8.2% of net rentable area; 11.0% of underwritten base rent; 1/31/2030 lease expiration) – CVS is a global pharmacy employing more than 290,000 people with more than 9,800 locations throughout the United States, Puerto Rico, and Brazil. CVS has been a tenant at the Bristow Center Property since 2009. CVS’s lease expires on January 31, 2030 with no renewal options.
3rdLargest Tenant: PNC Bank (A+/A3/A- by Fitch/Moody’s/S&P; 3,999 square feet; 2.5% of net rentable area; 7.2% of underwritten base rent; 6/30/2027 lease expiration) – PNC Bank is a diversified financial services institution with assets of approximately $380 billion as of September 30, 2018. PNC Bank has more than 52,000 employees throughout 40 states across the country and international offices in Canada, China, Germany and the United Kingdom. PNC Bank is an original tenant at the Bristow Center Property on a 20-year ground lease and has three, 5-year renewal options following its June 2027 lease expiration.
THE INFORMATION IN THIS STRUCTURAL AND COLLATERAL TERM SHEET IS NOT COMPLETE AND MAY BE AMENDED PRIOR TO THE TIME OF SALE. THIS TERM SHEET IS NOT AN OFFER TO SELL THESE SECURITIES AND IT IS NOT A SOLICITATION OF AN OFFER TO BUY THESE SECURITIES IN ANY JURISDICTION WHERE THE OFFER OR SALE IS NOT PERMITTED.
14
| Retail - Anchored | Loan #2 | Cut-off Date Balance: | $53,000,000 | |
| 10250-10492 Bristow Center Drive | Bristow Center | Cut-off Date LTV: | 67.4% | |
| Bristow, VA 20136 | U/W NCF DSCR: | 1.51x | ||
| U/W NOI Debt Yield: | 8.1% |
The following table presents certain information relating to the tenancy at the Bristow Center Property:
Major Tenants
| Tenant Name | Credit Rating (Fitch/Moody’s/ S&P)(1) | Tenant NRSF | % of NRSF | Annual U/W Base Rent PSF(2) | Annual U/W Base Rent(2) | % of Total Annual U/W Base Rent | Lease Expiration Date | Extension Options | Termination Option (Y/N) |
| Major Tenants | |||||||||
| Harris Teeter(3) | NR/Baa1/BBB | 56,298 | 35.6% | $15.67 | $882,000 | 19.5% | 5/31/2027 | 4, 5-year(4) | N |
| CVS | NR/Baa2/BBB | 12,900 | 8.2% | $38.50 | $496,650 | 11.0% | 1/31/2030 | None | N |
| PNC Bank(3) | A+/A3/A- | 3,999 | 2.5% | $81.39(5) | $325,459(5) | 7.2% | 6/30/2027 | 3, 5-year | N |
| BB&T(3) | A+/A2/A- | 3,999 | 2.5% | $72.34(6) | $289,290(6) | 6.4% | 4/30/2027 | 2, 5-year | N |
| Fauquier Bank(3) | NR/NR/NR | 3,000 | 1.9% | $67.19 | $201,570 | 4.5% | 7/31/2024 | 1, 5-year | N |
| Total Major Tenants | 80,196 | 50.7% | $27.37 | $2,194,969 | 48.6% | ||||
| Non-Major Tenant | 71,786 | 45.4% | $32.30 | $2,318,478 | 51.4% | ||||
| Occupied Collateral Total | 151,982 | 96.1% | $29.70 | $4,513,447 | 100.0% | ||||
| Vacant Space | 6,100 | 3.9% | |||||||
| Collateral Total | 158,082 | 100.0% | |||||||
| (1) | Certain ratings are those of the parent company whether or not the parent company guarantees the lease. |
| (2) | Annual U/W Base Rent PSF and Annual U/W Base Rent include contractual rent steps through January 2020 totaling $38,909 and straight line rent averaging through June 2027 totaling $52,686 for investment grade rated tenants. |
| (3) | Harris Teeter, PNC Bank, BB&T and Fauquier Bank are subject to ground leases and own their improvements. |
| (4) | Harris Teeter’s first 5-year extension option is at a rental rate of $18.02 per square foot. |
| (5) | Represents the straight line average over the remaining lease term due to investment grade rating. PNC Bank’s current rental rate is $74.41 per square foot. |
| (6) | Represents the straight line average over the remaining lease term due to investment grade rating. BB&T’s current rental rate is $66.14 per square foot. |
The following table presents certain information relating to major tenant sales at the Bristow Center Property:
Tenant Sales (PSF)
| Major Tenant Name | % of Total Annual U/W Base Rent | 2015 | 2016 | 2017 | TTM(1) | Major Tenant Occupancy Cost(1)(2) |
| Harris Teeter | 19.5% | $398 | $402 | $390 | $388 | 6.0% |
| (1) | TTM Sales PSF and Occupancy Cost are for the trailing 12-month period ending February 28, 2018 |
| (2) | Occupancy Cost is based on TTM sales, underwritten base rent and underwritten reimbursements. |
THE INFORMATION IN THIS STRUCTURAL AND COLLATERAL TERM SHEET IS NOT COMPLETE AND MAY BE AMENDED PRIOR TO THE TIME OF SALE. THIS TERM SHEET IS NOT AN OFFER TO SELL THESE SECURITIES AND IT IS NOT A SOLICITATION OF AN OFFER TO BUY THESE SECURITIES IN ANY JURISDICTION WHERE THE OFFER OR SALE IS NOT PERMITTED.
15
| Retail - Anchored | Loan #2 | Cut-off Date Balance: | $53,000,000 | |
| 10250-10492 Bristow Center Drive | Bristow Center | Cut-off Date LTV: | 67.4% | |
| Bristow, VA 20136 | U/W NCF DSCR: | 1.51x | ||
| U/W NOI Debt Yield: | 8.1% |
The following table presents certain information relating to the lease rollover schedule at the Bristow Center Property:
Lease Expiration Schedule(1)(2)
| Year Ending December 31, | No. of Leases Expiring | Expiring NRSF | % of Total NRSF | Cumulative Expiring NRSF | Cumulative % of Total NRSF | Annual U/W Base Rent(3) | % of Total Annual U/W Base Rent | Annual U/W Base Rent PSF |
| MTM | 1 | 4,963 | 3.1% | 4,963 | 3.1% | $162,000 | 3.6% | $32.64 |
| 2019 | 0 | 0 | 0.0% | 4,963 | 3.1% | $0 | 0.0% | $0.00 |
| 2020 | 4 | 6,192 | 3.9% | 11,155 | 7.1% | $205,617 | 4.6% | $33.21 |
| 2021 | 4 | 10,800 | 6.8% | 21,955 | 13.9% | $356,759 | 7.9% | $33.03 |
| 2022 | 10 | 22,525 | 14.2% | 44,480 | 28.1% | $909,333 | 20.1% | $40.37 |
| 2023 | 3 | 5,200 | 3.3% | 49,680 | 31.4% | $174,875 | 3.9% | $33.63 |
| 2024 | 4 | 8,024 | 5.1% | 57,704 | 36.5% | $377,752 | 8.4% | $47.08 |
| 2025 | 0 | 0 | 0.0% | 57,704 | 36.5% | $0 | 0.0% | $0.00 |
| 2026 | 0 | 0 | 0.0% | 57,704 | 36.5% | $0 | 0.0% | $0.00 |
| 2027 | 4 | 67,016 | 42.4% | 124,720 | 78.9% | $1,613,845 | 35.8% | $24.08 |
| 2028 | 1 | 2,862 | 1.8% | 127,582 | 80.7% | $93,416 | 2.1% | $32.64 |
| 2029 | 0 | 0 | 0.0% | 127,582 | 80.7% | $0 | 0.0% | $0.00 |
| Thereafter | 2 | 24,400 | 15.4% | 151,982 | 96.1% | $619,850 | 13.7% | $25.40 |
| Vacant | 0 | 6,100 | 3.9% | 158,082 | 100.0% | $0 | 0.0% | $0.00 |
| Total/Weighted Average | 33 | 158,082 | 100.0% | $4,513,447 | 100.0% | $29.70(3) |
| (1) | Information obtained from the underwritten rent roll. |
| (2) | Certain tenants may have lease termination options that are exercisable prior to the originally stated expiration date of the subject lease and that are not considered in the Lease Expiration Schedule. |
| (3) | Total/Weighted Average Annual U/W Base Rent and Annual U/W Base Rent PSF exclude vacant space. |
The following table presents historical occupancy percentages at the Bristow Center Property:
Historical Occupancy
12/31/2014(1) | 12/31/2015(1) | 12/31/2016(1) | 12/31/2017(1) | 11/1/2018(2) |
| 95.8% | 99.7% | 100.0% | 98.6% | 96.1% |
| (1) | Information obtained from a third-party market research provider. |
| (2) | Information obtained from the underwritten rent roll. |
THE INFORMATION IN THIS STRUCTURAL AND COLLATERAL TERM SHEET IS NOT COMPLETE AND MAY BE AMENDED PRIOR TO THE TIME OF SALE. THIS TERM SHEET IS NOT AN OFFER TO SELL THESE SECURITIES AND IT IS NOT A SOLICITATION OF AN OFFER TO BUY THESE SECURITIES IN ANY JURISDICTION WHERE THE OFFER OR SALE IS NOT PERMITTED.
16
| Retail - Anchored | Loan #2 | Cut-off Date Balance: | $53,000,000 | |
| 10250-10492 Bristow Center Drive | Bristow Center | Cut-off Date LTV: | 67.4% | |
| Bristow, VA 20136 | U/W NCF DSCR: | 1.51x | ||
| U/W NOI Debt Yield: | 8.1% |
Operating History and Underwritten Net Cash Flow. The following table presents certain information relating to the underwritten net cash flow at the Bristow Center Property:
Cash Flow Analysis
| 2016 | 2017 | TTM 10/31/2018 | U/W | %(1) | U/W $ per SF | |
| Rents in Place | $4,508,380 | $4,579,515 | $4,536,386 | $4,421,851 | 73.1% | $27.97 |
| Contractual Rent Steps(2) | 0 | 0 | 0 | 91,596 | 1.5 | 0.58 |
| Grossed Up Vacant Space | 0 | 0 | 0 | 218,042 | 3.6 | 1.38 |
| Gross Potential Rent | $4,508,380 | $4,579,515 | $4,536,386 | $4,731,489 | 78.2% | $29.93 |
| Other Income | 108,076 | 110,519 | 113,654 | 113,654 | 1.9 | 0.72 |
| Total Recoveries | 1,088,997 | 1,210,931 | 1,224,738 | 1,203,834 | 19.9 | 7.62 |
| Net Rental Income | $5,705,453 | $5,900,965 | $5,874,778 | $6,048,976 | 100.0% | $38.26 |
| (Vacancy & Credit Loss) | 0 | 0 | 0 | (236,574)(3) | (5.0) | (1.50) |
| Effective Gross Income | $5,705,453 | $5,900,965 | $5,874,778 | $5,812,402 | 96.1% | $36.77 |
| Real Estate Taxes | 594,372 | 683,319 | 655,141 | 673,798 | 11.6 | 4.26 |
| Insurance | 21,340 | 19,663 | 18,728 | 18,304 | 0.3 | 0.12 |
| Management Fee | 228,831 | 233,576 | 226,427 | 174,372 | 3.0 | 1.10 |
| Other Operating Expenses | 561,025 | 593,982 | 654,690 | 654,690 | 11.3 | 4.14 |
| Total Operating Expenses | $1,405,568 | $1,530,540 | $1,554,985 | $1,521,164 | 26.2% | $9.62 |
| Net Operating Income | $4,299,886 | $4,370,425 | $4,319,793 | $4,291,238 | 73.8% | $27.15 |
| Replacement Reserves | 0 | 0 | 0 | 18,970 | 0.3 | 0.12 |
| TI/LC | 0 | 0 | 0 | 130,257 | 2.2 | 0.82 |
| Net Cash Flow | $4,299,886 | $4,370,425 | $4,319,793 | $4,142,011 | 71.3% | $26.20 |
| NOI DSCR(5) | 1.56x | 1.59x | 1.57x | 1.56x | ||
| NCF DSCR(5) | 1.56x | 1.59x | 1.57x | 1.51x | ||
| NOI Debt Yield(5) | 8.1% | 8.2% | 8.2% | 8.1% | ||
| NCF Debt Yield(5) | 8.1% | 8.2% | 8.2% | 7.8% |
| (1) | Represents (i) percent of Net Rental Income for all revenue fields, (ii) percent of Gross Potential Rent for Vacancy & Credit Loss and (iii) percent of Effective Gross Income for all other fields. |
| (2) | Represents contractual rent steps through January 2020 and straight line rent averaging for investment grade tenants (see “Major Tenants” table above). |
| (3) | The underwritten economic vacancy is 5.0%. The Bristow Center Property was 96.1% leased as of November 1, 2018. |
Appraisal.The appraiser concluded to an “as-is” appraised value of $78,600,000 as of November 26, 2018.
Environmental Matters. According to a Phase I environmental site assessment dated November 20, 2018, there was no evidence of any recognized environmental conditions at the Bristow Center Property.
Market Overview and Competition.The Bristow Center Property is located in Bristow, Virginia, approximately 33.8 miles southwest of the Washington, D.C. central business district, 16.0 miles southwest of the Washington Dulles International Airport, and 28.7 miles southwest of the Ronald Reagan Washington National Airport. The Bristow Center Property is situated at 10250 – 10492 Bristow Center Drive, with two points of ingress and egress along Linton Hall Road and Fitzgerald Way, and with frontage along Nokesville Road. I-66 is approximately 5.2 miles north of the Bristow Center Property and access from I-66 is provided by Prince William Highway via Nokesville Road or Lee Highway/Linton Hall Road.
Major employers in the area include Lockheed Martin, Prince William Health System, Micron Technology, Bae Systems, Cogan Air, Aurora Flight Sciences, Didlake, and Comcast. These employers are located within 15 miles of the Bristow Center Property and represent concentrations in the defense, technology, medical, telecommunications, and aerospace industries. Regional employment nodes include Washington, D.C., Fairfax City, Vienna, Chantilly, and the Dulles Corridor.
According to the appraiser, the estimated 2018 population within a one-, three- and five-mile radius of the Bristow Center Property was 7,084, 36,117, and 126,146, respectively; and the estimated 2018 median household income within the same radii was $132,826, $127,211, and $98,880, respectively.
Submarket Information – According to the appraisal, the Bristow Center Property is situated within the Prince William County submarket of the Northern Virginia retail market. As of the second quarter of 2018, the submarket reported a total inventory of 9.8 million square feet with a 7.0% vacancy rate.
THE INFORMATION IN THIS STRUCTURAL AND COLLATERAL TERM SHEET IS NOT COMPLETE AND MAY BE AMENDED PRIOR TO THE TIME OF SALE. THIS TERM SHEET IS NOT AN OFFER TO SELL THESE SECURITIES AND IT IS NOT A SOLICITATION OF AN OFFER TO BUY THESE SECURITIES IN ANY JURISDICTION WHERE THE OFFER OR SALE IS NOT PERMITTED.
17
| Retail - Anchored | Loan #2 | Cut-off Date Balance: | $53,000,000 | |
| 10250-10492 Bristow Center Drive | Bristow Center | Cut-off Date LTV: | 67.4% | |
| Bristow, VA 20136 | U/W NCF DSCR: | 1.51x | ||
| U/W NOI Debt Yield: | 8.1% |
Appraiser’s Comp Set – The appraiser identified six primary competitive properties for the Bristow Center Property totaling approximately 2.0 million square feet, which reported an average occupancy rate of approximately 97.3%. The appraiser concluded to triple net market rents for the Bristow Center Property as described in the Market Rent Summary table below.
The following table presents certain information relating to the appraiser’s market rent conclusion for the Bristow Center Property:
Market Rent Summary(1)
| In-Line | Large In-Line | Anchor(2) | Outparcel(2) | Drug Store(2) | Day Care(2) | Premium In-Line | |
| Market Rent (PSF) | $35.00 | $32.00 | $15.00 | $63.65 | $38.00 | $13.04 | $40.00 |
| Lease Term (Years) | 7 | 7 | 10 | 15 | 15 | 15 | 7 |
| Lease Type (Reimbursements) | NNN | NNN | NNN | NNN | NNN | NNN | NNN |
| Rent Increase Projection | 3.0% per annum | 3.0% per annum | 10.0% every 5 years | 10.0% every 5 years | 10.0% every 5 years | 10.0% every 5 years | 3.0% per annum |
| (1) | Information obtained from the appraisal. |
| (2) | Represents ground lease market rents. |
The table below presents certain information relating to six comparable retail properties to the Bristow Center Property identified by the appraiser:
Competitive Set(1)
Bristow Center (Subject) | Center at Innovation | Braemar Village Center | Promenade at Virginia Gateway | Virginia Gateway | The Shops at Stonewall | Heritage Marketplace | |
| Location | Bristow, VA | Manassas, VA | Bristow, VA | Gainesville, VA | Gainesville, VA | Gainesville, VA | Gainesville, VA |
| Distance from Subject | -- | 1.3 miles | 2.3 miles | 5.2 miles | 5.8 miles | 8.1 miles | 6.9 miles |
| Property Type | Anchored Retail | Anchored Retail | Anchored Retail | Anchored Retail | Power Center | Anchored Retail | Anchored Retail |
Year Built/ Renovated | 2007/NAP | 2008/NAP | 2003/NAP | 2011/NAP | 1999/2008 | 2005/NAP | 2015/NAP |
| Anchors | Harris Teeter | Super Target, TJ Maxx, PetSmart | Safeway | BJ’s Wholesale Club, Regal Cinemas | Best Buy, Giant Food, HomeGoods, Lowe’s, PetSmart, Target, Walgreens | Wegman’s, Dick’s Sporting Goods, Michaels, Staples, Bed, Bath and Beyond, Ross Dress for Less | Harris Teeter |
| Total GLA | 158,082 SF(2) | 277,450 SF | 111,535 SF | 290,800 SF | 904,472 SF | 338,334 SF | 74,695 SF |
| Total Occupancy | 96.1%(2) | 97.0% | 100.0% | 98.0% | 100.0% | 100.0% | 89.0% |
| (1) | Information obtained from the appraisal. |
| (2) | Information obtained from the underwritten rent roll. |
THE INFORMATION IN THIS STRUCTURAL AND COLLATERAL TERM SHEET IS NOT COMPLETE AND MAY BE AMENDED PRIOR TO THE TIME OF SALE. THIS TERM SHEET IS NOT AN OFFER TO SELL THESE SECURITIES AND IT IS NOT A SOLICITATION OF AN OFFER TO BUY THESE SECURITIES IN ANY JURISDICTION WHERE THE OFFER OR SALE IS NOT PERMITTED.
18
| Retail - Anchored | Loan #2 | Cut-off Date Balance: | $53,000,000 | |
| 10250-10492 Bristow Center Drive | Bristow Center | Cut-off Date LTV: | 67.4% | |
| Bristow, VA 20136 | U/W NCF DSCR: | 1.51x | ||
| U/W NOI Debt Yield: | 8.1% |
The table below presents certain information relating to comparable sales for the Bristow Center Property identified by the appraiser:
Comparable Sales(1)
| Property Name | Location | Rentable Area (SF) | Sale Date | Sale Price | Sale Price (PSF) |
| Bristow Center (Subject) | Bristow, VA | 158,082 | Nov-18(2) | $78,600,000(2) | $497(2) |
| Maple Avenue Shopping Center | Vienna, VA | 111,810 | May-18 | $63,600,000 | $569 |
| Shops at Town Center | Germantown, MD | 124,970 | Feb-17 | $53,550,000 | $429 |
| South Lakes Village Shopping Center | Reston, VA | 109,527 | Sept-16 | $62,000,000 | $566 |
| Virginia Gateway | Gainesville, VA | 665,786 | Jan-16 | $255,000,000 | $383 |
| Hastings Marketplace | Manassas, VA | 93,047 | Jan-16 | $32,250,000 | $347 |
| (1) | Information obtained from the appraisal. |
| (2) | Represents the appraised value of the Bristow Center Property. |
Escrows.
Real Estate Taxes – The loan documents require an upfront real estate tax reserve of $112,298 and ongoing monthly real estate tax reserves in an amount equal to one-twelfth of the real estate taxes that the lender estimates will be payable during the next twelve months (initially $56,150).
Insurance – The loan documents do not require ongoing monthly escrows for insurance premiums as long as (i) no event of default has occurred and is continuing, (ii) the borrower or borrower affiliate provides the lender with evidence that the Bristow Center Property’s insurance coverage is included in a blanket policy and such policy is in full force and effect and (iii) the borrower pays all applicable insurance premiums and provides the lender with evidence of timely payment of insurance premiums/renewals.
Replacement Reserves – The loan documents require ongoing monthly replacement reserves of $1,581.
Economic Holdback –At origination, the Bristow Center Mortgage Loan was structured with an economic holdback totaling $1,750,000, which was to be released to the Bristow Center Borrower upon the Bristow Center Property achieving a net operating income debt yield equal to or greater than 8.1%. As of the securitization cut-off date, $1,500,000 of the economic holdback funds were disbursed to the Bristow Center Borrower due to Bristow Center Property achieving an 8.1% net operating income debt yield. The remaining $250,000 of the economic holdback funds were deposited into the TI/LC Reserve account.
TI/LC Reserve – As outlined above, $250,000 of the economic holdback funds were deposited into the TI/LC Reserve account. In addition, the borrower is required to deposit ongoing monthly TI/LC reserves of $13,174 (subject to a cap of $500,000).
Lockbox and Cash Management.The Bristow Center Mortgage Loan requires a hard lockbox with in-place cash management, which is already in place, and that the Bristow Center Borrower direct all tenants to pay rent directly into such lockbox account. The loan documents also require that all rents received by the borrower or the property manager be deposited into the lockbox account within one business day of receipt. All funds in the lockbox account are required to be swept each business day into the cash management account controlled by the lender and disbursed on each payment date in accordance with the loan documents. Prior to the occurrence of a Cash Trap Event Period (as defined below), all excess funds are required to be distributed to the borrower. During a Cash Trap Event Period, all excess funds are required to be swept to an excess cash flow subaccount controlled by the lender.
A “Cash Trap Event Period” will commence upon the earliest to occur of the following:
| (i) | an event of default under the Bristow Center Mortgage Loan; |
| (ii) | the net cash flow debt service coverage ratio falling below 1.05x at the end of any calendar quarter; or |
| (iii) | a Harris Teeter Cash Trap Event Period (as defined below). |
A Cash Trap Event Period will end upon the occurrence of:
| ● | with regard to clause (i) above, the cure of such event of default; |
| ● | with regard to clause (ii) above, the net cash flow debt service coverage ratio being equal to or greater than 1.10x for two consecutive calendar quarters; or |
| ● | with regard to clause (iii) above, a Harris Teeter Cash Trap Event Period Cure (as defined below). |
THE INFORMATION IN THIS STRUCTURAL AND COLLATERAL TERM SHEET IS NOT COMPLETE AND MAY BE AMENDED PRIOR TO THE TIME OF SALE. THIS TERM SHEET IS NOT AN OFFER TO SELL THESE SECURITIES AND IT IS NOT A SOLICITATION OF AN OFFER TO BUY THESE SECURITIES IN ANY JURISDICTION WHERE THE OFFER OR SALE IS NOT PERMITTED.
19
| Retail - Anchored | Loan #2 | Cut-off Date Balance: | $53,000,000 | |
| 10250-10492 Bristow Center Drive | Bristow Center | Cut-off Date LTV: | 67.4% | |
| Bristow, VA 20136 | U/W NCF DSCR: | 1.51x | ||
| U/W NOI Debt Yield: | 8.1% |
A “Harris Teeter Cash Trap Event Period” will commence upon the earliest to occur of the following:
| (i) | Harris Teeter notifying the lender of its intent to terminate its lease and/or vacate its space; |
| (ii) | Harris Teeter failing to be in actual, physical possession of or going dark in its entire space; |
| (iii) | Harris Teeter becoming insolvent or filing for bankruptcy; |
| (iv) | 12 months prior to Harris Teeter’s lease expiration (unless Harris Teeter extends its lease (i) at a base rental rate equal to or greater than its current base rental rate, or (ii) upon such other terms and conditions reasonably acceptable to the lender); |
| (v) | 24 months prior to Harris Teeter’s lease expiration (unless Harris Teeter reports sales equal to or greater than $21,800,000 (approximately $387 per square foot) during the most recent trailing 12-month period). |
A “Harris Teeter Cash Trap Event Period Cure” will occur upon:
| ● | with regard to clauses (i) and (iv) above, the entire Harris Teeter space being leased to a replacement tenant reasonably acceptable to the lender which has delivered an estoppel certificate confirming it has accepted its premises, taken possession thereof, is open for business, and is paying full unabated rent equal to or greater than Harris Teeter’s current base rental rate; |
| ● | with regard to clause (ii) above, Harris Teeter being in actual, physical possession of its entire space and open for business; |
| ● | with regard to clause (iii) above, Harris Teeter no longer being insolvent or subject to any bankruptcy or insolvency proceedings and its lease having been affirmed pursuant to a final and non-appealable order of a court of competent jurisdiction; and |
| ● | with regard to clause (v) above, the Bristow Center Borrower having delivered written evidence reasonably acceptable to the lender that either (Y)(1) Harris Teeter has extended its lease at a base rental rate equal to or greater than its current base rental rate, (2) on or after nine months prior to the Harris Teeter lease expiration date, subject to conditions further outlined in the loan documents, Harris Teeter has extended its lease (or effectively extended its lease via not terminating it) in accordance with the terms therein, or (3) if not in accordance with clause (1) or (2), Harris Teeter has extended its lease upon such other terms and conditions reasonably acceptable to the lender; or (Z) the entire Harris Teeter space has been leased to a replacement tenant reasonably acceptable to the lender which has delivered an estoppel certificate confirming it has accepted its premises, taken possession thereof, is open for business, and is paying full unabated rent equal to or greater than the base rent currently paid by Harris Teeter. |
Property Management. The Bristow Center Property is managed by an affiliate of the Bristow Center Borrower.
Partial Release. Not permitted.
Real Estate Substitution.Not permitted.
Ground Lease. None.
Terrorism Insurance.The Bristow Center Mortgage Loan documents require that the “all risk” insurance policy required to be maintained by the borrower provides coverage for terrorism in an amount equal to the full replacement cost of the Bristow Center Property, as well as business interruption insurance covering no less than the 18-month period following the occurrence of a casualty event, together with a 6-month extended period of indemnity (provided that if TRIPRA or a similar statute is not in effect, the borrower will not be obligated to pay terrorism insurance premiums in excess of two times the premium for the casualty and business interruption coverage on a stand-alone basis).
THE INFORMATION IN THIS STRUCTURAL AND COLLATERAL TERM SHEET IS NOT COMPLETE AND MAY BE AMENDED PRIOR TO THE TIME OF SALE. THIS TERM SHEET IS NOT AN OFFER TO SELL THESE SECURITIES AND IT IS NOT A SOLICITATION OF AN OFFER TO BUY THESE SECURITIES IN ANY JURISDICTION WHERE THE OFFER OR SALE IS NOT PERMITTED.
20
| No. 3 – Residence Inn Denver City Center | |||||||
| Mortgage Loan Information | Mortgaged Property Information | ||||||
| Mortgage Loan Seller: | Wells Fargo Bank, National Association | Single Asset/Portfolio: | Single Asset | ||||
Credit Assessment (DBRS/Fitch/Moody’s): | NR/NR/NR | Property Type – Subtype: | Hospitality – Extended Stay | ||||
| Original Principal Balance: | $47,500,000 | Location: | Denver, CO | ||||
| Cut-off Date Balance: | $47,500,000 | Size: | 228 Rooms | ||||
| % of Initial Pool Balance: | 6.1% | Cut-off Date Balance Per Room | $208,333 | ||||
| Loan Purpose: | Acquisition | Maturity Date Balance Per Room: | $208,333 | ||||
| Borrower Sponsor: | Noble Hospitality Fund IV - Income, L.P. | Year Built/Renovated: | 2006/2018 | ||||
| Guarantor: | Noble Hospitality Fund IV - Income, L.P. | Title Vesting: | Fee | ||||
| Mortgage Rate: | 5.1400% | Property Manager: | Interstate Management Company, LLC | ||||
| Note Date: | December 19, 2018 | Current Occupancy (As of)(2): | 77.8% (10/31/2018) | ||||
| Seasoning: | 2 months | YE 2017 Occupancy(2): | 82.6% | ||||
| Maturity Date: | January 11, 2026 | YE 2016 Occupancy(2): | 80.5% | ||||
| IO Period: | 84 months | YE 2015 Occupancy(2): | 82.6% | ||||
| Loan Term (Original): | 84 months | YE 2014 Occupancy(2): | 83.5% | ||||
| Amortization Term (Original): | NAP | Appraised Value(3): | $79,400,000 | ||||
| Loan Amortization Type: | Interest-only, Balloon | Appraised Value Per Room(3): | $348,246 | ||||
| Call Protection: | L(24),GRTR 1% or YM(53),O(7) | Appraisal Valuation Date(3): | November 14, 2019 | ||||
| Lockbox Type: | Springing | ||||||
| Additional Debt: | None | Underwriting and Financial Information | |||||
| Additional Debt Type (Balance): | NAP | TTM NOI (10/31/2018): | $6,070,595 | ||||
| YE 2017 NOI: | $6,490,440 | ||||||
| YE 2016 NOI: | $6,380,783 | ||||||
| YE 2015 NOI: | $6,695,914 | ||||||
| U/W Revenues: | $12,717,411 | ||||||
| U/W Expenses: | $6,451,396 | ||||||
| U/W NOI: | $6,266,014 | ||||||
| Escrows and Reserves(1) | U/W NCF: | $5,757,318 | |||||
| Initial | Monthly | Cap | U/W DSCR based on NOI/NCF: | 2.52x / 2.32x | |||
| Taxes | $457,128 | $65,304 | NAP | U/W Debt Yield based on NOI/NCF: | 13.2% / 12.1% | ||
| Insurance | $0 | Springing | NAP | U/W Debt Yield at Maturity based on NOI/NCF: | 13.2% / 12.1% | ||
| FF&E Reserve | $0 | $42,391 | NAP | Cut-off Date LTV Ratio(3): | 59.8% | ||
| PIP Reserve | $1,825,000 | Springing | NAP | LTV Ratio at Maturity(3): | 59.8% | ||
| Sources and Uses(4) | ||||||||
| Sources | Uses | |||||||
| Original Mortgage Loan Amount | $47,500,000 | 49.8% | Purchase price (Hotel)(4) | $75,500,000 | 79.2% | |||
| Garage loan amount | 10,000,000 | 10.5 | Purchase price (Garage)(4) | 16,500,000 | 17.3 | |||
| Borrower’s equity(4) | 37,808,248 | 39.7 | Upfront reserves | 2,282,128 | 2.4 | |||
| Closing costs(4) | 1,026,120 | 1.1 | ||||||
| Total Sources | $95,308,248 | 100.0% | Total Uses | $95,308,248 | 100.0% | |||
| (1) | See “Escrows” section. |
| (2) | The Current Occupancy, YE 2017 Occupancy, YE 2016 Occupancy, and YE 2015 Occupancy were obtained from the borrower. The YE 2014 Occupancy was obtained from a third party market research report. |
| (3) | The Appraised Value, Appraised Value Per Room, Cut-off Date LTV Ratio and LTV Ratio at Maturity are based on the appraiser’s prospective as-complete value as of November 14, 2019, which assumes completion of currently ongoing and planned renovation work (see “The Property” section). The borrower deposited upfront reserves totaling $1,825,000 for the estimated cost of the remaining renovation work (see “Escrows” section). The appraiser concluded to an “as-is” appraised value of $76,500,000 (as of November 14, 2018), which would result in a Cut-off Date LTV Ratio of 62.1%. |
| (4) | The borrower purchased the entire building comprising (i) the Residence Inn Denver City Center Property (as defined below) and (ii) a six-story parking garage, which is not part of the collateral for the Residence Inn Denver City Center Mortgage Loan (see “The Property” and “Condominium Regime” sections below). The closing costs and borrower’s equity shown above pertain to the purchase of both the Residence Inn Denver City Center Property and the parking garage. |
THE INFORMATION IN THIS STRUCTURAL AND COLLATERAL TERM SHEET IS NOT COMPLETE AND MAY BE AMENDED PRIOR TO THE TIME OF SALE. THIS TERM SHEET IS NOT AN OFFER TO SELL THESE SECURITIES AND IT IS NOT A SOLICITATION OF AN OFFER TO BUY THESE SECURITIES IN ANY JURISDICTION WHERE THE OFFER OR SALE IS NOT PERMITTED.
21
| Hospitality – Extended Stay | Loan #3 | Cut-off Date Balance: | $47,500,000 | |
| 1725 Champa Street | Residence Inn Denver City Center | Cut-off Date LTV: | 59.8% | |
| Denver, CO 80202 | U/W NCF DSCR: | 2.32x | ||
| U/W NOI Debt Yield: | 13.2% |
The Mortgage Loan. The mortgage loan (the “Residence Inn Denver City Center Mortgage Loan”) is evidenced by a single promissory note secured by a first mortgage encumbering the fee interest in an extended stay hotel located in Denver, Colorado (the “Residence Inn Denver City Center Property”).
The Borrower and Borrower Sponsor.The borrower is NF IV – I Denver, LLC, a Delaware limited liability company and single purpose entity with one independent director (the “Residence Inn Denver City Center Borrower”). The Residence Inn Denver City Center Borrower is directly owned by a Real Estate Investment Trust (“REIT”), which requires the borrower entity to lease the related hotel via an operating lease to a taxable REIT subsidiary. Legal counsel to the borrower delivered a non-consolidation opinion in connection with the origination of the Residence Inn Denver City Center Mortgage Loan. The borrower sponsor and nonrecourse carve-out guarantor of the Residence Inn Denver City Center Mortgage Loan is Noble Hospitality Fund IV - Income, L.P.
Founded in 1993, Noble Investment Group (“Noble”) is a real estate investment firm specializing in upscale select service and extended-stay hotels affiliated with Marriott, Hyatt and Intercontinental. As of December 2018, Noble had invested over $3 billion in upscale hotels throughout the United States. As of January 29, 2019, Noble operated more than 7,000 hotel and resort guest rooms including over 800,000 square feet of meeting space, convention and conference centers, championship golf courses, spas, and fine dining operations.
The Property.The Residence Inn Denver City Center Property is a 228-key extended-stay hotel located in Denver, Colorado. The Residence Inn Denver City Center Property comprises the ground floor and floors 8-14 of a larger building that also comprises a 447-space six-story parking garage on floors 2-7, which is not part of the collateral for the Residence Inn Denver City Center Mortgage Loan (See “Condominium Regime” section below). The Residence Inn Denver City Center Property was constructed in 2006 and contains 118 queen studio rooms, 103 one-bedroom queen suites, and seven two-bedroom queen suites. All guestrooms feature full kitchens with cookware, flat panel HD televisions and sleeper sofas (in addition to standard beds). Amenities at the Residence Inn Denver City Center Property comprise four meeting rooms totaling 1,742 square feet, a 24-hour convenience market, a fitness center, guest laundry rooms and a roof top patio. Additionally, the Residence Inn Denver City Center Property contains two ground floor retail spaces totaling 2,029 square feet, which are occupied by a Subway restaurant and a dry cleaner drop-off facility.
The Residence Inn Denver City Center Property underwent renovations from December 2017 through March 2018 for a total cost of approximately $6.3 million ($27,632/key). This renovation included upgrades to guestroom furniture, wall vinyl and carpeting in the guestrooms and corridors, and cabinetry lighting in the kitchens and bathrooms. Additional planned renovations totaling approximately $1.825 million ($8,004/key) were reserved for at closing for upgrades to exterior and interior public space including flooring and wall vinyl in the lobby, meeting rooms and fitness center, enhanced patio signage and lighting, and furniture replacement as needed. Of the planned renovations, approximately $930,000 is related to brand-mandated PIP work, which is required to be completed by June 19, 2020; and the remaining approximately $895,000 is elective work. At closing, the Residence Inn Denver City Borrower executed a new 20-year franchise agreement with Marriott, which expires on December 19, 2038, approximately 13 years beyond loan maturity.
The following table presents certain information relating to the trailing twelve-month period ending September 2018 demand analysis with respect to the Residence Inn Denver City Center Property based on market segmentation, as provided in the appraisal:
Market Segmentation
Corporate | Meeting/Group | Leisure | |||||
| 55.0% | 18.0% | 27.0% | |||||
Condominium Regime.At closing, the Residence Inn Denver City Center Borrower created a two-unit condominium regime comprising (i) the Residence Inn Denver City Center Property (the ground floor and floors 8-14) and (ii) a 447-space six story parking garage on floors 2-7, which is currently owned by an affiliate of the Residence Inn Denver City Center Borrower (the “Garage Condominium”). The Garage Condominium does not serve as collateral for the Residence Inn Denver City Center Mortgage Loan. The guests of the Residence Inn Denver City Center Property have access to parking through the Garage Condominium. The loan documents provide for full recourse to the borrower and guarantors if the condominium bylaws, rules or regulations or the condominium regime are amended, modified, cancelled, terminated or withdrawn by the borrower or with the consent or acquiescence of the Residence Inn Denver City Center Borrower, or the Residence Inn Denver City Center Property is made subject to any partition, in each case without the lender’s prior written consent. The Residence Inn Denver City Center Borrower has 50% of the voting rights in the related owners’ associations. See “Description of the Mortgage Pool—Mortgage Pool Characteristics—Condominium Interests” in the Preliminary Prospectus.
THE INFORMATION IN THIS STRUCTURAL AND COLLATERAL TERM SHEET IS NOT COMPLETE AND MAY BE AMENDED PRIOR TO THE TIME OF SALE. THIS TERM SHEET IS NOT AN OFFER TO SELL THESE SECURITIES AND IT IS NOT A SOLICITATION OF AN OFFER TO BUY THESE SECURITIES IN ANY JURISDICTION WHERE THE OFFER OR SALE IS NOT PERMITTED.
22
| Hospitality – Extended Stay | Loan #3 | Cut-off Date Balance: | $47,500,000 | |
| 1725 Champa Street | Residence Inn Denver City Center | Cut-off Date LTV: | 59.8% | |
| Denver, CO 80202 | U/W NCF DSCR: | 2.32x | ||
| U/W NOI Debt Yield: | 13.2% |
Operating History and Underwritten Net Cash Flow. The following table presents certain information relating to the historical operating performance and the underwritten net cash flow at the Residence Inn Denver City Center Property:
Cash Flow Analysis
| 2015 | 2016 | 2017 | TTM 10/31/2018(1) | U/W(1) | % of U/W Total Revenue(2) | U/W $ per Room | |
| Occupancy | 82.6% | 80.5% | 82.6% | 77.8% | 80.6% | ||
| ADR | $176.89 | $179.54 | $181.14 | $183.55 | $183.55 | ||
| RevPAR | $146.03 | $144.44 | $149.54 | $142.75 | $147.90 | ||
| Room Revenue | $12,152,753 | $12,053,322 | $12,444,802 | $11,879,407 | 12,308,496 | 96.8% | $53,985 |
| Other Revenue(3) | 310,898 | 315,823 | 368,001 | 408,915 | 408,915 | 3.2 | 1,793 |
| Total Revenue | $12,463,651 | $12,369,145 | $12,812,803 | $12,288,322 | 12,717,411 | 100.0% | $55,778 |
| Room Expense | 2,381,882 | 2,540,303 | 2,509,673 | 2,472,076 | 2,561,368 | 20.8 | 11,234 |
| Other Department Expense | 111,342 | 107,148 | 81,199 | 73,490 | 73,490 | 18.0 | 322 |
| Total Department Expenses | 2,493,224 | 2,647,451 | 2,590,872 | 2,545,566 | 2,634,858 | 20.7 | 11,556 |
| Gross Operating Income | $9,970,427 | $9,721,694 | $10,221,931 | $9,742,756 | $10,082,553 | 79.3% | $44,222 |
| Total Undistributed Expenses | 2,770,145 | 2,811,394 | 3,019,351 | 2,952,699 | 3,050,101 | 24.0 | 13,378 |
| Gross Operating Profit | $7,200,282 | $6,910,300 | $7,202,580 | $6,790,057 | $7,032,451 | 55.3% | $30,844 |
| Total Fixed Charges | 504,368 | 529,517 | 712,140 | 719,462 | 766,437 | 6.0 | 3,362 |
| Total Operating Expenses | $5,767,737 | $5,988,362 | $6,322,363 | $6,217,727 | $6,451,396 | 50.7% | $28,296 |
| Net Operating Income | $6,695,914 | $6,380,783 | $6,490,440 | $6,070,595 | $6,266,014 | 49.3% | $27,483 |
| FF&E | 0 | 0 | 0 | 0 | 508,696 | 4.0 | 2,231 |
| Net Cash Flow | $6,695,914 | $6,380,783 | $6,490,440 | $6,070,595 | $5,757,318 | 45.3% | $25,251 |
| NOI DSCR | 2.70x | 2.57x | 2.61x | 2.45x | 2.52x | ||
| NCF DSCR | 2.70x | 2.57x | 2.61x | 2.45x | 2.32x | ||
| NOI DY | 14.1% | 13.4% | 13.7% | 12.8% | 13.2% | ||
| NCF DY | 14.1% | 13.4% | 13.7% | 12.8% | 12.1% | ||
| (1) | Underwritten Occupancy and RevPAR are higher than TTM 10/31/2018, as the Residence Inn Denver City Center Property underwent an approximately $6.3 million ($27,632 per key) renovation from December 2017 through March 2018, which took rooms offline. |
| (2) | % of U/W Total Revenue for Room Expense, F&B Expense and Other Department Expenses are based on their corresponding revenue line items. All other line items represent percent of Total Revenue. |
| (3) | Other Revenue includes sundry shop income, meeting room rental, valet income, commercial tenant rent, and miscellaneous income. |
Appraisal.The appraiser concluded to an “as-complete” appraised value of $79,400,000 with an appraisal valuation date of November 14, 2019, which assumes the completion of the ongoing and planned renovation work (see “The Property” and the “Escrows” sections). The appraiser also concluded to an “as-is” appraised value of $76,500,000 as of November 14, 2018.
Environmental Matters. According to a Phase I environmental assessment dated October 4, 2018, there was no evidence of any recognized environmental conditions at the Residence Inn Denver City Center Property.
Market Overview and Competition.The Residence Inn Denver City Center Property is located in the central business district of Denver, Colorado. The Residence Inn Denver City Center Property is located approximately 1.4 miles southeast of Interstate 25, 2.7 miles south of Interstate 70, 0.9 miles southeast of Union Station, and 24.2 miles southwest of Denver International Airport.
The Residence Inn Denver City Center Property is situated approximately 0.4 miles north of the Colorado Convention Center. According to the appraisal, the Colorado Convention Center hosted 231 events with just under 1 million attendees in 2017, and is expected to draw an estimated 910,000 room nights in 2018 (an approximately 26% increase over 2017). The Residence Inn Denver City Center Property is situated within 1 mile of various tourist attractions including Coors Field (home of the Major League Baseball Colorado Rockies), Pepsi Center (home of the NBA Denver Nuggets), Colorado State Capital, the Denver Theater District and the Denver Performing Arts Complex. The Residence Inn Denver City Center Property is also proximate to the entrance of the 16th Street Mall, a mile-long pedestrian promenade of retailers, restaurants, breweries and the Denver Pavilions (an open-air mall). According to a third party market research report, in 2017, Denver experienced approximately 31.7 million total visitors who spent an estimated $6.5 billion, a 5.0% increase over 2016. According to the appraisal, Occupancy, ADR and RevPAR within the Downtown Denver submarket have increased by 13.1%, 18.4% and 33.9%, respectively, from 2008 to 2018.
According to the Appraisal, the Downtown Denver submarket has experienced annual population growth of approximately 4.5% since 2010, and is projected to increase by 2.0% annually through 2023. According to a third party market report, the estimated 2018 population within a one-, three- and five-mile radius of the Residence Inn Denver City Center Property was 40,683, 230,159 and 475,680, respectively; and the estimated 2018 average household income within the same radii was $100,370, $90,128 and $89,318,
THE INFORMATION IN THIS STRUCTURAL AND COLLATERAL TERM SHEET IS NOT COMPLETE AND MAY BE AMENDED PRIOR TO THE TIME OF SALE. THIS TERM SHEET IS NOT AN OFFER TO SELL THESE SECURITIES AND IT IS NOT A SOLICITATION OF AN OFFER TO BUY THESE SECURITIES IN ANY JURISDICTION WHERE THE OFFER OR SALE IS NOT PERMITTED.
23
| Hospitality – Extended Stay | Loan #3 | Cut-off Date Balance: | $47,500,000 | |
| 1725 Champa Street | Residence Inn Denver City Center | Cut-off Date LTV: | 59.8% | |
| Denver, CO 80202 | U/W NCF DSCR: | 2.32x | ||
| U/W NOI Debt Yield: | 13.2% |
respectively. According to the appraisal, there is a 157-room upscale extended-stay Element hotel that is anticipated to open in May 2019, which is expected to compete directly with the Residence Inn Denver City Center Property.
The following table presents historical occupancy, ADR, RevPAR and penetration rates relating to the Residence Inn Denver City Center Property’s competitive set:
Subject and Market Historical Occupancy, ADR and RevPAR(1)
Competitive Set | The Residence Inn Denver City | Penetration Factor | |||||||
Year | Occupancy | ADR | RevPAR | Occupancy | ADR | RevPAR | Occupancy | ADR | RevPAR |
| TTM 10/31/2018 | 76.4% | $169.24 | $129.28 | 78.1%(2) | $182.71 | $142.75(2) | 102.3%(2) | 108.0% | 110.4%(2) |
| 12/31/2017 | 75.6% | $171.36 | $129.51 | 82.6% | $181.14 | $149.54 | 109.2% | 105.7% | 115.5% |
| 12/31/2016 | 73.5% | $173.55 | $127.60 | 80.4% | $179.74 | $144.44 | 109.3% | 103.6% | 113.2% |
| 12/31/2015 | 74.8% | $170.03 | $127.20 | 81.8% | $178.52 | $146.03 | 109.3% | 105.0% | 114.8% |
| (1) | Information obtained from third party hospitality research reports dated November 19, 2018 and January 18, 2018. The competitive set includes the following hotels: Crowne Plaza Denver, Residence Inn Denver Downtown, Magnolia Hotel Denver, A Tribute Portfolio Hotel, Hampton Inn Suites Denver Downtown, and Embassy Suites Denver Downtown Convention Center |
| (2) | The Residence Inn Denver City Center Property underwent an approximately $6.3 million ($27,632 per key) renovation from December 2017 through March 2018, which took rooms offline. |
Escrows.
Real Estate Taxes – The loan documents require an upfront real estate tax reserve of $457,128 and ongoing monthly real estate tax reserves in an amount equal to one-twelfth of the real estate taxes that the lender estimates will be payable during the next 12 months (initially $65,304).
Insurance – The loan documents do not require ongoing monthly escrows for insurance premiums as long as (i) no event of default has occurred and is continuing, (ii) the borrower or borrower affiliate provides the lender with evidence that the Residence Inn Denver City Center Property’s insurance coverage is included in a blanket policy and such policy is in full force and effect and (iii) the borrower pays all applicable insurance premiums and provides the lender with evidence of payment of insurance premiums/renewals within ten business days.
FF&E Reserve – The loan documents require ongoing monthly FF&E Reserves of 4.0% of the total revenue (the initial estimated FF&E monthly deposit is $42,391).
PIP Reserve – The loan documents require an upfront reserve of $1,825,000 for estimated expenses related to remaining planned renovations, and an additional springing deposit of 100% of any additional PIP work required by the franchisor under the franchise agreement.
Lockbox and Cash Management.Upon the occurrence of a Cash Trap Event Period (as defined below), the Residence Inn Denver City Center Borrower is required to establish a lender-controlled lockbox account and deposits all rents and direct all credit card companies to pay all amounts due directly into such lockbox account. During the continuance of a Cash Trap Event Period, all funds in the lockbox account are required to be swept into the cash management account controlled by the lender and disbursed on each payment date in accordance with the Residence Inn Denver City Center Mortgage Loan documents and all excess funds are required to be swept to an excess cash flow subaccount controlled by the lender.
A “Cash Trap Event Period” will commence upon the earlier of the following:
| (i) | the occurrence and continuance of an event of default; or |
| (ii) | the net cash flow debt yield falling below 8.5% at the end of any calendar quarter. |
A Cash Trap Event Period will end upon the occurrence of the following:
| ● | with regard to clause (i), the cure of such event of default; or |
| ● | with regard to clause (ii), (a) the net cash flow debt yield being at least 8.75% for two consecutive calendar quarters or (b) the Residence Inn Denver City Center Borrower making a prepayment to the Residence Inn Denver City Center Mortgage Loan in an amount sufficient for the net cash flow debt yield to be equal to or greater than 8.5%. |
Property Management.The Residence Inn Denver City Center Property is managed by Interstate Management Company, LLC (“Interstate”). Founded in 1961, Interstate has over 35,000 employees and manages approximately 84,000 hotel rooms across 500 hotels, resorts and conference centers.
Partial Release.Not permitted.
THE INFORMATION IN THIS STRUCTURAL AND COLLATERAL TERM SHEET IS NOT COMPLETE AND MAY BE AMENDED PRIOR TO THE TIME OF SALE. THIS TERM SHEET IS NOT AN OFFER TO SELL THESE SECURITIES AND IT IS NOT A SOLICITATION OF AN OFFER TO BUY THESE SECURITIES IN ANY JURISDICTION WHERE THE OFFER OR SALE IS NOT PERMITTED.
24
| Hospitality – Extended Stay | Loan #3 | Cut-off Date Balance: | $47,500,000 | |
| 1725 Champa Street | Residence Inn Denver City Center | Cut-off Date LTV: | 59.8% | |
| Denver, CO 80202 | U/W NCF DSCR: | 2.32x | ||
| U/W NOI Debt Yield: | 13.2% |
Real Estate Substitution.Not permitted.
Subordinate and Mezzanine Indebtedness.Not permitted.
Ground Lease.None.
Right of First Refusal. Marriott International, Inc. has a right of first refusal (“ROFR”) to acquire the Residence Inn Denver City Center Property if there is a transfer of the hotel or the controlling direct or indirect interest in the Residence Inn Denver City Center Borrower to a Competitor (as defined in the loan documents). The ROFR is not extinguished by a foreclosure or deed-in-lieu thereof, and if the transfer to a Competitor is by foreclosure, or if the franchisee or its affiliates become a Competitor, the franchisor has the right to purchase the Residence Inn Denver City Center Property upon notice to the franchisee.
Terrorism Insurance.The Residence Inn Denver City Center Mortgage Loan documents require that the “all risk” insurance policy required to be maintained by the borrower provide coverage for terrorism in an amount equal to the full replacement cost of The Residence Inn Denver City Center Property, as well as business interruption insurance covering no less than the 18-month period following the occurrence of a casualty event, together with a six-month extended period of indemnity (provided that if TRIPRA or a similar statute is not in effect, the borrower will not be obligated to pay terrorism insurance premiums in excess of two times the premium for the casualty and business interruption coverage on a stand-alone basis).
THE INFORMATION IN THIS STRUCTURAL AND COLLATERAL TERM SHEET IS NOT COMPLETE AND MAY BE AMENDED PRIOR TO THE TIME OF SALE. THIS TERM SHEET IS NOT AN OFFER TO SELL THESE SECURITIES AND IT IS NOT A SOLICITATION OF AN OFFER TO BUY THESE SECURITIES IN ANY JURISDICTION WHERE THE OFFER OR SALE IS NOT PERMITTED.
25
| No. 4 – Shops at Trace Fork | |||||||
| Mortgage Loan Information | Mortgaged Property Information | ||||||
| Mortgage Loan Seller: | Rialto Mortgage Finance, LLC | Single Asset/Portfolio: | Single Asset | ||||
Credit Assessment (DBRS/Fitch/Moody’s): | NR/NR/NR | Property Type – Subtype: | Retail – Anchored | ||||
| Original Principal Balance: | $40,350,000 | Location: | Charleston, WV | ||||
| Cut-off Date Balance: | $40,350,000 | Size: | 367,460 SF | ||||
| % of Initial Pool Balance: | 5.2% | Cut-off Date Balance Per SF: | $109.81 | ||||
| Loan Purpose: | Refinance | Maturity Date Balance Per SF: | $109.81 | ||||
| Borrower Sponsors: | E. Stanley Kroenke | Year Built/Renovated: | 1999/NAP | ||||
| Guarantors: | E. Stanley Kroenke | Title Vesting: | Fee | ||||
| Mortgage Rate: | 4.8800% | Property Manager: | Self-managed | ||||
| Note Date: | January 24, 2019 | Current Occupancy (As of): | 98.3% (10/17/2018) | ||||
| Seasoning: | 1 month | YE 2017 Occupancy: | 99.4% | ||||
| Maturity Date: | February 6, 2029 | YE 2016 Occupancy: | 99.4% | ||||
| IO Period: | 120 months | YE 2015 Occupancy: | 99.4% | ||||
| Loan Term (Original): | 120 months | YE 2014 Occupancy: | 99.4% | ||||
| Amortization Term (Original): | NAP | Appraised Value: | $67,550,000 | ||||
| Loan Amortization Type: | Interest-only, Balloon | Appraised Value Per SF: | $183.83 | ||||
| Call Protection: | L(23),GRTR 1% or YM(93),O(4) | Appraisal Valuation Date: | November 26, 2018 | ||||
| Lockbox Type: | Springing | Underwriting and Financial Information | |||||
| Additional Debt: | None | TTM NOI (11/30/2018): | $4,570,886 | ||||
| Additional Debt Type (Balance): | NAP | YE 2017 NOI: | $4,647,574 | ||||
| YE 2016 NOI: | $4,600,171 | ||||||
| YE 2015 NOI: | $4,443,678 | ||||||
| U/W Revenues: | $5,583,492 | ||||||
| U/W Expenses: | $1,100,913 | ||||||
| U/W NOI: | $4,482,579 | ||||||
| Escrows and Reserves(1) | U/W NCF: | $4,243,730 | |||||
| Initial | Monthly | Cap | U/W DSCR based on NOI/NCF: | 2.24x / 2.12x | |||
| Taxes | $0 | Springing | NAP | U/W Debt Yield based on NOI/NCF: | 11.1% / 10.5% | ||
| Insurance | $0 | Springing | NAP | U/W Debt Yield at Maturity based on NOI/NCF: | 11.1% / 10.5% | ||
| Replacement Reserve | $0 | Springing | NAP | Cut-off Date LTV Ratio: | 59.7% | ||
| TI/LC Reserve | $0 | Springing | $918,650 | LTV Ratio at Maturity: | 59.7% | ||
| Sources and Uses | ||||||||
| Sources | Uses | |||||||
| Original loan amount | $40,350,000 | 100.0% | Loan payoff | $22,921,810 | 56.8% | |||
| Closing costs | 1,591,860 | 3.9 | ||||||
| Return of equity | 15,836,330 | 39.2 | ||||||
| Total Sources | $40,350,000 | 100.0% | Total Uses | $40,350,000 | 100.0% | |||
| (1) | See “Escrows” section below. |
The Mortgage Loan. The mortgage loan (the “Shops at Trace Fork Mortgage Loan”) is evidenced by a single promissory note secured by a first mortgage encumbering the fee interest in a 367,460 square feet power center located in Charleston, West Virginia (the “Shops at Trace Fork Property”).
The Borrowers and Borrower Sponsors.The borrowers are THF Onc Development, L.L.C., THF Onc Two Development, L.L.C., THF Onc Three Development, L.L.C. (collectively, the “Shops at Trace Fork Borrower”) each a Delaware limited liability company and single purpose entity with two independent directors. Legal counsel to the Shops at Trace Fork Borrower delivered a non-consolidation opinion in connection with the origination of the Shops at Trace Fork Mortgage Loan. The nonrecourse carve-out guarantor of the Shops at Trace Fork Mortgage Loan is E. Stanley Kroenke.
The borrower sponsor, E. Stanley Kroenke, is the chairman, cofounder, and owner of THF Realty, a real estate development firm. Mr. Kroenke holds real estate interests in shopping centers, office buildings, industrial and warehouse properties, sports stadiums and storage facilities across the United States. Mr. Kroenke owns 308 properties totaling approximately 43.6 million square feet. Mr. Kroenke’s current and former board and trustee memberships include Wal-Mart Stores, Inc., Central Bancompany, Boone County National Bank and Community Investments Partnerships of St. Louis. Mr. Kroenke also owns the Denver Nuggets of the National Basketball Association, the Colorado Avalanche of the National Hockey League, the Los Angeles Rams of the National Football League, and is the largest shareholder in Arsenal of the English Premier League. The borrower sponsor is one of several defendants under
THE INFORMATION IN THIS STRUCTURAL AND COLLATERAL TERM SHEET IS NOT COMPLETE AND MAY BE AMENDED PRIOR TO THE TIME OF SALE. THIS TERM SHEET IS NOT AN OFFER TO SELL THESE SECURITIES AND IT IS NOT A SOLICITATION OF AN OFFER TO BUY THESE SECURITIES IN ANY JURISDICTION WHERE THE OFFER OR SALE IS NOT PERMITTED.
26
| Retail - Anchored | Loan #4 | Cut-off Date Balance: | $40,350,000 | |
| 50 RHL Boulevard | Shops at Trace Fork | Cut-off Date LTV: | 59.7% | |
| Charleston, WV 25309 | U/W NCF DSCR: | 2.12x | ||
| U/W NOI Debt Yield: | 11.1% |
complaints filed in April 2016 by the City of St. Louis related to the decision to relocate the St. Louis Rams to Los Angeles. See“Description of the Mortgage Pool - Litigation and Other Considerations” in the Preliminary Prospectus.
The Property.The Shops at Trace Fork Property is a shopping center containing 367,460 square feet of net rentable area located in Charleston, West Virginia. Built in 1999, the Shops at Trace Fork Property consists of 13, one-story retail buildings located on a 63.0 acre parcel. The Shops at Trace Fork Property is anchored by Lowe’s, and junior-anchored by Dick’s Sporting Goods, Best Buy, Marshalls, PetSmart, and HomeGoods. There are eight pads that are ground leased to Hibachi Japanese, Kentucky Fried Chicken, Longhorn Steakhouse, Mountaineer Imaging, O’Charley’s, One Stop Gas, Rocas and Zippy Car Wash, which are not included in the overall square footage of the Shops at Trace Fork Property. Additionally, the Shops at Trace Fork Property is shadow anchored by Target (not part of the collateral). The Shops at Trace Fork Property contains 2,220 surface parking spaces, resulting in a parking ratio of 5.9 spaces per square feet of rentable area. As of October 17, 2018, the Shops at Trace Fork Property was 98.3% occupied by 29 national, regional and local tenants.
Major Tenants.
Largest Tenant: Lowe’s (22.6% of underwritten base rent; 7/31/2024 lease expiration) –Founded in 1946 and based in Mooresville, N.C., Lowe’s offers a complete line of products for maintenance, repair, remodeling, and decorating, and is the world’s second largest home improvement retailer. As of February 2, 2018, Lowe’s operated 2,152 home improvement and hardware stores, representing approximately 215 million square feet of retail selling space. Lowe’s has been a tenant at the Shops at Trace Fork Property since 1999 and has six, 5-year renewal options remaining.
2ndLargest Tenant: Dick’s Sporting Goods (12.1% of underwritten base rent; 1/31/2020 lease expiration) –Dick’s Sporting Goods, Inc., a omni-channel corporation sporting goods retailer was founded in 1948 and is headquartered in Pittsburgh, Pennsylvania. Dick’s Sporting Goods, Inc., which also owns Golf Galaxy, Field & Stream, and Dick’s Team Sports HQ, offers a broad assortment of brand name sporting goods equipment, apparel, and footwear in specialty shops and through in-store service. For fiscal year ended January 2018, Dick’s reported net sales of approximately $8.6 billion, an increase of 8.4% from the previous year. Dick’s Sporting Goods has been a tenant at the Shops at Trace Fork Property since 1999, and has four, 5-year renewal options remaining.
3rdLargest Tenant: Best Buy (5.9% of underwritten base rent; 1/31/2022 lease expiration) –Best Buy is a provider of technology products, services and solutions with retail operations located in the U.S., Canada and Mexico. Best Buy was founded in 1966 and is headquartered in Richfield, Minnesota. As of fiscal year 2018, Best Buy operated 1,293 domestic stores and 216 international stores. According to the 2018 annual report, net sales for fiscal 2018 were $42.1 billion, up 6.97% over the prior year’s total sales of $39.4 billion. Best Buy has been a tenant at the Shops at Trace Fork Property since 2010 and has four, 5-year renewal options remaining.
THE INFORMATION IN THIS STRUCTURAL AND COLLATERAL TERM SHEET IS NOT COMPLETE AND MAY BE AMENDED PRIOR TO THE TIME OF SALE. THIS TERM SHEET IS NOT AN OFFER TO SELL THESE SECURITIES AND IT IS NOT A SOLICITATION OF AN OFFER TO BUY THESE SECURITIES IN ANY JURISDICTION WHERE THE OFFER OR SALE IS NOT PERMITTED.
27
| Retail - Anchored | Loan #4 | Cut-off Date Balance: | $40,350,000 | |
| 50 RHL Boulevard | Shops at Trace Fork | Cut-off Date LTV: | 59.7% | |
| Charleston, WV 25309 | U/W NCF DSCR: | 2.12x | ||
| U/W NOI Debt Yield: | 11.1% |
The following table presents certain information relating to the tenancy at the Shops at Trace Fork Property:
Major Tenants
| Tenant Name | Credit Rating (Fitch/Moody’s/ S&P)(1) | Tenant NRSF | % of NRSF | Annual U/W Base Rent PSF(2) | Annual U/W Base Rent(2) | % of Total Annual U/W Base Rent | Lease Expiration Date | Extension Options | Termination Option (Y/N) |
| Anchor Tenants | |||||||||
| Lowe’s | NR/A3/A- | 135,197 | 36.8% | $8.08 | $1,093,067 | 22.6% | 7/31/2024 | 6, 5-year | N |
| Total Anchor Tenant | 135,197 | 36.8% | $8.08 | $1,093,067 | 22.6% | ||||
| Major Tenants | |||||||||
| Dick’s Sporting Goods | NR/NR/NR | 48,000 | 13.1% | $12.25 | $588,000 | 12.1% | 1/31/2020 | 4, 5-year | N |
| Best Buy | BBB/Baa1/BBB | 32,150 | 8.7% | $8.85 | $284,620 | 5.9% | 1/31/2022 | 4, 5-year | N |
| Marshall’s | NR/A2/A+ | 30,500 | 8.3% | $8.95 | $272,975 | 5.6% | 3/31/2025 | 2, 5-year | N |
| PetSmart | NR/B3/CCC | 26,988 | 7.3% | $13.65 | $368,386 | 7.6% | 1/31/2020 | 4, 5-year | N |
| HomeGoods | NR/A2/A+ | 25,000 | 6.8% | $10.00 | $250,000 | 5.2% | 11/30/2025 | 2, 5-year | N |
| Total Major Tenants | 162,638 | 44.3% | $10.85 | $1,763,981 | 36.4% | ||||
| Non-Major Tenant | 63,325 | 17.2% | $31.42 | $1,989,821 | 41.1% | ||||
| Occupied Collateral Total | 361,160 | 98.3% | $13.42 | $4,846,869 | 100.0% | ||||
| Vacant Space | 6,300 | 1.7% | |||||||
| Collateral Total | 367,460 | 100.0% | |||||||
| (1) | Certain ratings are those of the parent company whether or not the parent company guarantees the lease. |
| (2) | Annual U/W Base Rent PSF and Annual U/W Base Rent include contractual rent steps through August 2019 totaling $150,594. |
The following table presents certain information relating to tenant sales at the Shops at Trace Fork Property for tenants required to report sales:
Tenant Sales (PSF)
| Major Tenant Name | % of Total Annual U/W Base Rent | 2016 | 2017 | TTM(1) | Major Tenant Occupancy Cost(2) |
| Marshall’s | 5.6% | $285 | $290 | $290 | 4.3% |
| HomeGood’s | 5.2% | $256 | $265 | $265 | 4.8% |
| In-Line Sales PSF | $228 | $208 | $225 | ||
| In-Line Occupancy Cost | 9.4% | 10.3% | 9.5% |
| (1) | TTM Sales PSF and Occupancy Cost are for the trailing 12-month period ending August 30, 2018. |
| (2) | Occupancy Cost is based on TTM sales, underwritten base rent and underwritten reimbursements. |
THE INFORMATION IN THIS STRUCTURAL AND COLLATERAL TERM SHEET IS NOT COMPLETE AND MAY BE AMENDED PRIOR TO THE TIME OF SALE. THIS TERM SHEET IS NOT AN OFFER TO SELL THESE SECURITIES AND IT IS NOT A SOLICITATION OF AN OFFER TO BUY THESE SECURITIES IN ANY JURISDICTION WHERE THE OFFER OR SALE IS NOT PERMITTED.
28
| Retail - Anchored | Loan #4 | Cut-off Date Balance: | $40,350,000 | |
| 50 RHL Boulevard | Shops at Trace Fork | Cut-off Date LTV: | 59.7% | |
| Charleston, WV 25309 | U/W NCF DSCR: | 2.12x | ||
| U/W NOI Debt Yield: | 11.1% |
The following table presents certain information relating to the lease rollover schedule at the Shops at Trace Fork Property:
Lease Expiration Schedule(1)(2)
| Year Ending December 31, | No. of Leases Expiring | Expiring NRSF | % of Total NRSF | Cumulative Expiring NRSF | Cumulative % of Total NRSF | Annual U/W Base Rent | % of Total Annual U/W Base Rent | Annual U/W Base Rent PSF |
| MTM | 0 | 0 | 0.0% | 0 | 0.0% | $0 | 0.0% | $0.00 |
| 2019 | 4 | 15,520 | 4.2% | 15,520 | 4.2% | $278,660 | 5.7% | $17.95 |
| 2020 | 9 | 89,669 | 24.4% | 105,189 | 28.6% | $1,553,738 | 32.1% | $17.33 |
| 2021 | 5 | 18,601 | 5.1% | 123,790 | 33.7% | $422,159 | 8.7% | $22.70 |
| 2022 | 2 | 35,570 | 9.7% | 159,360 | 43.4% | $388,075 | 8.0% | $10.91 |
| 2023(3) | 2 | 2 | 0.0% | 159,362 | 43.4% | $177,895 | 3.7% | $88,947.50 |
| 2024 | 2 | 139,197 | 37.9% | 298,559 | 81.2% | $1,173,067 | 24.2% | $8.43 |
| 2025 | 2 | 55,500 | 15.1% | 354,059 | 96.4% | $522,975 | 10.8% | $9.42 |
| 2026 | 0 | 0 | 0.0% | 354,059 | 96.4% | $0 | 0.0% | $0.00 |
| 2027 | 0 | 0 | 0.0% | 354,059 | 96.4% | $0 | 0.0% | $0.00 |
| 2028 | 2 | 3,601 | 1.0% | 357,660 | 97.3% | $256,800 | 5.3% | $71.31 |
| 2029 | 1 | 3,500 | 1.0% | 361,160 | 98.3% | $73,500 | 1.5% | $21.00 |
| Thereafter | 0 | 0 | 0.0% | 361,160 | 98.3% | $0 | 0.0% | $0.00 |
| Vacant | 0 | 6,300 | 1.7% | 367,460 | 100.0% | $0 | 0.0% | $0.00 |
| Total/Weighted Average | 29 | 367,460 | 100.0% | $4,846,869 | 100.0% | $13.42(4) |
| (1) | Information obtained from the underwritten rent roll. |
| (2) | Certain tenants may have lease termination options that are exercisable prior to the originally stated expiration date of the subject lease and that are not considered in the Lease Expiration Schedule. |
| (3) | The 2023 Annual U/W Base Rent PSF results from the 2023 expirations of two out of eight ground leases, whose rents were included in the underwriting analysis, but their square footages were not. 1 square foot was assigned to each ground lease to underwrite the rents. |
| (4) | The Total/Weighted Average and Annual U/W Base Rent PSF exclude vacant space. |
The following table presents historical occupancy percentages at the Shops at Trace Fork Property:
Historical Occupancy
12/31/2014(1) | 12/31/2015(1) | 12/31/2016(1) | 12/31/2017(1) | 10/17/2018(2) |
| 99.5% | 99.5% | 99.5% | 99.5% | 98.3% |
| (1) | Information obtained from the Shops at Trace Fork Borrower. |
| (2) | Information obtained from the underwritten rent roll. |
THE INFORMATION IN THIS STRUCTURAL AND COLLATERAL TERM SHEET IS NOT COMPLETE AND MAY BE AMENDED PRIOR TO THE TIME OF SALE. THIS TERM SHEET IS NOT AN OFFER TO SELL THESE SECURITIES AND IT IS NOT A SOLICITATION OF AN OFFER TO BUY THESE SECURITIES IN ANY JURISDICTION WHERE THE OFFER OR SALE IS NOT PERMITTED.
29
| Retail - Anchored | Loan #4 | Cut-off Date Balance: | $40,350,000 | |
| 50 RHL Boulevard | Shops at Trace Fork | Cut-off Date LTV: | 59.7% | |
| Charleston, WV 25309 | U/W NCF DSCR: | 2.12x | ||
| U/W NOI Debt Yield: | 11.1% |
Operating History and Underwritten Net Cash Flow. The following table presents certain information relating to the underwritten net cash flow at the Shops at Trace Fork Property:
Cash Flow Analysis
| 2015 | 2016 | 2017 | TTM 11/30/2018 | U/W | %(1) | U/W $ per SF | |
| Rents in Place | $4,595,699 | $4,768,322 | $4,782,466 | $4,807,442 | $4,696,275 | 79.9% | $12.78 |
| Contractual Rent Steps(2) | 0 | 0 | 0 | 0 | 150,594 | 2.6 | 0.41 |
| Grossed Up Vacant Space | 0 | 0 | 0 | 0 | 130,175 | 2.2 | 0.35 |
| Gross Potential Rent | $4,595,699 | $4,768,322 | $4,782,466 | $4,807,442 | $4,977,044 | 84.7% | $13.54 |
| Other Income | 55,959 | 54,288 | 51,746 | 41,545 | 41,545 | 0.7 | 0.11 |
| Total Recoveries | 800,181 | 870,640 | 797,209 | 798,733 | 856,584 | 14.6 | 2.33 |
| Net Rental Income | $5,451,839 | $5,693,250 | $5,631,421 | $5,647,721 | $5,875,173 | 100.0% | $15.99 |
| (Vacancy & Credit Loss) | 0 | 0 | 0 | 0 | (291,681)(3) | (5.0) | (0.79) |
| Effective Gross Income | $5,451,839 | $5,693,250 | $5,631,421 | $5,647,721 | $5,583,492 | 95.0% | $15.19 |
| Real Estate Taxes | 385,023 | 395,595 | 395,120 | 388,217 | 398,135 | 7.1 | 1.08 |
| Insurance | 29,706 | 26,812 | 32,739 | 32,392 | 31,859 | 0.6 | 0.09 |
| Management Fee | 163,830 | 169,250 | 166,990 | 152,812 | 167,505 | 3.0 | 0.46 |
| Other Operating Expenses | 429,602 | 501,422 | 388,999 | 503,414 | 503,414 | 9.0 | 1.37 |
| Total Operating Expenses | $1,008,160 | $1,093,078 | $983,847 | $1,076,835 | $1,100,913 | 19.7% | $3.00 |
| Net Operating Income | $4,443,678 | $4,600,171 | $4,647,574 | $4,570,886 | $4,482,579 | 80.3% | $12.20 |
| Replacement Reserves | 0 | 0 | 0 | 0 | 55,119 | 1.0 | 0.15 |
| TI/LC | 0 | 0 | 0 | 0 | 183,730 | 3.3 | 0.50 |
| Net Cash Flow | $4,443,678 | $4,600,171 | $4,647,574 | $4,570,886 | $4,243,730 | 76.0% | $11.55 |
| NOI DSCR | 2.22x | 2.30x | 2.32x | 2.28x | 2.24x | ||
| NCF DSCR | 2.22x | 2.30x | 2.32x | 2.28x | 2.12x | ||
| NOI Debt Yield | 11.0% | 11.4% | 11.5% | 11.3% | 11.1% | ||
| NCF Debt Yield | 11.0% | 11.4% | 11.5% | 11.3% | 10.5% |
| (1) | Represents (i) percent of Net Rental Income for all revenue fields, (ii) percent of Gross Potential Rent for Vacancy & Credit Loss and (iii) percent of Effective Gross Income for all other fields. |
| (2) | Represents contractual rent steps through August 2019. |
| (3) | The underwritten economic vacancy is 5.0%.The Shops at Trace Fork Property was 98.3% leased as of October 17, 2018. |
THE INFORMATION IN THIS STRUCTURAL AND COLLATERAL TERM SHEET IS NOT COMPLETE AND MAY BE AMENDED PRIOR TO THE TIME OF SALE. THIS TERM SHEET IS NOT AN OFFER TO SELL THESE SECURITIES AND IT IS NOT A SOLICITATION OF AN OFFER TO BUY THESE SECURITIES IN ANY JURISDICTION WHERE THE OFFER OR SALE IS NOT PERMITTED.
30
| Retail - Anchored | Loan #4 | Cut-off Date Balance: | $40,350,000 | |
| 50 RHL Boulevard | Shops at Trace Fork | Cut-off Date LTV: | 59.7% | |
| Charleston, WV 25309 | U/W NCF DSCR: | 2.12x | ||
| U/W NOI Debt Yield: | 11.1% |
Appraisal.As of the appraisal valuation date of November 26, 2018, the Shops at Trace Fork Property had an “as-is” appraised value of $67,550,000.
Environmental Matters. According to a Phase I environmental site assessment dated November 15, 2018, there was no evidence of any recognized environmental conditions at the Shops at Trace Fork Property.
Market Overview and Competition.The Shops at Trace Fork Property is located in Charleston, Kanawah County, West Virginia, within the Charleston metropolitan statistical area. Charleston is the state capital and largest city within West Virginia and is located in the Appalachian Mountain region. Charleston’s economy is driven by trade, utilities, government, healthcare and education. Major employers include state government, local government, Charleston Area Medical Center, Kanawha County Schools and the federal government.
The Shops at Trace Fork Property is located approximately five miles northeast of the downtown Charleston. Downtown Charleston includes numerous restaurants and amenities, including the Kanawha County Courthouse, Charleston City Hall and the Robert C. Byrd Federal Courthouse. Access to the Shops at Trace Fork Property’s neighborhood is provided via US Highway 119, Route 60, and Interstate 64. The Shops at Trace Fork Property’s neighborhood consists of a mixture of commercial and residential development. Major retail development located along US Highway 119 include Dudley Farms Plaza (owned by an affiliate of the borrower), Southridge Shopping Center, Olive Garden, Home Depot, Chuck E. Cheese, McDonald’s, and Dollar Tree. According to a third party market research report, the 2018 estimated population within a one, three, and five-mile radius is 1,652, 30,751 and 62,210. The average household income within the same radii is $80,901, $71,803, and $70,673.
Submarket Information – According to a third-party market research report, the Shops at Trace Fork Property is situated within the South Charleston retail submarket. As of the second quarter of 2018, the submarket reported a total inventory of 1.5 million square feet with a 2.6% vacancy rate and an average quoted rental rate of $16.00 per square feet. As of the second quarter of 2018, the South Charleston retail submarket reported positive absorption of 1,513 square feet, with no new construction or deliveries.
Appraiser’s Comp Set – The appraiser identified five primary competitive properties for the Shops at Trace Fork Property totaling approximately 1.3 million square feet, which reported an average occupancy rate of approximately 95.6%. The appraiser concluded to net market rents for the Shops at Trace Fork Property of $13.00 per square foot, for anchor tenants, $12.00 per square foot for junior anchor tenants, $19.00 per square foot for large in-line tenants, $22.00 per square foot for small in-line tenants and $50,000 to $130,000 per year for pad leases.
The following table presents certain information relating to the appraiser’s market rent conclusion for the Shops at Trace Fork Property:
Market Rent Summary(1)
| Anchor | Jr. Anchor | Large In-Line | Small In-Line | Pad | |
| Market Rent (PSF) | $10.00 | $12.00 | $19.00 | $22.00 | $50,000 - $130,000 |
| Lease Term (Years) | 10 | 10 | 10 | 10 | 20 |
| Lease Type (Reimbursements) | Gross | NNN | NNN | NNN | Net, CAM |
| Rent Increase Projection | None | None | None | None | None |
| (1) | Information obtained from the appraisal. |
The table below presents certain information relating to comparable sales for the Shops at Trace Fork Property identified by the appraiser:
Comparable Sales(1)
| Property Name | Location | Rentable Area (SF) | Sale Date | Sale Price | Sale Price (PSF) |
| Hamilton Crossing | Alcoa, TN | 175,742 | Oct-18 | $27,750,000 | $157.90 |
| Winchester Station | Winchester, VA | 182,816 | Sep-18 | $30,550,000 | $167.11 |
| Shoppes at Legacy Park | Tuscaloosa, AL | 216,497 | Jan-18 | $46,500,669 | $214.79 |
| Oxford Exchange | Oxford, AL | 333,975 | Dec-17 | $53,500,000 | $160.19 |
| Verstavia Hills City Center | Vestavia Hills, AL | 391,899 | Nov-17 | $68,475,000 | $174.73 |
| (1) | Information obtained from the appraisal. |
THE INFORMATION IN THIS STRUCTURAL AND COLLATERAL TERM SHEET IS NOT COMPLETE AND MAY BE AMENDED PRIOR TO THE TIME OF SALE. THIS TERM SHEET IS NOT AN OFFER TO SELL THESE SECURITIES AND IT IS NOT A SOLICITATION OF AN OFFER TO BUY THESE SECURITIES IN ANY JURISDICTION WHERE THE OFFER OR SALE IS NOT PERMITTED.
31
| Retail - Anchored | Loan #4 | Cut-off Date Balance: | $40,350,000 | |
| 50 RHL Boulevard | Shops at Trace Fork | Cut-off Date LTV: | 59.7% | |
| Charleston, WV 25309 | U/W NCF DSCR: | 2.12x | ||
| U/W NOI Debt Yield: | 11.1% |
The table below presents certain information relating to four comparable retail properties to the Shops at Trace Fork Property identified by the appraiser:
Competitive Set(1)
| Property Name / Location | Year Built/ Renovated | Total GLA (SF) | Occupancy | Distance to Subject | Major / Anchor Tenants |
Shops at Trace Fork (Subject) Charleston, WV | 1999/NAP | 367,460 | 98.3% | - | Lowe’s, Dick’s Sporting Goods, Best Buy, Marshalls, PetSmart, HomeGoods |
Dudley Farms Plaza 222 RHL Blvd Charleston, WV | 2000/NAP | 198,769 | 100.0% | 1.0 mile | Kohl’s |
Nitro Marketplace 10-1000 Nitro Marketplace Roseville, WV | 1998/NAP | 440,949 | 99.0% | 10.6 miles | Walmart, Lowes |
Liberty Square Shopping Center 100 Liberty Square Hurricane, WV | 1990/1994 | 280,000 | 90.0% | 19.1 miles | Magic Mart, Elder-Beerman, Dollar Tree, Radio Shack, GNC, Factory Connection |
The Crossings 103-223 Crossing Mall Road Elkview, WV | 1989/NAP | 216,092 | 91.0% | 18.0 miles | AT&T, Brazilian Rest, Anytime Fitness, Rent-A-Center |
Merritt Creek Shopping Center Thundering Herd Drive Barboursville, WV | 2002/NAP | 257,969 | 98.0% | 39.5 miles | A.C. Moore Arts & Craft, Big Sandy Superstore, Dressbarn, Marshalls |
| (1) | Information obtained from the appraisal and the underwritten rent roll. |
The following table presents certain information relating to five comparable leases to those at the Shops at Trace Fork Property:
Comparable Leases(1)
| Property Name/Location | Year Built/ Renovated | Total GLA (SF) | Distance from Subject | Occupancy | Lease Term | Tenant Size | Annual Base Rent PSF | Reimbursement Amount PSF | Lease Type |
Dudley Farms Plaza 222 RHL Blvd. Charleston, WV | 2000/NAP | 198,769 | 1.0 mile | 100.0% | 6.0 – 10.0 Yrs | 4,000 – 12,000 SF | $18.00 - $25.00 | NAV | NNN |
Nitro Marketplace 10-10000 Nitro Marketplace Cross Lanes, WV | 1998/NAP | 440,949 | 10.6 miles | 99.0% | 3.0 – 5.0 Yrs | 1,500 – 24,000 SF | $10.50 - $19.00 | NAV | NNN |
Liberty Square Shopping Center 100 Liberty Square Hurricane, WV | 1990/1994 | 280,000 | 19.1 miles | 90.0% | 5.0 Yrs | 2,200 – 60,097 SF | $6.88 - $12.00 | NAV | NNN |
The Crossings 103 -223 Crossing Mall Road Elkview, WV | 1989/NAP | 216,092 | 18.0 miles | 91.0% | 2.7 - 6.1 Yrs | 2,150 – 5,260 SF | $9.50 - $15.00 | NAV | NNN |
Merritt Creek Shopping Center Thundering Herd Drive Barboursville, WV | 2002/NAP | 257,969 | 39.5 miles | 98.0% | 3.0 – 10.0 Yrs | 1,672 – 2,887 SF | $20.00 - $24.00 | NAV | NNN |
| (1) | Information obtained from the appraisal. |
Escrows.
Real Estate Taxes – The loan documents did not require an upfront real estate tax reserve. Ongoing monthly real estate tax reserves will not be required unless a Cash Management Trigger Event or Cash Sweep Event (see “Lockbox and Cash Management” section) has occurred and is continuing under the Shops at Trace Fork Mortgage Loan documents. In the event a Cash Management Trigger Event or Cash Sweep Event (as defined below) has occurred, the Shops at Trace Fork Borrower is required to deposit monthly real estate tax reserves in an amount equal to one-twelfth of the real estate taxes that the lender estimates will be necessary to pay taxes over the then succeeding twelve months.
Insurance – The loan documents did not require an upfront insurance reserve. Ongoing monthly insurance reserves will not be required unless a Cash Management Trigger Event or Cash Sweep Event has occurred and is continuing under the Shops at Trace Fork Mortgage Loan documents. In the event a Cash Management Trigger Event or Cash Sweep Event has occurred, the Shops at Trace Fork Borrower is required to deposit monthly insurance reserves in an amount equal to one-twelfth of the amount that the lender estimates will be necessary to pay insurance premiums over the then succeeding twelve months.
THE INFORMATION IN THIS STRUCTURAL AND COLLATERAL TERM SHEET IS NOT COMPLETE AND MAY BE AMENDED PRIOR TO THE TIME OF SALE. THIS TERM SHEET IS NOT AN OFFER TO SELL THESE SECURITIES AND IT IS NOT A SOLICITATION OF AN OFFER TO BUY THESE SECURITIES IN ANY JURISDICTION WHERE THE OFFER OR SALE IS NOT PERMITTED.
32
| Retail - Anchored | Loan #4 | Cut-off Date Balance: | $40,350,000 | |
| 50 RHL Boulevard | Shops at Trace Fork | Cut-off Date LTV: | 59.7% | |
| Charleston, WV 25309 | U/W NCF DSCR: | 2.12x | ||
| U/W NOI Debt Yield: | 11.1% |
Replacement Reserves – The loan documents did not require an upfront replacement reserve. Ongoing monthly replacement reserves will not be required unless as a Cash Management Trigger Event or Cash Sweep Event has occurred and is continuing under the Shops at Trace Fork Mortgage Loan documents. In the event a Cash Management Trigger Event or Cash Sweep Event has occurred, the Shops at Trace Fork Borrower is required to deposit monthly replacement reserves of $4,593.
TI/LC Reserve – The loan documents did not require an upfront tenant improvement and leasing commission reserve. Ongoing monthly tenant improvement and leasing commission reserves will not be required unless a Cash Management Trigger Event or Cash Sweep Event has occurred and is not continuing under the Shops at Trace Fork Mortgage Loan documents. In the event a Cash Management Trigger Event or Cash Sweep Event has occurred, the Shops at Trace Fork Borrower is required to deposit monthly tenant improvement and leasing commissions of $15,311, subject to a cap of $918,650. In addition, when a Cash Management Trigger Event and a Cash Sweep Event are in effect, the borrower is required to deposit in the TI/LC reserve any amounts paid to the borrower in connection with a termination, cancellation, sale or other disposition of any lease (or portion of the lease) other than any amount that relates to periods prior to such disposition date.
Lockbox and Cash Management.The Shops at Trace Fork Mortgage Loan documents require a springing lockbox and a springing cash management. Upon the occurrence and continuance of a Cash Management Trigger Event the borrower is required to establish a lender-controlled lockbox account and instruct tenants to deposit rents into such lockbox account. The Shops at Trace Fork Mortgage Loan documents also require that all revenues received by the Shops at Trace Fork Borrower or property manager be deposited into the lockbox account within one business day of receipt. Pursuant to the Shops at Trace Fork Mortgage Loan documents, all excess funds on deposit are required to be applied as follows (a) if a Cash Sweep Event (as defined below) is not in effect, to the Shops at Trace Fork Borrower; and (b) if a Cash Sweep Event is in effect due to the existence of a Critical Tenant Trigger Event (as defined below) to the Critical Tenant TI/LC account until the applicable Critical Tenant Trigger Event cure has occurred. If a Cash Sweep Event is in effect but a Critical Tenant Trigger Event is not in effect, then funds will be applied to the excess cash flow account.
A “Cash Management Trigger Event” will commence upon the occurrence of any of the following:
| (i) | an event of default; |
| (ii) | the Shops at Trace Fork Borrower’s second late debt service payment within a 12-month period; |
| (iii) | a bankruptcy action of the Shops at Trace Fork Borrower, guarantor or property manager; |
| (iv) | a Cash Management DSCR Trigger Event; or |
| (v) | a Critical Tenant Trigger Event. |
A Cash Management Trigger Event will end upon the occurrence of:
| ● | with regard to clause (i) above, the cure of such event of default having been accepted or waived by lender; |
| ● | with regard to clause (ii) above, the debt service payments having been paid on time for 12 consecutive months; |
| ● | with regard to clause (iii) above, such bankruptcy action petition having been discharged, stayed, or dismissed within 60 days of such filing among other conditions for the Shops at Trace Fork Borrower or guarantor and within 120 days for the property manager, or with respect to the property manager, the Shops at Trace Fork Borrower has replaced the property manager with a qualified property manager acceptable to the lender; |
| ● | with regard to clause (iv) above, the date the amortizing debt service coverage ratio based on the trailing 12-month period immediately preceding the date of such determination is greater than 1.15x for two consecutive quarters; and |
| ● | with regard to clause (v) above, a Critical Tenant Trigger Event Period Cure (as defined below). |
A “Cash Management DSCR Trigger Event” will occur on any day the debt service coverage ratio, based on the trailing 12-month period immediately preceding the date of determination, is less than 1.15x, unless within five days of such date, the Shops at Trace Fork Borrower delivers one or more Master Leases (as defined below) that result in a minimum debt service coverage ratio of 1.25x for the Shops at Trace Fork Mortgage Loan.
A “Cash Sweep Event” will commence upon the occurrence of any of the following:
| (i) | an event of default; |
| (ii) | a bankruptcy action of the Shops at Trace Fork Borrower, guarantor or property manager; |
| (iii) | a Cash Management DSCR Trigger Event; or |
| (iv) | a Critical Tenant Trigger Event. |
A Cash Sweep Event will end upon the occurrence of:
| ● | with regard to clause (i) above, the cure of such event of default having been accepted or waived by lender; |
| ● | with regard to clause (ii) above, such bankruptcy action petition having been discharged, stayed, or dismissed within 30 days of such filing among other conditions for the Shops at Trace Fork Borrower or guarantor and within 120 days for the property manager, or with respect to the property manager, the Shops at Trace Fork Borrower has replaced the property manager with a qualified property manager acceptable to the lender; |
| ● | with regard to clause (iii) above, the date the amortizing debt service coverage ratio based on the trailing 12-month period immediately preceding the date of such determination is greater than 1.10x for two consecutive quarters; and |
| ● | with regard to clause (iv) above, a Critical Tenant Trigger Event Period Cure. |
THE INFORMATION IN THIS STRUCTURAL AND COLLATERAL TERM SHEET IS NOT COMPLETE AND MAY BE AMENDED PRIOR TO THE TIME OF SALE. THIS TERM SHEET IS NOT AN OFFER TO SELL THESE SECURITIES AND IT IS NOT A SOLICITATION OF AN OFFER TO BUY THESE SECURITIES IN ANY JURISDICTION WHERE THE OFFER OR SALE IS NOT PERMITTED.
33
| Retail - Anchored | Loan #4 | Cut-off Date Balance: | $40,350,000 | |
| 50 RHL Boulevard | Shops at Trace Fork | Cut-off Date LTV: | 59.7% | |
| Charleston, WV 25309 | U/W NCF DSCR: | 2.12x | ||
| U/W NOI Debt Yield: | 11.1% |
A “Cash Sweep DSCR Trigger Event” will occur on any day the debt service coverage ratio, based on the trailing 12-month period immediately preceding the date of determination, is less than 1.10x, unless within five days of such date, the Shops at Trace Fork Borrower delivers one or more Master Leases that result in a minimum debt service coverage ratio of 1.25x for the Shops at Trace Fork Mortgage Loan.
A “Critical Tenant Trigger Event” will occur if E. Stanley Kroenke is not the guarantor of the Shops at Trace Fork Mortgage Loan and one of the following occurs:
| (i) | if Lowe’s Home Center, Inc., Dick’s Sporting Goods Inc. or any or any other tenant occupying the space currently occupied by such tenant or tenants (each, a “Critical Tenant” and each related lease, a “Critical Tenant Lease”) gives notice of its intention to not extend or renew its lease; |
| (ii) | the date that is twelve months prior to the related lease expiration date if the Critical Tenant has failed to give notice of its election to renew its lease; |
| (iii) | on or prior to the date on which the Critical Tenant is required under its lease to notify the Shops at Trace Fork Borrower of its election to renew its lease, the Critical Tenant fails to give such notice; |
| (iv) | an event of default under the Critical Tenant Lease; |
| (v) | a bankruptcy action with respect to the Critical Tenant; |
| (vi) | the Critical Tenant discontinues its normal business operations; or |
| (vii) | the Critical Tenant is downgraded below “BBB-” or the equivalent by an credit reporting agency. |
A “Critical Tenant Trigger Event Cure” will occur upon:
| ● | with regard to clause (i), (ii) or (iii) above, (x) the date that (1) the Critical Tenant Lease extension is executed and delivered to the lender by the Shops at Trace Borrower and the related tenant improvement costs, leasing commissions and other material costs and expenses have been deposited into the Critical Tenant TI/LC account; or (2) a Critical Tenant Space Re-Tenanting Event (as defined below) has occurred; |
| ● | with regard to clause (iv) above, a cure of the applicable default; |
| ● | with regard to clause (v) above, an affirmation that the Critical Tenant is actually paying all rents and other amounts under the lease; or |
| ● | with regard to clause (vi) above, the Critical Tenant re-commencing its normal business operations or a Critical Tenant Space Re-Tenanting Event (as defined below) having occurred; or |
| ● | with regard to clause (vii) above, the date the credit rating of the related Critical Tenant is no longer less than a “BBB-” or the equivalent by any credit reporting agency. |
A “Critical Tenant Space Re-tenant Event” will occur on the date each of the following conditions has been satisfied: (i) the Critical Tenant space is at least 75% leased to one or more replacement tenants for a term of at least five years and on terms that are acceptable to the lender; (ii) all tenant improvement costs, leasing commissions and other material costs and expenses relating to the re-letting of the space have been paid in full; and (iii) the replacement tenant(s) are conducting normal business operations at the related Critical Tenant space.
A “Master Lease” is a lease agreement between the Shops at Trace Fork Borrower, as landlord, and the guarantor, as tenant, that (i) is for a term of 10 or more years; (ii) is subordinate to the loan documents, and (iii) contains terms and conditions reasonably acceptable to the lender. The Master Lease may not be amended without the prior consent of the lender and can be terminated only if (x) no event of default exists and (y) as of the Master Lease termination date, (a) the debt service coverage ratio is not less than 1.25x for two consecutive quarters without including rent from the Master Lease, or (b) the Shops at Trace Fork Borrower has deposited with the lender an amount equal to cash flow that would have been swept into the excess cash flow account, among other conditions. There are no Master Leases currently in effect.
Property Management. The Shops at Trace Fork Property is managed by an affiliate of the Shops at Trace Fork Borrower.
Partial Release. Not permitted.
Real Estate Substitution.Not permitted.
Subordinate and Mezzanine Indebtedness.Not permitted.
Ground Lease. None.
Terrorism Insurance.The Shops at Trace Fork Mortgage Loan documents require that the “all risk” insurance policy required to be maintained by the Shops at Trace Fork Borrower provides coverage for terrorism in an amount equal to the full replacement cost of the Shops at Trace Fork Property, as well as business interruption insurance covering no less than the 18-month period following the occurrence of a casualty event, together with a 12-month extended period of indemnity.
THE INFORMATION IN THIS STRUCTURAL AND COLLATERAL TERM SHEET IS NOT COMPLETE AND MAY BE AMENDED PRIOR TO THE TIME OF SALE. THIS TERM SHEET IS NOT AN OFFER TO SELL THESE SECURITIES AND IT IS NOT A SOLICITATION OF AN OFFER TO BUY THESE SECURITIES IN ANY JURISDICTION WHERE THE OFFER OR SALE IS NOT PERMITTED.
34
| No. 5 – 575 Maryville | |||||||
| Mortgage Loan Information | Mortgaged Property Information | ||||||
| Mortgage Loan Seller: | Barclays Capital Real Estate Inc. | Single Asset/Portfolio: | Single Asset | ||||
Credit Assessment (DBRS/Fitch/Moody’s): | NR/NR/NR | Property Type – Subtype: | Office - Suburban | ||||
| Original Principal Balance: | $35,000,000 | Location: | Town & Country, MO | ||||
| Cut-off Date Balance: | $35,000,000 | Size: | 253,492 SF | ||||
| % of Initial Pool Balance: | 4.5% | Cut-off Date Balance Per SF: | $138.07 | ||||
| Loan Purpose: | Acquisition | Maturity Date Balance Per SF: | $138.07 | ||||
| Borrower Sponsors: | Ten Capital Management; Pembroke IV LLC | Year Built/Renovated: | 1999/NAP | ||||
| Guarantors(1): | Various | Title Vesting: | Fee | ||||
| Mortgage Rate: | 4.8220% | Property Manager: | Cushman & Wakefield U.S., Inc. | ||||
| Note Date: | December 12, 2018 | Current Occupancy (As of): | 97.0% (11/30/2018) | ||||
| Seasoning: | 2 months | YE 2017 Occupancy: | 88.5% | ||||
| Maturity Date: | January 6, 2029 | YE 2016 Occupancy(3): | 54.4% | ||||
| IO Period: | 120 months | YE 2015 Occupancy(3): | 81.8% | ||||
| Loan Term (Original): | 120 months | YE 2014 Occupancy(3): | 100.0% | ||||
| Amortization Term (Original): | NAP | Appraised Value: | $50,280,000 | ||||
| Loan Amortization Type: | Interest-only, Balloon | Appraised Value Per SF: | $198.35 | ||||
| Call Protection: | L(26),D(89),O(5) | Appraisal Valuation Date: | September 6, 2018 | ||||
| Lockbox Type: | Hard/Springing Cash Management | ||||||
| Additional Debt: | None | ||||||
| Additional Debt Type (Balance): | NAP | ||||||
| Underwriting and Financial Information | |||||||
| TTM NOI (9/30/2018)(4)(5): | $2,872,447 | ||||||
| YE 2017 NOI(4): | $3,443,544 | ||||||
| YE 2016 NOI(4): | $4,250,624 | ||||||
| Escrows and Reserves(2) | YE 2015 NOI(4): | $4,305,153 | |||||
| Initial | Monthly | Cap | U/W Revenues: | $6,561,178 | |||
| Taxes | $69,633 | $69,633 | NAP | U/W Expenses: | $2,591,920 | ||
| Insurance | $0 | Springing | NAP | U/W NOI(4)(5): | $3,969,258 | ||
| Replacement Reserve | $200,000 | $4,301 | NAP | U/W NCF: | $3,424,957 | ||
| TI/LC Reserve | $0 | $32,256 | NAP | U/W DSCR based on NOI/NCF: | 2.31x / 2.00x | ||
| Cushman Gap Rent Reserve | $344,312 | $0 | NAP | U/W Debt Yield based on NOI/NCF: | 11.3% / 9.8% | ||
| Cushman TI/LC Reserve | $1,560,919 | $0 | NAP | U/W Debt Yield at Maturity based on NOI/NCF: | 11.3% / 9.8% | ||
| Eastman TI/LC Reserve | $150,000 | $0 | NAP | Cut-off Date LTV Ratio: | 69.6% | ||
| Common Charges Reserve | $45,730 | $3,518 | NAP | LTV Ratio at Maturity: | 69.6% | ||
| Sources and Uses | ||||||||
| Sources | Uses | |||||||
| Original mortgage loan amount | $35,000,000 | 67.8% | Purchase price | $50,000,000 | 96.8% | |||
| Borrower equity | 16,640,164 | 32.2 | Purchase Credits(6) | (2,084,393) | (4.0) | |||
| Upfront reserves | 2,370,594 | 4.6 | ||||||
| Closing costs | 1,353,963 | 2.6 | ||||||
| Total Sources | $51,640,164 | 100.0% | Total Uses | $51,640,164 | 100.0% | |||
| (1) | The guarantors of the 575 Maryville Mortgage Loan (as defined below) are John B. Vander Zwaag, Richard C. Hamlin, Jeffrey J. Irmer, Benjamin Adams, Pembroke IV LLC, TCM Maryville GP LLC, and TCM Maryville LLC. |
| (2) | See “Escrows” section below. |
| (3) | See “Historical Occupancy” section below. |
| (4) | See “Cash Flow Analysis” section below. |
| (5) | The increase in Net Operating Income from TTM 9/30/2018 to U/W is primarily driven by (i) the expiration of free rent periods, (ii) Cushman & Wakefield’s expansion into an additional 21,605 square feet with a commencement date of 8/1/2019 (all gap rent reserved) and (iii) increased rent driven by contractual rent steps and straight line rent for Eastman. |
| (6) | Purchase Credits include (i) outstanding tenant improvement obligations for Cushman & Wakefield and Eastman and (ii) outstanding gap rent for Cushman & Wakefield. Such Purchase Credits were reserved for by the lender. See “Escrows” section for a full description of Escrows and Reserves. |
The Mortgage Loan. The mortgage loan (the “575 Maryville Mortgage Loan”) is evidenced by a single promissory note with an original principal balance of $35,000,000 and outstanding principal balance as of the Cut-off Date of $35,000,000 secured by a first mortgage encumbering the fee interest in a Class A office building located in Town & Country, Missouri (the “575 Maryville Property”).
THE INFORMATION IN THIS STRUCTURAL AND COLLATERAL TERM SHEET IS NOT COMPLETE AND MAY BE AMENDED PRIOR TO THE TIME OF SALE. THIS TERM SHEET IS NOT AN OFFER TO SELL THESE SECURITIES AND IT IS NOT A SOLICITATION OF AN OFFER TO BUY THESE SECURITIES IN ANY JURISDICTION WHERE THE OFFER OR SALE IS NOT PERMITTED.
35
| Office - Suburban | Loan #5 | Cut-off Date Balance: | $35,000,000 | |
| 575 Maryville Centre Drive | 575 Maryville | Cut-off Date LTV: | 69.6% | |
| Town & Country, MO 63141 | U/W NCF DSCR: | 2.00x | ||
| U/W NOI Debt Yield: | 11.3% |
The Borrower and Borrower Sponsors.The borrower is Pembroke TCM Maryville LLC (the “575 Maryville Borrower”), a Delaware limited liability company and single purpose entity with one independent director. Legal counsel to the 575 Maryville Borrower delivered a non-consolidation opinion in connection with the origination of the 575 Maryville Mortgage Loan. The nonrecourse carve-out guarantors of the 575 Maryville Mortgage Loan are John B. Vander Zwaag, Richard C. Hamlin, Jeffrey J. Irmer, Benjamin Adams, Pembroke IV LLC, TCM Maryville GP LLC, and TCM Maryville LLC.
The borrower sponsors of the 575 Maryville Mortgage Loan are Pembroke IV LLC and Ten Capital Management. Pembroke IV LLC was founded in 2007 and invests in commercial real estate, specifically where short to intermediate capital market inefficiencies create opportunities. John B. Vander Zwaag, the founder and chief executive officer of Pembroke IV LLC, has completed over $3.0 billion of transactions in the United States and Canada over his 30 year career in real estate finance and investment. John B. Vander Zwaag has assembled and managed nationally focused acquisitions, asset management and investment banking teams for four separate organizations. Jeffrey J. Irmer joined Pembroke IV LLC as a principal and chief operating officer in 2016. Richard C. Hamlin is a principal of Pembroke IV LLC and has been a practicing real estate attorney for over 35 years. Ten Capital Management is a privately held real estate investment company with Benjamin Adams as its founder and chief executive officer. TCM Maryville GP LLC and TCM Maryville LLC are affiliates of the 575 Maryville Borrower.
The Property.The 575 Maryville Property is a 253,492 square foot, Class A office building located in Town & Country, Missouri situated on 8.7 acres of land. The 575 Maryville Property is comprised of a six-story office building located approximately fifteen miles from the St. Louis Central Business District. The 575 Maryville Property is part of the larger Maryville Centre, a corporate campus featuring lakes, fountains, patios, three miles of nature and fitness trails, and the Marriott St. Louis West hotel (which has its own restaurant). The Maryville Centre has averaged 95.0% occupancy over the past five years, and rental rates in the office park have increased by approximately 15.0% since the beginning of 2014. Built in 1999, the building amenities include on-site dining, two shared conference rooms that can seat up to 100 people, and a 1,400 square foot fitness center. Over the past three years, the 575 Maryville Property has undergone $652,917 of property improvements, including upgrades to the fitness center, improvements to the café, garage, HVAC, security, and EMS system. Additionally, the 575 Maryville Property contains 1,077 parking spaces, including a three-level, 645 space parking garage, providing a ratio of 4.2 parking spaces per 1,000 square feet. As of November 30, 2018, the 575 Maryville Property was 97.0% leased to four tenants.
Major Tenants.
Largest Tenant: Cushman & Wakefield (55.3% of underwritten base rent; 7/31/2027 lease expiration) –Cushman & Wakefield (NYSE: CWK) is a leading global real estate services firm with approximately 48,000 employees in 400 offices and 70 countries. In the third quarter of 2018, the firm had revenue of approximately $1.5 billion across core services of property, facilities and project management, leasing, capital markets, valuation, and other services, up 16.8% from the third quarter of 2017. Cushman & Wakefield’s state-of-the-art Portfolio Services Center, which is located at the 575 Maryville Property, is the showpiece of Cushman & Wakefield’s Global Occupier Services. Cushman & Wakefield has invested approximately $7.6 million of their own money building out their space at the 575 Maryville Property. Cushman & Wakefield currently occupies the fifth and sixth floors at the 575 Maryville Property and has signed an expansion lease to occupy the third floor, taking an additional 45,688 square feet. Cushman & Wakefield took occupancy of 24,083 square feet of the third floor space in November 2018 and is expected to occupy the remaining 21,605 square feet of third floor space in August 2019, with all gap rent for this space escrowed at closing ($344,312).
2ndLargest Tenant: Eastman (19.4% of underwritten base rent; 9/30/2023 lease expiration) –Eastman (NYSE: EMN) is a Fortune 500 company that produces advanced materials, additives and functional products, specialty chemicals, and fibers found in products people use every day. In 1994, Eastman was spun off from its parent, Eastman Kodak. Eastman serves customers in more than 100 countries and had sales revenue of approximately $2.5 billion in the third quarter of 2018, up 3.3% from the third quarter of 2017. Solutia Inc., who Eastman acquired in 2012, was the original tenant at the 575 Maryville Property dating back to June 1999.
3rdLargest Tenant: Century Link (18.6% of underwritten base rent; 6/30/2022 lease expiration) –Century Link (NYSE: CTL) is a communications provider that offers television and cable, broadband services, and telecommunication services. As of December 31, 2017, Century Link operated approximately 10.3 million total access lines and served approximately 5.7 million broadband subscribers. Century Link is the second largest U.S. communications provider to global enterprise customers, with customers in more than 60 countries. Century Link’s revenue for the third quarter of 2018 was approximately $5.8 billion, up 3.6% from the third quarter of 2017. Century Link has been located at the 575 Maryville Property since 2008 and renewed their lease for an additional five years in 2017.
4thLargest Tenant: Maryville University (6.7% of underwritten base rent; 10/31/2025 lease expiration) –Founded in 1872, Maryville University is a private, coeducational university, with its 130-acre campus located directly west of the 575 Maryville Property. Maryville University has a current enrollment of approximately 3,700 undergraduate students and approximately 5,500 graduate students with a 14:1 student-to-faculty ratio. Maryville University offers over 90 degree programs, 25 online degrees, 19 master’s programs, and five doctoral programs. Maryville University utilizes their space at the 575 Maryville Property for administrative purposes and does not consist of classroom space.
THE INFORMATION IN THIS STRUCTURAL AND COLLATERAL TERM SHEET IS NOT COMPLETE AND MAY BE AMENDED PRIOR TO THE TIME OF SALE. THIS TERM SHEET IS NOT AN OFFER TO SELL THESE SECURITIES AND IT IS NOT A SOLICITATION OF AN OFFER TO BUY THESE SECURITIES IN ANY JURISDICTION WHERE THE OFFER OR SALE IS NOT PERMITTED.
36
| Office - Suburban | Loan #5 | Cut-off Date Balance: | $35,000,000 | |
| 575 Maryville Centre Drive | 575 Maryville | Cut-off Date LTV: | 69.6% | |
| Town & Country, MO 63141 | U/W NCF DSCR: | 2.00x | ||
| U/W NOI Debt Yield: | 11.3% |
The following table presents certain information relating to the tenancy at the 575 Maryville Property:
Major Tenants
| Tenant Name | Credit Rating (Fitch/Moody’s/ S&P)(1) | Tenant NRSF | % of NRSF | Annual U/W Base Rent PSF(2) | Annual U/W Base Rent(2) | % of Total Annual U/W Base Rent | Lease Expiration Date | Extension Options | Termination Option (Y/N) | ||
| Major Tenants | |||||||||||
| Cushman & Wakefield(3) | NR/NR/NR | 137,682 | 54.3% | $27.32 | $3,761,472 | 55.3% | 7/31/2027 | 2, 5-year | N(4) | ||
| Eastman | BBB/Baa2/BBB | 46,086 | 18.2% | $28.55 | $1,315,940 | 19.4% | 9/30/2023 | NAP | N | ||
| Century Link | BB/Ba3/BB | 45,807 | 18.1% | $27.58 | $1,263,357 | 18.6% | 6/30/2022 | NAP | N | ||
| Maryville University | NR/NR/NR | 16,417 | 6.5% | $27.80 | $456,311 | 6.7% | 10/31/2025 | NAP | N | ||
| Total Major Tenants | 245,992 | 97.0% | $27.63 | $6,797,079 | 100.0% | ||||||
| Occupied Collateral Total | 245,992 | 97.0% | $27.63 | $6,797,079 | 100.0% | ||||||
| Vacant Space | 7,500 | 3.0% | |||||||||
| Collateral Total | 253,492 | 100.0% | |||||||||
| (1) | Certain ratings are those of the parent company whether or not the parent company guarantees the lease. |
| (2) | Annual U/W Base Rent PSF and Annual U/W Base Rent include contractual rent steps through November 2019 totaling $102,320. Additionally, Eastman’s underwritten rent has been straight-line averaged over its lease term resulting in a $67,009 increase over in-place rent. |
| (3) | Cushman & Wakefield currently occupies the fifth and sixth floors at the 575 Maryville Property and has signed an expansion lease to occupy the third floor, taking an additional 45,688 square feet. Cushman & Wakefield occupied 24,083 square feet of the space in November 2018 and is expected to occupy the remaining 21,605 square feet in August 2019, with all gap rent for this space escrowed at closing ($344,312). Additionally, Cushman & Wakefield has the right to expand into (i) a portion of the first floor, (ii) the entire second floor (currently occupied by Eastman) and (iii) the entire fourth floor (currently occupied by Century Link). |
| (4) | While not currently exercisable, Cushman & Wakefield has the option to terminate its lease if the tenant is not retained as the exclusive property manager for the 575 Maryville Property, provided that the tenant (or its affiliate) leases a minimum of 90,000 rentable square feet at the 575 Maryville Property. The 575 Maryville Mortgage Loan documents provide that for so long as Cushman & Wakefield’s termination option is in effect the 575 Maryville Borrower may not terminate the management agreement with the tenant unless and until (A)(i) the tenant has waived its rights under the its termination option or (ii) the tenant has confirmed in writing that it will not exercise its right to terminate its lease and lender has approved a qualified replacement property manager in accordance with the 575 Maryville Mortgage Loan documents. The 575 Maryville Mortgage Loan documents provide for an event of default if the 575 Maryville Borrower terminates the management agreement with the tenant without the lender’s consent. Further, the 575 Maryville Mortgage Loan is fully recourse to the 575 Maryville Borrower and the guarantors in the event that the 575 Maryville Borrower terminates the exclusive management and leasing agreement with the tenant and the tenant terminates its lease as a result thereof. |
The following table presents certain information relating to the lease rollover schedule at the 575 Maryville Property:
Lease Expiration Schedule(1)(2)
| Year Ending December 31, | No. of Leases Expiring | Expiring NRSF | % of Total NRSF | Cumulative Expiring NRSF | Cumulative % of Total NRSF | Annual U/W Base Rent | % of Total Annual U/W Base Rent | Annual U/W Base Rent PSF |
| MTM | 0 | 0 | 0.0% | 0 | 0.0% | $0 | 0.0% | $0.00 |
| 2018 | 0 | 0 | 0.0% | 0 | 0.0% | $0 | 0.0% | $0.00 |
| 2019 | 0 | 0 | 0.0% | 0 | 0.0% | $0 | 0.0% | $0.00 |
| 2020 | 0 | 0 | 0.0% | 0 | 0.0% | $0 | 0.0% | $0.00 |
| 2021 | 0 | 0 | 0.0% | 0 | 0.0% | $0 | 0.0% | $0.00 |
| 2022 | 1 | 45,807 | 18.1% | 45,807 | 18.1% | $1,263,357 | 18.6% | $27.58 |
| 2023 | 1 | 46,086 | 18.2% | 91,893 | 36.3% | $1,315,940 | 19.4% | $28.55 |
| 2024 | 0 | 0 | 0.0% | 91,893 | 36.3% | $0 | 0.0% | $0.00 |
| 2025 | 1 | 16,417 | 6.5% | 108,310 | 42.7% | $456,311 | 6.7% | $27.80 |
| 2026 | 0 | 0 | 0.0% | 108,310 | 42.7% | $0 | 0.0% | $0.00 |
| 2027 | 1 | 137,682 | 54.3% | 245,992 | 97.0% | $3,761,472 | 55.3% | $27.32 |
| 2028 | 0 | 0 | 0.0% | 245,992 | 97.0% | $0 | 0.0% | $0.00 |
| Thereafter | 0 | 0 | 0.0% | 245,992 | 97.0% | $0 | 0.0% | $0.00 |
| Vacant | 0 | 7,500 | 3.0% | 253,492 | 100.0% | $0 | 0.0% | $0.00 |
| Total/Weighted Average | 4 | 253,492 | 100.0% | $6,797,079 | 100.0% | $27.63(3) |
| (1) | Information obtained from the underwritten rent roll. |
| (2) | Certain tenants may have lease termination options that are exercisable prior to the originally stated expiration date of the subject lease and that are not considered in the Lease Expiration Schedule. |
| (3) | Weighted Average Annual U/W Base Rent PSF excludes vacant space. |
THE INFORMATION IN THIS STRUCTURAL AND COLLATERAL TERM SHEET IS NOT COMPLETE AND MAY BE AMENDED PRIOR TO THE TIME OF SALE. THIS TERM SHEET IS NOT AN OFFER TO SELL THESE SECURITIES AND IT IS NOT A SOLICITATION OF AN OFFER TO BUY THESE SECURITIES IN ANY JURISDICTION WHERE THE OFFER OR SALE IS NOT PERMITTED.
37
| Office - Suburban | Loan #5 | Cut-off Date Balance: | $35,000,000 | |
| 575 Maryville Centre Drive | 575 Maryville | Cut-off Date LTV: | 69.6% | |
| Town & Country, MO 63141 | U/W NCF DSCR: | 2.00x | ||
| U/W NOI Debt Yield: | 11.3% |
The following table presents historical occupancy percentages at the 575 Maryville Property:
Historical Occupancy
12/31/2014(1) | 12/31/2015(1)(2) | 12/31/2016(1)(2) | 12/31/2017(1)(2) | 11/30/2018(3) |
| 100.0% | 81.8% | 54.4% | 88.5% | 97.0% |
| (1) | Information obtained from the 575 Maryville Borrower. |
| (2) | The decrease in historical occupancy from 2014 to 2015 is a result of Century Link downsizing by 46,125 square feet in November 2015. This space was backfilled by Cushman & Wakefield in February 2016. The decrease in historical occupancy from 2015 to 2016 is a result of a former tenant, State Farm, vacating their 45,869 square feet of space in June 2016 and Eastman downsizing by 69,605 square feet in 2016. The State Farm space was backfilled by Cushman & Wakefield in February 2017, and Cushman & Wakefield exercised their option to take a 45,688 square foot portion of the Eastman space in November 2016. Additionally, Maryville University, backfilled a different 16,417 square foot portion of the former Eastman space in August 2017. |
| (3) | Information obtained from the underwritten rent roll. |
Operating History and Underwritten Net Cash Flow. The following table presents certain information relating to the underwritten net cash flow at the 575 Maryville Property:
Cash Flow Analysis
| 2015 | 2016 | 2017 | TTM 9/30/2018(1) | U/W(1) | %(2) | U/W $ per SF | |
| Rents in Place | $6,479,856 | $6,462,355 | $6,020,095 | $5,762,487 | $6,627,749 | 94.0% | $26.15 |
| Contractual Rent Steps(3) | 0 | 0 | 0 | 0 | 169,329 | 2.4 | 0.67 |
| Grossed Up Vacant Space | 0 | 0 | 0 | 0 | 206,250 | 2.9 | 0.81 |
| Gross Potential Rent | $6,479,856 | $6,462,355 | $6,020,095 | $5,762,487 | $7,003,328 | 99.3% | $27.63 |
| Other Income | 0 | 0 | 29,970 | 37,666 | 37,666 | 0.5 | 0.15 |
| Total Recoveries | 339,367 | 294,705 | 364,157 | 229,652 | 10,417 | 0.1 | 0.04 |
| Net Rental Income | $6,819,223 | $6,757,060 | $6,414,222 | $6,029,804 | $7,051,411 | 100.0% | $27.82 |
| (Vacancy & Credit Loss)(4) | 0 | 0 | (504,492) | (586,371) | (490,233)(4) | (7.0)(5) | (1.93) |
| Effective Gross Income | $6,819,223 | $6,757,060 | $5,909,730 | $5,443,434 | $6,561,178 | 100.0% | $25.88 |
| Real Estate Taxes | 737,560 | 752,050 | 781,723 | 801,714 | 811,261 | 12.4 | 3.20 |
| Insurance | 86,999 | 79,521 | 78,460 | 75,114 | 52,450 | 0.8 | 0.21 |
| Management Fee | 204,883 | 199,729 | 177,460 | 162,786 | 196,835 | 3.0 | 0.78 |
| Other Operating Expenses | 1,484,628 | 1,475,136 | 1,428,543 | 1,531,373 | 1,531,373 | 23.3 | 6.04 |
| Total Operating Expenses | $2,514,070 | $2,506,436 | $2,466,186 | $2,570,987 | $2,591,920 | 39.5% | $10.22 |
| Net Operating Income | $4,305,153 | $4,250,624 | $3,443,544 | $2,872,447 | $3,969,258 | 60.5% | $15.66 |
| Replacement Reserves | 0 | 0 | 0 | 0 | 50,698 | 0.8 | 0.20 |
| TI/LC | 0 | 0 | 0 | 0 | 493,602 | 7.5 | 1.95 |
| Net Cash Flow | $4,305,153 | $4,250,624 | $3,443,544 | $2,872,447 | $3,424,957 | 52.2% | $13.51 |
| NOI DSCR | 2.51x | 2.48x | 2.01x | 1.67x | 2.31x | ||
| NCF DSCR | 2.51x | 2.48x | 2.01x | 1.67x | 2.00x | ||
| NOI Debt Yield | 12.3% | 12.1% | 9.8% | 8.2% | 11.3% | ||
| NCF Debt Yield | 12.3% | 12.1% | 9.8% | 8.2% | 9.8% |
| (1) | The increase in Net Operating Income from TTM 9/30/2018 to U/W is primarily driven by (i) the expiration of free rent periods, (ii) Cushman & Wakefield’s expansion into an additional 21,605 square feet with a commencement date of 8/1/2019 (all gap rent reserved) and (iii) increased rent driven by contractual rent steps and straight line rent for Eastman. |
| (2) | Represents (i) percent of Net Rental Income for all revenue fields, (ii) percent of Gross Potential Rent for Vacancy & Credit Loss and (iii) percent of Effective Gross Income for all other fields. |
| (3) | Represents contractual rent steps through November 2019 and straight line rent averaging for Eastman (see “Major Tenants” table above). |
| (4) | Vacancy & Credit Loss represents (i) free rent adjustments for 2017 and TTM 9/30/2018 and (ii) vacancy gross up and an additional vacancy adjustment for U/W. |
| (5) | The underwritten economic vacancy is 7.0%. The 575 Maryville Property was 97.0% leased as of November 30, 2018. |
THE INFORMATION IN THIS STRUCTURAL AND COLLATERAL TERM SHEET IS NOT COMPLETE AND MAY BE AMENDED PRIOR TO THE TIME OF SALE. THIS TERM SHEET IS NOT AN OFFER TO SELL THESE SECURITIES AND IT IS NOT A SOLICITATION OF AN OFFER TO BUY THESE SECURITIES IN ANY JURISDICTION WHERE THE OFFER OR SALE IS NOT PERMITTED.
38
| Office - Suburban | Loan #5 | Cut-off Date Balance: | $35,000,000 | |
| 575 Maryville Centre Drive | 575 Maryville | Cut-off Date LTV: | 69.6% | |
| Town & Country, MO 63141 | U/W NCF DSCR: | 2.00x | ||
| U/W NOI Debt Yield: | 11.3% |
Appraisal.The appraiser concluded to an “as-is” appraised value of $50,280,000 as of September 6, 2018.
Environmental Matters. According to a Phase I environmental site assessment dated September 18, 2018, there was no evidence of any recognized environmental conditions at the 575 Maryville Property.
Market Overview and Competition.The 575 Maryville Property is located in Town & Country, Missouri, about fifteen miles from the St. Louis central business district and located within West St. Louis County. The 575 Maryville Property is located directly off Interstate 64, a major east/west interstate spanning from Missouri to Virginia. Interstate 64 also provides access to Interstate 170 (approximately nine miles east of the 575 Maryville Property) and Interstate 70 (approximately 20 miles west of the property). According to the appraisal, several Fortune 500 companies are located in West St. Louis County, including Energizer, RGA, and Monsanto Company, as well as one of the largest private employers in the world, Edward Jones. West St. Louis County also contains the strongest retail corridor in the St. Louis MSA, with two new outlet malls – the 310,000 square-foot Taubman Prestige Outlets and the 420,000 square-foot St. Louis Premium Outlets – located 6.7 miles and 9.8 miles to the west of the 575 Maryville Property, respectively. Nearby Chesterfield also boasts one of the longest outdoor strip malls in the country, anchored by Walmart, Home Depot, Lowe’s, Target, Best Buy, and several others.
Geographically, St. Louis is the most centralized major metropolitan area in the United States. The greater St. Louis region has a highly diversified industry structure, with net job growth in the public sector, private industries, transportation/warehousing, and retail trade. St. Louis is the ninth most affordable metro area in the United States and is also ranked in the top 6% for the highest standard of living out of the largest 53 metro areas in the United States.
The 575 Maryville Property is located in the affluent suburb of Town & Country. The 2018 median household income within a 1-mile, 3-mile and 5-mile radius was $149,609, $111,359 and $99,232, respectively.
Submarket Information – According to a third-party market research report, the 575 Maryville Property is situated within the Chesterfield/Highway 40 submarket. As of year-end 2017, the submarket reported a total inventory of 5.7 million square feet with a 4.8% vacancy rate. According to the appraisal, the subject submarket is considered an upper-tier submarket in comparison to the overall market area.
Appraiser’s Comp Set – The appraiser identified five primary competitive properties for the 575 Maryville Property totaling approximately 538,035 square feet, which reported a weighted average occupancy rate of approximately 93.9%. The appraiser concluded to net market rents for the 575 Maryville Property of $27.50 per square foot for both office and small office tenants.
The following table presents certain information relating to the appraiser’s market rent conclusion for the 575 Maryville Property:
Market Rent Summary(1)
| Office | Office Small | |
| Market Rent (PSF) | $27.50 | $27.50 |
| Average Lease Term (Years) | 10 | 7 |
| Lease Type (Reimbursements) | Future Base Year | Future Base Year |
| Rent Increase Projection | 2.5% per annum | 2.5% per annum |
| (1) | Information obtained from the appraisal. |
THE INFORMATION IN THIS STRUCTURAL AND COLLATERAL TERM SHEET IS NOT COMPLETE AND MAY BE AMENDED PRIOR TO THE TIME OF SALE. THIS TERM SHEET IS NOT AN OFFER TO SELL THESE SECURITIES AND IT IS NOT A SOLICITATION OF AN OFFER TO BUY THESE SECURITIES IN ANY JURISDICTION WHERE THE OFFER OR SALE IS NOT PERMITTED.
39
| Office - Suburban | Loan #5 | Cut-off Date Balance: | $35,000,000 | |
| 575 Maryville Centre Drive | 575 Maryville | Cut-off Date LTV: | 69.6% | |
| Town & Country, MO 63141 | U/W NCF DSCR: | 2.00x | ||
| U/W NOI Debt Yield: | 11.3% |
The table below presents certain information relating to comparable sales for the 575 Maryville Property identified by the appraiser:
Comparable Sales(1)
| Property Name | Location | Rentable Area (SF) | Sale Date | Sale Price | Sale Price (PSF) |
| Maryville Center Buildings | St. Louis, MO | 252,378 | Apr-18 | $48,456,576 | $192.00 |
| Westview Place | Creve Coeur, MO | 125,645 | Dec-17 | $17,850,000 | $142.07 |
| One Chesterfield Place | Chesterfield, MO | 143,473 | Dec-16 | $27,500,000 | $191.67 |
| Woods Mill Pointe | Town & Country, MO | 79,131 | Apr-16 | $12,763,000 | $161.29 |
| Maryville Office Building | Town & Country, MO | 75,397 | Sep-14 | $14,200,000 | $188.34 |
| (1) | Information obtained from the appraisal. |
The table below presents certain information relating to five comparable office properties to the 575 Maryville Property identified by the appraiser:
Competitive Set(1)
| 575 Maryville (Subject) | The Fives @ Maryville | 530 Building | 520 Building | 540 Building | Woods Mill Pointe | |
| Location | Town & Country, MO | St. Louis, MO | Town & County, MO | St. Louis, MO | Town & Country, MO | Town & Country, MO |
| Distance from Subject | -- | 0.1 miles | 0.2 miles | 0.2 miles | 0.1 miles | 0.8 miles |
| Property Type | Office/Suburban | Office/Suburban | Office/Suburban | Office/Suburban | Office/Suburban | Office/Suburban |
| Year Built/Renovated | 1999/NAP | 2001/NAP | 1990/NAP | 1999/NAP | 1990/2001 | 1989/NAP |
| Total GLA | 253,492 SF | 127,082 SF | 107,962 SF | 115,453 SF | 107,972 SF | 79,566 SF |
| Total Occupancy | 97.0% | 92.0% | 98.0% | 100.0% | 81.0% | 100.0% |
| (1) | Information obtained from the appraisal and the underwritten rent roll. |
The following table presents certain information relating to five comparable leases to those at the 575 Maryville Property:
Comparable Leases(1)
| Property Name/Location | Year Built/ Renovated | Total GLA (SF) | Distance from Subject | Occupancy | Lease Term | Tenant Size | Annual Base Rent PSF |
The Fives @ Maryville 555 Maryville Centre Drive St. Louis, MO | 2001/NAP | 127,082 | 0.1 miles | 92.0% | 4.3 Yrs 7.7 Yrs 8.1 Yrs | 19,292 SF 9,773 SF 24,546 SF | $30.00 $29.50 $29.50 |
540 Building 540 Maryville Centre Drive, Town & Country, MO | 1990/2001 | 107,972 | 0.1 miles | 81.0% | 3.0 Yrs | 7,456 SF | $26.00 |
530 Building 530 Maryville Centre Drive, Town & Country, MO | 1990/NAP | 107,962 | 0.2 miles | 98.0% | 6.0 Yrs | 7,233 SF | $27.67 |
520 Building 520 Maryville Centre Drive, St. Louis, MO | 1999/NAP | 115,453 | 0.2 miles | 100.0% | 6.4 Yrs 10.3 Yrs 5.0 Yrs | 22,559 SF 11,673 SF 5,143 SF | $27.50 $28.75 $20.00 |
Woods Mill Pointe 425 S. Woods Mill Road, Town & Country, MO | 1989/NAP | 79,566 | 0.8 miles | 100.0% | 8.2 Yrs | 57,025 SF | $24.60 |
| (1) | Information obtained from the appraisal. |
THE INFORMATION IN THIS STRUCTURAL AND COLLATERAL TERM SHEET IS NOT COMPLETE AND MAY BE AMENDED PRIOR TO THE TIME OF SALE. THIS TERM SHEET IS NOT AN OFFER TO SELL THESE SECURITIES AND IT IS NOT A SOLICITATION OF AN OFFER TO BUY THESE SECURITIES IN ANY JURISDICTION WHERE THE OFFER OR SALE IS NOT PERMITTED.
40
| Office - Suburban | Loan #5 | Cut-off Date Balance: | $35,000,000 | |
| 575 Maryville Centre Drive | 575 Maryville | Cut-off Date LTV: | 69.6% | |
| Town & Country, MO 63141 | U/W NCF DSCR: | 2.00x | ||
| U/W NOI Debt Yield: | 11.3% |
Escrows.
Real Estate Taxes – The loan documents require an upfront real estate tax reserve of $69,633 and ongoing monthly real estate tax reserves in an amount equal to one-twelfth of the real estate taxes that the lender estimates will be payable during the next twelve months (initially $69,633).
Insurance – Ongoing monthly insurance reserves, equaling one-twelfth of the insurance premiums that the lender estimates will be payable during the next twelve months, are not currently required and will not be required so long as the 575 Maryville Borrower maintains a blanket policy acceptable to the lender.
Replacement Reserves – The loan documents require an upfront replacement reserve of $200,000 to cover the landlord’s share of any common area and lobby improvements pursuant to an agreement with Cushman & Wakefield. The loan documents require ongoing monthly replacement reserves of $4,301 for replacements and repairs required to be made to the property during the calendar year.
TI/LC Reserve –The loan documents require an ongoing monthly TI/LC reserve of $32,256.
Existing TI/LC Reserves – The loan documents require an upfront reserve of $1,710,919 for existing TI/LCs related to Cushman & Wakefield ($1,560,919) and Eastman ($150,000).
Gap Rent Reserve – The loan documents require an upfront reserve of $344,312 for gap rent related to Cushman & Wakefield.
Common Charges Reserve –The loan documents require an upfront common charges reserve of $45,730 and ongoing monthly common charges reserves in an amount equal to one-twelfth of the common charges that the lender estimates will be payable during the next twelve months (initially $3,518).
Lockbox and Cash Management.The 575 Maryville Mortgage Loan documents require a hard lockbox with springing cash management. The borrower was required at origination of the 575 Maryville Mortgage Loan to deliver written instructions to tenants directing them to deposit all rents payable under such leases directly into a lender-controlled lockbox account. The 575 Maryville Mortgage Loan documents require that all rents received by the 575 Maryville Borrower or the property manager be deposited into the lockbox account within one business day of receipt. Funds in the lockbox account, absent the occurrence and continuance of a Triggering Event (as defined below), are required to be transferred daily to a borrower operating account. Upon the first occurrence of a Triggering Event, the 575 Maryville Borrower is required to establish a cash management account under sole control of the lender, to which during a Triggering Event, all amounts in the lockbox account are required to be automatically transferred daily for the payment, among other things, of the debt service, monthly escrows, default interest and late payment charges. During a Cushman Trigger Event (as defined below), any remaining funds after such disbursements are required to be deposited to the Cushman & Wakefield rollover reserve account until such account equals or exceeds $5,507,280. Any remaining funds after such disbursements are required to be, (i) during a Low DSCR Period (defined below), distributed to an excess cash reserve account, and otherwise, (ii) to the 575 Maryville Borrower if no event of default has occurred and is continuing.
A “Triggering Event” will commence upon the earliest to occur of the following:
| (i) | an event of default under the 575 Maryville Mortgage Loan documents; |
| (ii) | the net cash flow debt service coverage ratio for the 575 Maryville debt falling below 1.20x based on a thirty-year amortization schedule (approximately 1.55x based on the interest only debt service) ( a “Low DSCR Period”); or |
| (iii) | a Cushman Trigger Event. |
A Triggering Event will end upon the occurrence of:
| ● | with regard to clause (i) above, the cure of such event of default; |
| ● | with regard to clause (ii) above, the net cash flow debt service coverage ratio for the 575 Maryville debt being equal to or greater than 1.25x based on a 30-year amortization schedule (approximately 1.61x based on the interest only debt service payment) for two consecutive calendar quarters; or |
| ● | with regard to clause (iii) above, a Cushman Re-Tenanting Event (as defined below). |
A “Cushman Trigger Event” will commence upon the occurrence of:
| (i) | the earliest to occur of (a) January 31, 2026 (18 months prior to Cushman & Wakefield’s lease expiration date), (b) Cushman & Wakefield giving notice that it intends to terminate its lease pursuant to the terms of the Cushman & Wakefield lease, or (c) Cushman & Wakefield giving notice to the 575 Maryville Borrower in writing of its intent not to renew its lease pursuant to the terms of its lease, provided that in each case of (a), (b), and (c) a Cushman Re-Tenanting Event (as defined below) has not occurred; |
| (ii) | Cushman & Wakefield abandoning its leased space of 137,682 square feet; |
| (iii) | Cushman & Wakefield filing for bankruptcy, insolvency, or reorganization; |
| (iv) | the Cushman & Wakefield lease has in fact been terminated provided that a Cushman Re-Tenanting Event has not then occurred; or |
| (v) | Cushman & Wakefield becomes delinquent under the payment obligations of its lease. |
THE INFORMATION IN THIS STRUCTURAL AND COLLATERAL TERM SHEET IS NOT COMPLETE AND MAY BE AMENDED PRIOR TO THE TIME OF SALE. THIS TERM SHEET IS NOT AN OFFER TO SELL THESE SECURITIES AND IT IS NOT A SOLICITATION OF AN OFFER TO BUY THESE SECURITIES IN ANY JURISDICTION WHERE THE OFFER OR SALE IS NOT PERMITTED.
41
| Office - Suburban | Loan #5 | Cut-off Date Balance: | $35,000,000 | |
| 575 Maryville Centre Drive | 575 Maryville | Cut-off Date LTV: | 69.6% | |
| Town & Country, MO 63141 | U/W NCF DSCR: | 2.00x | ||
| U/W NOI Debt Yield: | 11.3% |
A “Cushman Re-Tenanting Event” shall occur when the 575 Maryville Borrower has delivered to the lender:
| (i) | evidence reasonably satisfactory to the lender that (w) Cushman & Wakefield has given notice of renewal under the terms of its lease; (x) pursuant to a lease amendment or new lease, Cushman & Wakefield has agreed to remain in possession of its leased space at a rental rate of not less than $27.50 per square foot and otherwise constitutes a Qualified Replacement Lease (as defined below); (y) the entire Cushman & Wakefield space has been re-tenanted under one or more Qualified Replacement Leases; or (z) the Cushman & Wakefield lease has been affirmed by Cushman & Wakefield in a bankruptcy proceeding; and |
| (ii) | tenant estoppel(s) reasonably satisfactory to the lender. |
A “Qualified Replacement Lease” shall mean a lease (i) with a term no less than five years; (ii) with a tenant reasonably acceptable to the lender; (iii) containing rental rates of at least $27.50 per square foot; (iv) that does not have a material adverse effect on the use, value, or operation of the 575 Maryville Property; (v) that is an arms-length transaction with an independent third party tenant; (vi) is in compliance with the 575 Maryville Mortgage Loan documents; (vii) that is subject to and subordinate to the lien of the security instrument securing the 575 Maryville Mortgage Loan and the tenant agrees to attorn to lender; and (viii) that is otherwise on market terms and is reasonably acceptable to lender.
Property Management. The 575 Maryville Property is managed Cushman & Wakefield U.S., Inc., a subsidiary of Cushman & Wakefield.
Partial Release. Not permitted.
Real Estate Substitution.Not permitted.
Subordinate and Mezzanine Indebtedness.None.
Ground Lease. None.
Terrorism Insurance.The 575 Maryville Mortgage Loan documents require that the “all risk” insurance policy required to be maintained by the 575 Maryville Borrower provides coverage for terrorism in an amount equal to the full replacement cost of the 575 Maryville Property, as well as business interruption insurance covering no less than the 18-month period following the occurrence of a casualty event, together with a 365-day extended period of indemnity that covers acts of terrorism. Provided that the TRIPRA is no longer in effect and such policies contain an exclusion for acts of terrorism, the 575 Maryville Borrower will obtain, to the extent available, a stand-alone policy that provides the same coverage as the policies would have if such exclusion did not exist.
THE INFORMATION IN THIS STRUCTURAL AND COLLATERAL TERM SHEET IS NOT COMPLETE AND MAY BE AMENDED PRIOR TO THE TIME OF SALE. THIS TERM SHEET IS NOT AN OFFER TO SELL THESE SECURITIES AND IT IS NOT A SOLICITATION OF AN OFFER TO BUY THESE SECURITIES IN ANY JURISDICTION WHERE THE OFFER OR SALE IS NOT PERMITTED.
42
| No. 6 – Grapevine Station | |||||||
| Mortgage Loan Information | Mortgaged Property Information | ||||||
| Mortgage Loan Seller: | Wells Fargo Bank, National Association | Single Asset/Portfolio: | Single Asset | ||||
Credit Assessment (DBRS/Fitch/Moody’s): | NR/NR/NR | Property Type – Subtype: | Multifamily – Garden | ||||
| Original Principal Balance: | $34,000,000 | Location: | Grapevine, TX | ||||
| Cut-off Date Balance: | $34,000,000 | Size: | 273 Units | ||||
| % of Initial Pool Balance: | 4.4% | Cut-off Date Balance Per Unit: | $124,542 | ||||
| Loan Purpose: | Acquisition | Maturity Date Balance Per Unit: | $124,542 | ||||
| Year Built/Renovated: | 2013/NAP | ||||||
| Borrower Sponsor: | Myron a/k/a Michael Blackman; Michel D. Hibbert | Title Vesting: | Fee | ||||
| Guarantors: | (1) | Property Manager: | SunRidge Management Group, Inc. | ||||
| Mortgage Rate: | 5.1500% | Current Occupancy (As of): | 93.8% (11/15/2018) | ||||
| Note Date: | January 7, 2019 | YE 2017 Occupancy: | 95.0% | ||||
| Seasoning: | 2 months | YE 2016 Occupancy: | 97.0% | ||||
| Maturity Date: | January 11, 2029 | YE 2015 Occupancy(3): | 98.0% | ||||
| IO Period: | 120 months | YE 2014 Occupancy(3): | 83.0% | ||||
| Loan Term (Original): | 120 months | Appraised Value: | $53,000,000 | ||||
| Amortization Term (Original): | NAP | Appraised Value Per Unit: | $194,139 | ||||
| Loan Amortization Type: | Interest-only, Balloon | Appraisal Valuation Date: | November 8, 2018 | ||||
| Call Protection: | L(26),D(90),O(4) | ||||||
| Lockbox Type: | Soft/Springing Cash Management | Underwriting and Financial Information | |||||
| Additional Debt: | None | TTM NOI (10/31/2018): | $2,577,089 | ||||
| Additional Debt Type (Balance): | NAP | YE 2017 NOI: | $2,601,886 | ||||
| YE 2016 NOI: | $2,534,347 | ||||||
| YE 2015 NOI(4): | NAV | ||||||
| U/W Revenues: | $4,763,775 | ||||||
| U/W Expenses: | $2,116,301 | ||||||
| U/W NOI: | $2,647,474 | ||||||
| U/W NCF: | $2,579,224 | ||||||
| Escrows and Reserves(2) | U/W DSCR based on NOI/NCF: | 1.49x / 1.45x | |||||
| Initial | Monthly | Cap | U/W Debt Yield based on NOI/NCF: | 7.8% / 7.6% | |||
| Taxes | $92,787 | $92,787 | NAP | U/W Debt Yield at Maturity based on NOI/NCF: | 7.8% / 7.6% | ||
| Insurance | $0 | Springing | NAP | Cut-off Date LTV Ratio: | 64.2% | ||
| Replacement Reserve | $0 | $5,688 | NAP | LTV Ratio at Maturity: | 64.2% | ||
| Sources and Uses | ||||||||
| Sources | Uses | |||||||
| Original loan amount | $34,000,000 | 63.5% | Purchase price | $52,000,000 | 97.2% | |||
| Borrower’s equity | 19,523,581 | 36.5 | Upfront reserves | 92,787 | 0.2 | |||
| Closing costs | 1,430,794 | 2.7 | ||||||
| Total Sources | $53,523,581 | 100.0% | Total Uses | $53,523,581 | 100.0% | |||
| (1) | The Guarantors of the Grapevine Station Mortgage Loan (as defined below) are Myron a/k/a Michael Blackman, individually and as trustee of the Survivor’s Trust under the Myron and Roslyn Blackman Family Trust, Michel Daniel Hibbert as trustee of the Hibbert Living Trust and Michel D. Hibbert. |
| (2) | See “Escrows” section below. |
| (3) | The increase in Occupancy from YE 2014 to YE 2015 is a result of leasing commencing in early 2014 and subsequent occupancy stabilization. |
| (4) | Historical operating statements prior to 2016 are not available, as the Grapevine Station Property was recently acquired and such information was not made available by the prior owner. |
The Mortgage Loan. The mortgage loan (“Grapevine Station Mortgage Loan”) is evidenced by a single promissory note secured by a first mortgage encumbering the fee interest in a 273-unit multifamily garden style property located in Grapevine, Texas (the “Grapevine Station Property”).
THE INFORMATION IN THIS STRUCTURAL AND COLLATERAL TERM SHEET IS NOT COMPLETE AND MAY BE AMENDED PRIOR TO THE TIME OF SALE. THIS TERM SHEET IS NOT AN OFFER TO SELL THESE SECURITIES AND IT IS NOT A SOLICITATION OF AN OFFER TO BUY THESE SECURITIES IN ANY JURISDICTION WHERE THE OFFER OR SALE IS NOT PERMITTED.
43
| Multifamily – Garden | Loan #6 | Cut-off Date Balance: | $34,000,000 | |
| 1022 Texan Trail | Grapevine Station | Cut-off Date LTV: | 64.2% | |
| Grapevine, TX 76051 | U/W NCF DSCR: | 1.45x | ||
| U/W NOI Debt Yield: | 7.8% |
The Borrower and Borrower Sponsor.The borrower is BH Grapevine Station, LLC, a Delaware limited liability company and single purpose entity with one independent director. Legal counsel to the borrower delivered a non-consolidation opinion in connection with the origination of the Grapevine Station Mortgage Loan. The borrower sponsors are Myron a/k/a Michael Blackman and Michel D. Hibbert. The nonrecourse carve-out guarantors of the Grapevine Station Mortgage Loan are Myron a/k/a Michael Blackman, individually and as trustee of the Survivor’s Trust under the Myron and Roslyn Blackman Family Trust, Michel Daniel Hibbert as trustee of the Hibbert Living Trust and Michel D. Hibbert.
Mr. Blackman has been investing in multifamily real estate since 1986 and has been investing in apartment buildings in the Dallas, Texas area since 2005. Mr. Blackman currently owns approximately 512 apartment units plus an approximately 12,000 square foot office building, a 14,700 square foot Walgreens, an approximately 60,000 square foot office and retail complex and 2 apartment buildings under construction totaling approximately 92 units. Mr. Hibbert has been involved in real estate since 1985 as a broker specializing in the sale of apartment properties, development land and commercial-investment properties. Mr. Hibbert currently owns 13 multifamily properties in California and Texas, totaling approximately 668 units.
The Property. The Grapevine Station Property is a 273-unit, class A multifamily property comprising nine, three-story buildings located in Grapevine, Texas. Constructed in 2013, the Grapevine Station Property comprises 42 studio units, 164 one-bedroom units, 55 two-bedroom units, and 12 two-bedroom townhouse units. Common area amenities at the Grapevine Station Property include an outdoor swimming pool with a sundeck, a community courtyard, a fitness center, picnic areas with BBQ grills, a dog park and a club room. Unit amenities include nine-foot ceiling heights, stainless steel appliances, built-in microwaves, walk-in closets, private patio or balcony, granite countertops and garden tubs. As of November 15, 2018, the Grapevine Station Property was 93.8% occupied and has averaged 94.8% occupancy since 2015.
The Grapevine Station Property is situated on a 10.2-acre site with 472 total parking spaces (surface, covered and garage) resulting in a parking ratio of 1.7 spaces per unit. The garage and carport parking is rented to residents on a monthly basis with rental rates ranging from $135-250 per month for various one- and two-car garage spaces and $35-55 per month for carport spaces.
The following table presents certain information relating to the unit mix and the appraiser’s market rent conclusion of the Grapevine Station Property:
Unit Mix Summary(1)
| Unit Type | Total No. of Units | % of Total Units | Average Unit Size (SF) | Average Contract Monthly Rent per Unit | Market Monthly Rent |
| Studio / 1 Bathroom | 42 | 15.4% | 608 | $1,227 | $1,250 |
| 1 Bedroom / 1 Bathroom | 146 | 53.5% | 756 | $1,339 | $1,354 |
| 1 Bedroom / 1 Bathroom Flex | 18 | 6.6% | 829 | $1,530 | $1,551 |
| 2 Bedroom / 2 Bathroom | 55 | 20.1% | 1,100 | $1,766 | $1,802 |
| 2 Bedroom / 2.5 Bathroom Town House | 12 | 4.4% | 1,188 | $2,082 | $2,199 |
| Total/Weighted Average | 273 | 100.0% | 826 | $1,453 | $1,478 |
| (1) | Information obtained from the appraisal. |
The following table presents historical occupancy percentages at the Grapevine Station Property:
Historical Occupancy
12/31/2014(1)(2) | 12/31/2015(1)(2) | 12/31/2016(1) | 12/31/2017(1) | 11/15/2018(3) |
| 83.0% | 98.0% | 97.0% | 95.0% | 93.8% |
| (1) | Information obtained from the borrower. |
| (2) | The Grapevine Station Property was built in 2013. The increase in Occupancy from 12/31/2014 to 12/31/2015 is a result of leasing commencing in early 2014 and subsequent occupancy stabilization. |
| (3) | Information obtained from the underwritten rent roll. |
THE INFORMATION IN THIS STRUCTURAL AND COLLATERAL TERM SHEET IS NOT COMPLETE AND MAY BE AMENDED PRIOR TO THE TIME OF SALE. THIS TERM SHEET IS NOT AN OFFER TO SELL THESE SECURITIES AND IT IS NOT A SOLICITATION OF AN OFFER TO BUY THESE SECURITIES IN ANY JURISDICTION WHERE THE OFFER OR SALE IS NOT PERMITTED.
44
| Multifamily – Garden | Loan #6 | Cut-off Date Balance: | $34,000,000 | |
| 1022 Texan Trail | Grapevine Station | Cut-off Date LTV: | 64.2% | |
| Grapevine, TX 76051 | U/W NCF DSCR: | 1.45x | ||
| U/W NOI Debt Yield: | 7.8% |
Operating History and Underwritten Net Cash Flow. The following table presents certain information relating to the historical operating performance and the underwritten net cash flow at the Grapevine Station Property:
Cash Flow Analysis(1)
| 2016 | 2017 | TTM 10/31/2018 | U/W |
%(2) | U/W $ per Unit | ||||||||
| Base Rent | $4,225,047 | $4,381,047 | $4,352,878 | $4,512,432 | 85.9% | $16,529 | |||||||
| Grossed Up Vacant Space | 0 | 0 | 0 | 330,444 | 6.3 | 1,210 | |||||||
| Gross Potential Rent | $4,225,047 | $4,381,047 | $4,352,878 | $4,842,876 | 92.2% | $17,739 | |||||||
| Parking Income | 45,305 | 42,768 | 42,462 | 42,462 | 0.8 | 156 | |||||||
| Other Income(3) | 334,468 | 324,296 | 368,435 | 368,435 | 7.0 | 1,350 | |||||||
| Net Rental Income | $4,604,820 | $4,748,111 | $4,763,775 | $5,253,773 | 100.0% | $19,245 | |||||||
| Less Vacancy & Credit Loss | 0 | 0 | 0 | (489,998)(4) | (10.1) | (1,795) | |||||||
| Effective Gross Income | $4,604,820 | $4,748,111 | $4,763,775 | $4,763,775 | 90.7% | $17,450 | |||||||
| Real Estate Taxes | 898,907 | 961,068 | 970,075 | 1,003,407 | 21.1 | 3,675 | |||||||
| Insurance | 147,984 | 106,243 | 87,696 | 135,956 | 2.9 | 498 | |||||||
| Management Fee | 252,009 | 256,984 | 301,598 | 190,551 | 4.0 | 698 | |||||||
| Other Operating Expenses | 771,573 | 821,930 | 827,318 | 786,388 | 16.5 | 2,881 | |||||||
| Total Operating Expenses | $2,070,473 | $2,146,225 | $2,186,686 | $2,116,301 | 44.4% | $7,752 | |||||||
| Net Operating Income | $2,534,347 | $2,601,886 | $2,577,089 | $2,647,474 | 55.6% | $9,698 | |||||||
| Capital Expenditures | 0 | 0 | 0 | 68,250 | 1.4 | 250 | |||||||
| Net Cash Flow | $2,534,347 | $2,601,886 | $2,577,089 | $2,579,224 | 54.1% | $9,448 | |||||||
| NOI DSCR | 1.42x | 1.46x | 1.45x | 1.49x | |||||||||
| NCF DSCR | 1.42x | 1.46x | 1.45x | 1.45x | |||||||||
| NOI DY | 7.5% | 7.7% | 7.6% | 7.8% | |||||||||
| NCF DY | 7.5% | 7.7% | 7.6% | 7.6% |
| (1) | Historical operating statements prior to 2016 are not available, as the Grapevine Station Property was recently acquired and such information was not made available by the prior owner. |
| (2) | Represents (i) percent of Net Rental Income for all revenue fields, (ii) percent of Gross Potential Rent for Vacancy & Credit Loss and (iii) percent of Effective Gross Income for all other fields. |
| (3) | Other Income includes storage income, ratio utility billing system and other miscellaneous items such as pet fees and leases less than 12 months. |
| (4) | The underwritten economic vacancy is 10.1%. The Grapevine Station Property was 93.8% physically occupied and 93.1% economically occupied as of November 15, 2018. |
Appraisal.The appraiser concluded to an “as-is” appraised value of $53,000,000 as of November 8, 2018.
Environmental Matters. According to a Phase I environmental assessment dated November 15, 2018, there was no evidence of any recognized environmental conditions at the Grapevine Station Property.
Market Overview and Competition.The Grapevine Station Property is located in Grapevine, Texas, approximately 22.5 miles northwest of the Dallas central business district and 24.1 miles northeast of the Fort Worth central business district. The Grapevine Station Property is situated immediately adjacent to State Route 26 and State Route 114, approximately 2.9 miles southwest of Interstate 635 and 7.9 miles southwest of Interstate 35E. The intersection of State Route 26 and Ruth Wall Road is approximately 0.3 miles north of the Grapevine Station Property and, according to a third party market research provider, had a daily traffic count of approximately 31,810 vehicles as of 2017. According to a third party market research provider, the area within a 1-mile radius of the Grapevine Station Property grew by approximately 29.0% between 2010 and 2018. A population growth of approximately 9.7% is projected in the same area between 2018 and 2023.
The Grapevine Station Property is located approximately 6.7 miles northwest of Cypress Waters, a 1,000-acre master-planned development centered around a 362-acre lake. The Grapevine Station Property is also located approximately 4.1 miles northwest of Dallas Fort Worth International Airport, the 4th busiest airport in the world by total take-off and landing in 2017, per third-party news and market research providers. Grapevine Mills, a 1.5 million square foot Simon-owned regional mall is located approximately 2.4 miles northeast of the Grapevine Station Property. Grapevine Mills features approximately 180 stores including Neiman Marcus Last Call, Saks Fifth Avenue OFF 5TH, H&M, Forever 21, Nike Factory Store, Coach Factory, Under Armour, Disney Outlet and J Crew. Grapevine Mills also contains a 30-screen AMC Dine-In Theatre, LEGOLAND Discovery Center, Sea Life Aquarium, an escape room venue, bowling lanes and Rainforest Café.
According to a third party market report, the estimated 2018 population within a three- and five-mile radius of the Grapevine Station Property was 27,939 and 108,655, respectively; and the estimated 2018 average household income within the same radii was $93,068 and $135,854, respectively.
Submarket Information – According to a third-party market research report, the Grapevine Station Property is situated within the Grapevine submarket. As of the third quarter of 2018, the submarket reported a total inventory of 8,699 units with a 4.0% vacancy rate.
THE INFORMATION IN THIS STRUCTURAL AND COLLATERAL TERM SHEET IS NOT COMPLETE AND MAY BE AMENDED PRIOR TO THE TIME OF SALE. THIS TERM SHEET IS NOT AN OFFER TO SELL THESE SECURITIES AND IT IS NOT A SOLICITATION OF AN OFFER TO BUY THESE SECURITIES IN ANY JURISDICTION WHERE THE OFFER OR SALE IS NOT PERMITTED.
45
| Multifamily – Garden | Loan #6 | Cut-off Date Balance: | $34,000,000 | |
| 1022 Texan Trail | Grapevine Station | Cut-off Date LTV: | 64.2% | |
| Grapevine, TX 76051 | U/W NCF DSCR: | 1.45x | ||
| U/W NOI Debt Yield: | 7.8% |
Appraiser’s Comp Set – The appraiser identified five primary competitive properties for the Grapevine Station Property totaling 1,406 units, which reported an average occupancy rate of approximately 96.2%. The appraiser concluded to monthly market rents per unit ranging from $1,250 to $2,199 (see “Unit Mix Summary” table in “The Property” section above).
The following table presents certain information relating to comparable multifamily properties for the Grapevine Station Property:
Competitive Set(1)
| Grapevine Station (Subject) | Enclave at Grapevine | Montelena | Resort at 925 Main | Stoneledge | Wildwood Creek | |
| Location | Grapevine, TX | Grapevine, TX | Grapevine, TX | Grapevine, TX | Grapevine, TX | Grapevine, TX |
| Distance to Subject | -- | 2.2 miles | 0.7 miles | 0.8 miles | 0.5 miles | 0.6 miles |
| Property Type | Garden | Garden | Garden | Mid-Rise | Garden | Garden |
| Year Built/Renovated | 2013/NAP | 2013/NAP | 1997/NAP | 2008/NAP | 2012/NAP | 2001/NAP |
| Number of Units | 273 | 243 | 256 | 251 | 312 | 344 |
| Average Monthly Rent (per unit) | ||||||
| Studio | $1,227(2) | NAP | NAP | NAP | NAP | NAP |
| 1 Bedroom / 1 Bathroom | $1,360(2) | $1,305 | $1,165 | $1,525 | $1,260 | $1,152 |
| 2 Bedroom / 2 Bathroom | $1,766(2) | $1,365 | $1,487 | $2,150 | $1,640 | $1,634 |
| 2 Bedroom / 2.5 Bathroom TH | $2,082(2) | $2,325 | NAP | NAP | NAP | NAP |
| Occupancy | 93.8% | 98.0% | 96.0% | 94.0% | 97.0% | 96.0% |
| (1) | Information obtained from the appraisal and underwritten rent roll. |
| (2) | See “Unit Mix Summary” above for information related to the Grapevine Station Property. |
Escrows.
Real Estate Taxes – The loan documents require an upfront real estate tax reserve of $92,787 and ongoing monthly real estate tax reserves in an amount equal to one-twelfth of the real estate taxes that the lender estimates will be payable during the next twelve months (initially $92,787).
Insurance – The loan documents do not require ongoing monthly escrows for insurance premiums as long as (i) no event of default has occurred and is continuing, (ii) the borrower or borrower affiliate provides the lender with evidence that the Grapevine Station Property’s insurance coverage is included in a blanket policy and such policy is in full force and effect and (iii) the borrower pays all applicable insurance premiums and provides the lender with paid receipts no later than ten business days prior to the expiration of the policies.
Replacement Reserve – The loan documents require ongoing monthly replacement reserves of $5,688, which the lender may require the borrower to increase (not more than once per year) if the lender reasonably determines such increase is necessary to maintain the proper operation of the Grapevine Station Property.
Lockbox and Cash Management.The Grapevine Station Mortgage Loan is structured with a soft lockbox, which is already in-place, and springing cash management. Prior to the occurrence of a Cash Trap Event Period (as defined below), the loan documents require that the borrower or the property manager deposit all rents into the lockbox account within one business day of receipt and all funds in the lockbox account are required to be distributed to the borrower. During a Cash Trap Event Period, funds in the lockbox account are required to be swept to a lender-controlled cash management account and all excess funds are required to be swept to an excess cash flow subaccount controlled by the lender.
A “Cash Trap Event Period” will commence upon the earlier of the following:
| (i) | the occurrence and continuance of an event of default; or |
| (ii) | the net cash flow debt service coverage ratio falling below 1.20x at the end of any calendar quarter. |
A Cash Trap Event Period will end upon the occurrence of the following:
| ● | with regard to clause (i), the cure of such event of default; or |
| ● | with regard to clause (ii), the net cash flow debt service coverage ratio being equal to or greater than 1.25x for three consecutive calendar months. |
Property Management.The Grapevine Station Property is managed by SunRidge Management Group, Inc. (“SunRidge”), a full-service real estate management company. The company was formed in 1990 and has grown to a corporate staff of 24 and approximately 350 on-site associates. SunRidge currently manages approximately 100 properties across 12 states throughout the Southern and Western United States.
Partial Release.Not permitted
THE INFORMATION IN THIS STRUCTURAL AND COLLATERAL TERM SHEET IS NOT COMPLETE AND MAY BE AMENDED PRIOR TO THE TIME OF SALE. THIS TERM SHEET IS NOT AN OFFER TO SELL THESE SECURITIES AND IT IS NOT A SOLICITATION OF AN OFFER TO BUY THESE SECURITIES IN ANY JURISDICTION WHERE THE OFFER OR SALE IS NOT PERMITTED.
46
| Multifamily – Garden | Loan #6 | Cut-off Date Balance: | $34,000,000 | |
| 1022 Texan Trail | Grapevine Station | Cut-off Date LTV: | 64.2% | |
| Grapevine, TX 76051 | U/W NCF DSCR: | 1.45x | ||
| U/W NOI Debt Yield: | 7.8% |
Real Estate Substitution.Not permitted.
Subordinate and Mezzanine Indebtedness.Not permitted.
Ground Lease.None.
Terrorism Insurance.Grapevine Station Mortgage Loan documents require that the “all risk” insurance policy required to be maintained by the borrower provide coverage for terrorism in an amount equal to the full replacement cost of Grapevine Station Property, as well as business interruption insurance covering no less than the 12-month period following the occurrence of a casualty event, together with a six-month extended period of indemnity.
THE INFORMATION IN THIS STRUCTURAL AND COLLATERAL TERM SHEET IS NOT COMPLETE AND MAY BE AMENDED PRIOR TO THE TIME OF SALE. THIS TERM SHEET IS NOT AN OFFER TO SELL THESE SECURITIES AND IT IS NOT A SOLICITATION OF AN OFFER TO BUY THESE SECURITIES IN ANY JURISDICTION WHERE THE OFFER OR SALE IS NOT PERMITTED.
47
| No. 7 – Nostrand Avenue Shopping Center | |||||||
| Mortgage Loan Information | Mortgaged Property Information | ||||||
| Mortgage Loan Seller: | Barclays Capital Real Estate Inc. | Single Asset/Portfolio: | Single Asset | ||||
Credit Assessment (DBRS/Fitch/Moody’s): | NR/NR/NR | Property Type – Subtype: | Retail – Anchored | ||||
| Original Principal Balance: | $26,775,000 | Location: | Brooklyn, NY | ||||
| Cut-off Date Balance: | $26,775,000 | Size: | 80,991 SF | ||||
| % of Initial Pool Balance: | 3.5% | Cut-off Date Balance Per SF: | $330.59 | ||||
| Loan Purpose: | Acquisition | Maturity Date Balance Per SF: | $330.59 | ||||
| Borrower Sponsors: | Ben Ashkenazy; Ashkenazy Acquisition Corporation | Year Built/Renovated: | 1960/NAP | ||||
| Guarantor: | Ben Ashkenazy | Title Vesting: | Fee | ||||
| Mortgage Rate: | 5.1300% | Property Manager: | Self-managed | ||||
| Note Date: | December 21, 2018 | Current Occupancy (As of): | 92.7% (12/12/2018) | ||||
| Seasoning: | 2 months | YE 2017 Occupancy: | 90.0% | ||||
| Maturity Date: | January 6, 2029 | YE 2016 Occupancy: | 91.0% | ||||
| IO Period: | 120 months | YE 2015 Occupancy(2): | NAV | ||||
| Loan Term (Original): | 120 months | YE 2014 Occupancy(2): | NAV | ||||
| Amortization Term (Original): | NAP | Appraised Value: | $40,000,000 | ||||
| Loan Amortization Type: | Interest-only, Balloon | Appraised Value Per SF: | $493.88 | ||||
| Call Protection: | L(26),D(90),O(4) | Appraisal Valuation Date: | November 16, 2018 | ||||
| Lockbox Type: | Hard/Springing Cash Management | ||||||
| Additional Debt: | None | ||||||
| Additional Debt Type (Balance): | NAP | ||||||
| Underwriting and Financial Information | |||||||
| TTM NOI(3): | NAV | ||||||
| YE 2017 NOI(3): | NAV | ||||||
| YE 2016 NOI(3): | NAV | ||||||
| Escrows and Reserves(1) | YE 2015 NOI(3): | NAV | |||||
| Initial | Monthly | Cap | U/W Revenues: | $3,341,704 | |||
| Taxes | $62,569 | $62,569 | NAP | U/W Expenses: | $1,162,759 | ||
| Insurance | $0 | Springing | NAP | U/W NOI: | $2,178,945 | ||
| Replacement Reserves | $0 | $1,012 | $60,743 | U/W NCF: | $2,035,314 | ||
| TI/LC Reserve | $0 | $6,749 | $242,973 | U/W DSCR based on NOI/NCF: | 1.56x / 1.46x | ||
| Free Rent Reserve | $149,208 | $0 | NAP | U/W Debt Yield based on NOI/NCF: | 8.1% / 7.6% | ||
| Existing TI Reserve | $83,165 | $0 | NAP | U/W Debt Yield at Maturity based on NOI/NCF: | 8.1% / 7.6% | ||
| Tenant Repair Reserve | $12,800 | $0 | NAP | Cut-off Date LTV Ratio: | 66.9% | ||
| Immediate Repairs Reserve | $4,688 | $0 | NAP | LTV Ratio at Maturity: | 66.9% | ||
| Sources and Uses | ||||||||
| Sources | Uses | |||||||
| Original loan amount | $26,775,000 | 67.2% | Purchase price | $38,250,000 | 96.0% | |||
| Borrower equity | 13,074,769 | 32.8 | Purchase Credits(4) | (245,173) | (0.6) | |||
| Upfront reserves | 312,430 | 0.8 | ||||||
| Closing costs | 1,532,512 | 3.8 | ||||||
| Total Sources | $39,849,769 | 100.0% | Total Uses | $39,849,769 | 100.0% | |||
| (1) | See “Escrows” section below. |
| (2) | The Nostrand Avenue Shopping Center Property (as defined below) was acquired in 2018, and the prior owner did not provide historical occupancy figures earlier than 2016. Aldi and Blink Fitness backfilled the prior Pathmark tenant’s space in 2013. With the exception of Lucky Enterprises, all remaining tenants have been in occupancy since 2007 or earlier. |
| (3) | The prior owner did not provide complete historical financial information to the Nostrand Avenue Shopping Center Borrower (as defined below). However, the 2017 expense figures were provided, totaling $1,029,778. |
| (4) | Purchase Credits include (i) outstanding tenant improvement obligations for Blink Fitness ($83,165), (ii) outstanding gap rent for Rite Aid ($149,208), and (iii) a roof credit for Rite Aid ($12,800). Such Purchase Credits were reserved for by the lender. See “Escrows” section below. |
The Mortgage Loan. The mortgage loan (the “Nostrand Avenue Shopping Center Mortgage Loan”) is evidenced by a single promissory note with an original principal balance of $26,775,000 and outstanding balance as of the Cut-off Date of $26,775,000 secured by a first mortgage encumbering the fee interest in an anchored retail shopping center located in Brooklyn, New York (the “Nostrand Avenue Shopping Center Property”).
THE INFORMATION IN THIS STRUCTURAL AND COLLATERAL TERM SHEET IS NOT COMPLETE AND MAY BE AMENDED PRIOR TO THE TIME OF SALE. THIS TERM SHEET IS NOT AN OFFER TO SELL THESE SECURITIES AND IT IS NOT A SOLICITATION OF AN OFFER TO BUY THESE SECURITIES IN ANY JURISDICTION WHERE THE OFFER OR SALE IS NOT PERMITTED.
48
| Retail - Anchored | Loan #7 | Cut-off Date Balance: | $26,775,000 | |
| 3779-3861 Nostrand Avenue | Nostrand Avenue Shopping Center | Cut-off Date LTV: | 66.9% | |
| Brooklyn, NY 11235 | U/W NCF DSCR: | 1.46x | ||
| U/W NOI Debt Yield: | 8.1% |
The Borrowers and Borrower Sponsors.The borrowers comprise two tenants-in-common: Nostrand Property Owner LLC and Leonard Replacement Owner LLC (collectively, the “Nostrand Avenue Shopping Center Borrower”), each a Delaware limited liability company and single purpose entity with one independent director. Each tenant-in-common entity is majority-owned (either individually or as the beneficial interest holder of a trust) and controlled by Ben Ashkenazy, one of the borrower sponsors. Legal counsel to the Nostrand Avenue Shopping Center Borrower delivered a non-consolidation opinion in connection with the origination of the Nostrand Avenue Shopping Center Mortgage Loan. The nonrecourse carve-out guarantor of the Nostrand Avenue Shopping Center Mortgage Loan is Ben Ashkenazy.
The borrower sponsors are Ben Ashkenazy and Ashkenazy Acquisition Corporation. Ben Ashkenazy is the chief executive officer and chairman of Ashkenazy Acquisition Corporation. Founded in 1987, Ashkenazy Acquisition Corporation is a private investment firm focusing on retail, hotel and office assets. Ashkenazy Acquisition Corporation has acquired over 15 million square feet in retail, hospitality, office, and residential properties throughout the United States, Canada and England. Ashkenazy Acquisition Corporation’s portfolio contains more than 100 buildings valued at approximately $12.0 billion. Ashkenazy Acquisition Corporation has had five previous loans secured by unrelated properties that have been part of a workout. For more details, please see “Description of the Mortgage Pool – Loan Purpose; Default History, Bankruptcy Issues and Other Proceedings”in the Preliminary Prospectus.
The Property.The Nostrand Avenue Shopping Center Property consists of 80,991 square feet of grocery-anchored retail space situated on 3.1 acres of land in Brooklyn, New York. The Nostrand Avenue Shopping Center Property is comprised of three single-story retail buildings located on an entire city block bound by Nostrand Avenue, Avenues Y and Z, and Haring Place in the densely-populated Sheepshead Bay neighborhood of Brooklyn. The Nostrand Avenue Shopping Center Property features 700 feet of frontage along Nostrand Avenue, one of Sheepshead Bay’s most highly trafficked retail corridors. There are 200 parking spaces (resulting in a ratio of 2.5 spaces per 1,000 square feet) at the Nostrand Avenue Shopping Center Property, including rooftop parking above Aldi accessible via a ramp in the parking lot. As of December 12, 2018, the Nostrand Avenue Shopping Center Property was 92.7% leased to ten tenants. Seven of the ten tenants (49.1% of underwritten base rent) have been at the Nostrand Avenue Shopping Center Property for over ten years.
Major Tenants.
Largest Tenant: Aldi (16.7% of underwritten base rent; 7/31/2023 lease expiration) –AI Fund II, LLC (“Aldi”) is a grocery chain that operates more than 1,600 grocery stores in 35 states. Aldi’s inventory includes items that are more than 90.0% Aldi-exclusive brands, allowing the chain to provide customers with high quality products without the hidden costs of national brands. According to the tenant, more than 40 million customers each month benefit from Aldi’s streamlined inventory approach, bringing shoppers the highest quality products at the lowest possible prices. In 2017, Aldi grew its sales by $1.1 billion to $7.9 billion, a 16.2% increase. Aldi is currently undertaking a five-year, $5.3 billion growth plan, aiming to open 800 new stores and become the third largest grocer in the United States behind Kroger and Walmart. The Nostrand Avenue Shopping Center Property serves as one of only two Aldi locations in Brooklyn.
2ndLargest Tenant: Blink Fitness (21.9% of underwritten base rent; 6/30/2029 lease expiration) –Founded in 2011, Blink Fitness operates fitness clubs as a subsidiary of Equinox Holdings, Inc. Blink Fitness is a premium quality, value-based fitness brand with more than 90 locations open or in development throughout New York, New Jersey, Pennsylvania and California. Each Blink Fitness gym offers memberships priced between $15 and $26 per month based on location and access to other locations. The location at the Nostrand Avenue Shopping Center Property offers one-on-one personal training and provides over 80 pieces of cardio equipment, over 50 pieces of strength equipment, a weight training and functional area..
3rdLargest Tenant: Rite-Aid (21.2% of underwritten base rent; 6/30/2024 lease expiration) –Rite Aid of NY, Inc. (“Rite Aid”) (NYSE: RAD) operates drug stores that sell prescription drugs, as well as over-the-counter medications, health and beauty aids, personal care items, cosmetics, household items, convenience foods, greeting cards, and seasonal merchandise. It is the largest drug store chain on the east coast and the third largest in the United States. As of March 3, 2018, Rite Aid operated 2,550 stores in 19 states and the District of Columbia. Of the largest three tenants at the Nostrand Avenue Shopping Center Property, Rite-Aid is the only tenant required to report sales. In 2017, Rite-Aid had sales of $764 per square foot, 38.4% above the 2017 national sales average of all Rite-Aid locations. Rite-Aid has been located at the Nostrand Avenue Shopping Center Property since 1999 after it took over a local pharmacy’s lease that had been located at the property since 1959.
THE INFORMATION IN THIS STRUCTURAL AND COLLATERAL TERM SHEET IS NOT COMPLETE AND MAY BE AMENDED PRIOR TO THE TIME OF SALE. THIS TERM SHEET IS NOT AN OFFER TO SELL THESE SECURITIES AND IT IS NOT A SOLICITATION OF AN OFFER TO BUY THESE SECURITIES IN ANY JURISDICTION WHERE THE OFFER OR SALE IS NOT PERMITTED.
49
| Retail - Anchored | Loan #7 | Cut-off Date Balance: | $26,775,000 | |
| 3779-3861 Nostrand Avenue | Nostrand Avenue Shopping Center | Cut-off Date LTV: | 66.9% | |
| Brooklyn, NY 11235 | U/W NCF DSCR: | 1.46x | ||
| U/W NOI Debt Yield: | 8.1% |
The following table presents certain information relating to the tenancy at the Nostrand Avenue Shopping Center Property:
Major Tenants
| Tenant Name | Credit Rating (Fitch/Moody’s/ S&P)(1) | Tenant NRSF | % of NRSF | Annual U/W Base | Annual U/W Base Rent(2) | % of Total Annual U/W Base Rent | Lease Expiration Date | Extension Options | Termination Option (Y/N) |
| Major Tenants | |||||||||
| Aldi | NR/NR/NR | 18,481 | 22.8% | $25.50 | $471,266 | 16.7% | 7/31/2023 | 4, 5-year | N |
| Blink Fitness | NR/B2/B | 16,633 | 20.5% | $37.03 | $615,920 | 21.9% | 6/30/2029 | 1, 5-year | N |
| Rite Aid(3) | B/B2/B | 12,434 | 15.4% | $48.00 | $596,832 | 21.2% | 6/30/2024 | 1, 5-year | N |
| Party City | NR/Ba3/B+ | 10,000 | 12.3% | $35.00 | $350,000 | 12.4% | 6/30/2022 | N | N |
| Lucky Enterprises | NR/NR/NR | 9,088 | 11.2% | $38.11 | $346,344 | 12.3% | 7/31/2028 | 1, 5-year | N |
| Total Major Tenants | 66,636 | 82.3% | $35.72 | $2,380,361 | 84.6% | ||||
| Non-Major Tenant | 8,476 | 10.5% | $51.31 | $434,920 | 15.4% | ||||
| Occupied Collateral Total | 75,112 | 92.7% | $37.48 | $2,815,281 | 100.0% | ||||
| Vacant Space | 5,879 | 7.3% | |||||||
| Collateral Total | 80,991 | 100.0% | |||||||
| (1) | Certain ratings are those of the parent company whether or not the parent company guarantees the lease. |
| (2) | Annual U/W Base Rent PSF and Annual U/W Base Rent include contractual rent steps through December 2019 of $166,655. |
| (3) | Rite Aid has a three-month free rent period starting July 1, 2019. All free rent was reserved at closing ($149,208). |
The following table presents certain information relating to the lease rollover schedule at the Nostrand Avenue Shopping Center Property:
Lease Expiration Schedule(1)(2)
| Year Ending December 31, | No. of Leases Expiring | Expiring NRSF | % of Total NRSF | Cumulative Expiring NRSF | Cumulative % of Total NRSF | Annual U/W Base Rent | % of Total Annual U/W Base Rent | Annual U/W Base Rent PSF |
| MTM | 0 | 0 | 0.0% | 0 | 0.0% | $0 | 0.0% | $0.00 |
| 2019 | 1 | 871 | 1.1% | 871 | 1.1% | $43,506 | 1.5% | $49.95 |
| 2020 | 1 | 1,875 | 2.3% | 2,746 | 3.4% | $51,000 | 1.8% | $27.20 |
| 2021 | 1 | 1,125 | 1.4% | 3,871 | 4.8% | $64,159 | 2.3% | $57.03 |
| 2022 | 2 | 13,600 | 16.8% | 17,471 | 21.6% | $578,015 | 20.5% | $42.50 |
| 2023 | 2 | 19,486 | 24.1% | 36,957 | 45.6% | $519,506 | 18.5% | $26.66 |
| 2024 | 1 | 12,434 | 15.4% | 49,391 | 61.0% | $596,832 | 21.2% | $48.00 |
| 2025 | 0 | 0 | 0.0% | 49,391 | 61.0% | $0 | 0.0% | $0.00 |
| 2026 | 0 | 0 | 0.0% | 49,391 | 61.0% | $0 | 0.0% | $0.00 |
| 2027 | 0 | 0 | 0.0% | 49,391 | 61.0% | $0 | 0.0% | $0.00 |
| 2028 | 1 | 9,088 | 11.2% | 58,479 | 72.2% | $346,344 | 12.3% | $38.11 |
| Thereafter | 1 | 16,633 | 20.5% | 75,112 | 92.7% | $615,920 | 21.9% | $37.03 |
| Vacant | 0 | 5,879 | 7.3% | 80,991 | 100.0% | $0 | 0.0% | $0.00 |
| Total/Weighted Average | 10 | 80,991 | 100.0% | $2,815,281 | 100.0% | $37.48(3) |
| (1) | Information obtained from the underwritten rent roll. |
| (2) | Certain tenants may have lease termination options that are exercisable prior to the originally stated expiration date of the subject lease and that are not considered in the Lease Expiration Schedule. |
| (3) | Weighted Average Annual U/W Base Rent PSF excludes vacant space. |
THE INFORMATION IN THIS STRUCTURAL AND COLLATERAL TERM SHEET IS NOT COMPLETE AND MAY BE AMENDED PRIOR TO THE TIME OF SALE. THIS TERM SHEET IS NOT AN OFFER TO SELL THESE SECURITIES AND IT IS NOT A SOLICITATION OF AN OFFER TO BUY THESE SECURITIES IN ANY JURISDICTION WHERE THE OFFER OR SALE IS NOT PERMITTED.
50
| Retail - Anchored | Loan #7 | Cut-off Date Balance: | $26,775,000 | |
| 3779-3861 Nostrand Avenue | Nostrand Avenue Shopping Center | Cut-off Date LTV: | 66.9% | |
| Brooklyn, NY 11235 | U/W NCF DSCR: | 1.46x | ||
| U/W NOI Debt Yield: | 8.1% |
The following table presents historical occupancy percentages at the Nostrand Avenue Shopping Center Property:
Historical Occupancy
12/31/2014(1)(2) | 12/31/2015(1)(2) | 12/31/2016(1) | 12/31/2017(2) | 12/12/2018(3) |
| NAV | NAV | 91.0% | 90.0% | 92.7% |
| (1) | Information obtained from the borrower. |
| (2) | The Nostrand Avenue Shopping Center Property was acquired in 2018, and the prior owner did not provide historical occupancy figures earlier than 2016. Aldi and Blink Fitness backfilled the prior Pathmark tenant’s space in 2013. With the exception of Lucky Enterprises, all of the remaining tenants have been in occupancy since 2007 or earlier. |
| (3) | Information obtained from the underwritten rent roll. |
Operating History and Underwritten Net Cash Flow. The following table presents certain information relating to the underwritten net cash flow at the Nostrand Avenue Shopping Center Property:
Cash Flow Analysis(1)
| U/W | %(2) | U/W $ per SF | |
| Rents in Place | $2,648,626 | 73.8% | $32.70 |
| Contractual Rent Steps(3) | 166,655 | 4.6 | 2.06 |
| Grossed Up Vacant Space | 247,100 | 6.9 | 3.05 |
| Gross Potential Rent | $3,062,381 | 85.3% | $37.81 |
| Other Income | 0 | 0.0 | 0.00 |
| Total Recoveries | 526,423 | 14.7 | 6.50 |
| Net Rental Income | $3,588,804 | 100.0% | $44.31 |
| (Vacancy & Credit Loss)(4) | (247,100) | (8.1) | (3.05) |
| Effective Gross Income | $3,341,704 | 93.1% | $41.26 |
| Real Estate Taxes | $728,000 | 21.8% | $8.99 |
| Insurance | 31,500 | 0.9 | 0.39 |
| Management Fee | 100,251 | 3.0 | 1.24 |
| Other Operating Expenses | 303,008 | 9.1 | 3.74 |
| Total Operating Expenses | $1,162,759 | 34.8% | $14.36 |
| Net Operating Income | $2,178,945 | 65.2% | $26.90 |
| Replacement Reserves | 12,149 | 0.4 | 0.15 |
| TI/LC | 131,482 | 3.9 | 1.62 |
| Net Cash Flow | $2,035,314 | 60.9% | $25.13 |
| NOI DSCR | 1.56x | ||
| NCF DSCR | 1.46x | ||
| NOI Debt Yield | 8.1% | ||
| NCF Debt Yield | 7.6% |
| (1) | Historical information is not available because the Nostrand Avenue Shopping Center Property was acquired in 2018, and the prior owner did not provide complete historical financial information to the borrower. 2017 expense figures were provided, totaling $1,029,778. |
| (2) | Represents (i) percent of Net Rental Income for all revenue fields, (ii) percent of Gross Potential Rent for Vacancy & Credit Loss and (iii) percent of Effective Gross Income for all other fields. |
| (3) | Represents contractual rent steps through December 2019. |
| (4) | The underwritten economic vacancy is 8.1%. The Nostrand Avenue Shopping Center Property was 92.7% leased as of December 12, 2018. |
THE INFORMATION IN THIS STRUCTURAL AND COLLATERAL TERM SHEET IS NOT COMPLETE AND MAY BE AMENDED PRIOR TO THE TIME OF SALE. THIS TERM SHEET IS NOT AN OFFER TO SELL THESE SECURITIES AND IT IS NOT A SOLICITATION OF AN OFFER TO BUY THESE SECURITIES IN ANY JURISDICTION WHERE THE OFFER OR SALE IS NOT PERMITTED.
51
| Retail - Anchored | Loan #7 | Cut-off Date Balance: | $26,775,000 | |
| 3779-3861 Nostrand Avenue | Nostrand Avenue Shopping Center | Cut-off Date LTV: | 66.9% | |
| Brooklyn, NY 11235 | U/W NCF DSCR: | 1.46x | ||
| U/W NOI Debt Yield: | 8.1% |
Appraisal.The appraiser concluded to an “as-is” appraised value of $40,000,000 as of November 16, 2018.
Environmental Matters. According to a Phase I environmental site assessment dated November 14, 2018, there was evidence of two recognized environmental conditions at the Nostrand Avenue Shopping Center Property. The first recognized environmental condition is regarding the former presence of a dry cleaning tenant at the Nostrand Avenue Shopping Center Property, and the second recognized environmental condition is regarding the former presence of a dry cleaner adjacent to the Nostrand Avenue Shopping Center Property. A Phase II environmental site assessment was recommended for a limited subsurface investigation and was completed in December 2018. The report concluded that soil vapor intrusion is not occurring at the Nostrand Avenue Shopping Center Property and that the potential for adverse impact is minimal. The lender has obtained an environmental insurance policy from Great American Insurance Group for a 13-year term expiring on December 21, 2031. For more details, please see “Description of the Mortgage Pool – Environmental Conditions”in the Preliminary Prospectus.
Market Overview and Competition.The Nostrand Avenue Shopping Center Property is located in Brooklyn, Kings County, New York. Brooklyn is the second largest of the five boroughs by land area and is the most populous borough with one-third of New York City’s population. Over the past decade, Brooklyn has expanded at a rapid pace, attracting both businesses and residents. Since 2003, the number of businesses in Brooklyn has increased by 21.0% and job growth has grown by 19.8%, a rate twice as fast as the rest of New York City. With many restaurants, a growing nightlife, diverse neighborhoods, and accessibility to Manhattan, Brooklyn is attracting young professionals in large numbers. The Nostrand Avenue Shopping Center Property is located in the densely-populated Sheesphead Bay neighborhood bound by Nostrand Avenue, Avenues Y and Z, and Haring Place, and primarily serves the surrounding residential area. The Sheepshead Bay neighborhood is leading the growth of condominiums in Brooklyn, with over 515 units in the pipeline. According to the appraisal, as of 2017, the population within a 1-mile, 2-mile, and 3-mile radius totaled 86,886, 271,792, and 550,894 people, respectively. The intersection of Nostrand Avenue and Avenue Y has an annual average daily traffic count of approximately 15,000 vehicles. The Nostrand Avenue Shopping Center Property is serviced by the B and Q trains, providing access to New York City, with a local stop at Avenue U and Neck Road (0.7 miles from the Nostrand Avenue Shopping Center Property).
Submarket Information – According to a third-party market research report, the Nostrand Avenue Shopping Center Property is situated within the South Brooklyn retail submarket. As of the third quarter of 2018, the submarket reported a total inventory of 41.1 million square feet with a 2.8% vacancy rate and average rental rates of $45.64 per square foot.
Appraiser’s Comp Set – The appraiser did not identify a specific competitive set, but identified eight comparable sales, nine comparable grocery leases, seven comparable large inline leases (greater than 8,500 square feet), and thirteen small inline leases (less than 8,500 square feet).
The following table presents certain information relating to the appraiser’s market rent conclusion for the Nostrand Avenue Shopping Center Property:
Market Rent Summary(1)
| Supermarket | Large Retail(2) | Small Retail | Retail – Corner | Retail-Side Street | |
| Market Rent (PSF) | $30.00 | $40.00-$45.00 | $50.00 | $65.00 | $25.00 |
| Lease Term (Years) | 15 | 10 | 10 | 10 | 10 |
| Lease Type (Reimbursements) | Gross | Gross | Gross | Gross | Gross |
| Rent Increase Projection | 10.0% every 5 years | 10% every 5 years | 3.0% per annum | 3.0% per annum | 3.0% per annum |
| (1) | Information obtained from the appraisal. |
| (2) | Large Retail pertains to leases greater than 8,500 square feet. Inline Small, Inline Corner, and Inline-Side Street pertain to leases less than 8,500 square feet. |
THE INFORMATION IN THIS STRUCTURAL AND COLLATERAL TERM SHEET IS NOT COMPLETE AND MAY BE AMENDED PRIOR TO THE TIME OF SALE. THIS TERM SHEET IS NOT AN OFFER TO SELL THESE SECURITIES AND IT IS NOT A SOLICITATION OF AN OFFER TO BUY THESE SECURITIES IN ANY JURISDICTION WHERE THE OFFER OR SALE IS NOT PERMITTED.
52
| Retail - Anchored | Loan #7 | Cut-off Date Balance: | $26,775,000 | |
| 3779-3861 Nostrand Avenue | Nostrand Avenue Shopping Center | Cut-off Date LTV: | 66.9% | |
| Brooklyn, NY 11235 | U/W NCF DSCR: | 1.46x | ||
| U/W NOI Debt Yield: | 8.1% |
The table below presents certain information relating to comparable sales for the Nostrand Avenue Shopping Center Property identified by the appraiser:
Comparable Sales(1)
| Property Name | Location | Rentable Area (SF) | Sale Date | Sale Price | Sale Price (PSF) |
| Caesar’s Bay Bazaar | Brooklyn, NY | 300,000 | Jun-18 | $118,000,000 | $393.33 |
| 1100 King’s Highway & 2067 Coney Island Avenue | Brooklyn, NY | 43,318 | May-18 | $30,500,000 | $704.10 |
| 2857 West 8th Street | Brooklyn, NY | 52,302 | Apr-18 | $23,000,000 | $439.75 |
| Harlem Center | Upper Manhattan, NY | 126,234 | Sep-17 | $103,000,000 | $815.94 |
| Atlantic Center | Brooklyn, NY | 396,224 | Sep-17 | $195,000,000 | $492.15 |
| Shops at Bruckner Plaza | Parkchester, Bronx, NY | 115,545 | Jan-17 | $32,000,000 | $276.95 |
| Riverdale Crossings | Riverdale, Bronx, NY | 159,137 | Oct-15 | $133,000,000 | $835.76 |
| Shops at Grand Avenue | Maspeth, NY | 99,986 | Oct-14 | $56,000,000 | $560.08 |
| (1) | Information obtained from the appraisal. |
The following table presents certain information relating to nine comparable leases to those at the Nostrand Avenue Shopping Center Property:
Comparable Leases(1)(2)
| Property Name/Location | Year Built | Total GLA (SF) | Distance from | Occupancy | Lease Term | Tenant Size (SF) | Annual Base Rent PSF | Reimbursement Amount PSF | Lease Type | |
| Supermarket | ||||||||||
Georgetowne Shopping Center 2101-2181 Ralph Avenue Brooklyn, NY | 2018 | 700,000 | 3.2 miles | 100.0% | 20.0 Yrs | 36,868 | $27.00 | NAV | Net | |
Gateway Center II 339-579 Gateway Drive Brooklyn, NY | 2014 | 600,646 | 6.6 miles | 98.0% | 15.0 Yrs | 16,839 | $50.00 | NAV | Net | |
300 Ashland Place Brooklyn, NY | 2018 | 700,000 | 7.0 miles | NAV | 20.0 Yrs | 37,000 | $56.75 | NAV | Gross | |
| Large Inline | ||||||||||
2845 Coney Island Avenue Sheepshead Bay, NY | 1950 | 62,000 | 1.6 miles | NAV | 15.0 Yrs | 10,000 | $71.00 | NAV | Net | |
1601 Kings Highway Sheepshead Bay, NY | 2018 | 68,383 | 2.1 miles | 87.0% | 10.0 Yrs | 20,000 | $42.00 | NAV | Gross | |
12442 Flatlands Avenue Spring Creek, NY | 2017 | 360,000 | 6.3 miles | NAV | 10.0 Yrs | 11,035 | $35.00 | NAV | Gross | |
| Small Inline | ||||||||||
3860 Nostrand Avenue Sheepshead Bay, NY | 1959 | 70,293 | 0.5 miles | 95.0% | 10.0 Yrs | 2,108 | $40.00 | NAV | Net | |
2602 East 16th Street Sheepshead Bay, NY | 1960 | 5,000 | 0.9 miles | 100.0% | 10.0 Yrs | 700 | $50.00 | NAV | Net | |
902 Kings Highway Sheepshead Bay, NY | 1931 | 3,300 | 2.3 miles | 100.0% | 10.0 Yrs | 1,100 | $65.45 | NAV | Net |
| (1) | Information obtained from the appraisal. |
| (2) | This table contains a sample of the nine comparable grocery leases, seven comparable large inline leases (greater than 8,500 square feet), and the thirteen small inline leases (less than 8,500 square feet) identified by the appraiser. The leases were chosen based on proximity to and similarities between tenants with the Nostrand Avenue Shopping Center Property. |
THE INFORMATION IN THIS STRUCTURAL AND COLLATERAL TERM SHEET IS NOT COMPLETE AND MAY BE AMENDED PRIOR TO THE TIME OF SALE. THIS TERM SHEET IS NOT AN OFFER TO SELL THESE SECURITIES AND IT IS NOT A SOLICITATION OF AN OFFER TO BUY THESE SECURITIES IN ANY JURISDICTION WHERE THE OFFER OR SALE IS NOT PERMITTED.
53
| Retail - Anchored | Loan #7 | Cut-off Date Balance: | $26,775,000 | |
| 3779-3861 Nostrand Avenue | Nostrand Avenue Shopping Center | Cut-off Date LTV: | 66.9% | |
| Brooklyn, NY 11235 | U/W NCF DSCR: | 1.46x | ||
| U/W NOI Debt Yield: | 8.1% |
Escrows.
Real Estate Taxes – The loan documents require an upfront real estate tax reserve of $62,569 and ongoing monthly real estate tax reserves in an amount equal to one-twelfth of the real estate taxes that the lender estimates will be payable during the next twelve months (initially $62,569).
Insurance – Ongoing monthly insurance reserves, equaling one-twelfth of the insurance premiums that the lender estimates will be payable during the next twelve months, are not currently required and will not be required so long as the borrower maintains a blanket policy acceptable to the lender.
Replacement Reserves – The loan documents require ongoing monthly replacement reserves of $1,012 up to a cap of $60,743.
TI/LC Reserve –The loan documents require ongoing monthly TI/LC reserves of $6,749 up to a cap of $242,973.
Free Rent Reserve – The loan documents require an upfront reserve of $149,208 for gap rent related to Rite-Aid.
Existing TI Reserve – The loan documents require an upfront reserve of $83,165 for existing TI/LCs related to Blink Fitness.
Tenant Repair Reserve –The loan documents require an upfront reserve of $12,800 for tenant repairs related to Rite-Aid.
Immediate Repairs Reserve –The loan documents require an upfront reserve of $4,688 for immediate repairs.
Lockbox and Cash Management.The Nostrand Avenue Shopping Center Mortgage Loan documents require a hard lockbox with springing cash management. The Nostrand Avenue Shopping Center Mortgage Loan documents require the Nostrand Avenue Shopping Center Borrower to deliver written instructions to tenants to deposit all rents payable under such leases directly into a clearing account. The Nostrand Avenue Shopping Center Mortgage Loan documents require that all rents received by the Nostrand Avenue Shopping Center Borrower or the property manager be deposited into the lockbox account within two business days of receipt. Funds in the lockbox account, absent the continuance of a Trigger Period (as defined below), are required to be transferred daily to a borrower operating account. Upon the first occurrence of a Trigger Period, the Nostrand Avenue Shopping Center Borrower is required to establish a cash management account under the sole control of the lender, to which during a Trigger Period, all amounts in the lockbox account are required to be automatically transferred daily for the payment, among other things, of the debt service, monthly escrows, default interest and late payment charges. Absent the continuance of a Cash Sweep Period (as defined below), any remaining funds after such disbursements are required to be distributed to the borrower. Upon a Cash Sweep Period, all remain excess cash flow will be escrowed in an excess cash flow reserve account.
A “Trigger Period” will commence upon the earliest to occur of the following:
| (i) | an event of default under the Nostrand Avenue Shopping Center Mortgage Loan; or |
| (ii) | the debt service coverage ratio (as calculated in the loan documents) for the Nostrand Avenue Shopping Center debt falling below 1.05x based on a 30-year amortization schedule (approximately 1.32x based on the interest only debt service payment). |
A Trigger Period will end upon the occurrence of:
| ● | with regard to clause (i) above, the cure of such event of default; or |
| ● | with regard to clause (ii) above, the debt service coverage ratio for the Nostrand Avenue Shopping Center debt being equal to or greater than 1.10x based on a 30-year amortization schedule (approximately 1.38x based on the interest only debt service payment) for two consecutive calendar quarters. |
A “Cash Sweep Period” will commence upon the earliest to occur of the following:
| (i) | an event of default under the Nostrand Avenue Shopping Center Mortgage Loan; or |
| (ii) | the debt service coverage ratio for the Nostrand Avenue Shopping Center debt falling below 1.05x based on a 30-year amortization schedule (approximately 1.32x based on the interest only debt service payment) for two consecutive calendar quarters. |
A “Cash Sweep Period” will end upon the occurrence of:
| ● | with regard to clause (i) above, the cure of such event of default; or |
| ● | with regard to clause (ii) above, the debt service coverage ratio for the Nostrand Avenue Shopping Center debt being equal to or greater than 1.10x based on a 30-year amortization schedule (approximately 1.51x based on the interest only debt service payment ) for two consecutive calendar quarters. |
Property Management. The Nostrand Avenue Shopping Center Property is managed by an affiliate of the Nostrand Avenue Shopping Center Borrower.
Partial Release. Not permitted.
THE INFORMATION IN THIS STRUCTURAL AND COLLATERAL TERM SHEET IS NOT COMPLETE AND MAY BE AMENDED PRIOR TO THE TIME OF SALE. THIS TERM SHEET IS NOT AN OFFER TO SELL THESE SECURITIES AND IT IS NOT A SOLICITATION OF AN OFFER TO BUY THESE SECURITIES IN ANY JURISDICTION WHERE THE OFFER OR SALE IS NOT PERMITTED.
54
| Retail - Anchored | Loan #7 | Cut-off Date Balance: | $26,775,000 | |
| 3779-3861 Nostrand Avenue | Nostrand Avenue Shopping Center | Cut-off Date LTV: | 66.9% | |
| Brooklyn, NY 11235 | U/W NCF DSCR: | 1.46x | ||
| U/W NOI Debt Yield: | 8.1% |
Real Estate Substitution.Not permitted.
Subordinate and Mezzanine Indebtedness.None.
Ground Lease. None.
Terrorism Insurance.The Nostrand Avenue Shopping Center Mortgage Loan documents require that the “all risk” insurance policy required to be maintained by the borrower provides coverage for terrorism in an amount equal to the full replacement cost of the Nostrand Avenue Shopping Center Property, as well as business interruption insurance covering no less than the 12-month period following the occurrence of a casualty event, together with a 6-month extended period of indemnity that covers acts of terrorism. Provided that the TRIPRA is no longer in effect and such policies contain an exclusion for acts of terrorism, the Nostrand Avenue Shopping Center Borrower will obtain, to the extent available, a stand-alone policy that provides the same coverage as the policies would have if such exclusion did not exist.
THE INFORMATION IN THIS STRUCTURAL AND COLLATERAL TERM SHEET IS NOT COMPLETE AND MAY BE AMENDED PRIOR TO THE TIME OF SALE. THIS TERM SHEET IS NOT AN OFFER TO SELL THESE SECURITIES AND IT IS NOT A SOLICITATION OF AN OFFER TO BUY THESE SECURITIES IN ANY JURISDICTION WHERE THE OFFER OR SALE IS NOT PERMITTED.
55
| No. 8 – Roseville Shopping Center | |||||||
| Mortgage Loan Information | Mortgaged Property Information | ||||||
| Mortgage Loan Seller: | Rialto Mortgage Finance, LLC | Single Asset/Portfolio: | Single Asset | ||||
Credit Assessment (DBRS/Fitch/Moody’s): | NR/NR/NR | Property Type – Subtype: | Retail – Shadow Anchored | ||||
| Original Principal Balance: | $23,887,500 | Location: | Roseville, CA | ||||
| Cut-off Date Balance: | $23,887,500 | Size: | 96,791 SF | ||||
| % of Initial Pool Balance: | 3.1% | Cut-off Date Balance Per SF: | $246.79 | ||||
| Loan Purpose: | Acquisition | Maturity Date Balance Per SF: | $217.26 | ||||
| Borrower Sponsors: | Joshua Volen; Trevor Smith | Year Built/Renovated: | 1991/NAP | ||||
| Guarantors: | Joshua Volen; Trevor Smith | Title Vesting: | Fee | ||||
| Mortgage Rate: | 4.7500% | Property Manager: | Self-managed | ||||
| Note Date: | December 14, 2018 | Current Occupancy (As of): | 94.3% (11/20/2018) | ||||
| Seasoning: | 2 months | YE 2017 Occupancy:(2) | 80.4% | ||||
| Maturity Date: | January 6, 2029 | YE 2016 Occupancy: | 92.0% | ||||
| IO Period: | 36 months | YE 2015 Occupancy: | 93.0% | ||||
| Loan Term (Original): | 120 months | YE 2014 Occupancy: | 95.1% | ||||
| Amortization Term (Original): | 360 months | Appraised Value: | $34,500,000 | ||||
| Loan Amortization Type: | Interest-only, Amortizing Balloon | Appraised Value Per SF: | $356.44 | ||||
| Call Protection: | L(26),D(90),O(4) | Appraisal Valuation Date: | November 20, 2018 | ||||
| Lockbox Type: | Springing | ||||||
| Additional Debt: | None | ||||||
| Additional Debt Type (Balance): | NAP | Underwriting and Financial Information | |||||
| TTM NOI (9/30/2018)(3): | $2,245,979 | ||||||
| YE 2017 NOI: | $2,460,384 | ||||||
| YE 2016 NOI: | $2,405,155 | ||||||
| Escrows and Reserves(1) | U/W Revenues: | $3,505,675 | |||||
| Initial | Monthly | Cap | U/W Expenses: | $831,546 | |||
| Taxes | $89,325 | $28,357 | NAP | U/W NOI(2): | $2,674,128 | ||
| Insurance | $15,001 | $2,857 | NAP | U/W NCF: | $2,601,535 | ||
| Replacement Reserve | $0 | $1,210 | $43,556 | U/W DSCR based on NOI/NCF: | 1.79x / 1.74x | ||
| TI/LC Reserve | $0 | $4,840 | $174,224 | U/W Debt Yield based on NOI/NCF: | 11.2% / 10.9% | ||
| Deferred Maintenance | $9,275 | $0 | NAP | U/W Debt Yield at Maturity based on NOI/NCF: | 12.7% / 12.4% | ||
| Free Rent Reserve | $93,913 | $0 | NAP | Cut-off Date LTV Ratio: | 69.2% | ||
| Unfunded TI/LC Reserve | $1,026,607 | $0 | NAP | LTV Ratio at Maturity: | 61.0% | ||
| Sources and Uses | ||||||||
| Sources | Uses | |||||||
| Original loan amount | $23,887,500 | 71.5% | Purchase Price | $31,850,000 | 95.3% | |||
| Sponsor’s new equity contribution | 9,518,050 | 28.5 | Upfront reserves | 1,234,121 | 3.7 | |||
| Closing costs | 321,429 | 1.0 | ||||||
| Total Sources | $33,405,550 | 100.0% | Total Uses | $33,405,550 | 100.0% | |||
| (1) | See “Escrows” section below. |
| (2) | Occupancy dropped in 2017 as Party City, which formerly occupied the W Salon Suites space, vacated in September 2017. |
| (3) | The U/W NOI increased more than 5% compared to the TTM NOI due to the second largest tenant, W Salon Suites, commencing its lease in January 2019. |
The Mortgage Loan.The mortgage loan (the “Roseville Shopping Center Mortgage Loan”) is evidenced by a single promissory note secured by a first mortgage encumbering the borrower’s fee interest in a 96,791 square foot shadow anchored retail center located in Roseville, California (the “Roseville Shopping Center Property”).
The Borrowers and Borrower Sponsors.The borrowers, Roseville PH, LLC (74.06%) and Convoy Roseville, LLC (25.94%) (collectively, the “Roseville Shopping Center Borrower”), are tenants-in-common, each a single purpose Delaware limited liability company with one independent director. The Roseville Shopping Center Property is managed by CIRE Investment Services, Inc., an affiliate of the Roseville Shopping Center Borrower. Roseville PH, LLC is managed by CIRE Management, LLC and is owned 100% by Roseville Retail I, LLC, which is owned by class A Investor Members (93.88%) and class B CIRE Sponsorship LLC (6.12%). Convoy Roseville, LLC is managed by CIRE Management, LLC and is owned 100% by 6601 Convoy Ct, LLC, which is owned by Joshua Volen
THE INFORMATION IN THIS STRUCTURAL AND COLLATERAL TERM SHEET IS NOT COMPLETE AND MAY BE AMENDED PRIOR TO THE TIME OF SALE. THIS TERM SHEET IS NOT AN OFFER TO SELL THESE SECURITIES AND IT IS NOT A SOLICITATION OF AN OFFER TO BUY THESE SECURITIES IN ANY JURISDICTION WHERE THE OFFER OR SALE IS NOT PERMITTED.
56
| Retail – Shadow Anchored | Loan #8 | Cut-off Date Balance: | $23,887,500 | |
| 1901-1913, 1919-1925, 1927 | Roseville Shopping Center | Cut-off Date LTV: | 69.2% | |
| Douglas Boulevard | U/W NCF DSCR: | 1.74x | ||
| Roseville, CA 95661 | U/W NOI Debt Yield: | 11.2% |
(40.0%), Trevor Smith (40.0%), Jeff Robertson (15.0%), Alexis Volen (2.5%), and Jason Tamashiro (2.5%). CIRE Management, LLC is owned by Trevor Smith (50%) and Joshua Volen (50%). Legal counsel to the Roseville Shopping Center Borrower delivered a non-consolidation opinion in connection with the origination of the Roseville Shopping Center Mortgage Loan. The nonrecourse carve-out guarantors of the Roseville Shopping Center Mortgage Loan are Joshua Volen and Trevor Smith on a joint and several basis.
The borrower sponsors, Joshua Volen and Trevor Smith are co-founders and principals of CIRE Equity. Founded in 2010, CIRE Equity is based in Beverly Hills, California and San Diego, California and serves as a vertically integrated sponsor/operator that specializes in value-add acquisitions in the Southwestern United States. Joshua Volen has held roles at Marcus & Millichap, a commercial real estate brokerage firm. Mr. Volen has also played a role in the growth of his family office to over 500,000 square feet of office, industrial and retail properties in Northern California along with other key markets. Trevor Smith worked at Silverberg Development Corp, a boutique real estate investment and development firm in Los Angeles. Mr. Smith has experience in real estate acquisitions, valuation, financial analysis, market analysis, project management, asset management, and dispositions. Mr. Volen was a guarantor of a loan that went into maturity default in December 2009. The matter has been settled and paid in full. See“Description of the Mortgage Pool—Litigation and Other Considerations” in the Preliminary Prospectus.
The Property. The Roseville Shopping Center Property is a shadow anchored retail center located in Roseville, California, approximately 15 miles northeast of downtown Sacramento. The Roseville Shopping Center Property consists of eight retail buildings developed in 1991. The Roseville Shopping Center Property is situated on a 9.0 acre site, with 465 surface parking spaces, resulting in a parking ratio of 4.8 per 1,000 square feet of rentable area. The Roseville Shopping Center Property is part of a larger retail center, which is anchored by Target and Raley’s and includes a Jack in the Box outparcel (all of which are not part of the collateral). Target has been in occupancy since 1998 and reimburses the Roseville Shopping Center Borrower for its share of utilities expenses pursuant to an operation and easement agreement that covers the larger shopping center (including the Roseville Shopping Center Property, the “OEA”). Raley’s has been in occupancy since 1998 and recently renewed its lease through 2022. Jack in the Box has been in occupancy since 1998. Raley’s and Jack in the Box reimburse the Roseville Shopping Center Borrower for their respective share of common area maintenance expenses pursuant to the OEA. The Roseville Shopping Center Property’s major tenants include PetCo Animal Supplies, Inc., W Salon Suites and Big 5 Sporting Goods. As of November 20, 2018, the Roseville Shopping Center Property was 94.3% occupied by 24 tenants, and the Roseville Shopping Center Property also receives rent under a cell-tower agreement with T-Mobile.
Major Tenants.
Largest Tenant: PetCo Animal Supplies, Inc. (15,486 square feet; 16.0% of net rentable area; 13.9% of underwritten base rent; 6/30/2027 lease expiration) – PetCo Animal Supplies, Inc., (“PetCo”) is a privately held pet retailer in the United States, with corporate offices in San Diego and San Antonio. PetCo sells pet products and services, as well as certain types of live animals with more than 1,500 locations across the United States, Mexico, and Puerto Rico. According to the most recent lease extension, PetCo remodeled its premises in accordance with plans approved by the Roseville Shopping Center Borrower, for which it was reimbursed $250,000 in tenant allowance. PetCo has been a tenant at the Roseville Shopping Center Property since 1997 and has two, 5-year renewal options remaining after its June 2027 lease expiration.
2ndLargest Tenant: W Salon Suites (13,114 square feet; 13.5% of net rentable area; 11.8% of underwritten base rent; 3/31/2029 lease expiration) – W Salon Suites is a provider of private rental space for independent beauty professionals within the salon suite concept. They offer salon professionals the opportunity to own and operate their own business without the expense of facility management and maintenance. The locations are staffed with full-time salon managers who provide service to salon owners and their clients. W Salon Suites started its lease in January 2019 with a rent commencement date of April 2019. The Roseville Shopping Center Borrower escrowed $93,913 in a free rent reserve at origination. W Salon Suites has two, 5-year renewal options remaining after its March 2029 lease expiration.
3rdLargest Tenant: Big 5 Sporting Goods (10,000 square feet; 10.3% of net rentable area; 9.5% of underwritten base rent; 1/31/2021 lease expiration) – Big 5 Sporting Goods is a sporting goods retailer headquartered in El Segundo, California with 435 stores in Arizona, California, Colorado, Idaho, Nevada, New Mexico, Oregon, Texas, Utah, Washington and Wyoming. In 2014, Big 5 Sporting Goods launched its e-commerce platform to offer selected products online. Big 5 Sporting Goods product mix includes athletic shoes, apparel and accessories, as well as a broad selection of outdoor and athletic equipment for team sports. Big 5 Sporting Goods has been a tenant at the Roseville Shopping Center Property since 1991 and has one, 5-year renewal option remaining after its January 2021 lease expiration.
THE INFORMATION IN THIS STRUCTURAL AND COLLATERAL TERM SHEET IS NOT COMPLETE AND MAY BE AMENDED PRIOR TO THE TIME OF SALE. THIS TERM SHEET IS NOT AN OFFER TO SELL THESE SECURITIES AND IT IS NOT A SOLICITATION OF AN OFFER TO BUY THESE SECURITIES IN ANY JURISDICTION WHERE THE OFFER OR SALE IS NOT PERMITTED.
57
| Retail – Shadow Anchored | Loan #8 | Cut-off Date Balance: | $23,887,500 | |
| 1901-1913, 1919-1925, 1927 | Roseville Shopping Center | Cut-off Date LTV: | 69.2% | |
| Douglas Boulevard | U/W NCF DSCR: | 1.74x | ||
| Roseville, CA 95661 | U/W NOI Debt Yield: | 11.2% |
The following table presents certain information relating to the tenancy at the Roseville Shopping Center Property:
Major Tenants
| Tenant Name | Credit Rating (Fitch/Moody’s/ S&P)(1) | Tenant NRSF | % of NRSF | Annual U/W Base Rent PSF(2) | Annual U/W Base Rent(2) | % of Total Annual U/W Base Rent | Lease Expiration Date | Extension Options | Termination Option (Y/N) |
| Major Tenants | |||||||||
| PetCo Animal Supplies, Inc. | NR/B3/CCC+ | 15,486 | 16.0% | $24.00 | $371,664 | 13.9% | 6/30/2027 | 2, 5-year | N |
| W Salon Suites(3) | NR/NR/NR | 13,114 | 13.5% | $24.00 | $314,736 | 11.8% | 3/31/2029 | 2, 5-year | N |
| Big 5 Sporting Goods | NR/NR/NR | 10,000 | 10.3% | $25.28 | $252,768 | 9.5% | 1/31/2021 | 1, 5-year | N |
| Chevy’s Mexican Restaurant | NR/NR/NR | 6,500 | 6.7% | $45.90 | $298,350 | 11.2% | 2/28/2021 | None | N |
| Fed Ex Office | NR/Baa2/BBB | 6,400 | 6.6% | $40.17 | $257,088 | 9.6% | 1/31/2022 | None | N |
| Total Major Tenants | 51,500 | 53.2% | $29.02 | $1,494,606 | 56.1% | ||||
| Non-Major Tenants | 39,726(4) | 41.0% | $32.00(5) | $1,171,904(6) | 43.9% | ||||
| Occupied Collateral Total | 91,226(4) | 94.3% | $30.26(5) | 2,666,510(6) | 100.0% | ||||
| Vacant Space | 5,565 | 5.7% | |||||||
| Collateral Total | 96,791 | 100.0% | |||||||
| (1) | Certain ratings are those of the parent company whether or not the parent company guarantees the lease. |
| (2) | Annual U/W Base Rent PSF and Annual U/W Base Rent include contractual rent steps through November 2019 totaling $30,084. |
| (3) | W Salon Suites has taken the possession of its space and is required to begin paying rent on April 2019. |
| (4) | Include 3,100 square feet of storage space. |
| (5) | Annual U/W Base Rent PSF excludes vacant space and a 3,100 square feet of storage space with no attributable U/W Base Rent. |
| (6) | Cell tower rent is excluded. |
The following table presents certain information relating to tenant sales at the Roseville Shopping Center Property for tenants required to report sales:
Tenant Sales (PSF)
| Major Tenant Name | % of Total Annual U/W Base Rent | 2016(1) | 2017(1) | 2018(1) | Major Tenant Occupancy Cost(2) |
| PetCo Animal Supplies, Inc. | 13.9% | $214 | $207 | $184 | 17.9% |
| Big 5 Sporting Goods | 9.5% | $312 | $357 | $301 | 9.9% |
| Chevy’s Mexican Restaurant | 11.2% | $365 | $383 | $411 | 12.4% |
| In-Line Sales PSF | $286 | $296 | $303 | ||
| In-Line Occupancy Cost | 15.9% | 15.0% | 14.6% |
| (1) | TTM Sales PSF and Occupancy Cost are for the trailing 12-month period ending September 30 of each year. |
| (2) | Occupancy Cost is based on TTM 9/30/2018 sales, underwritten base rent and underwritten reimbursements. |
THE INFORMATION IN THIS STRUCTURAL AND COLLATERAL TERM SHEET IS NOT COMPLETE AND MAY BE AMENDED PRIOR TO THE TIME OF SALE. THIS TERM SHEET IS NOT AN OFFER TO SELL THESE SECURITIES AND IT IS NOT A SOLICITATION OF AN OFFER TO BUY THESE SECURITIES IN ANY JURISDICTION WHERE THE OFFER OR SALE IS NOT PERMITTED.
58
| Retail – Shadow Anchored | Loan #8 | Cut-off Date Balance: | $23,887,500 | |
| 1901-1913, 1919-1925, 1927 | Roseville Shopping Center | Cut-off Date LTV: | 69.2% | |
| Douglas Boulevard | U/W NCF DSCR: | 1.74x | ||
| Roseville, CA 95661 | U/W NOI Debt Yield: | 11.2% |
The following table presents certain information relating to the lease rollover schedule at the Roseville Shopping Center Property:
Lease Expiration Schedule(1)(2)
| Year Ending December 31, | No. of Leases Expiring | Expiring NRSF | % of Total NRSF | Cumulative Expiring NRSF | Cumulative % of Total NRSF | Annual U/W Base Rent | % of Total Annual U/W Base Rent | Annual U/W Base Rent PSF |
| MTM | 1 | 1,000 | 1.0% | 1,000 | 1.0% | $18,000 | 0.7% | $18.00 |
| 2019 | 5 | 11,611 | 12.0% | 12,611 | 13.0% | $335,052 | 12.6% | $28.86 |
| 2020 | 4 | 5,500 | 5.7% | 18,111 | 18.7% | $212,604 | 8.0% | $38.66 |
| 2021 | 8 | 31,100(3) | 32.1% | 49,211 | 50.8% | $977,078 | 36.6% | $31.42 |
| 2022 | 2 | 7,500 | 7.7% | 56,711 | 58.6% | $289,296 | 10.8% | $38.57 |
| 2023 | 1 | 2,400 | 2.5% | 59,111 | 61.1% | $63,360 | 2.4% | $26.40 |
| 2024 | 0 | 0 | 0.0% | 59,111 | 61.1% | $0 | 0.0% | $0.00 |
| 2025 | 0 | 0 | 0.0% | 59,111 | 61.1% | $0 | 0.0% | $0.00 |
| 2026 | 2 | 3,515 | 3.6% | 62,626 | 64.7% | $84,720 | 3.2% | $24.10 |
| 2027 | 1 | 15,486 | 16.0% | 78,112 | 80.7% | $371,664 | 13.9% | $24.00 |
| 2028 | 0 | 0 | 0.0% | 78,112 | 80.7% | $0 | 0.0% | $0.00 |
| 2029 | 1 | 13,114 | 13.5% | 91,226 | 94.3% | $314,736 | 11.8% | $24.00 |
| Thereafter | 0 | 0 | 0.0% | 91,226 | 94.3% | $0 | 0.0% | $0.00 |
| Vacant | 0 | 5,565 | 5.7% | 96,791 | 100.0% | $0 | 0.0% | $0.00 |
| Total/Weighted Average | 25 | 96,791 | 100.0% | $2,666,510(4) | 100.0% | $30.26(5) |
| (1) | Information obtained from the underwritten rent roll. |
| (2) | Certain tenants may have lease termination options that are exercisable prior to the originally stated expiration date of the subject lease and that are not considered in the Lease Expiration Schedule. |
| (3) | Includes 3,100 square feet of storage space. |
| (4) | Cell tower rent is excluded. |
| (5) | Total/Weighted Average Annual U/W Base Rent and Annual U/W Base Rent PSF exclude vacant space and a 3,100 square feet of storage space with no attributable U/W Base Rent. |
The following table presents historical occupancy percentages at the Roseville Shopping Center Property:
Historical Occupancy
12/31/2014(1) | 12/31/2015(1) | 12/31/2016(1) | 12/31/2017(1)(2) | 11/20/2018(3) | ||||
| 95.1% | 93.0% | 92.0% | 80.4% | 94.3% |
| (1) | Information obtained from the Roseville Shopping Center Borrower. |
| (2) | Occupancy dropped in 2017 as Party City, which formerly occupied the W Salon Suites space, vacated in September 2017. |
| (3) | Information obtained from the underwritten rent roll. |
THE INFORMATION IN THIS STRUCTURAL AND COLLATERAL TERM SHEET IS NOT COMPLETE AND MAY BE AMENDED PRIOR TO THE TIME OF SALE. THIS TERM SHEET IS NOT AN OFFER TO SELL THESE SECURITIES AND IT IS NOT A SOLICITATION OF AN OFFER TO BUY THESE SECURITIES IN ANY JURISDICTION WHERE THE OFFER OR SALE IS NOT PERMITTED.
59
| Retail – Shadow Anchored | Loan #8 | Cut-off Date Balance: | $23,887,500 | |
| 1901-1913, 1919-1925, 1927 | Roseville Shopping Center | Cut-off Date LTV: | 69.2% | |
| Douglas Boulevard | U/W NCF DSCR: | 1.74x | ||
| Roseville, CA 95661 | U/W NOI Debt Yield: | 11.2% |
Operating History and Underwritten Net Cash Flow. The following table presents certain information relating to the underwritten net cash flow at the Roseville Shopping Center Property:
Cash Flow Analysis
| 2016 | 2017 | TTM 9/30/2018 | U/W | %(1) | U/W $ per SF | ||||||||
| Rents in Place | $2,366,863 | $2,424,890 | $2,233,068 | $2,636,426 | 70.8 | % | $27.24 | ||||||
| Contractual Rent Steps | 0 | 0 | 0 | 30,084(2) | 0.8 | 0.31 | |||||||
| Grossed Up Vacant Space | 0 | 0 | 0 | 139,515 | 3.7 | 1.44 | |||||||
| Gross Potential Rent | $2,366,863 | $2,424,890 | $2,233,068 | $2,806,025 | 75.3 | % | $28.99 | ||||||
| Other Income(3) | 60,758 | 60,176 | 69,111 | 63,249 | 1.7 | 0.65 | |||||||
| Total Recoveries | 682,311 | 694,343 | 639,340 | 855,268 | 23.0 | 8.84 | |||||||
| Net Rental Income | $3,109,932 | $3,179,409 | $2,941,519 | $3,724,541 | 100.0 | % | $38.48 | ||||||
| (Vacancy & Credit Loss) | 0 | 0 | 0 | (218,866)(4) | (7.8) | (2.26) | |||||||
| Effective Gross Income | $3,109,932 | $3,179,409 | $2,941,519 | $3,505,675 | 92.2 | % | $36.22 | ||||||
| Real Estate Taxes | 258,876 | 269,106 | 267,990 | 366,643 | 10.5 | 3.79 | |||||||
| Insurance | 14,878 | 15,334 | 14,618 | 34,287 | 1.0 | 0.35 | |||||||
| Management Fee | 91,930 | 94,105 | 87,486 | 105,170 | 3.0 | 1.09 | |||||||
| Other Operating Expenses | 339,093 | 340,480 | 325,446 | 325,446 | 9.3 | 3.36 | |||||||
| Total Operating Expenses | $704,777 | $719,025 | $695,540 | $831,546 | 23.7 | % | $8.59 | ||||||
| Net Operating Income(5) | $2,405,155 | $2,460,384 | $2,245,979 | $2,674,128 | 76.3 | % | $27.63 | ||||||
| Replacement Reserves | 0 | 0 | 0 | 14,519 | 0.4 | 0.15 | |||||||
| TI/LC | 0 | 0 | 0 | 58,075 | 1.7 | 0.60 | |||||||
| Net Cash Flow | $2,405,155 | $2,460,384 | $2,245,979 | $2,601,535 | 74.2 | % | $26.88 | ||||||
| NOI DSCR | 1.61x | 1.65x | 1.50x | 1.79x | |||||||||
| NCF DSCR | 1.61x | 1.65x | 1.50x | 1.74x | |||||||||
| NOI Debt Yield | 10.1% | 10.3% | 9.4% | 11.2% | |||||||||
| NCF Debt Yield | 10.1% | 10.3% | 9.4% | 10.9% | |||||||||
| (1) | Represents (i) percent of Net Rental Income for all revenue fields, (ii) percent of Gross Potential Rent for Vacancy & Credit Loss and (iii) percent of Effective Gross Income for all other fields. |
| (2) | Represents contractual rent steps through November 2019. |
| (3) | Other Income includes income from fireworks sales in the parking area and T-Mobile rent for the cell tower. |
| (4) | The underwritten economic vacancy is 6.0%. The Roseville Shopping Center Property was 94.3% leased as of November 20, 2018. |
| (5) | The U/W NOI increased more than 5% compared to the TTM NOI due to the second largest tenant, W Salon Suites, starting its lease in January 2019. |
THE INFORMATION IN THIS STRUCTURAL AND COLLATERAL TERM SHEET IS NOT COMPLETE AND MAY BE AMENDED PRIOR TO THE TIME OF SALE. THIS TERM SHEET IS NOT AN OFFER TO SELL THESE SECURITIES AND IT IS NOT A SOLICITATION OF AN OFFER TO BUY THESE SECURITIES IN ANY JURISDICTION WHERE THE OFFER OR SALE IS NOT PERMITTED.
60
| Retail – Shadow Anchored | Loan #8 | Cut-off Date Balance: | $23,887,500 | |
| 1901-1913, 1919-1925, 1927 | Roseville Shopping Center | Cut-off Date LTV: | 69.2% | |
| Douglas Boulevard | U/W NCF DSCR: | 1.74x | ||
| Roseville, CA 95661 | U/W NOI Debt Yield: | 11.2% |
Appraisal.As of the appraisal valuation date of November 20, 2018, the Roseville Shopping Center Property had an “as-is” appraised value of $34,500,000.
Environmental Matters. According to a Phase I environmental site assessment dated November 14, 2018, there was no evidence of any recognized environmental conditions at the Roseville Shopping Center Property.
There was a Phase II environmental report on sub-slab soil gas dated June 11, 2018 to evaluate the potential impact of chlorinated solvents to sub-slab soil gas as a consequence of a release or releases from the historical on-site dry cleaning operations. None of the analyzed soil gas samples contained detectable concentrations of chlorinated solvents above commercial environmental screening levels, and no further action was recommended.
Market Overview and Competition.The Roseville Shopping Center Property is located in Roseville, Placer County, California, approximately 15 miles northeast of Downtown Sacramento. The Roseville Shopping Center Property is located approximately 1.25 miles east of the intersection of Douglas Boulevard and Interstate 80. Douglas Boulevard, East Roseville Parkway, Eureka Road, and Sierra College Boulevard have a large concentration of office and retail development. Roseville Galleria is located along Roseville Parkway in the northwest section of the Roseville Shopping Center Property’s neighborhood and is considered a regional mall containing over 1.0 million square feet. The Fountains at Roseville is also located northwest of the Roseville Shopping Center Property’s neighborhood, just across the street from the Roseville Galleria. Residential properties are located along secondary streets within Roseville Shopping Center Property’s neighborhood. According to the appraisal report, the estimated 2018 population within a one, three, and five-mile radius of the Roseville Shopping Center Property is 7,439, 103,338 and 263,307. The estimated 2018 average household income within the same radii is $92,257, $98,689, and $101,752.
Submarket Information – According to the appraisal, the Roseville Shopping Center Property is situated within the Roseville Retail submarket. As of third quarter 2018, the submarket reported a total inventory of 6.6 million square feet with a 3.5% vacancy rate and an average quoted rental rate of $18.60 per square foot.
Appraiser’s Comp Set – The appraiser identified eight competitive properties for the Roseville Shopping Center Property totaling approximately 2.2 million square feet, which reported an average occupancy rate of approximately 91.0%.
The following table presents certain information relating to the appraiser’s market rent conclusion for the Roseville Shopping Center Property:
Market Rent Summary(1)
| $2.00 Shop >3,000 SF | $2.25 Shop | $2.50 Shop | $3.25 Shop | $3.50 Shop | $2.00 Shop | $2.75 Pad | $4.25 Pad | $3.00 Shop | $3.75 Pad | |
| Market Rent (PSF) | $2.00 | $2.25 | $2.50 | $3.25 | $3.50 | $2.00 | $2.75 | $4.25 | $3.00 | $3.75 |
| Lease Term (Years) | 10 | 5 | 5 | 5 | 5 | 5 | 10 | 10 | 5 | 10 |
| Lease Type (Reimbursements) | NNN | NNN | NNN | NNN | NNN | NNN | NNN | NNN | NNN | NNN |
| Rent Increase Projection | 3.0% per annum | 3.0% per annum | 3.0% per annum | 3.0% per annum | 3.0% per annum | 3.0% per annum | 3.0% per annum | 3.0% per annum | 3.0% per annum | 3.0% per annum |
| (1) | Information obtained from the appraisal. |
THE INFORMATION IN THIS STRUCTURAL AND COLLATERAL TERM SHEET IS NOT COMPLETE AND MAY BE AMENDED PRIOR TO THE TIME OF SALE. THIS TERM SHEET IS NOT AN OFFER TO SELL THESE SECURITIES AND IT IS NOT A SOLICITATION OF AN OFFER TO BUY THESE SECURITIES IN ANY JURISDICTION WHERE THE OFFER OR SALE IS NOT PERMITTED.
61
| Retail – Shadow Anchored | Loan #8 | Cut-off Date Balance: | $23,887,500 | |
| 1901-1913, 1919-1925, 1927 | Roseville Shopping Center | Cut-off Date LTV: | 69.2% | |
| Douglas Boulevard | U/W NCF DSCR: | 1.74x | ||
| Roseville, CA 95661 | U/W NOI Debt Yield: | 11.2% |
The table below presents certain information relating to comparable sales for the Roseville Shopping Center Property identified by the appraiser:
Comparable Sales(1)
| Property Name | Location | Rentable Area (SF) | Sale Date | Adjusted Sale Price | Sale Price (PSF) |
| Walmart Central | Folsom, CA | 139,377 | Aug-17 | $39,933,500 | $286.51 |
| Rocky Ridge Town Center | Roseville, CA | 93,338 | Apr-17 | $36,000,000 | $385.70 |
| Raley’s Center Elk Grove | Elk Grove, CA | 103,853 | Apr-17 | $38,100,000 | $366.86 |
| Laguna Village | Sacramento, CA | 120,893 | Dec-16 | $34,000,000 | $281.24 |
| TJ Maxx Plaza | Roseville, CA | 126,498 | Mar-16 | $38,595,000 | $305.10 |
(1) Information obtained from the appraisal.
The table below presents certain information relating to eight comparable retail properties to the Roseville Shopping Center Property identified by the appraiser:
Competitive Set(1)
| Property Name / Location | Year Built/ Renovated | Total GLA (SF) | Occupancy | Distance to Subject | Major / Anchor Tenants |
Roseville Shopping Center (Subject) Roseville, CA | 1991/NAP | 96,791 | 94.3% | - | PetCo Animal Supplies, W Salon Suites, Big 5 Sporting Goods |
1950 Douglas Blvd Roseville, CA | 1989/NAP | 18,585 | 88.0% | 0.4 miles | Paul & Dan Chao |
Eureka Ridge Retail Center Roseville, CA | 2005/NAP | 37,296 | 100.0% | 0.6 miles | Instaphysique |
Renaissance Creek Roseville, CA | 2002/NAP | 188,000 | 99.0% | 1.7 miles | Ahi Poke |
Highland Reserve Marketplace Roseville, CA | 2004/NAP | 191,415 | 97.0% | 5.9 miles | The Posh Bagel, Freebirds World Burrito |
Nugget Plaza Roseville, CA | 2006/NAP | 140,274 | 96.0% | 5.9 miles | Aura Salon Company, Cycle Bare |
Fountains at Roseville Roseville, CA | 2007/NAP | 330,000 | 97.0% | 2.7 miles | Comcast (Xfinity) |
Palladio at Broadstone Folsom, CA | 2010/2018 | 623,777 | 81.0% | 14.4 miles | Brisas Do Sul, Pretty Sweet, Barnes & Noble |
Promenade at Sacramento Gateway Sacramento, CA | 2006/NAP | 665,593 | 86.0% | 17.9 miles | Burlington Coat Factory, Cost Plus, Ulta, Old Navy, Off Broadway Shoes, Barnes & Noble, Target |
| (1) | Information obtained from the appraisal and the underwritten rent roll. |
THE INFORMATION IN THIS STRUCTURAL AND COLLATERAL TERM SHEET IS NOT COMPLETE AND MAY BE AMENDED PRIOR TO THE TIME OF SALE. THIS TERM SHEET IS NOT AN OFFER TO SELL THESE SECURITIES AND IT IS NOT A SOLICITATION OF AN OFFER TO BUY THESE SECURITIES IN ANY JURISDICTION WHERE THE OFFER OR SALE IS NOT PERMITTED.
62
| Retail – Shadow Anchored | Loan #8 | Cut-off Date Balance: | $23,887,500 | |
| 1901-1913, 1919-1925, 1927 | Roseville Shopping Center | Cut-off Date LTV: | 69.2% | |
| Douglas Boulevard | U/W NCF DSCR: | 1.74x | ||
| Roseville, CA 95661 | U/W NOI Debt Yield: | 11.2% |
The following table presents certain information relating to eight comparable leases to those at the Roseville Shopping Center Property:
Comparable Leases(1)
| Property Name/ Location | Year Built/ Renovated | Total GLA (SF) | Distance from Subject | Occupancy | Lease Term | Tenant Size | Annual Base Rent PSF | Lease Type |
1950 Douglas Blvd. 1950 Douglas Blvd. Roseville, CA | 1989/NAP | 18,585 | 0.4 miles | 88.0% | 5.5 Yrs | 1,204 | $2.00 | NNN |
Eureka Ridge Retail Center 1470-1490 Eureka Road Roseville, CA | 2005/NAP | 37,296 | 0.6 miles | 100.0% | 5.3 Yrs | 2,125 | $2.19 | NNN |
Renaissance Creek 8620-8690 Sierra College Blvd. Roseville, CA | 2002/NAP | 188,000 | 1.7 miles | 99.0% | 7.0 Yrs | 2,870 | $3.25 | NNN |
Highland Reserve Marketplace 10301-10375 Fairway Drive Roseville, CA | 2004/NAP | 191,415 | 5.9 miles | 97.0% | 5.3 Yrs 4.0 Yrs | 1,500 2,116 | $3.00 $3.48 | NNN NNN |
Nugget Plaza NEC Fairway Dr. & Pleasant Grove Blvd., Roseville, CA | 2006/NAP | 140,274 | 5.9 miles | 96.0% | 5.5 Yrs 5.7 Yrs | 976 2,598 | $2.50 $2.25 | NNN NNN |
Fountains at Roseville 1162 Roseville Parkway Roseville, CA | 2007/NAP | 330,000 | 2.7 miles | 97.0% | 7.3 Yrs | 4,254 | $4.25 | NNN |
Palladio at Broadstone 200-460 Palladio Parkway Folsom, CA | 2010/2018 | 623,777 | 14.4 miles | 81.0% | 6.0 Yrs 6.1 Yrs 10.1 Yrs | 7,634 1,120 18,997 | $2.00 $2.20 $1.70 | NNN NNN Gross |
Promenade at Sacramento Gateway 3610 North Freeway Blvd. Sacramento, CA | 2006/NAP | 665,593 | 17.9 miles | 86.0% | 10.0 Yrs | 10,760 | $2.17 | NNN |
| (1) | Information obtained from the appraisal. |
Escrows.
Real Estate Taxes – The loan documents require an upfront real estate tax reserve of $89,325 and ongoing monthly real estate tax reserves in an amount equal to one-twelfth of the real estate taxes that the lender estimates will be payable during the next twelve months (initially $28,357).
Insurance – The loan documents require an upfront insurance reserve of $15,001 and ongoing monthly insurance reserves in an amount equal to one-twelfth of the insurance premiums that the lender estimates will be payable during the next twelve months (initially $2,857).
Replacement Reserves – The loan documents require ongoing monthly replacement reserves of $1,210, capped at $43,556.
TI/LC Reserve –The loan documents require ongoing monthly tenant improvement and leasing commissions reserves of $4,840, capped at $174,224.
Deferred Maintenance –The loan documents require an upfront deferred maintenance reserve of $9,275.
Free Rent Reserve – The loan documents require an upfront reserve of $93,913 for free rent related to W Salon Suites.
Unfunded TI/LC Reserve – The loan documents require an upfront reserve of $1,026,607 for unfunded TI/LCs related to W Salon Studios ($972,929), Bloom Hearing Aid ($45,936), and Seven Salon ($7,742).
Lockbox and Cash Management.Upon the occurrence of a Cash Management Trigger Event (as defined below) the Roseville Shopping Center Borrower will be required to establish a lender-controlled lockbox account and instruct each tenant to deposit rent into such lockbox account. Additionally, upon the occurrence of a Cash Management Trigger Event, all revenues received by the Roseville Shopping Center Borrower or the property manager relating to Roseville Shopping Center Property are required to be deposited into the lockbox within one business day of receipt. Other than during a Cash Sweep Event (as defined below), all excess funds on deposit are disbursed to the Roseville Shopping Center Borrower.
THE INFORMATION IN THIS STRUCTURAL AND COLLATERAL TERM SHEET IS NOT COMPLETE AND MAY BE AMENDED PRIOR TO THE TIME OF SALE. THIS TERM SHEET IS NOT AN OFFER TO SELL THESE SECURITIES AND IT IS NOT A SOLICITATION OF AN OFFER TO BUY THESE SECURITIES IN ANY JURISDICTION WHERE THE OFFER OR SALE IS NOT PERMITTED.
63
| Retail – Shadow Anchored | Loan #8 | Cut-off Date Balance: | $23,887,500 | |
| 1901-1913, 1919-1925, 1927 | Roseville Shopping Center | Cut-off Date LTV: | 69.2% | |
| Douglas Boulevard | U/W NCF DSCR: | 1.74x | ||
| Roseville, CA 95661 | U/W NOI Debt Yield: | 11.2% |
A “Cash Management Trigger Event” will commence upon the occurrence of the following:
| (i) | an event of default; |
| (ii) | any bankruptcy action of the Roseville Shopping Center Borrower, either guarantor or the property manager, or |
| (iii) | a Cash Management DSCR Trigger Event (as defined below). |
A “Cash Management DSCR Trigger Event” will occur on any day that the amortizing debt service coverage ratio, based on the trailing 12-month period immediately preceding the date of such determination, is less than 1.20x.
A Cash Management Trigger Event will end upon the occurrence of:
| ● | with regard to clause (i) above, the cure of such event of default being accepted or waived by lender; |
| ● | with regard to clause (ii) above, such bankruptcy petition being discharged, stayed, or dismissed within 120 days of such filing, among other conditions, for the Roseville Shopping Center Borrower, the related guarantor and the property manager; or, with respect to a bankruptcy action of the property manager, the Roseville Shopping Center Borrower replacing the property manager with a qualified manager acceptable to the lender; and |
| ● | with regard to clause (iii) above, the date that the amortizing debt service coverage ratio based upon the trailing 12-month period immediately preceding the date of such determination is greater than 1.20x for two consecutive calendar quarters. |
A “Cash Sweep Event” will commence upon the occurrence of the following:
| (i) | an event of default; |
| (ii) | any bankruptcy action of the Roseville Shopping Center Borrower, either guarantor or the property manager; or |
| (iii) | a Cash Sweep DSCR Trigger Event (as defined below); |
A “Cash Sweep DSCR Trigger Event” will occur on any day the amortizing debt service coverage ratio, based on the trailing 12-month period immediately preceding the date of such determination, is less than 1.10x.
A “Cash Sweep Event” will end upon the occurrence of:
| ● | with regard to clause (i) above, the cure of such event of default being accepted or waived by lender; |
| ● | with regard to clause (ii) above, such bankruptcy petition being discharged, stayed, or dismissed within 120 days of such filing among other conditions for the Roseville Shopping Center Borrower, the related guarantor or the property manager; or, with respect to a bankruptcy action of the property manager, the Roseville Shopping Center Borrower replacing the property manager with a qualified manger acceptable to the lender; and |
| ● | with regard to clause (iii) above, the date that the amortizing debt service coverage ratio based upon the trailing 12-month period immediately preceding the date of such determination is greater than 1.10x for two consecutive calendar quarters. |
Property Management. The Roseville Shopping Center Property is managed by CIRE Investment Services, Inc., an affiliate of the Roseville Shopping Center Borrower.
Partial Release. Not permitted.
Real Estate Substitution.Not permitted.
Subordinate and Mezzanine Indebtedness.Not permitted.
Ground Lease. None.
Terrorism Insurance.The Roseville Shopping Center Mortgage Loan documents require that the “all risk” insurance policy required to be maintained by the Roseville Shopping Center Borrower provides coverage for terrorism in an amount equal to the full replacement cost of the Roseville Shopping Center Property, as well as business interruption insurance covering no less than the 18-month period following the occurrence of a casualty event, together with a 12-month extended period of indemnity.
THE INFORMATION IN THIS STRUCTURAL AND COLLATERAL TERM SHEET IS NOT COMPLETE AND MAY BE AMENDED PRIOR TO THE TIME OF SALE. THIS TERM SHEET IS NOT AN OFFER TO SELL THESE SECURITIES AND IT IS NOT A SOLICITATION OF AN OFFER TO BUY THESE SECURITIES IN ANY JURISDICTION WHERE THE OFFER OR SALE IS NOT PERMITTED.
64
| No. 9 – Northchase Office Portfolio | |||||||
| Mortgage Loan Information | Mortgaged Property Information | ||||||
| Mortgage Loan Seller: | Wells Fargo Bank, National Association | Single Asset/Portfolio: | Portfolio | ||||
Credit Assessment (DBRS/Fitch/Moody’s): | NR/NR/NR | Property Type – Subtype: | Office – Suburban | ||||
| Original Principal Balance: | $19,500,000 | Location: | Various | ||||
| Cut-off Date Balance: | $19,500,000 | Size: | 255,726 SF | ||||
| % of Initial Pool Balance: | 2.5% | Cut-off Date Balance Per SF: | $76.25 | ||||
| Loan Purpose: | Refinance | Maturity Date Balance Per SF: | $76.25 | ||||
| Borrower Sponsor: | Rose Jarboe | Year Built/Renovated: | Various/2018 | ||||
| Guarantor: | Rose Jarboe | Title Vesting: | Fee | ||||
| Mortgage Rate: | 5.0000% | Property Manager: | Self-managed | ||||
| Note Date: | January 31, 2019 | Current Occupancy (As of): | 94.1% (12/1/2018) | ||||
| Seasoning: | 1 month | YE 2017 Occupancy: | 91.6% | ||||
| Maturity Date: | February 11, 2029 | YE 2016 Occupancy: | 94.1% | ||||
| IO Period: | 120 months | YE 2015 Occupancy: | 91.2% | ||||
| Loan Term (Original): | 120 months | YE 2014 Occupancy: | 84.2% | ||||
| Amortization Term (Original): | NAP | Appraised Value: | $30,450,000 | ||||
| Loan Amortization Type: | Interest-only, Balloon | Appraised Value Per SF: | $119.07 | ||||
| Call Protection: | L(25), D(91),O(4) | Appraisal Valuation Date: Various | |||||
| Lockbox Type: | Springing | ||||||
| Additional Debt: | None | ||||||
| Additional Debt Type (Balance): | NAP | Underwriting and Financial Information | |||||
| TTM NOI (10/31/2018): | $2,412,716 | ||||||
| YE 2017 NOI(2): | $2,428,917 | ||||||
| YE 2016 NOI(3): | NAV | ||||||
| Escrows and Reserves(1) | YE 2015 NOI(3): | NAV | |||||
| Initial | Monthly | Cap | U/W Revenues: | $4,471,635 | |||
| Taxes | $163,808 | $30,676 | NAP | U/W NCF: | $2,260,404 | ||
| Insurance | $0 | Springing | NAP | U/W DSCR based on NOI/NCF: | 2.53x / 2.28x | ||
| Immediate Repair Reserve | $44,750 | $0 | NAP | U/W Debt Yield based on NOI/NCF: | 12.9% / 11.6% | ||
| Replacement Reserve | $0 | $5,405 | NAP | U/W Debt Yield at Maturity based on NOI/NCF: | 12.9% / 11.6% | ||
| Leasing Reserve | $271,000 | $20,833 | $750,000 | Cut-off Date LTV Ratio: | 64.0% | ||
| Gap Rent Reserve | $66,819 | $0 | NAP | LTV Ratio at Maturity: | 64.0% | ||
| Sources and Uses | ||||||||
| Sources | Uses | |||||||
| Original loan amount | $19,500,000 | 100.0% | Loan payoff | $17,205,770 | 88.2% | |||
| Upfront reserves | 546,377 | 2.8 | ||||||
| Closing costs | 368,818 | 1.9 | ||||||
| Return of equity | 1,379,035 | 7.1 | ||||||
| Total Sources | $19,500,000 | 100.0% | Total Uses | $19,500,000 | 100.0% | |||
| (1) | See “Escrows” section below. |
| (2) | YE 2017 NOI includes full-year 2017 values for the Crestwood and Northchase properties and the 11-month period ending December 31, 2017, annualized, values for the Mansell property. |
| (3) | The sponsor acquired two of the three Northchase Office Portfolio Properties (as defined in “The Mortgage Loan” section below) in 2016. |
The Mortgage Loan. The mortgage loan (the “Northchase Office Portfolio Mortgage Loan”) is evidenced by a single promissory note secured by a first mortgage encumbering the fee interest in three suburban office properties located in Marietta, Duluth and Roswell, Georgia (the “Northchase Office Portfolio Properties”).
The Borrowers and Borrower Sponsors.The borrowers comprise three single purpose entities: Northchase Partners, LLC; Crestwood Partners, LLC; and Mansell Partners, LLC (collectively, the “Northchase Office Portfolio Borrower”), each a Georgia limited liability company. The borrower sponsor and nonrecourse carve-out guarantor of the Northchase Office Portfolio Mortgage Loan is Rose Jarboe.
Ms. Jarboe is the Chief Executive Officer of WePartner Management (“WePartner”), an Atlanta-based, fully integrated real estate investment and management firm specializing in acquisition, development and management of commercial office, industrial, retail and residential properties. WePartner’s entire 14-property portfolio is located in Georgia. Ms. Jarboe has over 20 years of experience in
THE INFORMATION IN THIS STRUCTURAL AND COLLATERAL TERM SHEET IS NOT COMPLETE AND MAY BE AMENDED PRIOR TO THE TIME OF SALE. THIS TERM SHEET IS NOT AN OFFER TO SELL THESE SECURITIES AND IT IS NOT A SOLICITATION OF AN OFFER TO BUY THESE SECURITIES IN ANY JURISDICTION WHERE THE OFFER OR SALE IS NOT PERMITTED.
65
| Office – Suburban | Loan #9 | Cut-off Date Balance: | $19,500,000 | |
| Property Addresses – Various | Northchase Office Portfolio | Cut-off Date LTV: | 64.0% | |
| U/W NCF DSCR: | 2.28x | |||
| U/W NOI Debt Yield: | 12.9% |
accounting, finance and real estate investments. At WePartner, Ms. Jarboe oversees all business activities including investment analysis, finance, property management and construction management.
The Properties.The Northchase Office Portfolio Properties comprise three, class B suburban office properties located in the northern suburbs of the greater Atlanta market. Constructed from 1986 to 1999 and renovated in 2018, the Northchase Office Portfolio Properties total 255,726 square feet and as of December 1, 2018 were 94.1% leased to 58 tenants across various industries, including financial, construction, insurance, legal and medical, with no single tenant representing more than 8.1% of net rentable area or 8.2% of underwritten base rent. Renovations were completed at all three Northchase Office Portfolio Properties from 2016 to 2018 for a total cost of approximately $528,000. The borrower sponsor acquired the Northchase and Crestwood properties in 2016 and acquired the Mansell property in 2017.
The Northchase Office Portfolio Properties range in size from 77,003 square feet to 93,681 square feet and comprise four, 2- to 5-story buildings. The Northchase Office Portfolio Properties have a weighted average parking ratio of 3.7 spaces per 1,000 square feet of rentable area with individual properties ranging from 2.8 to 4.5 spaces per 1,000 square feet of rentable area (see table below).
The following table presents certain information relating to the Northchase Office Portfolio Properties:
| Property Name – Location | Allocated Cut-off Date Balance | % of Portfolio Cut-off Date Balance | Occupancy | Year Built/ Renovated | Net Rentable Area (SF) | Appraised Value | Allocated Cut-off Date LTV | % of UW NOI | Parking Ratio (per 1,000 SF) |
Northchase - 1165 Northchase Parkway Southeast Marietta, GA | $6,550,000 | 33.6% | 94.3% | 1986/2018 | 85,042 | $10,000,000 | 65.5% | 35.6% | 4.5 |
Crestwood - 3675 Crestwood Parkway Northwest Duluth, GA | $6,480,000 | 33.2% | 93.1% | 1987/2018 | 93,681 | $10,650,000 | 60.8% | 34.9% | 2.8 |
Mansell - 675 and 695 Mansell Road Roswell, GA | $6,470,000 | 33.2% | 95.0% | 1999/2018 | 77,003 | $9,800,000 | 66.0% | 29.5% | 4.0 |
| Total/Weighted Average | $19,500,000 | 100.0% | 94.1% | 255,726 | $30,450,000 | 64.0% | 100.0% | 3.7 |
THE INFORMATION IN THIS STRUCTURAL AND COLLATERAL TERM SHEET IS NOT COMPLETE AND MAY BE AMENDED PRIOR TO THE TIME OF SALE. THIS TERM SHEET IS NOT AN OFFER TO SELL THESE SECURITIES AND IT IS NOT A SOLICITATION OF AN OFFER TO BUY THESE SECURITIES IN ANY JURISDICTION WHERE THE OFFER OR SALE IS NOT PERMITTED.
66
| Office – Suburban | Loan #9 | Cut-off Date Balance: | $19,500,000 | |
| Property Addresses – Various | Northchase Office Portfolio | Cut-off Date LTV: | 64.0% | |
| U/W NCF DSCR: | 2.28x | |||
| U/W NOI Debt Yield: | 12.9% |
The following table presents certain information relating to the tenancy at the Northchase Office Portfolio Properties:
Major Tenants
| Tenant Name (Property) | Credit Moody’s/ | Tenant NRSF | % of NRSF | Annual U/W Base Rent PSF(1) | Annual U/W Base Rent(1) | % of Total Annual U/W Base Rent | Lease Expiration Date | Extension Options | Termination Option (Y/N) |
| Major Tenants | |||||||||
| Oversight Systems, Inc (Northchase) | NR/NR/NR | 19,211 | 7.5% | $19.13 | $367,412 | 8.2% | 7/31/2020(2) | 1, 5-year(2) | N |
| NorthPoint Executives Suites Duluth, LLC (Crestwood) | NR/NR/NR | 20,835 | 8.1% | $17.05 | $355,301 | 7.9% | 8/31/2023 | None | N |
| CMI Limited Co. (Northchase) | NR/NR/NR | 14,484 | 5.7% | $20.00 | $289,680 | 6.4% | 4/30/2020 | None | N |
| Paperhost.com, Inc. (Mansell) | NR/NR/NR | 13,253 | 5.2% | $19.50 | $258,434 | 5.7% | 9/30/2020 | None | N |
| Medlytix, Inc. (Mansell) | NR/NR/NR | 12,149 | 4.8% | $19.15 | $232,653 | 5.2% | 6/30/2021 | None | N |
| Total Major Tenants | 79,932 | 31.3% | $18.81 | $1,503,480 | 33.4% | ||||
| Non-Major Tenant | 160,567 | 62.8% | $18.67 | $2,998,298 | 66.6% | ||||
| Occupied Collateral Total | 240,499 | 94.1% | $18.72 | $4,501,778 | 100.0% | ||||
| Vacant Space | 15,227 | 6.0% | |||||||
| Collateral Total | 255,726 | 100.0% | |||||||
| (1) | Annual U/W Base Rent PSF and Annual U/W Base Rent include contractual rent steps through February 2020 totaling $110,475. |
| (2) | Oversight Systems, Inc leases two suites at the Northchase Office Portfolio Properties. The lease for the 16,053 square foot suite expires on 7/31/2020 and has one, 5-year option to renew. The lease for the 3,158 square foot expansion space expires on 12/31/2022 and has no extension options. |
The following table presents certain information relating to the lease rollover schedule at the Northchase Office Portfolio Properties:
Lease Expiration Schedule(1)(2)
| Year Ending December 31, | No. of Leases Expiring | Expiring NRSF | % of Total NRSF | Cumulative Expiring NRSF | Cumulative % of Total NRSF | Annual U/W Base Rent(3) | % of Total Annual U/W Base Rent | Annual U/W Base Rent PSF(3) |
| MTM | 2 | 560 | 0.2% | 560 | 0.2% | $4,499 | 0.1% | $8.03 |
| 2019 | 11 | 26,239 | 10.3% | 26,799 | 10.5% | $513,128 | 11.4% | $19.56 |
| 2020 | 16 | 92,247 | 36.1% | 119,046 | 46.6% | $1,777,364 | 39.5% | $19.27 |
| 2021 | 13 | 48,958 | 19.1% | 168,004 | 65.7% | $913,361 | 20.3% | $18.66 |
| 2022 | 9 | 29,099 | 11.4% | 197,103 | 77.1% | $552,302 | 12.3% | $18.98 |
| 2023 | 3 | 23,771 | 9.3% | 220,874 | 86.4% | $412,897 | 9.2% | $17.37 |
| 2024 | 4 | 12,708 | 5.0% | 233,582 | 91.3% | $241,318 | 5.4% | $18.99 |
| 2025 | 0 | 0 | 0.0% | 233,582 | 91.3% | $0 | 0.0% | $0.00 |
| 2026 | 1 | 4,485 | 1.8% | 238,067 | 93.1% | $86,909 | 1.9% | $19.38 |
| 2027 | 0 | 0 | 0.0% | 238,067 | 93.1% | $0 | 0.0% | $0.00 |
| 2028 | 0 | 0 | 0.0% | 238,067 | 93.1% | $0 | 0.0% | $0.00 |
| 2029 | 0 | 0 | 0.0% | 238,067 | 93.1% | $0 | 0.0% | $0.00 |
| Thereafter(4) | 5 | 2,432 | 1.0% | 240,499 | 94.1% | $0 | 0.0% | $0.00 |
| Vacant | 0 | 15,227 | 6.0% | 255,726 | 100.0% | $0 | 0.0% | $0.00 |
| Total/Weighted Average | 64 | 255,726 | 100.0% | $4,501,778 | 100.0% | $18.72 |
| (1) | Information obtained from the underwritten rent roll. |
| (2) | Certain tenants may have lease termination options that are exercisable prior to the originally stated expiration date of the subject lease and that are not considered in the Lease Expiration Schedule. |
(3) Total/Weighted Average Annual U/W Base Rent and Total/Weighted Average Annual U/W Base Rent PSF exclude vacant space.
| (4) | Thereafter includes three storage units leased to property management and office tenants, one engineering office and one roof space that have no Annual U/W Base Rent or lease expiration date. |
THE INFORMATION IN THIS STRUCTURAL AND COLLATERAL TERM SHEET IS NOT COMPLETE AND MAY BE AMENDED PRIOR TO THE TIME OF SALE. THIS TERM SHEET IS NOT AN OFFER TO SELL THESE SECURITIES AND IT IS NOT A SOLICITATION OF AN OFFER TO BUY THESE SECURITIES IN ANY JURISDICTION WHERE THE OFFER OR SALE IS NOT PERMITTED.
67
| Office – Suburban | Loan #9 | Cut-off Date Balance: | $19,500,000 | |
| Property Addresses – Various | Northchase Office Portfolio | Cut-off Date LTV: | 64.0% | |
| U/W NCF DSCR: | 2.28x | |||
| U/W NOI Debt Yield: | 12.9% |
The following table presents historical occupancy percentages at the Northchase Office Portfolio Properties:
Historical Occupancy
12/31/2014(1)(2) | 12/31/2015(1)(2) | 12/31/2016(1) | 12/31/2017(1) | 12/1/2018(3) | ||||
| 84.2% | 91.2% | 94.1% | 91.6% | 94.1% |
| (1) | Information obtained from a third-party market research provider. |
| (2) | The increase in occupancy from 2014 to 2015 is attributed to six new leases signed at the Northchase Office Portfolio Properties between April 2014 and November 2014 totaling approximately 17.8% of net rentable area. |
| (3) | Information obtained from the underwritten rent roll. |
Operating History and Underwritten Net Cash Flow. The following table presents certain information relating to the historical operating performance and underwritten net cash flow at the Northchase Office Portfolio Properties:
Cash Flow Analysis(1)
| 2017(2) | TTM 10/31/18 | U/W | %(3) | U/W $ per SF | |
| Base Rent | $4,027,954 | $4,253,817 | $4,391,303 | 90.0% | $17.17 |
| Contractual Rent Steps(4) | 0 | 0 | 110,475 | 2.3 | 0.43 |
| Grossed Up Vacant Space | 0 | 0 | 279,364 | 5.7 | 1.09 |
| Gross Potential Rent | $4,027,954 | $4,253,817 | $4,781,142 | 98.0% | $18.70 |
| Other Income(5) | 11,636 | 12,195 | 10,334 | 0.2 | 0.04 |
| Total Recoveries | 92,449 | 86,972 | 86,972 | 1.8 | 0.34 |
| Net Rental Income | $4,132,039 | $4,352,985 | $4,878,448 | 100.0% | $19.08 |
| (Vacancy & Credit Loss) | 0 | 0 | (406,813)(6) | (8.5) | (1.59) |
| Effective Gross Income | $4,132,039 | $4,352,985 | $4,471,635 | 91.7% | $17.49 |
| Real Estate Taxes | 290,380 | 292,389 | 350,674 | 7.8 | 1.37 |
| Insurance | 43,225 | 45,620 | 42,504 | 1.0 | 0.17 |
| Management Fee | 165,100 | 169,900 | 134,149 | 3.0 | 0.52 |
| Other Operating Expenses | 1,204,416 | 1,432,358 | 1,432,358 | 32.0 | 5.60 |
| Total Operating Expenses | $1,703,121 | $1,940,268 | $1,959,685 | 43.8% | $7.66 |
| Net Operating Income | $2,428,917 | $2,412,716 | $2,511,950 | 56.2% | $9.82 |
| Replacement Reserves | 0 | 0 | 64,854 | 1.5 | 0.25 |
| TI/LC | 0 | 0 | 186,692 | 4.2 | 0.73 |
| Net Cash Flow | $2,428,917 | $2,412,716 | $2,260,404 | 50.5% | $8.84 |
| NOI DSCR | 2.45x | 2.43x | 2.53x | ||
| NCF DSCR | 2.45x | 2.43x | 2.28x | ||
| NOI Debt Yield | 12.5% | 12.4% | 12.9% | ||
| NCF Debt Yield | 12.5% | 12.4% | 11.6% |
| (1) | The borrower sponsor acquired the Northchase Office Portfolio Properties in 2016 and 2017. 2016 financials were not made available by the prior owner. |
| (2) | 2017 includes full-year 2017 values for the Crestwood and Northchase properties and the trailing 11-month period ending December 31, 2017, annualized, values for the Mansell property. |
| (3) | Represents (i) percent of Net Rental Income for all revenue fields, (ii) percent of Gross Potential Rent for Vacancy & Credit Loss and (iii) percent of Effective Gross Income for all other fields. |
| (4) | Represents contractual rent steps through February 2020 (see “Major Tenants” table above). |
| (5) | Other Income includes application fees, late fees, deposit forfeit, and other miscellaneous income. |
| (6) | The underwritten economic vacancy is 8.5%. The Northchase Office Portfolio Properties were 94.1% occupied as of December 1, 2018. |
THE INFORMATION IN THIS STRUCTURAL AND COLLATERAL TERM SHEET IS NOT COMPLETE AND MAY BE AMENDED PRIOR TO THE TIME OF SALE. THIS TERM SHEET IS NOT AN OFFER TO SELL THESE SECURITIES AND IT IS NOT A SOLICITATION OF AN OFFER TO BUY THESE SECURITIES IN ANY JURISDICTION WHERE THE OFFER OR SALE IS NOT PERMITTED.
68
| Office – Suburban | Loan #9 | Cut-off Date Balance: | $19,500,000 | |
| Property Addresses – Various | Northchase Office Portfolio | Cut-off Date LTV: | 64.0% | |
| U/W NCF DSCR: | 2.28x | |||
| U/W NOI Debt Yield: | 12.9% |
Appraisal.The appraiser concluded to an aggregate “as-is” appraised value for the Northchase Office Portfolio Properties of $30,450,000 as of valuation dates from November 5, 2018 to November 9, 2018.
Environmental Matters. According to Phase I environmental site assessments dated from November 8, 2018 to November 9, 2018, there was no evidence of any recognized environmental conditions at any of the Northchase Office Portfolio Properties.
Market Overview and Competition.The Northchase Office Portfolio Properties are located in the northern suburbs of the greater Atlanta market.
Northchase– The Northchase property is located in Marietta, Georgia, approximately 16.3 miles northwest of the Atlanta central business district (“CBD”) and 23.2 miles northwest of the Hartsfield-Jackson Atlanta International Airport (“ATL Airport”), the busiest airport in the world by total take-off and landing in 2017 and by total passenger traffic in 2017, per third-party news and market research providers. The Northchase property is located 0.9 miles southeast of Interstate 75, 3.3 miles northwest of SunTrust Park (home of the Major League Baseball Atlanta Braves) and 9.3 miles southeast of Town Center at Cobb, a Simon-owned regional mall anchored by Macy’s and Belk.
According to a third-party market research report, the Northchase property is situated within the Cumberland/Galleria submarket of the Atlanta Office Market. As of February 2019, the Cumberland/Galleria Office submarket reported a total inventory of approximately 30.6 million square feet with a 14.4% vacancy rate, which has decreased from 17.6% in 2011. The submarket reported a $24.52 per square foot gross market rent.
Crestwood– The Crestwood property is situated in Duluth, Georgia, approximately 1.0 mile east of Interstate 85, 23.2 miles northeast of the Atlanta CBD and 31.4 miles northeast of the ATL Airport. The Crestwood property is located approximately 1.1 miles south of Mall Corners Shopping Center (a 190,000 square foot center that features Furniture Mall and Men’s Warehouse) and 4.1 miles southwest of Sugarloaf Mills, which includes Bass Pro Shops Outdoor World, OFF 5th Saks Avenue Outlet, Off Broadway Shoes, Adidas, Nike Factory Store, and Burlington Coat Factory.
According to a third-party market research report, the Crestwood property is situated within the Duluth/Suwanee/Buford submarket of the Atlanta Office Market. As of February 2019, the Duluth/Suwanee/Buford Office submarket reported a total inventory of 16.9 million square feet with a 14.1% vacancy rate, which has decreased from 17.9% in 2012. The submarket reported a $21.00 per square foot gross market rent.
Mansell– The Mansell property is situated in Roswell, Georgia, approximately 23.9 miles north of the Atlanta CBD and 31.2 miles north of the ATL Airport. The Mansell property is located 3.1 miles west of North Point Mall, a 1.1 million square foot Brookfield-owned super regional mall that features Macy’s, Dillard’s, Von Maur and a 12-screen AMC Theatres.
According to a third-party market research report, the Mansell property is situated within the N Fulton/Forsyth County submarket of the Atlanta Office Market. As of February 2019, the N Fulton/Forsyth County Office submarket reported a total inventory of 37.3 million square feet with an 11.8% vacancy rate, which has decreased from 16.7% in 2010. Within a one-mile radius of the Mansell property, as of year-end 2018, there were 223 office properties totaling approximately 1.8 million square feet with a 5.4% vacancy rate, per a third-party market research provider. The submarket reported a $22.53 per square foot gross market rent.
The following table presents certain information relating to the appraiser’s market rent conclusion for the Northchase Office Portfolio Properties:
Market Rent Summary(1)
| Northchase | Crestwood | Mansell | |
| Market Rent (PSF) | $18.50 | $18.50 | $18.00 |
| Lease Term (Years) | 5 | 5 | 5 |
| Concessions | 3 mos. | 3 mos. | 3 mos. |
| Lease Type (Reimbursements) | Full Service | Full Service | Full Service |
| Rent Increase Projection | 3.0% per annum | 3.0% per annum | 3.0% per annum |
| Tenant Improvements (New Tenants) (PSF) | $10.00 | $10.00 | $10.00 |
| Tenant Improvements (Renewals) (PSF) | $2.00 | $2.00 | $2.00 |
| (1) | Information obtained from the appraisals. |
THE INFORMATION IN THIS STRUCTURAL AND COLLATERAL TERM SHEET IS NOT COMPLETE AND MAY BE AMENDED PRIOR TO THE TIME OF SALE. THIS TERM SHEET IS NOT AN OFFER TO SELL THESE SECURITIES AND IT IS NOT A SOLICITATION OF AN OFFER TO BUY THESE SECURITIES IN ANY JURISDICTION WHERE THE OFFER OR SALE IS NOT PERMITTED.
69
| Office – Suburban | Loan #9 | Cut-off Date Balance: | $19,500,000 | |
| Property Addresses – Various | Northchase Office Portfolio | Cut-off Date LTV: | 64.0% | |
| U/W NCF DSCR: | 2.28x | |||
| U/W NOI Debt Yield: | 12.9% |
The table below presents certain information relating to comparable sales, which pertain to all of the Northchase Office Portfolio Properties identified by the appraiser:
Comparable Sales(1)
| Property Name | Location | Rentable Area (SF) | Sale Date | Sale Price | Sale Price (PSF) |
| Founders Park at Northmeadow | Alpharetta, GA | 202,341 | Jul-18 | $23,011,375 | $113.73 |
| Huntcrest A+B | Lawrenceville, GA | 162,430 | Jul-18 | $19,500,000 | $120.05 |
| Pavillion Center | Roswell, GA | 44,714 | Feb-18 | $4,850,000 | $108.47 |
| Barrett Court | Kennesaw, GA | 32,378 | Jan-18 | $3,750,000 | $115.82 |
| Royal 400 Court | Alpharetta, GA | 27,272 | Jan-18 | $3,000,000 | $110.00 |
| Kings Landing | Roswell, GA | 77,967 | May-17 | $7,900,000 | $101.32 |
| (1) | Information obtained from the appraisals. |
Escrows.
Real Estate Taxes – The loan documents require an upfront real estate tax reserve of $163,808 and ongoing monthly real estate tax reserves in an amount equal to one-twelfth of the real estate taxes that the lender estimates will be payable during the next twelve months (initially $30,676).
Insurance – The loan documents do not require ongoing monthly escrows for insurance premiums as long as (i) no event of default has occurred and is continuing, (ii) the borrower or borrower affiliate provides the lender with evidence that the Northchase Office Portfolio Properties’ insurance coverage is included in a blanket policy and such policy is in full force and effect and (iii) the borrower pays all applicable insurance premiums and provides the lender with evidence of timely payment of insurance premiums/renewals.
Immediate Repair Reserve –The loan documents require an upfront reserve of $44,750 for various specified repairs required to be completed between 90 days and six months from loan origination.
Replacement Reserve – The loan documents require ongoing monthly Replacement Reserves of $5,405, which the lender may require the borrower to increase (not more than once per year) if the lender reasonably determines such increase is necessary to maintain the proper operation of the Northchase Office Portfolio Properties.
Leasing Reserve –The loan documents require an upfront general tenant improvements and leasing commissions (“TI/LC”) reserve of $271,000 and ongoing monthly TI/LC reserves of $20,833, subject to a cap of $750,000.
Gap Rent Reserve – The loan documents require an upfront reserve of $66,819 for gap rent related to So He Moon, Clickagy, Ameriprise, Brown & Brown and Virguez & Associates.
Lockbox and Cash Management.Upon the occurrence and continuance of a Cash Trap Event Period (as defined below), the borrower is required to establish a lender-controlled lockbox account and direct all rent directly into such lockbox account. During a Cash Trap Event Period, funds in the lockbox account are required to be swept to a lender-controlled cash management account and all excess funds are required to be swept to an excess cash flow subaccount controlled by the lender.
A “Cash Trap Event Period” will commence upon the earlier of the following:
| (i) | the occurrence and continuance of an event of default; or |
| (ii) | the net cash flow debt service coverage ratio (“NCF DSCR”) falling below 1.45x at the end of any calendar quarter. |
A Cash Trap Event Period will end upon the occurrence of the following:
| ● | with regard to clause (i), the cure of such event of default; or |
| ● | with regard to clause (ii), the NCF DSCR being greater than or equal to 1.55x for two consecutive calendar quarters. |
Property Management. The Northchase Office Portfolio Properties are managed by an affiliate of the Northchase Office Portfolio Borrower.
Partial Release. Following the defeasance lockout date and prior to the open period start date, the borrower may obtain the release of any of the Northchase Office Portfolio Properties,provided that, among other things, and in accordance with the loan documents, (a) no event of default has occurred and is continuing; (b) the Northchase Office Portfolio Mortgage Loan is partially defeased in an amount equal to the greater of (i) 125% of the allocated loan amount of the Northchase Office Portfolio property being released and (ii) the net sale proceeds applicable to such Northchase Office Portfolio property being released; (c) the net cash flow debt yield for the remaining Northchase Office Portfolio Properties immediately following the release is greater than 11.5%; (d) the loan-to-value
THE INFORMATION IN THIS STRUCTURAL AND COLLATERAL TERM SHEET IS NOT COMPLETE AND MAY BE AMENDED PRIOR TO THE TIME OF SALE. THIS TERM SHEET IS NOT AN OFFER TO SELL THESE SECURITIES AND IT IS NOT A SOLICITATION OF AN OFFER TO BUY THESE SECURITIES IN ANY JURISDICTION WHERE THE OFFER OR SALE IS NOT PERMITTED.
70
| Office – Suburban | Loan #9 | Cut-off Date Balance: | $19,500,000 | |
| Property Addresses – Various | Northchase Office Portfolio | Cut-off Date LTV: | 64.0% | |
| U/W NCF DSCR: | 2.28x | |||
| U/W NOI Debt Yield: | 12.9% |
ratio of the remaining Northchase Office Portfolio Properties, after giving effect to the release of such property is not greater than 60.0%; (e) a legal opinion covering compliance in all respects with all laws, rules and regulations governing REMICs has been delivered; and (f) rating agency confirmation is received.
Real Estate Substitution.Not permitted.
Subordinate and Mezzanine Indebtedness.Not permitted.
Ground Lease. None.
Terrorism Insurance.The Northchase Office Portfolio Mortgage Loan documents require that the “all risk” insurance policy required to be maintained by the borrower provides coverage for terrorism in an amount equal to the full replacement cost of the Northchase Office Portfolio Properties, as well as business interruption insurance covering no less than the 12-month period following the occurrence of a casualty event, together with a 6-month extended period of indemnity.
THE INFORMATION IN THIS STRUCTURAL AND COLLATERAL TERM SHEET IS NOT COMPLETE AND MAY BE AMENDED PRIOR TO THE TIME OF SALE. THIS TERM SHEET IS NOT AN OFFER TO SELL THESE SECURITIES AND IT IS NOT A SOLICITATION OF AN OFFER TO BUY THESE SECURITIES IN ANY JURISDICTION WHERE THE OFFER OR SALE IS NOT PERMITTED.
71
| No. 10 – Catania Pasadena | |||||||
| Mortgage Loan Information | Mortgaged Property Information | ||||||
| Mortgage Loan Seller: | Barclays Capital Real Estate Inc. | Single Asset/Portfolio: | Single Asset | ||||
Credit Assessment (DBRS/Fitch/Moody’s): | NR/NR/NR | Property Type – Subtype: | Multifamily – Mid-Rise | ||||
| Original Principal Balance: | $17,700,000 | Location: | Pasadena, CA | ||||
| Cut-off Date Balance: | $17,700,000 | Size: | 33 Units | ||||
| % of Initial Pool Balance: | 2.3% | Cut-off Date Balance Per Room | $536,364 | ||||
| Loan Purpose: | Refinance | Maturity Date Balance Per Room: | $536,364 | ||||
| Borrower Sponsor: | SKR Holdings, LLC (f/k/a CIM Group (CA), LLC) | Year Built/Renovated: | 2012/NAP | ||||
| Guarantor: | SKR Holdings, LLC (f/k/a CIM Group (CA), LLC) | Title Vesting: | Fee | ||||
| Mortgage Rate: | 5.3200% | Property Manager: | Self-managed | ||||
| Note Date: | December 21, 2018 | Current Occupancy (As of): | 93.9% (11/14/2018) | ||||
| Seasoning: | 2 months | 2017 Occupancy(3): | 94.6% | ||||
| Maturity Date: | January 1, 2029 | 2016 Occupancy(3): | 92.3% | ||||
| IO Period: | 120 months | 2015 Occupancy(3): | 90.3% | ||||
| Loan Term (Original): | 120 months | 2014 Occupancy(3): | 95.5% | ||||
| Amortization Term (Original): | NAP | Appraised Value: | $31,400,000 | ||||
| Loan Amortization Type: | Interest-only, Balloon | Appraised Value Per Unit: | $951,515 | ||||
| Call Protection: | L(26),D(88),O(6) | Appraisal Valuation Date: | October 31, 2018 | ||||
| Lockbox Type: | Springing | Underwriting and Financial Information | |||||
| Additional Debt(1): | Yes | TTM NOI (10/31/2018): | $1,334,463 | ||||
| Additional Debt Type (Balance)(1): | Future Mezzanine | YE 2017 NOI: | $1,374,060 | ||||
| YE 2016 NOI: | $1,499,896 | ||||||
| YE 2015 NOI: | $1,240,072 | ||||||
| U/W Revenues: | $2,453,820 | ||||||
| U/W Expenses: | $1,108,784 | ||||||
| U/W NOI: | $1,345,035 | ||||||
| U/W NCF: | $1,333,485 | ||||||
| Escrows and Reserves(2) | U/W DSCR based on NOI/NCF: | 1.40x / 1.39x | |||||
| Initial | Monthly | Cap | U/W Debt Yield based on NOI/NCF: | 7.6% / 7.5% | |||
| Taxes | $0 | Springing | NAP | U/W Debt Yield at Maturity based on NOI/NCF: | 7.6% / 7.5% | ||
| Insurance | $0 | Springing | NAP | Cut-off Date LTV Ratio: | 56.4% | ||
| Replacement Reserve | $0 | Springing | NAP | LTV Ratio at Maturity: | 56.4% | ||
| Sources and Uses | ||||||||
| Sources | Uses | |||||||
| Original loan amount | $17,700,000 | 100.0% | Loan payoff | $13,750,583 | 77.7% | |||
| Closing costs | 341,671 | 1.9 | ||||||
| Return of equity | 3,607,745 | 20.4 | ||||||
| Total Sources | $17,700,000 | 100.0% | Total Uses | $17,700,000 | 100.0% | |||
(1) See “Subordinate and Mezzanine Indebtedness” section below.
(2) See “Escrows” section below.
(3) Historical Occupancy figures represent a monthly average for the respective year.
The Mortgage Loan. The mortgage loan (“Catania Pasadena Mortgage Loan”) is evidenced by a single promissory note secured by a first mortgage encumbering the fee interest in a mid-rise multifamily property located in Pasadena, California (the “Catania Pasadena Property”).
The Borrowers and Borrower Sponsors. The borrower is 277 West Green Street (Pasadena) Fee Owner, LLC, a Delaware limited liability company and single purpose entity with one independent director (the “Catania Pasadena Borrower”). The nonrecourse carve-out guarantor and sponsor of the Catania Pasadena Mortgage Loan is SKR Holdings, LLC (f/k/a CIM Group (CA), LLC).
SKR Holdings, LLC is a California limited liability company with ownership interest in over 60 commercial real estate properties in New York and California. SKR Holdings, LLC is comprised of three individuals, Shaul Kuba, Richard Ressler, and Avraham Shemesh, all co-founders and principals of CIM Group. Established in 1994, CIM Group is a real estate investment firm focused on infrastructure development, property management, leasing, asset management, development, acquisition and investment advisory services in major United States metropolitan areas. CIM Group currently owns $29.4 billion of total assets in North America. One of the indirect owners of the Catania Pasadena Borrower is subject to a pending misdemeanor charge for a municipal violation in Los Angeles on a commercial
THE INFORMATION IN THIS STRUCTURAL AND COLLATERAL TERM SHEET IS NOT COMPLETE AND MAY BE AMENDED PRIOR TO THE TIME OF SALE. THIS TERM SHEET IS NOT AN OFFER TO SELL THESE SECURITIES AND IT IS NOT A SOLICITATION OF AN OFFER TO BUY THESE SECURITIES IN ANY JURISDICTION WHERE THE OFFER OR SALE IS NOT PERMITTED.
72
| Multifamily – Mid-Rise | Loan #10 | Cut-off Date Balance: | $17,700,000 | |
| 277 West Green Street | Catania Pasadena | Cut-off Date LTV: | 56.4% | |
| Pasadena, CA 91101 | U/W NCF DSCR: | 1.39x | ||
| U/W NOI Debt Yield: | 7.6% |
real estate property unrelated to the Catania Pasadena Property. SeeDescription of the Mortgage Pool – Loan Purpose; Default History, Bankruptcy Issues and Other Proceedings”in the Preliminary Prospectus.
The Property.The Catania Pasadena Property is a 33-unit, six-story multifamily property located in Pasadena, California. The Catania Pasadena Property was built in 2012 and is situated on a 0.7 acre parcel. The building includes 23 two-bedroom units and 10 three-bedroom units on floors two through six, with 4,510 square feet of retail space located on the ground floor. All units have 2.5 bathrooms. On-site amenities include 24-hour security, gated parking, a pool and spa, a fitness room and a clubhouse deck located on the sixth floor. Unit amenities include Wolf gas ranges, SubZero refrigerators, Bosch dishwashers and washers and dryers. The Catania Pasadena Property contains 83 parking spaces, resulting in a parking ratio of 2.5 spaces per unit. Regarding the retail space, 3,500 square feet is leased to Yoga Works with a lease expiration date of July 31, 2022.
The following table presents the apartment unit mix of the Catania Pasadena Property:
Apartment Unit Mix Summary(1)
| Unit Type | No. of Units | % of Total Units | Average Unit Size (SF) | Average Monthly Rent per Unit |
| Two Bedroom | 23 | 69.7% | 2,319 | $5,843 |
| Three Bedroom | 10 | 30.3% | 2,627 | $6,632 |
| Total/Weighted Average | 33 | 100.0% | 2,412 | $6,082 |
| (1) | Information obtained from underwritten rent roll dated November 14, 2018. There are an additional two commercial units totaling 4,510 square feet. |
The following table presents historical occupancy percentages at the Catania Pasadena Property:
Historical Occupancy
12/31/2014(1)(2) | 12/31/2015(1)(2) | 12/31/2016(1)(2) | 12/31/2017(1)(2) | 11/14/2018(3) |
| 95.5% | 90.3% | 92.3% | 94.6% | 93.9% |
| (1) | Information obtained from the Catania Pasadena Borrower. |
| (2) | Historical Occupancy figures represent a monthly average for the respective year. |
| (3) | Information obtained from the underwritten rent roll. |
THE INFORMATION IN THIS STRUCTURAL AND COLLATERAL TERM SHEET IS NOT COMPLETE AND MAY BE AMENDED PRIOR TO THE TIME OF SALE. THIS TERM SHEET IS NOT AN OFFER TO SELL THESE SECURITIES AND IT IS NOT A SOLICITATION OF AN OFFER TO BUY THESE SECURITIES IN ANY JURISDICTION WHERE THE OFFER OR SALE IS NOT PERMITTED.
73
| Multifamily – Mid-Rise | Loan #10 | Cut-off Date Balance: | $17,700,000 | |
| 277 West Green Street | Catania Pasadena | Cut-off Date LTV: | 56.4% | |
| Pasadena, CA 91101 | U/W NCF DSCR: | 1.39x | ||
| U/W NOI Debt Yield: | 7.6% |
Operating History and Underwritten Net Cash Flow. The following table presents certain information relating to the historical operating performance and the underwritten net cash flow at the Catania Pasadena Property:
Cash Flow Analysis
| 2015 | 2016 | 2017 | TTM 10/31/2018 | U/W | %(1) | U/W $ per Unit | |
| Base Rent | $2,211,395 | $2,230,590 | $2,307,225 | $2,391,677 | $2,408,652 | 91.5% | $72,989 |
| Retail Rent | 114,582 | 118,338 | 122,533 | 116,932 | 127,549 | 4.8 | 3,865 |
| Gross Potential Rent | $2,325,977 | $2,348,928 | $2,429,758 | $2,508,609 | $2,536,201 | 96.3% | $76,855 |
| Other Income | 70,169 | 69,866 | 58,347 | 44,574 | 44,574 | 1.7 | 1,351 |
| Retail Recoveries | 22,662 | 48,614 | 56,103 | 51,652 | 51,652 | 2.0 | 1,565 |
| Net Rental Income | $2,418,808 | $2,467,408 | $2,544,208 | $2,604,835 | $2,632,427 | 100.0% | $79,771 |
| (Vacancy) | (212,017) | (145,377) | (116,562) | (162,462) | (178,607)(2) | (7.0) | (5,412) |
| Effective Gross Income | $2,206,791 | $2,322,031 | $2,427,646 | $2,442,372 | $2,453,820 | 93.2% | $74,358 |
| Real Estate Taxes | 290,184 | 121,245 | 289,133 | 270,299 | 276,426 | 11.3 | 8,377 |
| Insurance | 18,053 | 19,111 | 16,948 | 16,124 | 15,992 | 0.7 | 485 |
| Management Fee | 66,092 | 69,020 | 70,539 | 78,736 | 73,615 | 3.0 | 2,231 |
| Other Operating Expenses | 592,390 | 612,759 | 676,966 | 742,751 | 742,751 | 30.3 | 22,508 |
| Total Operating Expenses | $966,719 | $822,135 | $1,053,586 | $1,107,909 | $1,108,784 | 45.2% | $33,600 |
| Net Operating Income | $1,240,072 | $1,499,896 | $1,374,060 | $1,334,463 | $1,345,035 | 54.8% | $40,759 |
| Replacement Reserves | 0 | 0 | 0 | 0 | 11,550 | 0.5 | 350 |
| TI/LC | 0 | 0 | 0 | 0 | 0 | 0.0 | 0 |
| Net Cash Flow | $1,240,072 | $1,499,896 | $1,374,060 | $1,334,463 | $1,333,485 | 54.3% | $40,409 |
| NOI DSCR | 1.30x | 1.57x | 1.44x | 1.39x | 1.40x | ||
| NCF DSCR | 1.30x | 1.57x | 1.44x | 1.39x | 1.39x | ||
| NOI Debt Yield | 7.0% | 8.5% | 7.8% | 7.5% | 7.6% | ||
| NCF Debt Yield | 7.0% | 8.5% | 7.8% | 7.5% | 7.5% |
| (1) | Represents (i) percent of Net Rental Income for all revenue fields, (ii) percent of Gross Potential Rent for Vacancy & Credit Loss and (iii) percent of Effective Gross Income for all other fields. |
| (2) | The underwritten economic vacancy is 6.8%. The Catania Pasadena Property was 93.9% leased as of November 14, 2018. |
Appraisal.The appraiser concluded an “as-is” appraised value of $31,400,000 as of October 31, 2018.
Environmental Matters.According to a Phase I environmental site assessment dated November 19, 2018, there was no evidence of any recognized environmental conditions at the Catania Pasadena Property.
Market Overview and Competition.According to the appraisal, the Catania Pasadena Property is located within a prestigious residential neighborhood in West Pasadena. The Catania Pasadena Property is bordered by the original Ambassador College Campus to the south, which has been undergoing redevelopment since 1997. The area of the campus located to the west of Interstate 210 has been fully built out with new apartment buildings with an average sales price of approximately $2.2 million. Upon completion of the construction associated with this project along Green Street, the Catania Pasadena Property will have access to the gardens and grounds of the former campus. Additionally, the Catania Pasadena Property is less than a quarter of a mile away from Old Town Pasadena, a major outdoor shopping area with a strong mix of restaurants, bars, hotels and retail tenants. The Catania Pasadena Property is approximately 0.5 miles from the Del Mar Gold Line stop, with stops from Azusa to East Los Angeles with transfers to lines providing access throughout the Los Angeles metro area. Access to the Catania Pasadena Property is provided by Interstate 210, located directly east of the Catania Pasadena Property and by CA-134, located approximately 0.5 miles north of the Catania Pasadena Property. According to the appraisal, the estimated 2018 population within a one-, three-, and five-mile radius is 21,052, 201,561, and 549,666, respectively, and the 2018 estimated median household income within the same radius is $80,692, $77,175, and $74,443, respectively.
Submarket Information –According to a third party research report, the Catania Pasadena Property is located within the Pasadena multifamily submarket. Pasadena is known as one of San Fernando Valley’s premier employment and entertainment hubs, driving multifamily demand. As of the third quarter of 2018, the Pasadena submarket reported a vacancy rate of 4.0% and average effective rent of $2,028 per month. This average effective rent results in a ratio of $2.47 per square foot compared to $2.55 per square foot at the Catania Pasadena Property. Additionally, the Pasadena submarket has experienced a 1.6% increase in asking rent growth year-over-year. As of November 14, 2018, the Catania Pasadena Property was 93.9% occupied.
THE INFORMATION IN THIS STRUCTURAL AND COLLATERAL TERM SHEET IS NOT COMPLETE AND MAY BE AMENDED PRIOR TO THE TIME OF SALE. THIS TERM SHEET IS NOT AN OFFER TO SELL THESE SECURITIES AND IT IS NOT A SOLICITATION OF AN OFFER TO BUY THESE SECURITIES IN ANY JURISDICTION WHERE THE OFFER OR SALE IS NOT PERMITTED.
74
| Multifamily – Mid-Rise | Loan #10 | Cut-off Date Balance: | $17,700,000 | |
| 277 West Green Street | Catania Pasadena | Cut-off Date LTV: | 56.4% | |
| Pasadena, CA 91101 | U/W NCF DSCR: | 1.39x | ||
| U/W NOI Debt Yield: | 7.6% |
Appraiser’s Comp Set –The appraisal identified five primary comparable rentals for the Catania Pasadena Property totaling 808 units, which reported a weighted average occupancy of 98.9% (excluding Monaco Terrace). The appraisal concluded that the net market rents for the Catania Pasadena Property are $5,600 per month for the two-bedroom units and $6,300 per month for the three-bedroom units. The three two-bedroom units and the two three-bedroom units on the sixth floor achieve a $2,000 and $2,200 premium per month, respectively.
The following table presents certain information relating to comparable sales for the Catania Pasadena Property identified by the appraisal:
Comparable Sales(1)
| Property Name | Location | Units | Avg. Square Feet per Unit | Sale Date | Sale Price | Sale Price per Unit(2) |
| The Highland | Hollywood, CA | 76 | 897 | Jul-18 | $52,000,000 | $684,211 |
| Chelsea Santa Monica | Santa Monica, CA | 53 | 792 | Sep-17 | $56,784,000 | $1,071,396 |
| 147 South Doheny Drive | Los Angeles, CA | 21 | 1,119 | Jul-17 | $16,909,500 | $805,214 |
| Larchmont Lofts | Los Angeles, CA | 21 | 1,419 | Jun-17 | $15,600,000 | $742,857 |
| (1) | Information obtained from the appraisal. |
| (2) | Each of the comparable properties average unit square footage is significantly less than that of the Catania Pasadena Property. After making qualitative adjustment, including for unit size, the appraiser concluded to an adjusted price per unit that ranged from $923,684 to $1,046,779. |
The table below presents certain information relating to five comparable multifamily rentals to the Catania Pasadena Property identified by the appraisal:
Comparable Rentals(1)(2)
Property Name | Location | Units | Year Built/Renov. | Distance? | Average Monthly Rent | Property Type | Occupancy |
| Catania Pasadena – Subject(1) | Pasadena, CA | 33 | 2012/NAP | NAP | $6,082 | Mid-Rise | 93.9% |
| Residences at Westgate | Pasadena, CA | 674 | 2015/NAP | 0.4 miles | $4,053 | Low-Rise | 99.0% |
| The Grove at Ambassador Gardens | Pasadena, CA | 21 | 2015/NAP | 0.4 miles | $8,850 | Low-Rise | 100.0% |
| Terra Bella | Pasadena, CA | 28 | 2010/NAP | 0.7 miles | $5,100 | Mid-Rise | 100.0% |
| Monaco Terrace(3) | Pasadena, CA | 21 | 2017/NAP | 0.8 miles | $5,300 | Low-Rise | NAV |
| Orange Grove Circle Apartments | Pasadena, CA | 64 | 1956/NAV | 1.3 miles | $4,688 | Low-Rise | 97.0% |
| (1) | Information obtained from the appraisal and the underwritten rent roll dated November 14, 2018. |
| (2) | According to the appraisal, except for The Grove at Ambassador Gardens (superior) and Terra Bella (similar), each of the comparable rental properties are considered to be inferior to the Catania Pasadena Property. |
| (3) | The appraiser did not provide units or occupancy figures for the Monaco Terrace comparable rental. Units field is from a third party source. |
Escrows.
Taxes -The Catania Pasadena Borrower is required to make monthly payments of one-twelfth of the taxes payable during the next twelve months upon the occurrence of a Triggering Event (as defined below).
Insurance -The Catania Pasadena Borrower is required to make monthly payments equal to one-twelfth of the insurance premiums estimated to be payable for the renewal of coverage upon a Triggering Event or if the borrower does not maintain a blanket policy satisfactory to the lender.
Replacement Reserve -The Catania Pasadena Borrower shall make monthly replacement reserve deposits of $962.50 upon the occurrence of a Triggering Event.
Lockbox and Cash Management.A springing lockbox is required with respect to the Catania Pasadena Mortgage Loan. The springing lockbox will be established upon the first occurrence of a Triggering Event. During the continuance of a Triggering Event, the Catania Pasadena Borrower is required to deposit, or cause to be deposited, all rents into the lockbox account within three business days of receipt. Additionally, upon the occurrence of a Triggering Event, all funds deposited in the lockbox account will be transferred to a cash management account and those funds will be disbursed in accordance with the Catania Pasadena Mortgage Loan documents, with all excess cash flow to be deposited into an excess cash flow reserve to be held as additional security for the Catania Pasadena Mortgage Loan.
THE INFORMATION IN THIS STRUCTURAL AND COLLATERAL TERM SHEET IS NOT COMPLETE AND MAY BE AMENDED PRIOR TO THE TIME OF SALE. THIS TERM SHEET IS NOT AN OFFER TO SELL THESE SECURITIES AND IT IS NOT A SOLICITATION OF AN OFFER TO BUY THESE SECURITIES IN ANY JURISDICTION WHERE THE OFFER OR SALE IS NOT PERMITTED.
75
| Multifamily – Mid-Rise | Loan #10 | Cut-off Date Balance: | $17,700,000 | |
| 277 West Green Street | Catania Pasadena | Cut-off Date LTV: | 56.4% | |
| Pasadena, CA 91101 | U/W NCF DSCR: | 1.39x | ||
| U/W NOI Debt Yield: | 7.6% |
A “Triggering Event” will commence upon the earliest of:
| (i) | an event of default; or |
| (ii) | the debt service coverage ratio being less than 1.15x on an interest-only basis. |
A “Triggering Event” shall be cured (i) upon the end of such event of default or (ii) the debt service coverage ratio being greater than or equal to 1.15x on an interest-only basis.
Property Management.The Catania Pasadena Property is managed by CIM Management, Inc., an affiliate of the Catania Pasadena Borrower.
Partial Release.Not permitted.
Real Estate Substitution.Not permitted.
Subordinate and Mezzanine Indebtedness.At any time after the payment date in March 2021, one or more of the ownership interests in the Catania Pasadena Borrower may obtain at least one permitted mezzanine loan, subject to, the satisfaction of the requirements as set forth in the Catania Pasadena Mortgage Loan documents including: (i) no event of default shall be continuing; (ii) aggregate debt yield must not be less than 7.53%; (iii) aggregate loan-to-value ratio must not be greater than 56.4%; (iv) aggregate debt service coverage ratio must not be less than 1.40x; (v) term must be coterminous with senior mortgage or longer;(vi) rating agency confirmation; (vii) the execution of a customary intercreditor agreement acceptable to the lender in its reasonable discretion, (viii) the Catania Pasadena Borrower pays all lender’s and rating agency expenses, and (ix) the Catania Pasadena Borrower’s rights are subject and subordinate to the lender’s rights to amend the loan.
Ground Lease.None.
Terrorism Insurance.The Catania Pasadena Mortgage Loan documents require that the “all risk” insurance policy required to be maintained by the Catania Pasadena Borrower provides coverage for terrorism in an amount equal to the full replacement cost of the Catania Pasadena Property, as well as business interruption insurance covering no less than the 12-month period following the occurrence of a casualty event, together with a six-month extended period of indemnity (provided that if TRIPRA or a similar statute is not in effect, the Catania Pasadena Borrower will not be obligated to pay terrorism insurance premiums in excess of two times the premium for the casualty and business interruption coverage on a stand-alone basis).
THE INFORMATION IN THIS STRUCTURAL AND COLLATERAL TERM SHEET IS NOT COMPLETE AND MAY BE AMENDED PRIOR TO THE TIME OF SALE. THIS TERM SHEET IS NOT AN OFFER TO SELL THESE SECURITIES AND IT IS NOT A SOLICITATION OF AN OFFER TO BUY THESE SECURITIES IN ANY JURISDICTION WHERE THE OFFER OR SALE IS NOT PERMITTED.
76
| Wells Fargo Commercial Mortgage Trust 2019-C49 | Transaction Contact Information |
VI. Transaction Contact Information
Questions regarding this Structural and Collateral Term Sheet may be directed to any of the following individuals:
| Wells Fargo Securities, LLC | |
| Brigid Mattingly | Tel. (312) 269-3062 |
| A.J. Sfarra | Tel. (212) 214-5613 |
| Alex Wong | Tel. (212) 214-5615 |
| Barclays Capital Inc. | |
| Daniel Vinson | Tel. (212) 528-8224 |
| Brian Wiele | Tel. (212) 412-5780 |
THE INFORMATION IN THIS STRUCTURAL AND COLLATERAL TERM SHEET IS NOT COMPLETE AND MAY BE AMENDED PRIOR TO THE TIME OF SALE. THIS TERM SHEET IS NOT AN OFFER TO SELL THESE SECURITIES AND IT IS NOT A SOLICITATION OF AN OFFER TO BUY THESE SECURITIES IN ANY JURISDICTION WHERE THE OFFER OR SALE IS NOT PERMITTED.
77