| FREE WRITING PROSPECTUS | ||
| FILED PURSUANT TO RULE 433 | ||
| REGISTRATION FILE NO.: 333-226486-05 | ||
 |  |  |
Free Writing Prospectus
Structural and Collateral Term Sheet
$937,965,076
(Approximate Initial Pool Balance)
Wells Fargo Commercial Mortgage Trust 2019-C50
as Issuing Entity
Wells Fargo Commercial Mortgage Securities, Inc.
as Depositor
Wells Fargo Bank, National Association
UBS AG
Rialto Mortgage Finance, LLC
Barclays Capital Real Estate Inc.
Rialto Real Estate Fund III – Debt, LP
Argentic Real Estate Finance LLC
as Sponsors and Mortgage Loan Sellers
Commercial Mortgage Pass-Through Certificates
Series 2019-C50
April 17, 2019
WELLS FARGO SECURITIES Co-Lead Manager and Joint Bookrunner | BARCLAYS Co-Lead Manager and Joint Bookrunner | UBS Securities LLC Co-Lead Manager and Joint Bookrunner |
Academy Securities Co-Manager | Drexel Hamilton Co-Manager |
STATEMENT REGARDING THIS FREE WRITING PROSPECTUS
The depositor has filed a registration statement (including a prospectus) with the Securities and Exchange Commission (‘‘SEC’’) (SEC File No. 333-226486) for the offering to which this communication relates. Before you invest, you should read the prospectus in the registration statement and other documents the depositor has filed with the SEC for more complete information about the depositor, the issuing entity and this offering. You may get these documents for free by visiting EDGAR on the SEC Web site at www.sec.gov. Alternatively, the depositor, any underwriter, or any dealer participating in the offering will arrange to send you the prospectus after filing if you request it by calling toll free 1-800-745-2063 (8 a.m. – 5 p.m. EST) or by emailing wfs.cmbs@wellsfargo.com.
Nothing in this document constitutes an offer of securities for sale in any jurisdiction where the offer or sale is not permitted. The information contained herein is preliminary as of the date hereof, supersedes any such information previously delivered to you and will be superseded by any such information subsequently delivered and ultimately by the final prospectus relating to the securities. These materials are subject to change, completion, supplement or amendment from time to time.
This free writing prospectus has been prepared by the underwriters for information purposes only and does not constitute, in whole or in part, a prospectus for the purposes of Directive 2003/71/EC (as amended) and/or Part VI of the Financial Services and Markets Act 2000, as amended, or other offering document.
STATEMENT REGARDING ASSUMPTIONS AS TO SECURITIES, PRICING ESTIMATES AND OTHER INFORMATION
The attached information contains certain tables and other statistical analyses (the “Computational Materials”) which have been prepared in reliance upon information furnished by the Mortgage Loan Sellers. Numerous assumptions were used in preparing the Computational Materials, which may or may not be reflected herein. As such, no assurance can be given as to the Computational Materials’ accuracy, appropriateness or completeness in any particular context; or as to whether the Computational Materials and/or the assumptions upon which they are based reflect present market conditions or future market performance. The Computational Materials should not be construed as either projections or predictions or as legal, tax, financial or accounting advice. You should consult your own counsel, accountant and other advisors as to the legal, tax, business, financial and related aspects of a purchase of these securities. Any weighted average lives, yields and principal payment periods shown in the Computational Materials are based on prepayment and/or loss assumptions, and changes in such prepayment and/or loss assumptions may dramatically affect such weighted average lives, yields and principal payment periods. In addition, it is possible that prepayments or losses on the underlying assets will occur at rates higher or lower than the rates shown in the attached Computational Materials. The specific characteristics of the securities may differ from those shown in the Computational Materials due to differences between the final underlying assets and the preliminary underlying assets used in preparing the Computational Materials. The principal amount and designation of any security described in the Computational Materials are subject to change prior to issuance. None of Wells Fargo Securities, LLC, Barclays Capital Inc., UBS Securities LLC, Academy Securities, Inc., Drexel Hamilton, LLC, or any of their respective affiliates, make any representation or warranty as to the actual rate or timing of payments or losses on any of the underlying assets or the payments or yield on the securities. The information in this presentation is based upon management forecasts and reflects prevailing conditions and management’s views as of this date, all of which are subject to change. In preparing this presentation, we have relied upon and assumed, without independent verification, the accuracy and completeness of all information available from public sources or which was provided to us by or on behalf of the Mortgage Loan Sellers or which was otherwise reviewed by us.
This free writing prospectus contains certain forward-looking statements. If and when included in this free writing prospectus, the words “expects”, “intends”, “anticipates”, “estimates” and analogous expressions and all statements that are not historical facts, including statements about our beliefs or expectations, are intended to identify forward-looking statements. Any forward-looking statements are made subject to risks and uncertainties which could cause actual results to differ materially from those stated. Those risks and uncertainties include, among other things, declines in general economic and business conditions, increased competition, changes in demographics, changes in political and social conditions, regulatory initiatives and changes in customer preferences, many of which are beyond our control and the control of any other person or entity related to this offering. The forward-looking statements made in this free writing prospectus are made as of the date stated on the cover. We have no obligation to update or revise any forward-looking statement.
Wells Fargo Securities is the trade name for the capital markets and investment banking services of Wells Fargo & Company and its subsidiaries, including but not limited to Wells Fargo Securities, LLC, a member of NYSE, FINRA, NFA and SIPC, Wells Fargo Prime Services, LLC, a member of FINRA, NFA and SIPC, and Wells Fargo Bank, N.A. Wells Fargo Securities, LLC and Wells Fargo Prime Services, LLC are distinct entities from affiliated banks and thrifts.
IMPORTANT NOTICE REGARDING THE OFFERED CERTIFICATES
The information herein is preliminary and may be supplemented or amended prior to the time of sale. In addition, the Offered Certificates referred to in these materials and the asset pool backing them are subject to modification or revision (including the possibility that one or more classes of certificates may be split, combined or eliminated at any time prior to issuance or availability of a final prospectus) and are offered on a “when, as and if issued” basis.
The underwriters described in these materials may from time to time perform investment banking services for, or solicit investment banking business from, any company named in these materials. The underwriters and/or their affiliates or respective employees may from time to time have a long or short position in any security or contract discussed in these materials.
The information contained herein supersedes any previous such information delivered to any prospective investor and will be superseded by information delivered to such prospective investor prior to the time of sale.
IMPORTANT NOTICE RELATING TO AUTOMATICALLY-GENERATED EMAIL DISCLAIMERS
Any legends, disclaimers or other notices that may appear at the bottom of any email communication to which this free writing prospectus is attached relating to (1) these materials not constituting an offer (or a solicitation of an offer), (2) any representation that these materials are accurate or complete and may not be updated or (3) these materials possibly being confidential, are not applicable to these materials and should be disregarded. Such legends, disclaimers or other notices have been automatically generated as a result of these materials having been sent via Bloomberg or another system.
THE INFORMATION IN THIS STRUCTURAL AND COLLATERAL TERM SHEET IS NOT COMPLETE AND MAY BE AMENDED PRIOR TO THE TIME OF SALE. THIS TERM SHEET IS NOT AN OFFER TO SELL THESE SECURITIES AND IT IS NOT A SOLICITATION OF AN OFFER TO BUY THESE SECURITIES IN ANY JURISDICTION WHERE THE OFFER OR SALE IS NOT PERMITTED.
2
| Wells Fargo Commercial Mortgage Trust 2019-C50 | Transaction Highlights |
A. Transaction Highlights
Mortgage Loan Sellers:
| Mortgage Loan Seller | Number of Mortgage Loans | Number of Mortgaged Properties | Aggregate Cut-off Date Balance | % of Initial Pool Balance | ||||||
| Wells Fargo Bank, National Association | 16 | 19 | $242,029,521 | 25.8 | % | |||||
| UBS AG | 14 | 263 | 215,571,505 | 23.0 | ||||||
| Rialto Mortgage Finance, LLC | 11 | 14 | 136,256,998 | 14.5 | ||||||
| Barclays Capital Real Estate Inc. | 8 | 32 | 123,216,458 | 13.1 | ||||||
| Rialto Real Estate Fund III – Debt, LP(1) | 9 | 12 | 120,005,526 | 12.8 | ||||||
| Argentic Real Estate Finance LLC | 6 | 6 | 100,885,068 | 10.8 | ||||||
| Total | 64 | 346 | $937,965,076 | 100.0 | % | |||||
| (1) | Rialto Real Estate Fund III – Debt, LP (“RREF”) acquired the RREF Mortgage Loans from BSPRT CMBS Finance, LLC, an affiliate of Benefit Street Partners L.L.C., and re-underwrote all of the RREF Mortgage Loans in accordance with the underwriting guidelines and processes. With respect to the Z Tower mortgage loan, BSPRT CMBS Finance, LLC acquired such mortgage loan from Basis Real Estate Capital II, LLC. |
Loan Pool:
| Initial Pool Balance: | $937,965,076 |
| Number of Mortgage Loans: | 64 |
| Average Cut-off Date Balance per Mortgage Loan: | $14,655,704 |
| Number of Mortgaged Properties: | 346 |
| Average Cut-off Date Balance per Mortgaged Property(1): | $2,710,882 |
| Weighted Average Mortgage Interest Rate: | 5.043% |
| Ten Largest Mortgage Loans as % of Initial Pool Balance: | 34.7% |
| Weighted Average Original Term to Maturity or ARD (months): | 116 |
| Weighted Average Remaining Term to Maturity or ARD (months): | 114 |
| Weighted Average Original Amortization Term (months)(2): | 350 |
| Weighted Average Remaining Amortization Term (months)(2): | 350 |
| Weighted Average Seasoning (months): | 2 |
| |
| (1) | Information regarding mortgage loans secured by multiple properties is based on an allocation according to relative appraised values or the allocated loan amounts or property-specific release prices set forth in the related loan documents or such other allocation as the related mortgage loan seller deemed appropriate. |
| (2) | Excludes any mortgage loan that does not amortize. |
Credit Statistics:
| Weighted Average U/W Net Cash Flow DSCR(1): | 1.83 | x | |
| Weighted Average U/W Net Operating Income Debt Yield(1): | 11.7 | % | |
| Weighted Average Cut-off Date Loan-to-Value Ratio(1): | 62.7 | % | |
| Weighted Average Balloon or ARD Loan-to-Value Ratio(1): | 55.7 | % | |
| % of Mortgage Loans with Additional Subordinate Debt(2): | 15.3 | % | |
| % of Mortgage Loans with Single Tenants(3): | 8.3 | % |
| (1) | With respect to any mortgage loan that is part of a whole loan, loan-to-value ratio, debt service coverage ratio and debt yield calculations include the related pari passu companion loan(s) but exclude any related subordinate companion loan(s) (unless otherwise stated). The debt service coverage ratio, debt yield and loan-to-value ratio information do not take into account any subordinate debt (whether or not secured by the related mortgaged property), that currently exists or is allowed under the terms of any mortgage loan. The information for each mortgaged property that relates to a mortgage loan that is cross-collateralized or cross-defaulted with one or more other mortgage loans is based upon the principal balance of that mortgage loan, except that the applicable loan-to-value ratio, debt service coverage ratio, and debt yield for each such mortgage loan is based upon the ratio or yield (as applicable) for the aggregate indebtedness evidenced by all loans in the group (without regard to any limitation on the amount of indebtedness secured by any mortgaged property in such cross-collateralized group). See “Description of the Mortgage Pool—Mortgage Pool Characteristics” in the Preliminary Prospectus and Annex A-1 to the Preliminary Prospectus |
| (2) | The percentage figure expressed as “% of Mortgage Loans with Additional Subordinate Debt” is determined as a percentage of the initial pool balance and does not take into account any future subordinate debt (whether or not secured by the mortgaged property), if any, that may be permitted under the terms of any mortgage loan or the pooling and servicing agreement. See “Description of the Mortgage Pool—Additional Indebtedness—Other Unsecured Indebtedness” in the Preliminary Prospectus. |
| (3) | Excludes mortgage loans that are secured by multiple single tenant properties. |
THE INFORMATION IN THIS STRUCTURAL AND COLLATERAL TERM SHEET IS NOT COMPLETE AND MAY BE AMENDED PRIOR TO THE TIME OF SALE. THIS TERM SHEET IS NOT AN OFFER TO SELL THESE SECURITIES AND IT IS NOT A SOLICITATION OF AN OFFER TO BUY THESE SECURITIES IN ANY JURISDICTION WHERE THE OFFER OR SALE IS NOT PERMITTED.
3
| Wells Fargo Commercial Mortgage Trust 2019-C50 | Characteristics of the Mortgage Pool |
B. Summary of the Whole Loans
| Property Name | Mortgage Loan Seller in WFCM 2019-C50 | Note(s)(1) | Original Balance | Holder of Note(1) | Lead Servicer for Whole Loan | Master Servicer Under Lead Securitization Servicing Agreement | Special Servicer Under Lead Securitization Servicing Agreement |
| Great Wolf Lodge Southern California | WFB | A-1 | $35,000,000 | WFCM 2019-C50 | Yes | Wells Fargo Bank National Association | Rialto Capital Advisors, LLC |
| A-2 | $25,000,000 | BANK 2019-BNK17 | No | ||||
| A-3 | $25,000,000 | WFB | No | ||||
| A-4 | $50,000,000 | Column Financial, Inc. | No | ||||
| A-5 | $15,000,000 | WFB | No | ||||
| B-1 | $20,000,000 | KSL Capital Partners Co Trust II | No | ||||
| Hilton at University Place | Barclays | A-1 | $35,000,000 | WFCM 2019-C50 | Yes | Wells Fargo Bank National Association | Rialto Capital Advisors, LLC |
| A-2 | $11,000,000 | Barclays | No | ||||
| Goodyear Portfolio | RMF | A-1 | $30,000,000 | WFCM 2019-C50 | Yes | Wells Fargo Bank National Association | Rialto Capital Advisors, LLC |
| A-2 | $16,000,000 | RMF | No | ||||
| A-3 | $2,000,000 | WFCM 2019-C50 | No | ||||
| A-4 | $1,500,000 | WFCM 2019-C50 | No | ||||
| A-5 | $1,000,000 | WFCM 2019-C50 | No | ||||
| B | $9,920,000 | Townsend Real Estate Fund, L.P. | No | ||||
| Inland Devon Self Storage Portfolio | Barclays | A-1 | $41,000,000 | Barclays | Yes | Wells Fargo Bank National Association(2) | Rialto Capital Advisors, LLC(2) |
| A-2 | $30,000,000 | WFCM 2019-C50 | No | ||||
| The Colonnade Office Complex | UBS AG | A-1 | $5,000,000 | UBS 2019-C16 | Yes | Midland Loan Services, a Division of PNC Bank, National Association | Midland Loan Services, a Division of PNC Bank, National Association |
| A-2-1 | $15,000,000 | WFCM 2019-C50 | No | ||||
| A-2-2 | $3,000,000 | WFCM 2019-C50 | No | ||||
| A-2-3 | $2,000,000 | UBS 2019-C16 | No | ||||
| A-3 | $15,000,000 | UBS AG | No | ||||
| A-4 | $10,000,000 | UBS 2019-C16 | No | ||||
| A-5 | $10,000,000 | WFCM 2019-C50 | No | ||||
| A-6 | $10,000,000 | UBS AG | No | ||||
| A-7 | $30,000,000 | UBS 2019-C16 | No | ||||
| A-8 | $5,000,000 | UBS AG | No | ||||
| B-1 | $30,000,000 | The Lincoln National Life Insurance Company | No | ||||
| B-2 | $5,000,000 | Athene Annuity & Life Assurance Company | No | ||||
| B-3 | $5,000,000 | Athene Annuity and Life Company | No |
THE INFORMATION IN THIS STRUCTURAL AND COLLATERAL TERM SHEET IS NOT COMPLETE AND MAY BE AMENDED PRIOR TO THE TIME OF SALE. THIS TERM SHEET IS NOT AN OFFER TO SELL THESE SECURITIES AND IT IS NOT A SOLICITATION OF AN OFFER TO BUY THESE SECURITIES IN ANY JURISDICTION WHERE THE OFFER OR SALE IS NOT PERMITTED.
4
| Wells Fargo Commercial Mortgage Trust 2019-C50 | Characteristics of the Mortgage Pool |
| Property Name | Mortgage Loan Seller in WFCM 2019-C50 | Note(s)(1) | Original Balance | Holder of Note(1) | Lead Servicer for Whole Loan | Master Servicer Under Lead Securitization Servicing Agreement | Special Servicer Under Lead Securitization Servicing Agreement |
| B-4 | $5,000,000 | American Equity Investment Life Insurance Company | No | ||||
| B-5 | $5,000,000 | Athene Annuity & Life Assurance Company | No | ||||
| B-6 | $5,000,000 | Athene Annuity & Life Assurance Company | No | ||||
| C | $63,000,000 | Nonghyup Bank as Trustee for Up Global Private Real Estate Fund V | No | ||||
| Great Value Storage Portfolio | UBS AG | A-1 | $35,000,000 | UBS 2018-C15 | No | Midland Loan Services, a Division of PNC Bank, National Association | Midland Loan Services, a Division of PNC Bank, National Association |
| A-2-1 | $30,000,000 | UBS 2019-C16 | Yes | ||||
| A-2-2 | $5,000,000 | WFCM 2019-C50 | No | ||||
| A-3 | $20,000,000 | UBS 2018-C15 | No | ||||
| A-4 | $10,000,000 | WFCM 2019-C50 | No | ||||
| A-5 | $5,000,000 | WFCM 2019-C50 | No | ||||
| A-6 | $5,000,000 | WFCM 2019-C50 | No | ||||
| The Block Northway | UBS AG | A-1-1 | $25,000,000 | WFCM 2019-C50 | No | Wells Fargo Bank National Association(3) | Rialto Capital Advisors, LLC(3) |
| A-1-2 | $5,000,000 | UBS AG | No | ||||
| A-2 | $20,000,000 | UBS 2019-C16 | No | ||||
| A-3 | $10,000,000 | UBS AG | No | ||||
| A-4 | $8,000,000 | Morgan Stanley Mortgage Capital Holdings LLC | No | ||||
| A-5 | $5,000,000 | Morgan Stanley Mortgage Capital Holdings LLC | No | ||||
| A-6 | $1,000,000 | UBS AG | Yes | ||||
| A-7-1 | $1,000,000 | UBS AG | No | ||||
| A-7-2 | $3,000,000 | UBS 2019-C16 | No | ||||
| A-8 | $6,000,000 | Morgan Stanley Mortgage Capital Holdings LLC | No | ||||
| Wolverine Portfolio | UBS AG | A-1 | $10,000,000 | WFCM 2019-C50 | No | Wells Fargo Bank National Association(2) | Rialto Capital Advisors, LLC(2) |
| A-2 | $10,000,000 | WFCM 2019-C50 | No | ||||
| A-3 | $10,000,000 | UBS AG | No | ||||
| A-4 | $5,000,000 | UBS AG | No | ||||
| A-5 | $5,000,000 | WFCM 2019-C50 | No | ||||
| A-6 | $5,000,000 | UBS AG | No | ||||
| A-7 | $5,000,000 | UBS AG | No |
THE INFORMATION IN THIS STRUCTURAL AND COLLATERAL TERM SHEET IS NOT COMPLETE AND MAY BE AMENDED PRIOR TO THE TIME OF SALE. THIS TERM SHEET IS NOT AN OFFER TO SELL THESE SECURITIES AND IT IS NOT A SOLICITATION OF AN OFFER TO BUY THESE SECURITIES IN ANY JURISDICTION WHERE THE OFFER OR SALE IS NOT PERMITTED.
5
| Wells Fargo Commercial Mortgage Trust 2019-C50 | Characteristics of the Mortgage Pool |
| Property Name | Mortgage Loan Seller in WFCM 2019-C50 | Note(s)(1) | Original Balance | Holder of Note(1) | Lead Servicer for Whole Loan | Master Servicer Under Lead Securitization Servicing Agreement | Special Servicer Under Lead Securitization Servicing Agreement | |
| A-8 | $5,000,000 | UBS AG | No | |||||
| A-9 | $2,000,000 | UBS AG | No | |||||
| A-10 | $2,000,000 | UBS AG | Yes | |||||
| Town Square | RREF | A-1 | $24,000,000 | WFCM 2019-C50 | Yes | Wells Fargo Bank National Association | Rialto Capital Advisors, LLC | |
| A-2 | $10,000,000 | BSPRT CMBS Finance, LLC | No | |||||
| Heartland Dental Medical Office Portfolio | UBS AG | A-1 | $40,000,000 | UBS 2018-C14 | No | Wells Fargo Bank National Association | Rialto Capital Advisors, LLC | |
| A-2-1 | $22,000,000 | WFCM 2019-C50 | Yes | |||||
| A-2-2 | $8,000,000 | UBS AG | No | |||||
| A-3 | $20,000,000 | Deutsche Bank | No | |||||
| A-4 | $20,000,000 | UBS 2018-C15 | No | |||||
| A-5 | $20,000,000 | UBS 2018-C15 | No | |||||
| A-6 | $15,000,000 | UBS 2018-C15 | No | |||||
| A-7 | $15,000,000 | UBS 2019-C16 | No | |||||
| A-8 | $10,000,000 | UBS 2019-C16 | No | |||||
| A-9 | $6,500,000 | UBS AG | No | |||||
| A-10 | $4,000,000 | UBS 2018-C14 | No | |||||
| (1) | Unless otherwise indicated, each note not currently held by a securitization trust is expected to be contributed to a future securitization. No assurance can be provided that any such note will not be split further. |
| (2) | The related whole loan is expected to initially be serviced under the WFCM 2019-C50 pooling and servicing agreement until the securitization of the related “lead” pari passu note (namely, the related pari passu note marked “Yes” in the column entitled “Lead Servicer for Whole Loan”), after which the related whole loan will be serviced under the pooling and servicing agreement governing such securitization of the related “lead” pari passu note. The master servicer and special servicer for such securitization will be identified in a notice, report or statement to holders of the WFCM 2019-C50 certificates after the closing of such securitization. |
| (3) | The related whole loan is expected to initially be serviced under the UBS 2019-C16 pooling and servicing agreement until the securitization of the related “lead” pari passu note (namely, the related pari passu note marked “Yes” in the column entitled “Lead Servicer for Whole Loan”), after which the related whole loan will be serviced under the pooling and servicing agreement governing such securitization of the related “lead” pari passu note. The master servicer and special servicer for such securitization will be identified in a notice, report or statement to holders of the UBS 2019-C16 certificates after the closing of such securitization. |
THE INFORMATION IN THIS STRUCTURAL AND COLLATERAL TERM SHEET IS NOT COMPLETE AND MAY BE AMENDED PRIOR TO THE TIME OF SALE. THIS TERM SHEET IS NOT AN OFFER TO SELL THESE SECURITIES AND IT IS NOT A SOLICITATION OF AN OFFER TO BUY THESE SECURITIES IN ANY JURISDICTION WHERE THE OFFER OR SALE IS NOT PERMITTED.
6
| Wells Fargo Commercial Mortgage Trust 2019-C50 | Characteristics of the Mortgage Pool |
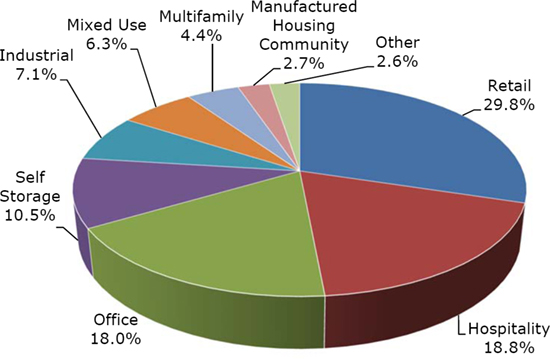
C. Property Type Distribution(1)
| Property Type | Number of Mortgaged Properties | Aggregate Cut-off Date Balance ($) | % of Initial Pool Balance (%) | Weighted Average Cut- off Date LTV Ratio (%) | Weighted Average Balloon LTV Ratio (%) | Weighted Average U/W NCF DSCR (x) | Weighted Average U/W NOI Debt Yield (%) | Weighted Average U/W NCF Debt Yield (%) | Weighted Average Mortgage Rate (%) | |||||||||||||||||
| Retail | 24 | $279,119,671 | 29.8 | % | 66.1 | % | 59.1 | % | 1.62 | x | 10.6 | % | 9.9 | % | 5.051 | % | ||||||||||
| Anchored | 12 | 171,344,974 | 18.3 | 65.8 | 57.5 | 1.54 | 10.7 | 10.0 | 5.141 | |||||||||||||||||
| Unanchored | 6 | 49,455,304 | 5.3 | 69.6 | 62.5 | 1.54 | 10.3 | 9.6 | 4.978 | |||||||||||||||||
| Single Tenant | 4 | 43,075,000 | 4.6 | 62.8 | 62.8 | 1.99 | 10.0 | 9.7 | 4.792 | |||||||||||||||||
| Shadow Anchored | 2 | 15,244,392 | 1.6 | 67.4 | 55.5 | 1.67 | 11.7 | 10.8 | 5.012 | |||||||||||||||||
| Hospitality | 17 | 175,931,378 | 18.8 | 61.5 | 50.7 | 1.95 | 14.7 | 13.0 | 5.348 | |||||||||||||||||
| Full Service | 4 | 91,132,357 | 9.7 | 56.9 | 49.9 | 1.99 | 14.2 | 12.2 | 5.244 | |||||||||||||||||
| Limited Service | 12 | 75,819,083 | 8.1 | 67.4 | 53.3 | 1.86 | 14.7 | 13.2 | 5.424 | |||||||||||||||||
| Extended Stay | 1 | 8,979,937 | 1.0 | 58.3 | 38.0 | 2.26 | 20.9 | 19.1 | 5.750 | |||||||||||||||||
| Office | 161 | 168,831,304 | 18.0 | 61.0 | 53.8 | 1.98 | 12.5 | 11.5 | 5.040 | |||||||||||||||||
| Suburban | 8 | 106,090,724 | 11.3 | 61.5 | 54.3 | 2.14 | 12.9 | 12.0 | 4.900 | |||||||||||||||||
| Medical | 150 | 37,160,432 | 4.0 | 58.5 | 49.6 | 1.66 | 12.0 | 11.0 | 5.222 | |||||||||||||||||
| CBD | 2 | 19,838,483 | 2.1 | 61.9 | 58.6 | 1.89 | 12.3 | 10.9 | 5.389 | |||||||||||||||||
| Urban | 1 | 5,741,665 | 0.6 | 64.9 | 54.3 | 1.25 | 8.9 | 8.4 | 5.250 | |||||||||||||||||
| Self Storage | 90 | 98,200,000 | 10.5 | 56.3 | 51.0 | 2.32 | 12.1 | 11.9 | 4.448 | |||||||||||||||||
| Self Storage | 90 | 98,200,000 | 10.5 | 56.3 | 51.0 | 2.32 | 12.1 | 11.9 | 4.448 | |||||||||||||||||
| Industrial | 8 | 66,240,414 | 7.1 | 62.7 | 58.3 | 1.97 | 11.6 | 11.0 | 4.938 | |||||||||||||||||
| Flex | 8 | 66,240,414 | 7.1 | 62.7 | 58.3 | 1.97 | 11.6 | 11.0 | 4.938 | |||||||||||||||||
| Mixed Use | 26 | 59,197,927 | 6.3 | 61.1 | 60.0 | 1.72 | 9.3 | 9.0 | 5.019 | |||||||||||||||||
| Office/Industrial | 1 | 27,000,000 | 2.9 | 64.3 | 64.3 | 1.77 | 8.8 | 8.5 | 4.750 | |||||||||||||||||
| Retail/Office | 1 | 23,500,000 | 2.5 | 60.0 | 60.0 | 1.73 | 9.4 | 9.1 | 5.180 | |||||||||||||||||
| Self Storage/Industrial | 1 | 4,800,000 | 0.5 | 53.2 | 47.3 | 1.44 | 10.0 | 9.5 | 5.190 | |||||||||||||||||
| Medical/Retail | 23 | 3,897,927 | 0.4 | 55.2 | 46.6 | 1.59 | 11.8 | 11.2 | 5.700 | |||||||||||||||||
| Multifamily | 9 | 41,444,383 | 4.4 | 60.1 | 48.3 | 1.43 | 10.6 | 9.7 | 5.409 | |||||||||||||||||
| Garden | 6 | 32,788,581 | 3.5 | 58.5 | 46.5 | 1.39 | 10.4 | 9.6 | 5.472 | |||||||||||||||||
| Student Housing | 2 | 4,758,897 | 0.5 | 69.0 | 58.1 | 1.31 | 9.4 | 9.1 | 5.640 | |||||||||||||||||
| High Rise | 1 | 3,896,904 | 0.4 | 62.8 | 51.0 | 1.93 | 13.3 | 11.9 | 4.600 | |||||||||||||||||
| Manufactured Housing Community | 10 | 25,000,000 | 2.7 | 69.8 | 63.0 | 1.29 | 8.4 | 8.2 | 4.900 | |||||||||||||||||
| Manufactured Housing Community | 10 | 25,000,000 | 2.7 | 69.8 | 63.0 | 1.29 | 8.4 | 8.2 | 4.900 | |||||||||||||||||
| Other | 1 | 24,000,000 | 2.6 | 70.4 | 70.4 | 1.51 | 7.7 | 7.7 | 5.020 | |||||||||||||||||
| Leased Fee | 1 | 24,000,000 | 2.6 | 70.4 | 70.4 | 1.51 | 7.7 | 7.7 | 5.020 | |||||||||||||||||
| Total/Weighted Average: | 346 | $937,965,076 | 100.0 | % | 62.7 | % | 55.7 | % | 1.83 | x | 11.7 | % | 10.9 | % | 5.043 | % | ||||||||||
| (1) | Because this table presents information relating to the mortgaged properties and not the mortgage loans, the information for mortgage loans secured by more than one mortgaged property is based on allocated amounts (allocating the principal balance of the mortgage loan to each of those properties according to the relative appraised values of the mortgaged properties or the allocated loan amounts or property-specific release prices set forth in the related mortgage loan documents or such other allocation as the related mortgage loan seller deemed appropriate). With respect to any mortgage loan that is part of a whole loan, the loan-to-value ratio, debt service coverage ratio and debt yield calculations include the relatedpari passu companion loan(s) (unless otherwise stated). With respect to each mortgage loan, debt service coverage ratio, debt yield and loan-to-value ratio information do not take into account any subordinate debt (whether or not secured by the related mortgaged property) that currently exists or is allowed under the terms of such mortgage loan. See Annex A-1 to the Preliminary Prospectus. |
THE INFORMATION IN THIS STRUCTURAL AND COLLATERAL TERM SHEET IS NOT COMPLETE AND MAY BE AMENDED PRIOR TO THE TIME OF SALE. THIS TERM SHEET IS NOT AN OFFER TO SELL THESE SECURITIES AND IT IS NOT A SOLICITATION OF AN OFFER TO BUY THESE SECURITIES IN ANY JURISDICTION WHERE THE OFFER OR SALE IS NOT PERMITTED.
7
| Wells Fargo Commercial Mortgage Trust 2019-C50 | Certain Terms and Conditions |
D.Large Loan Summaries
THE INFORMATION IN THIS STRUCTURAL AND COLLATERAL TERM SHEET IS NOT COMPLETE AND MAY BE AMENDED PRIOR TO THE TIME OF SALE. THIS TERM SHEET IS NOT AN OFFER TO SELL THESE SECURITIES AND IT IS NOT A SOLICITATION OF AN OFFER TO BUY THESE SECURITIES IN ANY JURISDICTION WHERE THE OFFER OR SALE IS NOT PERMITTED.
8
| No. 1 – Crown Center Office Park | |||||||
| Mortgage Loan Information | Mortgaged Property Information | ||||||
| Mortgage Loan Seller: | Wells Fargo Bank, National Association | Single Asset/Portfolio: | Single Asset | ||||
Credit Assessment (Fitch/KBRA/Moody’s): | NR/NR/NR | Property Type – Subtype: | Office – Suburban | ||||
| Original Principal Balance: | $43,500,000 | Location: | Fort Lauderdale, FL | ||||
| Cut-off Date Balance: | $43,500,000 | Size: | 341,965 SF | ||||
| % of Initial Pool Balance: | 4.6% | Cut-off Date Balance Per SF: | $127.21 | ||||
| Loan Purpose: | Refinance | Maturity Date Balance Per SF: | $110.52 | ||||
| Borrower Sponsors: | James Goldstein; Anders Schroeder | Year Built/Renovated: | 1987/2018 | ||||
| Guarantors: | James Goldstein; Anders Schroeder | Title Vesting: | Fee | ||||
| Mortgage Rate: | 5.1600% | Property Manager: | Self-managed | ||||
| Note Date: | March 6, 2019 | Current Occupancy (As of): | 85.5% (3/1/2019) | ||||
| Seasoning: | 2 months | YE 2017 Occupancy: | 79.4% | ||||
| Maturity Date: | March 11, 2029 | YE 2016 Occupancy(2): | 78.4% | ||||
| IO Period: | 24 months | YE 2015 Occupancy(2): | 67.8% | ||||
| Loan Term (Original): | 120 months | YE 2014 Occupancy(2): | 47.3% | ||||
| Amortization Term (Original): | 360 months | As-Is Appraised Value: | $58,800,000 | ||||
| Loan Amortization Type: | Interest-only, Amortizing Balloon | As-Is Appraised Value Per SF: | $171.95 | ||||
| Call Protection: | L(26),D(90),O(4) | As-Is Appraisal Valuation Date: | November 20, 2018 | ||||
| Lockbox Type: | Soft/Springing Cash Management | Underwriting and Financial Information | |||||
| Additional Debt: | None | TTM NOI (2/28/2019)(3): | $3,639,012 | ||||
| Additional Debt Type (Balance): | NAP | TTM 9/30/2017 NOI(3): | $3,269,241 | ||||
| TTM 9/30/2016 NOI(3): | $2,195,356 | ||||||
| YE 2015 NOI: | NAV | ||||||
| U/W Revenues: | $7,228,469 | ||||||
| U/W Expenses: | $3,098,611 | ||||||
| Escrows and Reserves(1) | U/W NOI: | $4,129,858 | |||||
| Initial | Monthly | Cap | U/W NCF: | $3,884,348 | |||
| Taxes | $298,636 | $59,727 | NAP | U/W DSCR based on NOI/NCF: | 1.45x / 1.36x | ||
| Insurance | $166,516 | $41,630 | NAP | U/W Debt Yield based on NOI/NCF: | 9.5% / 8.9% | ||
| Replacement Reserve | $0 | $5,984 | NAP | U/W Debt Yield at Maturity based on NOI/NCF: | 10.9% / 10.3% | ||
| Leasing Reserve | $3,000,000 | $28,497 | $3,000,000 | Cut-off Date LTV Ratio: | 74.0% | ||
| Rent Concession Reserve | $242,500 | $0 | NAP | LTV Ratio at Maturity: | 64.3% | ||
| Existing TI/LC Reserve | $293,631 | $0 | NAP | ||||
| Sources and Uses | ||||||||
| Sources | Uses | |||||||
| Original loan amount | $43,500,000 | 100.0% | Loan payoff | $33,396,671 | 76.8% | |||
| Upfront reserves | 4,001,283 | 9.2 | ||||||
| Closing costs | 925,379 | 2.1 | ||||||
| Return of equity | 5,176,667 | 11.9 | ||||||
| Total Sources | $43,500,000 | 100.0% | Total Uses | $43,500,000 | 100.0% | |||
| (1) | See “Escrows” section. |
| (2) | See “Historical Occupancy” section for a discussion of historical occupancy increases. |
| (3) | See “Cash Flow Analysis” section for a discussion of historical NOI increases and the increase in U/W NOI compared to the most recent NOI. |
The Mortgage Loan. The mortgage loan (the “Crown Center Office Park Mortgage Loan”) is evidenced by a single promissory note secured by a first mortgage encumbering the fee interest in a class B office property in Fort Lauderdale, Florida (the “Crown Center Office Park Property”).
The Borrower and Borrower Sponsors.The borrower is Fort Lauderdale Crown Center, LLC, a Delaware limited liability company and single purpose entity with one independent director. Legal counsel to the borrower delivered a non-consolidation opinion in connection with the origination of the Crown Center Office Park Mortgage Loan. The borrower sponsors and non-recourse carve-out guarantors of the Crown Center Office Park Mortgage Loan are James Goldstein and Anders Schroeder.
Mr. Goldstein and Mr. Schroeder co-founded the Midgard Group (“Midgard”), a South Florida real estate development, investment, and management company, of which Mr. Goldstein is the CEO and Mr. Schroeder is the Chairman. Midgard acquires, develops and manages office, industrial, hotel and other commercial real estate properties for its clients. Midgard owns and/or manages seven office properties totaling approximately 634,883 square feet in South Florida (Hollywood, Pompano Beach, Miami, Pembroke Pines and Fort Lauderdale, Florida). Mr. Goldstein has over 30 years of real estate experience, including land acquisition and commercial development of office,
THE INFORMATION IN THIS STRUCTURAL AND COLLATERAL TERM SHEET IS NOT COMPLETE AND MAY BE AMENDED PRIOR TO THE TIME OF SALE. THIS TERM SHEET IS NOT AN OFFER TO SELL THESE SECURITIES AND IT IS NOT A SOLICITATION OF AN OFFER TO BUY THESE SECURITIES IN ANY JURISDICTION WHERE THE OFFER OR SALE IS NOT PERMITTED.
9
Office – Suburban 1401, 1415, 1425, 1451 & 1475 West Cypress Creek Road Fort Lauderdale, Florida 33309 | Loan #1
Crown Center Office Park | Cut-off Date Balance: Cut-off Date LTV: U/W NCF DSCR: U/W NOI Debt Yield: | $43,500,000 74.0% 1.36x 9.5% |
warehouse, flex, self-storage and retail properties. Mr. Schroeder has over 35 years of real estate experience and is the former CEO of Jacob Holm, a Copenhagen Stock Exchange company involved in real estate development and industrial businesses, where he served for 11 years. Mr. Schroeder is the Chairman/CEO of Asgard, Ltd, a company with real estate investments and developments in the U.S. and Europe. An affiliate of Mr. Goldstein was involved in a mortgage default related to a storage facility project in which Mr. Goldstein was a limited partner. The general partner of the borrowing entity subsequently passed away with an unresolved estate and Mr. Goldstein took over as the active general partner of the borrowing entity. Mr. Goldstein filed Chapter 11 bankruptcy in order to be able to refinance the storage facility property. See“Description of the Mortgage Pool— Loan Purpose; Default History, Bankruptcy Issues and Other Proceedings”in the Preliminary Prospectus.
The Property.The Crown Center Office Park Property comprises five, 2- and 3-story class B office buildings totaling 341,965 square feet and located in Fort Lauderdale, Florida. Constructed in 1987 and renovated from 2015-2018, the Crown Center Office Park Property was 85.5% leased as of March 1, 2019 to 22 tenants across various industries, including financial, media, insurance, government and education, with no single tenant representing more than 18.1% of net rentable area or 18.9% of underwritten base rent. Approximately 23.8% of the net rentable area and 36.4% of underwritten base rent at the Crown Center Office Park Property is attributed to investment grade tenants (Broward County Sheriff’s Office, CBS Corporation, GSA – DOD, United Insurance Company of America and Branch Bank and Trust Company).
Renovations totaling approximately $1.7 million were completed at all five buildings of the Crown Center Office Park Property since 2015. Such renovations included a gut renovation to include a second floor and building expansion from 45,000 to 75,000 square feet at the 1401 Crown Center building; new restrooms and a newly renovated lobby with new flooring and lighting at the 1415 Crown Center building; new elevators, restrooms and lobby renovations at the 1475 Crown Center building; and new elevators, restrooms, corridors, executive suites and lobby renovations at the 1451 Crown Center building. The 1451 Crown Center building has received LEED Silver Certifications, a BOMA Award, and a Community Appearance Award from the City of Fort Lauderdale; while the 1475 Crown Center building has received LEED Certifications.
The Crown Center Office Park Property is situated on an approximately 11.8-acre site. The Crown Center Office Park Property has access to 1,713 total surface parking spaces (resulting in a parking ratio of approximately 5.0 spaces per 1,000 SF of net rentable area), of which 973 spaces are located on an adjacent surface parking lot ground leased by an affiliate of the borrower from the City of Fort Lauderdale, pursuant to a cross-easement agreement (the ground lease and cross-easement agreement each have a fully extended term expiring in 2080). See “Description of the Mortgage Pool—Mortgage Pool Characteristics—Property Types—Office Properties” in the Preliminary Prospectus.
Major Tenants.
Largest Tenant by UW Base Rent: Bayview Loan Servicing, LLC (61,884 square feet; 18.1% of net rentable area; 18.9% of underwritten base rent; 8/31/2022 lease expiration) – Founded in 1999, Bayview Loan Servicing, LLC (“Bayview”) is a servicer of both residential and commercial mortgage loans. Bayview services loans in all 50 states, Puerto Rico and Guam and is an approved seller/servicer by Fannie Mae and Freddie Mac. Bayview’s headquarters is located in Coral Gables, Florida, approximately 37.8 miles southwest of the Crown Center Office Park Property. Bayview has been a tenant at the Crown Center Office Park Property since January 2015 and has two, 5-year renewal options remaining following its August 2022 lease expiration. Bayview has a termination option for either its entire leased premises or its smaller 16,626 square foot space at the 1425 Crown Center building, each effective as of January 31, 2020 with a nine-month notice period. The termination option is subject to a fee in an amount equal to unamortized costs of landlord’s work, any future landlord concessions, base rent abatement and all leasing commissions, plus an interest rate of 6.0% per annum on a straight-line basis for all of the foregoing amounts.
2nd Largest Tenant by UW Base Rent: Broward County Sherriff’s Office (AAA/Aaa/AAA by Fitch/Moody’s/S&P; 32,600 square feet; 9.5% of net rentable area; 15.1% of underwritten base rent; 9/30/2026 lease expiration) – The Broward County Sherriff’s Office (“BSO”) is a full-service, nationally accredited public safety agency with approximately 5,400 employees, including more than 2,800 certified deputies and more than 600 fire rescue professionals. BSO’s space at the Crown Center Office Park Property serves as offices for the Child Protective Investigations Section (“CPIS”). The unit, which investigates allegations of abuse and neglect of children, has approximately 145 employees that work in the building, and complete between 1,000 and 1,200 investigations every month. BSO has been a tenant at the Crown Center Office Park Property since October 2016 and has two, 5-year renewal options remaining following its September 2026 lease expiration. The tenant has an appropriations related termination option with 60 days’ notice, which can be exercised only in the event that the approved annual funding is insufficient to pay the tenant’s rent under the lease or if the tenant ceases to provide CPIS (or its substantial equivalent) for the State of Florida in Broward County.
3rd Largest Tenant by UW Base Rent: CBS Corporation (BBB/Baa2/BBB by Fitch/Moody’s/S&P; 34,622 square feet; 10.1% of net rentable area; 14.1% of underwritten base rent; 3/31/2020 lease expiration) – CBS Corporation (“CBS”) is a mass media company that creates and distributes content across a variety of platforms to audiences around the world. CBS’s operations span multiple fields of media and entertainment, including cable, publishing, local TV, film and interactive. The Crown Center Office Park Property houses CBS Sports Digital, a division of CBS Interactive, which covers the full spectrum of sports leagues, and provides premium content across all digital platforms. With a focus on serving fans live coverage every day, CBS Sports Digital offers exclusive access to sports events, live and on-demand video, in-depth analysis, breaking news, scores and statistics, and a wide range of fantasy games and advice. CBS has been a tenant at the Crown Center Office Park Property since January 2010 and has two, 5-year renewal options remaining following its March 2020 lease expiration. CBS is currently in negotiations to expand its space by approximately 9,000 square feet and extend its lease through July 2027 at an estimated annual base rent of $17.00 per square foot with 3.0% annual increases; however, the lender provides no assurances that the lease extension and expansion will be executed or effectuated.
THE INFORMATION IN THIS STRUCTURAL AND COLLATERAL TERM SHEET IS NOT COMPLETE AND MAY BE AMENDED PRIOR TO THE TIME OF SALE. THIS TERM SHEET IS NOT AN OFFER TO SELL THESE SECURITIES AND IT IS NOT A SOLICITATION OF AN OFFER TO BUY THESE SECURITIES IN ANY JURISDICTION WHERE THE OFFER OR SALE IS NOT PERMITTED.
10
Office – Suburban 1401, 1415, 1425, 1451 & 1475 West Cypress Creek Road Fort Lauderdale, Florida 33309 | Loan #1
Crown Center Office Park | Cut-off Date Balance: Cut-off Date LTV: U/W NCF DSCR: U/W NOI Debt Yield: | $43,500,000 74.0% 1.36x 9.5% |
The following table presents certain information relating to the tenancy at the Crown Center Office Park Property:
Major Tenants
| Tenant Name | Credit Rating (Fitch/ Moody’s/ S&P)(1) | Tenant NRSF | % of NRSF | Annual U/W Base Rent PSF(2) | Annual U/W Base Rent(2) | % of Total Annual U/W Base Rent | Lease Expiration Date | Extension Options | Termination Option (Y/N) |
| Major Tenants | |||||||||
| Bayview Loan Servicing, LLC | NR/NR/NR | 61,884 | 18.1% | $15.36 | $950,538 | 18.9% | 8/31/2022(3) | 2, 5-year | Y(3) |
| Broward County Sheriff’s Office(4)(5) | AAA/Aaa/AAA | 32,600 | 9.5% | $23.31(4)(5) | $759,958(4) | 15.1% | 9/30/2026(6) | 2, 5-year | Y(6) |
| CBS Corporation(7) | BBB/Baa2/BBB | 34,622 | 10.1% | $20.56(7) | $711,720(7) | 14.1% | 3/31/2020(7) | 2, 5-year | N |
| Crown Center Executive Suites, Inc.(8) | NR/NR/NR | 32,246 | 9.4% | $16.60 | $535,284 | 10.6% | 10/31/2032 | 2, 5-year | N |
| Parkson Corporation | NR/NR/NR | 22,171 | 6.5% | $15.75 | $349,096 | 6.9% | 8/31/2027 | 3, 3-year | N |
| Total Major Tenants | 183,523 | 53.7% | $18.02 | $3,306,596 | 65.6% | ||||
| Non-Major Tenant | 109,025 | 31.9% | $15.89 | $1,732,434 | 34.4% | ||||
| Occupied Collateral Total | 292,548 | 85.5% | $17.22 | $5,039,030 | 100.0% | ||||
| Vacant Space | 49,417 | 14.5% | |||||||
| Collateral Total | 341,965 | 100.0% | |||||||
| (1) | Certain ratings are those of the parent company whether or not the parent company guarantees the lease. |
| (2) | Annual U/W Base Rent PSF and Annual U/W Base Rent include contractual rent steps through April 2020 totaling $90,037 and straight-line rent averaging for the investment grade tenants Broward County Sheriff’s Office and Branch Banking and Trust Company over their remaining lease terms totaling $88,762. |
| (3) | Bayview has a termination option for either its entire leased premises or its 16,626 square foot space at the 1425 Crown Center building, each effective as of January 31, 2020 with a nine-month notice period. The termination fee will consist of reimbursement of unamortized costs of landlord’s work, any future landlord concessions, base rent abatement and all leasing commissions, plus an interest rate of 6.0% per annum on a straight-line basis for all of the foregoing amounts. |
| (4) | Annual U/W Base Rent PSF and Annual U/W Base Rent for Broward County Sheriff’s Office represents straight-line rent averaging over the remaining lease term totaling $80,010. Broward County Sheriff’s Office’s current base rent is $20.86 per square foot. |
| (5) | The Broward County Sheriff’s Office lease is a gross lease, while the majority of leases at the Crown Center Office Park Property (including all leases shown on the table above) are triple net. |
| (6) | Broward County Sheriff’s Office has an appropriations related termination option with 60 days’ notice which can be exercised only in the event that the approved annual funding is insufficient to pay the tenant’s rent under the lease or if the tenant ceases to provide Child Protective Investigation Section services (or its substantial equivalent) for the State of Florida in Broward County. |
| (7) | CBS Corporation is currently in negotiations to expand its space by approximately 9,000 square feet and extend its lease through July 2027 at an estimated annual base rent of $17.00 per square foot with 3.0% annual increases; however, the lender provides no assurances that the lease extension and expansion will be executed or effectuated. |
| (8) | Crown Center Executive Suites, Inc. is affiliated with the Midgard Group, a borrower sponsor affiliate (see “The Borrower and Borrower Sponsors” section above for a full discussion of the Midgard Group). |
THE INFORMATION IN THIS STRUCTURAL AND COLLATERAL TERM SHEET IS NOT COMPLETE AND MAY BE AMENDED PRIOR TO THE TIME OF SALE. THIS TERM SHEET IS NOT AN OFFER TO SELL THESE SECURITIES AND IT IS NOT A SOLICITATION OF AN OFFER TO BUY THESE SECURITIES IN ANY JURISDICTION WHERE THE OFFER OR SALE IS NOT PERMITTED.
11
Office – Suburban 1401, 1415, 1425, 1451 & 1475 West Cypress Creek Road Fort Lauderdale, Florida 33309 | Loan #1
Crown Center Office Park | Cut-off Date Balance: Cut-off Date LTV: U/W NCF DSCR: U/W NOI Debt Yield: | $43,500,000 74.0% 1.36x 9.5% |
The following table presents certain information relating to the lease rollover schedule at the Crown Center Office Park Property:
Lease Expiration Schedule(1)(2)
| Year Ending December 31, | No. of Leases Expiring | Expiring NRSF | % of Total NRSF | Cumulative Expiring NRSF | Cumulative % of Total NRSF | Annual U/W Base Rent(3) | % of Total Annual U/W Base Rent | Annual U/W Base Rent PSF(3) |
| MTM | 0 | 0 | 0.0% | 0 | 0.0% | $0 | 0.0% | $0.00 |
| 2019 | 3 | 19,129 | 5.6% | 19,129 | 5.6% | $210,952 | 4.2% | $11.03 |
| 2020 | 4 | 49,462 | 14.5% | 68,591 | 20.1% | $939,727 | 18.6% | $19.00 |
| 2021 | 4 | 18,734 | 5.5% | 87,325 | 25.5% | $358,159 | 7.1% | $19.12 |
| 2022 | 5 | 89,308 | 26.1% | 176,633 | 51.7% | $1,462,333 | 29.0% | $16.37 |
| 2023 | 1 | 7,322 | 2.1% | 183,955 | 53.8% | $108,751 | 2.2% | $14.85 |
| 2024 | 0 | 0 | 0.0% | 183,955 | 53.8% | $0 | 0.0% | $0.00 |
| 2025 | 0 | 0 | 0.0% | 183,955 | 53.8% | $0 | 0.0% | $0.00 |
| 2026 | 2 | 38,624 | 11.3% | 222,579 | 65.1% | $850,469 | 16.9% | $22.02 |
| 2027 | 1 | 22,171 | 6.5% | 244,750 | 71.6% | $349,096 | 6.9% | $15.75 |
| 2028 | 0 | 0 | 0.0% | 244,750 | 71.6% | $0 | 0.0% | $0.00 |
| 2029 | 1 | 15,552 | 4.5% | 260,302 | 76.1% | $224,260 | 4.5% | $14.42 |
| Thereafter | 1 | 32,246 | 9.4% | 292,548 | 85.5% | $535,284 | 10.6% | $16.60 |
| Vacant | 0 | 49,417 | 14.5% | 341,965 | 100.0% | $0 | 0.0% | $0.00 |
| Total/Weighted Average | 22 | 341,965 | 100.0% | $5,039,030 | 100.0% | $17.22 |
| (1) | Information obtained from the underwritten rent roll. |
| (2) | Certain tenants may have lease termination options that are exercisable prior to the originally stated expiration date of the subject lease and that are not considered in the Lease Expiration Schedule. |
| (3) | Total/Weighted Average Annual U/W Base Rent and Annual U/W Base Rent PSF exclude vacant space. |
The following table presents historical occupancy percentages at the Crown Center Office Park Property:
Historical Occupancy
12/31/2014(1)(2)(3) | 12/31/2015(1)(3)(4) | 12/31/2016(1)(4) | 12/31/2017(1) | 3/1/2019(5) |
| 47.3% | 67.8% | 78.4% | 79.4% | 85.5% |
| (1) | Information obtained from the borrower. |
| (2) | Year-end 2014 occupancy was impacted by Bank of America vacating its space at lease expiration on March 31, 2013 (106,218 square feet, 30.8% of net rentable area) and GSA-DEA vacating its space upon lease expiration on July 31, 2014 (34,463 square feet, 10.0% of net rentable area). |
| (3) | The increase in occupancy from 2014 to 2015 is attributed to six new leases signed at the Crown Center Office Park Property between January 2015 and October 2015 totaling approximately 25.6% of net rentable area. |
| (4) | The increase in occupancy from 2015 to 2016 is attributed to four new leases signed at the Crown Center Office Park Property between July 2016 and October 2016 totaling approximately 11.5% of net rentable area |
| (5) | Information obtained from the underwritten rent roll. |
THE INFORMATION IN THIS STRUCTURAL AND COLLATERAL TERM SHEET IS NOT COMPLETE AND MAY BE AMENDED PRIOR TO THE TIME OF SALE. THIS TERM SHEET IS NOT AN OFFER TO SELL THESE SECURITIES AND IT IS NOT A SOLICITATION OF AN OFFER TO BUY THESE SECURITIES IN ANY JURISDICTION WHERE THE OFFER OR SALE IS NOT PERMITTED.
12
Office – Suburban 1401, 1415, 1425, 1451 & 1475 West Cypress Creek Road Fort Lauderdale, Florida 33309 | Loan #1
Crown Center Office Park | Cut-off Date Balance: Cut-off Date LTV: U/W NCF DSCR: U/W NOI Debt Yield: | $43,500,000 74.0% 1.36x 9.5% |
Operating History and Underwritten Net Cash Flow. The following table presents certain information relating to the historical operating performance and underwritten net cash flow at the Crown Center Office Park Property:
Cash Flow Analysis
| TTM 9/30/2016(1) | TTM 9/30/17(1)(2) | TTM 2/28/2019(2)(3) | U/W(3) | %(4) | U/W $ per SF | |
| Base Rent | $3,258,326 | $4,414,972 | $4,456,063 | $4,860,231 | 60.9% | $14.21 |
| Contractual Rent Steps(5) | 0 | 0 | 0 | 178,799 | 2.2 | 0.52 |
| Grossed Up Vacant Space | 0 | 0 | 0 | 746,908 | 9.4 | 2.18 |
| Gross Potential Rent | $3,258,326 | $4,414,972 | $4,456,063 | $5,785,938 | 72.5% | $16.92 |
| Other Income(6) | 14,100 | 16,223 | 14,265 | 14,808 | 0.2 | 0.04 |
| Total Recoveries | 1,651,961 | 1,803,272 | 2,121,754 | 2,174,631 | 27.3 | 6.36 |
| Net Rental Income | $4,924,387 | $6,234,467 | $6,592,081 | $7,975,377 | 100.0% | $23.32 |
| (Vacancy & Credit Loss) | 0 | 0 | 0 | (746,908)(7) | (12.9) | (2.18) |
| Effective Gross Income | $4,924,387 | $6,234,467 | $6,592,081 | $7,228,469 | 90.6% | $21.14 |
| Real Estate Taxes | 647,503 | 685,242 | 715,035 | 936,744 | 13.0 | 2.74 |
| Insurance | 380,224 | 390,969 | 438,808 | 475,768 | 6.6 | 1.39 |
| Management Fee | 345,542 | 355,084 | 333,996 | 216,854 | 3.0 | 0.63 |
| Other Operating Expenses | 1,355,762 | 1,533,931 | 1,465,231 | 1,469,245 | 20.3 | 4.30 |
| Total Operating Expenses | $2,729,031 | $2,965,226 | $2,953,070 | $3,098,611 | 42.9% | $9.06 |
| Net Operating Income | $2,195,356 | $3,269,241 | $3,639,012 | $4,129,858 | 57.1% | $12.08 |
| Replacement Reserves | 0 | 0 | 0 | 70,813 | 1.0 | 0.21 |
| TI/LC | 0 | 0 | 0 | 174,697 | 2.4 | 0.51 |
| Net Cash Flow | $2,195,356 | $3,269,241 | $3,639,012 | $3,884,348 | 53.7% | $11.36 |
| NOI DSCR | 0.77x | 1.15x | 1.28x | 1.45x | ||
| NCF DSCR | 0.77x | 1.15x | 1.28x | 1.36x | ||
| NOI Debt Yield | 5.0% | 7.5% | 8.4% | 9.5% | ||
| NCF Debt Yield | 5.0% | 7.5% | 8.4% | 8.9% |
| (1) | The increase in Net Operating Income from TTM 9/30/2016 to TTM 9/30/2017 was driven by eight new leasestotaling 22.3% of underwritten base rent commencing between October 2015 and April 2017 andone renewal leasetotaling 1.8% of underwritten base rent commencing July 2016. |
| (2) | The increase in Net Operating Income from TTM 9/30/2017 to TTM 2/28/2019 was driven by three new leasestotaling 6.3% of underwritten base rent commencing between December 2017 and October 2018 andone renewal leasetotaling 6.9% of underwritten base rent commencing May 2018. |
| (3) | The increase in Net Operating Income from TTM 2/28/2019 to U/W was driven by (i) one new lease totaling 4.5% of underwritten base rent commencing April 2019 and (ii) the inclusion of contractual rent steps through April 2020 totaling $90,037 and straight-line rent averaging for the investment grade tenants Broward County Sheriff’s Office and Branch Banking and Trust Company over their remaining lease terms totaling $88,762. |
| (4) | Represents (i) percent of Net Rental Income for all revenue fields, (ii) percent of Gross Potential Rent for Vacancy & Credit Loss and (iii) percent of Effective Gross Income for all other fields. |
| (5) | Represents contractual rent steps through April 2020 and straight-line rent averaging for the investment grade tenants over their remaining lease terms (see “Major Tenants” table above). |
| (6) | Other Income is primarily composed of parking revenue. |
| (7) | The underwritten economic vacancy is 12.9%. The Crown Center Office Park Property was 85.5% physically occupied as of March 1, 2019. |
Appraisal. The appraiser concluded to an “as-is” Appraised Value for the Crown Center Office Park Property of $58,800,000 as of November 20, 2018.
Environmental Matters. According to the Phase I environmental site assessment dated October 8, 2018, the presence of an on-site diesel underground storage tank is considered a recognized environmental condition. Based on the lack of release cases, the results of the Florida Department of Environmental Protection inspections, and availability of financial resources including insurance should a release occur, no further investigation was recommended by the environmental consultant. There was no evidence of any other recognized environmental conditions at the Crown Center Office Park Property.
Market Overview and Competition.The Crown Center Office Park Property is located in Fort Lauderdale, Broward County, Florida, approximately 1.2 miles west of Interstate 95 (provides access southbound to Hollywood and Miami), 3.3 miles west of Highway 1, 7.0 miles northwest of the Fort Lauderdale central business district and 12.8 miles northwest of the Fort Lauderdale-Hollywood International Airport. Cypress Creek Station is located approximately 0.9 miles southeast of the Crown Center Office Park Property and provides rail access northbound to West Palm Beach and southbound to the Miami International Airport via the Tri-Rail system. The Fort Lauderdale Station and Fort Lauderdale/Hollywood International Airport Station are each respectively located one and two
THE INFORMATION IN THIS STRUCTURAL AND COLLATERAL TERM SHEET IS NOT COMPLETE AND MAY BE AMENDED PRIOR TO THE TIME OF SALE. THIS TERM SHEET IS NOT AN OFFER TO SELL THESE SECURITIES AND IT IS NOT A SOLICITATION OF AN OFFER TO BUY THESE SECURITIES IN ANY JURISDICTION WHERE THE OFFER OR SALE IS NOT PERMITTED.
13
Office – Suburban 1401, 1415, 1425, 1451 & 1475 West Cypress Creek Road Fort Lauderdale, Florida 33309 | Loan #1
Crown Center Office Park | Cut-off Date Balance: Cut-off Date LTV: U/W NCF DSCR: U/W NOI Debt Yield: | $43,500,000 74.0% 1.36x 9.5% |
stops south of the Cypress Creek Station stop. Cypress Creek Station shopping center is located approximately 1.2 miles northeast of the Crown Center Office Park Property and features an LA Fitness, Office Depot, Longhorn Steakhouse, Five Guys and a 16-screen Regal Cinemas Theater.
According to a third party market research provider, the estimated 2019 population within a three- and five-mile radius of the Crown Center Office Park Property was approximately 128,730 and 437,255, respectively; and the estimated 2019 average household income within the same radii was approximately $63,609 and $64,560, respectively.
Submarket Information – According to a third-party market research report, the Crown Center Office Park Property is situated within the Cypress Creek submarket of the Fort Lauderdale Office Market. As of April 4, 2019, the Cypress Creek submarket reported a total inventory of approximately 8.2 million square feet with a 12.1% vacancy rate and average asking rent of $26.70 per square foot, gross. The submarket vacancy rate has decreased from 18.3% in 2013 and has averaged 14.9% from 2013 through 2018. Within a one-mile radius of the Crown Center Office Park Property, as of April 11, 2019, there were 85 office properties totaling approximately 4.1 million square feet with a 12.5% vacancy rate, per a third-party market research provider.
The following table presents certain information relating to the appraiser’s market rent conclusions for the Crown Center Office Park Property:
Market Rent Summary(1)
| < 5,000 SF | 5,000 – 10,000 SF | 10,000 – 20,000 SF | > 20,000 SF | Bank Space | |
| Market Rent (PSF) | $16.00 | $15.50 | $15.00 | $14.50 | $30.00 |
| Lease Term (Years) | 3-5 | 3-5 | 3-5 | 10 | 10 |
| Concessions | 3 mos. | 3 mos. | 6 mos. | 6 mos. | 6 mos. |
| Lease Type (Reimbursements) | Triple Net | Triple Net | Triple Net | Triple Net | Triple Net |
| Rent Increase Projection | 3.0% per annum | 3.0% per annum | 3.0% per annum | 3.0% per annum | 3.0% per annum |
| Tenant Improvements (New Tenants) (PSF) | $10.00 | $10.00 | $10.00 | $10.00 | $10.00 |
| Tenant Improvements (Renewals) (PSF) | $2.50 | $2.50 | $2.50 | $2.50 | $2.50 |
| (1) | Information obtained from the appraisal. |
The table below presents certain information relating to comparable sales pertaining to the Crown Center Office Park Property identified by the appraiser:
Comparable Sales(1)
| Property Name | Location | Rentable Area (SF) | Sale Date | Sale Price | Sale Price (PSF) |
| Waterford at Blue | Miami, FL | 357,466 | May-16 | $74,000,000 | $207.01 |
| Doral Corporate Center I | Doral, FL | 279,098 | Aug-16 | $48,750,000 | $174.67 |
| Arvida Executive Center | Boca Raton, FL | 122,608 | Apr-17 | $24,000,000 | $195.75 |
| Colonial Center at Town | Lake Mary, FL | 662,320 | May-17 | $136,070,000 | $205.44 |
| 301 Yamato | Boca Raton, FL | 206,946 | Jul-17 | $39,200,000 | $189.42 |
| Sabal Business Center | Tampa, FL | 100,001 | Jun-18 | $15,225,000 | $152.25 |
| Hillsboro Center | Deerfield Beach, FL | 216,114 | Nov-18 | $29,000,000 | $134.19 |
| (1) | Information obtained from the appraisal. |
THE INFORMATION IN THIS STRUCTURAL AND COLLATERAL TERM SHEET IS NOT COMPLETE AND MAY BE AMENDED PRIOR TO THE TIME OF SALE. THIS TERM SHEET IS NOT AN OFFER TO SELL THESE SECURITIES AND IT IS NOT A SOLICITATION OF AN OFFER TO BUY THESE SECURITIES IN ANY JURISDICTION WHERE THE OFFER OR SALE IS NOT PERMITTED.
14
Office – Suburban 1401, 1415, 1425, 1451 & 1475 West Cypress Creek Road Fort Lauderdale, Florida 33309 | Loan #1
Crown Center Office Park | Cut-off Date Balance: Cut-off Date LTV: U/W NCF DSCR: U/W NOI Debt Yield: | $43,500,000 74.0% 1.36x 9.5% |
The following table presents certain information relating to comparable properties to Crown Center Office Park Property:
Comparable Properties(1)
| Property Name/Location | Year Built/ Renovated | Total GLA (SF) | Distance from Subject | Occupancy | Available Space Size | Asking Base Rent PSF | Lease Type |
Cypress Court 6360 NW. 5th Way Fort Lauderdale, FL | 1986/NAP | 42,021 | 1.0 mile | 69.4% | 14,366 SF | $14.00 | NNN |
Cypress Creek Tower 800 W. Cypress Creek Fort Lauderdale, FL | 1974/2014 | 61,917 | 0.6 miles | 87.9% | 2,976 SF | $14.95 | NNN |
1901 W. Cypress Creek Fort Lauderdale, FL | 1987/NAP | 140,635 | 0.4 miles | 61.9% | 15,793 SF | $15.50 | NNN |
Roschman Business 6300 NE. 1st Ave. Fort Lauderdale, FL | 1987/NAP | 31,144 | 1.2 miles | 67.6% | 10,081 SF | $16.50 | NNN |
Hotwire Technology 2100 W. Cypress Creek Fort Lauderdale, FL | 1969/2006 | 185,000 | 0.6 miles | 90.9% | 16,779 SF | $17.50 | NNN |
1201 W Cypress Creek Fort Lauderdale, FL | 1980/1995 | 110,500 | 0.2 miles | 71.3% | 31,692 SF | $17.50 | NNN |
| (1) | Information obtained from the appraisal. |
Escrows.
Real Estate Taxes – The Crown Center Office Park Mortgage Loan documents require an upfront real estate tax reserve of $298,636 and ongoing monthly real estate tax reserves in an amount equal to one-twelfth of the real estate taxes that the lender estimates will be payable during the next twelve months (initially $59,727).
Insurance – The Crown Center Office Park Mortgage Loan documents require an upfront insurance reserve of $166,516 and ongoing monthly insurance reserves in an amount equal to one-twelfth of the insurance premiums that the lender estimates will be payable for the renewal of the coverage during the next twelve months (initially $41,630).
Replacement Reserve – The Crown Center Office Park Mortgage Loan documents require ongoing monthly replacement reserves of $5,984, which the lender may require the borrower to increase (not more than once per year) if the lender reasonably determines such increase is necessary to maintain the proper operation of the Crown Center Office Park Property.
Leasing Reserve –The Crown Center Office Park Mortgage Loan documents require an upfront general tenant improvements and leasing commissions (“TI/LC”) reserve of $3,000,000 and ongoing monthly TI/LC reserves of $28,497, subject to a cap of $3,000,000 (which cap will only apply so long as no event of default is continuing, the net cash flow debt yield (“NCF Debt Yield”) is equal to or greater than 8.25% and the Crown Center Office Park Property’s occupancy is no less than 80.0%). Of the $3,000,000 upfront general TI/LC reserve, $500,000 will be restricted to qualified leasing expenses for Bayview (“Restricted Funds”).
In the event that (i) Bayview waives its termination right or the termination option lapses (see “The Property” section above) or (ii) Bayview exercises its termination option and, following such termination, the NCF Debt Yield is greater than or equal to 8.25% and the Crown Center Office Park Property’s occupancy is at least 80.0%, the TI/LC reserve cap will be reduced to $1,500,000 and any funds in excess of the reduced cap will be (x) if no Cash Trap Event Period (as defined in the “Lockbox and Cash Management Section” below) is continuing, disbursed to the borrower and (y) if a Cash Trap Event Period is continuing, deposited into the lender-controlled cash management account to be applied in accordance with the Crown Center Office Park Mortgage Loan documents.
Provided that the NCF Debt Yield is greater than or equal to 8.25% and the Crown Center Office Park Property’s occupancy is at least 80.0% and upon either (i) a Major Tenant Re-Tenanting Event (as defined in the “Lockbox and Cash Management Section” below) having occurred with respect to space at the Crown Center Office Park Property in an amount equal to at least 75.0% of the Bayview space or (ii) Bayview having extended the term of its lease for at least 75.0% of the Bayview space at the Crown Center Office Park Property with one or more tenants satisfactory to the lender in accordance with the Crown Center Office Park Mortgage Loan documents together with receipt of an estoppel confirming that all obligations of the borrower to such tenant with respect to tenant improvements and leasing commissions have been satisfied in full and that such tenant is then paying full, unabated rent pursuant to the terms thereof (or amounts equal to the free or abated rent having been reserved) (collectively, a “Major Tenant Re-Leasing Event”), any Restricted Funds remaining after paying all related leasing expenses will be: (x) if no Cash Trap Event Period is continuing, disbursed to borrower and (y) if a Cash Trap Event Period is continuing, deposited into the lender-controlled cash management account to be applied in accordance with the Crown Center Office Park Mortgage Loan documents.
Starting with the August 2021 monthly payment date, all TI/LC reserve funds will only be available for lease renewals or new leases to be entered into for existing leases set to expire in 2022 until all such space has been leased to one or more satisfactory tenants which are in occupancy, paying full, unabated rent (or amounts equal to such free or abated rent having been reserved) and TI/LCs having been paid.
Rent Concession Reserve – The Crown Center Office Park Mortgage Loan documents require an upfront reserve of $242,500 for rent concessions related to the Early Learning Center tenant.
THE INFORMATION IN THIS STRUCTURAL AND COLLATERAL TERM SHEET IS NOT COMPLETE AND MAY BE AMENDED PRIOR TO THE TIME OF SALE. THIS TERM SHEET IS NOT AN OFFER TO SELL THESE SECURITIES AND IT IS NOT A SOLICITATION OF AN OFFER TO BUY THESE SECURITIES IN ANY JURISDICTION WHERE THE OFFER OR SALE IS NOT PERMITTED.
15
Office – Suburban 1401, 1415, 1425, 1451 & 1475 West Cypress Creek Road Fort Lauderdale, Florida 33309 | Loan #1
Crown Center Office Park | Cut-off Date Balance: Cut-off Date LTV: U/W NCF DSCR: U/W NOI Debt Yield: | $43,500,000 74.0% 1.36x 9.5% |
Existing TI/LC Reserve – The Crown Center Office Park Mortgage Loan documents require an upfront reserve of $293,631 for TI/LCs related to the Early Learning Center tenant.
Lockbox and Cash Management. The Crown Center Office Park Mortgage Loan is structured with a soft lockbox, which is already in place, and springing cash management. Prior to the occurrence of a Cash Trap Event Period (as defined below), the Crown Center Office Park Mortgage Loan documents require that the borrower or the property manager deposit all rents into the lockbox account within one business day of receipt and all funds in the lockbox account are required to be distributed to the borrower. During a Cash Trap Event Period, the borrower is required to direct all tenants to pay rent directly into such lockbox account and funds in the lockbox account are required to be swept on each business day to a lender-controlled cash management account and all excess funds are required to be swept to an excess cash flow subaccount controlled by the lender.
A “Cash Trap Event Period” will commence upon the earlier of the following:
| (i) | the occurrence and continuance of an event of default; |
| (ii) | the amortizing net cash flow debt service coverage ratio (“NCF DSCR”) falling below 1.15x at the end of any calendar quarter; or |
| (iii) | the occurrence and continuation of a Major Tenant Event Period (as defined below). |
A Cash Trap Event Period will end upon the occurrence of the following:
| ● | with regard to clause (i), the cure of such event of default; |
| ● | with regard to clause (ii), the amortizing NCF DSCR being greater than or equal to 1.20x for two consecutive calendar quarters; or |
| ● | with regard to clause (iii), a Major Tenant Event Period Cure (as defined below). |
A “Major Tenant Event Period” will commence upon the earliest to occur of the following:
| (i) | Bayview failing to renew or extend its lease on the terms set forth in its lease on or prior to the deadline to renew such lease (Bayview’s lease stipulates a nine-month notice period); |
| (ii) | a default, beyond any notice and grace period, under Bayview’s lease; |
| (iii) | Bayview filing, as a debtor, a bankruptcy or similar insolvency proceeding, or otherwise becoming involved, as a debtor, in a bankruptcy or any similar insolvency proceeding; or |
| (iv) | Bayview terminating or canceling its lease (or such lease otherwise fails to be in full force and effect), or giving notice of, or commencing a legal proceeding asserting any of the foregoing. |
A “Major Tenant Event Period Cure” will occur upon:
| ● | with regard to clause (i) above, upon the occurrence of (x) a Major Tenant Re-Tenanting Event (as defined below) or (y) a Major Tenant Re-Leasing Event; |
| ● | with regard to clause (ii) above, (x) a Major Tenant Re-Tenanting Event having occurred or (y) the applicable default having been cured and no other default under the related lease having occurred (beyond any notice and cure period) for a period of two consecutive calendar quarters; |
| ● | with regard to clause (iii) above, (x) a Major Tenant Re-Tenanting Event having occurred or (y) the bankruptcy or insolvency proceeding having been terminated in a manner satisfactory to the lender, the related lease having been affirmed, and the terms of such lease, as affirmed, being satisfactory to the lender; or |
| ● | with regard to clause (iv) above, (x) a Major Tenant Re-Tenanting Event having occurred. |
A “Major Tenant Re-Tenanting Event” will occur upon the lender receiving satisfactory evidence, including, without limitation, a satisfactory estoppel certificate from each such replacement tenant affirming, that: (i) space at the Crown Center Office Park Property in an amount equal to at least 75.0% of the Bayview space has been leased to one or more satisfactory replacement tenants pursuant to a satisfactory replacement lease, (ii) each such tenant is in occupancy of its premises, is open for business and is paying full, unabated rent pursuant to the terms of its lease (or such abatement having been reserved), and (iii) all tenant improvement costs and leasing commissions provided in each such replacement lease have been paid.
Property Management. The Crown Center Office Park Property is managed by an affiliate of the borrower.
Partial Release. Not permitted.
Real Estate Substitution.Not permitted.
Subordinate and Mezzanine Indebtedness.Not permitted.
Ground Lease. None.
Terrorism Insurance.The Crown Center Office Park Mortgage Loan documents require that the “all risk” insurance policy required to be maintained by the borrower provides coverage for terrorism in an amount equal to the full replacement cost of the Crown Center Office Park Property, as well as business interruption insurance covering no less than the 18-month period following the occurrence of a casualty event, together with a 6-month extended period of indemnity.
Windstorm Insurance. The Crown Center Office Park Mortgage Loan documents require windstorm insurance (including named storms) covering 100% of the full replacement cost of the Crown Center Office Park Property during the loan term.
THE INFORMATION IN THIS STRUCTURAL AND COLLATERAL TERM SHEET IS NOT COMPLETE AND MAY BE AMENDED PRIOR TO THE TIME OF SALE. THIS TERM SHEET IS NOT AN OFFER TO SELL THESE SECURITIES AND IT IS NOT A SOLICITATION OF AN OFFER TO BUY THESE SECURITIES IN ANY JURISDICTION WHERE THE OFFER OR SALE IS NOT PERMITTED.
16
| No. 2 – Ohio Hotel Portfolio | |||||||
| Mortgage Loan Information | Mortgaged Property Information | ||||||
| Mortgage Loan Seller: | RREF | Single Asset/Portfolio: | Portfolio | ||||
Credit Assessment (Fitch/KBRA/Moody’s): | NR/NR/NR | Property Type – Subtype: | Hospitality – Various | ||||
| Original Principal Balance: | $35,500,000 | Location: | Various, OH | ||||
| Cut-off Date Balance: | $35,429,107 | Size: | 359 Rooms | ||||
| % of Initial Pool Balance: | 3.8% | Cut-off Date Balance Per Room | $98,688 | ||||
| Loan Purpose: | Refinance | Maturity Date Balance Per Room: | $82,885 | ||||
| Year Built/Renovated: | Various/NAP | ||||||
| Borrower Sponsors: | Har S. Bhatnagar; Rani B. Bhatnagar | Title Vesting: | Fee | ||||
| Guarantors: | Har S. Bhatnagar; Rani B. Bhatnagar | Property Manager: | Self-managed | ||||
| Mortgage Rate: | 5.6000% | Current Occupancy (As of): | 75.3% (02/28/2019) | ||||
| Note Date: | February 21, 2019 | YE 2018 Occupancy: | 74.8% | ||||
| Seasoning: | 2 months | YE 2017 Occupancy: | 72.3% | ||||
| Maturity Date: | March 6, 2029 | YE 2016 Occupancy(2): | 69.7% | ||||
| IO Period: | NAP | YE 2015 Occupancy(2): | 70.4% | ||||
| Loan Term (Original): | 120 months | Appraised Value: | $53,000,000 | ||||
| Amortization Term (Original): | 360 months | Appraised Value Per Room: | $147,632 | ||||
| Loan Amortization Type: | Amortizing Balloon | Appraisal Valuation Date: | December 5, 2018 | ||||
| Call Protection: | L(26),D(90),O(4) | ||||||
| Lockbox Type: | Hard/Upfront Cash Management | ||||||
| Additional Debt: | None | Underwriting and Financial Information | |||||
| Additional Debt Type (Balance): | NAP | TTM 2/28/2019 NOI: | $4,389,142 | ||||
| YE 2018 NOI: | $4,266,285 | ||||||
| YE 2017 NOI: | $4,056,508 | ||||||
| YE 2016 NOI(2): | $2,917,736 | ||||||
| U/W Revenues: | $14,267,968 | ||||||
| Escrows and Reserves(1) | U/W Expenses: | $9,726,731 | |||||
| Initial | Monthly | Cap | U/W NOI: | $4,541,237 | |||
| Taxes | $145,847 | $59,032 | NAP | U/W NCF: | $3,970,518 | ||
| Insurance | $941 | Springing | NAP | U/W DSCR based on NOI/NCF: | 1.86x / 1.62x | ||
| FF&E Reserve | $0 | (1) | NAP | U/W Debt Yield based on NOI/NCF: | 12.8% / 11.2% | ||
| PIP Reserve | $898,701 | $0 | NAP | U/W Debt Yield at Maturity based on NOI/NCF: | 15.3% / 13.3% | ||
| Seasonality Reserve | $0 | (1) | $480,000 | Cut-off Date LTV Ratio: | 66.8% | ||
| Promissory Note Reserve | $1,393,751 | $0 | NAP | LTV Ratio at Maturity: | 56.1% | ||
| Sources and Uses | ||||||||
| Sources | Uses | |||||||
| Original loan amount | $35,500,000 | 98.9% | Loan payoff | $32,423,163 | 90.3% | |||
| Sponsor equity | 408,147 | 1.1 | Upfront reserves | 2,439,240 | 6.8 | |||
| Closing costs | 1,045,744 | 2.9 | ||||||
| Total Sources | $35,908,147 | 100.0% | Total Uses | $35,908,147 | 100.0% | |||
| (1) | See “Escrows” section below. |
| (2) | The Holiday Inn West Chester and SpringHill Suites Beavercreek opened in 2015 and 2016, respectively. Historical occupancy information for 2015 includes only the Holiday Inn Express & Suites Dayton. 2016 occupancy and NOI information includes only a partial year of the Holiday Inn West Chester and excludes the SpringHill Suites Beavercreek. 2017 occupancy and NOI information includes only a partial year of the SpringHill Suites Beavercreek. |
The Mortgage Loan. The mortgage loan (the “Ohio Hotel Portfolio Mortgage Loan”) is evidenced by a first mortgage encumbering the fee simple interest in two limited service hotels and one full service hotel, the SpringHill Suites Beavercreek located in Beavercreek, OH, the Holiday Inn West Chester located in West Chester, OH and the Holiday Inn Express & Suites Dayton located in Dayton, OH (collectively, the “Ohio Hotel Portfolio Properties”).
THE INFORMATION IN THIS STRUCTURAL AND COLLATERAL TERM SHEET IS NOT COMPLETE AND MAY BE AMENDED PRIOR TO THE TIME OF SALE. THIS TERM SHEET IS NOT AN OFFER TO SELL THESE SECURITIES AND IT IS NOT A SOLICITATION OF AN OFFER TO BUY THESE SECURITIES IN ANY JURISDICTION WHERE THE OFFER OR SALE IS NOT PERMITTED.
17
Hospitality – Various Property Addresses - Various, OH
| Loan #2
Ohio Hotel Portfolio
| Cut-off Date Balance: Cut-off Date LTV: U/W NCF DSCR: U/W NOI Debt Yield: | $35,429,107 66.8% 1.62x 12.8% |
The Borrowers and Borrower Sponsors.The borrowers under the Ohio Hotel Portfolio Mortgage Loan are Mall Innkeepers, LLC, Primary Dayton Innkeepers, LLC and Union Centre Innkeepers, LLC (collectively, the “Ohio Hotel Portfolio Borrowers”). The nonrecourse carve-out guarantors of the Ohio Hotel Portfolio Mortgage Loan are Har S. Bhatnagar and Rani B. Bhatnagar (collectively, the “Ohio Hotel Portfolio Sponsors”).
Har Bhatnagar founded Middletown Hotel Management (“Middletown”) in 1989 and has developed and operated 11 hotels. Middletown’s current portfolio consists of 968 keys across 8 properties.
The Properties.The Ohio Hotel Portfolio Properties include three properties located across Ohio comprised of a total of 359 rooms.
The SpringHill Suites Beavercreek, developed by the Ohio Hotel Portfolio Sponsors and opened in late 2016, is a 118-room, all-suite limited-service hotel located in Beavercreek, OH. The property offers a 24-hour reception desk, free high speed WiFi, 24-hour sundry marketplace, complimentary breakfast, a fitness center, a heated indoor pool, an onsite business center, a lounge serving beer/wine after 5pm, and an outdoor patio with fire pit. All standard guestrooms and suites feature en suite bathrooms with showers and tubs, black-out shades, a hair dryer, flat-screen TVs, a work desk with lamp, microwaves and mini refrigerators, and coffee or tea makers.
The Holiday Inn West Chester, developed by the Ohio Hotel Portfolio Sponsors and opened in late 2015, is a 130-room full-service hotel located in West Chester, OH. The property offers a 24-hour reception desk, free high speed WiFi, Johnny’s Italian Steakhouse, Blue Bar, room service, a fitness center, a heated indoor pool, and an onsite business center. The hotel features 25,605 SF of dedicated meeting space, spread across six interior and two exterior event spaces, the biggest of which is a 8,909 SF ballroom. All standard guestrooms and suites feature en suite bathrooms with showers and/or tubs, black-out shades, a hair dryer, flat-screen TVs, work desk with lamp, microwaves and mini refrigerators, and coffee or tea makers.
The Holiday Inn Express & Suites Dayton, built by the Ohio Hotel Portfolio Sponsors and opened in 2011, is a 111-room limited service hotel located in Dayton, OH along I-675, one of the region’s primary highways. The property offers a 24-hour reception desk, free high speed WiFi, a complimentary local area shuttle, complimentary breakfast buffet, a fitness center, an indoor pool, an onsite business center, and 2,438 square feet of event/meeting space. The hotel also offers room service from the Chop House Restaurant, which is located adjacent to the hotel (not a part of the collateral). All standard guestrooms and suites feature en suite bathrooms with showers and tubs, black-out shades, hair dryer, flat-screen TVs, a work desk with lamp, and coffee or tea makers. The lender will reserve $898,701 for the purpose of a property improvement plan (the “Holiday Inn Express & Suites Dayton PIP”).
| Property | Year Built/ Renovated | Rooms | Allocated Cut-off Date Principal Balance | % of Portfolio Cut-off Date Principal Balance | Cut-off Date Principal Balance Per Room | As Is Appraised Value | % of Appraised Value |
| SpringHill Suites Beavercreek | 2016/NAP | 118 | $13,822,342 | 39.0% | $117,138 | $19,000,000 | 35.8% |
| Holiday Inn West Chester | 2015/NAP | 130 | $13,173,640 | 37.2% | $101,336 | $20,000,000 | 37.7% |
| Holiday Inn Express & Suites Dayton | 2011/NAP | 111 | $8,433,126 | 23.8% | $75,974 | $14,000,000 | 26.4% |
| Total/Average | 359 | $35,429,107 | 100.0% | $98,688 | $53,000,000 | 100.0% |
The following table presents certain information relating to the 2018 demand analysis with respect to the Ohio Hotel Portfolio Properties based on market segmentation, as provided in the appraisal:
2018 Market Segmentation
(SpringHill Suites Beavercreek)
Corporate | Meeting/Group | Leisure |
| 50.0% | 30.0% | 20.0% |
THE INFORMATION IN THIS STRUCTURAL AND COLLATERAL TERM SHEET IS NOT COMPLETE AND MAY BE AMENDED PRIOR TO THE TIME OF SALE. THIS TERM SHEET IS NOT AN OFFER TO SELL THESE SECURITIES AND IT IS NOT A SOLICITATION OF AN OFFER TO BUY THESE SECURITIES IN ANY JURISDICTION WHERE THE OFFER OR SALE IS NOT PERMITTED.
18
Hospitality – Various Property Addresses - Various, OH
| Loan #2
Ohio Hotel Portfolio
| Cut-off Date Balance: Cut-off Date LTV: U/W NCF DSCR: U/W NOI Debt Yield: | $35,429,107 66.8% 1.62x 12.8% |
2018 Market Segmentation
(Holiday Inn West Chester)
Corporate | Meeting/Group | Leisure |
| 20.0% | 60.0% | 20.0% |
2018 Market Segmentation
(Holiday Inn Express & Suites Dayton)
Corporate | Meeting/Group | Leisure |
| 65.0% | 20.0% | 15.0% |
Operating History and Underwritten Net Cash Flow. The following table presents certain information relating to the historical operating performance and the underwritten net cash flow at the Ohio Hotel Portfolio Properties:
Cash Flow Analysis
| 2016(2) | 2017 | 2018 | TTM 2/28/2019 | U/W | % of U/W Total Revenue(1) | U/W $ per Room | |
| Occupancy | 69.7% | 72.3% | 74.8% | 75.3% | 75.3% | ||
| ADR | $110.45 | $112.17 | $112.75 | $113.07 | $113.07 | ||
| RevPAR | $76.93 | $81.09 | $84.29 | $85.11 | $85.11 | ||
| Room Revenue | $6,785,719 | $10,625,443 | $11,044,505 | $11,152,838 | $11,152,838 | 78.2% | $31,066 |
| F&B Revenue | 2,860,762 | 2,771,008 | 2,889,077 | 2,949,964 | 2,949,964 | 20.7 | 8,217 |
| Other Revenue | 148,754 | 168,862 | 161,439 | 165,166 | 165,166 | 1.2 | 460 |
| Total Revenue | $9,795,236 | $13,565,313 | $14,095,021 | $14,267,968 | $14,267,968 | 100.0% | $39,744 |
| Room Expense | 1,827,789 | 2,591,355 | 2,660,222 | 2,646,732 | 2,646,732 | 23.7 | 7,373 |
| F&B Expense | 1,571,753 | 2,072,331 | 2,171,521 | 2,215,855 | 2,215,855 | 75.1 | 6,172 |
| Other Department Expense | 79,448 | 107,482 | 117,885 | 123,005 | 123,005 | 74.5 | 343 |
| Total Department Expenses | 3,478,991 | 4,771,168 | 4,949,628 | 4,985,593 | 4,985,593 | 34.9 | 13,887 |
| Gross Operating Income | $6,316,245 | $8,794,145 | $9,145,393 | $9,282,376 | $9,282,376 | 65.1% | $25,856 |
| Total Undistributed Expenses | 3,017,852 | 4,042,457 | 4,002,987 | 4,024,386 | 3,905,419 | 27.4 | 10,879 |
| Gross Operating Profit | $3,298,393 | $4,751,688 | $5,142,407 | $5,257,990 | $5,376,957 | 37.7% | $14,978 |
| Total Fixed Charges | 380,657 | 695,180 | 876,122 | 868,848 | 835,720 | 5.9 | 2,328 |
| Total Operating Expenses | $6,877,499 | $9,508,805 | $9,828,736 | $9,878,826 | $9,726,731 | 68.2% | $27,094 |
| Net Operating Income | $2,917,736 | $4,056,508 | $4,266,285 | $4,389,142 | $4,541,237 | 31.8% | $12,650 |
| FF&E | 391,809 | 542,613 | 563,801 | 570,719 | 570,719 | 4.0 | 1,590 |
| Net Cash Flow | $2,525,927 | $3,513,896 | $3,702,484 | $3,818,423 | $3,970,518 | 27.8% | $11,060 |
| NOI DSCR | 1.19x | 1.66x | 1.74x | 1.79x | 1.86x | ||
| NCF DSCR | 1.03x | 1.44x | 1.51x | 1.56x | 1.62x | ||
| NOI DY | 8.2% | 11.4% | 12.0% | 12.4% | 12.8% | ||
| NCF DY | 7.1% | 9.9% | 10.5% | 10.8% | 11.2% | ||
| (1) | % of U/W Total Revenue for Room Expense, F&B Expense and Other Department Expenses are based on their corresponding revenue line items. All other line items represent percent of Total Revenue. |
| (2) | The Holiday Inn West Chester and SpringHill Suites Beavercreek opened in 2015 and 2016, respectively. Historical occupancy and NOI information for 2015 includes only the Holiday Inn Express & Suites Dayton. 2016 occupancy and NOI information includes only a partial year of the Holiday Inn West Chester and excludes the SpringHill Suites Beavercreek. 2017 occupancy and NOI information includes only a partial year of the SpringHill Suites Beavercreek. |
Appraisal.The appraiser for SpringHill Suites Beavercreek property concluded to an “as-is” appraised value of $19,000,000 with an appraisal valuation date of December 5, 2018. The appraiser for the Holiday Inn West Chester property concluded to an “as-is” appraised value of $20,000,000 with an appraisal valuation date of December, 5, 2018. The appraiser for Holiday Inn Express & Suites Dayton concluded to an “as-is” appraised value of $14,000,000 with an appraisal valuation date of December 5, 2018.
Environmental Matters. According to the Phase I environmental assessments dated December 17, 2018, there was no evidence of any recognized environmental conditions at the SpringHill Suites Beavercreek, Holiday Inn West Chester and Holiday Inn Express & Suites Dayton.
THE INFORMATION IN THIS STRUCTURAL AND COLLATERAL TERM SHEET IS NOT COMPLETE AND MAY BE AMENDED PRIOR TO THE TIME OF SALE. THIS TERM SHEET IS NOT AN OFFER TO SELL THESE SECURITIES AND IT IS NOT A SOLICITATION OF AN OFFER TO BUY THESE SECURITIES IN ANY JURISDICTION WHERE THE OFFER OR SALE IS NOT PERMITTED.
19
Hospitality – Various Property Addresses - Various, OH
| Loan #2
Ohio Hotel Portfolio
| Cut-off Date Balance: Cut-off Date LTV: U/W NCF DSCR: U/W NOI Debt Yield: | $35,429,107 66.8% 1.62x 12.8% |
Markets Overview and Competition.
SpringHill Suites Beavercreek
The SpringHill Suites Beavercreek property is located along Fairfield Commons Drive in Beavercreek, OH, with frontage along Fairfield Commons Drive. The SpringHill Suites Beavercreek property is located approximately 8 miles southwest of downtown Dayton. The SpringHill Suites Beavercreek property is located in close proximity to I-75, the main thoroughfare in the area.
Wright-Patterson Air Force Base (“WPAFB”) is the largest single-site employer in Ohio with more than 27,000 employees including military and civilian employees and contractors on a base covering more than 8,000 acres, which is located less than 5 miles from the SpringHill Suites Beavercreek, with the base creating an estimated annual economic impact of $4.2 billion for the State of Ohio. WPAFB helps seed local growth and innovation by sending hundreds of millions of dollars each year to small and medium-size companies in the Dayton area. As a result, WPAFB has helped turn Dayton into a center of aerospace innovation which has spawned growth in the life sciences and healthcare. The Dayton area also contains offices of companies like Lockheed Martin, Northrop Grumman, and General Dynamics that support the work at WPAFB. Additionally, Wright State University (18,500 students and staff) and the University of Dayton (11,500 students) provide demand to the local lodging market.
Estimated population in 2019 within a one-, three-, and five-mile radius of the SpringHill Suites Beavercreek is 2,975, 57,907 and 137,574, respectively. Estimated median household income in 2019 within the same one-, three-, and five-mile radius is $91,608, $62,209, and $58,404, respectively.
Holiday Inn West Chester
The Holiday Inn West Chester property is located along Muhlhauser Road in West Chester, OH, with frontage along Muhlhauser Road and Allen Road. West Chester Township is located approximately 25 miles north of downtown Cincinnati. The Holiday Inn West Chester property is accessible from I-75, which connects Lexington, KY, Cincinnati, and Dayton. The Greater Cincinnati area is home to headquarters and regional offices of various national and international companies such as American Financial Corporation, Duke Energy, Kroger Company, Omnicare, Cincinnati Milacron, Procter & Gamble Company, Western-Southern Insurance, and more.
Proctor & Gamble closed its Sharon Woods Innovation Center in Blue Ash to build a new center at the Mason Business Park, approximately eight miles east of the Holiday Inn West Chester property. Plans call for expansion of the 1.15 million square foot Mason Business Park campus by 500,000 square feet to accommodate the 1,150 employees and 200 contractors being relocated from the Blue Ash location. The company plans to spend $300 million to develop this new Beauty Innovation Center, which will house the company’s research and development arm of its beauty care business.
Estimated population in 2019 within a one-, three-, and five-mile radius of the Holiday Inn West Chester is 4,733, 41,117, and 147,650, respectively. Estimated median household income in 2019 within the same one-, three-, and five-mile radius is $89,175, $74,922, and $75,082, respectively.
Holiday Inn Express & Suites Dayton
The Holiday Inn Express & Suites Dayton property is located along Washington Village Drive in Dayton, OH, with frontage along Washington Village Drive. The property is located in Montgomery County in southwestern Ohio, approximately 55 miles northeast of Cincinnati. Dayton is the sixth-largest city in the state of Ohio and the county seat of Montgomery County. The Holiday Inn Express & Suites Dayton property is located just off I-675, one of Ohio’s primary transportation arteries, and close to the I-75 / I-675 interchange, which is a major commercial node. The proximity to these major highways makes the property a popular option with leisure travelers.
A major driver of business to the Holiday Inn Express & Suites Dayton property is the Department of Defense training school, referred to as the Defense Acquisition University (“DAU”), located 11.1 miles away. DAU is a corporate university of the Department of Defense offering acquisition, technology, and logistics training to military and Federal civilian staff and Federal contractors. The DAU in Ohio serves the training needs of over 25,000 people across a 13-state area. Along with defense and aerospace, healthcare accounts for much of the Dayton area's economy. The Holiday Inn Express & Suites Dayton property is also located less than 10 miles from the University of Dayton.
Estimated population in 2019 within a one-, three-, and five-mile radius of the Holiday Inn Express & Suites Dayton is 5,969, 58,297, and 153,447, respectively. Estimated median household income in 2019 within the same one-, three-, and five-mile radius is $67,906, $66,346, and $66,033, respectively.
THE INFORMATION IN THIS STRUCTURAL AND COLLATERAL TERM SHEET IS NOT COMPLETE AND MAY BE AMENDED PRIOR TO THE TIME OF SALE. THIS TERM SHEET IS NOT AN OFFER TO SELL THESE SECURITIES AND IT IS NOT A SOLICITATION OF AN OFFER TO BUY THESE SECURITIES IN ANY JURISDICTION WHERE THE OFFER OR SALE IS NOT PERMITTED.
20
Hospitality – Various Property Addresses - Various, OH
| Loan #2
Ohio Hotel Portfolio
| Cut-off Date Balance: Cut-off Date LTV: U/W NCF DSCR: U/W NOI Debt Yield: | $35,429,107 66.8% 1.62x 12.8% |
The following table presents historical estimated occupancy, ADR, RevPAR and penetration rates relating to the SpringHill Suites Beavercreek competitive set:
Subject and Market Historical Occupancy, ADR and RevPAR(1)
(SpringHill Suites Beavercreek)
Competitive Set | SpringHill Suites Beavercreek | Penetration Factor | |||||||
Year | Occupancy | ADR | RevPAR | Occupancy | ADR | RevPAR | Occupancy | ADR | RevPAR |
| TTM 02/28/2019 | 71.8% | $108.35 | $77.84 | 82.2% | $114.57 | $94.13 | 114.4% | 105.7% | 120.9% |
| 12/31/2018 | 70.2% | $108.72 | $76.30 | 82.2% | $113.53 | $93.34 | 117.1% | 104.4% | 122.3% |
| 12/31/2017 | 69.5% | $108.36 | $75.32 | 74.4% | $109.94 | $81.77 | 107.0% | 101.5% | 108.6% |
| 12/31/2016 | 71.8% | $107.41 | $77.17 | 54.2% | $101.77 | $55.19 | 75.5% | 94.7% | 71.5% |
| (1) | The competitive set includes the following hotels: Hampton Inn Dayton Fairborn Wright AFB, Residence Inn Dayton Beavercreek, Courtyard Dayton Beavercreek, Country Inn & Suites Fairborn South and Wingate By Wyndham Dayton Fairborn. |
The following table presents historical estimated occupancy, ADR, RevPAR and penetration rates relating to the Holiday Inn West Chester competitive set:
Subject and Market Historical Occupancy, ADR and RevPAR(1)
(Holiday Inn West Chester)
Competitive Set | Holiday Inn West Chester | Penetration Factor | |||||||
Year | Occupancy | ADR | RevPAR | Occupancy | ADR | RevPAR | Occupancy | ADR | RevPAR |
| TTM 02/28/2019 | 69.3% | $122.05 | $84.52 | 71.5% | $117.51 | $83.98 | 103.2% | 96.3% | 99.4% |
| 12/31/2018 | 68.3% | $121.84 | $83.20 | 70.8% | $116.87 | $82.73 | 103.7% | 95.9% | 99.4% |
| 12/31/2017 | 66.4% | $122.45 | $81.36 | 68.2% | $119.02 | $81.13 | 102.6% | 97.2% | 99.7% |
| 12/31/2016 | 70.3% | $122.82 | $86.35 | 66.2% | $116.18 | $76.88 | 94.1% | 94.6% | 89.0% |
| (1) | The competitive set includes the following hotels: Marriott Cincinnati North, Hampton Inn Cincinnati Union Centre, Drury Inn & Suites Cincinnati North, Courtyard Cincinnati North @ Union Centre, Hilton Garden Inn West Chester and Hyatt Place Cincinnati Sharonville Convention Center. |
The following table presents historical estimated occupancy, ADR, RevPAR and penetration rates relating to the Holiday Inn Express & Suites Dayton competitive set:
Subject and Market Historical Occupancy, ADR and RevPAR(1)
(Holiday Inn Express & Suites Dayton)
Competitive Set | Holiday Inn Express & Suites Dayton | Penetration Factor | |||||||
Year | Occupancy | ADR | RevPAR | Occupancy | ADR | RevPAR | Occupancy | ADR | RevPAR |
| TTM 02/28/2019 | 64.9% | $99.05 | $64.25 | 72.9% | $106.23 | $77.43 | 112.4% | 107.2% | 120.5% |
| 12/31/2018 | 65.2% | $99.84 | $65.08 | 72.0% | $106.89 | $77.01 | 110.5% | 107.1% | 118.3% |
| 12/31/2017 | 66.0% | $101.80 | $67.17 | 75.4% | $107.16 | $80.85 | 114.3% | 105.3% | 120.4% |
| 12/31/2016 | 67.4% | $101.09 | $68.10 | 75.2% | $103.00 | $77.44 | 111.6% | 101.9% | 113.7% |
| (1) | The competitive set includes the following hotels: Courtyard Dayton South Mall, Comfort Suites Miamisburg, Holiday Inn Express & Suites Dayton Centerville, Country Inn & Suites Dayton South, SpringHill Suites Dayton South Miamisburg and Hampton Inn Dayton Mall. |
THE INFORMATION IN THIS STRUCTURAL AND COLLATERAL TERM SHEET IS NOT COMPLETE AND MAY BE AMENDED PRIOR TO THE TIME OF SALE. THIS TERM SHEET IS NOT AN OFFER TO SELL THESE SECURITIES AND IT IS NOT A SOLICITATION OF AN OFFER TO BUY THESE SECURITIES IN ANY JURISDICTION WHERE THE OFFER OR SALE IS NOT PERMITTED.
21
Hospitality – Various Property Addresses - Various, OH
| Loan #2
Ohio Hotel Portfolio
| Cut-off Date Balance: Cut-off Date LTV: U/W NCF DSCR: U/W NOI Debt Yield: | $35,429,107 66.8% 1.62x 12.8% |
The following tables present year-end occupancy, estimated ADR and estimated RevPAR relating to each Ohio Hotel Portfolio Property’s primary competitive set according to the appraisal:
Primary Competitive Set(1)
Property Name | Location | Rooms | Year Built/Renov. | Estimated 12/31/2018 Occupancy | Estimated 12/31/2018 ADR | Estimated 12/31/2018 RevPAR |
| SpringHill Suites Beavercreek– Subject(1) | Beavercreek, OH | 118 | 2016/NAP | 83.2% | $113.96 | $94.85 |
| Hampton Inn Dayton Fairborn Wright AFB | Fairborn, OH | 61 | 1994/NAV | 75.0% - 80.0% | $105.00 - $110.00 | $80.00 – $85.00 |
| Residence Inn Dayton Beavercreek | Dayton, OH | 100 | 2002/NAV | 70.0% - 75.0% | $115.00 - $120.00 | $80.00 – $85.00 |
| Courtyard Dayton Beavercreek | Dayton, OH | 94 | 2002/NAV | 70.0% - 75.0% | $120.00 - $125.00 | $85.00 – $90.00 |
| Country Inn & Suites Fairborn South | Fairborn, OH | 69 | 2006/NAV | 65.0% - 70.0% | $95.00 - $100.00 | $65.00 - $70.00 |
| Wingate by Wyndham Dayton Fairborn | Fairborn, OH | 90 | 2010/NAV | 65.0% - 70.0% | $95.00 - $100.00 | $65.00 - $70.00 |
| (1) | Information obtained from the appraisal. |
Primary Competitive Set(1)
Property Name | Location | Rooms | Year Built/Renov. | Estimated 12/31/2018 Occupancy | Estimated 12/31/2018 ADR | Estimated 12/31/2018 RevPAR |
| Holiday Inn West Chester– Subject(1) | West Chester, OH | 130 | 2015/NAP | 70.7% | $118.42 | $83.67 |
| Courtyard Cincinnati at Union Centre | West Chester, OH | 126 | 2007/NAV | 65.0% - 70.0% | $125.00 - $130.00 | $80.00 – $85.00 |
| Hilton Garden Inn West Chester | West Chester, OH | 125 | 2014/NAV | 65.0% - 70.0% | $125.00 - $130.00 | $85.00 – $90.00 |
| Cincinnati Marriott North | West Chester, OH | 302 | 2000/NAV | 65.0% - 70.0% | $125.00 - $130.00 | $85.00 – $90.00 |
| Staybridge Suites Cincinnati North | West Chester, OH | 117 | 2003/NAV | 75.0% - 80.0% | $115.00 - $120.00 | $90.00 - $95.00 |
| Hampton Inn & Suites Cincinnati Union Centre | West Chester, OH | 100 | 2005/NAV | 70.0% - 75.0% | $125.00 - $130.00 | $90.00 - $95.00 |
| (1) | Information obtained from the appraisal. |
Primary Competitive Set(1)
Property Name | Location | Rooms | Year Built/Renov. | Estimated 12/31/2018 Occupancy | Estimated 12/31/2018 ADR | Estimated 12/31/2018 RevPAR |
| Holiday Inn Express & Suites Dayton – Subject(1) | Dayton, OH | 111 | 2011/NAP | 71.3% | $107.77 | $76.85 |
| Courtyard Dayton South/Mall | Miamisburg, OH | 146 | 1987/NAV | 45.0% - 50.0% | $105.00 - $110.00 | $50.00 – $55.00 |
| Comfort Suites Miamisburg | Miamisburg, OH | 56 | 2000/NAV | 65.0% - 70.0% | $75.00 - $80.00 | $50.00 – $55.00 |
| Holiday Inn Express & Suites Dayton Centerville | Dayton, OH | 74 | 2003/NAV | 75.0% - 80.0% | $115.00 - $120.00 | $85.00 – $90.00 |
| Country Inn & Suites Dayton South | Dayton, OH | 80 | 2003/NAV | 65.0% - 70.0% | $80.00 - $85.00 | $50.00 - $55.00 |
| SpringHill Suites Dayton South/Miamisburg | Dayton, OH | 84 | 2007/NAV | 70.0% - 75.0% | $100.00 - $105.00 | $75.00 - $80.00 |
| Hampton Inn Dayton/Dayton Mall | Dayton, OH | 95 | 2012/NAV | 70.0% - 75.0% | $105.00 - $110.00 | $75.00 - $80.00 |
| (1) | Information obtained from the appraisal. |
THE INFORMATION IN THIS STRUCTURAL AND COLLATERAL TERM SHEET IS NOT COMPLETE AND MAY BE AMENDED PRIOR TO THE TIME OF SALE. THIS TERM SHEET IS NOT AN OFFER TO SELL THESE SECURITIES AND IT IS NOT A SOLICITATION OF AN OFFER TO BUY THESE SECURITIES IN ANY JURISDICTION WHERE THE OFFER OR SALE IS NOT PERMITTED.
22
Hospitality – Various Property Addresses - Various, OH
| Loan #2
Ohio Hotel Portfolio
| Cut-off Date Balance: Cut-off Date LTV: U/W NCF DSCR: U/W NOI Debt Yield: | $35,429,107 66.8% 1.62x 12.8% |
Escrows.
Real Estate Taxes – The Ohio Hotel Portfolio Mortgage Loan documents require an upfront real estate tax reserve of $145,847 and ongoing monthly real estate tax reserves in an amount equal to one-twelfth of the real estate taxes that the lender estimates will be payable during the next twelve months (initially $59,032).
Insurance – The Ohio Hotel Portfolio Mortgage Loan documents require an upfront insurance premiums reserve of $941 and ongoing monthly insurance premiums will be springing upon (i) an event of default; (ii) an acceptable blanket insurance policy no longer being in place for 5 or more commercial properties exclusive of the property, (iii) the Ohio Hotel Portfolio Borrowers failing to provide the lender with evidence of payment; and (iv) the lender not receiving satisfactory evidence of insurance policies when the same is required under the terms of the loan documents.
FF&E Reserve – The Ohio Hotel Portfolio Mortgage Loan documents require ongoing FF&E reserves of 4.0% of the total revenue from the Ohio Hotel Portfolio Properties.
Seasonality Reserve – The Ohio Hotel Portfolio Mortgage Loan documents require monthly deposits for seasonality. As to all Ohio Hotel Portfolio Properties, on monthly payment dates May, June, July, September and November, the Ohio Hotel Portfolio Borrowers will be required to deposit an aggregate of $96,000. The seasonality reserve is capped at $480,000.
PIP Reserve– The Ohio Hotel Portfolio Mortgage Loan documents require an upfront PIP reserve of $898,701.
Promissory Note Reserve -The Ohio Hotel Portfolio Mortgage Loan documents required a $1,393,751 reserve at closing for future payments owed to a former partner who was bought out by the Ohio Hotel Portfolio Sponsors. There are monthly payments beginning December 1, 2018 and continuing through December 1, 2022, each in the amount of $32,786. The reserved funds will be released to Ohio Hotel Portfolio Borrowers as the amount owed is reduced (upon proof of payment) or upon the release of the Ohio Hotel Portfolio Borrowers from the debt. The Ohio Hotel Portfolio Sponsors are recourse guarantors for any additional liability tied to this obligation.
Lockbox and Cash Management.The Ohio Hotel Portfolio Mortgage Loan has upfront cash management that will be continuing upon the occurrence of a Cash Sweep Period (defined below).
A “Cash Sweep Period” will commence upon any of the following:
| (i) | origination of the Ohio Hotel Portfolio Mortgage Loan; |
| (ii) | the occurrence and continuance of an event of default under the Ohio Hotel Portfolio Mortgage Loan; |
| (iii) | the debt service coverage ratio being less than (a) 1.20x during the period from February 21, 2019 through February 21, 2020, (b) subject to clause (c), 1.30x during the period from February 22, 2020 through March 6 ,2029, and (c) 1.25x during any period in which the borrower is performing a franchisor-imposed PIP at any of the Ohio Hotel Portfolio Properties; or |
(iv) the occurrence of a Franchise Sweep Event as defined below:
A “Cash Sweep Period” will end upon the occurrence of the following:
| ● | with regard to clause (i), 115% of the amount reasonably determined by the lender to be required to complete the Holiday Inn Express & Suites Dayton PIP (approximately $1.6 million as of origination of the Ohio Hotel Portfolio Mortgage Loan) being on reserve with the lender; or |
| ● | with regard to clause (ii), the lender’s acceptance of a cure or waiver of such event of default; or |
| ● | with regard to clause (iii), the debt service coverage ratio being greater than 1.35x for two consecutive calendar quarters; or |
| ● | with regard to clause (iv), the lender’s acceptance of a cure of such event of default under the franchise agreement or management agreement, the Ohio Hotel Portfolio Borrowers having delivered evidence reasonably satisfactory to the lender, which may include a ”good standing” or similar letter from the franchisor, indicating that the franchise agreement is in full force and effect. |
A ”Franchise Sweep Event” will commence upon the earlier of the following:
| (i) | a default by the Ohio Hotel Portfolio Borrowers under any franchise agreement beyond all applicable notice and/or cure periods; |
| (ii) | any expiration, termination, cancellation, surrender or other cessation of existence of any franchise agreement, or notification by any franchisor of its intent to terminate or cancel its respective franchise agreement unless the conditions set forth in the loan agreement; |
| (iii) | the Ohio Hotel Portfolio Borrowers’ failure to make any deposit into the PIP reserve account required pursuant to conditions set forth in the loan agreement; or |
| (iv) | the date that is twelve (12) months prior to the scheduled expiration date of such franchise agreement. |
A “Franchise Sweep Event Cure” will occur upon:
| ● | with regards to clause (i), all defaults under the applicable franchise agreement having been cured and such cures having been accepted by the applicable franchisor, as demonstrated by delivery to the lender of a “good standing” letter (or equivalent) in form and substance acceptable to the lender; |
| ● | with regards to clause (ii), the applicable franchisor (1) revoking any notification of any termination, cancellation or surrender of such franchise agreement and (2) delivering to the lender a “good standing” letter (or equivalent evidence that there are no defaults or outstanding amounts owed under such franchise agreement, and the same is in full force and effect) in form and substance acceptable to the lender; |
| ● | with regards to clause (iii), the lender’s determination that the aggregate sum of FF&E reserves (solely counting any FF&E reserve funds that are attributable (as reasonably determined by the lender) to the applicable Ohio Hotel Portfolio Property |
THE INFORMATION IN THIS STRUCTURAL AND COLLATERAL TERM SHEET IS NOT COMPLETE AND MAY BE AMENDED PRIOR TO THE TIME OF SALE. THIS TERM SHEET IS NOT AN OFFER TO SELL THESE SECURITIES AND IT IS NOT A SOLICITATION OF AN OFFER TO BUY THESE SECURITIES IN ANY JURISDICTION WHERE THE OFFER OR SALE IS NOT PERMITTED.
23
Hospitality – Various Property Addresses - Various, OH
| Loan #2
Ohio Hotel Portfolio
| Cut-off Date Balance: Cut-off Date LTV: U/W NCF DSCR: U/W NOI Debt Yield: | $35,429,107 66.8% 1.62x 12.8% |
| that is subject to the franchise agreement under which the new PIP is imposed) and PIP reserve funds then on deposit (solely counting any PIP reserve funds deposited on account of the new PIP for which the Ohio Hotel Portfolio Borrowers initially failed to make the necessary deposit into the PIP reserve account) equals or exceeds (x) if the new PIP has a five percent (5%) contingency line item, one hundred fifteen percent (115%), or (y) if the new PIP does not have a five percent (5%) contingency line item, one hundred twenty-five percent (125%), in each of subclause (x) and (y), of the estimated costs required to complete such new PIP, such determination to be made in the lender’s reasonable discretion taking into account any portion of such new PIP with respect to which the lender has received satisfactory evidence that the same has previously been performed and paid for by the Ohio Hotel Portfolio Borrowers in accordance with the terms hereof and the related franchise agreement, and (2) payment by the Ohio Hotel Portfolio Borrowers of all costs and expenses incurred by the lender in connection with making the foregoing determination (including, without limitation, the costs of any inspections performed by the lender or any professionals engaged by the lender, it being agreed that the Ohio Hotel Portfolio Borrowers will permit all such persons to enter the particular Ohio Hotel Portfolio Property or any portion thereof as necessary for such inspections); and |
| ● | with regards to clause (iv), the lender receiving (1) evidence, in form and substance satisfactory to the lender, that the applicable Ohio Hotel Portfolio Borrower has entered into a replacement franchise agreement with a qualified franchisor with respect to the franchise agreement that caused the Franchise Sweep Event, and that an amount of PIP Reserves are on deposit and allocable pursuant to the terms and conditions of this agreement to cover at least 125% of the anticipated costs of all PIP work required to be performed in connection therewith, as reasonably determined by the lender (such evidence to include, without limitation, a fully executed copy of such replacement franchise agreement) and (2) a “comfort letter” (or equivalent agreement) with respect to such replacement franchise agreement, in form and substance acceptable to the lender. |
Property Management.The Ohio Hotel Portfolio Properties are managed by an affiliate of the Ohio Hotel Portfolio Borrowers.
Partial Release.The lender will agree to release a given property (each a “Release Property”) from the collateral in connection with a third-party, arms-length sale of the Release Property subject to, among other things, the following conditions:
| ● | No event of default has occurred or would occur as a result of the release; |
| ● | The remaining collateral has an LTV no greater than: |
| ○ | 65.0% for the first release, and |
| ○ | 60.0% for the second release; |
| ● | The remaining collateral has a DSCR no less than the greater of: |
| ○ | The DSCR in place at loan origination, and |
| ○ | The DSCR in place immediately prior to the release; |
| ● | Documentation (which may include a zoning report and/or legal opinion) confirming that the release of the Release Property will not violate any zoning, building, land use or subdivision regulations or other similar legal requirements and that the remaining collateral will still be a legal-conforming use and constitute a separate tax lot; |
| ● | To the extent necessary, the execution of an acceptable reciprocal easement agreement or similar agreement for access and parking between the parties; |
| ● | An acceptable endorsement to the title insurance policy and updated survey; |
| ● | Partial defeasance in an amount equal to the release price (the “Release Price”) and any prepayment penalty associated with the payment of the Release Price; |
| ● | Satisfaction of customary REMIC requirements; |
| ● | Payment of all other costs and expenses of the lender in connection with the release; |
| ● | The Release Price must equal the greater of 125% of the loan amount allocated to the Release Property and 100% of the net sales proceeds (subject to a cap of 140% of the allocated loan amount) after deducting the costs of closing the sale, which costs will be capped for purposes of determining the Release Price at 5% of gross sales proceeds and; |
| ● | The SpringHill Suites Beavercreek cannot be the first asset released and the Holiday Inn West Chester cannot be the last remaining single asset. |
Real Estate Substitution.Not permitted.
Subordinate and Mezzanine Indebtedness.Not permitted.
Ground Lease. None.
Terrorism Insurance. The mortgage loan documents require that the “all risk” insurance policy required to be maintained by the Ohio Hotel Portfolio Borrowers provides coverage for terrorism in an amount equal to the full replacement cost of the Ohio Hotel Portfolio property, as well as business interruption insurance covering no less than the 18-month period following the occurrence of a casualty event, together with a 6-month extended period of indemnity (provided that if TRIPRA or a similar statute is not in effect, the Ohio Hotel Portfolio Borrowers will not be obligated to pay terrorism insurance premiums in excess of two times the premium for the casualty and business interruption coverage on a stand-alone basis).
THE INFORMATION IN THIS STRUCTURAL AND COLLATERAL TERM SHEET IS NOT COMPLETE AND MAY BE AMENDED PRIOR TO THE TIME OF SALE. THIS TERM SHEET IS NOT AN OFFER TO SELL THESE SECURITIES AND IT IS NOT A SOLICITATION OF AN OFFER TO BUY THESE SECURITIES IN ANY JURISDICTION WHERE THE OFFER OR SALE IS NOT PERMITTED.
24
| No. 3 – Great Wolf Lodge Southern California | |||||||
| Mortgage Loan Information | Mortgaged Property Information | ||||||
| Mortgage Loan Seller: | Wells Fargo Bank, National Association | Single Asset/Portfolio: | Single Asset | ||||
Credit Assessment (Fitch/KBRA/Moody’s): | NR/NR/NR | Property Type – Subtype: | Hospitality – Full Service | ||||
| Location: | Garden Grove, CA | ||||||
| Original Principal Balance(1): | $35,000,000 | Size: | 603 Rooms | ||||
| Cut-off Date Balance(1): | $35,000,000 | Cut-off Date Balance Per Room(1): | $248,756 | ||||
| % of Initial Pool Balance: | 3.7% | Maturity Date Balance Per Room(1): | $248,756 | ||||
| Loan Purpose: | Refinance | Year Built/Renovated: | 2016/NAP | ||||
| Borrower Sponsor: | McWhinney Real Estate Services, Inc.; | Title Vesting: | Fee | ||||
| Chad McWhinney; Troy McWhinney; | Property Manager: | Self-managed | |||||
| Great Wolf Resorts, Inc. | Current Occupancy (As of): | 80.8% (1/31/2019) | |||||
| Guarantor: | McWhinney Holding Company, LLLP | YE 2018 Occupancy(6): | 80.3% | ||||
| Mortgage Rate(2): | 5.2533% | YE 2017 Occupancy(6): | 69.6% | ||||
| Note Date: | March 11, 2019 | YE 2016 Occupancy(6): | 56.0% | ||||
| Seasoning: | 2 months | YE 2015 Occupancy(6): | NAP | ||||
| Maturity Date: | March 11, 2029 | Appraised Value: | $302,900,000 | ||||
| IO Period: | 120 months | Appraised Value Per Room: | $502,322 | ||||
| Loan Term (Original): | 120 months | Appraisal Valuation Date: | November 28, 2018 | ||||
| Amortization Term (Original): | NAP | ||||||
| Loan Amortization Type: | Interest-only, Balloon | ||||||
| Call Protection(3): | L(26),D(87),O(7) | Underwriting and Financial Information | |||||
| Lockbox Type: | Soft/Springing Cash Management | TTM NOI (1/31/2019)(6): | $22,017,852 | ||||
| Additional Debt(1)(4): | Yes | YE 2018 NOI(6): | $21,673,034 | ||||
| Additional Debt Type (Balance)(1)(4): | Pari Passu/Subordinate | YE 2017 NOI(6): | $16,784,192 | ||||
| $115,000,000/$20,000,000 | YE 2016 NOI(6): | $10,271,409 | |||||
| U/W Revenues: | $84,732,839 | ||||||
| Escrows and Reserves(5) | U/W Expenses: | $62,846,900 | |||||
| Initial | Monthly | Cap | U/W NOI: | $21,885,939 | |||
| Taxes | $0 | $244,016 | NAP | U/W NCF: | $19,245,379 | ||
| Insurance | $0 | Springing | NAP | U/W DSCR based on NOI/NCF(1): | 2.73x / 2.40x | ||
| FF&E Reserve | $0 | Springing | NAP | U/W Debt Yield based on NOI/NCF(1): | 14.6% / 12.8% | ||
| Excess FF&E Reserve | $2,000,000 | NAP | NAP | U/W Debt Yield at Maturity based on NOI/NCF(1): | 14.6% / 12.8% | ||
| Seasonality Reserve | $0 | (5) | NAP | Cut-off Date LTV Ratio(1)(7): | 49.5% | ||
| Amortization Reserve | $0 | Springing | NAP | LTV Ratio at Maturity(1): | 49.5% | ||
| Sources and Uses | ||||||||
| Sources | Uses | |||||||
| Original senior loan amount(1) | $150,000,000 | 81.1% | Loan payoff | $180,192,917 | 97.4% | |||
| Subordinate loan amount(1)(4) | 20,000,000 | 10.8 | Upfront reserves | 2,000,000 | 1.1 | |||
| Cash equity contribution | 15,010,961 | 8.1 | Closing costs | 2,818,045 | 1.5 | |||
| Total Sources | $185,010,961 | 100.0% | Total Uses | $185,010,961 | 100.0% | |||
| (1) | The Cut-off Date Balance Per Room, Maturity Date Balance Per Room, U/W DSCR based on NOI/NCF, U/W Debt Yield based on NOI/NCF, U/W Debt Yield at Maturity based on NOI/NCF, Cut-off Date LTV Ratio and LTV Ratio at Maturity numbers presented above are based on the Great Wolf Lodge Southern California Senior Loan (as defined below). The Cut-off Date Balance Per Room, Maturity Date Balance Per Room, U/W DSCR based on NOI/NCF, U/W Debt Yield based on NOI/NCF, U/W Debt Yield at Maturity based on NOI/NCF, Cut-off Date LTV Ratio and LTV Ratio at Maturity numbers based on the Great Wolf Lodge Southern California Whole Loan (as defined below) are $281,924, $281,924, 2.15x, 1.89x, 12.9%, 11.3%, 12.9%, 11.3%, 56.1% and 56.1%, respectively. |
| (2) | The Great Wolf Lodge Southern California Mortgage Loan (as defined below) has an interest rate of 5.2533% and the Great Wolf Lodge Southern California Subordinate Companion Loan (as defined below) has an interest rate of 10.7500%. |
| (3) | Defeasance of the Great Wolf Lodge Southern California Whole Loan is permitted at any time after the earlier to occur of (a) the end of the two-year period commencing on the closing date of the securitization of the last Great Wolf Lodge Southern California Whole Loan to be securitized and (b) April 11, 2022. The assumed defeasance lockout period of 26 payments is based on the closing date of this transaction in May 2019. |
| (4) | See “Subordinate and Mezzanine Indebtedness” section below. |
| (5) | See “Escrows and Reserves” section below. |
| (6) | The increase in NOI and Occupancy from 2017 to 2018 was partly due to the fact that the Great Wolf Lodge Southern California Property opened in 2016 and was ramping up in performance over such time period. |
| (7) | The appraised value shown assumes that the Great Wolf Lodge Southern California Property is encumbered by the Disposition and Development Agreement and that Transient Occupancy Tax rebates are due (See “Disposition and Development Agreement and Transient Occupancy Tax” below). The appraiser also concluded to a value of $293,300,000, which assumes that the Great Wolf Lodge Southern California Property is not encumbered by the Disposition and Development Agreement and that no Transient Occupancy Tax rebates are due, which would equate to (i) a Cut-off Date LTV Ratio based on the Great Wolf Lodge Southern California Senior Loan of 51.1% and (ii) a Cut-off Date LTV Ratio based on the Great Wolf Lodge Southern California Whole Loan of 58.0%. |
THE INFORMATION IN THIS STRUCTURAL AND COLLATERAL TERM SHEET IS NOT COMPLETE AND MAY BE AMENDED PRIOR TO THE TIME OF SALE. THIS TERM SHEET IS NOT AN OFFER TO SELL THESE SECURITIES AND IT IS NOT A SOLICITATION OF AN OFFER TO BUY THESE SECURITIES IN ANY JURISDICTION WHERE THE OFFER OR SALE IS NOT PERMITTED.
25
Hospitality – Full Service 12681 Harbor Boulevard Garden Grove, CA 92840 | Loan # 3
Great Wolf Lodge Southern California | Cut-off Date Balance: Cut-off Date LTV: U/W NCF DSCR: U/W NOI Debt Yield: | $35,000,000 49.5% 2.40x 14.6% | |
The Mortgage Loan. The mortgage loan (the “Great Wolf Lodge Southern California Mortgage Loan”) is part of a whole loan (the “Great Wolf Lodge Southern California Whole Loan”) in the original principal balance of $170,000,000. The Great Wolf Lodge Southern California Whole Loan is secured by a first priority fee mortgage encumbering a full service hospitality property located in Garden Grove, California (the “Great Wolf Lodge Southern California Property”). The Great Wolf Lodge Southern California Whole Loan consists of (i) five senior notes totaling $150,000,000, which arepari passu with each other (collectively, the “Great Wolf Lodge Southern California Senior Loan”), and (ii) a subordinate promissory note with an original principal balance of $20,000,000 (the “Great Wolf Lodge Southern California Subordinate Companion Loan”), which is held by KSL Capital Partners Co Trust II and is subordinate to the Great Wolf Lodge Southern California Senior Loan.
The Great Wolf Lodge Southern California Mortgage Loan represents the controlling Note A-1, which has an original principal balance of $35,000,000. The remaining Great Wolf Lodge Southern California Senior Loanpari passu notes are referred to herein as the “Great Wolf Lodge Southern CaliforniaPari Passu Companion Loans”. See “Description of the Mortgage Pool—The Whole Loans—The AB Whole Loans—The Great Wolf Lodge Southern California Whole Loan” and “Pooling and Servicing Agreement—Servicing of the Non-Serviced Mortgage Loans” in the Preliminary Prospectus.
Great Wolf Lodge Southern California Whole Loan Summary
| Notes(1) | Original Balance | Cut-off Date Balance | Note Holder | Controlling Piece |
| Great Wolf Lodge Southern California Mortgage Loan | ||||
| A-1 | $35,000,000 | $35,000,000 | WFCM 2019-C50 | (2) |
| Great Wolf Lodge Southern California ServicedPari passu Companion Loans | ||||
| A-2 | $25,000,000 | $25,000,000 | BANK 2019-BNK17 | No |
| A-3 | $25,000,000 | $25,000,000 | Wells Fargo Bank, National Association | No |
| A-4(3) | $50,000,000 | $50,000,000 | Column Financial, Inc. | No |
| A-5 | $15,000,000 | $15,000,000 | Wells Fargo Bank, National Association | No |
| Great Wolf Lodge Southern California Subordinate Companion Loan | ||||
| B-1 | $20,000,000 | $20,000,000 | KSL Capital Partners Co Trust II | (2) |
| Total Great Wolf Lodge Southern California Whole Loan | $170,000,000 | $170,000,000 | ||
| (1) | The Great Wolf Lodge Southern California Subordinate Companion Loan is subordinate to the A-Notes. |
| (2) | The holder of the Great Wolf Lodge Southern California Subordinate Companion Loan will have the right to appoint the special servicer of the Great Wolf Lodge Southern California Whole Loan and to direct certain decisions with respect to the Great Wolf Lodge Southern California Whole Loan, unless a control appraisal event exists under the related co-lender agreement; provided that after the occurrence of a control appraisal event with respect to the Great Wolf Lodge Southern California Subordinate Companion Loan, the holder of the Great Wolf Lodge Southern California Note A-1 (or the directing certificate holder for the WFCM 2019-C50 securitization trust ) will have such rights. |
| (3) | The A-4 Note was sold to Column Financial, Inc. |
The Borrower and Borrower Sponsors.The borrower is GWGG, LLC (the “Great Wolf Lodge Southern California Borrower”), a single-purpose Delaware limited liability company with two independent directors. The borrower sponsors are McWhinney Real Estate Services, Inc. (“McWhinney”), Chad McWhinney, Troy McWhinney, and Great Wolf Resorts, Inc. (“Great Wolf”); and the non-recourse carve-out guarantor is McWhinney Holding Company, LLLP. The Great Wolf Lodge Southern California Borrower is owned by GWGG JV, LLC, a joint venture between MGWGG Investments, LLC (84.7% ownership interest), an entity managed by McWhinney and in which affiliates of McWhinney hold an ownership interest of at least 70.3%; and GWR Garden Grove, LLC (15.3% ownership interest), an affiliate of Great Wolf.
Founded in 1991 by Chad McWhinney, McWhinney’s holdings include approximately 1.2 million square feet of commercial space (office, industrial, retail and mixed use), 2,293 hotel keys, 708 multifamily units and more than 2,700 acres of land. McWhinney holds ownership interest in three other hotels in the Anaheim area including the Hilton Garden Inn – Anaheim, Homewood Suites – Anaheim, and Hampton Inn – Anaheim.
Founded in 1997, Great Wolf is the largest indoor water park family resort company in North America and currently operates 15 properties across the United States and Canada, as well as two additional properties under construction and land owned for potential future developments. Great Wolf caters to family travelers, particularly those seeking a resort atmosphere that caters to both children and adults.
The Property.The Great Wolf Lodge Southern California Property is a nine-story, 603-room, full service water park resort hotel located in Garden Grove, California, approximately 2.2 miles south of Disneyland. Built in 2016, the Great Wolf Lodge Southern California Property is situated on an 11.7-acre site and amenities include a 105,000-square-foot indoor waterpark, fitness center, outdoor pool area, miniature golf course, bowling alley, movie theater, arcade, kid-friendly spa, 21,226 square feet of meeting space, and multiple restaurants and retail outlets. The indoor waterpark includes a four-story treehouse water fort, 14 water slides, four splash pads and play pools, a surf simulator and large wave pool. In addition, the Great Wolf Lodge Southern California Property offers planned family activities and live performances.
The Great Wolf Lodge Southern California Property guestroom configuration includes 452 standard suites which sleep up to six people; 133 themed suites, including six-person Wolf Den suites with bunk beds and seven-person Kid Cabin suites with bunk beds and a day
THE INFORMATION IN THIS STRUCTURAL AND COLLATERAL TERM SHEET IS NOT COMPLETE AND MAY BE AMENDED PRIOR TO THE TIME OF SALE. THIS TERM SHEET IS NOT AN OFFER TO SELL THESE SECURITIES AND IT IS NOT A SOLICITATION OF AN OFFER TO BUY THESE SECURITIES IN ANY JURISDICTION WHERE THE OFFER OR SALE IS NOT PERMITTED.
26
Hospitality – Full Service 12681 Harbor Boulevard Garden Grove, CA 92840 | Loan # 3
Great Wolf Lodge Southern California | Cut-off Date Balance: Cut-off Date LTV: U/W NCF DSCR: U/W NOI Debt Yield: | $35,000,000 49.5% 2.40x 14.6% | |
bed; and 18 premium suites which sleep six to eight people. The Great Wolf Lodge Southern California Property also contains a five-story parking garage with 1,048 parking spaces, equating to a parking ratio of 1.7 spaces per room. According to the appraisal, the demand segmentation at the Great Wolf Lodge Southern California Property is 91% leisure and 9% meeting & group.
The Great Wolf Lodge Southern California Property is not subject to a franchise agreement; however, a management and license agreement is in-place with GWR Manager LLC (an affiliate of Great Wolf) through February 2041. The loan documents require that the Great Wolf Lodge Southern California Property is managed by a “Qualified Manager”, which means one of the following entities: an affiliate of the current manager, Walt Disney Parks and Resorts, Kalahari, Wilderness, Marriott International, Hyatt Hotels Corporation, MGM Resorts International, Hilton Worldwide, IHG, Cedar Fair, Six Flags Great Adventure, SeaWorld Parks and Entertainment, Merlin Entertainment, Wyndham, or an affiliate controlled by one of the foregoing operating any full service flag or brand with a STR Chainscale rating “Upscale” or higher, if such Qualified Manager has experience operating a substantial water amenity, or “Upper Upscale”, if such Qualified Manager does not have experience operating a substantial water amenity (or, in the case of IHG, “Upper Upscale” or higher), or a reputable and experienced organization possessing experience in managing or franchising full-service hotels (with waterpark) similar to the Great Wolf Lodge Southern California Property. Any replacement management agreement with a Qualified Manager is subject to written approval by the lender in the lender’s reasonable discretion, and such approval may be conditioned upon the lender’s receipt of rating agency confirmation.
Operating History and Underwritten Net Cash Flow. The following table presents certain information relating to the historical operating performance and the underwritten net cash flow at the Great Wolf Lodge Southern California Property:
Cash Flow Analysis
| 2016(1) | 2017(1) | 2018(1) | TTM 1/31/2019 | U/W | % of U/W Total Revenue(2) | U/W $ per Room | |
| Occupancy | 56.0% | 69.6% | 80.3% | 80.8% | 80.8% | ||
| ADR | $302.82 | $293.48 | $280.43 | $280.55 | $280.55 | ||
| RevPAR | $174.35 | $204.29 | $225.14 | $226.80 | $226.80 | ||
| Room Revenue | $37,321,683 | $44,962,428 | $49,532,819 | $49,916,915 | $49,916,915 | 58.9% | $82,781 |
| Food & Beverage Revenue | 12,651,097 | 15,786,521 | 18,549,243 | 18,659,206 | 18,659,206 | 22.0 | 30,944 |
| Other Income(3) | 9,801,978 | 12,432,751 | 15,836,332 | 16,156,718 | 16,156,718 | 19.1 | 26,794 |
| Total Revenue | $59,774,758 | $73,181,700 | $83,918,394 | $84,732,839 | $84,732,839 | 100.0% | $140,519 |
| Room Expense | 8,229,012 | 9,459,551 | 11,101,315 | 11,308,530 | 11,308,530 | 22.7 | 18,754 |
| Food & Beverage Expense | 10,057,613 | 11,069,358 | 11,906,573 | 12,095,948 | 12,095,948 | 64.8 | 20,060 |
| Other Departmental Expenses | 9,251,797 | 9,750,793 | 11,103,942 | 11,333,895 | 11,333,895 | 70.1 | 18,796 |
| Total Departmental Expenses | 27,538,422 | 30,279,702 | 34,111,830 | 34,738,373 | 34,738,373 | 41.0 | 57,609 |
| Gross Operating Income | $32,236,336 | $42,901,998 | $49,806,564 | $49,994,466 | $49,994,466 | 59.0% | $82,910 |
| Total Undistributed Expenses | 17,738,878 | 22,740,580 | 24,239,081 | 24,085,395 | 24,085,395 | 28.4 | 39,943 |
| Gross Operating Profit | $14,497,458 | $20,161,418 | $25,567,483 | $25,909,071 | $25,909,071 | 30.6% | $42,967 |
| Total Fixed Charges | 4,226,049 | 3,377,226 | 3,894,449 | 3,891,219 | 4,023,132 | 4.7 | 6,672 |
| Total Operating Expenses | $49,503,349 | $56,397,508 | $62,245,360 | $62,714,987 | $62,846,900 | 74.2% | $104,224 |
| Net Operating Income | $10,271,409 | $16,784,192 | $21,673,034 | $22,017,852 | $21,885,939 | 25.8% | $36,295 |
| FF&E | 0 | 0 | 0 | 0 | (3,389,314) | (4.0) | (5,621) |
| TOT Reimbursement(4) | 560,083 | 667,889 | 743,272 | 749,023 | 748,754 | 0.9 | 1,242 |
| Net Cash Flow | $10,831,492 | $17,452,081 | $22,416,306 | $22,766,875 | $19,245,379 | 22.7% | $31,916 |
| NOI DSCR(5) | 1.28x | 2.10x | 2.71x | 2.75x | 2.73x | ||
| NCF DSCR(5) | 1.35x | 2.18x | 2.80x | 2.84x | 2.40x | ||
| NOI Debt Yield(5) | 6.8% | 11.2% | 14.4% | 14.7% | 14.6% | ||
| NCF Debt Yield(5) | 7.2% | 11.6% | 14.9% | 15.2% | 12.8% |
| (1) | The increases in Net Operating Income from 2016 to 2018 were driven primarily by increases in Occupancy, Food & Beverage Revenue, and Other Income. The Great Wolf Lodge Southern California Property opened for business in 2016 and was ramping up performance over such time period. |
| (2) | % of U/W Total Revenue for Room Expense, Food & Beverage Expense, and Other Department Expenses are based on their corresponding revenue line items. All other line items represent the percent of Total Revenue. |
| (3) | Other Income consists of revenue from the waterpark, miniature golf, arcade games and other attractions, gift shop revenue, parking revenue, spa revenue, and other miscellaneous income. |
| (4) | Underwritten TOT Reimbursement is based on underwritten Room Revenue of $49,916,915 multiplied by the 2018 TOT Differential (as defined below) of 1.5% See “Disposition and Development Agreement and Transient Occupancy Tax” section below for further details on TOT reimbursement. |
| (5) | The debt service coverage ratios and debt yields shown are based on the Great Wolf Lodge Southern California Senior Loan, and excludes the Great Wolf Lodge Southern California Subordinate Companion Loan. |
THE INFORMATION IN THIS STRUCTURAL AND COLLATERAL TERM SHEET IS NOT COMPLETE AND MAY BE AMENDED PRIOR TO THE TIME OF SALE. THIS TERM SHEET IS NOT AN OFFER TO SELL THESE SECURITIES AND IT IS NOT A SOLICITATION OF AN OFFER TO BUY THESE SECURITIES IN ANY JURISDICTION WHERE THE OFFER OR SALE IS NOT PERMITTED.
27
Hospitality – Full Service 12681 Harbor Boulevard Garden Grove, CA 92840 | Loan # 3
Great Wolf Lodge Southern California | Cut-off Date Balance: Cut-off Date LTV: U/W NCF DSCR: U/W NOI Debt Yield: | $35,000,000 49.5% 2.40x 14.6% | |
Appraisal.The appraiser concluded to an “as-is” appraised value of $302,900,000 with an appraisal valuation date of November 28, 2018. The appraised value assumes that the Great Wolf Lodge Southern California Property is encumbered by the Disposition and Development Agreement and that Transient Occupancy Tax rebates are due (see “Disposition and Development Agreement and Transient Occupancy Tax” below). The appraiser also concluded to a value of $293,300,000, which assumes that the Great Wolf Lodge Southern California Property is not encumbered by the Disposition and Development Agreement and that no Transient Occupancy Tax rebates are due, which would equate to (i) a Cut-off Date LTV Ratio based on the Great Wolf Lodge Southern California Senior Loan of 51.1% and (ii) a Cut-off Date LTV Ratio based on the Great Wolf Lodge Southern California Whole Loan of 58.0%.
Environmental Matters. According to the Phase I environmental assessments dated December 6, 2018, there was no evidence of any recognized environmental conditions at the Great Wolf Lodge Southern California Property.
Market Overview and Competition.The Great Wolf Lodge Southern California Property is located in Garden Grove, California, Orange County, approximately 4.3 miles south of downtown Anaheim, 2.2 miles south of Disneyland, 11.1 miles north of John Wayne Airport, 30.3 miles southeast of downtown Los Angeles, and 35.0 miles southeast of the Los Angeles International Airport. The Great Wolf Lodge Southern California Property is situated on Harbor Boulevard, which is a main north/south thoroughfare that connects the Great Wolf Lodge Southern California Property to the Anaheim Resort Area, Disneyland and the Interstate 5 on-ramp to the north. Additional attractions in the area include Knott’s Berry Farm (8.8 miles northwest), Angel Stadium (home to Major League Baseball’s Los Angeles Angels; 2.9 miles northeast) and the Anaheim Convention Center (1.7 miles north). The Anaheim Convention Center is the largest convention center on the West Coast and recently completed a $190.0 million expansion.
According to the appraisal, the Anaheim/Garden Grove market is experiencing a period of expansion, primarily led by the tourism and leisure industry. According to the appraisal, the Orange County economy is primarily driven by the tourism industry, which employs more than 140,000 people in the area. Orange County hosted approximately 49.5 million visitors in 2017, a 2.7% increase from 2016, which led to an economic impact of more than $12.5 billion, marking a 3.1% increase in visitor spending from 2016. The Walt Disney Corporation is the largest private-sector employer in Orange County, with approximately 31,000 employees, and Disneyland is one of the largest demand generators in the area. While Disney does not publish attendance data, a 2018 third party research report estimated that Disneyland hosted approximately 18.3 million visitors in 2017, which surpassed the previous peak in 2015 when the park celebrated its 60th anniversary.
According to the appraisal, the 2018 population within a three- and five-mile radius of the Great Wolf Lodge Southern California Property was 305,784 and 856,177, respectively. The 2018 average household income within the same radii was $76,916 and $76,996, respectively.
The appraisal identified six new hotels totaling approximately 2,000 rooms that are expected to have some degree of competitive interaction with the Great Wolf Lodge Southern California Property and are expected to be constructed in 2019 and 2020; however, none of these hotels are anticipated to compete directly with the Great Wolf Lodge Southern California Property.
The following table presents historical occupancy, ADR, RevPAR and penetration rates relating to the Great Wolf Lodge Southern California Property’s competitive set:
Subject and Market Historical Occupancy, ADR and RevPAR(1)(2)
Competitive Set | Great Wolf Lodge Southern California Property | Penetration Factor | |||||||
Year | Occupancy | ADR | RevPAR | Occupancy | ADR | RevPAR | Occupancy | ADR(3) | RevPAR |
| TTM 1/31/2019 | 84.3% | $249.47 | $210.31 | 82.1% | $251.45 | $206.42 | 97.4% | 100.8% | 98.2% |
| TTM 1/31/2018(4) | 84.8% | $238.85 | $202.59 | 71.2% | $264.26 | $188.19 | 84.0% | 110.6% | 92.9% |
| TTM 1/31/2017(4) | 84.7% | $232.72 | $197.16 | 55.8% | $281.50 | $157.01 | 65.9% | 121.0% | 79.6% |
| (1) | Information obtained from third party hospitality research report dated February 19, 2019. The competitive set includes the following hotels: Anaheim Majestic Garden Hotel, Hilton Anaheim, Disney’s Disneyland Hotel, Sheraton Park Hotel @ The Anaheim Resort, Disney’s Paradise Pier Hotel, Hyatt Regency Orange County, Delta Hotel Anaheim Garden Grove, Hyatt Regency Huntington Beach & Spa, Disney’s Grand Californian Hotel & Spa, DoubleTree by Hilton Suites Anaheim Resort Convention Center, Legoland California Resort Hotel, and Courtyard Anaheim Theme Park Entrance. |
| (2) | Variances between the underwriting, the appraisal, and third party research report with respect to Occupancy, ADR and RevPAR at the Great Wolf Lodge Southern California Property are attributable to variances in reporting methodologies and/or timing differences. |
| (3) | The ADRs shown above for the Great Wolf Lodge Southern California Property exclude the daily resort fee. The historical and underwritten ADRs represented in the “Operating History and Underwritten Net Cash Flow” section below are inclusive of the daily resort fee. |
| (4) | The increase in performance from 1/31/2017 TTM to 1/31/2018 TTM is partly due to the fact that the Great Wolf Lodge Southern California Property opened in 2016 and was ramping up in performance over such time period. |
Escrows.
Real Estate Taxes – The Great Wolf Lodge Southern California Borrower is required to deposit ongoing monthly escrows for real estate taxes in an amount equal to one-twelfth of the real estate taxes that the lender estimates will be payable during the next twelve months (initially $244,016).
Insurance – The Great Wolf Lodge Southern California Borrower is not required to deposit ongoing monthly escrows for insurance as long as (i) no event of default has occurred and is continuing, (ii) the Great Wolf Lodge Southern California Borrower provides the lender with evidence that the insurance coverage for the Great Wolf Lodge Southern California Property is included in a blanket policy
THE INFORMATION IN THIS STRUCTURAL AND COLLATERAL TERM SHEET IS NOT COMPLETE AND MAY BE AMENDED PRIOR TO THE TIME OF SALE. THIS TERM SHEET IS NOT AN OFFER TO SELL THESE SECURITIES AND IT IS NOT A SOLICITATION OF AN OFFER TO BUY THESE SECURITIES IN ANY JURISDICTION WHERE THE OFFER OR SALE IS NOT PERMITTED.
28
Hospitality – Full Service 12681 Harbor Boulevard Garden Grove, CA 92840 | Loan # 3
Great Wolf Lodge Southern California | Cut-off Date Balance: Cut-off Date LTV: U/W NCF DSCR: U/W NOI Debt Yield: | $35,000,000 49.5% 2.40x 14.6% | |
and such policy is in full force and effect, and (iii) the Great Wolf Lodge Southern California Borrower provides the lender with evidence of timely payment of the insurance premiums and renewals.
FF&E Reserve – The Great Wolf Lodge Southern California Borrower is not required to deposit ongoing monthly escrows for capital expenditures as long as (i) the current manager (or any affiliates) is the manager and the management agreement is in full force and effect, (ii) the manager reserves funds for capital expenditures which will be disbursed pursuant to the terms of the management agreement, and (iii) there is no default beyond any applicable notice and cure period under the management agreement.
Excess FF&E Reserve – The Great Wolf Lodge Southern California Borrower was required to deposit an upfront capital expenditure reserve of $2,000,000.
Seasonality Reserve – Upon the request of the lender, the Great Wolf Lodge Southern California Borrower is required to deposit monthly deposits from June 2019 through August 2019 and commencing in 2020 and each year thereafter, from March through August during the term of the Great Wolf Lodge Southern California Whole Loan, into the seasonality reserve in an amount equal to the lesser of (a) $280,000 and (b) available net cash flow after all expenses and payments required under the loan documents. The Seasonality Reserve will be capped at an amount equal to two months of debt service (exclusive of any amortization payments).
Amortization Reserve –Based on the conditions outlined below, the Great Wolf Lodge Southern California Borrower will be required to commence depositing monthly payments into a reserve account consistent with the applicable hypothetical amortization schedules:
| (i) | As of April 1, 2022, if the net cash flow debt yield of the Great Wolf Lodge Southern California Whole Loan (inclusive of the Great Wolf Lodge Southern California Subordinate Companion Loan) is less than 12.0%, the Great Wolf Lodge Southern California Borrower will be required to deposit monthly payments consistent with a 30-year amortization schedule; |
| (ii) | As of April 1, 2024, if the net cash flow debt yield of the Great Wolf Lodge Southern California Whole Loan (inclusive of the Great Wolf Lodge Southern California Subordinate Companion Loan) is less than 13.0%, the Great Wolf Lodge Southern California Borrower will be required to deposit monthly payments consistent with a 27-year amortization schedule; and |
| (iii) | As of April 1, 2026, if the net cash flow debt yield of the Great Wolf Lodge Southern California Whole Loan (inclusive of the Great Wolf Lodge Southern California Subordinate Companion Loan) is less than 14.0%, the Great Wolf Lodge Southern California Borrower will be required to deposit monthly payments consistent with a 25-year amortization schedule. |
Lockbox and Cash Management.A soft lockbox with springing cash management is in-place with respect to the Great Wolf Lodge Southern California Whole Loan. The borrower and manager are required to deposit into the lockbox account (i) prior to a Great Wolf Cash Management Trigger Event (as defined below), only amounts payable (after operating expenses, management fees and transfers to the reserves) by the manager to the Great Wolf Lodge Southern California Borrower pursuant to the hotel management agreement on a weekly basis; and (ii) from and after a Great Wolf Cash Management Trigger Event, all income within three business days after receipt. Following a Great Wolf Cash Management Trigger Event, credit card providers are required to deposit rents and income directly into the lockbox account. Upon the occurrence and during the continuance of a Great Wolf Cash Management Trigger Event, all funds on deposit in the lockbox account are required to be transferred to the cash management account on a daily basis. Prior to a Cash Trap Event Period (as defined below), all funds on deposit in the cash management account will be disbursed (a) prior to a Great Wolf Cash Management Trigger Event, to the borrower’s operating account, and (b) after the date of a Great Wolf Cash Management Trigger Event, to the manager’s operating account. During a Cash Trap Event Period, all funds on deposit in the cash management account are required to be applied to the payment of, among other things, monthly escrows, debt service, operating expenses set forth in the lender-approved annual budget and extraordinary expenses approved by the lender; and all excess cash flow is required to be held in the excess cash flow subaccount as additional security for the Great Wolf Lodge Southern California Whole Loan.
A “Great Wolf Cash Management Trigger Event” will commence upon the earlier of the following:
| (i) | any Great Wolf Entity (as defined below) owning more than 25% of the direct or indirect interest in the Great Wolf Lodge Southern California Borrower; or |
| (ii) | any Great Wolf Entity controlling the Great Wolf Lodge Southern California Borrower. |
A “Great Wolf Entity” means (a) an entity that is controlled (directly or indirectly) by Great Wolf or any entity that controls Great Wolf; or (b) any entity that is under common control with Great Wolf.
A “Cash Trap Event Period” will commence upon the earlier of the following:
| (i) | the occurrence and continuance of an event of default; or |
| (ii) | the net cash flow debt yield of the Great Wolf Lodge Southern California Whole Loan (inclusive of the Great Wolf Lodge Southern California Subordinate Companion Loan) falling below 9.0% at the end of any calendar quarter. |
A Cash Trap Event Period will end upon the occurrence of the following:
| ● | with regard to clause (i), the cure of such event of default; or |
| ● | with regard to clause (ii), upon the net cash flow debt yield of the Great Wolf Lodge Southern California Whole Loan (inclusive of the Great Wolf Lodge Southern California Subordinate Companion Loan) being equal to or greater than 9.5% for two consecutive calendar quarters. |
Property Management.The Great Wolf Lodge Southern California Property is managed by an affiliate of the borrower.
Partial Release.Not permitted.
Real Estate Substitution.Not permitted.
THE INFORMATION IN THIS STRUCTURAL AND COLLATERAL TERM SHEET IS NOT COMPLETE AND MAY BE AMENDED PRIOR TO THE TIME OF SALE. THIS TERM SHEET IS NOT AN OFFER TO SELL THESE SECURITIES AND IT IS NOT A SOLICITATION OF AN OFFER TO BUY THESE SECURITIES IN ANY JURISDICTION WHERE THE OFFER OR SALE IS NOT PERMITTED.
29
Hospitality – Full Service 12681 Harbor Boulevard Garden Grove, CA 92840 | Loan # 3
Great Wolf Lodge Southern California | Cut-off Date Balance: Cut-off Date LTV: U/W NCF DSCR: U/W NOI Debt Yield: | $35,000,000 49.5% 2.40x 14.6% | |
Ground Lease.None.
Disposition and Development Agreement and Transient Occupancy Tax. McWhinney obtained the site to construct the Great Wolf Lodge Southern California Property through a disposition and development agreement (“DDA”) with the Garden Grove Agency of Community Development (“Agency”), which was signed in May 2009 and amended in April 2010. As part of the DDA, the Agency has the right to approve any transfer of the Great Wolf Lodge Southern California Property to a non-related entity, but such approval right does not apply to a foreclosure or deed in lieu of foreclosure or to a transfer by lender to a third party purchaser after foreclosure. In exchange for these protective covenants, the Agency provided approximately $47.0 million to McWhinney, with $5.0 million paid at the commencement of construction of the parking garage and $42.0 million at the opening of the Great Wolf Lodge Southern California Property. In addition, the Agency agreed to pay McWhinney, on an ongoing basis, an annual transient occupancy tax (“TOT”) reimbursement, which is based on the TOT Differential (as defined below) between the City of Anaheim and the City of Garden Grove and applied to total annual room revenue. See “Description of the Mortgage Pool—Mortgage Pool Characteristics—Property Types—Hospitality Properties” in the Preliminary Prospectus.
The “TOT Differential” is equal to (i) 2.0% (the “Benchmark TOT Variance”), minus (ii) the current TOT of the City of Anaheim minus the current TOT of the City of Garden Grove (the “Current TOT Variance”). In 2018, the TOTs of the City of Anaheim and the City of Garden Grove were 15.0% and 14.5%, respectively, resulting in a Current TOT Variance of 0.5% and a TOT Differential of 1.5% (TOT Differential calculated by subtracting the TOT Variance of 0.5% from the Benchmark TOT Variance of 2.0%). In 2018, based on room revenue of $49,532,819 and the TOT Differential of 1.5%, the TOT reimbursement was $743,272.
Subordinate and Mezzanine Indebtedness.The Great Wolf Lodge Southern California Property also secures the Great Wolf Lodge Southern CaliforniaPari PassuCompanion Loans, which have an aggregate Cut-off Date principal balance of $115,000,000 and the Great Wolf Lodge Southern California Subordinate Companion Loan, which has a Cut-off Date principal balance of $20,000,000. The Great Wolf Lodge Southern CaliforniaPari PassuCompanion Loans and the Great Wolf Lodge Southern California Subordinate Companion Loan are coterminous with the Great Wolf Lodge Southern California Mortgage Loan. The Great Wolf Lodge Southern CaliforniaPari PassuCompanion Loans accrue interest at the same rate as the Great Wolf Lodge Southern California Mortgage Loan, and the Great Wolf Lodge Southern California Subordinate Companion Loan accrues interest at an interest rate of 10.7500%. The Great Wolf Lodge Southern California Mortgage Loan and the Great Wolf Lodge Southern CaliforniaPari PassuCompanion Loans are eachpari passuin right of payment and together are senior in right of payment to the Great Wolf Lodge Southern California Subordinate Companion Loan. The holders of the Great Wolf Lodge Southern California Mortgage Loan, the Great Wolf Lodge Southern CaliforniaPari PassuCompanion Loans and the Great Wolf Lodge Southern California Subordinate Companion Loan have entered into a co-lender agreement which sets forth the allocation of collections on the Great Wolf Lodge Southern California Whole Loan. See “Description of the Mortgage Pool—The Whole Loans—The AB Whole Loans—The Great Wolf Lodge Southern California Whole Loan ” in the Preliminary Prospectus. The Great Wolf Lodge Southern California Subordinate Companion Loan is held by KSL Capital Partners Co Trust II.
The following table presents certain information relating to the Great Wolf Lodge Southern California Subordinate Companion Loan:
| B-Note Summary | |||||||||
B-Note Original Balance | B-Note Interest | Original Term (mos.) | Original Amort. Term (mos.) | Original IO Term | Total Debt NCF DSCR | Total Debt NOI Debt | Total Debt Date LTV | ||
| Great Wolf Lodge Southern California Subordinate Companion Loan | $20,000,000 | 10.7500% | 120 | 0 | 120 | 1.89x | 12.9% | 56.1% | |
Terrorism Insurance.The Great Wolf Lodge Southern California Whole Loan documents require that the “all risk” insurance policy required to be maintained by the borrower provide coverage for terrorism in an amount equal to the full replacement cost of the Great Wolf Lodge Southern California Property, as well as business interruption insurance covering no less than the 18-month period following the occurrence of a casualty event, together with a six-month extended period of indemnity. See “Risk Factors—Risks Relating to the Mortgage Loans—Terrorism Insurance May Not Be Available for All Mortgaged Properties” in the Preliminary Prospectus.
Earthquake Insurance.The Great Wolf Lodge Southern California Whole Loan documents do not require earthquake insurance; however, at the time of closing, earthquake insurance coverage is in-place for the Great Wolf Lodge Southern California Property through a blanket policy. The seismic report indicated a probable maximum loss of 4% for the Great Wolf Lodge Southern California Property
THE INFORMATION IN THIS STRUCTURAL AND COLLATERAL TERM SHEET IS NOT COMPLETE AND MAY BE AMENDED PRIOR TO THE TIME OF SALE. THIS TERM SHEET IS NOT AN OFFER TO SELL THESE SECURITIES AND IT IS NOT A SOLICITATION OF AN OFFER TO BUY THESE SECURITIES IN ANY JURISDICTION WHERE THE OFFER OR SALE IS NOT PERMITTED.
30
| No. 4 – Hilton at University Place | |||||||
| Mortgage Loan Information | Mortgaged Property Information | ||||||
| Mortgage Loan Seller: | Barclays Capital Real Estate Inc. | Single Asset/Portfolio: | Single Asset | ||||
Credit Assessment (Fitch/KBRA/Moody’s): | NR/NR/NR | Property Type – Subtype: | Hospitality – Full Service | ||||
| Original Principal Balance(1): | $35,000,000 | Location: | Charlotte, NC | ||||
| Cut-off Date Balance(1): | $34,958,718 | Size: | 393 Rooms | ||||
| % of Initial Pool Balance: | 3.7% | Cut-off Date Balance Per Room(1): | $116,910 | ||||
| Loan Purpose: | Refinance | Maturity Date Balance Per Room(1): | $96,563 | ||||
| Borrower Sponsor: | Kenneth K. Kochenour | Year Built/Renovated: | 1988/2016 | ||||
| Guarantor: | Kenneth K. Kochenour | Title Vesting: | Fee | ||||
| Mortgage Rate: | 5.1000% | Property Manager: | Self-managed | ||||
| Note Date: | April 4, 2019 | Current Occupancy (As of): | 73.7% (2/28/2019) | ||||
| Seasoning: | 1 month | YE 2018 Occupancy(3): | 73.4% | ||||
| Maturity Date: | April 6, 2029 | YE 2017 Occupancy(3): | 73.5% | ||||
| IO Period: | 0 months | YE 2016 Occupancy(3): | 75.0% | ||||
| Loan Term (Original): | 120 months | YE 2015 Occupancy(3): | 72.4% | ||||
| Amortization Term (Original): | 360 months | Appraised Value: | $69,500,000 | ||||
| Loan Amortization Type: | Amortizing Balloon | Appraised Value Per Room(1): | $176,845 | ||||
| Call Protection: | L(25),D(91),O(4) | Appraisal Valuation Date: | February 25, 2019 | ||||
| Lockbox Type: | Hard/Springing Cash Management | ||||||
| Additional Debt(1): | Pari Passu | Underwriting and Financial Information | |||||
| Additional Debt Type (Balance)(1): | $10,987,026 | TTM NOI (2/28/2019): | $6,194,602 | ||||
| YE 2018 NOI: | $5,847,613 | ||||||
| YE 2017 NOI: | $5,690,278 | ||||||
| YE 2016 NOI: | $5,915,341 | ||||||
| U/W Revenues: | $20,668,804 | ||||||
| U/W Expenses: | $14,586,891 | ||||||
| U/W NOI: | $6,081,913 | ||||||
| Escrows and Reserves(2) | U/W NCF: | $5,255,161 | |||||
| Initial | Monthly | Cap | U/W DSCR based on NOI/NCF(1): | 2.03x / 1.75x | |||
| Taxes | $204,583 | $40,917 | NAP | U/W Debt Yield based on NOI/NCF(1): | 13.2% / 11.4% | ||
| Insurance | $0 | Springing | NAP | U/W Debt Yield at Maturity based on NOI/NCF(1): | 16.0% / 13.8% | ||
| FF&E Reserve | $0 | $61,624 | NAP | Cut-off Date LTV Ratio(1): | 66.1% | ||
| LTV Ratio at Maturity(1): | 54.6% | ||||||
| Sources and Uses | ||||||||
| Sources | Uses | |||||||
| Original whole loan amount | $46,000,000 | 100.0% | Loan payoff(4) | $41,562,648 | 90.4% | |||
| Upfront reserves | 204,583 | 0.4 | ||||||
| Closing costs | 314,060 | 0.7 | ||||||
| Return of equity | 3,918,709 | 8.5 | ||||||
| Total Sources | $46,000,000 | 100.0% | Total Uses | $46,000,000 | 100.0% | |||
| (1) | The Hilton at University Place Mortgage Loan (as defined below) is part of the Hilton at University Place Whole Loan (as defined below), which comprises twopari passunotes with an aggregate original balance of $46,000,000. All statistical information related to the Cut-off Date Balance per Room, Maturity Date Balance per Room, U/W Debt Yield based on NOI/NCF, U/W Debt Yield at Maturity based on NOI/NCF, U/W DSCR based on NOI/NCF, Cut-off Date LTV Ratio and LTV Ratio at Maturity are based on the Hilton at University Place Whole Loan. |
| (2) | See “Escrows” section. |
| (3) | The YE 2018 Occupancy, YE 2017 Occupancy, and YE 2016 Occupancy were obtained from the Hilton at University Place Borrower (as defined below). The YE 2015 Occupancy was obtained from a third party market research report. |
| (4) | The Hilton at University Place Whole Loan proceeds were used to retire an approximately $41.6 million outstanding loan previously securitized in the COMM 2014-UBS3, pay closing costs and return equity to the Hilton at University Place Borrower. |
The Mortgage Loan. The mortgage loan (the “Hilton at University Place Mortgage Loan”) is part of a whole loan (the “Hilton at University Place Whole Loan”) evidenced by twopari passu notes with an original principal balance of $46,000,000 and an outstanding principal balance as of the Cut-off Date of $45,945,743 secured by a first mortgage encumbering the fee interest in a full-service hotel located in Charlotte, North Carolina (the “Hilton at University Place Property”). The Hilton at University Place Mortgage Loan represents the controlling Note A-1. See “Description of the Mortgage Pool—The Whole Loans—The Serviced Pari Passu Whole Loans” and “Pooling and Servicing Agreement” in the Preliminary Prospectus.
THE INFORMATION IN THIS STRUCTURAL AND COLLATERAL TERM SHEET IS NOT COMPLETE AND MAY BE AMENDED PRIOR TO THE TIME OF SALE. THIS TERM SHEET IS NOT AN OFFER TO SELL THESE SECURITIES AND IT IS NOT A SOLICITATION OF AN OFFER TO BUY THESE SECURITIES IN ANY JURISDICTION WHERE THE OFFER OR SALE IS NOT PERMITTED.
31
Hospitality – Full Service 8629 JM Keynes Drive Charlotte, NC 28262 | Loan #4
Hilton at University Place | Cut-off Date Balance: Cut-off Date LTV: U/W NCF DSCR: U/W NOI Debt Yield: | $34,958,718 66.1% 1.75x 13.2% |
Note Summary
| Notes | Original Principal Balance | Cut-off Date Balance | Note Holder | Controlling Interest |
| A-1 | $35,000,000 | $34,958,718 | WFCM 2019-C50 | Yes |
| A-2 | $11,000,000 | $10,987,026 | Barclays Capital Real Estate Inc. | No |
| Total | $46,000,000 | $45,945,743 |
The Borrower and Borrower Sponsor.The borrower is UPH Lakeside Limited Partnership, a Pennsylvania limited partnership and single purpose entity with one independent director (the “Hilton at University Place Borrower”). Legal counsel to the Hilton at University Place Borrower delivered a non-consolidation opinion in connection with the origination of the Hilton at University Place Whole Loan. The borrower sponsor and nonrecourse carve-out guarantor of the Hilton at University Place Whole Loan is Kenneth K. Kochenour.
The borrower sponsor is Kenneth K. Kochenour, the founder and Chief Executive Officer of GF Management, Inc. Kochenour has more than 25 years of experience owning and operating hotel and resort facilities, turnaround deals, property evaluations, market analyses and cost controls. GF Management, Inc. is a hospitality ownership and management company that specializes in hotels, resorts, golf courses and other related hospitality assets. Since its founding in 1988, GF Management, Inc. reports that it has operated more than 500 hotels in 45 states. They currently partner closely with Starwood, Hilton, Marriott, IHG, Wyndham and Carlson and Choice. Kenneth K. Kochenour has had one prior short sale and one previous foreclosure on unrelated properties. See “Description of the Mortgage Pool – Litigation and Other Considerations”and“– Loan Purpose; Default History, Bankruptcy Issues and Other Proceedings” in the Preliminary Prospectus.
The Property.The Hilton at University Place Property is a 393-room full service hotel located in Charlotte, North Carolina. The Hilton at University Place was constructed in 1988, and most recently renovated in 2016. The sponsor has owned the Hilton at University Place Property since 1990 and has demonstrated his commitment to the subject through his continued investment since his acquisition. In 1998, the sponsor added a guestroom tower, totaling 153 guestrooms for a total cost of approximately $11.6 million. Since 2006, the sponsor has invested $19.6 million on capital upgrades, $8.0 million of which were above and beyond franchise property improvement plan requirements. The most recent renovations in 2016 included new signage, a renovated lobby and reception areas, and the opening of a 40-seat, full-service restaurant.
The Hilton at University Place Property contains 192 king rooms, 196 double/double rooms and five one-bedroom suites. The twelfth floor comprises the executive rooms and bi-level executive lounge that offers continental breakfast and evening appetizers. Amenities at the Hilton at University Place Property include two full-service restaurants, a coffee house, an outdoor pool with cabanas and a seating area with a fireplace, a fitness center, a lobby workstation, outdoor patio seating, a lakeside walking and jogging trail, and 18,993 square feet of meeting space. The Hilton at University Place Property also contains 503 parking spots, resulting in a ratio of 1.3 spaces per room.
The Hilton at University Place Borrower is engaged in a franchise agreement with Hilton Franchise Holding LLC, a subsidiary of Hilton Worldwide. The Hilton at University Place Borrower recently extended their agreement on August 22, 2018, and the extension will expire on April 30, 2030.
The following table presents certain information relating to the 2018 demand analysis with respect to the Hilton at University Place Property based on market segmentation, as provided in the appraisal:
Market Segmentation
Corporate | Meeting/Group | Leisure |
| 40.0% | 40.0% | 20.0% |
THE INFORMATION IN THIS STRUCTURAL AND COLLATERAL TERM SHEET IS NOT COMPLETE AND MAY BE AMENDED PRIOR TO THE TIME OF SALE. THIS TERM SHEET IS NOT AN OFFER TO SELL THESE SECURITIES AND IT IS NOT A SOLICITATION OF AN OFFER TO BUY THESE SECURITIES IN ANY JURISDICTION WHERE THE OFFER OR SALE IS NOT PERMITTED.
32
Hospitality – Full Service 8629 JM Keynes Drive Charlotte, NC 28262 | Loan #4
Hilton at University Place | Cut-off Date Balance: Cut-off Date LTV: U/W NCF DSCR: U/W NOI Debt Yield: | $34,958,718 66.1% 1.75x 13.2% |
Operating History and Underwritten Net Cash Flow. The following table presents certain information relating to the historical operating performance and the underwritten net cash flow at the Hilton at University Place Property:
Cash Flow Analysis
| 2016 | 2017 | 2018 | TTM 2/28/2019 | U/W | % of U/W Total Revenue(1) | U/W $ per Room | |
| Occupancy | 75.0% | 73.5% | 73.4% | 73.7% | 73.7% | ||
| ADR | $136.90 | $135.77 | $137.38 | $140.39 | $140.39 | ||
| RevPAR | $102.71 | $99.73 | $100.91 | $103.53 | $103.53 | ||
| Room Revenue | $14,773,072 | $14,305,815 | $14,474,758 | $14,851,265 | $14,850,875 | 71.9% | $37,788 |
| Other Revenue(2) | 5,657,109 | 5,436,333 | 5,701,463 | 5,817,929 | 5,817,929 | 28.1 | 14,804 |
| Total Revenue | $20,430,181 | $19,742,148 | $20,176,221 | $20,669,194 | $20,668,804 | 100.0% | $52,592 |
| Room Expense | 3,548,594 | 3,401,929 | 3,453,465 | 3,482,310 | 3,482,218 | 23.4 | 8,861 |
| Other Department Expense | 3,358,343 | 3,257,847 | 3,328,173 | 3,366,291 | 3,366,291 | 57.9 | 8,566 |
| Total Department Expenses | 6,906,937 | 6,659,776 | 6,781,638 | 6,848,601 | 6,848,509 | 33.1 | 17,426 |
| Gross Operating Income | $13,523,244 | $13,082,372 | $13,394,583 | $13,820,593 | $13,820,295 | 66.9% | $35,166 |
| Total Undistributed Expenses | 6,863,768 | 6,642,703 | 6,758,061 | 6,841,656 | 6,935,570 | 33.6 | 17,648 |
| Gross Operating Profit | $6,659,475 | $6,439,669 | $6,636,523 | $6,978,938 | $6,884,725 | 33.3% | $17,518 |
| Total Fixed Charges | 744,134 | 749,391 | 788,910 | 784,336 | 802,812 | 3.9 | 2,043 |
| Total Operating Expenses | $14,514,840 | $14,051,870 | $14,328,608 | $14,474,592 | $14,586,891 | 70.6% | $37,117 |
| Net Operating Income | $5,915,341 | $5,690,278 | $5,847,613 | $6,194,602 | $6,081,913 | 29.4% | $15,476 |
| FF&E | 0 | 0 | 0 | 0 | 826,752 | 4.0 | 2,104 |
| Net Cash Flow | $5,915,341 | $5,690,278 | $5,847,613 | $6,194,602 | $5,255,161 | 25.4% | $13,372 |
| NOI DSCR | 1.97x | 1.90x | 1.95x | 2.07x | 2.03x | ||
| NCF DSCR | 1.97x | 1.90x | 1.95x | 2.07x | 1.75x | ||
| NOI DY | 12.9% | 12.4% | 12.7% | 13.5% | 13.2% | ||
| NCF DY | 12.9% | 12.4% | 12.7% | 13.5% | 11.4% | ||
| (1) | % of U/W Total Revenue for Room Expense and Other Department Expenses are based on their corresponding revenue line items. All other line items represent percent of Total Revenue. |
| (2) | Other Revenue includes food and beverage revenue, telephone revenue, rental income, vending commission, cancellation fees, gift shop sales, guest laundry and other miscellaneous income sources. Other Revenue in 2017, 2018, and TTM 2/28/2019 also includes a service fee on banquet and catering sales, a fee that management introduced in 2017. |
Appraisal.The appraiser concluded to an “as-is” appraised value of $69,500,000 with an appraisal valuation date of February 25, 2019.
Environmental Matters. According to a Phase I environmental assessment dated February 26, 2019, there was no evidence of any recognized environmental conditions at the Hilton at University Place Property.
Market Overview and Competition.The Hilton at University Place Property is located in the city of Charlotte, North Carolina in the West W.T. Harris Boulevard/State Highway 24 corridor. The University of North Carolina Charlotte is located directly across Highway 29 from the Hilton at University Place Property and offers 77 bachelor’s degree programs and 23 doctoral programs to approximately 29,710 students. Major businesses in the area include Bank of America and Wells Fargo (both approximately 9.0 miles from the Hilton at University Place Property). Business parks within the area include Innovation Park Campus, which houses companies such as Wells Fargo, AXA, TTI Floor Care America and Allstate is less than one mile southwest of the Hilton at University Place Property. University Executive Office Park (located 0.6 miles from the Hilton at University Place Property) is a 13-building office and medical park on a 50-acre campus. Additionally, University Research Park (located 2.4 miles from the Hilton at University Place Property) is the second largest employment center in the region, with 30,000 employees in various corporate headquarters and research facilities. The Shoppes at University Place is a large retail center located adjacent to the Hilton at University Place Property, containing 38 shops, services, and restaurants. Major attractions in the area include the Charlotte Motor Speedway (located 5.0 miles from the Hilton at University Place Property) that hosts numerous motor racing events generating approximately $451 million per annually, including three premiere NASCAR events. Additionally, PNC Music Pavilion, a 19,500-seat outdoor amphitheater hosting various music acts, is located approximately 3.5 miles from the Hilton at University Place Property on the University of North Carolina Charlotte campus. The Hilton at University Place is located approximately 0.6 miles from I-85, 2.6 miles from I-485, 6.8 miles from I-77 and 11 miles from Charlotte Douglas International Airport.
THE INFORMATION IN THIS STRUCTURAL AND COLLATERAL TERM SHEET IS NOT COMPLETE AND MAY BE AMENDED PRIOR TO THE TIME OF SALE. THIS TERM SHEET IS NOT AN OFFER TO SELL THESE SECURITIES AND IT IS NOT A SOLICITATION OF AN OFFER TO BUY THESE SECURITIES IN ANY JURISDICTION WHERE THE OFFER OR SALE IS NOT PERMITTED.
33
Hospitality – Full Service 8629 JM Keynes Drive Charlotte, NC 28262 | Loan #4
Hilton at University Place | Cut-off Date Balance: Cut-off Date LTV: U/W NCF DSCR: U/W NOI Debt Yield: | $34,958,718 66.1% 1.75x 13.2% |
According to the appraisal, Charlotte is the nation’s third-largest banking center, behind New York City and San Francisco, with an estimated 76,000 workers employed in the financial services sector. Bank of America has its headquarters in Uptown Charlotte, approximately 9.2 miles from the Hilton at University Place. The healthcare sector in Charlotte employs over 80,000 workers, making it the largest sector in the country. In total, there are six Fortune 500 companies headquartered in Charlotte in the financial, energy and healthcare sectors. According to a third party market report, the estimated 2019 population within a one-, three- and five-mile radius of the Hilton at University Place Property was 10,671, 74,214 and 186,521, respectively; and the estimated 2019 average household income within the same radii was $57,790, $73,998 and $82,926, respectively. According to the appraisal, there is a 226-room full-service Marriott Hotel and Conference Center (located 1.3 miles from the Hilton at University Place Property) anticipated to open in February 2021 and a 104-room Fairfield Inn & Suites (located 0.5 miles from the Hilton at University Place Property) anticipated to open in January 2020, which are expected to have some degree of competitive interaction with the Hilton at University Place Property.
The following table presents historical occupancy, ADR, RevPAR and penetration rates relating to the Hilton at University Place Property’s competitive set:
Subject and Market Historical Occupancy, ADR and RevPAR
Competitive Set(1) | Hilton at University Place(2) | Penetration Factor | |||||||
Year | Occupancy | ADR | RevPAR | Occupancy | ADR | RevPAR | Occupancy | ADR | RevPAR |
| TTM 2/28/2019(3) | NAV | NAV | NAV | 73.7% | $140.39 | $103.53 | NAV | NAV | NAV |
| 12/31/2018 | 71.3% | $119.55 | $85.24 | 73.4% | $137.38 | $100.91 | 103.0% | 114.9% | 118.4% |
| 12/31/2017 | 69.6% | $119.55 | $83.19 | 73.5% | $135.77 | $99.73 | 105.6% | 113.6% | 119.9% |
| 12/31/2016 | 72.6% | $121.51 | $88.23 | 75.0% | $136.90 | $102.71 | 103.3% | 112.7% | 116.4% |
| (1) | Information obtained from third party hospitality research reports dated January 17, 2019. The competitive set includes Homewood Suites by Hilton Charlotte North University Research Park, Courtyard Charlotte University Research Park, Holiday Inn Charlotte University Research Park, Comfort Suites University Research Park, Springhill Suites Charlotte University Research Park, Country Inn & Suites Charlotte University Place and Embassy Suites by Hilton Charlotte Concord Golf Resort & Spa. |
| (2) | Information is obtained from the Hilton at University Place Borrower for the competitive set and is based on the underwritten rent roll for the Hilton at University Place Property. |
| (3) | TTM 2/28/2019 information was unavailable for the competitive set. |
Escrows.
Real Estate Taxes – The loan documents require ongoing monthly real estate tax reserves in an amount equal to one-twelfth of the real estate taxes that the lender estimates will be payable during the next 12 months (initially $40,917).
Insurance – Ongoing monthly insurance reserves, equaling one-twelfth of the insurance premiums that the lender estimates will be payable during the next twelve months, are not currently required and will not be required so long as the Hilton at University Place Borrower maintains a blanket policy acceptable to the lender.
FF&E Reserve – The loan documents require ongoing monthly FF&E Reserves equal to 1/12th of the greater of (i) the sum of (x) 4.0% of the projected annual gross income from operations attributed to room revenues and (y) 2.5% of the aggregate total food and beverage revenues at the Hilton at University Place Property or (ii) the required amount of FF&E expenditure under the franchise agreement (initially $61,624).
Lockbox and Cash Management.The Hilton at University Place Whole Loan documents require a hard lockbox with springing cash management. The Hilton at University Place Borrower will cause all rents and other sums generated by the Hilton at University Place Property to be deposited directly into the account under control of the lender. Prior to the occurrence of a Trigger Period (as defined below), the amounts deposited into the account will be released to the Hilton at University Place Borrower on a daily basis. Upon the first occurrence of a Trigger Period, the Hilton at University Place Borrower is required to establish a cash management account under the sole control of the lender, into which all amounts in the lockbox account are required to be automatically transferred daily for the payment, among other things, of the debt service, monthly escrows, default interest and late payment charges. All excess cash will be disbursed to the Hilton at University Place Borrower instead of the excess cash account unless (i) a Low DSCR Period (as defined below) has occurred and is continuing or (ii) the expiration or termination of the franchise agreement in which case all excess cash flow will be deposited into the excess cash account. Excess cash will be swept to the FF&E Reserve account during the occurrence of a PIP Trigger (as defined below).
A “Trigger Period” will commence upon the earlier of (i) an event of default, (ii) the debt service coverage ratio falling below 1.30x based on a trailing 12-month basis, (iii) the expiration or termination of the franchise agreement or (iv) the occurrence of a PIP Trigger.A Trigger Period will end upon, with respect to clause (i) the end of such event of default;with respect to clause (ii), the debt service coverage ratio being greater than or equal to 1.35x for two consecutive calendar quarters; with respect to clause (iii) above, the Hilton at University Place Borrower has entered into a replacement franchise agreement acceptable to the lender; and with respect to clause (iv) above, a PIP Trigger cure, as described below.
A “Low DSCR Period” will commence upon the debt service coverage ratio being less than 1.30x for two consecutive calendar quarters and will end upon the debt service coverage ratio being greater than or equal to 1.35x for two consecutive calendar quarters.
THE INFORMATION IN THIS STRUCTURAL AND COLLATERAL TERM SHEET IS NOT COMPLETE AND MAY BE AMENDED PRIOR TO THE TIME OF SALE. THIS TERM SHEET IS NOT AN OFFER TO SELL THESE SECURITIES AND IT IS NOT A SOLICITATION OF AN OFFER TO BUY THESE SECURITIES IN ANY JURISDICTION WHERE THE OFFER OR SALE IS NOT PERMITTED.
34
Hospitality – Full Service 8629 JM Keynes Drive Charlotte, NC 28262 | Loan #4
Hilton at University Place | Cut-off Date Balance: Cut-off Date LTV: U/W NCF DSCR: U/W NOI Debt Yield: | $34,958,718 66.1% 1.75x 13.2% |
A ”PIP Trigger” is the date when the property improvement plan budget is greater than $750,000 and has been approved by the franchisor and agreed to by the Hilton at University Place Borrower with reasonable consultation with the lender. A PIP Trigger will end upon the date which is the earliest of (i) the payment date immediately following the date which is 18 months from the date of the occurrence of the PIP Trigger, (ii) the payment date immediately following the date the funds in the FF&E reserve account are sufficient to cover the property improvement plan budget, (iii) lender’s receipt of a letter of credit in the amount of the PIP Shortfall (as defined below) within 45 days of the PIP Trigger, or (iv) completion of the property improvement plan in accordance with the property improvement plan budget.
The “PIP Shortfall” is the amount of the approved property improvement plan budget minus (i) FF&E funds in the FF&E Reserve as of the date of the PIP Trigger and (ii) the estimated aggregate amount of the FF&E Reserve monthly deposits in the twelve months following the PIP Trigger.
Property Management.The Hilton at University Place is managed by GF Management, LLC, an affiliate of the Hilton at University Place Borrower.
Partial Release.Not permitted.
Real Estate Substitution.Not permitted.
Subordinate and Mezzanine Indebtedness.Not permitted.
Ground Lease.None.
Terrorism Insurance.The Hilton at University Place Whole Loan documents require that the “all risk” insurance policy required to be maintained by the Hilton at University Place Borrower provide coverage for terrorism in an amount equal to the full replacement cost of the Hilton at University Place Property, as well as business interruption insurance covering no less than the 18-month period following the occurrence of a casualty event, together with a six-month extended period of indemnity.
THE INFORMATION IN THIS STRUCTURAL AND COLLATERAL TERM SHEET IS NOT COMPLETE AND MAY BE AMENDED PRIOR TO THE TIME OF SALE. THIS TERM SHEET IS NOT AN OFFER TO SELL THESE SECURITIES AND IT IS NOT A SOLICITATION OF AN OFFER TO BUY THESE SECURITIES IN ANY JURISDICTION WHERE THE OFFER OR SALE IS NOT PERMITTED.
35
| No. 5 – Goodyear Portfolio | |||||||
| Mortgage Loan Information | Mortgaged Property Information | ||||||
| Mortgage Loan Seller: | Rialto Mortgage Finance, LLC | Single Asset/Portfolio: | Portfolio | ||||
Credit Assessment (Fitch/KBRA/Moody’s): | NR/NR/NR | Property Type – Subtype: | Industrial – Flex | ||||
| Original Principal Balance(1): | $34,500,000 | Location: | Akron, OH | ||||
| Cut-off Date Balance(1): | $34,500,000 | Size: | 2,046,012 SF | ||||
| % of Initial Pool Balance: | 3.7% | Cut-off Date Balance Per SF(1): | $24.68 | ||||
| Loan Purpose: | Refinance | Maturity Date Balance Per SF(1)(2): | $24.65 | ||||
| Borrower Sponsors: | Stuart Lichter and Stuart Lichter, as Trustee of the Stuart Lichter Trust dated November 13, 2011 | Year Built/Renovated: | Various/Various | ||||
| Guarantors: | Stuart Lichter and Stuart Lichter, as Trustee of the Stuart Lichter Trust, dated November 13, 2011 | Title Vesting: | Fee | ||||
| Mortgage Rate: | 4.9170% | Property Manager: | Self-managed | ||||
| Note Date: | April 9, 2019 | Current Occupancy (As of): | 100.0% (5/1/2019) | ||||
| Seasoning: | 0 months | YE 2017 Occupancy: | 100.0% | ||||
| Maturity Date: | May 1, 2029 | YE 2016 Occupancy: | 100.0% | ||||
| IO Period(2): | 120 months | YE 2015 Occupancy: | 100.0% | ||||
| Loan Term (Original): | 120 months | YE 2014 Occupancy: | 100.0% | ||||
| Amortization Term (Original)(2): | NAP | Appraised Value: | $88,300,000 | ||||
| Loan Amortization Type(2): | Interest-only, Balloon | Appraised Value Per SF: | $43.16 | ||||
| Call Protection: | L(24),D(92),O(4) | Appraisal Valuation Date: | January 25, 2019 | ||||
| Lockbox Type: | Hard/Upfront Cash Management | Underwriting and Financial Information(5) | |||||
| Additional Debt(1)(4): | Yes | YE 2018 NOI(6): | $5,058,634 | ||||
| Additional Debt Type (Balance)(1)(4): | Pari Passu($16,000,000); B Note ($9,920,000) | YE 2017 NOI: | $4,999,492 | ||||
| YE 2016 NOI: | $4,942,382 | ||||||
| YE 2015 NOI: | $4,825,134 | ||||||
| U/W Revenues: | $5,788,853 | ||||||
| U/W Expenses: | $173,666 | ||||||
| Escrows and Reserves(3) | U/W NOI(6): | $5,615,187 | |||||
| Initial | Monthly | Cap | U/W NCF: | $5,615,187 | |||
| Taxes | $0 | Springing | NAP | U/W DSCR based on NOI/NCF(1): | 2.22x / 2.22x | ||
| Insurance | $0 | Springing | NAP | U/W Debt Yield based on NOI/NCF(1): | 11.1% / 11.1% | ||
| Replacement Reserve | $0 | Springing | NAP | U/W Debt Yield at Maturity based on NOI/NCF(1) | 11.1% / 11.1% | ||
| TI/LC Reserve | $0 | Springing | NAP | Cut-off Date LTV Ratio(1): | 57.2% | ||
| Environmental Reserve | $35,736 | $0 | NAP | LTV Ratio at Maturity(2): | 57.1% | ||
| Sources and Uses | ||||||||
| Sources | Uses | |||||||
| Original whole loan amount | $60,420,000 | 100.% | Loan payoff | $48,834,190 | 80.8% | |||
| Closing costs | 870,036 | 1.4 | ||||||
| Upfront reserves | 35,736 | 0.1 | ||||||
| Return of equity | 10,680,038 | 17.7 | ||||||
| Total Sources | $60,420,000 | 100.0% | Total Uses | $60,420,000 | 100.0% | |||
| (1) | The Goodyear Portfolio Mortgage Loan (as defined below) is part of the Goodyear Portfolio Whole Loan (as defined below), which comprises fivepari passu notes with an aggregate original principal balance of $50,500,000 and one subordinate note with an original principal balance of $9,920,000. All statistical information related to the Cut-off Date Balance per SF, Maturity Date Balance per SF, U/W NOI Debt Yield, U/W NCF Debt Yield, U/W NOI DSCR, U/W NCF DSCR, Cut-off Date LTV Ratio and LTV Ratio at Maturity or ARD are based on the Goodyear Portfolio Senior Loan (as defined below). |
| (2) | The Goodyear Portfolio Senior Loan has 118 interest only payments and is amortized on the payment date prior to the maturity date, resulting in a maturity balance of $50,440,881. |
| (3) | See “Escrows” section below. |
| (4) | See “Subordinate and Mezzanine Indebtedness” section. |
| (5) | The U/W metrics are based on the Goodyear Portfolio Senior Loan. Including the Goodyear Portfolio B Note (as defined below), NOI DSCR, NCF DSCR, NOI Debt Yield, and NCF Debt Yield are 1.38x, 1.38x, 9.3%, and 9.3%, respectively. |
| (6) | The U/W NOI increased compared to the YE 2018 NOI due to straight line rent being underwritten based on the contractual rent increases per the leases and taken through the loan term. |
THE INFORMATION IN THIS STRUCTURAL AND COLLATERAL TERM SHEET IS NOT COMPLETE AND MAY BE AMENDED PRIOR TO THE TIME OF SALE. THIS TERM SHEET IS NOT AN OFFER TO SELL THESE SECURITIES AND IT IS NOT A SOLICITATION OF AN OFFER TO BUY THESE SECURITIES IN ANY JURISDICTION WHERE THE OFFER OR SALE IS NOT PERMITTED.
36
Industrial - Flex Various Akron, OH 44306 | Loan #5
Goodyear Portfolio | Cut-off Date Balance: Cut-off Date LTV: U/W NCF DSCR: U/W NOI Debt Yield: | $34,500,000 57.2% 2.22x 11.1% |
The Mortgage Loan. The mortgage loan, evidenced by four notes with an original principal balance and outstanding balance of $34,500,000 (the “Goodyear Portfolio Mortgage Loan”) is part of a whole loan (the “Goodyear Portfolio Whole Loan”) evidenced by the Goodyear Portfolio Mortgage Loan, thepari passu Note A-2 with an original and outstanding principal balance as of the Cut-off Date of $16,000,000 (the “GoodyearPari Passu Companion Note”), and together with the Goodyear Portfolio Mortgage Loan, (the “Goodyear Portfolio Senior Loan”) and a subordinate note with an original principal and outstanding balance as of the Cut-off Date of $9,920,000 (the “Goodyear Portfolio Subordinate Companion Loan”) secured by a first mortgage encumbering the fee interest in four industrial/flex properties located in Akron, Ohio (each, a “Goodyear Portfolio Property, and collectively, the “Goodyear Portfolio Properties”). The Goodyear Portfolio Mortgage Loan represents Note A-1, Note A-3, Note A-4, and Note A-5. The Goodyear Portfolio Whole Loan was originated on April 9, 2019 by Rialto Mortgage Finance, LLC, and on that same date, the Goodyear Portfolio Subordinate Companion Loan was transferred to Townsend Real Estate Fund, LP, a fund managed by Prima Capital Advisors. See “Description of the Mortgage Pool—The Whole Loans—The Serviced AB Whole Loans—The Goodyear Portfolio Whole Loan” and “Pooling and Servicing Agreement” in the Preliminary Prospectus.
Note Summary
| Notes | Original Principal Balance | Cut-off Date Balance | Note Holder | Controlling Interest |
| A-1 | $30,000,000 | $30,000,000 | WFCM 2019-C50 | No |
| A-2 | $16,000,000 | $16,000,000 | Rialto Mortgage Finance | No |
| A-3 | $2,000,000 | $2,000,000 | WFCM 2019-C50 | No |
| A-4 | $1,500,000 | $1,500,000 | WFCM 2019-C50 | No |
| A-5 | $1,000,000 | $1,000,000 | WFCM 2019-C50 | No |
| B | $9,920,000 | $9,920,000 | Townsend Real Estate Fund, LP | Yes(1) |
| Total | $60,420,000 | $60,420,000 |
| (1) | The initial controlling note is Note B, so long as no control appraisal period has occurred and is continuing. If and for so long as a control termination event has occurred and is continuing, then the controlling note will be Note A-1. See “Description of the Mortgage Pool—The Whole Loans—The Serviced AB Whole Loans—The Goodyear Portfolio Whole Loan”. |
The Borrower and Borrower Sponsor.The borrower is IRG RC Lessor KB, LLC, a Delaware limited liability company and single purpose entity with two independent directors (the “Goodyear Portfolio Borrower”). The Goodyear Portfolio Borrower is wholly owned by IRG RC Lessor LLC, which is directly owned by IRG Rubber City LLC and managed by S.L. Properties, Inc. IRG Rubber City LLC interest owners include Stuart Lichter Trust (80.55% Class A; 42.63% Class B Member), Christopher Semarjian (18.63% Class A; 42.63% Class B Member), and other members (0.82% Class A; 14.74% Class B Members). Legal counsel to the Goodyear Portfolio Borrower delivered a non-consolidation opinion in connection with the origination of the Goodyear Portfolio Whole Loan. The nonrecourse carve-out guarantor of the Goodyear Portfolio Whole Loan is Stuart Lichter and Stuart Lichter, as trustee of the Stuart Lichter Trust dated November 13, 2011, on a joint and several basis.
The non-recourse carveout guarantor Stuart Lichter is the President and Chairman of the Board of Industrial Realty Group, LLC (“IRG”). Mr. Lichter has over forty years of experience in transforming former military bases and industrial sites into thriving retail, residential and business communities. Primarily through Mr. Lichter’s efforts, IRG and its affiliated companies have acquired and developed over 100 industrial and commercial properties and has made the IRG portfolio one of the largest private holders of industrial and commercial real estate in the nation, according to its website. These properties include office buildings, industrial and warehouse buildings, shopping centers, business parks, hotels, mini-storage facilities, marinas, apartments, mobile home parks and mixed-use developments, with a primary emphasis on industrial and commercial.
The Properties.The Goodyear Portfolio Properties consist of four industrial/flex properties with a total of approximately 2.05 million square feet that house critical research and development, manufacturing, and product testing facilities utilized by The Goodyear Tire and Rubber Company (“Goodyear”). The Goodyear Portfolio Properties net rentable area is spread across four properties containing eight buildings located on approximately 30.3 acres. The Goodyear Portfolio Properties are all located on the Goodyear Global and North American headquarters campus, just south of Interstate 76, in Akron, Ohio approximately four miles from the downtown Akron area and approximately 41 miles south of Cleveland, Ohio.
Innovation Tech Center property is a two building 1,621,500 square feet flex/research & development property located at 200 Innovation Way and 1376 Tech Way Drive, Akron, Ohio (the “Innovation Tech Center Property”). The Innovation Tech Center Property consists of two, five-story buildings located on 5.8 acres. The two buildings are referred to as Tech Center A and Tech Center B and contain approximately 40% office space. The buildings were built in 1917 and renovated throughout the years latest in 2018. Goodyear uses the Innovation Tech Center Property for research, warehouse, manufacturing, and product testing. Tech Center A is attached via a grand entrance to the Goodyear global office headquarters building (which is not included as collateral), and Tech Center A and Tech Center B are connected via two walkways. Since acquisition, the borrower has invested approximately $51.9 million in renovations to the Innovation Tech Center Property, including renovations to the office finish within Tech Center A and the build-out of new office areas within the former shell manufacturing space in Tech Center B.
Research Center property is a 193,312 square foot lab/research and development property located at 142 Goodyear Boulevard and 130 Johns Avenue, Akron, Ohio (the “Research Center Property”). The Research Center Property consists of a single three-story building that was developed in 1942, renovated throughout the years latest in 2018, and is situated on 5.8 acres. The improvements include a partial below-grade level and contain approximately 79% office space. Since acquisition, the borrower has invested approximately $1.5
THE INFORMATION IN THIS STRUCTURAL AND COLLATERAL TERM SHEET IS NOT COMPLETE AND MAY BE AMENDED PRIOR TO THE TIME OF SALE. THIS TERM SHEET IS NOT AN OFFER TO SELL THESE SECURITIES AND IT IS NOT A SOLICITATION OF AN OFFER TO BUY THESE SECURITIES IN ANY JURISDICTION WHERE THE OFFER OR SALE IS NOT PERMITTED.
37
Industrial - Flex Various Akron, OH 44306 | Loan #5
Goodyear Portfolio | Cut-off Date Balance: Cut-off Date LTV: U/W NCF DSCR: U/W NOI Debt Yield: | $34,500,000 57.2% 2.22x 11.1% |
million in renovations to the Research Center Property. The Research Center Property is located on the north side of the Goodyear Campus, close to a Hilton Garden Inn.
Tire Testing property is a 145,600 square foot industrial property located at 309 Seiberling Street, Akron, Ohio (the “Tire Testing Property”). The Tire Testing Property consists of one, single-story building and one, two-story building which were built in multiple phases between 1956 and 1973, renovated throughout the years latest in 2018, and are situated on 11.6 acres. The buildings are used for office, research and development, product testing and storage. The Goodyear Tire Testing facility is the only test facility of its kind for Goodyear, and tires are brought to this location from across the world.
North Archwood property is four building 85,600 square foot industrial property located at 1485 East Archwood Avenue, Akron, Ohio (the “North Archwood Property”). The North Archwood Property, built in multiple phases between 1943 and 1964, renovated throughout the years latest in 2018, and consists of a 7.1-acre site housing three one- and two-story industrial buildings. The buildings are comprised of industrial and research and development space with 54% of the NRA configured as office space. The North Archwood Property is utilized for chemical testing and research and development. Since acquisition, the borrower sponsor has invested approximately $600,000 in renovations to the North Archwood Property.
The Tenant.
The Goodyear Tire and Rubber Company, (“Goodyear”) (2,046,012 square foot, 100.0% of net rentable area, 100.0% of underwritten base rent; 4/30/2038 lease expiration)Founded in 1898, Goodyear, together with its subsidiaries, develops, manufactures, markets, and distributes tires and related products and services in the United States and internationally under brands including: Goodyear, Dunlop, Kelly, Sava, Fulda and Debica. Goodyear is the largest tire maker in North America, Central and South America and the second largest tire maker in Europe. The company is headquartered in Akron, Ohio and employs approximately 64,000 people and operates 47 plants across 21 countries. The company operates approximately 1,000 tire and auto service center outlets, where it offers its products for retail sale and provides automotive repair and other services. Goodyear reported year-end 2018 sales of $15.48 billion and net income of $693.0 million. Each of the Goodyear Portfolio Properties currently operates under a 27-year absolute net lease, each of which was amended and restated in July 2011, will expire on April 30, 2038, and has 14, 5-year remaining options to renew (12 months’ prior notice). Goodyear has a right of first offering of any sale, conveyance or transfer of any Goodyear Portfolio Property or all or the Goodyear Portfolio Properties. The Goodyear Portfolio Whole Loan documents do not permit the voluntary transfer of an individual Goodyear Portfolio Property.
The following table presents certain information relating to the tenancy at the Goodyear Portfolio Properties:
Major Tenant
| Tenant Name | Credit Rating (Fitch/Moody’s/ S&P) | Tenant NRSF | % of NRSF | Annual U/W Base Rent PSF(1) | Annual U/W Base Rent(1) | % of Total Annual U/W Base Rent | Lease Expiration Date | Extension Options | Termination Option (Y/N) |
| Major Tenants | |||||||||
| Goodyear (Innovation Tech Center lease) | BB/Ba2/BB | 1,621,500 | 79.3% | $2.76 | $4,480,276 | 85.6% | 4/30/2038 | 14, 5-year | N |
| Goodyear (Research Center lease) | BB/Ba2/BB | 193,312 | 9.4% | $1.67 | $322,368 | 6.2% | 4/30/2038 | 14, 5-year | N |
| Goodyear (Tire Testing lease) | BB/Ba2/BB | 145,600 | 7.1% | $1.85 | $269,021 | 5.1% | 4/30/2038 | 14, 5-year | N |
| Goodyear (North Archwood lease) | BB/Ba2/BB | 85,600 | 4.2% | $1.92 | $164,383 | 3.1% | 4/30/2038 | 14, 5-year | N |
| Total Major Tenants | 2,046,012 | 100.0% | $2.56 | $5,236,048 | 100.0% | ||||
| Vacant Space | 0 | 0.0% | |||||||
| Collateral Total | 2,046,012 | 100.0% | |||||||
| (1) | Annual U/W Base Rent and Annual Base Rent include contractual rent steps taken through the term of the Goodyear Portfolio Whole Loan term. |
THE INFORMATION IN THIS STRUCTURAL AND COLLATERAL TERM SHEET IS NOT COMPLETE AND MAY BE AMENDED PRIOR TO THE TIME OF SALE. THIS TERM SHEET IS NOT AN OFFER TO SELL THESE SECURITIES AND IT IS NOT A SOLICITATION OF AN OFFER TO BUY THESE SECURITIES IN ANY JURISDICTION WHERE THE OFFER OR SALE IS NOT PERMITTED.
38
Industrial - Flex Various Akron, OH 44306 | Loan #5
Goodyear Portfolio | Cut-off Date Balance: Cut-off Date LTV: U/W NCF DSCR: U/W NOI Debt Yield: | $34,500,000 57.2% 2.22x 11.1% |
The following table presents certain information relating to the lease rollover schedule at the Goodyear Portfolio Properties:
Lease Expiration Schedule(1)
| Year Ending December 31, | No. of Leases Expiring | Expiring NRSF | % of Total NRSF | Cumulative Expiring NRSF | Cumulative % of Total NRSF | Annual U/W Base Rent | % of Total Annual U/W Base Rent | Annual U/W Base Rent PSF |
| MTM | 0 | 0 | 0.0% | 0 | 0.0% | $0 | 0.0% | $0.00 |
| 2019 | 0 | 0 | 0.0% | 0 | 0.0% | $0 | 0.0% | $0.00 |
| 2020 | 0 | 0 | 0.0% | 0 | 0.0% | $0 | 0.0% | $0.00 |
| 2021 | 0 | 0 | 0.0% | 0 | 0.0% | $0 | 0.0% | $0.00 |
| 2022 | 0 | 0 | 0.0% | 0 | 0.0% | $0 | 0.0% | $0.00 |
| 2023 | 0 | 0 | 0.0% | 0 | 0.0% | $0 | 0.0% | $0.00 |
| 2024 | 0 | 0 | 0.0% | 0 | 0.0% | $0 | 0.0% | $0.00 |
| 2025 | 0 | 0 | 0.0% | 0 | 0.0% | $0 | 0.0% | $0.00 |
| 2026 | 0 | 0 | 0.0% | 0 | 0.0% | $0 | 0.0% | $0.00 |
| 2027 | 0 | 0 | 0.0% | 0 | 0.0% | $0 | 0.0% | $0.00 |
| 2028 | 0 | 0 | 0.0% | 0 | 0.0% | $0 | 0.0% | $0.00 |
| 2029 | 0 | 0 | 0.0% | 0 | 0.0% | $0 | 0.0% | $0.00 |
| Thereafter | 4 | 2,046,012 | 100.0% | 2,046,012 | 100.0% | $5,236,048 | 100.0% | $2.56 |
| Vacant | 0 | 0 | 0.0% | 2,046,012 | 100.0% | $0 | 0.0% | $0.00 |
| Total/Weighted Average | 4 | 2,046,012 | 100.0% | $5,236,048 | 100.0% | $2.56 |
| (1) | Information obtained from the underwritten rent roll. |
The following table presents historical occupancy percentages at the Goodyear Portfolio Properties:
Historical Occupancy(1)
12/31/2015 | 12/31/2016 | 12/31/2017 | 05/01/2019 |
| 100.0% | 100.0% | 100.0% | 100.0% |
| (1) | Information obtained from the Goodyear Portfolio Borrower. |
THE INFORMATION IN THIS STRUCTURAL AND COLLATERAL TERM SHEET IS NOT COMPLETE AND MAY BE AMENDED PRIOR TO THE TIME OF SALE. THIS TERM SHEET IS NOT AN OFFER TO SELL THESE SECURITIES AND IT IS NOT A SOLICITATION OF AN OFFER TO BUY THESE SECURITIES IN ANY JURISDICTION WHERE THE OFFER OR SALE IS NOT PERMITTED.
39
Industrial - Flex Various Akron, OH 44306 | Loan #5
Goodyear Portfolio | Cut-off Date Balance: Cut-off Date LTV: U/W NCF DSCR: U/W NOI Debt Yield: | $34,500,000 57.2% 2.22x 11.1% |
Operating History and Underwritten Net Cash Flow. The following table presents certain information relating to the underwritten net cash flow at the Goodyear Portfolio Properties:
Cash Flow Analysis
| 2016 | 2017 | 2018 | U/W | %(1) | U/W $ per SF | |||||||||||||
| Rents in Place | $5,032,763 | $5,032,763 | $5,099,868 | $5,236,048 | 88.6 | % | $2.56 | |||||||||||
| Straight Line Rent(2) | 0 | 0 | 0 | 497,279 | 8.4 | 0.24 | ||||||||||||
| Contractual Rent Steps | 0 | 0 | 0 | 0 | 0.0 | 0.00 | ||||||||||||
| Grossed Up Vacant Space | 0 | 0 | 0 | 0 | 0.0 | 0.00 | ||||||||||||
| Gross Potential Rent | $5,032,763 | $5,032,763 | $5,099,868 | $5,733,327 | 97.1 | % | $2.80 | |||||||||||
| Other Income | 0 | 0 | 0 | 0 | 0.0 | 0.00 | ||||||||||||
| Total Recoveries | 570,908 | 465,201 | 562,828 | 173,666 | 2.9 | 0.08 | ||||||||||||
| Net Rental Income | $5,603,671 | $5,497,964 | $5,662,696 | $5,906,993 | 100.0 | % | $2.89 | |||||||||||
| (Vacancy & Credit Loss) | 0 | 0 | 0 | (118,140)(3) | (2.1 | ) | (0.06) | |||||||||||
| Effective Gross Income | $5,603,671 | $5,497,964 | $5,662,696 | $5,788,853 | 98.0 | % | $2.83 | |||||||||||
| Real Estate Taxes | 14,887 | 14,372 | 14,599 | 0 | 0.0 | 0.00 | ||||||||||||
| Insurance | 69,494 | 27,689 | 37,179 | 0 | 0.0 | 0.00 | ||||||||||||
| Management Fee | 0 | 96 | 78 | 173,666 | 3.0 | 0.08 | ||||||||||||
| Other Operating Expenses | 576,908 | 456,315 | 552,206 | 0 | 0.0 | 0.00 | ||||||||||||
| Total Operating Expenses | $661,289 | $498,472 | $604,062 | $173,666 | 3.0 | % | $0.08 | |||||||||||
| Net Operating Income(4) | $4,942,382 | $4,999,492 | $5,058,634 | $5,615,187 | 97.0 | % | $2.74 | |||||||||||
| Replacement Reserves | 0 | 0 | 0 | 0 | 0.0 | 0.00 | ||||||||||||
| TI/LC | 0 | 0 | 0 | 0 | 0.0 | 0.00 | ||||||||||||
| Net Cash Flow | $4,942,382 | $4,999,492 | $5,058,634 | $5,615,187 | 97.0 | % | $2.74 | |||||||||||
| NOI DSCR(5) | 1.96x | 1.98x | 2.00x | 2.22x | ||||||||||||||
| NCF DSCR(5) | 1.96x | 1.98x | 2.00x | 2.22x | ||||||||||||||
| NOI Debt Yield(5) | 9.8% | 9.9% | 10.0% | 11.1% | ||||||||||||||
| NCF Debt Yield(5) | 9.8% | 9.9% | 10.0% | 11.1% | ||||||||||||||
| (1) | Represents (i) percent of Net Rental Income for all revenue fields, (ii) percent of Gross Potential Rent for Vacancy & Credit Loss and (iii) percent of Effective Gross Income for all other fields. |
| (2) | Represents contractual rent steps per the leases taken through the term of the Goodyear Portfolio Whole Loan for the investment grade tenant (see “Major Tenant” table above). |
| (3) | The underwritten economic vacancy is 2.0%. The Goodyear Portfolio Properties were 100.0% leased as of May 1, 2019. |
| (4) | The U/W NOI increased compared to the YE 2018 NOI due to straight line rent being underwritten based on the contractual rent increases per the leases and taken through the loan term. |
| (5) | The debt service coverage ratios and debt yields are based on the Goodyear Portfolio Senior Loan. Including the Goodyear Portfolio B Note, NOI DSCR, NCF DSCR, NOI Debt Yield, and NCF Debt Yield are 1.38x, 1.38x, 9.3%, and 9.3%, respectively. |
Appraisal. The appraiser concluded to an “as-is” appraised value of $88,300,000 as of January 25, 2019.
Environmental Matters. According to a Phase I environmental site assessments dated February 01, 2019, February 07, 2019, and February 08, 2019, there was no evidence of any recognized environmental conditions at the Goodyear Portfolio Properties. However, the Phase I environmental site assessment identified one controlled recognized environmental condition (“CREC”), four historical recognized environmental conditions (“HRECs”), and a number of business environmental risks (“BERs”). The Goodyear Portfolio Borrower obtained an environmental impairment Liability insurance policy from Beazley (Lloyd’s of London Syndicates 623-2632) in the form of an Enviro Covered Location Insurance Policy (Site Environmental) (ECLIPSE) with per incident and aggregate limits of $1 million and with a deductible of $50,000 for a policy period through the Goodyear Portfolio Whole Loan maturity date. The lender is an additional named insured with its successors, assigns and/or affiliates. See “Description of the Mortgage Pool—Mortgage Pool Characteristics—Environmental Considerations” in the Preliminary Prospectus.
Market Overview and Competition.The Goodyear Portfolio Properties are located within the Akron, OH metropolitan statistical area (“Akron MSA”) in Akron, Summit County, Ohio approximately 41 miles south of Cleveland. The Akron MSA is the fifth largest in the state of Ohio. Akron’s economic base historically relied on the manufacturing industry, due to its location on the Ohio and Erie Canal. However, Akron is an now diversifying into other industries, including the polymer, education, healthcare, and biomedical sectors. The city is home to the Polymer Center, one of the leading centers of liquid crystal and polymer research, development and technology in the world, according to the city’s website. More than 400 companies in the area have formed a cluster named The Polymer Valley. Akron is home to over 20 Fortune 500 companies, including Goodyear Tire and Rubber Company’s and FirstEnergy’s headquarters. Other company headquarters include GOJO, Advanced Elastomer Systems, Acme Fresh Market and Sterling Jewelers. The city is also home to the Akron Biomedical Corridor, a 500-acre corridor connecting Akron General Hospital, Akron City Hospital and
THE INFORMATION IN THIS STRUCTURAL AND COLLATERAL TERM SHEET IS NOT COMPLETE AND MAY BE AMENDED PRIOR TO THE TIME OF SALE. THIS TERM SHEET IS NOT AN OFFER TO SELL THESE SECURITIES AND IT IS NOT A SOLICITATION OF AN OFFER TO BUY THESE SECURITIES IN ANY JURISDICTION WHERE THE OFFER OR SALE IS NOT PERMITTED.
40
Industrial - Flex Various Akron, OH 44306 | Loan #5
Goodyear Portfolio | Cut-off Date Balance: Cut-off Date LTV: U/W NCF DSCR: U/W NOI Debt Yield: | $34,500,000 57.2% 2.22x 11.1% |
Akron Children’s Hospital. Access to the Goodyear Portfolio Properties is provided via Interstate 77 and Interstate 76, which are located within one mile of the Goodyear Portfolio Properties.
Submarket Information – According to the appraisal, the Goodyear Portfolio Properties are situated within the Fairlawn/Montrose industrial submarket. As of fourth quarter 2018, the submarket reported a total inventory of 83.5 million square feet with a 3.1% vacancy rate and an average quoted rental rate of $4.58 per square foot. As of the fourth quarter of 2018, the Fairlawn/Montrose industrial submarket reported positive absorption of 5,576 square feet and 35,000 square feet of new construction.
Appraiser’s Comp Set – The appraiser identified six primary competitive properties for the Goodyear Portfolio Properties totaling approximately 2.0 million square feet, which reported an average occupancy rate of approximately 97.4%. The appraiser concluded to net market rents for the Goodyear Portfolio Properties of $3.00 per square foot, for office/manufacturing tenants, $2.00 per square foot gross for the manufacturing tenants, and $2.50 per square foot for R&D tenants.
The following table presents certain information relating to the appraiser’s market rent conclusion for the Goodyear Portfolio Properties:
Market Rent Summary(1)
| Office/Manufacturing | Manufacturing | R&D | |
| Market Rent (PSF) | $3.00 | $2.00 | $2.50 |
| Lease Term (Years) | 7 | 7 | 7 |
| Lease Type (Reimbursements) | Net | Net | Net |
| Rent Increase Projection | CPI | CPI | CPI |
| (1) | Information obtained from the appraisal. |
The table below presents certain information relating to comparable sales for the Goodyear Portfolio Properties identified by the appraiser:
Comparable Sales(1)
| Property Name | Location | Rentable Area (SF) | Sale Date | Sale Price | Sale Price (PSF) |
| Buckeye Corrugated Industrial Portfolio | Wooster, OH | 826,283 | Jun-18 | $50,500,000 | $61 |
| Troy Industrial Portfolio | Troy, MI | 392,739 | Aug-17 | $20,475,000 | $52 |
| Tuckerton Road Industrial/Flex Portfolio | Reading, PA | 537,220 | Jun-16 | $25,500,000 | $47 |
| High Street Realty Portfolio | Allentown, PA | 566,954 | Nov-16 | $37,000,000 | $65 |
| Dalfen American Portfolio | Multiple, OH | 2,077,000 | Mar-16 | $102,750,000 | $49 |
| Transpacific Development Indy Portfolio | Indianapolis, IN | 3,858,513 | Jan-16 | $164,000,000 | $43 |
| (1) | Information obtained from the appraisal. |
The table below presents certain information relating to four comparable properties to the Goodyear Portfolio Properties identified by the appraiser:
Competitive Set(1)
Goodyear Portfolio (Subject) | 866 West Wilbeth Road | Polaris | Martins Ferry Industrial Park | 13311 Industrial Parkway | DDS Building | Great Lakes Integrated | |
| Location | Akron, OH | Akron, OH | Akron, OH | Martins Ferry, OH | Marysville, OH | Grand Rapids, MI | Avon Lake, OH |
| Distance from Subject | -- | 4.5 miles | 5.6 miles | 112.9 miles | 248.4 miles | 41.4 miles | 165.9 miles |
| Property Type | Industrial / Flex | Office / Manufacturing | Office / Manufacturing | Office / Manufacturing | Office / Manufacturing | Office / Manufacturing | Office / Manufacturing |
| Year Built/Renovated | Various/Various | 1956/NAP | 1959/2009 | NAV | 1980/NAP | 1980/2008 | 1974/NAP |
| Tenant | Goodyear | NAV | Polaris | TRI-W Global Inc. | Arch Polymers | Diversified Distribution Systems | Great Lakes Integrated |
| Total GLA (SF) | 2,046,012 SF | 22,000 SF | 28,000 SF | 36,312 SF | 71,252 SF | 950,000 SF | 124,647 SF |
| Rent ($/SF/Yr.) | $2.56 | $2.25 | $3.25 | $4.00 | $2.95 | $2.95 | $3.15 |
| Total Occupancy | 100.0% | 100.0% | 100.0% | NAV | 87.0% | 100.0% | 100.0% |
| (1) | Information obtained from the appraisal and the underwritten rent roll. |
THE INFORMATION IN THIS STRUCTURAL AND COLLATERAL TERM SHEET IS NOT COMPLETE AND MAY BE AMENDED PRIOR TO THE TIME OF SALE. THIS TERM SHEET IS NOT AN OFFER TO SELL THESE SECURITIES AND IT IS NOT A SOLICITATION OF AN OFFER TO BUY THESE SECURITIES IN ANY JURISDICTION WHERE THE OFFER OR SALE IS NOT PERMITTED.
41
Industrial - Flex Various Akron, OH 44306 | Loan #5
Goodyear Portfolio | Cut-off Date Balance: Cut-off Date LTV: U/W NCF DSCR: U/W NOI Debt Yield: | $34,500,000 57.2% 2.22x 11.1% |
The following table presents certain information relating to five comparable leases to those at the Goodyear Portfolio Properties:
Comparable Leases(1)
| Property Name/Location | Year Built/ Renovated | Total GLA (SF) | Distance from Subject | Occupancy | Lease Term | Tenant Size (SF) | Annual Base Rent PSF | Reimbursement Amount PSF | Lease Type |
| Office/Manufacturing | |||||||||
866 West Wilbeth Road 866 West Wilbeth Road Akron, OH | 1956/NAV | 22,000 | 4.5 miles | 100.0% | 4.0 Yrs | 22,000 | $2.25 | NAV | Mod Gross |
Polaris 1310 DeValera Avenue Akron, OH | 1959/2009 | 28,000 | 5.6 miles | 100.0% | 1.0 Yr | 28,000 | $3.25 | NAV | Mod Gross |
Martins Ferry Industrial Park First and Licust Street Martins Ferry, OH | NAV | 500,000 | 112.9 miles | NAV | 3.0 Yrs | 36,312 | $4.00 | NAV | NNN |
13311 Industrial Parkway 13311 Industrial Parkway Marysville, OH | 1980/NAP | 334,500 | 248.4 miles | 87.0% | 5.0 Yrs | 71,252 | $2.95 | NAV | NNN |
DDS Building 1040 40th St SE Grand Rapids, MI | 1980/2008 | 950,000 | 41.4 miles | 100.0% | 6.0 Yrs | 950,000 | $2.95 | NAV | NNN |
Great Lakes Integrated 33625 Pin Oak Parkway Avon Lake, OH | 1974/NAP | 124,647 | 165.9 miles | 100.0% | 5.0 Yrs | 124,647 | $3.15 | NAV | Mod Gross |
| R&D | |||||||||
Single-Tenant Industrial (Bldg E) 15001 North Commerce Drive Dearborn, MI | 1973/NAP | 38,400 | 123.3 miles | 100.0% | 6.0 Yrs | 38,400 | $7.25 | NAV | NNN |
Dana Corp-Auburn Hills 4440 North Atlantic Boulevard Auburn Hills, MI | 2002/2017 | 144,400 | 146.6 miles | 100.0% | 12.0 Yrs | 144,400 | $6.50 | NAV | NNN |
Industrial 1000 Seville Rd., Wadsworth, OH | 1970/2016 | 110,335 | 15.2 miles | 100.0% | 10.0 Yrs | 110,335 | $7.21 | NAV | NN |
| (1) | Information obtained from the appraisal. |
Escrows.
Real Estate Taxes – The Goodyear Portfolio Whole Loan documents did not require an upfront real estate tax reserve. Ongoing monthly real estate tax reserves will not be required as long as (i) a Critical Tenant Lease (as defined below) is in effect, (ii) the Critical Tenant (as defined below) pays real estate taxes directly to the tax authority, (iii) the Goodyear Portfolio Borrower provides evidence to the lender that real estate taxes have been paid, and (iv) no Cash Sweep Event (as defined below) has occurred and is continuing, (collectively, the “Real Estate Tax Deposit Waiver Conditions”). In the event that the Real Estate Tax Deposit Waiver Conditions are not satisfied, the Goodyear Portfolio Borrower is required to make ongoing monthly real estate tax reserves in an amount equal to one-twelfth of the real estate taxes that the lender estimates to be necessary to pay taxes over the then succeeding twelve months.
Insurance – The Goodyear Portfolio Whole Loan documents did not require an upfront insurance reserve. Ongoing monthly insurance reserves will not be required as long as (i) a Critical Tenant Lease is in effect, (ii) the Critical Tenant pays all insurance premiums, (iii) the Goodyear Portfolio Borrower provides evidence to the lender that insurance premiums have been paid, and (iv) no Cash Sweep Event has occurred and is continuing, (collectively, the “Insurance Deposit Waiver Conditions”). In the event that the Insurance Deposit Waiver Conditions are not satisfied, the Goodyear Portfolio Borrower is required to make ongoing monthly insurance premium reserves in an amount equal to one-twelfth of the insurance premium that the lender estimates to be necessary to pay insurance over the then succeeding twelve months.
Replacement Reserves – The Goodyear Portfolio Whole Loan documents did not require an upfront replacement reserve. Ongoing monthly replacement reserves will not be required as long as (i) a Critical Tenant Lease is in effect, (ii) the Critical Tenant directly pays for all capital expenditures as required under the Critical Tenant Lease, (iii) the Critical Tenant pays for all Critical Tenant capital expenditures within the timeframe required within the Critical Tenant Lease, (iv) the Goodyear Portfolio Borrower provides evidence to the Lender that all capital expenditures have been performed and paid, and (v) no Cash Sweep Event has occurred and is continuing, (collectively, the “Capital Expenditure Deposit Waiver Conditions”). In the event that the Capital Expenditure Deposit Waiver Conditions are not satisfied, the Goodyear Portfolio Borrower is required to deposit monthly replacement reserves of $42,625.
TI/LC Reserves – The Goodyear Portfolio Whole Loan documents did not require an upfront tenant improvement and leasing commission reserve. Ongoing monthly tenant improvement and leasing commission reserves will not be required unless a Critical Tenant Trigger Event has occurred and is continuing under the Goodyear Portfolio Whole Loan documents. In the event a Critical Tenant Trigger Event has occurred, the Goodyear Portfolio Borrower is required to deposit monthly tenant improvement and leasing commission reserve of $17,050.
THE INFORMATION IN THIS STRUCTURAL AND COLLATERAL TERM SHEET IS NOT COMPLETE AND MAY BE AMENDED PRIOR TO THE TIME OF SALE. THIS TERM SHEET IS NOT AN OFFER TO SELL THESE SECURITIES AND IT IS NOT A SOLICITATION OF AN OFFER TO BUY THESE SECURITIES IN ANY JURISDICTION WHERE THE OFFER OR SALE IS NOT PERMITTED.
42
Industrial - Flex Various Akron, OH 44306 | Loan #5
Goodyear Portfolio | Cut-off Date Balance: Cut-off Date LTV: U/W NCF DSCR: U/W NOI Debt Yield: | $34,500,000 57.2% 2.22x 11.1% |
Environmental Reserve – The Goodyear Portfolio Whole Loan documents require an upfront reserve of $35,736 for an environmental insurance policy.
Lockbox and Cash Management.The Goodyear Portfolio Whole Loan documents requires a hard lockbox with an upfront cash management. The Goodyear Portfolio Whole Loan documents require the Goodyear Portfolio Borrower to deliver written notification to the tenants to deposit all rents payable under such leases directly into the clearing account, which is already in place. The Goodyear Portfolio Whole Loan documents also require that all rents received by the Goodyear Portfolio Borrower or the property manager be deposited into the lockbox account within one business day of receipt. All funds in the lockbox account are required to be swept each business day into the cash management account controlled by the lender and disbursed on each payment date in accordance with the loan documents. Pursuant to the Goodyear Portfolio Whole Loan documents, all excess funds on deposit are required to be applied as follows (a) if a Cash Sweep (as defined below) is not in effect, to the Goodyear Portfolio Borrower, and (b) if a Cash Sweep Event is in effect due to the existence of a Critical Tenant Trigger Event (as defined below) to the Critical Tenant TI/LC account until the applicable Critical Tenant Trigger Event cure has occurred. If a Cash Sweep Event is in effect but a Critical Tenant Trigger Event is not in effect, then funds will be applied to the excess cash flow account.
A “Cash Sweep Event” will commence upon the occurrence of the following:
| (i) | an event of default; |
| (ii) | a bankruptcy action of the Goodyear Portfolio Borrower, guarantor or property manager; |
| (iii) | a Cash Sweep DSCR Trigger Event (as defined below); or |
| (iv) | a Critical Tenant Trigger Event (as defined below). |
A Cash Sweep Event will end upon the occurrence of:
| ● | with regard to clause (i) above, the cure of such event of default has been accepted or waived by lender; |
| ● | with regard to clause (ii) above, when such bankruptcy action petition has been discharged, stayed, or dismissed within 90 days of such filing among other conditions for the Goodyear Portfolio Borrower or guarantor and within 120 days for the property manager, or with respect to the property manager, the Goodyear Portfolio Borrower replacing the manager with a qualified manager acceptable to the lender; |
| ● | with regard to clause (iii) above, the date the amortizing debt service coverage ratio based on the trailing 12-month period immediately preceding the date of such determination is greater than 1.20x for one quarter; and |
| ● | with regard to clause (iv) above, a Critical Tenant Trigger Event Period Cure (as defined below). |
A “Cash Sweep DSCR Trigger Event” will occur on any day the debt service coverage ratio, based on the trailing 12-month period immediately preceding the date of determination, is less than 1.10x.
A “Critical Tenant Trigger Event” will occur upon the following:
| (i) | an event of default under the Critical Tenant Lease (as defined below); |
| (ii) | a bankruptcy action of the related Critical Tenant (as defined below) or any guarantor of the Critical Tenant Lease occurs; |
| (iii) | the Critical Tenant elects to pay reduced rent under the Critical Tenant Lease; |
| (iv) | the Critical Tenant or any guarantor discontinues its normal business operations; or |
| (v) | the Critical Tenant is downgraded below “B+” or the equivalent by a credit reporting agency. |
A “Critical Tenant Trigger Event Cure” will occur upon:
| ● | with regard to clause (i), above, after a cure of the applicable default; |
| ● | with regard to clause (ii) above, after an affirmation that the Critical Tenant is actually paying all rents and other amounts under the lease; |
| ● | with regard to clause (iii) above, the Critical Tenant re-commences the payment of full unabated rent; |
| ● | with regard to clause (iv) above, the Critical Tenant re-commences its normal business operations or a Critical Tenant Space Re-Tenanting Event (as defined below) has occurred; or |
| ● | with regard to clause (v) above, the date the credit rating of the related Critical Tenant is no longer less than a “B+” or the equivalent by any credit reporting agency. |
A “Critical Tenant Lease” means the leases between Goodyear and the Goodyear Portfolio Borrower for each of the Innovation Center Property, the North Archwood Property, the Research Center Property, and Tire Testing Property.
A “Critical Tenant” means Goodyear and any other tenant occupying the space currently occupied by Goodyear under a Critical Tenant Lease.
A “Critical Tenant Space Re-tenant Event” will occur on the date each of the following conditions has been satisfied: (i) the space demised under the Critical Tenant Lease has been leased to one or more replacement tenants for a term of at least ten years and on terms that are acceptable to the lender; (ii) all tenant improvement costs, leasing commissions and other material costs and expenses relating to the re-letting of the space have been paid in full; and (iii) the replacement tenant(s) are conducting normal business operations at the space leased under the related Critical Tenant Lease.
Property Management. The Goodyear Portfolio Properties are managed by IRG Realty Advisors, LLC, an affiliate of the Goodyear Portfolio Borrower.
Partial Release. Not permitted.
Real Estate Substitution.Not permitted.
THE INFORMATION IN THIS STRUCTURAL AND COLLATERAL TERM SHEET IS NOT COMPLETE AND MAY BE AMENDED PRIOR TO THE TIME OF SALE. THIS TERM SHEET IS NOT AN OFFER TO SELL THESE SECURITIES AND IT IS NOT A SOLICITATION OF AN OFFER TO BUY THESE SECURITIES IN ANY JURISDICTION WHERE THE OFFER OR SALE IS NOT PERMITTED.
43
Industrial - Flex Various Akron, OH 44306 | Loan #5
Goodyear Portfolio | Cut-off Date Balance: Cut-off Date LTV: U/W NCF DSCR: U/W NOI Debt Yield: | $34,500,000 57.2% 2.22x 11.1% |
PILOT Agreement. The Innovation Tech Center Property is subject to a Declaration of Covenants and Conditions Relative to Service Payments in Lieu of Taxes (“PILOT Agreement”), that commenced January 15, 2015 in lieu of real estate taxes and ending in tax year 2040. Under the PILOT Agreement, in lieu of paying property taxes, the borrower is required to make service payments to the port authority to support the repayment of certain loans that were incurred by the port authority in connection with the redevelopment of the Innovation Tech Center Property and surrounding areas. Such service payments are in an amount which is at least the amount set forth in the PILOT Agreement, and the obligations to pay such service payments are treated in the same matter as real estate taxes for all lien purposes with the same priority as real estate taxes would have had if real estate taxes have been regularly assessed against the Innovation Tech Center Property.
Subordinate and Mezzanine Indebtedness.Townend Real Estate Fund, LP, a fund managed by Prima Capital Advisors purchased the Goodyear Portfolio Subordinate Companion Loan. The Goodyear Portfolio Subordinate Companion Loan is coterminous with the Goodyear Portfolio Senior Loan. The holders of the Goodyear Portfolio Mortgage Loan, the Goodyear PortfolioPari Passu Companion Loan and the Goodyear Portfolio Subordinate Companion Loan have entered into a co-lender agreement with sets for the allocation of collections on the Goodyear Portfolio Whole Loan.
Ground Lease. None.
Terrorism Insurance.The Goodyear Portfolio Whole Loan documents require that the “all risk” insurance policy required to be maintained by the Goodyear Portfolio Borrower provides coverage for terrorism in an amount equal to the full replacement cost of the Goodyear Portfolio Properties, as well as business interruption insurance covering no less than the 18-month period following the occurrence of a casualty event, together with a 12-month extended period of indemnity.
THE INFORMATION IN THIS STRUCTURAL AND COLLATERAL TERM SHEET IS NOT COMPLETE AND MAY BE AMENDED PRIOR TO THE TIME OF SALE. THIS TERM SHEET IS NOT AN OFFER TO SELL THESE SECURITIES AND IT IS NOT A SOLICITATION OF AN OFFER TO BUY THESE SECURITIES IN ANY JURISDICTION WHERE THE OFFER OR SALE IS NOT PERMITTED.
44
| No. 6 – Shreveport Storage Portfolio | |||||||
| Mortgage Loan Information | Mortgaged Property Information | ||||||
| Mortgage Loan Seller: | Wells Fargo Bank, National Association | Single Asset/Portfolio: | Portfolio | ||||
Credit Assessment (Fitch/KBRA/Moody’s): | NR/NR/NR | Property Type – Subtype: | Self Storage – Self Storage | ||||
| Original Principal Balance: | $32,000,000 | Location: | Various – See Table | ||||
| Cut-off Date Balance: | $32,000,000 | Size: | 336,447 SF | ||||
| % of Initial Pool Balance: | 3.4% | Cut-off Date Balance Per SF: | $95.11 | ||||
| Loan Purpose: | Acquisition | Maturity Date Balance Per SF: | $83.75 | ||||
| Borrower Sponsors: | The Coover Living Trust; James Coover; Kathleen Coover | Year Built/Renovated: | Various/NAP | ||||
| Guarantors: | Richard Schontz; Lawrence Charles Kaplan; George W. Thacker, III | Title Vesting: | Fee | ||||
| Mortgage Rate: | 4.7550% | Property Manager: | Storage Asset Management, LLC | ||||
| Note Date: | April 11, 2019 | Current Occupancy (As of): | 90.6% (2/24/2019) | ||||
| Seasoning: | 1 month | YE 2018 Occupancy: | 89.6% | ||||
| Maturity Date: | April 11, 2029 | YE 2017 Occupancy: | 88.4% | ||||
| IO Period: | 36 months | YE 2016 Occupancy: | 90.4% | ||||
| Loan Term (Original): | 120 months | YE 2015 Occupancy: | 90.4% | ||||
| Amortization Term (Original): | 360 months | As-Is Appraised Value: | $43,500,000 | ||||
| Loan Amortization Type: | Interest-only, Amortizing Balloon | As-Is Appraised Value Per SF: | $129.29 | ||||
| Call Protection: | L(25),D(91),O(4) | As-Is Appraisal Valuation Date: | February 25, 2019 | ||||
| Lockbox Type: | Springing | Underwriting and Financial Information | |||||
| Additional Debt: | None | TTM NOI (1/31/2019): | $2,870,071 | ||||
| Additional Debt Type (Balance): | NAP | YE 2018 NOI: | $2,882,368 | ||||
| YE 2017 NOI: | $2,895,122 | ||||||
| YE 2016 NOI: | $2,890,030 | ||||||
| U/W Revenues: | $3,969,850 | ||||||
| U/W Expenses: | $1,191,018 | ||||||
| U/W NOI: | $2,778,832 | ||||||
| Escrows and Reserves(1) | U/W NCF: | $2,728,365 | |||||
| Initial | Monthly | Cap | U/W DSCR based on NOI/NCF: | 1.39x / 1.36x | |||
| Taxes | $84,656 | $21,164 | NAP | U/W Debt Yield based on NOI/NCF: | 8.7% / 8.5% | ||
| Insurance | $0 | Springing | NAP | U/W Debt Yield at Maturity based on NOI/NCF: | 9.9% / 9.7% | ||
| Replacement Reserve | $0 | $4,206 | NAP | Cut-off Date LTV Ratio: | 73.6% | ||
| Immediate Repairs Reserve | $19,688 | $0 | NAP | LTV Ratio at Maturity: | 64.8% | ||
| Sources and Uses | ||||||||
| Sources | Uses | |||||||
| Original whole loan amount | $32,000,000 | 72.8% | Purchase price | $42,942,000 | 97.7% | |||
| Borrower sponsor’s new cash contribution | 11,972,469 | 27.2 | Closing costs | 926,125 | 2.1 | |||
| Upfront reserves | 104,344 | 0.2 | ||||||
| Total Sources | $43,972,469 | 100.0% | Total Uses | $43,972,469 | 100.0% | |||
| (1) | See “Escrows” section below. |
The Mortgage Loan.The mortgage loan (the “Shreveport Storage Portfolio Mortgage Loan”) is evidenced by a single promissory note secured by a first mortgage encumbering the fee interest in three self storage properties located in Shreveport, Louisiana (two properties) and Bossier City, Louisiana (one property; the “Shreveport Storage Portfolio Properties”).
The Borrower and Borrower Sponsors.The borrowers are CSGBSH SPLA I, LLC; CSGBSH SPLA II, LLC; and CSGBSH BCLA I, LLC (collectively, the “Shreveport Storage Portfolio Borrower”), each a Delaware limited liability company and single purpose entity. The borrower sponsors of the Shreveport Storage Portfolio Mortgage Loan are The Coover Living Trust, James Coover, and Kathleen Coover; and the nonrecourse carve-out guarantors are Richard Schontz, Lawrence Charles Kaplan, and George W. Thacker, III.
Mr. Schontz is the President and Chief Executive Officer of City Line Capital, a real estate company he founded in 2017. Throughout his career, Mr. Schontz has completed more than 150 real estate transactions exceeding $880 million.City Line Capital’s self storage portfolio currently includes 56 assets in 15 different U.S. states totaling more than 4 million rentable square feet.
Mr. Kaplan is the managing partner of CSG Partners, a boutique investment bank that he founded in 2001. CSG Partners specializes in three service areas: employee stock ownershipplans(“ESOP”), mergers and acquisitions, and capital advisory services.Mr. Kaplan is a defendant under a lawsuit filed in December 2018 by a former partner related to the former partner’s removal from the
THE INFORMATION IN THIS STRUCTURAL AND COLLATERAL TERM SHEET IS NOT COMPLETE AND MAY BE AMENDED PRIOR TO THE TIME OF SALE. THIS TERM SHEET IS NOT AN OFFER TO SELL THESE SECURITIES AND IT IS NOT A SOLICITATION OF AN OFFER TO BUY THESE SECURITIES IN ANY JURISDICTION WHERE THE OFFER OR SALE IS NOT PERMITTED.
45
Self Storage – Self Storage Various Various | Loan #6
Shreveport Storage Portfolio | Cut-off Date Balance: Cut-off Date LTV: U/W NCF DSCR: U/W NOI Debt Yield: | $32,000,000 73.6% 1.36x 8.7% | |
management of various companies in which Mr. Kaplan holds a majority stake. See“Description of the Mortgage Pool—Litigation and Other Considerations”in the Preliminary Prospectus.
Mr. Thacker is a Managing Director at CSG Partners. In addition to his focus in the firm’s ESOP practice, Mr. Thacker is a member of the real estate arm of CSG Partners and has spent over 10 years advising clients in acquiring approximately $1.0 billion in self storage and multifamily properties across the United States.
The Properties. The Shreveport Storage Portfolio Properties comprise three self storage properties located throughout the Shreveport-Bossier City metropolitan statistical area (“MSA”) with an aggregate of 3,250 units totaling 336,447 square feet of rentable area. The 3,250 total units include 3,132 conventional storage units and 118 vehicle storage units (26 covered and 92 uncovered). The Shreveport Storage Portfolio Properties contain 3,001 climate controlled units (95.8% of all conventional storage units). As of February 24, 2019 the Shreveport Storage Portfolio Properties were 90.6% occupied and have averaged 90.9% occupancy since 2015.
Airline Property
The “Airline Property” is a 1,294-unit (all conventional self storage units), 132,685-square-foot self storage facility located in Bossier City, Louisiana, and situated on a 6.1-acre site. The Airline Property comprises three, one-story buildings that were constructed in 2000 and 2007. Amenities at the Airline Property include surveillance cameras, keypad entry, on-site management, individual unit locks and alarms, and an office and apartment for the resident manager. Approximately 98.5% of units at the Airline Property are climate controlled. As of February 24, 2019 the Airline Property was 89.1% occupied and has averaged 88.3% occupancy since 2015.
EBK Property
The “EBK Property” is a 1,010-unit (943 conventional self storage units and 67 uncovered vehicle storage spaces for RV’s, boats, and automobiles), 107,694-square-foot self storage facility located in Shreveport, Louisiana, and situated on a 6.9-acre site. The EBK Property comprises six, one-story buildings that were constructed in 1997 and 2006. Amenities at the EBK Property include surveillance cameras, individual unit locks, keypad entry, on-site management, and an office and apartment for the resident manager. Approximately 88.2% of the conventional self storage units at the EBK Property are climate controlled. As of February 24, 2019 the EBK Property was 94.7% occupied and has averaged 92.8% occupancy since 2015.
I-49 Property
The “I-49 Property” is a 946-unit (895 conventional self storage units and 51 vehicle storage spaces (26 covered spaces and 25 uncovered spaces)), 96,068-square-foot self storage facility located in Shreveport, Louisiana, and situated on a 6.8-acre site. The I-49 Property comprises four, one-story buildings that were constructed in 2001 and 2005. Amenities at the I-49 Property include surveillance cameras, individual unit locks, keypad entry, on-site management, and an office and apartment for the resident manager.
All 895 conventional self storage units at the I-49 Property are climate controlled. As of February 24, 2019 the I-49 Property was 88.0% occupied and has averaged 92.4% occupancy since 2015.
The following table presents certain information relating to the Shreveport Storage Portfolio Properties:
| Property Name | Year Built/ Renovated | Net Rentable Area (SF)(1) | Net Rentable Area (Units)(1) | Occupancy(1) | % Climate Controlled Units (Conventional) | Allocated Cut-off Date | % of Portfolio Cut-off Date Balance | Appraised Value | U/W NCF |
| Airline | 2000 & 2007/NAP | 132,685 | 1,294 | 89.1% | 98.5% | $10,850,000 | 33.9% | $15,000,000 | $910,440 |
| EBK | 1997 & 2006/NAP | 107,694 | 1,010 | 94.7% | 88.2% | $10,750,000 | 33.6% | $14,500,000 | $961,836 |
| I-49 | 2001 & 2005/NAP | 96,068 | 946 | 88.0% | 100.0% | $10,400,000 | 32.5% | $14,000,000 | $856,089 |
Total/ Weighted Average | 336,447 | 3,250 | 90.6% | 95.8% | $32,000,000 | 100.0% | $43,500,000 | $2,728,365 | |
| (1) | Information obtained from the underwritten unit mix. |
The following table presents historical occupancy percentages at the Shreveport Storage Portfolio Properties:
Historical Occupancy
Property | 12/31/2015(1) | 12/31/2016(1) | 12/31/2017(1) | 12/31/2018(1) | 2/24/2019(2) |
| Airline | 89.9% | 88.1% | 87.2% | 87.9% | 89.1% |
| EBK | 94.6% | 93.8% | 91.9% | 91.0% | 94.7% |
| I-49 | 94.6% | 93.0% | 91.9% | 90.0% | 88.0% |
| Total/Weighted Average | 92.8% | 91.3% | 90.0% | 89.5% | 90.6% |
| (1) | Information obtained from a third party research report. |
| (2) | Information obtained from the underwritten rent roll. |
THE INFORMATION IN THIS STRUCTURAL AND COLLATERAL TERM SHEET IS NOT COMPLETE AND MAY BE AMENDED PRIOR TO THE TIME OF SALE. THIS TERM SHEET IS NOT AN OFFER TO SELL THESE SECURITIES AND IT IS NOT A SOLICITATION OF AN OFFER TO BUY THESE SECURITIES IN ANY JURISDICTION WHERE THE OFFER OR SALE IS NOT PERMITTED.
46
Self Storage – Self Storage Various Various | Loan #6
Shreveport Storage Portfolio | Cut-off Date Balance: Cut-off Date LTV: U/W NCF DSCR: U/W NOI Debt Yield: | $32,000,000 73.6% 1.36x 8.7% | |
Operating History and Underwritten Net Cash Flow. The following table presents certain information relating to the historical operating performance and underwritten net cash flow at the Shreveport Storage Portfolio:
Cash Flow Analysis
| 2016 | 2017 | 2018 | TTM 1/31/2019 | U/W | %(1) | U/W $ per SF | |
| Base Rent | $3,898,420 | $3,900,231 | $3,915,686 | $3,905,888 | $3,924,237 | 88.7% | $11.66 |
| Grossed Up Vacant Space | 0 | 0 | 0 | 0 | 452,976 | 10.3 | 1.35 |
| Gross Potential Rent | $3,898,420 | $3,900,231 | $3,915,686 | $3,905,888 | $4,377,213 | 99.0% | $13.01 |
| Other Income(2) | 47,936 | 45,699 | 45,155 | 45,614 | 45,614 | 1.0 | 0.14 |
| Net Rental Income | $3,946,356 | $3,945,930 | $3,960,840 | $3,951,501 | $4,422,826 | 100.0% | $13.15 |
| (Vacancy & Credit Loss) | 0 | 0 | 0 | 0 | (452,976)(3) | (10.3) | (1.35) |
| Effective Gross Income | $3,946,356 | $3,945,930 | $3,960,840 | $3,951,501 | $3,969,850 | 89.8% | $11.80 |
| Real Estate Taxes | 222,012 | 223,076 | 221,359 | 221,359 | 261,866 | 6.6 | 0.78 |
| Insurance | 74,283 | 75,353 | 77,032 | 77,032 | 158,786 | 4.0 | 0.47 |
| Management Fee | 118,391 | 118,378 | 118,825 | 118,545 | 119,096 | 3.0 | 0.35 |
| Other Operating Expenses | 641,642 | 634,001 | 661,256 | 664,494 | 651,270 | 16.4 | 1.94 |
| Total Operating Expenses | $1,056,327 | $1,050,807 | $1,078,472 | $1,081,430 | $1,191,018 | 30.0% | $3.54 |
| Net Operating Income | $2,890,030 | $2,895,122 | $2,882,368 | $2,870,071 | $2,778,832 | 70.0% | $8.26 |
| Replacement Reserves | 0 | 0 | 0 | 0 | 50,467 | 1.3 | 0.15 |
| TI/LC | 0 | 0 | 0 | 0 | 0 | 0.0 | 0.00 |
| Net Cash Flow | $2,890,030 | $2,895,122 | $2,882,368 | $2,870,071 | $2,728,365 | 68.7% | $8.11 |
| NOI DSCR | 1.44x | 1.44x | 1.44x | 1.43x | 1.39x | ||
| NCF DSCR | 1.44x | 1.44x | 1.44x | 1.43x | 1.36x | ||
| NOI Debt Yield | 9.0% | 9.0% | 9.0% | 9.0% | 8.7% | ||
| NCF Debt Yield | 9.0% | 9.0% | 9.0% | 9.0% | 8.5% |
| (1) | Represents (i) percent of Net Rental Income for all revenue fields, (ii) percent of Gross Potential Rent for Vacancy & Credit Loss and (iii) percent of Effective Gross Income for all other fields. |
| (2) | Other Income includes late fees, administrative fees, merchandise sales, and miscellaneous income and other fees. |
| (3) | The underwritten economic vacancy is 10.3%. As of February 24, 2019, the Shreveport Storage Portfolio was 90.6% occupied. |
Appraisal. The appraiser concluded to an aggregate “as-is” appraised value of $43,500,000 as of February 25, 2019.
Environmental Matters. According to the Phase I environmental site assessments dated February 26, 2019, there was no evidence of any recognized environmental conditions at the Shreveport Storage Portfolio Properties.
Market Overview.All of the Shreveport Storage Portfolio Properties are located within the Shreveport-Bossier City metropolitan statistical area (“MSA”), with the Airline Property located approximately 10.5 miles north of the EBK Property and 14.1 miles north of the I-49 Property, and the EBK Property located approximately 4.0 miles north of the I-49 Property. The Airline Property has an average traffic count of approximately 28,000 vehicles per day and is located approximately 1.1 miles north of Interstate 220, an east-west thoroughfare through Shreveport that leads to the Shreveport Regional Airport (approximately 13.2 miles south west of the Airline Property). The EBK Property has an average traffic count of approximately 46,000 vehicles per day and is located approximately 1.1 miles east of Highway 1 and 3.4 miles east of Interstate 49, which are north-south thoroughfares in the Shreveport-Bossier City MSA. The I-49 Property has an average traffic count of approximately 23,000 vehicles per day and is located approximately 0.6 miles east of Interstate 49.
According to a third party market report, Shreveport is considered to be an educational, commercial and cultural center of the greater Arkansas, Louisiana, and Texas region due to its location bordering Arkansas and Texas. There are numerous higher education institutions in the area, including Louisiana State University Shreveport, Louisiana Tech University Shreveport, Southern University at Shreveport, and Louisiana Baptist University. These institutions reported a combined total enrollment of more than 30,000 students for the 2017-2018 school year. According to the appraisals, the top three industries within the Shreveport-Bossier City MSA are health care/social assistance, retail trade, and educational services, which account for a combined total of approximately 37.0% of the area’s population. Further, the Shreveport-Bossier City MSA has an unemployment rate of 3.6%, which compares favorably to the unemployment rate of Louisiana at 4.9%, and the unemployment rate of United States at 3.9% as of 2018.
According to the appraisals, the five-mile trade area of the Shreveport Storage Portfolio Properties is generally under-supplied with climate controlled self storage units. Approximately 98.5% of the conventional self storage units at the Airline Property are climate controlled compared to the appraiser’s competitive set average of approximately 43.3%. Additionally, approximately 88.2% and 100.0% of the conventional self storage units at the EBK Property and I-49 Property, respectively, are climate controlled compared to the appraiser’s competitive set average of approximately 36.6%.
THE INFORMATION IN THIS STRUCTURAL AND COLLATERAL TERM SHEET IS NOT COMPLETE AND MAY BE AMENDED PRIOR TO THE TIME OF SALE. THIS TERM SHEET IS NOT AN OFFER TO SELL THESE SECURITIES AND IT IS NOT A SOLICITATION OF AN OFFER TO BUY THESE SECURITIES IN ANY JURISDICTION WHERE THE OFFER OR SALE IS NOT PERMITTED.
47
Self Storage – Self Storage Various Various | Loan #6
Shreveport Storage Portfolio | Cut-off Date Balance: Cut-off Date LTV: U/W NCF DSCR: U/W NOI Debt Yield: | $32,000,000 73.6% 1.36x 8.7% | |
According to the appraisals, the Shreveport Storage Portfolio Properties are situated within the Shreveport-Bossier City self storage market, which reported a 10.0% vacancy rate as of the fourth quarter of 2018. The appraiser concluded to market rents for the Shreveport Storage Portfolio Properties of $73 per unit per month for 10x10 non-climate controlled units (compared to average in-place rent of $69) and $125 per unit per month for 10x10 climate controlled units (compared to average in-place rent of $114).
The following table presents certain demographic information with respect to the Shreveport Storage Portfolio Properties:
Demographic Summary(1)
| Property | City | State | 2018 Population (within 1- / 3- / 5-mile radius) | 2018 Average Income (within 1- / 3- / 5-mile radius) |
| Airline | Bossier City | LA | 5,116 / 23,207 / 65,631 | $102,578 / $79,509 / $67,062 |
| EBK | Shreveport | LA | 4,144 / 56,105 / 134,400 | $69,728 / $79,319 / $66,642 |
| I-49 | Shreveport | LA | 1,154 / 41,667 / 102,652 | $75,302 / $76,272 / $75,898 |
| (1) | Based on the 2018 demographic and market information as provided by the appraisal. |
The following table presents certain information relating to some comparable self storage properties for the Airline Property:
Competitive Set(1)
(Airline Property)
Airline Property (Subject) | Best Yet Self Storage | Benton Road Storage Center | Cubby Hole Louisiana Storage 2 | SecurCare Self Storage | Barksdale Self Storage | South Bossier Storage Center | |
| Location | Bossier City, LA | Bossier City, LA | Bossier City, LA | Bossier City, LA | Bossier City, LA | Bossier City, LA | Bossier City, LA |
| Distance to Airline | -- | 3.7 miles | 1.0 mile | 3.2 miles | 4.3 miles | 4.2 miles | 4.3 miles |
| Property Type | Self Storage | Self Storage | Self Storage | Self Storage | Self Storage | Self Storage | Self Storage |
Year Built/ Renovated | 2000 & 2007/ NAP | 2015/NAP | 2013/NAP | 2003/NAP | 2005/NAP | 1984/NAP | 2015/NAP |
| Total Units | 1,294(2) | 400 | 425 | 633 | 454 | 418 | 750 |
| % of Climate Controlled Units | 98.5%(2) | 90.0% | 40.0% | 25.0% | 95.0% | 55.0% | 80.0% |
| Total SF | 132,685 SF(2) | 59,340 SF | 67,182 SF | 52,625 SF | 40,600 SF | 59,630 SF | 91,500 SF |
| Occupancy | 89.1%(2) | 90.0% | 95.0% | 91.0% | 91.0% | 95.0% | 92.0% |
| (1) | Information obtained from the appraisal. |
| (2) | Information obtained from the underwritten rent roll. |
THE INFORMATION IN THIS STRUCTURAL AND COLLATERAL TERM SHEET IS NOT COMPLETE AND MAY BE AMENDED PRIOR TO THE TIME OF SALE. THIS TERM SHEET IS NOT AN OFFER TO SELL THESE SECURITIES AND IT IS NOT A SOLICITATION OF AN OFFER TO BUY THESE SECURITIES IN ANY JURISDICTION WHERE THE OFFER OR SALE IS NOT PERMITTED.
48
Self Storage – Self Storage Various Various | Loan #6
Shreveport Storage Portfolio | Cut-off Date Balance: Cut-off Date LTV: U/W NCF DSCR: U/W NOI Debt Yield: | $32,000,000 73.6% 1.36x 8.7% | |
The following table presents certain information relating to some comparable self storage properties for the EBK Property I-49 Property:
Competitive Set(1)
(EBK Property and I-49 Property)
EBK Property (Subject) | I-49 Property (Subject) | CubeSmart Self Storage | Ellerbe Storage Center | Cubby Hole Louisiana Storage | SecurCare Self Storage | SecurCare Self Storage | Mansfield Road Storage | |
| Location | Shreveport, LA | Shreveport, LA | Shreveport, LA | Shreveport, LA | Shreveport, LA | Shreveport, LA | Shreveport, LA | Shreveport, LA |
| Distance to EBK | -- | 4.0 miles | 3.7 miles | 4.0 miles | 2.2 miles | 0.8 miles | 4.6 miles | 4.7 miles |
| Distance to I-49 | 4.0 miles | -- | 0.3 miles | 0.8 miles | 1.7 miles | 3.1 miles | 3.8 miles | 3.4 miles |
| Property Type | Self Storage | Self Storage | Self Storage | Self Storage | Self Storage | Self Storage | Self Storage | Self Storage |
Year Built/ Renovated | 1997 & 2006/ NAP | 2001 & 2005/ NAP | 1995/NAP | 2006/NAP | 2001/NAP | 1985/NAP | 2000/NAP | 1980/NAP |
| Total Units | 1,010(2)(3) | 946(2)(4) | 655 | 410 | 633 | 383 | 407 | 500 |
| % of Climate Controlled Units | 88.2%(2)(3) | 100.0%(2)(4) | 10.0% | 25.0% | 35.0% | 10.0% | 0.0% | 90.0% |
| Total SF | 107,694 SF(2) | 96,068 SF(2) | 90,000 SF | 61,500 SF | 67,300 SF | 39,000 SF | 40,700 SF | 62,500 SF |
| Total Occupancy | 94.7%(2) | 88.0%(2) | 90.0% | 94.0% | 92.0% | 93.0% | 95.0% | 92.0% |
| (1) | Information obtained from the appraisals. |
| (2) | Information obtained from the underwritten rent rolls. |
| (3) | The EBK Property’s 1,010 total units contain 943 conventional self storage units and 67 uncovered spaces for RV’s, boats, and automobiles. Of the 943 conventional self storage spaces, 832 are climate controlled. |
| (4) | The I-49 Property’s 946 total units contain 895 conventional self storage units and 51 spaces (26 uncovered and 25 covered) for RV’s, boats, and automobiles. All of the 895 conventional self storage spaces are climate controlled. |
Escrows.
Real Estate Taxes – The Shreveport Storage Portfolio Mortgage Loan documents require an upfront real estate tax reserve of $84,656 and ongoing monthly real estate tax reserves in an amount equal to one-twelfth of the real estate taxes that the lender estimates will be payable during the next twelve months (initially $21,164).
Insurance – The Shreveport Storage Portfolio Mortgage Loan documents do not require ongoing monthly escrows for insurance premiums as long as (i) no event of default has occurred and is continuing, (ii) the Shreveport Storage Portfolio Borrower or an affiliate provides the lender with evidence that the Shreveport Storage Portfolio Properties’ insurance coverage is included in a blanket policy and such policy is in full force and effect and (iii) the Shreveport Storage Portfolio Borrower pays all applicable insurance premiums and provides the lender with evidence of timely payment of insurance premiums/renewals.
Replacement Reserves – The Shreveport Storage Portfolio Mortgage Loan documents require ongoing monthly replacement reserves of $4,206.
Immediate Repairs Reserve –The Shreveport Storage Portfolio Mortgage Loan documents require an upfront reserve of $19,688 for immediate repairs, which is 125% of the amount recommended by the property engineering reports dated February 26, 2019.
Lockbox and Cash Management.Upon the occurrence of a Cash Trap Event Period (as defined below), the Shreveport Storage Portfolio Borrower is required to establish a lender-controlled lockbox account and cause all rents to be deposited immediately into such lockbox account. During the continuance of a Cash Trap Event Period, all funds in the lockbox account are required to be swept into the cash management account controlled by the lender and disbursed on each payment date in accordance with the Shreveport Storage Portfolio Mortgage Loan documents and all excess funds are required to be swept to an excess cash flow subaccount controlled by the lender.
A “Cash Trap Event Period” will commence upon the earliest to occur of the following:
| (i) | an event of default under the Shreveport Storage Portfolio Mortgage Loan; or |
| (ii) | the net cash flow debt service coverage ratio falling below 1.15x at the end of any calendar quarter. |
A Cash Trap Event Period will end upon the occurrence of:
| ● | with regard to clause (i) above, the cure of such event of default; or |
| ● | with regard to clause (ii) above, the net cash flow debt service coverage ratio being equal to or greater than 1.20x for two consecutive calendar quarters. |
Property Management. The Shreveport Storage Portfolio Properties are managed by Storage Asset Management, LLC (“SAM”), a property management & consulting company that specializes in self storage properties. With more than 300 employees and 70 years of industry experience, SAM employs a team of district managers, marketing professionals, accountants, store managers and assistant managers. SAM currently manages over 150 properties totaling more than 7.0 million square feet.
THE INFORMATION IN THIS STRUCTURAL AND COLLATERAL TERM SHEET IS NOT COMPLETE AND MAY BE AMENDED PRIOR TO THE TIME OF SALE. THIS TERM SHEET IS NOT AN OFFER TO SELL THESE SECURITIES AND IT IS NOT A SOLICITATION OF AN OFFER TO BUY THESE SECURITIES IN ANY JURISDICTION WHERE THE OFFER OR SALE IS NOT PERMITTED.
49
Self Storage – Self Storage Various Various | Loan #6
Shreveport Storage Portfolio | Cut-off Date Balance: Cut-off Date LTV: U/W NCF DSCR: U/W NOI Debt Yield: | $32,000,000 73.6% 1.36x 8.7% | |
Partial Release. Not permitted.
Real Estate Substitution.Not permitted.
Ground Lease. None.
Terrorism Insurance.The Shreveport Storage Portfolio Mortgage Loan documents require that the “all risk” insurance policy required to be maintained by the Shreveport Storage Portfolio Borrowerprovides coverage for terrorism in an amount equal to the full replacement cost of the Shreveport Storage Portfolio Properties, as well as business interruption insurance covering no less than the 18-month period following the occurrence of a casualty event, together with a six-month extended period of indemnity.
THE INFORMATION IN THIS STRUCTURAL AND COLLATERAL TERM SHEET IS NOT COMPLETE AND MAY BE AMENDED PRIOR TO THE TIME OF SALE. THIS TERM SHEET IS NOT AN OFFER TO SELL THESE SECURITIES AND IT IS NOT A SOLICITATION OF AN OFFER TO BUY THESE SECURITIES IN ANY JURISDICTION WHERE THE OFFER OR SALE IS NOT PERMITTED.
50
| No. 7 – Inland Devon Self Storage Portfolio | |||||||
| Mortgage Loan Information | Mortgaged Property Information | ||||||
| Mortgage Loan Seller: | Barclays Capital Real Estate Inc. | Single Asset/Portfolio: | Portfolio | ||||
Credit Assessment (Fitch/KBRA/Moody’s): | NR/NR/NR | Property Type – Subtype: | Self Storage – Self Storage | ||||
| Original Principal Balance(1): | $30,000,000 | Location: | Various | ||||
| Cut-off Date Balance(1): | $30,000,000 | Size: | 1,428,720 SF | ||||
| % of Initial Pool Balance: | 3.2% | Cut-off Date Balance Per SF(1): | $49.69 | ||||
| Loan Purpose: | Acquisition | Maturity Date Balance Per SF(1): | $45.21 | ||||
| Borrower Sponsor: | Inland Private Capital Corporation | Year Built/Renovated: | Various/Various | ||||
| Guarantor: | Inland Private Capital Corporation | Title Vesting: | Fee | ||||
| Mortgage Rate: | 4.1400% | Property Manager: | Devon Self Storage Holdings (US) LLC | ||||
| Note Date: | March 29, 2019 | Current Occupancy (As of): | 81.3% (3/6/2019) | ||||
| Seasoning: | 1 month | YE 2018 Occupancy: | 82.7% | ||||
| Maturity Date: | April 6, 2029 | YE 2017 Occupancy: | 83.2% | ||||
| IO Period: | 60 months | YE 2016 Occupancy: | 82.3% | ||||
| Loan Term (Original): | 120 months | YE 2015 Occupancy: | 79.1% | ||||
| Amortization Term (Original): | 360 months | Appraised Value: | $122,770,000 | ||||
| Loan Amortization Type: | Interest-only, Amortizing Balloon | Appraised Value Per SF(1): | $85.93 | ||||
| Call Protection: | L(24),GRTR 1% or YM(92),O(4) | Appraisal Valuation Date: | Various | ||||
| Lockbox Type: | Springing | Underwriting and Financial Information | |||||
| Additional Debt(1): | Pari Passu | TTM NOI (2/28/2019): | $7,526,287 | ||||
| Additional Debt Type (Balance)(1): | $41,000,000 | YE 2018 NOI: | $7,407,429 | ||||
| YE 2017 NOI: | $7,135,768 | ||||||
| YE 2016 NOI: | $6,699,524 | ||||||
| U/W Revenues: | $13,394,162 | ||||||
| U/W Expenses: | $6,494,187 | ||||||
| U/W NOI: | $6,899,975 | ||||||
| U/W NCF: | $6,752,457 | ||||||
| Escrows and Reserves(2) | U/W DSCR based on NOI/NCF(1): | 1.67x / 1.63x | |||||
| Initial | Monthly | Cap | U/W Debt Yield based on NOI/NCF(1): | 9.7% / 9.5% | |||
| Taxes | $0 | Springing | NAP | U/W Debt Yield at Maturity based on NOI/NCF(1): | 10.7% / 10.5% | ||
| Insurance | $0 | Springing | NAP | Cut-off Date LTV Ratio(1): | 57.8% | ||
| Replacement Reserve | $142,892 | Springing | $714,460 | LTV Ratio at Maturity(1): | 52.6% | ||
| Major Repair Reserve | $1,232,581 | $0 | NAP | ||||
| Sources and Uses | ||||||||
| Sources | Uses | |||||||
| Original whole amount | $71,000,000 | 58.7% | Purchase price | $118,300,000 | 97.8% | |||
| Sponsor equity | 49,911,054 | 41.3 | Upfront reserves | 1,375,473 | 1.1 | |||
| Closing costs | 1,235,581 | 1.0 | ||||||
| Total Sources | $120,911,054 | 100.0% | Total Uses | $120,911,054 | 100.0% | |||
| (1) | The Inland Devon Self Storage Portfolio Mortgage Loan (as defined below) is part of the Inland Devon Self Storage Portfolio Whole Loan (as defined below), which comprises twopari passunotes with an aggregate original balance of $71,000,000. All statistical information related to the Cut-off Date Balance per SF, U/W Debt Yield based on NOI/NCF, U/W Debt Yield at Maturity Based on NOI/NCF, U/W DSCR based on NOI/NCF, Cut-off Date LTV Ratio and LTV Ratio at Maturity are based on the Inland Devon Self Storage Portfolio Whole Loan. |
| (2) | See “Escrows” section for a full description of Escrows and Reserves. Additionally, and unrelated and separate from the Inland Devon Self Storage Portfolio Whole Loan, the Inland Devon Self Storage Portfolio Borrower (as defined below) funded $6,630,840 into a trust reserve account. Collectively, the Initial Escrows and Reserves and trust reserve account will be used for pay for (i) repairs and replacements of the structure, foundation, roof, exterior walls, and parking lot improvements at the Inland Devon Self Storage Portfolio Properties (as defined below), (ii) leasing commissions, (iii) any environmental costs, (iv) any repairs identified in the property condition reports, (v) insurance deductibles and (vi) any other necessary property improvements at the Inland Devon Self Storage Portfolio Properties. |
THE INFORMATION IN THIS STRUCTURAL AND COLLATERAL TERM SHEET IS NOT COMPLETE AND MAY BE AMENDED PRIOR TO THE TIME OF SALE. THIS TERM SHEET IS NOT AN OFFER TO SELL THESE SECURITIES AND IT IS NOT A SOLICITATION OF AN OFFER TO BUY THESE SECURITIES IN ANY JURISDICTION WHERE THE OFFER OR SALE IS NOT PERMITTED.
51
Self Storage – Self Storage Various Various | Loan #7
Inland Devon Self Storage Portfolio | Cut-off Date Balance: Cut-off Date LTV: U/W NCF DSCR: U/W NOI Debt Yield: | $30,000,000 57.8% 1.63x 9.7% | |
The Mortgage Loan.The mortgage loan (the “Inland Devon Self Storage Portfolio Mortgage Loan”) is part of a whole loan (the “Inland Devon Self Storage Portfolio Whole Loan”) evidenced by twopari passu notes with an original principal balance of $71,000,000 and an outstanding principal balance as of the Cut-off Date of $71,000,000 secured by a first mortgage encumbering the fee interest in 21 self-storage properties located in Tennessee, California, Texas, and Wisconsin (the “Inland Devon Self Storage Portfolio Properties” or the “Inland Devon Self Storage Portfolio”). The Inland Devon Self Storage Portfolio Mortgage Loan represents the non-controlling Note A-2. The controlling Note A-1 is expected to be contributed to a future securitization trust. The lender provides no assurances that the non-securitized note will not be split further. The Inland Devon Self Storage Portfolio Whole Loan will be serviced under the WFCM 2019-C50 pooling and servicing agreement until the securitization of controlling Note A-1, at which time servicing will shift to the pooling and servicing agreement governing the future securitization transaction. See “Description of the Mortgage Pool – The Whole Loans – The Serviced Pari Passu Whole Loans”, “—The Non-Serviced Pari Passu Whole Loans” and “Pooling and Servicing Agreement –Servicing of the Non-Serviced Mortgage Loans” in the Preliminary Prospectus.
Note Summary
| Notes | Original Principal Balance | Cut-off Date Balance | Note Holder | Controlling Interest |
| A-1 | $41,000,000 | $41,000,000 | Barclays Capital Real Estate Inc. | Yes |
| A-2 | $30,000,000 | $30,000,000 | WFCM 2019-C50 | No |
| Total | $71,000,000 | $71,000,000 |
The Borrower and Borrower Sponsor.The borrower is Four State Storage DST (the “Inland Devon Self Storage Portfolio Borrower”), a Delaware statutory trust (“DST”) that is a single purpose, bankruptcy-remote entity. Upon the occurrence of a Conversion Event (as defined below), the Inland Devon Self Storage Portfolio Borrower must convert from a DST to a Delaware limited liability company. The Inland Devon Self Storage Portfolio Borrower has master leased the Inland Devon Self Storage Portfolio Properties to a master lessee affiliated with the borrower sponsor. The master lessee is structured to be a single purpose entity. The master lessee’s interest in the master lease and all rents are assigned to the lender. The borrower sponsor has a 100% ownership interest in the master lessee. The master lease is subordinate to the Inland Devon Self Storage Portfolio Mortgage Loan. There is no income underwritten from the master lease as the Inland Devon Self Storage Portfolio was underwritten to the underlying property income. There is one independent director for the borrowing entity, one independent director for the master lessee and one independent director for the signatory trustee. Legal counsel to the Inland Devon Self Storage Portfolio Borrower delivered a non-consolidation opinion in connection with the origination of the Inland Devon Self Storage Portfolio Whole Loan. See“Description of the Mortgage Pool—Delaware Statutory Trusts” in the Preliminary Prospectus.
A “Conversion Event” will commence upon the earliest of (i) the occurrence of any event of default with respect to which the Inland Devon Self Storage Portfolio Borrower does not deliver within 10 business days a reasoned opinion of tax counsel acceptable to the lender that either (a) the Inland Devon Self Storage Portfolio Borrower is able to remedy such event of default without effectuating a conversion and (b) effectuating a conversion would not reasonably be expected to improve the ability of the Inland Devon Self Storage Portfolio Borrower to remedy the event of default; (ii) 30 days prior to the maturity date if the lender does not have reasonable evidence that the loan will be repaid; or (iii) the Inland Devon Self Storage Portfolio Borrower deeming it prudent to effectuate such conversion.
The borrower sponsor and carve-out guarantor of the Inland Devon Self Storage Portfolio Whole Loan is Inland Private Capital Corporation (“IPCC”). IPCC is an industry leader in securitized 1031 exchange transactions, sponsoring over 231 private placement programs since its inception that have offered more than $4.5 billion in equity and have served over 12,500 investors. According to the sponsor, through December 31, 2018, IPCC-sponsored private placements have been made up of 621 properties comprised of more than 44 million square feet of gross leasable area, including more than 16,500 residential units. As of December 31, 2018, IPCC has $7.3 billion assets under management. IPCC has had previous, and is involved in ongoing, foreclosures unrelated to the Inland Devon Self Storage Portfolio. See “Description of the Mortgage Pool – Loan Purpose; Default History, Bankruptcy Issues and Other Proceedings” in the Preliminary Prospectus.
The Properties. The Inland Devon Self Storage Portfolio is a 21-property, 1,428,720 square-foot self-storage portfolio located in Tennessee (10 properties, 49.3% of NRA), California (six properties, 32.0% of NRA), Texas (four properties, 14.6% of NRA), and Wisconsin (one property, 4.1% of NRA). The properties were constructed from 1966 to 2000 and range in size from 38,892 square feet to 109,255 square feet, with no property comprising of more than 7.6% of the total net rentable area. The Inland Devon Self Storage Portfolio has a total of 10,824 units, 1,735 of which are climate controlled. The Inland Devon Self Storage Portfolio also includes 486 RV/parking units, two billboard spaces, 38 office units and five cell towers. The portfolio was 81.3% occupied as of March 6, 2019.
THE INFORMATION IN THIS STRUCTURAL AND COLLATERAL TERM SHEET IS NOT COMPLETE AND MAY BE AMENDED PRIOR TO THE TIME OF SALE. THIS TERM SHEET IS NOT AN OFFER TO SELL THESE SECURITIES AND IT IS NOT A SOLICITATION OF AN OFFER TO BUY THESE SECURITIES IN ANY JURISDICTION WHERE THE OFFER OR SALE IS NOT PERMITTED.
52
Self Storage – Self Storage Various Various | Loan #7
Inland Devon Self Storage Portfolio | Cut-off Date Balance: Cut-off Date LTV: U/W NCF DSCR: U/W NOI Debt Yield: | $30,000,000 57.8% 1.63x 9.7% | |
The following table presents certain information regarding the Inland Devon Self Storage Properties:
| Property Name – Location | Allocated Cut-off Date Balance | % of Portfolio Cut-off Date Balance | Occupancy | Year Built/ Renovated | Net Rentable Area (SF) | Appraised Value | UW NOI | % of UW NOI | Storage Units |
67650 East Ramon Road Cathedral City, CA | $8,075,000 | 11.4% | 86.8% | 1987/NAP | 109,255 | $14,000,000 | $769,008 | 11.1% | 767 |
2700 Poplar Avenue Memphis, TN | $6,625,000 | 9.3% | 79.7% | 1966/NAV | 92,845 | $11,400,000 | $652,715 | 9.5% | 651 |
1400 South Gene Autry Trail Palm Springs, CA | $4,950,000 | 7.0% | 91.3% | 1987/NAP | 72,875 | $9,100,000 | $456,430 | 6.6% | 547 |
3686 Old Germantown Road Memphis, TN | $4,550,000 | 6.4% | 82.7% | 1986/NAP | 108,906 | $6,900,000 | $475,147 | 6.9% | 841 |
500 Radio Road Palm Springs, CA | $4,500,000 | 6.3% | 95.3% | 1989/NAP | 64,770 | $8,200,000 | $417,653 | 6.1% | 549 |
9275 Macon Road Memphis, TN | $4,450,000 | 6.3% | 76.0% | 1994/NAP | 67,900 | $7,900,000 | $413,771 | 6.0% | 549 |
72500 Varner Road Thousand Palms, CA | $4,225,000 | 6.0% | 82.0% | 1990/NAP | 74,855 | $7,400,000 | $402,153 | 5.8% | 693 |
22075 Highway 18 Apple Valley, CA | $4,050,000 | 5.7% | 87.3% | 1988/NAP | 73,565 | $6,600,000 | $410,341 | 5.9% | 573 |
3040 Austin Peay Highway Memphis, TN | $4,000,000 | 5.6% | 91.7% | 1973/NAP | 71,885 | $6,900,000 | $393,506 | 5.7% | 539 |
18690 Highway 18 Apple Valley, CA | $3,825,000 | 5.4% | 88.8% | 1988/NAP | 61,755 | $6,300,000 | $388,866 | 5.6% | 455 |
1700 US Highway 75 Sherman, TX | $3,450,000 | 4.9% | 89.2% | 1996/NAP | 48,625 | $5,200,000 | $350,318 | 5.1% | 393 |
1720 Loy Lake Road Sherman, TX | $3,200,000 | 4.5% | 77.5% | 1997/NAP | 55,100 | $5,350,000 | $323,594 | 4.7% | 502 |
6140 East Shelby Drive Memphis, TN | $2,900,000 | 4.1% | 87.7% | 1990/NAP | 72,700 | $4,450,000 | $285,489 | 4.1% | 577 |
6017 Interstate 30 Greenville, TX | $2,775,000 | 3.9% | 80.9% | 1990/NAP | 59,585 | $4,890,000 | $257,823 | 3.7% | 445 |
7777 Moriarty Road Memphis, TN | $2,550,000 | 3.6% | 70.3% | 1989/NAP | 54,325 | $4,700,000 | $251,132 | 3.6% | 368 |
8123 Wesley Street Greenville, TX | $1,950,000 | 2.7% | 79.8% | 2000/NAP | 45,100 | $3,480,000 | $182,701 | 2.6% | 307 |
2922 South 5th Court Milwaukee, WI | $1,950,000 | 2.7% | 69.1% | 1983/NAP | 58,700 | $3,400,000 | $183,202 | 2.7% | 488 |
3577 New Getwell Road Memphis, TN | $1,100,000 | 1.5% | 72.7% | 1984/NAP | 96,363 | $2,250,000 | $110,584 | 1.6% | 478 |
5141 American Way Memphis, TN | $875,000 | 1.2% | 84.5% | 1984/NAP | 40,399 | $1,600,000 | $85,611 | 1.2% | 329 |
6390 Winchester Road Memphis, TN | $550,000 | 0.8% | 72.1% | 1985/NAP | 38,892 | $1,200,000 | $53,961 | 0.8% | 316 |
4705 Winchester Road Memphis, TN | $450,000 | 0.6% | 53.2% | 1981/NAP | 60,320 | $1,550,000 | $35,969 | 0.5% | 457 |
| Total/Weighted Average | $71,000,000 | 100.0% | 81.3% | 1,428,720 | $122,770,000 | $6,899,975 | 100.0% | 10,824 |
The following table presents historical occupancy percentages at the Inland Devon Self Storage Portfolio:
Historical Occupancy
12/31/2015(1) | 12/31/2016(1) | 12/31/2017(1) | 12/31/2018(1) | 3/6/2019(2) |
| 79.1% | 82.3% | 83.2% | 82.7% | 81.3% |
| (1) | Information provided by the Inland Devon Self Storage Portfolio Borrower. |
| (2) | Information obtained from the underwritten rent roll. |
THE INFORMATION IN THIS STRUCTURAL AND COLLATERAL TERM SHEET IS NOT COMPLETE AND MAY BE AMENDED PRIOR TO THE TIME OF SALE. THIS TERM SHEET IS NOT AN OFFER TO SELL THESE SECURITIES AND IT IS NOT A SOLICITATION OF AN OFFER TO BUY THESE SECURITIES IN ANY JURISDICTION WHERE THE OFFER OR SALE IS NOT PERMITTED.
53
Self Storage – Self Storage Various Various | Loan #7
Inland Devon Self Storage Portfolio | Cut-off Date Balance: Cut-off Date LTV: U/W NCF DSCR: U/W NOI Debt Yield: | $30,000,000 57.8% 1.63x 9.7% | |
Operating History and Underwritten Net Cash Flow. The following table presents certain information relating to the historical operating performance and underwritten net cash flow at the Inland Devon Self Storage Portfolio Properties:
Cash Flow Analysis
| 2015 | 2016 | 2017 | 2018 | TTM 2/28/2019 | U/W | %(1) | U/W $ per SF | |
| Base Rent | $13,494,459 | $13,847,868 | $14,492,789 | $12,069,652 | $12,138,016 | $12,138,016 | 74.0 | 8.50 |
| Grossed Up Vacant Space | 0 | 0 | 0 | 0 | 0 | 2,999,319 | 18.3 | 2.10 |
| Gross Potential Rent | $13,494,459 | $13,847,868 | $14,492,789 | $12,069,652 | $12,138,016 | $15,137,335 | 92.3% | $10.60 |
| Other Income | 1,079,929 | 1,075,102 | 1,227,424 | 1,238,151 | 1,256,146 | 1,256,146 | 7.7 | 0.88 |
| Net Rental Income | $14,574,388 | $14,922,970 | $15,720,213 | $13,307,803 | $13,394,162 | $16,393,481 | 100.0% | $11.47 |
| (Vacancy & Credit Loss) | (3,315,954) | (3,115,402) | (3,077,179) | (77,556) | 0 | (2,999,319)(2) | (19.8) | (2.10) |
| Effective Gross Income | $11,258,434 | $11,807,568 | $12,643,034 | $13,230,247 | $13,394,162 | $13,394,162 | 81.7% | $9.37 |
| Real Estate Taxes | 1,484,366 | 1,451,932 | 1,527,597 | 1,595,121 | 1,591,735 | 1,893,881 | 14.1 | 1.33 |
| Insurance | 192,430 | 215,381 | 200,104 | 169,551 | 177,660 | 294,873 | 2.2 | 0.21 |
| Management Fee | 629,992 | 368,963 | 392,959 | 412,365 | 415,282 | 669,708 | 5.0 | 0.47 |
| Other Operating Expenses | 3,292,040 | 3,071,768 | 3,386,606 | 3,645,781 | 3,683,198 | 3,635,724 | 27.1 | 2.54 |
| Total Operating Expenses | $5,598,828 | $5,108,044 | $5,507,266 | $5,822,818 | $5,867,875 | $6,494,187 | 48.5% | $4.55 |
| Net Operating Income | $5,659,606 | $6,699,524 | $7,135,768 | $7,407,429 | $7,526,287 | $6,899,975 | 51.5% | $4.83 |
| Replacement Reserves | 142,967 | 142,864 | 142,864 | 142,864 | 142,864 | 147,518 | 1.1 | 0.10 |
| TI/LC | 0 | 0 | 0 | 0 | 0 | 0 | 0.0 | 0.00 |
| Net Cash Flow | $5,516,639 | $6,556,660 | $6,992,905 | $7,264,565 | $7,383,424 | $6,752,457 | 50.4% | $4.73 |
| NOI DSCR | 1.37x | 1.62x | 1.73x | 1.79x | 1.82x | 1.67x | ||
| NCF DSCR | 1.33x | 1.59x | 1.69x | 1.76x | 1.78x | 1.63x | ||
| NOI Debt Yield | 8.0% | 9.4% | 10.1% | 10.4% | 10.6% | 9.7% | ||
| NCF Debt Yield | 7.8% | 9.2% | 9.8% | 10.2% | 10.4% | 9.5% |
| (1) | Represents (i) percent of Net Rental Income for all revenue fields, (ii) percent of Gross Potential Rent for Vacancy & Credit Loss and (iii) percent of Effective Gross Income for all other fields. |
| (2) | The underwritten economic vacancy is 18.3%. The Inland Devon Self Storage Portfolio Properties were 81.3% occupied as of March 6, 2019. |
Appraisal.The appraiser concluded to an “as-is” Appraised Value for the Inland Devon Self Storage Portfolio Properties of $122,770,000 with appraisals dated from March 7, 2019 to March 12, 2019.
Environmental Matters.According to Phase I environmental site assessments dated from January 18, 2019 to January 25, 2019, there was no evidence of any recognized environmental conditions at the Inland Devon Self Storage Portfolio Properties.
Market Overview.The Inland Devon Self Storage Portfolio Properties are located in Tennessee (10 properties, 49.3% of NRA), California (six properties, 32.0% of NRA), Texas (four properties, 14.6% of NRA), and Wisconsin (one property, 4.1% of NRA). According to the appraisals, the Tennessee properties are located in the Memphis metro area with average monthly asking rents of $85.52 and $132.02 for 10x10 non-climate controlled and climate controlled units, respectively. As of year-end 2018, the Memphis Market had physical occupancy of 88.4% for self storage properties. According to the appraisals, the California properties are located within the San Bernardino/Riverside metro area with average monthly asking rents of approximately $113 and $152 for 10x10 non-climate controlled and climate controlled units, respectively. As of year-end 2018, the San Bernardino metro area had 91.6% physical occupancy for self storage properties. According to the appraisals, the Texas properties are located in the Dallas metro area with average monthly asking rents of $116.43 and $152.51 for non-climate controlled and climate controlled units, respectively. As of year-end 2018, the Dallas metro area had 88.9% physical occupancy for self storage properties. According to the appraisal, the Wisconsin property is located in the Milwaukee metro area with asking rents of approximately $91 and $121 for non-climate controlled and climate controlled units, respectively. As of year-end 2018, the Milwaukee metro area had 80.7% physical occupancy for self storage properties.
Escrows.
Real Estate Taxes –The Inland Devon Self Storage Portfolio Borrower is required to make monthly payments of one-twelfth of the taxes payable during the next 12 months upon (i) the occurrence and continuance of an event of default and (ii) the debt service coverage ratio being less than or equal to 1.15x based on a 30-year amortization schedule.
THE INFORMATION IN THIS STRUCTURAL AND COLLATERAL TERM SHEET IS NOT COMPLETE AND MAY BE AMENDED PRIOR TO THE TIME OF SALE. THIS TERM SHEET IS NOT AN OFFER TO SELL THESE SECURITIES AND IT IS NOT A SOLICITATION OF AN OFFER TO BUY THESE SECURITIES IN ANY JURISDICTION WHERE THE OFFER OR SALE IS NOT PERMITTED.
54
Self Storage – Self Storage Various Various | Loan #7
Inland Devon Self Storage Portfolio | Cut-off Date Balance: Cut-off Date LTV: U/W NCF DSCR: U/W NOI Debt Yield: | $30,000,000 57.8% 1.63x 9.7% | |
Insurance –The Inland Devon Self Storage Portfolio Borrower is required to make monthly payments of one-twelfth of the insurance premiums payable during the next 12 months upon (i) the occurrence and continuance of an event of default and (ii) the debt service coverage ratio being less than or equal to 1.15x based on a 30-year amortization schedule.
Replacement Reserves –At closing, the Inland Devon Self Storage Portfolio Borrower deposited $142,892 upfront to cover this year’s monthly replacement reserves. The Inland Devon Self Storage Portfolio Borrower is required to make monthly payments of $11,908 for replacement reserves which may be re-assessed as necessary on an annual basis, capped at $714,460. The Inland Devon Self Storage Portfolio Borrower’s obligation to make replacement reserves will be waived if each of the following conditions are satisfied: (i) the Inland Devon Self Storage Portfolio Borrower has deposited in the replacement reserve account an amount equal to $142,892 (the annual replacement reserve deposit) in either cash or by posting a letter of credit, (ii) no event of default exists, and (iii) the lender has acquired satisfactory evidence of payment of replacement reserves in an amount greater than or equal to $0.10 per square foot per annum.
Major Repair Fund –The Inland Devon Self Storage Portfolio Borrower deposited $1,232,581 for major repairs at the 1720 Loy Lake Road property and the 4705 Winchester Road property. The major repairs at the 1720 Loy Lake Road property are to repair damage caused by a fire in May 2018 affecting approximately 78 units. The required repairs are expected to be completed by May 2019 (but must be completed within two years from the closing date of the Inland Devon Self Storage Portfolio Whole Loan) using insurance funds, however, $123,119 was reserved for these repairs reflecting 120% of the expected cost. The major repairs at the 4705 Winchester Road property include repairs to certain roofs, eaves and gutters due to water damage to approximately 150 units. The required repairs must be completed within four years of the closing date of the Inland Devon Self Storage Portfolio Whole Loan, and $1,109,462 of the major repair fund was reserved for these repairs, reflecting 120% of the expected cost.
Lockbox and Cash Management. A springing lockbox is required with respect to the Inland Devon Self Storage Portfolio Whole Loan. The springing lockbox will be established within five business days of the first occurrence of a Triggering Event (as defined below). During the continuance of a Triggering Event, the Inland Devon Self Storage Portfolio Borrower is required to deposit, or cause to be deposited, all rents into the lockbox account within three business days of receipt. Additionally, upon the occurrence of a Triggering Event, all funds deposited in the lockbox account will be transferred to a cash management account and those funds will be disbursed in accordance with the Inland Devon Self Storage Portfolio Whole Loan documents. During the continuance of an Excess Cash Flow Trigger Event (as defined below), all excess cash flow to be deposited into an excess cash flow reserve to be held as additional security for the Inland Devon Self Storage Portfolio Whole Loan.
A “Triggering Event” will commence upon the earliest of (i) the occurrence and continuance of an event of default and (ii) the debt service coverage ratio being less than 1.20x at the end of any calendar quarter. A Triggering Event will expire with regard to clause (i), the end of such event of default and with respect to clause (ii), the debt service coverage ratio being greater than or equal to 1.25x for two consecutive calendar quarters.
An ”Excess Cash Flow Trigger Event” will commence upon the earliest of (i) the occurrence and continuance of an event of default and (ii) the debt service coverage ratio being less than 1.20x for two or more consecutive calendar quarters. An Excess Cash Flow Trigger Event will end upon, with respect to clause (i) above, the end of such event of default and with respect to clause (ii) above, the debt service coverage ratio being greater than or equal to 1.25x for two consecutive calendar quarters.
Property Management.The Inland Devon Self Storage Portfolio Properties are managed by Devon Self Storage Holdings (US) LLC, a Delaware limited liability company. Devon Self Storage Holdings (US) LLC was the property manager for and had a partial ownership interest in the Inland Devon Self Storage Portfolio prior to the sponsor’s acquisition thereof and is being retained by the sponsor to continue performing the role going forward. Founded in 1988, Devon Self Storage Holdings (US) LLC has owned or managed 183 facilities in 24 states and three European countries and is ranked as one of the top 15 self-storage operators in the United States.
Partial Release.After the lockout period, the Inland Devon Self Storage Portfolio Borrower may release an individual property provided that, among other conditions stated in the Inland Devon Self Storage Portfolio Whole Loan documents, (i) no event of default has occurred and is continuing; (ii) the amount of the Inland Devon Self Storage Portfolio Whole Loan prepaid will exceed 120% of the allocated loan amount; (iii) the debt service coverage ratio for the remaining properties after such release is at least equal to the greater of (a) 1.63x and (b) the debt service coverage ratio for the remaining properties and the released property for the preceding 12 months capped at 1.75x; (iv) the loan-to-value ratio after such release is less than or equal to the lesser of (a) 57.8% and (b) the loan-to-value ratio for the remaining properties and the released property immediately preceding the release of the property; however, this condition does not apply does not apply to the release of any individual property if, after such release, the aggregate allocated loan amounts of all the properties that have been released are less than 20% of the total original principal balance of the Inland Devon Self Storage Portfolio Whole Loan; (v) the debt yield for the remaining properties after such release is greater than or equal to the greater of (a) 9.73% and (b) the debt yield of the remaining properties and the released property for the 12 months prior to such release capped at 10.25%;(vi) rating agency confirmation; and (viii) the payment of the yield maintenance premium (if such partial release occurs prior to January 6, 2029).
Subordinate and Mezzanine Indebtedness.None.
Permitted Additional Unsecured Subordinate Indebtedness.Provided no event of default has occurred and is continuing, the Inland Devon Self Storage Portfolio Borrower may obtain unsecured loans from the guarantor of the Inland Devon Self Storage Portfolio Whole Loan provided that the proceeds of such loans are required to be used solely to pay the monthly debt service payment amount, capital expenditures (as approved by the lender), extraordinary expenses, maintenance expenses, re-tenanting of the Inland Devon Self Storage Portfolio Properties and actual operating expenses as a result of insufficient reserves held by the Inland Devon Self Storage Portfolio Borrower or as a result of insufficient rents being paid. The subordinate debt must at all times be, (i) unsecured, (ii) subordinate
THE INFORMATION IN THIS STRUCTURAL AND COLLATERAL TERM SHEET IS NOT COMPLETE AND MAY BE AMENDED PRIOR TO THE TIME OF SALE. THIS TERM SHEET IS NOT AN OFFER TO SELL THESE SECURITIES AND IT IS NOT A SOLICITATION OF AN OFFER TO BUY THESE SECURITIES IN ANY JURISDICTION WHERE THE OFFER OR SALE IS NOT PERMITTED.
55
Self Storage – Self Storage Various Various | Loan #7
Inland Devon Self Storage Portfolio | Cut-off Date Balance: Cut-off Date LTV: U/W NCF DSCR: U/W NOI Debt Yield: | $30,000,000 57.8% 1.63x 9.7% | |
in all respects to the Inland Devon Self Storage Portfolio Whole Loan pursuant to a subordination and standstill agreement, which is required to be executed and delivered by the guarantor prior to providing the subordinate debt, (iii) without a maturity date, and (iv) evidenced by a promissory note with terms and conditions otherwise acceptable to the lender. Under no circumstances may the subordinate debt be used to make distributions to any beneficial owners of the Inland Devon Self Storage Portfolio Borrower.
Ground Lease.None.
Terrorism Insurance.The Inland Devon Self Storage Portfolio Whole Loan documents require that the “all risk” insurance policy required to be maintained by the Inland Devon Self Storage Portfolio Borrower provides coverage for terrorism in an amount equal to the full replacement cost of the Inland Devon Self Storage Portfolio Properties, as well as business interruption insurance covering no less than the 18-month period following the occurrence of a casualty event, together with a six-month extended period of indemnity.
THE INFORMATION IN THIS STRUCTURAL AND COLLATERAL TERM SHEET IS NOT COMPLETE AND MAY BE AMENDED PRIOR TO THE TIME OF SALE. THIS TERM SHEET IS NOT AN OFFER TO SELL THESE SECURITIES AND IT IS NOT A SOLICITATION OF AN OFFER TO BUY THESE SECURITIES IN ANY JURISDICTION WHERE THE OFFER OR SALE IS NOT PERMITTED.
56
| No. 8 – The Colonnade Office Complex | |||||||
| Mortgage Loan Information | Mortgaged Property Information | ||||||
| Mortgage Loan Seller: | UBS AG | Single Asset/Portfolio: | Single Asset | ||||
Credit Assessment (Fitch/KBRA/Moody’s): | NR/BBB/A3 | Property Type – Subtype: | Office - Suburban | ||||
| Original Principal Balance(1): | $28,000,000 | Location: | Addison, TX | ||||
| Cut-off Date Balance(1): | $28,000,000 | Size: | 1,080,180 SF | ||||
| % of Initial Pool Balance: | 3.0% | Cut-off Date Balance Per SF(1): | $97.21 | ||||
| Loan Purpose: | Refinance | Maturity Date Balance Per SF(1): | $97.21 | ||||
| Borrower Sponsor: | Fortis Property Group, LLC | Year Built/Renovated: | 1983/2017 | ||||
| Guarantor: | Fortis Property Group, LLC | Title Vesting: | Fee | ||||
| Mortgage Rate: | 4.5680% | Property Manager: | Self-managed | ||||
| Note Date: | January 18, 2019 | Current Occupancy (As of): | 91.2% (9/30/2018) | ||||
| Seasoning: | 3 months | YE 2017 Occupancy: | 97.1% | ||||
| Maturity Date: | February 6, 2024 | YE 2016 Occupancy: | 94.2% | ||||
| IO Period: | 60 months | YE 2015 Occupancy: | 94.6% | ||||
| Loan Term (Original): | 60 months | YE 2014 Occupancy: | 94.2% | ||||
| Amortization Term (Original): | NAP | Appraised Value: | $347,590,000 | ||||
| Loan Amortization Type: | Interest-only, Balloon | Appraised Value Per SF: | $321.79 | ||||
| Call Protection(2): | L(27),D(28),O(5) | Appraisal Valuation Date: | October 31, 2018 | ||||
| Lockbox Type: | Hard/Springing Cash Management | ||||||
| Additional Debt(1)(3): | Yes | ||||||
| Additional Debt Type (Balance)(1)(3): | Pari Passu ($77,000,000) / Subordinate Secured Debt ($118,000,000) / Mezzanine ($17,000,000) | ||||||
| Underwriting and Financial Information | |||||||
| TTM NOI (9/30/2018): | $20,063,363 | ||||||
| YE 2017 NOI: | $19,976,818 | ||||||
| YE 2016 NOI: | $18,017,169 | ||||||
| YE 2015 NOI: | $16,949,065 | ||||||
| Escrows and Reserves(4) | U/W Revenues: | $33,260,523 | |||||
| Initial | Monthly | Cap | U/W Expenses: | $13,191,074 | |||
| Taxes | $502,948 | $502,948 | NAP | U/W NOI: | $20,069,449 | ||
| Insurance | $0 | Springing | NAP | U/W NCF: | $18,841,320 | ||
| Replacement Reserve | $0 | $17,987 | NAP | U/W DSCR based on NOI/NCF(1): | 4.12x / 3.86x | ||
| TI/LC Reserve | $4,000,000 | $89,933 | $6,000,000 | U/W Debt Yield based on NOI/NCF(1): | 19.1% / 17.9% | ||
| Immediate Repairs Reserve | $69,163 | $0 | NAP | U/W Debt Yield at Maturity based on NOI/NCF(1): | 19.1% / 17.9% | ||
| Landlord Obligations Reserve | $1,127,202 | $0 | NAP | Cut-off Date LTV Ratio(1): | 30.2% | ||
| Tenant Free Rent Funds Reserve | $631,755 | $0 | NAP | LTV Ratio at Maturity(1): | 30.2% | ||
| Sources and Uses | ||||||||
| Sources | Uses | |||||||
| Original whole loan amount | $223,000,000 | 92.9% | Loan payoff(5) | $213,024,497 | 88.8% | |||
| Mezzanine loan | 17,000,000 | 7.1 | Return of equity | 11,917,495 | 5.0 | |||
| Closing costs | 8,726,941 | 3.6 | ||||||
| Upfront reserves | 6,331,067 | 2.6 | ||||||
| Total Sources | $240,000,000 | 100.0% | Total Uses | $240,000,000 | 100.0% | |||
| (1) | See “The Mortgage Loan” section below. The Cut-off Date Balance per SF, Maturity Date Balance per SF, U/W DSCR based on NOI/NCF, U/W Debt Yield based on NOI/NCF, U/W Debt Yield at Maturity based on NOI/NCF, Cut-off Date LTV Ratio and LTV Ratio at Maturity presented above are based on The Colonnade Office Complex Senior Loan (as defined below). The Cut-off Date Balance per SF, Maturity Date Balance per SF, U/W DSCR based on NOI/NCF, U/W Debt Yield based on NOI/NCF, U/W Debt Yield at Maturity based on NOI/NCF, Cut-off Date LTV Ratio and LTV Ratio at Maturity based on The Colonnade Office Complex Whole Loan (as defined below) are $206, $206, 1.68x, 1.58x, 9.0%, 8.4%, 9.0%, 8.4%, 64.2% and 64.2%, respectively. The Cut-off Date Balance per SF, Maturity Date Balance per SF, U/W DSCR based on NOI/NCF, U/W Debt Yield based on NOI/NCF, U/W Debt Yield at Maturity based on NOI/NCF, Cut-off Date LTV Ratio and LTV Ratio at Maturity based on The Colonnade Office Complex Whole Loan and The Colonnade Office Complex Mezzanine Loan (as defined below) (together, “The Colonnade Office Complex Total Debt”) are $222, $222, 1.43x, 1.34x, 8.4%, 7.9%, 8.4%, 7.9%, 69.0% and 69.0%, respectively. |
| (2) | The lockout period will be at least 27 payments, beginning with and including the first payment date of March 6, 2019. Defeasance of The Colonnade Office Complex Mortgage Loan is permitted at any time after two years after the closing date of the securitization that includes the last note to be securitized. The assumed lockout period of 27 payments is based on the expected WFCM 2019-C50 securitization trust closing date in May 2019. |
| (3) | See “Subordinate and Mezzanine Indebtedness” section below. |
| (4) | See “Escrows” section below. |
| (5) | Loan payoff includes (i) costs to defease in the amount of $163,162,316 and (ii) the payoff of 10 member loans totaling $49,862,182. |
THE INFORMATION IN THIS STRUCTURAL AND COLLATERAL TERM SHEET IS NOT COMPLETE AND MAY BE AMENDED PRIOR TO THE TIME OF SALE. THIS TERM SHEET IS NOT AN OFFER TO SELL THESE SECURITIES AND IT IS NOT A SOLICITATION OF AN OFFER TO BUY THESE SECURITIES IN ANY JURISDICTION WHERE THE OFFER OR SALE IS NOT PERMITTED.
57
Office – Suburban 15301-15305 North Dallas Addison, TX 75001 | Loan #8
The Colonnade Office Complex | Cut-off Date Balance: Cut-off Date LTV: U/W NCF DSCR: U/W NOI Debt Yield: | $28,000,000 30.2% 3.86x 19.1% |
The Mortgage Loan. The mortgage loan (“The Colonnade Office Complex Mortgage Loan”) is part of a whole loan evidenced by (i) 10 seniorpari passu promissory notes with an aggregate original principal balance of $105,000,000 (“The Colonnade Office Complex Senior Loan”), (ii) six B-notes with an aggregate original principal balance of $55,000,000 (“The Colonnade Office Complex B-Note”), which are subordinate to The Colonnade Office Complex Senior Loan and (iii) a C-note with an original principal balance of $63,000,000 (“The Colonnade Office Complex C-Note”), which is subordinate to both The Colonnade Office Complex Senior Loan and The Colonnade Office Complex B-Note (The Colonnade Office Complex B-Note and The Colonnade Office Complex C-Note, collectively, “The Colonnade Office Complex Subordinate Notes”, and together with The Colonnade Office Complex Senior Loan, “The Colonnade Office Complex Whole Loan”). The Colonnade Office Complex Whole Loan is secured by a first mortgage encumbering the fee interest in a 1,080,180 square foot office complex located in Addison, Texas (“The Colonnade Office Complex Property”). The Colonnade Office Complex Mortgage Loan represents the non-controlling Notes A-2-2, A-5, A-6 and A-8. The below table summarizes The Colonnade Office Complex Whole Loan, including the remainingpari passu promissory notes comprising The Colonnade Office Complex Senior Loan, which are currently held by the entities listed below and are expected to be contributed to one or more future securitization trusts. The lender provides no assurances that any non-securitized notes will not be split further or replaced by new notes with reallocated balances. The Colonnade Office Complex Whole Loan will be serviced under the UBS 2019-C16 pooling and servicing agreement. See “Description of the Mortgage Pool—The Whole Loans—The AB Whole Loans” and “Pooling and Servicing Agreement” in the Preliminary Prospectus.
Note Summary
| Notes | Original Principal Balance | Cut-off Date Balance | Note Holder | Controlling Interest |
| A-1, A-2-3, A-4, A-7 | $47,000,000 | $47,000,000 | UBS 2019-C16 | No |
| A-2-1, A-3 | $30,000,000 | $30,000,000 | UBS AG, or an affiliate | No |
| A-2-2, A-5, A-6, A-8 | $28,000,000 | $28,000,000 | WFCM 2019-C50 | No |
| B-1 | $30,000,000 | $30,000,000 | The Lincoln National Life Insurance Company | No |
| B-2 | $5,000,000 | $5,000,000 | Athene Annuity & Life Assurance Company | No |
| B-3 | $5,000,000 | $5,000,000 | Athene Annuity and Life Company | No |
| B-4 | $5,000,000 | $5,000,000 | American Equity Investment Life Insurance Company | No |
| B-5 | $5,000,000 | $5,000,000 | Athene Annuity & Life Assurance Company | No |
| B-6 | $5,000,000 | $5,000,000 | Athene Annuity & Life Assurance Company | No |
| C | $63,000,000 | $63,000,000 | Nonghyup Bank as Trustee for Up Global Private Real Estate Fund V | Yes |
| Total | $223,000,000 | $223,000,000 |
The Borrower and Borrower Sponsor.The borrower is FPG Colonnade, LP (“The Colonnade Office Complex Borrower”), a Delaware limited partnership and single purpose entity. Legal counsel to The Colonnade Office Complex Borrower delivered a non-consolidation opinion in connection with the origination of The Colonnade Office Complex Whole Loan. The nonrecourse carve-out guarantor and borrower sponsor of The Colonnade Office Complex Whole Loan is Fortis Property Group, LLC (“Fortis”).
Fortis is a private U.S. real estate investment, operating and development company based in Brooklyn, New York. Founded in 2005, Fortis has acquired and/or developed approximately 8.0 million square feet throughout the United States, with an emphasis on the Northeast and Dallas, Texas markets. Fortis’ portfolio of developments and properties under management are primarily Class A office and multi-family rental and condominium properties, along with other assets such as retail and industrial.
The Property.The Colonnade Office Complex Property is comprised of three 14-story Class A office buildings totaling 1,080,180 square feet located in Addison, Texas. Situated on an approximately 12.4 acre site, The Colonnade Office Complex Property was constructed in 1983, and renovated between 2015 and 2017. The three buildings are connected by a three-story 70-foot high barrel vaulted glass atrium and an eight-level parking garage with 2,563 parking spaces and 137 surface parking spaces, resulting in a parking ratio of 2.5 spaces per 1,000 square feet. Amenities at The Colonnade Office Complex Property include a fitness facility, a business center, a full service bank, a 6,897 square foot food court, a coffee kiosk, a sundries shop, a conference center, storage spaces, and 24/7 security. The Colonnade Office Complex Property is LEED® Certified Gold for Existing Buildings Operations and Maintenance (LEED-EB O+M), and in 2004 and 2013, The Colonnade Office Complex Property was recognized as Building Owners and Managers Association’s "Building of the Year." Since the borrower sponsor’s acquisition of The Colonnade Office Complex Property in 2013, the borrower sponsor has spent approximately $32.5 million in capital improvements, tenant improvements, leasing commissions, and soft costs at The Colonnade Office Complex Property.
The Colonnade Office Complex Property was 91.2% leased as of September 30, 2018 to 59 office and telecommunications tenants, with approximately 19.6% of NRA and 21.4% of underwritten base rent leased to investment grade tenants. The borrower sponsor acquired The Colonnade Office Complex Property in 2014 with occupancy of 88.8% and subsequent to the capital improvements that the borrower sponsor has implemented, The Colonnade Office Complex Property has averaged occupancy of 95.1% over the past five years. The top three tenants at The Colonnade Office Complex Property are Hilton Domestic Operating Company (14.4% of NRA), USP Texas, L.P. (11.8% of NRA) and HQ Global Workplaces, LLC (5.0% of NRA). No other tenant at The Colonnade Office Complex Property represents more than 4.7% of NRA or 4.9% of underwritten base rent.
THE INFORMATION IN THIS STRUCTURAL AND COLLATERAL TERM SHEET IS NOT COMPLETE AND MAY BE AMENDED PRIOR TO THE TIME OF SALE. THIS TERM SHEET IS NOT AN OFFER TO SELL THESE SECURITIES AND IT IS NOT A SOLICITATION OF AN OFFER TO BUY THESE SECURITIES IN ANY JURISDICTION WHERE THE OFFER OR SALE IS NOT PERMITTED.
58
Office – Suburban 15301-15305 North Dallas Addison, TX 75001 | Loan #8
The Colonnade Office Complex | Cut-off Date Balance: Cut-off Date LTV: U/W NCF DSCR: U/W NOI Debt Yield: | $28,000,000 30.2% 3.86x 19.1% |
Major Tenants.
Largest Tenant: Hilton Domestic Operating Company (Ba2 by Moody’s; 155,572 square feet; 14.4% of net rentable area; 16.7% of underwritten base rent; 1/31/2021 lease expiration) –Hilton Domestic Operating Company is a subsidiary of Hilton Worldwide Holdings (“Hilton”) (NYSE: HIL). Founded in 1919, Hilton is a leading global hospitality company with a portfolio of more than 5,500 properties with nearly 895,000 rooms, in 109 countries and territories. Hilton’s portfolio of 16 brands include Waldorf Astoria Hotels & Resorts, Conrad Hotel & Suites, Hilton Hotels and Resorts, Curio, DoubleTree, Hilton Garden Inn, Hampton, and Hilton Grand Vacations. Hilton manages a customer loyalty program, Hilton Honors, which has over 85 million members as of year-end 2018. Hilton Domestic Operating Company currently occupies 155,572 square feet across nine suites at The Colonnade Office Complex Property. The leases related to seven suites totaling 106,860 square feet (9.9% of NRA, 10.6% of underwritten base rent) have a current expiration date of January 31, 2021 and provide for one, five-year renewal option. The leases related to two suites totaling 48,712 square feet (4.5% of NRA, 5.9% of underwritten base rent) have a current expiration date of November 30, 2023 and provide for one, two-year renewal option. Underwritten base rents for Hilton Domestic Operating Company’s nine suites range from $26.00 to $33.00 per square foot with a weighted average underwritten base rent of $28.96 per square foot. Hilton Domestic Operating Company does not have any termination options.
2nd Largest Tenant: USP Texas, L.P. (B/Caa1 by Fitch/Moody’s; 127,613 square feet; 11.8% of net rentable area; 12.7% of underwritten base rent; 10/31/2025 lease expiration) –United Surgical Partners Texas, L.P. (“USP”) is an ambulatory services provider and a subsidiary of Tenet Healthcare (NYSE: THC), a diversified healthcare services company. USP currently owns and operates over 400 ambulatory facilities, serving more than 9,000 physicians and over 2.5 million patients each year. With a team of approximately 17,000 employees, USP also maintains strategic joint-venture partnerships with more than 4,000 physicians and over 50 health systems nationwide. A tenant at The Colonnade Office Complex Property since January 2003, USP currently occupies six office suites totaling 123,249 square feet and two storage units totaling 4,364 square feet at The Colonnade Office Complex Property. USP pays current underwritten base rent of $27.37 per square foot for its office spaces and $12.00 per square foot for its storage spaces. USP’s lease has a current expiration date of October 31, 2025 and provides for one, five-year renewal option and no termination options.
rd Largest Tenant: HQ Global Workplaces, LLC (54,482 square feet; 5.0% of net rentable area; 5.2% of underwritten base rent; 4/30/2020 lease expiration) –HQ Global Workplaces, LLC (“HQ Global”) is a subsidiary of International Workplace Group (LSE: IWG) (“IWG”), one of the world’s largest providers of flexible workspace solutions for companies of any size. As of year-end 2017, IWG had approximately 3,125 business centers in more than 1,000 cities across over 110 countries. IWG owns and operates internationally renowned brands including HQ, Regus, Spaces, Signature, No 18, Basepoint, and Open Office with office outsourcing services in the Americas, Europe, Middle East, Africa, Asia Pacific, and the United Kingdom. HQ Global currently occupies 52,831 square feet of office space and 1,651 square feet of storage space at The Colonnade Office Complex Property with a lease that commenced on July 1, 2001 and expires on April 30, 2020. HQ Global currently pays underwritten base rent of $23.50 per square foot for 26,356 square feet of office space, $29.00 per square foot for 26,475 square feet of office space, and $12.00 per square foot for its storage space. HQ Global’s lease provides for one, five-year renewal option for its office spaces and no termination option.
THE INFORMATION IN THIS STRUCTURAL AND COLLATERAL TERM SHEET IS NOT COMPLETE AND MAY BE AMENDED PRIOR TO THE TIME OF SALE. THIS TERM SHEET IS NOT AN OFFER TO SELL THESE SECURITIES AND IT IS NOT A SOLICITATION OF AN OFFER TO BUY THESE SECURITIES IN ANY JURISDICTION WHERE THE OFFER OR SALE IS NOT PERMITTED.
59
Office – Suburban 15301-15305 North Dallas Addison, TX 75001 | Loan #8
The Colonnade Office Complex | Cut-off Date Balance: Cut-off Date LTV: U/W NCF DSCR: U/W NOI Debt Yield: | $28,000,000 30.2% 3.86x 19.1% |
The following table presents certain information relating to the tenancy at The Colonnade Office Complex Property:
Major Tenants
| Tenant Name | Credit Rating (Fitch/ Moody’s/S&P)(1) | Tenant NRSF | % of NRSF | Annual U/W Base Rent PSF(2) | Annual U/W Base Rent(2) | % of Total Annual U/W Base Rent | Lease Expiration Date | Extension Options | Termination Option (Y/N) |
| Major Tenants | |||||||||
| Hilton Domestic Operating Company(3) | NR/Ba2/NR | 155,572 | 14.4% | $28.96 | $4,505,134 | 16.7% | 1/31/2021 | 1, 5-year 1, 2-year | N |
| USP Texas, L.P. | B/Caa1/NR | 127,613 | 11.8% | $26.84 | $3,425,416 | 12.7% | 10/31/2025 | 1, 5-year | N |
| HQ Global Workplaces, LLC | NR/NR/NR | 54,482 | 5.0% | $25.82 | $1,406,953 | 5.2% | 4/30/2020 | 1, 5-year | N |
| Google, Inc.(4) | NR/Aa2/NR | 51,260 | 4.7% | $25.30 | $1,296,846 | 4.8% | 2/28/2026 | 2, 5-year | N |
| Systemware(5) | NR/NR/NR | 48,125 | 4.5% | $27.50 | $1,323,438 | 4.9% | 5/31/2022 | 1, 5-year | Y(6) |
| Willis Towers Watson | BBB/Baa3/NR | 46,266 | 4.3% | $27.38 | $1,266,534 | 4.7% | 12/31/2019 | 2, 5-year | N |
| Zurich American Insurance Company(7) | A-/A1/NR | 43,711 | 4.0% | $25.12 | $1,097,946 | 4.1% | 4/30/2027 | 2, 5-year | N |
| GenCorp Technologies, Inc. | NR/NR/NR | 41,082 | 3.8% | $26.58 | $1,091,892 | 4.1% | 2/28/2029 | 1, 5-year | N |
| RMG Enterprise Solutions, Inc. | NR/NR/NR | 31,255 | 2.9% | $29.00 | $906,395 | 3.4% | 3/31/2025 | 1, 5-year | Y(8) |
| Dillon Gage Incorporated of Dallas | NR/NR/NR | 28,874 | 2.7% | $27.07 | $781,509 | 2.9% | 5/31/2025 | 1, 5-year | N |
| Total Major Tenants | 628,240 | 58.2% | $27.22 | $17,102,061 | 63.6% | ||||
| Non-Major Tenants | 356,626 | 33.0% | $27.50 | $9,807,281 | 36.4% | ||||
| Occupied Collateral Total | 984,866 | 91.2% | $27.32 | $26,909,342 | 100.0% | ||||
| Vacant Space | 95,314 | 8.8% | |||||||
| Collateral Total | 1,080,180 | 100.0% | |||||||
| (1) | Certain ratings are those of the parent company whether or not the parent company guarantees the lease. |
| (2) | Annual U/W Base Rent PSF and Annual U/W Base Rent include contractual rent steps through March 2020 totaling $318,819. |
| (3) | Seven suites totaling 106,860 square feet have a current expiration date of January 31, 2021 with one, five-year renewal option and two suites totaling 48,712 square feet have a current expiration date of November 30, 2023 with one, two-year renewal option. |
| (4) | Three suites totaling 38,180 square feet have a current expiration date of February 28, 2026 and one suite totaling 13,080 square feet has a current expiration date of May 31, 2020. In addition, at origination of The Colonnade Office Complex Whole Loan, $89,271 was reserved for free rent with respect to the Google, Inc. lease. |
| (5) | At origination of The Colonnade Office Complex Whole Loan, $220,573 was reserved for free rent with respect to the Systemware lease. |
| (6) | Systemware has a one-time option to terminate its lease effective May 31, 2020 with at least 12-months’ written notice of such cancellation and payment of a termination fee equal to two months of then applicable base rent and the outstanding balance of leasing costs amortized over a 60-month term at 8%; provided, however, that such termination option will terminate if Systemware leases more than 5,000 square feet of additional space at The Colonnade Office Complex Property. |
| (7) | Two suites totaling 38,540 square feet have a current expiration date of April 30, 2027 and one suite totaling 5,171 square feet has a current expiration date of September 30, 2022. |
| (8) | RMG Enterprise Solutions, Inc. has a one-time option to terminate its lease effective December 31, 2021 with written notice, no earlier than 12 months prior and no later than nine months prior, of such cancellation and payment of a termination fee equal to five months of then applicable base rent and the outstanding balance of leasing costs amortized over its lease term at 8%; provided, however, that such termination option will terminate if RMG Enterprise Solutions, Inc. leases additional space at The Colonnade Office Complex Property. |
THE INFORMATION IN THIS STRUCTURAL AND COLLATERAL TERM SHEET IS NOT COMPLETE AND MAY BE AMENDED PRIOR TO THE TIME OF SALE. THIS TERM SHEET IS NOT AN OFFER TO SELL THESE SECURITIES AND IT IS NOT A SOLICITATION OF AN OFFER TO BUY THESE SECURITIES IN ANY JURISDICTION WHERE THE OFFER OR SALE IS NOT PERMITTED.
60
Office – Suburban 15301-15305 North Dallas Addison, TX 75001 | Loan #8
The Colonnade Office Complex | Cut-off Date Balance: Cut-off Date LTV: U/W NCF DSCR: U/W NOI Debt Yield: | $28,000,000 30.2% 3.86x 19.1% |
The following table presents certain information relating to the lease rollover schedule at The Colonnade Office Complex Property:
Lease Expiration Schedule(1)(2)
| Year Ending December 31, | No. of Leases Expiring | Expiring NRSF | % of Total NRSF | Cumulative Expiring NRSF | Cumulative % of Total NRSF | Annual U/W Base Rent(3) | % of Total Annual U/W Base Rent | Annual U/W Base Rent PSF(3) |
| MTM | 2 | 265 | 0.0% | 265 | 0.0% | $5,120 | 0.0% | $19.32 |
| 2019 | 11 | 75,469 | 7.0% | 75,734 | 7.0% | $1,912,030 | 7.1% | $25.34 |
| 2020 | 16 | 117,650 | 10.9% | 193,384 | 17.9% | $3,079,500 | 11.4% | $26.18 |
| 2021 | 18 | 192,308 | 17.8% | 385,692 | 35.7% | $5,429,641 | 20.2% | $28.23 |
| 2022 | 21 | 134,351 | 12.4% | 520,043 | 48.1% | $3,936,641 | 14.6% | $29.30 |
| 2023 | 9 | 109,232 | 10.1% | 629,275 | 58.3% | $3,081,821 | 11.5% | $28.21 |
| 2024 | 1 | 8,558 | 0.8% | 637,833 | 59.0% | $196,811 | 0.7% | $23.00 |
| 2025 | 18 | 229,231 | 21.2% | 867,064 | 80.3% | $6,232,731 | 23.2% | $27.19 |
| 2026 | 3 | 38,180 | 3.5% | 905,244 | 83.8% | $979,656 | 3.6% | $25.66 |
| 2027 | 2 | 38,540 | 3.6% | 943,784 | 87.4% | $963,500 | 3.6% | $25.00 |
| 2028 | 0 | 0 | 0.0% | 943,784 | 87.4% | $0 | 0.0% | $0.00 |
| 2029 | 8 | 41,082 | 3.8% | 984,866 | 91.2% | $1,091,892 | 4.1% | $26.58 |
| Thereafter | 0 | 0 | 0.0% | 984,866 | 91.2% | $0 | 0.0% | $0.00 |
| Vacant | 0 | 95,314 | 8.8% | 1,080,180 | 100.0% | $0 | 0.0% | $0.00 |
| Total/Weighted Average | 109 | 1,080,180 | 100.0% | $26,909,342 | 100.0% | $27.32 |
| (1) | Information obtained from the underwritten rent roll. |
| (2) | Certain tenants may have lease termination options that are exercisable prior to the originally stated expiration date of the subject lease and that are not considered in the Lease Expiration Schedule. |
| (3) | Total/Weighted Average Annual U/W Base Rent and Annual U/W Base Rent PSF exclude vacant space. |
The following table presents historical occupancy percentages at The Colonnade Office Complex Property:
Historical Occupancy
12/31/2014(1) | 12/31/2015(1) | 12/31/2016(1) | 12/31/2017(1) | 9/30/2018(2) |
| 94.2% | 94.6% | 94.2% | 97.1% | 91.2% |
| (1) | Information obtained from The Colonnade Office Complex Borrower. |
| (2) | Information obtained from the underwritten rent roll. |
THE INFORMATION IN THIS STRUCTURAL AND COLLATERAL TERM SHEET IS NOT COMPLETE AND MAY BE AMENDED PRIOR TO THE TIME OF SALE. THIS TERM SHEET IS NOT AN OFFER TO SELL THESE SECURITIES AND IT IS NOT A SOLICITATION OF AN OFFER TO BUY THESE SECURITIES IN ANY JURISDICTION WHERE THE OFFER OR SALE IS NOT PERMITTED.
61
Office – Suburban 15301-15305 North Dallas Addison, TX 75001 | Loan #8
The Colonnade Office Complex | Cut-off Date Balance: Cut-off Date LTV: U/W NCF DSCR: U/W NOI Debt Yield: | $28,000,000 30.2% 3.86x 19.1% |
Operating History and Underwritten Net Cash Flow. The following table presents certain information relating to the underwritten net cash flow at The Colonnade Office Complex Property:
Cash Flow Analysis
| 2015 | 2016 | 2017 | TTM 9/30/2018 | U/W | %(1) | U/W $ per SF | |||||||||
| Rents in Place | $25,083,835 | $25,712,275 | $27,530,368 | $27,615,394 | $26,590,522 | 73.0% | $24.62 | ||||||||
| Contractual Rent Steps(2) | 0 | 0 | 0 | 0 | 410,211 | 1.1 | 0.38 | ||||||||
| Grossed Up Vacant Space | 0 | 0 | 0 | 0 | 2,230,380 | 6.1 | 2.06 | ||||||||
| Gross Potential Rent | $25,083,835 | $25,712,275 | $27,530,368 | $27,615,394 | $29,231,113 | 80.3% | $27.06 | ||||||||
| Other Income | 1,257,497 | 906,483 | 1,087,285 | 1,050,028 | 1,075,323 | 3.0 | 1.00 | ||||||||
| Total Recoveries | 2,897,988 | 3,417,382 | 3,850,829 | 3,521,436 | 6,118,569 | 16.8 | 5.66 | ||||||||
| Net Rental Income | $29,239,321 | $30,036,140 | $32,468,482 | $32,186,858 | $36,425,006 | 100.0% | $33.72 | ||||||||
| (Vacancy & Credit Loss) | 0 | 0 | 0 | 0 | (3,164,483)(3) | (10.8) | (2.93) | ||||||||
| Effective Gross Income | $29,239,321 | $30,036,140 | $32,468,482 | $32,186,858 | $33,260,523 | 91.3% | $30.79 | ||||||||
| Real Estate Taxes | 4,630,522 | 4,759,713 | 4,969,763 | 4,464,863 | 5,890,787 | 17.7 | 5.45 | ||||||||
| Insurance | 183,318 | 189,099 | 192,657 | 194,728 | 172,361 | 0.5 | 0.16 | ||||||||
| Management Fee | 1,138,944 | 1,156,907 | 1,317,837 | 1,333,793 | 997,816 | 3.0 | 0.92 | ||||||||
| Other Operating Expenses | 6,337,472 | 5,913,252 | 6,011,406 | 6,130,111 | 6,130,111 | 18.4 | 5.68 | ||||||||
| Total Operating Expenses | $12,290,256 | $12,018,971 | $12,491,663 | $12,123,495 | $13,191,074 | 39.7% | $12.21 | ||||||||
| Net Operating Income | $16,949,065 | $18,017,169 | $19,976,818 | $20,063,363 | $20,069,449 | 60.3% | $18.58 | ||||||||
| Replacement Reserves | 0 | 0 | 0 | 0 | 86,414 | 0.3 | 0.08 | ||||||||
| TI/LC | 0 | 0 | 0 | 0 | 1,141,715 | 3.4 | 1.06 | ||||||||
| Net Cash Flow | $16,949,065 | $18,017,169 | $19,976,818 | $20,063,363 | $18,841,320 | 56.6% | $17.44 | ||||||||
| NOI DSCR(4) | 3.48x | 3.69x | 4.10x | 4.11x | 4.12x | ||||||||||
| NCF DSCR(4) | 3.48x | 3.69x | 4.10x | 4.11x | 3.86x | ||||||||||
| NOI Debt Yield(4) | 16.1% | 17.2% | 19.0% | 19.1% | 19.1% | ||||||||||
| NCF Debt Yield(4) | 16.1% | 17.2% | 19.0% | 19.1% | 17.9% |
| (1) | Represents (i) percent of Net Rental Income for all revenue fields, (ii) percent of Gross Potential Rent for Vacancy & Credit Loss and (iii) percent of Effective Gross Income for all other fields. |
| (2) | Represents (i) contractual rent steps through March 2020 totaling $318,819 and (ii) straight line rent averaging for investment grade tenants totaling $91,392. |
| (3) | The underwritten economic vacancy is 9.0%. The Colonnade Office Complex Property was 91.2% physically occupied as of September 30, 2018. |
| (4) | Based on The Colonnade Office Complex Senior Loan. |
THE INFORMATION IN THIS STRUCTURAL AND COLLATERAL TERM SHEET IS NOT COMPLETE AND MAY BE AMENDED PRIOR TO THE TIME OF SALE. THIS TERM SHEET IS NOT AN OFFER TO SELL THESE SECURITIES AND IT IS NOT A SOLICITATION OF AN OFFER TO BUY THESE SECURITIES IN ANY JURISDICTION WHERE THE OFFER OR SALE IS NOT PERMITTED.
62
Office – Suburban 15301-15305 North Dallas Addison, TX 75001 | Loan #8
The Colonnade Office Complex | Cut-off Date Balance: Cut-off Date LTV: U/W NCF DSCR: U/W NOI Debt Yield: | $28,000,000 30.2% 3.86x 19.1% |
Appraisal. The appraiser concluded to an “as-is” appraised value of $347,590,000 as of October 31, 2018.
Environmental Matters. According to a Phase I environmental site assessment dated November 8, 2018, there was no evidence of any recognized environmental conditions at The Colonnade Office Complex Property.
Market Overview and Competition.The Colonnade Office Complex Property is located along Dallas North Tollway in Addison, Dallas County, Texas. The Colonnade Office Complex Property is approximately 15.0 miles north of downtown Dallas, approximately 14.0 miles southwest of Plano, and approximately 29.9 miles northeast of Arlington. The neighborhood surrounding The Colonnade Office Complex Property consists primarily of retail and office development. Immediate access to The Colonnade Office Complex Property is provided by the Dallas North Tollway and Arapaho Road. Regional access to The Colonnade Office Complex Property is provided by Interstate 635 (2.9 miles south) and the President George Bush Turnpike (SH 190) (4.9 miles south). Public transportation in the area is provided by Dallas Area Rapid Transit, which services Dallas and 12 surrounding cities. The Colonnade Office Complex Property is located two blocks east of the Addison Transit Center, which is expected to become a station along the planned Cotton Belt Rail Line, according to the appraisal.
The Colonnade Office Complex Property is located in the Dallas-Fort Worth-Arlington metropolitan statistical area (the “Dallas MSA”). The Dallas MSA has a population of approximately 7.4 million, making it the fourth largest metropolitan statistical area in the United States. Major industries in the Dallas MSA economy include banking, commerce, telecommunications, technology, energy, healthcare and medical research, and transportation and logistics. In 2017, the Dallas MSA was home to 22 Fortune 500 companies, the third largest concentration of Fortune 500 companies in the nation, behind New York City and Chicago. Major employers in the Dallas MSA include Bank of America Corp., Texas Health Resources, Inc., Baylor Health Care System, AT&T, and JP Morgan & Chase Co. According to the appraisal, corporate relocations to the Dallas MSA in recent years include Toyota, Liberty Mutual, and State Farm.
Additional national retailers and restaurants within close proximity of The Colonnade Office Complex Property include Whole Foods Market, Walgreens, In-N-Out Burger, Whataburger, Outback Steakhouse, BJ’s Restaurants and Brewhouse, Chipotle, and McDonald’s. Nearby retail centers include Prestonwood Town Center (0.5 miles east), which is anchored by Walmart Supercenter, Michael’s, Best Buy, and DSW, as well as Addison Town Center (2.2 miles west), which is anchored by Target, Kroger, and PetSmart. The Galleria Mall, located approximately 2.4 miles south of The Colonnade Office Complex Property off North Dallas Parkway, is a regional mall anchored by Nordstrom, Macy’s, and Saks Fifth Avenue. Other retailers at the Galleria Mall include Tiffany, Gucci, Rolex, Bachendorf’s, Versace, and Louis Vuitton. The Galleria Mall has over 200 stores and restaurants and features an indoor ice skating rink. Nationally flagged hospitality properties are concentrated southwest of The Colonnade Office Complex Property, including Marriott, Renaissance, Courtyard by Marriott, Radisson Hotel, Hyatt House, and Residence Inn.
According to a third party market research report, the estimated 2018 population within a one-, three- and five-mile radius of The Colonnade Office Complex Property was 10,587, 143,954 and 373,092, respectively, and the 2018 estimated average household income within the same one-, three- and five-mile radius was $95,316, $97,719 and $101,781, respectively.
Submarket Information – According to a third-party market research report, The Colonnade Office Complex Property is situated within the Far North Dallas office submarket cluster. The Far North Dallas office submarket cluster contains approximately 64.7 million square feet of office space with a vacancy rate of 15.1% and an average asking rental rate of $28.66 per square foot NNN as of the third quarter of 2018. The Far North Dallas office submarket cluster experienced positive year to date net absorption of 666,235 square feet at the end of the third quarter of 2018.
Appraiser’s Comp Set – The appraiser identified five competitive properties built between 1982 and 2018 ranging in size from approximately 240,000 square feet to 549,170 square feet. The appraiser’s competitive set reported rent from $23.00 per square foot to $32.00 per square foot, with a weighted average rent of $25.93 per square foot. The appraisal indicated a market rent of $24.00 per square foot for office space.
The table below presents certain information relating to comparable sales for The Colonnade Office Complex Property identified by the appraiser:
Comparable Sales(1)
| Property Name | Location | Rentable Area (SF) | Sale Date | Sale Price | Sale Price (PSF) |
| Granite Park VII | Plano, TX | 322,917 | Sep-18 | $163,000,000 | $504.77 |
| 3838 Oak Lawn Avenue | Dallas, TX | 319,977 | Jul-17 | $121,000,000 | $378.15 |
| State Farm Campus | Richardson, TX | 2,262,902 | Oct-16 | $825,000,000 | $364.58 |
| 3102 Oak Lawn Avenue | Dallas, TX | 508,536 | Jun-18 | $177,538,139 | $349.12 |
| Parkside Tower | Dallas, TX | 378,088 | Mar-17 | $112,139,737 | $296.60 |
| (1) | Information obtained from the appraisal. |
THE INFORMATION IN THIS STRUCTURAL AND COLLATERAL TERM SHEET IS NOT COMPLETE AND MAY BE AMENDED PRIOR TO THE TIME OF SALE. THIS TERM SHEET IS NOT AN OFFER TO SELL THESE SECURITIES AND IT IS NOT A SOLICITATION OF AN OFFER TO BUY THESE SECURITIES IN ANY JURISDICTION WHERE THE OFFER OR SALE IS NOT PERMITTED.
63
Office – Suburban 15301-15305 North Dallas Addison, TX 75001 | Loan #8
The Colonnade Office Complex | Cut-off Date Balance: Cut-off Date LTV: U/W NCF DSCR: U/W NOI Debt Yield: | $28,000,000 30.2% 3.86x 19.1% |
The table below presents certain information relating to five comparable office properties to The Colonnade Office Complex Property identified by the appraiser:
Competitive Set(1)
| The Colonnade Office Complex (Subject) | Millennium Tower | Fourteen 555 North Building | Pinnacle Tower | One Galleria Tower | North Park Central | |
| Location | Addison, TX | Addison, TX | Dallas, TX | Dallas, TX | Dallas, TX | Dallas, TX |
| Distance from Subject | -- | 0.2 miles | 1.1 miles | 2.1 miles | 2.3 miles | 9.4 miles |
| Property Type | Office/Suburban | Office/Suburban | Office/Suburban | Office/Suburban | Office/Suburban | Office/Suburban |
| Year Built/Renovated | 1983/2017 | 1999/NAP | 2018/NAP | 1986/NAP | 1982/1991 | 1984/1994 |
| Total GLA | 1,080,180 SF | 357,102 SF | 240,000 SF | 549,170 SF | 477,790 SF | 508,102 SF |
| Total Occupancy | 91.2% | 80.0% | 85.0% | 91.0% | 88.0% | 92.0% |
| (1) | Information obtained from the appraisal and the underwritten rent roll. |
The following table presents certain information relating to five comparable leases to those at The Colonnade Office Complex Property:
Comparable Leases(1)
| Property Name/Location | Year Built/ Renovated | Total GLA (SF) | Distance from Subject | Occupancy | Lease Term | Tenant Size | Annual Base Rent PSF |
Millennium Tower 15455 Dallas Parkway Addison, TX | 1999/NAP | 357,102 | 0.2 miles | 80.0% | 5.0 Yrs | 9,633 SF | $23.00 |
Fourteen 555 North Building 14555 North Dallas Parkway Dallas, TX | 2018/NAP | 240,000 | 1.1 miles | 85.0% | 5.0 Yrs | 120,000 SF | $32.00 |
Pinnacle Tower 5005 LBJ Freeway Dallas, TX | 1986/NAP | 549,170 | 2.1 miles | 91.0% | 10.0 Yrs | 8,509 SF | $24.50 |
One Galleria Tower 13355 Noel Road Dallas, TX | 1982/1991 | 477,790 | 2.3 miles | 88.0% | 5.0 Yrs | 9,936 SF | $28.50 |
North Park Central 8750 North Central Expressway Dallas, TX | 1984/1994 | 508,102 | 9.4 miles | 92.0% | 5.0 Yrs | 6,938 SF | $24.25 |
| (1) | Information obtained from the appraisal. |
THE INFORMATION IN THIS STRUCTURAL AND COLLATERAL TERM SHEET IS NOT COMPLETE AND MAY BE AMENDED PRIOR TO THE TIME OF SALE. THIS TERM SHEET IS NOT AN OFFER TO SELL THESE SECURITIES AND IT IS NOT A SOLICITATION OF AN OFFER TO BUY THESE SECURITIES IN ANY JURISDICTION WHERE THE OFFER OR SALE IS NOT PERMITTED.
64
Office – Suburban 15301-15305 North Dallas Addison, TX 75001 | Loan #8
The Colonnade Office Complex | Cut-off Date Balance: Cut-off Date LTV: U/W NCF DSCR: U/W NOI Debt Yield: | $28,000,000 30.2% 3.86x 19.1% |
Escrows.
Real Estate Taxes – The loan documents require an upfront real estate tax reserve of $502,948 and ongoing monthly real estate tax reserves in an amount equal to one-twelfth of the real estate taxes that the lender estimates will be payable during the next twelve months (initially $502,948).
Insurance – The loan documents do not require ongoing monthly escrows for insurance premiums as long as The Colonnade Office Complex Borrower maintains a blanket policy acceptable to the lender.
Replacement Reserves –The loan documents require ongoing monthly replacement reserves of $17,987 for replacements and repairs required to be made to The Colonnade Office Complex Property during the calendar year.
TI/LC Reserve –The loan documents require an upfront reserve of $4,000,000 for TI/LCs and ongoing monthly TI/LC reserves of $89,933 (subject to a cap of $6,000,000).
Immediate Repairs Reserve – The loan documents require an upfront reserve of $69,163 for immediate repairs.
Landlord Obligations Reserve – The loan documents require an upfront reserve of $1,127,202 for outstanding landlord obligations with respect to USP Texas, L.P. ($495,495), Google, Inc. ($378,835), HQ Global Workplaces, LLC ($158,136) and Mitsui Sumitomo Marine Management (U.S.A.), Inc. ($94,736).
Tenant Free Rent Funds Reserve –The loan documents require an upfront reserve of $631,755 for free rent with respect to Systemware ($220,573), Dillon Gage Incorporated of Dallas ($148,292), Hiersche, Hayward, Drakeley & Urbach, P.C. ($103,842), Google, Inc. ($89,271), Roth Staffing Companies, L.P. ($19,273), Accounting Principals, Inc. ($18,899), Mitsui Sumitomo Marine Management (U.S.A.), Inc. ($16,757) and Mente Group, LLC ($14,848).
Lockbox and Cash Management.The Colonnade Office Complex Whole Loan documents require a hard lockbox with springing cash management. The Colonnade Office Complex Borrower was required at origination of The Colonnade Office Complex Whole Loan to deliver written instructions to tenants directing them to deposit all rents payable under such leases directly into a lender-controlled lockbox account. The Colonnade Office Complex Whole Loan documents require that all rents received by The Colonnade Office Complex Borrower or the property manager be deposited into the lockbox account within one business day of receipt. Funds in the lockbox account, absent the occurrence and continuance of a Triggering Event (as defined below), are required to be transferred daily to a borrower operating account. Upon the first occurrence of a Triggering Event, The Colonnade Office Complex Borrower is required to establish a cash management account under sole control of the lender, to which, during a Triggering Event, all amounts in the lockbox account are required to be automatically transferred daily for the payment, among other things, of the debt service, monthly escrows, default interest and late payment charges. Absent the continuance of a Cash Sweep Period (as defined below), any remaining funds after such disbursements are required to be distributed to The Colonnade Office Complex Borrower. Upon a Cash Sweep Period, all remaining excess cash flow will be escrowed in an excess cash flow reserve account (provided, however, that if a Cash Sweep Period has occurred solely as a result of a Material Tenant Trigger Event (as defined below), then such amount will be applied to a Material Tenant (as defined below) reserve account).
A “Triggering Event” will commence upon the earliest to occur of the following:
| (i) | an event of default under The Colonnade Office Complex Whole Loan documents or The Colonnade Office Complex Mezzanine Loan documents; |
| (ii) | the debt service coverage ratio for the immediately preceding 12-month period of The Colonnade Office Complex debt, including The Colonnade Office Complex Mezzanine Loan (the “Cumulative DSCR”), falling below 1.15x for two consecutive calendar quarters; |
| (iii) | the date on which The Colonnade Office Complex Borrower, the guarantor, or the property manager becomes insolvent or a debtor in a bankruptcy action; |
| (iv) | an indictment for fraud or misappropriation of funds by The Colonnade Office Complex Borrower, the guarantor, Louis Kestenbaum, Joel Kestenbaum or the property manager (provided, that in the case of a third party manager, such indictment is related to The Colonnade Office Complex Property); or |
| (v) | a Material Tenant Trigger Event. |
A Triggering Event will end upon the occurrence of:
| ● | with regard to clause (i) above, the cure of such event of default; |
| ● | with regard to clause (ii) above, the Cumulative DSCR being at least 1.20x for two consecutive calendar quarters; |
| ● | with regard to clause (iii) above, such bankruptcy action petition having been discharged, stayed, or dismissed within 120 days of such filing among other conditions, or with respect to the property manager, The Colonnade Office Complex Borrower having replaced the property manager with a qualified property manager acceptable to the lender; |
| ● | with regard to clause (iv) above, (a) the dismissal of the applicable indictment, (b) the acquittal of each applicable person with respect to the related charge(s) or (c) the replacement of the property manager with a qualified manager under a replacement property management agreement; or |
| ● | with regard to clause (v) above, the cure of such Material Tenant Trigger Event. |
THE INFORMATION IN THIS STRUCTURAL AND COLLATERAL TERM SHEET IS NOT COMPLETE AND MAY BE AMENDED PRIOR TO THE TIME OF SALE. THIS TERM SHEET IS NOT AN OFFER TO SELL THESE SECURITIES AND IT IS NOT A SOLICITATION OF AN OFFER TO BUY THESE SECURITIES IN ANY JURISDICTION WHERE THE OFFER OR SALE IS NOT PERMITTED.
65
Office – Suburban 15301-15305 North Dallas Addison, TX 75001 | Loan #8
The Colonnade Office Complex | Cut-off Date Balance: Cut-off Date LTV: U/W NCF DSCR: U/W NOI Debt Yield: | $28,000,000 30.2% 3.86x 19.1% |
A “Cash Sweep Period” will commence upon the earliest to occur of the following:
| (i) | an event of default under The Colonnade Office Complex Whole Loan documents or The Colonnade Office Complex Mezzanine Loan documents; |
| (ii) | the Cumulative DSCR falling below 1.10x for two consecutive calendar quarters; |
| (iii) | the date on which The Colonnade Office Complex Borrower, the guarantor, or the property manager becomes insolvent or a debtor in a bankruptcy action; or |
| (iv) | a Material Tenant Trigger Event. |
A Cash Sweep Period will end upon the occurrence of:
| ● | with regard to clause (i) above, the cure of such event of default; |
| ● | with regard to clause (ii) above, the Cumulative DSCR being at least 1.15x for two consecutive calendar quarters; |
| ● | with regard to clause (iii) above, such bankruptcy action petition having been discharged, stayed, or dismissed within 120 days of such filing among other conditions, or with respect to the property manager, The Colonnade Office Complex Borrower having replaced the property manager with a qualified property manager acceptable to the lender; or |
| ● | with regard to clause (iv) above, the cure of such Material Tenant Trigger Event. |
A “Material Tenant Trigger Event” will commence upon the occurrence of:
| (i) | a Material Tenant giving notice of its intent to terminate or not to extend or renew its lease; |
| (ii) | on or prior to twelve months prior to the expiration date of a Material Tenant’s lease, the related Material Tenant failing to extend or renew its lease; |
| (iii) | on or prior to the date on which a Material Tenant is required under its lease to provide notification of its election to renew its lease, such Material Tenant failing to give such notice; |
| (iv) | a monetary or a material non-monetary event of default under a Material Tenant lease that continues beyond any applicable notice and cure period; |
| (v) | any Material Tenant or any guarantor of the applicable Material Tenant lease becoming insolvent or a debtor in any bankruptcy action; |
| (vi) | a Material Tenant lease being terminated, in whole or in part, or being no longer in full force and effect; provided that with respect to a partial termination, such partial termination relates to a portion of a Material Tenant’s space that (a) makes up 10% or more of the total net rentable square footage or (b) is responsible for 10% or more of the total base rent of The Colonnade Office Complex Property; or |
| (vii) | any Material Tenant “going dark”, vacating or ceasing to occupy or conduct business at its space or a portion thereof constituting 10% or more of the total net rentable area at The Colonnade Office Complex Property. |
Notwithstanding the above, if the Cumulative DSCR excluding the rent paid or payable by such Material Tenant is at least 1.30x, no event relating to clause (i), (ii), or (iii) of this definition constitutes as a Material Tenant Trigger Event.
A Material Tenant Trigger Event will end upon the occurrence of:
| ● | with regard to clause (i) above, (a) the revocation or rescission by the applicable Material Tenant of all termination or cancellation notices with respect to such Material Tenant lease, (b) an acceptable Material Tenant lease extension with respect to the applicable Material Tenant space, or (c) all of the applicable Material Tenant space being leased to a replacement tenant; |
| ● | with regard to clauses (ii) and (iii) above, (x) an acceptable Material Tenant lease extension with respect to such Material Tenant space or (y) all of the applicable Material Tenant space being leased to a replacement tenant; |
| ● | with regard to clause (iv) above, a cure of the applicable event of default under the applicable Material Tenant lease; |
| ● | with regard to clause (v) above, an affirmation of the Material Tenant lease in the applicable bankruptcy proceeding and confirmation that the Material Tenant is actually paying all rents and other amounts due under its lease; |
| ● | with regard to clause (vi) above, all of the applicable Material Tenant space being leased to a replacement tenant; or |
| ● | with regard to clause (vii) above, the applicable Material Tenant having re-opened for business or the applicable Material Tenant space being leased to an acceptable replacement tenant. |
A “Material Tenant” shall mean (i) Hilton Domestic Operating Company, (ii) USP, or (iii) any tenant whose leases, either individually or when taken together with any other lease with the same tenant or affiliate tenant, (x) cover no less than 10% of the net rentable area at The Colonnade Office Complex Property or (y) require the payment of base rent that is no less than 10% of the total in-place base rent at The Colonnade Office Complex Property.
Property Management. The Colonnade Office Complex Property is managed by an affiliate of The Colonnade Office Complex Borrower.
Partial Release. Not permitted.
Real Estate Substitution.Not permitted.
Subordinate and Mezzanine Indebtedness.The Colonnade Office Complex B-Note, which has an original principal value of $55.0 million, is subordinate to The Colonnade Office Complex Senior Loan and accrues interest at a rate of 5.2500%per annum. The Colonnade Office Complex C-Note, which has an original principal value of $63.0 million, is subordinate to The Colonnade Office Complex B-Note and accrues interest at a rate of 6.4700%per annum. The Colonnade Office Complex Subordinate Notes are coterminous with The Colonnade Office Complex Senior Loan. The holders of The Colonnade Office Complex Senior Loan and The Colonnade Office Complex Subordinate Notes have entered into a co-lender agreement that sets forth the allocation of collections on
THE INFORMATION IN THIS STRUCTURAL AND COLLATERAL TERM SHEET IS NOT COMPLETE AND MAY BE AMENDED PRIOR TO THE TIME OF SALE. THIS TERM SHEET IS NOT AN OFFER TO SELL THESE SECURITIES AND IT IS NOT A SOLICITATION OF AN OFFER TO BUY THESE SECURITIES IN ANY JURISDICTION WHERE THE OFFER OR SALE IS NOT PERMITTED.
66
Office – Suburban 15301-15305 North Dallas Addison, TX 75001 | Loan #8
The Colonnade Office Complex | Cut-off Date Balance: Cut-off Date LTV: U/W NCF DSCR: U/W NOI Debt Yield: | $28,000,000 30.2% 3.86x 19.1% |
The Colonnade Office Complex Whole Loan. Based on The Colonnade Office Complex Whole Loan, the cumulative Cut-off Date LTV Ratio, cumulative U/W NCF DSCR and cumulative U/W NOI Debt Yield are 64.2%, 1.58x and 9.0%, respectively.
The Colonnade Office Complex Mezzanine Loan is comprised of a mezzanine loan in the original principal amount of $17.0 million, which is secured by the direct equity ownership in The Colonnade Office Complex Borrower. The Colonnade Office Complex Mezzanine Loan accrues interest at a rate of 12.0000%per annum and is coterminous with The Colonnade Office Complex Whole Loan. Including The Colonnade Office Complex Whole Loan and The Colonnade Office Complex Mezzanine Loan, the total Cut-off Date LTV Ratio, total U/W NCF DSCR and total U/W NOI Debt Yield are 69.0%, 1.34x and 8.4%, respectively. The lenders of The Colonnade Office Complex Whole Loan and The Colonnade Office Complex Mezzanine Loan have entered into an intercreditor agreement that governs their relationship.
Ground Lease. None.
Terrorism Insurance.The Colonnade Office Complex Borrower is required to obtain and maintain property insurance, commercial general liability insurance, and business income insurance that covers perils of terrorism and acts of terrorism, both foreign and domestic, provided that if the Terrorism Risk Insurance Program Reauthorization Act of 2015 or a subsequent statute is not in effect, The Colonnade Office Complex Borrower will not be required to pay annual premiums in excess of two times the property and business interruption insurance premiums required under The Colonnade Office Complex Whole Loan documents. See “Risk Factors—Risks Relating to the Mortgage Loans—Terrorism Insurance May Not Be Available for All Mortgaged Properties” in the Preliminary Prospectus.
THE INFORMATION IN THIS STRUCTURAL AND COLLATERAL TERM SHEET IS NOT COMPLETE AND MAY BE AMENDED PRIOR TO THE TIME OF SALE. THIS TERM SHEET IS NOT AN OFFER TO SELL THESE SECURITIES AND IT IS NOT A SOLICITATION OF AN OFFER TO BUY THESE SECURITIES IN ANY JURISDICTION WHERE THE OFFER OR SALE IS NOT PERMITTED.
67
| No. 9 – Mariner’s Landing | |||||||
| Mortgage Loan Information | Mortgaged Property Information | ||||||
| Mortgage Loan Seller: | Wells Fargo Bank, National Association | Single Asset/Portfolio: | Single Asset | ||||
Credit Assessment (Fitch/KBRA/Moody’s): | NR/NR/NR | Property Type – Subtype: | Mixed Use – Office/Industrial | ||||
| Original Principal Balance: | $27,000,000 | Location: | Sausalito, CA | ||||
| Cut-off Date Balance: | $27,000,000 | Size: | 84,801 SF | ||||
| % of Initial Pool Balance: | 2.9% | Cut-off Date Balance Per SF: | $318.39 | ||||
| Loan Purpose: | Refinance | Maturity Date Balance Per SF: | $318.39 | ||||
| Borrower Sponsor: | Daniel H. Morgan | Year Built/Renovated: | 1970/2018 | ||||
| Guarantors: | Daniel H. Morgan; Morgan Family 2018 Trust | Title Vesting: | Fee | ||||
| Mortgage Rate: | 4.7500% | Property Manager: | Self-managed | ||||
| Note Date: | March 21, 2019 | Current Occupancy (As of): | 94.6% (2/14/2019) | ||||
| Seasoning: | 1 month | YE 2018 Occupancy: | 96.5% | ||||
| Maturity Date: | April 11, 2029 | YE 2017 Occupancy: | 90.8% | ||||
| IO Period: | 120 months | YE 2016 Occupancy: | 97.8% | ||||
| Loan Term (Original): | 120 months | YE 2015 Occupancy: | 99.0% | ||||
| Amortization Term (Original): | NAP | As-Is Appraised Value: | $42,000,000 | ||||
| Loan Amortization Type: | Interest-only, Balloon | As-Is Appraised Value Per SF: | $495.28 | ||||
| Call Protection: | L(25),D(88),O(7) | As-Is Appraisal Valuation Date: | February 5, 2019 | ||||
| Lockbox Type: | Springing Cash Management | ||||||
| Additional Debt(1): | Yes | ||||||
| Additional Debt Type(1): | Future Mezzanine | Underwriting and Financial Information | |||||
| YE 2018 NOI(3): | $1,636,738 | ||||||
| YE 2017 NOI: | $1,673,298 | ||||||
| YE 2016 NOI(3): | $1,694,469 | ||||||
| YE 2015 NOI(3): | $1,386,892 | ||||||
| U/W Revenues: | $3,159,584 | ||||||
| Escrows and Reserves(2) | U/W Expenses: | $789,735 | |||||
| Initial | Monthly | Cap | U/W NOI(3): | $2,369,850 | |||
| Taxes | $21,603 | $21,603 | NAP | U/W NCF: | $2,303,458 | ||
| Insurance | $22,510 | $11,255 | NAP | U/W DSCR based on NOI/NCF: | 1.82x / 1.77x | ||
| Replacement Reserve | $0 | Springing | NAP | U/W Debt Yield based on NOI/NCF: | 8.8% / 8.5% | ||
| TI/LC Reserve | $1,000,000 | $16,888 | $300,000 | U/W Debt Yield at Maturity based on NOI/NCF: | 8.8% / 8.5% | ||
| Gap Rent Reserve | $28,336 | $0 | NAP | Cut-off Date LTV Ratio: | 64.3% | ||
| Existing TI Reserve | $117,000 | $0 | NAP | LTV Ratio at Maturity: | 64.3% | ||
| Sources and Uses | ||||||||
| Sources | Uses | |||||||
| Original loan amount | $27,000,000 | 98.5% | Loan payoff(4) | $23,874,177 | 87.1% | |||
| Cash equity contribution | 418,278 | 1.5 | Mezzanine loan payoff | 1,739,186 | 6.3 | |||
| Upfront reserves | 1,072,449 | 3.9 | ||||||
| Closing costs | 732,466 | 2.7 | ||||||
| Total Sources | $27,418,278 | 100.0% | Total Uses | $27,418,278 | 100.0% | |||
| (1) | See “Subordinate and Mezzanine Indebtedness” section below. |
| (2) | See “Escrows” section below. |
| (3) | See “Cash Flow Analysis” section below for details regarding the increase in NOI from 2015 to 2016 and from 2018 to U/W. |
| (4) | The proceeds from the Mariner’s Landing Mortgage Loan (as defined below) were used to refinance existing CMBS debt previously securitized in the GSMS 2013-GC16 trust. |
The Mortgage Loan. The mortgage loan (the “Mariner’s Landing Mortgage Loan”) is evidenced by a single promissory note secured by a first mortgage encumbering the fee interest in a six-building, mixed use office/industrial property located in Sausalito, California (the “Mariner’s Landing Property”).
The Borrower and Borrower Sponsor.The borrower is Mariner’s Landing, LLC (the “Mariner’s Landing Borrower”), a Delaware limited liability company and single purpose entity. The borrower sponsor of the Mariner’s Landing Mortgage Loan is Daniel H. Morgan, and the nonrecourse carve-out guarantors are Daniel H. Morgan, individually and as trustee of the Morgan Family 2018 Trust.
Mr. Morgan is a real estate developer in Northern California with 37 years of experience. Since 1982, Mr. Morgan has developed and sold 18 residential subdivisions totaling approximately 1,898 homes and has been involved in six commercial property investments,
THE INFORMATION IN THIS STRUCTURAL AND COLLATERAL TERM SHEET IS NOT COMPLETE AND MAY BE AMENDED PRIOR TO THE TIME OF SALE. THIS TERM SHEET IS NOT AN OFFER TO SELL THESE SECURITIES AND IT IS NOT A SOLICITATION OF AN OFFER TO BUY THESE SECURITIES IN ANY JURISDICTION WHERE THE OFFER OR SALE IS NOT PERMITTED.
68
Mixed Use – Office/Industrial Various Sausalito, California 94965 | Loan #9
Mariner’s Landing | Cut-off Date Balance: Cut-off Date LTV: U/W NCF DSCR: U/W NOI Debt Yield: | $27,000,000 64.3% 1.77x 8.8% |
including office, retail, warehouse, mixed-use and other property types. An affiliate of Mr. Morgan was involved in a mortgage default regarding a Coachella, CA residential subdivision development that resulted in a discounted pay-off in October 2010. See “Description of the Mortgage Pool— Loan Purpose; Default History, Bankruptcy Issues and Other Proceedings” in the Preliminary Prospectus.
The Property.The Mariner’s Landing Property comprises six, one- and two-story class B mixed-use industrial/office buildings, situated on four non-contiguous parcels (see “Partial Release” section below), totaling 84,801 square feet of rentable area. Constructed in 1970 and renovated in 2018, the Mariner’s Landing Property contains a variety of buildouts, including traditional office, artistic office (for design and production), traditional retail, and manufacturing and warehouse spaces. Recent renovations total approximately $2.7 million and include updates to exterior siding, HVAC and electrical circuits, roofing and flooring. The net rentable area of the Mariner’s Landing Property comprises approximately 67.5% office/art/production space, 26.9% warehouse, and 5.6% retail. As of February 14, 2019, the Mariner’s Landing Property was 94.6% leased to 34 tenants with an average occupancy rate of 95.7% since 2010.
The two largest tenants at the Mariner’s Landing Property are Oculus VR (a virtual reality company owned by Facebook) and CP Shades Inc. (“CP Shades”), which collectively account for 48.3% of net rentable area and 52.5% of underwritten base rent. No other tenant at the Mariner’s Landing Property accounts for more than 3.8% of net rentable area or 5.7% of underwritten base rent.
Major Tenants.
Largest Tenant: Oculus VR (21,394 square feet; 25.2% of net rentable area; 30.5% of underwritten base rent; 9/30/2025 lease expiration) – Founded in 2012, and acquired by Facebook in 2014, Oculus VR is a technology company that develops virtual reality products. Oculus VR has been a tenant at the Mariner’s Landing Property since November of 2015 and recently expanded its space from approximately 7,430 square feet to 21,394 square feet in September 2018, investing approximately $8.5 million ($400 per square foot) of its own funds. The entire Oculus VR space is subject to one, three-year renewal option or two, two-year renewal options following its September 2025 lease expiration. Oculus VR has the right to terminate its lease with respect to all or a portion of its premises on September 20, 2023 with notice by March 1, 2023, subject to a termination fee equal to all unamortized brokerage and attorney fees.
2nd Largest Tenant: CP Shades (19,605 square feet; 23.1% of net rentable area; 22.0% of underwritten base rent; 12/31/2022 lease expiration) – Founded in 1973, CP Shades mass produces handmade clothing and uses its space at the Mariner’s Landing Property as its headquarters, sewing facility and warehouse. CP Shades has been a tenant at the Mariner’s Landing Property since 2005 and has expanded five times since 2009 (most recently in November 2017), from approximately 5,300 square feet to 19,605 square feet.The tenant has one, 1- to 5-year renewal option remaining following its December 2022 lease expiration.
The following table presents certain information relating to the tenancy at the Mariner’s Landing Property:
Major Tenants
| Tenant Name | Credit Rating (Fitch/Moody’s/ S&P) | Tenant NRSF | % of NRSF | Annual U/W Base Rent PSF(1) | Annual U/W Base Rent(1) | % of Total Annual U/W Base Rent | Lease Expiration Date | Extension Options | Termination Option (Y/N) |
| Major Tenants | |||||||||
| Oculus VR | NR/NR/NR | 21,394 | 25.2% | $42.53(2) | $909,890(2) | 30.5% | 9/30/2025 | 2, 2-yr or 1, 3-yr | Y(3) |
| CP Shades Inc. | NR/NR/NR | 19,605 | 23.1% | $33.42 | $655,200 | 22.0% | 12/31/2022 | 1, 1-5 year | N |
| Carve Designs, Inc.(4) | NR/NR/NR | 3,220 | 3.8% | $52.80 | $170,016 | 5.7% | 4/30/2023(5) | 1, 5-year | N |
| RePower Capital | NR/NR/NR | 2,694 | 3.2% | $36.70 | $98,868 | 3.3% | 8/31/2023 | 1, 3-year | N |
| Ready Set Go Therapy Inc. | NR/NR/NR | 2,467 | 2.9% | $34.20 | $84,371 | 2.8% | 2/28/2021 | NAP | Y(6) |
| Total Major Tenants | 49,380 | 58.2% | $38.85 | $1,918,345 | 64.4% | ||||
| Non-Major Tenants | 30,871 | 36.4% | $34.35 | $1,060,534 | 35.6% | ||||
| Occupied Collateral Total | 80,251 | 94.6% | $37.12 | $2,978,879 | 100.0% | ||||
| Vacant Space | 4,550 | 5.4% | |||||||
| Collateral Total | 84,801 | 100.0% | |||||||
| (1) | Annual U/W Base Rent PSF and Annual U/W Base Rent include contractual rent steps through April 2020 totaling $62,241 and straight line rent averaging through September 2025 for Oculus VR totaling $78,539. |
| (2) | Represents the straight line average over the remaining lease term for Oculus VR, which is owned by Facebook. Oculus VR’s current weighted average rental rate is $38.86. |
| (3) | Oculus VR has the right to terminate its lease with respect to all or a portion of its premises on September 20, 2023 with notice by March 1, 2023, subject to a termination fee equal to all unamortized brokerage and attorney fees. |
THE INFORMATION IN THIS STRUCTURAL AND COLLATERAL TERM SHEET IS NOT COMPLETE AND MAY BE AMENDED PRIOR TO THE TIME OF SALE. THIS TERM SHEET IS NOT AN OFFER TO SELL THESE SECURITIES AND IT IS NOT A SOLICITATION OF AN OFFER TO BUY THESE SECURITIES IN ANY JURISDICTION WHERE THE OFFER OR SALE IS NOT PERMITTED.
69
Mixed Use – Office/Industrial Various Sausalito, California 94965 | Loan #9
Mariner’s Landing | Cut-off Date Balance: Cut-off Date LTV: U/W NCF DSCR: U/W NOI Debt Yield: | $27,000,000 64.3% 1.77x 8.8% |
| (4) | The Mariner’s Landing Borrower is currently building out Carve Designs, Inc.’s (“Carve”) space and the tenant has not yet taken occupancy or commenced paying rent. Carve has a signed lease and is expected to take occupancy and begin paying rent on April 15, 2019. The Mariner’s Landing Borrower deposited an upfront reserve of $28,336 for gap rent related to Carve. |
| (5) | Carve’s lease expiration is based on when the tenant takes occupancy and begins paying rent. The lease expiration date shown assumes an occupancy and rent commencement date of April 15, 2019. |
| (6) | Ready Set GO Therapy Inc. has the right to terminate its lease at any time on or after Feb 28, 2020, with 90 days’ notice. |
The following table presents certain information relating to the lease rollover schedule at the Mariner’s Landing Property:
Lease Expiration Schedule(1)(2)
| Year Ending December 31, | No. of Leases Expiring | Expiring NRSF | % of Total NRSF | Cumulative Expiring NRSF | Cumulative % of Total NRSF | Annual U/W Base Rent(3) | % of Total Annual U/W Base Rent | Annual U/W Base Rent PSF(3) |
| MTM | 7 | 5,027 | 5.9% | 5,027 | 5.9% | $127,812 | 4.3% | $25.43 |
| 2019 | 8 | 7,354 | 8.7% | 12,381 | 14.6% | $243,475 | 8.2% | $33.11 |
| 2020 | 2 | 1,288 | 1.5% | 13,669 | 16.1% | $49,320 | 1.7% | $38.29 |
| 2021 | 3 | 5,706 | 6.7% | 19,375 | 22.8% | $202,150 | 6.8% | $35.43 |
| 2022 | 7 | 26,703 | 31.5% | 46,078 | 54.3% | $920,953 | 30.9% | $34.49 |
| 2023 | 5 | 10,792 | 12.7% | 56,870 | 67.1% | $453,747 | 15.2% | $42.04 |
| 2024 | 0 | 0 | 0.0% | 56,870 | 67.1% | $0 | 0.0% | $0.00 |
| 2025 | 1 | 21,394 | 25.2% | 78,264 | 92.3% | $909,890 | 30.5% | $42.53 |
| 2026 | 0 | 0 | 0.0% | 78,264 | 92.3% | $0 | 0.0% | $0.00 |
| 2027 | 0 | 0 | 0.0% | 78,264 | 92.3% | $0 | 0.0% | $0.00 |
| 2028 | 1 | 1,987 | 2.3% | 80,251 | 94.6% | $71,532 | 2.4% | $36.00 |
| 2029 | 0 | 0 | 0.0% | 80,251 | 94.6% | $0 | 0.0% | $0.00 |
| Thereafter | 0 | 0 | 0.0% | 80,251 | 94.6% | $0 | 0.0% | $0.00 |
| Vacant | 0 | 4,550 | 5.4% | 84,801 | 100.0% | $0 | 0.0% | $0.00 |
| Total/Weighted Average | 34 | 84,801 | 100.0% | $2,978,879 | 100.0% | $37.12 |
| (1) | Information obtained from the underwritten rent roll. |
| (2) | Certain tenants may have lease termination options that are exercisable prior to the originally stated expiration date of the subject lease and that are not considered in the Lease Expiration Schedule. |
| (3) | Total/Weighted Average Annual U/W Base Rent and Annual U/W Base Rent PSF exclude vacant space. |
The following table presents historical occupancy percentages at the Mariner’s Landing Property:
Historical Occupancy
12/31/2014(1) | 12/31/2015(1) | 12/31/2016(1) | 12/31/2017(1) | 12/31/2018(1) | 2/14/2019(2) |
| 91.9% | 99.0% | 97.8% | 90.8% | 96.5% | 94.6% |
| (1) | Information obtained from the Mariner’s Landing Borrower. |
| (2) | Information obtained from the underwritten rent roll. |
THE INFORMATION IN THIS STRUCTURAL AND COLLATERAL TERM SHEET IS NOT COMPLETE AND MAY BE AMENDED PRIOR TO THE TIME OF SALE. THIS TERM SHEET IS NOT AN OFFER TO SELL THESE SECURITIES AND IT IS NOT A SOLICITATION OF AN OFFER TO BUY THESE SECURITIES IN ANY JURISDICTION WHERE THE OFFER OR SALE IS NOT PERMITTED.
70
Mixed Use – Office/Industrial Various Sausalito, California 94965 | Loan #9
Mariner’s Landing | Cut-off Date Balance: Cut-off Date LTV: U/W NCF DSCR: U/W NOI Debt Yield: | $27,000,000 64.3% 1.77x 8.8% |
Operating History and Underwritten Net Cash Flow. The following table presents certain information relating to the historical operating statements and underwritten net cash flow at the Mariner’s Landing Property:
Cash Flow Analysis
| 2015(1) | 2016(1) | 2017 | 2018(2) | U/W(2) | %(3) | U/W $ per SF | |||||||||
| Rents in Place | $1,985,439 | $2,210,740 | $2,266,744 | $2,182,020 | $2,838,099 | 85.6% | $33.47 | ||||||||
| Contractual Rent Steps(4) | 0 | 0 | 0 | 0 | $140,780 | 4.2 | 1.66 | ||||||||
| Grossed Up Vacant Space | 0 | 0 | 0 | 0 | $129,320 | 3.9 | 1.52 | ||||||||
| Gross Potential Rent | $1,985,439 | $2,210,740 | $2,266,744 | $2,182,020 | $3,108,198 | 93.8% | $36.65 | ||||||||
| Other Income | 4,641 | 6,455 | 13,181 | 5,567 | 5,567 | 0.2 | 0.07 | ||||||||
| Total Recoveries | 41,611 | 87,672 | 115,631 | 121,625 | 201,229 | 6.1 | 2.37 | ||||||||
| Net Rental Income | $2,031,691 | $2,304,867 | $2,395,556 | $2,309,212 | $3,314,994 | 100.0% | $39.09 | ||||||||
| (Vacancy & Credit Loss) | 0 | 0 | 0 | 0 | (155,410)(5) | (5.0) | (1.83) | ||||||||
| Effective Gross Income | $2,031,691 | $2,304,867 | $2,395,556 | $2,309,212 | $3,159,584 | 95.3% | $37.26 | ||||||||
| Real Estate Taxes | 204,656 | 216,437 | 233,767 | 246,887 | 246,887 | 7.8 | 2.91 | ||||||||
| Insurance | 99,570 | 54,834 | 80,968 | 81,492 | 128,628 | 4.1 | 1.52 | ||||||||
| Management Fee | 82,473 | 71,348 | 70,664 | 78,908 | 94,788 | 3.0 | 1.12 | ||||||||
| Other Operating Expenses | 258,100 | 267,779 | 336,860 | 265,187 | 319,432 | 10.1 | 3.77 | ||||||||
| Total Operating Expenses | $644,799 | $610,398 | $722,259 | $672,474 | $789,735 | 25.0% | $9.31 | ||||||||
| Net Operating Income | $1,386,892 | $1,694,469 | $1,673,298 | $1,636,738 | $2,369,850 | 75.0% | $27.95 | ||||||||
| Replacement Reserves | 0 | 0 | 0 | 0 | 8,480 | 0.3 | 0.10 | ||||||||
| TI/LC | 0 | 0 | 0 | 0 | 57,912 | 1.8 | 0.68 | ||||||||
| Net Cash Flow | $1,386,892 | $1,694,469 | $1,673,298 | $1,636,738 | $2,303,458 | 72.9% | $27.16 | ||||||||
| NOI DSCR | 1.06x | 1.30x | 1.28x | 1.26x | 1.82x | ||||||||||
| NCF DSCR | 1.06x | 1.30x | 1.28x | 1.26x | 1.77x | ||||||||||
| NOI Debt Yield | 5.1% | 6.3% | 6.2% | 6.1% | 8.8% | ||||||||||
| NCF Debt Yield | 5.1% | 6.3% | 6.2% | 6.1% | 8.5% |
| (1) | The increase in Effective Gross Income and Net Operating Income from 2015 to 2016 was driven partly by (i) the Mariner’s Landing Borrower commencing insurance reimbursement collection in 2016; and (ii) 4 new leases totaling 11,186 SF (13.2% NRA, 14.4% UW rent) with commencement dates ranging from April 2015 to November 2015. |
| (2) | The increase in Effective Gross Income and Net Operating Income from 2018 to U/W was driven partly by (i) 11 new leases totaling 24,632 square feet (29.0% NRA; 33.1% U/W base rent) with commencement dates ranging from August 2018 to March 2019; (ii) 10 renewal leases totaling 19,687 square feet (23.2% NRA, 26.3% U/W base rent) with commencement dates ranging from April 2018 to April 2019; (iii) contractual rent steps through April 2020 totaling $62,241; and (iv) straight line rent averaging for Oculus VR totaling $78,539. |
| (3) | Represents (i) percent of Net Rental Income for all revenue fields, (ii) percent of Gross Potential Rent for Vacancy & Credit Loss and (iii) percent of Effective Gross Income for all other fields. |
| (4) | Represents contractual rent steps through January 2020 and straight line rent averaging for Oculus VR (see “Major Tenants” table above). |
| (5) | The underwritten economic vacancy is 5.0%. The Mariner’s Landing Property was 94.6% leased as of February 14, 2019. |
Appraisal.As of the appraisal valuation date of February 5, 2019 the Mariner’s Landing Property had an “as-is” appraised value of $42,000,000.
Environmental Matters.According to the Phase I environmental site assessment dated February 12, 2019, there are no recognized environmental conditions at the Mariner’s Landing Property.
Market Overview and Competition.The Mariner’s Landing Property is located in Sausalito, California, within Marin County, approximately 9.8 miles north of the San Francisco central business district, 8.6 miles south of San Rafael and 22.5 miles northwest of the San Francisco International Airport. The city of Sausalito is situated near the northern end of the Golden Gate Bridge, which provides direct access to San Francisco, and is largely bounded by the protected spaces of the Golden Gate National Recreation Area. Primary access to the area is provided by US Highway 101, which crosses Marin County in a north/south direction and connects the area to San Francisco, the East Bay, the Peninsula and the South Bay.
According to a third party market research report, the estimated 2019 population within a three- and five-mile radius of the Mariner’s Landing Property was 44,645 and 73,496, respectively; and the estimated 2019 median household income within the same radii was $133,776 and $140,188, respectively. According to the appraisal, the majority of the city of Sausalito is residential land use with some of the highest home prices in the San Francisco region. In 2018, the city reported a median home sale price of approximately $1.2 million and a median single-family home sale price of approximately $2.0 million.
THE INFORMATION IN THIS STRUCTURAL AND COLLATERAL TERM SHEET IS NOT COMPLETE AND MAY BE AMENDED PRIOR TO THE TIME OF SALE. THIS TERM SHEET IS NOT AN OFFER TO SELL THESE SECURITIES AND IT IS NOT A SOLICITATION OF AN OFFER TO BUY THESE SECURITIES IN ANY JURISDICTION WHERE THE OFFER OR SALE IS NOT PERMITTED.
71
Mixed Use – Office/Industrial Various Sausalito, California 94965 | Loan #9
Mariner’s Landing | Cut-off Date Balance: Cut-off Date LTV: U/W NCF DSCR: U/W NOI Debt Yield: | $27,000,000 64.3% 1.77x 8.8% |
Submarket Information – According to the appraisal, the Mariner’s Landing Property is situated within the Sausalito Office and Flex market. As of March 1, 2019, the market reported an inventory of 80 flex buildings totaling approximately 1.1 million square feet with a 6.1% vacancy rate and average vacancy rate of 6.1% since 2010. From 2010 to 2018, average rental rates within the office and flex market increased by approximately 48.3%, from $35.52 per square foot to $52.68 per square foot, gross.
Appraiser’s Comp Set – The appraiser identified 13 properties that compete directly with the Mariner’s Landing Property, which reported asking rents ranging from $36.00 to $57.00 per square foot, gross, with a weighted average occupancy rate of 93.0%. According to the appraisal, contract rents at the Mariner’s Landing Property, on average, are approximately 5% below market rents.
The following table presents certain information relating to the appraiser’s market rent conclusions for the Mariner’s Landing Property:
Market Rent Summary
| Average Office/Art/Production | Good Office/Art | Excellent Office/Art | Warehouse | Retail | |
| Market Rent (PSF) | $36.00 | $40.00 | $52.80 | $24.00 | $40.00 |
| Market Rent Range | $34.00-$38.00 | $38.00-$42.00 | $48.00-$54.00 | $22.00-$26.00 | $38.00-$42.00 |
| Lease Term (Months) | 60 | 60 | 60 | 60 | 60 |
| Lease Type (Reimbursements) | Modified Gross | Modified Gross | Modified Gross | Modified Gross | Modified Gross |
| Rent Increase Projection | CPI | CPI | CPI | CPI | CPI |
Escrows.
Real Estate Taxes – The loan documents require an upfront real estate tax reserve of $21,603 and ongoing monthly real estate tax reserves in an amount equal to one-twelfth of the real estate taxes that the lender estimates will be payable during the next twelve months (initially $21,603).
Insurance – The loan documents require an upfront insurance reserve of $22,510 and ongoing monthly insurance reserves in an amount equal to one-twelfth of the insurance premium that the lender estimates will be payable during the next twelve months (initially $11,255).
Replacement Reserve – The loan documents do not require ongoing monthly escrows for replacement reserves as long as (i) no event of default has occurred and is continuing, and (ii) the Mariner’s Landing Borrower is properly maintaining the Mariner’s Landing Property as reasonably determined by the lender based on annual site inspections.
Leasing Reserve –The loan documents require an upfront general tenant improvements and leasing commissions (“TI/LC”) reserve of $1,000,000 and ongoing monthly TI/LC reserves of $16,888, subject to a cap of $300,000; provided, however, ongoing monthly TI/LC reserve deposits are required to continue beyond the cap (i) upon the occurrence of an event of default, or (ii) if the Mariner’s Landing Property fails to maintain physical and economic occupancy of at least 75% .
Gap Rent Reserve – The loan documents require an upfront reserve of $28,336 for gap rent related to Carve Designs, Inc.
Existing TI Reserve - The loan documents require an upfront reserve of $117,000 for outstanding tenant improvements related to Oculus VR.
Lockbox and Cash Management.Upon the occurrence and continuance of a Cash Trap Event Period (as defined below), the Mariner’s Landing Borrower is required to establish a lender-controlled lockbox account and direct all tenants to deposit rent directly into such lockbox account. During a Cash Trap Event Period, funds in the lockbox account are required to be swept to a lender-controlled cash management account and all excess funds are required to be swept to a reserve for tenant improvements and leasing commission costs for the Mariner’s Landing Property controlled by the lender (subject to a cap of $1,000,000 if the Cash Trap Event Period results solely from an Oculus VR Go Dark Event (as defined below)).
A “Cash Trap Event Period” will commence upon the earlier of the following:
| (i) | the occurrence and continuance of an event of default; |
| (ii) | the net cash flow debt service coverage ratio (“NCF DSCR”) falling below 1.20x for two consecutive calendar quarters (tested quarterly); or |
| (iii) | the occurrence of an Oculus VR Cash Trap Event Period (as defined below). |
A Cash Trap Event Period will end upon the occurrence of:
| ● | with regard to clause (i) above, the cure of such event of default; |
| ● | with regard to clause (ii) above, the NCF DSCR being equal to or greater than 1.25x for two consecutive calendar quarters; or |
| ● | with regard to clause (iii) above, an Oculus VR Cash Trap Event Period Cure (as defined below). |
An “Oculus VR Cash Trap Event Period” will commence upon the earliest to occur of the following (for clauses (i)-(vii) below, the term ‘Oculus VR’ includes any replacement tenant that occupies at least 20% of the space currently occupied by Oculus VR):
THE INFORMATION IN THIS STRUCTURAL AND COLLATERAL TERM SHEET IS NOT COMPLETE AND MAY BE AMENDED PRIOR TO THE TIME OF SALE. THIS TERM SHEET IS NOT AN OFFER TO SELL THESE SECURITIES AND IT IS NOT A SOLICITATION OF AN OFFER TO BUY THESE SECURITIES IN ANY JURISDICTION WHERE THE OFFER OR SALE IS NOT PERMITTED.
72
Mixed Use – Office/Industrial Various Sausalito, California 94965 | Loan #9
Mariner’s Landing | Cut-off Date Balance: Cut-off Date LTV: U/W NCF DSCR: U/W NOI Debt Yield: | $27,000,000 64.3% 1.77x 8.8% |
| (i) | Oculus VR terminating or cancelling its lease or notifying the lender of its intent to terminate or cancel its lease; |
| (ii) | Oculus VR being in monetary default or material non-monetary default under the lease beyond any applicable notice and/or cure period; |
| (iii) | Oculus VR materially modifying its lease without the lender’s prior consent; |
| (iv) | Oculus VR “going dark”, vacating or otherwise failing to occupy its space (“Oculus VR Go Dark Event”); |
| (v) | Oculus VR failing to renew or extend its lease on or prior to the date that is the earlier of (a) the deadline to give notice of renewal (currently defined in the Oculus VR lease as six months prior to lease expiration date) or (b) 12 months prior to the scheduled lease expiration date; |
| (vi) | Oculus VR becoming insolvent or filing for bankruptcy; or |
| (vii) | Oculus VR failing to waive its lease termination option by the earlier of (a) three months prior to the lease expiration date or (b) the lease termination notice date (March 1, 2023 in the Oculus VR lease). |
An “Oculus VR Cash Trap Event Period Cure” will occur upon:
| ● | with regard to clause (i) above, a Major Re-Tenanting Event having occurred (as defined below); |
| ● | with regard to clause (ii) above, (a) the Mariner’s Landing Borrower having delivered written evidence to the lender (including an estoppel certificate) confirming that said default has been cured or (b) a Major Re-Tenanting Event having occurred; |
| ● | with regard to clause (iii) above, (a) a Major Re-Tenanting Event having occurred or (b)(1) either (x) the applicable modification having been rescinded and no longer being in further force and effect or (y) the lender having approved such modification, or (2) to the extent such modification constituted an event of default, the lender having accepted the cure of such event of default; |
| ● | with regard to clause (iv) above, (a) Oculus VR resuming occupancy of its space, resuming normal business operations in its space and being open for business during customary hours for a period of two consecutive calendar quarters or (b) a Major Re-Tenanting Event having occurred; |
| ● | with regard to clause (v) above, (a) a Major Re-Tenanting Event having occurred or (b) Oculus VR renewing or extending its lease term pursuant to the lease provisions or otherwise on terms and conditions reasonably acceptable to the lender; |
| ● | with regard to clause (vi) above, (a) a Major Re-Tenanting Event having occurred or (b) the bankruptcy or insolvency proceeding having terminated in a manner satisfactory to the lender, the Oculus VR lease having been affirmed and the terms of said lease, as affirmed, being satisfactory to the lender; and |
| ● | with regard to clause (vii) above, (a) a Major Re-Tenanting Event having occurred or (b) the lender receiving reasonably satisfactory evidence that Oculus VR has irrevocably waived its lease termination option. |
A “Major Re-Tenanting Event” will occur upon the entire Oculus VR space (or a portion thereof representing at least 20% of the net leasable area of the Mariner’s Landing Property) having been leased to one or more replacement tenants reasonably acceptable to the lender (including, if the lease is for less than the entire Oculus VR space, base rent that, after giving effect to the new lease, represents at least 20% of the total rental income of the Mariner’s Landing Property) with such tenant having delivered an estoppel certificate confirming it has taken occupancy of and is conducting normal business operations in its entire premises, and is paying full, unabated rent and all TI/LCs have been paid (or reserved for with lender).
Property Management.The Mariner’s Landing Property is managed by an affiliate of the Mariner’s Landing Borrower.
Partial Release.Following the defeasance lockout period, and in connection with a sale to an unaffiliated third-party, the Mariner’s Landing Borrower is permitted to release any of the Mariner’s Landing Property’s four legal parcels (each a “Release Parcel” defined below), provided that, among other things, and in accordance with the Mariner’s Landing Mortgage Loan documents (i) no event of default has occurred and is continuing, (ii) the Mariner’s Landing Mortgage Loan is partially defeased in an amount equal to the Release Price (as defined below); (iii) the amortizing NCF DSCR (based on a hypothetical 30-year amortization schedule) of the remaining Mariner’s Landing Property is not less than the greater of 1.30x or the amortizing NCF DSCR immediately prior to the release; (iv) the net cash flow debt yield (“NCF DY”) of the remaining Mariner’s Landing Property is not less than the greater of 9.0% or the NCF DY immediately prior to the release; (v) the loan-to-value ratio (“LTV”) of the remaining Mariner’s Landing Property is no more than the lesser of 65.0% or the LTV immediately prior to the release (clauses (iii)-(v) being collectively referred to as the “Economic Release Conditions”); (vi) the lender receives rating agency confirmation from Fitch, KBRA and Moody’s that the sale and release will not result in a downgrade, withdrawal or qualification of the respective ratings assigned to the Series 2019–C50 Certificates; and (vii) the lender receives a legal opinion covering compliance in all respects with all laws, rules and regulations governing REMICs has been delivered.
If the Economic Release Conditions are not satisfied, the Mariner’s Landing Borrower has the right to partially defease the Mariner’s Landing Mortgage Loan in an amount established by the lender, in its sole discretion, such that the Economic Release Conditions are satisfied.
In the event that, after giving effect to the Release Parcel release, any lease (individually or when aggregated with all other leases with the same tenant or its affiliates), accounts for 50.0% or more of the total rental income for the remaining Mariner’s Landing Property, then (i) the term of any such lease is required to extend at least two years beyond the maturity date of the Mariner’s Landing Mortgage Loan, (ii) the loan-to-dark value ratio of the remaining parcel is required to not exceed 85.0% and (iii) the Release Parcel release is required to be subject to the lender’s approval based on its then-current underwriting of the remaining Mariner’s Landing Property.
The “Release Price” for any Mariner’s Landing Release Parcel being released is an amount equal to the greater of (a) the net sale proceeds for such Release Parcel, as reasonably determined by the lender, or (b) 110% of the Allocated Loan Amount (as defined in the table below) of such Release Parcel.
THE INFORMATION IN THIS STRUCTURAL AND COLLATERAL TERM SHEET IS NOT COMPLETE AND MAY BE AMENDED PRIOR TO THE TIME OF SALE. THIS TERM SHEET IS NOT AN OFFER TO SELL THESE SECURITIES AND IT IS NOT A SOLICITATION OF AN OFFER TO BUY THESE SECURITIES IN ANY JURISDICTION WHERE THE OFFER OR SALE IS NOT PERMITTED.
73
Mixed Use – Office/Industrial Various Sausalito, California 94965 | Loan #9
Mariner’s Landing | Cut-off Date Balance: Cut-off Date LTV: U/W NCF DSCR: U/W NOI Debt Yield: | $27,000,000 64.3% 1.77x 8.8% |
| Parcel | Allocated Loan Amount | Net Rentable Area | % of Net Rentable Area |
| 2656 & 2658 Bridgeway | $9,083,527 | 26,150 | 30.8% |
| 401-413 Coloma Street (a/k/a 310 & 350-360 Gate 5 Road) | $7,078,886 | 23,080 | 27.2% |
| 441-475 Coloma Street | $7,110,209 | 23,926 | 28.2% |
| 150, 160 & 170 Gate 5 Road | $3,727,378 | 11,645 | 13.7% |
Real Estate Substitution.Not permitted.
Subordinate and Mezzanine Indebtedness.Provided no event of default has occurred and is continuing, the Mariner’s Landing Borrower is permitted to incur future mezzanine debt under the following conditions, among others: (i) the combined LTV ratio of the Mariner’s Landing Mortgage Loan and the permitted mezzanine loan will not be greater than 65.0%; (ii) the combined debt service coverage ratio of the Mariner’s Landing Mortgage Loan and the permitted mezzanine loan shall not be less than 1.25x; (iii) the combined debt yield of the Mariner’s Landing Mortgage Loan and the permitted mezzanine loan is equal to or greater than 8.2%; (iv) delivery of a satisfactory intercreditor agreement and (v) rating agency confirmation.
Ground Lease. None.
Terrorism Insurance.The loan documents require that the “all risk” insurance policies required to be maintained by the Mariner’s Landing Borrower provide coverage for terrorism in an amount equal to the full replacement cost of the Mariner’s Landing Property. The loan documents also require business interruption insurance covering no less than the 12-month period following the occurrence of a casualty event, together with a six-month extended period of indemnity.
Windstorm Insurance. The loan documents require windstorm and flood insurance covering the full replacement cost of the Mariner’s Landing Property during the loan term. At the time of loan closing, Mariner’s Landing Property had windstorm insurance coverage and flood insurance in the maximum limit available under the National Flood Insurance Program together with excess coverage.
Earthquake Insurance.The loan documents do not require earthquake insurance. The seismic report indicated a probable maximum loss for the entire Mariner’s Landing Property of 16.0%.
THE INFORMATION IN THIS STRUCTURAL AND COLLATERAL TERM SHEET IS NOT COMPLETE AND MAY BE AMENDED PRIOR TO THE TIME OF SALE. THIS TERM SHEET IS NOT AN OFFER TO SELL THESE SECURITIES AND IT IS NOT A SOLICITATION OF AN OFFER TO BUY THESE SECURITIES IN ANY JURISDICTION WHERE THE OFFER OR SALE IS NOT PERMITTED.
74
| No. 10 – Great Value Storage Portfolio | |||||||
| Mortgage Loan Information | Mortgaged Property Information | ||||||
| Mortgage Loan Seller: | UBS AG | Single Asset/Portfolio: | Portfolio | ||||
Credit Assessment (Fitch/KBRA/Moody’s): | BBB-/AAA/Aa1 | Property Type – Subtype: | Self Storage – Self Storage | ||||
| Original Principal Balance(1): | $25,000,000 | Location: | Various | ||||
| Cut-off Date Balance(1): | $25,000,000 | Size(4): | 4,103,764 SF | ||||
| % of Initial Pool Balance: | 2.7% | Cut-off Date Balance Per SF(1): | $26.80 | ||||
| Loan Purpose: | Refinance | Maturity Date Balance Per SF(1): | $26.80 | ||||
| Borrower Sponsor: | Natin Paul | Year Built/Renovated: | Various/Various | ||||
| Guarantor: | Natin Paul | Title Vesting(5): | Fee | ||||
| Mortgage Rate: | 4.13977% | Property Manager: | Self-managed | ||||
| Note Date: | November 30, 2018 | Current Occupancy (As of): | 87.0% (9/16/2018) | ||||
| Seasoning: | 5 months | YE 2017 Occupancy(6): | 83.7% | ||||
| Maturity Date: | December 6, 2023 | YE 2016 Occupancy(6): | 85.7% | ||||
| IO Period: | 60 months | YE 2015 Occupancy(6): | 86.1% | ||||
| Loan Term (Original): | 60 months | YE 2014 Occupancy(6): | NAV | ||||
| Amortization Term (Original): | NAP | As-Is Appraised Value(7): | $376,000,000 | ||||
| Loan Amortization Type: | Interest-only, Balloon | As-Is Appraised Value Per SF: | $91.62 | ||||
| Call Protection: | L(29),D(24),O(7) | As-Is Appraisal Valuation Date: | October 10, 2018 | ||||
| Lockbox Type: | Hard/Springing Cash Management | Underwriting and Financial Information | |||||
| Additional Debt(1)(2): | Yes | TTM NOI (9/30/2018)(6): | $20,930,541 | ||||
| Additional Debt Type (Balance)(1)(2): | Pari Passu ($85,000,000) / Mezzanine ($185,000,000) | YE 2017 NOI(6): | $19,633,132 | ||||
| YE 2016 NOI(6): | $17,914,420 | ||||||
| YE 2015 NOI(6): | $10,310,304 | ||||||
| U/W Revenues: | $35,706,011 | ||||||
| U/W Expenses: | $13,600,995 | ||||||
| U/W NOI(6): | $22,105,016 | ||||||
| Escrows and Reserves(3) | U/W NCF: | $21,671,000 | |||||
| Initial | Monthly | Cap | U/W DSCR based on NOI/NCF(1): | 4.77x / 4.68x | |||
| Taxes | $525,978 | $328,736 | NAP | U/W Debt Yield based on NOI/NCF(1): | 20.1% / 19.7% | ||
| Insurance | $807,323 | $93,875 | NAP | U/W Debt Yield at Maturity based on NOI/NCF(1): | 20.1% / 19.7% | ||
| Replacement Reserve | $0 | $34,198 | NAP | Cut-off Date LTV Ratio(1)(7): | 29.3% | ||
| Immediate Repairs Reserve | $536,017 | $0 | NAP | LTV Ratio at Maturity(1)(7): | 29.3% | ||
| Sources and Uses | ||||||||
| Sources | Uses | |||||||
| Original whole loan amount | $110,000,000 | 39.9% | Loan payoff(8) | $253,809,659 | 92.0% | |||
| Mezzanine loans(2) | 166,000,000 | 60.1 | Return of equity | 14,301,457 | 5.2 | |||
| Closing costs | 6,019,566 | 2.2 | ||||||
| Upfront reserves | 1,869,318 | 0.7 | ||||||
| Total Sources | $276,000,000 | 100.0% | Total Uses | $276,000,000 | 100.0% | |||
| (1) | See “The Mortgage Loan” section below. The Cut-off Date Balance per SF, Maturity Date Balance per SF, U/W DSCR based on NOI/NCF, U/W Debt Yield based on NOI/NCF, U/W Debt Yield at Maturity based on NOI/NCF, Cut-off Date LTV Ratio and LTV Ratio at Maturity presented above are based on the Great Value Storage Portfolio Whole Loan (as defined below). The Cut-off Date Balance per SF, Maturity Date Balance per SF, U/W DSCR based on NOI/NCF, U/W Debt Yield based on NOI/NCF, U/W Debt Yield at Maturity based on NOI/NCF, Cut-off Date LTV Ratio and LTV Ratio at Maturity based on the Great Value Storage Portfolio Whole Loan and the Great Value Storage Portfolio Mezzanine Loans (as defined below) are $71.89, $71.89, 1.25x, 1.23x, 7.5%, 7.3%, 7.5%, 7.3%, 78.5% and 78.5%, respectively. |
| (2) | The Great Value Storage Portfolio Whole Loan was originated concurrently with two mezzanine loans with an aggregate original principal balance of $166.0 million. As of January 7, 2019, the subordinate mezzanine loan, which had an original principal balance of $63.0 million, was amended to increase the outstanding principal balance to $82.0 million in accordance with the loan documents for a total aggregate original principal balance of $185.0 million (the “Great Value Storage Portfolio Mezzanine Loans”). See “The Mortgage Loan” and “Subordinate and Mezzanine Indebtedness” sections below. |
| (3) | See “Escrows” section below. |
| (4) | The Great Value Storage Portfolio (as defined below) has 30,811 units totaling 4,103,764 SF. |
| (5) | A strip of land bisecting the GVS - 4901 South Freeway property is owned by a utility company and is not collateral for the Great Value Storage Portfolio Whole Loan. As of May 2011, the utility company, as licensor, has granted a license to the Great Value Storage Portfolio Borrowers (as defined below) for use of the strip of land for parking. The strip of land has several power lines and electrical transmission towers, but is not improved by any other buildings, and the two portions of the GVS - 4901 South Freeway property have separate access. All income and expenses attributed to the strip of land have been excluded from the valuation and underwriting. |
| (6) | The Great Value Storage Portfolio Borrowers acquired two properties, GVS - 2502 Bay Street and GVS - 410 Gulf Freeway, in 2016 and two additional properties, GVS - 443 Laredo Street and GVS 7273 Kearney Street and 6345 East 78th Avenue, in 2017. As such, 2016 historical performance does not include GVS - 2502 Bay Street and GVS - 410 Gulf Freeway and 2017 historical performance does not include GVS - 443 Laredo Street and GVS - 7273 Kearney Street and 6345 East 78th Avenue. The increase in NOI is primarily due to the inclusion of the acquired additions. U/W NOI is based on the underwritten unit mix. |
THE INFORMATION IN THIS STRUCTURAL AND COLLATERAL TERM SHEET IS NOT COMPLETE AND MAY BE AMENDED PRIOR TO THE TIME OF SALE. THIS TERM SHEET IS NOT AN OFFER TO SELL THESE SECURITIES AND IT IS NOT A SOLICITATION OF AN OFFER TO BUY THESE SECURITIES IN ANY JURISDICTION WHERE THE OFFER OR SALE IS NOT PERMITTED.
75
Self Storage – Self Storage Property Addresses – Various
| Loan #10
Great Value Storage Portfolio
| Cut-off Date Balance: Cut-off Date LTV: U/W NCF DSCR: U/W NOI Debt Yield:
| $25,000,000 29.3% 4.68x 20.1%
|
| (7) | On a portfolio basis, the Great Value Storage Portfolio has an “as-is” appraised value of $376,000,000 as of October 10, 2018 and an “as stabilized” appraised value of $392,000,000 as of October 10, 2019. On a stand-alone basis, the 64 Great Value Storage Portfolio Properties (as defined below) have an aggregate “as-is” appraised value of $326,000,000. The Cut-off Date LTV Ratio and the LTV Ratio at Maturity based on the Great Value Storage Portfolio Whole Loan and the aggregate stand-alone “as-is” appraised value of $326,000,000 are 33.7% and 33.7%, respectively. The Cut-off Date LTV Ratio and LTV Ratio at Maturity based on the Great Value Storage Portfolio Whole Loan and the portfolio “as stabilized” appraised value of $392,000,000 are 28.1% and 28.1%, respectively. |
| (8) | Loan payoff includes defeasance costs of approximately $527,879. |
The Mortgage Loan.The mortgage loan (the “Great Value Storage Portfolio Mortgage Loan”) is part of a whole loan (the “Great Value Storage Portfolio Whole Loan”) evidenced by sevenpari passupromissory notes secured by a first mortgage encumbering the borrowers’ fee interest in a 4,103,764 square foot, 30,811-unit portfolio of 64 self-storage properties located across 10 states (each a “Great Value Storage Portfolio Property”, and collectively, the “Great Value Storage Portfolio Properties” or “Great Value Storage Portfolio”). The Great Value Storage Portfolio Mortgage Loan represents the non-controlling Notes A-2-2, A-4, A-5 and A-6. The Great Value Storage Portfolio Whole Loan is serviced under the UBS 2019-C16 pooling and servicing agreement. See “Description of the Mortgage Pool—The Whole Loans—The Non-Serviced Pari Passu Whole Loans” and “Pooling and Servicing Agreement” in the Preliminary Prospectus.
Note Summary
| Notes | Original Principal Balance | Cut-off Date Balance | Note Holder | Controlling Interest |
| A-1, A-3 | $55,000,000 | $55,000,000 | UBS 2018-C15 | No |
| A-2-1 | $30,000,000 | $30,000,000 | UBS 2019-C16 | Yes |
| A-2-2, A-4, A-5, A-6 | $25,000,000 | $25,000,000 | WFCM 2019-C50 | No |
| Total | $110,000,000 | $110,000,000 |
The Borrowers and Borrower Sponsor.The borrowers are 12 Delaware special purpose entities (each individually, a “Great Value Storage Portfolio Borrower”, and collectively, the “Great Value Storage Portfolio Borrowers”), which are controlled and owned, directly and indirectly by World Class Holding Company, LLC. Each borrowing entity is structured to be bankruptcy remote with two independent directors in its organizational structure. Legal counsel to the Great Value Storage Portfolio Borrowers delivered a non-consolidation opinion in connection with the origination of the Great Value Storage Portfolio Whole Loan. The borrower sponsor and non-recourse guarantor of the Great Value Storage Portfolio Whole Loan is Natin Paul, who is the sole owner of 100% of the common units in World Class Holding Company, LLC.
Natin Paul is the Founder, President, and CEO of World Class, a holding company that owns a diverse portfolio of real estate assets and operating companies, including real estate investment platforms, World Class Property Company, World Class Equity, and Great Value Storage. World Class Property Company, headquartered in Austin, Texas, owns and operates a portfolio of over 150 properties across 16 states, in addition to a portfolio of development sites entitled for over 50 million square feet of potential development. The existing portfolio includes office buildings, retail properties, apartment communities, mixed-use assets, industrial warehouses, parking facilities, hospitality properties, marina, and land located throughout the nation. Founded in 2008, Great Value Storage (“GVS”) owns and operates 83 self storage facilities comprising approximately 6.5 million square feet of rentable space across 11 states.
The Properties. The Great Value Storage Portfolio Whole Loan is secured by 64 self storage properties located across 10 states with an aggregate of 30,811 units totaling 4,103,764 square feet. The Great Value Storage Portfolio Sponsor acquired the Great Value Storage Portfolio Properties over the past 10 years at a total cost basis of approximately $310.0 million. Since August 2016, the borrower sponsor has invested approximately $4.4 million in non-reoccurring capital improvements, which included uniformity in branding across the properties, full repainting of the exteriors and interiors of properties, new awnings, new signage, new unit doors, access improvements, office construction and LED light installation.
Excluding four properties not owned prior to January 2016, the Great Value Storage Portfolio’s net operating income has increased 4.5% from 2016 to 2017 and 4.8% from 2017 to the trailing twelve-months ending in September 30, 2018. The Great Value Storage Portfolio has average quarterly portfolio occupancy between 83.0% and 87.9% since the first quarter of 2015 and as of the underwritten unit mix dated September 16, 2018, the Great Value Storage Portfolio occupancy based on square footage and units was 87.0% and 85.7%, respectively.
The Great Value Storage Portfolio includes 3,758 climate-controlled units totaling 403,764 square feet, 25,560 non-climate-controlled units totaling 3,537,581 square feet and 87 other office/warehouse/retail storage units totaling 125,562 square feet. The non-climate-controlled units average 138 square feet and range in unit size from nine square feet to 4,428 square feet. The climate-controlled units average 107 square feet and range in unit size from 13 square feet to 375 square feet. The office/warehouse/retail storage units average 1,443 square feet and range in unit size from 160 square feet to 7,020 square feet. The storage units account for 99.1% of net rentable square footage and 95.9% of U/W base rent.
In addition to conventional storage units, the Great Value Storage Portfolio includes 1,380 covered and uncovered vehicle parking units, 13 office/warehouse/retail commercial spaces, four campsites, seven billboard and two cell tower leases. Five of the Great Value Storage Portfolio Properties lease 34,457 square feet to 11 commercial tenants, accounting for UW base rent of $291,303 (0.9% of annual U/W base rent). The commercial tenants include Jack Williams Tire Company (16,065 square feet, 32.6% of commercial U/W base rent), which utilizes its space as a tire repair shop, JJ Auto Sales (4,800 square feet, 12.8% of commercial U/W base rent), which utilizes its space as a used car dealership, and West Licking Joint Fire Department (2,404 square feet, 6.6% of commercial U/W base rent), which utilizes its space as the city fire department. Six of the Great Value Storage Portfolio Properties lease seven billboards and
THE INFORMATION IN THIS STRUCTURAL AND COLLATERAL TERM SHEET IS NOT COMPLETE AND MAY BE AMENDED PRIOR TO THE TIME OF SALE. THIS TERM SHEET IS NOT AN OFFER TO SELL THESE SECURITIES AND IT IS NOT A SOLICITATION OF AN OFFER TO BUY THESE SECURITIES IN ANY JURISDICTION WHERE THE OFFER OR SALE IS NOT PERMITTED.
76
Self Storage – Self Storage Property Addresses – Various
| Loan #10
Great Value Storage Portfolio
| Cut-off Date Balance: Cut-off Date LTV: U/W NCF DSCR: U/W NOI Debt Yield:
| $25,000,000 29.3% 4.68x 20.1%
|
two of the Great Value Storage Portfolio Properties lease two cell towers, accounting for UW base rent of $37,854 (0.2% of annual U/W base rent) in the aggregate. Additionally, the GVS - 10013 FM 620 property leases four open area campsites totaling 2,400 square feet.
The following table presents certain information relating to the Great Value Storage Portfolio Properties:
| State | Average Year Built/ Renovated | No. of Props | Net Rentable Area (SF)(1) | Net Rentable Area (Units)(1) | Occupancy (1)(2) | Allocated Cut-off Date Balance(3) | % of Portfolio Cut-off Date Balance | Appraised Value(4) | Allocated Cut-off Date LTV(3)(4) | U/W NCF |
| Texas | 1981/1998 | 34 | 2,186,173 | 15,947 | 86.5% | $56,634,060 | 51.5% | $174,135,000 | 32.5% | $10,861,717 |
| Ohio | 1985/1991 | 16 | 939,677 | 7,567 | 90.4% | $26,304,340 | 23.9% | $72,930,000 | 36.1% | $5,449,419 |
| Mississippi | 1988/NAP | 3 | 236,355 | 1,801 | 83.6% | $5,858,700 | 5.3% | $17,550,000 | 33.4% | $1,113,642 |
| Illinois | 2001/2004 | 2 | 163,944 | 1,387 | 63.3% | $4,543,470 | 4.1% | $12,900,000 | 35.2% | $892,530 |
| Colorado | 1984/NAP | 2 | 103,520 | 717 | 90.8% | $4,025,360 | 3.7% | $11,700,000 | 34.4% | $869,445 |
| Nevada | 1954/NAP | 1 | 131,744 | 694 | 99.5% | $3,427,550 | 3.1% | $9,200,000 | 37.3% | $660,453 |
| New York | 1966/NAP | 2 | 90,862 | 736 | 89.9% | $3,387,680 | 3.1% | $9,100,000 | 37.2% | $712,156 |
| Missouri | 1997/NAP | 1 | 70,000 | 480 | 87.7% | $2,072,460 | 1.9% | $6,700,000 | 30.9% | $397,172 |
| Tennessee | 1979/NAP | 2 | 108,575 | 766 | 91.2% | $2,032,610 | 1.8% | $6,275,000 | 32.4% | $389,694 |
| Indiana | 1985/NAP | 1 | 72,914 | 716 | 81.0% | $1,713,770 | 1.6% | $5,510,000 | 31.1% | $324,771 |
| Total/Weighted Average | 64 | 4,103,764 | 30,811 | 87.0% | $110,000,000 | 100.0% | $376,000,000 | 29.3% | $21,671,000 | |
| (1) | Information obtained from the underwritten unit mix. |
| (2) | Occupancy is based on the net rentable square footage at each Great Value Storage Portfolio Property. The weighted average occupancy of the Great Value Storage Portfolio, based on net rentable units, is 85.7%. |
| (3) | Allocated Cut-off Date Balance and Allocated Cut-off Date LTV are based on the Great Value Storage Portfolio Whole Loan. |
| (4) | The aggregate Appraised Value for each state represents the “as-is” appraised value on a stand-alone basis. Total Appraised Value and weighted average Allocated Cut-off Date LTV are based on the portfolio “as-is” appraised value of $376,000,000 as of October 10, 2018. Weighted average Allocated Cut-off Date LTV based on the aggregate stand-alone “as-is” appraised value of $326,000,000 is 33.7%. |
The following table presents certain information relating to the unit mix at the Great Value Storage Portfolio Properties:
| Unit Type | Net Rentable Area (SF) | % of Net Rentable Area (SF) | Net Rentable Area (Units) | % of Net Rentable Area (Units) | Occupancy (%)(1) | Annual U/W Base Rent | % of Annual U/W Base Rent |
| Storage Units (Conventional)(2) | 4,066,907 | 99.1% | 29,405 | 95.4% | 85.5% | $31,736,047 | 95.9% |
| Parking Spaces (Covered) | N/A | N/A | 97 | 0.3% | 95.9% | $128,282 | 0.4% |
| Parking Spaces (Uncovered) | N/A | N/A | 249 | 0.8% | 90.8% | $177,023 | 0.5% |
| Parking Spaces (Other) | N/A | N/A | 1,034 | 3.4% | 87.6% | $708,962 | 2.1% |
| Commercial Units | 34,457 | 0.8% | 13 | 0.0% | 100.0% | $291,303 | 0.9% |
| Campsite | 2,400 | 0.1% | 4 | 0.0% | 75.0% | $16,800 | 0.1% |
| Billboard | N/A | N/A | 7 | 0.0% | 100.0% | $20,745 | 0.1% |
| Cell Tower | N/A | N/A | 2 | 0.0% | 100.0% | $17,109 | 0.1% |
| Total/Weighted Average | 4,103,764 | 100.0% | 30,811 | 100.0% | 85.7% | $33,096,271 | 100.0% |
| (1) | Occupancy (%) is based on the net rentable units at each Great Value Storage Portfolio Property. The weighted average occupancy of the Great Value Storage Portfolio, based on net rentable square footage, is 87.0%. |
| (2) | Includes non-climate-controlled, climate-controlled, and office/warehouse/retail storage space. |
THE INFORMATION IN THIS STRUCTURAL AND COLLATERAL TERM SHEET IS NOT COMPLETE AND MAY BE AMENDED PRIOR TO THE TIME OF SALE. THIS TERM SHEET IS NOT AN OFFER TO SELL THESE SECURITIES AND IT IS NOT A SOLICITATION OF AN OFFER TO BUY THESE SECURITIES IN ANY JURISDICTION WHERE THE OFFER OR SALE IS NOT PERMITTED.
77
Self Storage – Self Storage Property Addresses – Various
| Loan #10
Great Value Storage Portfolio
| Cut-off Date Balance: Cut-off Date LTV: U/W NCF DSCR: U/W NOI Debt Yield:
| $25,000,000 29.3% 4.68x 20.1%
|
The following table presents historical occupancy percentages at the Great Value Storage Portfolio Properties:
Historical Occupancy
12/31/2014(1) | 12/31/2015(1) | 12/31/2016(1) | 12/31/2017(1) | 9/16/2018(2) |
| NAV | 86.1% | 85.7% | 83.7% | 87.0% |
| (1) | Information obtained from the Great Value Storage Portfolio Borrowers. The Great Value Storage Portfolio Borrowers did not provide historical occupancy figures earlier than 2015. |
| (2) | Information obtained from the underwritten unit mix. |
Operating History and Underwritten Net Cash Flow. The following table presents certain information relating to the historical operating performance and underwritten net cash flow at the Great Value Storage Portfolio:
Cash Flow Analysis
| 2015 | 2016 | 2017 | TTM 9/30/2018 | U/W | %(1) | U/W $ per SF | |
| Base Rent | $22,628,101 | $33,749,269 | $35,854,083 | $36,656,519 | $33,096,271 | 77.5% | $8.06 |
| Grossed Up Vacant Space | 0 | 0 | 0 | 0 | 5,019,402 | 11.8 | 1.22 |
| Gross Potential Rent(2) | $22,628,101 | $33,749,269 | $35,854,083 | $36,656,519 | $38,115,673 | 89.3% | $9.29 |
| Other Income(3) | 1,517,842 | 3,982,911 | 4,227,152 | 4,573,337 | 4,573,337 | 10.7 | 1.11 |
| Net Rental Income | $24,145,943 | $37,732,180 | $40,081,235 | $41,229,856 | $42,689,010 | 100.0% | $10.40 |
| (Vacancy & Credit Loss) | (5,152,600) | (7,664,434) | (7,786,197) | (6,788,471) | (6,983,000)(4) | (18.3) | (1.70) |
| Effective Gross Income | $18,993,343 | $30,067,746 | $32,295,038 | $34,441,385 | $35,706,011 | 83.6% | $8.70 |
| Real Estate Taxes | 2,394,083 | 3,551,110 | 3,838,282 | 4,150,084 | 4,150,084 | 11.6 | 1.01 |
| Insurance | 697,536 | 882,274 | 947,701 | 1,013,731 | 1,126,497 | 3.2 | 0.27 |
| Management Fee | 1,014,223 | 1,425,051 | 1,352,473 | 1,444,103 | 1,428,240 | 4.0 | 0.35 |
| Other Operating Expenses | 4,577,197 | 6,294,891 | 6,523,450 | 6,902,925 | 6,896,174 | 19.3 | 1.68 |
| Total Operating Expenses | $8,683,039 | $12,153,326 | $12,661,906 | $13,510,843 | $13,600,995 | 38.1% | $3.31 |
| Net Operating Income | $10,310,304 | $17,914,420 | $19,633,132 | $20,930,541 | $22,105,016 | 61.9% | $5.39 |
| Replacement Reserves | 0 | 0 | 0 | 0 | 434,016 | 1.2 | 0.11 |
| TI/LC | 0 | 0 | 0 | 0 | 0 | 0.0 | 0.00 |
| Net Cash Flow | $10,310,304 | $17,914,420 | $19,633,132 | $20,930,541 | $21,671,000 | 60.7% | $5.28 |
| NOI DSCR(5) | 2.23x | 3.87x | 4.24x | 4.52x | 4.77x | ||
| NCF DSCR(5) | 2.23x | 3.87x | 4.24x | 4.52x | 4.68x | ||
| NOI Debt Yield(5) | 9.4% | 16.3% | 17.8% | 19.0% | 20.1% | ||
| NCF Debt Yield(5) | 9.4% | 16.3% | 17.8% | 19.0% | 19.7% |
| (1) | Represents (i) percent of Net Rental Income for all revenue fields, (ii) percent of Gross Potential Rent for Vacancy & Credit Loss and (iii) percent of Effective Gross Income for all other fields. |
| (2) | The Great Value Storage Portfolio Borrowers acquired two properties, GVS - 2502 Bay Street and GVS - 410 Gulf Freeway, in 2016 and two additional properties, GVS - 443 Laredo Street and GVS 7273 Kearney Street and 6345 East 78th Avenue, in 2017. As such, the 2016 historical performance does not include GVS - 2502 Bay Street and GVS - 410 Gulf Freeway and the 2017 historical performance does not include GVS - 443 Laredo Street and GVS - 7273 Kearney Street and 6345 East 78th Avenue. The increase in Gross Potential Rent is primarily due to the inclusion of the acquired properties. U/W Gross Potential Rent is based on the underwritten unit mix and includes base rental revenue from conventional self storage units, vehicle parking spaces, commercial units, campsites, billboards, and cell towers. |
| (3) | Other Income includes personal property protection reimbursement, late fees, lien fees, admin fees, merchandise sales, miscellaneous income and other fees. |
| (4) | The underwritten economic vacancy is 15.4%. As of September 16, 2018, The Great Value Storage Portfolio was 87.0% occupied, based on net rentable square footage, and 85.7%, based on net rentable units. |
| (5) | Based on the Great Value Storage Portfolio Whole Loan. |
Appraisal.The appraiser concluded to an “as-is” appraised value of $376,000,000 as of October 10, 2018 and an “as stabilized” appraised value of $392,000,000 as of October 10, 2019. On a stand-alone basis, the 64 Great Value Storage Portfolio Properties have an aggregate “as-is” appraised value of $326,000,000.
Environmental Matters. According to a Phase I environmental site assessments dated from September 10, 2018 to October 24, 2018, there was no evidence of any recognized environmental conditions at any of the Great Value Storage Portfolio Properties.
THE INFORMATION IN THIS STRUCTURAL AND COLLATERAL TERM SHEET IS NOT COMPLETE AND MAY BE AMENDED PRIOR TO THE TIME OF SALE. THIS TERM SHEET IS NOT AN OFFER TO SELL THESE SECURITIES AND IT IS NOT A SOLICITATION OF AN OFFER TO BUY THESE SECURITIES IN ANY JURISDICTION WHERE THE OFFER OR SALE IS NOT PERMITTED.
78
Self Storage – Self Storage Property Addresses – Various
| Loan #10
Great Value Storage Portfolio
| Cut-off Date Balance: Cut-off Date LTV: U/W NCF DSCR: U/W NOI Debt Yield:
| $25,000,000 29.3% 4.68x 20.1%
|
Market Overview and Competition.The Great Value Storage Portfolio benefits from geographical diversity with properties located across 10 states and 38 cities. Of these, 34 properties are located across five statistical metropolitan areas (“SMAs”) in Texas (53.3% of net rental square footage, 51.5% of the allocated cut-off date balance). Additionally, 16 properties are located across five SMAs in Ohio (22.9% of net rentable square footage, 23.9% of the allocated cut-off date balance). No individual property represents more than 3.5% of net rentable square footage or 3.9% of the allocated cut-off date balance.
The weighted average estimated 2018 population and average household income within a three-mile radius and five-mile radius of the Great Value Storage Portfolio Properties is 102,474 and $71,294 and 237,731 and $75,872, respectively. The Great Value Storage Portfolio Properties are primarily located in accessible urban and suburban areas along commercial roadways, in which the weighted average traffic count, based on the nearest major intersection to the Great Value Storage Portfolio Properties, is 18,875.
According to a third party research report, there are approximately 52,747 self storage facilities across the United States, which represents an increase of 1.1% over 2017. National occupancy rates have continued to improve from 82.8% in 2011 to 88.5% as of 2018. Within the Great Value Storage Portfolio, 34 properties are located within the Southwest division of the self storage market, which exhibited a national average occupancy rate of 87.3% for 2018. Additionally, 19 properties are located within the East North Central division of the self storage market, which exhibited a national average occupancy rate of 88.2% for 2018. According to the appraisal, 2018 nationwide non-climate-controlled storage units and climate-controlled storage units have an average rental rate of $15.42 per square foot and $19.11 per square foot, respectively. Non-climate-controlled storage units and climate-controlled storage units at the Great Value Storage Portfolio Properties have an average rental rate of $7.58 per square foot and $11.32 per square foot, respectively.
The following table presents certain information relating to the SMAs for the Great Value Storage Portfolio Properties:
| SMA | No. of Props | Net Rentable Area (SF)(1) | U/W NCF | % of U/W NCF | Traffic Count(2) | 2018 Population 5-mile Radius(3) | Allocated Cut-off Date Balance(4) | Appraised Value(5) | Allocated Cut-off Date LTV(4)(5) |
| Houston-The Woodlands-Sugar Land, TX | 22 | 1,385,596 | $6,865,943 | 31.7% | 11,308 | 302,438 | $36,467,390 | $114,440,000 | 31.9% |
| Dallas-Fort Worth-Arlington, TX | 6 | 582,612 | $2,789,948 | 12.9% | 43,739 | 334,063 | $14,547,100 | $42,900,000 | 33.9% |
| Columbus, OH | 7 | 456,336 | $2,788,848 | 12.9% | 15,829 | 240,262 | $13,510,870 | $38,000,000 | 35.6% |
| Dayton, OH | 5 | 276,069 | $1,375,388 | 6.3% | 13,286 | 144,025 | $6,934,780 | $19,060,000 | 36.4% |
| Other, OH(6) | 4 | 207,272 | $1,285,183 | 5.9% | 12,168 | 97,731 | $5,858,690 | $15,870,000 | 36.9% |
| Champaign-Urbana, IL | 2 | 163,944 | $892,530 | 4.1% | 38,100 | 129,539 | $4,543,470 | $12,900,000 | 35.2% |
| Denver-Aurora-Lakewood, CO | 2 | 103,520 | $869,445 | 4.0% | 9,597 | 264,542 | $4,025,360 | $11,700,000 | 34.4% |
| Jackson, MS | 2 | 159,600 | $743,406 | 3.4% | 29,765 | 75,818 | $3,905,800 | $11,900,000 | 32.8% |
| Las Vegas-Henderson-Paradise, NV | 1 | 131,744 | $660,453 | 3.0% | 38,000 | 415,102 | $3,427,550 | $9,200,000 | 37.3% |
| Austin-Round Rock, TX | 4 | 113,270 | $734,845 | 3.4% | 2,929 | 173,371 | $3,188,410 | $8,770,000 | 36.4% |
| Other, TX(7) | 2 | 104,695 | $470,982 | 2.2% | 3,035 | 31,574 | $2,431,160 | $8,025,000 | 30.3% |
| Orange-Rockland-Westchester, NY | 1 | 63,137 | $472,277 | 2.2% | 18,300 | 108,334 | $2,271,740 | $6,100,000 | 37.2% |
| Kansas City, MO-KS | 1 | 70,000 | $397,172 | 1.8% | 2,824 | 154,766 | $2,072,460 | $6,700,000 | 30.9% |
| Memphis, TN-AR-MS | 2 | 108,575 | $389,694 | 1.8% | 31,612 | 196,642 | $2,032,610 | $6,275,000 | 32.4% |
| Hattiesburg, MS | 1 | 76,755 | $370,236 | 1.7% | 10,000 | 66,649 | $1,952,900 | $5,650,000 | 34.6% |
| Indianapolis-Carmel-Anderson, IN | 1 | 72,914 | $324,771 | 1.5% | 19,774 | 187,001 | $1,713,770 | $5,510,000 | 31.1% |
| Poughkeepsie-Newburgh-Middletown NY | 1 | 27,725 | $239,879 | 1.1% | 9,180 | 22,489 | $1,115,940 | $3,000,000 | 37.2% |
| Total/Weighted Average | 64 | 4,103,764 | $21,671,000 | 100.0% | 18,875 | 237,731 | $110,000,000 | $376,000,000 | 29.3% |
| (1) | Information obtained from the underwritten unit mix. |
| (2) | Information obtained from third party market research reports. |
| (3) | Information obtained from the appraisals. |
| (4) | Allocated Cut-off Date Balance and Allocated Cut-off Date LTV are based on the Great Value Storage Portfolio Whole Loan. |
| (5) | The aggregate Appraised Value for each SMA represents the “as-is” appraised value on a stand-alone basis. Total Appraised Value and weighted average Allocated Cut-of Date LTV are based on the portfolio “as-is” appraised value of $376,000,000 as of October 10, 2018. Weighted average Allocated Cut-off Date LTV based on the aggregate stand-alone “as-is” appraised value of $326,000,000 is 33.7%. |
| (6) | Includes two properties in the Youngstown-Warren-Boardman, OH-PA SMA, one property in the Mansfield, OH SMA and one property in the Cincinnati, OH-KY-IN SMA. |
| (7) | Includes one property in the Brownsville-Harlingen, TX SMA and one property in the San Antonio-New Braunfels, TX SMA. |
THE INFORMATION IN THIS STRUCTURAL AND COLLATERAL TERM SHEET IS NOT COMPLETE AND MAY BE AMENDED PRIOR TO THE TIME OF SALE. THIS TERM SHEET IS NOT AN OFFER TO SELL THESE SECURITIES AND IT IS NOT A SOLICITATION OF AN OFFER TO BUY THESE SECURITIES IN ANY JURISDICTION WHERE THE OFFER OR SALE IS NOT PERMITTED.
79
Self Storage – Self Storage Property Addresses – Various
| Loan #10
Great Value Storage Portfolio
| Cut-off Date Balance: Cut-off Date LTV: U/W NCF DSCR: U/W NOI Debt Yield:
| $25,000,000 29.3% 4.68x 20.1%
|
Escrows.
Real Estate Taxes – The loan documents require an upfront real estate tax reserve of $525,978 and ongoing monthly real estate tax reserves in an amount equal to one-twelfth of the real estate taxes that the lender estimates will be payable during the next twelve months (initially $328,736).
Insurance – The loan documents require an upfront insurance reserve of $807,323 and ongoing monthly insurance reserves in an amount equal to one-twelfth of the insurance premiums that the lender estimates will be payable during the next twelve months (initially $93,875).
Replacement Reserves –The loan documents require ongoing monthly replacement reserves of $34,198 for replacements and repairs required to be made to the Great Value Storage Portfolio Properties during the calendar year.
Immediate Repairs Reserve – The loan documents require an upfront reserve of $536,017 for immediate repairs.
Lockbox and Cash Management.The Great Value Storage Portfolio Whole Loan documents require a hard lockbox with springing cash management. The Great Value Storage Portfolio Borrowers were required at origination of the Great Value Storage Portfolio Whole Loan to deliver written instructions to certain major tenants and to each credit card company directing them to deposit all rents payable under such leases and all credit card payments directly into a lender-controlled lockbox account. The Great Value Storage Portfolio Whole Loan documents require that all rents received by the Great Value Storage Portfolio Borrowers or the property manager be deposited into the lockbox account within three business days of receipt. Funds in the lockbox account, absent the occurrence and continuance of a Triggering Event (as defined below), are required to be transferred daily to a borrower operating account. Upon the first occurrence of a Triggering Event, the Great Value Storage Portfolio Borrowers are required to establish a cash management account under sole control of the lender, to which, during a Triggering Event, all amounts in the lockbox account are required to be automatically transferred daily for the payment, among other things, of the debt service, monthly escrows, default interest and late payment charges. Absent the continuance of a Cash Sweep Period (as defined below), any remaining funds after such disbursements are required to be distributed to the Great Value Storage Portfolio Borrowers. Upon a Cash Sweep Period, all remaining excess cash flow will be escrowed in an excess cash flow reserve account.
A “Triggering Event” will commence upon the earliest to occur of the following:
| (i) | an event of default under the Great Value Storage Portfolio Whole Loan documents or the Great Value Storage Portfolio Mezzanine Loans’ documents; |
| (ii) | the debt service coverage ratio as of the end of any calendar quarter for the immediately preceding 12-month period of the Great Value Storage Portfolio debt, including the Great Value Storage Portfolio Mezzanine Loans (the “Cumulative DSCR”), falling below 1.16x; |
| (iii) | the date on which the Great Value Storage Portfolio Borrowers, the borrower sponsor, the guarantor, or the property manager becomes insolvent or a debtor in a bankruptcy action; or |
(iv) an indictment for fraud or misappropriation of funds by the Great Value Storage Portfolio Borrowers, the borrower sponsor, the guarantor, or the property manager.
A Triggering Event will end upon the occurrence of:
| ● | with regard to clause (i) above, the cure of such event of default; |
| ● | with regard to clause (ii) above, (a) the Cumulative DSCR being at least 1.21x for two consecutive calendar quarters or (b) the Great Value Storage Portfolio Borrowers deposit with the lender, either in cash or letter of credit, an amount that if applied to the reduction of the outstanding principal balances of the Great Value Storage Portfolio Whole Loan and the Great Value Storage Portfolio Mezzanine Loans, would result in a Cumulative DSCR of at least 1.16x; |
| ● | with regard to clause (iii) above, such bankruptcy action petition having been discharged, stayed, or dismissed within 60 days of such filing for the Great Value Storage Portfolio Borrowers, the borrower sponsor, or guarantor, or within 120 days of such filing for the property manager, among other conditions; or |
| ● | with regard to clause (iv) above, the dismissal of the applicable indictment with prejudice or the acquittal of the applicable person with respect to the related charge or the replacement of the property manager with a qualified manager pursuant to the Great Value Storage Portfolio Whole Loan documents. |
A “Cash Sweep Period” will commence upon the earliest to occur of the following:
| (i) | an event of default under the Great Value Storage Portfolio Whole Loan documents or the Great Value Storage Portfolio Mezzanine Loans’ documents; |
| (ii) | the Cumulative DSCR falling below 1.16x as of the end of any calendar quarter; or |
| (iii) | the date on which the Great Value Storage Portfolio Borrowers, the borrower sponsor, the guarantor, or an affiliated property manager becomes insolvent or a debtor in a bankruptcy action. |
THE INFORMATION IN THIS STRUCTURAL AND COLLATERAL TERM SHEET IS NOT COMPLETE AND MAY BE AMENDED PRIOR TO THE TIME OF SALE. THIS TERM SHEET IS NOT AN OFFER TO SELL THESE SECURITIES AND IT IS NOT A SOLICITATION OF AN OFFER TO BUY THESE SECURITIES IN ANY JURISDICTION WHERE THE OFFER OR SALE IS NOT PERMITTED.
80
Self Storage – Self Storage Property Addresses – Various
| Loan #10
Great Value Storage Portfolio
| Cut-off Date Balance: Cut-off Date LTV: U/W NCF DSCR: U/W NOI Debt Yield:
| $25,000,000 29.3% 4.68x 20.1%
|
A Cash Sweep Period will end upon the occurrence of:
| ● | with regard to clause (i) above, the cure of such event of default; |
| ● | with regard to clause (ii) above, (a) the Cumulative DSCR being at least 1.21x for two consecutive calendar quarters or (b) the Great Value Storage Portfolio Borrowers deposit with the lender, either in cash or letter of credit, an amount that if applied to the reduction of the outstanding principal balances of the Great Value Storage Portfolio Whole Loan and the Great Value Storage Portfolio Mezzanine Loans, would result in a Cumulative DSCR of at least 1.16x; or |
| ● | with regard to clause (iii) above, such bankruptcy action petition having been discharged, stayed, or dismissed within 60 days of such filing for the Great Value Storage Portfolio Borrowers, the borrower sponsor, or guarantor, or within 120 days of such filing for the property manager, among other conditions. |
Property Management. The Great Value Storage Portfolio Properties are managed by an affiliate of the Great Value Storage Portfolio Borrowers.
Partial Release. The Great Value Storage Portfolio Borrowers may partially defease the Great Value Storage Portfolio Whole Loan and obtain the release of any of the Great Value Storage Portfolio Properties securing the Great Value Storage Portfolio Whole Loan, at any time after the lockout period,provided that, among other things, (i) the Great Value Storage Portfolio Borrowers prepay a portion of the Great Value Storage Portfolio Whole Loan equal to 110% of the allocated loan amount of the property being released, (ii) the Cumulative DSCR for the remaining properties following the release based on the trailing 12 months is no less than the greater of (a) the Cumulative DSCR immediately preceding such release and (b) the Cumulative DSCR as of the origination date, (iii) the debt yield for the remaining properties is no less than the greater of (a) the debt yield immediately preceding such release and (b) the debt yield at origination of the Great Value Storage Portfolio Whole Loan, (iv) the loan-to-value ratio for the remaining properties is no greater than the lesser of (a) the loan-to-value ratio (based on the appraisals obtained in connection with the origination of the Great Value Storage Portfolio Whole Loan) immediately preceding such release and (b) the loan-to-value ratio at origination of the Great Value Storage Portfolio Whole Loan, (v) the aggregate net operating income (“NOI”) of the remaining properties located in the Houston, Texas metropolitan area will not exceed 40% of the aggregate NOI of the remaining properties and the aggregate NOI of the remaining properties located in the Dallas, Texas metropolitan area will not exceed 20% of the aggregate NOI of the remaining properties and (vi) if any Great Value Storage Portfolio Mezzanine Loan is outstanding, the applicable Great Value Storage Portfolio Borrower prepays a portion of the Great Value Storage Portfolio Mezzanine Loan equal to 110% of the allocated loan amount of the property being released. See “Description of the Mortgage Pool—Certain Terms of the Mortgage Loans—Releases; Partial Releases” in the Preliminary Prospectus.
Real Estate Substitution.Not permitted.
Subordinate and Mezzanine Indebtedness.The Great Value Storage Portfolio Mezzanine Loans are comprised of a mezzanine loan in the original principal amount of $103.0 million (the “Great Value Storage Portfolio Mezzanine A Loan”), which is secured by the direct equity ownership in the Great Value Storage Portfolio Borrowers, and a mezzanine loan in the outstanding principal amount of $82.0 million (the “Great Value Storage Portfolio Mezzanine B Loan”), which is subordinate to the Great Value Storage Portfolio Mezzanine A Loan. The Great Value Storage Portfolio Mezzanine A Loan and Great Value Storage Portfolio Mezzanine B Loan have a coupon of 5.5000%per annum and 8.7150%per annum, respectively, and are coterminous with the Great Value Storage Portfolio Whole Loan. The lenders of the Great Value Storage Portfolio Whole Loan and Great Value Storage Portfolio Mezzanine Loans have entered into an intercreditor agreement that governs their relationship.
Ground Lease. None.
Terrorism Insurance.The Great Value Storage Portfolio Borrowers are required to obtain and maintain property insurance, commercial general liability insurance, and business income or rental loss insurance that covers perils of terrorism and acts of terrorism, both foreign and domestic.
THE INFORMATION IN THIS STRUCTURAL AND COLLATERAL TERM SHEET IS NOT COMPLETE AND MAY BE AMENDED PRIOR TO THE TIME OF SALE. THIS TERM SHEET IS NOT AN OFFER TO SELL THESE SECURITIES AND IT IS NOT A SOLICITATION OF AN OFFER TO BUY THESE SECURITIES IN ANY JURISDICTION WHERE THE OFFER OR SALE IS NOT PERMITTED.
81
| Wells Fargo Commercial Mortgage Trust 2019-C50 | Transaction Contact Information |
E. Transaction Contact Information
Questions regarding this Structural and Collateral Term Sheet may be directed to any of the following individuals:
| Wells Fargo Securities, LLC | |
| Brigid Mattingly | Tel. (312) 269-3062 |
| A.J. Sfarra | Tel. (212) 214-5613 |
| Alex Wong | Tel. (212) 214-5615 |
| Barclays Capital Inc. | |
| Daniel Vinson | Tel. (212) 528-8224 |
| Brian Wiele | Tel. (212) 412-5780 |
| UBS Securities LLC | |
| David Schell | Tel. (212) 713-3375 |
| Nicholas Galeone | Tel. (212) 713-8832 |
| Siho Ham | Tel. (212) 713-1278 |
THE INFORMATION IN THIS STRUCTURAL AND COLLATERAL TERM SHEET IS NOT COMPLETE AND MAY BE AMENDED PRIOR TO THE TIME OF SALE. THIS TERM SHEET IS NOT AN OFFER TO SELL THESE SECURITIES AND IT IS NOT A SOLICITATION OF AN OFFER TO BUY THESE SECURITIES IN ANY JURISDICTION WHERE THE OFFER OR SALE IS NOT PERMITTED.
82